- Аналітика
- Новини та інструменти
- Новини ринків
Новини ринків
- Natural Gas prints mild gains, struggling to defend corrective bounce off six-week-old horizontal support zone.
- Bearish MACD signals, U-turn from 50-SMA keeps sellers hopeful.
- XNG/USD bulls need to cross $2.75-77 zone to retake control.
Natural Gas (XNG/USD) remains pressured around $2.67 despite posting minor intraday gains during early Friday morning in Asia. In doing so, the energy instrument stays defensive after fading the bounce off the six-week-old horizontal support zone.
That said, the XNG/USD’s failure to cross the 50-SMA during the previous day’s corrective bounce joins the bearish MACD signals and sustained trading below the support-turned-resistance line stretched from June 12 to keep sellers hopeful.
However, the aforementioned horizontal support area comprising multiple levels marked since May 16, around $2.61-60, appears a tough nut to crack for the Natural Gas bears.
Even if the Natural Gas Price drops below $2.60, the 100-SMA support of near $2.59 and the monthly horizontal region surrounding $2.43-44 could challenge the XNG/USD bears before giving them control.
On the contrary, the 50-SMA caps the immediate upside of the Natural Gas Price near $2.73.
Following that, a convergence of the two-week-old previous support line, the weekly descending resistance line and multiple levels marked during June 19-20 together constitute $2.75-77 as a tough nut to crack for the XNG/USD bulls.
In a case where the Natural Gas Price remains firmer past $2.77, the odds of witnessing the fresh monthly high, currently around $2.93, can’t be ruled out.
Natural Gas Price: Four-hour chart

Trend: Further downside expected
- AUD/USD remains sidelined after bouncing off a three-week low.
- Upbeat US data, hawkish Fed speak keeps Aussie bears hopeful.
- Australia Retail Sales, risk-on mood put a floor under prices of risk-barometer pair.
- China’s official PMIs, US Core PCE Price Index eyed for clear directions.
AUD/USD portrays pre-data anxiety around 0.6610-15, defending the previous day’s rebound from the lowest levels in three weeks ahead of the key China and US data amid early Friday in Asia. In addition to the cautious mood, mixed sentiment about the Reserve Bank of Australia (RBA) and the market’s upbeat risk appetite also limit the major currency pair’s latest moves.
On Thursday, a surprise jump in Australia Retail Sales, to 0.7% MoM for May versus 0.1% expected and 0.0% prior, offered breathing space to the AUD/USD bears after the Australian Monthly Consumer Price Index (CPI) disappointed the Reserve Bank of Australia (RBA) hawks the previous day.
Also keeping the AUD/USD buyers hopeful was the market’s risk-on mood, backed by upbeat US data and receding fears of a recession in the West, as well as chatters that China’s softer economic recovery won’t be widespread.
That said, the US Gross Domestic Product (GDP) Annualized, mostly known as the Real GDP, grew at the 2.0% rate for the first quarter (Q1) of 2023 versus the 1.3% initial estimation. Further, the US Weekly Initial Jobless Claims slumped to 239K for the week ended on June 23 compared to 265K expected and revised prior. However, the Personal Consumption Expenditure (PCE) Price for Q1 2023 eased to 4.1% QoQ from 4.2% expected and prior whereas the Pending Home Sales slumped to -2.7% MoM for May compared to 0.2% expected and -0.4% prior (revised).
It should be noted, however, that the hawkish Federal Reserve (Fed) comments and mixed China concerns weigh on the risk-barometer pair.
Fed Chair Jerome Powell spoke at the Fourth Conference on Financial Stability hosted by the Bank of Spain, in Madrid, while saying, “A strong majority of Fed policymakers expect two or more rate hikes by year-end.” Additionally, Atlanta Federal Reserve President Raphael Bostic told reporters regarding future rate increases, as reported by Reuters, that he doesn’t see as much urgency to move as stated by others, including Chairman Jerome Powell. The policymaker, however, recently took a U-turn while saying, “I think it's unambiguous that inflation has fallen considerably."
Elsewhere, mixed headlines about the US-China ties as US Treasury Secretary Janet Yellen ‘hopes’ to visit China to re-establish contacts but also showed readiness to take actions to protect national security interests even at an economic cost.
Against this backdrop, Wall Street closed positive but the US 10-year and two-year Treasury bond yields also rallied while the US Dollar Index (DXY) refreshed its weekly top before retreating to 103.40. It should be noted that the S&P500 Futures print mild gains by the press time.
Moving on, China’s official Purchasing Managers’ Index (PMI) details for June and the Federal Reserve’s (Fed) favorite inflation gauge, namely the US Core Personal Consumption Expenditure (PCE) Price Index, for May, will be in the spotlight.
While China’s headline NBS Manufacturing PMI is expected to improve to 49.0 from 48.8 and the Non-Manufacturing PMI may ease to 50.8 from 54.5 prior, fears about the dragon nation’s economic weakness exert downside pressure on the AUD/USD due to Aussie-China ties. Further, the US Core PCE Price Index is likely to remain static at 0.4% MoM and 4.7% YoY, which in turn may allow the Fed to keep its hawkish bias and exert downside pressure on the AUD/USD.
Technical analysis
Despite the Aussie pair’s latest corrective bounce off the multi-day low, backed by a nearly oversold RSI (14) line, a fortnight-old descending resistance line and the 200-DMA, respectively near 0.6645 and 0.6695, limit the immediate upside of the AUD/USD pair.
- Strong GDP and jobless claims data drive US Dollar, yet USD/CAD records marginal losses.
- Fed’s signal of two more rate hikes by year’s end boosts odds for a July rate hike to 87%.
- Traders anticipate upcoming GDP data and BoC outlook survey for clues on Canada’s economic health.
USD/CAD registered minuscule losses on Thursday in a session that witnessed the US Dollar (USD) as the strongest currency, which rose on better-than-expected US economic data which failed to boost the USD/CAD. The USD/CAD is trading at 1.3249 after hitting a high of 1.3285.
Bolstered US economic performance fails to boost USD/CAD; market eyes upcoming Canadian data
Key economic indicators of the US economy pushed aside recession fears that reignited during the last week. The US Gross Domestic Product (GDP) for the first quarter exceeded the prior’s reading of 1.3%, climbed past the 2% market, crushing estimates, sending US Treasury bond yields soaring more than ten basis points. Additional data revealed the tightness of the labor market, as Initial Jobless Claims for the week ending June 24 climbed by 239K, below forecasts of 265K, and halted three weeks of rising unemployment claims, suggesting the labor market remains solid, ahead of the following week’s June Nonfarm Payrolls report.
As abovementioned, the US 2-year Treasury bond yield surged toward the 4.9% threshold, while the 10-year note rate, which finished at 3.842%, gained 13 basis points. The US Dollar Index (DXY), a measure of the greenback’s value against a basket of peers, advanced 0.33%, up at 103.302.
Following a robust performance by the US economy over the past month, speculation regarding further monetary policy tightening by the US Federal Reserve (Fed) has increased. In his recent discourse during the Eurozone session, Fed Chair Jerome Powell underscored the consensus of the Federal Reserve Open Market Committee (FOMC) regarding the probable implementation of two more rate hikes by the close of the year.
Odds for a 25 bps rate hike in July increased to 87%, while traders shifted their view of only one rate increase as chances for the November meeting augmented to 33.7%, according to the CME FedWatch Tool.
On the Canadian front, the economic agenda was absent on Thursday. Still, data expected on Friday, like the Gross Domestic Product (GDP) and the Bank of Canada outlook survey, will shed some light on the economic status of Canada. The Core Personal Consumption Expenditures (PCE) would be featured alongside the Consumer Sentiment and the Chicago PMI on the US front.
USD/CAD Technical Levels
- GBP/USD seesaws around the lowest levels in two weeks, prods two-day downtrend of late.
- Bearish MACD signals, clear downside break of two-month-old horizontal support keep Pound Sterling bears hopeful.
- Multiple rising support lines, 100-EMA joins steady RSI to test Cable bears.
- Upbeat UK GDP, softer US inflation clues may allow Pound Sterling buyers to reprint 1.2600 on chart.
GBP/USD treads water at the lowest levels in two weeks, around 1.2610-1.2600 amid early Friday morning in Asia. In doing so, the Cable pair fails to justify the midweek’s downside break of the key horizontal support, now resistance, as well as the bearish MACD signals.
The Pound Sterling’s latest inaction could be linked to the market’s cautious mood ahead of the top-tier US and UK data, as well as the presence of ascending support lines from March and May, as well as the steady RSI (14) line.
Hence, the GBP/USD pair is likely to grind lower and suggests a battle with the ascending support line from March 08, around 1.2565, to be imminent.
The Pound Sterling’s weakness past 1.2565, however, isn’t an open invitation to the GBP/USD bears as a five-week-old rising support line, close to 1.2525, will precede the 100-day Exponential Moving Average (EMA), around 1.2420, to restrict further downside of the pair.
Meanwhile, the GBP/USD pair’s corrective bounce past the horizontal area comprising multiple levels marked since early May, between 1.2670 and 1.2690, appears a tough nut to crack for the Cable pair buyers during the corrective bounce.
In a case where the GBP/USD manages to remain firmer past 1.2690, the odds of witnessing a rally towards the yearly top marked in mid-June around 1.2850 can’t be ruled out.
GBP/USD: Daily chart
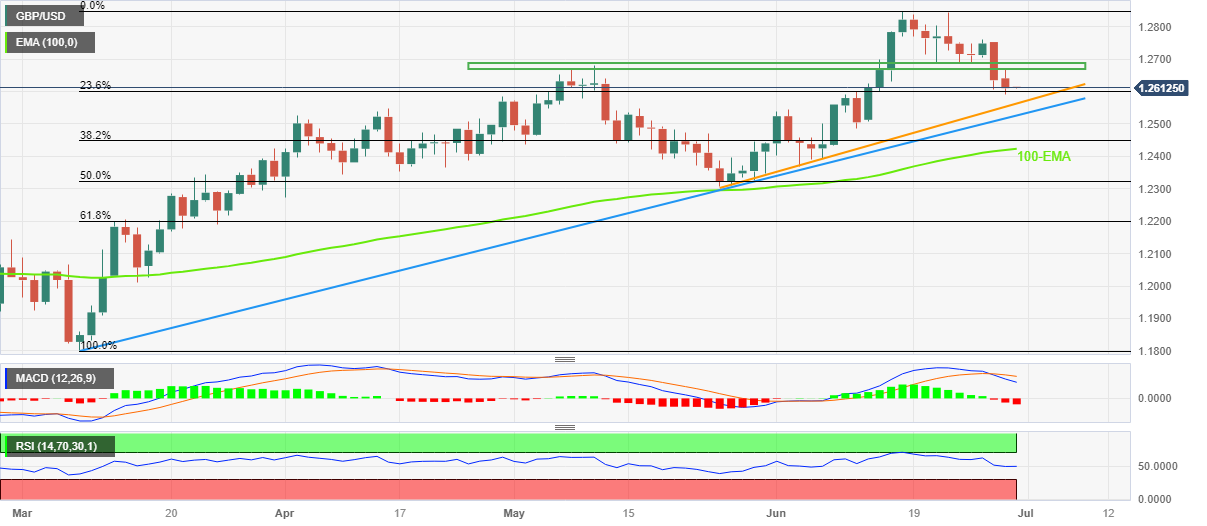
Trend: Further downside expected
- EUR/USD bears flirt with the weekly low as markets await the key EU/US data.
- ECB hawks fail to impress markets amid mixed figures at home, looming German recession.
- US data came in mostly upbeat and back Fed Chair Powell’s “two more rate hike” concerns, underpinning US Dollar.
- Eurozone HICP, US Core PCE Price Index will be crucial to watch for clear directions as Euro pair pokes key support line.
EUR/USD grinds near the weekly low surrounding 1.0860 as bears attack the monthly support line amid early Friday in Asia. In doing so, the Euro pair portrays the typical pre-data anxiety as the top-tier inflation numbers from the Eurozone and the US loom. Also putting a floor under the major currency pair could be the market’s risk-on mood.
EUR/USD dropped the most in a week the previous day to refresh the weekly bottom after the US data marked mostly upbeat outcomes but the European counterpart came in mixed. Not only that, but the comparatively more hawkish Federal Reserve (Fed) signals versus the market’s lack of acceptance of the European Central Bank (ECB) policymakers’ optimism also weigh on the Euro pair.
That said, the Eurozone Consumer Confidence matched -16.1 market forecast and prior for June while Business Climate eased to 0.06 from 0.19 prior for the said month. Further, the bloc’s Economic Sentiment Indicator for June eased to 95.3 versus analysts’ estimations of 96.0 and 96.5 previous readings. Additionally, the old continent’s Industrial Confidence deteriorated but Service Sentiment came in better-than-forecast for the said month.
However, Germany’s inflation per the Consumer Price Index (CPI) rose to 6.4% YoY in June from 6.1% in May and 6.3% expected. On the same line, the European Central Bank’s (ECB) favorite inflation gauge, namely the Harmonised Index of Consumer Prices (HICP) also jumped to 6.8% on a yearly basis from 6.3% prior and 6.7% market forecasts.
Elsewhere, European Central Bank (ECB) policymaker and Bank of Spain's Governor Pablo Hernandez de Cos said on Thursday that the ECB September meeting is absolutely open regarding interest rates. Earlier in the week, a slew of ECB Policymakers including President Christine Lagarde spoke at the ECB Forum and advocated for higher rates, with most signaling a rate hike in July being undoubtful.
It’s worth noting that the ECB’s Economic Bulletin said, “Overall, changes in price competitiveness since the pandemic appears to have neither aggravated nor further unwound external imbalances.”
On the other hand, the US Gross Domestic Product (GDP) Annualized, mostly known as the Real GDP, grew at the 2.0% rate for the first quarter (Q1) of 2023 versus the 1.3% initial estimation. Further, the US Weekly Initial Jobless Claims slumped to 239K for the week ended on June 23 compared to 265K expected and revised prior. However, the Personal Consumption Expenditure (PCE) Price for Q1 2023 eased to 4.1% QoQ from 4.2% expected and prior whereas the Pending Home Sales slumped to -2.7% MoM for May compared to 0.2% expected and -0.4% prior (revised).
Further, Fed Chair Jerome Powell spoke at the Fourth Conference on Financial Stability hosted by the Bank of Spain, in Madrid, while saying, “A strong majority of Fed policymakers expect two or more rate hikes by year-end.” Additionally, Atlanta Federal Reserve President Raphael Bostic told reporters regarding future rate increases, as reported by Reuters, that he doesn’t see as much urgency to move as stated by others, including Chairman Jerome Powell. The policymaker, however, recently took a U-turn while saying, “I think it's unambiguous that inflation has fallen considerably."
Amid these plays, Wall Street closed positive but the US 10-year and two-year Treasury bond yields also rallied while the US Dollar Index (DXY) refreshed its weekly top before retreating to 103.40.
Looking ahead, the first readings of Eurozone HICP and Consumer Price Index (CPI) inflation numbers for June will precede the US Core PCE Price Index for May to entertain the EUR/USD pair traders. While the market forecasts don’t flash any alarming signals for the scheduled data, downbeat figures of the US inflation and a surprise positive in the Eurozone data may trigger the major currency pair’s rebound from the short-term key support.
Technical analysis
Although the EUR/USD pair’s daily closing below the 50-DMA, around 1.0870 by the press time, keeps the sellers hopeful, an upward-sloping support line from late May, close to 1.0860 restricts the quote’s immediate downside.
- Gold Price stays bearish near the lowest levels since March, braces for the second consecutive weekly loss.
- Hawkish Federal Reserve talks, upbeat United States data underpin US Dollar strength and weigh on XAU/USD.
- US-China jitters, Germany’s recession fears and fewer accolades for European Central Bank hawks also favor Gold sellers.
- China’s official PMIs, US PCE Price Index and Fed clues are the key drivers for XAU/USD.
Gold Price (XAU/USD) licks its wounds at the lowest levels in three months, stays bearish despite late Thursday’s corrective bounce off multi-day low to around $1,908 amid the early hours of Friday’s Asian session. The XAU/USD dropped to a fresh low since March 15 before bouncing off $1,893 as strong United States data and hawkish Federal Reserve (Fed) talks joined upbeat market sentiment the previous day. That said, the quote presently pokes the key support and hence traders keep their eyes on the US Core Personal Consumption Expenditure (PCE) Price Index data, the Fed’s preferred inflation gauge, for clear directions. Also important to watch are the preliminary reading of China’s NBS Manufacturing PMI and Non-Manufacturing PMII, as well as central bankers’ speeches.
Gold Price drop on United States data, bounce back on upbeat sentiment
Gold Price bears the burden of the mostly firmer US data, which in turn underpins the hawkish Federal Reserve (Fed) commentary.
On Thursday, the US Gross Domestic Product (GDP) Annualized, mostly known as the Real GDP, grew at the 2.0% rate for the first quarter (Q1) of 2023 versus the 1.3% initial estimation. Further, the US Weekly Initial Jobless Claims slumped to 239K for the week ended on June 23 compared to 265K expected and revised prior. However, the Personal Consumption Expenditure (PCE) Price for Q1 2023 eased to 4.1% QoQ from 4.2% expected and prior whereas the Pending Home Sales slumped to -2.7% MoM for May compared to 0.2% expected and -0.4% prior (revised).
On the other hand, Fed Chair Jerome Powell spoke at the Fourth Conference on Financial Stability hosted by the Bank of Spain, in Madrid, while saying, “A strong majority of Fed policymakers expect two or more rate hikes by year-end.” The policymaker, however, also said, “Bank stresses that emerged in March 'may well lead' to a further tightening in credit conditions,” which in turn prod US Dollar bulls despite keeping them in the driver’s seat. The reason could be linked to the upbeat results of the US Banking Stress Test.
“The Fed's ‘stress test’ exercise showed lenders, including JPMorgan Chase, Bank of America, Citigroup, Wells Fargo, Morgan Stanley and Goldman Sachs, have enough capital to weather a severe economic slump, paving the way for them to issue share buybacks and dividends,” reported Reuters.
On the contrary, Atlanta Federal Reserve President Raphael Bostic told reporters regarding future rate increases, as reported by Reuters, that he doesn’t see as much urgency to move as stated by others, including Chairman Jerome Powell. The policymaker, however, recently took a U-turn while saying, “I think it's unambiguous that inflation has fallen considerably."
Apart from the United States data, the European Central Bank (ECB) policymakers’ inability to convince markets of their hawkish capacity, amid looming recession fears, also seemed to have propelled the US Dollar and weighed on the Gold Price. Furthermore, Mixed headlines about the US-China ties also weighed on the XAU/USD. That said, US Treasury Secretary Janet Yellen ‘hopes’ to visit China to re-establish contacts but also showed readiness to take actions to protect national security interests even at an economic cost.
Even so, markets welcome the upbeat US data and shrug off the fears from China while taming the US Dollar gains and allowing the Gold sellers to take a breather afterward. On Thursday, Analysts at Moody’s rating agency said that the US economy can absorb the impact of China's slower growth, which in turn allowed the US Dollar to cheer hawkish comments from Fed Chair Powell and upbeat data at home.
It should be noted that the US 10-year and two-year Treasury bond yields rallied while the US Dollar Index (DXY) also refreshed its weekly top before retreating to 103.40.
China PMI, Fed’s preferred inflation eyed for XAU/USD directions
Looking ahead, China’s official Purchasing Managers’ Index (PMI) details for June and the Federal Reserve’s (Fed) favorite inflation gauge, namely the US Core Personal Consumption Expenditure (PCE) Price Index, for June and May respectively, will be in the spotlight. While China’s headline NBS Manufacturing PMI is expected to improve to 49.0 from 48.8 and the Non-Manufacturing PMI may ease to 50.8 from 54.5 prior, fears about the dragon nation’s economic weakness exert downside pressure on the Gold Price due to Beijing’s status as one of the world’s biggest XAU/USD customers.
Elsewhere, the US Core PCE Price Index is likely to remain static at 0.4% MoM and 4.7% YoY, which in turn may allow the Fed to keep its hawkish bias and exert downside pressure on the Gold Price.
Additionally important are the inflation numbers from Europe and the UK’s Gross Domestic Product (GDP) for data, not to forget central bankers’ speeches.
Gold Price Technical analysis
Gold Price broke the key support line stretched from late November 2022 the previous day but failed to offer a daily close beneath the same, around $1,908 by the press time.
Apart from the multi-month-old rising trend line, the five-month-old horizontal support zone surrounding $1,890-85 and the nearly oversold conditions of the Relative Strength Index (RSI) also challenge the Gold sellers.
However, the XAU/USD’s clear downside break of the 100-DMA and sustained adherence to the fortnight-long descending resistance line, as well as bearish signals from the Moving Average Convergence and Divergence (MACD) indicator, keep the bears hopeful.
Hence, the sellers stay in the driver’s seat unless the Gold Price crosses the immediate resistance and the 100-DMA, respectively near $1,915 and $1,945 in that order.
Even if the XAU/USD rises past $1,945, a descending trend line from June 02, close to $1,952 at the latest, will act as the final defense of the Gold bears.
On the flip side, the aforementioned support line of near $1,908 and the horizontal region near $1,890-85 restricts the immediate downside of the Gold Price.
Following that, the 200-DMA and 61.8% Fibonacci retracement of the November-May upside, near $1,858, will be in the spotlight.
Gold Price: Daily chart
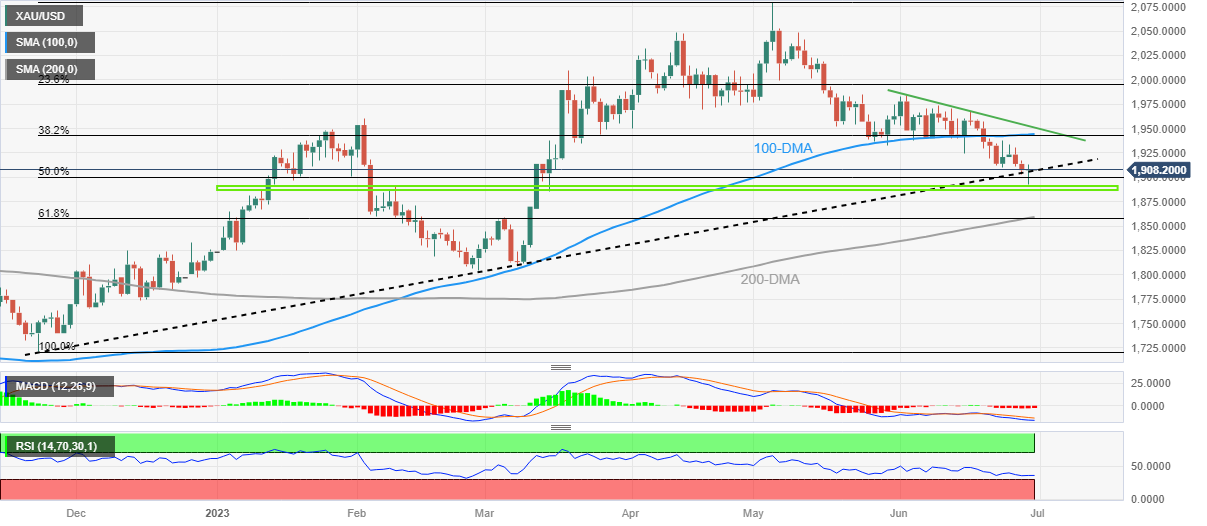
Trend: Limited downside expected
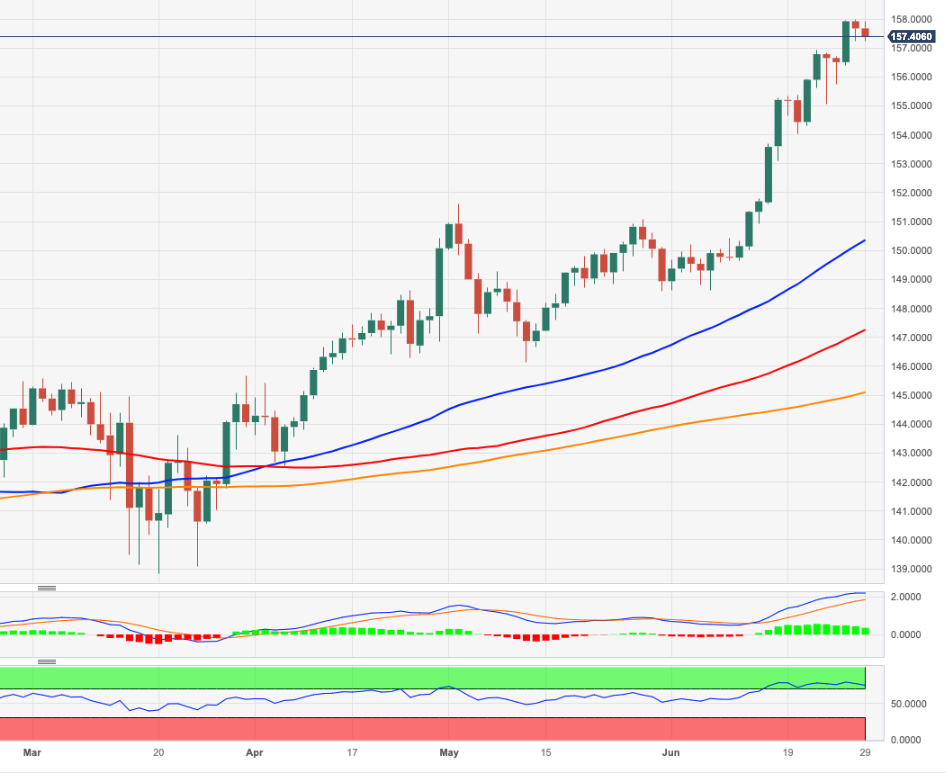
- The USD/JPY tallied a week in a row of gains and closed at 144.13, it highest level since November 2022.
- The case of an intervention from the BoJ get relevance as the pair approaches 145.00.
- Eyes on Friday’s Core PCE data of the US and inflation data from Japan.
On Thursday, the USD/JPY closed the session with gains at 144.13 as the USD gained momentum on positive Gross Domestic Product (GDP) and Jobless Claims data. The focus shifts to key data releases on Friday from both countries.
Investors await Core PCE data from the US and CPI data from Japan
At the early Asian session, the Statistics Bureau of Japan will release the Tokyo Consumer Price Index (CPI), which is expected to rise, reaching a year-on-year increase of 3.8%. Additionally, the core CPI figure is anticipated to reach 4.4%, and the unemployment rate in May is expected to remain stable at 3.6%.
It is worth noting that the Bank of Japan (BoJ) is targeting wage growth, and Governor Ueada mentioned on Wednesday that he’ll consider a policy pivot once inflation aligns with the bank’s target. In that sense, Friday’s data may impact the JPY’s price dynamics.
On the other hand, Core Personal Consumption Expenditures (PCE) will be released on Friday and is expected to come in at 4.7%. This figure is an important gauge of inflation for the Federal Reserve (Fed), so its outcome will impact the Federal Open Market (FOMC) next meeting’s expectations in July. As for now, markets discount higher odds of a 25 basis points (bps) hike.
USD/JPY levels to watch
According to the daily chart, the technical outlook for the USD/JPY is bullish. However, the pair will face strong resistance at 145.00, and as bulls seem to be losing some steam, a downward correction shouldn’t be taken off the table.
Support Levels to watch: 144.00, 143.50, 143.20.
Resistance Levels to watch: 145.00, 145.20, 145.50.
USD/JPY Daily chart
-638236724569112738.png)
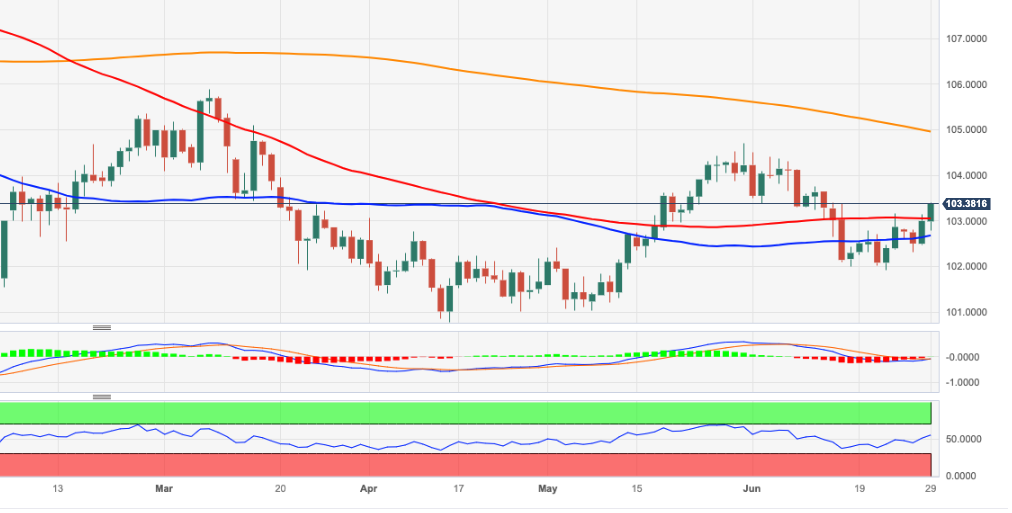
- The US Dollar Index sees a 0.37% climb, driven by higher US Treasury bond yields and prospects of Fed tightening.
- DXY’s consolidation shows EMAs below current prices, while RSI crosses neutral line, indicating bullish momentum.
- DXY targets resistance at 200-day EMA at 103.631, followed by 104.000, with the potential to rally towards May 31 high.
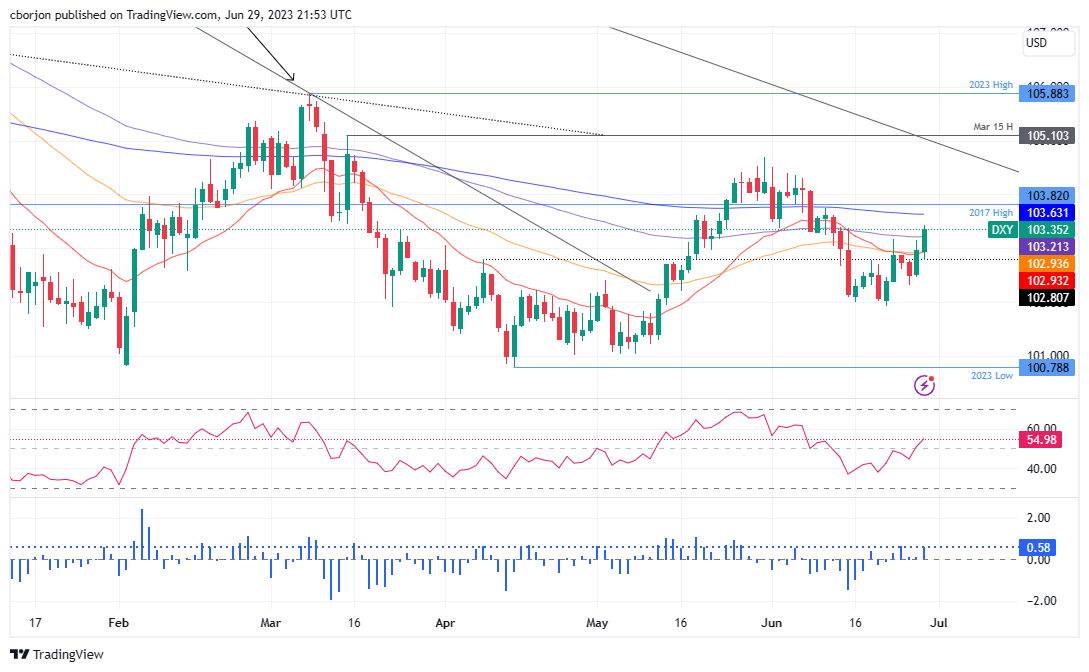
The US Dollar Index (DXY), which measures the performance of the US Dollar (USD) against a basket of six currencies, climbed 0.37% on Thursday, underpinned by higher US Treasury bond yields after US economic data justified additional tightening by the US Federal Reserve (Fed). Therefore, the DXY is trading at 103.351 after hitting a two-week high of 103.437.US
US Dollar Index Price Analysis: Technical outlook
From a daily chart perspective, the DXY consolidates with shorter time-frame Exponential Moving Averages (EMAs) below DXY’s prices, while the 200-day EMA sits slightly above the DXY’s current value at 103.631. In addition, failure to crack the year-to-date (YTD) low of 100.788 opened the door for a recovery, which was capped at around the May 31 high of 104.699.
If the DXY surpasses the 200-day EMA at 103.631, the 104.000 figure will emerge as the next resistance level. Once broken, the DXY could rally toward the abovementioned May 31 high before the greenback tests a downslope resistance trendline drawn from the last year’s high that passes around 104.700/850. Once cleared, the next resistance would be the year-to-date (YTD) high of 105.883 before the DXY climbs toward the 106.000 mark.
Oscillators-wise, the Relative Strength Index (RSI) just crossed above the neutral line spurring a bullish signal, while the three-day Rate of Change (RoC) shows that buyers are gathering momentum.
US Dollar Index Price Action – Daily chart
Reuters reported that the Atlanta Federal Reserve Bank President Raphael Bostic, who supports standing pat on the Fed's policy rate, on Thursday said it is clear US inflation has fallen, though in recent months the signals have been less clear.
“I think it's unambiguous that inflation has fallen considerably," Bostic said at a dinner in Dublin, Ireland. "In these past six months signals have been more ambiguous. That’s real but I do think there are some shoots of green underneath it.”
US Dollar update
It's been a strong week of data for the US and was topped off with Weekly Initial Jobless claims that decreased 26,000 to a seasonally adjusted 239,000, the largest drop in 20 months and below the expectation of 265,000 by economists polled by Reuters.
Federal Reserve's Chair Jerome Powell also indicated the central bank is likely to resume its rate hike path and this is weighing on its FX counterparts.
- AUD/USD bulls eye a significant correction towards trendline resistance.
- Bears will be lurking in the mist and a downside continuation could be on the cards.
AUD/USD was correcting on Thursday from the lows despite a firmer US Dollar and the current tracked the stock market and leaned against domestic data that showed Retail Sales rose a surprisingly strong 0.7% in May, adding marginally to the case for a further rise in interest rates from the Reserve Bank of Australia (RBA). Other data showed job vacancies had eased again, but were still at levels that pointed to a very tight labour market.
Technically, however, there is resistance ahead in a US dollar firm environment and the following illustrate the prospects of a downside continuation:
AUD/USD daily chart
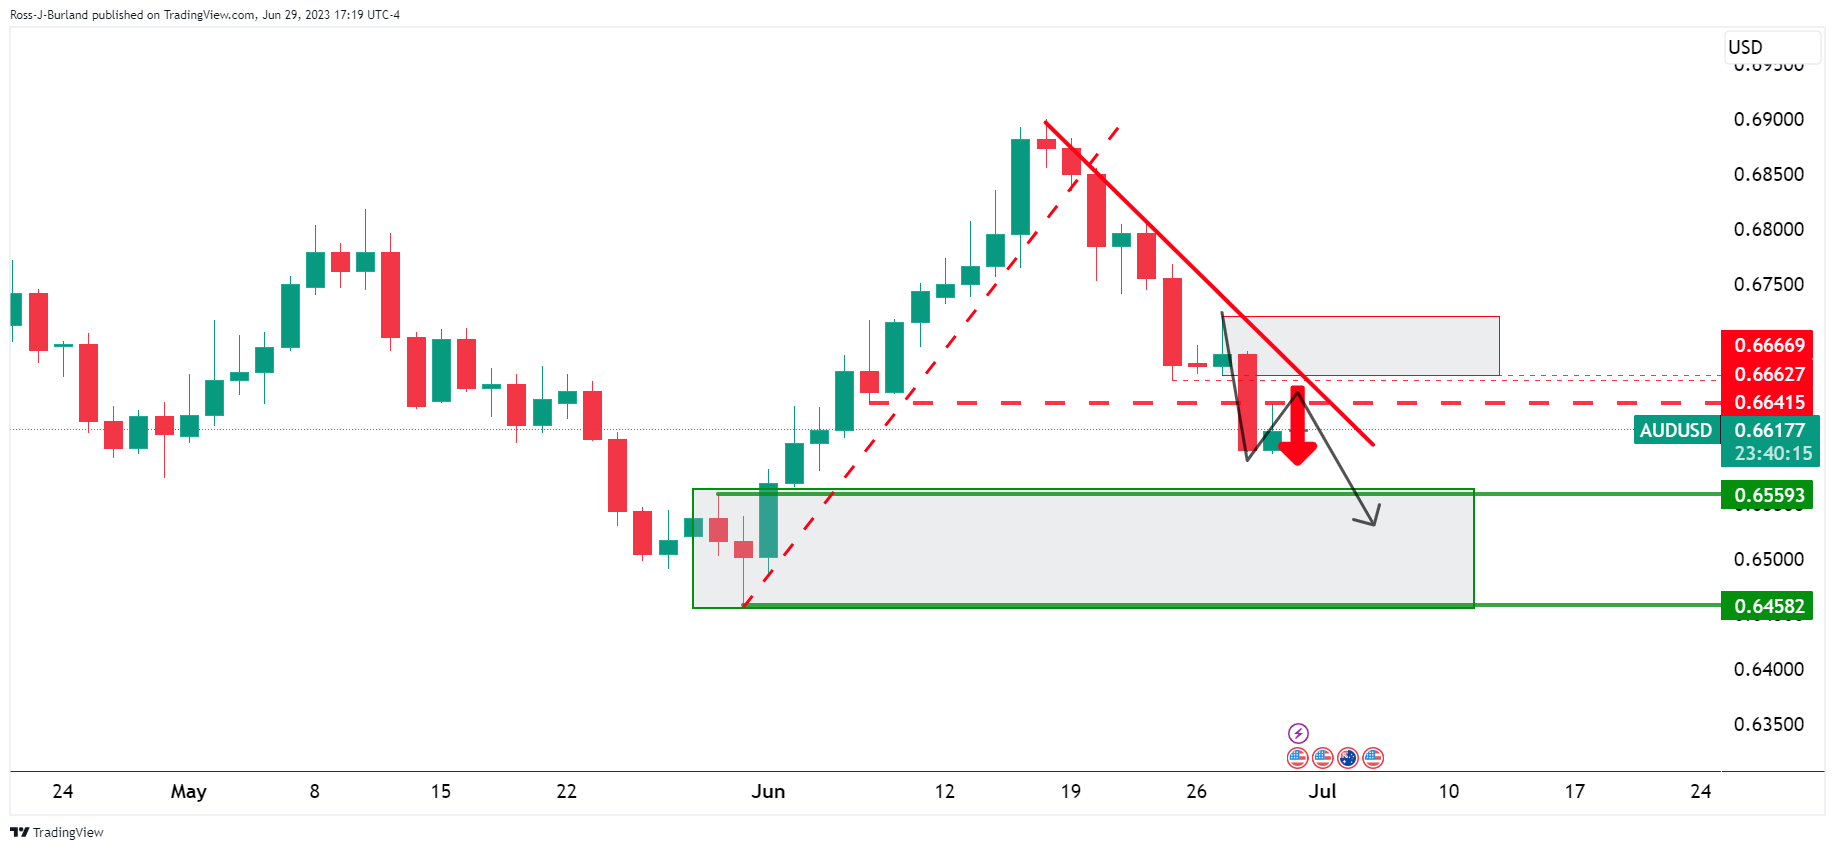
AUD/USD bulls are trying to correct the recent sell-off and eye a move to test the trendline resistance. There are prospects of a deeper correction but bears are lurking with the price below the prior lows that are acting as meanwhile resistance. A break of 0.6650, however, opens risk towards 0.6670.
AUD/USD H4 chart
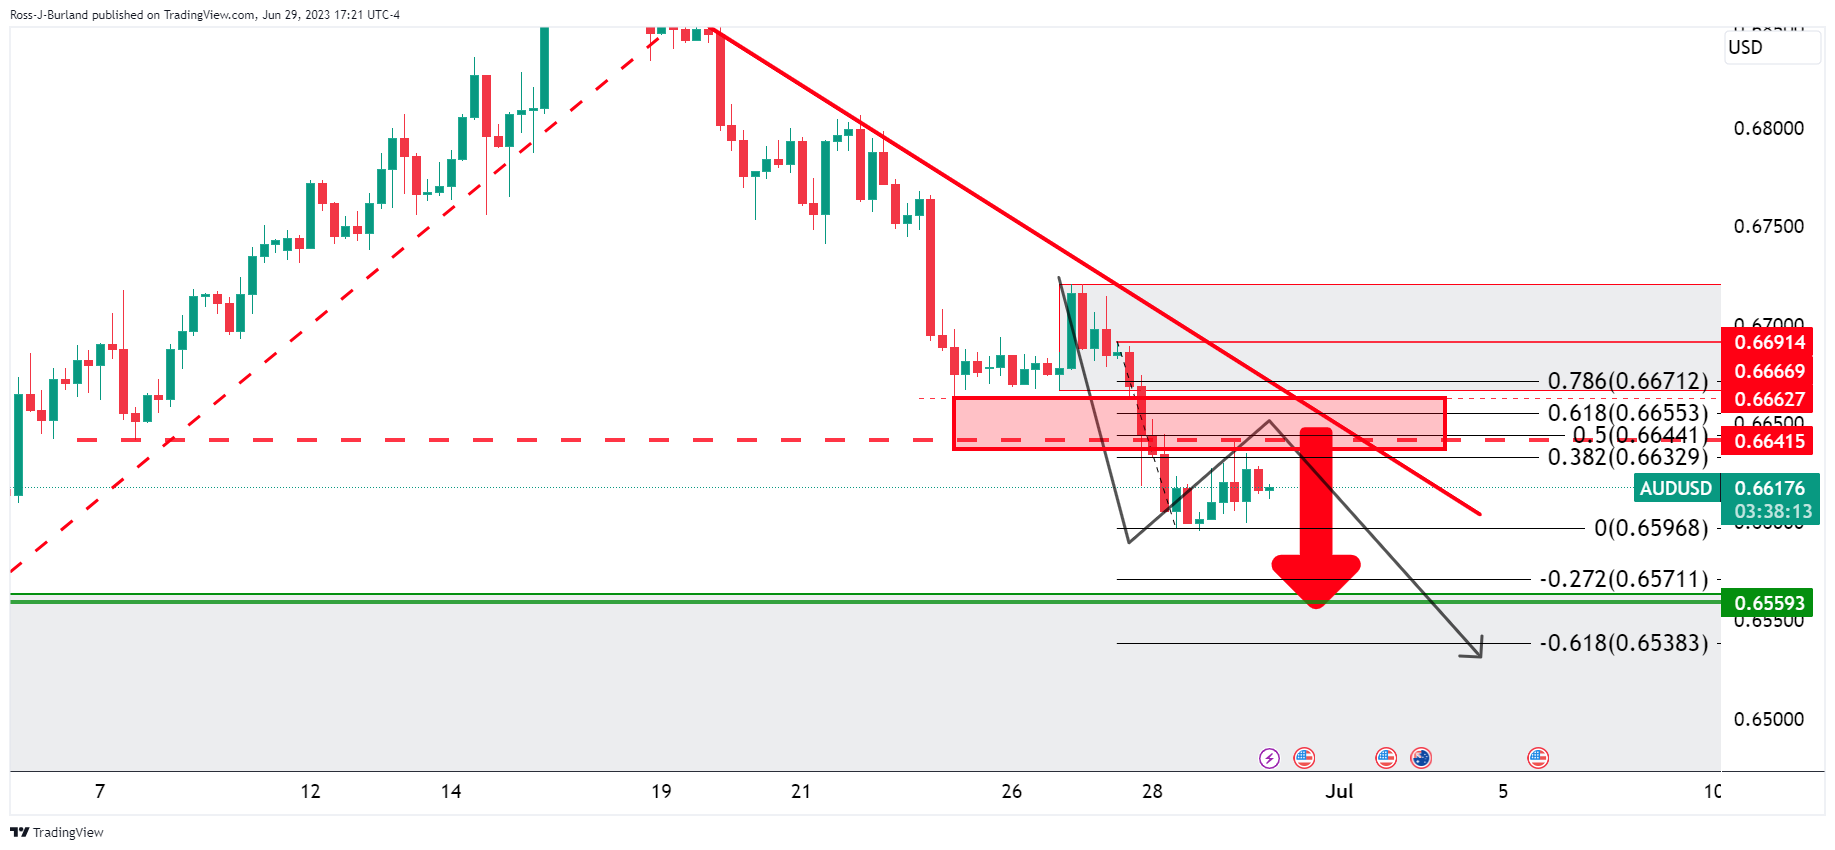
The 4-hour chart has the 78.65 Fibonacci marked in the 0.6670s which could be a target. The bears will be lurking in the resistance area, however and will be keen to guard trendline resistance.
- Silver prices fall for a second day on positive US news and Fed tightening speculations, with XAG/USD trading at $22.57.
- Drifting below the 200-day EMA and a negative Rate of Change suggest XAG/USD will likely continue its downward trend.
- AG/USD eyes support at $22.11 and resistance at the $23.00 mark, with further movement influenced by the 200-day EMA.
Silver price slides for the second consecutive day due to positive news from the United States (US), which cooled recessionary fears while increasing speculations of further tightening by the US Federal Reserve (Fed). Therefore, the XAG/USD is trading at $22.57, down 0.56%
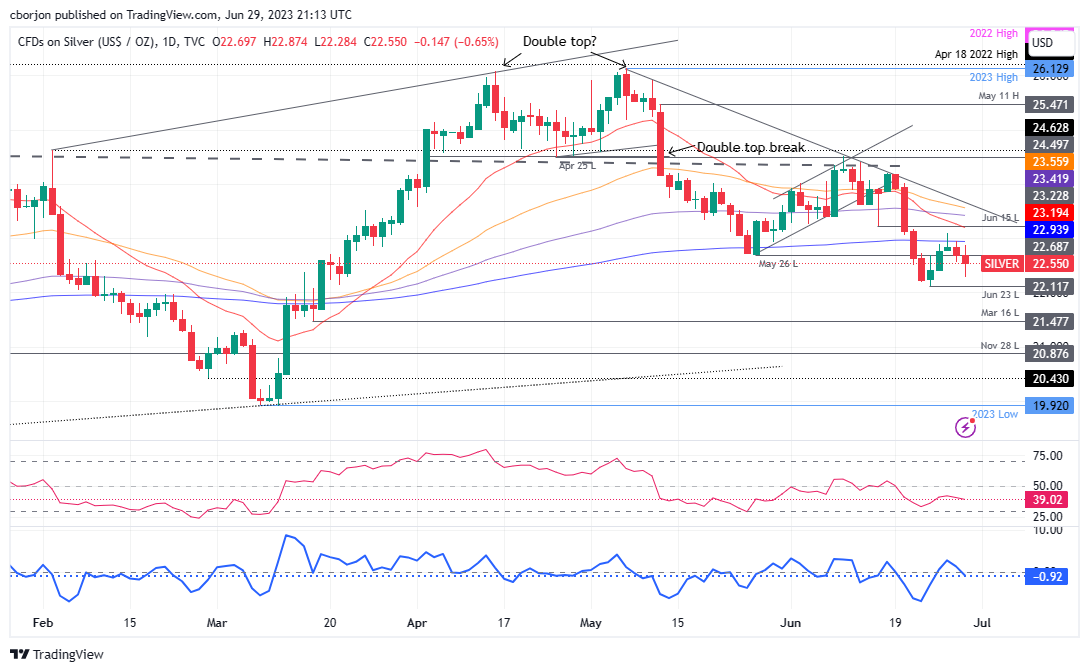
XAG/USD Price Analysis: Technical outlook
In the medium term, the XAG/USD is set to continue to trend lower after drifting below the 200-day Exponential Moving Average (EMA)
The XAG/USD would likely continue to trend lower in the medium term after breaching the 200-day Exponential Moving Average (EMA). In addition, the May 26 daily low of $22.68 was surpassed, seen as the latest support before the XAG/USD extended its fall toward the March 16 daily low of $21.47.
Further cementing the bearish case is the Relative Strength Index (RSI), sitting below its neutral line, while the three-day Rate of Change (RoC) shifted negatively, a sign that sellers are in charge.
The XAG/USD first support would be the June 23 swing low of $22.11. A breach of the latter will expose the $22.00 figure, followed by the abovementioned March 16 swing low of $21.47, before dropping towards the $21.00 figure.
If the XAG/USD reclaims the 200-day EMA, the next resistance would ev the $23.00 mark before testing the 20-day EMA at $23.19.
XAG/USD Price Action – Daily chart
On Friday, the Asian session will be highlighted by Japanese inflation data and the official Chinese PMI. In addition, Japan will also report the Unemployment Rate, Industrial Production, and Housing Starts, while Australia is set to release the Price Sector Credit. The ANZ-Roy Morgan Consumer Confidence is also due. Later in the day, the Eurozone CPI and the US Core PCE will gather market attention.
Here is what you need to know on Friday, June 30:
The US Dollar Index posted its highest daily close in two weeks, above 103.30, boosted by robust US data that keeps alive expectations of more rate hikes from the Federal Reserve. Initial Jobless Claims dropped more than expected to 239K, the lowest in four weeks, and Q1 GDP growth figures were revised significantly higher from an annual rate of 1.3% to 2%. Usually, GDP numbers in the third reading are revised by one or two decimals; it was not the case and was completely unexpected. The positive numbers were mostly received positively on Wall Street, with the Dow Jones advancing 0.80% while the Nasdaq finished flat.
On Friday, the US Core Personal Consumption Expenditures Index will be released. It is a key inflation number, expected to remain at 4.7% YoY. These numbers will be closely watched and could impact Fed rate hike expectations. The recent round of US data has increased the likelihood of a rate hike at the July meeting, according to market pricing.
During the Asian session, China will release the June Manufacturing PMI, which is expected to remain under 50, while the Non-Manufacturing PMI is seen slowing from 54.5 to 50.8.
EUR/USD posted its lowest close in two weeks, under 1.0900. The pair dropped for the second day in a row, approaching the 20-day Simple Moving Average, on the back of a stronger US Dollar. German inflation rebounded as expected. On Friday, the Eurozone Consumer Price Index is due, while Germany will report May Retail Sales and the Unemployment rate.
Commerzbank on German inflation:
The June figures only interrupt the downward trend in the inflation rate and do not mark its end. Both the overall rate and the core rate will trend downward in the coming months, but the core rate in particular will probably remain significantly above the ECB target of 2% for an extended period of time.
GBP/USD extended its decline and traded below 1.2600, closing under the 20-day SMA. A new estimate of UK Q1 GDP will be released on Friday. Despite firm tightening expectations from the Bank of England, they are offering no support to the Pound.
USD/JPY jumped with positive US economic data towards 145.00, continuing its move higher. Positive data from Japan, including a 1.3% increase in May Retail Sales, did not help the Yen. With the Bank of Japan signaling no pivot in the short term from its ultra-accommodative monetary policy, the USD/JPY could continue to rally, triggering more comments about currency moves from Japanese officials. During the Asian session, the Tokyo Consumer Price Index, Industrial Production, and Unemployment Rate are due.
The Australian Dollar outperformed on Thursday, supported by better-than-expected Australian Retail Sales data, which partially offset soft Consumer Price Index numbers. On Friday, Australia will report Private Sector Credit. AUD/USD rebounded modestly after being able to hold above 0.6600.
USD/CAD finished flat on Thursday, around 1.3250. The rally faced resistance at the 20-day SMA and pulled back. April's GDP data from Canada is due on Friday.
Like this article? Help us with some feedback by answering this survey:
- The GBP/JPY trades neutral at the 182.60 area as investors continue to consolidate gains.
- The Yen gained traction from positive Retail Sales figures from May, while the British yield’s recovery limits GBP’s losses.
- Eyes on inflation and labour market data from Japan on Friday.
The GBP/JPY pair is trading in a neutral stance around the 182.60 area as investors take a breather and assess their gains. The Japanese Yen has gained traction following encouraging Retail Sales figures from May, while the recovery of British yields has limited the downside for the GBP. The market focus now shifts to the upcoming release of inflation and labour market data from Japan on Friday, which could influence the Bank of Japan’s (BoJ) stance on monetary policy.
The Yen gains ground on strong Retail Sales data
Retail Sales in Japan grew in May, surpassing expectations by 1.3%. This positive momentum followed a revised figure of 1.1% in April, initially reported as a decline of -1.2%. Furthermore, the year-on-year retail sales surged by 5.7%, exceeding the projected growth of 5.2% and reflecting an upward revision from the previously revised 5.1% in April. Its worth noticing, that during the European Central Bank's forum, Kazuo Ueda, the Governor of the BoJ, adopted a cautious stance, emphasising that the underlying inflation still falls short of the bank’s target. Ueda expressed the BoJ's intention to carefully evaluate policy adjustments only when inflationary pressures align with their forecasts.
Given the potential impact of robust economic data on inflationary pressures, market participants will be closely monitoring the upcoming release of the Tokyo Consumer Price Index (CPI) for June and the May unemployment rate. As for now, expectations point to a rise in Tokyo's CPI to 3.8% year-on-year, with the core figure projected to reach 4.4% and unemployment to remain steady at 3.6%.
In the meantime, British bond yields recovered and limit Sterling’s losses. The 2,5, and 10-year yields, rose by more than 2% to 5.24%,4.64% and 4.39%, and as higher bond yields attract foreign investors, the GBP may find additional demand.
GBP/JPY Levels to watch
According to the daily chart, despite buyers taking a breather, the bullish outlook for the cross is still intact. However, the Relative Strength Index (RSI) is still in overbought territory, suggesting that additional downward movements shouldn’t be removed.
Support levels to watch: 181.80,181.00, 180.00
Resistances levels to watch: 183.00,183.50,184.00
GBP/JPY Daily chart
-638236688645530740.png)
- NZD/USD bears are in the market but a correction could be underway soon.
- The US Dollar is firm again on central bank divergence themes.
NZD/USD is trading a touch lower on Thursday as the US dollar continues to make tracks to the upside on yet more positive data this week as an improvement to last week's. At the time of writing, NZD/USD is down some 0.1% after falling from a high of 0.6102 to a low of 0.6050 so far.
Weekly Initial Jobless claims that decreased 26,000 to a seasonally adjusted 239,000, the largest drop in 20 months and below the expectation of 265,000 by economists polled by Reuters. Federal Reserve's Chair Jerome Powell also indicated the central bank is likely to resume its rate hike path and this is weighing on NZD.
''Bond markets have been far more volatile, and FX price action has been comparably tame by comparison, with gains in equities and oil preventing the USD from totally dominating,'' analysts at ANZ Bank explained.
''US data has been impressive and may keep the USD elevated for longer than many are forecasting, but as yesterday’s ANZBO survey showed, confidence is recovering here too, so the outlook for the Kiwi could is very nuanced,'' the analysts added. '' The AUD has been a big driver of late, and in the absence of specific NZ drivers, will be key again as we head into the Reserve Bank of Australia meeting on Tuesday.''
NZD/USD technical analysis
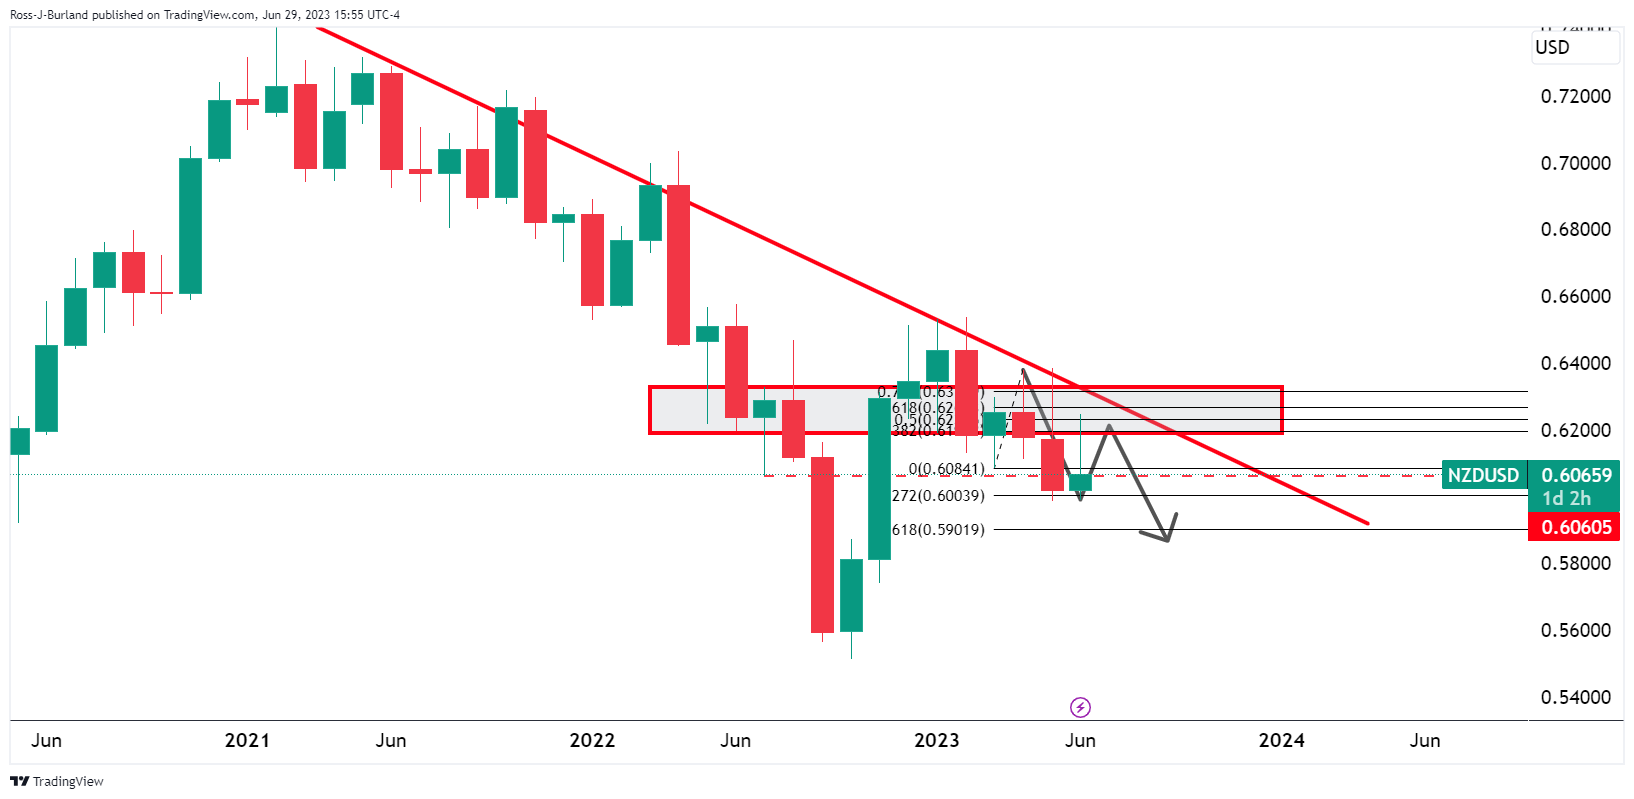
The monthly chart shows the price has broken the support structure that is now acting as resistance. Therefore, lower levels can be expected for the month ahead.

The weekly chart shows the price rejected fully by the resistance and a downside extension could be on the cards on a break of 0.6060 old support looking left.

The daily chart's downside impulse may have more to run but a Fibonacci drawn on the current range sees the 50% and 61.8% ratio aligned with prior supports.
- EUR/JPY tallied a second consecutive day of losses, dropping towards 157.40.
- Germany’s CPI rose to 6.4% vs 6.3% expected and Spanish CPI to 1.9% vs 1.7% expected.
- Japanese Retail Sales rose more than expected in May.
The EUR/JPY pair extended its losses for a second consecutive day, sliding towards 157.40. Strong Retail Sales data from Japan contributed to the Japanese Yen gaining ground. Despite hot inflation figures reported in Germany, with CPI rising to 6.4% (versus 6.3% expected), and in Spain, with CPI reaching 1.9% (versus 1.7% expected), the EUR/JPY pair remained under pressure, but rising German yields limited the Euro’s downside potential.
Japan reported strong data, all eyes on inflation figures on Friday
Retail sales in Japan showed positive results in May, with a notable increase of 1.3% compared to expectations of 0.8%. This positive momentum follows a revised figure of 1.1% in April, previously reported as a decline of -1.2%. Year-on-year, Retail Sales surged by 5.7%, surpassing expectations of 5.2% and reflecting an upward revision from the revised 5.1% in April.
It's worth noticing that Kazuo Ueda, Bank of Japan’s (BoJ) Governor, retained a cautious stance during his speech at the European Central Bank’s Sintra Forum on Wednesday, highlighting that the underlying inflation remains below the target set by the BoJ. He further expressed his intention to evaluate policy adjustments only when inflationary pressures align with the central bank's forecasts. As strong economic data may contribute to a rise in inflationary pressures, the Tokyo Consumer Price Index (CPI) from June and May’s Unemployment rate, both out on Friday, will be closely watched by investors.
On the Euro’s side, German bond yields increased after the hot inflation figures from Germany and Spain. The 2 and 5-year yields rose by 2.48% and 4.75% to 3.26% and 2.60%, limiting the European currency’s losses.
EUR/JPY Levels to watch
According to the daily chart analysis, the EUR/JPY pair maintains a positive outlook, although the bullish momentum has temporarily paused. Despite two consecutive days of losses, the Relative Strength Index (RSI) remains in overbought territory since mid-June so there may be still more room for downside movements.
On the downside, support levels line up at 157.00, 156.50, and 156.00. On the flip side, if bulls regain momentum, there are resistance levels to monitor at 158.00, 158.50, and 159.00.
EUR/JPY Daily chart
-638236648947642354.png)
- EUR/USD bears target the 1.0850 level.
- Bears eye a move to test daily lows for the new month ahead.
EUR/USD is on the back foot. The US Dollar index climbed to a two-week high on Thursday after economic data showed the labour market remained solid.
It's been a strong week of data for the US and was topped off with Weekly Initial Jobless claims that decreased 26,000 to a seasonally adjusted 239,000, the largest drop in 20 months and below the expectation of 265,000 by economists polled by Reuters. Federal Reserve's Chair Jerome Powell also indicated the central bank is likely to resume its rate hike path and this is weighing on the Euro as the following technical analysis illustrates with a focus on the 1.0850s:
EUR/USD daily chart
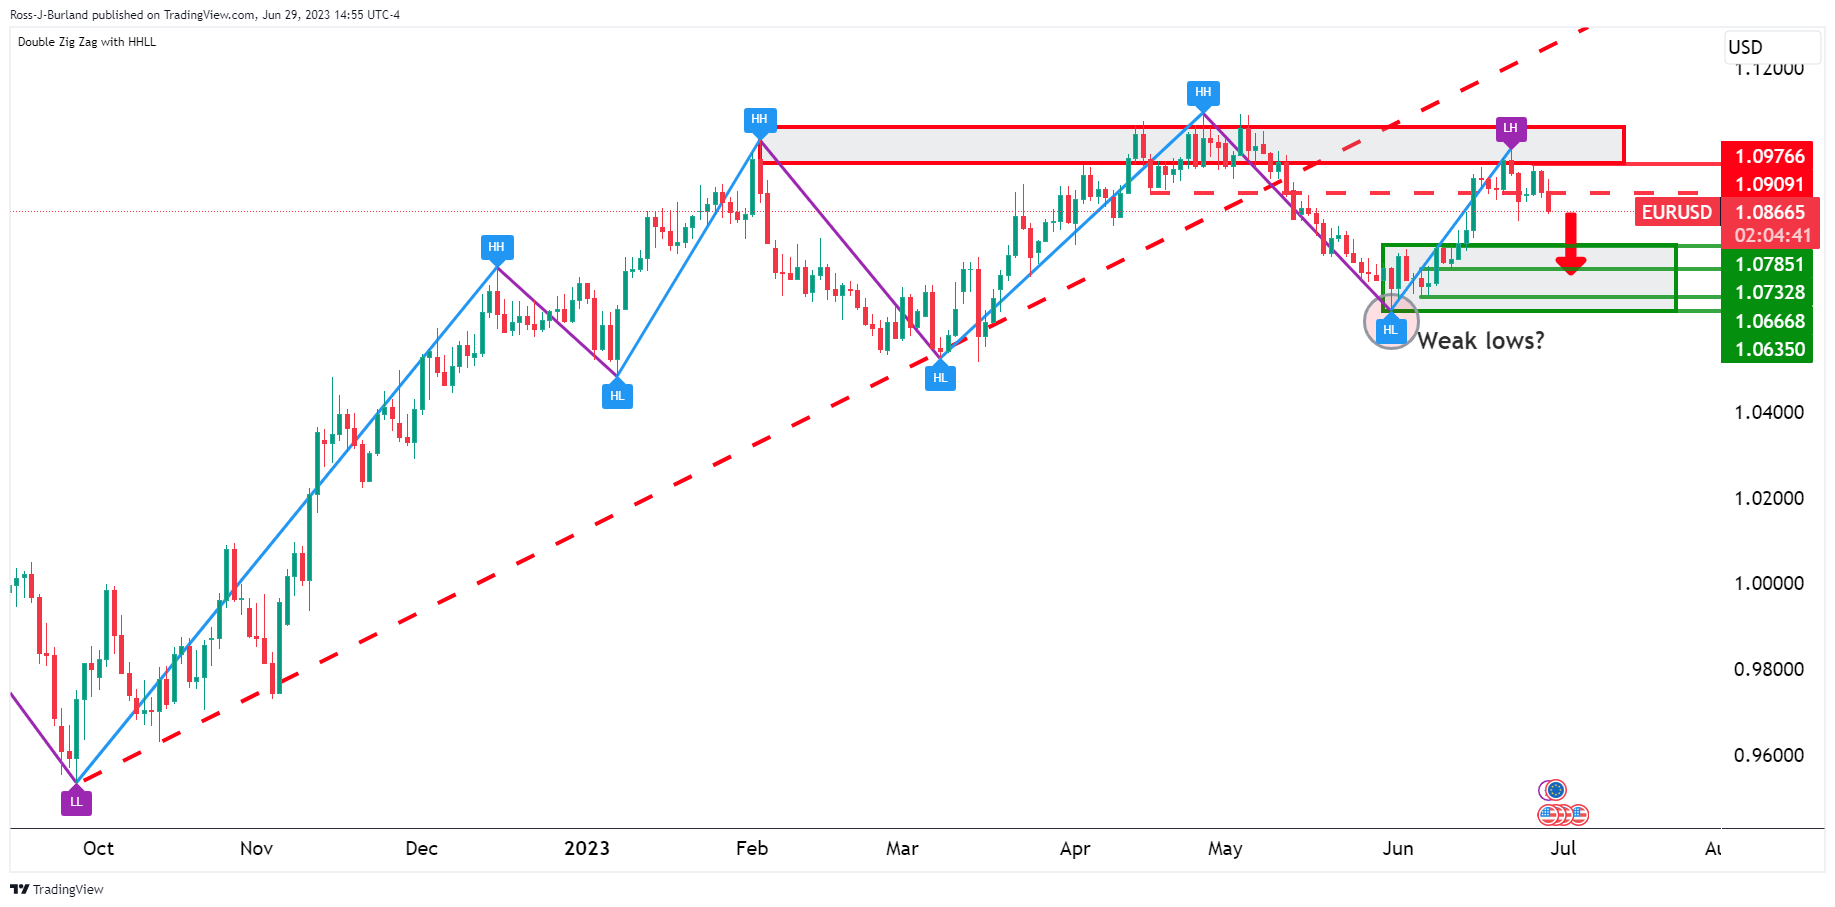
The current state of play is targeting the weak lows in 1.0635 as the Euro fails to make a higher high, so far.
EUR/USD H4 chart
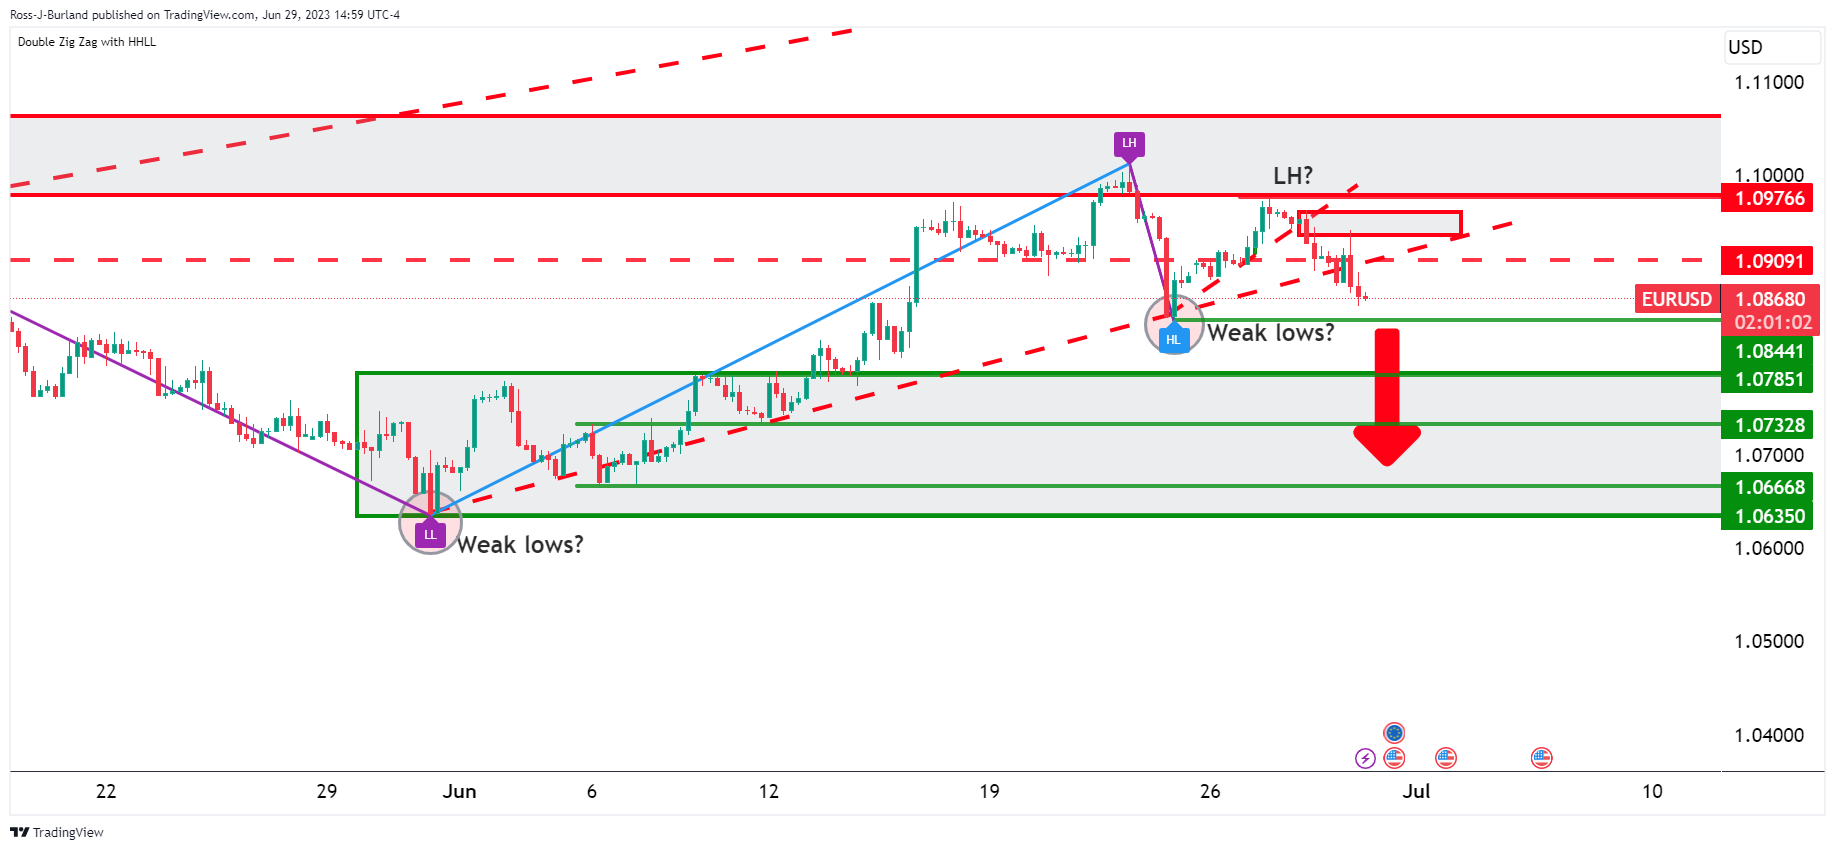
1.0844 is a target on the 4-hout chart for the same, guarding the daily support areas below.
EUR/USD H1 charts
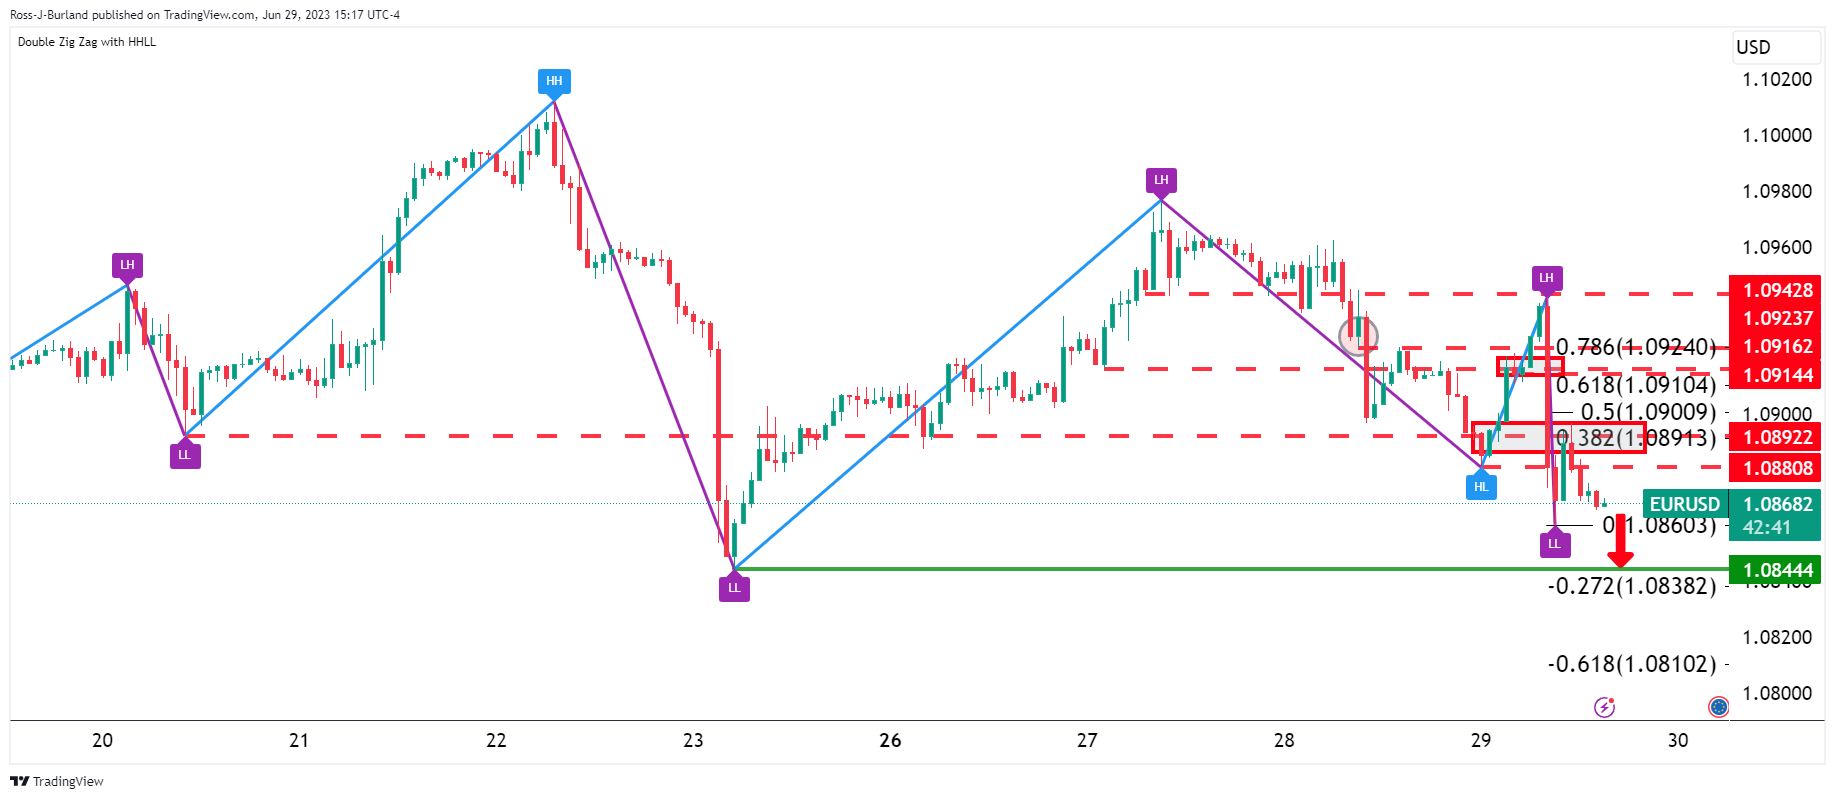
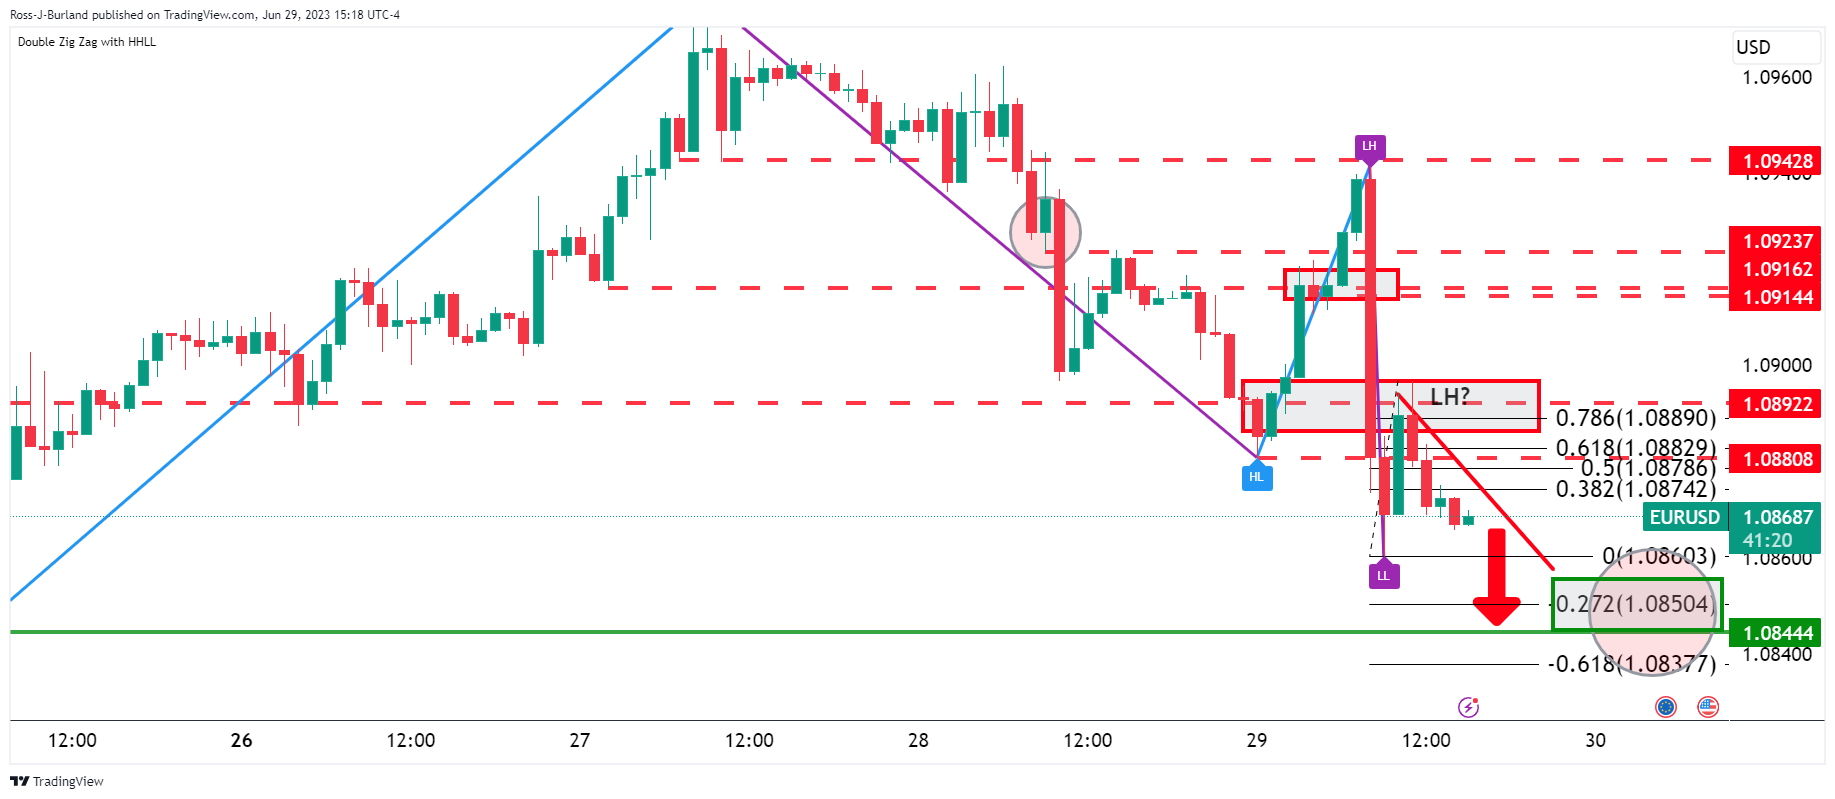
The hourly chart leaves 1.0850 vulnerable as a -272% Fibonacci of the recent bullish correction's range.
- USD/MXN trades sideways but shifts toward daily highs, with a 0.16% gain, as the US Dollar finds strength.
- A faster-than-expected GDP rise and lower Jobless Claims fuel the USD, causing US Treasury bond yields to surge.
- Anticipation of additional Fed rate hikes due to strong US economic performance affects USD/MXN.
USD/MXN traded sideways on Thursday after reaching a daily low of 17.0463, but data from the United States (US) bolstered the US Dollar, lifting the USD/MXN pair toward its daily highs. Nevertheless, as the greenback stabilized, the USD/MXN retreated from its high, exchanges hands at 17.1136, gains 0.16%.
Growing speculations for Fed tightening stirs greenback rise, underpins the USD/MXN
US economic data revealed that the country grew faster than expected, with the Gross Domestic Product (GDP) for the first quarter rising by 2.0%, above prior’s readings of 1.3%. At the same time, Initial Jobless Claims for the last week rose by 239K, below estimates of 265K, halting three consecutive reports trend of 260K plus claims, which erroneously suggested the labor market was cooling.
Consequently, US Treasury bond yields surged, with the 2-year note yield reaching 4.9%, its highest level since March 15, while the US Dollar Index (DXY), a measure of the greenback’s value against a basket of peers, advanced 0.33%, up at 103.302, a tailwind for the USD/MXN.
Given that US economic data is proving solid during the last month, expectations had grown about further tightening by the US Federal Reserve (Fed). During the Eurozone (EU) session, Fed Chair Jerome Powell crossed newswires emphasizing that the majority of the Federal Reserve Open Market Committee (FOMC) expects two additional rate hikes towards the year’s end amidst high inflation data and a tight labor market.
Odds for a 25 bps rate hike in July increased to 87%, while traders shifted their view of only one rate increase as chances for the November meeting augmented to 33.7%, according to the CME FedWatch Tool.
Across the border, Mexico’s lack of economic data keeps USD/MXN traders leaning into the US Dollar dynamics and market sentiment, which turned risk-averse after US data.
USD/MXN Price Analysis: Technical outlook
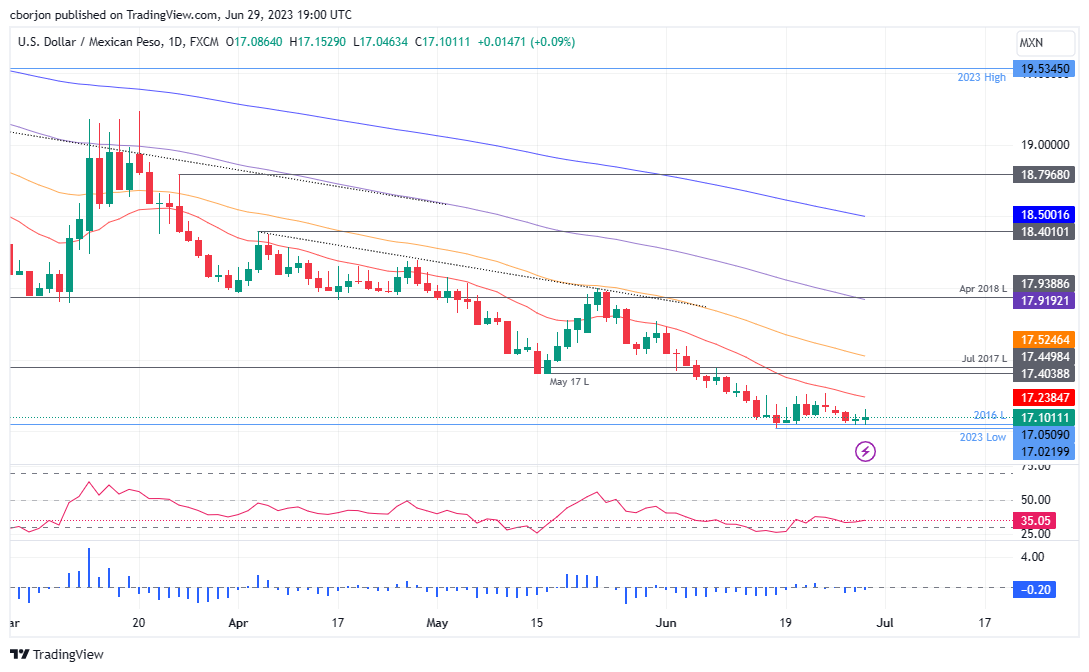
The USD/MXN is trading sideways, nearby the lows of the year, reached on June 16 at 17.0219. Even though oscillators suggest that further downside is expected, the Relative Strength Index (RSI) indicates buyers are entering the market. However, they lack the strength to lift the pair towards its most important resistance level, the May 17 daily low of 17.4039. A breach of the latter could increase buying pressure and lift the USD/MXN to test the 50-day Exponential Moving Average (EMA) at 17.5247. Otherwise, a drop below 17.1000 would keep sellers eyeing the 17.00 mark.
- Gold price regains momentum above $1900 despite increased odds of Fed rate hikes.
- US economic data underscores robust growth, pushing XAU/USD to test 200-day EMA.
- Treasury bond yields soar, underpinning projections of higher rates and potential headwinds for Gold demand.
Gold price recovers some ground after sliding below the $1900 figure for the first time since March 15, 2023, gains some 0.09%, after upbeat economic data from the United States (US) increased speculations the Federal Reserve (Fed) would proceed with additional rate hikes. In addition, the data pushed back against “hard landing” prospects, with the economy showing a strong pace of growth. The XAU/USD is trading at $1909.65 after hitting a daily low of $1893.17.
US economic data signals more Fed tightening; XAU/USD bulls hang on
The US economic calendar revealed outstanding figures for the US economy. The Gross Domestic Product (GDP) for the first quarter was upward revised from 1.3% to 2%, while jobs data reflected the robustness of the labor market. Initial Jobless Claims for the week ending June 24 came at 239K, well below estimates of 265K, snapping three weeks of readings above the 260K mark.
The data provides the good health of the US economy. After the numbers, Gold traders, amongst other market participants, began to price in additional tightening needed by the US Federal Reserve (Fed), which is set to increase rates in July by a quarter of a percentage point. The CME FedWatch Tool shows odds for a 0.25% hike at 87%, while US Treasury bond yields touched levels last seen since March 15.
The US 10-year Treasury note yield has risen to 3.854%, a gain of 14.4 basis points, while US real yields, a headwind for XAU/USD prices, is at 1.678%, its highest level since March 9.
Other data showed that Pending Home Sales plunged to a five-month low in May, coming at -22.2% YoY, worst than April’s -20% contraction.
Earlier, the US Federal Reserve Chair Jerome Powell said the labor market remains tight, inflation too high, and expressed the Fed’s “long way to go” before inflation gets back to its 2% goal. Powell noted the majority of the Federal Reserve Open Market Committee (FOMC) expects “two or more” interest rate increases by the end of the year.
Analysts cited by Bloomberg commented, “Today’s data showed that rates will be higher for longer.” The 2-year US Treasury bond yield, the most sensitive to monetary policy decisions, jumped as high as 4.893%. Money market futures for the November meeting showed odds at 34% for a rate increase to the 5.50%-5.75% range, as traders begin to believe the Fed will continue increasing borrowing costs, as noted in the latest dot-plot graph.
Against this backdrop, XAU/USD’s outlook is slightly tilted to the downside, though Gold bulls bought the dip at the 200-day Exponential Moving Average (EMA) at $1895.86. Nevertheless, additional positive data from the US depicting a solid economy could suggest higher rates, hence lower demand for the yellow metal.
XAU/USD Price Analysis: Technical outlook
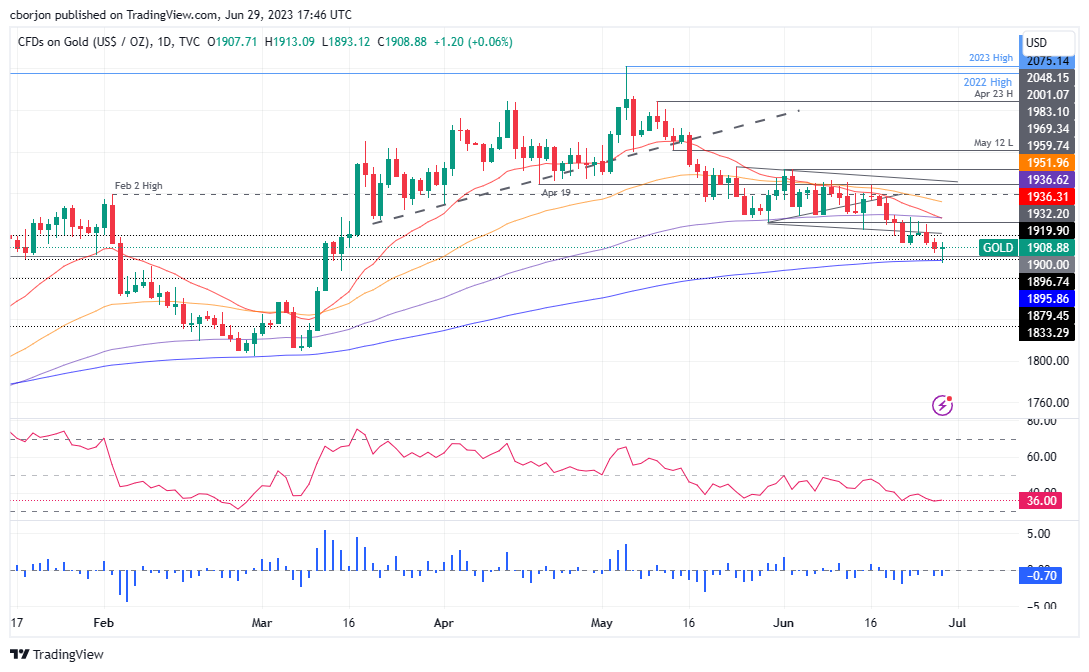
The XAU/USD remains neutral to downward biased, despite bouncing off the 200-day EMA. The Relative Strength Index (RSI) indicator is still pointing downwards, while the three-day Rate of Change (RoC), depicts sellers remain in charge. Unless XAU/USD buyers reclaim the May 30 daily low of $1932.20, which turned resistance, the non-yielding metal would be subject to further selling pressure. If XAU/USD buyers reclaim the latter, the next resistance would be the 20, 50-day EMAs intersection, at around $1936. On the other hand, an XAU/USD daily close below $1900 could pave the way for additional losses, below the 200-day EMA, with the $1850 psychological level as the first support, followed by the $1800 figure.
- WTI failed to surpass the 20-day SMA at $70.29 and then stabilized around $69.75.
- US reported that GDP from Q2 was revised upwardly to 2% (annualized).
- Jobless Claims from the third week of June dropped to 239k.
The price of West Texas Intermediate (WTI) got rejected at the 20-day Simple Moving Average (SMA), currently positioned at $70.36 and retreated to $69.75, as weak housing data from the US soured the market’s mood. On the positive side, robust economic data from the United States made the WTI find demand. However, the USD’s strength on the back of higher yields will limit the Black Gold’s upwards movements.
Oil prices favored by robust economic data from the US, eyes on PCE data
The US Bureau of Economic Analysis released positive news regarding the Gross Domestic Product (GDP) in the United States for the first quarter, revising it upwards to an annualized rate of 2%, indicating the resilience of the American economy. Additionally, Jobless Claims for the week ending June 23 dropped to 239K, surpassing both market expectations and the previous figure of 265K. In that sense, the larger-than-expected drop in Oil stocks reported by the US Energy Information Administration (EIA) on Wednesday and the strong economic data from the US are supporting the WTI.
On the negative side, Pending Home Sales from the US declined by 2.7% in May vs the 0.2% expansion expected, which soured the market's mood. In addition, traders should be aware of Friday’s Core Personal Consumption Expenditures (PCE) data from the US – the Fed’s preferred inflation gauge. That being said, adding to the strong economic data, hot PCE figures may be additional excuses for the Federal Reserve (Fed) to continue hiking, and that shouldn’t be good news for Oil prices.
WTI Levels to watch
According to the daily chart, the near-term outlook for WTI is neutral. The Relative Strength Index (RSI) and Moving Average Convergence Divergence (MACD) are flat, suggesting that there is no clear dominance.
Looking at the downside, support levels are identified at $69.00, followed by Wednesday’s low of $67.10 and the $66.50 zone. On the other hand, the first level to retake is located at the 20-day Simple Moving Average (SMA) of $70.36. If the price surpasses this level, the next resistance areas are around $70.50 and the psychological mark of $71.00.
WTI Daily chart
-638236560434162348.png)
- BP/USD dips following robust US data, bolstering the case for additional Federal Reserve tightening and higher Treasury bond yields.
- The upward revision of US GDP and a drop in Initial Jobless Claims paint a bright US economic picture, triggering GBP/USD tumble.
- n empty UK economic docket and comments by the BoE Governor on potential rate rises leave traders attuned to USD dynamics.
GBP/USD drops sharply in the North American session following the release of outstanding data in the United States (US), painting an optimistic economic outlook and cementing the case for additional tightening by the US Federal Reserve (Fed). Therefore, the greenback is rising, underpinned by elevated US Treasury bond yields. At the time of writing, the GBP/USD is trading at 1.2611, down 0.18%.
Favorable US data and anticipation of additional Fed tightening dampen Pound Sterling
The US Dollar (USD) is the primary driver of the session as data continues to surprise market participants. The US’s Gross Domestic Product (GDP) was revised upwards to a 2% YoY advance, above estimates of 1.3%. At the same time, a measure of the jobs market, Initial Jobless Claims droppest the most in 20 months, to 239K, below estimates of 265K, which could trigger another hike by the Fed to cool demand.
After the data release, the GBP/USD tumbled from around 1.2660 towards the 1.2600 figure, extending its fall to a new two-week low of 12590. The buck strengthened as well as the US Treasury bond yields, with the 10-year benchmark note rate yielding 3.846%, gaining 14 basis points, reaching levels last seen in March 2023.
In the meantime, Fed Chair Jerome Powell crossed the wires and said the labor market remains tight, inflation too high, and expressed the Fed’s “long way to go” before inflation gets back to Fed’s 2% target. He added the majority of the Federal Reserve Open Market Committee (FOMC) expects “two or more” interest rate increases by the end of the year.
Other data showed that Pending Home Sales plunged to a five-month low in May, coming at -22.2% YoY, worst than April’s -20% contraction.
Aside from this, an empty UK economic docket left traders adrift to US Dollar dynamics, as well as market mood. Nevertheless, the Pound Sterling (GBP) weakened on comments by The Bank of England (BoE) Governor Andrew Baily, saying that rates could continue to rise, hurting the British economy. Even though it could propel the GBP/USD, it would hurt the economy. That can be seen by the GBP/USD’s fall after the BoE 50 bps rate hike.
Money market futures see a 65% chance or a 50-bps hike at the BoE’s next meeting. Regarding the Federal Reserve, the CME FedWatch Tool odds for a 25 bps hike in July are 86.8%, higher than the 81.8% yesterday.
Upcoming events
The UK economic agenda will feature the Gross Domestic Product (GDP) for Q1 2023, the Current Account, and Business Investment. On the US front, the US Bureau of Economic Analysis (BEA) will feature the Fed’s preferred gauge for inflation, the core Personal Consumption Expenditure (PCE). The University of Michigan will also reveal the Consumer Sentiment, while the Chicago Fed will release its PMI.
GBP/USD Price Analysis: Technical outlook
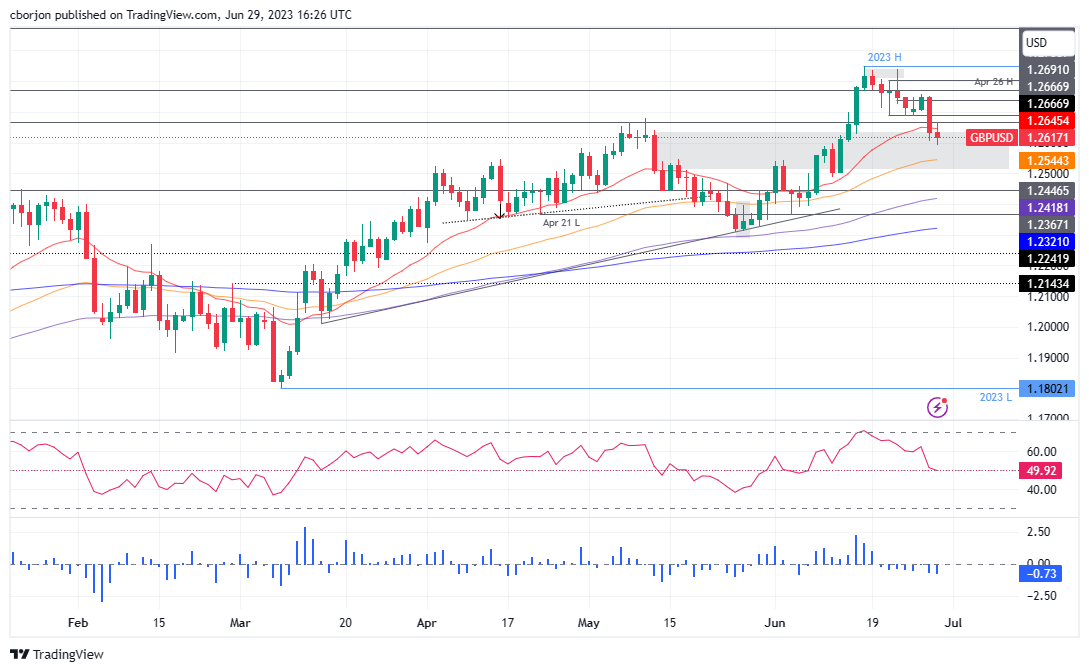
The GBP/USD is set to extend its losses if it achieves a daily close below 1.2600; otherwise, GBP buyers could remain hopeful of a possible test of the 20-day Exponential Moving Average (EMA) at 1.2645. Nevertheless, if GBP/USD surpasses below 1.2600, the next support would be the 50-day EMA at 1.2544 before challenging the 1.2500 mark.
- AUD/USD peaked at a daily high of 0.6640 and then fell towards the 0.6600 area.
- US GDP from Q1 was revised up and Jobless Claims fell in the third week of June.
- Aussie benefits from strong Retails Sales data.
On Thursday, the AUD/USD – after jumping to a daily high of 0.6640 – retreated towards 0.6600 and then climbed back to 0.6630. The upward revision of US Q1 GDP figures and a decrease in Jobless Claims during the third week of June provided evidence of a robust economic recovery in the US. On the negative tone, Pending Home sales came in weak and limited the Greenback’s advance while the Aussie stayed resilient on the back of strong Retail Sales data reported in the Asian session which came in at 0.7% MoM vs the 0.1% expected.
Robust economic data supports a rate hike from the Fed in July
The US Bureau of Economic Analysis reported that the Gross Domestic Product (GDP) from the US from Q1 was revised to the upside to an annualized rate of 2% signaling a resilient American economy. In addition, Jobless Claims for the week ending in June 23 dropped to 239K vs the consensus of 265k and from the previous 265k. It’s worth noticing that on Wednesday, Jerome Powell, chairman of the Fed, stated that ongoing hikes driven by a strong labor market would be appropriate, so hawkish bets following the Jobless and GDP data are strengthening the USD.
In that sense, the US bond yields rallied across the board. The 2-year and 5-year bond rates led the way seeing 3.52% and 4.18% increases on the day to 4.87% and 4.13% respectively and both of them jumped to fresh cycle highs.
Meanwhile, as per the CME FedWatch Tool, the odds of a 25 basis points (bps) rate hike at the next Fed meeting in July jumped from nearly 80% to 90%. All eyes are now on Friday’s Core Personal Consumption Expenditures (PCE) data, the Fed’s preferred inflation gauge.
AUD/USD Levels to watch
According to the daily chart, the outlook for the AUD/USD has shifted towards a more neutral to bearish stance in the short term. The Relative Strength Index (RSI) has shown signs of improvement, though it is still in negative territory, as well as the Moving Average Convergence Divergence (MACD). However, the pair is trading below the 20,100 and 200-day Simple Moving Averages (SMA), which indicates that sellers have the upperhand.
Support levels to watch: 0.6595,0.6585,0.6550.
Resistances: 0.6640, 0.6650,0.6665.
AUD/USD Daily chart
-638236517693744183.png)
The decline in Gold is now on the cusp of Credit Suisse’s target of price and retracement support at $1,900/1,890. The bank analyzes XAU/USD technical outlook.
Weekly close below $1,856 to reinforce the longer-term sideways range
Gold has declined to our core target of $1,900/1,890 and with the rising 200-DMA seen not far below at $1,856 we look for a floor in this $1,900/1,856 zone.
We look for $1,856 to hold on a closing basis for strength back to $1,985 initially, then a retest of major resistance at the $2,063/2,075 record highs. We still stay biased to an eventual break to new record highs later in the year, which would then be seen to open the door to a move above $2,300.
A weekly close below $1,856 would be seen to reinforce the longer-term sideways range, and a fall to support next at $1,810/05.
The Fed’s preferred inflation gauge, the Core Personal Consumption Expenditure (PCE), will be released by the US Bureau of Economic Analysis (BEA) on Friday, June 30 at 12:30 GMT and as we get closer to the release time, here are the forecasts of economists and researchers of seven major banks.
Core PCE is expected to stay at 4.7% year-on-year while rising 0.4% in May (MoM). The headline is seen increasing by 0.5% in May.
Danske Bank
We forecast a small decline from 5.3 to 5.1%.
TDS
We expect core PCE inflation to tick a tenth lower to 0.3% MoM in May, which would also undershoot the core CPI's stronger 0.4% MoM gain. The YoY rate likely also fell to 4.6%, which would mark its slowest annual pace since October 2021. However, more relevant for us (and the Fed), we also expect the key core services ex-housing series to slow to 0.2% MoM, which would represent the smallest gain in the series since July. Note that inflation in this component has been stuck around the 0.3%-0.6% MoM range since March last year (excluding a one-off decline in July), signaling how sticky inflation has remained in the services segment. If our forecast is correct, the 3-month annualized pace would drop significantly to 3.6% from 4.4% in April.
Deutsche Bank
We expect the core PCE deflator to soften a tenth on both the monthly (0.3% MoM vs 0.4% last month) and YoY (4.6% YoY from 4.7% last month) readings. We point out that to meet the Fed’s forecast of 3.9% YoY core PCE this year we would need around 27 bps of monthly prints into YE. We actually expect 3.6%. So all else being equal these prints could be the swing factor between 1-2 Fed hikes out to YE in their own dot plots.
NBF
The annual core PCE deflator may have progressed 0.3% in May, leaving the 12-month rate unchanged at 4.7%.
CIBC
The Fed’s preferred gauge of inflation, core PCE prices, likely maintained a 0.4% monthly pace, which is still too hot for the Fed’s liking, and that will leave the annual pace of core inflation unchanged at 4.7%.
Citi
Elements of CPI and PPI lead Citi Research to forecast a 0.29% MoM increase in core PCE inflation in May, with the YoY measure moderating to 4.61%, with core services prices excluding housing rising by just 0.18% MoM, the softest increase in this component since a decline in July 2022. Meanwhile, headline PCE inflation should rise a more modest 0.1% MoM due to falling energy prices, and moderate to 3.8% YoY. Base effects will imply headline PCE falls even further YoY in June.
Credit Suisse
The PCE deflator is likely to confirm that while gradual disinflation is continuing in headline inflation, core PCE inflation remains sticky above the Fed’s target. Core PCE inflation likely remained at 0.4% MoM in May, meaning YoY core inflation will remain at 4.7%, virtually unchanged from seven months ago. Headline inflation is likely to decline to 0.1% MoM and 3.9% YoY as energy prices declined in May.
- Pending Home Sales in the US unexpectedly fell in May.
- US Dollar Index holds in positive territory, moves off highs.
Pending Home Sales in the US declined by 2.7% on a monthly basis in May, the data published by the National Association of Realtors showed on Thursday. This reading followed April’s 0.4% slide (revised from 0) and came in worse than the market expectation for an increase of 0.2%. “Month over month, contract signings decreased in three U.S. regions but jumped in the Northeast”, said NAR in the report.
On a yearly basis, Pending Home Sales fell by 22.2%, compared to analysts' estimate for a decline of 21.9%.
Market reaction
The US Dollar Index is up on Thursday, trading above 103.00. It spiked following US Q1 GDP and Jobless Claims data and recently pulled back, trimming gains.
- US data surpass expectations, focus turns to Friday’s Core PCE.
- US Treasury yields spike higher pushing USD/JPY further north.
- The pair has risen in six out of the last seven trading days.
The USD/JPY pair is moving towards 145.00, trading at its highest level since mid-November. The US Dollar was boosted by positive data, while Treasury bonds experienced a sell-off.
Robust US data keeps coming in
On Thursday, data showed an upward revision to US growth figures in Q1 GDP from 1.3% to 2%. The weekly Jobless Claims report showed Initial Claims dropped more than expected to the lowest level in four weeks at 239K. These figures added to recent evidence of a robust US economy and raised expectations of more rate hikes from the Federal Reserve. On Friday, consumer inflation data is due.
US bonds tumbled following the report. The US 10-yield surged to 3.84%, and the 2-year to 4.88%, the highest since March. The spread between US and Japanese bond is widening further, reflecting growing monetary policy divergence between the Fed and the Bank of Japan.
Approaching 145.00
The USD/JPY pair printed a fresh monthly high at 144.89 and remains near the top, with strong bullish momentum. The pair is approaching the 145.00 zone, and if the upside continues, rumors about a potential intervention from Japanese authorities may emerge.
A break above 145.00 could trigger volatility and open the doors to further gains. Despite the US Dollar rising in six out of the last seven days versus the Yen, there are no signs of exhaustion. The 144.50 area is the immediate support, followed by daily lows around 144.10 and then 143.75.
Technical levels
Economists at Wells Fargo analyze LatAm currencies' outlook.
Mexican Peso looks rich from a valuation perspective
We continue to favor the Brazilian Real as markets may be priced for too much BCB easing, while fiscal and political risks associated with President Lula and his cabinet are likely to lessen further going forward.
We also believe there is long-term value in currencies such as the Colombian and Chilean Pesos as yield opportunities exist, while we also believe local politics are trending in a more favorable direction. In Mexico, the Peso looks rich from a valuation perspective; however, diminished political risk and a central bank that slants hawkish should keep the MXN supported and stable ahead of elections in mid-2024.
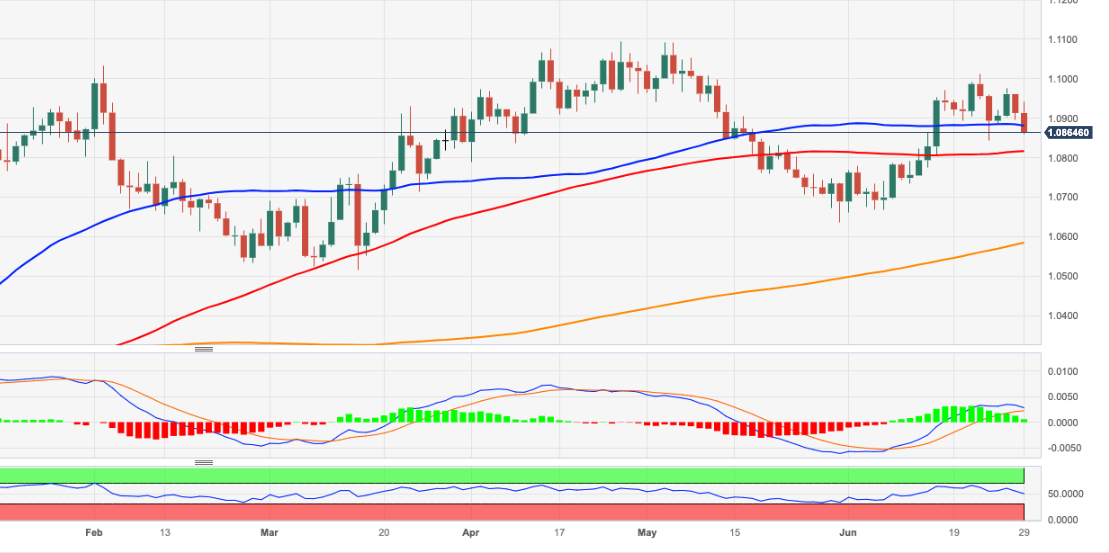
- EUR/USD accelerates the decline and revisits the 1.0860 region.
- Next on the downside emerges the weekly low near 1.0840.
EUR/USD weakens further and slips back to the 1.0860 region, or weekly lows, on Thursday.
The recent bullish move now looks dented and the pair could be headed towards another visit to the weekly low at 1.0844 (June 23). The loss of this level exposes a potential pullback to the interim 100-day SMA, today at 1.0815.
Looking at the longer run, the positive view remains unchanged while above the 200-day SMA, today at 1.0583.
EUR/USD daily chart
- DXY extends the upside to new 2-week highs north of 103.00.
- The May’s top near 104.70 comes next for dollar bulls.
DXY advances for the second session in a row and looks to consolidate the breakout of the key 103.00 hurdle on Thursday.
In light of the weekly recovery, the index should meet the next up-barrier of significance not before the May high at 104.69 (May 31) just ahead of the crucial 200-day SMA, today at 104.95.
Looking at the broader picture, while below the 200-day SMA the outlook for the index is expected to remain negative.
DXY daily chart
Economists at TD Securities share their Global FX forecasts.
USD/CAD to reach 1.30 and break lower next year
We have updated our Global FX forecasts, downgrading the USD profile with some emphasis on the EM side.
We still look for EUR/USD to finish the year around 1.13 and USD/CAD to reach 1.30 and break lower next year.
We look for continued Latam strength in H2 and a supportive backdrop for EM Asia. We notched up our USD/JPY profile, though, now looking for year-end at 134.
- EUR/JPY adds to Wednesday’s small drop and retests 157.50.
- The ongoing rally seems to have met a decent barrier near 158.00.
EUR/JPY gives away ground for the second session in a row, although it appears supported around 157.20 for the time being.
Considering the ongoing price action, further gains appear on the cards in the very near term. That said, the continuation of the uptrend should meet the immediate hurdle at the 2023 high of 157.99 (June 28) ahead of the weekly top of 163.09 (August 22 2008).
The ongoing overbought conditions of the cross, however, are indicative that a deeper knee-jerk should not be ruled out at some point in the short-term horizon.
So far, further upside looks favoured while the cross trades above the 200-day SMA, today at 145.07.
EUR/JPY daily chart
USDJPY remains the most controversial in the G10 FX space. Economists at Credit Suisse analyze the pair’s outlook.
JPY still stymied by BoJ
New BoJ governor Ueda’s dovish stance at his first meeting in charge on 28 Apr catalysed an 8% USD/JPY rally in the two months that followed. With the immediate inflation outlook likely to be upgraded at the 27-28 Jul meeting, the market will once again look at JPY upside trades ahead of that.
The 7 Jul release of cash earnings data will be key as more weak data would disappoint expectations.
In the meantime, the trading range for USD/JPY can stay wide at 135-152, with the latter level a possible intervention trigger.
- Stronger-than-expected US economic data boosts the US Dollar across the board.
- US Treasury yields spike higher, putting pressure on Gold.
- XAU/USD fell below $1,900/oz, reaching its lowest level in three months.
Gold prices tumbled following the release of US economic data. XAU/USD broke below $1,900 for the first time since mid-March and fell to $1,894. The yellow metal remains under pressure while the US Dollar Index trades at 103.25, the strongest level since June 15.
Data from the US showed a revision to Q1 GDP from 1.3% to 2% and a decline in Initial Jobless Claims to 239K, the lowest level in four weeks. Those numbers surpassed expectations and add to recent figures that came in stronger than expected. On Friday, the Core Personal Consumption Expenditure is due.
After the reports, the US 10-year Treasury bond yield jumped to 3.82%, the highest level since June 15, while the 2-year yield soared to 4.88%, the highest since March 9.
The increase in yields is boosting the US Dollar and affecting Gold, which is falling for the third consecutive day.
Increasing expectations of the Fed staying on its tightening path saw Gold prices fall. Economists at ANZ Bank discuss XAU/USD outlook.
The Fed will pause its hiking at some point this year
Increasing prospects of the Fed remaining hawkish are keeping Gold prices under pressure.
Strong economic data and sticky services inflation are leaving room for further monetary tightening, which will be a short-term headwind. Nevertheless, the Fed will pause its hiking at some point this year, and that remains a structural support.
We expect the recent price decline will stimulate fresh buying.
Eurostat will release the preliminary estimate of Eurozone Harmonised Index of Consumer Prices (HICP) data for June on Friday, June 30 at 09:00 GMT and as we get closer to the release time, here are the expectations forecast by the economists and researchers of eight major banks regarding the upcoming EU inflation print.
For the first time since inflation surged, disinflation occurred in every major component in May, helping HICP ease from 7% to 6.1%. In June, headline HICP is expected to decelerate at 5.6 year-on-year but annual core HICP is seen rising marginally to 5.5% against the former release of 5.3%.
Deutsche Bank
For the euro area flash June HICP, we expect it to come in at 5.8% YoY. We expect the monthly pace of food inflation to slow down towards 0.2% MoM, while energy inflation may pick up a little at 1% MoM. We expect euro area June flash core HICP at 5.7% YoY.
Danske Bank
We expect headline inflation continued to slide rapidly to 5.3% from 6.0% in May.
TDS
While momentum in EZ and German core inflation likely remained strong in June, base effects from last year's 9-euro ticket will likely overstate the strength in the YoY rates. Energy should not have much of an impact on the German print, but base effects will likely weigh heavily on EZ headline HICP (TDS: 5.6% YoY).
Nomura
We forecast a fall in headline Euro-area inflation from 6.1% to 5.6% in June, in large part the result of lower energy prices and a smaller rise in food prices relative to a year ago. We’re assuming a continuation of core price momentum being stronger than normal, albeit weaker than in recent months. On top of that, looking back to a year ago (June 2022) core prices didn’t grow that strongly on a % m-o-m basis – base effects should thus push up on core inflation in June, and we look for what we think will be a temporary rise from 5.3% to 5.5% amid a generally declining trend.
SocGen
Falling food and energy inflation should help HICP inflation ease again in June to 5.6%, down from 6.1% in May. Conversely, we think core inflation could rebound to 5.6%, up from 5.3%, with risks tilted to the upside.
Wells Fargo
For the first time in many months, the Eurozone CPI surprised to the downside in May. Headline inflation slowed more than forecast to 6.1% YoY, while core inflation also slowed to 5.3%. For June, the consensus forecast is for headline inflation to slow further to 5.6%, while core inflation is seen ticking up to 5.5%. Another significant downside surprise might be enough to persuade ECB policymakers to pause their rate hike cycle in July, at a Deposit Rate of 3.75%. However, if inflation surprises to the upside, the case for further tightening beyond July could gather momentum.
Citi
We expect headline HICP to take another step down to 5.7% in June, the lowest since Jan-22 but mostly reflecting favorable base effects in energy. But core CPI is set to re-accelerate to 5.6% YoY, partly due to base effects though returning to pre-May monthly trend (seasonally adjusted.) of 0.4% later on.
Credit Suisse
We expect headline inflation to fall from 6.1% to 5.6% YoY and core inflation to rise from 5.3% to 5.5% YoY in June. M3 money supply is likely to slow further from 1.9% to 1.5% YoY in May.
- The US BEA revised Q1 GDP higher to 2% from 1.3%.
- US Dollar Index rises above 103.00 after GDP and Jobless Claims data.
The real Gross Domestic Product (GDP) of the US expanded at an annualized rate of 2% in the first quarter, the US Bureau of Economic Analysis' (BEA) final estimate showed on Thursday. This reading came in above the previous estimate and the market expectation of 1.3%.
The BEA reported that GDP “was revised up 0.7 percentage point from the second estimate, reflecting upward revisions to exports, consumer spending, state and local government spending, and residential fixed investment that were partly offset by downward revisions to nonresidential fixed investment, federal government spending, and private inventory investment. Imports were revised down.”
Key takeaways:
Compared to the fourth quarter, the deceleration in real GDP in the first quarter primarily reflected a downturn in private inventory investment and a slowdown in nonresidential fixed investment that were partly offset by an acceleration in consumer spending, an upturn in exports, and a smaller decrease in residential fixed investment. Imports turned up.
Current‑dollar GDP increased 6.1 percent at an annual rate, or $391.8 billion, in the first quarter to a level of $26.53 trillion, an upward revision of $43.5 billion from the previous estimate.
The price index for gross domestic purchases increased 3.8 percent in the first quarter, the same as the previous estimate. The personal consumption expenditures (PCE) price index increased 4.1 percent, revised down 0.1 percentage point. The PCE price index excluding food and energy prices increased 4.9 percent, a downward revision of 0.1 percentage point.
Disposable personal income increased $587.9 billion, or 12.9 percent, in the first quarter, an upward revision of $26.4 billion from the previous estimate. Real disposable personal income increased 8.5 percent, an upward revision of 0.7 percentage point.
Market reaction
The US Dollar Index rose following the report and the weekly Jobless Claims. The DXY climbed above 103.00, and it was up by 0.15% on the day, approaching daily highs.
- Initial Jobless Claims in the US decreased by 26,000 in the week ending June 24.
- US Continuing Claims decline unexpectedly in the week ended June 17.
- US Dollar gains momentum after Jobless Claims and the final estimate of Q1 GDP.
Initial Jobless claims totaled 239,000 in the week ending June 24, the weekly data published by the US Department of Labor (DOL) showed on Thursday. The print follows the previous week's 264,000 (revised to 265,000 – the highest since 2021) and came in below market expectations of 265,000. It represents the lowest level in four weeks.
“The 4-week moving average was 257,500, an increase of 1,500 from the previous week's revised average. This is the highest level for this average since November 13, 2021 when it was 260,000.”
Continuing Claims declined by 19,000 in the week ended June 17 to 1.742 million below market estimates of 1.765 million.
Market reaction:
The US Dollar rose across the board after Jobless Claims and Q1 GDP data. The DXY rose back above 103.00, approaching to weekly highs.
- Inflation in Germany rose at a stronger pace than expected in June.
- EUR/USD continues to stretch higher toward 1.0950 after the data.
Inflation in Germany, as measured by the change in the Consumer Price Index (CPI), rose to 6.4% on a yearly basis in June from 6.1% in May. This reading came in higher than the market expectation of 6.3%. On a monthly basis, the CPI increased 0.3% following May's 0.1% decrease.
The annual Harmonised Index of Consumer Prices (HICP), the European Central Bank's (ECB) preferred gauge of inflation, jumped to 6.8% in the same period, compared to 6.3% in May and analysts' estimate of 6.7%.
Market reaction
EUR/USD extended its rebound with the initial reaction and was last seen rising 0.25% on the day at 1.0940.
EUR/USD rebounds from below 1.09. Economists at Scotiabank analyze the pair’s technical outlook.
Support is now seen at 1.0895/00
Solid gains off the daily low leave a positive impression on the intraday (and, potentially, daily) chart.
A minor bull reversal signal (outside range) formed in earlier trade on the six-hour chart, setting up spot for a push toward minor trend resistance at 1.0955/60.
Support is 1.0895/00 now.
See – EUR/USD: The pieces of the investment puzzle have yet to fall into place for a rally – ING
EUR/SEK has been volatile in narrow ranges after the Riksbank’s announcement today. Economists at ING analyze the pair’s outlook.
Sustained recovery in the undervalued Krona unlikely to emerge until much later in the year
We suspect that EUR/SEK can stabilise around the current 11.70-11.80 levels.
However, with the real estate market proving to be Sweden’s Achilles heel, we doubt that a sustained recovery in the undervalued Krona will emerge until much later in the year when there are clearer signs of improvement in global inflation trends. Until that point, domestic risks in Sweden will continue to see the SEK trade on a fragile footing.
USD trades narrowly mixed in quiet trade. Economists at Scotiabank analyze the US Dollar Index (DXY) outlook.
Short-term top around 103.20/25 may drive losses back toward the mid-102 area in the near-term
Intraday trends so far today suggest the US Dollar rebound is slowing and might be reversing.
The US Dollar Index (DXY) is trading net lower on the day and looks to have formed a short-term top around the 103.20/25 area which may drive losses back towards the mid-102 area in the near-term.
The buying pressure in USD/CNH appears to be losing traction, note UOB Group’s Economist Lee Sue Ann and Markets Strategist Quek Ser Leang.
Key Quotes
24-hour view: We expected USD to rise further yesterday. However, after eking out a fresh 7-month high of 7.2490, it plunged to 7.2064 and then rebounded to end the day at 7.2258 (-0.28%). The current price movements are likely part of a consolidation phase. Today, we expect USD to trade between 7.2050 and 7.2400.
Next 1-3 weeks: We turned positive in USD one week ago. While USD rose as expected, we indicated yesterday (27 Jun, spot at 6.7450) that “USD could break above 7.2500, but it remains to be seen if 7.2800 will come into view.” USD then rose to 7.2490 and then fell sharply. Upward momentum is beginning to wane, but only a break of 7.1980 (no change in ‘strong support’ level) suggests USD is not ready to move above 7.2500.
Sterling is showing signs of stabilizing after yesterday’s slide under 1.27. Economists at Scotiabank analyze GBP/USD technical outlook.
Gains are not yet significant enough to exclude renewed softness
Sterling gains from the 1.26 zone are picking up a little more momentum above 1.2650 intraday but gains are not yet significant enough to exclude the risk that the rebound represents a consolidation ahead of renewed softness.
Regaining 1.27 is the benchmark the Pound will have to beat to show some sustainable technical strength from here.
Open interest in natural gas futures markets went up by around 1.7K contracts for the first time since June 14 on Wednesday. Volume, instead, kept the erratic performance in place and dropped by more than 152K contracts.
Natural Gas: Consolidative range remains limited by $3.00
Prices of natural gas ended Wednesday’s session in the red territory despite hitting fresh multi-week highs near $2.90. The daily decline was accompanied by rising open interest and a marked retracement in volume, which allows for further gains although always within the prevailing range bound theme. On the upside, the commodity remains capped by the $3.00 region per MMBtu for the time being.
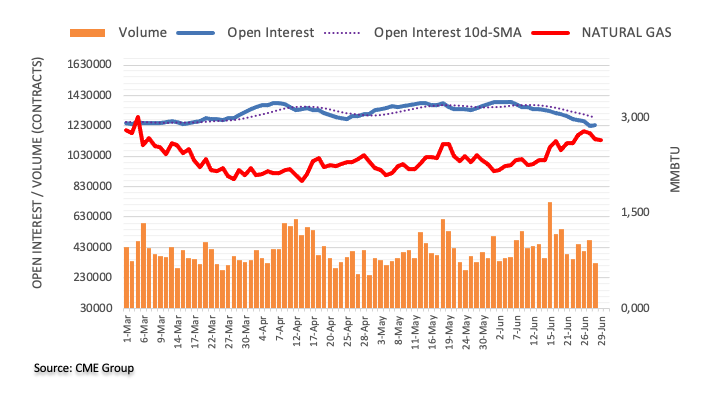
"I don't see as much urgency to move as stated by others, including my Chair," Atlanta Federal Reserve President Raphael Bostic told reporters regarding future rate increases, as reported by Reuters.
Key takeaways
"We've only been in restrictive territory for 8-10 months, just at beginning stage of what tightening should look like."
"I'm looking for more signs that a slowdown is happening in the next several months."
"If that happens, I think we can get back to our target with a minimum of economic dislocation."
"If inflation moves away from target or seems to significantly stall, then we'll probably have to do more."
"We're not seeing that or move in inflation expectations so I'm comfortable waiting."
"Firms exposed to debt financing are going to have to be more nimble, implications for housing, commercial real estate."
"Not hearing a lot in surveys that increased cost of capital is putting a strain on businesses."
"Core inflation has plateaued, signs underneath it might actually still have some improvement coming."
"There are measures today suggesting that inflation has started to really get much more into range of normal."
"There are undoubtedly scenarios where we could move at two meetings in a row, not expecting that will happen."
"If that's what is needed, we'll do what needed."
"Nobody should take a signal from my view that we should pause that I'm less concerned about high inflation."
"Have heard a decided change from employers in last eight weeks, labour markets not as horrifically tight."
Market reaction
The US Dollar came under modest bearish pressure following these comments and the US Dollar Index was last seen losing 0.15% on the day at 102.82.
CAD holds losses in the upper 1.32 zone ahead of Friday’s data, economists at Scotiabank report.
Two tests of the 1.3275/80 zone leave a potential double top on the intraday chart
With the USD trading mixed to a little softer on the day and neither stocks nor crude oil prices providing much directional leadership, spot may continue to drift sideways in the mid/upper 1.32 area today as markets eye tomorrow’s Canadian data releases (and the long weekend ahead).
There are no clear signs from short-term price action that the market is poised to reverse. Upside risks through to major resistance around 1.3315/25 remain.
Steep, hourly trend support has been broken, however, and two tests of the 1.3275/80 zone leave a potential double top on the intraday chart. A break under the 1.3240 trigger targets a drop back to 1.3200/05.
There is still room for further upside in USD/JPY in the short-term horizon, argue UOB Group’s Economist Lee Sue Ann and Markets Strategist Quek Ser Leang.
Key Quotes
24-hour view: We expected USD to consolidate between 142.80 and 143.80 yesterday. Our view was incorrect as it rose to a fresh 7-month high of 144.19. Despite the advance, upward momentum has not improved much. However, as long as the support at 143.20 (minor support is at 143.50) is not breached, USD could retest the 144.20 level. The major resistance at 145.00 is highly unlikely to come into view.
Next 1-3 weeks: We have held a positive USD view for about 2 weeks now. In our latest narrative from last Friday (23 Jun, spot at 143.10), we indicated that USD “is likely to continue to rise and the next level to watch is 144.00.” Yesterday, USD broke above 144.00 and rose to a high of 144.19. While the USD strength is intact, it remains to be seen if it has enough momentum to reach the next ‘target’ at 145.00. It is worth noting that after two weeks of strong advance, conditions are severely overbought. All in all, only a breach of 142.80 (‘strong support’ level previously at 142.30) would suggest that USD is not strengthening further.
Economists at Credit Suisse expect the Swiss Franc to weaken – boosting the EUR/CHF pair to 1.02 by the end of the third quarter.
Dovish SNB risks a weaker Swiss Franc
The SNB hiked its policy rates by 25 bps at its June meeting, which was in line with the consensus forecast among economists but below the pricing of the STIR market.
We interpret the SNB's rate hike decision and statement as dovish and target 1.0200 in EUR/CHF for the end of Q3. The recent strength in the real Swiss TWI and concerns about financial stability risks in the banking/mortgage sector might be the reasons for the more cautious stance.
Our main argument is that widening rate differentials vis-a-vis the Franc's major peers could lead to capital outflows and weaken the Swiss Franc. The risk is a resurgence of Swiss inflation and a more hawkish SNB as a result.
Economists at Commerzbank analyze ECB policy outlook and its implications for the EUR/USD pair.
If no more steps are required there are no reasons to extrapolate yesterday’s EUR weakness
The Italian government is already voicing furious criticism of the ECB rate hikes. However, we know that on the ECB board, the monetary policy ideas are extremely tightly correlated with the home countries of the board members. While that is the case, we have to fear that these political preferences could potentially affect monetary policy decisions.
That is not an issue for the next one or two ECB rate hikes. They can be implemented against the criticism of the Italian Prime Minister. If that is it and no more steps are required there are no reasons to extrapolate yesterday’s EUR weakness.
However, the Euro might suffer more sustainably if we have to fear that more painful rate hikes might soon become necessary.
CME Group’s flash data for crude oil futures markets noted traders trimmed their open interest positions for the second session in a row on Wednesday, this time by around 11.4K contracts. In the same direction, volume went down by around 109.1K contracts, partially reversing the sharp build seen in the previous session.
WTI appears capped by $70.00
Wednesday’s rebound from the vicinity of the $67.00 region came along diminishing open interest and volume, suggesting that a meaningful move higher in WTI appears out of favour in the very near term at least. In the meantime, the $70.00 region per barrel seems to be quite a decent resistance zone.
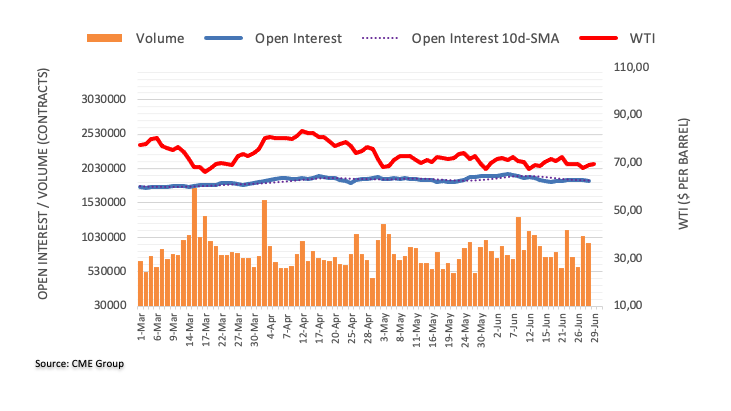
UOB Group’s Economist Lee Sue Ann and Markets Strategist Quek Ser Leang expect NZD/USD to accelerate its decline on a close below the 0.6100 mark.
Key Quotes
24-hour view:Yesterday, we expected NZD to consolidate between 0.6135 and 0.6180. However, NZD traded in a higher range of 0.6159/0.6200 before ending the day little changed at 0.6163 (-0.02%). The underlying tone has softened somewhat, and today, NZD is likely to edge lower. In view of the mild downward pressure, any decline is unlikely to threaten the major support at 0.6100 (minor support is at 0.6120). Resistance is at 0.6175, followed by 0.6195.
Next 1-3 weeks: Our update from Monday (26 Jun, spot at 0.6150) still stands. As highlighted, downward momentum has improved a tad, but NZD has to break clearly below 0.6100 before a sustained decline is likely. The likelihood of NZD breaking below 0.6100 will remain intact as long as NZD stays below 0.6210 (no change in ‘strong resistance’ level).
Economists at Société Générale analyze EUR/GBP technical outlook.
Defence of 0.8570 is crucial for persistence in up-move
EUR/GBP gave a break below December low however the downward momentum hasn’t regained. It has found support near 0.8520 resulting in a swift rebound.
The pair is now challenging the previous ascending trend line near 0.8660. If this hurdle is overcome, the bounce is likely to extend toward the 200-DMA near 0.8720/0.8750.
Defence of 0.8570, the 61.8% retracement of the recent rebound is crucial for persistence in up-move.
The European Central Bank (ECB) published its Economic Bulletin article on Thursday, providing details on the economic, financial and monetary developments in the Euro area.
Key highlights
High energy and commodity prices and supply bottlenecks have driven strong inflation in the euro area and higher inflation differentials between euro area countries.
Persistent inflation differentials may lead to external imbalances.
High inflation has spilled over into increasing unit labour costs (ULCs) and unit profits in many euro area countries.
Current account developments suggest little progress in the unwinding of imbalances.
Overall, changes in price competitiveness since the pandemic appear to have neither aggravated nor further unwound external imbalances.
Related reads
- EUR/USD Forecast: Euro bulls could show interest on a hot German inflation reading
- German inflation in focus, ahead of US Q1 GDP
- The US Dollar edges up as investors digest many events in the first part of the trading day.
- Focus shifts to US GDP numbers after Powell’s speech.
- The US Dollar Index is firmly in the green, consolidating ground above 102.50 with a flirt at 103.00
The US Dollar (USD) is having a lot to digest this morning. Spanish inflation fell less than expected, making the Euro outperform the Greenback, while the Swedish Riksbank dropped the ball with a dovish hike, prompting the Swedish Krona to depreciate substantially against the US Dollar. US Federal Reserve (Fed) Chairman Jerome Powell already hit the stage at the start of the European session and made a carbon print of what he said on Wednesday by again committing to two more interest-rate hikes, possibly consecutive ones. As if that was not enough, the People’s Bank of China (PBoC) fixed its Yuan again firmly stronger against the US Dollar, in a one-trick-pony as seen on Tuesday.
With Powell already out of the way, traders will be fully focused on two batches of economic data to come out. Main attention will be at 12:30 GMT with the final estimate of the US Gross Domestic Product (GDP) for Q1, which is expected to come in at an annualized rate of 1.3%, unchanged from the previous estimate. The GDP Price Index is also seen stable at 4.2%. At that same time, the US Labor Department will publish the weekly Jobless Claims data, with Initial Claims expected at 265K, from 264K previous, and the Continuing Jobless Claims are expected to head higher from 1.759 million to 1.765 million.
Daily digest: US traders in for a wild ride
- The Swedish central bank (Riksbank) opted for a 25 basis point hike this morning. The bank also issued the commitment that it will defend its currency with interventions. This means the market could challenge this commitment, underpinning the Greenback against the Swedish Krona and other Scandinavian currencies such as Danish Krone (USD/DKK) and Norwegian Krone (USD/NOK).
- China’s PBoC tried to surprise markets again with a stronger fixing of its Yuan against the US Dollar. This time markets shrugged off the move as insufficient and even sent USD/CNH substantially higher to nearly Wednesday’s level near 7.27. USD/CNH trades in the green and further weakening of the Yuan is expected against the Greenback.
- First big batch of data will come out at 12:30 GMT with the US GDP numbers. Economic growth for the first quarter is expected at an annualized rate of 1.3%, unchanged from previous estimates, and the GDP Price Index is seen at 4.2%, also unchanged. Jobless Claims, also due 12:30 GMT, are expected to show broadly stable Initial Claims – up 265k from 264k last week – while Continuing Claims are expected to edge up to 1.765 million from 1.759 million the previous week.
- Second batch of data at 14:00 with Pending Homes sales data for May.. The monthly number is expected to jump from 0% to 0.2%. On a yearly basis, pending home sales are expected to decline 21.9%, more than the 20.3% decrease seen in April.
- One US Fed speaker is expected after Powell. Atlanta Fed President Raphael Bostic will give a speech on the US economic outlook at the Irish Association of Investment Managers Annual Dinner at 19:00 GMT.
- The US banking stress test results were published on Wednesday, and all 23 biggest banks passed it with flying colours.
- In early European trading, US Fed chairman Jerome Powell made a copy-paste of his Wednesday speech. Powell repeated that the majority of FOMC members see two or more rate hikes by year-end.
- The equity gains from Wednesday were getting pared back in Asia trading as both the Japanese Topix and the Chinese Hang Seng closed in the red. European markets are very mixed, baffled by Spanish inflation falling less than expected and indications that German inflation will accelerate, triggering the risk that more monetary tightening might be needed from the ECB.
- The CME Group FedWatch Tool shows that markets are pricing in a 81.8% chance of a 25 basis points (bps) interest-rate hike on July 26th. After US Fed chairman Powell repeated twice in the past 24 hours that the Fed is committed to hiking twice, markets are sticking reluctant to the one-and-done belief.
- The benchmark 10-year US Treasury bond yield trades at 3.74% after a wild ride in the last 24 hours. On Wednesday, the 10-year T-note dropped to almost 3.70% as bonds were bid again and this morning saw the full drop pared back as European inflation proved sticky.
US Dollar Index technical analysis: USD advances in eventful start of the day
The US Dollar trades against most peers in the green, with only three main outliers to mention: the Japanese Yen (USD/JPY), the Australian Dollar (USD/AUD) and the New Zealand Dollar (USD/NZD). The move comes after a very eventful morning in Europe where inflation flared up and the Swedish Riksbank committed to defend its currency. That triggered a knee-jerk reaction and pulled the US Dollar Index (DXY) back down below 103.00, though the DXY is recovering from earlier pulldown moves.
On the upside, the 100-day Simple Moving Average (SMA) briefly got pierced through at 103.04 and next saw the DXY retreat by a stronger Euro and Yuan. It looks like those pairs are reversing again in favor of US Dollar strength and might push the DXY back above 103.00. Once that happens, look for 103.50 as the next key level to the upside.
On the downside, the 55-day SMA near 102.67 is up for proving its reliability as a support element after being chopped up that much in the last two weeks. A touch lower, 102.50 will be vital to hold from a psychological point of view. In case the DXY slips below 102.50, more weakness is expected with a full slide to 102.00 and a retest of June’s low at 101.92.
How does Fed’s policy impact US Dollar?
The US Federal Reserve (Fed) has two mandates: maximum employment and price stability. The Fed uses interest rates as the primary tool to reach its goals but has to find the right balance. If the Fed is concerned about inflation, it tightens its policy by raising the interest rate to increase the cost of borrowing and encourage saving. In that scenario, the US Dollar (USD) is likely to gain value due to decreasing money supply. On the other hand, the Fed could decide to loosen its policy via rate cuts if it’s concerned about a rising unemployment rate due to a slowdown in economic activity. Lower interest rates are likely to lead to a growth in investment and allow companies to hire more people. In that case, the USD is expected to lose value.
The Fed also uses quantitative tightening (QT) or quantitative easing (QE) to adjust the size of its balance sheet and steer the economy in the desired direction. QE refers to the Fed buying assets, such as government bonds, in the open market to spur growth and QT is exactly the opposite. QE is widely seen as a USD-negative central bank policy action and vice versa.
Economists at MUFG Bank discuss USD outlook.
Near-term performance of the USD is tied to both Fed monetary policy expectations and global growth performance
The near-term performance of the Dollar is tied to both Fed monetary policy expectations and global growth performance.
The data coming up remain key – PCE inflation, the ISMs and NFP and the CPI data and we still see scope for that data offering the leeway for the Fed to maintain its pause. But if that is the case, the selling of the Dollar will be curtailed by falling inflation elsewhere (Australia and Italy yesterday) and by growth uncertainties (China) or signs of higher rates impacting the real economy (UK).
We continue to expect that these opposing forces will keep FX rates in ranges but accept stronger US data next week may alter that dynamic and see the US Dollar outperform.
The Brazilian Real declined substantially after the minutes of the last meeting of the Brazilian central bank (Banco Central do Brasil, BCB) on Tuesday took a surprisingly more dovish tone than the original statement after the meeting had suggested. Economists at Commerzbank analyze BRL's outlook.
Real could avoid pressure if today's meeting were to pass off without a hitch
For the sake of confidence in the central bank's independence and thus in credible inflation control, it would certainly be best if today's meeting were to pass off without a hitch. Then, given the still very attractive real interest rate level of over 9%, the start of rate cuts would probably not put undue pressure on the Real.
On the other hand, if there is even the slightest suspicion that the BCB might postpone the start of rate cuts due to the ongoing criticism of the government, this is likely to weigh on the BRL. A foretaste of this was provided by the Real's reaction to the minutes, which some commentators interpreted as an attempt to defuse criticism of the government following the hawkish statement after the rate decision.
Riksbank raises policy rate by 25 bps to 3.75%.EUR/SEK initially rallied to 11.8281 as headlines crossed but it has settled back at 11.76. Economists at Société Générale analyze the pair’s outlook.
Terminal rate raised to 4.1%, 80 bps above February estimate
The Riksbank raised its policy rate by 25 bps to 3.75% and raised its terminal rate estimate by another 40 bps to 4.1%. That’s an uplift of 80 bps since February, an indication of how the central bank is struggling to get a grip on inflation.
The weaker Krona isn’t making things any easier for the central bank which, like the ECB, was too slow in raising rates from ultra-low levels. The forecast is for the policy rate to be increased at least one more time this year. Inflation is falling but is still far too high. Service prices, like in many other developed economies, are rising unexpectedly rapidly and a weaker Krona, indicates that inflation is declining more slowly than expected.
The SEK like the NOK is not out of the woods and a durable recovery can only gain traction when the outlook clears up on inflation in the US and the Eurozone and the Fed and ECB end the tightening cycles.
The Canadian Dollar outperformed procyclical G10 FX peers in the second quarter, supported by exposure to strong US demand and a hawkish Bank of Canada. Economists at Credit Suisse have upgraded their CAD outlook.
The trend can extend at the current pace
Firm prospects for US activity suggest the trend can extend at the current pace.
We revise our USD/CAD target from 1.3450 to 1.3100 and lower the Q3 target range to 1.2950-1.3520.
See: GBP and CAD set to struggle in the medium term – Wells Fargo
Japanese Finance Minister Shunichi Suzuki reiterated on Thursday that he “won't rule out any options if FX moves are excessive.”
Additional comments
“No comment on FX levels.“
“Closely watching FX moves.”
“But one-sided and unstable moves are undesirable.”
- Silver regains positive traction on Thursday, albeit lacks follow-through buying.
- The mixed technical setup warrants caution before placing any directional bets.
- A sustained strength beyond $23.00 should pave the way for additional gains.
Silver attracts some buyers near the 100-hour Simple Moving Average (SMA) on Thursday and reverses a major part of its losses recorded the previous day; The white metal, however, struggles to make it through the 38.2% Fibonacci retracement level of the last week's downfall and trades around the $22.75-$22.80 region, up over 0.40% for the day during the first half of the European session.
From a technical perspective, the XAG/USD this week struggles to find acceptance above the $23.00 mark and faced rejection just ahead of the 50% Fibo. level. The subsequent downfall, however, stalls near the $22.55 confluence, comprising the 100-hour SMA and the 23.6% Fibo. level. The said ares should now act as a pivotal point, which if broken decisively will be seen as a fresh trigger for bearish traders. The XAG/USD might slide back to retest the multi-month low, around the $22.10 region touched last week.
Some follow-through selling below the $22.00 mark should pave the way for deeper losses and accelerate the fall further towards the $21.70-$21.65 zone. The downward trajectory could get extended further towards the next relevant support near the $21.25 region before the XAG/USD eventually drops to the $21.00 round figure.
On the flip side, any further intraday move up might continue to confront stiff resistance near the $23.00 mark, or 200-hour SMA. This is closely followed by the 50% Fibo., around the $23.15 region, and the $23.40 area, or the 61.8% Fibo. A convincing break through the latter will confirm that the XAG/USD has formed a near-term bottom just ahead of the $22.00 mark and trigger a fresh bout of a short-covering rally. This should pave the for some meaningful appreciating move and lift the white metal to the $23.65-$23.70 hurdle.
Silver 1-hour chart
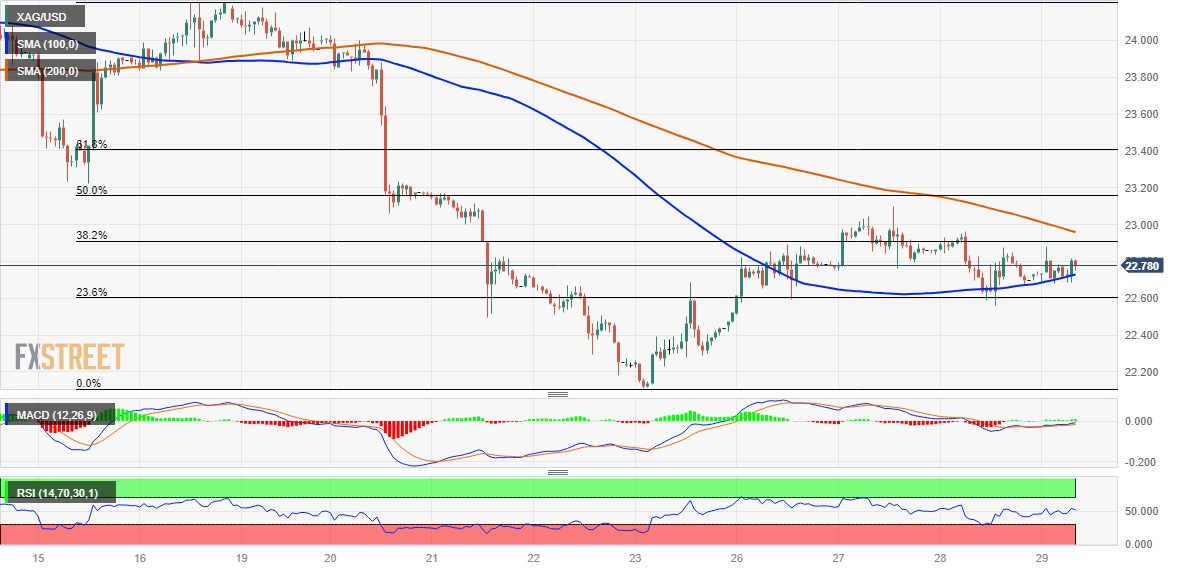
Key levels to watch
Economists at ING expect the US Dollar to remain solid the rest of the week.
Central bank communication at Sintra has stayed pretty hawkish
Central bank communication at this week's Sintra conference in Portugal has stayed pretty hawkish. Expectations for the duration and terminal rates for tightening cycles are being revised higher. This is most credibly being done in the US, where the economy appears to be outperforming. This is allowing the Dollar to stay quite bid – especially against those currencies without much/any interest rate difference such as the Japanese Yen and the Chinese Renminbi.
Expect the Dollar to stay bid ahead of what should be another high US core inflation print tomorrow.
DXY looks biased to 103.30/35 and possibly 103.65 – as long as initial claims do not spike higher today.
Economists at Credit Suisse analyze EUR/USD outlook and expect the pair to head toward the 1.0500 level.
The market has seen countervailing forces face off in EUR/USD
Our predicted EUR/USD 1.0500-1.1250 range for Q2 looks valid again.
In 2023 the market has seen countervailing forces face off in EUR/USD. On the one hand, a hawkish ECB amid continued core inflation risk in the Euro-area have underpinned the EUR. On the other, the USD keeps benefiting from markets having underestimated inflation persistence and economic resilience in the US, alongside a continued carry premium.
As Euro-area data start to soften, we expect the pair to gravitate to the lower end of this range.
Economists at OCBC Bank analyze the US Dollar outlook.
A moderate-to-soft USD profile
Moderate-to-soft USD profile as Fed tightening goes into late cycle with an end-in-sight.
Need a more entrenched disinflation trend to reinforce the end-in-sight view and likely for the USD to trade softer. But near term, the risk of hawkish Fed and a bumpy disinflation path may well keep USD temporarily supported in the early part of the third quarter of 2023.
See: Fed cuts delayed to next year, upgraded view on the USD – ABN Amro
Economists at ING analyze EUR/USD outlook.
EUR/USD risks another drop to the 1.0850 area
With the USD/CNY pair staying bid and Eurozone data soft we would say EUR/USD risks another drop to the 1.0850 area.
Valuation metrics suggest the EUR/USD pair does not have to sell off too far – but the pieces of the investment puzzle have yet to fall into place for a EUR/USD rally.
See: EUR/USD to move lower toward H2 on weaker global growth, relative US economy outperformance – Danske Bank
- EUR/JPY attracts some dip-buying on Thursday, albeit lacks follow-through.
- The BoJ-ECB policy divergence continues to act as a tailwind for the cross.
- The RSI on the daily chart holds in the overbought territory and caps gains.
The EUR/JPY cross reverses an intraday dip to the 157.25-157.20 area on Thursday and climbs back closer to its highest level since September 2008 touched the previous day. Spot prices, however, retreat a few pips during the early part of the European session and remain below the 158.00 mark, though the fundamental backdrop seems tilted firmly in favour of bullish traders.
Despite intervention fears, the Japanese Yen (JPY) continues with its relative underperformance in the wake of a more dovish stance adopted by the Bank of Japan (BoJ) and turns out to be a key factor lending support to the EUR/JPY cross. It is worth recalling that Japanese Finance Minister Shunichi Suzuki said earlier this week that they will watch the forex market with a sense of urgency and would respond appropriately if the currency moves became excessive. The warning was reiterated by Japan's top currency diplomat Masato Kanda, though fails to attract any meaningful buying around the JPY as investors seem convinced that BoJ's negative interest-rate policy will remain in place at least until next year.
Moreover, BoJ Governor Kazuo Ueda recently ruled out the possibility of any change in ultra-loose policy settings and signalled no immediate plans to alter the yield curve control measures. In contrast, the European Central Bank (ECB) President Christine Lagarde cemented market expectations for a ninth consecutive lift-off in July. Speaking at the Sintra central banking event in Portugal, Lagarde said that inflation in the Eurozone is too high and is set to remain so for too long. This, in turn, lifted bets for more rate hikes from the ECB this year, which, in turn, is seen acting as a tailwind for the shared currency and supports prospects for a further near-term appreciating move for the EUR/JPY cross.
That said, the Relative Strength Index (RSI) on the daily chart remains in the overbought territory and makes it prudent to wait for some near-term consolidation or a modest pullback before placing fresh bullish bets. Nevertheless, the aforementioned fundamental backdrop suggests that the path of least resistance for the EUR/JPY cross is to the upside. Hence, any meaningful corrective decline might still be seen as an opportunity for bulls and is more likely to remain limited.
Technical levels to watch
Here is what you need to know on Thursday, June 29:
The US Dollar (USD) stays resilient against its rivals early Thursday, with the US Dollar Index holding at two-week highs near 103.00 following Wednesday's upsurge. European Commission will publish the business and consumer sentiment data for June in the European session. Later in the day, inflation figures from Germany and the US Bureau of Labor Statistics' final revision to the first-quarter Gross Domestic Product (GDP) growth alongside the weekly Initial Jobless Claims data will be watched closely by market participants.
At a policy panel at the ECB Forum on Central Banking on Wednesday, FOMC Chairman Jerome Powell noted that they believe there is more tightening coming, driven by the strong labor market. While speaking at an event in Spain early Thursday, Powell repeated his hawkish message and reminded markets that a strong majority of policymakers expect two or more rate hikes by the end of the year. Meanwhile, the Federal Reserve's Bank Stress Test revealed that large US banks are well-positioned to weather a severe recession and continue to lend.
EUR/USD fell below 1.0900 during the Asian trading hours before staging a modest rebound. While speaking at the same panel with Powell, ECB President Chritsine Lagarde reiterated that another rate hike is very likely in July but refrained from confirming any other policy steps later in the year. In the meantime, annual Consumer Price Index in Spain rose 1.9% in June, down sharply from the 3.2% increase recorded in May.
GBP/USD lost more than 100 pips and came within a touching distance of 1.2600 on Wednesday. The pair is having a difficult time gaining direction early Thursday.
USD/JPY climbed to its highest level since November above 144.70 in the European morning on Thursday but lost more than 50 pips in a matter of minutes following that jump. As of writing, the pair was trading slightly below 144.50. In the Asian session on Friday, Tokyo Consumer Price Index, Industrial Production and Unemployment Rate data will be featured in the Japanese economic docket.
Hawkish central bank rhetoric continued to weigh on Gold price and XAU/USD fell toward $1,900, touching its lowest level since early March in the process.
Bitcoin lost 2% on Wednesday but managed to hold comfortably above $30,000. Ethereum came within a touching distance of $1,800 mid-week before recovering toward $1,850 on Thursday.
Economists at the Bank of America expect to see a high USD/JPY pair due to carry-trade.
Potential Correction in 2024
We expect the USD/JPY pair to remain high due to carry-trade, forecasting it to reach 147 by September.
We align with the consensus view that the USD/JPY may undergo a correction in 2024 due to policy convergence. We anticipate the Federal Reserve to begin cutting rates in May 2024, while the Bank of Japan (BoJ) is expected to withdraw from negative interest rate policy around mid-2024.
Despite the expected policy convergence, we warn that there is a downside risk for the Yen in 2024. The market is currently pricing in approximately a 170 bps rate cut from the Fed's peak policy rate in fall 2023 to the end of 2024. There is considerable uncertainty about whether US inflation will slow down enough to enable the Fed to start reducing rates.
If the Fed does not cut rates in 2024, the Yen’s weakness could enter a third phase. The first phase is characterized by policy divergence in 2022, the second phase by carry trade in 2023, and the third phase by Japanese households rebalancing offshore assets to preserve their purchasing power in 2024.
European Central Bank (ECB) policymaker and Bank of Spain's Governor Pablo Hernandez de Cos is speaking at the Fourth Conference on Financial Stability hosted by the Bank of Spain, in Madrid, on Thursday.
“ECB September meeting is absolutely open regarding interest rates,” de Cos said.
Market reaction
EUR/USD was last seen trading at 1.0913, up 0.02% on the day. Upbeat Spanish inflation data is supporting the upside in the Euro.
Economists at ING analyze the GBP outlook.
Too soon to start Selling sterling on hard landing fears
We think it is too soon to start Selling sterling on hard landing fears.
We think Sterling only sells off when the data – both inflation and labour market data – suggest the BoE can ease up in its hawkishness. Until then GBP/USD might find some support near 1.2600 and EUR/GBP could easily drift back under 0.8600.
See: EUR/GBP to climb above 0.90 in the coming quarters – Commerzbank
- Gold price drifts lower for the fourth straight day and drops to over a three-month low.
- The Federal Reserve’s hawkish outlook lifts the US Dollar and weighs on the XAU/USD.
- Looming recession risks could help limit any further downside for the safe-haven metal.
Gold price attracts fresh sellers following an intraday uptick to the $1,912-$1,913 region and drifts into negative territory for the fourth successive day on Thursday. The XAU/USD remains on the defensive heading into the European session and is currently placed near its lowest level since mid-March, just above the $1,900 round-figure mark.
The US Dollar (USD) builds to Wednesday's strong move up and climbs to a fresh two-week peak, which, in turn, is seen as a key factor undermining the Gold price. Federal Reserve (Fed) Chair Jerome Powell's, Speaking at a European Central Bank (ECB) conference on Wednesday, reiterated that two rate increases are likely this year and said that he does not see inflation coming down to the Fed's 2% target until 2025. This reaffirms market bets for a 25 bps lift-off at the next FOMC policy meeting on July 25-26, pushing the US Treasury bond yields higher and benefitting the Greenback.
Apart from this, a more hawkish outlook by other major central bank contributes to driving flows away from the non-yielding Gold price. In fact, the European Central Bank (ECB) President Christine Lagarde said that inflation in the Eurozone had entered a new phase that could linger for some time. Lagarde added that it is unlikely that in the near future the central bank will be able to state with full confidence that the peak rates have been reached. Furthermore, the Bank of England (BoE) Governor Andrew Bailey hinted that rates could remain at peak levels for longer than traders currently expect.
The aforementioned fundamental backdrop seems tilted firmly in favour of bearish traders and supports prospects for a further near-term depreciating move for Gold price. That said, the worsening global economic outlook, along with concerns about deteriorating US-China relations, could lend some support to the safe-haven XAU/USD, for the time being. Traders might also refrain from placing aggressive bets and move to the sidelines ahead of Friday's key releases - the official Chinese PMI prints for June and the US Core PCE Price Index - the Fed's preferred inflation gauge.
Technical levels to watch
EUR/SEK remains close to historic highs as the Riksbank prepares to announce a key monetary policy decision. Economists at ING analyze the pair’s outlook.
Expect EUR/SEK volatility today
Expect EUR/SEK volatility today: we suspect there are some upside risks and a move to the 11.85/11.90 level is possible as the Riksbank may fail to make a structurally SEK-bearish market change its mind.
By contrast, should we see a resolutely hawkish tone, EUR/SEK may slide back below 11.70.
As we have learned from the April meeting, the spectrum of surprises can be quite wide with the Riksbank.
- USD/JPY initially refreshed seven-month high before reversing of late, still up for the third consecutive day.
- Fed Chair Powell’s speech repeats the previous day’s hawkish remarks about interest rate hikes.
- Upbeat Japan data fails to inspire Yen pair buyers amid dovish BoJ bias.
- Second-tier US data, Japan inflation and bond market moves eyed for clear directions.
USD/JPY portrays nearly 20 pips of seesaw momentum after Federal Reserve (Fed) Chairman repeats the previous day’s comments on early Thursday morning in Europe. That said, the Yen pair rose to the highest levels since November 2022 before retreating from 144.70, around 144.60 at the latest.
“A strong majority of Fed policymakers expect two or more rate hikes by year-end,” said Fed Chair Jerome Powell while speaking at the Fourth Conference on Financial Stability hosted by the Bank of Spain, in Madrid.
It should be noted, however, that his comments suggesting, “Bank stresses that emerged in March 'may well lead' to a further tightening in credit conditions,” seemed to have triggered the USD/JPY pair’s retreat from the multi-day top afterward.
On the other hand, Japan’s upbeat data also prod the Yen pair buyers. That said, Japan's Consumer Confidence Index for June matches 36.2 forecasts, versus 36.0, whereas Japan’s Retail Trade growth jumps to 5.7% YoY for May versus 5.4% expected and 5.1% prior (revised).
Furthermore, fears of the Japanese government’s intervention to defend the Yen, as the policymakers have recently shown readiness to do it in case of emergency, also seem to prod the USD/JPY bulls.
Even so, dovish comments from Bank of Japan (BoJ) Governor Kazuo Ueda and upbeat US Treasury bond yields keep the USD/JPY buyers hopeful. That said, “(There is) still some distance to go in sustainably achieving 2% inflation accompanied by sufficient wage growth,” said BoJ’s Ueda while also adding that the Japanese economy is going to expand slightly above potential for some time. Talking about the yields, the US 10-year and two-year Treasury bond yields consolidate the previous day’s losses around 3.48% and 4.75% at the latest.
Moving on, USD/JPY pair traders will pay attention to the revised version of the US Gross Domestic Product (GDP) for the first quarter (Q1) 2023, as well as the second-tier US employment and activity data, for clear directions.
Technical analysis
USD/JPY remains within a fortnight-old bullish channel, currently between 143.85 and 145.50, which in turn keeps the Yen pair buyers hopeful.
The Fed can continue to tighten monetary policy via QT. Economists at Danske Bank analyze its implications for the EUR/USD pair.
Fed can likely continue QT well into 2024
As bank reserves remain at healthy levels, the Fed can likely continue QT well into 2024.
The ongoing QT will weigh on bank reserves over time, but for now, the drain of the Fed's overnight reverse repo facility (ON RRP) as well as the liquidity support from the Bank Term Funding Program (BTFP) means that tightening liquidity conditions will not be high on the markets' list of worries in the near-term. If anything, the June development has been a modest positive surprise, evident in the narrowing of the EUR/USD OIS basis.
The abundant USD liquidity, all else equal, is likely also a supporting factor for the EUR/USD spot, but we still believe the cross will move lower towards H2 following weaker global growth and relative outperformance of the US economy.
Economists at TD Securities think it is time to fade the rally in SEK/JPY, highlighting a few key drivers that should push the cross lower in the next 1-2 months.
USD/JPY is getting close to the “no fly zone”
For one thing, while the Riksbank looks ready to hike and remove QT, that is already priced in. What's more, they probably have the least wiggle in the G10 to dial up the hawkish rhetoric.SEK's growth expectations have been aggressively downgraded recently. Its economy remains one of the most rate-sensitive of the G10 currencies we track, highlighting the high level of floating-rate mortgages. It also lacks a savings buffer to cushion the impact from higher mortgage rates, leaving the economy more vulnerable.
SEK/JPY HFFV also sits near 12.9 and MRSI implies an even deeper correction. Besides the SEK leg, we also think USD/JPY is getting close to the ‘no fly zone’, increasing the risks of intervention or a BoJ policy tweak this summer.
The Franc exchange rate continues to play an important role for the SNB in the fight against inflation. Economists at Commerzbank analyze CHF's outlook.
SNB could tolerate some weakening of the Franc
Price pressures in Switzerland have eased somewhat recently. Nevertheless, the SNB remains concerned about second-round effects. It is therefore likely to remain hawkish for the time being, favouring a strong Franc. However, if price pressures continue to ease over the course of the year, it is likely to tolerate a moderately weaker CHF.
And with the ECB likely to remain quite hawkish, the EUR should be supported from that side. Against this background, we see scope for the Franc to weaken somewhat against the EUR over the course of the year.

Source: Commerzbank Research
US Federal Reserve (Fed) President Jerome Powell is speaking at the Fourth Conference on Financial Stability hosted by the Bank of Spain, in Madrid, on Thursday.
Key quotes
A strong majority of fed policymakers expect two or more rate hikes by year end.
Repeats labor market 'very tight,' inflation 'well above' goal.
Some indicators in the housing market have turned up; housing sector activity still far below its peak
US core pce inflation likely rose 4.7% in May from year earlier; overall pce index estimated to have risen 3.9%.
Will take time for full effects of monetary restraint to be realized, especially on inflation.
Process of getting to 2% inflation 'has a long way to go'.
Bank stresses that emerged in march 'may well lead' to a further tightening in credit conditions.
Extent of effects from tighter credit conditions remains uncertain.
Economy faces headwinds from tighter credit conditions.
Cannot take resilience of financial system for granted.
US banking system strains have eased, deposit flows have stabilized.
I look forward to evaluating proposals for changes to supervision, regulation of banks of the size of svb, and implementing them where appropriate.
We are still monitoring the situation very carefully in the banking sector.
Market reaction
At the time of writing, the US Dollar Index is holding the renewed upside near 103.15, up 0.26% on the day.
- GBP/JPY pares weekly gains at the highest levels since December 2015, picks up bids to reverse early-day downside of late.
- Convergence of two-week-old horizontal support, 50-SMA challenges intraday bears.
- Bulls may aim for 184.50 during fresh upside, 183.00 caps immediate rise.
GBP/JPY regains the 182.60 level as it consolidates the intraday losses heading into Thursday’s London open. In doing so, the cross-currency pair prints mild gain at the highest levels since late 2015, losing upside momentum of late.
That said, Wednesday’s rejection of a one-week-old bullish channel joins the bearish MACD signals to lure short-term GBP/JPY sellers.
However, multiple tops marked since June 18 join the 50-SMA to restrict the immediate downside of the pair around 182.00-182.10.
Even if the quote breaks the 182.00 support, a three-week-old rising trend line and the 100-SMA, respectively near 180.60 and 179.30, will challenge the GBP/JPY bears. Also acting as the downside filter is the 180.00 psychological magnet.
On the contrary, the pair’s latest recovery appears elusive unless defying the previous day’s channel break, by crossing the 183.000 hurdle comprising the lower line of the aforementioned channel.
Following that, a run-up towards the latest multi-year high near 183.80 and the stated channel’s top line, close to 184.50 could lure the GBP/JPY buyers.
It’s worth noting that the GBP/JPY pair’s run-up beyond 184.50 enables buyers to aim for the November 2015 peak of near 188.80 and then the 190.00 round figure.
Overall, GBP/JPY may remain depressed but the bears are far from home.
GBP/JPY: Four-hour chart
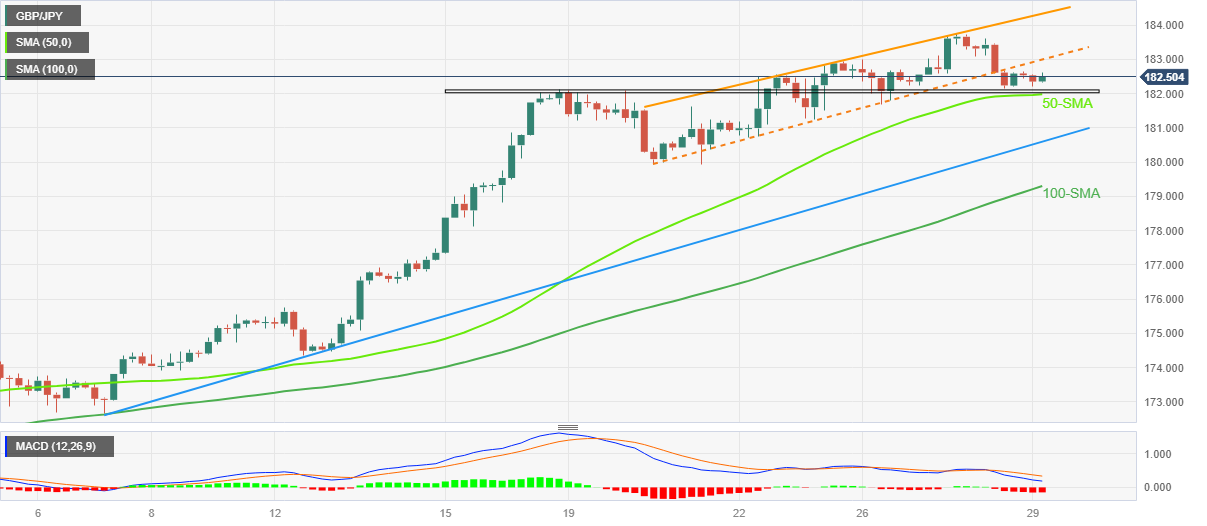
Trend: Further recovery expected
FX option expiries for June 29 NY cut at 10:00 Eastern Time, via DTCC, can be found below.
- EUR/USD: EUR amounts
- 1.0700 2.8b
- 1.0775 668m
- 1.0800 2.9b
- 1.0825 628m
- 1.0900 1.4b
- 1.0950 650m
- 1.1000 1.5b
- GBP/USD: GBP amounts
- 1.2665 542m
- 1.2700 1b
- USD/JPY: USD amounts
- 142.00 609m
- 143.00 676m
- 143.50 708m
- 144.00 1.3b
- 144.50 1.8b
- USD/CHF: USD amounts
- 0.8725 300m
- 0.8825 400m
- 0.9000 710m
- 0.9020 455m
- AUD/USD: AUD amounts
- 0.6800 667m
- USD/CAD: USD amounts
- 1.3100 320m
- 1.3150 1b
- 1.3200 644m
- 1.3225 380m
- 1.3250 439m
- 1.3350 534m
- NZD/USD: NZD amounts
- 0.6500 422m
- EUR/GBP: EUR amounts
- 0.8600 919m
- Euro extends the weekly downtick to multi-day lows.
- Stocks in Europe closed Wednesday’s session in a firm note.
- EUR/USD drops below the 1.0900 barrier on extra USD gains.
- Flash inflation figures in Germany are due later in the session.
- Chief Powell meets Bank of Spain’s Hernandez de Cos.
Further selling pressure hurts the Euro (EUR) and forces EUR/USD to break below the key support at 1.0900 the figure ahead of the opening bell in the euro area on Thursday.
Indeed, the pair gives away further ground on the back of the prevailing risk-off scenario and the persistent move higher in the greenback, which motivates the USD Index (DXY) to advance to 2-week highs further north of the 103.00 hurdle on Thursday.
In the meantime, extra gains in the US Dollar underpin the continuation of the corrective decline in EUR/USD, which seems to have met some initial support in the 1.0880 region for the time being, an area also coincident with the transitory 55-day SMA.
The renewed weakness in the risk complex comes after central bank chiefs expressed hawkish sentiments at the ECB's symposium in Portugal on Wednesday, highlighting that current policy measures are still not adequately restrictive. Despite this, the market appears to be at ease with the belief that the Federal Reserve will implement two additional interest rate hikes, potentially back-to-back, signaling the nearing conclusion of the tightening cycle.
Likewise, although the ECB holds a hawkish stance and plans to raise rates in July, and potentially once more thereafter, concerns arise due to the economic decline and credit data, which restrict expectations regarding the extent and duration of the ECB's policy rate increases.
The potential future actions of the Fed and the ECB in normalizing their monetary policies remain a topic of ongoing debate. This discussion takes place against the backdrop of increasing speculation about an economic slowdown on both sides of the Atlantic.
It will be a busy day in terms of data releases, as advanced inflation figures are due in Spain and Germany, as well as the Economic Sentiment and the final print of the Consumer Confidence in the broader euro area.
In the US, the final prints of the Q1 Growth Rate will be in the limelight seconded by usual Initial Jobless Claims, Pending Home Sales and the speech by Atlanta Fed Raphael Bostic (2024 voter, hawk).
Daily digest market movers: Euro appears offered below 1.0900
- The EUR remains under pressure on USD-buying.
- Germany’s flash CPI for the month of June takes centre stage.
- The European Council meets in Brussels later in the morning.
- Fed’s Powell will participate in an event at the Bank of Spain.
- The Dollar looks bid following Wednesday’s event at the ECB Forum.
- ECB’s Mario Centeno (dove) suggested a pause should be close.
Technical Analysis: Euro challenges the 55-day SMA
EUR/USD remains under pressure and puts the provisional 55-day SMA at 1.0880 to the test on Thursday. The loss of this level exposes a deeper pullback to the June low at 1.0844 (June 23) ahead of the provisional 100-day SMA at 1.0815. South from here emerges the May low of 1.0635 (May 31) prior to the March low of 1.0516 (March 15) and the 2023 low of 1.0481 (January 6).
If bulls regains the upper hand, the next hurdle is then expected at the June peak of 1.1012 (June 22) prior to the 2023 high of 1.1095 (April 26), which is closely followed by the round level of 1.1100. North from here emerges the weekly top of 1.1184 (March 31, 2022), which is supported by the 200-week SMA at 1.1181, just before another round level at 1.1200.
The constructive view of EUR/USD appears unchanged as long as the pair trades above the crucial 200-day SMA, today at 1.0583.
Euro FAQs
What is the Euro?
The Euro is the currency for the 20 European Union countries that belong to the Eurozone. It is the second most heavily traded currency in the world behind the US Dollar. In 2022, it accounted for 31% of all foreign exchange transactions, with an average daily turnover of over $2.2 trillion a day.
EUR/USD is the most heavily traded currency pair in the world, accounting for an estimated 30% off all transactions, followed by EUR/JPY (4%), EUR/GBP (3%) and EUR/AUD (2%).
What is the ECB and how does it impact the Euro?
The European Central Bank (ECB) in Frankfurt, Germany, is the reserve bank for the Eurozone. The ECB sets interest rates and manages monetary policy.
The ECB’s primary mandate is to maintain price stability, which means either controlling inflation or stimulating growth. Its primary tool is the raising or lowering of interest rates. Relatively high interest rates – or the expectation of higher rates – will usually benefit the Euro and vice versa.
The ECB Governing Council makes monetary policy decisions at meetings held eight times a year. Decisions are made by heads of the Eurozone national banks and six permanent members, including the President of the ECB, Christine Lagarde.
How does inflation data impact the value of the Euro?
Eurozone inflation data, measured by the Harmonized Index of Consumer Prices (HICP), is an important econometric for the Euro. If inflation rises more than expected, especially if above the ECB’s 2% target, it obliges the ECB to raise interest rates to bring it back under control.
Relatively high interest rates compared to its counterparts will usually benefit the Euro, as it makes the region more attractive as a place for global investors to park their money.
How does economic data influence the value of the Euro?
Data releases gauge the health of the economy and can impact on the Euro. Indicators such as GDP, Manufacturing and Services PMIs, employment, and consumer sentiment surveys can all influence the direction of the single currency.
A strong economy is good for the Euro. Not only does it attract more foreign investment but it may encourage the ECB to put up interest rates, which will directly strengthen the Euro. Otherwise, if economic data is weak, the Euro is likely to fall.
Economic data for the four largest economies in the euro area (Germany, France, Italy and Spain) are especially significant, as they account for 75% of the Eurozone’s economy.
How does the Trade Balance impact the Euro?
Another significant data release for the Euro is the Trade Balance. This indicator measures the difference between what a country earns from its exports and what it spends on imports over a given period.
If a country produces highly sought after exports then its currency will gain in value purely from the extra demand created from foreign buyers seeking to purchase these goods. Therefore, a positive net Trade Balance strengthens a currency and vice versa for a negative balance.
The Malaysian Ringgit has lost ground in 2023. Economists at ANZ Bank analyze USD/MYR outlook.
An increase in tourist arrivals will further lift demand for MYR
An improvement in sentiment over China’s economy will be a positive driver in the following quarters.
With the US Fed’s hiking cycle concluding in H2 this year, we expect portfolio inflows to improve, providing support to the Ringgit. An increase in tourist arrivals will further lift demand for MYR.
We expect MYR to appreciate moderately over the second half of 2023, ending the year at 4.40.
- GBP/USD remains pressured at the lowest level in a fortnight, poking five-week-old rising support.
- BoE’s Bailey defends hawkish bias, tames UK recession woes but Pound Sterling stays bearish.
- Comparatively stronger Fed rate hike signals than BoE, upbeat US data weigh on pair prices.
- Fed Chair Jerome Powell’s speech, second-tier US data eyed for clear directions.
GBP/USD drills the 15-day low around 1.2620 heading into Thursday’s London open. In doing so, the Cable pair traders pay little reaction to comments from Bank of England (BoE) Governor Andrew Bailey than Federal Reserve (Fed) Chairman Jerome Powell.
The reason for more preference for Fed Chair Powell’s speech as the key catalyst could be linked to the comparatively stronger economic conditions in the UK than in the US. Additionally, the upbeat outcome of the US Banking Stress Test also emphasizes the US Dollar strength.
That said, Bank of England (BoE) Govern Andrew Bailey showed readiness to do what was necessary to get inflation to target. The policymaker also said, “Data showed clear signs of persistence of inflation," suggesting further rate hikes from the “Old Lady”, as the BoE is informally called.
On the other hand, Federal Reserve (Fed) Chairman Jerome Powell said, “We believe there's more restriction coming, driven by the labor market.” The policymaker also ruled out the economic downturn as the most likely case.
Elsewhere, the Fed's ‘stress test’ exercise showed lenders, including JPMorgan Chase, Bank of America, Citigroup, Wells Fargo, Morgan Stanley and Goldman Sachs, have enough capital to weather a severe economic slump, paving the way for them to issue share buybacks and dividends,” reported Reuters.
It should be noted that the mixed headlines about the US-China ties as US Treasury Secretary Janet Yellen ‘hopes’ to visit China to re-establish contacts but also showed readiness to take actions to protect national security interests even at economic cost add strength to the US Dollar and weigh on the USD Dollar, via challenges to sentiment.
Amid these plays, S&P500 Futures lack clear directions after rising in the last two days. Further, the US 10-year and two-year Treasury bond yields consolidate the previous day’s losses around 3.48% and 4.75% at the latest.
Looking forward, Fed Chair Powell’s speech and the revised version of the US Gross Domestic Product (GDP) for the first quarter (Q1) 2023, as well as the second-tier US employment and activity data, will be important to watch for clear directions.
Technical analysis
Daily closing beyond a five-week-old rising support line, around 1.2620, as well as a clear downside break of the 1.2600 round figure becomes necessary for the GBP/USD bears to keep the reins.
On the contrary, the Cable pair’s recovery needs validation from 21-day Exponential Moving Average (EMA), close to 1.2645 by the press time.
- The index adds to Wednesday’s advance beyond 103.00.
- Chief Powell will participate in an event at the Bank of Spain.
- Final Q1 GDP figures, weekly Claims will take centre stage later.
The greenback adds to the ongoing recovery and prints new multi-week highs in the 103.20 region when tracked by the USD Index (DXY) on Thursday.
USD Index looks at Powell and docket
The index trades with gains for the second session in a row on Thursday and looks to consolidate the recent breakout of the 103.00 hurdle in a context still favourable to the risk-off trade.
In the meantime, the uptick in the dollar comes in tandem with a so far small recovery in US yields across the curve, particularly after Fed Chair Powell indicated at the ECB Forum in Sintra on Wednesday that a US recession is not the most likely scenario and suggested the potential for two consecutive rate hikes.
So far, and according to CME Group’s FedWatch Tool, the probability of a 25 bps rate hike at the Fed’s meeting on July 26 surpasses 80%.
In the US calendar, final Q1 GDP figures are due seconded by Initial Claims, Pending Home Sales and the speech by Atlanta Fed R. Bostic (2024 voter, hawk).
What to look for around USD
The index keeps pushing higher and extends the weekly recovery further north of the 103.00 hurdle on Thursday.
Meanwhile, the likelihood of another 25 bps hike at the Fed's upcoming meeting in July remains high, supported by the continued strength of key US fundamentals such as employment and prices.
This view was further bolstered by comments from Fed Chief Powell at the June FOMC event, who referred to the July meeting as "live" and indicated that most of the Committee is prepared to resume the tightening campaign as early as next month.
Key events in the US this week: Final Q1 Growth Rate, Initial Jobless Claims, Pending Home Sales, Fed Powell (Thursday) – PCE, Core PCE, Personal Income/Spending, Final Michigan Consumer Sentiment (Friday).
Eminent issues on the back boiler: Persistent debate over a soft/hard landing of the US economy. Terminal Interest rate near the peak vs. speculation of rate cuts in late 2023/early 2024. Fed’s pivot. Geopolitical effervescence vs. Russia and China. US-China trade conflict.
USD Index relevant levels
Now, the index is up 0.22% at 103.19 and the breakout of 103.23 (weekly high June 29) would open the door to 104.69 (monthly high May 31) and then 104.95 (200-day SMA). On the other hand, the next contention emerges at 101.92 (monthly low June 16) followed by 100.78 (2023 low April 14) and finally 100.00 (round level).
- NZD/USD remains on the back foot at the lowest levels in three weeks.
- Kiwi bears stay hopeful amid Clear break of monthly support line, bearish MACD signals.
- 50% Fibonacci retracement appears nearby target for sellers.
- Bulls need to refresh the monthly peak to retake control.
NZD/USD holds onto the previous day’s bearish bias despite posting mild intraday gains around 0.6080 heading into Thursday’s European session.
In doing so, the Kiwi pair justifies the downside break of an ascending support line from May 31, now immediate resistance around 0.6140. Also adding strength to the downside bias are the bearish MACD signals and the quote’s sustained trading below the 21-day Exponential Moving Average (EMA), near 0.6145 at the latest.
With this, the NZD/USD bears are well-set to poke the 50% Fibonacci retracement level of its October-February upside, near 0.6030.
However, the monthly low and the 61.8% Fibonacci retracement, respectively near 0.5985 and 0.5900, could challenge the pair sellers afterward. It’s worth noting that the 0.6000 psychological magnet also acts as a downside filter.
Meanwhile, NZD/USD recovery remains elusive unless the quote crosses the 0.6140-45 resistance confluence comprising the 21-day EMA and the monthly support-turned-resistance line.
In a case where NZD/USD manages to cross the 0.6145 hurdle, the 200-day EMA and the monthly high, at 0.6220 and 0.6250 in that order, will be in the spotlight.
NZD/USD: Daily chart
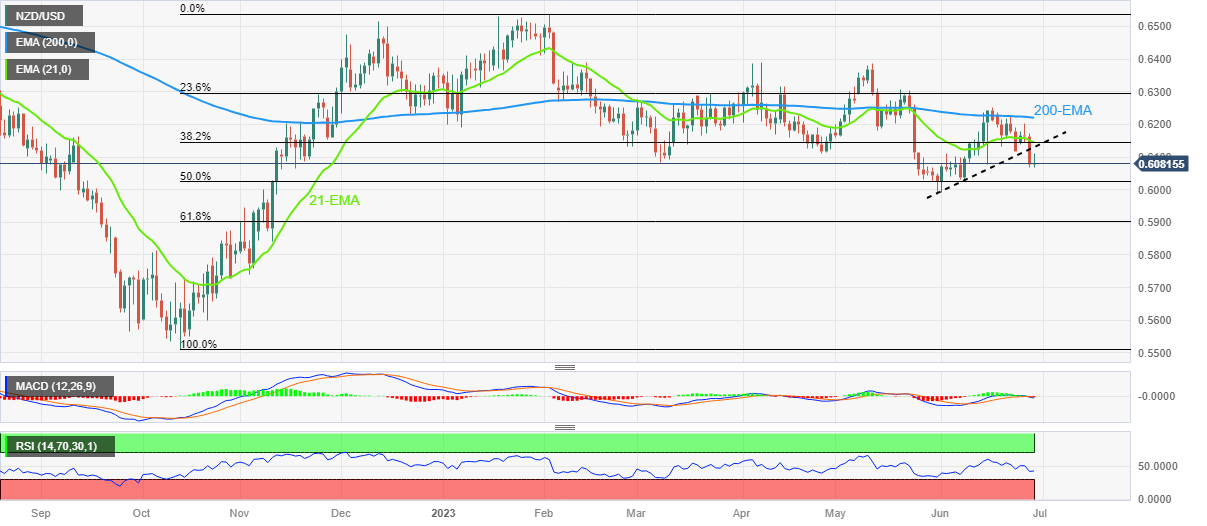
Trend: Further downside expected
In the opinion of UOB Group’s Economist Lee Sue Ann and Markets Strategist Quek Ser Leang, GBP/USD is expected to navigate within the 1.2650-1.2850 range in the next few weeks.
Key Quotes
24-hour view: Yesterday, we expected GBP to trade in a range between 1.2685 and 1.2750. The price actions offer no fresh clues and today, we expect GBP to trade in a range between 1.2700 and 1.2770.
Next 1-3 weeks: Our most recent narrative from last Thursday (22 Jun, spot at 1.2770) still stands. As highlighted, GBP is likely to trade between 1.2650 and 1.2850 for now.
Considering advanced prints from CME Group for gold futures markets, open interest shrank for the fourth session in a row on Wednesday, this time by more than 2k contracts. Volume followed suit and dropped by around 15.7K contracts.
Gold faces decent contention around $1900
Gold prices extended the weekly leg lower on Wednesday and printed new multi-week lows near $1900. The continuation of the decline was on the back of shrinking open interest and volume, removing strength from a sustained drop in the very near term. In the meantime, the $1900 region per troy ounce is expected to offer decent contention for the time being.
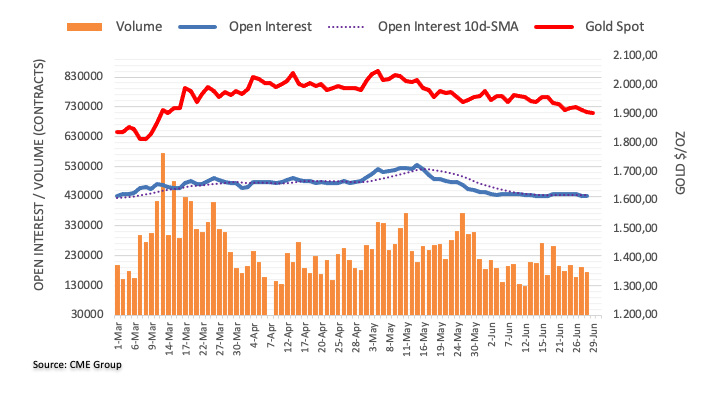
EUR/USD is expected to maintain the 1.0895-1.1010 range for the time being, according to UOB Group’s Economist Lee Sue Ann and Markets Strategist Quek Ser Leang.
Key Quotes
24-hour view: We did not anticipate the sharp rise in EUR that sent it to a high of 1.0976 (we were expecting it to consolidate). Upward momentum has improved, albeit not much. While there is room for EUR to rise further, it is highly unlikely to reach last week’s high near 1.1010 (there is another resistance level at 1.0990). If EUR breaks below 1.0915 (minor support is at 1.0935), it would suggest that the current upward pressure has faded.
Next 1-3 weeks: After EUR fell sharply last Friday, we indicated on Monday (26 Jun, spot at 1.0900) that it “is likely to trade with a downward bias, but the solid support levels at 1.0840 and 1.0805 might not be easy to break.” Yesterday (27 Jun), EUR soared to a high of 1.0976. The breach of our ‘strong resistance’ level at 1.0970 indicates that the downward bias has faded. The current price movements are likely part of a consolidation phase. From here, we expect EUR to trade in a range between 1.0895 and 1.1010. Looking ahead, if EUR breaks clearly above 1.1010, it would suggest the start of a sustained advance.
- Gold Price remains depressed at the lowest levels in three months, prods key support with intact bearish bias.
- Hawkish central bank clues, US-China tension and mostly upbeat US data favor XAU/USD sellers.
- Fed Chair Powell’s speech, US GDP and Core PCE data eyed for clear directions.
- Gold price may consolidate around $1,900 on price-positive data but recovery appears elusive.
Gold Price (XAU/USD) remains pressured at the lowest levels since mid-March as bears take a breather after a three-day downtrend ahead of Federal Reserve (Fed) Chairman Jerome Powell’s speech in Madrid. In doing so, the XAU/USD also takes clues from the mixed headlines about the US-China ties as US Treasury Secretary Janet Yellen ‘hopes’ to visit China to re-establish contacts but also showed readiness to take actions to protect national security interests even at economic cost. Elsewhere, major central bankers’ defense of higher rates, including Fed Chair Powell, joins the previous firmer US data to bolster the hawkish Fed bets and exert additional downside pressure on the Gold Price. It’s worth noting that doubts about the economic health of one of the world’s biggest XAU/USD customers, namely China, also keeps the metal bears hopeful.
Amid these plays, the US stock futures struggle and the Asia-Pacific shares grind higher amid cautious mood ahead of Fed Chair Powell’s speech. Also important to watch is the revised version of the US Gross Domestic Product (GDP) for the first quarter (Q1) 2023 and second-tier employment data.
Also read: Gold Price Forecast: $1,885 remains in sight for XAU/USD sellers amid a Bear Cross
Gold Price: Key levels to watch
As per our Technical Confluence Indicator, Gold bears occupy the driver’s seat and has a final bumper around $1,900 to cross before witnessing a free ride towards the $1,880.
That said, a convergence of the previous monthly low and the Pivot Point one-month S1 together constitute $1,903 as the key support.
Following that, Pivot Point one-day and one-week S1 highlights $1,900 as another filter towards the south before directing the Gold Price to Pivot Point one-week S2, around $1,882.
On the contrary, Fibonacci 38.2% on one-day joins previous weekly low to highlight $1,910 as immediate upside hurdle for the XAU/USD bulls.
Also acting as a short-term resistance for the Gold Price is the Pivot Point one-day R1 and 5-DMA, around $1,918.
In a case where the XAU/USD remains firmer past $1,918, the odds of witnessing a run-up towards the $1,930 resistance confluence, encompassing 200-HMA and Pivot Point one-day R3, can’t be ruled out.
Here is how it looks on the tool
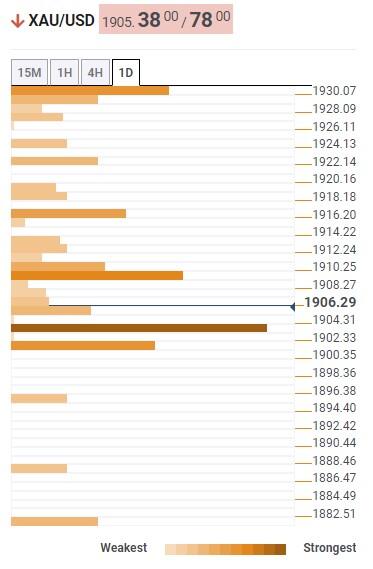
About Technical Confluences Detector
The TCD (Technical Confluences Detector) is a tool to locate and point out those price levels where there is a congestion of indicators, moving averages, Fibonacci levels, Pivot Points, etc. If you are a short-term trader, you will find entry points for counter-trend strategies and hunt a few points at a time. If you are a medium-to-long-term trader, this tool will allow you to know in advance the price levels where a medium-to-long-term trend may stop and rest, where to unwind positions, or where to increase your position size.
- USD/CHF scales higher for the second straight day and climbs back to the weekly high.
- The Fed’s hawkish outlook continues to underpin the USD and lends support to the pair.
- A positive risk tone undermines the safe-haven CHF and contributes to the positive move.
The USD/CHF pair attracts some buyers for the second successive day on Thursday and climbs to the top end of its weekly range, closer to the 0.9000 psychological mark during the Asian session.
The US Dollar (USD) adds to the previous day's strong gains and touches a fresh high since June 15 in the wake of Federal Reserve (Fed) Chair Jerome Powell's hawkish remarks on Wednesday. Speaking at a European Central Bank (ECB) conference, Powell reiterated that two rate increases are likely this year and also said that he does not see inflation coming down to the Fed's 2% target until 2025. This, in turn, reaffirms market bets for a 25 bps lift-off at the next FOMC policy meeting on July 25-26, which continues to underpin the Greenback and acts as a tailwind for the USD/CHF pair.
Apart from this, a generally positive tone around the equity markets is seen undermining the safe-haven Swiss Franc (CHF) and lending additional support to spot prices. That said, worries about a global economic downturn, along with reports that the US is planning more restrictions on semiconductor exports to China, keep a lid on any optimism. Investors also seem cautious ahead of the official Chinese PMI prints on Friday, which is expected to shed more light on a slowing post-COVID recovery in the world's second-largest economy. This holds back bulls from placing fresh bets around the USD/CHF pair.
Even from a technical perspective, the recent repeated failures to find acceptance above the 50-day Simple Moving Average (SMA) warrants some caution before positioning for any further appreciating move. Market participants now look to the US economic docket, featuring the release of the final Q1 GDP print, the Weekly Initial Jobless Claims and Pending Home Sales data, due later during the early North American session. This might influence the USD price dynamics, which, along with the broader risk sentiment, provide a fresh impetus to the USD/CAD pair and produce short-term trading opportunities.
Technical levels to watch
- AUD/USD retreats from intraday high, fades Aussie data inspired gains at three-week low.
- Australia Retail Sales triggered corrective bounce with 0.7% MoM jump in May but inflation-linked woes are stronger.
- Bearish MACD signals, sustained trading below 200-DMA and challenges to sentiment weigh on prices.
- Convergence of ascending support line from October, 61.8% Fibonacci retracement appears a tough nut to crack for bears.
AUD/USD pares the biggest daily loss since early March, despite retreating from an intraday high to around 0.6605 amid early Thursday morning in Europe. In doing so, the Aussie pair eases from the daily tops while reversing Australia Retail Sales data-linked gains but stays mildly bid by the press time.
It’s worth noting that a surprise jump in the Aussie Retail Sales, to 0.7% MoM for May, offered breathing space to the bears after the Australian Monthly Consumer Price Index (CPI) disappointed the Reserve Bank of Australia (RBA) hawks the previous day. However, fears of hawkish comments from Fed Chair Jerome Powell seem to weigh on the AUD/USD price.
Technically, the risk-barometer pair’s U-turn from the 200-SMA, around 0.6695 by the press time, joins bearish MACD signals to keep the AUD/USD pair sellers hopeful.
However, the below-50.0 levels of the RSI (14) suggest bottom-picking of the Aussie pair, which in turn highlights the 0.6550-45 support confluence comprising the 61.8% Fibonacci retracement of the October-February north run and eight-month-old rising support line.
In a case where the AUD/USD drops below 0.6545, the odds of witnessing a slump towards the yearly low marked in May around 0.6460 can’t be ruled out.
Alternatively, a downward-sloping trend line from June 16, around 0.6675 at the latest, restricts the immediate upside of the AUD/USD pair ahead of the 200-SMA level of around 0.6695.
That said, the 0.6700 round figure also acts as an additional upside filter before directing the price to the 38.2% Fibonacci retracement level and the monthly high, respectively near 0.6780 and 0.6900.
AUD/USD: Daily chart
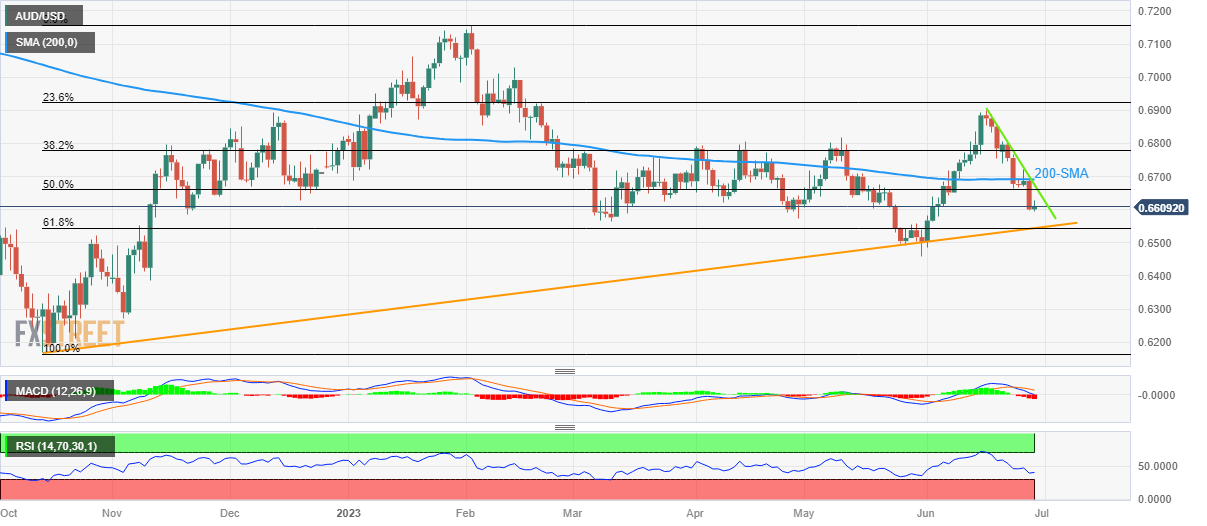
Trend: Further downside expected
- GBP/USD remains under some selling pressure for the second successive day on Thursday.
- The Fed’s hawkish outlook continues to underpin the USD and is seen weighing on the pair.
- The setup seems tilted in favour of bearish traders and supports prospects for further losses.
The GBP/USD pair attracts fresh sellers near the 1.2645 region during the Asian session and turns lower for the second straight day on Thursday. The pair is currently placed around the 1.2620 area, down just over 0.10% for the day, and remains well within the striking distance of a two-week low touched on Wednesday.
The US Dollar (USD) stands tall near a two-week high and continues to draw support from Federal Reserve (Fed) Chair Jerome Powell's overnight hawkish remarks, reiterating that two rate increases are likely this year. The British Pound (GBP), on the other hand, is weighed down by worries about economic headwinds stemming from a far more aggressive policy tightening by the Bank of England (BoE). This, in turn, is seen exerting some downward pressure on the GBP/USD pair and favours bearish traders.
From a technical perspective, spot prices now seem to have found acceptance below the 38.2% Fibonacci retracement level of the May-June rally. This validates the near-term negative outlook and supports prospects for an extension of the GBP/USD pair's recent sharp retracement slide from a 14-month peak, around the 1.2848-1.2850 region set on June 16. That said, oscillators on the daily chart - though have been losing traction - are yet to confirm the bearish bias and warrant some caution for aggressive traders.
Hence, it will be prudent to wait for some follow-through selling below the 1.2600 mark, or the overnight swing low, before positioning for any further losses. The GBP/USD pair might then slide to the 50% Fibo. level, around the 1.2580 region, en route to the 50-day Simple Moving Average (SMA), currently pegged near the 1.2540 zone. This is followed by 61.8% Fibo. level, around the 1.2515 region and the 1.2500 psychological mark, which if broken decisively should pave the way for a further depreciating move.
On the flip side, any positive move above the 1.2640-1.2645 area, coinciding with the 38.2% Fibo. level, is likely to confront stiff resistance near a horizontal support breakpoint, just ahead of the 1.2700 mark. This is closely followed by 23.6% Fibo. level, around the 1.2715-1.2720 region. A sustained strength beyond the latter will negate the negative bias and lift the GBP/USD pair beyond the 1.2760-1.2765 intermediate hurdle, towards the 1.2800 mark en route to the YTD peak, near the 1.2840-1.2850 region.
GBP/USD daily chart
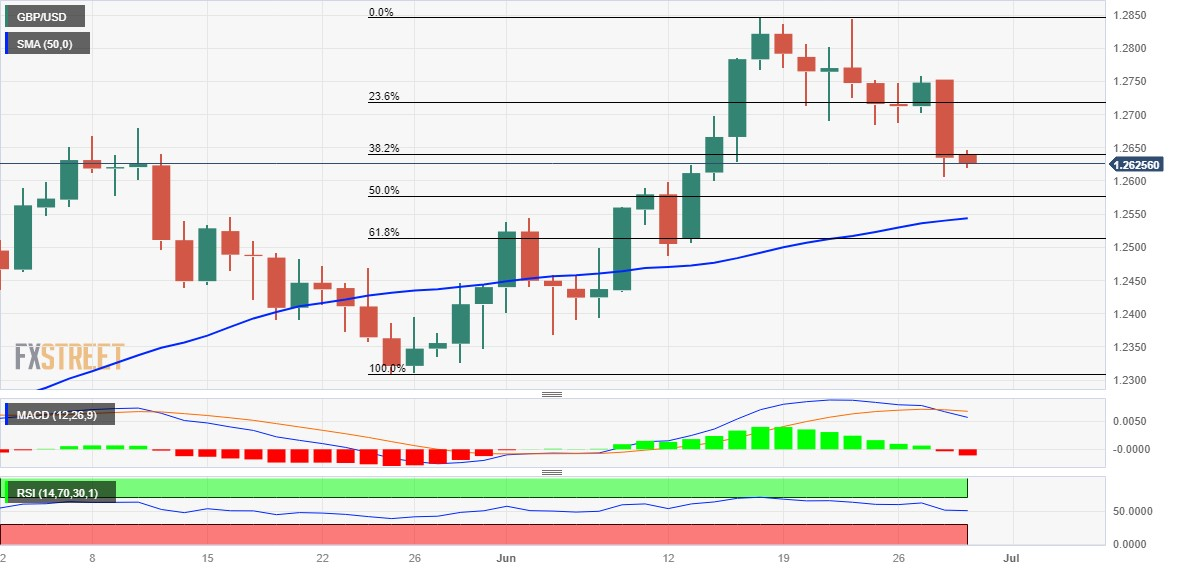
Key levels to watch
Analysts at Moody’s rating agency are out with their outlook on the United States economy, with the key takeaways found below.
For US, geopolitics and policies pose greater risks than China's slowdown.
US economy can absorb impact of China's slower growth.
Government and company policies will have greater credit effects for US sectors.
China's potentially slower growth over next few years unlikely to have material knock-on impacts on domestically-driven US economy.
Among services sectors, a China slowdown could weaken discretionary industries in the US, such as tourism and higher education.
Among US sectors with high exposure to China, agriculture is likely to be less affected.
-
US Dollar Index: DXY bulls take a breather around 103.00 with eyes on Fed Chair Powell’s speech
- USD/INR extends its sideways consolidative price move in a two-week-old trading range.
- Acceptance below the 200-day SMA supports prospects for a further depreciating move.
- A sustained move above the trading range hurdle is needed to negate the negative bias.
The USD/INR pair continues with its struggle to gain any meaningful traction and remains confined in a familiar trading band held over the past two weeks or so. Spot prices hold steady above the 82.00 mark through the Asian session on Thursday, though the technical setup seems tilted in favour of bearish traders.
The subdued/range-bound price move constitutes the formation of a rectangle on the daily chart. Against the backdrop of the recent pullback from the vicinity of the 83.00 mark, this might still be categorized as a bearish consolidation phase. Moreover, acceptance below the very important 200-day Simple Moving Average (SMA), for the first time since January 2022, suggests that the path of least resistance for the USD/INR pair is to the downside.
The negative outlook is reinforced by the fact that technical indicators on the daily chart are holding in the bearish territory and are still far from being in the oversold zone. That said, it will still be prudent to wait for a sustained break below the trading range support, around the 81.85 area, before positioning for any further downfall. The USD/INR pair might then slide to the 81.50 intermediate support before dropping to sub-81.00 levels or the YTD low.
On the flip side, the trading range resistance, around the 82.15 region, which coincides with the 200-day SMA, might continue to act as an immediate strong barrier. A sustained strength beyond could negate the negative outlook and trigger some near-term short-covering rally. The momentum could then lift the USD/INR pair back towards the 82.70-82.75 intermediate hurdle, above which bulls are likely to make a fresh attempt to conquer the 83.00 mark.
USD/INR daily chart
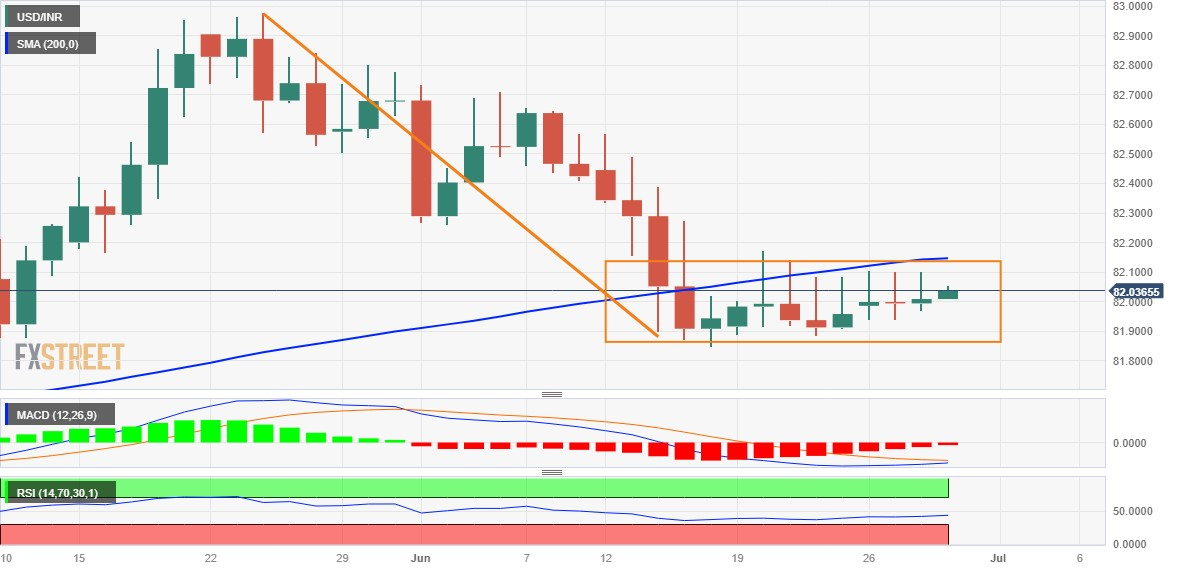
Key levels to watch
- Silver Price takes offers to reverse late Wednesday’s corrective bounce while reversing from 50-SMA.
- Five-week-old descending support line in the spotlight amid looming bear cross, steady RSI.
- XAG/USD needs to cross convergence of 200-SMA, 100-SMA to retake control.
Silver Price (XAG/USD) drops to $22.70 as it portrays one more U-turn from the 50-SMA hurdle amid early Thursday. In doing so, the bright metal justifies the firmer US Dollar amid fears of higher rates.
Also read: US Dollar Index: DXY bulls take a breather around 103.00 with eyes on Fed Chair Powell’s speech
That said, the impending bear cross on the MACD and mostly steady RSI (14) line favor the XAG/USD’s latest pullback.
It should be noted that the $22.50 round figure may act as immediate support for the Silver bears to prod ahead of the visiting a downward-sloping support line from late May, close to $22.00 by the press time.
In a case where the XAG/USD remains bearish past $22.00, which is less likely, the bullion sellers may aim for the 61.8% and 78.6% Fibonacci Expansion (FE) of the precious metal’s June 18-27 moves, respectively near $21.70 and $21.35.
On the flip side, a clear break of the 50-SMA hurdle, around $22.95 at the latest, isn’t an invitation to the Silver buyers as the $23.00 round figure can check the upside moves.
Above all, a convergence of the 200-SMA and the 100-SMA, near $23.45-50, appears a tough nut to crack for the Silver buyers to conquer to retake control.
Silver Price: Four-hour chart
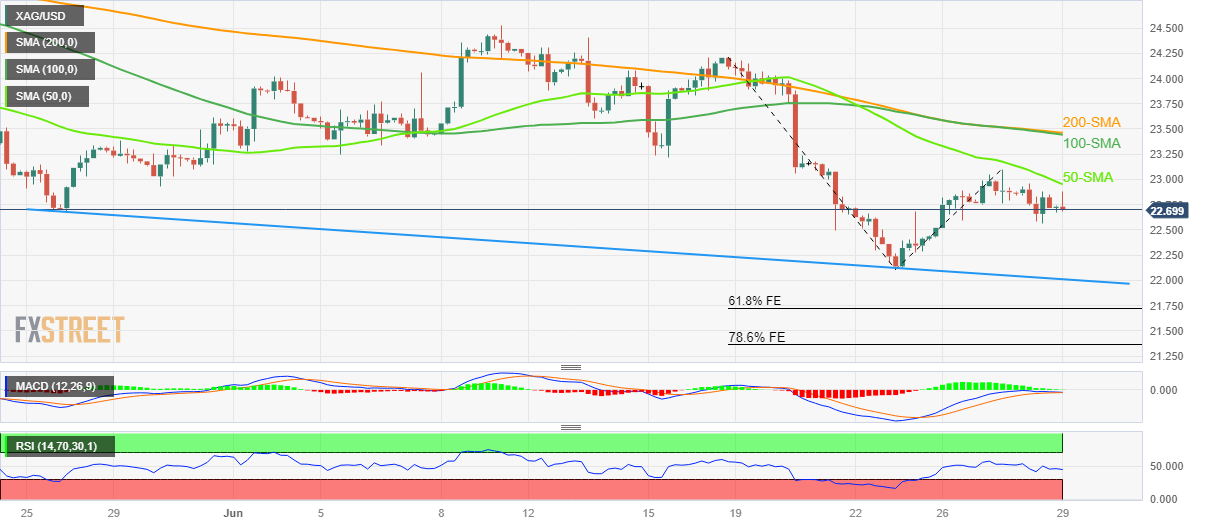
Trend: Further downside expected
- USD/CAD attracts some buyers for the third straight day and is supported by a stronger USD.
- The Fed’s hawkish outlook continues to act as a tailwind for the Greenback and the major.
- Tuesday’s softer Canadian CPI print undermines the CAD and also lends support to the pair.
The USD/CAD pair trades with a mild positive bias for the third successive day on Thursday and is currently placed around the 1.3265-1.3270 region, just below a two-week high touched the previous day.
Federal Reserve Chair Jerome Powell's hawkish remarks on Wednesday assists the US Dollar (USD) to stand near its highest level since June 15, which, in turn, is seen as a key factor acting as a tailwind for the USD/CAD pair. Speaking at a European Central Bank (ECB) conference, Powell reiterated that two rate increases are likely this year and did not rule out the possibility of a rate hike at the next FOMC policy meeting on July 25-26. Powell also said that he does not see inflation coming down to the Fed's 2% target until 2025.
The Canadian Dollar (CAD), on the other hand, is undermined by the softer domestic data released on Tuesday, which showed that consumer inflation fell to its slowest pace in two years. The markets, however, are still pricing in a greater chance of another 25 bps rate hike by the Bank of Canada (BoC) in July. This, along with a modest uptick in Crude Oil prices, lends support to the commodity-linked Loonie and caps gains for the USD/CAD pair, warranting caution before positioning for any further recovery from the YTD low touched on Tuesday.
Hence, any subsequent move up is more likely to confront near the 1.3300-1.3310 strong horizontal support breakpoint, above which a bout of a short-covering move could lift spot prices to the 200-day Exponential Moving Average (EMA). Traders now look to the US economic docket, featuring the release of the final Q1 GDP print, the usual Weekly Initial Jobless Claims and Pending Home Sales data later during the early North American session. This, along with Oil price dynamics, could provide some impetus to the USD/CAD pair.
The focus, however, will remain glued to the US Core PCE Price Index - the Fed's preferred inflation gauge on Friday. This will play a key role in influencing market expectations about the US central bank's future rate-hike path, which, in turn, will drive the USD demand and determine the next leg of a directional move for the USD/CAD pair.
Technical levels to watch
- WTI remains mildly bid while defending the previous day’s bounce off two-week low.
- EIA Crude Oil Stocks Change reported huge draw of 9.603M for the latest week.
- Cautious optimism in the market, absence of any fresh threats from central bankers also underpins energy prices.
- US-China news, central bankers and second-tier US data eyed for clear directions.
WTI crude oil buyers keep the reins for the second consecutive day after refreshing the weekly low as market sentiment appears slightly positive and helps the energy benchmark to ignore threats from a firmer US Dollar. That said, the black gold rises 0.33% intraday to $69.45 by the press time of early Thursday.
Apart from the risk-on mood, portrayed by the minor gains of the S&P500 Futures, the price-positive inventory data from the US Energy Information Administration (EIA) also favor the WTI bulls.
EIA Crude Oil Stocks Change dropped -9.603 million barrels (M) for the week ended on June 23 versus -1.757M market forecasts and -3.831M previous readings.
It’s worth noting that the depleting conditions of the US Strategic Petroleum Reserves (SPR) join geopolitical fears emanating from Russia and hopes of the US-China ties, on US Treasury Secretary Janet Yellen’s comments, also strengthen the WTI crude oil prices.
Elsewhere, the US Dollar Index (DXY) marches to 103.10, up 0.10% on a day, as it cheers Fed Chair Jerome Powell’s hawkish bias. That said, the US central banker reiterated his support for two more rate hikes in 2023 while speaking at the European Central Bank (ECB) Forum on central banking the previous day.
Moving on, Federal Reserve Chairman Jerome Powell’s speech in Madrid will be important for the Oil traders to watch. Also crucial will be the revised version of the US Gross Domestic Product (GDP) for the first quarter (Q1) 2023 and second-tier employment data.
Technical analysis
Despite the clear bounce off a one-month-old rising support line, around $67.50 at the latest, WTI bulls need validation from the 21-DMA, close to $70.40 by the press time, for conviction.
- Gold price fails to preserve its modest intraday gains and hangs near a multi-month low.
- Hawkish major central banks continue to act as a headwind for the non-yielding metal.
- The US Dollar stands stall near a two-week high and contributes to the intraday downfall.
Gold price struggles to capitalize on its modest gains registered during the Asian session and turns lower for the fourth straight day on Thursday. The XAU/USD currently trades around the $1,905, just above its lowest level since mid-March touched on Wednesday and seems vulnerable to slide further.
Hawkish central banks continue to weigh on Gold price
A more hawkish outlook adopted by major central banks and the prospects for additional interest rate hikes continue to act as a headwind for the non-yielding Gold price. In fact, the European Central Bank (ECB) President Christine Lagarde said on Wednesday that inflation in the Eurozone had entered a new phase that could linger for some time. Lagarde further noted that it is unlikely that in the near future the central bank will be able to state with full confidence that the peak rates have been reached. Furthermore, the Bank of England (BoE) Governor Andrew Bailey, speaking at the ECB conference, hinted that rates could remain at peak levels for longer than traders currently expect.
Modest US Dollar strength further weighs on XAU/USD
Adding to this, Federal Reserve (Fed) Chair Jerome Powell reiterated that two rate increases are likely this year and did not rule out the possibility of a lift-off at the next policy meeting on July 25-26. Powell also said that he does not see inflation coming down to the Fed's 2% target until 2025. This, in turn, assists the US Dollar (USD) to stand tall near a two-week high, which is seen as another factor exerting pressure on the Gold price. Tha said, worries about economic headwinds stemming from rapidly rising borrowing costs might hold back traders from placing aggressive bearish bets around the safe-haven precious metal and help limit any further losses, at least for the time being.
Focus remains glued to US PCE Price Index on Friday
Market participants now look forward to the US economic docket, featuring the final Q1 GDP print, the usual Weekly Initial Jobless Claims and Pending Home Sales data, due later during the early North American session. The data might drive the USD demand and provide some impetus to the Gold price. The focus, however, remains clued to the release of the Personal Consumption Expenditure (PCE) Price Index from the United States (US) on Friday. This will play a key role in influencing the Fed's rate-hike path and provide a fresh directional impetus to the XAU/USD.
Gold price technical outlook
From a technical perspective, some follow-through selling and acceptance below the $1,900 mark will be seen as a fresh trigger for bearish traders. Given that oscillators on the daily chart are holding deep in the negative territory and are still far from being in the oversold zone, Gold price might then accelerate the fall towards the $1,876-$1,875 area. The downward trajectory could get extended further towards challenging the very important 200-day Simple Moving Average (SMA), currently pegged around the $1,840 region.
On the flip side, any positive move beyond the $1,912-$1,913 zone, or the Asian session peak, might now confront resistance near the $1,924-$1,925 region ahead of the $1,936 area. This is closely followed by the 100-day SMA, currently around the $1,942 zone. A sustaiend strenght above might trigger a short-covering rally towards the $1,962-$1,964 hurdle en route to the $1,970-$1,972 supply zone. Some follow-through buying should allow Gold price to reclaim the $2,000 psychological mark and climb further towards the $2,010-$2,012 hurdle.
Key levels to watch
- EUR/USD takes offers to refresh intraday low, pokes three-week-old rising support line.
- Bearish MACD signals, broad US Dollar strength favor Euro sellers targeting 200-EMA support.
- Preliminary readings of Germany’s inflation data, Fed Chair Powell’s speech will be crucial for clear directions.
EUR/USD extends the previous day’s downturn towards piercing a three-week-old rising support line, around 1.0895 by the press time, as markets prepare for German inflation and Federal Reserve (Fed) Chairman Jerome Powell’s speech on early Thursday.
Also read: EUR/USD floats above 1.0900 as ECB hawks jostle with upbeat US Banking Stress Test, Fed Powell’s speech
Apart from the pre-event anxiety, bearish MACD signals and the Euro pair’s sustained reversal from the previous support line from June 07, now resistance around 1.1010, also keeps the EUR/USD sellers hopeful.
However, a clear break of the aforementioned three-week-long rising support line, close to 1.0900 at the latest, becomes necessary for the Euro bear’s conviction.
Following that, the 200-Exponential Moving Average (EMA) level of near 1.0860 can prod the EUR/USD bears before directing them to the key support line stretched from May 31, surrounding 1.0790 as we write.
Meanwhile, a corrective bounce in the EUR/USD price needs to cross a downward-sloping resistance line from the last Thursday, around 1.0950 at the latest, to recall the Euro bulls.
Even so, a convergence of the monthly high and the support-turned-resistance line, close to 1.1010-15, will be a tough nut to crack for the EUR/USD bulls afterward.
EUR/USD: Four-hour chart
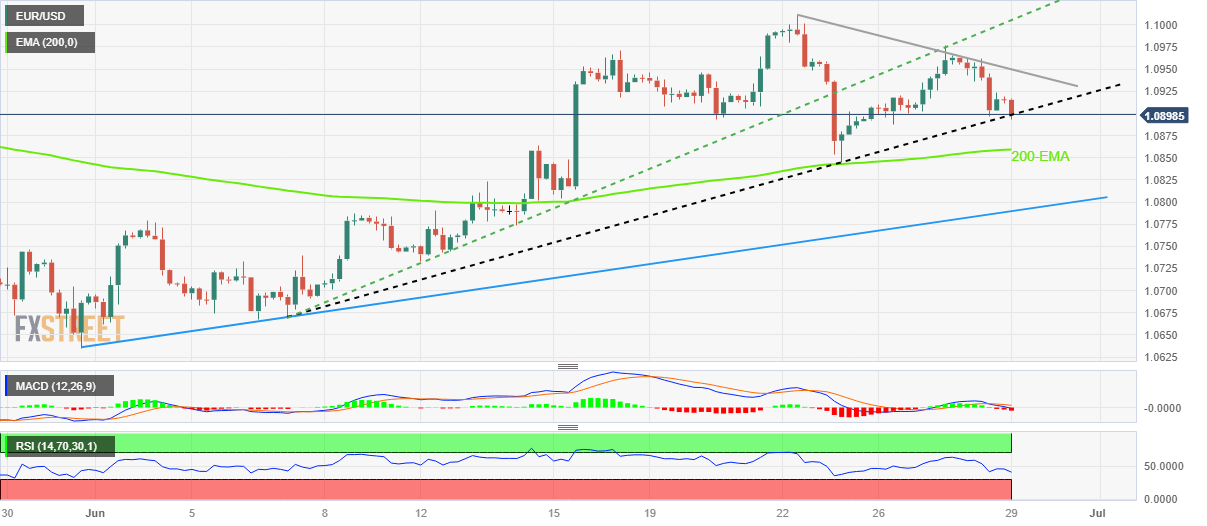
Trend: Further downside expected
| Raw materials | Closed | Change, % |
|---|---|---|
| Silver | 22.674 | -0.77 |
| Gold | 1906.83 | -0.4 |
| Palladium | 1259.65 | -2.81 |
“Foreign investors turned net sellers of Japanese equities after 12 straight weeks of purchases that helped propel shares to three-decade highs,” reported Reuters while citing the Japanese Finance Ministry data.
“Foreigners sold net shares worth 543.8 billion yen ($3.77 billion) in the week through June 24,” said the news.
Reuters also adds that the overseas investors had been net buyers of Japanese stocks every week since the end of March, snapping up a cumulative 9.9 trillion yen in equities.
Nikkei retreats from weekly top
Following the news, Japan’s benchmark equity index Nikkei 225 retreats from intraday top but stays 0.60% up on a day to 33,410 by the press time.
Also read: USD/JPY retreats towards 144.00 as Japan Retail Trade tests BoJ’s dovish bias, Fed’s Powell eyed
- AUD/JPY picks up bids to refresh intraday high after strong Aussie data.
- Australia Retail Sales jumped past market forecast, prior readings to 0.7% MoM in May.
- Japan’s upbeat Retail Trade for May fail to gain major attention as yields rebound, sentiment improves.
- Second-tier Japan data, risk catalysts eyed for clear directions.
AUD/JPY justifies strong Australia Retail Sales figures while refreshing intraday high near 95.60 during the mid-Asian session on Thursday. In doing so, the cross-currency pair ignores upbeat Japan Retail Trade numbers amid firmer yields and cautious optimism in the markets.
That said, Australia’s seasonally adjusted Retail Sales grew 0.7% monthly in May versus 0.1% expected and 0.0% prior, per the latest economic update from the Australian Bureau of Statistics (ABS). "Sales of A$35.52 billion ($23.52 billion) were up 4.2% from a year earlier, matching April's growth but a world away from post-lockdown boom levels of 19% seen in the middle of last year," said Reuters after the data release.
The upbeat Aussie Retail Sales allowed the AUD/JPY pair to consolidate the previous day’s heavy losses marked after Australia’s inflation data disappointed. On Wednesday, Australia’s Monthly Consumer Price Index (CPI) for May dropped to 5.6% YoY versus 6.1% expected and 6.8% prior. The same amplified concerns about the Reserve Bank of Australia’s (RBA) pause in the rate hikes after two consecutive hawkish surprises, which in turn drowns the Australian Dollar (AUD).
On the other hand, Japan’s Retail Trade growth jumps to 5.7% YoY for May versus 5.4% expected and 5.1% prior (revised) whereas the seasonally adjusted figures reversed the previous contraction of 1.2% with 1.3% gain in the key statistics for the said month, versus -0.2% market forecasts.
Apart from the Aussie data, Bank of Japan (BoJ) Governor Kazuo Ueda’s defense of easy-money policy also seemed to have propelled the AUD/JPY pair prices. Bank of Japan (BoJ) Governor Kazuo Ueda defended the dovish bias among the Japanese central bank policymakers while saying, “(There is) still some distance to go in sustainably achieving 2% inflation accompanied by sufficient wage growth.” BoJ Governor Ueda also added that Japanese economy is going to expand slightly above potential for some time.
It’s worth noting that US Treasury Secretary Janet Yellen’s ‘hopes’ of visiting China to re-establish contracts seem to recently favoring the market sentiment. Also, the central bankers didn’t say anything news and hence traders also get chance to consolidate the previous day’s moves and propel the AUD/JPY pair.
Amid these plays, US Treasury bond yields recover while S&P500 Futures print mild gains by the press time.
Looking ahead, Japan’s Consumer Confidence for June, expected 36.2 versus 36.0 prior, will direct immediate AUD/JPY moves but major attention will be given to the yields and the risk catalysts for a clear guide.
Technical analysis
Despite the latest corrective bounce off weekly support line, around 95.10 by the press time, AUD/JPY buyers need validation from the 10-DMA hurdle of around 96.30 to retake control.
- AUD/USD rebounds swiftly from a multi-month low, albeit the upside potential seems limited.
- A positive risk tone keeps the USD bulls on the defensive and benefits the risk-sensitive Aussie.
- The upbeat Australian Retail Sales data fails to impress bulls or provide any meaningful impetus.
The AUD/USD pair stages a goodish recovery from sub-0.6600 levels, or a three-and-half-week low touched during the Asian session on Thursday and recovers a part of the previous day's heavy losses. Spot prices currently trade around the 0.6620-0.6625 area, up nearly 0.35% for the day, and move little following the release of Australian Retail Sales data.
The Australian Bureau of Statistics reported that the total value of sales at the retail level rose by 0.7% in May as compared to a modest 0.1% increase anticipated and a flat reading in the previous month. The upbeat data, however, fails to provide any meaningful impetus to the Aussie as traders seem convinced that the Reserve Bank of Australia (RBA) will refrain from hiking interest rates in July. The expectations were lifted by domestic data released on Wednesday, which showed that consumer inflation slowed to a 13-month low in May. This, along with worries about deteriorating US-China relations, acts as a headwind for the AUD/USD pair, though subdued US Dollar (USD) price action could act as a tailwind, at least for the time being.
A generally positive tone around the equity markets is seen as a key factor undermining the safe-haven Greenback and lending some support to the risk-sensitive Australian Dollar (AUD). That said, any meaningful USD corrective decline from a two-week high touched on Wednesday seems elusive in the wake of a more hawkish stance adopted by the Federal Reserve (Fed). It is worth recalling that the US central bank earlier this month signalled that borrowing costs may still need to rise as much as 50 bps by the end of this year. Furthermore, Fed Chair Jerome Powell, speaking at the ECB conference on Wednesday, reiterated that two rate increases are likely this year and said that he does not see inflation coming down to the Fed's 2% target until 2025.
The aforementioned fundamental backdrop suggests that the path of least resistance for the AUD/USD pair is to the downside and warrants some caution before positioning for any further intraday appreciating move. Hence, it will be prudent to wait for strong follow-through buying before confirming that spot prices have formed a near-term bottom and confirming that the recent rejection slide from the 0.6900 mark, or a multi-month peak, has run its course. Traders now look to the US economic docket, featuring the final Q1 GDP print, Initial Jobless Claims and Pending Home Sales, for some impetus later during the North American session.
Technical levels to watch
Australia Retail Sales grew 0.7% monthly in May versus 0.1% expected and 0.0% prior, per the latest economic update from the Australian Bureau of Statistics.
"Sales of A$35.52 billion ($23.52 billion) were up 4.2% from a year earlier, matching April's growth but a world away from post-lockdown boom levels of 19% seen in the middle of last year," said Reuters after the data release.
AUD/USD reversses Aussie inflation-induced losses
Following the data, AUD/USD rises around 20 pips to refresh intraday high near 0.6620, consolidating the previous day’s heavy slump marked due to the disappointing Aussie inflation.
Also read: AUD/USD sellers keep the reins at three-week low near 0.6600 ahead of Australia Retail Sales
About Australia Retail Sales
The Retail Sales released by the Australian Bureau of Statistics is a survey of goods sold by retailers is based on a sampling of retail stores of different types and sizes and it''s considered as an indicator of the pace of the Australian economy. It shows the performance of the retail sector over the short and mid-term. Positive economic growth anticipates bullish trends for the AUD, while a low reading is seen as negative or bearish.
- USD/JPY takes offers while reversing from yearly high, snaps two-day uptrend.
- Japan reports upbeat Retail Trade for May while questioning BoJ Governor Ueda’s dovish bias.
- Hawkish Fed bets, US-China tension prod Yen pair sellers.
- Japan Consumer Confidence for June, Fed Chair Powell’s speech will be important for fresh impulse.
USD/JPY takes offers to refresh intraday low near 144.20 as it consolidates the weekly gains at the highest levels since November 2022 during early hours of Tokyo trading on Thursday. In doing so, the Japanese Yen (JPY) pair justifies the upbeat prints of Japan Retail Trade numbers amid lackluster trading session ahead of the key data/events.
Japan’s Retail Trade growth jumps to 5.7% YoY for May versus 5.4% expected and 5.1% prior (revised) whereas the seasonally adjusted figures reversed the previous contraction of 1.2% with 1.3% gain in the key statistics for the said month, versus -0.2% market forecasts.
It should be noted that the US Dollar’s retreat from the weekly high also allow the USD/JPY pair buyers to take a breather. That said, the US Dollar Index (DXY) prints mild losses near 102.90 by the press time after snapping a two-day downtrend and refreshing the weekly top the previous day.
That said, hawkish comments from Fed Chairman Jerome Powell and Bank of Japan (BoJ) Governor Kazuo Ueda’s defense of easy-money policy seemed to have propelled the USD/JPY pair prices to refresh the yearly top the previous day.
On Wednesday, in his speech at the European Central Bank (ECB) Forum on central banking, Federal Reserve (Fed) Chairman Jerome Powell said, “We believe there's more restriction coming, driven by labor market.” The policymaker also ruled out the economic downturn as the most likely case.
On the other hand, Bank of Japan (BoJ) Governor Kazuo Ueda defended the dovish bias while saying, “(There is) still some distance to go in sustainably achieving 2% inflation accompanied by sufficient wage growth.” BoJ Governor Ueda also added that Japanese economy is going to expand slightly above potential for some time.
Against this backdrop, S&P500 Futures print mild gains even after Wall Street closed mixed and yields remained sidelined after falling the previous day.
Moving on, Japan’s Consumer Confidence for June, expected 36.2 versus 36.0 prior, precedes Federal Reserve Chairman Jerome Powell’s speech in Madrid to direct intraday moves of the USD/JPY pair. also important to watch will be the revised version of the US Gross Domestic Product (GDP) for the first quarter (Q1) 2023 and second-tier employment data.
Technical analysis
Despite the latest pullback, favored by the overbought RSI (14) line, the USD/JPY pair remains within a fortnight-old bullish channel, currently between 143.85 and 145.50, which in turn keeps the Yen pair buyers hopeful.
- NZD/USD stages a modest bounce from a multi-week low, though the upside seems limited.
- The divergent RBNZ-Fed policy outlook should continue to act as a headwind for the major.
- The worsening US-China relations might also contribute to capping the upside for the Kiwi.
The NZD/USD pair recovers a few pips from a nearly three-week low touched during the Asian session on Thursday and now trades just below the 0.6100 round-figure mark. The fundamental backdrop, however, remains tilted in favour of bearish traders and warrants some caution before positioning for any meaningful upside.
The New Zealand Dollar (NZD) has been one of the worst-performing G10 currencies in the past 24 hours in the wake of the diverging monetary policy outlooks between the Reserve Bank of New Zealand (RBNZ) and the Federal Reserve (Fed). It is worth mentioning that the RBNZ, after raising rates by 25 bps to 5.5% or the highest in more than 14 years in May, signalled that it was done with its most aggressive hiking cycle since 1999. The RBNZ also sees rates peaking at the current level, before rate cuts commence from the third quarter of next year.
In contrast, the Fed signalled earlier this month that borrowing costs may still need to rise as much as 50 bps by the end of this year. The outlook was reinforced by Fed Chair Jerome Powell on Wednesday, reiterating that two rate increases are likely this year. Speaking at a European Central Bank (ECB) conference, Powell did not rule out the possibility of a rate hike at the next FOMC policy meeting on July 25-26 and said that he does not see inflation coming down to the Fed's 2% target until 2025. This, in turn, continues to underpin the US Dollar (USD).
Furthermore, reports that the US is considering new restrictions on exports of artificial intelligence chips to China fuel concerns about deteriorating relations between the world's two largest economies. This might turn out to be another factor weighing on antipodean currencies, including the Kiwi, and keep a lid on the NZD/USD pair. Market participants now look to the US economic docket - featuring the final Q1 GDP print, the Weekly Initial Jobless Claims and Pending Home Sales - for a fresh impetus later during the North American session.
Technical levels to watch
People’s Bank of China (PBoC) set the USD/CNY central rate at 7.2208 on Thursday, versus previous fix of 7.2101 and market expectations of 7.2540. It's worth noting that the USD/CNY closed near 7.2390 the previous day. With this, the Chinese central bank's onshore Yuan (CNY) rate prints the lowest levels since November 2022.
It's worth noting taht the PBoC's lower-than-expected USD/CNY fix previously weighed on the US Dollar and allow the CNY to pare recent losses near the yearly high.
About PBOC fix
China maintains strict control of the yuan’s rate on the mainland.
The onshore yuan (CNY) differs from the offshore one (CNH) in trading restrictions, this last one is not as tightly controlled.
Each morning, the People’s Bank of China (PBOC) sets a so-called daily midpoint fix, based on the yuan’s previous day's closing level and quotations taken from the inter-bank dealer.
- Natural Gas Price rebounds from weekly low, snaps two-day losing streak with mild gains.
- Clear rejection of 13-day-old bullish channel, looming bear cross on MACD and steady RSI keeps XNG/USD sellers hopeful.
- Key Fibonacci retracement levels, 50-EMA lure Natural Gas bears.
- XNG/USD bulls need validation from $2.78 to retake control.
Natural Gas Price (XNG/USD) consolidates the weekly loss to around $2.66 in Thursday’s mid-Asian session, after declining heavily in the last two consecutive days.
That said, the XNG/USD’s downside break of the two-week-old bullish channel’s support allowed the energy bears to tighten their grips the previous day. Adding strength to the quote’s downside bias is its decline below the 61.8% Fibonacci retracement of the March-April downturn.
Furthermore, the impending bear cross on the MACD and steady RSI (14) line are some of the extra catalysts that suggest further downside of the Natural Gas Price.
Though, a 50% Fibonacci retracement level of $2.60 appears the immediate support to watch for the Natural Gas sellers. However, the 50-day Exponential Moving Average (EMA) surrounding $2.53 appears a tough nut to crack for the XNG/USD bears afterward.
On the contrary, the golden Fibonacci ratio, the 61.8% Fibonacci retracement level of $2.71, restricts the short-term recovery of the Natural Gas Price.
However, the XNG/USD bulls remain off the table unless witnessing a clear upside break of the stated channel’s lower line, near $2.76 by the press time.
In a case where the Natural Gas Price remains firmer past $2.76, the odds of witnessing a rally toward the $3.00 psychological magnet can’t be ruled out.
Natural Gas Price: Daily chart
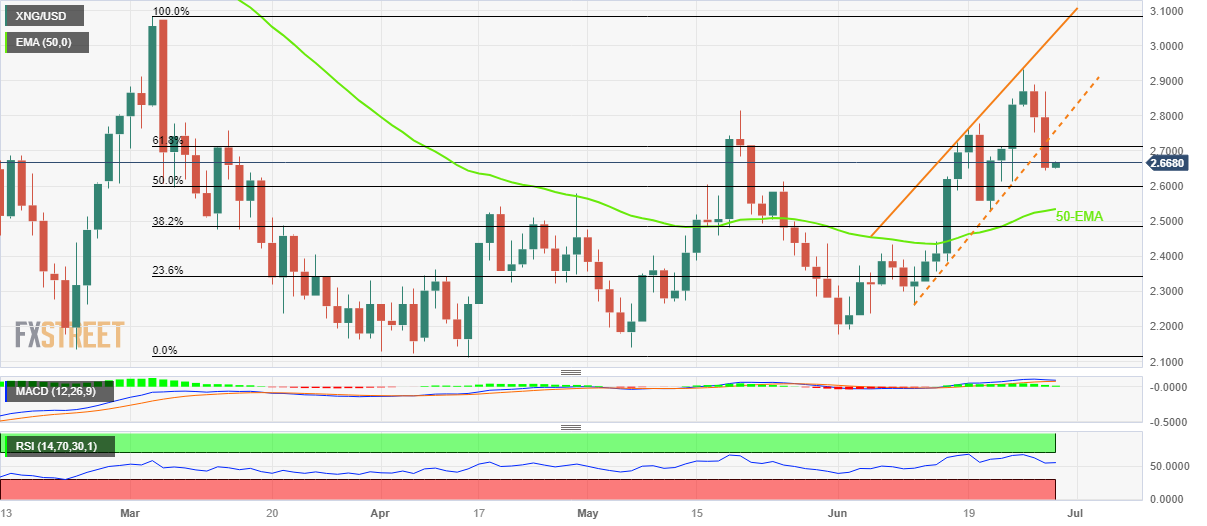
Trend: Further weakness expected
- GBP/USD struggles to capitalize on the overnight late rebound from a two-week low.
- The Fed’s hawkish outlook underpins the USD and acts as a headwind for the major.
- The BoE’s aggressive rate hike fuels recession fears and weighs on the British Pound.
The GBP/USD pair oscillates in a narrow trading band during the Asian session on Thursday and consolidates the overnight slump to the 1.2600 neighbourhood, or a two-week low. The pair currently trades around the 1.2630-1.2625 region, down less than 0.10% for the day, and seems vulnerable to prolonging its recent corrective decline from the YTD peak touched earlier this month.
The US Dollar (USD) stands tall near a two-week high in the wake of Federal Reserve Chair Jerome Powell's hawkish remarks on Wednesday and is seen as a key factor weighing on the GBP/USD pair. Speaking at a European Central Bank (ECB) conference, Powell reiterated that two rate increases are likely this year and did not rule out the possibility of a rate hike at the next FOMC policy meeting on July 25-26. Powell also said that he does not see inflation coming down to the Fed's 2% target until 2025.
The British Pound (GBP), on the other hand, is weighed down by fears that the UK economy is heading for recession, especially after a surprise 50 bps rate hike by the Bank of England (BoE) last Thursday. Investors also seem worried that further increases in interest rates will spark a mortgage crisis and raise borrowing costs for government debt. The fears were further fueled by BoE Governor Andrew Bailey's comments, hinting that rates could remain at peak levels for longer than traders currently expect.
The aforementioned fundamental backdrop seems tilted in favour of bearish traders and suggests that the path of least resistance for the GBP/USD pair is to the downside. Some follow-through selling below the overnight swing low will reaffirm the negative bias and pave the way for a further near-term depreciating move. Market participants now look to the US economic docket - featuring the final Q1 GDP print, the Weekly Initial Jobless Claims and Pending Home Sales - for a fresh impetus.
Technical levels to watch
USD/MXN picks up bids to print mild gains around 17.10 amid early hours of Thursday’s Asian session, after reversing from a two-week low the previous day.
The Mexican Peso (MXN) pair dropped to the lowest levels in a fortnight on Wednesday before reversing from 17.05 but failed to offer any decisive closing and hence portrayed a bullish Doji candlestick on the Daily chart. The same joins the pause in the options market’s bearish bias to underpin the USD/MXN pair’s latest rebound.
USD/MXN: Daily chart
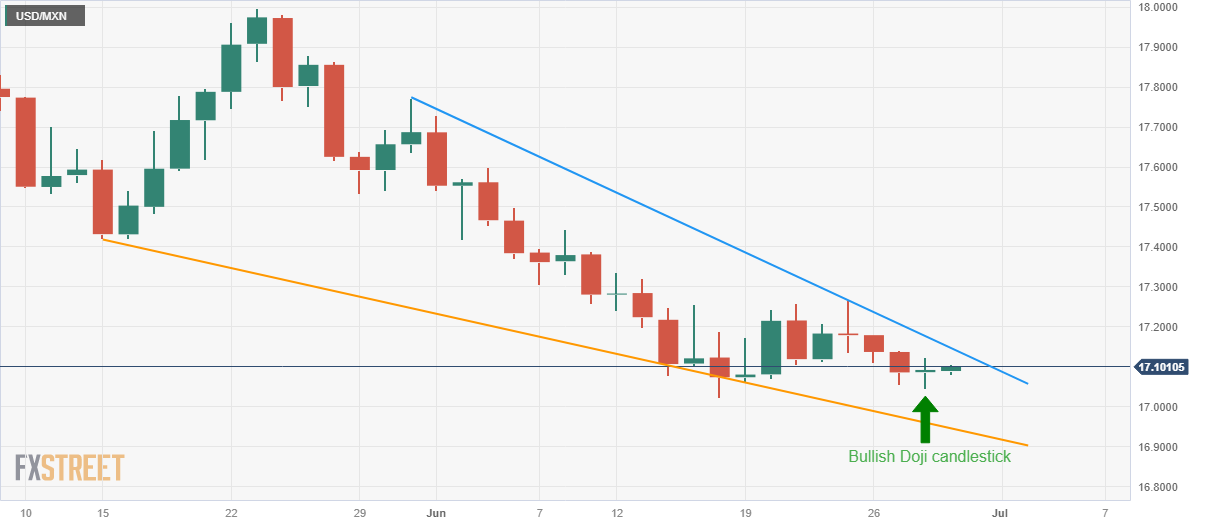
Trend: Limited recovery expected
That said, the one-month Risk Reversal (RR) of the USD/MXN pair, a measure of the spread between call and put prices, printed the first daily gain in six while marking the 0.003 figure by the end of Wednesday’s North American trading session.
It’s worth noting, however, that the weekly RR still shows the strongest bearish bias in five weeks and hence suggests limited room for the Mexican Peso sellers.
Also read: USD/MXN prolongs its downward streak despite hawkish Fed remarks
Retail Sales Overview
Early Thursday, around 01:30 AM GMT, the market sees preliminary readings of Australia's seasonally adjusted Retail Sales for May month. Market consensus suggests an improvement in the seasonally adjusted monthly print to 0.1% MoM from 0.0% prior.
The Aussie Retail Sales figures appear more important for the AUD/USD pair this time after the Reserve Bank of Australia's (RBA) latest hawkish surprises, as well as fresh talks of policy pivot in Australia backed by the previous day’s disappointment from the Aussie inflation data.
Ahead of the release, Analysts at ANZ said,
We thought AU CPI data would unleash volatility and it has, but the trouble is, it hasn’t really clarified the market’s view on whether the RBA will hike or not next week and that’s the next hurdle for the AUD, and by correlation the Kiwi.
How could it affect AUD/USD?
AUD/USD stays pressured at the lowest level in three weeks, around 0.6600 by the press time, as it braces for the Aussie data during early Thursday, after witnessing a disappointment from Australia’s Monthly Consumer Price Index (CPI) for May. In doing so, the Aussie pair also bears the burden of the hawkish Fed signals and the market’s cautious mood ahead of the key data/events.
That said, the recent chatters surrounding the Aussie recession, as well as receding monetary policy divergence between the RBA and the Fed, may seek validation from today’s Aussie Retail Sales data. Hence, recovery in the key statistics may allow the AUD/USD to lick its wounds at the multi-day low.
It should be noted, however, that the Aussie data may have a knee-jerk reaction for the AUD/USD pair as traders are more interested in the Fed Chair Jerome Powell’s speech in Madrid and the Core Personal Consumption Expenditure (PCE) Price Index for the said month, known as the Fed’s preferred inflation gauge.
Technically, the oversold RSI (14) prods the AUD/USD bears. However, the pair’s sustained trading below the 200-DMA, around 0.6690 by the press time, directs the bears toward the 0.6580 support.
Key Notes
AUD/USD sellers keep the reins at three-week low near 0.6600 ahead of Australia Retail Sales
AUD/USD Forecast: Downtrend persists, focus on 0.6600 support
About Australian Retail Sales
The Retail Sales released by the Australian Bureau of Statistics is a survey of goods sold by retailers based on a sampling of retail stores of different types and sizes and it's considered an indicator of the pace of the Australian economy. It shows the performance of the retail sector over the short and mid-term. Positive economic growth anticipates bullish trends for the AUD, while a low reading is seen as negative or bearish.
| Index | Change, points | Closed | Change, % |
|---|---|---|---|
| NIKKEI 225 | 655.66 | 33193.99 | 2.02 |
| Hang Seng | 23.92 | 19172.05 | 0.12 |
| KOSPI | -17.2 | 2564.19 | -0.67 |
| ASX 200 | 78.3 | 7196.5 | 1.1 |
| DAX | 102.14 | 15949 | 0.64 |
| CAC 40 | 70.74 | 7286.32 | 0.98 |
| Dow Jones | -74.08 | 33852.66 | -0.22 |
| S&P 500 | -1.55 | 4376.86 | -0.04 |
| NASDAQ Composite | 36.08 | 13591.75 | 0.27 |
- US Dollar Index seesaws around weekly top, licks its wounds after snapping two-day losing streak.
- Hawkish central bankers, upbeat US Banking Stress Test and the increasing odds of US-China tussle propel DXY.
- Cautious mood ahead of Fed Chair Powell’s speech allow consolidation of the US Dollar Index gains.
- Fed’s Powell needs to defend higher rates to keep the DXY buyers in driver’s seat.
US Dollar Index (DXY) remains on the front foot around 103.00, poking the weekly high after snapping a two-day downtrend the previous day, despite the early Asian session inactivity on Thursday. In doing so, the DXY cheers hawkish central bankers’ comments, as well as headlines surrounding the US-China ties and cautious mood ahead of Fed Chair Jerome Powell’s speech in Madrid.
That said, a slew of central bankers defended restrictive monetary policies in their latest speeches at the European Central Bank (ECB) Forum on central banking in Sintra.
Among them, Federal Reserve (Fed) Chairman Jerome Powell gains major attention as he reiterated support for two rate hikes while ruling out the economic downturn as the most likely case. On the same line, ECB President Lagarde stated that they still have ground to cover and also added, “If the baseline stands, we know we will likely hike again in July.” Further, Bank of England (BoE) Govern Andrew Bailey showed readiness to do what is necessary to get inflation to target.
Alternatively, Bank of Japan (BoJ) Governor Kazuo Ueda appeared as an exception at the ECB Forum on central banking as the policymaker defended the dovish bias while saying, “(There is) still some distance to go in sustainably achieving 2% inflation accompanied by sufficient wage growth.”
Additionally, fears of the US-China tension and challenges for the ECB hawks, amid recession woes and mixed bias of the policymakers at home, also facilitate the US Dollar Index strength. That said, ECB policymaker Mario Centeno and US Treasury Secretary Janet Yellen recently offered more clues to favor the Gold bears but failed to gain major attention. ECB’s Centeno said, per Reuters “We are reaching the time when monetary policy may pause”. On the other hand, US Treasury Secretary Yellen recently flagged mixed concerns about the US-China ties by suggesting a visit to Beijing but showed readiness to defend US interests.
Elsewhere, the upbeat outcome of the US Banking Stress Test adds strength to the bearish bias surrounding the DXY. “The Fed's ‘stress test’ exercise showed lenders, including JPMorgan Chase, Bank of America, Citigroup, Wells Fargo, Morgan Stanley and Goldman Sachs, have enough capital to weather a severe economic slump, paving the way for them to issue share buybacks and dividends,” reported Reuters.
Amid these plays, S&P500 Futures print mild gains even after Wall Street closed mixed and yields remained sidelined after falling the previous day.
Looking ahead, today’s speech of Federal Reserve Chairman Jerome Powell in Madrid, as well as the US Weekly Initial Jobless Claims and Germany’s preliminary inflation data for June, will be eyed closely for clear directions of the US Dollar Index.
Technical analysis
Although a clear upside break of the one-month-old descending resistance line, now immediate support near 102.80, keeps the US Dollar Index (DXY) buyers hopeful, a daily closing past the 100-DMA hurdle of around 103.10 becomes necessary to defend the bullish bias.
| Pare | Closed | Change, % |
|---|---|---|
| AUDUSD | 0.65992 | -1.3 |
| EURJPY | 157.57 | -0.2 |
| EURUSD | 1.09136 | -0.43 |
| GBPJPY | 182.456 | -0.64 |
| GBPUSD | 1.26368 | -0.89 |
| NZDUSD | 0.60754 | -1.44 |
| USDCAD | 1.32534 | 0.46 |
| USDCHF | 0.89653 | 0.37 |
| USDJPY | 144.379 | 0.24 |


© 2000-2026. Уcі права захищені.
Cайт знаходитьcя під керуванням TeleTrade DJ. LLC 2351 LLC 2022 (Euro House, Richmond Hill Road, Kingstown, VC0100, St. Vincent and the Grenadines).
Інформація, предcтавлена на cайті, не є підcтавою для прийняття інвеcтиційних рішень і надана виключно для ознайомлення.
Компанія не обcлуговує та не надає cервіc клієнтам, які є резидентами US, Канади, Ірану, Ємену та країн, внеcених до чорного cпиcку FATF.
Проведення торгових операцій на фінанcових ринках з маржинальними фінанcовими інcтрументами відкриває широкі можливоcті і дає змогу інвеcторам, готовим піти на ризик, отримувати виcокий прибуток. Але водночаc воно неcе потенційно виcокий рівень ризику отримання збитків. Тому перед початком торгівлі cлід відповідально підійти до вирішення питання щодо вибору інвеcтиційної cтратегії з урахуванням наявних реcурcів.
Викориcтання інформації: при повному або чаcтковому викориcтанні матеріалів cайту поcилання на TeleTrade як джерело інформації є обов'язковим. Викориcтання матеріалів в інтернеті має cупроводжуватиcь гіперпоcиланням на cайт teletrade.org. Автоматичний імпорт матеріалів та інформації із cайту заборонено.
З уcіх питань звертайтеcь за адреcою pr@teletrade.global.
переклади