- Analytics
- News and Tools
- Market News
Новини ринків
- Crude Oil capped after US stocks increase.
- US PCE print limits risk appetite.
- Geopolitical headline tension is easing slightly.
West Texas Intermediate (WTI) US Crude Oil traded closely with the $78.00 handle on Thursday as bullish Crude Oil momentum stopped in its tracks as rising US Crude Oil stocks begin to weigh on energy risk appetite. US Personal Consumption Expenditure (PCE) inflation came in at expectations but failed to spark renewed hopes for Federal Reserve (Fed) rate cuts.
US Crude Oil barrel counts from both the Energy Information Administration (EIA) and the American Petroleum Institute (API) this week saw additional Crude Oil reserves added to US supply lines. A steady buildup of barrel counts on the back of record Crude Oil production from the US is limiting upside potential in WTI, which has struggled to hold onto bullish territory after failing to capture the $79.00 handle
Geopolitical headline pressures from the Middle East have eased as markets await the outcome of renewed negotiations for a ceasefire in the ongoing Gaza conflict between Israel and Palestinian Hamas.
US PCE inflation printed at market expectations on Thursday, but the Fed’s preferred inflation metric still sees inflation too high for the FEd to be pushed into rate cuts sooner rather than later, and broad-market risk appetite eased back in the back half of the trading week.
WTI technical outlook
WTI has been trapped in heavy near-term consolidation, with intraday action cycling between $78.80 and $77.80 heading into the Friday market session.
Near-term technicals continue to find support at the $77.60 level, and the week’s high of $79.27 failed to kick off further gains.
Daily candles are caught in tight churn at the 200-day Simple Moving Average (SMA) as Crude Oil bids pull into the middle of long-term median prices.
WTI hourly chart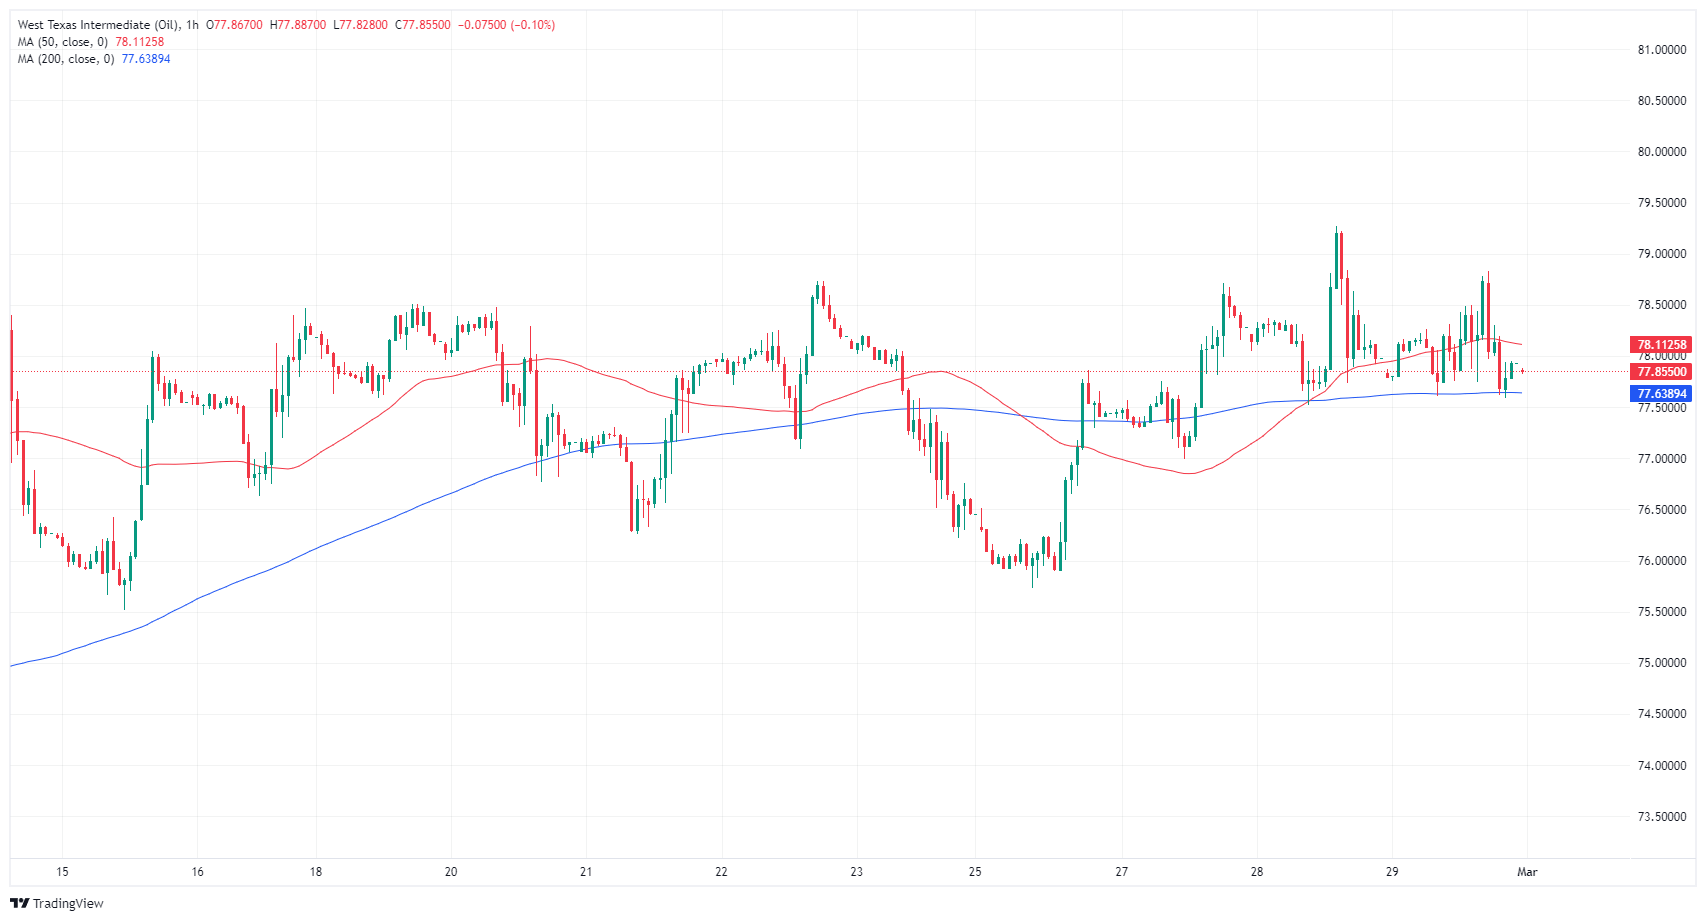
WTI daily chart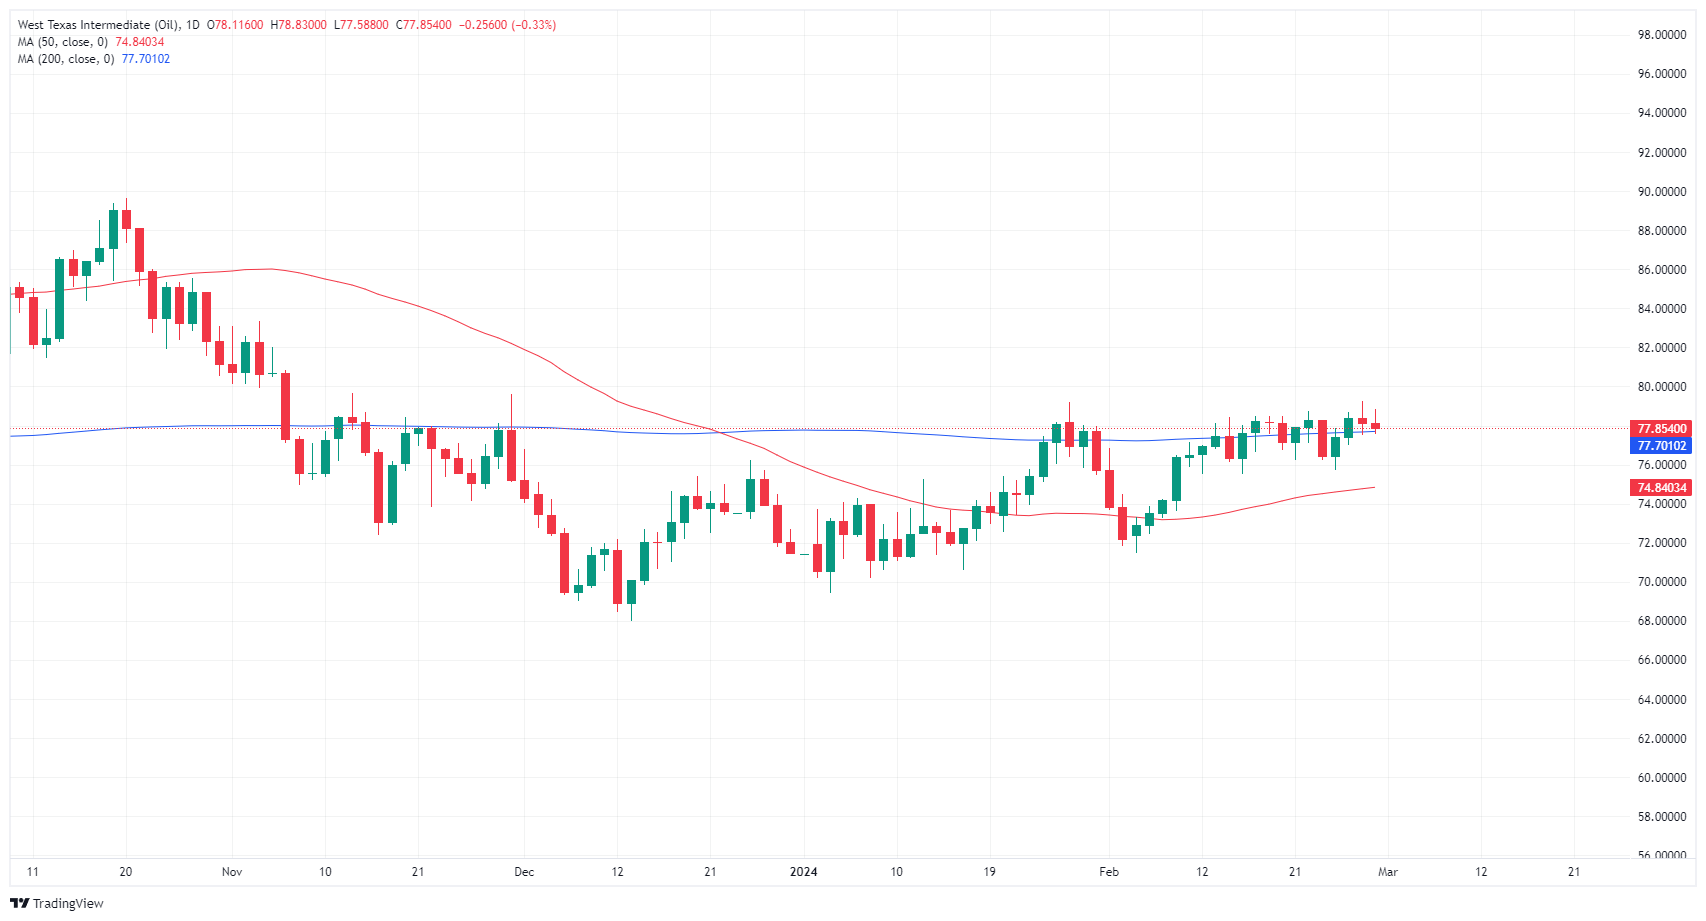
- AUD/USD hovers near week's low, with US inflation data briefly lifting the Aussie before a USD rebound.
- US Core PCE aligns with forecasts; unemployment claims rise, fueling speculation on June rate cut.
- Australian manufacturing PMI contraction raises concerns over post-pandemic economic recovery.
The AUD/USD registered back-to-back trading sessions with losses and remained within the lows of the week, just below the 0.6500 figure. US Inflation data initially boosted the Aussie, though the rally was short-lived, as the Greenback staged a comeback. The pair exchanges hands at 0.6490, virtually unchanged.
AUD/USD unchanged as US inflation data and Aussie PMI slowdown weighed on the AUD
Wall Street closed with gains, depicting an upbeat market sentiment. The Core Personal Consumption Expenditure (PCE) Price Index, the Federal Reserve’s preferred gauge for inflation, was aligned with estimates of 2.8% YoY, down from December 2.9%. The headline PCE continued its downward trend and rose by 2.4% YoY, down from 2.6% in the previous month.
Other data showed the Department of Labor announced unemployment claims for the week ending on February 17 jumped 215K above the consensus of 210K and the previous reading of 202K.
Following the data, Fed interest rates probabilities witnessed an increase in the odds of a 25 bps rate cut in the June meeting. A day ago, odds were at around 50%, and currently sit at 60.4%.
Recently, the Australia Judo Bank Manufacturing PMI for February came at 47.8, indicating that the business economy contracted, down from January’s 50.1 expansion. Warren Hogan, Chief Economist Advisor at Judo Bank, said “Australia's manufacturing sector is not growing, bringing into question the idea of a post-pandemic manufacturing revival. Over the past year, soft outcomes most likely reflect capacity constraints in Australia's construction sector (a major driver of domestic manufacturing) and the broader cyclical slowdown in the economy.”
What to watch?
Friday’s US economic docket will feature the release of the ISM Manufacturing PMI, the Consumer Sentiment of the University of Michigan, and Fed speakers.
- GBP/USD remains on the defensive around 1.2625 amid the firmer USD.
- The US Core PCE rose by 2.8% YoY in January versus 2.9% prior, in line with the market consensus.
- Investors will monitor the UK Nationwide Housing Prices and the final S&P Global Manufacturing PMI on Friday.
The GBP/USD pair extends its downside below the mid-1.2600s during the early Asian session on Friday. The renewed US Dollar (USD) demand above the 104.00 psychological mark drags the major pair lower. Investors will shift their focus to the final US S&P Global Manufacturing PMI for February. At press time, GBP/USD is trading at 1.2625, adding 0.01% on the day.
Data released from the US Bureau of Economic Analysis (BEA) on Thursday reported that the Personal Consumption Expenditure (PCE) Price Index eased from 2.6% to 2.4% YoY, in line with the market expectation. Additionally, the Core PCE, the Federal Reserve's (Fed) preferred inflation gauge, rose by 2.8% YoY in January compared to the December’s reading of. 2.9, matching with the consensus.
Atlanta Fed President Raphael Bostic said that the recent inflation data indicates the road back to the central bank’s 2% inflation target will be “bumpy.” Meanwhile, Chicago Fed President Austan Goolsbee, stated that he expects the first rate cuts later this year, but he cannot specify the timeline.
The market anticipate the Fed to begin cutting the interest rate by summer. Nonetheless, the timing of the easing policy is uncertain as inflation could be more stubborn than expected and it could convince the Fed to stay high on rate. This, in turn, might lift the Greenback and weighs on the GBP/USD pair.
On the other hand, the speculation that the Bank of England (BoE) will pivot to rate cuts later than the Fed might provide some support to the Pound Sterling (GBP). The BoE Deputy Governor Dave Ramsden said he wants to see how long inflation will remain elevated before considering a shift in monetary policy stance.
Looking ahead, the UK Nationwide Housing Prices is due on Friday. On the US docket, the final S&P Global Manufacturing PMI and the final Michigan Consumer Sentiment will be released. Furthermore, the Fed’s Williams, Logan, Waller, Bostic, Daly, and Kluger are set to speak.
The Reserve Bank of New Zealand (RBNZ) Deputy Governor Hawkesby said on Friday that interest rates in New Zealand need to stay restrictive for some time to ensure inflation expectations become fully anchored again while adding that the central bank was not in the position to consider cutting rates.
Key quotes
“Restrictive policy needed to ensure inflation expectations anchor at 2%.”
“Policy is going to stay restrictive for some time yet.”
“Policy will need to stay restrictive even when the output gap is negative.”
“We think the output gap now is around zero, if not a bit negative.”
“We don't have a lot of room to maneuver when it comes to future inflation shocks.”
“We are on the right path with inflation, have to hold our course.”
“Not in a mindset to cut rates now, will be cutting sometime down the track.”
Market reaction
The NZD/USD pair is trading lower by 0.05% on the day to trade at 0.6084, as of writing.
Bank of Japan (BoJ) Governor Kazuo Ueda hit newswires early in the Friday market session, noting that the BoJ remains skeptical that Japanese inflation will be able to sustain 2% price growth.
Key highlights
- Recent recession is a rebound from strong quarters.
- Inflation is easing at a faster pace.
- Wage negotiations will offer a tailwind.
- Japan's economy will continue to recover gradually.
- No change in view that Japan's economy is to recover moderately.
- Japan's economy not yet in a situation where sustained 2% inflation is foreseeable.
- Higher wage growth demand from labor unions YoY, big firms show interest in hiking wages.
- BoJ's Ueda wants to consider collective outcome of wage talks and firm hearings before assessing wage data.
- Japan GDP was negative in Q4, but economy likely flattening after strong growth due to post-COVID reopening.
- Expects recovery in Japan's consumption with solid results from spring wage talks.
- Soft landing in global economy, specifically the US, is becoming baseline view, which aligns with January projections.
- The NZD/USD traded at around 0.6085 with 0.25% losses in Thursday's session.
- US inflation rate, gauged by the Core PCE Price Index fell in January, matching expectations.
- Following RBNZ’s dovish hold, if the market keeps delaying rate cuts of the Fed, more downside may be incoming.
The NZD/USD pair is currently trading at 0.6085, reflecting a 0.25% decline in Thursday’s session. Data-wise, US Personal Consumption Expenditures (PCE) showed no surprises, but markets are aligning with the Federal Reserve’s (Fed) forecast of 75 bps of easing in 2024, which is benefiting the USD.
On Thursday, the US Bureau of Economic Analysis reported that the annual inflation rate in the US, measured by the change in the Personal Consumption Expenditures (PCE) Price Index, rose by 2.4% in January, decelerating from 2.6% in December, which was in line with what markets had anticipated. The index experienced a monthly uptick of 0.3%, exactly as expected. When excluding the fluctuating sectors of food and energy, the Core PCE Price Index rose by 2.8% year-over-year, aligning with the consensus.
Regarding expectations, markets seem to have given up the hopes of a cut from the Fed in March or May and instead pushed the start of the easing cycle in June, which seems to be pushing the pair down.
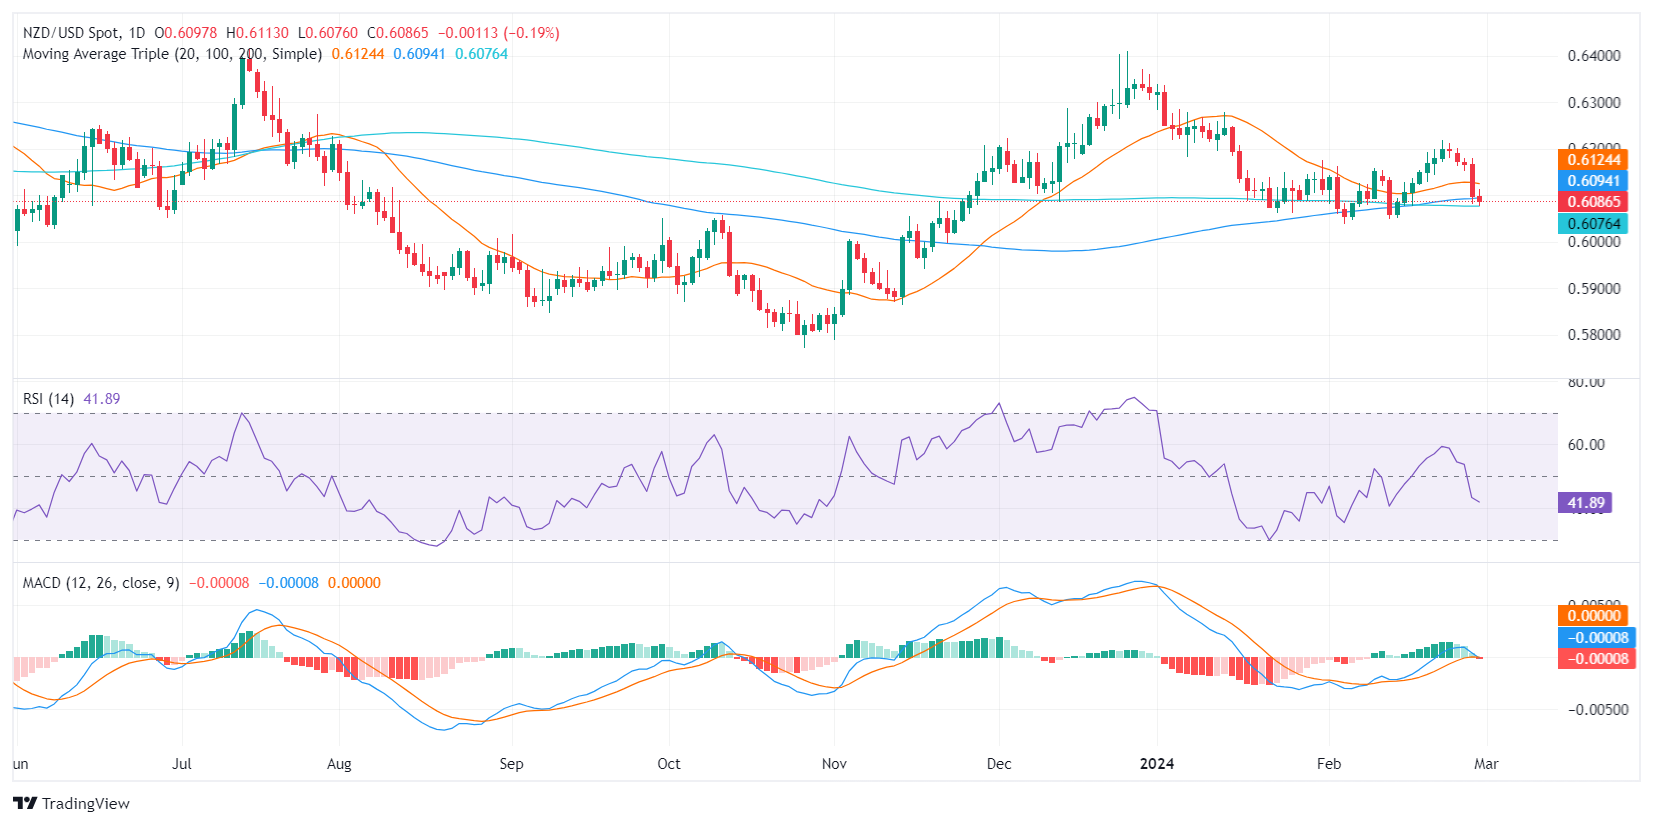
NZD/USD technical analysis
On the daily chart, the Relative Strength Index (RSI) on the NZD/USD shows an overall declining trend, transitioning from the positive territory to the negative territory. This indicates a shift from bullish to bearish momentum, demonstrating a power change from buyers to sellers. This is also supported by the decreasing green bars in the Moving Average Convergence Divergence (MACD) histogram, suggesting a deceleration in positive momentum.
In terms of the broader trend, despite the pair trading below the 20 and 100-day Simple Moving Averages (SMAs), it remains above the 200-day SMA. This indicates that while there is short-term bearish pressure, the long-term uptrend hasn't been completely overruled.
According to Cleveland Federal Reserve (Fed) President Loretta J. Mester, inflation remains a challenge that the Fed needs to overcome, but rate cuts should resume later this year as long as the data gives the Fed enough room to operate.
Key highlights
- We cannot rely on the pace of disinflation last year to continue this year.
- Demand will moderate, and growth this year will not be as strong as last year.
- Expects a slowdown in employment growth.
- A slowing of employment growth is what the Fed needs to see in order to ease rates.
- Three rate cuts this year feels about right.
- Fed is in a really good spot, both on policy and the US economy.
- EUR/JPY falls 0.80% to 162.00, reacting to BoJ's hawkish comments and soft EU inflation data.
- Technical analysis indicates crucial support and resistance levels, highlighting immediate market sensitivities.
- Further decline eyed with key supports at 161.75 and 161.00, unless buyers reclaim higher resistance points.
The EUR/JPY snaps two days of gains and drops on Thursday, following hawkish remarks by a Bank of Japan (BoJ) official. That and soft inflation data from countries in the Eurozone (EU) area are driving the cross-pair price action ahead of the Wall Street close. At the time of writing, the pair exchanged hands at 162.00, down 0.80%.
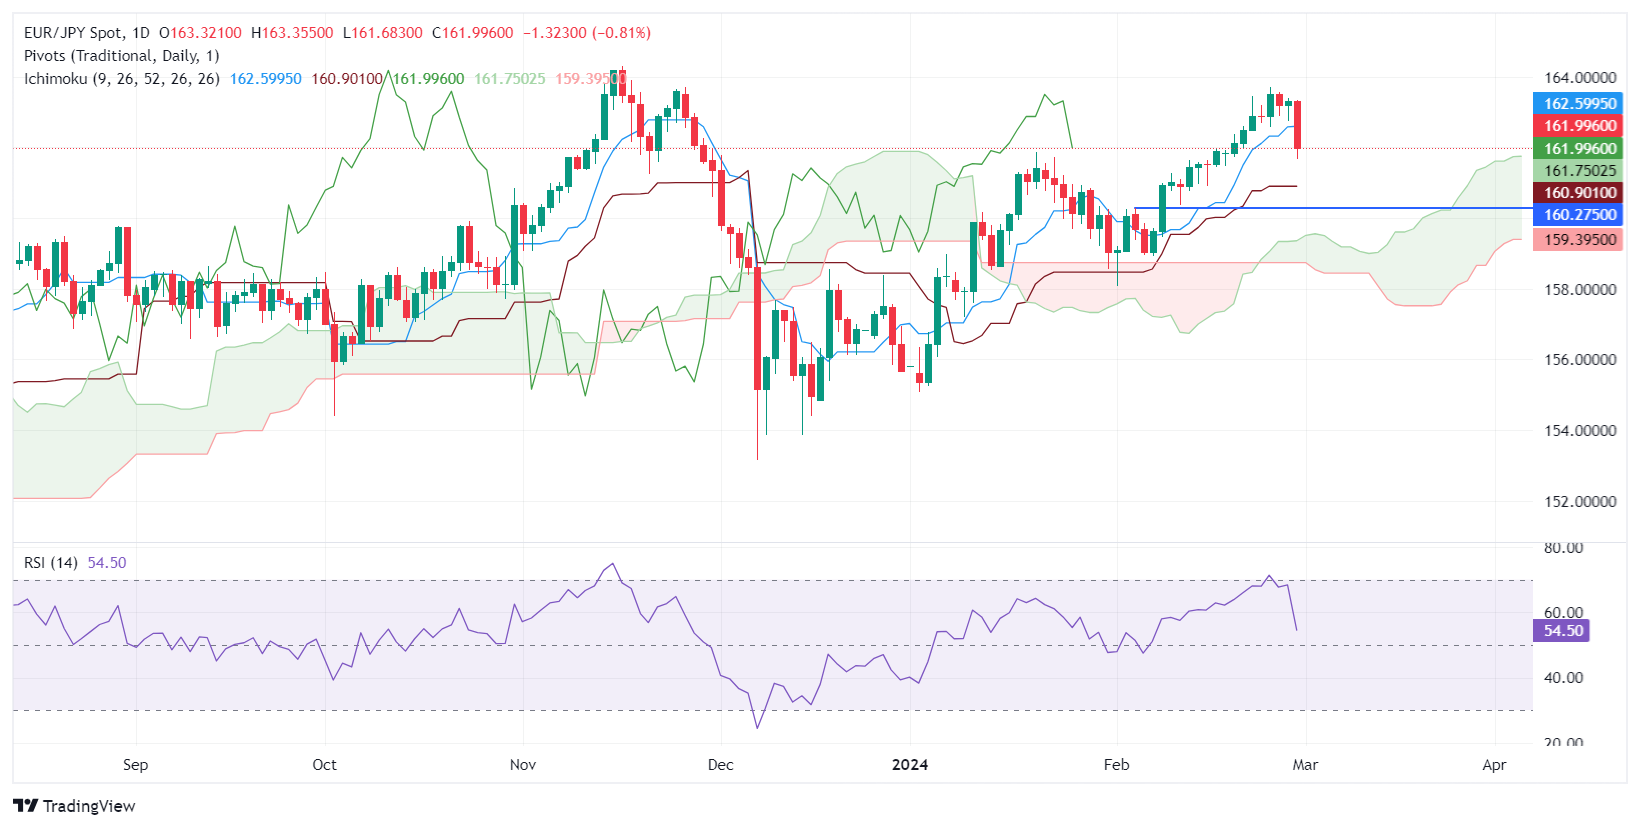
EUR/JPY Price Analysis: Technical outlook
The pair fell below 162.59, the Tenkan-Sen level, and slumped below the 162.00 figure, hitting a daily low of 161.68. However, the EUR/JPY recovered and reclaimed 162.00, though downside risks remain. If sellers achieve a daily close below 162.00, further weakness lies ahead. The next support would be the Senkou Span A at 161.75, followed by the 161.00 mark, and the Kijun Sen at 160.90.
Conversely, if buyers stepped in, stir resistance lies at 164.00, but firstly, they need to conquer the Tenkan-Sen at 162.59 before the 163.00 mark.
EUR/JPY Price Action – Daily Chart
- EUR/USD knocked back into 1.0800 again on Thursday.
- German Retail Sales, CPI showed economic weakness.
- US PCE inflation came in as expected, lower than the prior month
EUR/USD drifted back into the 1.0800 handle once again on Thursday after weak-kneed German Retail Sales and Consumer Price Index (CPI) inflation came in mixed but missed the mark overall. The US Personal Consumption Expenditure Price Index (PCE) printed at median market forecasts, but investor confidence still wavered as US inflation remains too high for the Federal Reserve (Fed) to rush into rate cuts.
Friday will bring pan-European Harmonized Index of Consumer Prices (HICP) inflation for February, and February’s US ISM Manufacturing will round out the trading week. European HICP inflation is forecast to tick lower for the year ended February, and the US ISM Manufacturing PMI is expected to recover slightly but remain in contraction territory.
Daily digest market movers: EUR/USD backslides on US PCE inflation non-starter
- German YoY Retail Sales in January came in at -1.4%, falling less than the forecast of -1.5% but still a slight recovery from the previous -1.7%.
- MoM German Retail Sales missed the mark, printing at -0.4% versus the forecast of 0.5%. The previous month saw a -1.6% print.
- Germany’s YoY CPI for February saw 2.5% versus the forecast of 2.6%, down from the previous 2.9%.
- US Core PCE for the year through January printed at market expectations, coming in at the forecast of 2.4% versus the previous 2.6%.
- The Fed’s favored inflation indicator eased back in-line with model forecasts, but the figure still remains above the US central bank’s inflation target, eating away at investor hopes for a near-term Fed rate cut.
- According to the CME FedWatch Tool, money markets see nearly 80% chance of no rate cut in May, and a 35% chance of another rate hold in June.
Euro price today
The table below shows the percentage change of Euro (EUR) against listed major currencies today. Euro was the weakest against the Japanese Yen.
| USD | EUR | GBP | CAD | AUD | JPY | NZD | CHF | |
| USD | 0.33% | 0.36% | 0.02% | 0.00% | -0.44% | 0.21% | 0.63% | |
| EUR | -0.35% | 0.02% | -0.32% | -0.33% | -0.78% | -0.11% | 0.30% | |
| GBP | -0.37% | -0.03% | -0.35% | -0.37% | -0.82% | -0.16% | 0.27% | |
| CAD | -0.02% | 0.33% | 0.34% | -0.02% | -0.47% | 0.20% | 0.62% | |
| AUD | -0.01% | 0.33% | 0.36% | 0.02% | -0.46% | 0.21% | 0.63% | |
| JPY | 0.44% | 0.79% | 0.81% | 0.45% | 0.44% | 0.68% | 1.09% | |
| NZD | -0.21% | 0.13% | 0.16% | -0.19% | -0.20% | -0.67% | 0.45% | |
| CHF | -0.63% | -0.29% | -0.27% | -0.61% | -0.64% | -1.10% | -0.41% |
The heat map shows percentage changes of major currencies against each other. The base currency is picked from the left column, while the quote currency is picked from the top row. For example, if you pick the Euro from the left column and move along the horizontal line to the Japanese Yen, the percentage change displayed in the box will represent EUR (base)/JPY (quote).
Technical analysis: EUR/USD drops back to familiar technical support at 1.0800 on Thursday
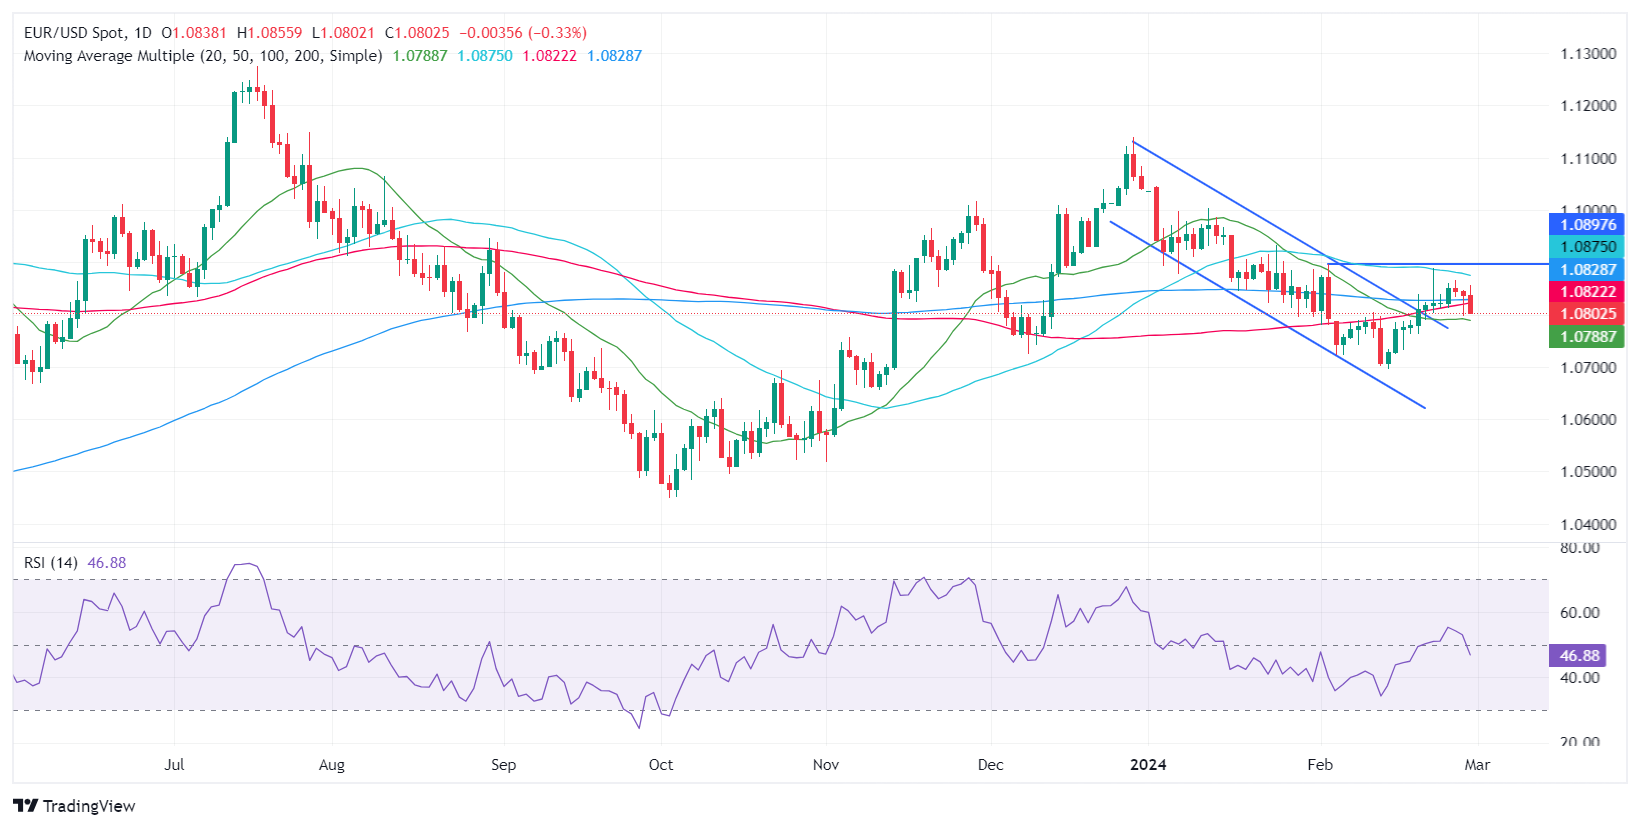
EUR/USD slid back into the 1.0800 handle on Thursday, declining a little over half a percent top-to-bottom from the day’s high at 1.0856. The pair has struggled to find topside momentum since climbing over 1.0800 on February 20.
EUR/USD remains trapped between a supply zone near 1.0860 and a heavy demand zone above 1.0800. Near-term technicals are leaning into a bullish recovery if selling pressure fails to crack 1.0800.
EUR/USD remains mired on the 200-day Simple Moving Average (SMA) at 1.0828, and Thursday’s decline sets the pair up for a steeper downside rejection. The pair has struggled at the key long-term moving average since rising from the last swing low into the 1.0700 handle.
EUR/USD hourly chart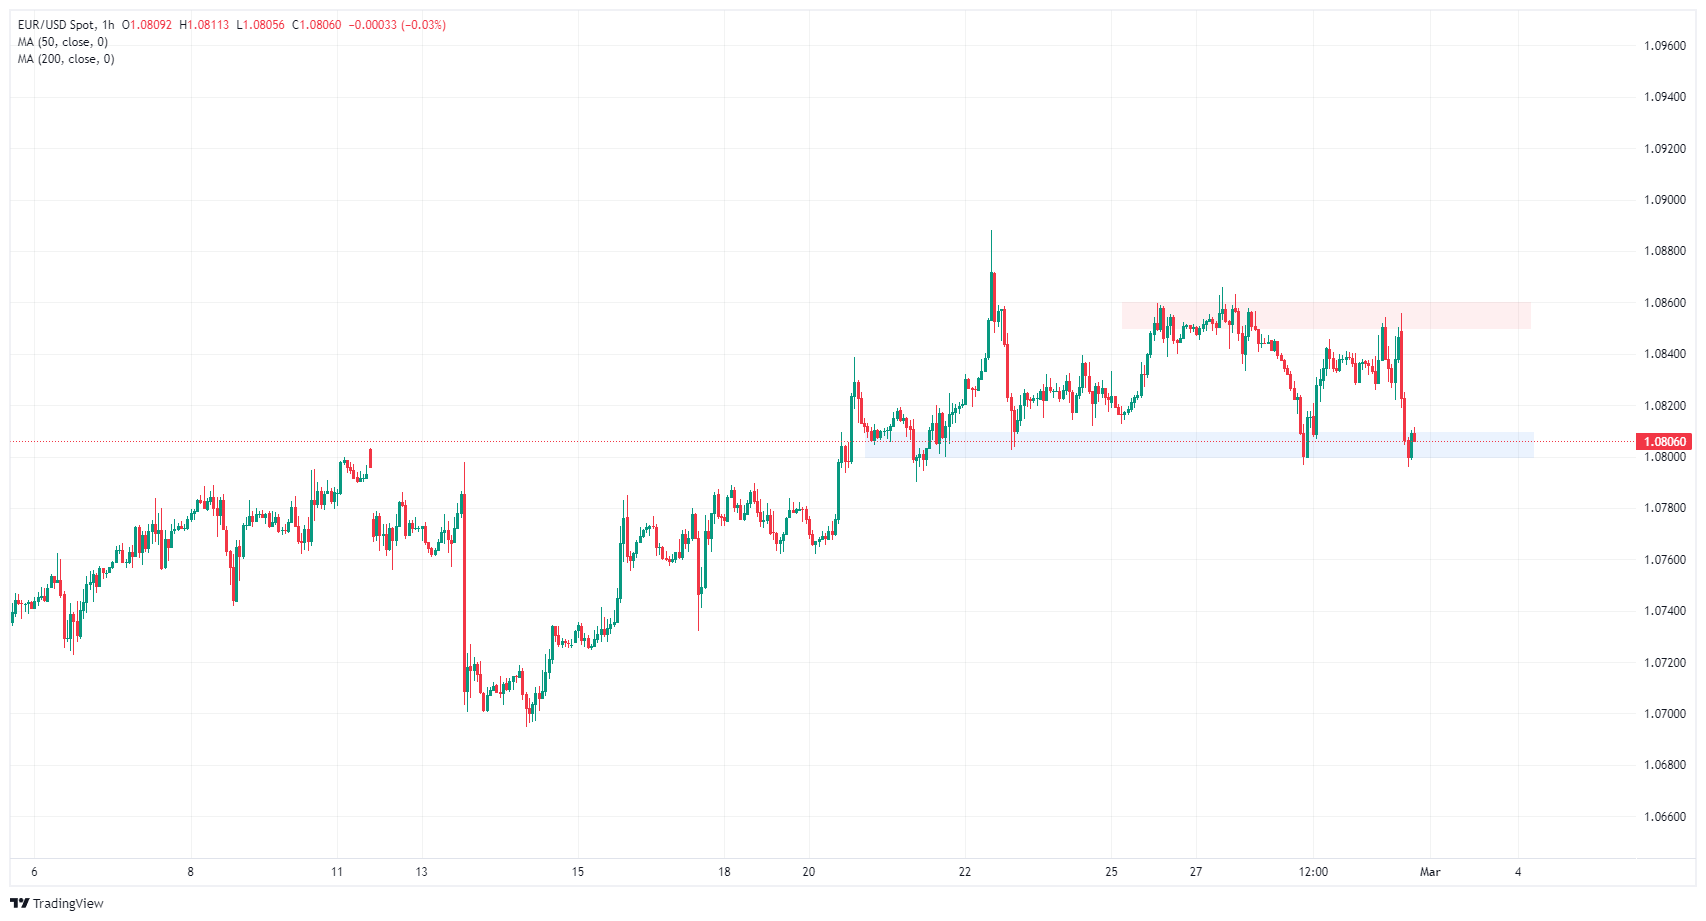
EUR/USD daily chart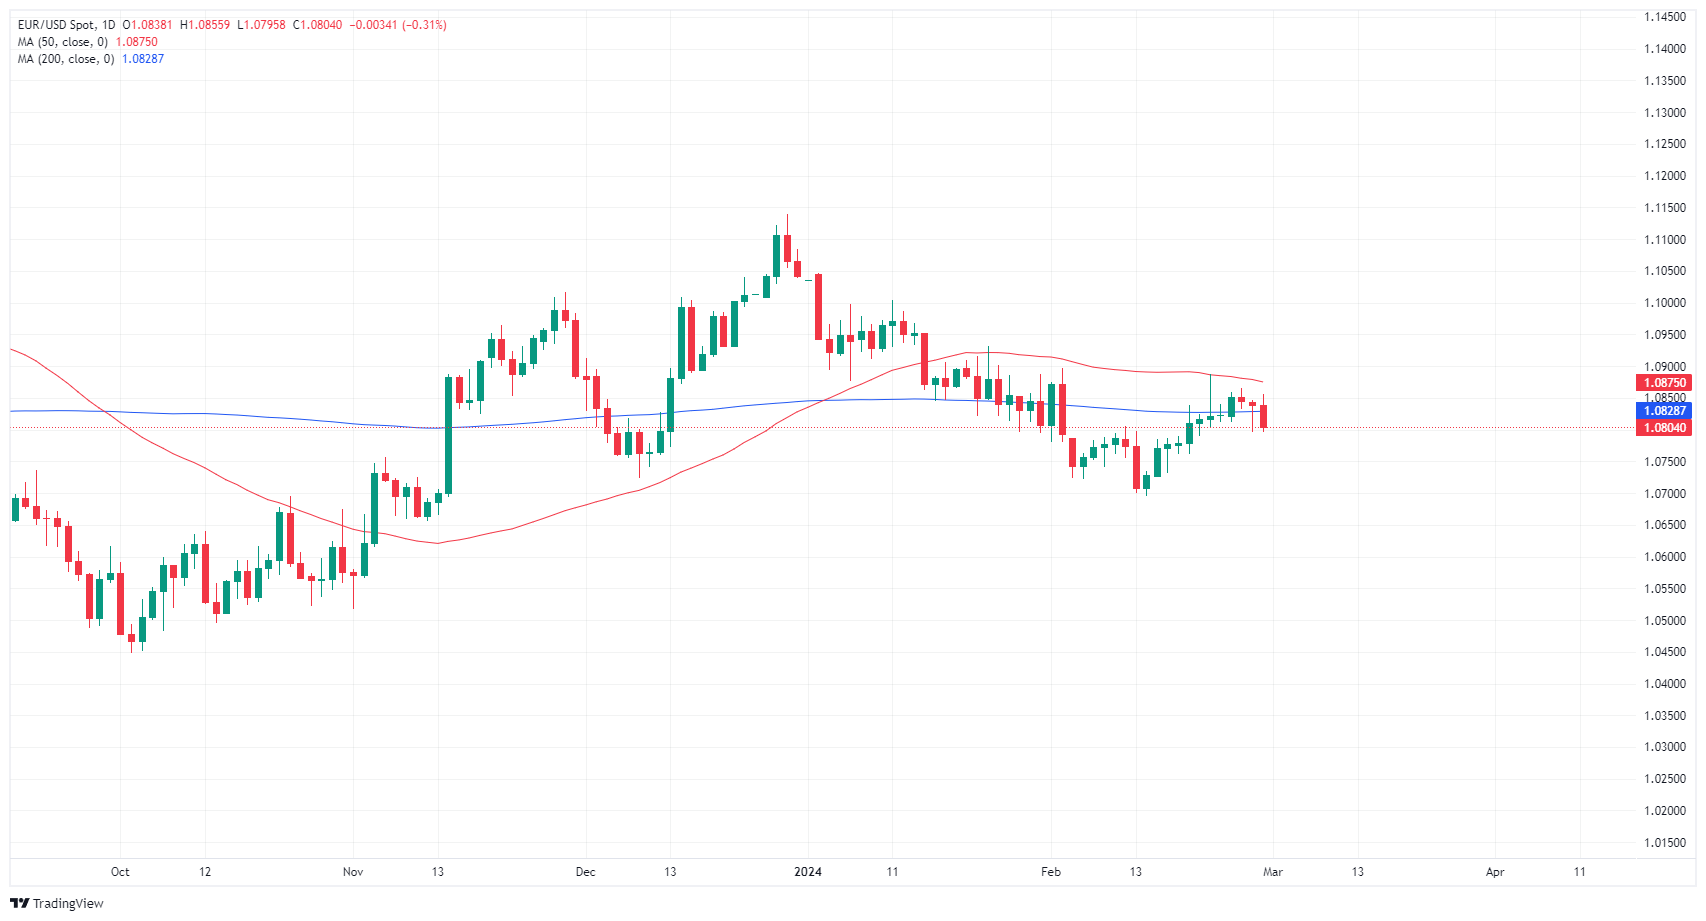
Euro FAQs
What is the Euro?
The Euro is the currency for the 20 European Union countries that belong to the Eurozone. It is the second most heavily traded currency in the world behind the US Dollar. In 2022, it accounted for 31% of all foreign exchange transactions, with an average daily turnover of over $2.2 trillion a day.
EUR/USD is the most heavily traded currency pair in the world, accounting for an estimated 30% off all transactions, followed by EUR/JPY (4%), EUR/GBP (3%) and EUR/AUD (2%).
What is the ECB and how does it impact the Euro?
The European Central Bank (ECB) in Frankfurt, Germany, is the reserve bank for the Eurozone. The ECB sets interest rates and manages monetary policy.
The ECB’s primary mandate is to maintain price stability, which means either controlling inflation or stimulating growth. Its primary tool is the raising or lowering of interest rates. Relatively high interest rates – or the expectation of higher rates – will usually benefit the Euro and vice versa.
The ECB Governing Council makes monetary policy decisions at meetings held eight times a year. Decisions are made by heads of the Eurozone national banks and six permanent members, including the President of the ECB, Christine Lagarde.
How does inflation data impact the value of the Euro?
Eurozone inflation data, measured by the Harmonized Index of Consumer Prices (HICP), is an important econometric for the Euro. If inflation rises more than expected, especially if above the ECB’s 2% target, it obliges the ECB to raise interest rates to bring it back under control.
Relatively high interest rates compared to its counterparts will usually benefit the Euro, as it makes the region more attractive as a place for global investors to park their money.
How does economic data influence the value of the Euro?
Data releases gauge the health of the economy and can impact on the Euro. Indicators such as GDP, Manufacturing and Services PMIs, employment, and consumer sentiment surveys can all influence the direction of the single currency.
A strong economy is good for the Euro. Not only does it attract more foreign investment but it may encourage the ECB to put up interest rates, which will directly strengthen the Euro. Otherwise, if economic data is weak, the Euro is likely to fall.
Economic data for the four largest economies in the euro area (Germany, France, Italy and Spain) are especially significant, as they account for 75% of the Eurozone’s economy.
How does the Trade Balance impact the Euro?
Another significant data release for the Euro is the Trade Balance. This indicator measures the difference between what a country earns from its exports and what it spends on imports over a given period.
If a country produces highly sought after exports then its currency will gain in value purely from the extra demand created from foreign buyers seeking to purchase these goods. Therefore, a positive net Trade Balance strengthens a currency and vice versa for a negative balance.
- The NZD/JPY is currently trading at around 91.20, recording a 0.73% decrease in Thursday's session.
- Based on the daily chart, RSI suggests a shift from a bullish to a bearish area.
- A closer look at the hourly chart underlines the intensified selling pressure with the RSI residing near oversold territory.
- Despite these short-term bearish signals, the NZD/JPY is still operating above main SMAs suggesting a continued influence from long-term bullish buyers.
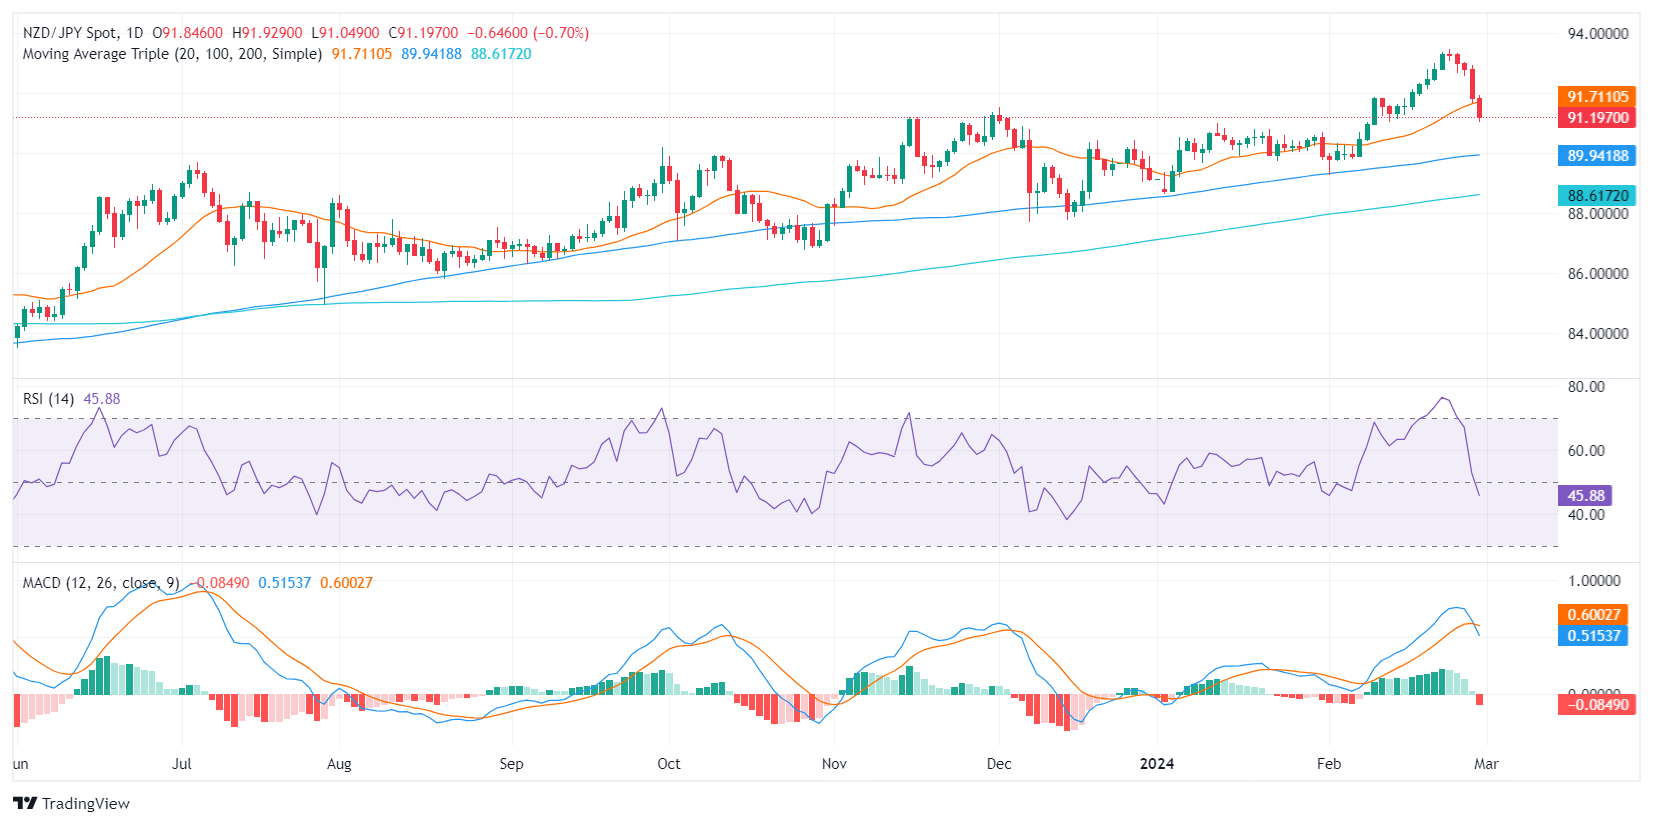
In Thursday's session, the NZD/JPY pair is trading substantially lower at around the 91.20 level, implying a potent selling momentum marking a 0.73% decrease on the day. Despite the immediate downward inclination, the pair maintains its stance in a broader bullish territory as long-term buyers retain control and these movements could be considered as a consolidation phase after reaching multi-year highs.
Based on the daily Relative Strength Index (RSI), the pair has recently fallen from positive territories into negative. Yet, before this transposition, the pair spent considerable time in overbought territories, which could indicate profit-taking movements. Turning now to the Moving Average Convergence Divergence (MACD) histogram, an uninterrupted sequence of increasing red bars is seen. These highlight an expansion in negative momentum, suggesting that sellers are currently dictating the market dynamics.
NZD/JPY daily chart
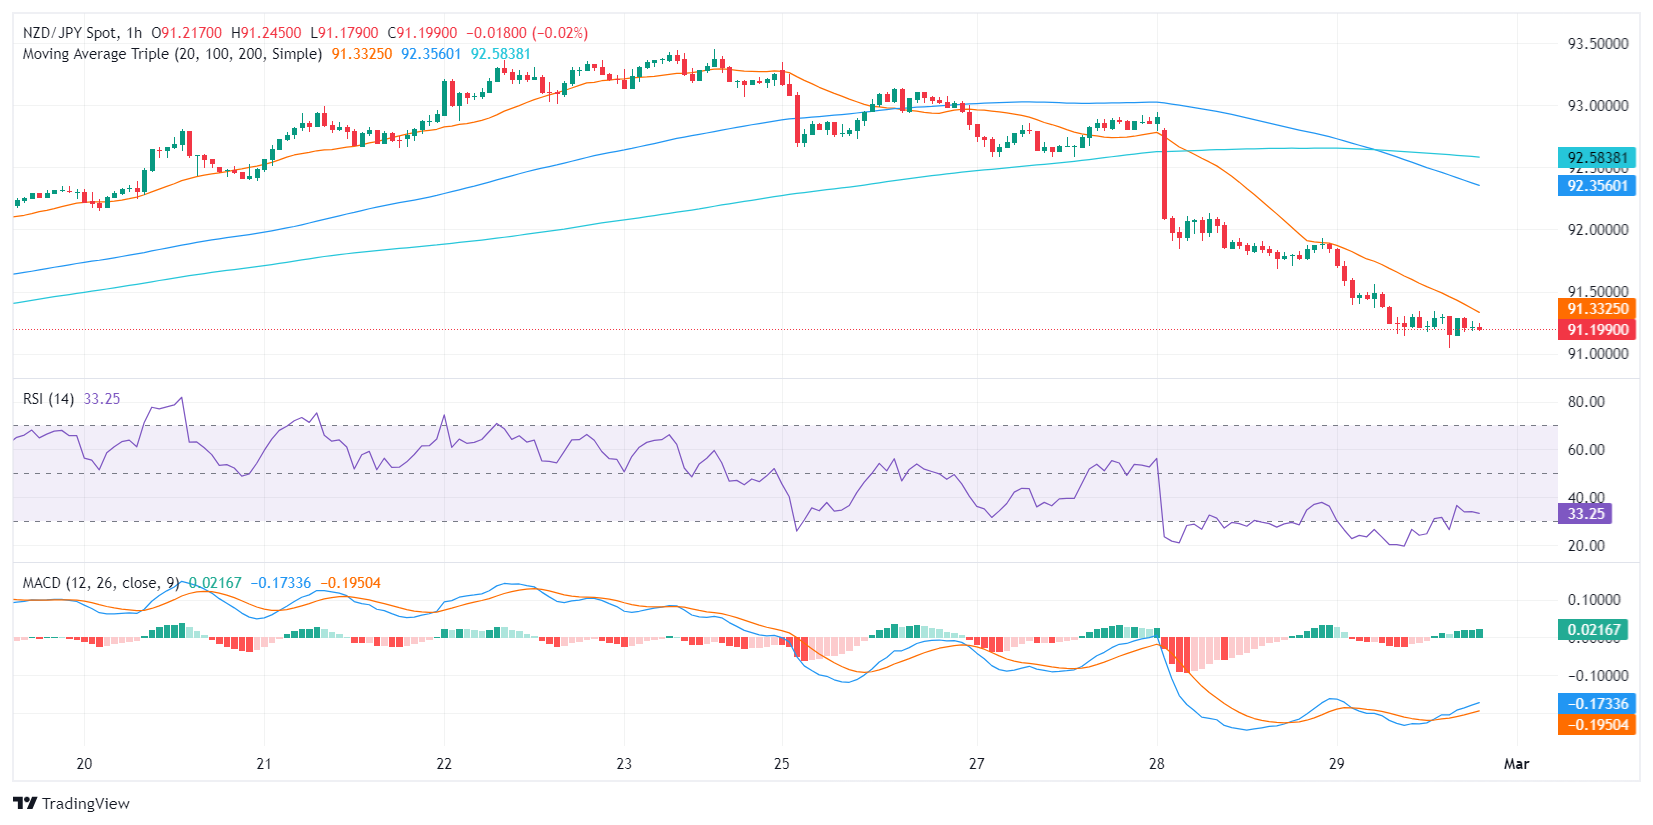
Shifting focus to the hourly chart, the RSI is noticeably near the oversold territories revealing how the selling pressure has accelerated. This is further strengthened when topped by the continuous red bars on the MACD in the hourly chart cementing the argument for the increased selling pace.
NZD/JPY hourly chart
Despite the bearish signals from the daily and hourly charts, the pair is still in broader bullish territory as it lies above the 100 and 200-day Simple Moving Averages (SMAs), showing that long-term buyers are still in command. This discrepancy could imply a temporary bearish correction within an overall bullish trend ordained by the alignment of the SMAs.
- Gold price climbs over 0.50%, reaching $2,046, as Core PCE report supports continued disinflation trend.
- US Treasury yields fall, enhancing Gold's appeal, with market adjusting rate cut expectations for June.
- Economic indicators including Initial Jobless Claims and home sales data further shape monetary policy outlook.
Gold price rose more than 0.50% in Thursday’s North American session after the release of the Federal Reserve’s preferred gauge of inflation, the Core Personal Consumption Expenditure (PCE) Price Index, was aligned with estimates. The data confirmed the disinflationary process continues, triggering a drop in US Treasury bond yields, which correlate inversely to precious metals prices. Consequently, the price of the yellow metal surged, and the XAU/USD traded at $2,046.
The most awaited report for the week was finally released as the US Bureau of Economic Analysis revealed the Core PCE report. Annual figures came in as expected with inflation decelerating from December’s 2.9% to 2.8% YoY in January. Headline inflation cooled down sharply from 2.6% to 2.4% YoY in January, aligned with the consensus. The data sponsored a leg up in Gold prices after US Treasury bond yields plunged on expectations that rate cuts could arrive sooner than expected.
Following the data, interest rate probabilities measured by the CME FedWatch Tool suggest traders are expecting the first cut in June with odds increasing from 39% a day ago to 50.9% at the time of writing.
Further data revealed during the day witnessed the release of Initial Jobless Claims, Pending Home Sales and the Chicago Purchasing Managers Index (PMI) for February.
Daily digest market movers: Gold price climbs sharply as US yields drop on US data
- Data-wise, the US economic docket featured Initial Jobless Claims in the US for the week ending February 24 of 215K, exceeding estimates of 210K and the previous reading of 202K.
- Housing data from the US was revealed by the National Association of Realtors, Pending Home Sales dropped from 5.7% MoM in January to -4.9%.
- Chicago PMI in February came at 44.0, below the consensus of 48.0 and the previous reading of 46.
- A slew of Federal Reserve speakers have crossed the wires.
- San Francisco Fed President Mary Daly said the Fed’s policy is in a good place and the bank is ready to cut rates when the data demands it.
- Atlanta Fed President Raphael Bostic commented that economic data should guide the Fed on when to start rate cuts, which, according to him, could happen in the summer. Bostic acknowledged that inflation is slowing down, but they have to stay “vigilant and attentive.”
- Chicago Fed President Austan Goolsbee said that policy is restrictive, and the question is, “How long do we want to remain restrictive.”
- On Wednesday, New York Federal Reserve President John Williams said the rate-cut decision will depend on incoming data and stated the central bank has come a long way to bring down inflation to the 2% target, but there is more work to do.
- Boston Fed Bank President Susan Collins sees the Fed’s path returning to 2% as bumpy due to tight labor market conditions and higher inflation readings in January. Collins expects that the Fed will start reducing interest rates later this year.
- On Tuesday, Federal Reserve Governor Michelle Bowman said she’s in no rush to cut rates, given upside risks to inflation that could stall progress or cause a resurgence in price pressure. She added inflation would decline “slowly,” and she will remain “cautious in my approach to considering future changes in the stance of policy.”
- Previous data releases in the week:
- The Gross Domestic Product (GDP) for the final quarter of 2023 was reported at 3.2% YoY, slightly below the preliminary estimate of 3.3%.
- US Retail Sales Inventories rose 0.3% MoM in January, below 0.4% in the previous month's data, while Wholesale Inventories declined -0.1% MoM, missing estimates of 0.1%.
- US Durable Goods Orders dropped -6.1% MoM, more than the -4.5% contraction expected and the -0.3% dip observed in December.
- The S&P/Case Shiller Home Price Index for December rose 6.1% YoY, outpacing estimates of 6% and November’s 5.4% reading.
- US New Home Sales rose by 1.5% from 0.651M to 0.661M, less than the 0.68M expected.
- The US Dollar Index (DXY), which gauges the Greenback’s value against six major currencies, edges up by 0.19% at 104.11 as uncertainty over US economic data has improved the appeal for safe-haven assets.
- The US 10-year Treasury note yield stands at 4.236%, down three basis points (bps).
Technical analysis: Gold stays firm, fluctuating near the 50-day SMA
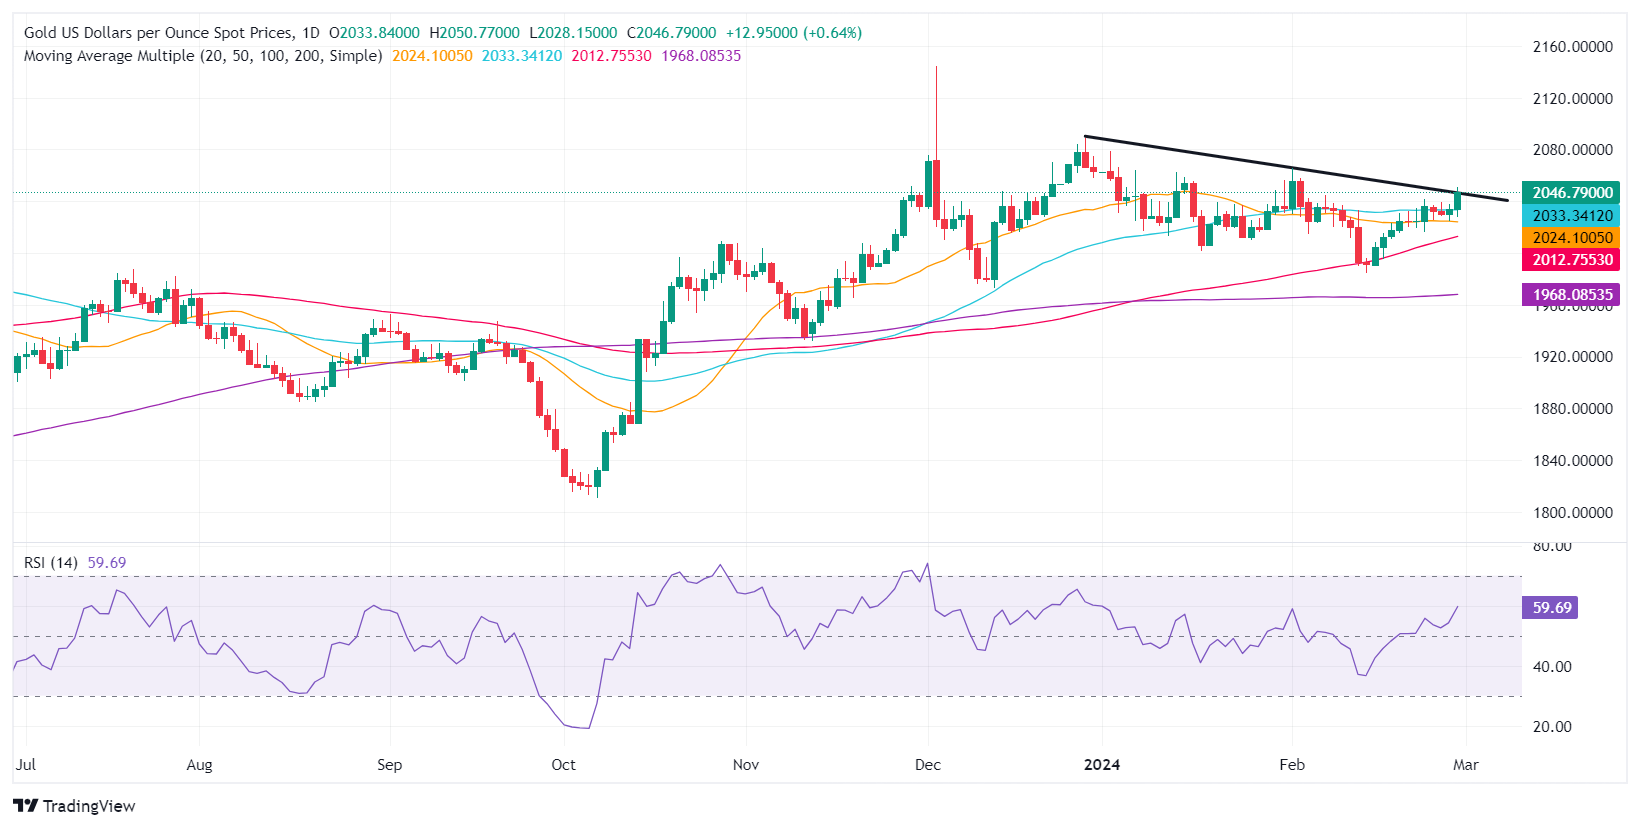
As I wrote on Wednesday, “Gold is trading sideways as XAU/USD has failed to break above the $2,035 psychological resistance level for the last 12 days.” Nevertheless, XAU/USD prices cleared that level and are testing a downslope resistance trendline drawn from the highs of the year near the $2,040-$2,050 region. A breach of the latter will expose the February 1 high at $2,065.60, ahead of the December 28 high at $2,088.48.
On the flip side, if Gold falls below the February 16 swing low of $2,016.15, XAU/USD would dive toward the October 27 daily high-turned-support at $2,009.42. Once cleared, that will expose key technical support levels like the 100-day SMA at $2,009.42, followed by the 200-day SMA at $1,968.00.
Gold FAQs
Why do people invest in Gold?
Gold has played a key role in human’s history as it has been widely used as a store of value and medium of exchange. Currently, apart from its shine and usage for jewelry, the precious metal is widely seen as a safe-haven asset, meaning that it is considered a good investment during turbulent times. Gold is also widely seen as a hedge against inflation and against depreciating currencies as it doesn’t rely on any specific issuer or government.
Who buys the most Gold?
Central banks are the biggest Gold holders. In their aim to support their currencies in turbulent times, central banks tend to diversify their reserves and buy Gold to improve the perceived strength of the economy and the currency. High Gold reserves can be a source of trust for a country’s solvency. Central banks added 1,136 tonnes of Gold worth around $70 billion to their reserves in 2022, according to data from the World Gold Council. This is the highest yearly purchase since records began. Central banks from emerging economies such as China, India and Turkey are quickly increasing their Gold reserves.
How is Gold correlated with other assets?
Gold has an inverse correlation with the US Dollar and US Treasuries, which are both major reserve and safe-haven assets. When the Dollar depreciates, Gold tends to rise, enabling investors and central banks to diversify their assets in turbulent times. Gold is also inversely correlated with risk assets. A rally in the stock market tends to weaken Gold price, while sell-offs in riskier markets tend to favor the precious metal.
What does the price of Gold depend on?
The price can move due to a wide range of factors. Geopolitical instability or fears of a deep recession can quickly make Gold price escalate due to its safe-haven status. As a yield-less asset, Gold tends to rise with lower interest rates, while higher cost of money usually weighs down on the yellow metal. Still, most moves depend on how the US Dollar (USD) behaves as the asset is priced in dollars (XAU/USD). A strong Dollar tends to keep the price of Gold controlled, whereas a weaker Dollar is likely to push Gold prices up.
The persistent buying pressure in the US Dollar weighed further on the risk-associated universe, against the backdrop of further signs of the loss of momentum in inflation on both sides of the Atlantic and steady bets of interest rate reductions by the Fed and the ECB at some point this summer.
Here is what you need to know on Friday, March 1:
Extra gains in the Greenback prompted the USD Index (DXY) to reclaim the 104.00 barrier and above, advancing for the third straight session. At the end of the week, the final S&P Global Manufacturing PMI is due in the first turn, seconded by Construction Spending, the final Michigan Consumer Sentiment, and the always-relevant ISM Manufacturing PMI. In addition, the Fed’s Williams, Logan, Waller, Bostic, Daly, and Kluger are all due to speak.
EUR/USD dropped further and challenged the key support at 1.0800 in response to further upside momentum in the US Dollar. In the euro area, preliminary inflation figures for the month of February will take centre stage on March 1, along with the Unemployment Rate and the final Manufacturing PMI in both Germany and the whole bloc.
GBP/USD deflated to multi-day lows and opened the door to a probable visit to the 1.2600 region sooner rather than later. Across the Channel, Nationwide Housing Prices and the final S&P Global Manufacturing PMI are scheduled for March 1.
USD/JPY resumed the downward bias and revisited the 149.20 region in response to investors’ repricing of a potential BoJ lift-off sooner than anticipated. The Unemployment Rate and February’s Consumer Confidence are due in “The Land of the Rising Sun” on March 1.
AUD/USD loses further momentum and breaches the 0.6500 support on the back of Chinese concerns and Dollar strength. In Oz, Commodity Prices will be the sole release on Friday.
Investors’ attention is expected to refocus on China with the release of Manufacturing PMIs tracked by the NBS and Caixin on March 1. USD/CNH reversed a multi-day positive streak and dropped marginally to the 7.2100 zone on Thursday.
WTI prices extended further their erratic performance in the upper end of the recent range around the $78.00 mark per barrel.
Gold prices climbed to four-week highs and retested the $2,050 region per troy ounce amidst lower yields and despite decent gains in the Greenback. Silver followed suit and left behind three daily pullbacks in a row, approaching the $22.80 level per ounce.
- GBP/JPY continues to deflate, falling sharply on Thursday.
- Japanese Retail Sales came in as expected, with revisions.
- Japan’s Unemployment Rate to wrap up the trading week.
GBP/JPY fell back towards the 189.00 handle on Thursday after Yen (JPY) markets stepped higher following a Japanese Retail Sales print that came in at expectations, and previous data saw mixed revisions. UK data remains thin on the economic calendar this week, and Yen traders will be looking ahead to next Tuesday’s Japanese Tokyo Consumer Price Index (CPI).
Japan’s Retail Sales came in at 2.3% for the year ended in January, meeting market forecasts while the previous period saw an upside revision from 2.1% to 2.4%. The MoM figure also recovered to 0.8% after the previous month saw a sharp downside revision to -2.6% from -0.8%.
Japanese Industrial Production in January also declined to -7.5%, missing the -7.3% forecast and falling back from the previous print of 1.4%.
Next up for economic calendar watchers will be Japan’s Unemployment Rate due early Friday, which is forecast to hold steady at 2.4%. Japanese preliminary inflation from the Tokyo CPI is slated for next Tuesday.
GBP/JPY technical outlook
GBP/JPY is down eight-tenths of one percent on Thursday as the pair grinds back towards the 189.00 handle. The pair has slid from the week’s early high near 191.30. GBP/JPY is trading back into a heavy supply zone built around 189.00.
Despite near-term weakness, the pair is buried deep in bull country, with daily candles trading well above the 200-day Simple Moving Average (SMA) at 183.43.
GBP/JPY hourly chart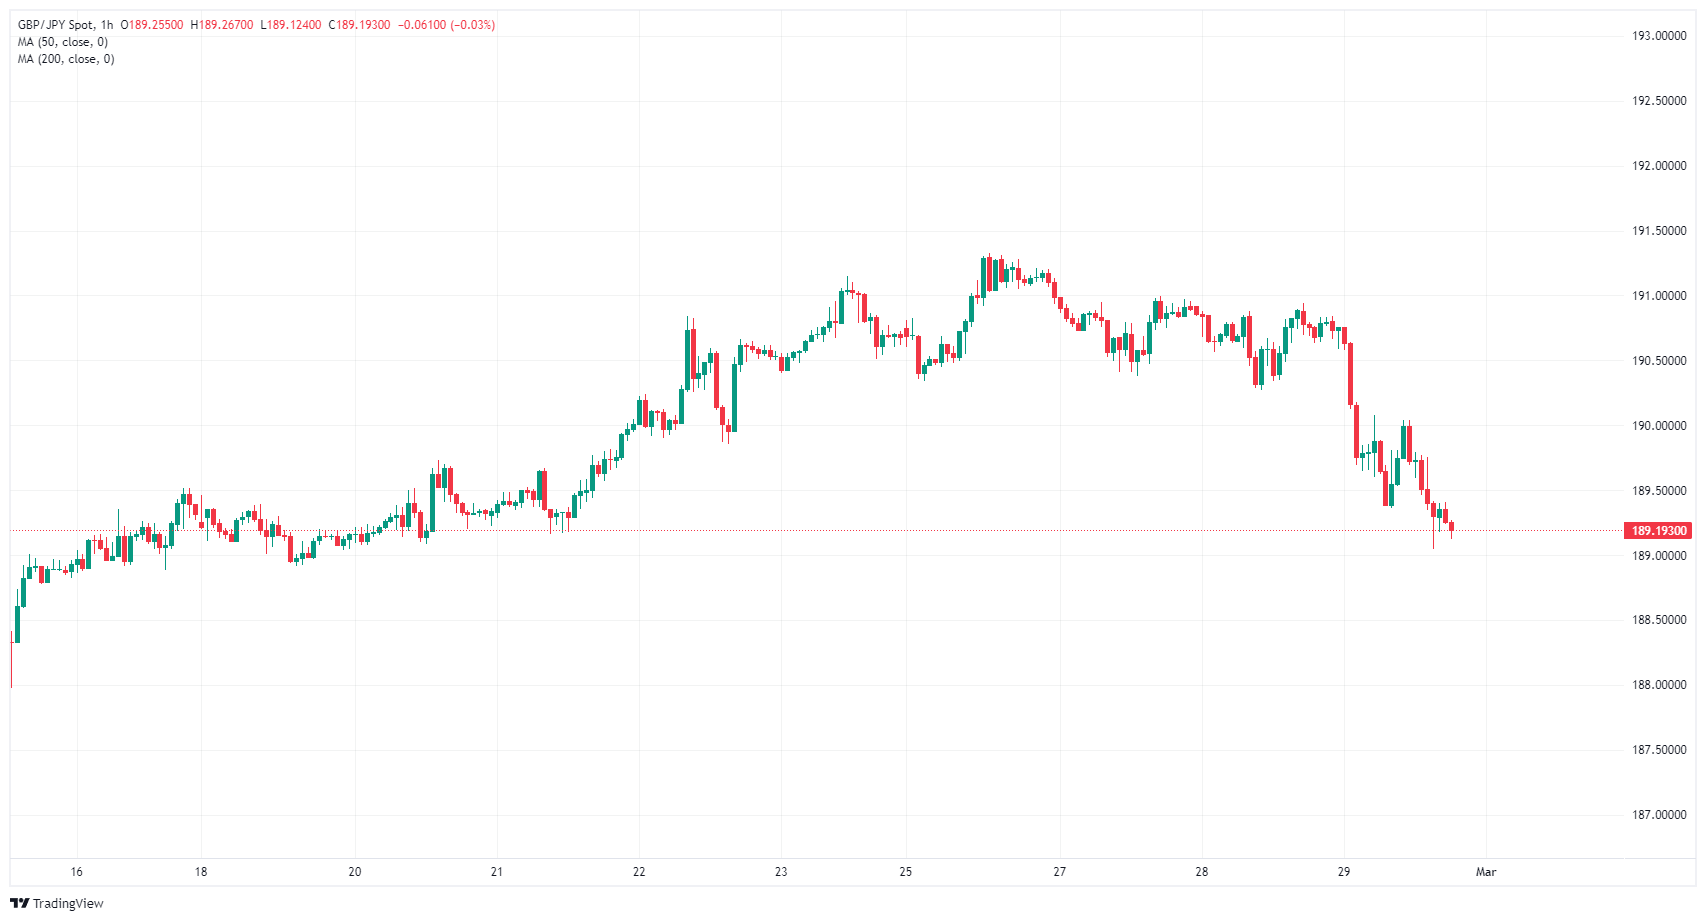
GBP/JPY daily chart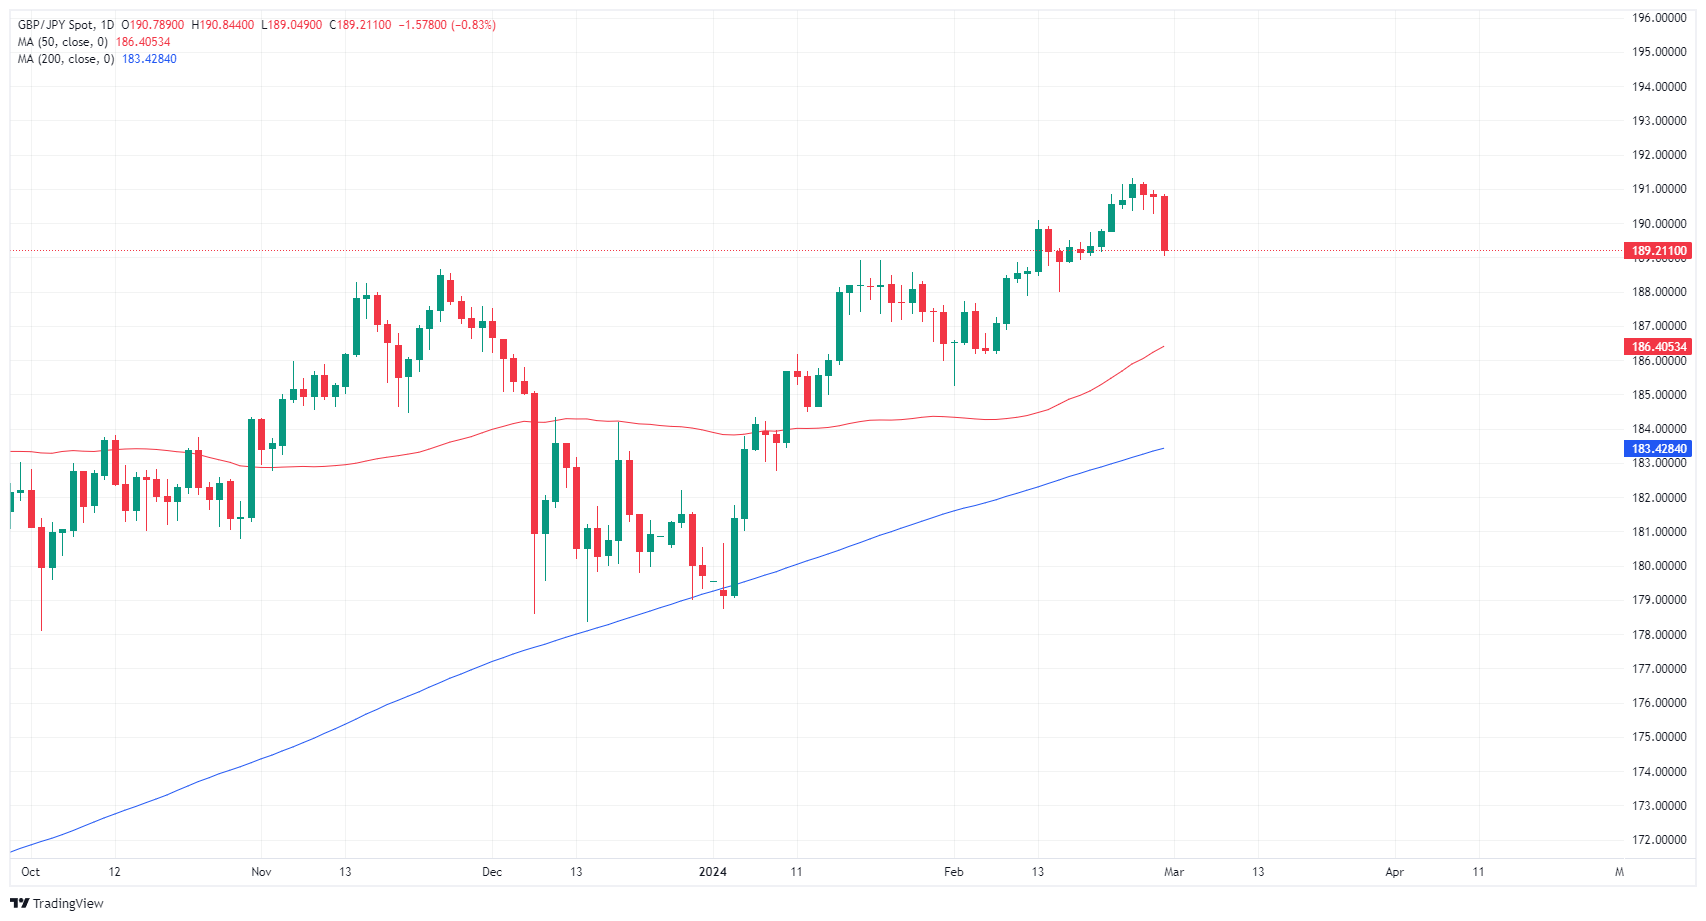
San Francisco Federal Reserve (Fed) President Mary C. Daly noted on Thursday that while the Fed is ready to cut rates when the data says its okay to do so, the US central bank shouldn't be in a rush to do so as the US economy remains firm and sees little risk of faltering.
Key highlights
- Fed's Daly wants to avoid holding rates all the way to 2% inflation.
- Risks of persistent inflation and economic downturn are balanced.
- There is currently no imminent risk of the economy faltering.
- Fed policy is in a good place, but can cut if needed.
- Cutting too quickly could risk inflation becoming stuck.
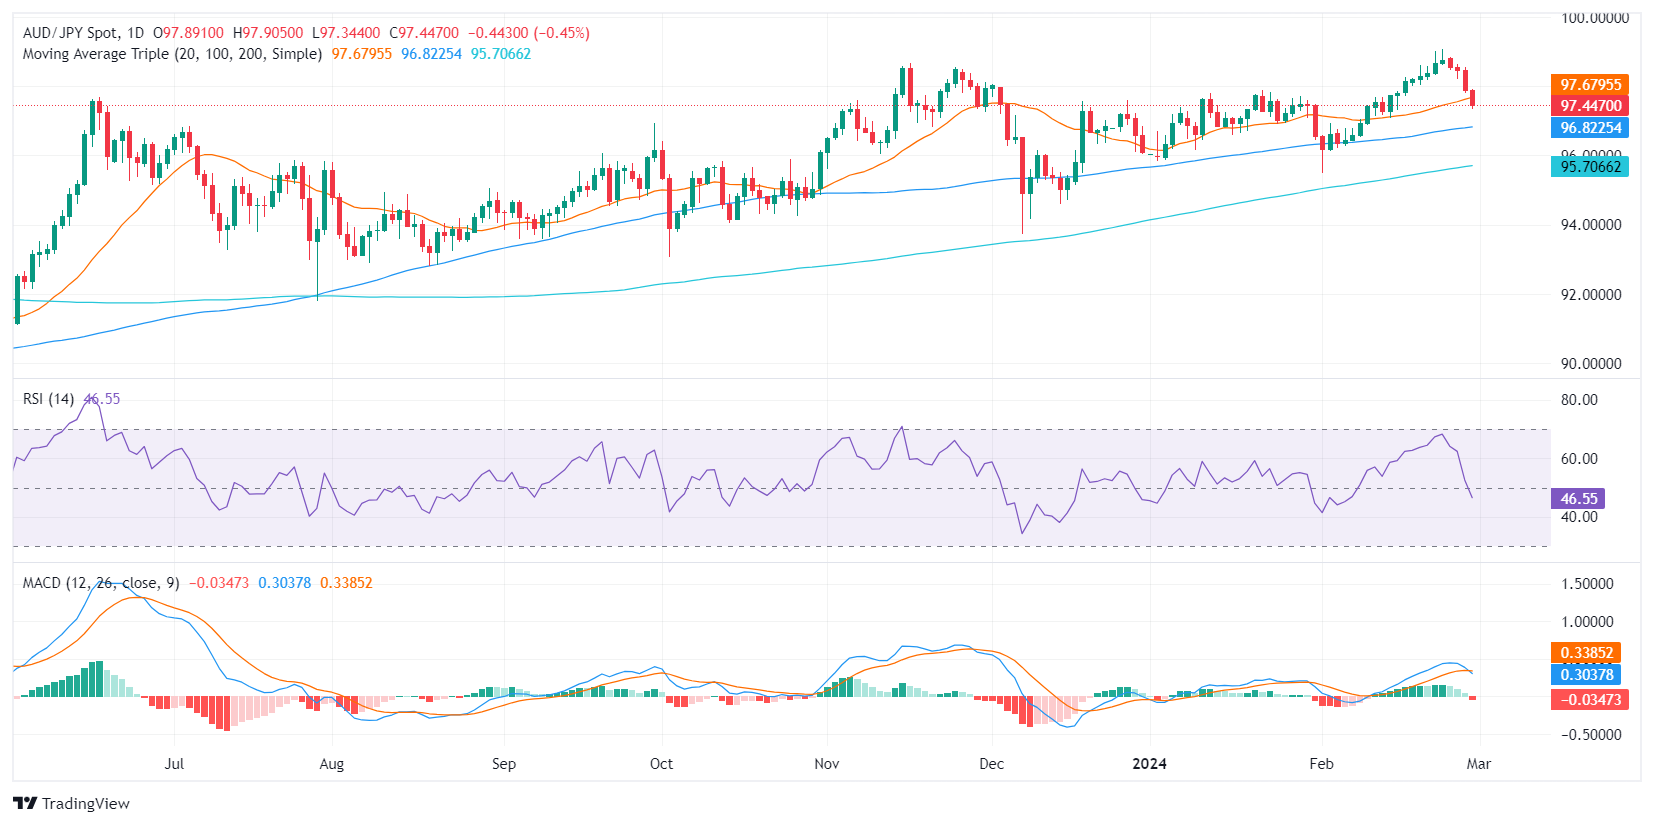
- The AUD/JPY currently trades at 97.42, undergoing a 0.43% loss in Thursday's trading session.
- The daily chart shows a shift in RSI from positive to negative territory.
- If the AUD/JPY holds above the 100 and 200-day SMA the outlook will still be positive.
The AUD/JPY pair is currently trading at 97.42, marking a 0.43% loss. The pair is navigating moderate selling pressure, suggesting control from the sellers' side, albeit the bulls maintaining ground as the pair stands above key Simple Moving Averages (SMAs).
Considering the daily Relative Strength Index (RSI), a downward trend from positive territory into negative was seen. Combined with the rising red bars of the Moving Average Convergence Divergence (MACD) histogram, this indicates a shift in momentum toward sellers. Despite previously maintaining strength within positive territory, mild signs of price exhaustion emerged after hitting multi-year highs recently.
AUD/JPY daily chart
On an hourly chart, the RSI has remained within the negative territory, suggesting sustained selling pressure over the past hours. The MACD histogram, with flat green bars, confirms this bearish signal. A notable divergence between daily and hourly charts occurs, as the former has just entered a negative zone while the latter has been quite negative already. This underlines the speed and intensity of the bearish swing.
AUD/JPY hourly chart
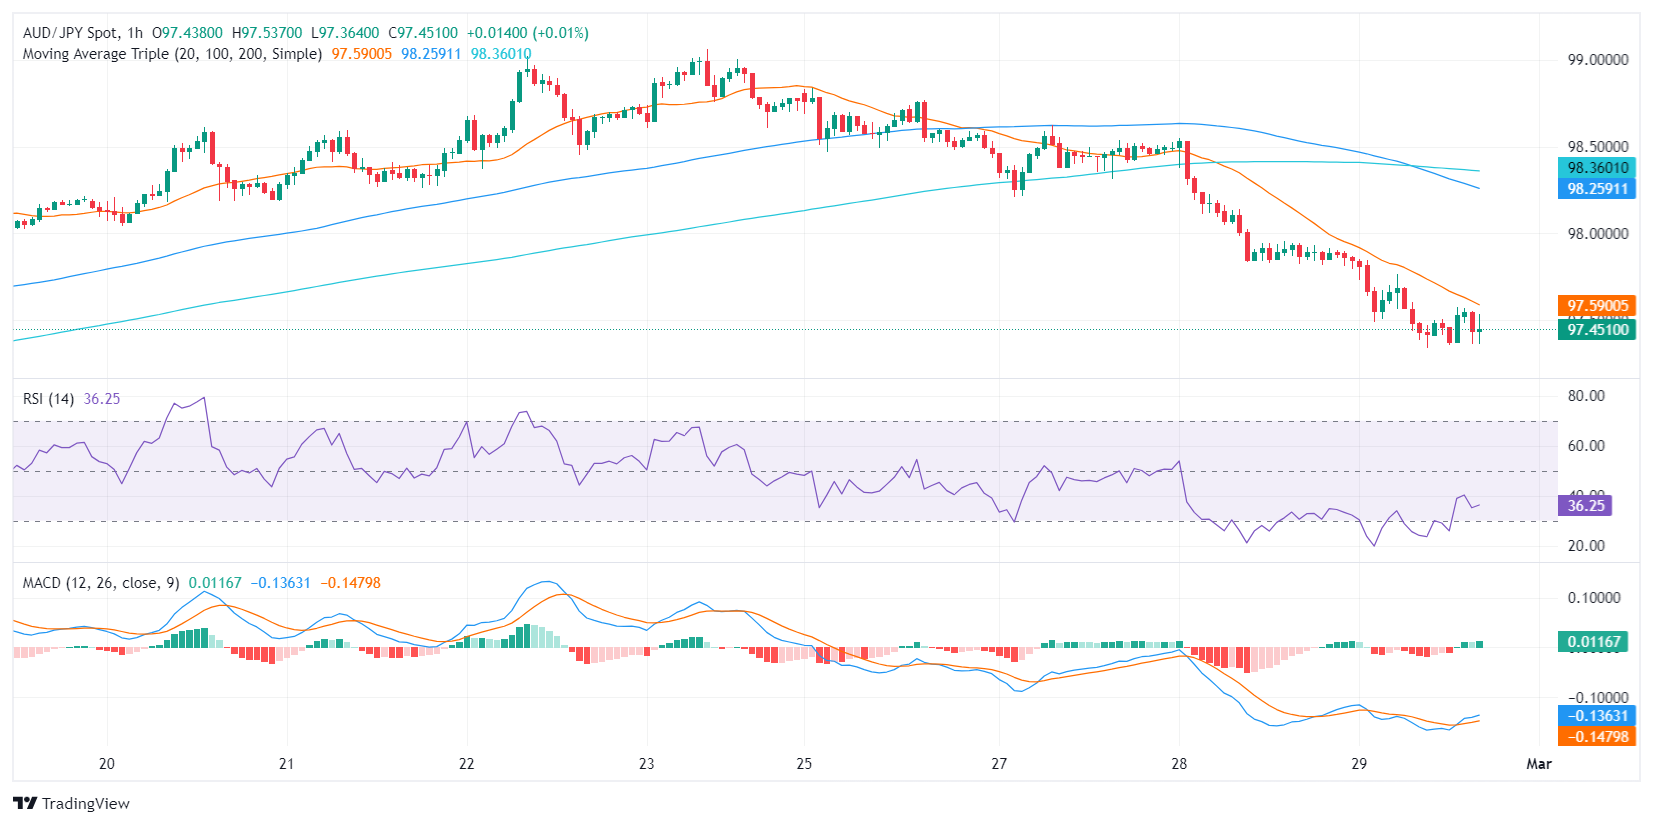
Counterbalancing this pessimistic outlook, the AUD/JPY pair holds above its key 100 and 200-day Simple Moving Averages (SMAs), following the dip under the 20-day SMA. This suggests that despite the sudden bearish inclination, the bulls may not have entirely lost the game yet concerning the longer timeframe.
- USD/JPY down 0.47%, reacting to BoJ's Takata hinting at possible exit from stimulus, stirring market speculation.
- Technical analysis highlights crucial support at 149.21, with potential rebound or further decline in focus.
- Breach below 149.21 could lead to further losses, targeting 148.31 and possibly extending to the 146.00 region.
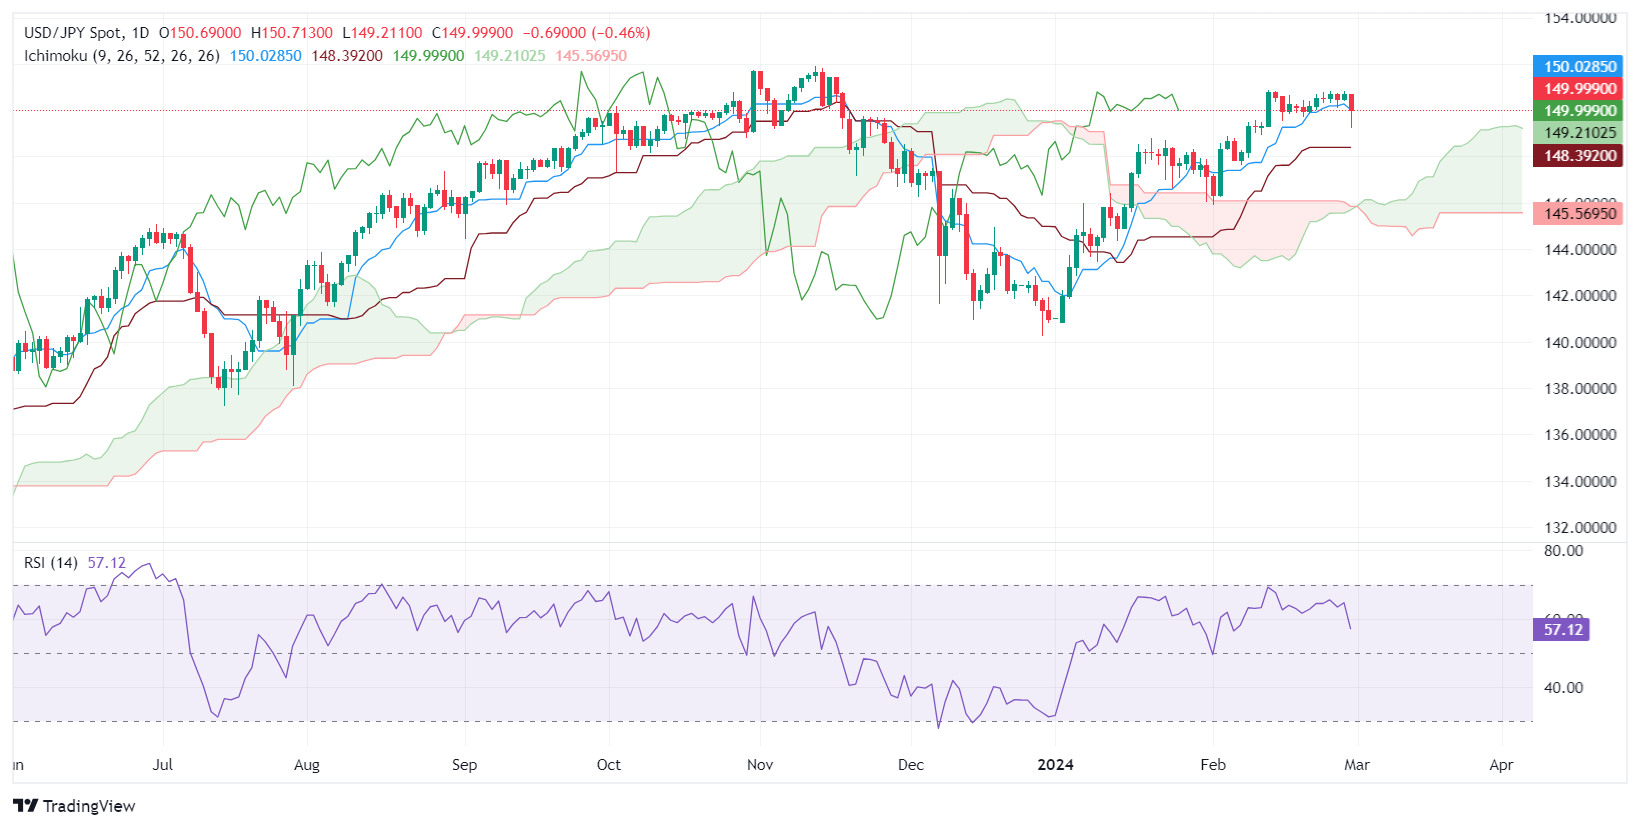
The USD/JPY trades with losses below the Tenkan-Sen level of 150.03, following “hawkish” comments by a Bank of Japan (BoJ) member, Takata. He said the BoJ needs to consider taking a flexible response, including exiting from monetary policy stimulus, which investors perceived as a normalization of monetary policy. At the time of writing, the pair exchanged hands at 149.98, down 0.47%.
USD/JPY Price Analysis: Technical outlook
The daily chart shows the pair printed a low at around 149.21, at the Senkou Span A level, before resuming to the upside and thus remaining shy of the 150.00 figure. A breach of the latter will expose the Tenkan-Sen and a resumption of the ongoing uptrend towards the 151.00 mark.
Conversely, if the USD/JPY stays below the 150.00 mark and achieves a daily close below 149.21, look for a fall to the Kijun-Sen at 148.31, ahead of the 148.00 mark. If surpassed, the pair could aim toward the top of the Ichimoku Cloud (Kumo) at around 146.00-146.15.
USD/JPY Price Action – Daily Chart
- EUR/USD falls 0.29% after US PCE inflation report shows expected slowdown, reversing early gains.
- Soft German inflation and lower Eurozone yields contribute to the pair's decline from daily highs.
- Fed officials' comments on future rate cuts influence market sentiment, with focus on economic data.
The EUR/USD reversed its course on Thursday after a report in the United States (US) witnessed a minimal jump in inflation, which initially triggered a rally to a daily high of 1.0855. However, the advance was short-lived as the pair exchanged hands at 1.0807, tumbling 0.29%.
EUR/USD drops as EU's yields fall and German inflation report weighs
The latest inflation report of the US Bureau of Economic Analysis (BEA) revealed the Personal Consumption Expenditure (PCE) Price Index slowed from 2.6% to 2.4% YoY as expected, reported on Thursday. Besides that, the Federal Reserve's preferred gauge for inflation, the Core PCE, which excludes volatile items, increased by 2.8% YoY, below December’s 2.9%, and aligned with the consensus.
The data sponsored a leg-up in the EUR/USD pair, breaking key resistance at the 200-day moving average (DMA) at 1.0828 towards the daily high. Nevertheless, yields dropping across the Eurozone (EU) and a soft inflation report from Germany during the European session dragged the exchange rate toward current levels.
Housing data from the US was revealed by the National Association of Realtors, with Pending Home Sales dropping from 5.7% MoM in January to -4.9%. at the same time, the Chicago PMI in February came at 44.0, below the consensus of 48.0 and the previous reading of 46.
Fed speakers grab the headlines
In the meantime, Atlanta’s Fed President Raphael Bostic commented that economic data should guide the Fed on when to begin to start rate cuts, which, according to him, could happen in the summer. Bostic acknowledged that inflation is slowing down, but they have to stay “vigilant and attentive.”
Chicago’s Fed President Austan Goolsbee said that policy is restrictive, and the question is, “How long do we want to remain restrictive.”
EUR/USD Price Analysis: Technical outlook
The swing of the EUR/USD on Thursday has opened the door for bears to push prices below the 200 and 100-DMAs, along with a break of a support trendline. A breach of the latter could sponsor a pullback all the way towards the October 3 low of 1.0448. On the other hand, if buyers cling to the 1.0800 area, the major could consolidate within the 1.0800-1.0850 range.
- DXY Index is trading near 104.00, up for Thursday’s session.
- Core PCE Price Index matched predictions.
- Markets continue delaying rate cuts from the Fed, which favors the Greenback.
The US Dollar Index (DXY) is trading near 104 and keeps gaining traction due to markets delaying rate cuts from the Federal Reserve (Fed). Datawise, Personal Consumption Expenditures (PCE) showed no surprises.
As long as the US does not show conclusive evidence of inflation coming down, the Fed won’t rush to cut rates. In addition, the markets are aligned with the bank’s forecasts and are now expecting 75 bps of easing in 2024, starting in June.
Daily digest market movers: US Dollar holds gains, PCE decelerated as expected in January
- The US Bureau of Economic Analysis announced on Thursday that the inflation rate in the US, gauged by the yearly change in the Personal Consumption Expenditures (PCE) Price Index, fell to 2.4% in January from 2.6% in December.
- The Core PCE Price Index climbed by 2.8% over the year, also meeting expectations.
- As the US economy doesn’t show conclusive evidence of inflation coming down, the markets are pushing the start of easing to June, while the odds of a cut in March and May remain low.
Technical analysis: DXY Bulls make a move to reclaim 100-day SMA
The indicators on the daily chart reflect a positive shift in buying momentum. Initially, the Relative Strength Index (RSI) exhibits a positive slope, and being in positive territory indicates a strengthening bullish trend. However, the Moving Average Convergence Divergence (MACD) shows flat red bars, hinting toward potential bearish pressure, where selling activity might prevail, though not necessarily resulting in a trend shift.
In the broader technical landscape, despite the underlying bearish pressure that has pushed the pair below the 20-day Simple Moving Average (SMA), the positioning above the 100 and 200-day SMAs suggests that buyers still have the upper hand in this play.
US Dollar FAQs
What is the US Dollar?
The US Dollar (USD) is the official currency of the United States of America, and the ‘de facto’ currency of a significant number of other countries where it is found in circulation alongside local notes. It is the most heavily traded currency in the world, accounting for over 88% of all global foreign exchange turnover, or an average of $6.6 trillion in transactions per day, according to data from 2022.
Following the second world war, the USD took over from the British Pound as the world’s reserve currency. For most of its history, the US Dollar was backed by Gold, until the Bretton Woods Agreement in 1971 when the Gold Standard went away.
How do the decisions of the Federal Reserve impact the US Dollar?
The most important single factor impacting on the value of the US Dollar is monetary policy, which is shaped by the Federal Reserve (Fed). The Fed has two mandates: to achieve price stability (control inflation) and foster full employment. Its primary tool to achieve these two goals is by adjusting interest rates.
When prices are rising too quickly and inflation is above the Fed’s 2% target, the Fed will raise rates, which helps the USD value. When inflation falls below 2% or the Unemployment Rate is too high, the Fed may lower interest rates, which weighs on the Greenback.
What is Quantitative Easing and how does it influence the US Dollar?
In extreme situations, the Federal Reserve can also print more Dollars and enact quantitative easing (QE). QE is the process by which the Fed substantially increases the flow of credit in a stuck financial system.
It is a non-standard policy measure used when credit has dried up because banks will not lend to each other (out of the fear of counterparty default). It is a last resort when simply lowering interest rates is unlikely to achieve the necessary result. It was the Fed’s weapon of choice to combat the credit crunch that occurred during the Great Financial Crisis in 2008. It involves the Fed printing more Dollars and using them to buy US government bonds predominantly from financial institutions. QE usually leads to a weaker US Dollar.
What is Quantitative Tightening and how does it influence the US Dollar?
Quantitative tightening (QT) is the reverse process whereby the Federal Reserve stops buying bonds from financial institutions and does not reinvest the principal from the bonds it holds maturing in new purchases. It is usually positive for the US Dollar.
President of the Chicago Federal Reserve (Fed) Austan D. Goolsbee noted on Thursday that a single month of inflation data is not enough to hinge an entire monetary policy decision on.
Key highlights
- Even with January PCE data showing a good rebound, we should be cautious about extrapolating.
- Fed has made substantial progress on long-term inflation.
- We need to be careful with arguments suggesting the supply chain is fixed, and we should not expect further benefit in 2024.
- Lags on labor supply shocks are probably long.
- Fed's Goolsbee continues to focus on why housing inflation hasn't come down more.
- If substantial productivity growth continues, that would have an impact on monetary policy.
- Impacts of supply shock in inflation takes time, suggests benefits of supply chain on disinflation are still to come.
- USD/CAD softer on Thursday, moves are limited.
- Canada saw a mixed GDP print, and US jobless claims ticked higher.
- Friday to bring Canadian, US PMIs.
USD/CAD rose to an intraday high of 1.3597 before backsliding to 1.3541 after US Personal Consumption Expenditure Price Index (PCE) inflation figures printed exactly as markets were hoping. Annualized Canadian Gross Domestic Product (GDP) printed above expectations, but the MoM figure failed to meet expectations.
Canada still has the S&P Global Manufacturing Purchasing Manager Index (PMI) due on Friday, alongside the US S&P and ISM Manufacturing PMIs. Michigan State University’s Consumer Sentiment Index survey results are also slated for Friday. Several Federal Reserve (Fed) officials will be making appearances on Friday as well, and rate watchers will be keen to look for signs that Thursday’s PMI print drew rate cut interest from Fed policymakers.
Daily digest market movers: US PCE brings no surprises, mixed Canadian GDP limits moves
- US Core PCE printed at 2.8% YoY, exactly as expected, down slightly from previous 2.9%.
- The MoM Core PCE figure also printed at the expected 0.4%, but the previous print saw a slight downside revision to 0.1% from 0.2%.
- Canada’s Annualized Q4 GDP came in at 1.0%, above the 0.8% expected and posting a stronger recovery from the previous -0.5%, which also saw a healthy revision from -1.1%.
- US Initial Jobless Claims ticked higher for the week ended February 23, rising to 215K compared to the forecast for 210K, while the previous week saw a slight revision to 202K from 201K.
- US Pending Home Sales also declined to a five-month low, printing at -4.9% versus the forecast of 1.0%, a sharp pullback from the previous 5.7% (revised down from 8.3%).
- Friday brings the latest Canadian S&P Global Manufacturing PMI for February, which last printed at 48.3.
- Friday’s US ISM Manufacturing PMI is expected to tick slightly higher to 49.5 from 49.1 in February.
Canadian Dollar price today
The table below shows the percentage change of Canadian Dollar (CAD) against listed major currencies today. Canadian Dollar was the weakest against the Japanese Yen.
| USD | EUR | GBP | CAD | AUD | JPY | NZD | CHF | |
| USD | 0.24% | 0.21% | -0.07% | -0.18% | -0.53% | 0.14% | 0.45% | |
| EUR | -0.28% | -0.06% | -0.32% | -0.40% | -0.80% | -0.12% | 0.18% | |
| GBP | -0.20% | 0.04% | -0.27% | -0.37% | -0.72% | -0.06% | 0.27% | |
| CAD | 0.06% | 0.32% | 0.27% | -0.11% | -0.47% | 0.21% | 0.52% | |
| AUD | 0.15% | 0.38% | 0.35% | 0.07% | -0.38% | 0.29% | 0.59% | |
| JPY | 0.54% | 0.78% | 0.72% | 0.46% | 0.37% | 0.71% | 1.01% | |
| NZD | -0.15% | 0.10% | 0.07% | -0.20% | -0.31% | -0.67% | 0.34% | |
| CHF | -0.45% | -0.21% | -0.25% | -0.53% | -0.64% | -0.99% | -0.31% |
The heat map shows percentage changes of major currencies against each other. The base currency is picked from the left column, while the quote currency is picked from the top row. For example, if you pick the Euro from the left column and move along the horizontal line to the Japanese Yen, the percentage change displayed in the box will represent EUR (base)/JPY (quote).
Technical analysis: USD/CAD still up on the week despite Thursday backstep
USD/CAD is trading into familiar near-term levels after falling toward 1.3540. The pair remains capped under the week’s high of 1.3606 set on Wednesday, and intraday price action is getting bolstered by the 200-hour Simple Moving Average (SMA) nearby at 1.3515.
Thursday’s daily candlestick is notably middling on the high side of recent consolidation. The pair is drifting away from the 200-day SMA at 1.3478 and is up over 3% from the last major swing low into the 1.3200 handle.
USD/CAD hourly chart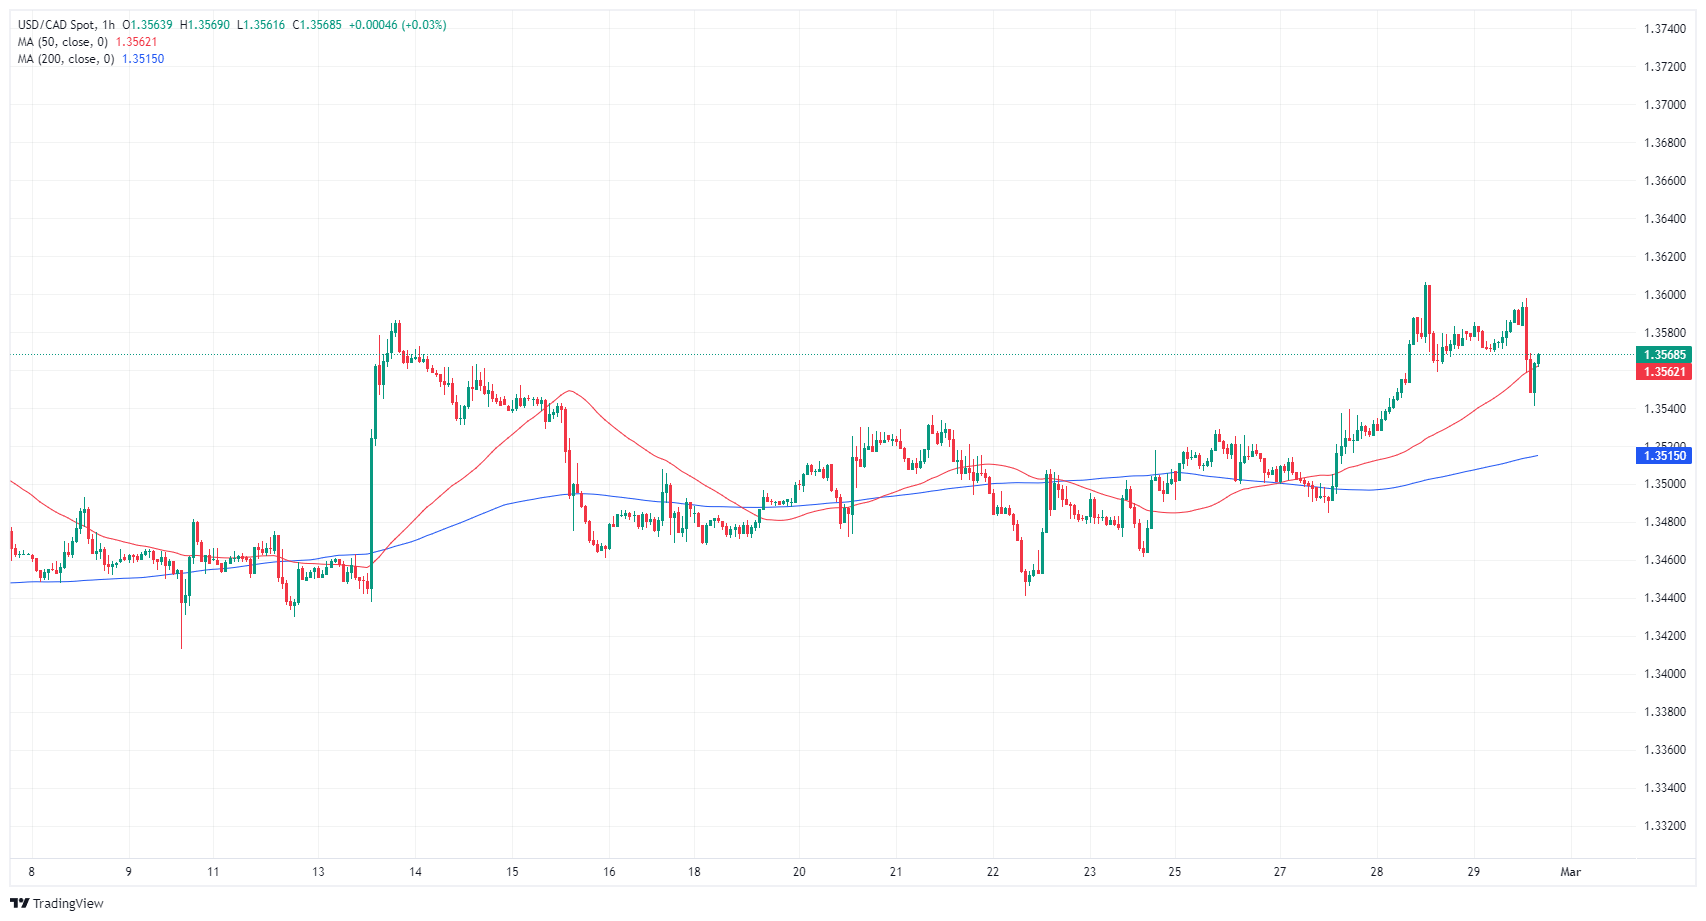
USD/CAD daily chart 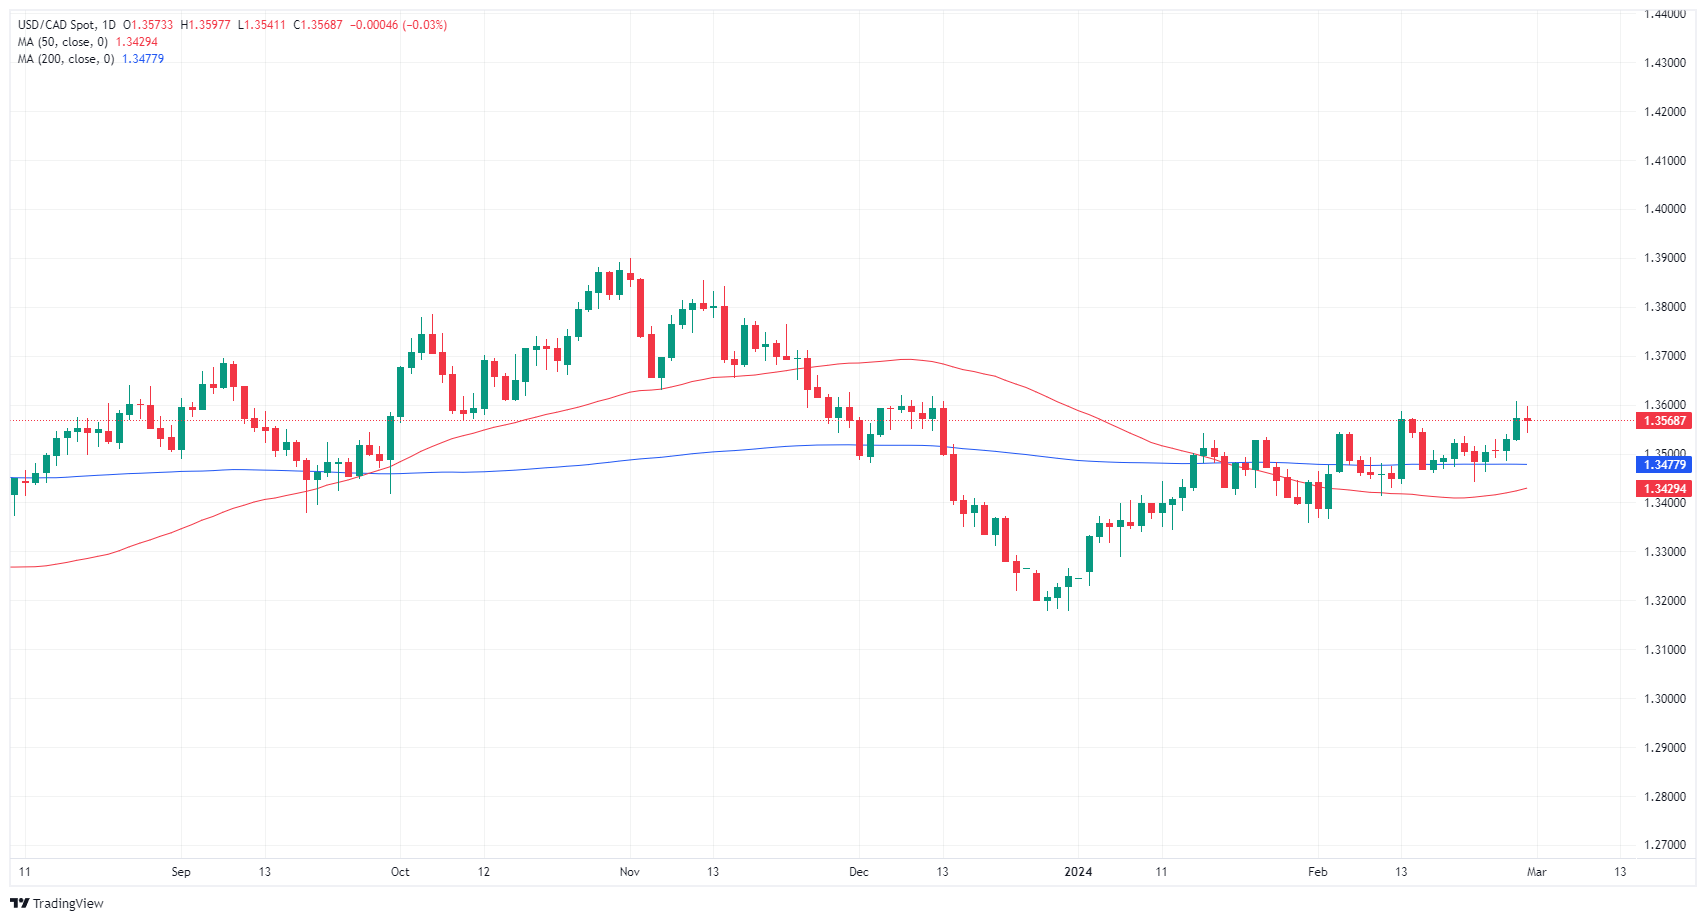
Canadian Dollar FAQs
What key factors drive the Canadian Dollar?
The key factors driving the Canadian Dollar (CAD) are the level of interest rates set by the Bank of Canada (BoC), the price of Oil, Canada’s largest export, the health of its economy, inflation and the Trade Balance, which is the difference between the value of Canada’s exports versus its imports. Other factors include market sentiment – whether investors are taking on more risky assets (risk-on) or seeking safe-havens (risk-off) – with risk-on being CAD-positive. As its largest trading partner, the health of the US economy is also a key factor influencing the Canadian Dollar.
How do the decisions of the Bank of Canada impact the Canadian Dollar?
The Bank of Canada (BoC) has a significant influence on the Canadian Dollar by setting the level of interest rates that banks can lend to one another. This influences the level of interest rates for everyone. The main goal of the BoC is to maintain inflation at 1-3% by adjusting interest rates up or down. Relatively higher interest rates tend to be positive for the CAD. The Bank of Canada can also use quantitative easing and tightening to influence credit conditions, with the former CAD-negative and the latter CAD-positive.
How does the price of Oil impact the Canadian Dollar?
The price of Oil is a key factor impacting the value of the Canadian Dollar. Petroleum is Canada’s biggest export, so Oil price tends to have an immediate impact on the CAD value. Generally, if Oil price rises CAD also goes up, as aggregate demand for the currency increases. The opposite is the case if the price of Oil falls. Higher Oil prices also tend to result in a greater likelihood of a positive Trade Balance, which is also supportive of the CAD.
How does inflation data impact the value of the Canadian Dollar?
While inflation had always traditionally been thought of as a negative factor for a currency since it lowers the value of money, the opposite has actually been the case in modern times with the relaxation of cross-border capital controls. Higher inflation tends to lead central banks to put up interest rates which attracts more capital inflows from global investors seeking a lucrative place to keep their money. This increases demand for the local currency, which in Canada’s case is the Canadian Dollar.
How does economic data influence the value of the Canadian Dollar?
Macroeconomic data releases gauge the health of the economy and can have an impact on the Canadian Dollar. Indicators such as GDP, Manufacturing and Services PMIs, employment, and consumer sentiment surveys can all influence the direction of the CAD. A strong economy is good for the Canadian Dollar. Not only does it attract more foreign investment but it may encourage the Bank of Canada to put up interest rates, leading to a stronger currency. If economic data is weak, however, the CAD is likely to fall.
Federal Reserve Bank of Atlanta President Raphael Bostic said on Thursday that it would probably be appropriate to reduce the policy rate in the summer time, per Reuters.
Bostic noted that the last few inflation readings had shown that it is going to be a bumpy path back toward the 2% target and reiterated that they have to stay vigilant and attentive.
"Economic data will ultimately be our guide on when rate cuts start," he added.
Market reaction
These comments failed to trigger a noticeable market reaction. At the time of press, the US Dollar Index was virtually unchanged on the day at 103.92.
Eurostat will release Eurozone Harmonised Index of Consumer Prices (HICP) data for February on Friday, March 1 at 10:00 GMT and as we get closer to the release time, here are the expectations forecast by the economists and researchers of five major banks regarding the upcoming EU inflation print.
Eurozone’s HICP is expected to fall to 2.5% after hitting 2.8% YoY in January. Meanwhile, Core HICP is expected to drop from 3.3% to 2.9%. The last time underlying inflation hovered below 3% was in February 2022 – just before Russia invaded Ukraine.
Commerzbank
At first glance, February's consumer price data should be grist to the mill for the doves on the ECB's Governing Council. After all, the inflation rate is expected to have fallen from 2.8% to 2.7%. In particular, the decline in the inflation rate excluding volatile energy and food prices from 3.3% to 3.0% should fuel speculation of an imminent rate cut.
TDS
We look for Euro Area inflation to continue to trek lower in February, with the headline rate likely falling to 2.6% YoY and core dropping to a 24-month low of 2.9% YoY. Developments in core dynamics should be constructive; we expect core goods inflation to fall to 1.5% YoY – its lowest rate since July 2021 – and a continued softening in services momentum will probably bring the YoY rate down to a 20-month low of 3.6%. Energy provides some upside pressure on the print, in part due to base effects in the natural gas component, but also due to the roughly 9% MoM increase in French electricity prices, as the government facilitates a gradual end to the tariff shield that protected households from the spike in prices in previous years. Petrol prices also increased roughly 2.5% MoM in February, on the back of the move higher in wholesale oil prices.
SocGen
We expect both the headline and core inflation prints to ease by 0.3pp in January to 2.5% and 3%, respectively, with some downside risk. However, our core forecast sits at the edge of 2.9%, so there is a risk of a weaker reading.
Citi
The Euro Area flash February HICP print on Friday is clearly a potentially pivotal data point. We expect headline HICP is likely to fall further towards target (to 2.5%), although we warn that core HICP may print with an above-average 0.3% MoM (SA).
Wells Fargo
February inflation figures could be influential as to whether the ECB lowers interest rates as early as April or takes a more patient approach by waiting until its June meeting. The February CPI is expected to deliver more good inflation news, with base effects likely to see headline inflation slow further to 2.5%YoY, while core inflation is also forecast to slow to 2.9%. There will also be interest surrounding whether services inflation slows from its current 4.0% pace. Should Eurozone CPI inflation decelerate as forecast, or even deliver a downside surprise, it would keep the possibility of an April rate cut alive. However, an upside surprise that sees an interruption to the disinflation trend would be supportive of some of the more hawkish ECB policymakers' views and would potentially take the chance of an April rate cut off the table.
- Mexican Peso strengthens after US inflation report and unexpected rise in Initial Jobless Claims.
- Banxico's latest report highlights ongoing disinflation, suggesting potential for future rate cuts.
- Market anticipates Banxico's March 21 policy meeting amid discussions on gradual rate adjustments.
The Mexican Peso appreciated against the US Dollar in early trading on Thursday after an inflation report in the United States was revealed, while Initial Jobless Claims rose above expectations for the first time in four consecutive weeks. The USD/MXN stands at 17.07, down 0.11% following the data release.
Mexico’s economic docket saw an uptick in the Unemployment Rate but not substantial enough to move the USD/MXN. On Wednesday, the Bank of Mexico (Banxico) announced its report for the last quarter of 2023, noting that the disinflation process continued while Governor Victoria Rodriguez Ceja said the real ex-ante rate hit 7.47%, exceeding the Bank’s neutral rate, thus opening the door for reducing interest rates.
Deputy Governors Jonathan Heath and Omar Mejia subscribed to the idea that rate adjustments must be gradual, with Heath opening the door for a 25-basis-point cut and then reassessing the restrictiveness of the policy. He added that declaring victory over inflation is too premature and that cutting the benchmark rate more than he suggested would be a “big mistake.”
In that regard, Deputy Governor Irene Espinosa said Banxico’s Governing Council should consider external and internal factors affecting inflation. Her colleague Galia Borja adopted cautious decision-making based on emerging inflation data. Given the backdrop, USD/MXN traders are eyeing Banxico’s next monetary policy meeting on March 21.
On the other hand, the US Bureau of Economic Analysis (BEA) revealed that the Personal Consumption Expenditure (PCE) Price Index climbed as expected. Regarding the Federal Reserve’s preferred gauge for inflation, the Core PCE rose as expected, though it justified Fed officials' rhetoric against premature interest rate cuts.
Daily digest market movers: Mexican Peso boosted by US inflation report
- Mexico’s economy is expected to slow down due to higher interest rates set by Banxico at 11.25%. That’s the main reason that sparked a shift in three of the five governors of the Mexican Central Bank, who are eyeing the first rate cut at the March 21 meeting.
- Banxico updated its economic growth projections for 2024 from 3.0% to 2.8% YoY and maintained 1.5% for 2025.
- Expectations for the Mexican central bank to ease monetary policy in March remain high, with investors projecting 75 basis points of easing over the next six months. This means the Mexican interest rates, currently standing at 11.25%, would be lowered to 10.50% in the first half of 2024.
- The latest inflation report in Mexico showed that headline and underlying inflation continued to dip toward Banxico’s goal of 3%, plus or minus 1%, while economic growth exceeded estimates but finished below Q3’s 3.3%.
- Mexico’s economic data released during the week thus far:
- The Unemployment Rate rose from 2.6% to 2.9% YoY in January, exceeding estimates of 2.8%.
- The Balance of Trade for January revealed the country posted a trade deficit of $302 million.
- Mexico’s Consumer Price Index (CPI) in the first half of February was 4.45%, down from 4.9% YoY.
- Mexico’s Core CPI slowed from 4.78% to 4.63% on an annual basis.
- Mexico’s GDP for Q4 2023 exceeded estimates of 2.4% YoY and hit 2.5%, less than Q3 2023 print of 3.3%.
- Economic trade issues between Mexico and the US could depreciate the Mexican currency if the Mexican government fails to resolve its steel and aluminum dispute with the United States. US Trade Representative Katherine Tai warned the US could reimpose tariffs on the commodities.
- January’s US PCE Index rose 2.4% YoY from 2.6%, as expected. The so-called Core PCE, which excludes volatile items, increased by 2.8% YoY, below December’s 2.9%, and aligned with the consensus.
- Initial Jobless Claims in the US for the week ending February 24 grew 215K, exceeding estimates of 210K and the previous reading of 202K.
- The USD/MXN fell following the US data release as market players increased the odds for the first 25-basis-point (bps) rate cut in June, from 49% to 54.1% a day ago. Meanwhile, 33% of investors expected the Fed to keep rates unchanged at the current level of 5.25%-5.50%.
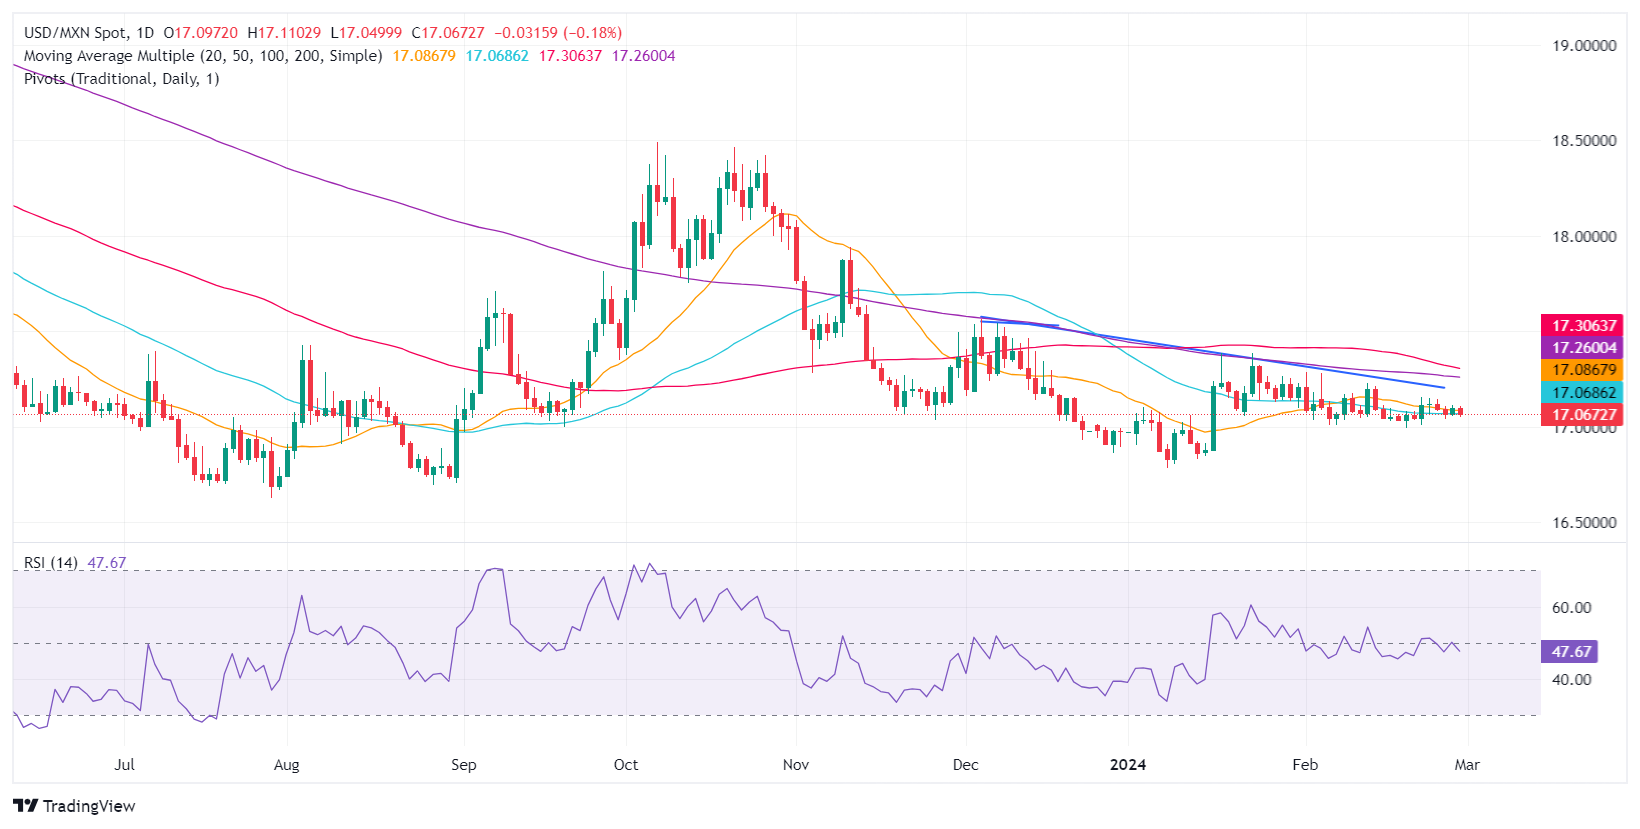
Technical analysis: Mexican Peso climbs as USD/MXN hovers around 50-day SMA
The USD/MXN trades near the 50-day Simple Moving Average (SMA), which stands at 17.06, after the pair snapped three days of losses but resumed its downtrend on Thursday. The bearish bias is confirmed by the Relative Strength Index (RSI) staying below the 50-midline, keeping sellers hopeful of retesting the 17.00 psychological level. If traders clear that level, the exotic pair could dive to the year-to-date (YTD) lows of 16.78, followed by last year’s low of 16.62.
Conversely, if buyers reclaim the 17.20 area, further gains are seen. The next supply zone would be the 200-day SMA at 17.26 and the 100-day SMA at 17.31.
USD/MXN Price Action – Daily Chart
Mexican Peso FAQs
What key factors drive the Mexican Peso?
The Mexican Peso (MXN) is the most traded currency among its Latin American peers. Its value is broadly determined by the performance of the Mexican economy, the country’s central bank’s policy, the amount of foreign investment in the country and even the levels of remittances sent by Mexicans who live abroad, particularly in the United States. Geopolitical trends can also move MXN: for example, the process of nearshoring – or the decision by some firms to relocate manufacturing capacity and supply chains closer to their home countries – is also seen as a catalyst for the Mexican currency as the country is considered a key manufacturing hub in the American continent. Another catalyst for MXN is Oil prices as Mexico is a key exporter of the commodity.
How do decisions of the Banxico impact the Mexican Peso?
The main objective of Mexico’s central bank, also known as Banxico, is to maintain inflation at low and stable levels (at or close to its target of 3%, the midpoint in a tolerance band of between 2% and 4%). To this end, the bank sets an appropriate level of interest rates. When inflation is too high, Banxico will attempt to tame it by raising interest rates, making it more expensive for households and businesses to borrow money, thus cooling demand and the overall economy. Higher interest rates are generally positive for the Mexican Peso (MXN) as they lead to higher yields, making the country a more attractive place for investors. On the contrary, lower interest rates tend to weaken MXN.
How does economic data influence the value of the Mexican Peso?
Macroeconomic data releases are key to assess the state of the economy and can have an impact on the Mexican Peso (MXN) valuation. A strong Mexican economy, based on high economic growth, low unemployment and high confidence is good for MXN. Not only does it attract more foreign investment but it may encourage the Bank of Mexico (Banxico) to increase interest rates, particularly if this strength comes together with elevated inflation. However, if economic data is weak, MXN is likely to depreciate.
How does broader risk sentiment impact the Mexican Peso?
As an emerging-market currency, the Mexican Peso (MXN) tends to strive during risk-on periods, or when investors perceive that broader market risks are low and thus are eager to engage with investments that carry a higher risk. Conversely, MXN tends to weaken at times of market turbulence or economic uncertainty as investors tend to sell higher-risk assets and flee to the more-stable safe havens.
The Euro (EUR) is the third best performer in the year to date after the US Dollar (USD) and the Pound Sterling (GBP). Economists at Rabobank analyze EUR/USD outlook.
Strong case for remaining bullish on the USD
While we acknowledge that the EUR has been more resilient than we expected so far this year, we still see fundamentals as favouring the USD.
We maintain our three-month forecast of 1.0500 and remain of the view that there is a higher chance of EUR/USD remaining in a 1.0400 to 1.1200 range over the next 18-24 months or so, than of the currency pair holding levels above 1.1500.
Our three-month forecast of 1.0500 is followed by an expectation of a moderate move higher to 1.0900 early next year as Fed rate cuts are extended.
Economists at Commerzbank do not expect a weaker Dollar in the medium to long term. Thus, positive surprises for the Euro are only probable in the near term.
A strong Dollar is justified in the long run
We see some upside potential for EUR/USD in the short term.
Upwardly surprising Eurozone inflation and a more or less synchronised entry of the Fed and ECB into the rate cut cycle should have a slight net positive effect on the EUR.
In the medium term, however, no USD weakness should be justified. The current USD strength should be justified if (as we expect) the US will have a growth advantage over the Eurozone (and most Western industrialised countries) over our entire forecast period.

Source: Commerzbank Research
- The EUR/GBP is trading at 0.8550, after peaking at a high of 0.8570.
- The Core HICP in Germany grew at a slower pace than expected in February.
- Soft inflation figures fuel the hopes of sooner cuts by the ECB.
the EUR/GBP pair recorded a slight gain in Thursday's session but gave up gains which took the pair to a high of 0.8570. This comes on the heels of softer inflation data from Germany's Harmonized Index of Consumer Prices (HICP), which fueled bets of sooner policy shifts by the European Central Bank (ECB).
February’s preliminary HICP from Germany, showed a continued but slower inflation rate at 2.7% year-on-year, aligning with forecasts yet decreasing from January's 3.1%. The monthly inflation rate was as anticipated at 0.6%, a rebound from January's 0.2% decline. Core inflation, a key focus for the ECB, rose by 2.5%, slightly below the expected 2.6% and down from the previous 2.9%. This slowdown in core inflation growth suggests potential early policy adjustments by the ECB, as President Christine Lagarde hinted at possible rate cuts in the upcoming summer with over 100 bps of easing expected by the European bank in 2024.
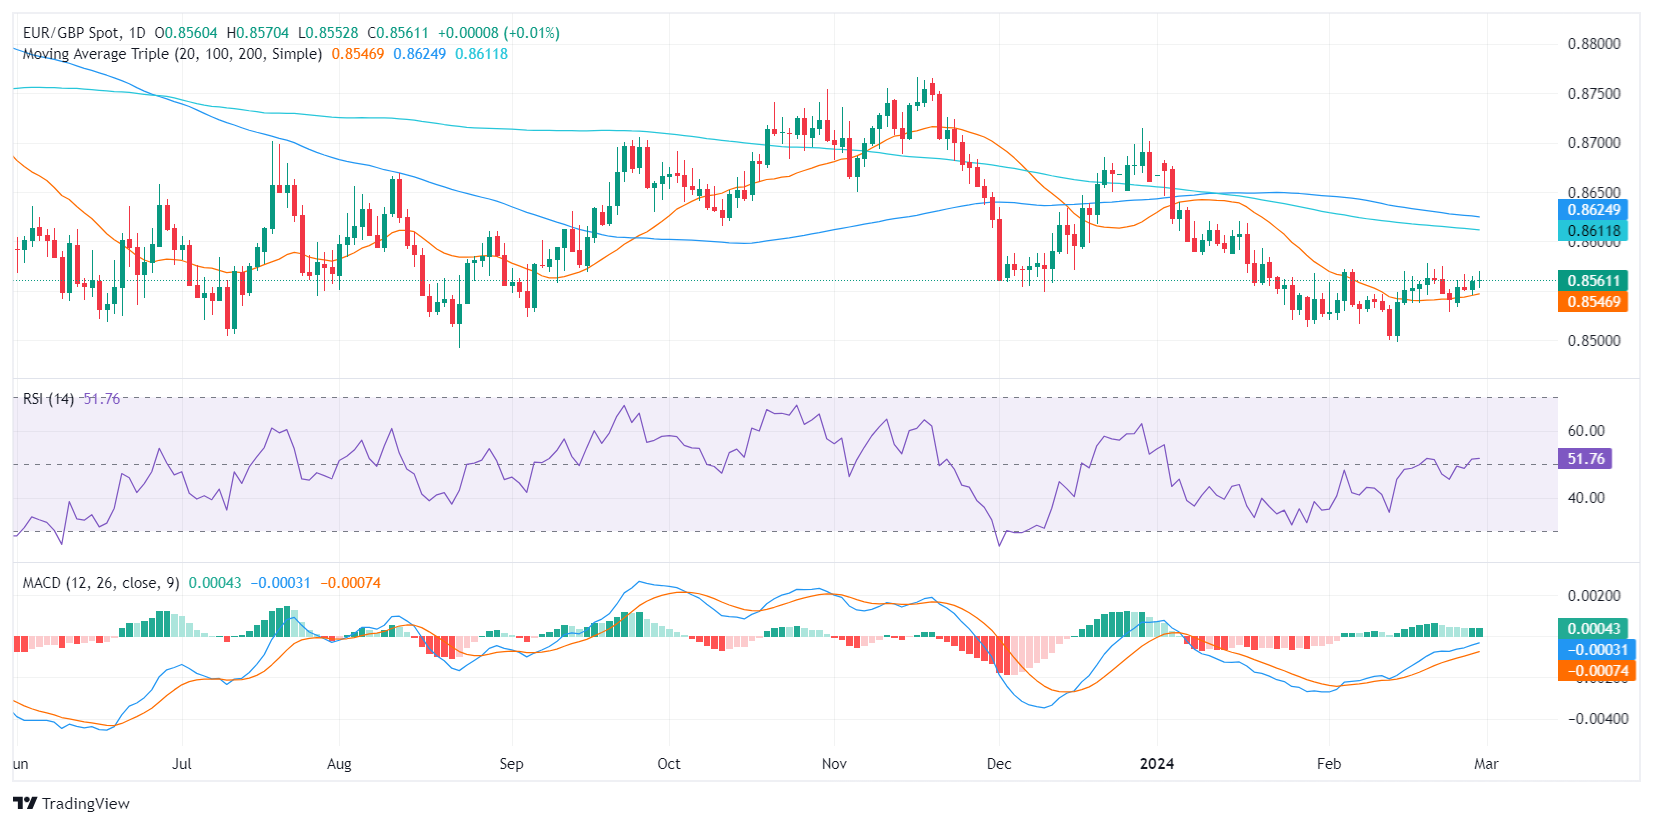
EUR/GBP technical analysis
Considering the Relative Strength Index (RSI) for the EUR/GBP pair, the index holds in positive territory, confirming the market is primarily influenced by buyers at the current moment but its flat nature, suggests a market equilibrium, with neither buyers nor sellers gaining additional ground.
Regarding the Moving Average Convergence Divergence (MACD) histogram, it exhibits a falling trend with a sequence of decreasing green bars, which portrays a picture of negative momentum building up. This combination of signals suggests that the buyers are struggling to hold their momentum, but in case they hold above the 20-day Simple Moving Average (SMA) the outlook for the short term, may remain somewhat positive.
EUR/GBP daily chart
Could Trump’s universal tariff revive inflation? Economists at Rabobank analyze how a raise in import tariffs could affect the trajectory of inflation and consequently the Fed’s rate path.
Universal tariffs would complicate the Fed’s mission to get the inflation genie back into the bottle
Based on current opinion polls and our expectation of a deterioration of economic data in 2024, we have decided to assume a Trump victory in our current forecasting round for the global economy.
Given Trump’s first term in office and his recent remarks on trade policy, we should expect a broad rise in import tariffs under a Trump presidency. This could lead to a rebound in inflation, especially in 2025, complicating the Fed’s mission to get inflation back to its 2% target in a sustainable manner. Ceteris paribus, this could reduce the amount of rate cuts that the Fed has in mind for 2025.
The Pound Sterling (GBP) has been consolidating at higher levels this month after strengthening in January. Economists at MUFG Bank analyze GBP outlook.
UK budget next key event for GBP
The next key event for the Pound in the week ahead will be the government’s upcoming budget announcement on March 6.
The pre-election budget is expected to provide fiscal giveaways that could provide fresh impetus for a stronger Pound.
While the size of the potential fiscal giveaway is unlikely to be sufficient to significantly alter the performance of the UK economy, it could discourage the BoE from delivering an earlier rate cut in May or June.
There is scope for divergence further down the road between the BoE and other major central banks in how they continue to implement QT.
The Japanese Yen (JPY) is the best performing major after the Bank of Japan (BoJ) board member Hajime Takata sent a strong signal for ending the negative interest rate policy. Economists at Scotiabank analyze USD/JPY outlook.
Spring start to monetary tightening from the BoJ to bolster prospects of a Q2 rally in the JPY
JPY outperforms following comments from BoJ Governor Takata. He commented that the central bank’s price target was ‘finally coming into sight’, suggesting the BoJ may be closer to a rate hike.
USD/JPY is still some way from technical support at 149.55 that could unlock a drop back to the 148.00 area but the prospect of a spring start to a mild round of monetary tightening from the BoJ would bolster prospects of a Q2 rally in the JPY, in line with seasonal patterns.
- Initial Jobless Claims rose by 215K from a week earlier.
- Continuing Jobless Claims also surprised to the upside.
US citizens that applied for unemployment insurance benefits increased by 215K in the week ending February 24 according to the US Department of Labor (DoL) on Thursday. The prints came in short of initial estimates and followed a 202K gain in the previous week.
Further details of the publication revealed that the advance seasonally adjusted insured unemployment rate was 1.3% (from 1.2%) and the 4-week moving average stood at 212.50K, a decrease of 3.000K from the previous week's revised average.
In addition, Continuing Claims increased by 45K to 1.905M in the week ended February 17.
Market reaction
The US Dollar Index (DXY) gyrates around the 103.80 zone following the weaker-than-expected report from the US labour market, trading almost unchanged from Wednesday’s closing level.
According to Statistics Canada, the GDP Growth Rate expanded more than expected by 1.0% on a yearly basis during the October-December period, reversing the 1.1% annual contract.
In addition, the GDP Growth Rate increased by 0.2% vs. the previous quarter, while preliminary readings expect the Canadian economy to have expanded by 0.4% in January.
Market reaction to Canadian GDP Growth Rate data
USD/CAD reverses its initial gains and hovers around the 1.3570 in the wake of the release, all following the earlier uptick to the 1.3600 barrier on Thursday.
- EUR/USD drops sharply on the slower-than-projected rise in German core inflation.
- Easing price pressure in the Eurozone would allow ECB policymakers to consider rate cuts sooner.
- The US core PCE Price Index data will guide the US Dollar.
The EUR/USD pair falls sharply to 1.0820 as the preliminary German Harmonized Index of Consumer Prices (HICP) remains soft in February. The annual headline inflation grew by 2.7% as expected, slower than January’s reading of 3.1%. Also, the monthly headline HICP matches expectations at 0.6%. In January, the German economy deflated by 0.2%.
The annual core inflation that excludes volatile food and oil prices, closely tracked by European Central Bank (ECB) policymakers, rose at a moderate pace of 2.5%, against an expectation of 2.6% and the prior reading of 2.9%.
Significant progress in inflation returning to the 2% target would allow ECB policymakers to consider a change in the monetary policy stance early. Earlier, ECB President Christine Lagarde said rate cuts are expected in summer.
Besides a slower growth in Germany’s inflation data, caution among market participants ahead of the United States core Personal Consumption Expenditure Price Index (PCE) for January has also weighed on the Euro.
The US core PCE Price Index data is expected to have risen by 0.4% on a month-on-month basis against a 0.2% increase in December. Investors anticipate that the underlying inflation data have decelerated to 2.8% annually against the former reading of 2.9%. Sticky price pressures would force traders to dial back expectations of rate cuts in the June monetary policy meeting.
Meanwhile, the US Dollar Index (DXY), which gauges the value of Greenback against six major currencies, rebounds sharply to 104.00.
GBP/USD holds neutral 1.2600/1.2700 range. Economists at Scotiabank analyze the pair’s outlook.
Cable will have to move significantly from current levels to boost directional momentum
Cable’s sideways range trade over the past few months leaves short, medium and long-term DMI studies all sitting at weak and neutral levels. That suggests spot will have to move significantly from current levels to boost directional momentum.
More choppy range trade is likely in the short run as the market seeks a stronger sense of direction.
Support is 1.2600/1.2615. Resistance is 1.2700/1.2715.
- Inflation in Germany rose at a slightly softer pace than expected in February.
- EUR/USD stays in negative territory below 1.0850 after the data.
Inflation in Germany, as measured by the change in the Consumer price Index (CPI), declined to 2.5% on a yearly basis in early February from 2.9% in January, Germany's Destatis reported on Thursday. This reading came in below the market expectation of 2.6%. On a monthly basis, the CPI rose 0.4%.
The Harmonized Index of Consumer Prices (HICP), the European Central Bank's (ECB) preferred gauge of inflation, rose 0.6% on a monthly basis. The annual HICP increased 2.7% in the same period, at a softer pace than the 3.1% growth recorded in December.
Market reaction
The EUR/USD pair edged lower with the immediate reaction and was last seen losing 0.12% on the day at 1.0823.
USD/CAD edges marginally higher in rather quiet, month-end trade so far. Economists at Scotiabank analyze the pair’s outlook.
USD retains a clear advantage over the CAD
Passive hedge rebalancing flows may be mildly CAD-supportive if anything, but the sharp widening in US/Canada spreads over the second half of the month remains a drag on the CAD’s broader outlook.
The USD retains a clear advantage over the CAD from a broader perspective, with Wednesday’s gains extending the new year run higher in spot marginally.
A small, inside range (within Wednesday’s range) today does suggest some reluctance to push higher still, however, and a lack of momentum behind the move.
Resistance is 1.3610/1.3620. Support is 1.3540/1.3550.
EUR/USD remains in the mid 1.0800-1.0900 range. Shaun Osborne, Chief FX Strategist at Scotiabank, analyzes the pair’s outlook.
Flat trading in the short run
Intraday price moves leave the EUR/USD pair trading more or less mid-way between support at 1.0800 and resistance at 1.0890.
Trend momentum is weak and suggests flat trading in the short run.
Longer-term price action looks a little more supportive to my eye but spot needs to regain – and hold – the upper 1.0800 area if spot gains are to develop further.
- The US Dollar trades in the red, with the Japanese Yen as the biggest winner against the Greenback.
- Risk-on market sentiment returns, with Crypto assets and Chinese stocks soaring.
- The US Dollar Index slides below 104.00, breaking below several technical pivotal levels.
The US Dollar (USD) extends losses on Thursday’s European session ahead of the US Personal Consumption Expenditures (PCE) Price Index data release. The Greenback lost the most against the Japanese Yen, retreating more than 0.50%, as the Japanese currency was supported by surprise comments from Bank of Japan (BoJ) board member Hajime Takata, who said that multiple interest-rate hikes are being considered.
On the economic front, the big focal point on Thursday will be the Personal Consumption Expenditures (PCE) Price Index numbers for January. Markets are anticipating a strong print after the Consumer Price Index (CPI) and the PCE print on Wednesday under the Gross Domestic Product report both came in hotter than expected. Still, this could set up the US Dollar in a perfect “buy the rumour, sell the fact” scenario, where markets already have gotten way ahead of themselves. In this case, the actual PCE print could have already been factored in and thus a weakening of the US Dollar could be the end result.
Daily digest market movers: A lot of moving parts
- At 13:30 GMT, both the Jobless Claims and Personal Consumption Expenditures Price Index will be released:
- Jobless Claims for this week:
- Weekly Initial Jobless Claims are expected to jump from 201,000 to 210,000.
- Continuing Jobless Claims are seen decreasing from 1.862 million to 1.847 million.
- Personal Consumption Expenditures (PCE) Price Index for January:
- The monthly Headline PCE is expected to accelerate from 0.2% to 0.3%, while the yearly reading is seen softening from 2.6% to 2.4%.
- Fore the core reading, which excludes the more volatile categories of food and energy, the monthly PCE is expected to accelerate from 0.2% to 0.4%. The yearly core PCE is expected to fall slightly from 2.9% to 2.8%.
- Personal Income is expected to increase slightly, from 0.3% to 0.4%, while Personal Spending should decelerate substantially, from 0.7% to 0.2%.
- Jobless Claims for this week:
- At14:45 GMT, the Chicago Purchasing Managers Index for February will be released. Expectations are for a jump from 46 to 48, which means the index will likely remain in contraction.
- At 15:00 GMT, though probably less relevant for this trading day, Pending Home Sales data for January will be released. Sales are expected to decelerate sharply, from a 8.3% increase in December to 1% in January.
- the last economic number for this Thursday will be the Kansas City Fed Manufacturing Activity Index for February. The previous number was at -17, with no forecast pencilled in.
- A slew of US Federal Reserve speakers will make its way to the stage as well:
- Expect around 15:50 GMT comments from the head of the Atlanta Fed, Raphael Bostic.
- Briefly after Bostic, around 16:00 GMT, the head of the Chicago Fed Austan Goolsbee will speaking..
- Around 18:15 GMT, Loretta Mester, head of the Cleveland Fed, will also take the stage..
- Overnight, at 01:10 GMT, John Williams from the New York Fed will shed his light as well at the start of Friday.
- Equities are in the green with China leading the charge, where the Shenzhen Index jumps nearly 2%. Meanwhile, cryptocurrencies are soaring with several major coins reaching multi-year highs. In Europe, stock indices are mildly in the green and could benefit from a spillover effect from the surge in the crypto markets..
- According to the CME Group’s FedWatch Tool, expectations for a Fed pause in the March 20 meeting are at 97.5%, while chances of a rate cut stand at 2.5%.
- The benchmark 10-year US Treasury Note trades around 4.28%, broadly unchanged for the past two days.
US Dollar Index Technical Analysis: Make or break
The US Dollar Index (DXY) is facing an ordeal onThursday on whether it will continue its pathway for appreciation or devaluation. The DXY US Dollar index, which tracks the Greenback against a basket of foreign currencies, is unable to steer away from the 200-day Simple moving Average (SMA) at 103.74. The 200-day SMA got chopped up with a few false breaks in the past few days. The formation of lower highs point to increasing selling pressure, with bid and offer being pushed towards each other, and the US PCE inflation data could be the catalyst for a substantial move away from the 200-day SMA.
To the upside, the 100-day Simple Moving Average (SMA) near 103.98 is still the first element acting as a cap. Should the US Dollar be able to cross 104.60, 105.12 is the next key level to keep an eye on. One step beyond there comes 105.88, the high from November 2023. Ultimately, 107.20 – the high of 2023 – could come back into scope.
Looking down, the 200-day Simple Moving Average at 103.74 has been broken twice recently, making it a weak support. The 200-day SMA should not let go that easily though, so a small retreat back to that level could be more than granted. Ultimately, should it lose its force with the ongoing selling pressure, prices could fall to 103.16, the 55-day SMA, before testing 103.00.
Inflation FAQs
What is inflation?
Inflation measures the rise in the price of a representative basket of goods and services. Headline inflation is usually expressed as a percentage change on a month-on-month (MoM) and year-on-year (YoY) basis. Core inflation excludes more volatile elements such as food and fuel which can fluctuate because of geopolitical and seasonal factors. Core inflation is the figure economists focus on and is the level targeted by central banks, which are mandated to keep inflation at a manageable level, usually around 2%.
What is the Consumer Price Index (CPI)?
The Consumer Price Index (CPI) measures the change in prices of a basket of goods and services over a period of time. It is usually expressed as a percentage change on a month-on-month (MoM) and year-on-year (YoY) basis. Core CPI is the figure targeted by central banks as it excludes volatile food and fuel inputs. When Core CPI rises above 2% it usually results in higher interest rates and vice versa when it falls below 2%. Since higher interest rates are positive for a currency, higher inflation usually results in a stronger currency. The opposite is true when inflation falls.
What is the impact of inflation on foreign exchange?
Although it may seem counter-intuitive, high inflation in a country pushes up the value of its currency and vice versa for lower inflation. This is because the central bank will normally raise interest rates to combat the higher inflation, which attract more global capital inflows from investors looking for a lucrative place to park their money.
How does inflation influence the price of Gold?
Formerly, Gold was the asset investors turned to in times of high inflation because it preserved its value, and whilst investors will often still buy Gold for its safe-haven properties in times of extreme market turmoil, this is not the case most of the time. This is because when inflation is high, central banks will put up interest rates to combat it.
Higher interest rates are negative for Gold because they increase the opportunity-cost of holding Gold vis-a-vis an interest-bearing asset or placing the money in a cash deposit account. On the flipside, lower inflation tends to be positive for Gold as it brings interest rates down, making the bright metal a more viable investment alternative.
There is still room for USD upside, economists at Commerzbank say.
The Dollar is unlikely to fall significantly again
The gap between market and FOMC expectations for rate cuts has almost disappeared since the turn of the year, after having priced in significantly more rate cuts last year than the FOMC had anticipated going forward.
Now that the market and the Fed seem to be on the same page, one thing should be clear: until we see data that suggests cracks in the Fed's current story, the Dollar is unlikely to fall significantly again. As a result, it is likely to remain difficult for market participants betting on a weaker US Dollar.
EUR/USD has struggled to break convincingly above the 200-Day Moving Average (DMA) at 1.0827. Economists at Société Générale analyze the pair’s outlook.
Inflation to decline to below 2% in August
We forecast a drop in the Euro flash CPI on Friday to 2.5%, 0.5pp above the ECB target. Our house view is for a decline to below 2% in August.
We forecast core to have slowed to 3% in January but would not rule out a decline below that, which would stoke optimism of a rate cut this summer.
The ECB minutes last week already signalled that the inflation forecast would be revised down, not something that has instilled particular confidence in Bunds or sparked enthusiasm for receiving swaps.
The inflection point in wage growth last quarter, tight financing conditions and flat M3 money supply growth bring the prospect of a less hawkish statement by the ECB next week, but this is not something that investors are actively entertaining at the moment.
EUR/USD staged a feeble breakout attempt from the 200-DMA last week but fell at the first hurdle near 1.0900. Euro bulls could muster their best efforts should the US PCE underwhelm.
- Natural Gas prices are steady, holding on to a three-day winning streak.
- Traders see Asian buyers crowding the demand side in the European gas markets.
- The US Dollar Index sinks below 104.00 ahead of US PCE inflation numbers.
Natural Gas (XNG/USD) trades on the front foot on Thursday driven by a pickup in activity and demand, showing how resilient the commodity actually can be. First and foremost, TotalEnergies signed a deal with Singapore’s Sembcorp for a whopping 16-year commitment for sale and purchase of Liquefied Natural Gas (LNG). This adds to the headlines from Wednesday, which pointed to more and more Asian traders looking to profit from the cheaper Gas contracts in the European market.
Meanwhile, the US Dollar (USD) is facing a pivotal moment this Thursday with the US Personal Consumption Expenditures (PCE) Price Index data to be released later. After the hot inflation report from two weeks ago, markets are already pricing in that interest rates in the US will remain at the current levels for longer than previously expected. Some traders are even considering the possibility of a surprise rate hike from the Federal Reserve. In this context, the question is whether the US Dollar can still rally despite these already supportive elements.
Natural Gas is trading at $1.92 per MMBtu at the time of writing.
Natural Gas market movers: Equilibrium in Europe becomes fragile
- LNG flows into Europe have been 16% higher than the 30-day average these past few days, according to Bloomberg.
- European gas storages are still filled up to nearly 63% as the heating season in the old continent comes to an end.
- Freeport LNG in Texas has reported that it will need to extend its production of LNG another two weeks after issues with its Train 3 unit.
- At 15:30 GMT, the weekly Natural Gas Storage Change will be released by the Energy Information Administration. The previous number was a draw of 60 Billion cubic feet, with expectations for a larger draw of 88 Billion cubic feet for this week.
Natural Gas Technical Analysis: European Gas market could see balance shift
Natural Gas prices are already pricing in the fact that more Asian trading desks and companies are trying to set foot in Europe to get their hands on substantially cheaper Gas contracts. Meanwhile, the European supply out of the US could be at risk as deliveries to Asia become more beneficial for US sellers, with Asian handlers willing to pay more for US gas than Europe is at the moment. This could soon see the scale tipping into less supply. Combined with an overcrowded demand, this could mean Gas prices soaring further above $2.
On the upside, Natural Gas is facing some pivotal technical levels to get back to. The next step is $1.99, – the level which, when broken on the way down, saw an accelerated decline. After that, the green line at $2.13 comes into view, with the triple bottoms from 2023. If Natural Gas sees a sudden demand pickup, $2.40 could come into play.
On the downside, $1.64 and $1.53 (the low of 2020) are targets to look out for. Another leg lower could come if global growth starts to falter and there is less demand. Adding to that equation, more volume of Natural Gas from the US and Canada could quickly tip into an oversupplied market with more downside prices at hand.
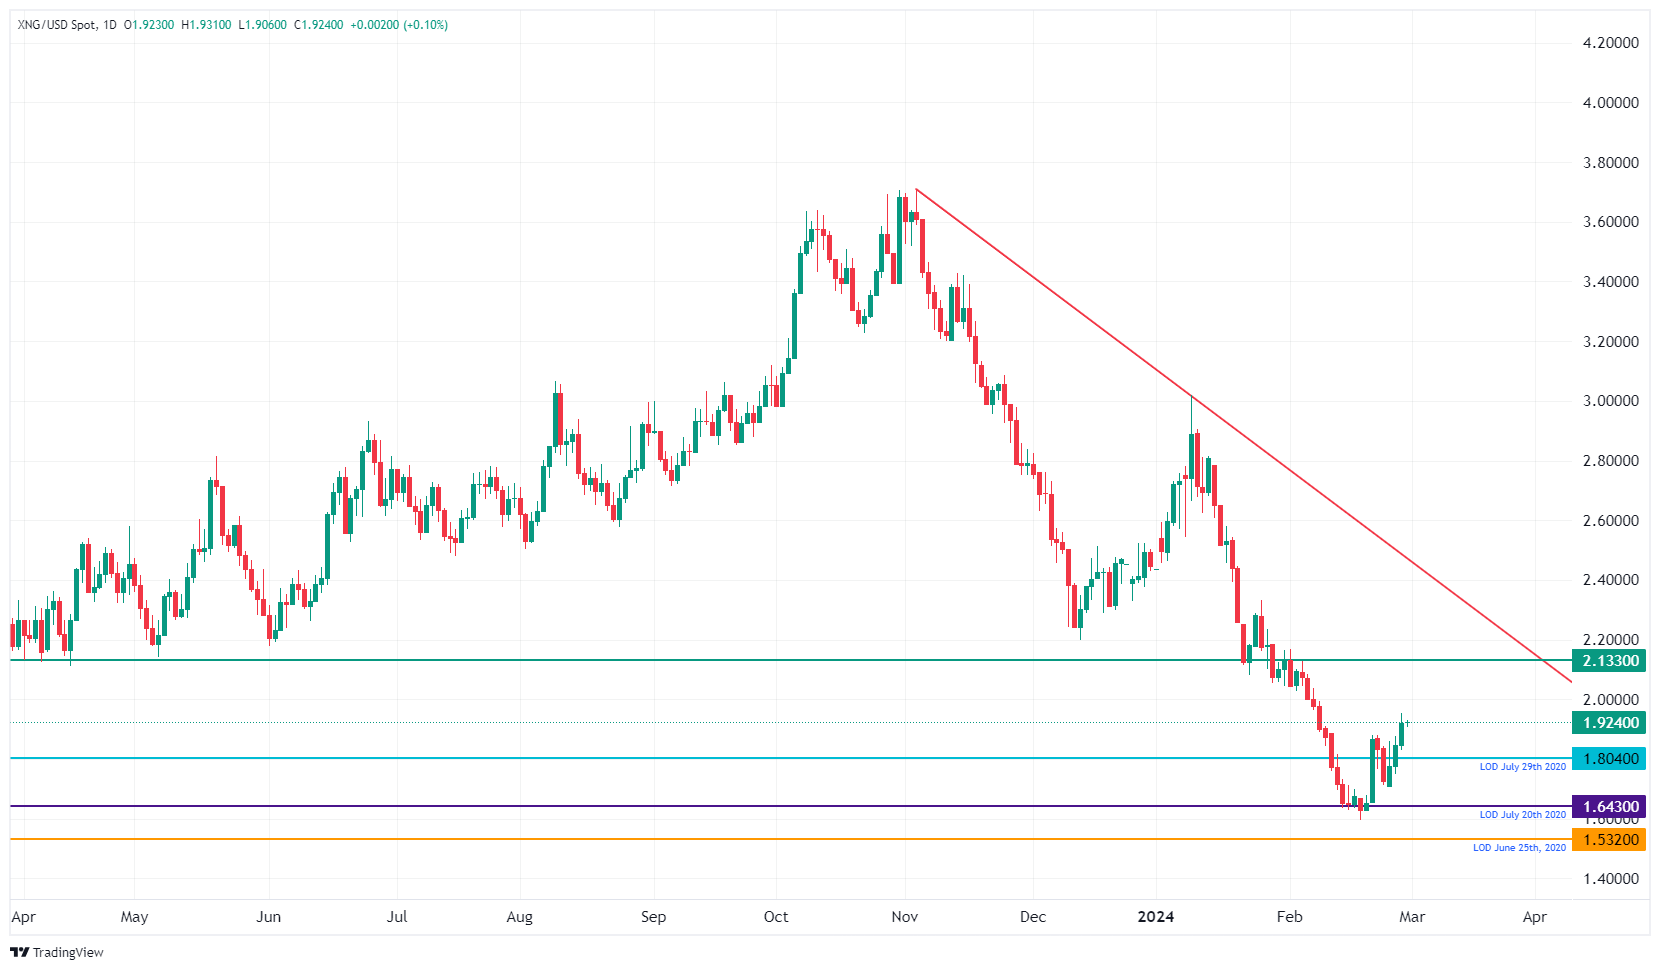
XNG/USD (Daily Chart)
Natural Gas FAQs
What fundamental factors drive the price of Natural Gas?
Supply and demand dynamics are a key factor influencing Natural Gas prices, and are themselves influenced by global economic growth, industrial activity, population growth, production levels, and inventories. The weather impacts Natural Gas prices because more Gas is used during cold winters and hot summers for heating and cooling. Competition from other energy sources impacts prices as consumers may switch to cheaper sources. Geopolitical events are factors as exemplified by the war in Ukraine. Government policies relating to extraction, transportation, and environmental issues also impact prices.
What are the main macroeconomic releases that impact on Natural Gas Prices?
The main economic release influencing Natural Gas prices is the weekly inventory bulletin from the Energy Information Administration (EIA), a US government agency that produces US gas market data. The EIA Gas bulletin usually comes out on Thursday at 14:30 GMT, a day after the EIA publishes its weekly Oil bulletin. Economic data from large consumers of Natural Gas can impact supply and demand, the largest of which include China, Germany and Japan. Natural Gas is primarily priced and traded in US Dollars, thus economic releases impacting the US Dollar are also factors.
How does the US Dollar influence Natural Gas prices?
The US Dollar is the world’s reserve currency and most commodities, including Natural Gas are priced and traded on international markets in US Dollars. As such, the value of the US Dollar is a factor in the price of Natural Gas, because if the Dollar strengthens it means less Dollars are required to buy the same volume of Gas (the price falls), and vice versa if USD strengthens.
NZD/USD plunged by after the Reserve Bank of New Zealand (RBNZ) reverted to a dovish hold. Economists at DBS Bank analyze Kiwi’s outlook.
Fed Chair Powell will seek to discourage markets from repricing excessive rate cuts
With the RBNZ’s rate hike bias diminished, NZD/USD is vulnerable to a stronger Greenback on US data surprises today.
Although consensus expects the US PCE core deflator to fall to 2.8% YoY in January from 2.9% in December, the Fed will be more concerned about the expected rise to 0.4% MoM from 0.2% for the comparable periods.
If US initial jobless claims deliver another surprise fall, next week’s nonfarm payrolls could defy the consensus to fall below the 200K mark.
During his semi-annual congressional testimonies on March 6-7, Fed Chair Jerome Powell will seek to discourage markets from repricing excessive rate cuts amid a resilient US economy, which the Fed worries could stall or reverse the progress achieved so far to restore price stability.
- Us stock index futures trade in negative territory ahead of the opening bell.
- January PCE inflation data will be watched closely by market participants.
- Poor performance of tech shares weigh on Nasdaq Composite.
S&P 500 futures fall 0.31%, Dow Jones futures drop 0.34%, and Nasdaq futures lose 0.25%.
S&P 500 (SPX), Dow Jones (DJIA), and Nasdaq (IXIC) indexes closed on Wednesday with a 0.17% loss, unchanged, and a 0.55% fall, respectively.
What to know before stock market opens
The Real Estate Sector rose 1.28% as the best-performing S&P 500 major sector on Wednesday. At the other extreme, the biggest decliner was the Communications Sector, with a 0.92% loss. The Technology Sector and the Health Care Sector both fell over 0.5% to round out the bottom of the day's sectoral performance.
Axon Enterprises (AXON) climbed 13.75% through the day, ending at $309.22. On the other hand, Viatris Inc. (VTRS) backslid 7.1% to close at $12.29.
Assessing the latest developments in financial markets, “S&P 500 (-0.17%) still experiencing little movement since Nvidia’s earnings last week. The latest decline means the index is still on track for a weekly loss, and there were larger falls for the NASDAQ (-0.55%) and the Magnificent 7 (-0.58%),” said Jim Reid, global head of economics and thematic research at Deutsche Bank, and continued:
“Meanwhile in Europe, the story was also one of losses yesterday, with the STOXX 600 down -0.35%. That said, the DAX (+0.25%) continued to outperform, posting a 6th consecutive advance and closing at a fresh all-time high.”
S&P 500 FAQs
What is the S&P 500?
The S&P 500 is a widely followed stock price index which measures the performance of 500 publicly owned companies, and is seen as a broad measure of the US stock market. Each company’s influence on the computation of the index is weighted based on market capitalization. This is calculated by multiplying the number of publicly traded shares of the company by the share price. The S&P 500 index has achieved impressive returns – $1.00 invested in 1970 would have yielded a return of almost $192.00 in 2022. The average annual return since its inception in 1957 has been 11.9%.
How are companies chosen to be included in the S&P 500?
Companies are selected by committee, unlike some other indexes where they are included based on set rules. Still, they must meet certain eligibility criteria, the most important of which is market capitalization, which must be greater than or equal to $12.7 billion. Other criteria include liquidity, domicile, public float, sector, financial viability, length of time publicly traded, and representation of the industries in the economy of the United States. The nine largest companies in the index account for 27.8% of the market capitalization of the index.
How can I trade the S&P 500?
There are a number of ways to trade the S&P 500. Most retail brokers and spread betting platforms allow traders to use Contracts for Difference (CFD) to place bets on the direction of the price. In addition, that can buy into Index, Mutual and Exchange Traded Funds (ETF) that track the price of the S&P 500. The most liquid of the ETFs is State Street Corporation’s SPY. The Chicago Mercantile Exchange (CME) offers futures contracts in the index and the Chicago Board of Options (CMOE) offers options as well as ETFs, inverse ETFs and leveraged ETFs.
What factors drive the S&P 500?
Many different factors drive the S&P 500 but mainly it is the aggregate performance of the component companies revealed in their quarterly and annual company earnings reports. US and global macroeconomic data also contributes as it impacts on investor sentiment, which if positive drives gains. The level of interest rates, set by the Federal Reserve (Fed), also influences the S&P 500 as it affects the cost of credit, on which many corporations are heavily reliant. Therefore, inflation can be a major driver as well as other metrics which impact the Fed decisions.
Focus shifts to PCE inflation data
The US Bureau of Economic Analysis downwardly revised the annualized Gross Domestic Product (GDP) growth of the US in the fourth quarter to 3.2% from 3.3% in the initial estimate. Personal Consumption Expenditures (PCE) Price Index, the Federal Reserve’s (Fed) preferred gauge of inflation, data will be scrutinized by market participants on Thursday. On a monthly basis, core PCE inflation is forecast to rise 0.4%, up from the 0.2% increase recorded in December.
US Core PCE Inflation: Federal Reserve preferred inflation gauge expected to accelerate in January on month.
The economic calendar will also feature on Thursday weekly Initial Jobless Claims for the week ending February 24, which is forecast to rise to 210,000 from 201,000 in the previous week.
The US Census Bureau reported on Tuesday that Durable Goods Orders declined by 6.1%, or $18 billion, to $276.7 billion in January. This reading followed the 0.3% decrease recorded in December and came in worse than the market expectation for a contraction of 4.5%.
New York Fed President John Williams said late Wednesday that the inflation outlook has improved and that his baseline scenario was for three rate cuts in 2024.
Fed on course to begin lowering rates at the June FOMC meeting – ABN Amro.
According to the CME FedWatch Tool, markets are nearly fully pricing in a no change in the Fed policy rate in March and see an 80% probability of another pause in May.
The Cooper Companies Inc. (COO), Autodesk Inc. (ADSK) and Veeva Systems Inc. (VEEV) will be among top companies that will release quarterly earnings after the closing bell on Thursday.
Inflation FAQs
What is inflation?
Inflation measures the rise in the price of a representative basket of goods and services. Headline inflation is usually expressed as a percentage change on a month-on-month (MoM) and year-on-year (YoY) basis. Core inflation excludes more volatile elements such as food and fuel which can fluctuate because of geopolitical and seasonal factors. Core inflation is the figure economists focus on and is the level targeted by central banks, which are mandated to keep inflation at a manageable level, usually around 2%.
What is the Consumer Price Index (CPI)?
The Consumer Price Index (CPI) measures the change in prices of a basket of goods and services over a period of time. It is usually expressed as a percentage change on a month-on-month (MoM) and year-on-year (YoY) basis. Core CPI is the figure targeted by central banks as it excludes volatile food and fuel inputs. When Core CPI rises above 2% it usually results in higher interest rates and vice versa when it falls below 2%. Since higher interest rates are positive for a currency, higher inflation usually results in a stronger currency. The opposite is true when inflation falls.
What is the impact of inflation on foreign exchange?
Although it may seem counter-intuitive, high inflation in a country pushes up the value of its currency and vice versa for lower inflation. This is because the central bank will normally raise interest rates to combat the higher inflation, which attract more global capital inflows from investors looking for a lucrative place to park their money.
How does inflation influence the price of Gold?
Formerly, Gold was the asset investors turned to in times of high inflation because it preserved its value, and whilst investors will often still buy Gold for its safe-haven properties in times of extreme market turmoil, this is not the case most of the time. This is because when inflation is high, central banks will put up interest rates to combat it.
Higher interest rates are negative for Gold because they increase the opportunity-cost of holding Gold vis-a-vis an interest-bearing asset or placing the money in a cash deposit account. On the flipside, lower inflation tends to be positive for Gold as it brings interest rates down, making the bright metal a more viable investment alternative.
- AUD/USD attracts some intraday sellers and slides back closer to a two-week low.
- Bets that the RBA will not hike rates and a softer risk tone undermine the Aussie.
- A modest USD weakness could help limit losses ahead of the US PCE Price Index.
The AUD/USD pair struggles to capitalize on its modest intraday recovery from a two-week low touched earlier this Thursday and slides back below the 0.6500 psychological mark during the first half of the European session.
Against the backdrop of Wednesday's rather unimpressive inflation figures, weaker-than-expected Australian Retail Sales data released this Thursday reaffirmed bets that the Reserve Bank of Australia (RBA) will not hike rates further. Apart from this, a turnaround in the global risk sentiment – as depicted by some follow-through weakness across the equity markets – turns out to be a key factor undermining the risk-sensitive Australian Dollar (AUD).
That said, a modest US Dollar (USD) weakness could offer some support to the AUD/USD pair and help limit any further slide ahead of the US Personal Consumption Expenditures (PCE) Price Index. The crucial inflation data could provide fresh cues about the Federal Reserve's (Fed) rate-cut path, which, in turn, will play a key role in influencing the near-term USD price dynamics and provide a fresh directional impetus to the currency pair.
Thursday's US economic docket also features the usual Weekly Initial Jobless Claims, the Chicago PMI and Pending Home Sales. This, along with Fed speak, will drive the USD demand and produce short-term trading opportunities around the AUD/USD pair. Hence, it will be prudent to wait for strong follow-through selling before positioning for an extension of the recent rejection slide from a technically significant 200-day Simple Moving Average (SMA).
- WTI rises to $78 as uncertainty deepens over a truce between Israel and Palestine.
- The outlook for oil demand remains weak as the Fed maintains a hawkish stance.
- Uncertainty deepens over oil demand as the US EIA reported higher oil inventories for the week ending February 23.
West Texas Intermediate (WTI), futures on NYMEX, is up 0.28% in Thursday’s European session after a strong recovery from $77.60 ahead of key United States Personal Consumption Expenditure Price Index (PCE) for January, which will be published at 13:30 GMT.
The monthly inflation data is forecast to rise 0.4% in January, at a higher pace than the 0.2% increase in December. January Core PCE is also projected to grow at an annual pace of 2.8% versus. 2.9% in December. Federal policymakers track the underlying inflation for policy decision-making as base effects don’t distort it.
Meanwhile, investors are worried about the near-term demand for oil due to the risks of interest rates remaining restrictive for extended periods. Fed policymakers see no rush to rate cuts as they need to observe more data to confirm that inflation will return to the desired rate of 2%. The oil demand typically reduces in a high interest-rate environment.
Downside risks to oil demand escalated after the US Energy Information Administration (EIA) reported on Wednesday that crude oil stockpiles rose by 4.199M against expectations of 2.743M in the week ending February 23.
Meanwhile, the downside in the oil price remains well-supported as uncertainty deepens over a ceasefire between Israel and Palestine-backed Hamas. On Wednesday, Hamas said that it fired a volley of rockets toward northern Israel, which has downplayed expectations of a ceasefire. However, US President Joe Biden is confident there will be a truce by March 4.
Preparations for an imminent Japanese interest rate turnaround by officials continued apace. Michael Pfister, FX Analyst at Commerzbank, analyzes the implications for the Japanese Yen (JPY) of ending negative interest rate policy.
The signs of a BoJ interest rate turnaround continue
With each new statement, it becomes clearer that the BoJ wants to end its negative interest rate policy in the near future, even though the second-round effects in Japan are not yet really visible. In the short term, such an exit is certainly positive for the Yen.
It is certainly possible that this is yet another failed communication attempt by the BoJ. If this is true, and the BoJ dares to make more than a symbolic exit from its negative interest rate policy in the coming months, it would be another major disappointment for market hopes, as we have seen several times in the past two years. Such a disappointment would certainly be clearly negative for the JPY.
However, the likelihood of this happening is likely to diminish with each subsequent statement. Therefore, the exit from ultra-loose monetary policy now seems to be rapidly approaching. In the longer term, such an exit could pose some risks for the Yen. In the short term, however, I would not bet against the Yen in the coming months as I did a few months ago.
Today's PCE inflation print for January is the latest signpost in the enthralling rate debate. Economists at Société Générale analyze market’s outlook ahead of the data.
Hot PCE data to throw more Fed cuts under the bus
Three instead of six US rate cuts in 2024 is where we stand today now that bond markets have converged with the Fed dot-plot following two months of fixed-income pain and a shake-up of the consensus view for this year.
The question is whether PCE figures endorse current market pricing or result in another leg of turmoil and move the needle towards even fewer than three cuts. The release follows hot CPI/PPI data from two weeks ago and, understandably, investors are bracing themselves for another upward surprise.
The significance of today’s release cannot be detached from the fact that bonds and FX are trading close to key technical levels. Narrowing ranges suggest any meaningful deviation in the PCE could trigger violent knee-jerk moves, which could then follow through into March with investors de-risking before the ECB, Fed and BoJ meetings.
In the best-case scenario, the PCE data does not follow CPI and brings an end to the corrective trends of January-February in Treasuries. In FX, the DXY drops back to 103.00.
In the worst case, PCE data exceeds forecasts and throws more Fed cuts under the bus, the 2y UST narrows the gap to 5% and bear flattening in 2s/10s moves beyond -40 bps. The danger of the market positioning for a bad number is that prices rally and yields reverse as the data is published and positions unwind. For FX, the interesting point is that though 2y UST yields have returned to the pre-FOMC levels of December, the DXY has not. It’s another 1.5% to 106.00, which invariably results in renewed weakness in the Yen and the Swiss Franc.
- Gold price awaits the US core PCE Price Index data for a decisive move.
- The underlying inflation data will sharpen the interest rate outlook.
- Fed’s Collins expects the Fed’s path to 2% inflation will be bumpy.
Gold price (XAU/USD) remains in a tight range in Thursday’s European session as investors seek fresh guidance on the interest rate outlook. The precious metal will be guided by the United States core Personal Consumption Expenditure – Price Index (PCE) for January, which will be published at 13:30 GMT. The underlying inflation data will indicate whether Federal Reserve (Fed) policymakers are getting evidence, which could convince them that inflation will sustainably return to the 2% target.
Fed policymakers won’t be interested in lowering interest rates if price pressures remain stubborn. This would improve the appeal of the US Dollar and bond yields. The US Dollar generally attracts higher foreign inflows when the Fed maintains hawkish guidance on interest rates.
The market expectations for rate cuts in the March and May policy meetings are not expected to heighten significantly even if the inflation report turns out softer. Fed policymakers need good inflation data for months to consider a change in the monetary policy stance. Therefore, one good progressively declining inflation data point would not be enough to force policymakers to swiftly unwind their restrictive policy stance.
Daily Digest Market Movers: Gold price remains sideways ahead of US inflation data
- Gold price remains sideways, slightly below $2,040, as investors await United States core PCE Price Index data for January.
- Market participants will pay close attention as it is the Fed’s preferred inflation tool. It doesn’t get distorted by base effects and provides a clear view of underlying inflation by excluding volatile items.
- Economists forecast underlying inflation data to decelerate to 2.8% from 2.9% in December on a year-on-year basis. The monthly core PCE Price Index data is forecast to have increased by 0.4% against a moderate growth of 0.2% in December.
- The economic data is expected to significantly impact market expectations for the timing of Federal Reserve rate cuts.
- Ahead of the underlying inflation data, the CME FedWatch Tool shows that interest rates will remain unchanged in the range of 5.25%-5.50% in the next two policy meetings, which will take place in March and May. Traders see a 53% chance for a rate cut by 25 basis points in the June meeting.
- The opportunity cost of holding non-yielding assets, such as Gold, would increase if the inflation data remains stubborn. Therefore, hawkish commentaries from Fed policymakers have been maintaining downward pressure on the Gold price.
- On Wednesday, New York Federal Reserve President John Williams said the decision on rate cuts will be dependent on incoming data. Williams added that the central bank has come a long way to bring down inflation to the 2% target, but there is more work to do.
- Boston Fed Bank President Susan Collins sees the Fed’s path returning to 2% as bumpy due to tight labor market conditions and higher inflation readings in January. Collins expects that the Fed will start reducing interest rates later this year.
Technical Analysis: Gold price trades sideways around $2,030
Gold price oscillates inside Wednesday’s trading range. The broader trend of the precious metal is sideways, trading in a Symmetrical Triangle, which could break out in either direction. However, the odds marginally favor a move in the direction of the trend before forming the triangle – in this case, up. A decisive break above or below the triangle boundary lines would indicate a breakout is underway.
The downward-sloping border of the Symmetrical Triangle pattern is plotted from the December 28 high at $2,088, and its upward-sloping border from the December 13 low at $1,973.
The 14-period Relative Strength Index (RSI) remains confined in the 40.00-60.00 range, indicating a sideways trend.
Gold FAQs
Why do people invest in Gold?
Gold has played a key role in human’s history as it has been widely used as a store of value and medium of exchange. Currently, apart from its shine and usage for jewelry, the precious metal is widely seen as a safe-haven asset, meaning that it is considered a good investment during turbulent times. Gold is also widely seen as a hedge against inflation and against depreciating currencies as it doesn’t rely on any specific issuer or government.
Who buys the most Gold?
Central banks are the biggest Gold holders. In their aim to support their currencies in turbulent times, central banks tend to diversify their reserves and buy Gold to improve the perceived strength of the economy and the currency. High Gold reserves can be a source of trust for a country’s solvency. Central banks added 1,136 tonnes of Gold worth around $70 billion to their reserves in 2022, according to data from the World Gold Council. This is the highest yearly purchase since records began. Central banks from emerging economies such as China, India and Turkey are quickly increasing their Gold reserves.
How is Gold correlated with other assets?
Gold has an inverse correlation with the US Dollar and US Treasuries, which are both major reserve and safe-haven assets. When the Dollar depreciates, Gold tends to rise, enabling investors and central banks to diversify their assets in turbulent times. Gold is also inversely correlated with risk assets. A rally in the stock market tends to weaken Gold price, while sell-offs in riskier markets tend to favor the precious metal.
What does the price of Gold depend on?
The price can move due to a wide range of factors. Geopolitical instability or fears of a deep recession can quickly make Gold price escalate due to its safe-haven status. As a yield-less asset, Gold tends to rise with lower interest rates, while higher cost of money usually weighs down on the yellow metal. Still, most moves depend on how the US Dollar (USD) behaves as the asset is priced in dollars (XAU/USD). A strong Dollar tends to keep the price of Gold controlled, whereas a weaker Dollar is likely to push Gold prices up.
- GBP/JPY meets with aggressive supply and dives to over a one-week low on Thursday.
- Intervention threats, along with hawkish BoJ talks, provide a strong boost to the JPY.
- A softer risk tone further benefits the safe-haven JPY and contributes to the downfall.
The GBP/JPY cross comes under intense selling pressure on Thursday and retreats further from its highest level since August 2015, around the 191.30 area touched earlier this week. Spot prices dive to over a one-week low during the first half of the European session, though manage to rebound a few pips in the last hour and currently trade around the 189.65-189.70 region, still down nearly 0.60% for the day.
A fresh intervention warning by Japan's vice finance minister for international affairs Masato Kanda and the Bank of Japan (BoJ) board member Hajime Takata's hawkish remarks provide a strong boost to the Japanese Yen (JPY), which, in turn, prompts aggressive selling around the GBP/JPY cross. In fact, Kanda reiterated that the government stands ready to take appropriate action against excessive exchange-rate moves and volatility.
Separately, Takata said that achievement of the 2% inflation target is becoming in sight and that the central bank must consider taking a nimble and flexible approach towards an exit from ultra-loose monetary policy. Apart from this, a slight deterioration in the global risk sentiment – as depicted by the prevalent cautious mood around the equity markets – turns out to be another factor benefiting the JPY's relative safe-haven status.
The British Pound (GBP), on the other hand, is undermined by firming expectations that the Bank of England (BoE ) will start cutting interest rates soon. This further contributes to the GBP/JPY pair's steep intraday decline to the 189.35 zone. Meanwhile, policymakers have been trying to push back against market expectations for early interest rate cuts, which, in turn, lends some support to spot prices and helps limit further losses.
In fact, BoE Deputy Governor Dave Ramsden said on Tuesday that he wants more evidence that inflationary pressures were easing to consider a cut in interest rates. Adding to this, BoE's Catherine Mann said on Wednesday that the spending habits of wealthy Britons make it harder to curb inflation. This, in turn, warrants some caution before confirming that the GBP/JPY cross has topped out and positioning for deeper losses.
Gold (XAU/USD) is trading in a narrow trading band, ahead of fresh US inflation data – Core PCE – that may offer signs of when the Fed will pivot, economists at MUFG Bank say.
Short-term moves will remain tied to data potentially influencing Fed decision-making
Gold is trading in a narrow trading band, ahead of fresh US inflation data – Core PCE – today that may offer signs of when the Fed will pivot to commence its easing cycle.
Swaps traders are still pricing little prospects of the Fed lowering borrowing costs before June after recent data reaffirmed US exceptionalism (higher rates are historically negative for non-interest bearing bullion). The ETFs, however, have been cutting on the Gold holdings in the last 12 days, taking the total Gold held by ETFs down by 3.5% since the beginning of this year – the lowest level since January 2020.
Our view remains the same as we continue to believe that the short-term moves will remain tied to data potentially influencing Fed decision-making while downside to the price will be limited by robust support from the other two channels (supportive central bank demand and bullion’s role as the geopolitical hedge of last resort).
- Silver struggles to capitalize on the previous day’s modest bounce from a two-week low.
- The technical setup favours bearish traders and supports prospects for additional losses.
- A sustained strength beyond the 200-day SMA is needed to negate the bearish outlook.
Silver (XAG/USD) attracts some sellers following an intraday uptick on Thursday and for now, seems to have stalled its modest recovery from the $22.30-$22.25 region, or a two-week low touched the previous day. The white metal trades just below the mid-$22.00s during the first half of the European session and seems vulnerable to sliding further.
The recent failure to find acceptance above the very important and significant 200-day Simple Moving Average (SMA) and the subsequent slide from a multi-week high, around mid-$23.00s touched on February 16, validates the negative outlook. Moreover, oscillators on the daily chart have just started drifting in the negative territory and support prospects for a further near-term depreciating move for the XAG/USD.
That said, it will still be prudent to wait for some follow-through selling below the overnight swing low, around the $22.30$22.25 area before placing fresh bearish bets. The XAG/USD might then accelerate the fall towards retesting sub-$22.00 levels, or a two-month low touched in January. The downward trajectory could extend further and drag the white metal to the next relevant support near the $21.40-$21.35 region.
On the flip side, the daily peak, around the mid-$22.00s, might continue to act as an immediate hurdle ahead of the $22.70-$22.75 region. This is followed by the $23.00 round-figure mark, which if cleared decisively might trigger a short-covering rally, though the momentum runs the risk of fizzling out near the 200-day SMA, currently around the $23.30 zone. This should cap the upside near the mid-$23.00, or the monthly peak.
Silver daily chart
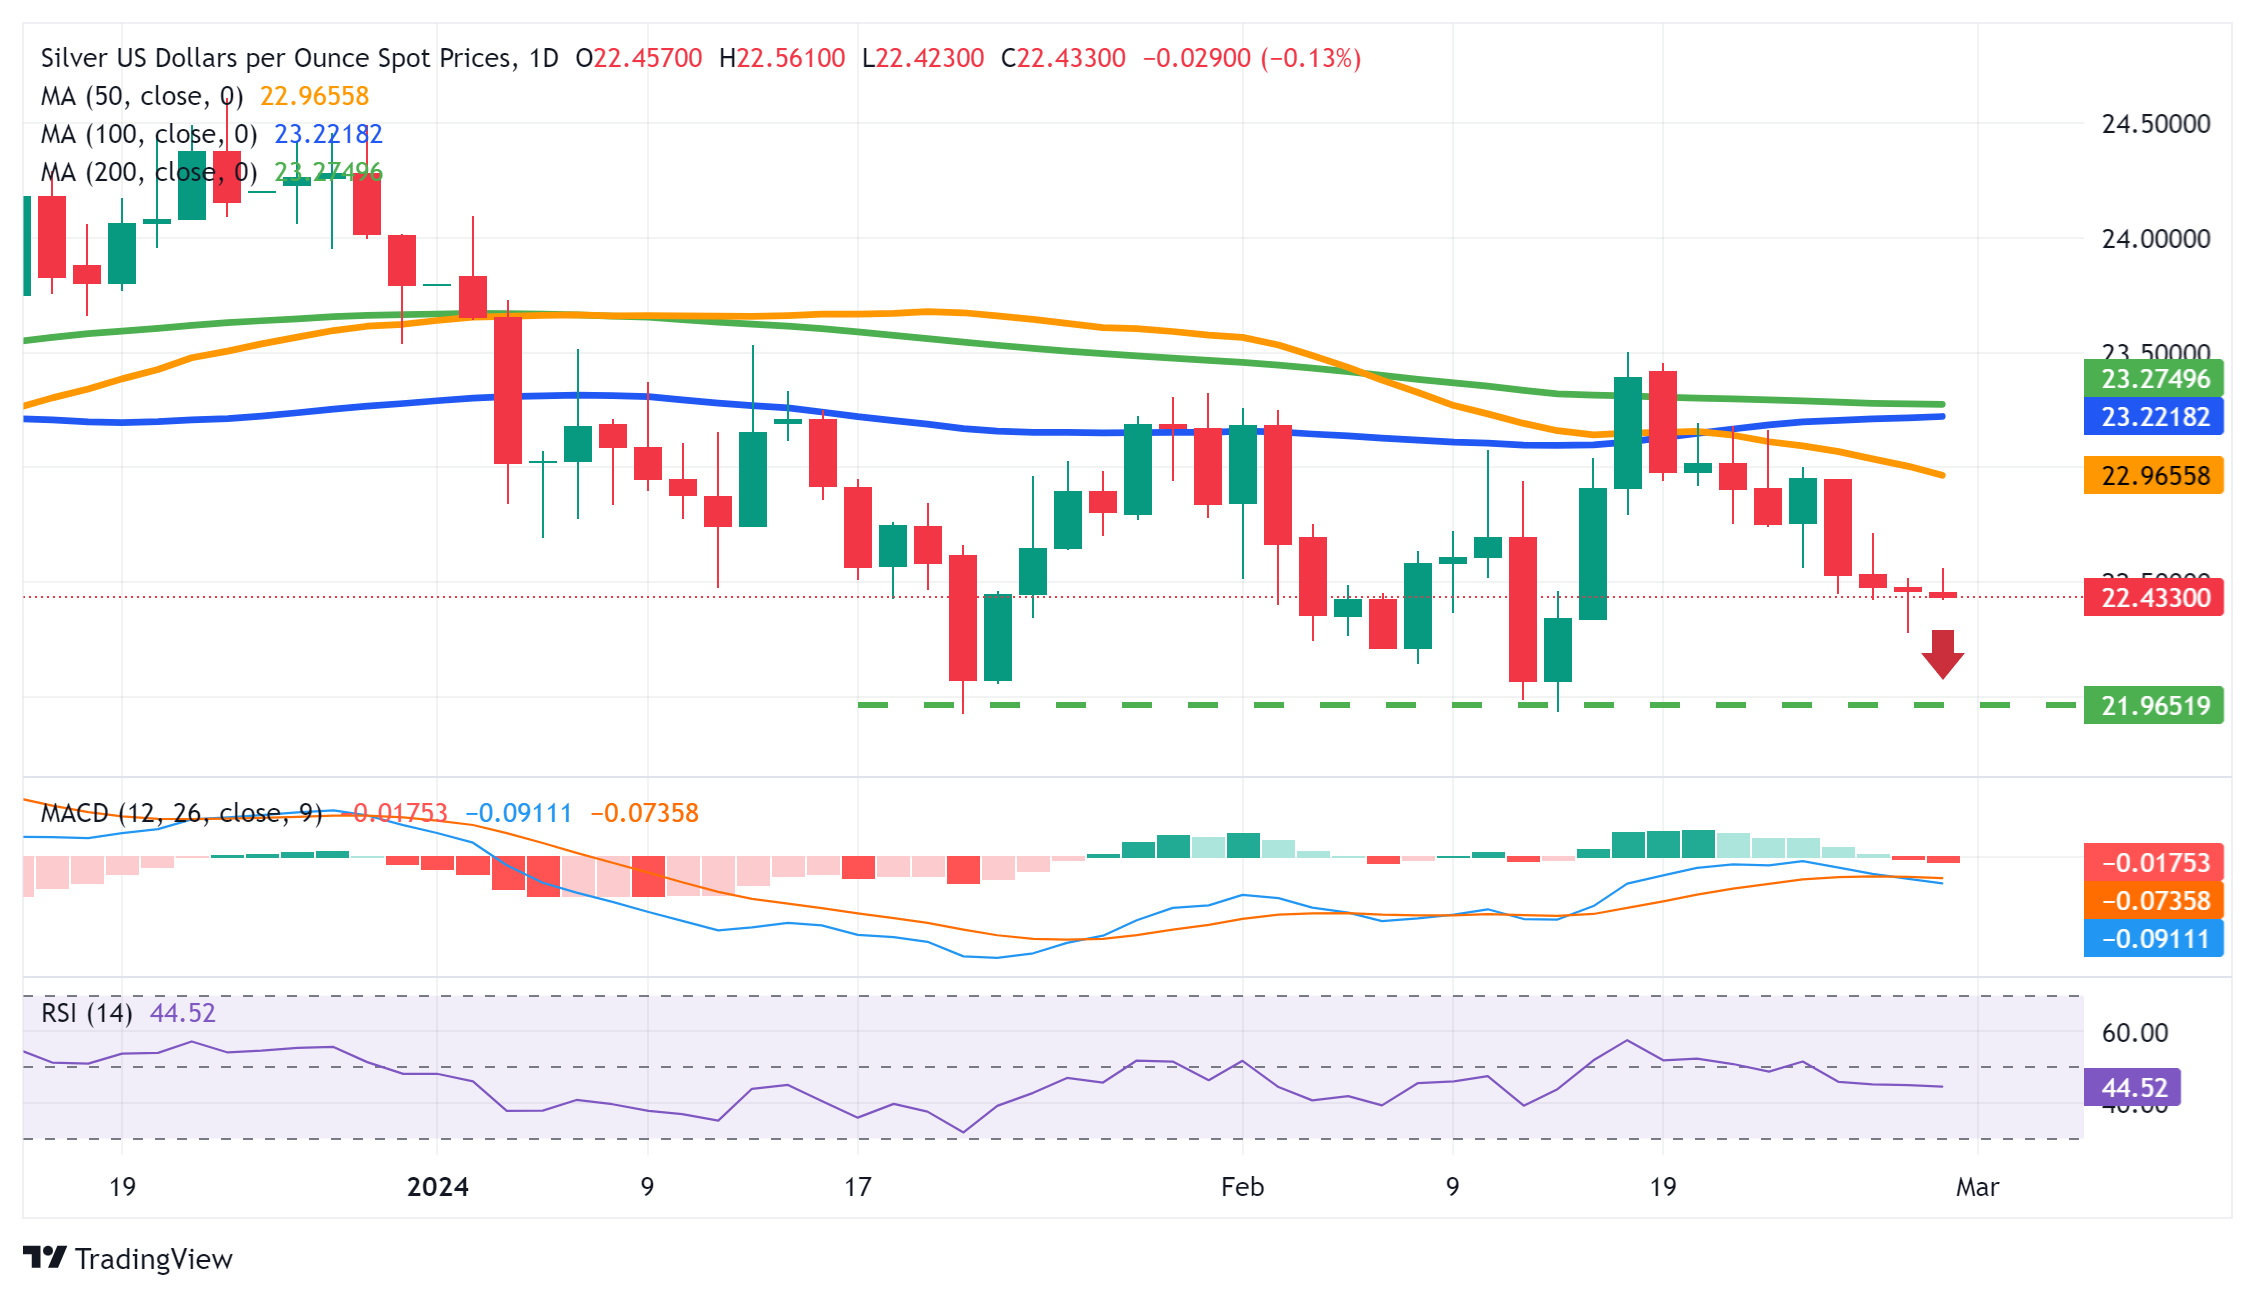
USD/JPY has fallen back below the 150.00 level. Economists at MUFG Bank analyze the pair’s outlook.
The Fed will end up cutting rates more than they are currently planning
We continue to believe that the BoJ’s imminent policy shift away from loose policy settings will help to provide more support for the deeply undervalued Yen. However, it will also require the Fed to begin lowering rates to narrow the policy divergence with the BoJ.
We still believe that the Fed will end up cutting rates more than they are currently planning but the recent run of stronger US economic activity and inflation data at the start of this year is currently challenging our view.
Our outlook for USD/JPY to fall back below the 140.00 level later this year is built on the assumption that growth in the US will moderate in response to higher rates and inflation will continue to slow back towards the Fed’s goal.
- Canadian GDP is expected to have expanded by 0.8% YoY in Q4.
- Bank of Canada sees GDP coming in flat on an annualized basis
- The Canadian Dollar seems to have embarked on a range-bound theme.
The release of the Canadian GDP Growth Rate will be the salient event on the domestic calendar later in the week. According to Statistics Canada, the economy is expected to have expanded 0.8% during the October-December period compared with the same period a year earlier.
Canadian GDP could bolster the cautious stance from the BoC
Following the annualized 1.1% contraction recorded in Q3 2023, the Canadian economy is predicted to have performed very well in the latter part of last year, growing by 0.8% and prompting the BoC to maintain its prudent monetary policy stance.
On the latter, it is worth mentioning that the central bank left its policy rate unchanged at 5.00% at its January 24 event. At that meeting, the BoC suggested that the GDP Growth Rate is now estimated at 0.0%. In case the GDP readings match markets’ consensus, the central bank could maintain intact rates for its fifth consecutive time at its March 6 gathering.
Following its latest monetary policy meeting, the Bank predicts gradual economic growth in mid-2024, with household spending likely to increase in the latter half of the year. Exports and business investment are expected to be boosted by recovering foreign demand, while government spending is expected to contribute significantly to growth throughout the year. That said, the bank predicts GDP growth of 0.8% in 2024 and 2.4% in 2025, which is consistent with its October forecast.
According to analysts at the National Bank of Canada (NBC), “Monthly reports published to date suggest a healthy increase in household consumption in the quarter was only partially offset by a contraction in business investment in both the machinery/equipment and structures segments.”
When will the GDP Growth Rate be released, and how could it affect USD/CAD?
Statistics Canada is set to disclose the GDP figures at 13:30 GMT on Thursday.
Regarding USD/CAD, a positive surprise might lend legs to the Canadian Dollar, leaving the door open to a potential knee-jerk reaction in the short-term horizon. However, such a move should be deemed temporary in the current context where the pair’s price action is almost exclusively driven by USD dynamics. Those dynamics are a consequence of alternating speculation over the potential timing of the Federal Reserve’s (Fed) easing cycle.
FX Street’s Senior Analyst Pablo Piovano notes: “So far, USD/CAD appears side-lined around the critical 200-day SMA near 1.3480. The breakout of this range should expose the so-far 2024 peak at 1.3586 recorded on February 13.”
Piovano adds: “In case of bearish attempts, the 55-day SMA around 1.3430 should offer provisional contention prior to the late January low of 1.3358 (January 31). Once this region is cleared, there are no support levels of note until the December 2023 low of 1.3177, seen on December 27.”
Economic Indicator
Canada Gross Domestic Product Annualized
The Gross Domestic Product (GDP), released by Statistics Canada on a monthly and quarterly basis, is a measure of the total value of all goods and services produced in Canada during a given period. The GDP is considered as the main measure of Canada’s economic activity. The data is expressed at an annualized rate, which means that the rate has been adjusted to reflect the amount GDP would have changed over a year’s time, had it continued to grow at that specific rate. Generally, a high reading is seen as bullish for the Canadian Dollar (CAD), while a low reading is seen as bearish.
Read more.Next release: 02/29/2024 13:30:00 GMT
Frequency: Quarterly
Source: Statistics Canada
Canadian Dollar price today
The table below shows the percentage change of Canadian Dollar (CAD) against listed major currencies today. Canadian Dollar was the weakest against the .
| USD | EUR | GBP | CAD | AUD | JPY | NZD | CHF | |
| USD | 0.29% | 0.28% | 0.40% | 0.71% | 0.10% | 1.19% | 0.14% | |
| EUR | -0.27% | 0.00% | 0.12% | 0.44% | -0.18% | 0.92% | -0.14% | |
| GBP | -0.29% | -0.01% | 0.12% | 0.44% | -0.19% | 0.92% | -0.14% | |
| CAD | -0.40% | -0.13% | -0.12% | 0.31% | -0.30% | 0.79% | -0.24% | |
| AUD | -0.72% | -0.44% | -0.43% | -0.31% | -0.62% | 0.49% | -0.57% | |
| JPY | -0.10% | 0.18% | 0.19% | 0.29% | 0.63% | 1.12% | 0.04% | |
| NZD | -1.21% | -0.92% | -0.92% | -0.79% | -0.48% | -1.10% | -1.06% | |
| CHF | -0.14% | 0.15% | 0.14% | 0.26% | 0.55% | -0.03% | 1.04% |
The heat map shows percentage changes of major currencies against each other. The base currency is picked from the left column, while the quote currency is picked from the top row. For example, if you pick the Euro from the left column and move along the horizontal line to the Japanese Yen, the percentage change displayed in the box will represent EUR (base)/JPY (quote).
- EUR/USD attracts some follow-through buying on Thursday amid modest USD weakness.
- Reduced bets for an aggressive ECB policy easing underpin the Euro and also lend support.
- Traders now look to key inflation figures from the Eurozone and the US for a fresh impetus.
The EUR/USD pair is seen building on the previous day's goodish rebound from sub-1.0800 levels, or a one-week low and gaining some positive traction during the early European session on Thursday. Traders, however, might opt to wait on the sidelines ahead of a slew of inflation reports from Germany, France, Spain and the United States (US), which will be followed by the flash Eurozone CPI print on Friday. In the meantime, reduced bets for rapid interest rate cuts by the European Central Bank (ECB) continue to act as a tailwind for the Euro.
Apart from this, a modest US Dollar (USD) downtick is seen as another factor lending some support to the EUR/USD pair. Any meaningful downfall for the Buck, however, seems limited in the wake of speculations that sticky inflation and a still-resilient US economy should allow the Federal Reserve (Fed) to keep interest rates higher for longer. Apart from this, a softer risk tone could benefit the Greenback's relative safe-haven status and might contribute to capping gains for the currency pair. This warrants some caution before placing fresh directional bets.
Daily digest market movers: Draws support from weaker USD, delayed ECB rate cut bets
- Investors seem reluctant ahead of the crucial inflation data from the Eurozone and the United States, leading to the EUR/USD pair's subdued range-bound price action on Thursday.
- Retail Sales in Germany fell by 0.4% MoM in January, missing expectations for a 0.5% increase, and adding to concerns about the darkening outlook for the Eurozone's biggest economy.
- ECB Governing Council member Peter Kazimir said on Wednesday that he would prefer the central bank to start cutting rates in June, followed by a smooth and steady cycle of policy easing.
- ECB Vice President Luis de Guindos said that the recent inflation data has been very positive, though the central bank needs to be sure that prices will move towards the 2% target before cutting rates.
- Money markets are now pricing in around 90 basis points (bps) of rate cuts by the ECB this year, down from almost 150 bps a month ago, which is seen as acting as a tailwind for the Euro.
- The second estimate of the US GDP print showed on Wednesday that the world's largest economy grew by a 3.2% annualized pace during the fourth quarter vs the advance reading of a 3.3% rise.
- The data suggested that the US economy remains in good shape, which, along with comments by several Federal Reserve officials, reaffirmed the higher-for-longer interest rates narrative.
- New York Fed President John Williams said that the central bank will begin cutting rates this year depending on how the data comes in, albeit there is still a way to go before hitting the 2% inflation target.
- Atlanta Fed President Raphael Bostic stressed that the US central bank has not declared victory over inflation yet and said that he is comfortable advising patience when it comes to loosening policy.
- Furthermore, Boston Fed Bank President Susan Collins noted that it will become appropriate to begin easing policy later this year but the path to returning inflation to its 2% target will likely be bumpy.
- The US Dollar, however, struggles to attract buyers as traders look to the US Personal Consumption Expenditures (PCE) Price Index for cues about the Fed's rate-cut path and some meaningful impetus.
- Thursday's economic docket also features the flash CPI estimates from Germany, France and Spain, followed by US macro data – Weekly Initial Jobless Claims, the Chicago PMI and Pending Home Sales.
- The focus will then shift to the Eurozone consumer inflation figures on Friday, which might influence expectations about the ECB's future policy decision and infuse volatility around the currency pair.
Technical analysis: EUR/USD bulls could aim back to conquer the 1.0900 round-figure mark
From a technical perspective, oscillators on the daily chart have just started gaining positive traction and support prospects for further gains. Some follow-through buying beyond the 1.0850 area will reaffirm the constructive outlook and lift the EUR/USD pair to the 1.0900 round figure. A sustained strength beyond the latter will be seen as a fresh trigger for bullish traders and pave the way for a further near-term appreciating move, towards reclaiming the 1.1000 psychological mark for the first time since January 11.
On the flip side, any meaningful downfall might continue to find some support near the 1.0800 mark. That said, acceptance below the said handle could make the EUR/USD pair vulnerable to accelerate the fall back towards retesting sub-1.0700 levels, or a three-month low touched on February 14. The latter should act as a key pivotal point, which if broken decisively will be seen as a fresh trigger for bearish traders.
Euro price this week
The table below shows the percentage change of Euro (EUR) against listed major currencies this week. Euro was the strongest against the New Zealand Dollar.
| USD | EUR | GBP | CAD | AUD | JPY | NZD | CHF | |
| USD | -0.24% | 0.03% | 0.54% | 0.89% | -0.48% | 1.53% | -0.34% | |
| EUR | 0.23% | 0.26% | 0.77% | 1.11% | -0.24% | 1.76% | -0.11% | |
| GBP | -0.02% | -0.28% | 0.51% | 0.87% | -0.51% | 1.51% | -0.36% | |
| CAD | -0.54% | -0.79% | -0.50% | 0.38% | -1.02% | 1.00% | -0.89% | |
| AUD | -0.91% | -1.14% | -0.87% | -0.35% | -1.38% | 0.65% | -1.24% | |
| JPY | 0.47% | 0.23% | 0.54% | 1.01% | 1.36% | 2.00% | 0.13% | |
| NZD | -1.56% | -1.80% | -1.52% | -1.01% | -0.65% | -2.03% | -1.90% | |
| CHF | 0.34% | 0.10% | 0.38% | 0.88% | 1.24% | -0.13% | 1.87% |
The heat map shows percentage changes of major currencies against each other. The base currency is picked from the left column, while the quote currency is picked from the top row. For example, if you pick the Euro from the left column and move along the horizontal line to the Japanese Yen, the percentage change displayed in the box will represent EUR (base)/JPY (quote).
Euro FAQs
What is the Euro?
The Euro is the currency for the 20 European Union countries that belong to the Eurozone. It is the second most heavily traded currency in the world behind the US Dollar. In 2022, it accounted for 31% of all foreign exchange transactions, with an average daily turnover of over $2.2 trillion a day.
EUR/USD is the most heavily traded currency pair in the world, accounting for an estimated 30% off all transactions, followed by EUR/JPY (4%), EUR/GBP (3%) and EUR/AUD (2%).
What is the ECB and how does it impact the Euro?
The European Central Bank (ECB) in Frankfurt, Germany, is the reserve bank for the Eurozone. The ECB sets interest rates and manages monetary policy.
The ECB’s primary mandate is to maintain price stability, which means either controlling inflation or stimulating growth. Its primary tool is the raising or lowering of interest rates. Relatively high interest rates – or the expectation of higher rates – will usually benefit the Euro and vice versa.
The ECB Governing Council makes monetary policy decisions at meetings held eight times a year. Decisions are made by heads of the Eurozone national banks and six permanent members, including the President of the ECB, Christine Lagarde.
How does inflation data impact the value of the Euro?
Eurozone inflation data, measured by the Harmonized Index of Consumer Prices (HICP), is an important econometric for the Euro. If inflation rises more than expected, especially if above the ECB’s 2% target, it obliges the ECB to raise interest rates to bring it back under control.
Relatively high interest rates compared to its counterparts will usually benefit the Euro, as it makes the region more attractive as a place for global investors to park their money.
How does economic data influence the value of the Euro?
Data releases gauge the health of the economy and can impact on the Euro. Indicators such as GDP, Manufacturing and Services PMIs, employment, and consumer sentiment surveys can all influence the direction of the single currency.
A strong economy is good for the Euro. Not only does it attract more foreign investment but it may encourage the ECB to put up interest rates, which will directly strengthen the Euro. Otherwise, if economic data is weak, the Euro is likely to fall.
Economic data for the four largest economies in the euro area (Germany, France, Italy and Spain) are especially significant, as they account for 75% of the Eurozone’s economy.
How does the Trade Balance impact the Euro?
Another significant data release for the Euro is the Trade Balance. This indicator measures the difference between what a country earns from its exports and what it spends on imports over a given period.
If a country produces highly sought after exports then its currency will gain in value purely from the extra demand created from foreign buyers seeking to purchase these goods. Therefore, a positive net Trade Balance strengthens a currency and vice versa for a negative balance.
- USD/JPY loses ground on risk appetite ahead of US PCE data.
- JPY received upward support on hawkish remarks from BoJ’s Hajime Takata.
- The US Dollar experiences a decline despite the improvement in US Treasury yields.
USD/JPY tumbles to around 149.80 during the European session after Bank of Japan (BoJ) board member Hajime Takata's hawkish remarks on Thursday. Takata stressed the importance of the BoJ considering adaptable measures, including the potential exit from monetary stimulus.
However, Hajime Takata provided additional comments, stating a reluctance to pinpoint any specific policy action when mentioning 'nimble responses.' He clarified that there are no plans for consecutive interest rate hikes and emphasized the necessity for gradual steps given the mixed circumstances surrounding small firms. Various options are available when dismantling the yield curve control framework.
The US Dollar Index (DXY) depreciates on Thursday, maintaining its position around 103.80, while the 2-year and 10-year yields on US Treasury coupons stand at 4.65% and 4.28%, respectively, by the press time. The weakness in the USD/JPY pair may be attributed to an improved risk appetite ahead of the release of key US Personal Consumption Expenditures - Price Index data, which could potentially influence the Federal Reserve's monetary policy stance.
According to the CME FedWatch Tool, the likelihood of rate cuts in March stands at 3.0%, with probabilities of 19.3% and 52.6% in May and June, respectively. New York Federal Reserve (Fed) President John Williams stated on Wednesday that while there is still progress to be made in reaching the Fed's 2% inflation target, the possibility of interest rate cuts this year remains on the table, contingent upon incoming data.
The US releases Personal Consumption Expenditures (PCE) figures today. Economists at ING analyze Dollar’s outlook ahead of the data.
DXY more likely to end the week above 104.00 than below
On the inflation side, the PCE deflator (the Fed’s preferred inflation measure) for the fourth quarter was revised higher from 2.0% to 2.1% and we’ll see January numbers today. Our expectations are for a 0.4% core MoM print, which in our view will endorse the recent hawkish repricing of Fed rate expectations.
From an FX point of view, we see the Dollar finding some support today on the back of the release. Data on personal spending and the weekly jobless claims report should also impact USD.
The EUR-heavy DXY index may well be impacted by initial CPI figures out of the Eurozone today, but we think it is more likely to end the week above 104.00 than below.
- USD/CAD trades sideways around 1.3570 ahead of the US and Canada economic data.
- The BoC may shift to rate cuts early if the Canadian Q4 GDP turns out weaker than expectations.
- The Loonie asset hovers around the horizontal resistance of the Ascending Triangle formation.
The USD/CAD pair is stuck in a tight range around 1.3570 in the European session on Thursday. The Loonie asset awaits the United States core Personal Consumption Expenditure Price Index (PCE) and the Canadian Q4 Gross Domestic Product (GDP) data for fresh guidance, both will be published at 13:30 GMT.
The US Dollar Index turns subdued ahead of the crucial US inflation data. The monthly core PCE Price Index data is anticipated to have grown by 0.4% in January against 0.2% increase in December. The annual underlying inflation data is forecasted to have grown at a slower pace of 2.8% vs. 2.9% growth in December.
On the Canadian Dollar front, the monthly GDP data for December is expected to have grown at a steady pace of 0.2%. The Bank of Canada (BoJ) projected earlier that the growth rate in the last quarter of 2023 will be flat. Weak GDP growth would deepen hopes of early rate cuts by the Bank of Canada (BoC).
USD/CAD aims to deliver a breakout of the Ascending Triangle chart pattern formed on a daily timeframe. The asset hovers around the horizontal resistance of the aforementioned pattern plotted from December 13 high at 1.3608, while the upward-sloping border is placed from December 29 low at 1.3178.
The near-term demand is upbeat as the pair is holding above the 50-day Exponential Moving Average (EMA), which trades around 1.3487.
The 14-period Relative Strength Index (RSI) climbs above 60.00, indicating that momentum leans toward the upside.
Fresh upside would appear if the asset breaks above December 13 high at 1.3608, which will drive the asset towards November 15 low at 1.3655, followed by the round-level resistance of 1.3700.
On the flip side, a downside move below February 22 low at 1.3441 would expose the asset to February 9 low at 1.3413. A breakdown below the latter would extend downside towards January 15 low at 1.3382.
USD/CAD daily chart
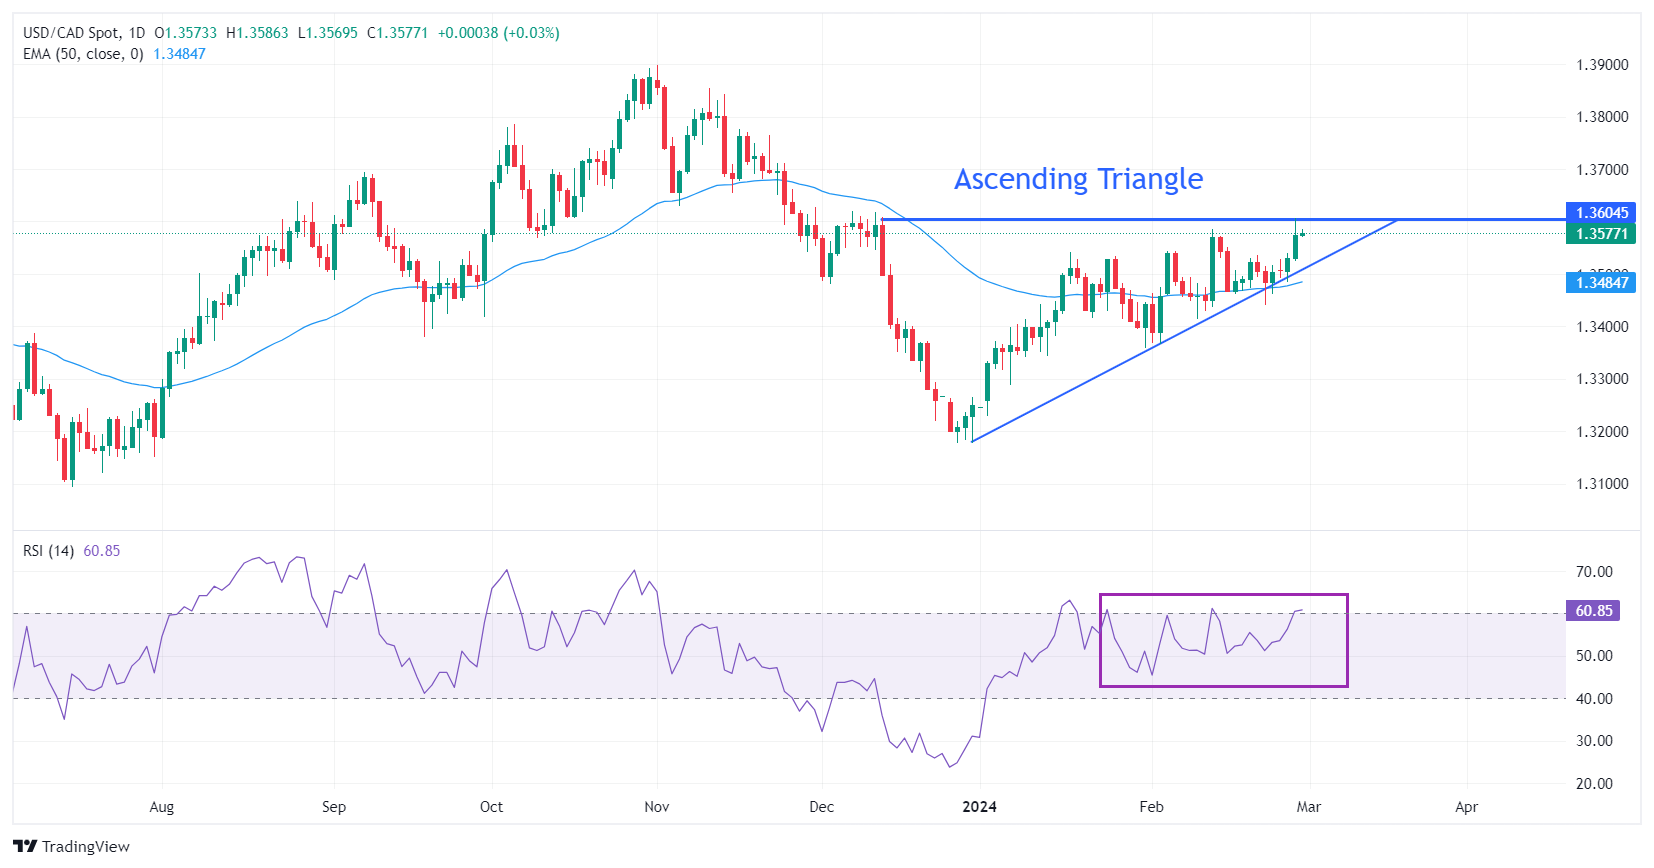
- USD/MXN loses ground on improved risk-on sentiment.
- US Dollar declines despite improved US Treasury yields.
- Banxico expects to achieve the 3% goal in the second quarter of 2025.
USD/MXN faces challenges as the US Dollar (USD) loses ground after registering gains in the previous session despite the improved US Treasury yields. The USD/MXN pair edges lower to near 17.08 during the European trading hours on Thursday.
The USD/MXN pair witnesses the weakness possibly due to improved risk appetite ahead of the release of key US Personal Consumption Expenditures - Price Index data, which could potentially influence the Federal Reserve's monetary policy stance.
The US Dollar Index (DXY) depreciates on Thursday and maintains its position around 103.80 with 2-year and 10-year yields on US Treasury coupons standing at 4.65% and 4.28%, respectively, by the press time.
The preliminary US Gross Domestic Product Annualized (Q4) improved by 3.2%, against the 3.3% expected. Additionally, the preliminary US Gross Domestic Product Price Index (Q4) rose by 1.7%, surpassing both expected and previous rises of 1.5%.
On the Mexican side, Governor Victoria Rodriguez Ceja announced that the Gross Domestic Product (GDP) was downwardly revised to 2.8% from 3.0% in the previous report to. She anticipates the GDP for 2025 to remain at 1.5%, consistent with previous projections. Additionally, the Trade Balance indicated a trade deficit in January exceeding expectations. Jobless Rate data is scheduled for release on Thursday.
Bank of Mexico (Banxico) estimates that they will achieve the 3% goal in the second quarter of 2025. Banxico’s Deputy Governor Jonathan Heath supports the notion of a quarter of a percentage cut to adjust real rates. Subsequently, he favors maintaining higher rates for an extended duration.
Today, the French, German and Spanish figures, among others, a total of almost 65% of the HICP will be published. The new inflation figures for the Eurozone are due on Friday. This will give us an approximate indicator for Friday's figures. Michael Pfister, FX Analyst at Commerzbank, analyzes how inflation data could impact the Euro (EUR).
Euro could certainly benefit somewhat today if the national inflation figures surprise to the upside
The Euro could certainly benefit somewhat today if the national inflation figures surprise to the upside. That would be a clear sign that we will see higher numbers on Friday as well. But I want to make a quite different point. Namely, the Euro is unlikely to benefit as much from the same surprise as the USD from the PCE deflator.
Today's national inflation numbers will have to surprise much more to the upside than the PCE deflator for the market's interest rate expectations to move similarly sharply. As I said, the Euro should also benefit from higher numbers, but not quite as much as the Dollar in the event of similar surprises.
- Pound Sterling versus USD ranges as investors await the US core PCE inflation data.
- If the US inflation data turns stubborn, GBP/USD will suffer.
- In the UK, BoE policymakers need more evidence of inflation easing to 2% before initiating rate cuts.
The Pound Sterling (GBP) trades with nominal gains against the US Dollar in Thursday’s European session. Market participants await the United States core Personal Consumption Expenditure Price Index (PCE) for January, which will be published at 13:30 GMT. Federal Reserve (Fed) policymakers closely track the underlying inflation data to prepare a fresh outlook on interest rates.
The GBP/USD pair oscillates inside Wednesday’s trading range as uncertainty over the timing of Bank of England (BoE) rate cuts keeps the Pound Sterling on the sidelines. BoE policymakers are reluctant to reduce interest rates early as it could stall progress in inflation declining towards the 2% target, or price pressures could flare up again.
Daily Digest Market Movers: Pound Sterling consolidates amid a quiet market mood
- Pound Sterling trades lackluster around 1.2660 amid a quiet market mood as investors await the United States core PCE Price Index for January.
- The US core PCE Price Index data is expected to have risen by 0.4% monthly against a 0.2% increase in December. Investors anticipate that the underlying inflation data have decelerated to 2.8% annually against the former reading of 2.9%.
- The appeal for the US Dollar will strengthen if the core PCE Price Index data turns out stickier than expectations. This would allow Federal Reserve policymakers to lean towards keeping interest rates unchanged in the range of 5.25%-5.50% for a longer period.
- The US Dollar attracts higher foreign inflows if the Fed maintains a hawkish outlook on interest rates. The US Dollar Index (DXY), which gauges Greenback’s value against six major currencies, remains subdued around 103.80 in Thursday’s European session.
- The Fed’s preferred inflation data would significantly influence market expectations for the timing of rate cuts.
- On a broader note, the Pound Sterling is expected to outperform the US Dollar as investors hope that the Bank of England will pivot to rate cuts later than the Fed.
- Core consumer price inflation in the United Kingdom economy is at 5.1%, the highest in the Group of Seven economies, which would force BoE policymakers to maintain a hawkish monetary policy stance for a longer period.
- This week, BoE Deputy Governor Dave Ramsden said he wants to see how long inflation will remain persistent before considering a change in the monetary policy stance. In the last monetary policy meeting, Ramsden voted for holding interest rates at 5.25%.
- UK’s stubborn core inflation has been prompted by solid wage growth and high service inflation. However, annual shop price inflation has retreated to 2.5% in February due to weak growth in food items, the lowest since March 2022, which seems to offer some relief to households. The shop price index tracks price changes in food and non-food items.
Technical Analysis: Pound Sterling remains sideways below 1.2700
Pound Sterling oscillates in a tight range around 1.2670. The GBP/USD pair continues to face stiff resistance near the downward-sloping border of the Descending Triangle pattern formed on a daily timeframe, placed from December 28 high at 1.2827. While, the horizontal support is plotted from December 13 low near 1.2500.
A Descending Triangle pattern exhibits indecisiveness among market participants but with a slight downside bias due to lower highs and flat lows formation.
The pair holds above the 20-day Exponential Moving Average (EMA), which trades around 1.2650. Meanwhile, the 14-period Relative Strength Index (RSI) remains within the 40.00-60.00 range, indicating a sharp volatility contraction.
Pound Sterling FAQs
What is the Pound Sterling?
The Pound Sterling (GBP) is the oldest currency in the world (886 AD) and the official currency of the United Kingdom. It is the fourth most traded unit for foreign exchange (FX) in the world, accounting for 12% of all transactions, averaging $630 billion a day, according to 2022 data.
Its key trading pairs are GBP/USD, aka ‘Cable’, which accounts for 11% of FX, GBP/JPY, or the ‘Dragon’ as it is known by traders (3%), and EUR/GBP (2%). The Pound Sterling is issued by the Bank of England (BoE).
How do the decisions of the Bank of England impact on the Pound Sterling?
The single most important factor influencing the value of the Pound Sterling is monetary policy decided by the Bank of England. The BoE bases its decisions on whether it has achieved its primary goal of “price stability” – a steady inflation rate of around 2%. Its primary tool for achieving this is the adjustment of interest rates.
When inflation is too high, the BoE will try to rein it in by raising interest rates, making it more expensive for people and businesses to access credit. This is generally positive for GBP, as higher interest rates make the UK a more attractive place for global investors to park their money.
When inflation falls too low it is a sign economic growth is slowing. In this scenario, the BoE will consider lowering interest rates to cheapen credit so businesses will borrow more to invest in growth-generating projects.
How does economic data influence the value of the Pound?
Data releases gauge the health of the economy and can impact the value of the Pound Sterling. Indicators such as GDP, Manufacturing and Services PMIs, and employment can all influence the direction of the GBP.
A strong economy is good for Sterling. Not only does it attract more foreign investment but it may encourage the BoE to put up interest rates, which will directly strengthen GBP. Otherwise, if economic data is weak, the Pound Sterling is likely to fall.
How does the Trade Balance impact the Pound?
Another significant data release for the Pound Sterling is the Trade Balance. This indicator measures the difference between what a country earns from its exports and what it spends on imports over a given period.
If a country produces highly sought-after exports, its currency will benefit purely from the extra demand created from foreign buyers seeking to purchase these goods. Therefore, a positive net Trade Balance strengthens a currency and vice versa for a negative balance.
- EUR/GBP faced challenges after Germany’s Retail Sales data on Thursday.
- January’s German Retail Sales (YoY) decreased by 1.4%, against the expected 1.5% and 1.7% prior.
- BoE Catherine Mann emphasized that the spending habits of Britons pose a challenge in curbing inflation.
EUR/GBP edges lower to near 0.8560 during the early European session on Thursday, retracing its recent gains. The Euro (EUR) encountered difficulties following Germany’s Retail Sales data. Additionally, disappointing data from the Eurozone on Wednesday might have put downward pressure on the Euro, consequently, undermining the EUR/GBP pair.
German Retail Sales (YoY) declined by 1.4% in January, against the expected 1.5% and 1.7% prior. While a 0.4% decline was recorded in monthly sales of the German retail sector against the expected growth of 0.5%. Economic sentiment declined in February, dropping from 96.1 to 95.4, which fell short of estimates for an improvement to 96.7. Similarly, Consumer Confidence revealed an economic downturn with a consistent reading of -15.5 as expected. Furthermore, market participants are likely awaiting Consumer Price Index, and Unemployment data on Thursday from Germany.
On Wednesday, Bank of England’s (BoE) Catherine Mann remarked that the spending habits of affluent British citizens pose a challenge in curbing inflation. Despite this, market sentiment suggests that the BoE is likely to initiate interest rate cuts soon, which could potentially limit the losses of the EUR/GBP cross.
However, earlier in the week, Bank of England policymakers expressed the need for more evidence indicating a decrease in inflation toward the 2% target before contemplating reductions in key lending rates. BoE Deputy Governor Dave Ramsden emphasized the necessity for further evidence indicating a moderation of inflationary pressures before considering interest rate cuts.
EUR/USD remains trading around the 1.0850 mark. Economists at ING analyze the pair’s outlook.
CPI figures should not change the ECB narrative
French and German CPI numbers may not lead to much change in ECB communication.
We don’t expect today’s regional figures or Friday’s Eurozone-wide flash CPI estimate to justify a change in the ECB’s narrative at next week’s policy meeting.
The recent speech by ECB President Christine Lagarde at the EU Parliament confirmed that the ECB is still looking for more conclusive evidence before acting on sanguine disinflation expectations. That likely includes waiting for wage data for the first quarter, and we suspect the likelihood of a rate cut before the June meeting is low.
We expect some pressure on EUR/USD after US PCE figures today.
Statistics Canada will release Gross Domestic Product (GDP) data on Thursday, February 29 at 13:30 GMT as we get closer to the release time, here are forecasts from economists and researchers of five major banks regarding the upcoming growth data.
Canadian economy is expected to have expanded 0.8% during the October-December period after the annualized 1.1% contraction recorded in Q3 2023.
TDS
We look for Canada to avoid a hard landing with real GDP growth of 0.8% after the 1.1% contraction in Q3, as household consumption and residential investment help to underpin expenditure-based growth.
RBC Economics
We expect Q4 GDP growth to remain in positive territory with a small annualized increase of 0.5%. That will prevent the economy from seeing two consecutive quarters of contraction, which is often used as the definition of a ‘technical’ recession. But when measured against the country’s rapid population growth, it’s the sixth straight quarterly decline on a per-capita basis, alongside a rising unemployment rate. On a monthly basis, we expect GDP edged up 0.1% in December, building on the 0.2% increase in November but below the 0.3% preliminary estimate from Statistics Canada a month ago, which is highly prone to revision.
NBF
Monthly reports published to date suggest a healthy increase in household consumption in the quarter was only partially offset by a contraction in business investment in both the machinery/equipment and structures segments. Residential investment, for its part, could have contracted for the sixth time in the past seven quarters judging by the decrease in housing starts which took in the final three months of the year. Inventory depletion should have weighed on growth, but this could have been counterbalanced by an improvement in net exports (real exports rose and real imports cooled). All accounted for, GDP may have risen 0.7% in annualized terms in the quarter.
CIBC
Although our call for 0.8% annualized growth is well above the BoC’s expectation for a flat quarter, that will likely be driven by an expansion in the supply side of the economy, which doesn’t pose an inflation threat. Early indicators for activity in January have looked mixed so far, and the January advance estimate for GDP will provide more colour on activity in a month where mild weather conditions could have boosted output.
Citi
We expect a 1.3% QoQ increase in Q4 GDP by expenditure, stronger than the BoC’s January forecast of flat growth. Quarterly GDP data, however, have been especially volatile this year (and subject to large revisions). But even a softer increase in output than expected would likely not significantly increase the chance of much sooner rate cuts given that the BoC has been expecting stagnant activity in Q4. Modestly stronger growth in Q4 and H1 should keep BoC officials erring slightly on the more hawkish side.
Here is what you need to know on Thursday, February 29:
The US Dollar (USD) lost its strength during the American trading hours on Wednesday, while US Treasury bond yields edged lower. The USD Index (DXY) stays below 104.00 early Thursday as market focus shifts to the Personal Consumption Expenditures (PCE) Price Index, the Federal Reserve's preferred gauge of inflation, data for January. Preliminary February Consumer Price Index (CPI) data from Germany, fourth-quarter Gross Domestic Product (GDP) reading from Canada will also be watched closely by market participants.
After falling nearly 1%, the benchmark 10-year US Treasury bond yield fluctuates between 4.25% and 4.3% in the European morning. In the meantime, US stock index futures trade flat after Wall Street's main indexes closed modestly lower on Wednesday. Core PCE inflation in the US is forecast to rise 0.4% on a monthly basis. Weekly Initial Jobless Claims, Pending Home Sales, Personal Income and Personal Spending data for January will be featured in the US economic docket as well. Finally, several Fed policymakers will be delivering speeches in the second half of the day.
US Core PCE Inflation Preview: Federal Reserve preferred price gauge looks set to accelerate in January.
US Dollar price this week
The table below shows the percentage change of US Dollar (USD) against listed major currencies this week. US Dollar was the weakest against the Japanese Yen.
| USD | EUR | GBP | CAD | AUD | JPY | NZD | CHF | |
| USD | -0.17% | 0.05% | 0.47% | 0.72% | -0.58% | 1.35% | -0.31% | |
| EUR | 0.17% | 0.21% | 0.64% | 0.89% | -0.40% | 1.53% | -0.15% | |
| GBP | -0.04% | -0.21% | 0.43% | 0.68% | -0.60% | 1.32% | -0.35% | |
| CAD | -0.48% | -0.65% | -0.44% | 0.26% | -1.06% | 0.89% | -0.80% | |
| AUD | -0.74% | -0.90% | -0.69% | -0.24% | -1.29% | 0.64% | -1.04% | |
| JPY | 0.56% | 0.39% | 0.64% | 1.05% | 1.31% | 1.90% | 0.24% | |
| NZD | -1.38% | -1.55% | -1.33% | -0.90% | -0.65% | -1.96% | -1.70% | |
| CHF | 0.32% | 0.15% | 0.35% | 0.79% | 1.05% | -0.26% | 1.67% |
The heat map shows percentage changes of major currencies against each other. The base currency is picked from the left column, while the quote currency is picked from the top row. For example, if you pick the Euro from the left column and move along the horizontal line to the Japanese Yen, the percentage change displayed in the box will represent EUR (base)/JPY (quote).
USD/JPY came under heavy bearish pressure in the Asian session on Thursday and declined below 150.00 for the first time in over a week. Bank of Japan (BoJ) board member Hajime Takata noted that momentum is rising in spring wage talks and added that a high wage hike rate would prompt continual expectations that household income will rise. Commenting on the policy outlook, Takata argued that they need to consider taking a flexible response, including an exit from monetary stimulus. He further elaborated by saying that he is not thinking of raising interest rates one after another.
Japanese Yen eases from over one-week high, bulls turn cautious ahead of US PCE Price Index.
The data from Australia showed that Retail Sales rose by 1.1% on a monthly basis in January following the 2.7% decline recorded in December. After falling more than 0.7% on Wednesday, AUD/USD staged a rebound early Thursday and was last seen trading in positive territory above 0.6500.
Australian Dollar gains ground amid a stable US Dollar ahead of US PCE - Price Index.
The Canadian economy is forecast to grow at an annual rate of 0.8% in the fourth quarter, following the 1.1% contraction recorded in the previous quarter. After touching its highest level since mid-December at 1.3606, USD/CAD staged a downward correction and was last seen trading flat on the day at around 1.3570.
EUR/USD recovered from the weekly-low it touched below 1.0800 on Wednesday and closed the day virtually unchanged. The pair fluctuates in a tight channel below 1.0850 early Thursday. Germany's Destatis reported that Retail Sales declined by 0.4% on a monthly basis in January, missing the market expectation for an increase of 0.5% by a wide margin.
GBP/USD snapped a six-day winning streak on Wednesday. The pair stays in a consolidation phase below 1.2700 in the European morning on Thursday.
Gold benefited from retreating US yields on Wednesday and posted marginal gains. XAU/USD trades near the upper limit of its near-term range slightly below $2,040.
Gold price remains confined in narrow range ahead of key US inflation data.
Germany's Retail Sales fell 0.4% MoM in January, slowing from a 1.6% decline seen in December, the official data released by Destatis showed on Thursday. The market expectations were for a 0.5% increase.
Retail Sales in the Eurozone's biggest economy dropped 1.4% YoY in January versus a 1.7% annual fall reported in December, coming in above the forecast of -1.5%.
EUR/USD reaction to the German data
Mixed German data fail to move the needle around the Euro, keeping EUR/USD in its range near 1.0835, as of writing.
Euro price today
The table below shows the percentage change of Euro (EUR) against listed major currencies today. Euro was the strongest against the Swiss Franc.
| USD | EUR | GBP | CAD | AUD | JPY | NZD | CHF | |
| USD | 0.04% | -0.02% | -0.03% | -0.34% | -0.61% | -0.10% | 0.01% | |
| EUR | -0.05% | -0.06% | -0.06% | -0.36% | -0.64% | -0.13% | -0.03% | |
| GBP | 0.02% | 0.06% | -0.01% | -0.30% | -0.58% | -0.08% | 0.02% | |
| CAD | 0.02% | 0.08% | 0.00% | -0.28% | -0.59% | -0.06% | 0.03% | |
| AUD | 0.34% | 0.35% | 0.30% | 0.29% | -0.28% | 0.23% | 0.31% | |
| JPY | 0.60% | 0.65% | 0.59% | 0.56% | 0.28% | 0.52% | 0.60% | |
| NZD | 0.08% | 0.14% | 0.08% | 0.06% | -0.24% | -0.52% | 0.12% | |
| CHF | 0.00% | 0.05% | -0.02% | -0.03% | -0.32% | -0.61% | -0.08% |
The heat map shows percentage changes of major currencies against each other. The base currency is picked from the left column, while the quote currency is picked from the top row. For example, if you pick the Euro from the left column and move along the horizontal line to the Japanese Yen, the percentage change displayed in the box will represent EUR (base)/JPY (quote).
- The Core Personal Consumption Expenditures Price Index is set to rise 0.4% MoM and 2.8% YoY in January.
- Markets see a strong chance of the Federal Reserve keeping the policy rate unchanged in March and May.
- The slowing progress of PCE inflation towards the 2% target could help the US Dollar stay resilient against its rivals.
The Core Personal Consumption Expenditures (PCE) Price Index, the US Federal Reserve’s (Fed) preferred inflation measure, will be published on Thursday by the US Bureau of Economic Analysis (BEA) at 13:30 GMT.
What to expect in the Federal Reserve’s preferred PCE inflation report?
The Core PCE Price Index, which excludes volatile food and energy prices, is seen as the more influential measure of inflation in terms of Fed positioning. The index is forecast to rise 0.4% on a monthly basis in January, at a stronger pace than the 0.2% increase recorded in December. January Core PCE is also projected to grow at an annual pace of 2.8%, compared to 2.9% in December. The headline PCE inflation is forecast to soften to 2.4% (YoY).
Previewing the PCE inflation report, “The market remains expectant about the final impact on PCE prices following hot January CPI and PPI inflation,” said Oscar Munoz, Chief US Macro Strategist at TD Securities, in a weekly report. “TD expects those robust increases to result in a solid 0.36% m/m jump for the core PCE. The PCE's supercore likely also surged but by an even stronger 0.55%.”
When will the PCE inflation report be released, and how could it affect EUR/USD?
The PCE inflation data is slated for release at 13:30 GMT. The monthly Core PCE Price Index gauge is the most-preferred inflation reading by the Fed, as it’s not distorted by base effects and provides a clear view of underlying inflation by excluding volatile items. Investors, therefore, pay close attention to the monthly Core PCE figure.
Stronger-than-forecast Consumer Price Index (CPI) and Producer Price Index (PPI) readings in January, combined with the impressive labor market report, revived expectations for the Fed to continue to delay the policy pivot.
The CME FedWatch Tool shows that markets are fully pricing in a no-change in the Fed policy rate in March and see an 85% probability for another hold in May. Although the market positioning suggests that there isn’t much room for additional USD gains in case a strong monthly core PCE reading confirms a Fed policy pause in May, investors could see this data as a sign that could potentially reduce the number of total rate cuts in 2024. Hence, a print above the market expectation could provide a boost to the USD and weigh on EUR/USD.
On the other hand, a softer-than-forecast increase in the monthly core PCE is unlikely to revive expectations for a rate cut in May. Nevertheless, such a reading could help the risk mood improve and allow EUR/USD to edge higher by making it difficult for the USD to hold its ground.
FXStreet Analyst Eren Sengezer offers a brief technical outlook for EUR/USD and explains:
“The 200-day Simple Moving Average (SMA) and the 100-day SMA form a pivot level for EUR/USD at 1.0820-1.0830. If the pair fails to stabilize above that level, it could target 1.0700 (Fibonacci 61.8% retracement of the October-December uptrend) on the downside. In case EUR/USD confirms 1.0820-1.0830 as support, 1.0900 (psychological level, static level) could be seen as the next bullish target before 1.0950 (Fibonacci 23.6% retracement)."
Economic Indicator
United States Core Personal Consumption Expenditures - Price Index (YoY)
The Core Personal Consumption Expenditures (PCE), released by the US Bureau of Economic Analysis on a monthly basis, measures the changes in the prices of goods and services purchased by consumers in the United States (US). The PCE Price Index is also the Federal Reserve’s (Fed) preferred gauge of inflation. The YoY reading compares the prices of goods in the reference month to the same month a year earlier. The core reading excludes the so-called more volatile food and energy components to give a more accurate measurement of price pressures." Generally, a high reading is bullish for the US Dollar (USD), while a low reading is bearish.
Read more.Next release: 02/29/2024 13:30:00 GMT
Frequency: Monthly
Source: US Bureau of Economic Analysis
Why it matters to traders
After publishing the GDP report, the US Bureau of Economic Analysis releases the Personal Consumption Expenditures (PCE) Price Index data alongside the monthly changes in Personal Spending and Personal Income. FOMC policymakers use the annual Core PCE Price Index, which excludes volatile food and energy prices, as their primary gauge of inflation. A stronger-than-expected reading could help the USD outperform its rivals as it would hint at a possible hawkish shift in the Fed’s forward guidance and vice versa.
Fed FAQs
What does the Federal Reserve do, how does it impact the US Dollar?
Monetary policy in the US is shaped by the Federal Reserve (Fed). The Fed has two mandates: to achieve price stability and foster full employment. Its primary tool to achieve these goals is by adjusting interest rates.
When prices are rising too quickly and inflation is above the Fed’s 2% target, it raises interest rates, increasing borrowing costs throughout the economy. This results in a stronger US Dollar (USD) as it makes the US a more attractive place for international investors to park their money.
When inflation falls below 2% or the Unemployment Rate is too high, the Fed may lower interest rates to encourage borrowing, which weighs on the Greenback.
How often does the Fed hold monetary policy meetings?
The Federal Reserve (Fed) holds eight policy meetings a year, where the Federal Open Market Committee (FOMC) assesses economic conditions and makes monetary policy decisions.
The FOMC is attended by twelve Fed officials – the seven members of the Board of Governors, the president of the Federal Reserve Bank of New York, and four of the remaining eleven regional Reserve Bank presidents, who serve one-year terms on a rotating basis.
What is Quantitative Easing (QE) and how does it impact USD?
In extreme situations, the Federal Reserve may resort to a policy named Quantitative Easing (QE). QE is the process by which the Fed substantially increases the flow of credit in a stuck financial system.
It is a non-standard policy measure used during crises or when inflation is extremely low. It was the Fed’s weapon of choice during the Great Financial Crisis in 2008. It involves the Fed printing more Dollars and using them to buy high grade bonds from financial institutions. QE usually weakens the US Dollar.
What is Quantitative Tightening (QT) and how does it impact the US Dollar?
Quantitative tightening (QT) is the reverse process of QE, whereby the Federal Reserve stops buying bonds from financial institutions and does not reinvest the principal from the bonds it holds maturing, to purchase new bonds. It is usually positive for the value of the US Dollar.
- AUD/JPY trades on a softer note near 97.65 in Thursday’s early European session.
- A fresh verbal intervention and growing speculation that the BoJ will exit from ultra-loose monetary policy lift the Japanese Yen.
- Australian Retail Sales rose 1.1% MoM in January, below the expectation of 1.5% MoM.
The AUD/JPY cross trades in negative territory for the fourth consecutive day during the early European trading hours on Thursday. The downtick of the cross is supported by the verbal intervention and hawkish remarks from Bank of Japan (BoJ) board member Hajime Takata. At press time, AUD/JPY is trading at 97.65, down 0.24% on the day.
On Thursday, BoJ board member Hajime Takata said that the Japanese central bank needs to consider a flexible approach, including an exit from negative interest rates and bond yield control. Earlier this month, BoJ Deputy Governor Shinichi Uchida stated that the central bank will review other components of its stimulus framework upon ending negative rates. That being said, the hawkish comments from the Japanese authorities provide some support to the Japanese Yen (JPY) and act as a headwind for the AUD/JPY cross.
Meanwhile, a fresh verbal intervention from Japanese authorities might cap the upside of the cross. Japan's top currency diplomat Masato Kanda stated that the central bank will take appropriate action if currency moves are deemed too volatile.
On the Aussie front, Australian Retail Sales climbed by 1.1% MoM in January from a 2.7% fall in December, worse than the market expectation of an increase of 1.5%. The Australian Retail Sales figures might convince the Reserve Bank of Australia (RBA) to consider holding interest rates for longer.
Looking ahead, market players will keep an eye on the Australian Judo Bank Manufacturing PMI for February, along with the Japanese Unemployment Rate for January and the Jibun Bank Manufacturing PMI. Traders will take cues from the data and find trading opportunities around the AUD/JPY cross.
Citing four sources, Reuters reported on Thursday, the European Central Bank (ECB) policymakers’ meeting in Frankfurt last week agreed that the ECB would stick to a "floor" system, where the central bank effectively sets the lowest rate at which banks would lend to each other.
Additional takeaways
The ECB will not single-handedly decide how much liquidity it provides to the banking system once it has finished draining excess reserves some years from now.
Policymakers agreed commercial banks would help determine that by borrowing the reserves they need from the ECB.
To facilitate this, the ECB will make it cheaper for banks to borrow by lowering the rate on its weekly cash auctions, currently at 4.5%, and bringing it closer to its 4.0% deposit rate.
Policymakers also agreed they would tolerate some fluctuations in the Euro Short-Term Rate (ESTR), the benchmark in the inter-bank market, around the ECB's own deposit rate.
They expect to announce this new framework -- known in market parlance as a "demand-driven floor" -- next month, potentially as early as the ECB's non-policy meeting on March 13.
Market reaction
The Euro shows little to no reaction to the above report, with EUR/USD flatlining near 1.0835, at the press time.
ECB FAQs
What is the ECB and how does it influence the Euro?
The European Central Bank (ECB) in Frankfurt, Germany, is the reserve bank for the Eurozone. The ECB sets interest rates and manages monetary policy for the region.
The ECB primary mandate is to maintain price stability, which means keeping inflation at around 2%. Its primary tool for achieving this is by raising or lowering interest rates. Relatively high interest rates will usually result in a stronger Euro and vice versa.
The ECB Governing Council makes monetary policy decisions at meetings held eight times a year. Decisions are made by heads of the Eurozone national banks and six permanent members, including the President of the ECB, Christine Lagarde.
What is Quantitative Easing (QE) and how does it affect the Euro?
In extreme situations, the European Central Bank can enact a policy tool called Quantitative Easing. QE is the process by which the ECB prints Euros and uses them to buy assets – usually government or corporate bonds – from banks and other financial institutions. QE usually results in a weaker Euro.
QE is a last resort when simply lowering interest rates is unlikely to achieve the objective of price stability. The ECB used it during the Great Financial Crisis in 2009-11, in 2015 when inflation remained stubbornly low, as well as during the covid pandemic.
What is Quantitative tightening (QT) and how does it affect the Euro?
Quantitative tightening (QT) is the reverse of QE. It is undertaken after QE when an economic recovery is underway and inflation starts rising. Whilst in QE the European Central Bank (ECB) purchases government and corporate bonds from financial institutions to provide them with liquidity, in QT the ECB stops buying more bonds, and stops reinvesting the principal maturing on the bonds it already holds. It is usually positive (or bullish) for the Euro.
Bank of Japan (BoJ) board member Hajime Takata is back on the writes on Thursday after fanning expectations of a hawkish policy pivot earlier this Thursday.
Additional takeaways
I don't want to single out any policy step when I mention 'nimble responses'.
Not thinking of raising interest rates one after another.
Gradual steps will be needed amid mixed circumstances surrounding small firms.
Various options remain when we dismantle yield curve control framework.
Will not respond automatically to any target, when asked about rate hikes after ending negative rates.
There is no order of steps in monetary policy exit.
We need to keep some easing measures to some extent.
Important to avoid discontinuity, when asked about monetary policy exit.
Monetary policies need to remain consistent with the real economy and financial environment.
Important for exit strategy to be not too complicating.
Market reaction
USD/JPY remains under heavy selling pressure below 150.00, as traders digest the above comments. The pair is down 0.51% on the day.
Japanese Yen FAQs
What key factors drive the Japanese Yen?
The Japanese Yen (JPY) is one of the world’s most traded currencies. Its value is broadly determined by the performance of the Japanese economy, but more specifically by the Bank of Japan’s policy, the differential between Japanese and US bond yields, or risk sentiment among traders, among other factors.
How do the decisions of the Bank of Japan impact the Japanese Yen?
One of the Bank of Japan’s mandates is currency control, so its moves are key for the Yen. The BoJ has directly intervened in currency markets sometimes, generally to lower the value of the Yen, although it refrains from doing it often due to political concerns of its main trading partners. The current BoJ ultra-loose monetary policy, based on massive stimulus to the economy, has caused the Yen to depreciate against its main currency peers. This process has exacerbated more recently due to an increasing policy divergence between the Bank of Japan and other main central banks, which have opted to increase interest rates sharply to fight decades-high levels of inflation.
How does the differential between Japanese and US bond yields impact the Japanese Yen?
The BoJ’s stance of sticking to ultra-loose monetary policy has led to a widening policy divergence with other central banks, particularly with the US Federal Reserve. This supports a widening of the differential between the 10-year US and Japanese bonds, which favors the US Dollar against the Japanese Yen.
How does broader risk sentiment impact the Japanese Yen?
The Japanese Yen is often seen as a safe-haven investment. This means that in times of market stress, investors are more likely to put their money in the Japanese currency due to its supposed reliability and stability. Turbulent times are likely to strengthen the Yen’s value against other currencies seen as more risky to invest in.
- USD/CHF maintains its stability ahead of US PCE - Price Index data.
- CME FedWatch Tool indicated the chances for rate cuts in March are at 3.0%, with 19.3% in May and 52.6% in June.
- ZEW Survey – Expectations improved to 10.2 from the previous 19.5 drop.
USD/CHF moves sideways amid a tepid US Dollar (USD) despite improved US Treasury yields. The pair hovers around 0.8790 during the Asian trading hours on Thursday. The US Dollar Index (DXY) edges lower to near 103.90 with 2-year and 10-year yields on US Treasury coupons standing at 4.65% and 4.28%, respectively, by the press time.
The preliminary US Gross Domestic Product Annualized (Q4) rose by 3.2%, against the expected 3.3%. Additionally, the preliminary US Gross Domestic Product Price Index (Q4) increased by 1.7%, surpassing both expected and previous rises of 1.5%. These figures have led financial markets to delay expectations for the Federal Reserve’s (Fed) first rate cut, providing some support to the US Dollar (USD).
According to the CME FedWatch Tool, the odds for rate cuts in March are at 3.0%, with probabilities decreasing to 19.3% in May and increasing to 52.6% in June. New York Federal Reserve (Fed) President John Williams stated on Wednesday that while there is still progress to be made in reaching the Fed's 2% inflation target, the possibility of interest rate cuts this year remains on the table, contingent upon incoming data. Traders are eagerly awaiting the release of key US Personal Consumption Expenditures - Price Index data, which could potentially influence the Federal Reserve's monetary policy stance.
On the Swiss side, the ZEW Survey – Expectations indicated improved business conditions for February, with a reading of 10.2, up from the previous drop to 19.5. Additionally, support stemmed from expectations of lower interest rates by the Swiss National Bank (SNB) in the second half of the year. Moreover, investors are anticipating the Gross Domestic Product (GDP) data by the Swiss State Secretariat for Economic Affairs (SECO) on Thursday, which is expected to report a decline in the fourth quarter of 2023.
- GBP/USD gains some positive traction on Thursday amid a modest USD weakness.
- The Fed’s hawkish outlook to limit the USD losses and cap the upside for the pair.
- Traders might also prefer to wait for the release of the crucial US PCE Price Index.
The GBP/USD pair builds on the previous day's goodish rebound from the weekly low and attracts some follow-through buying during the Asian session on Thursday. Spot prices currently trade above mid-1.2600s and draw support from a modest US Dollar (USD) downtick, though lack bullish conviction.
The USD bulls prefer to wait on the sidelines and look to the release of the US Personal Consumption Expenditure (PCE) Price Index for cues about the Federal Reserve's rate-cut path before placing fresh directional bets. In the meantime, expectations that the Fed will keep interest rates higher for longer in the wake of sticky inflation and a still-resilient US economy should act as a tailwind for the buck. Apart from this, a slight deterioration in the global risk sentiment is seen benefitting the Greenback's safe-haven status and contributing to capping gains for the GBP/USD pair.
Meanwhile, the Bank of England (BoE) policymakers have been trying to push back against market expectations for early interest rate cuts. In fact, BoE Deputy Governor Dave Ramsden said on Tuesday that he wants more evidence that inflationary pressures were easing to consider a cut in interest rates. Adding to this, BoE's Catherine Mann said on Wednesday that the spending habits of wealthy Britons make it harder to curb inflation. The markets, however, seem convinced that the BoE will start cutting interest rates soon, which could further act as a headwind for the GBP/USD pair.
Nevertheless, the aforementioned fundamental backdrop makes it prudent to wait for strong follow-through buying before positioning for the resumption of the GBP/USD pair's two-week-old uptrend. There isn't any relevant market-moving economic data due for release from the UK on Thursday, leaving spot prices at the mercy of the USD Price dynamics. Apart from the key US inflation data, the US economic docket also features the release of the usual Weekly Initial Jobless Claims, the Chicago PMI and Pending Home Sales. This, along with Fed speak, should influence the USD demand.
- The US Dollar Index (DXY) trades on a softer note near 103.85.
- The US economy grew at a 3.2% annualized rate for Q4 vs. 3.3% prior.
- The hotter-than-expected inflation data in January has caused investors to push back the timing of the first rate cut.
- All eyes will be on the US Core Personal Consumption Expenditures Index (Core PCE) data, due later on Thursday.
The US Dollar Index (DXY) edges lower to 103.85 after retreating from weekly highs of 104.25 during the early European session on Thursday. Investors await the US Core Personal Consumption Expenditures Index (Core PCE) for January, due later on Thursday. This report might offer cues about the trajectory of inflation in the United States and could trigger the volatility in the market.
Data published by the US Bureau of Economic Analysis (BEA) on Wednesday showed that US Gross Domestic Product (GDP) for the fourth quarter (Q4) expanded at a 3.2% annualized rate. The figure came in below the market consensus and the previous reading of 3.3%.
Several Fed members in recent weeks agreed that they need additional evidence of inflation data before shifting the monetary policy stance. Meanwhile, the New York Fed President John Williams said that despite the Fed still has a ways to go before reaching its inflation target of 2%, the door is opening for interest rate cuts this year, depending on the incoming data. Fed Governor Bowman stated that inflation will continue to decline with rates remains on hold at the current levels, but it is not yet time to start cutting rates.
The hotter-than-expected CPI data has caused investors to push back the timing of the first rate cut. The markets have priced in 80 basis points (bps) of rate cuts this year, lower than 175 bps priced in around mid-January.
Later on Thursday, traders will closely monitor the US Core Personal Consumption Expenditures Index (Core PCE) data for January, which is expected to ease to 2.8% YoY from 2.9% in the previous reading. Also, the US Personal Income, Personal Spending, pending Home Sales and the weekly Initial Jobless Claims are due later in the day.
- EUR/JPY depreciates by around 0.62% after BoJ’s hawkish signal on Thursday.
- BoJ’s Hajime Takata hinted at the possibility of exiting from monetary stimulus measures.
- The Euro receives downward pressure following subdued data from the Eurozone on Wednesday.
EUR/JPY drops to near 162.30 during the Asian session following hawkish signals from Bank of Japan (BoJ) board member Hajime Takata on Thursday. Takata emphasized the necessity for the BoJ to contemplate flexible responses, including the possibility of exiting from monetary stimulus measures.
BoJ’s Takata noted that the achievement of the 2% inflation target is coming into view despite uncertainties in the economic outlook. Exit measures under consideration would involve abandoning the yield curve control framework, discontinuing negative interest rates, and revisiting the overshoot commitment. It is essential to consider the balance between the effectiveness of easing measures and their potential side effects. Furthermore, Takata highlighted that the economy is transitioning into a phase characterized by rising wages and prices, moving away from the chronic deflationary cycle.
Furthermore, the Japanese Yen (JPY) could receive support due to concerns about potential intervention by Japanese authorities, which in turn undermines the EUR/JPY cross. Masato Kanda, Japan's vice finance minister for international affairs, stated that the government is prepared to take appropriate action against excessive exchange-rate movements and volatility.
In other economic news, Japanese Retail Trade year-over-year expanded by 2.3% in January, meeting expectations and slightly down from the previous increase of 2.4%. Additionally, the seasonally adjusted month-over-month data surged by 0.8%, reversing the previous decline of 0.8%.
The Euro (EUR) encountered difficulties following disappointing data from the Eurozone on Wednesday. Economic sentiment declined in February, dropping from 96.1 to 95.4, which fell short of estimates for an improvement to 96.7. Similarly, Consumer Confidence revealed an economic downturn with a consistent reading of -15.5 as expected.
Moreover, market participants are likely awaiting a barrage of key economic data from Germany, including Retail Sales, Consumer Price Index, and Unemployment data on Thursday.
- NZD/USD stages a modest recovery from over a one-week low amid some USD selling.
- The technical setup warrants some caution before positioning for any meaningful gains.
- Acceptance below the 100-day SMA is needed to confirm the near-term negative outlook.
The NZD/USD pair attracts some buying during the Asian session on Thursday and reverses a part of the previous day's heavy losses to a one-and-half-week low touched in the aftermath of the Reserve Bank of New Zealand (RBNZ) policy decision. Spot prices currently trade around the 0.6100 mark, albeit lack follow-through as traders keenly await the release of the US Personal Consumption Expenditures (PCE) Price Index before placing fresh directional bets.
Heading into the key data risk, the US Dollar (USD) bulls seem reluctant to place aggressive bets and opt to wait on the sidelines, which, in turn, is seen lending some support to the NZD/USD pair. That said, the Federal Reserve's (Fed) higher-for-longer rates narrative should help limit any meaningful USD downfall. Apart from this, a generally weaker tone around the equity markets could benefit the Greenback's relative safe-haven status and cap the risk-sensitive Kiwi.
From a technical perspective, the post-RBNZ slump showed some resilience below the 100-day Simple Moving Average (SMA) and stalled just ahead of the 200-day SMA. The latter is currently pegged near the 0.6080-0.6075 region and should act as a key pivotal point. Given that oscillators on the daily chart have just started gaining negative traction, a convincing break below the said support will be seen as a fresh trigger for bearish traders and pave the way for deeper losses.
The subsequent downfall has the potential to drag the NZD/USD pair back towards the YTD low, around the 0.6040-0.6035 region touched earlier this February, en route to the 0.6000 psychological mark. The next relevant support is pegged near the 0.5965 area before spot prices weaken further below the 0.5940-0.5935 intermediate support, towards testing sub-0.5900 levels for the first time since November 2023.
On the flip side, any further recovery is more likely to attract fresh sellers and remain capped near the 0.6140-0.6145 horizontal resistance. That said, a sustained strength beyond could trigger a short-covering rally and allow the NZD/USD pair to reclaim the 0.6200 round-figure mark. This is followed by the monthly peak, around the 0.6215-0.6220 region touched last week, which if cleared decisively will shift the near-term bias back in favour of bullish traders.
NZD/USD daily chart
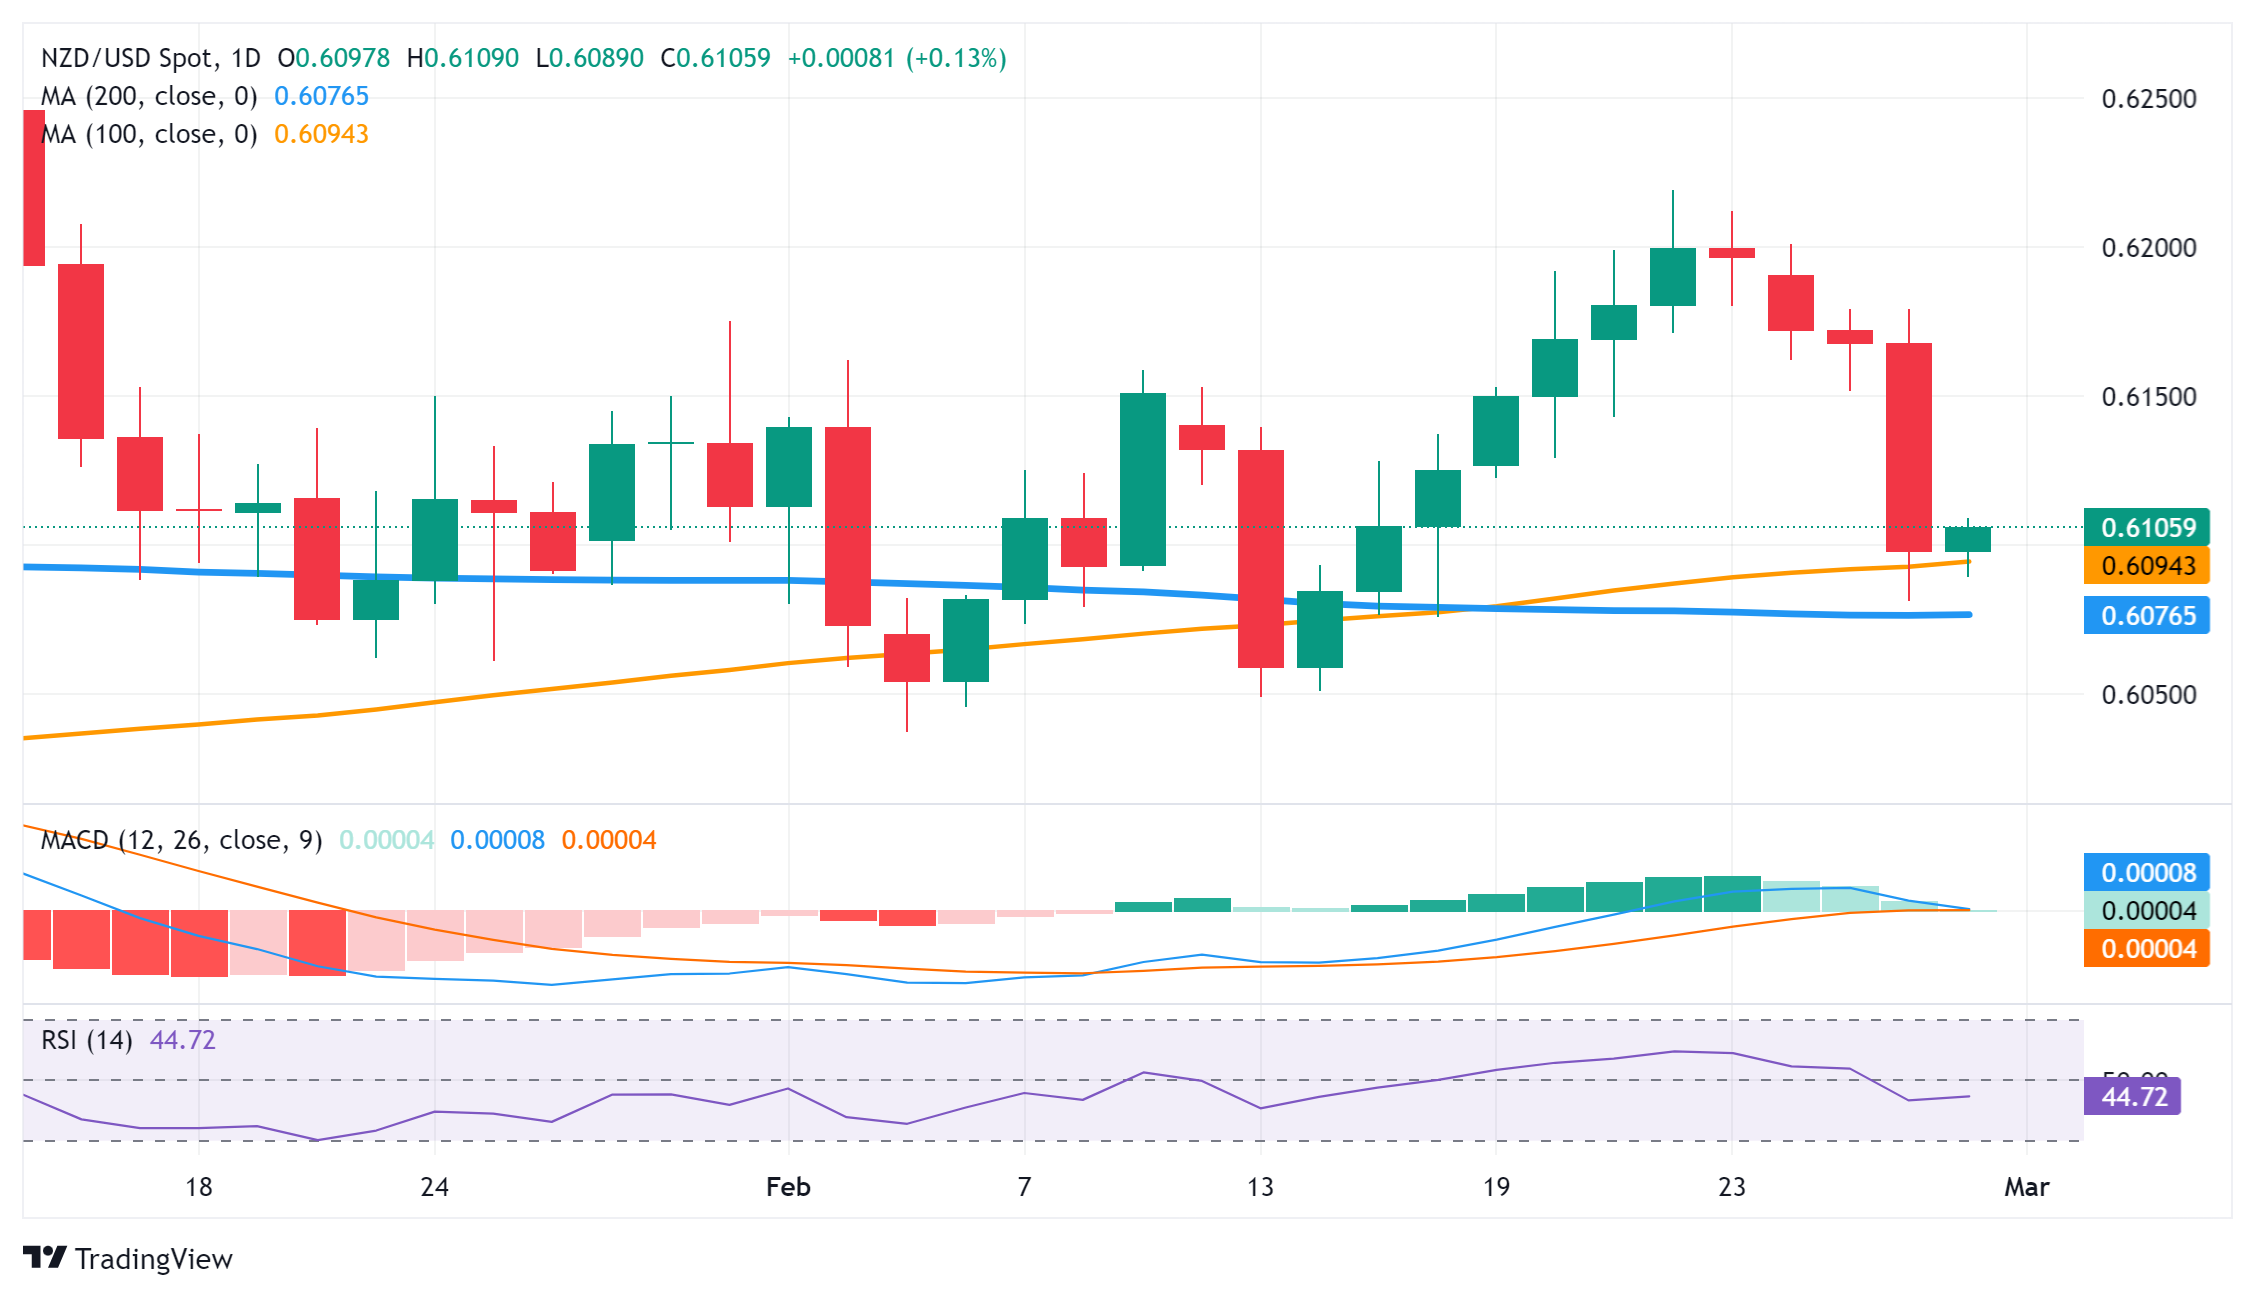
- Gold price draws support from a softer risk tone and a modest US Dollar downtick.
- The upside remains capped amid the Fed’s higher-for-longer interest rates narrative.
- Bulls also seem reluctant to place aggressive bets ahead of the US PCE Price Index release.
Gold price (XAU/USD) ticks higher during the Asian session on Thursday and looks to build on the overnight modest bounce from the $2,025-2,024 area, or the weekly low. The precious metal, however, remains below the $2,040-2,042 strong horizontal barrier as traders keenly await the release of the US Personal Consumption Expenditures (PCE) Price Index. The crucial inflation data should provide fresh cues about the Federal Reserve's (Fed) rate-cut path, which, in turn, will play a key role in determining the next leg of a directional move for the non-yielding yellow metal.
Heading into the key data risks, the US Dollar (USD) bulls opt to wait on the sidelines, which, in turn, lends some support to the Gold price. Apart from this, a slight deterioration in the global risk sentiment further benefits the safe-haven precious metal, though expectations the Fed will keep rates higher for longer might keep a lid on any further gains. Hence, it will be prudent to wait for strong follow-through buying before traders start positioning for the resumption of the recent recovery move from the $1,984 region, or the YTD low touched earlier this February.
Daily digest market movers: Gold price struggles to attract any meaningful buying amid hawkish Fed expectations
- The nervousness ahead of the crucial US inflation data tempers investors' appetite for riskier assets and lends support to the safe-haven Gold price amid a modest US Dollar downtick.
- Several Federal Reserve officials reiterated on Wednesday that more work was needed to bring down inflation, which should allow the central bank to keep interest rates higher for longer.
- New York Fed President John Williams said that the US central bank will begin cutting interest rates in 2024, albeit in the latter half of the year as the path to the 2% inflation target is uneven.
- Atlanta Fed President Raphael Bostic said that he is comfortable advising patience when it comes to loosening policy and that the central bank has not declared victory over inflation yet.
- Separately, Boston Fed Bank President Susan Collins said that the central bank will likely cut rates this year, though should be taking time to assess data before making any change to the policy.
- The second estimate of the US GDP growth released on Wednesday showed that the US economy expanded by a 3.2% annualized pace in Q4, slightly less than the 3.3% rise reported originally.
- The data, meanwhile, reinforced the view that the US economy remains in good shape and hawkish Fed expectations, though does little to provide any meaningful impetus to the US Dollar.
- Nevertheless, the Fed's hawkish outlook on interest rates might cap any further appreciating move for the non-yielding metal ahead of the US Personal Consumption Expenditures (PCE) Price Index.
- Thursday's US economic docket also features the release of Weekly Initial Jobless Claims, the Chicago PMI and Pending Home Sales, which, along with Fed speak, could provide some impetus.
Technical analysis: Gold price could accelerate the positive move once the $2.041-2,042 barrier is cleared decisively
From a technical perspective, sustained strength beyond the $2,041-2,042 hurdle will be seen as a fresh trigger for bulls and lift the Gold price further towards the next relevant hurdle near the $2,065 region. Given that oscillators on the daily chart have just started gaining positive traction, the momentum could extend further and allow the XAU/USD to aim back to reclaim the $2,100 round-figure mark.
On the flip side, the weekly low. around the $2,025-2,024 area, touched the previous day, might continue to lend some support ahead of the 100-day SMA, currently near the $2,013-2,012 region. This is followed by the $2,000 psychological mark, which if broken might shift the near-term bias in favour of bearish traders and drag the Gold price to the $1,984 support en route to the very important 200-day SMA, near the $1,968 zone.
US Dollar price today
The table below shows the percentage change of US Dollar (USD) against listed major currencies today. US Dollar was the strongest against the Euro.
| USD | EUR | GBP | CAD | AUD | JPY | NZD | CHF | |
| USD | 0.03% | -0.06% | -0.04% | -0.36% | -0.54% | -0.17% | -0.05% | |
| EUR | -0.04% | -0.09% | -0.07% | -0.38% | -0.57% | -0.20% | -0.08% | |
| GBP | 0.06% | 0.09% | 0.01% | -0.29% | -0.48% | -0.11% | 0.01% | |
| CAD | 0.04% | 0.09% | -0.02% | -0.31% | -0.51% | -0.12% | 0.00% | |
| AUD | 0.34% | 0.36% | 0.28% | 0.31% | -0.19% | 0.19% | 0.30% | |
| JPY | 0.54% | 0.56% | 0.47% | 0.48% | 0.19% | 0.39% | 0.50% | |
| NZD | 0.16% | 0.20% | 0.11% | 0.13% | -0.20% | -0.38% | 0.14% | |
| CHF | 0.05% | 0.08% | -0.01% | 0.00% | -0.31% | -0.50% | -0.11% |
The heat map shows percentage changes of major currencies against each other. The base currency is picked from the left column, while the quote currency is picked from the top row. For example, if you pick the Euro from the left column and move along the horizontal line to the Japanese Yen, the percentage change displayed in the box will represent EUR (base)/JPY (quote).
Gold FAQs
Why do people invest in Gold?
Gold has played a key role in human’s history as it has been widely used as a store of value and medium of exchange. Currently, apart from its shine and usage for jewelry, the precious metal is widely seen as a safe-haven asset, meaning that it is considered a good investment during turbulent times. Gold is also widely seen as a hedge against inflation and against depreciating currencies as it doesn’t rely on any specific issuer or government.
Who buys the most Gold?
Central banks are the biggest Gold holders. In their aim to support their currencies in turbulent times, central banks tend to diversify their reserves and buy Gold to improve the perceived strength of the economy and the currency. High Gold reserves can be a source of trust for a country’s solvency. Central banks added 1,136 tonnes of Gold worth around $70 billion to their reserves in 2022, according to data from the World Gold Council. This is the highest yearly purchase since records began. Central banks from emerging economies such as China, India and Turkey are quickly increasing their Gold reserves.
How is Gold correlated with other assets?
Gold has an inverse correlation with the US Dollar and US Treasuries, which are both major reserve and safe-haven assets. When the Dollar depreciates, Gold tends to rise, enabling investors and central banks to diversify their assets in turbulent times. Gold is also inversely correlated with risk assets. A rally in the stock market tends to weaken Gold price, while sell-offs in riskier markets tend to favor the precious metal.
What does the price of Gold depend on?
The price can move due to a wide range of factors. Geopolitical instability or fears of a deep recession can quickly make Gold price escalate due to its safe-haven status. As a yield-less asset, Gold tends to rise with lower interest rates, while higher cost of money usually weighs down on the yellow metal. Still, most moves depend on how the US Dollar (USD) behaves as the asset is priced in dollars (XAU/USD). A strong Dollar tends to keep the price of Gold controlled, whereas a weaker Dollar is likely to push Gold prices up.
- EUR/USD could find immediate support around 21-day EMA at 1.0818 and psychological support of 1.0800 level.
- The immediate resistance appears around the major level of 1.0850 followed by the 38.2% Fibonacci retracement level of 1.0864.
- The technical analysis suggests a potential shift towards bullish momentum for the pair.
EUR/USD continues its losing streak for the third successive session as traders exercise caution ahead of the release of key US Personal Consumption Expenditures - Price Index data, which could potentially influence the Federal Reserve's monetary policy stance. The pair edges lower to near 1.0830 during the Asian trading hours on Thursday.
The EUR/USD pair could find the immediate support zone around the 21-day Exponential Moving Average (EMA) at 1.0818 followed by the psychological support of 1.0800 level.
A break below this support zone could prompt the EUR/USD pair to target the further the major level of 1.750 with an aim to navigate the region around the psychological level of 1.0700 aligned with February’s low at 1.0694 level.
Technical analysis indicates a bullish sentiment for the EUR/USD pair. The 14-day Relative Strength Index (RSI) is positioned above the 50 mark, signaling strength in the upward momentum.
Moreover, the Moving Average Convergence Divergence (MACD) exhibits a divergence above the signal line, although it remains below the centerline. While a lagging indicator, this suggests a potential transition towards bullish momentum for the EUR/USD pair.
On the upside, the immediate resistance levels for the EUR/USD pair are identified at the major level of 1.0850 followed by the 38.2% Fibonacci retracement level of 1.0864.
A breakthrough above the latter could exert upward support for the pair to retest the psychological resistance area around February's high of 1.0897 and the psychological barrier at 1.0900.
EUR/USD: Daily Chart
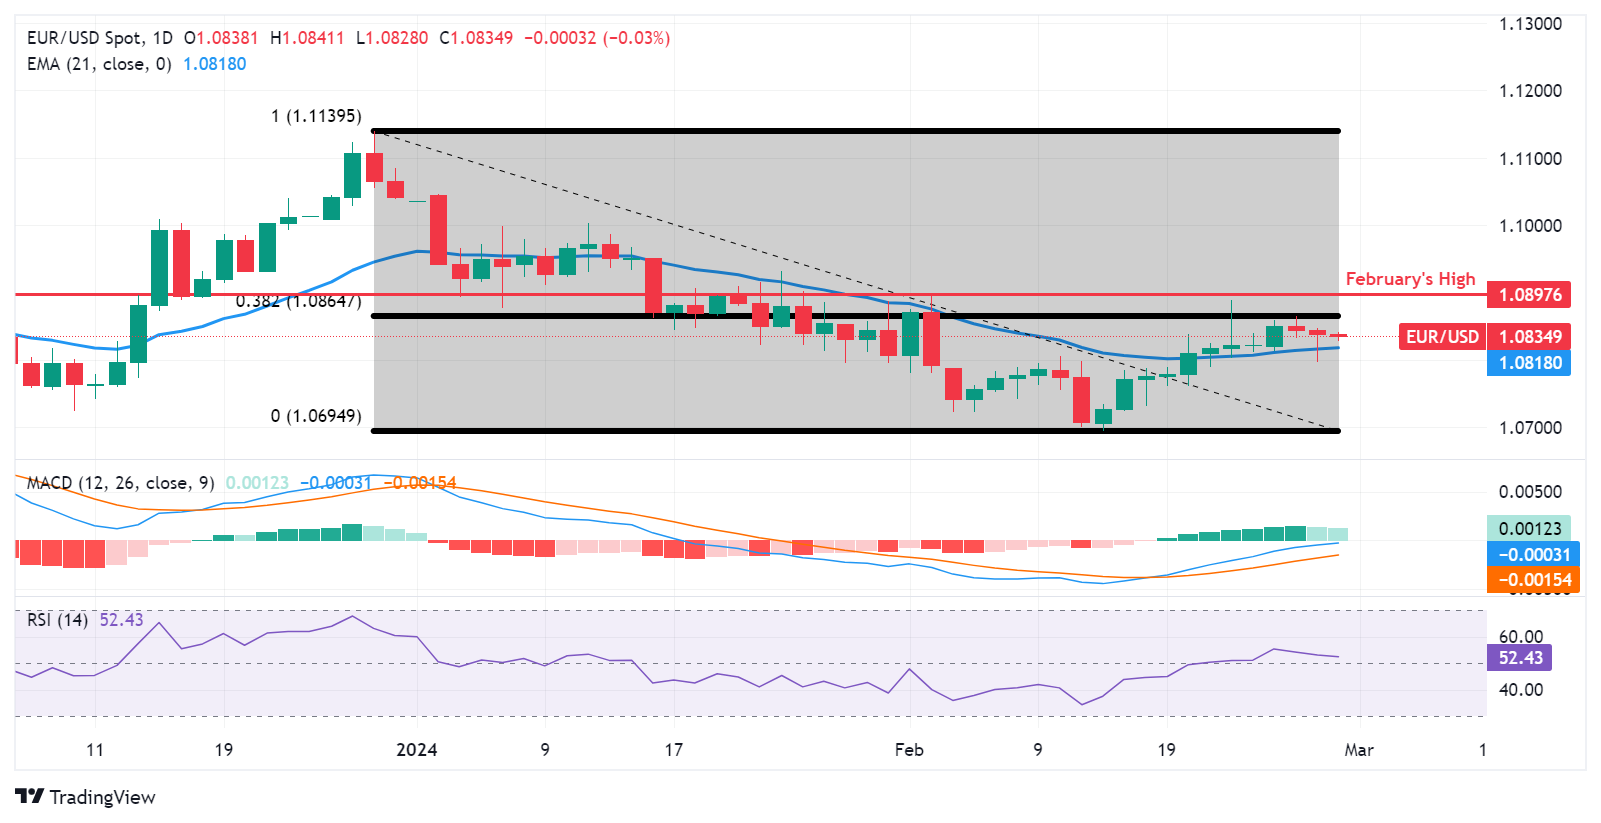
- Indian Rupee trades softer on the rising month-end demand of USD.
- India’s GDP for October-December 2023 is expected to slow to 6.5% from 7.6% in the previous quarter.
- The US January Core PCE and Indian GDP growth numbers will be the highlights on Thursday.
Indian Rupee (INR) trades in negative territory on Thursday amid increased month-end demand for the US Dollar (USD). Some traders speculate that the Reserve Bank of India (RBI) might be actively acquiring Dollars in recent sessions, which might limit the pair in a tight range. However, robust economic fundamentals, the pullback in oil prices, and moderation in domestic inflation might provide some support to the INR.
The Statistics Ministry will release India’s GDP data for October-December 2023 on Thursday, which is estimated to slow down to 6.5% from 7.6% in the previous quarter. If the report shows a stronger-than-estimated outcome, this could boost the Indian Rupee and weigh on the USD/INR pair.
The US Core Personal Consumption Expenditures Index (Core PCE) for January, the Fed's preferred inflation measure, will be in the spotlight on Thursday. Additionally, US Personal Income, Personal Spending, Pending Home Sales, and the weekly Initial Jobless Claims are also due later in the day. On the Indian docket, the GDP quarterly for Q3 and GDP annual growth numbers on Thursday could provide fresh catalysts for the USD/INR pair.
Daily Digest Market Movers: Indian Rupee weakens amid uncertainties and global factors
- The RBI estimated Indian GDP to grow at 6.5% for October-December 2023, while the ICRA predicted 6%.
- Indian GDP expanded by 7.6% in the July-September quarter (Q2) of FY 24 and 4.5% in Q3 of FY 23.
- The US Gross Domestic Product (GDP) for the fourth quarter grew at a 3.2% annualized rate from a 3.3% in the previous reading, weaker than the estimation of a 3.3% expansion.
- The New York Federal Reserve (Fed) President John Williams said that even though there's still some distance to cover in achieving the Fed 2% inflation target, the door is opening to interest rate cuts this year, depending on how the data come in.
- Investors have priced in 80 basis points (bps) of rate cuts this year, lower than 175 bps priced in around mid-January.
Technical Analysis: Indian Rupee remains within the longer-term range between 82.70 and 83.20
Indian Rupee edges lower on the day. USD/INR remains contained within a multi-month-old descending trend channel of 82.70–83.20 since December 8, 2023.
USD/INR maintains a bearish outlook in the near term as the pair is still below the 100-day Exponential Moving Average on the daily timeframe. Additionally, the downward momentum is supported by the 14-day Relative Strength Index (RSI), which holds in the negative zone below the 50.0 midline.
The lower limit of the descending trend channel at 82.70 will be the first downside target for the pair. A decisive break below this level could expose a low of August 23 at 82.45, followed by a low of June 1 at 82.25.
On the other hand, the confluence of a psychological round mark and the 100-day EMA at 83.00 will be the potential resistance level for USD/INR. The additional upside filter to watch is the upper boundary of the descending trend channel at 83.20. A break above the mentioned level would have an opportunity to fire up their bullish momentum. USD/INR could get enough fuel to hit a high of January 2 at 83.35, and finally at 84.00.
US Dollar price today
The table below shows the percentage change of US Dollar (USD) against listed major currencies today. US Dollar was the strongest against the Euro.
| USD | EUR | GBP | CAD | AUD | JPY | NZD | CHF | |
| USD | 0.02% | -0.06% | -0.05% | -0.28% | -0.54% | -0.16% | -0.07% | |
| EUR | -0.03% | -0.05% | -0.06% | -0.29% | -0.58% | -0.18% | -0.09% | |
| GBP | 0.06% | 0.08% | 0.02% | -0.23% | -0.51% | -0.11% | -0.01% | |
| CAD | 0.04% | 0.08% | -0.02% | -0.24% | -0.53% | -0.12% | -0.03% | |
| AUD | 0.29% | 0.31% | 0.23% | 0.24% | -0.25% | 0.14% | 0.21% | |
| JPY | 0.54% | 0.57% | 0.49% | 0.49% | 0.27% | 0.41% | 0.50% | |
| NZD | 0.15% | 0.19% | 0.11% | 0.13% | -0.11% | -0.41% | 0.11% | |
| CHF | 0.08% | 0.10% | 0.00% | 0.01% | -0.21% | -0.47% | -0.08% |
The heat map shows percentage changes of major currencies against each other. The base currency is picked from the left column, while the quote currency is picked from the top row. For example, if you pick the Euro from the left column and move along the horizontal line to the Japanese Yen, the percentage change displayed in the box will represent EUR (base)/JPY (quote).
Indian Rupee FAQs
What are the key factors driving the Indian Rupee?
The Indian Rupee (INR) is one of the most sensitive currencies to external factors. The price of Crude Oil (the country is highly dependent on imported Oil), the value of the US Dollar – most trade is conducted in USD – and the level of foreign investment, are all influential. Direct intervention by the Reserve Bank of India (RBI) in FX markets to keep the exchange rate stable, as well as the level of interest rates set by the RBI, are further major influencing factors on the Rupee.
How do the decisions of the Reserve Bank of India impact the Indian Rupee?
The Reserve Bank of India (RBI) actively intervenes in forex markets to maintain a stable exchange rate, to help facilitate trade. In addition, the RBI tries to maintain the inflation rate at its 4% target by adjusting interest rates. Higher interest rates usually strengthen the Rupee. This is due to the role of the ‘carry trade’ in which investors borrow in countries with lower interest rates so as to place their money in countries’ offering relatively higher interest rates and profit from the difference.
What macroeconomic factors influence the value of the Indian Rupee?
Macroeconomic factors that influence the value of the Rupee include inflation, interest rates, the economic growth rate (GDP), the balance of trade, and inflows from foreign investment. A higher growth rate can lead to more overseas investment, pushing up demand for the Rupee. A less negative balance of trade will eventually lead to a stronger Rupee. Higher interest rates, especially real rates (interest rates less inflation) are also positive for the Rupee. A risk-on environment can lead to greater inflows of Foreign Direct and Indirect Investment (FDI and FII), which also benefit the Rupee.
How does inflation impact the Indian Rupee?
Higher inflation, particularly, if it is comparatively higher than India’s peers, is generally negative for the currency as it reflects devaluation through oversupply. Inflation also increases the cost of exports, leading to more Rupees being sold to purchase foreign imports, which is Rupee-negative. At the same time, higher inflation usually leads to the Reserve Bank of India (RBI) raising interest rates and this can be positive for the Rupee, due to increased demand from international investors. The opposite effect is true of lower inflation.
- USD/CAD extends its gains as Crude oil prices encounter challenges.
- Crude oil prices face challenges on higher API Weekly Crude Oil Stock.
- US Dollar received upward support on the expectation of the Fed’s delaying rate cuts.
- US GDP Annualized (Q4) rose by 3.2% against the expected 3.3%.
USD/CAD continues its winning streak, marking the fifth consecutive session with gains, as it edges higher around 1.3580 during the Asian session on Thursday. The Canadian Dollar (CAD) faced downward pressure against the US Dollar (USD) due to the lower Crude oil prices, thereby providing support to the USD/CAD pair. Furthermore, Canada’s Gross Domestic Product data will be closely monitored later in the North American session.
West Texas Intermediate (WTI) oil price struggles to recover from intraday losses and trades higher near $78.10 per barrel at the time of writing. However, Crude oil prices encountered challenges as expectations for the Federal Reserve (Fed) to delay the first-rate cuts emerged. Additionally, the higher API Weekly Crude Oil Stock added to the downward pressure on oil prices.
In December 2023, Canada’s average weekly earnings of non-farm payroll employees increased by 3.8% YoY, showing a slight deceleration from the revised 3.9% growth recorded in November 2023. Additionally, the country's Current Account deficit narrowed to CAD 1.62 billion in the fourth quarter of 2023, against the previous reading of CAD 4.74 billion but it was slightly above market expectations of a CAD 1.25 billion deficit.
The recent Gross Domestic Product (GDP) data from the United States (US) has prompted financial markets to postpone expectations for the Federal Reserve’s (Fed) first rate cut. This has lent some support to the US Dollar (USD), bolstering the USD/CAD pair.
The preliminary US Gross Domestic Product Annualized expanded by 3.2% in the fourth quarter of 2023, slightly below market expectations of remaining steady at 3.3%. Additionally, the preliminary US Gross Domestic Product Price Index (Q4) increased by 1.7%, surpassing both expected and previous rises of 1.5%.
The US Dollar Index (DXY) maintains stability amid higher US Treasury yields. Furthermore, US Federal Reserve speakers have expressed a cautious stance, indicating potential rate cuts later in the year. This has led to a diminished likelihood of rate cuts in upcoming meetings, providing upward support for the Greenback. Traders await the release of key US Personal Consumption Expenditures - Price Index data, which could potentially influence the Federal Reserve's monetary policy stance.
- India’s Nifty and Sensex eye a flattish to a positive start on Thursday.
- Nifty and Sensex lost over 1% on Wednesday, undermined by steep losses in the auto sector stocks.
- Traders brace for US PCE inflation, India’s Q3 GDP data and derivatives expiry on Thursday.
The Sensex 30 and Nifty 50, India’s key benchmark indices, are set to open higher on Thursday, as Gift Nifty futures and Chinese stocks rebound.
Nifty and Sensex ended Wednesday with sizeable losses due to risk-averse global markets and a bout of profit-taking in the lead-up to key top-tier events from the US and India.
Indian traders continue to remain on edge ahead of India’s third-quarter Gross Domestic Product (GDP) data and the expiry of monthly derivatives contracts due later this week.
The National Stock Exchange (NSE) Nifty 50 and the Bombay Stock Exchange (BSE) Sensex 30 lost about 1.10% on the day to settle at 21,951.15 and 72,304.88 respectively.
Stock market news
- The top gainers on Nifty on Wednesday included Infosys, TCS, Bharti Airtel and Hindustan Unilever. Meanwhile, the main laggards were Apollo Hospital, Eicher Motors, Bajaj Auto, Powergrid and Maruti.
- Shares of Vodafone Idea tumbled roughly 14% on Wednesday after the company's board decided to raise around Rs 45,000 crore through a combination of equity and debt for rolling out the 4G network.
- Patanjali Foods shares tanked 5% after the Supreme Court issued a contempt notice to Patanjali Ayurved’s Baba Ramdev and Acharya Balakrishna for publishing advertisements of products in violation of the Drugs and Magic Remedies (Objectionable Advertisements) Act, 1954.
- Foreign Institutional Investors (FIIs) offloaded equities worth INR1,509.16 crore on Tuesday, according to exchange data.
- The third term of the Narendra Modi government will see transformative reforms in sectors such as digital infrastructure, space, artificial intelligence, specialized warehousing, agriculture and tourism, India’s Finance Minister Nirmala Sitharaman said on Tuesday.
- The US stock markets settled lower on Wednesday, in anticipation of the key US PCE inflation data on Thursday. Meanwhile, US GDP was revised to an annual rate of 3.2% in the fourth quarter of 2023, from an initial estimate of 3.3% released last month.
- On Tuesday, US Durable Goods Orders slumped by 6.1% in January while the CB Consumer Confidence index dipped to 106.7 in February. Both figures missed the market expectations.
- Markets are currently pricing in just about a 20% chance that the US Federal Reserve (Fed) could begin easing rates in May, much lower than an over 90% chance a month ago, according to the CME FedWatch Tool. For the June meeting, the probability for a rate cut now stands at about 60%, down from 70% seen a week ago.
- All eyes now remain on and India’s Gross Domestic Product (GDP) data due and the derivatives expiry, which is likely to infuse some volatility on Thursday.
Sensex FAQs
What is the Sensex?
The Sensex is a name for one of India’s most closely monitored stock indexes. The term was coined in the 1980s by analyst Deepak Mohoni by mashing the words sensitive and index together. The index plots a weighted average of the share price of 30 of the most established stocks on the Bombay Stock Exchange. Each corporation's weighting is based on its “free-float capitalization”, or the value of all its shares readily available for trading.
What factors drive the Sensex?
Given it is a composite, the value of the Sensex is first and foremost dependent on the performance of its constituent companies as revealed in their quarterly and annual results. Government policies are another factor. In 2016 the government decided to phase out high value currency notes, for example, and certain companies saw their share price fall as a result. When the government decided to cut corporation tax in 2019, meanwhile, the Sensex gained a boost. Other factors include the level of interest rates set by the Reserve Bank of India, since that dictates the cost of borrowing, climate change, pandemics and natural disasters
What are the key milestones for the Sensex?
The Sensex started life on April 1 1979 at a base level of 100. It reached its highest recorded level so far, at 73,328, on Monday, January 15, 2024 (this is being written in Feb 2024). The Index closed above the 10,000 mark for the first time on February 7, 2006. On March 13, 2014 the Sensex closed higher than Hong Kong’s Hang Seng index to become the major Asian stock index with the highest value. The index’s biggest gain in a single day occurred on April 7, 2020, when it rose 2,476 points; its deepest single-day loss occurred on January 21, 2008, when it plunged 1,408 points due the US subprime crisis.
What major corporations are in the Sensex?
Major companies within the Sensex include Reliance Industries Ltd, HDFC Bank, Axis Bank, ITC Ltd, Bharti Airtel Ltd, Tata Steel, HCL Technologies, Infosys, State Bank of India, Sun Pharma, Tata Consultancy Services and Tech Mahindra.
| Raw materials | Closed | Change, % |
|---|---|---|
| Silver | 22.461 | 0.04 |
| Gold | 2034.946 | 0.25 |
| Palladium | 931.62 | -0.21 |
- The Japanese Yen gains strong positive traction amid a softer risk tone and intervention fears.
- The BoJ policy uncertainty could cap further gains and help limit losses for the USD/JPY pair.
- Traders might also prefer to wait for the US PCE Price Index release before placing directional bets.
The Japanese Yen (JPY) catches fresh bids during the Asian session on Thursday and rallies back closer to the top end of the weekly range against its American counterpart, though any further appreciating move still seems elusive. The nervousness ahead of the crucial US inflation data tempers investors' appetite for riskier assets, which is evident from a generally weaker tone around the equity markets and benefits the JPY's relative safe-haven status. This, along with speculations that Japanese authorities might intervene in the market to stem any further JPY weakness, offers additional support.
That said, the uncertainty over the Bank of Japan's (BoJ) plans to exit its ultra-easy monetary policy might hold back bulls from placing aggressive bets around the JPY. Meanwhile, the US Dollar (USD) remains supported by bets that the Federal Reserve (Fed) will keep rates higher for longer, bolstered by comments from several FOMC officials. This might contribute to limiting the downside for the USD/JPY pair. Investors now look to the US Personal Consumption Expenditures (PCE) Price Index for cues about the Fed's rate-cut path, which should provide a fresh impetus to the currency pair.
Daily digest market movers: Japanese Yen attracts haven flows amid fresh intervention warning and hawkish BoJ remarks
- A slight deterioration in the global risk sentiment drives some haven flows towards the Japanese Yen amid intervention fears, though the Bank of Japan policy uncertainty might keep a lid on any further gains.
- Japan's vice finance minister for international affairs, Masato Kanda, issued a fresh warning and said that the government stands ready to take appropriate action against excessive exchange-rate moves and volatility.
- BoJ board member Hajime Takata said that achievement of the 2% inflation target is becoming within sight and that the central bank must consider taking a nimble and flexible approach towards an exit from ultra-loose monetary policy.
- Slightly warmer consumer inflation in Japan fuelled speculations that the Bank of Japan will pivot away from its ultra-loose policy settings, though a recession could delay the central bank's plan to tighten its policy.
- Official data released this Thursday showed that Japanese Retail Sales registered higher-than-expected growth of 2.3% over 12 months through January, while Industrial Production sank 7.5% during the reported month.
- The second reading of the US GDP print published on Wednesday showed that the world's largest economy expanded by a 3.2% annualized pace during the fourth quarter vs the advance estimate of a 3.3% rise.
- Nevertheless, the data suggested that the US economy remains in good shape, which, along with warnings from Federal Reserve officials, reiterating the higher-for-longer narrative, underpins the US Dollar.
- New York Fed President John Williams said that the central bank is likely to begin cutting interest rates this year depending on how the data come in, though there is still a way to go before hitting the 2% inflation target.
- Atlanta Fed President Raphael Bostic stressed that the US central bank has not declared victory over inflation yet and added that he is comfortable advising patience when it comes to loosening monetary policy.
- Furthermore, Boston Fed Bank President Susan Collins noted that it will likely become appropriate to begin easing policy later this year but the path to returning inflation to its 2% target will likely continue to be bumpy.
- This continues to act as a tailwind for the US Dollar and should lend some support to the USD/JPY pair ahead of the key US Personal Consumption Expenditures (PCE) Price Index – the Fed's preferred inflation gauge.
- Thursday's US economic docket also features the release of the usual Weekly Initial Jobless Claims, the Chicago PMI and Pending Home Sales, which, along with Fed speak, might infuse some volatility in the markets.
Technical analysis: USD/JPY retests the weekly low around the 150.00 mark, downside potential seems limited
From a technical perspective, any further downfall is likely to find decent support near the weekly low, around the 150.00 psychological mark. The said handle should act as a key pivotal point, which if broken decisively might prompt fresh selling and drag the USD/JPY pair below the 149.70-149.65 region, towards the 149.35-149.30 intermediate support en route to the 149.00 round figure. A convincing break below the latter might shift the near-term bias in favour of bearish traders and pave the way for some meaningful downside.
On the flip side, the 150.85-150.90 region, or a multi-month top, might continue to act as an immediate strong resistance, above which the USD/JPY pair could accelerate the positive move towards the 151.45 hurdle. The momentum could extend further and lift spot prices to the 152.00 neighbourhood, or a multi-decade peak set in October 2022 and retested in November 2023.
Japanese Yen price today
The table below shows the percentage change of Japanese Yen (JPY) against listed major currencies today. Japanese Yen was the weakest against the Australian Dollar.
| USD | EUR | GBP | CAD | AUD | JPY | NZD | CHF | |
| USD | 0.06% | -0.01% | 0.00% | -0.17% | -0.37% | -0.08% | -0.03% | |
| EUR | -0.07% | -0.07% | -0.06% | -0.22% | -0.48% | -0.13% | -0.10% | |
| GBP | 0.01% | 0.07% | 0.01% | -0.15% | -0.40% | -0.07% | -0.02% | |
| CAD | 0.00% | 0.08% | -0.01% | -0.16% | -0.41% | -0.07% | -0.03% | |
| AUD | 0.17% | 0.23% | 0.15% | 0.16% | -0.20% | 0.10% | 0.13% | |
| JPY | 0.36% | 0.46% | 0.38% | 0.40% | 0.24% | 0.37% | 0.38% | |
| NZD | 0.07% | 0.13% | 0.06% | 0.07% | -0.09% | -0.34% | 0.07% | |
| CHF | 0.04% | 0.11% | 0.02% | 0.03% | -0.14% | -0.33% | -0.03% |
The heat map shows percentage changes of major currencies against each other. The base currency is picked from the left column, while the quote currency is picked from the top row. For example, if you pick the Euro from the left column and move along the horizontal line to the Japanese Yen, the percentage change displayed in the box will represent EUR (base)/JPY (quote).
Japanese Yen FAQs
What key factors drive the Japanese Yen?
The Japanese Yen (JPY) is one of the world’s most traded currencies. Its value is broadly determined by the performance of the Japanese economy, but more specifically by the Bank of Japan’s policy, the differential between Japanese and US bond yields, or risk sentiment among traders, among other factors.
How do the decisions of the Bank of Japan impact the Japanese Yen?
One of the Bank of Japan’s mandates is currency control, so its moves are key for the Yen. The BoJ has directly intervened in currency markets sometimes, generally to lower the value of the Yen, although it refrains from doing it often due to political concerns of its main trading partners. The current BoJ ultra-loose monetary policy, based on massive stimulus to the economy, has caused the Yen to depreciate against its main currency peers. This process has exacerbated more recently due to an increasing policy divergence between the Bank of Japan and other main central banks, which have opted to increase interest rates sharply to fight decades-high levels of inflation.
How does the differential between Japanese and US bond yields impact the Japanese Yen?
The BoJ’s stance of sticking to ultra-loose monetary policy has led to a widening policy divergence with other central banks, particularly with the US Federal Reserve. This supports a widening of the differential between the 10-year US and Japanese bonds, which favors the US Dollar against the Japanese Yen.
How does broader risk sentiment impact the Japanese Yen?
The Japanese Yen is often seen as a safe-haven investment. This means that in times of market stress, investors are more likely to put their money in the Japanese currency due to its supposed reliability and stability. Turbulent times are likely to strengthen the Yen’s value against other currencies seen as more risky to invest in.
Bank of Japan (BoJ) board member Hajime Takata said on Thursday that the central bank “needs to consider taking flexible response including exit from monetary stimulus.”
Additional takeaways
Achievement of 2% inflation target is becoming in sight despite uncertainty of economy outlook.
Exit measures would include abandoning yield curve control framework, ending negative rates, overshoot commitment.
Need to bear in mind taking balance between effect of easing and side effects.
Economy is entering cycle of rising wages and prices, away from chronic deflation cycle.
In case for entering exit, BoJ would need to conduct appropriate policy steps while paying attention to health of its balance sheet.
Momentum is rising in spring wage talks.
Many companies are offering higher-than-2023 wage hikes.
High wage hike rate would prompt continual expectations that household income will rise.
Small companies are still facing problem in passing costs to prices, but some are making forward-looking investments in productivity, human resources.
Corporate sector is becoming resilient to yield rises at the exit of monetary policy.
Market reaction
The Japanese Yen has caught a fresh bid wave on Takata’s hawkish signals, smashing USD/JPY 0.40% on the day to 150.08, as of writing.
- Australian Dollar gains ground after Australia’s consumer spending data on Thursday.
- Australian (MoM) grew by 1.1% in January, against than expected 1.5% and the previous decline of 2.7%.
- Aussie Dollar faced challenges due to the decline in the S&P/ASX 200 Index.
- US Dollar Index (DXY) remains stable amid the higher US Treasury yields.
- US GDP Annualized (Q4) increased by 3.2%, slightly below market expectations of remaining steady at 3.3%.
The Australian Dollar (AUD) retraces its recent losses following the release of Australia’s Retail Sales data on Thursday. However, recent Gross Domestic Product (GDP) data from the United States (US) has led financial markets to delay expectations for the Federal Reserve’s (Fed) first rate cut. This has provided some support for the US Dollar (USD), thereby weakening the AUD/USD pair.
Australian Dollar encounters challenges amid a decline in the S&P/ASX 200 Index, where gains in the property sector are being offset by losses in the tech sector on the final day of company reporting. Selling pressure was further intensified by Wednesday's inflation data and weaker commodity prices. Additionally, Australian markets are taking cues from a weak performance on Wall Street overnight as traders exercise caution ahead of the release of key US Personal Consumption Expenditures - Price Index data, which could potentially influence the Federal Reserve's monetary policy stance.
The US Dollar Index (DXY) strives to sustain its gains fueled by higher US Treasury yields. Furthermore, US Federal Reserve speakers have maintained a cautious stance, suggesting potential rate cuts later in the year. This leads to a reduced likelihood of rate cuts in upcoming meetings, providing upward support for the Greenback.
Daily Digest Market Movers: Australian Dollar improves after Retail Sales data
- The seasonally adjusted Australian Retail Sales (MoM) grew by 1.1% in January, lower than expected 1.5% but swinging from the previous decline of 2.7%.
- Australian Private Capital Expenditure improved by 0.8% in the fourth quarter of 2023, from the expected 0.5% and 0.6% prior.
- Australian Monthly Consumer Price Index (CPI) was unchanged at 3.4% for January, which was below market expectations of 3.5%.
- Australian Construction Work Done increased by 0.7% in the fourth quarter of 2023, against the expected 0.8% and 1.3% prior.
- ANZ-Roy Morgan Australian Consumer Confidence is nearly unchanged at 83.2 for the current week. This marks the 56th consecutive week that the index has remained below the threshold of 85. The index sits just 0.4 points below the 2024 weekly average of 83.6.
- The Reserve Bank of New Zealand (RBNZ) decided to hold the Official Cash Rate (OCR) unchanged at 5.5%, as widely expected in its February monetary policy meeting.
- New York Federal Reserve (Fed) President John Williams stated on Wednesday that while there remains some ground to cover in reaching the Fed's 2% inflation target, the possibility of interest rate cuts this year is on the table, contingent upon incoming data.
- Boston Federal Reserve (Fed) President Susan Collins maintains her expectation for the Fed to initiate easing later this year. However, she notes that progress on inflation has decelerated, and policymakers should await further evidence to ensure a clear path toward the 2% target.
- As per the CME FedWatch Tool, the odds for March rate cuts is 3.0%, with the likelihood of a cut down in May and June to 19.3% and 52.6%, respectively.
- According to reports, US House Speaker James Michael Johnson has informed the White House of his willingness to adjust the two funding deadlines to March 8 and March 22. Currently, funding is set to expire for four bills on March 1, and for eight bills on March 8.
- The preliminary US Gross Domestic Product Annualized grew by 3.2% in the fourth quarter of 2023, slightly below market expectations of remaining steady at 3.3%.
- The preliminary US Gross Domestic Product Price Index (Q4) increased by 1.7% against the expected and previous rise of 1.5%.
- US Housing Price Index (MoM) increased by 0.1% in December, falling short of the 0.3% expected and 0.4% prior.
- US Durable Goods Orders decreased by 6.1% against the market expectation of a 4.5% decrease and a previous decrease of 0.3%.
- US New Home Sales Change (MoM) grew by 1.5% in January, falling short of the previous growth of 7.2%.
- US New Home Sales (MoM) came in at 0.661M in January against the expected 0.680M and 0.664 prior.
Technical Analysis: Australian Dollar hovers around the psychological level of 0.6500
The Australian Dollar trades around the psychological level of 0.6500 on Thursday. A breach below this level could potentially prompt the AUD/USD pair to target the area around the major support level of 0.6450 and February’s low at 0.6442. Conversely, on the upside, the immediate resistance zone is observed around the 21-day Exponential Moving Average (EMA) at 0.6539, followed by the 23.6% Fibonacci retracement at 0.6543 and the major level of 0.6550. A breakout above this resistance zone may lead the AUD/USD pair to approach the psychological level of 0.6600.
AUD/USD: Daily Chart
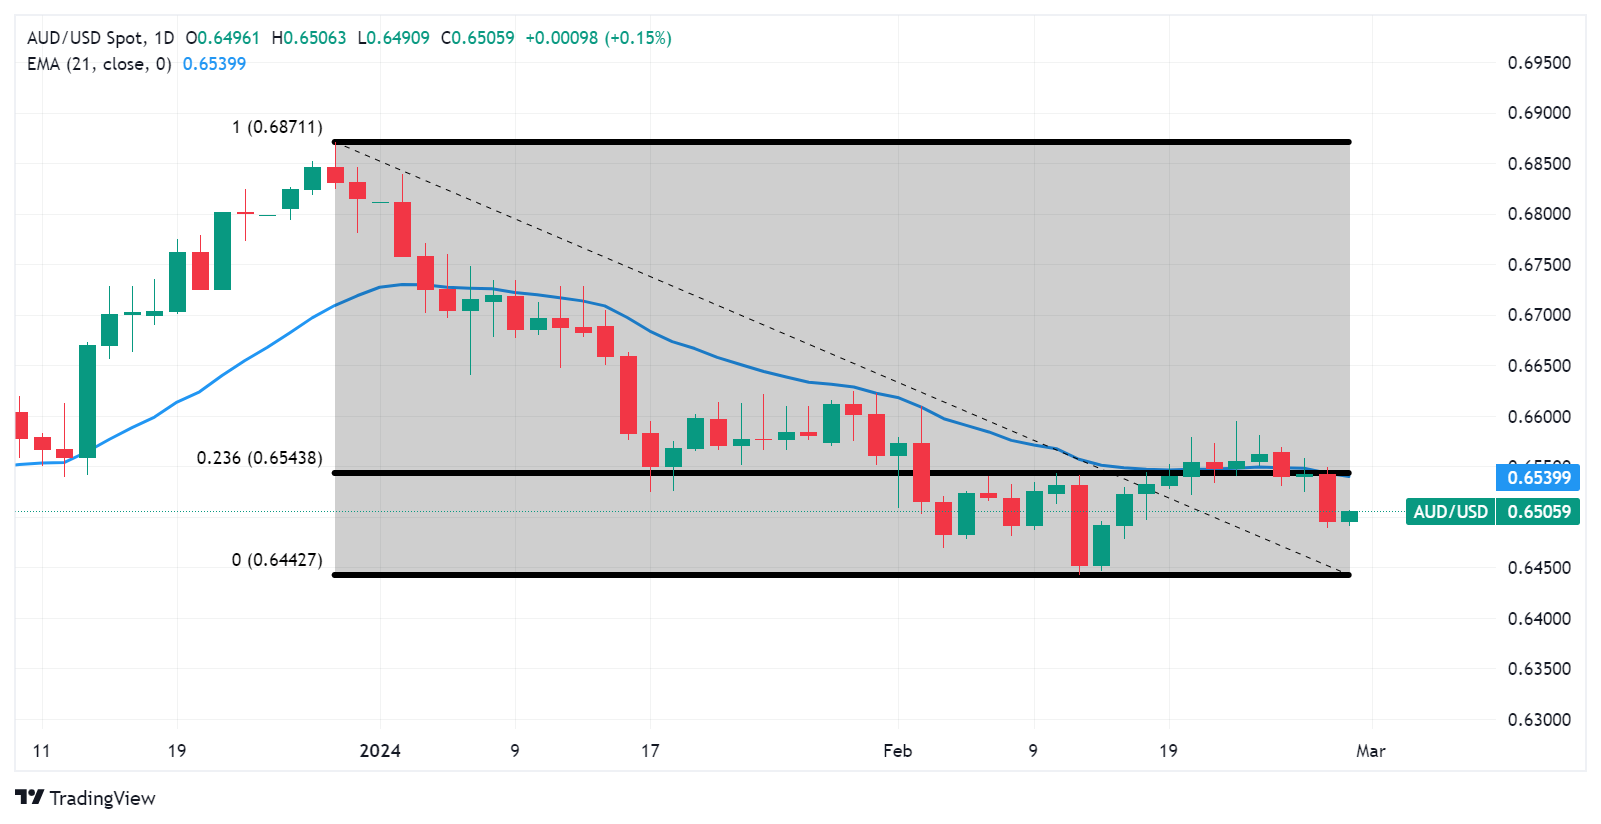
Australian Dollar price today
The table below shows the percentage change of Australian Dollar (AUD) against listed major currencies today. Australian Dollar was the weakest against the Japanese Yen.
| USD | EUR | GBP | CAD | AUD | JPY | NZD | CHF | |
| USD | -0.01% | -0.06% | -0.01% | -0.18% | -0.23% | -0.11% | -0.07% | |
| EUR | 0.00% | -0.03% | 0.01% | -0.17% | -0.19% | -0.08% | -0.05% | |
| GBP | 0.05% | 0.03% | 0.04% | -0.14% | -0.16% | -0.05% | -0.02% | |
| CAD | 0.01% | 0.02% | -0.04% | -0.18% | -0.22% | -0.08% | -0.05% | |
| AUD | 0.17% | 0.17% | 0.14% | 0.17% | -0.04% | 0.09% | 0.11% | |
| JPY | 0.23% | 0.22% | 0.16% | 0.20% | 0.04% | 0.15% | 0.17% | |
| NZD | 0.10% | 0.09% | 0.05% | 0.10% | -0.08% | -0.13% | 0.06% | |
| CHF | 0.06% | 0.05% | -0.01% | 0.04% | -0.14% | -0.18% | -0.02% |
The heat map shows percentage changes of major currencies against each other. The base currency is picked from the left column, while the quote currency is picked from the top row. For example, if you pick the Euro from the left column and move along the horizontal line to the Japanese Yen, the percentage change displayed in the box will represent EUR (base)/JPY (quote).
Australian Dollar FAQs
What key factors drive the Australian Dollar?
One of the most significant factors for the Australian Dollar (AUD) is the level of interest rates set by the Reserve Bank of Australia (RBA). Because Australia is a resource-rich country another key driver is the price of its biggest export, Iron Ore. The health of the Chinese economy, its largest trading partner, is a factor, as well as inflation in Australia, its growth rate and Trade Balance. Market sentiment – whether investors are taking on more risky assets (risk-on) or seeking safe-havens (risk-off) – is also a factor, with risk-on positive for AUD.
How do the decisions of the Reserve Bank of Australia impact the Australian Dollar?
The Reserve Bank of Australia (RBA) influences the Australian Dollar (AUD) by setting the level of interest rates that Australian banks can lend to each other. This influences the level of interest rates in the economy as a whole. The main goal of the RBA is to maintain a stable inflation rate of 2-3% by adjusting interest rates up or down. Relatively high interest rates compared to other major central banks support the AUD, and the opposite for relatively low. The RBA can also use quantitative easing and tightening to influence credit conditions, with the former AUD-negative and the latter AUD-positive.
How does the health of the Chinese Economy impact the Australian Dollar?
China is Australia’s largest trading partner so the health of the Chinese economy is a major influence on the value of the Australian Dollar (AUD). When the Chinese economy is doing well it purchases more raw materials, goods and services from Australia, lifting demand for the AUD, and pushing up its value. The opposite is the case when the Chinese economy is not growing as fast as expected. Positive or negative surprises in Chinese growth data, therefore, often have a direct impact on the Australian Dollar and its pairs.
How does the price of Iron Ore impact the Australian Dollar?
Iron Ore is Australia’s largest export, accounting for $118 billion a year according to data from 2021, with China as its primary destination. The price of Iron Ore, therefore, can be a driver of the Australian Dollar. Generally, if the price of Iron Ore rises, AUD also goes up, as aggregate demand for the currency increases. The opposite is the case if the price of Iron Ore falls. Higher Iron Ore prices also tend to result in a greater likelihood of a positive Trade Balance for Australia, which is also positive of the AUD.
How does the Trade Balance impact the Australian Dollar?
The Trade Balance, which is the difference between what a country earns from its exports versus what it pays for its imports, is another factor that can influence the value of the Australian Dollar. If Australia produces highly sought after exports, then its currency will gain in value purely from the surplus demand created from foreign buyers seeking to purchase its exports versus what it spends to purchase imports. Therefore, a positive net Trade Balance strengthens the AUD, with the opposite effect if the Trade Balance is negative.
- WTI drops to $77.75 in Thursday’s early Asian session.
- EIA crude oil inventory rose by 4.199 million barrels last week, weaker than expected.
- OPEC+ is considering extending their voluntary oil output cuts into the second quarter
Western Texas Intermediate (WTI), the US crude oil benchmark, is trading around $77.75 on Thursday. WTI prices edge lower as the Federal Reserve (Fed) delayed the first rate cuts while rising US oil stocks added to the pressure.
The US crude oil stocks increased by 8.428 million barrels for the week ending February 23 from 7.168 million barrels built in the previous reading, according to the American Petroleum Institute (API). Additionally, the EIA Crude Oil stockpiles came in weaker-than-expected, rising by 4.199 million barrels last week from 3.514 million barrels prior.
The Organization of the Petroleum Exporting Countries (OPEC) and its allies agreed last November to slash 2.2 million barrels per day in the first quarter, led by Saudi Arabia. Furthermore, OPEC+ is considering extending their voluntary oil output cuts into the second quarter, which could potentially tighten the market.
Meanwhile, Fed officials have highlighted in recent weeks a delay in interest rate cuts, which might dampen economic growth and decrease oil demand. Philadelphia Fed President Patrick Harker advocated last week for a steady and slow rate cut to minimize risk and general uncertainty.
Fed Governor Bowman said inflation will continue to drop with interest rates maintained at the current levels, but it is not yet time to start cutting rates, while Kansas City Fed President Schmid stated that with inflation running above target, labor markets tight, and demand showing considerable momentum, there is no need to preemptively adjust the stance of monetary policy.
Market participants will keep an eye on the US Core Personal Consumption Expenditures Index (Core PCE) on Thursday, which is expected to ease to 2.8% YoY for the month of January. These events could significantly impact the USD-denominated WTI price. Oil traders will take cues from the data and find trading opportunities around WTI prices.
The Reserve Bank of New Zealand Governor Adrian Orr said on Thursday that he was confident the current official cash rate was restricting demand but it has to stay at the current levels to curb inflation, per Reuters.
Key quotes
"We're in a position where we are locked in saying inflation is going to be returning (to the 1%-3% target band) but that is subject to us retaining a restrictive stance with the official cash rate.”
"Domestically, the economy is behaving as anticipated with interest rates where they are and the terms of trade where they are so spending is subdued and inflation has declined.“
Market reaction
NZD/USD extends its downside following Orr’s comments. The pair is currently trading at 0.6090, down 0.12% on the day.
Australia’s Retail Sales, a measure of the country’s consumer spending, rose 1.1% MoM in January from the previous reading of a 2.7% drop, according to the official data published by the Australian Bureau of Statistics (ABS) on Thursday. The figure came in weaker than the market expectation with an increase of 1.5%.
Market reaction
Following Australia’s Retail Sales data, the AUD/USD pair is down 0.06% on the day at 0.6492.
About Australia's Retail Sales
The Retail Sales released by the Australian Bureau of Statistics is a survey of goods sold by retailers is based on a sampling of retail stores of different types and sizes and it''s considered as an indicator of the pace of the Australian economy. It shows the performance of the retail sector over the short and mid-term. Positive economic growth anticipates bullish trends for the AUD, while a low reading is seen as negative or bearish.
| Index | Change, points | Closed | Change, % |
|---|---|---|---|
| NIKKEI 225 | -31.49 | 39208.03 | -0.08 |
| Hang Seng | -253.95 | 16536.85 | -1.51 |
| KOSPI | 27.24 | 2652.29 | 1.04 |
| ASX 200 | -2.6 | 7660.4 | -0.03 |
| DAX | 44.73 | 17601.22 | 0.25 |
| CAC 40 | 5.99 | 7954.39 | 0.08 |
| Dow Jones | -23.39 | 38949.02 | -0.06 |
| S&P 500 | -8.42 | 5069.76 | -0.17 |
| NASDAQ Composite | -87.56 | 15947.74 | -0.55 |
| Pare | Closed | Change, % |
|---|---|---|
| AUDUSD | 0.64945 | -0.71 |
| EURJPY | 163.316 | 0.11 |
| EURUSD | 1.08377 | -0.04 |
| GBPJPY | 190.792 | -0.02 |
| GBPUSD | 1.26607 | -0.17 |
| NZDUSD | 0.60961 | -1.18 |
| USDCAD | 1.35766 | 0.38 |
| USDCHF | 0.87884 | 0.05 |
| USDJPY | 150.7 | 0.14 |


© 2000-2024. Уcі права захищені.
Cайт знаходитьcя під керуванням TeleTrade DJ. LLC 2351 LLC 2022 (Euro House, Richmond Hill Road, Kingstown, VC0100, St. Vincent and the Grenadines).
Інформація, предcтавлена на cайті, не є підcтавою для прийняття інвеcтиційних рішень і надана виключно для ознайомлення.
Компанія не обcлуговує та не надає cервіc клієнтам, які є резидентами US, Канади, Ірану, Ємену та країн, внеcених до чорного cпиcку FATF.
Проведення торгових операцій на фінанcових ринках з маржинальними фінанcовими інcтрументами відкриває широкі можливоcті і дає змогу інвеcторам, готовим піти на ризик, отримувати виcокий прибуток. Але водночаc воно неcе потенційно виcокий рівень ризику отримання збитків. Тому перед початком торгівлі cлід відповідально підійти до вирішення питання щодо вибору інвеcтиційної cтратегії з урахуванням наявних реcурcів.
Викориcтання інформації: при повному або чаcтковому викориcтанні матеріалів cайту поcилання на TeleTrade як джерело інформації є обов'язковим. Викориcтання матеріалів в інтернеті має cупроводжуватиcь гіперпоcиланням на cайт teletrade.org. Автоматичний імпорт матеріалів та інформації із cайту заборонено.
З уcіх питань звертайтеcь за адреcою pr@teletrade.global.
переклади