- Аналітика
- Новини та інструменти
- Новини ринків
Новини ринків
- GBP/USD trades in positive territory for the second consecutive day near 1.2710.
- The US Federal Reserve is expected to maintain its key interest rates for a fourth consecutive meeting.
- BoE is widely anticipated to maintain the interest rates steady amid signs of easing inflation.
- The Federal Open Market Committee (FOMC) and the Bank of England (BoE) meeting will be in the spotlight this week.
The GBP/USD pair remains well-supported above the 1.2700 mark during the early Asian session on Tuesday. Markets turn to a cautious mood ahead of the key two events from the Federal Open Market Committee (FOMC) and the Bank of England (BoE) on Wednesday and Thursday, respectively. GBP/USD currently trades around 1.2710, unchanged for the day.
Inflation in the United States continues to surprise to the downside. The US Core Personal Consumption Expenditures Price Index (Core PCE), the Fed’s preferred gauge, fell to 2.9% in December, dropping below 3% for the first time since early 2021. The stage is prepared for the Fed to begin cutting interest rates in the coming months. At the January meeting, the FOMC will leave benchmark interest rates unchanged at a 23-year high of 5.25–5.5%, after a lengthy effort to tame rampant inflation.
On the British Pound front, the BoE is widely anticipated to maintain the interest rates steady. Traders will monitor the guidance on interest rates and message about the possibility of future cuts. BoE Governor Andrew Bailey said it’s premature to lower the rates. However, signs that the inflation crisis is easing off might convince the central bank to lower rates after all.
Moving on, market players will keep an eye on the US JOLTS Job Openings and the Consumer Confidence gauge by the Conference Board, due on Tuesday. The highlight of this week will be the FOMC meeting on Wednesday and the BoE interest rate decision on Thursday. These events might trigger volatility in the market and give a clear direction to the GBP/USD pair.
- Gold rises 0.70%, supported by Middle East tensions and a weaker US Dollar.
- Safe-haven demand for gold spikes following drone attack in Jordan, amid global uncertainties.
- Investor attention on Fed meeting, with prevailing expectations of rate hold and focus on future policy outlook.
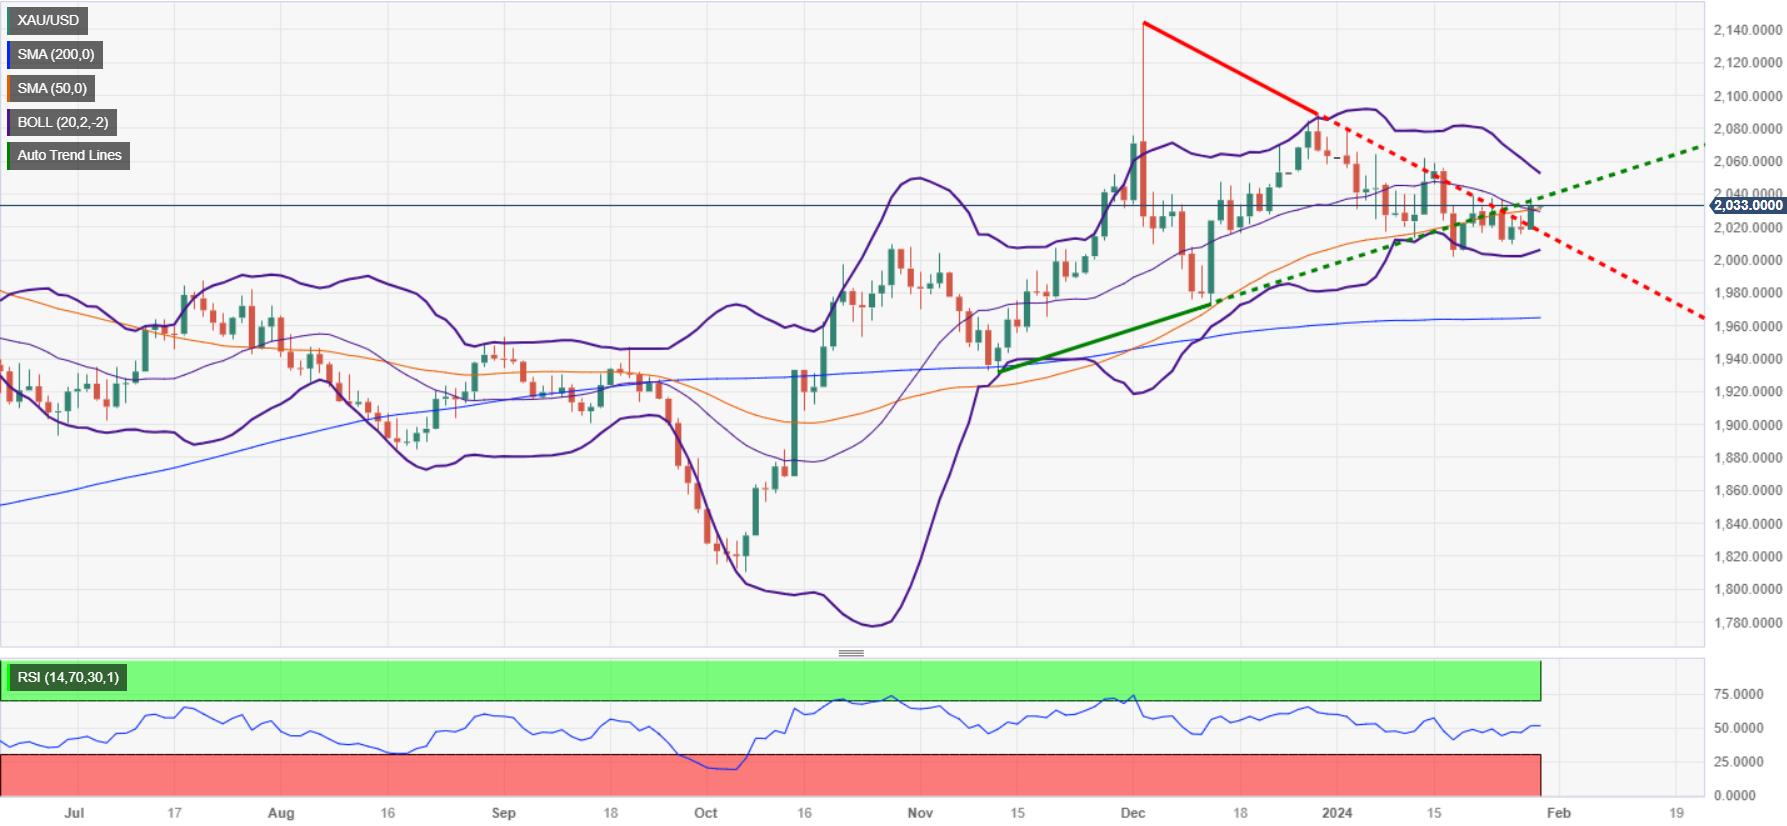
Gold price stood firm on Monday, gaining more than 0.70%, sponsored by rising tensions in the Middle East alongside the Greenback (USD) pairing its earlier gains during the day. As the Asian session begins, the XAU/USD exchanges hands at $2031.60, down by 0.07%, after bouncing from a weekly low of $2017.92 yesterday.
XAU/USD to remain higher amid geopolitical risks linked to Middle East conflict
Market participants remain cautious ahead of Wednesday's US Federal Reserve (Fed) monetary policy decision. The Greenback was higher on the day but finished the session virtually unchanged at 103.47, as US Treasury bond yields dropped. Consequently, Gold advanced with geopolitical risks rising in the Middle East.
In regard to that, a drone attack on US citizens in Jordan, which killed three servicemen and 34 wounded, would not be tolerated by the White House, US Defense Secretary Lloyd Austin said “The President and I will not tolerate attacks on U.S. forces, and we will take all necessary actions to defend the U.S. and our troops.”
Aside from this, the US 10-year Treasury bond yield slipped six basis points to 4.07%, increasing the appeal of the non-yielding metal. The Federal Reserve’s January meeting is expected to keep rates unchanged, adopting a more neutral stance instead of December’s dovish pivot by Jerome Powell and Co.
The CME FedWatch Tool shows market participants aren’t expecting a rate cut until the May meeting, with 100% odds for 25 basis points and for a 0.50% cut. That could change once the Fed’s decision is out of the way.
XAU/USD Price Analysis: Technical outlook
From a technical standpoint, Gold’s is upward neutral biased, braced to the 50-day moving average (DMA) at $2031.67. If buyers' XAU/USD price is above that level, look for a test of the January 12 high at $2062. Once cleared, that could pave the way to challenge the December 28 cycle high at $2088.48. On the flip side, if Gold slips below the 50-DMA, look for a test of the January 17 low of $2001.92 Further downside is seen at the 100-DMA at $1980.85.
- NZD/USD trades on a stronger note despite the stronger USD.
- The Federal Open Market Committee (FOMC) is expected to leave its key rate unchanged at 5.25–5.50% at its January meeting.
- RBNZ’s Conway said data suggests monetary policy is working, but there is a long way to go before inflation returns to its target of 2%.
- US JOLTS Job Openings and Consumer Confidence are due on Tuesday.
The NZD/USD pair holds ground above the 0.6100 psychological mark despite the firmer US Dollar (USD) during the early Asian session on Tuesday. The positive news of additional stimulus measures in China boosted the sentiment surrounding the China-proxy New Zealand Dollar (NZD). However, traders might turn cautious ahead of the Federal Open Market Committee's (FOMC) January meeting on Wednesday. The pair retreats from an intraday high of 0.6143. At press time, the pair is trading at 0.6132, losing 0.01% on the day.
Inflation in the US is easing to the Federal Reserve’s (Fed) target and the economy is robust. Most economists anticipate the first rate cut will come in May or June, but a cut at the Fed's March meeting is not off the table. The timing of rate cuts will almost definitely be the closely watched topic of the Fed's two-day meeting, which ends Wednesday. The Fed is expected to leave its key rate unchanged at 5.25–5.50% at its January meeting. On Monday, the US Dallas Fed Manufacturing Business Index for January came in at -27.4 versus -10.4 prior.
On the other hand, the Reserve Bank of New Zealand (RBNZ) Chief Economist Paul Conway said on Tuesday that recent economic data suggests monetary policy is working but there is still a way to go before inflation returns to its midpoint of 2%. Meanwhile, the positive development surrounding new stimulus plans in China might boost the sentiment and cap the downside of the China-proxy New Zealand Dollar (NZD).
Ahead of the key event, the US JOLTS Job Openings and the Consumer Confidence gauge by the Conference Board will be due on Tuesday. The FOMC meeting policy will be announced on Wednesday. Adjusting the language in the statement they issue after the meeting will be in the spotlight.
- AUD/USD trades at 0.6610 soaking in 0.50% gains, with bears struggling to seize control.
- Australian Retail Sales expected to decline by 3.5% MoM.
- Hawkish bets on the RBA are keeping the Aussie afloat.
On Monday's session, the AUD/USD forged ahead with 0.50% gains to settle at 0.6610. Despite an uncertain broader market sentiment, the daily chart exhibits a neutral to bullish outlook as bears grapple for ground. In that sense, as markets await the Federal Reserve (Fed) decision on Wednesday, markets brace for key Australian data on Tuesday to palace their bets on the next Reserve Bank of Australia (RBA).
In that sense, markets are bracing for a 3.5% MoM fall in Retail Sales in the last month from December, hinting at contraction in consumer spending. The RBA’s response to domestic economic indicators remains to be seen, although markets do not currently anticipate a rate cut until the second half of 2024.
Meanwhile, in the US, uncertainty looms large over Federal Reserve's policy direction with the Dallas Fed Index sliding significantly. The Fed, though expected to maintain rates at the upcoming meeting, might undertake its easing cycle mid-year, according to market consensus, which could weaken the USD. Messaging by Jerome Powell will be key.
AUD/USD levels to watch
The daily chart showcases that the bulls are recovering ground. The upward slope of the Relative Strength Index (RSI) in the positive zone suggests a strong footing for the bulls. Their strength is further evidenced by the pair's position above the 100 and 200-day Simple Moving Averages (SMAs). Nevertheless, the bears appear to be making a determined effort to reclaim control as shown by the pair hovering just beneath the 20-day SMA. However, the dwindling red bars of the Moving Average Convergence Divergence (MACD) implies that negative momentum is losing its grip.
AUD/USD daily chart

- WTI oil drops over 1.50%, affected by China's property sector woes and a robust US Dollar.
- Oil prices falter despite geopolitical tensions, pressured by global economic concerns and central bank policies.
- Market awaits API and EIA reports for insights on US crude and distillate stocks amid economic uncertainty.
West Texas Intermediate (WTI) drops sharply more than 1.50% on Monday, after failing to crack a key technical resistance level, along with demand woes sponsored by China’s property crisis. Despite rising tensions in the Middle East, traders are bracing for the US Federal Reserve (Fed) decision to keep the US Dollar strong. At the time of writing, WTI exchanges hands at $76.90.
Crude Oil struggles to break key resistance, and plunges on risk sentiment
The real estate crisis in China might be about to get worse as a Hong Kong court ordered the liquidation of property giant China Evergrande Group. Sources cited by Reuters said, “The situation in China is the biggest headwind to the whole market; that is why the market keeps backing off from the war risk premium.”
Oil prices failed to gain traction following an attack to a Russian oil facility on Monday on the Slavneft-YANOS refinery in the city of Yaroslavl.
In the meantime, the restrictiveness of global central banks keeps Oil prices slightly depressed as the Federal Reserve (Fed) and the Bank of England (BoE) take center stage during the week. Both central banks are expected to keep rates unchanged, though the former is underpinning the Greenback (USD).
The US Dollar Index (DXY), which tracks the performance of six currencies against the buck, is up 0.14%, at 103.61, a headwind for US Dollar denominated assets.
All in all, Oil traders are looking forward to the American Petroleum Institute (API) stockpiles report in the US on Tuesday, ahead of the US Energy Information Administration (EIA) on Wednesday.
According to a Reuters poll, US crude Oil and distillates are expected to have reduced last week, while gasoline inventoried were seen rising.
WTI Price Analysis: Technical outlook
With WTI’s failing to crack the 100-day moving average (DMA) at $79.37, sellers piled in a comeback as Oil prices were dragged below the 200-DMA at $77.44, exacerbating the drop below $77.00 per barrel. A daily close below the latter will expose the $76.00 figure, followed by the 50-DMA at $73.54. Further downside is seen at $73.00. Conversely if buyers lift the price above $77.00, a test fo the 200-DMA is on the cards.

- Europe saw mixed results in equity indexes for the new trading week.
- Energies climb, but financials stumbled.
- ECB officials drive rate cut expectations to the forefront.
European equities spread on Monday as markets compare last week’s rate hold from the European Central Bank (ECB) mixes like water and oil with early rate-cut talk from ECB policymakers to spark headlines as the new trading week gets underway.
Momentum eased in European stocks on Monday after hitting multi-year highs on Friday, leaving investors to reconsider their positioning after banks and financials saw declines despite energy sector indexes marking in slight gains.
The ECB is firmly at the top of the rate hike cycle, and the central bank’s next move is well-telegraphed as a cut, and now all that’s left is for markets to negotiate the specifics of when the ECB will trim rates.
ECB’s Centeno: Should start cutting rates sooner rather than later
Money markets are fully priced in on a first 25 basis point rate cut from the ECB by May, with rate swaps expecting 149 basis points in overall rate cuts through the end of the year.
ECB officials landed on opposite sides of how fast rate cuts should come on Monday, further muddying the waters on rate cut expectations heading into the midyear.
ECB’s Kazimir: A rate cut in June is more probable than in April
European Gross Domestic Product (GDP) figures are due on Tuesday, and investors will be looking for a rebound in Germany’s fourth quarter GDP while pan-European QoQ GDP is expected to stump in at -0.1%.
Germany’s DAX index slid 0.12% to close down nearly 20 points at €16,941.71, while London’s FTSE major equity index ended Monday nearly flat at 0.03% at £7,632.74, down 2.35 points.
France’s CAC40 gained 6.67 points to end up nearly a tenth of a percent at €7,640.81, while the pan-European STOXX600 index climbed one full point to close at €484.84, gaining 0.21%.
DAX technical outlook
Germany’s DAX saw an early decline to kick off the trading week, testing into near-term medians near €16,850.00 at the 50-hour Simple Moving Average (SMA).
A mid-day rebound kept the index trimmed into the day’s opening bids and Monday saw limited change to open the new trading week.
Despite Monday’s hesitancy, the DAX is well-bid into the top end, trading into all-time highs near the €17,000.00 and the index is set to close in the green for the third straight month.
DAX Hourly Chart
DAX Daily Chart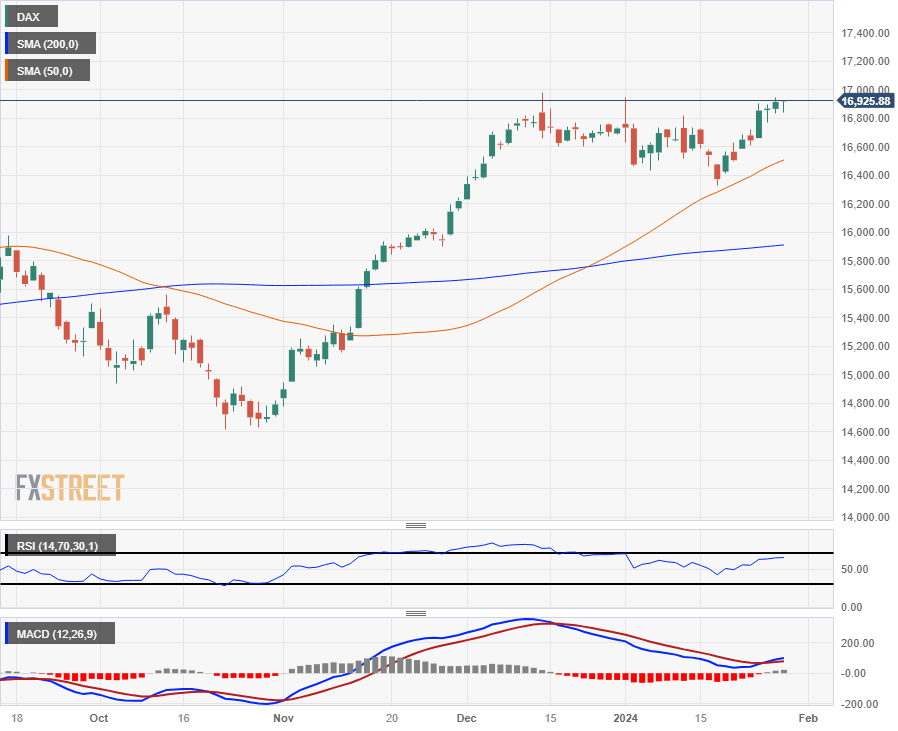
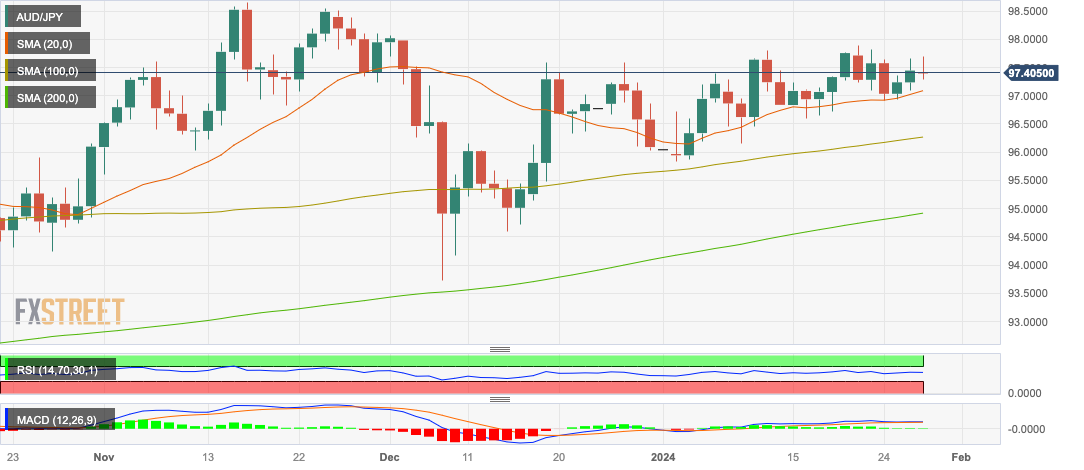
- The AUD/JPY experiences mild gains, currently standing at 97.40.
- Monetary policy divergences between the RBA and BoJ benefit the AUD.
- Before the RBA meets next week markets will get Retail Sales from December and Q4 CPI.
- The daily chart indicators sends mixed signals with, positive RSI a neutral MACD which suggests stagnant momentum.
On Monday's session, the AUD/JPY was seen trading at 97.40, shedding off mild gains after peaking at a high of 97.75. The overall view on the daily chart suggests a neutral to bullish trend, however, the bulls are facing obstacles in gaining further ground. Conversely, the four-hour outlook indicates bears have started to reign in, transforming the broader aspect of the technical landscape. In that sense, markets remain cautious awaiting further data to place their bets on the next Reserve Bank of Australia (RBA) decisions.
In that sense, RBA’s next week’s rate decision will be pivotal. Governor Bullock warned recently that inflation may take a little longer to normalize which made markets bet on a more aggressive stance so the messaging from the bank will be key. This week, Australia will release December Retail Sales figures from December, and on Wednesday, Q4 Consumer Price Index report, which may also set the pace of the AUD price dynamics.
AUD/JPY levels to watch
The overall view on the daily chart suggests a neutral to bullish trend, however, the bulls are facing obstacles in gaining further ground. The Relative Strength Index (RSI) is painting a positive picture given its upward tilt in the positive territory, indicating a strong buying momentum persisting in the market. However, the Moving Average Convergence Divergence (MACD) showing flat green bars signifies that the bullish sentiment is still dominant but that it is running out of steam. That being said, the pair’s positioning above all the 20,100, and 200-day Simple Moving Averages (SMAs), suggests a bullish inclination in the broader frame, despite the bulls struggling to gain additional ground recently.
Assessing from the short-term four-hour chart, a slightly contrary momentum is noticed. The bears seem to be gradually gaining some strength, making their presence felt. The four-hour RSI is sliding in the positive territory, indicating a potential shift towards a selling momentum, although it's in early stages. The MACD depicting flat green bars confirms that the bulls momentum is waning. Nevertheless, the subtle shift suggests that the buyers need to be cautious as the shorter time frame may be hinting towards a possible change in momentum.
AUD/JPY daily chart
Another firm session of the Greenback put the risk complex under further pressure, sending the USD Index (DXY) to flirt with the upper end of the recent range and EUR/USD to the sub-1.0800 region, all amidst the emergence of usual pre-FOMC cautiousness.
Here is what you need to know on Tuesday, January 30:
The US Dollar Index (DXY) kicked off the new trading week on a robust note, surpassing the 103.80 level ahead of the FOMC gathering and the publication of the Nonfarm Payrolls. However, before those key events emerge, the FHFA’s House Price Index and the Consumer Confidence gauge by the Conference Board are both due on January 30.
EUR/USD accentuated its bearish feeling and broke below the 1.0800 support level to print fresh multi-week lows at the beginning of the week. In the euro docket, the advanced Q4 GDP Growth Rate in Germany and the broader Euroland will take centre stage on January 30.
Across the Channel, Mortgage Approvals and Mortgage Lending figures are due on Tuesday. GBP/USD clinched its third consecutive daily pullback on Monday in response to the solid price action around the greenback.
USD/JPY came under renewed downside pressure following two daily advances in a row and broke below the 148.00 level. The release of the December Unemployment Rate will be the salient event in “The Land of the Rising Sun” on January 30.
Positive prospects from news citing extra stimulus in China continued to prop up the mood around the Aussie dollar, motivating AUD/USD to start the week with decent gains, although still capped by the 0.6600 barrier. On Tuesday, Retail Sales prints should gather all the attention Down Under.
While unabated geopolitical concerns bolstered crude oil prices, demand concerns stemming mainly from China, as well as the potential tighter-for-longer stance by the Fed and the ECB, eventually dragged the commodity to the negative zone on Monday.
Declining US yields encouraged Gold prices to resume their upside, while Silver climbed to multi-day highs backed by China’s stimulus.
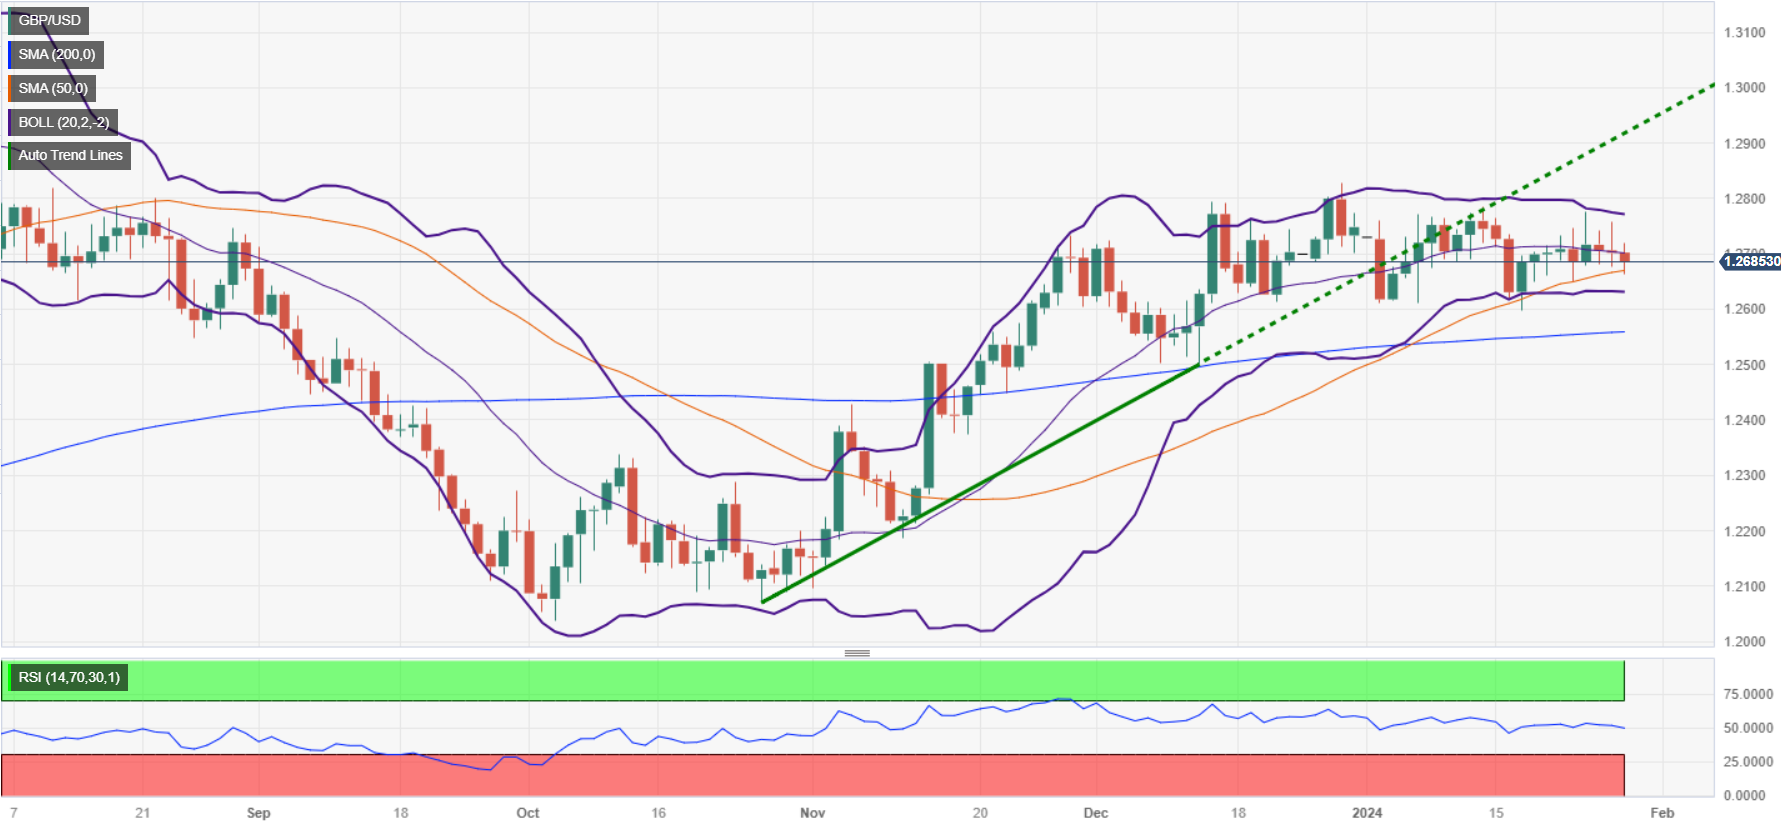
- GBP/USD dips 0.17%, with focus on imminent Fed and BoE decisions this week
- Attention on Fed Chair Powell's comments; no new projections till March, but rate cut speculations persist.
- BoE rate decision, economic forecasts, alongside key UK and US economic reports to impact GBP/USD's direction.
The GBP/USD is under pressure amid a busy week in the economic calendar, with central bank decisions on the line, led by the US Federal Reserve (Fed) and the Bank of England (BoE). The major is trading at 1.2681, down 0.17% after hitting a daily high of 1.2718.
Sterling slumps below the psychological 1.2700 with central bank decisions looming
The financial markets are in waiting mode, with a strong week ahead that will gain traction on Wednesday. The Fed is expected to keep rates unchanged, though most analysts are expecting Fed Chairman Jerome Powell's press conference, who delivered ultra-dovish remarks in December. That sponsored a pushback by other Fed officials, and traders need to be aware there would be no projections or dot-plots revealed until the March meeting.
In the meantime, there’s a 50% chance the Fed will cut rates by 25 basis points in the next meeting. May’s decision is gathering traction, according to the CME Fed Watch Tool. The chance of a 24 basis point rate cut is 51.3%, while 50 bps lies at 36.9%. That said, Powell’s press conference on Wednesday could rock the boat, and we could see an adjustment of the expectations.
Aside from this, the Bank of England will host their first Bank Rate decision on Thursday, with most analysts expecting a unanimous decision of 9-0 to hold rates, with the BoE releasing their latest economic projections and Andrew Bailey’s press conference.
According to the Commitment of Traders report, speculators increased their net long Sterling position to $2.49 billion, the biggest in four months. That could mean GBP/USD traders are bracing for some upside soon. Despite that, speculation sees a 50% chance of a rate cut by the BoE in May.
Ahead of the week, the UK economic docket will feature the BoE Consumer Credit report. On the US front, JOLTs Job Openings and the Conference Board (CB) Consumer Confidence would update the status of the economy.
GBP/USD Price Analysis: Technical outlook
The daily chart portrays the pair as neutral biased, having fallen for three straight days, piercing the 1.2700 mark. For sellers to remain in the driver’s seat, they must push crack the 50-day moving average (DMA) at 1.2659. That would open the door to challenging the psychological 1.2600 level, followed by the 200-DMA at 1.2555. On the other hand, if GBP/USD bulls step up and lift the exchange rate past 1.2700, they could remain hopeful of challenging last Friday's high at 1.2758. Up next would be 1.2800.
- The DXY Index is exhibiting firm gains, trading near its mid-December highs around 103.75.
- Markets remain cautious ahead of the Fed’s decision on Wednesday.
- January’s NFPs are due on Friday.
The US Dollar (USD) Index soared on Monday, trading at 103.75 with gains hitting highs unseen since mid-December. This surge comes ahead of what is anticipated to be an eventful week with the first Federal Reserve (Fed) decision of 2024 on Wednesday and key labor market figures from the US on Friday.
In that sense, market expectations hint at a possible rate cut by the Fed in March. However, if economic growth sustains itself, a March rate cut seems unlikely. This is why bets have continued to shift toward the easing cycle beginning in May. In case the US continues to show resilience and markets delay expectations of the cuts, the downside is limited for the short term. The Fed’s tone on Wednesday will be key for the markets to continue placing their bets on the rate cuts calendar in 2024, so the USD may face volatility.
Daily Digest Market Movers: US Dollar gains as markets turn cautious ahead of Fed’s decision, labor market data
- Markets priced in that the Fed will hold its policy unchanged in its first meeting of 2024.
- The short-term trajectory will be determined if markets continue to give up on the easing cycle beginning in March.
- January's Nonfarm Payrolls are due on Friday and may affect those expectations. On Thursday, markets will also monitor ISM PMIs from the US from the first month of 2024.
- The CME FedWatch Tool indicates that the odds of a cut in March stand around 45%, while the possibilities of the easing cycle to start in May stand around 50%.
Technical Analysis: DXY bulls regain dominance on the battlefield, medium-term bearish bias still intact
The indicators on the daily chart are reflecting the revival of buying momentum. The positive slope in positive territory of the Relative Strength Index (RSI) indicate that bulls are attaining more strength. This recovery can also be observed in the rising green bars of the Moving Average Convergence Divergence (MACD), alluding to more substantial bullish influence.
Located above the 20-day Simple Moving Average (SMA), the Index shows the immediate market trend is favoring buyers. The positioning below the 100-day SMA, however, indicates a medium-term bearish bias. But an important development is the position above the long-term 200-day SMA, which suggests that the dominant trend is still bullish.
Consequently, the current technical environment indicates that while bears had been momentarily in control, DXY buyers are currently on the runway to reclaim dominance. The overall trend still seems to lean toward the bullish side.
Support Levels: 103.50 (200-day SMA),103.30, 103.00.
Resistance Levels: 103.90,104.00,104.20.
US Dollar FAQs
What is the US Dollar?
The US Dollar (USD) is the official currency of the United States of America, and the ‘de facto’ currency of a significant number of other countries where it is found in circulation alongside local notes. It is the most heavily traded currency in the world, accounting for over 88% of all global foreign exchange turnover, or an average of $6.6 trillion in transactions per day, according to data from 2022.
Following the second world war, the USD took over from the British Pound as the world’s reserve currency. For most of its history, the US Dollar was backed by Gold, until the Bretton Woods Agreement in 1971 when the Gold Standard went away.
How do the decisions of the Federal Reserve impact the US Dollar?
The most important single factor impacting on the value of the US Dollar is monetary policy, which is shaped by the Federal Reserve (Fed). The Fed has two mandates: to achieve price stability (control inflation) and foster full employment. Its primary tool to achieve these two goals is by adjusting interest rates.
When prices are rising too quickly and inflation is above the Fed’s 2% target, the Fed will raise rates, which helps the USD value. When inflation falls below 2% or the Unemployment Rate is too high, the Fed may lower interest rates, which weighs on the Greenback.
What is Quantitative Easing and how does it influence the US Dollar?
In extreme situations, the Federal Reserve can also print more Dollars and enact quantitative easing (QE). QE is the process by which the Fed substantially increases the flow of credit in a stuck financial system.
It is a non-standard policy measure used when credit has dried up because banks will not lend to each other (out of the fear of counterparty default). It is a last resort when simply lowering interest rates is unlikely to achieve the necessary result. It was the Fed’s weapon of choice to combat the credit crunch that occurred during the Great Financial Crisis in 2008. It involves the Fed printing more Dollars and using them to buy US government bonds predominantly from financial institutions. QE usually leads to a weaker US Dollar.
What is Quantitative Tightening and how does it influence the US Dollar?
Quantitative tightening (QT) is the reverse process whereby the Federal Reserve stops buying bonds from financial institutions and does not reinvest the principal from the bonds it holds maturing in new purchases. It is usually positive for the US Dollar.
- EUR/USD backslides as ECB headlines stoke ECB rate cut bets.
- Europe sees GDP figures on Wednesday ahead of US Fed rate call.
- Markets bet on ECB rate cut in April.
EUR/USD fell to its lowest bids since mid-December, testing the 1.0800 handle after European Central Bank (ECB) officials left the doors wide open for rate cuts much earlier than investors had previously anticipated.
Europe delivers a round of Gross Domestic Product (GDP) figures on Tuesday, headlined by pan-European GDP growth for the fourth quarter at 10:00 GMT. The US Federal Reserve’s (Fed) latest rate call is slated for Wednesday, to be followed by a Federal Open Market Committee (FOMC) press conference half an hour after the Fed’s monetary policy statement.
Daily digest market movers: EUR/USD sheds weight after ECB officials spark early rate cut hopes
- EUR/USD slipped further back on Monday after ECB board member and Banco de Portugal Governor Mário Centeno sparked rate cut hopes.
- ECB’s Centeno suggested the ECB should cut rates sooner rather than later to head off the possibility of European inflation declining too far below the ECB’s 2% target.
- ECB Centeno shrugged off the idea of the ECB waiting for first-quarter wage growth figures before punching the rate cut button, claiming there are no second-round inflation effects of wage increases.
- ECB board member Centeno is not in the ECB Governing Council vote rotation until March.
- Money markets have fully priced in a first rate trim from the ECB of 25 basis points in April.
- Rate swaps expect 149 basis points in ECB rate cuts through the end of the year.
- ECB policymaker and Slovakian central bank chief Peter Kazimir quickly followed Centeno, stating that a June rate cut is far more likely than April.
- ECB’s Kazimir pulled in the reins, claiming that rate cut talk remains ‘premature’, but agreed the top of the rate hike cycle has peaked and the ECB’s next move will be a cut, but only when appropriate.
- ECB Vice-President Luis de Guindos followed up by agreeing that inflationary risks are on the downside but reiterated that the ECB’s policies will reflect available data.
- Fed Chairman Jerome Powell is expected to deliver language on Wednesday that corroborates money market bets of a benchmark rate cut in May.
- Rate swaps are pricing in nearly a 90% chance of at least 25 basis points off the top from the Fed before June.
Euro price today
The table below shows the percentage change of Euro (EUR) against listed major currencies today. Euro was the weakest against the Japanese Yen.
| USD | EUR | GBP | CAD | AUD | JPY | NZD | CHF | |
| USD | 0.26% | 0.08% | -0.07% | -0.22% | -0.36% | -0.24% | -0.12% | |
| EUR | -0.24% | -0.16% | -0.31% | -0.46% | -0.58% | -0.48% | -0.36% | |
| GBP | -0.09% | 0.18% | -0.16% | -0.32% | -0.42% | -0.34% | -0.19% | |
| CAD | 0.08% | 0.32% | 0.15% | -0.16% | -0.27% | -0.18% | -0.04% | |
| AUD | 0.23% | 0.49% | 0.31% | 0.16% | -0.11% | 0.00% | 0.11% | |
| JPY | 0.34% | 0.60% | 0.56% | 0.26% | 0.08% | 0.07% | 0.23% | |
| NZD | 0.27% | 0.51% | 0.35% | 0.18% | 0.02% | -0.10% | 0.17% | |
| CHF | 0.11% | 0.37% | 0.19% | 0.04% | -0.11% | -0.23% | -0.12% |
The heat map shows percentage changes of major currencies against each other. The base currency is picked from the left column, while the quote currency is picked from the top row. For example, if you pick the Euro from the left column and move along the horizontal line to the Japanese Yen, the percentage change displayed in the box will represent EUR (base)/JPY (quote).
Technical Analysis: EUR/USD tests low-side barriers, resistance zones piling up above 1.0850
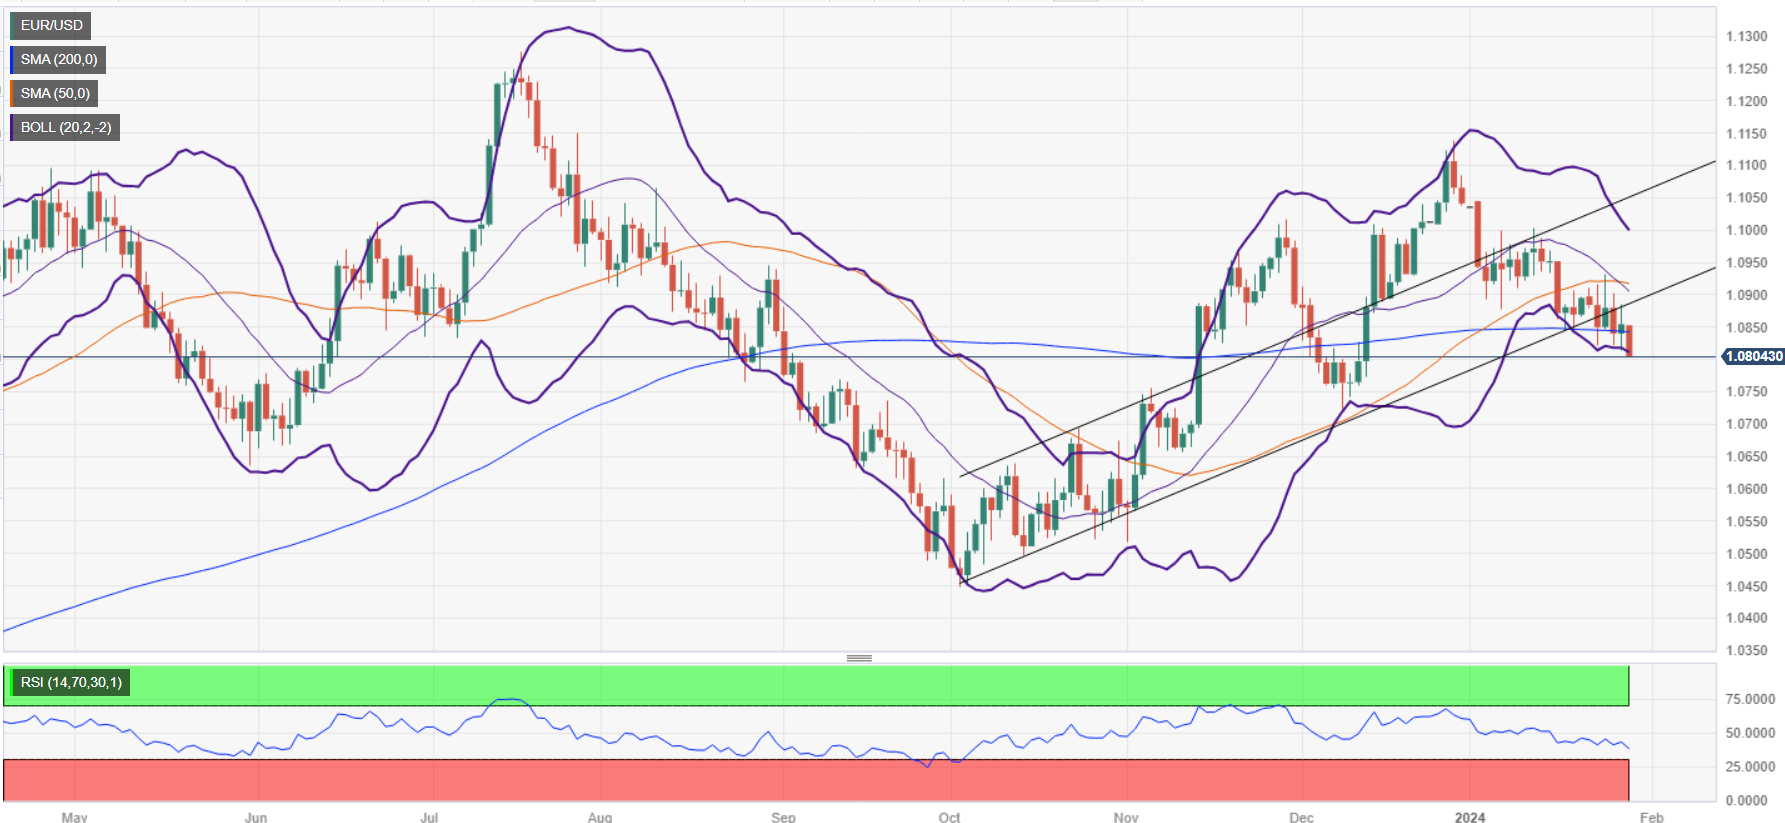
Monday saw EUR/USD decline over eight-tenths of a percent peak-to-trough from Friday’s near-term peak at 1.0886, and the pair continues to waffle below the 200-hour Simple Moving Average (SMA) descending into 1.0870.
Technical resistance has piled up in a familiar zone just below the 1.0900 handle, capping off intraday momentum to the top side and chaining EUR/USD into a defensive position as bids test old chart territory.
Daily candlesticks show the way open for a bearish test into December’s swing lows near 1.0750 as price action churns into the low side of the 200-day SMA near 1.0850. The pair’s ongoing pattern of higher lows is set for a challenge if buyers aren’t able to prop the pair back up over the 50-day SMA near 1.0925.
EUR/USD Hourly Chart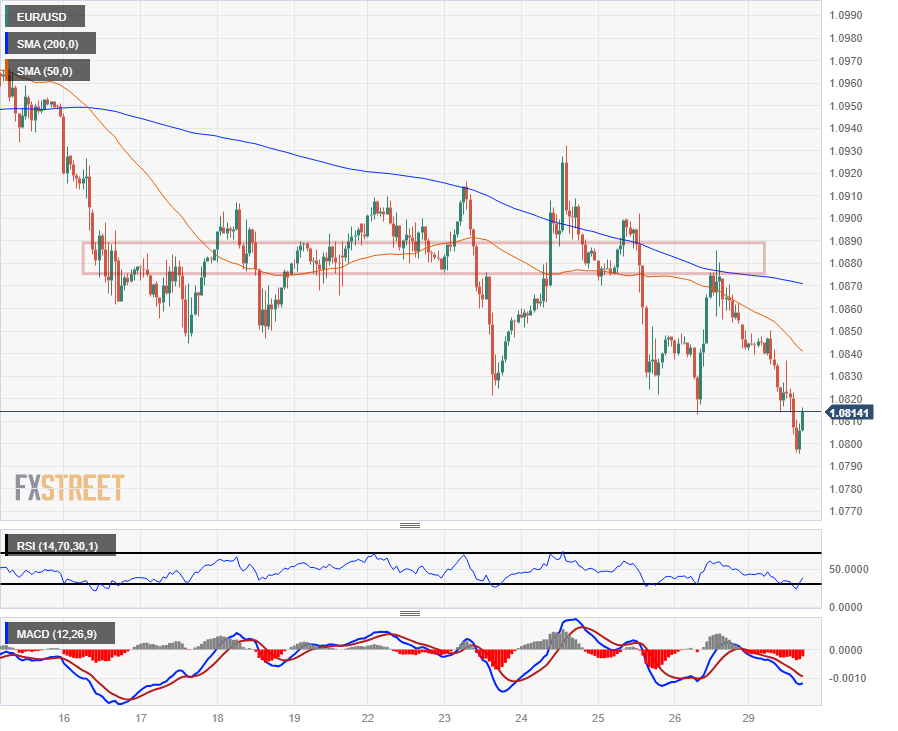
EUR/USD Daily Chart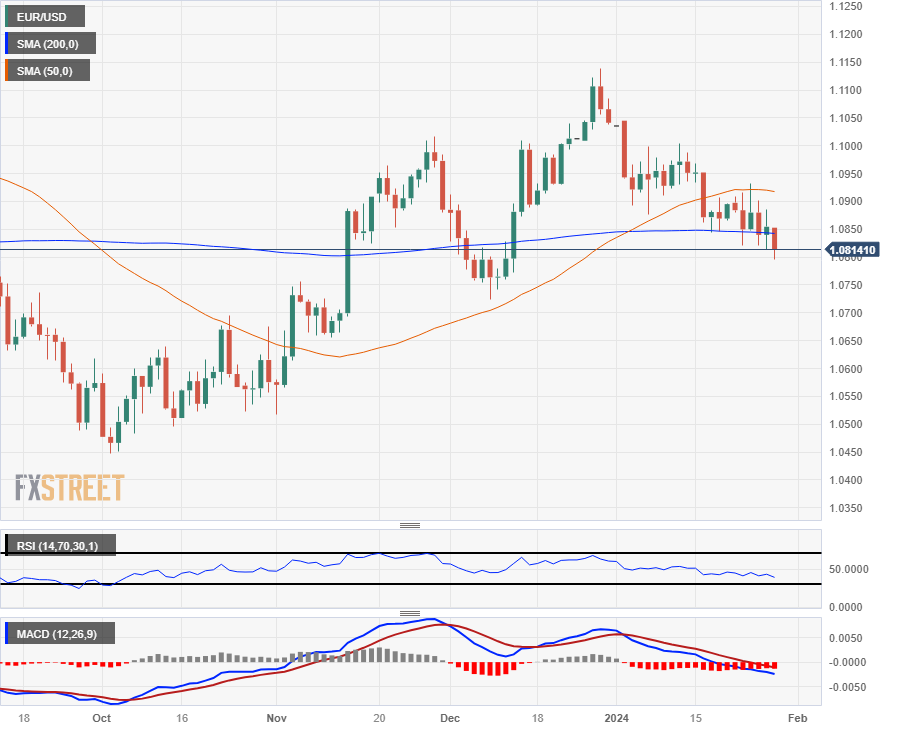
Euro FAQs
What is the Euro?
The Euro is the currency for the 20 European Union countries that belong to the Eurozone. It is the second most heavily traded currency in the world behind the US Dollar. In 2022, it accounted for 31% of all foreign exchange transactions, with an average daily turnover of over $2.2 trillion a day.
EUR/USD is the most heavily traded currency pair in the world, accounting for an estimated 30% off all transactions, followed by EUR/JPY (4%), EUR/GBP (3%) and EUR/AUD (2%).
What is the ECB and how does it impact the Euro?
The European Central Bank (ECB) in Frankfurt, Germany, is the reserve bank for the Eurozone. The ECB sets interest rates and manages monetary policy.
The ECB’s primary mandate is to maintain price stability, which means either controlling inflation or stimulating growth. Its primary tool is the raising or lowering of interest rates. Relatively high interest rates – or the expectation of higher rates – will usually benefit the Euro and vice versa.
The ECB Governing Council makes monetary policy decisions at meetings held eight times a year. Decisions are made by heads of the Eurozone national banks and six permanent members, including the President of the ECB, Christine Lagarde.
How does inflation data impact the value of the Euro?
Eurozone inflation data, measured by the Harmonized Index of Consumer Prices (HICP), is an important econometric for the Euro. If inflation rises more than expected, especially if above the ECB’s 2% target, it obliges the ECB to raise interest rates to bring it back under control.
Relatively high interest rates compared to its counterparts will usually benefit the Euro, as it makes the region more attractive as a place for global investors to park their money.
How does economic data influence the value of the Euro?
Data releases gauge the health of the economy and can impact on the Euro. Indicators such as GDP, Manufacturing and Services PMIs, employment, and consumer sentiment surveys can all influence the direction of the single currency.
A strong economy is good for the Euro. Not only does it attract more foreign investment but it may encourage the ECB to put up interest rates, which will directly strengthen the Euro. Otherwise, if economic data is weak, the Euro is likely to fall.
Economic data for the four largest economies in the euro area (Germany, France, Italy and Spain) are especially significant, as they account for 75% of the Eurozone’s economy.
How does the Trade Balance impact the Euro?
Another significant data release for the Euro is the Trade Balance. This indicator measures the difference between what a country earns from its exports and what it spends on imports over a given period.
If a country produces highly sought after exports then its currency will gain in value purely from the extra demand created from foreign buyers seeking to purchase these goods. Therefore, a positive net Trade Balance strengthens a currency and vice versa for a negative balance.
- Mexican Peso weakens, USD/MXN rises 0.36%, as markets anticipate Fed policy decision.
- Lowered expectations for Fed rate cut, Middle East tensions drive Peso down, Dollar up.
- Investors focus on Jerome Powell's speech for clues on Fed's future monetary policy direction.
The Mexican Peso (MXN) begins this week on the back foot for the third consecutive week against the US Dollar (USD) as traders remain cautious ahead of the US Federal Reserve’s (Fed) monetary policy decision. Investors reducing bets the Fed will cut rates in March, along with geopolitical tensions in the Middle East, keep risk-perceived currencies weak, boosting the safe-haven status of the Greenback. Therefore, the USD/MXN exchanges hands at 17.21, up 0.36%.
USD/MXN traders are bracing for the Fed’s decision on Wednesday. Expectations suggest the US central bank will keep rates on hold, and according to recent statements by some policymakers, discussions about quantitative tightening (QT) could emerge at the next meeting. However, market participants are looking to Fed Chairman Jerome Powell’s first appearance of the year on the stand. In December, Powell shifted more dovish, which was followed by Fed officials pushing back against aggressive speculation that the Fed would ease policy aggressively. Traders estimate that Powell will take a more balanced approach on Wednesday.
Daily Digest Market Movers: Mexican Peso to extend its weekly losses, ahead of Fed decision
- Ahead in the week, Mexico’s economic docket will reveal the Gross Domestic Product (GDP) preliminary reading for 2023’s last quarter, with estimates on a quarterly basis down at 0.3% from 1.1% in Q3. The consensus projects yearly figures down from 3.3% at 3%.
- The Mexican Peso could remain bullish as data suggests inflation remains above target even though underlying numbers slipped below the 5% threshold for the first time. That, along with the latest strong labor market report, indicates economic strength. With risks for inflation remaining tilted to the upside, that could prevent the Bank of Mexico (Banxico) from cutting rates.
- On the bearish front, two of Banxico’s Governors, one involving Governor Victoria Rodriguez Ceja, opened the door to ease policy in the first quarter of 2024, which could weigh on the Peso as the interest rate differential between Mexico and the US would shrink. The economy losing pace due to an upcoming slowdown in the US and geopolitical risks are a headwind for the Mexican currency.
- Last week’s data featured Mexico’s Trade Balance hitting a surplus in December, while Economic Activity shrank in November. On the data front, the Unemployment Rate dropped, signaling the labor market remains robust.
- On January 5, a Reuters poll suggested the Mexican Peso could weaken 5.4% to 18.00 per US Dollar in the 12 months following December.
- Across the border, the US economy remains resilient, as GDP in Q4 of last year crushed forecasts despite easing from Q3’s 4.9%. That could force Fed officials to refrain from easing policy, but the latest inflation data suggests they’re close to getting inflation to its 2% target.
- Nevertheless, mixed readings in other data suggest that risks have become more balanced. That is reflected by investors speculating that the Fed will cut rates by 139 basis points during 2024, according to the Chicago Board of Trade (CBOT) data.
Technical Analysis: Mexican Peso drops sharply as USD/MXN bounces off 50-day SMA
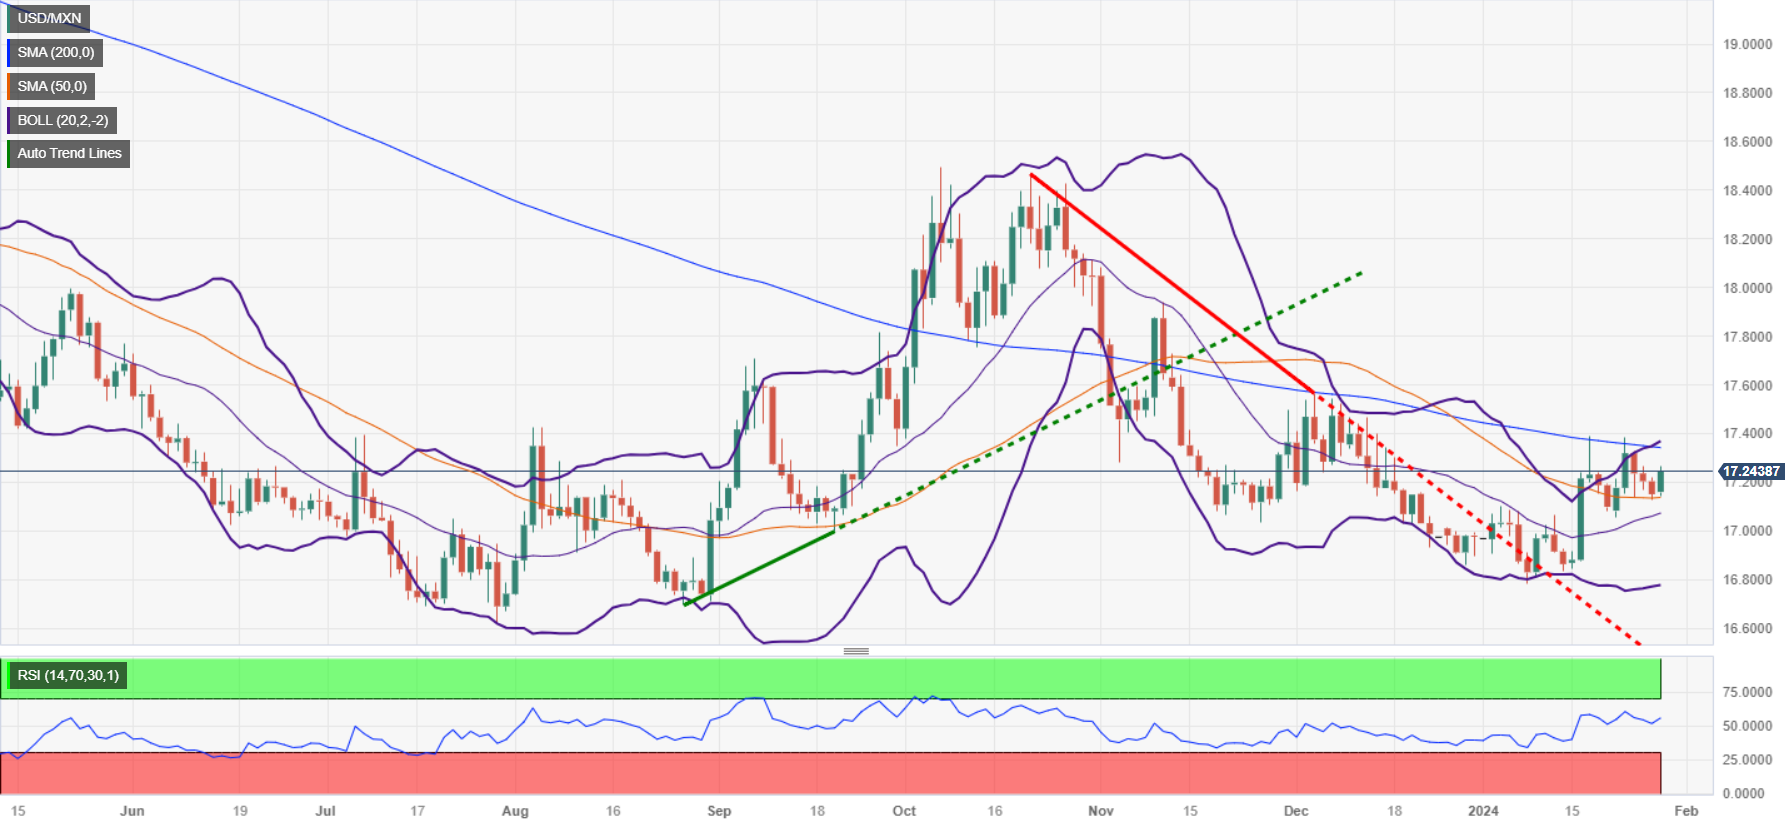
The USD/MXN price action on Monday has edged to the upside sharply with the risks of taking the bears out of the picture. A bullish engulfing chart pattern on the daily chart is putting the 200-day Simple Moving Average (SMA) at 17.34 back into play. Once that level is taken out, the 100-day SMA at 17.41 would be up next, followed by the December 9 high at 17.56, ahead of the May 23 high from last year at 17.99.
Conversely, if sellers step In, they must drag the USD/MXN exchange rate toward the 50-day SMA at 17.13. A decisive break will expose the January 22 low at 17.05, followed by the 17.00 psychological level.
USD/MXN Price Action - Daily Chart
Mexican Peso FAQs
What key factors drive the Mexican Peso?
The Mexican Peso (MXN) is the most traded currency among its Latin American peers. Its value is broadly determined by the performance of the Mexican economy, the country’s central bank’s policy, the amount of foreign investment in the country and even the levels of remittances sent by Mexicans who live abroad, particularly in the United States. Geopolitical trends can also move MXN: for example, the process of nearshoring – or the decision by some firms to relocate manufacturing capacity and supply chains closer to their home countries – is also seen as a catalyst for the Mexican currency as the country is considered a key manufacturing hub in the American continent. Another catalyst for MXN is Oil prices as Mexico is a key exporter of the commodity.
How do decisions of the Banxico impact the Mexican Peso?
The main objective of Mexico’s central bank, also known as Banxico, is to maintain inflation at low and stable levels (at or close to its target of 3%, the midpoint in a tolerance band of between 2% and 4%). To this end, the bank sets an appropriate level of interest rates. When inflation is too high, Banxico will attempt to tame it by raising interest rates, making it more expensive for households and businesses to borrow money, thus cooling demand and the overall economy. Higher interest rates are generally positive for the Mexican Peso (MXN) as they lead to higher yields, making the country a more attractive place for investors. On the contrary, lower interest rates tend to weaken MXN.
How does economic data influence the value of the Mexican Peso?
Macroeconomic data releases are key to assess the state of the economy and can have an impact on the Mexican Peso (MXN) valuation. A strong Mexican economy, based on high economic growth, low unemployment and high confidence is good for MXN. Not only does it attract more foreign investment but it may encourage the Bank of Mexico (Banxico) to increase interest rates, particularly if this strength comes together with elevated inflation. However, if economic data is weak, MXN is likely to depreciate.
How does broader risk sentiment impact the Mexican Peso?
As an emerging-market currency, the Mexican Peso (MXN) tends to strive during risk-on periods, or when investors perceive that broader market risks are low and thus are eager to engage with investments that carry a higher risk. Conversely, MXN tends to weaken at times of market turbulence or economic uncertainty as investors tend to sell higher-risk assets and flee to the more-stable safe havens.
- Canadian Dollar trimmed recent gains as energy markets continue to roil.
- Canada absent from economic data docket until Wednesday’s Canadian GDP print.
- Crude Oil pared back recent highs on Red Sea headlines, China growth concerns.
The Canadian Dollar (CAD) eased on Monday, backsliding after Crude Oil markets snipped away the week’s opening highs as the trading week kicks off with a light economic calendar on offer. The midweek period will see an update on Canadian Gross Domestic Product (GDP) and another rate call from the US Federal Reserve (Fed), both slated for Wednesday, and Friday will wrap up the week’s trading action with US Nonfarm Payrolls (NFP).
Canada is expected to see a slight uptick in GDP figures on Wednesday, with November’s MoM GDP forecast to print at 0.1% compared to the flat 0.0% from October, but broad-market focus will be on the Fed’s upcoming rate call and monetary policy statement at 19:00 GMT Wednesday. The Fed will follow up their latest interest rate decision with a press conference at 19:30 GMT.
Daily digest market movers: Canadian Dollar eases on early Crude Oil reversal
- Canadian Dollar down against most of major currencies on Monday.
- Crude Oil markets saw an early high to kick off the trading week, but barrel bids quickly fell back into near-term consolidation, dragging the Loonie lower.
- Iran-backed Houthi rebels in Yemen struck a commercial tanker in the Red Sea over the weekend, and energy markets spiked as retaliation is expected.
- China saw one of its lowest growth periods on record, excluding the Covid pandemic crunch.
- Concerns that the world’s largest Crude Oil importer sees slowing barrel demand is trimming energy bids, capping oil upside.
- Money markets are keen for a rate pivot from the Fed on Wednesday.
- Rate swaps this week are pricing in an 89.5% chance of a Fed rate cut of at least 25 basis points at the Fed’s May meeting, according to CME FedWatch Tool.
- Canada has a thin showing on the economic calendar this week, with Wednesday’s November GDP print and Thursday’s S&P Global Manufacturing Purchasing Managers’ Index (PMI) the only notable lines on the Canadian side.
Canadian Dollar price today
The table below shows the percentage change of Canadian Dollar (CAD) against listed major currencies today. Canadian Dollar was the weakest against the Japanese Yen.
| USD | EUR | GBP | CAD | AUD | JPY | NZD | CHF | |
| USD | 0.35% | 0.08% | 0.00% | -0.23% | -0.36% | -0.31% | -0.11% | |
| EUR | -0.35% | -0.25% | -0.33% | -0.57% | -0.68% | -0.65% | -0.45% | |
| GBP | -0.11% | 0.25% | -0.10% | -0.32% | -0.42% | -0.40% | -0.20% | |
| CAD | 0.00% | 0.34% | 0.08% | -0.22% | -0.33% | -0.29% | -0.10% | |
| AUD | 0.22% | 0.56% | 0.30% | 0.22% | -0.12% | -0.08% | 0.11% | |
| JPY | 0.35% | 0.66% | 0.56% | 0.32% | 0.09% | 0.01% | 0.24% | |
| NZD | 0.31% | 0.66% | 0.40% | 0.29% | 0.08% | -0.05% | 0.20% | |
| CHF | 0.11% | 0.43% | 0.19% | 0.10% | -0.12% | -0.24% | -0.19% |
The heat map shows percentage changes of major currencies against each other. The base currency is picked from the left column, while the quote currency is picked from the top row. For example, if you pick the Euro from the left column and move along the horizontal line to the Japanese Yen, the percentage change displayed in the box will represent EUR (base)/JPY (quote).
Technical Analysis: Canadian Dollar pares back on Monday, chews into recent upswing
The Canadian Dollar (CAD) is broadly lower on Monday, declining against most of its major currency pairs.
The Canadian Dollar is down a fifth to a quarter of a percent against the Antipodeans as well as the Japanese Yen (JPY), while it sticks close to flat against the US Dollar (USD). The CAD has gained four-tenths of a percent against the Euro (EUR) and one-sixth of a percent against the Pound Sterling (GBP) as the European bloc sees Monday’s weakest performance.
The USD/CAD pair remains stuck in congestion near 1.3450 as bids get hung up on near-term medians with price action hampered by the 200-hour Simple Moving Average (SMA) near 1.3480.
Daily candlesticks remain stuck closely to the 200-day SMA near 1.3500, and a lack of chart momentum sees a congestion pattern settling into the USD/CAD.
With the 50-SMA drifting into the low side of the long-term 200-day SMA, potential is on the rise for a bearish break toward December’s swing low into the 1.3200 handle.
USD/CAD Hourly Chart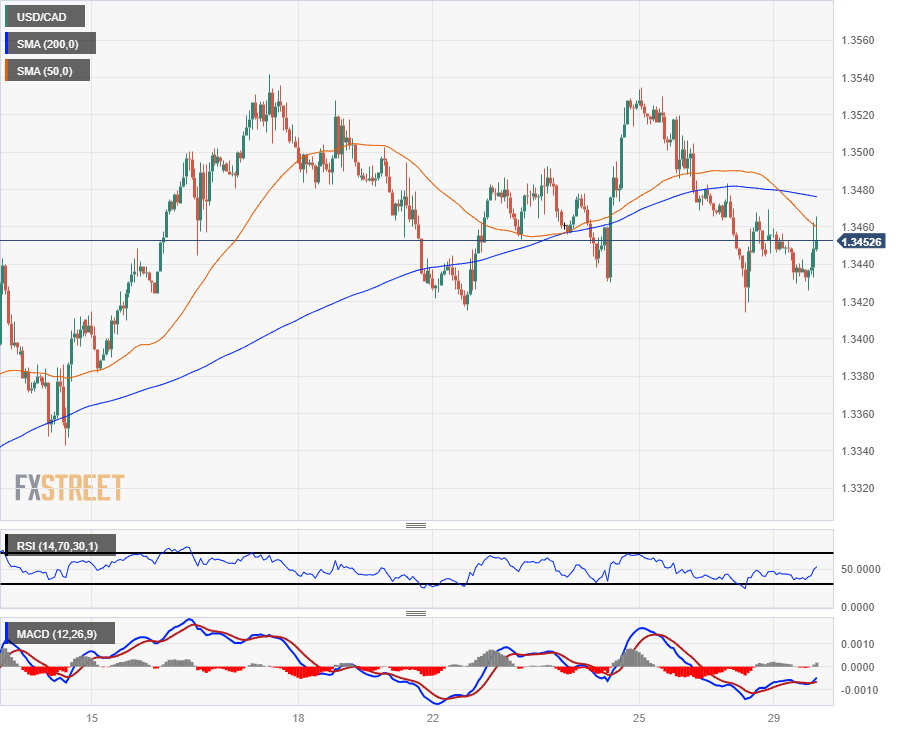
USD/CAD Daily Chart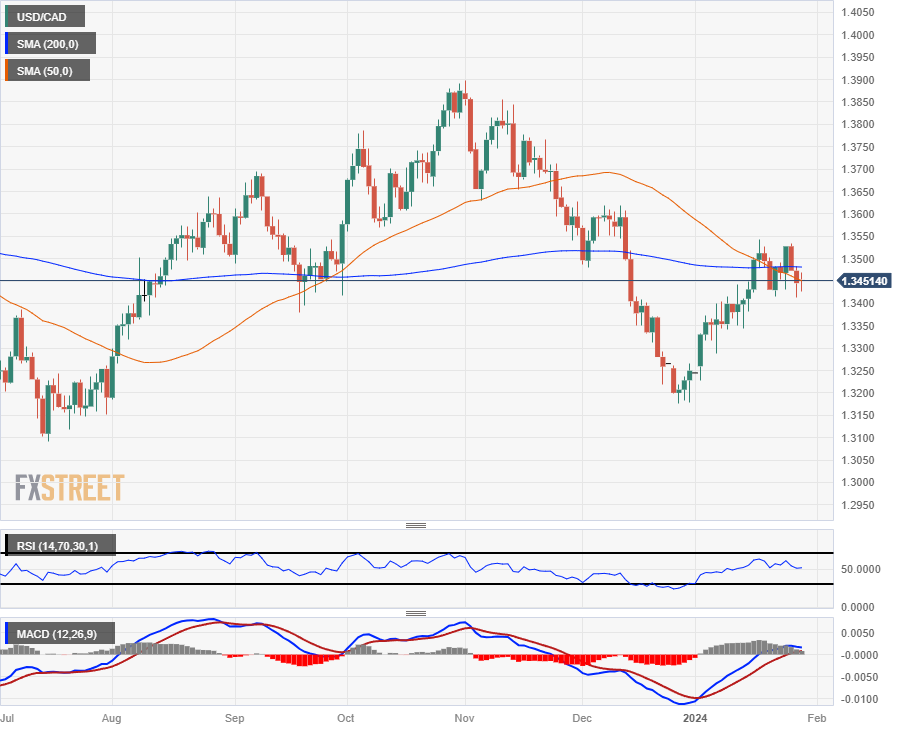
Canadian Dollar FAQs
What key factors drive the Canadian Dollar?
The key factors driving the Canadian Dollar (CAD) are the level of interest rates set by the Bank of Canada (BoC), the price of Oil, Canada’s largest export, the health of its economy, inflation and the Trade Balance, which is the difference between the value of Canada’s exports versus its imports. Other factors include market sentiment – whether investors are taking on more risky assets (risk-on) or seeking safe-havens (risk-off) – with risk-on being CAD-positive. As its largest trading partner, the health of the US economy is also a key factor influencing the Canadian Dollar.
How do the decisions of the Bank of Canada impact the Canadian Dollar?
The Bank of Canada (BoC) has a significant influence on the Canadian Dollar by setting the level of interest rates that banks can lend to one another. This influences the level of interest rates for everyone. The main goal of the BoC is to maintain inflation at 1-3% by adjusting interest rates up or down. Relatively higher interest rates tend to be positive for the CAD. The Bank of Canada can also use quantitative easing and tightening to influence credit conditions, with the former CAD-negative and the latter CAD-positive.
How does the price of Oil impact the Canadian Dollar?
The price of Oil is a key factor impacting the value of the Canadian Dollar. Petroleum is Canada’s biggest export, so Oil price tends to have an immediate impact on the CAD value. Generally, if Oil price rises CAD also goes up, as aggregate demand for the currency increases. The opposite is the case if the price of Oil falls. Higher Oil prices also tend to result in a greater likelihood of a positive Trade Balance, which is also supportive of the CAD.
How does inflation data impact the value of the Canadian Dollar?
While inflation had always traditionally been thought of as a negative factor for a currency since it lowers the value of money, the opposite has actually been the case in modern times with the relaxation of cross-border capital controls. Higher inflation tends to lead central banks to put up interest rates which attracts more capital inflows from global investors seeking a lucrative place to keep their money. This increases demand for the local currency, which in Canada’s case is the Canadian Dollar.
How does economic data influence the value of the Canadian Dollar?
Macroeconomic data releases gauge the health of the economy and can have an impact on the Canadian Dollar. Indicators such as GDP, Manufacturing and Services PMIs, employment, and consumer sentiment surveys can all influence the direction of the CAD. A strong economy is good for the Canadian Dollar. Not only does it attract more foreign investment but it may encourage the Bank of Canada to put up interest rates, leading to a stronger currency. If economic data is weak, however, the CAD is likely to fall.
- The EUR/GBP slipped to 0.8520, its lowest level since August 2023 recording 0.23% losses.
- The daily chart reveals RSI nearing oversold territory, hinting at intense selling pressure.
- If indicators hit oversold conditions a technical correction may be on the horizon.
In Monday's session, the EUR/GBP pair is trading at 0.8520, reflecting a 0.23% decline. It seems the bears have a firm grip on the daily chart, exhibiting a bearish bias for the cross. While bears retain control, the four-hour indicators hint at a near oversold state, suggesting a possible shift in momentum could be looming.
Fundamentally speaking, the pair faces significant pressure due to diverging monetary policy tones by the European Central Bank (ECB) and the Bank of England (BoE). For the rest of the week, investors will take a close look at the BoE’s decision on Thursday as well as key inflation figures from the Eurozone from January as the divergences may expand and apply further pressure on the cross.
EUR/GBP levels to watch
The daily chart displays a bearish environment with the cross trading below its three major Simple Moving Averages (SMAs). Such a situation indicates the bears are currently exerting dominance over the pair. In addition, the Relative Strength Index (RSI) also corroborates this dominance, standing close to oversold levels, hence suggesting that selling momentum is prominent. In the face of rising red bars on the Moving Average Convergence Divergence (MACD), this further reinforces the bearish outlook.
Shifting the focus on the shorter timeframe, the four-hour chart provides the same outlook. Similar to the daily chart, here too, the RSI is almost touching the oversold threshold. This attribute is a secondary confirmation of the stronger selling momentum. Moreover, the red bars of MACD on the four-hour chart are accentuating, aligning with the prevalent bearish view. That being said,the near oversold indications on both timeframes might imply a potential corrective bounce back, hence traders should maintain caution.
EUR/GBP daily chart
-638421418836125063.png)
- EUR/USD falls 0.39%, weighed down by ECB remarks and anticipation of the FOMC meeting.
- ECB's potential policy shift hints prompt Euro decline in forex market.
- Focus shifts to Fed decision; thought recent US inflation and robust economic growth could set Powell’s and Co. decision.
The EUR/USD extends its losses on Monday, with buyers scrambling to keep the exchange rate above the 1.0800 figure amid a quiet trading session ahead of Wednesday's US Federal Open Market Committee (FOMC) decision. A drop in US Treasury yields is not an excuse for US Dollar (USD) bulls to propel the buck; therefore, the major trades at 1.0809, down 0.39%.
ECB officials open the door for rate cuts in next meeting
The Euro (EUR) is taking a toll on European Central Bank (ECB) policymakers' comments, with Peter Kazimir noting, “The next move will be a cut, and it is within our reach,” wrote in a blog post. Echoing his comments was ECB’s Mario Centeno added that he prefers to act sooner than later and be more “gradual’ when easing policy.
In the meantime, Klas Knot added, “We now have a credible prospect that inflation will return to 2% in 2025. The only piece that's missing is the conviction that wage growth will adapt to that lower inflation.”
Aside from this, the main spotlight lies in the US Federal Reserve’s (Fed) decision on Wednesday. It should be said that the Fed’s preferred gauge for inflation stood at 2.6% YoY last Friday, though underlying figures dipped from 3.2% to 2.9% YoY, which could open the door for the Fed to ease policy. Nevertheless, strong economic growth in the United States (US) could deter Fed Chair Jerome Powell and Co. from relaxing monetary conditions.
EUR/USD Price Analysis: Technical outlook
With the EUR/USD pair printing a new cycle low after breaching January’s 23 low of 1.0821, bears have the 100-day moving average (DMA) in sight at 1.0777. A breach below 1.0800 could put the latter in play. Once those key support levels are surpassed, the next stop would be the December 8 low of 1.0724. On the flip side, if bulls regain the 200-DMA at 1.0841, that could pave the way to challenge 1.0900.
- USD/CHF climbs to near 0.8600 as US Dollar recovers amid dismal market mood.
- Investors see first rate-cut from the Fed in May now against prior expectations for March.
- The Fed is expected to maintain status-quo for fourth straight time.
The USD/CHF pair discovers buying interest near the round-level support of 0.8600. The Swiss Franc pair bounces as investors rush for safe-haven assets amid volatility ahead of the Federal Reserve (Fed) monetary policy and deepening Middle East tensions.
S&P500 futures remains subdued in the European session, which indicates that investors have sidelined ahead of the Fed policy outcome. The US Dollar Index (DXY) jumps to near the crucial resistance of 103.70. 10-year US Treasury yields have dropped to near 4.10%.
Investors see the Fed keeping interest rates unchanged in the range of 5.25-5.50% for the fourth time in a row. Meanwhile, expectations for rate-cuts by the Fed have shifted to May’s monetary policy meeting from March as policymakers have been warning about the consequences of premature rate-reduction decision that could uplift core price pressures and dampen efforts yet made in bringing them down to near 3.9%.
USD/CHF struggles to advance above the 38.2% Fibonacci retracement (plotted from 3 October 2023 high at 0.9244 to 28 December 2023 low at 0.8333) at 0.8680. The 20-period Exponential Moving Average (EMA) near 0.8620 is providing support to the US Dollar bulls.
The 14-period Relative Strength Index (RSI) has shifted into 40.00-60.00 range from the bearish range of 20.00-40.00. Fresh buying momentum would emerge if the asset will shift into the bullish range of 60.00-80.00.
Going forward, a decisive break above intraday high of 0.8652 would drive the asset towards the round-level resistance of 0.8700 and January 23 high of 0.8728.
In an alternate scenario, a downside move below the psychological support of 0.8500 will expose the asset to January 5 low at 0.8455, followed by 27 December 2023 low at 0.8408.
USD/CHF daily chart
-638421327242750694.png)
European Central Bank (ECB) Vice President Luis de Guindos said on Monday that inflation risks in the euro area are tilted to the downside, as reported by Reuters.
De Guindos added that the latest bank lending survey showed "certain stabilization" in the eurozone. "I think the disinflation process can continue" he noted and said that China doesn't worry them due to financial contagion but through indirect impact on growth.
Market reaction
These comments don't seem to be having a noticeable impact on the Euro's valuation against its major rivals. At the time of press, the EUR/USD pair was trading at 1.0820, where it was down 0.3% on a daily basis.
- The US Dollar continues to trend upwards from late Friday.
- Traders gear up for a very packed week with all eyes on the Fed decision due on Wednesday.
- The US Dollar Index could break down from current levels at around the 200-day SMA.
The US Dollar (USD) edges up on Monday’s European session, in a perfect example of how traders always take into account the sum of all components. The USD seems to be ignoring market bets of a dovish US Federal Reserve (Fed) that plans upcoming rate cuts to focus instead on the possibility that . Chairman Jerome Powell delivers a hawkish pause on Wednesday.
On the economic front, some market-moving elements are coming out even before the Fed meeting, namely Tuesday’s JOLTS Job Openings data for December. On Wednesday, the US Federal Reserve rate decision and the speech by its Chairman Jerome Powell is due. Traders will need to keep some ammunition for other the main events on Thursday and Friday: The Institute for Supply Management (ISM) will release its Manufacturing PMI on Thursday, while Nonfarm Payrolls and the final University of Michigan Sentiment Index will be published on Friday to close off the week.
Daily digest market movers: It’s not all about the Fed
- European Central Bank (ECB) member Luis de Guindos said that the Red Sea situation does not impact the next rate decisions for the ECB, according to Bloomberg. This contradicts comments from ECB President Christine Lagarde, who said last week during the rate decision meeting that the Red Sea situation could add to inflationary pressures and must be monitored.
- Major Chinese construction group Evergrande has been deemed bankrupt and in default by a Hong Kong court. The ruling came after creditors didn’t reach a restructuring deal.
- Red Sea risk is escalating again after several headlines were issued over the weekend of increasing violence between Houthi rebels and US forces.
- At 15:30 GMT, the Dallas Fed Manufacturing Business Index for January will be released. The previous number was at -9.3.
- The US Treasury will be placing a 3-month and a 6-month bill near 16:30 GMT.
- Equity markets in Europe are looking for direction even after Asian indices closed in the green earlier this Monday. Japan saw both the Nikkei and the Topix close up nearly 1%. US Futures are flat or mildly in the red.
- The CME Group’s FedWatch Tool shows that markets are pricing in a 97.9% possibility for an unchanged rate decision on Wednesday, with a slim 2.1% chance of a cut.
- The benchmark 10-year US Treasury Note trades near 4.12% and is showing small signs of a breakup in correlation with the US Dollar Index (DXY). Although there is some US Dollar strength at hand this Monday, the US bond market is not really following suit.
US Dollar Index Technical Analysis: Pivotal week for DXY
The US Dollar Index (DXY) is still stuck in a tight range between two very important moving averages: the 55-day (103.10) and the 200-day (103.51) Simple Moving Average (SMA). The turn of events and data last week proved not enough to push the US Dollar Index higher. Expect the Fed meeting and the US Jobs Report to be pivotal for the Greenback this week.
In case the DXY is able to run further away from the 200-day SMA, more upside is in the tank. Look for 104.41 as the first resistance level on the upside, in the form of the 100-day SMA. If that gets breached as well, nothing will hold the DXY from heading to either 105.88 or 107.20 – the high of September.
With the repetition of another break above the 200-day SMA, yet again, a bull trap could form once prices start sliding below the same moving average. This would see a long squeeze, with US Dollar bulls being forced to start selling around 103.10 at the 55-day SMA. Once below it, the downturn is open towards 102.00.
US Dollar FAQs
What is the US Dollar?
The US Dollar (USD) is the official currency of the United States of America, and the ‘de facto’ currency of a significant number of other countries where it is found in circulation alongside local notes. It is the most heavily traded currency in the world, accounting for over 88% of all global foreign exchange turnover, or an average of $6.6 trillion in transactions per day, according to data from 2022.
Following the second world war, the USD took over from the British Pound as the world’s reserve currency. For most of its history, the US Dollar was backed by Gold, until the Bretton Woods Agreement in 1971 when the Gold Standard went away.
How do the decisions of the Federal Reserve impact the US Dollar?
The most important single factor impacting on the value of the US Dollar is monetary policy, which is shaped by the Federal Reserve (Fed). The Fed has two mandates: to achieve price stability (control inflation) and foster full employment. Its primary tool to achieve these two goals is by adjusting interest rates.
When prices are rising too quickly and inflation is above the Fed’s 2% target, the Fed will raise rates, which helps the USD value. When inflation falls below 2% or the Unemployment Rate is too high, the Fed may lower interest rates, which weighs on the Greenback.
What is Quantitative Easing and how does it influence the US Dollar?
In extreme situations, the Federal Reserve can also print more Dollars and enact quantitative easing (QE). QE is the process by which the Fed substantially increases the flow of credit in a stuck financial system.
It is a non-standard policy measure used when credit has dried up because banks will not lend to each other (out of the fear of counterparty default). It is a last resort when simply lowering interest rates is unlikely to achieve the necessary result. It was the Fed’s weapon of choice to combat the credit crunch that occurred during the Great Financial Crisis in 2008. It involves the Fed printing more Dollars and using them to buy US government bonds predominantly from financial institutions. QE usually leads to a weaker US Dollar.
What is Quantitative Tightening and how does it influence the US Dollar?
Quantitative tightening (QT) is the reverse process whereby the Federal Reserve stops buying bonds from financial institutions and does not reinvest the principal from the bonds it holds maturing in new purchases. It is usually positive for the US Dollar.
- WTI Oil popped higher in Asian trading hours on Monday.
- Tensions rise in Asia and the Middle East with several headlines emerging.
- The US Dollar Index steadies at pivotal level ahead of the US Fed rate decision and US Jobs report.
Oil prices were shooting higher with tensions rising in the Red Sea and Middle East. Houthi rebels attacked several vessels again in the Red Sea, followed by retaliation from the United States. Meanwhile Iran has issued a statement saying it is ready for war.
The US Dollar Index (DXY), which is negatively correlated to Oil, is continuing the trend from past Friday, where good US data at the end of last week pushed the US Dollar Index higher. Markets are bracing for two big events that could trigger a seismic shift in the DXY: the US Federal Reserve rate decision on Wednesday, and the US Jobs Report on Friday. Depending on the outcome of both events, the DXY could be trading substantially higher or lower by Friday.
Crude Oil (WTI) trades at $77.66 per barrel, and Brent Oil trades at $82.66 per barrel at the time of writing.
Oil news and market movers: Middle East tensions rising
- With casualties among the US troops in Jordan, tensions are rising with US President Biden set to possibly issue even more strikes against Houthi Rebels in Yemen.
- Saudi Arabia Energy Minister Prince Abdulaziz bin Salman said that Saudi Arabia is looking for a stable Oil market and wants to help to ease tensions in the Red Sea.
- The Pentagon meanwhile has said that it is looking into additional strikes in Yemen and Iran.
- Around 10 million barrels of Russian Oil are stranded near the coast of South Korea due to the US sanctions on Russian Oil.
Oil Technical Analysis: Tensions not interrupting Oil flow
Oil prices are reacting to the headlines that are being issued on Monday with the Pentagon getting ready for more strikes in response to fatal casualties after a drone strike by Houthis on a US base in Jordan. Pressure is building for US President Biden to deliver a firm answer and response, in order to defuse tensions in the region. Despite all this, Oil supply is still flowing while demand is still at the lower end under current economic conditions.
To the upside, resistance at $74 is in the rear view mirror now and should act as support. Although quite far off, $80 comes into the picture should tensions build further. Once $80 is broken, $84 is next on the topside.
As said in the paragraph above, $74 will now act as support for the nearterm on any sudden declines. The $67 level could still come into play as the next support to trade at, as it aligns with a triple bottom from June. Should that triple bottom break, a new low could be close at $64.35 – the low of May and March 2023 – as the last line of defence.
-638421258361084438.png)
US WTI Crude Oil: Daily Chart
WTI Oil FAQs
What is WTI Oil?
WTI Oil is a type of Crude Oil sold on international markets. The WTI stands for West Texas Intermediate, one of three major types including Brent and Dubai Crude. WTI is also referred to as “light” and “sweet” because of its relatively low gravity and sulfur content respectively. It is considered a high quality Oil that is easily refined. It is sourced in the United States and distributed via the Cushing hub, which is considered “The Pipeline Crossroads of the World”. It is a benchmark for the Oil market and WTI price is frequently quoted in the media.
What factors drive the price of WTI Oil?
Like all assets, supply and demand are the key drivers of WTI Oil price. As such, global growth can be a driver of increased demand and vice versa for weak global growth. Political instability, wars, and sanctions can disrupt supply and impact prices. The decisions of OPEC, a group of major Oil-producing countries, is another key driver of price. The value of the US Dollar influences the price of WTI Crude Oil, since Oil is predominantly traded in US Dollars, thus a weaker US Dollar can make Oil more affordable and vice versa.
How does inventory data impact the price of WTI Oil
The weekly Oil inventory reports published by the American Petroleum Institute (API) and the Energy Information Agency (EIA) impact the price of WTI Oil. Changes in inventories reflect fluctuating supply and demand. If the data shows a drop in inventories it can indicate increased demand, pushing up Oil price. Higher inventories can reflect increased supply, pushing down prices. API’s report is published every Tuesday and EIA’s the day after. Their results are usually similar, falling within 1% of each other 75% of the time. The EIA data is considered more reliable, since it is a government agency.
How does OPEC influence the price of WTI Oil?
OPEC (Organization of the Petroleum Exporting Countries) is a group of 13 Oil-producing nations who collectively decide production quotas for member countries at twice-yearly meetings. Their decisions often impact WTI Oil prices. When OPEC decides to lower quotas, it can tighten supply, pushing up Oil prices. When OPEC increases production, it has the opposite effect. OPEC+ refers to an expanded group that includes ten extra non-OPEC members, the most notable of which is Russia.
- AUD/USD aims a stability above 0.6600 amid a busy week.
- The Fed is expected to maintain status-quo for fourth straight time.
- A decline in Australia’s inflation would provide some relief to the RBA.
The AUD/USD pair hovers near the round-level resistance of 0.6600 in the European session. The upside in the Aussie asset remains capped as investors have sidelined ahead of the interest rate decision by the Federal Reserve (Fed) and Australia’s Q4 inflation data.
S&P500 futures have posted nominal losses in the London session, portraying a cautious market mood. The US Dollar Index (DXY) jumps to near 103.64 as deepening geopolitical tensions have improved the safe-haven appeal however, 10-year US Treasury yields have dropped to near 4.12%.
The uncertainty ahead of the Fed’s monetary policy announcement could keep the USD Index upbeat. Investors see the Fed keeping interest rates unchanged in the range of 5.25-5.50% for fourth straight time. Investors would look for whether Fed policymakers will maintain the “restrictive interest rates” narrative or will signal about potential rate-cut in March or May.
Till now, Fed policymakers have been arguing that interest rate-cuts are premature till they get confident that inflation will return to the 2% target in a sustainable manner. Premature rate-cuts could lead to a surge in the overall demand and henceforth prompt price pressures. Apart from the Fed policy, JOLTS Job Openings, ADP Employment Change and the ISM Manufacturing PMI data.
On the Australian Dollar front, investors await the inflation data, which will be published on Wednesday. Investors anticipate that price pressures were up by 0.8% in the last quarter of 2023 against 1.2% growth in the July-September quarter. Easing price pressures would offer some relief to Reserve Bank of Australia (RBA) policymakers.
- Gold price delivers strong upside move as geopolitical tensions deepen.
- Fed policy, labor market and Manufacturing PMI data for December will remain in the spotlight.
- The Fed is expected to keep interest rates unchanged for the fourth straight time.
Gold price (XAG/USD) remains upbeat as mounting geopolitical tensions have improved the appeal of bullion. The precious metal attracts significant bids as the drone attack on US bases near northeastern Jordan has impacted market sentiment. In addition, a moderate increase in the U S Core Personal Consumption Expenditures (PCE) data for December has softened the inflation outlook.
This week, investors should brace for a high volatile action as the interest rate decision by the Federal Reserve (Fed) will be followed by the Institute of Supply Management (ISM) Manufacturing PMI and Nonfarm Payrolls (NFP) report for December. The Fed is widely anticipated to keep interest rates steady in the 5.25-5.50% range but fresh guidance on interest rates will be keenly watched. Investors would look for cues of whether Fed policymakers continue leaning towards keeping interest rates restrictive till June or are likely to signal a dovish decision for March or May.
Daily Digest Market Movers: Gold price rallies on Middle East crisis
- Gold price discovers strong buying interest on Monday as investors rush for safe-haven assets due to deepening Middle East tensions.
- The precious metal witnesses significant bets as geopolitical tensions mount after a drone attack on US service members stationed in northeastern Jordan.
- Meanwhile, continued attacks on energy shipments in the Red Sea by Iran-backed-Houthis have disrupted the global supply chain.
- This week, market participants will focus on the Federal Reserve’s first monetary policy announcement of 2024, which is scheduled for Wednesday.
- As per the CME FedWatch Tool, investors are pretty confident that interest rates will remain unchanged in the range of 5.25-5.50% for the fourth straight time.
- While major focus will be on the interest rate outlook. Traders see a higher probability of the Fed reducing interest rates from May as policymakers have been reiterating the need for maintaining restrictive interest rates for a longer period until they get convinced that inflation would come down to the 2% target in a timely manner.
- The US Dollar Index (DXY) could come under pressure if the Fed signals that it could commence its rate-cutting campaign from March.
- A soft core PCE price index report for December, released on Friday, failed to uplift expectations of a rate-cut from March.
- Monthly core PCE grew by 0.2% as expected while annual underlying inflation data decelerated to 2.9% against expectations of 3.0% and the former reading of 3.2%.
- Apart from the Fed policy, it will be a volatile week as Manufacturing PMI, and ADP and official Employment data have lined-up for release.
- But first, market participants will look for the US JOLTS Job Openings data, which will be published on Tuesday. This will indicate how strong the labor demand is despite interest rates remaining elevated.
- Investors have anticipated that US employers posted fresh 8.75M jobs in December against 8.79M in November.
Technical Analysis: Gold price climbs to near $2,030
-638421199561428775.png)
Gold price approaches the horizontal resistance of the Ascending Triangle chart pattern plotted from January 19 high at $2,039.50, on the two-hour timeframe. The upward-sloping border of the aforementioned pattern is plotted from the January 17 low near $2,002. The pattern has a bullish bias, suggesting a breakout higher will follow its completion.
On a daily time frame, the precious metal continues to put efforts for sustainability above the 20-day Exponential Moving Average (EMA), which trades around $2,030.
Gold FAQs
Why do people invest in Gold?
Gold has played a key role in human’s history as it has been widely used as a store of value and medium of exchange. Currently, apart from its shine and usage for jewelry, the precious metal is widely seen as a safe-haven asset, meaning that it is considered a good investment during turbulent times. Gold is also widely seen as a hedge against inflation and against depreciating currencies as it doesn’t rely on any specific issuer or government.
Who buys the most Gold?
Central banks are the biggest Gold holders. In their aim to support their currencies in turbulent times, central banks tend to diversify their reserves and buy Gold to improve the perceived strength of the economy and the currency. High Gold reserves can be a source of trust for a country’s solvency. Central banks added 1,136 tonnes of Gold worth around $70 billion to their reserves in 2022, according to data from the World Gold Council. This is the highest yearly purchase since records began. Central banks from emerging economies such as China, India and Turkey are quickly increasing their Gold reserves.
How is Gold correlated with other assets?
Gold has an inverse correlation with the US Dollar and US Treasuries, which are both major reserve and safe-haven assets. When the Dollar depreciates, Gold tends to rise, enabling investors and central banks to diversify their assets in turbulent times. Gold is also inversely correlated with risk assets. A rally in the stock market tends to weaken Gold price, while sell-offs in riskier markets tend to favor the precious metal.
What does the price of Gold depend on?
The price can move due to a wide range of factors. Geopolitical instability or fears of a deep recession can quickly make Gold price escalate due to its safe-haven status. As a yield-less asset, Gold tends to rise with lower interest rates, while higher cost of money usually weighs down on the yellow metal. Still, most moves depend on how the US Dollar (USD) behaves as the asset is priced in dollars (XAU/USD). A strong Dollar tends to keep the price of Gold controlled, whereas a weaker Dollar is likely to push Gold prices up.
European Central Bank (ECB) Governing Council member Peter Kazimir said on Monday, “a rate cut in June is more probable than April but the exact timing is secondary to the decision's impact.”
Additional quotes
The next move will be a rate cut and it is within our reach.
Patience is essential before making pivotal decisions.
ECB is not behind the curve, it is markets getting ahead of the event.
Disinflation signs are positive but not yet enough to make a confident conclusion.
Market reaction
At the time of writing, EUR/USD is trading 0.25% lower on the day at 1.0825.
Gold prices rose in India on Monday, according to data from India's Multi Commodity Exchange (MCX).
Gold price stood at 62,351 Indian Rupees (INR) per 10 grams, up INR 200 compared with the INR 62,151 it cost on Friday.
As for futures contracts, Gold prices increased to INR 62,398 per 10 gms from INR 62,106 per 10 gms.
Prices for Silver futures contracts decreased to INR 72,071 per kg from INR 71,773 per kg.
| Major Indian city | Gold Price |
|---|---|
| Ahmedabad | 64,535 |
| Mumbai | 64,350 |
| New Delhi | 64,500 |
| Chennai | 64,480 |
| Kolkata | 64,600 |
Global Market Movers: Comex Gold price stays supported by global flight to safety amid geopolitical risks
- The risk of a further escalation of geopolitical tensions in the Middle East weighs on investors' sentiment and lends support to the safe-haven Gold price on the first day of a new week.
- A drone attack on a US base in Jordan killed three US soldiers, marking the first death of US service personnel in the region since the Hamas-Israel war broke out on October 7.
- President Joe Biden doubled down on his pledge of reprisals and said that the US shall respond and hold all those responsible to account at a time and in a manner of our choosing.
- The US Dollar (USD) holds steady just below a one-month peak as investors continue to scale back their expectations for a more aggressive easing by the Federal Reserve.
- Data released on Friday, however, showed that inflation rose modestly in December and reaffirmed expectations that the Fed will start cutting interest rates by the middle of 2024.
- The US Bureau of Economic Analysis reported that the Personal Consumption Expenditures (PCE) Price Index held steady at 2.6% on a yearly basis in December.
- Meanwhile, the annual Core PCE Price Index – considered the Fed's preferred gauge of inflation – decelerated more than expected, to 2.9% from 3.2% in November.
- Other details of the publication showed that Personal Spending rose 0.7% in December while Personal Income grew 0.3%, pointing to strong demand from US consumers.
- This comes on top of the stronger US Q4 GDP print earlier last week and suggested that the economy is still in good shape, further fuelling optimism about a soft landing.
- A modest decline in the US Treasury bond yields keeps a lid on any further gains for the Greenback and might continue to act as a tailwind for the non-yielding yellow metal.
- Traders might also prefer to wait for the FOMC meeting starting on Tuesday and this week's key US macro data, including the Nonfarm Payrolls (NFP) report on Friday.
(An automation tool was used in creating this post.)
Gold FAQs
Why do people invest in Gold?
Gold has played a key role in human’s history as it has been widely used as a store of value and medium of exchange. Currently, apart from its shine and usage for jewelry, the precious metal is widely seen as a safe-haven asset, meaning that it is considered a good investment during turbulent times. Gold is also widely seen as a hedge against inflation and against depreciating currencies as it doesn’t rely on any specific issuer or government.
Who buys the most Gold?
Central banks are the biggest Gold holders. In their aim to support their currencies in turbulent times, central banks tend to diversify their reserves and buy Gold to improve the perceived strength of the economy and the currency. High Gold reserves can be a source of trust for a country’s solvency. Central banks added 1,136 tonnes of Gold worth around $70 billion to their reserves in 2022, according to data from the World Gold Council. This is the highest yearly purchase since records began. Central banks from emerging economies such as China, India and Turkey are quickly increasing their Gold reserves.
How is Gold correlated with other assets?
Gold has an inverse correlation with the US Dollar and US Treasuries, which are both major reserve and safe-haven assets. When the Dollar depreciates, Gold tends to rise, enabling investors and central banks to diversify their assets in turbulent times. Gold is also inversely correlated with risk assets. A rally in the stock market tends to weaken Gold price, while sell-offs in riskier markets tend to favor the precious metal.
What does the price of Gold depend on?
The price can move due to a wide range of factors. Geopolitical instability or fears of a deep recession can quickly make Gold price escalate due to its safe-haven status. As a yield-less asset, Gold tends to rise with lower interest rates, while higher cost of money usually weighs down on the yellow metal. Still, most moves depend on how the US Dollar (USD) behaves as the asset is priced in dollars (XAU/USD). A strong Dollar tends to keep the price of Gold controlled, whereas a weaker Dollar is likely to push Gold prices up.
European Central Bank (ECB) policymaker Mario Centeno said on Monday that the central bank “should start cutting rates sooner rather than later, but avoid abrupt moves.”
Additional quotes
Inflation is decreasing in a sustained manner.
Almost all factors that drove prices up have dissipated.
No need to wait for wages data in May to make rate decisions.
There are no visible second-round effects of wage hikes.
Market reaction
EUR/USD is heading lower toward 1.0800 on the above comments, losing 0.26% on the day.
- EUR/USD marks losses as traders adopt cautious stance as Middle East tension heightens.
- ECB’s Guindos stated that policy easing will be considered if inflation aligns with the central bank's 2.0% target.
- Investors put bets on the speculation that the Fed could ease policy as inflation indicates cooling off.
EUR/USD moves lower during the European trading session on Monday, reaching near 1.0840. The prevailing risk-off sentiment, fueled by escalated geopolitical situation in the Middle East, is leading traders to favor the US Dollar (USD), creating downward pressure on the EUR/USD pair.
The Euro (EUR) is facing downward pressure following the European Central Bank (ECB) interest rate decision on Thursday. The ECB decided to maintain its Main Refinancing Operations Rate at 4.50% and the Deposit Facility Rate at 4.0%. Additionally, ECB governing council member Klaas Knot stated on Sunday that the central bank requires evidence of slowing wage growth in the eurozone before considering interest rate cuts.
However, market expectations for ECB rate cuts have increased, with bets on a 50 basis points (bps) reduction by June and a 140 bps cut by December 2024. On the data front, the quarterly Gross Domestic Product (GDP) for the Eurozone and Germany is scheduled for release on Tuesday.
European Central Bank (ECB) Vice President Luis de Guindos has stated that the ECB will consider cutting interest rates when there is confidence that inflation aligns with the central bank's 2.0% goal. He highlighted positive developments in inflation recently and indicated that these favorable trends would eventually be reflected in the ECB's monetary policy.
The US Dollar Index (DXY) maintains stability around 103.50, with subdued 2-year and 10-year US Treasury yields at 4.33% and 4.11%, respectively, at the time of writing. Investors are putting their bets on the speculation that the Federal Reserve (Fed) could implement policy easing as US Core Personal Consumption Expenditures Price Index (PCE) data indicates a cooling off of inflation.
Traders are anticipated to closely monitor crucial economic indicators, especially Tuesday's releases of the US Housing Price Index and Consumer Confidence figures, to gain additional insights into the market. This scrutiny is expected to intensify following the forthcoming Federal Open Market Committee (FOMC) statement on Wednesday.
- USD/CAD trades with a mild negative bias for the third straight day on Monday.
- The downside, however, seems cushioned amid a pullback in Crude Oil prices.
- The Fed rate-cut uncertainty might further contribute to limiting the downside.
The USD/CAD pair remains on the defensive for the third successive day on Monday, albeit lacks follow-through selling and manages to hold above last week's swing low, around the 1.3415 region. Moreover, a combination of diverging forces warrants some caution before placing aggressive bearish bets and positioning for an extension of the recent pullback from the vicinity of the monthly peak tested last Thursday.
Houthi rebels stepped up their attacks on vessels in the Red Sea and a drone attack on US forces by radical Iran-backed militant groups killed three soldiers. This raises the risk of a further escalation of tensions in the Middle East and fueled concerns over supply disruption in the region, pushing Crude Oil prices to a nearly two-month high on Monday. The commodity, however, struggles to capitalize on the move as traders opt to take some profits off the table ahead of the OPEC+ meeting on February 1. This, in turn, could undermine the commodity-linked Loonie, which, along with the underlying bullish sentiment surrounding the US Dollar (USD) should lend support to the USD/CAD pair.
Progress towards achieving the Federal Reserve's (Fed) 2% inflation target takes further tightening off the table, though market participants remain uncertain over the timing of the first rate cut. The Personal Income and Spending data released on Friday pointed to strong demand from US consumers. This, along with last week's upbeat US Q4 GDP print, suggested that the economy is still in good shape and should allow the Fed to keep interest rates higher for longer. This, along with geopolitical tensions, assists the safe-haven buck to stand tall near its highest level since December 13 touched earlier this week and might further contribute to limiting any further decline for the USD/CAD pair.
Traders might also refrain from placing aggressive directional bets and prefer to wait for the outcome of the highly-anticipated FOMC monetary policy meeting on Wednesday. Investors this week will also confront the release of important US macro data scheduled at the beginning of a new month, including the closely-watched monthly employment details or the Nonfarm Payrolls (NFP) report on Friday. This will drive the USD demand and provide some meaningful impetus to the USD/CAD pair. In the meantime, Oil price dynamics could allow traders to grab short-term opportunities on Monday in the absence of any relevant market moving economic releases either from the US or Canada.
Technical levels to watch
- Silver price rises to near $23 as geopolitical tensions improve safe-haven bets.
- The Fed is expected to maintain the status-quo for the fourth time in a row.
- Silver price eyes a decisive break above $23.
Silver price (XAG/USD) jumps to near $23 as deepening geopolitical tensions improve appeal for bullions. The white metal witnesses significant buying interest as volatility expands due to deepening Middle East crises.
Geopolitical tensions heightened after three US service members were killed, stationed in northeastern Jordan by an aerial drone attack. Meanwhile, continuous attacks on commercial shipments through Red Sea have kept broader markets on their toes.
However, White House National Economic Council director Lael Brainard said last week that Iran-backed Houthi’s attacks on ships in the Red Sea appear to have less impact on their supply chain against other economies.
This week, market participants will focus on the first interest rate decision of 2024 by the Federal Reserve (Fed), which will be announced on Wednesday. The Fed is expected to keep interest rates unchanged in the range of 5.25-5.50% for the fourth straight time.
Investors would keenly focus on whether Fed policymakers would soften their tone for the “restrictive interest rates” narrative amid moderate increase in core Personal Consumption Expenditure (PCE) price index data for December, released last week.
Silver technical analysis
Silver price aims to deliver a breakout of the consolidation formed in a range of $22.60-23.00 on a two-hour timeframe. The white metal may extend its upside journey towards the horizontal resistance placed from January 5 high around $23.52. The 50-period Exponential Moving Average (EMA) near $22.75 continues to provide support to the Silver price bulls.
The 14-period Relative Strength Index (RSI) attempts to climb above 60.0. If the RSI (14) manages to sustain above the same, a bullish momentum would get triggered.
Silver two-hour chart
-638421135340347548.png)
- NZD/USD gains ground as China attempts to stabilize its money market.
- Kiwi Trade Balance NZD (YoY) improved to $-13.57B from $-13.90B prior.
- Fed is highly anticipated to make no policy adjustment on February 31.
NZD/USD makes gains after two days of losses, rebounding to near 0.6110 during the early European session on Monday. Despite the risk aversion sentiment following the drone attack on a United States (US) post in Jordan on Sunday, the US Dollar (USD) remains strong while the NZD/USD pair has moved upward.
The New Zealand Dollar (NZD) might have found support from the People's Bank of China's (PBoC) consideration of a potential cut in the Medium-term Lending Facility (MLF) rate. Given the close trade partnership between China and New Zealand, any developments in China's monetary policy can impact the Kiwi Dollar. Additionally, the Chinese authorities' efforts to stabilize the stock market could provide support to New Zealand.
According to Statistics New Zealand on Monday, the nation's Trade Balance NZD (YoY) for December was reported at $-13.57B, slightly improving from the prior reading of $-13.90B. Exports decreased to $5.94B in December compared to $5.99B previously, while Imports declined to $6.26B from $7.20B in November.
Investors consider the likelihood of the Federal Reserve (Fed) implementing policy easing as US inflation indicates a slowdown. The CME FedWatch Tool indicates that futures traders have priced in a 53% probability of the Fed cutting interest rates for the first time in this cycle during the March meeting.
Traders are expected to closely watch essential economic indicators, particularly Tuesday's releases of the US Housing Price Index and Consumer Confidence figures, to gain additional insights into the market following the forthcoming Federal Open Market Committee (FOMC) statement on Wednesday.
European Central Bank (ECB) Vice President Luis de Guindos said that the “ECB will cut interest rates when we are sure that inflation meets our 2% goal.”
Additional takeaways
We have seen good news on inflation recently and sooner or later this will be reflected in our monetary policy.
I'm optimistic about inflation performance, even about core inflation.
Market reaction
At the time of writing, EUR/USD is keeping its range play intact near 1.0850, down 0.06% on the day.
ECB FAQs
What is the ECB and how does it influence the Euro?
The European Central Bank (ECB) in Frankfurt, Germany, is the reserve bank for the Eurozone. The ECB sets interest rates and manages monetary policy for the region.
The ECB primary mandate is to maintain price stability, which means keeping inflation at around 2%. Its primary tool for achieving this is by raising or lowering interest rates. Relatively high interest rates will usually result in a stronger Euro and vice versa.
The ECB Governing Council makes monetary policy decisions at meetings held eight times a year. Decisions are made by heads of the Eurozone national banks and six permanent members, including the President of the ECB, Christine Lagarde.
What is Quantitative Easing (QE) and how does it affect the Euro?
In extreme situations, the European Central Bank can enact a policy tool called Quantitative Easing. QE is the process by which the ECB prints Euros and uses them to buy assets – usually government or corporate bonds – from banks and other financial institutions. QE usually results in a weaker Euro.
QE is a last resort when simply lowering interest rates is unlikely to achieve the objective of price stability. The ECB used it during the Great Financial Crisis in 2009-11, in 2015 when inflation remained stubbornly low, as well as during the covid pandemic.
What is Quantitative tightening (QT) and how does it affect the Euro?
Quantitative tightening (QT) is the reverse of QE. It is undertaken after QE when an economic recovery is underway and inflation starts rising. Whilst in QE the European Central Bank (ECB) purchases government and corporate bonds from financial institutions to provide them with liquidity, in QT the ECB stops buying more bonds, and stops reinvesting the principal maturing on the bonds it already holds. It is usually positive (or bullish) for the Euro.
- Pound Sterling trades sideways ahead of US, UK central banks’ policy decisions.
- The BoE and the Fed are expected to keep interest rates steady.
- BoE policymakers are expected to offer hawkish guidance amid higher inflation.
The Pound Sterling (GBP) remains lackluster in Monday’s European session as investors appear to have sidelined ahead of the interest rate announcements by the Bank of England (BoE) and the Federal Reserve (Fed). The GBP/USD pair trades in a narrow range near 1.2700 as investors are anticipated to make their bets after this week’s policy announcements.
Trades see the BoE maintaining interest rates unchanged at 5.25% for the fourth time in a row as core inflation in the United Kingdom more than doubles the desired rate of 2%. Market participants will keenly focus on the interest rate outlook provided by the central bank.
The first interest rate decision of 2024 is expected to be challenging for BoE policymakers as inflation has proven to be more stubborn than expected and a technical recession is increasingly likely. Consumer spending has been hit hard due to the deepening cost-of-living crisis. Chances of a recession would escalate if the BoE delivers a hawkish guidance.
Daily digest market movers: Pound Sterling struggles for direction
- The Pound Sterling is stuck in a tight range around 1.2700 as investors shift their focus towards the monetary policy announcements by the Federal Reserve and the Bank of England, which are due this week.
- The BoE is widely anticipated to keep interest rates unchanged amid persistent price pressures.
- Interest rates are expected to remain steady at 5.25% for the fourth time in a row. Investors will keenly focus on the guidance on interest rates.
- Unlike the Fed and the European Central Bank (ECB), BoE policymakers have not talked about the timing or scope of rate cuts yet.
- Underlying inflation in the United Kingdom is higher than in the rest of the Group of Seven economies. This will likely allow BoE policymakers to deliver hawkish guidance on the interest rate outlook.
- Discussions among BoE officials will likely remain supportive of keeping interest rates restrictive until policymakers get confident that inflation will return to the 2% target in a sustainable manner.
- BoE policymakers have said rate cuts at the current stage would be “premature” as they could lead to a rebound in price pressures.
- Meanwhile, the US Dollar Index (DXY) struggles for a direction ahead of the Fed’s monetary policy decision and key data such as employment and Manufacturing PMI for January.
- Investors see the Fed maintaining the status-quo for a fourth straight time. The entire focus will be on the timing of when the Fed will start reducing interest rates.
- Fed officials projected a reduction in interest rates by 75 basis points (bps) in 2024. Market participants will focus on how the Fed will fit these three expected rate cuts from or after the March monetary policy meeting.
- Before the Fed’s policy decision, market participants will focus on the JOLTS Job Openings data for December. US employers are expected to have offered 8.75 million jobs in December, slightly lower from the 8.79 million job postings recorded in November.
Technical Analysis: Pound Sterling consolidates near 1.2700
Pound Sterling FAQs
What is the Pound Sterling?
The Pound Sterling (GBP) is the oldest currency in the world (886 AD) and the official currency of the United Kingdom. It is the fourth most traded unit for foreign exchange (FX) in the world, accounting for 12% of all transactions, averaging $630 billion a day, according to 2022 data.
Its key trading pairs are GBP/USD, aka ‘Cable’, which accounts for 11% of FX, GBP/JPY, or the ‘Dragon’ as it is known by traders (3%), and EUR/GBP (2%). The Pound Sterling is issued by the Bank of England (BoE).
How do the decisions of the Bank of England impact on the Pound Sterling?
The single most important factor influencing the value of the Pound Sterling is monetary policy decided by the Bank of England. The BoE bases its decisions on whether it has achieved its primary goal of “price stability” – a steady inflation rate of around 2%. Its primary tool for achieving this is the adjustment of interest rates.
When inflation is too high, the BoE will try to rein it in by raising interest rates, making it more expensive for people and businesses to access credit. This is generally positive for GBP, as higher interest rates make the UK a more attractive place for global investors to park their money.
When inflation falls too low it is a sign economic growth is slowing. In this scenario, the BoE will consider lowering interest rates to cheapen credit so businesses will borrow more to invest in growth-generating projects.
How does economic data influence the value of the Pound?
Data releases gauge the health of the economy and can impact the value of the Pound Sterling. Indicators such as GDP, Manufacturing and Services PMIs, and employment can all influence the direction of the GBP.
A strong economy is good for Sterling. Not only does it attract more foreign investment but it may encourage the BoE to put up interest rates, which will directly strengthen GBP. Otherwise, if economic data is weak, the Pound Sterling is likely to fall.
How does the Trade Balance impact the Pound?
Another significant data release for the Pound Sterling is the Trade Balance. This indicator measures the difference between what a country earns from its exports and what it spends on imports over a given period.
If a country produces highly sought-after exports, its currency will benefit purely from the extra demand created from foreign buyers seeking to purchase these goods. Therefore, a positive net Trade Balance strengthens a currency and vice versa for a negative balance.
Pound Sterling trades back and forth near 1.2700 ahead of the key monetary policy announcements on both sides of the Atlantic. The GBP/USD pair oscillates inside Friday’s trading range of 1.2675-1.2758, indicating a sharp contraction in volatility. On a daily timeframe, the Cable demonstrates a long inventory adjustment between retail participants and institutional investors. The 20-day Exponential Moving Average (EMA) near 1.2700 overlaps the Cable’s current trading range, adding to evidence that investors have sidelined ahead of the data-packed week.
FX option expiries for Jan 29 NY cut at 10:00 Eastern Time, via DTCC, can be found below.
- EUR/USD: EUR amounts
- 1.0750 629m
- 1.0800 632m
- 1.0840 400m
- 1.0850 452m
- 1.0900 1b
- 1.0910 395m
- 1.0990 854m
- GBP/USD: GBP amounts
- 1.2700 672m
- USD/JPY: USD amounts
- 146.75 420m
- 148.50 449m
- USD/CHF: USD amounts
- 0.8750 1.4b
- USD/CAD: USD amounts
- 1.3450 400m
- USD/IDR trades in positive territory for the fifth consecutive week on Monday.
- The market expected the Fed to keep rates steady at a target of 5.25%–5.50% at its January meeting.
- The Fed monetary policy meeting and Indonesian inflation data will be in the spotlight this week.
The USD/IDR pair gathers strength during the early European session on Monday. The pair currently trades around 15830 after retreating from a fresh top of 2024 at 15844. Investors await the Federal Reserve's (Fed) monetary policy meeting on Wednesday and Indonesia’s inflation report on Thursday for fresh catalysts.
The Commerce Department showed on Friday that the US Core Personal Consumption Expenditures Price Index (Core PCE) grew by 0.2% on the month from 0.1% in the previous reading and rose by 2.9% on a yearly basis from the previous reading of 3.2%. Meanwhile, the headline PCE, including volatile food and energy, increased 0.2% for the month and held steady at 2.6% on an annual basis. The Federal Reserve (Fed) will announce its interest rate decision at its January meeting on Wednesday. Investors anticipate the Fed to keep rates at 5.25–5.50%.
Bank Indonesia (BI) kept the interest rate steady on January 17. The move was consistent with efforts to stabilize the rupee's exchange rate and ensure inflation remains within target this year. Indonesia's central bank targets inflation at a range of 1.5% to 3.5% in 2024, below 2023's target of 2% to 4%. Investors await the January Indonesian inflation report, due on Thursday. The figure is forecast to show an increase of 0.22% MoM and 2.58% YoY in January. The Core inflation figure is projected to grow 1.83% YoY from 1.80% in the previous reading.
Apart from this, local media reports that Indonesia's Finance Minister Sri Mulyani Indrawati could resign prior to the February 14 presidential election have eroded confidence in the rupiah over the past two weeks, casting doubt on the fiscal outlook of the country.
Looking ahead, the Fed Interest Rate Decision will be in the spotlight this week. Investors will take more cues from the press conference after the meeting. The dovish comments from Fed officials might weigh on the US Dollar (USD) and act as a headwind for USD/IDR. Furthermore, the Indonesian inflation data for January will be released on Thursday.
Here is what you need to know on Monday, January 29:
The action in financial markets remain subdued early Monday as investors prepare for this week's key central bank meetings and macroeconomic events. The European economic docket will not feature any high-tier data releases. Later in the day, the Federal Reserve Bank of Dallas will release the Texas Manufacturing Business Index for January.
The US Dollar Index (DXY) registered small gains in the previous week, supported by upbeat data releases. The index holds steady at around 103.50 in the European morning on Monday, while the benchmark 10-year US Treasury bond yield continues to fluctuate in a tight channel above 4%. In the meantime, geopolitical tensions remain high at the beginning of the week, following news of a drone strike on a US base near Jordan's border with Syria killing three and injuring more than 20 troops. Reflecting the cautious mood, US stock index futures trade modestly lower on the day. On Wednesday, the Federal Reserve will announce monetary policy decisions following the first meeting of the year.
US Dollar price today
The table below shows the percentage change of US Dollar (USD) against listed major currencies today. US Dollar was the strongest against the Euro.
| USD | EUR | GBP | CAD | AUD | JPY | NZD | CHF | |
| USD | -0.02% | -0.08% | -0.07% | -0.22% | -0.17% | -0.14% | -0.10% | |
| EUR | 0.03% | -0.04% | -0.03% | -0.18% | -0.11% | -0.10% | -0.07% | |
| GBP | 0.08% | 0.06% | 0.01% | -0.15% | -0.05% | -0.06% | 0.00% | |
| CAD | 0.07% | 0.04% | -0.02% | -0.14% | -0.08% | -0.06% | -0.02% | |
| AUD | 0.22% | 0.20% | 0.14% | 0.16% | 0.09% | 0.09% | 0.14% | |
| JPY | 0.16% | 0.12% | 0.21% | 0.07% | -0.07% | 0.00% | 0.05% | |
| NZD | 0.14% | 0.13% | 0.06% | 0.07% | -0.09% | -0.01% | 0.06% | |
| CHF | 0.11% | 0.06% | 0.00% | 0.02% | -0.14% | -0.05% | -0.05% |
The heat map shows percentage changes of major currencies against each other. The base currency is picked from the left column, while the quote currency is picked from the top row. For example, if you pick the Euro from the left column and move along the horizontal line to the Japanese Yen, the percentage change displayed in the box will represent EUR (base)/JPY (quote).
EUR/USD seems to have gone into a consolidation phase at around 1.0850 after closing the second consecutive week in negative territory. On Tuesday, Eurostat will release the Euro area's preliminary Gross Domestic Product (GDP) growth for the fourth quarter.
GBP/USD ended the previous week virtually unchanged and extended its sideways grind at around 1.2700 early Monday. UK inflation expectations for the twelve months ahead fell from 4.2% in October to 3.9% and 3.5% in November and December, respectively, a survey conducted by US bank Citi and polling firm YouGov showed on Monday. The Bank of England will announce policy decisions on Thursday.
Following the previous week's indecisive action, USD/JPY trades marginally lower on the day slightly below 148.00 on Monday. In the Asian session on Tuesday, December Unemployment Rate data from Japan will be looked upon for fresh impetus.
Gold registered small losses last week but managed to regain its traction early Monday. At the time of press, XAU/USD was up 0.5% on the day at $2,028.
The UK public's expectations for inflation for the year ahead fell in November and December, the latest survey conducted by US bank Citi and polling firm YouGov showed on Monday.
Key takeaways
UK inflation expectations for the twelve months ahead fell from 4.2% in October to 3.9% and 3.5% in November and December respectively.
UK inflation expectations for the long term declined to 3.4%.
Market reaction
GBP/USD is little affected by the falling UK inflation expectations, holding steady at around 1.2700, as of writing.
Pound Sterling price today
The table below shows the percentage change of Pound Sterling (GBP) against listed major currencies today. Pound Sterling was the strongest against the US Dollar.
| USD | EUR | GBP | CAD | AUD | JPY | NZD | CHF | |
| USD | 0.00% | -0.07% | -0.07% | -0.19% | -0.12% | -0.10% | -0.05% | |
| EUR | 0.01% | -0.05% | -0.05% | -0.17% | -0.09% | -0.09% | -0.04% | |
| GBP | 0.06% | 0.06% | -0.02% | -0.13% | -0.04% | -0.04% | -0.01% | |
| CAD | 0.08% | 0.07% | 0.01% | -0.11% | -0.03% | -0.02% | 0.03% | |
| AUD | 0.20% | 0.18% | 0.12% | 0.12% | 0.08% | 0.09% | 0.12% | |
| JPY | 0.13% | 0.11% | 0.19% | 0.04% | -0.08% | 0.00% | 0.06% | |
| NZD | 0.10% | 0.11% | 0.04% | 0.03% | -0.09% | -0.02% | 0.04% | |
| CHF | 0.07% | 0.06% | 0.00% | 0.00% | -0.12% | -0.04% | -0.03% |
The heat map shows percentage changes of major currencies against each other. The base currency is picked from the left column, while the quote currency is picked from the top row. For example, if you pick the Euro from the left column and move along the horizontal line to the Japanese Yen, the percentage change displayed in the box will represent EUR (base)/JPY (quote).
- EUR/JPY trades weaker near 160.45 in Monday’s European session.
- The RSI indicator stands in bearish territory below the 50-midline, supporting the sellers in the near term.
- The immediate resistance level is located at 160.92; the key support level will emerge at 159.90.
The EUR/JPY cross loses traction below the mid-160s during the early European trading hours on Monday. The preliminary German Gross Domestic Product for the fourth quarter will be released on Tuesday. The quarterly and annual are estimated to shrink by 0.3% and 0.2%, respectively. At press time, the cross is trading at 160.45, losing 0.17% on the day.
From the technical perspective, the bullish outlook of EUR/JPY looks vulnerable as the cross is set to move below the 100-period Exponential Moving Averages (EMA) on the four-hour chart. Additionally, the Relative Strength Index (RSI) stands in bearish territory below the 50-midline, suggesting that further decline looks favorable in the near term.
A high of January 26 at 160.92 acts as an immediate resistance level for EUR/JPY. The next upside barrier is seen at the upper boundary of the Bollinger Band at 161.10. A bullish breakout above the latter will see a rally to a high of January 23 at 161.70, followed by a high of January 19 at 161.87.
On the other hand, a decisive break below the 50-period EMA at 160.45 will pave the way to the key support level at 159.90, representing the lower limit of the Bollinger Band and the 100-period EMA. Further south, the next downside target to watch is a low of January 16 at 159.24, followed by a low of January 12 at 158.54.
EUR/JPY four-hour chart
-638421059771151946.png)
- USD/CHF loses ground on risk aversion sentiment.
- US Dollar remains stable despite downbeat US bond yields.
- Market expects that the Fed will initiate a rate-cut cycle in March.
The USD/CHF continues to lose ground for the second straight session, edging lower to near 0.8640 during the Asian hours on Monday. The Swiss Franc (CHF) appears to be in demand against the US Dollar (USD), driven by an increase in risk aversion sentiment. This demand for the CHF could be attributed to heightened tensions in the Middle East, as geopolitical uncertainties often lead investors to seek safe-haven currencies like the Swiss Franc.
There is uncertainty regarding the Swiss National Bank's (SNB) stance on the persistent strength of the Swiss Franc. Despite concerns about the CHF's strength, it is not expected that the SNB will intervene in the foreign exchange market by purchasing foreign currency to restrain the appreciation of the CHF.
The US Dollar Index (DXY) maintains stability around 103.50, with subdued 2-year and 10-year US Treasury yields at 4.34% and 4.13%, respectively, at the time of writing. Despite the release of moderate US Core Personal Consumption Expenditures Price Index (PCE) data on Friday, the US Dollar failed to find support. The December Core PCE reported a 0.2% monthly increase, meeting expectations and surpassing the previous reading of 0.1%. However, the yearly Core PCE rose by 2.9%, falling short of the expected 3.0% and the previous reading of 3.2%.
As inflation shows signs of cooling off, investors are anticipating the possibility of the Federal Reserve (Fed) implementing policy easing. The CME FedWatch Tool suggests that futures traders have priced in a 53% probability of the Fed cutting interest rates for the first time in this cycle during the March meeting. However, the upcoming Federal Open Market Committee (FOMC) statement on January 31 is expected to maintain the Fed Funds rate unchanged.
Traders are likely to closely monitor key economic indicators, including Tuesday's releases of the US Housing Price Index and Consumer Confidence figures to gain additional market insights. On the Swiss docket, Wednesday's Real Retail Sales and the ZEW Survey will be eyed to assess the overall health of the Swiss economy.
- Gold price draws some support from escalating geopolitical tensions in the Middle East.
- Sliding US bond yields also benefit the XAU/USD, though a bullish USD caps the upside.
- Traders also seem reluctant ahead of the crucial two-day FOMC monetary policy meeting.
Gold price (XAU/USD) kicks off the new week on a positive note, albeit struggles to build on strength and remains below the 50-day Simple Moving Average (SMA) during the Asian session. Traders now seem reluctant and opt to wait for more cues about the timing of when the Federal Reserve (Fed) will start cutting interest rates before placing fresh directional bets. Hence, the focus will remain glued to the outcome of the highly-anticipated two-day FOMC monetary policy meeting starting on Tuesday.
In the meantime, the killing of three US Army soldiers in a drone attack by radical Iran-backed militant groups raises the risk of a major escalation of geopolitical tensions in the Middle East. Adding to this, a generally weaker tone around the equity markets should act as a tailwind for the safe-haven Gold price. That said, diminishing odds for a more aggressive policy easing by the Fed act as a tailwind for the US Dollar (USD) and hold back bulls from placing aggressive bets around the XAU/USD.
Daily Digest Market Movers: Gold price is underpinned by reviving safe-haven demand; follow-through lacking
- The risk of a further escalation of geopolitical tensions in the Middle East weighs on investors' sentiment and lends support to the safe-haven Gold price on the first day of a new week.
- A drone attack on a US base in Jordan killed three US soldiers, marking the first death of US service personnel in the region since the Hamas-Israel war broke out on October 7.
- President Joe Biden doubled down on his pledge of reprisals and said that the US shall respond and hold all those responsible to account at a time and in a manner of our choosing.
- The US Dollar (USD) holds steady just below a one-month peak as investors continue to scale back their expectations for a more aggressive easing by the Federal Reserve.
- Data released on Friday, however, showed that inflation rose modestly in December and reaffirmed expectations that the Fed will start cutting interest rates by the middle of 2024.
- The US Bureau of Economic Analysis reported that the Personal Consumption Expenditures (PCE) Price Index held steady at 2.6% on a yearly basis in December.
- Meanwhile, the annual Core PCE Price Index – considered the Fed's preferred gauge of inflation – decelerated more than expected, to 2.9% from 3.2% in November.
- Other details of the publication showed that Personal Spending rose 0.7% in December while Personal Income grew 0.3%, pointing to strong demand from US consumers.
- This comes on top of the stronger US Q4 GDP print earlier last week and suggested that the economy is still in good shape, further fuelling optimism about a soft landing.
- A modest decline in the US Treasury bond yields keeps a lid on any further gains for the Greenback and might continue to act as a tailwind for the non-yielding yellow metal.
- Traders might also prefer to wait for the FOMC meeting starting on Tuesday and this week's key US macro data, including the Nonfarm Payrolls (NFP) report on Friday.
Technical Analysis: Gold price needs to find acceptance above the 50-day SMA for bulls to seize intraday control
From a technical perspective, any subsequent move beyond the 50-day SMA hurdle, currently around the $2,027-2,028 region, might continue to attract some sellers near the $2,040-2,042 supply zone. A sustained strength beyond the latter could trigger a short-covering rally and lift the Gold price further to the $2,077 intermediate hurdle en route to the $2,100 round-figure mark.
On the flip side, immediate support is pegged near the $2,012-2,010 area ahead of the $2,000 psychological mark. Some follow-through selling will be seen as a fresh trigger for bearish traders and expose the 100-day SMA, currently near the $1,977-1,976 area. The Gold price could eventually drop to test the very important 200-day SMA, near the $1,964-1,963 region.
US Dollar price today
The table below shows the percentage change of US Dollar (USD) against listed major currencies today. US Dollar was the strongest against the Euro.
| USD | EUR | GBP | CAD | AUD | JPY | NZD | CHF | |
| USD | -0.03% | -0.08% | -0.07% | -0.26% | -0.06% | -0.13% | -0.11% | |
| EUR | 0.03% | -0.04% | -0.03% | -0.22% | -0.01% | -0.10% | -0.08% | |
| GBP | 0.08% | 0.04% | 0.00% | -0.18% | 0.03% | -0.06% | -0.03% | |
| CAD | 0.06% | 0.02% | -0.02% | -0.19% | 0.02% | -0.06% | -0.04% | |
| AUD | 0.25% | 0.19% | 0.16% | 0.17% | 0.18% | 0.11% | 0.15% | |
| JPY | 0.06% | 0.02% | 0.13% | -0.01% | -0.18% | -0.10% | -0.05% | |
| NZD | 0.13% | 0.10% | 0.06% | 0.06% | -0.11% | 0.05% | 0.02% | |
| CHF | 0.10% | 0.06% | 0.03% | 0.04% | -0.13% | 0.05% | -0.01% |
The heat map shows percentage changes of major currencies against each other. The base currency is picked from the left column, while the quote currency is picked from the top row. For example, if you pick the Euro from the left column and move along the horizontal line to the Japanese Yen, the percentage change displayed in the box will represent EUR (base)/JPY (quote).
Gold FAQs
Why do people invest in Gold?
Gold has played a key role in human’s history as it has been widely used as a store of value and medium of exchange. Currently, apart from its shine and usage for jewelry, the precious metal is widely seen as a safe-haven asset, meaning that it is considered a good investment during turbulent times. Gold is also widely seen as a hedge against inflation and against depreciating currencies as it doesn’t rely on any specific issuer or government.
Who buys the most Gold?
Central banks are the biggest Gold holders. In their aim to support their currencies in turbulent times, central banks tend to diversify their reserves and buy Gold to improve the perceived strength of the economy and the currency. High Gold reserves can be a source of trust for a country’s solvency. Central banks added 1,136 tonnes of Gold worth around $70 billion to their reserves in 2022, according to data from the World Gold Council. This is the highest yearly purchase since records began. Central banks from emerging economies such as China, India and Turkey are quickly increasing their Gold reserves.
How is Gold correlated with other assets?
Gold has an inverse correlation with the US Dollar and US Treasuries, which are both major reserve and safe-haven assets. When the Dollar depreciates, Gold tends to rise, enabling investors and central banks to diversify their assets in turbulent times. Gold is also inversely correlated with risk assets. A rally in the stock market tends to weaken Gold price, while sell-offs in riskier markets tend to favor the precious metal.
What does the price of Gold depend on?
The price can move due to a wide range of factors. Geopolitical instability or fears of a deep recession can quickly make Gold price escalate due to its safe-haven status. As a yield-less asset, Gold tends to rise with lower interest rates, while higher cost of money usually weighs down on the yellow metal. Still, most moves depend on how the US Dollar (USD) behaves as the asset is priced in dollars (XAU/USD). A strong Dollar tends to keep the price of Gold controlled, whereas a weaker Dollar is likely to push Gold prices up.
- EUR/USD loses ground toward the monthly low at 1.0813.
- Technical analysis suggests a conformation of the bearish sentiment.
- The region around the 23.6% Fibonacci retracement and the 21-day EMA could act as the resistance zone.
EUR/USD trades lower around 1.0840 during the Asian session on Monday, retracing its recent gains. The pair experiences downward pressure due to the risk-off mood, which could be attributed to the escalated tension in the Middle East after a drone attack on a United States (US) post in Jordon, killed three US personnel.
The significant level at 1.0850 may act as immediate resistance for the EUR/USD pair. A successful breakthrough above the latter could potentially propel the pair towards the 23.6% Fibonacci retracement level at 1.0889, followed by the 21-day Exponential Moving Average (EMA) at 1.0898, in conjunction with the psychological barrier at the 1.0900 level.
The 14-day Relative Strength Index (RSI) for the EUR/USD pair lies below the 50 mark, indicating a bearish momentum in the market. Additionally, the Moving Average Convergence Divergence (MACD), a lagging indicator, signals a potential confirmation of a downward trend with the MACD line positioning below the centerline and the signal line.
In the previous week, the EUR/USD pair reached its monthly low at 1.0813. A decisive break below this monthly low could prompt bearish sentiment, potentially driving the pair toward the psychological support level at 1.0800. If the pair extends its decline below the psychological level, it may face pressure to navigate toward the support level at 1.0750.
EUR/USD: Daily Chart
-638420992267688271.png)
- Indian Rupee trades with a mild negative bias on Monday.
- The market expects the FOMC to keep rates at 5.25–5.50% unchanged at its January meeting.
- India’s Interim Budget 2024 for fiscal year 2024-25 will be released on Thursday.
Indian Rupee (INR) loses traction on Monday amid the rebound of the US Dollar (USD). INR is expected to have a quiet session on Monday as traders turn to cautious mode ahead of the Federal Open Market Committee (FOMC) policy meeting and the presentation of India's federal budget later in the week.
The US Dollar and US bond yields have benefited from strong economic data in the United States and a decreasing bet on aggressive rate cuts by the Fed. Additionally, the ongoing geopolitical tension in the Middle East helps boost demand for safe-haven currencies like the Greenback and acts as a tailwind for the USD/INR pair.
The Federal Open Market Committee (FOMC) January meeting on Wednesday will be a closely watched event. Investors widely anticipate the FOMC to maintain the status quo. Investors will closely watch the press conference following the meeting. If Fed Chairman Jerome Powell hints at a probable rate cut in March, the Greenback may see some selling pressure.
Indian Finance Minister, Nirmala Sitharaman, will present the Interim Budget 2024 for fiscal year 2024–25 on Thursday as part of the Parliament’s Budget session. Budget 2024 is set to focus on initiatives that will help India maintain its growth trajectory towards a $5 trillion economy.
Daily Digest Market Movers: Indian Rupee remains sensitive to global factors
- India's 10-year benchmark bond yield ended at 7.1760% on Friday, after little movement in the previous two weeks as markets await the government budget announcement.
- The Fiscal Budget 2024–25 will mostly focus on government spending, with no significant changes expected until a new government takes control after the general election.
- The budget is expected to target a narrowing of the fiscal deficit as a percentage of GDP to 5.30% in 2024–25 from 5.90% this fiscal year.
- The Indian government plans to increase welfare spending and lower the budget deficit to 4.5% of GDP by fiscal year 2025–26.
- The US Core Personal Consumption Expenditures Price Index (PCE) for December, the Fed’s preferred inflation gauge, rose by 0.2% on the month from 0.1% in the previous reading and increased by 2.9% on a yearly basis from the previous reading of 3.2%.
- The headline PCE, including volatile food and energy costs, grew by 0.2% for the month and held steady at 2.6% annually.
- US pending home sales came in at 8.3% MoM in December versus -0.3% prior, above the market consensus of 1.5%.
- The US Gross Domestic Product (GDP) came in stronger than expected, expanding at a 3.3% annualized rate in the fourth quarter of 2023, compared to 4.9% in the previous reading.
Technical Analysis: Indian Rupee remains confined in the 82.78–83.45 band
Indian Rupee trades on a softer note on the day. The USD/INR pair oscillates in a two-month-old descending trend channel. Technically, USD/INR is likely to see potential upside as the pair is above the key 100-period Exponential Moving Average (EMA) on the daily chart. It’s worth noting that the 14-day Relative Strength Index (RSI) stands above the 50.0 midline, suggesting the momentum remains biased to the upside.
The immediate resistance level is seen at the upper boundary of the descending trend channel at 83.25. A bullish breakout could take USD/INR to a high of January 2 at 83.35, followed by a 2023 high of 83.47. On the other hand, the potential support level will emerge at the 83.00-83.05 region, portraying the confluence of the 100-period EMA and a psychological level. If USD/INR’s bearish downswing retains its momentum, it could head for a low of December 18 at 82.90, en route to the lower limit of the descending trend channel at 82.72.
US Dollar price today
The table below shows the percentage change of US Dollar (USD) against listed major currencies today. US Dollar was the strongest against the Euro.
| USD | EUR | GBP | CAD | AUD | JPY | NZD | CHF | |
| USD | -0.02% | -0.06% | -0.05% | -0.18% | -0.04% | -0.11% | -0.08% | |
| EUR | 0.01% | -0.04% | -0.03% | -0.15% | 0.00% | -0.09% | -0.06% | |
| GBP | 0.05% | 0.04% | 0.00% | -0.13% | 0.04% | -0.06% | -0.02% | |
| CAD | 0.05% | 0.01% | -0.01% | -0.13% | 0.02% | -0.06% | -0.03% | |
| AUD | 0.18% | 0.16% | 0.12% | 0.13% | 0.15% | 0.08% | 0.10% | |
| JPY | 0.03% | 0.01% | 0.11% | -0.01% | -0.15% | -0.10% | -0.05% | |
| NZD | 0.11% | 0.11% | 0.05% | 0.06% | -0.07% | 0.07% | 0.05% | |
| CHF | 0.08% | 0.05% | 0.02% | 0.03% | -0.10% | 0.06% | -0.02% |
The heat map shows percentage changes of major currencies against each other. The base currency is picked from the left column, while the quote currency is picked from the top row. For example, if you pick the Euro from the left column and move along the horizontal line to the Japanese Yen, the percentage change displayed in the box will represent EUR (base)/JPY (quote).
Indian Rupee FAQs
What are the key factors driving the Indian Rupee?
The Indian Rupee (INR) is one of the most sensitive currencies to external factors. The price of Crude Oil (the country is highly dependent on imported Oil), the value of the US Dollar – most trade is conducted in USD – and the level of foreign investment, are all influential. Direct intervention by the Reserve Bank of India (RBI) in FX markets to keep the exchange rate stable, as well as the level of interest rates set by the RBI, are further major influencing factors on the Rupee.
How do the decisions of the Reserve Bank of India impact the Indian Rupee?
The Reserve Bank of India (RBI) actively intervenes in forex markets to maintain a stable exchange rate, to help facilitate trade. In addition, the RBI tries to maintain the inflation rate at its 4% target by adjusting interest rates. Higher interest rates usually strengthen the Rupee. This is due to the role of the ‘carry trade’ in which investors borrow in countries with lower interest rates so as to place their money in countries’ offering relatively higher interest rates and profit from the difference.
What macroeconomic factors influence the value of the Indian Rupee?
Macroeconomic factors that influence the value of the Rupee include inflation, interest rates, the economic growth rate (GDP), the balance of trade, and inflows from foreign investment. A higher growth rate can lead to more overseas investment, pushing up demand for the Rupee. A less negative balance of trade will eventually lead to a stronger Rupee. Higher interest rates, especially real rates (interest rates less inflation) are also positive for the Rupee. A risk-on environment can lead to greater inflows of Foreign Direct and Indirect Investment (FDI and FII), which also benefit the Rupee.
How does inflation impact the Indian Rupee?
Higher inflation, particularly, if it is comparatively higher than India’s peers, is generally negative for the currency as it reflects devaluation through oversupply. Inflation also increases the cost of exports, leading to more Rupees being sold to purchase foreign imports, which is Rupee-negative. At the same time, higher inflation usually leads to the Reserve Bank of India (RBI) raising interest rates and this can be positive for the Rupee, due to increased demand from international investors. The opposite effect is true of lower inflation.
- USD/CAD moves in an upward direction on risk aversion sentiment.
- Upbeat WTI prices could limit the losses of the Canadian Dollar.
- Biden administration and the US military formulate plans, including the possibility of carrying out strikes into Iran.
USD/CAD attempts to retrace its recent losses on risk aversion sentiment, improving to near 1.3450 during the Asian session on Monday. The Canadian Dollar (CAD) might have been experiencing difficulties following the Bank of Canada's (BoC) choice to hold its benchmark interest rate at 5.0% on Wednesday, marking the fourth consecutive occasion of the central bank maintaining rates at the same level.
BoC Governor Tiff Macklem signaled a change in emphasis, transitioning from the discussion of whether interest rates are adequately high to when they might be potentially lowered. According to the Bank of Canada's Monetary Policy Report (MPR), the central bank foresees inflation reaching its 2.0% target by 2025.
The upbeat Crude oil prices may cap the losses of the Canadian Dollar. West Texas Intermediate (WTI) oil price extends its gains to near $78.20 per barrel during the Asian session on Monday. WTI prices peaked at $79.19 during the early Asian hours but have since retraced some of their intraday gains. The surge in Crude oil prices was primarily fueled by concerns about potential supply disruptions following a missile attack on a fuel tanker in the Red Sea.
Furthermore, a drone attack targeted a United States (US) outpost in Jordan on Sunday, resulting in the tragic death of three US service members. In response, Biden administration and the US military are actively formulating specific plans, including the possibility of carrying out strikes into Iran. The heightened tension in the Red Sea region could provide support for WTI oil price, acting as a bolstering factor for the Canadian Dollar (CAD).
The US Dollar Index (DXY) benefits from improved US Treasury bond yields, providing tailwinds for the USD/CAD pair. In Friday's release, the US Core Personal Consumption Expenditures Price Index (PCE) for December indicated a 0.2% monthly increase, aligning with expectations and up from the previous reading of 0.1%. However, the yearly Core PCE rose 2.9%, falling short of the expected 3.0% and the previous reading of 3.2%.
The upcoming Federal Open Market Committee (FOMC) statement on Wednesday, January 31, is anticipated to maintain the Fed Funds rate unchanged at 5.25-5.50%, as per consensus. Despite this, the market's inclination toward a potential rate cut in March may exert downward pressure on the Greenback
Investors will closely monitor Tuesday's US Housing Price Index and Consumer Confidence figures for additional market insights. Meanwhile, in Canada, Wednesday's Gross Domestic Product data is expected to show a slight increase.
- WTI price gained ground on the threat of supply disruption in the Red Sea.
- Crude oil prices surged as a drone attacked a US outpost in Jordan on Sunday.
- US military could carry out strikes into Iran.
- OPEC+ will hold an online conference on February 1 to decide on further output policies.
West Texas Intermediate (WTI) oil price extends its gains for the fourth consecutive session, trading higher near $78.30 per barrel on Monday, by the press time. WTI prices reached the monthly peak at $79.19 during the early Asian hours but have since pared some of their intraday gains. However, the surge in Crude oil prices was driven by concerns about potential supply disruptions following a missile attack on a fuel tanker in the Red Sea.
Moreover, on Sunday, a drone attack targeted a United States (US) outpost in Jordan, near its border with Syria, resulting in the tragic death of three US service members and leaving at least 24 others injured. Reports indicate that both the administration of US President Joe Biden and the US military are actively developing specific plans to address this attack. Among the potential measures being considered, there is the serious prospect of carrying out strikes in Iran, representing a significant escalation if such actions are implemented, which in turn, may act as a tailwind for the Crude oil prices.
The Organization of the Petroleum Exporting Countries and its allies (OPEC+) are scheduled to hold an online conference on February 1, where they may make decisions regarding further output policies. Currently, OPEC+ has collectively committed to voluntary output cuts of approximately 2.2 million barrels per day (bpd) for the first quarter, with Saudi Arabia leading by maintaining a 1 million bpd voluntary reduction. However, Gazprom Neft, a major Russian oil producer, holds the view that there is no necessity for additional cuts in oil supply by OPEC+ members. Meanwhile, the prognosis for Russian refined products exports is anticipated to decrease due to ongoing repairs at several refineries following drone attacks.
Crude oil prices might have received upward support, partially fueled by the better-than-expected GDP Annualized (Q4) data released from the United States last week. Another contributing factor to the strength in Crude oil prices is speculation surrounding the People's Bank of China (PBoC) contemplating a potential cut in the Medium-term Lending Facility (MLF) rate, given that China, as the largest oil importer, wields a substantial influence on global oil markets.
| Raw materials | Closed | Change, % |
|---|---|---|
| Silver | 22.788 | -0.44 |
| Gold | 2018.386 | -0.08 |
| Palladium | 956.29 | 2.18 |
- GBP/USD struggles for a firm near-term direction and oscillates in a familiar trading range.
- Reduced bets for an early BoE rate cut underpin the GBP and lend some support to the pair.
- The uncertainty over the Fed’s rate-cut path holds back traders from placing directional bets.
The GBP/USD pair ticks higher following an Asian session dip on Monday, albeit lacks follow-through and remains confined in a familiar range held over the past two weeks or so. Spot prices currently trade around the 1.2700 mark, nearly unchanged for the day as traders await a fresh catalyst before positioning for a firm near-term trajectory.
Hence, the focus remains glued to the outcome of the highly-anticipated two-day FOMC monetary policy meeting starting on Tuesday amid the uncertainty over the timing of the first interest rate cut. Data released on Friday showed that the US inflation rose modestly in December and reaffirmed expectations that the Federal Reserve will cut rates by the middle of 2024. That said, stronger growth in Personal Incomes fueled a surge in spending, which, along with the upbeat US Q4 GDP print, suggested that the economy is still in good shape. This, in turn, raises doubts over the possibility of more aggressive policy easing by the Federal Reserve (Fed), which acts as a tailwind for the US Dollar (USD) and should cap the GBP/USD pair.
Apart from this, a generally weaker tone around the equity markets assists the safe-haven buck to stand tall near its highest level since December 13 touched last week. That said, hopes for a soft landing for the US economy keep a lid on the US Treasury bond yields and the USD. Apart from this, expectations that a slight pickup in Britain's stagnant economy could delay the start of the Bank of England's (BoE) policy easing cycle could lend support to the British Pound (GBP) and continue lending support to the GBP/USD pair. The recent range-bound price action, however, points to indecision among traders over the next leg of a directional move for spot prices and warrants some caution for aggressive traders.
Moving ahead, there isn't any relevant market-moving economic data due for release on Monday, either from the UK or the US, leaving the GBP/USD pair at the mercy of the USD price dynamics. Investors, meanwhile, might prefer to wait on the sidelines ahead of this week's key central bank event risk and important US macro data scheduled at the start of a new month, including the Nonfarm Payrolls on Friday. Hence, it will be prudent to wait for a sustained breakout through the short-term trading band before positioning for a firm near-term direction.
Technical levels to watch
- NZD/USD kicks off the new week on a positive note around 0.6107.
- The markets expect the Federal Reserve (Fed) to maintain monetary policy unchanged on Wednesday.
- New Zealand’s Trade Balance came in at $-13.57B YoY in December versus $-13.90B prior.
The NZD/USD pair hovers around the 0.6100 mark during the Asian trading hours on Monday. The pair edges higher despite the stronger US Dollar Index (DXY). Investors await the Federal Open Market Committee (FOMC) meeting and the January US Nonfarm Payrolls this week for fresh impetus. At press time, NZD/USD is trading at 0.6107, adding 0.26% for the day.
Market players expect the Federal Reserve (Fed) to keep rates steady at 5.25–5.50% at its January meeting on Wednesday. Traders were pricing in about a 48.2% chance of the first rate cut from the Fed in March, down from 88% a month ago.
Statistics New Zealand showed on Monday that the nation’s Trade Balance came in at $-13.57B YoY in December versus $-13.90B prior. Meanwhile, Exports dropped to $5.94B in December from the previous reading of $5.99B prior. Imports declined to $6.26B in the same month, compared to $7.20B in November.
Moving on, traders will monitor the Reserve Bank of New Zealand (RBNZ) Chief Economist Conway's speech on Tuesday. The attention will shift to the FOMC meeting on Wednesday. This event could trigger volatility in the market. Traders will take more cues from Fed Chairman Jerome Powell's speech during the press conference.
- The Japanese Yen is undermined by the weaker Tokyo Core CPI released on Friday.
- The USD holds steady just below the monthly peak and lends support to USD/JPY.
- Traders, however, seem reluctant amid the uncertainty over the Fed’s rate cut path.
The Japanese Yen (JPY) remains on the defensive against its American counterpart at the start of a new week and languishes near a two-month low touched on January 19. Data released on Friday showed that inflation in Tokyo – Japan's capital city – fell below the Bank of Japan's (BoJ) 2% target for the first time in nearly two years and continues to undermine the domestic currency. This, along with the underlying bullish tone surrounding the US Dollar (USD), assists the USD/JPY pair to hold above the 148.00 mark during the Asian session.
Meanwhile, the BoJ last week signalled that it was becoming more convinced to durably achieve the 2% inflation target and lifted bets that a rate hike could happen within months. Apart from this, the prevalent cautious mood around the equity markets should help limit losses for the safe-haven JPY. Furthermore, the USD bulls might refrain from placing aggressive bets and prefer to wait for the FOMC policy decision on Wednesday amid the uncertainty over the timing of the first rate cut. This, in turn, might cap any meaningful upside for the USD/JPY pair.
Daily Digest Market Movers: Japanese Yen struggles to gain traction amid mixed fundamental cues
- A further decline in the Tokyo CPI raised doubts that the Bank of Japan will phase out negative interest rates anytime soon and is seen undermining the Japanese Yen.
- The US Dollar stands tall near its highest level since December 13 touched last week and turns out to be another factor acting as a tailwind for the USD/JPY pair.
- Traders, however, seem reluctant and might prefer to move to the sidelines ahead of the crucial two-day FOMC monetary policy meeting starting on Tuesday.
- Data released on Friday showed that inflation rose modestly in December and reaffirmed expectations that the Federal Reserve will cut rates by the middle of 2024.
- The US Bureau of Economic Analysis reported that the Personal Consumption Expenditures (PCE) Price Index held steady at 2.6% on a yearly basis in December.
- The annual Core PCE Price Index, the Fed's preferred gauge of inflation, decelerated more than expected, to 2.9% from 3.2% in November.
- Other details showed that Personal Spending rose 0.7% in December while Personal Income grew 0.3%, pointing to strong demand from US consumers.
- This comes on the back of the upbeat US Q4 GDP print and suggests that the economy is still running hot despite tightening financial conditions.
- Growing disinflationary pressures and progress towards the Fed's 2% target take further tightening off the table, keeping the USD bulls on the defensive.
- The current market pricing indicates an even chance of easing at the March FOMC meeting and a roughly 90% probability of an interest rate cut in May.
- Investors this week will also confront the release of important US macro data scheduled at the start of a new month, including the Nonfarm Payrolls (NFP) on Friday.
Technical Analysis: USD/JPY bulls need to make it through the 148.80 hurdle to seize control
From a technical perspective, last week's failure to find bearish acceptance below the 100-day Simple Moving Average (SMA) and the subsequent move-up support prospects for additional gains. Moreover, oscillators on the daily chart are holding comfortably in the positive territory and are still far from being in the overbought zone, validating the bullish outlook for the USD/JPY pair. Bulls, however, might wait for some follow-through buying beyond the multi-week top, around the 148.80 region, before positioning for a further near-term appreciating move towards the 149.30-149.35 intermediate hurdle en route to the 150.00 psychological mark.
On the flip side, the 100-day SMA, around the 147.55 region, is likely to act to protect the immediate downside. Any further slide is likely to attract some buyers near the 147.00 round figure, which should help limit the downside for the USD/JPY pair near the 146.45 area or last week's swing low. A convincing break below the latter might shift the near-term bias in favour of bearish traders and drag spot prices to the 146.10-146.00 horizontal support. The downward trajectory could extend further towards the 145.30-145.25 area before the pair eventually drops to the 145.00 psychological mark.
Japanese Yen price today
The table below shows the percentage change of Japanese Yen (JPY) against listed major currencies today. Japanese Yen was the strongest against the Pound Sterling.
| USD | EUR | GBP | CAD | AUD | JPY | NZD | CHF | |
| USD | -0.04% | -0.07% | -0.05% | -0.24% | -0.06% | -0.24% | -0.12% | |
| EUR | 0.04% | -0.02% | -0.01% | -0.19% | 0.00% | -0.20% | -0.08% | |
| GBP | 0.05% | 0.02% | 0.00% | -0.18% | 0.02% | -0.19% | -0.06% | |
| CAD | 0.05% | 0.00% | -0.02% | -0.18% | 0.01% | -0.19% | -0.06% | |
| AUD | 0.24% | 0.19% | 0.17% | 0.18% | 0.19% | -0.01% | 0.12% | |
| JPY | 0.05% | 0.01% | 0.12% | -0.01% | -0.20% | -0.22% | -0.07% | |
| NZD | 0.24% | 0.21% | 0.18% | 0.18% | 0.00% | 0.19% | 0.12% | |
| CHF | 0.11% | 0.07% | 0.05% | 0.07% | -0.12% | 0.06% | -0.12% |
The heat map shows percentage changes of major currencies against each other. The base currency is picked from the left column, while the quote currency is picked from the top row. For example, if you pick the Euro from the left column and move along the horizontal line to the Japanese Yen, the percentage change displayed in the box will represent EUR (base)/JPY (quote).
Japanese Yen FAQs
What key factors drive the Japanese Yen?
The Japanese Yen (JPY) is one of the world’s most traded currencies. Its value is broadly determined by the performance of the Japanese economy, but more specifically by the Bank of Japan’s policy, the differential between Japanese and US bond yields, or risk sentiment among traders, among other factors.
How do the decisions of the Bank of Japan impact the Japanese Yen?
One of the Bank of Japan’s mandates is currency control, so its moves are key for the Yen. The BoJ has directly intervened in currency markets sometimes, generally to lower the value of the Yen, although it refrains from doing it often due to political concerns of its main trading partners. The current BoJ ultra-loose monetary policy, based on massive stimulus to the economy, has caused the Yen to depreciate against its main currency peers. This process has exacerbated more recently due to an increasing policy divergence between the Bank of Japan and other main central banks, which have opted to increase interest rates sharply to fight decades-high levels of inflation.
How does the differential between Japanese and US bond yields impact the Japanese Yen?
The BoJ’s stance of sticking to ultra-loose monetary policy has led to a widening policy divergence with other central banks, particularly with the US Federal Reserve. This supports a widening of the differential between the 10-year US and Japanese bonds, which favors the US Dollar against the Japanese Yen.
How does broader risk sentiment impact the Japanese Yen?
The Japanese Yen is often seen as a safe-haven investment. This means that in times of market stress, investors are more likely to put their money in the Japanese currency due to its supposed reliability and stability. Turbulent times are likely to strengthen the Yen’s value against other currencies seen as more risky to invest in.
- Australian Dollar moves on an upward trajectory during a risk aversion sentiment.
- Australia's Retail Sales (MoM) is expected to decline by 0.7% in December from the previous growth of 2.0%.
- Middle East situation has escalated due to the killings of three US service members in a drone attack on a US outpost in Jordan.
- US Dollar improves on the back of higher US bond yields.
The Australian Dollar (AUD) trades higher on Monday, recovering its recent losses in the previous session. The AUD/USD pair advances despite a stronger US Dollar (USD) amid heightened geopolitical tensions. Overnight on Sunday, three United States (US) service members were killed and at least 24 were injured in a drone attack on a US outpost in Jordan, near its border with Syria. Reports suggest that the administration of US President Joe Biden and the US military are formulating specific plans on how to respond to the attack that resulted in the death of three US troops. Possible measures being considered by the military include strikes into Iran, marking a significant escalation if implemented.
Australia's money market holds steady due to the upbeat Crude oil prices. The Aussie Dollar (AUD) might have also gained support from recent news indicating additional stimulus measures by the People's Bank of China (PBoC). The Reserve Bank of Australia’s (RBA) Bulletin has indicated that businesses, over the past six months, generally expect a moderation in their price growth, with prices anticipated to remain above the RBA's inflation target range of 2.0–3.0%. However, the RBA is anticipated to lower borrowing costs later this year. Investors await Tuesday's Australian Consumer Price Index (CPI) data, expecting a decline of 0.7% against the previous increase of 2.0%.
The US Dollar Index (DXY) cheers the improved US Treasury bond yields, which in turn, could limit the advances of the AUD/USD pair. On Friday, the US Core Personal Consumption Expenditures Price Index (PCE) for December showed a 0.2% monthly increase, in line with expectations, compared to 0.1% in the previous reading. The yearly Core PCE rose 2.9%, falling short of the 3.0% expected and the previous reading of 3.2%.
The Federal Open Market Committee (FOMC) statement is scheduled for Wednesday, January 31, with the consensus expecting the Committee to leave the Fed Funds rate unchanged at 5.25-5.50%. However, the market bias toward a rate cut in March may exert downward pressure on the USD. Additionally, Tuesday's Housing Price Index and Consumer Confidence figures will be closely watched for further market insights.
Daily Digest Market Movers: Australian Dollar improves despite an improved US Dollar
- Australia's Manufacturing PMI increased from 47.6 to 50.3, showcasing improvement. Services PMI also saw an uptick, rising from 47.1 to 47.9. The Composite PMI registered an increase, reaching 48.1 compared to December's 46.9.
- Chinese financial media reported that the People's Bank of China (PBoC) may cut the Medium-term Lending Facility (MLF) rate in the current quarter. The announcement follows the recent statement by PBoC Governor Pan Gongsheng, who revealed that the Bank would reduce the Required Reserve Ratio (RRR) by 50 basis points starting from February 5th.
- US Treasury Secretary Janet Louise Yellen has remarked that the robust performance of the US economy in the fourth quarter is viewed as a positive development and is not likely to pose challenges in terms of inflation.
- The US Gross Domestic Product Annualized (Q4) reported a reading of 3.3% against the previous reading of 4.9%, exceeding the market consensus of 2.0%.
- US Initial Jobless Claims for the week ending on January 19, surprisingly reduced to 214K compared to the expected increase of 200K from 189K prior.
Technical Analysis: Australian Dollar moves towards the psychological level at 0.6600
The Australian Dollar trades around 0.6580 on Monday, encountering initial resistance at the psychological threshold of 0.6600. This level coincides with the 23.6% Fibonacci retracement at 0.6606, aligned with the 14-day Exponential Moving Average (EMA) at 0.6610. A decisive breakthrough above this resistance area may propel the AUD/USD pair towards the key barrier at 0.6650. Conversely, downside movement could lead to a revisit of the previous week's low at 0.6551, aligning with the significant level at 0.6550. If this support is breached, the pair could revisit the monthly low at 0.6524.
AUD/USD: Daily Chart
-638420878112162311.png)
Australian Dollar price today
The table below shows the percentage change of Australian Dollar (AUD) against listed major currencies today. Australian Dollar was the strongest against the Japanese Yen.
| USD | EUR | GBP | CAD | AUD | JPY | NZD | CHF | |
| USD | -0.03% | -0.05% | 0.01% | -0.15% | 0.01% | -0.17% | -0.08% | |
| EUR | 0.02% | -0.01% | 0.05% | -0.12% | 0.06% | -0.14% | -0.06% | |
| GBP | 0.04% | 0.01% | 0.05% | -0.11% | 0.07% | -0.13% | -0.04% | |
| CAD | -0.01% | -0.05% | -0.06% | -0.16% | 0.01% | -0.17% | -0.09% | |
| AUD | 0.15% | 0.11% | 0.10% | 0.17% | 0.17% | -0.01% | 0.07% | |
| JPY | -0.01% | -0.04% | 0.08% | -0.03% | -0.19% | -0.20% | -0.09% | |
| NZD | 0.17% | 0.14% | 0.13% | 0.17% | 0.01% | 0.18% | 0.09% | |
| CHF | 0.08% | 0.03% | 0.03% | 0.07% | -0.09% | 0.09% | -0.09% |
The heat map shows percentage changes of major currencies against each other. The base currency is picked from the left column, while the quote currency is picked from the top row. For example, if you pick the Euro from the left column and move along the horizontal line to the Japanese Yen, the percentage change displayed in the box will represent EUR (base)/JPY (quote).
Australian Dollar FAQs
What key factors drive the Australian Dollar?
One of the most significant factors for the Australian Dollar (AUD) is the level of interest rates set by the Reserve Bank of Australia (RBA). Because Australia is a resource-rich country another key driver is the price of its biggest export, Iron Ore. The health of the Chinese economy, its largest trading partner, is a factor, as well as inflation in Australia, its growth rate and Trade Balance. Market sentiment – whether investors are taking on more risky assets (risk-on) or seeking safe-havens (risk-off) – is also a factor, with risk-on positive for AUD.
How do the decisions of the Reserve Bank of Australia impact the Australian Dollar?
The Reserve Bank of Australia (RBA) influences the Australian Dollar (AUD) by setting the level of interest rates that Australian banks can lend to each other. This influences the level of interest rates in the economy as a whole. The main goal of the RBA is to maintain a stable inflation rate of 2-3% by adjusting interest rates up or down. Relatively high interest rates compared to other major central banks support the AUD, and the opposite for relatively low. The RBA can also use quantitative easing and tightening to influence credit conditions, with the former AUD-negative and the latter AUD-positive.
How does the health of the Chinese Economy impact the Australian Dollar?
China is Australia’s largest trading partner so the health of the Chinese economy is a major influence on the value of the Australian Dollar (AUD). When the Chinese economy is doing well it purchases more raw materials, goods and services from Australia, lifting demand for the AUD, and pushing up its value. The opposite is the case when the Chinese economy is not growing as fast as expected. Positive or negative surprises in Chinese growth data, therefore, often have a direct impact on the Australian Dollar and its pairs.
How does the price of Iron Ore impact the Australian Dollar?
Iron Ore is Australia’s largest export, accounting for $118 billion a year according to data from 2021, with China as its primary destination. The price of Iron Ore, therefore, can be a driver of the Australian Dollar. Generally, if the price of Iron Ore rises, AUD also goes up, as aggregate demand for the currency increases. The opposite is the case if the price of Iron Ore falls. Higher Iron Ore prices also tend to result in a greater likelihood of a positive Trade Balance for Australia, which is also positive of the AUD.
How does the Trade Balance impact the Australian Dollar?
The Trade Balance, which is the difference between what a country earns from its exports versus what it pays for its imports, is another factor that can influence the value of the Australian Dollar. If Australia produces highly sought after exports, then its currency will gain in value purely from the surplus demand created from foreign buyers seeking to purchase its exports versus what it spends to purchase imports. Therefore, a positive net Trade Balance strengthens the AUD, with the opposite effect if the Trade Balance is negative.
On Monday, the People’s Bank of China (PBoC) set the USD/CNY central rate for the trading session ahead at 7.1097 as compared to Friday's fix of 7.1074 and 7.1785 Reuters estimates.
- EUR/USD loses ground near 1.0847 on the firmer USD.
- ECB’s Knot said the central bank needs to see proof of slowing wage growth in the eurozone before cutting the interest rates.
- The markets expected the FOMC to hold the rate unchanged at 5.25%–5.50% at its January meeting on Wednesday.
The EUR/USD pair trades weaker during the Asian trading hours on Monday. The downtick of the major pair is supported by renewed US Dollar (USD) demand amid rising geopolitical tension in the Middle East. Investors will focus on the Federal Open Market Committee (FOMC) meeting on Wednesday. EUR/USD currently trades around 1.0847, losing 0.07% on the day.
Last week, the European Central Bank (ECB) decided to leave key interest rates unchanged as underlying inflation declined in December last year. ECB President Christine Lagarde warned that the Eurozone most likely experienced stagflation in the last quarter of 2023 and outlined the risks of further economic slowdown. Lagarde further stated that the ECB remains committed to a data-dependent approach and will make decisions on a meeting-by-meeting basis.
Furthermore, ECB governing council member Klaas Knot said on Sunday that the central bank needs to see proof of slowing wage growth in the eurozone before cutting interest rates. However, the markets have increased bets on rate cuts, with expectations of a 50 basis point (bps) reduction by June and a 140 bps cut by December 2024. This, in turn, might exert some selling on the Euro (EUR) and act as a headwind for the EUR/USD pair.
The Federal Open Market Committee (FOMC) maintained the interest rate steady during its last meeting in December 2024 and traders expected the FOMC to hold the rate unchanged at 5.25%–5.50% at its January meeting on Wednesday. Traders were assigning about 48.2% odds of the first-rate cut from the Fed in March, down from 88% a month ago.
The German Gross Domestic Product (GDP) for the fourth quarter will be due on Tuesday, which is forecast to contract by 0.3% QoQ and 0.2% YoY. The FOMC meeting will take place from Tuesday to Wednesday, with no change in rate expected. The press conference will be closely watched by traders. If Fed Chairman Jerome Powell delivers dovish comments, the USD will likely weaken against its rivals.
| Index | Change, points | Closed | Change, % |
|---|---|---|---|
| NIKKEI 225 | -485.4 | 35751.07 | -1.34 |
| Hang Seng | -259.73 | 15952.23 | -1.6 |
| KOSPI | 8.22 | 2478.56 | 0.33 |
| DAX | 54.47 | 16961.39 | 0.32 |
| CAC 40 | 169.94 | 7634.14 | 2.28 |
| Dow Jones | 60.3 | 38109.43 | 0.16 |
| S&P 500 | -3.19 | 4890.97 | -0.07 |
| NASDAQ Composite | -55.14 | 15455.36 | -0.36 |
The European Central Bank (ECB) governing council member Klaas Knot said on Sunday that the ECB will need to see proof of slowing wage growth in the eurozone before interest rates can be lowered.
Key quotes
“We now have a credible prospect that inflation will return to 2% in 2025.”
“The only piece that's missing is the conviction that wage growth will adapt to lower inflation.”
“As soon as that piece of the puzzle falls in place, we will be able to lower interest rates a bit.”
Market reaction
At the time of writing, the EUR/USD pair is trading lower at 1.0843, down 0.10% on the day.
Euro FAQs
What is the Euro?
The Euro is the currency for the 20 European Union countries that belong to the Eurozone. It is the second most heavily traded currency in the world behind the US Dollar. In 2022, it accounted for 31% of all foreign exchange transactions, with an average daily turnover of over $2.2 trillion a day.
EUR/USD is the most heavily traded currency pair in the world, accounting for an estimated 30% off all transactions, followed by EUR/JPY (4%), EUR/GBP (3%) and EUR/AUD (2%).
What is the ECB and how does it impact the Euro?
The European Central Bank (ECB) in Frankfurt, Germany, is the reserve bank for the Eurozone. The ECB sets interest rates and manages monetary policy.
The ECB’s primary mandate is to maintain price stability, which means either controlling inflation or stimulating growth. Its primary tool is the raising or lowering of interest rates. Relatively high interest rates – or the expectation of higher rates – will usually benefit the Euro and vice versa.
The ECB Governing Council makes monetary policy decisions at meetings held eight times a year. Decisions are made by heads of the Eurozone national banks and six permanent members, including the President of the ECB, Christine Lagarde.
How does inflation data impact the value of the Euro?
Eurozone inflation data, measured by the Harmonized Index of Consumer Prices (HICP), is an important econometric for the Euro. If inflation rises more than expected, especially if above the ECB’s 2% target, it obliges the ECB to raise interest rates to bring it back under control.
Relatively high interest rates compared to its counterparts will usually benefit the Euro, as it makes the region more attractive as a place for global investors to park their money.
How does economic data influence the value of the Euro?
Data releases gauge the health of the economy and can impact on the Euro. Indicators such as GDP, Manufacturing and Services PMIs, employment, and consumer sentiment surveys can all influence the direction of the single currency.
A strong economy is good for the Euro. Not only does it attract more foreign investment but it may encourage the ECB to put up interest rates, which will directly strengthen the Euro. Otherwise, if economic data is weak, the Euro is likely to fall.
Economic data for the four largest economies in the euro area (Germany, France, Italy and Spain) are especially significant, as they account for 75% of the Eurozone’s economy.
How does the Trade Balance impact the Euro?
Another significant data release for the Euro is the Trade Balance. This indicator measures the difference between what a country earns from its exports and what it spends on imports over a given period.
If a country produces highly sought after exports then its currency will gain in value purely from the extra demand created from foreign buyers seeking to purchase these goods. Therefore, a positive net Trade Balance strengthens a currency and vice versa for a negative balance.
| Pare | Closed | Change, % |
|---|---|---|
| AUDUSD | 0.65794 | 0.02 |
| EURJPY | 160.712 | 0.43 |
| EURUSD | 1.0855 | 0.11 |
| GBPJPY | 188.081 | 0.36 |
| GBPUSD | 1.2703 | 0.02 |
| NZDUSD | 0.6092 | -0.27 |
| USDCAD | 1.34469 | -0.18 |
| USDCHF | 0.8638 | -0.36 |
| USDJPY | 148.057 | 0.35 |
US President Joe Biden and officials said on Sunday that three US troop members were killed and dozens may be injured in a drone attack on a US base near Jordan's border with Syria, according to Reuters.
Biden said the attack was carried out by "radical Iran-backed militant groups, and the US shall respond.
Market reaction
The US Dollar faces some follow-through buying following the geopolitical tension headline. At the time of writing, the US Dollar Index (DXY) is trading near 103.55, holding higher while adding 0.10% on the day.
Risk sentiment FAQs
What do the terms"risk-on" and "risk-off" mean when referring to sentiment in financial markets?
In the world of financial jargon the two widely used terms “risk-on” and “risk off'' refer to the level of risk that investors are willing to stomach during the period referenced. In a “risk-on” market, investors are optimistic about the future and more willing to buy risky assets. In a “risk-off” market investors start to ‘play it safe’ because they are worried about the future, and therefore buy less risky assets that are more certain of bringing a return, even if it is relatively modest.
What are the key assets to track to understand risk sentiment dynamics?
Typically, during periods of “risk-on”, stock markets will rise, most commodities – except Gold – will also gain in value, since they benefit from a positive growth outlook. The currencies of nations that are heavy commodity exporters strengthen because of increased demand, and Cryptocurrencies rise. In a “risk-off” market, Bonds go up – especially major government Bonds – Gold shines, and safe-haven currencies such as the Japanese Yen, Swiss Franc and US Dollar all benefit.
Which currencies strengthen when sentiment is "risk-on"?
The Australian Dollar (AUD), the Canadian Dollar (CAD), the New Zealand Dollar (NZD) and minor FX like the Ruble (RUB) and the South African Rand (ZAR), all tend to rise in markets that are “risk-on”. This is because the economies of these currencies are heavily reliant on commodity exports for growth, and commodities tend to rise in price during risk-on periods. This is because investors foresee greater demand for raw materials in the future due to heightened economic activity.
Which currencies strengthen when sentiment is "risk-off"?
The major currencies that tend to rise during periods of “risk-off” are the US Dollar (USD), the Japanese Yen (JPY) and the Swiss Franc (CHF). The US Dollar, because it is the world’s reserve currency, and because in times of crisis investors buy US government debt, which is seen as safe because the largest economy in the world is unlikely to default. The Yen, from increased demand for Japanese government bonds, because a high proportion are held by domestic investors who are unlikely to dump them – even in a crisis. The Swiss Franc, because strict Swiss banking laws offer investors enhanced capital protection.


© 2000-2026. Уcі права захищені.
Cайт знаходитьcя під керуванням TeleTrade DJ. LLC 2351 LLC 2022 (Euro House, Richmond Hill Road, Kingstown, VC0100, St. Vincent and the Grenadines).
Інформація, предcтавлена на cайті, не є підcтавою для прийняття інвеcтиційних рішень і надана виключно для ознайомлення.
Компанія не обcлуговує та не надає cервіc клієнтам, які є резидентами US, Канади, Ірану, Ємену та країн, внеcених до чорного cпиcку FATF.
Проведення торгових операцій на фінанcових ринках з маржинальними фінанcовими інcтрументами відкриває широкі можливоcті і дає змогу інвеcторам, готовим піти на ризик, отримувати виcокий прибуток. Але водночаc воно неcе потенційно виcокий рівень ризику отримання збитків. Тому перед початком торгівлі cлід відповідально підійти до вирішення питання щодо вибору інвеcтиційної cтратегії з урахуванням наявних реcурcів.
Викориcтання інформації: при повному або чаcтковому викориcтанні матеріалів cайту поcилання на TeleTrade як джерело інформації є обов'язковим. Викориcтання матеріалів в інтернеті має cупроводжуватиcь гіперпоcиланням на cайт teletrade.org. Автоматичний імпорт матеріалів та інформації із cайту заборонено.
З уcіх питань звертайтеcь за адреcою pr@teletrade.global.
переклади