- Analytics
- News and Tools
- Market News
Новини ринків
- Gold price holds ground near $2,065, unchanged for the day.
- The recovery in USD and US Treasury bond yields weighs on the yellow metal.
- US Initial Jobless Claims increased to 218,000, above the forecast of 210,000; Continuing Claims were 1.875 million, the highest in four weeks.
Gold price (XAU/USD) hovers around $2,065 after retracing from $2,088 during the early Asian session on Friday. The rebound in US Dollar (USD) and higher US Treasury bond yields weigh on the yellow metal. The downside of gold might be limited amid the anticipation of a rate cut by the Federal Reserve (Fed) in March 2024.
Meanwhile, the US Dollar Index (DXY), a measure of the value of the USD against a weighted basket of currencies used by US trade partners, recovers from the lowest level since July near 100.85 to 101.20. The Treasury yields edge higher, with the 10-year yield standing at 3.85%.
The core PCE Price Index, the Federal Reserve's preferred inflation gauge, cooled to a 3.2% annual rise in November. The United States has experienced the greatest expansion of any large economy, and unemployment is nearing historic lows. Investors believe the Federal Reserve (Fed) is done with its rate hike cycle and will cut interest rates as early as March of next year.
On Thursday, Initial Jobless Claims in the United States increased to 218,000 for the week ending December 23, above the market's forecast of 210,000. The number of Continuing Claims was 1.875 million, the highest in four weeks. Finally, Pending Home Sales remained flat in November, falling short of the market estimate of a 1% gain.
Gold traders will focus on the Chicago Purchasing Managers' Index for December, due on Friday. This figure might not trigger action as traders enter holiday mode heading into 2024.
- AUD/USD loses ground near 0.6830 amid the quiet session on Friday.
- US Initial Jobless Claims grew to 218,000, better than expected.
- The RBA's first board meeting for 2024 will be held on February 5 and 6.
- The Chicago Purchasing Managers' Index for December is due on Friday.
The AUD/USD pair loses its recovery momentum during the early Asian session on Friday. The US Dollar (USD) bounces off the lowest level since July near 100.85 and then recovers to 101.25. The market is likely to be quiet on the last trading day of 2023 due to the light economy data and the holiday mode. AUD/USD currently trades around 0.6830, down 0.02% on the day.
Data released on Thursday showed that the US Initial Jobless Claims for the week ending December 23 rose to 218,000, better than the market expectation of 210,000. Continuing Claims came in at 1.875 million, the highest level in four weeks. Finally, Pending Home Sales remained flat in November, below the market consensus of a 1% increase.
As per the minutes of the Reserve Bank of Australia (RBA), the members agreed to wait for further data to evaluate how the risk balance was evolving, however, there had been encouraging signs of progress towards the board's objectives and that this needed to continue. Traders will look for evidence that inflation is continuing to drop towards the RBA target in the quarterly Consumer Price Index (CPI) coming on January 31. The RBA's first board meeting for 2024 will be held on February 5 and 6.
Moving on, the Chicago Purchasing Managers' Index for December will be released later on Friday. However, this figure might not have a significant impact on the market amid the light trading volume.
- The US major equity index is inches away from new all-time highs.
- A late-day pullback sparked by rising Treasury yields pushed assets lower.
- 2023 set for deja vu with the S&P challenging familiar peak levels.
The Standard & Poor’s 500 (S&P) large-cap equity index came within ten points of posting new all-time highs on Friday before getting dragged back after a surprise bump in Treasury yields following a 7-year T-note auction that splashed water on the market’s ongoing risk rally fueled by rate cut expectations in 2024.
US 7-year Treasury yields rose from 3.837% to 3.859% on Thursday in a $40 billion bond auction, sparking a reversal of the week’s risk appetite flows. Risk bids were extended by misses in US economic data early Thursday, with US Initial Jobless Claims and Pending Home Sales both missing the mark.
Forex Today: Santa’s rally continues, Dollar rebounds
US Initial Jobless Claims for the week ended December 22 also ticked higher, showing 218K new jobless benefits seekers versus the previous week’s 206K (revised from 205K). US Pending Home Sales in November also flubbed market expectations, coming in flat at 0.0% and missing the market’s forecast 1.0% rebound from October’s -1.2% decline (revised upwards from -1.5%).
Money markets continue to pin their hopes and dreams on an accelerated pace of rate cuts from the Federal Reserve (Fed) in 2024, with investors betting on rate cuts to start as soon as March and pegging upwards of 160 basis points in rate cuts through the end of next year.
S&P 500 Technical Outlook
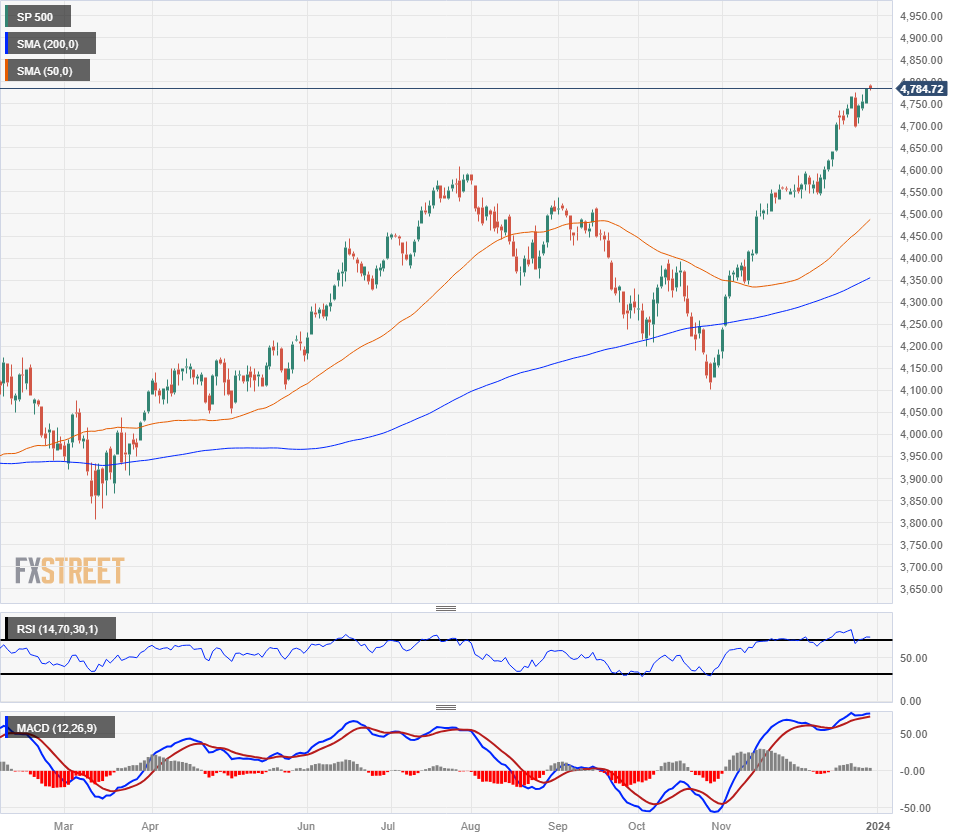
The S&P 500 is set for a ninth straight week of gains as the equity index climbs towards all-time highs with the ceiling at $4,814.68, set in January of 2021 with markets set to repeat the pattern of setting a technical record at the outset of a new trading year.
The S&P 500 has been on the rise since rebounding from the 200-day Simple Moving Average (SMA) near $4,250 in early November. Crossing the $4,800 handle sets the index up to clear all-time highs, while a pullback from extremely oversold conditions sets the index up for an extended decline into the last swing low at $4,100 from late October.
S&P 500 Daily Chart
S&P 500 Technical Levels
- USD/CAD bounced back from multi-month lows near 1.3200.
- CAD getting dragged down by a pullback in Crude Oil.
- Broad-market risk appetite sours after surprise bump in Treasury yields.
The USD/CAD climbed back over the 1.3200 handle on Thursday, pulling back from recent declines but still on pace to close in the red for a third straight week. The US Dollar (USD) is poised to close down against the Canadian Dollar (CAD) for seven of the last nine consecutive trading weeks.
Risk bids were extended by misses in US economic data early Thursday, with US Initial Jobless Claims and Pending Home Sales both missing the mark.
US Initial Jobless Claims missed expectations, printing at 218K for the week ended December 22 versus the forecast 210K, vaulting over the previous week’s print of 206K (revised slightly higher from 205K). US Pending Home Sales in November also missed the mark, printing at a flat 0.0% versus the forecast 1.0% rebound from October’s -1.2% print (revised upwards from -1.5%).
Crude Oil decline drags CAD lower
Data misses from the US initially sparked a risk appetite run as softening economic indicators from the US increases the odds of pushing the Fed into a rate-cutting cycle sooner rather than later.
However, a misfire in a US 7-year Treasury auction is watering down risk appetite ahead of the Thursday closing bell. US 7-year Treasury yields rose from 3.837% to 3.859% on Thursday in a $40 billion bond auction, sparking a reversal of the week’s risk appetite flows.
Crude Oil fell on Thursday as broad-market risk appetite retreated back into the US Dollar, dragging the Loonie lower and setting the stage for a late-week rebound in the USD/CAD as 2023’s trading gets set to wrap up on Friday.
USD/CAD Technical Outlook
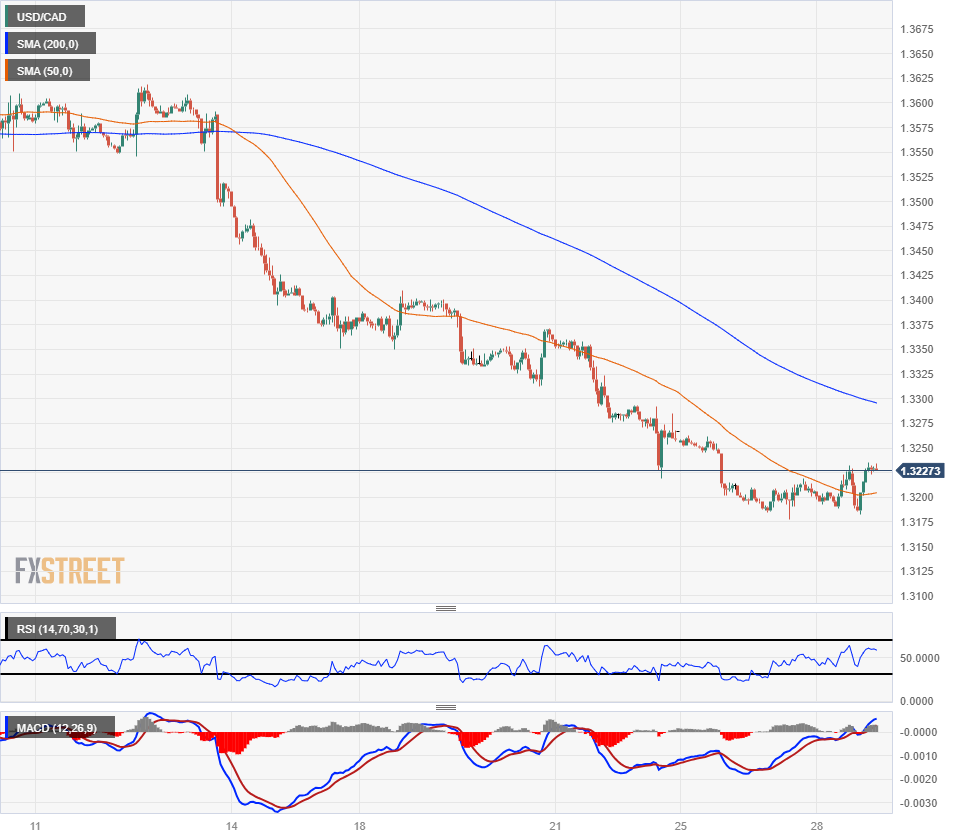
A late topside break for the Greenback pulled the USD/CAD back into fresh highs on Thursday after several weeks of consistent declines, rebounding from the 1.3200 handle to retest the 1.3240 region.
The pair continues to trade closely with the 50-hour Simple Moving Average amidst steady bearish intraday chart action, with near-term bids capped off by the 200-hour SMA descending through the 1.3300 handle.
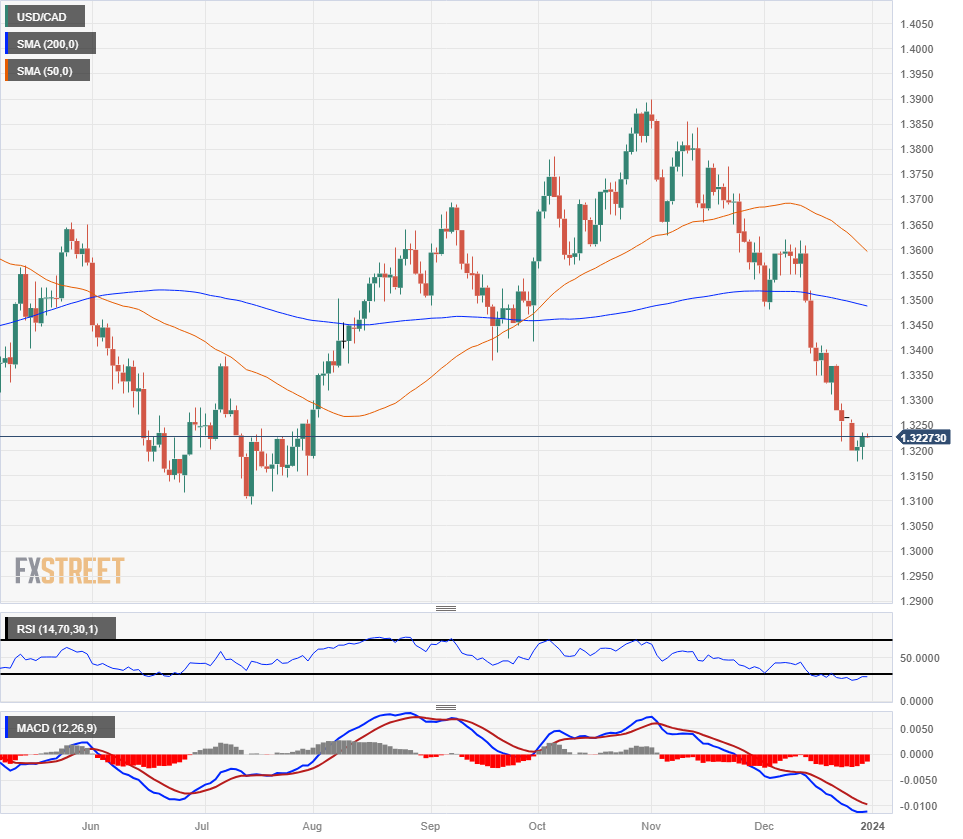
The USD/CAD is down nearly 5% from the November swing high into 1.3900, and the 50-day SMA is accelerating into the downside, set for a bearish cross of the 200-day SMA.
USD/CAD Hourly Chart
USD/CAD Daily Chart
USD/CAD Technical Levels
- WTI declined on Thursday, extending losses as broad-market risk flows reverse direction.
- Crude Oil markets are facing declines, shrugging off an unexpected decline in US crude stocks.
- Rough year-end markets are pulling down barrel prices to close out 2023.
West Texas Intermediate (WTI) US Crude Oil extended a decline on Thursday, backsliding into the low end and testing below the $72 handle as market risk appetite sours following a surprise jump in US Treasury yields, and shrugging off a surprise decline in US crude stocks.
According to figures from the Energy Information Administration (EIA), US barrel counts declined an unexpected -6.9 million barrels for the week ended December 22, far below the forecast 2.7 million decline and eating away at the previous week’s 2.9 million barrel buildup.
Red Sea tensions have begun to recede as logistics return to the region. Tensions mounted after Iran-backed Houthi rebels in Yemen began attacking logistics ships passing through the Red Sea, but a coalition naval force has descended on the region to allow ships to resume passing through the critical supply line between Europe and Asia.
2023’s production clampdown by the Organization of the Petroleum Exporting Countries (OPEC) failed to spark a long-term bull run in Crude Oil bids, as several smaller member states snub the oil cartel’s voluntary production caps, sparking the departure of Angola from the oil organization’s ranks. Despite key member states dedicated to ongoing production cuts, most notably Saudi Arabia extending over a million barrels per day in pumping reductions, Crude Oil production continues to outpace global oil demand.
WTI Technical Levels
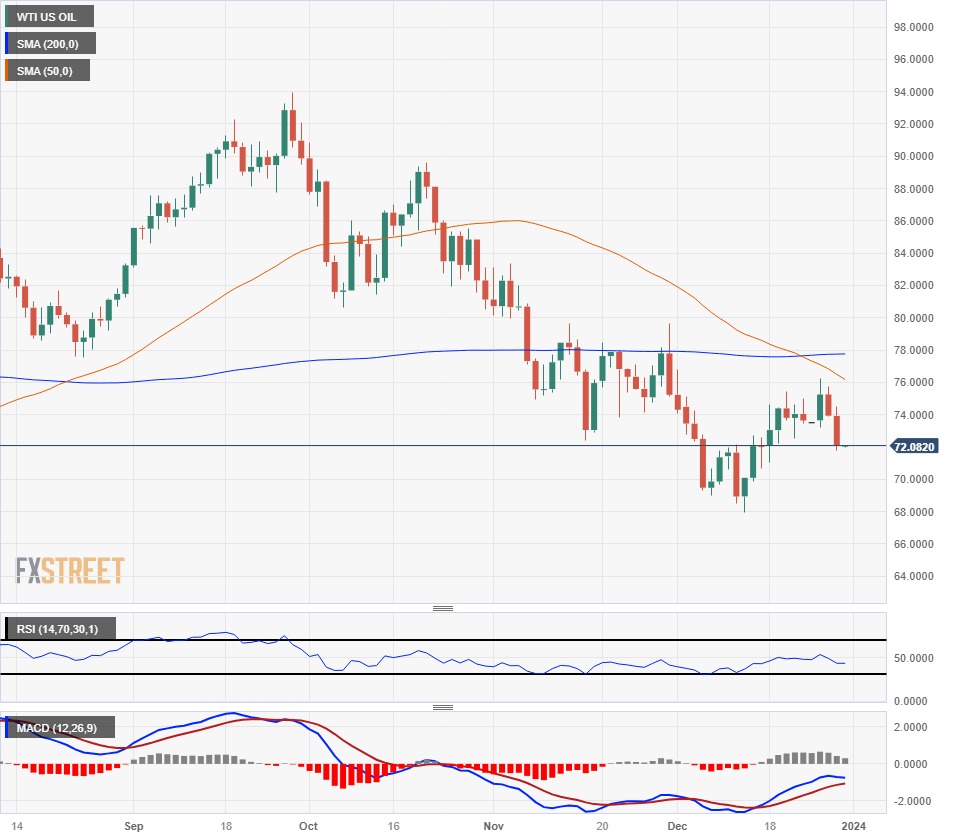
Intraday US Crude Oil action has dragged WTI down through the 200-day Simple Moving Average (SMA) near $73.75, descending to re-test chart territory below the $72 handle.
WTI has declined nearly 6% from the week’s high near $76.20, marking in a lower high on the daily candlesticks and pricing in a new technical ceiling while the 50-day SMA accelerates into the low side of the 200-day SMA after confirming a bearish cross.
WTI Daily Chart
WTI Technical Levels
- The EUR/GBP is trading near 0.8695 showing an uptick of 0.25%.
- Positive signals of the daily RSI and the rising trend in MACD's histogram allude to an increasing buying drive.
- Bull strength is palpable from the pair's position defiantly above the main SMAs.
- Four-hour chart indicators hint at diminished bullish momentum.
In Thursday's session, the EUR/GBP is trading at 0.8695, posting a modest gain of 0.25%. The daily chart indicates a bullish trend with the buyers firmly in control, gaining valuable ground. However, the four-hour chart suggests a slight stagnation as the indicators have turned flat, and the earlier bullish momentum has noticeably eased off.
Looking at the daily chart indicators, the positive inclination in the Relative Strength Index (RSI) and the upward trend of the Moving Average Convergence Divergence (MACD) with its increasing green histogram hint towards a dominant buying momentum. The overall bullish bias is further confirmed by the pair's position above its 20-day, 100-day, and 200-day Simple Moving Averages (SMAs).
Shifting the focus to the shorter time frame, the four-hour chart paints a contrasting picture. Following a period of bullish momentum, indicators have leveled off, and the buying sentiment seems to have cooled down a bit. The Relative Strength Index (RSI) on the four-hour chart is flat but remains in positive territory, suggesting a slight slowdown in the buying momentum. Similarly, the Moving Average Convergence Divergence (MACD) shows green bars that are rising, yet the bullish momentum appears to have waned.
Support Levels: 0.8675, 0.8665 (200-day SMA), 0.8640 (100-day SMA).
Resistance Levels: 0.8700, 0.8750, 0.8800.
EUR/GBP daily chart
-638393918914074891.png)
The focus is on 2024, particularly considering that the first week will be a busy one. On the last trading day of 2023, the economic calendar is light. The attention will be on Spain's preliminary December consumer inflation figures.
Here is what you need to know on Friday, December 29:
Data from the US released on Thursday revealed that Initial Jobless Claims rose by 12,000 in the week ended December 23 to 218,000, above the market consensus of 210,000. Continuing claims reached 1.875 million, the highest level in four weeks. Pending Home Sales remained flat in November, falling short of expectations for a 1% increase. On Friday, the Chicago PMI is due. Regarding economic reports, the focus is on next week's employment figures.
The US Dollar Index (DXY) bottomed at 100.86, marking the lowest level since July, and then rebounded sharply, rising to 101.25. Higher US Treasury yields helped boost the Greenback, with the 10-year yield rising to 3.85% following the auction of the 7-year note.
The Greenback staged a correction, trimming weekly losses, even as the rally on Wall Street continued. The Dow Jones was on track for another all-time high close. The USD overall trend remains downward, but the correction appears to have further potential.
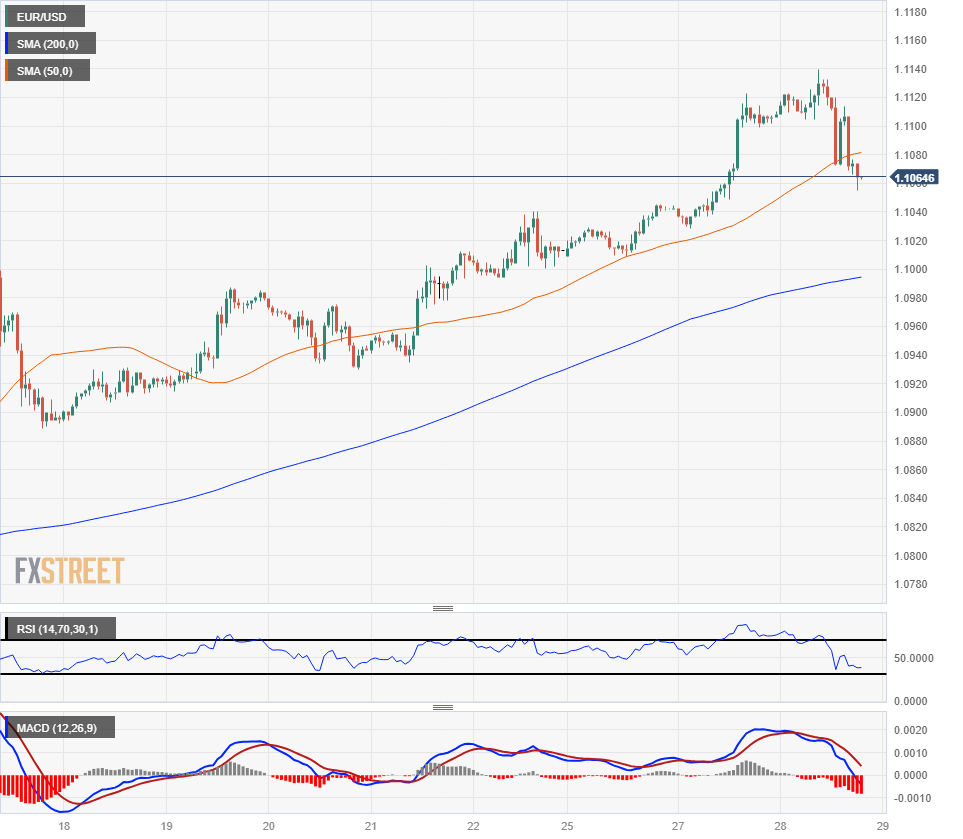
EUR/USD experienced its worst decline in two weeks. The pair hit a fresh monthly high at 1.1139 before pulling back to the 1.1055 area. The most relevant report of the day will be Spain's inflation figures, with the preliminary reading of the December Consumer Price Index (CPI). Eurostat will release the figures for the Eurozone on January 5.
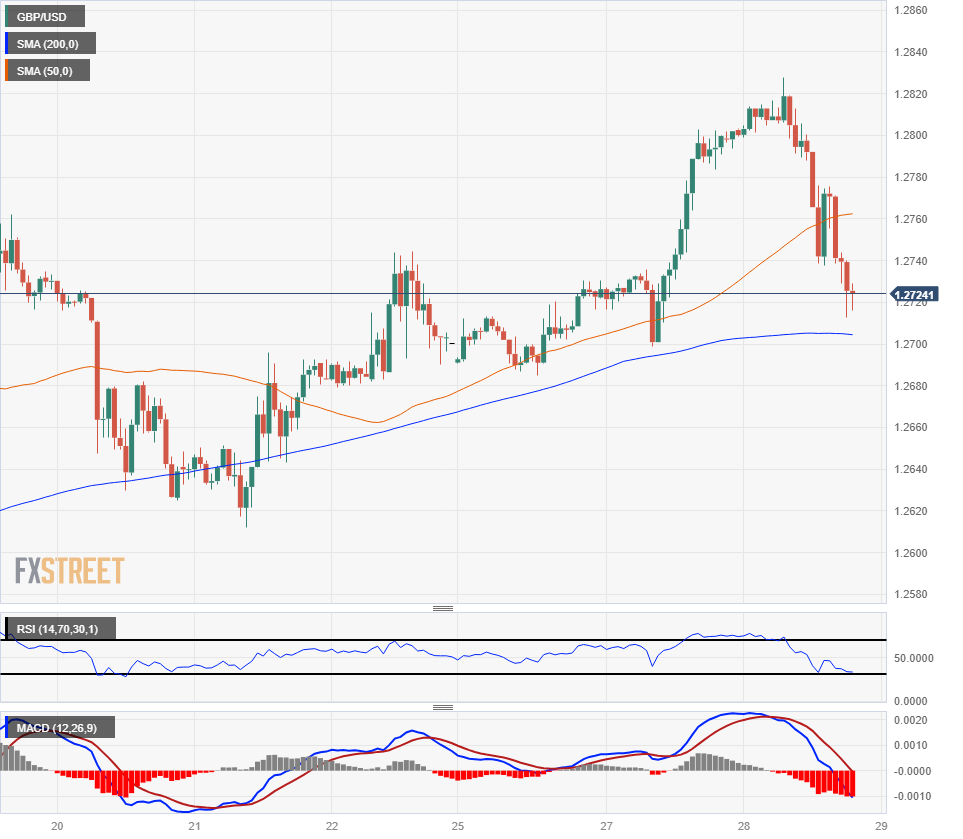
GBP/USD also retreated from monthly highs, falling from above 1.2800 to around 1.2700. The final economic report of 2023 in the UK will be the Nationwide Housing Prices for December.
Another volatile day for USD/JPY, which fell to 140.23, the lowest level since July, but then trimmed losses and rose to 141.40, supported by higher yields.
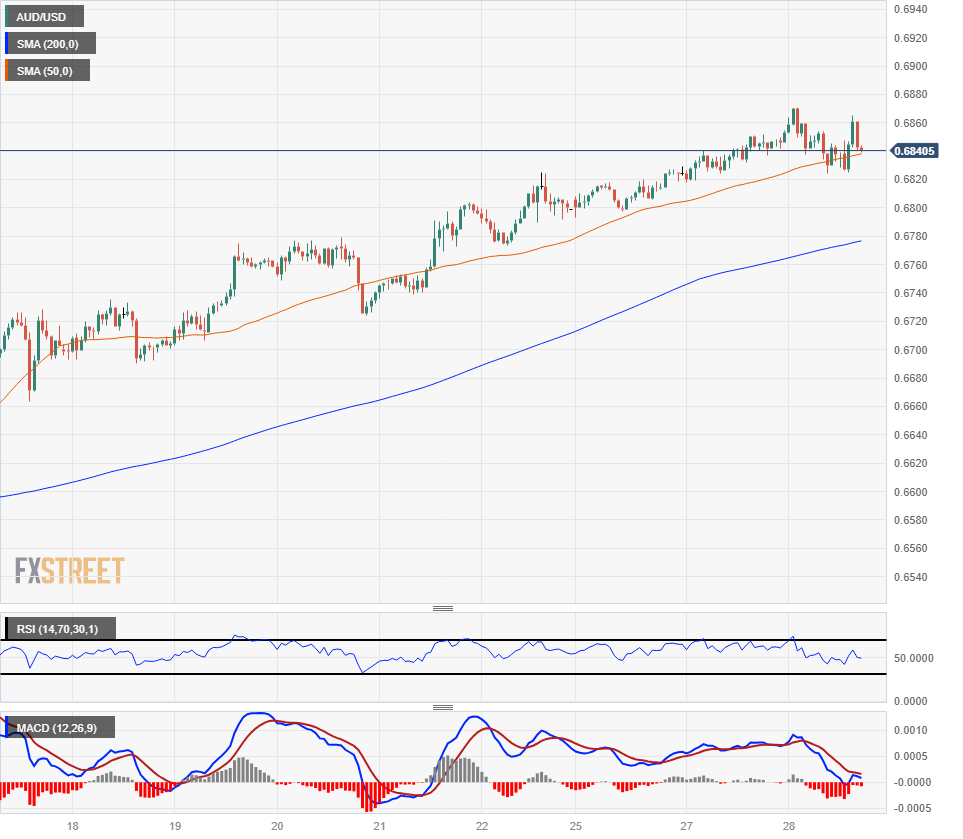
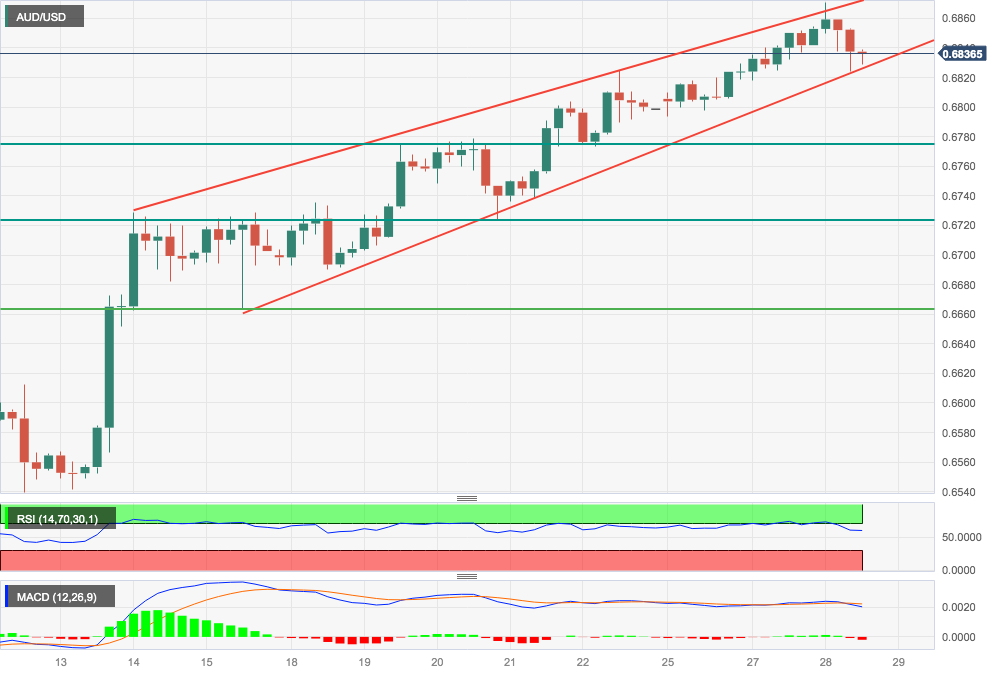
AUD/USD peaked at 0.6871 but failed to sustain gains, and retreat to 0.6835 as bullish momentum faded. The pair has immediate support in the 0.6825 zone, while a move above 0.6850 could strengthen the Aussie.
Gold experienced a pullback from $2,088 to $2,065 due to the rebound in the US Dollar and yields. The main trend remains upward, but the current conditions point to a downside bias ahead of the Asian session.
US Dollar price today
The table below shows the percentage change of US Dollar (USD) against listed major currencies today. US Dollar was the strongest against the Pound Sterling.
| USD | EUR | GBP | CAD | AUD | JPY | NZD | CHF | |
| USD | 0.36% | 0.55% | 0.18% | 0.28% | -0.04% | 0.25% | 0.11% | |
| EUR | -0.37% | 0.19% | -0.18% | -0.09% | -0.41% | -0.11% | -0.26% | |
| GBP | -0.53% | -0.18% | -0.36% | -0.29% | -0.58% | -0.31% | -0.45% | |
| CAD | -0.18% | 0.19% | 0.39% | 0.10% | -0.22% | 0.08% | -0.07% | |
| AUD | -0.25% | 0.09% | 0.28% | -0.09% | -0.34% | -0.02% | -0.18% | |
| JPY | 0.03% | 0.38% | 0.58% | 0.18% | 0.29% | 0.28% | 0.13% | |
| NZD | -0.26% | 0.12% | 0.30% | -0.06% | 0.01% | -0.27% | -0.14% | |
| CHF | -0.09% | 0.27% | 0.44% | 0.07% | 0.17% | -0.16% | 0.15% |
The heat map shows percentage changes of major currencies against each other. The base currency is picked from the left column, while the quote currency is picked from the top row. For example, if you pick the Euro from the left column and move along the horizontal line to the Japanese Yen, the percentage change displayed in the box will represent EUR (base)/JPY (quote).
- GBP/USD spread in both directions on Thursday, climbing to a multi-month high before pulling back.
- US Dollar flows are dominating the FX market to wrap up 2023.
- US data misses initially sparked a risk rally, but rising Treasury yields ended it just as quickly.
The GBP/USD rose in early Thursday’s trading window, climbing to a 20-week high before slumping back and seeing a downside extension sparked by an unexpected climb in US Treasury yields during a 7-year T-note auction.
The US Dollar (USD) is now flat on the week against the Pound Sterling (GBP), declining nearly 0.9% from Thursday’s high as the GBP/USD heads back towards the 1.2700 handle.
Treasury yields cut risk rally short
The last trading week of 2023 has been largely marked by a long-winded risk rally that has seen the US Dollar decline across the board as money markets tilt fully into risk-on territory as investors lean into bets of an accelerated pace of rate cuts from the Federal Reserve (Fed) in 2024, but a policy pivot from the US central bank is still well off into the future, and risk bids were caught by surprise by an unexpected uptick in US Treasury yields during a 7-year note auction.
US 7-year Treasury yields rose from 3.837% to 3.859% on Thursday in a $40 billion bond auction, sparking a reversal of the week’s risk appetite flows. Risk bids were extended by misses in US economic data early Thursday, with US Initial Jobless Claims and Pending Home Sales both missing the mark.
US weekly Initial Jobless Claims rise to 218K vs. 210K expected
Deflating US economic indicators helped to step up market expectations of Fed rate cuts coming sooner rather than later, but jitters in bond yields quickly ended the late week’s “bad news is good news” narrative as investors retreated into the safe haven US Dollar in the second-last trading day of the year.
US Pending Home Sales unchanged in November
The last trading week of 2023 will wrap up on Friday with low-impact UK Nationwide Housing Prices, to be followed by the US Chicago Purchasing Managers’ Index (PMI). UK Housing Prices are expected to hold flat at 0.0% in December compared to November’s 0.2% increase, while the Chicago PMI is forecast to slip from November’s 55.8 to 51.0 in December.
GBP/USD Technical Outlook
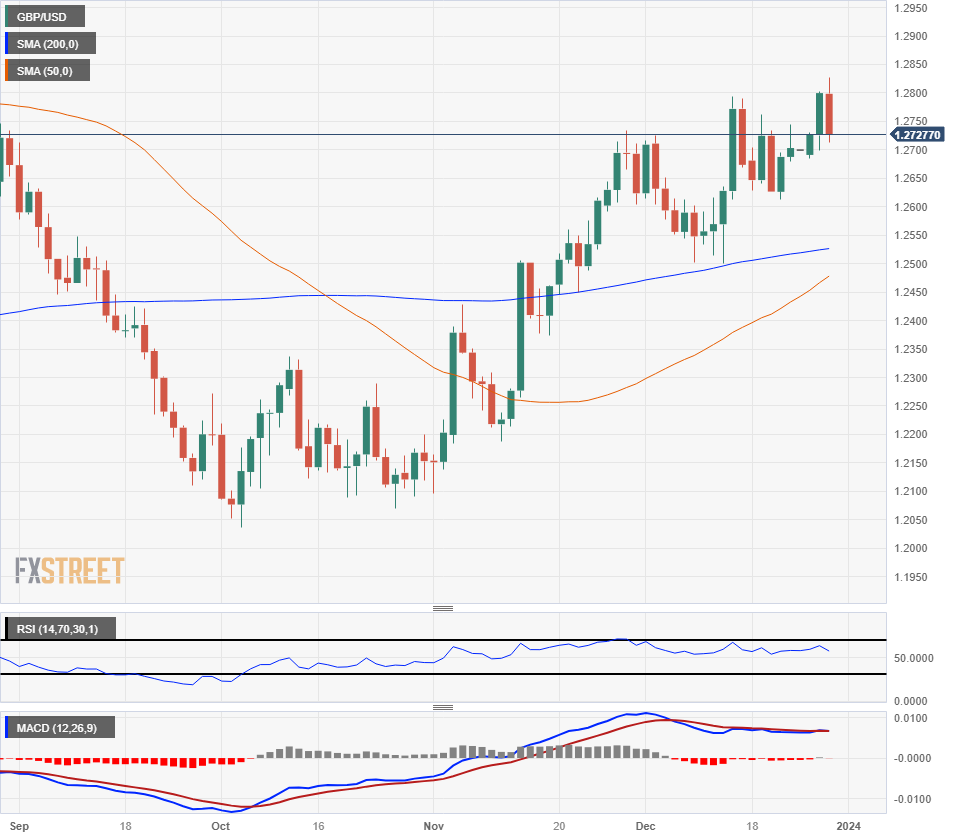
Thursday’s decline in the GBP/USD drags the pair down from multi-month highs near 1.2830 back towards the 200-hour Simple Moving Average (SMA) near the 1.2700 handle, just above a familiar near-term support zone from 1.2700 to 1.2690.
Daily candlesticks have the GBP/USD at risk of tumbling back into familiar price level as intraday bids dip back into a familiar technical zone near the 1.2700 handle, and the medium-term price floor is sitting at the 200-day SMA above the 1.2500 major handle.
GBP/USD Hourly Chart
GBP/USD Daily Chart
GBP/USD Technical Levels
- The EUR/USD touched 1.1140, a 21-week high before risk-off flows extended a pullback.
- The Euro is now into the red on Thursday as risk appetite sees a late reversal.
- US 7-year Treasuries saw yields tick higher, sparking a retreat into the Greenback.
The EUR/USD is seeing some rough chop on Thursday as holiday-thinned markets churn rounding the corner into the last trading day of 2023.
The Euro (EUR) briefly rose to a 21-week high of 1.1140 early Thursday as broader markets sell off the US Dollar (USD) in anticipation of rate cuts from the Federal Reserve (Fed), but overheated market expectations of a structural pivot from the Fed have run well ahead of the present day, and an uptick in 7-year US Treasuries has sparked a pullback into the safe haven USD, pushing riskier assets like the Euro back into the red during 2023’s second-last trading day.
US Initial Jobless Claims for the week ended December 22 also ticked higher, showing 218K new jobless benefits seekers versus the previous week’s 206K (revised from 205K). US Pending Home Sales in November also flubbed market expectations, coming in flat at 0.0% and missing the market’s forecast 1.0% rebound from October’s -1.2% decline (revised upwards from -1.5%).
US data misses fuel risk rally, rising Treasury yields end it
Data misses from the US initially sparked a risk appetite run as softening economic indicators from the US increases the odds of pushing the Fed into a rate-cutting cycle sooner rather than later. However, a misfire in a US 7-year Treasury auction is watering down risk appetite ahead of the Thursday closing bell.
US 7-year Treasuries hit a high yield of 3.859% in a $40 billion note auction on Thursday afternoon, rising from the previous yield of 3.857%, and runaway rate cut expectations are crashing against a hard wall of near-term reality as softening economic data sends jitters through bond markets.
Friday marks the last trading day of the 2023 calendar year, and with Eurozone data entirely absent from the calendar this week, will wrap things up with the US Chicago Purchasing Managers’ Index (PMI) for December, forecast to decline from 55.8 to 51.0.
EUR/USD Technical Outlook
The EUR/USD kicked off Thursday trading into a new 21-week high at 1.1140 before backsliding towards 1.1050, sending intraday price action back below the 50-hour Simple Moving Average (SMA) as near-term momentum reverses direction and sends the Euro back towards the 200-hour SMA near 1.0995.
The EUR/USD is down nearly 0.7% from Thursday’s high after a late-day reversal, but the US Dollar is still down against the Euro a third of a percent on the week, and it’s the Euro’s ballgame to lose as markets gear up for the final trading sessions of 2023.
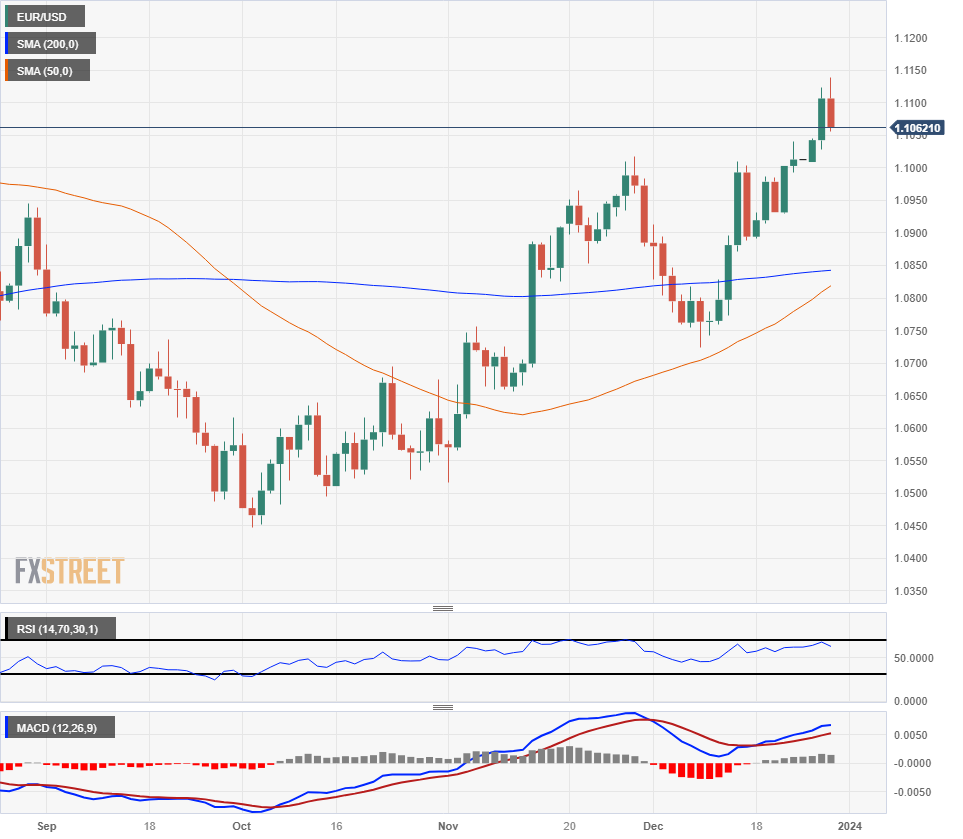
Despite Thursday’s pullback the EUR/USD remains well bid, up over 3% from the last swing low into 1.0723, and the 1.1000 is currently the near-term technical floor as a recent technical barrier, with the 200-day SMA rising into 1.0850 to act as a long-term price floor.
EUR/USD Hourly Chart
EUR/USD Daily Chart
EUR/USD Technical Levels
- The USD/JPY wrestles near the 141.50 area.
- Markets currently project a considerable 160 basis points rate cuts by the Fed in 2024, weighting on the pair.
- Ahead of key NFP figures of December, weekly Jobless Claims came in higher than expected.
In Thursday's session, the USD/JPY pair declined to 140.25 but then recovered to 141.50. Dovish bets on the Federal Reserve (Fed) made the markets dump the US Dollar, and disappointing US Jobless Claims, which rose in the third week of December, dragged the USD/JPY down. During the American session, a recovery in US yields seems to give the Greenback traction. Next week, the US will report additional key labor market figures.
During their final 2023 gathering, the Federal Reserve recognized an inflation deceleration, reinforcing the notion that there will be no rate increases in 2024, and the Summary of Economic Projections (SEP) showed that the Federal Open Market Committee (FOMC) members forecast 75 bps of easing. This led to a broad USD selloff, and markets are expecting a rate reduction in both March and May. The dovish sentiments got further impetus from the recent Personal Consumption Expenditures (PCE) data from November, the Fed's preferred inflation metric, which came in lower than expected. The demonstration of decelerating inflation has subsequently suppressed the strength of the US Dollar.
In the meantime, US Treasury yields found support in multi-month lows and recovered. The 2-year rate is at 4.28%, while the 5-year and 10-year yields sit at 3.85 each, and their upward movements helped the pair trim losses.
Next week, the US is set to release key labor market statistics, including a Nonfarm Payrolls report, Average Hourly Earnings data, and the Unemployment rate. These figures will be critically observed as key indicators of the nation's economic health, so in case further evidence of cooling down is shown, the pair may see further downside.
USD/JPY levels to watch
The daily chart suggests that the pair has a bearish outlook. The Relative Strength Index (RSI) is near oversold conditions, indicating that the selling pressure has perhaps been overextended, and a price recovery may be due soon. This somewhat contrasts with the Moving Average Convergence Divergence (MACD), where rising red bars denote that sellers still seem to be gaining momentum for the moment.
However, keeping in perspective the broader trend, the pair is trading below its 20, 100, and 200-day Simple Moving Averages (SMAs). This is usually a strong bearish sign, signifying that the overall trend remains in the favor of sellers.
Support Levels: 140.20,140.00,139.00.
Resistance Levels:142.95 (200-day SMA),144.00 (20-day SMA),145.00..
USD/JPY daily chart
-638393875187947463.png)
- DXY Index recovered back above 101.00 after bottoming at 100.60.
- US Weekly Jobless Claims rose in the third week of December.
- US bond yields slightly recovered but remain at their lowest levels in months.
The US Dollar (USD) recovered to the 101.10 area during the American session after hitting a low of around 100.60. However, dovish bets on the Federal Reserve (Fed) and negative US Jobless Claims figures may limit the upside. In addition, US bond yields edged higher, which favored the Dollar's bounce, but they still remain at multi-month lows.
In its last 2023 meeting, the Federal Reserve acknowledged a slowdown in inflation, confirming that there won’t be rate hikes in 2024 while hinting at 75 bps of easing. The market is now pricing in a rate cut in March and another in May. The dovish bets were also fueled by US Personal Consumption Expenditures (PCE) Price Index figures last week, the Fed’s preferred gauge of inflation, as further evidence of the economy cooling down drove down the US Dollar.
Daily digest market movers: US Dollar with mild gains, cooling inflation and weak labor market may limit the upside
- Dovish bets on the Federal Reserve (Fed) due to cooling inflation are the main reason the USD suffered selling pressure in the last sessions.
- In terms of job data, the US Initial Jobless Claims report from the US Department of Labor came in at 218K vs the 210k expected in the week ending December 22.
- Next week, the US will report key labor market data, including a Nonfarm Payrrols report from December which could dictate the pace of the US Dollar for the short term.
- US bond yields are slightly recovering. The 2-year yield is at 4.26%, the 5-year yield is at 3.83%, and the 10-year yield is at 3.82%.
- Overall, markets are pricing in 160 bps of easing in 2024 vs the median of the Federal Open Market Committee (FOMC) of 75 bps.
Technical Analysis: DXY selling pressure persists despite oversold conditions
The Relative Strength Index (RSI) indicates oversold conditions in the DXY, which would traditionally be a buying signal, as it suggests the asset could be undervalued. Meanwhile, the Moving Average Convergence Divergence (MACD) shows rising red bars, which points out an increasing bearish momentum.
Given that the index is trading below all three key Simple Moving Averages (SMAs) – the 20, 100, and 200-day SMAs – this may serve as a confirmation of a bearish market and that this downtrend could continue.
Support levels: 100.70, 100.50, 100.30.
Resistance levels: 101.15, 101.30, 101.50.
US Dollar FAQs
What is the US Dollar?
The US Dollar (USD) is the official currency of the United States of America, and the ‘de facto’ currency of a significant number of other countries where it is found in circulation alongside local notes. It is the most heavily traded currency in the world, accounting for over 88% of all global foreign exchange turnover, or an average of $6.6 trillion in transactions per day, according to data from 2022.
Following the second world war, the USD took over from the British Pound as the world’s reserve currency. For most of its history, the US Dollar was backed by Gold, until the Bretton Woods Agreement in 1971 when the Gold Standard went away.
How do the decisions of the Federal Reserve impact the US Dollar?
The most important single factor impacting on the value of the US Dollar is monetary policy, which is shaped by the Federal Reserve (Fed). The Fed has two mandates: to achieve price stability (control inflation) and foster full employment. Its primary tool to achieve these two goals is by adjusting interest rates.
When prices are rising too quickly and inflation is above the Fed’s 2% target, the Fed will raise rates, which helps the USD value. When inflation falls below 2% or the Unemployment Rate is too high, the Fed may lower interest rates, which weighs on the Greenback.
What is Quantitative Easing and how does it influence the US Dollar?
In extreme situations, the Federal Reserve can also print more Dollars and enact quantitative easing (QE). QE is the process by which the Fed substantially increases the flow of credit in a stuck financial system.
It is a non-standard policy measure used when credit has dried up because banks will not lend to each other (out of the fear of counterparty default). It is a last resort when simply lowering interest rates is unlikely to achieve the necessary result. It was the Fed’s weapon of choice to combat the credit crunch that occurred during the Great Financial Crisis in 2008. It involves the Fed printing more Dollars and using them to buy US government bonds predominantly from financial institutions. QE usually leads to a weaker US Dollar.
What is Quantitative Tightening and how does it influence the US Dollar?
Quantitative tightening (QT) is the reverse process whereby the Federal Reserve stops buying bonds from financial institutions and does not reinvest the principal from the bonds it holds maturing in new purchases. It is usually positive for the US Dollar.
- The Aussie sees some rough sideways action in year-end trading.
- Broad-market US Dollar sell-off flows keeping AUD/USD pinned near the top.
- US data dominates the docket to wrap up 2023.
The AUD/USD briefly touched multi-month highs just below 0.6900 in early Thursday trading before settling back to cycle near 0.6850 as markets churn in the second-last trading day of 2023, with US Dollar flows setting the tone for the broader market.
Money markets continue to pin their hopes and dreams on an accelerated pace of rate cuts from the Federal Reserve (Fed) in 2024, with investors betting on rate cuts to start as soon as March and pegging upwards of 160 basis points in rate cuts through the end of next year.
With markets leaning into expectations of a major policy shift from the Fed in the coming months, US data is driving the economic calendar as 2023 draws to a close.
US data driving the market cart as investors await Fed rate cuts
US Initial Jobless Claims missed expectations, printing at 218K for the week ended December 22 versus the forecast 210K, vaulting over the previous week’s print of 206K (revised slightly higher from 205K). US Pending Home Sales in November also missed the mark, printing at a flat 0.0% versus the forecast 1.0% rebound from October’s -1.2% print (revised upwards from -1.5%).
Bad news is good news for money markets, as waffling US data increases the chances that the Fed will get pushed into the next rate-cut cycle sooner rather than later. As recently as a month ago, the Fed was firmly entrenched in a “rates higher for longer” narrative, and the US central bank’s sudden stance shift in December sparked a massive risk rally in the tail-end of 2023. Multiple attempts from Fed officials to splash cold water on hot markets have thus far had little impact with the US Dollar plunging over 3.5% against the Australian Dollar (AUD).
Friday will close out the 2023 trading year with the US Chicago Purchasing Managers’ Index for December, forecast to decline from 55.8 to 51.0.
AUD/USD Technical Outlook
Despite broad-market Greenback weakness, and a fresh multi-month high for the AUD/USD, the Aussie is struggling to take meaningful territory from the US Dollar on Thursday, waffling into the 50-hour Simple Moving Average (SMA) as bullish bids stretch their upper limits.
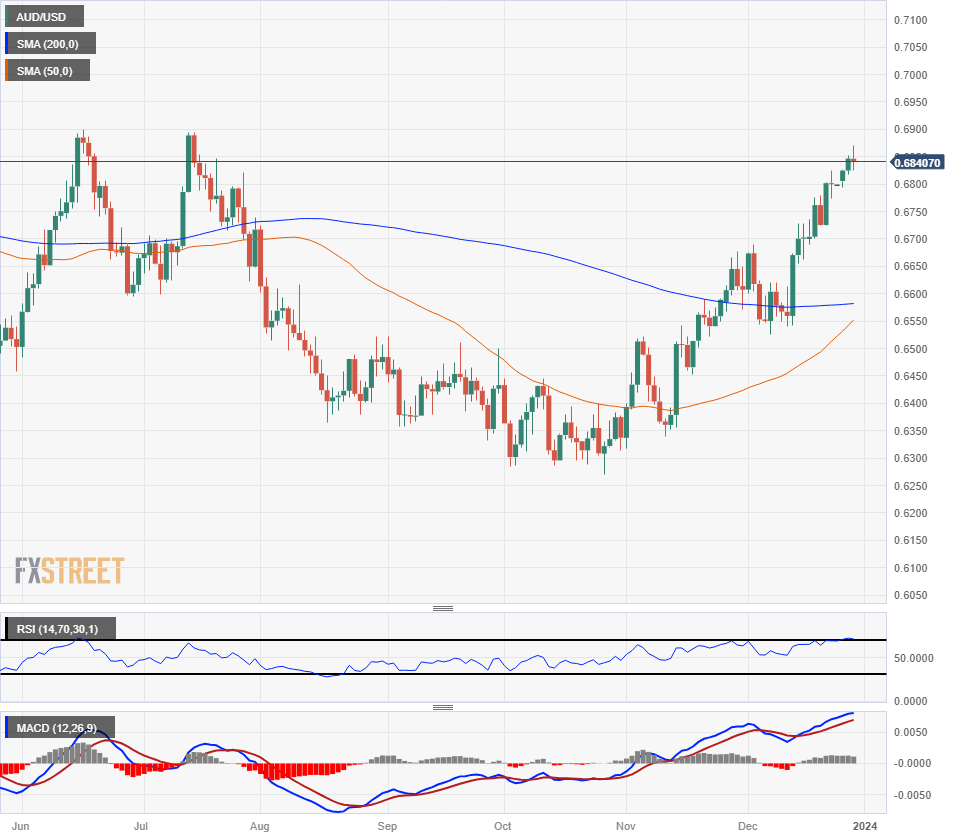
The AUD/USD is set for a third straight week of gains and has gained over 9% from October’s bottom bids near 0.6270, and long-term resistance sits at the 200-day SMA parked just below 0.6600 with the nearest price floor sitting at early December’s previous swing high marked in just below the 0.6700 handle.
AUD/USD Hourly Chart
AUD/USD Daily Chart
AUD/USD Technical Levels
- The Mexican Peso gains further ground as the US Dollar selloff continues.
- Mexico's Jobless Rate stays unchanged in November, US Jobless Claims climbed last week.
- Coming up on Friday: US Chicago PMI, Mexico Fiscal Balance.
The Mexican Peso (MXN) continued to climb through the penultimate trading day of 2023, poised for a third straight week of gains against the US Dollar (USD) as the Greenback faces broad-market selling pressure.
Mexico’s unadjusted Jobless Rate held steady in November, thumbing its nose at market expectations of a minor decline, though the seasonally adjusted figure ticked higher. On the US side, Initial Jobless Claims and Pending Home Sales both missed expectations to come in worse than expected. With US data softening at the print, bad news is good news in topsy-turvy markets that are looking for accelerated rate cuts from the Federal Reserve (Fed).
Daily digest market movers: Mexican Peso hits fresh 16-week as Greenback continues to backslide
- The Mexican Peso is up around 0.3% against the US Dollar on Thursday, gaining 0.8% from the week’s opening bids.
- Broad-market USD selling pressure is bolstering the Peso, with the US Dollar the single worst-performing of the majors, in the red across the board for the last trading week of the year.
- Mexico’s unadjusted Jobless Rate held steady at 2.7% in November versus the forecast tickdown to 2.6%, though the seasonally-adjusted figure showed a slight jump to 2.8%.
- US Initial Jobless Claims jumped to 218K for the week ended December 22, vaulting over the forecast 210K and pushing even higher from the previous week’s 206K (revised upwards from 205K).
- US Pending Home Sales in November also failed to recover as much ground as forecasts expected, printing at a flat 0.0% compared to a forecast 1.0% gain; October’s print of -1.2% was revised slightly upwards from -1.5%.
- Friday will round out the 2023 trading year with the US Chicago Purchasing Managers’ Index for December, forecast to decline from 55.8 to 51.0.
- Mexico’s Fiscal Balance in Peso terms for November will wrap up the year’s economic data prints from Mexico. The Secretaría de Hacienda y Crédito Público, Mexico’s finance ministry, last printed a MXN 29.58 billion deficit in October.
US Dollar price this week
The table below shows the percentage change of US Dollar (USD) against listed major currencies this week. US Dollar was the strongest against the Pound Sterling.
| USD | EUR | GBP | CAD | AUD | JPY | NZD | CHF | |
| USD | -0.48% | -0.20% | -0.54% | -0.73% | -0.95% | -0.76% | -2.02% | |
| EUR | 0.57% | 0.32% | 0.05% | -0.20% | -0.46% | -0.19% | -1.43% | |
| GBP | 0.33% | -0.35% | -0.07% | -0.51% | -0.78% | -0.39% | -1.91% | |
| CAD | 0.54% | -0.27% | 0.28% | -0.45% | -0.42% | -0.06% | -1.62% | |
| AUD | 0.73% | 0.18% | 0.51% | 0.19% | -0.26% | 0.01% | -1.47% | |
| JPY | 0.94% | 0.50% | 0.58% | 0.73% | 0.25% | 0.40% | -1.18% | |
| NZD | 0.75% | 0.24% | 0.58% | 0.22% | 0.00% | -0.27% | -1.17% | |
| CHF | 2.15% | 1.38% | 1.59% | 1.59% | 1.49% | 1.17% | 1.25% |
The heat map shows percentage changes of major currencies against each other. The base currency is picked from the left column, while the quote currency is picked from the top row. For example, if you pick the Euro from the left column and move along the horizontal line to the Japanese Yen, the percentage change displayed in the box will represent EUR (base)/JPY (quote).
Technical Analysis: Mexican Peso stretching for further gains to wrap up the year, USD/MXN sinks in rough trading
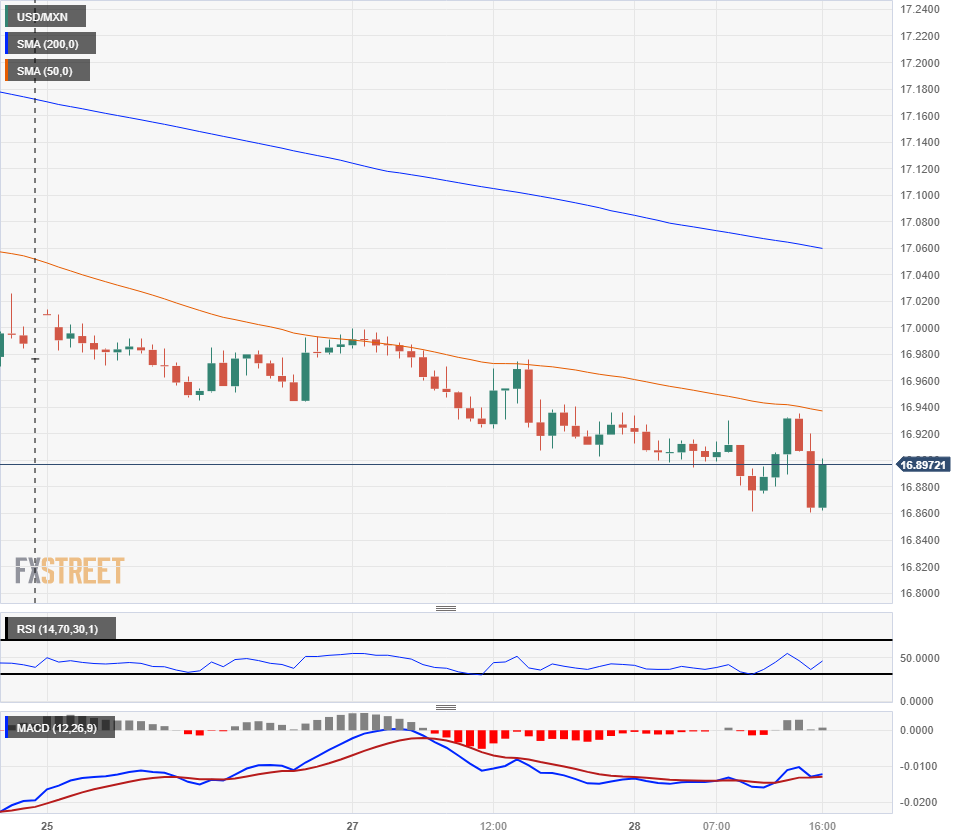
The Mexican Peso (MXN) climbed to a fresh 16-week high against the US Dollar on Thursday, sending the USD/MXN to a multi-month low of 16.86. The pair has steadily declined through the shortened trading week and is currently down nearly a full percent peak-to-trough.
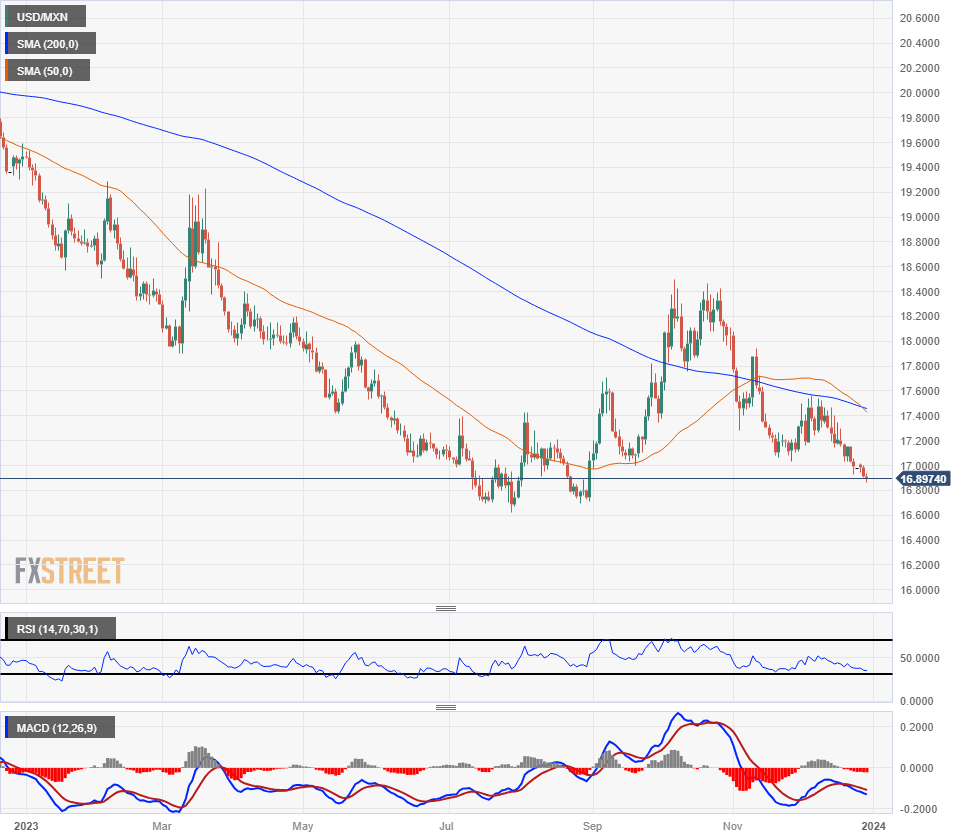
The USD/MXN is poised to close in the red for the third straight week and is set to close December in the red as well, rounding out one of the US Dollar’s worst-performing years against the Peso to date, closing lower for 9 of the past 12 straight months.
Ongoing selling pressure has brought the USD/MXN within multi-year lows near 16.60, and a break below this level would mark the pair’s weakest bids since December 2015.
On the high side, the 200-day Simple Moving Average (SMA) is parked near 17.45, and bearish cross of the 50-day SMA is chalking in a long-term resistance barrier to cap off any bullish reversals.
USD/MXN Hourly Chart
USD/MXN Daily Chart
Mexican Peso FAQs
What key factors drive the Mexican Peso?
The Mexican Peso (MXN) is the most traded currency among its Latin American peers. Its value is broadly determined by the performance of the Mexican economy, the country’s central bank’s policy, the amount of foreign investment in the country and even the levels of remittances sent by Mexicans who live abroad, particularly in the United States. Geopolitical trends can also move MXN: for example, the process of nearshoring – or the decision by some firms to relocate manufacturing capacity and supply chains closer to their home countries – is also seen as a catalyst for the Mexican currency as the country is considered a key manufacturing hub in the American continent. Another catalyst for MXN is Oil prices as Mexico is a key exporter of the commodity.
How do decisions of the Banxico impact the Mexican Peso?
The main objective of Mexico’s central bank, also known as Banxico, is to maintain inflation at low and stable levels (at or close to its target of 3%, the midpoint in a tolerance band of between 2% and 4%). To this end, the bank sets an appropriate level of interest rates. When inflation is too high, Banxico will attempt to tame it by raising interest rates, making it more expensive for households and businesses to borrow money, thus cooling demand and the overall economy. Higher interest rates are generally positive for the Mexican Peso (MXN) as they lead to higher yields, making the country a more attractive place for investors. On the contrary, lower interest rates tend to weaken MXN.
How does economic data influence the value of the Mexican Peso?
Macroeconomic data releases are key to assess the state of the economy and can have an impact on the Mexican Peso (MXN) valuation. A strong Mexican economy, based on high economic growth, low unemployment and high confidence is good for MXN. Not only does it attract more foreign investment but it may encourage the Bank of Mexico (Banxico) to increase interest rates, particularly if this strength comes together with elevated inflation. However, if economic data is weak, MXN is likely to depreciate.
How does broader risk sentiment impact the Mexican Peso?
As an emerging-market currency, the Mexican Peso (MXN) tends to strive during risk-on periods, or when investors perceive that broader market risks are low and thus are eager to engage with investments that carry a higher risk. Conversely, MXN tends to weaken at times of market turbulence or economic uncertainty as investors tend to sell higher-risk assets and flee to the more-stable safe havens.
Fed’s explicit pivot further reinforces OCBC Bank’s sell-on-rally view on the US Dollar.
Dovish pivot sets the tone
Given Fed’s pivot, the next leg of USD’s decline will depend on 1/ how much more markets expect the Fed to cut (dependent on US data) and 2/ how global growth pans out.
If global growth can trudge along well, alongside a more sustained exports recovery momentum seen in Asia so far, then counter-cyclical USD could further stay under pressure for the coming months ahead.
Economists at Société Générale expect the USD/CNY pair to rise a bit more before starting a gradual decline.
The final leg of CNY depreciation is not over yet
The USD/CNY is likely to grind even higher before the pair peaks out in 1H24.
We believe the final leg of CNY depreciation is not over yet, although it should now be only moderate in scale.
The USD/CNY is likely to peak out at 7.50 in 1H24 and start a gradual decline to 7.30 by the end of next year.
The policy effort of containing CNY depreciation became a permanent factor in PBOC’s policy toolkit. However, extended monetary policy divergence would keep pushing the USD/CNY higher until there is a clear sign of a US Fed pivot. Policy balancing between local rates and FX is likely to be slightly tilted toward lower local rates at the expense of a slightly higher USD/CNY.
- The XAG/USD trades near the $24.20 level with mild losses.
- Jobless Claims for the third week of December came in higher than expected.
- US yields are mildly up, still near multi-month lows.
- Markets anticipate a sizeable 160 basis point rate cuts for 2024.
In Thursday's trading session, the Silver price (XAG/USD) trades neutral at about $24.20. That being said, the upside is open for the precious metal as dovish sentiment regarding the Federal Reserve's monetary policy and weaker-than-expected US Jobless Claims data may pave the way for further upward movements.
Recognizing the inflation decelerating at the last 2023 meeting, the Federal Reserve gave assurances of no rate increases in 2024 while suggesting a 75 basis points reduction. This has led markets to anticipate a rate decrease in both March and May and the dovish market bets gained momentum following the release of soft Personal Consumption Expenditures (PCE) from November, the Fed's favored inflation metric. As these figures provided additional proof of economic deceleration, they subsequently weakened the US Dollar and yields favoring the metal's advance.
On Thursday, it was reported that the Jobless Claims for the week ending in December 22 rose to 218K, vs. the 210K expected and accelerated from the last 206K, which seems to be applying further pressure on the US Dollar.
That being said, the US bond yields are recovering but are still near multi-month lows. The 2-year rate stands at 4.27%, while the 5-year and 10-year yields are observed at 3.82% each. These upward movements may limit the upside during the session for the grey metal as US Treasury yields often represent their opportunity cost.
XAG/USD levels to watch
The indicators on the daily chart reflect a bullish bias, but there are some signs of buying exhaustion. The Relative Strength Index (RSI), flat and in positive territory, coupled with the green bars of the Moving Average Convergence Divergence (MACD) being flat, further emphasizes the inertia from the buyer's side, which seems to be running out of steam.
Despite the short-term mixed outlook, the price remains above the 20,100,200-day Simple Moving Averages (SMAs), illuminating the stronghold of the bulls in larger time frames.
Support Levels: $24.00 (20-day SMA), $23.65 (200-day SMA), $23.50.
Resistance Levels: $24.40, $24.60, $24.80.
XAG/USD daily chart
-638393743030923823.png)
The Dollar's importance as a reserve currency and as the currency of denomination for trade and financial transactions has not diminished despite the declining importance of the United States in the global economy, analysts at Natixis report.
Declining weight of the US in the global economy
The US accounted for 35% of global GDP in 1986, 26% in 1990, 29% in 2000, 24% in 2010, and 25% in 2022, so the size of the US in relation to the global economy has been steadily declining.
However, the Dollar’s share of trade invoicing, foreign exchange reserves, international bond issuance and foreign exchange transactions has not fallen.
This resilience of the Dollar's economic and financial weight, despite the decline in the economic and financial weight of the US, shows that the international monetary system is best organised around a single reserve currency.
- Pending Home Sales in the US declined 5.2% on a yearly basis in November.
- US Dollar Index stays in negative territory below 101.00.
Pending Home Sales in the US were unchanged on a monthly basis in November, the National Association of Realtors reported on Thursday. This reading followed a 1.2% decrease recorded in October and came in weaker than the market expectation for an increase of 1%. On a yearly basis, Pending Home Sales fell 5.2%.
Market reaction
The US Dollar showed no immediate reaction to this data. At the time of press, the US Dollar Index was down 0.12% on a daily basis at 100.82.
Economists at Danske Bank remain medium-term bearish on the Swedish Krona (SEK).
Tactical downside vs. strategic upside
While we have remained strategically bullish on EUR/SEK, our tactical view has shifted over the year with e.g. near-term bullish view on SEK this autumn.
The SEK rebound could run a bit further with positive risk sentiment and broad-based USD weakness as the Fed is set to move slightly earlier than peers. However, the cyclical backdrop remains a challenge for the SEK amid a bleak global growth outlook, a Swedish economy characterized by vulnerable households, a Riksbank that will not lag the ECB in the easing cycle and a choppy environment for global equities.
The structural flows picture is still a medium-term headwind for the SEK. Should the global economy pick up more than expected in 2024, this could lend support to the SEK over the medium-term.
On balance, we lower the forecast trajectory slightly over all horizons.
EUR/SEK Forecast: 11.20 (1M), 11.40 (3M), 11.60 (6M), 11.60 (12M)
Economists at ANZ Bank see a turning point for the EUR/USD and forecast the pair at 1.15 by the end of the next year.
Interest rate cuts are not necessarily negative for the EUR
We expect the EUR to be at 1.15 at the end of 2024. The driver of this is the bearish USD view, which we saw take the EUR to 1.10 in late November. We think cyclical factors will also drive the EUR higher, based on a view that growth indicators are stabilising and the EUR/USD low has already been set for this cycle.
The upward move in the EUR will likely be more dominant in H2 2024, as the USD is seasonally stronger at the start of the year.
We expect the ECB to begin easing in March 2024. Interest rate cuts are not necessarily negative for the EUR. As the real yield differential between the US and EUR narrows, we think this will contribute to supporting upside in the EUR/USD.
EUR/SEK has been again trading as a high-beta currency. Economists at Société Générale analyze the pair’s outlook.
Sweden’s fundamentals set to improve only gradually
As Sweden’s fundamentals are set to improve only gradually, the return of a meaningful correlation with equities could be a supporting factor if their bounce is sustained.
Whereas the market will be focusing on the timing of ECB and Fed cuts, the Riksbank could ultimately fuel the Swedish Krona recovery.
EUR/SEK – 1Q24 11.40 2Q24 11.20 3Q24 11.10 4Q24 11.00
- The Dollar remains practically unaffected by higher-than-expected US Jobless Claims data
- The higher claims increase the odds of rate cuts in early 2024.
- Later today, the US Pending Home Sales might give some support to the US Dollar.
The impact on the Dollar of the higher than expected US Jobless Claims in the US has been muted, as the pair remains consolidating losses near eight-yers lows, at 0.8335
First-time claims for unemployment benefits increased by 218K in the US on the week of December, 15. This reading beats the market consensus of 110K and is significantly higher than the 206K upward revised level seen in the previous week.
These figures add to evidence that the US labour market is losing pace, which endorses the narrative of a soft landing and bolsters the case for Fed cuts in 2024.
Later today, the US Pending Home Sales are expected to have increased by 1% in November, following a 1.5% decline in October. These figures might provide some support for the US Dollar.
The technical picture remains bearish, although the heavily oversold levels allow for some correction. Resistances are at 0.8400 and 0.8515.
On the downside, below the intra-day low at 0.8340, the next target is 2015 low at 0.8300.
Technical levels to watch
- Initial Jobless Claims in the US increased by 12,000 in the week ending December 23.
- US Dollar Index slides modestly, stays under modest bearish pressure, below 101.00.
There were 218,000 initial jobless claims in the week ending December 23, the weekly data published by the US Department of Labor (DOL) showed on Thursday. This print followed the previous week's print of 206,000 (revised from 205,000) and came in worse than the market expectation of 210,000.
Further details of the publication revealed that the advance seasonally adjusted insured unemployment rate was 1.3% and the 4-week moving average stood at 212,000, a decrease of 250 from the previous week's revised average.
Continuing Claims increased by 14,000 to 1.875 million in the week ended December 16, the highest level in four weeks.
Market reaction
The US Dollar Index dropped modestly after the data, falling below 100.80. US Treasury yields remained in positive territory for the day but moved off highs. Later in the day, at 15:00 GMT, the November Pending Home Sales report is due.
If the US Dollar weakens in general, it is likely to do so against the CAD, too, economists at Société Générale report.
Fed and BoC to ease monetary policy at a similar pace to each other
The biggest drivers of USD/CAD will probably be the general direction of the USD (which we expect to be weaker as US growth slows) and the relative shifts in Canadian and US longer-dated bond yields. A falling US yield environment and a weakening Dollar should drag USD/CAD lower in the absence of fresh new idiosyncratic drivers of the CAD.
In a not very imaginative forecast, we expect USD/CAD to fall to around 1.3% next year, as US yields fall (10s trading down to 3.75%) and the Fed and Bank of Canada ease monetary policy at a similar pace to each other.
- USD/JPY prints a fresh four-month low near 140.65.
- The market mood is cheerful as investors lean towards expectations of rate cuts by the Fed from March.
- The BoJ may exit from ultra-loose policy stance after wage growth would be able to keep inflation above 2%.
The USD/JPY pair is consistently declining as investors are confident about the rate cuts by the Federal Reserve (Fed) from March 2024. The asset has dropped to 140.65 and is expected to witness more losses amid a cheerful market mood.
S&P500 futures have generated nominal gains in the European session, indicating further improvement in the risk-appetite of the market participants. The US Dollar Index (DXY) has witnessed nominal buying interest near 100.60 but further downside is likely as investors see Fed starting to reduce borrowing costs due to easing price pressures.
As per the CME Fedwatch tool, the likelihood of a rate cut announcement by the central bank is almost 88%. Chances are almost 65% that the Fed will continue reducing interest rates in its May monetary policy meeting.
Contrary to market expectations, Fed policymakers believe that market reaction to commentary about rate cuts from Jerome Powell is overwhelming despite the achievement of price stability is far from over.
On the Tokyo front, investors hope that the Bank of Japan (BoJ) may not unveil their plans of exiting from the ultra-loose monetary policy until policymakers get enough confidence that wage growth would be sufficient to keep the National Consumer Price Index (CPI) stably above 2%. Meanwhile, the BoJ has announced that it will reduce its bond-buying operations in 2024.
The Aussie trims gains after rejection at 0.6870.
US Employment and housing data might give some support to the USD.
AUD/USD will face a stronger bearish pressure below 0.6820.
The Aussie rally has found some resistance at 0.6870 multi-month hughes before retreating to 0.6825 during Thursday’s European trading session. The broader, trend, however, remains positive with downside attempts seen as good entry opportunities for buyers.
Later today the US Jobless claims are expected to have increased to 210K from 205K in the previous week. Shortly afterward, US Pending Home Sales are expected to have increased 1% in November, following a 1.5% decline in October.
These figures might provide some support for the US Dollar, which is trying to trim some losses. The unexpectedly dovish message conveyed by the US Federal Reserve last week has boosted bets for rate cuts in early 2024, crushing the USD across the board.
AUD/USD technical analysis
Technical indicators remain positive although the ever-narrowing trading range of the pair, which results in an upward wedge pattern, and the overbought levels in the daily chart suggests the possibility of a deeper correction.
The pair is now testing trendline support at 0.6820. Below here, bearish pressure would increase with the next targets at 0.6775 and 0.6720. Resistances are 0.6870 and the June and July peaks, at 0.6895.
AID/USD 4-Hour Chart
Technical levels to watch
- The US Dollar gaps opened on Thursday after a big miss on the Richmond Manufacturing Index.
- Equity markets are steady while US bond markets are seeing substantial buying.
- The US Dollar Index breaks lower and is on its way to test 100.
The US Dollar (USD) is on the chopping block this Thursday. The US Dollar Index (DXY) is gapping open this Thursday morning in Asia with heavy buying in the US bond market. The Greenback faces further substantial devaluation with US yields dropping like a stone, which eats into the worth or return in yield when investing in the US Dollar against a few months ago when yields were substantially higher across the yield curve in different maturities.
On the economic front, the Jobless Claims data will be in the spotlight and might move the needle. Although a strong number might move the needle in favour of the US Dollar, rather expect markets to keep its course. Pending Home Sales is the second data point, though it is not expected that that will trigger any market reaction.
Daily digest Market Movers: All about the Jobless ones
- Near 13:30 GMT the Jobless Claims are coming out:
- Initial Jobless Claims are set to jump from 205,000 to 210,000.
- Continuing Claims are set to soar higher as well from 1,865,000 to 1,875,000.
- At the same time, Wholesale Inventories are due to come out, heading from -0.4% to -0.2%.
- The Goods Trade Balance for November will be released at 13:30. Previous was at -89.8 billion USD. No forecast pencilled in.
- At 15:00, Pending Home Sales will come out, and are expected to jump from -1.5% to +1% for November.
- The US Treasury is heading to markets for some cheaper funding, allocating a 4-week bill and a 7-year Note.
- Equities are going sideways with only one outlier: China. Both the Hang Seng and the Shenzhen Index are up over 2% after the Chinese regulator backtracked on earlier comments of a crackdown on electronic gaming and gambling companies.
- The CME Group’s FedWatch Tool shows that markets are pricing in an 83.5% chance that the Federal Reserve will keep interest rates unchanged at its January 31 meeting. Around 16.5% expect the first cut already to take place. The uptick in favour of a rate cut comes after the big miss on expectations and further negative number in the Richmond Manufacturing Index on Wednesday.
- The benchmark 10-year US Treasury Note trades near 3.81%, the lowest level since summer.
US Dollar Index Technical Analysis: Fingers burned
The US Dollar Index is gasping for air with US yields sinking lower across the yield curve in different maturities. Although the yields of other currencies are seeing their yields drop as well, markets are having tunnel vision with focus on the Greenback. Seeing the very thin-populated trading desks and several investors being out of the markets, not much counterweight is present to turn the ship back in favour of the Greenback for the remaining part of 2023.
First upside resistance to face is near 101.78 at the low of December 21. Although a long way to go, it looks not unthinkable that the DXY might test the descending trend line near 103.00. Depending on the catalyst that fuels the recovery in the Greenback, the 200-day Simple Moving Average (SMA) near 103.45 is firm last resistance before having more upside.
To the downside, the pivotal level at 101.70 – the low of August 4 and 10 – is now gone and holds no bearing anymore for support as it is too far gone. The current level, near 100.82, which aligns with the bottoms from February and April, could still hold some relevance and might hold for this Thursday. Should that level snap, nothing will stand in the way of DXY heading to the sub-100 region.
US Dollar FAQs
What is the US Dollar?
The US Dollar (USD) is the official currency of the United States of America, and the ‘de facto’ currency of a significant number of other countries where it is found in circulation alongside local notes. It is the most heavily traded currency in the world, accounting for over 88% of all global foreign exchange turnover, or an average of $6.6 trillion in transactions per day, according to data from 2022.
Following the second world war, the USD took over from the British Pound as the world’s reserve currency. For most of its history, the US Dollar was backed by Gold, until the Bretton Woods Agreement in 1971 when the Gold Standard went away.
How do the decisions of the Federal Reserve impact the US Dollar?
The most important single factor impacting on the value of the US Dollar is monetary policy, which is shaped by the Federal Reserve (Fed). The Fed has two mandates: to achieve price stability (control inflation) and foster full employment. Its primary tool to achieve these two goals is by adjusting interest rates.
When prices are rising too quickly and inflation is above the Fed’s 2% target, the Fed will raise rates, which helps the USD value. When inflation falls below 2% or the Unemployment Rate is too high, the Fed may lower interest rates, which weighs on the Greenback.
What is Quantitative Easing and how does it influence the US Dollar?
In extreme situations, the Federal Reserve can also print more Dollars and enact quantitative easing (QE). QE is the process by which the Fed substantially increases the flow of credit in a stuck financial system.
It is a non-standard policy measure used when credit has dried up because banks will not lend to each other (out of the fear of counterparty default). It is a last resort when simply lowering interest rates is unlikely to achieve the necessary result. It was the Fed’s weapon of choice to combat the credit crunch that occurred during the Great Financial Crisis in 2008. It involves the Fed printing more Dollars and using them to buy US government bonds predominantly from financial institutions. QE usually leads to a weaker US Dollar.
What is Quantitative Tightening and how does it influence the US Dollar?
Quantitative tightening (QT) is the reverse process whereby the Federal Reserve stops buying bonds from financial institutions and does not reinvest the principal from the bonds it holds maturing in new purchases. It is usually positive for the US Dollar.
Economists at ANZ Bank expect the Pound Sterling (GBP) to strengthen in the coming year with Cable forecast to end at 1.34.
Easing of inflationary pressures point to a robust GBP in 2024
While the growth outlook is challenging, signs of resilience and the easing of inflationary pressures point to a robust GBP in 2024.
We don’t see the BoE easing rates until Q3 2024, giving the GBP the strong backdrop of higher real yields for longer and a recovering economic momentum.
We see the GBP/USD at 1.34 by year’s end.
- The Euro is trading lower against a stronger Yen.
- The JPY is the biggest beneficiary of the US Treasury yields’ decline.
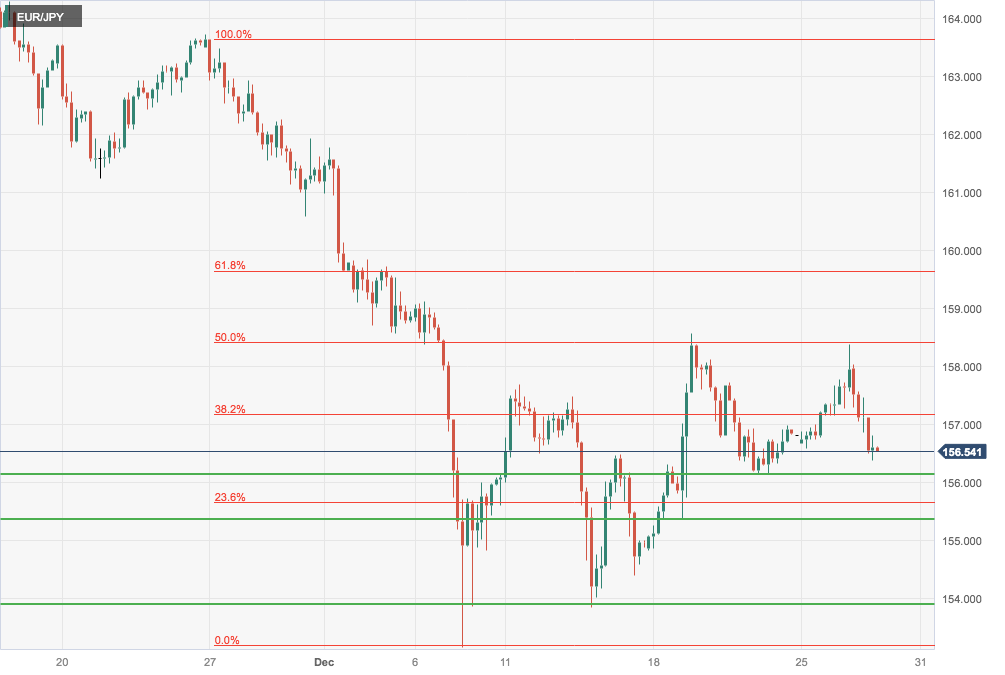
- The EUR/JPY has a strong resistance area of 158.45.
The Euro is extending losses on Thursday following the second consecutive rejection at the 158.45 resistance area in the last two weeks.
The common currency has succumbed to JPY strength favoured by the narrowing US - Japanese Treasury yields’ spread, with the investors focusing on Fed cuts in 2024.
Technical indicators are pointing lower, with price action crossing below the 4h 50 and 100 SMAs and the RSI crossing below the 50 level. In this context, a retest of the December 21 lows, at 156.15 seems likely.
Below 156.15, the next targets would be 155.35 and 153.90, which close the path towards the four-month low, at 153.14.
On the upside, the pair faces strong resistance at 158.45, which is the 50% Fibonacci retracement of the late-November sell-off. Bulls would need to break this level to confirm the upside bias and extend to 159.00 ahead of the 61.8% retracement of the mentioned trend, at 159.65.
EUR/JPY 4-hour chart
Technical levels to watch
- WTI Oil drops back below $74, under important support.
- API overnight print was double the previous build.
- The DXY US Dollar Index sells off further and snaps below 101.
Oil prices are dropping near 1% during European trading hours on Thursday. The slide comes on the back of another build in US Stockpile numbers published overnight from the American Petroleum Institute (API). With a build of 1.837 million barrels against 0.939 million last week, the US seems to be plumbing Black Gold at an elevated pace.
The US Dollar (USD) gapped lower this Thursday at the start of the Asian session and is still sliding lower. With that move, the US Dollar Index (DXY) snaps below 101 and is on its way to 100. As long as US yields do not stop falling, the Greenback looks to be hanging in the ropes – normally a positive for Oil but not today.
Crude Oil (WTI) trades at $73.41 per barrel, and Brent Oil trades at $78.82 per barrel at the time of writing.
Oil News and Market Movers: US keeps flooding markets
- Overnight Crude Stockpile publication from the American Petroleum Institute (API) was a surprise build of 1.837 million barrels against 0.939 million last week.
- This evening near 15:30 GMT the Energy Information Administration (EIA) will release its number of barrels. Previous was a build of 2.909 million, with a drawdown of 2.704 million expected.
- QatarEnergy has signed a supply agreement with Shell International in Singapore to supply 18 million barrels per year of Qatari Crude as of 2024.
- Refiners in India are triggering a boost in supplies from the Middle East and other nearby countries. Recent attacks on ships in the Red Sea raises the risk of longer shipping time and higher costs, which puts margins of Indian refiners under pressure.
Oil Technical Analysis: US is acting as “Big Brother”
Oil prices are erasing gains from Wednesday and slipping below $74. The recent API numbers are showing that the US is trying to counterbalance any sudden blip in demand by relentlessly pumping Oil and dumping it on the market, in order to keep Oil prices muted. Outstanding question at the moment is of course how long this tug-of-war between the US and OPEC+ can continue.
On the upside, $74 is still holding some importance, although the level has become very chopped up. Once back above there, $80 comes into the picture. Although still far off, $84 is next on the topside once Oil sees a few daily closes above the $80 level.
Below $74, the $67 level could still come into play as the next support level to trade at as it aligns with a triple bottom from June. Should that triple bottom break, a new low for 2023 could be close at $64.35 – the low of May and March – as the last line of defence. Although still quite far off, $57.45 is worth mentioning as the next level to keep an eye on if prices fall sharply.
-638393620536647878.png)
US WTI Crude Oil: Daily Chart
WTI Oil FAQs
What is WTI Oil?
WTI Oil is a type of Crude Oil sold on international markets. The WTI stands for West Texas Intermediate, one of three major types including Brent and Dubai Crude. WTI is also referred to as “light” and “sweet” because of its relatively low gravity and sulfur content respectively. It is considered a high quality Oil that is easily refined. It is sourced in the United States and distributed via the Cushing hub, which is considered “The Pipeline Crossroads of the World”. It is a benchmark for the Oil market and WTI price is frequently quoted in the media.
What factors drive the price of WTI Oil?
Like all assets, supply and demand are the key drivers of WTI Oil price. As such, global growth can be a driver of increased demand and vice versa for weak global growth. Political instability, wars, and sanctions can disrupt supply and impact prices. The decisions of OPEC, a group of major Oil-producing countries, is another key driver of price. The value of the US Dollar influences the price of WTI Crude Oil, since Oil is predominantly traded in US Dollars, thus a weaker US Dollar can make Oil more affordable and vice versa.
How does inventory data impact the price of WTI Oil
The weekly Oil inventory reports published by the American Petroleum Institute (API) and the Energy Information Agency (EIA) impact the price of WTI Oil. Changes in inventories reflect fluctuating supply and demand. If the data shows a drop in inventories it can indicate increased demand, pushing up Oil price. Higher inventories can reflect increased supply, pushing down prices. API’s report is published every Tuesday and EIA’s the day after. Their results are usually similar, falling within 1% of each other 75% of the time. The EIA data is considered more reliable, since it is a government agency.
How does OPEC influence the price of WTI Oil?
OPEC (Organization of the Petroleum Exporting Countries) is a group of 13 Oil-producing nations who collectively decide production quotas for member countries at twice-yearly meetings. Their decisions often impact WTI Oil prices. When OPEC decides to lower quotas, it can tighten supply, pushing up Oil prices. When OPEC increases production, it has the opposite effect. OPEC+ refers to an expanded group that includes ten extra non-OPEC members, the most notable of which is Russia.
A return to USD/JPY 130 is possible by the end of 2024, economists at Société Générale report.
EUR/JPY and CHF/JPY have considerable room to fall in 2024
In the absence of fresh terms of trade shock, and with the help of falling US Treasury yields, the Yen should make substantial gains in 2024. A back-of-the-envelope regression of USD/JPY and the yield gap, coupled with our yield forecasts, point to a return to USD/JPY 130-135 in 2H24.
Given the Yen’s sensitivity to long-term yields, how much it has fallen relative to the Euro, and how much bad news is ‘in the price’ for the North Asian currencies, EUR/JPY and indeed (in a less scary world) CHF/JPY have considerable room to fall in 2024.
Economists at ANZ Bank expect KRW and TWD to be the best Asian currencies in the coming year.
Sentiment towards TWD might be cautious ahead of January’s presidential election
With the upswing in the global semiconductor cycle underway, we expect the currencies of the technology-export-oriented economies to outperform.
We forecast KRW and TWD to strengthen the most, with our year-end target for USD/KRW at 1,220 and for USD/TWD at 30.20.
Sentiment towards TWD might be cautious ahead of January’s presidential election, but the focus is likely to turn towards the improving export outlook once that is out of the way.
- The Sterling breaks trendline support to test the 180.00 level.
- The Pound looks vulnerable against a stronger Yen.
- Below 180.00 the target will be October and November lows at the 178.10/30 area.
The Sterling has broken below the bottom of the last three weeks' triangle pattern, at 181.80, weigher by broad-based Yen strength, and is testing the 180.00 support area at the moment of writing.
A clear break below 179.90 would clear the path towards the big target, at the 178.10/30 area, the mid-December and early October lows, which would confirm the continuation of the downtrend from late November highs.
The 180.00 level is a significant support zone, which has capped bears several times in the last two weeks. In this sense, I would not discard a retest of the reverse trendline, around 180.85 before further decline takes place.
A bullish reaction above the mentioned trendline would ease downside pressure and set put 182.35 resistance back into play
GBP/JPY 4-hour chart
-638393591679289118.png)
Technical levels to watch
- USD/CAD discovers buying interest near 1.3200 despite a sell-off in the US Dollar.
- The Canadian Dollar has weakened due to a significant fall in the oil price.
- Oil prices fell sharply as commercial shipments resumed from Red Sea route.
The USD/CAD pair finds cushion near the round-level support of 1.3200 in the European session. The Loonie asset has rebounded to near 1.3220 amid a sharp sell-off in oil prices due to higher inventories for the week ending December 22 and resumption of oil shipment from Red Sea route.
West Texas Intermediate (WTI), futures on NYMEX, fell 1.5% on Thursday to near $73.00. The oil price faced an intense sell-off after an establishment of US-led maritime taskforce to protect commercial oil vessels against Houthi attacks.
In addition to trade resumption from Red Sea, higher oil stockpiles have weighed heavily on the oil price. The United States Energy Information Administration (EIA) reported on Wednesday crude inventories were higher by 1.8 million barrels.
It is worth noting that Canada is the leading exporter of oil to the United States and lower oil prices weigh on the Canadian Dollar.
Meanwhile, S&P500 futures added some gains in the London session, portraying an improvement in the risk-appetite of the market participants. The US Dollar Index (DXY) has printed a fresh five-month low near 100.60. The USD Index struggles for a firm footing as investors continue to bet in favour of rate cuts by the Federal Reserve (Fed) from March 2024.
Amid festive season, the economic calendar is very light, therefore, second-tier weekly Initial Jobless Claims data will be keenly watched by the market participants. Next week, the employment data from Canada and the US will be of utmost importance.
The Swiss Franc has been the best-performing G10 currency year to date. Economists at Société Générale analyze EUR/CHF outlook.
EUR/USD to grind beyond 1.15 next year
As we expect EUR/USD to grind beyond 1.15 next year, EUR/CHF looks set to return above parity.
With Swiss inflation below 2% over the past quarter, the SNB should be much more comfortable with a weaker currency.
Switzerland’s growth outlook was downgraded after the summer, and the CHF has yet to adjust to this change.
See: EUR/CHF seen at 0.94 in 6-12M – Danske Bank
"Monetary policy normalization is already showing its impact on slowing inflation, but it would still be premature to think about rate cuts," European Central Bank Governing Council member Robert Holzmann said on Thursday, as reported by Bloomberg News.
Holzmann added there is no guarantee of rate reductions in 2024 "even if the ECB is past an unprecedented series of ten consecutive rate increases".
Market reaction
The EUR/USD pair edged higher after these comments and was last seen rising 0.25% on the day at 1.1130.
The Ringgit (MYR) was one of the worst-performing currencies in Asia. Economists at ANZ Bank analyze USD/MYR outlook.
MYR will be supported by a recovery in the tourism sector and improving demand from China
Next year, we expect MYR will be supported by a recovery in the tourism sector and improving demand from China. Tourist arrivals in 2023 surpassed targets and are expected to gather momentum in 2024, which will be positive for MYR. Exporter conversion of past accumulated receipts will also add further support.
We expect the USD/MYR to appreciate steadily in 2024 and end the year at 4.45. However, lower oil prices and weaker-than-expected improvement in exports might result in some drag on net exports and thereby on MYR.
- NZD/USD falls sharply to near 0.6330 as US Treasury yields attempted recovery.
- The USD Index has printed a fresh five-month low near 100.60.
- NZD/USD aims for stabilization after a Falling channel breakout.
The NZD/USD pair has fallen to near 0.6330 amid a surprise recovery in the US Treasury yields. The 10-year US Treasury yields have rebounded to near 3.82%. The broader appeal for the Kiwi asset remains upbeat as investors lean towards expectations of early rate cuts by the Federal Reserve (Fed).
S&P500 futures have added some gains in the London session, portraying an improvement in the risk-appetite of the market participants. The US Dollar Index has refreshed five-month low near 100.60 as slowing price pressures in the United States economy may allow Fed policymakers to discuss about unwinding interest rates earlier than previously anticipated.
The New Zealand Dollar will be in action after the release of the Caixin Manufacturing PMI data for December, which will release on Tuesday. The economic data is expected to remain above the 50.0 threshold. Being a proxy to Chinese economy, the New Zealand Dollar will be benefitted by upbeat factory data.
NZD/USD has been sustaining at higher levels after a breakout of the Falling Channel chart pattern formed on a daily scale. Upward-sloping 20-period Exponential Moving Average (EMA) at 0.6230 continues to provide support to the New Zealand Dollar bulls.
The Relative Strength Index (RSI) (14) oscillates in the bullish range of 60.00-80.00, which indicates that upside momentum is intact.
Gradual correction towards the round-level support of 0.6300 would emerge as a buying opportunity for the market participants, which will drive asset towards intraday high at 0.6370, followed by December 26 high near 0.6410.
On the flip side, a downside move below December 25 low at 0.6246 would expose the asset to November 29 high at 0.6208 and December 14 low at 0.6168.
NZD/USD daily chart
-638393553552535530.png)
- The Euro bounces up to retest 0.8700 buoyed by ECB´s Holzmann's comments.
- Holzmann affirms that there is no guarantee for rate cuts in 2024.
- The absence of Eurozone data increases the impact of ECB rhetoric.
The Euro maintains its bullish tone against the British Pound on Thursday, with the pair bouncing strongly at 0.8670 to test one-month highs at 0.8700.
The pair has been supported by ECB member and Governor of the Austrian National Bank, who has played down speculation about rate cuts in 2024, providing a fresh impulse to the Euro.
Apart from that, the positive risk sentiment seems to be favouring the Euro rather than the Pound. The common currency is surfing on the Santa Claus rally, favoured by the absence of key Eurozone data to negate the hawkish comments by ECB policymakers.
From a technical perspective, Tuesday´s bullish engulfing candle has confirmed the positive trend, giving extra hopes for buyers, although the 0.8700 seems to be a challenging level, as shown by Wednesday´s reversal.
A clear break of the 0.8700 level would increase bullish pressure towards the November 22 and 23 highs, at 0.8725 and November’s peak, at 0.8765.
On the downside, support levels are 0.8645 and 0.8600.
Technical levels to watch
The US Dollar has continued to weaken over the holiday period. Economists at MUFG Bank analyze Greenback’s outlook.
No let up for USD selling over holiday period
In the absence of important economic data releases and/or central bank speakers, there is unlikely to be a fundamental trigger to reverse the US Dollar’s weakening trend heading into year-end.
If inflation continues to slow at the start of next year, it will become harder for the Fed to justify keeping the policy at current restrictive levels.
- The Euro maintains a bid tone with the Dollar vulnerable on Fed-easing hopes.
- Cooling US inflation and weaker economic growth fuel hopes of interest rate cuts in March.
- ECB-Fed divergence is likely to support the pair until Eurozone data is released in the first week of 2024.
The Euro (EUR) maintains its positive tone during Thursday’s European trading session. The pair is contained within a tight range above 1.1100, set for its third consecutive weekly rally, with the Dollar drifting to fresh mid-term lows amid heightened hopes that the Fed will start cutting interest rates in March.
US macroeconomic data released last week confirmed the narrative of cooler inflation and a softening economic growth, the soft-landing theory that will allow the Fed to retrace the monetary tightening path.
In the absence of key fundamental releases this week, today´s US Weekly Jobless Claims and Existing Home Sales, which are expected to have bounced up in November, might provide some support to an ailing US Dollar.
Daily digest market movers: US Dollar dives with investors bracing for Fed cuts in 2024
- The Euro consolidates at five-month highs above 1.1100, with the US Dollar weighed on hopes of Fed rate cuts.
- US PCE Prices Index data released last week showed that inflation is decelerating at a faster-than-expected pace
- The US Gross Domestic Product was revised to a 4.9% growth in the third quarter, down from the 5.2% previously estimated
- The calendar is light this week and investors remain focused on last week’s figures to feed hopes that the Fed will start cutting rates in early 2024.
- Futures markets are pricing nearly 90% chances of Fed cuts in March, and 150 bps cuts in the whole year, according to the CME Group Fed Watch Tool.
- In contrast, the ECB struck a more hawkish tone after its December policy meeting, defending the “higher for longer” view, which is underpinning support for the Euro.
Technical Analysis: Euro consolidates gains above 1.1100
The Euro maintains its bullish bias with price action standing comfortably at five-month highs above 1.1100. The US Dollar weakness, with the Dollar Index trading at its lowest level since late July – and more than 6% below November´s peak – is acting as a tailwind for the Euro.
Technical indicators are positive, although the overbought levels reflected in the four-hour RSIs suggest that consolidation or even a certain retracement might be ahead.
On the upside, immediate resistance lies at the July 27 high, 1.1145, which closes the path toward the 2023 high, at 1.1280. Support levels are at 1.1100 ahead of a previous resistance area, at 1.1010 and 1.0930.
Euro FAQs
What is the Euro?
The Euro is the currency for the 20 European Union countries that belong to the Eurozone. It is the second most heavily traded currency in the world behind the US Dollar. In 2022, it accounted for 31% of all foreign exchange transactions, with an average daily turnover of over $2.2 trillion a day.
EUR/USD is the most heavily traded currency pair in the world, accounting for an estimated 30% off all transactions, followed by EUR/JPY (4%), EUR/GBP (3%) and EUR/AUD (2%).
What is the ECB and how does it impact the Euro?
The European Central Bank (ECB) in Frankfurt, Germany, is the reserve bank for the Eurozone. The ECB sets interest rates and manages monetary policy.
The ECB’s primary mandate is to maintain price stability, which means either controlling inflation or stimulating growth. Its primary tool is the raising or lowering of interest rates. Relatively high interest rates – or the expectation of higher rates – will usually benefit the Euro and vice versa.
The ECB Governing Council makes monetary policy decisions at meetings held eight times a year. Decisions are made by heads of the Eurozone national banks and six permanent members, including the President of the ECB, Christine Lagarde.
How does inflation data impact the value of the Euro?
Eurozone inflation data, measured by the Harmonized Index of Consumer Prices (HICP), is an important econometric for the Euro. If inflation rises more than expected, especially if above the ECB’s 2% target, it obliges the ECB to raise interest rates to bring it back under control.
Relatively high interest rates compared to its counterparts will usually benefit the Euro, as it makes the region more attractive as a place for global investors to park their money.
How does economic data influence the value of the Euro?
Data releases gauge the health of the economy and can impact on the Euro. Indicators such as GDP, Manufacturing and Services PMIs, employment, and consumer sentiment surveys can all influence the direction of the single currency.
A strong economy is good for the Euro. Not only does it attract more foreign investment but it may encourage the ECB to put up interest rates, which will directly strengthen the Euro. Otherwise, if economic data is weak, the Euro is likely to fall.
Economic data for the four largest economies in the euro area (Germany, France, Italy and Spain) are especially significant, as they account for 75% of the Eurozone’s economy.
How does the Trade Balance impact the Euro?
Another significant data release for the Euro is the Trade Balance. This indicator measures the difference between what a country earns from its exports and what it spends on imports over a given period.
If a country produces highly sought after exports then its currency will gain in value purely from the extra demand created from foreign buyers seeking to purchase these goods. Therefore, a positive net Trade Balance strengthens a currency and vice versa for a negative balance.
Interest rates FAQs
What are interest rates?
Interest rates are charged by financial institutions on loans to borrowers and are paid as interest to savers and depositors. They are influenced by base lending rates, which are set by central banks in response to changes in the economy. Central banks normally have a mandate to ensure price stability, which in most cases means targeting a core inflation rate of around 2%.
If inflation falls below target the central bank may cut base lending rates, with a view to stimulating lending and boosting the economy. If inflation rises substantially above 2% it normally results in the central bank raising base lending rates in an attempt to lower inflation.
How do interest rates impact currencies?
Higher interest rates generally help strengthen a country’s currency as they make it a more attractive place for global investors to park their money.
How do interest rates influence the price of Gold?
Higher interest rates overall weigh on the price of Gold because they increase the opportunity cost of holding Gold instead of investing in an interest-bearing asset or placing cash in the bank.
If interest rates are high that usually pushes up the price of the US Dollar (USD), and since Gold is priced in Dollars, this has the effect of lowering the price of Gold.
What is the Fed Funds rate?
The Fed funds rate is the overnight rate at which US banks lend to each other. It is the oft-quoted headline rate set by the Federal Reserve at its FOMC meetings. It is set as a range, for example 4.75%-5.00%, though the upper limit (in that case 5.00%) is the quoted figure.
Market expectations for future Fed funds rate are tracked by the CME FedWatch tool, which shapes how many financial markets behave in anticipation of future Federal Reserve monetary policy decisions.
- Gold price eases intraday gains amid recovery in US Treasury yields.
- The broader appeal for the Gold price is bullish as Fed may unwind its restrictive policy stance sooner.
- The USD Index is expected to end 2023 with losses of around 2.5%.
Gold price (XAU/USD) faced nominal pressure on Thursday after registering a fresh three-week high. The precious metal surrendered some gains as profit-booking kicked-in after the sharp rally of the last two weeks. This came as the opportunity cost of owning the non-yielding metal rose amid US Treasury yields showing signs of recovery.
The broader appeal for the Gold price, however, is expected to remain upbeat as investors see the Federal Reserve (Fed) reducing interest rates from March and with underlying inflation clearly now in a downward trajectory. The US Dollar is consistently facing a sell-off amid early rate cut expectations, helping to underpin the precious metal’s Dollar-denominated value.
Contrary to investors’ expectations, Fed policymakers see a high likelihood of a market reaction on rate-cut commentary from Federal Reserve Chairman Jerome Powell. Fed policymakers have been considering rate cut discussions as “premature” in the current scenario amid absence of confidence in inflation declining towards 2%.
Daily Digest Market Movers: Gold price falls as US yields rebound
- Gold price faces marginal selling pressure amid a recovery in US Treasury yields. The 10-year US Treasury yields rebounded to near 3.82%,
- Earlier, the Gold price extended its four-day winning spell as market participants are pricing in a rate cut by the Federal Reserve from March 2024.
- The Fed is expected to start reducing interest rates as inflation in the United States economy is in a downtrend.
- As per the CME Fedwatch tool, market participants see more than 88% chance of the Fed cutting interest rates in March. The likelihood of the Fed trimming interest rates further in May is more than 65%.
- Bets in favour of early rate cuts by the Fed are very healthy as the underlying inflation rate has dropped to 3.2% in November. The Fed, in its latest projections, anticipated this number at the end of December 2023.
- There is a reasonable chance that the Fed will achieve a soft landing as the Unemployment Rate has been steady around 3.7% and lay-offs have remained lower than new payroll additions in every month of 2023.
- As 2024 is set to kick-in, a further move in the Gold price would be guided by whether investors have priced in rate cuts too much or whether economic shrinkage will emerge suggesting current pricings are fair.
- A league of investors and Fed policymakers believe that investors have gone too far ahead in discounting rate cuts. The impact is clearly visible in the US Dollar Index (DXY), which is down 6.31% from October’s high of 107.35.
- The USD Index is expected to end the year with a loss of almost 2.5% on expectations that the Fed would be the first major central bank to cut.
- Nevertheless, other western economies are also expected to start reducing interest rates as price pressures are easing globally.
- Unlike other economies that are prone to economic contraction, the US economy is resilient. Sheer strength in economic prospects could keep additional inflationary pressures above the required rate of 2%.
- Due to a light economic calendar, second-tier weekly Initial Jobless Claims data for the week ending December 22 may bring some action in the FX domain.
- Market participants are anticipating individuals claiming jobless benefits rose to 210K, nominally higher than the former reading of 205K.
- Next week, employment and Manufacturing PMI data for December will keep investors busy.
Technical Analysis: Gold price prints a fresh three-week high
Gold price prints a fresh three-week high near $2,090 as investors hope that the opportunity cost of holding non-yielding bullions will be lower as interest rates come down. The precious metal is expected to remain in a bullish trajectory, being supported by upward-sloping 20 and 50-day Exponential Moving Averages (EMAs). Momentum oscillators have shifted into the bullish range, indicating more upside ahead.
Gold FAQs
Why do people invest in Gold?
Gold has played a key role in human’s history as it has been widely used as a store of value and medium of exchange. Currently, apart from its shine and usage for jewelry, the precious metal is widely seen as a safe-haven asset, meaning that it is considered a good investment during turbulent times. Gold is also widely seen as a hedge against inflation and against depreciating currencies as it doesn’t rely on any specific issuer or government.
Who buys the most Gold?
Central banks are the biggest Gold holders. In their aim to support their currencies in turbulent times, central banks tend to diversify their reserves and buy Gold to improve the perceived strength of the economy and the currency. High Gold reserves can be a source of trust for a country’s solvency. Central banks added 1,136 tonnes of Gold worth around $70 billion to their reserves in 2022, according to data from the World Gold Council. This is the highest yearly purchase since records began. Central banks from emerging economies such as China, India and Turkey are quickly increasing their Gold reserves.
How is Gold correlated with other assets?
Gold has an inverse correlation with the US Dollar and US Treasuries, which are both major reserve and safe-haven assets. When the Dollar depreciates, Gold tends to rise, enabling investors and central banks to diversify their assets in turbulent times. Gold is also inversely correlated with risk assets. A rally in the stock market tends to weaken Gold price, while sell-offs in riskier markets tend to favor the precious metal.
What does the price of Gold depend on?
The price can move due to a wide range of factors. Geopolitical instability or fears of a deep recession can quickly make Gold price escalate due to its safe-haven status. As a yield-less asset, Gold tends to rise with lower interest rates, while higher cost of money usually weighs down on the yellow metal. Still, most moves depend on how the US Dollar (USD) behaves as the asset is priced in dollars (XAU/USD). A strong Dollar tends to keep the price of Gold controlled, whereas a weaker Dollar is likely to push Gold prices up.
Economists at ANZ Bank expect the SGD to trade at 1.30 against the US Dollar by the end of the next year.
Monetary Authority of Singapore will likely keep policy tight for most of 2024
While the Monetary Authority of Singapore will likely keep policy tight for most of 2024, there is a limit to how much SGD can appreciate because the S$NEER is currently trading at the upper bound of the policy band.
We see the USD/SGD pair at 1.30 by year-end 2024.
- USD/MXN experienced losses as the Fed is expected to ease policy tightening in early 2024.
- Improved US yields seem failing to contribute support for the US Dollar.
- Mexico's Jobless Rate is expected to eased at 2.6% from 2.7% prior.
USD/MXN attempts to snap its recent losses, holding ground near 16.91 during the European session on Thursday. The USD/MXN faces challenges due to the weaker US Dollar (USD), which could be attributed to the potential for rate cuts by the Federal Reserve (Fed) in the first quarter of 2024.
CME Fedwatch tool suggests that markets are pricing in a probability of more than 88% for a rate cut in March, with full pricing in of a rate cut in May. These figures underscore the prevailing expectations among investors for potential monetary policy easing by the Federal Reserve (Fed).
Additionally, the decline in the US Treasury yields contributed to downward pressure to undermining the Greenback. However, the 2-year and 10-year yields on US bond coupons attempt to halt recent losses, standing at 4.26% and 3.81%, respectively.
Last week’s softer US Core PCE – inflation adds to the belief that the Federal Reserve may consider easing its monetary stance to address economic conditions. This economic indicator plays a crucial role in the Fed's assessment of inflation trends and overall economic health.
Investors are expected to closely monitor Thursday's releases as these data points provide additional insights into the labor market and the real estate sector. US Initial Jobless Claims for the week ending on December 22 is expected to print a slightly higher number of 210K against the previous 205K. Moreover, Pending Home Sales could rise to 1.0%, swinging from the previous decline of 1.5%.
On Mexico’s side, the Jobless Rate for November will be released by the National Institute of Statistics and Geography of Mexico (INEGI) on Thursday. The market expects that the rate of unemployed workers will be reduced to 2.6% from the previous 2.7%. Moreover, Fiscal Balance for November is due to be released on Saturday.
The biggest mover in the FX market today is the Yen. Economists at MUFG Bank analyze USD/JPY outlook.
BoJ on course to exit negative rates but exact timing of first hike uncertain
While the exact timing of the first rate hike remains uncertain, the direction of travel is clear. We continue to expect the BoJ to exit negative rate policy in the 1H of next year helping to reinforce the Yen’s rebound from deeply undervalued levels.
So far the recent rebound for the Yen has been mainly driven by expectations that major central banks outside of Japan including the Fed will begin to cuts rates earlier and deeper next year helping to narrow policy divergences with the BoJ.
Gold prices rose in India on Thursday, according to data from India's Multi Commodity Exchange (MCX).
Gold price stood at 63,412 Indian Rupees (INR) per 10 grams, up INR 446 compared with the INR 62,966 it cost on Wednesday.
As for futures contracts, Gold prices decreased to INR 63,522 per 10 gms from INR 63,678 per 10 gms.
Prices for Silver futures contracts decreased to INR 75,374 per kg from INR 75,647 per kg.
| Major Indian city | Gold Price |
|---|---|
| Ahmedabad | 65,660 |
| Mumbai | 65,410 |
| New Delhi | 65,520 |
| Chennai | 65,650 |
| Kolkata | 65,580 |
Global Market Movers: Comex Gold price capitalizes on dovish Fed pivot
- Comex Gold price is sitting close to a three-week high of $2,089, as a sharper-than-projected decline in the United States core PCE price index data has fuelled bets in favor of early rate cuts by the Fed.
- The US core PCE price index data softened to 3.2% vs. the estimates of 3.3% and the former reading of 3.5%. On a monthly basis, the underlying inflation data grew slightly by 0.1% while market participants projected a steady growth of 0.2%.
- It is worth noting that the Fed forecasted core PCE price index at 3.2% by the year-end in its Summary of Projections (SOP) released last week. This indicates that the Fed has achieved its inflation target of 2023.
- This greater-than-projected decline in the Fed’s preferred inflation tool may force policymakers to endorse rate cuts sooner than previously thought.
- As per the CME Fedwatch tool, market participants are pricing in a more than 75% odds chance of an interest rate cut in March.
- Till now, Fed policymakers have been pushing back rate cut expectations, citing the need for a restrictive interest rate policy for a longer period to ensure the achievement of price stability.
- A significant decline in the US inflation data is setting a better start for the Fed for 2024, which would allow them to achieve a soft landing for the economy. Such a soft landing would enable price stability without triggering a recession.
- Apart from the US core PCE price index data, investors also focused on the Durable Goods Orders for November, released on Friday.
- New orders for durable goods rose at a stronger pace of 5.4% against expectations of 2.2%. In October, orders of durable goods contracted by 5.1%.
- Subsiding inflation in the US economy has boosted consumer confidence. The Michigan Consumer Sentiment index for December, released last week, rose to 69.7, against projections and the former reading of 69.4.
- Deepening rate cut expectations by the Fed have weighed heavily on the US Dollar and Treasury yields.
- Lower interest rates, or their expectation, tend to reduce foreign capital inflows negatively impacting a currency.
- The US Dollar Index hovers near a five-month low below 101.50 and 10-year US Treasury yields have dropped further to near 3.87%.
- This week, the economic calendar will be light due to it being a holiday week while the second-tier weekly jobless claims data will be in focus.
(An automation tool was used in creating this post.)
Gold FAQs
Why do people invest in Gold?
Gold has played a key role in human’s history as it has been widely used as a store of value and medium of exchange. Currently, apart from its shine and usage for jewelry, the precious metal is widely seen as a safe-haven asset, meaning that it is considered a good investment during turbulent times. Gold is also widely seen as a hedge against inflation and against depreciating currencies as it doesn’t rely on any specific issuer or government.
Who buys the most Gold?
Central banks are the biggest Gold holders. In their aim to support their currencies in turbulent times, central banks tend to diversify their reserves and buy Gold to improve the perceived strength of the economy and the currency. High Gold reserves can be a source of trust for a country’s solvency. Central banks added 1,136 tonnes of Gold worth around $70 billion to their reserves in 2022, according to data from the World Gold Council. This is the highest yearly purchase since records began. Central banks from emerging economies such as China, India and Turkey are quickly increasing their Gold reserves.
How is Gold correlated with other assets?
Gold has an inverse correlation with the US Dollar and US Treasuries, which are both major reserve and safe-haven assets. When the Dollar depreciates, Gold tends to rise, enabling investors and central banks to diversify their assets in turbulent times. Gold is also inversely correlated with risk assets. A rally in the stock market tends to weaken Gold price, while sell-offs in riskier markets tend to favor the precious metal.
What does the price of Gold depend on?
The price can move due to a wide range of factors. Geopolitical instability or fears of a deep recession can quickly make Gold price escalate due to its safe-haven status. As a yield-less asset, Gold tends to rise with lower interest rates, while higher cost of money usually weighs down on the yellow metal. Still, most moves depend on how the US Dollar (USD) behaves as the asset is priced in dollars (XAU/USD). A strong Dollar tends to keep the price of Gold controlled, whereas a weaker Dollar is likely to push Gold prices up.
The Swiss Franc finishes 2023 as the top G10 performer. Economists at ANZ Bank analyze CHF outlook.
Weaker EU growth is associated with a stronger CHF TWI on a broader time horizon
We think the SNB will be less concerned with supporting CHF strength in 2024.
Weaker EU growth is associated with a stronger CHF Trade Weighted Index on a broader time horizon. So, if the EU remains trapped in a period of slow to negative growth, what some consider to be the CHF’s overvaluation is likely to persist for longer than expected.
The bottom line is that while tailwinds will diminish as we enter 2024, the CHF could remain overvalued near term, given that Europe’s economic woes will likely extend into the first half of next year. However, the softer USD and easing rate cycles globally should see the CHF retreat from multi-year highs against other G10 crosses.
We see the USD/CHF at 0.86 by the end of 2024.
- USD/JPY moves below the 141.00 psychological level on the back of the subdued US Dollar.
- A firm break above the 142.00 level could lead the pair to reach a nine-day EMA at 142.41.
- Technical indicators suggest a bearish sentiment to test the major support at 140.50.
USD/JPY extends its losses as the US Dollar (USD) weakens on the back of the dovish Federal Reserve’s (Fed) outlook in the first quarter of 2024. The USD/JPY pair trades lower around 140.80 during the early European session on Thursday. The 141.00 psychological level emerges as the immediate resistance following the next barrier at the 142.00 level.
if there is a breakthrough above the psychological level, it may support the USD/JPY pair to reach the nine-day Exponential Moving Average (EMA) at 142.41, following the psychological resistance at the 143.00 level. If the pair successfully surpasses this level, the next barrier would be the 23.6% Fibonacci retracement level at 143.35.
The 14-day Relative Strength Index (RSI) below the 50 level indicates a weaker sentiment for the USD/JPY pair. Additionally, the Moving Average Convergence Divergence (MACD) line is positioned below the centerline and the signal line, signaling a bearish momentum in the market for the USD/JPY pair.
The bearish sentiment could potentially lead the USD/JPY pair towards the major support region around 140.50. If there is a decisive break below this level, it may open the door for the pair to test the psychological level at 140.00.
USD/JPY: Daily Chart
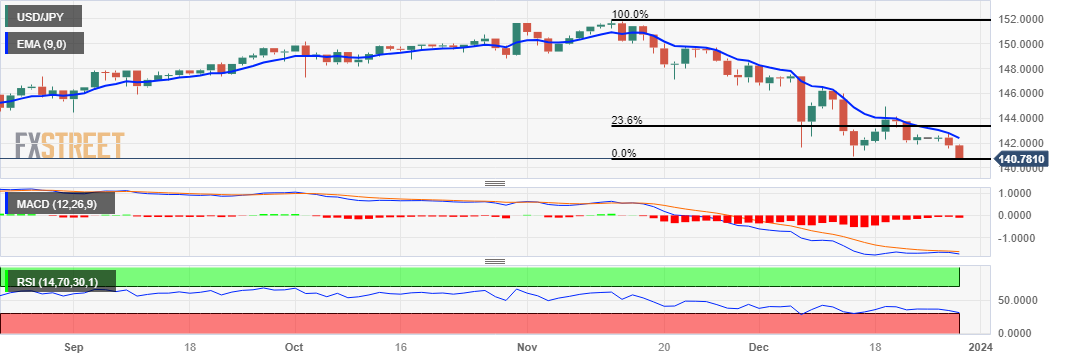
Economists at MUFG Bank expect Asian currencies to appreciate against the Dollar in 2024 with the Korean Won being the front-runner.
A recovery global semiconductor industry is positive for KRW
KRW is set to be front runner among its Asian peers.
A recovery global semiconductor industry and continued favourable AI trend and electronic cycle would stimulate Korea’s exports and improve trade balance.
South Korea likely benefit from China’s more balanced recovery next year and deliver a positive growth of exports to China in 2024.
Additionally, due to the Fed’s policy rate cutting, the negative yield spread between South Korea and the US likely turns positive in 2H2024, providing another layer of support for KRW.
We forecast USD/KRW to reach 1,285 by 1Q2024 and 1,235 by end-2024.
- Pound Sterling advances above 1.2800 against the US Dollar on upbeat market sentiment.
- High inflation and recession fears in the UK may complicate the idea of BoE remaining a laggard in cutting rates.
- The economic calendar is light due to the festive season.
The Pound Sterling (GBP) prints a fresh four-month high as investors hope that the Bank of England (BoE) will maintain a restrictive monetary policy stance for a longer period than other Group of Seven economies. The GBP/USD pair has continued its four-day winning streak as the market mood is quite cheerful due to early rate cut expectations from the Federal Reserve (Fed).
BoE policymakers are expected to face enormous difficulties as price pressures in the United Kingdom are high and the economy is on the verge of a technical recession due to deteriorating demand in domestic and overseas markets. The BoE could be forced to turn dovish due to economic shrinkage.
Daily Digest Market Movers: Pound Sterling jumps higher while US Dollar tumbles
- Pound Sterling refreshes four-month high as the risk-appetite of the market participants continues to surge.
- The overall market mood remains upbeat as investors lean towards expectations of early rate cuts by the Federal Reserve.
- The Fed is expected to start lowering borrowing costs from March as price pressures in the United States economy are clearly in a downtrend.
- Action in the FX domain clearly indicates that markets are confident about early rate cuts by the Fed. The US Dollar continues to face pressure despite thin trading volume and empty economic docket.
- The Pound Sterling continues to enjoy higher demand as the Bank of England is expected to be laggard in the adaptation of a rate-cut mindset.
- The underlying inflation in the UK economy is highest in comparison with other Group of Seven economies, which would force BoE policymakers to remain leaned towards restrictive monetary policy stance.
- The UK core Consumer Price Index (CPI) has softened to 5.1% but is still more than double the required rate of 2% due to robust wage growth.
- This would allow BoE policymakers to stick with a restrictive monetary policy stance for a longer period.
- Meanwhile, expectations of a technical recession in the UK economy have deepened after the Office for National Statistics (ONS) revised in a slight contraction in Q3 Gross Domestic Product (GDP) by 0.1%, escalating the need for early rate cut discussions.
- Chances for unwinding of BoE’s tight monetary policy stance would escalate if the UK economy shrinks in the last quarter of 2024.
- The BoE reported in its latest projections that the economy would remain stagnant in the last quarter.
- UK Finance Minister Jeremy Hunt said last week there is a reasonable chance that if we stick to the course, the administration would be able to bring inflation down and the central bank would start cutting interest rates.
- This week, the economic calendar is light. Therefore, investors will focus on the weekly Initial Jobless Claims data for the week ending December 22, which will be published at 13:30 GMT.
- As per the consensus, individuals claiming jobless benefits are forecast to be higher at 210K from the former reading of 205K.
Technical Analysis: Pound Sterling aims for stability above 1.2800
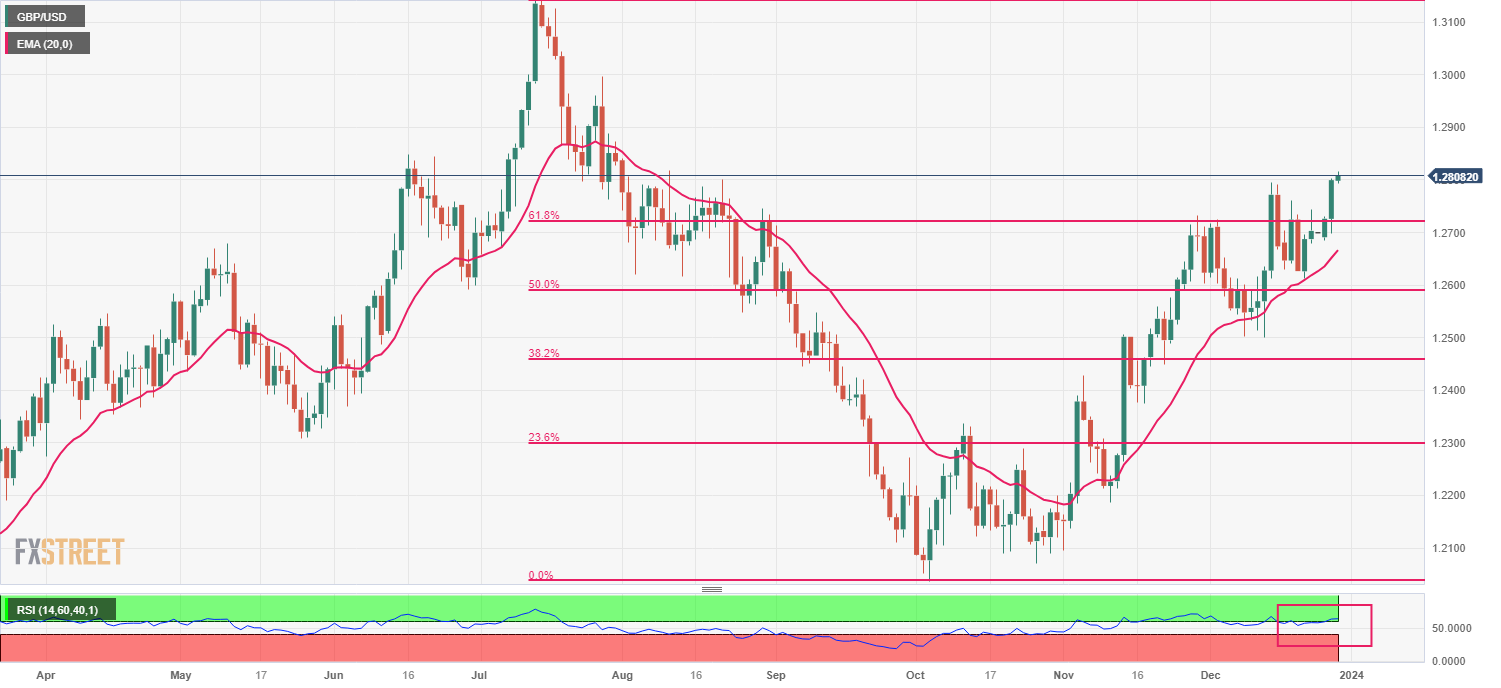
Pound Sterling climbs slightly above the round-level resistance of 1.2800, being supported by cheerful market mood. The Cable aims stability above the 61.8% Fibonacci retracement (plotted from July 14 high at 1.3142 to October 4 low at 1.2037) at 1.2740. The upward-sloping 20-day Exponential Moving Average (EMA) at 1.2670 continues to support the Pound Sterling bulls.
The Relative Strength Index (RSI) (14) has climbed above 60. Sustainability above aforementioned levels would trigger a bullish momentum.
Pound Sterling FAQs
What is the Pound Sterling?
The Pound Sterling (GBP) is the oldest currency in the world (886 AD) and the official currency of the United Kingdom. It is the fourth most traded unit for foreign exchange (FX) in the world, accounting for 12% of all transactions, averaging $630 billion a day, according to 2022 data.
Its key trading pairs are GBP/USD, aka ‘Cable’, which accounts for 11% of FX, GBP/JPY, or the ‘Dragon’ as it is known by traders (3%), and EUR/GBP (2%). The Pound Sterling is issued by the Bank of England (BoE).
How do the decisions of the Bank of England impact on the Pound Sterling?
The single most important factor influencing the value of the Pound Sterling is monetary policy decided by the Bank of England. The BoE bases its decisions on whether it has achieved its primary goal of “price stability” – a steady inflation rate of around 2%. Its primary tool for achieving this is the adjustment of interest rates.
When inflation is too high, the BoE will try to rein it in by raising interest rates, making it more expensive for people and businesses to access credit. This is generally positive for GBP, as higher interest rates make the UK a more attractive place for global investors to park their money.
When inflation falls too low it is a sign economic growth is slowing. In this scenario, the BoE will consider lowering interest rates to cheapen credit so businesses will borrow more to invest in growth-generating projects.
How does economic data influence the value of the Pound?
Data releases gauge the health of the economy and can impact the value of the Pound Sterling. Indicators such as GDP, Manufacturing and Services PMIs, and employment can all influence the direction of the GBP.
A strong economy is good for Sterling. Not only does it attract more foreign investment but it may encourage the BoE to put up interest rates, which will directly strengthen GBP. Otherwise, if economic data is weak, the Pound Sterling is likely to fall.
How does the Trade Balance impact the Pound?
Another significant data release for the Pound Sterling is the Trade Balance. This indicator measures the difference between what a country earns from its exports and what it spends on imports over a given period.
If a country produces highly sought-after exports, its currency will benefit purely from the extra demand created from foreign buyers seeking to purchase these goods. Therefore, a positive net Trade Balance strengthens a currency and vice versa for a negative balance.
Economists at ANZ Bank analyze Indian Rupee’s (INR) and Indonesian Rupiah’s (IDR) outlook for the next year.
RBI to keep the Rupee within a narrow trading range
India is benefiting from a structural increase in foreign direct investment inflows. Bond index inclusion from 2024 will see consistent foreign buying of Indian government bonds by asset managers. However, this is unlikely to benefit the INR, as we expect the RBI to absorb those inflows and continue to keep the currency within a narrow trading range.
IDR is among the better performers in the region so far in 2023, thanks to favourable terms of trade. But as the commodity prices for its major exports decline, this will lead to a deterioration in Indonesia’s current account into 2024, which will limit the extent of IDR appreciation. We forecast USD/IDR to reach 15,000 by year-end 2024.
Here is what you need to know on Thursday, December 28:
The US Dollar (USD) continued to weaken against its rivals mid-week, with the USD Index dropping to its lowest level in five months below 101.00. Early Thursday, the USD stays on the back foot as investors await weekly Initial Jobless Claims and Goods Trade Balance data for November.
US Dollar price this week
The table below shows the percentage change of US Dollar (USD) against listed major currencies this week. US Dollar was the weakest against the Swiss Franc.
| USD | EUR | GBP | CAD | AUD | JPY | NZD | CHF | |
| USD | -0.85% | -0.81% | -0.58% | -0.78% | -1.14% | -0.80% | -1.98% | |
| EUR | 0.94% | 0.07% | 0.38% | 0.13% | -0.27% | 0.14% | -1.02% | |
| GBP | 0.93% | -0.12% | 0.49% | 0.04% | -0.36% | 0.19% | -1.28% | |
| CAD | 0.58% | -0.58% | -0.27% | -0.45% | -0.55% | -0.06% | -1.52% | |
| AUD | 0.77% | -0.13% | -0.05% | 0.19% | -0.39% | 0.02% | -1.36% | |
| JPY | 1.13% | 0.30% | 0.14% | 0.82% | 0.42% | 0.53% | -0.97% | |
| NZD | 0.79% | -0.11% | 0.01% | 0.20% | -0.02% | -0.42% | -1.11% | |
| CHF | 2.12% | 0.99% | 0.97% | 1.52% | 1.40% | 0.95% | 1.17% |
The heat map shows percentage changes of major currencies against each other. The base currency is picked from the left column, while the quote currency is picked from the top row. For example, if you pick the Euro from the left column and move along the horizontal line to the Japanese Yen, the percentage change displayed in the box will represent EUR (base)/JPY (quote).
The benchmark 10-year US Treasury bond yield turned south and lost more than 2% in the American session on Wednesday, causing the USD to come under selling pressure. In the European morning, the 10-year yield holds steady near 3.8%. Meanwhile, US stock index futures trade marginally higher on the day after Wall Street's main indexes registered small gains.
In the early Asian session, the data from Japan revealed that Retail Trade increased by 5.3% on a yearly basis in November. This reading followed the 4.1% growth recorded in October and surpassed the market expectation for an expansion of 5%. Other data showed that Industrial production contracted by 0.9% on a monthly basis in November. In an interview with Japanese public broadcaster NHK on Wednesday, Bank of Japan (BoJ) Governor Kazuo Ueda said that the possibility of ending negative rates next year is "not zero." Following a bullish start to the day, USD/JPY pushed lower and closed deep in negative territory on Wednesday. The pair continued to stretch lower early Thursday and slumped to a multi-month low below 141.00.
EUR/USD gathered bullish momentum and climbed to its highest level since late July above 1.1100.
GBP/USD took advantage of the broad-based USD weakness and rose above 1.2800 for the first time in nearly five months.
USD/CAD dropped to the 1.3170 area but recovered toward 1.3200 and settled there. Crude Oil prices declined on Wednesday, with the barrel of West Texas Intermediate (WTI) losing 2%, making it difficult for the commodity-sensitive Canadian Dollar to outperform the USD.
After moving sideways slightly below $2,070 in the first half of the day on Wednesday, Gold regained its traction and rose above $2,080, closing the fifth consecutive day in positive territory. XAU/USD continues to stretch higher and was last seen trading at around $2,085.
- WTI prices gain ground near $74.30, adding 0.52% on the day.
- The weaker USD due to a raised bet on rate cuts from the Fed, lifts the black gold.
- The escalating tension in the Red Sea prompted fears of shipping disruption.
Western Texas Intermediate (WTI), the US crude oil benchmark, is trading around $74.30 on Thursday. The recovery of WTI prices is bolstered by the softer US Dollar (USD), which lends some support to USD-denominated commodities.
That being said, the decline of the USD to a five-month low due to raising bets on interest rate cuts from the US Federal Reserve (Fed) has boosted the black gold. Investors have priced in over 88% of a rate cut starting in March 2024 and expect more than 150 basis points (bps) of rate cuts next year.
Market players will closely monitor the developments in the Red Sea as a drone attack on an oil tanker prompted fears of shipping disruption. Furthermore, the ongoing Israeli military attack in Gaza remained a major driver of market sentiment. Central Gaza was pummelling by land, sea, and air by Israeli forces on Wednesday, one day after Israel's Chief of Staff Herzi Halevi, stated that the conflict would last for many months.
According to the American Petroleum Institute weekly report on Wednesday, US crude oil inventories increased by 1.837M barrels for the week ending December 23 from the previous reading of 0.939M barrels gain.
Oil traders will keep an eye on the EIA Crude Oil Stocks Change report, due on Thursday. Also, the US Initial weekly Jobless Claims, Trade Balance for November, and Pending Home Sales will be released. Traders will take cues from the data and find trading opportunities around WTI prices.
- USD/CHF loses ground as the Fed is expected to lower interest rates in early 2024.
- The demand for the Swiss Franc is heightened on risk aversion due to the Middle-East conflict.
- CME Fedwatch tool indicated that markets are pricing in the probability of a Fed rate cut in March and in May.
USD/CHF posted an all-time low at 0.8394 during the Asian trading hours on Thursday, trading around 0.8400 at the time of writing. The USD/CHF faces challenges due to the weaker US Dollar (USD). The escalated geopolitical situation in the Middle East is fostering risk aversion, leading to an increase in demand for the safe-haven Swiss Franc (CHF).
Investors seek refuge in assets like the CHF during times of heightened geopolitical tensions. Concerns are particularly centered around the potential closure of the Gibraltar Strait by Iran, adding to the geopolitical uncertainties. However, major shipping firms have begun to return to the Red Sea, indicating a tentative normalization in the region.
According to the CME Fedwatch tool, markets are pricing in a probability of more than 88% for a rate cut in March and a full pricing in of a rate cut in May. These figures indicate the prevailing expectations among investors for potential monetary policy easing by the Federal Reserve (Fed).
Additionally, the softer US Core Personal Consumption Expenditures (PCE) – inflation further reinforces the belief that the Federal Reserve may contemplate easing its monetary stance to address economic conditions. On Wednesday, the US Richmond Fed Manufacturing Index experienced a notable decrease of 11 points in December, contrary to the expected decrease of 7 points and a 5-point decrease in November.
Investors are anticipated to focus on Thursday's releases of Initial Jobless Claims and Pending Home Sales from the United States, which could offer additional insights into the labor market and the real estate sector, respectively.
- USD/CAD extends its downside near the 1.3200 mark in a quiet session on Thursday.
- US Richmond Fed Manufacturing Index fell to 11 in December versus -5 prior, weaker than expected.
- The rebound in oil prices lends some support to the Loonie.
- US Initial weekly Jobless Claims, Trade Balance for November, and Pending Home Sales will be released later on Thursday.
The USD/CAD pair trades in negative territory for the third consecutive week during the early European session on Thursday. The downward momentum of the pair is backed by the softer US Dollar (USD) and the lower US Treasury bond yields. The last week of 2023 is likely to be quiet as traders turn to holiday mode. At press time, USD/CAD is trading at 1.3204, losing 0.02% on the day.
On Wednesday, the US Richmond Fed Manufacturing Index fell to 11 in December versus -5 in November, weaker than the expectation of a 7 drop. Meanwhile, the USD edges lower to its lowest level since July near 100.80. That being said, the decline in November’s US Core Personal Consumption Expenditure Price Index (Core PCE) triggered the bets on early rate cuts by the Federal Reserve (Fed) in 2024. According to the CME Fedwatch tool, markets are now pricing in over 88% of a rate cut starting in March 2024, with more than 150 basis points (bps) of cuts priced in for next year.
On the Loonie front, the rebound in oil prices lifts the Canadian Dollar (CAD) and acts as a headwind for the USD/CAD pair. Apart from this, the Bank of Canada (BoC) said at a recent meeting that an additional rate hike cannot be ruled out. However, the markets anticipate that the odds of another rate hike have decreased, and investors widely expect its next move will be to cut interest rates sometime next year.
Moving on, market players will monitor the US Initial weekly Jobless Claims, Trade Balance for November, and Pending Home Sales on Thursday. These figures might not have a significant impact on the market amid the light trading volume.
- EUR/USD rises toward the major resistance at the 1.1150 level.
- Technical indicators suggest a bullish momentum to reach the psychological level of 1.1200.
- The psychological level of 1.1100 could act as key support following the seven-day EMA at 1.1041.
EUR/USD maintains its winning streak, with the Euro (EUR) gaining ground against the subdued US Dollar (USD). This trend is likely influenced by the anticipated dovish stance of the US Federal Reserve (Fed) on the interest rate trajectory. The EUR/USD pair trades around the 1.1110 level during the Asian session on Thursday.
The Moving Average Convergence Divergence (MACD) signals an overall positive momentum for the EUR/USD pair. The MACD line's position above the centerline and the divergence above the signal line indicates a bullish sentiment.
This positive momentum could inspire bulls of the EUR/USD pair to aim for a breakthrough above the five-month high at 1.1122. If successful, it may pave the way for the EUR/USD pair to explore major resistance at 1.1150, following the next significant level at the psychological level of 1.1200.
In addition to the positive momentum indicated by the MACD, the lagging indicator 14-day Relative Strength Index (RSI) positions above the 50 mark. This suggests a confirmation of the potential upward trend in the EUR/USD pair.
On the downside, the EUR/USD pair could find support at the psychological level of 1.1100, following the seven-day Exponential Moving Average (EMA) at 1.1041. A break below the EMA could lead the pair to test the psychological support region around 1.1000, further navigating towards the region around the 23.6% Fibonacci retracement level at 1.0964.
EUR/USD: Daily Chart
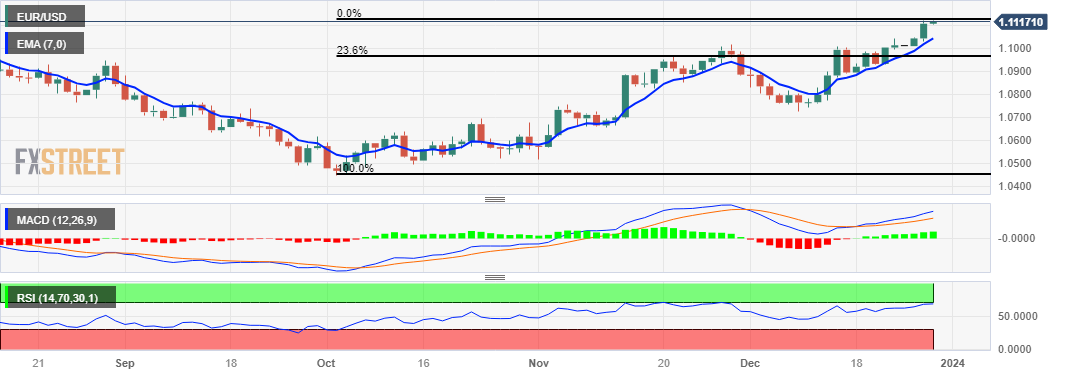
- Gold price gains ground as the US Dollar continuously depreciates.
- The Middle East conflict contributes to strengthening the demand for the yellow metal.
- China NDRC’s Chairman Zheng Shanjie said to implement policy measures to recover the economy.
- CME Fedwatch tool indicated that markets price in around 88% probability of a rate cut in March.
Gold price trades higher around its three-week high near $2,088 per troy ounce during the Asian session on Thursday. The improved risk appetite due to the potential for rate cuts by the Federal Reserve (Fed) in the first quarter of 2024, is giving rise to the price of the yellow metal.
The return of major shipping firms to the Red Sea suggests a tentative normalization, possibly influenced by the deployment of a multinational task force in the region. Despite this, concerns linger about the potential closure of the Gibraltar Strait by Iran. The complex and dynamic geopolitical situation in the Middle East continues to impact market sentiments and contribute to an increase in the demand for safe-haven assets like Gold.
China's commitment to implementing familiar policy measures, as expressed by the National Development and Reform Commission's (NDRC) Chairman, Zheng Shanjie, is geared towards expanding domestic demand, ensuring a speedy economic recovery, and promoting stable growth. Any positive developments in the Chinese economy are likely to influence the Gold price, causing it to gain ground.
The markets are pricing in more than an 88% probability of a rate cut in March, and they are fully pricing in a rate cut in May, as indicated by the CME Fedwatch tool. This reflects the prevailing expectations among investors for potential monetary policy easing by the Federal Reserve. Additionally, the softer US Core PCE – inflation adds to these expectations, contributing to the belief that the Fed may consider easing its monetary stance to address economic conditions. Investors will likely focus on Thursday's releases of Initial Jobless Claims and Pending Home Sales from the United States.
- Indian Rupee trades on a positive note on the weaker US Dollar.
- CEBR stated in its report that India is expected to be the largest economic superpower by 2100.
- US Initial weekly Jobless Claims, November’s Trade Balance and Pending Home Sales will be released on Thursday.
Indian Rupee (INR) recovers its recent losses on Thursday amid the US Dollar (USD) weakness. India is set to become the world's third-biggest by 2032 and will eventually surpass China and the United States to become the "world's largest economic superpower" by 2100, the Centre for Economics and Business Research (CEBR) stated in its report on Wednesday. Earlier this week, Fitch Ratings projected India to be the world’s fastest-growing country, with resilient GDP growth of 6.5% during fiscal 2024–25.
Nonetheless, the next general elections in India will be closely watched by investors as the outcomes will significantly impact India's domestic and foreign policy. Later on Thursday, market players will focus on the US Initial weekly Jobless Claims, Trade Balance for November, and Pending Home Sales. These figures might not have a significant impact on the market as traders enter holiday mode heading into 2024.
Daily Digest Market Movers: Indian Rupee shows resilience amid multiple headwinds
- According to the Reserve Bank of India (RBI), the Gross Non-Performing Asset (GNPA) ratio of Indian banks improved further in the second quarter of the current fiscal year, easing to a new decadal low.
- India's current account deficit narrowed to $8.3 billion in the second quarter of 2023–24.
- India's foreign currency reserves were $606.9 billion on December 8, ranking fourth among major foreign exchange reserve-holding countries, and increased by $28.4 billion during 2023–2024.
- The US Richmond Fed Manufacturing Index fell to 11 in December from a 5 drop in November, below the market consensus of -7.
- The US Dallas Fed Manufacturing Business Index for December came in at -9.3 versus -19.9 prior. November's Chicago Fed National Activity Index arrived at 0.03 from a 0.49 decline in the previous reading.
Technical Analysis: Indian Rupee extends the longer-term range theme
Indian Rupee trades firmer on the day. The USD/INR pair maintains a multi-month-old trading band of 82.80–83.40 unchanged. From a technical perspective, the further upside of USD/INR looks favorable as the pair holds above the key 100-period Exponential Moving Average (EMA) on the daily chart. The 14-day Relative Strength Index (RSI) contributed to the upward momentum as it bounces back above the 50.0 midpoint.
The immediate resistance level of the pair will emerge at the upper boundary of the trading range at 83.40. Further north, the year-to-date (YTD) high of 83.47 and the 84.00 psychological mark will be the next upside targets. On the downside, the critical support level for USD/INR is seen near the round figure at 83.00. The additional downside filter to watch is the confluence of the lower limit of the trading range and a low of September 12 at 82.80. A breach of this level will pave the way to a low of August 11 at 82.60.
US Dollar price today
The table below shows the percentage change of US Dollar (USD) against listed major currencies today. US Dollar was the weakest against the Swiss Franc.
| USD | EUR | GBP | CAD | AUD | JPY | NZD | CHF | |
| USD | -0.09% | -0.10% | -0.06% | -0.06% | -0.04% | -0.19% | -0.22% | |
| EUR | 0.08% | -0.01% | 0.02% | 0.02% | 0.04% | -0.10% | -0.14% | |
| GBP | 0.11% | 0.01% | 0.04% | 0.00% | 0.06% | -0.10% | -0.12% | |
| CAD | 0.06% | -0.03% | -0.02% | -0.01% | 0.01% | -0.12% | -0.15% | |
| AUD | 0.09% | -0.02% | -0.02% | 0.01% | 0.03% | -0.12% | -0.15% | |
| JPY | 0.03% | -0.05% | -0.05% | -0.06% | -0.05% | -0.13% | -0.20% | |
| NZD | 0.19% | 0.11% | 0.10% | 0.16% | 0.13% | 0.19% | 0.01% | |
| CHF | 0.22% | 0.14% | 0.12% | 0.15% | 0.14% | 0.17% | 0.01% |
The heat map shows percentage changes of major currencies against each other. The base currency is picked from the left column, while the quote currency is picked from the top row. For example, if you pick the Euro from the left column and move along the horizontal line to the Japanese Yen, the percentage change displayed in the box will represent EUR (base)/JPY (quote).
Indian Rupee FAQs
What are the key factors driving the Indian Rupee?
The Indian Rupee (INR) is one of the most sensitive currencies to external factors. The price of Crude Oil (the country is highly dependent on imported Oil), the value of the US Dollar – most trade is conducted in USD – and the level of foreign investment, are all influential. Direct intervention by the Reserve Bank of India (RBI) in FX markets to keep the exchange rate stable, as well as the level of interest rates set by the RBI, are further major influencing factors on the Rupee.
How do the decisions of the Reserve Bank of India impact the Indian Rupee?
The Reserve Bank of India (RBI) actively intervenes in forex markets to maintain a stable exchange rate, to help facilitate trade. In addition, the RBI tries to maintain the inflation rate at its 4% target by adjusting interest rates. Higher interest rates usually strengthen the Rupee. This is due to the role of the ‘carry trade’ in which investors borrow in countries with lower interest rates so as to place their money in countries’ offering relatively higher interest rates and profit from the difference.
What macroeconomic factors influence the value of the Indian Rupee?
Macroeconomic factors that influence the value of the Rupee include inflation, interest rates, the economic growth rate (GDP), the balance of trade, and inflows from foreign investment. A higher growth rate can lead to more overseas investment, pushing up demand for the Rupee. A less negative balance of trade will eventually lead to a stronger Rupee. Higher interest rates, especially real rates (interest rates less inflation) are also positive for the Rupee. A risk-on environment can lead to greater inflows of Foreign Direct and Indirect Investment (FDI and FII), which also benefit the Rupee.
How does inflation impact the Indian Rupee?
Higher inflation, particularly, if it is comparatively higher than India’s peers, is generally negative for the currency as it reflects devaluation through oversupply. Inflation also increases the cost of exports, leading to more Rupees being sold to purchase foreign imports, which is Rupee-negative. At the same time, higher inflation usually leads to the Reserve Bank of India (RBI) raising interest rates and this can be positive for the Rupee, due to increased demand from international investors. The opposite effect is true of lower inflation.
| Raw materials | Closed | Change, % |
|---|---|---|
| Silver | 24.268 | 0.25 |
| Gold | 2077.236 | 0.46 |
| Palladium | 1153.55 | -1.51 |
- GBP/USD attracts some buyers above 1.2800 amid the USD softness.
- Markets are now pricing in over 88% of a rate cut from the Fed starting in March 2024.
- The Bank of England (BoE) has insisted on keeping borrowing costs at their 5.25% level for some time.
- Investors will focus on the US Initial Jobless Claims, Trade Balance, and November Pending Home Sales on Thursday.
The GBP/USD pair extends its upside above the 1.2800 mark during the Asian trading hours on Thursday. The decline in inflationary pressure in the US economy and dovish comments from the Federal Reserve (Fed) have dragged the US Dollar (USD) lower and lent some support to GBP/USD. At press time, the major pair is trading at 1.2810, up 0.09% on the day.
The Greenback remains under pressure as investors anticipate that the Federal Reserve (Fed) could soon cut interest rates. Markets are now pricing in over 88% of a rate cut starting in March 2024, according to the CME Fedwatch tool, with more than 150 basis points (bps) of cuts priced in for next year.
On the other hand, the Bank of England (BoE) indicated that the rate cuts are not yet close in the UK. The BoE maintained interest rates for the third successive meeting and insisted on keeping borrowing costs at their 5.25% level for some time. The central bank policymakers said earlier that it’s premature to talk about cutting rates. However, money markets expected the interest rate cuts next year, with the first cut coming in May.
Amidst the holiday season's thin trading, the risk sentiment is likely to continue influencing GBP/USD movements until the New Year. Later on Thursday, the US Initial weekly Jobless Claims, Trade Balance, and November Pending Home Sales will be released. The UK Nationwide Housing Prices and the US Chicago Purchasing Managers' Index will be due on Friday.
- Australian Dollar continues to reach fresh highs on the subdued US Dollar.
- Australian robust economic conditions influence the RBA to maintain its hawkish stance.
- China's NDRC's Chairman, Zheng Shanjie mentioned that China will strive to expand domestic demand.
- Investors await US data releases to gain further impetus on the Fed’s stance.
The Australian Dollar (AUD) continues to gain ground on Thursday as the US Dollar (USD) fell below the 101.00 mark, influenced by subdued US Treasury yields. The AUD/USD pair receives additional upward support from improved risk appetite, with investors speculating on a dovish stance from the Federal Reserve (Fed) regarding interest rates in early 2024.
Australia's inflation and housing prices are displaying resilience, potentially influencing the Reserve Bank of Australia (RBA) to maintain its hawkish stance. The latest RBA forecasts are nearing the upper boundary of the 2-3% inflation target by the end of the year 2025. In its recent Meeting Minutes, the RBA emphasized the importance of carefully examining additional data to assess the balance of risks before making future interest rate decisions. There is widespread anticipation that the RBA will refrain from a rate cut in February's policy meeting.
China's National Development and Reform Commission's (NDRC) Chairman, Zheng Shanjie, has expressed the country's commitment to implementing familiar policy measures. In a meeting held on Tuesday, Zheng mentioned that China will strive to expand domestic demand, ensuring a speedy economic recovery, and promoting stable growth.
The US Dollar Index (DXY) experiences continued weakness as the market anticipates potential rate cuts by the Federal Reserve (Fed) in the first quarter of the upcoming year. This expectation stems from the Fed's policy pivot in December, where the dot plot of rate expectations suggested the possibility of up to three cuts, amounting to a total of 75 basis points in rate reductions by the end of 2024.
US Richmond Fed Manufacturing Index recorded a significant decline of 11 points in December, exceeding the market's expectation of a 7-point drop. This comes after a 5-point decrease in November. The unexpected contraction in the manufacturing index may impact market perceptions of economic conditions. Investors will likely turn their attention to Thursday's Initial Jobless Claims and Pending Home Sales releases.
Daily Digest Market Movers: Australian Dollar extends gains on improved risk appetite
- RBA Private Sector Credit (MoM) demonstrated a 0.4% increase in November, surpassing the previous rise of 0.3%. However, the Year-over-Year data indicated a decrease of 4.7%, compared to the previous 4.8% rise.
- RBA highlighted the examination of additional data to assess the balance of risks before deciding on future interest rates in its recent Meeting Minutes.
- China's year-on-year Industrial Profits for January to November registered a decline of 4.4%, indicating a slowdown and highlighting the need for additional policy support from Beijing to bolster growth in the world's second-largest economy.
- Former Dallas Federal Reserve President Robert Kaplan emphasized that he believed that the Federal Reserve is cautious to avoid a scenario where the monetary tightening becomes overly restrictive.
- US Housing Price Index (MoM) contracted to 0.3% from 0.7% prior, falling short of 0.5% expectations in October.
- US Bureau of Economic Analysis (BEA) reveals that the Core Personal Consumption Expenditures - Price Index (YoY) grew at 3.2% in November, falling short of the 3.3% expectations and 3.4% prior. Meanwhile, the MoM data showed consistency at 0.1% against the market expectation of 0.2%.
- US Gross Domestic Product Annualized grew at a rate of 4.9% in Q3, slightly below the expected consistency of 5.2%.
Technical Analysis: Australian Dollar moves above 0.6850 major level
The Australian Dollar hovers around 0.6860 on Thursday. The prevailing bullish sentiment suggests a potential for the AUD/USD pair to approach the key resistance at the psychological level of 0.6900. On the downside, support levels are identifiable at the psychological level of 0.6850, followed by the seven-day Exponential Moving Average (EMA) at 0.6810 before the psychological support at 0.6800. A breach below this crucial support zone could potentially lead the AUD/USD pair to navigate the 23.6% Fibonacci retracement level at 0.6729.
AUD/USD: Daily Chart
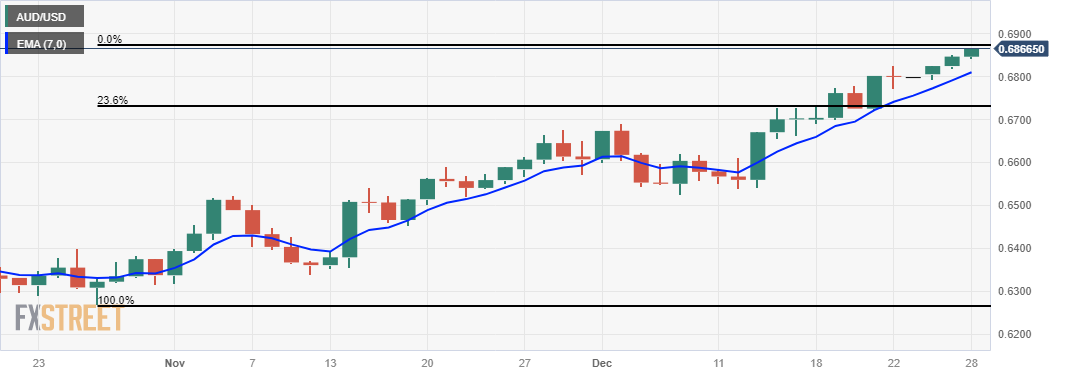
Australian Dollar price today
The table below shows the percentage change of Australian Dollar (AUD) against listed major currencies today. Australian Dollar was the strongest against the US Dollar.
| USD | EUR | GBP | CAD | AUD | JPY | NZD | CHF | |
| USD | -0.08% | -0.09% | -0.08% | -0.23% | -0.08% | -0.28% | -0.21% | |
| EUR | 0.08% | -0.01% | -0.01% | -0.15% | 0.00% | -0.21% | -0.12% | |
| GBP | 0.10% | 0.00% | 0.02% | -0.17% | 0.01% | -0.21% | -0.13% | |
| CAD | 0.09% | 0.01% | 0.02% | -0.14% | 0.00% | -0.19% | -0.13% | |
| AUD | 0.25% | 0.15% | 0.15% | 0.16% | 0.14% | -0.06% | 0.02% | |
| JPY | 0.07% | -0.02% | -0.02% | -0.02% | -0.16% | -0.22% | -0.14% | |
| NZD | 0.28% | 0.22% | 0.21% | 0.22% | 0.05% | 0.23% | 0.09% | |
| CHF | 0.20% | 0.11% | 0.10% | 0.11% | -0.05% | 0.11% | -0.09% |
The heat map shows percentage changes of major currencies against each other. The base currency is picked from the left column, while the quote currency is picked from the top row. For example, if you pick the Euro from the left column and move along the horizontal line to the Japanese Yen, the percentage change displayed in the box will represent EUR (base)/JPY (quote).
Australian Dollar FAQs
What key factors drive the Australian Dollar?
One of the most significant factors for the Australian Dollar (AUD) is the level of interest rates set by the Reserve Bank of Australia (RBA). Because Australia is a resource-rich country another key driver is the price of its biggest export, Iron Ore. The health of the Chinese economy, its largest trading partner, is a factor, as well as inflation in Australia, its growth rate and Trade Balance. Market sentiment – whether investors are taking on more risky assets (risk-on) or seeking safe-havens (risk-off) – is also a factor, with risk-on positive for AUD.
How do the decisions of the Reserve Bank of Australia impact the Australian Dollar?
The Reserve Bank of Australia (RBA) influences the Australian Dollar (AUD) by setting the level of interest rates that Australian banks can lend to each other. This influences the level of interest rates in the economy as a whole. The main goal of the RBA is to maintain a stable inflation rate of 2-3% by adjusting interest rates up or down. Relatively high interest rates compared to other major central banks support the AUD, and the opposite for relatively low. The RBA can also use quantitative easing and tightening to influence credit conditions, with the former AUD-negative and the latter AUD-positive.
How does the health of the Chinese Economy impact the Australian Dollar?
China is Australia’s largest trading partner so the health of the Chinese economy is a major influence on the value of the Australian Dollar (AUD). When the Chinese economy is doing well it purchases more raw materials, goods and services from Australia, lifting demand for the AUD, and pushing up its value. The opposite is the case when the Chinese economy is not growing as fast as expected. Positive or negative surprises in Chinese growth data, therefore, often have a direct impact on the Australian Dollar and its pairs.
How does the price of Iron Ore impact the Australian Dollar?
Iron Ore is Australia’s largest export, accounting for $118 billion a year according to data from 2021, with China as its primary destination. The price of Iron Ore, therefore, can be a driver of the Australian Dollar. Generally, if the price of Iron Ore rises, AUD also goes up, as aggregate demand for the currency increases. The opposite is the case if the price of Iron Ore falls. Higher Iron Ore prices also tend to result in a greater likelihood of a positive Trade Balance for Australia, which is also positive of the AUD.
How does the Trade Balance impact the Australian Dollar?
The Trade Balance, which is the difference between what a country earns from its exports versus what it pays for its imports, is another factor that can influence the value of the Australian Dollar. If Australia produces highly sought after exports, then its currency will gain in value purely from the surplus demand created from foreign buyers seeking to purchase its exports versus what it spends to purchase imports. Therefore, a positive net Trade Balance strengthens the AUD, with the opposite effect if the Trade Balance is negative.
- NZD/USD gains momentum around 0.6360 on the weaker USD.
- ANZ’s analysts forecast that a global return of risk appetite and the NZD’s high carry advantage will propel the upside until 2024.
- The US Richmond Fed Manufacturing Index came in at -11 in December from -5 in November.
- Traders await the US Jobless Claims, Trade Balance, and Pending Home Sales.
The NZD/USD pair trades on a stronger note above the 0.6350 area. The upward momentum of the pair is supported by the weaker US Dollar (USD) and risk appetite amid the thin trading volume in the last week of 2023. At press time, NZD/USD is trading at 0.6360, up 0.34% for the day.
The New Zealand Dollar (NZD) benefits from the improved consumer and business confidence in New Zealand. Furthermore, the Reserve Bank of New Zealand's (RBNZ) hawkish stance has contributed to the NZD's support. Analysts from ANZ forecast that a global return of risk appetite and the NZD’s high carry advantage will drive the upside into 2024.
The US Richmond Fed Manufacturing Index arrived at -11 in December from -5 in the previous month and fell short of the market estimate of -7, according to data published on Wednesday. The US will release the Initial weekly Jobless Claims report on Thursday, which are predicted to show a 210K rise in the week ending December 23.
The US Dollar dropped to its lowest level since July near 100.85, as the decline in November’s US Core Personal Consumption Expenditure Price Index (PCE) triggered bets on early rate cuts by the Federal Reserve (Fed) in 2024. Investors anticipate the Fed to hold the rates at its upcoming January meeting and cut the rate as early as March next year.
Looking ahead, market players will take more cues from the US weekly Jobless Claims, Trade Balance and the November Pending Home Sales report, due on Thursday. On Friday, the Chicago Purchasing Managers' Index for December will be released. These figures might not have a significant impact on the market as traders enter holiday mode heading into 2024.
- USD/JPY loses ground as Japan showed improvement in retail trade.
- Retail Trade YoY and MoM improved to 5.3% and 1.0%, respectively, in November.
- BoJ Governor Kazuo Ueda’s dovish remarks could limit the profits of the Japanese Yen.
- The speculation of the Fed’s dovish stance in early 2024 weakens the US Dollar.
USD/JPY continues its losing streak for the second straight session, trading lower around 141.30 during the Asian hours on Thursday. The improved Japanese trade data for November put pressure on the USD/JPY pair. However, the less aggressive remarks from the Bank of Japan (BoJ) Governor Kazuo Ueda could weigh on the Japanese Yen (JPY).
Japan’s Ministry of Economy, Trade and Industry revealed on Thursday that Retail Trade (YoY) improved to 5.3% from 4.1% prior. The seasonally adjusted Retail Trade (MoM) also rose to 1.0%, swinging from the previous decline of 1.6%. Moreover, the preliminary Industrial Production (YoY) improved to 5.3% from the previous reading of 1.1%.
BoJ Governor Kazuo Ueda conveyed on Wednesday that there is no rush to unwind the ultra-loose monetary policy. Ueda cited the relatively small risk of inflation running well above the 2% target and accelerating. Regarding the possibility of a policy shift at the January policy meeting, he expressed, "For now, I don't think the chance of this happening is large."
On the other side, market participants anticipate that the Federal Reserve (Fed) will implement rate cuts in the first quarter of 2024, contributing to the continuous weakening of the US Dollar (USD). This expectation follows the Fed's policy pivot in December, where the Fed's dot plot of rate expectations indicated the possibility of up to three cuts, totaling 75 basis points in rate cuts through the end of 2024.
Federal Reserve Bank of Richmond surveyed information on shipments, new orders, order backlogs, and inventories. On Wednesday, the US Richmond Fed Manufacturing Index experienced a notable decline of 11 points in December, contrary to the market's expectation of a 7-point drop. This follows a 5-point decrease in November. The data provides valuable insights into the current activity levels within the manufacturing sector. Investors will likely observe Initial Jobless Claims and Pending Home Sales on Thursday.
- Gold price trades in positive territory for the fifth straight day on Thursday.
- The decline in the Federal Reserve's preferred gauge of inflation triggered the bets on early rate cuts by the Fed.
- China intends to enhance domestic demand to expedite economic recovery and promote stable growth.
Gold price (XAU/USD) gains traction above a record close of $2,070 during the early Asian session on Thursday. The upward momentum of yellow metal is bolstered by the softer US Dollar (USD) across the board. Gold price currently trades near $2,080, gaining 0.09% on the day.
Meanwhile, the US Dollar Index (DXY), a measure of the value of the USD against a weighted basket of currencies used by US trade partners, drops to its lowest level since July near 100.85. The Treasury yields edge lower, with the 10-year yield standing at 3.80%.
The decline in November’s US Core Personal Consumption Expenditure Price Index (PCE), the Federal Reserve's preferred gauge of inflation, triggered the bets on early rate cuts by the Fed. This, in turn, weighs on the Greenback and lends some support to USD-denominated gold. The markets are pricing in more than 88% odds of a rate cut in March and fully pricing in a rate cut in May, according to the CME Fedwatch tool.
Data released on Wednesday revealed that the US Richmond Fed Manufacturing Index came in at -11 in December versus -5 prior, below the market consensus of -7. On Thursday, the US will report weekly Jobless Claims figures, which are expected to show an increase of 210K in the week ending December 23.
Furthermore, China intends to enhance domestic demand to expedite economic recovery and promote stable growth. The nation will also prevent and resolve risks in key areas. The positive developments surrounding China’s economic condition might boost gold, as China is the world’s major gold consumer.
Market players will focus on the US weekly Jobless Claims, Trade Balance, and the November Pending Home Sales report on Thursday. However, these figures might not have a significant impact on the market.
| Index | Change, points | Closed | Change, % |
|---|---|---|---|
| NIKKEI 225 | 375.39 | 33681.24 | 1.13 |
| Hang Seng | 284.43 | 16624.84 | 1.74 |
| KOSPI | 10.91 | 2613.5 | 0.42 |
| ASX 200 | 59.6 | 7561.2 | 0.79 |
| DAX | 35.89 | 16742.07 | 0.21 |
| CAC 40 | 3 | 7571.82 | 0.04 |
| Dow Jones | 111.19 | 37656.52 | 0.3 |
| S&P 500 | 6.83 | 4781.58 | 0.14 |
| NASDAQ Composite | 24.61 | 15099.18 | 0.16 |
The Bank of Japan (BoJ) Governor Kazuo Ueda spoke with NHK on Wednesday that he was not in a rush to unwind the central bank's ultra-loose monetary policy, noting that the risk of inflation exceeding 2% and rising further was minimal.
Key quotes
"For now, I don't think the chance of this happening is large”
“It will require substantial time before the data of all smaller firms will become available.”
“Not quite convinced yet that Japan can foresee inflation sustainably achieving the BOJ's 2% target.”
“The chance of moving short-term interest rates out of negative territory next year "was not zero”.”
“Key factor would be whether wage hikes will broaden to smaller firms in 2024's annual spring wage negotiations, but the BOJ could decide even before the smaller firms' wage talk outcome becomes available if their profits turn out to be very strong.”
Market reaction
The reaction was largely muted following Ueda’s comments. At the time of writing, the USD/JPY pair is trading around 141.29, down 0.38% on the day.
Bank of Japan FAQs
What is the Bank of Japan?
The Bank of Japan (BoJ) is the Japanese central bank, which sets monetary policy in the country. Its mandate is to issue banknotes and carry out currency and monetary control to ensure price stability, which means an inflation target of around 2%.
What has been the Bank of Japan’s policy?
The Bank of Japan has embarked in an ultra-loose monetary policy since 2013 in order to stimulate the economy and fuel inflation amid a low-inflationary environment. The bank’s policy is based on Quantitative and Qualitative Easing (QQE), or printing notes to buy assets such as government or corporate bonds to provide liquidity. In 2016, the bank doubled down on its strategy and further loosened policy by first introducing negative interest rates and then directly controlling the yield of its 10-year government bonds.
How do Bank of Japan’s decisions influence the Japanese Yen?
The Bank’s massive stimulus has caused the Yen to depreciate against its main currency peers. This process has exacerbated more recently due to an increasing policy divergence between the Bank of Japan and other main central banks, which have opted to increase interest rates sharply to fight decades-high levels of inflation. The BoJ’s policy of holding down rates has led to a widening differential with other currencies, dragging down the value of the Yen.
Is the Bank of Japan’s ultra-loose policy likely to change soon?
A weaker Yen and the spike in global energy prices have led to an increase in Japanese inflation, which has exceeded the BoJ’s 2% target. Still, the Bank judges that the sustainable and stable achievement of the 2% target has not yet come in sight, so any sudden change in the current policy looks unlikely.
| Pare | Closed | Change, % |
|---|---|---|
| AUDUSD | 0.68462 | 0.35 |
| EURJPY | 157.499 | 0.3 |
| EURUSD | 1.11065 | 0.59 |
| GBPJPY | 181.511 | 0.27 |
| GBPUSD | 1.27993 | 0.61 |
| NZDUSD | 0.63404 | 0.23 |
| USDCAD | 1.32073 | 0.09 |
| USDCHF | 0.84307 | -1.17 |
| USDJPY | 141.813 | -0.36 |


© 2000-2024. Уcі права захищені.
Cайт знаходитьcя під керуванням TeleTrade DJ. LLC 2351 LLC 2022 (Euro House, Richmond Hill Road, Kingstown, VC0100, St. Vincent and the Grenadines).
Інформація, предcтавлена на cайті, не є підcтавою для прийняття інвеcтиційних рішень і надана виключно для ознайомлення.
Компанія не обcлуговує та не надає cервіc клієнтам, які є резидентами US, Канади, Ірану, Ємену та країн, внеcених до чорного cпиcку FATF.
Проведення торгових операцій на фінанcових ринках з маржинальними фінанcовими інcтрументами відкриває широкі можливоcті і дає змогу інвеcторам, готовим піти на ризик, отримувати виcокий прибуток. Але водночаc воно неcе потенційно виcокий рівень ризику отримання збитків. Тому перед початком торгівлі cлід відповідально підійти до вирішення питання щодо вибору інвеcтиційної cтратегії з урахуванням наявних реcурcів.
Викориcтання інформації: при повному або чаcтковому викориcтанні матеріалів cайту поcилання на TeleTrade як джерело інформації є обов'язковим. Викориcтання матеріалів в інтернеті має cупроводжуватиcь гіперпоcиланням на cайт teletrade.org. Автоматичний імпорт матеріалів та інформації із cайту заборонено.
З уcіх питань звертайтеcь за адреcою pr@teletrade.global.
переклади