- Analytics
- News and Tools
- Market News
Новини ринків
- Spot Gold is lurching higher as broad markets go risk-on, tipping into $2,040.
- Fedspeak is bolstering market bets that interest rates will be coming down sooner than expected.
- Fed Governor Waller sparked investor expectations of a pivot in the Fed's rate outlook.
Gold prices climbed on Tuesday in their best single-day performance in over six weeks, climbing 1.5% on the day and settling at a seven-month peak of $2,044.
Markets saw a risk rally as investor sentiment bid up assets across the board, sparked by Dovish Fed comments in the early US market session that sent Gold climbing on the day.
Fed's Waller sees no need to insist on high rates
Federal Reserve (Fed) Governor Christopher Waller noted on Tuesday that as long as inflation continues to fall back towards Fed targets, there's no reason to continue forcing rates to remain higher for longer.
The offhand comment made during a conversation with Michael Strain, Director of Economic Policy Studies, at the American Enterprise Institute was all it took to spark a risk bid in US markets, sending Gold, equities, and risk assets climbing while the US Dollar declined.
Fedspeak is sparking bets that the Fed will be pivoting from their "higher for longer" stance on interest rates, increasing market hopes for an accelerated path towards Fed rate cuts sooner rather than later.
XAU/USD Technical Outlook
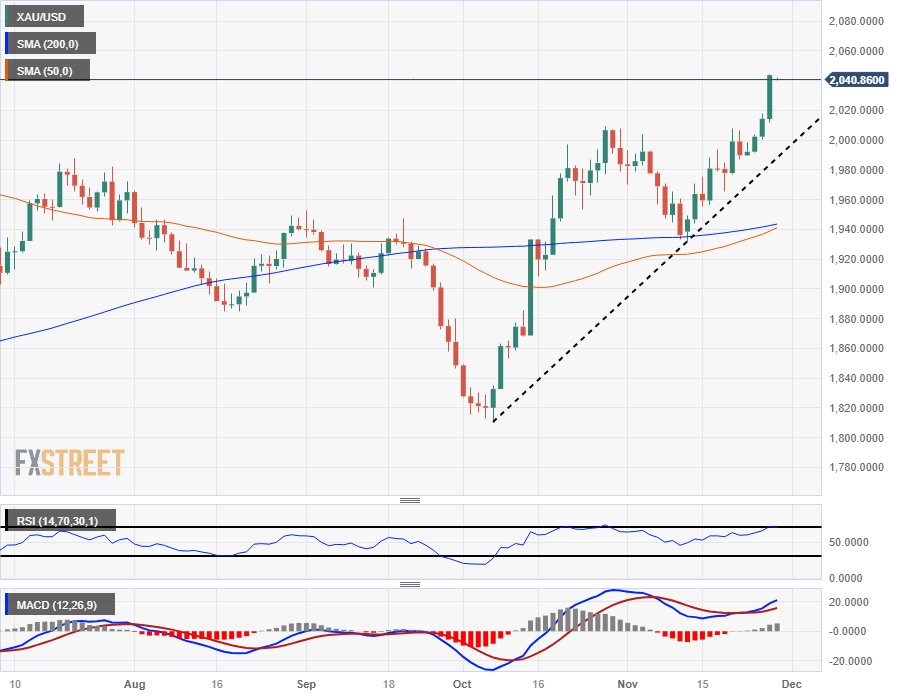
Spot Gold has tipped into seven-month highs above $2,040 and has climbed almost 13% from October's lows near $1,810.
XAU/USD continues to rally after catching a bounce from the 200-day Simple Moving Average (SMA) near $1,940, and a bullish lean in average price gains is pushing the 50-day SMA into a bullish crossover of the 200-day SMA.
The last higher low is etching in a rising trendline from October's lows, and sellers will need to break through rising technical support in order to challenge near-term bullish momentum.
XAU/USD Daily Chart
XAU/USD Technical Levels
- USD/JPY extends its downside to 147.00, the lowest since mid-September.
- The dovish comments from the Federal Reserve’s Waller created a headwind to the US Dollar.
- Inflation data in Japan remained above the Bank of Japan's 2% target for the 19th consecutive month in October.
- All eyes are on the US GDP data on Wednesday.
The USD/JPY pair tumbles to the 147.00 mark during the early Asian trading hours on Wednesday. The decline in the US Dollar (USD) and lower US yields drags the major pair lower to the lowest level since mid-September. USD/JPY currently trades around 147.07, down 0.28% on the day.
The dovish comments from the Federal Reserve (Fed) officials created a headwind to the pair. On Tuesday, Fed Governor Christopher Waller said he’s confident that policy is in place now to bring inflation back under control. He added that the Fed won’t need to hike rates further from here and might start cutting rates if inflation continues to ease over the next three to five months. The Greenback attracted some selling following these comments, falling to 102.60 and the 10-year US Treasury yield fell to 4.325%, the lowest since September 20.
About the data, the US CB Consumer Confidence improved to 102.00 in November versus a downward revision to 99.1. The Richmond Fed Manufacturing dropped to 5.0 from the previous reading of 3.0 rise. The S&P/Case-Shiller Home Price Index climbed 3.9% YoY in September, below the market expectation of 4.0%.
On the other hand, the Japanese headline and core CPI data last week indicated that inflation data in Japan remained above the Bank of Japan's 2% target for the 19th consecutive month in October. Apart from this, the rising speculation that the Bank of Japan (BoJ) will abandon its ultra-dovish policy in 2024 lifts the Japanese Yen (JPY) against the USD.
Moving on, traders will monitor the US Gross Domestic Product Annualized for the third quarter (Q3). The growth rate is expected to expand by 5.0%. These data could give a clear direction to the USD/JPY pair.
- AUD/USD attracts some buyers to 0.6648 on the weaker USD.
- Fed’s Waller said interest rates don’t have to go higher to help get inflation back to 2%.
- RBA Governor Bullock said the central bank has to be cautious when using rates to bring down inflation without raising unemployment.
- The Australian CPI, US GDP data will be closely monitored by traders.
The AUD/USD pair edges higher to the mid-0.6600s during the early Asian session on Wednesday. A softer USD, triggered by a less hawkish stance from the Federal Reserve (Fed), lends some support to the pair. At press time, AUD/USD is trading near 0.6648, up 0.05% for the day.
On Tuesday, the US CB Consumer Confidence climbed to 102.00 in November versus a downward revision to 99.1. Meanwhile, the Richmond Fed Manufacturing Index showed activity slowed in November, declining to -5.0 from 3.0 in the previous reading. The S&P/Case-Shiller Home Price Index grew 3.9% YoY in September, below the market consensus of 4.0%.
Fed Governor Christopher Waller stated that interest rates don’t have to go higher to help get inflation back to 2%. Waller added that he could see a point where the Fed might start lowering rates if inflation continues to ease over the next three to five months. This, in turn, exerts some selling pressure on the Greenback and acts as a tailwind for the AUD/USD pair.
On the Aussie front, Reserve Bank of Australia (RBA) Governor Michele Bullock said the central bank has to be cautious with using rates to bring down inflation without raising unemployment. Bullock emphasized the expectation of lowering inflation to under 3.0% in 2025.
Market players will focus on the Australian monthly CPI, which is expected to ease to 5.2% YoY in October from 5.6% in September. The stronger-than-expected data could support further upside in the AUD. Later on Wednesday, the US Gross Domestic Product Annualized for the third quarter (Q3) will be released. Traders will take cues from the data and find trading opportunities around the AUD/USD pair.
- NZD/USD could extend its rally toward 0.6200 if RBNZ’s Governor Orr strikes a hawkish message.
- A dovish tilt by the RBNZ could drive the pair toward the 200-DMA and below the latter.
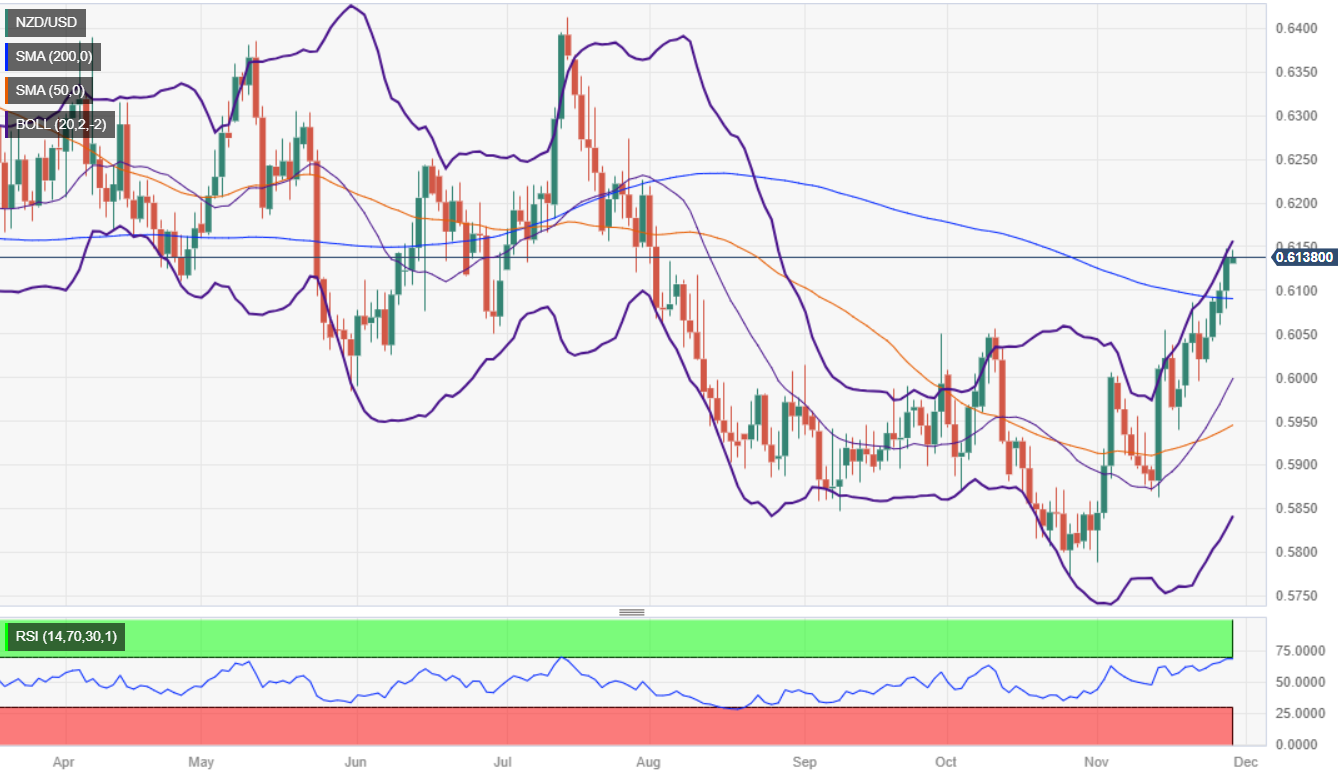
The New Zealand Dollar (NZD) is flat against the US Dollar (USD), early during Wednesday’s Asian session, ahead of the Reserve Bank of New Zealand (RBNZ) monetary policy decision. At the time of writing, the pair exchanges hands at around 0.6134, sitting above the 200-day moving average (DMA), suggesting the pair remains bullish.
Given the backdrop, a hawkish stance by the RBNZ could likely underpin the pair to test the next resistance area at 0.6225, the July 31 swing high, followed by the July 27 high at 0.6273.
Conversely, and the most likely scenario, RBNZ Governor Adrian Orr and Co. are expected to hold rates unchanged for the fifth consecutive meeting, which would likely weigh on the NZD/USD pair, which would dive toward the 0.6100 figure, ahead of the 200-DMA at 0.6089. If the exchange rates pierces that support level, the losses could extend to 0.6050, and beyond.
NZD/USD Price Analysis – Daily Chart
Also read: New Zealand Dollar traders prepare for RBNZ interest rate meeting
NZD/USD Technical Levels
- The US Dollar Index (DXY) declined to its lowest bids in over three months on Tuesday.
- The DXY fell nearly half a percent heading into Wednesday.
- Dovish Fed talk sparked a risk bid that pushed the US Dollar down across the board.
The US Dollar Index (DXY) shed half a percent on Tuesday following a broad-market recovery in risk appetite as investors hit the bids, sending the US Dollar (USD) down against all of its major FX currency peers.
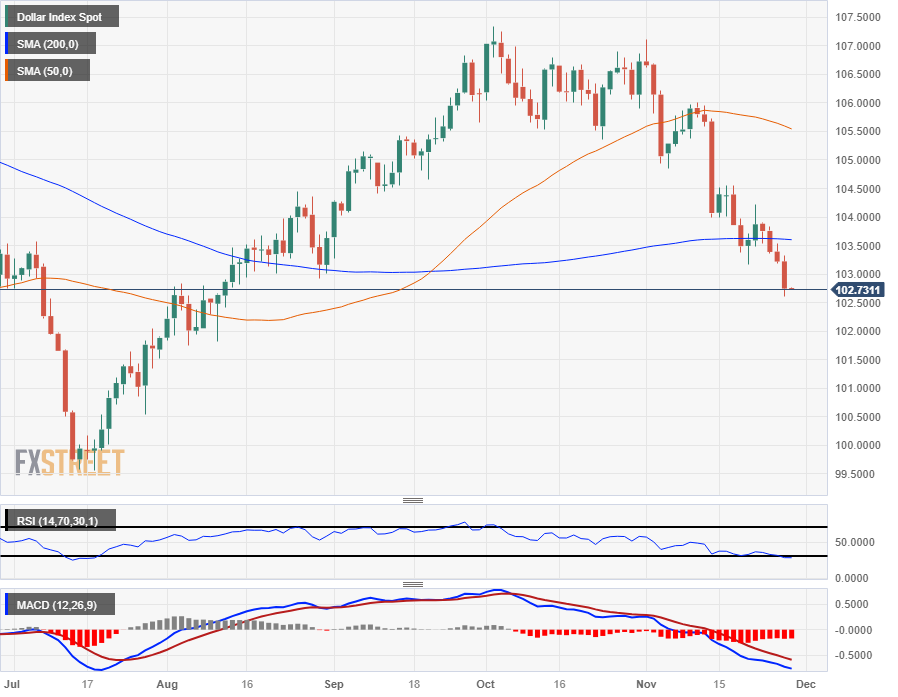
The DXY extended into a three-month low past 102.70 and is down six-tenths of a percent on the week heading into the Wednesday market session.
Fed's Waller sparks Dollar decline
The US Dollar saw firm selling pressure after Federal Reserve Governor Christopher Waller commented on interest rates while speaking with Michael Strain, the Director of Economic Policy Studies, at the American Enterprise Institute.
Fed Governor Waller noted that if inflation continues to decline towards the Fed's targets, he sees no reason to keep interest rates elevated going forward.
The dovish sentiment, lacking particulars, was enough to kick off a fresh risk bid across the markets, sending equities, Gold markets, and risk asset classes higher as the DXY sold off.
Next Up: US GDP, PCE prices
Wednesday markets will be turning towards the US' latest quarterly Gross Domestic Product (GDP) growth, with median market forecasts calling for a QoQ uptick from 4.9% to an even 5.0%, while Personal Consumption Expenditure (PCE) Prices for the third quarter will also be seeing a preliminary print.
With inflation the market's hot-button topic of choice as Fed watchers loom, US PCE could see an outsized impact if prices or GDP growth surprise to the upside. QoQ PCE Prices last printed at 2.9% for the second quarter, and will provide a preview for Friday's Core PCE Price Index reading for October.
Markets are currently hoping that MoM Core PCE Index figures will decline from 0.3% to 0.2%. An upside disappointment to the figure could see the DXY rally as inflation-fearing market participants tumble back into safe haven bets on the US Dollar.
US Dollar price today
The table below shows the percentage change of US Dollar (USD) against listed major currencies today. US Dollar was the weakest against the Japanese Yen.
| USD | EUR | GBP | CAD | AUD | JPY | NZD | CHF | |
| USD | -0.35% | -0.47% | -0.29% | -0.58% | -0.69% | -0.54% | -0.28% | |
| EUR | 0.34% | -0.12% | 0.06% | -0.23% | -0.33% | -0.21% | 0.07% | |
| GBP | 0.48% | 0.13% | 0.21% | -0.09% | -0.19% | -0.07% | 0.19% | |
| CAD | 0.28% | -0.07% | -0.19% | -0.30% | -0.40% | -0.26% | -0.01% | |
| AUD | 0.58% | 0.22% | 0.11% | 0.29% | -0.10% | 0.04% | 0.32% | |
| JPY | 0.67% | 0.33% | 0.21% | 0.41% | 0.10% | 0.13% | 0.41% | |
| NZD | 0.54% | 0.20% | 0.07% | 0.26% | -0.04% | -0.14% | 0.27% | |
| CHF | 0.27% | -0.08% | -0.21% | 0.00% | -0.31% | -0.42% | -0.26% |
The heat map shows percentage changes of major currencies against each other. The base currency is picked from the left column, while the quote currency is picked from the top row. For example, if you pick the Euro from the left column and move along the horizontal line to the Japanese Yen, the percentage change displayed in the box will represent EUR (base)/JPY (quote).
Dollar Index Technical Outlook
The US Dollar flattened across the board on Tuesday, declining against all of its major currency pairings.
The USD declined the most against its Pacific market peers, shedding almost seven-tenths of a percent against the Japanese Yen (JPY), nearly 0.6% against the Aussie (AUD), and just under six-tenths of a percent against the Kiwi (NZD).
Tuesday's half-percent backslide in the DXY takes the Dollar Index further south of the 200-day Simple Moving Average (SMA), and there is little in the way of near-term technical support for the DXY until mid-July's swing lows below the major 100.00 handle.
Dollar Index Daily Chart
Dollar Index Technical Levels
- GBP/JPY witnesses a decline of over 0.20%, with the Japanese Yen gaining strength against major currencies.
- Despite the pair's overall bullish trend, recent price actions have formed a 'double top' pattern, thought further confirmation needed, with prices breaking below 184.46.
- Conversely, a move above the November 28 daily high of 187.87 could set the stage for the pair to test the year-to-date high at 188.80.
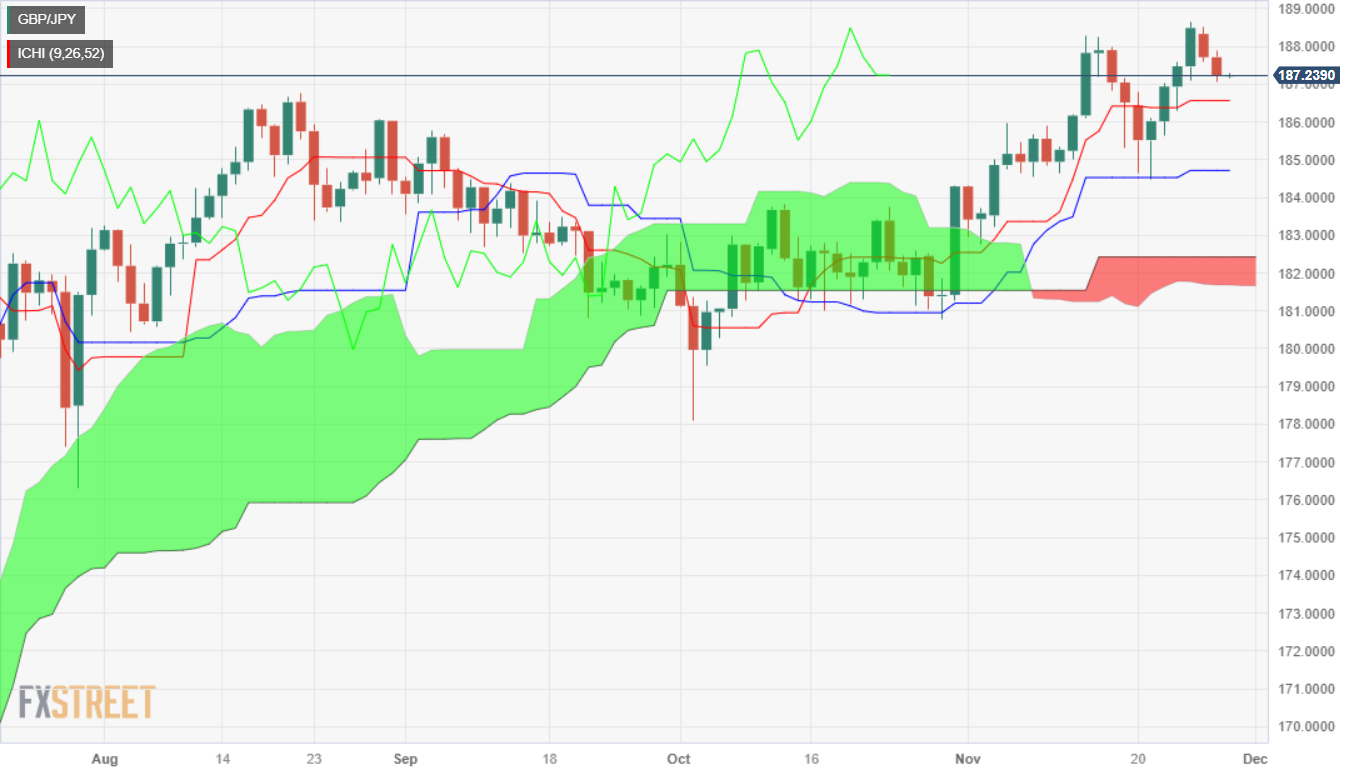
The GBP/JPY retreats on Tuesday by more than 0.20%, as the Japanese Yen (JPY) appreciated further against most G8 FX currencies. Market participants estimate that central banks in developed countries would cut rates, boosting the appetite for the Yen's safe-haven status and Gold. Therefore, the pair is trading at 187.24 after hitting a daily high of 187.87.
Even though the GBP/JPY remains bullish, price action during the last couple of days, has formed a ‘double top’ chart pattern, implying that lower prices are coming. Nevertheless to confirm the pattern, the cross must drop below the November 21 swing low at 184.46, but sellers must breach support levels on its way to the latter.
The first support would be the Tenkan-Sen at 186.55, followed by the Senkou-Span A at 185.63. A decisive break, the pair would dive to the Kijun-Sen at 184.71, before testing the latest cycle low. Once done, the ‘double top’ chart pattern targets the 180.50 area.
On the flip side, if GBP/JPY buyers reclaim the November 28 daily high at 187.87, that could open the door to challenge the year-to-date (YTD) high at 188.80.
GBP/JPY Price Analysis – Daily Chart
GBP/JPY Technical Levels
- EUR/USD pegged a fresh 15-week high after testing just above the 1.1000 major handle.
- The pair is settling back as Tuesday's trading session wraps up and heads into the close.
- Wednesday brings Eurozone Consumer Confidence, US GDP growth.
The EUR/USD is easing back into the 1.0980 neighborhood after tipping into a 15-week high just above 1.1000, bolstered by a broad-market uptick in risk appetite, pushing the US Dollar (USD) down across the board and into the red against all other major currencies on Tuesday.
Fed’s Waller: I am increasingly confident that policy is currently well positioned
Markets mixed in the first half of Tuesday's trading before markets surged in the US session, with risk bids climbing and the Greenback facing a selloff after Federal Reserve (Fed0 Governor Christopher Waller noted that he was confident that monetary policy is tight enough to bring inflation back down to 2%.
Waller went on to note that he sees no reason to maintain elevated interest rates as long as inflation continues to settle lower, sparking a risk rally that saw the broader market lurch higher, dragging down the US Dollar.
Wednesday brings a fresh round of Eurozone Consumer Confidence and November's Economic Sentiment Indicator, as well as another printing of quarterly US Gross Domestic Product (GDP) growth.
Eurozone Consumer Confidence is expected to hold steady at -16.9 for November, while the Economic Sentiment Indicator, a measure of European consumers' confidence in the European economy, is forecast to see a slight uptick from October's 93.3 to 93.7.
US GDP for the third quarter will be the figure to watch on Wednesday, and the US is expected to see QoQ GDP growth tick upwards from 4.9% to 5.0%.
Japanese Yen price today
The table below shows the percentage change of Japanese Yen (JPY) against listed major currencies today. Japanese Yen was the strongest against the US Dollar.
| USD | EUR | GBP | CAD | AUD | JPY | NZD | CHF | |
| USD | -0.28% | -0.47% | -0.25% | -0.49% | -0.68% | -0.50% | -0.25% | |
| EUR | 0.28% | -0.19% | 0.03% | -0.21% | -0.38% | -0.22% | 0.04% | |
| GBP | 0.46% | 0.19% | 0.23% | -0.02% | -0.20% | -0.03% | 0.23% | |
| CAD | 0.23% | -0.06% | -0.25% | -0.27% | -0.43% | -0.27% | -0.02% | |
| AUD | 0.51% | 0.21% | 0.04% | 0.26% | -0.17% | 0.01% | 0.28% | |
| JPY | 0.66% | 0.38% | 0.20% | 0.42% | 0.17% | 0.16% | 0.43% | |
| NZD | 0.50% | 0.20% | 0.03% | 0.26% | -0.01% | -0.17% | 0.26% | |
| CHF | 0.23% | -0.06% | -0.24% | -0.01% | -0.26% | -0.45% | -0.27% |
The heat map shows percentage changes of major currencies against each other. The base currency is picked from the left column, while the quote currency is picked from the top row. For example, if you pick the Euro from the left column and move along the horizontal line to the Japanese Yen, the percentage change displayed in the box will represent EUR (base)/JPY (quote).
EUR/USD Technical Outlook
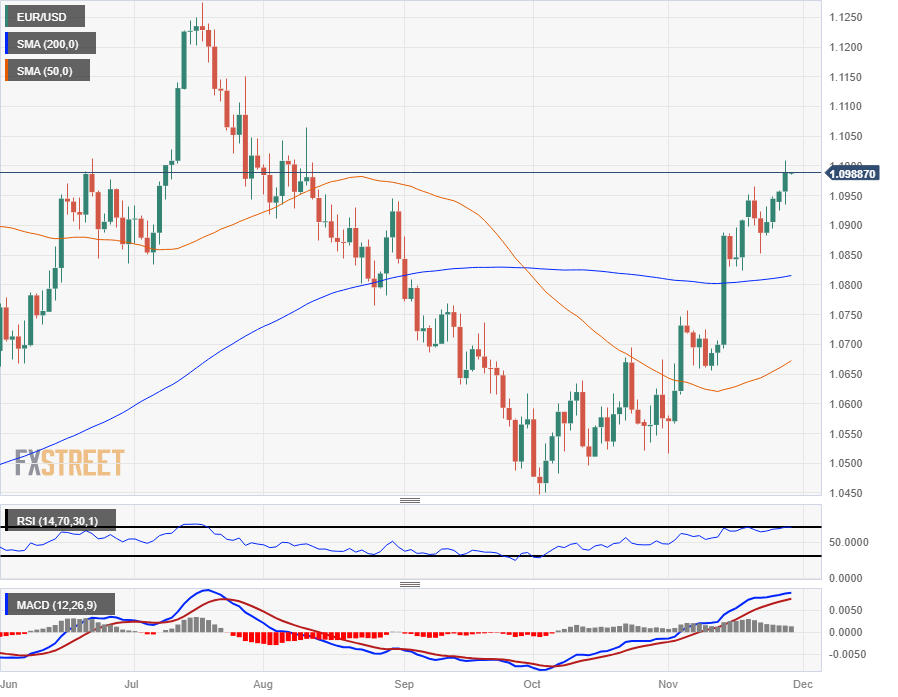
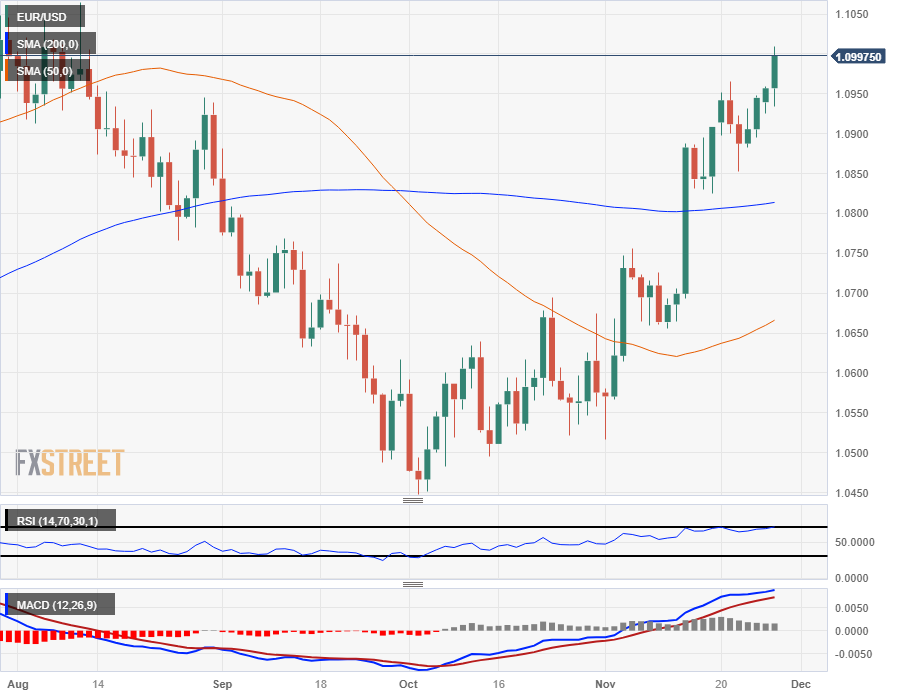
The Euro's rally fueled by Greenback-selling across the broader FX marketspace saw the EUR/USD clipping into the 1.1000 handle before settling back into the Tuesday close, but still climbing three-tenths of a percent on the day.
The EUR/USD easily broke through the 200-day Simple Moving Average (SMA) in mid-November near the 1.0800 handle, and ongoing EUR bullishness is sending the pair steadily higher as the USD waffles.
The pair has potentially climbed too far, too fast with the 50-day SMA still trading well below prices and in bearish territory, and the moving average is currently rotating towards the topside from just north of 1.0650.
The Relative Strength Index (RSI) is flashing warning signs that the EUR/USD may have gone too far, too quickly with the signal line testing into the overbought boundary line, and the pair could see an extended pullback if bears are able to capitalize on any profit-taking.
EUR/USD Daily Chart
EUR/USD Technical Levels
During the Asian session, the Australian Monthly CPI is due. Additionally, the Reserve Bank of New Zealand will announce its decision on monetary policy. Later in the day, inflation figures from Spain and Germany will be closely watched. The US will report an updated estimate for Q3 GDP.
Here is what you need to know on Wednesday, November 29:
The US Dollar tumbled across the board. The comments from Federal Reserve Governor Christopher Waller stating that if inflation consistently declines, there is no reason to insist on keeping interest rates really high reinforced the negative momentum of the Greenback. Fed's Mester will speak on Wednesday.
The US Dollar Index (DXY) broke below 103.00, falling to 102.60, the lowest intraday level since August 11. The 10-year US Treasury yield fell to 4.33%, the lowest since September 20. The Dow Jones reached its highest level since August, continuing the rally and adding another negative factor for the US Dollar.
The CB Consumer Confidence Index rose in November to 102.0 but after a downward revision to October figures from 102.6 to 99.1. The US S&P/Case-Shiller Home Price Index rose 3.9% YoY in September, slightly below the expected 4%. Data due from the US on Wednesday includes a new estimate of Q3 GDP growth. Later in the day, the Federal Reserve will release the Beige Book.
EUR/USD tested levels above 1.1000 and pulled back. The trend remains up, but a correction seems overdue. It will be a crucial day regarding economic data for the European Central Bank (ECB) as Spain and Germany will release inflation figures for November, with both countries expected to report a slowing in the annual inflation rate. Eurostat will release its Sentiment survey.
GBP/USD rose for the fourth consecutive day and reached levels above 1.2700 before pulling back. With technical indicators at overbought levels, like many currency pairs, some consolidation seems likely.
USD/JPY tumbled amid lower US Yields, falling to 107.50. The bearish pressure persists, and there is scope for further losses.
AUD/USD continued to edge higher and climbed to 0.6665 before pulling back. Risk appetite, lower yields, and higher commodity prices support the upside. The Australia Monthly Consumer Price Index is due, with the annual inflation rate expected to slow from 5.6% in September to 5.2% in October.
Australian CPI Preview: Forecasts from five major banks, inflation likely to be lower
NZD/USD broke above the 200-day Simple Moving Average (SMA) and 0.6100, finding resistance around 0.6150. The bias is to the upside, with the RSI approaching 70 in the daily chart. The Reserve Bank of New Zealand (RBNZ) will announce its decision on monetary policy. No change in rates is expected.
RBNZ expected to hold interest rate steady at 5.50% at November meeting
Gold accelerated to the upside and posted the highest daily close since May, around $2,040, boosted by the decline in US yields. Despite extreme readings, the positive momentum prevails, and XAU/USD is looking for a new equilibrium level. Silver rose to the $25.00 area.
Like this article? Help us with some feedback by answering this survey:
- The Reserve Bank of New Zealand is set to hold Official Cash Rate steady at 5.50% in November.
- RBNZ Governor Orr’s press conference and updated macro forecasts could cause volatility.
- The New Zealand Dollar is more likely to be impacted by Orr’s words than the RBNZ decision.
The Reserve Bank of New Zealand (RBNZ) is set to leave the Official Cash Rate (OCR) unchanged at 5.50%, following its monetary policy meeting on Wednesday. New Zealand’s central bank will likely keep the interest rate on hold for the fifth straight meeting while retaining its hawkish bias.
The New Zealand Dollar (NZD) is subject to extreme volatility should the RBNZ offer any surprises in the language of its Monetary Policy Statement.
What to expect from the RBNZ interest rate decision?
With a steady interest rate decision by the Reserve Bank of New Zealand fully baked in, markets are expected to focus on the central bank’s updated economic forecasts and Governor Adrian Orr’s press conference. The decision will be announced at 01:00 GMT on Wednesday, followed by the presser at 02:00 GMT.
In the Minutes of its October policy meeting, the RBNZ said that “interest rates are constraining economic activity and reducing inflationary pressure as required.” Meanwhile, the policy statement said that the “Committee agreed that interest rates may need to remain at a restrictive level for a more sustained period of time.”
Following the October policy announcement, the official data from Statistics New Zealand (Stats NZ) showed that the Consumer Price Index (CPI) in the 12 months to September rose 5.6%, lower than expectations of 5.9% and the prior quarter’s reading of 6.0%. On a quarterly basis, New Zealand’s inflation increased to 1.8% but fell short of expectations of 2.0%.
The latest labor market report showed that New Zealand's Unemployment Rate climbed to 3.9% in the September quarter, compared with 3.6% last quarter,
Cooling inflation and loosening labor market conditions justify the potential status-quo stance by the central bank, although it remains to be seen if the RBNZ maintains the hawkish rhetoric, as the recent data added signs that the central bank has come to the end of its tightening cycle.
On Monday, the New Zealand Institute of Economic Research’s (NZIER) 'Shadow Board' recommended to leave the cash rate at 5.50%. The Shadow Board said, “some members considered that recent developments in inflation and the labor market, along with the waves of mortgage refixing, provide the Reserve Bank with some comfort that the OCR increases to date would be enough to contain inflation back towards its 1 to 3 percent inflation target band.“
Markets are expecting no changes to the RBNZ’s OCR track in its updated forecasts. The October monetary policy review (MPR) showed that the RBNZ continued to forecast the OCR to remain at 5.50% with around a 40% chance of a further 25 basis point hike to 5.75% in 2024. The track indicated that the central bank does not expect to cut until the first half of 2025.
However, Bloomberg’s “World Interest Rate Probabilities (WIRP) suggests 5.0% odds of a hike February 28. After that, it’s all about the rate cuts and the first one is fully priced in for August 14,” analysts at BBH noted.
How will the RBNZ interest decision impact the New Zealand Dollar?
Should the RBNZ forecasts fan any premature expectations of interest rate cuts in the second half of 2024 while suggesting that the Bank is done with its rate hiking cycle, the New Zealand Dollar is likely to come under intense selling pressure against the US Dollar.
At the time of writing, NZD/USD is sitting at a fresh three-month high above 0.6100. In case of a dovish RBNZ pause, the Kiwi pair could see a sharp corrective downside toward the 0.6000 level.
On the other hand, if RBNZ Governor Orr manages to convince markets that one more interest rate hike remains in the offing, the ongoing uptrend in the NZD/USD pair could gain extra legs, with buyers aiming for the 0.6200 threshold.
The New Zealand Dollar, however, could remain supported on a potential hawkish surprise, in case New Zealand’s new coalition government abandons the central bank’s dual mandate, only focusing on price stability.
Dhwani Mehta, FXStreet’s Senior Analyst, offers a brief technical outlook for trading the New Zealand Dollar on the RBNZ policy announcements: “The NZD/USD pair looks to extend the uptrend, having closed Monday above the critical 200-day Simple Moving Average (SMA) at 0.6090. The 14-day Relative Strength Index (RSI) indicator is sitting beneath the overbought territory while comfortably above the midline, suggesting that there is room for more upside.”
“The next upside hurdle is seen at the 0.6200 round level, above which the July 27 high of 0.6274 will come into play. NZD buyers will then aim for the 0.6300 figure. On the flip side, a sharp sell-off below the 200-day SMA could put the 0.6000 mark at risk. Further down, the confluence of the November 22 low and the 100-day SMA near 0.5995 could emerge as a powerful support for NZD/USD,” Dhwani adds.
Economic Indicator
New Zealand RBNZ Interest Rate Decision
The Reserve Bank of New Zealand (RBNZ) announces its interest rate decision after its seven scheduled annual policy meetings. If the RBNZ is hawkish and sees inflationary pressures rising, it raises the Official Cash Rate (OCR) to bring inflation down. This is positive for the New Zealand Dollar (NZD) since higher interest rates attract more capital inflows. Likewise, if it reaches the view that inflation is too low it lowers the OCR, which tends to weaken NZD.
Read more.Next release: 11/29/2023 01:00:00 GMT
Frequency: Irregular
Source: Reserve Bank of New Zealand
Why it matters to traders
The Reserve Bank of New Zealand (RBNZ) holds monetary policy meetings seven times a year, announcing their decision on interest rates and the economic assessments that influenced their decision. The central bank offers clues on the economic outlook and future policy path, which are of high relevance for the NZD valuation. Positive economic developments and upbeat outlook could lead the RBNZ to tighten the policy by hiking interest rates, which tends to be NZD bullish. The policy announcements are usually followed by Governor Adrian Orr’s press conference.
RBNZ FAQs
What is the Reserve Bank of New Zealand?
The Reserve Bank of New Zealand (RBNZ) is the country’s central bank. Its economic objectives are achieving and maintaining price stability – achieved when inflation, measured by the Consumer Price Index (CPI), falls within the band of between 1% and 3% – and supporting maximum sustainable employment.
How does the Reserve Bank of New Zealand’s monetary policy influence the New Zealand Dollar?
The Reserve Bank of New Zealand’s (RBNZ) Monetary Policy Committee (MPC) decides the appropriate level of the Official Cash Rate (OCR) according to its objectives. When inflation is above target, the bank will attempt to tame it by raising its key OCR, making it more expensive for households and businesses to borrow money and thus cooling the economy. Higher interest rates are generally positive for the New Zealand Dollar (NZD) as they lead to higher yields, making the country a more attractive place for investors. On the contrary, lower interest rates tend to weaken NZD.
Why does the Reserve Bank of New Zealand care about employment?
Employment is important for the Reserve Bank of New Zealand (RBNZ) because a tight labor market can fuel inflation. The RBNZ’s goal of “maximum sustainable employment” is defined as the highest use of labor resources that can be sustained over time without creating an acceleration in inflation. “When employment is at its maximum sustainable level, there will be low and stable inflation. However, if employment is above the maximum sustainable level for too long, it will eventually cause prices to rise more and more quickly, requiring the MPC to raise interest rates to keep inflation under control,” the bank says.
What is Quantitative Easing (QE)?
In extreme situations, the Reserve Bank of New Zealand (RBNZ) can enact a monetary policy tool called Quantitative Easing. QE is the process by which the RBNZ prints local currency and uses it to buy assets – usually government or corporate bonds – from banks and other financial institutions with the aim to increase the domestic money supply and spur economic activity. QE usually results in a weaker New Zealand Dollar (NZD). QE is a last resort when simply lowering interest rates is unlikely to achieve the objectives of the central bank. The RBNZ used it during the Covid-19 pandemic.
- USD/CHF extends its downward trajectory for the third consecutive session
- Fed Governor Christopher Waller suggested that if the disinflation process persists, there might be no need to maintain high-interest rates.
- US and Swiss economic dockets, to deliver additional data to give direction on the USD/CHF.
The USD/CHF extends its downtrend for the third straight session, though bounced from daily lows reached at 0.8762. At the time of writing, the major is trading at 0.8783, down 0.22% sponsored by a Federal Reserve (Fed) official opening the door for rate cuts.
US Dollar struggles against the Swiss Franc as Fed officials' remarks on interest rates
Earlier, Fed’s Governor Christopher Waller said the current stance of monetary policy is sufficiently restrictive and added if the disinflation process continues for several months, he sees “no reason” to keep rates high. Contrarily, Fed Governor Michelle Bowman pushed back against Waller’s commentary, as she said it is “quite possible” the US central bank will need Fed policy rate at a higher level than pre-pandemic levels.
As of writing, New York Fed President John Williams finds encouraging that inflation is declining. HE said the Fed remains committed to getting inflation back to target.
Earlier, the US economic docket featured Home Prices for September, which rose 6.1% in 12 months to September, exceeding August’s 5.8%, blamed on lower mortgage rates after the US central bank decided to hold rates unchanged in back-to-back meetings. Furthermore, the Conference Board (CB) revealed the Consumer Confidence for October was revised to 99.1, though it climbed in November by 102, exceeding forecasts of 101.
On the Switzerland front, the ZEW Survey showed investors sentiment deterioration in October, which stood at -37.8. That data, alongside the release of Retail Sales for October on Thursday, would shed some light regarding the status of the economy is Switzerland.
USD/CHF Technical Levels
- Crude Oil sees a reprieve from selling pressure, bucking a four-day losing streak.
- WTI climbs around 2% from Tuesday's opening bids near $75.00.
- Markets tilted into a risk-on mood late Tuesday to push assets higher.
West Texas Intermediary (WTI) Crude Oil caught a bid in a broad-market risk bid as investor sentiment improved across the board.
Safe havens are swooning and riskier assets are climbing as Tuesday trading winds towards the close.
WTI recovered recent losses, reclaiming familiar territory near the $77.00 handle.
Crude Oil markets have been souring lately after tensions flared between member states of the Organization of the Petroleum Exporting Countries (OPEC), causing a delay in an OPEC finance ministers' meeting last week, which has been moved to the 30th.
Saudi Arabia, one of the preeminent OPEC member states, has been actively pursuing intense Crude Oil production cuts in order to keep global fuel prices elevated, and the fierce production quota caps are facing intensifying objections from smaller OPEC member states that rely more heavily on regular oil exports to fund their budgets.
With current OPEC production caps not enough to stem the tide of declining Crude Oil prices, energy markets will be paying extra attention to the global oil cartel's conversations at the upcoming meeting, where production quotas are sure to be the primary topic of conversation.
WTI Technical Outlook
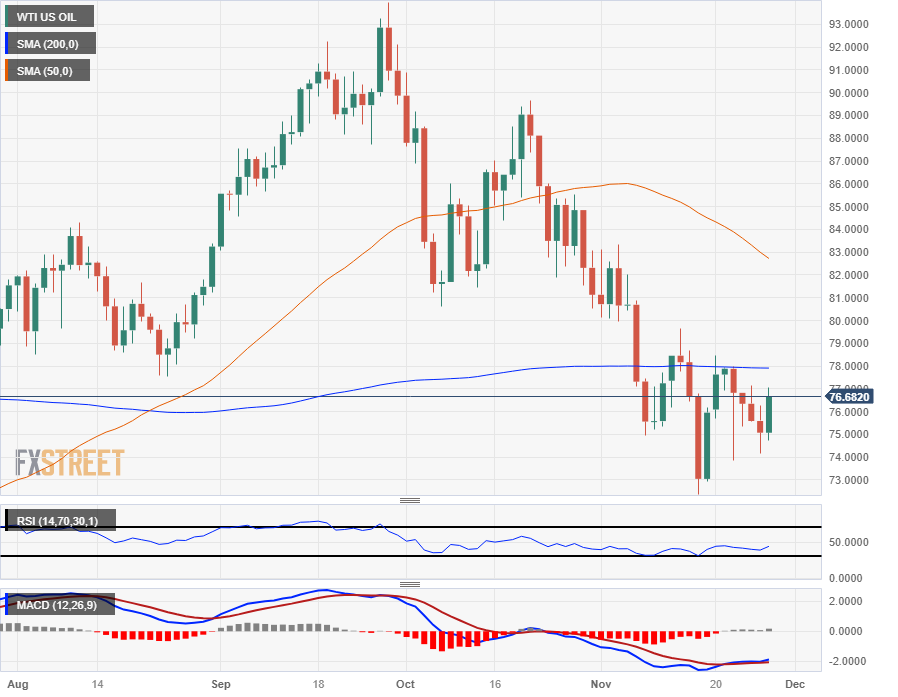
Tuesday's risk bid is seeing Crude Oil step higher with the WTI bidding into the $77.00 handle late in the day, but with daily candlesticks continuing to get capped off by the 200-day Simple Moving Average (SMA) near $78.00, upside momentum could remain limited.
On the low side, technical support is firming up with repeated downside rejections from $75.00 to $73.00, and the next step for bidders will be to push WTI back over $80.00 before the 50-day SMA finishes rolling into a bearish crossover of the 200-day SMA.
WTI Daily Chart
WTI Technical Levels
- Silver price rallies more than 1.10% on Tuesday, courtesy of the Fed’s dovish comments.
- Buyers remain in charge but must reclaim $25.00 so they can test year-to-date (YTD) figures.
- If sellers keep the spot price below $25.00, that will sponsor a leg-down to $24.00.
Silver price refreshed three-month highs shy of the $25.00 figure and retreated to the $24.80s area after dovish remarks by a Federal Reserve (Fed) official weakened the Greenback. At the time of writing, the XAG/USD is trading at $24.88, gaining more than 1%
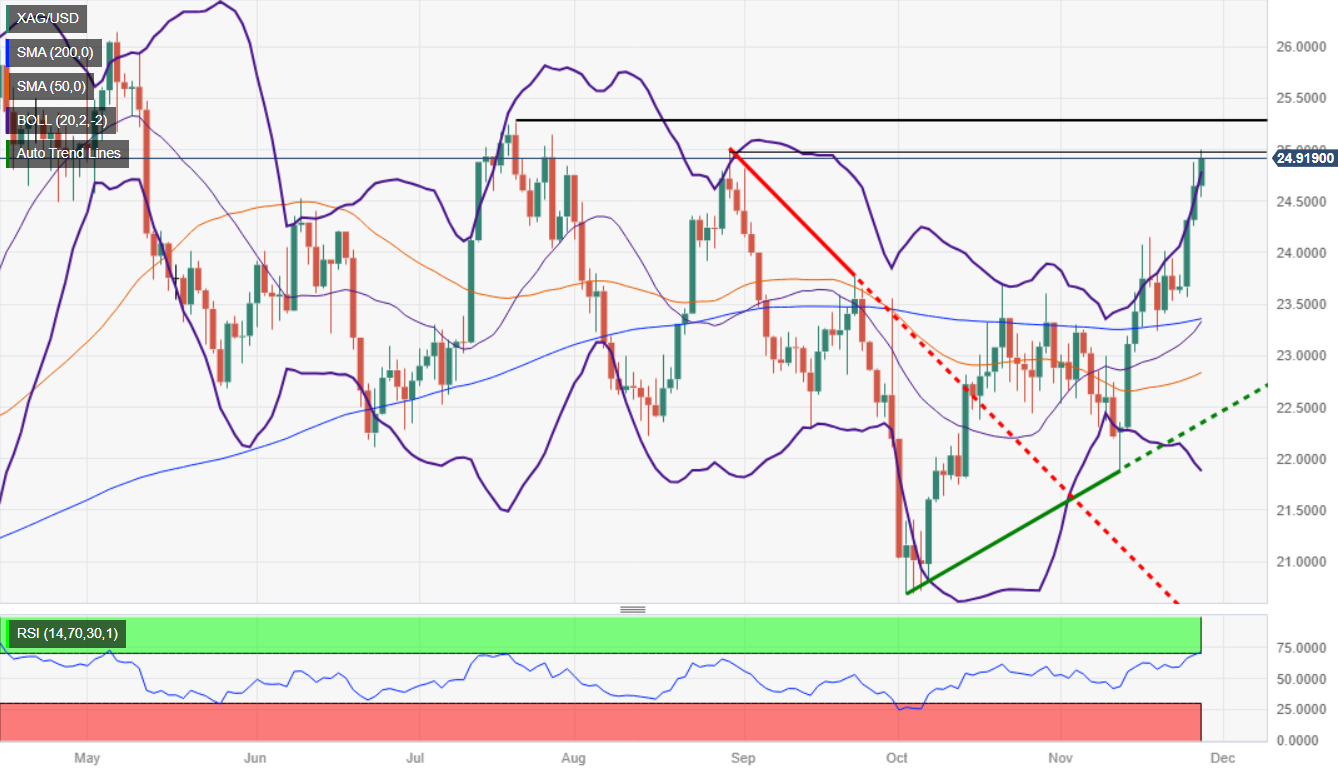
XAG/USD has extended its gains for the fourth straight session, though it failed to climb above the $25.00 figure, which would likely sponsor a leg up towards the July 19 high at $25.23. Once those two ceiling levels are conquered, buyers would need to decisively break the $26.00 mark, ahead of testing the May 5 high at $26.13.
On the downside, if Silver sellers keep the grey metal from printing a daily close above $25.00, expect a leg-down, initially to test the waters at around the November 27 daily low of $24.27. Prices could potentially consolidate around that area, but further support lies at around the November 17 high at $24.14, ahead of the $24.00 mark.
XAG/USD Price Analysis – Daily Chart
XAG/USD Technical Levels
- The USD/JPY is down after shedding a full percent peak-to-trough from Tuesday's high bids.
- The US Dollar accelerated losses as broader markets flip the switch on risk appetite.
- The USD/JPY is testing into last week's lows just above the 147.00 handle.
The US Dollar (USD) is seeing broad-market declines on Tuesday as market sentiment lurches higher. The Greenback is down a full percentage point from Tuesday's peak bids near 148.80 against the Japanese Yen (JPY), shedding half a percent from the day's opening prices at 148.10.
The Greenback's Tuesday backslide is being fueled by unexpectedly dovish comments from Federal Reserve (Fed) Governor Christopher Wallace, who insisted in public comments that he sees no reason to continue holding interest rates at high levels if inflation continues to decline.
Fed’s Waller: If inflation constantly declines, there is no reason to insist in really high rates
The dovish Fed appearance helped spark a decline in the US Dollar Index (DXY), shrugging off an equally hawkish statement from Fed Governor Michelle Bowman who declared she is just as willing to support further rate hikes if inflation continues to overshoot Fed targets.
Fed’s Bowman: I remain willing to support rate hikes if progress on inflation stalls
The mid-week's focal point will be a US quarterly Gross Domestic Product (GDP) growth print, and markets are expecting a slight uptick in QoQ US GDP growth from 4.9% to 5%.
Japanese Yen price today
The table below shows the percentage change of Japanese Yen (JPY) against listed major currencies today. Japanese Yen was the strongest against the US Dollar.
| USD | EUR | GBP | CAD | AUD | JPY | NZD | CHF | |
| USD | -0.14% | -0.33% | -0.18% | -0.33% | -0.51% | -0.30% | -0.19% | |
| EUR | 0.14% | -0.17% | -0.01% | -0.16% | -0.35% | -0.13% | -0.04% | |
| GBP | 0.33% | 0.17% | 0.17% | 0.01% | -0.18% | 0.03% | 0.14% | |
| CAD | 0.17% | 0.01% | -0.17% | -0.16% | -0.34% | -0.13% | -0.03% | |
| AUD | 0.31% | 0.15% | -0.02% | 0.15% | -0.19% | 0.03% | 0.17% | |
| JPY | 0.49% | 0.35% | 0.17% | 0.36% | 0.16% | 0.22% | 0.33% | |
| NZD | 0.28% | 0.15% | -0.05% | 0.11% | -0.05% | -0.22% | 0.12% | |
| CHF | 0.18% | 0.04% | -0.14% | 0.03% | -0.15% | -0.33% | -0.10% |
The heat map shows percentage changes of major currencies against each other. The base currency is picked from the left column, while the quote currency is picked from the top row. For example, if you pick the Euro from the left column and move along the horizontal line to the Japanese Yen, the percentage change displayed in the box will represent EUR (base)/JPY (quote).
USD/JPY Technical Outlook
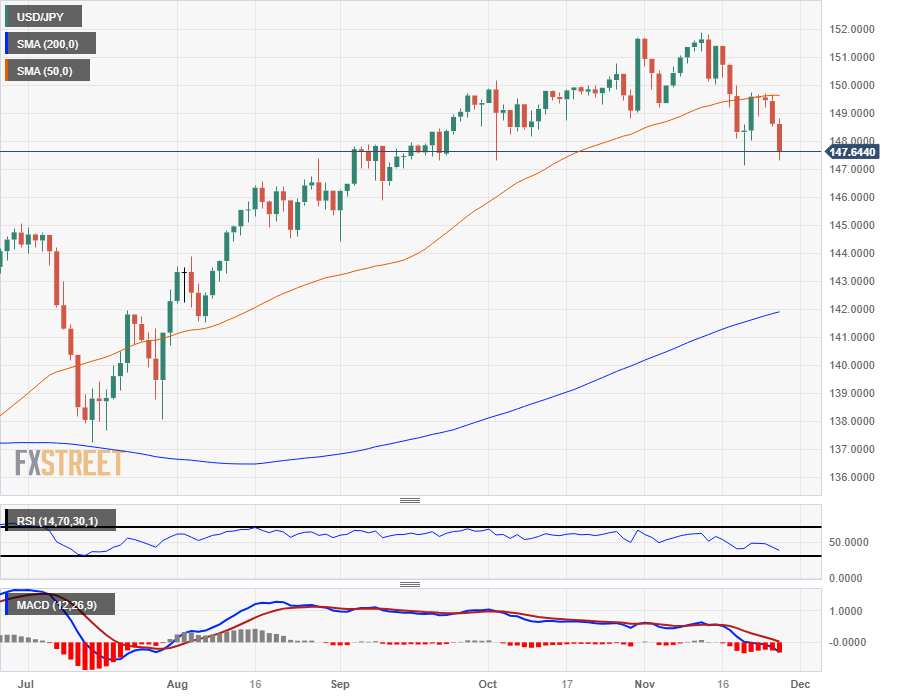
The USD/JPY's downside push on Tuesday sees the pair challenging recent lows just north of the 147.00 handle, and the Dollar-Yen pairing is seeing further downside play on the low side of the 50-day Simple Moving Average (SMA).
The early week's near-term swing high into the 149.70 area sees the 50-day SMA now acting as technical resistance for immediate moves higher, and further downside will see the USD/JPY slipping into the chart territory below 147.00.
The USD/JPY remains firmly well-bid in the long-term, trading under 3% back from the year's highs near 152.00, and the pair is still up almost 14% from 2023's lows near 127.20.
USD/JPY Daily Chart
USD/JPY Technical Levels
- The EUR/USD has clipped a new 15-week high, cracking the 1.1000 major handle on Tuesday.
- Broader markets are rallying in a risk bid across the board, forcing the USD lower.
- Risk assets like the Euro and Gold are rallying into the Tuesday US session.
The EUR/USD has ticked into a fresh 15-week high above the 1.1000 major handle on Tuesday, fueled by a broad-market US Dollar (USD) selloff that is sending the Euro (EUR) higher as investor risk appetite climbs heading into the mid-week.
Fed’s Bowman: I remain willing to support rate hikes if progress on inflation stalls
Markets are shrugging off appearances from central bank policymakers from both sides of the pond. Federal Reserve (Fed) Governor Michelle Bowman hit newswires stating that the Fed is ready to continue increasing rates if progress on inflation stalls.
ECB's President Lagarde: Central bank to discuss QT in the “not too distant future”
Across the Atlantic, European Central Bank (ECB) President Christine Lagarde noted that quantitative tightening could be on the cards for the ECB sooner rather than later. ECB President Lagarde stated that the ECB's governing council could table QT in the "not-too-distant future" as the ECB grapples with European inflation that continues to overshoot ECB targets.
Next Up: EU Sentiment, US GDP
Wednesday sees European Economic Sentiment and Consumer Confidence figures, while the US market will see the next print of US quarterly Gross Domestic Product (GDP) growth.
Markets are forecasting that Pan-EU Consumer Confidence in November will hold steady at -16.9, in-line with October's print.
On the US Side, GDP growth is expected to tick higher from 4.9% to 5.0% for the third quarter.
Euro price today
The table below shows the percentage change of Euro (EUR) against listed major currencies today. Euro was the strongest against the US Dollar.
| USD | EUR | GBP | CAD | AUD | JPY | NZD | CHF | |
| USD | -0.39% | -0.52% | -0.30% | -0.64% | -0.62% | -0.57% | -0.39% | |
| EUR | 0.38% | -0.15% | 0.09% | -0.26% | -0.23% | -0.19% | 0.01% | |
| GBP | 0.52% | 0.14% | 0.24% | -0.11% | -0.09% | -0.05% | 0.17% | |
| CAD | 0.29% | -0.10% | -0.23% | -0.36% | -0.32% | -0.29% | -0.09% | |
| AUD | 0.64% | 0.25% | 0.11% | 0.35% | 0.02% | 0.07% | 0.30% | |
| JPY | 0.62% | 0.23% | 0.11% | 0.34% | -0.01% | 0.04% | 0.26% | |
| NZD | 0.56% | 0.20% | 0.05% | 0.28% | -0.07% | -0.05% | 0.22% | |
| CHF | 0.37% | -0.01% | -0.16% | 0.08% | -0.28% | -0.26% | -0.20% |
The heat map shows percentage changes of major currencies against each other. The base currency is picked from the left column, while the quote currency is picked from the top row. For example, if you pick the Euro from the left column and move along the horizontal line to the Japanese Yen, the percentage change displayed in the box will represent EUR (base)/JPY (quote).
EUR/USD Technical Outlook
The Euro's rally fueled by Greenback-selling across the broader FX marketspace sees the EUR/USD clipping into the 1.1000 handle, climbing four-tenths of a percent with further gains on the cards if market sentiment continues to climb.
The EUR/USD easily broke through the 200-day Simple Moving Average (SMA) in mid-November near the 1.0800 handle, and ongoing EUR bullishness is sending the pair steadily higher as the USD waffles.
The pair has potentially climbed too far, too fast with the 50-day SMA still trading well below prices and in bearish territory, and the moving average is currently rotating towards the topside from just north of 1.0650.
The Relative Strength Index (RSI) is flashing warning signs that the EUR/USD may have gone too far, too quickly with the signal line testing into the overbought boundary line, and the pair could see an extended pullback if bears are able to capitalize on any profit-taking.
EUR/USD Daily Chart
Risk sentiment FAQs
What do the terms"risk-on" and "risk-off" mean when referring to sentiment in financial markets?
In the world of financial jargon the two widely used terms “risk-on” and “risk off'' refer to the level of risk that investors are willing to stomach during the period referenced. In a “risk-on” market, investors are optimistic about the future and more willing to buy risky assets. In a “risk-off” market investors start to ‘play it safe’ because they are worried about the future, and therefore buy less risky assets that are more certain of bringing a return, even if it is relatively modest.
What are the key assets to track to understand risk sentiment dynamics?
Typically, during periods of “risk-on”, stock markets will rise, most commodities – except Gold – will also gain in value, since they benefit from a positive growth outlook. The currencies of nations that are heavy commodity exporters strengthen because of increased demand, and Cryptocurrencies rise. In a “risk-off” market, Bonds go up – especially major government Bonds – Gold shines, and safe-haven currencies such as the Japanese Yen, Swiss Franc and US Dollar all benefit.
Which currencies strengthen when sentiment is "risk-on"?
The Australian Dollar (AUD), the Canadian Dollar (CAD), the New Zealand Dollar (NZD) and minor FX like the Ruble (RUB) and the South African Rand (ZAR), all tend to rise in markets that are “risk-on”. This is because the economies of these currencies are heavily reliant on commodity exports for growth, and commodities tend to rise in price during risk-on periods. This is because investors foresee greater demand for raw materials in the future due to heightened economic activity.
Which currencies strengthen when sentiment is "risk-off"?
The major currencies that tend to rise during periods of “risk-off” are the US Dollar (USD), the Japanese Yen (JPY) and the Swiss Franc (CHF). The US Dollar, because it is the world’s reserve currency, and because in times of crisis investors buy US government debt, which is seen as safe because the largest economy in the world is unlikely to default. The Yen, from increased demand for Japanese government bonds, because a high proportion are held by domestic investors who are unlikely to dump them – even in a crisis. The Swiss Franc, because strict Swiss banking laws offer investors enhanced capital protection.
EUR/USD Technical Levels
- GBP/USD is increasing more than 0.60% courtesy of the Fed’s Waller dovish comments.
- Fed’s Governor Bowman commented further rate hikes are needed if inflation progress halts.
- GBP/USD Technical Outlook: Bulls eye the August 30 high near the 1.2750 area.
GBP/USD rallies sharply for the fourth straight day as the Greenback tumbles following dovish remarks by US Federal Reserve officials, suggesting a deceleration in inflation would warrant lower rates. After those words, the major has printed a leg-up and trades above the 1.2700 figure, posting more than 0.60% gains.
GBP/USD climbs above 1.2700 as it gains momentum following Fed’s dovish remarks
Recently, Fed Governor Christopher Waller, a hawkish member of the Federal Open Market Committee (FOMC), suggested that if inflation consistently declined, there was no reason to keep rates higher. That sent the S&P 500 rallying, while the US Dollar Index (DXY) plunged more than 0.50%, extending its losses toward the 102.63 area.
On the contrary, Fed’s Governor Michelle Bowman said the central bank would need to raise rates higher if the disinflation process stalls.
Before Wall Street opened, the Federal Housing Finance Agency (FHFA) revealed that home prices expanded 6.1% YoY in September. Recently, the Conference Board released November’s figures, which came at 12, exceeding forecasts of 101, and October’s downward revised number to 99.1.
Meanwhile, the Bank of England Deputy Governor Dave Ramsden commented on Tuesday that monetary policy must remain restrictive to curb inflation, pushing against market participants' expectations that BoE would slash rates next year.
GBP/USD Price Analysis: Technical outlook
The GBP/USD extended its gains to a three month high, with buyers eyeing a test of the August 30 swing high at 1.2746, which, once cleared, could pave the way for GBP bulls to challenge the 1.2800 mark. On the flip side, if sellers drag the spot price below 1.2700, they could remain hopeful of lower prices, though they must reclaim the 1.2600 figure, ahead of 1.2550.
GBP7USD Technical Levels
- The Aussie is seeing a boost into new 16-week highs with the Australian CPI due early Wednesday.
- The AUD/USD is seeing a firm rally after rebounding off of 0.6600, and the pair has climbed into 0.6650.
- Aussie bidders are shrugging off Tuesday's Australia Retail Sales miss, dovish RBA Governor Bullock.
The AUD/USD has kicked into a 16-week high twice on Tuesday, climbing into 0.6632 early in the session despite a downside print in Australian Retail Sales. The Aussie (AUD) waffled back into the 0.6600 handle against the US Dollar (USD) before markets again rallied the AUD/USD into 0.6660.
Australian October Retail Sales came in below expectations, printing at -0.2% versus the forecast 0.1% improvement, a steeper decline from September's 0.9% increase.
Reserve Bank of Australia (RBA) Governor Michele Bullock also hit newswires early Tuesday, noting that Australia's inflation outlook looks similar to countries overseas.
Governor Bullock also noted that the RBA has been on the cautious side on rate hikes, but stating that monetary policy remains restrictive and that rate hikes have dampened demand, blaming second-round inflation on high immigration.
RBA’s Bullock: Australian inflation path similar to overseas
Australian Monthly Consumer Price Index (CPI) figures for the year into October are due early Wednesday, and markets are expecting a slight decline of headline CPI inflation to 5.2% from September's 5.6%.
Later Wednesday could see markets hit some turbulence when US Gross Domestic Product (GDPO) figures land during the US market session. US GDP for the third quarter is expected to tick upward from 4.9% to an even 5.0%.
AUD/USD Technical Outlook
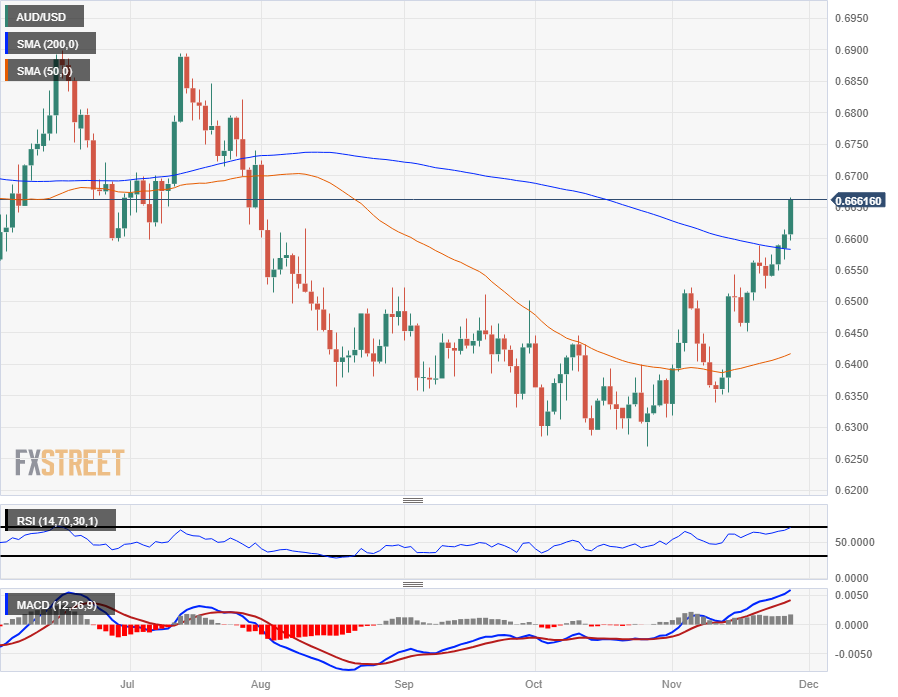
The Aussie's Tuesday rally brings the AUD/USD up over 0.6660, a 16-week high as the AUD shrugs off any bearish sentiment and plows higher against the USD.
The AUD/USD is up three-quarters of a percent from Tuesday's opening bids and the Aussie remains the only major currency that is in the green against all other major currencies on the board.
Tuesday's rally sees the pair easily extending beyond the 200-day Simple Moving Average (SMA), and the long-term trend moving average is set to begin acting as technical support from just beneath 0.6600 if bullish momentum takes a breather.
A pullback represents a very real risk of the pair collapsing back into the midrange near the 50-day SMA at 0.6425. Bullish breaks of the 200-day SMA have proven to be volatile, but short-lived in 2023, and with the RBNA firmly hobbled in place on rates it's difficult to see the Aussie maintaining bullish momentum without external support.
AUD/USD Daily Chart
AUD/USD Technical Levels
ECB President Lagarde participated through a pre-recorded video at the European Financial Reporting Advisory Group Conference, in Brussels, and mentioned quantitative tightening (QT). Among other things, Lagarde said it will come up for “discussion and consideration within the governing council in the not-too-distant future.”
Financial markets ignored Lagarde's words and focused more on Federal Reserve (Fed) officials' comments inclined to the dovish spectrum. Market participants seem to believe that ending the pandemic emergency purchase programme (PEPP) won't be an easy or quick task.
The EUR/USD pair consolidates gains just ahead of the multi-month low posted earlier in the day at 1.1001.
- The Canadian Dollar is seeing some lift on Tuesday as Crude Oil rebounds from early week swing low.
- Current Account figures from Canada and US quarterly GDP update on the docket for Wednesday.
- The US Dollar is down across the board on Tuesday, helping to bolster the Loonie.
The Canadian Dollar (CAD) is continuing to grind higher against the US Dollar (USD), driven by a general decline in the Greenback and a slight boost from Crude Oil prices recovering from Tuesday’s swing low.
The economic calendar is strictly mid-tier on Tuesday. Despite mixed results for US figures overall, market sentiment appears to be on the front foot with the USD receding slightly against its major currency peers.
Daily Digest Market Movers: Canadian Dollar sees bids, buoyed by broad market Greenback weakness
- The Canadian Dollar is extending against the US Dollar with mild bids on Tuesday.
- Crude Oil recovers from Tuesday’s low bids, WTI climbs 2.5% from $74.20 into $76.00.
- Broad markets are seeing a general softening in the Greenback, USD in the red against the entire swath of major currencies.
- Canadian third quarter Current Account slated for Wednesday, market forecasts expect a rebound in the headline figure from CAD $-6.63 billion to a surplus of CAD $1 billion.
- CAD trade balance to be overshadowed by US Gross Domestic Product (GDP) numbers in a side-by-side release schedule.
- US third quarter GDP expected to tick upward from 4.9% to 5% over the previous quarter.
- General market sentiment edging into risk appetite despite mixed US data on Tuesday.
- US Housing Price Index held steady in September at 0.6%, beating forecast decline to 0.4%.
- US CB Consumer Confidence improved in November, but October’s number sees downside revision.
Canadian Dollar price today
The table below shows the percentage change of Canadian Dollar (CAD) against listed major currencies today. Canadian Dollar was the strongest against the US Dollar.
| USD | EUR | GBP | CAD | AUD | JPY | NZD | CHF | |
| USD | -0.20% | -0.40% | -0.16% | -0.42% | -0.40% | -0.46% | -0.22% | |
| EUR | 0.20% | -0.20% | 0.05% | -0.22% | -0.18% | -0.26% | -0.01% | |
| GBP | 0.40% | 0.19% | 0.23% | -0.04% | 0.01% | -0.10% | 0.20% | |
| CAD | 0.14% | -0.06% | -0.25% | -0.27% | -0.23% | -0.31% | -0.07% | |
| AUD | 0.41% | 0.21% | 0.02% | 0.27% | 0.03% | -0.03% | 0.23% | |
| JPY | 0.38% | 0.18% | -0.01% | 0.23% | -0.04% | -0.08% | 0.18% | |
| NZD | 0.43% | 0.26% | 0.06% | 0.30% | 0.04% | 0.06% | 0.25% | |
| CHF | 0.23% | 0.01% | -0.19% | 0.06% | -0.21% | -0.18% | -0.24% |
The heat map shows percentage changes of major currencies against each other. The base currency is picked from the left column, while the quote currency is picked from the top row. For example, if you pick the Euro from the left column and move along the horizontal line to the Japanese Yen, the percentage change displayed in the box will represent EUR (base)/JPY (quote).
Technical Analysis: Canadian Dollar rebound grinds the USD/CAD back into 1.3600
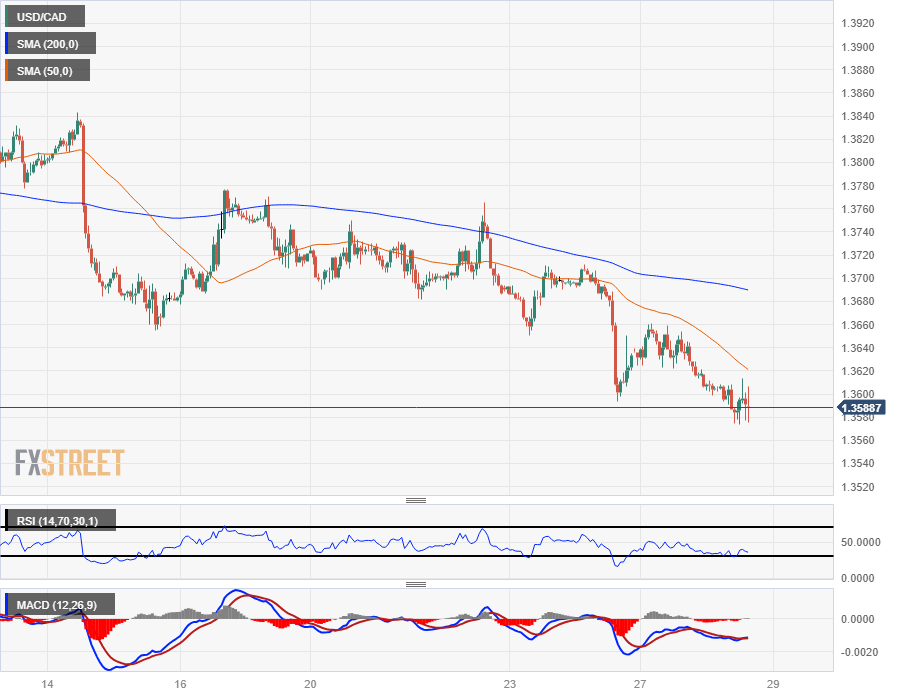
The Canadian Dollar (CAD) is getting a push as the US Dollar (USD) recedes against the broad FX market, taking the USD/CAD back into the 1.3600 handle on Tuesday.
Intraday short pressure has the pair pulling away from near-term averages, accelerating declines with the 50-hour Simple Moving Average (SMA) and 200-hour SMA struggling to keep up with declining bids.
The 50-hour SMA is providing technical resistance from 1.3620, while the 200-hour SMA sees any near-term bullish rebounds capped at 1.3690.
The pair has closed either flat or in the red for the past eight trading days, and Tuesday’s declines see the USD/CAD declining further away from the 50-day SMA near 1.3680.
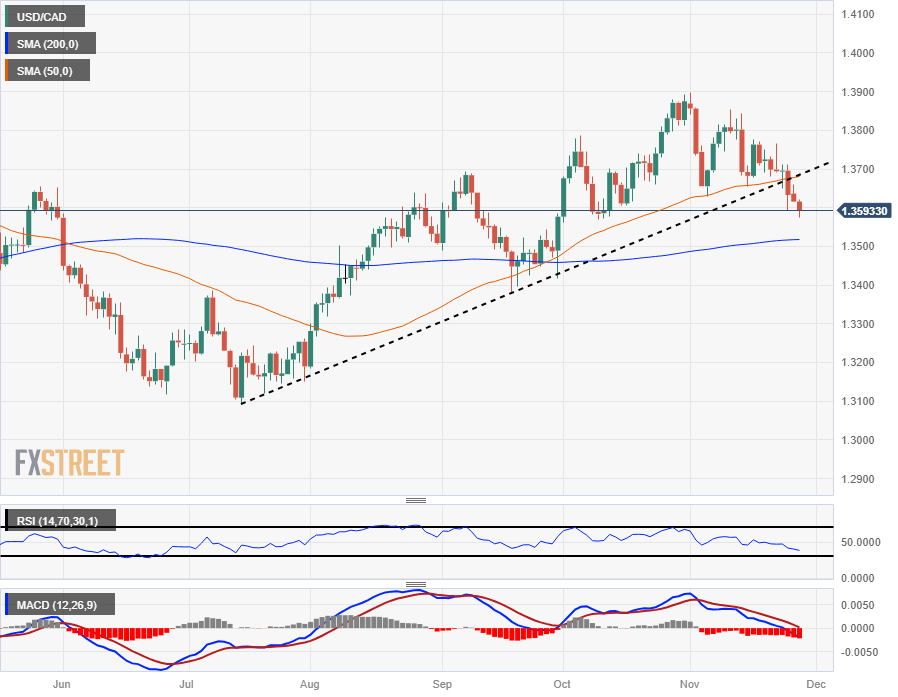
Further downside will see the USD/CAD challenging the 200-day SMA currently lifting from the 1.3500 handle, while any bullish pullbacks will face resistance from the last lower swing high into the 1.3800 price level.
Technical indicators are beginning to flash warning signs that the USD/CAD is approaching oversold conditions. The Relative Strength Index is approaching the lower boundary, while the Moving Average Convergence-Divergence (MACD) sees the signal lines crossing the midpoint into oversold territory.
USD/CAD Hourly Chart
USD/CAD Daily Chart
Canadian Dollar FAQs
What key factors drive the Canadian Dollar?
The key factors driving the Canadian Dollar (CAD) are the level of interest rates set by the Bank of Canada (BoC), the price of Oil, Canada’s largest export, the health of its economy, inflation and the Trade Balance, which is the difference between the value of Canada’s exports versus its imports. Other factors include market sentiment – whether investors are taking on more risky assets (risk-on) or seeking safe-havens (risk-off) – with risk-on being CAD-positive. As its largest trading partner, the health of the US economy is also a key factor influencing the Canadian Dollar.
How do the decisions of the Bank of Canada impact the Canadian Dollar?
The Bank of Canada (BoC) has a significant influence on the Canadian Dollar by setting the level of interest rates that banks can lend to one another. This influences the level of interest rates for everyone. The main goal of the BoC is to maintain inflation at 1-3% by adjusting interest rates up or down. Relatively higher interest rates tend to be positive for the CAD. The Bank of Canada can also use quantitative easing and tightening to influence credit conditions, with the former CAD-negative and the latter CAD-positive.
How does the price of Oil impact the Canadian Dollar?
The price of Oil is a key factor impacting the value of the Canadian Dollar. Petroleum is Canada’s biggest export, so Oil price tends to have an immediate impact on the CAD value. Generally, if Oil price rises CAD also goes up, as aggregate demand for the currency increases. The opposite is the case if the price of Oil falls. Higher Oil prices also tend to result in a greater likelihood of a positive Trade Balance, which is also supportive of the CAD.
How does inflation data impact the value of the Canadian Dollar?
While inflation had always traditionally been thought of as a negative factor for a currency since it lowers the value of money, the opposite has actually been the case in modern times with the relaxation of cross-border capital controls. Higher inflation tends to lead central banks to put up interest rates which attracts more capital inflows from global investors seeking a lucrative place to keep their money. This increases demand for the local currency, which in Canada’s case is the Canadian Dollar.
How does economic data influence the value of the Canadian Dollar?
Macroeconomic data releases gauge the health of the economy and can have an impact on the Canadian Dollar. Indicators such as GDP, Manufacturing and Services PMIs, employment, and consumer sentiment surveys can all influence the direction of the CAD. A strong economy is good for the Canadian Dollar. Not only does it attract more foreign investment but it may encourage the Bank of Canada to put up interest rates, leading to a stronger currency. If economic data is weak, however, the CAD is likely to fall.
- The New Zealand Dollar continues rising on the eve of the RBNZ’s November policy decision.
- Although recent data appears to reflect a slowdown, the RBNZ could still tilt hawkish, say analysts.
- NZD/USD forms a worrying-looking ending wedge pattern on the 4-hour chart, suggesting the risk of a pullback.
The New Zealand Dollar (NZD) trades higher in most pairs on Tuesday ahead of the Reserve Bank of New Zealand (RBNZ) meeting. Although few expect the RBNZ to lift interest rates at the meeting on Wednesday, given recent subdued data, some analysts still see a risk of hawkish hold. Forecasts and commentary from Reserve Bank Governor Adrian Orr are likely to come under intense scrutiny for cues.
Daily digest market movers: New Zealand Dollar faces risk from RBNZ decision
- The New Zealand Dollar rises on the eve of the RBNZ meeting policy announcement on Wednesday at 01:00 GMT.
- There is a low probability the bank will change interest rates, according to Bloomberg’s World Interest Rate Probabilities (WIRP), which suggest 5.0% odds of a hike in the bank’s prime lending rate, the Official Cash Rate (OCR), which currently stands at 5.50%.
- New Zealand data has come out below expectations recently, suggesting that if anything interest rates are at risk of being cut.
- “..official data from Statistics New Zealand (Stats NZ) showed that the Consumer Price Index (CPI) in the 12 months to September rose 5.6%, lower than expectations of 5.9% and the prior quarter’s reading of 6.0%. On a quarterly basis, New Zealand’s inflation increased to 1.8% but fell short of expectations of 2.0%.” Says Dhwani Mehta, senior analyst at FXStreet.
- New Zealand's Unemployment Rate climbed to 3.9% in the September quarter, compared with 3.6% last quarter, however, with the new right-wing coalition government set to scrap the RBNZ’s dual mandate, which includes maintaining full employment, and replacing it with just ‘maintaining price stability’, the rising jobless rate is unlikely to be a concern for the RBNZ.
- Some analysts think Orr’s commentary could sway hawkish, fueling further upside for the Kiwi.
- "..with so much easing now priced in, the risks could be skewed slightly to the upside for the Kiwi on a non-dovish outcome," say economists at ANZ Bank in a note.
- Asian markets closed with the Hang Seng almost 1.0% lower on Tuesday, reflecting a negative outlook for China, New Zealand’s main trading partner.
- Chinese Industrial firms showed lower-than-expected profits in October with only a 2.7% year-on-year rise in profit growth. This marked a return back to single digits, following an 11.9% increase in September and a 17.2% gain in August, according to Reuters.
- The data suggests the Chinese authorities will have to continue providing stimulus to prompt growth, adds the report.
- The Chinese property market remains a concern. On Tuesday there was more bad news regarding troubled property developer Evergrande, which was sued by one of its own subsidiaries, Jinbi Property Management Company, for 2 billion yuan ($279.60 million) in deposit certificate pledge guarantees, according to a report by Reuters.
- Chinese asset manager Zhongzhi announced liabilities totalling between $58 and $64 billion recently.
- Foreign Direct Investment, a gauge of foreign investor confidence in China fell into negative territory for the first time this century in Q3 of 2023, a sign that foreign companies previously heavily reliant on Chinese suppliers might be diversifying as part of a “de-risking” strategy, according to Reuters.
New Zealand Dollar technical analysis: NZD/USD continues higher, worrying wedge on 4-hour chart
NZD/USD – the number of US Dollars that can be bought with one New Zealand Dollar – pushes higher ahead of the highly anticipated RBNZ event.
The NZD/USD now makes a foot hold clearly above the key 200-day Simple Moving Average (SMA), at an over 3-month high, on Tuesday.
-638367838977940062.png)
New Zealand Dollar vs US Dollar: Daily Chart
The pair is in a short and medium-term bullish trend, which continues to bias longs over shorts.
The MACD momentum indicator is rising in line with price suggesting the medium-term uptrend is healthy.
A possible bullish inverse head and shoulders (H&S) pattern may be unfolding. The inverse H&S is identified by the labels applied to the daily chart. L and R stand for the left and right shoulders, whilst H stands for the head. The target for the inverse H&S is at 0.6215, which has still not been met yet, suggesting more upside is still on the horizon. The pair has already breached the neckline at the October highs, confirming activation of the pattern’s target.
Another way of looking at the chart is that the pattern is in fact a ‘cup and handle’ pattern, with the ‘head’ of the inverse H&S actually a ‘cup’ and the right shoulder a ‘handle’. Regardless of which pattern is forming, the target would be similar to that of the inverse H&S.
-638367839418196844.png)
New Zealand Dollar vs US Dollar: 4-hour Chart
Despite evidence of bullish patterns, a bearish ending wedge price pattern has also formed. This can be seen most clearly on the 4-hour chart above. The pattern raises concerns for bulls in the short-term context and could be a sign of a pullback on the horizon. A decisive break below the wedge’s lower boundary line at about 0.6080-75 would lead to a likely sell-off back down to support at 0.6000, the conservative price target for the wedge.
The MACD on the 4-hour chart is undergoing bearish divergence with price, as can be seen by the progressively higher highs in price as it forms the wedge not being matched by MACD, which is producing lower highs instead. This further suggests underlying weakness in the short-term uptrend.
The long-term trend is still bearish, suggesting a risk of a recapitulation remains.
New Zealand Dollar FAQs
What key factors drive the New Zealand Dollar?
The New Zealand Dollar (NZD), also known as the Kiwi, is a well-known traded currency among investors. Its value is broadly determined by the health of the New Zealand economy and the country’s central bank policy. Still, there are some unique particularities that also can make NZD move. The performance of the Chinese economy tends to move the Kiwi because China is New Zealand’s biggest trading partner. Bad news for the Chinese economy likely means less New Zealand exports to the country, hitting the economy and thus its currency. Another factor moving NZD is dairy prices as the dairy industry is New Zealand’s main export. High dairy prices boost export income, contributing positively to the economy and thus to the NZD.
How do decisions of the RBNZ impact the New Zealand Dollar?
The Reserve Bank of New Zealand (RBNZ) aims to achieve and maintain an inflation rate between 1% and 3% over the medium term, with a focus to keep it near the 2% mid-point. To this end, the bank sets an appropriate level of interest rates. When inflation is too high, the RBNZ will increase interest rates to cool the economy, but the move will also make bond yields higher, increasing investors’ appeal to invest in the country and thus boosting NZD. On the contrary, lower interest rates tend to weaken NZD. The so-called rate differential, or how rates in New Zealand are or are expected to be compared to the ones set by the US Federal Reserve, can also play a key role in moving the NZD/USD pair.
How does economic data influence the value of the New Zealand Dollar?
Macroeconomic data releases in New Zealand are key to assess the state of the economy and can impact the New Zealand Dollar’s (NZD) valuation. A strong economy, based on high economic growth, low unemployment and high confidence is good for NZD. High economic growth attracts foreign investment and may encourage the Reserve Bank of New Zealand to increase interest rates, if this economic strength comes together with elevated inflation. Conversely, if economic data is weak, NZD is likely to depreciate.
How does broader risk sentiment impact the New Zealand Dollar?
The New Zealand Dollar (NZD) tends to strengthen during risk-on periods, or when investors perceive that broader market risks are low and are optimistic about growth. This tends to lead to a more favorable outlook for commodities and so-called ‘commodity currencies’ such as the Kiwi. Conversely, NZD tends to weaken at times of market turbulence or economic uncertainty as investors tend to sell higher-risk assets and flee to the more-stable safe havens.
Federal Reserve (Fed) Governor Michelle Bowman said on Tuesday that she remains willing to support raising interest rates “should the incoming data indicate that progress on inflation has stalled or is insufficient to bring inflation down to 2 percent in a timely way.”
In a speech delivered at the Utah Bankers Association and Salt Lake City Chamber Banker and Business Leader Breakfast, Bowman explained that is is possible that the fed funds rate will need to be at a higher level than before the COVID-19 pandemic, to foster low, stable inflation.
Key takeaways from the speech:
Finally, given all of the considerations I have just discussed, it is not yet clear whether the appropriate level of the federal funds rate will need to remain at a higher level than before the pandemic in order to effectively foster low and stable inflation and support full employment.
I continue to see an unusually high level of uncertainty as I consider current economic conditions and my own views on the outlook for the economy and monetary policy. My colleagues and I will continue to make our monetary policy decisions at each meeting based on the incoming data and the implications for the economic outlook.
I remain willing to support raising the federal funds rate at a future meeting should the incoming data indicate that progress on inflation has stalled or is insufficient to bring inflation down to 2 percent in a timely way.
We should keep in mind the historical lessons and risks associated with prematurely declaring victory in the fight against inflation, including the risk that inflation may settle at a level above our 2 percent target without further policy tightening.
Market reaction
The US Dollar Index (DXY) moved modestly off lows, but remains under 103.00, on its way to the weakest daily close in months. US yields are sharply lower, affected by comments from Fed’s Waller.
The Brazilian Real was up a smidgen last week. Economists at analyze USD/BRL outlook.
Reclaiming 200-DMA near 4.98 essential to affirm a meaningful up move
USD/BRL has experienced a steady down move after its rebound faltered near 5.21, the 61.8% retracement from November 2022. It is now close to the low of September near 4.84 which is interim support. The decline has stalled however reclaiming the 200-DMA near 4.98 would be essential to affirm a meaningful up move.
In case the pair fails to defend 4.84, the phase of decline could extend towards projections of 4.78 and perhaps even towards 4.69.
- Mexican Peso is suffocated, unable to keep the USD/MXN below the 17.10 area.
- US Consumer Confidence improves, while Fed officials emphasize that rates will drag inflation down.
- Banxico Heath’s dovish remarks continue to weigh on the Mexican currency.
Mexican Peso (MXN) prints slim losses against the US Dollar (USD), with the USD/MXN virtually unchanged, up by a marginal 0.01%, after hitting a daily high of 17.21.Market participants are digesting recent comments from US Federal Reserve (Fed) officials, Christopher Waller and Chicago Fed President Austan Goolsbee. At the time of writing, the exotic pair exchanges hands at around 17.14.
Mexico’s scarce economic docket keeps USD/MXN traders focused on US economic data. The US Conference Board (CB) revealed that Consumer Confidence in November rose above forecasts and October’s downward revised data. At the same time, Fed Governor Christopher Waller commented he’s confident the current policy is well-positioned to slow the economy and get inflation back to 2%. Chicago Fed President Austan Goolsbee said they had made progress on inflation outside of food prices.
Daily digest movers: Mexican Peso is parked at around the 17.05/17.15 range after Banxico Heath’s remarks
- On November 27, Banxico’s Deputy Governor, Jonathan Heath, commented that core prices must come down more, adding that one or two rate cuts may come next year, but “very gradually” and “with great caution.”
- November’s US CB Consumer Confidence rose 102, above forecasts and October’s data, each at 101 and 99.1, respectively.
- On November 24, a report revealed the economy in Mexico grew as expected in the third quarter on an annual and quarterly basis, suggesting the Bank of Mexico would likely stick to its hawkish stance, even though it opened the door for some easing.
- Mexico's annual inflation increased from 4.31% to 4.32%, while core continued to ease from 5.33% to 5.31%, according to data on November 23.
- The financial markets' narrative that the US Federal Reserve (Fed) is done hiking rates has kept the Greenback on the backfoot, but today, it has found some relief. The US Dollar Index (DXY) is down 0.18%, exchanging hands at 103.00.
- Data published earlier this month showed prices paid by consumers and producers in the US dipped, increasing investors' speculations that the Fed’s tightening cycle has ended.
- A Citibanamex poll suggests that 25 of 32 economists polled expect Banxico's first rate cut in the first half of 2024.
- The poll shows “a great dispersion” for interest rates next year, between 8.0% and 10.25%, revealed Citibanamex.
- The same survey revealed that economists foresee headline annual inflation at 4.00% and core at 4.06%, both readings for the next year, while the USD/MXN exchange rate is seen at 19.00, up from 18.95, toward the end of 2024
- The swap market suggests traders expect 85 basis points of rate cuts by the Fed in 2024.
Technical Analysis: Mexican Peso losses strength as USD/MXN stays near the weekly high
The USD/MXN has consolidated during the last seven days, within the 17.05/17.20 area, unable to drop or rise above the range, while the 20-day Simple Moving Average (SMA) at 17.37 aims toward the 100-day SMA at 17.34, suggesting that sellers are gathering momentum in the short term. Hence, they need to reclaim the 17.05 figure, ahead of driving prices toward the 17.00 figure and below.
Contrarily, buyers must pierce the 17.20 area and reclaim the 100-day SMA, so they could threaten to test the 200-day SMA at 17.58 before they rally to the 50-day SMA at 17.68, both dynamic resistance levels.
Mexican Peso FAQs
What key factors drive the Mexican Peso?
The Mexican Peso (MXN) is the most traded currency among its Latin American peers. Its value is broadly determined by the performance of the Mexican economy, the country’s central bank’s policy, the amount of foreign investment in the country and even the levels of remittances sent by Mexicans who live abroad, particularly in the United States. Geopolitical trends can also move MXN: for example, the process of nearshoring – or the decision by some firms to relocate manufacturing capacity and supply chains closer to their home countries – is also seen as a catalyst for the Mexican currency as the country is considered a key manufacturing hub in the American continent. Another catalyst for MXN is Oil prices as Mexico is a key exporter of the commodity.
How do decisions of the Banxico impact the Mexican Peso?
The main objective of Mexico’s central bank, also known as Banxico, is to maintain inflation at low and stable levels (at or close to its target of 3%, the midpoint in a tolerance band of between 2% and 4%). To this end, the bank sets an appropriate level of interest rates. When inflation is too high, Banxico will attempt to tame it by raising interest rates, making it more expensive for households and businesses to borrow money, thus cooling demand and the overall economy. Higher interest rates are generally positive for the Mexican Peso (MXN) as they lead to higher yields, making the country a more attractive place for investors. On the contrary, lower interest rates tend to weaken MXN.
How does economic data influence the value of the Mexican Peso?
Macroeconomic data releases are key to assess the state of the economy and can have an impact on the Mexican Peso (MXN) valuation. A strong Mexican economy, based on high economic growth, low unemployment and high confidence is good for MXN. Not only does it attract more foreign investment but it may encourage the Bank of Mexico (Banxico) to increase interest rates, particularly if this strength comes together with elevated inflation. However, if economic data is weak, MXN is likely to depreciate.
How does broader risk sentiment impact the Mexican Peso?
As an emerging-market currency, the Mexican Peso (MXN) tends to strive during risk-on periods, or when investors perceive that broader market risks are low and thus are eager to engage with investments that carry a higher risk. Conversely, MXN tends to weaken at times of market turbulence or economic uncertainty as investors tend to sell higher-risk assets and flee to the more-stable safe havens.
Federal Reserve Governor Christopher Waller said on Tuesday that if inflation consistently declines, there is no reason to insist that interest rates need to remain really high.
In a conversation with Michael Strain, Director of Economic Policy Studies, at the American Enterprise Institute, Waller added that there are good economic arguments that if inflation continues to decline for several more months, it is possible to lower the policy rate. Earlier, Waller delivered a speech.
Market reaction
Following these comments, the US Dollar Index accelerated its decline, falling below 103.00 to reach fresh lows not seen in months. Meanwhile, stock prices on Wall Street climbed to new daily highs, and there was a significant slide in Treasury yields.
Economists at ING analyze NZD/USD outlook ahead of the Reserve Bank of New Zealand (RBNZ) monetary policy announcement.
RBNZ may deliver a hawkish hold
RBNZ will almost certainly keep rates on hold again.
We think the Bank will try to discourage further rate cut expectations by signalling rates will be held at 5.50% or cut only by 25 bps in the whole of 2024. That can help NZD get some further support, although the very good performance of the Kiwi of late remains almost solely a function of external factors.
Domestically, it’s worth keeping an eye on the expected change in the RBNZ remit by the newly installed government, which plans to remove the dual mandate to focus on inflation only. In our view, that is a long-term NZD-positive.
See – RBNZ Preview: Forecasts from seven major banks, pushing back against rate cuts
Federal Reserve Governor Christopher Waller said on Tuesday that he is confident that monetary policy is positioned to slow the economy and get inflation back to 2%.
In a speech at the American Enterprise Institute, Waller added that the labor market is cooling off, but still tight. Regarding the outlook, he considers that supply-side problems are mostly behind.
“I cannot say for sure whether the FOMC has done enough to achieve price stability. Hopefully, the data we receive over the next couple of months will help answer that question”, Waller said.
Key takeaways:
While I am encouraged by the early signs of moderating economic activity in the fourth quarter based on the data in hand, inflation is still too high, and it is too early to say whether the slowing we are seeing will be sustained.
I am increasingly confident that policy is currently well positioned to slow the economy and get inflation back to 2 percent.
Data on economic activity in October indicate that consumer spending is cooling from its pace in the third quarter.
The labor market is also cooling off. Job creation is down this year from the high rates of 2022, and the unemployment rate has risen from a more than 50-year low of 3.4 percent in April to 3.9 percent in October.
These are all signs of a loosening labor market. But for all of the measures I have mentioned, they are still at levels that, historically, would be associated with a fairly tight labor market.
The October data I have cited on economic activity and inflation are consistent with the kind of moderating demand and easing price pressure that will help move inflation back to 2 percent, and I will be looking to see that confirmed in upcoming data releases.
Before the next FOMC meeting we will get data on PCE inflation and job openings, and a job report and supply manager's survey for November.
All of that data will tell us whether inflation and aggregate demand are continuing to move in the right direction and inflation is on a path to our 2 percent goal.
Market reaction
The US Dollar Index remains in negative territory, trading below 103.00 at the weakest level since August.
The S&P 500 registered its fourth consecutive weekly gain, leaving the index up almost 19% year-to-date and less than 1% from its 2023 high. Economists at UBS analyze equities outlook.
Risks remain despite upbeat mood in equity markets
Our base case is for further modest gains in 2024, with the S&P 500 Index ending the year around 4,700.
But, an unusually wide range of risks could still spoil the outlook. While inflation is declining, markets could be unsettled by any slowing of this process. This could add to fears of a hard landing in the US, as the Fed keeps rates higher for longer. The wars between Russia and Ukraine and between Israel and Hamas both have the potential to trigger volatility. And the US presidential election will take place against a background of an increasingly dysfunctional budget process.
- US CB Consumer Confidence Index rose in November, after a negative revision to October figures.
- US Dollar Index remains around 103.00, at monthly lows.
Consumer sentiment in the US continued to weaken in November, with the Conference Board's Consumer Confidence Index rising to 102.0 in November from 99.1 in October (revised from 102.6).
Further details of the publication revealed that the Present Situation Index edged lower to 138.2 from 138.6 and the Consumer Expectations Index rose to 77.8 from 72.7.
Finally, the one-year consumer inflation rate expectation receded to 5.7% from 5.9%.
Market reaction
The US Dollar Index remained below 103.00, trading at its lowest level since mid-August.
Gold price is back above $2,000, but why? Strategists at Commerzbank analyze the yellow metal’s outlook.
Any upside potential for Gold is probably more or less exhausted for the time being
The falling interest rates and weaker US Dollar we envisage as a result point to a rising Gold price, which is why we anticipate a further increase to $2,100 by the end of next year. This would also see Gold surpass its record high from August 2020.
That said, any upside potential for the Gold price is probably more or less exhausted for the time being. This is because the upswing since early October was probably facilitated by the covering of speculative short positions, a process that should have been completed by now. For the Gold price to gain any further, rate cut speculation would need to intensify, which would require weaker US economic data or corresponding comments by Fed officials.
Loonie is a moderate outperformer on the session. Economists at Scotiabank analyze the USD/CAD pair outlook.
Tech momentum turns bearish
USD/CAD losses through daily trend/channel support around 1.3660/1.3665 this week are putting the CAD in a good position to extend gains.
Intraday and daily trend momentum oscillators are weak but do signal an intensifying move lower is developing as the USD pressures retracement support at 1.3590 (38.2% Fibonacci of the July/November USD rally). Further weakness below here targets 1.3490/1.3500.
Month-end flows may be helping the CAD along a little in the short run.
- EUR/USD accelerates its march north and surpasses 1.0980.
- Further upside could see 1.1000 revisited in the short term.
EUR/USD advances further and reaches new monthly highs in the 1.0980/85 band on Tuesday.
The continuation of the upward bias could see the pair challenging the psychological threshold of 1.1000. Beyond this level comes the August top of 1.1064 (August 10).
So far, while above the significant 200-day SMA, today at 1.0812, the pair’s outlook should remain constructive.
EUR/USD daily chart
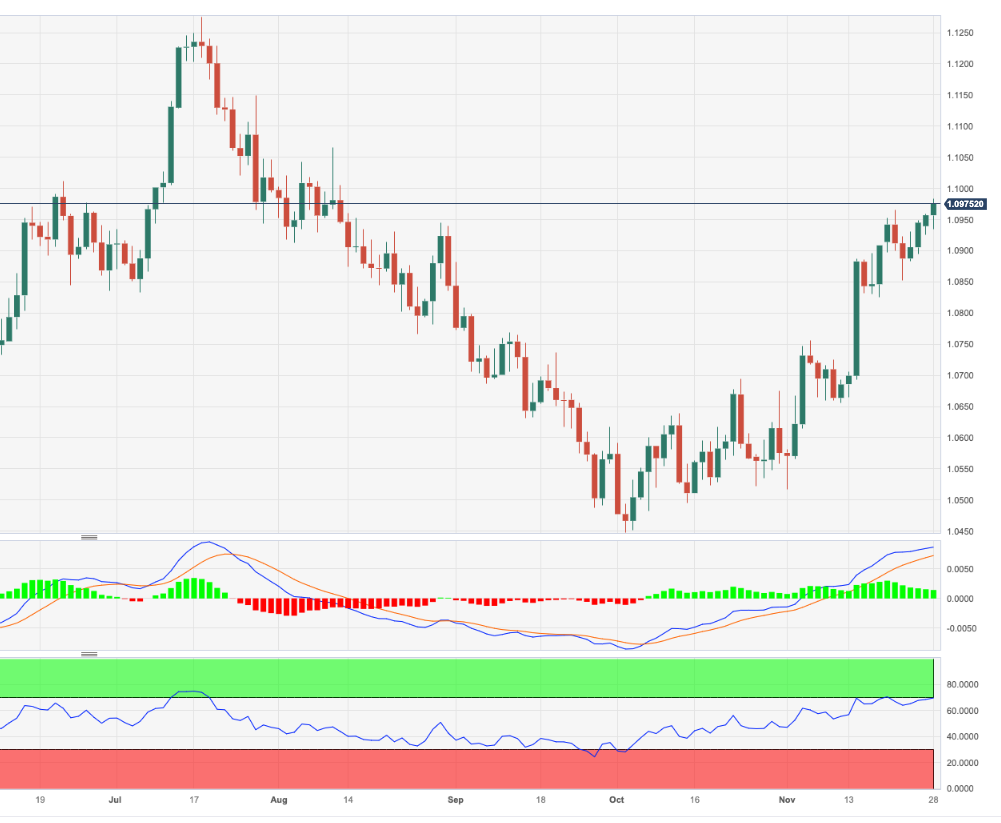
- Gold prices (XAU/USD) have soared, reaching a six-month high, with a more than 0.50% increase in the early North American session.
- US economic data indicates a 6.1% YoY increase in home prices for September, as the Federal Housing Finance Agency (FHFA) reported.
- Speculation is growing that the Federal Reserve may halt interest rate hikes, contributing to the rise in Gold’s price.
Gold price climbs to a six-month high, more than 0.50% on Tuesday, early in the North American session, as the Greenback remains on the defensive, undermined by falling US Treasury bond yields. At the time of writing, the XAU/USD exchanges hands at $2025, after bouncing from daily lows of $2011.79.
XAU/USD reaches $2028.01 as the market anticipates potential Fed rate cuts
The market mood shifted sour as participants await remarks from some US Federal Reserve (Fed) officials during the day. The US economic data revealed home prices, which expanded at a 6.1% YoY pace in September, according to the Federal Housing Finance Agency (FHFA). The report showed the cost of mortgage loans has fallen as the Fed kept rates unchanged for the last two meetings. Speculations are mounting that the US central bank is done raising interest rates, triggering a fall in US Treasury bond yields.
In the meantime, money market futures have priced in 85 basis points of rate cuts for the next year. Therefore, the US Dollar Index (DXY), which measures the performance of the buck against six currencies, is treading water, drops 0.22%, at 102.97. The US 10-year Treasury bond yield is virtually unchanged at 4.40%.
Ahead in the calendar, the Chicago Fed President Austan Goolsbee is expected to deliver some remarks at around 15:00 GMT. At the same time, the Conference Board is expected to release November’s consumer confidence, awaited at 101, which suggests a slim deterioration compared to October’s 102.6 data, along with Richmond’s Fed Manufacturing Index.
XAU/USD Price Analysis: Technical outlook
Gold’s daily chart portrays the yellow metal as upward biased, with bulls in charge and eyeing the April 23 swing high at $2048.15, before challenging the all-time high at $2081.82. A decisive breach of those levels will put into play, the $2100 figure. On the other hand, bears must bring prices below October 27, the latest cycle high at $2009.42, before extending its losses to the $2000 mark.
The S&P CoreLogic Case-Shiller U.S. National Home Price NSA Index reported a 3.9% annual change in September, up from a 2.5% change in the previous month, S&P reported. Market consensus was for a 4% increase.
According to the Federal Housing Finance Agency (FHFA) seasonally adjusted House Price Index, house prices rose in September 0.6% from August, surpassing market expectations of a 0.4% increase.
Market reaction
The US Dollar Index (DXY) remains under pressure, trading near 103.00, at the lowest level in almost three months. More data from the US is due later on Tuesday with CB Consumer Confidence. Also, many Federal Reserve (Fed) official will speak.
GBP/USD gains are blocked in the mid-1.26s. Economists at Scotiabank analyze the pair’s outlook.
Cable is consolidating
The short-term bull trend is showing some signs of tiring but underlying dynamics remain bullish and scope for losses appears limited at this point.
Sterling’s break above 1.2586 – the 50% retracement resistance of the July/October decline in the Pound keeps the upside focus on a push higher to the low 1.27s (61.8% retracement at 1.2716).
Support is seen at 1.2565/1.2570.
See – GBP/USD: Heading towards 1.2670/1.2720 – SocGen
The Australian Bureau of Statistics (ABS) will release the Monthly Consumer Price Index (CPI) figures on Wednesday, November 29 at 00:30 GMT and as we get closer to the release time, here are forecasts from economists and researchers of five major banks regarding the upcoming inflation data.
For October, CPI is expected at 5.2% year-on-year vs. 5.6% in September. It would be the first deceleration since July. Nonetheless, inflation remains well above the 2-3% target range.
SocGen
Monthly headline CPI inflation is likely to have fallen in October to 5.2% after the increases in August and September. We expect to see a much lower transport sector inflation print due to base effects from automotive fuel (i.e., oil prices). Housing sector inflation is also likely to have declined, on the back of base effects from electricity prices, while inflation in rents and new dwelling purchases should have remained largely unchanged in our view. Among other sectors, we expect inflation to have picked up slightly in the furnishings, household equipment/services and recreation/culture sectors. Relative to headline inflation, some inflation figures, such as trimmed mean inflation and inflation excluding ‘volatile items’ and holiday travel, are likely to show a more modest decline.
ING
The inflation number should be still above the RBA’s target but could edge lower in October to 5.0% YoY.
Citi
We expect the YoY CPI Indicator to ease from 5.6% in September to 5.1% in October. The YoY forecast translates to a -0.1% change in the indicator for the month. The risk is that the decline could be larger than expected. However, Citi’s Q4 official CPI forecast of 4.5% mechanically requires positive monthly CPI Indicator results for November and December. So a negative October monthly result should not cause alarm.
NAB
We expect 5.2% YoY from 5.6% in line with consensus. Year-ended core measures are also likely to slow, but the October number is overweight goods and has low coverage of services, which means October data won’t help much to gauge domestic pressures.
TDS
We expect Oct monthly CPI at 5.4% YoY (Sep: 5.6%), cooling off from the big acceleration last month. Volatile fuel prices will have another outsized impact on the monthly CPI print as fuel prices pulled back after surging in the past two months. However, price pressures have proved stickier than expected and we expect rents, utility bills and other domestic costs to keep inflation elevated in Oct. Another big surprise in the Oct print will increase the odds of a Feb hike as we think the Board won't have enough information by Dec to move again, especially after the dovish guidance last month.
The USD is narrowly mixed against the major currencies in calm trade. Economists at Scotiabank analyze Greenback’s outlook.
Soft data will maintain pressure on US term yields
Asian FX has outperformed on the session, with the JPY taking advantage of lower US yields to test the low 148 area. The CNH continues to consolidate close to its 200-DMA against the USD (7.1370) after a solid rebound in November so far. Trends in both the JPY and CNH warrant attention, both have underperformed this year so far and both are shaping up to perhaps reverse some of that underperformance which will add to USD headwinds generally.
We get (a lot more) US housing data today as well as the November reading of the Conference Board’s Consumer Confidence measure. Markets are expecting some softening in the November data. High interest rates and signs of some slackening in the labour market are impediments for confidence and support the outlook for a fourth consecutive decline in the index. A 101 result would be the lowest since July 2022. Soft data will maintain pressure on US term yields.
EUR/USD consolidates after a retest of last week’s 1.0965 high. Economists at Scotiabank analyze the pair’s outlook.
Scope for losses is limited
EUR gains have slowed over the past week, with EUR progress blocked by retracement resistance at 1.0961 (61.8% Fibonacci of the H2 decline in spot).
The underlying trend higher in the EUR looks solid, if a little overextended in the short run – which may account for the sideways range trading seen recently.
Scope for EUR losses is limited, with firm support likely to emerge in the upper 1.08s in the short run.
Above 1.0960/1.0965 targets additional gains to 1.11.
Economists at Commerzbank analyze Kiwi’s outlook ahead of the Reserve Bank of New Zealand (RBNZ) monetary policy meeting.
Too early for an RBNZ U-turn?
It is consensus that New Zealand's central bank (RBNZ) will keep its key rate unchanged at 5.50%. Anything else would be a major surprise.
According to the RBNZ, there is the risk that in the medium run, weaker global and Chinese growth will have negative effects on commodity prices and New Zealand’s export revenue. As soon as discernible evidence of that emerges, the RBNZ might move towards rate cuts.
The latest economic data from New Zealand and China provided reason for cautious optimism though. I therefore believe that it is still a little early to find any evidence of rate cuts at this meeting. That means NZD should be able to maintain its positive performance for now, above all against the struggling Dollar.
See – RBNZ Preview: Forecasts from seven major banks, pushing back against rate cuts
The Mexican Peso has rallied 5.9% vs. the US Dollar this month. Economists at Société Générale analyze USD/MXN outlook.
17.70 is near term hurdle
The MXN is on track to strengthen to 17.00/USD for the first time since early September amid broad USD weakness.
The pair is expected to drift towards next potential supports at 17.00 and July/August lows near 16.60.
Confluence of 50-DMA and 200-DMA near 17.70 is near term hurdle.
The Banxico will release its quarterly inflation report on Wednesday. The forecast should be in line with those of November: average inflation steadily slowing to 4.4% in 4Q23 and 3.4% in 2024, with the average core slowing to 5.3% and 3.3%, respectively.
- DXY keeps the negative performance in the low-103.00s.
- Next on the downside emerges the weekly low of 102.93.
DXY extends the leg lower for the fourth session in a row on turnaround Tuesday.
Further weakness in the index is expected to challenge the key support at 103.00 sooner rather than later. The loss of this region exposes the weekly low of 102.93 (August 30) ahead of another round level at 102.00.
In the meantime, while below the key 200-day SMA (103.60), the outlook for the index is expected to remain bearish.
DXY daily chart
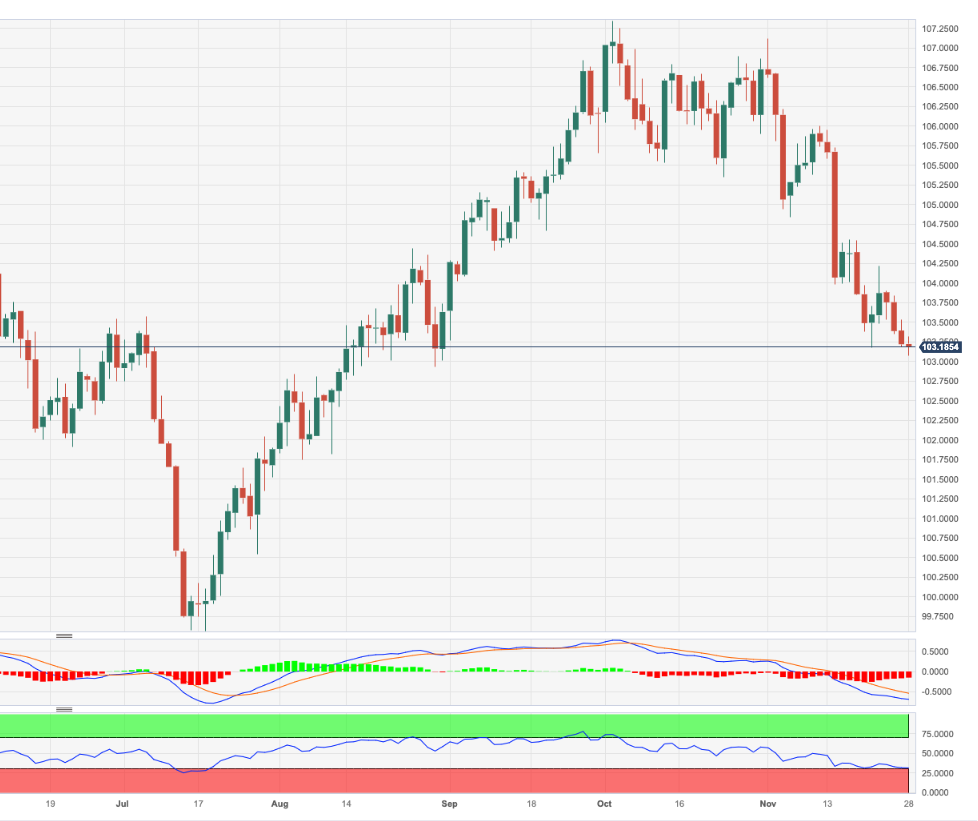
- The Greenback trades flat, attempting to push against the recent downtrend.
- US traders will hear from no less than four Fed members this Tuesday.
- The US Dollar Index is steady above 103 and tries to head back to 104.
The US Dollar (USD) is trying to put up a fight this Tuesday as the downtrend is coming to a halt for now. Best way to look at it is via the US Dollar Index (DXY) which is seeing a little bit of a bounce in Asian trading this Tuesday, with the DXY holding above 103. The economic calendar this Tuesday could spark some more movements in favour of the Greenback again and see the bounce add another leg up later in the trading session this Tuesday.
Besides some rather light US data points, markets can look forward to comments from no less than four US Federal Reserve members. Two of them are actually speaking twice this Tuesday, so that makes it in total seven guidance events for the markets. Expect to see traders look for clues on any further confirmation that the Fed is truly done hiking, or more tightening is needed according to some members.
Daily digest: Fed speakers rule
- As mentioned in the paragraphs above, four Fed officials are due to speak:
- Austan Goolsbee from the Chicago Fed is due to speak around 15:00 GMT and will close off this Tuesday with comments at 22:00 GMT.
- Just five minutes after Goolsbee, Christopher Waller from the Board of directors will speak at 15:05 GMT.
- Michelle Bowman, who sits at the Board of Governors of the Fed, will speak around 15:45 GMT.
- Fed’s Vice Chairman Michael Barr will speak twice this Tuesday: Once at 18:05 GMT and once at 20:30 GMT.
- Near 13:55 GMT the Redbook Index for the week of NOvember 24th is due to come out. Previous was at 3.4%.
- At 14:00 GMT the Housing Price Index for September is due. Previous was a rise of 0.6% with 0.4% forecasted.
- At that same time, 14:00 GMT, the Case-Shiller Home Price Index is due as well. Previous was at 2.2% with 4% forecasted.
- At 15:00 GMT markets will hear from the US consumer as the Consumer Confidence for November will be due. Previous was at 102.6 and should soften a touch to 101.
- Be on the lookout for the Richmond Fed Manufacturing Index for November as well at 15:00 GMT, expected to head from 3 to 1.
- The US Treasury will head to markets to auction a 52-week Bill and a 7-year Note respectively at 16:30 GMT and 18:00 GMT.
- Equities are continuing their decline from Monday, with nearly every major index in the red across the globe. in Asia the Hong Kong Hang Seng Index is down by 1%. European indices and US equity futures are rather mildly in the red and can still turn around the ship in the course of this Tuesday.
- The CME Group’s FedWatch Tool shows that markets are pricing in a 96.6% chance that the Federal Reserve will keep interest rates unchanged at its meeting in December. The chance for another hike is gaining by 3.4%.
- The benchmark 10-year US Treasury Note traders at 4.38% and is steady after briefly hitting 4.51%.
US Dollar Index technical analysis: Divergence
The US Dollar is breaking up the pattern traders saw forming over the past few days and which has led to the decline in the Greenback. US Yields are continuing to decline, narrowing the yield gap with other developed currencies. Although, the Greenback on its own is not following suit this Tuesday, breaking up the correlation, there is a risk that the correlation kicks in again later today and might see another snap lower in the US Dollar Index.
The DXY is hanging below the 200-day Simple Moving Average (SMA), which is near 103.62. The DXY could still make it back up there, should US traders come back in the market and start buying the current dip. A two-tiered pattern of a daily close and next an opening higher would quickly see the DXY back above 104.25, with the 200-day and 100-day SMA turned over to support levels.
To the downside the 200-day SMA is losing its support properties. The lows of last week at 103.18 and 102.98 would rather be seen as levels for a brief bounce. Should any of the US numbers this week be a substantial disappointment, look for even a 2.5% devaluation in the Greenback to 100.82 with little to support along the way.
US Dollar FAQs
What is the US Dollar?
The US Dollar (USD) is the official currency of the United States of America, and the ‘de facto’ currency of a significant number of other countries where it is found in circulation alongside local notes. It is the most heavily traded currency in the world, accounting for over 88% of all global foreign exchange turnover, or an average of $6.6 trillion in transactions per day, according to data from 2022.
Following the second world war, the USD took over from the British Pound as the world’s reserve currency. For most of its history, the US Dollar was backed by Gold, until the Bretton Woods Agreement in 1971 when the Gold Standard went away.
How do the decisions of the Federal Reserve impact the US Dollar?
The most important single factor impacting on the value of the US Dollar is monetary policy, which is shaped by the Federal Reserve (Fed). The Fed has two mandates: to achieve price stability (control inflation) and foster full employment. Its primary tool to achieve these two goals is by adjusting interest rates.
When prices are rising too quickly and inflation is above the Fed’s 2% target, the Fed will raise rates, which helps the USD value. When inflation falls below 2% or the Unemployment Rate is too high, the Fed may lower interest rates, which weighs on the Greenback.
What is Quantitative Easing and how does it influence the US Dollar?
In extreme situations, the Federal Reserve can also print more Dollars and enact quantitative easing (QE). QE is the process by which the Fed substantially increases the flow of credit in a stuck financial system.
It is a non-standard policy measure used when credit has dried up because banks will not lend to each other (out of the fear of counterparty default). It is a last resort when simply lowering interest rates is unlikely to achieve the necessary result. It was the Fed’s weapon of choice to combat the credit crunch that occurred during the Great Financial Crisis in 2008. It involves the Fed printing more Dollars and using them to buy US government bonds predominantly from financial institutions. QE usually leads to a weaker US Dollar.
What is Quantitative Tightening and how does it influence the US Dollar?
Quantitative tightening (QT) is the reverse process whereby the Federal Reserve stops buying bonds from financial institutions and does not reinvest the principal from the bonds it holds maturing in new purchases. It is usually positive for the US Dollar.
On Monday, AUD/USD finished the session over 0.66. Economists at Commerzbank analyze Aussie’s outlook.
Something could still come Down Under
A final, perhaps only small, rate step of 15 basis points is still possible. However, the RBA is unlikely to be in a hurry. I think it will stay on hold in December, take its leave for the summer break and then assess in February, on the basis of the inflation figures for the fourth quarter and other economic data, whether another move is necessary or not.
In general, however, the prospect of a possible interest rate hike should support the AUD. Especially if the price data and economic data surprise to the upside in the coming weeks.
- EUR/JPY adds to the negative start of the week and tests 162.20.
- Further losses could revisit the 161.20 zone in the near term.
EUR/JPY corrects further down and drops to four-day lows around 162.20 on Tuesday.
The continuation of the downward bias carries the potential to drag the cross to the weekly low of 161.20/25 band (November 21) prior to the provisional 55-day SMA, today at 159.40.
So far, the longer term positive outlook for the cross appears favoured while above the 200-day SMA at 153.37.
EUR/JPY daily chart
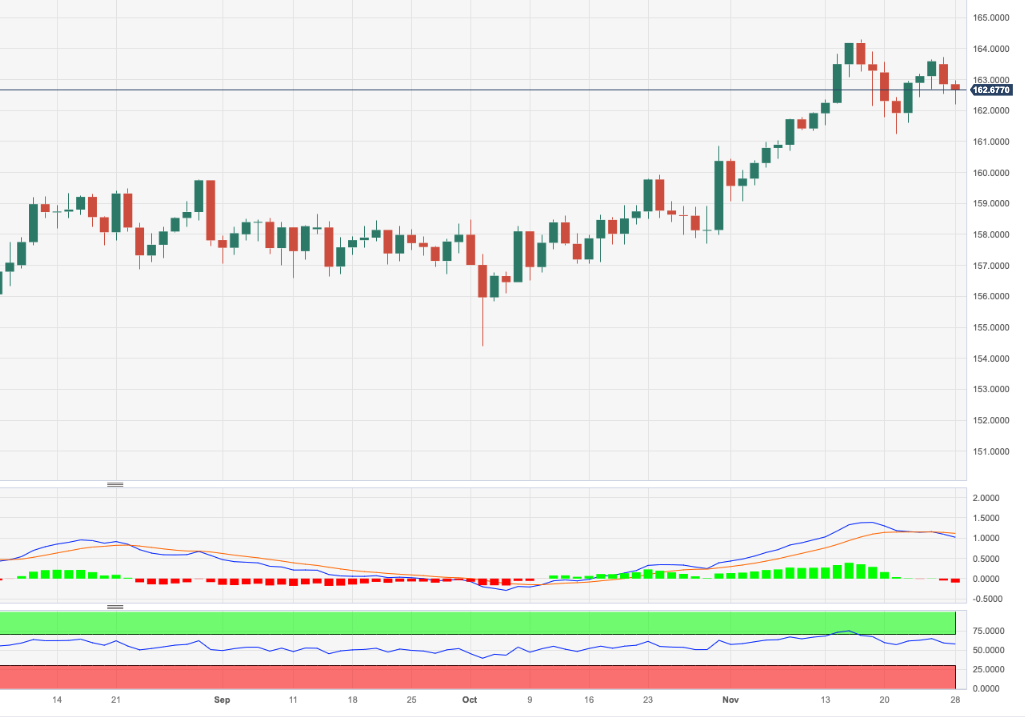
EUR/CHF shuffled sideways most of last week after scaling a new November high of 0.9685. Economists at Société Générale analyze the pair’s outlook.
Bearish price action has been observed in EUR/CHF in December in six of the last seven years
Bearish price action has been observed in EUR/CHF in December in six of the last seven years thanks outperformance of the Franc vs the USD over the EUR.
A return to 0.9713 (200-DMA) still appears ambitious with a push in EUR/USD above 1.10.
The Reserve Bank of New Zealand (RBNZ) will announce its Interest Rate Decision on Wednesday, November 29 at 01:00 GMT and as we get closer to the release time, here are the expectations as forecast by the economists and researchers of seven major banks.
The RBNZ is expected to keep the Official Cash Rate (OCR) at 5.50% for the fourth consecutive meeting. The outlook and tone will be key.
Standard Chartered
We expect the RBNZ to maintain the OCR at 5.50%. We think it is premature to expect any rate cuts in November, considering that CPI inflation eased to a still-elevated 5.6% YoY in Q3-2023. We continue to expect the first rate cut to materialise in May 2024 on the expectation that growth concerns will become more salient in H1-2024. Risks to our view include more persistent inflationary pressures on the back of continuing macroeconomic resilience, keeping wage growth and the labour market well-supported.
ANZ
We expect the RBNZ to hold the OCR unchanged at 5.50%, and publish an OCR track that is very similar to August (with a peak of 5.59% but potentially later cuts). We don’t expect the RBNZ’s medium-term forecasts for either activity or non-tradable inflation to change significantly (though we’d note ours are higher), with the overall theme continuing to be ‘so far so good.’
Westpac
We expect the RBNZ will leave the OCR unchanged at 5.50%. The RBNZ’s forward profile for the OCR is likely to be little changed and suggests no change in the OCR in 2024. On balance, recent data will have left the RBNZ more comfortable with an ‘on hold’ stance. Notably, price data indicates that imported inflation is easing faster than previously anticipated. In addition, we have continued to see weakness in cyclical demand indicators, such as retail spending, the PMIs, credit growth and imports. Short-term inflation forecasts will be reduced, but the longer-term profile will likely be little changed. The RBNZ will be keen to ensure that much of the recent increase in mortgage rates remains in place for a while.
Danske Bank
We expect an unchanged rate decision.
TDS
We expect the RBNZ to stay on hold, keeping the OCR at 5.50%. While it is an MPS month which entails an updated OCR track, we don’t expect major revisions to the Bank's OCR projection as the RBNZ is likely to keep a hawkish tone to avoid speculation of earlier rate cuts. Overall, the Bank appears content with current monetary policy settings and is cognizant that any premature speculations of easing may drive up asset prices and halt the Bank's current progress.
Citi
Unlike in Australia, CPI in New Zealand is moderating more quickly than the RBNZ’s timetable. It is therefore likely that the RBNZ will mark to market the November edition of the CPI forecasts lower to reflect this. In addition, weaker NZ Q3 labor market data shows supply and demand is in the process of rebalancing and the MPC can deliver a neutral policy assessment and hold the OCR unchanged at 5.50% for the fourth consecutive meeting. However, the RBNZ is unlikely to unwind language designed to maintain expectations that rates need to remain restrictive. However, the risk is that the policy statement may bring forward moderation in the OCR track from Q1’25 to Q4’24. We continue to expect no further OCR increase in this cycle and for the first OCR cut to occur in Q2’24.
Rabobank
We do not anticipate any changes to the OCR of 5.50%, and OIS futures suggest that a change in the policy rate is virtually zero chance. What will be interesting to watch is whether the RBNZ updates its guidance on the peak in the OCR (currently projected at 5.5o%), or the timing of a first rate cut in New Zealand. The RBNZ currently doesn’t expect a cut until early 2025, whereas we see this as more likely to occur in the final quarter of 2024.
AUD/USD closed above 0.66. Economists at Société Générale analyze the pair’s outlook.
Recent pivot low at 0.6450 likely to provide support
A retest of the trend line drawn since 2022 near 0.6660 is expected. Once this is overcome, AUD/USD could embark on an extended up move. Next potential objectives could be located at July/July highs of 0.6900.
Recent pivot low near 0.6450 is expected to provide support in case short-term pullback develops.
See – AUD/NZD: There is room for a to move back closer to the 1.1000 level – MUFG
Considering advanced prints from CME Group for natural gas futures markets, open interest resumed the decline and shrank by around 17.7K contracts on Monday. On the other hand, volume reversed two daily pullbacks in a row and rose by around 107.6K contracts.
Natural Gas: Recovery could revisit the $3.300 zone
Monday’s drop in prices of natural gas to multi-week lows near the $2.700 region was amidst the largest daily retracement in open interest since late October. That said, the commodity could now attempt a bounce with the immediate target at the weekly high of $3.275 per MMBtu (November 15) in the very near term.
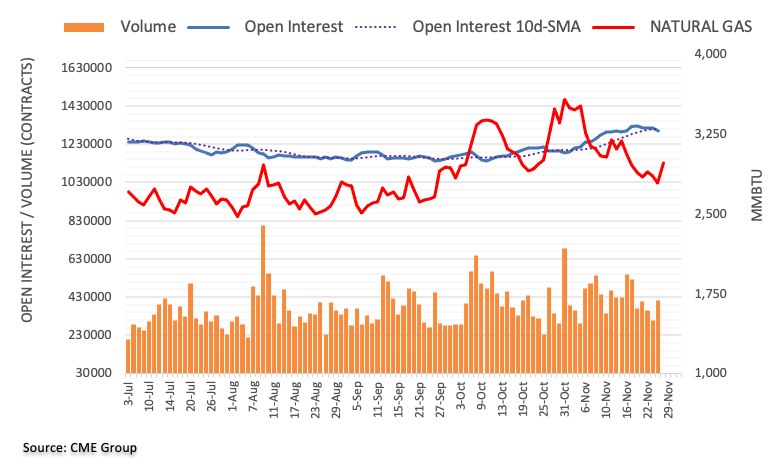
EUR/USD should remain almost solely a function of USD moves and Fed rate expectations, economists at ING report.
Too early for a move above 1.10
EUR/USD is eyeing the key 1.10 level, but we suspect that any breaks above that level will prove unsustainable as the rates picture remains broadly supportive for the Dollar until the US growth picture turns decisively negative.
We are not convinced the pair has enough backing on the rates side to trade sustainably above 1.10 and favour instead a correction below 1.0900 in the coming days.
- WTI Oil off the lows and steady near $75 this Tuesday.
- The US Dollar is trading flat and is holding its head above water to try and halt the recent downturn.
- Oil could sink if API numbers reveal another build in US stockpiles.
Oil prices are off the lows this Tuesday and are putting this week’s performance in the green despite some more bearish undertone in recent headlines. The Gaza ceasefire has been prolonged by two days for more prisoner exchanges and humanitarian aid. Markets meanwhile have adjusted their positioning on the internal divisions within OPEC+, with tension now building toward Thursday’s meeting and a possible reaction that could push crude higher.
The US Dollar (USD) is off its low levels for this month as well, with US traders having resumed their normal work schedule. The Greenback is trying to erase Monday’s losses and is mildly higher in a mixed picture this Tuesday. With no less than five Federal Reserve speakers to speak, traders will be on the lookout for any guidance on the next step from the Federal Reserve (Fed) in December.
Crude Oil (WTI) trades at $75.64 per barrel and Brent Oil trades at $80.56 per barrel at the time of writing.
Oil news and market movers: Hawkeye on OPEC+
- A lack of individual comments from OPEC+ members ahead of Thursday makes tensions build for traders in terms of prepositioning.
- Meanwhile OPEC did come out with a statement, a defence of the Oil-and-Gas industry ahead of the big climate convention COP28. The statement also pushes back against the International Energy Agency (IEA) and highlights the scattered debate over how best to tackle global warming.
- Saudi Arabia continues demanding all OPEC members reduce their production quotas in a joint effort to shore up the supply side.
- As per normal, on Tuesday evening near 21:30 GMT, the American Petroleum Institute is due to release its latest stockpile figures. Previous data showed a build of 9.047 million barrels, with projections now of 2 million drawdown; possibly ending the supply build up throughout November.
Oil Technical Analysis: November stockpile buildup coming to an end
Oil prices may have reached the end of the line for now in their downturn. Price pressure is building ahead of the OPEC+ decision on Thursday. This evening the API stockpile numbers are expected to show a drawdown in stockpiles for the first time in November, which could mean that the US production has reached its limits for now and will see demand soaring again on the global Oil market, while OPEC+ seeks to shore up the supply.
On the upside, $80.00 is the resistance to watch out for. Should crude be able to jump above that again, look for $84.00 (purple line) as the next level to see some selling pressure or profit taking. Should Oil prices be able to consolidate above there, the topside for this fall near $93.00 could come back into play.
On the downside, traders are seeing a soft floor forming near $74.00. This level is acting as the last line of defence before entering $70.00 and lower. Watch out for $67.00 with that triple bottom from June as the next support level to trade at.
-638367652311807615.png)
US WTI Crude Oil: Daily Chart
WTI Oil FAQs
What is WTI Oil?
WTI Oil is a type of Crude Oil sold on international markets. The WTI stands for West Texas Intermediate, one of three major types including Brent and Dubai Crude. WTI is also referred to as “light” and “sweet” because of its relatively low gravity and sulfur content respectively. It is considered a high quality Oil that is easily refined. It is sourced in the United States and distributed via the Cushing hub, which is considered “The Pipeline Crossroads of the World”. It is a benchmark for the Oil market and WTI price is frequently quoted in the media.
What factors drive the price of WTI Oil?
Like all assets, supply and demand are the key drivers of WTI Oil price. As such, global growth can be a driver of increased demand and vice versa for weak global growth. Political instability, wars, and sanctions can disrupt supply and impact prices. The decisions of OPEC, a group of major Oil-producing countries, is another key driver of price. The value of the US Dollar influences the price of WTI Crude Oil, since Oil is predominantly traded in US Dollars, thus a weaker US Dollar can make Oil more affordable and vice versa.
How does inventory data impact the price of WTI Oil
The weekly Oil inventory reports published by the American Petroleum Institute (API) and the Energy Information Agency (EIA) impact the price of WTI Oil. Changes in inventories reflect fluctuating supply and demand. If the data shows a drop in inventories it can indicate increased demand, pushing up Oil price. Higher inventories can reflect increased supply, pushing down prices. API’s report is published every Tuesday and EIA’s the day after. Their results are usually similar, falling within 1% of each other 75% of the time. The EIA data is considered more reliable, since it is a government agency.
How does OPEC influence the price of WTI Oil?
OPEC (Organization of the Petroleum Exporting Countries) is a group of 13 Oil-producing nations who collectively decide production quotas for member countries at twice-yearly meetings. Their decisions often impact WTI Oil prices. When OPEC decides to lower quotas, it can tighten supply, pushing up Oil prices. When OPEC increases production, it has the opposite effect. OPEC+ refers to an expanded group that includes ten extra non-OPEC members, the most notable of which is Russia.
Open interest in crude oil futures markets increased for the fourth straight session at the beginning of the week, now by around 4.5K contracts. Volume followed suit and rose by around 41.5K contracts amidst the broad erratic performance seen as of late.
WTI: The 200-day SMA caps the upside so far
Prices of WTI kicked off the week in a negative fashion against the backdrop of rising open interest and volume. That said, further downside now emerges in the pipeline, with the commodity now risking a deeper pullback to, initially, the November low of $72.22 (November 16) in the very near term.
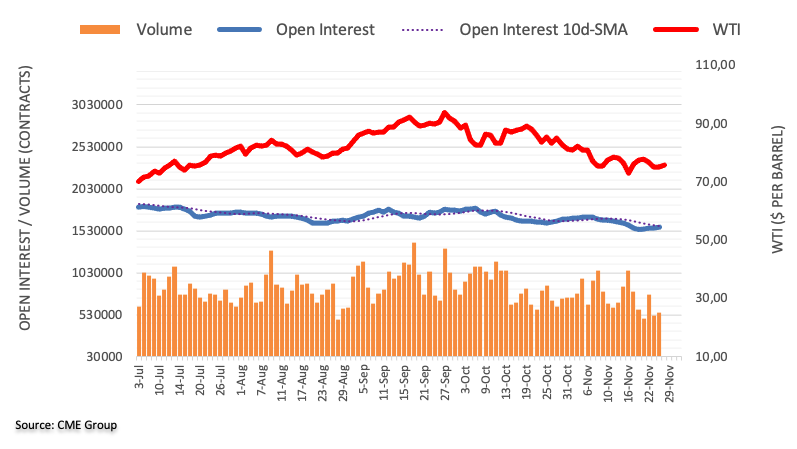
CME Group’s flash data for gold futures markets noted traders reduced their open interest positions for the third consecutive session on Monday, this time by around 2.3K contracts. Volume, instead, added to the previous daily build and went up by around 103.3K contracts.
Gold: Next on tap comes the 2023 high
Gold prices extended its march north above the $2000 mark at the beginning of the week. The move, however, was accompanied by shrinking open interest, which should remove strength from the rally in the precious metal in the very near term. In the meantime, the immediate target for bulls emerges at the 2023 high near the $2070 level per troy ounce (May 4).
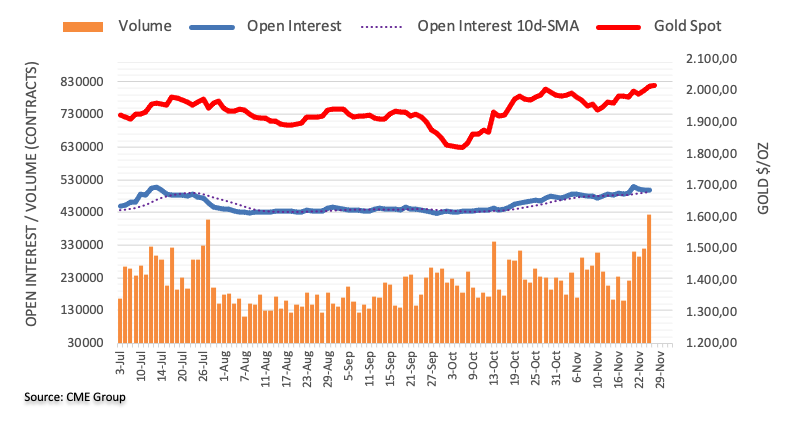
GBP/USD captures 1.26. Economists at Société Générale analyze the pair’s technical outlook.
200-DMA at 1.2450 is near term support
GBP/USD recently broke out from a base and reclaimed the 200-DMA. This has resulted in an extended bounce leading the pair towards neckline of previous Head and Shoulders.
Daily MACD has entered within positive territory denoting regain of upward momentum.
The pair is likely to inch higher towards 1.2670/1.2720, the 61.8% retracement from July and 1.2880.
The 200-DMA at 1.2450 should cushion near term downside.
AUD/NZD has diverged from yield spreads this month. Economists at MUFG Bank analyze the pair’s outlook.
NZD has benefitted more from the improvement in global investor risk sentiment
In the FX market, the recent widening of yield spreads in favour of the Australian Dollar over the New Zealand Dollar has not been fully reflected in the AUD/NZD rate.
Kiwi has benefitted more this month from the improvement in global investor risk sentiment.
Yield spreads indicate that there is room for AUD/NZD to move back closer to the 1.1000 level.
The Dollar has stayed under pressure at the start of this week. Nonetheless, economists at ING keep favouring a Dollar comeback in the near term.
Month-end flows may get in the mix and delay a Dollar recovery
Expect the Dollar to remain very sensitive to US data, including today’s Conference Board Consumer Confidence index, which is expected to have mildly declined.
On the Fed side, there are a number of speakers to monitor: Austan Goolsbee, Christopher Waller, Michelle Bowman and Michael Barr. The recent drop in rates significantly increases the chances of pushbacks against rate cut speculations, which can help the Dollar rebound.
Month-end flows may get in the mix and delay a Dollar recovery, but we remain of the view that it is too early to chase the USD bear trend. There is still some resilience in US data into year-end that can prop up the high-yielding Dollar.
EUR/USD stalls at 1.0960 hurdle. Economists at Société Générale analyze the pair’s outlook.
December seasonality bullish
Month-end equity portfolio rebalancing flows could renew EUR/USD buying interest this week and guide the pair back above 1.0960 resistance which stands in the way of a rise to 1.10.
Seasonality turns resolutely bullish Euro in December. The average gain of the last 10 years is 1.1%. Based on current spot, this would translate into 1.1050 for EUR/USD by year-end.
The combination of China stimulus (housing/ foreign orders) and lower oil prices are supportive for higher EUR/USD so long as the bear steepening in US yields does not reignite.
EUR/GBP declined during Monday's session. Economists at ING analyze the pair’s outlook.
Bearish momentum in EUR/GBP may not last
We suspect the EUR/GBP pair may be reaching the bottom of its recent downtrend, as risk sentiment may start to soften into key US data and the UK fiscal event’s impact on markets wears off.
We expect increasing support for the pair around 0.8650 and at the 0.8640 100-DMA. When it comes to Cable, our view is very similar to that of EUR/USD; the probability of a correction from these levels appears rather high.
- The Euro gives aways part of its recent advance against the US Dollar.
- European stocks open Tuesday’s session with generalized losses.
- Markets’ attention will be on US Consumer Confidence and Fedspeak.
The Euro has so far abandoned its march north against the US Dollar, motivating EUR/USD to leave behind the area of recent peaks around 1.0960 on Tuesday.
On the flip side, the Greenback appears to be tepidly bid in the low 103.00s when tracked by the USD Index (DXY), managing to regain some balance following early lows near the 103.00 support.
There are no changes to the monetary policy front, as investors continue to factor in the likelihood of interest rate cuts by both the Federal Reserve (Fed) and the European Central Bank (ECB) at some point in the spring of 2024.
On the domestic calendar, Consumer Confidence in Germany, measured by GfK, improved marginally to -27.8 in December, while Consumer Confidence in France edged higher to 87 in November.
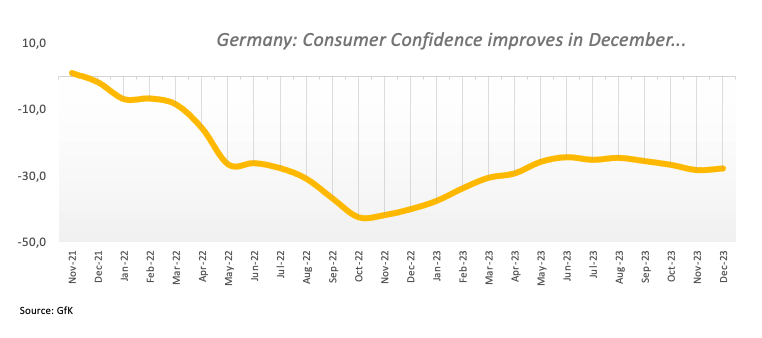
In the US docket, the Conference Board’s Consumer Confidence will take centre stage, followed by the FHFA’s House Price Index.
Additionally, Chicago Fed Austan Goolsbee (voter, centrist), FOMC Christopher Waller (permanent voter, hawk), FOMC Michelle Bowman (permanent voter, centrist), and FOMC Michael Barr (permanent voter, centrist) are all due to speak.
Daily digest market movers: Euro meets a solid resistance around 1.0960
- The EUR reverses part of the recent gains against the USD.
- US and German yields edge a tad higher early on Tuesday.
- Markets see the Fed starting its interest rate cuts in Q2 2024.
- Investors’ consensus place the ECB extending its pause until H2 2024.
- ECB’s Joaquim Nagel does not rule out rate hikes if inflation picks up pace.
- RBA’s Michele Bullock kept the cautious tone earlier in the Asian session.
Technical Analysis: Euro continues to target 1.1000
EUR/USD’s upside momentum appears so far limited by the area of monthly highs in the 1.0960-1.0965 band.
The November high of 1.0965 (November 21) is now the immediate goal for bulls ahead of the critical 1.1000 level. Further north, EUR/USD might face resistance around the August top of 1.1064 (August 10) and another weekly peak of 1.1149 (July 27), both of which precede the 2023 high of 1.1275 (July 18).
In the meanwhile, any corrective dips should find support initially at the key 200-day SMA at 1.0812, followed by the temporary 55-day SMA at 1.0665. South from here comes the weekly low of 1.0495 (October 13) prior to the 2023 low of 1.0448 (October 3).
Overall, the pair's chances should remain strong as long as it stays above the 200-day SMA.
Euro FAQs
What is the Euro?
The Euro is the currency for the 20 European Union countries that belong to the Eurozone. It is the second most heavily traded currency in the world behind the US Dollar. In 2022, it accounted for 31% of all foreign exchange transactions, with an average daily turnover of over $2.2 trillion a day.
EUR/USD is the most heavily traded currency pair in the world, accounting for an estimated 30% off all transactions, followed by EUR/JPY (4%), EUR/GBP (3%) and EUR/AUD (2%).
What is the ECB and how does it impact the Euro?
The European Central Bank (ECB) in Frankfurt, Germany, is the reserve bank for the Eurozone. The ECB sets interest rates and manages monetary policy.
The ECB’s primary mandate is to maintain price stability, which means either controlling inflation or stimulating growth. Its primary tool is the raising or lowering of interest rates. Relatively high interest rates – or the expectation of higher rates – will usually benefit the Euro and vice versa.
The ECB Governing Council makes monetary policy decisions at meetings held eight times a year. Decisions are made by heads of the Eurozone national banks and six permanent members, including the President of the ECB, Christine Lagarde.
How does inflation data impact the value of the Euro?
Eurozone inflation data, measured by the Harmonized Index of Consumer Prices (HICP), is an important econometric for the Euro. If inflation rises more than expected, especially if above the ECB’s 2% target, it obliges the ECB to raise interest rates to bring it back under control.
Relatively high interest rates compared to its counterparts will usually benefit the Euro, as it makes the region more attractive as a place for global investors to park their money.
How does economic data influence the value of the Euro?
Data releases gauge the health of the economy and can impact on the Euro. Indicators such as GDP, Manufacturing and Services PMIs, employment, and consumer sentiment surveys can all influence the direction of the single currency.
A strong economy is good for the Euro. Not only does it attract more foreign investment but it may encourage the ECB to put up interest rates, which will directly strengthen the Euro. Otherwise, if economic data is weak, the Euro is likely to fall.
Economic data for the four largest economies in the euro area (Germany, France, Italy and Spain) are especially significant, as they account for 75% of the Eurozone’s economy.
How does the Trade Balance impact the Euro?
Another significant data release for the Euro is the Trade Balance. This indicator measures the difference between what a country earns from its exports and what it spends on imports over a given period.
If a country produces highly sought after exports then its currency will gain in value purely from the extra demand created from foreign buyers seeking to purchase these goods. Therefore, a positive net Trade Balance strengthens a currency and vice versa for a negative balance.
- Silver is seen oscillating in a narrow range below a three-month top touched on Monday.
- The technical setup favours bulls and supports prospects for additional near-term gains.
- Any meaningful dip could be seen as a buying opportunity and is likely to remain limited.
Silver (XAG/USD) enters a bullish consolidation phase and oscillates in a narrow trading band just above mid-$24.00s through the first half of the European session on Tuesday. The white metal, however, remains well within the striking distance of a near three-month high touched on Monday and seems poised to prolong its recent strong appreciating move witnessed over the past two weeks or so.
From a technical perspective, the recent breakout through the 200-day Simple Moving Average (SMA) and a subsequent strength beyond the $24.00 round figure was seen as a fresh trigger for bullish traders. Furthermore, oscillators on the daily chart are holding comfortably in the positive territory and are still far from being in the overbought zone, validating the near-term positive outlook for the XAG/USD.
Hence, any meaningful downside might still be seen as a buying opportunity near the aforementioned resistance breakpoint now turned support near the $24.00 mark. This should help limit the downside for the XAG/USD near the 200-day SMA, currently pegged near the $23.35-$23.30 region. That said, a convincing break below might prompt some technical selling and pave the way for some meaningful downside.
The XAG/USD, meanwhile, still seems poised to make a fresh attempt to conquer the $25.00 psychological mark. The next relevant hurdle is pegged near the $25.25 region, or the YTD peak touched in May, which if cleared decisively will reaffirm the bullish bias. The white metal might then accelerate the positive momentum towards reclaiming the $26.00 round figure for the first time since April 2022.
Silver daily chart
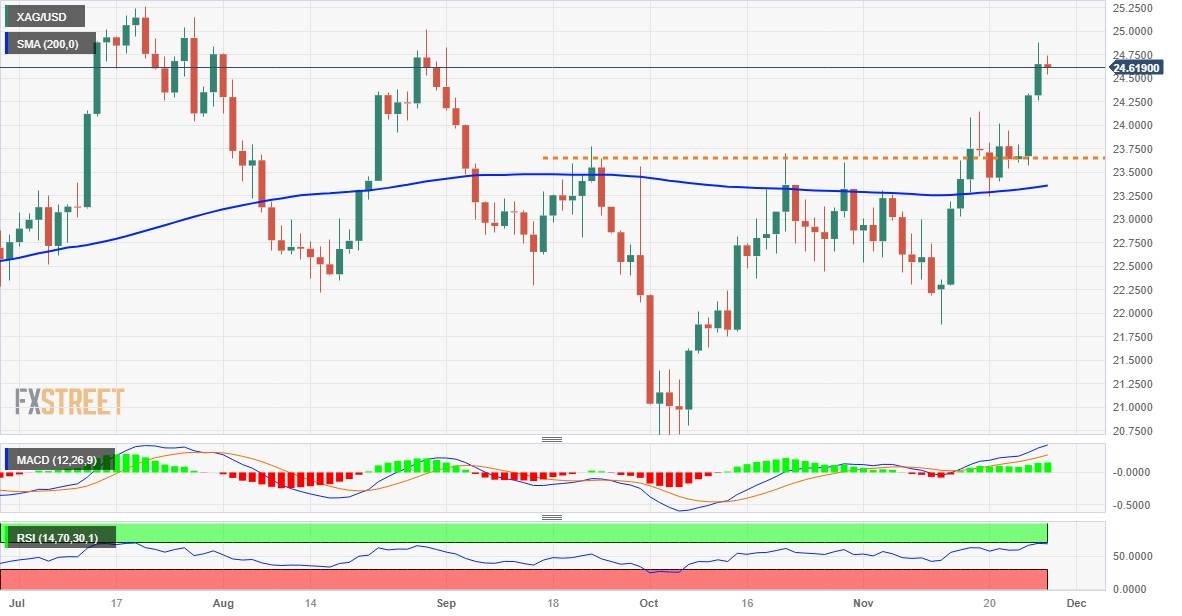
Technical levels to watch
NZD/USD is treading water ahead of the Reserve Bank of New Zealand (RBNZ) Monetary Policy Statement. Economists at ANZ Bank analyze Kiwi’s outlook.
Kiwi could be in for a slight fall on a lower OCR track
We expect the Official Cash Rate (OCR) and the OCR track to be left unchanged, but it seems clear that markets are looking for a lower track (flatlined at 5.5%). While that would signal complete neutrality, the act of lowering it will be seen by markets as the first step toward easing, so if that is what we see, the Kiwi could be in for a slight fall.
But with easier expectations built in, it’s arguably stability (or a higher track) that would have the biggest (upside) impact on the Kiwi, and it’s increasingly looking like it won’t be a snooze.
European Central Bank (ECB) policymaker and Bundesbank Chief Joachim Nagel said on Tuesday, “rate hikes are not necessarily over. “
Additional comments
Would have to hike again if inflation outlook worsened.
Premature to discuss about rate cuts, would prefer to err on the side of caution.
Inflation outlook is encouraging but core inflation dynamics continue to be strong.
It's too early to declare victory over inflation.
The large ECB balance sheet must shrink significantly.
Market reaction
At the time of writing, EUR/USD is trading 0.13% lower on the day at 1.0939, unfazed by the above comments.
- WTI price struggles to halt its losing streak.
- OPEC+ is expected to extend the oil production cut in 2024.
- IEA anticipates a slight surplus in Crude oil production in the next year.
Western Texas Intermediate (WTI) price struggles to snap its losing streak that began on Wednesday, hovering above $75.00 per barrel during the European session on Tuesday.
Amidst the negative bias for the US Dollar, there's an expectation that the upcoming meeting of the Organization of the Petroleum Exporting Countries and its allies (OPEC+) on Thursday could bring some support to crude oil prices. The anticipation is centered around the possibility of OPEC+ extending the oil production cut in 2024.
The upcoming OPEC+ meeting takes place against the backdrop of a significant decline in Crude oil prices, driven by concerns about oversupply despite the ongoing output cuts by OPEC+. The substantial production from non-OPEC countries, notably the United States (US), has added pressure on oil prices.
Meanwhile, China's release of the NBS Purchasing Managers Index (PMI) data on Thursday holds potential significance. Better-than-expected data from the world's largest Crude oil importer could have a positive impact on WTI prices.
Last week, OPEC+ contributed to the volatility by postponing its meeting to address disagreements over production targets for African producers. Furthermore, the International Energy Agency (IEA) anticipates a slight surplus in Crude oil production in 2024, even if OPEC+ nations extend their cuts into the next year.
Oil traders will watch API Weekly Crude Oil Stock for the week ending on November 24 on Tuesday and EIA Crude Oil Stocks Change for the said period on Wednesday.
EUR/USD consolidated within the mid 1.09-1.10 range. Antje Praefcke, FX Analyst at Commerzbank, analyzes the pair’s outlook.
Homing in on the Dollar
I get the impression that at the moment the market is homing in on the Dollar. Anything that suggests that a recession is looming and that Fed Funds might soon fall again, seems to be taken as an opportunity to trade the USD weaker. That means that US economic data is more likely to entail downside potential for the Dollar, above all the PCE deflator on Thursday.
The Dollar might take another hit today if Consumer Confidence for November disappoints. If it records a surprise recovery, I see little chance of the Dollar recovering with EUR/-USD easing to 1.09, as in my view the risks are asymmetrical – to the Dollar’s disadvantage. Perhaps now is the time to test the 1.10 mark after all?
FX option expiries for Nov 28 NY cut at 10:00 Eastern Time, via DTCC, can be found below.
- EUR/USD: EUR amounts
- 1.0855 744m
- 1.0900 818m
- 1.1000 838m
- USD/JPY: USD amounts
- 148.50 1.5b
- 149.00 1.8b
- 150.00 568m
- USD/CHF: USD amounts
- 0.8860 420m
- AUD/USD: AUD amounts
- 0.6570 571m
- 0.6585 542m
- NZD/USD: NZD amounts
- 0.6050 408m
- 0.6100 670m
- EUR/GBP: EUR amounts
- 0.8705 430m
- 0.8730 398m
- NZD/USD receives upward gains as the US Dollar declines.
- Fed is expected to reduce 85 bps rate cuts in 2024.
- RBNZ could keep its OCR unchanged at 5.50% in Wednesday's meeting.
NZD/USD recovers its recent losses registered in the previous session. The NZD/USD pair trades higher near 0.6100 during the early European session on Tuesday. The strength of the New Zealand Dollar (NZD) against the US Dollar (USD) is further bolstered by the subdued performance of the US Dollar (USD). This comes in the wake of expectations that the US Federal Reserve (Fed) is nearing the end of its monetary rate hike cycle, coupled with the anticipation of almost 85 basis points of interest rate cuts by the Fed in the coming year.
Reserve Bank of New Zealand (RBNZ) will release a monetary policy decision on Wednesday. Expectations are that the RBNZ will maintain its Overnight Cash Rate (OCR) at 5.50% for the fourth consecutive meeting, with some speculation about a potential future rate cut.
Additionally, the recent Chinese stimulus plan aimed at boosting the property sector is providing support to the New Zealand Dollar (NZD), which often acts as a China-proxy currency.
US Dollar Index (DXY) hovers around 103.20 with a negative bias. US Census Bureau revealed a significant 5.6% drop in New Home Sales for October, falling to 679K and missing the market expectation of 725K. This data, coupled with a dip in US Treasury yields, continues to drive the prevailing trend toward the downside for the US Dollar.
Looking ahead to Tuesday, the focus remains on the United States, with the release of the Housing Price Index and CB Consumer Confidence. Additionally, insights from Federal Reserve (Fed) officials are expected, providing a comprehensive view of the economic landscape.
Economists at Commerzbank see the Polish Zloty (PLN) depreciating gradually over 2024-25.
The central bank could become a source of uncertainty
Our base case is that a Donald Tusk-led opposition coalition will assume power for at least the coming year. This may improve the prospect for EU funds somewhat. Nevertheless, the risk remains high that only some initial tranches of recovery or other EU funds may be released symbolically. After that, the EC may demand that further policy changes be actually implemented, which may prove time consuming. The coalition government may struggle to achieve internal consensus, survive or implement major changes. If it fails to continue, then PiS could return to power. This heightened uncertainty will likely be reflected via a wider risk premium on the Zloty through 2024-25.
Monetary policy will be a source of uncertainty. A majority of the MPC was nominated by PiS-controlled circles in the last round. The incoming government could launch lengthy probes into these MPC members, which could de-stabilise routine functioning of the central bank. These members will still dominate monetary policy in the medium-term until their terms finish. Still, PiS-nominated MPC members will not have any incentive to support a rival government with rate cuts. Their stance could be unpredictable. Because of such risks, we see the Zloty depreciating gradually over 2024-25.
Here is what you need to know on Tuesday, November 28:
Another day of mixed trading was seen in Asia on Tuesday, as traders took the lead from the negative close on Wall Street and bore the brunt of renewed China concerns. Beijing's Stock Exchange suffered a 6% sell-off after major shareholders were advised to refrain from selling on Monday. China’s property market issues also continue to sap investor’s confidence.
Markets also remain cautious, as they assess the US Federal Reserve (Fed) interest rate outlook ahead of this week’s key PCE inflation data from the United States.
Heading into the European trading, however, there seems to be a slight improvement in the market mood, reflective of a modest uptick in the US S&P 500 futures. Investors find some comfort from the extended recovery in the US bond market, as the benchmark 10-year US Treasury bond yield drops back below the 4.40% key level.
This suggests that the US Dollar is likely to remain vulnerable against its main competitors. However, a bunch of Fed policymakers could provide fresh directional impetus to the Greenback in the day ahead. At the time of writing, the US Dollar Index is consolidating near a new three-month low of 103.07 reached earlier in the Asian session.
US Dollar price today
The table below shows the percentage change of US Dollar (USD) against listed major currencies today. US Dollar was the weakest against the Canadian Dollar.
| USD | EUR | GBP | CAD | AUD | JPY | NZD | CHF | |
| USD | 0.12% | 0.12% | -0.06% | -0.01% | 0.01% | 0.09% | 0.02% | |
| EUR | -0.12% | 0.00% | -0.17% | -0.13% | -0.09% | 0.01% | -0.07% | |
| GBP | -0.13% | 0.00% | -0.17% | -0.13% | -0.10% | -0.03% | -0.09% | |
| CAD | 0.06% | 0.16% | 0.17% | 0.06% | 0.08% | 0.17% | 0.10% | |
| AUD | 0.03% | 0.10% | 0.13% | -0.04% | 0.03% | 0.14% | 0.08% | |
| JPY | 0.05% | 0.17% | 0.17% | 0.00% | -0.03% | 0.14% | 0.02% | |
| NZD | -0.12% | 0.01% | 0.00% | -0.18% | -0.13% | -0.10% | -0.08% | |
| CHF | -0.04% | 0.07% | 0.08% | -0.10% | -0.06% | -0.04% | 0.07% |
The heat map shows percentage changes of major currencies against each other. The base currency is picked from the left column, while the quote currency is picked from the top row. For example, if you pick the Euro from the left column and move along the horizontal line to the Japanese Yen, the percentage change displayed in the box will represent EUR (base)/JPY (quote).
The US Dollar continues to reel from the pain of the ongoing sell-off in the USD/JPY pair. The Japanese Yen extends its bullish momentum against the US Dollar, as Japan’s inflation data suggested that the economy is making progress towards achieving sustainably its 2.0% price target, fanning speculations that the BoJ will shift gears from its ultra-dovish stance in 2024.
The Australian Dollar (AUD) and the New Zealand Dollar (NZD) keep their range close to multi-month highs against the US Dollar. AUD/USD is supported above 0.6600 while the NZD/USD is flirting with 0.6100.
The Aussie pair fails to regain upside traction due to the downbeat Australian monthly Retail Sales data, which showed a drop of 0.2% in October, as against the expectations for a 0.1% increase. Meanwhile, cautious remarks from Reserve Bank of Australia (RBA) Governor Michele Bullock also weigh on the AUD. Bullock said that “the central bank has to be a "little bit careful" with using rates to bring down inflation without lifting unemployment.”
EUR/USD is battling 1.0950 in early European trading after facing rejection once again near 1.0965. Testifying before the European Parliament’s Committee on Economic and Monetary Affairs on Monday, European Central Bank (ECB) President Christine Lagarde warned that “headline inflation may rise again slightly in the coming months.” Lagarde is due to speak again on Tuesday, in a pre-recorded video at the European Financial Reporting Advisory Group Conference, in Brussels.
GBP/USD is holding fort above 1.2600, retesting the two-month high of 1.2644 in the Asian session. The Pound Sterling remains underpinned by Bank of England (BoE) policymakers’ efforts to maintain the narrative of ‘higher interest rate for longer.’
Gold price is challenging six-month highs of $2,018 early Europe while WTI is fluctuating around $75.00, with the downside capped by expectations of further oil output cuts by OPEC and its allies (OPEC+). OPEC+ is set to meet on November 30 to decide on the continuation of output cuts next year.
- GBP/USD could reach the resistance level at 1.2650.
- Technical indicators suggest testing 1.2700 followed by September’s high.
- The psychological level of 1.2600 could act as immediate support following the seven-day EMA.
GBP/USD continues its winning streak that began on Thursday, trading higher around 1.2630 during the Asian session on Tuesday. The Pound Sterling (GBP) shows strength against the US Dollar (USD) for the fourth consecutive day, showcasing the resilience of the UK economy. This steadfast performance comes despite the tightening measures implemented by the Bank of England (BoE).
The GBP/USD pair could meet the resistance barrier at 1.2650. The Moving Average Convergence Divergence (MACD) line, positioned above the centerline and exhibiting divergence above the signal line, implies a strong momentum in the GBP/USD pair.
Additionally, the technical indicators for the GBP/USD pair are signaling a bullish outlook. The 14-day Relative Strength Index (RSI) above the 50 level indicates upward support, suggesting that the pair could reach the 1.2700 psychological level followed by September’s high at 1.2712.
On the downside, the GBP/USD pair could find support around the psychological level at 1.2600 following the seven-day Exponential Moving Average (EMA) at 1.2562 level aligned with the 1.2550 major level.
A decisive break below the level could push the GBP/USD pair to navigate the next support area around the 23.6% Fibonacci retracement at 1.2504 lined up with the 1.2500 psychological level.
GBP/USD: Daily Chart
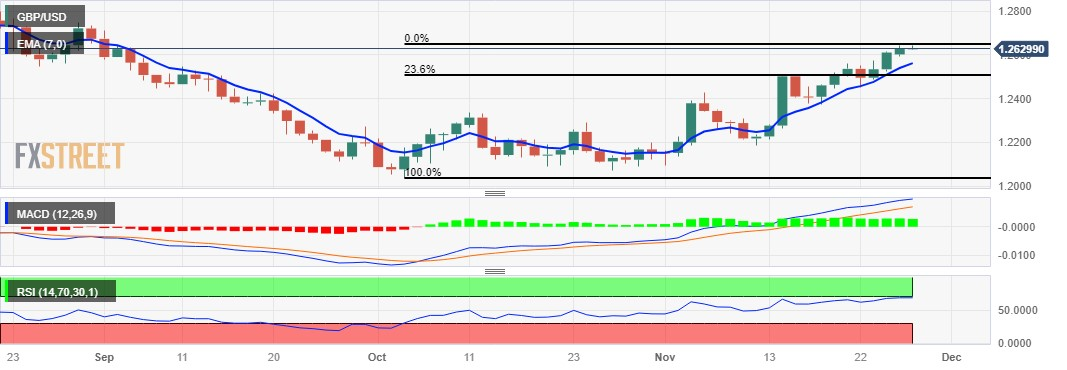
- The index approaches the key 103.00 support.
- US yields look poised to extend the decline.
- Consumer Confidence, Fedspeak come next in the docket.
The greenback alternates gains with losses near the 103.00 neighbourhood when gauged by the USD Index (DXY) on turnaround Tuesday.
USD Index focuses on key data, Fed speakers
The index remains under pressure and keeps the offered stance well in place, navigating at the same time its third consecutive week of losses and its worth month since November 2022 so far.
In the meantime, the perception that the Federal Reserve might start reducing its interest rates at some point in the spring of 2024 remains well on the rise despite the consensus around this view is still elusive among Fed rate setters.
Back on the US docket, the always relevant Consumer Confidence tracked by the Conference Board will be the salient event seconded by the FHFA’s House Price Index.
In addition, Chicago Fed A. Goolsbee (voter, centrist), FOMC C. Waller (permanent voter, hawk), FOMC M. Bowman (permanent voter, centrist) and FOMC M. Barr (permanent voter, centrist) are all due to speak.
What to look for around USD
The index extends the leg lower and flirts with the key contention zone near 103.00 on Tuesday.
Looking at the broader picture, the dollar appears depressed against the backdrop of rising speculation of probable interest rate cuts in H1 2024, all in response to further disinflationary pressures and the gradual cooling of the labour market.
Some support for the greenback, however, still emerges the resilience of the US economy as well as a persistent hawkish narrative from some Fed rate setters.
Key events in the US this week: FHFA’s House Price Index, CB Consumer Confidence (Tuesday) – MBA Mortgage Applications, Q3 GDP Growth Rate, Goods Trade Balance, Fed Beige Book (Wednesday) – PCE, Core PCE, Initial Jobless Claims, Personal Income, Personal Spending, Pending Home Sales (Thursday) – Final S&P Global Manufacturing PMI, ISM Manufacturing PMI, Construction Spending, Fed’s Powell (Friday).
Eminent issues on the back boiler: Growing perception of a soft landing for the US economy. Speculation of rate cuts at some point in the spring of 2024. Omnipresent geopolitical effervescence vs. Russia and China. Potential spread of the Middle East crisis to other regions.
USD Index relevant levels
Now, the index is down 0.02% at 103.17 and faces immediate contention at 103.07 (monthly low November 28) ahead of 102.93 (weekly low August 30) and then the psychological 100.00 threshold. On the upside, the breakout of 104.21 (weekly high November 22) could expose a move to 106.00 (weekly high November 10) and finally 106.88 (weekly high October 26).
- EUR/USD loses its recovery momentum near 1.0950 amid renewed USD demand.
- The bullish outlook of the pair remains intact as it holds above the 50- and 100-hour EMAs.
- The immediate resistance level is located at 1.0972; the 1.0890–1.0900 area acts as an initial support level for the pair.
The EUR/USD pair snaps the three-day winning streak during the early European session on Tuesday. A modest US Dollar (USD) demand dragged the major pair lower. As of writing, EUR/USD is trading near 1.0950, down 0.06% on the day.
The European Central Bank (ECB) President Christine Lagarde acknowledged that growth in the Eurozone is likely to remain weak for the rest of the year and that there are some indications of job growth slowing. However, Largarde added that while the short-term outlook remains subdued, the economy is set to strengthen again in the coming years as inflation drops further.
Technically, the EUR/USD pair maintains a bullish outlook as the major pair holds above the 50- and 100-hour Exponential Moving Averages (EMA) on the four-hour chart. The upside momentum is supported by the Relative Strength Index (RSI) which stands in bullish territory above 50, indicating that further upside looks favorable.
The immediate resistance level for the major pair is located near the upper boundary of the Bollinger Band at 1.0972. The critical upside barrier to watch is a psychological round figure and a high of August 11 at 1.1000. A break above the latter will see the rally to a high of August 4 at 1.1042, followed by a high of July 27 at 1.1149.
On the downside, the 1.0890-1.0900 zone acts as an initial support level for the major pair. The mentioned level is the confluence of the lower limit of the Bollinger Band, a round mark, and the 50-hour EMA. Further south, the next contention level is a low of November 22 at 1.0852, and finally the 100-hour EMA at 1.0835. A breach of the latter will see a drop to a high of November 9 at 1.0725.
EUR/USD four-hour chart
-638367495846046056.png)
- USD/CHF receives downward pressure as the Fed is expected to reduce 85 bps rate cuts in 2024.
- US Dollar trades with a negative sentiment as risk-on sentiment improves.
- Traders await Swiss ZEW Survey Expectations to gain further insights into business conditions in Switzerland.
USD/CHF trades above the 0.8800 psychological level during the Asian session on Tuesday, rebounding from the three-month low at 0.8793. The USD/CHF pair struggles to halt the losses due to the weaker US Dollar (USD) following the likelihood of the US Federal Reserve (Fed) to conclude its monetary rate hike cycle. Additionally, investors price in nearly 85 basis points of interest rate cuts by the Fed in the next year.
US Dollar Index (DXY) hovers around 103.20 at the time of writing, with a negative bias as the risk-on sentiment is reinforced by the latest report from the US Census Bureau, showing a notable 5.6% drop in New Home Sales for October at 679,000, as compared to the market expectation of 725,000. The prevailing trend continues to lean towards the downside, fueled by a dip in US Treasury yields.
On Tuesday, the United States (US) will release the Housing Price Index and CB Consumer Confidence, along with insights from Federal Reserve (Fed) officials, providing a comprehensive look at the economic landscape.
The upcoming Swiss ZEW Survey – Expectations on Wednesday holds particular significance as it kicks off the week's notable data releases. The last reported reading in October stood at -37.8, indicating a prevailing pessimism among businesses regarding the Swiss economy.
Moreover, Swiss Real Retail Sales for October is scheduled to be released on Thursday, expecting to see an improvement of 0.2% from the previous 0.6% decline. On Friday, the Gross Domestic Product for the third quarter will be eyed.
Pan Gongsheng, Governor of the People's Bank of China (PBOC), said in a statement on Wednesday, the Chinese central bank “will continue to keep monetary policy accommodative.”
Additional quotes
China's economy continues to gain momentum.
CPI is gradually bottoming out in China.
CPI November drop due to food prices, especially the fall in pork.
China should focus on forming new growth drivers.
High quality, sustainable growth in China more important
Confident China will enjoy sustainable growth in 2024.
Will make it easier for foreign financial institutions to do business in China.
Related reads
- Australian Dollar moves sideways amid RBA Bullock's cautious remarks
- Premier Li: China opposes any form of decoupling and cutting off of supply chains
Gold prices rose in India on Tuesday, according to data from India's Multi Commodity Exchange (MCX).
Gold price stood at 61,229 Indian Rupees (INR) per 10 grams, up INR 54 compared with the INR 61,175 it cost on Friday.
As for futures contracts, Gold prices increased to INR 62,052 per 10 gms from INR 61,937 per 10 gms.
Prices for Silver futures contracts decreased to INR 76,340 per kg from INR 76,485 per kg.
| Major Indian city | Gold Price |
|---|---|
| Ahmedabad | 63,540 |
| Mumbai | 63,360 |
| New Delhi | 63,500 |
| Chennai | 63,490 |
| Kolkata | 63,565 |
An automation tool was used in creating this post.
Global Market Movers: Comex Gold price at six-month highs, supported by dovish Fed expectations
- Growing acceptance that the Federal Reserve is done raising rates assists the non-yielding Comex Gold price to hold steady above the $2,000 psychological mark.
- Softer US consumer inflation figures released two weeks ago lifted bets that the Fed will hold rates at the current levels and begin easing policy in 2024.
- Data released on Monday showed that sales of new single-family homes in the US fell more than expected in October as higher mortgage rates reduced affordability.
- The benchmark 10-year US Treasury bond yield languishes near a two-month low and drags the US Dollar to a near three-month low, benefitting the XAU/USD.
- Looming recession risks lend additional support to the safe-haven precious metal, though a positive tone around the equity markets caps any further gains.
- Traders now look to the Conference Board's US Consumer Confidence Index and speeches by Fed officials for some impetus later during the North American session.
- The market focus, meanwhile, will remain glued to the release of the Fed's preferred inflation gauge – the core PCE Price Index – scheduled on Thursday.
Gold FAQs
Why do people invest in Gold?
Gold has played a key role in human’s history as it has been widely used as a store of value and medium of exchange. Currently, apart from its shine and usage for jewelry, the precious metal is widely seen as a safe-haven asset, meaning that it is considered a good investment during turbulent times. Gold is also widely seen as a hedge against inflation and against depreciating currencies as it doesn’t rely on any specific issuer or government.
Who buys the most Gold?
Central banks are the biggest Gold holders. In their aim to support their currencies in turbulent times, central banks tend to diversify their reserves and buy Gold to improve the perceived strength of the economy and the currency. High Gold reserves can be a source of trust for a country’s solvency. Central banks added 1,136 tonnes of Gold worth around $70 billion to their reserves in 2022, according to data from the World Gold Council. This is the highest yearly purchase since records began. Central banks from emerging economies such as China, India and Turkey are quickly increasing their Gold reserves.
How is Gold correlated with other assets?
Gold has an inverse correlation with the US Dollar and US Treasuries, which are both major reserve and safe-haven assets. When the Dollar depreciates, Gold tends to rise, enabling investors and central banks to diversify their assets in turbulent times. Gold is also inversely correlated with risk assets. A rally in the stock market tends to weaken Gold price, while sell-offs in riskier markets tend to favor the precious metal.
What does the price of Gold depend on?
The price can move due to a wide range of factors. Geopolitical instability or fears of a deep recession can quickly make Gold price escalate due to its safe-haven status. As a yield-less asset, Gold tends to rise with lower interest rates, while higher cost of money usually weighs down on the yellow metal. Still, most moves depend on how the US Dollar (USD) behaves as the asset is priced in dollars (XAU/USD). A strong Dollar tends to keep the price of Gold controlled, whereas a weaker Dollar is likely to push Gold prices up.
- WTI prices post modest gains near $75.00 ahead of the OPEC+ meeting.
- Analysts anticipate OPEC+ to prolong or deepen production cut into next year.
- IEA expected a slight surplus in crude oil production in 2024, even if OPEC+ nations extend their cuts into next year.
- Oil traders await the US GDP, Chinese PMI, and the outcome of the OPEC+ meeting.
Western Texas Intermediate (WTI), the US crude oil benchmark, is trading around $75.05 so far on Tuesday. A modest uptick in WTI prices is backed by the anticipation that the Organization of the Petroleum Exporting Countries and its allies (OPEC+) will extend the oil production cut in its upcoming meeting on Thursday.
Given the latest oil price drop, analysts anticipate OPEC+ to prolong or deepen production cut into next year. Saudi Arabia, the world's major oil exporter, is expected to extend oil supply cuts by 1 million barrels a day until next year, while Russia might consider further supply cuts with their 300,000 barrels per day. If the OPEC+ members decide to deepen output cuts next year, this could cap the downside of the WTI prices.
Furthermore, China will release the NBS Purchasing Managers Index (PMI) data on Thursday. The better-than-expected data might lift WTI prices as China is the world's largest gold producer and consumer.
On the other hand, the International Energy Agency (IEA) expected a slight surplus in crude oil production in 2024, even if OPEC+ nations extend their cuts into next year. Additionally, strong production by non-OPEC nations such as the US might contributed to pricing pressure.
Moving on, oil traders will focus on the US growth number on Wednesday. The US Gross Domestic Product (GDP) Annualized for the third quarter (Q3) is expected to grow 5% from duck previous reading of 4.9%. On Thursday, the US Personal Consumption Expenditure (PCE) inflation and Chinese NBS PMI data will be released. The outcome of the OPEC+ meeting later this week will be closely watched by traders. These events could significantly impact the USD-denominated WTI price. Oil traders will take cues from the data and find trading opportunities around WTI prices.
- Asian markets adopt a cautious stance ahead of US and China data.
- Australia's ASX 200 experienced gains due to strength in real estate and mining stocks.
- South Korean KOSPI rose despite downbeat Consumer Confidence for November.
- Japan's Nikkei 225 index halted its rally to 33-year highs.
Asian stocks showed a mixed picture on Tuesday as traders adopted a cautious stance ahead of crucial economic readings from the United States (US) and China scheduled later in the week.
As of now, China's SSE Composite Index gaining 0.10% at 3,034, and the Shenzhen Component Index improving by 0.23% to 9,808. Japan's Nikkei 225, however, has experienced a decline to 33,335, down by 0.32%. Hong Kong's Hang Seng is at 17,419, reflecting a decrease, while the Korean KOSPI has risen to 2,512.
Australia's ASX 200 stood out as one of the stronger performers at 7,015, up by 0.41%, driven by strength in real estate and mining stocks. Surprisingly, a decline in Australian retail sales contributed to optimism about easing inflation, potentially leading to a less hawkish stance from the Reserve Bank of Australia.
In South Korea, the KOSPI rose despite data indicating a further deterioration in consumer confidence for November. However, sentiment remained significantly above 2023 lows, supported by recent improvements in the South Korean economy.
Meanwhile, Japan's Nikkei 225 index saw a decline, pausing its rally to 33-year highs as investors awaited additional economic cues. Key readings on Japanese industrial production and retail sales are expected later in the week, influencing market sentiment moving forward.
The focus of markets is primarily on any indications of a slowdown in US economic growth, fueled by the prevailing expectation that the Federal Reserve (Fed) had concluded its interest rate hikes. This sentiment positions most Asian bourses for a robust performance in November, with investors closely monitoring the evolving economic landscape.
Tuesday seems to be a day packed with important events on the economic front! The focus is on key US data, with the Housing Price Index and CB Consumer Confidence taking center stage. These indicators will likely offer valuable insights into the current state of the US housing market and consumer sentiment.
Adding to the mix, speeches from Federal Reserve (Fed) officials are on the agenda. These addresses often provide a glimpse into the central bank's outlook on the economic landscape, shedding light on potential policy directions.
- Gold price trades with a positive bias for the fourth straight day, near a multi-month peak.
- Bets that the Fed is done raising rates and start easing its policy in 2024 remain supportive.
- A positive risk tone caps the upside as traders await the US PCE Price Index on Thursday.
Gold price (XAU/USD) pushed through the $2,008-2,010 horizontal barrier and advanced to the $2,018 region on Monday, or its highest level since mid-May. The precious metal holds steady near the said area through the Asian session on Tuesday and seems poised to prolong a near three-week-old uptrend amid expectations for a pause in the Federal Reserve's monetary tightening cycle. Moreover, bets for a Fed rate cut in 2024 have been brought forward in the wake of signs of easing inflationary pressures, which continues to undermine the US Dollar (USD) and validates the positive outlook for the non-yielding yellow metal.
Apart from this, concerns about a global economic downturn turn out to be another factor lending support to the safe-haven Gold price. That said, a positive tone around the Asian equity markets acts as a headwind for the precious metal. Bullish traders also seem reluctant to place aggressive bets and prefer to wait for the release of the Personal Consumption Expenditure (PCE) Price Index from the United States (US) for some meaningful impetus. In the meantime, the release of the Conference Board's Consumer Confidence Index and speeches by influential FOMC members could produce short-term trading opportunities later this Tuesday.
Daily Digest Market Movers: Gold price remains supported by dovish Fed expectations
- Growing acceptance that the Federal Reserve is done raising rates assists the non-yielding Gold price to hold steady above the $2,000 psychological mark.
- Softer US consumer inflation figures released two weeks ago lifted bets that the Fed will hold rates at the current levels and begin easing policy in 2024.
- Data released on Monday showed that sales of new single-family homes in the US fell more than expected in October as higher mortgage rates reduced affordability.
- The benchmark 10-year US Treasury bond yield languishes near a two-month low and drags the US Dollar to a near three-month low, benefitting the XAU/USD.
- Looming recession risks lend additional support to the safe-haven precious metal, though a positive tone around the equity markets caps any further gains.
- Traders now look to the Conference Board's US Consumer Confidence Index and speeches by Fed officials for some impetus later during the North American session.
- The market focus, meanwhile, will remain glued to the release of the Fed's preferred inflation gauge – the core PCE Price Index – scheduled on Thursday.
Technical Analysis: Gold price seems poised to prolong a nearly three-week-old uptrend
From a technical perspective, the overnight breakout through the $2,008-2,010 horizontal barrier was seen as a fresh trigger for bullish traders. Moreover, oscillators on the daily chart are holding comfortably in the positive territory and are still far from being in the overbought zone. This, in turn, suggests that the path of least resistance for the Gold price is to the downside. Hence, a subsequent move up towards testing the next relevant resistance, around the $2,035 region, looks like a distinct possibility. The momentum could get extended further towards the $2,048 intermediate hurdle en route to the YTD peak, around the $2,078 region touched in May.
On the flip side, the $2,010-2,008 resistance breakpoint now seems to protect the immediate downside ahead of the $2,000 mark. Some follow-through selling, leading to a subsequent slide below the $1,988-1,987 region, could pave the way for deeper losses. The Gold price might then accelerate the fall towards the $1,978 zone en route to the $1,967-1,966 area and the $1,955 support zone. A convincing break below the latter will expose the 200-day Simple Moving Average (SMA), currently pegged near the $1,942 region and the $1,935-1,934 confluence – comprising the 100- and the 50-day SMAs.
US Dollar price this month
The table below shows the percentage change of US Dollar (USD) against listed major currencies this month. US Dollar was the strongest against the Canadian Dollar.
| USD | EUR | GBP | CAD | AUD | JPY | NZD | CHF | |
| USD | -3.58% | -3.98% | -2.00% | -4.42% | -2.07% | -5.05% | -3.37% | |
| EUR | 3.43% | -0.41% | 1.52% | -0.84% | 1.43% | -1.45% | 0.18% | |
| GBP | 3.83% | 0.39% | 1.92% | -0.44% | 1.85% | -1.05% | 0.59% | |
| CAD | 1.96% | -1.56% | -1.94% | -2.39% | -0.07% | -3.00% | -1.35% | |
| AUD | 4.24% | 0.81% | 0.43% | 2.32% | 2.27% | -0.58% | 1.01% | |
| JPY | 2.02% | -1.48% | -1.89% | 0.08% | -2.32% | -2.97% | -1.25% | |
| NZD | 4.82% | 1.43% | 1.04% | 2.93% | 0.61% | 2.87% | 1.63% | |
| CHF | 3.25% | -0.22% | -0.60% | 1.32% | -1.04% | 1.22% | -1.65% |
The heat map shows percentage changes of major currencies against each other. The base currency is picked from the left column, while the quote currency is picked from the top row. For example, if you pick the Euro from the left column and move along the horizontal line to the Japanese Yen, the percentage change displayed in the box will represent EUR (base)/JPY (quote).
Gold FAQs
Why do people invest in Gold?
Gold has played a key role in human’s history as it has been widely used as a store of value and medium of exchange. Currently, apart from its shine and usage for jewelry, the precious metal is widely seen as a safe-haven asset, meaning that it is considered a good investment during turbulent times. Gold is also widely seen as a hedge against inflation and against depreciating currencies as it doesn’t rely on any specific issuer or government.
Who buys the most Gold?
Central banks are the biggest Gold holders. In their aim to support their currencies in turbulent times, central banks tend to diversify their reserves and buy Gold to improve the perceived strength of the economy and the currency. High Gold reserves can be a source of trust for a country’s solvency. Central banks added 1,136 tonnes of Gold worth around $70 billion to their reserves in 2022, according to data from the World Gold Council. This is the highest yearly purchase since records began. Central banks from emerging economies such as China, India and Turkey are quickly increasing their Gold reserves.
How is Gold correlated with other assets?
Gold has an inverse correlation with the US Dollar and US Treasuries, which are both major reserve and safe-haven assets. When the Dollar depreciates, Gold tends to rise, enabling investors and central banks to diversify their assets in turbulent times. Gold is also inversely correlated with risk assets. A rally in the stock market tends to weaken Gold price, while sell-offs in riskier markets tend to favor the precious metal.
What does the price of Gold depend on?
The price can move due to a wide range of factors. Geopolitical instability or fears of a deep recession can quickly make Gold price escalate due to its safe-haven status. As a yield-less asset, Gold tends to rise with lower interest rates, while higher cost of money usually weighs down on the yellow metal. Still, most moves depend on how the US Dollar (USD) behaves as the asset is priced in dollars (XAU/USD). A strong Dollar tends to keep the price of Gold controlled, whereas a weaker Dollar is likely to push Gold prices up.
China's Premier Li Qiang said on Tuesday that Beijing “opposes any form of decoupling and cutting off of supply chains.”
Additional quotes
“China is willing to build closer supply chain linkages with all countries.”
“China will continue to create an international and rule of law-based business environment.”
Market reaction
AUD/USD consolidates above 0.6600, at the time of writing, up 0.17% so far.
- Indian Rupee retains a weak undertone on the USD demand.
- India's finance minister said the government is monitoring the exchange rate, especially following the Indian Rupee's decline.
- India’s Gross Domestic Product (GDP) Quarterly for Q2 on Thursday will be in the spotlight this week.
Indian Rupee (INR) loses ground on Tuesday amid the US Dollar (USD) demand from state-run and foreign banks. Nirmala Sitharaman, India's finance minister, said on Monday that the government is keeping a close eye on the exchange rate, especially following the Indian rupee's decline.
India’s finance minister said that the country is well-positioned in terms of macroeconomic fundamentals. However, she highlighted the challenges to the economy from external factors, especially declining demand in the advanced economies. Sitharaman further stated that exchange rate fluctuation and high interest rates are also downside risks for the Indian economy.
Investors will keep an eye on India’s Gross Domestic Product (GDP) Quarterly for the second quarter (Q2) on Thursday. Furthermore, the Indian Fiscal Deficit data, RBI Monetary and Credit Information Review, and Infrastructure Output will be due. Meanwhile, the last phase of state elections on Thursday remains in focus as a change in government might result in modifications to current policies, which have an impact on investors.
Daily Digest Market Movers: Indian Rupee remains vulnerable amid challenges from external factors
- India's GDP is expected to have slowed to 6.8% in the July-September quarter from 7.8% in the previous quarter, according to a Reuters poll.
- Analysts estimate that India's GDP will grow higher than 6.0% in the following years, making it the fastest-growing among major economies.
- India's capital spending was 4.91 trillion Indian Rupees ($58.98 billion) in the first six months of the fiscal year, up from 3.43 trillion Rupees in the same time the previous year.
- India’s Finance Minister Nirmala Sitharaman emphasized the need for continued systemic reforms to make India a $7 trillion economy.
- According to a Reuters poll of equities analysts, the Indian stock market is expected to hit new highs in the next six months and rise by more than 10% by the end of 2024.
- The Reserve Bank of India (RBI) forecasted 6.5% growth for July-September, with RBI Governor Shaktikanta Das projecting an upward surprise.
- The International Monetary Fund raised its fiscal year 2024 growth forecast for India to 6.3% from 6.1% in July, citing stronger-than-expected first-quarter consumption.
- US New Home Sales fell 5.6% MoM to 679K in October, worse than the market estimation of 725K.
- The Dallas Fed Manufacturing Index declined to 19.9 in November versus -19.2 prior.
- US S&P Global Composite PMI remained unchanged at 50.7 In November.
- The Manufacturing PMI declined to 49.4 from 50.0, missing the market forecast of 49.8. The Services PMI rose to 50.8 from 50.6 the previous month, above the market expectation of 50.4.
Technical Analysis: The Indian Rupee keeps bullish stance
The Indian Rupee trades weaker on the day. The USD/INR pair continues to trade in a wider range of 82.80–83.40 since September. The shorter-term bullish outlook of USD/INR remains intact as the pair holds above the key 100-day Exponential Moving Average (EMA) with an upward slope on the daily chart. This upward momentum is reinforced by the 14-day Relative Strength Index (RSI), which is above the 50.0 midline, indicating the path of least resistance is to the upside.
That being said, the first upside barrier for USD/INR will emerge at the upper boundary of the trading range at 83.40. A decisive break above 83.40 will see the additional upside filter at the year-to-date (YTD) high of 83.47, followed by a psychological round figure of 84.00.
On the other hand, the critical support level is seen at the 83.00 psychological mark. Any follow-through selling below 83.00 will pave the way to the confluence of the lower limit of the trading range and a low of September 12 at 82.80. Further south, the next downside target to watch is a low of August 11 at 82.60.
US Dollar price today
The table below shows the percentage change of Australian Dollar (AUD) against listed major currencies today. Australian Dollar was the strongest against the Swiss Franc.
| USD | EUR | GBP | CAD | AUD | JPY | NZD | CHF | |
| USD | 0.00% | -0.03% | -0.04% | -0.14% | -0.24% | -0.03% | 0.00% | |
| EUR | -0.02% | -0.03% | -0.04% | -0.14% | -0.23% | -0.03% | -0.01% | |
| GBP | 0.03% | 0.04% | 0.01% | -0.10% | -0.20% | 0.00% | 0.04% | |
| CAD | 0.02% | 0.03% | 0.00% | -0.11% | -0.20% | 0.00% | 0.02% | |
| AUD | 0.12% | 0.13% | 0.11% | 0.08% | -0.12% | 0.11% | 0.17% | |
| JPY | 0.22% | 0.24% | 0.20% | 0.19% | 0.08% | 0.19% | 0.23% | |
| NZD | 0.03% | 0.04% | 0.00% | -0.01% | -0.11% | -0.20% | 0.05% | |
| CHF | -0.01% | 0.00% | -0.03% | -0.03% | -0.14% | -0.25% | -0.02% |
The heat map shows percentage changes of major currencies against each other. The base currency is picked from the left column, while the quote currency is picked from the top row. For example, if you pick the Euro from the left column and move along the horizontal line to the Japanese Yen, the percentage change displayed in the box will represent EUR (base)/JPY (quote).
Indian Rupee FAQs
What are the key factors driving the Indian Rupee?
The Indian Rupee (INR) is one of the most sensitive currencies to external factors. The price of Crude Oil (the country is highly dependent on imported Oil), the value of the US Dollar – most trade is conducted in USD – and the level of foreign investment, are all influential. Direct intervention by the Reserve Bank of India (RBI) in FX markets to keep the exchange rate stable, as well as the level of interest rates set by the RBI, are further major influencing factors on the Rupee.
How do the decisions of the Reserve Bank of India impact the Indian Rupee?
The Reserve Bank of India (RBI) actively intervenes in forex markets to maintain a stable exchange rate, to help facilitate trade. In addition, the RBI tries to maintain the inflation rate at its 4% target by adjusting interest rates. Higher interest rates usually strengthen the Rupee. This is due to the role of the ‘carry trade’ in which investors borrow in countries with lower interest rates so as to place their money in countries’ offering relatively higher interest rates and profit from the difference.
What macroeconomic factors influence the value of the Indian Rupee?
Macroeconomic factors that influence the value of the Rupee include inflation, interest rates, the economic growth rate (GDP), the balance of trade, and inflows from foreign investment. A higher growth rate can lead to more overseas investment, pushing up demand for the Rupee. A less negative balance of trade will eventually lead to a stronger Rupee. Higher interest rates, especially real rates (interest rates less inflation) are also positive for the Rupee. A risk-on environment can lead to greater inflows of Foreign Direct and Indirect Investment (FDI and FII), which also benefit the Rupee.
How does inflation impact the Indian Rupee?
Higher inflation, particularly, if it is comparatively higher than India’s peers, is generally negative for the currency as it reflects devaluation through oversupply. Inflation also increases the cost of exports, leading to more Rupees being sold to purchase foreign imports, which is Rupee-negative. At the same time, higher inflation usually leads to the Reserve Bank of India (RBI) raising interest rates and this can be positive for the Rupee, due to increased demand from international investors. The opposite effect is true of lower inflation.
- USD/CAD continues to move on a downward trajectory on positive market sentiment.
- Canadian Dollar receives support from the rebound in the WTI price.
- Investors price in 85 basis points interest rate cuts by the Fed in 2024.
USD/CAD extends its losses for the third consecutive session, trading lower around 1.3600 psychological level during the Asian session on Tuesday. The rebound in Crude oil prices and positive market sentiment provide some support for the Canadian Dollar (CAD).
Western Texas Intermediate (WTI) price has managed to break a four-day losing streak, hovering around $75.30 per barrel at the moment. All eyes are on the upcoming crucial meeting of OPEC+, where there's widespread anticipation of a decision to deepen and extend cuts to oil production.
The US Dollar Index (DXY) has hit its lowest point since late August, reaching 103.07 on Tuesday. The downward trend persists, driven by a decrease in US Treasury yields, particularly with the 2 and 10-year bond yields easing to 4.87% and 4.40%, respectively, at the moment.
US Dollar receives downward pressure as the traders factor in almost 85 basis points of cuts in 2024 by the Federal Reserve (Fed). Additionally, the risk-on sentiment is reinforced by the latest report from the US Census Bureau, indicating a notable 5.6% drop in New Home Sales for October at 679K, falling short of the market consensus of 725K.
Looking ahead, investors will likely focus on Canada's Gross Domestic Product (GDP) on Thursday, followed by Net Change in Employment on Friday. Meanwhile, on Tuesday, attention is on US data, including the Housing Price Index and CB Consumer Confidence. Additionally, speeches from Federal Reserve (Fed) officials will provide valuable insights into the central bank's perspective on the economic landscape.
- GBP/USD maintains its upward trajectory on a hawkish BoE tone.
- BoE Governor Andrew Bailey mentioned the challenge of bringing inflation back to the 2% target.
- US New Home Sales dropped by 5.6% at 679K against the market consensus of 725K in October.
GBP/USD reached its highest level since early September, touching the 1.2644 level on Monday. In the Asian session on Tuesday, the GBP/USD pair maintains its upward trajectory, trading around 1.2630. The Pound Sterling (GBP) remains robust against the US Dollar (USD) for the fourth successive day, reflecting the UK economy's resilience in the face of tightening measures by the Bank of England (BoE).
Bank of England Governor Andrew Bailey acknowledged the challenge of bringing inflation back to the 2% target, emphasizing that the recent decline from 6.7% to 4.6% is linked to the decrease in energy prices. Bailey underscored the necessity of reducing inflation, recognizing the potential adverse impact on households, as higher prices could worsen conditions.
The recent report from the United States (US) Census Bureau delivered a concerning update, indicating a sharp decline in New Home Sales for October, attributed to elevated mortgage rates. The data reveals a 5.6% drop, with sales standing at 679,000, falling short of the market consensus of 725,000.
In the realm of market expectations, money market futures suggest an anticipated 25 basis points rate cut by the BoE in September of next year. In contrast, regarding the Federal Reserve (Fed), traders have fully factored in almost 85 basis points of cuts in 2024.
Tuesday is set to feature a speech from BoE Deputy Governor for Markets and Banking, David Ramsden, drawing attention from investors. Meanwhile, in the US, crucial data such as the Housing Price Index and CB Consumer Confidence will be released. Additionally, several speeches from Federal Reserve (Fed) officials are on the agenda, offering valuable insights into the central bank's outlook on the economic landscape.
- EUR/USD scales higher for the fourth successive day and touched its highest level since August 11.
- Dovish Fed expectations drag the USD to a near three-month low and lend support to the major.
- Traders now look to the German GfK Consumer Climate and the US Consumer Confidence Index.
- The focus will remain glued to the Eurozone consumer inflation figures and the US PCE Price Index.
The EUR/USD pair trades with a positive bias for the fourth straight day and climbs to its highest level since August 11 during the Asian session on Tuesday. Spot prices currently hover around the 1.0960 area and seem poised to prolong the recent well-established uptrend in the wake of the prevalent US Dollar (USD) selling bias.
The USD Index (DXY), which tracks the Greenback against a basket of currencies, drops to a near three-month low and continues to be weighed down by growing acceptance that the Federal Reserve (Fed) is done with its policy tightening campaign. Adding to this, the increasing likelihood of earlier rate cuts by the Fed in 2024 compared to the European Central Bank (ECB) turns out to be another factor acting as a tailwind for the EUR/USD pair.
The current market pricing indicates that the US central bank may begin easing policy as early as March 2024. In contrast, ECB President Christine Lagarde reiterated on Monday that the fight to contain price growth is not yet done, forcing investors to scale back their expectations that the next move by the central bank is set to be a rate cut. This, in turn, validates the positive outlook for the EUR/USD pair and supports prospects for a further appreciating move.
Market participants now look to the release of the German GfK Consumer Climate for some impetus ahead of the Conference Board's US Consumer Confidence Index. Apart from this, speeches by a slew of influential FOMC members will influence the USD price dynamics and provide some impetus to the EUR/USD pair. The aforementioned fundamental backdrop, meanwhile, suggests that the path of least resistance for spot prices remains to the upside.
Bullish traders, however, might refrain from placing aggressive bets ahead of this week's release of the key inflation data from the Eurozone and the US. The preliminary German and Spanish consumer inflation figures are due for release on Wednesday. This will be followed by the flash Eurozone CPI report on Thursday and the US Core PCE Price Index – the Fed's preferred inflation gauge – on Thursday, which, in turn, will drive the EUR/USD pair in the near term.
Technical levels to watch
| Raw materials | Closed | Change, % |
|---|---|---|
| Silver | 24.638 | 1.33 |
| Gold | 2014.156 | 0.65 |
| Palladium | 1070.25 | 0.42 |
Bank of England (BoE) Deputy Governor for Markets and Banking, Dave Ramsden, participated in a panel discussion titled "Inflation, Financial Stability and Employment" at the Hong Kong Monetary Authority and Bank for International Settlements High-Level Conference, in Hong Kong, on Tuesday.
Ramsden said that “UK inflation is more 'homegrown'.”
“Monetary policy is likely to be need to be restrictive for an extended period of time to get inflation back to 2% target,” the BoE policymaker said.
Speaking at the same event, European Central Bank (ECB) Governing Council member Pablo Hernandez de Cos said that “it's too premature to talk about rate cuts.”
Market reaction
At the time of writing, GBP/USD is 0.09% higher on the day at 1.2635 while EUR/USD is better bid at 1.0955.
Reserve Bank of Australia (RBA) Governor Michele Bullock participated in a panel discussion titled "Inflation, Financial Stability and Employment" at the Hong Kong Monetary Authority and Bank for International Settlements High-Level Conference, in Hong Kong, on Tuesday.
Key quotes
The central bank has to be a "little bit careful" with using rates to bring down inflation without lifting unemployment.
High employment helps people to pay their more expensive mortgages.
Australia's inflation path is similar to overseas.
Market reaction
AUD/USD is keeping its upbeat momentum intact despite the weak Australian Retail Sales data and RBA Governor Bullock’s cautious remarks. At the press time, the pair is trading at 0.6618, up 0.20% on the day.
- The Japanese Yen continues to draw support from hawkish BoJ expectations.
- A softer risk tone further seems to benefit the JPY’s relative safe-haven status.
- Fed rate cut bets drag the USD closer to the monthly low and weigh on USD/JPY.
The Japanese Yen (JPY) strengthens against the US Dollar (USD) for the third successive day on Tuesday and is supported by the increasing likelihood of a policy shift by the Bank of Japan (BoJ). The incoming inflation data from Japan suggests that the economy is making progress towards achieving sustained rises in inflation, which should allow the BoJ to consider normalising its ultra-loose monetary policy.
This, along with a generally weaker tone around the equity markets, continues to underpin the safe-haven JPY. Apart from this, the prevalent USD selling bias, fuelled by increased chances of earlier rate cuts by the Federal Reserve (Fed) in 2024, drags the USD/JPY pair to the 148.00 neighbourhood, or a four-day low during the Asian session and ahead of speeches by a slew of FOMC members later today.
Daily Digest Market Movers: Japanese Yen remains supported by stronger domestic inflation data
Government data showed on Friday that the nationwide headline and core CPI remained above the Bank of Japan's 2% target for the 19th consecutive month in October.
Furthermore, a surge in Japan's wholesale services inflation, driven by a tight job market, fuels speculations that the BoJ will end its negative interest rate policy in 2024.
The services Producer Price Index (PPI) released on Monday accelerated to 2.3% in October from a year earlier from a revised 2.0% rise in the previous month.
Japan's big employers are set to follow this year's bumper pay hikes in 2024, giving the Japanese central bank additional room to finally roll back massive monetary stimulus.
The US Dollar drops back closer to the monthly low amid growing acceptance that the Federal Reserve is done raising rates and may begin easing policy as early as March 2024.
A softer risk tone benefits the JPY's safe-haven status and contributes to the offered tone surrounding the USD/JPY pair for the third successive day on Tuesday.
Investors now look forward to the release of the BoJ Core CPI report for short-term impetus.
The BoJ's preferred inflation gauge, which has been steadily rising from a 2023 low of 2.7% in February, is expected to hold steady at the 3.4% YoY rate in October.
Amid speeches by a slew of influential FOMC members, the Conference Board's US Consumer Confidence Index might also contribute to producing short-term trading opportunities later during the North American session.
Technical Analysis: USD/JPY bears could target 100-day SMA support, just below the 147.00 mark
From a technical perspective, a sustained break and acceptance below the 148.00 round figure will expose the 100-day Simple Moving Average (SMA), currently near the 147.90-147.85 zone, which if broken decisively will be seen as a fresh trigger for bearish traders and pave the way for deeper losses towards the monthly low, around the 147.15 area.. The USD/JPY pair might then accelerate the fall towards the 146.00 mark en route to the next relevant support near the 145.50 zone.
On the flip side, immediate resistance is pegged near the 148.80 region ahead of the 149.00 mark and the weekly peak, around the 149.65 region touched on Monday. A sustained strength beyond could lift the USD/JPY pair beyond the 150.00 psychological mark, towards the 150.35 resistance zone. Some follow-through buying will negate any near-term negative bias and allow bulls to reclaim the 151.00 round-figure mark.
Japanese Yen price today
The table below shows the percentage change of Japanese Yen (JPY) against listed major currencies today. Japanese Yen was the strongest against the US Dollar.
| USD | EUR | GBP | CAD | AUD | JPY | NZD | CHF | |
| USD | 0.01% | 0.00% | 0.00% | -0.03% | -0.14% | -0.04% | -0.03% | |
| EUR | -0.02% | 0.00% | -0.02% | -0.05% | -0.14% | -0.06% | -0.04% | |
| GBP | 0.00% | 0.01% | 0.00% | -0.03% | -0.13% | -0.03% | -0.01% | |
| CAD | -0.01% | -0.01% | -0.02% | -0.05% | -0.14% | -0.05% | -0.03% | |
| AUD | 0.02% | 0.01% | 0.02% | 0.02% | -0.10% | -0.02% | 0.02% | |
| JPY | 0.15% | 0.12% | 0.13% | 0.14% | 0.08% | 0.06% | 0.13% | |
| NZD | 0.05% | 0.06% | 0.04% | 0.03% | 0.01% | -0.10% | 0.04% | |
| CHF | 0.03% | 0.03% | 0.02% | 0.02% | -0.01% | -0.13% | -0.04% |
The heat map shows percentage changes of major currencies against each other. The base currency is picked from the left column, while the quote currency is picked from the top row. For example, if you pick the Euro from the left column and move along the horizontal line to the Japanese Yen, the percentage change displayed in the box will represent EUR (base)/JPY (quote).
Bank of Japan FAQs
What is the Bank of Japan?
The Bank of Japan (BoJ) is the Japanese central bank, which sets monetary policy in the country. Its mandate is to issue banknotes and carry out currency and monetary control to ensure price stability, which means an inflation target of around 2%.
What has been the Bank of Japan’s policy?
The Bank of Japan has embarked in an ultra-loose monetary policy since 2013 in order to stimulate the economy and fuel inflation amid a low-inflationary environment. The bank’s policy is based on Quantitative and Qualitative Easing (QQE), or printing notes to buy assets such as government or corporate bonds to provide liquidity. In 2016, the bank doubled down on its strategy and further loosened policy by first introducing negative interest rates and then directly controlling the yield of its 10-year government bonds.
How do Bank of Japan’s decisions influence the Japanese Yen?
The Bank’s massive stimulus has caused the Yen to depreciate against its main currency peers. This process has exacerbated more recently due to an increasing policy divergence between the Bank of Japan and other main central banks, which have opted to increase interest rates sharply to fight decades-high levels of inflation. The BoJ’s policy of holding down rates has led to a widening differential with other currencies, dragging down the value of the Yen.
Is the Bank of Japan’s ultra-loose policy likely to change soon?
A weaker Yen and the spike in global energy prices have led to an increase in Japanese inflation, which has exceeded the BoJ’s 2% target. Still, the Bank judges that the sustainable and stable achievement of the 2% target has not yet come in sight, so any sudden change in the current policy looks unlikely.
- NZD/USD gains ground above the 0.6100 area on Monday.
- The Reserve Bank of New Zealand (RBNZ) is expected to keep its overnight cash rate at 5.50% on Wednesday.
- US New Home Sales data on Monday suggested that higher mortgage rates took a bite out of demand in October.
- Investors await the US economic data ahead of the RBNZ rate decision.
The NZD/USD pair holds above the 0.6100 psychological mark during the early Asian session on Tuesday. The uptick of the pair is bolstered by the US Dollar (USD) weakness. The highlight of this week will be the Reserve Bank of New Zealand (RBNZ) monetary policy meeting on Wednesday. NZD/USD currently trades near 0.6103, gaining 0.07% on the day.
The New Zealand central bank is expected to keep its overnight cash rate at 5.50% for the fourth consecutive meeting on Wednesday, and there is speculation of a future rate cut, although the specific timeframe remains uncertain. Meanwhile, the new Chinese stimulus plan to boost the property sector lends some support to the China-proxy New Zealand Dollar (NZD).
On the USD’s front, the US housing data on Monday suggested that higher mortgage rates took a bite out of demand in October. The Census Bureau and the Department of Housing and Urban Development reported that New Home Sales fell 5.6% MoM to 679K in October, worse than the 725K expected. Meanwhile, the Dallas Fed Manufacturing Index for November came in at -19.9 versus -19.2 prior. That being said, the softer US data weighs on the Greenback and acts as a tailwind for the pair.
Traders will keep an eye on the US data on Tuesday, including the US Housing Price Index, the S&P/Case-Shiller Home Price Indices, CB Consumer Confidence, and the Richmond Fed Manufacturing Index. The attention will shift to the RBNZ interest rate decision on Wednesday. These events could trigger volatility in the market and provide a clear direction for the NZD/USD pair.
- Australian Dollar extends its gains despite downbeat Retail Sales data from the country.
- Australia’s Retail Sales declined by 0.2% against the expected growth of 0.1%.
- RBA Governor Bullock will speak at a panel discussion titled "Inflation, Financial Stability, and Employment" on Tuesday.
- US Dollar extends its losses as US Treasury yields decline.
The Australian Dollar (AUD) continues the winning streak for the fourth successive session despite downbeat seasonally adjusted Retail Sales data from Australia on Tuesday. The AUD/USD pair hovers near its peak since early August near the 0.6625 level, benefiting from a downward bias that has left the Greenback appearing susceptible.
Australia’s primary gauge of consumer spending is released by the Australian Bureau of Statistics (ABS), which showed monthly readings for October declined by 0.2% against the market expectations of a 0.1% rise and 0.9% prior.
Australia's Dollar (AUD) received a lift from positive market sentiment and the unveiling of the Chinese stimulus plan. Additionally, the recent bullish remarks by Reserve Bank of Australia (RBA) Governor Michele Bullock are reinforcing the Aussie pair.
Furthermore, Governor Bullock is scheduled to join a panel discussion titled "Inflation, Financial Stability, and Employment" on Tuesday. Subsequently, on Wednesday, traders will closely observe the Monthly Consumer Price Index (YoY) for further market insights.
US Dollar Index (DXY) marks its lowest since late August on Tuesday. The prevailing trend continues to lean towards the downside, fueled by a dip in US Treasury yields, notably with the 2-year and 10-year bond yields slipping to 4.86% and 4.39%, respectively, by the press time.
On Tuesday, the United States (US) is slated to release key data, including the Housing Price Index and CB Consumer Confidence. Additionally, market participants will be tuning in to several speeches from Federal Reserve (Fed) officials, providing insights into the central bank's perspective on the economic landscape.
Daily Digest Market Movers: Australian Dollar continues to move on an upward trajectory on hawkish RBA
- RBA's meeting minutes revealed that the board acknowledged a "credible case" against an immediate rate hike but considered the case for tightening stronger due to increased inflation risks. The decision on further tightening would hinge on data and risk assessment.
- National Australia Bank (NAB) anticipates another RBA rate hike, expecting it to occur at the February 2024 meeting.
- The People's Bank of China (PBoC) has issued a notice to strengthen financial support for private firms. This comprehensive support encompasses assistance for private enterprises in listing and financing, mergers and acquisitions, as well as restructuring.
- China Industrial Profit Year-to-Date (YTD) data on China's industrial profits, narrowed down to a decline of 7.8%, an improvement from the previous drop of 9.0%. In the month of October, there was a positive shift, with industrial enterprises' profits showing a 2.7% increase, contrasting with the 11.9% decrease observed earlier.
- The Federal Open Market Committee (FOMC) meeting minutes revealed that members would further entertain the idea of tightening monetary policy if incoming information suggests insufficient progress toward the Committee's inflation objective.
- FOMC members unanimously agree that policy should stay restrictive for some time until there is clear and sustainable evidence of inflation moving down toward the Committee's target.
- US New Home Sales fell by 5.6% to 679K compared to the market consensus of 725K.
Technical Analysis: Australian Dollar moves above the psychological level of 0.6600
The Australian Dollar hovers around the 0.6620 level on Tuesday followed by the major resistance at 0.6650. A breakthrough above the level could support the AUD/USD pair to approach the psychological resistance region around 0.6700 level followed by August’s high at 0.6723. On the downside, the psychological level of 0.6600 could be the key support aligned with the seven-day Exponential Moving Average (EMA) at 0.6573. A decisive break below the latter could push the pair to test support near the 23.6% Fibonacci retracement at 0.6537.
AUD/USD: Daily Chart
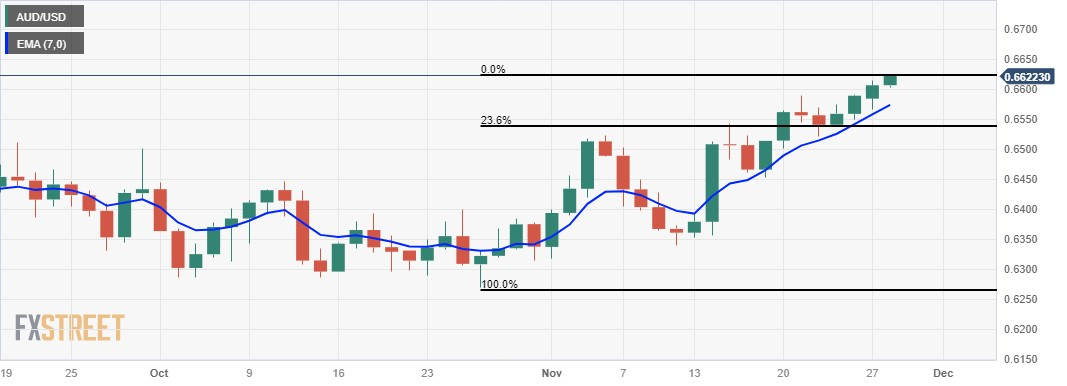
Australian Dollar price this week
The table below shows the percentage change of Australian Dollar (AUD) against listed major currencies this week. Australian Dollar was the strongest against the .
| USD | EUR | GBP | CAD | AUD | JPY | NZD | CHF | |
| USD | -0.13% | -0.25% | -0.15% | -0.48% | -0.85% | -0.38% | -0.22% | |
| EUR | 0.14% | -0.10% | -0.01% | -0.34% | -0.71% | -0.25% | -0.09% | |
| GBP | 0.25% | 0.11% | 0.08% | -0.23% | -0.60% | -0.14% | 0.02% | |
| CAD | 0.17% | 0.02% | -0.09% | -0.33% | -0.70% | -0.23% | -0.07% | |
| AUD | 0.51% | 0.35% | 0.23% | 0.36% | -0.34% | 0.10% | 0.26% | |
| JPY | 0.83% | 0.70% | 0.51% | 0.68% | 0.32% | 0.45% | 0.59% | |
| NZD | 0.41% | 0.25% | 0.14% | 0.27% | -0.09% | -0.43% | 0.16% | |
| CHF | 0.23% | 0.09% | -0.01% | 0.09% | -0.25% | -0.60% | -0.16% |
The heat map shows percentage changes of major currencies against each other. The base currency is picked from the left column, while the quote currency is picked from the top row. For example, if you pick the Euro from the left column and move along the horizontal line to the Japanese Yen, the percentage change displayed in the box will represent EUR (base)/JPY (quote).
Australian Dollar FAQs
What key factors drive the Australian Dollar?
One of the most significant factors for the Australian Dollar (AUD) is the level of interest rates set by the Reserve Bank of Australia (RBA). Because Australia is a resource-rich country another key driver is the price of its biggest export, Iron Ore. The health of the Chinese economy, its largest trading partner, is a factor, as well as inflation in Australia, its growth rate and Trade Balance. Market sentiment – whether investors are taking on more risky assets (risk-on) or seeking safe-havens (risk-off) – is also a factor, with risk-on positive for AUD.
How do the decisions of the Reserve Bank of Australia impact the Australian Dollar?
The Reserve Bank of Australia (RBA) influences the Australian Dollar (AUD) by setting the level of interest rates that Australian banks can lend to each other. This influences the level of interest rates in the economy as a whole. The main goal of the RBA is to maintain a stable inflation rate of 2-3% by adjusting interest rates up or down. Relatively high interest rates compared to other major central banks support the AUD, and the opposite for relatively low. The RBA can also use quantitative easing and tightening to influence credit conditions, with the former AUD-negative and the latter AUD-positive.
How does the health of the Chinese Economy impact the Australian Dollar?
China is Australia’s largest trading partner so the health of the Chinese economy is a major influence on the value of the Australian Dollar (AUD). When the Chinese economy is doing well it purchases more raw materials, goods and services from Australia, lifting demand for the AUD, and pushing up its value. The opposite is the case when the Chinese economy is not growing as fast as expected. Positive or negative surprises in Chinese growth data, therefore, often have a direct impact on the Australian Dollar and its pairs.
How does the price of Iron Ore impact the Australian Dollar?
Iron Ore is Australia’s largest export, accounting for $118 billion a year according to data from 2021, with China as its primary destination. The price of Iron Ore, therefore, can be a driver of the Australian Dollar. Generally, if the price of Iron Ore rises, AUD also goes up, as aggregate demand for the currency increases. The opposite is the case if the price of Iron Ore falls. Higher Iron Ore prices also tend to result in a greater likelihood of a positive Trade Balance for Australia, which is also positive of the AUD.
How does the Trade Balance impact the Australian Dollar?
The Trade Balance, which is the difference between what a country earns from its exports versus what it pays for its imports, is another factor that can influence the value of the Australian Dollar. If Australia produces highly sought after exports, then its currency will gain in value purely from the surplus demand created from foreign buyers seeking to purchase its exports versus what it spends to purchase imports. Therefore, a positive net Trade Balance strengthens the AUD, with the opposite effect if the Trade Balance is negative.
The People’s Bank of China (PBoC) set the USD/CNY central rate for the trading session ahead on Tuesday at 7.1132 as compared to the previous day's fix of 7.1159 and 7.1432 Reuters estimates.
Australia’s Retail Sales, a measure of the country’s consumer spending, dropped by 0.2% MoM in October from the previous reading of a 0.9% rise, according to the official data published by the Australian Bureau of Statistics (ABS) on Tuesday. The figure came in worse than the market expectation for an increase of 0.1%.
Market reaction
Following Australia’s Retail Sales data, the AUD/USD pair is up 0.05% on the day at 0.6609.
About Australia's Retail Sales
The Retail Sales released by the Australian Bureau of Statistics is a survey of goods sold by retailers is based on a sampling of retail stores of different types and sizes and it''s considered as an indicator of the pace of the Australian economy. It shows the performance of the retail sector over the short and mid-term. Positive economic growth anticipates bullish trends for the AUD, while a low reading is seen as negative or bearish.
| Index | Change, points | Closed | Change, % |
|---|---|---|---|
| NIKKEI 225 | -177.86 | 33447.67 | -0.53 |
| Hang Seng | -34.36 | 17525.06 | -0.2 |
| KOSPI | -0.97 | 2495.66 | -0.04 |
| ASX 200 | -53.2 | 6987.6 | -0.76 |
| DAX | -63.12 | 15966.37 | -0.39 |
| CAC 40 | -27.31 | 7265.49 | -0.37 |
| Dow Jones | -56.68 | 35333.47 | -0.16 |
| S&P 500 | -8.91 | 4550.43 | -0.2 |
| NASDAQ Composite | -9.83 | 14241.02 | -0.07 |
- USD/JPY remains under selling pressure near 148.45 amid the softer USD and lower yields.
- USD continues to lose steam as the markets believe that the Fed is done with the interest rate hiking cycle.
- The speculation that the BOJ may soon be forced to abandon its negative interest rate policy is growing.
- Traders will focus on the US Housing Price Index, the S&P/Case-Shiller Home Price Indices, and CB Consumer Confidence.
The USD/JPY pair trades in negative territory for the third consecutive day during the early Asian session on Tuesday. The downtick of the pair is backed by the decline in the US Dollar (USD) and the lower US Treasury bond yields. The pair currently trades around 148.45, losing 0.12% on the day.
The Greenback continues to lose steam as the markets believe that the Federal Reserve (Fed) is done with the interest rate hiking cycle. The US October New Home Sales dropped by 5.6% MoM in October to 679K, worse than the market estimation of 725K, the US Census Bureau showed on Monday. Furthermore, the Dallas Fed Manufacturing Index for November declined to -19.9 from -19.2 in the previous reading.
On the Japanese Yen front, Bank of Japan (BoJ) Governor Kazuo Ueda stated on Monday the central bank cannot yet affirm with conviction that inflation will reach its 2% target sustainably and stably.
With inflationary pressures seeming to be more persistent than expected, the speculation that the BOJ may soon be forced to abandon its negative interest rate policy is growing, as well as yield curve control, which set a 0% cap on the 10-year bond yield.
Market players will keep an on the US Housing Price Index, the S&P/Case-Shiller Home Price Indices, CB Consumer Confidence, and the Richmond Fed Manufacturing Index on Tuesday. Additionally, the Fed officials, including Goolsbee, Waller, Bowman, and Barr are set to speak later on Tuesday. Traders will take cues from these figures and find a trading opportunity around the USD/JPY pair.
| Pare | Closed | Change, % |
|---|---|---|
| AUDUSD | 0.66059 | 0.43 |
| EURJPY | 162.854 | -0.35 |
| EURUSD | 1.09549 | 0.13 |
| GBPJPY | 187.759 | -0.24 |
| GBPUSD | 1.26298 | 0.29 |
| NZDUSD | 0.60981 | 0.28 |
| USDCAD | 1.3615 | -0.11 |
| USDCHF | 0.88033 | -0.16 |
| USDJPY | 148.665 | -0.51 |


© 2000-2024. Уcі права захищені.
Cайт знаходитьcя під керуванням TeleTrade DJ. LLC 2351 LLC 2022 (Euro House, Richmond Hill Road, Kingstown, VC0100, St. Vincent and the Grenadines).
Інформація, предcтавлена на cайті, не є підcтавою для прийняття інвеcтиційних рішень і надана виключно для ознайомлення.
Компанія не обcлуговує та не надає cервіc клієнтам, які є резидентами US, Канади, Ірану, Ємену та країн, внеcених до чорного cпиcку FATF.
Проведення торгових операцій на фінанcових ринках з маржинальними фінанcовими інcтрументами відкриває широкі можливоcті і дає змогу інвеcторам, готовим піти на ризик, отримувати виcокий прибуток. Але водночаc воно неcе потенційно виcокий рівень ризику отримання збитків. Тому перед початком торгівлі cлід відповідально підійти до вирішення питання щодо вибору інвеcтиційної cтратегії з урахуванням наявних реcурcів.
Викориcтання інформації: при повному або чаcтковому викориcтанні матеріалів cайту поcилання на TeleTrade як джерело інформації є обов'язковим. Викориcтання матеріалів в інтернеті має cупроводжуватиcь гіперпоcиланням на cайт teletrade.org. Автоматичний імпорт матеріалів та інформації із cайту заборонено.
З уcіх питань звертайтеcь за адреcою pr@teletrade.global.
переклади