- Аналітика
- Новини та інструменти
- Новини ринків
Новини ринків
- The S&P 500 rose on Thursday alongside the other major US indices as equities recover from recent losses.
- Equities have struggled in September, and the month is set to be the worst-performing of the year for stocks.
- Upcoming US PCE inflation figures could see volatility jump as equity traders fear Fed moves.
The Standard & Poor's (S&P) 500 major equity index eked out a reasonable gain on Thursday, closing up almost 0.60% just shy of $4,300.00.
The Dow Jones Industrial Average (DJIA) also finished in the green, up 116 points on Thursday to end the day at $33,666.34 (0.35%); The Nasdaq Composite also beat the bids on Thursday, climbing over 0.80% to close at $13,201.28.
A recovery in US equities was a welcome change of pace for investors on Thursday; the S&P has dropped rapidly in recent weeks, and is currently down over 5.0% from September's highs near $4,540.00.
September is on pace to be the year's single worst-performing month for equities, with the majority of indexes broadly off of the summer highs.
Overboiling selling pressure eased off on Thursday alongside a reprieve for US Treasury yields, giving equities a chance to rebound heading into Friday's bumper US Personal Consumption Expenditure (PCE) Price Index data release.
On the docket: US PCE inflation measure to close out trading week
Recession worries and investors rattled by a possible US government shutdown over partisan grandstanding have weighed heavily on equities. US yields initially hit a fresh 15-year high on Thursday after US data showed better-than-expected Initial Jobless Claims.
US PCE inflation is broadly expected to hold steady at 0.2% for the month of August.
S&P 500 technical outlook
The S&P 500 has fallen away from the 34-day Exponential Moving Average (EMA) in the last few weeks' fast drop from the month's peak near $4,540.00. The 200-day Simple Moving Average (SMA) is sitting just north of the $4,200.00 level.
Despite Thursday's rebound, the S&P is still in the red for the week which started near $4,325.00, and markets will be looking to firm up a bullish rally into the year's top at $4,600.00.
On the short side, there's little in the way of technical support beyond the 200-day SMA, and the bottom opens up towards the last major swing low at March's bottom at the $3,800.00 handle.
S&P 500 daily chart

S&P 500 technical levels
According to the latest data published by the Statistics Bureau of Japan, the headline Tokyo Consumer Price Index (CPI) for September eased to 2.8%% YoY from 2.9% in the previous reading. Meanwhile, the Tokyo CPI ex Fresh Food, Energy came in at 3.8% YoY from 4.0% in August.
Additionally, Tokyo CPI ex Fresh Food eased from 2.8% to 2.5% for the said month compared to analysts’ estimations of 2.6%.
Market reaction
As of writing, the USD/JPY pair was down 0.01% on the day at 149.29.
About Tokyo Consumer Price Index (CPI)
The Tokyo Consumer Price Index is released by the Statistics Bureau and it's a measure of price movements obtained by comparison of the retail prices of a representative shopping basket of goods and services. The index captures inflation in Tokyo. CPI is the most significant way to measure changes in purchasing trends. The purchase power of JPY is dragged down by inflation. Generally a high reading is seen as positive.
Federal Reserve Bank of Richmond President Thomas Barkin stated earlier on Friday that the Fed holding steady at the September FOMC meeting was appropriate
Key quotes
“Fed holding steady at the September FOMC meeting was appropriate”
“Fed has time to see data before deciding what’s next for rates”
“The path forward depends on what happens with inflation”
“Will be watching the job market closely for clues”
“Cautions against reading too much into Federal Reserve forecasts”
“The job market has remained very healthy”
“Not sure how the economy will perform over coming months”
“There is still a lot of uncertainty about how the Fed's balance sheet influences the economy”
Market reaction
The US Dollar stays on the back foot after this comment, As of writing, the US Dollar Index was unchanged on the day at 106.14.
- AUD/USD recovers its recent losses around 0.6428 amid the weakening of the US Dollar.
- US real Gross Domestic Product (GDP) grew at an annual rate of 2.1% in Q2, as expected.
- Australian Retail Sales rose 0.2% in August MoM vs. the 0.3% rise expected.
- Market players await the US Core Personal Consumption Expenditure Price Index report.
The AUD/USD pair recovers some lost ground and consolidates near 0.6428 during the early Asian session on Friday. The rebound of the pair is supported by a correction of the US Dollar (USD) and lower US Treasury yields. Meanwhile, the US Dollar Index (DXY) edges lower to 106.10 after retreating from 106.83, the highest since November.
Data released on Thursday revealed that the US real Gross Domestic Product (GDP) expanded at an annual rate of 2.1% in the second quarter, as expected. Additionally, Initial unemployment claims rose from 202,000 to 204,000, below the 215, 000 anticipated. The pending home sales fell 7.1% MoM in August, compared to estimates for a 1.0% drop MoM.
Chicago Federal Reserve (Fed) President Austan Goolsbee said on Thursday that the Fed will return inflation to target and has a chance to do something rare by accomplishing that without a recession. Richmond Fed President Thomas Barkin remarked that the past five months of inflation data have been upbeat but that it is too early to determine what monetary policy would be next. Barkin added that lost data due to the government shutdown would complicate understanding the economy. Investors will assess the narrative of a higher for longer rate in the US against the growth risks posed by the possibility of an imminent US government shutdown. This, in turn, might cap the upside of the Greenback.
On the other hand, data published by the Australian Bureau of Statistics (ABS) on Thursday showed that the nation’s Retail Sales rose 0.2% in August on a monthly basis from a 0.5% increase in July, below the market consensus of 0.3% rise. The softer-than-expected Retail Sales data in August might convince the Reserve Bank of Australia (RBA) to hold the interest rate next week.
Looking ahead, the Australian Private Sector Credit will be due later on Friday. However, market players will closely watch the US Core Personal Consumption Expenditure Price Index, the Federal Reserve's preferred inflation gauge. The annual figure is expected to decline from 4.25% to 3.9%. The stronger data could potentially lift the US Dollar.
- The USD/JPY got strung along the middle for Thursday, cycling 149.30.
- The pair closed down 20 pips on the day but missed any major moves.
- Friday sees Japanese Tokyo CPI, US PCE inflation numbers.
The USD/JPY went sideways on Thursday ahead of Friday's inflation double-feature. The pair is off the week's peak near 149.70, and analyst bets of USD/JPY hitting 150.00 are holding steady.
Despite a broad-market US Dollar (USD) Index retreat on firming risk appetite, the USD/JPY remains mostly flat for Thursday. The pair started Thursday trading off with an early high of 149.50 before falling back to familiar territory near 149.30.
Officials from the Bank of Japan (BoJ) has put some significant effort into trying to jawbone the JPY to hold steady, but visibly-empty threats of tightening monetary policy have provided little effect thus far.
Read More:
USD/JPY: It remains dangerous to bet on the patience of the MOF – Commerzbank
USD/JPY: A move to 150 now appears on the horizon – UOB
Friday sees Japan's Tokyo Consumer Price Index (CPI) reading for the annualized period into September, and the core CPI element (CPI less food but still including energies) is forecast to print at 2.6%, versus the previous reading of 2.8%.
Japanese inflation remains well above the BoJ's 2% target, but the BoJ continues to hold off on any rate adjustments until they are "convinced" that inflation will remain above their minimum target heading into a potential slowdown period in price growth.
Friday will also see US Personal Consumption Expenditure (PCE), which is expected to hold steady at the previous quarter's 0.2%.
USD/JPY technical outlook
The USD/JPY remains firmly bullish from a technical standpoint, having closed in the green or flat for ten of the eleven last consecutive trading weeks.
The pair is up over 13% from the year's early lows near 127.20, and currently remains well above major moving averages, with the 34-day Exponential Moving Average (EMA) sitting far below current price action near the 147.00 handle.
USD/JPY daily chart

USD/JPY technical levels
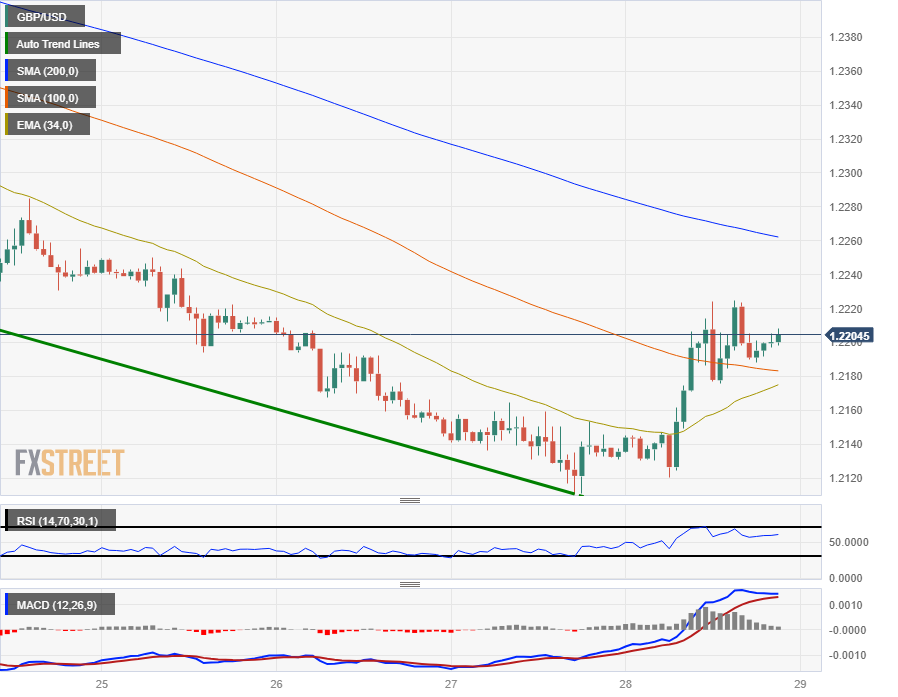
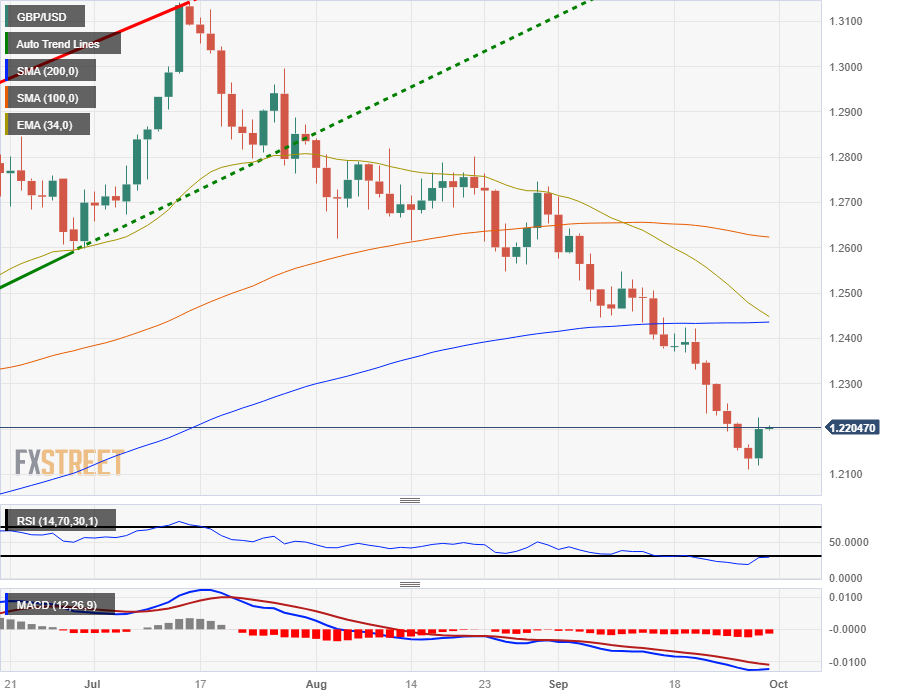
- The GBP/USD caught some lift on Thursday, rising back to the 1.2200 handle.
- Friday sees UK GDP figures amidst a slew of low-tier data.
- The Pound Sterling is broadly expected to continue weakening looking out long-term.
The GBP/USD managed to eke out a minor recovery on Friday, owing more to a step back in the broad-market US Dollar Index (DXY) than any intrinsic strength to be found in the Pound Sterling (GBP).
Market analysts broadly expect the GBP to continue to weaken moving forward, and a continued backslide to the 1.2000 major handle is all but a foregone conclusion for many instutitions.
The upcoming Friday trading session will kick things off for the GBP/USD with UK Gross Domestic Product figures due at 06:00 GMT. The UK GDP for the second quarter is forecast to hold steady at 0.2%, and a miss for headline economic growth in the British economy is all set to see the Pound lose what little gains it's recovered for Thursday.
Friday also brings high-impact data for the USD, most notably the Personal Consumption Expenditure (PCE) Price Index at 12:30 GMT. The PCE numbers are expected to hold steady at 0.2% for the month of August, with the annualized figure for the same period seen ticking down from 4.2% to 3.9%.
US figures hit a middling note on Thursday, with US Initial Jobless Claims clocking in at 204K versus the previous 202K; US annualized GDP for the second quarter came in exactly at expectations at 2.1%.
The big miss for Thursday was US Pending Home Sales, which surprised to the downside by not-insignificant -7.1%, far below the forecast -0.8% and dropping away from the previous 0.9%.
Read More:
GBP/USD remains vulnerable to the 1.20/1.21 area – ING
The Pound and Euro should weaken substantially through early 2024 – Wells Fargo
GBP/USD needs to surpass 1.2350 to show more meaningful technical strength – Scotiabank
GBP/USD technical outlook
The GBP/USD rose half a percent on Thursday, lifting to a session high of 1.2220 after pinging into six-month lows at 1.2110 the previous day.
Hourly candles have the pair rising into technical support coming down from the bearish 200-hour Simple Moving Average (SMA) near 1.2260.
On daily candlesticks the GBP/USD is firmly bearish and potentially primed for a minor relief rally. Price action will be capped off by the 200-day SMA above 1.2400, and the 34-day Exponential Moving Average (EMA) is racing to make a bearish cross of the longer moving average.
the GBP/USD is over 7% off its last meaningful swing high in July at 1.3140.
GBP/USD hourly chart
GBP/USD daily chart
GBP/USD technical levels
- Gold spot trims losses, trading at $1866.44, after US Treasury bond yields retract from multi-year highs, causing the USD to weaken.
- US GDP for Q2 meets expectations at 2.1%, with inflation dropping to 1.7%, below the previous 3.9%, indicating economic stability.
- Federal Reserve officials hint at potential further rate hikes if inflation progress stalls, adding another layer of uncertainty to gold’s outlook.
Gold spot tumbles as Wall Street closes, but earlier printed a six-month low of $1857.82, as US Treasury bond yields skyrocketed, a headwind for the yellow metal. Nevertheless, the XAU/USD trimmed some of its losses as US bond yields retraced. At the time of writing, the non-yielding metal trades at $1866.44 after hitting a daily high of $1879.58, down 0.49%
Gold prices experience a tumble, reaching a six-month low of $1857.82, as rising US Treasury bond yields and a strong USD are headwinds for the precious metal
Market sentiment improved on Thursday, while US Treasury bond yields retreated from multi-year highs of around 4.68% to 4.577%. Consequently, the Greenback (USD) is weakening, as portrayed by the US Dollar Index (DXY), down 0.49%, at 106.13.
Data in the United States (US) came as expected, particularly Gross Domestic Product (GDP) for Q2 on its final reading at 2.1%, aligned with the consensus but below the previous reading, which was upward revised to 2.2%. Inflation for the second quarter dropped to 1.7%, below the previous reading at 3.9%.
At the same time, the US Department of Labor revealed that Americans filing for unemployment on the week ending on September 23 rose by 204K, below estimates of 215K but more than last week’s 202K, portraying a robust labor market.
Aside from this, Federal Reserve officials continued to cross newswires. Chicago Fed’s President Austan Goolsbee said if the US central bank sees lack of progress on inflation, it would have to raise rates further while saying he’s not decided what to do at the next meeting. Meanwhile, Richmond’s Fed President Thomas Barkin stated the latest five months of inflation data have been encouraging, though he commented that it’s too soon to say what’s next on monetary policy.
XAU/USD Price Analysis: Technical outlook
After dropping to a new cycle low on Wednesday, Gold slumped below $1860, but it remains shy of the March 8 swing low at $1809.48. It should be said a death-cross in Gold’s daily chart, formed since Tuesday, cementing the XAU/USD bearish bias, but If it achieves a weekly close below $1900, that could exacerbate a drop to the latter and $1800. Otherwise, the yellow metal could pose a threat and test the 20-day moving average (DMA) at $1916.57
During the Asian session, Japan will release critical economic reports including the September Tokyo Consumer Price Index, the August Unemployment Rate, Industrial Production, Retail Sales, and Housing Starts. In Australia, Private Sector Credit data is due. Later in the day, a new estimate of UK Q2 GDP and Consumer Credit will be reported, while Germany will release Retail Sales and the Unemployment Rate. The key report to watch will be the Eurozone CPI. The focus will then shift to the US Core Personal Consumption Expenditures and Canada's monthly GDP.
Here is what you need to know on Friday, September 29:
It is the last day of September and the end of the third quarter, which could contribute to increased volatility on Friday due to end-of-month flows. The key economic report will be the US Core Personal Consumption Expenditure Price Index, the Federal Reserve's preferred inflation gauge. It is expected to show a decline from 4.25% to 3.9%. A higher-than-expected number could potentially trigger further gains for the US Dollar. The report also includes personal income and personal spending data. Later, the University of Michigan's final reading of Consumer Sentiment for September is due.
US Core PCE Preview: Forecasts from seven major banks, losing speed
The US Dollar index (DXY) experienced a correction lower on Thursday, declining by 0.50%. After rallying for five consecutive days and reaching a monthly high, the index pulled back toward the 106.00 area.
The Greenback weakened amid improved risk sentiment and lower US Treasury yields. Second-quarter US GDP growth data aligned with expectations, while Initial Jobless Claims rose less than expected. The US 10-year Treasury yield fell from 4.69% (the highest since 2007) to 4.57%.
A US government shutdown is looming as bills to fund the government have yet to become law in both the House and Senate. A government shutdown could have a negative impact on economic growth and delay the publication of key economic reports.
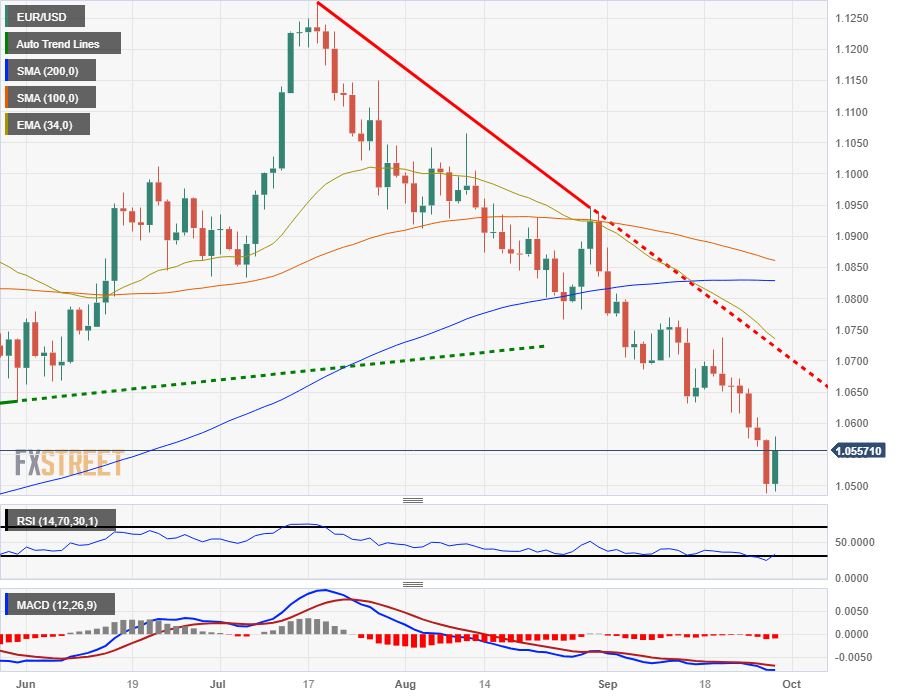
EUR/USD rebounded from below 1.0500 toward 1.0600. The overall trend is still down, but the short-term outlook has improved for the Euro. A break above 1.0580 would strengthen the common currency. The Eurozone Harmonized Index of Consumer Prices is due on Friday, although its impact may be limited considering that Germany has already released its inflation numbers. Additionally, German Retail Sales and the Unemployment Rate are also due on Friday.
Analysts at Commerzbank on German inflation:
German inflation fell from 6.1% to 4.5% in September. This is partly due to the fact that the 9-euro ticket and the tax cuts on fuel ("petrol rebate") expired a year ago. But even without this base effect, headline inflation and the core rate excluding energy and food would have fallen significantly. This trend is likely to continue in the months ahead. Next year, underlying inflation is expected to stabilize well above the ECB's target of 2%, as wage growth picks up noticeably.
GBP/USD had its best day in over a month, benefiting from a weaker US Dollar, hovering around the 1.2200 area. The correction could continue in the next sessions, but the outlook is bearish as long as it stays below 1.2460. The UK is set to release a new estimate of Q2 GDP growth and later Consumer Credit data.
USD/JPY experienced a modest drop despite the reversal in US yields. The pair is still holding above 149.00. Japan has several economic data releases scheduled for Friday, including the Tokyo Consumer Price Index for September, Unemployment Rate, Industrial Production, and Retail Sales for August.
AUD/USD gained nearly 80 pips on Thursday, recovering from monthly lows and moving back above the 20-day Simple Moving Average (SMA). It consolidated around 0.6420. Australia will release Private Sector Credit data.
The Canadian Dollar (CAD) lagged behind on Thursday because of the correction in crude oil prices. USD/CAD essentially remained unchanged near 1.3500 despite the weaker US Dollar. Canada will report July GDP data on Friday.
Analysts at TD Securities on Canada's GDP
We look for GDP to rise by 0.1% in July, unwinding half of June's pullback, with the goods sector leading the rebound. Manufacturing/mining will provide a source of strength, while services should underperform with a muted performance for retail/wholesale trade. New flash estimates should point to another soft (+0.1%) print in August, providing more evidence that higher rates are working to slow demand. We would need a sizeable miss to shake the additional hike priced in for the BoC out of the market.
Gold extended its decline, printing fresh monthly lows at $1,857 before rebounding to the $1,866 area. The recovery can be attributed to the reversal in US yields. Although the yellow metal remains under pressure, the potential for a weaker Dollar and lower yields could support a stabilization.
Like this article? Help us with some feedback by answering this survey:
- The EUR/USD saw gains for Thursday as the DXY recedes.
- Analysts expect further weakness from the Euro moving forward on the end of rate hike cycles.
- Friday to close out the trading week with EU & US key inflation measures.
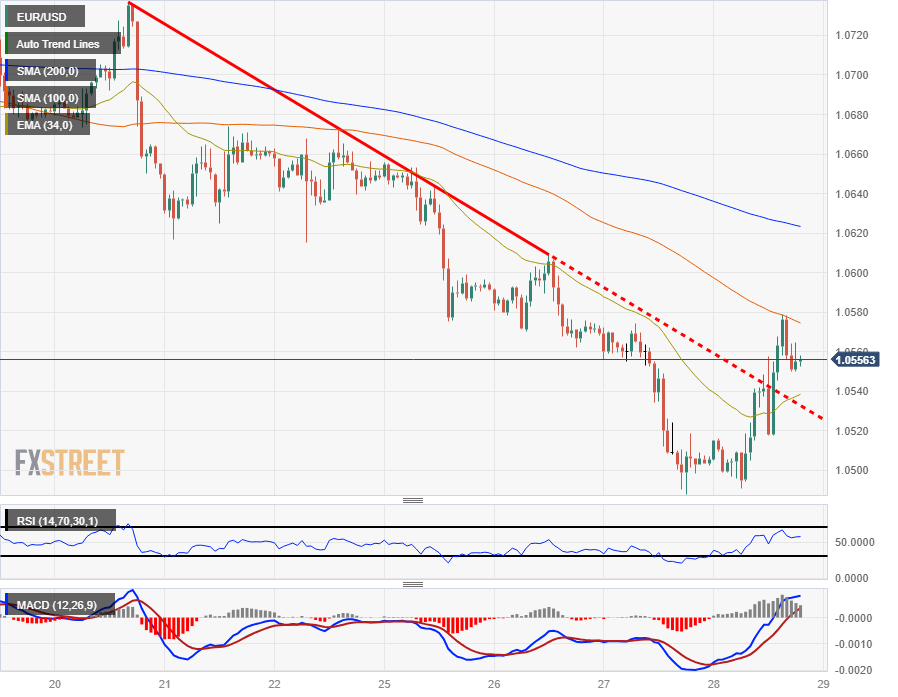
The EUR/USD tapped into an intraday high of 1.0580 on Thursday before settling to close out the US trading session down near 0.10550. The US Dollar (USD) has gained across the board with the US Dollar Index (DXY) catching a broad-market lift as risk appetite sours on weakening economic data, spiking Treasury yields, and recession concerns.
Investors are gearing up for a full data docket on Friday, with European Consumer Price Index (CPI) figures kicking things off.
European inflation is expected to decline moderately. with the annualized CPI reading for September forecast to tick down from 5.3% to 4.8%.
Market forecasters are expecting a half-percent cut in the rate of price growth for Europe as the continental economy wobbles, with a dovish European Central Bank (ECB) looking entirely set to start looking for rate cuts if the economy continues to sour.
Friday will also see US Personal Consumption Expenditure (PCE) Price Index numbers. US PCE inflation is forecast to hold steady for the month of August at 0.2%, while the annualized figure for the same period is seen ticking lower from 4.2% to 3.9%.
Analysts broadly expect both EU and US inflation readings to step lower, but the weak-side bet goes to Europe as price growth is expected to slump noticeably in the coming months.
Read More:
The Pound and Euro should weaken substantially through early 2024 – Wells Fargo
EUR/USD Price Analysis: A drop to the YTD low appears on the table
Eurozone HICP Preview: Forecasts from five major banks, overall inflation-slowing trend
EUR/USD technical outlook
The EUR/USD is testing around 1.0555 after taking a downside rebound from the 100-hour Simple Moving Average (SMA) near 1.0580 in mid-Thursday trading. Hourly candles have broken to the upside of a descending intraday trendline from last week's swing high near 1.0730.
Technical resistance comes from the 200-hour SMA near 1.0620, while near-term price action will see support from the 34-hour Exponential Moving Average (EMA) near 1.0540.
On the daily candlesticks, the EUR/USD is desperate for a green day after closing flat or in the red for the past seven straight trading sessions, and price action still remains firmly bearish with upside momentum capped by a descending trendline from July's peak near 1.1275.
The EUR/USD daily candles have accelerated away from the 200-day SMA, which is turning bearish from just north of the 1.0800 handle.
EUR/USD hourly chart
EUR/USD daily chart
EUR/USD technical levels
- USD/CHF retreats to around 0.9150 after reaching a new cycle high at 0.9225.
- To resume the uptrend, the pair must rally past 0.9225, allowing buyers to challenge the year-to-date highs at 0.9440.
- If USD/CHF fails to reclaim 0.9200, a drop towards 0.9100 is likely, with the 200-hour moving average eyed at 0.9071.
USD/CHF reverses its direction after rallying for 16 straight days, though the pair loses steam as technical indicators signal the major is overbought. Hence, the USD/CHF is trading at around 0.9150s, down 0.57%.
The uptrend remains intact, as shown by the daily chart, as the USD/CHF reached a new cycle high at 0.9225 and broke above the 200-day moving average (DMA) at 0.9029. However, to resume its uptrend, the major must rally past the former, so buyers can challenge the year-to-date (YTD) highs at 0.9440. A breach of the latter can open the door for parity.
In short, the USD/CHF hourly chart portrays the break of market structure on the downside. After hitting a multi-month high, the major retraced below 0.9200, extending its losses past the 50-hour moving average (HMA) at 0.9182. That exacerbated a fall below the 61.8% Fibonacci retracement, though lately buyers stepped in, and lifted the spot price above 0.9159. If the USD/CHF reclaims 0.9200, a test of September’s high at 0.9225 is on the cards. Otherwise, expect a drop towards 0.9100, followed by the 200-HMA at 0.9071.
USD/CHF Price Action – Hourly chart

USD/CHF Key Technical Levels
- The Kiwi is facing upside momentum, climbing nearly a percent against the Greenback for Thursday.
- Ongoing market unease over China property woes is capping upside potential for the NZD.
- A broad-market DXY selloff sees the NZD/USD up around 50 pips for the day.
The NZD/USD has ticked about five basis points higher through Thursday's market trading, driven by a receding Greenback (USD). Ongoing economic concerns and spiking US Treasury yields has seen the USD bolstered across the broader market this week, but Thursday sees a step back in US Dollar action, giving the Kiwi (NZD) a brief reprieve and recovering some recent losses.
China's ongoing property debacle continues to sap confidence in the Asia sector currencies. Evergrande, the world's single most indebted property developer, had its chairman Hui Ka Yan placed under police watch this week as funding and liquidity concerns grip China's real estate sector. China's real estate and property development segment has reached such an outsized proportion of China's domestic economy that increased instability in construction could threaten the rest of the economy.
Next Up: US PCE inflation reading to close out the week
There is little of note on the economic calendar for the Kiwi, and market participants will be looking ahead to the US Personal Consumption Expenditure (PCE) Price Index figures due on Friday at 12:30 GMT.
The US PCE inflation reading is forecast to hold steady for the month of August at the previous print of 0.2%, with the annualized figure for the same period seen tipping back from 4.2% to 3.9%.
A beat on the Federal Reserve's (Fed) favorite inflation indicator could see the USD spike further on the charts, as higher-than-expected inflation will be increasingly likely to push the Fed into holding higher interest rates for even longer than anticipated.
NZD/USD technical outlook
The Kiwi is currently capped under the 0.5970 handle after reaching an intraday high of 0.5975. The NZD/USD has broken to the north side of a minor descending trendline on hourly candles, and near-term support is baked in at the 200-hour Simple Moving Average (SMA) near 0.5940.
On daily candlesticks, the NZD/USD is pinned to the 34-day Exponential Moving Average, and the pair is pricing in a floor from the 0.5900 major handle. Long-term moving averages are rolling over bearish, and the 200-day SMA is settling to the low side of 0.6200.
Bidders will first have to crack the 34-day EMA and the 0.600 major psychological level before moving higher, while a resurgence of downside pressure will see the pair set to take a new run at ten-month lows below 0.5845.
NZD/USD hourly chart

NZD/USD daily chart

NZD/USD technical levels
- Loonie is tracking crude barrel prices, USD closely.
- Canada GDP is expected to see sluggish growth.
- Canadian inflation remains sticky, keeping the BoC on its toes.
The Canadian Dollar (CAD) is seeing minor gains against the US Dollar (USD) on Thursday as the Greenback eases off from recent gains. With Oil barrel prices also taking a quick breather, and crude Canada’s main export, the CAD is seeing limited momentum. The USD/CAD is largely flat for Thursday, down a scant 0.2% at its lowest point as the pair threatens consolidation near 1.3500.
Canada's economic data remains thin on the calendar, with Friday’s Gross Domestic Product (GDP) figures closing out an otherwise data-empty trading week. Canadian GDP for the month of July is forecast to print a meager 0.1% versus the previous month’s -0.2%. Oil prices and the broad-market US Dollar Index (DXY) are set to remain the CAD’s main drivers on the charts.
Daily Digest Market Movers: Canadian Dollar twisting into the middle
- The CAD gained nearly 2.3% against the USD in September, bolstered by scorching Oil prices.
- The USD/CAD is currently down 1.5%, with surging DXY winning the head-to-head battle with crude barrel prices in the near term.
- Canadian GDP is seen struggling to firm up growth as stubborn inflation remains.
- Bank of Canada (BoC) officials have been routinely hitting the wires trying to jawbone inflation lower with threats of higher interest rates.
- The BoC’s Governor Macklem and Deputy Governor Kozicki have made appearances, reiterating calls for rates to remain higher for longer as inflation still remains too high.
- Canada was the world’s second-largest oil exporter in Dollar-adjusted terms, exporting over $120 billion USD of crude in 2022, nearly 9% of the entire global oil export market.
- One of the top oil exporting countries globally, the Loonie sees a majority of its momentum dictated by barrel prices.
Technical Analysis: Canadian Dollar
The Canadian Dollar (CAD) has gained against the US Dollar (USD) from September’s peak in the USD/CAD near 1.3695, and is set to close out the month near where it started at 1.3500, if directional momentum remains elusive heading into the final days of September’s trading.
The USD/CAD is currently pinned to the 34-day Exponential Moving Average (EMA) at the 1.3500 handle, with near-term support from the 200-day Simple Moving Average near 1.3450. A floor is priced in from the last swing low into 1.3380, while 1.3650 remains a significant technical resistance barrier that has rejected price action multiple times this year.
Canadian Dollar FAQs
What key factors drive the Canadian Dollar?
The key factors driving the Canadian Dollar (CAD) are the level of interest rates set by the Bank of Canada (BoC), the price of Oil, Canada’s largest export, the health of its economy, inflation and the Trade Balance, which is the difference between the value of Canada’s exports versus its imports. Other factors include market sentiment – whether investors are taking on more risky assets (risk-on) or seeking safe-havens (risk-off) – with risk-on being CAD-positive. As its largest trading partner, the health of the US economy is also a key factor influencing the Canadian Dollar.
How do the decisions of the Bank of Canada impact the Canadian Dollar?
The Bank of Canada (BoC) has a significant influence on the Canadian Dollar by setting the level of interest rates that banks can lend to one another. This influences the level of interest rates for everyone. The main goal of the BoC is to maintain inflation at 1-3% by adjusting interest rates up or down. Relatively higher interest rates tend to be positive for the CAD. The Bank of Canada can also use quantitative easing and tightening to influence credit conditions, with the former CAD-negative and the latter CAD-positive.
How does the price of Oil impact the Canadian Dollar?
The price of Oil is a key factor impacting the value of the Canadian Dollar. Petroleum is Canada’s biggest export, so Oil price tends to have an immediate impact on the CAD value. Generally, if Oil price rises CAD also goes up, as aggregate demand for the currency increases. The opposite is the case if the price of Oil falls. Higher Oil prices also tend to result in a greater likelihood of a positive Trade Balance, which is also supportive of the CAD.
How does inflation data impact the value of the Canadian Dollar?
While inflation had always traditionally been thought of as a negative factor for a currency since it lowers the value of money, the opposite has actually been the case in modern times with the relaxation of cross-border capital controls. Higher inflation tends to lead central banks to put up interest rates which attracts more capital inflows from global investors seeking a lucrative place to keep their money. This increases demand for the local currency, which in Canada’s case is the Canadian Dollar.
How does economic data influence the value of the Canadian Dollar?
Macroeconomic data releases gauge the health of the economy and can have an impact on the Canadian Dollar. Indicators such as GDP, Manufacturing and Services PMIs, employment, and consumer sentiment surveys can all influence the direction of the CAD. A strong economy is good for the Canadian Dollar. Not only does it attract more foreign investment but it may encourage the Bank of Canada to put up interest rates, leading to a stronger currency. If economic data is weak, however, the CAD is likely to fall.
- WTI dips 1.30% to $92.45, retracting from a 12-month high of $94.99, as traders speculate on profit-booking and the potential economic impact of rate hikes.
- US economy exhibits resilience with a 2.1% growth in Q2 and an anticipated 4.9% GDP growth in Q3, amidst decelerating inflation.
- A possible US government shutdown looms, adding uncertainty to the markets, as Republicans and Democrats debate the 2024 Federal Government budget.
West Texas Intermediate (WTI), the US crude oil benchmark, retreats after rising to a new 12-month high on Thursday at $94.99 on speculations that traders book profits. That alongside worries that high-interest rates would weigh on global economies, dented Oil’s demand. WTI is trading at $92.45, losses 1.30%.
West Texas Intermediate faces a setback amid profit-booking speculations and concerns over high-interest rates impacting global economies, despite positive US economic data
Market sentiment improved, as seen by US equities trading in positive territory. The latest data from the United States (US) showed the economy grew steadily by 2.1% in the second quarter of 2023, while inflation decelerated. Also, growth estimates for the third quarter Gross Domestic Product (GDP) stand at 4.9%.
However, the story could be different if the US faces a shutdown, as Republicans and Democrats discuss the Federal Government budget for 2024, threatening to halt the government’s function if the bill hasn’t passed past Saturday night.
Most Federal Reserve officials remained hawkish during the week, with some taking a more neutral approach. Market participants are eyeing Fed’s Chair Jerome Powell's speech, later at 20:00 GMT.
Data-wise the latest US crude oil inventories fell by 2.2 million barrels last week, to their lowest level since July 2022, announced the US Energy Information Administration (EIA) office.
US crude draws followed cuts by Saudi Arabia and Russia, of 1.3 million combined, as the Organization of Petroleum Exporting Countries (OPEC) brings demand and supply into balance.
WTI Price Analysis: Technical outlook
After registering gains of more than 22% from August 24 lows toward the year-to-date (YTD) high of $94.99, WTI’s pullback was necessary. The Relative Strength Index (RSI) is exiting overbought conditions, aiming lower, while oil is expected to remain trading above $90.00 per barrel, though it’s currently testing the September 19 daily high of $92.63. A breach of the latter would expose the $90.00 mark, while an upward resumption and prices might challenge the psychological $95.00 level.
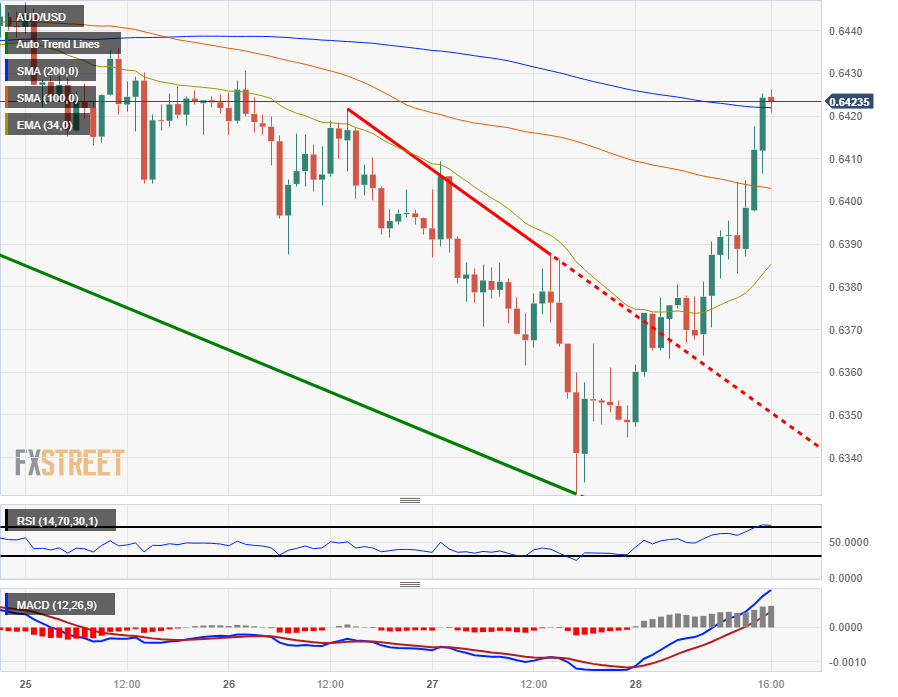
- The AUD/USD has rebounded from recent lows, pushed higher by a retreating US Dollar.
- Australian economic data remains on the weak side, but broader market flows are determining direction.
- Markets are looking ahead to US PCE inflation figures on Friday.
The AUD/USD has caught a much-needed bounce from near-term lows around 0.6340, and the pair is up over 1% after reclaiming the 0.6400 handle in Thursday trading. The Aussie-Dollar pairing is currently taking a breather and marking in territory near 0.6420.
Australian Retail Sales came in below expectations early Thursday, printing at a seasonally-adjusted 0.2% for the month of August. The previous reading saw 0.5%, and the actual headline figure failed to meet market forecasts of 0.3%.
US data came in mixed on Thursday, with Gross Domestic Product (GDP) hitting the middle at expectations.
US GDP for the second quarter printed as-expected at 2.1% over the previous quarter; Initial Jobless Claims improved slightly, from 202K to 204K.
The downside came from US Pending Home Sales for August, which clocked in an abysmal -7.1%, far below the forecast -0.8% and a complete reversal from the previous print of 0.9%.
All that's left on the economic calendar data docket for the US Dollar is Friday's Personal Consumption Expenditure (PCE) Price Index. August's PCE is forecast to hold steady at 0.2%.
AUD/USD technical outlook
The Aussie broke loose from recent intraday bearish action, jumping up a full percentage point to ping against the 200-hour Simple Moving Average near 0.6420.
Near-term technical resistance sits at the last swing high last week near 0.6460, and bidders will be looking to catch support from the 100-hour SMA currently drifting into the 0.6400 handle.
The overall trend still remains firmly bearish, and the AUD/USD remains well off recent highs on the daily candlesticks. Price action will see resistance from the 34-day Exponential Moving Average (EMA) just north of 0.6450, while downside momentum will see a support zone baked in at recent swing lows between 0.6400 and 0.6350.
AUD/USD hourly chart
AUD/USD daily chart
AUD/USD technical levels
- The Mexican Peso recovers some ground despite a risk-off impulse, with traders eyeing Banxico’s decision.
- The economy in Mexico remains resilient, though the recent economic budget for 2024 could undermine the MXN.
- Nearshoring and interest rate differentials between Mexico and the US, favors USD/MXN downside.
The Mexican Peso (MXN) is recovering early in the North American session after losing nearly 3.50% in the week due to risk aversion and the Federal Reserve's (Fed) hawkish rhetoric, as most officials expect another rate hike for 2023. The emerging market currency hit a four-month low at 17.8161 against the Greenback (USD) on Wednesday. Still, the looming central Bank of Mexico (Banxico) decision boosted Mexico’s currency, a headwind for the USD/MXN pair.
The latest economic data revealed the Mexican economy remains robust, benefiting from nearshoring opportunities after the COVID-19 pandemic. It should be said the country’s inflation remains “stable” thought in the upper band of Banxico's goal of 3% plus or minus 1%, at around 4.64% YoY in August. Nevertheless, the recent economic budget for 2024 raises analysts' eyebrows, as it projects an increase in the deficit to 4.9%. Speculations grow around the Mexican central bank's opinion and measures to consider the proposed budget.
Daily Digest Market Movers: Mexican Peso halts its slide on US Dollar correction
- The Mexican Peso recovered some ground after depreciating to levels last seen in late May 2023 and approached the 200-day Simple Moving Average (SMA) at 17.88411 on risk aversion.
- The Bank of Mexico is expected to keep its monetary policy restrictive and hold rates unchanged at 11.25%.
- September’s first-half inflation report in Mexico was 4.44%, down from 4.64% in August, according to the National Statistics Agency, INEGI.
- Being an emerging market currency, the Mexican Peso weakens on risk aversion. Therefore, news emerging of a possible US government shutdown triggered a flow toward safe-haven assets, weakening the Mexican Peso.
- The drop in Oil prices weakens the Mexican currency, as its economy relies on crude exports.
- Moody’s rating agency warned the fiscal strategy of the Mexican government in 2024 must be credible after the June elections in defining the country’s stable outlook.
- In July, Moody lowered Mexico's rating to “Baa2” with a “stable” outlook but warned of fiscal pressures for the next government due to the 2024 economic budget.
- US Treasury bond yields jumped after September’s Federal Reserve Open Market Committee (FOMC) decision to hold rates unchanged. However, the dot plots above 5% in 2024 confirmed the Federal Reserve’s higher-for-longer mantra.
- Recent US Dollar strength weighed on the Mexican currency after printing multi-month highs.
Technical Analysis: Mexican Peso
The Mexican Peso found its foot after depreciating to 17.8161 versus the US Dollar, near the 200-day Simple Moving Average (SMA) at 17.8410, though it is staging a comeback and trimming some of its losses, currently below the 17.6000 area. Nevertheless, further upside is expected after printing a new cycle high, while the 50-day SMA reduces the distance to the 100-day SMA. Near-term, actual price action could be seen as a pullback, as the Relative Strength Index (RSI) aims lower, though the uptrend remains intact.
Interest rates FAQs
What are interest rates?
Interest rates are charged by financial institutions on loans to borrowers and are paid as interest to savers and depositors. They are influenced by base lending rates, which are set by central banks in response to changes in the economy. Central banks normally have a mandate to ensure price stability, which in most cases means targeting a core inflation rate of around 2%.
If inflation falls below target the central bank may cut base lending rates, with a view to stimulating lending and boosting the economy. If inflation rises substantially above 2% it normally results in the central bank raising base lending rates in an attempt to lower inflation.
How do interest rates impact currencies?
Higher interest rates generally help strengthen a country’s currency as they make it a more attractive place for global investors to park their money.
How do interest rates influence the price of Gold?
Higher interest rates overall weigh on the price of Gold because they increase the opportunity cost of holding Gold instead of investing in an interest-bearing asset or placing cash in the bank.
If interest rates are high that usually pushes up the price of the US Dollar (USD), and since Gold is priced in Dollars, this has the effect of lowering the price of Gold.
What is the Fed Funds rate?
The Fed funds rate is the overnight rate at which US banks lend to each other. It is the oft-quoted headline rate set by the Federal Reserve at its FOMC meetings. It is set as a range, for example 4.75%-5.00%, though the upper limit (in that case 5.00%) is the quoted figure.
Market expectations for future Fed funds rate are tracked by the CME FedWatch tool, which shapes how many financial markets behave in anticipation of future Federal Reserve monetary policy decisions.
The Mexican Peso has suffered significant losses in recent days. Economists at Commerzbank analyze USD/MXN outlook.
Support for MXN from Banxico's restrictive monetary policy may have peaked
Although the real interest rate outlook remains attractive for the time being, the support for the Peso from Banxico's restrictive monetary policy may have peaked.
Other issues are likely to come to the fore for the exchange rate: In addition to the US outlook, we think the main one will be the elections due in the summer. In this context, Mexico's persistent structural problems are likely to come to the fore again. The exchange rate developments of recent weeks confirm our view that the depreciation risks for the MXN are slowly increasing.
Economists at Wells Fargo expect further weakness in the major European currencies.
ECB and BoE have signaled that policy rates have likely reached their peak
Sentiment surveys for both economies have softened sharply in recent months, and European underperformance relative to the US should weigh on both currencies.
The European Central Bank and Bank of England have also signaled that policy rates have likely reached their peak, thus lessening interest rate support for their respective currencies.
We see a softer Pound and Euro through early 2024, targeting a low for Cable around 1.1600 and a low for EUR/USD around 1.0200.
- Pending Home Sales in the US declined sharply in August.
- US Dollar Index stays deep in negative territory below 106.30.
Pending Home Sales in the US declined 7.1% in August, the National Association of Realtors reported on Thursday. This reading followed a 0.9% increase recorded in July and came in much worse than the market expectation for a decrease of 0.8%.
On a yearly basis, Pending Home Sales fell 18.3%.
Commenting on the data, "mortgage rates have been rising above 7% since August, which has diminished the pool of home buyers," said Lawrence Yun, NAR chief economist.
"Some would-be home buyers are taking a pause and readjusting their expectations about the location and type of home to better fit their budgets," he added.
Market reaction
The US Dollar stays on the back foot after this report. As of writing, the US Dollar Index was down 0.4% on the day at 106.23.
The Fed’s preferred inflation gauge, the Core Personal Consumption Expenditure (PCE), will be released by the US Bureau of Economic Analysis (BEA) on Friday, September 29 at 12:30 GMT and as we get closer to the release time, here are the forecasts of economists and researchers of seven major banks.
Core PCE is expected at 3.9% year-on-year vs. 4.2% in August. On a monthly basis, it is seen steady at 0.2%.
Deutsche Bank
We expect core PCE to hold on to +0.2% MoM gains, which would have the effect of lowering the YoY growth rate by a little over 30 bps (to 3.9%).
ING
We are also aware that the Fed’s favoured measure of inflation, the core PCE deflator, could come in a little higher than the market is forecasting. The core PCE deflator could come in a little higher than the market is forecasting. We look for a 0.3% MoM increase in prices, similar to the CPI report, whereas the consensus is for a more benign 0.2% MoM print.
TDS
We expect core PCE inflation to register a third consecutive 0.2% MoM increase in August; undershooting the core CPI's stronger 0.3% gain. The YoY rate likely also fell to 3.9%, while we expect the key core svcs ex-housing series to slow to 0.2% MoM following July's 0.5% surge.
NBF
The annual core PCE deflator may have progressed 0.5% in August, a result which should translate into a three-tick increase of the 12-month rate to 3.9%.
SocGen
We forecast a more modest decline in US core PCE to 3.9% YoY.
Citi
Elements of 0.28% MoM US core CPI in August but some softer details of PPI data lead Citi Research to forecast a more modest 0.14% MoM increase in core PCE inflation. Core services prices ex-housing, which rose a solid 0.37% MoM in CPI, should rise 0.17% MoM in PCE inflation while goods prices should decline modestly as in CPI. Shelter prices should continue to slow over the coming months, but this will have less of a disinflationary impact on PCE inflation than on CPI. Meanwhile, headline PCE inflation should rise 0.4% MoM due to higher energy prices and rebound modestly to 3.4% YoY.
Wells Fargo
We forecast the PCE deflator increased 0.4% in August, and the core PCE deflator rose 0.2%. This, along with our forecasts for personal income to rise 0.5% and personal spending to rise 0.5% in the month, should bring real disposable income growth back to the black.
- USD/CAD finds buying interest near 1.3500 as the US Dollar attempts to recover and oil price falls.
- Investors await Canada’s GDP and US PCE price index data, which are scheduled for Friday.
- USD/CAD tests the breakout region of the Symmetrical Triangle pattern near 1.3500.
The USD/CAD pair found support after a corrective move to near the psychological support of 1.3500 in the early New York session. The recovery in the Loonie asset is supported by a rebound in the US Dollar and a sharp decline in oil prices.
Earlier, the US Dollar Index (DXY) corrected to near 106.20 as the risk appetite of the market participants improved. While the broader bias in the US Dollar remains upbeat as the US economy is absorbing the consequences of higher interest rates by the Federal Reserve (Fed).
Going forward, the Canadian Dollar will dance to the tune of the monthly Gross Domestic Product (GDP) data for July, which will be published on Friday at 12:30 GMT. As per estimates, the Canadian economy grew by a nominal pace of 0.1%. In June, the GDP data contracted by 0.2%.
USD/CAD tests the breakout region of the Symmetrical Triangle chart pattern formed on a two-hour scale. A breakout of the aforementioned chart pattern results in wider ticks and heavy buying volume. The broader trend is still bearish as the asset is trading below the 200-day Exponential Moving Average (EMA), which trades around 1.3512.
The Relative Strength Index (RSI) (14) trades in the 40.00-60.00 range, which signifies consolidation.
A decisive break above September 21 high at 1.3524 would drive the asset towards September 11 low around 1.3560, followed by the round-level resistance at 1.3600.
In an alternate scenario, a breakdown below September 25 low around 1.3450 would drag the asset toward September 20 low near 1.3400. A further breakdown could expose the asset to six-week low near 1.3356.
USD/CAD two-hour chart
-638315073762594618.png)
Economists at ANZ Bank analyze the correlation between the US yield and Gold and discuss the yellow metal’s outlook.
USD strength is likely to wane in 2024
History suggests Gold returns remain decent during rate hiking cycles and outperform during easing and a lower rate environment.
The negative beta with the US yield weakens during hiking cycles and strengthens during easing cycles.
USD strength is likely to wane in 2024. While we think appreciation in the USD will sustain to year-end, firmer expectations of rate cuts and slowing economic growth momentum will see the USD dropping again next year.
- EUR/USD rebounds from new eight-month lows around 1.0490.
- Further selling pressure should target the YTD low at 1.0481.
EUR/USD manages to regain some pace soon after hitting fresh multi-month lows in the 1.0490 region on Thursday.
The continuation of the downward bias should leave the pair vulnerable to further losses with the immediate target at the 2023 low at 1.0481 (January 6).
While below the key 200-day SMA at 1.0827, the pair is likely to face extra weakness.
EUR/USD daily chart
- Silver price delivers volatile moves near $22.50 as US Dollar attempts recovery.
- Weekly jobless claims increased by 2K to 204K this week but remained below expectations of 215K.
- Silver price forms a Head and Shoulder pattern whose breakdown triggers a bearish reversal.
Silver price (XAG/USD) demonstrates a volatile action near $22.50 after the release of lower-than-anticipated weekly Jobless Claims data for the week ending September 22. The US Department of Labor reported that individuals claiming jobless claims for the first time increased by 2K to 204K from the previous week’s release but remained lower than expectations of 215K.
Meanwhile, the final reading of real Gross Domestic Product (GDP) for the April-June quarter remained in line with the previous estimate and the market expectation of 2.1% on an annualized basis.
The US Dollar Index (DXY) corrects to 106.20 after refreshing a six-month high near 106.80 as profit-booking kicks in. The broader bias for the US Dollar is still bullish as the US economy is resilient due to falling inflation, an upbeat labor market, and robust consumer spending. The 10-year US Treasury yields jump to near 4.65%, showing strength in expectations of one more interest rate hike from the Federal Reserve (Fed).
Minneapolis Federal Reserve Bank President Neel Kashkari said on Wednesday that he is unsure whether the central bank has hiked enough to bring down core inflation to 2%.
For further guidance, investors will focus on the US core Personal Consumption Expenditure (PCE) price Index data for August, which will be published on Friday at 12:30 GMT.
Silver technical analysis
Silver price forms a Head and Shoulder chart pattern on a daily scale, which indicates a prolonged consolidation whose breakdown triggers a bearish reversal. The neckline of the aforementioned chart pattern is plotted from June 23 low at $22.11. The white metal trades below the 20-day Exponential Moving Average (EMA) at $23.15, which indicates that the short-term trend is bearish.
The Relative Strength Index (RSI) (14) slips below 40.00, indicating no signs of divergence and oversold, warranting more downside.
Silver daily chart
-638315056464856305.png)
US-Japanese yield differentials are wider than they were last October when USD/JPY surged above 150. Kit Juckes, Chief Global FX Strategis at Société Générale, analyzes Yen’s outlook and its implications for the AUD/USD pair.
AUD would be a loser if – when – USD/JPY breaks 150
US-Japanese yield differentials, real or nominal, five or ten years, are wider today than they were when USD/JPY spiked briefly above 150, 11 months ago. Only fear of a policy reaction is holding the Yen here. A break would complicate things, adding downward pressure to the Yuan (which the Chinese authorities are resisting vigorously) and the rest of the Asia/Pacific currencies as well. And if the Japanese start intervening in earnest, that will add to upward pressure on US yields too.
USD/JPY will probably break 150 in October and the next week or so.
Today’s small AUD bounce is unlikely to represent a low. Last October we saw a break below 0.62 shortly after USD/JPY reached 150 and we expect a repeat this year.
- DXY comes under pressure after printing new YTD tops.
- Extra gains target the 107.00 hurdle and beyond.
DXY faces some downside pressure and abandons the area of 2023 highs in the 106.80/85 band on Thursday.
Despite the ongoing technical correction, extra gains appear likely for the time being. The surpass of the year high could encourage the index to challenge the weekly top at 107.19 (November 30, 2022) prior to another weekly peak at 107.99 (November 21 2022).
In the meantime, while above the key 200-day SMA, today at 103.08, the outlook for the index is expected to remain constructive.
DXY daily chart
The Federal Reserve (Fed) will return inflation to target and has a chance to do something 'rare' by accomplishing that without a recession, Chicago Fed President Austan Goolsbee said on Thursday, as reported by Reuters.
Key takeaways
"Holding to inevitability that job losses are needed to slow inflation risks a near-term policy error."
"Some analysis shows inflation reaching target soon, without further policy tightening and only a modest slowdown in growth."
"Fed needs to be extra careful of tying policy to historical relationships that may not hold up in the current economy."
"Recent data, with inflation slowing without job losses, have run against past US patterns."
"Long-run inflation expectations are well-anchored, can help lower inflation with less economic pain than previously."
"Importance of expectations and Fed credibility makes proposals to raise the inflation target from 2% quite risky."
"Risks to the outlook include oil prices, slowdown in China, possibility of a protracted US auto strike, or a disruptive government shutdown."
"Housing will be key to continued inflation progress in the next few quarters, with risk that rising home prices could also boost market rents."
"Wages typically lag prices, so short-term movements should not be used to predict inflation."
Market reaction
The US Dollar stays on the back foot following these comments. As of writing, the US Dollar Index was down 0.3% on the day at 106.30.
Eurostat will release the preliminary estimate of Eurozone Harmonised Index of Consumer Prices (HICP) data for September on Friday, September 29 at 09:00 GMT and as we get closer to the release time, here are the expectations forecast by the economists and researchers of five major banks regarding the upcoming EU inflation print.
It appears that inflationary pressures will continue to ease. Headline is expected at 4.5% year-on-year vs. 5.2% in August, while core is expected at 4.8% YoY vs. the prior release of 5.3%. If so, headline would decelerate for the fifth straight month to the lowest since October 2021.
Commerzbank
Euro area inflation is expected to have fallen sharply by 0.8 percentage points to 4.4% in September. The core rate, which excludes the volatile prices of energy, food, alcohol and tobacco, is also expected to have fallen from 5.3% to 4.7%. However, half of this is due to the expiry of the three-month €9 ticket in Germany in September 2022. This price increase is now excluded from the YoY comparison. But even without this effect, the trend in the core rate is down.
Deutsche Bank
We expect a 4.6% reading for the headline (5.2% in August) and 4.9% for core (5.3%).
Danske Bank
We expect a decline in headline HICP to 4.4% from 5.3% in August driven by negative energy inflation, lower food prices, and a downtick in core inflation from 5.3% to 4.8%.
SocGen
We expect headline inflation to fall by 0.7pp to 4.5%, due to energy base effects, while core could fall by 0.5pp to 4.7%, with an upside risk of 4.8%.
Citi
Headline and core inflation rates should drop back sharply on base effects (gas spike and German train ticket in Sep-22), to 4.5% and 4.8%, respectively. However, sequential growth is more interesting to gauge price pressures – energy HICP should be up again this month, by 1.3% MoM, and we pencil in another gain of 0.3% (seas adj) for core HICP (0.5% MoM NSA). September is usually a month with a high concentration of price changes, which should allow those sub-sectors still lagging behind in the price adjustment to hike their prices.
Peso’s September correction continues. Economists at ING analyze USD/MXN outlook.
Good Peso buying interest should USD/MXN trade over 18
High US interest rates are proving a headwind to emerging currencies worldwide – even to the mighty Mexican Peso. In addition, the Peso this month is facing the unwind of Banxico's FX intervention book – a front-loaded exercise that we felt could weigh on the MXN this month and perhaps into October, too.
With the Dollar set to stay strong for the next few weeks, USD/MXN could head up to the 200-Day Moving Average at 17.85 or even briefly trade above 18. However, we like the Peso multi-quarter and expect good Peso buying interest should USD/MXN trade over 18.
- US Initial Jobless Claims in the US advanced by 2,000 in the week ending September 23.
- Continuing Claims declined/increased by 12,000 in the week ending September 16.
- US Dollar Index remains in negative territory below 106.30.
Initial Jobless Claims totaled 204,000 in the week ending September 23, the weekly data published by the US Department of Labor (DOL) showed on Thursday. It is the second-lowest reading since late January. This follows the previous week's print of 202,000 (revised from 201,000) and came below the market expectation of 215,000. "The 4-week moving average was 211,000, a decrease of 6,250 from the previous week's revised average"; the DOL revealed.
Continuing claims decreased by 12,000 in the week ending September 16 to 1.670 million, below market expectations of 1.675 million.
Market reaction
The US Dollar Index printed fresh daily lows under 106.30 after the release of US data that included a new estimate of Q2 GDP growth.
- The US economy grew at an annual rate of 2.1% in Q2 as expected.
- The US Dollar Index stays in negative territory below 106.50.
The real Gross Domestic Product (GDP) of the United States expanded at an annual rate of 2.1% in the second quarter, the US Bureau of Economic Analysis' (BEA) final estimate showed on Thursday. This reading came in line with the previous estimate and the market expectation.
"The update primarily reflected a downward revision to consumer spending that was partly offset by upward revisions to nonresidential fixed investment, exports, and inventory investment," the BEA said.
"Imports, which are a subtraction in the calculation of GDP, were revised down," the publication read.
Market reaction
The US Dollar stays on the back foot after this data. As of writing, the US Dollar Index was down 0.4% on the day at 106.24.
- EUR/JPY extended upside near 157.50 as German HICP remained softer than expectations.
- German HICP expanded at a slower pace despite rising energy prices.
- The odds for BoJ’s intervention are high as Kazuo Ueda conveyed it is premature to ditch easy monetary policy.
The EUR/JPY pair stretched upside to near 157.50 in the late European session. The asset rallies as the preliminary German Harmonized Index of Consumer Price (HICP) report for September remained softer than expectations.
Monthly HICP expanded at a slower pace of 0.2% against expectations of 0.3% and August’s reading of 0.4%. On an annualized basis, the headline HICP softened to 4.3% vs. the estimates of 4.5% and the former release of 6.4%. Inflation in the German economy decelerated despite rising energy prices. This indicates that households’ demand is weakening as inflation bites real income.
In spite of inflation softening in Germany, the odds for one more interest rate hike from the European Central Bank (ECB) remain intact. ECB President Christine Lagarde said this week that despite progress on inflation it is seen too high for too long as the labor market has so far remained resilient. She made it very clear that interest rates will remain sufficiently restrictive for long enough till inflation comes down to near 2%.
For further guidance, investors will focus on the Eurozone HICP data, which will be published on Friday at 09:00 GMT.
On the Japanese Yen front, expectations for a stealth intervention by the Bank of Japan (BoJ) in the FX domain due to excessive currency volatility have deepened. The Japanese Yen has dropped to near 150.00 against the US Dollar. The odds for BoJ’s stealth intervention are high as Governor Kazuo Ueda conveyed that it is premature to ditch expansionary monetary policy as inflation needs to stabilize above the 2% target.
A decent move lower in the USD broadly greets traders today. Economists at Scotiabank analyze Greenback’s outlook.
Month-end in focus
Passive rebalancing for month and quarter-end may be checking the USD advance.
There is little more coverage on the screens of the USD’s broader advance looking stretched and some major currencies slipping deeper into undervaluation versus the USD but this has been a factor for a while and the USD is not relenting.
High absolute and relative yields and firm Oil prices remain broadly USD supportive and while we have a down session for the USD today, it will take a lot more to signal any sort of correction or sustained weakness in the USD at this point.
DXY gains might still extend towards 107/109.
EUR/USD has tested sub-1.05 levels twice in the past few hours. Economists at Scotiabank analyze the pair’s outlook.
Headwinds remain
A minor low/reversal may have been reached in the short run after the EUR tested the upper 1.04 area twice since Wednesday. A minor double bottom is in play but upside may be limited to the 1.0550/1.0600 area.
The Euro does appear to be deeply oversold in the short run at least but the pair will need to regain 1.06+ to suggest a more sustained rebound is unfolding.
Support is 1.0475/1.0480.
Loonie is underperforming but that essentially means no movement in USD/CAD around the 1.35 level. Shaun Osborne, Chief FX Strategist at Scotiabank, analyzes the pair’s outlook.
USD/CAD remains in consolidation mode
Technically, USD/CAD remains in consolidation mode; gains extended a little more than I had expected on Wednesday but price action still appears to be consolidating (bear wedge/flag pattern) after the mid-September slide in the USD.
Weakness below short-term support at 1.3490 should see the USD give up a little more ground to low/mid-1.34s.
Resistance is 1.3540/1.3550.
GBP/USD is putting in a solid session – by recent standards – so far today. Economists at Scotiabank analyze the pair’s outlook.
Cable looks heavily oversold in the short run
The GBP/USD pair looks heavily oversold in the short run and intraday price signals are bullish which may point to gains extending to the mid/upper 1.22s.
Cable would need to surpass the 1.2350 mark to show more meaningful technical strength.
Support is seen at 1.2100/1.2110.
See: GBP/USD remains vulnerable to the 1.20/1.21 area – ING
- The US Dollar keeps squeezing markets with new highs.
- All eyes on US GDP numbers on Thursday.
- The US Dollar Index reaches a new 10-month high above 106.75.
The US Dollar (USD) is on track to lock in an eleventh consecutive week of gains as the interest-rate differential between the US and other countries gets bigger by the day. This differential keeps backing the US Dollar as it does the flight to safe havens, where the Greenback is the place to be. King Dollar’s rally hasn’t likely finished and might head toward the 52-week high when measured by the DXY US Dollar Index.
Investors' eyes are on the final estimate of US Gross Domestic Product numbers for Q2, due at 12:30 GMT.. Although the number is of big importance, analysts do not expect any market-moving reaction, as it is the third reading for the second quarter. Rather keep an eye on the usual weekly Initial Jobless Claims, which might be the devil in the detail.
Daily digest: US Dollar racks in piles of money
- Two big data points hit the markets at 12:30 GMT. The US Gross Domestic Product (GDP) annualised growth rate for the second quarter is expected at 2.1%, while the Price Index is set to remain unrevised at 2%. Core Personal Consumption Expenditures is seen growing at 3.7%. Bear in mind that this is the third reading, so big moves aren’t expected even as the GDP basket is facing its five-year reshuffling.
- The second big data point are the Jobless Claims: Initial claims are expected to head from 201,000 to 215,000. The Continuing Claims are seen heading from 1,662,000 to 1,675,000.
- Around 13:00 GMT, markets expect to hear comments from Austan D. Goolsbee, the president of the Federal Reserve Bank of Chicago.
- At 14:00 GMT, Pending Homes Sales data will come out. The monthly reading is expected to fall 0.8%, swinging from a 0.9% increase a month earlier..
- The Kansas City Fed Manufacturing Activity Index for September is expected to come in at 15:00 GMT. Previous was at -12.
- A big slew of US Federal Reserve (Fed) speakers are set to speak. Fed Board Governor Lisa D. Cook will speak at around 17:00 GMT, Richmond Fed President Thomas Barkin will do so at 19:00 and, lastly, Fed Chairman Jerome Powell will speak at 20:00 GMT.
- Equities are dropping again with Asian markets registering falls of more than 1%. European and US equities are mildly in the red.
- The CME Group FedWatch Tool shows that markets are pricing in an 80.4 % chance that the Federal Reserve will keep interest rates unchanged at its meeting in November.
- The benchmark 10-year US Treasury yield traded as high as 4.62% and takes a small step back from Monday’s peak as investors start to buy safe bonds as a shield for any possible US government shutdown.
US Dollar Index technical analysis: 107.00 as target this week
The US Dollar looks to be on a mission this week, surprising friends and foes with yet again a firm winning streak. Another weekly gain is almost locked in, making it an eleven straight week of gains for the US Dollar. With the US Dollar Index (DXY) breaking above 106.00, traders are eyeballing 107.00 next.
The US Dollar Index opened around 106.50, though the overheated RSI might make it difficult to maintain this level. Traders that want to hit a new 52-week high need to be aware that a lot of road needs to be covered towards 114.78. Rather look for 107.19, the high of November 30, 2022, as the next profit target on the upside.
On the downside, the recent resistance at 105.88 should be seen as first support. Still, it has just been broken to the upside, so it isn’t likely to be a strong barrier. Rather look for 105.12 to do the trick and keep the DXY above 105.00.
US Dollar FAQs
What is the US Dollar?
The US Dollar (USD) is the official currency of the United States of America, and the ‘de facto’ currency of a significant number of other countries where it is found in circulation alongside local notes. It is the most heavily traded currency in the world, accounting for over 88% of all global foreign exchange turnover, or an average of $6.6 trillion in transactions per day, according to data from 2022.
Following the second world war, the USD took over from the British Pound as the world’s reserve currency. For most of its history, the US Dollar was backed by Gold, until the Bretton Woods Agreement in 1971 when the Gold Standard went away.
How do the decisions of the Federal Reserve impact the US Dollar?
The most important single factor impacting on the value of the US Dollar is monetary policy, which is shaped by the Federal Reserve (Fed). The Fed has two mandates: to achieve price stability (control inflation) and foster full employment. Its primary tool to achieve these two goals is by adjusting interest rates.
When prices are rising too quickly and inflation is above the Fed’s 2% target, the Fed will raise rates, which helps the USD value. When inflation falls below 2% or the Unemployment Rate is too high, the Fed may lower interest rates, which weighs on the Greenback.
What is Quantitative Easing and how does it influence the US Dollar?
In extreme situations, the Federal Reserve can also print more Dollars and enact quantitative easing (QE). QE is the process by which the Fed substantially increases the flow of credit in a stuck financial system.
It is a non-standard policy measure used when credit has dried up because banks will not lend to each other (out of the fear of counterparty default). It is a last resort when simply lowering interest rates is unlikely to achieve the necessary result. It was the Fed’s weapon of choice to combat the credit crunch that occurred during the Great Financial Crisis in 2008. It involves the Fed printing more Dollars and using them to buy US government bonds predominantly from financial institutions. QE usually leads to a weaker US Dollar.
What is Quantitative Tightening and how does it influence the US Dollar?
Quantitative tightening (QT) is the reverse process whereby the Federal Reserve stops buying bonds from financial institutions and does not reinvest the principal from the bonds it holds maturing in new purchases. It is usually positive for the US Dollar.
EUR/USD traded below 1.05 for the first time since January. Economists at Rabobank analyze the pair’s outlook.
EUR/USD could remain lower for longer into 2024
The USD is likely to remain well supported until the market has the confidence to move back into higher risk assets. In our view, this suggests that the USD is set to find support on safe-haven demand even as the US economy slows. As a result, EUR/USD could remain lower for longer.
Our forecasts for the Eurozone indicate technical recession for H2 and a slow recovery next year. The backdrop suggests scope for further downside pressure for the EUR. On the margin, rising concerns about the fiscal pledges of Italy’s right-wing government could also become a EUR negative factor since this has the potential to create tensions with Brussels going forward.
Having breached our former 1.06 target, we have revised our forecasts lower and now expect EUR/USD to move to 1.02 on a three-month view and remain lower for longer into 2024.
AUD/USD finally attracts buyers after 2.7% swoon since last week. Economists at Société Générale analyze the pair’s outlook.
Support 0.6310, Resistance 0.6440
AUD/USD has failed to overcome the hurdle of 0.6525 representing high of late August and the 50-DMA. It is attempting a break below recent consolidation zone denoting a regain of downward momentum.
Inability to cross above 0.6440, the 61.8% retracement of recent dip could mean persistence in decline.
Next potential objectives are located at 0.6310, the trend line connecting lows of March and May and projections near 0.6200/0.6170.
Strategists at ANZ Bank analyze Copper’s outlook.
Upward pressure on prices remains in place
Copper demand is likely to grow by nearly 4% this year, which will keep the market marginally undersupplied.
With inventories sitting near multi-year lows, upward pressure on prices remains in place.
We expect Copper to trade near the $9,000 level by the end of this year.
See:
- Gold Price Forecast: XAU/USD to trade near $2,000 by year-end – ANZ
-
Gold Price Forecast: Positive real US yields reduce the attractiveness of XAU/USD – Erste
- Natural Gas pops higher towards $3.
- The US Dollar looks set for an eleventh straight week of gains.
- US Natural Gas prices are in an ascending trendline formation and could break to $3.3.
Natural Gas prices are trending higher despite Oil attracting all the attention in the energy market. Gas prices are soaring on more negative news out of Norway, raising concerns over gas supply from the Scandinavian bloc to Europe. Mounting supply problems could leave the old continent on balance of falling short of gas to fill up its reserves full ahead of the winter season.
The US Dollar (USD) is on track to lock in an eleventh consecutive week of gains as the interest-rate differential between the US and other countries gets bigger by the day. This differential keeps backing the US Dollar as it does the flight to safe havens, where the Greenback is the place to be. King Dollar’s rally hasn’t likely finished and might head toward the 52-week high when measured by the DXY US Dollar Index.
Natural Gas is trading at $2.99 per MMBtu at the time of writing.
Natural Gas news and market movers
- The Norwegian Asgard field is having unforeseen capacity reductions due to a delayed ramp up after maintenance, network manager Gassco AS said Thursday.
- Also in Norway, the works at the Kvitebjorn field are extended to October 1.
- The Norwegian Oseberg field and the Emden terminal are as well signalling issues and delays in reopening by another three days until after October 1.
- Contracts for September are rolling off on Thursday. Looking back at their performance, the September contracts have moved up 15% in value, with a 4.2% gain solely on Wednesday.
- With October set to get underway, the first big drawdowns from European gas storages might start.
- All eyes are on the weekly Energy Information Administration (EIA) publication of US gas storage changes. Expectations are for another build from 64 billion to 88 billion cubic feet.
Natural Gas Technical Analysis: Seasonal pop
Natural Gas is grinding higher at the moment when bigger brother Oil is hijacking all the headlines. The surprise delays and cuts in gas supply from Norway to Europe disrupts the supply side briefly, which grants an upside move. On the technical front, the current bullish triangle is an element to watch as a breakout might see Natural Gas trading near $3.3 soon.
Awaiting the breakout of the triangle, $3 remains a key level that needs to be broken. Seeing the current equilibrium, a catalyst is needed to move the needle upwards. Gas prices could rally to $3.25 in a bullish triangle breakout, testing the upper band of the ascending trend channel.
On the downside, the ascending trendline at $2.90 should support any attempts to break lower. The 200-day Simple Moving Average (SMA) at $2.80 could act as a circuit breaker in case there is a nosedive move. Should that give way, some area will be crossed before the next support kicks in at $2.75. This level aligns with the 55-day SMA, which is likely to step in to avoid any price crashes in the commodity.
-638314926457806390.png)
XNG/USD (Daily Chart)
Natural Gas FAQs
What fundamental factors drive the price of Natural Gas?
Supply and demand dynamics are a key factor influencing Natural Gas prices, and are themselves influenced by global economic growth, industrial activity, population growth, production levels, and inventories. The weather impacts Natural Gas prices because more Gas is used during cold winters and hot summers for heating and cooling. Competition from other energy sources impacts prices as consumers may switch to cheaper sources. Geopolitical events are factors as exemplified by the war in Ukraine. Government policies relating to extraction, transportation, and environmental issues also impact prices.
What are the main macroeconomic releases that impact on Natural Gas Prices?
The main economic release influencing Natural Gas prices is the weekly inventory bulletin from the Energy Information Administration (EIA), a US government agency that produces US gas market data. The EIA Gas bulletin usually comes out on Thursday at 14:30 GMT, a day after the EIA publishes its weekly Oil bulletin. Economic data from large consumers of Natural Gas can impact supply and demand, the largest of which include China, Germany and Japan. Natural Gas is primarily priced and traded in US Dollars, thus economic releases impacting the US Dollar are also factors.
How does the US Dollar influence Natural Gas prices?
The US Dollar is the world’s reserve currency and most commodities, including Natural Gas are priced and traded on international markets in US Dollars. As such, the value of the US Dollar is a factor in the price of Natural Gas, because if the Dollar strengthens it means less Dollars are required to buy the same volume of Gas (the price falls), and vice versa if USD strengthens.
Since mid-July, AUD/USD has weakened significantly. Economists at Commerzbank analyze the pair’s outlook.
The main focus of the RBA is inflation
The data currently paints a picture of a fairly resilient economy that is still surprisingly able to withstand interest rate increases. Ultimately, the still-strong economic indicators suggest that the risks to the RBA's monetary policy are tilted towards a tighter stance.
The market is currently undecided whether there will be another rate hike this year. The best time for this would probably be at the November meeting, as the new quarterly inflation figures will be published shortly before. If these surprise to the upside, indicating that underlying inflationary pressures remain strong, there is a chance that the RBA will react and hike again.
However, it is likely to focus on ‘higher for longer’ for now – supported by the strong economy. In our view, this should support the Aussie in the coming months.
- USD/JPY fails to recapture 150.00 for now as profit-booking hits US Dollar, more upside seems favored.
- Broader appeal for the US Dollar is still bullish amid resilient US economy and Fed’s hawkish stance.
- The Japanese Yen may discover strength if BoJ intervenes.
The USD/JPY pair faced nominal sell-off while attempting to recapture the psychological resistance of 150.00 on Thursday. The asset corrects marginally, following footprints of the US Dollar Index (DXY), which faces long liquidation after printing a afresh 10-month high at 106.80.
S&P500 futures generated some gains in the London session, portraying some improvement in the risk-appetite of the market participants. US equities ended on a flat note on Wednesday amid caution about Federal Reserve’s (Fed) interest rate outlook. The US Dollar Index (DXY) corrects gradually to near 106.30 after failing to stretch rally.
Broader appeal for the US Dollar is still bullish as the United States economy is resilient due to declining inflation, stable labor growth and robust consumer spending. Unlike other G7 economies, which are struggling for a firm footing due to their inability in coping with the consequences of higher interest rates by central bankers.
The US economy has been showing excellence on the grounds of labor market, households’ demand, and inflation but its Manufacturing PMI have been contracting consistently from past 10 months. Investors anticipate a recovery in factory activities ahead as order book for core goods surprisingly expanded in August. The Durable Goods Orders rose by 0.2% while investors anticipated a decline by 0.5%. In July, Orders were contracted sharply by 5.6%.
The Japanese Yen may strengthen on the potential intervention of the Bank of Japan (BoJ). Japanese Finance Minister Shunichi Suzuki reiterated on Thursday, he won't rule out any steps to respond if there's any excessive FX volatility. He further added, the authority is closely watching FX moves with sense of urgency.
Senior Economist Alvin Liew and Associate Economist Jester Koh at UOB Group assess the recently published Industrial Production readings in Singapore.
Key Takeaways
Singapore’s Aug IP contracted 12.1% y/y, the weakest y/y reading since Nov 2019 while the contraction in Jul’s IP was revised slightly deeper to -1.1% y/y (prior: -0.9%). The 12.1% y/y contraction in Aug IP was significantly worse than Bloomberg’s consensus of -3.1% and even below our more bearish forecast of 6.5%. On a seasonally adjusted basis, IP contracted 10.5% m/m SA in Aug while the previous month’s expansion was revised to a shallower 3.7% (from 4.1%). Likewise, the Aug m/m SA reading was much weaker than Bloomberg consensus of -1.5% m/m SA and our estimate of -4.4%. In the first 8 months of 2023, IP contracted by 6.6% y/y.
IP Outlook – The latest IP reading reaffirms that the electronics downcycle and more broadly, the trade downcycle has yet to find a bottom. With external demand likely to weaken further amidst an elevated interest rate environment and tighter global financial conditions, we expect the weakness in manufacturing activity to persist for the rest of the year and any signs of recovery will only likely to emerge earliest in 1Q24, in our view. Consequently, we downgrade our 2023 full-year industrial production forecast to -7.0% from our earlier projection of -5.4%. Concurrently, we cut our full year 2023 GDP forecast to 0.4% (prev: 0.7%), slightly below the lower end of the MTI’s official projection of 0.5-1.5% and maintain our 2024 growth forecast at 3.0%, albeit with risks to the downside. We expect Singapore’s 3Q23 GDP advanced estimate reading to be released in the week of 09-13 Oct, concurrently with the Oct Monetary Policy Statement, likely on 13 Oct (Fri).
USD/MXN has likely formed a tactical bottom after returning above 17.70 and failing to retrace below 17.00 last week, economists at Société Générale report.
Recent pivot low at 17.00 is key support
USD/MXN has staged the expected rebound after carving out higher trough near 17.00 earlier this month. It is now challenging the 200-DMA and the trend line drawn since July 2022 at 17.85/18.00. This could be an intermittent hurdle.
A large downside is not envisaged; recent pivot low at 17.00 is key support.
A move beyond 17.85/18.00 could result in an extended up move towards 18.25 and 18.60, the 76.4% retracement from March.
- Gold price faces an intense sell-off as Fed Kashkari said he sees one more interest rate hike this year.
- Strength in the US economy due to tight labor market and strong consumer spending have backed the Fed’s hawkish stance.
- The US Dollar refreshes a six-month high near 106.80 amid global slowdown risks and impending government shutdown.
Gold price (XAU/USD) has been dumped heavily by market participants as Federal Reserve (Fed) policymakers reiterate their hawkish stance on the interest rate outlook. The precious metal continues its three-day losing spell as bets for unchanged interest rates fade amid a resilient US economy. The US Dollar attracts significant bids as strong consumer spending and tight labor market conditions may keep excess inflation persistent.
In August, demand for Durable Goods remained upbeat as business spending on equipment increased. It seems that optimism among US firms is returning as traders see no more interest rate hikes from the Fed this year. For more clues about the inflation outlook, investors await the Fed’s preferred Core Personal Consumption Expenditure (PCE) Price Index data for August, which is scheduled for Friday.
Daily Digest Market Movers: Gold price falls as Fed sees more rate hikes appropriate
- Gold price drops further, printing a fresh six-month low at $1,872.60, as Federal Reserve policymakers continue to support more interest rate hikes ahead.
- Minneapolis Federal Reserve Bank President Neel Kashkari said on Wednesday that he is unsure whether the central bank has hiked enough to bring down core inflation to 2%.
- Kashkari supported one more interest rate hike this year and signaled that the Fed is expected to hold rates steady next year. Kashkari seems cautious that the policy is not restrictive enough due to strong consumer spending coupled with a resilient US economy.
- Robust consumer spending momentum may keep overall demand strong and inflationary pressures intact. This is making the so-called ‘last mile’ of inflation, which needs to be tamed, a hard nut to crack.
- As per the CME Group Fedwatch tool, chances that interest rates will remain steady at 5.25%-5.50% at the November monetary policy meeting have dropped to 77% from 81% earlier. Traders see a 58% chance for interest rates remaining unchanged for the remainder of the year, down from 64% on Wednesday.
- While Gold price is going through a tough phase, the US Dollar and Treasury yields are consistently delivering more gains due to a resilient US economy.
- On Wednesday, the US Durable Goods Orders for August unexpectedly increased. Orders surprisingly rose by 0.2% against expectations of a 0.5% decline. In July, Orders contracted by a sharp 5.6%.
- Business spending on machinery and equipment accelerated as investors expect the Fed is done hiking interest rates. Orders for core goods also rose, indicating persistence in core inflation ahead.
- The US Manufacturing PMI has been contracting for the past 10 months. Still, upbeat order data for equipment has improved the sector’s outlook.
- Apart from the resilient US economy, the US Dollar is capitalizing on global slowdown fears and rising expectations of a government shutdown.
- On Wednesday, Goldman Sachs warned that the likelihood of an impending government shutdown is at 90% and may commence from October 1. The investment banking firm said that another shutdown threat would resurface in the fourth quarter of 2023 even if Congress manages to achieve a temporary funding resolution.
- China’s real-estate sector woes continue, as trading in shares of China Evergrande group was suspended as its chairman is in police custody amid deepening liquidation risks. Apart from that, deflation risks in the world’s second-largest economy are expected to mount further due to the growing jobless rate in the country.
- Going forward, investors will shift focus to the US Core Personal Consumption Expenditure (PCE) Price Index data for August, which will be published on Friday. The Fed’s preferred inflation gauge is seen expanding at a steady pace of 0.2% per month. On an annual basis, inflation is seen decelerating to 3.9% from July’s reading of 4.2%.
Technical Analysis: Gold price forms consecutive bearish Marubozu candle
Gold price forms consecutive bearish Marubozu candlesticks on the daily timeframe. This indicates that each pullback in Gold price has been considered as selling opportunities by market participants. The precious metal stabilizes below the 200-day Exponential Moving Average (EMA), which trades around $1,910.00, indicating that the broader trend has turned bearish. Momentum oscillators shifted into the bearish territory, warranting more weakness ahead.
Fed FAQs
What does the Federal Reserve do, how does it impact the US Dollar?
Monetary policy in the US is shaped by the Federal Reserve (Fed). The Fed has two mandates: to achieve price stability and foster full employment. Its primary tool to achieve these goals is by adjusting interest rates.
When prices are rising too quickly and inflation is above the Fed’s 2% target, it raises interest rates, increasing borrowing costs throughout the economy. This results in a stronger US Dollar (USD) as it makes the US a more attractive place for international investors to park their money.
When inflation falls below 2% or the Unemployment Rate is too high, the Fed may lower interest rates to encourage borrowing, which weighs on the Greenback.
How often does the Fed hold monetary policy meetings?
The Federal Reserve (Fed) holds eight policy meetings a year, where the Federal Open Market Committee (FOMC) assesses economic conditions and makes monetary policy decisions.
The FOMC is attended by twelve Fed officials – the seven members of the Board of Governors, the president of the Federal Reserve Bank of New York, and four of the remaining eleven regional Reserve Bank presidents, who serve one-year terms on a rotating basis.
What is Quantitative Easing (QE) and how does it impact USD?
In extreme situations, the Federal Reserve may resort to a policy named Quantitative Easing (QE). QE is the process by which the Fed substantially increases the flow of credit in a stuck financial system.
It is a non-standard policy measure used during crises or when inflation is extremely low. It was the Fed’s weapon of choice during the Great Financial Crisis in 2008. It involves the Fed printing more Dollars and using them to buy high grade bonds from financial institutions. QE usually weakens the US Dollar.
What is Quantitative Tightening (QT) and how does it impact the US Dollar?
Quantitative tightening (QT) is the reverse process of QE, whereby the Federal Reserve stops buying bonds from financial institutions and does not reinvest the principal from the bonds it holds maturing, to purchase new bonds. It is usually positive for the value of the US Dollar.
UOB Group’s Senior Economist Alvin Liew and Associate Economist Jester Koh review the latest inflation figures in Singapore.
Key Takeaways
Singapore’s headline CPI inflation edged lower to 4.0% y/y (0.9% m/m) in Aug from 4.1% y/y (-0.2% m/m) in Jul, with the y/y print in-line with Bloomberg consensus but lower than UOB’s estimate of 4.3% y/y.
Core inflation (which excludes private transport and accommodation) moderated to 3.4% y/y (0.1% m/m) in Aug, from 3.8% y/y (0.2% m/m) in Jul, with the y/y reading below Bloomberg consensus of 3.5% y/y and UOB’s forecast of 3.6% y/y.
Our Inflation Outlook – We maintain our 2023 headline inflation forecast at 4.7% and core inflation forecast at 4.0%. Excluding the effects of the GST increase, we expect headline inflation to average 3.7% and core inflation to average 3.0% in 2023, both still above the “standard” 2% objective. Risks to inflation remain on the upside given the recent food supply shocks on climate-related events and export restrictions and levies imposed by India as well as the recent surge in global oil prices.
- EUR/GBP corrects significantly to near 0.8630 ahead of the German HICP data for September.
- Germany’s annual HICP inflation is seen softening despite rising energy prices.
- The UK economy is facing the headwinds of a stubborn inflation outlook and economic woes.
The EUR/GBP pair drops vertically to near 0.8630 in the European session. The asset faces selling pressure ahead of Germany’s preliminary Harmonized Index of Consumer Prices (HICP) data for September, which will be published at 12:00 GMT.
Germany’s annual HICP inflation is seen dropping sharply to 4.5% in September from 6.4% in August. The core HICP is likely to rise 0.3% in September, compared with a 0.4% acceleration in August. The headline Eurozone HICP is expected to rise 4.5% annually in September, a slowdown from August’s 5.2% increase.
Inflationary pressures in the German economy are expected to soften despite rising energy prices, which indicate a sharp slowdown in consumer spending momentum. Last week, European Central Bank (ECB) President Christine Lagarde reiterated the need for keeping interest rates sufficiently restrictive for a longer period as inflation is still high despite progress in slowdown. ECB Lagarde highlighted the risk of a tight labor market that may keep inflationary pressures intact.
Later, investors’ focus will shift to the Eurozone HICP data, which will be released on Friday.
On the Pound Sterling front, fears of a slowdown in the UK economy have deepened as the Services PMI shifted to contraction territory. Middle-class families have cut spending on services as high inflation squeezes real income.
Economists at UBS analyze EUR/JPY outlook.
Yield pickup in EUR/JPY
We reiterate our belief that the recent highs of 159-160 in EUR/JPY should mark a peak. This favors selling the upside risk above these levels for a yield pickup.
We expect the yield differentials to stabilize and to narrow next year. The Bank of Japan has signaled greater concern over the weakness of JPY and signaled that it could consider further policy normalization.
With the Japan authorities leaning against further Yen weakness, we think the upside risk for EUR/JPY to rise significantly beyond 160 looks rather limited.
The Dollar continues its relentless grind higher. Economists at ING analyze Greenback’s outlook.
DXY looks like it can grind to 107.00/107.20
In theory, a US government shutdown should be slightly Dollar-negative in that it provides a hit to activity and not to US creditworthiness. But it is going to take a lot to turn the Dollar and it could well stay bid into mid-October when US corporates in California need to pay their taxes.
DXY looks like it can grind to 107.00/107.20 and perhaps the biggest threat to the Dollar is the Bank of Japan selling $20-30bn near 150 in USD/JPY as Japanese officials watch FX 'with a strong sense of urgency'.
NZD/USD fell sharply and only just managed to maintain a 0.59 handle. Economists at ANZ Bank analyze Kiwi’s outlook.
USD strength story is the only game in town
So much for the ‘fade USD strength’ story; instead, it’s the only game in town! While that fits with the soft-landing narrative, we do have one word of caution, and that’s to take month/quarter-end moves with a bit of a grain of salt.
Still, the Kiwi is still holding its own on many crosses, notably NZD/AUD and it has wide interest rate differentials to thank for that. Bring on next week’s RBNZ MPR, that’s the next signpost in this volatile journey.
- USD/CHF moves below 0.9200 ahead of the macros from both countries.
- ANZ Bank analysis showed that CHF has become the top-performing currency among the G10 currencies.
- US Dollar strengthens due to market caution on the Fed’s interest rate trajectory, coupled with elevated US Treasury yields.
USD/CHF pulls back from the six-month high marked on Wednesday, trading around 0.9190 during the European session on Thursday. The Swiss Franc (CHF) is receiving upward support, and this may be attributed to a recent analysis by economists at ANZ Bank. Their analysis has highlighted that the CHF has become the top-performing currency among the G10 currencies in relation to the US Dollar (USD).
However, the Swiss National Bank (SNB) is expected to maintain a hawkish stance in its monetary policy. The central bank is likely to continue this approach as a means of guarding against a potential increase in imported inflation, even though it paused its rate-hiking cycle at the September meeting.
The persistent concerns about China's troubled property sector and worries about the economic challenges arising from rapidly rising borrowing costs. These concerns have led to a risk-off sentiment among investors, which has benefited the CHF due to its reputation as a safe-haven currency. As a result, the USD/CHF pair could face limitations on further gains.
The US Dollar Index (DXY) retreats from its highest levels since December, trading lower around 106.50 by the press time. However, the US Dollar (USD) strengthened due to risk aversion, higher US Treasury yields over an impending US government shutdown, and hot US economic data.
The positive performance of US Treasury yields is bolstering the Greenback's position. The yield on the 10-year US Treasury note has reached record highs, standing at 4.62%.
Additionally, Solid economic data from the United States is supporting the strength of the buck. In August, US Durable Goods Orders rebounded with a 0.2% increase, a notable turnaround from the previous month's 5.6% decline. This performance exceeded market expectations, which had anticipated a 0.5% decline.
Moreover, EIA Crude Oil Stocks Change data on the week ending September 22 showed that stocks decreased by 2.170 million barrels compared with the 2.135 million drawdowns seen a week earlier. Markets expected Oil stockpiles to decline by a much lesser 0.32 million barrels.
Federal Reserve (Fed) board members. Neel Kashkari, President of the Minneapolis Federal Reserve, recently indicated the potential for further interest rate hikes in the future. The hawkish tone from a Fed member might have supported the bullish momentum of the USD.
Additionally, Kashkari suggested that the option of keeping interest rates unchanged at their current levels remains open, especially if any potential rate cuts are postponed even further. These remarks from Fed officials are contributing to the upward trajectory of the Greenback.
Market participants will likely watch Switzerland’s Real Retail Sales on Friday. Along with, the US Core Personal Consumption Expenditure (PCE) Price Index, the Fed's preferred measure of consumer inflation will be eyed., which is expected to reduce from 4.2% to 3.9%.
- Silver consolidates in a range just above a nearly two-week low touched on Wednesday.
- Bears now await a break below an ascending trend-line support before placing fresh bets.
- Any meaningful recovery attempt is more likely to attract fresh sellers and remain capped.
Silver struggles to gain any meaningful traction on Thursday and oscillates in a narrow band, around mid-$22.00s through the first half of the European session. The white metal remains well within the striking distance of a nearly two-week low, around the $22.40 region touched on Wednesday, which is closely followed by an ascending trend line support extending from the June monthly low.
The latter is currently pegged around the $22.35 area, which if broken will be seen as a fresh trigger for bearish traders and set the stage for an extension of the recent downfall witnessed over the past week or so. Given that oscillators on the daily chart are holding deep in the negative territory and are still far from being in the oversold zone, the XAG/USD might then slide to test the next relevant support near the $22.00 round-figure mark. Some follow-through selling could accelerate the downward trajectory further towards the $21.25 intermediate support en route to the $21.00 level.
On the flip side, the $22.75-$22.80 region is likely to act as an immediate hurdle ahead of the $23.00 mark and the $23.20-$23.25 zone. This is closely followed by the very important 200-day Simple Moving Average (SMA), currently around the $23.45 region and last week's swing high, around the $23.75 area. A convincing break through the said barrier should lift the XAG/USD to the $24.00 round figure en route to the $24.30-$24.35 barrier. Bulls might eventually aim to reclaim the $25.00 psychological mark.
Silver daily chart
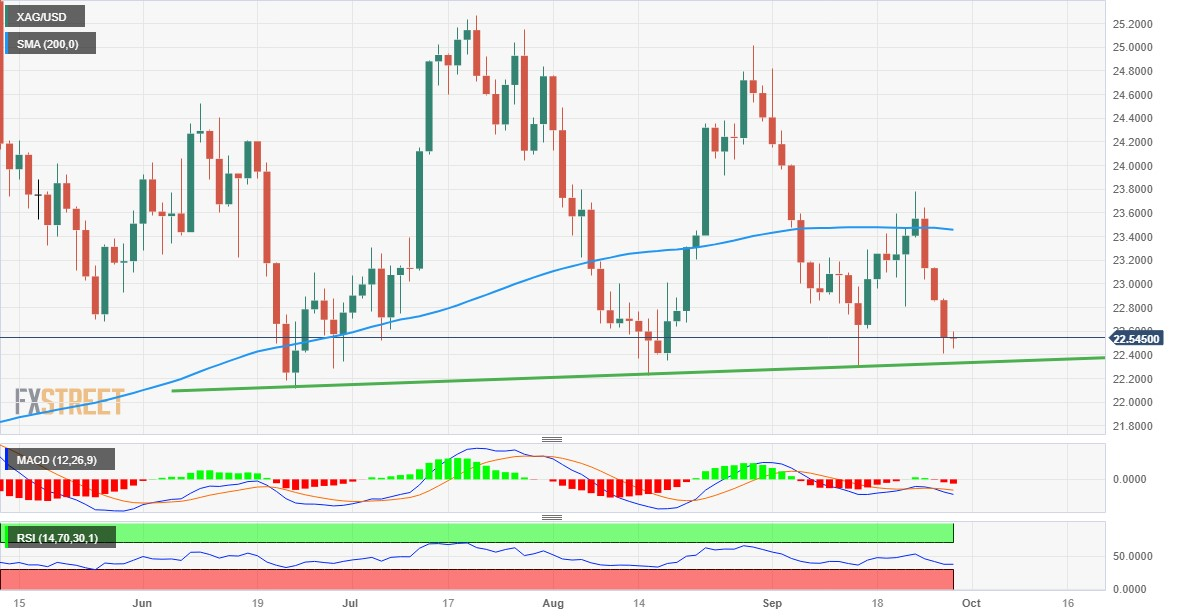
Technical levels to watch
- The Federal Statistical Office of Germany will publish the German inflation data on Thursday.
- Headline CPI is set to rise 4.6% YoY in September, down sharply from a prior increase of 6.1%.
- German inflation data to offer fresh hints on the Eurozone figures, impacting the ECB’s policy.
Interest rates will stay high ‘as long as necessary’, European Central Bank (ECB) President Christine Lagarde told the European Parliament’s committee on economic and monetary affairs on Monday. Does this mean an end to the ECB rate hike cycle or the door is still left ajar for one more rate hike this year?
The ECB meets next month for its monetary policy review, and therefore, the upcoming Harmonized Index of Consumer Prices (HICP) inflation data from Germany and the Eurozone hold utmost significance for its impact on the central bank’s policy decision.
The Euro (EUR) is poised to extend its downtrend if the inflation data from the Eurozone economies, especially Germany, highlights the underlying disinflationary trend.
What to expect in the next German inflation report?
The official data will be released by the Federal Statistical Office of Germany (Destatis) on Thursday. The annual German Consumer Price Index (CPI) is expected to rise 4.6% in September, down from a 6.1% increase reported in August. The monthly CPI inflation is set to increase at a steady rate of 0.3% in the reported period.
Germany’s annual HICP inflation is seen dropping sharply to 4.5% in September from 6.4% in August. The core HICP is likely to rise 0.3% in September, compared with a 0.4% acceleration in August.
Further cooldown in inflation in Europe’s largest economy is likely to hint at softer inflation readings in the bloc’s overall inflation data, which will be published on Friday.
The headline Eurozone Harmonized Index of Consumer Prices is expected to rise 4.5% YoY in September, a slowdown from August’s 5.2% increase. The Core HICP inflation, the gauge closely watched by the European Central Bank, is also seen lower at 4.8% in the said period as against a 5.3% increase seen in the previous month.
Commenting on inflation developments, Lagarde said that price growth is likely to remain "too high for too long" despite the recent decline. “Strong spending on holidays and travel and increasing wages were slowing the decline in price levels even as the economy stays sluggish”, she added. Therefore, it remains to be seen if the German and Eurozone inflation data underscore the hidden disinflationary signals or point to a renewed uptrend in inflation in the face of the recent surge in Oil prices.
The regional inflation data point could hint at the trend in German headline inflation in September. North Rhine-Westphalia (NRW) is the first German state to report September inflation readings and, as it is the most populous state, the reading can often be a signal of the trend in the figure for the whole of Germany.
Still, North-Rhine Westfalia figures don’t always work well as a forward-looking indicator. In August, inflation in this German state rose to 5.9% on year, up from 5.8% in July, signaling the possibility of an unexpected rise in overall German inflation. However, the nationwide figures eventually showed softer inflation figures as some other major states saw easing price pressures. For example, consumer prices in the German State of Bavaria rose by 5.9% YoY in August, the lowest inflation rate since February 2022 and easing from a 6.1% increase in the previous month. The annual inflation rate in the German state of Saxony ticked up to 6.8% in August 2023, from 6.7% in July.
For September, consumer prices in the German state of NRW rose by 0.2 % over the month in September and were up by 4.2 % YoY, the state's statistics office said on Thursday.
Previewing the August inflation data, Deutsche Bank explains: “September preview: Headline and core inflation prints might drop substantially. Owing to the petering out of two larger base effects – stemming from last summer's fuel discount and 9-Euro-ticket, we anticipate Germany's CPI headline and core inflation rates to fall more substantially again in September.”
“In this context, we gauge that the above-mentioned two effects could have boosted the year-over-year prints between June and August in the order of up to ¾ pp,” analysts at Deutsche Bank noted.
As usual, Spain has already published its national inflation figures for August, providing clues about the direction of the whole Eurozone HICP data.
Spain's Consumer Price Index (CPI) rose 3.5% YoY in September, preliminary data from the National Statistics Institute (INE) showed on Thursday. The 12-month inflation was higher than the 2.6% rate in August and in line with the 3.5% expected.
When will the HICP inflation report be released and how could it affect EUR/USD?
Germany's preliminary HICP is due at 12:00 GMT. In the lead-up to the Eurozone inflation showdown, the Euro (EUR) is wallowing in six-month lows near 1.0550 against the US Dollar, as the Fed-ECB monetary policy and macroeconomic divergence are back in play.
The US Federal Reserve (Fed) is widely expected to hike interest rates one more time this year while markets speculate that the September 25 basis points (bps) rate hike by the ECB will likely be the last one. Further, the Eurozone is on the brink of recession while the US economy has shown encouraging signs of resilience, based on the recent strong economic data.
A hotter-than-expected headline and core HICP inflation data could reinforce expectations for one more ECB rate hike by year-end. In such a case, EUR/USD could initiate a recovery toward the 1.0700 level. However, if the bloc’s inflation shows a quicker-than-expected decline, the main currency pair is likely to extend the downside toward 1.0400.
Dhwani Mehta, Asian Session Lead Analyst at FXStreet, offers a brief technical outlook for the major and explains: “EUR/USD is on the verge of confirming a Death Cross, represented by the 50-day Simple Moving Average (SMA) crossing below the 200 DMA. Meanwhile, the 14-day Relative Strength Index (RSI) is well within the oversold territory. Thus, the daily technical setup of EUR/USD suggests that a rebound could be in the offing before the next downtrend resumes.”
Dhwani also outlines important technical levels to trade the EUR/USD pair: “The previous day’s high at 1.0575 is the first hurdle on the road to recovery, above which Euro buyers will challenge the 1.0600 hurdle. On the downside, the psychological barrier at 1.0450 could lend some support to the pair, below which a test of the 1.0400 round number cannot be ruled out.”
Euro price this week
The table below shows the percentage change of Euro (EUR) against listed major currencies this week. Euro was the strongest against the Swiss Franc.
| USD | EUR | GBP | CAD | AUD | JPY | NZD | CHF | |
| USD | 1.18% | 0.56% | 0.20% | 1.06% | 0.62% | 0.23% | 1.33% | |
| EUR | -1.20% | -0.63% | -0.97% | -0.11% | -0.59% | -0.97% | 0.14% | |
| GBP | -0.56% | 0.64% | -0.36% | 0.52% | 0.05% | -0.34% | 0.77% | |
| CAD | -0.22% | 0.98% | 0.36% | 0.88% | 0.40% | 0.02% | 1.11% | |
| AUD | -1.07% | 0.10% | -0.52% | -0.86% | -0.47% | -0.86% | 0.25% | |
| JPY | -0.62% | 0.59% | -0.04% | -0.42% | 0.46% | -0.41% | 0.72% | |
| NZD | -0.24% | 0.96% | 0.34% | 0.00% | 0.85% | 0.38% | 1.10% | |
| CHF | -1.35% | -0.14% | -0.77% | -1.13% | -0.23% | -0.71% | -1.11% |
The heat map shows percentage changes of major currencies against each other. The base currency is picked from the left column, while the quote currency is picked from the top row. For example, if you pick the Euro from the left column and move along the horizontal line to the Japanese Yen, the percentage change displayed in the box will represent EUR (base)/JPY (quote).
Euro FAQs
What is the Euro?
The Euro is the currency for the 20 European Union countries that belong to the Eurozone. It is the second most heavily traded currency in the world behind the US Dollar. In 2022, it accounted for 31% of all foreign exchange transactions, with an average daily turnover of over $2.2 trillion a day.
EUR/USD is the most heavily traded currency pair in the world, accounting for an estimated 30% off all transactions, followed by EUR/JPY (4%), EUR/GBP (3%) and EUR/AUD (2%).
What is the ECB and how does it impact the Euro?
The European Central Bank (ECB) in Frankfurt, Germany, is the reserve bank for the Eurozone. The ECB sets interest rates and manages monetary policy.
The ECB’s primary mandate is to maintain price stability, which means either controlling inflation or stimulating growth. Its primary tool is the raising or lowering of interest rates. Relatively high interest rates – or the expectation of higher rates – will usually benefit the Euro and vice versa.
The ECB Governing Council makes monetary policy decisions at meetings held eight times a year. Decisions are made by heads of the Eurozone national banks and six permanent members, including the President of the ECB, Christine Lagarde.
How does inflation data impact the value of the Euro?
Eurozone inflation data, measured by the Harmonized Index of Consumer Prices (HICP), is an important econometric for the Euro. If inflation rises more than expected, especially if above the ECB’s 2% target, it obliges the ECB to raise interest rates to bring it back under control.
Relatively high interest rates compared to its counterparts will usually benefit the Euro, as it makes the region more attractive as a place for global investors to park their money.
How does economic data influence the value of the Euro?
Data releases gauge the health of the economy and can impact on the Euro. Indicators such as GDP, Manufacturing and Services PMIs, employment, and consumer sentiment surveys can all influence the direction of the single currency.
A strong economy is good for the Euro. Not only does it attract more foreign investment but it may encourage the ECB to put up interest rates, which will directly strengthen the Euro. Otherwise, if economic data is weak, the Euro is likely to fall.
Economic data for the four largest economies in the euro area (Germany, France, Italy and Spain) are especially significant, as they account for 75% of the Eurozone’s economy.
How does the Trade Balance impact the Euro?
Another significant data release for the Euro is the Trade Balance. This indicator measures the difference between what a country earns from its exports and what it spends on imports over a given period.
If a country produces highly sought after exports then its currency will gain in value purely from the extra demand created from foreign buyers seeking to purchase these goods. Therefore, a positive net Trade Balance strengthens a currency and vice versa for a negative balance.
USD/INR has held within the narrow 2.5% range for the most part of the past eleven months. Economists at ANZ Bank analyze the pair’s outlook.
INR to underperform the broader Asian currency complex
A sizable balance of payments surplus may not result in a materially stronger Rupee, as the RBI may build up its FX reserves further, keeping the INR in a tight range.
A stable exchange rate also serves well to stabilise imported inflation while supporting exports and manufacturing. This has however dampened the incentives among exporters and importers for hedging and could complicate domestic liquidity management amid FX absorption when inflation has flared up.
We expect INR to underperform the broader Asian currency complex once the US Dollar begins to ease.
USD/INR – Dec 23 82.80 Mar 24 82.50 Jun 24 82.00 Sep 24 81.50 Dec 24 80.00 Mar 25 79.50 Jun 25 79.00 Sep 25 79.00 Dec 25 79.00
- The Euro manages to pick some traction against the US Dollar.
- Stocks in Europe open Thursday’s session mostly with gains.
- EUR/USD drops to new multi-month lows near 1.0490.
- The DXY USD Index gives away some gains following new year-to-date peaks.
- Flash inflation figures in Germany will take centre stage in Europe.
- Final Q2 GDP readings, weekly Claims, Fedspeak come next in the US docket.
Following new eight-month lows around 1.0490, the Euro (EUR) manages to gather some fresh upside traction against the US Dollar (USD), encouraging the EUR/USD to reclaim the 1.0500 barrier and above in the the opening bell on the old continent on Thursday.
On the other hand, the Greenback’s rally faces some headwinds after hitting new 2023 peaks in the 106.80-106.85 band when gauged by the USD Index (DXY). The knee-jerk in the index also comes in tandem with the lack of direction in US yields, which remain at multi-year levels across the curve.
The same situation occurs in the German money market, where 10-year bund yields approach 2.90% for the first time since mid-July 2011.
From a monetary policy perspective, investors are still incorporating the expectation of the Federal Reserve (Fed) implementing a further 25 bps interest rate hike by the end of the year. At the same time, market conversations continue to suggest a potential pause at the European Central Bank (ECB) despite inflation levels staying well above the bank's target and growing worries about a possible recession.
Later in the session, Germany’s preliminary inflation Rate will grab all the attention seconded by Eurozone Economic Sentiment and Consumer Confidence in the broader euro bloc.
Across the ocean, investors are expected to closely follow the release of the final prints of the Q2 GDP, followed by the usual weekly Initial Jobless Claims and speeches by Chicago Fed President Austan Goolsbee and FOMC Governor Lisa Cook. In addition, Chair Jerome Powell will participate in an event with educators in Washington DC.
Daily digest market movers: Euro shows some signs of life around 1.0500
- The EUR rebounds from multi-month lows against the USD.
- US and German yields trade without clear direction on Thursday.
- Markets factor in the Fed hiking rates by 25 bps before year-end.
- Investors anticipate potential interest rate cuts by the Fed in Q3 2024.
- Traders sees the ECB’s tightening campaign entering an impasse.
- Inflation rate in Spain ticked higher in September, according to preliminary data.
- Intervention fears remain as USD/JPY approaches the 150.00 hurdle.
Technical Analysis: Immediate downside comes at 1.0481
Despite the mild rebound, EUR/USD remains well under pressure and continues to target the 2023 low in the 1.0480 region.
Looking at contention levels for the EUR/USD, immediate support emerges at the September 28 low of 1.0491, seconded by the 2023 low at 1.0481 seen on January 6.
When considering potential resistance levels, there is a minor obstacle at the September 12 high of 1.0767, and a more substantial barrier at the 200-day Simple Moving Average (SMA) at 1.0828. If the pair manages to surpass this level, it could open the path for further recovery, targeting the temporary 55-day SMA at 1.0865, with the potential to reach the August 30 high of 1.0945. Exceeding this level might shift the focus towards the psychological 1.1000 hurdle, ahead of the August 10 peak of 1.1064. Beyond these points, the pair could potentially retest the July 27 top at 1.1149, and even reach the 2023 high at 1.1275 from July 18.
As long as the EUR/USD remains below the 200-day SMA, there remains a possibility of persisting downward pressure.
Euro FAQs
What is the Euro?
The Euro is the currency for the 20 European Union countries that belong to the Eurozone. It is the second most heavily traded currency in the world behind the US Dollar. In 2022, it accounted for 31% of all foreign exchange transactions, with an average daily turnover of over $2.2 trillion a day.
EUR/USD is the most heavily traded currency pair in the world, accounting for an estimated 30% off all transactions, followed by EUR/JPY (4%), EUR/GBP (3%) and EUR/AUD (2%).
What is the ECB and how does it impact the Euro?
The European Central Bank (ECB) in Frankfurt, Germany, is the reserve bank for the Eurozone. The ECB sets interest rates and manages monetary policy.
The ECB’s primary mandate is to maintain price stability, which means either controlling inflation or stimulating growth. Its primary tool is the raising or lowering of interest rates. Relatively high interest rates – or the expectation of higher rates – will usually benefit the Euro and vice versa.
The ECB Governing Council makes monetary policy decisions at meetings held eight times a year. Decisions are made by heads of the Eurozone national banks and six permanent members, including the President of the ECB, Christine Lagarde.
How does inflation data impact the value of the Euro?
Eurozone inflation data, measured by the Harmonized Index of Consumer Prices (HICP), is an important econometric for the Euro. If inflation rises more than expected, especially if above the ECB’s 2% target, it obliges the ECB to raise interest rates to bring it back under control.
Relatively high interest rates compared to its counterparts will usually benefit the Euro, as it makes the region more attractive as a place for global investors to park their money.
How does economic data influence the value of the Euro?
Data releases gauge the health of the economy and can impact on the Euro. Indicators such as GDP, Manufacturing and Services PMIs, employment, and consumer sentiment surveys can all influence the direction of the single currency.
A strong economy is good for the Euro. Not only does it attract more foreign investment but it may encourage the ECB to put up interest rates, which will directly strengthen the Euro. Otherwise, if economic data is weak, the Euro is likely to fall.
Economic data for the four largest economies in the euro area (Germany, France, Italy and Spain) are especially significant, as they account for 75% of the Eurozone’s economy.
How does the Trade Balance impact the Euro?
Another significant data release for the Euro is the Trade Balance. This indicator measures the difference between what a country earns from its exports and what it spends on imports over a given period.
If a country produces highly sought after exports then its currency will gain in value purely from the extra demand created from foreign buyers seeking to purchase these goods. Therefore, a positive net Trade Balance strengthens a currency and vice versa for a negative balance.
GBP/USD extended its decline and came within a touching distance of 1.2100 on Wednesday. Economists at ING analyze Sterling’s outlook.
Caught in the crossfire
Sterling has probably been caught in the crossfire of position adjustment. Speculators had been trying to hold onto long Euro and Sterling positions through the spring, despite the strengthening Dollar. Presumably, these positions have now been cut.
Like EUR/USD, the GBP/USD pair remains vulnerable to the 1.20/1.21 area.
See: GBP/USD could consolidate back above 1.27 by year-end – ANZ
Further range bound trade remains likely in USD/CNH for the time being, comment Markets Strategist Quek Ser Leang and Senior FX Strategist Peter Chia at UOB Group.
Key Quotes
24-hour view: Yesterday, we expected USD to trade sideways in a range of 7.3000/7.3200. USD then dropped to 7.3008 and then rose to a high of 7.3268. Despite the advance, upward momentum has only improved slightly. Today there is room for USD to rise, but any advance is unlikely to threaten the major resistance at 7.3400 (there is another resistance at 7.3300). Support is at 7.3100, followed by 7.3000.
Next 1-3 weeks: We continue to hold the same view as last Thursday (21 Sep, spot at 7.3150), wherein the recent downward pressure has faded, and USD is likely to trade in a range, probably between 7.2800 and 7.3400.
- Pound Sterling turns sideways after finding an interim support near 1.2110, downside remains favored.
- The UK economy is likely to continue to face the wrath of high inflation and slowing demand.
- High inflation and slowing labor demand could trigger stagflation risks in the UK economy.
The Pound Sterling (GBP) remains on the backfoot as investors continue to dump risk-perceived assets as the market mood turns cautious. The GBP/USD pair may continue to remain on the tenterhooks as risks of a recession in the United Kingdom have increased due to vulnerable economic prospects. The UK’s Manufacturing and Services PMI, which gauge the health of both sectors, have fallen into contraction territory, while strong labor demand appears to be fading.
The UK economy is seen losing strength amid uncertainty over the interest rate outlook ahead of the general elections. UK Prime Minister Rishi Sunak promised to halve inflation to around 5.3% by year-end, but the pause announced by BoE policymakers signals that the Prime Minister may fail to keep the word. For further action, investors will focus on the final S&P Global Manufacturing and Services PMI, which will be released next week.
Daily Digest Market Movers: Pound Sterling remains weak as risk-off mood intensifies
- Pound Sterling turns choppy after posting a fresh six-month low near 1.2110 as the downside remains favored amid a cautious market mood.
- The appetite of investors for risk-perceived assets remains slim as rising Oil prices and high inflation are deepening risks of a global slowdown.
- The GBP/USD pair remains under intense pressure as the UK economy is facing the headwinds of a stubborn inflation outlook and deepening recession risks.
- Unlike the US economy, the UK is struggling to cope with the consequences of higher interest rates.
- The Bank of England surprisingly paused its historically aggressive policy-tightening spell after raising interest rates 14 times in a row.
- The sudden interest rate pause conveyed that the UK economy is going through tough times. Before the pause, traders were expecting the interest rate peak at 5.75% as inflation in the UK is the highest among G7 economies.
- The BoE’s pause has elevated upside risks to inflation, further dampening the UK’s economic prospects. Labor demand has recently softened, but wage growth remains strong and this may keep inflation persistently high.
- Investors remain worried whether UK PM Rishi Sunak will fulfill his promise of halving inflation to around 5.3% by the year-end.
- Fears of a slowdown in the UK economy have deepened as the Services PMI shifted to contraction territory. Middle-class families have cut spending on services as high inflation squeezes real income.
- While the BoE’s interest rate pause highlighted the poor economic outlook, there is increasing evidence that the situation of the real-estate sector is improving as home-buyers see scope for lower mortgage rates ahead. UK’s property website Zoopla said the volume of inquiries for new homes rose by 12% over the past four weeks.
- Meanwhile, there are increasing risks of piling debt on the UK economy. Britain's Institute for Fiscal Studies (IFS) estimated on Thursday that there was a 90% chance that public borrowing in four years' time would be higher than the government's budget watchdog has forecast, Reuters reports.
- The US Dollar continues to capitalize on the risk-off market mood, a resilient US economy, and the hawkish stance of Federal Reserve (Fed) policymakers on interest rates.
- The US Dollar Index (DXY) is inches away from an 11-month high of around 107.00. The asset is expected to continue its four-day winning spell as investors shift focus to the Fed’s preferred inflation gauge.
- On Wednesday, the US Dollar strengthened further after the release of surprisingly positive US Durable Goods Orders data. Orders surprisingly rose by 0.2% against expectations of a 0.5% decline. In July, Orders contracted by a sharp 5.6%.
Technical Analysis: Pound Sterling extends six-day losing spell
Pound Sterling looks set to continue its losing spell for a seventh trading session as investors move to safe-haven assets. The GBP/USD pair refreshes a six-month low at 1.2110 and is expected to test the round-level support of 1.2100. The downside spell in the GBP/USD pair could continue to the psychological support of 1.2000 as the 200-day Exponential Moving Average (EMA) starts declining. Momentum indicators continue to trade in the bearish territory, warranting more downside for the pair.
BoE FAQs
What does the Bank of England do and how does it impact the Pound?
The Bank of England (BoE) decides monetary policy for the United Kingdom. Its primary goal is to achieve ‘price stability’, or a steady inflation rate of 2%. Its tool for achieving this is via the adjustment of base lending rates. The BoE sets the rate at which it lends to commercial banks and banks lend to each other, determining the level of interest rates in the economy overall. This also impacts the value of the Pound Sterling (GBP).
How does the Bank of England’s monetary policy influence Sterling?
When inflation is above the Bank of England’s target it responds by raising interest rates, making it more expensive for people and businesses to access credit. This is positive for the Pound Sterling because higher interest rates make the UK a more attractive place for global investors to park their money. When inflation falls below target, it is a sign economic growth is slowing, and the BoE will consider lowering interest rates to cheapen credit in the hope businesses will borrow to invest in growth-generating projects – a negative for the Pound Sterling.
What is Quantitative Easing (QE) and how does it affect the Pound?
In extreme situations, the Bank of England can enact a policy called Quantitative Easing (QE). QE is the process by which the BoE substantially increases the flow of credit in a stuck financial system. QE is a last resort policy when lowering interest rates will not achieve the necessary result. The process of QE involves the BoE printing money to buy assets – usually government or AAA-rated corporate bonds – from banks and other financial institutions. QE usually results in a weaker Pound Sterling.
What is Quantitative tightening (QT) and how does it affect the Pound Sterling?
Quantitative tightening (QT) is the reverse of QE, enacted when the economy is strengthening and inflation starts rising. Whilst in QE the Bank of England (BoE) purchases government and corporate bonds from financial institutions to encourage them to lend; in QT, the BoE stops buying more bonds, and stops reinvesting the principal maturing on the bonds it already holds. It is usually positive for the Pound Sterling.
- USD/CAD remains below the 1.3500 psychological level due surge in Crude oil prices.
- Fed’s hawkish stance is reinforcing the bullish momentum of the US Dollar.
- Higher US Treasury yields are providing support for the solid Greenback.
- The prices of liquid gold exceeded one-year highs due to global supply reduction and cautious optimism toward the Chinese economic situation.
USD/CAD extends losses on the second successive day, trading lower around 1.3490 during the early European trading hours on Thursday. The pair is facing challenges due to the surge in Crude Oil prices.
Crude oil prices surged to levels exceeding one-year highs due to ongoing indications of a tightening global supply and cautious optimism regarding an economic recovery in China, which is the world's largest oil importer. WTI price continues the winning streak for the third consecutive day, trading above $93.20 per barrel by the press time.
EIA Crude Oil Stocks Change data on the week ending September 22 showed that stocks decreased by 2.170 million barrels compared with the 2.135 million drawdowns seen a week earlier. Markets expected Oil stockpiles to decline by a much lesser 0.32 million barrels.
The decline in US crude inventories raises concerns about economic downfall stemming from rapidly rising borrowing costs, which supports WTI prices. This, in turn, could undermine the USD/CAD pair as Canada is one of the largest oil exporters to the United States (US).
The US Dollar Index (DXY) extends its gains at its highest levels since December, bolstered by risk aversion, higher US Treasury yields, and economic data. The spot price is hovering around 106.70 by the press time.
The DXY is reinforced by solid macroeconomic data from the US. The US Dollar’s (USD) strength is attributed to the positive performance of US Treasury yields over an impending US government shutdown.
The yield on the 10-year US Treasury note has reached record highs, with standing at 4.61% at the time of writing.
Federal Reserve (Fed) board members. Neel Kashkari, President of the Minneapolis Federal Reserve, recently indicated the potential for further interest rate hikes in the future. The hawkish tone from a Fed member might have supported the bullish momentum of the USD.
Additionally, Kashkari suggested that the option of keeping interest rates unchanged at their current levels remains open, especially if any potential rate cuts are postponed even further. These remarks from Fed officials are contributing to the upward trajectory of the Greenback.
In August, US Durable Goods Orders rebounded with a 0.2% increase, a notable turnaround from the previous month's 5.6% decline. This performance exceeded market expectations, which had anticipated a 0.5% decline.
Market participants will likely watch Canada’s Gross Domestic Product (GDP) on Friday. Along with, the US Core Personal Consumption Expenditure (PCE) Price Index, the Fed's preferred measure of consumer inflation will be eyed., which is expected to reduce from 4.2% to 3.9%.
EUR/USD dropped to below 1.0500 for the first time since early January. Economists at ING analyze the pair’s outlook.
Some new negatives
We can probably all agree that the dominant trend is a strong Dollar. However, two developments this week warn that the Euro may be due to some independent weakness. Italy pushing the budget boundaries and some European Central Bank officials discussing large rises in Minimum Required Reserves. We think an MRR hike would be a clear Euro negative.
There seems no reason to fight this bearish EUR/USD trend just yet. But for today, keep a look out for German and Spanish inflation – in case it builds momentum for one last ECB hike. If not, expect EUR/USD to continue drifting to the 1.0400/1.0410 area.
- The index comes under some downside pressure near 106.60.
- US yields extend the move higher to new multi-year highs.
- Final Q2 GDP figures, weekly Claims, Fedspeak next on tap.
The greenback now faces some selling pressure and recedes to the 106.60 region when tracked by the USD Index (DXY) during the European morning on Thursday.
USD Index looks at data, yields
The index now gives away part of the recent four-session advance, including Wednesday’s move to new YTD peaks in the 106.80/85 band, and revisits the 106.60 area on the back of some mild recovery in the appetite for the risk complex.
In the meantime, the rally in the greenback remains well supported by the persistent sell-off in the US bonds markets, which in turn propelled yields to multi-year tops in response to investors’ perception that the Federal Reserve would surely maintain its restrictive stance for a longer period.
In the US data space, the final figures of Q2 GDP will take centre stage seconded by usual weekly Initial Claims, Pending Home Sales and speeches by Austan Goolsbee (Chicago), Lisa Cook (FOMC Governor). In addition, Chief Jerome Powell will participate in an event with educators in Washington DC.
What to look for around USD
Despite the ongoing knee-jerk, the index remains well supported by both investors’ sentiment and higher yields, which have pushed the dollar to new yearly peaks around the 106.80 on Wednesday.
In the meantime, support for the dollar keeps coming from the good health of the US economy, which at the same time appears underpinned by the renewed tighter-for-longer stance narrative from the Federal Reserve.
Key events in the US this week: Initial Jobless Claims, Pending Home Sales, Final Q2 GDP Growth Rate, Fed Powell (Thursday) – PCE, Core PCE, Personal Income, Personal Spending, Advanced Goods Trade Balance, Final Michigan Consumer Sentiment (Friday).
Eminent issues on the back boiler: Persevering debate over a soft or hard landing for the US economy. Incipient speculation of rate cuts in early 2024. Geopolitical effervescence vs. Russia and China.
USD Index relevant levels
Now, the index is losing 0.10% at 106.55 and faces initial support at 104.42 (weekly low September 11) ahead of 103.08 (200-day SMA) and then 102.93 (weekly low August 30). On the other hand, a breakout of 106.83 (2023 high September 27) would open the door to 107.19 (weekly high November 30, 2022) and finally 107.99 (weekly high November 21 2022).
FX analysts are currently spellbound by the question of whether USD/JPY will breach the 150 mark. Economists Commerzbank analyze the pair’s outlook.
The magic level of 150 in USD/JPY
I feel sympathetic towards market participants who are not agonizing about interventions, but that is easy for me to say. Many had the idea of betting against the MOF in the 1990s and early 2000s, and many got burned.
It remains dangerous to bet on the patience of the MOF. In particular, as Minister of Finance Shunichi Suzuki is increasingly tightening the screw of verbal interventions. The MOF was ‘watching FX carefully with a sense of urgency’, he pointed out.
In the view of Markets Strategist Quek Ser Leang and Senior FX Strategist Peter Chia at UOB Group, USD/JPY now targets the key 150.00 region in the next few weeks.
Key Quotes
24-hour view: We indicated yesterday that “the bias for USD is tilted to the upside”. However, we were of the view that “any advance is still unlikely to reach 149.50.” USD then rose more than expected, reaching a high of 149.72. The bias remains tilted to the upside, but today, 150.00 is likely out of reach. The upside bias will fade if USD breaks below 149.05 (minor support is at 149.20).
Next 1-3 weeks: Two days ago (26 Sep, spot at 148.95), we indicated that “upward momentum has improved further and USD could advance to 149.50.” Yesterday (27 Sep), USD rose to a high of 149.72. Upward momentum continues to improve, albeit not much. USD could advance further to 150.00 if it stays above 148.55 (‘strong support’ level previously at 148.10).
Open interest in natural gas futures markets shrank for the fourth session in a row on Wednesday, this time by just 179 contracts according to preliminary readings from CME Group. In the same line, volume went down by around 161.3K contracts, partially reversing the previous daily build.
Natural Gas: Upside appears limited around $3.00
Natural gas prices gapped higher on Wednesday and reached multi-week highs around the $2.90 region. The sharp move, however, was on the back of shrinking open interest and volume and exposes a potential knee-jerk in the very near term. In the meantime, there is a tough up-barrier around the $3.00 mark per MMBtu.
Here is what you need to know on Thursday, September 28:
The US Dollar (USD) continued to outperform its rivals mid-week and the USD Index touched a fresh 2023-high near 107.00 as the bond sell-off continued, lifting the yield on the 10-year reference above 4.6% for the first time since 2007. Ahead of German inflation data for September, markets stay relatively quiet. The US economic docket will feature weekly Initial Jobless Claims data alongside the final revision to the second-quarter Gross Domestic Product (GDP) growth and August Pending Home Sales.
Growing fears over a US government shutdown and its potential negative impact on the US credit rating, caused markets to continue to sell US bonds. "I don't see the support in the House" for the funding bill presented by the Senate, Republican House Speaker Kevin McCarthy said Wednesday. Top Senate Democrat Chuck Schumer noted that the next procedural vote on the bill is expected to take place on Thursday. Following a positive opening to the day, Wall Street's main indexes lost traction and closed virtually unchanged, reflecting the sour market mood. In the European morning, US stock index futures trade marginally higher.
US Dollar price this week
The table below shows the percentage change of US Dollar (USD) against listed major currencies this week. US Dollar was the strongest against the Swiss Franc.
| USD | EUR | GBP | CAD | AUD | JPY | NZD | CHF | |
| USD | 1.47% | 0.98% | 0.14% | 1.11% | 0.64% | 0.33% | 1.54% | |
| EUR | -1.49% | -0.49% | -1.33% | -0.33% | -0.85% | -1.14% | 0.09% | |
| GBP | -0.99% | 0.49% | -0.83% | 0.15% | -0.34% | -0.65% | 0.57% | |
| CAD | -0.15% | 1.32% | 0.83% | 0.98% | 0.49% | 0.19% | 1.40% | |
| AUD | -1.12% | 0.34% | -0.15% | -0.98% | -0.50% | -0.80% | 0.43% | |
| JPY | -0.66% | 0.85% | 0.36% | -0.51% | 0.49% | -0.30% | 0.92% | |
| NZD | -0.34% | 1.13% | 0.65% | -0.19% | 0.80% | 0.30% | 1.22% | |
| CHF | -1.58% | -0.09% | -0.58% | -1.42% | -0.43% | -0.92% | -1.23% |
The heat map shows percentage changes of major currencies against each other. The base currency is picked from the left column, while the quote currency is picked from the top row. For example, if you pick the Euro from the left column and move along the horizontal line to the Japanese Yen, the percentage change displayed in the box will represent EUR (base)/JPY (quote).
EUR/USD dropped to below 1.0500 for the first time since early January and was last seen consolidating its weekly losses near that level. The annual Consumer Price Index (CPI) in Germany is forecast to rise 4.6% in September, down sharply from 6.4% in August. Ahead of this data, Eurostat will release consumer and business sentiment data for September.
GBP/USD extended its slide and came within a touching distance of 1.2100 on Wednesday. In the European morning, the pair fluctuates in a tight channel below 1.2150.
USD/JPY continued to climb higher on Wednesday but lost its traction before testing 150.00 as investors moved to the sidelines amid growing risk of a Bank of Japan intervention. In the European morning, the pair holds steady below 149.50. Once again, Japanese Finance Minister Shunichi Suzuki said that they won't rule out any steps to respond if there's any excessive volatility in foreign exchange markets.
Gold price suffered heavy losses amid surging US Treasury yields. XAU/USD fell below $1,880 for the first time since March in the second half of the week and was last seen consolidating its losses at around mid-$1,870s.
- NZD/USD holds ground around 0.5937 after bouncing off the low of 0.5860 on Thursday.
- The upbeat US Durable Goods Orders boosts the US Dollar (USD) broadly,
- The fear of China's property market woes exerts some pressure on the China-proxy Kiwi.
- Traders await the US weekly Jobless Claims, US GDP for Q2, and Pending Home Sales.
The NZD/USD pair remains confined above the 0.5900 psychological support level during the early European session on Thursday. As of writing, the pair is up 0.25% on the day to trade at 0.5937.
Risk aversion dominated markets as investors assessed the narrative of a higher for longer rate in the US against the growth risks posed by the possibility of an imminent US government shutdown. However, market participants will closely monitor this week's speech by Federal Reserve (Fed) Chair Jerome Powell. The less hawkish tone of officials may limit the USD's upside against its rivals.
About the data, the US Census Bureau reported on Wednesday that US Durable Goods Orders rebounded in August, climbing 0.2% MoM from the previous reading's 5.6% drop, versus estimations of a 0.5% m/m drop. Furthermore, Durable Goods Orders Excluding Transportation grew by 0.4% m/m, above the 0.1% rise forecast. Core capital goods orders grew 0.9% from the previous month's figure of 0.4%, above the market expectation of 0%.
Earlier Thursday, the National Bank of New Zealand revealed that the nation’s ANZ Business Confidence for September rose to 1.5 from a 3.7 decline in August. Additionally, the ANZ Activity Outlook improved to 10.9 in September from 11.2% in the previous reading. The market anticipates the Reserve Bank of New Zealand (RBNZ) to maintain the current monetary policy unchanged in next week’s policy meeting but expects the RBNZ would hike again in November’s meeting.
Apart from this, the fear of China's property market woes exert some pressure on the China-proxy New Zealand Dollar (NZD). On Thursday, Reuters reported that China’s Evergrande Group Chairman Hui Ka Yan had been placed under police watch, raising fears about the cash-strapped developer's future amid mounting liquidation risk. It’s worth noting that Evergrande is the world's most indebted real estate developer, and it is at the heart of a property market crisis that is dragging down China's economic development.
Moving on, traders will focus on the US weekly Jobless Claims data, the third revision of growth number for the second quarter, and Pending Home Sales data due later in the American session on Thursday. The Core Personal Consumption Expenditure (PCE) Price Index report will be in the spotlight on Friday. The annual figure is expected to ease from 4.2% to 3.9%. These figures could give a clear direction for the NZD/USD pair.
The 1.05 mark in EUR/USD was taken out on Wednesday. Economists at Commerzbank analyze the pair’s outlook.
US data holds the key
Durable goods orders in August were much stronger than analysts had expected before. There is more US data due for publication again today. I hope that they will be close to market expectations. If the Dollar were to then ease that would be a signal that at current levels the air is getting thin for the Dollar.
If it were to appreciate further, we would have to come to the conclusion that the trend of USD strength still has further momentum. On Wednesday, the data did not do us that favor but we have another opportunity today!
NZD/USD could weaken further as long as it trades below the 0.5970 level, suggest Markets Strategist Quek Ser Leang and Senior FX Strategist Peter Chia at UOB Group.
Key Quotes
24-hour view: We did not anticipate NZD to drop to a low of 0.5901 (we were expecting it to trade in a range). While downward momentum has not improved much, there is room for NZD to retest the 0.5900 level before a more sustained rebound is likely. The next support at 0.5880 is unlikely to come under threat. Resistance is at 0.5940, followed by 0.5955.
Next 1-3 weeks: Our latest narrative was from Monday (25 Sep, spot at 0.5955), wherein “while upward momentum has improved slightly, NZD must break and stay above 0.6015 before a sustained advance is likely.” Yesterday (27 Sep), NZD dropped below our ‘strong support’ level of 0.5905. The breach of 0.5905 invalidated our view. Not only has upward momentum faded, but downward momentum has also built. From here, as long as NZD remains below 0.5970 (‘strong resistance’ level), it could weaken to 0.5860 in the coming days.
Considering advanced prints from CME Group for crude oil futures markets, open interest increased by more than 35K contracts on Wednesday, adding to the previous daily advance. Volume followed suit and went up by around 615K contracts, the largest single-day build since early April.
WTI now looks at a visit to $100.00
WTI prices added to the weekly advance and climbed to fresh 2023 peaks past the $94.00 mark on Wednesday. The uptick was on the back of rising open interest and volume and is indicative that extra gains remain in store for the commodity for the time being. Immediately to the upside now comes the psychological mark at $100.00 per barrel.
The CHF became the best performing G10 currency against the USD. Economists at ANZ Bank analyze Franc’s outlook.
SNB will remain vigilant against a rebound in inflation
The Swiss National Bank (SNB) is likely to retain a hawkish stance in its monetary policy, guarding against a rise in imported inflation, despite the pause at the September meeting.
External pressure via imported inflation is well and truly in the SNB’s crosshairs, which means the CHF could receive FX intervention if it weakens too much, especially against the EUR and USD.
Our year-end reading for the USD/CHF is 0.88.
Markets Strategist Quek Ser Leang and Senior FX Strategist Peter Chia at UOB Group note GBP/USD could weaken further and revisit the 1.2100 region.
Key Quotes
24-hour view: Yesterday, we held the view that “further GBP weakness is not ruled out, but subdued downward momentum suggests the major support at 1.2100 is likely out of reach.” Our view turned out to be correct as GBP dropped to a low of 1.2111 before settling at 1.2135 (-0.19%). While the weakness in GBP has not really stabilised, downward momentum is showing tentative signs of slowing. Today, there is room for GBP to test 1.2100, but a clear break below this level is unlikely. Resistance is at 1.2160; if GBP breaks above 1.2190, it would mean that the weakness in GBP has stabilised.
Next 1-3 weeks: There is not much to add to our update from two days ago (26 Sep, spot at 1.2215). As highlighted, the GBP weakness that started early this month is still in place. GBP could continue to weaken, and the next level to watch is 1.2100. The weakness in GBP will remain intact as long as it stays below 1.2220 (‘strong resistance’ level previously at 1.2245). Looking ahead, if GBP breaks clearly below 1.2100, there is room for it to drop further to 1.2050 before the risk of a recovery increases.
- Asian stocks mostly trades lower on Thursday in subdued trading.
- Investors worried about China's property woes after Evergrande Chairman had been placed under police watch.
- The possible higher US interest rates and rising Treasury yields weigh on heavyweight technology stocks in Japan.
- The US Core Personal Consumption Expenditure (PCE) Price Index on Friday will be a closely watched event.
Most Asian stock markets trade lower on Thursday as investors were concerned about the possible additional interest rate hike from the Federal Reserve (Fed) this year.
At press time, China’s Shanghai is up 0.15% to 3,111, the Shenzhen Component Index rises 0.08% to 10,112, Hong Kong’s Hang Sang drops 0.88% to 17,458, South Japan’s Nikkei falls 1.76% and trading was closed in South Korea for a holiday.
Meanwhile, September is on course to be the worst month of the year for the S&P 500 as the market attempts to digest a rise in Treasury yields to levels not seen since 2007. The US Dollar Index (DXY) climbs to 106.65, the highest since November. The 10-year Treasury yield settled at 4.60%, its highest level since 2007.
Trading in China Evergrande Group shares was halted on Thursday after a report that its Chairman Hui Ka Yan had been placed under police watch, raising fears about the cash-strapped developer's future amid mounting liquidation risk.
Evergrande is the world's most indebted real estate developer, and it is at the heart of a property market crisis that is dragging down China's economic development.
The prospect of higher US interest rates and rising Treasury yields weigh on heavyweight technology stocks in Japan. Meanwhile, USD/JPY currently trades near the 150.00 mark on Thursday, which triggers some fear that Japanese authorities would take action to address the Japanese Yen's depreciation. On Wednesday, Japanese Finance Minister Shunichi Suzuki is back on the wires with some verbal intervention. Suzuki said once again that he was watching FX with a sense of urgency.
Looking ahead, market players await the US weekly Jobless Claims report, the third revision of Gross Domestic Product (GDP) for the second quarter, and Pending Home Sales data due later on Thursday. The attention will shift to the US Core Personal Consumption Expenditure (PCE) Price Index on Friday.
CME Group’s flash data for gold futures markets noted traders reduced their open interest positions for yet another session on Wednesday, this time by around 3.7K contracts. On the flip side, volume went up for the third session in a row, now by around 30.6K contracts.
Gold meets initial support around $1870
Gold prices retreated to six-month lows around $1870 per troy ounce on Wednesday. The sharp downtick was on the back of shrinking open interest and leaves the door open to a near-term rebound. In the meantime, the 200-day SMA at $1927 emerges as the next target for any recovery attempt.
- EUR/USD attempts to stay above the 1.0500 psychological level.
- Momentum indicators suggest a potential bearish sentiment in the market.
- The region around January’s low could act as a key support.
EUR/USD attempts to snap the losing streak that began on September 19, hovering around 1.0500 psychological level during the Asian session on Thursday. The pair is under pressure due to risk aversion, coupled with upbeat US Treasury yields and economic data.
On Wednesday, Germany’s downbeat Gfk Consumer Confidence Survey exerted pressure on the EUR/USD pair. The consumer sentiment revealed a decline of -26.5 in October from -25.6 prior.
The current downward momentum in EUR/USD appears to have a potential bearish bias, given that the 14-day Relative Strength Index (RSI) remains below the 50 level. However, there is a support region around January’s low at 1.0481 that may pose a challenge for further losses.
If there's a breakthrough below the level, it could lead the EUR/USD bears to navigate the area around the psychological level at 1.0450.
On the upside, the EUR/USD pair may encounter significant resistance levels in its price movement. The seven-day Exponential Moving Average (EMA) at 1.0575 could act as a barrier, followed by the 1.0600 psychological level.
If the pair breaks above the latter, it may then explore the region around the 23.6% Fibonacci retracement at 1.0673.
The Moving Average Convergence Divergence (MACD) indicator is providing a bearish signal for the EUR/USD pair. The MACD line lies below the centerline and the signal line. This configuration suggests that there is potentially weak momentum in the price movement.
EUR/USD: Daily Chart
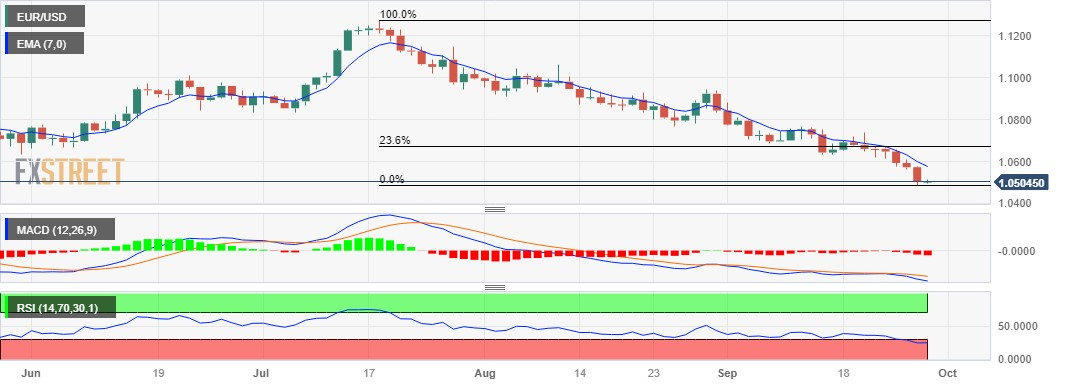
Further decline could see EUR/USD slip back to the 1.0430 region in the near term, according to Markets Strategist Quek Ser Leang and Senior FX Strategist Peter Chia at UOB Group.
Key Quotes
24-hour view: While we expected EUR to decline yesterday, we were of the view that “The major support at 1.0515 is unlikely to come into view.” We did not anticipate the sharp selloff as EUR broke below 1.0515 and dropped to within a few pips of the year’s low of 1.0482 (NY low of 1.0486). The sharp drop is severely oversold, but has not stabilised. There is room for EUR to drop further to 1.0470 before stabilisation is likely. This time around, we hold the view that the next support at 1.0430 is unlikely to come into view. Resistance is at 1.0530; if EUR breaks above 1.0555, it would mean that the weakness has stabilised.
Next 1-3 weeks: Last Thursday (21 Sep, spot at 1.0655), we highlighted that “EUR is likely to trade in a range of 1.0590/1.0730.” We added, “if it breaks below 1.0590, it will likely lead to a sustained decline to 1.0515.” After EUR broke below 1.0590, in our latest narrative from two days ago (26 Sep, spot at 1.0590), we pointed out that the price action suggests that EUR “is likely to weaken to 1.0515 in the coming days.” Yesterday (27 Sep), EUR broke below 1.0515 and dropped to a low of 1.0486. The price action continues to suggest EUR weakness. The next level to watch is at 1.0430. On the upside, a breach of 1.0585 (‘strong resistance’ level was at 1.0650 previously) would indicate that EUR is not weakening further.
- GBP/USD remains under selling pressure around 1.2133, bouncing off the lowest since March 17 of 1.2110.
- The pair holds below the 50- and 100-hour EMAs with the oversold RSI condition.
- The key resistance level will emerge at 1.2250; 1.2100 will be the critical support level.
The GBP/USD pair extends its downside for the seventh consecutive day during the Asian session on Thursday. The downtick of the pair is supported by the firmer US Dollar (USD), higher Treasury Yield and upbeat US economic data. The pair currently trades near 1.2133, losing 0.02% on the day.
The Bank of England (BoE) unexpectedly paused its rate hike cycle while the Federal Reserve (Fed) offered hawkish remarks and signaled that rate additional rate hike is possible. The divergence of monetary policy between the BoE and Fed exerts pressure on the British Pound (GBP) and acts as a headwind for the GBP/USD pair.
According to the four-hour chart, GBP/USD holds below the 50- and 100-hour Exponential Moving Averages (EMAs) with a downward slope, which means further downside looks favorable. The Relative Strength Index (RSI) holds in bearish territory below 50. However, the oversold RSI condition indicates that further consolidation cannot be ruled out before positioning for any near-term GBP/USD depreciation.
The key resistance level for GBP/USD will emerge near the upper boundary of the Bollinger Band and the 50-hour EMA at 1.2250. The additional upside filter is located at 1.2351 (the 100-hour EMA). The next barrier to watch is near a high of September 21 at 1.2421, followed by a psychological round mark at 1.2500.
On the downside, 1.2100 will be the critical support level for the GBP/USD pair. The mentioned level is the confluence of the lower limit of the Bollinger Band, a psychological figure, and a low of March 17. Further south, the next stop is located at 1.2025 (a low of March 16). Any intraday pullback below the latter would expose the next downside stop at 1.2000 (a round mark).
GBP/USD four-hour chart
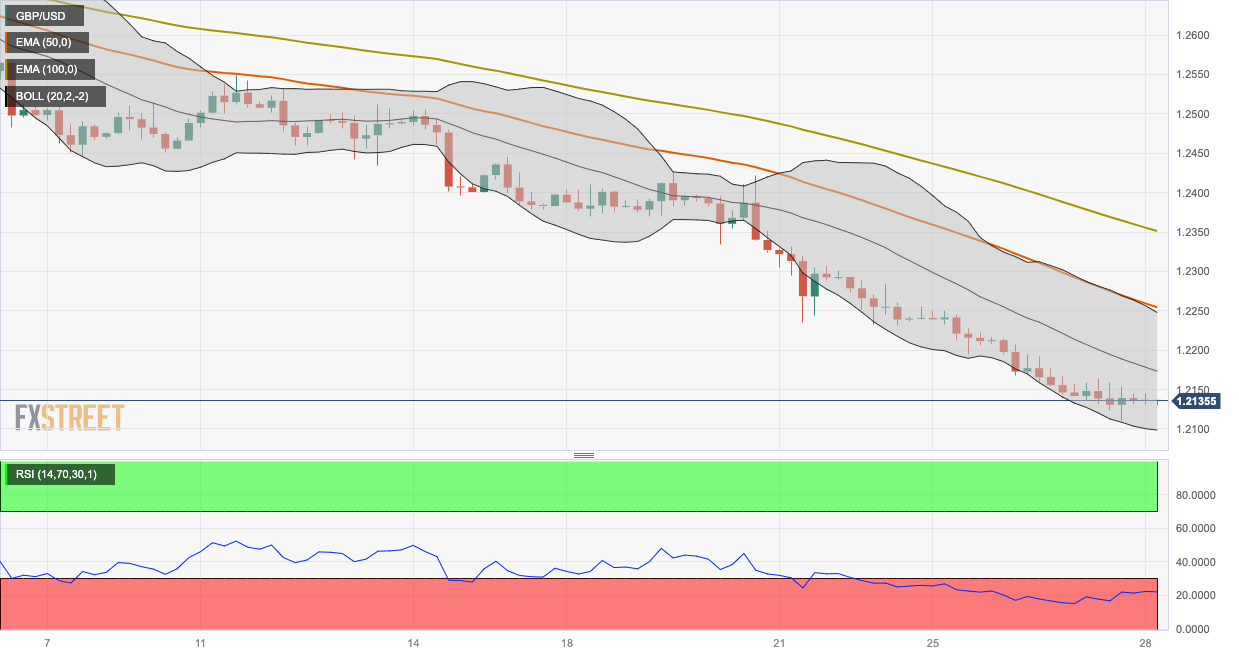
- USD/CHF is seen consolidating its recent strong positive move to a six-month high.
- The Fed’s hawkish outlook continues to underpin the USD and remains supportive.
- The risk-off mood benefits the safe-haven CHF and keeps a lid on any further gains.
The USD/CHF pair reverses a modest Asian session dip on Thursday and now trades above the 0.9200 mark, well within the striking distance of its highest level since late March touched the previous day.
Despite a modest downtick in the US Treasury bond yields, the US Dollar (USD) manages to hold steady near a 10-month high and turns out to be a key factor acting as a tailwind for the USD/CHF pair. Market participants now seem convinced that the Federal Reserve (Fed) will stick to its hawkish stance and have been pricing in the possibility of at least one more rate hike by the end of this year. The bets were reaffirmed by the overnight hawkish comments by Minneapolis Fed President Neel Kashkari, saying that it is not clear yet whether the central bank is finished raising rates amid ample evidence of ongoing economic strength.
Adding to this, the better-than-expected release of the US Durable Goods Orders prompted some economists to raise the third-quarter GDP growth estimates and should allow the Fed to keep rates higher for longer. This, in turn, pushed the yield on the yield on the benchmark 10-year US government bond to a 16-year peak and favours the USD bulls. That said, extremely overbought conditions, along with the increasing possibility of a US government shutdown, hold back the USD bulls from placing fresh bets. Republican US House Speaker Kevin McCarthy on Wednesday rejected a stopgap funding bill advancing in the Senate.
This comes on top of persistent worries over China's ailing property sector and concerns about economic headwinds stemming from rapidly rising borrowing costs, which, in turn, tempers investors' appetite for riskier assets. This is evident from the prevalent risk-off environment and benefits the Swiss Franc's (CHF) relative safe-haven status, keeping a lid on any further gains for the USD/CHF pair. Traders now look to the US economic docket, featuring the final Q2 GDP print and the usual Weekly Initial Jobless Claims. This, along with the US bond yields, might influence the USD and provide some impetus to the USD/CHF pair.
Technical levels to watch
- Gold price enters a bearish consolidation phase near a multi-month low touched on Wednesday.
- The prevalent risk-off environment is seen lending some support to the safe-haven XAU/USD.
- Bullish USD and elevated US Treasury bond yields should keep a lid on any recovery move.
Gold price (XAU/USD) plunged to a six-and-half-month low, around the $1,873-1,872 region on Wednesday and registered its biggest single-day fall in two months. The precious metal remains on the defensive through the Asian session on Thursday and seems vulnerable to prolonging its rejection slide from a technically significant 200-day Simple Moving Average (SMA) tested last week.
A strong bullish sentiment surrounding the US Dollar (USD), along with elevated US Treasury bond yields, might continue to drive flows away from the Gold price. Rising bets for at least one more rate hike by the Federal Reserve (Fed) in 2023 act as a tailwind for the US bond yields and boost the USD. That said, the prevalent risk-off environment could lend some support to the safe-haven Gold price. This, along with the risk of a partial US government shutdown, might hold back traders from placing fresh bets around the XAU/USD.
Traders now look to the final US Q2 GDP print for some impetus later during the early North American session. The focus, however, will remain on the US Core PCE Price Index on Friday, which will provide fresh cues about the Fed's future interest rate-hike path and provide a fresh directional impetus to the non-yielding Gold price.
Daily Digest Market Movers: Gold price hovers near multi-month low on stronger USD, higher US bond yields
- Gold price registered its biggest single-day fall in two months on Wednesday and seems vulnerable to slide further.
- Hawkish comments by Minneapolis Fed President Neel Kashkari lift bets for at least one more rate hike in 2023.
- The better-than-expected US Durable Goods Orders ensure that the Fed will keep interest rates higher for longer.
- The US Dollar stands tall near a 10-month high, while the 10-year US Treasury yields flirt with a 16-year peak.
- Bullish USD and elevated US bond yields might continue to undermine demand for non-yielding yellow metal.
- Investors remain worried about China's property sector and headwinds stemming from rising borrowing costs.
- Republican US House Speaker Kevin McCarthy on Wednesday rejected a stopgap funding bill advancing in the Senate, bringing the government closer to its fourth partial shutdown in a decade.
- The risk-off impulse might hold back bears from placing fresh bets around the Gold price and help limit losses.
- Traders now look to the final US Q2 GDP, though the focus remains on the US Core PCE Price Index on Friday.
Technical Analysis: Gold price might consolidate before the next leg down
From a technical perspective, the subdued range-bound price action might be categorized as a bearish consolidation phase. Moreover, the lack of any buying interest suggests that the path of least resistance for the Gold price remains on the downside. That said, the Relative Strength Index (RSI) on the daily chart has just started drifting in the oversold zone and warrants some caution. Hence, it will be prudent to wait for some near-term consolidation or a modest rebound before traders start positioning for a further depreciating move. Nevertheless, the XAU/USD seems poised to test the next relevant support near the $1,860-1,858 region before eventually dropping to the $1,820 level.
Fed FAQs
What does the Federal Reserve do, how does it impact the US Dollar?
Monetary policy in the US is shaped by the Federal Reserve (Fed). The Fed has two mandates: to achieve price stability and foster full employment. Its primary tool to achieve these goals is by adjusting interest rates.
When prices are rising too quickly and inflation is above the Fed’s 2% target, it raises interest rates, increasing borrowing costs throughout the economy. This results in a stronger US Dollar (USD) as it makes the US a more attractive place for international investors to park their money.
When inflation falls below 2% or the Unemployment Rate is too high, the Fed may lower interest rates to encourage borrowing, which weighs on the Greenback.
How often does the Fed hold monetary policy meetings?
The Federal Reserve (Fed) holds eight policy meetings a year, where the Federal Open Market Committee (FOMC) assesses economic conditions and makes monetary policy decisions.
The FOMC is attended by twelve Fed officials – the seven members of the Board of Governors, the president of the Federal Reserve Bank of New York, and four of the remaining eleven regional Reserve Bank presidents, who serve one-year terms on a rotating basis.
What is Quantitative Easing (QE) and how does it impact USD?
In extreme situations, the Federal Reserve may resort to a policy named Quantitative Easing (QE). QE is the process by which the Fed substantially increases the flow of credit in a stuck financial system.
It is a non-standard policy measure used during crises or when inflation is extremely low. It was the Fed’s weapon of choice during the Great Financial Crisis in 2008. It involves the Fed printing more Dollars and using them to buy high grade bonds from financial institutions. QE usually weakens the US Dollar.
What is Quantitative Tightening (QT) and how does it impact the US Dollar?
Quantitative tightening (QT) is the reverse process of QE, whereby the Federal Reserve stops buying bonds from financial institutions and does not reinvest the principal from the bonds it holds maturing, to purchase new bonds. It is usually positive for the value of the US Dollar.
- USD/INR sticks to modest gains below the mid-83.00s ahead of US data.
- US Durable Goods Orders rose by 0.2% MoM vs. -5.6% prior.
- Reserve Bank of India (RBI) is likely to keep the interest rate unchanged at its October meeting.
- Investors will closely watch the US consumer inflation due on Friday.
USD/INR posts modest gains during the Asian session on Thursday. The uptick in the pair is supported by the rally of US Dollar (USD) broadly and higher Treasury yield. The pair currently trades around 83.22, losing 0.07% on the day.
Meanwhile, the US Dollar Index (DXY), a measure of the value of the USD relative to a basket of foreign currencies, climbs to 106.65, the highest since November. The higher for longer rates narrative and risk-averse sentiment are the main drivers of the pair. However, growth risks from the possibility of an imminent government shutdown in the US might cap the upside of the Greenback against its rivals.
On Wednesday, the US Census Bureau reported that the US Durable Goods Orders rebounded in August, rising 0.2% m/m from a 5.6% drop in the previous reading, against expectations of a 0.5% m/m fall. Additionally, Durable Goods Orders ex Transportation rose by 0.4% m/m, a better than expected of 0.1% rise. Core capital goods orders rose 0.9% from the previous reading of a 0.4% drop, above the market consensus of 0%.
On the other hand, the Reserve Bank of India (RBI) is likely to maintain a status quo on interest rates for the fourth consecutive time at its upcoming monetary policy meeting scheduled for October 4-6. The benchmark repo rate was lifted to 6.5% in February and remained unchanged since then due to elevated retail inflation and global factors, including high crude oil prices.
Looking ahead, market players will monitor the US weekly Jobless Claims report, the third revision of Gross Domestic Product (GDP) for the second quarter, and Pending Home Sales data due later on Thursday. On Friday, the Indian Federal Fiscal Deficit for August, Current Account, and Reserve Bank of India (RBI) Monetary Credit and Information Review will be released. The closely watched event will be the US Core Personal Consumption Expenditure (PCE) Price Index on Friday. These figures could give a clear direction of the USD/INR pair.
- USD/JPY retreats with a positive bias, holding grounds below 149.50.
- Momentum indicators point toward a prevailing bullish sentiment in the market.
- The psychological level at 150.00 could emerge as a key resistance, following October’s high.
USD/JPY retreats with a positive bias from the highs since November, trading lower around 149.40 during the Asian session on Thursday. The pair is under pressure due to market caution about the US Federal Reserve’s (Fed) interest rate trajectory, coupled with higher US Treasury yields and economic data.
However, Japanese Finance Minister Shunichi Suzuki reaffirmed on Thursday that he is open to taking any necessary measures to address excessive foreign exchange (FX) market volatility. Suzuki also emphasizes that currencies move in a stable manner. The policymaker is closely watching FX moves with a sense of urgency, although declined to comment on any plans for a rate check.
The current upward momentum in USD/JPY appears to have a potential bullish bias, given that the 14-day Relative Strength Index (RSI) remains above the 50 level. However, there is a psychological resistance level at 150.00 that may pose a challenge for further gains.
If there's a strong breakthrough above the level, it could serve as an encouragement for USD/JPY bulls to explore higher levels, potentially targeting the area around the October high at 151.94.
On the flip side, the USD/JPY pair may encounter significant support levels in its price movement. The first notable support level could be around the 14-day Exponential Moving Average (EMA) at 148.27. Below that, there is the psychological support level at 148.00, which often holds significance in market dynamics.
If the pair breaks below the latter, it may then navigate towards the region around the psychological support level at 147.00, followed by the 23.6% Fibonacci retracement at 146.76.
The Moving Average Convergence Divergence (MACD) indicator is providing a bullish signal for the USD/JPY pair. The MACD line is positioned above both the centerline and the signal line. This configuration suggests that there is potentially strong momentum in the USD/JPY's price movement, indicating a prevailing bullish sentiment in the market.
USD/JPY: Daily Chart
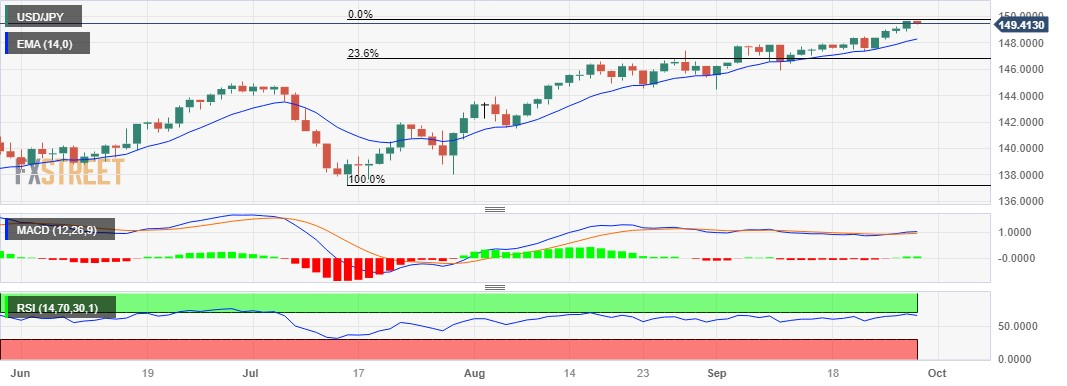
- USD/MXN continues to strengthen due to market caution on the Fed’s interest rate trajectory.
- Fed’s hawkish stance is reinforcing the bullish momentum of the US Dollar.
- Higher US Treasury yields are providing support for the solid Greenback.
- Banxico is expected to maintain its current interest rates at 11.25%.
USD/MXN continues the winning streak that began on Monday, trading higher around 17.7110 during the Asian session on Thursday. The pair experiences upward support due to risk aversion, higher US Treasury yields, and economic data.
The US Dollar Index (DXY) extends its gains at its highest levels since December, hovering around 106.70 by the press time. The DXY is bolstered by solid macroeconomic data from the United States (US). US Dollar’s (USD) strength is attributed to the positive performance of US Treasury yields over an impending US government shutdown.
The yield on the 10-year US Treasury note has reached record highs, standing at 4.61% at the time of writing.
The bullish momentum of the USD is being strengthened by the hawkish comments from Federal Reserve (Fed) board members. Neel Kashkari, President of the Minneapolis Federal Reserve, recently made statements indicating the potential for further interest rate hikes in the future.
Additionally, Kashkari suggested that the option of keeping interest rates unchanged at their current levels remains open, especially if any potential rate cuts are postponed even further. These remarks from Fed officials are contributing to the upward trajectory of the Greenback.
In August, US Durable Goods Orders rebounded with a 0.2% increase, a notable turnaround from the previous month's 5.6% decline. This performance exceeded market expectations, which had anticipated a 0.5% decline.
Regarding EIA Crude Oil Stocks Change data for the week ending September 22, showing a decrease with a reading of -2.17 million barrels, compared to the previous reading of -2.135 million barrels. This index was expected to be published at -0.32 million barrels figures.
Mexico's President, Andres Manuel Lopez Obrador, has acknowledged the effective performance of the Bank of Mexico (Banxico) as inflation rates decrease. However, the President has also emphasized the importance of Banxico focusing more on fostering economic development.
If the trend of declining inflation persists, Banxico might contemplate making changes to its monetary policy. These potential adjustments could have repercussions on the value of the Mexican Peso against the US Dollar.
Market participants will likely watch Mexico’s Jobless Rate for August and the Bank of Mexico (Banxico) interest rate decision on Thursday. On the US docket, the Core Personal Consumption Expenditure (PCE) Price Index, the Fed's preferred measure of consumer inflation will be eyed on Friday, which is expected to reduce from 4.2% to 3.9%.
- WTI Crude Oil prices scale higher for the third straight day and rise to over a one-year high.
- The EIA report released on Wednesday pointed to signs of tighter supply and lend support.
- Hopes for an economic recovery in China remain supportive of the ongoing positive move.
West Texas Intermediary (WTI) Crude Oil prices build on this week's goodish rebound from the vicinity of mid-$88.00s and scale higher for the third successive day on Wednesday. The momentum lifts the commodity closer to the $94.00/barrel mark, or the highest level since late August 2022 during the Asian session and remains well supported by continued signs of tighter global supply.
According to the data published by the US Energy Information Administration (EIA) on Wednesday, US crude oil inventories for the week ended September 22 decreased more-than-expected, by 2.169 million barrels from the previous week. This marks the second straight week of a drawdown and comes on top of deep supply cuts from the world's two largest Oil producers – Russia and Saudi Arabia. This, in turn, adds to bets that global supplies will tighten further this year and continues to act as a tailwind for Crude Oil prices.
Apart from this, some optimism over an economic recovery in China acts as a tailwind for the black liquid and contributes to the ongoing positive momentum. Furthermore, fuel demand in China – the world’s largest Oil importer – is also expected to pick up during the week-long Autumn festival holiday, starting on Friday. This, in turn, suggests that the path of least resistance for Oil prices is to the upside and supports prospects for a further appreciating move, though overbought conditions on the daily chart might cap gains.
Traders might also prefer to wait on the sidelines ahead of the release of the official Chinese PMI prints, due on Sunday. The data will provide fresh insights into the economic activity in the world's second-largest economy and provide some impetus to Oil prices. In the meantime, the aforementioned supporting factors, which, to a larger extent, have outweighed worries about economic headwinds stemming from rapidly rising borrowing costs, should help limit any meaningful corrective decline in Crude Oil prices.
Technical levels to watch
| Raw materials | Closed | Change, % |
|---|---|---|
| Silver | 22.539 | -1.38 |
| Gold | 1875.156 | -1.36 |
| Palladium | 1223.5 | -0.34 |
- EUR/USD loses traction amid the firmer US dollar and upbeat US data.
- German Consumer Sentiment fell to -26.5 in October from -25.6 in September.
- US Durable Goods Orders improved in August, climbing 0.2% m/m vs. -5.6% prior.
- Traders will monitor Eurozone CPI, US GDP due later on Thursday.
The EUR/USD pair loses momentum around 1.0500 during the early Asian session on Thursday. The selling pressure of the major pair is supported by the firmer US Dollar (USD), higher US economic data, and higher Treasury yield. EUR/USD currently trades near 1.0512, gaining 0.09% for the day.
Meanwhile, the US Dollar Index (DXY), a measure of the value of the USD relative to a basket of foreign currencies, climbs to 106.60, the highest since November whereas US Treasury yields edge higher with the 10-year Treasury yield settled at 4.618%, its highest level since 2007.
The downbeat Eurozone economic data exert some selling pressure on the Euro and acts as a headwind for the EUR/USD pair. German Consumer Sentiment revealed by GfK fell to -26.5 in October from -25.6 in September. Furthermore, Spain and Germany will publish preliminary September Consumer Price Index (CPI) numbers. Spanish annual inflation is expected to rise, while German inflation will likely decline. These initial inflation figures are crucial for shaping monetary policy expectations and can impact the markets.
Across the pond, the US Census Bureau revealed on Wednesday that US Durable Goods Orders improved in August, climbing 0.2% m/m from the previous reading's 5.6% fall, compared to estimates for a 0.5% m/m drop. Furthermore, Durable Goods Orders Excluding Transportation rose by 0.4% m/m, above the 0.1% gain anticipated. Core capital goods orders grew 0.9% from the previous month's figure of 0.4%, above the market estimate of 0%. Following the better-than-expected US data, the Greenback gains traction across the board, acting as a headwind for the EUR/USD pair.
Markets were driven by risk-aversion as investors weighed higher for longer rates narrative against growth risks from the possibility of an imminent government shutdown in the US. Traders will monitor Federal Reserve (Fed) Chair Jerome Powell's address this week for fresh catalysts. The less hawkish tone of officials may limit the USD's upside and lift the Euro.
Looking ahead, market players await the preliminary Spanish and German inflation data for September. Also, the Eurozone's Consumer and Business Confidence data will be released on Thursday. On the US docket, the US weekly Jobless Claims report, the third revision of Gross Domestic Product (GDP) for the second quarter and Pending Home Sales data will be released on Thursday. The attention will shift to the US Core Personal Consumption Expenditure (PCE) Price Index on Friday. The annual figure is expected to ease from 4.2% to 3.9%. Traders will take cues from the data and find a clear direction of the EUR/USD pair.
- Australian Dollar attempts to recover from the 10-month low.
- Australia’s Retail Sales dropped to 0.2% compared to the expected 0.3% readings.
- US Dollar continues to strengthen on Higher US Treasury yields, coupled with upbeat economic data.
The Australian Dollar (AUD) hit a 10-month low on Wednesday. However, the AUD/USD pair attempts to recover from the recent losses despite disappointing Australia's Retail Sales data.
Australia's monthly Consumer Price Index (CPI) has rebounded from July's reading, which could be attributed to the increasing energy prices. This expected increase in inflation has raised anticipations of another interest rate hike by the Reserve Bank of Australia (RBA). However, the AUD failed to gain traction of positive Consumer Price Index (CPI) figures.
The Aussie Dollar is under downward pressure due to increased risk aversion sentiment in the market. The drop-in commodity prices are also acting as a limiting factor on the upside potential of the AUD/USD pair.
The US Dollar Index (DXY) continues to strengthen, propelled by robust macroeconomic data from the United States (US), trading at its highest levels since December. This surge in the US Dollar (USD) is attributed to the positive performance of US Treasury yields over an impending US government shutdown. The yield on the 10-year US Treasury note has reached record highs.
The bullish momentum in the USD is further reinforced by the hawkish remarks made by Federal Reserve (Fed) board members. Neel Kashkari, the President of the Minneapolis Federal Reserve, recently made comments that suggest the potential for additional rate hikes in the future.
Kashkari also left open the possibility of interest rates remaining at their current levels if rate cuts are delayed even further.
Daily Digest Market Movers: Australian Dollar falls on market caution, higher US Treasury yields, hot macros
- AUD/USD attempts to rebound after hitting a 10-month low at 0.6331 on Wednesday, trading around 0.6360 at the time of writing during early Asian trading hours on Thursday.
- Australian Retail Sales for August, fell to 0.2% from the previous rate of 0.5%. The index was expected to grow at a 0.3% rate.
- Australia’s Monthly Consumer Price Index (CPI) year-over-year for August rose 5.2% as expected, up from the previous rate of 4.9%.
- There is a growing expectation for rate increases in the subsequent November and December meetings by the RBA.
- US Durable Goods Orders rose 0.2%, swinging from the previous decline of 5.6% and market expectation of a 0.5% decline in August.
- EIA Crude Oil Stocks Change data, on the week ending on September 22, decreased to a reading of -2.17M from -2.135M prior. The report was expected to release a -0.32M figures.
- The situation in China regarding Evergrande continues to worsen, with increasing turmoil, intrigue, and uncertainty. Bloomberg reported on Wednesday that the chairman of the company had been placed under police surveillance.
- Evergrande, the world's most indebted developer with over $300 billion in total liabilities, is at the heart of an unprecedented liquidity crisis in China's property sector.
- The hawkish remarks from Neel Kashkari, the President of the Minneapolis Federal Reserve have led to a broad-based strengthening of the US Dollar (USD) and have acted as a headwind for the AUD/USD pair. Kashkari emphasized the potential for additional rate hikes in the future.
- Traders await the US data such as the Core Personal Consumption Expenditure (PCE) Price Index, the Fed's preferred measure of consumer inflation, which is due on Friday. The annual rate is expected to reduce from 4.2% to 3.9%.
Technical Analysis: Australian Dollar hovers around 0.6350, barrier at 0.6400 psychological level
Australian Dollar trades higher around 0.6360 psychological level during the Asian session on Thursday. AUD/USD pair could find a barrier around 0.6400 psychological level, followed by the 21-day Exponential Moving Average (EMA) at 0.6422. A firm break above the latter could support the Aussie Dollar (AUD) to explore the region around 26.6% Fibonacci retracement at 0.6464. On the downside, the monthly low at 0.6357 aligned with the 0.6350 psychological level could be the key support, following the 0.6300 psychological level.
AUD/USD: Daily Chart
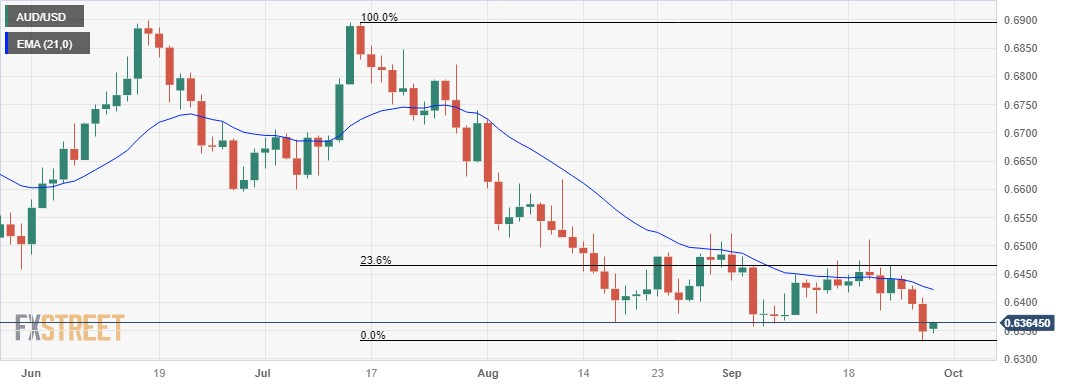
Australian Dollar FAQs
What key factors drive the Australian Dollar?
One of the most significant factors for the Australian Dollar (AUD) is the level of interest rates set by the Reserve Bank of Australia (RBA). Because Australia is a resource-rich country another key driver is the price of its biggest export, Iron Ore. The health of the Chinese economy, its largest trading partner, is a factor, as well as inflation in Australia, its growth rate, and Trade Balance. Market sentiment – whether investors are taking on more risky assets (risk-on) or seeking safe havens (risk-off) – is also a factor, with risk-on positive for AUD.
How do the decisions of the Reserve Bank of Australia impact the Australian Dollar?
The Reserve Bank of Australia (RBA) influences the Australian Dollar (AUD) by setting the level of interest rates that Australian banks can lend to each other. This influences the level of interest rates in the economy as a whole. The main goal of the RBA is to maintain a stable inflation rate of 2-3% by adjusting interest rates up or down. Relatively high interest rates compared to other major central banks support the AUD, and the opposite for relatively low. The RBA can also use quantitative easing and tightening to influence credit conditions, with the former AUD-negative and the latter AUD-positive.
How does the health of the Chinese Economy impact the Australian Dollar?
China is Australia’s largest trading partner so the health of the Chinese economy is a major influence on the value of the Australian Dollar (AUD). When the Chinese economy is doing well it purchases more raw materials, goods and services from Australia, lifting demand for the AUD, and pushing up its value. The opposite is the case when the Chinese economy is not growing as fast as expected. Positive or negative surprises in Chinese growth data, therefore, often have a direct impact on the Australian Dollar and its pairs.
How does the price of Iron Ore impact the Australian Dollar?
Iron Ore is Australia’s largest export, accounting for $118 billion a year according to data from 2021, with China as its primary destination. The price of Iron Ore, therefore, can be a driver of the Australian Dollar. Generally, if the price of Iron Ore rises, AUD also goes up, as aggregate demand for the currency increases. The opposite is the case if the price of Iron Ore falls. Higher Iron Ore prices also tend to result in a greater likelihood of a positive Trade Balance for Australia, which is also positive of the AUD.
How does the Trade Balance impact the Australian Dollar?
The Trade Balance, which is the difference between what a country earns from its exports versus what it pays for its imports, is another factor that can influence the value of the Australian Dollar. If Australia produces highly sought after exports, then its currency will gain in value purely from the surplus demand created from foreign buyers seeking to purchase its exports versus what it spends to purchase imports. Therefore, a positive net Trade Balance strengthens the AUD, with the opposite effect if the Trade Balance is negative.
- USD/CAD drifts lower for the second straight day and retreats further from over a one-week high.
- Bullish Oil prices continue to underpin the Loonie and exert pressure amid subdued USD demand.
- The Fed’s hawkish outlook should act as a tailwind for the buck and help limit losses for the major.
The USD/CAD pair extends the overnight retracement slide from the vicinity of mid-1.3500s, or a one-and-half-week high and remains under some selling pressure for the second successive day on Thursday. The steady descent drags spot prices further below the 1.3500 psychological mark during the Asian session and is sponsored by surging Crude Oil prices.
In fact, Oil prices jump to over a one-year high on continued signs of tighter global supply and some optimism over an economic recovery in China – the world’s largest oil importer. US crude inventories shrank by a bigger-than-expected 2.2 million barrels (mb) in the week to September 22, marking the fifth week of draws in the previous seven. This, in turn, outweighs worries about economic headwinds stemming from rapidly rising borrowing costs and continues to act as a tailwind for the black liquid, which, in turn, is seen underpinning the commodity-linked Loonie and weighing on the USD/CAD pair.
The US Dollar (USD), on the other hand, consolidates its recent strong gains to the highest level since November 2022 and does little to influence the USD/CAD pair. Any meaningful USD corrective slide, however, still seems elusive in the wake of firming expectations for further policy tightening by the Federal Reserve (Fed). Investors now seem convinced that the Fed will keep rates higher for longer and have been pricing in the possibility of at least one more lift-off by the end of this year. The bets were reaffirmed by the overnight hawkish comments by Minneapolis Fed President Neel Kashkari.
It is not clear yet whether the central bank is finished raising rates amid ample evidence of ongoing economic strength, Kashkari noted. Adding to this, the better-than-expected release of the US Durable Goods Orders raised hopes for a stronger third-quarter GDP growth, which should allow the Fed to stick to its hawkish stance. This led to an extended selloff in the US fixed-income market, pushing the yield on the benchmark 10-year US government bond to a fresh 16-year peak, further beyond the 4.50% threshold, and should continue to act as a tailwind for the Greenback.
The aforementioned fundamental backdrop makes it prudent to wait for strong follow-through selling before positioning for any further depreciating move for the USD/CAD pair. Traders now look to the release of the final US Q2 GDP print, due later during the early North American session, which, along with the US bond yields, will drive the USD demand. Apart from this, Oil price dynamics provide some impetus to the USD/CAD pair and allow traders to grab short-term opportunities.
Technical levels to watch
Japanese Finance Minister Shunichi Suzuki is reiterating on Thursday, he won't rule out any steps to respond if there's any excessive FX volatility
Additional comments
Important for currencies to move in stable manner.
Closely watching FX moves with sense of urgency.
Declined to comment when asked about any plans for rate check.
Market reaction
At the time of writing, USD/JPY is losing 0.10% on the day at 149.47.
Australia’s Retail Sales, a measure of the country’s consumer spending, rose 0.2% in August on a monthly basis, as against July’s 0.5% increase, according to the official data published by the Australian Bureau of Statistics (ABS) on Thursday.
The market consensus was for an increase of 0.3%.
Market reaction
AUD/USD is shrugging off the disappointing Australian data. The spot is trading at 0.6363, up 0.20% on the day, as of writing.
On Thursday, the People’s Bank of China (PBoC) set the USD/CNY central rate for the trading session ahead at 7.1798, compared with the previous day's fix of 7.1717 and 7.3239 estimated.
- PBOC injects 508 billion in open market operations (OMOs) via 7-day RR, sets rate at 1.80%, and 105 billion Yuan via 14-day RR, sets rate at 1.95%.
- 169 billion Yuan of RRs mature today and thus a net 440 billion Yuan injection on the day in OMOs.
- GBP/USD builds on the overnight bounce from a multi-month low and edges higher on Thursday.
- The USD take a brief pause after rising to a fresh YTD peak and lends some support to the major.
- The divergence Fed-BoE policy outlook might continue to act as a headwind and cap the upside.
The GBP/USD pair ticks higher during the Asian session on Thursday and moves away from its lowest level since March 17, around the 1.2110 region touched the previous day. Spot prices, however, remain below mid-1.2100s and seem vulnerable to prolonging the well-established downtrend witnessed over the past two months or so.
The US Dollar (USD) pauses following the recent strong runup to a 10-month high and turns out to be a key factor lending some support to the GBP/USD pair. The near-term bias, meanwhile, seems tilted firmly in favour of the USD bulls in the wake of growing acceptance that the Federal Reserve (Fed) will continue to tighten its monetary policy further and keep interest rates higher for longer. The bets were reaffirmed by the overnight hawkish comments by Minneapolis Fed President Neel Kashkari, saying that it is not clear yet whether the central bank is finished raising rates amid ample evidence of ongoing economic strength.
Adding to this, the better-than-expected release of the US Durable Goods Orders prompted some economists to raise the third-quarter GDP growth estimates and lifted bets for at least one more Fed rate hike move by the end of this year. This led to an extended selloff in the US fixed-income market, pushing the yield on the benchmark 10-year US government bond to a fresh 16-year peak, further beyond the 4.50% threshold, which continues to underpin the Greenback. That said, extremely overbought conditions hold back the USD bulls from placing fresh bets and act as a tailwind for the GBP/USD pair, though any meaningful recovery seems elusive.
The Bank of England (BoE) surprisingly paused its interest rate hiking cycle and also provided little evidence of it intends to raise rates any further. This marks a divergence in comparison to the Fd's hawkish outlook, which, in turn, suggests that the path of least resistance for the GBP/USD pair is to the upside. Hence, any subsequent move up might be seen as a selling opportunity and runs the risk of fizzling out rather quickly. Traders now look to the release of the final US Q2 GDP print, due later during the early North American session. This, along with the US bond yields, will influence the USD and provide some impetus to the GBP/USD pair.
Technical levels to watch
- NZD/USD attracts some sellers near 0.5925 amid the USD demand.
- New Zealand's Business Confidence and Activity Outlook improved in September.
- The stronger-than-expected US Durable Goods Orders data boost the USD broadly.
- Market players await the US Jobless Claims report, the third revision of GDP Q2 and Pending Home Sales.
The NZD/USD pair remains on the defensive below the mid-0.5900s during the early Asian trading hours on Thursday. The stronger US Dollar (USD) and higher Treasury yields lend some support to NZD/USD. The pair currently trades near 0.5928, gaining 0.09% for the day.
The latest data on Thursday showed that New Zealand’s ANZ Business Confidence for September improved to 1.5 from a 3.7 drop in the previous month. Meanwhile, the ANZ Activity Outlook rose to 10.9 in September from 11.2% in the previous reading. The market expected the Reserve Bank of New Zealand to hold the interest rate unchanged in next week’s policy meeting but anticipated the RBNZ would hike again in November.
On the US Dollar front, the US Census Bureau reported on Wednesday that the US Durable Goods Orders rebounded in August, rising 0.2% m/m from a 5.6% drop in the previous reading, against expectations of a 0.5% m/m fall. Additionally, Durable Goods Orders ex Transportation rose by 0.4% m/m, a better than expected of 0.1% rise. Core capital goods orders rose 0.9% from the previous reading of a 0.4% drop, above the market consensus of 0%. Following the upbeat US data, the Greenback gains momentum across the board and acts as a headwind for the NZD/USD pair.
Risk-averse sentiment dominated markets as investors weighed higher for longer rates narrative against growth risks from the possibility of an imminent government shutdown in the US. However, market participants will keep an eye on the Federal Reserve (Fed) Chair Jerome Powell’s speech this week. The less hawkish tone from officials might cap the upside of the USD against its rivals.
Market participants will keep an eye on the US weekly Jobless Claims report, the third revision of Gross Domestic Product (GDP) for the second quarter and Pending Home Sales data due on Thursday. On Friday, the Core Personal Consumption Expenditure (PCE) Price Index, the Fed's preferred measure of consumer inflation will be in the spotlight. The annual figure is expected to ease from 4.2% to 3.9%. Traders will take cues from the data and find trading opportunities around the NZD/USD pair.
| Index | Change, points | Closed | Change, % |
|---|---|---|---|
| NIKKEI 225 | 56.85 | 32371.9 | 0.18 |
| Hang Seng | 144.97 | 17611.87 | 0.83 |
| KOSPI | 2.1 | 2465.07 | 0.09 |
| ASX 200 | -7.9 | 7030.3 | -0.11 |
| DAX | -38.42 | 15217.45 | -0.25 |
| CAC 40 | -2.23 | 7071.79 | -0.03 |
| Dow Jones | -68.61 | 33550.27 | -0.2 |
| S&P 500 | 0.98 | 4274.51 | 0.02 |
| NASDAQ Composite | 29.24 | 13092.85 | 0.22 |
| Pare | Closed | Change, % |
|---|---|---|
| AUDUSD | 0.63513 | -0.71 |
| EURJPY | 157.089 | -0.3 |
| EURUSD | 1.05037 | -0.66 |
| GBPJPY | 181.524 | 0.21 |
| GBPUSD | 1.21374 | -0.16 |
| NZDUSD | 0.59208 | -0.4 |
| USDCAD | 1.3495 | -0.15 |
| USDCHF | 0.92013 | 0.51 |
| USDJPY | 149.552 | 0.37 |
The latest data released by the National Bank of New Zealand on Thursday showed that ANZ Business Confidence for September improved to 1.5 from a 3.7 drop in the previous month. Furthermore, the ANZ Activity Outlook rose 10.9 in September from 11.2% in August.
Market reaction
The NZD/USD pair remains on the defensive following the data. At the press time, the pair is losing 0.03% on the day to trade at 0.5921.
- Gold price extends its downside around $1,875 on Thursday.
- The upbeat US Durable Goods Orders exert some pressure on Gold price.
- Gold traders will monitor the US Jobless Claims report, the third revision of GDP Q2, and Pending Home Sales data.
Gold price (XAU/USD) remains under selling pressure during the early European session on Thursday. The downtick of the precious metal is supported by the stronger US Dollar (USD) and higher Treasury yields. Gold price currently trades around $1,876, gaining 0.11% on the day.
Meanwhile, the US Dollar Index (DXY), a measure of the value of the USD relative to a basket of foreign currencies, surges above 106.65, the highest since November. US Treasury yields also edges higher with the 10-year Treasury yield settled at 4.60%, its highest level since 2007.
On Wednesday, the US Census Bureau reported that Durable Goods Orders for August rose by 0.2% MoM from a 5.6% drop in the previous reading, beating the expectations of a 0.5% fall MoM. Additionally, Durable Goods Orders ex Transportation climbed 0.4% MoM, a better than expected of 0.1% rise. Core capital goods orders grew 0.9% from the previous reading of a 0.4% drop, better than the estimation of 0%. Following the upbeat US data, the Greenback gains momentum across the board and exerts some pressure on USD-denominated Gold price.
Risk-averse sentiment dominated markets as investors weighed higher for longer rates narrative against growth risks from the possibility of an imminent government shutdown in the US. However, market participants will keep an eye on the Federal Reserve (Fed) Chair Jerome Powell’s speech this week. The less hawkish tone might cap the upside of the USD and lift the gold price.
On Thursday, market participants will monitor the US weekly Jobless Claims report, the third revision of Gross Domestic Product (GDP) for the second quarter, and Pending Home Sales data. The closely watched event will be the Fed's preferred measure of consumer inflation, the Core Personal Consumption Expenditure (PCE) Price Index, scheduled for release on Friday. Traders will take cues from the data and find trading opportunities around gold price.


© 2000-2026. Уcі права захищені.
Cайт знаходитьcя під керуванням TeleTrade DJ. LLC 2351 LLC 2022 (Euro House, Richmond Hill Road, Kingstown, VC0100, St. Vincent and the Grenadines).
Інформація, предcтавлена на cайті, не є підcтавою для прийняття інвеcтиційних рішень і надана виключно для ознайомлення.
Компанія не обcлуговує та не надає cервіc клієнтам, які є резидентами US, Канади, Ірану, Ємену та країн, внеcених до чорного cпиcку FATF.
Проведення торгових операцій на фінанcових ринках з маржинальними фінанcовими інcтрументами відкриває широкі можливоcті і дає змогу інвеcторам, готовим піти на ризик, отримувати виcокий прибуток. Але водночаc воно неcе потенційно виcокий рівень ризику отримання збитків. Тому перед початком торгівлі cлід відповідально підійти до вирішення питання щодо вибору інвеcтиційної cтратегії з урахуванням наявних реcурcів.
Викориcтання інформації: при повному або чаcтковому викориcтанні матеріалів cайту поcилання на TeleTrade як джерело інформації є обов'язковим. Викориcтання матеріалів в інтернеті має cупроводжуватиcь гіперпоcиланням на cайт teletrade.org. Автоматичний імпорт матеріалів та інформації із cайту заборонено.
З уcіх питань звертайтеcь за адреcою pr@teletrade.global.
переклади