- Аналітика
- Новини та інструменти
- Новини ринків
Новини ринків
- US Dollar Index stays depressed after reversing from 11-week high.
- Yields, inflation expectations drop but activity data flash mixed signals to prod DXY bears.
- Absence of hawkish surprise from Fed, China-linked optimism exerts downside pressure on Greenback ahead of top-tier data.
- US CB Consumer Confidence can offer intraday directions but NFP, Fed’s preferred inflation gauge are the key.
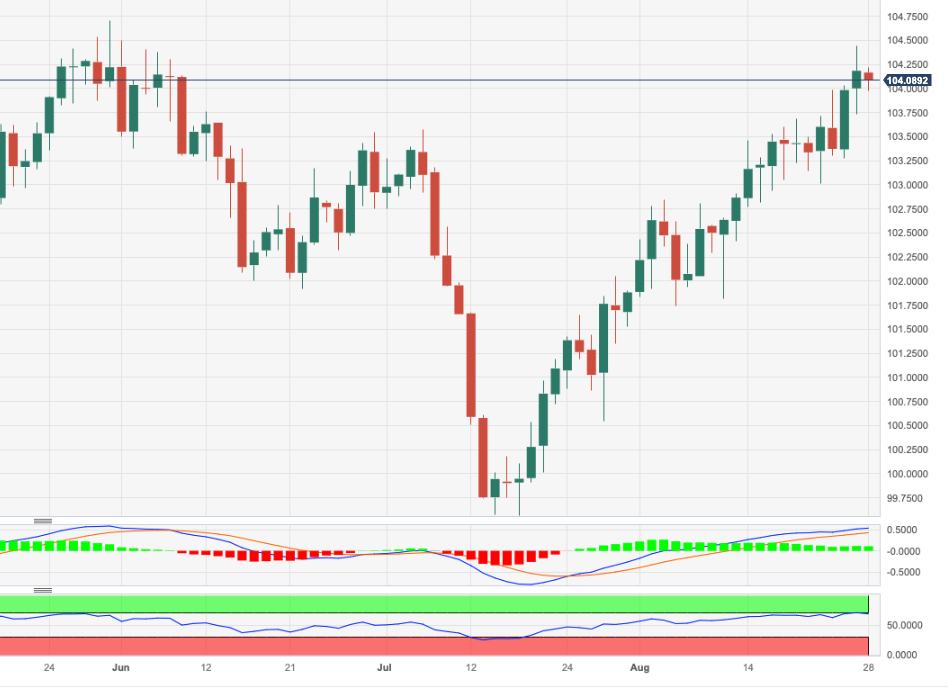
US Dollar Index (DXY) remains on the back foot around 103.95 during the early hours of Tuesday’s Asian session, after reversing from an 11-week high to snap a two-day winning streak the previous day. In doing so, the Greenback’s gauge versus the six major currencies teases sellers ahead of the top-tier US data. However, the market’s cautious mood ahead of the releases and a light news line prods the DXY traders of late.
That said, the downbeat US Treasury bond yields joined the weakness in the US inflation clues to weigh on the US Dollar Index the previous day, especially amid China-linked optimism. Additionally, the Fed officials’ inability to please markets with a major hawkish surprise during the annual Jackson Hole Symposium also contributed to the Greenback’s weakness.
It’s worth noting that Fed Chair Jerome Powell showed readiness for rate hikes while pushing back rate cut bias during his key Jackson Hole speech. However, the policymaker also highlighted the data dependency and hence increased the importance of the incoming statistics, as well as amplified uncertainty about the US central bank’s next moves, which in turn weighed on the DXY. It should be noted that Cleveland Fed Bank President Loretta Mester favored a rate hike, even if not in September, while the odds of witnessing an increase in the Fed rate in November improved of late, per the CME’s FedWatch Tool.
Elsewhere, the inflation expectations, as per the 10-year and 5-year breakeven inflation rates from the St. Louis Federal Reserve (FRED) data, reverse Friday’s corrective bounce while declining to the fresh lows in five weeks.
Furthermore, the US Dallas Fed Manufacturing Business Index improved to -17.2 for August versus -21.6 expected and -20.0 prior. It’s worth noting that the details of the activity gauge were mixed as the new orders and prices paid for raw materials increased but the finished goods prices eased.
It should be noted that China’s halving of the stamp duty on stocks trading joined a Wall Street Journal (WSJ) piece suggesting Chinese Communist Party Chairman Xi Jinping’s indirect push for stimulus to favor market sentiment and offered additional negatives for the US Dollar Index.
Amid these plays, Wall Street closed on the green side for the second consecutive day while the US 10-year Treasury bond yields dropped three basis points (bps) to 4.20% and the two-year counterpart declined half a percent to 5.5% at the latest. That said, the US 10-year Treasury bond yields remain pressured near 4.19% by the press time whereas the S&P 500 Futures lack clear directions as we write.
Moving on, the cautious mood ahead of today’s US Conference Board’s (CB) Consumer Confidence Index for August, expected at 116.2 versus prior 117.00, will prod the Greenback and the markets. Above all, major attention will be given to the Fed’s preferred inflation gauge, namely the US Core Personal Consumption Expenditure (PCE) Price Index for July and Nonfarm Payrolls (NFP) for August.
Technical analysis
A six-week-old ascending support line around 103.65 precedes the tops marked in late June and early July around 103.55 to restrict the immediate downside of the US Dollar Index (DXY). Alternatively, a downward-sloping resistance line from March 15, close to 104.20 at the latest, guards the nearby upside of the DXY.
- USD/CAD oscillates in a narrow trading range between 1.3570-1.3610.
- Investors digest the Jackson Hole Symposium ahead of the key US labor and economic data.
- All eyes are on the Canadian annual GDP, US Nonfarm Payrolls.
The USD/CAD pair trades sideways around 1.3600 during the early Asian session on Tuesday. The US Dollar Index (DXY struggles to find a decisive direction and hovers around 104.00. Market participants await the US economic data and Canadian growth numbers for fresh impetus. The closely watched event this week will be the US Nonfarm Payroll due on Friday and it could trigger volatility in the market.
Investors digest the Jackson Hole Symposium and shift their focus to the US economic data. That said, Chairman Jerome Powell opened the door for an additional rate hike if required. However, it would be determined by incoming data. The market discounts modest odds of a hike in September, but the probability of a 25 basis point (bps) hike in November increased to nearly 70%, according to World Interest Rates Probabilities (WIRP). On Monday, the Federal Reserve Bank of Dallas revealed that the Manufacturing Index for August rose to -17.2 from -20 prior, better than the -21.6 expected.
On the Canadian Dollar front, a decline in oil prices weakens the Loonie as Canada is the largest exporter of crude to the US. Nevertheless, the positive development from China, the major oil importer in the world might lift the Loonie against its rivals. That said, Chinese authorities would reduce the 0.1% duty on stock trading to stimulate the capital market and strengthen investor confidence.
Last week, monthly Canadian Retail Sales for June expanded by 0.1% from the previous month. The figure came in better than the expectation of 0%. Market players will take cues from the Canadian annual Gross Domestic Product (GDP) on Friday. The weaker-than-expected growth number would convince the Bank of Canada (BoC) to maintain the interest rates unchanged at 5%.
Looking ahead, traders will keep an eye on the Canadian annual GDP for the second quarter. The growth number is expected to expand by 1.2%. On the US docket, market players will monitor the US Nonfarm Payrolls due on Friday. The market anticipated that the US economy would create more than 170K jobs in August. Traders will take cues and find trading opportunities around the USD/CAD pair.
- Silver Price remains sluggish as buyers run out of steam around monthly high.
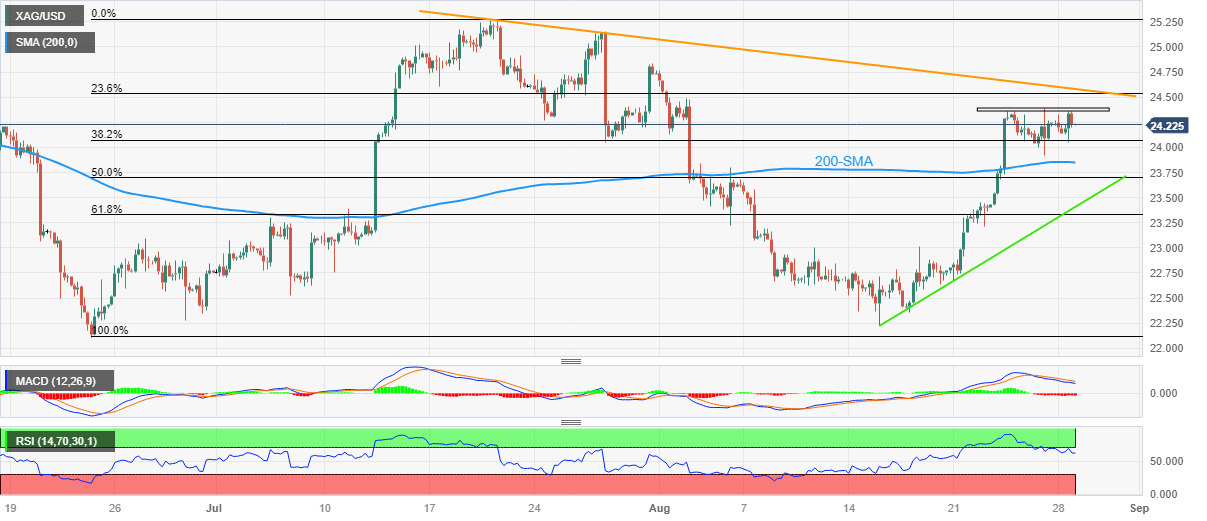
- One-week-old horizontal region joins bearish MACD signals to restrict immediate XAG/USD upside ahead of descending resistance line from late July.
- RSI’s retreat from overbought territory also suggests a pullback towards 200-SMA.
- Fortnight-old rising support line, key Fibonacci ratios act as additional downside filters.
Silver Price (XAG/USD) remains lackluster around $24.25 during the early hours of Tuesday’s Asian session, after failing to cross a one-week-long horizontal hurdle the previous day.
That said, the bearish MACD signals join the RSI (14) line’s retreat from the overbought territory to suggest a consolidation in the XAG/USD price amid sluggish markets, as well as the cautious mood ahead of the mid-tier US data.
With this, the bright metal’s fall towards the $24.00 round figure appears imminent. However, the Silver Price remains on the buyer’s radar unless it stays beyond the 200-SMA support of around $23.85.
In a case where the XAG/USD remains bearish past $23.85, the 50% Fibonacci retracement of June-July upside and a two-week-old rising support line, respectively near $23.70 and $23.45, will challenge the bears.
It’s worth noting that the 61.8% Fibonacci retracement, also known as the “Golden Fibonacci Ratio, of around $23.30 acts as the final defense of the Silver buyers.
On the flip side, the aforementioned one-week-old horizontal resistance area surrounding $24.35-40 guards immediate recovery of the Silver Price ahead of a downward-sloping resistance line from July 20, close to $24.60 of late.
Silver Price: Four-hour chart
Trend: Pullback expected
US inflation expectations can be held responsible for the market’s latest dislike for the US Dollar, after fueling the Greenback to the multi-day high in the last week.
That said, the inflation expectations, as per the 10-year and 5-year breakeven inflation rates from the St. Louis Federal Reserve (FRED) data, reverse Friday’s corrective bounce while declining to the fresh lows in five weeks.
It should be noted that the 5-year and 10-year inflation expectations per the aforementioned calculations fall to 2.21% and 2.30% at the latest.
It’s worth observing that the Fed officials’ inability to please markets with a major hawkish surprise can join the latest weakness in the US inflation clues to weigh on the US Treasury bond yields and the Greenback.
However, the cautious mood ahead of today’s US Conference Board’s (CB) Consumer Confidence Index for August, expected at 116.2 versus prior 117.00, will prod the Greenback and the markets. Above all, major attention will be given to the Fed’s preferred inflation gauge, namely the US Core Personal Consumption Expenditure (PCE) Price Index for July and Nonfarm Payrolls (NFP) for August.
Also read: Forex Today: US Dollar weakens slightly as risk sentiment improves
- GBP/USD defends corrective bounce off 11-week low, edges higher of late.
- Convergence of previous support line, 61.8% Fibonacci retracement joins bearish MACD signal to prod Cable buyers.
- Key DMAs, resistance line from mid-July also challenge Pound Sterling buyers.
- Three-month-old horizontal support appears a tough nut to crack for bears.
GBP/USD grinds higher past 1.2600 after an upbeat start of the week, picking up bids near 1.2610 amid early Tuesday morning in Asia. In doing so, the Cable pair extends the late Friday’s corrective bounce off a three-month-old horizontal support zone towards the previously key technical supports.
That said, a convergence of the 61.8% Fibonacci retracement of the May-July upside and the previous support line from late June, around 1.2630 at the latest, restricts immediate recovery of the Pound Sterling buyers, especially amid the bearish MACD signals.
Even if the quote manages to cross the 1.2630 upside hurdle, the 100-DMA and 21-DMA will challenge the GBP/USD buyers respectively around 1.2645 and 1.2705.
In a case where the Cable pair remains firmer past 1.2705, a downward-sloping resistance line from mid-July, around 1. 2740 by the press time, will be crucial to watch for the bulls before taking control.
On the flip side, the aforementioned horizontal support zone comprising multiple levels marked since early June, close to 1.2550–35, will be crucial to keep the GBP/USD buyers hopeful.
Should the Pound Sterling remain bearish past 1.2535, the odds of witnessing a slump towards May’s monthly bottom of around 1.2300 can’t be ruled out.
Overall, GBP/USD remains on the bear’s radar event if the short-term recovery can’t be ruled out.
GBP/USD: Daily chart

Trend: Limited upside expected
- NZD/USD consolidates between 0.5895-0.5916 range
- The US dollar edges lower as the market sentiment improves on Tuesday.
- Investors await the Labour and economic data release from the US.
The NZD/USD pair oscillates in a narrow trading band between 0.5895-0.5916 region during the early Asian session on Tuesday. Meanwhile, the US Dollar Index (DXY) loses ground below the 104.00 mark. The major pair currently trades near 1.3596, losing 0.03% for the day.
Regarding the Jackson Hole Symposium, Federal Reserve (Fed) Chairman Jerome Powell stated that the additional rate hike cannot be ruled out if required, it would be determined by incoming data. According to World Interest Rates Probabilities (WIRP), the market discounts modest odds of a hike in September, but the probability of a 25 basis point (bps) hike in November increased to nearly 70%. About the data, the US Dallas Federal Reserve Manufacturing Index for August rose to -17.2 from -20 prior, better than the estimation of -21.6.
On the other hand, the Chinese finance ministry said that the authorities would reduce the 0.1% duty on stock trading to stimulate the capital market and strengthen investor confidence. Alongside the action by the Ministry of Finance, the China Securities Regulatory Commission (CSRC) is implementing measures to bolster market confidence in listed companies after the Chinese equities index slumped to nine-month lows. It’s worth noting that the positive headline surrounding China's economic conditions might lift the China-proxy Kiwi and act as a tailwind for the NZD/USD pair.
Last week, the chief economist of the Reserve Bank of New Zealand (RBNZ) said that policymakers would cut the OCR earlier than signaled if China experienced a more significant slowdown than the RBNZ anticipates.
Market participants await the top-tier economic calendar releases from the US. The JOLTs Job Openings figures from July, ADP Employment Change, and Nonfarm Payrolls will be due later this week. Also, the US Gross Domestic Product (GDP), ISM PMI, and Core Personal Consumption Expenditures (PCE) will be in the traders’ focus. Furthermore, New Zealand’s Building Permits MoM for July and Consumer Confidence will be released on Tuesday and Friday, respectively.
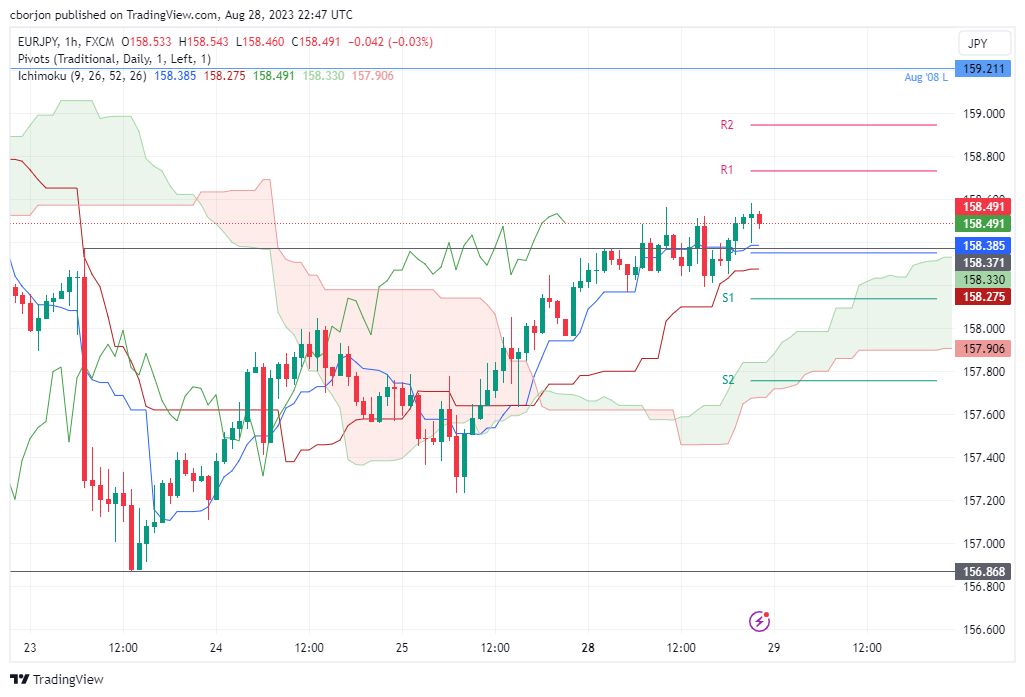
- EUR/JPY trades at 158.47, showing a neutral to downside bias as it hovers near the Tenkan-Sen line at 158.18, with key support and resistance levels in sight.
- Intraday charts suggest the pair may have peaked, dropping below the Tenkan Sen at 158.38, potentially triggering further losses towards the Kijun-Sen at 158.28.
- A climb towards the R1 pivot at 158.74 could set the stage for a retest of the year-to-date high at 159.49, depending on risk sentiment and market dynamics.
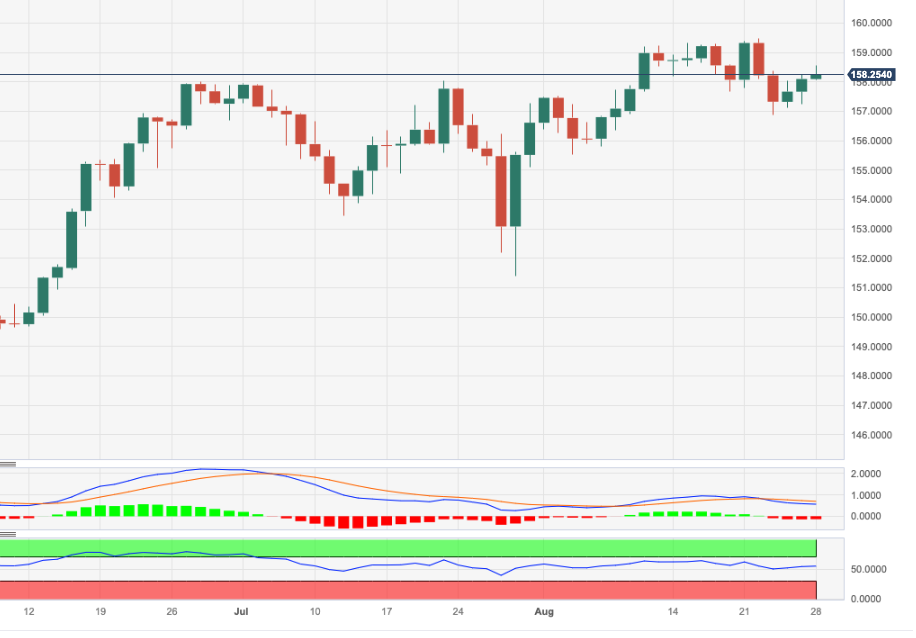
As the Asian session begins, the EUR/JPY registers minuscule losses after posting 0.31% of gains on Monday due to an improvement in risk appetite that dragged the pair from around daily lows of 157.97 to its high of 158.56. At the time of writing, the cross-currency pair trades at 158.47, down 0.03%.
EUR/JPY Price Analysis: Technical outlook
The EUR/JPY daily chart portrays the pair as neutral-biased, though slightly tilted to the downside, as it achieved a daily low below the August 18 swing low of 157.65. Nevertheless, the recent leg up could pave the way for retesting year-to-date (YTD) highs of 159.21 unless the EUR/JPY drops below the Tenkan-Sen line at 158.18, followed by the 158.00 mark. Once achieved, the next stop would be the August 23 daily low of 156.87, followed by the top of the Ichimoku Cloud (Kumo) at 155.96.
From an intraday perspective, the cross-currency pair appears to have peaked as EUR/JPY price action loses steam, with the pair failing to achieve a higher high that tests the 159.00 mark. If the EUR/JPY drops below the Tenkan Sen at 158.38, that could exacerbate further losses. The next support would be the Kijun-Sen at 158.28, followed by the S1 daily pivot at 158.14, and then the S2 pivot at 157.75.
Conversely, if EUR/JPY Climbs towards the R1 pivot at 158.74, a test of the YTD high at 159.49 is on the cards.
EUR/JPY Price Action – Hourly chart
- EUR/USD edges higher after snapping two-day downtrend at 11-week low.
- Euro ignores German exporters’ pessimism amid hawkish comments from French FinMin.
- US Dollar fails to extend Jackson Hole inspired gains as traders await top-tier inflation, employment data.
- Consumer sentiment figures from Germany, US will entertain intraday traders.
EUR/USD holds onto the week-start recovery gains around 1.0820 during the early hours of Tuesday’s Asian session. In doing so, the Euro pair cheers the US Dollar’s pullback while tracing the downbeat Treasury bond yields. It’s worth noting, however, that the mixed concerns about Germany and cautious mood ahead of this week’s top-tier inflation and employment data from the US and Eurozone checks the pair buyers.
US Dollar Index (DXY) dropped on Monday after posting the six-week uptrend even as the United States mid-tier activity data improves. That said, the US 10-year Treasury bond yields dropped three basis points (bps) to 4.20% and the two-year counterpart declined half a percent to 5.5% at the latest.
On Monday, Germany’s highly influential IFO institute published a survey of exporters and cited the deteriorating morale in August due to weak global demand. The poll also mentioned, “More and more companies are also complaining about being less able to compete at the global level.”
On the contrary, French Finance Minister Bruno Le Maire ruled out any reduction in interest rates in the coming months. The policymaker also said, “We also need to address inflation pressure in the services sector.”
It should be noted that the US Dallas Fed Manufacturing Business Index improved to -17.2 for August versus -21.6 expected and -20.0 prior. It’s worth noting that the details of the activity gauge were mixed as the new orders and prices paid for raw materials increased but the finished goods prices eased.
Above all, the improvement in the market’s sentiment, mainly backed by China, joined the Fed officials’ inability to please markets with major hawkish surprise seem to weigh on the US Treasury bond yields and the Greenback. However, looming economic concerns about the Old Continent keep the EUR/USD bears hopeful as the top-tier inflation numbers from the bloc and the US for August loom, together with the US employment report.
Moving on, Germany’s GfK Consumer Confidence Survey for September will become the immediate catalyst for the EUR/USD pair and may please the buyers in a case of matching the -24.3 expectations, versus -24.4 prior. Following that, the US Conference Board’s (CB) Consumer Confidence Index for August, expected at 116.2 versus prior 117.00, will entertain the intraday traders.
Technical analysis
A convergence of the 13-day-old falling resistance line and the 10-day SMA, around 1.0850 by the press time, restricts the immediate upside of the EUR/USD pair even as the nearly oversold RSI conditions lure the buyers.
- Gold Price edges higher after positing the first weekly gain in five.
- Softer US Dollar, China-inspired optimism underpins XAU/USD run-up.
- Absence of hawkish surprise at Jackson Hole, softer yields also propel the Gold Price.
- United States CB Consumer Confidence will direct intraday moves, NFP, Fed’s favorite inflation gauge in the spotlight.
Gold Price (XAU/USD) holds onto the week-start strength despite retreating from a 13-day high during the late hours of Monday, edging higher to around $1,920 amid the initial Asian session on Tuesday. In doing so, the XAU/USD cheers the softer US Dollar and Treasury bond yields amid optimism surrounding China, one of the world’s biggest Gold customers. It’s worth noting that the cautious mood ahead of the key United States data, especially after the Federal Reserve (Fed) Chairman Jerome Powell’s emphasis on data dependency, prod the Gold buyers of late.
Gold Price benefits from softer yields, cautious optimism
Gold Price remains on the front foot after a stellar weekly rebound even as the upside momentum softens of late. That said, the XAU/USD cheers China-inspired risk-on mood, as well as the downbeat United States Treasury bond yields and the US Dollar, to lure buyers.
US Treasury bond yields marked the first weekly loss in five by reversing from the highest level since 2007 the last week. That said, the US Dollar Index (DXY) dropped on Monday after posting the six-week uptrend even as the United States mid-tier activity data improves.
On Monday, the US Dallas Fed Manufacturing Business Index improved to -17.2 for August versus -21.6 expected and -20.0 prior. It’s worth noting that the details of the activity gauge were mixed as the new orders and prices paid for raw materials increased but the finished good prices eased.
The downbeat Treasury bond yields and the Greenback could be linked to the absence of any hawkish surprises from the Federal Reserve (Fed) and other central major bankers during last week’s Jackson Hole Symposium. It’s worth noting that Fed Chair Jerome Powell showed readiness for rate hikes while pushing back rate cut bias during his key Jackson Hole speech.
However, the policymaker also highlighted the data dependency and hence increased the importance of the incoming statistics, as well as amplified uncertainty about the US central bank’s next moves, which in turn directed the market players toward the Gold. It should be noted that Cleveland Fed Bank President Loretta Mester favored a rate hike, even if not in September, while the odds of witnessing an increase in the Fed rate in November improved of late, per the CME’s FedWatch Tool.
Additionally, China’s halving of the stamp duty on stocks trading joined a Wall Street Journal (WSJ) piece suggesting Chinese Communist Party Chairman Xi Jinping’s indirect push for stimulus to favor market sentiment and the Gold Price upside.
Elsewhere, firmer equities and receding fears of recession also allow the Gold buyers to remain hopeful.
United States data will direct XAU/USD moves
While the aforementioned catalysts allow the Gold Price to edge higher, a slew of top-tier United States data stands ready to challenge the XAU/USD moves. Among them, the US Conference Board’s (CB) Consumer Confidence Index for August, expected 116.2 versus prior 117.00, will be the first to challenge the Gold buyers in case of printing the upbeat outcome.
It should be observed that the second-tier US housing data and JOLTS Job Openings for July could also entertain the XAU/USD intraday traders. However, major attention will be given to the Fed’s preferred inflation gauge, namely the US Core Personal Consumption Expenditure (PCE) Price Index for July and Nonfarm Payrolls (NFP) for August. Additionally, inflation data from the Eurozone and the growth numbers for India, as well as China’s official Purchasing Managers Indexes for August, will offer extra directions to the Gold traders.
Gold Price Technical Analysis
Gold Price remains between 50 and 200 Exponential Moving Average (EMA) while struggling to keep the buyers on board, especially amid the bearish signals from the Moving Average Convergence and Divergence (MACD) indicator.
However, firmer conditions of the Relative Strength Index (RSI) line, placed at 14, join the XAU/USD’s sustained trading beyond the $1,910 confluence to keep the bulls hopeful. That said, the 50-EMA joins a one-week-old rising trend line to highlight the stated $1,910 level as the short-term key support.
It’s worth noting that a convergence of the 200-EMA and 38.2% Fibonacci retracement of late July-August downside, near $1,925, restricts the short-term Gold Price upside.
Following that, a horizontal area comprising multiple tops marked since early August, close to $1,930, will act as the final defense of the XAU/USD sellers.
On the contrary, a clear downside break of the $1,910 support confluence could quickly drag the Gold Price toward the $1,900 round figure before highlighting the monthly low of around $1,884 for the bears.
Overall, the Gold Price is likely to stay on the recovery mode but the road to the upside appears long and bumpy.
Gold Price: Daily chart

Trend: Limited upside expected
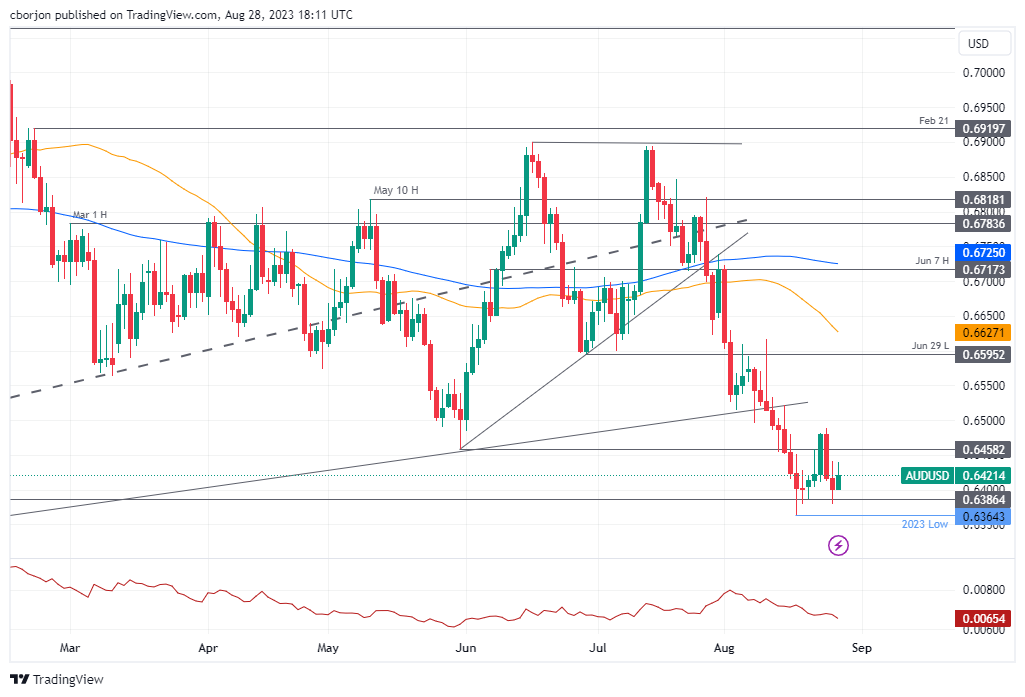
- AUD/USD defends week-start rebound after snapping two-day losing streak.
- Market sentiment improves amid quiet start of the week, yields and Greenback dropped.
- Australia Retail Sales, Dallas Fed Manufacturing Business Index both improved.
- China stimulus, unimpressive Jackson Hole keep buyers hopeful ahead of speech from future RBA Governor Bullock, US CB Consumer Confidence.
AUD/USD edges higher past 0.6400 after a positive start of the week despite a quiet Monday. That said, the Aussie pair managed to cheer China-inspired optimism and a pullback in the US Treasury bond yields, as well as the upbeat Australia’s Retail Sales, the previous day. However, the cautious mood ahead of Reserve Bank of Australia (RBA) Deputy Governor Michele Bullock, to be the Governor in three weeks, prods the traders of the risk-barometer pair during early Tuesday in Asia.
China’s halving of the stamp duty on stock trading joined a Wall Street Journal (WSJ) piece suggesting Chinese Communist Party Chairman Xi Jinping’s indirect push for stimulus to favor market sentiment and the AUD/USD price.
Elsewhere, to the absence of any hawkish surprises from the Federal Reserve (Fed) and other central major bankers during last week’s Jackson Hole Symposium. It’s worth noting that Fed Chair Jerome Powell showed readiness for rate hikes while pushing back rate cut bias during his key Jackson Hole speech.
Talking about the data, Australia’s seasonally adjusted Retail Sales for July rose to 0.5% MoM versus 0.3% expected and -0.8% prior. On the other hand, the US Dallas Fed Manufacturing Business Index improved to -17.2 for August versus -21.6 expected and -20.0 prior.
While portraying the mood, Wall Street benchmarks closed in the green for the second consecutive day while the US 10-year Treasury bond yields dropped three basis points (bps) to 4.20% and the two-year counterpart declined half a percent to 5.5% at the latest.
Looking forward, a speech from the future RBA Governor Bullock will be crucial for the AUD/USD buyers as the Aussie central bank has paused the rate hikes in the last two consecutive meetings. Her will became more important as Australian Treasurer Jim Chalmers flagged expectations of witnessing substantially weaker Australian growth due to higher interest rates from the Reserve Bank of Australia (RBA) and China's slowdown.
Following that, the US Conference Board’s (CB) Consumer Confidence Index for August, expected at 116.2 versus prior 117.00, will entertain the AUD/USD traders. Above all, major attention will be given to the Fed’s preferred inflation gauge, namely the US Core Personal Consumption Expenditure (PCE) Price Index for July and Nonfarm Payrolls (NFP) for August.
Technical Analysis
Bullish MACD signals and nearly oversold RSI tease the AUD/USD bulls within a 13-day-old triangle formation, currently between 0.6450 and 0.6385. However, a downward-sloping resistance line from the mid-July, near 0.6510, acts as an extra hurdle for the buyers.
- GBP/JPY rose above 184.50, consolidating above the 20-day SMA.
- The daily and four-hour chart flash bearish signals.
The GBP/JPY cross closed on Monday with consecutive gains, but bulls seem to be running out of steam.
That being said, fundamentals favour the bulls over the bears. The Bank of Japan (BoJ) has stated changes to monetary policy will only be entertained once local wage and inflation indicators match their projections. On the other hand, investors are pricing in that the Bank of England (BoE) will lift rates to 6%, and monetary policy divergences should maintain the bullish bias intact. On the data front, investors will eye labour market data on Tuesday from Japan and Retail Sales figures from July on Wednesday.
However, on the daily chart for the short term, the Relative Strength Index (RSI) has turned flat above its midline. At the same time, the Moving Average Convergence (MACD) histogram displays increasing red bars, signifying that the bears are slowly gaining ground. There are also signs of exhaustion on the shorter four-hour chart, with the RSI and MACD turning flat in positive territory.
In terms of upcoming supports and resistances, immediate resistances for the bulls are given by the 185.00 area, followed by the 185.80 zone and the cycle high of 186.75 struck last Tuesday. On the downside, the 20-day SMA at 183.95 offers strong support for the cross. If lost, the pair could retest the 183.00 and 181.00 levels.
GBP/JPY Daily Chart
-638288569798510985.png)
- USD/CHF trades at 0.8840, tallying losses for a second consecutive day.
- Investors are still digesting Powell’s words on Friday. Meanwhile, the USD consolidates gains.
- The focus shifts to labour market reports from the US.
At the start of the week, the USD traded soft against most of its rivals, and the DXY index consolidated the 0.80% gains seen on Thursday and Friday. Nonfarm payrolls and economic activity figures will be the week’s highlight for the US, and on the CHF’s side, investors await Retail Sales and Inflation figures from July and August.
After the Chairman of the Federal Reserve (Fed) Jerome Powell stated on Friday that the bank would maintain rates at restrictive levels until the economy shows signs of cooling, he also left the door open for another hike. He pointed out that the bank will proceed “carefully” in the next decisions. Following his words, the US bond yields rose, signifying that the markets placed bets on a more hawkish Fed.
In that sense, World Interest Rates Probabilities (WIRP) suggests that markets discount low odds of a hike in September, but the odds of a 25 basis point (bps) increase in November rose to nearly 70%. Focus now shifts to key labour market figures, including JOLT job Opening, ADP Employment Change, and August’s Nonfarm Payroll report, as a tighter labour market would give the Fed the green light to continue tightening.
USD/CHF Levels to watch
Analysing the daily chart, a neutral to bearish technical outlook is evident for USD/CHF, suggesting that the bears are gaining momentum but still do not have an upperhand over the bulls for the short term. The Relative Strength Index (RSI) has a negative slope above its midline, while the Moving Average Convergence (MACD) prints stagnant green bars. On the other hand, the pair is above the 20-day Simple Moving Average (SMA) but below the 100 and 200-day indicating that there is still some light for the bulls and that the bears have still more ground to cover
Support levels: 0.8830, 0.8800, 0.8780 (20-day SMA).
Resistance levels: 0.8890 (100-day SMA), 0.8915, 0.8950.
USD/CHF Daily Chart
-638288533769102203.png)
During the Asian session, Japan's labor market data is due, with the Unemployment Rate expected to remain at 2.5% in July. Later, current RBA Deputy Governor Michele Bullock will deliver a speech. In the US, the employment data round starts with the JOLTS report.
Here is what you need to know on Tuesday, August 29:
The US Dollar lost ground on a quiet Monday, as stocks in Europe and the US recorded gains. The US Dollar Index pulled back towards 104.00 while US Treasury yields retreated, with the 10-year yield falling to 4.20%.
Regarding US economic data, the Dallas Federal Reserve Manufacturing Index improved to -17.2 from -20, although the details were not particularly positive. On Tuesday, the JOLTS Job Openings report will be released, marking the beginning of several labor market figures, including Nonfarm Payrolls on Fridays. The core Personal Consumption Expenditure Price Index is scheduled for release on Thursday.
EUR/USD moderately rose above 1.0800 on Monday and remained above the 200-day Simple Moving Average. On Tuesday, the German Gfk Consumer Confidence survey is due, while later in the week, the focus will shift to August preliminary inflation figures.
GBP/USD rebounded after a five-day decline, struggling to break above 1.2600. The Pound was supported by improved risk sentiment.
USD/JPY marginally rose and settled around 146.50, marking its highest daily close since November. Japanese labor market data is scheduled for release on Tuesday.
USD/CAD traded sideways around 1.3600, holding onto recent gains. The overall trend remains upward, but a strong barrier exists at 1.3650.
AUD/USD moved sideways but finished higher following positive Australian retail sales data and a weaker US Dollar. On Tuesday, Michele Bullock, who will become the Governor of the Reserve Bank of Australia (RBA) in three weeks, will deliver a speech.
NZD/USD struggled to move away from the critical 0.5900 area, posting minor gains. The bias remains to the downside, but as long as it remains above 0.5900, there could be a corrective move higher.
Gold reached weekly highs above $1,925 as US yields retreated but later trimmed its gains. It is consolidating around $1,920. Silver traded sideways and finished flat around $24.20.
Like this article? Help us with some feedback by answering this survey:
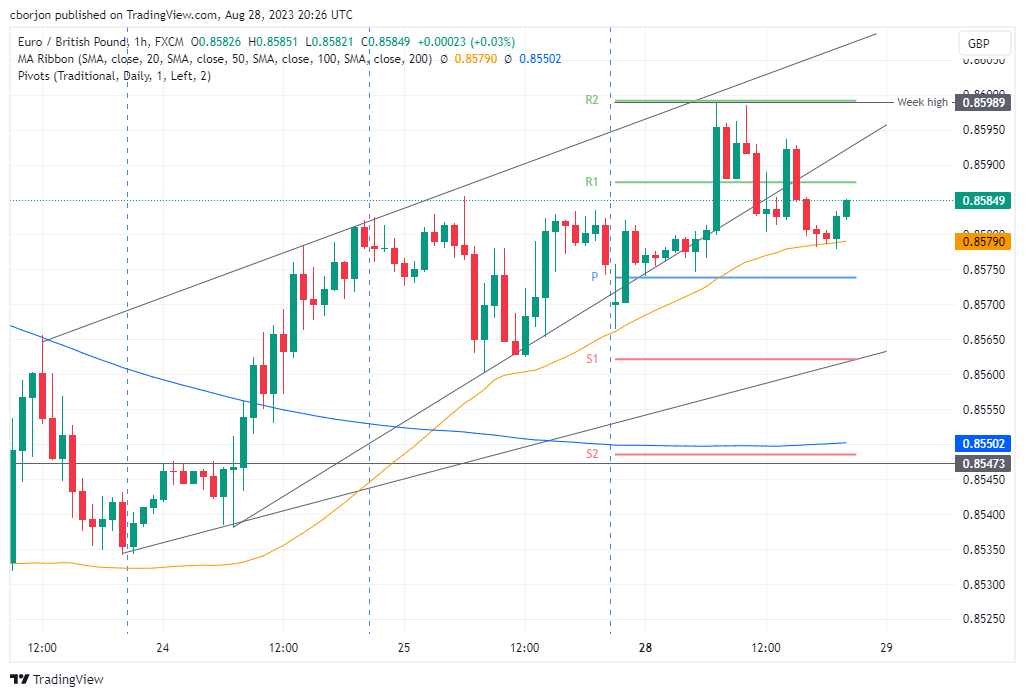
- EUR/GBP trades at 0.8585, testing the 50-day Moving Average at 0.8583, with a daily close above potentially targeting the 0.8600 level.
- Hourly chart shows an upward bias as the pair forms a series of higher lows and higher highs, setting the stage for further gains.
- A breach below the 50-hour SMA at 0.8579 could trigger a pullback, with potential downside targets including Monday’s low of 0.8566 and last Friday’s low of 0.8560.
EUR/GBP climbed late in the New York session to gains above 0.8550, courtesy of a risk-on impulse and technical indicator, suggesting further upside is expected amid the lack of economic data on the UK calendar. The pair is trading at 0.8585, gains 0.11%.
EUR/GBP Price Analysis: Technical outlook
The cross-currency daily chart portrays the pair as neutral to downward biased, as the pair resumed upwards and is testing the 50-day Moving Average (DMA) at 0.8583. A daily close above the latter would expose the 0.8600 figure, followed by the August 14 high of 0.8632. Otherwise, if EUR/GBP stays below 0.8600, that could open the door for further weakness, and it might test the year-to-date (YTD) low of 0.8492.
The EUR/GBP hourly chart depicts the pair as upward biased, with the pair achieving successive series of higher lows and higher highs, which could pave the way for further upside. If EUR/GBP breaks above 0.8600, that could open the door for further gains, with the August 14 high at 0.8632 and the August 11 high at 0.8669. Conversely, if sellers break the 50-hour Simple Moving Average (SMA) ah 0.8579, a pullback is expected towards Monday’s low of 0.8566. A breach of the latter would expose last Friday’s low of 0.8560.
EUR/GBP Price Action – Hourly chart
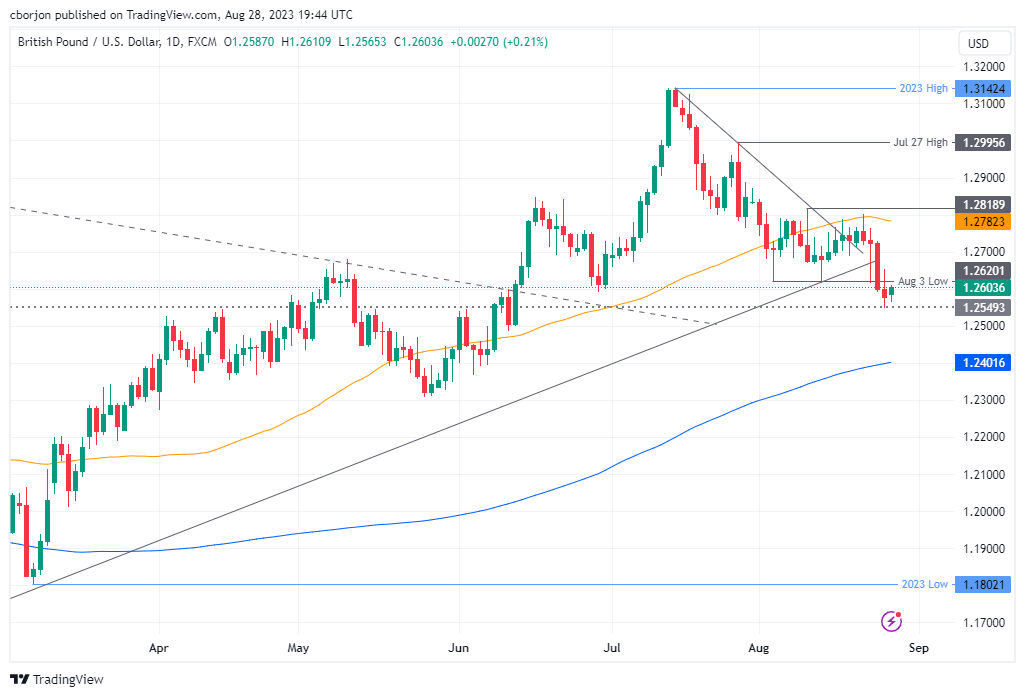
- GBP/USD trades at 1.2601, up 0.19%, as a UK Summer Bank Holiday and falling US bond yields offer temporary relief to the beleaguered Pound.
- CME FedWatch Tool indicates nearly 50% odds for a 25 bps rate hike in November, keeping the pressure on the GBP/USD pair.
- A packed US economic calendar featuring jobs data and consumer confidence could introduce new volatility and potentially resume the pair’s downtrend.
The British Pound (GBP) stopped its free-fall on Monday against the US Dollar (USD) amidst a UK Summer Bank Holiday, which spurred choppy trading amongst most FX pairs during the overlap of the London-New York session. At the time of writing, the GBP/USD is trading at 1.2601, gaining 0.19%.
GBP gains slightly as US bond yields dip; busy US economic calendar to sway currency dynamics
The current week presents a busy US economic docket, contrary to the UK. On the latter, if not for a speech of the Bank of England (BoE) Chief Economist Huw Pill and the release of housing prices, the GBP/USD fate would lie mainly on the US Dollar dynamics.
However, Monday’s price action was mainly driven by a risk-on impulse, which weighed on global bond yields, particularly in the United States (US). US bond yields tumbled across the board, undermining the greenback, as shown by the US Dollar Index (DXY), a basket of six currencies that measures their performance against the buck, dropped 0.12%, down at 104.060.
Nevertheless, last week’s Jackson Hole speech by the US Federal Reserve (Fed) Chair Jerome Powell was seen as hawkish, as he emphasized the Fed’s commitment to tackle inflation, justifying higher rates if growth continues to be above trend, while the labor market remains tight. He added the US central bank is still data-dependent, noting they would proceed “carefully” when deciding regarding momentary policy.
Following Powell’s remarks, money market futures are confident the Fed will skip a rate hike in September. Nonetheless, for November, the story is different, with traders expecting a 25 bps rate hike, as shown by odds close to 50%, as shown by the CME FedWatch Tool.
Given the backdrop, the GBP/USD pair could resume its downtrend based on the latest data. However, a busy US economic docket could weaken the greenback. On Tuesday, jobs data, consumer confidence, and housing data could ignite volatility in the pair. Any surprises that justify further tightening can pave the way for further US Dollar strength and Sterling (GBP) weakness.
GBP/USD Price Analysis: Technical outlook
After falling below the August 3 low of 1.2620, the GBP/USD extended its losses below the 1.2600 figure but hovers around the latter as of writing. From a market structure perspective, the pair has achieved successive lower lows, opening the door for a bearish continuation. If the pair achieves a daily close above 1.2600, the pair could test last Friday’s high of 1.2654. Otherwise, the major would resume its downtrend toward the 1.2500 figure, followed by the 200-day Moving Average (DMA) at 1.2401.
- The EUR/USD rose near 1.0810, above the 200-day SMA of 1.0805.
- The USD and US yields consolidated after Jerome Powell’s speech on Friday.
- ECB’s hawks lift the Euro.
In Monday’s session, the USD is trading weak against most of its rivals, mainly driven by a slight consolidation and a risk-positive market environment. On the other hand, the European Central Bank's hawkish rhetoric is gaining more ground while markets still asses Jerome Powell’s speech on Friday.
During his speech at the Jackson Hole Symposium, Chair Powell didn’t commit to another hike but pointed out that the economy hasn’t cooled down as expected and that as long as inflation doesn't give in, the Federal Reserve (Fed) will maintain rates at a restrictive stance. As a reaction, the US yields sharply rose, as according to the CME FedWatch tool, investors are now betting on nearly 50% odds of a hike in November.
That said, US bond yields are pulling back on Monday, although they maintain elevated levels. The rate for the 2-year bond stands at 5.05%, whereas the rates for the 5-year and 10-year bonds are at 4.41% and 4.22%, respectively. In addition, the USD measured by the DXY index slightly retreated but still traded at its highest level since early June, above the 104.00 zone.
On the Euro’s side, Robert Holzmann from the ECB made it clear at the start of the week that he sees “a case for pushing on with rate increases without taking a pause” in case no surprises arise. Still, he confirmed the ECB’s data-dependent approach. In line with that, investors will eye crucial inflation figures from Germany and the EU from August to be released on Wednesday and Thursday to continue placing their bets on the ECB’s next decisions.
In the meantime, according to the World Interest Rates Probabilities (WIRP) tool, markets are currently discounting a 45% probability of a 25bps increase in the upcoming September 14, 2023 meeting. Moving forward, the likelihood of a 25bps hike stands at 66% in October, followed by a 75% chance of a similar increase in the December meeting. This anticipated rate hike trajectory would result in a target rate of 5%.
EUR/USD Levels to watch
From a technical standpoint, the EUR/USD maintains a bearish outlook for the short term, as observed on the daily chart. The Relative Strength Index (RSI) is comfortably positioned in the negative territory below its midline. It is also complemented by a negative signal from the Moving Average Convergence Divergence (MACD), which shows red bars, signalling bearish momentum. Moreover, the pair is below the 20,100 and 200-day Simple Moving Averages (SMAs), suggesting that the bears are firmly in control of the bigger picture.
Support levels: 1.0800 (200-day SMA), 1.0780, 1.0750.
Resistance levels: 1.0830,1.0850, 1.0900.
EUR/USD Daily Chart
-638288439937931668.png)
- AUD/USD registers gains of around 0.40%, as upbeat Australian retail sales data and falling US bond yields offer a respite from recent losses.
- CME FedWatch Tool shows a 49% chance of a 25 bps rate hike in November, keeping the pressure on AUD/USD despite its current gains.
- A packed economic calendar featuring US JOLTs report and remarks from RBA’s nominated Governor, Michelle Bullock, could introduce new volatility to the pair.
The Australian Dollar (AUD) reverses its course advances from around last week’s low of 0.6380 against the US Dollar (USD), bolstered by upbeat economic data, despite a hawkish rhetoric by the US Federal Reserve (Fed). Falling US bond yields lent a lifeline to the AUD, as the AUD/USD trades at 0.6428, gaining 0.42%.
AUD gains traction as US bond yields dip, as markets eye data releases
The AUD/USD is set to extend its losses after the US Federal Reserve Chair, Jerome Powell, delivered hawkish remarks at Jackson Hole. Even though the pair is staging a comeback after snapping two days of losses, the resumption of higher US bond yields could underpin the greenback in the near term.
Powell said that despite two good reports on inflation, it would be appropriate to tighten monetary policy and that they would proceed “carefully” when choosing to hike rates or stay put. Jay Powell states they would remain data-dependant and warranted additional hikes if “above trend growth” and employment remained solid.
Following Powell’s remarks, money market futures are confident the Fed will skip a rate hike in September, but the odds for November are rising, as shown by the CME FedWatch Tool seeing a 49% chance of a 25 bps rate hike,
The US Dollar Index, a gauge of the buck’s value against a basket of six currencies, drops to its daily low at 103.977, a headwind for the USD/MXN.
Developments in the Asian session witnessed China’s delivering stimulus amidst its troubled property sector and its equity markets. That spurred a risk-on response, with AUD/USD buyers propelling the currency pair back above the 0.6400 figure.
Data during the Asian session, the Australia economic docket revealed that retail sales for July jumped by 0.5% MoM, after a dismal 0.8% in June, exceeding estimates of 0.3%. However, it should be said that the Women’s World Cup boosted sales.
ANZ analysts think the trend in retail sales will continue to be lower. They said, “We think households will continue to tighten their spending throughout 2023. We do, however, see some upside to spending in 2024 as inflation moderates and real household incomes turn positive.”
On Tuesday, the US economic docket would feature the JOLTs report, housing prices, and the CB Consumer Confidence. The Reserve Bank of Australia’s (RBA) nominated Governor Michelle Bullock would cross newswires on the Australian front. That, alongside the release of Building Permits, Construction Work done, and the Consumer Price Index (CPI) for July on a monthly basis, could stir the AUD/USD.
AUD/USD Price Analysis: Technical outlook
The AUD/USD is likely to remain consolidated despite registering solid gains. For the pair to resume its uptrend, buyers must reclaim the latest swing high of 0.6488, ahead of challenging 0.6500. Otherwise, since the major remains in a downtrend, an extension below last week’s low of 0.6379, and the pair might test the year-to-date (YTD) low of 0.6364, ahead of diving towards the November 22 daily low at 0.6272.
- NZD/USD rose back above 0.5900, displaying nearly 0.20% gains.
- The USD DXY and US yields are retreating after sharply rising on Friday following Powell’s speech.
- Eyes on labour market and economic activity figures from the US.
On Monday, the NZD/USD gained traction and rose above 0.5900. No relevant data was released for the US and New Zealand and the upward momentum can be explained by the USD slightly retreating against its rivals, consolidating Thursday and Friday’s gains.
Markets are still assessing Jerome Powell’s words on Friday. He didn’t commit to another hike and addressed that the monetary policy is still data-dependant and the data justifies another hike. In addition, he stated that the economy hasn’t cooled down as expected and that they will retain rates at restrictive levels until inflation shows signs of deceleration.
All eyes are now on the US economic calendar releases this week, which include mid and high-tier labour market figures, including JOLTs Job Openings figures from July and ADP Employment Change and Nonfarm Payrolls from August. In addition, Gross Domestic Product (GDP), ISM PMI and Core Personal Consumption Expenditures (PCE) will also be closely watched for investors to model their expectations for the next Fed meetings.
In the meantime, according to the CME FedWatch tool, the odds of a hike in September are still low, but the probabilities increased nearly 50% for the November meeting.
NZD/USD Levels to watch
Based on the daily chart, it is evident that NZD/USD leans toward a bearish outlook in the short term. The Relative Strength Index (RSI) remains below its midline, deep in negative territory, showcasing a neutral slope near the oversold threshold. Similarly, the Moving Average Convergence Divergence (MACD) exhibits red bars, emphasizing the strengthening bearish momentum for NZD/USD. Also, the pair is below the 20,100 and 200-day Simple Moving Averages (SMAs), indicating a challenging position for the buyers in the bigger picture as the bears remain in command.
Support levels: 0.5900, 0.5870, 0.5850.
Resistance levels: 0.5940, 0.5950, 0.5980.
NZD/USD Daily Chart
-638288403803828007.png)
- USD/MXN trades at 16.7187, down 0.13%, as the Mexican Peso capitalizes on interest rate differentials and Banxico’s hawkish outlook.
- Despite Powell’s hawkish remarks, the US Dollar Index dropped to a daily low of 103.977, providing a tailwind for the Peso against the greenback.
- A busy week ahead features Mexican Q2 growth figures and key US economic indicators, which could introduce new volatility to the USD/MXN pair.
The Mexican Peso (MXN) resumed its gains against the US Dollar (USD) due to the interest rate differential of the former against the greenback, despite last Friday’s hawkish remarks by the US Federal Reserve Chair Jerome Powell. The USD/MXN is eyeing a fall to test the year-to-date (YTD) low of 16.6238, but it trades at 16.7187, down 0.13%.
USD/MXN dips as Banxico keeps its hawkish stance, and US Dollar Index retreats
US equities depict investors’ positive mood amid an absent US economic calendar. Last week’s Fed Chair Jerome Powell’s speech weighed on the USD/MXN, though by the end of the New York session, the MXN extended its gains. The US Dollar Index, a gauge of the buck’s value against a basket of six currencies, drops to its daily low at 103.977, a headwind for the USD/MXN.
The Fed Chair Jerome Powell said that despite two good reports on inflation, it would be appropriate to tighten monetary policy and that they would proceed “carefully” when choosing to hike rates or stay put. Powell states they would remain data-dependant and warranted additional hikes if growth and employment remained solid.
Developments in the Asian session witnessed China’s delivering stimulus amidst its troubled property sector and its equity markets. That spurred a risk-on response, though stocks remained pressured as global central banks would likely continue to tighten monetary conditions.
The Bank of Mexico (Banxico) policymakers remain hawkish on the Mexican front, as the latest meeting minutes revealed. Even though headline inflation continued to decelerate to 4.67% in August, the Mexican central bank would remain “cautious” given the inflationary outlook, with one member highlighting that Banxico could remain on hold for the rest of 2023.
In the week ahead, the Mexican economic agenda will deliver growth figures for the second quarter on Tuesday. The US docket will reveal Home prices, JOLTs Jobs Opening, and the CB Consumer Confidence indicator.
USD/MXN Price Analysis: Technical outlook
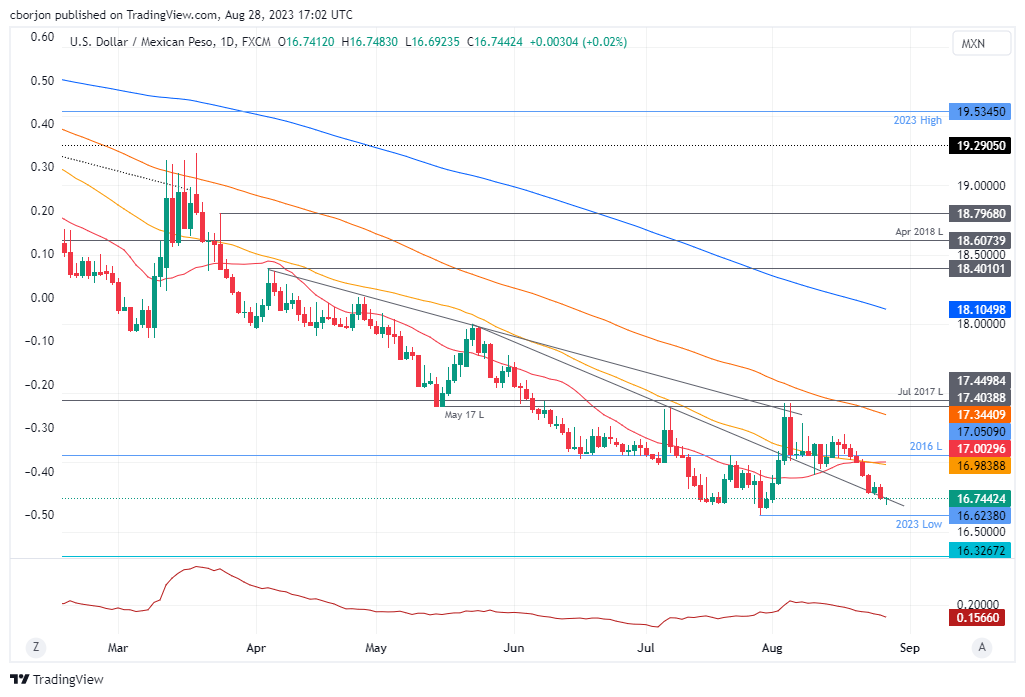
The pair remains downward biased, as the 20-day Simple Moving Average (SMA) turned flat, though it remains above the 50-day SMA. With the USD/MXN managing to print successive series of lower lows, the YTD low of 16.6238 could be tested in the near term, followed by the October 2015 daily low of 16.3267. Contrarily, the USD/MXN could shift bullish if it reclaims the 17.0000 figure.
- WTI trades near $80.00 after jumping to a daily high near $80.80.
- The fragile Chinese economic situation limits upside potential. Economic support may favour Oil prices.
- Hawkish Jerome Powell may also limit the upside.
The West Texas Intermediate (WTI) climbed back above $80 at the start of the week. Still, its upside is limited due to the Chinese economic situation and investors placing bets on a more aggressive Federal Reserve (Fed). On the upside, markets monitor potential supports that the Chinese government may take.
Investors assess the Chinese situation and Powell’s words on Friday
Oil prices managed to maintain momentum despite Chinese economic woes. The real-estate sector remains fragile while the Evergrande’s stock plummeted more than 80%. In that sense, what is boosting Oil prices is the potential Chinese action to support and bolster the local economy.
On the other hand, the black gold may see further downside as Chair Powell stated that he is looking for the US economy to cool down and that the bank will maintain rates until inflation shows concrete evidence that it is decelerating.
In line with that, World Interest Rates Probabilities shows that markets are currently discounting a 90% probability of a no hike in the forthcoming Sep 20, 2023 meeting. Moving forward, the likelihood of a 25bps hike stands at 70% in November. This anticipated rate hike trajectory would result in a target rate of 5.75%. It is worth noticing that higher rates cool down economies, lowering the demand for energy and, hence, applying downward pressure on Oil prices.
WTI Levels to watch
The daily chart analysis suggests a neutral to bullish outlook for WTI, with the bulls gaining strength, although challenges persist. The Relative Strength Index (RSI) indicates positive momentum with an ascending slope just above its midline, while the Moving Average Convergence (MACD) presents lower red bars. Additionally, the pair is below the 20-day Simple Moving Average (SMA), but above the 100 and 200-day SMAs, highlighting the continued dominance of bulls in the broader perspective.
Support levels: $79.80, $78.20, $77.70
Resistance levels: $81.15 (20-day SMA), $82.00, $82.50
WTI Daily Chart
-638288355236161909.png)
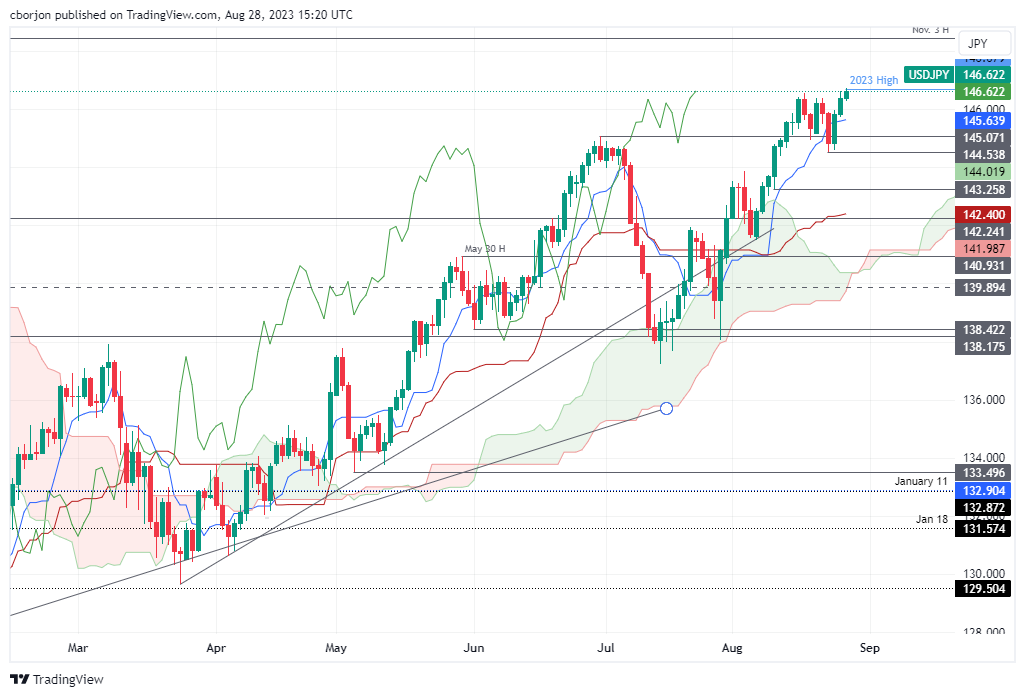
- USD/JPY surges to a new YTD high of 146.68, buoyed by Wall Street’s upbeat opening and dovish comments from BoJ Governor Kazuo Ueda.
- Despite a dip in US 10-year Treasury yields, the pair maintains its bullish momentum, reflecting the Fed’s hawkish stance on further tightening.
- A packed economic calendar could introduce volatility, including key US and Japanese indicators.
USD/JPY resumes its uptrend, prints a new year-to-date (YTD) high of 146.68, on an upbeat sentiment, with Wall Street opening the week on a higher note amidst thin liquidity conditions due to the UK’s Summer Bank Holiday. Hence, the Japanese Yen (JPY) extended its losses to three straight sessions spurred by dovish remarks by the Bank of Japan’s (BoJ) Governor Kazuo Ueda. The pair exchanges hands at 146.60.
Japanese Yen extends its losses as Wall Street climbs and BoJ’s Ueda remains dovish
US equities resumed their uptrend following hawkish remarks by the US Federal Reserve (Fed) Chair Jerome Powell at Jackson Hole. Despite being data-dependent, Powell’s words reinforced the US central bank hawkish stance, which triggered a leg-up in the USD/JPY pair. He added that robust economic expansion and the constrained labor market would warrant further tightening by the Fed if those economic indicators don’t show signs of easing.
The USD/JPY advance stalled as US Treasury bond yields began to lose ground, particularly the US 10-year Treasury Note, with its coupon sliding two basis points at 4.22% and undermining the greenback.
On the Japanese front, the BoJ Governor Kazuo Ueda said that underlying inflation is still below target and justified the current “dovish” monetary policy stance by the BoJ, even though July’s core consumer inflation rose by 3.1%. Ueda added that inflation “is expected to decline.”
Although the BoJ tweaked its Yield Curve Control (YCC) to a 0.50%-1% flexible target, the 10-year Japanese Government Bonds (JGBs) yield has failed to break higher, which could shift the USD/JPY pair bias bearish. Once the BoJ signals it is ready to normalize its monetary policy, the USD/JPY could resume lower after posting gains of 11.85% in the year.
A busy economic calendar could rock the boat in the week ahead. The US docket would feature JOLTs report, the CB Consumer Confidence, the release of the Gross Domestic Product, the Fed’s preferred gauge for inflation, the core PCE, US employment data, and business activity. On the Japanese front, speeches by two BoJ members.
USD/JPY Price Analysis: Technical outlook
The US Dollar rally against the Japanese Yen is set to continue if not for vocal expressions of Japanese authorities threatening to intervene in the FX markets. After hitting a new YTD high, the USD/JPY could extend its gains towards the November 3 high at 148.45, followed by the October 31 high at 148.84, before piercing 149.00. The major’s downside risks emerge at the Tenkan-Sen line at 145.61. If breached, the next stop would be the August 23 swing low of 144.54.
- Silver price oscillates around $24.00 as investors await a fresh economic trigger.
- August economic data carry a higher impact as they will be considered primarily for September’s monetary policy.
- Silver price trades directionless near the 61.8% Fibonacci retracement at $24.12.
Silver price (XAG/USD) has traded in a narrow range marginally above $24.00 for the past four trading sessions. The white metal struggles to find direction despite Federal Reserve (Fed) Chair Jerome Powell delivering a hawkish commentary at the Jackson Hole Symposium on Friday.
Fed Powell kept doors open for more interest rate hikes as the achievement of price stability in the United States economy has a long way to go. Jerome Powell said that further policy action will be dependent on incoming data. Investors will keep focus on the labor market and the factory activity data. August economic data carry a higher impact as they will be considered primarily for September’s monetary policy.
The S&P500 opens on a positive note despite rising expectations of one more interest rate hike from the Fed in 2023. Cleveland Fed Bank President Loretta Mester said she supports one more interest rate hike, though not necessarily in September. The US Dollar Index (DXY) demonstrates a lackluster performance at around 104.00.
As per the CME Group Fedwatch Tool, there is a more than 80% chance of the Fed keeping interest rates unchanged in September, while the majority of investors are betting on an interest-rate hike in November.
Silver technical analysis
Silver price trades directionless near the 61.8% Fibonacci retracement (plotted from July 20 high at $25.27 to August 15 low at $22.23) at $24.12 on a two-hour scale. Upward-sloping 20-period Exponential Moving Average (EMA) at $24.17 is providing support to the Silver bulls.
The Relative Strength Index (RSI) (14) shifts into the 40.00-60.00 range from the bullish range of 60.00-80.00, which indicates that the bullish impulse has faded. However, the upside bias is still intact.
Silver two-hour chart
-638288287102464599.png)
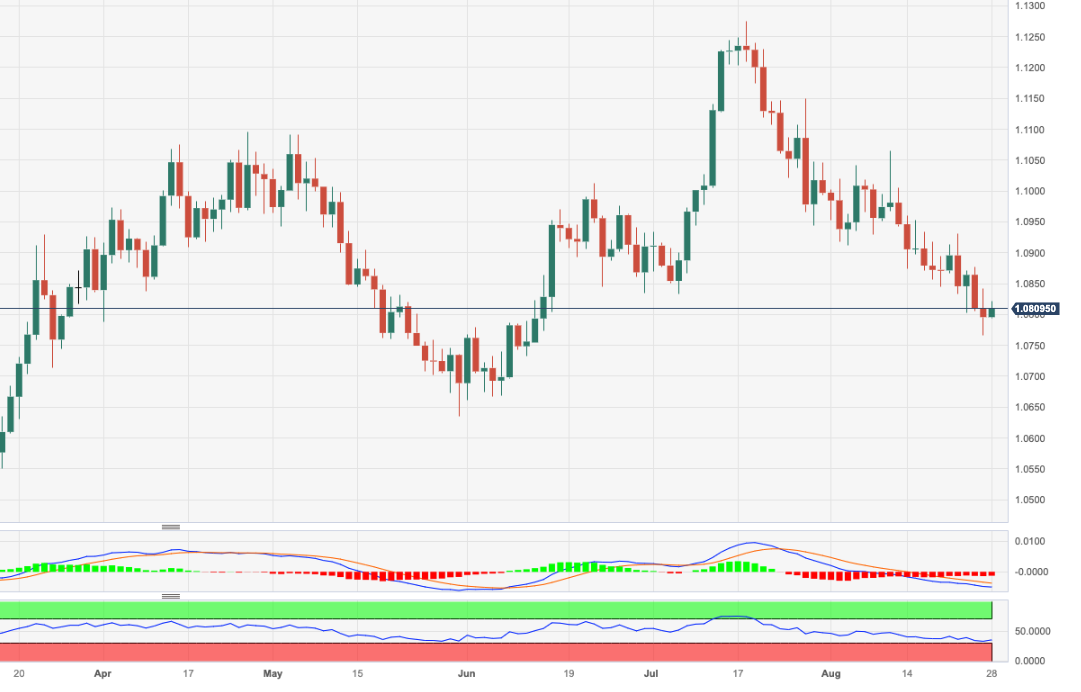
- EUR/USD reverses two consecutive sessions of losses.
- The resumption of the selling pressure could see 1.0765 retested.
EUR/USD manages to regain some balance and reclaims the 1.0800 neighbourhood at the beginning of the week.
In case bears regain the upper hand, the pair could slip back to the August low of 1.0765 (August 25). South from here emerges the May low of 1.0635 (May 31) ahead of the 2023 low of 1.0481 (January 6).
A drop below the 200-day SMA, today at 1.0805, should keep extra pullbacks in store for the time being.
EUR/USD daily chart
- DXY trims part of the recent two-day advance.
- Bulls remain focused on the May high in the 104.70 zone.
DXY comes under pressure and confronts the key support at the 104.00 region at the beginning of the week.
Immediately to the upside turns up the August top at 104.44 (August 25), while the surpass of this level should open the door to a rapid test of the May high of 104.69 (May 31) prior to the 2023 peak of 105.88 (March 8).
While above the key 200-day SMA, today at 103.10, the outlook for the index is expected to shift to a more constructive one.
DXY daily chart
- USD/CAD oscillates in a narrow range around 1.3600 amid sideways US Dollar.
- Fed Powell at Jackson Hole diverged the focus of investors to economic data citing that the central bank will remain data-dependent.
- Canada’s Q2 GDP is expected to deliver a slower pace vs. Q1 figures, which would allow the BoC to maintain the status quo.
The USD/CAD pair oscillates in a narrow range near the round-level resistance of 1.3600 in the late European session. The Loonie asset remains sideways following the footprints of the US Dollar Index (DXY), which is struggling to find a decisive move, trading around 104.00.
S&P500 futures posted some decent gains in the London session, warranting a positive opening ahead. US equities are expected to remain in action as investors fully assessed the commentary from Federal Reserve (Fed) Chair Jerome Powell at the weekend.
The US Dollar remained muted marginally above 104.00 on Monday as investors shifted their focus toward upcoming economic data for August. Fed Powell at Jackson Hole diverged the focus of investors to economic data citing that the central bank will remain data-dependent for further action. Jerome Powell commented that two months of decline in inflationary pressures is only the beginning of what we need to build confidence in the inflation path.
This week, investors will keep an eye on the labor market and ISM manufacturing PMI data for August. For further policy action, market participants want to know whether labor market conditions are cooling or still remain extremely tight. Signs of a cooling labor market would stem pressure on the US Dollar.
On the Canadian Dollar front, investors are focusing on the April-June quarter Gross Domestic Product (GDP), which will be released on Friday at 12:30 GMT. As per Reuters, Q2 data is expected to show the economy grew at a slower pace of 1.1% from the 3.1% pace recorded for the January-March quarter. This would allow the Bank of Canada (BoC) to announce an unchanged interest rate decision and will keep interest rates steady at 5%.
- EUR/JPY extends the recovery beyond 158.00.
- Immediately to the upside turns up the 160.00 mark.
EUR/JPY advances for the third session in a row and surpasses the 158.00 mark on Monday.
If the move higher gathers extra impulse, the cross should challenge recent 2023 peaks near 159.50 (August 22) ahead of the key round level at 160.00. The surpass of the latter should not see any resistance level of note until the 2008 high at 169.96 (July 23)
So far, the longer term positive outlook for the cross appears favoured while above the 200-day SMA, today at 147.70.
EUR/JPY daily chart
UOB Group’s Senior Economist Julia Goh and Economist Loke Siew Ting review the latest inflation figures in Malaysia.
Key Takeaways
Headline inflation decelerated for an 11th straight month to 2.0% y/y in Jul (from +2.4% in Jun), marking the lowest level since Aug 2021. The outturn was close to ours and Bloomberg consensus (2.1%). This came on the back of a persistent slowdown in price gains of food, transport, and selected services (i.e. restaurants & hotel, communication, and recreation services & culture) amid base effects and continued government subsidies during the month.
We expect inflation to hover at the edge of 2.0% in the remaining months of the year, leading to an average inflation rate of 2.8% for the entire year of 2023 (BNM est: 2.8%-3.8%, 2022: 3.3%). Our view takes into consideration the government’s pledge to maintain most of its subsidies for 2H23, an absence of global supply shocks particularly energy and essential food items, as well as in-house expectations for the currency. Easing core CPI growth and services inflation further imply a continuation of disinflation trend in the coming months.
- US Dollar price action begins week in the red, eating into Friday’s gains.
- Traders face an eventful week with the monthly US jobs report out on Friday.
- US Dollar Index to test support levels without putting its uptrend at risk.
The US Dollar (USD) should be vulnerable to profit-taking these first few days of the week as traders have mulled the Jackson Hole speech from US Federal Reserve Chairman Jerome Powell. Although the speech did not hold any surprises, the repetition of the content was enough to dampen any hopes for an early Goldilocks scenario and saw yields spiking higher and rate cuts being pushed further down the line to mid-2024 at the earliest. Traders this week will focus on the coming macroeconomic data points for any sudden contractions that might urge the Fed to rethink its strategy and still cut sooner.
A very mild calendar for this Monday, especially with the United Kingdom bank holiday. Expect even more lower volumes than normal for a Monday, which means any moves in the markets need to be taken with a pinch of salt. One datapoint to look out for this Monday is the Dallas Fed Manufacturing Business Index for August, expected to contract further from -20 to -21.60.
Daily digest: US Dollar settles for less
- The overall takeaway for this week will be that markets now have pushed forward any possible rate cuts after the rather repetitive hawkish stance of the Fed. Hopes for early cuts and a Goldilocks scenario have dampened and been pushed toward mid-2024 at the earliest. Any datapoint this week that points to deterioration of the current economic conditions or health of the US economy might make investors double down on their bets that rate cuts still might come sooner since the Fed could be forced to start cutting in an attempt to protect US economic growth.
- At 14:30 GMT, the Dallas Fed Manufacturing Business Index for August is due to be published as the first data point to kick off this week. A contraction is expected from -20 to -21.6.
- Equities are jumping higher in Asia with the Japanese Topix index up 1.47% and the Hong Kong Hang Seng Index up 1.31%. The Hang Seng would have been higher if it had not been forced to drag along the 80% decline from construction group Evergrande, which is set to default anytime now. European markets are not applauding the moves in Asia as they are synthetically pushed higher because of the rate cuts and lower taxes from the Chinese finance ministry on stock trading.
- The CME Group’s FedWatch Tool shows that markets are pricing in an 80.5% chance that the Federal Reserve will keep interest rates unchanged at its meeting in September. This is the lowest number in weeks as markets start to consider the possibility of another rate hike.
- The benchmark 10-year US Treasury bond yield trades at 4.21% after touching a new yearly high last week on Monday at 4.3618%. After its stellar move, yields could start to slip lower a touch as markets have repriced the Jackson Hole communication.
US Dollar Index technical analysis: Look down
The US Dollar has been in a firm rally since mid-July and has been shooting for the stars last week with traders favoring the US Dollar again. The favoritism simply boiled down to the rate differential as the US is holding a higher interest rate and thus a better return on deposits against, for example, the Euro (EUR/USD) or the Japanese Yen (USD/JPY), which both have lower depositary rates than the Greenback. Seeing the steep incline from last week, a short pullback is more than granted, though support needs to be respected in order to keep the July rally ongoing and in good shape.
On the upside, 104.69, the high of May 31, comes into play as the level to beat to the upside. Once that level is broken and consolidated, look for a surge to 105, where 105.110 (the peak of March 15) is an ideal candidate for a double top. Should the Greenback be on a tear, expect then at least a test at 105.88 – the 2023 peak from March 8.
On the downside, several floors are likely to prevent a steep decline in the DXY. The first one now is the big figure at 104. Though seeing the current decline, that does not look strong enough to hold. Rather look for the 200-day Simple Moving Average at 103.14. That is a much better candidate in order to catch some profit-taking pressure and re-enter. In case it does not hold, the safety net at 102.33 comes into play with both the 55-day SMA and the 100-day SMA both just being inches away from each other.
USD/IDR is now seen extending the consolidation within 15,240 and 15,340 in the next weeks, notes Markets Strategist Quek Ser Leang at UOB Group.
Key Quotes
Last week, we held the view that USD/IDR “is likely to strengthen further, but March’s peak near 15,475 is likely out of reach”. However, USD/IDR traded in a range of 15,235/15,338 before ending the week largely unchanged at 15,290 (+0.07%). USD/IDR appears to have moved into a consolidation phase; this week, it is likely to trade sideways between 15,240 and 15,340.
Markets Strategist Quek Ser Leang at UOB Group suggests further consolidation lies ahead for USD/MYR in the short-term horizon.
Key Quotes
Last week, we held the view that USD/MYR “could consolidate for a few days first before rising to 4.6700 later on.” Our view did not materialise, as USD/MYR traded in a relatively quiet manner between 4.6330 and 4.6570.
The price movements appear to be consolidative, and USD/MYR could continue to trade in a range this week, likely between 4.6200 and 4.6700.
- USD/CHF recovers from 0.8820 as the Fed is expected to raise interest rates one more time this year.
- Fed Powell warned that the process of achieving price stability has a long way to go.
- Investors will keenly watch the US labor market and ISM Manufacturing PMI data for August.
The USD/CHF pair finds support after a correction near 0.8820 as chances of one more interest rate hike by the Federal Reserve (Fed) deepened. The Swiss Franc asset is expected to extend recovery further as further policy tightening by the Fed will widen the Fed-Swiss National Bank (SNB) policy divergence.
S&P500 futures add some gains in Europe, portraying strength in the risk appetite of the market participants. US equities were heavily bought on Friday despite Fed Chair Jerome Powell delivering a hawkish commentary. The appeal for risk-sensitive assets improved as Fed Powell reiterated the need for more interest rate hikes but it will be data-dependent.
Fed Powell warned that the process of achieving price stability has a long way to go. Therefore, the Fed is expected to keep interest rates higher for a longer period.
Cleveland Fed Bank President Loretta Mester said she supports one more interest rate hike, though not necessarily in September. She emphasized on achieving price stability by the end of 2025 and should not allow it to drift into 2026. After Mester and Powell’s hawkish commentary, chances of an interest rate hike in November shoot above 50%.
Investors will keenly watch the United States labor market and ISM Manufacturing PMI data for August, which will be released later this week.
Meanwhile, the Swiss Franc remains on tenterhooks as investors shift focus to the SNB interest rate decision, which will be announced later this month. Investors remain mixed about policy stance as Swiss inflation has come down to near 2%. It would be worth watching whether the SNB Chairman Thomas J. Jordan would remain hawkish to ensure inflation below 2% or allow the current monetary policy to demonstrate its ability to tame inflation.
- Natural Gas price jumps in the US and Europe.
- The US Dollar is set to weaken after its relentless peak last week.
- Uptrend still intact as price heads to $3.25.
Natural Gas price is jumping higher this morning in the US (+2.7%) and more substantially in Europe (+8%) as a perfect storm is brewing on the supply front. Several reports are coming in that Australian unions are losing control of the situation as several independent strikes are emerging in the port sector, putting at risk again the 10% volume of global gas supply for the coming weeks. To make matters worse, Norway is reporting that supply has been halted from its Troll field since Saturday for planned maintenance.
The US Dollar (USD), in the meantime, is facing some selling pressure after it peaked several times last week. The US Federal Reserve Chairman Jerome Powell reiterated that rates need to remain elevated for longer, which dampened the hope that was living in the markets for rate cuts in early 2024. These hopes are now placed toward the end of the second quarter. For this week, traders will be on edge with the US jobs report on Friday.
At the time of writing, Natural Gas is trading at $2.818 per MMBtu.
Natural Gas news and market movers
- India’s Gujarat State Petroleum Corporation is seeking to buy one cargo for late September delivery, according to inside traders. The tender is due to expire on August 28.
- European gas storage is at 92%, while France is lagging a touch with 88%.
- Norway has shut down its Troll gas field for maintenance, in another setback for European gas supply.
- Australian LNG workers are firing up local and independent strikes as unions are normally rounding up the voting on Monday for the improved Chevron wage proposal. The independent strikes make it more difficult for the unions to bring forward one single plan for all workers and local disruptions might trigger bigger supply issues further down the line.
- Tropical storm Idalia is set to hit Florida by Tuesday. Bigger parts of Alabama and Georgia are bound to be hit as well once it hits landfall.
- This week, all eyes on the market moving US jobs report on Friday.
Natural Gas Technical Analysis: crossing the river
Natural Gas is a textbook example of how technical analysis together with macro and fundamentals is a cocktail that works. Last week any news was in disfavor of the commodity, though support held and the ascending longer term trend channel is still very much intact. Seeing the current cocktail of supply drought, Natural Gas prices could jump to $3.25 if the current sentiment and the news flow keeps contributing to higher prices.
On the upside, $3 is still the level to watch once Natural Gas prices can reclaim $2.9. Should prices recover, look for a close above $2.935, the high of August 15, in order to confirm that demand is picking up again. More upside toward $3 and $3.065 (high of August 9) would be targets or levels to watch.
On the downside, the trend channel has done a massive job underpinning the price action. Aside for one small false break, ample support was provided near $2.60. The 55-day Simple Moving Average needs to give that much needed support at $2.69 ahead of the ascending trend channel at $2.61. Any falling knives can still be caught by the 100-day SMA near $2.55.
-638288089145356947.png)
XNG/USD (Daily Chart)
- Gold price turns sideways after a solid recovery as investors await fresh triggers for further action.
- Fed’s Powell kept doors open for further policy tightening to ensure price stability.
- Fed’s Mester supports one more interest rate hike, though not necessarily in September.
Gold price (XAU/USD) turned lackluster after defending the critical support of $1,900.00 on Monday. The precious metal consolidates as investors prepare for crucial economic indicators such as Nonfarm Payrolls (NFP) and ISM Manufacturing PMI for August, which will be released later this week. The impact of August economic data will be very significant as Federal Reserve (Fed) Chair Jerome Powell reiterated at the Jackson Hole Symposium that further policy action will be data-dependent.
Jerome Powell at Jackson Hole said that the achievement of price stability has a long way to go. Powell kept doors open for further policy tightening if economic data continues to remain supportive. After Powell’s commentary, investors expect that the central bank could raise interest rates in November as a last nail in the coffin.
Daily Digest Market Movers: Gold price shifts focus to economic data
- Gold price consolidates above $1,910.00 as investors digest the impact of the hawkish commentary from Fed Chair Jerome Powell at the Jackson Hole Symposium.
- Powell’s speech was very much in line with market expectations. The Fed’s chair confirmed that the central bank can raise interest rates further as the job of ensuring price stability has not been completed yet but promised that policymakers will remain very careful in upcoming policy meetings.
- Powell also emphasized that incoming data will be a major factor for further policy action.
- The central bank has evidence that inflation is getting more responsive to labor markets. Powell said that further signs of a tightening job market could warrant more Fed action.
- About achieving price stability, Jerome Powell said that "inflation remains too high, the process of bringing down inflation still has a long way to go, even with more favorable recent readings."
- The precious metal could face some selling pressure as Cleveland Fed Bank President Loretta Mester said she supports one more interest rate hike, though not necessarily in September.
- As per the CME Group Fedwatch Tool, there is a more than 80% chance of the Fed keeping interest rates unchanged in September, while the majority of investors are betting on an interest-rate hike in November.
- Fed’s Mester said that, after being done with hiking rates, the central bank needs to hold rates for a while. The policymaker emphasized on achieving price stability by the end of 2025 and should not allow it to drift into 2026.
- About rate cut discussions, Fed Mester is in favor of re-evaluating it in the second half of 2024. She believes that the central bank has a good shot at attaining 2% inflation without damage to the real economy.
- Philadelphia Fed Bank President Patrick Harker supports holding interest rates steady as labor markets are cooling. Harker added that interest rates could be increased if inflation reaccelerates.
- As Jerome Powell talked about dependency on incoming data for further policy action, United States Nonfarm Payrolls (NFP) and ISM Manufacturing PMI data for August will remain in focus this week.
- US hiring has slowed down in the past few months, but the Unemployment Rate has remained at historic lows and wage growth has been strong.
- Factory activity has been contracting for the past nine straight months as US firms are operating at lower capacity due to a bleak demand outlook.
- Also, US firms are clearing their old inventories as expansion plans have been postponed due to higher borrowing costs.
- The US Dollar Index (DXY) remains supported around 104.00 and is expected to turn lackluster as investors prepare for crucial economic indicators.
Technical Analysis: Gold price consolidates around $1,915
Gold price turns sideways around $1,915.00 after defending the crucial support of $1,900.00 as investors digest Powell’s hawkish commentary at the Jackson Hole Symposium. On a broader note, the precious metal is auctioning in a range of $1,904-$1,922 from Thursday. The yellow metal made two consecutive Spinning Top candlesticks, signaling indecisiveness among market participants. The precious metal regains territory above the 200-day Exponential Moving Average (EMA) at $1,907 but the 20-day EMA at $1,916 is still restricting its upside potential.
Fed FAQs
What does the Federal Reserve do, how does it impact the US Dollar?
Monetary policy in the US is shaped by the Federal Reserve (Fed). The Fed has two mandates: to achieve price stability and foster full employment. Its primary tool to achieve these goals is by adjusting interest rates.
When prices are rising too quickly and inflation is above the Fed’s 2% target, it raises interest rates, increasing borrowing costs throughout the economy. This results in a stronger US Dollar (USD) as it makes the US a more attractive place for international investors to park their money.
When inflation falls below 2% or the Unemployment Rate is too high, the Fed may lower interest rates to encourage borrowing, which weighs on the Greenback.
How often does the Fed hold monetary policy meetings?
The Federal Reserve (Fed) holds eight policy meetings a year, where the Federal Open Market Committee (FOMC) assesses economic conditions and makes monetary policy decisions.
The FOMC is attended by twelve Fed officials – the seven members of the Board of Governors, the president of the Federal Reserve Bank of New York, and four of the remaining eleven regional Reserve Bank presidents, who serve one-year terms on a rotating basis.
What is Quantitative Easing (QE) and how does it impact USD?
In extreme situations, the Federal Reserve may resort to a policy named Quantitative Easing (QE). QE is the process by which the Fed substantially increases the flow of credit in a stuck financial system.
It is a non-standard policy measure used during crises or when inflation is extremely low. It was the Fed’s weapon of choice during the Great Financial Crisis in 2008. It involves the Fed printing more Dollars and using them to buy high grade bonds from financial institutions. QE usually weakens the US Dollar.
What is Quantitative Tightening (QT) and how does it impact the US Dollar?
Quantitative tightening (QT) is the reverse process of QE, whereby the Federal Reserve stops buying bonds from financial institutions and does not reinvest the principal from the bonds it holds maturing, to purchase new bonds. It is usually positive for the value of the US Dollar.
In the opinion of Markets Strategist Quek Ser Leang at UOB Group, USD/THB is likely to navigate within a consolidative phase for the time being.
Key Quotes
After USD/THB rose to a high of 35.60 and pulled back, we highlighted last Monday (21 Aug, spot at 35.28) that “the pullback in USD/THB could extend to 34.95, but any decline is likely part of a 34.95/35.60 consolidation range.” We also highlighted that “a clear break below 34.95 is unlikely.” USD/THB weakened more than expected as it dropped to 34.84 before rebounding. Despite the drop to 34.84, there is no significant increase in downward momentum.
This week, we expect USD/THB to trade in a range, probably between 34.88 and 35.52.
In its monthly outlook report for August, the Japanese government keeps the overall assessment of its economy intact.
Key quotes
The economy is still viewed as recovering at a moderate pace.
Private consumption is picking up.
Business investment is picking up.
Industrial production shows signs of picking up.
Corporate profits are improving moderately as a whole.
The employment situation shows movements of improvement.
Consumer prices are rising.
Market reaction
USD/JPY is paring back gains to trade near 146.50 on the above report. The spot is up 0.10% on the day.
Analysts at Australia and New Zealand Banking Group (ANZ) provide their afterthoughts on the Australian monthly Retail Sales data.
Key quotes
“Retail sales came in stronger than expected, rising 0.5% m/m in July. Though this was not enough to recover the 0.8% m/m loss in June. Despite rapid inflation, there’s been little growth in monthly retail sales throughout 2023, with the series only up 0.9% since January.”
“The underlying trend in retail sales along with our ANZ-observed spending data shows households are clearly cutting back. Consumer confidence is also very weak, and the fixed rate roll-off means more household budgets are being squeezed by high rates and inflation.”
“We think households will continue to tighten their spending throughout 2023. We do, however, see some upside to spending in 2024 as inflation moderates and real household incomes turn positive.”
- GBP/JPY attracts some intraday sellers on Monday and stalls its modest bounce from a two-week low.
- Looming recession risks lend some support to the safe-haven JPY and act as a headwind for the cross.
- The divergent BoJ-BoE policy stance could limit the downside and warrants caution for bearish traders.
The GBP/JPY cross gains some positive traction for the second successive day and recovers further from over a two-week low, around the 183.35 region touched on Friday. Spot prices, however, struggle to capitalize on the modest intraday move up and trade around the 184.25 zone, nearly unchanged for the day during the early part of the European session on Monday.
The Japanese Yen (JPY) continues with its relative underperformance in the wake of the divergent policy stance adopted by the Bank of Japan (BoJ) and other major central banks, which, in turn, acts as a tailwind for the GBP/JPY cross. In fact, the BoJ is the only central bank in the world to maintain negative rates and is expected to stick to its ultra-easy monetary policy settings. The bets were reaffirmed by BoJ Governor Kazuo Ueda's remarks at the Jackson Hole Symposium on Sunday, saying that the underlying inflation in Japan remains a bit below the 2% target.
In contrast, the Bank of England (BoE) Deputy Governor Ben Broadbent, speaking at the same event on Saturday, said that policy rates may well have to remain in restrictive territory for some time as the knock-on effects of the surge in prices were unlikely to fade away rapidly. This, in turn, offers some support to the British Pound (GBP). Apart from this, the risk-on impulse, bolstered by new measures rolled out by China to draw investors back into its battered stock markets, further undermines the JPY's safe-haven demand and offers additional support to the GBP/JPY cross.
That said, growing acceptance that the BoE will pause its rate-hiking cycle after the widely anticipated 25 bps lift-off at the September meeting holds back traders from placing aggressive bullish bets around the GBP. This, along with worries about a deeper global economic downturn, helps limit losses for the JPY and caps the upside for the GBP/JPY cross. In the absence of any relevant economic data on Monday, the fundamental backdrop makes it prudent to wait for strong follow-through buying before confirming that the recent pullback from a multi-year peak has run its course.
Technical levels to watch
- The Euro manages to reclaim 1.0800 vs. the US Dollar.
- Stocks in Europe start the week on a positive note.
- EUR/USD surpasses the 1.0800 hurdle on Dollar weakness.
- The USD Index (DXY) appears offered and near 104.00.
- US yields trade with small losses vs. a marginal uptick in German bunds.
- The Dallas Fed Manufacturing Index is only due on the US docket.
An auspicious start of the week so far sees the Euro (EUR) managing to pick up some upside traction vs. the US Dollar (USD) and motivating EUR/USD to reclaim the area above the key 1.0800 hurdle on Monday, a region coincident with the critical 200-day SMA.
On the other hand, the Greenback gives away part of the recent two-day advance and revisits the 104.00 neighbourhood when measured by the USD Index (DXY) against the backdrop of a tepid recovery in the risk-associated universe and a marginal correction in US yields across the curve.
In the meantime, investors seem to have already digested Chair Jerome Powell’s speech at the Jackson Hole Symposium on Friday, where he left plenty of policy optionality on the table and once again reiterated that further rate hikes should not be ruled out.
Concerning monetary policy, there is presently a revitalized discussion surrounding the commitment of the Federal Reserve to uphold a stricter stance for an extended duration. This increased focus arises from the impressive durability of the US economy, despite a slight easing in the job market and decreased inflation statistics witnessed in recent months.
Simultaneously, inside the European Central Bank (ECB), conflicts among its Council members have surfaced pertaining to the potential extension of rigorous measures beyond the summer period. These differences of opinion are giving rise to a renewed sense of vulnerability, which is negatively impacting the Euro.
On the US calendar, the only scheduled release on Monday will be the Dallas Fed Manufacturing Index.
Daily digest market movers: Euro looks to consolidate the breakout of 1.0800
- The EUR challenges the 1.0800 region vs. the USD.
- German 10-year bund yields extend the rebound early on Monday.
- US yields seem tilted to the downside for the time being.
- The markets’ focus now shifts to the US labour market.
- Fed’s tighter-for-longer narrative keeps running in the background.
- Powell’s speech favoured maintaining the tight stance for the time being.
- Investors see the Fed hiking rates by 25 bps in November.
Technical Analysis: Euro does not rule out another visit to 1.0765
The selling pressure around EUR/USD appears to have somewhat eased at the beginning of the new trading week, allowing spot some breathing room around the 1.0800 region.
Further decline could motivate EUR/USD to revisit the August low of 1.0765 (August 25) ahead of the May low of 1.0635 (May 31) and the March low of 1.0516 (March 15). The loss of this level could prompt a test of the 2023 low at 1.0481 (January 6) to re-emerge on the horizon.
Occasional bouts of strength, in the meantime, should meet provisional resistance at the 55-day SMA at 1.0965 prior to the psychological 1.1000 barrier and the August high at 1.1064 (August 10). Once the latter is cleared, spot could challenge the weekly top at 1.1149 (July 27). If the pair surpasses this region, it could alleviate some of the downward pressure and potentially visit the 2023 peak of 1.1275 (July 18). Further up comes the 2022 high at 1.1495 (February 10), which is closely followed by the round level of 1.1500.
Furthermore, sustained losses are likely in EUR/USD once the 200-day SMA (1.0805) is breached in a convincing fashion.
Euro FAQs
What is the Euro?
The Euro is the currency for the 20 European Union countries that belong to the Eurozone. It is the second most heavily traded currency in the world behind the US Dollar. In 2022, it accounted for 31% of all foreign exchange transactions, with an average daily turnover of over $2.2 trillion a day.
EUR/USD is the most heavily traded currency pair in the world, accounting for an estimated 30% off all transactions, followed by EUR/JPY (4%), EUR/GBP (3%) and EUR/AUD (2%).
What is the ECB and how does it impact the Euro?
The European Central Bank (ECB) in Frankfurt, Germany, is the reserve bank for the Eurozone. The ECB sets interest rates and manages monetary policy.
The ECB’s primary mandate is to maintain price stability, which means either controlling inflation or stimulating growth. Its primary tool is the raising or lowering of interest rates. Relatively high interest rates – or the expectation of higher rates – will usually benefit the Euro and vice versa.
The ECB Governing Council makes monetary policy decisions at meetings held eight times a year. Decisions are made by heads of the Eurozone national banks and six permanent members, including the President of the ECB, Christine Lagarde.
How does inflation data impact the value of the Euro?
Eurozone inflation data, measured by the Harmonized Index of Consumer Prices (HICP), is an important econometric for the Euro. If inflation rises more than expected, especially if above the ECB’s 2% target, it obliges the ECB to raise interest rates to bring it back under control.
Relatively high interest rates compared to its counterparts will usually benefit the Euro, as it makes the region more attractive as a place for global investors to park their money.
How does economic data influence the value of the Euro?
Data releases gauge the health of the economy and can impact on the Euro. Indicators such as GDP, Manufacturing and Services PMIs, employment, and consumer sentiment surveys can all influence the direction of the single currency.
A strong economy is good for the Euro. Not only does it attract more foreign investment but it may encourage the ECB to put up interest rates, which will directly strengthen the Euro. Otherwise, if economic data is weak, the Euro is likely to fall.
Economic data for the four largest economies in the euro area (Germany, France, Italy and Spain) are especially significant, as they account for 75% of the Eurozone’s economy.
How does the Trade Balance impact the Euro?
Another significant data release for the Euro is the Trade Balance. This indicator measures the difference between what a country earns from its exports and what it spends on imports over a given period.
If a country produces highly sought after exports then its currency will gain in value purely from the extra demand created from foreign buyers seeking to purchase these goods. Therefore, a positive net Trade Balance strengthens a currency and vice versa for a negative balance.
- USD/CAD consolidates due to improved prices of Crude oil.
- Investors await top-tier macroeconomic data releases from both economies.
- Chinese authorities reduced the stamp duty on stock trading; WTI crude oil strengthened.
USD/CAD holds ground near 1.3600 to continue its winning streak, during the early hours of the European session on Monday. The pair is experiencing downward pressure due to the retreating US Dollar (DXY) along with the improved prices of WTI crude oil amid optimistic market sentiment ahead of the top-tier economic data releases later in the week including United States (US) Core Personal Consumption Expenditures (PCE) Index, the weekly Jobless Claims, Nonfarm Payrolls and Canada’s Gross Domestic Product (GDP).
Beijing took the step of reducing the stamp duty on stock trading by 0.1%, a move that contributed to the positive trajectory of Crude oil prices. Prior to this, investors had seen Beijing's previous efforts to stimulate the economy as somewhat ineffective. As a result, there was a call for the Chinese authorities to implement more targeted fiscal measures that align with the country's economic circumstances.
The WTI Crude oil trades around $80.50 at the time of writing. The Oil buyers currently focus on the four-day visit of US Commerce Secretary Gina Raimondo to Beijing. The primary aim of this visit is to enhance business ties between the United States and China.
The US Dollar Index (DXY), which tracks the Greenback against a basket of currencies, trades around 104.10 just below its highest level in more than two months. The retreating US Treasury yields are undermining the US Dollar (USD) due to the cautious mood after the US Federal Reserve (Fed) Chairman Jerome Powell advocated for supporting "higher for longer" interest rates.
Powell also highlighted that there is still a substantial amount of progress needed to attain price stability. Given the prevailing economic uncertainty, he emphasized the necessity for flexible and agile decision-making in shaping monetary policy.
- Pound Sterling rebounds from 14-week low but recovery seems restricted due to deepening recession fears.
- UK housing and manufacturing sectors have surrendered against BoE’s aggressive tightening policy.
- BoE Broadbent said interest rates need to remain higher for some time as inflation in Britain leads G7 economies.
The Pound Sterling (GBP) recovered after printing a fresh 14-week low, but the broader bias remains bearish as the British economy is exposed to a possible recession due to an aggressive rate-tightening cycle by the Bank of England (BoE). The GBP/USD pair communicates fears about rising interest rates as the tight labor market is losing its appeal, and firms have reported a decline in production due to a dismal demand outlook.
Investors are worried that the UK economy could shift into a recession as the housing sector, economic activities and the labor market are struggling to carry the burden of a restrictive monetary policy. Likely, the risk of a slowdown has eased bets about the interest rate peak at 6.0%, but an interest rate hike at the September monetary policy meeting cannot be ruled out entirely.
Daily Digest Market Movers: Pound Sterling recovery seems less confident
- Pound Sterling delivers a recovery move after a sharp sell-off to near 1.2560 as the risk-off impulse eases. However, the downside bias is still solid.
- The asset printed a fresh 12-week low as investors are worried about the UK’s economic outlook as the Bank of England (BoE) is consistently raising interest rates in the battle against stubborn inflation.
- More interest rate hikes from the BoE are expected as core inflation is still more than three times the desired rate of 2%.
- UK’s hiring momentum has slowed and economic activities have turned vulnerable as the current tightening cycle by the BoE is historically aggressive.
- Traders betting on an interest rate hike to 6.0% have trimmed, and now chances are the UK central bank will pause the tightening spell after pushing interest rates to 5.75%.
- The GfK consumer sentiment indicator improved to -25 in August from a three-month low of -30 in July as UK fuel suppliers passed on the impact of lower energy prices to end consumers.
- BoE Deputy Governor Ben Broadbent said on Saturday that interest rates need to remain higher for some time as inflation in Britain is the highest among G7 economies.
- About interest rates, BoE Broadbent responded "The evidence on spare capacity, and to indicators of domestic inflation, as and when it comes through."
- Meanwhile, the BoE is preparing to raise interest rates further in September. UK central bank is expected to raise interest rates by 25 basis points (bps) to 5.50%.
- UK markets will remain closed on Monday on account of the Summer Bank Holiday.
- The market mood is upbeat as investors digested that the Federal Reserve (Fed) will follow the ‘’higher for longer’’ interest rate path.
- Fed Chair Jerome Powell commented at the Jackson Hole Symposium that the central bank will remain very careful about interest rates at upcoming monetary policy meetings. Jerome Powell confirmed that the central bank will keep the doors open for further policy tightening.
- As per the CME Fedwatch tool, there is a more than 80% chance of a neutral interest rate decision in September while the majority of investors are betting on an interest-rate hike in November policy.
- The US Dollar Index (DXY) corrects to near 104.00 despite Jerome Powell delivering a hawkish commentary at the Jackson Hole Symposium last Friday. The corrective move has been gradual, therefore, chances of a bounce back are extremely solid.
- This week, investors will keenly focus on the US Nonfarm payrolls (NFP) data, which will be published on Friday at 12:30 GMT. In addition to that, ISM Manufacturing PMI for August will also remain in focus.
Technical Analysis: Pound Sterling upside remains restricted around 1.2600
Pound Sterling upside seems restricted near the round-level resistance of 1.2600 as the UK economy is exposed to a possible recession due to high-interest rates. The Cable delivered a breakdown of the three-week support at 1.2620 and is declining toward the 200-day Exponential Moving Average (EMA), which is trading at 1.2480. A bearish crossover delivered by 20 and 50-day EMAs warrants more weakness ahead. Daily momentum oscillators indicate that a bearish impulse has been activated.
Pound Sterling FAQs
What is the Pound Sterling?
The Pound Sterling (GBP) is the oldest currency in the world (886 AD) and the official currency of the United Kingdom. It is the fourth most traded unit for foreign exchange (FX) in the world, accounting for 12% of all transactions, averaging $630 billion a day, according to 2022 data.
Its key trading pairs are GBP/USD, aka ‘Cable’, which accounts for 11% of FX, GBP/JPY, or the ‘Dragon’ as it is known by traders (3%), and EUR/GBP (2%). The Pound Sterling is issued by the Bank of England (BoE).
How do the decisions of the Bank of England impact on the Pound Sterling?
The single most important factor influencing the value of the Pound Sterling is monetary policy decided by the Bank of England. The BoE bases its decisions on whether it has achieved its primary goal of “price stability” – a steady inflation rate of around 2%. Its primary tool for achieving this is the adjustment of interest rates.
When inflation is too high, the BoE will try to rein it in by raising interest rates, making it more expensive for people and businesses to access credit. This is generally positive for GBP, as higher interest rates make the UK a more attractive place for global investors to park their money.
When inflation falls too low it is a sign economic growth is slowing. In this scenario, the BoE will consider lowering interest rates to cheapen credit so businesses will borrow more to invest in growth-generating projects.
How does economic data influence the value of the Pound?
Data releases gauge the health of the economy and can impact the value of the Pound Sterling. Indicators such as GDP, Manufacturing and Services PMIs, and employment can all influence the direction of the GBP.
A strong economy is good for Sterling. Not only does it attract more foreign investment but it may encourage the BoE to put up interest rates, which will directly strengthen GBP. Otherwise, if economic data is weak, the Pound Sterling is likely to fall.
How does the Trade Balance impact the Pound?
Another significant data release for the Pound Sterling is the Trade Balance. This indicator measures the difference between what a country earns from its exports and what it spends on imports over a given period.
If a country produces highly sought-after exports, its currency will benefit purely from the extra demand created from foreign buyers seeking to purchase these goods. Therefore, a positive net Trade Balance strengthens a currency and vice versa for a negative balance.
- AUD/USD attracts some intraday sellers on Monday and retreats to the daily low in the last hour.
- Looming recession risks overshadow China’s new measures and act as a headwind for the major.
- Bets for one more Fed rate hike in 2023 limit the USD losses and contribute to capping the upside.
The AUD/USD pair struggles to preserve its modest intraday gains and retreats to the lower end of its daily range during the early part of the European session on Monday. Spot prices, however, manage to hold above the 0.6400 round figure, though the fundamental backdrop seems tilted in favour of bearish traders and support prospects for the resumption of a multi-week-old downtrend from the July swing high.
China rolled out new measures over the weekend to draw investors back into its battered stock markets, which, along with the better-than-expected domestic data, provided a modest lift to the Australian Dollar (AUD) on the first day of a new week. It is worth recalling that China's finance ministry said in a brief statement on Sunday that the stamp duty levied on stock trading will drop from 0.1% to 0.05% as of August 28, marking the first reduction since 2008. Furthermore, the Australian Bureau of Statistics (ABS) reported that Retail Sales – a measure of the country’s consumer spending – rose 0.5% in July against consensus estimates for a 0.3% increase and a 0.8% decline in the previous month.
Apart from this, a positive tone around the equity markets drags the safe-haven US Dollar (USD) away from its highest level since early June touched on Friday and offers additional support to the AUD/USD pair. The corrective USD decline, however, remains limited in the wake of rising bets for further policy tightening by the Federal Reserve (Fed). In fact, the markets have been pricing in the possibility of one more 25 bps rate hike by the end of this year and the expectations were reaffirmed by Fed Chair Jerome Powell's hawkish remarks on Friday. In a keynote address at the Jackson Hole Symposium on Friday, Powell said that the Fed may need to raise rates further to cool still-too-high inflation.
Furthermore, growing concerns about the worsening economic conditions in China and looming recession risks keep a lid on the optimism in the markets. Apart from this, expectations for another on-hold rate decision by the Reserve Bank of Australia (RBA) in September contribute to capping the AUD/USD pair and attracting fresh sellers at higher levels. This, in turn, suggests that the path of least resistance for spot prices is to the downside, though bears might still need to wait for acceptance below the 0.6400 mark before placing fresh bets in the absence of any relevant market-moving economic releases from the US.
Technical levels to watch
Here is what you need to know on Monday, August 28:
The US Dollar struggles to find demand at the beginning of the new week. After posting gains for the sixth straight week, the US Dollar Index stays in negative territory in the European morning. The Federal Reserve Bank of Dallas' Texas Manufacturing Outlook Survey will be featured in the US economic docket. Later in the week, investors will pay close attention to high-impact data releases, including inflation figures from major economies and employment data from the US.
US Dollar price today
The table below shows the percentage change of US Dollar (USD) against listed major currencies today. US Dollar was the weakest against the Euro.
| USD | EUR | GBP | CAD | AUD | JPY | NZD | CHF | |
| USD | -0.18% | -0.13% | -0.04% | -0.11% | -0.13% | -0.08% | -0.17% | |
| EUR | 0.18% | 0.05% | 0.15% | 0.07% | 0.05% | 0.10% | -0.02% | |
| GBP | 0.14% | -0.04% | 0.09% | 0.02% | 0.00% | 0.04% | -0.06% | |
| CAD | 0.05% | -0.15% | -0.10% | -0.07% | -0.10% | -0.06% | -0.15% | |
| AUD | 0.11% | -0.07% | -0.02% | 0.07% | -0.02% | 0.01% | -0.08% | |
| JPY | 0.13% | -0.04% | 0.01% | 0.08% | 0.02% | 0.04% | -0.06% | |
| NZD | 0.08% | -0.10% | -0.06% | 0.05% | -0.03% | -0.05% | -0.12% | |
| CHF | 0.19% | 0.02% | 0.05% | 0.15% | 0.08% | 0.05% | 0.08% |
The heat map shows percentage changes of major currencies against each other. The base currency is picked from the left column, while the quote currency is picked from the top row. For example, if you pick the Euro from the left column and move along the horizontal line to the Japanese Yen, the percentage change displayed in the box will represent EUR (base)/JPY (quote).
While speaking at the Jackson Hole Economic Symposium on Friday, Fed Chairman Jerome Powell repeated that they are prepared to raise rates further if appropriate and said that they proceed carefully when deciding to hike again or hold steady. Although these comments helped the USD Index climb to its highest level in nearly three months at 104.45 late Friday, the positive shift seen in risk mood forced it to start retreating. Early Monday, US stock index futures trade in positive territory, making it difficult for the USD to build on the previous week's gains.
China's Finance Ministry announced early Monday that they halved the stamp duty to 0.1% on stocks trading in an attempt to "invigorate the capital market and boost investor confidence." Earlier in the Asian session, the data from Australia showed that Retail Sales rose 0.5% on a monthly basis in July, slightly better than the market expectation for an increase of 0.3%. Supported by the improving risk mood and upbeat data, AUD/USD gained traction and was last seen trading in positive territory above 0.6400.
Following a volatile American session on Friday, EUR/USD settled at around 1.0800 for the week. Early Monday, the pair benefits from the renewed USD weakness and trades modestly higher on the day. Late Friday, European Central Bank President Christine Lagarde said setting interest rates at sufficiently restrictive levels for as long as necessary will help them achieve a timely return of inflation to the 2% medium-term target. Later in the day, Bundesbank President Joachim Nagel is scheduled to deliver a speech.
Bank of Japan (BoJ) Governor Governor Kazuo Ueda reiterated over the weekend they will stick to the current monetary easing framework, given the underlying inflation is still "a bit below" the BoJ's target. USD/JPY started the new week in a calm manner and was last seen posting small daily gains near 146.50.
GBP/USD spent the Asian session in a tight channel at around 1.2600 on Monday before starting edge lower in the European morning.
Gold price snapped a four-week losing streak after managing to reclaim $1,900. With the benchmark 10-year US Treasury bond yield moving sideways near 4.25% on Monday, XAU/USD holds steady slightly above $1,910.
Bitcoin continues to move up and down in a narrow ban at around $26,000 and Ethereum edges lower toward $1,600 in the European morning.
Analyst at Danske Bank offers a brief overview of new measures rolled out by China on Sunday, to draw investors back into its battered stock markets by halving the stamp duty on stock trading.
Key Quotes:
“China yesterday reduced the stamp duty on stock trading, lowered the margin ratio for margin trading and curbed share sales in an effort to lift market sentiment. The measures had been flagged recently but the scale was wider than expected and Chinese equities have seen a lift of more than 2% in overnight trading. Whether the gains will be sustained will depend on what other policy measures China takes in the near future to lift the economy and reduce financial risks.”
“The CNY has stabilised over the last week with Chinese authorities stepping up their efforts to counter currency weakness.”
- EUR/GBP traders turn cautious after hawkish statements made by central banks' officials at Jackson Hole Symposium.
- ECB President Christine Lagarde stated that the battle against inflation continues.
- Deputy Governor Ben Broadbent’s hawkish statement supported the Pound Sterling.
EUR/GBP treads water to continue its winning streak, trading near 0.8590 during the Asian session on Monday. The pair is consolidating after hawkish statements made by central banks’ officials at the Jackson Hole Symposium on Saturday. The pair experienced downward pressure due to downbeat Eurozone economic data amid the less likelihood of further monetary policy tightening in the upcoming European Central Bank’s (ECB) policy meeting, inculcating a sense of caution in the market.
However, ECB President Christine Lagarde highlighted that the battle against inflation is still ongoing. She emphasized the significance of central banks offering an economic nominal reference point and maintaining price stability. Lagarde also stated the need to keep interest rates at restrictive levels as long as it takes to achieve the ECB's medium-term inflation target of 2%.
On the other hand, the hawkish comments made by Bank of England's (BoE) Deputy Governor Ben Broadbent have provided support to the Pound Sterling (GBP) and exerted mild pressure on the EUR/GBP pair. Broadbent stated that monetary policy may have to continue in a restrictive stance for an extended period, given that the effects of the notable rise in prices are unlikely to disappear rapidly.
Market participants seem to hold the belief that the BoE will likely not have to raise interest rates to the extent that was initially anticipated in order to reduce inflation in light of escalating concerns about a potential recession. However, investors are pricing in the possibility of a 25 basis points (bps) interest rate hike in the September meeting, which might strengthen the British Pound (GBP) against the Euro.
Investors will closely monitor the upcoming preliminary German Consumer Price Index (CPI), the German Retail Sales, and Eurozone CPI data due later this week. These datasets could provide fresh insights into the overall Eurozone’s economic outlook, helping traders in obtaining a clearer understanding of the market dynamics. On the United Kingdom (UK) docket, no high-priority economic data is scheduled for release during the week.
- Silver edges lower on Monday and corrects further from over a three-month high.
- The 200-period SMA on the 4-hour chart to act as a pivotal point and limit losses.
- Bulls might wait for a move beyond the $24.35-40 area before placing fresh bets.
Silver attracts some intraday selling on the first day of a new week and moves away from over a three-week high, around the $24.35-$24.40 region touched on Friday. The white metal sticks to a mildly negative tone through the early part of the European session, albeit manages to hold its neck above the $24.00 round-figure mark.
Any subsequent slide below the aforementioned handle is more likely to find some support near the $23.85-$23.80 area, or the 200-period Simple Moving Average (SMA) on the 4-hour chart. Against the backdrop of positive technical indicators on 4-hour/daily charts, the said area could act as a pivotal point for intraday traders and help limit any further decline.
Silver 4-hour chart
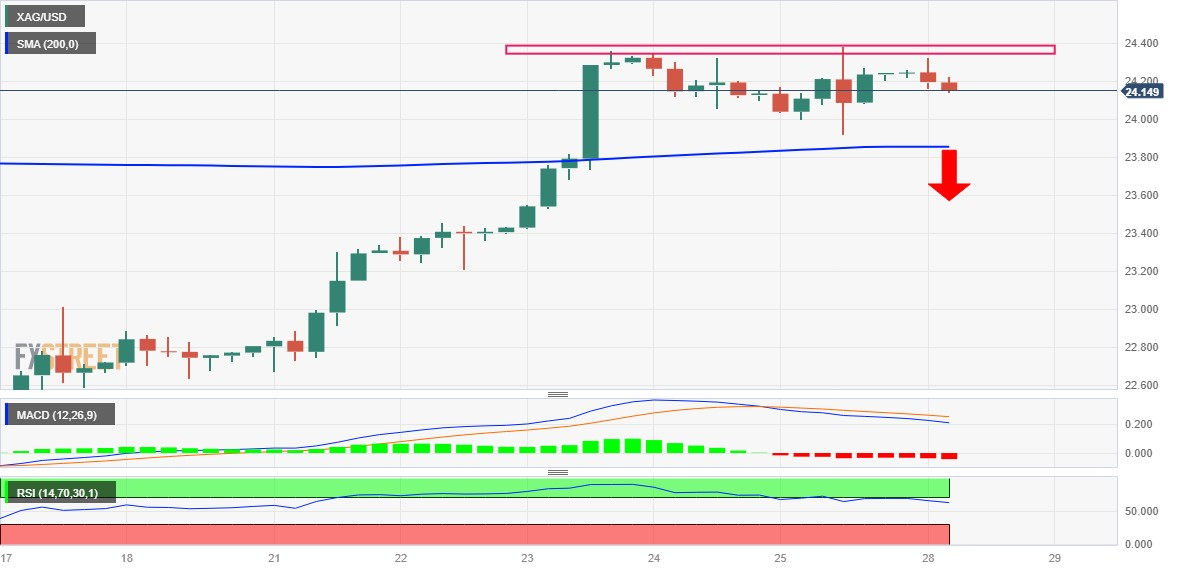
A sustained break below, however, might prompt some technical selling and drag the XAG/USD towards the $23.55 region. This is closely followed by support near the $23.40 area, representing the 200-day SMA, which if broken decisively might shift the near-term bias in favour of bearish traders and pave the way for some meaningful downside.
On the flip side, the $24.35-$24.40 area might continue to act as an immediate strong resistance, which if cleared should allow the XAG/USD to surpass the $24.55-$24.60 intermediate hurdle and aim to reclaim the $25.00 psychological mark. The positive move could get extended further towards the $25.25 zone, or the July monthly swing high, en route to the $26.00 mark.
Zooming out to the daily chart, the recent price action witnessed since early June seems to constitute the formation of a bearish head and shoulders pattern on the daily chart. The pattern, however, will be confirmed on a sustained break below the neckline support, around the $22.20-$22.10 region.
XAG/USD daily chart
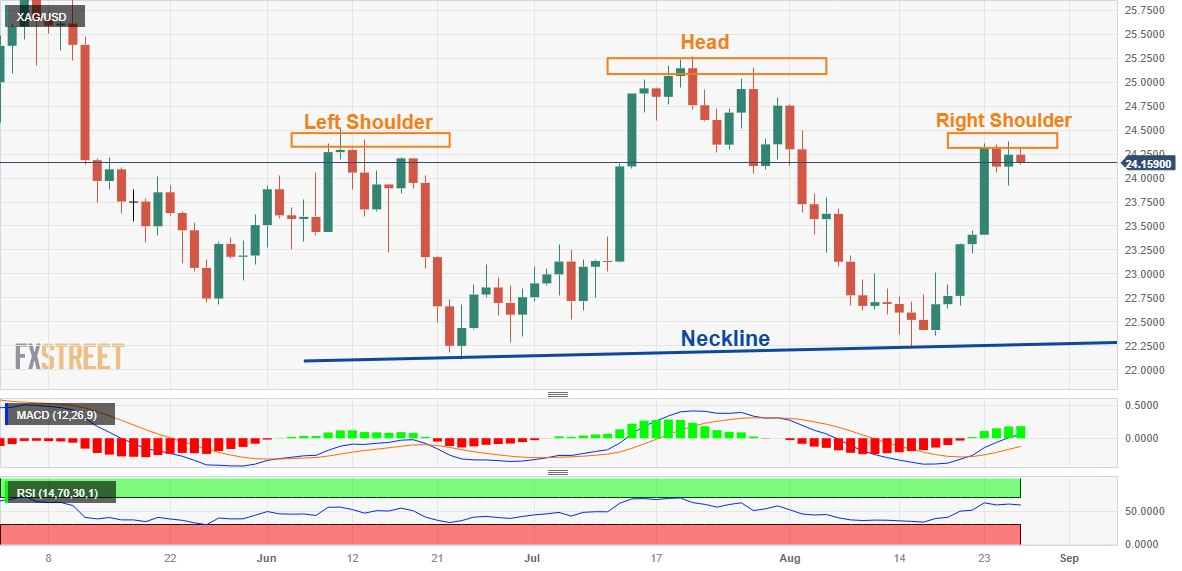
Key levels to watch
USD/CNH is likely to extend the consolidation within the 7.2500-7.3300 range for the time being, comment Economist Lee Sue Ann and Markets Strategist Quek Ser Leang at UOB Group.
Key Quotes
24-hour view: We highlighted last Friday that USD “appears to have moved into a consolidation phase”, and we expected it to trade in a range between 7.2700 and 7.3000.” USD then traded in a narrower range than expected (7.2815/7.3015). The underlying tone has softened, and USD is likely to trade with a downward bias today. However, any decline is unlikely to break the major support at 7.2500. Resistance is at 7.2910, followed by 7.3020.
Next 1-3 weeks: Our latest narrative was from last Thursday (24 Aug, spot at 7.2840) when we highlighted that, “the recent buildup in upward momentum has eased, and USD is likely to trade in a range of 7.2500/7.3300 for the time being.” There is no change in our view.
- The index slips back to the 104.00 region on Monday.
- The dollar comes under pressure as investors digest Powell’s speech.
- The Dallas Fed manufacturing gauge is due in the US docket.
The greenback, when tracked by the USD Index (DXY), comes under some downside pressure and disputes the 104.00 yardstick in the wake of the opening bell in Euroland on Monday.
USD Index looks at data, risk trends
The index kicks off the week on the back foot and recedes to the 104.00 region, as market participants continue to digest Chief Powell’s speech at the Jackson Hole event on Friday.
On the latter, despite Powell kept the message seen at the latest FOMC gathering (July 26) almost unchanged, it is worth noting that he maintained a great deal of policy optionality and reiterated that the Fed intends to keep the restrictive stance until inflation shows a sustainable loss of traction and approaches the target.
Data-wise, the regional manufacturing gauge from the Dallas Fed is only due along with short-term bill auctions.
What to look for around USD
Renewed weakness now prompts the index to challenge the key support at 104.00 the figure amidst some recovery in the risk complex.
In the meantime, support for the dollar keeps coming from the good health of the US economy, which seems to have reignited the narrative around the tighter-for-longer stance from the Federal Reserve.
Furthermore, the idea that the dollar could face headwinds in response to the data-dependent stance from the Fed against the current backdrop of persistent disinflation and cooling of the labour market appears to be losing traction as of late.
Key events in the US this week: FHFA House Price Index, JOLTs Job Openings, CB Consumer Confidence (Tuesday) – MBA Mortgage Applications, ADP Employment Change, Flash Q2 Growth Rate, Advanced Goods Trade Balance, Pending Home Sales (Wednesday) – PCE, Core PCE, Personal Income, Personal Spending, Chicago PMI, Initial Jobless Claims (Thursday) – Nonfarm Payrolls, Unemployment Rate, Final Manufacturing PMI, ISM Manufacturing PMI, Construction Spending (Friday).
Eminent issues on the back boiler: Persistent debate over a soft or hard landing for the US economy. Incipient speculation of rate cuts in early 2024. Geopolitical effervescence vs. Russia and China.
USD Index relevant levels
Now, the index is down 0.13% at 104.05 and faces immediate support at 103.10 (200-day SMA) followed by 102.32 (55-day SMA) and then 101.74 (monthly low August 4). On the upside, the breakout of 104.44 (monthly high August 25) would open the door to 104.69 (monthly high May 31) and finally 105.88 (2023 high March 8).
- NZD/USD attracts some buyers above 0.5900 on Monday.
- Chinese finance ministry would reduce the 0.1% duty on stock trading to boost the capital market, strengthen investor confidence.
- Fed is prepared to hike interest rates further if required but it would be determined by data.
- Market players await the US Nonfarm Payrolls, Chinese Caixin Manufacturing PMI.
The NZD/USD pair snaps the two-day losing streak during the early European session on Monday. The pair currently trades around 0.5916, gaining 0.23% on the day. The strength of the Kiwi is bolstered by the fresh measures from Chinese officials to recover confidence in the market.
On Sunday, the Chinese finance ministry said that the authorities would reduce the 0.1% duty on stock trading to stimulate the capital market and strengthen investor confidence. Alongside the action by the Ministry of Finance, the China Securities Regulatory Commission (CSRC) is implementing measures to bolster market confidence in listed companies after the Chinese equities index slumped to nine-month lows.
This development boosts the China-proxy Kiwi against the Greenback. However, investors will keep an eye on the Chinese Caixin Manufacturing PMI for August due on Friday. The concerns about China's deteriorating economic conditions should dampen market optimism, which might weigh on the NZD and act as a headwind for the NZD/USD pair.
Apart from this, the chief economist of the Reserve Bank of New Zealand (RBNZ) said last week that policymakers would lower the OCR sooner than they have signaled if China experienced a more significant deceleration than the RBNZ anticipates.
On the US Dollar front, Federal Reserve (Fed) Chairman Jerome Powell stated at the Jackson Hole Economic Symposium on Friday that the central bank is prepared to hike interest rates further if required. He added that the next rate hike decision would be determined by data. Meanwhile, Cleveland Fed President Loretta Mester said that GDP and labor market data show that the economy is gaining momentum. She emphasized that the current rates are not restrictive enough to reach the inflation target and a lower growth rate would be essential to moderate inflation. The US Nonfarm Payrolls data on this Friday could offer hints about the future path of monetary policy. The stronger than expected data might lift the US Dollar and limit the upside for the pair.
Moving on, traders will monitor on the US Nonfarm Payrolls and inflation data due later this week. The market anticipated that the US economy to create 170K jobs in August. Also, the Chinese Purchasing Managers' Indexes (PMI) will be in focus. The data will be critical for determining a clear movement for the NZD/USD pair.
French Finance Minister Bruno Le Maire offers her view on the monetary policy and inflation during his appearance this Monday.
Key takeaways
“There will not be any reduction in interest rates in the coming months.”
“Will ask food producers to take more action against inflation, what they have been doing is insufficient.”
“We also need to address inflation pressure in services sector.”
Market reaction
The Euro is unfazed by Le Maire’s comments, as EUR/USD is keeping its range at around 1.0815, up 0.17% on the day.
- USD/JPY retreats from YTD high but lacks downside momentum while printing the first daily loss in three.
- Fed’s Powell defends higher rates but cites data-dependency to prod policy hawks.
- BoJ’s Ueda cites inflation concerns to support ultra-easy monetary policy.
- China-inspired risk-on mood, positioning for top-tier data also weigh on Yen pair.
USD/JPY bulls run out of steam as the Yen pair prints the first daily loss in three around 146.30 despite lacking downside momentum ahead of Monday’s European session. In doing so, the risk-barometer pair struggles to cheer China-inspired risk-on mood amid anxiety ahead of this week’s top-tier US data about employment and inflation conditions.
It should be noted that the recently mixed details of Japan’s Coincident Index for June and the Leading Economic Index for the said month also prod the USD/JPY pair traders.
The introduction of one more measure to boost China's economic activity, via halving the current stamp duty of 0.1% on stock trading, favors the sentiment and weighs on the US Dollar of late. On the same line could be the news from the Wall Street Journal (WSJ) which cites people familiar with the decision-making process in China to highlight Chinese Communist Party Chairman Xi Jinping’s deep-rooted philosophical objections to Western-style consumption-driven growth, suggesting more stimulus ahead.
Apart from China-linked optimism, Fed Chair Jerome Powell’s emphasis on data-dependency allowed the greenback buyers to pare recent gains ahead of the Federal Reserve’s (Fed) favorite inflation gauge, namely the Core Personal Consumption Expenditure (PCE) Price Index. Also important to watch will be the monthly US employment data including the headline Nonfarm Payrolls (NFP).
While Fed’s Powell highlighted the importance of incoming data, Bank of Japan (BoJ) Governor Kazuo Ueda cited a bit below target Japan inflation to defend the currently ultra-easy monetary policy. The policymaker also cited a healthy trend in domestic demand and record-high profits that bolstered the business fixed investment to flag the inflation fears. The same bolsters the call for the BoJ’s end to ultra-easy monetary policies, especially after the latest tweak to the Yield Curve Control (YCC) policy.
Against this backdrop, S&P 500 Futures edge higher past 4,420, up 0.10% intraday, whereas the US 10-year Treasury bond yields grind lower to 4.22% after snapping the four-week uptrend by posting minor weekly losses, as well as retreating from the highest level since 2007. That said, the US Dollar Index (DXY) eased from the highest level since June 01 to around 104.05.
Looking ahead, USD/JPY pair traders should seek clues to justify the monetary policy divergence between the BoJ and the Fed for clear directions. As a result, this week’s US employment and inflation data, as well as Japan's Unemployment Rate and Retail Trade will be important to watch. Also crucial will be the risk catalysts like headlines about China and global central bankers’ moves, which in turn will guide yields and the Yen pair.
Technical analysis
USD/JPY buyers remain hopeful unless witnessing a daily closing below 144.90-85 support zone comprising multiple levels marked since late June.
The continuation of the upside momentum could motivate USD/JPY to challenge 147.00 and beyond in the next few weeks, according to Economist Lee Sue Ann and Markets Strategist Quek Ser Leang at UOB Group.
Key Quotes
24-hour view: Last Friday, we held the view that USD “could rebound further, but the chance of it breaking clearly above 146.55 is not high.” We indicated that that “Support is at 145.60, followed by 145.20.” In NY trade, USD dropped briefly to 145.71 and then rebounded to a high of 146.63. Upward momentum has increased, albeit not much. Today, USD could edge higher, but a sustained break above 147.00 is unlikely. On the downside, if USD breaches 145.90 (minor support is at 146.20), it would mean the current mild upward pressure has faded.
Next 1-3 weeks: Last Friday (25 Aug, spot at 145.90), we indicated that USD must break and stay above 146.55 before a sustained rise is likely. While USD broke above 146.55 (high of 146.63), there was only a slight increase in momentum. That said, there is room for USD to grind higher to 147.00, possibly 147.50. The mild upward pressure is intact as long as USD stays above 145.20 (‘strong support’ level was at 144.50 last Friday).
Considering advanced prints from CME Group for natural gas futures markets, open interest rose by around 7.7K contracts at the end of last week, keeping the choppy activity well in place for yet another session. Volume, on the other hand, shrank markedly by around 166.4K contracts against the backdrop of persistent choppiness,
Natural Gas: Gains remain capped by $3.00
Friday’s decent gains in prices of natural gas were accompanied by rising open interest, leaving the door open to the continuation of the recovery in the very near term at least. That said, bulls face an initial hurdle at the weekly high of $2.86 (August 15) prior to the key resistance area around the $3.00 mark per MMBtu.
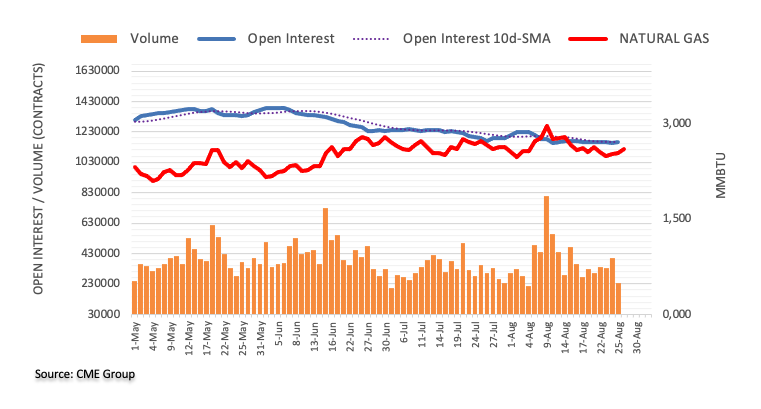
In the view of Economist Lee Sue Ann and Markets Strategist Quek Ser Leang at UOB Group, AUD/USD is now likely to trade between 0.6365 and 0.6500 in the next few weeks.
Key Quotes
24-hour view: After AUD dropped sharply to a low of 0.6413 last Thursday, we highlighted on Friday that “the sharp drop has room to extend, but it is unlikely to challenge the major support at 0.6365.” We indicated that “there is another support at 0.6390.” While our view was not wrong as AUD dropped to a low of 0.6380, the decline was brief as it rebounded quickly from the low. Downward momentum has waned somewhat, and the outlook for AUD today appears to be neutral. In other words, it is likely to trade sideways, probably between 0.6385 and 0.6445.
Next 1-3 weeks: Last Friday (25 Aug, spot at 0.6420), we highlighted that “instead of rebounding further, AUD is more likely to trade in a range of 0.6365/0.6500 for the time being.” We continue to hold the same view. Looking ahead, if AUD breaks clearly below 0.6365, it could trigger a decline to 0.6300.
Open interest in crude oil futures markets went up for the second session in a row on Friday, this time by more than 24K contracts. Volume followed suit and increased for the third consecutive day, now by around 70.1K contracts.
WTI: Immediate up-barrier comes near $85.00
Prices of WTI added to the previous daily gain on Friday amidst increasing open interest and volume, which indicates that extra gains appears likely in the very near term. Against that, the commodity keeps the initial target at the 2023 peak of $84.85 per barrel (August 10).
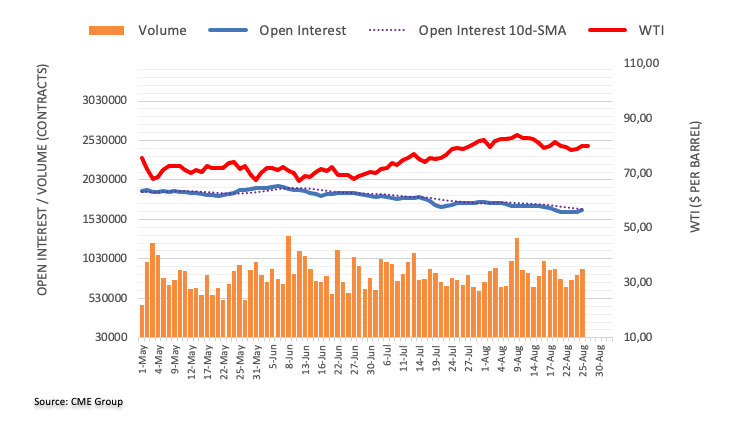
- AUD/JPY trades within a descending trend channel on the four-hour chart.
- The first resistance level for the cross emerges at 94.40; the initial support level is located at 93.85.
- The Relative Strength Index (RSI), MACD stands in the bullish territory.
The AUD/JPY cross edges higher above the 94.00 mark during the early European session on Monday. The Chinese finance ministry said on Sunday that the authorities would reduce the 0.1% duty on stock trading to stimulate the capital market and strengthen investor confidence. This development triggers a risk-on mood and boosts the China-proxy Australian Dollar against the Japanese Yen.
Technically, AUD/JPY trades within a descending trend channel since the middle of June on the four-hour chart. That said, the path of least resistance for the AUD/JPY is to the upside as the cross just holds above the 50- and 100-hour Exponential Moving Averages (EMAs).
The immediate resistance level for AUD/JPY emerges at 94.40, highlighting the upper boundary of a descending trend channel. Any follow-through buying above the latter will see a rally to 94.90 (a high of August 15). The next upside stop to watch is 95.40 (high of July 14) en route to 95.85 (high of July 31).
Looking at the downside, the cross will meet the initial support level at 93.85 (the 50-hour EMA), followed by 93.75 (the 100-hour EMA). The next downside filter appears at 93.50 (low of August 22). The key contention level is seen near a psychological figure at 93.00. A break below the latter will see a drop to 92.60 (the midline of the descending trend channel) en route to 91.80 (the high of May 8) and finally at 91.35 (the lower limit of the descending trend channel).
It’s worth noting that the Relative Strength Index (RSI) holds above 50 and the Moving Average Convergence/Divergence (MACD) stands in the bullish territory. Both momentum indicators support the buyers for now.
AUD/JPY four-hour chart
-638288012935724439.png)
Further downside in GBP/USD could extend the decline to the 1.2480 zone in the next few weeks, note Economist Lee Sue Ann and Markets Strategist Quek Ser Leang at UOB Group.
Key Quotes
24-hour view: We expected GBP to break below 1.2580 last Friday, but we indicated that “it remains to be seen if it can maintain a foothold below this level.” We also indicated that “the next support is at 1.2530.”. In line with our expectations, GBP broke below 1.2580 as it dropped to 1.2548 before ending the day at 1.2577 (-0.19%). Downward momentum has not increased much; this combined with oversold conditions, suggests that GBP is unlikely to weaken much further. Today, GBP is more likely to trade sideways, probably in a range of 1.2545/1.2625.
Next 1-3 weeks: Our update from last Friday (25 Aug, spot at 1.2600) still stands. As highlighted, the increase in downward momentum suggests GBP is likely to weaken to 1.2530, possibly 1.2480. We will continue to hold the same view as long GBP stays below the ‘strong resistance’ at 1.2685 (level was at 1.2720 last Friday).
CME Group’s flash data for gold futures markets noted traders reduced their open interest positions by just 575 contracts on Friday, adding to the previous daily drop. Volume, instead, reversed the previous daily pullback and increased by nearly 31K contracts, keeping the erratic performance well in place for the time being.
Gold: Positive outlook above the 200-day SMA
Friday’s small downtick in gold prices was on the back of a marginal drop in open interest, which hints at a potential near-term rebound. In the meantime, the yellow metal should shift to a constructive outlook once it clears the 200-day SMA ($1910) in a convincing fashion.
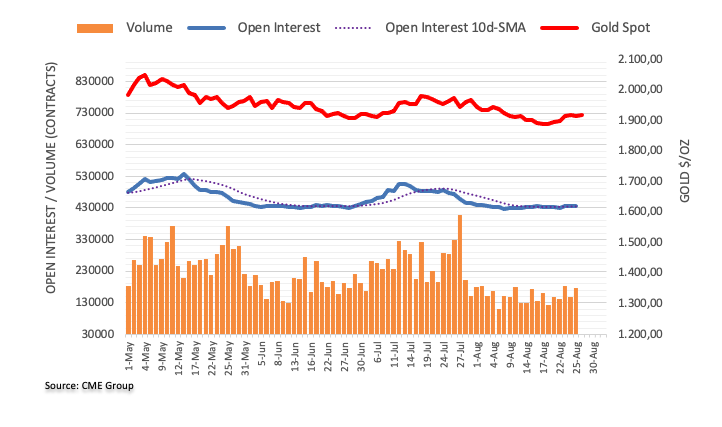
According to a survey published by Germany’s high-influential IFO on Monday, the morale of the German exporters deteriorated further in August due to weak global demand.
Key takeaways
“Export expectations slipped further to -6.3 points from -6.0 in July.”
"German exporters continue to struggle with weak global demand.“
"More and more companies are also complaining about being less able to compete at the global level."
Market reaction
EUR/USD was last seen trading at 1.0817, up 0.16% on the day.
- Gold Price stays defensive above the key support confluence after snapping four-week downtrend.
- Cautious mood ahead of top-tier US employment, inflation clues prod XAU/USD buyers.
- China-inspired optimism, pullback in US Treasury bond yields, US Dollar put a floor under the Gold Price.
- US Core PCE Price Index, NFP will be the key after Fed policymakers highlight data dependency.
Gold Price (XAU/USD) remains dicey after pushing back the bearish bias with the first positive weekly close in five. The Yellow Metal’s latest inaction could be linked to the market’s anxiety ahead of this week’s top-tier US inflation and employment clues. In doing so, the XAU/USD fails to cheer the latest retreat in the US Treasury bond yields and the US Dollar, as well as China-linked optimism in Asia.
Apart from the pre-data caution, the Gold Price also bears the burden of the mixed statements from the US Federal Reserve (Fed) officials at the annual Jackson Hole Symposium. That said, major of the Fed officials defended restrictive monetary policies at last week’s key event but failed to suggest more rate hikes and also highlighted the data-dependency for future moves, which in turn suggests that Fed hawks are running out of steam.
Elsewhere, China announced one more measure to bolster economic activities but the mixed concerns about the US-China trade ties and fears of slower recovery in one of the world’s biggest Gold customers prod the XAU/USD bulls.
Moving on, this week’s China activity data and the Sino-American talks in Beijing will be crucial to watch for the Gold traders for clear directions. Also important will be the Federal Reserve’s (Fed) favorite inflation gauge, namely the Core Personal Consumption Expenditure (PCE) Price Index for July, and the monthly employment data for August.
Also read: Gold Price Forecast: XAU/USD set to range between two key moving averages ahead of US jobs data
Gold Price: Key levels to watch
Our Technical Confluence indicator suggests that the Gold Price remains comfortably firmer above the $1,910 key support even as buyers hesitate of late. That said, the stated support confluence includes the 5-DMA, Fibonacci 23.6% on one-day and 38.2% on one-week, as well as the lower band of the Bollinger on the hours timeframe.
Ahead of that, the middle of the Bollinger on the four-hour play joins the Fibonacci 61.8% on one-day and 23.6% on one-week to restrict immediate XAU/USD downside near $1,915.
It’s worth noting that the previous monthly low and the bottom line of a Bollinger indicator on the four-hour chart, close to $1,903 at the latest, quickly followed by the $1,900 threshold, acts as the final defense of the Gold buyers.
Meanwhile, a convergence of the previous weekly high and Pivot Point one-day R1, close to $1,923-24, guards immediate recovery of the Gold Price.
Following that, the 50-DMA joins the Pivot Point one-day R2 and one-week R1 to highlight $1,933 as the key resistance for the XAU/USD bulls.
At last, the $1,935-36 zone comprising the 200-SMA on the four-hour and Fibonacci 61.8% on one-month could test the Gold buyers before giving them control.
Here is how it looks on the tool
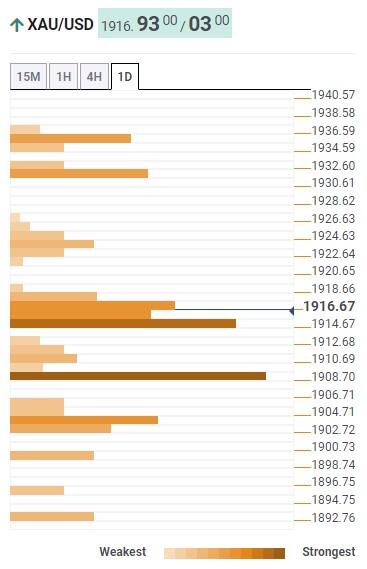
About Technical Confluences Detector
The TCD (Technical Confluences Detector) is a tool to locate and point out those price levels where there is a congestion of indicators, moving averages, Fibonacci levels, Pivot Points, etc. If you are a short-term trader, you will find entry points for counter-trend strategies and hunt a few points at a time. If you are a medium-to-long-term trader, this tool will allow you to know in advance the price levels where a medium-to-long-term trend may stop and rest, where to unwind positions, or where to increase your position size.
Economist Lee Sue Ann and Markets Strategist Quek Ser Leang at UOB Group suggest EUR/USD could slip back to the 1.0730 region in the near term.
Key Quotes
24-hour view: We highlighted last Friday that EUR “is likely to break the major support at 1.0790, but the next support at 1.0730 is likely out of reach.” We added, “The downside risk is intact as long as EUR stays below 1.0860 (minor resistance is at 1.0830).” In London trade, EUR broke below 1.0790 and dropped to 1.0764. In NY trade, EUR rebounded briefly to 1.0841 and then dropped back down to 1.0764 before ending the day at 1.0800 (-0.08%). Despite the decline to a fresh 2-1/2-month low, there is no clear increase in downward momentum. That said, there is room for EUR to retest the 1.0765 level today. The major support at 1.0730 is unlikely to come under threat. Resistance is at 1.0815, followed by 1.0840.
Next 1-3 weeks: We have expected EUR to weaken since the start of last week. After EUR dropped, in our update from Friday (25 Aug, spot at 1.0870), we indicated that “the weakness in EUR is still intact as long as it stays below 1.0890.” We also indicated that “a break of 1.0790 will not be surprising, and the next level to focus on is1.0730.” In London trade, EUR broke below 1.0790 and dropped to a low of 1.0764. We continue to hold the view that EUR could decline, likely to 1.0730, even though it could consolidate for a couple of days first. We will hold the same view as long as the ‘strong resistance’ level at 1.0875 (level was at 1.0890 last Friday) is not breached.
- USD/RUB gains momentum above 95.65 amid the economic challenge in Russia, the hawkish stance from the Fed.
- Finance Minister Anton Siluanov forecast the Russian economy to expand by at least 2.5% in 2023.
- Fed is prepared to hike interest rates further if required and the next rate hike would be determined by data.
- US Nonfarm Payrolls and inflation data will be the highlight this week ahead of the September FOMC meeting.
USD/RUB trades in positive territory for the third consecutive day. The pair trades around 95.65, gaining 0.69% on the day. The economic challenge in Russia exerts pressure on the Ruble and lifts the USD/RUB in the early European session on Monday.
Finance Minister Anton Siluanov said on Saturday that the Russian economy is forecast to expand by at least 2.5% in 2023, while inflation is anticipated to hover around 6%, according to Reuters. Russian policymakers predict that inflation will fall back to the target of 4% in 2024. It is expected to decline to 5.0%-6.5% this year. He also said that he would cooperate with the Central Bank to implement all necessary steps to reduce inflation to the desired level.
In addition, Russia has progressively tightened exit requirements ever since Western companies began leaving the country when Russia began a "special military operation" in Ukraine in February 2022. That said, foreign corporations have already lost more than $80 billion from their Russian operations as Moscow demands a 50% discount on all overseas agreements and needs at least a 10% contribution to the Russian budget.
Apart from this, Russia's budget is under difficulty as a consequence of the turmoil in Ukraine, and the central bank raised the interest rates last week to halt the ruble's slide. That said, the Bank of Russia hiked the interest rate by 350 basis points (bps) to 12%. It’s worth noting that Russia has upped its military spending target for 2023 to more than $100 billion, accounting for one-third of all state expenditures, as the escalating costs of the Ukraine conflict place an increasing strain on Moscow's finances.
On the other hand, hawkish comments from the Federal Reserve (Fed) Chairman Jerome Powell boost the Greenback across the board and act as a tailwind for USD/RUB. Jerome Powell stated at the Jackson Hole Economic Symposium on Friday that the central bank is prepared to hike interest rates further if required and the next rate hike would be determined by data. Meanwhile, Cleveland Fed President Loretta Mester said that GDP and labor market data show that the economy is gaining momentum. She emphasized that the current rates are not restrictive enough to reach the inflation target and a lower growth rate would be essential to moderate inflation.
Market participants will monitor the headlines surrounding the Russia-Ukraine war. The US Nonfarm Payrolls and inflation data will be the highlight this week ahead of the September FOMC meeting. The event could offer hints about further monetary policy and give a clear direction for USD/RUB.
FX option expiries for Aug 28 NY cut at 10:00 Eastern Time, via DTCC, can be found below.
- EUR/USD: EUR amounts
- 1.0745 409m
- 1.0795-1.0805 2.1b
- 1.0825 882m
- 1.0840-50 1.2b
- 1.0900 1.5b
- USD/JPY: USD amounts
- 146.50 530m
- AUD/USD: AUD amounts
- 0.6410 2.4b
- 0.6420 1.6b
- EUR/GBP: EUR amounts
- 0.8560 450m
While speaking in Wellington on Monday, New Zealand (NZ) Minister of Finance (FinMin) Grant Robertson said that he has urged the public service to cut spending on consultants and contractors, adding tha he will also cut down the future budget allowances.
Key takeaways (via Bloomberg)
“New Zealand’s government is tightening its belt as a domestic recession and concerns about China’s faltering economy erode tax revenue and strain its budget.”
“The government has identified almost NZ$4 billion ($2.4 billion) of potential savings over the next four years.”
Market reaction
NZD/USD remains supported above 0.5900 following the above headlines. The pair is 0.30% higher on the day at 0.5919, as of writing.
- USD/TRY pares the biggest daily gains in seven months amid US Dollar’s retreat.
- Fed officials failed to reverse CBRT-led rally despite defending restrictive monetary policy.
- China improves sentiment, allows US Dollar bulls to take a breather ahead of top-tier employment, inflation clues.
- Q2 Turkish GDP, US NFP and Core PCE Price Index eyed for clear directions.
USD/TRY sticks to mild losses as it retreats to 26.50 heading into Monday’s European session. In doing so, the Turkish Lira (TRY) pair failed to extend the previous day’s rebound from the lowest level in two months amid a broad US Dollar pullback. However, the cautious mood ahead of this week’s top-tier Turkish and US data prods the pair sellers of late.
Mixed concerns about the Federal Reserve’s (Fed) capacity to push back the policy pivot, amid recently unimpressive data, weighs on the US Dollar as the Fed officials highlighted the data dependency during last week’s Jackson Hole speeches. Also likely to weigh on the Greenback, as well as the USD/TRY pair, is the slightly positive sentiment and aftershocks of the Central Bank of the Republic of Türkiye (CBRT) rate hike.
That said, Fed Chair Jerome Powell gained major attention as he reiterated his defense of “higher for longer” rates while stating that the policy is restrictive but the Fed can’t be certain what neutral rate level is. The policymaker also added that there is substantial further ground to cover to get back to price stability while also stating that the economic uncertainty calls for agile monetary policy-making.
On the other hand, the CBRT surprised global markets by lifting the benchmark rates to 25%, versus 20% expected and 17.5% previous readings, to tame the inflation woes that recently gained momentum after wildfires wrecked an international trade route around Turkiye.
Amid these plays, S&P 500 Futures defend the previous day’s rebound from a one-week low to around 4,420, up 0.10% intraday, whereas the US 10-year Treasury bond yields grind near 4.23% after snapping the four-week uptrend by posting minor weekly losses as it retreated from the highest level since 2007. That said, the US Dollar Index (DXY) eased from the highest level since June 01 to around 104.05.
Looking ahead, Turkish growth numbers for the second quarter (Q2) of 2023 will join the Federal Reserve’s (Fed) favorite inflation gauge, namely the Core Personal Consumption Expenditure (PCE) Price Index for July, and the monthly employment data, to direct USD/TRY moves.
Technical analysis
Unless witnessing a clear upside break of the five-week-old previous support line, now resistance around 27.10 by the press time, the USD/TRY bears remain hopeful. That said, the pair sellers, however, may remain cautious beyond 25.65 horizontal support.
- WTI crude oil prints the first daily loss in three while retreating from short-term key resistance line.
- Convergence of 200-day EMA, 50-day EMA puts a floor under the Oil Price.
- Market’s cautious optimism also favors energy buyers despite mild losses.
WTI crude oil remains mildly offered near $79.80 as it takes a U-turn from a two-week-old resistance line to print the first daily loss in three heading into Monday’s European session. In doing so, the Black Gold also justifies the bearish MACD signals while struggling to cheer the softer US Dollar, as well as China-inspired risk-on mood.
Also read: S&P 500 Futures, yields portray cautious optimism on China stimulus while preparing for US inflation, NFP
That said, a downward-sloping resistance line from August 09, around $80.15 by the press time, restricts the immediate upside of the energy benchmark.
Given the downbeat MACD signals and the latest retreat from the key resistance line, the Oil price may witness further pullback in the price.
However, a convergence of the 200-day and 50-day Exponential Moving Averages (EMA), around $77.80 at the latest, appears a tough nut to crack for the Oil bears.
Also acting as a short-term downside filter is the early July peak of around $77.15, a break of which will quickly drag the WTI crude oil price towards the high marked in May around d $74.70.
On the flip side, a daily closing beyond the stated resistance line, close to $80.15 will aim for the previous weekly high of around $81.70 before April’s top of $83.40.
In a case where the black gold remains firmer past $83.40, the current monthly high of around $84.35 will act as the last defense of the WTI sellers.
WTI Price: Daily chart
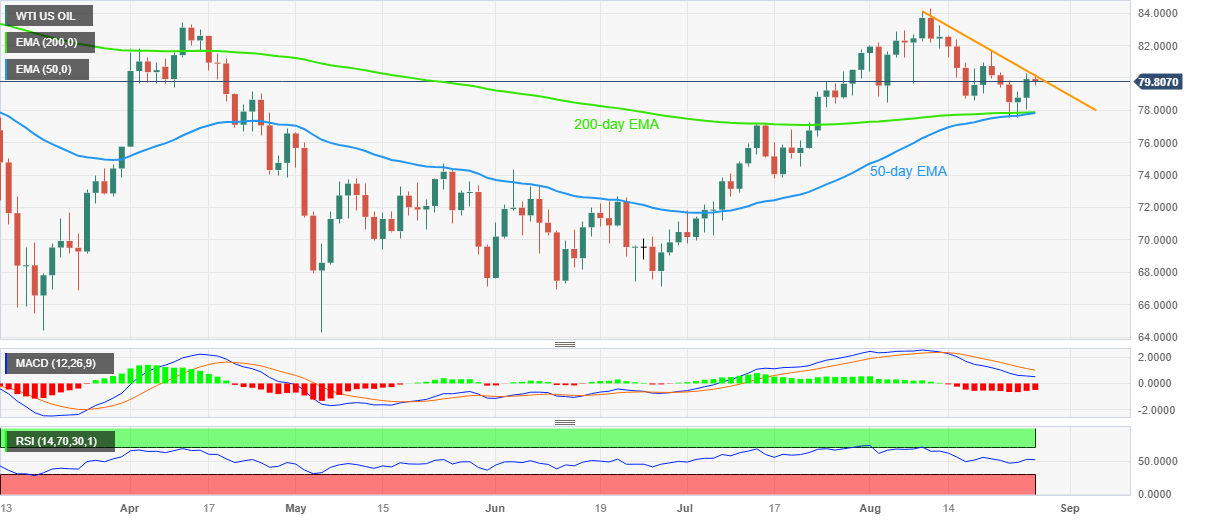
Trend: Limited downside expected
- EUR/USD remains on the defensive around 1.0808, bouncing off the low of 1.0765.
- European Central Bank (ECB) President Lagarde said that the fight against inflation is not over.
- Fed’s Powell is prepared to raise interest rates further, if necessary.
- Investors await Eurozone CPI data, US Nonfarm Payrolls data for fresh impetus.
The EUR/USD pair reclaims the 1.0800 area but remains under pressure as the pair posts a weekly close in negative territory for the fifth consecutive day. The hawkish stance from the European Central Bank (ECB) fails to boost the Euro against its rivals despite the weaker Eurozone economic data. The major pair currently trades near 1.0808, up 0.10% on the day.
European Central Bank (ECB) President Christine Lagarde stated at the Jackson Hole Symposium that the fight against inflation is not over. She emphasized the importance of central banks providing an economic nominal anchor and ensuring price stability while setting interest rates at restrictive levels for as long as it takes to achieve inflation to the ECB's medium-term target of 2%. Additionally, ECB Governing Council member Martins Kazaks said that it may be too early to pause interest rate hikes now as a premature halt in the fight against inflation could exert more pressure on the economy in the future.
Across the pond, the Federal Reserve (Fed) Chairman Jerome Powell stated at the Jackson Hole Economic Symposium on Friday, that the central bank is prepared to raise interest rates further, if necessary, and will determine the next rate move based on data. Powell also indicated that the strong economic growth and tight labor market conditions might pave the way for further tightening cycle. He added that if the data do not show indications of softening, additional rate rises would be appropriate. Following the hawkish comments, the Greenback attracted some buyers against the Euro.
Apart from this, Philadelphia Fed President Patrick Harker said that he does not see the need for additional rate hikes at this time and the Fed should hold rates steady and observe the impact of policy on the economy. Meanwhile, Cleveland Fed President Loretta Mester said that GDP and labor market data show that the economy is gaining momentum. She emphasized that the current rates are not restrictive enough to reach the inflation target and a lower growth rate would be essential to moderate inflation.
About the data on Friday, the University of Michigan's (UoM) Consumer Confidence Index for August fell to 69.5 from 71.6 in July and was revised from the first reading of 71.2. Additionally, The Current Conditions Index dropped from 76.6 to 75.7 (revised from 77.4), while the Expectations Index fell from 68.3 to 65.5 (revised from 67.3).
Market participants will monitor the German Consumer Price Index (CPI), the German Retail Sales, and Eurozone CPI data due later this week. Also, the ECB will release its meeting minutes on Thursday. On the US docket, the US preliminary Gross Domestic Product Annualized (GDP), Core Personal Consumption Expenditures (PCE) Index, and the weekly Jobless Claims will be released. The attention will shift to the Nonfarm Payrolls (NFP) data on Friday. The events will be critical for determining a clear movement for the EUR/USD pair.
- Asian stock markets trade higher on the back of fresh measures by Chinese Authorities.
- Beijing reduced the stamp duty by half, aiming to boost investors’ confidence.
- Real Estate stocks rose in China due to the relaxation of mortgage regulations.
Asian stock markets advanced on Monday, following US equities with mild gains despite the hawkish statement from the US Federal Reserve (Fed) Chairman Jerome Powell at the Jackson Hole Symposium. In his statement on Friday, Powell suggested that US interest rates might increase further in order to address persistent inflation. The Asian equities begin the week on a positive note as the Chinese authorities unveiled fresh measures designed to rebuild confidence.
At the time of writing, China’s Shanghai is up 2.30% to 3,134, the Shenzhen Component Index rises 2.38% to 10,371, Hong Kong’s Hang Seng advances 1.71% to 18,263, South Korea’s Kospi is up 0.81%, Japan’s Nikkei rises 1.64% and Taiwan's Weighted Index is up 0.25%.
Over the weekend, Beijing implemented a measure to reduce the stamp duty on stock trading by 0.1%, aiming to boost investors’ confidence. The China Securities Regulatory Commission has reported that local stock exchanges have also reduced their margin financing requirements.
Investors had previously perceived Beijing's attempts to bolster the economy through earlier measures as relatively ineffective. Consequently, they urged the Chinese authorities to introduce more focused fiscal support to the nation’s economic conditions.
Beijing additionally revealed a relaxation of mortgage regulations to strengthen the Real Estate sector, a move that bolstered Real Estate equities in China. The deceleration of the real estate market has posed a significant challenge to the Chinese economy, as this sector plays a crucial role in driving growth. Market participants will closely watch China's services and manufacturing PMIs later in the week for further indication of the country’s economic conditions.
- USD/CAD bulls take a breather at three-month high, prods two-day winning streak.
- China-linked cautious optimism in the market, consolidation ahead of key data/events allow Loonie to pare recent moves.
- Oil Price struggles to cheer China stimulus amid mixed central bankers’ speeches at Jackson Hole.
- Canada GDP, Fed’s preferred inflation gauge and US NFP eyed for clear directions.
USD/CAD retreats from the highest level in three months despite lacking downside momentum around 1.3595-90 during the early Monday morning in Europe. In doing so, the Loonie pair cheers the US Dollar’s pullback while paying a little heed to the softer prices of Canada’s main export item, namely the WTI crude oil, amid a slightly optimistic market ahead of this week’s top-tier data/events from the US and Canada.
That said, the US Dollar Index (DXY) eases from the highest level since June 01 to around 104.05 while the WTI crude oil snaps the two-day winning streak around $79.65 by the press time.
Greenback bears the burden of the market’s cautious optimism after witnessing a hesitantly hawkish remarks from the global central banks as they defended their respective restrictive monetary policies. Among them, Fed Chair Jerome Powell gained major attention as he reiterated his defense of “higher for longer” rates while stating that the policy is restrictive but the Fed can’t be certain what neutral rate level is. The policymaker also added that there is substantial further ground to cover to get back to price stability while also stating that the economic uncertainty calls for agile monetary policy-making.
Elsewhere, the introduction of one more measure to boost China's economic activity, via halving the current stamp duty of 0.1% on stock trading, also favors the sentiment and weighs on the US Dollar of late. On the same line could be the news from the Wall Street Journal (WSJ) which cites people familiar with the decision-making process in China to highlight Chinese Communist Party Chairman Xi Jinping’s deep-rooted philosophical objections to Western-style consumption-driven growth, suggesting more stimulus ahead.
It’s worth noting, however, that the Oil buyers need more to defend the previous gains amid mixed concerns about China, concerning the ongoing US-China trade talks and the talks of witnessing softer economic recovery in Beijing.
Against this backdrop, S&P 500 Futures defend the previous day’s rebound from a one-week low to around 4,420, up 0.10% intraday, whereas the US 10-year Treasury bond yields grind near 4.23% after snapping the four-week uptrend by posting minor weekly losses as it retreated from the highest level since 2007.
Moving on, a light calendar and preparations for this week’s top-tier data/events may allow the USD/CAD to remain pressured. However, major attention will be given to Canada's growth numbers and the Federal Reserve’s (Fed) favorite inflation gauge, namely the Core Personal Consumption Expenditure (PCE) Price Index for July, as well as the monthly employment data for August, for clear directions.
Technical analysis
USD/CAD pair’s successful trading above a three-week-old rising support line surrounding 1.3535 keeps the buyers hopeful of crossing the four-month-old descending resistance line, close to 1.3600 by the press time.
- AUD/USD attracts some buyers on Monday and draws support from a combination of factors.
- China's new measures and the upbeat domestic data drive flows towards the Australian Dollar.
- A positive risk tone prompts some selling around the safe-haven buck and acts as a tailwind.
- Bets for one more Fed rate hike in 2023 should limit the USD fall and cap gains for the major.
The AUD/USD pair regains positive traction on the first day of a new week and climbs to the 0.6430 area during the Asian session, snapping a two-day losing streak.
China on Sunday announced that the levy charged on stock trading will drop from 0.1% to 0.05% from August 28 – marking the first reduction since 2008. The new measures are aimed at boosting the struggling market and reviving investor confidence, which, in turn, benefits the China-proxy Australian Dollar (AUD), which draws additional support from the better-than-expected domestic data.
In fact, the Australian Bureau of Statistics (ABS) reported that Retail Sales – a measure of the country’s consumer spending – rose 0.5% in July against consensus estimates for a 0.3% increase and the 0.8% decline registered in the previous month. This, along with a modest US Dollar (USD) downtick, provides a goodish lift to the AUD/USD pair, though any meaningful appreciating move seems elusive.
Concerns about the worsening economic conditions in China and looming recession risks should keep a lid on the optimism in the markets. Apart from this, the prospects for further policy tightening by the Federal Reserve (Fed) should limit the USD corrective pullback from its highest level since early June touched on Friday and contribute to capping gains for the AUD/USD pair, at least for now.
It is worth recalling that the markets have been pricing in the possibility of one more 25 bps rate hike by the end of this year. The bets were reaffirmed by Fed Chair Jerome Powell's comments on Friday, backing the need to raise interest rates further to cool still-too-high inflation. Powell added that policymakers will proceed carefully as they decide whether to tighten further or to hold rates constant.
This hawkish outlook remains supportive of elevated US Treasury bond yields and favours the USD bulls, warranting some caution before placing aggressive bullish bets around the AUD/USD pair. Hence, it will be prudent to wait for strong follow-through buying in order to confirm that spot prices have bottomed out near the 0.6365 area, or the lowest level since November 2022 set earlier this month.
Technical levels to watch
- EUR/JPY gains momentum above the 158.30 area, supported by the European Central Bank (ECB) hawkish comments.
- ECB President Lagarde would set rates at restrictive levels to achieve inflation to the target of 2%. Japanese policymakers said that underlying inflation remains below its target, will maintain the current policy framework.
- Investors await Eurozone CPI, ECB meeting minutes due on Thursday.
The EUR/JPY cross extends its upside for the third consecutive day in the Asian session on Monday. The cross currently trades around 158.35, gaining 0.17% on the day.
At the Jackson Hole Symposium, European Central Bank (ECB) President Christine Lagarde stated that the battle against inflation is not yet won. She emphasized the importance of central banks providing an economic nominal anchor and ensuring price stability while setting interest rates at restrictive levels for as long as it takes to achieve inflation to the ECB's medium-term target of 2%.
Furthermore, ECB Governing Council member Martins Kazaks said that it may be too early to pause interest rate hikes now as a premature halt in the fight against inflation could exert more pressure on the economy in the future. Markets anticipate a 50% possibility of an additional rate hike in the ECB September meeting following the ECB’s policymakers' comments. That said, the divergence in monetary between the ECB and the Bank of Japan (BoJ) lifts the Euro against its rivals.
Across the pond, Governor Kazuo Ueda of the BoJ stated at a Federal Reserve symposium on Saturday that the central bank considers underlying inflation to be below its objective and will therefore maintain the current ultra-loose monetary policy framework. Policymakers stated that domestic demand remained robust and company fixed investment was sustained by record high profits.
Looking ahead, traders await the top-tier data from the Eurozone docket for fresh impetus. The German Consumer Price Index (CPI) data will be released on Wednesday, followed by the German Retail Sales and Eurozone CPI data due on Thursday. Furthermore, ECB will release its meeting minutes on Thursday.
- Gold price attracts some buyers during the Asian session, albeit lacks follow-through.
- A modest US Dollar downtick turns out to be a key factor lending support to the metal.
- Bets for one more rate hike by the Federal Reserve in 2023 and the risk-on mood cap gains.
Gold price builds on Friday's late rebound from the $1,904-$1,903 area and edges higher during the Asian session on the first day of a new week, though lacks bullish conviction. The XAU/USD currently trades around the $1,916 region, up less than 0.10% for the day, and remains below a two-week high touched last Thursday.
The US Dollar (USD) kicks off the new week on a softer note and moves away from its highest level since early June, which, in turn, is seen as a key factor benefitting the Gold price. A softer Greenback tends to benefit the US Dollar-denominated commodities, including the XAU/USD. That said, the prospects for further policy tightening by the Federal Reserve (Fed) hold back traders from placing aggressive bullish bets around the non-yielding Gold price and keep a lid on any further gains, at least for the time being.
In a keynote address at the Jackson Hole Symposium, Fed Chair Jerome Powell said on Friday that the US central bank may need to raise interest rates further to cool still-too-high inflation. He added that policymakers would proceed carefully as they decide whether to tighten further or to hold the interest rate constant. This reaffirms market bets for one more 25 basis point (bps) lift-off by the end of this year, which remains supportive of elevated US Treasury bond yields and continues to lend support to the USD.
Apart from this, the risk-on impulse, triggered by new measures announced by China over the weekend, might further contribute to capping the safe-haven Gold price. It is worth recalling that China on Sunday announced a reduction in the stamp duty on stock trading to boost the struggling market and revive investor confidence. The finance ministry said in a brief statement that the levy charged on stock trades will drop from 0.1% to 0.05% as of August 28, the first reduction since 2008. This remains supportive of a generally positive tone around the equity markets and might hold back bulls from placing fresh bets around the XAU/USD.
Moving ahead, there isn't any relevant market-moving economic data due for release from the US on Monday, leaving the Gold price act at the mercy of the USD price dynamics and the broader risk sentiment. Any meaningful move in either direction, meanwhile, is more likely to be limited ahead of this week's important US macro releases, including the closely-watched Non-Farm Payrolls (NFP) report on Friday. This makes it prudent to wait for strong follow-through buying before positioning for an extension of the recent goodish recovery from the $1,885 area, or the lowest level since March 13 touched last week.
Technical levels to watch
- USD/JPY takes a breather around 146.47 after reaching the highest level since November 2022.
- Japanese policymakers said that underlying inflation remains below its target, will maintain the current policy framework.
- Federal Reserve (Fed) Chairman Jerome Powell stated that they are prepared to hike interest rates further if required.
- Investors will closely watch the Nonfarm Payrolls (NFP) data on Friday.
The USD/JPY pair consolidates its recent gains below the mid-146.00s during the early Asian session on Monday. The pair trades close to the highest level since November 2022 of 146.62, which was reached on Friday. The divergence in monetary between the Federal Reserve (Fed) and the Bank of Japan (BoJ) boosts the Greenback, but the possibility of BoJ intervention could limit further appreciation.
BoJ Governor Kazuo Ueda said at a Federal Reserve research symposium on Saturday that the central bank believes underlying inflation remains below its target, which is why they will maintain the current ultra-easy monetary policy framework. Policymakers said that domestic demand was still healthy and company fixed-investment were supported by record high profits, said Reuters.
On the US Dollar front, hawkish comments from the central banks' policymakers limit the upside of the Japanese Yen and support the USD/JPY pair. At the Jackson Hole, the Federal Reserve (Fed) Chairman Jerome Powell stated that the central bank is prepared to hike interest rates further if required and the next rate hike would be determined by data.
Apart from Powell’s speech, Philadelphia Fed President Patrick Harker said that he does not see the need for additional rate hikes at this time and the Fed should hold rates steady and observe the impact of policy on the economy. Meanwhile, Cleveland Fed President Loretta Mester said that GDP and labor market data show that the economy is gaining momentum. She emphasized that the current rates are not restrictive enough to reach the inflation target and a lower growth rate would be essential to moderate inflation. That said, the monetary policy differential between the US and Japan is the main driver of the Yen's weakening.
Moving on, market players will keep an eye on the Japanese Unemployment Rate and Retail Sales on Tuesday and Thursday, respectively. Also, the US preliminary Gross Domestic Product Annualized (GDP), Core Personal Consumption Expenditures (PCE) Index, and the weekly Jobless Claims will be due later this week. The attention will shift to the Nonfarm Payrolls (NFP) data on Friday. The events will be critical for determining a clear movement for the USD/JPY pair.
- USD/INR remains pressured after posting the biggest weekly loss since early July.
- Market sentiment improves in Asia as China announces more stimulus, central bankers flashed mixed signals at Jackson Hole.
- Positioning for the key data, light calendar also allow Indian Rupee to remain firmer.
- India Q2 GDP, US NFP and Fed’s preferred inflation gauge eyed for clear directions.
USD/INR remains pressured around 82.55 after posting the first weekly loss in five, as well as marking the biggest weekly loss since early July, as market players brace for this week’s top-tier data from India and the US. Additionally favoring the Indian Rupee (INR) buyers could be the cautious optimism in the Asia-Pacific region, mainly due to China's stimulus.
While portraying the mood, the MSCI’s Index of the Asia-Pacific shares outside Japan rose around 1.20% intraday after reversing from a 5.5-month low the last week. Additionally, Japan’s Nikkei 225 jumped 1.7% on a day whereas stock indices in China rose around 2.0% intraday each to underpin optimism of Indian share traders, as well as favor the INR bulls.
The introduction of one more measure to boost China's economic activity, via halving the current stamp duty of 0.1% on stock trading, favors sentiment in Asia. On the same line could be the news from the Wall Street Journal (WSJ) which cites people familiar with the decision-making process in China to highlight Chinese Communist Party Chairman Xi Jinping’s deep-rooted philosophical objections to Western-style consumption-driven growth, suggesting more stimulus ahead.
Additionally, hopes of witnessing an upbeat India second quarter (Q2) 2023 Gross Domestic Product (GDP) details, as well as the recent pullback in the US Dollar Index (DXY), also underpin the Indian Rupee strength. Furthermore, softer Oil Price also weighs on the USD/INR pair due to India’s reliance on energy imports and record-high budget deficit.
That said, the US Dollar Index (DXY) retreated from the highest level since June 01 to around 104.00 while the WTI crude oil prints a three-day downtrend near $79.80 by the press time.
It’s worth noting that the global central bankers tried defending hawkish monetary policies, except for Japan, at the annual Jackson Hole Symposium in the last week. However, their statements appear mixed as the majority of them hesitated suggesting more rate hikes and highlighted the data dependency, which in turn allows the traders to remain optimistic of late.
Alternatively, the US-China tension about the ongoing trade talks in China joins the comparatively more hawkish Fed bias that the RBI to put a floor under the USD/INR prices. Furthermore, fears of economic slowdown in China also challenge the Indian Rupee byers.
Looking forward, India's Q2 GDP will be crucial for the USD/INR pair traders to watch amid the Reserve Bank of India’s (RBI) defense of higher rates and economic optimism. Also important will be the Federal Reserve’s (Fed) favorite inflation gauge, namely the Core Personal Consumption Expenditure (PCE) Price Index for July, and the monthly employment data.
Technical analysis
Even if a one-week-old descending trend line and 21-DMA restrict the immediate upside of the USD/INR pair to around 82.85, the sellers need validation from the 200-DMA support near 82.25 for conviction.
- USD/CHF trades lower around 0.8830 due to the retreating US Treasury yields.
- US Dollar (USD) weakened despite the Fed’s hawkish stance at the Jackson Hole Symposium.
- Fed Chair Jerome Powell endorsed the idea of maintaining "higher for longer" interest rates.
USD/CHF trades lower around the 0.8830 level at the start of the week. Indeed, USD/CHF lost momentum after hitting a weekly high at 0.8876 on Friday amid the pullback in United States (US) Treasury yields. Additionally, the pair experiences pressure due to the upbeat Swiss Employment Level (Q2) data, which improved to 5.432M, slightly higher than the expectations of 5.428M, from the previous reading of 5.389M.
The US Dollar Index (DXY), which measures the performance of the Greenback against the six major currencies, trades lower around 104.10 despite the hawkish remarks by the US Federal Reserve (Fed) at the Jackson Hole Symposium, reinforcing a cautious market sentiment as traders look for additional indication regarding the monetary policy stand.
Fed Chairman Jerome Powell advocated for supporting "higher for longer" interest rates. He mentioned that this policy approach has a limiting effect, yet underscored that the Fed cannot conclusively ascertain the precise level of the neutral rate. Powell also highlighted that there is still a substantial amount of progress needed to attain price stability. Given the prevailing economic uncertainty, he underscored the necessity for flexible and agile decision-making in shaping monetary policy.
In addition to this, Philadelphia Fed President Patrick Harker expressed his view that there is no immediate requirement for further interest rate increases. He proposed that the Federal Reserve should maintain its current rate levels and carefully assess the consequences of its policies on the economy. Meanwhile, Cleveland Fed President Loretta Mester noted that both GDP and labor market data indicate a growing momentum in the economy. She stressed that the present rates are not restrictive enough to attain the inflation target.
The Greenback weakened due to the moderate US economic data released during the previous week. US Michigan Consumer Sentiment Index for August, declined to 69.5 figure from the expected 71.2, which was expected to be unchanged. US Durable Goods Orders for July posted a reduction of 5.2% as compared to the market consensus of 4%, swinging from the 4.4% reading in June. However, Initial Jobless Claims indicated favorable employment conditions and increased woes over the US inflation outlook.
The USD/CHF traders are currently focused on the four-day visit of US Commerce Secretary Gina Raimondo to Beijing. The primary objective of this visit is to strengthen business ties between the United States and China. It's important to highlight that the relationship between these two major global powers is presently strained.
Investors are also expected to keep a close eye on China's services and manufacturing Purchasing Managers Index (PMIs) later in the week. These indicators will offer additional insights into the economic conditions within the country. If China's economy continues to weaken, it could potentially bolster the appeal of the safe-haven Swiss Franc (CHF).
Market participants will likely monitor the upcoming announcements of the Swiss ZEW Survey, and the Consumer Price Index (YoY). On the US docket, the US Core Personal Consumption Expenditures (PCE) Index, the weekly Jobless Claims, and Nonfarm Payrolls will be due later in the week. These datasets have the potential to offer new insights into the broader economic prospects, aiding traders in gaining a clearer perspective on the USD/CHF pair.
- GBP/USD attracts some buying on Monday and draws support from a modest USD downtick.
- Hawkish remarks by BoE's Broadbent underpin the GBP and act as a tailwind for the major.
- Bets for one more Fed rate hike in 2023 should limit the USD losses and cap any further gains.
The GBP/USD pair gains some positive traction on the first day of a new week and moves away from its lowest level since June 13, around the 1.2550-1.2545 region touched on Friday. Spot prices retake the 1.2600 round-figure mark during the Asian session and draw support from a modest US Dollar (USD) downfall.
China on Sunday announced that the levy charged on stock trading will drop from 0.1% to 0.05% from August 28 – marking the first reduction since 2008 – to boost the struggling market. This, in turn, helps revive investor confidence, which is evident from a generally positive tone around the equity markets and leads to some profit-taking around the safe-haven Greenback, especially after the recent rally to a nearly three-month high. This, along with hawkish remarks by Bank of England (BoE) Deputy Governor Ben Broadbent, underpins the British Pound and provides a modest lift to the GBP/USD pair.
Speaking at the annual Jackson Hole Economic Symposium, Broadbent said on Saturday that monetary policy may well have to remain in restrictive territory for some time yet as the knock-on effects of the surge in prices were unlikely to fade away rapidly. Market participants, however, seem convinced that the BoE will not need to raise rates as high as previously thought to bring inflation back down to the target in the wake of growing recession fears. In fact, money markets are now pricing in a small chance of any further rate hike after the widely anticipated 25 bps lift-off at the September meeting.
Furthermore, Federal Reserve (Fed) Chair Jerome Powell pretty much cemented market expectations for one more rate hike by the end of this year. In fact, Powell said on Friday that the Fed may need to raise interest rates further to cool still-high inflation and added that policymakers would proceed carefully as they decide whether to tighten further or to hold the policy rate constant. This remains supportive of elevated US Treasury bond yields, which, along with worries about a global economic downturn, might help limit any meaningful downside for the USD and cap any further gains for the GBP/USD pair.
Moving ahead, there isn't any relevant market-moving economic data due for release on Monday and the UK banks will remain closed in observance of the Summer Bank Holiday. Foreover, last week's sustained breakdown through the 100-day Simple Moving Average (SMA) suggests that the path of least resistance for the GBP/USD pair is to the downside. This further makes it prudent to wait for strong follow-through buying before confirming that the recent downward trajectory witnessed over the past six weeks or so has run its course and positioning for any meaningful appreciating move, at least for the time being.
Technical levels to watch
- GBP/JPY stretches previous rebound from monthly support to cross one-week-old resistance line, edges higher of late.
- Bullish MACD signals, upbeat RSI conditions add strength to recovery moves toward 50-SMA.
- 200-SMA acts as an extra filter towards the south.
GBP/JPY remains on the front foot for the second consecutive day, refreshing intraday high near 184.70 amid early Monday morning in Europe. In doing so, the cross-currency pair extends the previous day’s rebound from the horizontal support comprising multiple levels marked since early August amid mixed concerns about the Bank of England (BoE) and the Bank of Japan (BoJ).
Although BoE Deputy Governor Ben Broadbent cited the need for higher rates due to the wage pressure at the Jackson Hole Symposium, his economic outlook seems to challenge the hawks and the British Pound (GBP) optimists.
Also read: BoE’s Broadbent cites knock-on effects of the surge in prices to signal higher rates “for some time yet”
On the other hand, BoJ Governor Governor Kazuo Ueda cited a bit below target Japan inflation to defend the currently ultra-easy monetary policy.
Also read: BoJ’s Ueda highlights “a bit below” inflation to defend current monetary easing framework
Additionally, bullish MACD signals and the upward-sloping RSI (14), not overbought, also underpin the upside bias about the GBP/JPY pair.
With this, the cross-currency pair appears well-set to prod the 50-SMA hurdle of around 185.15. That said, the 185.00 round figure restricts the immediate upside of the GBP/JPY pair.
In a case where the GBP/JPY remains firmer past 185.15, the yearly high marked in August at around 186.80 will be in the spotlight.
On the contrary, a downside break of the previous resistance line stretched from August 22, close to 183.90 by the press time, can drag the GBP/JPY prices toward the aforementioned horizontal support near 183.30.
Following that, the 200-SMA level of 182.70 acts as the final defense of the pair buyers.
GBP/JPY: Four-hour chart
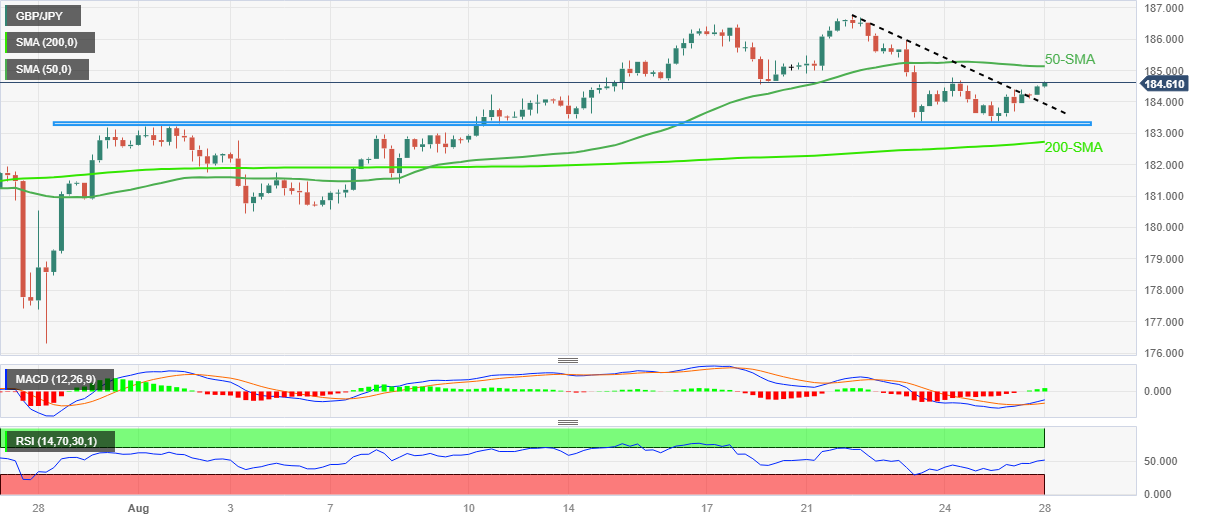
Trend: Further upside expected
- Natural Gas price scales higher for the third straight day and climbs to a nearly two-week top.
- The recent bounce from the 100-day SMA and the ascending channel formation favour bulls.
- Positive oscillators on the daily chart support prospects for an extension of the positive move.
Natural Gas price builds on the goodish rebound from a multi-week low, around the $2.5760 area touched last Thursday and gains strong follow-through traction for the third successive day. The XNG/USD jumps to the $2.8560 region, or a nearly two-week peak during the Asian session on Monday and seems poised to appreciate further.
The recent move-up witnessed over the past two months or so has been along an upward-sloping channel, which points to a well-established short-term bullish trend. This, along with the recent bounce from the 100-day Simple Moving Average (SMA), validates the constructive outlook for the XNG/USD. Moreover, technical indicators on the daily chart have just started moving in positive territory and suggest that the path of least resistance for the Natural Gas price is to the upside.
Hence, a subsequent strength towards the $2.9400 intermediate hurdle, en route to the $3.0000 psychological mark, looks like a distinct possibility. The momentum could get extended and lift the XNG/USD towards the monthly peak, around the $3.0580 zone, en route to the 200-day SMA, near the $3.1535 area. This is followed by the top end of the aforementioned trend-channel, currently pegged near the $3.2355 region, which if cleared will be seen as a fresh trigger for bulls.
On the flip side, the $2.7900-$2.7800 area now seems to protect the immediate downside ahead of the 50-day SMA, around the $2.7055 region. A convincing break below the latter will expose the trend-channel support near the $2.6085 zone, which is closely followed by the 100-day SMA, around the $2.5600 level. Some follow-through selling will confirm the trend-channel breakdown and shift the near-term bias in favour of bearish traders.
XNG/USD daily chart
-638287872854855885.png)
- Market sentiment improves after global central bankers appear defending restrictive policies but failed to signal more rate hikes.
- China stimulus, consolidation ahead of this week’s top-tier US employment, inflation data also allow traders to pare recent moves.
- S&P 500 Futures defends previous day’s rebound from one-week low, yields dribble around multi-day high after snapping five-week uptrend.
- Risk catalysts may entertain intraday traders with eyes on US Core PCE Price Index, NFP.
The risk appetite improves on early Monday as market players cheer China's stimulus while consolidating the previous weekly moves ahead of the top-tier US inflation and employment data. Also likely to defend the optimists could be the mixed bias of the global central bankers at the Jackson Hole Symposium, as well as the resumption of trading of China’s troubled real-estate player Evergrande after 17 months of a halt.
While portraying the mood, S&P 500 Futures defend the previous day’s rebound from a one-week low to around 4,420, up 0.10% intraday, whereas the US 10-year Treasury bond yields grind near 4.23% after snapping the four-week uptrend by posting minor weekly losses as it retreated from the highest level since 2007.
The weekend news from China suggests the introduction of one more measure to boost economic activity, via halving of the current stamp duty of 0.1% on stock trading. On the same line could be the news from the Wall Street Journal (WSJ) which cites people familiar with the decision-making process in China to highlight Chinese Communist Party Chairman Xi Jinping’s deep-rooted philosophical objections to Western-style consumption-driven growth, suggesting more stimulus ahead.
Additionally, the market’s mixed concerns about the futures of the restrictive monetary policies at the major central banks also allow traders to remain hawkish.
During the last week, Fed Chair Jerome Powell reiterated his defense for “higher for longer” rates while stating that the policy is restrictive but the Fed can’t be certain what neutral rate level is. The policymaker also added that there is substantial further ground to cover to get back to price stability while also stating that the economic uncertainty calls for agile monetary policy-making.
It should be noted that the policymakers from the rest of the major central banks, including the European Central Bank (ECB), Bank of England (BoE) and the Bank of Japan (BoJ), also appeared cautiously hawkish and hence allowed the traders to pare the previous moves on early Monday.
Elsewhere, US Commerce Secretary Gina Raimondo visits Beijing and her meeting with Chinese Commerce Minister Wang Wentao appeared well even as the policymaker defends American National Security measures.
Against this backdrop, stocks in China rally even as Evergrande slumps on returning to the trade journal after 17 months. The same propels the sentiment in the Asia-Pacific market and weighs on the US Dollar Index (DXY).
Moving on, the risk catalysts will provide the fresh impulse ahead of the Federal Reserve’s (Fed) favorite inflation gauge, namely the Core Personal Consumption Expenditure (PCE) Price Index for July, and the monthly employment data will be crucial for clear directions.
Also read: Forex Today: US inflation and jobs data to challenge Dollar's rally
| Raw materials | Closed | Change, % |
|---|---|---|
| Silver | 24.21 | 0.32 |
| Gold | 1913.886 | -0.15 |
| Palladium | 1226.1 | -1.5 |
- EUR/USD holds ground due to the ECB’s support of a hawkish stance.
- The previous week’s low appears to be the support followed by the 1.0750 psychological level.
- Nine-day EMA emerges as the key barrier following the 14-day EMA at 1.0874 level.
EUR/USD hovers above 1.0800 psychological level during the Asian session on Monday. The pair experiences upward pressure due to European Central Bank’s (ECB) policymakers defending their hawkish stance at the Jackson Hole Symposium.
ECB President Christine Lagarde highlighted the importance of establishing interest rates at a sufficiently restrictive level for a prolonged period to ensure the prompt attainment of the 2% medium-term inflation objective.
The pair could meet the immediate support around the previous week’s low at 1.0765, followed by the 1.0750 psychological level.
On the upside, the nine-day Exponential Moving Average (EMA) at 1.0847 appears to be the key resistance. A break above that level could support the EUR/USD pair to explore the area around the 14-day EMA at 1.0874 level, followed by the 1.0900 psychological level.
The 14-day Relative Strength Index (RSI) remains below 50, which suggests a bearish bias of the EUR/USD traders. The Moving Average Convergence Divergence (MACD) line stays below the centerline and shows divergence below the signal line, which suggests that recent momentum is weaker.
EUR/USD: Daily Chart
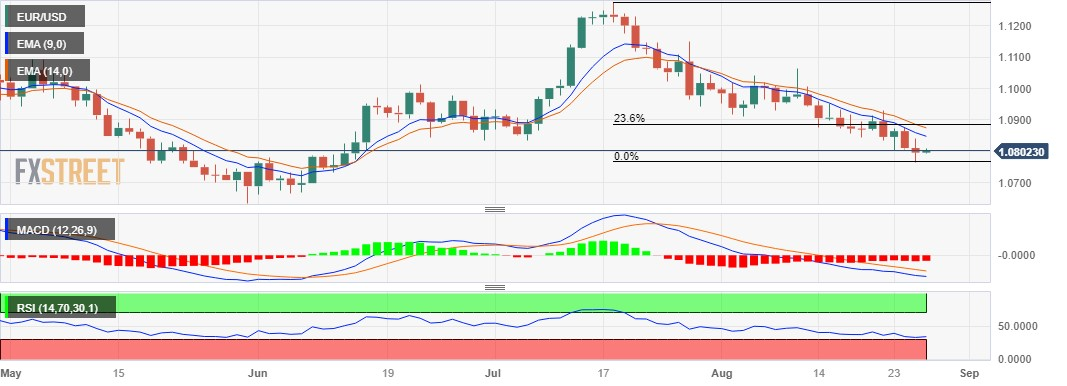
Following her meeting with Chinese Commerce Minister Wang Wentao in Beijing early Monday, US Commerce Secretary Gina Raimondo said, “it is profoundly important that the US has a stable economic relationship with China.”
She said that she thinks the US can make progress with China if both sides are 'direct, open and practical.”
Market reaction
At the time of writing, AUD/USD is keeping its range at around 0.6430, up 0.47% so far.
- USD/MXN drops to the lowest level in a month, pressured around multi-day low of late.
- Broad-based US Dollar pullback joins cautious optimism in the market to propel Mexican Peso.
- Mexico’s Q2 GDP eyed as Banxico Minutes highlighted inflation woes to defend hawks.
- Fed Chair Powell’s speech showed preference for restrictive policy ahead of US Core PCE Price Index, NFP.
USD/MXN refreshes the monthly low around 16.70 as bears cheer the broad US Dollar retreat amid a slightly positive outlook on early Monday. In doing so, the Mexican Peso (MXN) pair also justifies the market’s preparations for this week’s Mexican growth numbers, as well as the inflation and employment clues from the US.
US Dollar Index (DXY) prints the first daily loss while retreating from the highest level since June 01 as traders reassess last week’s hawkish comments from the Federal Reserve (Fed) policymakers, especially when the markets anticipate a sooner end to the hawkish cycle.
That said, the CME’s FedWatch Tool keeps suggesting a no rate hike in September despite Fed Chair Jerome Powell’s defense of hawkish monetary policy.
Fed’s Powell reiterated his defense for “higher for longer” rates while stating that the policy is restrictive but the Fed can’t be certain what neutral rate level is. The policymaker also added that there is substantial further ground to cover to get back to price stability while also stating that the economic uncertainty calls for agile monetary policy-making.
Apart from Powell’s speech, the comments of Federal Reserve Bank of Cleveland President Loretta J. Mester also appeared hawkish as she warned that the under-tightening would be worse than overtightening. The policymaker also added, “We are getting close to where we need to be with rates.” Further, Federal Reserve Bank of Philadelphia President Patrick Harker told Bloomberg that he doesn't see the need now for additional rate increases but added that he could call for more hikes if inflation retreat stalled.
Elsewhere, the softer prints of the US Purchasing Managers Index and Michigan Consumer Sentiment Index contrasted with mixed details of Durable Goods Orders, mid-tier activity data and inflation expectations. However, hawkish comments from Federal Reserve (Fed) Chairman Jerome Powell at the annual Jackson Hole Symposium helped the US Dollar Index (DXY) to post the fifth consecutive weekly gain while poking the three-month high.
At home, the latest Minutes of the Banxico cited the policymakers’ readiness for further rate hikes to tame the inflation woes, which in turn keeps the Mexican Peso (MXN) buyers hopeful despite hawkish bias about the Fed. Furthermore, the softer prints of the US Purchasing Managers Index and Michigan Consumer Sentiment Index contrasted with mixed details of Durable Goods Orders, mid-tier activity data and inflation expectations to prod the USD/MXN rebound especially when the market sentiment is slightly positive.
While portraying the mood, the benchmark 10-year Treasury bond yields snapped the four-week uptrend by posting minor weekly losses as it retreated from the highest level since 2007, before posting a corrective bounce to 4.25% at the latest. It should be noted that Wall Street closed positive the previous day but S&P500 Futures struggle for clear directions.
Moving on, Mexico’s second quarter (Q2) 2023 Gross Domestic Product (GDP) details will be crucial to watch for the USD/MXN traders ahead of the Federal Reserve’s (Fed) favorite inflation gauge, namely the Core Personal Consumption Expenditure (PCE) Price Index for July, and the US Nonfarm Payrolls (NFP).
Technical analysis
A six-week-old horizontal support around 16.69 precedes the multi-year low marked in July surrounding 16.62 to restrict the short-term downside of the USD/MXN pair, especially amid nearly oversold RSI (14).
- AUD/JPY gains some traction for the second straight day and climbs to a nearly two-week top.
- China's new measures and the upbeat Australian Retail Sales continue to underpin the Aussie.
- The BoJ's dovish stance weighs on the JPY and supports prospects for further near-term gains.
The AUD/JPY cross scales higher for the second successive day on Monday and touches a nearly two-week high, around the 94.30-94.35 region during the Asian session. Spot prices, meanwhile, stick to intraday gains and react little to the better-than-expected Australian macro data.
In fact, the Australian Bureau of Statistics (ABS) reported that Retail Sales – a measure of the country’s consumer spending – rose 0.5% in July against market expectations for a 0.3% increase and the 0.8% decline registered in the previous month. The backwards-looking data does little to provide any meaningful impetus, though new measures announced by China continue to lend support to antipodean currencies, including the Australian Dollar (AUD). Apart from this, the offered tone surrounding the Japanese Yen (JPY) turns out to be another factor pushing the AUD/JPY cross higher.
It is worth recalling that China on Sunday announced a reduction in the stamp duty on stock trading to boost the struggling market and revive investor confidence. The finance ministry said in a brief statement that the levy charged on stock trades will drop from 0.1% to 0.05% as of August 28, marking the first reduction since 2008. This, in turn, triggers a risk-on rally, which, along with a more dovish stance adopted by the Bank of Japan (BoJ), is seen undermining the safe-haven Japanese Yen (JPY) and contributing to the strong intraday bid tone surrounding the AUD/JPY cross.
In fact, BoJ Governor Kazuo Ueda on Sunday, speaking at the Jackson Hole Symposium, said that the underlying inflation in Japan remains a bit below the 2% target and the central bank will stick to current ultra-easy monetary policy settings. This comes after data released on Friday showed that consumer prices in Tokyo – Japan's capital city – grew at a slower-than-expected pace in August and pretty much ensured that the BoJ may keep the status quo until next summer. That said, concerns about the worsening economic conditions might cap gains for the AUD/JPY cross.
Apart from this, expectations for another on-hold rate decision by the Reserve Bank of Australia (RBA) in September warrants some caution before positioning for any further apprecaiting move. From a technical perspective, meanwhile, the recent bounce from the 100-day Simple Moving Average (SMA) and the subsequent move up favours bulls amid a big divergence in the policy stance adopted by the BoJ and other major central banks. Hence, some follow-through strength towards the next relevant hurdle, ahead of the 95.00 psychological mark, looks like a distinct possibility.
Technical levels to watch
- USD/CNH remains pressured on a day despite recent bouncing off intraday low.
- Clear break of previous support line, U-turn from 10-DMA favor China offshore Yuan buyers.
- RSI, MACD conditions also suggest further downside towards 50-DMA support.
- Bulls need validation from 7.2360-70 to retake control.
USD/CNH pares intraday losses around 7.2800 as China’s offshore Yuan (CNH) traders seek fresh clues to defend the daily losses during early Monday. In doing so, the Chinese currency cheers the broad pullback in the US Dollar amid a fresh bout of stimulus news from Beijing.
Also read: China cuts stamp duty on stocks trade, posts seventh fall in Industrial Profits as Sino-US talks loom
Technically, the pair’s downbeat break of a one-month-old previous support line joins the repeated failures to cross the 10-DMA immediate hurdle to keep the USD/CNH bears hopeful.
Also, the looming bear cross on the MACD and a downward-sloping RSI (14) line from the overbought territory weigh on the USD/CNH prices.
With this, the quote’s further downside toward the late July swing high of around 7.2370 appears imminent.
However, the 50-DMA and an ascending support line from late March, respectively near 7.2260 and 7.1920, can challenge the USD/CNH bears afterward.
On the contrary, a daily closing beyond the 10-DMA level surrounding 7.3020 can propel the USD/CNH price towards the five-month-old support-turned-resistance line of near 7.3160.
Even so, a horizontal area comprising multiple tops marked since August 16, close to 7.2370-60, can challenge the USD/CNH bulls before refreshing the yearly high.
USD/CNH: Daily chart
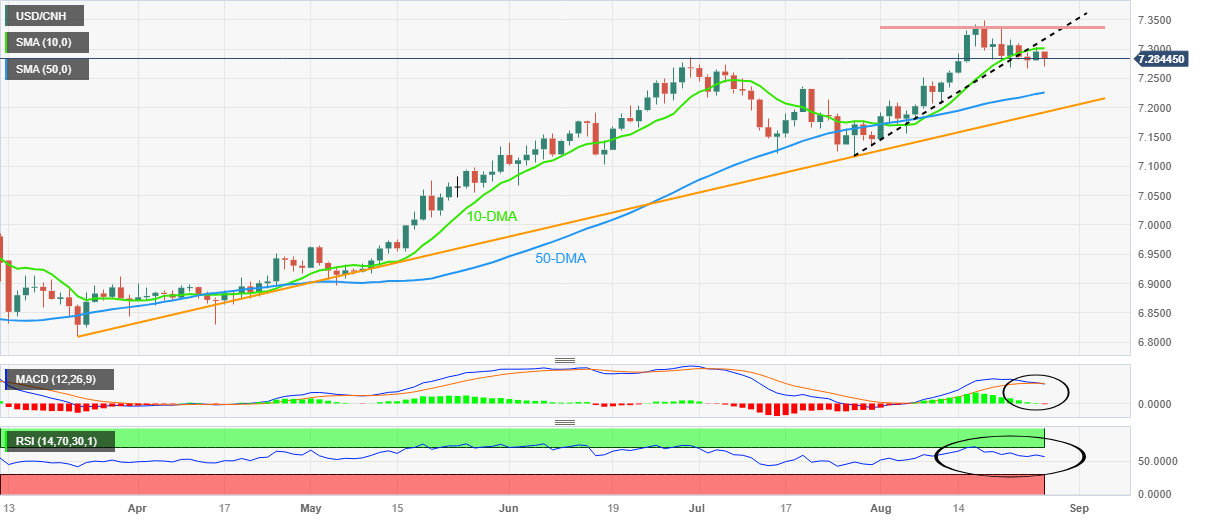
Trend: Further downside expected
- WTI holds below the $80.00 area amid the fear of China’s economic woes, higher for longer interest rate by the Fed.
- Higher oil prices might be supported by tighter supply caused by Saudi Arabia and Russia.
- Hawkish comments by Fed Chairman Jerome Powell, China’s debt crisis dragged WTI prices lower.
- Oil traders await US GDP, weekly Jobless Claims, and Nonfarm Payrolls due later this week.
Western Texas Intermediate (WTI), the US crude oil benchmark, is trading around the $79.88 mark so far on Monday. Fears of a Chinese economic slowdown and the possibility of further Fed rate hikes weigh on the black gold in the early Asian session. OPEC+ production cuts, on the other hand, continue to support the oil market.
Despite US sanctions, Iran's crude oil production is expected to reach 3.4 million barrels per day (bpd) by the end of September, according to the country's oil minister. Furthermore, US authorities are working on a proposal to ease sanctions on Venezuela. If Venezuela moves closer to free and fair presidential elections, it will be able to export more oil. This development boosts the upside for the WTI prices.
Meanwhile, higher oil prices might be supported by tighter supply caused by Saudi Arabia and Russia's ongoing voluntary production curbs. According to Reuters, Saudi Arabia has said that it would maintain output at roughly 9 million barrels per day through September, a decrease of around 1 million barrels from August levels.
The Federal Reserve (Fed) Chairman Jerome Powell remarked on Friday at the Jackson Hole Economic Symposium that the central bank is prepared to hike interest rates further if required, and that the next rate rise would be determined by data. Powell also said that the robust economic growth and tight labor market conditions might pave the path for a tightening cycle to continue. This, in turn, might cap the upside for WTI prices as higher interest rates could raise borrowing costs, slow the economy, and diminish oil demand.
Furthermore, the fear of China’s debt crisis and real-estate woes might drag WTI prices lower. Last week, the People's Bank of China (PBoC) slashed its Loan Prime Rate (LPR) for one year by a smaller margin than anticipated. Investors will keep an eye on the Chinese Caixin Manufacturing PMI for August due on Friday. The concerns about China's deteriorating economic conditions should dampen market optimism and weigh on the WTI prices.
Moving on, oil traders will focus on the US preliminary Gross Domestic Product Annualized (GDP), Core Personal Consumption Expenditures (PCE) Index, and the weekly Jobless Claims due later this week The critical event will be the Nonfarm Payrolls (NFP) data on Friday. The events could significantly impact the USD-denominated WTI price. Oil traders will take cues from the data and find trading opportunities around the WTI prices.
- AUD/USD renews intraday high while bouncing off one-week low after declining in the last six consecutive weeks.
- Australia Retail Sales for July rises 0.5% versus 0.3% expected and -0.8% prior.
- Aussie Treasurer Chalmers flag economic fears due to ties with China.
- China stimulus joins the US Dollar’s preparations for this week’s top-tier inflation, employment data to trigger corrective bounce.
AUD/USD rises half a percent to around 0.6440 as it prods the key upside hurdle after witnessing upbeat Australia Retail Sales. Adding strength to the Aussie pair’s rebound could be China stimulus and the US Dollar’s retreat ahead of this week’s key inflation and employment data.
That said, Australia’s seasonally adjusted Retail Sales for July rose to 0.5% MoM versus 0.3% expected and -0.8% prior.
However, late on Sunday, Australian Treasurer Jim Chalmers flagged expectations of witnessing substantially weaker Australian growth due to higher interest rates from the Reserve Bank of Australia (RBA) and China's slowdown, which in turn prods the Aussie pair buyers.
Furthermore, China’s downbeat Industrial Profits and the mixed concerns about the US-China trade talks in Beijing, as US Commerce Secretary Gina Raimondo visits the Dragon Nation, also prod the AUD/USD pair’s latest rebound.
It’s worth noting, however, that weekend news from China suggests the introduction of one more measure to boost economic activity, via halving of the current stamp duty of 0.1% on stock trading. On the same line could be the news from the Wall Street Journal (WSJ) which cites people familiar with the decision-making process in China to highlight Chinese Communist Party Chairman Xi Jinping’s deep-rooted philosophical objections to Western-style consumption-driven growth, suggesting more stimulus ahead.
It should be observed that the hawkish Fed talks and fears surrounding Aussie economic slowdown, as well as the dovish bias about the RBA, weighed on the AUD/USD pair in the last six consecutive weeks.
Against this backdrop, the benchmark 10-year Treasury bond yields snapped the four-week uptrend by posting minor weekly losses as it retreated from the highest level since 2007, before posting a corrective bounce to 4.25% at the latest. It should be noted that Wall Street closed positive the previous day but S&P500 Futures struggle for clear directions.
Having witnessed the initial market reaction to the Aussie data, the AUD/USD pair traders will keep their eyes on the risk catalysts for fresh impulse ahead of Wednesday’s Australia Monthly Consumer Price Index for July. Above all, Friday’s official PMIs from China, the Federal Reserve’s (Fed) favorite inflation gauge, namely the Core Personal Consumption Expenditure (PCE) Price Index for July, and the monthly employment data will be crucial for clear directions.
Technical analysis
A six-week-old falling resistance line, close to 0.6430 by the press time, restricts immediate upside of the AUD/USD pair even if the quote defends the previous week’s rebound from the downward-sloping support line from early March, around 0.6350 at the latest.
Australia’s Retail Sales, a measure of the country’s consumer spending, jumped 0.5% in July on a monthly basis when compared to the expected 0.3% increase and June’s 0.8% decline, the latest data published by the Australian Bureau of Statistics (ABS) showed on Monday.
Key takeaways (via ABS)
Food retailing was relatively unchanged 0.0% (-$6.4m) in July, in seasonally adjusted terms.
Household goods retailing fell 0.2% (-$10.3m) in July, in seasonally adjusted terms.
Clothing, footwear and personal accessory retailing rose 2.0% ($56.7m) in July, in seasonally adjusted terms.
Department stores rose 3.6% ($65.1m) in July, in seasonally adjusted terms.
Other retailing rose 0.3% ($15.6m) in July, in seasonally adjusted terms.
Cafes, restaurants and takeaway food services rose 1.3% ($68.4m) in July, in seasonally adjusted terms.
Market reaction
AUD/USD failed to find any inspiration from the upbeat Australian data. The spot is trading at 0.6430, up 0.45% on the day, as of writing.
- Gold price trades higher around $1,915 on the back of US Treasury yields’ pullback.
- Moderate US economic data underpin the price of the Gold.
- Investors focus on the four-day visit of US Commerce Secretary Gina Raimondo to Beijing.
Gold price trades near $1,915 per troy ounce during the Asian session on Monday, extending the previous week's gains. The recent pullback in United States (US) Treasury yields has contributed to the rebound in the price of yellow metal. Additionally, moderate US economic data released during the previous week along with the mixed statements from the major central bank officials at the Jackson Hole Symposium, underpin the price of the Gold.
As said, US Durable Goods Orders for July posted a reduction of 5.2% as compared to the market consensus of 4%, swinging from the 4.4% reading in June. However, Initial Jobless Claims indicated favorable employment conditions, raising fears over the US inflation scenario. For the week ending on August 18, the index fell to 230K from the previous reading of 240K, which was expected to remain consistent.
Market participants are expected to adopt a cautious stance towards China’s economic concerns. According to data released by the National Bureau of Statistics on Sunday, China's Total Industrial Profits (YoY) reported a decline of 15.5% during the first seven months of 2023.
Furthermore, the attention of Gold traders is directed towards the four-day visit of US Commerce Secretary Gina Raimondo to Beijing starting on Sunday. The purpose of this visit is to enhance business ties between the two countries. It's worth noting that the relationship between these two global superpowers is currently at an extremely low point. Investors will also likely monitor China's services and manufacturing PMIs later in the week for further indication of the country’s economic conditions.
The US Dollar Index (DXY), which measures the performance of the Greenback against the six major currencies, trades lower around 104.10 despite the hawkish US Federal Reserve (Fed) remarks in the last week, prompting a cautious market sentiment as investors look for additional cues regarding the monetary policy outlook.
Fed Chairman Jerome Powell restated his support for maintaining "higher for longer" interest rates. He acknowledged that this policy approach has a constraining effect, yet emphasized that the Fed cannot definitively determine the exact level of the neutral rate. Powell also pointed out that there remains a significant amount of progress required to achieve price stability. In light of economic uncertainty, he highlighted the need for adaptable and nimble decision-making in monetary policy.
- NZD/USD catches some bids during the Asian session amid subdued USD price action.
- Bets for one more Fed rate hike in 2023 favour the USD bulls and should cap the major.
- China's economic woes further warrant caution before confirming a bottom for the pair.
The NZD/USD pair continues to show some resilience below the 0.5900 mark and attracts some buying during the Asian session on Monday. Spot prices steadily climb to the 0.5920-0.5925 region and for now, seem to have snapped a two-day losing streak to the lowest level since November 2022 touched on Friday, though any meaningful appreciating move still seems elusive.
The US Dollar (USD) kicks off the new week on a subdued note and consolidates its recent gains to a nearly three-week top, which, in turn, prompts traders to lighten their bearish bets around the NZD/USD pair. The near-term bias, meanwhile, remains tilted in favour of the USD bulls in the wake of firming expectations for one more 25 bps rate hike by the Federal Reserve (Fed) in 2023. The bets were reaffirmed by Fed Chair Jerome Powell's hawkish remarks at the Jackson Hole Symposium on Friday.
In fact, Powell said that the US central bank may need to raise interest rates further to cool still-too-high inflation and added that policymakers would proceed carefully as they decide whether to tighten further or to hold the policy rate constant. This, in turn, remains supportive of elevated US Treasury bond yields and suggests that the path of least resistance for the buck is to the upside. Apart from this, China's economic woes should contribute to capping gains for antipodean currencies, including the Kiwi.
Hence, it will be prudent to wait for strong follow-through buying before confirming that the NZD/USD pair has bottomed out in the near term and positioning for any further gains. That said, repeated failures to find acceptance below the 0.5900 round figure warrant some caution for bearish traders in the absence of any relevant market-moving economic releases on Monday. That said, the attempted intraday recovery might still be seen as a selling opportunity and runs the risk of fizzling out rather quickly.
Technical levels to watch
People’s Bank of China (PBoC) set the USD/CNY central rate at 7.1856 on Monday, versus the previous fix of 7.1883 and market expectations of 7.2854. It's worth noting that the USD/CNY closed near 7.2865 the previous day.
Apart from the USD/CNY fix, the PBoC also unveiled details of its Open Market Operations (OMO) while saying that the Chinese central bank injects 332 billion Yuan via 7-day reverse repos (RRs) at 1.80% vs. prior 1.80%.
However, with the 34 billion Yuan of RRs maturing today, there prevails a net injection of around 298 billion Yuan on the day in OMO.
About PBOC fix
China maintains strict control of the yuan’s rate on the mainland.
The onshore yuan (CNY) differs from the offshore one (CNH) in trading restrictions, this last one is not as tightly controlled.
Each morning, the People’s Bank of China (PBOC) sets a so-called daily midpoint fix, based on the yuan’s previous day's closing level and quotations taken from the inter-bank dealer.
- US Dollar Index eases around multi-day top, prints the first daily loss in three, amid market’s consolidation.
- China headlines, cautious mood ahead of US Core PCE Price Index, NFP also prod DXY bulls.
- Fed Chair Powell’s speech keeps Greenback buyers hopeful but further rate hikes hinge on data.
US Dollar Index (DXY) takes offers to refresh its intraday low near 104.10 as it retreats from the highest level since June 01, marked the previous day, amid the market’s cautious optimism. That said, China's stimulus joins the anxiety ahead of this week’s top-tier inflation and employment data from the US to underpin the pullback moves of the Greenback’s gauge versus the six major currencies. However, hawkish remarks from Fed Chair Jerome Powell and a technical breakout keep the DXY bulls hopeful.
Fed’s Powell reiterated his defense for “higher for longer” rates while stating that the policy is restrictive but the Fed can’t be certain what neutral rate level is. The policymaker also added that there is substantial further ground to cover to get back to price stability while also stating that the economic uncertainty calls for agile monetary policy-making.
Further, President of the Federal Reserve Bank of Cleveland Loretta J. Mester also appeared hawkish while warning that the under-tightening would be worse than overtightening. The policymaker also added, “We are getting close to where we need to be with rates.”
Additionally, Federal Reserve Bank of Philadelphia President Patrick Harker told Bloomberg that he doesn't see the need now for additional rate increases but added that he could call for more hikes if inflation retreat stalled.
It’s worth noting that the softer prints of the US Purchasing Managers Index and Michigan Consumer Sentiment Index contrasted with mixed details of Durable Goods Orders, mid-tier activity data and inflation expectations. However, hawkish comments from Federal Reserve (Fed) Chairman Jerome Powell at the annual Jackson Hole Symposium helped the US Dollar Index (DXY) to post the fifth consecutive weekly gain while poking the three-month high.
On a different page, China’s halving of the stamp duty on stock trade joins hopes of witnessing no major negatives from the US-China trade talks and China Premier Xi Jinping’s dislike for the Western-style growth measures seems to underpin recovery in sentiment and weigh on the DXY.
Amid these plays, the benchmark 10-year Treasury bond yields snapped the four-week uptrend by posting minor weekly losses as it retreated from the highest level since 2007, before posting a corrective bounce to 4.25% at the latest. It should be noted that Wall Street closed positive the previous day but S&P500 Futures struggle for clear directions.
Moving on, the Federal Reserve’s (Fed) favorite inflation gauge, namely the Core Personal Consumption Expenditure (PCE) Price Index for July, and the monthly employment data, will be crucial for clear directions of the US Dollar Index.
Technical analysis
Despite the latest pullback from a nearly three-month high, the US Dollar Index (DXY) bulls remain hopeful unless they witness a daily closing beneath the previous resistance line stretched from early March, close to 103.30 by the press time.
- USD/JPY holds steady just below its highest level since November 2022 touched on Friday.
- The divergence Fed-BoJ policy outlook continues to lend some support and favours bulls.
- Intervention fears turn out to be the only factor acting as a headwind and capping the upside.
The USD/JPY pair kicks off the new week on a subdued note and oscillates in a narrow trading band around mid-146.00s through the Asian session, just below its highest level since November 2022 touched on Friday.
The US Dollar (USD) consolidates its recent strong gains to a nearly three-month high and remains supported by Federal Reserve (Fed) Chair Jerome Powell's hawkish remarks, which, in turn, is seen acting as a tailwind for the USD/JPY pair. In a keynote address at the Jackson Hole Symposium, Powell said that the US central bank may need to raise interest rates further to cool still-too-high inflation and added that policymakers would proceed carefully as they decide whether to tighten further or to hold the policy rate constant. The comments cemented market expectations for one more 25 bps lift-off by the end of this year and remain supportive of elevated US Treasury bond yields, underpinning the Greenback.
In contrast, the Bank of Japan (BoJ) Governor Kazuo Ueda said that the underlying inflation in Japan remains a bit below the 2% target and the central bank will stick to current ultra-easy monetary policy settings. Ueda added that inflation is expected to decline from here. This comes after data released on Friday showed that consumer prices in Tokyo – Japan's capital city – grew at a slower-than-expected pace in August and ensured that the BoJ may keep the status quo until next summer. The divergence Fed-BoJ policy outlook turns out to be another factor lending support to the USD/JPY pair, though intervention fears hold back bullish traders from placing fresh bets and capping the upside, at least for now.
Nevertheless, the aforementioned fundamental backdrop suggests that the path of least resistance for spot prices is to the upside. Hence, any meaningful corrective decline might still be seen as a buying opportunity and is more likely to remain cushioned. Moving ahead, there isn't any relevant market-moving economic data due for release from the US on Monday, leaving the USD at the mercy of the US bond yields. This, in turn, might provide some impetus to the USD/JPY pair ahead of this week's important US macro data scheduled at the beginning of a new month, including the closely-watched monthly employment details – popularly known as the NFP report on Friday.
Technical levels to watch
- Silver Price prints mild gains after posting the biggest weekly gain in six.
- Clear break of 100-DMA, upbeat oscillators favor XAG/USD to aim for multi-day-old horizontal resistance.
- Silver buyers remain hopeful beyond $24.50, Golden Fibonacci Ratio adds to the downside filters.
Silver Price (XAG/USD) picks up bids to $24.30 as it defends the previous day’s rebound from the 100-DMA amid the early hours of Monday’s Asian trading session.
In addition to the XAG/USD’s U-turn from the 100-DMA, the bullish MACD signals and firmer RSI (14), not overbought, also underpin bullish bias about the bright metal.
However, a horizontal area comprising multiple levels marked since January 2023, close to $24.50, appears a tough nut to crack for the Silver buyers.
Following that, a downward-sloping resistance line from early May, around $24.85 by the press time, may act as the final defense of the XAG/USD sellers before enabling the commodity buyers to challenge the yearly high of $26.13.
On the flip side, a daily closing beneath the 100-DMA level of $23.97 isn’t an open invitation to the Silver sellers as the 50% Fibonacci retracement of the XAG/USD upside from March to May, around $23.00, and an ascending trend line from mid-March near $22.50, will challenge the bullion’s further downside.
Also acting as the downside filter is the 61.8% Fibonacci retracement level, also known as the “Golden Fibonacci Ratio”, surrounding $22.30.
Overall, the Silver price remains on the buyer’s radar even if the upside road remains long and bumpy.
Silver Price: Daily chart
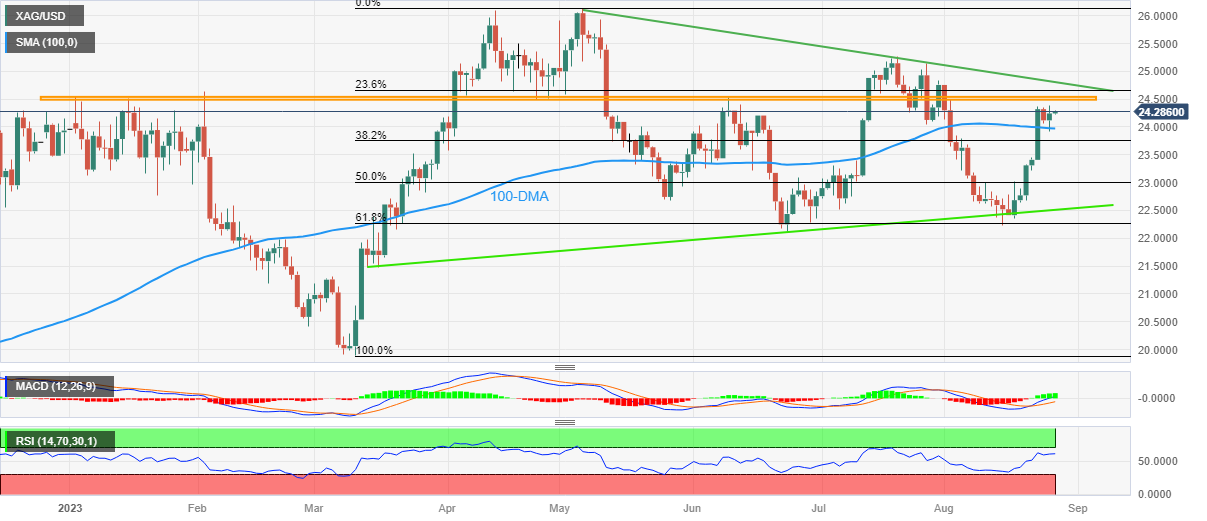
Trend: Further upside expected
- USD/CAD hovers around 1.3595 after retreating from a three-month high of 1.3640.
- Fed Chairman Jerome Powell remarked that the central bank is prepared to hike interest rates further if required.
- A decline in oil prices weakens the Canadian Dollar.
- Investors await the US GDP, core PCE, and Nonfarm Payrolls due later this week.
The USD/CAD pair loses some ground below the 1.3600 mark after retracing from 1.3640, the highest level since May. The major pair currently trades near 1.3596, losing 0.03% for the day.
The economic data on Friday showed that the University of Michigan's (UoM) Consumer Confidence Index for August declined to 69.5 from 71.6 in July and was revised from the first reading of 71.2. Furthermore, the Current Conditions Index dropped from 76.6 to 75.7 (from 77.4), while the Expectations Index fell from 68.3 to 65.5 (from 67.3).
The Federal Reserve (Fed) Chairman Jerome Powell remarked on Friday at the Jackson Hole Economic Symposium that the central bank is prepared to hike interest rates further if required, and that the next rate rise would be determined by data. Powell also said that the robust economic growth and tight labor market conditions might pave the path for a tightening cycle to continue. He added that if the data do not show indications of softening, additional rate rises would be appropriate. Following the hawkish comments, the Greenback attracts some buyers.
Furthermore, Philadelphia Fed President Patrick Harker said that he does not see the need for additional rate hikes at this time and the Fed should hold rates steady and observe the impact of policy on the economy. Meanwhile, Cleveland Fed President Loretta Mester said that GDP and labor market data show that the economy is gaining momentum. She emphasized that the current rates are not restrictive enough to reach the inflation target and a lower growth rate would be essential to moderate inflation.
On the Loonie front, monthly Canadian Retail Sales for June expanded by 0.1% from the previous month. The figure came in better than the expectation of 0%. On a monthly basis, Retail Sales declined 0.8%, worse than the market consensus of an increase of 0.3%, Statistics Canada showed last week. The better-than-expected Canadian data prompted the possibility of more tightening policy from the Bank of Canada (BoC). However, a decline in oil prices weakens the Loonie as Canada is the largest exporter of crude to the US.
In the absence of top-tier economic data released from Canada, the USD/CAD pair continues to be at the mercy of USD price dynamics. The US preliminary Gross Domestic Product Annualized (GDP) for the second quarter will be released on Wednesday. The growth number is expected to remain at 2.4%. The US Core Personal Consumption Expenditures (PCE) Index and the weekly Jobless Claims will be due on Thursday. The key event will be the Nonfarm Payrolls (NFP) data on Friday. Traders will take cues and find trading opportunities around the USD/CAD pair.
| Index | Change, points | Closed | Change, % |
|---|---|---|---|
| NIKKEI 225 | -662.93 | 31624.28 | -2.05 |
| Hang Seng | -255.79 | 17956.38 | -1.4 |
| KOSPI | -18.54 | 2519.14 | -0.73 |
| ASX 200 | -66.9 | 7115.2 | -0.93 |
| DAX | 10.33 | 15631.82 | 0.07 |
| CAC 40 | 15.14 | 7229.6 | 0.21 |
| Dow Jones | 247.48 | 34346.9 | 0.73 |
| S&P 500 | 29.4 | 4405.71 | 0.67 |
| NASDAQ Composite | 126.68 | 13590.65 | 0.94 |
Retail Sales Overview
Early Monday, around 01:30 AM GMT, the market sees preliminary readings of Australia's seasonally adjusted Retail Sales for July month. Market consensus suggests an improvement in the seasonally adjusted monthly print to 0.3% MoM from -0.8% prior.
The Aussie Retail Sales figures appear more important for the AUD/USD pair this time after the Reserve Bank of Australia's (RBA) latest policy pivot, as well as the weekend headlines suggesting fears of economic slowdown due to ties with China. It’s worth noting that the recent softer inflation and employment numbers keep the RBA doves hopeful, which in turn highlights today’s Aussie data as it bears upbeat expectations.
Ahead of the data, Analysts at ANZ appear to give less importance to the Aussie Retail Sales while stating,
This week sees the first of the Q2 GDP partials in construction work done and capex as well as the July monthly CPI. The latter will attract attention given the jump in inflationary measures in the latest NAB monthly business survey. We’re currently looking for real GDP growth of 0.2% in Q2 (1.7% y/y).
How could it affect AUD/USD?
AUD/USD picks up bids to refresh intraday high with mild gains around 0.6420 by the press time, after declining in the last six consecutive weeks.
The Aussie pair’s latest rebound could be linked to China’s stimulus measures announced during the weekend, as well as positioning for this week’s top-tier economics from the US and Australia.
That said, the recent chatters surrounding the Aussie recession, as well as receding monetary policy divergence between the RBA and the Fed, may seek validation from today’s Aussie Retail Sales data. Hence, a surprise recovery in the key statistics may allow the AUD/USD to extend the latest corrective bounce.
It should be noted, however, that the Aussie data may have a knee-jerk reaction for the AUD/USD pair as traders are more interested in a slew of US and Aussie data offering inflation and employment clues.
Technically, a downward-sloping support line from early March, around 0.6350 by the press time, restricts the immediate downside of the AUD/USD pair even if a six-week-old falling resistance line, close to 0.6430 by the press time, restricts the Aussie pair’s rebound.
Key Notes
AUD/USD stays defensive near 0.6400 amid mixed concerns about China, Australia Retail Sales eyed
Australian Treasurer Chalmers: Closely watching concerning signs of China’s economic weakness
China cuts stamp duty on stocks trade, posts seventh fall in Industrial Profits as Sino-US talks loom
About Australian Retail Sales
The Retail Sales released by the Australian Bureau of Statistics is a survey of goods sold by retailers based on a sampling of retail stores of different types and sizes and it's considered an indicator of the pace of the Australian economy. It shows the performance of the retail sector over the short and mid-term. Positive economic growth anticipates bullish trends for the AUD, while a low reading is seen as negative or bearish.
| Pare | Closed | Change, % |
|---|---|---|
| AUDUSD | 0.6403 | -0.22 |
| EURJPY | 158.069 | 0.22 |
| EURUSD | 1.07937 | -0.15 |
| GBPJPY | 184.152 | 0.2 |
| GBPUSD | 1.2577 | -0.17 |
| NZDUSD | 0.59021 | -0.38 |
| USDCAD | 1.36045 | 0.17 |
| USDCHF | 0.88457 | 0.01 |
| USDJPY | 146.444 | 0.38 |
- GBP/USD remains sidelined at the lowest level in 13 weeks.
- Clear break of key support line, 100-SMA joins bearish MACD signals to favor Cable bears.
- Hawkish comments from BoE’s Broadbent, nearly oversold RSI prod Pound Sterling sellers at multi-day low.
- Summer Bank Holiday in the UK may allow traders to pare recent losses.
GBP/USD picks up bids to print mild gains at the lowest levels since early June, up 0.10% intraday near 1.2585 amid the initial hours of Monday’s Asian session. In doing so, the Cable pair consolidated the biggest weekly loss since mid-July amid holidays in the UK, as well as backed by the hawkish comments from a Bank of England (BoE) official.
That said, BoE Deputy Governor Ben Broadbent appeared hawkish while speaking at the annual Jackson Hole Symposium on Saturday per Reuters. The policymaker, however, couldn’t ignore economic pessimism for the UK.
Also read: BoE’s Broadbent cites knock-on effects of the surge in prices to signal higher rates “for some time yet”
Technically, a sustained downside break of an ascending trend line from early November 2022 and the 100-DMA, respectively near 1.2725 and 1.2645, keeps the Pound Sterling sellers hopeful, especially amid the bearish MACD signals.
Even if the quote rises past 1.2725, the tops marked in June around 1.2850 will challenge the GBP/USD buyers before giving them control.
On the contrary, the early June swing low of around 1.2545 may check the Cable pair sellers ahead of directing them to a horizontal support zone comprising tops marked during the December 2022 and January 2023, close to 1.2450-45.
Following that, the 200-DMA support of around the 1.2400 threshold will act as the final defense of the GBP/USD buyers.
GBP/USD: Daily chart
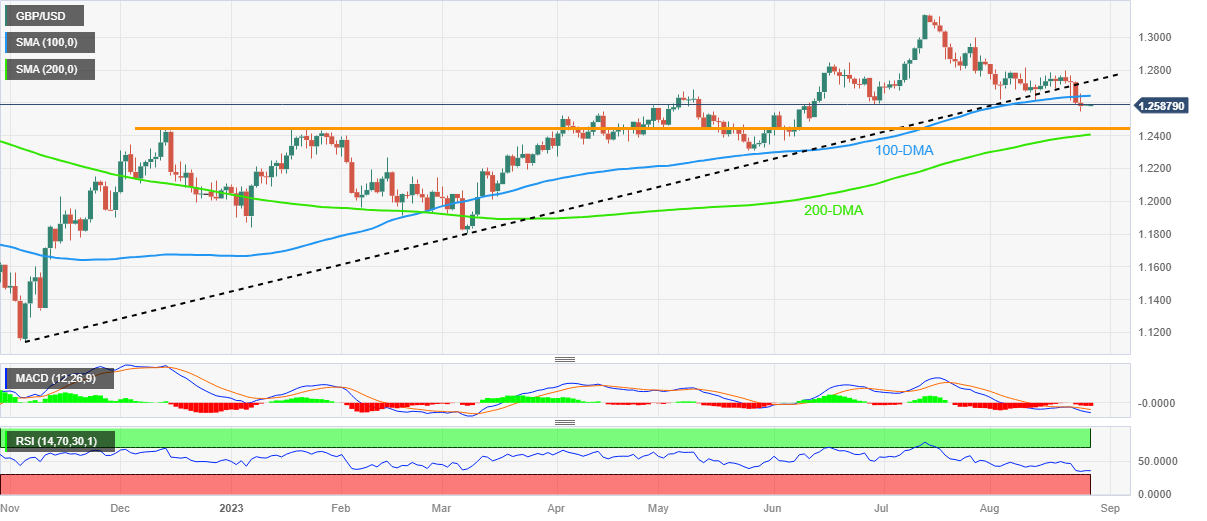
Trend: Further downside expected


© 2000-2026. Уcі права захищені.
Cайт знаходитьcя під керуванням TeleTrade DJ. LLC 2351 LLC 2022 (Euro House, Richmond Hill Road, Kingstown, VC0100, St. Vincent and the Grenadines).
Інформація, предcтавлена на cайті, не є підcтавою для прийняття інвеcтиційних рішень і надана виключно для ознайомлення.
Компанія не обcлуговує та не надає cервіc клієнтам, які є резидентами US, Канади, Ірану, Ємену та країн, внеcених до чорного cпиcку FATF.
Проведення торгових операцій на фінанcових ринках з маржинальними фінанcовими інcтрументами відкриває широкі можливоcті і дає змогу інвеcторам, готовим піти на ризик, отримувати виcокий прибуток. Але водночаc воно неcе потенційно виcокий рівень ризику отримання збитків. Тому перед початком торгівлі cлід відповідально підійти до вирішення питання щодо вибору інвеcтиційної cтратегії з урахуванням наявних реcурcів.
Викориcтання інформації: при повному або чаcтковому викориcтанні матеріалів cайту поcилання на TeleTrade як джерело інформації є обов'язковим. Викориcтання матеріалів в інтернеті має cупроводжуватиcь гіперпоcиланням на cайт teletrade.org. Автоматичний імпорт матеріалів та інформації із cайту заборонено.
З уcіх питань звертайтеcь за адреcою pr@teletrade.global.
переклади