- Analytics
- News and Tools
- Market News
Новини ринків
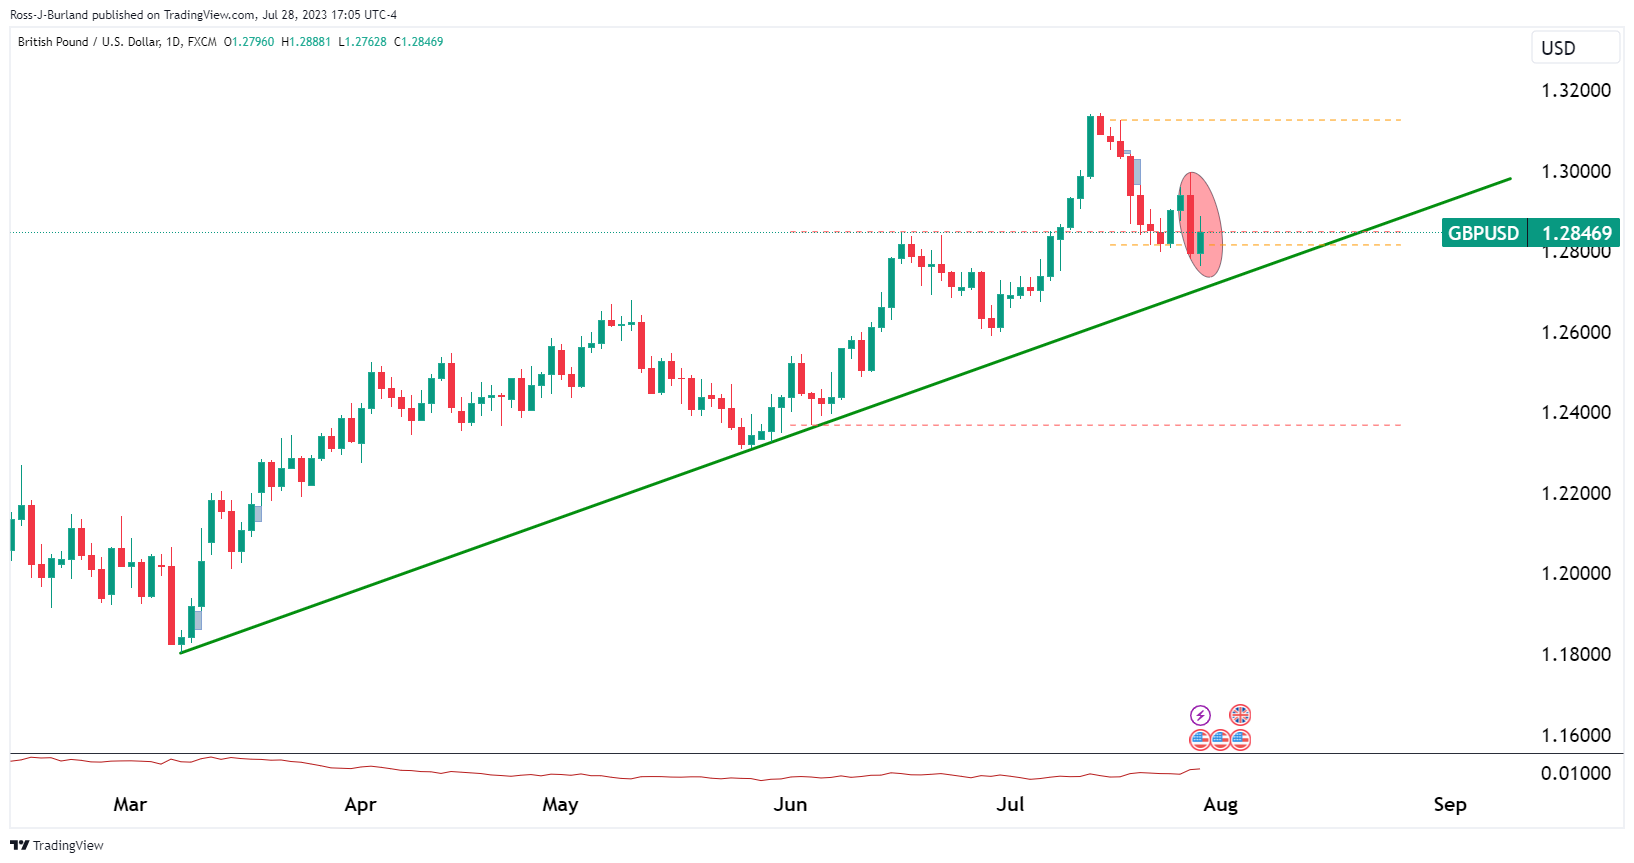
- GBP/USD bears eye a 50% mean reversion if not the 61.8%ratio.
- The 4-hour W-formation neckline support has a confluence with the 78.6% Fibonacci.
GBP/USD ended at around 1.2840 on Friday after reaching its lowest level since July 6 while investors remain concerned that the hawks will continue to circle over the Federal Reserve following the release of stronger-than-expected second-quarter Gross Domestic Product data from the US.
Meanwhile, in the UK, weaker-than-expected PMI data and lesser inflation are pointing towards a less hawkish outcome at the Bank of England next week. Markets still anticipate a 25 bps hike at the central bank's August meeting but money markets see a peak of 5.75% in November, lower than prior projections. This leaves a bearish focus on the charts for GBP/USD and bears are already moving in at the end of the week:
GBP/USD daily charts
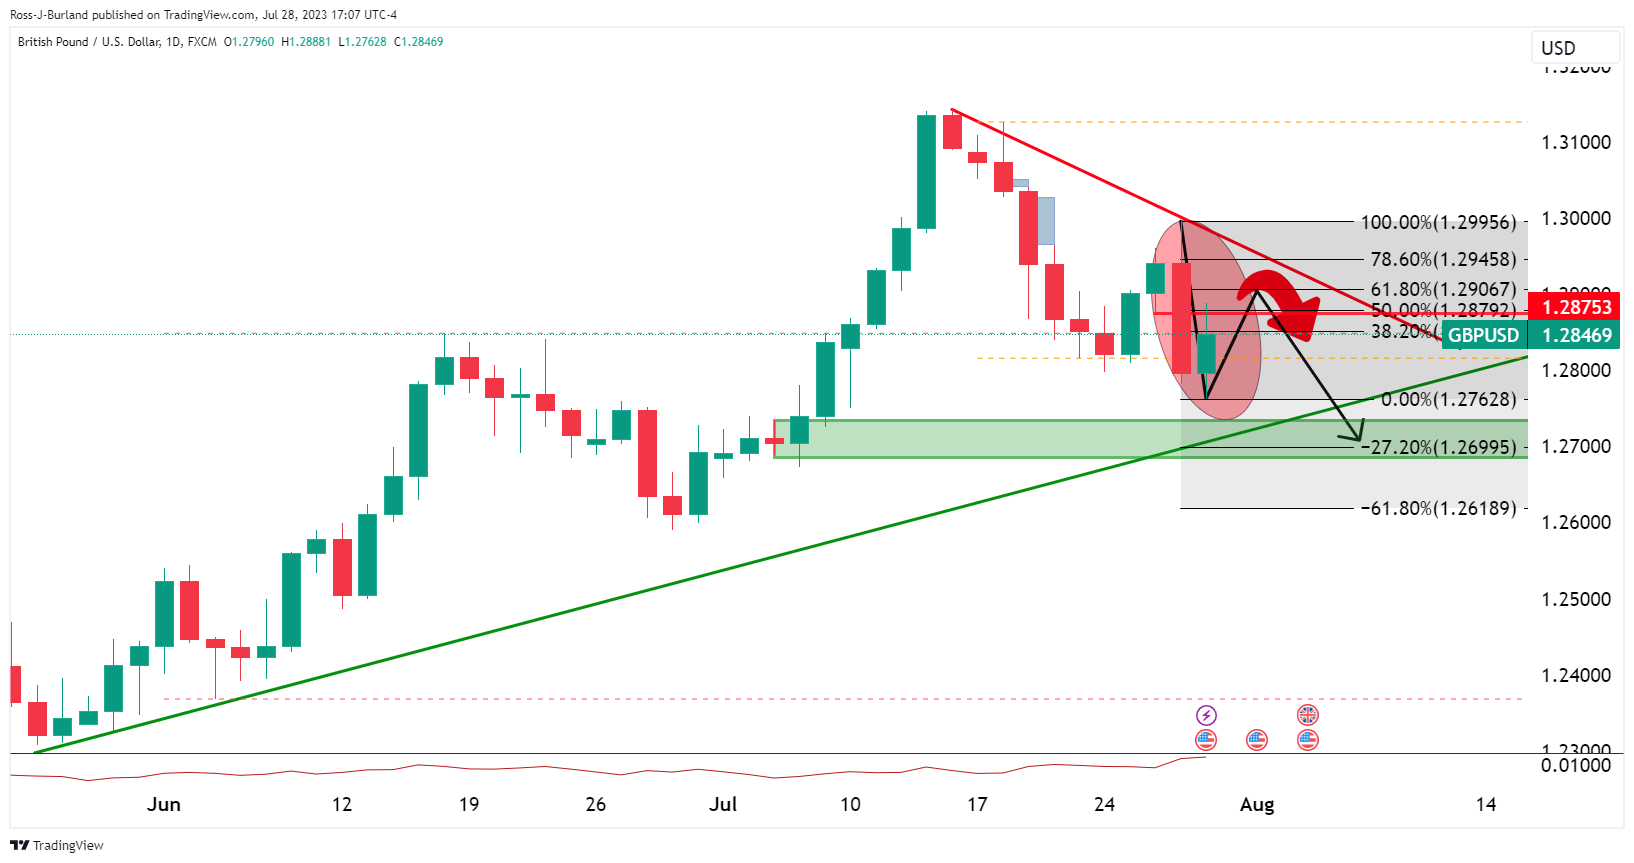
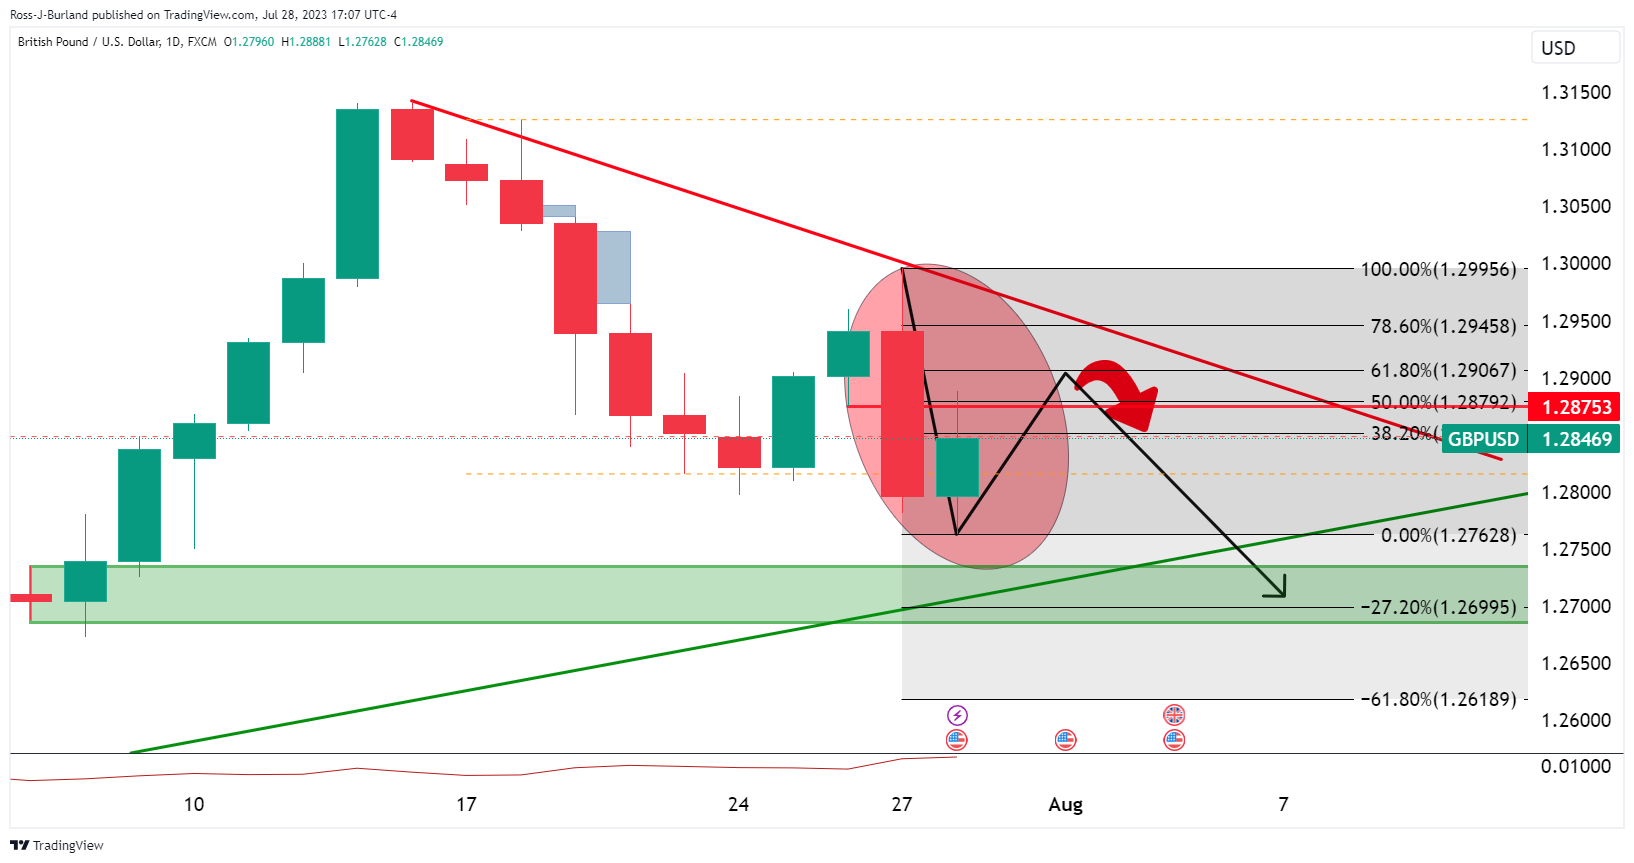
We could be somewhat premature in the sell-off but that is not to say that we do not have any downside in play for the initial balance next week:
GBP/USD H4 chart
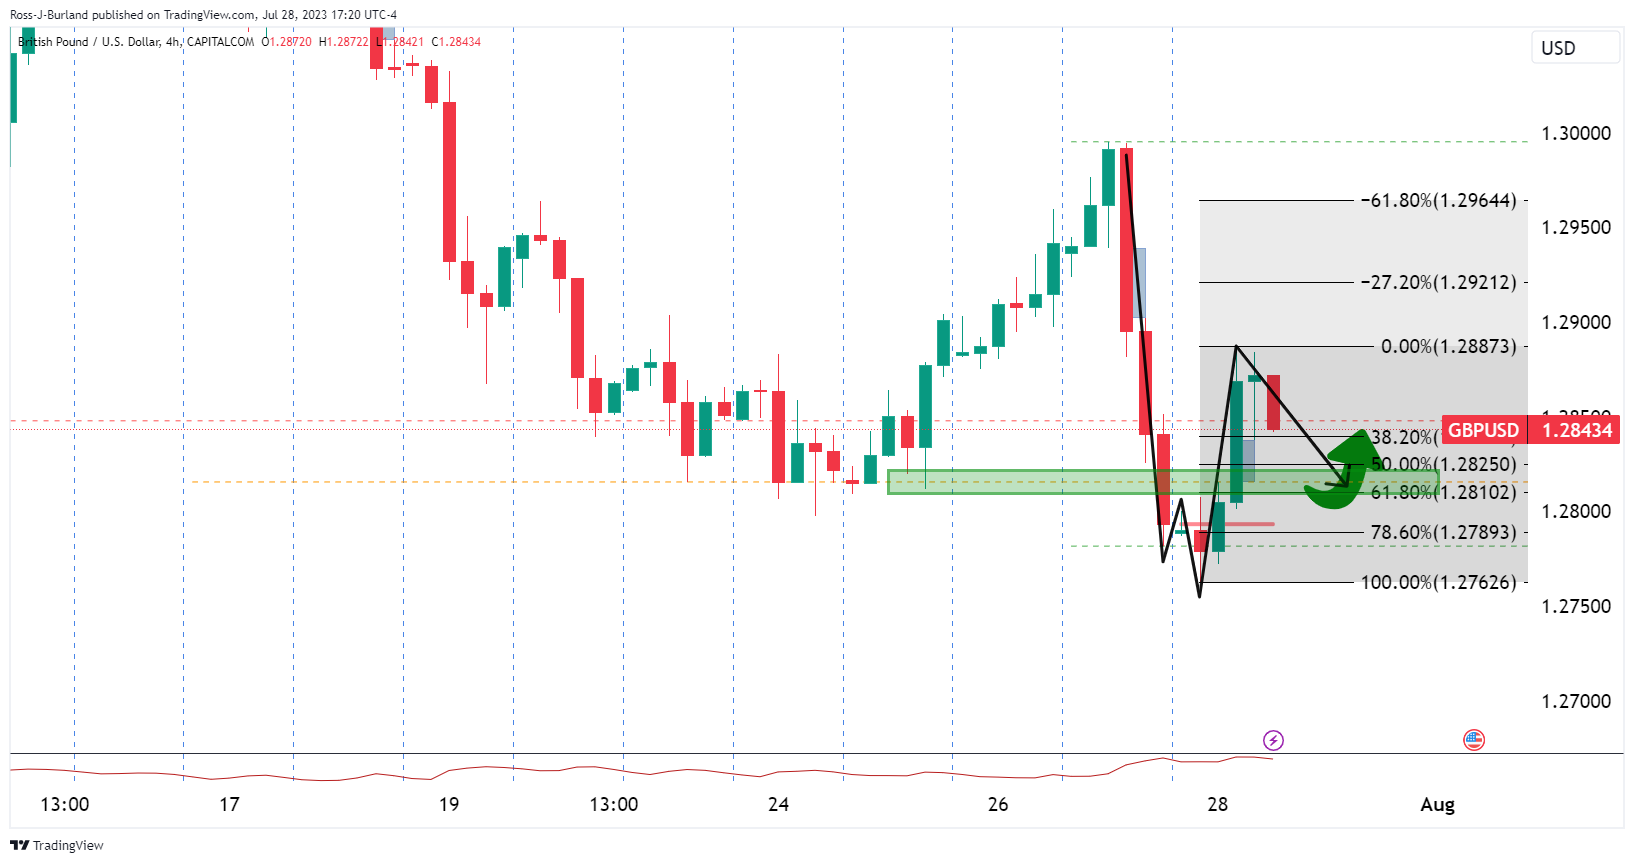
The W-formation is compelling and could be a pull on the price towards last week's lows that meets a 50% mean reversion if not the 61.8%ratio. The neckline support has a confluence with the 78.6% Fibonacci.
- The two-day BOJ meeting concluded with an unexpected adjustment to the Yield Curve Control.
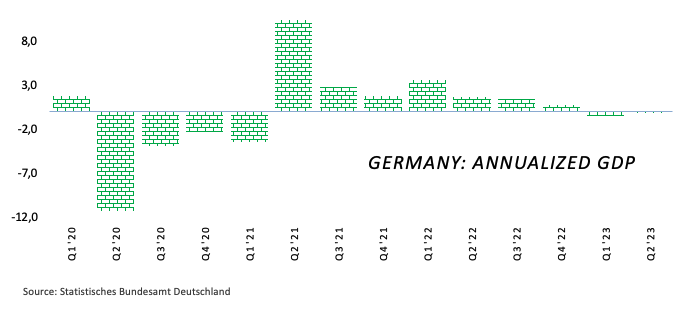
- Germany's Inflation data came in line with expectations of 6.5% but lower than the previous 6.6%, and Q2 GDP data disappointed.
- Ueda’s dovish tone weights on the Yen.
At the time of writing, the EUR/JPY pair is trading near the 155.50 area, marking a significant 1.54% increase from its opening price. The pair experienced a daily low of 151.40, and then the Yen lost interest as investors took the Bank of Japan decision as dovish.
On the one hand, Thursday’s rumours materialised, and the two-day BoJ meeting concluded with an unexpected adjustment to the Yield Curve Control (YCC) and the offer to buy 10-year JGBs at 1.0% every day, leading to market volatility. The 2-year yield rose to -0.012%, while the 5 and 10-year yields reached 0.162% and 0.567%, respectively. However, the BoJ interest rate decision remained unchanged. Still, Governor Ueda commented that the YCC tweak wasn’t a step to normalisation and that the bank, nowhere near raising rates, is weakening the Yen.
On the other hand, Germany reported encouraging economic data. The Harmonized Index of Consumer Prices (HICP) (YoY) for July aligned with expectations of 6.5%, a bit lower than the previous 6.4%. In addition, the Gross Domestic Product (YoY) for Q2 decreased but was lower than expected at 0.2% vs the projections of 0.3%.
On Thursday, Christine Lagarde commented that monetary policy decisions would be based on incoming data, so soft inflation figures make markets bet on a dovish European Central Bank (ECB). In that sense, the 2, 5 and 10-year German yields are decreasing by more than 0.50%.
EUR/JPY Levels to watch
The daily candlestick chart shows that the EUR/JPY trades bullish, ending the week. The Relative Strength Index (RSI) is just slightly above the midline, with a steep positive slope of 90 degrees. The Moving Average Convergence Divergence (MACD) prints fading soft red bars indicating that bulls are quickly gaining ground. On the bigger picture, the pair trades above the 20-day Simple Moving Average (SMA), reinforcing a bullish momentum.
Resistance levels: 155.84 (20-day SMA), 156.00, 156.50.
Support levels: 155.00, 153.00,151.50.
EUR/JPY Daily chart
-638261727671760866.png)
- WTI is attempting to breakdown but the bulls stay in charge.
- A break of $79.00 is required for bearish thesis to be solidified.
WTI crude also rose 4.6% for the week, marking the fifth consecutive weekly increase, the longest winning streak since the week ending June 10, 2022. This leaves the longs exposed for the days ahead with the past 5 weeks of fundamentals playing in and ripe for a squeeze despite this week's EIA data that was skewed slightly bullish.
The following analysis is leaning bearish, but there are a number of developments that need to occur to conclude the thesis of a long squeeze for the week ahead:
WTI weekly charts
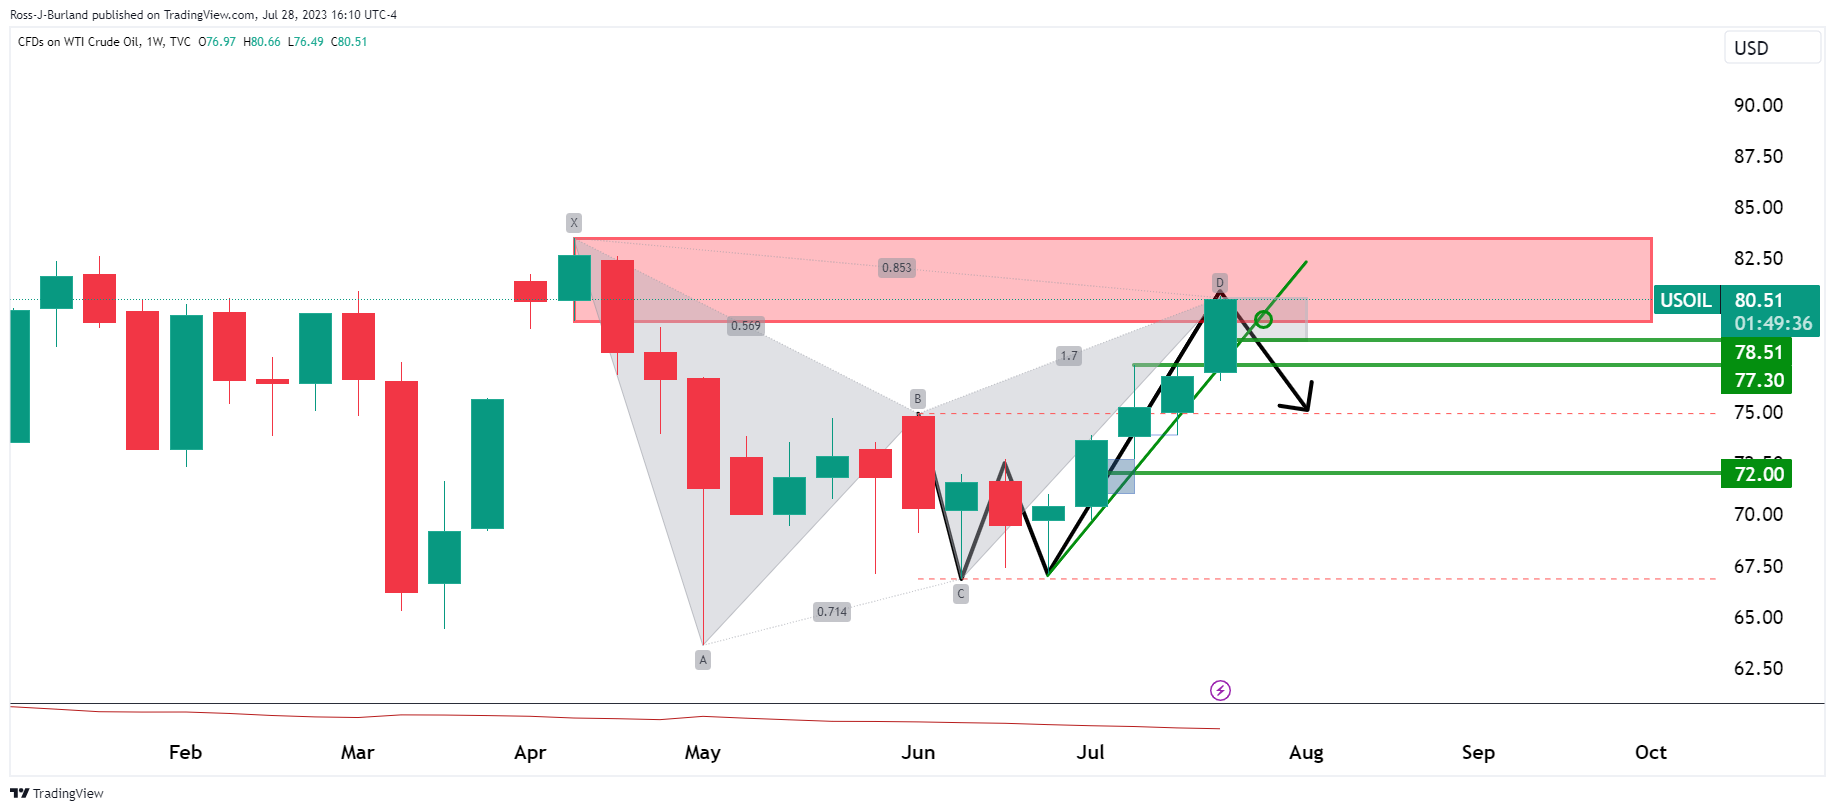
The bearish Gartley is compelling as is the weekly W-formation:
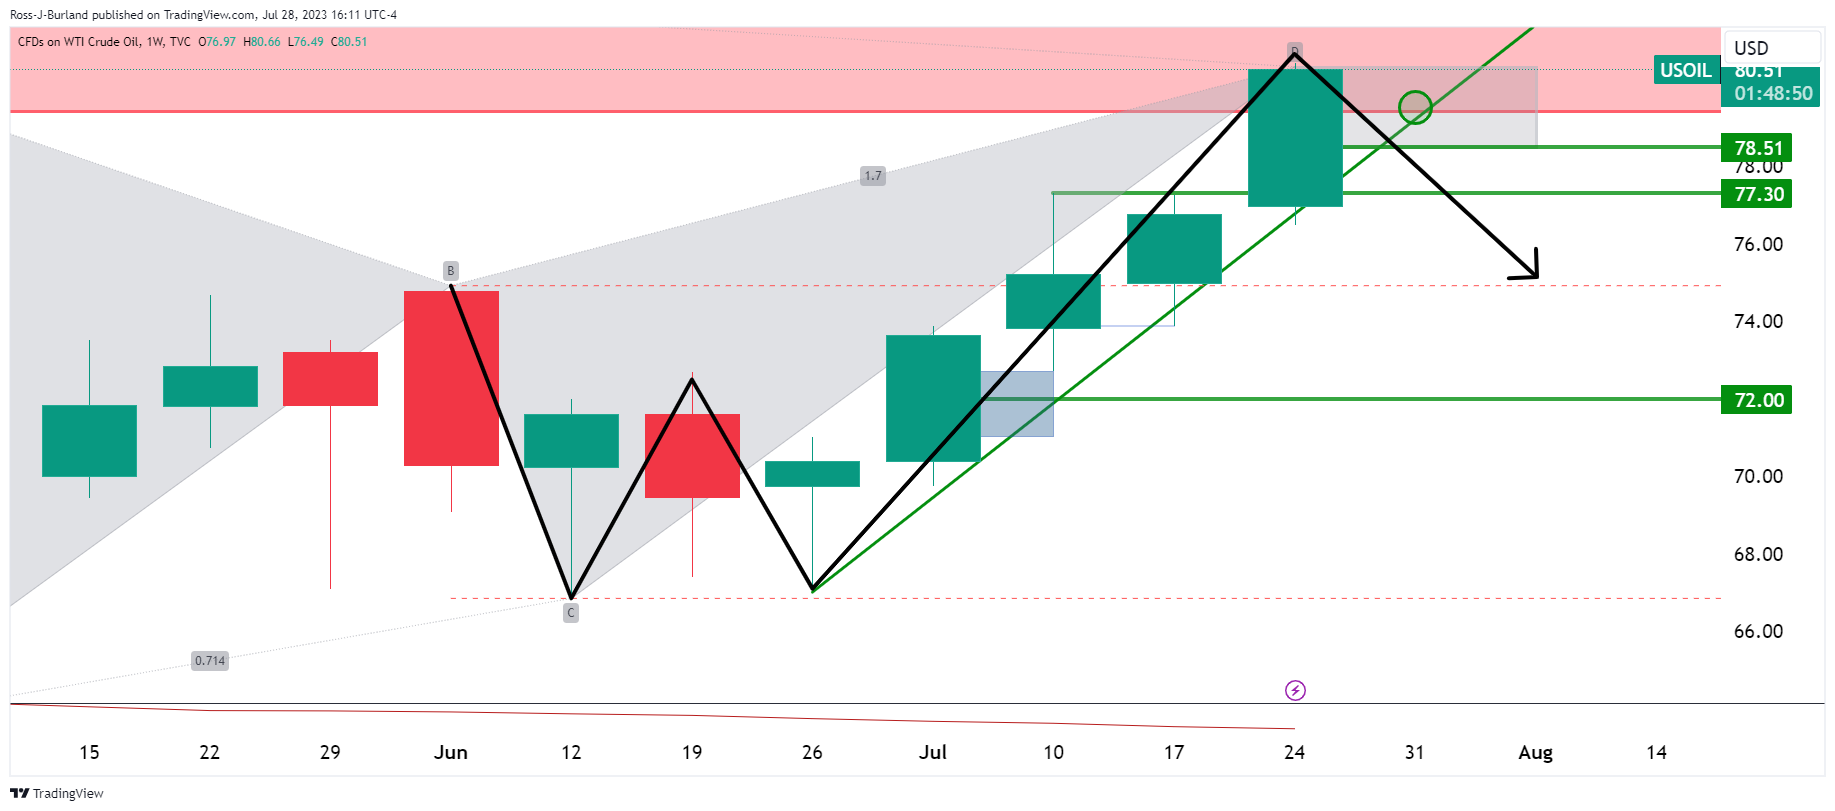
However, the price is still very much front side of the bullish trendline.
WTI daily charts
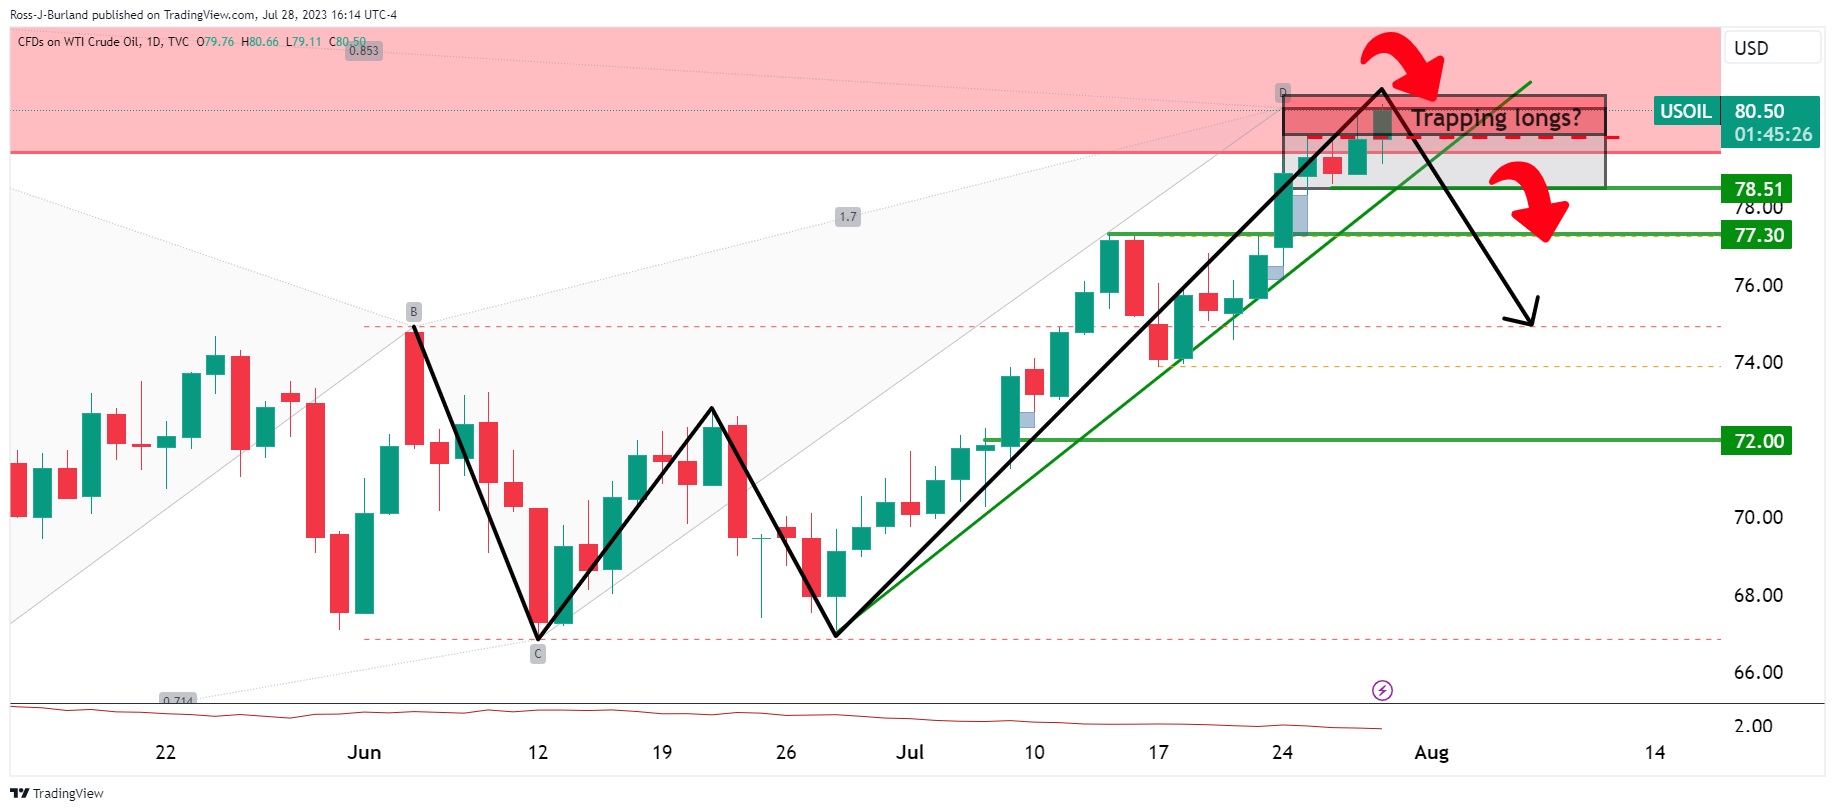
Do we have a final peak formation coming into play with trapped longs up top?
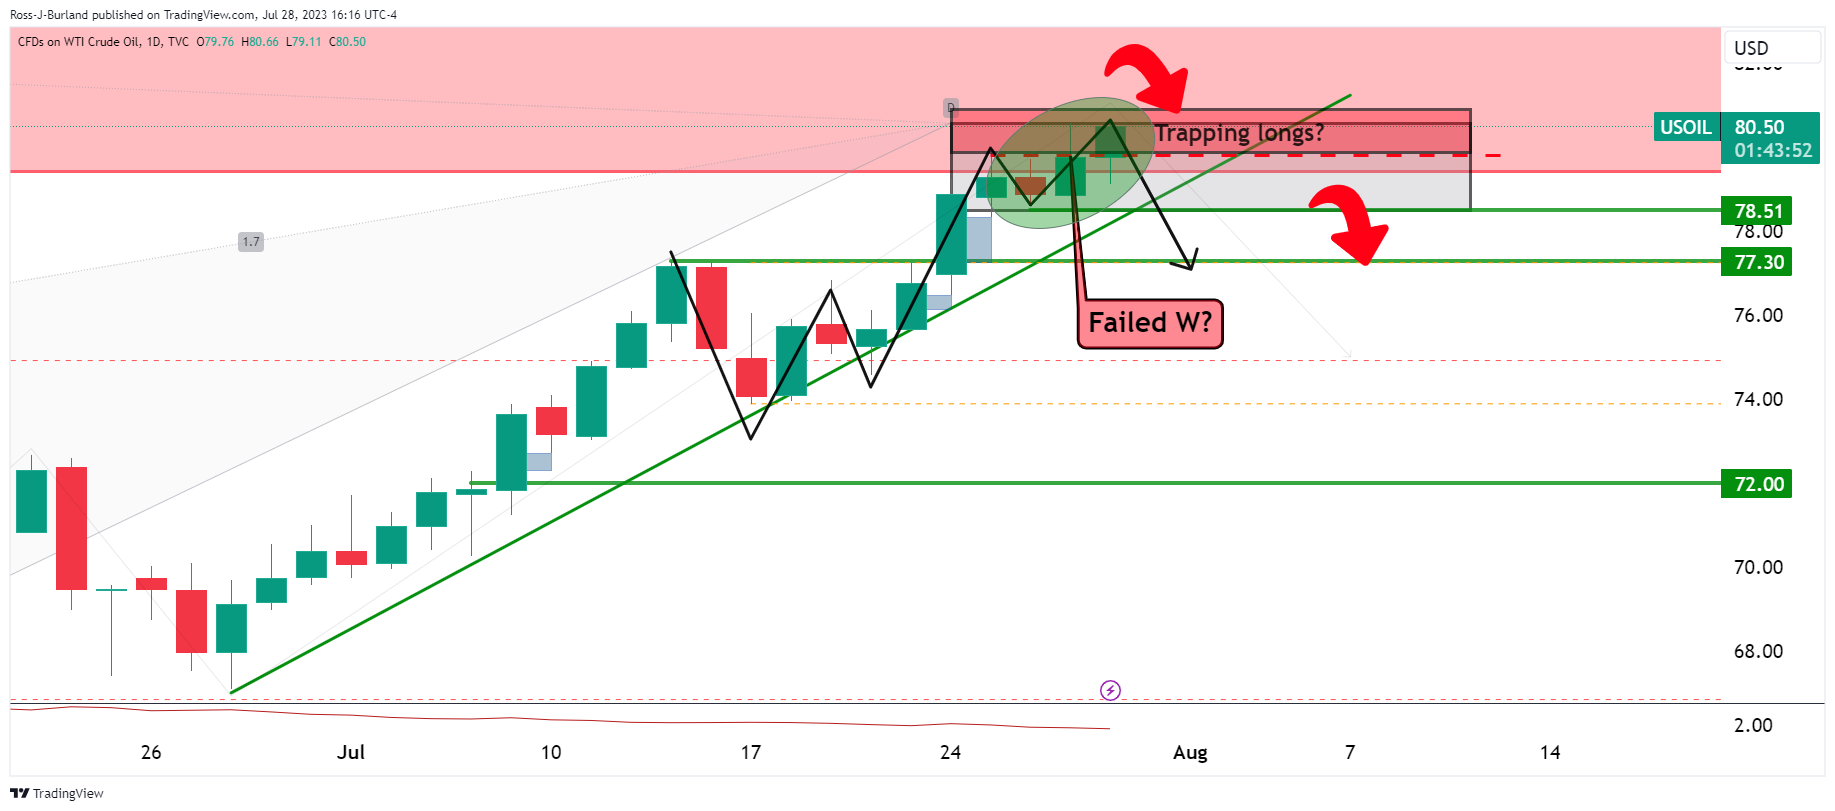
The daily chart's W formation is also compelling, although has it failed to draw in the price? So far the bulls stay in control into weekly resistance.
WTI H4 chart
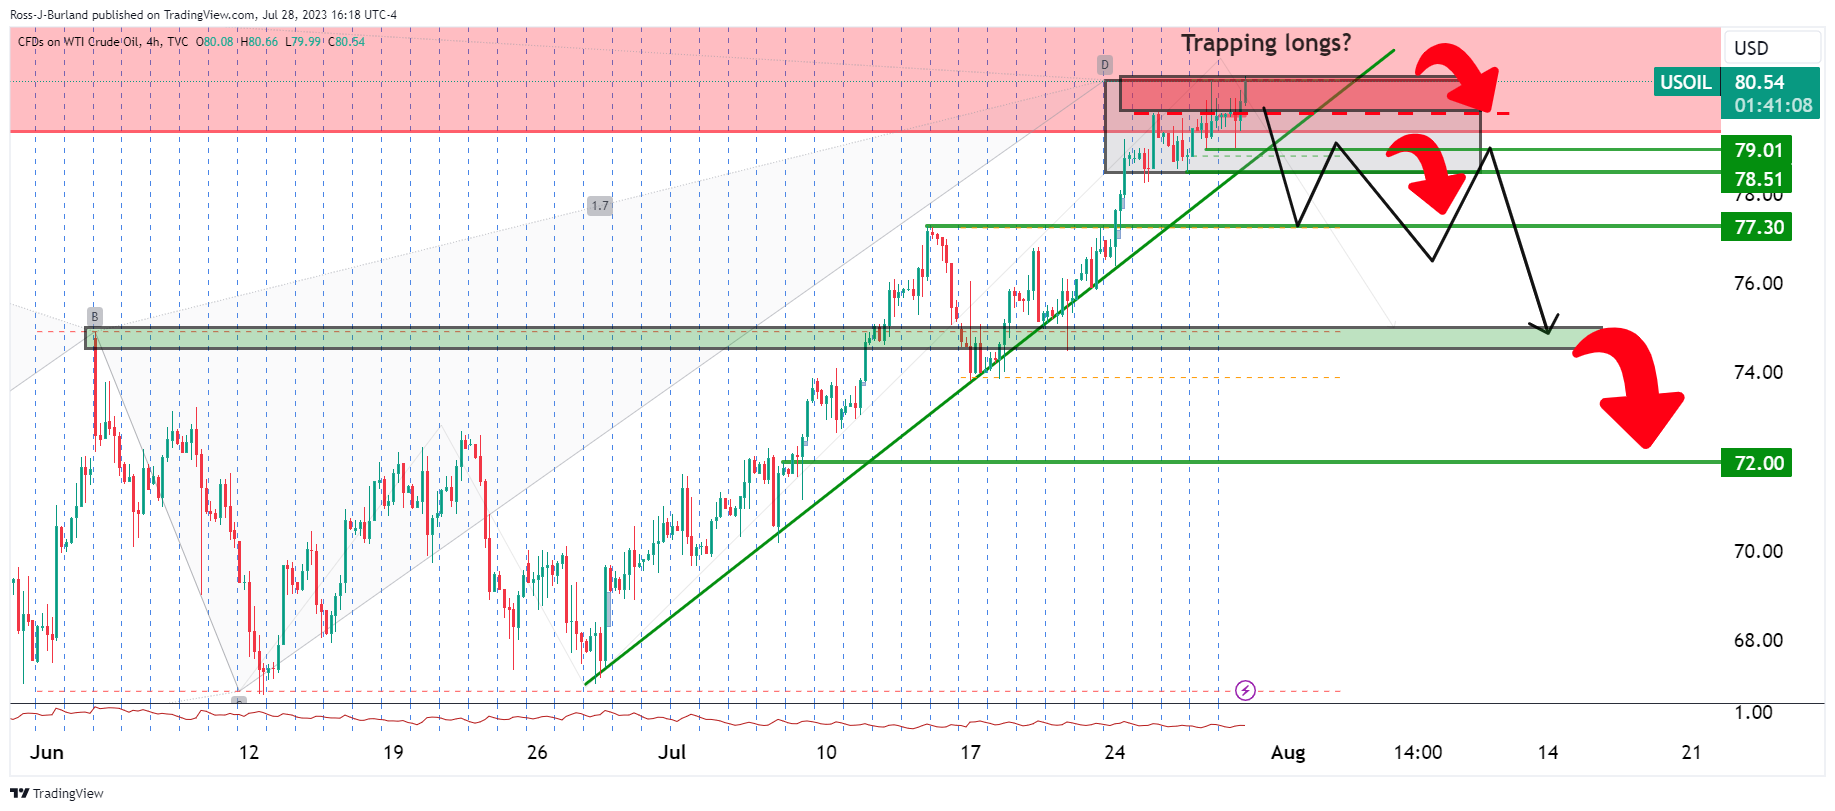
A break of the trendline is required and we also need to see a breakout $79 structure before a bearish thesis can be solidified.
- EUR/USD bulls are in the market but face a wall of resistance.
- EUR/USD bears eye the 4-hour W-formation and a move into test key support.
EUR/USD traded higher Friday as the US Dollar bears pounced on data that inflation showed further signs of cooling in June according to Personal Consumption Expenditure data. However, the DXY was still set for the second straight week of gains, underpinned by stronger-than-expected US economic data.
Nevertheless, EUR/USD was headed towards the close on Wall Street higher by some 0.43% after moving up from a low of 1.0943 to score a high of 1.1047 on the day. Technically, though, the rally off the May monthly low appears vulnerable, and unless key US data next week cooperates longs could be in for a squeeze as the following illustrates:
EUR/USD daily chart, bearish
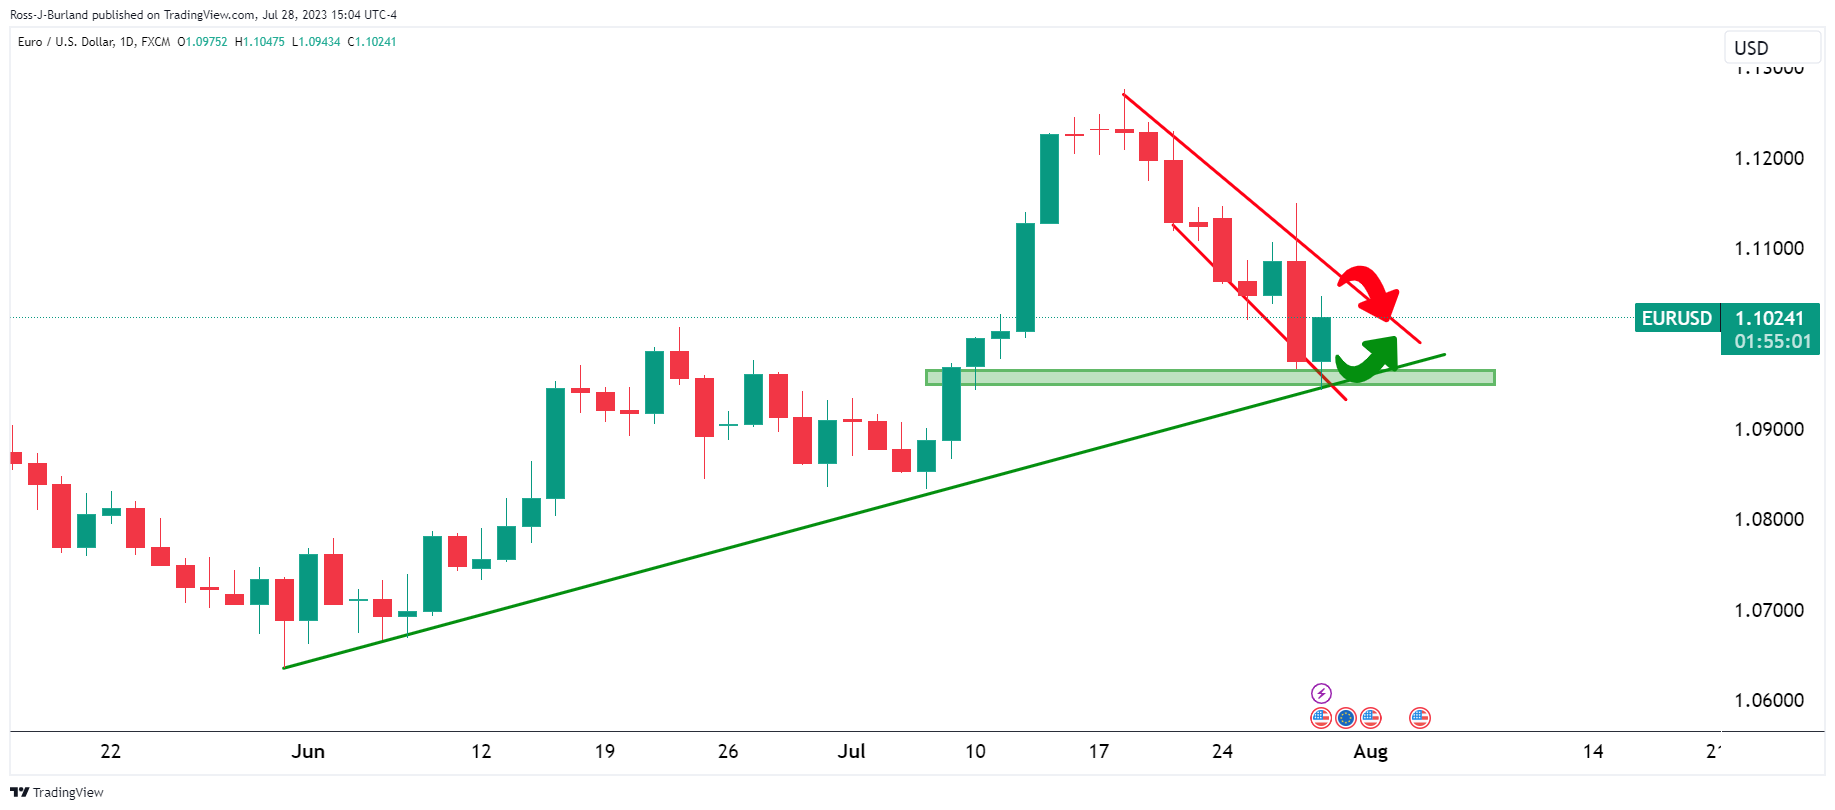
Bulls are in the market within a down channel and front side of the bullish trend. However...
EUR/USD daily chart Fibonacci resistance
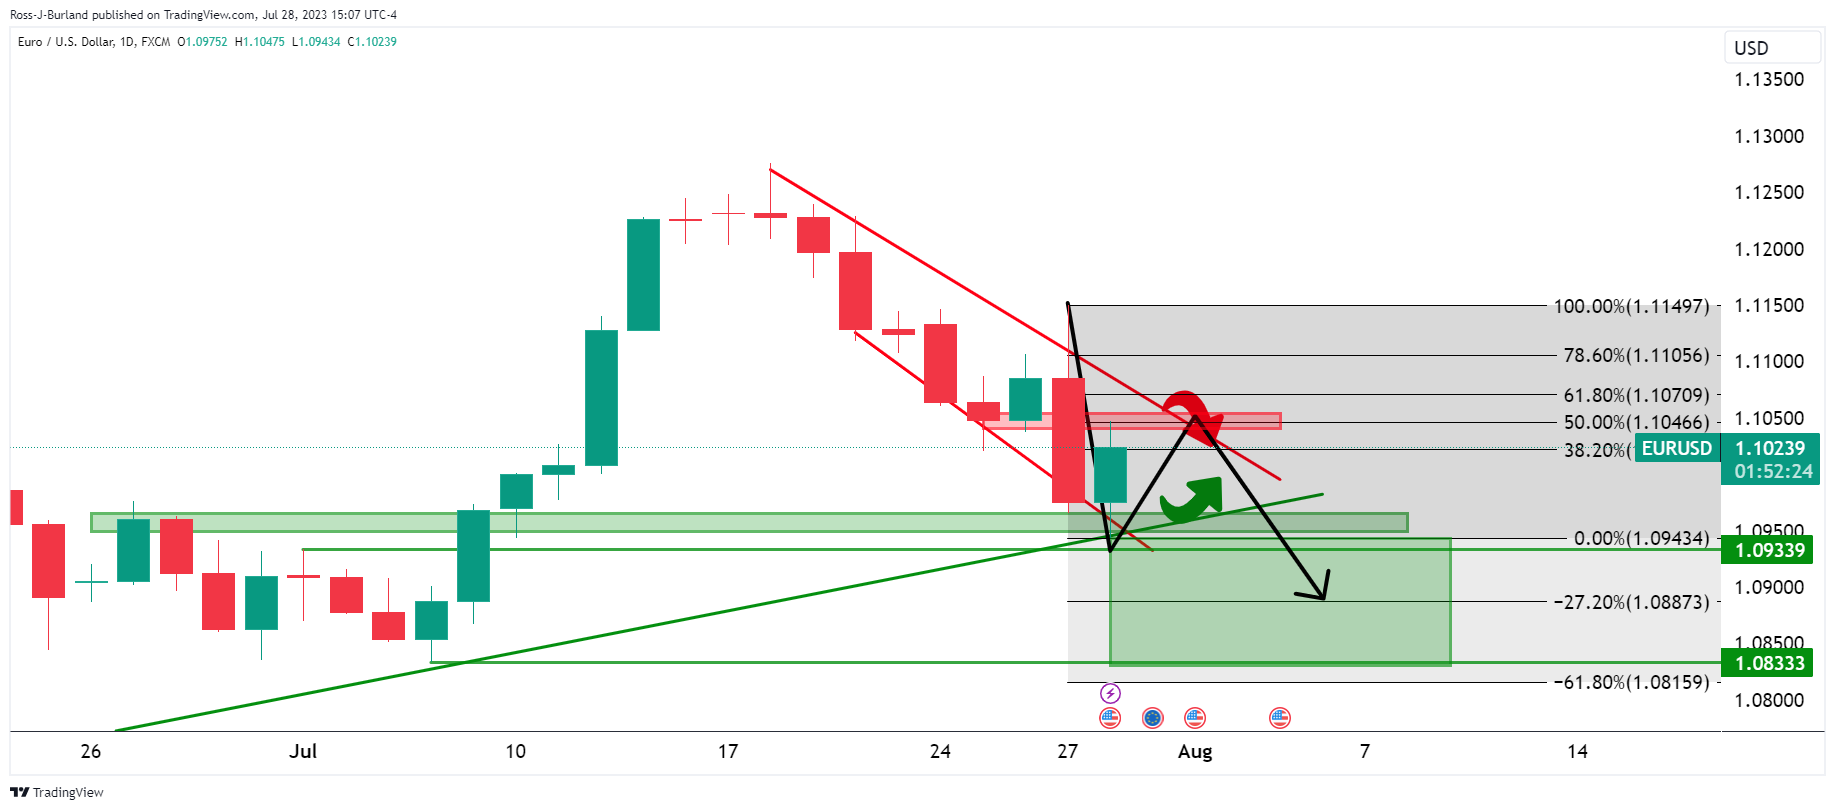
We have horizontal resistance and trendline resistance that meet at a key level within the Fibonacci scale. 1.0710 at a 61.8% ratio could be a tough nut to crack.
EUR/USD H4 chart
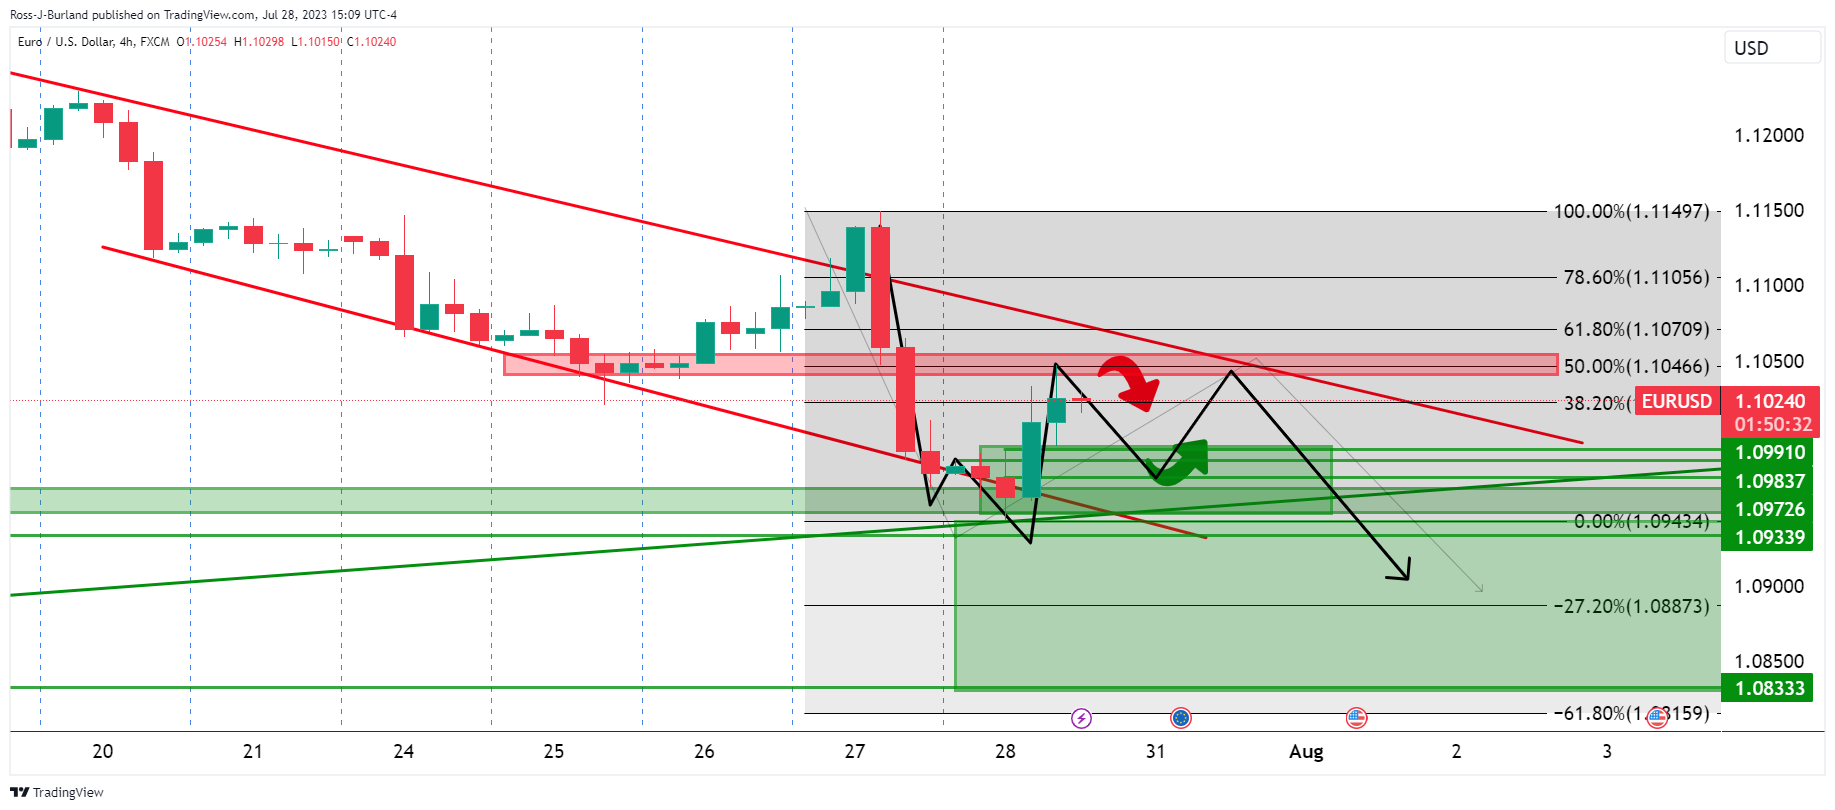
Meanwhile, the 4-hour chart's W-formation is troublesome and could be a pull on the price for the near future.
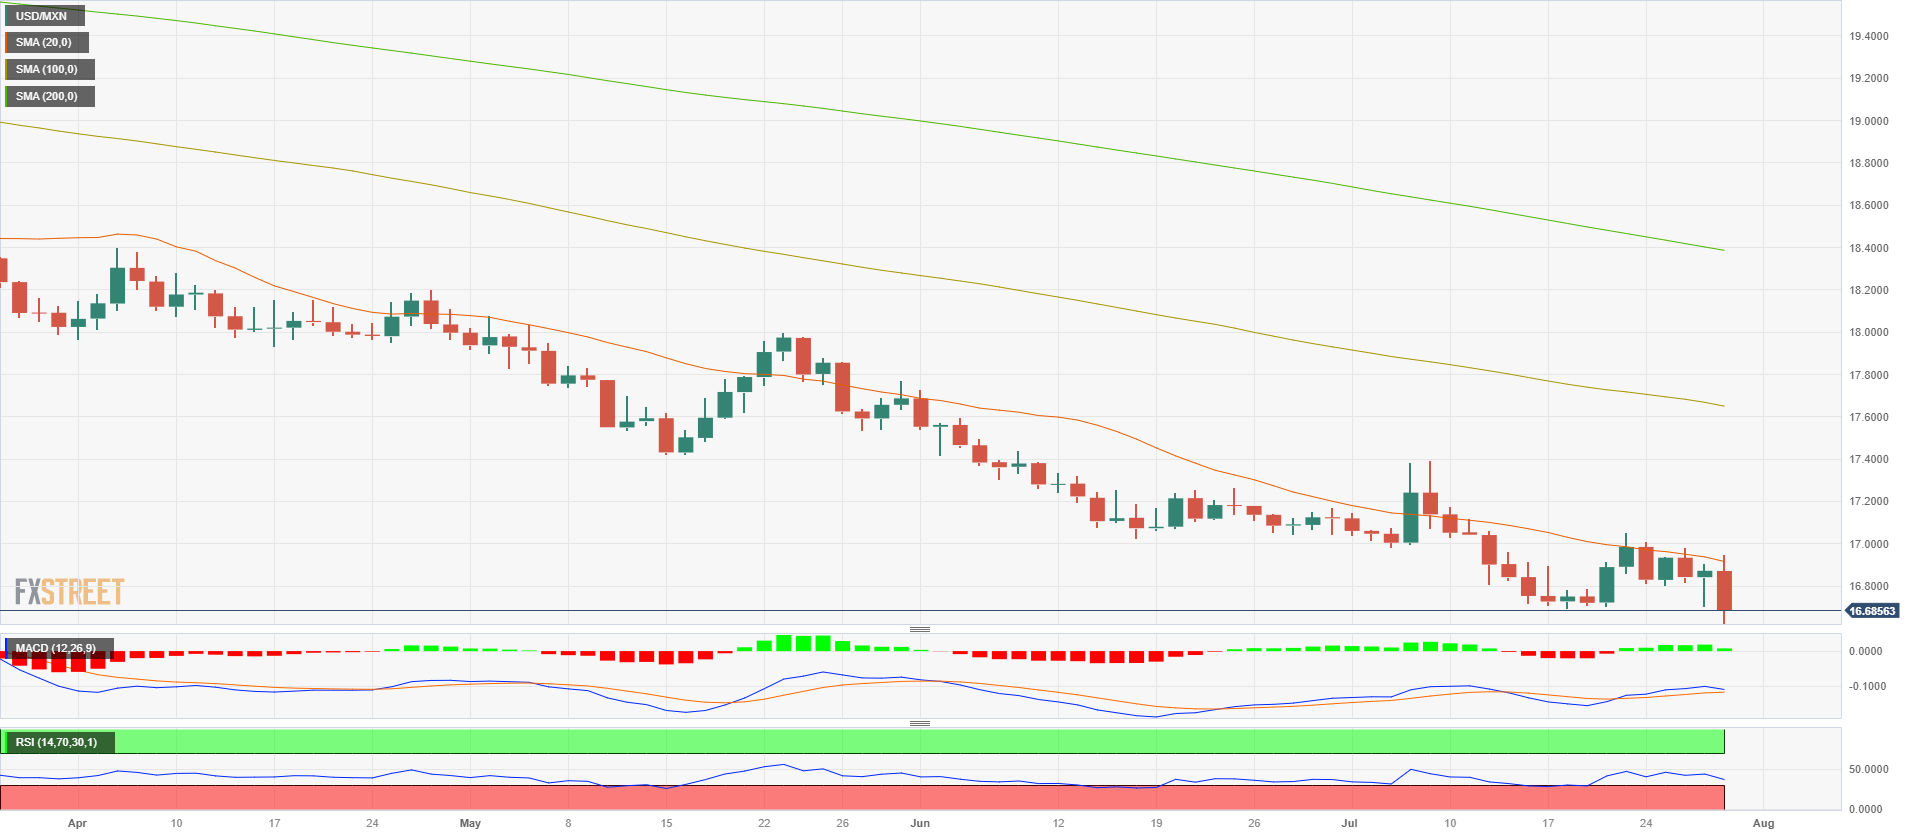
- USD/MXN printed a fresh cycle low on Friday of 16.62 and is poised to close a 1.70% weekly loss.
- Core US CPI retreated to 4.1% YoY in June.
- Falling US yields limit the Greenback’s advance as markets start to place bets on the September meeting.
On Friday, the USD/MXN pair fell to its lowest point since December 2015, this time weakened but soft Core Personal Consumption Expenditures (PCE) figure from June.
In that sense, the figures, which act as an essential gauge of inflation for the Federal Reserve (Fed), dropped to 4.1% YoY in June, lower than the 4.2% expected and the previous 4.6%. Its worth noticing that regarding September’s meeting, Jerome Powell added that the Fed can pause or hike and will depend solely on the data, so soft inflation figures make a case for a pause stronger, making the US yields decrease across the board.
However, the economic outlook from the US is strong as on Thursday, positive Q2 Gross Domestic Product (GDP) was reported, along with robust Durable Goods and Jobless Claims data. That being said, the next two set of inflation and job report figures before the Federal Open Market Committee (FOMC) meeting will be the ones which model the tightening expectations.
USD/MXN Levels to watch
The daily and weekly charts show that the technical outlook is bearish. On the daily chart, the Relative Strength Index (RSI) and the Moving Average Convergence Divergence (MACD) hint at the bears holding strong momentum while the pair trades below the 20,100 and 200-day Simple Moving Averages (SMA).
Support levels: 16.60, 16.50, 16.30.
Resistance levels: 16.90 (20-day SMA), 17.00, 17.20.
More central bank decisions await in the coming week, with live meetings at the Reserve Bank of Australia and the Bank of England. US data will remain in the spotlight with key employment data, including Nonfarm Payrolls. Canada and New Zealand will also release job market data. Eurostat will release inflation and growth data.
Here is what you need to know for next week:
After the FOMC meeting, the focus in the US turns to jobs data. On Tuesday, we will have the JOLTS Job Openings report; on Wednesday, ADP Private Employment; on Thursday, the weekly Jobless Claims and the Unit Labor Cost; and on Friday, the highlight of the week with Nonfarm Payrolls. The economy is expected to have added 180,000 jobs in July, and the Unemployment Rate to have stayed at 3.6%. Also relevant will be the ISM Manufacturing PMI on Tuesday and the ISM Service PMI on Thursday.
The US Dollar rose during the week and was among the top performers, supported by US economic data. For the rally to continue, the Greenback needs another round of positive numbers. The DXY notched its second weekly gain after Thursday's rally following US GDP data and closed above 101.50. Technically, it is not out of the woods yet, but it continues to recover from one-year lows.
US Treasury yields ended the week higher, supporting the US Dollar. The 10-year reached levels above 4.0% but then pulled back, while the 2-year settled around 4.9%. Eurozone bond yields also rose but at a more moderate pace.
EUR/USD dropped for the second week in a row, retreating further from one-year highs. It bottomed at 1.0940 and then bounced back above 1.1000. The main trend is still up, but momentum for the Euro is fading. Germany will report Retail Sales on Monday and Unemployment Rate on Tuesday. The preliminary July Eurozone Consumer Price Index is due on Monday, with a slowdown in the annual rate from 5.5% to 5.2% expected. On Thursday, Eurostat will release the EZ Producer Price Index (PPI), and on Friday, Retail Sales.
GBP/USD finished the week flat, hovering around 1.2850/60 after staging a limited correction. An important event of the week will be the Bank of England Monetary Policy Committee meeting. The central bank is expected to announce a rate hike on Thursday. The debate is whether it will be 25 or 50 basis points. While inflation and wage growth suggest that a 50 bps hike could be the decision, signs of a slowing labor market and the economic outlook favor a smaller hike.
Following a volatile Friday, USD/JPY finished the week modestly lower, near 141.00 and far from the bottom hit on Friday after the Bank of Japan's surprise move. The market will look for clues about the next move and how close the central bank is to significantly changing its monetary policy stance. Any signs toward normalization could boost the Japanese Yen.
USD/CHF rose for the second week in a row, extending the recovery from multi-year lows and finishing slightly below 0.8700. Switzerland will release the July Consumer Price Index on Thursday, with a decline in the annual rate expected from 1.7% to 1.5%.
AUD/USD failed to hold above 0.6800 and remained around 0.6600. The pair continues to move sideways. The Reserve Bank of Australia (RBA) will have its monetary policy meeting on Tuesday, with a 25 basis point rate hike expected.
NZD/USD also moves without a clear direction after being unable to break above 0.6400. It approached the 0.6100 support area. Early on Wednesday, New Zealand will release the Q2 employment report, including the Unemployment Rate and the Labor Cost Index.
USD/CAD rose marginally but remains capped by 1.3250. The pair is still biased to the downside. Canada will release the employment report on Friday after showing an impressive 59,900 positive employment change in June.
Like this article? Help us with some feedback by answering this survey:
- The pair stands rose nearly to 150.00 after four consecutive days of losses.
- USD/JPY surrendered earlier gains after the BOJ's Monetary Policy Statement reaffirmed its ultra-loose policy.
- Core PCE from the US retreated to 4.1% YoY in June, fueling a decrease in US yields.
At the time of writing, the USD/JPY pair is trading near the 150.00 area, 1% above its opening price, after reaching a daily low of 138.05. The U.S. dollar, measured by the DXY index, trades relatively flat at the end of the week following pressured down by soft Core Personal Consumption Expenditures (PCE) figures from June.
In that sense, US Treasury yields are decreasing to Core PCE, retreating to 4.1% below the expectations as Jerome Powell clearly stated that ongoing decisions will depend on incoming data. However, the Federal Reserve (Fed), until the next September meeting, will get two additional sets of inflation and job report figures which will be the ones which model the tightening expectations.
However, the pair’s upwards trajectory is explained by markets considering dovish the Bank of Japan (BoJ) monetary policy decision. No hikes were announced or hinted but concluded with an unexpected Yield Curve Control (YCC) adjustment. Regarding Governor Ueda's comments, he stated that the decision was not a step toward normalisation as the bank is still far from where it can raise short-term rates, and its dovish tone seems to be weakening the Yen.
USD/JPY Levels to watch
The technical outlook for the USD/JPY is neutral to bullish for the short term. Indicators have gained some strength but remain in negative territory while the pair is capped by the 20-day Simple Moving Average (SMA) at 140.93.
Resistance Levels: 140.93 (20-day SMA), 141.50, 142.00.
Support levels: 138.70, 138.00, 137.40 (100-day SMA).
USD/JPY Daily chart
-638261652941187296.png)
Data released on Friday showed that Canadian GDP posted a 0.3% monthly increase in May, in line with forecasts. Analysts at CIBC pointed out that the economy had its ups and downs during the second quarter, but despite the monthly volatility, it appears that growth cooled a little more than the Bank of Canada had assumed in its July Monetary Policy Report (MPR).
Key quotes:
“With today's data suggesting that growth was a little weaker than the Bank of Canada's MPR projection in Q2, there is a clear risk that policymaker's won’t hike interest rates one more time as we had previously anticipated.”
“However, because the slowdown in growth during Q2 was at least partly driven by supply side disruptions within public admin and the energy sector, we suspect that signs of continued loosening in the labour market and the trend in core inflation will be more important for the Bank as it determines whether to raise rates again or move back onto the sidelines. We will get more information on that front with the labour force survey next week.”
- Canadian GDP expanded 0.3% in May.
- US data shows core consumer inflation slowing down.
- USD/CAD moves sideways on Friday, remaining near the levels it had a week ago.
The USD/CAD dropped to the 1.3200 area following US and Canadian economic data but then rebounded, approaching the key resistance area at 1.3250. The pair hit weekly highs at 1.3248 but failed to break higher as it continues to move sideways, and is about to end the week unchanged.
Sideways despite data
Data released on Friday showed that the Canadian GDP expanded 0.3% in May, in line with consensus. The Loonie rose after the data but then pulled back, with USD/CAD moving sideways. “Several temporary factors distorted May's GDP data. While the end of the federal employees' strike boosted the economy, forest fires resulted in a contraction of the energy sector. Excluding these two factors, the Canadian economy grew 0.4%, better than the headline figure (0.3%). But this rebound may be short-lived,” explained analysts at the National Bank of Canada.
Regarding US data, the annual Core Personal Consumption Expenditure Index fell from 4.6% to 4.1% in June, weighing on the US Dollar. Personal Income rose 0.3%, below the 0.5% of market consensus, and Personal Spending rose by 0.5% above the expected 0.4%. A different report showed that the Employment Cost Index during the second quarter rose 1%, less than the 1.1% of market forecast.
The US Dollar pulled back after the data that pointed to softer inflation. The US Dollar Index is falling 0.20% on Friday, erasing some of Thursday's gains. On a weekly basis, the DXY is up, headed toward the second consecutive weekly gain. Next week, the US and Canada will release employment reports.
USD/CAD still under 1.3250
The USD/CAD is moving with a slight bullish bias but remains capped by the 1.3250 area. A break higher could lead to an acceleration, with the next resistance seen at 1.3290. The key support stands at 1.3150; before that level, an interim support emerges at 1.3190.
Technical levels
Interest rate expectations are likely to continue driving the Gold price, strategists at Commerzbank report.
US economic data should be a key driver of the Gold price
The US economy grew by 2.4% on an annualised basis in the second quarter, and thus more sharply than expected. This means there is still little sign of the US Federal Reserve’s aggressive rate hikes, which in the market’s eyes increases the likelihood of a ‘soft landing’ for the US economy. This view was also boosted by the Fed, which abandoned its forecast of a US recession at its meeting on Wednesday, which saw it increase key rates by 25 bps as expected.
This is relevant to the Gold price in the sense that rate cuts in the foreseeable future will be noticeably less likely if no recession is forthcoming. The market’s rate cut expectations for the coming year are at this point, however, quite supportive for the precious metal. Consequently, US economic data are likely to be watched very carefully over the coming days and weeks and should therefore be a key driver of the Gold price.
The ECB delivered a 25 bps rate hike as expected. Economists at Société Générale expect one more 25 bps hike from the ECB in September.
ECB moves to full data dependency
The ECB hiked rates by another 25 bps, as signalled in June, taking the deposit rate to 3.75%. Instead of signalling any particular action in September (apart from ruling out rate cuts), ECB action at the coming meetings will now be fully data-dependent, implying that rates may still rise after a pause.
The ECB also reduced the remuneration of minimum reserves to 0% – due to their small size, this is unlikely to impact the policy stance and market rates. This shows that the ECB is sensitive to the losses generated by so much excess reserves. We think the theme of reducing losses will continue next year, via ramped-up QT.
We still see room for one more rate hike before core inflation turns definitively downwards, but the latest weakening in the flow of economic data also suggests that the September decision will be a tight call.
The Yen is choppy but holds gains after BoJ allows the 10Y yield to rise as high as 1%. Economists at Scotiabank analyze JPY outlook.
BoJ makes changes to its YCC policy
The BoJ maintained its target for 10Y yields at 0% but henceforth, it will consider 0.5% as a reference point and tolerate yields up to 1%.
The BoJ’s key policy rate remains at -0.1% and Governor Ueda said the BoJ was a long way from being able to tighten policy.
Higher long-term yields in Japan should be JPY-supportive as US/Japan spreads have some opportunity to compress a little more moving forward.
The JPY has been the laggard in the broader G10 FX move against the USD this year so even moderate JPY strength will add to broader DXY headwinds.
- Silver finds stabilization after a sell-off to near $24.00 amid strength in the US Dollar.
- The US core PCE price index gained at a pace of 0.2% in June as expected by the market participants.
- Silver price delivers a breakdown of the Double Top chart pattern formed above $25.00.
Silver price (XAG/USD) remains topsy-turvy above the crucial support of $24.00 in the New York session. The white metal struggles to find direction as investors need strong cues about September’s monetary policy by the Federal Reserve (Fed) as policymakers held incoming data accountable for further action.
S&P500 opens on a bullish note as fears of a recession in the United States have faded significantly. Considering the stellar performance of the US economy in the April-June quarter and commentary from Fed officials that they are not expecting a recession due to the tight labor market, investors find strength for pumping money into US equities.
The US Dollar Index (DXY) rebounds firmly after correcting to near 101.40 as soft US core Personal Consumption Expenditure (PCE) price index data fails to offset the impact of upbeat Gross Domestic Product (GDP) data.
The US core PCE price index gained at a pace of 0.2% in June as expected by the market participants but remained slower than the 0.3% figure, being registered in May. On an annualized basis, Federal Reserve’s (Fed) preferred inflation tool softened sharply to 4.1% vs. the expectations of 4.2% and the former release of 4.6%.
Silver technical analysis
Silver price delivers a breakdown of the Double Top chart pattern formed above $25.00 on a two-hour scale. The aforementioned pattern was triggered after slipping below July 24 low at $24.27 and a bearish reversal has been triggered. The 20-period Exponential Moving Average (EMA) at $24.40 is acting as a barricade for the Silver bulls.
The Relative Strength Index (RSI) (14) has shifted into the bearish range of 20.00-40.00, which indicates that the bearish momentum is active.
Silver two-hour chart
-638261494189173865.png)
Gold saw a sharp pullback on Thursday. But Gold is still expected to eventually retest the $2,063/75 record highs, economists at Credit Suisse report.
Weekly close below $1,883 would reinforce the longer-term sideways range
We maintain our long-held view for a major floor to be found the key rising 200-DMA of $1,883 and for an eventual retest of major resistance at the $2,063/2,075 record highs to be seen.
We still stay biased to an eventual break to new record highs later in the year, which would then be seen to open the door to a move to $2,150 next, then $2,355/65.
A weekly close below $1,883 though would be seen to reinforce the longer-term sideways range, and a fall to support next at $1,810/05.
Economists at MUFG Bank analyze EUR/USD outlook following Thursday’s ECB policy update.
ECB signals it is close to the end of their hiking cycle
We still believe current price action is a temporary setback for the pair rather than a sustained reversal lower given our expectation that further US Dollar weakness will lift the pair back into a higher range between 1.1000 and 1.1500 through the rest of this year.
The main surprise was the clear signal from the ECB that it is close to the end of its hiking cycle.
USD/CHF has seen a rollercoaster week. Economists at Credit Suisse analyze the pair’s outlook.
Support at 0.8661 needs to hold to maintain an immediate upside bias
A close above 0.8703 today is seen needed to confirm which we would then look to prove the platform for a deeper, but we think still corrective recovery to resistance initially at 0.8780/82 ahead of the May low and ‘measured base objective’ at 0.8819/29.
Support at 0.8661 is seen needing to hold to maintain an immediate upside bias and thoughts of a base. Below though would ease thoughts of recovery for a retest in due course of the 0.8557/52 lows.
Yen and JGB yields gain after BoJ tweaks YCC. Economists at Société Générale analyze JPY outlook.
BoJ introduces flexible YCC
BoJ surprises, adjustment of curve control and flexible interpretation of 0.5% as a reference point effectively widen the band to +/-100 bps. They will take action to keep yields between 0.5% and 1%.
The decision is positive for JGB yields. The resulting narrowing of UST/JGB spreads should bolster the appeal of the Yen and diminish pressure to intervene in Yen.
The forecast of headline inflation was revised up for FY23 but down for FY24 and unchanged for FY25.
For Governor Ueda, today’s move is not a step towards normalisation of policy and stable inflation with wage growth is not yet in sight.
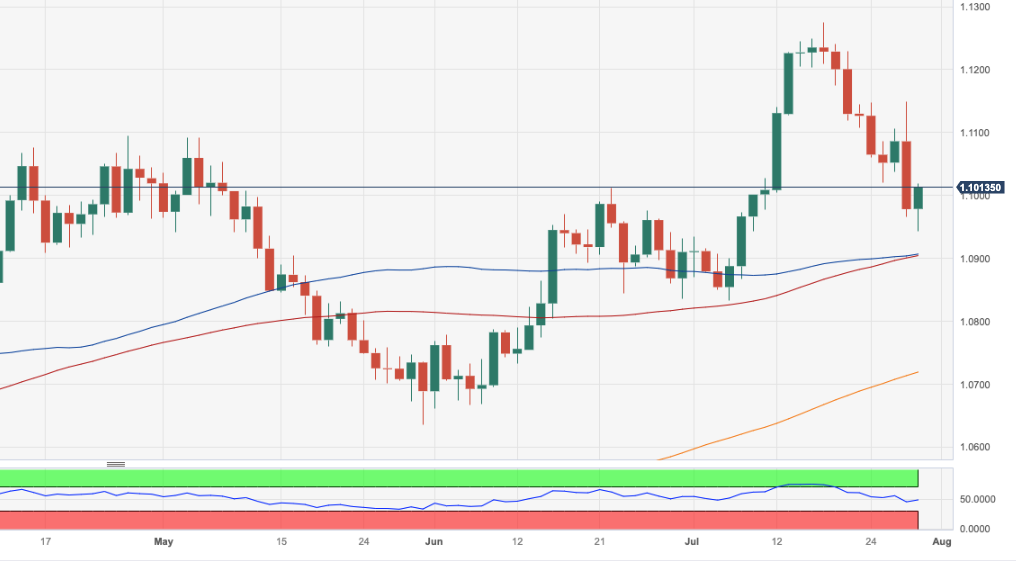
Markets Strategist Quek Ser Leang at UOB Group comments on the ongoing price action and prospects for EUR/USD.
Key Quotes
Our last Chart of the Day was from about 2 weeks ago, on 13 July 2023. At that time, when EUR/USD was trading at 1.1140, we highlighted that weekly MACD appeared poised to crossover into positive territory, and we were of the view that it boded well for further EUR/USD strength. However, we noted, “It remains to be seen if EUR/USD has enough momentum to reach the solid resistance level at 1.1485 in the next couple of months.”
We also stated that “In order to keep the momentum going, EUR/USD must stay above the daily trendline support, currently near 1.0880.” After our update, EUR/USD continued to rise and touched a high of 1.1275 in mid-July. EUR/USD pulled back sharply from the high and yesterday (28 July 2023), it plunged below the previous high of 1.1010. Today, EUR/USD appeared to have dropped slightly below the trendline indicated above (the trendline at 1.0865 is also close to the 55-day exponential moving average).
While it is premature to expect a major bearish reversal, the break of the trendline and the 55-day exponential moving average indicates that the 1.1275 high could be a top for now. In other words, 1.1275 is unlikely to come back into view in the next month or so. That said, the pace of any decline is likely to be slow as there are several significant support levels* that are relatively close to each other.
*On the weekly chart, the rising trendline connecting the lows of Sep last year and May this year is at 1.0880. This level is also close to the 21-week exponential moving average. On the daily chart, the top of the daily Ichimoku cloud support is at 1.0865 now. This level is not far above the early July low of 1.0832. Further down, the 55-week exponential moving average is currently at 1.0770.
Economists at TD Securities analyze Gold (XAU/USD) outlook after the release of softer-than-expected Employment Cost Index (ECI).
Soft landing theme places a cap on optimism for Gold for the time being
A softer-than-expected ECI adds to evidence that inflation pressures continue to abate. Ultimately, the US disinflation theme remains a key driver of the weakness in the broad US Dollar, amid a low vol environment, elusive signs of a global recession and with a Fed likely on hold. These pressures are supportive of Gold prices, as highlighted by largely neutral price action despite an additional hike in the history book.
Still, the data continue to lend strength to the soft landing theme, which places a cap on optimism for the yellow metal for the time being.
Economists at MUFG Bank analyze EUR/USD outlook after the ECB policy update.
Further near-term gains for cyclical currencies
We believe the dovish policy shift from the Fed will be more important for FX markets leaving the door open for EUR/USD to strengthen modestly through the rest of this year even if the ECB hiking cycle has ended.
The developments are supportive for further near-term gains for cyclical currencies (commodity & EM FX) against the Euro and US Dollar.
See – EUR/USD: Euro will be able to appreciate over the coming months – Commerzbank
The uptrend in the S&P 500 showing clear signs of tiring beneath price resistance at 4,637, analysts at Credit Suisse report.
Close below here 4,448/39 to suggest a correction lower has begun
With both daily and weekly RSI momentum still not confirming the new highs, we stay reluctant to chase the market directly higher and instead, we still look for 4,637 to cap temporarily, prompting a pullback and some consolidation and ideally a correction lower.
Should strength instead extend directly above 4,637 though, then we would see no reason not to look for a test of the 4,819 record high.
Below support at 4,530 is now seen needed to ease the immediate upside bias for support next at 4,448/39. A close below here though is needed to suggest a correction lower has indeed begun, with support then seen next at the lower end of the uptrend channel, now seen higher at 4,370.
- EUR/USD bounces off 3-week lows near 1.0940 on Friday.
- A deeper pullback could see the 1.0900 region revisited.
EUR/USD manages well to rebound from earlier 3-week lows in the 1.0945/40 band and reclaim the area just beyond 1.1000 the figure at the end of the week.
Considering the recent price action, extra weakness should not be discarded. Once the weekly low of 1.0943 (July 28) is cleared, further losses could extend to the transitory 55-day and 100-day SMAs just above the 1.0900 mark.
Looking at the longer run, the positive view remains unchanged while above the 200-day SMA, today at 1.0718.
EUR/USD daily chart
- NZD/USD delivers a solid recovery from 0.6120 ahead of Fed’s preferred inflation gauge.
- S&P500 futures have generated decent gains, portraying some recovery in the risk appetite.
- Loosening labor market conditions would allow the RBNZ to maintain interest rates steady at 5.5%.
The NZD/USD pair finds stellar buying interest near 0.6120 after a sell-off in the European session. The Kiwi asset demonstrates V-shape recovery as the US Dollar has come under scrutiny ahead of the United States Q2 Employment cost index and core Personal Consumption Expenditure (PCE) price index data, which will be published at 12:30 GMT.
S&P500 futures have generated decent gains in the London session, portraying some recovery in the risk appetite of the market participants. US equities faced significant pressure on Thursday as the upbeat performance of the United States economy in the April-June quarter stemmed fears of an interest rate hike by the Federal Reserve (Fed) in September.
US Q2 Gross Domestic Product (GDP) and June’s Durable Goods Orders data remained robust, indicating solid momentum in consumer spending. Also, jobless claims remained lower last week, conveying that employment program by firms is maintaining momentum.
Going forward, investors will keep an eye on Fed’s preferred inflation gauge. The impact is expected to remain light as Fed officials will give more weightage to July’s PCE data for September policy. Analysts at BBH expect that headline PCE is expected at 3.0% y/y vs. 3.8% in May, while core is expected at 4.2% y/y vs. 4.6% in May.
On the New Zealand Dollar front, investors will focus on Q2 Employment data, which will release on Wednesday. NZ's jobless rate has remained at record lows consistently. Loosening labor market conditions would allow the Reserve Bank of New Zealand (RBNZ) to maintain interest rates steady at 5.5%.
Economists at Société Générale analyze USD/CAD technical outlook.
A short-term bounce can’t be ruled out towards 50-DMA near 1.3300
USD/CAD broke below the trendline since last year resulting in steady decline. It has so far defended the projections of 1.3110. Daily MACD has started posting positive divergence denoting lack of steady downward momentum.
A short-term bounce can’t be ruled out towards 50-DMA near 1.3300 and the high achieved earlier this month at 1.3385.
If the pair fails to defend 1.3110, there would be risk of a deeper pullback towards 1.3000/1.2930, the 50% retracement of the 2021/2022 uptrend.
- DXY comes under pressure soon after hitting tops above 102.00.
- The downside pressure looks mitigated above the 102.60 area.
DXY now sees its earlier gains trimmed after climbing to fresh peaks just past 102.00 the figure on Friday.
Despite the ongoing knee-jerk, the index appears poised to extend the recent recovery. That said, the next target emerges at the transitory 55-day SMA at 102.57. The surpass of this region should alleviate the downside bias in the dollar and allow for extra gains.
Looking at the broader picture, while below the 200-day SMA at 103.78 the outlook for the index is expected to remain negative.
DXY daily chart
Analysts at Credit Suisse look for a test of price support at 0.6598/94, with a break lower now seen likely.
Break above 0.6714/15 needed to ease the immediate downside bias
AUD/USD completed a large bearish ‘outside day’ on Thursday. This is expected to clear the way for further weakness for a test of the July low and late June low at 0.6598/94. Whilst an attempt to hold here should be allowed for, our bias is now for a break in due course and for further weakness to be seen to support next at 0.6562/60, with scope for the potential uptrend from last October, today seen at 0.6532.
A break above 0.6714/15 is needed to ease the immediate downside bias to reassert the broader choppy range for resistance next at 0.6750, then 0.6785.
- EUR/JPY trades in a volatile fashion after the initial drop to 151.40.
- In the current context, further losses should remain on the table.
EUR/JPY trades in quite a volatile fashion following both the ECB and the BoJ meetings.
Once the dust settles, further decline could prompt the cross to test the interim 100-day SMA around 149.80. On the other hand, the resumption of the uptrend could motivate the cross to dispute the 2023 high in the 158.00 zone.
So far, the longer term positive outlook for the cross appears favoured while above the 200-day SMA, today at 146.43.
EUR/JPY daily chart

BoJ surprises again. The JPY reaction too suggests that the market does not interpret today’s monetary policy decision as the start of a restrictive process, economists at Commerzbank report.
BoJ introduces greater flexibility around YCC
The BoJ has announced that it will now control its yield curve in a more flexible way. Even though the target for the yield of Japanese government bonds with a 10-year maturity remains 0% and the tolerance range for yield movements around the target also remains at +/-0.5 percentage points, this limit should no longer be seen as a strict boundary but is more flexible. At the same time, there still is a red line as the BoJ will prevent a rise of 10-year yields above 1% with daily purchase operations.
The BoJ can be congratulated because, at first glance, it has managed to allow more movement at the long end of the yield curve, which would of course be a first step towards an exit from YCC, without the market perceiving this as an exit from ultra-expansive monetary policy. However, the BoJ is playing a dangerous game. Such half-baked measures, it is fueling concerns that an actual end to yield curve control may not even be desired or sought irrespective of the development of inflation, possibly also in view of the high level of government debt.
Even if the Yen for now benefits from the possibility of slightly higher interest rates long-term that would be a disastrous signal for the JPY.
GBP/USD fell sharply on Thursday. Economists at Credit Suisse analyze the pair’s technical outlook.
Resistance is seen at 1.2878/83 initially, then more importantly at 1.2997
There is scope for a deeper setback to be seen for a 55-DMA and price support at 1.2676/58, but with fresh buyers expected here, for an eventual resumption of its broader uptrend. Should a close below 1.2658 be seen though this would keep the immediate risk lower with support then seen next at 1.2631/27, then 1.2483/73.
Resistance is seen at 1.2878/83 initially, a close back above which is needed to raise the potential we have seen a ‘false’ break of the uptrend. Above the ‘outside day’ high of yesterday though at 1.2997 is needed to mark a reversal higher to reassert the core uptrend for a move back to the 1.3143 high.
USD/CAD gains extended marginally to near 1.3250. Economists at Scotiabank analyze the pair’s technical outlook.
Losses through 1.3215/20 should push USD/CAD back to the upper 1.31 area
Broader USD gains have lifted spot away from the mid-1.31 (bear) consolidation range base tested on Thursday and tilt risks marginally towards more USD strength in the short run. But a clear break through 1.3250 is still needed to drive more USD strength.
Intraday support is 1.3215/20; losses through here should push the USD back to the upper 1.31 area.
USD/JPY is still expected to find a floor at key support at 137.46/136.70, analysts at Credit Suisse report.
Resistance seen at 141.33, then 141.97/142.08
We continue to look for the 38.2% retracement of the 2023 rally at 138.26 and then more importantly at the ‘neckline’ to the base and 200-DMA, seen at 137.46 and 136.70 respectively, to ideally remain a solid floor for an eventual resumption of the broader uptrend.
Resistance is seen at the 13-day exponential average at 140.45 initially, with a close back above the 55-DMA at 140.60 seen needed to clear the way back to 141.33, with this seen as the barrier to a retest of 141.97/142.08.
GBP/USD rebounds tentatively from the 1.28 area. Economists at Scotiabank analyze the pair’s outlook.
Intraday techs are bullish
Bargain hunters appear to be supporting the GBP on dips, with positive yield spreads versus the USD still providing support for GBP sentiment.
Intraday trading patterns reflect firm demand and a bullish, short-term price signal (bull ‘hammer’ pattern) as Cable edged briefly under 1.28 earlier.
GBP gains through 1.2850 should help develop a stronger technical tone in the short run at least.
See: GBP/USD to reach the 1.40 level by end-2024 – Scotiabank
EUR losses extended a little more before steadying and reversing from the mid-1.09 area. Economists at Scotiabank analyze EUR/USD outlook.
Some decent demand for EUR on dips to the mid-1.09s
Significant net losses on Thursday for the EUR after trading as high as 1.1150 on the day leave a big, bearish print on the daily candle chart and point to spot extending its run lower from the mid-month peak of 1.1275.
Intraday patterns are reflecting some decent demand for EUR on dips to the mid-1.09s, however, and may see some of Thursday’s sharp losses recovered in the short run.
Resistance is 1.1020. Support is 1.0900/10.
The US Dollar Index (DXY) has recovered strongly but despite this strength analysts at Credit Suisse view this as a temporary rally before the risk turns lower in due course.
Close above 102.64 would suggest the DXY is back on a broad and choppy range
The DXY continues to recover strongly but despite this, our bias for now remains to see this as temporary and corrective following the completion of a large bearish ‘triangle’ continuation pattern, and we thus stay bearish and look for an eventual resumption of the core downtrend.
Price and 55-DMA resistance at 102.56/64 need to cap on a closing basis to maintain our negative stance for a fall back to 99.58/50 ahead of what we would look to be better support at the 61.8% retracement of the 2021/2022 uptrend and 200-week average at 98.98 and 98.26 respectively.
A close above 102.64 though would suggest the DXY is back on a broad and choppy range and the current recovery can extend further yet to the July high and 200-day average at 103.57/93 but with a better cap expected here.
Later today we could see the first big cut in Latam, in Chile. Economists at ING analyze the Chilean Peso (CLP) outlook.
The start of the easing cycle
Expectations are that the policy rate will be cut by 75 bps today to 10.50%. We doubt that will weigh on the CLP. But equally, we have been forecasting that the CLP lags the currency rally in Brazil and especially in Mexico because FX reserves are too low in Chile.
In June, Chile announced that it would start a new FX reserve rebuilding programme – ostensibly to redress last year’s massive FX support programme for the Peso, which saw FX reserves halve.
We doubt USD/CLP trades below 800 on a sustained basis.
Economist at UOB Group Enrico Tanuwidjaja and Junior Economist Agus Santoso comment on the latest Total Investment figures in Indonesia.
Key Takeaways
Indonesia continued to attract higher total investment in second quarter of 2023 at IDR349.8tn, registering a robust 15.7% y/y growth and marking a new record high in the last decade. Key drivers include investment in the metal processing industries which is in line with government’s program to enhance the down-streaming capacities onshore and optimism in Indonesian industry that remains in expansion zone.
Foreign Direct Investment (FDI) contributed IDR163.5tn or 53.3% of total investment, while Domestic Direct Investment (DDI) contributed IDR163.5tn or 46.7%. Spatially, total investment outside of Java stood 52% share of total investment, while investment in Java recorded 48% of share. Higher investment outside of Java aligned with Indonesian government focus to accelerate infrastructure and industry development equality in eastern Indonesia.
In terms of job creation, investment into Indonesia in 2Q23 contributed 464.3k new jobs, rising sharply by 44.9% y/y or +79.6k addition viz. the previous quarter. Going forward, Indonesian government is determined to expand minerals downstream which targeted 21 commodities as its target priority by 2023-2035. This agenda may encourage investment to grow larger continuing its trajectory.
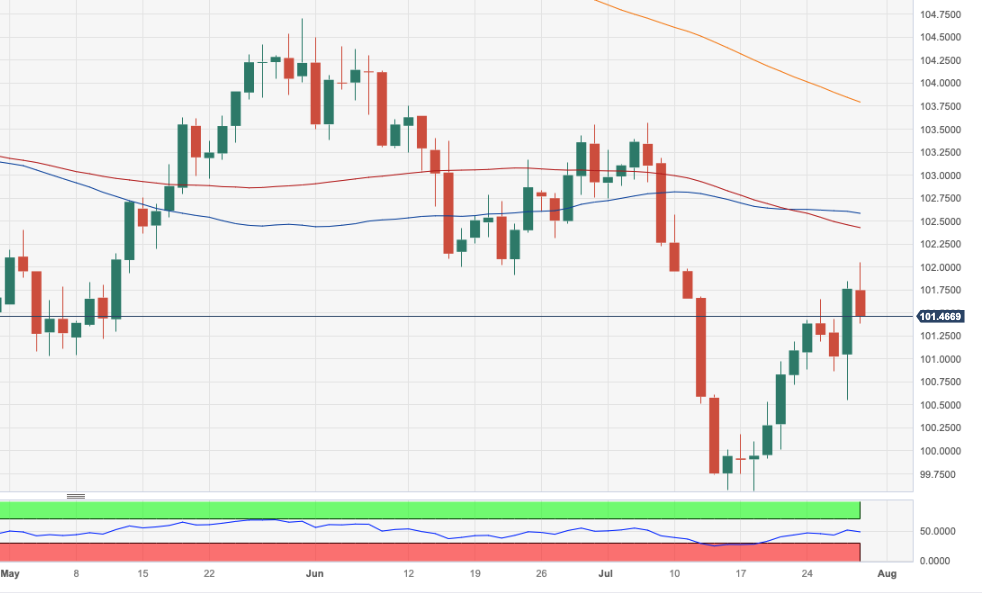
USD/JPY witnessed a gradual decline for five consecutive sessions. Economists at Société Générale analyze the pair’s technical outlook.
Move beyond 142 would be essential for an extended up-move
The pair is now close to key support of 138/137 representing the upper limit of previous multi-month consolidation. An initial bounce is expected, however, a move beyond 142 would be essential for an extended up-move.
In case USD/JPY establishes below 137, the decline could extend towards 135.60 and projections of 134/133.80.
See: USD/JPY likely has further room to run lower – TDS
EUR/USD has corrected sharply lower. Economists at Credit Suisse analyze the pair’s technical outlook.
Below 1.0833, weakness can extend further yet to test the 200-DMA at 1.0714
There is scope for further weakness yet to the 1.0905/1.0833 support cluster – the rising 55-DMA, uptrend from last September and early July lows. This needs to hold to suggest weakness is corrective ahead of strength back to 1.1152 and then a retest of 1.1275/77. An eventual break above here can see resistance next at 1.1391/96 ahead of 1.1495 and eventually 1.1703/1.1748 – the March 2021 low and 78.6% retracement of the 2021/2022 fall.
Below 1.0833 though would neutralise our current tactical view and suggest weakness can extend further yet to test the 200-DMA, currently at 1.0714, where we would expect fresh buyers to show.
- Oil prices turn sideways after a rally around $80.00 as investors await US data.
- Investors hope a peak in Fed’s interest rates has been seen and the central bank will keep rates stable for the entire year.
- WTI prices delivered a breakout of the Descending Triangle chart pattern.
West Texas Intermediate (WTI), futures on NYMEX, demonstrate a directionless performance after climbing to near the crucial resistance of $80.00 in the London session. The oil price struggles to find further direction as investors await more guidance about September’s monetary policy of the Federal Reserve (Fed).
Meanwhile, investors hope a peak in interest rates by the Fed has seen and the central bank will keep rates stable for the entire year. For further guidance, investors will focus on United States Q2 labor cost index and the Fed’s preferred gauge of inflation.
It is worth noting that oil prices have maintained strength despite global central banks raising interest rates further. This indicates that investors believe that global interest rates are near peak and a bad time for oil is over.
WTI prices delivered a breakout of the Descending Triangle chart pattern formed on a daily scale. A breakout of the aforementioned chart pattern results in wider ticks and heavy volume. Upward-sloping 20-period Exponential Moving Average (EMA) at $76.00 indicates that the short-term trend is bullish.
The Relative Strength Index (RSI) (14) has shifted into the bullish range of 60.00-80.00, which indicates that the upside momentum is active.
For further upside, the oil price needs to break the intraday high of $80.42 decisively, which will drive the asset toward January 3 high at $81.56 followed by April 12 high at $83.40.
In an alternate scenario, an explosive downside move below July 17 low at $73.80 would drag the asset toward June 21 high at $72.70 and the round-level support of $70.00.
WTI daily chart
-638261359301581286.png)
Senior Economist Alvin Liew at UOB Group reviews the latest monetary policy meeting by the Federal Reserve (July 26).
Key Takeaways
As expected, the Fed in its 25-26 Jul 2023 Federal Open Market Committee (FOMC) meeting, unanimously agreed to raise the target range of its Fed Funds Target Rate (FFTR) by 25-bps to 5.25%-5.50%, the highest in 22 years. This was the 11th rate hike in the Fed’s current rate tightening cycle following a brief pause in Jun after having raised rates for ten meetings in a row since Mar 2022. The Fed also voted unanimously to raise the interest rate paid on reserve (IOER) balances by 25-bps to 5.40%.
The Jul FOMC monetary policy statement (MPS) only contained two material changes, 1) the 25-bps increase to the FFTR and 2) the upgrade of the growth outlook to “moderate” from “modest”. The greater emphasis was on Powell’s post-FOMC comments. Powell mentioned he believes that monetary policy is restrictive, but with core inflation still too elevated, he said the Fed needs to keep policy restrictive till they are confident that inflation is coming down sustainably to 2%. While he was non-committal to the possible course of Fed action in Sep FOMC, his emphasis on a “meeting by meeting”, data dependent approach (and yet “afford to be a little patient, as well as resolute”) gives an overall dovish feel to his press conference.
FOMC Outlook – On Hold For Rest Of 2023. The latest FOMC statement and dovish tone to Powell’s latest comments reaffirm our stance that after the Jul rate hike, the Fed will be on pause for the rest of 2023 with the terminal FFTR level at 5.25-5.50%. We continue to expect no rate cuts in 2023 but with rate cuts coming in from 1Q 2024 onwards. There is a risk that the Fed will hike by one more 25-bps, but we think the Fed [hiking] cycle is at/very near the end, and it is very unlikely to see FFTR go to 6%, in our view.
The World Gold Council’s quarterly report on the second-quarter demand trends in the Gold market will be released next Tuesday. Economists at Commerzbank analyze its implications for the Gold price.
WGC data merely constitute a glance in the rear-view mirror
Though the World Gold Council is likely to report higher Gold demand for the second quarter than in the same period last year, we do not expect this to have any impact on the Gold price.
WGC data merely constitute a glance in the rear-view mirror and allow virtually no conclusions to be drawn about Gold demand this quarter.
Today's highlight will be the US Employment Cost Index data. A soft number could hit the Dollar, economists at ING report.
DXY could head back to Thursday's low near 100.50
A soft ECI number can wipe out the final 8 bps that is priced for the US tightening cycle this year and will probably knock the Dollar 0.5-1.0% lower. This would be a good story for risk assets, where both the Fed and seemingly the ECB would be closer to ending tightening cycles.
If we are right with our call on the ECI, DXY could head back to Thursday's low near 100.50.
The Yen has strengthened following the BoJ’s latest policy meeting. Economists at MUFG Bank analyze JPY outlook.
BoJ’s YCC adjustment triggers modest Yen rebound
The Yen has strengthened in response to the BoJ’s decision to adjust YCC policy settings to make them more flexible.
With the BoJ still not confident that inflation can be sustained at their 2.0% target, the BoJ is trying to differentiate today’s decision to make YCC more flexible from any future decisions to tighten monetary policy.
The commitment to maintain negative rates should help to dampen speculation over rate hikes through the rest of this year helping to dampen upward pressure on yields and the JPY.
Overall, the developments are in line with our expectations and we maintain our forecast for further Yen upside in the year ahead.
- EUR/GBP resumes its downside journey as BoE prepares for 14th consecutive interest-rate hike.
- UK retail orders and factory activities are facing wrath due to higher cost pressures and an uncertain demand outlook.
- The ECB raised interest rates by 25 bps to 4.25% and will remain data-dependent for the September policy.
The EUR/GBP pair falls back sharply after facing stiff barricades around 0.8590 in the European session. The asset faces significant offers as the Bank of England (BoE) is expected to continue its rate-hiking spell despite elongated fears of a recession in the United Kingdom.
UK’s authority shows concerns about deepening recession fears due to aggressive interest-rate hikes by the BoE. UK Treasury Advisers to Finance Minister Jeremy Hunt suggest slowing down the pace of hiking interest rates so that the economy could be defended from entering into a recession.
Investors should note that the BoE has already raised its interest rates to 5.0% and is preparing to raise straight for the 14th time. It is expected that the BoE will announce a 25 basis point (bp) interest rate hike on August 03 and will push interest rates to 5.25%.
The UK economy is under severe pressure as the housing sector has started faltering due to higher borrowing costs. Also, retail orders and factory activities are facing wrath due to higher cost pressures and an uncertain demand outlook.
Meanwhile, the Euro fails to outperform despite the European Central Bank (ECB) raising interest rates by 25 basis points (bps) to 4.25% on Thursday. ECB President Christine Lagarde was expected to deliver a hawkish stance as the job market has remained exceptionally strong in Eurozone.
The ECB is expected to remain data-dependent for its September policy, as commented by ECB Lagarde. On the economic data front, the German economy remained stagnant in the second quarter while investors were anticipating a nominal growth of 0.1% against a contraction of 0.3%, being recorded in the January-March quarter.
European Central Bank (ECB) Governing Council Gediminas Šimkus said on Friday, “we are close to a peak or at the peak.”
Further comments
A September pause wouldn't mean no hikes after that.
We might see the situation of a september pause and an October hike.
I wouldn't expect any fast cuts on interest rates.
I have doubts on cuts in 1H, it's not a probable scenario.
The choice for September is between a 25 bps hike and unchanged rates.
The economy in the short term is weaker than projected.
I see a "soft-landing scenario in the euro area".
Market reaction
The ECB commentary fails to move a needle around the EUR/USD, as traders await the US PCE inflation data for a fresh trading impulse. The pair is currently trading at 1.0961, down 0.09% on the day.
Commenting on the European Central Bank (ECB) interest rate path, the central bank policymaker Peter Kazimir said on Friday, “even if we were to take break in September, it would be premature to consider it the end.”
Additional comments
We are nearing completion of monetary policy tightening.
I am still waiting for an answer to what's coming in September.
Today our mission is still not fulfilled and we should take firm step further.
We are looking for the right place to stay for a large part of next year.
- Euro sinks to three-week lows near 1.0940 ahead of key inflation data
Thursday proved a bad day back in the office for EUR/USD. Economists at ING analyze the pair’s outlook.
ECI to the rescue
The ECB press conference proved a negative for the Euro as ECB President Lagarde backed away from a September rate hike and seemed to acknowledge both softer activity data and welcome disinflation. This was not really a bloodbath for the Euro – indeed the trade-weighted Euro did not move too much, nor did two-year rate differentials. It just so happened that we had some strong US data coming out at the same time.
If we are right today with our call for a soft ECI number, we could see EUR/USD breaking back above 1.1000 and starting to trace out the kind of 1.1000-1.1150 range over the coming sessions.
- AUD/USD continues losing ground on Friday and drops to a nearly three-week low.
- The USD gains follow-through traction and is seen as a key factor exerting pressure.
- Technical selling below the 200-day SMA also contributes to the heavily offered tone.
The AUD/USD pair extends the previous day's sharp retracement slide from the 0.6820 region and remains under heavy selling pressure on Friday, or the third successive day. The downward trajectory remains uninterrupted through the first half of the European session and drags spot prices to a nearly three-week low, around the 0.6620 region in the last hour.
The US Dollar (USD) gains some follow-through traction on the last day of the week and climbs to its highest level since July 10, which, in turn, is seen weighing on the AUD/USD pair. The stronger US macro data released on Friday - the Advance Q2 GDP print and Weekly Initial Jobless Claims - pointed to an extremely resilient US economy and increased the likelihood that the Federal Reserve (Fed) could hike interest rates further. It is worth recalling that Fed Chair Jerome Powell said on Wednesday that the economy still needs to slow and the labour market to weaken for inflation to credibly return to the 2% target.
This keeps the door for one more 25 bps rate-hike in September or November wide open and remains supportive of a further rise in the US Treasury bond yields. In fact, the yield on the yield on the benchmark 10-year US government bond climbs back above the 4.0% threshold and continues to underpin the Greenback. Adding to this, the worsening US-China relations overshadow the stronger Australian CPI print released on Thursday and drive flows away from the China-proxy Aussie. This, along with technical selling below the 200-day Simple Moving Average (SMA) contributes to the AUD/USD pair's downward trajectory.
That said, it will still be prudent to wait for some follow-through selling and acceptance below the 0.6600 mark before traders start positioning for an extension of the recent rejection slide from the 0.6900 neighbourhood. Market participants now look to the release of the US Core PCE Price Index - the Fed's preferred inflation gauge - for a fresh impetus later during the early North American session. The data might influence market expectations about the Fed's next policy move, which, along with the broader risk sentiment, should drive the USD demand and produce short-term trading opportunities around the AUD/USD pair.
Technical levels to watch
Lee Sue Ann, Economist at UOB Group, comments on the upcoming RBA gathering on August 1.
Key Takeaways
Headline CPI came in at 0.8% q/q for 2Q23, lower than expectations of 1.0% q/q, and the reading of 1.4% q/q in 1Q23. Compared to the same period a year ago, CPI rose 6.0% y/y, also lower than expectations of 6.2% y/y, and the 7.0% y/y print in 1Q23.
Meanwhile, employment rose by 32,600 positions in Jun, following a 76,500 surge in May. The participation rate remained around record-highs of 66.8%. Strong job growth saw the jobless rate unchanged at 3.5%.
The Reserve Bank of Australia (RBA) is aware that rates are “clearly restrictive”, and there is a chance they remain on pause at 4.10%. However, we look for a further 25bps rate hike, keeping in mind that inflation rates remain substantially above the RBA’s target band of 2-3%. The decision on 1 Aug, will nonetheless, be a close call.
The USD/TRY pair has been stuck in an unnaturally narrow range near the 26.95 mark since after the last central bank meeting (on 20 July). Economists at Commerzbank analyze Lira's outlook.
Volatility of the Lia abruptly evaporated
The price action of the past week strongly resembles what we had witnessed during the preceding era of FX intervention and Lira support by local banks (at the cost of their own balance sheets). This seems to be the only explanation for why volatility of the TRY abruptly evaporated.
As in the past, such FX intervention inevitably destroys FX reserves and proves to be unsustainable, after which things lead to equally strong volatility down the road. We have to get prepared once again.
- Gold price falls back as Greenback swallows steroids amid US economic resilience.
- US Q2 GDP, demand for Durable Goods in June remained robust due to higher consumer spending.
- US recession fears fade significantly amid upbeat labor market conditions.
Gold price (XAU/USD) retreated after a less-confident recovery in Friday’s European session as the Greenback footing firms further amid resilience in the United States economy. The precious metal faces the burden of a stellar performance by the US economy in the second quarter, robust demand for durable products, and already tight labor market conditions. The further downside in the Gold price cannot be ruled out as fears of further policy-tightening by the Federal Reserve (Fed) are renewed.
United States' economic resilience due to surprisingly higher Gross Domestic Product (GDP) data has defended against fears of recession. Also, Fed Chair Jerome Powell in his commentary on Wednesday said Fed officials are not anticipating a recession in the face of a tight labor market. More action will be witnessed in the US Dollar amid the release of the Fed’s preferred inflation gauge and the Employment Cost Index data.
Daily Digest Market Movers: Gold price senses pressure as Greenback climbs further
- Gold price rebounds to near $1,950.00, downside seems favored as upbeat United States economic data propels the need for one more interest rate hike from the Federal Reserve.
- The performance of the US economy in the second quarter was surprisingly more upbeat than expected by investors.
- US GDP grew at a pace of 2.4% in the April-June quarter, much better than estimates of 1.8% delivered by Reuters. In the January-March quarter, GDP expanded by 2.0%. The higher pace of GDP figures has reduced fears of a recession in the US economy.
- The US Durable Goods Orders for June expanded at a phenomenal pace of 4.7% against expectations of 1.0% and May’s reading of 1.8%.
- Robust demand for durable goods indicates upbeat momentum in consumer spending. This could make the core Consumer Price Index (CPI) more stubborn ahead.
- Apart from the US GDP and factory orders, Initial Jobless Claims for the week ending July 21 remained below expectations. Individuals applying for jobless claims for the first time were 221K vs. the expected figure of 235K and prior reading of 228K.
- In the face of a tight labor market and economic resilience, the Fed could raise interest rates at its September policy meeting.
- Fed Chair Jerome Powell commented that September’s policy will be data-dependent.
- The US Dollar Index climbs to near 102.00 due to robust economic data.
- More action in the US Dollar is anticipated ahead of the Core Personal Consumption Expenditure (PCE) index for June and Employment Cost Index for the second quarter.
- As per the preliminary forecasts, the Fed’s preferred gauge expanded by 0.2% in June, slower than May’s figure of 0.3%. On an annual basis, the economic data is seen declining to 4.2% against a prior release of 4.6%.
- While the Labor Cost Index fell to 1.1% vs. the former release of 1.2%, investors should note that higher wages have been a major contributor to sticky US inflation. A decline in the index would raise hopes of easing inflationary pressures further.
- For interest-rate guidance, Vanguard, an asset manager, expects the Fed to maintain a hawkish stance by either keeping interest rates elevated for longer than what the market is pricing or by tightening monetary conditions even further.
- To safeguard US regional banks in a turbulent environment, US bank regulators released a proposal Thursday that would direct the nation's largest banks to raise their capital, arguing a larger cushion is needed to ensure stability, Reuters reported.
Technical Analysis: Gold price skids below 20-and 50-day EMAs
Gold price faces pressure after a short-lived recovery move close to $1,956.00 as the US Dollar extends its upside. The precious metal shifts into bearish territory after delivering a breakdown of the Double Top chart pattern around $1,980.00, which foreshadows a bearish reversal. The yellow metal tests the region below the 20-day and 50-day Exponential Moving Averages (EMAs), which conveys that the short and medium-term trend is turning bearish.
Interest rates FAQs
What are interest rates?
Interest rates are charged by financial institutions on loans to borrowers and are paid as interest to savers and depositors. They are influenced by base lending rates, which are set by central banks in response to changes in the economy. Central banks normally have a mandate to ensure price stability, which in most cases means targeting a core inflation rate of around 2%.
If inflation falls below target the central bank may cut base lending rates, with a view to stimulating lending and boosting the economy. If inflation rises substantially above 2% it normally results in the central bank raising base lending rates in an attempt to lower inflation.
How do interest rates impact currencies?
Higher interest rates generally help strengthen a country’s currency as they make it a more attractive place for global investors to park their money.
How do interest rates influence the price of Gold?
Higher interest rates overall weigh on the price of Gold because they increase the opportunity cost of holding Gold instead of investing in an interest-bearing asset or placing cash in the bank.
If interest rates are high that usually pushes up the price of the US Dollar (USD), and since Gold is priced in Dollars, this has the effect of lowering the price of Gold.
What is the Fed Funds rate?
The Fed funds rate is the overnight rate at which US banks lend to each other. It is the oft-quoted headline rate set by the Federal Reserve at its FOMC meetings. It is set as a range, for example 4.75%-5.00%, though the upper limit (in that case 5.00%) is the quoted figure.
Market expectations for future Fed funds rate are tracked by the CME FedWatch tool, which shapes how many financial markets behave in anticipation of future Federal Reserve monetary policy decisions.
- Euro extends its decline well south of 1.1000 against the US Dollar.
- Stocks in Europe open Friday’s session mostly on the defensive.
- EUR/USD weakens to three-week lows near 1.0940.
- Flash Q2 GDP Growth Rate in Germany came in short of estimates.
- Investors’ attention remains on US PCE, advanced Germany’s CPI.
The Euro (EUR) continues to face significant pressure and loses ground against the US Dollar (USD) as the week comes to a close, resulting in EUR/USD weakening to levels not seen in three weeks, near 1.0940.
The rapid decline in the pair gained momentum after the European Central Bank (ECB) decided to raise its policy rates by 25 bps on Thursday. This decision came together with a dovish message, as the bank indicated the possibility of a pause in its rate-hiking cycle as early as the September meeting. The ECB also painted a less-optimistic picture regarding the economic outlook for the region.
Regarding the potential rate pause, President Christine Lagarde appears to have reinforced this view by suggesting an "open-minded" approach to the September meeting. She also emphasized that future rate decisions will depend on economic data.
As investors continue to sell off the Euro, the US Dollar Index (DXY) is gaining traction and may potentially test the 102.00 region. This is supported by continued buying interest in the Greenback towards the end of the week, along with higher yields in the US bond market, particularly in the belly and the long end of the curve.
On the domestic front, preliminary GDP figures in Germany indicate a 0.2% YoY contraction in the economy for the April-June period. Later in the session, advanced inflation figures are expected to be released for Germany, as well as the final Consumer Confidence data for the broader euro area.
In the US, all eyes are on the release of inflation figures, measured by the PCE and Core PCE. Additionally, other crucial data to be released includes Personal Income, Personal Spending, Employment Costs Index, and the final Michigan Consumer Sentiment gauge.
Daily digest market movers: Euro regains downside pressure after ECB
- The EUR accelerates losses after breaching 1.1000 against the USD.
- The USD Index faces extra buying pressure and flirts with 102.00.
- German preliminary Q2 GDP figures disappoint.
- US, German 10-year yields advance modestly.
- Investors’ focus will be on German CPI, US PCE.
- The BoJ surprises everybody after tweaking its yield-curve-control stance.
- ECB’s Simkus, Vasle suggested a pause in September is an option.
- ECB’s SPF sees inflation barely changed in the next three years.
Technical Analysis: Euro could potentially drop to the 1.0900 region
EUR/USD breaks below the 1.1000 key support with apparent determination, suggesting that a potential deeper pullback is in store in the short-term horizon.
If bears push harder, EUR/USD should meet immediate contention at the temporary 55-day and 100-day SMAs at 1.0905 and 1.0902, respectively. The loss of this region could open the door to a potential visit to the July 6 low of 1.0833 ahead of the key 200-day SMA at 1.0717 and the May 31 low of 1.0635. South from here emerges the March 15 low of 1.0516 before the 2023 low of 1.0481 on January 6.
On the other hand, occasional bullish attempts could motivate the pair to challenge the 2023 high at 1.1275 recorded on July 18. Once this level is cleared, there are no resistance levels of significance until the 2022 peak of 1.1495 on February 10, which is closely followed by the round level of 1.1500.
The constructive view of EUR/USD appears unchanged as long as the pair trades above the key 200-day SMA.
Euro FAQs
What is the Euro?
The Euro is the currency for the 20 European Union countries that belong to the Eurozone. It is the second most heavily traded currency in the world behind the US Dollar. In 2022, it accounted for 31% of all foreign exchange transactions, with an average daily turnover of over $2.2 trillion a day.
EUR/USD is the most heavily traded currency pair in the world, accounting for an estimated 30% off all transactions, followed by EUR/JPY (4%), EUR/GBP (3%) and EUR/AUD (2%).
What is the ECB and how does it impact the Euro?
The European Central Bank (ECB) in Frankfurt, Germany, is the reserve bank for the Eurozone. The ECB sets interest rates and manages monetary policy.
The ECB’s primary mandate is to maintain price stability, which means either controlling inflation or stimulating growth. Its primary tool is the raising or lowering of interest rates. Relatively high interest rates – or the expectation of higher rates – will usually benefit the Euro and vice versa.
The ECB Governing Council makes monetary policy decisions at meetings held eight times a year. Decisions are made by heads of the Eurozone national banks and six permanent members, including the President of the ECB, Christine Lagarde.
How does inflation data impact the value of the Euro?
Eurozone inflation data, measured by the Harmonized Index of Consumer Prices (HICP), is an important econometric for the Euro. If inflation rises more than expected, especially if above the ECB’s 2% target, it obliges the ECB to raise interest rates to bring it back under control.
Relatively high interest rates compared to its counterparts will usually benefit the Euro, as it makes the region more attractive as a place for global investors to park their money.
How does economic data influence the value of the Euro?
Data releases gauge the health of the economy and can impact on the Euro. Indicators such as GDP, Manufacturing and Services PMIs, employment, and consumer sentiment surveys can all influence the direction of the single currency.
A strong economy is good for the Euro. Not only does it attract more foreign investment but it may encourage the ECB to put up interest rates, which will directly strengthen the Euro. Otherwise, if economic data is weak, the Euro is likely to fall.
Economic data for the four largest economies in the euro area (Germany, France, Italy and Spain) are especially significant, as they account for 75% of the Eurozone’s economy.
How does the Trade Balance impact the Euro?
Another significant data release for the Euro is the Trade Balance. This indicator measures the difference between what a country earns from its exports and what it spends on imports over a given period.
If a country produces highly sought after exports then its currency will gain in value purely from the extra demand created from foreign buyers seeking to purchase these goods. Therefore, a positive net Trade Balance strengthens a currency and vice versa for a negative balance.
The BoJ tweaks, fiddles, and tinkers around. Kit Juckes, Chief Global FX Strategist at Société Générale, analyzes JPY outlook.
YCC is a dangerous policy which needs to be retired as soon as possible
Short term BoJ inflation forecasts have been revised up, longer-term ones left alone, reflecting lack of confidence that deflation is in any way defeated. The longer-term growth path is also unimpressive with 2025 GDP at 1%. Given this evident lack of confidence in the future, it’s no surprise that the BoJ is reluctant to allow bond yields (or the Yen for that matter) to soar. Economists’ consensus forecasts are no more hopeful, overall.
Despite this, YCC is a dangerous policy that needs to be retired as soon as possible. And by anchoring JGB yields at a time when other major central banks have been raising rates, it has been a major factor in the yen reaching its lowest level, in real terms, since the 1970s. So, the BoJ wants to very carefully dismantle YCC, and the Yen will rally as slowly as they do so. For the moment, that means there is little upside to USD/JPY, but the fall from here is also likely to be very slow until the global trend in bond yields turns decisively lower.
- EUR/JPY witnessed good two-way price swings on Friday after the crucial BoJ decision.
- The BoJ pledges to guide yield with flexibility and provides a strong boost to the JPY.
- The lack of hawkish signals from the ECB undermines the Euro and should cap the upside.
The EUR/JPY cross fades an intraday bullish spike to the 155.00 neighbourhood and plummets to its lowest level since mid-June in the aftermath of a somewhat hawkish message from the Bank of Japan (BoJ) on Friday. Spot prices, however, manage to recover a major part of the intraday losses and trade just above the 153.00 mark, nearly unchanged for the day during the early European session.
The BoJ took steps to make its Yield Curve Control (YCC) policy more flexible and said that the 0.5% cap on the 10-year Japanese government bond yield will now be "references" rather than "rigid limits". The Japanese central bank added that it would now step into the markets at a yield of 1.0%, which was seen as a move towards an eventual shift away from the massive monetary stimulus. This, in turn, pushes the 10-year JGB yield to its highest level since September 2014 and provides a strong boost to the JPY, prompting aggressive intraday selling around the EUR/JPY cross.
Spot prices tumble around 350 pips intraday, albeit manage to find decent support near the 151.40 area after the BoJ Governor Kazuo Ueda, speaking at the post-meeting press conference, reiterated the need to maintain monetary support. Ueda added that the central bank won't hesitate to ease policy further as needed and that more time was needed to sustainably achieve the 2% inflation target. This, along with a positive tone around the US equity futures, undermines the safe-haven JPY and assists the EUR/JPY cross to attract some buying at lower levels.
Any meaningful recovery, however, still seems elusive as bulls remain wary of placing fresh bets around the shared currency in the wake of mixed signals regarding the European Central Bank's (ECB) next policy move. In fact, the ECB did not provide any explicit forward guidance on Thursday, raising the possibility of a potential pause in September. Furthermore, ECB policymaker Madis Muller noted on Friday that the rate-hike decisions are no longer obvious at the current level. Separately, ECB's Boštjan Vasle said that the September meeting could bring a hike or a pause.
Apart from this, the worsening economic downturn in the Euro Zone, fueled by the disappointing PMI prints for July, might continue to undermine the Euro and keep a lid on the EUR/JPY cross, at least for the time being. Hence, it will be prudent to wait for strong follow-through buying before confirming that the recent sharp corrective decline from the 158.00 mark, or the highest level since September 2008 has run its course.
Technical levels to watch
USD squeeze may extend in the short run, economists at Scotiabank report.
The peak in the Fed cycle is close
There is some potential for the USD to firm up a little more in the short run, particularly. Beyond the issue of short-term interest rate differentials, the broader USD outlook is likely to be handicapped by a few other factors, however. The peak in the Fed cycle is close. Seasonal trends are USD negative through end Q3. Technical pointers are USD-bearish in broad terms.
DXY gains could extend to test 102.50, potentially 104, in the next couple of weeks before renewed weakness develops.
The likelihood of further downside in USD/CNH now appears to have lost some traction according to Economist Lee Sue Ann and Markets Strategist Quek Ser Leang at UOB Group.
Key Quotes
24-hour view: We highlighted yesterday that “the soft underlying suggests USD could test 7.1240.” While USD broke below 7.1240 (low of 7.1170), it staged a sharp rebound to 7.1774. Today, USD could rebound further, but it is unlikely to threaten 7.2000 (minor resistance is at 7.1870). On the downside, if USD breaks below 7.1500 (minor support is at 7.1585), it would mean that USD is not rebounding further.
Next 1-3 weeks: Two days ago (26 Jul, spot at 7.1465), we highlighted that “downward momentum has increased, and there is room for USD to weaken further.” We added, “it is worth noting that there are a couple of strong support levels at 7.1240 and 7.1000.” Yesterday, USD fell to a low of 7.1170 before rebounding strong. The buildup in downward momentum appears to be fading. From here, if USD breaks above 7.2000 (no change in ‘strong resistance’ level), it would suggest that 7.1000 is not coming into view this time around.
- The index adds to Thursday’s gains and approaches 102.00.
- US yields trade in a mixed fashion so far on Friday.
- Inflation tracked by the PCE, Consumer Sentiment next on tap.
The USD Index (DXY), which gauges the greenback vs. a bundle of its main rival currencies, extends the optimism seen in the second half of the week and trades at shouting distance from the key hurdle at 102.00 the figure on Friday.
USD Index focused on US data
The index continues to build on Thursday’s gains on the back of the generalized bearish note in the risk complex, which was particularly magnified following the dovish tone from the ECB and its impact on the European currency at its event in the previous session.
In the meantime, the index flirts with multi-session tops near the 102.00 barrier on the back of a small recovery in yields in the belly and the long end of the curve vs. some weakness observed in the short end, especially in the wake of the FOMC gathering on Wednesday.
Data-wise in the US docket, inflation figures measured by the PCE/Core PCE are expected to take centre stage along with Personal Income, Personal Spending, Employment Cost Index and the final print of the Consumer Sentiment for the current month.
What to look for around USD
The index keeps the recovery well in place and already trades closer to the key 102.00 hurdle.
In the meantime, the dollar appears benefited from the post-ECB weakness in the risk-associated space, while it could face extra headwinds in response to the data-dependent stance from the Fed against the current backdrop of persistent disinflation and cooling of the labour market.
Furthermore, speculation that the July hike might have been the last of the current hiking cycle is also expected to keep the buck under some pressure for the time being.
Key events in the US this week: PCE, Core PCE, Personal Income, Personal Spending and Final Michigan Consumer Sentiment (Friday).
Eminent issues on the back boiler: Persistent debate over a soft or hard landing for the US economy. Terminal Interest rate near the peak vs. speculation of rate cuts in late 2023 or early 2024. Geopolitical effervescence vs. Russia and China. US-China trade conflict.
USD Index relevant levels
Now, the index is gaining 0.22% at 101.92 and the breakout of 102.58 (55-day SMA) would open the door to 103.54 (weekly high June 30 and finally 103.78 (200-day SMA). On the other hand, immediate contention emerges at 100.00 (psychological level) prior to 99.57 (2023 low July 13) and then 97.68 (weekly low March 30).
The Kiwi has had a volatile week, having generally bounced around on the whims of USD moves. Economists at ANZ Bank analyze NZD outlook.
Kiwi to reach 0.63 by year-end
With the RBNZ and RBA both on hold and the US Fed Funds rate now on a par with the OCR, the NZD doesn’t really stand out against its peers.
Higher bond yields are supportive, but going the other way we have New Zealand’s twin deficits, which have a feel of persistence about them.
Our forecasts continue to call for the Kiwi to reach 0.63 by year-end; that’s not far from current levels, partly reflecting improved prospects for the USD and the generally resilient US economy.
- Pound Sterling drops sharply as market sentiment turns bearish amid recession woes.
- United Kingdom authority remains concerned about economic growth due to aggressive policy tightening by BoE.
- Rising cost pressures, uncertain demand outlook, and tight credit policy build pressure on Pound Sterling.
The Pound Sterling (GBP) extends downside below the round-level support of 1.2800 as market sentiment turns negative and the United Kingdom loses resilience in an aggressively restrictive monetary policy environment. The GBP/USD pair faces wrath as the UK authority shows concerns about deepening recession fears due to consistent interest rate hikes by the central bank.
Higher inflation and restrictive interest rate policy elevate the burden on United Kingdom households as their real income squeezes sharply. Britain’s housing sector, retailers, and factories are going through turbulent times due to rising borrowing costs and uncertain forward demand. Despite restrictive factors, the BoE is preparing to raise interest rates further to achieve price stability.
Daily Digest Market Movers: Pound Sterling loses footing ahead of interest rate policy
- Pound Sterling stretches downside below 1.2800 as the United Kingdom economy loses resilience due to the aggressive interest rate policy by the Bank of England.
- UK’s housing sector, factory activities, and retail orders have come under pressure due to the heavy burden of higher inflation and soaring interest rates.
- Inflation in Britain softened beyond expectations in June but a one-time decline is insufficient to infuse optimism among households.
- A survey by the UK's Royal Institution of Chartered Surveyors (RICS) on Wednesday showed that 68% of respondents believe that the housing sector has turned vulnerable in the face of higher borrowing costs.
- The Confederation of British Industry (CBI) reported its monthly balance of retail sales, which compares volumes with a year ago, which fell to -25 in July from -9 in June, Reuters reported. CBI economist Martin Sartorius said cost pressures, a tight labor market, and rising interest rates, alongside uncertain demand conditions, make the current environment difficult to navigate for retailers."
- On Thursday, UK Treasury advisers to UK Finance Minister Jeremy Hunt flagged concerns about deepening recession fears due to aggressive policy-tightening by the BoE.
- The seven-member Economic Advisory Council is of the view that the central bank should slow down its rate-hiking spree, which is the fastest in three decades, as some economic indicators suggest a potential slowdown ahead for the economy.
- In spite of deepening recession fears, BoE policymakers cannot pause the rate-hiking spell as current inflationary pressures are four times the desired rate of 2%. Meanwhile, a significant recovery in oil prices has stemmed fears of a rebound in global inflation.
- The BoE prepares to raise interest rates by 25 basis points (bps) to 5.25% at its policy meeting scheduled for August 3. This will be the 14th consecutive interest rate hike by the UK central bank.
- Market participants anticipate that interest rates in the UK would peak around 5.75%.
- Investors seem baffled whether UK PM Rishi Sunak will fulfill his promise of halving inflation to 5% by year-end.
- The US Dollar Index (DXY) turns back-and-forth after a rally to near 101.80 as the United States economy performed surprisingly better in the second quarter than expected.
- US Gross Domestic Product (GDP) expanded at a higher pace of 2.4% vs. 2.0% for the first quarter. Investors were expecting that GDP expanded at 1.8% on an annualized basis.
- Durable Goods Orders data for June rose by 4.7% against expectations of 1.0% and May’s figure of 1.8%.
- For the week ending July 21, jobless claims for the first time rose by 221K, lower than expectations of 235K.
- After an interest rate hike to 5.25-5.50%, the Federal Reserve confirmed that September’s monetary policy would be data-dependent.
- Resilience in the US economy along with tight labor market conditions could force the Fed to continue the rate-hiking spell.
Technical Analysis: Pound Sterling declines toward 50-EMA at 1.2740
Pound Sterling prints a fresh fortnight low at 1.2763 as the market mood turns cautious. The Cable fails to sustain above the 20-day Exponential Moving Average (EMA) at 1.2858 and is declining toward the 50-day EMA, which is trading around 1.2740. The asset declines toward the lower portion of the Rising Channel chart pattern formed on a daily period, which could be bought by market participants.
BoE FAQs
What does the Bank of England do and how does it impact the Pound?
The Bank of England (BoE) decides monetary policy for the United Kingdom. Its primary goal is to achieve ‘price stability’, or a steady inflation rate of 2%. Its tool for achieving this is via the adjustment of base lending rates. The BoE sets the rate at which it lends to commercial banks and banks lend to each other, determining the level of interest rates in the economy overall. This also impacts the value of the Pound Sterling (GBP).
How does the Bank of England’s monetary policy influence Sterling?
When inflation is above the Bank of England’s target it responds by raising interest rates, making it more expensive for people and businesses to access credit. This is positive for the Pound Sterling because higher interest rates make the UK a more attractive place for global investors to park their money. When inflation falls below target, it is a sign economic growth is slowing, and the BoE will consider lowering interest rates to cheapen credit in the hope businesses will borrow to invest in growth-generating projects – a negative for the Pound Sterling.
What is Quantitative Easing (QE) and how does it affect the Pound?
In extreme situations, the Bank of England can enact a policy called Quantitative Easing (QE). QE is the process by which the BoE substantially increases the flow of credit in a stuck financial system. QE is a last resort policy when lowering interest rates will not achieve the necessary result. The process of QE involves the BoE printing money to buy assets – usually government or AAA-rated corporate bonds – from banks and other financial institutions. QE usually results in a weaker Pound Sterling.
What is Quantitative tightening (QT) and how does it affect the Pound Sterling?
Quantitative tightening (QT) is the reverse of QE, enacted when the economy is strengthening and inflation starts rising. Whilst in QE the Bank of England (BoE) purchases government and corporate bonds from financial institutions to encourage them to lend; in QT, the BoE stops buying more bonds, and stops reinvesting the principal maturing on the bonds it already holds. It is usually positive for the Pound Sterling.
European Central Bank (ECB) policymaker Madis Muller said on Friday, “rate hikes to date are clearly having an effect.”
Further comments
The near-term GDP outlook is worse than a few months ago.
At the current rate level, ecb decisions are no longer obvious.
Market reaction
EUR/USD is little changed on the above comments, keeping its range near 1.0970 at the press time.
In the view of Economist Lee Sue Ann and Markets Strategist Quek Ser Leang at UOB Group, USD/JPY risks sustained pullbacks on a break below 138.50.
Key Quotes
24-hour view: The spike in volatility in USD came as a surprise. After soaring to a high of 141.31 in NY trade, USD reversed and nose-dived to a low of 138.76. The sharp decline appears to be overdone, but there is a chance for USD to test the critical support at 138.50. At this stage, it is unclear if USD can maintain a foothold below this level. Resistance is at 140.00, followed by 140.60.
Next 1-3 weeks: Yesterday (27 Jul, spot at 140.40), we noted that the recent upward pressure had eased. We expected USD to consolidate and trade in a range of 138.50/141.95. In NY trade, USD rose to 141.31 before selling off sharply to 138.76. Momentum is beginning to build again, but USD must break clearly below the critical support at 138.50 before further weakness is likely. The likelihood of USD breaking clearly below 138.50 will remain intact as long as it stays below 141.30 in the next couple of days. Looking ahead, the next level to watch below 138.50 is Jul’s low near 137.25.
European Central Bank (ECB) policymaker, Boštjan Vasle, made some comments on the central bank’s latest policy decision.
Key quotes
The latest data shows the euro area economy cooling.
Hikes are increasingly reflected in the banking sector.
Core inflation remains high and persistent.
The September meeting could bring a hike or a pause.
Market reaction
At the time of writing, EUR/USD is trading almost unchanged on the day at 1.0970.
- Silver regains positive traction on Friday and moves away from a two-week low.
- The bearish technical setup warrants caution before positioning for further gains.
- A sustained move beyond the $25.00 mark is needed to negate the negative bias.
Silver attracts some buying on the last day of the week and reverses a part of Thursday's steep intraday slide to the $24.00 mark or over a two-week low. The white metal sticks to its modest intraday gains through the early European session and currently trades around the $24.20-$24.15 region, up nearly 0.30% for the day.
From a technical perspective, the overnight failure ahead of the $25.00 psychological mark and the subsequent slump below the $24.30-$24.25 horizontal zone might have already shifted the near-term bias in favour of bearish traders. Furthermore, oscillators on hourly charts are holding deep in the negative territory and suggest that any subsequent intraday positive move runs the risk of fizzling out rather quickly.
That said, technical indicators on the daily chart - though have been losing traction - are yet to confirm the negative outlook. This makes it prudent to wait for some follow-through selling and acceptance below the $24.00 mark before placing fresh bearish bets. The XAG/USD could then slide to the $23.20-$23.15 region en route to the very important 200-day Simple Moving Average (SMA), around the $22.00 mark.
The downward trajectory could get extended further and make the XAG/USD vulnerable to challenge the multi-month low, around the $22.15-$22.10 area touched in June.
On the flip side, momentum beyond the $24.25-$24.30 region is likely to attract fresh sellers near the $24.60-$24.65 area. This, in turn, should cap the XAG/USD near the $25.00 mark. This is followed by the monthly peak, around the $25.25 zone, which if cleared decisively will negate the negative outlook. Silver might then aim to surpass the $25.50-$25.55 intermediate hurdle and accelerate the move to reclaim the $26.00 mark.
Silver daily chart
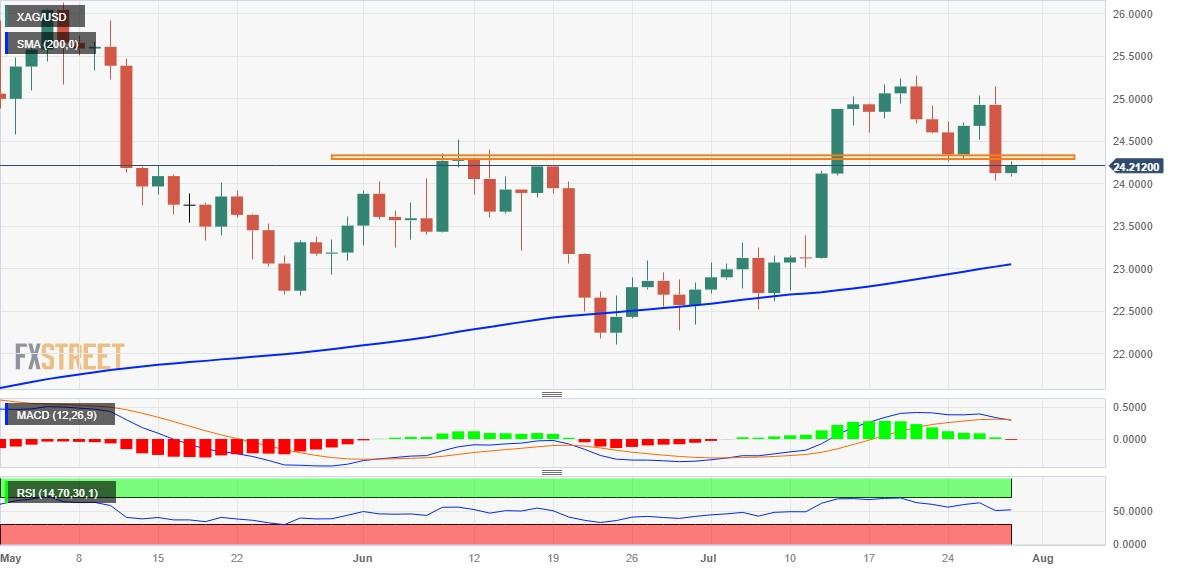
Key levels to watch
Japanese Chief Cabinet Hirokazu Matsuno said on Friday, “the Bank of Japan (BoJ) decision will make YCC flexible and improve the sustainability of easy monetary policy.”
He said he “expects BoJ to carry out appropriate monetary policy management.”
Related reads
- BoJ’s Ueda: Will consider appropriate steps if interest rates breach 1%
- Bank of Japan maintains interest rate, pledges to make YCC more flexible
EUR/USD is trading back below 1.10. Economists at Commerzbank analyze the pair’s outlook.
US data suggests that the Fed will leave the key rate at peak levels for longer
If both the Fed and the ECB are now being driven entirely by data, the risk-reward ratio seems considerably more attractive on the Dollar side in view of the economic data from the US and the Eurozone over the past few days.
Thursday’s strong US data suggests that the Fed will leave the key rate at peak levels for longer and will not cut interest rates as quickly as the market might have originally expected. Just to stress this at the end: that does not change our expectation that the Euro will be able to appreciate over the coming months.
Our projections are based on the expectation of our ECB experts that the ECB – contrary to the Fed and contrary to what the market is currently expecting – will not cut its key rate again. If that does happen, that clearly constitutes a positive surprise for the Euro. This did not become less likely on Thursday, but at best moved a bit further into the future than we currently assume in our EUR/USD forecast.
- Core Personal Consumption Expenditures Price Index is set to rise 0.2% MoM and 4.2% YoY in June.
- The Federal Reserve left doors open for more rate hikes but Powell stressed data-dependency.
- US Dollar could see a meaningful recovery on hot PCE inflation data.
The Bureau of Economic Analysis (BEA) will publish the US Federal Reserve’s (Fed) favored inflation gauge, the Core Personal Consumption Expenditures (PCE) Price Index, on Friday, July 28 at 12:30 GMT.
What to expect in the Federal Reserve’s preferred PCE inflation report?
Personal Consumption Expenditures Price Index, excluding food and energy, is likely to edge higher by 0.2% in June when compared to a 0.3% increase in May. The annual Core PCE Price Index for June is seen rising 4.2% vs. the 4.6% growth reported previously.
Meanwhile, the headline Personal Consumption Expenditures Price Index is expected to drop 0.1% MoM in June after easing to its slowest pace in more than two years in May. The annual PCE figure is expected to rise 3.1%, at a slower pace than May’s increase of 3.8%.
Back in May, the details of the report showed that “consumer spending, adjusted for prices, was little changed after a downwardly revised 0.2% gain in April. From February through May, household spending has essentially stalled after an early-year surge. Spending on merchandise dropped, while outlays for services increased,” according to Bloomberg.
The Fed watches the headline number, officials have said repeatedly that core PCE usually provides a better long-term indicator of where inflation is headed because it strips out prices that can be volatile over shorter time periods.
Heading into the June PCE release, investors are digesting the US Federal Reserve’s dovish policy outlook at its July meeting. The Fed raised rates by the widely expected 25 basis points (bps) to a 22-year high of 5.25%-5.50% and left doors open for more tightening without committing to the timing of the next lift-off. Powell refrained from providing any forward guidance, emphasizing a ‘data-dependent’ and ‘meeting-by-meeting’ approach.
Commenting on cooling infation, during his post-policy meeting press conference, Powell said the latest report could be a one-off. He stressed that "if we see inflation coming down credibly, we can move down to a neutral level and then below neutral at some point.”
Strategists at BBH offered their expectations on the upcoming inflation report, noting that “June core PCE Friday will be important. Headline is expected at 3.0% y/y vs. 3.8% in May, while core is expected at 4.2% y/y vs. 4.6% in May. Of note, the Cleveland Fed’s inflation Nowcast sees the two at 3.0% y/y and 4.2% y/y, respectively and right at consensus.”
“However, its model suggests both PCE measures will accelerate in July to 3.4% y/y and 4.5% y/y, respectively. Personal income and spending will be reported at the same time. Income is expected at 0.5% m/m while spending is expected at 0.4% m/m. Real personal spending is expected at 0.3% m/m,” the analysts said.
When will be the Personal Consumption Expenditures Price Index report released and how could it affect EUR/USD?
The PCE Inflation report is slated for release at 12:30 GMT, on July 28. Following the dovish Fed and strong US economic data, the US Dollar clings to recovery gains, keeping EUR/USD in weekly lows on the 1.0900 level.. Markets continue pricing a probability of 22% and 30% for rate hikes by the Fed in September and November respectively.
The United States economy surprisingly accelerated to a 2.4% annual growth rate in the June quarter vs. 1.8% expected and a 2.0% growth recorded in the first quarter. According to the US Department of Commerce, in seasonally adjusted term Durable Goods Orders jumped 4.7% on a monthly basis to reach $302.5bn. Meanwhile, the latest data published by the US Department of Labor (DOL) showed that Initial Jobless Claims decreased by 7,000 to 221,000 in the week ending July 22.
The US Dollar could extend its weekly gains in case the monthly Core PCE inflation surpasses the expected 0.2% increase in the reported period. Hot inflation data could strengthen bets for a September rate increase by the Fed. On the other hand, softer-than-expected inflation figures are likely to renew the downside in the Greenback.
FXStreet Analyst Dhwani Mehta offers a brief technical outlook for EUR/USD and explains: “Having breached the critical 21-day Simple Moving Average (SMA) on a daily closing basis on Thursday, Euro sellers are extending control heading toward the US PCE Inflation data release. The 14-day Relative Strength Index (RSI) on the daily chart is sitting below the 50 level, adding credence to the bearish bias.”
Dhwani also highlights the important technical levels for EUR/USD: “On the downside, initial technical support is seen at the confluence of the 50 and 100 DMAs near 1.0910.. A daily close below that level could intensify selling pressure, fuelling a fresh downtrend toward the July 6 low of 1.0833.”
About the Core Personal Consumption Expenditures Price Index
The Core Personal Consumption Expenditures released by the US Bureau of Economic Analysis is an average amount of money that consumers spend in a month. "Core" excludes seasonally volatile products such as food and energy in order to capture an accurate calculation of the expenditure. It is a significant indicator of inflation. A high reading is bullish for the USD, while a low reading is bearish.
Further comments are flowing in from new Bank of Japan Governor Kazuo Ueda on Friday, as he addresses the press conference that follows the monetary policy meeting.
It is appropriate to maintain strong monetary easing.
Will consider appropriate steps if interest rates breach 1%.
Will fall behind the curve if we try to respond to excessive interest rate rise at the time.
We have expanded room for ability to deal with upward moves in interest rates.
- USD/CHF prints mild gains after bouncing off the lowest level since 2015, picking up bids of late.
- Swiss Real Retail Sales growth improves to 1.8% YoY in June, versus -0.9% prior.
- US Dollar Index grinds near three-week high as bulls lack follow-through ahead of Fed’s favorite inflation.
- Market’s cautious optimism, lackluster yields also prod Swiss Franc pair after a volatile week.
USD/CHF rises to the highest level in two weeks, near 0.8710 at the latest, as it stretches the previous day’s rebound from the lowest levels since 2015 amid the early hours of Friday’s European session. In doing so, the Swiss Franc (CHF) pair cheers the recently published data at home as the US Dollar edges higher ahead of the top-tier data.
Swiss Real Retail Sales growth improves to 1.8% YoY in June compared to the previous contraction of 0.9%. With this, the Swiss National Bank’s (SNB) hawkish bias gains credence.
However, the previous day’s positive surprise from the US Gross Domestic Product (GDP) Annualized for the second quarter (Q2) and the Durable Goods orders for June renew calls for the Federal Reserve’s (Fed) rate hike in September and favor the US Dollar to remain firmer despite latest inaction.
It’s worth noting that the cautious optimism in the market, as portrayed by the mildly bid US and European stock futures, prod the US Dollar Index (DXY) at a three-week high. That said, the greenback’s gauge versus the six major currencies rallied the most in four months the previous day and triggered the USD/CHF pair’s run-up from the multi-year low after upbeat US data and strong yields.
Earlier in the week, the Fed’s inability to convince hawks, despite a 0.25% rate hike and showing readiness for a September rate lift, drowned the US Dollar before the previous day’s run-up.
Looking ahead, a light calendar at home and cautious mood before the Fed’s favorite inflation gauge, namely the Core Personal Consumption Expenditure (PCE) Price Index for June, expected 4.2% YoY versus 4.6% prior, could prod the USD/CHF traders. In a case where the US inflation data print upbeat outcomes, the Swiss Franc pair will extend the latest rebound from the multi-year low.
Technical analysis
A daily closing beyond the weekly high of around 0.8700 becomes necessary to extend the latest corrective from the multi-year low toward May’s bottom of around 0.8820.
- USD/CAD gains momentum near 1.3230 ahead of the economic data released from Canada and the US.
- The Federal Reserve (Fed) Chairman Jerome Powell left the room for another 25 bps rate hike this year.
- BoC Governor Tiff Macklem said future policy decisions will be based on the incoming data and inflation.
The USD/CAD pair retreats from 1.3248 and currently trades around 1.3225, up 0.01% for the day. The encouraging GDP figure supports the uptick of the US Dollar. The US Dollar Index (DXY), a measure of the Greenback against a basket of currencies used by US trade partners, holds above 101.70 heading into the early European session. Market participants will keep an eye on the economic data for fresh impetus later in the North American session.
Following the release of upbeat US economic statistics on Thursday, the US dollar has attracted some buyers across the board. The US Bureau of Economic Analysis (BEA) first estimate reported that the US real Gross Domestic Product (GDP) expanded at a 2.4% annualized rate, beating the market expectation of 1.8% and following the 2% growth reported in the first quarter. Meanwhile, Durable Goods Orders rose 4.7% on a monthly basis to $302.5 billion. Initial Jobless Claims declined by 7,000 to 221,000 in the week ending July 22, the lowest reading in five months. The data bolstered optimism that the economy could avoid a recession this year. This, in turn, could support the Greenback and cap the upside in the commodity-linked Loonie.
After the July policy meeting, Fed Chairman Jerome Powell said it’s possible for another 25 basis point (bps) rate rise in September or November if the data warrants it. The more hawkish stance of the Fed than the Bank of Canada (BoC) acts as a tailwind for the USD/CAD pair.
On the Canadian Dollar front, the BoC announced a 25 basis point rate hike to a 22-year high of 5.0% on July 12. BoC Governor Tiff Macklem stated that the central bank would base future policy decisions on the incoming data and the inflation outlook. It's worth noting that the next policy meeting is scheduled for September 6.
However, market players anticipated that the Bank of Canada (BoC) would likely not see the need to raise rates further this year. According to a survey of market participants released by the central bank on Monday, a median of the participants anticipate the bank to maintain interest rates at a 22-year high of 5.00% until the end of 2023 before cutting the rates in March.
Meanwhile, the uptick in oil prices has supported the Loonie and offset a slowdown in the Canadian manufacturing sector. Higher crude prices strengthen the Canadian Dollar, as the country is the leading oil exporter to the United States.
Later in the day, investors will closely watch the Canadian Gross Domestic Product (GDP) data. The figure is expected to rise by 0.3% from the previous reading of 0%. Also, the Fed's preferred inflation gauge, US Core Personal Consumption Expenditure (PCE) report, will be released in the North American session. The inflation figure is expected to drop from 4.6% to 4.2% annually. The data will be critical for determining a clear movement for the pair ahead of next week's employment data.
Considering advanced prints from CME Group for natural gas futures markets, open interest increased by around 18.2K contracts after several pullbacks in a row on Thursday. Volume followed suit and remained choppy after contracts rose by around 35.5K contracts, reversing the previous daily drop.
Natural Gas faces the next support near $2.50
Thursday’s decline in prices of natural gas was amidst rising open interest, which suggests that extra decline could be in the pipeline in the very near term. Against that, the commodity should face the next contention around the monthly lows near the $2.50 mark per MMBtu (July 17).
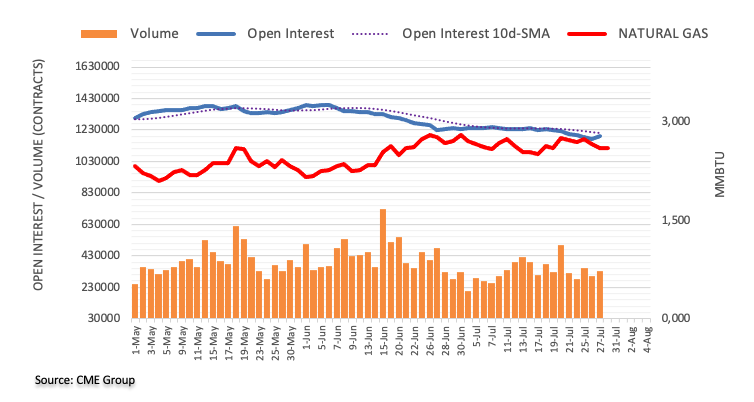
The Bank of Japan (BoJ) pledged flexibility to YCC stance. Economists at TD Securities analyze JPY outlook.
The BoJ opted for a YCC tweak
The BoJ opted for a YCC tweak with hawkish undertones in the statement as the Bank now highlights upward movements in medium to long-term inflation expectations and greater upside risk on the inflation outlook. However, this wasn't accompanied by upward revisions to FY2024/25 inflation forecasts (more relevant to policy), which came as a surprise.
The YCC tweak doesn't come as too much of a surprise, reflecting the backdrop of relatively strong inflation, ongoing fiscal support, an uber-cheap JPY, and political concerns around the negative cost of living impact of higher inflation. The macro story of a move was always more compelling than the BoJ rhetoric. By extension, USD/JPY likely has further room to run lower.
Bank of Japan (BOJ) Governor Kazuo Ueda is speaking at the post-July policy meeting conference on Friday, noting that they “need to patiently continue monetary easing to support the economy.”
Additional quotes
Today's decision is aimed at making YCC more sustainable.
Long-term rates could move beyond 0.5% cap.
Will flexibly respond to uncertainties of Japan economy.
Won't hesitate to easy policy further as needed.
Will respond to speed and level of long-term interest rates if they move beyond 0.5%.
Signs of change emerging from companies' price-setting behaviour.
There's still distance to achievement of 2% inflation target.
Will conduct consecutive fixed-rate purchase operations if long-term yield exceeds 1%, to curb yield jump.
Recent long-term yields are moving slightly below 0.5% level.
Not expecting long-term yield to rise to 1%.
Drastic changes to FY2023 price outlook suggests outlook in april was possibly underestimated.
No change to judgement that achievement of 2% inflation target is still distant.
Created 0.5-to-1.0% frame in addition to plus-minus 0.5% to respond to future risks.
Market reaction
In reaction to the above comments, USD/JPY is holding steady, currently testing 139.44, digesting Ueda’s remarks.
Losses in AUD/USD could accelerate on a breakdown of the 0.6680 level, suggest Economist Lee Sue Ann and Markets Strategist Quek Ser Leang at UOB Group.
Key Quotes
24-hour view: We highlighted yesterday that “the outlook for AUD is mixed”, and we expected it to trade in a range of 0.6725/0.6795. However, AUD traded in a volatile manner between 0.6699 and 0.6821 before ending the day on a weak note at 0.6709 (-0.75%). While oversold, the weakness in AUD could test the major support at 0.6680. Today, a sustained drop below this level is unlikely. On the upside, if AUD breaks above 0.6750 (minor resistance is at 0.6730), it would mean that the weakness in AUD has stabilised.
Next 1-3 weeks: Our latest narrative was from two days (26 Jul, spot at 0.6765) when we highlighted that “downward momentum is fading and the chance of AUD breaking below 0.6700 has decreased.” Yesterday, AUD spiked above our ‘strong resistance’ level of 0.6800 (high of 0.6821) and then plunged to test 0.6700 (low of 0.6699). While downward momentum is building again, AUD has to break and stay below the major support at 0.6680 before further weakness is likely. The chance of AUD breaking clearly below 0.6680 appears to be high. Looking ahead, the next level to watch below 0.6680 is 0.6640. In order not to lose momentum, AUD must stay below 0.6785.
- EUR/USD remains sidelined at the lowest level in three weeks as market await the key inflation data from Germany, US.
- ECB rate hike failed to please Euro bulls amid recession fears in bloc.
- Strong US growth numbers back Fed’s September rate increase but US Core PCE Price Index will be crucial to follow.
- German inflation can trigger corrective bounce as ECB emphasizes “meeting by meeting” approach for interest rate decisions.
EUR/USD licks its wounds at the lowest levels in three weeks, picking up bids to 1.0985 amid the early hours of Friday’s European session. In doing so, the Euro pair portrays the positioning for the top-tier inflation clues from Germany and the US amid sluggish markets.
The major currency pair slumped the most in four months the previous day after the European Central Bank (ECB) failed to impress the Euro bulls despite announcing 25 basis points (bps) increase in the benchmark rates. That said, the policy statement showed the board is “open-minded” about further tightening.
The reason could be linked to an edit in the ECB Statement and President Christine Lagarde’s comments stating, “The wording change in the statement was not random or irrelevant.”
That said, the recently positive mood in the market, amid hopes of a sooner end to the restrictive monetary policies at major central banks, seems to weigh on the US Dollar and allow the EUR/USD to print a corrective bounce.
The US Dollar’s retreat from a three-week high also allows the major currency pair to consolidate the weekly losses. That said, the US Dollar Index (DXY) prints mild losses around 101.70 after rising to the highest since July 11 during the previous day’s heavy run-up. It’s worth noting that the greenback’s gauge versus the six major currencies jumped the most since March 15 the previous day, not to forget mentioning a stellar rebound from the weekly low, as the US statistics recall the Fed hawks and bolstered the Treasury bond yields. Among the major positives for the DXY were the preliminary readings of the US Gross Domestic Product (GDP) Annualized for the second quarter (Q2) and the Durable Goods orders for June.
Amid these plays, Wall Street benchmarks closed with nearly half a percent of daily losses whereas the benchmark US 10-year Treasury bond yields marked the biggest daily jump in a month to refresh a three-week high near 4.02%. However, the S&P500 Futures print mild gains and the US 10-year Treasury bond yields retreat to 3.99% by the press time.
Moving on, the first prints of the German GDP and inflation clues will precede the Fed’s favorite inflation gauge, namely the Core Personal Consumption Expenditure (PCE) Price Index for June, to entertain the EUR/USD moves. In a case where the German data amplifies recession concerns and softer inflation, the Euro won’t hesitate to refresh the multi-day low. However, the downside also depends on how strong the US inflation clues are.
Technical analysis
The 50-day Exponential Moving Average (EMA) and a two-month-old rising support line, respectively near 1.0970 and 1.0955, restrict the EUR/USD pair’s immediate downside. Alternatively, recovery moves remain elusive unless providing a clear upside break of a five-week-old horizontal resistance surrounding 1.1010-20.
Open interest in crude oil futures markets shrank for the second straight session on Thursday, now by around 2.5K contracts according to preliminary readings from CME Group. On the other hand, volume went up sharply by nearly 130K contracts after two daily pullbacks in a row.
WTI: Further gains need to surpass the $80.00 mark
WTI prices rose past the key $80.00 mark per barrel on Thursday, although they closed below it. The daily gains were amidst shrinking open interest and warns against the continuation of the uptrend in the very near term. In the meantime, the $80.00 region remains a key resistance area for the time being.

The Fed’s preferred inflation gauge, the Core Personal Consumption Expenditure (PCE), will be released by the US Bureau of Economic Analysis (BEA) on Friday, July 28 at 12:30 GMT and as we get closer to the release time, here are the forecasts of economists and researchers of six major banks.
Core PCE is seen softening to 4.2% year-on-year vs. 4.6% in May. On a monthly basis, it is expected to decelerate to 0.2% vs. the prior release of 0.3%.
Credit Suisse
We expect the core PCE deflator to take a welcome step lower to 0.2% MoM after months stuck well above target. Headline inflation is likely to grow 0.2% MoM, with YoY inflation stepping lower to 3.1%. Gradual disinflation in shelter should weigh on the run rate of PCE in the coming months. However, shelter is a smaller weight in PCE than CPI inflation, and more limited progress on other core services, which are a higher weight, could keep PCE stickier than CPI later in the year.
TDS
We expect core PCE inflation to decelerate by another tenth to 0.2% MoM in June, matching the core CPI's gain. We look for the YoY rate to slow to 4.2% – its weakest pace since Q321. Importantly, we expect the key core services ex-housing measure to post a 0.3% MoM gain in June, which is up from 0.2% in May but still the second lowest MoM increase since July 2022.
NBF
The annual core PCE deflator may have progressed 0.2% in June, a result which should translate into a 5-tick decline of the 12-month rate to 4.1%. Although still high, this would still be the lowest rate observed in 21 months.
SocGen
The PCE and core-PCE deflators should match the 0.2% MoM gains posted by the CPI for June.
Citi
Core PCE inflation should rise 0.21% MoM in June based on elements of CPI and PPI inflation. Slowing shelter prices and falling used car prices in CPI in June, dynamics which will very likely continue over the coming months will weigh on core PCE.
Wells Fargo
We look for the PCE deflator to rise by 0.2%.
Further downside pressure remains on the cards for GBP/USD in the next few weeks, note Economist Lee Sue Ann and Markets Strategist Quek Ser Leang at UOB Group.
Key Quotes
24-hour view: We highlighted yesterday that GBP “could rise to 1.2975 before the risk of a pullback increases”. We added, “The major resistance at 1.3000 is still unlikely to come into view.” While 1.3000 did not come into view, we did not anticipate the outsized selloff from 1.2995 (GBP plunged to a 1.2782 in NY trade). Further GBP weakness is not ruled out. However, the major support at 1.2720 is likely out of reach today. Resistance is at 1.2835, followed by 1.2870.
Next 1-3 weeks: Two days ago (26 Jul, spot at 1.2895), we highlighted that “downward pressure has faded”, and we expected GBP to trade in a range between 1.2800 and 1.3100. Yesterday, GBP plunged and took out the support at 1.2800 (low was 1.2782). Downward momentum is building again, but after the outsized drop yesterday, it remains to be seen if GBP can break the major support at 1.2720. All in all, we expect GBP to trade with a downward bias as long as it stays below 1.2930 (‘strong resistance’ level).
CME Group’s flash data for gold futures markets noted traders reduced their open interest positions for the third session in a row on Thursday, this time by around 13.2K contracts. Volume, instead, went up for the second consecutive session, now by around 77.5K contracts.
Gold appears supported around $1940
Thursday’s strong pullback in gold prices was accompanied by declining open interest, which leaves the door open to a near-term rebound. In the meantime, the yellow metal is seen decently supported around the $1940 region per troy ounce for the time being.
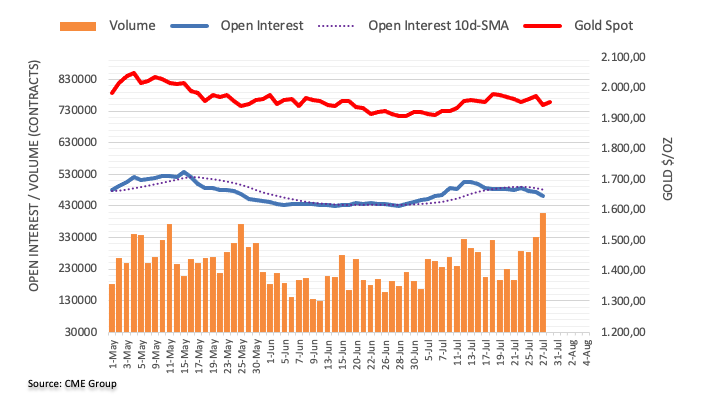
Here is what you need to know on Friday, July 28:
The Japanese Yen fluctuated wildly during the Asian trading hours on Friday and the Nikkei 225 Index fell sharply as markets assessed the monetary policy decisions of the Bank of Japan. Meanwhile, the US Dollar went into a consolidation phase following Thursday's impressive rally. Consumer and business sentiment data from the Eurozone and Personal Consumption Expenditures (PCE) Price Index from the US will be watched closely by market participants ahead of the weekend.
The BoJ left monetary policy settings unchanged after July meeting, maintaining the policy rate at -0.1% and allowing the 10-year Japanese government bond yield to fluctuate in the range of around plus and minus 0.5%. The bank, however, said in its policy statement that it will “conduct yield curve control with greater flexibility, regarding the upper and lower bounds the range as references, not as rigid limits, in its market operations.” BoJ Board member Toyoaki Nakamura dissented the guidance on the yield curve control (YCC) stance, noting that it would be desirable to allow greater flexibility after confirming rise in firms' earnings power from sources such as financial statements statistics. Following a quick decline to a fresh 10-day low near 138.00, USD/JPY staged a rebound and was last seen trading slightly above 139.00.
On Thursday, upbeat macroeconomic data releases from the US provided a boost to the US Dollar Index (DXY) and helped it erase the losses it suffered on Wednesday following the Federal Reserve's policy announcements.
The real Gross Domestic Product (GDP) in the US expanded at an annual rate of 2.4% in the second quarter and Durable Goods Orders rose by 4.7% in June. Additionally, weekly Initial Jobless Claims came in at 221,000, much lower than the market expectation of 235,000. The DXY rose more than 0.5% on Thursday and was last seen moving sideways above 101.50. In the meantime, US stock index futures trade in positive territory after Wall Street's main indexes closed in the red on Thursday. Finally, while the 10-year US Treasury bond yield holds steady slightly below 4%.
Pressured by the European Central Bank's (ECB) dovish tone and the renewed US Dollar strength, EUR/USD suffered heavy losses and dropped below 1.1000 for the first time in over two weeks on Thursday. At the time of press, EUR/USD was consolidating its losses at around 1.0980.
GBP/USD lost more than 100 pips on Thursday and continued to push lower in the Asian session on Friday. After touching a three-week-low of 1.2763, the pair recovered toward 1.2800 heading into the European session.
Surging US yields weighed heavily on gold price on Thursday and XAU/USD dropped below $1,950. Early Friday, the pair stages a modest rebound and holds steady above that level.
The data from Australia showed that Retail Sales declined 0.8% on a monthly basis in June. Moreover, the Producer Price Index rose 3.9% in the second quarter as expected, down noticeably from 5.2% increase recorded in the first quarter. AUD/USD stays under strong bearish pressure following Thursday's decline and trades deep in negative territory at around 0.6650.
Bitcoin struggles to find direction and continues to move up and down in a tight channel slightly above $29,000. Ethereum holds steady at around $1,850 following Thursday's 0.6% decline.
- Market sentiment remains slightly positive despite volatile moves in Asia.
- BoJ’s inaction teases Yen buyers as policymakers show readiness for YCC move.
- US-China tension, US Q2 GDP fail prod optimists amid talks of nearness to policy pivot at major central banks.
- Nikkei drops 0.50%, bonds edge higher ahead of Fed’s preferred inflation gauge.
The risk profile remains slightly positive on early Friday despite looming fears of a hawkish move at the Bank of Japan (BoJ). Also likely to check the market optimists are the latest US statistics and fears about the Sino-American ties. However, growing concerns that the major central banks are approaching the peak rates seem to keep the equity buyers hopeful.
While portraying the mood, the MSCI’s index of Asia-Pacific shares outside Japan prints mild gains as it prods the previous day’s pullback from the five-month high. That said, Japan’s Nikkei 225 drops 0.50% at the latest, after staging an initial slump of nearly 1.0% on the BoJ signals.
BoJ keeps benchmark interest rates and the yield curve control (YCC) policy unchanged but showed readiness to tweak the measures in the future if needed, which in turn propelled the Yen and drowned the stocks and bonds in Tokyo.
Also read: Bank of Japan maintains interest rate, pledges to make YCC more flexible
Elsewhere, China equities edge higher despite the latest fears for the US-China ties as the Washington Post (WaPo) quotes anonymous US officials familiar with the matter to signal the White House's restrictions for the Hong Kong Leader from attending November’s Asia-Pacific Economic Cooperation (APEC) leaders’ summit in San Francisco.
Further, stocks in Australia print mild losses amid mixed inflation clues and Retail Sales whereas equities from Auckland also drop on downbeat New Zealand consumer sentiment data for July. Additionally, Indian equities drop half a percent at the latest as bulls take a breather at the record tops.
On a broader front, Wall Street benchmarks closed with nearly half a percent of daily losses whereas the benchmark US 10-year Treasury bond yields marked the biggest daily jump in a month to refresh a three-week high near 4.02%. However, the S&P500 Futures print mild gains and the US 10-year Treasury bond yields retreat to 3.99% by the press time.
It’s worth noting that the market sentiment remains firmer amid hopes of witnessing no more major rate hikes from the top-tier central banks whereas the yields retreat from a multi-day high.
Also read: Forex Today: Yen jumps amid speculations of a tweak at the BoJ; Dollar rallies on US data
- AUD/USD remains on a defensive around the 0.6660 area on Friday, losing 0.61% on the day.
- The initial support level appears to be 0.6625; the key support level is located at 0.6700.
- The Relative Strength Index (RSI) lines up in an oversold condition; MACD stands in the bearish territory.
The AUD/USD pair remains under pressure and trades on a defensive note around the 0.6660 mark during the Asian session on Friday. The prevalent US Dollar buying bias following the upbeat US economic data released supports the US Dollar and exerts pressure on AUD/USD. The major pair currently trades around 0.6665, losing 0.61% for the day.
The encouraging second-quarter US GDP growth, solid Durable Goods, and consistently tight labor market conditions suggest that the Federal Reserve (Fed) may decide to hike interest rates further. The US real Gross Domestic Product (GDP) rose at a 2.4% annualized rate in the second quarter, above the market estimate of 1.8% by a wide margin and following the 2% growth recorded in the first quarter.
From a technical perspective, AUD/USD holds below the 50- and 100-hour Exponential Moving Averages (EMAs) on the one-hour chart, which means further downside looks favorable.
That said, any intraday pullback below 0.6625 (Low of July 10) would expose the critical support level of the 0.6600 area, representing a psychological round mark and a low of July 6. Further south, the next stop of the AUD/USD is located at 0.6565 (Low of June 1) and finally at 0.6500 (a psychological round figure).
Looking at the upside, some follow-through buying towards a psychological round mark and a low of July 27, around 0.6700, will see a rally to the next barrier at 0.6740. The mentioned level highlights the confluence of a low on July 26 and the 50-hour EMA. Following that, AUD/USD has room to test the additional upside filter at 0.6755 (100-hour EMA) and 0.6795–0.6800 (a psychological mark, a high of July 25).
The Relative Strength Index (RSI) lines in the oversold condition and Moving Average Convergence Divergence (MACD) stands in the bearish territory, challenging the pair’s immediate downside for the time being.
AUD/USD one-hour chart
-638261207867780753.png)
EUR/USD risks extra losses while below the 1.1070 level, according to Economist Lee Sue Ann and Markets Strategist Quek Ser Leang at UOB Group.
Key Quotes
24-hour view: We did not anticipate the surge in volatility in EUR yesterday. After rising to a high of 1.1143, EUR sold off sharply and plunged to 1.0964. Unsurprisingly, the sharp and swift drop is oversold. However, the weakness has not stabilised just yet. Today, EUR could drop below the major support near 1.0965, but it might not be able to maintain a foothold below this level. The next support at 1.0920 is unlikely to come into view. Resistance is at 1.1010, followed by 1.1035.
Next 1-3 weeks: Our latest narrative was from two days ago (26 Jul, spot at 1.1050), wherein, while EUR “could dip below 1.1010, the probability of it dropping to the next major support at 1.0965 is not high for now.” Yesterday, EUR rose above our ‘strong resistance’ level of 1.1135 (high was 1.1143) before plunging to a low of 1.0965 (unfortunately, we were unable to anticipate the spike in volatility). From here, EUR must break and stay below 1.0965 before further EUR weakness is likely. The risk of EUR breaking clearly below 1.0965 will remain intact as long as it stays below 1.1070 in the next couple of days. Looking ahead, the next levels to watch below 1.0965 are at 1.0920 and 1.0865.
- NZD/USD stays pressured at the lowest level in three weeks, down for the third consecutive day.
- Downside break of 200-SMA, short-term key support line favor Kiwi bears.
- 61.8% Fibonacci retracement level, rising trend line from late May can test further downside amid oversold RSI.
NZD/USD remains depressed at the lowest level in three weeks, down half a percent near 0.6155 heading into Friday’s European session. In doing so, the Kiwi pair drops for the third consecutive day while justifying the downside break of the 200-SMA and an upward-sloping trend line from July 06.
It’s worth noting, however, that the market’s cautious mood ahead of the Fed’s favorite inflation gauge, namely the Core Personal Consumption Expenditure (PCE) Price Index for June, expected 4.2% YoY versus 4.6% prior, restricts the NZD/USD pair’s immediate fall.
Also limiting the Kiwi pair’s further downside is the oversold RSI and the 61.8% Fibonacci retracement level of its upside from late May to mid-July, close to 0.6150.
Even if the quote breaks the key Fibonacci retracement level surrounding 0.6150, often termed the golden Fibonacci ratio, the NZD/USD pair’s slump isn’t guaranteed as an ascending support line from late May, close to 0.6115, will act as the final defense of the bulls.
Meanwhile, NZD/USD recovery remains elusive below the three-week-long support-turned-resistance line, around 0.6180 by the press time.
Following that, the 200-SMA level of around 0.6205 and the weekly high surrounding 0.6275 could check the Kiwi pair buyers before giving them control.
NZD/USD: Four-hour chart
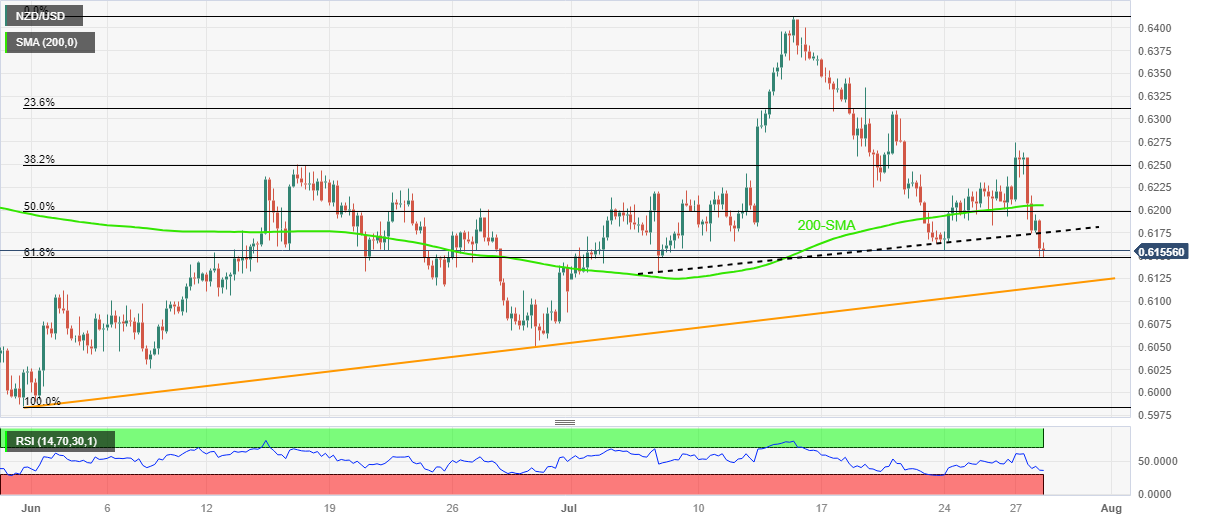
Trend: Further downside expected
- USD/JPY shed gains and reverses quickly after the BoJ policy announcement.
- The US Dollar Index is juggling in a narrow range around 101.80 after a rally as the US economy turned surprisingly resilient than expected.
- USD/JPY is declining towards the horizontal support which is plotted around 137.43.
The USD/JPY pair demonstrates wild spikes after the Bank of Japan (BoJ) allows more flexibility in Japanese Government Bonds (JGBs) yields but as usual, keeps interest rates unchanged. Changing dynamics in the Japanese economy as wages and corporate earnings have increased are allowing the central bank to gradually move towards tightening monetary policy so that the Japanese yen could be safeguarded against other currencies.
Before the policy announcement, Japanese Finance Minister Shunichi Suzuki hit the wires, citing that they are “closely watching fed and other central banks' policy decisions.” This indicates that expectations of an intervention to provide a cushion to the Japanese Yen are still open.
Meanwhile, the US Dollar Index (DXY) is juggling in a narrow range around 101.80 after a rally as the United Stated economy turned surprisingly resilient than expected.
USD/JPY is declining towards the horizontal support which is plotted from May 19 low around 137.43 on a four-hour scale. The asset has failed to sustain above the 50-period Exponential Moving Average (EMA) at 140.36, which indicates that the short-term trend is bearish.
A slippage below 40.00 by the Relative Strength Index (RSI) (14) would activate the bearish momentum.
Going forward, a decisive breakdown of May 19 low around 137.43 would expose the asset to May 16 low at 135.67 followed by May 11 low at 133.75.
In an alternate scenario, a decisive move above July 21 high at 142.00 would send the major toward July 10 high at 143.00. Breach of the latter would drive the asset towards June high at 145.07.
USD/JPY four-hour chart
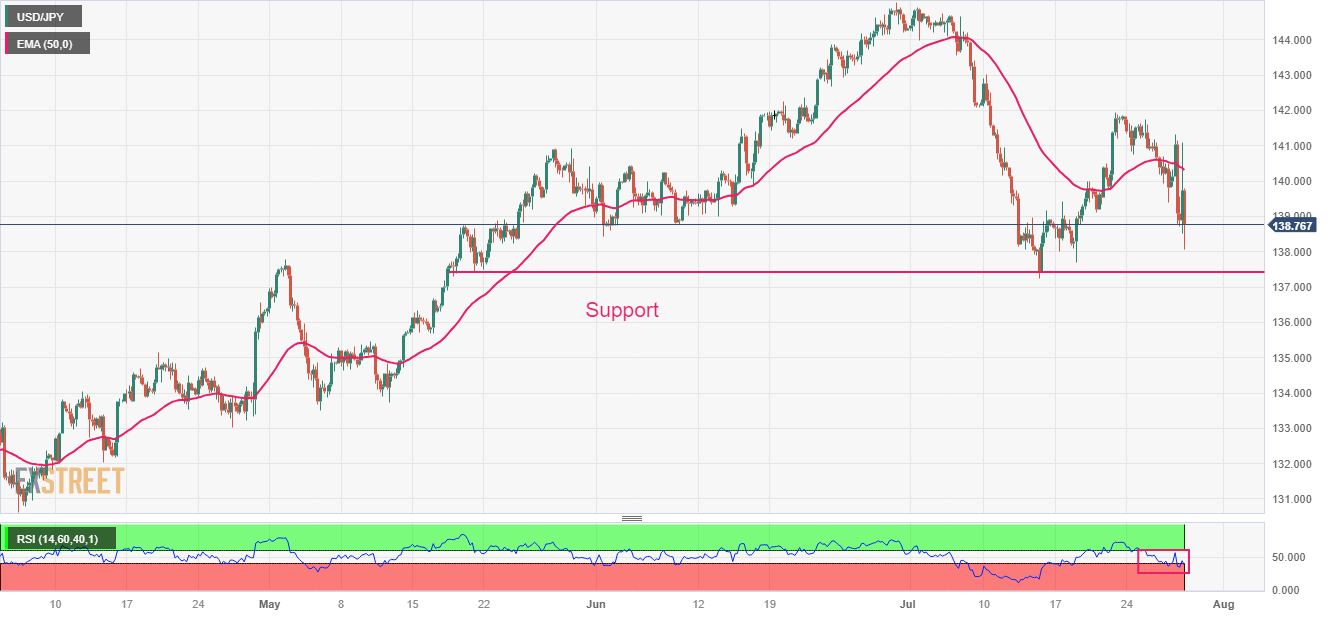
- Gold Price pares the biggest daily loss in two months at the lowest level in a fortnight.
- US Dollar grinds near 13-day top as markets await more clues to extend previous data-backed rally.
- Fed’s readiness for September rate hike amplifies importance of US Core PCE Price Index, NFP.
- Risk catalysts, yields should also be eyed closely as XAU/USD stays beneath $1,975 resistance confluence.
Gold Price (XAU/USD) prints mild gains as it consolidates the biggest daily loss since June 02 while staying on the way to posting the first weekly loss in four. In doing so, the bright metal justifies the market’s cautious optimism amid mixed concerns about the Federal Reserve’s (Fed) next step and the US-China tension ahead of the last shot of the top-tier US data.
Market sentiment dwindles as the stock futures print mild gains and the yields edge higher amid the battle between the strong US growth data and the central bank’s inability to convince policy hawks. Adding to this, Washington’s latest measures renew fears of the fresh US-China tussles and prod the XAU/USD recovery, along with expectations of a September rate hike from the Federal Reserve (Fed).
That said, the Fed’s favorite inflation gauge, namely the Core Personal Consumption Expenditure (PCE) Price Index for June, expected 4.2% YoY versus 4.6% prior, will be crucial to watch for clear directions ahead of the next week’s employment data.
Also read: Gold Price Forecast: XAU/USD needs validation from 100 DMA on the road to recovery
Gold Price: Key levels to watch
As per our Technical Confluence indicator, the Gold Price stays beneath the short-term key resistance despite the latest corrective bounce at the lowest level in 13 days.
That said, Fibonacci 38.2% on one-day restricts the immediate upside of the XAU/USD around $1,958 while the 100-DMA prods the Gold buyers around $1,965 resistance.
However, major attention is given to the convergence of the Fibonacci 38.2% on one-week and the Pivot Point one-day, as well as one-month, R1 surrounding $1,975.
Following that, the Gold Price can hit the $2,000 psychological magnet.
Alternatively, the 50-DMA joins the middle band of the Bollinger on the daily chart and the previous weekly low to highlight $1,946 as an immediate support for the XAU/USD sellers to watch during the quote’s fresh fall.
Also restricting the nearby decline of the Gold Price is the joint of Pivot Point one-week S1, previous daily low and lower band of the Bollinger on the four-hour chart, close to $1,944 at the latest.
In a case where the Gold Price drops below $1,944, the bears can quickly touch the Pivot Point one-day S1 surrounding $1,932 before jostling with the Fibonacci 38.2% on one-month, close to $1,930.
Overall, the Gold Price remains on the bear’s radar unless breaking $1,975 ressistance.
Here is how it looks on the tool
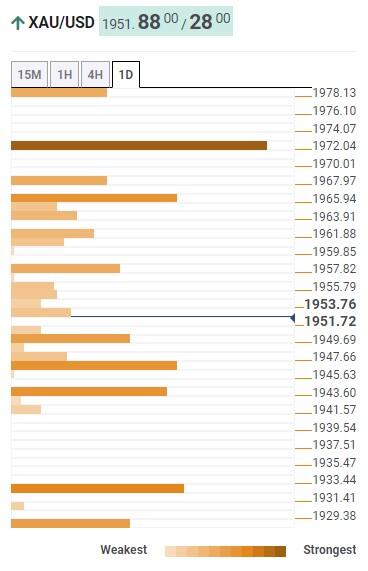
About Technical Confluences Detector
The TCD (Technical Confluences Detector) is a tool to locate and point out those price levels where there is a congestion of indicators, moving averages, Fibonacci levels, Pivot Points, etc. If you are a short-term trader, you will find entry points for counter-trend strategies and hunt a few points at a time. If you are a medium-to-long-term trader, this tool will allow you to know in advance the price levels where a medium-to-long-term trend may stop and rest, where to unwind positions, or where to increase your position size.
- GBP/JPY cross remains under selling pressure and slides to the 177.20 area after the BoJ rate decision.
- Bank of Japan (BoJ) kept its short-term interest rates at -0.1%, 10-year JGB yield target around 0%.
- BoJ is closely watching the Federal Reserve's (Fed) and other central banks' policy decisions.
The GBP/JPY cross remains under selling pressure on Friday. The cross accelerates its bearish correction after retreating from the 181.50–177.00 region. GBP/JPY currently trades around 177.28, losing 0.64% for the day. The Japanese yen appreciated against its rivals following the central bank's interest rate decision.
The Bank of Japan maintained its ultra-low interest rates on Friday and decided to maintain its short-term interest rates at -0.1% while keeping its 10-year JGB yield target around 0%. Also, the central bank is allowed to make its yield curve control policy more flexible by moving 0.5% around the 0% target.
Earlier on Friday, Nikkei News reported that the BoJ will discuss tweaking its yield curve control policy to allow long-term interest rates to rise beyond the 0.5% ceiling. The Japanese Yen strengthened sharply against the Pound Sterling, and the 10-year Japanese government bond (JGB) yield rose to 0.519%.
BoJ Governor Kazuo Ueda reiterated that he would likely maintain ultra-loose policy to sustainably achieve the 2% inflation target. BoJ officials added that central banks prefer to examine more data before adjusting monetary policy.
Japanese Finance Minister Shunichi Suzuki also stated that the central bank is closely watching the Federal Reserve (Fed) and other central banks' policy decisions.
The latest report from the Statistics Bureau of Japan showed on Friday that July's headline Tokyo Consumer Price Index (CPI) rose to 3.2% YoY from 3.1% prior, against the market expectation of 2.8%. Meanwhile, the core Tokyo CPI, excluding Fresh Food and energy, improved to 4.0% from 3.8% previously. Furthermore, the Tokyo CPI ex-fresh food fell from 3.2% to 3.0% for the same month, against the market consensus of 2.9%.
On the other side, the Pound Sterling (GBP) weakens as worries of a recession in the UK economy might convince the BoE to aggressively tighten policy. The Bank's most aggressive rate hikes in three decades fuel concern about the impact on the UK’s economy, which exerts pressure on the Pound Sterling.
In the absence of top-tier economic data released from the United Kingdom, market participants will digest the data and statements from the BoJ. The JPY's valuation is likely to continue to influence the cross's movement in the next few sessions.
- GBP/USD adds to the overnight losses and drops t a nearly three-week low on Friday.
- The USD remains well supported by Thursday's upbeat macro data and exerts pressure.
- A sustained break below a two-month-old ascending trend-line favours bearish traders.
The GBP/USD pair remains depressed for the second successive day on Friday and touches a nearly three-week low, around the 1.2765 region during the Asian session.
The US Dollar (USD) builds on the previous day's strong rally from a one-week low and climbs to its highest level since July 10, which, in turn, is seen as a key factor exerting some pressure on the GBP/USD pair. Thursday's upbeat US macro data pointed to an extremely resilient US economy and increased the likelihood that the Federal Reserve (Fed) could further hike interest rates. The US Commerce Department reported that the world's largest economy expanded by 2.4% annualized pace during the April-June quarter, beating expectations. Adding to this, the Initial Jobless Claims unexpectedly fell to 221K in the week ended July 22.
This comes after Fed Chair Jerome Powell left the door open for one more 25 bps rate-hike in September or November by saying that the economy still needs to slow and the labour market to weaken for inflation to credibly return to the 2% target. The outlook remains supportive of a further rise in the US Treasury bond yields. In fact, the yield on the yield on the benchmark 10-year US government bond climbs back above the 4.0% threshold, which, along with a slight deterioration in the global risk sentiment, benefits the Greenback's relative safe-haven stats and contributes to the selling bias surrounding the GBP/USD pair.
Friday's downfall, meanwhile, could further be attributed to some technical selling following the overnight sustained break and close below a two-month-old ascending trend-line support. Apart from this, diminishing odds for aggressive rate hikes by the Bank of England (BoE), especially after the softer UK consumer inflation figures released last week, suggests that the path of least resistance for the GBP/USD pair is to the downside. Market participants now look forward to the release of the US Core PCE Price Index - the Fed's preferred inflation gauge - for some meaningful impetus later during the early North American session.
Technical level to watch
- EUR/USD is seen oscillating in a narrow trading band near a two-and-half-week low.
- The overnight breakdown through the 1.1050 resistance-turned-support favours bears.
- Attempted recovery might be seen as a selling opportunity and fizzle out rather quickly.
The EUR/USD pair consolidates the overnight sharp fall to a two-and-half-week low and oscillates in a narrow trading band, just below the 1.1000 psychological mark through the Asian session on Friday.
The US Dollar (USD) manages to preserve the previous day's strong move up to its highest level since July 11 and remains well supported by the upbeat US macro data, which increased the likelihood of more interest rate hikes by the Federal Reserve (Fed). The shared currency, on the other hand, is weighed down by the fact that the European Central Bank (ECB) did not provide any explicit forward guidance about upcoming moves, raising the possibility of a potential pause in September. This, in turn, is holding back traders from placing bullish bets around the EUR/USD pair and acting as a headwind.
From a technical perspective, the overnight sustained breakdown through the 1.1050 strong horizontal resistance breakpoint-turned-support was seen as a fresh trigger for bearish traders. The subsequent downfall, however, stalls just ahead of the 50% Fibonacci retracement level of the May-July rally. The said support is pegged near the mid-1.0900s and should act as a pivotal point, which if broken decisively should pave the way for deeper losses. The EUR/USD pair might then challenge the 100-day Simple Moving Average (SMA) near the 1.0900 mark, before dropping to the 61.8% Fibo., around the 1.0880-1.0875 zone.
On the flip side, the 1.1000 psychological mark now seems to act as an immediate hurdle ahead of the 38.2% Fibo. level, around the 1.1030 region. A sustained strength beyond could trigger a short-covering rally and allow the EUR/USD pair to reclaim the 1.1100 mark. The upward trajectory could get extended further, though runs the risk of fizzling out rather quickly near the 1.1125 region, representing the 23.6% Fibo. level. This is followed by the overnight swing high, which if cleared will shift the bias in favour of bulls and pave the way for a move beyond the 1.1200 mark, towards retesting the multi-month peak near the 1.1275 area.
EUR/USD daily chart
-638261134090978615.png)
Key levels to watch
- USD/INR snaps three-day winning streak while consolidating recovery from 12-week low.
- Upbeat oscillators, sustained trading above the key EMAs, support lines keep Indian Rupee bears hopeful.
- Sustained downside break of multi-day-old symmetrical triangle becomes necessary for pair sellers to retake control.
- Bulls have a bumpy road to travel as 23.6% Fibonacci retracement guards immediate upside.
USD/INR pares the first weekly gain in three while posting mild losses around 82.20 on Friday morning in India. In doing so, the Indian Rupee (INR) pair prints the first daily fall in four as markets brace for the Fed’s favorite inflation gauge, namely, the Core Personal Consumption Expenditure (PCE) Price Index for June, expected 4.2% YoY versus 4.6% prior.
Despite the USD/INR pair’s latest retreat, the 100-Exponential Moving Average (EMA), around 82.15 by the press time, restricts the immediate downside of the pair.
Following that, a convergence of an upward-sloping support line stretched from Tuesday and the 50% Fibonacci retracement of its late January-February upside, near the 82.00 round figure, will challenge the USD/INR bears.
In a case where the Indian Rupee pair drops below 82.00, the bottom line of a symmetrical triangle connecting levels marked since March, currently between 82.80 and 81.85, will be in the spotlight.
It’s worth observing that the 200-EMA and 61.8% Fibonacci retracement, near 81.70, appears a tough nut to crack for the USD/INR bears.
On the contrary, the 23.6% Fibonacci retracement level and the previously stated multi-day-old symmetrical triangle’s top line, respectively near 82.60 and 82.80, can challenge the USD/INR buyers during the fresh upside.
That said, the intraday buyers will wait for a fresh weekly high, around 82.40 by the press time, to initiate long positions.
USD/INR: Daily chart

Trend: Recovery expected
- AUD/JPY takes a U-turn from the multi-day low after BoJ keeps monetary policy unchanged.
- BoJ not only defend interest rates but also turns down market’s expectations of YCC tweak.
- Key support break, bearish MACD signals keep AUD/JPY bears hopeful below 94.00.
- Convergence of 100-DMA, 200-DMA and 50% Fibonacci retracement eyed during further downside.
AUD/JPY offered a stark reaction to the Bank of Japan’s (BoJ) inaction before resuming the original bearish move to around 93.00 amid early Friday. That said, the Bank of Japan (BoJ) left its monetary policy unchanged despite the market’s expectations of witnessing a tweak to the Yield Curve Control (YCC) policy.
Also read:
Technically, the AUD/JPY pair’s sustained trading beneath the previous support line stretched from late March joins bearish MACD signals to keep the sellers hopeful.
However, a horizontal support zone comprising multiple levels marked since early May, around 92.45-40, restricts the immediate downside of the pair.
Even if the quote breaks the 92.40 support area, the 200-day Exponential Moving Average (EMA) will join the 100-EMA and the 50% Fibonacci retracement of its March-June upside to highlight 91.95-90 as the key downside support for the bears to watch.
Alternatively, recovery remains elusive below the support-turned-resistance line, around 93.90 by the press time.
Following that, the 23.6% Fibonacci retracement level surrounding 95.00 and a five-week-old falling resistance line, close to 95.70 at the latest, will test the AUD/JPY bulls before giving them control.
AUD/JPY: Daily chart
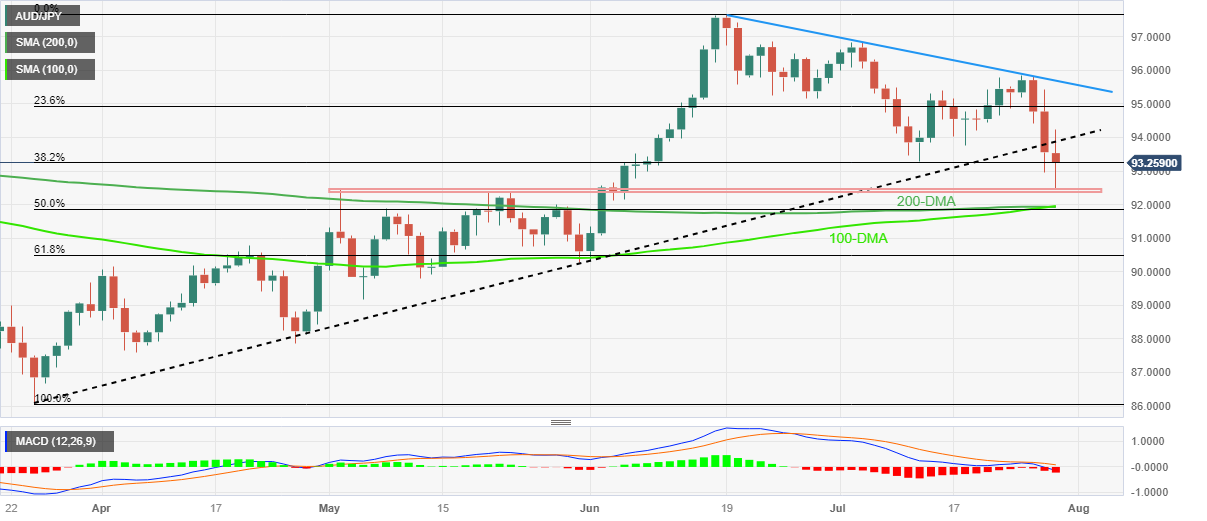
Trend: Further downside expected
- EUR/JPY catches aggressive bids after the BoJ decided to leave its policy setting unchanged.
- A softer risk tone lends some support to the safe-haven JPY and caps the upside for the cross.
- The lack of hawkish signals from the ECB holds back the Euro bulls from placing fresh bets.
The EUR/JPY cross stages a solid intraday recovery from its lowest level since mid-June touched this Friday and spikes to a fresh daily high after the Bank of Japan (BoJ) announced its policy decision. The strong intraday rally, however, fizzles ahead of the 155.00 psychological mark, dragging spot prices back below mid-153.00s in the last hour.
The Japanese Yen (JPY) weakens across the board in reaction to the BoJ's decision to leave its current accommodative monetary policy settings unchanged, which turns out to be a key factor that prompts aggressive short-covering around the EUR/JPY cross. Spot prices rally nearly 300 pips intraday and for now, seem to have snapped a four-day losing streak, reversing a major part of the previous day's heavy losses. That said, a slight deterioration in the global risk sentiment helps limit any further losses for the safe-haven JPY.
Moreover, bulls seem reluctant to place aggressive bets around the shared currency as the European Central Bank (ECB) did not provide any explicit forward guidance about upcoming moves, raising the possibility of a potential pause in September. In fact, the ECB noted that inflation, though continues to decline, is still expected to remain too high for too long. However, the central bank said that the Governing Council will continue to follow a data-dependent approach to determining the appropriate level and duration of restriction.
Hence, it will be prudent to wait for strong follow-through buying before confirming that the EUR/JPY pair's recent sharp pullback from the 158.00 mark, or its highest level since September 2008 touched last Friday has run its course. Nevertheless, the cross remains on track to end the week deep in the red.
Technical levels to watch
- USD/JPY jumps 250 pips after BoJ rejects market’s chatters of YCC tweak with inaction.
- BoJ keeps benchmark rates, target for JGB yields unchanged during July monetary policy meeting.
- US Dollar’s consolidation of the biggest daily gain in four months also prods Yen pair buyers.
- BoJ Governor Ueda’s speech, US Core PCE Price Index for June eyed for clear directions.
USD/JPY reverses the early-day fall while jumping to 141.00 round figure after the Bank of Japan (BoJ) left its monetary policy unchanged despite the market’s expectations of witnessing a tweak to the Yield Curve Control (YCC) policy.
That said, the BoJ keeps its benchmark rates near 0.10% while keeping the target of restricting the 10-year Japanese Government Bond (JGB) yields within the band of +/-0.50%.
Also read: Breaking: Bank of Japan keeps interest rate and YCC policy steady in July
Earlier in the day, the Statistics Bureau of Japan released monthly prints of the Tokyo Consumer Price Index for July. The details suggest that the headline Tokyo CPI improves to 3.2% YoY from 3.1% prior, versus 2.8% market forecasts, whereas the Tokyo CPI ex Fresh Food, Energy rises to 4.0% from 3.8% previous readings. More importantly, Tokyo CPI ex Fresh Food eases from 3.2% to 3.0% for the said month compared to analysts’ estimations of 2.9%.
Additionally, Japan Finance Minister Sunichi Suzuki also conveyed his expectations BoJ to conduct policy appropriately. On the same line were comments from Japan’s Chief Cabinet Secretary Hirokazu Matsuno, published the previous day.
It’s worth noting that the USD/JPY pair ignored a strong US Dollar rally the previous day to refresh the weekly low amid news shared via Nikkei suggesting the BoJ’s likely edit to its +/- 0.50% limit for the 10-year Japanese Government Bond (JGB) yields in monetary policy announcements. The talks of a likely change in the BoJ’s Yield Curve Control (YCC) policy propelled the JGB to the highest levels in three months after Tokyo inflation.
US Dollar Index (DXY) posted the biggest daily jump since March 15 the previous day, mostly sticky around 101.70 by the press time. That said, the DXY marked a stellar rebound from the weekly low on Thursday as the US statistics recall the Fed hawks and bolstered the Treasury bond yields.
On Thursday, the preliminary readings of the US Gross Domestic Product (GDP) Annualized for the second quarter (Q2) improved to 2.4% from 2.0% prior, versus 1.8% market forecast. On the same line, the US Durable Goods Orders also jumps 4.7% for June compared to 1.0% expected and 1.8% expected (revised). Additionally, Initial Jobless Claims declines to 221K for the week ended on July 21 versus 235K prior and analysts’ estimations of 228K. It should be observed that the US Pending Home Sales for June also improved to 0.3% MoM versus -0.5% expected and -2.5% prior (revised). However, the first estimations of the US Q2 Core Personal Consumption Expenditure eases to 3.8% QoQ from 4.9% prior and 4.0% market forecasts whereas GDP Price Index edges lower to 2.6% from 4.1% previous readings and 3.0% expected.
Apart from BoJ action and US Dollar moves, a fresh blow to the US-China ties by the White House also seems interesting to note. Late on Thursday, the Washington Post (WaPo) quotes anonymous US officials familiar with the matter to signal the White House's readiness to stop the Hong Kong Leader from attending November’s Asia-Pacific Economic Cooperation (APEC) leaders’ summit in San Francisco.
While portraying the market’s mood, Wall Street benchmarks closed with nearly half a percent of daily losses whereas the benchmark US 10-year Treasury bond yields marked the biggest daily jump in a month to refresh a three-week high near 4.02%. However, the S&P500 Futures print mild gains and the US 10-year Treasury bond yields retreat to 3.99% by the press time.
Having witnessed the initial market reaction to the BoJ, USD/JPY traders should pay attention to BoJ Governor Kazuo Ueda’s press conference, scheduled for 06:00 AM GMT, ahead of the Fed’s favorite inflation gauge, namely the Core Personal Consumption Expenditure (PCE) Price Index for June, expected 4.2% YoY versus 4.6% prior.
Also read: PCE Inflation Preview: Price pressures set to fade in Fed favorite figures, US Dollar to follow suit
Technical analysis
A daily closing beneath the 50% Fibonacci retracement level of October 2022 to January 2023 fall, near 139.60 by the press time, directs USD/JPY toward the horizontal area comprising multiple levels marked since December 2022, close to 138.00-137.80.
However, the RSI conditions are below and suggest bottom-picking, which in turn may challenge the bears.
Even so, the USD/JPY buyers remain off guard unless witnessing a clear upside break of the 50% Fibonacci retracement level of 139.60 and the 140.00 round figure.
Also read: USD/JPY Price Analysis: Bears occupy driver’s seat near 139.00 amid talks of BoJ’s YCC tweak
The Bank of Japan’s (BoJ) published its quarterly outlook report, following its July policy meeting, with Reuters citing key highlights from the report.
Key takeaways
Risk to inflation skewed to upside for fiscal 2023, 2024.
Japan's economy is recovering moderately.
Inflation expectations showing signs of heightening again.
Japan's economy likely to continue recovering moderately.
Japan's economy to continue expanding above potential.
Wage growth has risen, signs of change have been seen in firms' wage, price-setting behaviour.
Inflation expectations have shown some upward movements again.
If upward movement in prices continue, effects of monetary easing will strengthen through decline in real interst rates.
Strictly capping long-term yields could affect bond market functioning, volatility in other markets.
Such effects are expected to be mitigated by conducting yield curve control with greater flexibility.
If downside risks to economy materialise, effects of monetary easing will be maintained through decline in long-term yields under yield curve control framework.
Board's core CPI fiscal 2023 median forecast at +2.5% vs +1.8% in April.
Board's core CPI fiscal 2024 median forecast at +1.9% vs +2.0% in April.
Board's core CPI fiscal 2025 median forecast at +1.6% vs +1.6% in April.
Board's real GDP median forecast for fiscal 2023 at +1.3% vs +1.4% in April.
Board's real GDP median forecast for fiscal 2024 at +1.2% vs +1.2% in April.
Board's real GDP median forecast for fiscal 2025 at +1.0% vs +1.0% in April.
Related reads
- Bank of Japan keeps interest rate and YCC policy steady in July
- USD/JPY rallies to 141.00 on BoJ status quo, focus on Ueda’s speech, Fed inflation
At the highly-anticipated July policy review meeting, the Bank of Japan (BoJ) board members decided to leave their current monetary policy settings unchanged, maintaining rates and 10yr JGB yield target at -10bps and 0.00% respectively.
Summary of the statement
BoJ maintains band around 10-year JGB yield target at up and down 0.5% each.
BoJ makes decision on ycc by 8-1 vote.
BoJ board member Nakamura dissents to decision on YCC.
BoJ board member Nakamura dissents to decision on YCC, considering it was desirable to allow greater flexibility after confirming rise in firms' earnings power from sources such as financial statements statistics.
BoJ board member Nakamura dissents to decision on ycc but in favour of idea of conducting ycc with greater flexibility.
Will guide yield curve control more flexibly.
Appropriate to heighten sustainability of monetary easing.
Will operate yield curve control more flexibly to respond nimbly to upside, downside risks.
Will keep offering fixed-rate operations for 10-year JGB yield at 1.0%.
In order to encourage formation of yield curve that is consistent guideline, boj will continue with large-scale jgb buying and make nimble responses for each maturity.
For exmaple, by increasing amount of jgb buying and conducting fixed-rate purchase ops and funds-supplying ops against pooled collateral.
Market reaction
USD/JPY’s renewed upside gained extra traction on the BoJ’s policy announcements. The pair is currently trading at 140.06, up 0.45% on the day, having tested 140.80 in a knee-jerk reaction to the BoJ decision.
Central banks FAQs
What does a central bank do?
Central Banks have a key mandate which is making sure that there is price stability in a country or region. Economies are constantly facing inflation or deflation when prices for certain goods and services are fluctuating. Constant rising prices for the same goods means inflation, constant lowered prices for the same goods means deflation. It is the task of the central bank to keep the demand in line by tweaking its policy rate. For the biggest central banks like the US Federal Reserve (Fed), the European Central Bank (ECB) or the Bank of England (BoE), the mandate is to keep inflation close to 2%.
What does a central bank do when inflation undershoots or overshoots its projected target?
A central bank has one important tool at its disposal to get inflation higher or lower, and that is by tweaking its benchmark policy rate, commonly known as interest rate. On pre-communicated moments, the central bank will issue a statement with its policy rate and provide additional reasoning on why it is either remaining or changing (cutting or hiking) it. Local banks will adjust their savings and lending rates accordingly, which in turn will make it either harder or easier for people to earn on their savings or for companies to take out loans and make investments in their businesses. When the central bank hikes interest rates substantially, this is called monetary tightening. When it is cutting its benchmark rate, it is called monetary easing.
Who decides on monetary policy and interest rates?
A central bank is often politically independent. Members of the central bank policy board are passing through a series of panels and hearings before being appointed to a policy board seat. Each member in that board often has a certain conviction on how the central bank should control inflation and the subsequent monetary policy. Members that want a very loose monetary policy, with low rates and cheap lending, to boost the economy substantially while being content to see inflation slightly above 2%, are called ‘doves’. Members that rather want to see higher rates to reward savings and want to keep a lit on inflation at all time are called ‘hawks’ and will not rest until inflation is at or just below 2%.
Is there a president or head of a central bank?
Normally, there is a chairman or president who leads each meeting, needs to create a consensus between the hawks or doves and has his or her final say when it would come down to a vote split to avoid a 50-50 tie on whether the current policy should be adjusted. The chairman will deliver speeches which often can be followed live, where the current monetary stance and outlook is being communicated. A central bank will try to push forward its monetary policy without triggering violent swings in rates, equities, or its currency. All members of the central bank will channel their stance toward the markets in advance of a policy meeting event. A few days before a policy meeting takes place until the new policy has been communicated, members are forbidden to talk publicly. This is called the blackout period.
- Gold price regains positive traction on Friday, though the upside potential seems limited.
- Looming recession risks, the worsening US-China relations lend support to the XAU/USD.
- The hawkish outlook by major central banks should cap any meaningful upside for the metal.
Gold price attracts some buying during the Asian session on Friday and reverses a part of the previous day's steep decline to over a two-week low touched in the aftermath of upbeat macro data from the United States (US). The XAU/USD currently trades around the $1,950 region, up 0.20% for the day, though the upside seems limited in the wake of the increasing likelihood of more interest rate hikes by the Federal Reserve (Fed).
Bets for more rate hikes by Federal Reserve might cap Gold price
It is worth recalling that Fed Chair Jerome Powell, addressing the press after lifting borrowing costs to the highest level since 2001 on Wednesday, said that the economy still needs to slow and the labour market to weaken for inflation to credibly return to the 2% target. Adding to this, the US Commerce Department reported on Thursday that the world's largest economy expanded by a 2.4% annualized pace during the April-June quarter. Adding to this, the Initial Jobless Claims unexpectedly fell to 221K during the week ended July 22. This points to an extremely resilient US economy and supports prospects for further policy tightening by the Fed. This led to the overnight sharp rise in the US Treasury bond yields, which assists the US Dollar (USD) to stand tall near a two-and-half-week high and could act as a headwind for the Gold price.
Hawkish major central banks also warrant caution for bullish traders
Furthermore, the European Central Bank (ECB) kept the door for further rate hikes wide open and noted that inflation, though has been declining, is still expected to remain too high for too long. The ECB, however, did not share any forward guidance about upcoming moves and said that the Governing Council will continue to follow a data-dependent approach to determining the appropriate level and duration of restriction. Meanwhile, the Bank of England (BoE) is also expected to follow suit and raise its benchmark interest rate by 25 bps on August 3, to 5.25%, or the highest since early 2008. The markets have been pricing in two more BoE rate hikes by the end of this year as price pressures persist. This might further contribute to capping any meaningful gains for the non-yielding Gold price and warrants caution for bulls.
Looming recession/geopolitical risks could support Gold price
That said, worries about economic headwinds stemming from rising borrowing costs, further fueled by the disappointing release of flash PMI prints this week, continue to weigh on investors' sentiment and seem to lend support to the safe-haven precious metal. Apart from this, geopolitical risk and the worsening US-China relations might hold back traders from placing aggressive bearish bets around the Gold price, at least for the time being. In fact, the Washington Post, citing three officials familiar with the matter, reported that the White House has decided it will bar Hong Kong’s top government official from attending a major economic summit in the US this fall. Responding to the move, a spokesman for the Chinese Embassy in Washington, Liu Pengyu, said that the decision violates the APEC rules and the US’s break of the commitment.
Traders now look to US Core PCE Price Index for a fresh impetus
Moving ahead, the market focus now shifts to the release of the US Personal Consumption Expenditures (PCE) Price Index, the Fed's preferred inflation gauge, due later during the early North American session. The data might influence market expectations about the Fed's next policy move, which, in turn, should drive the USD demand and provide a fresh impetus to the Gold price. Traders will further take cues from the broader risk sentiment to grab short-term opportunities around the XAU/USD on the last day of the week. Nevertheless, the metal seems poised to register modest losses for the first time in the previous four weeks as the focus shifts to next week's important US macro data scheduled at the start of a new month.
Key levels to watch
- USD/CAD clings to mild gains despite positing inaction during four-day winning streak near weekly high.
- US Dollar steadies after stellar run-up as markets await Core PCE Price Index for June.
- US data allowed DXY to print the biggest daily gains in four months, Oil cheered risk-on mood to refresh multi-day peak.
- Fed’s favorite inflation gauge may allow the US central bank to secure September rate hike and fuel Loonie pair.
USD/CAD remains sidelined near 1.3230, mildly bid during a four-day uptrend amid early Friday. In doing so, the Loonie pair defends the previous day’s run-up at the weekly top even as the market turns cautious ahead of the top-tier US data, as well as due to the mixed sentiment about the US-China ties. It’s worth noting that a pullback in the WTI crude oil prices from a multi-day high also prods the Loonie pair as Canada relies heavily on energy exports for earnings.
Market sentiment remains mildly positive of late and prods the US Dollar bulls by the press time despite fears of fresh US-China tension due to the White House's readiness to stop the Hong Kong Leader from attending November’s Asia-Pacific Economic Cooperation (APEC) leaders’ summit in San Francisco.
Even so, WTI crude oil retreats from the highest levels since April 19, down 0.20% intraday near $79.50 as the markets await Fed’s favorite inflation gauge, namely the Core Personal Consumption Expenditure (PCE) Price Index for June, expected 4.2% YoY versus 4.6% prior. It’s worth noting that the risk-on mood superseded the US Dollar’s rally to propel the Oil price the previous day.
On the other hand, US Dollar Index (DXY) posted the biggest daily jump since March 15 the previous day, not to forget mentioning a stellar rebound from the weekly low, as the US statistics recall the Fed hawks and bolstered the Treasury bond yields. It’s worth noting that the Wall Street benchmarks closed with nearly half a percent of daily losses whereas the benchmark US 10-year Treasury bond yields marked the biggest daily jump in a month to refresh a three-week high near 4.02%, close to 4.0% by the press time.
Talking about the US data, the preliminary readings of the US Gross Domestic Product (GDP) Annualized for the second quarter (Q2) improved to 2.4% from 2.0% prior, versus 1.8% market forecast. On the same line, the US Durable Goods Orders also jumps 4.7% for June compared to 1.0% expected and 1.8% expected (revised). Additionally, Initial Jobless Claims declines to 221K for the week ended on July 21 versus 235K prior and analysts’ estimations of 228K. It should be observed that the US Pending Home Sales for June also improved to 0.3% MoM versus -0.5% expected and -2.5% prior (revised). However, the first estimations of the US Q2 Core Personal Consumption Expenditure eases to 3.8% QoQ from 4.9% prior and 4.0% market forecasts whereas GDP Price Index edges lower to 2.6% from 4.1% previous readings and 3.0% expected.
Moving on, the US Core PCE Price Index for June will be crucial to watch for clear directions of the USD/CAD price. Also important will be the monthly Canada GDP for May, expected 0.3% MoM versus 0.03% prior.
Technical analysis
Daily closing beyond a one-week-old descending resistance line, now support around 1.3200, keeps the USD/CAD pair buyers hopeful.
| Raw materials | Closed | Change, % |
|---|---|---|
| Silver | 24.119 | -3.17 |
| Gold | 1944.77 | -1.34 |
| Palladium | 1240.5 | -1.67 |
Ahead of the Bank of Japan (BoJ) policy announcements, Japanese Finance Minister Shunichi Suzuki hit the wires, citing that they are “closely watching fed and other central banks' policy decisions.”
Additional quotes
Won't comment on the BoJ policy decision.
Expects BoJ to conduct policy appropriately.
Market reaction
At the time of writing, USD/JPY is trading near 139.48, up 0.04% on the day.
- Natural Gas Price picks up bids to recover from weekly low, snaps two-day losing streak.
- Two-month-old rising support line prods XNG/USD bears as US Dollar stabilizes ahead of Core PCE Price Index data.
- 50-DMA, steady RSI also favor Natural Gas recovery as market awaits Fed’s preferred inflation gauge.
- Five-month-old horizontal resistance, descending trend line from March appear strong challenges for the XNG/USD bulls.
Natural Gas Price (XNG/USD) clings to mild gains around $2.63 during the mid-Asian session on Friday. In doing so, the XNG/USD prints the first daily gains in three while bouncing off the weekly low.
That said, the energy instrument dropped the most in more than a fortnight the previous day amid the broad US Dollar strength.
The XNG/USD downside, however, failed to conquer an upward-sloping support line from late May, around $2.58 by the press time.
It should be noted that the steady RSI (14) and the 50-DMA challenge the Natural Gas sellers unless the quote provides a daily closing beneath the $2.56 level.
Following that the 38.2% Fibonacci retracement of the March-April downside, near $2.48, will be in the spotlight before directing the XNG/USD bears toward the previous monthly low surrounding $2.17.
On the contrary, the 61.8% Fibonacci retracement level of $2.71 guards the immediate upside of the Natural Gas price ahead of a five-month-old horizontal resistance surrounding $2.78.
Even if the XNG/USD crosses the $2.78 hurdle, a downward-sloping resistance line from March, close to $2.89 by the press time, will act as the last defense of the bears.
Natural Gas Price: Daily chart
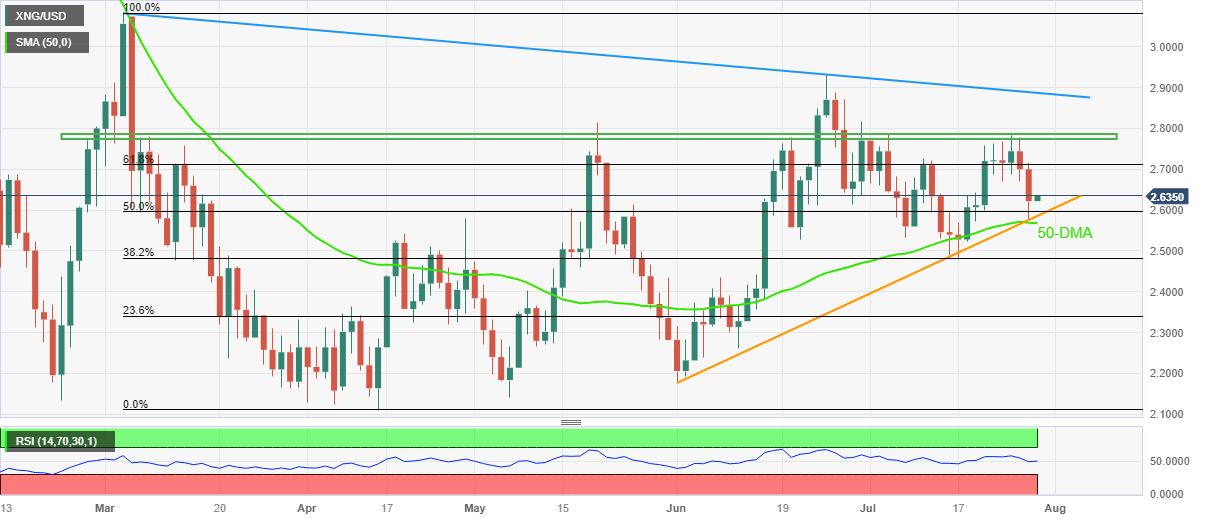
Trend: Limited recovery expected
- USD/CHF consolidates its recent gains near a critical resistance level of 0.8700.
- The upbeat US data broadly boosts the US dollar, acting as a tailwind for the USD/CHF pair.
- The Swiss ZEW Survey Expectations came in at -32.6 versus -30.8 prior and a worse-than-expected 31.1.
The USD/CHF pair recovers its losses and consolidates its gain near 0.8692 during the early Asian session on Friday. The pair gains momentum following the upbeat US economic data released on Thursday. The US Dollar Index (DXY), a measure of the value of the Greenback against six other major currencies, rebounds above 101.70.
The optimistic US GDP growth in the second quarter, robust Durable Goods, and persistently constrained labor market conditions suggest that the Federal Reserve (Fed) could decide to raise additional interest rates. The data released on Thursday reported that the US real Gross Domestic Product (GDP) expanded at a 2.4% annualized rate, above the market consensus of 1.8% by a wide margin and following the 2% growth reported in the first quarter.
Furthermore, Durable Goods Orders rose 4.7% on a monthly basis to $302.5 billion. Initial Jobless Claims declined by 7,000 to 221,000 in the week ending July 22. It is the lowest reading in five months. The upbeat US data broadly boosts the US dollar, acting as a tailwind for the USD/CHF pair.
Federal Reserve (Fed) Chairman Jerome Powell stated that it's possible to raise the Fed funds rate again at the September meeting if the data warrants it. It’s worth noting that the Fed raised interest rates by 25 basis points (bps) to a target range of 5.25%–5.5%, as expected at the July meeting on Wednesday.
On the Swiss franc front, the Swiss ZEW Survey Expectations data by the Centre for European Economic Research reported that the figure came in at -32.6 versus -30.8 prior and a worse-than-expected 31.1.
Meanwhile, the headline surrounding the US-China relationship remains in focus. On Wednesday, US Treasury Undersecretary Jay Shambaugh stated that the Biden administration would not hesitate to take targeted actions against China to protect human rights and defend the national interests of the US and its allies. However, he added that the two nations must work together to address global challenges, said Reuters. The renewed tension between the world’s two largest economies might cap the upside for USD/CHF and benefit the Swiss Franc, a traditional safe-haven currency.
Moving on, the Swiss Retail Sales for June YoY and the KOF Leading Indicator for July could offer clues about the Swiss Franc movement. Market players will also monitor the Core Personal Consumption Expenditure (PCE) Price Index MoM at 12:00 GMT for fresh impetus. The inflation figure is expected to drop from 4.6% to 4.2% annually. Traders will take cues from this development and find opportunities around the USD/CHF pair.
Early on Friday, around 03:00 AM GMT, the Bank of Japan (BoJ) will announce the likely extraordinary monetary policy meeting decisions taken after a two-day brainstorming. Following the rate decision, BoJ Governor Kazuo Ueda will attend the press conference, around 06:00 AM GMT, to convey the logic behind the latest policy moves.
The Japanese central bank is widely expected to keep the short-term interest rate target at -0.1% while directing 10-year Japanese Government Bond (JGB) yields with the bank of +/-0.50%.
Escalating the importance of today’s BoJ announcements is the quarterly BoJ Outlook Report and the latest chatters suggesting the Japanese central bank’s readiness for tweaking the Yield Curve Control (YCC) policy.
Also, the latest increase in the Japanese inflation clues and the hawkish performance of major central banks highlights today’s BoJ monetary policy meeting announcements as market players place heavy bets on the end of ultra-easy measures during 2023.
Ahead of the event, Analysts at Standard Chartered said,
We expect the BoJ to keep the policy rate unchanged. While some market participants are expecting a change in YCC amid JPY weakness, we think the BoJ will adopt a wait-and-see stance for at least the next couple of months. Considering Japan’s long-standing deflation, the BoJ may want to remain dovish for now.
How could it affect the USD/JPY?
USD/JPY pares intraday losses during the five-day losing streak at the lowest level in a week ahead of the BoJ event. In doing so, the Yen pair justifies the latest corrective bounce in the US Dollar amid fears of the US-China tension, as well as due to the cautious mood ahead of the Fed’s favorite inflation gauge, namely the Core Personal Consumption Expenditure (PCE) Price Index for June, expected 4.2% YoY versus 4.6% prior.
It’s worth noting that the US Dollar Index (DXY) rallied the most since March the previous day after the US growth numbers impressed the greenback bulls. However, chatters about the likely BoJ’s tweak to its YCC policy exert downside pressure on the USD/JPY price.
Japanese policymakers have already jostled with the expectations of a major move to alter the ultra-easy monetary policy, by suggesting no need for monetary policy change. However, the recent announcements of the US bond issuance due to the debt-ceiling deal are talks of the town supporting the official push for higher rates in late 2023. It should be noted, however, that the BoJ’s play of the Yield Curve Control (YCC) will be crucial to observe during today’s monetary policy releases.
In a case where Ueda manages to pave the way for future rate hikes, either via the alteration of the YCC band or dumping the YCC ultimately, the USD/JPY could extend its downside break of the 50% Fibonacci retracement level of October 2022 to January 2023 fall, near 139.60 by the press time, toward the horizontal area comprising multiple levels marked since December 2022, close to 138.00-137.80.
Alternatively, a 50% Fibonacci retracement level of 139.60 and the 140.00 round figure may initially restrict the USD/JPY recovery ahead of directing the bulls to May’s high of near 140.95, quickly followed by the 141.00 round figure.
Key Notes
USD/JPY bounces off over one-week low, retakes 139.00 mark ahead of BoJ decision
USD/JPY Price Analysis: Bears occupy driver’s seat near 139.00 amid talks of BoJ’s YCC tweak
BoJ Preview: Forecasts from nine major banks, YCC tweaks are possible
About BoJ Rate Decision
BoJ Interest Rate Decision is announced by the Bank of Japan. Generally, if the BoJ is hawkish about the inflationary outlook of the economy and rises the interest rates it is positive, or bullish, for the JPY. Likewise, if the BoJ has a dovish view of the Japanese economy and keeps the ongoing interest rate, or cuts the interest rate it is negative, or bearish.
- AUD/USD drops to over a two-week low and is pressured by a combination of factors.
- The USD remains supported by Thursday's upbeat macro data and a softer risk tone.
- The worsening US-China relations, weaker domestic data also weigh on the Aussie.
The AUD/USD pair extended the previous day's sharp retracement slide of over 120 pips from the weekly top and continues losing ground through the Asian session on Friday. This marks the third straight day of a negative move and drags spot prices to over a two-week low, below the 0.6700 mark in the last hour, confirming a breakdown below a technically significant 200-day Simple Moving Average (SMA).
The US Dollar (USD) stands tall near a two-and-half-week top touched and remains well supported by Thursday's upbeat US macro data, which, in turn, is seen exerting downward pressure on the AUD/USD pair. The US Commerce Department reported that the world's largest economy expanded by 2.4% annualized pace during the second quarter, beating expectations. Adding to this, the Initial Jobless Claims unexpectedly fell to 221K during the week ended July 22, pointing to an extremely resilient US economy. This increases the likelihood that the Federal Reserve (Fed) could further hike interest rates and continues to underpin the buck.
Moreover, Fed Chair Jerome Powell on Wednesday said that the economy still needs to slow and the labour market to weaken for inflation to credibly return to the 2% target, leaving the door open for one more 25 bps rate-hike in September or November. This led to the overnight sharp rise in the US Treasury bond yields, which, along with a slight deterioration in the global risk sentiment, benefits the Greenback's relative safe-haven status. Apart from this, the worsening US-China relations overshadow the stronger Australian CPI report released on Thursday and further contribute to driving flows away from the China-proxy Aussie.
In fact, the Washington Post, citing three officials familiar with the matter, reported that the White House has decided it will bar Hong Kong’s top government official from attending a major economic summit in the US this fall. In response, a spokesman for the Chinese Embassy in Washington, Liu Pengyu, said that the decision violates the APEC rules and the US’s break of the commitment. This, along with the disappointing release of the Producer Price Index (PPI) and Retail Sales figures from Australia, suggests that the path of least resistance for the AUD/USD pair remains to the downside and supports prospects for a further depreciating move.
Even from a technical perspective, a break below the very important 200-day SMA could be seen as a fresh trigger for bearish traders and validates the negative outlook. Market participants now look forward to the release of the US Core PCE Price Index - the Fed's preferred inflation gauge - to grab short-term trading opportunities around the AUD/USD pair later during the early North American session. Nevertheless, spot prices seem poised to register losses for the second straight week and remain at the mercy of the USD price dynamics on the last day of the week.
Technical levels to watch
- AUD/JPY fades bounce off intraday low after Australia PPI, Retail Sales disappoints Aussie bulls.
- Australia Q2 PPI eases to 0.5% QoQ, Retail Sales contracts 0.8% MoM in June.
- Risk-negative headlines about US-China ties, pullback in yields and JPY’s strength ahead of BoJ weigh on prices.
- BoJ is expected to keep the monetary policy unchanged but may tweak YCC measures and propel Yen.
AUD/JPY justifies downbeat Australian data, as well as the cautious mood ahead of the Bank of Japan (BoJ) Monetary Policy Meeting, around 93.30 amid early Friday. In doing so, the cross-currency pair prints mild losses at the lowest levels in seven weeks marked the previous day, printing a three-day downtrend by the press time.
Australia Retail Sales slumps 0.8% MoM in June versus 0.0% expected and prior growth of 0.7%. It should be noted that the second-quarter Producer Price Index (PPI) data have been disappointing with 3.9% YoY and 0.5% QoQ figures.
Also read: Australian Retail Sales drop 0.8% MoM in June vs. 0% expected
That said, the quote slumped the most in five weeks the previous day after news from Nikkei signaled that the BoJ may edit its +/- 0.50% limit for the 10-year Japanese Government Bond (JGB) yields in today’s monetary policy announcements. The talks of a likely change in the BoJ’s Yield Curve Control (YCC) policy propelled the JGB to the highest levels in three months after Tokyo inflation.
Earlier in the day, the Statistics Bureau of Japan released monthly prints of the Tokyo Consumer Price Index for July. The details suggest that the headline Tokyo CPI improves to 3.2% YoY from 3.1% prior, versus 2.8% market forecasts, whereas the Tokyo CPI ex Fresh Food, Energy rises to 4.0% from 3.8% previous readings. More importantly, Tokyo CPI ex Fresh Food eases from 3.2% to 3.0% for the said month compared to analysts’ estimations of 2.9%.
Elsewhere, fears of fresh US-China tension due to the White House's readiness to stop the Hong Kong Leader from attending November’s Asia-Pacific Economic Cooperation (APEC) leaders’ summit in San Francisco seem to also exert downside pressure on the AUD/JPY.
Even so, the S&P500 Futures print mild gains and the US 10-year Treasury bond yields ease from a three-week high after making the biggest daily jump in a month, to 3.99% by the press time.
Looking ahead, AUD/JPY will pay attention to the BoJ moves for clear directions as the YCC tweak could favor the bears.
Technical analysis
A daily closing below the four-month-old rising support line, now immediate resistance near 93.85, directs AUD/JPY towards 91.95-90 DMA confluence comprising 100 and 200 moving averages on the daily chart.
Consumer spending in Australia, represented by, Retail Sales, dropped 0.8\ % in June over the month, compared with the 0% expected and May’s 0.7% increase, according to the latest data published by the Australian Bureau of Statistics (ABS).
Separately, the Stats agency reported the country’s Producer Price Index (PPI) for Q2, which rose 0.5% QoQ vs. 0.9% expected and 1.0% previous.
On an annual basis, Australia’s PPI inflation eased to 3.9% in the second quarter, as against a clip of 5.2% seen in Q1 while matching the market consensus of 3.9%.
Market reaction
AUD/USD dropped to hit intraday lows at 0.6686 before rebounding to near 0..6705, where it now wavers. The spot is down 0.05% on the day.
- GBP/JPY stages a goodish recovery from the vicinity of its lowest level since mid-June.
- Some repositioning trade ahead of the key BoJ decision prompts intraday short-covering.
- Diminishing odds for more aggressive BoE rate hikes keep a lid on any meaningful upside.
The GBP/JPY cross attracts some buying near the 177.50 area during the Asian session on Friday and stages a modest bounce from its lowest level since mid-May touched the previous day. Spot prices climb to a fresh daily peak in the last hour, albeit lack any follow-through beyond mid-178.00s as traders keenly await the outcome of the highly-anticipated two-day Bank of Japan (BoJ) policy meeting.
Some repositioning trade ahead of the key central bank event risk turns out to be a key factor behind the GBP/JPY pair's intraday recovery of around 100 pips. The upside, however, remains capped in the wake of speculations that the BoJ might tweak its Yield Curve Control (YCC) policy. The bets were reaffirmed by stronger Tokyo CPI figures, which unexpectedly rose in July, and remain well above the BoJ’s 2% target range. This, in turn, pushes the yield on the 10-year Japanese Government Bond (JGB) above the BoJ's tolerance band, which, along with a softer risk tone, underpins the safe-haven Japanese Yen (JPY) and acts as a headwind for the cross.
Apart from this, diminishing odds for more aggressive rate hikes by the Bank of England (BoE), bolstered by softer UK consumer inflation figures last week, contributes to capping the upside for the GBP/JPY cross. That said, BoJ Governor Kazuo Ueda reiterated that the central bank will stick to its accommodative monetary stance and added that the long-term yield rate remains stable under the YCC policy. Moreover, a government spokesperson noted earlier this week that Japan's inflation will likely slow to around 1.5% next year when stripping away the effect of one-off factors. This, in turn, is holding back traders from placing aggressive directional bets.
Technical levels to watch
- GBP/USD treads water at multi-day low after falling the most since March.
- Pound Sterling slumped heavily after US data bolstered US Dollar, UK policymakers criticize BoE rate hike amid recession woes.
- Lack of major clues from UK requires Cable to rely upon US catalysts and print inaction amid cautious mood in Asia.
- US Core PCE Price Index for June eyed closely for clear directions due to its status as the Fed’s preferred inflation gauge.
GBP/USD licks its wounds at the lowest level in two weeks, making rounds to 1.2790-2800 during Friday’s Asian session, amid the market’s consolidation ahead of the Federal Reserve’s (Fed) preferred inflation gauge. It should be noted that the Cable pair dropped the most since early March the previous day after the US Dollar rallied on the upbeat data. Also weighing on the Pound Sterling price could be the concerns challenging the Bank of England (BoE) hawks.
On Thursday, Bloomberg came out with news suggesting the dislike among British Chancellor Jeremy Hunt’s advisers for the BoE’s rate hike considering the looming fears of an economic slowdown. The news signals the advisers’ fears of recession if the BoE fastens its rate hike trajectory.
On the other hand, the preliminary readings of the US Gross Domestic Product (GDP) Annualized for the second quarter (Q2) improved to 2.4% from 2.0% prior, versus 1.8% market forecast. On the same line, the US Durable Goods Orders also jumps 4.7% for June compared to 1.0% expected and 1.8% expected (revised). Additionally, Initial Jobless Claims declines to 221K for the week ended on July 21 versus 235K prior and analysts’ estimations of 228K. It should be observed that the US Pending Home Sales for June also improved to 0.3% MoM versus -0.5% expected and -2.5% prior (revised). However, the first estimations of the US Q2 Core Personal Consumption Expenditure eases to 3.8% QoQ from 4.9% prior and 4.0% market forecasts whereas GDP Price Index edges lower to 2.6% from 4.1% previous readings and 3.0% expected.
With this, US Dollar Index (DXY) posted the biggest daily jump since March 15 the previous day, not to forget mentioning a stellar rebound from the weekly low, as the US statistics recall the Fed hawks and bolstered the Treasury bond yields. It’s worth noting that the Wall Street benchmarks closed with nearly half a percent of daily losses whereas the benchmark US 10-year Treasury bond yields marked the biggest daily jump in a month to refresh a three-week high near 4.02%, close to 4.0% by the press time.
It should be observed that the market sentiment remains mildly positive of late and prod the US Dollar bulls by the press time despite fears of fresh US-China tension due to the White House's readiness to stop the Hong Kong Leader from attending November’s Asia-Pacific Economic Cooperation (APEC) leaders’ summit in San Francisco.
Moving on, GBP/USD may benefit from the US Dollar’s retreat but is less likely to regain upside momentum amid the fears about the UK economy and the BoE. That said, today’s Fed’s favorite inflation gauge, namely the Core Personal Consumption Expenditure (PCE) Price Index for June, expected 4.2% YoY versus 4.6% prior, becomes crucial to watch for clear directions.
Technical analysis
A daily closing beneath the two-month-old rising support line, now immediate resistance near 1.2820, directs the GBP/USD bears toward the 50-DMA support of around 1.2700.
People’s Bank of China (PBoC) set the USD/CNY central rate at 7.3138 on Friday, versus the previous fix of 7.1265 and market expectations of 7.1665. It's worth noting that the USD/CNY closed near 7.1700 the previous day.
Apart from the USD/CNY fix, the PBoC also unveiled details of its Open Market Operations (OMO) while saying that the Chinese central bank injects 65 billion Yuan via 7-day reverse repos (RRs) at 1.90% vs prior 1.90%.
However, the 13 billion Yuan of RRs mature today, which in turn suggests a net 52 billion Yuan injection on the day in OMOs.
About PBOC fix
China maintains strict control of the yuan’s rate on the mainland.
The onshore yuan (CNY) differs from the offshore one (CNH) in trading restrictions, this last one is not as tightly controlled.
Each morning, the People’s Bank of China (PBOC) sets a so-called daily midpoint fix, based on the yuan’s previous day's closing level and quotations taken from the inter-bank dealer.
- WTI edges higher near $79.50, the highest level since mid-April.
- The Gross Domestic Product (GDP) data indicates that the US economy is still robust.
- Saudi Arabia is anticipated to extend its 1 million-barrel oil supply cut into September.
- Traders will focus on the US data, OPEC+ group's Joint Ministerial Monitoring Committee (JMMC) on August 4.
Western Texas Intermediate (WTI), the US crude oil benchmark, is trading around the $79.40 mark so far in the Asian session. WTI prices gains momentum on Friday, bolstered by upbeat US economic data and signs of tighter supply.
That said, the Gross Domestic Product (GDP) data indicates that the US economy is still robust amid the Federal Reserve (Fed) tightening monetary policy cycle. The US Bureau of Economic Analysis (BEA) showed on Thursday that the real Gross Domestic Product (GDP) rose at an annualized rate of 2.4% in the second quarter. This number followed the first quarter's 2% growth rate and was above the market's estimated 1.8% by a wide margin.
Meanwhile, the GDP Price Index declined to 2.6% from 4.1% in the first quarter, and the Core Personal Consumption Expenditures dropped to 3.8% from 4.9% in the same period.
WTI has edged higher for four consecutive weeks, with supplies projected to tighten due to curbs by the Organisation of Petroleum Exporting Countries (OPEC) and allies such as Russia, known as OPEC+. The agreement by OPEC+ to limit supply through 2024 was announced in April and brings the total announced output reductions to over five million barrels per day (bpd), or approximately 5% of global oil production.
Additionally, Saudi Arabia is anticipated to extend its 1 million barrel oil supply cut into September after it was previously extended into August, according to experts and traders surveyed by Bloomberg.
On the other hand, the US Energy Information Administration (EIA) reported that US crude inventories decreased by 600,000 barrels in the week ended July 21, compared to forecasts of a 2.35 million barrel decrease. This report sparked concerns about US summer travel demand.
Looking ahead, oil traders will focus on the US Core Personal Consumption Expenditure (PCE) index, the Fed's preferred inflation gauge, due later in the North American session. The inflation figure is expected to drop from 4.6% to 4.2% annually. Next week, the focus will be on the OPEC+ group's Joint Ministerial Monitoring Committee (JMMC), scheduled for August 4. This key event could significantly impact the USD-denominated WTI price.
- Silver Price picks up bids to pare the biggest daily loss since June 20.
- Clear downside break of three-week-old rising trend line, looming bear cross on MACD lure XAG/USD sellers.
- Short-term DMAs can test Silver bears ahead of $23.00 support confluence; XAG/USD recovery remains elusive blow $24.70.
Silver Price (XAG/USD) consolidates the previous day’s heavy losses by printing mild gains around $24.20 during early Friday morning in Asia. In doing so, the XAG/USD bounces off the 21-DMA while reversing from the lowest level in a fortnight.
Despite the latest recovery, the XAG/USD stays on the bear’s radar as it stays beneath the previous support line stretched from July 06 amid an impending bear cross on the MACD.
It’s worth noting that the 23.6% Fibonacci retracement of the Silver Price run-up during the March-May period joins the support-turned-resistance line to highlight $24.70 as the short-term key upside hurdle.
Following that, a downward-sloping resistance line from early May, near $25.20 at the latest, will be crucial to watch for the XAG/USD bulls before challenging the yearly top marked in May, close to $26.15.
On the flip side, a daily close beneath the 21-DMA support of $24.00 isn’t an open invitation to the Silver bears as the 50-DMA can challenge the downside near $23.60.
Above all, a convergence of an upward-sloping trend line from March 10 and a 50% Fibonacci retracement, close to $23.00 by the press time, appears a tough nut to crack for the XAG/USD bears.
Silver Price: Daily chart
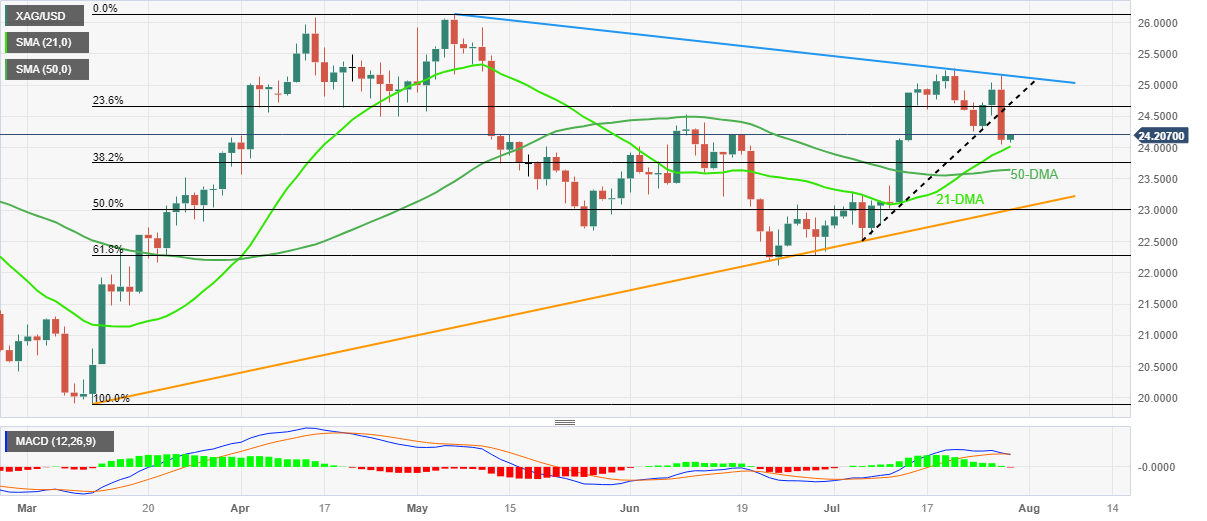
Trend: Limited downside expected
- USD/JPY continues losing ground for the fifth straight day and drops to over a one-week low.
- Speculations of a tweak in the BoJ's YCC policy boost the JPY and exert pressure on the pair.
- The USD stands tall near a multi-week high and lends support ahead of the crucial BoJ decision.
The USD/JPY pair drifts lower for the fifth successive day and drops to a one-and-half-week low during the Asian session on Friday. Spot prices, however, manage to rebound a few pips in the last hour and climbs back above the 139.00 mark in the last hour as traders now look to the crucial Bank of Japan (BoJ) policy decision before placing fresh directional bets.
It is worth recalling that BoJ Governor Kazuo Ueda had reiterated that the central bank will stick to its accommodative monetary stance and added that the long-term yield rate remains stable under the yield curve control (YCC) policy. Investors, however, are still pricing in the possibility of a YCC tweak and the bets were lifted by stronger Tokyo CPI data for July, which remains above the BoJ's target. This, in turn, pushes the yield on the 10-year Japanese Government Bond (JGB) above the BoJ's tolerance band and underpins the Japanese Yen (JPY). Apart from this, a slight deterioration in the global risk sentiment benefits the JPY's safe-haven status and contributes to the offered tone surrounding the USD/JPY pair.
The US Dollar (USD), on the other hand, sticks to the overnight strong rally to over a two-week high touched in the aftermatch of the upbeat US macro data and lends support to the USD/JPY pair. The advance estimate released by the US Commerce Department showed that the world's largest economy grew by 2.4% annualized pace during the second quarter, beating expectations. Adding to this, the Initial Jobless Claims unexpectedly fell to 221K during the week ended July 22. This points to an extremely resilient US economy and increases the likelihood that the Federal Reserve (Fed) could further hike interest rates. In fact, the Fed on Wednesday left the door open for one more 25 bps lift-off in September or November.
Furthermore, Fed Chair Jerome Powell had said that the economy still needs to slow and the labour market to weaken for inflation to credibly return to the 2% target. This, in turn, favours the USD bulls and should help limit any further downside for the USD/JPY pair. Moreover, the aforementioned mixed fundamental backdrop might hold back traders on the sidelines heading into the key central bank event risk. Nevertheless, spot prices, at current levels, remain on track to register weekly losses, though hold comfortably above technically significant 100-day and 200-day Simple Moving Averages (SMAs).
Technical levels to watch
| Index | Change, points | Closed | Change, % |
|---|---|---|---|
| NIKKEI 225 | 222.82 | 32891.16 | 0.68 |
| Hang Seng | 273.97 | 19639.11 | 1.41 |
| KOSPI | 11.45 | 2603.81 | 0.44 |
| ASX 200 | 53.9 | 7455.9 | 0.73 |
| DAX | 274.57 | 16406.03 | 1.7 |
| CAC 40 | 150.17 | 7465.24 | 2.05 |
| Dow Jones | -237.4 | 35282.72 | -0.67 |
| S&P 500 | -29.34 | 4537.41 | -0.64 |
| NASDAQ Composite | -77.17 | 14050.11 | -0.55 |
Early Friday morning in Asia, the Washington Post (WaPo) quotes anonymous US Officials familiar with the matter while stated the White House decision to bar Hong Kong’s top government officials including Chief Executive John Lee from attending November’s Asia-Pacific Economic Cooperation leaders’ summit in San Francisco.
More to come.
- US Dollar Index stabilizes at two-week high after jumping the most since March 15.
- Strong US Q2 GDP Annualized, Durable Goods Orders and housing data fuelled DXY before the latest consolidation.
- Cautious mood ahead of US Core PCE for June prods greenback buyers.
US Dollar Index (DXY) seesaws around 13-day high, printing mild losses near 101.70 by the press time of Friday’s Asian session. In doing so, the greenback’s gauge versus the six major currencies struggles to justify the previous day’s bullish bias that fuelled the DXY the most in 19 weeks.
That said, the DXY cheered upbeat US data and a jump in the US Treasury bond yields to please the bulls. However, the cautious mood ahead of the top-tier US inflation clues and the Bank of Japan (BoJ) Monetary Policy Meeting, which in turn alter yields and the US Dollar, seem to prod the US Dollar Index of late.
It should be noted that the US Federal Reserve’s (Fed) inability to defend the hawkish bias despite announcing a 0.25% rate hike and leaving doors open for a September hike previously weighed on the US Dollar.
However, strong US growth and inflation clues joined upbeat yields to propel the US Dollar.
Talking about the US data, the preliminary readings of the US Gross Domestic Product (GDP) Annualized for the second quarter (Q2) improved to 2.4% from 2.0% prior, versus 1.8% market forecast. On the same line, the US Durable Goods Orders also jumps 4.7% for June compared to 1.0% expected and 1.8% expected (revised). Additionally, Initial Jobless Claims declines to 221K for the week ended on July 21 versus 235K prior and analysts’ estimations of 228K. It should be observed that the US Pending Home Sales for June also improved to 0.3% MoM versus -0.5% expected and -2.5% prior (revised).
However, the first estimations of the US Q2 Core Personal Consumption Expenditure eases to 3.8% QoQ from 4.9% prior and 4.0% market forecasts whereas GDP Price Index edges lower to 2.6% from 4.1% previous readings and 3.0% expected.
With this, the US statistics recall the Fed hawks and bolstered the Treasury bond yields. It’s worth noting that the Wall Street benchmarks closed with nearly half a percent of daily losses whereas the benchmark US 10-year Treasury bond yields marked the biggest daily jump in a month to refresh a three-week high near 4.02%, close to 4.0% by the press time.
On Friday, the DXY may witness a corrective pullback in the greenback amid mixed sentiment and caution mood ahead of the Fed’s favorite inflation gauge, namely the Core Personal Consumption Expenditure (PCE) Price Index for June, expected 4.2% YoY versus 4.6% prior.
Also read: PCE Inflation Preview: Price pressures set to fade in Fed favorite figures, US Dollar to follow suit
Technical analysis
US Dollar Index (DXY) prints mild losses as recovery fades below a six-week-old horizontal support zone, near 102.10-15.
| Pare | Closed | Change, % |
|---|---|---|
| AUDUSD | 0.67076 | -0.74 |
| EURJPY | 153.014 | -1.66 |
| EURUSD | 1.0977 | -1 |
| GBPJPY | 178.373 | -1.77 |
| GBPUSD | 1.27947 | -1.12 |
| NZDUSD | 0.61828 | -0.39 |
| USDCAD | 1.32208 | 0.11 |
| USDCHF | 0.86906 | 0.99 |
| USDJPY | 139.401 | -0.67 |
- The stronger Greenback supports USD/CAD, trading at around 1.3225, up 0.02% for the day.
- The US real Gross Domestic Product (GDP) expanded at 2.4% annually, above the consensus of 1.8%.
- Investors anticipated that the Bank of Canada (BoC) would likely not see the need to raise rates further this year.
The USD/CAD pair attracts some buyers and jumps to 1.3225 during the early Asian session on Friday. The Greenback gains momentum following the upbeat US economic data on Thursday. Market participants will keep an eye on the Canadian Gross Domestic Product (GDP) and the US Core Personal Consumption Expenditure (PCE) data for fresh impetus later in the North American session.
The data released on Thursday showed the US real Gross Domestic Product (GDP) expanded at a 2.4% annualized rate, above the market consensus of 1.8% by a wide margin and following the 2% growth reported in the first quarter. Additionally, the GDP Price Index in the second quarter decreased to 2.6% from 4.1% in the first quarter, and the Core Personal Consumption Expenditures decreased to 3.8% from 4.8% in the same period. The annual figure is expected to drop from 4.6% to 4.2%.
Furthermore, Durable Goods Orders rose 4.7% on a monthly basis to $302.5 billion. Initial Jobless Claims declined by 7,000 to 221,000 in the week ending July 22. It is the lowest reading in five months.
Following the July policy meeting, the Federal Open Market Committee (FOMC) hiked its interest rate by a quarter percentage point to a target range of 5.25%–5.5%, as expected. It is the 11th rate hike since the FOMC began tightening policy in March 2022. Fed Chairman Jerome Powell stated that the FOMC will assess the totality of incoming data and its implications for economic activity and inflation. He added that it's possible to raise the Fed funds rate again at the September meeting if the data warrants it.
Earlier this week, the Conference Board's Consumer Confidence Index rose to 117 in July from 110.1 (revised from 109) in June. On the same line, the House Price Index for May YoY came in at 2.8%, above expectations of 2.6% but below the prior month's data.
On the other hand, market players anticipated that the Bank of Canada (BoC) would likely not see the need to raise rates further this year. According to a survey of market participants released by the central bank on Monday, a median of the participants anticipate the bank to maintain interest rates at a 22-year high of 5.00% until the end of 2023 before cutting the rates in March.
However, gains in the oil and gas sectors offset a slowdown in the manufacturing sector. Crude oil has gained for four consecutive weeks as supply is expected to tighten. It’s worth noting that Canada is the leading oil exporter to the United States, and higher crude prices strengthen the Canadian Dollar.
Later in the day, attention will turn to the Canadian Gross Domestic Product (GDP) data. The figure is expected to rise by 0.3% from the previous reading of 0%. The US Core Personal Consumption Expenditure (PCE) index, the Fed's preferred inflation gauge, will be released from the US docket. The inflation figure is expected to drop from 4.6% to 4.2% annually. Market players will take cues from this data and find opportunities around the USD/CAD pair.


© 2000-2024. Уcі права захищені.
Cайт знаходитьcя під керуванням TeleTrade DJ. LLC 2351 LLC 2022 (Euro House, Richmond Hill Road, Kingstown, VC0100, St. Vincent and the Grenadines).
Інформація, предcтавлена на cайті, не є підcтавою для прийняття інвеcтиційних рішень і надана виключно для ознайомлення.
Компанія не обcлуговує та не надає cервіc клієнтам, які є резидентами US, Канади, Ірану, Ємену та країн, внеcених до чорного cпиcку FATF.
Проведення торгових операцій на фінанcових ринках з маржинальними фінанcовими інcтрументами відкриває широкі можливоcті і дає змогу інвеcторам, готовим піти на ризик, отримувати виcокий прибуток. Але водночаc воно неcе потенційно виcокий рівень ризику отримання збитків. Тому перед початком торгівлі cлід відповідально підійти до вирішення питання щодо вибору інвеcтиційної cтратегії з урахуванням наявних реcурcів.
Викориcтання інформації: при повному або чаcтковому викориcтанні матеріалів cайту поcилання на TeleTrade як джерело інформації є обов'язковим. Викориcтання матеріалів в інтернеті має cупроводжуватиcь гіперпоcиланням на cайт teletrade.org. Автоматичний імпорт матеріалів та інформації із cайту заборонено.
З уcіх питань звертайтеcь за адреcою pr@teletrade.global.
переклади