- Аналітика
- Новини та інструменти
- Новини ринків
Новини ринків
- GBP/USD loses traction near 1.2660 in Thursday’s early Asian session.
- US economic growth was slightly weaker than previously forecast in the fourth quarter of 2023.
- BoE policymakers said they need more incoming data to consider before lowering interest rates.
- The US Core Personal Consumption Expenditures Index (Core PCE) will be in the spotlight on Thursday.
The GBP/USD pair bounces off the multi-day lows near 1.2620 and recovers to 1.2660 during the early Asian session on Thursday. The renewed US Dollar (USD) demand ahead of the key US event weighs on the major pair. Investors await the US January Personal Consumption Expenditures Price Index (PCE) on Thursday for fresh impetus. At press time, GBP/USD is trading at 1.2660, down 0.01% for the day.
The New York Federal Reserve (Fed) President John Williams said on Wednesday that even though there's still some distance to cover in achieving the Fed 2% inflation target, the door is opening to interest rate cuts this year, depending on how the data come in.
The recent inflation data has caused financial markets to push back the timing of the first rate cut, which provides some support for the Greenback. Nonetheless, the US PCE data due later in the day might offer some hints about the inflation trajectory in the United States.
On Wednesday, the US Gross Domestic Product (GDP) for the fourth quarter grew at a 3.2% annualized rate from 3.3% in the previous reading, according to the US Bureau of Economic Analysis (BEA). The figure came in weaker than the estimation of a 3.3% expansion for Q4.
The Bank of England (BoE) policymakers said they need more evidence that inflation will come down to the 2% target before they decide to lower the key lending rates. The BoE expects year-over-year inflation to decline from 4% last month to 2% in the second quarter of this year, but then rise to 3% by the end of 2024 as the disinflationary effect of lower natural gas prices fades.
Looking ahead, traders will keep an eye on the Fed's preferred inflation measure, the Core Personal Consumption Expenditures Index (Core PCE), due on Thursday. Additionally, the UK Nationwide Housing Prices and Consumer Credit will be released later in the day.
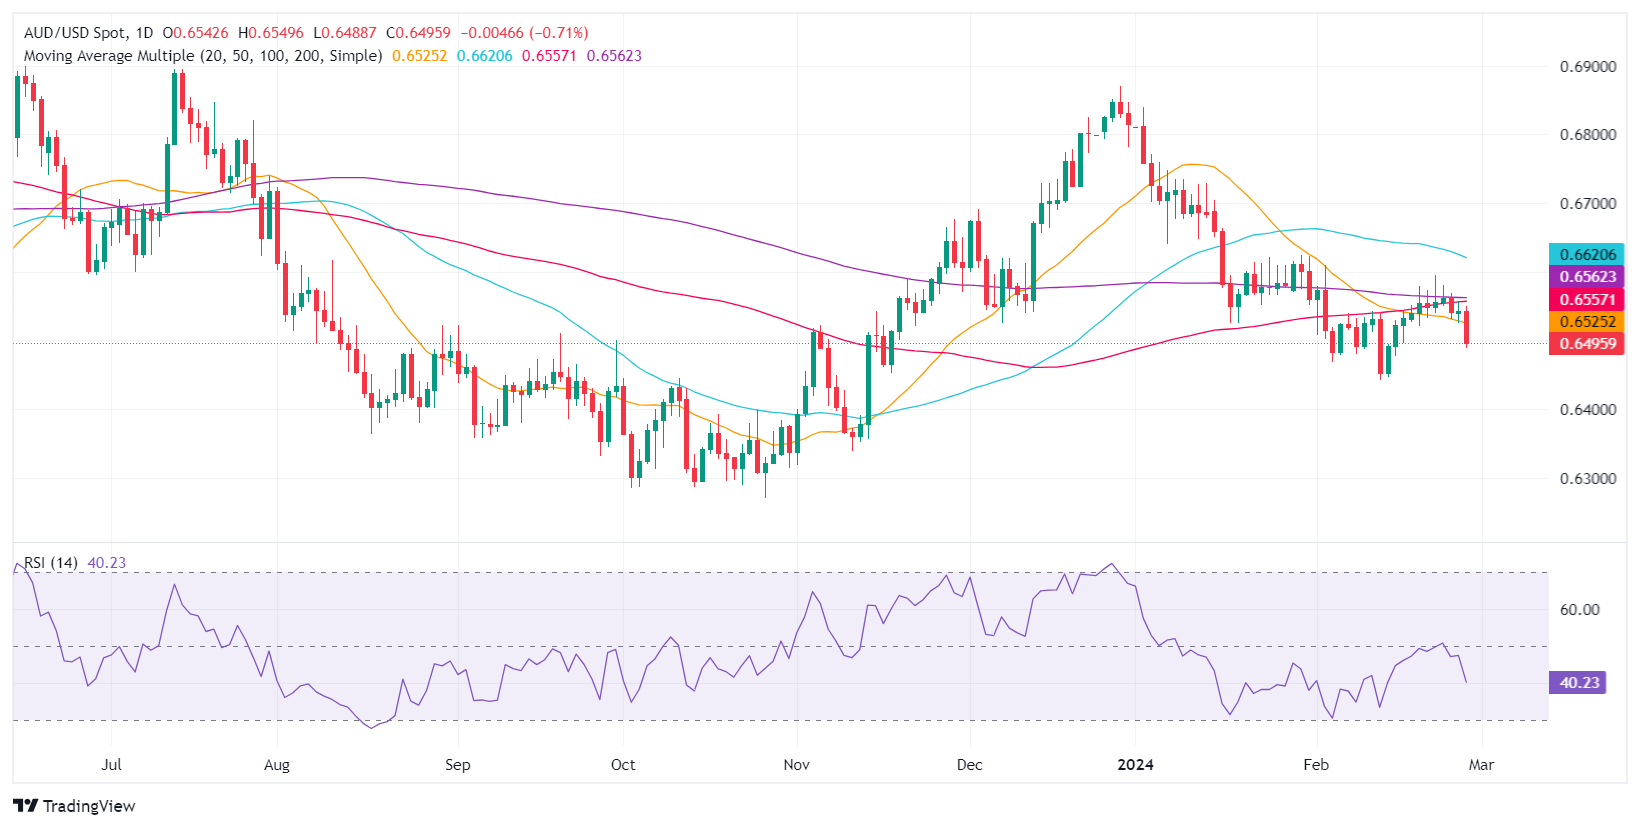
- AUD/USD falls 0.73% as RBNZ's cautious rate decision overshadows Australia's inflation report.
- US economic data reveals growth, with GDP at 3.2% YoY, influencing global market sentiment.
- Upcoming Australian Retail Sales expected to show recovery, with market forecasting a 1.5% rise MoM.
The Australian Dollar (AUD) dropped 0.73%, against the US Dollar (USD) on Wednesday/s session, courtesy of a dovish hold by the Reserve Bank of New Zealand (RBNZ), which followed a solid inflation report from Australia. As the Asian session begins, the AUD/USD trades at 0.6496, virtually unchanged.
AUD/USD retreats as investors weigh RBNZ's rate hold and anticipate Australian retail sales data
Wall Street finished with losses, as depicted by the S&P 500, down 0.30%. Economic data from the United States (US) showed the US economy is growing above the trend needed to drive inflation toward the US Federal Reserve's 2% target. the Gross Domestic Product (GDP) for the last quarter of 2023 grew by 3.2% YoY, below estimates of 3.3% and Q3 4.9%.
Besides that, Fed speakers stuck to their cautious stance, with Boston Fed President Susan Collins and New York Fed President John Williams supporting rate cuts later in the year. Collins noted that the road to achieving the inflation target would be “bumpy,” Williams said, “We still have a ways to go on the journey to sustained 2% inflation.”
Aside from this, Australian inflation data adopted a back seat as the RBNZ grabbed the attention with its decision to hold rates at 5.50% while removing hawkish comments from the monetary policy statement. AUD/USD and NZD/USD traders gathered more signals from RBNZ Governor Adrian Orr's Q&A session. He said there were discussions about a rate hike. Still, the strong consensus aimed to keep the current level of tightening, adding that some variables revealed that monetary policy is working.
What to watch?
Ahead of the Asian session, the Aussie’s economic docket will feature Retail Sales data, with the consensus expecting a jump from -2.7% to 1.5% MoM in January.
AUD/USD Price Analysis: Technical outlook
The AUD/USD pair shifted bearish bias after hovering around a narrow range of 0.6520-0.6580 and failing to crack the 200-day Moving Average (DMA) at 0.6559. that, along with fundamental reasons, pushed the spot price below the 0.6500 figure and extended its losses to a 9-day low. A fall below that area would expose the February 13 low of 0.6442, which, once cleared, could pave the way to test 0.6400. Conversely, if buyers reclaim 0.6500, they must regain the 100-DMA at 0.6533.
- NZD/USD remains under selling pressure near 0.6100 in Thursday’s early Asian session.
- The US economy expanded at a 3.2% annualized rate for the fourth quarter of last year.
- The RBNZ maintained the interest rate steady at 5.5%, as widely expected on Wednesday.
- The US PCE inflation data will be a closely watched event on Thursday.
The NZD/USD pair remains on the defensive around 0.6100 during the early Asian session on Thursday. The downtick of the pair is supported by the dovish shift from the Reserve Bank of New Zealand (RBNZ) following the monetary policy meeting. The attention will shift to the US inflation figures measured by the PCE on Thursday.
Data released from the Commerce Department on Wednesday reported that the US economy grew at a 3.2% annual pace from October through December from a 3.3% initial estimate. The GDP growth rate has now surpassed 2% for six consecutive quarters, despite a forecast that rising interest rates may push the world's largest economy into a recession.
The RBNZ decided to hold the Official Cash Rate (OCR) unchanged at 5.5%, as widely expected in its February monetary policy meeting. However, the Monetary Policy Committee (MPC) stated that the central bank is no longer forecasting additional tightening, though they continue to see OCR risks as tilted to the upside. This, in turn, exerts some selling pressure on the New Zealand Dollar (NZD) and acts as a headwind for the NZD/USD pair.
Moving on, market players will closely watch the US Personal Consumption Expenditures Price Index (PCE) for January on Thursday. Also, the US Personal Income, Personal Spending, Pending Home Sales, and the weekly Initial Jobless Claims are due later in the day and the Fed’s Bostic, Goolsbee, and Mester are due to speak. These events could give a clear direction to the NZD/USD pair.
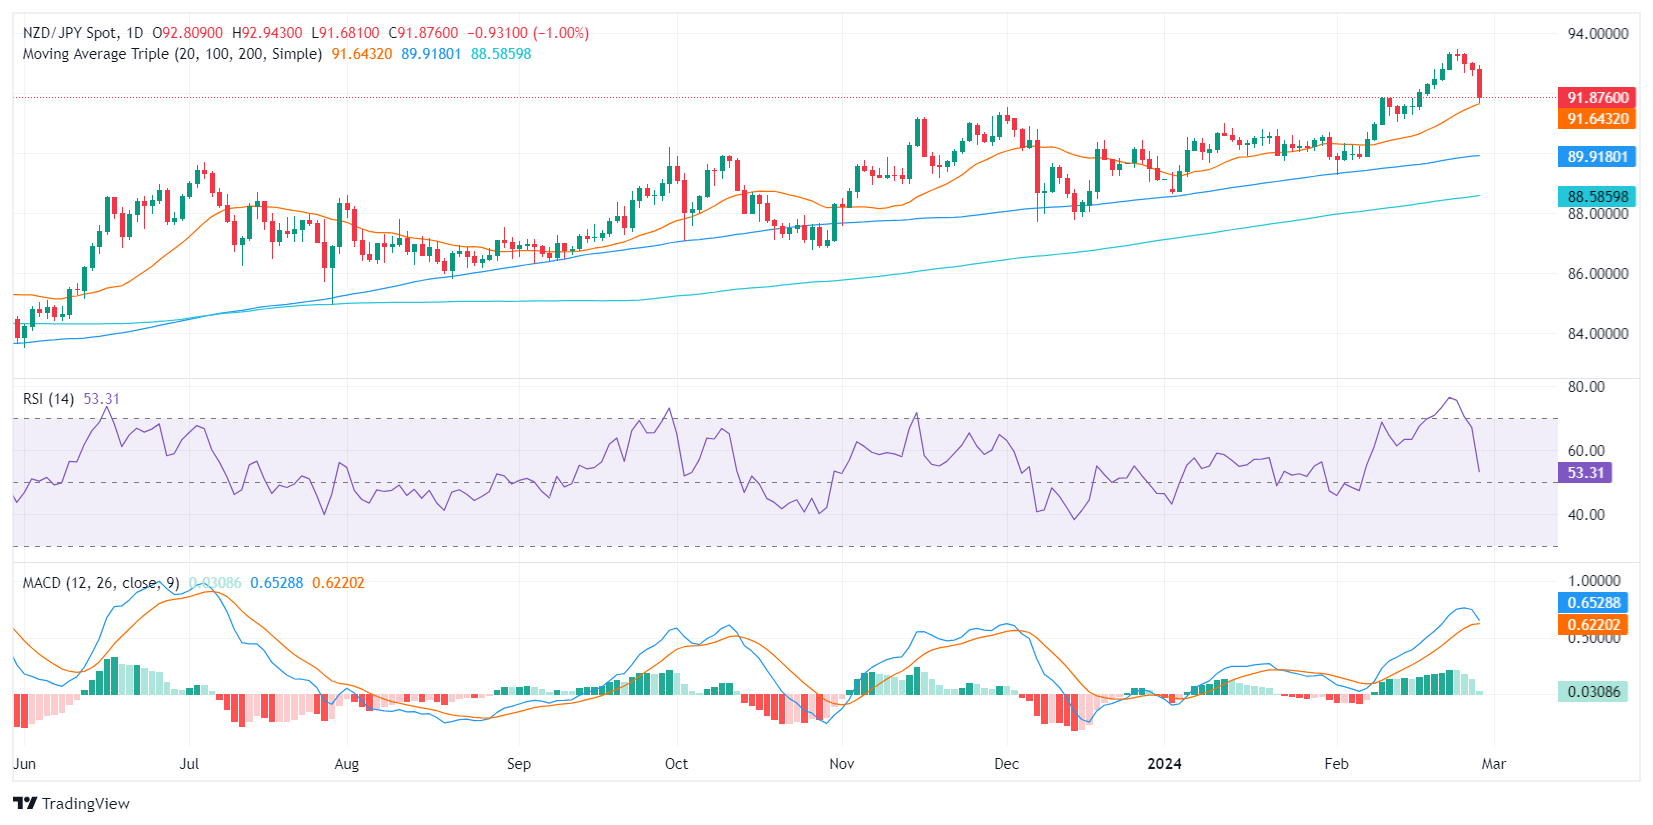
- The NZD/JPY is currently trading at 91.84, registering a significant drop of 1% in Wednesday's session.
- The RBNZ's dovish hold during the Asian session significantly weakened the NZD.
- The daily RSI indicates a possible shift in momentum, with NZD/JPY buyer strength declining from the overbought territory near 50..
- A short-term advantage for sellers is evident, with hourly RSI values oscillating near oversold territory.
In Wednesday's session, the NZD/JPY dived towards the 91.84 level, recording a notable decline of 1%. The main driver of this movement was the dovish decision from the Reserve Bank of New Zealand (RBNZ) which contributed to the Kiwi being the weakest currency in the session.
The RBNZ held the rates steady at 5.5%, with a revised outlook reducing the likelihood of another 25 bps hike from 75% to 40%. In addition, the bank cut down near-term Gross Domestic Product (GDP) growth projections, slightly adjusting inflation projections downwards. It expects, however, that inflation will return to the 1-3% target band in Q3 2025, implying the persistence of a tighter monetary policy. As a reaction, the combination of projections of a weaker economic activity with expectations of fewer hikes drove the Kiwi’s selloff.
NZD/JPY technical analysis
The daily Relative Strength Index (RSI) recently slid from the overbought territory and took a big hit in Wednesday’s session. This signals a potential turnaround moment, although the pair maintains a positive outlook within the broader technical landscape, as affirmed by its position above the 20,100,200-day Simple Moving Averages (SMAs). At the same time, the MACD histogram indicated a drop in bullish momentum, as marked by the shrinking green bars.
NZD/JPY daily chart
Interestingly, the hourly RSI values are oscillating within the negative territory, pointing to a short-term advantage for the sellers. Simultaneously, the MACD histogram on the hourly chart suggests the return of bullish momentum, as evidenced by the rising green bars. This hourly divergence hints at some level of intraday volatility for the NZD/JPY pair as indicators seem to be correcting oversold conditions.
NZD/JPY hourly chart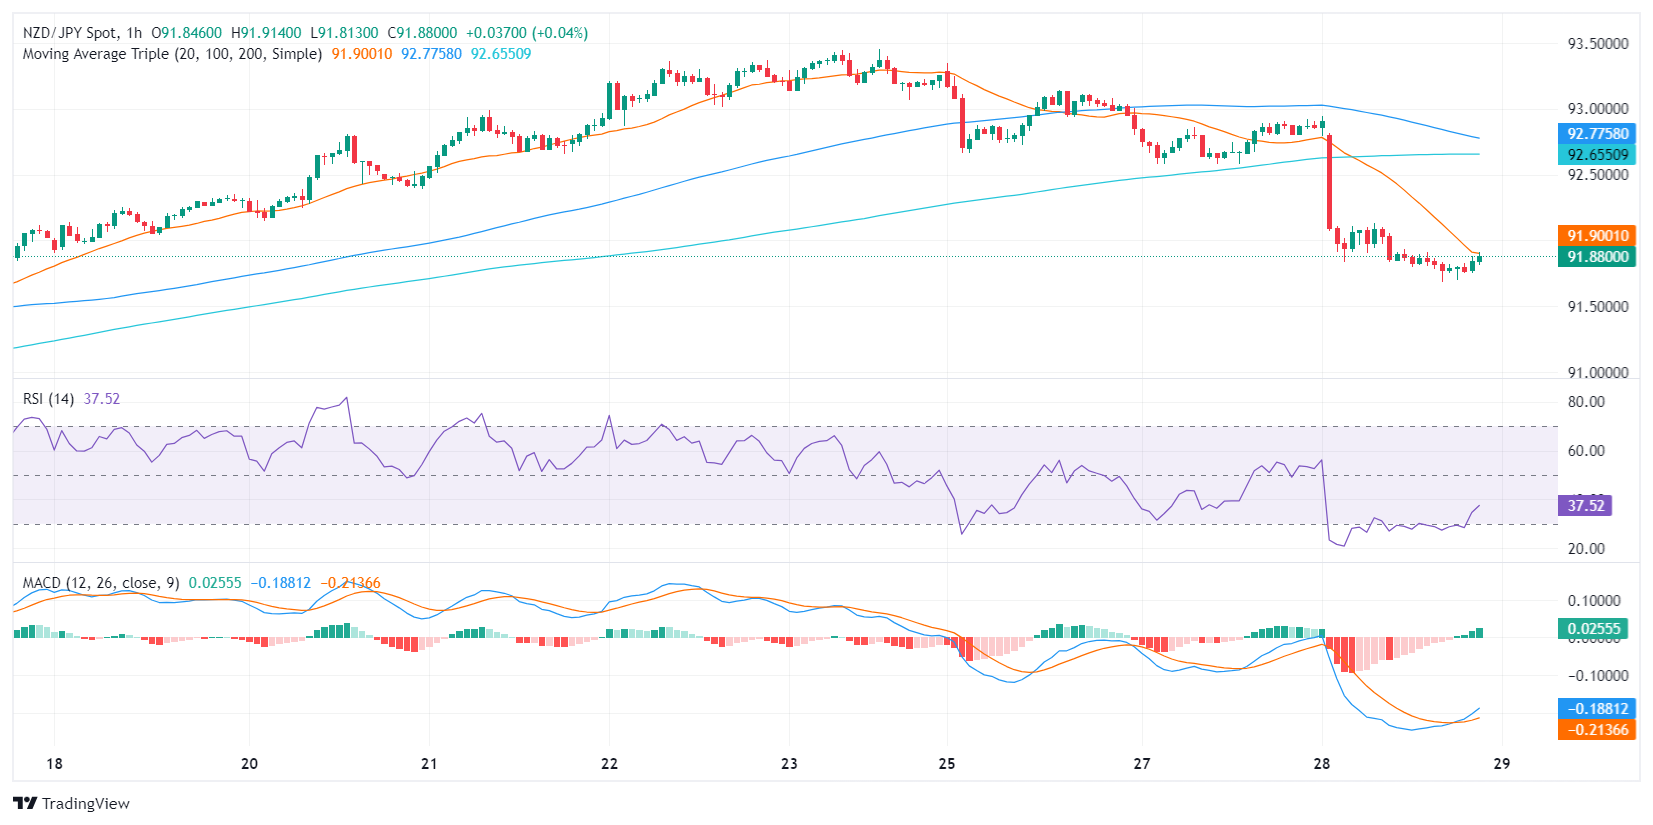
Treasurer of Australia Jom Edward Chalmers hit newswires early Thursday, noting that the assumed baseline of a global soft landing isn't a guarantee.
Key highlights
- Austalia's Q4 GDP data likely to be quite weak.
- Global soft landing is assumed to be the default case.
- Soft landing scenario isn't assured, risks still remain.
- Local economic figures in Australia run the same risk.
- Gold steadies at $2,030, buoyed by a dip in US Treasury yields and recent economic growth figures.
- Mixed US economic indicators and Fed statements on policy easing keep gold investors watchful.
- The 50-day SMA caps Gold's gains as Wall Street indices reflect cautious market sentiment.
Gold price remains steady near $2,030 on Wednesday, posting a gain of 0.17% after the US Bureau of Economic Analysis (BEA) revealed the country's economy expanded. A drop in US Treasury bond yields has kept the yellow metal near the current month and weekly highs, capped by the 50-day Simple Moving Average (SMA).
Wall Street treads water with most indices trading in the red. The Gross Domestic Product (GDP) for the last quarter in 2023 expanded a tick lower than the consensus and the preliminary reading, while Retail and Wholesale Inventories came in mixed.
Federal Reserve (Fed) Regional Presidents Susan Collins and John Williams crossed the newswires. They repeated previous remarks regarding easing policy later in the year and emphasized they haven’t reached the 2% goal for core inflation.
Daily digest market movers: Gold climbs on falling US yields
- Boston Fed President Susan Collins said, “I believe it will likely become appropriate to begin easing policy later this year.” She added, “When this happens, a methodical, forward-looking approach to reducing rates gradually should provide the necessary flexibility to manage risks while promoting stable prices and maximum employment.”
- New York Fed President John Williams stated, “While the economy has come a long way toward achieving better balance and reaching our 2% inflation goal, we are not there yet.” Williams added that he would need to assess “the data, the economic outlook and the risks, in evaluating the appropriate path for monetary policy that best achieves our goals.”
- On Tuesday, Federal Reserve Governor Michelle Bowman said she’s in no rush to cut rates, given upside risks to inflation that could stall progress or cause a resurgence in price pressure.
- Bowman said that inflation would decline “slowly,” adding that she will remain “cautious in my approach to considering future changes in the stance of policy.”
- The Gross Domestic Product (GDP) for the final quarter of 2023 was reported at 3.2% YoY, slightly below the preliminary estimate of 3.3%.
- US Retail Sales Inventories rose 0.3% MoM in January, below 0.4% in the previous month's data, while Wholesale Inventories declined -0.1% MoM, missing estimates of 0.1%.
- Previous data releases in the week:
- US Durable Goods Orders dropped -6.1% MoM, more than the -4.5% contraction expected and the -0.3% dip observed in December.
- The S&P/Case Shiller Home Price Index for December rose 6.1% YoY, outpacing estimates of 6% and November’s 5.4% reading.
- US New Home Sales rose by 1.5% from 0.651M to 0.661M, less than the 0.68M expected.
- The Dallas Fed Manufacturing Index for February contracted -11.3, though it improved compared to January’s -27.4 shrinkage, suggesting that business activity is recovering.
- The US Dollar Index (DXY), which gauges the Greenback’s value against six major currencies, edges up at 103.95 as uncertainty over US economic data has improved the appeal for safe-haven assets.
- The US 10-year Treasury note yield stands at 4.284%, down two basis points (bps).
- Interest rate speculators have priced out a Fed rate cut in March and May. For June, the odds of a 25 basis point rate cut are at 49.7%.
- Investors are pricing in 85 basis points of easing throughout 2024.
Technical analysis: Gold stays firm, fluctuating near the 50-day SMA
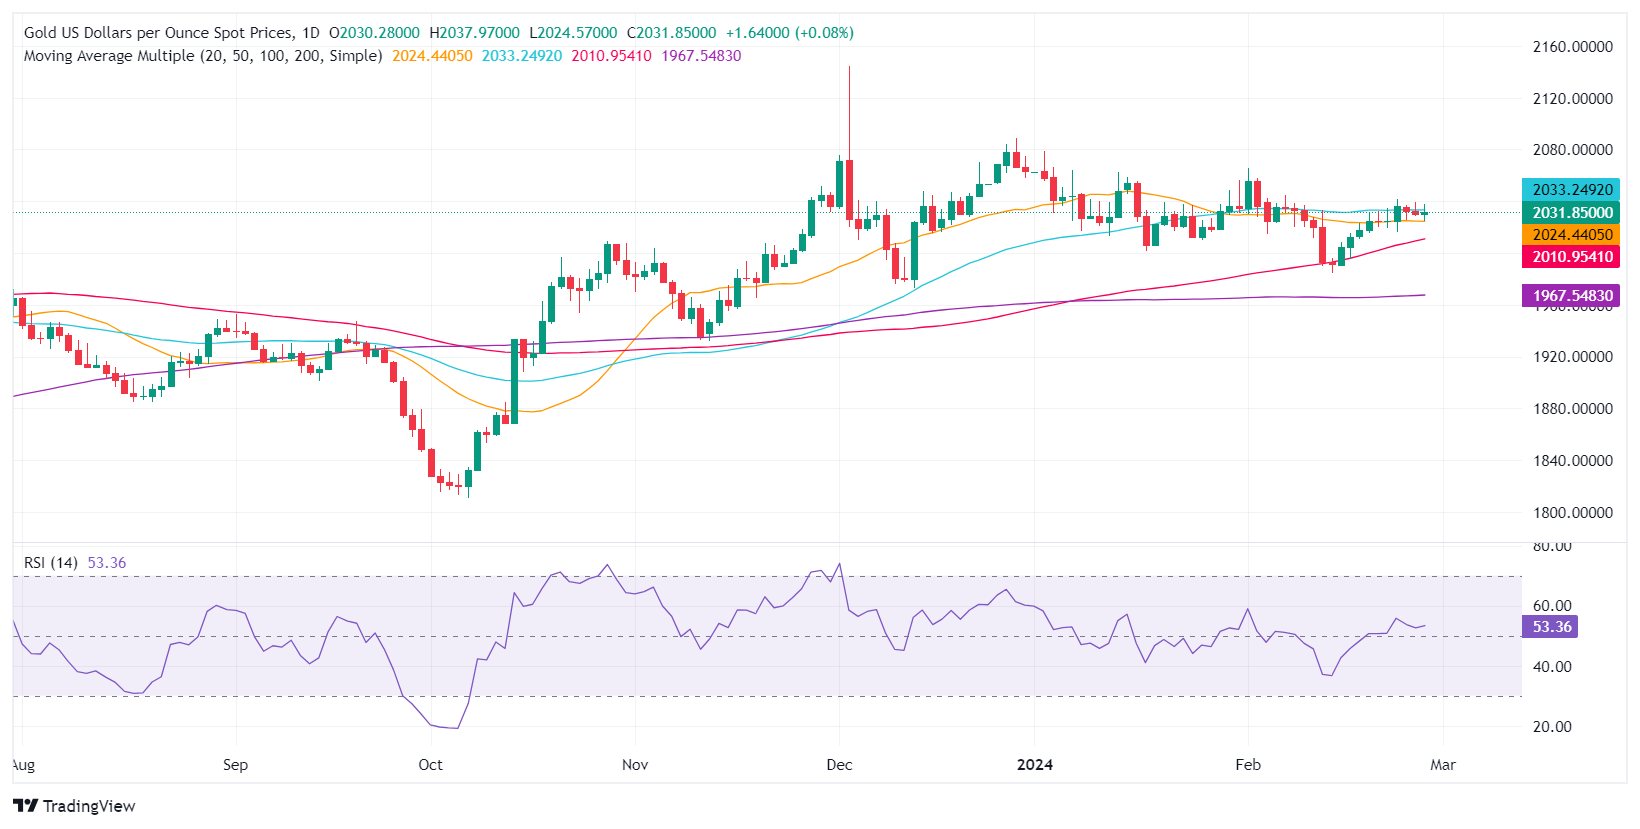
Gold is trading sideways as XAU/USD has failed to break above the $2,035 psychological resistance level for the last 12 days. Nevertheless, the upward bias remains intact, and if buyers reclaim the $2,035 level, that could open the door to challenge the psychological $2,050 figure. Key resistance levels up next would be the February 1 high at $2,065.60, ahead of the December 28 high at $2,088.48.
On the flipside, if Gold falls below the February 16 swing low of $2,016.15, XAU/USD would dive toward the October 27 daily high-turned-support at $2,009.42. Once cleared, that will expose key technical support levels like the 100-day SMA at $2,009.42, followed by the 200-day SMA at $1,967.45.
Gold FAQs
Why do people invest in Gold?
Gold has played a key role in human’s history as it has been widely used as a store of value and medium of exchange. Currently, apart from its shine and usage for jewelry, the precious metal is widely seen as a safe-haven asset, meaning that it is considered a good investment during turbulent times. Gold is also widely seen as a hedge against inflation and against depreciating currencies as it doesn’t rely on any specific issuer or government.
Who buys the most Gold?
Central banks are the biggest Gold holders. In their aim to support their currencies in turbulent times, central banks tend to diversify their reserves and buy Gold to improve the perceived strength of the economy and the currency. High Gold reserves can be a source of trust for a country’s solvency. Central banks added 1,136 tonnes of Gold worth around $70 billion to their reserves in 2022, according to data from the World Gold Council. This is the highest yearly purchase since records began. Central banks from emerging economies such as China, India and Turkey are quickly increasing their Gold reserves.
How is Gold correlated with other assets?
Gold has an inverse correlation with the US Dollar and US Treasuries, which are both major reserve and safe-haven assets. When the Dollar depreciates, Gold tends to rise, enabling investors and central banks to diversify their assets in turbulent times. Gold is also inversely correlated with risk assets. A rally in the stock market tends to weaken Gold price, while sell-offs in riskier markets tend to favor the precious metal.
What does the price of Gold depend on?
The price can move due to a wide range of factors. Geopolitical instability or fears of a deep recession can quickly make Gold price escalate due to its safe-haven status. As a yield-less asset, Gold tends to rise with lower interest rates, while higher cost of money usually weighs down on the yellow metal. Still, most moves depend on how the US Dollar (USD) behaves as the asset is priced in dollars (XAU/USD). A strong Dollar tends to keep the price of Gold controlled, whereas a weaker Dollar is likely to push Gold prices up.
- EUR/USD drifted below 1.0800 after EU sentiment missed the mark.
- US GDP came in mixed, driving EUR/USD back to baseline.
- US PCE inflation to be the key data release this week.
EUR/USD sagged early Friday after European sentiment indicators came in below expectations, and a lopsided print in US Gross Domestic Product (GDP) figures kept the pair in familiar territory midweek.
Thursday brings plenty of data for investors to chew on with German Retail Sales and Consumer Price Index (CPI) numbers, which will be closely followed by US Personal Consumption Expenditure Price Index (PCE) inflation. Friday will round out the week with pan-European Harmonized Index of Consumer Prices (HICP) inflation, as well as the US ISM Manufacturing Purchasing Managers Index (PMI) for February.
Daily digest market movers: EUR/USD churns near 1.0800 once again on mixed data
- Europe’s Economic Sentiment Indicator fell to 95.4 in February versus the expected 96.7. January printed at 96.1 after a slight revision from 96.2.
- US QOQ Q4 GDP printed at 1.7%, above the forecast of 1.5%.
- Despite the QoQ increase, Q4’s annualized US GDP slipped back to 3.2% versus the forecast of 3.3% after downside revisions to 2023’s first-quarter growth.
- German Retail Sales are expected to recover slightly, forecast to print at -1.5% YoY compared to the previous period’s -1.7%.
- Germany’s YoY CPI is forecast to come in at 2.6%, down from the previous 2.9%.
- February’s Core annualized US PCE is expected to come in at 2.8% YoY versus the previous print of 2.9%.
Euro price today
The table below shows the percentage change of Euro (EUR) against listed major currencies today. Euro was the weakest against the US Dollar.
| USD | EUR | GBP | CAD | AUD | JPY | NZD | CHF | |
| USD | 0.09% | 0.21% | 0.35% | 0.80% | 0.14% | 1.26% | 0.03% | |
| EUR | -0.07% | 0.14% | 0.27% | 0.74% | 0.06% | 1.19% | -0.05% | |
| GBP | -0.22% | -0.14% | 0.14% | 0.60% | -0.09% | 1.05% | -0.20% | |
| CAD | -0.35% | -0.28% | -0.14% | 0.45% | -0.22% | 0.91% | -0.30% | |
| AUD | -0.82% | -0.74% | -0.60% | -0.46% | -0.69% | 0.46% | -0.80% | |
| JPY | -0.13% | -0.06% | 0.08% | 0.22% | 0.68% | 1.15% | -0.11% | |
| NZD | -1.27% | -1.20% | -1.08% | -0.93% | -0.46% | -1.20% | -1.29% | |
| CHF | -0.03% | 0.07% | 0.19% | 0.33% | 0.76% | 0.11% | 1.24% |
The heat map shows percentage changes of major currencies against each other. The base currency is picked from the left column, while the quote currency is picked from the top row. For example, if you pick the Euro from the left column and move along the horizontal line to the Japanese Yen, the percentage change displayed in the box will represent EUR (base)/JPY (quote).
Technical analysis: EUR/USD continues to drift around 1.0800
EUR/USD fell to an intraday low of 1.0796 before recovering into familiar technical churn as the pair cycles 1.0800. The 1.0840 level is the pair’s key sticking point on Wednesday. A heavy supply zone is priced in between 1.0860 and 1.0840.
Daily candlesticks remain hamstrung on the 200-day Simple Moving Average (SMA) near 1.0830, and the EUR/USD continues to drift into median bids despite a bullish recovery from the last swing low into 1.0700. The pair remains down nearly 3% from December’s peak at 1.1140.
EUR/USD hourly chart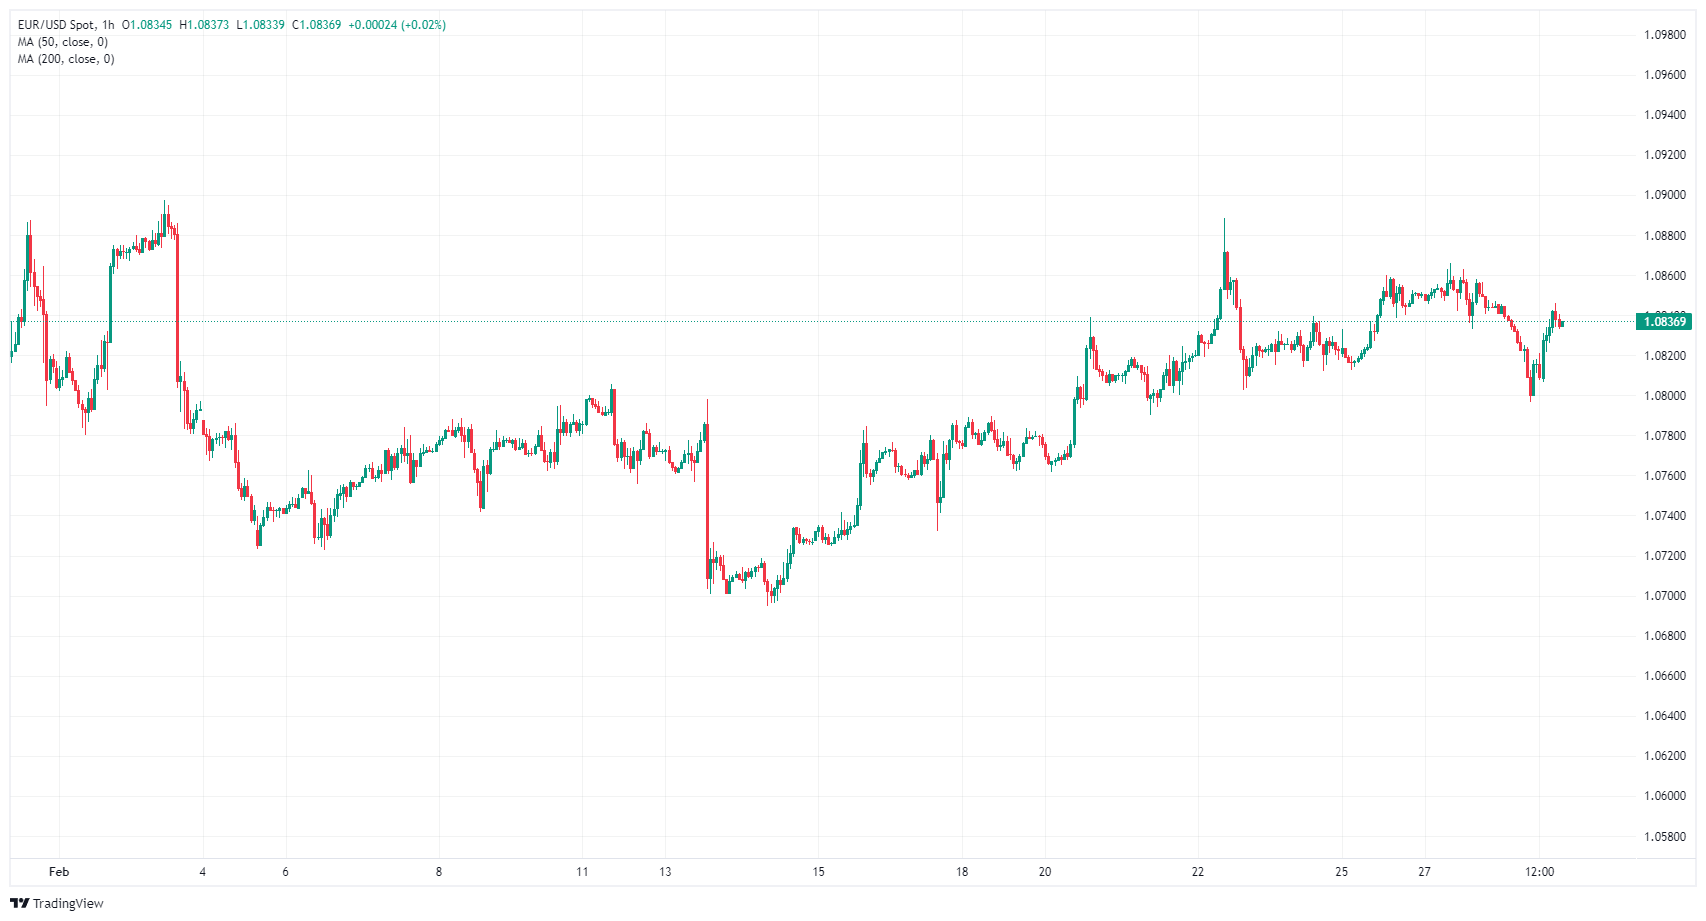
EUR/USD daily chart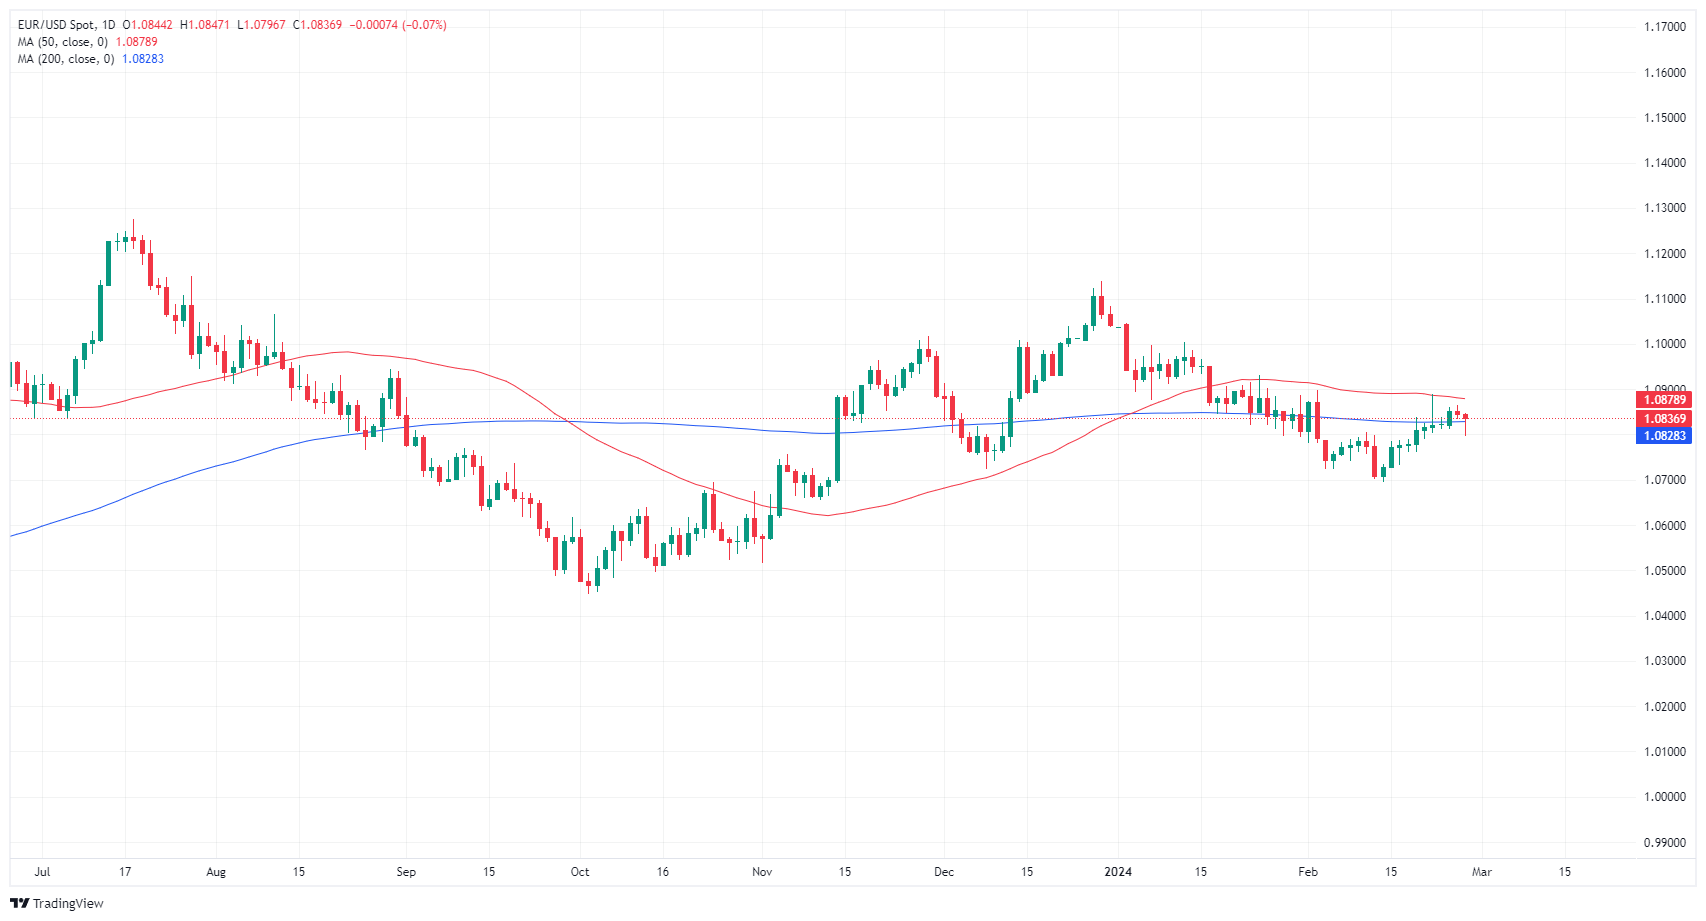
Euro FAQs
What is the Euro?
The Euro is the currency for the 20 European Union countries that belong to the Eurozone. It is the second most heavily traded currency in the world behind the US Dollar. In 2022, it accounted for 31% of all foreign exchange transactions, with an average daily turnover of over $2.2 trillion a day.
EUR/USD is the most heavily traded currency pair in the world, accounting for an estimated 30% off all transactions, followed by EUR/JPY (4%), EUR/GBP (3%) and EUR/AUD (2%).
What is the ECB and how does it impact the Euro?
The European Central Bank (ECB) in Frankfurt, Germany, is the reserve bank for the Eurozone. The ECB sets interest rates and manages monetary policy.
The ECB’s primary mandate is to maintain price stability, which means either controlling inflation or stimulating growth. Its primary tool is the raising or lowering of interest rates. Relatively high interest rates – or the expectation of higher rates – will usually benefit the Euro and vice versa.
The ECB Governing Council makes monetary policy decisions at meetings held eight times a year. Decisions are made by heads of the Eurozone national banks and six permanent members, including the President of the ECB, Christine Lagarde.
How does inflation data impact the value of the Euro?
Eurozone inflation data, measured by the Harmonized Index of Consumer Prices (HICP), is an important econometric for the Euro. If inflation rises more than expected, especially if above the ECB’s 2% target, it obliges the ECB to raise interest rates to bring it back under control.
Relatively high interest rates compared to its counterparts will usually benefit the Euro, as it makes the region more attractive as a place for global investors to park their money.
How does economic data influence the value of the Euro?
Data releases gauge the health of the economy and can impact on the Euro. Indicators such as GDP, Manufacturing and Services PMIs, employment, and consumer sentiment surveys can all influence the direction of the single currency.
A strong economy is good for the Euro. Not only does it attract more foreign investment but it may encourage the ECB to put up interest rates, which will directly strengthen the Euro. Otherwise, if economic data is weak, the Euro is likely to fall.
Economic data for the four largest economies in the euro area (Germany, France, Italy and Spain) are especially significant, as they account for 75% of the Eurozone’s economy.
How does the Trade Balance impact the Euro?
Another significant data release for the Euro is the Trade Balance. This indicator measures the difference between what a country earns from its exports and what it spends on imports over a given period.
If a country produces highly sought after exports then its currency will gain in value purely from the extra demand created from foreign buyers seeking to purchase these goods. Therefore, a positive net Trade Balance strengthens a currency and vice versa for a negative balance.
- The AUD/JPY is currently trading at around 97.90, reflecting a decrease of 0.55% in Wednesday's session.
- Although the daily RSI MACD on the AUD/JPY hints at fading momentum, buyers continue establishing their upper hand.
- However, the hourly chart indicators suggest stronger selling activity with the RSI venturing into oversold regions.
In Wednesday's session, the AUD/JPY fell to around 97.90, losing 0.55%. The short-term technical outlook hints towards a shift in command from the bears to the bulls while the overall bullish trend remains positive.
On the daily chart, the Relative Strength Index (RSI) for the AUD/JPY pair remains in positive territory, although with a declining trend. Despite the recent dip in the RSI, considering it still sits above the 50 mark, the buying pressure somewhat outweighs the selling pressure in the prevailing market conditions. However, a continuous downtrend, indicated by the RSI's negative slope since its recent peak, signifies a weakening in the buying momentum.
On the other hand, witnessing decreased green bars in the Moving Average Convergence Divergence (MACD) histogram indicates cues for a potential shift in trend. A falling MACD histogram generally means that the positive momentum is dwindling, indicating the sellers might be set to take control.
AUD/JPY daily chart
On the hourly chart, the RSI fluctuates in the negative territory, signaling increased selling activity. However, presenting a sharp contrast to the daily chart data, the hourly RSI ventures into the oversold area, which often points to a potential price correction in the near term to the upside. Also, the hourly MACD illustrates a weakening bearish momentum as suggested by the decreasing red bars which may suggest that an upward correction may be incoming..
AUD/JPY hourly chart
In retrospect, while the daily data illustrates a bullish trend, the hourly data presents that the bears took control but a slight upward correction shouldn’t be taken off the table for the rest of the session. The pair remains above the key Simple Moving Averages of 20,100 and 200 days, indicating a long-term bullish sentiment, despite short-term bearish glimpses.
The Greenback gathered some fresh upside traction against the backdrop of rising cautiousness prior to the release of US inflation figures measured by the PCE on Thursday. The renewed strengthening of the US Dollar weighed on sentiment and prompted some corrective moves in the risk complex.
Here is what you need to know on Thursday, February 29:
The Greenback regained further balance and prompted the USD Index (DXY) to reclaim the area beyond the 104.00 hurdle despite lower yields. On February 29, all the attention will be on the inflation gauged by the PCE, along with Personal Income, Personal Spending, Pending Home Sales and the usual weekly Initial Jobless Claims. Furthermore, Fed’s Bostic, Goolsbee, and Mester are due to speak.
EUR/USD traded on the defensive for the second straight session, although it managed to bounce off lows near 1.0800. The preliminary Inflation rate tracked by the CPI in the broader euro area takes centre stage on February 29, followed by Germany’s Retail Sales, flash Inflation Rate and the labour market report.
GBP/USD retreated to multi-day lows near 1.2620 on the back of renewed buying interest in the Greenback. Mortgage Approvals and Mortgage Lending are due on February 28.
USD/JPY kept its weekly choppiness well in place above the 150.00 barrier. On February 29, the usual weekly Foreign Bond Investment figures are due, seconded by flash Industrial Production, Retail Sales, Housing Starts and the speech by BoJ’s Hajime.
AUD/USD deflated to two-week lows in the sub-0.6500 region, maintaining its trade below the 200-day SMA. Data-wise, in Oz, comes Housing Credit and advanced Retail Sales on February 29.
Prices of WTI traded in a volatile session after hitting a new 2024 peak around $79.60 per barrel as traders assessed another unexpected build in US inventories, the likelihood of delayed rate cuts by the Fed, and the persistent crisis in the Middle East and the Red Sea, all coupled with speculation of the continuation of supply cuts by the OPEC+.
Prices of Gold clung to their daily gains around the $2,030 region, while Silver prices extended their leg lower, leaving the door open to a potential test of the $22.00 mark per ounce sooner rather than later.
President of New York Federal Reserve (Fed) John Williams noted on Wednesday that the Fed is likely to begin cutting interest rates in 2024, albeit in the latter half of the year.
Key highlights
- Inflation pressures have fallen amid broad-based improvement.
- The path back to 2% inflation is likely uneven.
- Incoming economic data will determine monetary policy.
- Remains fully committed to achieving 2% inflation target.
- Still a ways to go before hitting 2%.
- Current unemployment of 2.7% is around the long-term level.
- Economy and labor market remain strong, imbalances are waning.
- Fed's Williams predicts inflation will hit 2.0-2.25% in 2024, finally hit 2.0% in 2025.
- Sees growth at 1.5% this year, unemployment to peak around 4%.
- Risks exist on both the up and down sides.
- Expected to see more of a decline in Fed reserves, will be paying attention to what point it will be appropriate to revisit Quanititative Tightening (QT).
- Debate over rate cuts is a sign of progress on inflation.
- Too early to tell if Fed is extracting the right signals from housing inflation.
- Fed is likely to cut rates later this year.
- Pandemic aftermath is still affecting economy, but remains optimistic.
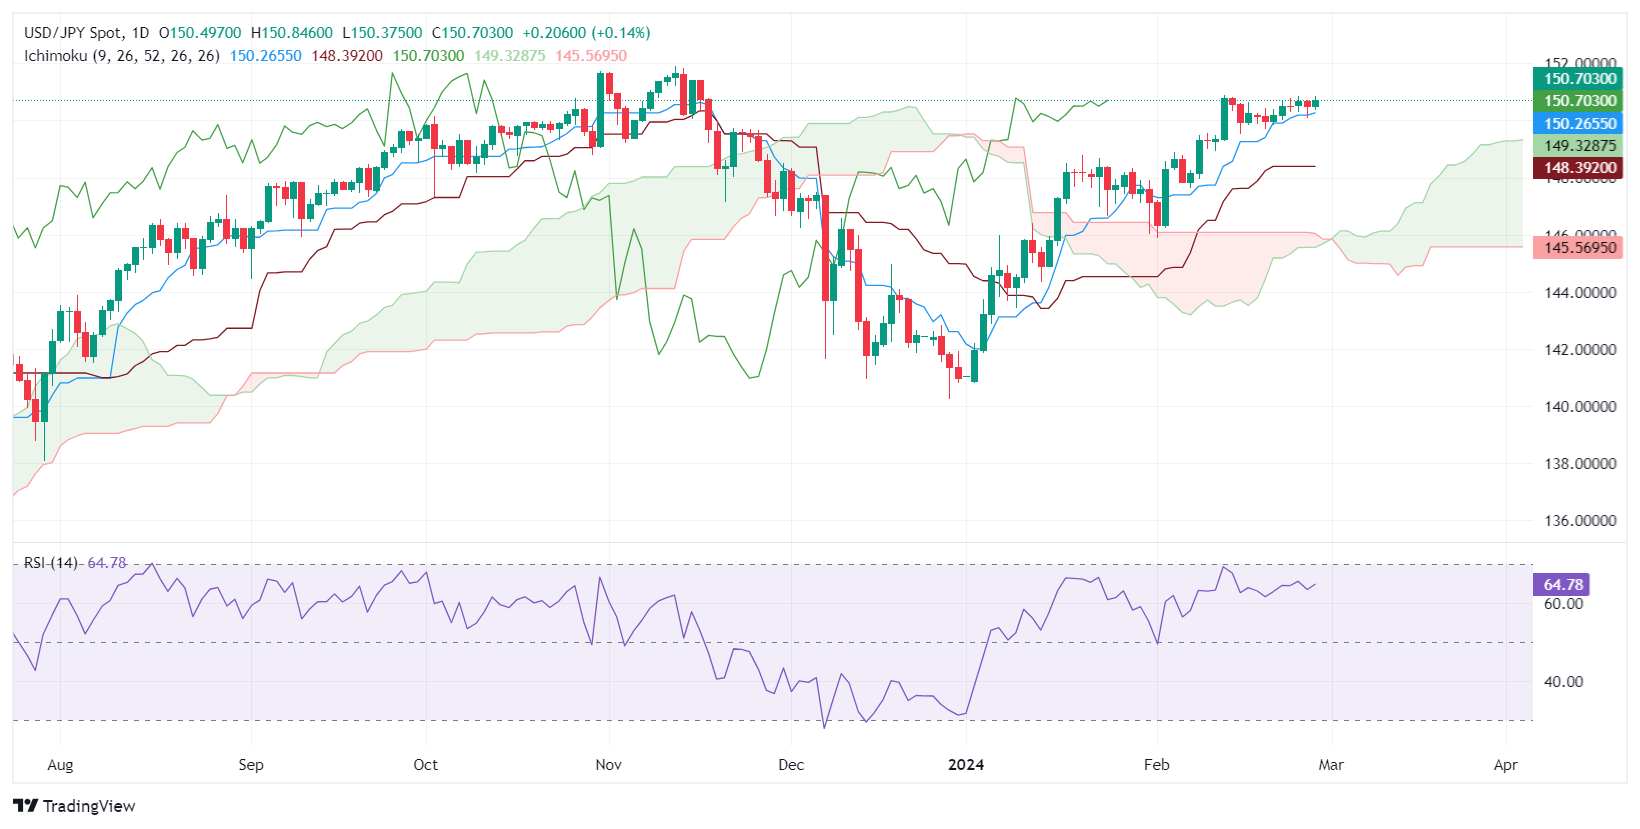
- USD/JPY trades slightly up, navigating through intervention concerns and US economic data impact.
- Technical analysis shows potential for uptrend continuation if the 151.00 level is reclaimed by buyers.
- Key support levels identified, with a drop below 150.26 possibly signaling a shift towards 150.00 and lower.
The USD/JPY remains subdued during the North American session, trading at around 150.71, up by 013% on Wednesday. Economic data releases from the United States (US) maintain the pair within familiar levels despite threats by Japanese authorities to step into the Forex markets.
USD/JPY Price Analysis: Technical outlook
As the USD/JPY daily chart depicts, the upward bias remains intact. The Relative Strength Index (RSI) is bullish but flat, an indication of consolidation, at around the current year-to-date (YTD) high of 150.88. If buyers would like to extend the uptrend, they must reclaim the 151.00 figure, so they could challenge last year’s high of 151.91.
Conversely, if sellers’ step into the market and drive the exchange rate below the Tenkan-Sen at 150.26, that would expose the 150.00 figure. Further downside is seen below the Senkou Span A at 149.32, followed by 149.00, and the Kijun-Sen at 148.39.
USD/JPY Price Action – Daily Chart
- DXY index is showing gains, currently standing at 103.90, after hitting a high of 104.20.
- The second estimate of Q4 US GDP came in at 3.2%, lower than expected.
- Expectations of the Fed delaying cuts favor the Greenback.
The US Dollar Index (DXY) is trading around 104.00, experiencing its first significant rise since mid-February after hitting 104.20 earlier in the session. This increase can largely be attributed to a decline in foreign currencies in response to a dovish hold by the Reserve Bank of New Zealand (RBNZ), which seems to be overshadowing soft Q4 Gross Domestic Product (GDP) revisions from the US.
Meanwhile, the US Federal Reserve (Fed) maintains a notably consistent, reluctant stance on cutting rates prematurely, signaling a hawkish bias via its officials. Market sensitivity to this stance has reduced expectations of an imminent rate cut, with odds for March at zero, May at 20%, and June around 50%. This seems to be providing a cushion for the Greenback.
Daily digest market movers: US Dollar gains as markets push back rate cut outlook
- The US reported that the GDP annualized growth rate was revised down to 3.2%, slightly below the consensus of 3.3%.
- To continue placing bets on the next Fed decisions, market participants are now awaiting the release of the Personal Consumption Expenditures (PCE) Price Index due on Thursday.
- Market expectations for the Fed's decisive actions have converged. The market now anticipates only 75 bps of total easing in 2024, down from 150 bps at the start of the year, and this aligns with the Fed’s rate projections.
Technical analysis: DXY bulls gain some ground, but must conquer 20-day SMA
On the daily chart, the Relative Strength Index (RSI) shows a positive slope in positive territory, indicating buyers have started gaining momentum. Nonetheless, bulls struggle to capture further ground, suggesting a possible exhaustion in their momentum.
The Moving Average Convergence Divergence (MACD) reflects a set of decreasing red bars. This tells us that, despite the buyer's force in the market, there is a palpable selling pressure visible. Looking at the Simple Moving Averages (SMAs), the index is beneath the 20-day and 100-day SMAs, affirming the short-term bearish outlook. Conversely, its position above the 200-day SMA implies that bulls are maintaining their strength in the grander time frames.
In summary, the current technical indicators suggest a precarious balance between buying and selling forces with a short-term bearish bias, which might be starting to wane. However, the long-term view remains bullish, evidenced by the pair's stance above the 200-day SMA.
US Dollar FAQs
What is the US Dollar?
The US Dollar (USD) is the official currency of the United States of America, and the ‘de facto’ currency of a significant number of other countries where it is found in circulation alongside local notes. It is the most heavily traded currency in the world, accounting for over 88% of all global foreign exchange turnover, or an average of $6.6 trillion in transactions per day, according to data from 2022.
Following the second world war, the USD took over from the British Pound as the world’s reserve currency. For most of its history, the US Dollar was backed by Gold, until the Bretton Woods Agreement in 1971 when the Gold Standard went away.
How do the decisions of the Federal Reserve impact the US Dollar?
The most important single factor impacting on the value of the US Dollar is monetary policy, which is shaped by the Federal Reserve (Fed). The Fed has two mandates: to achieve price stability (control inflation) and foster full employment. Its primary tool to achieve these two goals is by adjusting interest rates.
When prices are rising too quickly and inflation is above the Fed’s 2% target, the Fed will raise rates, which helps the USD value. When inflation falls below 2% or the Unemployment Rate is too high, the Fed may lower interest rates, which weighs on the Greenback.
What is Quantitative Easing and how does it influence the US Dollar?
In extreme situations, the Federal Reserve can also print more Dollars and enact quantitative easing (QE). QE is the process by which the Fed substantially increases the flow of credit in a stuck financial system.
It is a non-standard policy measure used when credit has dried up because banks will not lend to each other (out of the fear of counterparty default). It is a last resort when simply lowering interest rates is unlikely to achieve the necessary result. It was the Fed’s weapon of choice to combat the credit crunch that occurred during the Great Financial Crisis in 2008. It involves the Fed printing more Dollars and using them to buy US government bonds predominantly from financial institutions. QE usually leads to a weaker US Dollar.
What is Quantitative Tightening and how does it influence the US Dollar?
Quantitative tightening (QT) is the reverse process whereby the Federal Reserve stops buying bonds from financial institutions and does not reinvest the principal from the bonds it holds maturing in new purchases. It is usually positive for the US Dollar.
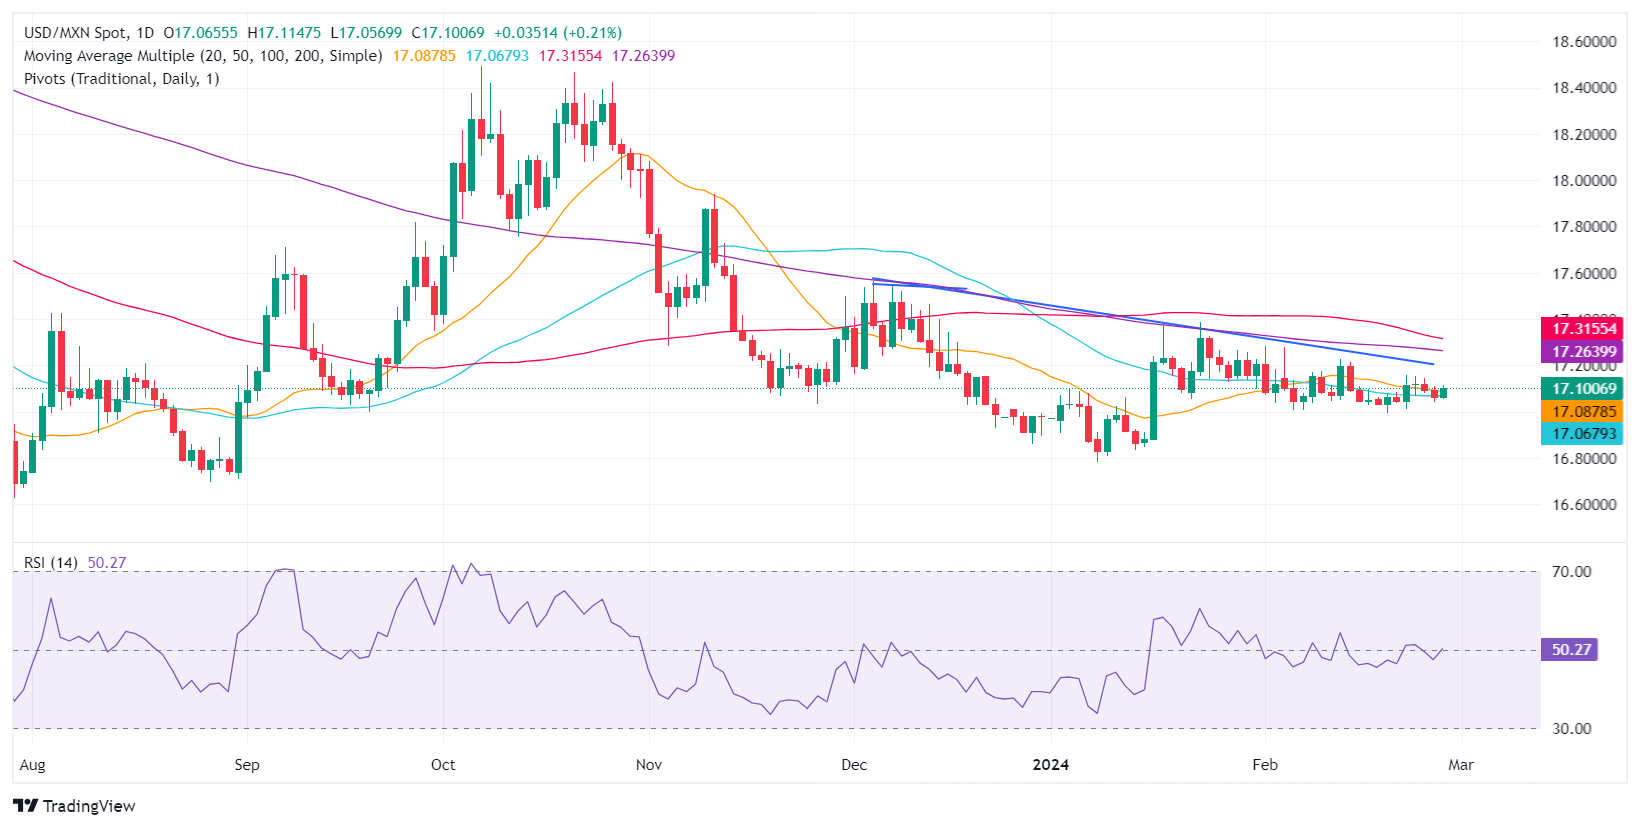
- Mexican Peso declines slightly against the Dollar, traders focus on upcoming Banxico monetary policy insights.
- Market anticipates 75 basis points of rate cuts from Banxico in the first half of 2024, eyeing a shift to 10.50%.
- US economic data and Federal Reserve officials' speeches set the backdrop for MXN's movements against the USD.
Mexican Peso edges lower against the US Dollar on Wednesday, posting modest losses ahead of the Bank of Mexico (Banxico) Q4 2023 report, which would update the view of monetary policy and projections. Data from the United States showed the economy expanded at a slower pace. The USD/MXN exchanges hands at 17.09, up 0.21%.
Mexico’s economic docket is light, except for Banxico’s release. Expectations that the Mexican central bank would ease monetary policy in March remain high with market participants estimating 75 basis points of easing over the next six months. This means the Mexican interest rates, currently standing at 11.25%, would be lowered to 10.50% in the first half of 2024.
Across the border, the US schedule featured the release of Gross Domestic Product (GDP) data for Q4 2023 and Retail and Wholesale Inventories for January. Meanwhile, Federal Reserve (Fed) policymakers will cross the wires, led by regional Fed Presidents Raphael Bostic, Susan Collins and John C. Williams.
Daily digest market movers: Mexican Peso drifts lower ahead of Banxico’s Q4 2023 report
- Mexico’s economy is expected to slow down due to higher interest rates set by Banxico at 11.25%. That’s the main reason that sparked a shift in three of the five governors of the Mexican Central Bank, who are eyeing the first rate cut at the March 21 meeting.
- In that event, the Mexican Peso could depreciate, opening the door for further upside on the USD/MXN pair.
- The latest inflation report in Mexico showed that headline and underlying inflation continued to dip toward Banxico’s goal of 3%, plus or minus 1%, while economic growth exceeded estimates but finished below Q3’s 3.3%.
- Mexico’s economic data released during the week from February 26 to March 1.
- The Balance of Trade for January revealed the country posted a trade deficit of $302 million.
- Mexico’s Consumer Price Index (CPI) in the first half of February was 4.45%, down from 4.9% YoY.
- Mexico’s Core CPI slowed from 4.78% to 4.63% on an annual basis.
- Mexico’s GDP for Q4 2023 exceeded estimates of 2.4% YoY and hit 2.5%, less than Q3 2023 print of 3.3%.
- Economic trade issues between Mexico and the US could depreciate the Mexican currency if the Mexican government fails to resolve its steel and aluminum dispute with the United States. US Trade Representative Katherine Tai warned the US could reimpose tariffs on the commodities.
- Across the border, Gross Domestic Product (GDP) for the last quarter of 2023 missed estimates by a tick, though it came at 3.2% YoY, down from Q3 4.9%.
- US Retail Sales Inventories rose 0.3% MoM in January, below 0.4% in the previous month's data, while Wholesale Inventories declined -0.1% MoM, missing estimates of 0.1%
- In January, US Durable Goods Orders significantly declined to -6.1% MoM, exceeding the anticipated contraction of -4.5% and marking a steeper fall compared to December's -0.3% decrease.
- In December, the S&P/Case-Shiller Home Price Index indicated a monthly decline of -0.3%, a slight acceleration in the contraction pace from November's -0.2%. On an annual basis, home prices rose by 6.1%, surpassing both expectations and the growth rate from the previous month.
- Market players had trimmed the odds for the first 25 basis point (bps) rate cut in June, with odds lying at 49%, down from 53% a day ago, while 39% of investors expected the Fed to keep rates unchanged at the current level of 5.25%-5.50%.
Technical analysis: Mexican Peso trips down as USD/MXN meanders above 50-day SMA
The USD/MXN is trading above the 50-day Simple Moving Average (SMA), which stands at 17.06, after the pair posted three days of losses. Relative Strength Index (RSI) studies are about to turn bullish, which could exacerbate a leg up toward the 17.10 area. Once cleared, traders could target 17.20. Further upside would be expected if buyers reclaim the 200-day SMA at 17.25 and the 100-day SMA at 17.33.
On the flip side, if USD/MXN drops below the 50-day SMA, look for a challenge of the 17.00 mark. A breach of the latter, and the pair would tumble to test yearly lows of 16.78, followed by last year’s low of 16.62.
USD/MXN Price Action – Daily Chart
Mexican Peso FAQs
What key factors drive the Mexican Peso?
The Mexican Peso (MXN) is the most traded currency among its Latin American peers. Its value is broadly determined by the performance of the Mexican economy, the country’s central bank’s policy, the amount of foreign investment in the country and even the levels of remittances sent by Mexicans who live abroad, particularly in the United States. Geopolitical trends can also move MXN: for example, the process of nearshoring – or the decision by some firms to relocate manufacturing capacity and supply chains closer to their home countries – is also seen as a catalyst for the Mexican currency as the country is considered a key manufacturing hub in the American continent. Another catalyst for MXN is Oil prices as Mexico is a key exporter of the commodity.
How do decisions of the Banxico impact the Mexican Peso?
The main objective of Mexico’s central bank, also known as Banxico, is to maintain inflation at low and stable levels (at or close to its target of 3%, the midpoint in a tolerance band of between 2% and 4%). To this end, the bank sets an appropriate level of interest rates. When inflation is too high, Banxico will attempt to tame it by raising interest rates, making it more expensive for households and businesses to borrow money, thus cooling demand and the overall economy. Higher interest rates are generally positive for the Mexican Peso (MXN) as they lead to higher yields, making the country a more attractive place for investors. On the contrary, lower interest rates tend to weaken MXN.
How does economic data influence the value of the Mexican Peso?
Macroeconomic data releases are key to assess the state of the economy and can have an impact on the Mexican Peso (MXN) valuation. A strong Mexican economy, based on high economic growth, low unemployment and high confidence is good for MXN. Not only does it attract more foreign investment but it may encourage the Bank of Mexico (Banxico) to increase interest rates, particularly if this strength comes together with elevated inflation. However, if economic data is weak, MXN is likely to depreciate.
How does broader risk sentiment impact the Mexican Peso?
As an emerging-market currency, the Mexican Peso (MXN) tends to strive during risk-on periods, or when investors perceive that broader market risks are low and thus are eager to engage with investments that carry a higher risk. Conversely, MXN tends to weaken at times of market turbulence or economic uncertainty as investors tend to sell higher-risk assets and flee to the more-stable safe havens.
Boston Federal Reserve (Fed) President Susan Collins still expects the Fed to begin easing later this year, but progress on inflation has slowed and policymakers need to wait for more evidence that the road to 2% remains clear.
Key highlights
- Need to see more evidence that the disinflationary process will continue before carefully normalizing policy.
- More time is needed to discern if the economy is sustainably on the path to stability, while still maintaining a healthy labor market.
- Fed's Collins wants to see continued evidence that wage growth is not contributing to inflation.
- Return to 2% likely requires a moderating of the pace of demand growth.
- Looking for well-anchored inflation expectations and an orderly moderation in labor demand.
- Wants to see continued declines in housing price inflation and non-shelter services inflation.
- The threat of inflation remaining above 2% has receded.
- EIA reported another Crude Oil inventory build.
- The API also reported an increase in barrel counts late Tuesday.
- OPEC officially weighs extending Q1 production caps through Q2.
West Texas Intermediate (WTI) US Crude Oil found further room on the top end on Wednesday, briefly climbing above $79.00 before getting pulled back down by another surprise buildup in US Crude Oil inventories according to the Energy Information Administration (EIA). The EIA’s uptick in barrel counts adds to another reported buildup from the American Petroleum Institute (API) which came through late Tuesday.
According to the EIA, US Crude Stocks Change for the week ended February 23 rose 4.199 million barrels, above the 2.743 million forecast and adding to the previous week’s 3.514 million buildup. This also adds to the API Weekly Crude Oil Stock count for the same period, which added another 8.428 million barrels compared to the previous week’s 7.168 million.
With inventories on the rise, the Organization of the Petroleum Exporting Countries (OPEC) has extended the first quarter’s production caps through June, and the Crude Oil cartel is formally weighing extending pumping reductions through the second quarter. The consortium is trying to bolster Crude prices by stemming the tide of Crude Oil supply getting pumped into markets by non-OPEC countries, specifically the US which recently became the single largest exporter of Crude Oil to Europe.
WTI technical outlook
WTI briefly tested into its highest prices since late November, etching in a daily high of $79.27 before falling back into the low end for Wednesday.
WTI continues to run aground of the 200-day Simple Moving Average (SMA) at $77.67. US Crude Oil is struggling to develop further bullish momentum, but is still up around 9% from the last swing low into $72.00 in early February.
WTI hourly chart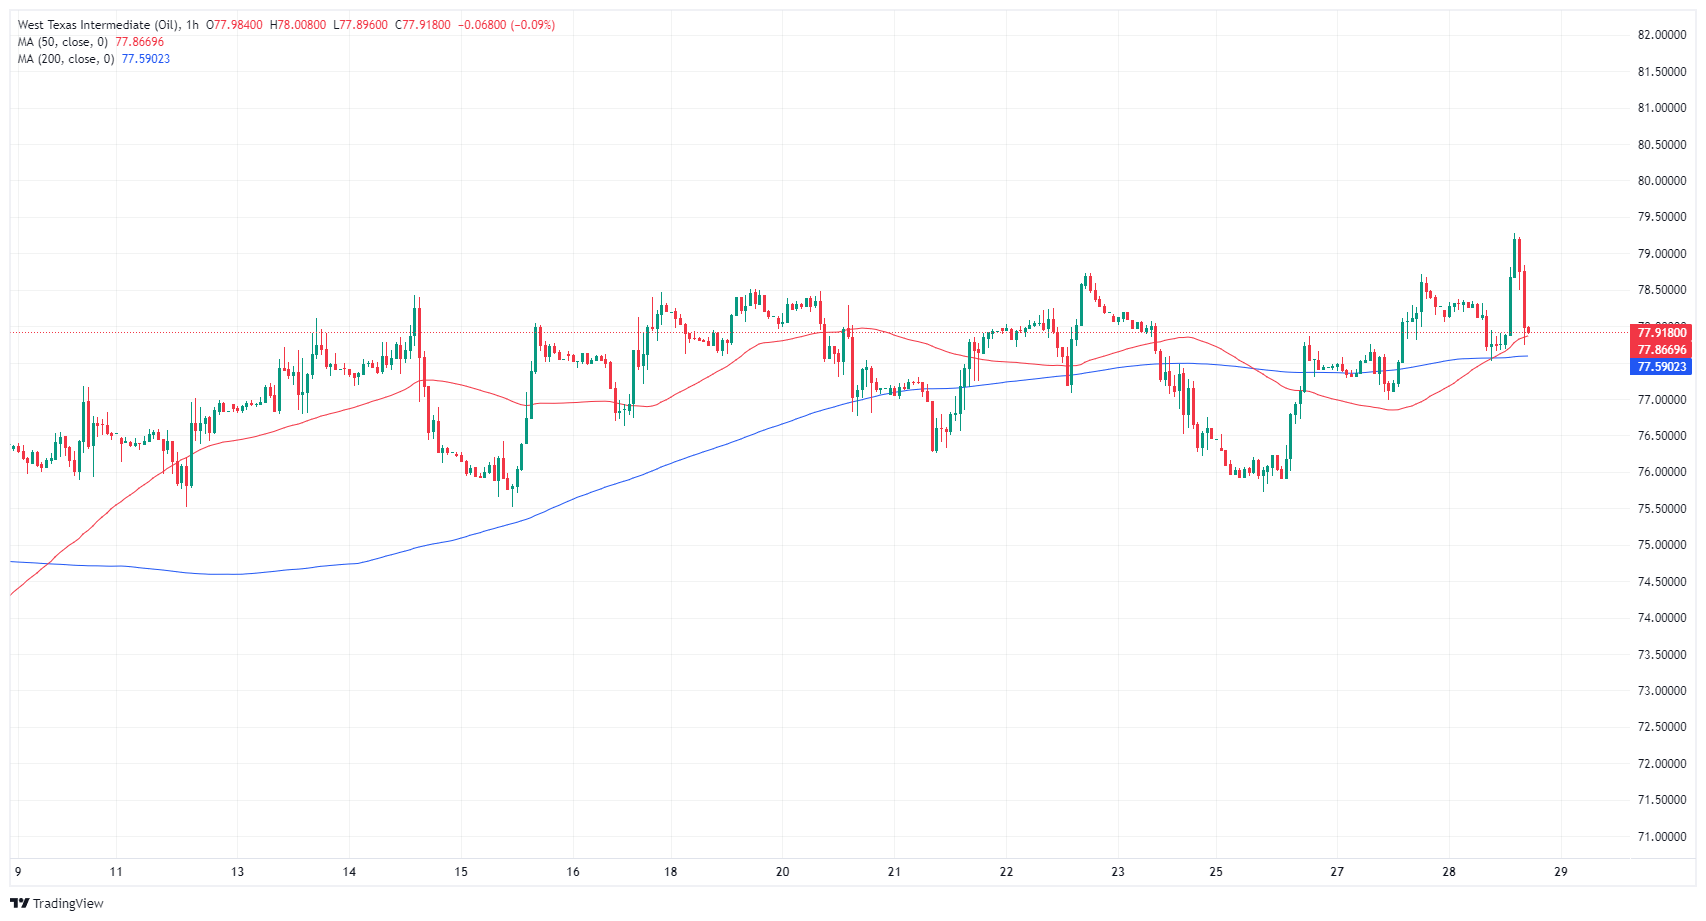
WTI daily chart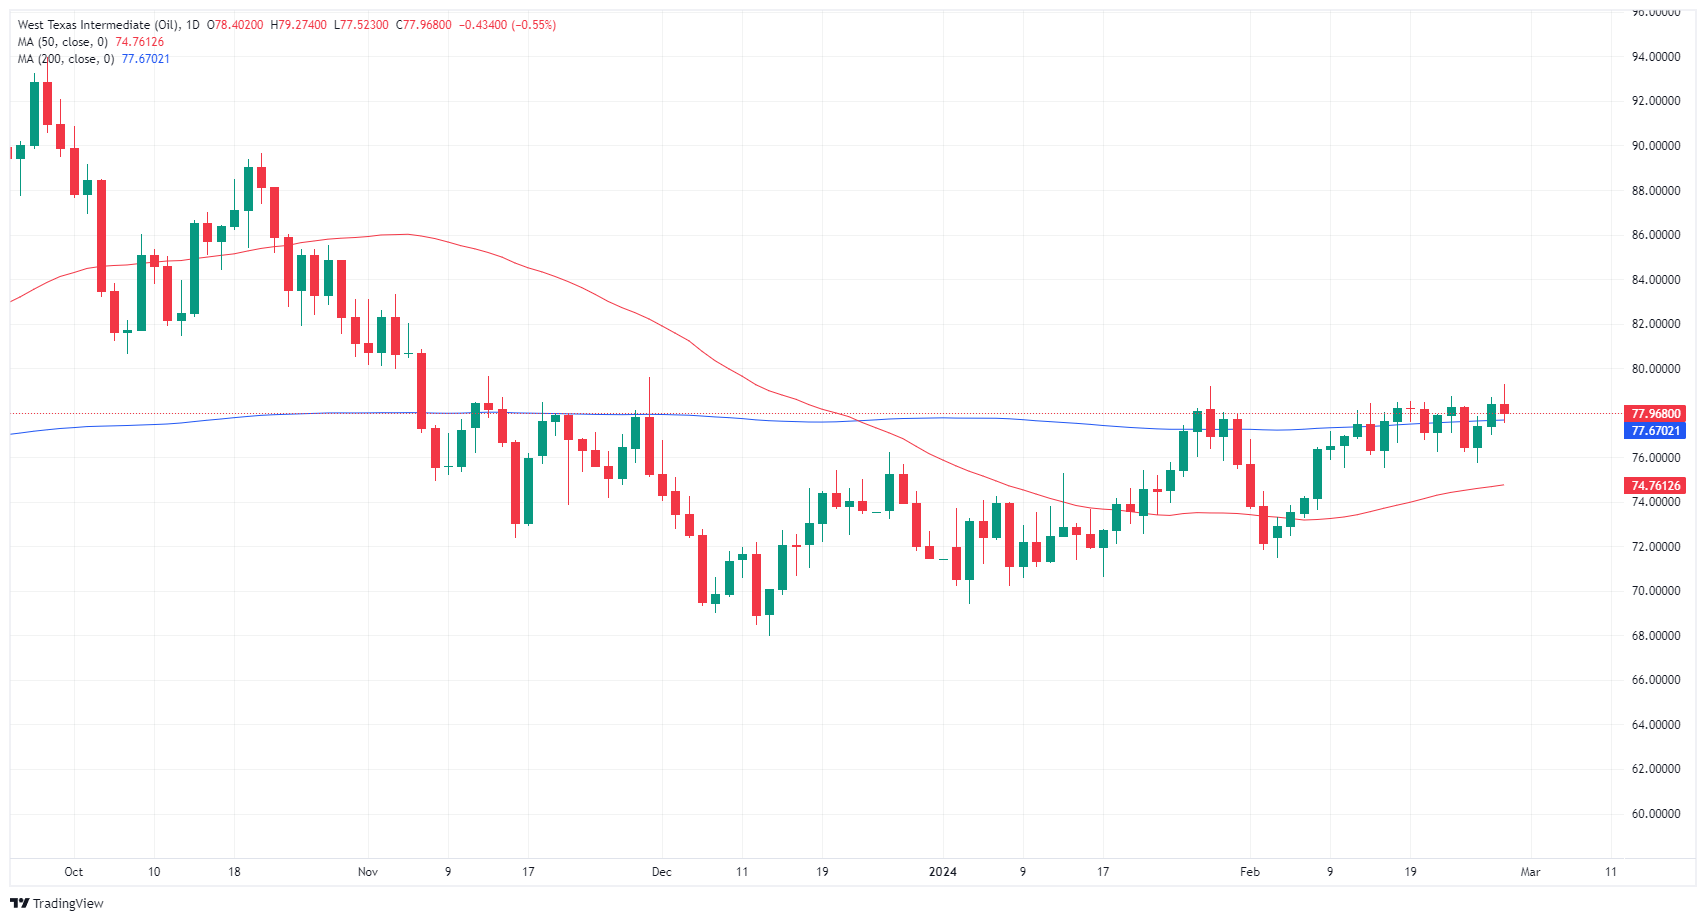
- USD/CAD flubs recovery above 1.3600 due to mixed US Q4 GDP.
- Canada sees soured Current Account print that misses expectations.
- Thursday’s Canada GDP to be eclipsed by US PCE.
USD/CAD saw an early Wednesday rally above the 1.3600 handle pull back into recent congestion after US Gross Domestic Product (GDP) figures were mixed on release. Markets will be pivoting to focus on Thursday’s US Personal Consumption Expenditure Price Index (PCE) as the Federal Reserve’s (Fed) inflation metric of choice.
Canada saw a worse-than-expected print in the fourth quarter Current Account, but the figure still recovered from the previous decline. Canadian Q4 GDP is also slated for Thursday, but it is set to be entirely overshadowed by the US PCE inflation update.
Daily digest market movers: USD/CAD sours but still on the high side
- Canada’s Q4 Current Account came in at -1.62 billion, missing the forecast recovery of -1.25 billion but still improved on the previous quarter’s -4.74 billion, which was revised lower from -3.22 billion.
- US Q4 GDP accelerated QoQ to 1.7% from the previous 1.5%.
- Annualized Q4 US GDP ticked lower to 3.2% from the steady forecast of 3.3% after late revisions to Q1 GDP dragged the yearly average lower.
- Read more: US Q4 GDP growth revised lower to 3.2% from 3.3%.
- Early US PCE numbers came in slightly higher than expected, with QoQ Core PCE for Q4 rising to 2.1% from the forecasted flat print at 2.0%, and PCE Prices ticked up to 1.8% from the expected flat print at 1.7%.
- Markets will be pivoting to Thursday’s US PCE Price Index, scheduled for 13:30 GMT.
- US Core PCE Preview: Forecasts from nine major banks, a hot reading.
- Core PCE Price Index for the year ended January is forecast to tick down to 2.8% from the previous 2.9%.
- Q4’s Canadian GDP Annualized is expected to rebound to 0.8% from the previous -1.1%.
Canadian Dollar price today
The table below shows the percentage change of Canadian Dollar (CAD) against listed major currencies today. Canadian Dollar was the weakest against the US Dollar.
| USD | EUR | GBP | CAD | AUD | JPY | NZD | CHF | |
| USD | 0.08% | 0.21% | 0.24% | 0.74% | 0.19% | 1.31% | 0.09% | |
| EUR | -0.06% | 0.15% | 0.17% | 0.69% | 0.12% | 1.25% | 0.03% | |
| GBP | -0.21% | -0.15% | 0.03% | 0.54% | -0.03% | 1.11% | -0.12% | |
| CAD | -0.24% | -0.18% | -0.05% | 0.51% | -0.05% | 1.05% | -0.12% | |
| AUD | -0.76% | -0.70% | -0.55% | -0.52% | -0.58% | 0.57% | -0.66% | |
| JPY | -0.18% | -0.15% | 0.02% | 0.06% | 0.57% | 1.15% | -0.09% | |
| NZD | -1.33% | -1.28% | -1.14% | -1.10% | -0.58% | -1.16% | -1.25% | |
| CHF | -0.09% | -0.03% | 0.12% | 0.15% | 0.63% | 0.09% | 1.23% |
The heat map shows percentage changes of major currencies against each other. The base currency is picked from the left column, while the quote currency is picked from the top row. For example, if you pick the Euro from the left column and move along the horizontal line to the Japanese Yen, the percentage change displayed in the box will represent EUR (base)/JPY (quote).
Technical analysis: USD/CAD hesitates on the top end after testing 1.3600
USD/CAD rallied on Wednesday, briefly crossing the 1.3600 handle before paring back into recent technical levels. The pair found a fresh ten-week high at 1.3606, but 1.3580 remains a tricky barrier to break.
Daily candlesticks continue to etch out a rough pattern of higher highs as momentum runs aground of the 200-day Simple Moving Average (SMA) at 1.3478. Despite near-term congestion, USD/CAD has closed in the green for all but one of the last eight consecutive weeks.
USD/CAD hourly chart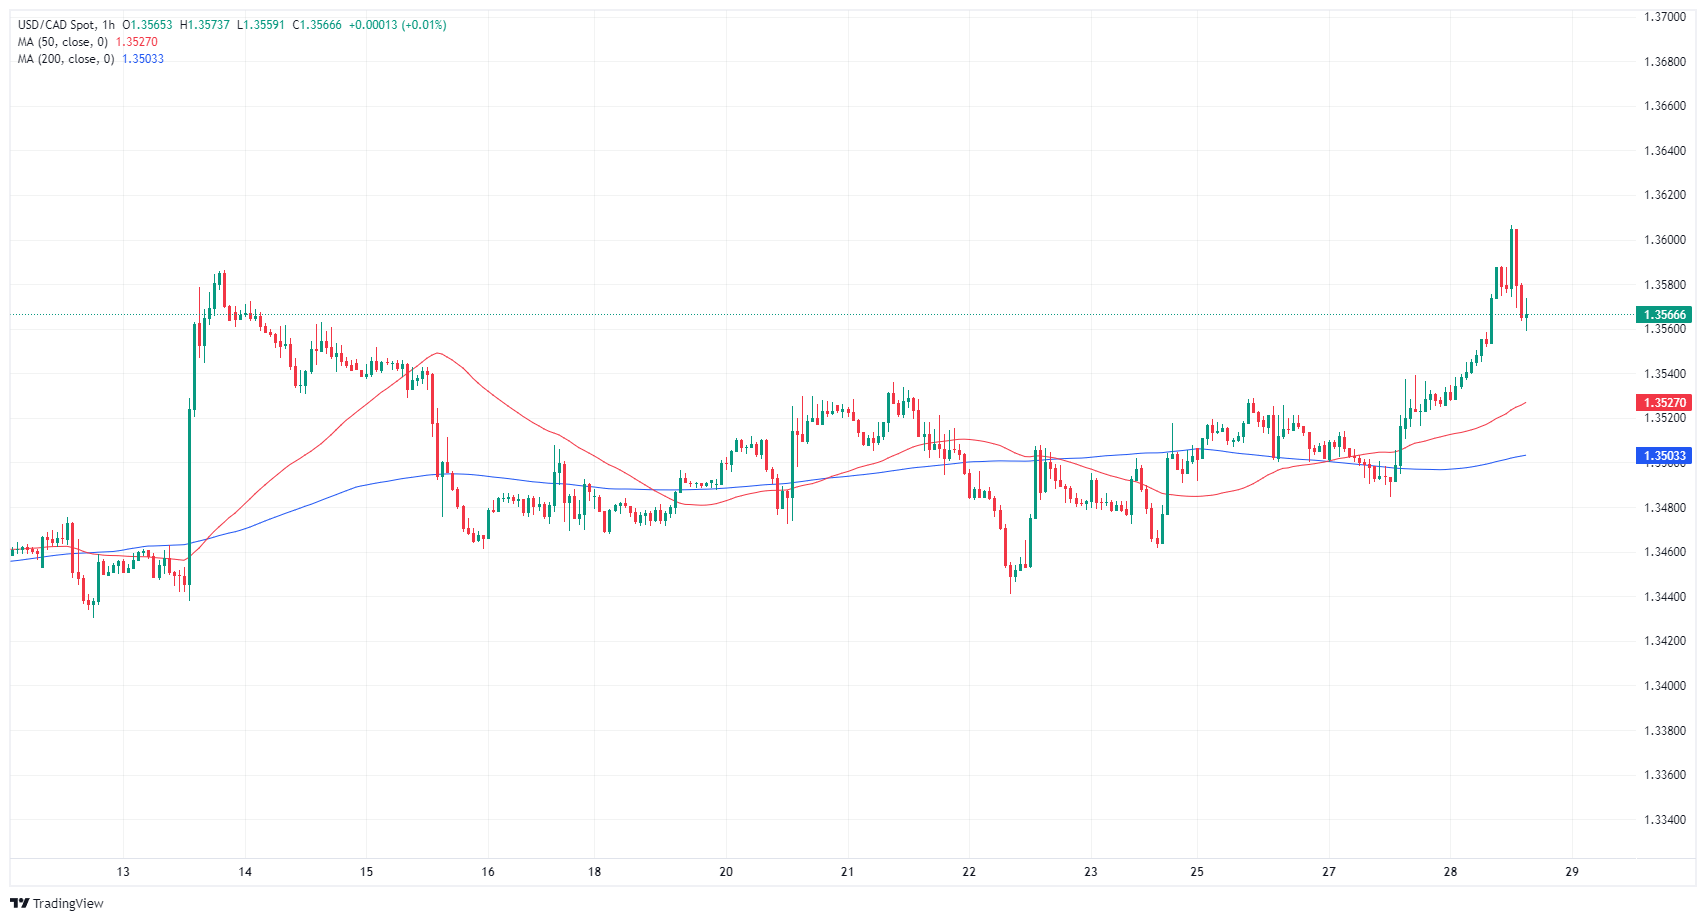
USD/CAD daily chart
Canadian Dollar FAQs
What key factors drive the Canadian Dollar?
The key factors driving the Canadian Dollar (CAD) are the level of interest rates set by the Bank of Canada (BoC), the price of Oil, Canada’s largest export, the health of its economy, inflation and the Trade Balance, which is the difference between the value of Canada’s exports versus its imports. Other factors include market sentiment – whether investors are taking on more risky assets (risk-on) or seeking safe-havens (risk-off) – with risk-on being CAD-positive. As its largest trading partner, the health of the US economy is also a key factor influencing the Canadian Dollar.
How do the decisions of the Bank of Canada impact the Canadian Dollar?
The Bank of Canada (BoC) has a significant influence on the Canadian Dollar by setting the level of interest rates that banks can lend to one another. This influences the level of interest rates for everyone. The main goal of the BoC is to maintain inflation at 1-3% by adjusting interest rates up or down. Relatively higher interest rates tend to be positive for the CAD. The Bank of Canada can also use quantitative easing and tightening to influence credit conditions, with the former CAD-negative and the latter CAD-positive.
How does the price of Oil impact the Canadian Dollar?
The price of Oil is a key factor impacting the value of the Canadian Dollar. Petroleum is Canada’s biggest export, so Oil price tends to have an immediate impact on the CAD value. Generally, if Oil price rises CAD also goes up, as aggregate demand for the currency increases. The opposite is the case if the price of Oil falls. Higher Oil prices also tend to result in a greater likelihood of a positive Trade Balance, which is also supportive of the CAD.
How does inflation data impact the value of the Canadian Dollar?
While inflation had always traditionally been thought of as a negative factor for a currency since it lowers the value of money, the opposite has actually been the case in modern times with the relaxation of cross-border capital controls. Higher inflation tends to lead central banks to put up interest rates which attracts more capital inflows from global investors seeking a lucrative place to keep their money. This increases demand for the local currency, which in Canada’s case is the Canadian Dollar.
How does economic data influence the value of the Canadian Dollar?
Macroeconomic data releases gauge the health of the economy and can have an impact on the Canadian Dollar. Indicators such as GDP, Manufacturing and Services PMIs, employment, and consumer sentiment surveys can all influence the direction of the CAD. A strong economy is good for the Canadian Dollar. Not only does it attract more foreign investment but it may encourage the Bank of Canada to put up interest rates, leading to a stronger currency. If economic data is weak, however, the CAD is likely to fall.
The Fed’s preferred inflation gauge, the Core Personal Consumption Expenditure (PCE), will be released by the US Bureau of Economic Analysis (BEA) on Thursday, February 29 at 13:30 GMT and as we get closer to the release time, here are the forecasts of economists and researchers of nine major banks.
Core PCE price index is expected to have grown by 0.4% on a month-on-month basis in January against a 0.2% increase in December. If so, it would be the largest gain since last January. Annually, the underlying inflation data is forecast to have fallen a tick to 2.8%. Meanwhile, headline PCE is expected to fall two ticks to 2.4% YoY.
Commerzbank
We forecast a core rate of 0.4% MoM, i.e. an annualised rate of around 5%. This would be a significant setback for those expecting a rapid return of inflation to the Fed's 2% target. Some special effects may have played a role here, so a smaller increase is to be expected in February. However, January's data will reinforce our view that, on balance, inflation is falling only slowly and should eventually stabilise above the Fed's target.
ING
The core (ex-food & energy) personal consumer expenditure deflator is set to post a 0.4% MoM increase. We need to see MoM prints consistently below 0.2% MoM to be confident that inflation will return to the 2% YoY target over time, and we have been making excellent progress with six out of the past seven months seeing inflation come in sub 0.2%. However, the January PPI and CPI reports suggest that key components within the PCE deflator will post outsized increases this month with insurance, medical and portfolio management fees boosting inflation. Much of this isn’t especially driven by fundamental demand and supply factors – insurance is caused by higher crime relating to more expensive assets while strong equity market gains have boosted portfolio fees – but it presents a major stumbling block regarding the prospect of interest rate cuts. We are hopeful that February will post better numbers.
Deutsche Bank
We expect core PCE to show +0.36% MoM growth in January. This would make it the highest since last January. The fact that last January was 0.51% means that rolling out base effects should help the YoY rate edge down a tenth to 2.8%. However, it's the monthly print that will be all important.
TDS
Robust increases in Jan CPI/PPI data will likely result in a solid 0.36% MoM jump for the core PCE – its largest increase since 23Q1. The PCE's supercore likely also surged 0.55%, while we project the headline PCE to rise by a less solid 0.28% MoM. Firm inflation supports the Fed's desire to be patient before cutting rates.
NBF
The annual core PCE deflator may have progressed 0.4% MoM in January, a result which should translate into a one-tick decline of the 12-month rate to 2.8%. Although still above the Fed, this would still be the lowest rate observed in 34 months.
SocGen
The Fed may favour the PCE deflator over the CPI as an inflation measure, but confidence that inflation is moderating and can sustain the desired 2% pace will require all the inflation evidence to offer consistent views. The latest CPI for January shook confidence to the extent that CPI-core inflation was no longer converging upon the lower PCE inflation trend. It could be a one-month piece of noise. Unfortunately, we are expecting the PCE to be more elevated versus recent months as well. Not only were the CPI components that feed directly into the PCE up but healthcare costs and financial costs available in the PPI were also up. The risk may be on the core PCE, where we estimate a 0.4% MoM increase, but that is a rounded figure, and our estimate is closer to 0.36%. Rounding down versus rounding up could be the key to how markets react to the immediate release.
CIBC
We expect core PCE numbers to be a hot one with a 0.4% MoM reading based on the CPI and PPI data. Markets should not be too surprised with a hot core PCE reading given it’s the consensus view so we don’t expect much overreaction. Most Fed speakers have emphasized that cuts are not imminent and the pace of easing is going to be gradual.
Citi
Surprising strength in services prices across the board in both CPI and PPI data lead Cus to forecast similar strength in core PCE inflation in January, with a 0.38% MoM increase and the YoY reading moderating only slightly to 2.8%. This would also imply the 6-month annualized pace rises to 2.4% from 1.9%. Details of core PCE should also echo strength in services prices, with core services excluding shelter rising 0.55%, the strongest monthly pace since March 2022. On the other hand, goods prices should decline in core PCE, but less so than in core CPI.
Wells Fargo
We look for the headline deflator to slip to a year-ago rate of 2.4% and the core measure to fall further to 2.8%. However, the hot January CPI and PPI data suggest firmer monthly prints for both the headline and core (0.3% and 0.4%, respectively), driven by broad-based strength in services. We expect services less energy, food and housing to rise 0.6% in January, lifting the three-month annualized rate to 4.2%. Given services remain key to getting inflation on a sustained trajectory lower, it will likely prevent imminent rate cuts from the Fed.
Next week brings the UK budget. The budget has the potential to impact the Pound Sterling (GBP) – which is currently the second best performing G10 currency in 2024 after the US Dollar, economists at Rabobank say.
EUR/GBP to edge lower to 0.8500 on a three-month view
The market is likely prepared for a moderate amount of fiscal loosening next week. Press reports suggest that this may include fresh changes to National Insurance, rather than income tax. Even a low level of fiscal stimulus would likely reinforce the consensus view that the BoE would likely be in a rush to cut interest rates.
Of particular interest to the market could be any supply-side reforms that could increase incentives to work or regulation changes that could enhance incentives to invest. While any increase in the labour pool would be anti-inflationary, such policies would be pro-growth and are thus likely to be seen as GBP-friendly.
Assuming that budgetary prudence is adhered to by Chancellor Hunt and maintained in the pledges of the opposition, we expect EUR/GBP to edge lower to 0.8500 on a three-month view before moving down to 0.8400 on a six-month view.
- EUR/USD declines amid signs of US economic resilience, despite slight GDP adjustment to 3.2% YoY.
- Fed's inflation measure, PCE, anticipated to show deceleration, potentially impacting rate cut expectations.
- Eurozone economic sentiment dips, highlighting stagnation as traders await critical Eurozone inflation figures.
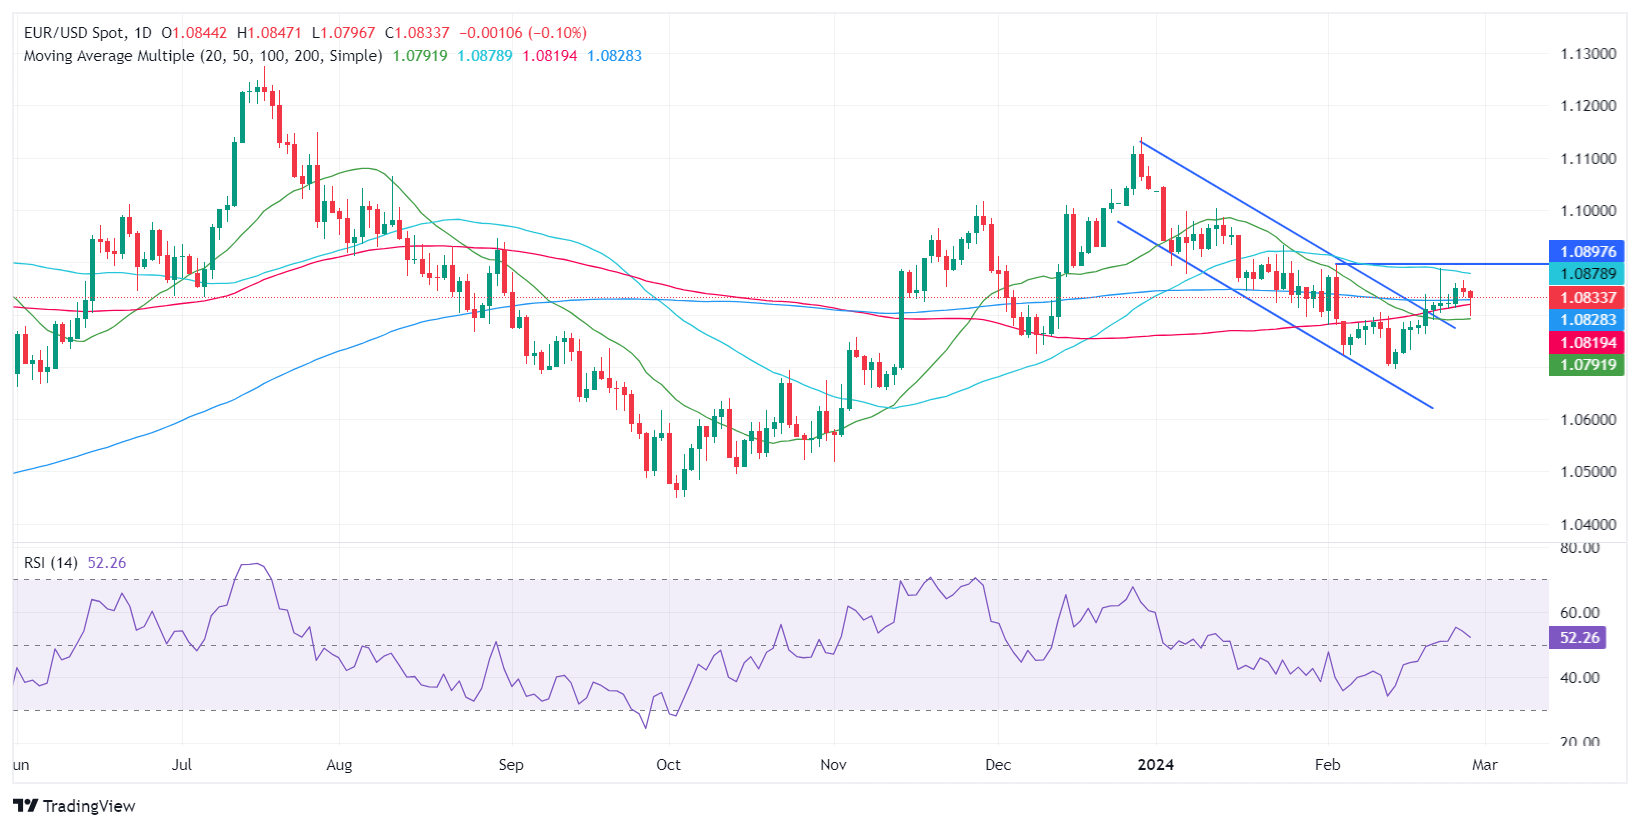
The Euro stumbles for the second straight day against the US Dollar as investors assess recent data from the United States, revealing the economy remains strong. At the time of writing, the EUR/USD edges lower 0.12% and exchanges hands at 1.0830.
EUR/USD falls as US GDP shows economy losses momentum, inflation data in focus
The US Bureau of Economic Analysis (BEA) reported the second estimate of the Gross Domestic Product (GDP) for the last quarter of 2023, coming a tenth lower at 3.2% YoY compared to the 3.3% preliminary reading. Although the economy remains robust, recent data suggests the economy is losing momentum, as Retail Sales and Durable Goods Orders declined in January.
EUR/USD traders’ eyes are laser-focused on the release of the inflation figures for January. The Federal Reserve’s (Fed) preferred gauge for inflation is the Personal Consumption Expenditure (PCE). The consensus sees the PCE at 2.4% YoY and the Core PCE at 2.8%, with both cases slowing compared to December’s data.
If the data eases, look for a more aggressive re-pricing of rate cut expectations by the swaps market, which converged towards the Fed’s projections of three rate cuts towards the end of 2024.
Across the pond, the Eurozone economy is stagnating, as Economic Sentiment fell again in February, from 96.1 to 95.4, below estimates of an improvement to 96.7. According to ING analysts, “The eurozone economy has been stagnant since late 2022, and surveys have shown that there is no meaningful improvement happening in the first quarter.” In the meantime, traders would be eyeing the release of the latest inflation data from the Eurozone, with estimates for the Harmonized Index of Consumer Prices (HICP) at 2.5%, while core HICP at 2.9%.
EUR/USD Price Analysis: Technical outlook
From a technical perspective, the EUR/USD is trading sideways, though in the last couple of days, achieved remained above the 200-day moving average (DMA), which lies at 1.0827. A daily close above that level could pave the way to test the 50-DMA at 1.0878 before testing 1.0900. On the flip side, a daily close below the aforementioned level could pave the way to test the 1.0800 mark.
Economists at HSBC see modest downside risks for the Euro (EUR) and the Pound Sterling (GBP).
The ECB and BoE are likely to pivot more explicitly towards policy easing in the months ahead
We expect the start of the rate-cut cycles in 2024 to be mildly negative for both EUR and GBP, even if markets have currently priced in rate cuts, as they had been in previous cycles.
We expect the first rate cut from the Fed and the ECB in June, while August is more likely for the BoE. Neither the ECB nor the BoE is likely to deliver idiosyncratic rate cuts, but both could end up with a more dovish cycle than the Fed, weighing on their currencies.
At the same time, the global economy is expected to slow this year, so risk sentiment is unlikely to improve significantly. As such, support for both currencies is set to be limited.
Given the circumstances, we expect both the EUR and GBP to weaken modestly against the USD in 2024.
The Reserve Bank of New Zealand (RBNZ) held its Official Cash Rate (OCR) unchanged. Economists at Danske Bank analyze NZD/USD outlook after the decision.
RBNZ holds rates steady
The Reserve Bank of New Zealand (RBNZ) held monetary policy unchanged. In contrast to other G10 central banks eyeing the start of their respective rate cutting cycles, markets have speculated on an additional rate hike from the RBNZ, but the tone of today's announcement was clearly to the dovish side, suggesting that the current level of policy rate is seen as sufficiently restrictive.
We expect NZD/USD to decline further over the coming year, with a 12M target at 0.5700.
The FOMC has kept rates on hold since its last rate hike in July. Economists at ABN Amro still expect the Fed to start cutting rates from June.
Upper bound of the FFR to reach 4.25% by end-2024, and 3% by mid-2025
We expect the Fed to start cutting rates in June, with the risk somewhat tilted to earlier cuts.
Even with rate cuts starting next year, monetary policy is expected to remain restrictive throughout 2024 and even into 2025.
We expect the upper bound of the fed funds rate to reach 4.25% by end-2024, and 3% by mid-2025.
The Fed also looks set to wind down its quantitative tightening somewhat sooner than previously expected, though this will be well-telegraphed and gradual.
The US Dollar Index (DXY) recovers above 104.00. Economists at Scotiabank analyze Greenback’s outlook.
Spreads have moved only marginally in the USD’s favour over the past month
Although markets continue to reprice Fed rate cut risks in the coming months (Fed swaps imply only 75 bps of easing through the end of the year now, about half of what was priced in at the start of February), this is not an obvious driver of USD gains because implied rate cuts by other central banks have been slashed as well.
Spreads have moved only marginally (5-6 bps for 2Y spreads) in the USD’s favour over the past month and the DXY is still trading above my estimated fair value (based on DXY-weighted yield differentials) which sits at 103.04 today.
There may be little potential for USD gains to develop further, in other words.
- US GDP growth for Q4 is revised lower to 3.2% from 3.3%.
- US Dollar Index stays in positive territory above 104.00.
The United States' Gross Domestic Product (GDP) grew at an annual rate of 3.2% in the fourth quarter, the US Bureau of Economic Analysis (BEA) said in its second estimate on Wednesday. The BEA reported in its advanced estimate the real GDP growth was 3.3%.
"The update primarily reflected a downward revision to private inventory investment that was partly offset by upward revisions to state and local government spending and consumer spending," the BEA explained in the press release.
Market reaction
The US Dollar Index (DXY) edged slightly lower with the immediate reaction and was last seen rising 0.26% on the day at 104.07.
EUR/USD looks soft again in the low 1.0800s. Economists at Scotiabank analyze the pair’s outlook.
Support below the 1.0800 figure should firm up in the 1.0770/1.0790 zone
EURUSD’s loss of minor support around 1.0850 added to the negative undertone for price action on the short-term chart.
EUR losses have steadied around the 1.0800 level but the rebound in price, so far, has been limited.
A rebound back through 1.0835 resistance intraday will ease bearish pressure on the EUR and put a move back up to the mid/upper 1.0800s on the cards.
EUR support below the figure should firm up in the 1.0770/1.0790 zone.
USD/CAD is retesting the mid-February high at 1.3590. Economists at Scotiabank analyze the pair’s outlook.
Loonie likely to remain soft for now
The Canadian Dollar is likely to remain soft for now, with little fundamental incentive for the CAD to strengthen, given the recent widening in US/Canada interest rate differentials.
Solid gains on the day have reinvigorated short-term trend strength oscillators in the USD’s favour but the overall trend in spot through February remains flat and the USD will need to push on through 1.3585/1.3590 to see gains develop just a little more through to the low/mid 1.3600s.
Support is 1.3540/1.3550.
- The US Dollar trades in the green across the board.
- Market sentiment turns into risk-off, with equities in the red in both Asia and Europe.
- The US Dollar Index recovers above 104.00, posting a fresh five-day high.
The US Dollar (USD) is recovering on Wednesday to a five-day high driven by safe-haven inflows. Markets got shaken by a mix of elements coming from China and New Zealand. In China, additional measures were issued to support the housing, leisure and gaming sector, although stimulus was far less than what markets were expecting.
On the economic front, markets had to digest a surprisingly dovish stance from the Reserve Bank of New Zealand (RBNZ), which limited the odds of future rate hikes. In the US calendar, all eyes will be on the second reading for the US Gross Domestic Product (GDP) for the fourth quarter, although not much movement is expected. Rather, some volatility can be expected near the European close as no less than three Fed speakers will take the stage within a one-hour timeframe.
Daily digest market movers: Risk off sets the scene
- Ahead of the US session, some European Central Bank (ECB) comments from ECB's Peter Kazimir, who said that disinflation is taking place much quicker than expected, and that there is no reason to rush for a rate cut, with June as best guess from the ECB member.
- The Mortgage Bankers Association (MBA) has released its Mortgage Applications Index for this week. Last week there was a decline of 10.6%, with this week another 5.6% decline.
- At 13:30 GMT, the second reading of the US Gross Domestic Product (GDP) for the fourth quarter will be released:
- Headline GDP is expected to grow at an annualized rate of 3.3%, unchanged from the first estimate.
- Core Personal Consumption Expenditures is also set to remain unchanged from the previous estimate at 2%.
- The quarterly Personal Consumption Expenditures Price Index is expected to remain unchanged at 1.7%.
- Between 17:00 and 17:45 GMT, three US Federal Reserve officials are due to take the stage.
- At 17:00 GMT, Atlanta Fed President Raphael Bostic will speak first.
- Near 17:15 GMT, Boston Fed President Susan Collins will follow.
- At 17:45 GMT, New York Fed President John Williams will take the stage.
- Equities are in the red across the board. Especially the Chinese equities, with both major indices down over 1% after disappointing supportive measures for the construction, leisure and gaming sector. European and US equities are all in the red, though less than 0.50%.
- According to the CME Group’s FedWatch Tool, expectations for a Fed pause in the March 20 meeting are at 99.5%, while chances of a rate cut stand at 0.5%.
- The benchmark 10-year US Treasury Note trades around 4.29%, and is not far off this week’s peak at 4.32%.
US Dollar Index Technical Analysis: Risk remains for another leg lower
The US Dollar Index (DXY) has brushed off over five days of losses, setting a new five-day high on Wednesday. The move comes with the risk-off inflows after both Chinese stimulus measures and a dovish Reserve Bank of New Zealand rate decision disappointed markets. Do bear in mind that month-end flows are often negative for the US Dollar, so current gains possibly will be given up by Thursday.
To the upside, the 100-day Simple Moving Average (SMA) near 104.00 is being tested as its resistance got broken, though could still shape into a bull trap. Should the US Dollar be able to cross 104.60, 105.12 is the next key level to keep an eye on. One step beyond there comes 105.88, the high from November 2023. Ultimately, 107.20 – the high of 2023 – could even come back into scope, but that would be when markets reprice the timing of a Fed rate cut again, possibly delaying it to the last quarter of 2024.
Looking down, the 200-day Simple Moving Average at 103.74 has been broken twice recently, making it a weak support. The 200-day SMA should not let go that easily, so a small retreat back to that level could be more than granted. Ultimately, it will lose its force with the ongoing selling pressure and could fall to 103.16, the 55-day SMA, before testing 103.00.
US Dollar FAQs
What is the US Dollar?
The US Dollar (USD) is the official currency of the United States of America, and the ‘de facto’ currency of a significant number of other countries where it is found in circulation alongside local notes. It is the most heavily traded currency in the world, accounting for over 88% of all global foreign exchange turnover, or an average of $6.6 trillion in transactions per day, according to data from 2022.
Following the second world war, the USD took over from the British Pound as the world’s reserve currency. For most of its history, the US Dollar was backed by Gold, until the Bretton Woods Agreement in 1971 when the Gold Standard went away.
How do the decisions of the Federal Reserve impact the US Dollar?
The most important single factor impacting on the value of the US Dollar is monetary policy, which is shaped by the Federal Reserve (Fed). The Fed has two mandates: to achieve price stability (control inflation) and foster full employment. Its primary tool to achieve these two goals is by adjusting interest rates.
When prices are rising too quickly and inflation is above the Fed’s 2% target, the Fed will raise rates, which helps the USD value. When inflation falls below 2% or the Unemployment Rate is too high, the Fed may lower interest rates, which weighs on the Greenback.
What is Quantitative Easing and how does it influence the US Dollar?
In extreme situations, the Federal Reserve can also print more Dollars and enact quantitative easing (QE). QE is the process by which the Fed substantially increases the flow of credit in a stuck financial system.
It is a non-standard policy measure used when credit has dried up because banks will not lend to each other (out of the fear of counterparty default). It is a last resort when simply lowering interest rates is unlikely to achieve the necessary result. It was the Fed’s weapon of choice to combat the credit crunch that occurred during the Great Financial Crisis in 2008. It involves the Fed printing more Dollars and using them to buy US government bonds predominantly from financial institutions. QE usually leads to a weaker US Dollar.
What is Quantitative Tightening and how does it influence the US Dollar?
Quantitative tightening (QT) is the reverse process whereby the Federal Reserve stops buying bonds from financial institutions and does not reinvest the principal from the bonds it holds maturing in new purchases. It is usually positive for the US Dollar.
GBP/USD slides in line with peers but rebound from low looks constructive, economists at Scotiabank say.
Support is 1.2580/1.2590
Sterling has succumbed to the stronger USD tone, in line with its major currency peers. There are no obvious fundamental drivers for Sterling’s slide, beyond the shift into the USD amid weaker risk assets. The GBP has found firm support around the daily low, however, and may be staging one of the stronger rebounds among its peers as the North American session gets underway.
Intraday chart patterns reflect a low/reversal (bullish outside range) developed on the hourly chart in response to Cable’s drop to 1.2622 a little earlier.
GBP gains through 1.2665/1.2670 on the session should help deepen the rebound to 1.2700+.
Support is 1.2580/1.2590.
Is it time to normalize the BoJ's monetary policy? Ulrich Leuchtmann, Head of FX and Commodity Research at Commerzbank, analyzes how the end of ultra-expansionary monetary policy could impact the Japanese Yen (JPY).
If the BoJ begins to exit in three weeks, JPY may initially benefit
For the Yen, an end to ultra-expansionary monetary policy is a double-edged sword: on the one hand, it means slightly higher JPY carry, but on the other hand, no higher carry in the long run.
In my view, this means that if the BoJ does indeed begin to exit in three weeks, this may initially have a positive effect on the JPY. However, this effect would be limited. At the same time, the chances of at least real (i.e. inflation-adjusted) positive real interest rates would decline.
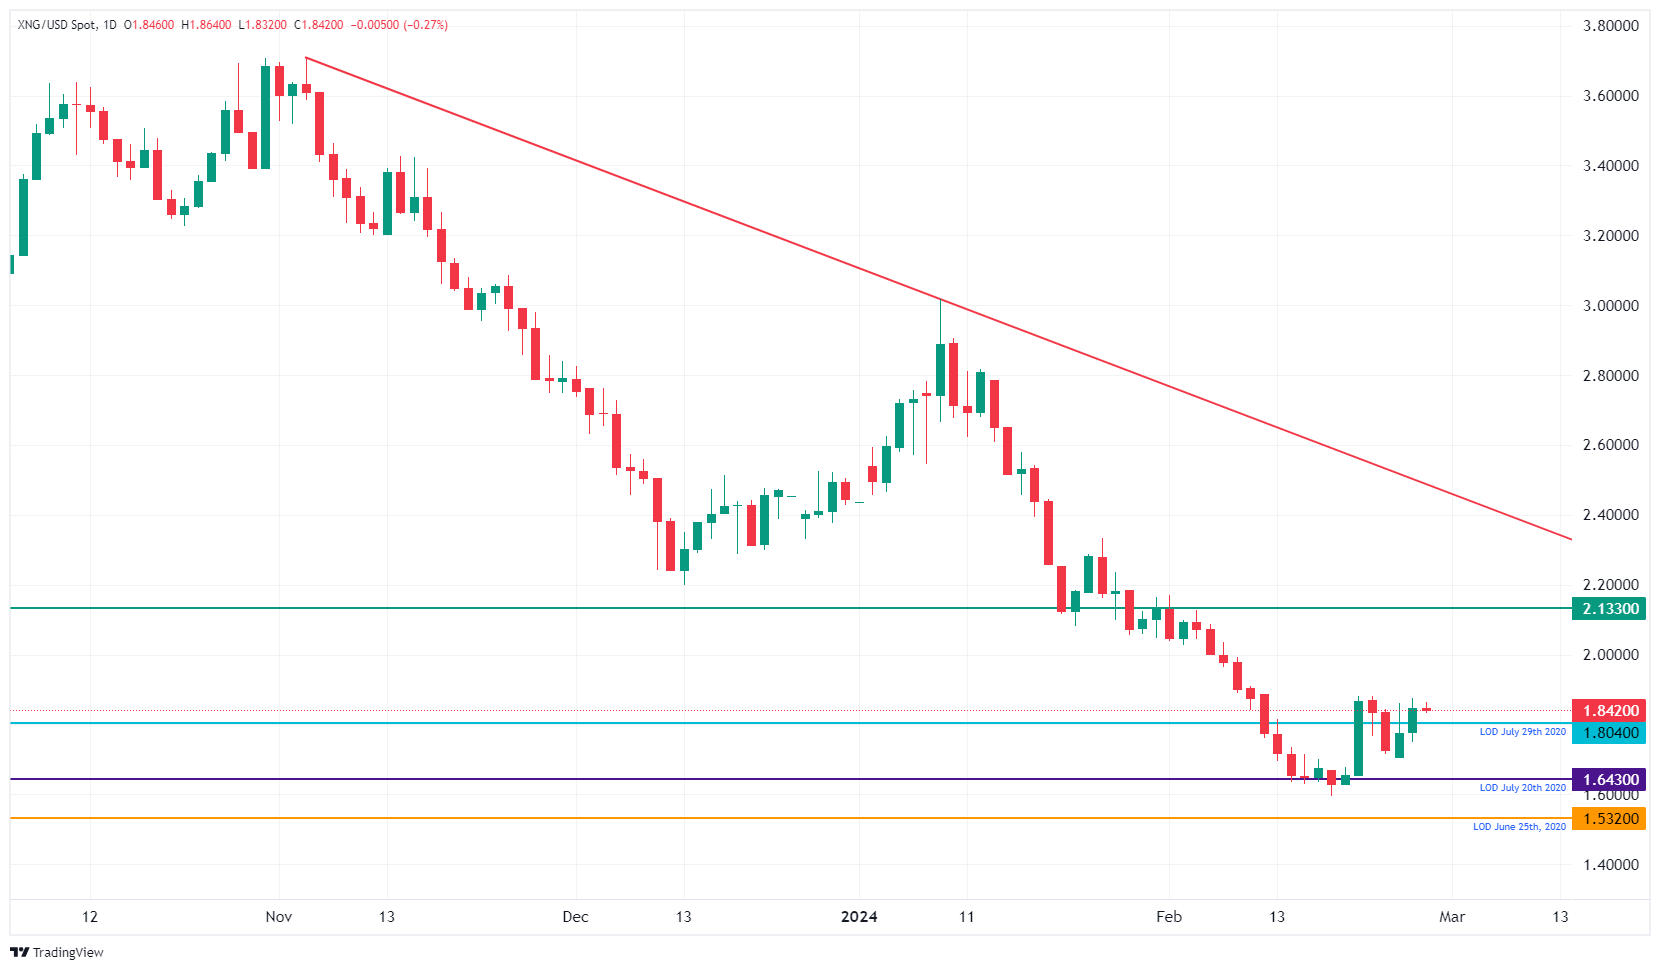
- Natural Gas prices are flat halfway through the European session but with upside potential.
- Traders see the risk of overcrowded demand for cheap European Gas contracts.
- The US Dollar Index rallies above 104.00 and sets a three-day high.
Natural Gas (XNG/USD) is trading back above $1.80 after a two-day winning streak. Traders are seeing more room for some upside with the European Gas trading market becoming very crowded. Due to the recent multi-year low in prices, several foreign traders are making their way into the European Gas trading market, with Asia being very active in buying up contracts.
The US Dollar (USD) is delivering a gut-punch to the markets by stretching to a three-day high in the European trading session. Ahead of the second reading of the US Gross Domestic Product (GDP), the Greenback is making its way back up against most major peers. Risk-off sentiment in Asia was the main trigger for the start of the US Dollar strength this Wednesday.
Natural Gas is trading at $1.84 per MMBtu at the time of writing.
Natural Gas market movers: Europe’s LNG markets get crowded
- Recent declines in European Gas prices have spurred other parts of the world into buying. This could push prices higher in Europe, and spillover into global Gas prices.
- China’s Gas imports are expected to climb by 8.2% this year. Buyers are buying more Gas than needed, especially at current cheap prices.
- Turkey’s Natural Gas imports have declined by 8% in 2023, with Russia being the biggest supplier.
- This Wednesday morning EU President Ursula Von Der Leyen proposed to start using the frozen Russian assets for Ukrainian support.
Natural Gas Technical Analysis: European Gas market getting crowded
Natural Gas in Europe is set to face a hot summer with more and more market participants entering the bloc’s Gas trading market. All new additions are buyers, mainly from Asia, interested in the European Gas market with at the moment multi-year low prices and the guaranteed price cap the EU has put in place to protect households from rising Gas prices after Russia decreased its supplies to Europe. Although Europe looks well equipped to refuel ahead of the next heating season, the risk of some volatile spikes could be on the horizon over the summer period.
On the upside, Natural Gas is facing some pivotal technical levels to get back to. The next step is $1.99, – the level which, when broken on the way down, saw an accelerated decline. After that, the green line at $2.13 comes into view, with the triple bottoms from 2023. If Natural Gas sees sudden demand pick up, $2.40 could come into play.
On the downside, $1.64 and $1.53 (the low of 2020) are targets to look out for. Another leg lower could come if global growth starts to shrink and there is less demand. Add to that equation both the US and Canada trying to free up more volume of Natural Gas mining, and the scale could quickly tip into an oversupplied market with more downside prices at hand.
XNG/USD (Daily Chart)
Natural Gas FAQs
What fundamental factors drive the price of Natural Gas?
Supply and demand dynamics are a key factor influencing Natural Gas prices, and are themselves influenced by global economic growth, industrial activity, population growth, production levels, and inventories. The weather impacts Natural Gas prices because more Gas is used during cold winters and hot summers for heating and cooling. Competition from other energy sources impacts prices as consumers may switch to cheaper sources. Geopolitical events are factors as exemplified by the war in Ukraine. Government policies relating to extraction, transportation, and environmental issues also impact prices.
What are the main macroeconomic releases that impact on Natural Gas Prices?
The main economic release influencing Natural Gas prices is the weekly inventory bulletin from the Energy Information Administration (EIA), a US government agency that produces US gas market data. The EIA Gas bulletin usually comes out on Thursday at 14:30 GMT, a day after the EIA publishes its weekly Oil bulletin. Economic data from large consumers of Natural Gas can impact supply and demand, the largest of which include China, Germany and Japan. Natural Gas is primarily priced and traded in US Dollars, thus economic releases impacting the US Dollar are also factors.
How does the US Dollar influence Natural Gas prices?
The US Dollar is the world’s reserve currency and most commodities, including Natural Gas are priced and traded on international markets in US Dollars. As such, the value of the US Dollar is a factor in the price of Natural Gas, because if the Dollar strengthens it means less Dollars are required to buy the same volume of Gas (the price falls), and vice versa if USD strengthens.
EUR/USD has been trading within a narrow band between 1.0500 and 1.1000 since December 2022. Economists at Goldman Sachs analyze the pair’s outlook.
Significant economic or policy shifts are necessary to catalyze a breakout in either direction
EUR/USD has been trading within a tight range of 1.0500 to 1.1000 for several months. We expect this pattern to persist in the near term. Significant economic or policy shifts are necessary to catalyze a breakout in either direction.
A more compelling case for a breakout in the EUR/USD pair would likely stem from either a notable divergence in monetary policy between the European Central Bank and the Federal Reserve or a convergence in the economic cycles of the Eurozone and the United States.
- US stock index futures trade in negative territory on Wednesday.
- US economic calendar will feature Q4 GDP revision.
- PCE inflation and Jobless Claims data will be released on Thursday.
S&P 500 futures fall 0.37%, Dow Jones futures drop 0.35%, and Nasdaq futures lose 0.46%.
S&P 500 (SPX), Dow Jones (DJIA), and Nasdaq (IXIC) indexes closed on Tuesday with a 0.17% gain, a 0.25% drop, and a 0.37% rise, respectively.
What to know before stock market opens
The Utilities Sector climbed 1.9% on Tuesday as the best-performing sector for the day, followed by the Communication Services Sector, which rose 1%. The Energy Sector recovered from daily lows but lost 0.43%.
Norwegian Cruise Line Holdings Ltd. (NCLH) and Carnival Corp. (CCL) were the biggest gainers for the day. NCLH rose 19.8%, while CCL added nearly 17%. Tuesday's worst performer was the NASDAQ-listed Workday Inc. (WDAY), which backslid 4% to hit $295.05 at the closing bell.
Assessing the latest developments in financial markets, “among equities, there were some modest movements, with the S&P 500 (+0.17%) closing just below its all-time high, having basically been in a narrow band since the Nvidia results last week. Currently it’s down -0.21% for the week, meaning it still needs to recover a bit in order to achieve a joint record of 16 weekly advances in the last 18 (currently on 15/17 for first time since 1989),” said Jim Reid, global head of economics and thematic research at Deutsche Bank, and continued:
“Small-cap stocks continued to outperform, with the Russell 2000 up +1.34%, in contrast to the Dow Jones, which was down -0.25%. Tech stocks saw a marginal outperformance, with the NASDAQ up +0.37% and Magnificent 7 up +0.22%. It shows the signs of the times that Apple yesterday announced the closure of its electric car unit which it set up in 2014 that at one point promised autonomous driving within a reasonable timeframe. The fact that they did this partly to divert resources to AI shows how trends can change.”
Nasdaq FAQs
What is the Nasdaq?
The Nasdaq is a stock exchange based in the US that started out life as an electronic stock quotation machine. At first, the Nasdaq only provided quotations for over-the-counter (OTC) stocks but later it became an exchange too. By 1991, the Nasdaq had grown to account for 46% of the entire US securities’ market. In 1998, it became the first stock exchange in the US to provide online trading. The Nasdaq also produces several indices, the most comprehensive of which is the Nasdaq Composite representing all 2,500-plus stocks on the Nasdaq, and the Nasdaq 100.
What is the Nasdaq 100?
The Nasdaq 100 is a large-cap index made up of 100 non-financial companies from the Nasdaq stock exchange. Although it only includes a fraction of the thousands of stocks in the Nasdaq, it accounts for over 90% of the movement. The influence of each company on the index is market-cap weighted. The Nasdaq 100 includes companies with a significant focus on technology although it also encompasses companies from other industries and from outside the US. The average annual return of the Nasdaq 100 has been 17.23% since 1986.
How can I trade the Nasdaq 100?
There are a number of ways to trade the Nasdaq 100. Most retail brokers and spread betting platforms offer bets using Contracts for Difference (CFD). For longer-term investors, Exchange-Traded Funds (ETFs) trade like shares that mimic the movement of the index without the investor needing to buy all 100 constituent companies. An example ETF is the Invesco QQQ Trust (QQQ). Nasdaq 100 futures contracts allow traders to speculate on the future direction of the index. Options provide the right, but not the obligation, to buy or sell the Nasdaq 100 at a specific price (strike price) in the future.
What Factors Drive the Nasdaq 100
Many different factors drive the Nasdaq 100 but mainly it is the aggregate performance of the component companies revealed in their quarterly and annual company earnings reports. US and global macroeconomic data also contributes as it impacts on investor sentiment, which if positive drives gains. The level of interest rates, set by the Federal Reserve (Fed), also influences the Nasdaq 100 as it affects the cost of credit, on which many corporations are heavily reliant. As such the level of inflation can be a major driver too as well as other metrics which impact on the decisions of the Fed.
Eyes on GDP revision ahead of PCE inflation report
The US Bureau of Economic Analysis will announce the second estimate of the Gross Domestic Product (GDP) growth for the fourth quarter on Wednesday. Personal Consumption Expenditures (PCE) Price Index, the Federal Reserve’s (Fed) preferred gauge of inflation, figures will be scrutinized by market participants on Thursday.
The economic calendar will also feature on Thursday weekly Initial Jobless Claims for the week ending February 24, which is forecast to rise to 210,000 from 201,000 in the previous week.
The US Census Bureau reported on Wednesday that Durable Goods Orders declined by 6.1%, or $18 billion, to $276.7 billion in January. This reading followed the 0.3% decrease recorded in December and came in worse than the market expectation for a contraction of 4.5%.
New York Fed President John Williams is scheduled to speak later in the session. Williams said on Friday that he expects the US central bank to start lowering the policy rate in the second half of the year.
According to the CME FedWatch Tool, markets are nearly fully pricing in a no change in the Fed policy rate in March and see an 85% probability of another pause in May.
Salesforce Inc. (CRM), Snowflake Inc.(SNOW) and Monster Beverage Corp. (MNST) are among top companies that will release quarterly earnings reports after the closing bell on Wednesday.
GDP FAQs
What is GDP and how is it recorded?
A country’s Gross Domestic Product (GDP) measures the rate of growth of its economy over a given period of time, usually a quarter. The most reliable figures are those that compare GDP to the previous quarter e.g Q2 of 2023 vs Q1 of 2023, or to the same period in the previous year, e.g Q2 of 2023 vs Q2 of 2022.
Annualized quarterly GDP figures extrapolate the growth rate of the quarter as if it were constant for the rest of the year. These can be misleading, however, if temporary shocks impact growth in one quarter but are unlikely to last all year – such as happened in the first quarter of 2020 at the outbreak of the covid pandemic, when growth plummeted.
How does GDP influence currencies?
A higher GDP result is generally positive for a nation’s currency as it reflects a growing economy, which is more likely to produce goods and services that can be exported, as well as attracting higher foreign investment. By the same token, when GDP falls it is usually negative for the currency.
When an economy grows people tend to spend more, which leads to inflation. The country’s central bank then has to put up interest rates to combat the inflation with the side effect of attracting more capital inflows from global investors, thus helping the local currency appreciate.
How does higher GDP impact the price of Gold?
When an economy grows and GDP is rising, people tend to spend more which leads to inflation. The country’s central bank then has to put up interest rates to combat the inflation. Higher interest rates are negative for Gold because they increase the opportunity-cost of holding Gold versus placing the money in a cash deposit account. Therefore, a higher GDP growth rate is usually a bearish factor for Gold price.
European Central Bank (ECB) Governing Council member Peter Kazimir said on Wednesday that he would prefer the ECB to start cutting rates in June, followed by a smooth and steady cycle of policy easing, per Reuters.
Key takeaways
"Headline disinflation is going quicker than expected but core is still uncertain."
"ECB to acknowledge improved inflation outlook but should avoid forward guidance on rates in March."
"Market's rate cut pricing now is more realistic, pleased with recent shift in expectations."
"Economic soft landing base case but growth problems structural, not due to high rates."
"Framework review should resurrect interbank funding market, limit size of structural portfolio."
Market reaction
EUR/USD edged slightly higher from session lows after these remarks and was last seen losing 0.3% on the day at 1.0812.
The Reserve Bank of New Zealand (RBNZ) changed its tone only moderately, keeping the threat of another hike on. However, the New Zealand Dollar (NZD) fell. Economists at ING analyze Kiwi’s outlook.
New Zealand’s inflation issues point to extended hawkish outlook
The RBNZ kept rates unchanged and did not tweak the projected rate path substantially. The new forecasts include a very marginally revised peak in the OCR at 5.60% as opposed to 5.69% in the November forecast, which lowers the implied probability of a hike to around 40%. The statement from the central bank, however, showed a clearer softening in the threat of more tightening.
The inflation forecast was revised lower to align it with recent figures, but it is unchanged when it comes to the medium term. Headline CPI is still seen at 2.5% in 4Q24, and non-tradeable CPI projections were also unchanged at 3.4% for the end of this year.
Some unwinding of recently growing net-long positions on NZD and the fact that some investors were still expecting a rate hike this week triggered a substantial fall in the NZD/USD pair. Our view in the medium term for New Zealand and NZD is – however – unchanged. NZD is due to benefit from an attractive carry for longer thanks to a more problematic disinflation path.
- GBP/JPY gauges an intermediate cushion near 190.40 as the BoE sees no rush for rate cuts.
- UK’s high wage growth and service inflation keep the inflation outlook stubborn.
- Japan’s National CPI remains higher at 2% than expectations.
The GBP/JPY pair discovers a temporary cushion near 190.40 in Wednesday’s European session. The asset remains broadly upbeat as the Bank of England (BoE) is not ready for imminent rate cuts due to a stubborn inflation outlook.
BoE policymakers want to see more evidence to gain confidence that inflation will sustainably return to the 2% target to begin reducing interest rates.
On Tuesday, BoE Deputy Governor Dave Ramsden, who voted for holding interest rates at 5.25% in the last monetary policy meeting, said he wants to see how long inflation will remain persistent. Ramsden added the duration of inflation remaining persistent will determine how long interest rates will be maintained at 5.25%.
This week, the British Retail Consortium (BRC) reported that the annual shop price inflation retreated to 2.5% in February, the lowest since March 2022, which seems to offer some relief to households. However, strong wage growth and high service inflation continue to keep the outlook of consumer price inflation sticky.
The United Kingdom’s economic calendar is light this week. Therefore, the Pound Sterling will be guided by market expectations for rate cuts by the BoE.
Meanwhile, the Japanese Yen finds some buying interest as Japan’s inflation remains more stubborn than expectations in January. The annual National Consumer Price Index (CPI) rises by 2.0% against expectations of 1.8% but decelerates from December’s reading of 2.3%.
Ulrich Leuchtmann, Head of FX and Commodity Research at Commerzbank, analyzes the last Bank of England’s (BoE) move and its implications for the Pound Sterling (GBP).
Money should always and everywhere be scarce
The BoE is planning to get rid of the securities that it, like the other major central banks, accumulated after the Great Financial Crisis of 2008.
I am neither a money market expert nor a banking sector expert. Therefore, I cannot promise you that this plan will succeed. However, my idea of monetary theory tells me that money should always and everywhere be scarce – even in the interbank market. Otherwise, it smells strange to me. Even if things have been going well for almost 16 years.
Apart from all the other arguments for or against the Pound, I, therefore, believe that the monetary policy normalization planned by the BoE, which is unique in this sense, is a GBP-positive argument.
- AUD/USD meets with heavy supply following the release of the softer Australian CPI report.
- A strong pickup in the USD demand exerts additional pressure and contributes to the fall.
- Traders now look to the US Q4 GDP for some impetus ahead of the US PCE on Thursday.
The AUD/USD pair comes under intense selling pressure following the previous day's directionless price action and dives to a nearly two-week low during the first half of the European session. Spot prices slide back below the 0.6500 psychological mark in the last hour and seem vulnerable to waken further amid broad-based US Dollar (USD) strength.e
The initial market reaction to Tuesday's disappointing US Durable Goods Orders turns out to be short-lived amid expectations that the Federal Reserve (Fed) will keep interest rates higher for longer. Furthermore, a turnaround in the global risk sentiment – as depicted by a pullback in the equity markets – benefits the Greenback's relative safe-haven status and drives flows away from the perceived riskier Aussie.
The Australian Dollar (AUD), on the other hand, is undermined by domestic consumer inflation figures, which held steady at a two-year low in January as against consensus estimates for an uptick. In fact, the Australian Bureau of Statistics (ABS) reported that the headline CPI rose by the 3.4% YoY rate during the reported month, matching the lowest reading since November 2021 touched in December.
Adding to this, the Core CPI, which excludes volatile items such as fuel, fresh food and holiday travel, eased from the 4.2% YoY rate seen in the previous month to 4.1% in January. The data fuelled speculations that price pressures could abate more rapidly than expected and reduce the possibility of another interest rate hike by the Reserve Bank of Australia (RBA), which, in turn, weighs heavily on the AUD.
Meanwhile, the flight to safety triggers a fresh leg down in the US Treasury bond yields and might hold back the USD bulls from placing aggressive bets. This could lend support to the AUD/USD pair ahead of the crucial US Personal Consumption Expenditure (PCE) Price Index on Thursday. In the meantime, traders on Wednesday will take cues from the prelim US Q4 GDP print and Fed speaks for some impetus.
The Australian Dollar (AUD) is under the gun after below forecast Aussie Consumer Price Index (CPI) data. Economists at Société Générale analyze AUD/USD outlook.
Australia’s CPI steady at 3.4% in January, core eases to 4.1%
The RBA will draw comfort from the January CPI data but will not declare victory.
Inflation stagnated at 3.4% instead of accelerating again, and core slowed to 4.1%, the lowest in two years. Progress is glacial but the central bank can be confident in the base case playing out and inflation will return to the target range of 2-3% in 2025 without the need for additional tightening.
For AUD/USD, the chart does not look great and price action is reminiscent of early February when the successful break above the 200-DMA proved short-lived. Support must hold at 0.6480 to avoid a deeper pullback.
- Gold price falls sharply as Fed policymakers maintain a hawkish narrative.
- The US Dollar strengthens as market expectations for early Fed rate cuts ease.
- Investors await the US core PCE inflation data for fresh guidance.
Gold price (XAU/USD) comes under pressure in Wednesday’s European session as Federal Reserve (Fed) policymakers are not interested in lowering interest rates anytime in the first half of 2024. Higher interest rates are negative for non-yielding Gold as they increase the opportunity cost of holding the precious metal
For fresh cues about the timing for rate cuts, investors will focus on the United States core Personal Consumption Expenditure price index (PCE) data for January, which will be published on Thursday. Market expectations for rate cuts will be trimmed if the underlying inflation data turns out stickier than expectations. Such an outcome could trigger a downside move in Gold price.
Downbeat US Durable Goods Orders data for January released on Tuesday failed to catalyze gains in Gold price. Fresh orders for Durable Goods were down by 6.1%, while investors projected a decline of 4.5%. Weak demand for durable goods indicates a poor outlook for consumer spending.
Daily Digest Market Movers: Gold price eases while US Dollar strengthens
- Gold price trades lower below $2,030, while the US Dollar strengthens ahead of the United States core PCE price index data for January, which will be published on Thursday.
- The underlying inflation data will provide cues about when the Federal Reserve could consider a dovish shift in its monetary policy stance.
- Expectations are for the core PCE price index to have grown by 0.4% on a month-on-month basis in January against a 0.2% increase in December. Annually, the underlying inflation data is forecast to have decelerated to 2.8% from 2.9% in December.
- Sticky price pressures would allow Fed policymakers to argue in favor of keeping interest rates restrictive in the first half of 2024.
- Most Fed policymakers want to see more evidence to confirm that inflation will return sustainably to the 2% target before cutting rates.
- Currently, market expectations for rate cuts are considerably aligned with Fed policymakers who see no need to rush to reduce interest rates.
- The CME FedWatch tool shows that interest rates will remain unchanged in the range of 5.25%-5.50% in the March and May policy meetings. For the June meeting, traders see a 50% chance for a rate cut by 25 basis points (bps).
- On Tuesday, Federal Reserve Governor Michelle Bowman also supported keeping interest rates steady as early rate cuts could stall progress in inflation easing towards 2% or resurge price pressures.
- Michelle Bowman added that strong inflation readings in January and a tight labor market suggest slowing progress in inflation declining to 2%.
- Meanwhile, the US Dollar will be guided by the second estimate of Q4 Gross Domestic Product (GDP), which will be published at 13:30 GMT on Wednesday.
- The Q4 annualized GDP is expected to come out unchanged at 3.3%.
- The US Dollar Index (DXY), which gauges the Greenback’s value against six major currencies, soars above 104.00 as uncertainty over US economic data has improved the appeal for safe-haven assets.
Technical Analysis: Gold price fails to sustain above $2,040
Gold price drops after failing to climb above the downward-sloping border of the Symmetrical Triangle pattern, which is plotted from the December 28 high at $2,088. The upward-sloping border of the chart pattern is placed from the December 13 low at $1,973.
The triangle could break out in either direction. However, the odds marginally favor a move in the direction of the trend before the formation of the triangle – in this case, up. A decisive break above or below the triangle boundary lines would indicate a breakout is underway.
The 14-period Relative Strength Index (RSI) oscillates in the 40.00-60.00 region, which indicates indecisiveness among investors.
Gold FAQs
Why do people invest in Gold?
Gold has played a key role in human’s history as it has been widely used as a store of value and medium of exchange. Currently, apart from its shine and usage for jewelry, the precious metal is widely seen as a safe-haven asset, meaning that it is considered a good investment during turbulent times. Gold is also widely seen as a hedge against inflation and against depreciating currencies as it doesn’t rely on any specific issuer or government.
Who buys the most Gold?
Central banks are the biggest Gold holders. In their aim to support their currencies in turbulent times, central banks tend to diversify their reserves and buy Gold to improve the perceived strength of the economy and the currency. High Gold reserves can be a source of trust for a country’s solvency. Central banks added 1,136 tonnes of Gold worth around $70 billion to their reserves in 2022, according to data from the World Gold Council. This is the highest yearly purchase since records began. Central banks from emerging economies such as China, India and Turkey are quickly increasing their Gold reserves.
How is Gold correlated with other assets?
Gold has an inverse correlation with the US Dollar and US Treasuries, which are both major reserve and safe-haven assets. When the Dollar depreciates, Gold tends to rise, enabling investors and central banks to diversify their assets in turbulent times. Gold is also inversely correlated with risk assets. A rally in the stock market tends to weaken Gold price, while sell-offs in riskier markets tend to favor the precious metal.
What does the price of Gold depend on?
The price can move due to a wide range of factors. Geopolitical instability or fears of a deep recession can quickly make Gold price escalate due to its safe-haven status. As a yield-less asset, Gold tends to rise with lower interest rates, while higher cost of money usually weighs down on the yellow metal. Still, most moves depend on how the US Dollar (USD) behaves as the asset is priced in dollars (XAU/USD). A strong Dollar tends to keep the price of Gold controlled, whereas a weaker Dollar is likely to push Gold prices up.
The New Zealand Dollar (NZD) is losing its ground after the Reserve Bank of New Zealand (RBNZ) poured cold water on further rate increases this year. Economists at TD Securities analyze Kiwi’s outlook.
RBNZ on hold till May'25
The RBNZ kept the Overnight Cash Rate (OCR) on hold in line with consensus at 5.50% but the accompanying Monetary Policy Statement (MPS) read less hawkish than its Nov'23 MPS.
The Bank has set a very high bar to act. We now expect the RBNZ to remain on hold till May next year when it starts cutting.
Markets were likely positioned for a hawkish RBNZ judging by the bids in NZD over the past two weeks, but the lack of any hawkish bias would likely see NZD retrace the bulk of its recent gains.
In the near term, NZD/USD could revisit the 100-DMA and 200-DMAa at 0.6093 and 0.6077 respectively.
After the red-hot run, equities may be due for a pullback as the earnings season wraps up, which poses downside risk to NZD.
- Silver loses ground for the third straight day and drops to over a two-week low.
- The technical setup favours bears and supports prospects for additional losses.
- A sustained move above the 200-day SMA is needed to negate the negative bias.
Silver (XAG/USD) remains under heavy selling pressure for the third successive day on Wednesday – also marking the fifth day of a negative move in the previous six and drops to over a two-week low during the first half of the European session. The white metal currently trades around the $22.30 region and seems vulnerable to prolonging its recent downfall witnessed over the past two weeks or so.
From a technical perspective, the recent failure to find acceptance above the very important and significant 200-day Simple Moving Average (SMA) and the subsequent decline validate the near-term negative outlook. Moreover, oscillators on the daily chart have just started gaining negative traction and further suggest that the path of least resistance for the XAG/USD remains to the downside.
Hence, some follow-through weakness towards retesting sub-$22.00 levels, or the two-month low touched in January, looks like a distinct possibility. A convincing break below the latter will be seen as a fresh trigger for bearish traders and pave the way for additional losses, dragging the XAG/USD towards the $21.40-$21.35 support zone.
On the flip side, the daily swing high, around the mid-$22.00s, now seems to act as an immediate hurdle ahead of the $22.70-$22.75 region. This is closely followed by the $23.00 round figure, which if cleared decisively might trigger a short-covering rally, though is likely to attract fresh sellers near the 200-day SMA, currently pegged around the $23.30 zone, and remain capped near mid-$23.00, or the monthly peak.
Silver daily chart
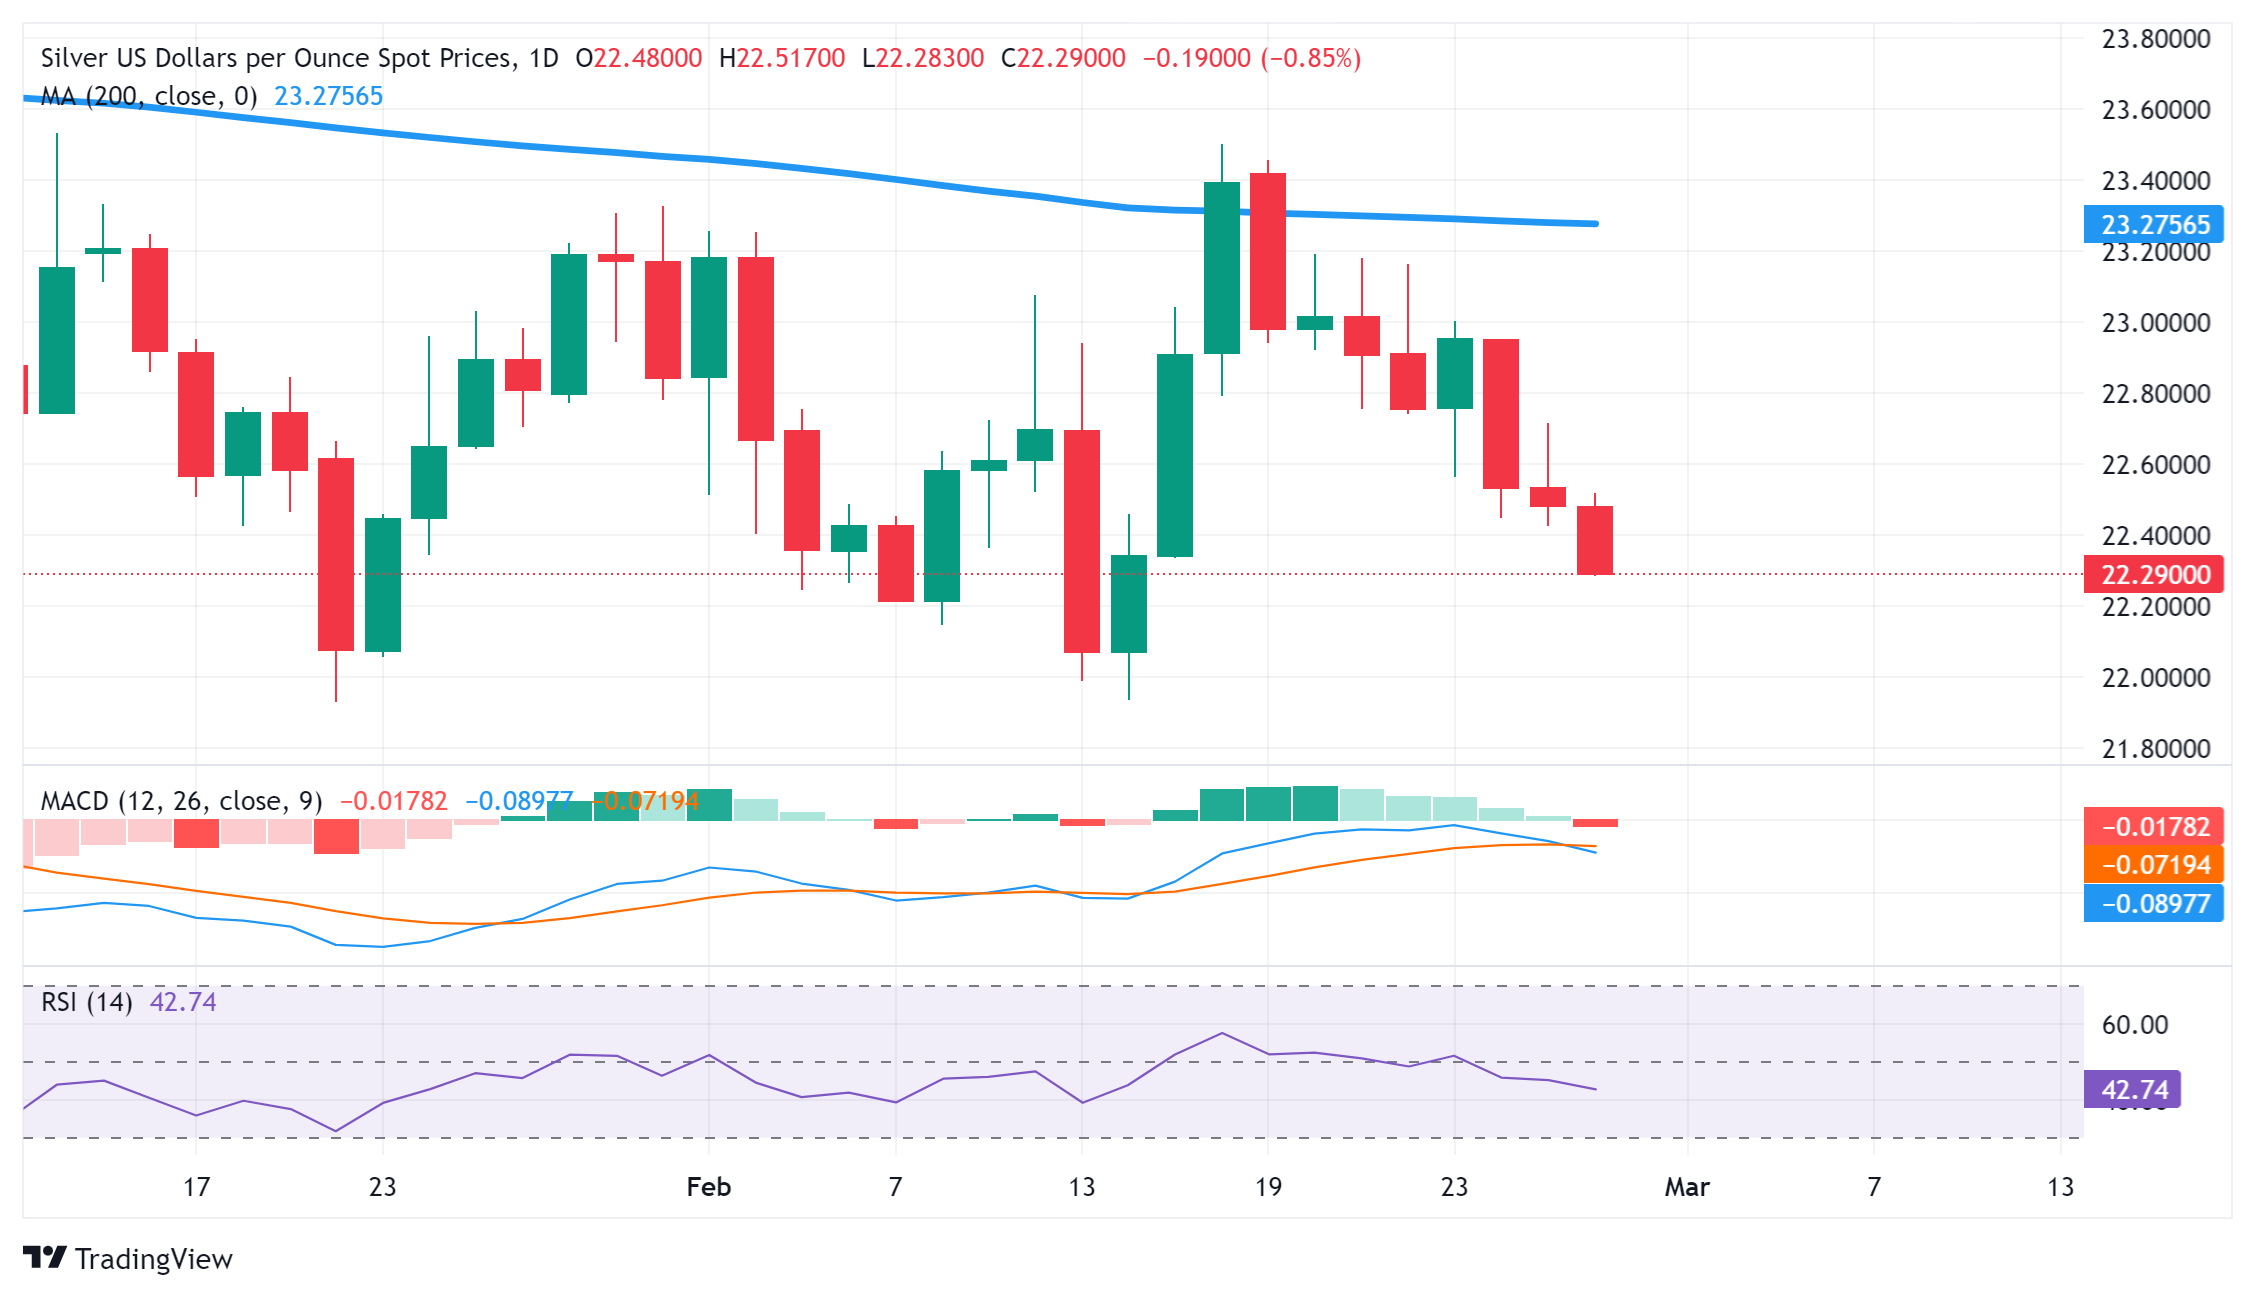
The Australian Dollar (AUD) declined after lower-than-expected Australian Monthly Consumer Price Index (CPI). Economists at ING analyze Aussie’s outlook.
Not trusting AUD weakness
In Australia, January inflation was unchanged at 3.4%, below the 3.6% consensus. That contributed to the AUD's weakness, with some of that weakness also a consequence of the RBNZ decision.
We remain worried about the prospects of disinflation in Australia, and we expect higher inflation in February and towards the middle of the year before a clearer downward path re-emerges.
We do not exclude another rate hike by the RBA, and we still think AUD looks attractive in the medium term.
- EUR/USD drifts lower for the second straight day amid resurgent USD demand.
- Hawkish Fed expectations and the cautious mood boost the safe-haven buck.
- Reduced bets for more aggressive ECB rate cuts could limit any further losses.
The EUR/USD pair extends the previous day's modest pullback from the 1.0865 region and remains under some selling pressure for the second successive day on Wednesday. The downward trajectory drags spot prices closer to a fresh weekly low, around the 1.0800 mark during the early European session, driven by a pickup in the US Dollar (USD) demand. Against the backdrop of the Federal Reserve's (Fed) higher-for-longer interest rates narrative, the market nervousness ahead of the crucial US Personal Consumption Expenditure (PCE) Price Index on Thursday appears to be benefiting the safe-haven buck.
Investors this week will also confront a slew of inflation reports from Germany, France and Spain on Thursday, followed by the flash Eurozone CPI print on Friday. In the meantime, the flight to safety triggers a fresh leg down in the US Treasury bond yields and might hold back the USD bulls from placing aggressive bets. Moreover, European Central Bank (ECB) officials have been pushing back against market expectations for a rapid monetary policy easing. This could support the shared currency and limit any meaningful depreciating move for the EUR/USD pair.
Daily digest market movers: Bulls remain on the sidelines despite delayed ECB rate cut bets
- The Federal Reserve's hawkish outlook on interest rates, along with the cautious market mood, boosts the safe-haven US Dollar and drags the EUR/USD pair lower for the second successive day on Wednesday.
- Fed Governor Michelle Bowman said on Tuesday that she was in no rush to cut interest rates and that the slower-than-expected progress on inflation has left policymakers cautious about monetary policy stance. This reaffirms bets that the US central bank will wait until June before cutting rates and tempers investors' appetite for riskier assets ahead of the US Personal Consumption Expenditure Price Index on Thursday.
- Meanwhile, the looming US government shutdown and Tuesday's disappointing release of US Durable Goods Orders do little to influence the USD uptick, though retreating US Treasury bond yields might cap gains.
- US President Joe Biden urged Congress leaders to move quickly and emphasized the necessity of finding a solution to avert a detrimental government shutdown as a legislative logjam showed no signs of abating.
- The US Census Bureau reported that orders for long-lasting US manufactured goods registered a steep fall of 6.1% in January, the most in nearly four years and worse than the 4.5% decline anticipated.
- Separately, the Conference Board's Consumer Sentiment Index fell to 106.7 for February after three straight months of gains amid anxiety over potential recession, despite declining inflation expectations.
- Furthermore, the Richmond Fed's Manufacturing Index recorded the fourth successive month of a negative reading, though it improved to -5 in February as compared to -15 in the previous month.
- Traders have scaled back their bets for a rapid reduction in borrowing costs by the European Central Bank and now expect less than 100 bps of rate cuts this year, down from around 150 bps at the start of February.
- The market focus remains on the country-level consumer inflation data from Germany, France and Spain, to be published on Thursday. These data will be followed by the Eurozone region-wide flash CPI print on Friday.
Technical analysis: Mixed setup warrants some caution before placing aggressive bearish bets
From a technical perspective, the recent failure ahead of the 1.0900 mark and the subsequent slide below the 200-day Simple Moving Average (SMA) could be seen as a fresh trigger for bearish traders. That said, oscillators on the daily chart are yet to confirm the negative outlook and warrant some caution before positioning for any further losses. Hence, any further downfall is more likely to find decent support near the 1.0785 horizontal zone. The said area should act as a key pivotal point, which if broken decisively could make the EUR/USD pair vulnerable to accelerate the fall back towards retesting sub-1.0700 levels, or a three-month low touched on February 14.
On the flip side, the 1.0850 region seems to act as an immediate resistance, above which the EUR/USD pair could make a fresh attempt to conquer the 1.0900 round figure. Some follow-through buying should pave the way for a further near-term appreciating move towards reclaiming the 1.1000 psychological mark for the first time since January 11.
Euro price today
The table below shows the percentage change of Euro (EUR) against listed major currencies today. Euro was the weakest against the US Dollar.
| USD | EUR | GBP | CAD | AUD | JPY | NZD | CHF | |
| USD | 0.32% | 0.37% | 0.32% | 0.68% | 0.19% | 1.06% | 0.21% | |
| EUR | -0.29% | 0.08% | 0.01% | 0.39% | -0.13% | 0.77% | -0.10% | |
| GBP | -0.37% | -0.07% | -0.06% | 0.30% | -0.19% | 0.69% | -0.19% | |
| CAD | -0.32% | -0.04% | 0.06% | 0.36% | -0.13% | 0.75% | -0.09% | |
| AUD | -0.70% | -0.39% | -0.32% | -0.38% | -0.51% | 0.38% | -0.48% | |
| JPY | -0.19% | 0.10% | 0.17% | 0.12% | 0.52% | 0.87% | 0.02% | |
| NZD | -1.08% | -0.77% | -0.69% | -0.76% | -0.39% | -0.89% | -0.86% | |
| CHF | -0.21% | 0.11% | 0.16% | 0.10% | 0.49% | -0.02% | 0.85% |
The heat map shows percentage changes of major currencies against each other. The base currency is picked from the left column, while the quote currency is picked from the top row. For example, if you pick the Euro from the left column and move along the horizontal line to the Japanese Yen, the percentage change displayed in the box will represent EUR (base)/JPY (quote).
Euro FAQs
What is the Euro?
The Euro is the currency for the 20 European Union countries that belong to the Eurozone. It is the second most heavily traded currency in the world behind the US Dollar. In 2022, it accounted for 31% of all foreign exchange transactions, with an average daily turnover of over $2.2 trillion a day.
EUR/USD is the most heavily traded currency pair in the world, accounting for an estimated 30% off all transactions, followed by EUR/JPY (4%), EUR/GBP (3%) and EUR/AUD (2%).
What is the ECB and how does it impact the Euro?
The European Central Bank (ECB) in Frankfurt, Germany, is the reserve bank for the Eurozone. The ECB sets interest rates and manages monetary policy.
The ECB’s primary mandate is to maintain price stability, which means either controlling inflation or stimulating growth. Its primary tool is the raising or lowering of interest rates. Relatively high interest rates – or the expectation of higher rates – will usually benefit the Euro and vice versa.
The ECB Governing Council makes monetary policy decisions at meetings held eight times a year. Decisions are made by heads of the Eurozone national banks and six permanent members, including the President of the ECB, Christine Lagarde.
How does inflation data impact the value of the Euro?
Eurozone inflation data, measured by the Harmonized Index of Consumer Prices (HICP), is an important econometric for the Euro. If inflation rises more than expected, especially if above the ECB’s 2% target, it obliges the ECB to raise interest rates to bring it back under control.
Relatively high interest rates compared to its counterparts will usually benefit the Euro, as it makes the region more attractive as a place for global investors to park their money.
How does economic data influence the value of the Euro?
Data releases gauge the health of the economy and can impact on the Euro. Indicators such as GDP, Manufacturing and Services PMIs, employment, and consumer sentiment surveys can all influence the direction of the single currency.
A strong economy is good for the Euro. Not only does it attract more foreign investment but it may encourage the ECB to put up interest rates, which will directly strengthen the Euro. Otherwise, if economic data is weak, the Euro is likely to fall.
Economic data for the four largest economies in the euro area (Germany, France, Italy and Spain) are especially significant, as they account for 75% of the Eurozone’s economy.
How does the Trade Balance impact the Euro?
Another significant data release for the Euro is the Trade Balance. This indicator measures the difference between what a country earns from its exports and what it spends on imports over a given period.
If a country produces highly sought after exports then its currency will gain in value purely from the extra demand created from foreign buyers seeking to purchase these goods. Therefore, a positive net Trade Balance strengthens a currency and vice versa for a negative balance.
European Central Bank (ECB) Vice President Luis de Guindos expressed his view on the central bank’s policy outlook during his appearance on Wednesday.
Key takeaways
Recent inflation outlook has been very positive, prices will continue to decline, we need to be sure that prices will move towards our 2% target.
If new data confirm our recent assessment, ECB’s governing council will modify its monetary policy.
Market reaction
At the time of writing, EUR/USD is attacking 1.0800, down 0.37% on the day.
ECB FAQs
What is the ECB and how does it influence the Euro?
The European Central Bank (ECB) in Frankfurt, Germany, is the reserve bank for the Eurozone. The ECB sets interest rates and manages monetary policy for the region.
The ECB primary mandate is to maintain price stability, which means keeping inflation at around 2%. Its primary tool for achieving this is by raising or lowering interest rates. Relatively high interest rates will usually result in a stronger Euro and vice versa.
The ECB Governing Council makes monetary policy decisions at meetings held eight times a year. Decisions are made by heads of the Eurozone national banks and six permanent members, including the President of the ECB, Christine Lagarde.
What is Quantitative Easing (QE) and how does it affect the Euro?
In extreme situations, the European Central Bank can enact a policy tool called Quantitative Easing. QE is the process by which the ECB prints Euros and uses them to buy assets – usually government or corporate bonds – from banks and other financial institutions. QE usually results in a weaker Euro.
QE is a last resort when simply lowering interest rates is unlikely to achieve the objective of price stability. The ECB used it during the Great Financial Crisis in 2009-11, in 2015 when inflation remained stubbornly low, as well as during the covid pandemic.
What is Quantitative tightening (QT) and how does it affect the Euro?
Quantitative tightening (QT) is the reverse of QE. It is undertaken after QE when an economic recovery is underway and inflation starts rising. Whilst in QE the European Central Bank (ECB) purchases government and corporate bonds from financial institutions to provide them with liquidity, in QT the ECB stops buying more bonds, and stops reinvesting the principal maturing on the bonds it already holds. It is usually positive (or bullish) for the Euro.
- USD/CAD continues to gain ground on risk-off sentiment ahead of GDP data from both nations.
- The Canadian Dollar faces challenges due to the decline in the WTI price.
- CME FedWatch Tool suggests a 1.0% probability of rate cuts in March.
USD/CAD continues its winning streak for the fourth consecutive session, trading higher around 1.3570 during the European session on Wednesday. The Canadian Dollar (CAD) received downward pressure due to the decline in Crude oil prices, consequently, underpinning the USD/CAD pair. Furthermore, Canada’s Gross Domestic Product data will be eyed on Thursday.
West Texas Intermediate (WTI) oil prices snap its two-day winning streak, dropping to near $77.80 per barrel, at the time of writing. The challenges facing the oil market due to higher borrowing costs are indeed impacting global economic growth and reducing oil demand.
Additionally, the ongoing uncertainty surrounding ceasefire talks between Israel and Hamas, along with the continued targeting of civilian shipping vessels in the Red Sea by Iran-backed Houthis, adds further complexity to the situation.
The US Dollar Index (DXY) gains ground despite the subdued US Treasury yields. The DXY rises to nearly 104.10, while the 2-year and 10-year yields on US Treasury bonds stand at 4.69% and 4.29%, respectively, by the press time.
The improved US Dollar (USD) is bolstering the USD/CAD pair, possibly due to prevailing risk-off sentiment in the market ahead of the release of the preliminary Gross Domestic Product Annualized data from the United States scheduled for Wednesday. However, market expectations anticipate that the US GDP will remain steady at 3.3% in the fourth quarter of 2023.
The Federal Reserve’s (Fed) officials have signaled caution regarding any rapid reductions in interest rates, resulting in a reduced likelihood of a rate cut in the upcoming meetings. According to the CME FedWatch Tool, the probability of rate cuts in March has decreased to 1.0%, while the likelihood of cuts in May and June stands at 21% and 49.8%, respectively.
The US Dollar moves decisively higher early Wednesday. Economists at ING analyze Greenback’s outlook.
Evidence of resilient inflation in the PCE will offer more support to USD into the end of the week
Today, along with January’s wholesale inventory data, we’ll see the second release of 4Q GDP in the US, which includes the personal consumption and PCE components. Expectations are for confirmation of strong 3.3% quarter-on-quarter annualised growth as per the advanced release. Personal consumption may be revised mildly lower and core PCE should be confirmed at 2.0% QoQ.
Thursday’s PCE numbers for January are much more relevant for markets, and consensus is now aligned for a 0.4% month-on-month core print – even though the distribution of economists’ expectations is skewed to the downside.
We remain of the view that evidence of resilient inflation in the Fed’s preferred measure of inflation will offer more support to the Dollar into the end of the week.
EUR/USD remained stable in the mid 1.0800-1.0900 range but it has come under pressure early Wednesday. Economists at ING analyze the pair’s outlook.
1.0800 test in sight
EUR/USD continues to follow the Dollar dynamics without showing any material impact from eurozone-specific drivers. The pair looks likely to test 1.0800 in the coming days.
The EUR-USD 2-year swap rate differential seems to have found a bottom recently but remains significantly wide in negative territory (130bp) and would be consistent with a softer EUR/USD if it wasn’t for the supportive equity environment of recent months.
- USD/MXN snaps its losing streak on risk-off sentiment on Wednesday.
- US Gross Domestic Product Annualized (Q4) is expected to be unchanged at 3.3%.
- Mexico’s Trade Balance posted a trade deficit of $4.315 billion in January, against the expected deficit of $2.286 billion.
USD/MXN rebounds after experiencing losses in the prior two sessions, with the pair advancing to around 17.08 during European trading hours on Wednesday. The strength of the US Dollar (USD) is driving the movement in the USD/MXN pair, possibly influenced by a risk-off sentiment prevailing in the market ahead of the release of the preliminary Gross Domestic Product Annualized (Q4) data from the United States scheduled for later in the day.
The US Dollar Index (DXY) continues to strengthen despite the subdued US Treasury yields. The DXY has risen to nearly 104.10, while the 2-year and 10-year yields on US Treasury bonds stand at 4.69% and 4.29%, respectively, at the time of reporting.
In economic news, the US Housing Price Index (MoM) saw a modest increase of 0.1% in December, falling short of expectations for a 0.3% increase and below the prior month's increase of 0.4%. Additionally, US Durable Goods Orders experienced a significant decline of 6.1%, contrasting sharply with expectations for a decrease of 4.5% and the previous month's decrease of 0.3%.
On Mexico’s side, the higher interest rates set by the Bank of Mexico (Banxico) at 11.25% may have had an impact on economic activities. The Jobless Rate data by INEGI is expected to be released on Thursday, with an anticipated slight increase to 2.8% in January from the previous increase of 2.6%.
On Tuesday, Mexico reported the Trade Balance for January, revealing a trade deficit of $4.315 billion, surpassing the expected deficit of $2.286 billion and exceeding the previous deficit of $4.242 billion. The seasonally adjusted figures reported a deficit of $0.302 billion compared to the previous surplus of $1.659 billion. These subdued trade figures may have contributed to undermining the Mexican Peso (MXN), consequently providing support for the USD/MXN pair.
- NZD/USD drops vertically to 0.6100 on dismal mood, RBNZ signals peak for interest rates.
- The RBNZ sees inflation declining to the 1%-3% range by Q32024.
- Investors await the US core PCE price index data for fresh guidance.
The NZD/USD pair witnesses an intense sell-off amid multiple headwinds. The Kiwi asset plunges to the round-level support of 0.6100 due to dismal market sentiment and a dovish guidance from the Reserve Bank of New Zealand (RBNZ).
The RBNZ kept its Official Cash Rate (OCR) unchanged at 5.50% for the fifth time in a row to maintain downward pressures on sticky inflation. The central bank sees the consumer price inflation returning to the desired range of 1%-3% by the third quarter of 2024.
Meanwhile, chances of further policy tightening by the RBNZ have eased dramatically as it has warned about potential risks to the New Zealand economy. However, latest forecasts from the RBNZ show that no rate cuts are expected before 2025.
In addition to that, dismal market sentiment has weighed heavily on the New Zealand Dollar. The market mood has turned cautious as investors await the United States core Personal Consumption Expenditure price index (PCE) data for January, which will be published on Thursday. The underlying inflation data will provide more cues about when the Federal Reserve (Fed) will start reducing interest rates.
The consensus from economists shows that the core PCE price index grew by 0.4% on a month-on-month basis against a 0.2% increase in December. Annually, the underlying inflation data decelerated to 2.8% from 2.9% in December. Soft inflation data would prompt expectations of rate cuts by the Fed.
The Reserve Bank of New Zealand (RBNZ) left interest rates unchanged and revised its forecasts downward. NZD/USD is down nearly 1% after the announcement. Economists at Commerzbank analyze Kiwi’s outlook.
Sharper economic slowdown this year
The RBNZ adjusted its interest rate forecast, lowering the overall path by around 10 bps. It now expects rates to start falling from the first quarter of 2025 (previously Q2 2025). Not really a big move.
However, the other forecasts have been revised significantly. Inflation is now expected to be 3.8% in 2024 (previously 4.3%). And the growth forecast has been downgraded even further, from 1.2% average annual growth to just 0.3%. It is little consolation that the forecast for the unemployment rate has been lowered, given the recent positive developments in the labor market.
It is therefore not entirely incomprehensible that the market does not really believe that the RBNZ will keep rates on hold for so long. After all, growth has already not looked too good lately. However, it should also be noted that the RBNZ has revised its inflation forecast for 2025 slightly higher.
In short, the forecasts are pointing to a weaker economy, but not an all-clear for inflation. Practically stagflation fears in their purest form. No wonder the Kiwi is under so much pressure today.
- Pound Sterling faces a sell-off as market sentiment turns volatile.
- BoE Ramsden wants to see how long price pressures will remain sticky.
- The US Dollar rises ahead of US core PCE price index data.
The Pound Sterling (GBP) dips in Wednesday’s European session as the market sentiment remains volatile ahead of critical United States core Personal Consumption Expenditure price index (PCE) data for January. The GBP/USD pair falls on the back foot despite expectations that the Bank of England (BoE) will begin reducing interest rates later than the Federal Reserve (Fed). This supports the Pound Sterling as higher interest rates generally attract greater foreign capital inflows.
Investors see the BoE considering a change in monetary policy stance later than other central banks as price pressures in the United Kingdom economy are stubborn due to high wage growth – a plus for Sterling. BoE policymakers have warned that the pace at which Average Earnings are decelerating is half of what is required to achieve price stability.
Going ahead, the Pound Sterling will be guided by market expectations for rate cuts by the BoE. Stock investors hope that the BoE will start reducing interest rates from August as this will support the wider stock market. This might be the time when inflation flares up again after declining to 2%, as projected by the BoE, revealed in the latest monetary policy statement.
Daily Digest Market Movers: Pound Sterling weakens on subdued market sentiment
- Pound Sterling falls sharply after failing to recapture the round-level resistance of 1.2700 amid a cautious market mood.
- Investors are holding to the sidelines ahead of the crucial United States core PCE price index data for January, which will be published on Thursday.
- This crucial inflation data will provide more cues on when the Federal Reserve (Fed) could begin reducing interest rates.
- Projections from market participants show that the underlying inflation data decelerated to 2.8% from 2.9% in December on a year-on-year basis.
- The US Dollar Index (DXY), which values the Greenback against six major currencies, rises to the crucial resistance of 104.00.
- On the domestic front, the Pound Sterling will be guided by market expectations for rate cuts by the Bank of England.
- BoE policymakers are less interested in lowering key lending rates currently as they need more evidence that inflation will come down to the 2% target.
- On Tuesday, BoE Deputy Governor Dave Ramsden, who voted for holding interest rates at 5.25% in the last monetary policy meeting, said he wants to see how long inflation will remain persistent.
- Dave Ramsden added the duration of inflation remaining persistent will determine how long interest rates will be maintained at 5.25%.
- Price pressures in the United Kingdom economy are stubborn due to higher wage growth and service inflation.
- These key inflation indicators have come down sharply, but the pace of decline is still inconsistent, with inflation declining towards the 2% target.
Technical Analysis: Pound Sterling falls from 1.2700
Pound Sterling drops sharply after facing stiff resistance near 1.2700. The GBP/USD pair is consistently facing barricades near the downward-sloping border of the Descending Triangle pattern formed on a daily time frame, with the upper border line traced from the December 28 high at 1.2827. The triangle’s horizontal support is plotted from December 13 low near 1.2500.
A Descending Triangle pattern demonstrates indecisiveness among market participants but with a slight downside bias due to lower highs and flat lows formation.
The pair declines toward the 20 and 50-day Exponential Moving Averages (EMAs), which trade around 1.2630. Meanwhile, the 14-period Relative Strength Index (RSI) remains inside the 40.00-60.00 region, which indicates a sharp contraction in volatility.
Pound Sterling FAQs
What is the Pound Sterling?
The Pound Sterling (GBP) is the oldest currency in the world (886 AD) and the official currency of the United Kingdom. It is the fourth most traded unit for foreign exchange (FX) in the world, accounting for 12% of all transactions, averaging $630 billion a day, according to 2022 data.
Its key trading pairs are GBP/USD, aka ‘Cable’, which accounts for 11% of FX, GBP/JPY, or the ‘Dragon’ as it is known by traders (3%), and EUR/GBP (2%). The Pound Sterling is issued by the Bank of England (BoE).
How do the decisions of the Bank of England impact on the Pound Sterling?
The single most important factor influencing the value of the Pound Sterling is monetary policy decided by the Bank of England. The BoE bases its decisions on whether it has achieved its primary goal of “price stability” – a steady inflation rate of around 2%. Its primary tool for achieving this is the adjustment of interest rates.
When inflation is too high, the BoE will try to rein it in by raising interest rates, making it more expensive for people and businesses to access credit. This is generally positive for GBP, as higher interest rates make the UK a more attractive place for global investors to park their money.
When inflation falls too low it is a sign economic growth is slowing. In this scenario, the BoE will consider lowering interest rates to cheapen credit so businesses will borrow more to invest in growth-generating projects.
How does economic data influence the value of the Pound?
Data releases gauge the health of the economy and can impact the value of the Pound Sterling. Indicators such as GDP, Manufacturing and Services PMIs, and employment can all influence the direction of the GBP.
A strong economy is good for Sterling. Not only does it attract more foreign investment but it may encourage the BoE to put up interest rates, which will directly strengthen GBP. Otherwise, if economic data is weak, the Pound Sterling is likely to fall.
How does the Trade Balance impact the Pound?
Another significant data release for the Pound Sterling is the Trade Balance. This indicator measures the difference between what a country earns from its exports and what it spends on imports over a given period.
If a country produces highly sought-after exports, its currency will benefit purely from the extra demand created from foreign buyers seeking to purchase these goods. Therefore, a positive net Trade Balance strengthens a currency and vice versa for a negative balance.
Here is what you need to know on Wednesday, February 28:
The New Zealand Dollar (NZD) came under heavy bearish pressure following the Reserve Bank of New Zealand's (RBNZ) policy announcements early Wednesday. Meanwhile, the US Dollar recovers modestly as market focus shifts to the second estimate of the annualized fourth-quarter Gross Domestic Product (GDP) growth. The European economic docket will feature business and consumer sentiment data. Later in the American session, markets will pay close attention to comments from Federal Reserve (Fed) policymakers.
RBNZ board members decided to keep the Official Cash Rate (OCR) unchanged at 5.5% following the February policy meeting as expected. "Ongoing restrictive monetary policy settings are necessary to guard against the risk of a rise in inflation expectations," the RBNZ said in its policy statement. On a dovish note, the RBNZ lowered the peak cast rate projection to 5.59% in June 2024 from 5.67% in the previous forecast. Commenting on the policy outlook in a press conference, RBNZ Governor Adrian Orr said there was strong consensus among policymakers that rates were sufficient. NZD/USD declined sharply during the Asian trading hours and it was last seen losing more than 1% on the day at 0.6103.
Orr Speech: RBNZ Governor speaks on policy outlook after holding interest rate.
New Zealand Dollar price today
The table below shows the percentage change of New Zealand Dollar (NZD) against listed major currencies today. New Zealand Dollar was the weakest against the US Dollar.
| USD | EUR | GBP | CAD | AUD | JPY | NZD | CHF | |
| USD | 0.23% | 0.26% | 0.19% | 0.53% | 0.15% | 1.08% | 0.25% | |
| EUR | -0.22% | 0.06% | -0.04% | 0.33% | -0.07% | 0.86% | 0.03% | |
| GBP | -0.26% | -0.04% | -0.07% | 0.29% | -0.11% | 0.83% | -0.01% | |
| CAD | -0.17% | 0.04% | 0.10% | 0.37% | -0.02% | 0.92% | 0.11% | |
| AUD | -0.55% | -0.33% | -0.28% | -0.36% | -0.40% | 0.54% | -0.30% | |
| JPY | -0.15% | 0.05% | 0.10% | 0.02% | 0.39% | 0.94% | 0.11% | |
| NZD | -1.09% | -0.87% | -0.83% | -0.93% | -0.54% | -0.94% | -0.84% | |
| CHF | -0.25% | -0.02% | 0.01% | -0.07% | 0.27% | -0.09% | 0.84% |
The heat map shows percentage changes of major currencies against each other. The base currency is picked from the left column, while the quote currency is picked from the top row. For example, if you pick the Euro from the left column and move along the horizontal line to the Japanese Yen, the percentage change displayed in the box will represent EUR (base)/JPY (quote).
The benchmark 10-year US Treasury bond yield edged slightly higher on Tuesday before stabilizing slightly below 4.3% midweek. In the meantime, US stock index futures trade marginally lower after Wall Street's main indexes closed mixed on Tuesday.
The data from Australia showed earlier in the day that the Consumer Price Index (CPI) held steady at 3.4% on a yearly basis in January. This reading came in below the market expectation of 3.5%. AUD/USD stays on the back foot and trades deep in negative territory near 0.6500 in the early European morning.
Australian Dollar depreciates amid an improved US Dollar ahead of US GDP Annualized.
EUR/USD continues to push lower toward 1.0800 on Wednesday after closing in negative territory on Tuesday. European Commission will release Economic Sentiment Indicator, Industrial Confidence, Consumer Confidence, Services Sentiment and Business Climate data for February.
USD/JPY declined toward 150.00 but erased a large portion of its losses to close marginally lower at around 150.50 on Tuesday. The pair fluctuates above this level in the European morning on Wednesday. Earlier in the day, the data from Japan showed that the Leading Economic Index improved slightly to 110.2 in December from 110.0.
Japanese Yen hangs near weekly low against USD, looks to US GDP/Fedspeak for fresh impetus.
GBP/USD lost its traction and dropped toward 1.2650 to start the European session on Wednesday following Tuesday's indecisive action.
Gold met resistance near $2,040 on Tuesday and retreated to the $2,030 area by the end of the day on Tuesday. XAU/USD fluctuates in a tight range slightly below $2,030 on Wednesday.
- EUR/GBP gains ground ahead of the Eurozone Economic Sentiment Indicator on Wednesday.
- Commerzbank's economists observe no clear trend suggesting a weaker Euro.
- BoE’s Dave Ramsden stated that UK inflation is more homegrown.
EUR/GBP recovers recent losses registered on Tuesday, edging higher to near 0.8550 during the early European hours on Wednesday. The pair experiences upward support while traders adopt a cautious stance ahead of the Eurozone Economic Sentiment Indicator for February.
European Commission is expected to report that the consumers' confidence, in economic activity, may slightly improve to a reading of 96.7 from 96.2 prior. However, on Tuesday, the Gfk German Consumer Confidence Survey for March printed a reading of -29 as expected, compared to the previous reading of -29.6 in February. Later in the week, the focus will be on the Harmonized Index of Consumer Prices data from the Eurozone and Germany for further insights into the economic landscape.
Economists at Commerzbank mention that Friday's inflation figures would be crucial but no discernible trend indicating a weaker Euro. Earlier this week, European Central Bank (ECB) President Christine Lagarde mentioned that although inflation is steadily approaching the central bank's targets, the ECB is committed to keeping its current policy measures unchanged for the foreseeable future.
Bank of England (BoE) Deputy Governor for Markets and Banking, Dave Ramsden, attended the High-Level Conference hosted by the Hong Kong Monetary Authority and the Bank for International Settlements in Hong Kong on Tuesday. Ramsden highlighted persistent inflationary pressures, noting that inflation in the United Kingdom (UK) is primarily domestically driven. He suggested that monetary policy may need to remain restrictive for an extended period to return inflation to the 2% target.
Investors are likely to closely monitor the speech by Catherine L Mann of the Bank of England for further insights into the central bank's stance on monetary policy and inflation management.
Year-to-date, the Indian Rupee is up 0.4% vs, the US Dollar (USD) while Asia ex-Japan currencies are down on average by 2.3%. Economists at Commerzbank analyze USD/INR outlook.
RBI to stay on hold for the foreseeable future
INR continues to be well supported by strong economic fundamentals, the pullback in Oil prices, and moderation in domestic inflation.
RBI is expected to leave rates unchanged at 6.5% for the foreseeable future and to take their cue from the Fed.
We project USD/INR to hold steady at around 83.50 by the end of 2024.

Source: Commerzbank Research
FX option expiries for Feb 28 NY cut at 10:00 Eastern Time, via DTCC, can be found below.
- EUR/USD: EUR amounts
- 1.0825 580m
- 1.0550 5.2b
- GBP/USD: GBP amounts
- 1.3000 800m
- USD/JPY: USD amounts
- 149.00 1.9b
- 151.00 1.8b
- EUR/JPY trades on a softer note around 163.05 in Wednesday’s early European session.
- The positive outlook of the cross remains intact above the key EMA; RSI indicator supports the bullish momentum.
- The immediate resistance level is seen at 163.21; the key support level is located at the 162.60–162.70 zone.
The EUR/JPY cross finds support above the 163.00 psychological figure during the early European trading hours on Wednesday. The upbeat Japanese inflation data for January surprised the upside and sparked speculation that the Bank of Japan (BoJ) will exit negative interest rates by June this year. This, in turn, lifts the Japanese Yen (JPY) and weighs on the EUR/JPY cross. The cross currently trades near 163.05, down 0.09% on the day.
Technically, EUR/JPY maintains the bullish bias unchanged as the cross holds above the 50- and 100-period Exponential Moving Averages (EMA) on the four-hour chart. The upward momentum is supported by the Relative Strength Index (RSI), which lies above the 50-midline, indicating the path of least resistance is to the upside.
A high of February at 163.21 acts as an immediate resistance level for EUR/JPY. Further north, the upper boundary of the Bollinger Band at 163.60 will be the next upside barrier. A bullish breakout above this level will pave the way to a psychological mark at 164.00.
On the flip side, the crucial support level will emerge at the 162.60–162.70 region, portraying the confluence of the lower limit of the Bollinger Band and the 50-period EMA. The additional downside filter to watch is the 100-period EMA at 161.90. The next contention level is seen at a low of February 15 at 160.91, followed by a low of February 12 at 160.38.
EUR/JPY four-hour chart
-638446996079787099.png)
- The US Dollar Index (DXY) attracts some buyers near 103.95 in Wednesday’s early European session.
- Several Fed officials suggested a cautious and slow approach to the policy stance, which lends some support to the USD.
- US Durable Goods Orders fell 6.1% in January from a 0.3% decline in December, weaker than estimated.
- US GDP growth numbers for Q4 will be the highlight on Wednesday.
The US Dollar Index (DXY) rebounds to nearly the 104.00 mark during the early European session on Wednesday. Investors await the US Gross Domestic Product (GDP) data for the fourth quarter (Q4). Meanwhile, the hawkish comments from Federal Reserve (Fed) officials provide some support for the US Dollar (USD). At press time, DXY is trading at 103.95, up 0.12% on the day.
Several Fed officials have hinted in recent days about a cautious and slow approach. Philadelphia Fed President Patrick Harker advocated last week for steady and slow rate cuts to minimize risk and general uncertainty. Fed Governor Bowman said inflation will continue to drop with interest rates maintained at the current levels, but it is not yet time to start cutting rates, while Kansas City Fed President Schmid stated that with inflation running above target, labor markets tight, and demand showing considerable momentum, there is no need to preemptively adjust the stance of monetary policy.
The Fed has held its benchmark interest rate steady at its highest level since 2001. Policymakers said they prefer to wait for more data showing inflation returns to their target of annualized 2% before they will begin to cut the fed funds rate, despite inflation having fallen significantly since its summer peak. Financial markets expected the first rate cut will come in June meeting, from anticipation for a rate cut as early as March
Data released from the US Census Bureau on Tuesday showed that US Durable Goods Orders fell 6.1% in January from a 0.3% decline in December, weaker than the market expectation of a 4.5% drop. The Goods New Orders ex Defense, a proxy for capital spending, rose +0.1% MoM, matching the expectations. Finally, the US Consumer Confidence Index by the Conference Board arrived at 106.7, below the market consensus of 115.0.
Market participants will focus on the US GDP growth number for Q4, preliminary Goods Trade Balance, and Fed’s Bostic, Collins, and Williams speeches, due on Wednesday. The US Core Personal Consumption Expenditures Price Index (PCE) will take center stage on Thursday. Traders will take cues from the data and find trading opportunities around the Dollar Index.
- USD/CHF improves to near 0.8800 ahead of Swiss ZEW Survey Expectations.
- Swiss GDP is expected to report a decline in the fourth quarter of 2023.
- US GDP is anticipated to remain unchanged at 3.3% in the fourth quarter of 2023.
USD/CHF rebounds after two days of losses, improving to near psychological level of 0.8800 during the Asian trading hours on Wednesday. The Swiss Franc (CHF) receives downward pressure ahead of the Swiss ZEW Survey – Expectations, scheduled to be released later in the day.
Furthermore, investors await the Gross Domestic Product (GDP) by the Swiss State Secretariat for Economic Affairs (SECO) on Thursday, which is expected to report a decline in the fourth quarter of 2023.
Furthermore, the Swiss Real Retail Sales conducted by the Swiss Federal Statistical Office will be released on Thursday. The market expectation is to grow by 0.4% year-over-year in January, swinging from the previous decline of 0.8% in December.
On the other side, market expectations anticipate that the US GDP will remain steady at 3.3% in the fourth quarter of 2023. The Federal Reserve (Fed) has signaled caution regarding any hasty reductions in interest rates, leading to a decreased likelihood of a rate cut in March. This has exerted downward pressure on the US Dollar (USD).
According to the CME FedWatch Tool, the probability of rate cuts in March has decreased to 1.0%, while the likelihood of cuts in May and June stands at 21% and 49.8%, respectively.
US Housing Price Index (MoM) increased by 0.1% in December, falling short of both the expected 0.3% increase and the prior 0.4% increase. Additionally, US Durable Goods Orders declined by 6.1%, contrasting with an expected decrease of 4.5% and a previous decrease of 0.3%.
- GBP/USD meets with some supply on Wednesday amid a modest pickup in the USD demand.
- The mixed technical setup warrants caution for bears and before positioning for further losses.
- A sustained move beyond the 1.2700 mark is needed to support prospects for additional gains.
The GBP/USD pair comes under heavy selling pressure following the previous day's two-way directionless price moves and drops to the 1.2665 region during the Asian session on Wednesday.
Despite Tuesday’s disappointing release of the US Durable Goods Orders, investors seem convinced that the Federal Reserve (Fed) will wait until the June policy meeting before cutting interest rates. This helps revive the US Dollar (USD) demand, which, in turn, is seen as a key factor exerting downward pressure on the GBP/USD pair. The downfall, meanwhile, seems unaffected by the overnight hawkish remarks by the Bank of England (BoE) Deputy Governor Dave Ramsden, saying that he wanted more evidence that inflationary pressures were easing to consider a cut in interest rates.
From a technical perspective, the recent repeated failures to find acceptance above the 50-day Simple Moving Average (SMA) and a slide below the 23.6% Fibonacci retracement level of a nearly two-week-old uptrend favours bearish traders. That said, oscillators on the daily chart are holding in the positive territory and warrant some caution. Hence, any subsequent decline is more likely to find decent support near the 1.2645 area, representing 38.2% Fibo. level. A convincing break below, however, will set the stage for a further near-term depreciating move for the GBP/USD pair.
Spot prices might then accelerate the slide towards the 50% Fibo. level, around the 1.2625 region, before dropping to the 1.2600 mark, or the 61.8% Fibo. level, and the 1.2575 confluence. The latter comprises the 78.6% Fibo. level and the very important 200-day SMA, which if broken decisively will be seen as a fresh trigger for bearish traders and prompt aggressive technical selling around the GBP/USD pair.
On the flip side, momentum beyond the 50-day SMA might continue to confront some resistance ahead of the 1.2700 mark. Some follow-through buying beyond last week's swing high, around the 1.2710 area, however, could trigger a short-covering rally and lift the GBP/USD pair back towards the monthly swing high, around the 1.2770 supply zone. A sustained strength beyond the latter has the potential to lift spot prices beyond the 1.2800 mark, towards the December 2023 peak, around the 1.2825-1.2830 region.
GBP/USD daily chart
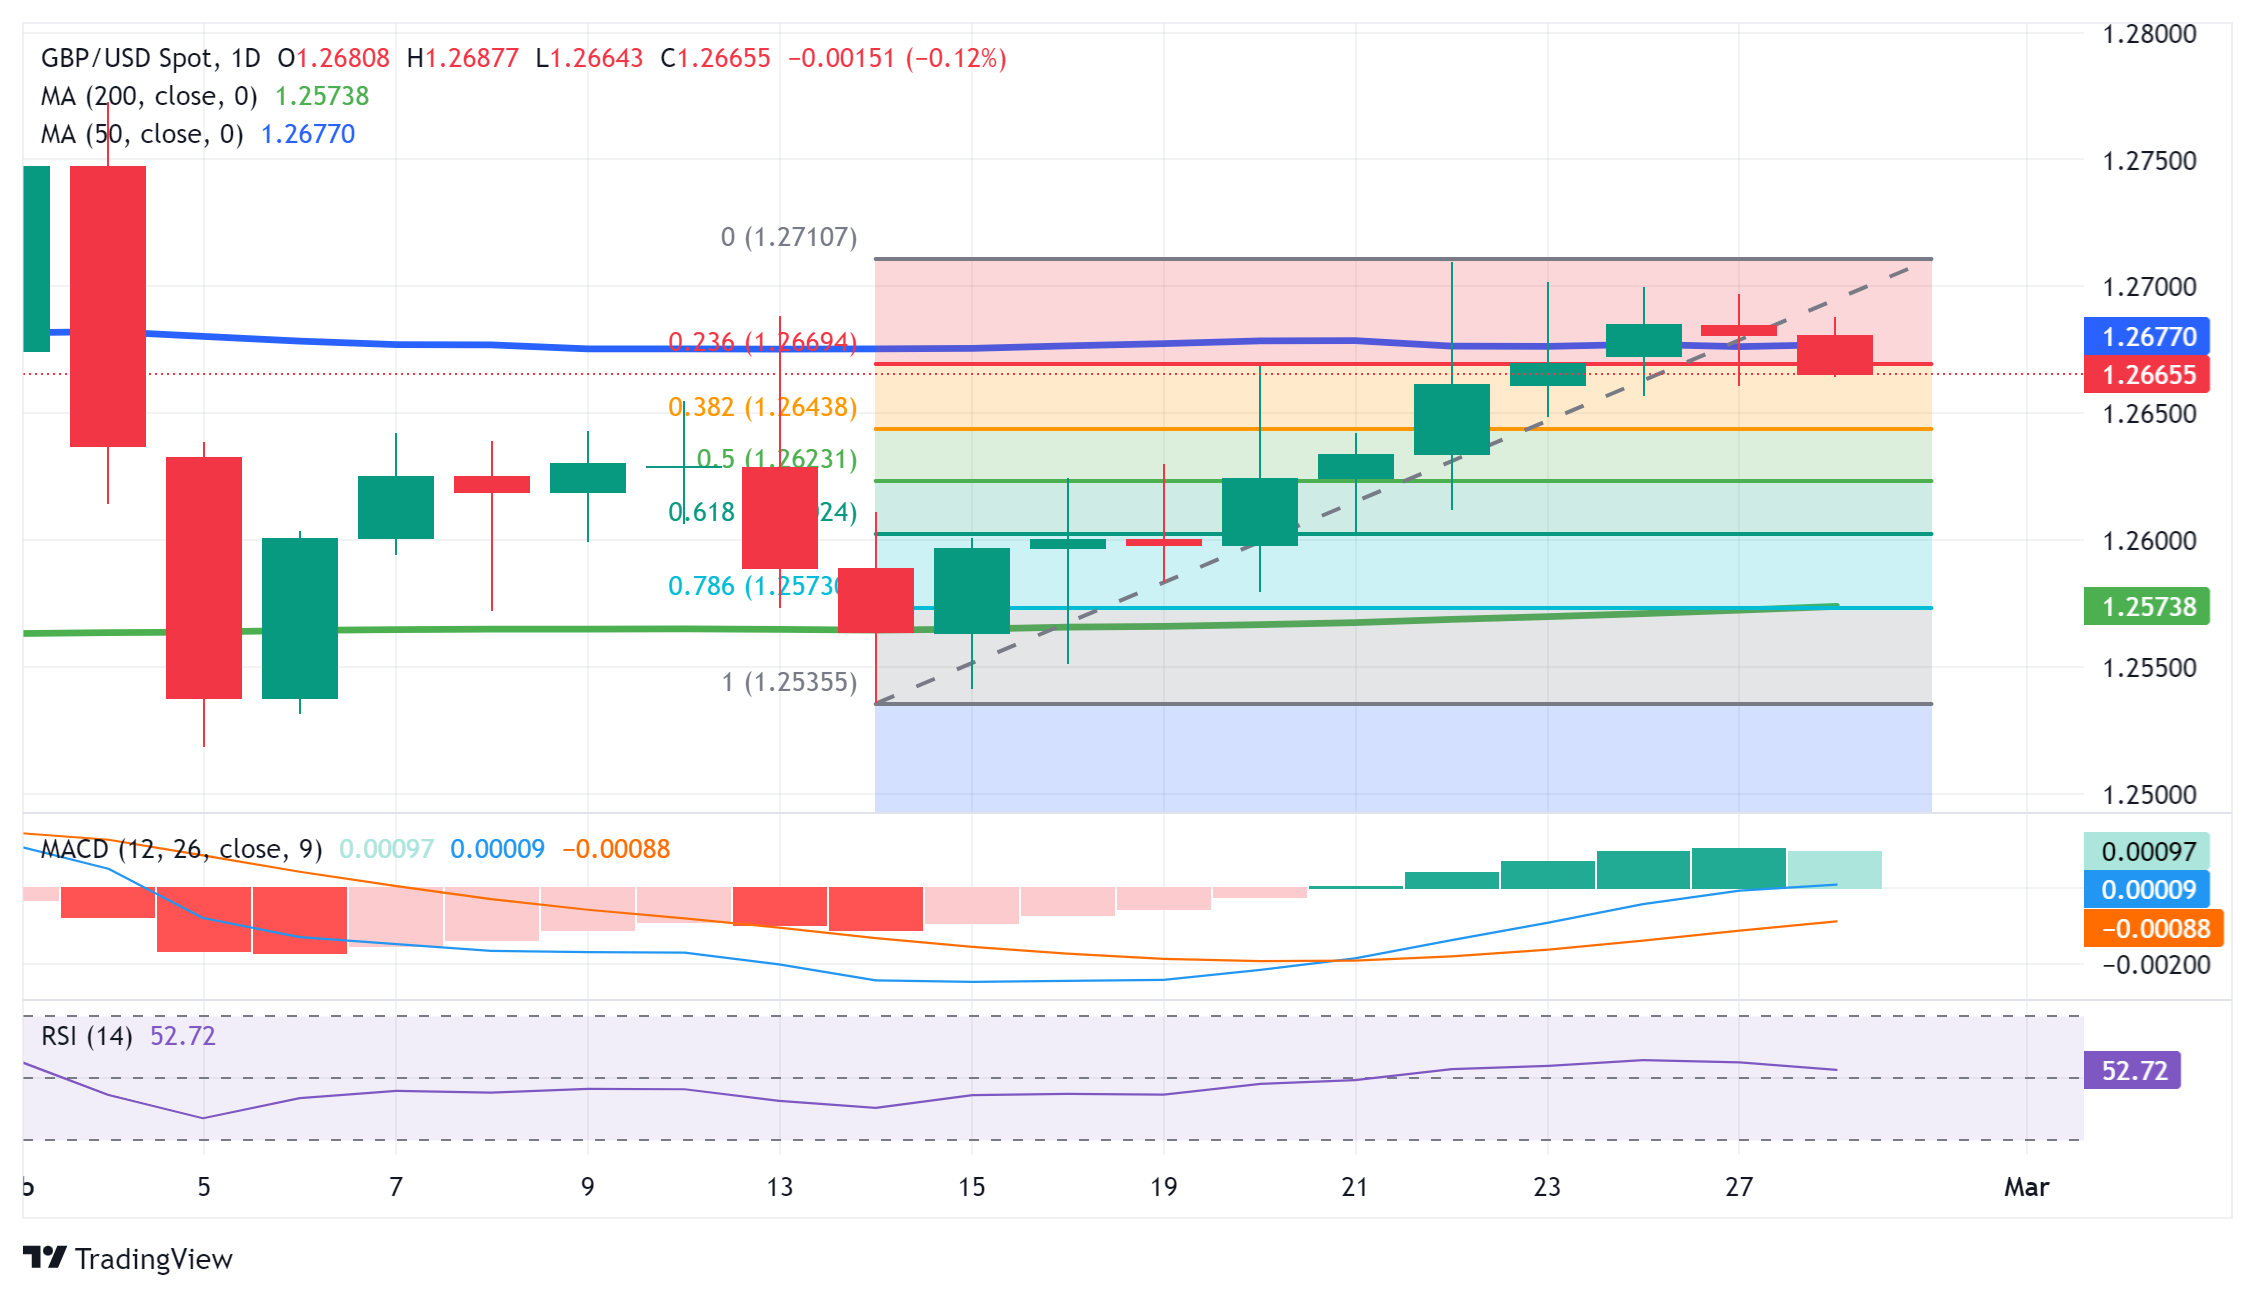
- WTI price depreciates as OPEC+ could extend voluntary oil output cuts into Q2.
- Geopolitical supply risks in the Middle East help to offset the concerns about global oil demand.
- API Weekly Crude Oil Stock increased to 8.428 million barrels from the previous 7.168 million barrels.
West Texas Intermediate (WTI) oil prices decline after two consecutive days of gains, with trading around $78.30 per barrel during the Asian session on Wednesday. The oil market is facing challenges due to higher borrowing costs, which are dampening global economic growth and subsequently reducing oil demand. Additionally, uncertainty persists regarding the outcome of ceasefire talks between Israel and Hamas, while Iran-backed Houthis continue to target civilian shipping vessels in the Red Sea.
Crude benchmarks received upward support following a Reuters report stating that the Organization of the Petroleum Exporting Countries and allies (OPEC+) are contemplating extending voluntary oil output cuts into the second quarter. In November, OPEC+ had agreed to voluntary cuts amounting to around 2.2 million barrels per day (bpd) for the first quarter of this year. Additionally, Russia has announced a six-month ban on gasoline exports starting from March 1. This decision, as reported by Russia’s RBC, is aimed at stabilizing oil prices.
However, persistent geopolitical supply risks in the Middle East, coupled with indications of a stronger US physical market, are helping to mitigate the effect of the concerns about global oil demand. As a result, the decline in Crude oil prices is being limited. Recent data reveals an increase in demand for US crude exports, while Chinese buyers are actively participating in the spot market following the Chinese Lunar New Year, boosting Crude oil consumption.
American Petroleum Institute (API) revealed that Weekly Crude Oil Stock increased to 8.428 million barrels for the week ending on February 23, from the previous 7.168 million barrels. Furthermore, the US Energy Information Administration (EIA) is expected to report a decline in the Crude Oil Stocks Change on Wednesday.
- USD/CAD gains positive traction for the fourth straight day amid a modest USD uptick.
- Bullish Crude Oil prices could underpin the Loonie and keep a lid on any further gains.
- The prelim US Q4 GDP could provide some impetus ahead of US PCE data on Thursday.
The USD/CAD pair scales higher for the fourth successive day on Wednesday and climbs to a nearly two-week high, around the 1.3545 region during the Asian session. The positive move is exclusively sponsored by a modest pickup in the US Dollar (USD) demand, though bullish Crude Oil prices might keep a lid on any further gains.
The initial market reaction to Tuesday's disappointing US Durable Goods Orders fades rather quickly amid growing acceptance that the Federal Reserve (Fed) will keep interest rates higher for longer. This, in turn, assists the USD Index (DXY), which tracks the Greenback against a basket of currencies, to build on the overnight bounce from a technically significant 200-day Simple Moving Average (SMA) and acts as a tailwind for the USD/CAD pair.
That said, the looming US government shutdown, along with a fresh leg down in the US Treasury bond yields and the risk-on rally across the global equity markets, could act as a headwind for the safe-haven buck. Meanwhile, Crude Oil prices stand tall near the monthly peak touched on Tuesday and underpin the commodity-linked Loonie. This could further contribute to capping gains for the USD/CAD pair and warrants caution for bullish traders.
Talks of an extension to production cuts from OPEC+ come on top of attacks on ships in the Red Sea by Iran-aligned Houthis in Yemen and continue to lend support to Crude Oil prices. This, in turn, could underpin the commodity-linked Loonie and keep a lid on any further appreciating move for the USD/CAD pair. Traders might also prefer to wait on the sidelines ahead of the US Personal Consumption Expenditures Price Index on Thursday.
The crucial US inflation data should provide fresh cues about the Fed's rate-cut path, which, in turn, will drive the USD demand and help in determining the next leg of a directional move for the USD/CAD pair. In the meantime, traders will take cues from the release of the Prelim US Q4 GDP print, which, along with speeches by influential FOMC members, might produce short-term opportunities later during the North American session.
- Gold price attracts some buyers on Wednesday, albeit it lacks bullish conviction.
- Hawkish Fed expectations underpin the USD and act as a headwind for the metal.
- Traders also seem reluctant to place aggressive bets ahead of key US macro data.
Gold price (XAU/USD) edges higher during the Asian session on Wednesday and for now, seems to have stalled the previous day's modest pullback from the $2,040-$2,042 resistance. Despite the uptick, the precious metal remains confined in a familiar range as traders keenly await the US Personal Consumption Expenditures (PCE) Price Index on Thursday for cues about the Federal Reserve's (Fed) rate-cut path. This, in turn, will play a key role in influencing the near-term US Dollar (USD) price dynamics and provide a fresh directional impetus to the non-yielding yellow metal.
In the meantime, the FOMC meeting minutes released last week, along with the recent comments by Fed officials, suggested that the US central bank is in no rush to cut interest rates. This assists the USD Index (DXY), which tracks the Greenback against a basket of currencies, to hold steady above a technically significant 200-day Simple Moving Average (SMA) and a multi-week low touched last Thursday. Apart from this, the recent risk-on rally across the global equity markets contributes to capping the safe-haven Gold price, though sliding US Treasury bond yields act as a tailwind.
Daily digest market movers: Gold price extends the range play amid mixed fundamental cues
- A combination of diverging forces fails to provide any meaningful impetus to the Gold price, which extends its consolidative price move in a nearly one-week-old trading range.
- The Federal Reserve's higher-for-longer interest rates narrative lends some support to the US Dollar and continues to undermine the non-yielding yellow metal on Wednesday.
- A fresh leg down in the US bond yields, along with the looming US government shutdown and Tuesday's disappointing release of US Durable Goods Orders, should cap the USD.
- US President Joe Biden emphasized the necessity of finding a solution to prevent a detrimental government shutdown on March 1 as a legislative logjam showed no signs of abating.
- The US Census Bureau reported that orders for long-lasting US manufactured goods experienced a larger-than-expected decline of 6.1% in January, the most in nearly four years.
- Meanwhile, the Conference Board's Consumer Sentiment Index fell after three straight months of gains and came in at 106.7 for February, despite declining inflation expectations.
- The Richmond Fed's Manufacturing Index recorded the fourth successive month of a negative reading, though improved to -5 in February as compared to -15 in the previous month.
- Traders now look to the release of the Prelim US GDP print, which is expected to match the original estimates and show that the economy expanded by a 3.3% annualized pace in Q4.
- This, along with speeches by influential FOMC members, will play a key role in driving the USD demand and producing some meaningful trading opportunities around the XAU/USD.
- The focus, however, remains glued to the US Personal Consumption Expenditures Price Index on Thursday, which should provide fresh cues about the Fed's rate-cut path.
Technical analysis: Gold price needs to break through $2,040-42 barrier for bulls to seize control
From a technical perspective, the $2,041-2,042 area, or over a two-week high touched last Thursday, might continue to act as an immediate hurdle and cap gains for the Gold price. That said, a sustained strength beyond will confirm a break through the 50-day Simple Moving Average (SMA) barrier and pave the way for additional gains. Given that oscillators on the daily chart have just started gaining positive traction, the XAU/USD might then climb to the next relevant hurdle near the $2,065 region before aiming to reclaim the $2,100 round-figure mark.
On the flip side, the weekly trough. around the $2,025 region, now seems to protect the immediate downside ahead of the 100-day SMA, currently near the $2,011-2,010 area, and the $2,000 psychological mark. Some follow-through selling below the latter will shift the near-term bias back in favour of bearish traders and drag the Gold price to the $1,984 region en route to the very important 200-day SMA support near the $1,967 zone.
US Dollar price today
The table below shows the percentage change of US Dollar (USD) against listed major currencies today. US Dollar was the strongest against the New Zealand Dollar.
| USD | EUR | GBP | CAD | AUD | JPY | NZD | CHF | |
| USD | 0.09% | 0.09% | 0.07% | 0.33% | -0.02% | 1.03% | 0.09% | |
| EUR | -0.07% | 0.02% | -0.01% | 0.27% | -0.10% | 0.96% | 0.01% | |
| GBP | -0.10% | -0.02% | -0.02% | 0.25% | -0.12% | 0.94% | -0.01% | |
| CAD | -0.07% | 0.00% | 0.02% | 0.26% | -0.10% | 0.96% | 0.04% | |
| AUD | -0.34% | -0.27% | -0.25% | -0.27% | -0.37% | 0.70% | -0.26% | |
| JPY | 0.02% | 0.09% | 0.11% | 0.09% | 0.36% | 1.06% | 0.11% | |
| NZD | -1.04% | -0.99% | -0.97% | -0.98% | -0.71% | -1.08% | -0.96% | |
| CHF | -0.09% | 0.00% | 0.00% | -0.02% | 0.22% | -0.11% | 0.94% |
The heat map shows percentage changes of major currencies against each other. The base currency is picked from the left column, while the quote currency is picked from the top row. For example, if you pick the Euro from the left column and move along the horizontal line to the Japanese Yen, the percentage change displayed in the box will represent EUR (base)/JPY (quote).
Gold FAQs
Why do people invest in Gold?
Gold has played a key role in human’s history as it has been widely used as a store of value and medium of exchange. Currently, apart from its shine and usage for jewelry, the precious metal is widely seen as a safe-haven asset, meaning that it is considered a good investment during turbulent times. Gold is also widely seen as a hedge against inflation and against depreciating currencies as it doesn’t rely on any specific issuer or government.
Who buys the most Gold?
Central banks are the biggest Gold holders. In their aim to support their currencies in turbulent times, central banks tend to diversify their reserves and buy Gold to improve the perceived strength of the economy and the currency. High Gold reserves can be a source of trust for a country’s solvency. Central banks added 1,136 tonnes of Gold worth around $70 billion to their reserves in 2022, according to data from the World Gold Council. This is the highest yearly purchase since records began. Central banks from emerging economies such as China, India and Turkey are quickly increasing their Gold reserves.
How is Gold correlated with other assets?
Gold has an inverse correlation with the US Dollar and US Treasuries, which are both major reserve and safe-haven assets. When the Dollar depreciates, Gold tends to rise, enabling investors and central banks to diversify their assets in turbulent times. Gold is also inversely correlated with risk assets. A rally in the stock market tends to weaken Gold price, while sell-offs in riskier markets tend to favor the precious metal.
What does the price of Gold depend on?
The price can move due to a wide range of factors. Geopolitical instability or fears of a deep recession can quickly make Gold price escalate due to its safe-haven status. As a yield-less asset, Gold tends to rise with lower interest rates, while higher cost of money usually weighs down on the yellow metal. Still, most moves depend on how the US Dollar (USD) behaves as the asset is priced in dollars (XAU/USD). A strong Dollar tends to keep the price of Gold controlled, whereas a weaker Dollar is likely to push Gold prices up.
- NZD/USD plunges after the RBNZ decides to hold OCR at 5.5%.
- A break below 0.6100 could lead the pair to navigate the region around the major support of 0.6050 and February’s low at 0.6037.
- The immediate resistance appears around the 23.6% Fibonacci retracement level of 0.6124 followed by the major barrier at 0.6150.
NZD/USD extends its losing streak for the fourth consecutive session, plunging to near 0.6110 during the Asian trading hours on Wednesday. The pair faces challenges as the Reserve Bank of New Zealand (RBNZ) decided to hold the Official Cash Rate (OCR) unchanged at 5.5% in its February monetary policy meeting.
The immediate support for the NZD/USD pair is anticipated at the psychological level of 0.6100. A break below this psychological support could put downward pressure on the pair to navigate the region around the major support level of 0.6050 followed by February’s low at 0.6037.
The lagging indicator Moving Average Convergence Divergence (MACD) suggests a momentum shift toward the downward sentiment for the NZD/USD pair. The MACD line is positioned above the centerline but shows convergence above the signal line.
Additionally, the technical analysis of the 14-day Relative Strength Index (RSI) lies below the 50 level, suggesting a bearish sentiment.
On the upside, the NZD/USD pair could find the immediate resistance around the 23.6% Fibonacci retracement level of 0.6124 followed by the major barrier at 0.6150. A breakthrough above this level could lead the pair to explore the resistance zone around the 38.2% Fibonacci retracement level of 0.6179 and the psychological level of 0.6200.
Further improvement of the NZD/USD pair could retest February’s high at 0.6219.
NZD/USD: Daily Chart
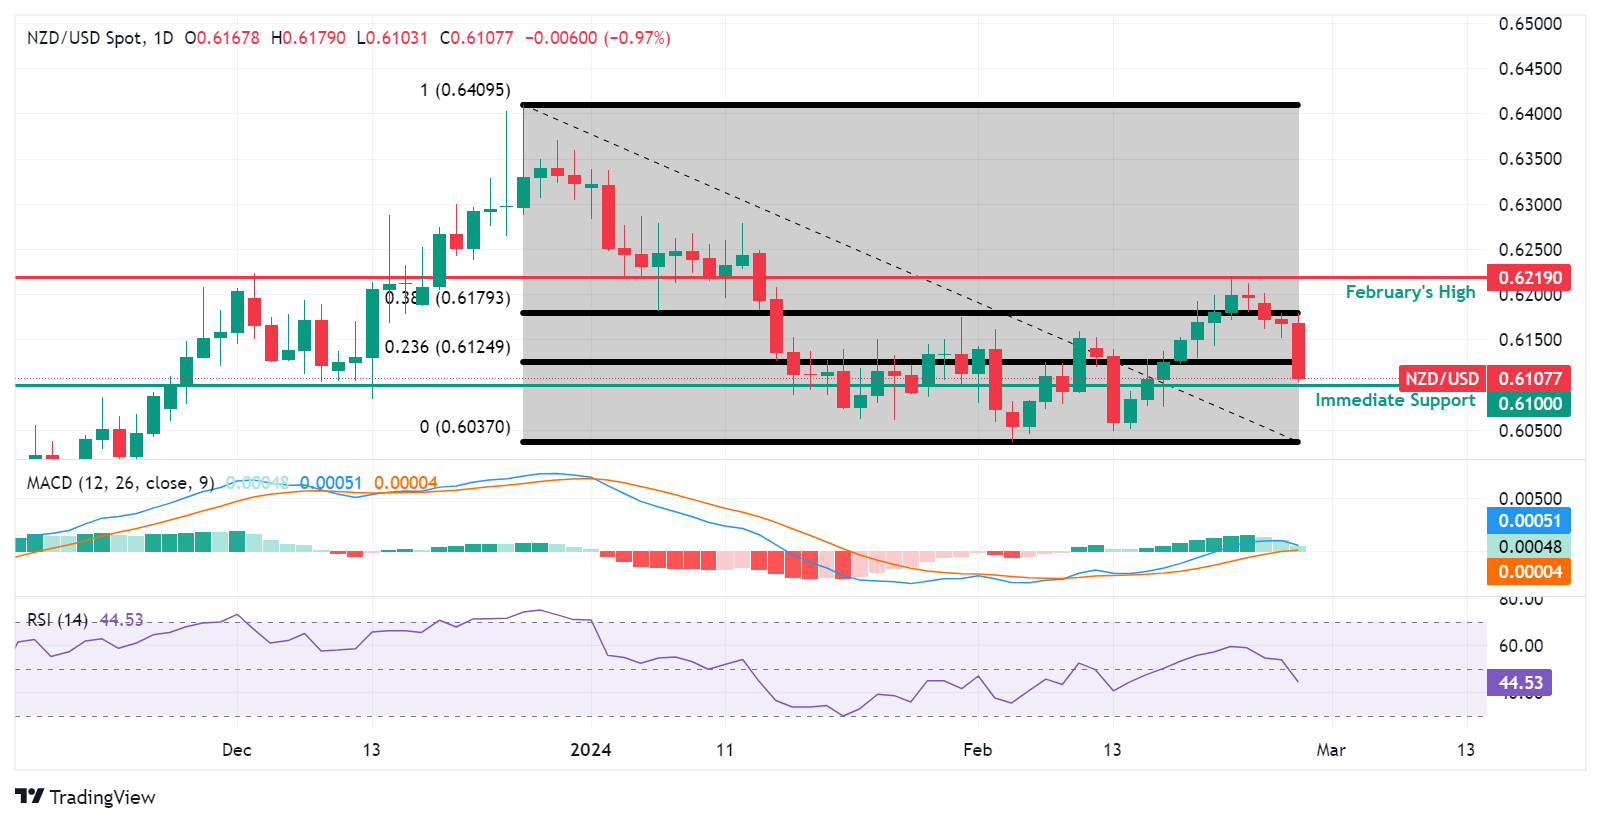
- Indian Rupee trades on a softer note on the renewed USD demand.
- India is expected to achieve real GDP growth of at least 6–6.5% in the long term, according to a Deutsche Bank report.
- The US Gross Domestic Product (GDP) for the fourth quarter (Q4) will be released later on Wednesday.
Indian Rupee (INR) edges lower on Wednesday amid the modest recovery of the US Dollar (USD). The pair is likely to remain in a tight range due to USD inflows from importers and the potential intervention by the Reserve Bank of India (RBI).
According to the Deutsche Bank report, the Indian economy has shown remarkable resilience, with growth momentum holding up significantly better than expected despite the Russia-Ukraine war last year. Furthermore, India is anticipated to achieve real GDP growth of at least 6–6.5% over the long term. This is considerably higher than in similar developing nations. Investors will take more cues from the Indian GDP annual growth numbers on Thursday, followed by the S&P Global Manufacturing PMI for February on Friday. If the reports show stronger-than-expected results, this might boost the INR and act as a headwind for the USD/INR pair.
Investors will monitor the US Gross Domestic Product (GDP) for the fourth quarter (Q4), due on Wednesday, along with preliminary Goods Trade Balance, Fed’s Bostic, Collins, and Williams speeches. The attention will shift to the Core Personal Consumption Expenditures Price Index (PCE), the Fed's preferred inflation gauge, due on Thursday.
Daily Digest Market Movers: Indian Rupee remains vulnerable to geopolitical risks
- India’s real GDP growth for the December quarter is forecast to grow 7% year-on-year, higher than previously anticipated, according to Deutsche Bank.
- Indian Rupee is likely to have additional support this week from MSCI-rebalancing inflows, which are estimated to drive passive inflows of $1.2 billion into Indian equities, according to Nuvama Alternative & Quantitative Research.
- Foreign investors have net purchased over $2.4 billion of Indian bonds in February so far.
- Fed Governor Bowman said inflation will continue to decline with interest rates held at current levels, but it is not yet time to start lowering rates.
- Kansas City Fed President Schmid stated that there is no need to preemptively adjust the stance of monetary policy as inflation is running above target, labor markets are tight, and demand is showing considerable momentum.
Technical Analysis: Indian Rupee oscillates in a longer-term trading band of 82.70–83.20
Indian Rupee trades weaker on the day. USD/INR remains confined within a multi-month-old descending trend channel of 82.70–83.20 since December 8, 2023.
In the near term, the negative outlook of USD/INR remains intact as the pair is below the key 100-day Exponential Moving Average (EMA) on the daily timeframe. Additionally, the 14-day Relative Strength Index (RSI) lies in bearish territory below the 50.0 midline, indicating that a further decline looks favorable.
In the case of a bearish environment, the lower limit of the descending trend channel at 82.70 acts as an initial support level for USD/INR. A breach of this level could put a move to a low of August 23 at 82.45 on the table, followed by a low of June 1 at 82.25.
On the upside, the crucial resistance level for the pair is seen at the confluence of a psychological round mark and the 100-day EMA at 83.00. A break above the mentioned level could attract bullish momentum that may take the pair to the upper boundary of the descending trend channel at 83.20, en route to a high of January 2 at 83.35, and finally at 84.00.
US Dollar price today
The table below shows the percentage change of US Dollar (USD) against listed major currencies today. US Dollar was the strongest against the New Zealand Dollar.
| USD | EUR | GBP | CAD | AUD | JPY | NZD | CHF | |
| USD | 0.10% | 0.10% | 0.07% | 0.34% | -0.01% | 1.03% | 0.10% | |
| EUR | -0.08% | 0.02% | 0.00% | 0.27% | -0.09% | 0.95% | 0.02% | |
| GBP | -0.10% | -0.01% | -0.02% | 0.25% | -0.11% | 0.93% | 0.00% | |
| CAD | -0.08% | 0.00% | 0.02% | 0.26% | -0.09% | 0.95% | 0.05% | |
| AUD | -0.36% | -0.27% | -0.25% | -0.27% | -0.36% | 0.68% | -0.25% | |
| JPY | 0.00% | 0.08% | 0.10% | 0.07% | 0.36% | 1.04% | 0.11% | |
| NZD | -1.04% | -0.94% | -0.92% | -0.97% | -0.69% | -1.05% | -0.92% | |
| CHF | -0.10% | -0.01% | 0.00% | -0.02% | 0.22% | -0.10% | 0.93% |
The heat map shows percentage changes of major currencies against each other. The base currency is picked from the left column, while the quote currency is picked from the top row. For example, if you pick the Euro from the left column and move along the horizontal line to the Japanese Yen, the percentage change displayed in the box will represent EUR (base)/JPY (quote).
Indian Rupee FAQs
What are the key factors driving the Indian Rupee?
The Indian Rupee (INR) is one of the most sensitive currencies to external factors. The price of Crude Oil (the country is highly dependent on imported Oil), the value of the US Dollar – most trade is conducted in USD – and the level of foreign investment, are all influential. Direct intervention by the Reserve Bank of India (RBI) in FX markets to keep the exchange rate stable, as well as the level of interest rates set by the RBI, are further major influencing factors on the Rupee.
How do the decisions of the Reserve Bank of India impact the Indian Rupee?
The Reserve Bank of India (RBI) actively intervenes in forex markets to maintain a stable exchange rate, to help facilitate trade. In addition, the RBI tries to maintain the inflation rate at its 4% target by adjusting interest rates. Higher interest rates usually strengthen the Rupee. This is due to the role of the ‘carry trade’ in which investors borrow in countries with lower interest rates so as to place their money in countries’ offering relatively higher interest rates and profit from the difference.
What macroeconomic factors influence the value of the Indian Rupee?
Macroeconomic factors that influence the value of the Rupee include inflation, interest rates, the economic growth rate (GDP), the balance of trade, and inflows from foreign investment. A higher growth rate can lead to more overseas investment, pushing up demand for the Rupee. A less negative balance of trade will eventually lead to a stronger Rupee. Higher interest rates, especially real rates (interest rates less inflation) are also positive for the Rupee. A risk-on environment can lead to greater inflows of Foreign Direct and Indirect Investment (FDI and FII), which also benefit the Rupee.
How does inflation impact the Indian Rupee?
Higher inflation, particularly, if it is comparatively higher than India’s peers, is generally negative for the currency as it reflects devaluation through oversupply. Inflation also increases the cost of exports, leading to more Rupees being sold to purchase foreign imports, which is Rupee-negative. At the same time, higher inflation usually leads to the Reserve Bank of India (RBI) raising interest rates and this can be positive for the Rupee, due to increased demand from international investors. The opposite effect is true of lower inflation.
Bank of Japan Executive Director Seiichi Shimizu made some comments on the central bank’s inflation target, in his speech following the Japanese Consumer Price Index (CPI) released on Tuesday.
Shimizu said that the “likelihood of inflation target achievement is still not sufficiently high.”
“The BoJ will review its massive monetary easing when it can foresee the achievement of inflation target confidently, and it will "rigorously" check wage trends along with price data,” he added.
Market reaction
At the press time, USD/JPY is keeping its sideway momentum intact near 150.50, down 0.04% on the day.
Japanese Yen FAQs
What key factors drive the Japanese Yen?
The Japanese Yen (JPY) is one of the world’s most traded currencies. Its value is broadly determined by the performance of the Japanese economy, but more specifically by the Bank of Japan’s policy, the differential between Japanese and US bond yields, or risk sentiment among traders, among other factors.
How do the decisions of the Bank of Japan impact the Japanese Yen?
One of the Bank of Japan’s mandates is currency control, so its moves are key for the Yen. The BoJ has directly intervened in currency markets sometimes, generally to lower the value of the Yen, although it refrains from doing it often due to political concerns of its main trading partners. The current BoJ ultra-loose monetary policy, based on massive stimulus to the economy, has caused the Yen to depreciate against its main currency peers. This process has exacerbated more recently due to an increasing policy divergence between the Bank of Japan and other main central banks, which have opted to increase interest rates sharply to fight decades-high levels of inflation.
How does the differential between Japanese and US bond yields impact the Japanese Yen?
The BoJ’s stance of sticking to ultra-loose monetary policy has led to a widening policy divergence with other central banks, particularly with the US Federal Reserve. This supports a widening of the differential between the 10-year US and Japanese bonds, which favors the US Dollar against the Japanese Yen.
How does broader risk sentiment impact the Japanese Yen?
The Japanese Yen is often seen as a safe-haven investment. This means that in times of market stress, investors are more likely to put their money in the Japanese currency due to its supposed reliability and stability. Turbulent times are likely to strengthen the Yen’s value against other currencies seen as more risky to invest in.
- EUR/USD faces downward pressure as investors adopt a cautious stance ahead of key data.
- The subdued US Treasury yields could weaken the US Dollar.
- Traders await the Eurozone Economic Sentiment Indicator for February on Wednesday.
EUR/USD extends losses to near 1.0840 during the Asian session on Wednesday as traders adopt a cautious stance ahead of the Euro Zone Economic Sentiment Indicator for February and the preliminary Gross Domestic Product Annualized (Q4) from the United States, scheduled to be released later in the day.
The US Dollar Index (DXY) attempts to extend its gains on risk-off sentiment, however, subdued US Treasury yields could have contributed to the downward pressure for the US Dollar (USD). The DXY improves to near 103.90 with the 2-year and 10-year yields on US Treasury bonds standing at 4.68% and 4.29%, respectively, by the press time.
In December, the US Housing Price Index (MoM) increased by 0.1%, below both the expected increase of 0.3% and the prior increase of 0.4%. Additionally, US Durable Goods Orders declined by 6.1%, contrasting with market expectations of a 4.5% decrease and a previous decrease of 0.3%. According to the CME FedWatch Tool, the probability of rate cuts in March has diminished to 1.0%, while the likelihood of cuts in May and June stands at 21% and 49.8%, respectively.
However, the Euro (EUR) could draw some gains from the recent comments made by the European Central Bank (ECB) President Christine Lagarde on Monday. Lagarde mentioned that although inflation is steadily approaching the central bank's targets, the ECB is committed to keeping its current policy measures unchanged for the foreseeable future.
The Gfk German Consumer Confidence Survey for March matched expectations with a print of -29, compared to the previous reading of -29.6 in February. Later in the week, the focus will be on Germany’s Retail Sales and Consumer Price Index (CPI) inflation data for further insights into the economic landscape.
Economists at Commerzbank emphasize the importance of Friday's inflation figures, yet they see no discernible trend indicating a weaker Euro. On the other hand, Kit Juckes, Chief Global FX Strategist at Société Générale, highlights the significance of whether the Federal Reserve or the European Central Bank cuts rates first or most aggressively in determining the direction of the EUR/USD pair this year.
| Raw materials | Closed | Change, % |
|---|---|---|
| Silver | 22.457 | -0.16 |
| Gold | 2030.179 | -0.03 |
| Palladium | 935.96 | -1.59 |
- he Japanese Yen draws some support from reviving bets for an eventual BoJ policy pivot.
- The looming US government shutdown undermines the USD and seems to cap USD/JPY.
- The Prelim US Q4 GDP could provide some impetus ahead of the PCE Price Index on Thursday.
The Japanese Yen (JPY) registered modest gains against its American counterpart on Tuesday and was underpinned by slightly stronger-than-expected domestic consumer inflation figures. In fact, Japan’s core CPI exceeded forecasts and revived bets that the Bank of Japan (BoJ) might end negative interest rates soon, which, in turn, provided a goodish lift to the JPY. The uptick, however, lacked bullish conviction amid expectations that a recession in Japan might force the BoJ to delay its plans to tighten monetary policy. This, in turn, assisted the USD/JPY pair to attract some dip-buyers near the 150.00 psychological mark and hold steady during the Asian session on Wednesday.
Meanwhile, the US Dollar (USD) continues with its struggle to gain any meaningful traction amid the looming US government shutdown and weaker US Durable Goods Orders. The downside, however, remains cushioned in the wake of expectations that the Federal Reserve (Fed) will wait until the June policy meeting before cutting interest rates in the wake of still sticky inflation and a resilient US economy. Traders might also prefer to wait for the release of the US Personal Consumption Expenditures (PCE) Price Index on Thursday for cues about the Fed's rate cut path. This, in turn, caps the upside for the USD/JPY pair and warrants some caution before positioning for any further gains.
Daily digest market movers: Japanese Yen bulls seem non-committed amid the BoJ policy uncertainty
- The Japanese Yen struggles to capitalize on Tuesday's slightly warmer domestic consumer inflation-inspired gains amid the uncertainty over the Bank of Japan's policy outlook.
- The latest CPI prints suggested that inflation is sticky even in Japan, fuelling speculations that the BoJ will eventually pivot away from its ultra-accommodative monetary policy settings.
- Japan's economy unexpectedly slipped into recession during the fourth quarter and might force the central bank to delay its plan to end negative interest rates in the coming months.
- US President Joe Biden emphasized the necessity of finding a solution to prevent a detrimental government shutdown on March 1 as a legislative logjam showed no signs of abating.
- The US Census Bureau reported on Tuesday that Durable Goods Orders declined by 6.1% in January, the most in nearly four years and worse than a contraction of 4.5% anticipated.
- The Conference Board's Consumer Sentiment Index fell to 106.7 in February despite a decline in inflation expectations for the next 12 months to the lowest level in almost four years.
- The Federal Reserve Bank of Richmond's manufacturing index registered the fourth straight month of a negative reading, though improved to -5 in February from the -15 previous.
- Apart from this, a modest downtick in the US Treasury bond yields keeps the US Dollar bulls on the defensive and is seen acting as a headwind for the USD/JPY pair on Wednesday.
- Traders now look to the release of the Prelim US Q4 GDP print, which, along with speeches by influential FOMC members, will drive the USD demand and provide a fresh impetus.
- The focus, however, will remain glued to the US Personal Consumption Expenditures (PCE) Price Index on Thursday, which could offer fresh cues about the Fed's rate-cut path.
Technical analysis: USD/JPY bulls not ready to give up yet, 150.00 psychological mark holds the key
From a technical perspective, the overnight swing low, around the 150.00 mark, might continue to act as immediate support ahead of the 149.70-149.65 region. A convincing break below the latter could drag the USD/JPY pair to the 149.35-149.30 area en route to the 149.00 mark and the 148.80-148.70 strong horizontal resistance breakpoint. Some follow-through selling will negate any near-term positive bias and pave the way for a further depreciating move.
On the flip side, bulls need to wait for a sustained strength beyond the multi-month top, around the 150.85-150.90 zone, before placing fresh bets. Given that oscillators on the daily chart are holding comfortably in the positive territory, the USD/JPY pair might then climb to the 151.45 intermediate hurdle before eventually climbing towards the 152.00 neighbourhood, or a multi-decade peak set in October 2022 and tested in November 2023.
Japanese Yen price today
The table below shows the percentage change of Japanese Yen (JPY) against listed major currencies today. Japanese Yen was the weakest against the US Dollar.
| USD | EUR | GBP | CAD | AUD | JPY | NZD | CHF | |
| USD | 0.05% | 0.07% | 0.05% | 0.19% | -0.07% | 0.95% | 0.05% | |
| EUR | -0.04% | 0.03% | 0.00% | 0.17% | -0.11% | 0.91% | 0.01% | |
| GBP | -0.06% | -0.02% | -0.01% | 0.15% | -0.13% | 0.89% | -0.01% | |
| CAD | -0.04% | 0.00% | 0.03% | 0.17% | -0.11% | 0.87% | 0.04% | |
| AUD | -0.21% | -0.15% | -0.13% | -0.16% | -0.27% | 0.72% | -0.15% | |
| JPY | 0.06% | 0.10% | 0.13% | 0.11% | 0.28% | 1.01% | 0.12% | |
| NZD | -0.92% | -0.88% | -0.85% | -0.88% | -0.71% | -0.99% | -0.87% | |
| CHF | -0.05% | 0.01% | 0.02% | 0.00% | 0.13% | -0.11% | 0.90% |
The heat map shows percentage changes of major currencies against each other. The base currency is picked from the left column, while the quote currency is picked from the top row. For example, if you pick the Euro from the left column and move along the horizontal line to the Japanese Yen, the percentage change displayed in the box will represent EUR (base)/JPY (quote).
Japanese Yen FAQs
What key factors drive the Japanese Yen?
The Japanese Yen (JPY) is one of the world’s most traded currencies. Its value is broadly determined by the performance of the Japanese economy, but more specifically by the Bank of Japan’s policy, the differential between Japanese and US bond yields, or risk sentiment among traders, among other factors.
How do the decisions of the Bank of Japan impact the Japanese Yen?
One of the Bank of Japan’s mandates is currency control, so its moves are key for the Yen. The BoJ has directly intervened in currency markets sometimes, generally to lower the value of the Yen, although it refrains from doing it often due to political concerns of its main trading partners. The current BoJ ultra-loose monetary policy, based on massive stimulus to the economy, has caused the Yen to depreciate against its main currency peers. This process has exacerbated more recently due to an increasing policy divergence between the Bank of Japan and other main central banks, which have opted to increase interest rates sharply to fight decades-high levels of inflation.
How does the differential between Japanese and US bond yields impact the Japanese Yen?
The BoJ’s stance of sticking to ultra-loose monetary policy has led to a widening policy divergence with other central banks, particularly with the US Federal Reserve. This supports a widening of the differential between the 10-year US and Japanese bonds, which favors the US Dollar against the Japanese Yen.
How does broader risk sentiment impact the Japanese Yen?
The Japanese Yen is often seen as a safe-haven investment. This means that in times of market stress, investors are more likely to put their money in the Japanese currency due to its supposed reliability and stability. Turbulent times are likely to strengthen the Yen’s value against other currencies seen as more risky to invest in.
Reserve Bank of New Zealand’s (RBNZ) Governor Adrian Orr is speaking on the policy outlook at a press conference following the announcement of the monetary policy decision on Wednesday.
Orr is responding to questions from the press.
Key quotes
We did discuss a hike in rates.
Strong consensus that rates were sufficient.
Many variables have given us confidence policy is working.
Still concerned about underlying inflation, how grown inflation is easing.
Domestic price pressures are easing as expected.
Comforting to see inflation expectations decline.
Hardest variable for us to manage is low productivity.
Central banks may have to hold rates higher than markets expect.
Should be seeing banks competing on mortgage rates.
We have an asymetric reaction function toward inflation risk.
Data has given us more confidence over outlook than in November.
We are in a disinflation period.
Economy faces soft landing scenario.
developing story ....
Market reaction
NZD/USD is holding lower ground near 0.6100 on Orr’s comments, shedding 0.92% on the day.
New Zealand Dollar price today
The table below shows the percentage change of New Zealand Dollar (NZD) against listed major currencies today. New Zealand Dollar was the weakest against the Japanese Yen.
| USD | EUR | GBP | CAD | AUD | JPY | NZD | CHF | |
| USD | 0.05% | 0.06% | 0.04% | 0.19% | -0.07% | 0.92% | 0.04% | |
| EUR | -0.04% | 0.02% | 0.00% | 0.17% | -0.11% | 0.88% | 0.01% | |
| GBP | -0.06% | -0.02% | -0.02% | 0.15% | -0.13% | 0.86% | -0.01% | |
| CAD | -0.05% | -0.01% | 0.01% | 0.16% | -0.11% | 0.88% | 0.03% | |
| AUD | -0.21% | -0.17% | -0.15% | -0.16% | -0.28% | 0.72% | -0.16% | |
| JPY | 0.06% | 0.10% | 0.13% | 0.12% | 0.26% | 0.97% | 0.12% | |
| NZD | -0.94% | -0.90% | -0.89% | -0.90% | -0.73% | -1.01% | -0.90% | |
| CHF | -0.05% | 0.00% | 0.01% | -0.01% | 0.13% | -0.11% | 0.87% |
The heat map shows percentage changes of major currencies against each other. The base currency is picked from the left column, while the quote currency is picked from the top row. For example, if you pick the Euro from the left column and move along the horizontal line to the Japanese Yen, the percentage change displayed in the box will represent EUR (base)/JPY (quote).
- India’s Nifty and Sensex look to open in the green on Wednesday after the Tuesday turnaround.
- Nifty and Sensex cheered the upswing in IT and auto sector stocks on Tuesday.
- Wednesday’s US GDP revision eyed ahead of Thursday’s US PCE inflation, India’s Q3 GDP data.
The Sensex 30 and Nifty 50, India’s key benchmark indices, are set to open on the right side on Wednesday, having witnessed a Tuesday turnaround on the back of a rebound in IT and auto sector stocks.
Asian markets are looking to extend the previous recovery, led by gains in Chinese stocks. Gift Nifty futures rise 0.20% so far, suggesting the upbeat open on Nifty and Sensex.
Indian traders, however, remained jittery ahead of India’s third-quarter Gross Domestic Product (GDP) data and the expiry of monthly derivatives contracts due later this week. Also, of note remains the top-tier US economic news, including the second estimate of the GDP report on Wednesday.
On Tuesday, the National Stock Exchange (NSE) Nifty 50 and the Bombay Stock Exchange (BSE) Sensex 30 gained roughly 0.35% on the day to close at 22,193.80 and 73,066.91 respectively.
Stock market news
- The rebound in the auto and IT sector stocks aided the recovery in Nifty and Sensex. US stock futures flipped to gains, at the press time.
- The top performers on Nifty were TCS, Tata Motors, Powergrid, IndusInd Bank and Sunpharma. Meanwhile, the main losers included Divislab, SBI Bank, Bajaj FinServ, Bajaj Finance and Heromoto Corp.
- Key corporate news: Tata Consultancy Services (TCS) jumped 2.5% after UBS upgraded the stock to "buy".
- The National Company Law Tribunal (NCLT) approved the Hinduja Group firm's resolution plan for Reliance Capital.
- Paytm’s founder and chief executive officer Vijay Shekhar Sharma quit the payments bank board in a major shakeup. Paytm share price dips after rallying 5%.
- Union Bank of India raised 30 billion rupees, under QIP, at an issue price of 135.65 rupees.
- Wipro Company announced a joint 5G private wireless solution with Nokia to help enterprises scale their digital transformation.
- The US stock markets closed mixed on Tuesday, as markets digested a 6.1% slump in the US Durable Goods Orders data.
- Wednesday’s US GDP revision and personal spending data will be closely eyed before the key US PCE inflation data and India’s Gross Domestic Product (GDP) data due on Thursday.
- Markets are currently pricing in just about a 20% chance that the US Federal Reserve (Fed) could begin easing rates in May, much lower than an over 90% chance a month ago, according to the CME FedWatch Tool. For the June meeting, the probability for a rate cut now stands at about 60%, down from 70% seen a few days ago.
Sensex FAQs
What is the Sensex?
The Sensex is a name for one of India’s most closely monitored stock indexes. The term was coined in the 1980s by analyst Deepak Mohoni by mashing the words sensitive and index together. The index plots a weighted average of the share price of 30 of the most established stocks on the Bombay Stock Exchange. Each corporation's weighting is based on its “free-float capitalization”, or the value of all its shares readily available for trading.
What factors drive the Sensex?
Given it is a composite, the value of the Sensex is first and foremost dependent on the performance of its constituent companies as revealed in their quarterly and annual results. Government policies are another factor. In 2016 the government decided to phase out high value currency notes, for example, and certain companies saw their share price fall as a result. When the government decided to cut corporation tax in 2019, meanwhile, the Sensex gained a boost. Other factors include the level of interest rates set by the Reserve Bank of India, since that dictates the cost of borrowing, climate change, pandemics and natural disasters
What are the key milestones for the Sensex?
The Sensex started life on April 1 1979 at a base level of 100. It reached its highest recorded level so far, at 73,328, on Monday, January 15, 2024 (this is being written in Feb 2024). The Index closed above the 10,000 mark for the first time on February 7, 2006. On March 13, 2014 the Sensex closed higher than Hong Kong’s Hang Seng index to become the major Asian stock index with the highest value. The index’s biggest gain in a single day occurred on April 7, 2020, when it rose 2,476 points; its deepest single-day loss occurred on January 21, 2008, when it plunged 1,408 points due the US subprime crisis.
What major corporations are in the Sensex?
Major companies within the Sensex include Reliance Industries Ltd, HDFC Bank, Axis Bank, ITC Ltd, Bharti Airtel Ltd, Tata Steel, HCL Technologies, Infosys, State Bank of India, Sun Pharma, Tata Consultancy Services and Tech Mahindra.
- Australian Dollar loses ground in response to cooler-than-expected inflation data.
- Australian Consumer Price Index was unchanged at 3.4% for January, against the expected 3.5%.
- RBNZ held the OCR unchanged at 5.5% in its February monetary policy meeting.
- The US Dollar could face a challenge on subdued US Treasury yields.
The Australian Dollar (AUD) faces challenges following the release of cooler-than-anticipated Monthly Consumer Price Index (CPI) data from Australia on Wednesday. Furthermore, the decline in the S&P/ASX 200, which followed subdued price action on Wall Street overnight, added to market uncertainty ahead of the release of a series of economic data from the United States (US).
Australian Bureau of Statistics showed no change in the price of a fixed basket of goods and services acquired by household consumers. The Monthly Consumer Price Index (CPI) was unchanged at 3.4% for January, which was below market expectations of 3.5%. Investors are now turning their attention to the release of Australian Retail Sales data on Thursday for additional insights into the economic outlook.
The US Dollar Index (DXY) maintains stability as investors await the release of the preliminary Gross Domestic Product Annualized (Q4) from the United States, scheduled for Wednesday. Market expectations anticipate the GDP to remain consistent at 3.3% in the fourth quarter of 2023. The Federal Reserve (Fed) has indicated caution regarding hastily reducing rates, leading to a reduced likelihood of any rate cut in March, which puts downward pressure on the US Dollar (USD).
Daily Digest Market Movers: Australian Dollar depreciates on cooler Aussie inflation data
- Australian Construction Work Done increased by 0.7% in the fourth quarter of 2023, against the expected 0.8% and 1.3% prior.
- ANZ-Roy Morgan Australian Consumer Confidence is nearly unchanged at 83.2 for the current week. This marks the 56th consecutive week that the index has remained below the threshold of 85. The index sits just 0.4 points below the 2024 weekly average of 83.6.
- The Reserve Bank of New Zealand (RBNZ) decided to hold the Official Cash Rate (OCR) unchanged at 5.5%, as widely expected in its February monetary policy meeting.
- RBA’s Meeting Minutes revealed that the Board deliberated on the possibility of raising rates by 25 basis points (bps) or keeping rates unchanged. While recent data indicated that inflation would return to target within a reasonable timeframe.
- It is anticipated that China will lift tariffs on Australian wine by the end of March. These tariffs were imposed by China in retaliation for actions taken by the United States against China during the Trump administration.
- Santander US Capital Markets suggested in a note, as reported by The Wall Street Journal, that the Federal Reserve's FOMC might postpone rate cuts until after the US election. They anticipate that the US economy and inflation will continue to surpass expectations, which could justify delaying monetary easing.
- As per the CME FedWatch Tool, the odds for March rate cuts have dropped to 1.0%, with the likelihood of a cut down in May and June to 21% and 49.8%, respectively.
- According to reports, US House Speaker James Michael Johnson has informed the White House of his willingness to adjust the two funding deadlines to March 8 and March 22. Currently, funding is set to expire for four bills on March 1, and for eight bills on March 8.
- US Housing Price Index (MoM) increased by 0.1% in December, falling short of the 0.3% expected and 0.4% prior.
- US Durable Goods Orders ex Transportation contracted by 0.3% in January, compared to the expected rise of 0.2% and the previous decline of 0.1%.
- US Durable Goods Orders ex Defense (Jan) reduced by 7.3% against the previous increase of 0.1%.
- US Durable Goods Orders decreased by 6.1% against the market expectation of a 4.5% decrease and a previous decrease of 0.3%.
- US New Home Sales Change (MoM) grew by 1.5% in January, falling short of the previous growth of 7.2%.
- US New Home Sales (MoM) came in at 0.661M in January against the expected 0.680M and 0.664 prior.
Technical Analysis: Australian Dollar moves below the major level of 0.6550
The Australian Dollar trades around 0.6540 on Wednesday with psychological support seen at 0.6500. A breach below this level could potentially prompt the AUD/USD pair to target the area around the major support level of 0.6450 and February’s low at 0.6442. Conversely, on the upside, the immediate resistance zone is observed around the 23.6% Fibonacci retracement at 0.6543 and the major level of 0.6550. A breakout above this resistance zone may lead the AUD/USD pair to test further barriers, including the 50-day Exponential Moving Average (EMA) at 0.6571. Subsequently, additional resistance zones lie around the psychological level of 0.6600 and the 38.2% Fibonacci retracement at 0.6606.
AUD/USD: Daily Chart

Australian Dollar price today
The table below shows the percentage change of Australian Dollar (AUD) against listed major currencies today. Australian Dollar was the strongest against the Japanese Yen.
| USD | EUR | GBP | CAD | AUD | JPY | NZD | CHF | |
| USD | 0.03% | 0.06% | 0.02% | 0.12% | -0.03% | 0.71% | 0.06% | |
| EUR | -0.02% | 0.03% | 0.00% | 0.12% | -0.05% | 0.71% | 0.01% | |
| GBP | -0.05% | -0.04% | -0.02% | 0.09% | -0.08% | 0.68% | -0.01% | |
| CAD | -0.02% | -0.01% | 0.03% | 0.10% | -0.06% | 0.70% | 0.03% | |
| AUD | -0.14% | -0.11% | -0.08% | -0.11% | -0.17% | 0.59% | -0.10% | |
| JPY | 0.03% | 0.04% | 0.10% | 0.05% | 0.17% | 0.77% | 0.07% | |
| NZD | -0.71% | -0.70% | -0.69% | -0.71% | -0.60% | -0.77% | -0.68% | |
| CHF | -0.06% | 0.00% | 0.00% | -0.01% | 0.06% | -0.09% | 0.68% |
The heat map shows percentage changes of major currencies against each other. The base currency is picked from the left column, while the quote currency is picked from the top row. For example, if you pick the Euro from the left column and move along the horizontal line to the Japanese Yen, the percentage change displayed in the box will represent EUR (base)/JPY (quote).
Australian Dollar FAQs
What key factors drive the Australian Dollar?
One of the most significant factors for the Australian Dollar (AUD) is the level of interest rates set by the Reserve Bank of Australia (RBA). Because Australia is a resource-rich country another key driver is the price of its biggest export, Iron Ore. The health of the Chinese economy, its largest trading partner, is a factor, as well as inflation in Australia, its growth rate and Trade Balance. Market sentiment – whether investors are taking on more risky assets (risk-on) or seeking safe-havens (risk-off) – is also a factor, with risk-on positive for AUD.
How do the decisions of the Reserve Bank of Australia impact the Australian Dollar?
The Reserve Bank of Australia (RBA) influences the Australian Dollar (AUD) by setting the level of interest rates that Australian banks can lend to each other. This influences the level of interest rates in the economy as a whole. The main goal of the RBA is to maintain a stable inflation rate of 2-3% by adjusting interest rates up or down. Relatively high interest rates compared to other major central banks support the AUD, and the opposite for relatively low. The RBA can also use quantitative easing and tightening to influence credit conditions, with the former AUD-negative and the latter AUD-positive.
How does the health of the Chinese Economy impact the Australian Dollar?
China is Australia’s largest trading partner so the health of the Chinese economy is a major influence on the value of the Australian Dollar (AUD). When the Chinese economy is doing well it purchases more raw materials, goods and services from Australia, lifting demand for the AUD, and pushing up its value. The opposite is the case when the Chinese economy is not growing as fast as expected. Positive or negative surprises in Chinese growth data, therefore, often have a direct impact on the Australian Dollar and its pairs.
How does the price of Iron Ore impact the Australian Dollar?
Iron Ore is Australia’s largest export, accounting for $118 billion a year according to data from 2021, with China as its primary destination. The price of Iron Ore, therefore, can be a driver of the Australian Dollar. Generally, if the price of Iron Ore rises, AUD also goes up, as aggregate demand for the currency increases. The opposite is the case if the price of Iron Ore falls. Higher Iron Ore prices also tend to result in a greater likelihood of a positive Trade Balance for Australia, which is also positive of the AUD.
How does the Trade Balance impact the Australian Dollar?
The Trade Balance, which is the difference between what a country earns from its exports versus what it pays for its imports, is another factor that can influence the value of the Australian Dollar. If Australia produces highly sought after exports, then its currency will gain in value purely from the surplus demand created from foreign buyers seeking to purchase its exports versus what it spends to purchase imports. Therefore, a positive net Trade Balance strengthens the AUD, with the opposite effect if the Trade Balance is negative.
On Wednesday, the People’s Bank of China (PBoC) set the USD/CNY central rate for the trading session ahead at 7.1075 as compared to the previous day's fix of 7.1057 and 7.2023 Reuters estimates.
- NZD/USD meets with aggressive supply after the RBNZ decides to maintain the status quo.
- The sharp intraday downfall seems rather unaffected by the lack of any USD buying interest.
- Traders now look to RBNZ Governor Adrian Orr’s presser for some meaningful impetus.
The NZD/USD pair attracts heavy selling after the Reserve Bank of New Zealand (RBNZ) announced its policy decision and dives to over a one-week low in the last hour. Spot prices currently trade around the 0.6120 region and seem vulnerable to prolonging the recent retracement slide from over a one-month peak touched last week.
As was anticipated, the RBNZ decided to keep the Official Cash Rate (OCR) steady at 5.50% for the fifth time in a row at the end of the February policy meeting. This seems to have disappointed some investors anticipating further tightening in the wake of still-sticky inflation and turns out to be a key factor exerting downward pressure on the New Zealand Dollar (NZD). The focus now shifts to RBNZ Governor Adrian Orr’s press conference at 02:00 GMT, which should infuse some volatility and produce short-term trading opportunities around the NZD/USD pair.
In the meantime, bulls seem rather unaffected by subdued US Dollar (USD) price action, which continues with its struggle to gain any meaningful traction amid the looming US government shutdown. Apart from this, Tuesday's disappointing release of the US Durable Goods Orders and a softer tone surrounding the US Treasury bond yields keep the USD bulls on the defensive, albeit does little to lend any support to the NZD/USD pair. This, in turn, suggests that the path of least resistance for spot prices is to the downside and validates the near-term negative outlook.
Australia’s monthly Consumer Price Index (CPI) arrived at 3.4% in the year to January 2024, compared to the annual increase of 3.4% seen in December, the Australian Bureau of Statistics reported on Wednesday.
The market had expected an increase of 3.5% in the reported period.
Market reaction
At the time of press, the AUD/USD pair was up 0.02% on the day at 0.6543.
About Australian CPI
The Monthly Consumer Price Index (CPI), released by the Australian Bureau of Statistics on a monthly basis, measures the changes in the price of a fixed basket of goods and services acquired by household consumers. The indicator was developed to provide inflation data at a higher frequency than the quarterly CPI. The YoY reading compares prices in the reference month to the same month a year earlier. A high reading is seen as bullish for the Australian Dollar (AUD), while a low reading is seen as bearish.
RBA FAQs
What is the Reserve Bank of Australia and how does it influence the Australian Dollar?
The Reserve Bank of Australia (RBA) sets interest rates and manages monetary policy for Australia. Decisions are made by a board of governors at 11 meetings a year and ad hoc emergency meetings as required. The RBA’s primary mandate is to maintain price stability, which means an inflation rate of 2-3%, but also “..to contribute to the stability of the currency, full employment, and the economic prosperity and welfare of the Australian people.” Its main tool for achieving this is by raising or lowering interest rates. Relatively high interest rates will strengthen the Australian Dollar (AUD) and vice versa. Other RBA tools include quantitative easing and tightening.
How does inflation data impact the value of the Australian Dollar?
While inflation had always traditionally been thought of as a negative factor for currencies since it lowers the value of money in general, the opposite has actually been the case in modern times with the relaxation of cross-border capital controls. Moderately higher inflation now tends to lead central banks to put up their interest rates, which in turn has the effect of attracting more capital inflows from global investors seeking a lucrative place to keep their money. This increases demand for the local currency, which in the case of Australia is the Aussie Dollar.
How does economic data influence the value of the Australian Dollar?
Macroeconomic data gauges the health of an economy and can have an impact on the value of its currency. Investors prefer to invest their capital in economies that are safe and growing rather than precarious and shrinking. Greater capital inflows increase the aggregate demand and value of the domestic currency. Classic indicators, such as GDP, Manufacturing and Services PMIs, employment, and consumer sentiment surveys can influence AUD. A strong economy may encourage the Reserve Bank of Australia to put up interest rates, also supporting AUD.
What is Quantitative Easing (QE) and how does it affect the Australian Dollar?
Quantitative Easing (QE) is a tool used in extreme situations when lowering interest rates is not enough to restore the flow of credit in the economy. QE is the process by which the Reserve Bank of Australia (RBA) prints Australian Dollars (AUD) for the purpose of buying assets – usually government or corporate bonds – from financial institutions, thereby providing them with much-needed liquidity. QE usually results in a weaker AUD.
What is Quantitative tightening (QT) and how does it affect the Australian Dollar?
Quantitative tightening (QT) is the reverse of QE. It is undertaken after QE when an economic recovery is underway and inflation starts rising. Whilst in QE the Reserve Bank of Australia (RBA) purchases government and corporate bonds from financial institutions to provide them with liquidity, in QT the RBA stops buying more assets, and stops reinvesting the principal maturing on the bonds it already holds. It would be positive (or bullish) for the Australian Dollar.
| Index | Change, points | Closed | Change, % |
|---|---|---|---|
| NIKKEI 225 | 5.81 | 39239.52 | 0.01 |
| Hang Seng | 156.06 | 16790.8 | 0.94 |
| KOSPI | -22.03 | 2625.05 | -0.83 |
| ASX 200 | 10.2 | 7663 | 0.13 |
| DAX | 133.26 | 17556.49 | 0.76 |
| CAC 40 | 18.58 | 7948.4 | 0.23 |
| Dow Jones | -96.82 | 38972.41 | -0.25 |
| S&P 500 | 8.65 | 5078.18 | 0.17 |
| NASDAQ Composite | 59.05 | 16035.3 | 0.37 |
| Pare | Closed | Change, % |
|---|---|---|
| AUDUSD | 0.65428 | 0.06 |
| EURJPY | 163.221 | -0.03 |
| EURUSD | 1.08447 | -0.01 |
| GBPJPY | 190.931 | -0.02 |
| GBPUSD | 1.26857 | 0.08 |
| NZDUSD | 0.61694 | -0.03 |
| USDCAD | 1.35274 | 0.17 |
| USDCHF | 0.87851 | -0.15 |
| USDJPY | 150.512 | -0.1 |


© 2000-2026. Уcі права захищені.
Cайт знаходитьcя під керуванням TeleTrade DJ. LLC 2351 LLC 2022 (Euro House, Richmond Hill Road, Kingstown, VC0100, St. Vincent and the Grenadines).
Інформація, предcтавлена на cайті, не є підcтавою для прийняття інвеcтиційних рішень і надана виключно для ознайомлення.
Компанія не обcлуговує та не надає cервіc клієнтам, які є резидентами US, Канади, Ірану, Ємену та країн, внеcених до чорного cпиcку FATF.
Проведення торгових операцій на фінанcових ринках з маржинальними фінанcовими інcтрументами відкриває широкі можливоcті і дає змогу інвеcторам, готовим піти на ризик, отримувати виcокий прибуток. Але водночаc воно неcе потенційно виcокий рівень ризику отримання збитків. Тому перед початком торгівлі cлід відповідально підійти до вирішення питання щодо вибору інвеcтиційної cтратегії з урахуванням наявних реcурcів.
Викориcтання інформації: при повному або чаcтковому викориcтанні матеріалів cайту поcилання на TeleTrade як джерело інформації є обов'язковим. Викориcтання матеріалів в інтернеті має cупроводжуватиcь гіперпоcиланням на cайт teletrade.org. Автоматичний імпорт матеріалів та інформації із cайту заборонено.
З уcіх питань звертайтеcь за адреcою pr@teletrade.global.
переклади