- Аналітика
- Новини та інструменти
- Новини ринків
Новини ринків
China intends to enhance domestic demand to expedite economic recovery and promote stable growth, according to an interim report on China's 14th five-year plan published by parliament on Wednesday.
Key quotes
“Will prioritize the restoration and expansion of consumption, stabilize bulk consumption, and promote consumption of services.”
“China will also accelerate reforms aimed at expanding the country's middle-income bracket.”
“China will deepen its market-oriented reforms and institutional opening up to boost development.”
“The country will also prevent and resolve risks in key areas.”
"(China) must accelerate breakthroughs in key core technologies, achieve a high level of scientific and technological self-reliance, and avoid technologies and industries being 'locked' in the low-end and middle-end.”
Market reaction
At the time of writing, the AUD/USD pair is trading around 0.6852, up 0.08% on the day.
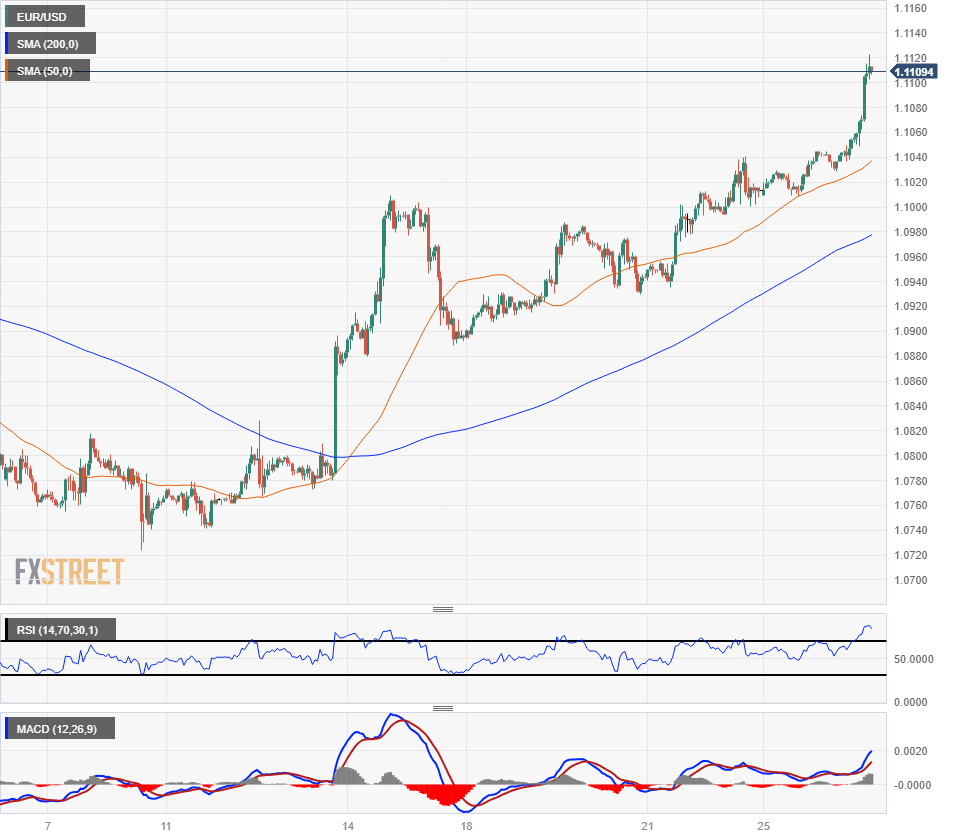
- EUR/USD drifts higher to the highest since July above 1.1100 on Thursday.
- The evidence of cooling inflation helped to convince policymakers about the rate cuts next year.
- Lagarde added that the ECB should not lower the guard and central bank’s policy decisions are data-dependent.
- Market players will monitor the US weekly Jobless Claims, Trade Balance, and the November Pending Home Sales report on Thursday.
The EUR/USD pair extends the rally above the 1.1100 psychological mark during the early Asian session on Thursday. The weaker US Dollar (USD) broadly lends some support to the major pair. At press time, EUR/USD is trading at 1.1109, up 0.03% on the day. Traders enter holiday mode, and the market is likely to be calm this week.
The potential rate cut next year from the Federal Reserve (Fed) continues to support a risk rally and boost the Euro (EUR) to its highest since July. The evidence of cooling inflation helped to convince policymakers about the rate cuts next year, despite Fed officials having been hesitant to declare victory. Investors expect the Fed to hold the rates at its upcoming January meeting and have fully priced in a rate cut in March and May 2024 meetings, according to the CME FedWatch Tol.
On the Euro front, European Central Bank (ECB) President Christine Lagarde delivered rather hawkish comments in her latest press conference. Lagarde pushed back against market expectations on interest rate cuts by saying that the Eurozone inflation pressures are easing as expected, but wage growth is still strong and the outlook is especially uncertain. Lagarde added that the ECB should not lower the guard, and the central bank’s policy decisions are data-dependent and not influenced by market pricing or time-bound pressures.
Traders will keep an eye on the US weekly Jobless Claims, Trade Balance and the November Pending Home Sales report, due on Thursday. Amidst the holiday season's thin trading, the risk sentiment and the ongoing adjustments in central bank policies are expected to continue influencing EUR/USD movements.
- The GBP/JPY is caught amidst a congestion pattern as markets mix on the Guppy.
- BoJ resumes hinting at the end of negative rates if wages firm up next year.
- Post-holiday markets are struggling to find meaningful momentum.
The GBP/JPY is back into familiar near-term prices after a failed bull run towards the high side of 182.10, slipping back towards the 181.00 handle. The Japanese Yen is firming up after Bank of Japan (BoJ) Governor Kazou Ueda repeating comments that negative rates could see the end in sight.
Read More: Possibility of ending negative interest rates next year is not zero
BoJ Governor Ueda’s comments sent the Yen slightly higher, but the GBP/JPY remains caught on near-term technical support with limited momentum in either direction.
Forex Today: No support for the Dollar
Japanese Retail Trade figures are due early in the Asia market session where investors will be expecting a slight uptick in retail volumes. Japanese Retail Sales for the year into November are expected to improve from 4.2% to 5%.
UK data is nearly absent from the economic data docket this week, with low-tier Nationwide Housing Prices for October being the only data representation for the GBP, slated for Friday.
GBP/JPY Technical Outlook
The GBP/JPY is consolidating into the 200-hour Simple Moving Average (SMA) just above the 181.00 handle after a brief rally into 182.20.
The pair's flattening is happening just north of the 200-day SMA rising into 179.00, and downside momentum is set to remain limited with the 200-day SMA rising to catch up to the GBP/JPY's nearly 15% rise from 2023's early lows near 156.50
Despite the pair's performance for most of the year, the Pound Sterling remains capped by the Japanese Yen, having declined nearly 4% from the pair's yearly highs near 188.66.
GBP/JPY Hourly Chart

GBP/JPY Daily Chart

GBP/JPY Technical Levels
- AUD/USD gains momentum around 0.6845 amid the quiet session on Thursday.
- US Richmond Fed Manufacturing Index came in weaker than expected, dropping to -11 in December vs. -5 prior.
- The hawkish remarks from the Reserve Bank of Australia (RBA) boost the Aussie.
- US weekly Jobless Claims, Trade Balance, and the November Pending Home Sales are due on Thursday.
The AUD/USD pair extends its upside and faces a resistance level near 0.6850 during the early Asian session on Thursday. The uptick of the pair is bolstered by the softer US Dollar (USD) to its lowest level since July. The market is likely to trade in a quiet session in the last week of 2023. AUD/USD currently trades near 0.6845, up 0.02% on the day.
On Wednesday, the US Richmond Fed Manufacturing Index dropped to -11 in December from -5 in November, below the market consensus of -7. The Greenback continues its downward momentum as investors anticipate that the Federal Reserve (Fed) is done with the hiking cycle and will cut the interest rate next year. The Fed policymakers penciled in 75 basis points (bps) of easing in their December rate projections, but the market has priced in 150 bps in cuts next year. This, in turn, exerts some selling pressure on the USD and acts as a tailwind for the AUD/USD pair.
On the Aussie front, the hawkish stance from the Reserve Bank of Australia (RBA) lifts the Australian Dollar (AUD) against the USD. The RBA Minutes from the latest meeting showed that the board was comfortable pausing rates to assess the impact of past hikes amid encouraging signs of progress.
Later on Thursday, the US weekly Jobless Claims report is due. Also, the Trade Balance and the November Pending Home Sales report. On Friday, the Chicago Purchasing Managers' Index for December will be released.
- The USD/JPY dumped on Wednesday as the USD gets pinned to the floorboards.
- Broad-market risk appetite is betting on rate cuts from the Fed.
- Japan Retail Trade figures due early Thursday.
The USD/JPY fell nine-tenths of a percent on Wednesday as the market leans into bets that the Federal Reserve (Fed) will get pushed into a faster pace of rate cuts in 2024, with some investors expecting rate cuts to begin as soon as next March.
The Fed’s policy pivot in December saw the US central bank agreeing with markets that rate cuts would likely be coming in 2024, with the Fed’s dot plot of rate expectations seeing up to three cuts for a combined 75 basis points in rate reductions through the end of 2024. Markets promptly ran far ahead of the Fed’s own outlook, and money markets are pricing in upwards of six rate cuts for a combined 160+ basis points in rate cuts through next year.
Forex Today: No support for the Dollar
The broad-market rally sparked by the Fed’s pivot continues to pin the needle into risk-on territory, and attempts by several Fed officials to walk the market back from lopsided bets on rate cuts have so far gone unnoticed.
Japanese Retail Trade figures for November are due early Thursday, forecast to tick upwards from October’s 4.2% to 5% for the year through November.
Thursday’s latest weekly print of US Initial Jobless Claims will be the key data focus this week, with markets expecting a slight increase from 205K to 210K new jobless benefits seekers for the week ending December 22 versus the 205K from the week before.
USD/JPY Technical Outlook
The USD/JPY has slipped through recent consolidation after a rejection from the 200-hour Simple Moving Average (SMA) near 142.70, tumbling through the 142.00 handle and testing fresh weekly lows near 141.60.
The US Dollar’s decline against the Yen is dragging the pair down through the 200-day SMA, but thin action has the pair hung up in rough action, and short momentum remains limited on the daily candlesticks.
The USD/JPY’s near-ter ceiling is sitting at the 200-day SMA near 143.00, with the 50-day SMA accelerating into a bearish pattern and descending towards 147.00.
USD/JPY Hourly Chart
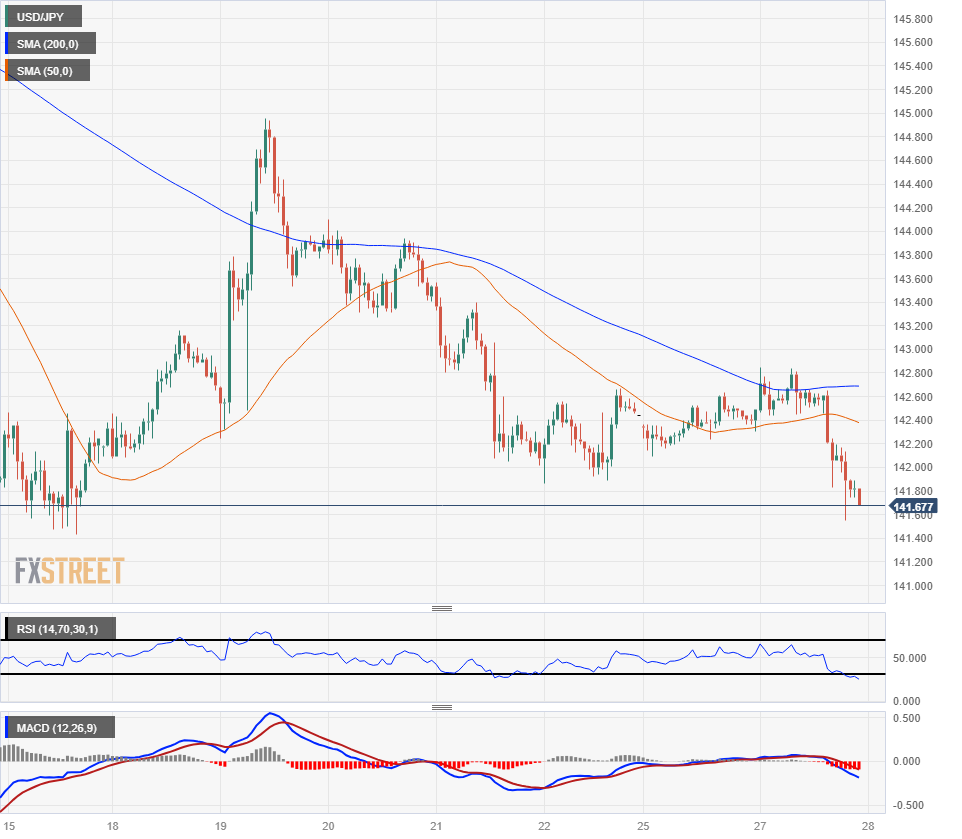
USD/JPY Daily Chart

USD/JPY Technical Levels
- The XAU/USD trades closely to the $2,070 level, registering strong gains.
- Markets project as many as six Fed rate hikes in 2024, which shook down the US Treasury yields.
- US Jobless Claims on Thursday may fuel volatility in the bond market.
In Wednesday's session, the XAU/USD Gold Spot price jumped towards $2,070, marking a 0.50% gain. This essentially was in response to growing speculation of dovish bets towards the Federal Reserve (Fed), coupled with yields seemingly stuck in multi-month lows, which favored the yellow's metal advance.
With the US Personal Consumption Expenditures (PCE) price index seeing a sizeable drop in November, optimism is growing for potential initial rate cuts from the Federal Reserve at the beginning of next year. This also comes after consecutive decelerating Consumer Price Index (CPI) readings alongside the Fed officials forecasting 75 bps of easing in 2024, which applied pressure to the US Dollar and the US bond yields. According to the CME FedWatch Tool, markets place bets on 15% odds of a cut in January and are pricing in 50 bps of easing between March and May.
In line with that, US bond yields are declining and reached multi-month lows. The 2-year rate is 4.23% (low since May), while the 5 and 10-year yields are trading at 3.78% each, their lowest since June and July, respectively. This downturn positively affects the price of non-yielding metals, as bond yields are often viewed as the opportunity cost of holding them.
On Thursday, the US will report weekly Jobless Claims figures, which may fuel volatility in the USD and bond market price dynamics.
XAU/USD levels to watch
The daily chart hints that the metal is exhibiting a bullish inclination. The Relative Strength Index (RSI) is approaching overbought territory which typically signifies a strong buying momentum, but also caution as it may also indicate potential short-term- trend reversal if the index crosses into the overbought region.
Further evidence of bullish sentiment is shown in the Moving Average Convergence Divergence (MACD) indicator. The presence of rising green bars signifies increased buyer enthusiasm, potentially paving the way for a continuation of the uptrend.
Providing a broader picture, the metal's position above the 20, 100, and 200-day Simple Moving Averages (SMAs) confirms the dominance of the buyers in the overall trend. Being above these SMA levels typically suggests a bullish market environment.
Support Levels: $2,060, $2,050, $2,030 (20-day SMA).
Resistance Levels: $2,081, $2,100, $2,115.
XAU/USD daily chart
-638393082422997405.png)
- GBP/USD rose 0.8% bottom-to-top on Wednesday as markets lean into rate cut bets.
- Markets are anticipating an accelerated rate cut cycle from the Federal Reserve as soon as March.
- Thin data on the economic calendar this week, Thursday’s US Initial Jobless Claims in focus.
The GBP/USD climbed higher on Wednesday as broad-market risk appetite pushed the US Dollar (USD) into the floorboards, bolstering the Pound Sterling (GBP). The GBP/USD climbed over three-quarters of a percent from Wednesday’s low bids near 1.2700 to pin into the 1.2800 handle heading into the Thursday market session.
UK data is nearly absent from the economic data docket this week, with low-tier Nationwide Housing Prices for October being the only data representation for the GBP, slated for Friday.
US Initial Jobless Claims will be the key data focus this week, with markets expecting a slight increase from 205K to 210K new jobless benefits seekers for the week ending December 22 versus the 205K from the week before.
Broad-market risk appetite continues to surge higher as investors lean into bets that the Federal Reserve will be pushed into an increased rate cut cycle, with many market participants betting on rate cuts to begin as soon as March. The Fed’s rate stance pivot pinned investor hopes on an accelerated pace of rate cuts, and multiple attempts from Fed officials to throw water on red-hot market expectations have had little effect.
GBP/USD Technical Outlook
The GBP/USD hit a 19-week high on Wednesday, and the pair is on pace to close in the green for eight of the past nine trading weeks. The pair rallied off of the 50-hour Simple Moving Average (SMA) as intraday action pins firmly into risk-on, sending the GBP into the ceiling near the 1.2800 handle.
The GBP/USD continues to lift on the back of US Dollar weakness than any particular GBP strength, climbing over 6% from October’s bottom bids near 1.2040.
The 200-day SMA is providing long-term technical support from 1.2525, and the next immediate challenge for GBP/USD bulls, or Dollar bears in general, will be to muscle the pair back over the 1.3000 major handle.
GBP/USD Hourly Chart

GBP/USD Daily Chart

GBP/USD Technical Levels
Another day in an unusual week. During the Asian session, Japanese data is due, including Industrial Production and Retail Trade. The key report of the day will be the weekly US Jobless Claims.
Here is what you need to know on Thursday, December 28:
The US Dollar Index (DXY) extended its slide and dropped below 101.00, reaching its lowest level since July. The 10-year Treasury yield fell to 3.78%, a five-month low, while the 2-year settled at 4.24%, the lowest since May.
US stocks held near recent highs, with the Dow Jones on its way to another all-time high. The combination of risk appetite and lower Treasury yields continued to weigh on the US Dollar.
Data released on Wednesday showed the Richmond Fed Manufacturing Index dropping to -11 in December, worse than the market consensus of -7. Shipments fell from -8 to -17, new orders decreased from -5 to -14, and employment edged down from 0 to -1. On Thursday, the weekly Jobless Claims report is due, along with trade figures and the November Pending Home Sales report.
EUR/USD reached levels above 1.1100 for the first time in five months, boosted by broad-based Dollar weakness. EUR/GBP hit monthly highs slightly below 0.8700 but then pulled back.
GBP/USD peaked at 1.2802, the strongest level since August, and then retreated modestly. The trend is up, but the Pound needs to consolidate above 1.2800 to open the doors to more gains.
The Japanese Yen outperformed during the American session, boosted by the decline in Treasury yields. USD/JPY fell below 142.00, approaching December lows. Japanese data due on Thursday includes Industrial Production and Retail Sales figures for November.
AUD/USD remains in an upward channel, facing resistance around 0.6850. NZD/USD continued to rise and reached the 0.6350 area. Both currency pairs are supported by risk appetite and lower yields.
The loonie lagged on Wednesday. USD/CAD bottomed at 1.3175, the lowest since August, but then climbed back above 1.3200 to end the day with modest gains.
Gold was headed toward a record close above $2,070, rising for the fourth consecutive trading day. The bias remains to the upside. Silver failed to follow Gold and closed flat around $24.25.
- WTI chipped lower as shipping continued through Red Sea despite new rebel attacks.
- Crude bids are eating away at last week’s gains as shipping lanes remain open.
- API, EIA stock figures slated for this week.
West Texas Intermediate (WTI) Crude Oil is easing back on Wednesday after last week’s 2%-plus gain on the back of transportation cancellations through the Red Sea following attacks on cargo ships by Iran-backed Houthi rebels in Yemen.
Houthi rebels have vowed to keep up the pace of attacks in the region, with Tuesday seeing an uptick in ship attacks, but logistics companies that previously suspended shipping lanes through the Yemen region of the Red Sea have returned to the area despite fresh attacks, sailing behind a joint task force that has settling into the region in an effort to quell rebel activity.
With Crude Oil production continuing to outpace declining barrel demand, even in the face of steepening production cuts from member states of the Organization of the Petroleum Exporting Countries (OPEC), and it’s organization of allies the OPEC+, Crude Oil continues to see stiff bearish pressure.
US Crude Oil stocks continue to flaunt expectations of declining reserves, and both the American Petroleum Institute (API) and the Energy Information Administration (EIA) will be publishing updated barrel buildup figures on Wednesday and Thursday, respectively.
The API Weekly Crude Oil Stocks count last posted a 939K barrel increase last week while the EIA Crude Oil Stocks Change last showed a buildup of nearly three million barrels, and is forecast to print a -2.6 million barrels reduction for the week ended December 22.
WTI Technical Outlook
Near-term momentum continues to vex WTI, leeping prices pinned close to the 50-hour Simple Moving Average (SMA) as near-term bullish plays regularly run out of steam. US Crude Oil continues to trade on the north side of the 200-hour SMA, but the gap is closing quickly with the 200-day SMA rising into $73.50.
Oil bidders will be looking to gather enough steam to crach through the 200-day SMA currently floating near the $78.00 handle, while short sellers will note that WTI is approaching a technical confluence zone between familiar price peaks and a fresh bearish cross of the 50-day and 200-day SMAs just above $77.00.
WTI Hourly Chart
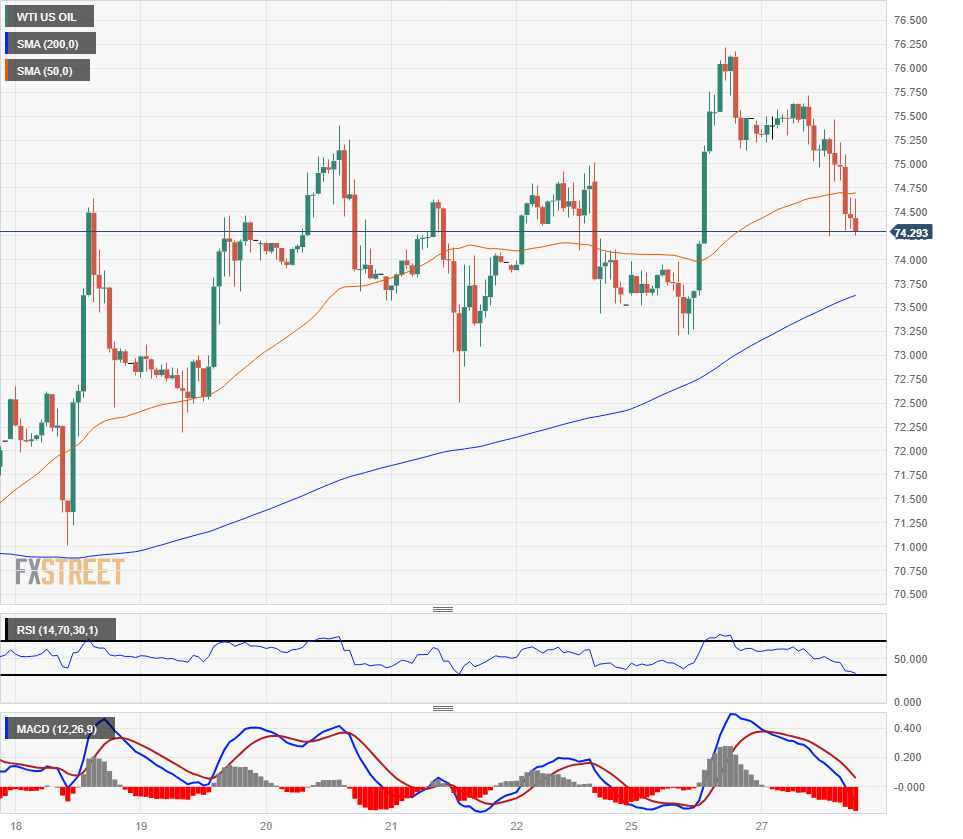
WTI Daily Chart
WTI Technical Levels
- The DXY Index fell to its lowest level since July, below 101.00.
- Markets are placing bets on six rate cuts by the Federal Reserve for 2024.
- As for now, investors are pricing in the first cut in March.
The US Dollar (USD) continues to experience sharp losses, with the US Dollar Index (DXY) trading at 100.95 its lowest level in five months. This downturn has been largely driven by dovish bets taking precedence following the release of soft US Personal Consumption Expenditures (PCE) Price Index figures last week.
In the last meeting of 2023, the Federal Reserve showcased a dovish stance, welcoming tame inflation figures and ruling out a 2024 rate hike, favoring 75 bps of easing instead. Market anticipations for March and May rate cuts further underscore this position. The prospects of monetary easing by the Fed typically weaken the US Dollar, as reduced interest rates make dollar-denominated assets less attractive, leading investors to seek higher yields elsewhere. Moreover, the release of soft US PCE Price Index figures exacerbated those bets as cooling inflation favors the case for a sooner-than-expected start of the easing cycle.
Daily digest market movers: US Dollar Index retreats amid dovish market expectations, lower bond yields weigh
- The US Core Personal Consumption Expenditures (PCE) Price Index in November was reported to have increased by 3.2% year-over-year, slightly below market expectations of 3.3%.
- According to the CME FedWatch Tool, markets are predicting a rate hold for the upcoming January Federal Reserve meeting, and it shows a low probability of 15% for a rate cut. For the March and May 2024 meetings, markets are pricing in rate cuts.
- Overall, markets are pricing in 160 bps of easing in 2024 vs the median of the Federal Open Market Committee (FOMC) of 75 bps.
- No relevant reports are due in the last week of 2023. Markets will keep an eye on Thursday’s weekly US Jobless Claims.
Technical Analysis: DXY Index selling pressure persists, an upward correction is likely
The indicators on the daily chart reflect a dominant selling pressure on the US Dollar Index. The Relative Strength Index (RSI) is currently in oversold levels, which, from a contrarian perspective, signals a potential upcoming correction. The Moving Average Convergence Divergence (MACD) displays rising red bars, usually an indication of significant bearish momentum.
On a broader scale, the index is positioned below the 20, 100, and 200-day Simple Moving Averages (SMAs), a strong testament to the persistent bearish control in the market. In the face of these indicators, buyers need to significantly step up their endeavors for a bullish reversal to occur.
Support levels: 100.80, 100.50, 100.30.
Resistance levels: 101.00, 101.30, 101.50.
US Dollar FAQs
What is the US Dollar?
The US Dollar (USD) is the official currency of the United States of America, and the ‘de facto’ currency of a significant number of other countries where it is found in circulation alongside local notes. It is the most heavily traded currency in the world, accounting for over 88% of all global foreign exchange turnover, or an average of $6.6 trillion in transactions per day, according to data from 2022.
Following the second world war, the USD took over from the British Pound as the world’s reserve currency. For most of its history, the US Dollar was backed by Gold, until the Bretton Woods Agreement in 1971 when the Gold Standard went away.
How do the decisions of the Federal Reserve impact the US Dollar?
The most important single factor impacting on the value of the US Dollar is monetary policy, which is shaped by the Federal Reserve (Fed). The Fed has two mandates: to achieve price stability (control inflation) and foster full employment. Its primary tool to achieve these two goals is by adjusting interest rates.
When prices are rising too quickly and inflation is above the Fed’s 2% target, the Fed will raise rates, which helps the USD value. When inflation falls below 2% or the Unemployment Rate is too high, the Fed may lower interest rates, which weighs on the Greenback.
What is Quantitative Easing and how does it influence the US Dollar?
In extreme situations, the Federal Reserve can also print more Dollars and enact quantitative easing (QE). QE is the process by which the Fed substantially increases the flow of credit in a stuck financial system.
It is a non-standard policy measure used when credit has dried up because banks will not lend to each other (out of the fear of counterparty default). It is a last resort when simply lowering interest rates is unlikely to achieve the necessary result. It was the Fed’s weapon of choice to combat the credit crunch that occurred during the Great Financial Crisis in 2008. It involves the Fed printing more Dollars and using them to buy US government bonds predominantly from financial institutions. QE usually leads to a weaker US Dollar.
What is Quantitative Tightening and how does it influence the US Dollar?
Quantitative tightening (QT) is the reverse process whereby the Federal Reserve stops buying bonds from financial institutions and does not reinvest the principal from the bonds it holds maturing in new purchases. It is usually positive for the US Dollar.
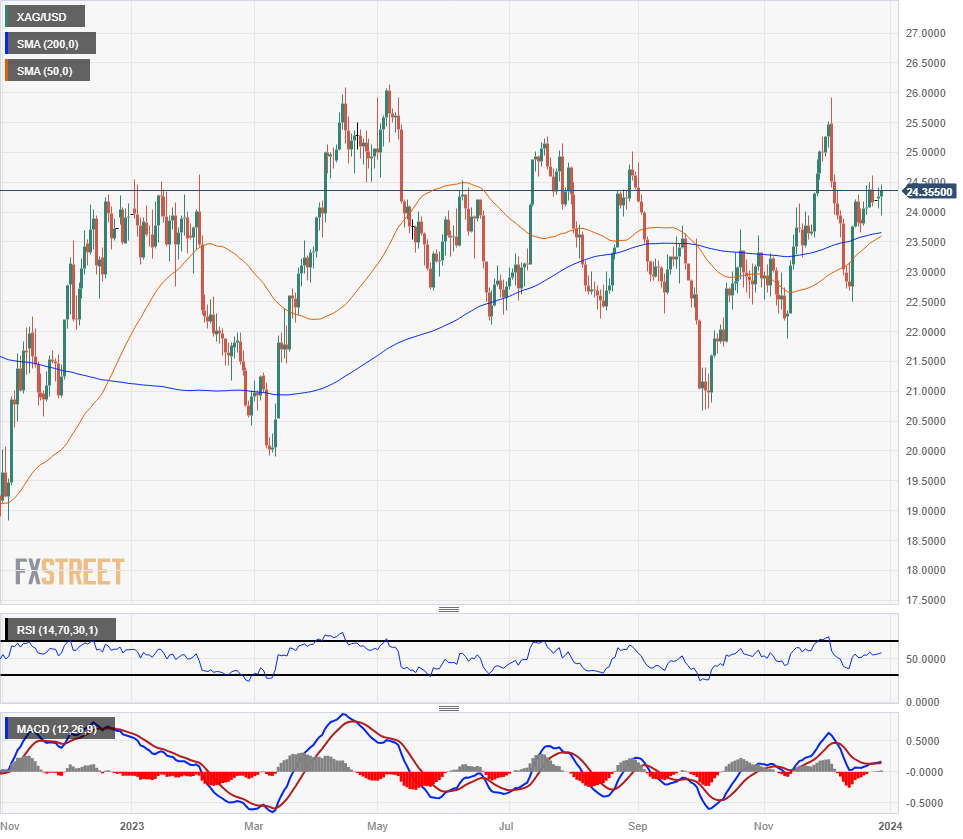
- XAG/USD caught a bounce from $24.00 to retest $24.40.
- Silver markets are churning as investors weigh Fed rate cut odds.
- Despite the bullish lean, Silver remains capped below $24.60.
XAG/USD caught a broad-market risk appetite surge on Wednesday as investors continue to lean heavily into bets that the Federal Reserve (Fed) will start cutting interest rates in 2024, with some expecting the first cuts to begin as soon as March of next year.
Silver up on broad-market sentiment shift, but remains weighed down, gains limited
Spot Silver is leaning notably bullish as markets wrap up 2023 with a thin, shortened post-holiday trading week, keeping XAG/USD pinned into a familiar but rough near-term range, caught between $24.00 and $24.60.
US Treasury yields are easing back and the US Dollar is slumping further as investors pile into Fed rate cut bets, with the US 2-year Treasury yield slipping to 4.26% after starting Wednesday near 4.3%. As investors ramp up risk bids on rate cut expectations, the 2-year Treasury yield has fallen to its lowest level since May of this year, but Silver is seeing only limited knock-on bidding from broad-market risk flows.
XAG/USD Technical Outlook
Spot Silver caught a batch of bids back into the $24.40 region after seeing a sloppy bounce from the 200-hour Simple Moving Average (SMA) near $24.10, and XAG/USD is now caught into familiar congestion points that have plagued Spot Silver markets in the near-term.
XAG/USD has spent most of the year trapped in a rough cyclical pattern, circling the 200-day SMA near $23.50 as Silver struggles to capitalize meaningfully on broad-market Greenback bearishness.
The outlook heading into 2024 is leaning cautiously bullish as the 50-day SMA gears up for a bullish cross of the 200-day SMA, which could provide technical support for any pullbacks, but topside momentum remains limited and could pose a risk for any overextended long buildups.
XAG/USD Hourly Chart
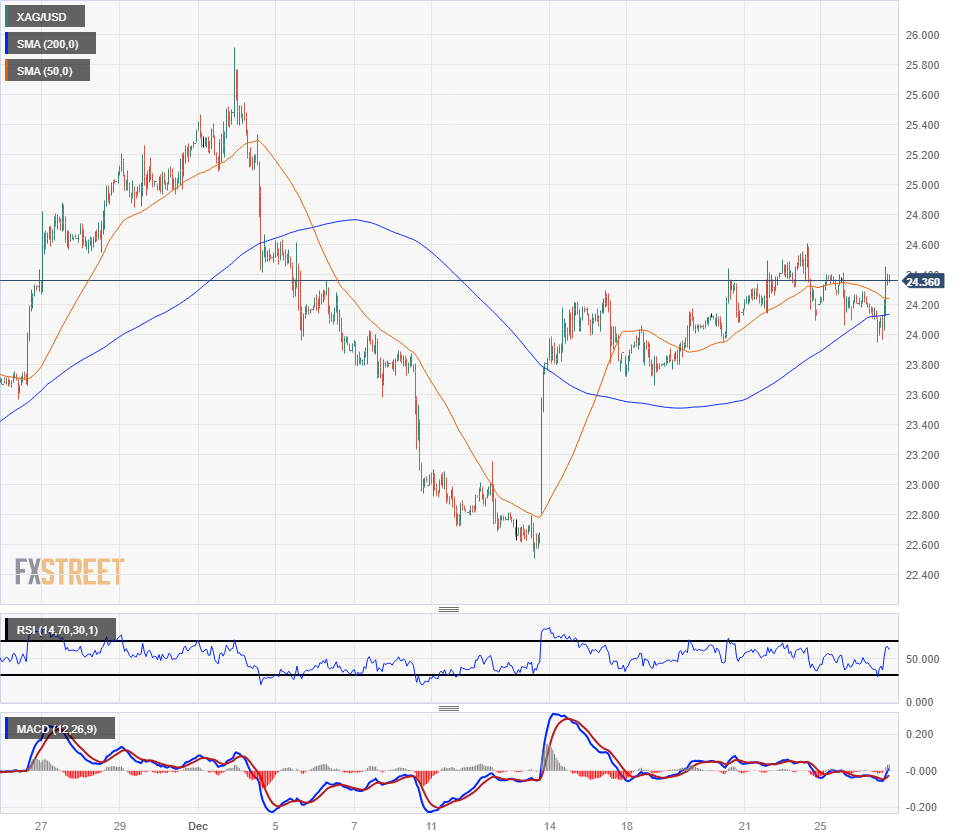
XAG/USD Daily Chart
XAG/USD Technical Levels
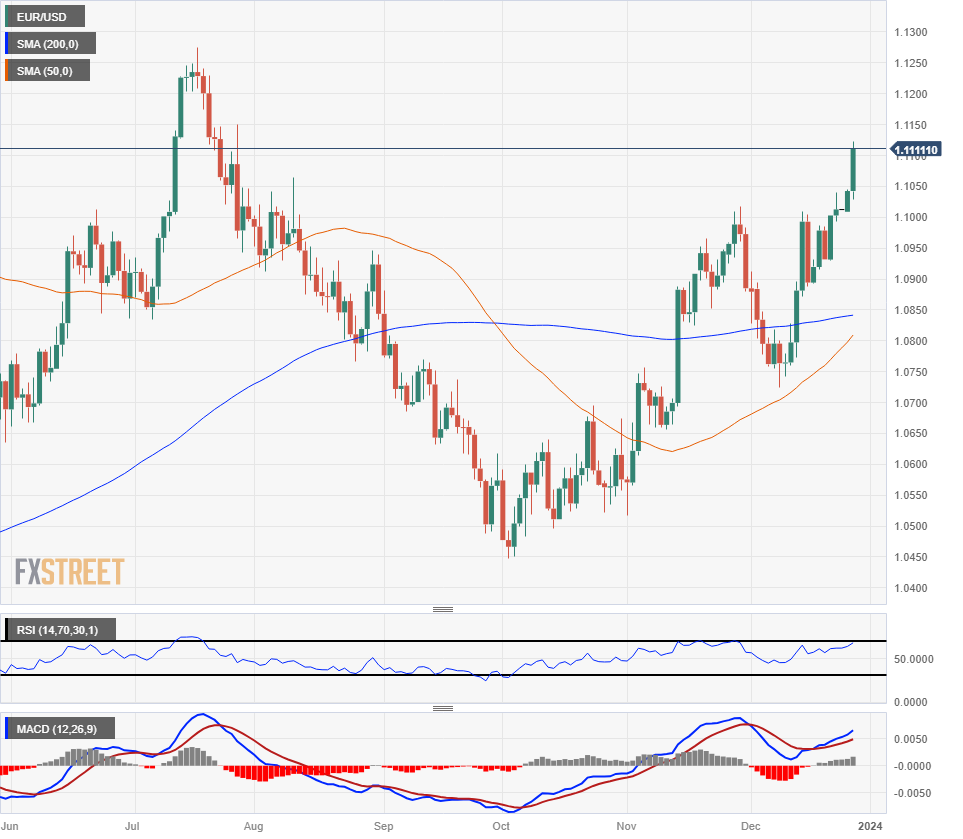
- EUR/USD etches in new December high heading into the yearly rollover.
- US economic data continues to soften, markets lean further into Fed rate cut bets.
- After a 6.5% rally, the EUR/USD is less than 1.5% away from 2023’s high bid of 1.1275.
The EUR/USD is gaining ground in thin post-holiday markets as investors gear up for the new year and head towards 2024 with sentiment leaning notably risk-on, pushing the US Dollar (USD) down once more in the last partial trading week of the year.
Broad-market risk appetite is singularly focused on Federal Reserve (Fed) rate cut expectations, with investors currently piling into bets that the Fed will begin the next rate-cutting cycle as soon as next March.
Markets shrug off EU headlines to lean further into rate cut bets
Despite deepening cracks in the European Union and lopsided growth figures pointing towards recession across the Eurozone, markets are bidding the Euro (EUR) higher in the partial post-holiday trading week. Italy’s government is expected to reject reforms to the European Stability Mechanism, with Italian Economic Minister Giancarlo Giorgetti stating that there is no need for additional budget adjustments in order to comply with new EU fiscal policy rules. The Italian Economic Minister’s comments appear to be at odds with the fact that the overwhelming majority of Eurozone economies are currently overshooting EU debt and spending restrictions, with the gap only expected to widen in 2024 as European economies grapple with a looming economic downturn.
Declining economic macro indicators from the US are underpinning risk appetite, as economic softness from the US accelerates market bets of faster, longer, and deeper rate cuts from the US Federal Reserve.
The Richmond Fed Manufacturing Index for December printed -11 versus the forecast -7, backsliding even further from November’s -5 print.
Thursday will bring a fresh round of US data with Initial Jobless Claims for the week into December 22 expected to tick upwards from 205K to 210K. US Pending Home Sales are expected to rebound slightly in November, forecast to gain 1% after October’s -1.5% backslide.
EUR/USD Technical Outlook
The Euro jumped on Wednesday as broad-market flows pull down the US Dollar, sending the EUR/USD to a near-term high of 1.1120, extending recent bullish action further into the top end with the pair trading well above the 200-hour Simple Moving Average (SMA) near 1.0980.
Wednesday’s EUR/USD gains puts the pair into its highest prices since late July, and the pair has climbed nearly 6.5% from October’s bottom bids of 1.0450.
On the daily candlesticks the EUR/USD is threatening to tip even deeper into overbought territory, extending from the 200-day SMA near 1.0850 and closing in the green for all but two of the last 12 consecutive trading days.
EUR/USD Hourly Chart
EUR/USD Daily Chart
EUR/USD Technical Levels
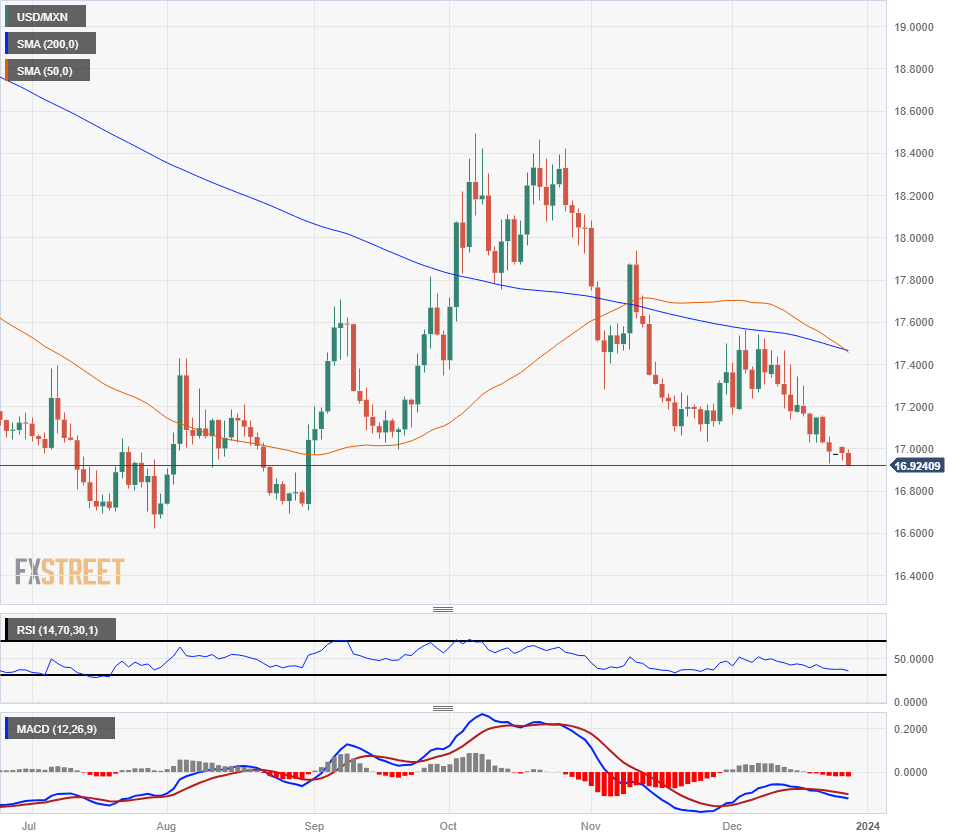
- The Mexican Peso holds steady near familiar highs as markets head towards 2024.
- Mexico's Jobless Rate figures are due Thursday.
- A light week on the economic calendar sees only medium-impact data on the docket.
The Mexican Peso (MXN) is seeing choppy markets amidst post-holiday volume constraints but sticking close to recent highs as markets continue to lean into rate cut expectations from the Federal Reserve (Fed).
It’s a thin showing on the economic calendar for the shortened week heading into the new year, with October’s Mexico Jobless Rate slated for Thursday.
The Mexican Peso briefly tested a fresh 16-week high against the US Dollar (USD) before USD/MXN settled into a near-term trading range between 17.00 and 16.90.
Daily digest market movers: Mexican Peso testing highs amidst near-term chop as the year draws to a close
- The Mexican Peso has had a decent run, with the USD/MXN falling over three and a half percent from December’s peak of 17.56.
- December’s theme has been a Greenback selloff as markets gear up for Fed rate cuts in 2024.
- The US Dollar is deeply in the red for the month, falling across the major currency board and bolstering the Peso to multi-month highs.
- The US Richmond Fed Manufacturing Index dipped even lower in December, falling to -11 and accelerating past the market forecast of -7 following November’s -5 print.
- Softening economic data from the US increases the odds of further Fed rate cuts.
- Mexico’s November Jobless Rate due on Thursday, forecast to improve slightly from 2.7% to 2.6%.
- US Initial Jobless Claims for the week into December 22 and November’s US Pending Home Sales also on the docket for Thursday.
- US Initial Jobless Claims expected to tick higher once more from 205K to 210K.
- US Pending Home Sales from November is forecast to rebound to 1% growth after October’s 1.5% contraction.
US Dollar price this month
The table below shows the percentage change of US Dollar (USD) against listed major currencies this month. US Dollar was the strongest against the Pound Sterling.
| USD | EUR | GBP | CAD | AUD | JPY | NZD | CHF | |
| USD | -2.09% | -1.35% | -2.77% | -3.71% | -4.35% | -3.11% | -4.01% | |
| EUR | 2.04% | 0.71% | -0.68% | -1.60% | -2.23% | -1.00% | -1.88% | |
| GBP | 1.33% | -0.72% | -1.42% | -2.33% | -2.96% | -1.74% | -2.62% | |
| CAD | 2.70% | 0.69% | 1.39% | -0.91% | -1.54% | -0.33% | -1.18% | |
| AUD | 3.57% | 1.57% | 2.29% | 0.91% | -0.60% | 0.57% | -0.28% | |
| JPY | 4.16% | 2.20% | 2.87% | 1.51% | 0.63% | 1.20% | 0.34% | |
| NZD | 3.01% | 1.00% | 1.71% | 0.32% | -0.58% | -1.21% | -0.87% | |
| CHF | 3.82% | 1.82% | 2.53% | 1.17% | 0.26% | -0.36% | 0.83% |
The heat map shows percentage changes of major currencies against each other. The base currency is picked from the left column, while the quote currency is picked from the top row. For example, if you pick the Euro from the left column and move along the horizontal line to the Japanese Yen, the percentage change displayed in the box will represent EUR (base)/JPY (quote).
Technical Analysis: Mexican Peso leans into recent highs on thin market volumes
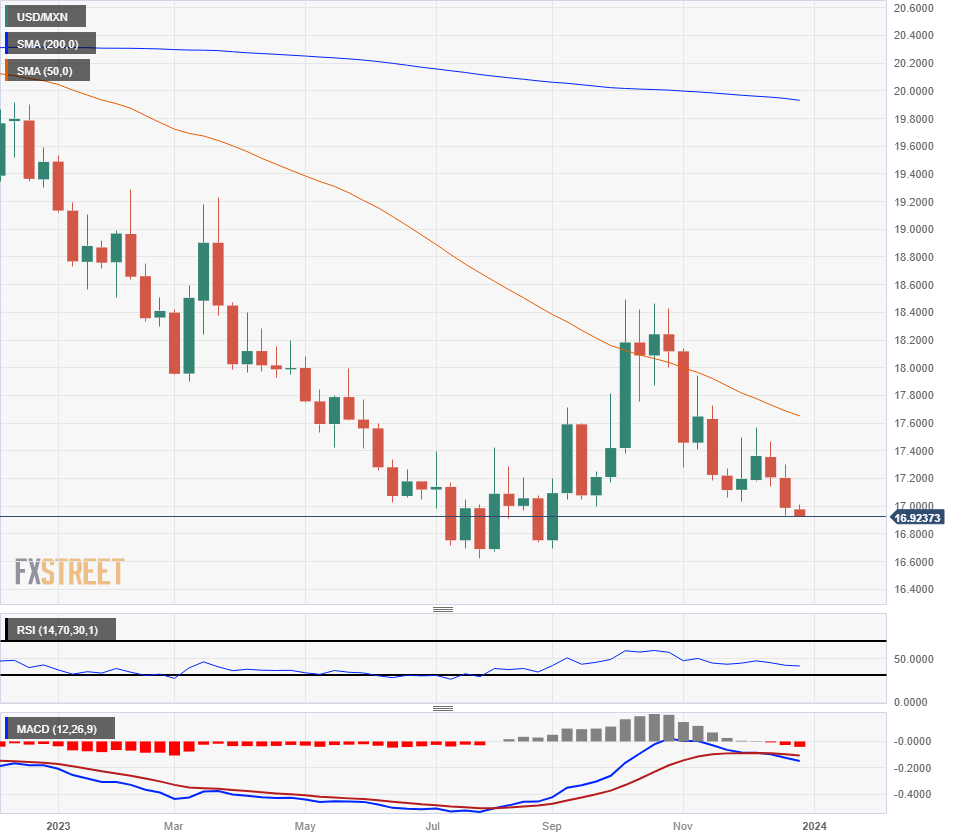
The Mexican Peso (MXN) is seeing some gains in choppy post-holiday markets, rising 0.4% on Wednesday to a new 16-week high. Momentum is unlikely to materialize with market depth on the thin side heading into the new year, but overall market sentiment is keeping pressure on the US Dollar, keeping the Greenback on the low side.
The USD/MXN continues to be sold off after getting rejected from the 200-day Simple Moving Average (SMA) near 17.60, and the 50-day SMA is set to confirm a bearish cross of the long-term moving average as price action continues to tilt towards the downside.
The last trading week of 2023 is set to close out with the US Dollar on the back foot once more, and the USD/MXN pair is likewise heading for another down month as the Greenback waffles against the Peso.
The USD/MXN has so far closed in the red for all but three months of the year.
USD/MXN Daily Chart
USD/MXN Weekly Chart
Mexican Peso FAQs
What key factors drive the Mexican Peso?
The Mexican Peso (MXN) is the most traded currency among its Latin American peers. Its value is broadly determined by the performance of the Mexican economy, the country’s central bank’s policy, the amount of foreign investment in the country and even the levels of remittances sent by Mexicans who live abroad, particularly in the United States. Geopolitical trends can also move MXN: for example, the process of nearshoring – or the decision by some firms to relocate manufacturing capacity and supply chains closer to their home countries – is also seen as a catalyst for the Mexican currency as the country is considered a key manufacturing hub in the American continent. Another catalyst for MXN is Oil prices as Mexico is a key exporter of the commodity.
How do decisions of the Banxico impact the Mexican Peso?
The main objective of Mexico’s central bank, also known as Banxico, is to maintain inflation at low and stable levels (at or close to its target of 3%, the midpoint in a tolerance band of between 2% and 4%). To this end, the bank sets an appropriate level of interest rates. When inflation is too high, Banxico will attempt to tame it by raising interest rates, making it more expensive for households and businesses to borrow money, thus cooling demand and the overall economy. Higher interest rates are generally positive for the Mexican Peso (MXN) as they lead to higher yields, making the country a more attractive place for investors. On the contrary, lower interest rates tend to weaken MXN.
How does economic data influence the value of the Mexican Peso?
Macroeconomic data releases are key to assess the state of the economy and can have an impact on the Mexican Peso (MXN) valuation. A strong Mexican economy, based on high economic growth, low unemployment and high confidence is good for MXN. Not only does it attract more foreign investment but it may encourage the Bank of Mexico (Banxico) to increase interest rates, particularly if this strength comes together with elevated inflation. However, if economic data is weak, MXN is likely to depreciate.
How does broader risk sentiment impact the Mexican Peso?
As an emerging-market currency, the Mexican Peso (MXN) tends to strive during risk-on periods, or when investors perceive that broader market risks are low and thus are eager to engage with investments that carry a higher risk. Conversely, MXN tends to weaken at times of market turbulence or economic uncertainty as investors tend to sell higher-risk assets and flee to the more-stable safe havens.
- The USD/CHF trades below the 0.8500 level its lowest since 2015.
- Expectations of six rate cuts in 2024 drives down the US dollar.
- Markets are pricing in a rate cut as early as in March
In Wednesday's session, the USD/CHF saw pronounced downward movements, sliding to multi-year lows of 0.8440, seeing a steep 1% dip. Dovish bets on the Federal Reserve primarily triggered this significant downturn as yields sunk to multi-month lows, making the Greenback lose interest.
Following last week’s decline in the Personal Consumption Expenditure price index (PCE), the Fed’s preferred gauge of inflation, from the month of November, optimism for sooner rate cuts soared. As for now, traders anticipate the Fed's initial rate decrease to occur in March, followed by another in May, and then place bets on four additional cuts.
In the meantime, the US bond yields are sharply declining, with the 2-year rate settling at 4.26%, while the 5 and 10-year yields are trading at 3.83% each, respectively, all three in multi-month lows. This dip in bond rates, driven by the dovish bets on the Fed, tends to decrease the demand for the US Dollar as lower local yields are less attractive for foreign investors.
For the rest of the last week of 2023, the highlight will be the weekly Jobless Claims from the US set to be released on Thursday, which may fuel further volatility on the pair.
USD/CHF levels to watch
The daily chart suggests that the pair has a strong prevailing selling pressure, with the Relative Strength Index (RSI) reaching oversold conditions. However, this is often an initial indication that the selling momentum is potentially reaching its limit, but this oversold sentiment is not guaranteed to trigger an immediate reversal, as further selling pressure could still be ahead before buyers take control.
Siding with the bearish momentum is the position of the pair, currently residing below its 20, 100, and 200-day Simple Moving Averages (SMAs). This indicates that the selling force retains stronger control in a broader perspective. The bearishness is further confirmed by the Moving Average Convergence Divergence (MACD), which is currently printing rising red bars, suggesting that the momentum favors the sellers for the time being.
Support Levels: 0.8430, 0.8400, 0.8350.
Resistance Levels: 0.8500, 0.8550, 0.8600.
USD/CHF daily chart
-638392904984962670.png)
Geopolitical risks remain high. Strategists at Danske Bank discuss what to look out for in 2024.
Severe geopolitical shocks and persistent tensions
We think 2024 could mark a watershed for political and military support for Ukraine, particularly as elections will be held in the US. Military support from the US is critical, and if the war enters a stalemate phase, Ukraine could face growing pressure to negotiate. A peace deal would likely entail territorial concessions, which would raise long-term risks to European security.
Apart from the US ballot in November, the key event next year will be the Taiwan election on 13 January for US-China relations. DPP is favourite to keep power, but should the Presidency go to KMT, we could see an easing of China-Taiwan tensions. The US election campaign will likely lead to tougher rhetoric on China, and a potential Trump win would put relations on a more unpredictable path.
Elections for the European Parliament in June will also be something to watch next year. The EP has legislative power, and it oversees the EU budget. Hence, it is key in approving trade agreements and support packages for Ukraine.
The US Dollar Index (DXY) has suffered a sharp sell-off from a high of 107 to a low of 102.5 in October and November. Economists at ANZ Bank analyze Greenback’s outlook.
Fading fiscal support in the US combined with the impact of interest rate hikes will impact growth in the US
We think the DXY will extend its decline and forecast it will be at 98 in Q4 2024; but it will be a choppy, non-linear, gradual move given late cycle dynamics.
Fading fiscal support in the US combined with the impact of interest rate hikes will impact growth in the US. Further widening of the deficit will likely drive investors to demand a higher risk premium for US assets once again. Credit rating agencies have placed the US sovereign credit rating on negative outlook after partisan disagreements over the national budget. These developments are long-term issues and will not be resolved in the short term. This adds to our bearish view of the USD.
- The AUD/USD is trading closer to the 0.6840 level, in highs since July.
- Markets are forecasting six Federal Reserve rate cuts in 2024.
- Traders also speculate on a potential interest rate cut in January, which applies pressure on the USD.
- US yields declined to multi-month lows.
In Wednesday's trading session, the AUD/USD is seeing gains, currently at the 0.6843 level. These movements are largely driven by the intensifying dovish bets on the Federal Reserve (Fed), which applies pressure on the US Dollar. As a result, the Australian dollar is outpacing its US counterpart at a quiet end of the year.
For the next Fed meeting in January, based on the FedWatch tool by the CME Group, investors are betting on an 85.5% likelihood that the bank will maintain its current interest rate steady, but they also place 14.5% bets on first-rate cuts.
In addition, markets are anticipating six interest rate cuts in 2024 and seem to be disregarding almost every statement made by the members of the US Federal Reserve following December's interest rate decision and the soft readings of the Consumer Price and Personal Consumption Expenditures indexes from the same month. In that sense, as investors remain confident that the American bank will take a dovish approach next year, the US Dollar may see further downsides.
In line with that, US Treasury yields is on a downswing, which makes the Greenback lose interest. The 2-year rate is seen at 4.26%, its lowest since May, while the 5-year and 10-year rates are both recorded at 3.84%, also in multi-month lows.
AUD/USD levels to watch
The indicators on the daily chart reflect a dominantly bullish momentum for the AUD/USD. The Relative Strength Index (RSI) trading in the overbought territory reflects that the uptrend is quite strong, typically confirming that buyers are in control.
Adding weight to this bullish view is the Moving Average Convergence Divergence (MACD) histogram. The rising green bars suggest that momentum currently favors the buyers. This is usually a strong sign of an ongoing upward price shift and might entice more buyers to the market, thereby further fuelling the bullish momentum.
The pair's position above the 20,100,200-day Simple Moving Averages (SMAs) further illustrates that the bulls are also in control of the broader time horizon. This generally points to a more robust and enduring bullish trend, which could see the pair climb even higher in the coming sessions.
However, the overbought conditions as indicated by the RSI, while a sign of current buying momentum, also serve as a cautionary signal. It implies that prices have been increasing robustly, and a short-term pullback might be on the horizon for traders to lock in gains.
Support Levels: 0.6800,0.6760, 0.6730.
Resistance Levels: 0.6850, 0.6870, 0.6900.
AUD/USD daily chart
-638392865299080452.png)
- The Greenback fails at 143.00 as the US Dollar index dives to new multi-month lows.
- A dovish Boj is weighing on the Yen.
- Longer-term, the downtrend from mid-November highs remains intact.
The US Dollar is trading water against the Japanese Yen, with price action failing to find any relevant acceptance above 143.00 as the US Dollar Index dives to fresh five-month lows.
The Yen suffers on the back of BoJ dovishness
The Greenback had been taking advantage of a broad-based JPY weakness, after the release of a split BoJ Summary of Opinions and the dovish comments by Governor Ueda.
The BoJ disappointed investors in December by maintaining its ultra-loose policy. Earlier today, BoJ Chair Ueda maintained that any policy shift will depend on the progress of the inflation target, which has failed to improve investors’ confidence on the Japanese currency.
Beyond that, the positive risk sentiment is weighing on both currencies against their main rivals, which might lead to sideways trading.
Technical indicators are mixed with the 4h RSI flattening near the 50 level, which suggests a lack of clear direction. From a longer perspective, the downtrend from mid-November highs remains intact.
On the upside, the falling trendline from the mentioned November highs, now at 143.55, and the December 19 high, at 144.90 are the nearest targets. Supports lie at 141.95.00 and 141.00.
Technical levels to watch
With the year drawing to a close, economists at the National Bank of Canada take stock of the economic situation and offer their predictions for the coming months.
A challenging year ahead for the US economy?
Our analysis suggests that economic growth in the US is less vigorous than it might seem. As for the future, the few leading economic indicators that have proven their predictive value in previous cycles almost all point in the same direction: that of an economic slowdown in 2024. While we recognize that the probability of the Fed achieving a soft landing is non-zero, we have our doubts about the arguments underpinning this scenario. That's why our economic forecasts remain significantly less optimistic than the consensus.
After a strong end to 2023, we expect growth in the US to decelerate significantly in the first half of 2024. We then see the economy tipping into recession around mid-year.
- USD/CAD looks set for further breakdown as the US Dollar weakens further.
- The underlying inflation in the US economy is clearly in a downtrend.
- Momentum oscillators indicate more downside ahead.
The USD/CAD pair trades back and forth in a narrow range near the round-level support of 1.3200 in the early New York session. The Loonie asset struggles for a direction amid decline in volume due to shortened week.
S&P500 futures added nominal gains in the European session, portraying higher risk-appetite of the market participants. The US Dollar Index (DXY) has printed a fresh five-month low near 101.30 as investors are expecting that the Federal Reserve (Fed) would continue the rate-unwinding program from March.
A sharp decline in the underlying inflation data released on Friday indicates that price pressures are clearly in a downtrend.
The oil price recovers strongly after Russian Deputy PM Alexander Novak said their companies are sticking to their obligations on supply cuts. It is worth noting that Canada is the leading exporter of oil to the United States and higher oil prices support the Canadian Dollar.
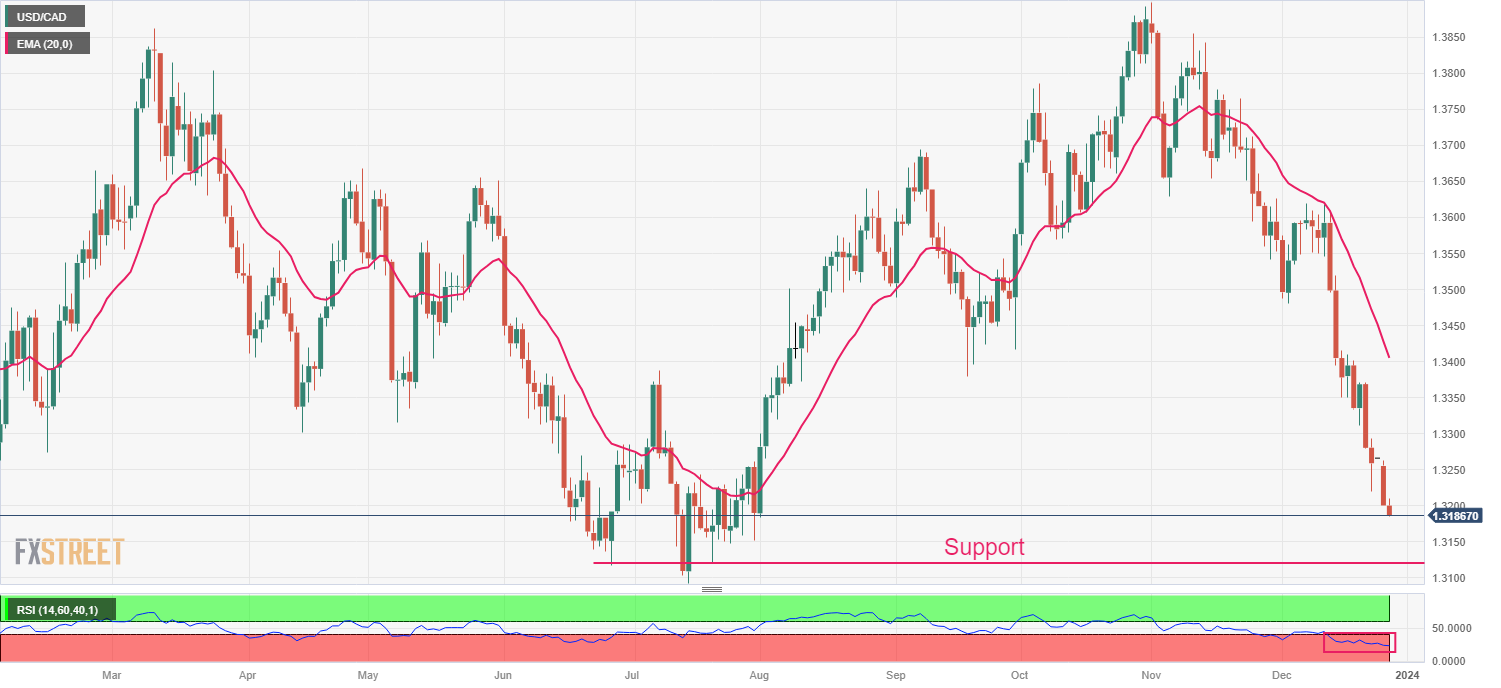
USD/CAD has been falling since the first day of November and is expected to decline further towards June 27 low, which is around 1.3117. Downward-sloping 20-day Exponential Moving Average (EMA) indicates that the near-term trend is bearish.
The Relative Strength Index (RSI) (14) hovers in the bearish range of 20.00-40.00, which indicates downside momentum is intact.
Going forward, a breakdown below intraday low of 1.3180 would expose the asset to July 25 low near 1.3150, followed by July 13 low around 1.3193.
In an alternate scenario, a recovery move above April 14 low around 1.3300 would drive the asset towards December 21 high at 1.3370. A breach of the latter would push the Loonie asset towards May 16 low at 1.3404.
USD/CAD daily chart
Economists at ANZ Bank expect the USD/CAD pair to move lower in 2024.
CAD to ease over the year against other commodity currencies
The Canadian Dollar could enjoy higher real yields for longer as well as a relatively solid economic backdrop in 2024.
On crosses, a weaker USD goes hand-in-hand with CAD underperformance on G10 crosses, especially against the AUD and NZD. Our forecast of a weaker USD amidst improving risk sentiment, may see the CAD ease over the year against other commodity currencies, like the AUD and NZD.
We see the USD/CAD at 1.28 by year’s end.
- The Pound is bouncing up from the bottom of a triangle pattern
- On the upside, a break of 182.35 would expose the triangle top, at 184.05.
- Below 180.90, the next supports 179.85, and the triangle target, at 178.30.
The Sterling has been trading without a clear direction during the last three weeks, which results in the triangle pattern we can see in the daily and four-hour charts.
This pattern has a downside bias, although investors’ disappointment at the dovish BoJ monetary policy decision and the more recent comments by Governor Ueda are providing some support to the Pound.
The pair is now trading with a moderately positive tone, after breaching the 4h 50 SMA and heading to the 182.35 where bulls are expected to be challenged. Above here, the next resistance would be the triangle top, now at 184.05, and the December 11 high, at 184.50.
On the downside, the bottom of the triangle is now at 180.90, which closes the path towards 179.85 and the target of the triangle pattern, at 178.30.
GBP/JPY 4-hour chart
-638392812893098464.png)
Technical levels to watch
- USD/CHF struggles for a firm footing near 0.8500.
- More downside looks likely amid weakness in the US Dollar.
- The 20-period EMA is barricading US Dollar bulls from any upside.
The USD/CHF pair finds interim support after refreshing eight-year low near 0.8500. The broader appeal for the USD Index is still downbeat as the market participants are seeing an interest rate cut by the Federal Reserve (Fed) in March after two years of historically faster rate-tightening spell.
Following sideways cues from S&P500 futures, the US indices are expected to open on a lacklustre note. The USD Index has refreshed its five-month low near 101.30 as investors hope that price pressures in the United States are clearly in a downtrend.
The Swiss Franc asset continues to remain upbeat as the Swiss National Bank (SNB) is expected to maintain restrictive monetary policy stance to ensure bringing inflation below 2%.
USD/CHF hovers near the crucial support of 0.8516, plotted from December 22 low on a two-hour scale. The 20-period Exponential Moving Average (EMA) around 0.8544 continues to act as a strong barrier for the US Dollar bulls.
The Relative Strength Index (RSI) (14) oscillates in the bearish range of 20.00-40.00, which indicates that the bearish momentum is intact.
Going forward, a downside move below December 22 low around 0.8516 would drag the asset towards 0.8450 and the round-level support of 0.8400.
On the contrary, a recovery move above December 27 high of 0.8550 would drive the asset towards December 26 high at 0.8580, followed by December 21 high at 0.8633.
USD/CHF two-hour chart
-638392798831521257.png)
- The New Zealand Dollar is approaching a relevant resistance area at 0.6400
- The positive market mood on hopes of lower rates in 2024 is weighing on the US Dollar.
- NZD/USD is expected to appreciate further in 2024 – ANZ.
The Kiwi maintains its near-term bullish bias intact and keeps trading higher against the US Dollar, consolidating at five-month highs at 0.6330, favoured by the positive market mood.
Risk appetite is driving markets on a calm post-Cristmas session, with investors cheerful as they see the turning point in the global tightening cycle.
The US Federal Reserve is seen rolling back its restrictive policy from March with the rest of the major central banks coming shortly afterwards. This is expected to promote economic growth and avoid a global recession, which is supporting risky assets like the Kiwi, to the detriment of the safe-haven US Dollar.
The calendar is practically void today, and the only events worth mentioning this week are the US Weekly Jobless claims and the Existing Home Sales, due on Thursday.
Against this backdrop, risk appetite is expected to drive the FX markets before relevant macroeconomic data is released in the first week of 2024.
NZD/USD is expected to appreciate further next year – ANZ
From a wider perspective, the ANZ Bank´s Technical analysis team seesaw the pair advancing in 2024: “We think the NZD has room to rise in 2024, but not without volatility. Our year-end forecast for NZD/USD is 0.63 in 2024 (...) A global return of risk appetite and the NZD’s high carry advantage will drive the upside we expect into 2024. Our bearish USD view and a positive cyclical outlook bode well for high beta currencies like NZD.”
Technical levels to watch
It is worth noting that the Euro will celebrate its 25th birthday at the turn of the year. Economists at Commerzbank take a brief look back.
Successful, but no rival to the US Dollar
Among the four major currencies, the Euro has performed well since its launch. Even taking into account the recent period of high inflation, the inflation target has only been narrowly missed overall; the Euro is as strong against its trading partners as the lower inflation rate relative to these countries would suggest. The real economic impact of exchange rate fluctuations is therefore minimal.
Of course, the Euro is not a competitor to the US Dollar. It cannot match the significant strength of the USD in the years since the financial market crisis, nor can it seriously compete with the Greenback as the world's leading currency.
- The US Dollar is in a standoff between bears and bulls.
- Equity markets trade flat with US futures hesitant to continue the Christmas rally.
- The DXY US Dollar Index trades near 101 and a breach could see an accelerated nosedive.
The US Dollar (USD) is hanging over an abyss of substantial downturn since its weak performance ahead of Christmas. On the US Dollar Index (DXY) chart, a broad area is open for a quick decline in the Greenback’s value. With a lot of trading desks running on half power and most companies closed for the holiday season, thin liquidity could either salvage the situation or make it even worse for the Greenback.
On the economic front, some light data lie ahead with the Richmond Fed Manufacturing Index. Market reaction to the numbers should be fairly muted. The main driver will rather be the risk factor – with equities either advancing or correcting into year-end.
Daily digest Market Movers: Mild calendar ahead
- Richmond Fed Manufacturing Index for December is due near 15:00. Previous was at -5, with -7 expected for this month.
- The US Treasury will have some people coming into the office to allocate a 5-year Note in the market near 18:00 GMT.
- Equities are very geographically divided this Wednesday: Asian equities are jumping higher and are booking over 1% gains in Japan and Chinas’ major indices. European equities look rather reluctant to take over the positive vibe out of Asia and are mildly in the green by less than 0.5%. US futures are all trading marginally in the red.
- The CME Group’s FedWatch Tool shows that markets are pricing in an 85.5% chance that the Federal Reserve will keep interest rates unchanged at its January 31 meeting. Around 14.5% expect the first cut already to take place.
- The benchmark 10-year US Treasury Note trades near 3.86%, the lowest level since summer.
US Dollar Index Technical Analysis: Flip a coin
The US Dollar Index looks incapable of recovering soon from the current downturn since November. Traders should be warned that these days between Christmas and New Year usually exhibit thin liquidity and a low number of market participants being present in the markets. Should the US Dollar be able to hold the current position in the DXY, some recovery could be at hand once traders come back in January.
First upside resistance to face is near 101.78 at the low of December 21st. Although a long way to go, it looks not unthinkable that the DXY might test the descending trend line near 103.00. Depending on the catalyst that fuels the recovery in the Greenback, the 200-day Simple Moving Average (SMA) near 103.45 is firm last resistance before having more upside.
To the downside, the pivotal level at 101.70 – the low of August 4 and 10 – is vital to hold and could still see a close this week. Once broken, look for 100.82, which aligns with the bottoms from February and April. Should that level snap, nothing will stand in the way of DXY heading to the sub-100 region.
US Dollar FAQs
What is the US Dollar?
The US Dollar (USD) is the official currency of the United States of America, and the ‘de facto’ currency of a significant number of other countries where it is found in circulation alongside local notes. It is the most heavily traded currency in the world, accounting for over 88% of all global foreign exchange turnover, or an average of $6.6 trillion in transactions per day, according to data from 2022.
Following the second world war, the USD took over from the British Pound as the world’s reserve currency. For most of its history, the US Dollar was backed by Gold, until the Bretton Woods Agreement in 1971 when the Gold Standard went away.
How do the decisions of the Federal Reserve impact the US Dollar?
The most important single factor impacting on the value of the US Dollar is monetary policy, which is shaped by the Federal Reserve (Fed). The Fed has two mandates: to achieve price stability (control inflation) and foster full employment. Its primary tool to achieve these two goals is by adjusting interest rates.
When prices are rising too quickly and inflation is above the Fed’s 2% target, the Fed will raise rates, which helps the USD value. When inflation falls below 2% or the Unemployment Rate is too high, the Fed may lower interest rates, which weighs on the Greenback.
What is Quantitative Easing and how does it influence the US Dollar?
In extreme situations, the Federal Reserve can also print more Dollars and enact quantitative easing (QE). QE is the process by which the Fed substantially increases the flow of credit in a stuck financial system.
It is a non-standard policy measure used when credit has dried up because banks will not lend to each other (out of the fear of counterparty default). It is a last resort when simply lowering interest rates is unlikely to achieve the necessary result. It was the Fed’s weapon of choice to combat the credit crunch that occurred during the Great Financial Crisis in 2008. It involves the Fed printing more Dollars and using them to buy US government bonds predominantly from financial institutions. QE usually leads to a weaker US Dollar.
What is Quantitative Tightening and how does it influence the US Dollar?
Quantitative tightening (QT) is the reverse process whereby the Federal Reserve stops buying bonds from financial institutions and does not reinvest the principal from the bonds it holds maturing in new purchases. It is usually positive for the US Dollar.
Economists at the Bank of Montreal expect the US Dollar to lose altitude next year.
Loonie could mildly benefit relative to a sagging Greenback
A more dovish Fed, a cooler US economy, and a drive by many emerging markets to move away from the big Dollar point to some softening in the year ahead.
Meantime, the Canadian Dollar now largely dances to the tune of the USD itself. The old link between commodity prices and the Loonie has all but gone away. While we are no Canadian Dollar bulls, the currency could mildly benefit relative to a sagging Greenback.
Stretch Call: The trade-weighted US Dollar has its biggest annual drop since 2011 when it fell by 4.5%.
In an interview with Japanese public broadcaster NHK on Wednesday, Bank of Japan (BoJ) Governor Kazuo Ueda said that the possibility of ending negative rates next year is "not zero," per Reuters.
Key quotes
"Want to scrutinize next year's wage outlook, whether wage rises will spread to inflation."
"Even if smaller firms' wage data not available, if their profits are very strong and raises hope of higher wages, that will be a big factor in deciding policy."
"The chance of Japan returning to deflation in the near future is very low."
"The risk of inflation accelerating well above 2% is not high, so we're in no rush."
Market reaction
The USD/JPY pair showed no immediate reaction to these comments and was last seen trading modestly higher on the day at around 142.60.
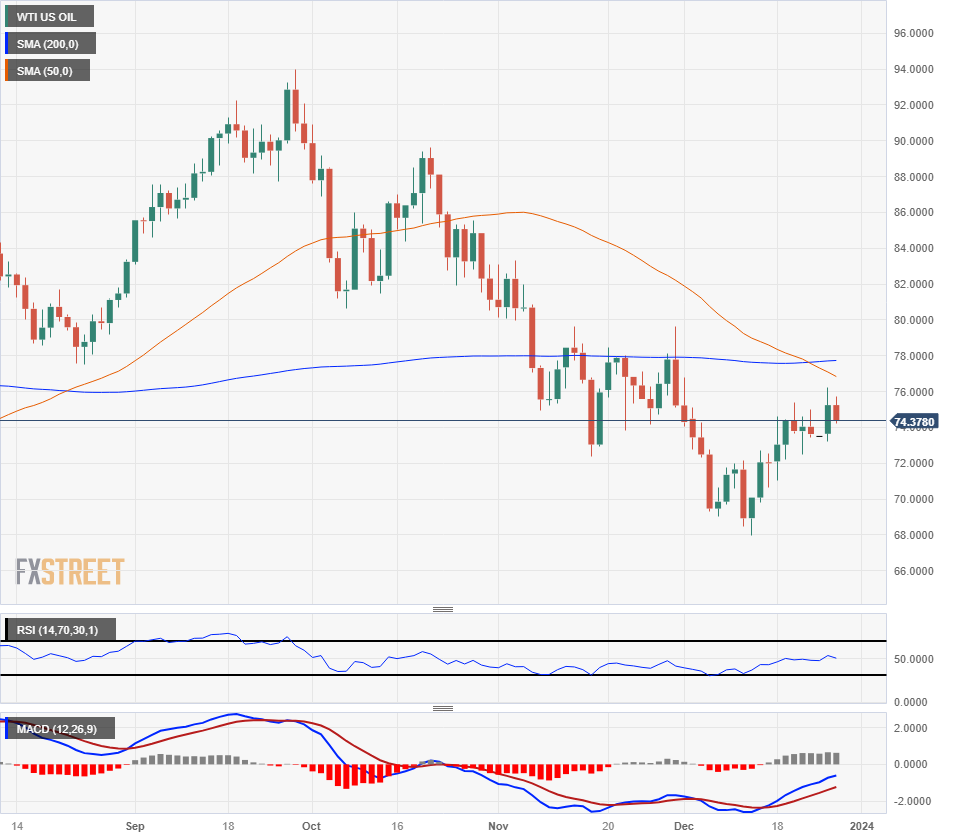
- WTI Oil snaps above 75 after Houthi Rebels hit a commercial ship.
- Russian Oil loading in Black Sea halted due to severe storms.
- The DXY US Dollar Index flirts with more downside.
Oil prices are jumping higher this Wednesday with several geopolitical tensions back on the table. Yemeni Houthi rebels said on Tuesday that they attacked a commercial MSC United ship in the Red Sea after issuing three warning calls. Meanwhile Reuters is reporting that Russia is halting its Black Sea loadings at Novorossiysk due to severe weather conditions.
The US Dollar (USD) meanwhile is again residing near session lows with the Greenback not finding any support amidst all these geopolitical tensions. With US equities slowly but surely reaching all time highs, the risk-on sentiment in that asset class is the main driver for the devaluation of the US Dollar. The Greenback has no catalyst or main driver for now that could spark a turnaround.
Crude Oil (WTI) trades at $75.24 per barrel, and Brent Oil trades at $80.50 per barrel at the time of writing.
Oil News and Market Movers: Oil headlines buzzing
- Reuters reports that Russia has halted Crude loadings in port Novorossiysk, due to severe weather conditions in the Black Sea.
- Linked to the above, Kazakhstan is reporting it is pausing its Oil output with the Caspian Pipeline Consortium (CPC) halting acceptance.
- Houthi Rebels attacked a commercial MSC United ship in the Red Sea on Tuesday.
- Deputy Prime Minister Alexander Novak said in an interview at Rossiya 24 TV Channel that Brent prices are to average $80-85/bbl in 2024. Russian Oil producers are complying with OPEC+ production restrictions.
Oil Technical Analysis: Crude to pop 10%
Oil prices are on track to hit $85 within a few weeks at this pace. The markets are redirecting their view as the current economic slowdown might be priced in, in full, Any hiccup in any way or form for the supply side could mean an uptick for Crude prices in the coming weeks.
On the upside, $74 got broken and tested for support, offering more upside. Once through there, $80 comes into the picture. Although still far off, $84 is next on the topside once Oil sees a few daily closes above the $80 level.
Below $74, the $67 level could still come into play as the next support level to trade at as it aligns with a triple bottom from June. Should that triple bottom break, a new low for 2023 could be close at $64.35 – the low of May and March – as the last line of defence. Although still quite far off, $57.45 is worth mentioning as the next level to keep an eye on if prices fall sharply.
-638392679419910781.png)
US WTI Crude Oil: Daily Chart
WTI Oil FAQs
What is WTI Oil?
WTI Oil is a type of Crude Oil sold on international markets. The WTI stands for West Texas Intermediate, one of three major types including Brent and Dubai Crude. WTI is also referred to as “light” and “sweet” because of its relatively low gravity and sulfur content respectively. It is considered a high quality Oil that is easily refined. It is sourced in the United States and distributed via the Cushing hub, which is considered “The Pipeline Crossroads of the World”. It is a benchmark for the Oil market and WTI price is frequently quoted in the media.
What factors drive the price of WTI Oil?
Like all assets, supply and demand are the key drivers of WTI Oil price. As such, global growth can be a driver of increased demand and vice versa for weak global growth. Political instability, wars, and sanctions can disrupt supply and impact prices. The decisions of OPEC, a group of major Oil-producing countries, is another key driver of price. The value of the US Dollar influences the price of WTI Crude Oil, since Oil is predominantly traded in US Dollars, thus a weaker US Dollar can make Oil more affordable and vice versa.
How does inventory data impact the price of WTI Oil
The weekly Oil inventory reports published by the American Petroleum Institute (API) and the Energy Information Agency (EIA) impact the price of WTI Oil. Changes in inventories reflect fluctuating supply and demand. If the data shows a drop in inventories it can indicate increased demand, pushing up Oil price. Higher inventories can reflect increased supply, pushing down prices. API’s report is published every Tuesday and EIA’s the day after. Their results are usually similar, falling within 1% of each other 75% of the time. The EIA data is considered more reliable, since it is a government agency.
How does OPEC influence the price of WTI Oil?
OPEC (Organization of the Petroleum Exporting Countries) is a group of 13 Oil-producing nations who collectively decide production quotas for member countries at twice-yearly meetings. Their decisions often impact WTI Oil prices. When OPEC decides to lower quotas, it can tighten supply, pushing up Oil prices. When OPEC increases production, it has the opposite effect. OPEC+ refers to an expanded group that includes ten extra non-OPEC members, the most notable of which is Russia.
Economists at Danske Bank expect the EUR/PLN to move back higher over the coming months.
Return to rate cuts during Q1 2024 likely to provide further headwinds for PLN
A lot of positive news has already been priced in to the Zloty over the past months and EUR/PLN looks increasingly ripe for a correction higher.
As we expect the global economy to be characterized by weaker growth and inflation impulses during at least H1 2024, an environment usually ill-fitting for Polish assets, we see medium-term headwinds still in place for the Zloty.
In addition to the above, the recent hawkish re-pricing of NBP looks somewhat exaggerated to us and a return to rate cuts during Q1 2024 is likely to provide further headwinds for the PLN.
Forecast: 4.40 (1M), 4.40 (3M), 4.50 (6M), 4.60 (12M)
- The Euro keeps crawling higher, favoured by the positive market mood
- A dovish BoJ is weighing further on the Yen.
- EUR/JPY is testing 157.75 ahead of the key 158.55 level
The Euro keeps trading higher against a weak Japanese Yen on a calm post-Christmas session. The pair is paring previous losses fuelled by a risk-on mood and a dovish BoJ, that has frustrated market hopes of a major policy shift at December´s meeting.
The dovish BoJ outlook hurts the Yen
The BoJ Summary of options, released on Tuesday confirmed the diverging opinions among policymakers revealed in press releases earlier this month. Some committee members advocate ending the ultra-loose policy while others are more cautious on the back of what they consider small risks to inflation.
Earlier this week, Governor Ueda failed to shed more light on the bank´s policy outlook. The BoJ chairman affirmed that any policy shift will be dependent on the progress on the inflation target, which has disappointed investors.
This scenario is favourable to the Euro, which is testing 157.75 resistance area at the moment of writing, with the next target above here, at 158.55, where the December 19 high meets the 50% Fibonacci retracement of the late-November sell-off.
Support levels are at 157.00 and 156.15.
Technical levels to watch
Any Bank of Japan shifts from accommodative monetary policy are likely to drive JPY appreciation, economists at ANZ Bank report.
Stronger JPY requires patience
While we expect a shift in stance from the BoJ in 2024, this does not mean we have seen the last of JPY weakness. The transition away from accommodative monetary policy will take time and is unlikely to be accomplished in one meeting early in the year. Economic fundamentals in Japan are challenging and still support the case for low interest rates.
Market expectations of a BoJ move often outpace any realistic outcomes. We’ve seen this several times over the year in reaction to communication from Governor Ueda. The brief reaction in the USD/JPY to Yield Curve Control changes in July and October is informative on this front. This dynamic around BoJ meetings will continue to plague the JPY as we enter Q1 2024, so there is still likely to be volatility in JPY crosses next year. Nonetheless, monetary policy normalisation and a weaker USD over 2024 will help the JPY recover to become less undervalued on a fair-value basis.
We see the USD/JPY at 136 by year’s end.
- Silver price falls to near $24.00 in a shortened week.
- The US Dollar has printed a fresh five-month low near 101.40.
- The 61.8% Fibo retracement acted as a strong barrier for the Silver price.
Silver price (XAG/USD) extends its correction to near $24.00 as trading volume has dropped significantly amid festive market mood. The white metal faces selling pressure despite the Federal Reserve (Fed) is expected to start lower interest rates sooner than earlier anticipated.
The market mood is quite as market participants are expected to build fresh positions from next year. The US Dollar Index (DXY) has refreshed its five-month low near 101.40 as investors hope that more-than-projected decline in the United States core Personal Consumption Expenditure (PCE) price index may force Fed policymakers to lean towards early rate cuts.
Investors hope that the US inflation is in a clear downtrend. This has weighed heavily on the US Dollar. This week, the USD Index may face more pressure amid absence of 1st-tier economic events. Meanwhile, investors will focus on the weekly Initial Jobless Claims data, which will be published on Thursday.
Meanwhile, expectations of lower interest rates have propelled home prices in the US economy. The Federal Housing Finance Agency (FHFA) report showed that prices of residential properties grew 6.3% in October on a yearly basis.
Silver technical analysis
Silver price drops after facing selling pressure near the 61.8% Fibonacci retracement (plotted from December 3 high at $25.90 to December 13 low around $22.60) at $22.60 on a two-hour scale. The asset has dropped below the 50-period Exponential Moving Average (EMA), which trades around $24.20.
The Relative Strength Index (RSI) (14) has slipped below 40.00, which indicates that the asset is not bullish anymore.
Silver two-hour chart
-638392714375766984.png)
Economists at MUFG Bank expect SGD to perform in line with the Dollar after two years of strong outperformance.
MAS to keep exchange rate policy on hold through 2024
We forecast USD/SGD at 1.325 in 3 months and 1.29 in 12 months, with SGD generally moving in line with the Dollar’s trend through 2024.
Key to our forecast is our view that MAS is likely to keep its exchange rate policy on hold through 2024, with S$NEER remaining slightly below the top of the exchange rate policy band as GDP growth improves while inflation moderates gradually. We estimate that S$NEER is currently trading around 0.5% below the top of the band.
- The Euro fails at 0.8690, the 61,8% Fib. retracement of the late November decline.
- UK economy contracted in the third quarter, against expectations.
- UK retail sales bounce up unexpectedly and ease negative pressure on the Pound.
The Euro bounced up sharply on Tuesday to retrace earlier losses resuming its uptrend from early December lows and erasing most of the losses of the late-November sell-off.
The euro seems to be faring better on the risk-on sentiment, with markets celebrating the end of t the prospects of rate cuts next year, which are expected to contribute to avoiding a deep recession next year.
The Eurozone and UK economic docket is empty this week, with market sentiment expected to drive both currencies higher against the US Dollar. This might lead to volatile movements in the pair.
The technical picture remains positive, as confirmed by Tuesday´s bullish engulfing candle, which has increased bulls’ confidence to break previous highs, at 0.8685, aiming to 0.8705 and 0.8725.
On the downside, immediate support is at 0.8665 and below here, 0.8645.
Technical levels to watch
- The US Dollar is trying to bounce up from four-month lows at 1.3185.
- Oil prices’ recovery and a dovish Fed are weighing on the US Dollar.
- USD/CAD is in a corrective reaction from oversold levels.
The US Dollar is showing a mild recovery attempt after having reached its lowest level since August, at 1.3185. The pair, however, remains under strong bearish pressure on the back of increasing hopes of Fed cuts in 2024 and higher oil prices.
The attacks in the Red Sea have forced shipping forms to find alternative routes to oil cargo. Apart from increasing costs, this has boosted fears about supply disruptions, ultimately pushing prices higher and boosting the CAD, as Canada is one of the world’s major oil exporters.
Beyond that, the downward revision of the US Q3 GDP combined with the larger-than-expected decline in the PCE Prices Index has cemented hopes that the US central bank will start cutting rates in early 2024.
In this scenario, with the Dollar Index depressed at multi-year lows, the current USD recovery is likely to be a correction from oversold levels. Resistances at 1.3220 and 1.3275 are likely to challenge bulls. On the downside, supports are 1.3150 and 1.3090.
Technical levels to watch
- USD/JPY struggles for a firm recovery as the Fed is expected to start lowering interest rates in early 2024.
- The USD index refreshes five-month low amid risk-on mood.
- The BoJ will reduce bond-buying operations in 2024.
The USD/JPY pair delivered a pullback move after discovering moderate buying interest near 142.00. The asset is expected to resume its downside journey as the pullback move seems short-lived due to downbeat US Dollar Index (DXY).
S&P500 futures remain flat in the European trading session, portraying a quiet market mood in a truncated week amid festive mood. The US Dollar Index has refreshed five-month low near 101.40 as investors hope that Federal Reserve’s (Fed) rate-tightening campaign is over and it will start cutting them to avoid any impact on the labour market.
The United States core Personal Consumption Expenditure price index (PCE) for November, released on Friday, was decelerated to 3.2% against expectations of 3.3% and the former reading of 3.5%. A softer-than-projected decline in the underlying inflation has boosted expectations for early rate cuts by the Fed.
It is highly anticipated that Fed policymakers may continue to push back expectations of early rate cuts without ensuring the achievement of the price stability. Resilient US economy due to tight labour market could keep inflation sticky ahead.
On the Tokyo front, the Bank of Japan (BoJ) is expected to endorse an exit from the ultra-loose monetary policy only after gaining confidence that wage growth could keep inflation steadily above 2%.
The BoJ has announced that it will reduce its bond-buying operations in 2024. This could be the outcome of inflation remaining above 2% for more than a year.
AUS/USD traded in a wide range of 0.62-0.71 this year, with the pair above 0.66 for more than 50% of the year. Economists at ANZ Bank analyze Aussie’s outlook.
RBA is priced as the last to reduce rates, which may give the AUD a strong footing to start the year
The moves were largely driven by USD direction and developments in China. Looking ahead, we expect these two factors to dominate. In addition, given our view that RBA rate cuts will only begin at the end of 2024, it is likely that the carry advantage that the AUD will have against currencies where interest rates have eased aggressively will matter.
Furthermore, global risk sentiment is positive as we look into 2024, with global inflation moderating and global central banks easing. This sentiment is feeding into risk assets, and the AUD, being a high beta currency, stands to benefit.
We expect the AUD/USD to be at 0.68 in Q1 and 0.70 in Q4.
- The Euro keeps crawling higher on risk appetite and a weak US Dollar.
- A softer US economic growth outlook and easing inflation pressures are boosting hopes of Fed cuts.
- In the absence of key data, risk appetite might buoy the Euro before key Eurozone figures are released.
The Euro (EUR) is trading with a mild bullish tone in Wednesday’s European session, following a long Christmas weekend. The pair is moving in the mid-range of 1.1000 with investors celebrating the end of the global tightening cycle, which is expected to support economic growth and lessen the risks of a deep recession next year.
Data released in the US last week revealed that inflation is ebbing fast. The Personal Consumption Expenditures (PCE) Prices Index, the Fed´s favorite inflation gauge, declined to its lowest reading in nearly three years.
Beyond that, third quarter US Gross Domestic Product was revised down to a 4.9% growth from the same period last year, which was lower than previous estimations of 5.2%.
These figures confirm the soft landing rhetoric of lower growth and receding inflation that fuels prospects that the US central bank will start cutting rates in early 2024. This is boosting investors’ appetite for risk and weighing the US Dollar across the board.
Daily digest market movers: Hopes of Fed cuts are hammering the US Dollar
- The Euro remains steady at four-month highs as the Dollar keeps heading south on hopes of Fed cuts.
- Last week, the US PCE Price Index declined to 2.6% year-on-year from the downwardly revised 2.9% in October.
- The Core PCE Prices Index, which removes the impact of seasonal products like food and energy, showed a milder decline, to 3.2% from 3.4% in October. Still, it was lower than the 3.3% expected and well below the 5.6% peak seen in April 2022.
- The Core PCE Prices Index, which removes the impact of seasonal products like food and energy, is seen growing steadily at 0.2% and down to 3.3% from 3.5% in the year.
- These figures have cemented investors’ hopes of Fed rate cuts in early 2024. Futures markets are pricing more than 70% chances of a quarter-point rate cut in March and 150 bps cuts in 2024, according to the CME Group FedWatch Tool.
- US Treasury yields remain declining, with the benchmark 10 yield at 3.85%, more than 100 pips below the 5% peak reached in late October. This is adding negative pressure on the US Dollar.
- The calendar is light this week and the positive mood might support the Euro before the focus turns to key Eurozone macroeconomic releases.
Technical Analysis: Euro remains buoyed with 1.1065 and 1.1100 in sight
The Euro is trading with a moderately positive tone during a calm trading session on Wednesday. The pair remains supported above the 1.1000 level, with technical indicators pointing higher.
The US Dollar Index remains depressed below a strong resistance area at 101.80, and pushing towards multi-month lows at 101.40. A successful move below here would give a fresh boost to the Euro.
The technical picture, as mentioned earlier remains positive, with price action well above the main SMAs and oscillators still below overbought levels, suggesting the possibility of further appreciation.
Immediate resistance levels lie at 1.1065, which closes the path towards the 78.6% Fibonacci retracement of the third quarter´s sell-off, in the vicinity of 1.1100 and the July 27 high, at 1.1145.
Supports are the mentioned 1.1000 and 1.0930.
Euro price this week
The table below shows the percentage change of Euro (EUR) against listed major currencies this week. Euro was the strongest against the Japanese Yen.
| USD | EUR | GBP | CAD | AUD | JPY | NZD | CHF | |
| USD | -0.25% | -0.05% | -0.50% | -0.51% | 0.07% | -0.46% | -0.48% | |
| EUR | 0.35% | 0.23% | -0.12% | -0.19% | 0.36% | -0.10% | -0.13% | |
| GBP | 0.17% | -0.29% | -0.19% | -0.46% | 0.09% | -0.24% | -0.55% | |
| CAD | 0.52% | -0.06% | 0.41% | -0.25% | 0.59% | 0.22% | -0.11% | |
| AUD | 0.51% | 0.19% | 0.48% | 0.01% | 0.56% | 0.12% | -0.15% | |
| JPY | -0.07% | -0.30% | -0.30% | -0.29% | -0.55% | -0.33% | -0.69% | |
| NZD | 0.46% | 0.15% | 0.43% | -0.04% | -0.09% | 0.46% | 0.04% | |
| CHF | 0.66% | 0.11% | 0.27% | 0.13% | 0.21% | 0.69% | 0.05% |
The heat map shows percentage changes of major currencies against each other. The base currency is picked from the left column, while the quote currency is picked from the top row. For example, if you pick the Euro from the left column and move along the horizontal line to the Japanese Yen, the percentage change displayed in the box will represent EUR (base)/JPY (quote).
Euro FAQs
What is the Euro?
The Euro is the currency for the 20 European Union countries that belong to the Eurozone. It is the second most heavily traded currency in the world behind the US Dollar. In 2022, it accounted for 31% of all foreign exchange transactions, with an average daily turnover of over $2.2 trillion a day.
EUR/USD is the most heavily traded currency pair in the world, accounting for an estimated 30% off all transactions, followed by EUR/JPY (4%), EUR/GBP (3%) and EUR/AUD (2%).
What is the ECB and how does it impact the Euro?
The European Central Bank (ECB) in Frankfurt, Germany, is the reserve bank for the Eurozone. The ECB sets interest rates and manages monetary policy.
The ECB’s primary mandate is to maintain price stability, which means either controlling inflation or stimulating growth. Its primary tool is the raising or lowering of interest rates. Relatively high interest rates – or the expectation of higher rates – will usually benefit the Euro and vice versa.
The ECB Governing Council makes monetary policy decisions at meetings held eight times a year. Decisions are made by heads of the Eurozone national banks and six permanent members, including the President of the ECB, Christine Lagarde.
How does inflation data impact the value of the Euro?
Eurozone inflation data, measured by the Harmonized Index of Consumer Prices (HICP), is an important econometric for the Euro. If inflation rises more than expected, especially if above the ECB’s 2% target, it obliges the ECB to raise interest rates to bring it back under control.
Relatively high interest rates compared to its counterparts will usually benefit the Euro, as it makes the region more attractive as a place for global investors to park their money.
How does economic data influence the value of the Euro?
Data releases gauge the health of the economy and can impact on the Euro. Indicators such as GDP, Manufacturing and Services PMIs, employment, and consumer sentiment surveys can all influence the direction of the single currency.
A strong economy is good for the Euro. Not only does it attract more foreign investment but it may encourage the ECB to put up interest rates, which will directly strengthen the Euro. Otherwise, if economic data is weak, the Euro is likely to fall.
Economic data for the four largest economies in the euro area (Germany, France, Italy and Spain) are especially significant, as they account for 75% of the Eurozone’s economy.
How does the Trade Balance impact the Euro?
Another significant data release for the Euro is the Trade Balance. This indicator measures the difference between what a country earns from its exports and what it spends on imports over a given period.
If a country produces highly sought after exports then its currency will gain in value purely from the extra demand created from foreign buyers seeking to purchase these goods. Therefore, a positive net Trade Balance strengthens a currency and vice versa for a negative balance.
EUR/CHF has moved lower on the back of ECB repricing and lower rates in general. Economists at Danske Bank analyze the pair’s outlook.
SNB to deliver its first 25 bps cut in June
We expect the SNB to deliver its first 25 bps cut in June but see risks tilted towards earlier. We do not expect the SNB to commence on FX intervention any time soon (neither selling nor buying).
We forecast a modest move lower in EUR/CHF on the back of fundamentals, continued tight financial conditions and a global growth slowdown.
We target the cross at 0.94 in 6-12M.
Gold prices rose in India on Wednesday, according to data from India's Multi Commodity Exchange (MCX).
Gold price stood at 62,966 Indian Rupees (INR) per 10 grams, up INR 527 compared with the INR 62,439 it cost on Tuesday.
As for futures contracts, Gold prices increased to INR 63,350 per 10 gms from INR 63,025 per 10 gms.
Prices for Silver futures contracts decreased to INR 75,143 per kg from INR 75,026 per kg.
| Major Indian city | Gold Price |
|---|---|
| Ahmedabad | 65,240 |
| Mumbai | 64,990 |
| New Delhi | 65,065 |
| Chennai | 65,220 |
| Kolkata | 65,175 |
Global Market Movers: Comex Gold price hovers near three-week high
- Comex Gold price trades near a three-week high around $2,065 as a sharper-than-projected decline in the United States core PCE price index data has fuelled bets in favour of early rate cuts by the Fed.
- The US core PCE price index data softened to 3.2% vs. the estimates of 3.3% and the former reading of 3.5%. On a monthly basis, the underlying inflation data grew slightly by 0.1% while market participants projected a steady growth of 0.2%.
- It is worth noting that the Fed forecasted core PCE price index at 3.2% by the year-end in its Summary of Projections (SOP) released last week. This indicates that the Fed has achieved its inflation target of 2023.
- This greater-than-projected decline in the Fed’s preferred inflation tool may force policymakers to endorse rate cuts sooner than previously thought.
- As per the CME Fedwatch tool, market participants are pricing in a more than 71% odds chance of an interest rate cut in March. The likelihood of a second rate cut in May is more than 68%.
- Till now, Fed policymakers have been pushing back rate cut expectations, citing the need for a restrictive interest rate policy for a longer period to ensure the achievement of price stability.
- A significant decline in the US inflation data is setting a better start for the Fed for 2024, which would allow them to achieve a soft landing for the economy. Such a soft landing would enable price stability without triggering a recession.
- Apart from the US core PCE price index data, investors also focused on the Durable Goods Orders for November, released on Friday.
- New orders for durable goods rose at a stronger pace of 5.4% against expectations of 2.2%. In October, orders of durable goods contracted by 5.1%.
- Subsiding inflation in the US economy has boosted consumer confidence. The Michigan Consumer Sentiment index for December, released last week, rose to 69.7, against projections and the former reading of 69.4.
- Deepening rate cut expectations by the Fed have weighed heavily on the US Dollar and Treasury yields.
- Lower interest rates, or their expectation, tend to reduce foreign capital inflows negatively impacting a currency.
- The US Dollar Index hovers near a five-month low below 101.50 and 10-year US Treasury yields have dropped further to near 3.87%.
- This week, the economic calendar will be light due to it being a holiday week while the second-tier weekly jobless claims data will be in focus.
(An automation tool was used in creating this post.)
Gold FAQs
Why do people invest in Gold?
Gold has played a key role in human’s history as it has been widely used as a store of value and medium of exchange. Currently, apart from its shine and usage for jewelry, the precious metal is widely seen as a safe-haven asset, meaning that it is considered a good investment during turbulent times. Gold is also widely seen as a hedge against inflation and against depreciating currencies as it doesn’t rely on any specific issuer or government.
Who buys the most Gold?
Central banks are the biggest Gold holders. In their aim to support their currencies in turbulent times, central banks tend to diversify their reserves and buy Gold to improve the perceived strength of the economy and the currency. High Gold reserves can be a source of trust for a country’s solvency. Central banks added 1,136 tonnes of Gold worth around $70 billion to their reserves in 2022, according to data from the World Gold Council. This is the highest yearly purchase since records began. Central banks from emerging economies such as China, India and Turkey are quickly increasing their Gold reserves.
How is Gold correlated with other assets?
Gold has an inverse correlation with the US Dollar and US Treasuries, which are both major reserve and safe-haven assets. When the Dollar depreciates, Gold tends to rise, enabling investors and central banks to diversify their assets in turbulent times. Gold is also inversely correlated with risk assets. A rally in the stock market tends to weaken Gold price, while sell-offs in riskier markets tend to favor the precious metal.
What does the price of Gold depend on?
The price can move due to a wide range of factors. Geopolitical instability or fears of a deep recession can quickly make Gold price escalate due to its safe-haven status. As a yield-less asset, Gold tends to rise with lower interest rates, while higher cost of money usually weighs down on the yellow metal. Still, most moves depend on how the US Dollar (USD) behaves as the asset is priced in dollars (XAU/USD). A strong Dollar tends to keep the price of Gold controlled, whereas a weaker Dollar is likely to push Gold prices up.
- Gold price is set to continue rallying as the Fed is expected to cut rates sooner than anticipated.
- The core PCE price index declined more than expected to 3.2% in November.
- Action could be limited due to a thin-trading week.
Gold price (XAU/USD) looks set to rally further after a significant decline in the United States core Personal Consumption Expenditure price index (PCE) in November has boosted hopes of early rate cuts by the Federal Reserve (Fed). Market participants are pricing in the first rate cut by the Fed in March, and second in May after two years of historically rapid rate-tightening by the central bank.
Fed policymakers, who were endorsing higher for longer interest rates to ensure a return of inflation to 2%, may support an early reduction in borrowing costs. The current cycle in which interest rates have undergone tightening for a longer period may impact the overall state of employment in the economy. Hopes of interest rate cuts have propelled home prices higher, which remained muted from February 2022 till June.
Daily Digest Market Movers: Gold price hovers near three-week high
- Gold price trades near a three-week high around $2,065 as a sharper-than-projected decline in the United States core PCE price index data has fuelled bets in favour of early rate cuts by the Fed.
- The US core PCE price index data softened to 3.2% vs. the estimates of 3.3% and the former reading of 3.5%. On a monthly basis, the underlying inflation data grew slightly by 0.1% while market participants projected a steady growth of 0.2%.
- It is worth noting that the Fed forecasted core PCE price index at 3.2% by the year-end in its Summary of Projections (SOP) released last week. This indicates that the Fed has achieved its inflation target of 2023.
- This greater-than-projected decline in the Fed’s preferred inflation tool may force policymakers to endorse rate cuts sooner than previously thought.
- As per the CME Fedwatch tool, market participants are pricing in a more than 71% odds chance of an interest rate cut in March. The likelihood of a second rate cut in May is more than 68%.
- Till now, Fed policymakers have been pushing back rate cut expectations, citing the need for a restrictive interest rate policy for a longer period to ensure the achievement of price stability.
- A significant decline in the US inflation data is setting a better start for the Fed for 2024, which would allow them to achieve a soft landing for the economy. Such a soft landing would enable price stability without triggering a recession.
- Apart from the US core PCE price index data, investors also focused on the Durable Goods Orders for November, released on Friday.
- New orders for durable goods rose at a stronger pace of 5.4% against expectations of 2.2%. In October, orders of durable goods contracted by 5.1%.
- Subsiding inflation in the US economy has boosted consumer confidence. The Michigan Consumer Sentiment index for December, released last week, rose to 69.7, against projections and the former reading of 69.4.
- The confidence of US residents in the economic outlook was also boosted by expectations of higher disposable income among households due to easing price pressures.
- Meanwhile, annual home prices continued to accelerate in October amid deepening expectations of earlier rate cuts by the Fed.
- The Federal Housing Finance Agency (FHFA) report showed that prices of residential properties grew 6.3% in October on a yearly basis, up from a former reading of 6.2%.
- Deepening rate cut expectations by the Fed have weighed heavily on the US Dollar and Treasury yields.
- Lower interest rates, or their expectation, tend to reduce foreign capital inflows negatively impacting a currency.
- The US Dollar Index hovers near a five-month low below 101.50 and 10-year US Treasury yields have dropped further to near 3.87%.
- This week, the economic calendar will be light due to it being a holiday week while the second-tier weekly jobless claims data will be in focus.
Technical Analysis: Gold price eyes more upside above $2,070
Gold price hovers near a two-day high at around $2,066 in a thin-trading week. The precious metal is expected to remain sideways amid an absence of critical events ahead. More upside would appear if the Gold price manages to sustain above the crucial resistance at $2,070. Short-to-long term daily Exponential Moving Averages (EMAs) are sloping higher, pointing towards an upside bias. Momentum oscillators swing in a bullish trajectory, indicating a healthy trend to the upside.
Gold FAQs
Why do people invest in Gold?
Gold has played a key role in human’s history as it has been widely used as a store of value and medium of exchange. Currently, apart from its shine and usage for jewelry, the precious metal is widely seen as a safe-haven asset, meaning that it is considered a good investment during turbulent times. Gold is also widely seen as a hedge against inflation and against depreciating currencies as it doesn’t rely on any specific issuer or government.
Who buys the most Gold?
Central banks are the biggest Gold holders. In their aim to support their currencies in turbulent times, central banks tend to diversify their reserves and buy Gold to improve the perceived strength of the economy and the currency. High Gold reserves can be a source of trust for a country’s solvency. Central banks added 1,136 tonnes of Gold worth around $70 billion to their reserves in 2022, according to data from the World Gold Council. This is the highest yearly purchase since records began. Central banks from emerging economies such as China, India and Turkey are quickly increasing their Gold reserves.
How is Gold correlated with other assets?
Gold has an inverse correlation with the US Dollar and US Treasuries, which are both major reserve and safe-haven assets. When the Dollar depreciates, Gold tends to rise, enabling investors and central banks to diversify their assets in turbulent times. Gold is also inversely correlated with risk assets. A rally in the stock market tends to weaken Gold price, while sell-offs in riskier markets tend to favor the precious metal.
What does the price of Gold depend on?
The price can move due to a wide range of factors. Geopolitical instability or fears of a deep recession can quickly make Gold price escalate due to its safe-haven status. As a yield-less asset, Gold tends to rise with lower interest rates, while higher cost of money usually weighs down on the yellow metal. Still, most moves depend on how the US Dollar (USD) behaves as the asset is priced in dollars (XAU/USD). A strong Dollar tends to keep the price of Gold controlled, whereas a weaker Dollar is likely to push Gold prices up.
NZD/USD has traded a wide range this year from a high above 0.65 to a low below 0.58 and stabilising at a mid-point in December. Economists at ANZ Bank analyze Kiwi’s outlook.
Kiwi has room to rise in 2024, but not without volatility
We think the NZD has room to rise in 2024, but not without volatility. Our year-end forecast for NZD/USD is 0.63 in 2024.
A global return of risk appetite and the NZD’s high carry advantage will drive the upside we expect into 2024. Our bearish USD view and a positive cyclical outlook bode well for high beta currencies like NZD.
- NZD/USD remains calm on low volume market ahead of US labor and housing data.
- New Zealand Dollar received upward support on improved Kiwi’s Consumer and Business Confidence.
- US Core PCE Inflation data came in lower than expected; weakening the US Dollar.
- Downbeat US bond yields added to the downward pressure on the Greenback.
NZD/USD trades slightly lower around 0.6320 during the European session on Wednesday. However, market participants bet on the US Federal Reserve’s (Fed) dovish stance on interest rate trajectory in early 2024, which weakens the demand for US Dollar (USD). This reinforces the strength of the NZD/USD pair.
The Kiwi Dollar receives support as improved Consumer Confidence and Business Confidence in New Zealand suggest a positive economic outlook. This could influence the Reserve Bank of New Zealand (RBNZ) to potentially delay policy easing, contributing to the underpinning of the NZD. RBNZ Governor Adrian Orr's cautious approach and acknowledgment of the challenges ahead, especially with elevated inflation levels, highlight the complexity of navigating the economic scenario.
The US Dollar Index (DXY) hovers around 101.50, facing pressure influenced by subdued US Treasury yields. Both the 2-year and 10-year yields on US bond coupons are trading lower, standing at 4.29% and 3.88%, respectively, at the time of writing.
The US Dollar encountered added pressure as the US Bureau of Economic Analysis (BEA) released a softer Core Personal Consumption Expenditures (PCE) – Index for November. The US Core PCE Inflation (Year-on-Year) recorded a growth of 3.2%, falling short of the expected 3.3% and the previous 3.4%. Additionally, the Month-on-Month report revealed a consistency of 0.1%, slightly below the market expectation of 0.2%.
In the upcoming week, Thursday is expected to be significant with the release of Initial Jobless Claims and Pending Home Sales data from the United States (US). These indicators will offer valuable insights into the labor market and the real estate sector, contributing to a better understanding of the overall economic landscape. Conversely, there are no scheduled data releases on the Kiwi economic docket for the week.
Russian Deputy PM Alexander Novak expressed his view on oil supply cuts and Brent oil prices in 2024, in his appearance on Wednesday.
Key comments
Russia is a responsible participant of OPEC+ agreement
Our companies are sticking to their obligations on supply cuts.
Russia ensures stable work of oil industry and its strategic development.
On oil prices in 2024, Novak said, “we do not target oil prices.”
According to analyst estimates, Brent oil prices are seen at $80-$85 per barrel in 2024.
Around 1.5 mln t of oil was shipped via Northern Sea route this year.
Related reads
- WTI rises near $75.50 on dovish Fed outlook, Maersk, CMA CGM return to Red Sea
- US crude above $75pb, as US stock and bond rally extends
The Bank of Japan (BoJ) on Wednesday announced its plan of regular bond-buying operations for the January-March quarter of 2024.
Key details
Plans to buy between 300 bln to 650 bln Yen of 1-3 year JGBs 4 times a month in Jan-March (vs 350 bln to 650 bln Yen, 4 times in previous quarter).
Plans to buy between 350 bln to 750 bln Yen of 3-5 year JGBs 4 times in Jan-March (vs 400 bln to 750 bln Yen, 4 times in previous quarter).
Plans to buy between 100 bln to 500 bln Yen of 10-25 year JGBs 3 times in Jan-March (vs 100 bln Yen to 500 bln Yen, 4 times in previous quarter).
Plans to buy between 50 bln to 350 bln Yen of JGBs with more than 25 years of maturity 2 times in Jan-March (vs 50 bln to 350 bln Yen, 3 times in previous quarter).
Market reaction
At the time of writing, USD/JPY is clinging to early gains at around 142.60, up 0.19% on a daily basis.
The Dollar was broadly weaker against the majors last week. Economists at BBH analyze Greenback’s outlook for the last days of the year.
The last week of 2023 is likely to be the calm before the storm
The Dollar is likely to remain under pressure this week due to the lack of any major data that might slow the downward momentum.
Early January will bring a slew of key economic data that calls the pivot into question. Until then, the Greenback is likely to remain under pressure.
- USD/CHF remains below 0.8550 as risk aversion increases the safe-haven CHF demand.
- Shipping firms to return to the Red Sea despite Iran’s threat to close the Gibraltar Strait.
- Former Dallas Fed President Robert Kaplan expects the Fed not to become overly restrictive.
USD/CHF pair is relatively quiet, hovering around 0.8540 during the early European hours on Wednesday. Heightened risk aversion seems to lead to the increased demand for safe-haven currencies like the Swiss Franc (CHF).
There are concerns about Iran potentially closing the Gibraltar Strait, many doubt the feasibility of such an action. However, major shipping firms have started to return to the Red Sea, indicating a tentative normalization with the deployment of a multinational task force in the region.
The Swiss National Bank (SNB) is poised to adopt a proactive approach, as revealed in its recent Quarterly Bulletin. The SNB has communicated its readiness to intervene actively in the foreign exchange market when deemed necessary. This signals a hawkish stance, indicating the bank's commitment to managing currency dynamics and supporting the Swiss Franc (CHF).
The US Dollar Index (DXY) moves above 101.50 amid 2-year and 10-year yields on US bond coupons are trading lower, standing at 4.29% and 3.87%, respectively, by the press time. This decline in yields contributes to the overall subdued performance of the US Dollar (USD) in the market.
Former Dallas Federal Reserve President Robert Kaplan's sentiments align with the notion that the central bank is treading cautiously. Kaplan emphasizes the Federal Reserve's historical mistake of maintaining prolonged excessive accommodation even as the economy improved. According to Kaplan, the central bank is now exercising caution to avoid a similar error on the flip side, being mindful not to become overly restrictive.
The upcoming Thursday holds the promise of valuable insights into the economic landscape as the United States (US) is scheduled to release Initial Jobless Claims and Pending Home Sales data. These indicators play a crucial role in understanding the health of the labor market and the real estate sector, providing investors with essential information for assessing the overall economic condition.
CNY depreciated by 3.6% year-to-date against the US Dollar. Economists at MUFG Bank analyze USD/CNY outlook.
Yuan to appreciate on a more balanced economic recovery
We hold a positive outlook for CNY against the Dollar, due to the considerations of a gradual and more balanced economic recovery in 2024, narrower negative yield spread between China and US, recovering market sentiments towards Chinese economy and assets, and the significant underweight of Chinese assets (both equity and bonds).
We expect a 5% appreciation of CNY against the Dollar in 2024.
We forecast USD/CNY to reach 7.05 by the end of 1Q2024 and 6.80 by the end of 2024.
- Pound Sterling trades in a range during a holiday-truncated week.
- The Fed is expected to cut rates sooner than the BoE.
- A recession in the UK economy is highly likely.
The Pound Sterling (GBP) demonstrates volatility contraction in a thin-trading week. The GBP/USD pair remains broadly upbeat as investors hope that the Bank of England (BoE) will start its rate-cut campaign later than the Federal Reserve (Fed) as inflationary pressures in the United States are in a clear downtrend.
Investors continue to channel liquidity into the Pound Sterling despite deepening fears of a recession in the United Kingdom economy. As per the latest estimates, the British economy contracted by 0.1% in the July-September period. According to the latest projections from the BoE, the economy is expected to remain stagnant in the last quarter this year. The UK economy would be in a technical recession if it contracts again.
Daily Digest Market Movers: Pound Sterling remains upbeat amid risk-on mood
- Pound Sterling manages to hold strength against the US Dollar as easing price pressures in the United States economy have fuelled bets for early rate cuts by the Federal Reserve in 2024.
- The Pound Sterling clings to gains, benefitting from the upbeat Retail Sales data for November due to robust sales at non-food retail stores.
- Higher discounts by non-food retail stores amid Black Friday sales led to a robust increment in consumer spending.
- Monthly Retail Sales recorded a higher 1.3% against the consensus of 0.4% and a stagnant performance in October. Surprisingly, annual sales at retail stores were up by 0.1% while investors forecasted a contraction by 1.3%.
- The Pound Sterling continues to hold gains tightly despite deepening fears of a recession in the United Kingdom.
- The UK Office for National Statistics (ONS), in its revised estimates, revealed a contraction in the economy of 0.1% in the third quarter of 2023. Earlier, it anticipated a stagnant performance in the same period.
- Meanwhile, the Bank of England, in its latest projections, indicated that the economy would remain stagnant in the final quarter of this year.
- Last week, the UK’s Finance Minister, the Chancellor of the Exchequer Jeremy Hunt said there is a reasonable chance that the central bank may decide to reduce interest rates if we stay on course and manage to bring down inflation.
- On the contrary, BoE policymakers have been stating interest rate cuts would be “premature” in spite of a significant fall in the price index. Stronger wage growth is dampening confidence that inflation is clearly in a downtrend.
- Last week, Barclays said that the BoE may initiate its rate cut campaign from May, when it was previously expected from August.
- Major factors that are fueling early rate-cut hopes are expectations of a recession in the UK economy and the rare step of the Chancellor Jeremy Hunt suggesting the central bank make rate cuts to boost growth.
- Going forward, the market mood is expected to remain quite amid a holiday-truncated week.
- The US Dollar Index (DXY) trades near five-month low around 101.46 as a more-than-anticipated decline in the core Personal Consumption Expenditure price index (PCE) for November has pumped bets in favour of early rate cuts by the Fed.
- Monthly US core PCE data grew slightly by 0.1% while investors projected a growth rate of 0.2% as recorded for October. On an annualized basis, the underlying inflation has decelerated to 3.2% vs. the consensus of 3.3% and the former reading of 3.5%.
- Investors should note that the Federal Reserve (Fed), in its Summary of Projections (SOP) released last week, forecasted core PCE at 3.2% by the year-end.
Technical Analysis: Pound Sterling marches toward 1.2800
Pound Sterling approaches the immediate resistance of 1.2800, being supported by a risk-on mood. The GBP/USD pair demonstrates a Symmetrical Triangle chart pattern formation on an intraday time frame amid the festive season. The formation of the aforementioned chart pattern indicates a sheer contraction in volatility.
On a daily time frame, the Cable is being consistently supported by upward-sloping 20-day Exponential Moving Average (EMA), which trades around 1.2630.
The Relative Strength index (RSI) (14) is on the verge of breaking above 60.00. A bullish momentum would trigger if the RSI manages to do so.
Pound Sterling FAQs
What is the Pound Sterling?
The Pound Sterling (GBP) is the oldest currency in the world (886 AD) and the official currency of the United Kingdom. It is the fourth most traded unit for foreign exchange (FX) in the world, accounting for 12% of all transactions, averaging $630 billion a day, according to 2022 data.
Its key trading pairs are GBP/USD, aka ‘Cable’, which accounts for 11% of FX, GBP/JPY, or the ‘Dragon’ as it is known by traders (3%), and EUR/GBP (2%). The Pound Sterling is issued by the Bank of England (BoE).
How do the decisions of the Bank of England impact on the Pound Sterling?
The single most important factor influencing the value of the Pound Sterling is monetary policy decided by the Bank of England. The BoE bases its decisions on whether it has achieved its primary goal of “price stability” – a steady inflation rate of around 2%. Its primary tool for achieving this is the adjustment of interest rates.
When inflation is too high, the BoE will try to rein it in by raising interest rates, making it more expensive for people and businesses to access credit. This is generally positive for GBP, as higher interest rates make the UK a more attractive place for global investors to park their money.
When inflation falls too low it is a sign economic growth is slowing. In this scenario, the BoE will consider lowering interest rates to cheapen credit so businesses will borrow more to invest in growth-generating projects.
How does economic data influence the value of the Pound?
Data releases gauge the health of the economy and can impact the value of the Pound Sterling. Indicators such as GDP, Manufacturing and Services PMIs, and employment can all influence the direction of the GBP.
A strong economy is good for Sterling. Not only does it attract more foreign investment but it may encourage the BoE to put up interest rates, which will directly strengthen GBP. Otherwise, if economic data is weak, the Pound Sterling is likely to fall.
How does the Trade Balance impact the Pound?
Another significant data release for the Pound Sterling is the Trade Balance. This indicator measures the difference between what a country earns from its exports and what it spends on imports over a given period.
If a country produces highly sought-after exports, its currency will benefit purely from the extra demand created from foreign buyers seeking to purchase these goods. Therefore, a positive net Trade Balance strengthens a currency and vice versa for a negative balance.
USD/IDR continued to be buffeted by volatile and rising US rates in 2023. Economists at MUFG Bank analyze the pair’s outlook for the next year.
Good macro stability offsets lower commodity prices
We forecast USD/IDR at 15,350 in 3 months and 15,000 in 12 months.
We think IDR will benefit from lower US yields and a weaker Dollar through the course of 2024.
Indonesia’s domestic macro stability such as inflation and the fiscal deficit continue to look quite robust, notwithstanding headwinds outside of its control such as low coal and palm prices.
We see Bank Indonesia cutting rates by 50 bps in 2024, with risk tilted toward earlier and faster cuts assuming IDR stability continues.
- Gold price moves sideways, indicating consolidation in market activity.
- Middle East conflict adds to the heightened risk-off sentiment, further boosting demand for safe-haven Gold.
- Friday softer US data contributed to the downward pressure on the Greenback.
Gold price hovers above $2,060 per troy ounce during the Asian session on Wednesday. The upward movement in Gold prices is attributed to traders factoring in the potential for rate cuts by the Federal Reserve (Fed). Moreover, WIRP indicated that the market has priced in a 15% probability of a cut on January 31 and has fully priced in cuts by March 20, with six cuts fully priced in by the end of 2024.
The geopolitical tensions in the Middle East are adding to the heightened risk-off sentiment, further boosting demand for Gold as a safe-haven asset. Despite concerns, major shipping firms like Maersk and CMA CGM have started to return to the Red Sea, indicating a tentative normalization with the deployment of a multinational task force in the region. The decision of Hapag-Lloyd on resuming shipments is awaited on Wednesday. It's worth noting that while there are concerns about Iran potentially closing the Gibraltar Strait, many doubt the feasibility of such an action.
The US Dollar Index (DXY) stays below 101.50 at the time of writing. The DXY appears to be under pressure, influenced by subdued US Treasury yields. Both the 2-year and 10-year yields on US bond coupons are trading lower, with figures at 4.29% and 3.88%, respectively, by the press time. The sentiments are further echoed by former Dallas Federal Reserve President Robert Kaplan, who highlighted the central bank's past error of prolonged excessive accommodation. Kaplan believes that the Federal Reserve is now exercising caution to avoid making a similar mistake on the opposite end, ensuring not to become overly restrictive and potentially hinder economic growth.
The US Dollar faced additional pressure as the US Bureau of Economic Analysis (BEA) reports a softer Core Personal Consumption Expenditures (PCE) – Index for November. The US Core PCE Inflation (Year-on-Year) registered a growth of 3.2%, falling short of the expected 3.3% and the previous 3.4%. Meanwhile, the Month-on-Month (MoM) data maintained consistency at 0.1%, slightly below the market expectation of 0.2%. Looking ahead, Thursday is set to bring the release of Initial Jobless Claims and Pending Home Sales data from the United States (US), providing further insights into the economic landscape.
Here is what you need to know on Wednesday, December 27:
Following a long weekend, the US Dollar (USD) continued to weaken against its rivals on Tuesday. Although major markets are back in action on Wednesday, thin trading conditions cause the action to remain choppy. Weekly MBA Mortgage Applications and Richmond Fed Manufacturing Index will be featured in the US economic docket in the second half of the day.
US Dollar price this week
The table below shows the percentage change of US Dollar (USD) against listed major currencies this week. US Dollar was the weakest against the Canadian Dollar.
| USD | EUR | GBP | CAD | AUD | JPY | NZD | CHF | |
| USD | -0.17% | -0.10% | -0.64% | -0.54% | 0.16% | -0.57% | -0.27% | |
| EUR | 0.27% | 0.10% | -0.34% | -0.29% | 0.36% | -0.29% | -0.01% | |
| GBP | 0.23% | -0.16% | -0.27% | -0.42% | 0.23% | -0.29% | -0.29% | |
| CAD | 0.64% | 0.14% | 0.48% | -0.15% | 0.80% | 0.23% | 0.21% | |
| AUD | 0.53% | 0.29% | 0.41% | -0.10% | 0.65% | 0.00% | 0.06% | |
| JPY | -0.15% | -0.30% | -0.44% | -0.51% | -0.66% | -0.53% | -0.58% | |
| NZD | 0.57% | 0.33% | 0.48% | -0.07% | 0.00% | 0.65% | 0.35% | |
| CHF | 0.48% | 0.01% | 0.02% | -0.19% | 0.00% | 0.59% | -0.25% |
The heat map shows percentage changes of major currencies against each other. The base currency is picked from the left column, while the quote currency is picked from the top row. For example, if you pick the Euro from the left column and move along the horizontal line to the Japanese Yen, the percentage change displayed in the box will represent EUR (base)/JPY (quote).
After losing nearly 1% in the previous week, the USD Index edged lower to start the last week of 2023. At the time of press, the index was flat on the day slightly below 101.50 and the benchmark 10-year US Treasury bond yield was down more than 0.5% below 3.9%.
EUR/USD touched its highest level since August near 1.1050 on Tuesday and stabilized near that level early Wednesday.
During the Asian trading hours, the Bank of Japan (BoJ) published the Summary of Opinions of the December monetary policy meeting. The publication reiterated that policymakers saw the need to maintain the ultra-easy monetary policy for now. USD/JPY rose sharply toward 143.00 in the early Asian session but lost its bullish momentum before settling above 142.50. November Retail Trade and Industrial Production data from Japan will be looked upon for fresh impetus early Thursday.
GBP/USD registered small gains and stabilized above 1.2700 early Wednesday. Nationwide Housing Prices for December, which will be released on Friday, will be the only data featured in the UK economic this week.
Gold climbed above $2,060 on Tuesday but struggled to preserve its bullish momentum.
AUD/USD gained traction on persistent USD weakness and advanced beyond 0.6800 to reach its highest level since July. Similarly, NZD/USD was last seen trading at its strongest level in five months above 0.6300.
- GBP/JPY trades in positive territory for the third straight day on Wednesday.
- The UK's inflation dropped to its lowest level in nearly two years, prompting investors to expect a rate cut from the BoE in 2024.
- BoJ’s members were split between those who were cautious about raising rates and others who saw the need for a future exit.
The GBP/JPY cross holds positive ground during the early European session on Wednesday. The cross edges higher following the Bank of Japan's (BoJ) publication of its Summary of the December Meeting. The cross currently trades near 181.63, up 0.21% on the day.
The cooling inflation in the UK economy to its lowest rate in over two years, encouraging investors to raise their bets that the Bank of England (BoE) would cut the interest rates in the first half of next year. The markets are pricing in nearly 50% possibility of a rate cut by March 2024 and fully pricing in a BoE rate cut by May 2024.
About the data, the UK Gross Domestic Product (GDP) for the third quarter (Q3) came in weaker than market expectations, arriving at -0.1% QoQ versus 0% prior, while the annual GDP growth number expanded by 0.3% from the previous reading of 0.6%. Additionally, November’s UK Retail Sales climbed 1.3% MoM from 0% in October.
On the JPY’s front, the BoJ released the Summary of Opinions from the December Monetary Policy meeting on Wednesday. While the board maintained an ultra-loose policy and kept its dovish guidance unchanged, the members were split between those who were cautious about raising rates and others who saw the need to start preparing for a future exit.
The BoJ Governor Kazuo Ueda said on Monday that the possibility of achieving the central bank’s inflation target was "gradually rising, and it would consider exiting policy if prospects of sustainably achieving the 2% target increased sufficiently. Nonetheless, many market participants anticipate the BOJ to end its negative rate policy in 2024, with some expecting a policy shift in January or April.
Moving on, the Japanese Retail Trade for November and Industrial Production will be due on Thursday. On Friday, the UK’s Nationwide Housing Prices will be released. Amidst the holiday season's thin trading, the risk sentiment and the ongoing adjustments in central bank policies are expected to continue influencing the GBP/JPY cross movements.
- EUR/USD remains in a narrow trading range amid the light trading volume.
- The positive outlook of the pair remains intact above the key EMA; RSI indicator stands in bullish territory above the 50 midline.
- 1.1050 acts as an immediate resistance level; the initial support level is seen at the 1.1000 mark.
The EUR/USD pair oscillates in a narrow range during the early European session on Wednesday. The market is likely to trade in a quiet session amid the holiday season in the last week of 2023. The major pair currently trades near 1.1041, down 0.01% on the day.
According to the four-hour chart, the positive outlook of EUR/USD remains intact as the major pair holds above the key 100-hour Exponential Moving Averages (EMA) with an upward slope. Additionally, the 14-day Relative Strength Index (RSI), which is in bullish territory above the 50 midline, supports the bullish momentum.
The upper boundary of the Bollinger Band at 1.1050 acts as an immediate resistance level for EUR/USD. The additional upside filter to watch is a high of August 10 at 1.1065, en route to a high of July 24 at 1.1147.
On the flip side, the initial support level will emerge at the 1.1000 psychological round mark. The critical contention is seen at the 1.0970-1.0980 region, representing the confluence of the lower limit of the Bollinger Band and the 50-hour EMA. Further south, the next downside target is located near the 100-hour EMA at 1.0926 and finally at 1.0888 (Low of December 15).
EUR/USD four-hour chart
-638392518949750243.png)
- WTI price gains ground as expected rate cuts could help in increasing oil demand.
- Crude oil prices could find resistance as Major shipping firms have begun returning to the Red Sea.
- US has completed contracts to acquire three million barrels of oil to replenish the SPR.
West Texas Intermediate (WTI) price trades higher around $75.50 per barrel during the Asian session on Wednesday. The increase in Crude oil prices is partially attributed to optimism surrounding potential US interest rate cuts, which could stimulate economic growth and increase fuel demand.
Despite ongoing attacks and escalating tensions in the Middle East, there's a possibility that oil prices could face constraints. Major shipping firms, including Maersk and CMA CGM, have begun returning to the Red Sea following the deployment of a multinational task force in the region. The decision of Hapag-Lloyd regarding the resumption of shipments is anticipated on Wednesday. The return of these shipping giants to the Red Sea suggests a cautious normalization despite the persisting security concerns in the region.
The United States (US) has completed contracts to acquire three million barrels of oil, aiming to replenish the Strategic Petroleum Reserve (SPR). This move comes after the largest sale in the history of the SPR last year. The US Department of Energy announced this development on Tuesday, signaling a strategic effort to bolster the country's reserves and address energy security concerns.
Market participants will likely closely monitor the US API Weekly Crude Oil Stock data for the week ending on December 22 on Wednesday. Following that, on Thursday, attention will shift to the release of the EIA Crude Oil Stocks Change, providing insights into the inventory levels. Finally, on Friday, the Baker Hughes US Oil Rig Count will be released, offering information on the number of active oil rigs, which can indicate trends in oil exploration and production.
- Indian Rupee trades on a softer note amid the light trading volume.
- Fitch Ratings predicts India's robust economic growth will boost corporate demand, offsetting global market challenges.
- Fitch Ratings anticipated India’s GDP growth of 6.5% during fiscal 2024–25.
Indian Rupee (INR) edges lower on Wednesday amid the holiday season's thin trading. In its latest research report on ’India Corporates: Sector Trends 2024’, Fitch Ratings forecasted that India’s resilient economic growth will boost the performance of the corporate sector and offset weaknesses from global market challenges. Furthermore, the leading credit rating agency stated that India is expected to be the world’s fastest-growing country, with resilient GDP growth of 6.5% during the fiscal 2024-25.
Despite robust macroeconomic dynamics, investors will monitor the developments surrounding food inflation and how the impending general elections in 2024 will eventually play out in shaping future economic policies. Later this week, the risk sentiment is expected to continue influencing currency movements amid the quiet session in the last week of 2023.
Daily Digest Market Movers: Indian Rupee remains strong despite global risks and uncertainties
- India's current account deficit narrowed to $8.3 billion in the second quarter of 2023-24, according to the Reserve Bank of India (RBI).
- The market capitalization of India's stock markets has surpassed $4 trillion, with the benchmark Nifty50 returning 17% this year.
- India's total trade in GDP has expanded from around 15% in the early 1990s to nearly 50% in 2022.
- India's foreign currency reserves were at $606.9 billion on December 8, 2023, ranking fourth among major foreign exchange reserve-holding countries, and climbed by $28.4 billion between 2023 and 2024.
- The US Dallas Fed Manufacturing Business Index for December dropped 9.3 versus -19.9 prior. November's Chicago Fed National Activity Index arrived at 0.03 from the previous reading of a 0.49 drop.
- November’s Core Personal Consumption Expenditures Price Index (Core PCE) rose 0.1% MoM and grew 3.2% YoY. Meanwhile, the headline PCE came in at -0.1% MoM and 2.6%. YoY.
Technical Analysis: Indian Rupee clings to the longer-term range theme
Indian Rupee trades weaker on the day. The USD/INR pair remains stuck within a familiar multi-month-old trading band of 82.80–83.40. Technically, the path of least resistance is to the upside as the pair holds above the key 100-period Exponential Moving Average (EMA) on the daily chart. However, the shorter-term bullish outlook looks vulnerable, hinted by the 14-day Relative Strength Index (RSI) that stands below the 50.0 midpoint.
Any follow-through buying above the upper boundary of the trading range at 83.40 will pave the way to the year-to-date (YTD) high of 83.47, en route to the 84.00 psychological mark. On the other hand, the round figure at 83.00 acts as a key support level for USD/INR. The next contention level is seen near the confluence of the lower limit of the trading range and a low of September 12 at 82.80. A decisive break below 82.80 will see a drop to a low of August 11 at 82.60.
US Dollar price today
The table below shows the percentage change of US Dollar (USD) against listed major currencies today. US Dollar was the strongest against the Euro.
| USD | EUR | GBP | CAD | AUD | JPY | NZD | CHF | |
| USD | 0.07% | 0.02% | -0.01% | -0.16% | 0.06% | -0.08% | 0.00% | |
| EUR | -0.06% | -0.04% | -0.06% | -0.23% | 0.01% | -0.15% | -0.06% | |
| GBP | -0.02% | 0.04% | -0.03% | -0.17% | 0.05% | -0.10% | -0.02% | |
| CAD | 0.02% | 0.09% | 0.03% | -0.14% | 0.08% | -0.06% | 0.02% | |
| AUD | 0.16% | 0.24% | 0.17% | 0.14% | 0.22% | 0.08% | 0.16% | |
| JPY | -0.06% | 0.00% | -0.05% | -0.10% | -0.19% | -0.12% | -0.08% | |
| NZD | 0.08% | 0.16% | 0.09% | 0.05% | -0.08% | 0.16% | 0.08% | |
| CHF | 0.00% | 0.07% | 0.02% | -0.01% | -0.15% | 0.08% | -0.07% |
The heat map shows percentage changes of major currencies against each other. The base currency is picked from the left column, while the quote currency is picked from the top row. For example, if you pick the Euro from the left column and move along the horizontal line to the Japanese Yen, the percentage change displayed in the box will represent EUR (base)/JPY (quote).
Indian Rupee FAQs
What are the key factors driving the Indian Rupee?
The Indian Rupee (INR) is one of the most sensitive currencies to external factors. The price of Crude Oil (the country is highly dependent on imported Oil), the value of the US Dollar – most trade is conducted in USD – and the level of foreign investment, are all influential. Direct intervention by the Reserve Bank of India (RBI) in FX markets to keep the exchange rate stable, as well as the level of interest rates set by the RBI, are further major influencing factors on the Rupee.
How do the decisions of the Reserve Bank of India impact the Indian Rupee?
The Reserve Bank of India (RBI) actively intervenes in forex markets to maintain a stable exchange rate, to help facilitate trade. In addition, the RBI tries to maintain the inflation rate at its 4% target by adjusting interest rates. Higher interest rates usually strengthen the Rupee. This is due to the role of the ‘carry trade’ in which investors borrow in countries with lower interest rates so as to place their money in countries’ offering relatively higher interest rates and profit from the difference.
What macroeconomic factors influence the value of the Indian Rupee?
Macroeconomic factors that influence the value of the Rupee include inflation, interest rates, the economic growth rate (GDP), the balance of trade, and inflows from foreign investment. A higher growth rate can lead to more overseas investment, pushing up demand for the Rupee. A less negative balance of trade will eventually lead to a stronger Rupee. Higher interest rates, especially real rates (interest rates less inflation) are also positive for the Rupee. A risk-on environment can lead to greater inflows of Foreign Direct and Indirect Investment (FDI and FII), which also benefit the Rupee.
How does inflation impact the Indian Rupee?
Higher inflation, particularly, if it is comparatively higher than India’s peers, is generally negative for the currency as it reflects devaluation through oversupply. Inflation also increases the cost of exports, leading to more Rupees being sold to purchase foreign imports, which is Rupee-negative. At the same time, higher inflation usually leads to the Reserve Bank of India (RBI) raising interest rates and this can be positive for the Rupee, due to increased demand from international investors. The opposite effect is true of lower inflation.
- USD/CAD faces challenges on improved market sentiment.
- Traders price in the speculation of policy easing by the Fed in the upcoming year.
- Downbeat US Treasury yields added to the downward pressure on the Greenback.
- Canadian GDP continues to point towards an economic slowdown.
USD/CAD hovers below 1.3200 during the Asian trading hours on Wednesday. However, Canadian economic data showed an economic slowdown. Canadian Gross Domestic Product (GDP) (MoM) failed to print growth for a fourth straight in October, coming in flat at 0.0% after September’s GDP print saw a downside revision from a meager 0.1% to flat.
However, the US Dollar (USD) encounters downward pressure due to growing speculations of potential easing by the US Federal Reserve (Fed), which limits the advance of the USD/CAD pair. The prevailing weakening sentiment is further amplified by the decline in US Treasury yields, adding to the factors undermining the strength of the US Dollar.
Moreover, former Dallas Federal Reserve President Robert Kaplan shared his insights with the media on Tuesday. Kaplan underscored the Federal Reserve's previous error of maintaining prolonged excessive accommodation, even in the face of positive economic indicators. He expressed the belief that the central bank is now cautious to avoid repeating this mistake on the flip side, being mindful not to become overly restrictive and potentially impede economic growth.
Additionally, the US Bureau of Economic Analysis (BEA) reveals a softer Core Personal Consumption Expenditures (PCE) – Index for November, which contributed to pressure for the US Dollar. US Core PCE Inflation (YoY) grew at 3.2%, falling short of the 3.3% expectations and 3.4% prior. At the same time, the MoM data showed consistency at 0.1% against the market expectation of 0.2%.
Thursday will bring the release of Initial Jobless Claims and Pending Home Sales data from the United States (US). Meanwhile, there are no scheduled data releases on the Canadian economic docket for the week.
- GBP/USD rises on elevated speculation of interest rate cuts by the Fed in early 2024.
- Downbeat US Treasury yields put pressure on the US Dollar.
- Former Dallas Fed President Robert Kaplan expects the Fed not to be overly restrictive.
- UK Retail Sales showed improvement in November. While UK GDP came in softer in Q3.
GBP/USD hovers around 1.2720 during the Asian session on Wednesday. The US Dollar (USD) encounters downward pressure against Pound Sterling (GBP) as growing speculations of potential easing by the US Federal Reserve (Fed).
The weakening sentiment is intensified by the fall in US Treasury yields, contributing to the factors eroding the strength of the US Dollar. The 2-year and 10-year yields on US bond coupons trade lower, standing at 4.29% and 3.88%, respectively, at the time of writing.
Former Dallas Federal Reserve President Robert Kaplan conveyed his thoughts to the media on Tuesday. Kaplan stressed the Federal Reserve's past mistake of prolonged excessive accommodation, despite positive economic indicators. He believes the central bank is now wary of repeating this error on the flip side, being cautious not to become overly restrictive and hinder economic growth.
The British Pound (GBP) found support on Friday, thanks to better-than-expected Retail Sales figures from the United Kingdom (UK) in November. Retail Sales (Month-on-Month) saw a growth of 1.3%, surpassing the forecast of 0.4% and rebounding from October's stagnant reading of 0.0%. Retail Sales (YoY) exceeded market expectations, registering a 0.1% increase compared to the anticipated decline of 1.3%. This marked a turnaround from the previous 2.5% decline.
However, the UK Gross Domestic Product (GDP) for Q3 came in below expectations. GDP (YoY) came in at just 0.3% versus the forecast hold at 0.6%. GDP (QoQ) declined by 0.1% versus the forecast 0.0% flat reading.
On Thursday, Initial Jobless Claims and Pending Home Sales from the United States (US) will be released. In the absence of the high-impact data from the UK’s docket, the low-impact Nationwide Housing Prices is due on Friday.
| Raw materials | Closed | Change, % |
|---|---|---|
| Silver | 24.221 | 0.06 |
| Gold | 2067.226 | 0.48 |
| Palladium | 1167.7 | -3.34 |
- USD/JPY trades in positive territory near 142.60, adding 0.14% on the day.
- The BoJ Summary of Opinions suggested that the central bank will consider a policy shift if the wage-price cycle intensifies.
- The US Core Personal Consumption Expenditures Price Index (PCE) grew 3.2% YoY in November, below the market consensus of 3.3%.
The USD/JPY pair gains ground during the early Asian session on Wednesday. The pair has reached 142.84 following the release of the Bank of Japan's (BoJ) Summary of Opinions and currently trades around 142.60. The market is likely to be quiet amid the light trading volume in the last week of 2023.
Early Wednesday, the BoJ released the Summary of Opinions from the December Monetary Policy meeting. The remarks from the meeting were not surprised by the market, and the Japanese central bank is aware that conditions may emerge for withdrawing YCC and ultimately raising short-term interest rates out of negative territory. However, there’s no decision yet on the timing of the policy shift.
On Monday, BoJ Governor Kazuo Ueda said that the possibility of achieving the central bank's inflation target was gradually rising and that it would consider adjusting policy if prospects of sustainably achieving the 2% target increased sufficiently.
On the other hand, the cooling inflation figures last week fueled expectations that the Federal Reserve (Fed) may cut interest rates in the coming year. This, in turn, exerts some selling pressure on the US Dollar. The US Core Personal Consumption Expenditures Price Index (PCE), which excludes energy and food prices, rose 3.2% YoY in November, below the market consensus of 3.3%. The monthly Core PCE figures arrived at 0.1% in the same period, weaker than the expectation of 0.2%.
The risk sentiment and the ongoing adjustments in central bank policies are expected to continue influencing currency movements amid the holiday season's thin trading. Later this week, the US Richmond Fed Manufacturing Index for December and the Initial Jobless Claims will be released on Wednesday and Thursday, respectively. However, these figures might not have a significant impact on the market.
Bank of Japan (BoJ) published the Summary of Opinions from its December monetary policy meeting, with the key findings noted below.
One member said must patiently maintain monetary easing
One member said must confirm sustainable, stable achievement of price target is foreseen in order to end negative rate, YCC.
One member said must scrutinize wage, price moves under YCC given strong upward pressure on prices likely stabilized.
One member said even if next spring's wage hikes are considerably higher than expected, risk that this will cause underlying inflation to significantly exceed 2% is small.
One member said we are not in situation where we would fall behind the curve in raising rates, even if we decided to wait after seeing wage talk outcomes next spring.
One member said from perspective of maintaining confidence in its ability to conduct monetary policy in exit phase, it is important for BoJ to provide communication on central banks' balance sheet.
One member said momentum toward wage hike heightening compared with last year.
Market reaction
USD/JPY caught a fresh bid wave on the above headlines, adding 0.21% on the day to trade at 142.68, as of writing.
- Australian Dollar posts fresh five-month high on subdued Greenback.
- Australian central bank could be hawkish in early 2024 as inflation remains solid.
- China's Jan-Nov Industrial Profits (YoY) declined by 4.4%.
- US Dollar faces challenges on speculation of the Fed going softer in the upcoming year.
The Australian Dollar (AUD) moves sideways on Wednesday amid US Dollar (USD) shows signs of weakness, influenced by the speculation on a dovish stance of the Federal Reserve (Fed) on interest rates. The AUD/USD pair trades below its recent high of 0.6829, a mark untouched for nearly five months.
Australia’s central bank reflects a hawkish outlook, driven by robust inflation and stable housing prices, contributing to the resilience of the Australian Dollar. The upcoming year might witness a tug-of-war between expectations of rate cuts and the Reserve Bank of Australia's (RBA) resistance. With the latest RBA forecasts approaching the upper boundary of the 2-3% inflation target by the close of 2025, the RBA may still be open to additional deliberation.
China's year-on-year Industrial Profits for January to November registered a decline of 4.4%, indicating a slowdown and highlighting the need for additional policy support from Beijing to bolster growth in the world's second-largest economy. China takes center stage in shaping the global economic landscape in 2024, marked by stable inflation and low borrowing costs. The world is keenly observing as the global economy gains traction, particularly with the prospect of economic stimulus from China. Such developments could sway the Reserve Bank of Australia (RBA) to maintain its hawkish stance, guided by trade relations between the two countries.
The US Dollar Index (DXY) is encountering downward pressure amid growing speculations of potential easing by the US Federal Reserve (Fed). This sentiment is further exacerbated by the decline in US Treasury yields, adding to the factors undermining the strength of the Greenback.
Former Dallas Federal Reserve President Robert Kaplan shared his insights with the media on Tuesday. Kaplan emphasized the Federal Reserve's previous error of maintaining excessive accommodation for an extended period, even as the economy showed signs of improvement. He believed that the central bank is cautious not to repeat the same mistake on the opposite end, avoiding a scenario where it becomes overly restrictive.
Daily Digest Market Movers: Australian Dollar rises on hawkish RBA, weaker Greenback
- RBA Private Sector Credit (MoM) demonstrated a 0.4% increase in November, surpassing the previous rise of 0.3%. However, the Year-over-Year data indicated a decrease of 4.7%, compared to the previous 4.8% rise.
- RBA highlighted the examination of additional data to assess the balance of risks before deciding on future interest rates in its recent Meeting Minutes.
- US Housing Price Index (MoM) contracted to 0.3% from 0.7% prior, falling short of 0.5% expectations in October.
- US Bureau of Economic Analysis (BEA) reveals that the Core Personal Consumption Expenditures - Price Index (YoY) grew at 3.2% in November, falling short of the 3.3% expectations and 3.4% prior. While the MoM data showed consistency at 0.1% against the market expectation of 0.2%.
- US Gross Domestic Product Annualized grew at a rate of 4.9% in Q3, slightly below the expected consistency of 5.2%.
Technical Analysis: Australian Dollar trades near 0.6820 below a five-month high
The Australian Dollar hovers around 0.6820, slightly below its five-month high of 0.6829 on Monday. The prevailing bullish sentiment suggests a potential for the AUD/USD pair to approach the key resistance at the major level of 0.6850. On the downside, support levels are identifiable at the psychological level of 0.6800, followed by the seven-day Exponential Moving Average (EMA) at 0.6785. A breach below this crucial support zone could lead the AUD/USD pair towards the psychological support at 0.6700 before encountering the 23.6% Fibonacci retracement at 0.6693.
AUD/USD: Daily Chart
-638392372257197397.png)
Australian Dollar price today
The table below shows the percentage change of Australian Dollar (AUD) against listed major currencies today. Australian Dollar was the strongest against the Japanese Yen.
| USD | EUR | GBP | CAD | AUD | JPY | NZD | CHF | |
| USD | 0.08% | 0.07% | 0.02% | 0.02% | 0.16% | 0.06% | 0.05% | |
| EUR | -0.08% | -0.01% | -0.05% | -0.05% | 0.08% | -0.02% | -0.05% | |
| GBP | -0.06% | 0.00% | -0.04% | -0.04% | 0.10% | 0.01% | -0.03% | |
| CAD | -0.01% | 0.06% | 0.05% | 0.02% | 0.15% | 0.07% | 0.02% | |
| AUD | -0.02% | 0.05% | 0.03% | -0.01% | 0.13% | 0.04% | 0.03% | |
| JPY | -0.17% | -0.09% | -0.09% | -0.16% | -0.12% | -0.11% | -0.14% | |
| NZD | -0.08% | 0.02% | 0.01% | -0.07% | -0.04% | 0.12% | -0.04% | |
| CHF | -0.04% | 0.04% | 0.03% | -0.02% | 0.00% | 0.14% | 0.04% |
The heat map shows percentage changes of major currencies against each other. The base currency is picked from the left column, while the quote currency is picked from the top row. For example, if you pick the Euro from the left column and move along the horizontal line to the Japanese Yen, the percentage change displayed in the box will represent EUR (base)/JPY (quote).
Australian Dollar FAQs
What key factors drive the Australian Dollar?
One of the most significant factors for the Australian Dollar (AUD) is the level of interest rates set by the Reserve Bank of Australia (RBA). Because Australia is a resource-rich country another key driver is the price of its biggest export, Iron Ore. The health of the Chinese economy, its largest trading partner, is a factor, as well as inflation in Australia, its growth rate and Trade Balance. Market sentiment – whether investors are taking on more risky assets (risk-on) or seeking safe-havens (risk-off) – is also a factor, with risk-on positive for AUD.
How do the decisions of the Reserve Bank of Australia impact the Australian Dollar?
The Reserve Bank of Australia (RBA) influences the Australian Dollar (AUD) by setting the level of interest rates that Australian banks can lend to each other. This influences the level of interest rates in the economy as a whole. The main goal of the RBA is to maintain a stable inflation rate of 2-3% by adjusting interest rates up or down. Relatively high interest rates compared to other major central banks support the AUD, and the opposite for relatively low. The RBA can also use quantitative easing and tightening to influence credit conditions, with the former AUD-negative and the latter AUD-positive.
How does the health of the Chinese Economy impact the Australian Dollar?
China is Australia’s largest trading partner so the health of the Chinese economy is a major influence on the value of the Australian Dollar (AUD). When the Chinese economy is doing well it purchases more raw materials, goods and services from Australia, lifting demand for the AUD, and pushing up its value. The opposite is the case when the Chinese economy is not growing as fast as expected. Positive or negative surprises in Chinese growth data, therefore, often have a direct impact on the Australian Dollar and its pairs.
How does the price of Iron Ore impact the Australian Dollar?
Iron Ore is Australia’s largest export, accounting for $118 billion a year according to data from 2021, with China as its primary destination. The price of Iron Ore, therefore, can be a driver of the Australian Dollar. Generally, if the price of Iron Ore rises, AUD also goes up, as aggregate demand for the currency increases. The opposite is the case if the price of Iron Ore falls. Higher Iron Ore prices also tend to result in a greater likelihood of a positive Trade Balance for Australia, which is also positive of the AUD.
How does the Trade Balance impact the Australian Dollar?
The Trade Balance, which is the difference between what a country earns from its exports versus what it pays for its imports, is another factor that can influence the value of the Australian Dollar. If Australia produces highly sought after exports, then its currency will gain in value purely from the surplus demand created from foreign buyers seeking to purchase its exports versus what it spends to purchase imports. Therefore, a positive net Trade Balance strengthens the AUD, with the opposite effect if the Trade Balance is negative.
EUR/USD trades with mild losses near 1.1037 amid light trading.
The Federal Reserve’s favored inflation gauge, the Core PCE, grew 3.2% YoY, below the 3.3% expected.
ECB’s Lagarde clarified that the ECB's policy decisions are data-dependent and not influenced by market pricing or time-bound pressures.
The EUR/USD pair trades near the highest level since August around 1.1040 during the early Asian trading hours on Wednesday. No top-tier economic data will be released this week, and the US Dollar (USD) is likely to remain under pressure due to the lack of any major data that might slow the downward momentum. EUR/USD currently trades around 1.1037, losing 0.04% on the day,
The Federal Reserve’s favored inflation gauge, the Core Personal Consumption Expenditures Price Index (PCE), which excludes energy and food prices, grew 3.2% YoY, below the forecast 3.3%. On a monthly basis, the Core PCE rose 0.1%, below the consensus of 0.2%. The Federal Open Market Committee (FOMC) decided to keep the interest rate steady at its recent December meeting and signaled that three rate cuts could come in 2024.
On the Euro front, the European Central Bank (ECB) left its benchmark interest rates unchanged at its last meeting of the year. ECB President Christine Lagarde clarified that the ECB's policy decisions are data-dependent and not influenced by market pricing or time-bound pressures.
ECB Vice President Luis de Guindos said that it’s premature to start easing monetary policy while adding that the central bank does not foresee a technical recession in the Eurozone. That being said, the more hawkish remarks from the ECB might lift the Euro (EUR) and cap the downside of the EUR/USD pair.
The US Richmond Fed Manufacturing Index for December will be due on Wednesday, and the Initial Jobless Claims will be released on Thursday. In the absence of top-tier US economic data from the Eurozone and the United States, risk sentiment is likely to remain the key driver behind the EUR/USD price action.
| Index | Change, points | Closed | Change, % |
|---|---|---|---|
| NIKKEI 225 | 51.82 | 33305.85 | 0.16 |
| KOSPI | 3.08 | 2602.59 | 0.12 |
| Dow Jones | 159.36 | 37545.33 | 0.43 |
| S&P 500 | 20.12 | 4774.75 | 0.42 |
| NASDAQ Composite | 81.6 | 15074.57 | 0.54 |
Former Dallas Federal Reserve (Fed) President Robert Kaplan said on Tuesday that he expects the central bank to start cutting interest rates soon to avoid the risk of sending the US economy into recession.
Key quotes
“One of the reasons we got into this inflationary problem is the Fed stayed way too accommodative for too long, even as the economy was improving, and I don’t think it wants to make the same mistake on the flip side, where it stays too restrictive."
“As the economy and inflation softened, it doesn’t want to make the opposite mistake either.”
Market reaction
The comments above have little to no impact on the US Dollar. The US Dollar Index (DXY) is trading higher by 0.06% on the day to trade at 101.50, as of writing.
Fed FAQs
What does the Federal Reserve do, how does it impact the US Dollar?
Monetary policy in the US is shaped by the Federal Reserve (Fed). The Fed has two mandates: to achieve price stability and foster full employment. Its primary tool to achieve these goals is by adjusting interest rates.
When prices are rising too quickly and inflation is above the Fed’s 2% target, it raises interest rates, increasing borrowing costs throughout the economy. This results in a stronger US Dollar (USD) as it makes the US a more attractive place for international investors to park their money.
When inflation falls below 2% or the Unemployment Rate is too high, the Fed may lower interest rates to encourage borrowing, which weighs on the Greenback.
How often does the Fed hold monetary policy meetings?
The Federal Reserve (Fed) holds eight policy meetings a year, where the Federal Open Market Committee (FOMC) assesses economic conditions and makes monetary policy decisions.
The FOMC is attended by twelve Fed officials – the seven members of the Board of Governors, the president of the Federal Reserve Bank of New York, and four of the remaining eleven regional Reserve Bank presidents, who serve one-year terms on a rotating basis.
What is Quantitative Easing (QE) and how does it impact USD?
In extreme situations, the Federal Reserve may resort to a policy named Quantitative Easing (QE). QE is the process by which the Fed substantially increases the flow of credit in a stuck financial system.
It is a non-standard policy measure used during crises or when inflation is extremely low. It was the Fed’s weapon of choice during the Great Financial Crisis in 2008. It involves the Fed printing more Dollars and using them to buy high grade bonds from financial institutions. QE usually weakens the US Dollar.
What is Quantitative Tightening (QT) and how does it impact the US Dollar?
Quantitative tightening (QT) is the reverse process of QE, whereby the Federal Reserve stops buying bonds from financial institutions and does not reinvest the principal from the bonds it holds maturing, to purchase new bonds. It is usually positive for the value of the US Dollar.
| Pare | Closed | Change, % |
|---|---|---|
| AUDUSD | 0.68253 | 0.35 |
| EURJPY | 157.19 | 0.39 |
| EURUSD | 1.10414 | 0.34 |
| GBPJPY | 181.161 | 0.35 |
| GBPUSD | 1.27248 | 0.3 |
| NZDUSD | 0.6327 | 0.73 |
| USDCAD | 1.31957 | -0.44 |
| USDCHF | 0.85353 | -0.03 |
| USDJPY | 142.369 | 0.06 |
- The US Core PCE for November advanced 3.2% year-on-year, the smallest rise since April 2021.
- The six rate cuts are fully priced in by the end of 2024, according to the WIRP.
- The Middle East conflicts might boost safe-haven flows.
Gold price (XAU/USD) holds above $2,060 during the early Asian session on Wednesday. The last week of 2023 is likely to be quiet amid the light trading volume. At press time, the gold price is trading at $2,066, losing 0.09% on the day.
The US Dollar was broadly weaker against its rivals. Meanwhile, the US Dollar Index (DXY), a measure of the value of the USD against a weighted basket of currencies used by US trade partners, drops to its lowest level since July near 101.45. The Treasury yields edge lower, with the 10-year yield standing at 3.89%.
Fed easing expectations have intensified. According to the WIRP, the market has priced in 15% odds of a cut on January 31 and fully priced in March 20 with the six cuts fully priced in by end-2024. However, traders will take more cues from the data in the coming weeks. It’s worth noting that lower interest rates benefit the yellow metal as they decrease the opportunity cost of holding non
Last week, November’s Core Personal Consumption Expenditures Price Index (Core PCE) came in at 0.1% MoM, below the market consensus of 0.2%. On an annual basis, the Core PCE showed the smallest rise since April 2021, arriving at 3.2% YoY from 3.4% in October, worse than the market expectation of 3.3%.
Apart from this, Yemen continues to threaten the Red Sea, but there are also concerns about a wider threat to shipping. Iran said it could shut down the Gibraltar Strait, which is something that most people doubt. This, in turn, might lift the price of a safe-haven asset like gold.
Moving on, gold traders will keep an eye on the developments surrounding the geopolitical tension in the Middle East. The US Richmond Fed Manufacturing Index for December and the Initial Jobless Claims will be due on Wednesday and Thursday, respectively.


© 2000-2026. Уcі права захищені.
Cайт знаходитьcя під керуванням TeleTrade DJ. LLC 2351 LLC 2022 (Euro House, Richmond Hill Road, Kingstown, VC0100, St. Vincent and the Grenadines).
Інформація, предcтавлена на cайті, не є підcтавою для прийняття інвеcтиційних рішень і надана виключно для ознайомлення.
Компанія не обcлуговує та не надає cервіc клієнтам, які є резидентами US, Канади, Ірану, Ємену та країн, внеcених до чорного cпиcку FATF.
Проведення торгових операцій на фінанcових ринках з маржинальними фінанcовими інcтрументами відкриває широкі можливоcті і дає змогу інвеcторам, готовим піти на ризик, отримувати виcокий прибуток. Але водночаc воно неcе потенційно виcокий рівень ризику отримання збитків. Тому перед початком торгівлі cлід відповідально підійти до вирішення питання щодо вибору інвеcтиційної cтратегії з урахуванням наявних реcурcів.
Викориcтання інформації: при повному або чаcтковому викориcтанні матеріалів cайту поcилання на TeleTrade як джерело інформації є обов'язковим. Викориcтання матеріалів в інтернеті має cупроводжуватиcь гіперпоcиланням на cайт teletrade.org. Автоматичний імпорт матеріалів та інформації із cайту заборонено.
З уcіх питань звертайтеcь за адреcою pr@teletrade.global.
переклади