- Аналітика
- Новини та інструменти
- Новини ринків
Новини ринків
According to Société Générale, market expectations of rate cuts beginning in the first half of 2024 could be overblown, as core inflation measures within the broader European economy come home to roost with marginally higher inflation that will keep rate cuts from the European Central Bank (ECB) at bay.
Core and headline inflation could only drop to 2.5% by end-2024
The downward inflation momentum should continue in November and could add weight to the narrative that the ECB starts cutting rates in 1H24. However, we believe this narrative could well be turned on its head in early 2024, as governments unwind their energy support measures, and core proves to be sticky, resulting in core and headline only falling to 2.5% by end-2024.
Upside surprises to Brent meant energy has been much stronger in the near term than we had forecasted... the unwinding of the government support measures to alleviate the energy crisis, starting in December 2023 and ending in May 2024, should keep headline inflation around its current rates.
Markets are expecting headline inflation to return to 2% in late summer 2024, but we think they may be proven wrong.
- Gold price surges to a six-month high around $2,015 in the early Tuesday trading session.
- The October New Home Sales fell by 5.6% MoM to 679k, below the market expectation.
- The expectation of lower inflation weighs on the USD and increases investors' appetite for commodities.
- US Housing Price Index, the S&P/Case-Shiller Home Price Indices, and CB Consumer Confidence will be due on Tuesday.
Gold price (XAU/USD) extends the rally above the $2,000 key level during the early Asian trading hours on Tuesday. The yellow metal climbs to a six-month high amid the softer US Dollar (USD) and the lower US Treasury bond yields. Gold price currently trades near $2,015, losing 0.01% on the day.
Meanwhile, the US Dollar Index (DXY) declined to the lowest level since late August around 103.20, which lifts the USD-denominated gold. The Treasury yields edge lower, the 10-year dropping from 4.51% to 4.39%.
That being said, the softer US data dragged the Greenback lower. The US Census Bureau revealed on Monday that the October New Home Sales fell by 5.6% m/m to 679k, below the market consensus of 725K. Additionally, the Dallas Fed Manufacturing Index for November declined to -19.9 from the previous reading of -19.2.
Furthermore, the expectation of lower inflation weighs on the USD and increases investors' appetite for commodities. Last week, the US PMI data suggested that the private sector in the US continued to grow at a slower pace in early November. The markets place a bet that the Federal Reserve (Fed) will cut interest rates in the middle of next year.
China will release the NBS Purchasing Managers Index (PMI) data on Thursday. The Manufacturing and Services PMI figures are expected to improve to 49.6 and 51.1, respectively. If the report shows the weaker-than-expected result, this could exert some selling pressure on the precious metal as China is the world's largest gold producer and consumer
Moving on, gold traders will focus on the US Housing Price Index, the S&P/Case-Shiller Home Price Indices, CB Consumer Confidence, and the Richmond Fed Manufacturing Index on Tuesday. Later this week, the attention will shift to the US Gross Domestic Product (GDP) on Wednesday and the Personal Consumption Expenditure (PCE) inflation figures on Thursday.
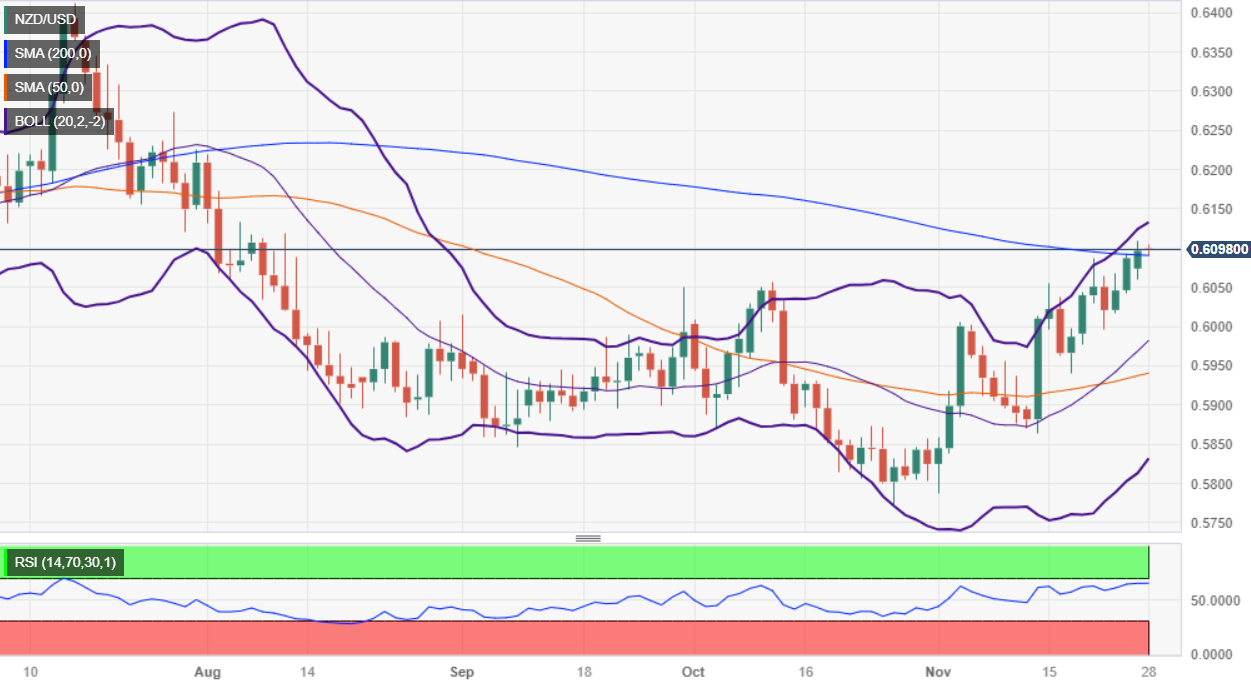
- NZD/USD is bullish but at the brisk of tumbling below the 0.6000 mark.
- Buyers must reclaim 0.6100 to gather momentum and test the 0.6200 mark.
- Sellers target a downward break of the 200-DMA, as they target 0.5900.
NZD/USD extended its gains to three straight trading days, hitting a three-and-a-half-month high of 0.6107 on Monday. At the time of writing, the pair is virtually unchanged, trading at 0.6096 as the Tuesday Asian session begins.
From a daily chart perspective, the NZD/USD is upward biased, but it remains at buyers' expense to keep the exchange rate above the 200-day moving average (DMA), which sits at 0.6089. In that outcome, the 0.6100 figure is the first ceiling level to be conquered, so the pair remains bullish. The next key resistance level would be the 0.6150 psychological level, followed by the 0.6200 figure and the July 31 high at 0.6225.
Otherwise, the NZD/USD’s dropping below the 200-DMA would open the door for sellers to push the price toward the November 27 daily low of 0.6060, before eyeing the November 22 swing low of 0.5996. Once those levels are cleared, the pair would drop to the confluence of the November 17 low and the 50-DMA at around 0.5940.
NZD/USD Price Analysis – Daily Chart
NZD/USD Technical Levels
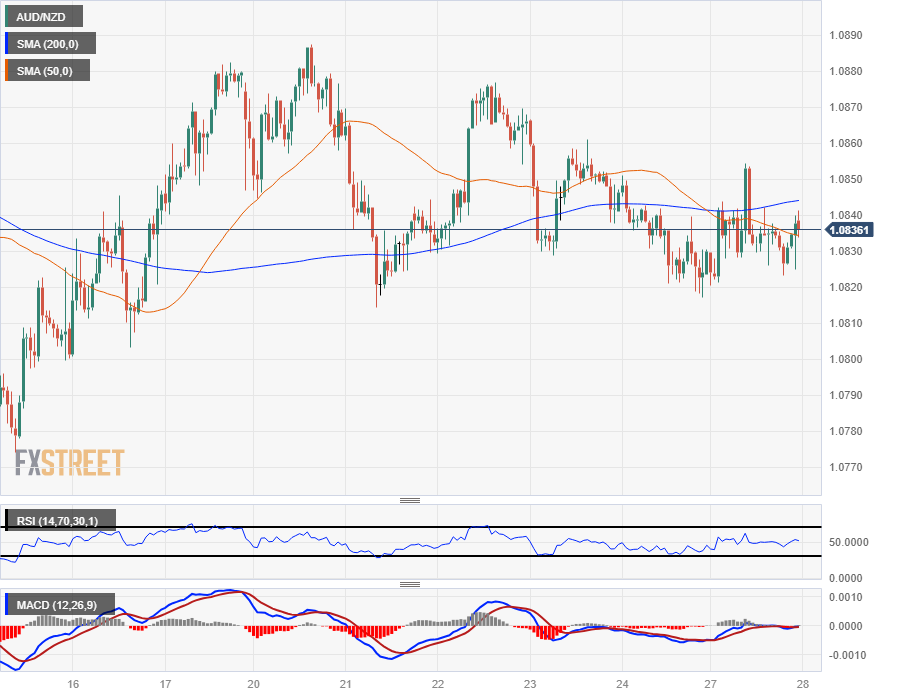
- The AUD/NZD pair continues to grind into heavy congestion, trapped near long-term midranges.
- Intraday action on the AUD/NZD is leaning towards the downside as the pair sees a mild bearish drift.
- The 200-day SMA is proving too strong a magnet for the AUD/NZD to pull away from.
The AUD/NZD is up for the week after climbing a scant one-tenth of a percent on Monday, but bullish momentum remains constrained on the hourly chart by the 200-hour Simple Moving Average (SMA) and a lower-highs pattern on the intraday charts from last week's peak at 1.0887.
The Aussie (AUD) tipped into a fresh low near 1.0820 against the Kiwi (NZD) late last Friday, and Monday's action saw the pair clawing back losses, but topside momentum remains limited. The pair is catching technical support from the 200-day SMA drifting towards 1.0800, with the 50-day SMA drifting lower in tandem with the longer moving average.
Near-term directional momentum has fully evaporated out of the pair as technical indicators drift into their midranges. The Relative Strength Index (RSI) is flatlining near the 50.0 level, and the Moving Average Convergence-Divergence (MACD) is seeing the fast and slow moving averages waffle into the middle histogram.
Australian Dollar price this week
The table below shows the percentage change of Australian Dollar (AUD) against listed major currencies this week. Australian Dollar was the strongest against the US Dollar.
| USD | EUR | GBP | CAD | AUD | JPY | NZD | CHF | |
| USD | -0.14% | -0.24% | -0.12% | -0.39% | -0.67% | -0.32% | -0.23% | |
| EUR | 0.15% | -0.09% | 0.03% | -0.22% | -0.51% | -0.17% | -0.09% | |
| GBP | 0.24% | 0.10% | 0.09% | -0.15% | -0.45% | -0.10% | -0.01% | |
| CAD | 0.12% | -0.02% | -0.12% | -0.25% | -0.56% | -0.20% | -0.11% | |
| AUD | 0.38% | 0.24% | 0.13% | 0.26% | -0.30% | 0.06% | 0.15% | |
| JPY | 0.66% | 0.52% | 0.36% | 0.54% | 0.29% | 0.34% | 0.43% | |
| NZD | 0.32% | 0.18% | 0.08% | 0.22% | -0.05% | -0.35% | 0.10% | |
| CHF | 0.24% | 0.10% | 0.00% | 0.12% | -0.13% | -0.43% | -0.08% |
The heat map shows percentage changes of major currencies against each other. The base currency is picked from the left column, while the quote currency is picked from the top row. For example, if you pick the Euro from the left column and move along the horizontal line to the Japanese Yen, the percentage change displayed in the box will represent EUR (base)/JPY (quote).
AUD/NZD Hourly Chart
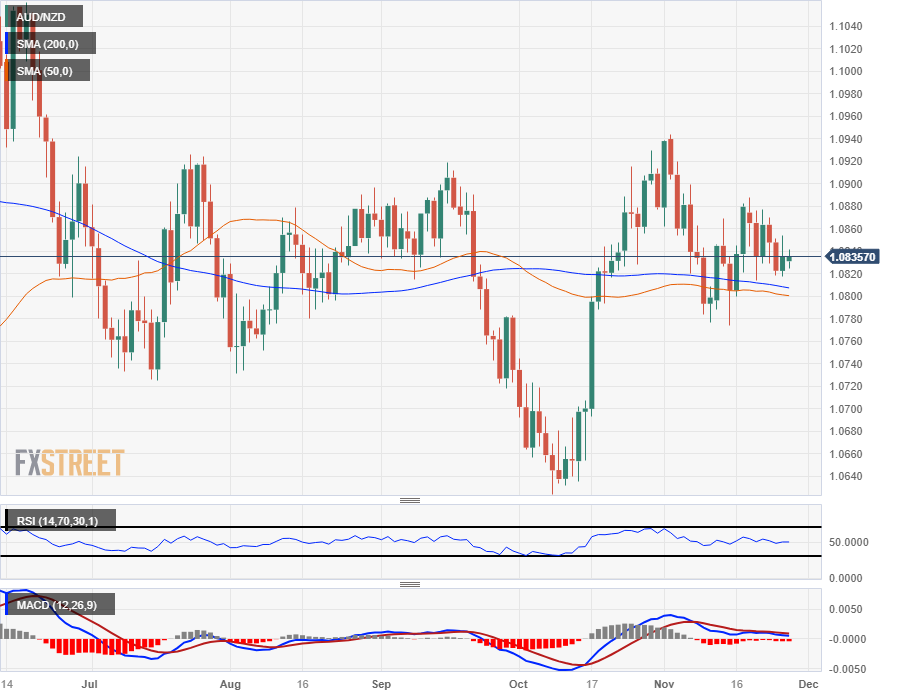
AUD/NZD Daily Chart
AUD/NZD Technical Levels
- AUD/USD surges to 0.6605 on the weaker USD in early Monday trading.
- US New Home Sales fell more than expected in October.
- An additional one to two rate hikes from the Reserve Bank of Australia (RBA) over the coming quarters cannot be ruled out.
- Market players will monitor the Australian Retail Sales for October and RBA Governor Bullock's speech on Tuesday.
The AUD/USD pair extends the rally above the 0.6600 psychological level during the early Asian session on Tuesday. The pair has reached its highest level since early August amid the US Dollar (USD) weakness. At press time, AUD/USD is trading around 0.6605, down 0.02% on the day.
On Monday, the US New Home Sales fell more than expected in October, dropping by 5.6% MoM to 679K, worse than the market expectation of 725K. Meanwhile, the November Dallas Fed Manufacturing Index dropped to -19.9 versus 19.2 prior. The US Dollar (USD) remains under pressure by declining to 103.20 as markets have moved to price-in a peak in the Federal Reserve's (Fed) tightening.
On the other hand, the risk-on mood, news of the Chinese stimulus plan, and the hawkish stance from the Reserve Bank of Australia (RBA) boost the Australian Dollar (AUD). The RBA Minutes last week suggested that an additional one to two rate hikes over coming quarters cannot be ruled out.
Market players await the Australian Retail Sales for October, due later on Tuesday. The figure is expected to drop from 0.9% to 0.1% MoM. Also, RBA Governor Bullock is set to speak at an event. On Wednesday, traders will take more cues from the Consumer Price Index (CPI). If the report does not surprise to the upside, the RBA will most likely hold the rate at its December meeting.
On the US docket, the US Housing Price Index, the S&P/Case-Shiller Home Price Indices, CB Consumer Confidence, and the Richmond Fed Manufacturing Index will be released on Tuesday. These events could give clear direction to the AUD/USD pair.
- WTI prints minimal losses of less than 0.20%, though set to finish below $75.00.
- Disagreements among OPEC+ countries were one of the reasons behind last week's Oil’s 3% plus drop.
- Saudi Arabia and Russia are preparing to extend their 1.3 million Crude Oil production cut into Q1 2024.
The US Crude Oil benchmark, also known as Western Texas Intermediate (WTI), dropped 0.20% on Monday due to a delay of the Organization of Petroleum Exporting Countries and its allies (OPEC+) reunion, as members disagreed on production targets. Hence, WTI is trading at $74.99, late in the New York session.
WTI struggles to reclaim $75.00 amid disagreements between OPEC+ members
Some of the clashes lie in setting African producers' quotas, alongside some OPEC+ members suggesting crude oil production cuts are needed to keep the market in balance and underpin Oil prices.
Analysts at ING said they expect Saudi Arabia to extend its 1 million crude Oil production into the next year, and Russia to follow suit, with their 300,000 barrels per day cut. Goldman Sachs analysts noted, “We still expect an extension for the unilateral Saudi and Russian cuts through at least the first quarter of 2024.”
Meanwhile, the United Arab Emirates is poised to ramp up production, while Iraq will resume its northern crude exports via Turkey.
The International Energy Agency (IEA) announced it expects a slight surplus in Crude Oil production in 2024, even if OPEC+ nations extend their cuts into next year. Another headwind for OPEC+ countries is that US crude production continues to increase, exerting downward pressure on Oil prices while easing tensions in the Middle East cooled energy prices.
WTI Price Analysis: Technical Outlook
WTI is set to consolidate at around the $75.00-$80.00 range, after failing to decisively break the November 22 swing low of $73.85, which could have exacerbated a drop to $70.00 per barrel. That said, WTI’s success in registering a daily close above $75.00 could open the door to test the first resistance at the 20-day moving average (DMA) at $77.62 before buyers could lift prices to the 200-DMA $78.06. Further upside is expected once the latter is breached.
WTI Technical Levels
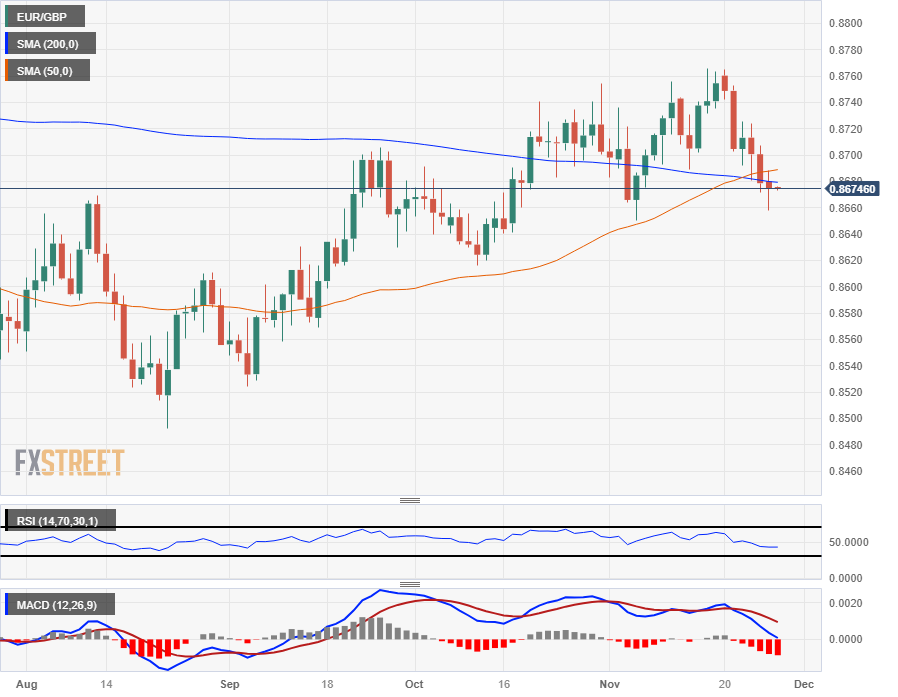
- The EUR/GBP is struggling to hold its head above water as the Euro slips back.
- The ECB is holding steady on their policy stance, but warning that inflation may tick higher.
- An appearance by BoE Governor Bailey, EU HICP inflation on the docket later in the week.
The EUR/GBP saw another downside push on Monday, testing below 0.8660 before seeing a moderate rebound that sees the Euro (EUR) struggling to recover 0.8680 against the Pound Sterling (GBP).
The European Central Bank (ECB) is ramping up their market rhetoric in the run-up into Thursday's Eurozone Harmonized Index of Consumer Prices (HICP) inflation figures. Eurozone inflation is expected to tick slightly lower from 2.9% to 2.7% for the annualized period into November, but ECB President Christine Lagarde warned early Monday that the Eurozone could see slightly higher inflation figures in the coming months.
ECB’s Lagarde: Headline inflation may rise again slightly in the coming months
Wednesday will see another public outing by Bank of England (BoE) Governor Andrew Bailey, who will be delivering prepared remarks at an event celebrating the 50th anniversary of the London Foreign Exchange Joint Standing Committee. A question period is not expected, but the Governor's presence will still see investors keeping an eye out for comments from the BoE head regarding policy as it pertains to the FX markets.
EUR/GBP Technical Outlook
The Euro has been capped off by the 50-hour Simple Moving Average (SMA) against the Pound Sterling since backsliding from a near-term high of 0.8765 last week, and despite multiple bullish attempts at breaking the shortfall, the EUR/GBP is down a full percentage point from last week's peak.
With the EUR/GBP slipping back, the pair is currently challenging the 200-day SMA, while the 50-day SMA is in the process of confirming a bullish crossover of the longer moving average, and 0.8680 could prove to be a technical ceiling if selling pressure continues unabated.
EUR/GBP Daily Chart
EUR/GBP Technical Levels
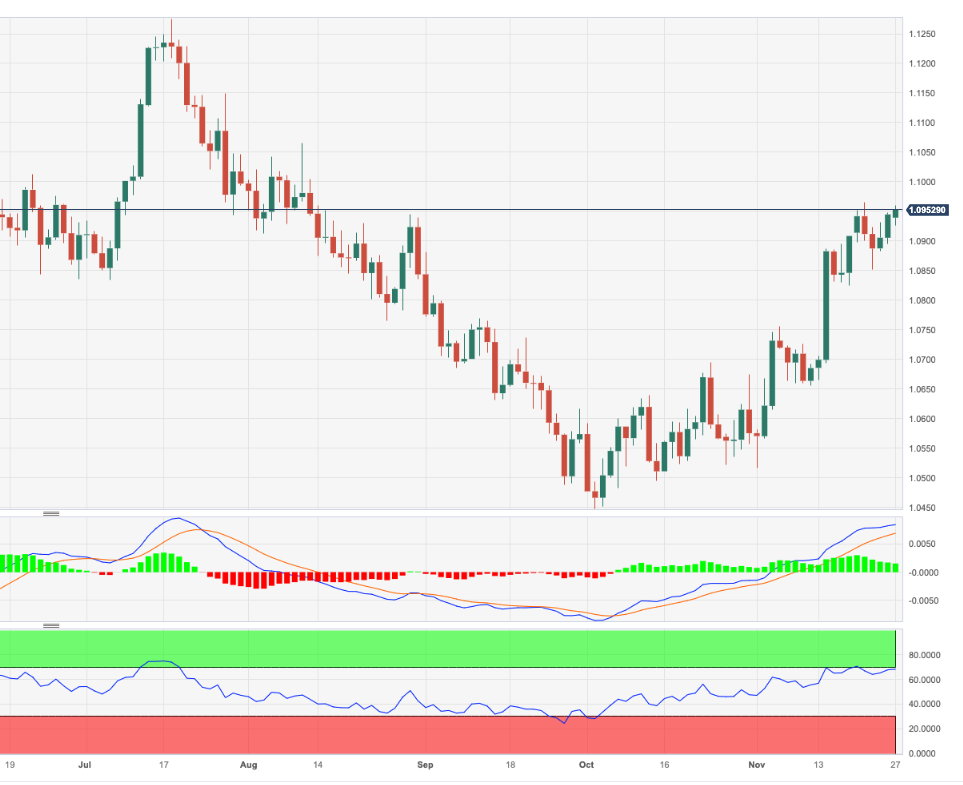
- The EUR/USD trading near the 1.0960 level with moderate gains on the day, steering towards highs since August.
- Before the European Parliament, Christine Lagarde sounded somewhat hawkish.
- No relevant reports other than minor housing data figures were seen during the session.
In Monday's trading session, the EUR/USD pair is staging a climb, confidently edging northwards and flirting with multi-month highs near the 1.0960 area. The catalyst behind this positive momentum is the USD trading vulnerable while the Euro got a boost after Lagarde’s hawkish words. On the data front, the US reported minor housing data, which saw New Home Sales from October from the US coming in lower than expected but didn’t trigger any significant reaction on the pair.
On the Euro front, during her address at the European Parliament, Christine Lagarde, the President of the European Central Bank (ECB), cautioned that headline inflation could experience a slight increase in the near future. Lagarde also noted that economic growth is expected to remain weak. In addition, he didn’t give any clues on how long the bank will maintain rates at a restrictive level or a time frame of when it will cut rates.
For the rest of the week, the highlights of the pair will be on Thursday when Eurostat will release the Harmonized Index of Consumer Prices (HICP) from the Euro area and the US will report the Core Personal Consumption Expenditures Index (PCE) from October, the Federal Reserve (Fed) preferred’s gauge of inflation. In that sense, both inflation figures will likely shape the expectations of the ECB and the Fed, impacting the short-term trajectory of the pair.
EUR/USD levels to watch
The daily chart's technical indicators exhibit bullish signals but flash reversal warnings. The Relative Strength Index (RSI) is nearing overbought levels - signalling a potentially temporary overheat in the buying momentum. However, the Moving Average Convergence Divergence (MACD) demonstrates rising green bars, highlighting an underlying buying enthusiasm.
Despite the short-term outlook in which the bulls may consolidate gains, the pair resides above the 20, 100, and 200-day Simple Moving Averages (SMAs), indicating that buyers continue to dominate price action on a broader scale.
Support Levels: 1.0900, 1.0850, 1.0800.
Resistance Levels: 1.0965, 1.1000, 1.1050.
EUR/USD daily chart
-638367192644512666.png)
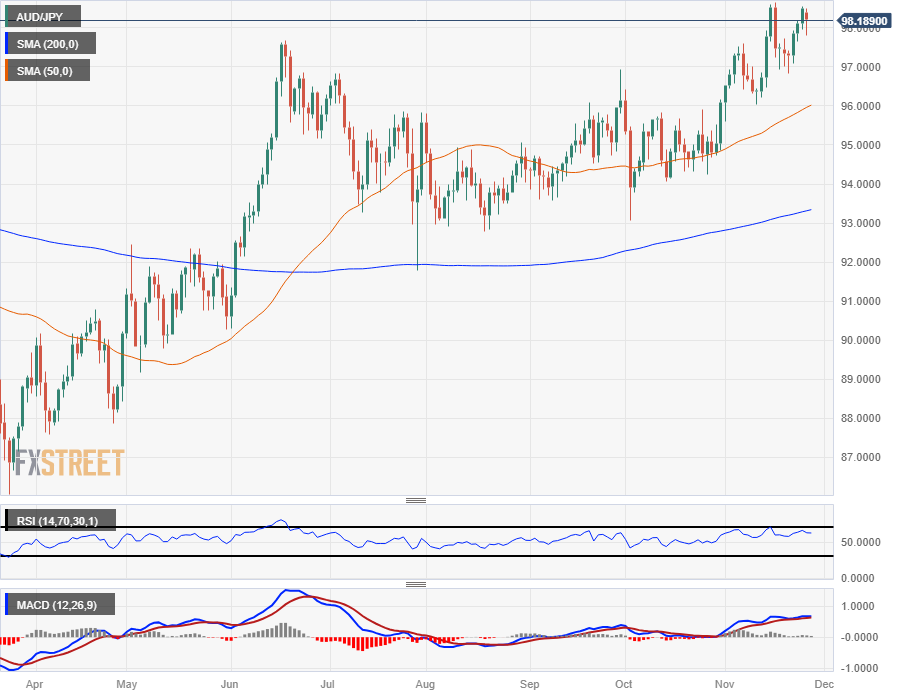
- The AUD/JPY is sticking close to the midrange after getting pulled in both directions.
- The Aussie remains down against the Yen about three-tenths of a percent on Monday.
- Tuesday sees Australian Retail Sales figures, as well as an appearance from RBA Governor Bullock.
The AUD/JPY pair is drifting in the midrange after setting both the high and the low of the day in early Monday trading, dipping into 97.81 at the starting bell before rallying back into a Monday high of 98.49.
The pair is currently adrift just above the 98.00 handle, down 0.3% from Monday's peak as Aussie (AUD) traders gear up for Australian Retail Sales data and a speaking engagement from the Reserve Bank of Australia (RBA) Governor Michele Bullock.
The Japanese Yen (JPY) has seen some recovery across the board on Monday, but long-term bear pressure on the Yen is expected to continue as the Bank of Japan (BoJ) continues to court a hyper-easy monetary policy stance. The BoJ fears that inflation within Japan's domestic economy will waiver below the Japanese central bank's 2% target.
Australian Retail Sales for October are expected to slow down from 0.9% to 0.1% as Australians grapple with sticky inflation eating away at their purchasing power.
RBA Governor Michele Bullock will be taking part in a panel discussion labeled "Inflation, Financial Stability and Employment" at the Hong Kong Monetary Authority and Bank for International Settlements High-Level Conference in Hong Kong early Tuesday.
AUD/JPY Technical Outlook
The Aussie is seeing a firming-up in the overall FX marketspace, up against everything except the rebounding Yen, and the AUD/JPY is getting hung up on the 50-hour Simple Moving Average (SMA).
Intraday action continues to find support from the 200-hour SMA just north of 97.70, and the AUD/JPY pair is also seeing technical resistance at last turnaround near 98.50.
The pair remains firmly buried in bull country, trading close to its highest bids for the year, with 2023's peak sitting nearby at 98.66 and daily candles seeing technical support from the 50-day SMA scrambling to catch up to price action near the 96.00 handle.
AUD/JPY Hourly Chart

AUD/JPY Daily Chart
AUD/JPY Technical Levels
On Tuesday, during the Asian session, Australia will release Real Sales data, and RBA Governor Bullock will participate in an event. Later in the day, the Gfk German survey is due. In the US, housing price data and consumer confidence figures will be released. Several Fed officials are scheduled to speak.
Here is what you need to know on Tuesday, November 28:
On a quiet session, the US Dollar Index lost 0.20% and posted its lowest daily close since late August, near 103.20. The bias remains to the downside, with the Greenback looking vulnerable. Treasury yields declined, with the 2-year falling to 4.89% and the 10-year sliding from 4.50% to 4.38%.
US New Home Sales unexpectedly dropped by 5.6% to 679K, below the market consensus of 725K. Data due on Tuesday from the US includes the Housing Price Index, the S&P/Case-Shiller Home Price Indices, CB Consumer Confidence, and the Richmond Fed Manufacturing Index. Later in the week, the Core Personal Consumption Expenditure Index is due. Fed officials Goolsbee, Waller, Bowman, and Barr will speak on Tuesday. The blackout period begins on Saturday.
EUR/USD posted its highest close in three months. While above 1.0950, further gains seem likely, and a test of 1.1000 appears to be a matter of time. On Tuesday, the German GfK survey is due. The focus in the region is on inflation figures that will start coming out on Tuesday.
GBP/USD rose for the third consecutive day, breaking above 1.2600. The bias is tilted to the upside, with the pair looking for a new equilibrium level.
USD/JPY tumbled after trading quietly for three days, falling towards 148.50, affected by lower yields.
AUD/USD rose above 0.6600, reaching the highest levels since early August, and also surpassed the 200-day Simple Moving Average (SMA). Reserve Bank of Australia Governor Bullock will participate in a panel discussion titled "Inflation, Financial Stability, and Employment." October Retail Sales data is due.
USD/CAD remained below the 55-day SMA and seems positioned towards the 1.3600 zone. Risks are tilted to the downside. Employment data will be released on Friday.
Gold rose sharply and traded above a key resistance area seen at $2,010. Silver also jumped and posted the highest daily close in weeks above $24.50.
Like this article? Help us with some feedback by answering this survey:
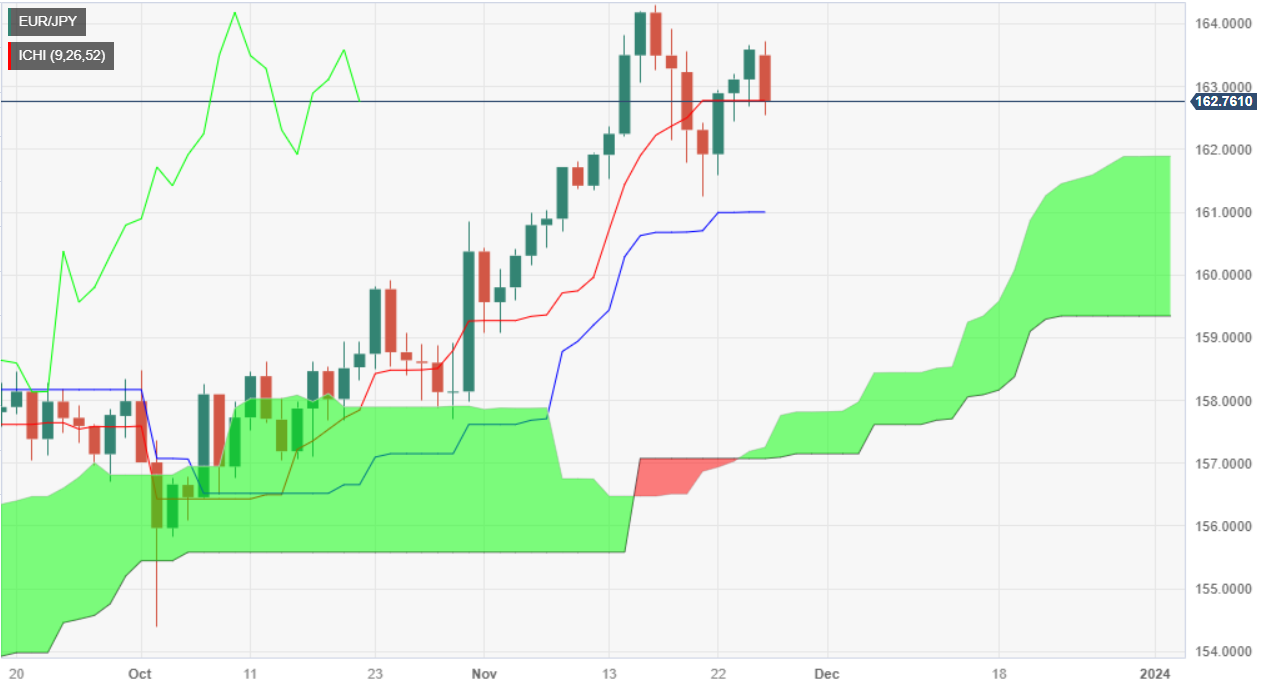
- EUR/JPY buying momentum wanes after bulls struggle to crack the 164.00 figure.
- Key support is seen at the Tenkan-Sen, with sellers eyeing a drop to 162.00 below the latter.
- If buyers reclaim 163.00, the EUR/JPY could remain sideways, ahead of climbing to 164.00.
EUR/JPY rally showed some weakness on Monday, with the pair witnessing a two-week high of 163.72, but buying pressure fades as the cross retreats below the 163.00 figure toward the 162.00 handle. At the time of writing, the EUR/JPY pair exchanges hands at 162.73, down by 0.40%.
The EUR/JPY is testing the Tenkan-Sen support level at 162.77 after reaching a two-week high of 163.72, suggesting the pair began the week with a negative tone. If JPY buyers drag the pair below the Tenkan-Sen, bears will gather momentum, driving the exchange rates toward the 162.00 figure. Further downside risks emerge below that level, with the November 21 swing low at 161.24, followed by the Kijun-Sen at 161.88.
For a bullish resumption, EUR/JPY buyers must reclaim the 163.00 figure, which could put into play a test of 163.72, followed by the 164.00 mark. A breach of the latter would expose the November 16 high at 164.31 before climbing to 165.00.
EUR/JPY Price Analysis – Daily Chart
EUR/JPY Technical Levels
- The USD/NOK encounters a 0.50% downslide and trades around the 10.650 level, below the dual resistance of 200 and 100-day SMAs.
- The US Dollar is facing downward pressure due to growing dovish bets on the Fed.
- Thursday’s October PCE figures from the US will be the week’s highlight.
In Monday's trading session, the USD/NOK plummeted, dipping below both the 200 and 100-day Simple Moving Averages and standing around 10.650. These movements are largely attributable to the growing weakness of the USD, particularly ahead of the expected Personal Consumption Expenditures (PCE) figures for the US from October on Thursday, which will be important for the expectations on the next Federal Reserve's movements. No relevant reports were released during the session.
The upcoming week will primarily focus on two key economic indicators for the USD: Gross Domestic Product (GDP) figures for Q3 and the Core Personal Consumption Expenditures (PCE) Price Index, which serves as the Federal Reserve's preferred measure of inflation. It is important to note that the outcome of the PCE data will greatly influence the short-term expectations of the central bank, potentially impacting the trajectory of the USD/NOK pair.
The Fed has recently hinted that it has yet to see further evidence of inflation coming down after the October Consumer Price Index (CPI) report, which saw the inflation in the US decelerating. In that sense, the PCE and GDP figures on Thursday will give markets further guidance on the US economy's current situation to continue placing their bets. As for now, rate swaps suggest that a no-hike is priced in for the next December meeting, while investors see rate cuts by mid-2024.
That said, it will all come down to the incoming data as the Fed left the door for further tightening in case needed.
USD/NOK levels to watch
Given the technical indicators on the daily chart, the selling momentum is in command for the time being. The Relative Strength Index (RSI) shows a negative slope pointing towards an increasing bearish momentum. Moreover, it's in the negative territory, solidifying the sellers' dominance. The Moving Average Convergence Divergence (MACD) further affirms the bearish inclination, as the red bars are on an upward trajectory, indicating that bearish momentum is gaining traction
Another bearish signal is the pair's position in relation to its Simple Moving Averages (SMAs). The USD/NOK is trading below its 20,100 and 200-day SMAs, suggesting that the bear's control surpasses the immediate time frame.
Support Levels: 10.600,10.530,10.460.
Resistance Levels 10.660-10.680 (200 and 100-day SMA convergence), 10.705,10.730.
USD/NOK daily chart
-638367091034049966.png)
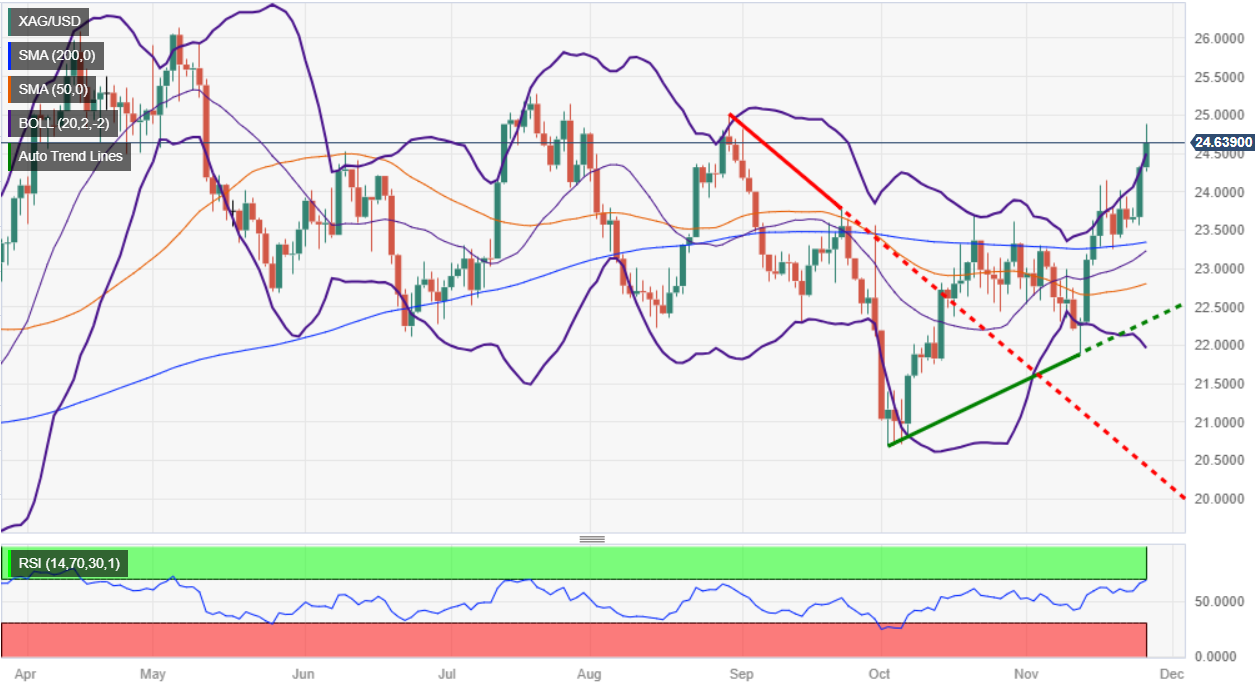
- Silver prices climb to a new three-month high at around the $ 24.80 area.
- US Treasury bond yields pullback, driving the grey-metal price higher.
- XAG/USD is bullish above $24.50, otherwise, expect a pullback below $24.00.
Silver price encounters solid resistance at around $24.90, though it remains trading in the green, posting solid gains of more than 1.30% on Monday due to a retracement of US Treasury bond yields, weakening the buck. That, alongside a scarce economic calendar, keeps investors focused on the release of the Personal Consumption Expenditures (PCE) Price Index later in the week. The XAG/USD is trading at $23.65 after hitting a low of $24.27.
The XAG/USD daily chart portrays the grey metal reached a new three-month high at $24.87, but buyers failure to test the $25.00 figure sponsored the current pullback toward $24.65, above the Bollinger-band’s top standard deviation. Further upside is seen above the August 30 high at $25.00, immediately followed by the next supply zone at $25.26, the July 20 high, followed by the May 10 swing high at $25.91.
On the bearish scenario, if Silver’s price drops below the psychological $24.50 area, a test of the 200-day moving average (DMA) at $23.34 is on the cards. The next key demand areas would be the 20-DMA at $23.22, followed by the 50-DMA at $22.79.
XAG/USD Price Analysis – Daily Chart
XAG/USD Technical Levels
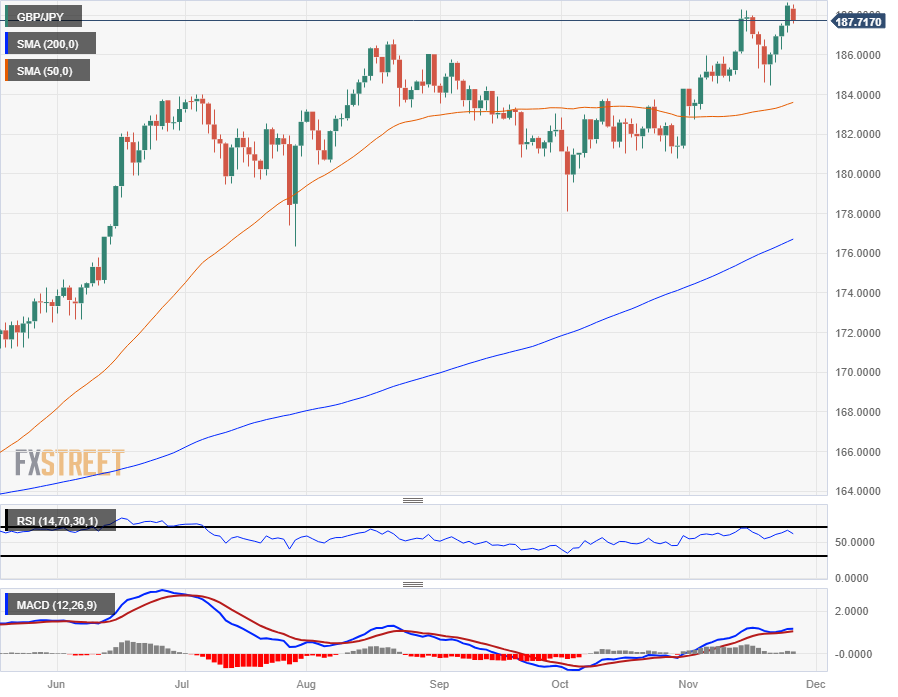
- The GBP/JPY is trading to the south side of 188.00 as the Yen firms up slightly.
- A thin showing for the economic calendar this week for the GBP/JPY.
- BoE Governor Bailey to make a speech on Wednesday, Japan Retail Trade on Thursday.
The GBP/JPY is sagging below the 188.00 handle on Monday as the Pound Sterling (GBP) finds itself falling back against the Japanese Yen (JPY), trimming back gains after the GBP/JPY peaked at 188.66 last week.
The pair hit an eight-year high last week with the GBP trading into its highest prices against the JPY since August of 2015, and the Guppy is seeing some pullback to start the new trading week.
BoE Governor Bailey to make an appearance this week, Japan Retail figures on offer
GBP/JPY traders will be turning their focus to Bank of England (BoE) Governor Andrew Bailey’s appearance on Wednesday, due to speak at an event celebrating the 50th anniversary of the London Foreign Exchange Joint Standing Committee.
Early Thursday will follow up with the release of October’s annualized Japan Retail Trade numbers. Japanese Large Retail Sales last printed at 5% for September, and the median market forecast sees overall Retail Trade for the year into October to come in at 5.9%, a slight uptick from September’s reading of 5.8%.
GBP/JPY Technical Outlook
With the GBP/JPY trading back from multi-year highs set last week at 188.66, the pair is getting snarled on the 50-hour Simple Moving Average (SMA) just below the 188.00 handle, and near-term technical support sits at the 200-hour SMA near 186.80.
Daily candlesticks are still looking firmly well-bid for the GBP/JPY, and Guppy bears will be looking for an extended decline back below the last swing low into the 184.00 handle after the pair closed in the green for four consecutive trading days last week.
GBP/JPY Daily Chart
GBP/JPY Technical Levels
- AUD/USD extends its upward trajectory for the third consecutive day, breaking past the 200-day moving average to trade around 0.6594.
- US Dollar's decline is driven by falling US Treasury yields and speculation about the Fed's policy direction.
- US New Home Sales data for October shows a decline, contributing to a brief pullback in AUD/USD below the 0.6600 level.
The AUD/USD prolongs its gains to three straight days and pierces the 200-day moving average (DMA) of 0.6583, up by 0.21%, after bouncing from daily lows witnessed at around 0.6567. A softer US Dollar (USD) due to falling US bond yields sponsored the Aussie Dollar (AUD) last month's rally of more than 4%. At the time of writing, the pair exchanges hands at 0.6594.
The AUD/USD climbs to a three-month high, as RBA rate hike estimates for next year tops 80%
Market sentiment remains mixed, a headwind for the AUD/USD, which so far has stayed in positive territory due to bears' failure to drag prices toward the 200-DMA. Speculations the US Federal Reserve (Fed) ended its tightening cycle continue to drive US Dollar weakness across the board. Consequently, US Treasury bond yields remained depressed. For example, the 10-year benchmark note plunged 55 basis points to 4.414% after reaching a yearly high of 5.02%.
Therefore, financial conditions had loosened, not good news for the Fed. Some US central bankers suggested the reasons behind the latest two decisions to keep rates unchanged were elevated US bond yields.
On the data front, the US economic calendar revealed that New Home Sales plummeted in October by 5.6% YoY, coming at 0.679 million, below forecasts of 0.725 million, revealed the US Census Bureau. The figures sponsored a minuscule recovery on the buck, as the AUD/USD dropped below the 0.6600 figure after hitting a 3-month high at 0.6614.
On the Australia front, the economic calendar was scarce, though traders are looking for the release of the Consumer Price Index (CPI) on Wednesday. Analysts estimate the CPI dropped to 5.2%. On the central bank space, the Reserve Bank of Australia (RBA) Governor Michele Bullock remained hawkish, though markets see a 15% chance the RBA would raise rates in December, odds for another hike in early 2024, stood at 88%.
AUD/USD Technical Levels
- DXY Index trades neutral at 103.40.
- The US reported mixed housing market data on Monday.
- All eyes are on PCE data from October to be reported on Thursday.
The US Dollar (USD) Index hovers at 103.40 in neutral territory. The Greenback remains vulnerable due to dovish speculation on the Federal Reserve's future movements, and markets brace for Thursday's Personal Consumption Expenditures (PCE) figures, the Federal Reserve's (Fed) preferred inflation gauge. On the data front, October's reports of New Home Sales and Building Permits, released during the session, did not impact the USD’s dynamics.
Amid cooling labour market performance and inflation in the United States economy, the markets are betting on a dovish Federal Reserve, which has weakened the US Dollar. Before the December meeting, where markets will get clear guidance, investors will get October’s PCE figures, an additional jobs report, and the November Consumer Price Index (CPI). These releases will likely set the pace for the next movements of the US Dollar..
Daily Market Movers: US Dollar trades neutral; markets await guidance on October PCE inflation figures
- The US Dollar navigates a neutral range, susceptible to looming PCE inflation figures and dovish bets on the Fed.
- On the data front, October registered a downturn in New Home Sales, coming short of the expected 725K with an actual figure of 679K, as reported by the US Census Bureau.
- A bright spot in October was the Building Permits figure, which exceeded both previous and predicted numbers at 1.498 million.
- The tables have turned for US bond yields, which are witnessing a downturn to start the week with 2-year, 5-year and 10-year yields standing at 4.92%, 4.44% and 4.42%, respectively, now limiting the USD’s advance.
- According to the CME FedWatch Tool, markets are pricing in a no-hike at the December meeting. Rate swaps futures see rate cuts in mid-2024.
Technical Analysis: US Dollar faces headwinds as bearish trend persists
The Relative Strength Index (RSI) indicates that the US Dollar is trading near oversold territory. This suggests that the selling pressure is excessive, hence the prevailing bearish momentum. Additionally, the Moving Average Convergence Divergence (MACD) histogram shows the MACD line is below the signal line, providing evidence of a potential bearish reversal.
Adding to the bearish case, the currency pair remains under the shield of its 20, 100 and 200-day Simple Moving Averages (SMAs), indicating that bulls are having a tough time wresting control from bears. With the pair beneath the SMAs, a continuation of the downtrend could be on the cards.
Support levels: 103.30, 103.15, 103.00.
Resistance levels: 103.60 (200-day SMA), 104.00, 104.20 (100-day SMA)
US Dollar FAQs
What is the US Dollar?
The US Dollar (USD) is the official currency of the United States of America, and the ‘de facto’ currency of a significant number of other countries where it is found in circulation alongside local notes. It is the most heavily traded currency in the world, accounting for over 88% of all global foreign exchange turnover, or an average of $6.6 trillion in transactions per day, according to data from 2022.
Following the second world war, the USD took over from the British Pound as the world’s reserve currency. For most of its history, the US Dollar was backed by Gold, until the Bretton Woods Agreement in 1971 when the Gold Standard went away.
How do the decisions of the Federal Reserve impact the US Dollar?
The most important single factor impacting on the value of the US Dollar is monetary policy, which is shaped by the Federal Reserve (Fed). The Fed has two mandates: to achieve price stability (control inflation) and foster full employment. Its primary tool to achieve these two goals is by adjusting interest rates.
When prices are rising too quickly and inflation is above the Fed’s 2% target, the Fed will raise rates, which helps the USD value. When inflation falls below 2% or the Unemployment Rate is too high, the Fed may lower interest rates, which weighs on the Greenback.
What is Quantitative Easing and how does it influence the US Dollar?
In extreme situations, the Federal Reserve can also print more Dollars and enact quantitative easing (QE). QE is the process by which the Fed substantially increases the flow of credit in a stuck financial system.
It is a non-standard policy measure used when credit has dried up because banks will not lend to each other (out of the fear of counterparty default). It is a last resort when simply lowering interest rates is unlikely to achieve the necessary result. It was the Fed’s weapon of choice to combat the credit crunch that occurred during the Great Financial Crisis in 2008. It involves the Fed printing more Dollars and using them to buy US government bonds predominantly from financial institutions. QE usually leads to a weaker US Dollar.
What is Quantitative Tightening and how does it influence the US Dollar?
Quantitative tightening (QT) is the reverse process whereby the Federal Reserve stops buying bonds from financial institutions and does not reinvest the principal from the bonds it holds maturing in new purchases. It is usually positive for the US Dollar.
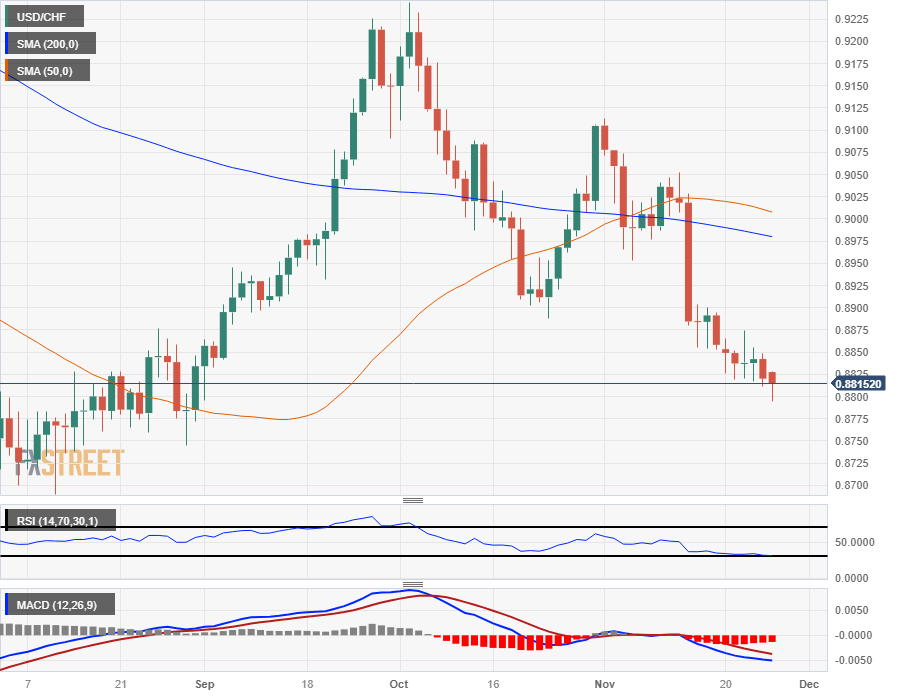
- The USD/CHF briefly tested below 0.8800 on Monday before recovering.
- Despite a steady drift lower, the US Dollar continues to find support against the Swiss Franc.
- Plenty of back-and-forth for the USD/CHF between Swiss and US economic data releases.
The USD/CHF saw a dip back below the 0.8800 price level in Monday's thin trading, and the US Dollar (USD) made a quick recovery against the Swiss Franc (CHF) as investors push towards the middle.
Monday is seeing thin, steady markets as investors gear up for a hectic latter half of the week on the economic calendar, with a decent spread across the board.
Wednesday will kick off this week's meaningful data releases with the Swiss ZEW Survey of Business Expectations at 09:00 GMT. The survey last showed a reading of -37.8 in October as businesses continue to remain pessimistic over the Swiss economy.
According to data compiled by Credit Suisse, Swiss citizens' primary cost concerns center on healthcare, with health insurance, health issues, and premiums taking the top spot in responses, cited by 40% of all polled citizens compared to 24% the year before.
The negative outlook from Swiss citizens is weighing on business expectations, and the Business Expectations Survey's results were the worst showing from the report in almost six months.
On the US side, Gross Domestic Product (GDP) growth figures are due later Wednesday, and markets are broadly expecting an uptick in the annualized quarterly figure from 4.9% to 5.0%.
With markets broadly focused on Fedspeak, Wednesday's Core Personal Consumption Expenditure (PCE) inflation reading for the US will draw some heads as investors try to suss out how far along the path to rate cuts the US truly is.
USD/CHF Technical Analysis
The USD/CHF has been sticking close to median prices at the 50-hour Simple Moving Average (SMA), though overall momentum in the pair has remained down ever since the pair lost grip of the 0.9100 handle back in early October.
Topside momentum remains capped by the 200-hour SMA near 0.8850.
On the daily charts, the USD/CHF is seeing a further extension of the recent bearish momentum, dropping away from the 200-day SMA just south of the 0.900 major handle, and the 50-day SMA is set for a downside acceleration and the 50- and 200-day SMAs are looking at a bearish crossover in short order.
USD/CHF Daily Chart
USD/CHF Levels
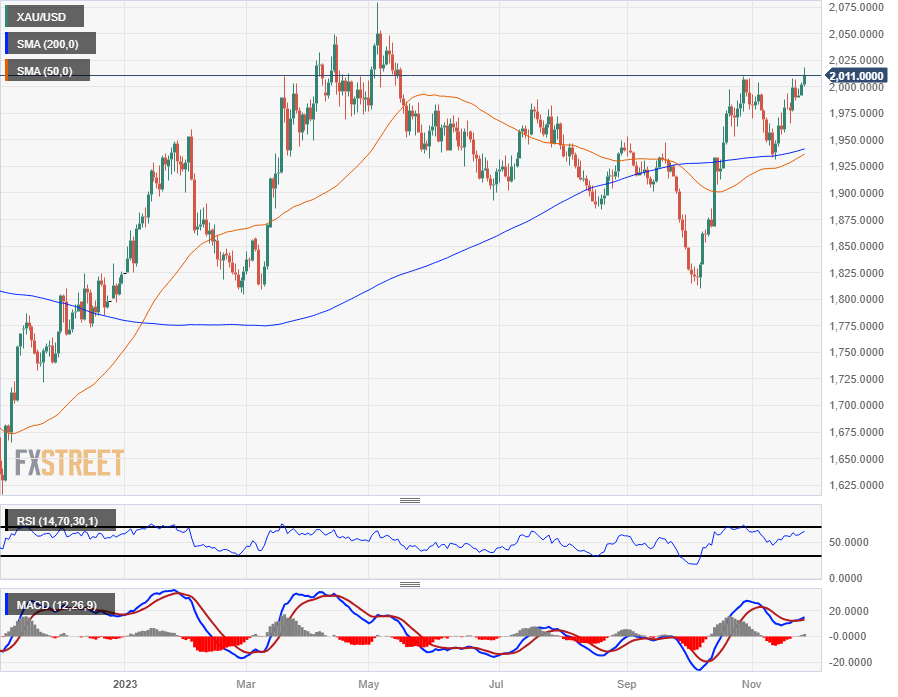
- Spot Gold saw an early rally to kick off Monday’s market action.
- XAU/USD paring back after peaking just shy of $2,020.
- Monday’s early peak set a fresh five-month rally for Gold.
Gold prices are on the topside of the new trading week, setting a new five-month high near $2,020 as XAU/USD continues to firm up bids after a firm bounce off of technical support in mid-November.
Markets are testing deeper into Gold bids as investors increase their bets that the Federal Reserve (Fed) is done with the current rate hike cycle, though overeager bidders continue to face frequent knockbacks.
Despite inflation slowing enough to cool the Fed’s rate hikes, markets continue to price in rate cuts occurring sooner rather than later, and the Fed remains committed to a “higher for longer” policy stance, at least until economic data sours enough to force a shift the Fed’s dot plot.
In the meantime, Gold is seeing some bolstering in the bids as money markets price in a 90% chance that the Fed will stand pat on rates for the next two consecutive policymaker meetings.
With Fed rate hike moves in the rearview mirror, the point of contention for Spot Gold markets becomes a matter of when Fed rate cuts begin. Markets are currently seeing a 25% chance of a rate cut as soon as next March, and Gold investors will be keeping a close eye on talking points from Fed officials this week.
Fed Chairman Jerome Powell will be making a late-week appearance on Friday afternoon to participate in a fireside chat at Atlanta’s Spelman College, where the Fed head will be discussing "Navigating Pathways to Economic Mobility".
XAU/USD Technical Outlook
Spot Gold finds itself trading into multi-month highs, looking to clear more topside space after climbing back over the $2,000 handle once more.
Finding chart territory north of $2,000 has proven a challenge for Gold bidders after the XAU/USD dropped below the key level back in May, trading back into the year's lows near the $1,800 region.
October saw the XAU/USD rally back into positive territory, and Gold is up over 11% from October's low of $1,810.
Spot Gold saw fresh bidding after getting pulled down into the 200-day Simple Moving Average (SMA), and buyers will be looking for a fresh round of bids if the XAU/USD sinks back towards $1,950.
XAU/USD Daily chart
XAU/USD Technical Levels
- GBP/USD stays in green territory, though under pressure as sentiment shifts sour.
- The US Dollar Index erases earlier gains, cushioning the Pound Sterling advance.
- BoE’s Bailey: Inflation is down due to energy prices falling; monetary and fiscal policy would do the rest of the job.
GBP/USD climbed above the 1.2600 figure during the early morning in the North American session after bouncing from daily lows of 1.2590 due to data portraying the UK economy’s resilience despite the Bank of England’s (BoE) tightening. The pair is trading at 1.2607, clinging to 0.10% gains at the time of writing.
BoE Bailey remains hawkish but risk-off mood, capped the GBP/USD rally
US equities are trading in the red amidst the market’s narrative that stocks are in overbought territory. Also, a weaker-than-expected Industrial Profits report from China weighed on market sentiment as deflationary pressures persisted.
The latest report from the US Census Bureau revealed that New Home Sales plunged in October due to high mortgage rates, as the US Federal Reserve (Fed) tightened monetary policy by 525 basis points since March 2022. Purchases dropped -5.6% YoY, missing estimates. The data failed to undermine the GBP/USD, which clings to gains due to a risk-off impulse.
Hence, the US Dollar Index, a measure of the buck’s value against a basket of six currencies paired with some of its earlier losses, is up 0.03%, at 103.44.
Meanwhile, the Bank of England Governor Andrew Bailey said getting inflation back to the 2% target will be “hard work,” acknowledging the recent fall from 6.7% to 4.6% is attributed to the drop in energy prices. Bailey emphasized they have to bring inflation down, even though it harms households; higher prices would worsen conditions.
Meanwhile, according to money market futures, the BoE is expected to cut rates by 25 bps in September of next year. Regarding the Fed, traders had fully priced in almost 85 bps of cuts in the next year.
GBP/USD Price Analysis: Technical outlook
From a technical perspective, the pair is neutral to upwards but has lost some steam. If the GBP/USD turns negative and prints a daily close below 1.2600, that would sponsor a leg-down in the major. The first support is at the November 24 daily low of 1.25223, followed by 1.2500. On the other hand, if the pair stays above 1.2600, further upside is expected. Buyers’ reclaiming 1.2700, could test the August 30 high at 1.2746.
- USD/JPY is trading near 149.00, with 0.30% losses recorded.
- Japan's inflation figures from Friday showed no surprises. Kazuo Ueada hints at uncertainty regarding a potential policy tweak.
- US Dollar braces for key PCE information from October, which will likely impact the pair’s trajectory.
In Monday's trading session, the USD/JPY pair is experiencing a downturn, anchored currently at the 148.90 mark. No relevant events were released during the session, and investors await the Personal Consumption Expenditures (PCE) figures from the United States for October to be released on Thursday. On the other hand, markets digest inflation figures from Japan released on Friday.
According to the National Consumer Price Index (CPI) for October, there was an increase in inflation by 3.3% compared to the same period last year, marking a rise from the 3.0% observed in September. However, regarding the National CPI figures that excludes Food and Energy, there was a slight decrease to 4.0% on a year-on-year basis, down from 4.2% in the previous measure. Meanwhile, the National CPI that excludes Fresh Food showed a marginal increase, moving up to 2.9% from the earlier figure of 2.8%.
Kazuo Ueda, who heads the Bank of Japan (BoJ), expressed a reserved outlook regarding Japan's ability to achieve its inflation target of 2.0%. He also advised caution regarding market expectations for a near-term change in the Bank of Japan's policies. In that sense, if the markets do not get any additional guidance on a potential policy tweak, the upside will be limited for the JPY. For the rest of the week, investors will closely watch Japan's Retail Trade data for further insights into the Japanese economic outlook.
On the USD side, the week’s highlight will be Gross Domestic Product (GDP) figures for Q3 and the Core Personal Consumption Expenditures (PCE) Price Index, the Federal Reserve (Fed) preferred gauge of inflation. Its worth noticing that the outcome of the PCE data will shape the short-term expectations of the bank, likely impacting the trajectory of the pair.
USD/JPY levels to watch
The indicators on the daily chart reflect a somewhat mixed picture. The Relative Strength Index (RSI) currently has a negative slope and resides in negative territory, suggesting selling momentum dominates, aligning the Moving Average Convergence Divergence (MACD), which prints its rising red bars.
That said, despite bears exerting downward pressure and the pair residing below the 20-day Simple Moving Average (SMA), the USD/JPY still stands firm above the crucial 100 and 200-day SMAs. This positioning indicates that the bulls still have the upper hand in the overall trend, suggesting that the buying momentum remains strong from a broader technical perspective.
Support Levels: 148.15, 147.00, 146.80 (100-day SMA).
Resistance Levels: 150.00, 150.20 (20-day SMA), 151.00.
USD/JPY daily chart
-638366993436757479.png)
- The Canadian Dollar is grappling with sideways momentum on Monday.
- Markets look ahead to key data for both the US and Canada in the latter half of the week.
- US PCE inflation & ISM Manufacturing, Canada GDP & employment change are on the horizon.
The Canadian Dollar (CAD) is middling against the US Dollar (USD) in early Monday trading, and markets are set for a calmer start to the week before high-impact figures for both the US and Canada begin to print in the back half of the trading week.
Loonie traders will be keeping an eye on Gross Domestic Product (GDP) growth figures from Canada on Thursday, with November’s Canadian Net Change in Employment slated for Friday.
On the USD side of the economic calendar, broader markets will see the FX space driven by US Core Personal Consumption Expenditures (PCE) price inflation on Thursday, as well as US ISM Manufacturing Purchasing Managers Index (PMI) figures on Friday.
Daily Digest Market Movers: Canadian Dollar treads water as markets take a breather before the mid-week data calendar gets underway
- Monday sees flat action on the Canadian Dollar side as investors await headlines or a change in underlying momentum.
- Loonie traders look ahead to Thursday’s Canadian GDP growth, markets expect a rebound to 0.2% annualized growth after the previous quarter’s -0.2% print.
- Canadian data releases to be overshadowed by US figures this week, the main focus will be US PCE inflation numbers for October, expected to show a slight decline in inflation price growth from 3.7% to 3.5% for the annualized period into October.
- US PCE inflation to print alongside Canadian GDP figures at 13:30 GMT on Thursday.
- Friday sees Canadian wages and labor figures alongside November’s US ISM Manufacturing PMI.
- The trading week will cap off with a late Friday appearance from Federal Reserve (Fed) Chairman Jerome Powell, due to participate in a “fireside chat” labeled "Navigating Pathways to Economic Mobility" at Atlanta’s Spelman College.
Canadian Dollar price today
The table below shows the percentage change of Canadian Dollar (CAD) against listed major currencies today. Canadian Dollar was the strongest against the Euro.
| USD | EUR | GBP | CAD | AUD | JPY | NZD | CHF | |
| USD | 0.04% | -0.07% | 0.07% | -0.21% | -0.43% | -0.15% | -0.11% | |
| EUR | -0.06% | -0.13% | 0.01% | -0.26% | -0.50% | -0.21% | -0.16% | |
| GBP | 0.07% | 0.13% | 0.14% | -0.13% | -0.36% | -0.08% | -0.04% | |
| CAD | -0.06% | -0.02% | -0.13% | -0.27% | -0.49% | -0.21% | -0.18% | |
| AUD | 0.20% | 0.27% | 0.13% | 0.27% | -0.23% | 0.05% | 0.11% | |
| JPY | 0.43% | 0.50% | 0.30% | 0.50% | 0.23% | 0.30% | 0.33% | |
| NZD | 0.17% | 0.21% | 0.08% | 0.23% | -0.05% | -0.28% | 0.05% | |
| CHF | 0.10% | 0.14% | 0.04% | 0.18% | -0.10% | -0.32% | -0.04% |
The heat map shows percentage changes of major currencies against each other. The base currency is picked from the left column, while the quote currency is picked from the top row. For example, if you pick the Euro from the left column and move along the horizontal line to the Japanese Yen, the percentage change displayed in the box will represent EUR (base)/JPY (quote).
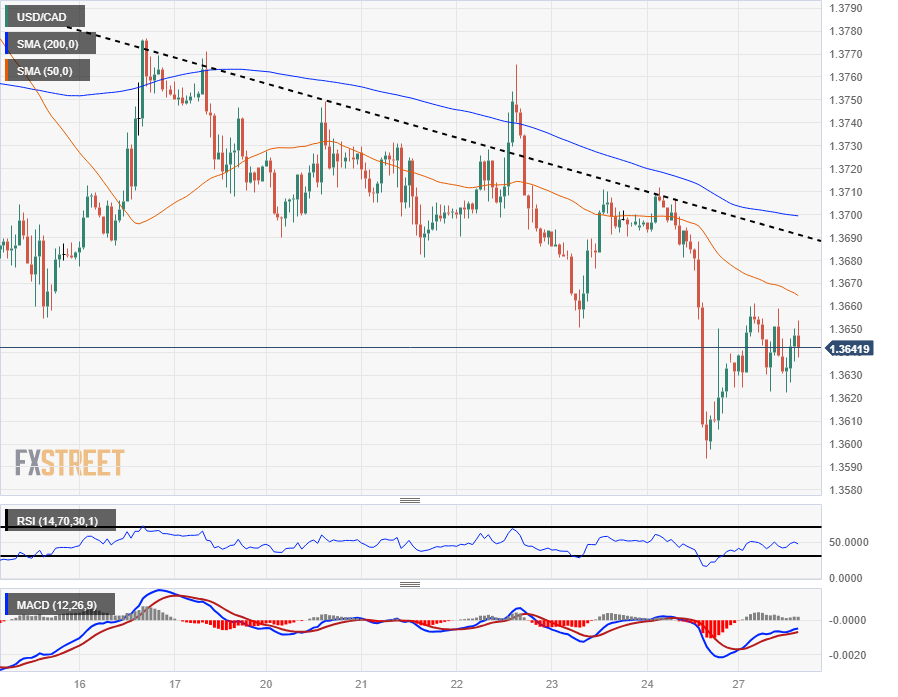
Technical Analysis: Canadian Dollar grinds sideways as markets await a spark in the headlines
The Canadian Dollar (CAD) is caught in a tight range between 1.3660 and 1.3630 against the US Dollar (USD) for Monday’s trading window.
The USD/CAD is currently capped by the 50-hour Simple Moving Average (SMA) descending into 1.3665, with intraday support currently priced in at the day’s lows near 1.3620.
Near-term bullish momentum will see a technical ceiling at the 200-hour SMA drifting into the 1.3700 handle, and rallies could see bidders getting caught in a short squeeze, though a topside break of last Friday’s peak of 1.3712 will see a shift in the lower-highs pattern.
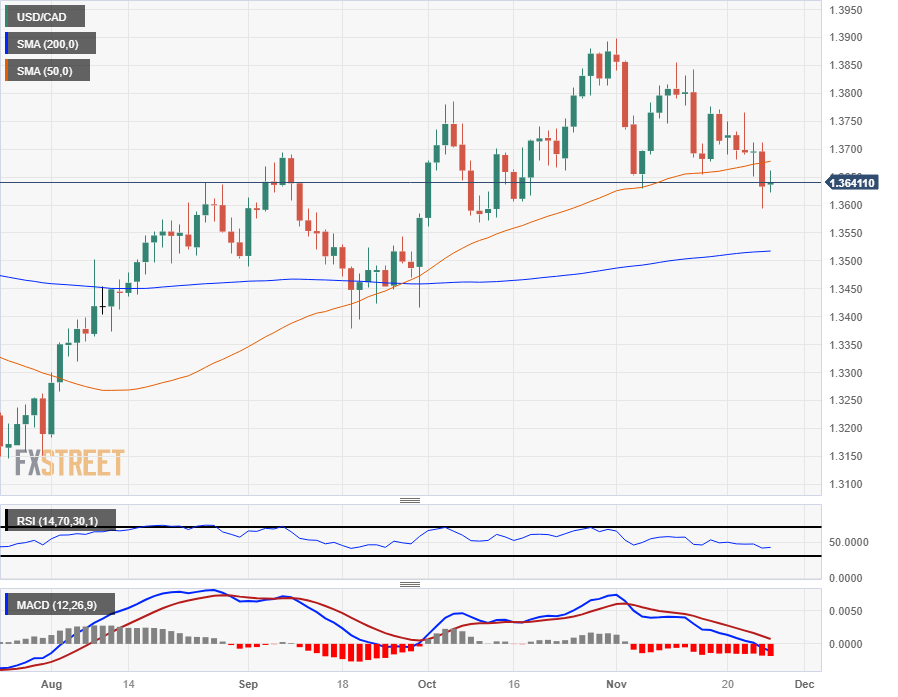
On the daily candlesticks, the USD/CAD remains trapped under the 50-day SMA, and the pair is drifting toward the median at the 200-day SMA, just north of the 1.3500 handle.
USD/CAD Hourly Chart
USD/CAD Daily Chart
Canadian Dollar FAQs
What key factors drive the Canadian Dollar?
The key factors driving the Canadian Dollar (CAD) are the level of interest rates set by the Bank of Canada (BoC), the price of Oil, Canada’s largest export, the health of its economy, inflation and the Trade Balance, which is the difference between the value of Canada’s exports versus its imports. Other factors include market sentiment – whether investors are taking on more risky assets (risk-on) or seeking safe-havens (risk-off) – with risk-on being CAD-positive. As its largest trading partner, the health of the US economy is also a key factor influencing the Canadian Dollar.
How do the decisions of the Bank of Canada impact the Canadian Dollar?
The Bank of Canada (BoC) has a significant influence on the Canadian Dollar by setting the level of interest rates that banks can lend to one another. This influences the level of interest rates for everyone. The main goal of the BoC is to maintain inflation at 1-3% by adjusting interest rates up or down. Relatively higher interest rates tend to be positive for the CAD. The Bank of Canada can also use quantitative easing and tightening to influence credit conditions, with the former CAD-negative and the latter CAD-positive.
How does the price of Oil impact the Canadian Dollar?
The price of Oil is a key factor impacting the value of the Canadian Dollar. Petroleum is Canada’s biggest export, so Oil price tends to have an immediate impact on the CAD value. Generally, if Oil price rises CAD also goes up, as aggregate demand for the currency increases. The opposite is the case if the price of Oil falls. Higher Oil prices also tend to result in a greater likelihood of a positive Trade Balance, which is also supportive of the CAD.
How does inflation data impact the value of the Canadian Dollar?
While inflation had always traditionally been thought of as a negative factor for a currency since it lowers the value of money, the opposite has actually been the case in modern times with the relaxation of cross-border capital controls. Higher inflation tends to lead central banks to put up interest rates which attracts more capital inflows from global investors seeking a lucrative place to keep their money. This increases demand for the local currency, which in Canada’s case is the Canadian Dollar.
How does economic data influence the value of the Canadian Dollar?
Macroeconomic data releases gauge the health of the economy and can have an impact on the Canadian Dollar. Indicators such as GDP, Manufacturing and Services PMIs, employment, and consumer sentiment surveys can all influence the direction of the CAD. A strong economy is good for the Canadian Dollar. Not only does it attract more foreign investment but it may encourage the Bank of Canada to put up interest rates, leading to a stronger currency. If economic data is weak, however, the CAD is likely to fall.
- The New Zealand Dollar pares gains in most pairs after lackluster industrial profits from China pall the outlook.
- The Kiwi stalls ahead of RBNZ meeting this week, although some analysts are hawkish – bullish for NZD.
- NZD/USD finally meets its date with the 200-day SMA and pokes its head above 0.6100.
The New Zealand Dollar (NZD) trades lower in most pairs at the start of the new week after investor sentiment sours during the Asian session and investors see a risk of a slightly hawkish tone coming from the Reserve Bank of New Zealand (RBNZ) at their meeting on Thursday.
The Hang Seng index ends Monday down 0.20% after disappointing economic data from China, whilst Japan’s Nikkei falls over half a percent after the Bank of Japan (BoJ) gets more vociferous about the threat of inflation – thereby raising the risk of higher growth-stunting interest rates, and a weaker Yen.
Given New Zealand’s close trade ties with Asia, a negative outlook for the region raises the specter of reduced demand for New Zealand exports and by association its currency.
Daily digest market movers: New Zealand Dollar pulls back on Asia growth fears
- The New Zealand Dollar falls against most counterparts after data shows lower-than-expected profits in Chinese Industrial firms in October, despite a rise compared to the previous year. The 2.7% year-on-year rise sees profit growth narrow back to single digits, following an 11.9% increase in September and a 17.2% gain in August, according to Reuters.
- The data suggests the Chinese authorities will have to continue providing stimulus to prompt growth, adds the Reuters report.
- It comes after the bad news last Friday regarding Chinese asset manager Zhongzhi – another fatality of the China property bubble. The company announced it was insolvent with liabilities totalling between $58 and $64 billion, according to a report by Reuters.
- Some investors see the risk of a hawkish tilt at the November 29 RBNZ policy meeting on Thursday, which could push the Kiwi higher.
- "..with so much easing now priced in, the risks could be skewed slightly to the upside for the Kiwi on a non-dovish outcome," say economists at ANZ Bank in a note.
New Zealand Dollar technical analysis: NZD/USD meets 200-day Simple Moving Average
NZD/USD – the number of US Dollars that can be bought with one New Zealand Dollar – pushes higher amid continued US Dollar weakness, despite the NZD falling in most other pairs.
The NZD/USD meets the key 200-day Simple Moving Average (SMA) and pokes above the 0.6100 level – an over 3-month high, on Monday.
-638366979177939038.png)
New Zealand Dollar vs US Dollar: Daily Chart
Despite meeting tough resistance at the 200-day SMA and pulling back, the pair is in a short and medium-term bullish trend, which continues to bias longs over shorts.
The MACD momentum indicator is rising in line with price suggesting the medium-term uptrend is healthy.
If Monday ends the day as a spinning top Japanese candlestick pattern, as looks possible, it might suggest a temporary pullback is about to emerge, however. This is reinforced by the proximity of the 200-day SMA serving as an antagonist to further upside. Given the trading session has not ended yet, however, it's still too early to say.
The Kiwi has also formed a possible bullish inverse head and shoulders (H&S) pattern at the lows. The inverse H&S is identified by the labels applied to the chart above. L and R stand for the left and right shoulders, whilst H stands for the head. The target for the inverse H&S is at 0.6215. The pair has already breached the neckline at the October highs, confirming activation of the pattern’s target.
Another way of looking at the lines on the chart is that the pattern is in fact a ‘cup and handle’ pattern, with the ‘head’ of the inverse H&S actually a ‘cup’ and the right shoulder a ‘handle’. Regardless of which pattern is forming, the target would be similar to that of the inverse H&S.
The identification of possible reversal patterns adds more weight to the bullish argument.
The long-term trend is still bearish, however, suggesting a risk of a recapitulation remains.
New Zealand Dollar FAQs
What key factors drive the New Zealand Dollar?
The New Zealand Dollar (NZD), also known as the Kiwi, is a well-known traded currency among investors. Its value is broadly determined by the health of the New Zealand economy and the country’s central bank policy. Still, there are some unique particularities that also can make NZD move. The performance of the Chinese economy tends to move the Kiwi because China is New Zealand’s biggest trading partner. Bad news for the Chinese economy likely means less New Zealand exports to the country, hitting the economy and thus its currency. Another factor moving NZD is dairy prices as the dairy industry is New Zealand’s main export. High dairy prices boost export income, contributing positively to the economy and thus to the NZD.
How do decisions of the RBNZ impact the New Zealand Dollar?
The Reserve Bank of New Zealand (RBNZ) aims to achieve and maintain an inflation rate between 1% and 3% over the medium term, with a focus to keep it near the 2% mid-point. To this end, the bank sets an appropriate level of interest rates. When inflation is too high, the RBNZ will increase interest rates to cool the economy, but the move will also make bond yields higher, increasing investors’ appeal to invest in the country and thus boosting NZD. On the contrary, lower interest rates tend to weaken NZD. The so-called rate differential, or how rates in New Zealand are or are expected to be compared to the ones set by the US Federal Reserve, can also play a key role in moving the NZD/USD pair.
How does economic data influence the value of the New Zealand Dollar?
Macroeconomic data releases in New Zealand are key to assess the state of the economy and can impact the New Zealand Dollar’s (NZD) valuation. A strong economy, based on high economic growth, low unemployment and high confidence is good for NZD. High economic growth attracts foreign investment and may encourage the Reserve Bank of New Zealand to increase interest rates, if this economic strength comes together with elevated inflation. Conversely, if economic data is weak, NZD is likely to depreciate.
How does broader risk sentiment impact the New Zealand Dollar?
The New Zealand Dollar (NZD) tends to strengthen during risk-on periods, or when investors perceive that broader market risks are low and are optimistic about growth. This tends to lead to a more favorable outlook for commodities and so-called ‘commodity currencies’ such as the Kiwi. Conversely, NZD tends to weaken at times of market turbulence or economic uncertainty as investors tend to sell higher-risk assets and flee to the more-stable safe havens.
- Mexican Peso erases gains after USD/MXN approached the 17.00 figure.
- Mexico's Balance of Trade posted a deficit non-seasonally adjusted.
- Banxico’s Heath: Rates could be cut by February or March, but gradually.
Mexican Peso (MXN) is virtually unchanged against the US Dollar (USD) early during Monday’s North American session after USD/MXN hit a two-month low of 17.03. Nevertheless, the Greenback pared some losses, underpinning the USD/MXN, which trades at 17.13, up a decent 0.23% on the day.
Mexico’s economic calendar revealed a current surplus of $2.628 billion in October, equivalent to 0.6% of the Gross Domestic Product (GDP), the Bank of Mexico (Banxico) reported. In the meantime, Banxico’s Deputy Governor, Jonathan Heath, commented that core prices must come down more for inflation to keep easing. Heath added that a slowdown in the Core Consumer Price Index (CPI) could put into play a possible rate cut by February or March next year, he said in a radio interview at Imagen Radio.
Daily digest movers: Mexican Peso could weaken next year if Banxico adopts a dovish stance
- Banxico’s Deputy Governor Jonathan Heath added that one or two rate cuts may come, but “very gradually” and “with great caution.”
- Mexico’s Balance of Trade in non-seasonally adjusted terms posted a deficit of $252 million.
- On November 24, a report revealed the economy in Mexico grew as expected in the third quarter on an annual and quarterly basis, suggesting the Bank of Mexico would likely stick to its hawkish stance, even though it opened the door for some easing.
- Mexico's annual inflation increased from 4.31% to 4.32%, while core continued to ease from 5.33% to 5.31%, according to data on November 23.
- The financial markets' narrative that the US Federal Reserve (Fed) is done hiking rates has kept the Greenback on the backfoot, but today, it has found some relief. The US Dollar Index (DXY) is up 0.04%, exchanging hands at 103.45.
- Data published earlier this month showed prices paid by consumers and producers in the US dipped, increasing investors' speculations that the Fed’s tightening cycle has ended.
- A Citibanamex poll suggests that 25 of 32 economists polled expect Banxico's first rate cut in the first half of 2024.
- The poll shows “a great dispersion” for interest rates next year, between 8.0% and 10.25%, revealed Citibanamex.
- The same survey revealed that economists foresee headline annual inflation at 4% and core at 4.06%, both readings for the next year, while the USD/MXN exchange rate is seen at 19.00, up from 18.95, toward the end of 2024
- The swap market suggests traders expect 84 basis points of rate cuts by the Fed in 2024.
Technical Analysis: Mexican Peso remains firm, but USD/MXN double-bottom could open the door for a leg-up
The USD/MXN downtrend remains in place from a daily chart perspective, but Monday’s price action suggests a ‘double bottom’ chart pattern could be emerging. Further upside above the November 21 latest swing high at 17.26 would confirm the chart pattern, targeting a rally toward 17.50. On its way north, the 100-day Simple Moving Average (SMA) at 17.34 must be cleared, followed by the 20-day SMA at 17.41.
On the flip side, a decisive breach of the 17.05 figure could open the door to test the 17.00 figure, followed by the year-to-date (YTD) low of 16.62.
Mexican Peso FAQs
What key factors drive the Mexican Peso?
The Mexican Peso (MXN) is the most traded currency among its Latin American peers. Its value is broadly determined by the performance of the Mexican economy, the country’s central bank’s policy, the amount of foreign investment in the country and even the levels of remittances sent by Mexicans who live abroad, particularly in the United States. Geopolitical trends can also move MXN: for example, the process of nearshoring – or the decision by some firms to relocate manufacturing capacity and supply chains closer to their home countries – is also seen as a catalyst for the Mexican currency as the country is considered a key manufacturing hub in the American continent. Another catalyst for MXN is Oil prices as Mexico is a key exporter of the commodity.
How do decisions of the Banxico impact the Mexican Peso?
The main objective of Mexico’s central bank, also known as Banxico, is to maintain inflation at low and stable levels (at or close to its target of 3%, the midpoint in a tolerance band of between 2% and 4%). To this end, the bank sets an appropriate level of interest rates. When inflation is too high, Banxico will attempt to tame it by raising interest rates, making it more expensive for households and businesses to borrow money, thus cooling demand and the overall economy. Higher interest rates are generally positive for the Mexican Peso (MXN) as they lead to higher yields, making the country a more attractive place for investors. On the contrary, lower interest rates tend to weaken MXN.
How does economic data influence the value of the Mexican Peso?
Macroeconomic data releases are key to assess the state of the economy and can have an impact on the Mexican Peso (MXN) valuation. A strong Mexican economy, based on high economic growth, low unemployment and high confidence is good for MXN. Not only does it attract more foreign investment but it may encourage the Bank of Mexico (Banxico) to increase interest rates, particularly if this strength comes together with elevated inflation. However, if economic data is weak, MXN is likely to depreciate.
How does broader risk sentiment impact the Mexican Peso?
As an emerging-market currency, the Mexican Peso (MXN) tends to strive during risk-on periods, or when investors perceive that broader market risks are low and thus are eager to engage with investments that carry a higher risk. Conversely, MXN tends to weaken at times of market turbulence or economic uncertainty as investors tend to sell higher-risk assets and flee to the more-stable safe havens.
The GBP strengthened modesty over the past week against both the EUR and USD. Economists at MUFG Bank analyze Sterling’s outlook.
BoE rate cut expectations have been pared back supporting GBP
Fears over more persistent inflation risks in the UK encouraging rate market to price in more gradual dovish BoE policy shift.
The developments should help to provide more support for the GBP in the near-term in so far as short-term yield spreads are moving back in favour of the UK. However, we remain sceptical that the recent upward adjustment for UK rates will be sustained.
The GBP could strengthen further in the near-term against EUR and USD, but the gains are built on shaky foundations.
Economists at the National Australia Bank analyze Australian economic outlook
Inflation is now clearly past its peak for this cycle in Australia
We now see a cash rate peak of 4.6% in February, with the RBA staying on hold until late 2024. That said, our broad outlook remains unchanged with below trend GDP growth (1.4% and 1.7% over 2023 and 2024, respectively) and an ongoing easing in the labour market as slower growth in labour demand is unable to fully absorb still strong population growth.
The moderation in inflation is expected to continue, but be bumpy, with the underlying rate ending 2024 at 4.5% before easing to 3.3% by end-2024.
We continue to see the Aussie ending the year at around 0.66 before tracking higher over 2024 – ending 2024 at around 0.73.
- New Home Sales in the US declined 5.6% in October.
- US Dollar Index continues to hover around 103.40 after the data.
Sales of new single‐family houses in October 2023 were at a seasonally adjusted annual rate of 679,000, according to estimates released jointly on Monday by the US Census Bureau and the Department of Housing and Urban Development. The number represents a decline of 5.6% from the September revised rate of 719,000 ans is below market consensus of 725,000.
The median sales price of new houses sold in October 2023 was $409,300 and the average sales price was $487,000, the publication revealed.
Market reaction
The US Dollar Index (DXY) remained around 103.40, marginally lower for the the day.
EUR/USD has settled above the 1.09 level. Economists at Rabobank analyze the pair’s outlook.
USD’s turnaround will not be smooth
In the weeks ahead, we expect choppy activity as asset prices react to economic data releases in the hope of second-guessing Fed policy and see scope for EUR/USD to dip on a three-month view as the Fed battles to contain market expectations regarding the timing of interest rate cuts.
Moreover, we maintain the view that the EUR is likely to be pressured by weak growth and low competitiveness in the Eurozone which suggests the potential for a prolonged period of relative weakness for the EUR.
While we have revised up our EUR/USD forecasts and now see EUR/USD at 1.09 on a 12-month view rather than 1.05, this is well below most model based estimates for fair value for EUR/USD.
Over the past to trading days, the US Dollar eased quite significantly. Ulrich Leuchtmann, Head of FX and Commodity Research at Commerzbank, sees a good chance that the USD correction will last.
The previous USD strength is now regarded as excessive
The previous USD strength is now regarded as excessive because the US monetary policy appears not as exceptional as the USD bulls had previously expected after all. I therefore assume that the USD weakness seen since Wednesday evening was not just a Thanksgiving special effect, but the continuation of the dominant subject.
We expect a period of economic weakness in the US medium-term. To an extent that will likely deserve the label ‘recession’. I am therefore principally pessimistic about the US data. And even secondary data could support a USD-negative view. Also, from the point of view of the traders who return from their Thanksgiving break. They would then be more inclined to jump onto the bandwagon they missed as a result of all the turkey eating.
Gold has staged a steady bounce. Strategists at Société Générale analyze the yellow metal’s outlook.
Retest of $2,070/$2,075 on cards
A retest of the graphical levels at $2,070/$2,075 representing highs of 2020 and 2022 is expected. Interestingly, this is also the upper limit of the range within which Gold has evolved since last three years. Once this hurdle is overcome, Gold would confirm an extended uptrend. Next objectives are located at projections of $2,180 and $2,240.
Last week’s low of $1,965 is first layer of support near term.
The macro backdrop in the Eurozone remains challenging. Therefore, economists at MUFG Bank do not see further upside for the EUR against the USD.
Upside limited from here
The still weak economic backdrop in the Eurozone and the signs of increased confidence in lowering inflation could see increased ECB easing speculation that lowers yields further in the Eurozone.
Political uncertainty and social unrest risks are also rising which combined may act to limit EUR advances from here.
See: EUR/USD set to correct to the 1.0825/1.0850 area this week – ING
European Central Bank (ECB) President Christine Lagarde said on Monday that the economy is likely to remain weak for the rest of the year, and wage pressures remain strong. Regarding inflation, she warned that it may tick up again in the coming months. She delivered a speech at the Hearing of the Committee on Economic and Monetary Affairs of the European Parliament.
Key takeaways from the speech:
Wage pressures, meanwhile, remain strong.
Looking ahead, we expect the weakening of inflationary pressures to continue, even though headline inflation may rise again slightly in the coming months, mainly owing to some base effects. However, the medium-term outlook for inflation remains surrounded by considerable uncertainty.
Euro area activity has stagnated in recent quarters and is likely to remain weak for the rest of the year.
Manufacturing output has continued to fall and activity in the services sector is weakening further. Despite the slowdown in activity, the labour market remains resilient overall, although there are some signs that job growth may lose momentum towards the end of the year.
This is not the time to start declaring victory. We need to remain attentive to the different forces affecting inflation and firmly focused on our mandate of price stability.
Market reactions
Market participants mostly ignored Lagarde’s comments. EUR/USD is trading flat around 1.0940 and EUR/GBP is holding onto modest losses, hovering around 0.8665.
The USD ended last week on the defensive. Economists at Scotiabank analyze Greenback’s outlook.
Volumes may pick up in the next day or so
The USD retains a weak undertone to start the new week and continued USD softness looks the main risk for markets in the near-term at least as investors adjust to the USD’s reduced growth and yield advantages.
Trading is relatively becalmed today after the US Thanksgiving break; volumes may pick up in the next day or so around the more important data releases ahead and month-end.
After closing out the weekly strongly and outperforming on Friday, the CAD is little changed on the day against the USD. Economists at Scotiabank analyze USD/CAD outlook.
Support is 1.3570/1.3590
The USD has recovered to the 1.3650 area where it does appear to be meeting firm resistance intraday.
The drift lower in the USD since early November has the look of a ‘slow motion’ rollover to me – in that the technical tone has clearly shifted (bearishly for the USD) but the CAD is finding it hard to make meaningful progress at the moment.
Loss of trend support off the July lows for the USD tilts risks more clearly to the downside for funds in the near-term at least. It also should mean strong resistance on USD gains to the 1.3665/1.3670 area.
Support is 1.3570/1.3590, then 1.3495/1.3500.
EUR/USD remains firm. Economists at Scotiabank analyze the pair’s outlook.
Solid bull trend develops
The EUR uptrend persists and is backed by bullishly aligned trend oscillator signals on the intraday, daily and weekly charts. This implies a solid technical uptrend is playing out and that the EUR will remain well supported on – likely – shallow dips for now.
Spot is within reach of last week’s 1.0965 high, which equated to a test of the 61.8% retracement resistance from the EUR’s H2 decline. Gains through here target a push on towards 1.11 (76.4% Fibonacci resistance at 1.1080).
Support is 1.0925 and 1.0875.
- EUR/USD extends the bullish move to the 1.0960 zone.
- Extra advances could revisit the 1.1000 threshold.
EUR/USD climbs for the third session in a row and revisits the 1.0960 zone, or monthly highs, on Monday.
The continuation of the upward bias could see the psychological threshold of 1.1000 revisited ahead of the August top of 1.1064 (August 10).
So far, while above the significant 200-day SMA, today at 1.0810, the pair’s outlook should remain constructive.
EUR/USD daily chart
GBP/USD continues to push on, reaching the low 1.26s. Economists at Scotiabank analyze the pair’s outlook.
Cable targets low 1.27s
New highs for the move up and solidlooking DMI oscillators across the short, medium and long-term studies give the GBP a positive technical undertone.
Cable closed out last week above the 50% retracement resistance (1.2589) which targets additional gains towards 1.2720 (61.6% Fib) now.
Minor dips to the figure area (or just below) should be well-supported.
See – EUR/GBP: A close under 0.8660 could unlock 0.8630 or even 0.8600 – ING
- The Greenback trades steady at the start of this week.
- US traders are back to their normal schedule after Thanksgiving.
- The US Dollar Index is showcasing a descent which could see it eking out more losses this week.
The US Dollar (USD) is on the back foot, and the statistics are not pointing to a recovery anytime soon. From the standpoint of a weekly performance, the Greenback opens a third straight week of losses, losing its grip on several substantial supportive pivotal levels in the US Dollar Index (DXY). US traders will be back in full in the market after the US holidays and are facing a quite heavy macroeconomic schedule for this week, together with a delayed OPEC+ meeting in Dubai on Thursday, while COP28 will kick off as well on the same day in the same venue.
This week starts very light with some data on New Home Sales this Monday. The focal point will be at the last three days of the week, with US Gross Domestic Product (GDP) on Wednesday. Thursday will be market moving with Jobless Claims and the Personal Consumption Expenditures Price Index (PCE) for October. Right at the end of this week, the Institute of Supply Management (ISM) is due to release its Manufacturing Purchase Managers Index (PMI) for November, with cherry on top a speech from US Federal Reserve Chairman Jerome Powell to close out the week.
Daily digest: Resuming to normal programming
- Iran is coming out with a ‘hopeful’ communication where it supports a long-term truce between Israel and Hamas.
- China’s industrial companies profit falls 7.8% year-over-year measured year-to-date. This means China industrial companies will more than likely not be able to lock in gains for 2023.
- A late start on this Monday for the US session with New Home Sales for October at 15:00 GMT. Expectations are for a slowdown from 0.759 million to 0.725 million.
- Near 15:30 GMT the Dallas Fed Manufacturing Business Index for November is due. Previous was at -19.2.
- The US Treasury will have a busy day, with no less than four auctions:
- Near 16:30 GMT a 3-month Bill is due to be auctioned, together with a 6-month bill.
- At 18:00 GMT a 2-year and a 5-year Note is to be allocated in the markets.
- Interesting – though a lagging indicator – this evening near 20:30 the Commodity Futures Trading Commission (CFTC), will publish their weekly positioning data for the futures markets. The positioning in the US Dollar will be one to watch if investors who are net long USD, having unwound further their positions in favour of other currencies.
- Equities are starting this week in the red after earlier China data disappointed markets, dampening hopes for a speedy recovery of the Chinese economy. All indices are in the red, though less than 1%.
- The CME Group’s FedWatch Tool shows that markets are pricing in a 96.8% chance that the Federal Reserve will keep interest rates unchanged at its meeting in December.
- The benchmark 10-year US Treasury Note traders at 4.48% and is steady after briefly hitting 4.51%.
US Dollar Index technical analysis: A new page
The US Dollar is drifting away from its lifelines on both a daily and weekly chart of the US Dollar Index (DXY). With this, more downside starts to open up, and makes traders possibly see further unwinding of their net long positions in the Greenback. Should any datapoint this week bear a negative connotation, it could mean substantially more downside to come for the US Dollar and the DXY.
The DXY is hanging below the 200-day Simple Moving Average (SMA), which is near 103.62. The DXY could still make it back up there, should US traders come back in the market and start buying the current dip. A two-tiered pattern of a daily close and next an opening higher would quickly see the DXY back above 104.25, with the 200-day and 100-day SMA turned over to support levels.
To the downside the 200-day SMA is losing its element as support and is unable to provide any. Rather look for lows of last week at 103.18 and 102.98 as levels for a brief bounce. Should any of the US numbers this week be a substantial disappointment, look for even a 2.5% devaluation in the Greenback to 100.82 with little to support along the way.
US Dollar FAQs
What is the US Dollar?
The US Dollar (USD) is the official currency of the United States of America, and the ‘de facto’ currency of a significant number of other countries where it is found in circulation alongside local notes. It is the most heavily traded currency in the world, accounting for over 88% of all global foreign exchange turnover, or an average of $6.6 trillion in transactions per day, according to data from 2022.
Following the second world war, the USD took over from the British Pound as the world’s reserve currency. For most of its history, the US Dollar was backed by Gold, until the Bretton Woods Agreement in 1971 when the Gold Standard went away.
How do the decisions of the Federal Reserve impact the US Dollar?
The most important single factor impacting on the value of the US Dollar is monetary policy, which is shaped by the Federal Reserve (Fed). The Fed has two mandates: to achieve price stability (control inflation) and foster full employment. Its primary tool to achieve these two goals is by adjusting interest rates.
When prices are rising too quickly and inflation is above the Fed’s 2% target, the Fed will raise rates, which helps the USD value. When inflation falls below 2% or the Unemployment Rate is too high, the Fed may lower interest rates, which weighs on the Greenback.
What is Quantitative Easing and how does it influence the US Dollar?
In extreme situations, the Federal Reserve can also print more Dollars and enact quantitative easing (QE). QE is the process by which the Fed substantially increases the flow of credit in a stuck financial system.
It is a non-standard policy measure used when credit has dried up because banks will not lend to each other (out of the fear of counterparty default). It is a last resort when simply lowering interest rates is unlikely to achieve the necessary result. It was the Fed’s weapon of choice to combat the credit crunch that occurred during the Great Financial Crisis in 2008. It involves the Fed printing more Dollars and using them to buy US government bonds predominantly from financial institutions. QE usually leads to a weaker US Dollar.
What is Quantitative Tightening and how does it influence the US Dollar?
Quantitative tightening (QT) is the reverse process whereby the Federal Reserve stops buying bonds from financial institutions and does not reinvest the principal from the bonds it holds maturing in new purchases. It is usually positive for the US Dollar.
NZD/USD ended the week on a high note. Economists at ANZ Bank analyze Kiwi’s outlook ahead of this week’s RBNZ meeting.
Anything too hawkish could be seen by markets as a bluff
This week the focus shifts to the RBNZ and a likely communications challenge. A pause is universally expected, so it’ll be their tone and projections that will drive markets on the day.
The Committee knows lowering the OCR track or anything suggesting cuts could be sooner than indicated will be met with a big easing in financial conditions, but equally, anything too hawkish could be seen by markets as a bluff.
We think they’ll leave the track much as is and stay in data-watch mode, but with so much easing now priced in, the risks could be skewed slightly to the upside for the Kiwi on a non-dovish outcome.
- DXY puts the 103.00 region to the test once again on Monday.
- The loss of this area could expose further retracements.
DXY retreats for the third consecutive session and approaches the area of three-month lows near 103.00 at the beginning of the week.
In case sellers push harder, the breakdown of the November low of 103.17 should leave the door open to extra losses in the near term. That said, the loss of the weekly low of 102.93 (August 30) could put a potential visit to the psychological 100.00 mark back on the radar.
In the meantime, while below the key 200-day SMA at 103.61, the outlook for the index is expected to remain bearish.
DXY daily chart
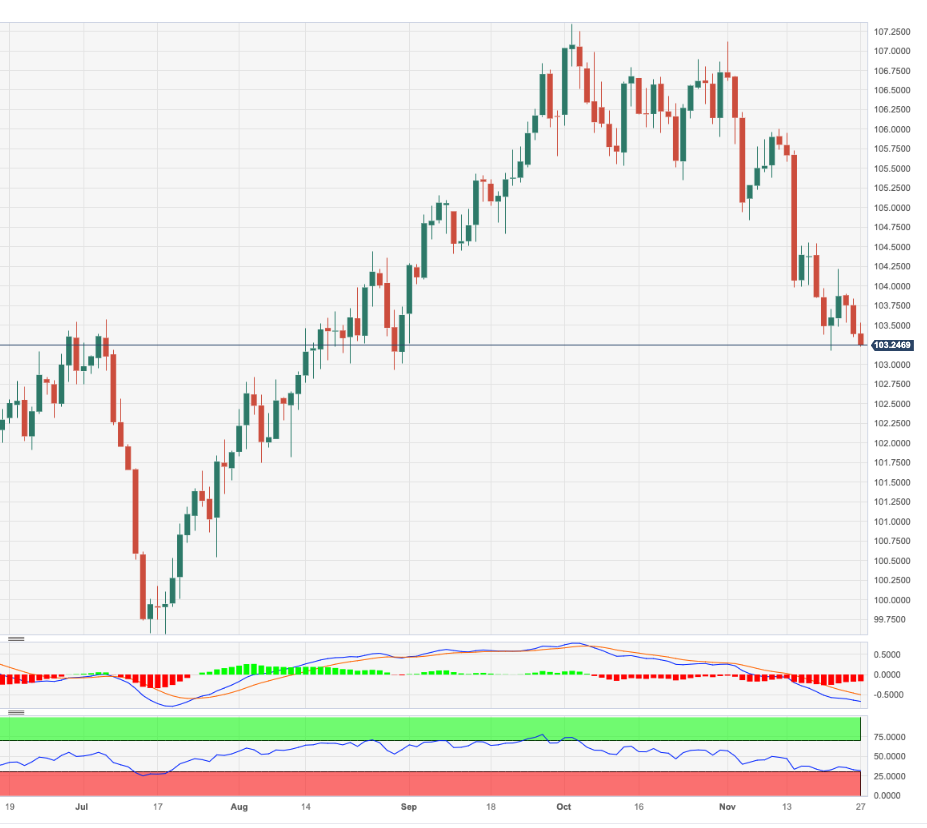
- EUR/JPY gives away part of the recent three-day advance.
- Further up comes the 2023 peaks around 164.30.
EUR/JPY surrenders part of the recent bullish move and retests the key support around 163.00.
In case bulls regain the upper hand, the cross could attempt another visit to the YTD tops around 164.30 (November 16) in the short-term horizon.
Against that, the surpass of the yearly high is expected to face the next significant resistance level not before the 2008 top of 169.96 (July 23).
So far, the longer term positive outlook for the cross appears favoured while above the 200-day SMA, today at 153.28.
EUR/JPY daily chart
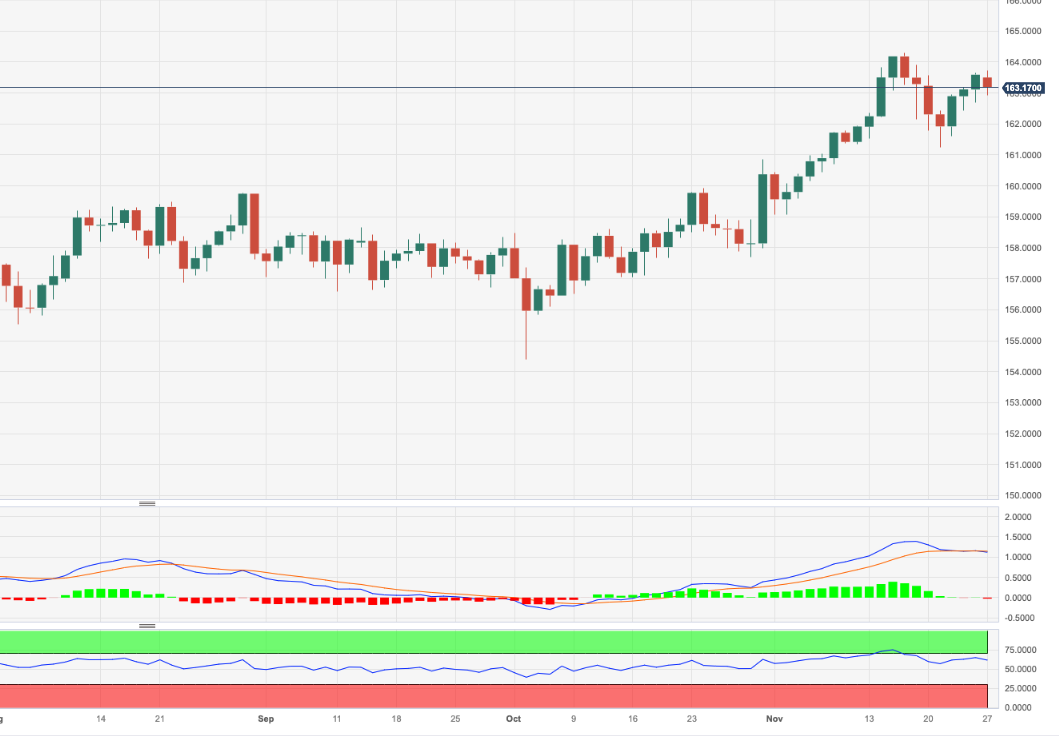
- WTI Oil sinks to $74 and hits pivotal level.
- The US Dollar is trading flat to lower as traders brace for an eventful calendar this week.
- Oil could sink below $70 if OPEC+ can not unify and come out with a set of supportive measures.
Oil prices are looking very bleak as it trades for a fourth straight day at a loss. Markets are selling Crude futures based on the current split within OPEC+ about what to do next, and the base case scenario that no severe measures will be taken to support Oil prices. With the recent disappointing data out of China revealing that a recovery is not going to happen in 2023, demand is not there either, disqualifying another factor that could provide ample demand.
The US Dollar (USD) is flat and sideways this Monday as US traders return to their trading stations. Their brief hiatus because of Thanksgiving and Black Friday caused some weakness in the Greenback. They will now, no doubt be bracing for a chunky macroeconomic calendar with pivotal points at the end of the week, and comments from US Federal Reserve Chairman Jerome Powell on Friday evening, rounding out the week.
Crude Oil (WTI) trades at $74.25 per barrel and Brent Oil trades at $79.17 per barrel at the time of writing.
Oil news and market movers: All about OPEC+
- The postponement of the OPEC+ meeting to a virtual one on Thursday is proof of severe division within the organisation. This is not good news for Oil prices which need a united front to keep at present levels.
- Together with the Thursday meeting of OPEC+, in Dubai the COP28 meeting will kick off.
- Several market participants have issued their forecast for OPEC+ decisions. The consensus is that even if OPEC+ extends current production cuts, it is unlikely to result in a rally. The group needs to issue a big and bold strategy in order to regain credibility.
- Overnight the China Industrial profit numbers revealed a year-to-date loss of 7.8% against last year. This points to a continued delay in the recovery of China’s industrial complex, undermining a pickup in demand for Oil from the Asian powerhouse.
Oil Technical Analysis: Headlines to pick up later this week
Oil prices are set to drop further as no countermeasures are in place to contradict any of the bearish elements that are being factored in. Ahead of Thursday, single comments from OPEC participants will not be enough to create a floor and halt the decline. At this pace, Oil prices could head to $67.00 by Thursday if more bearish elements are added.
On the upside, $80.00 is the resistance to watch out for. Should crude be able to jump above that again, look for $84.00 (purple line) as the next level to see some selling pressure or profit taking. Should Oil prices be able to consolidate above there, the topside for this fall near $93.00 could come back into play.
On the downside, traders are seeing a soft floor forming near $74.00. This level is acting as the last line of defence before entering $70.00 and lower. Watch out for $67.00 with that triple bottom from June as next support level to trade at.
-638366802713148085.png)
US WTI Crude Oil: Daily Chart
WTI Oil FAQs
What is WTI Oil?
WTI Oil is a type of Crude Oil sold on international markets. The WTI stands for West Texas Intermediate, one of three major types including Brent and Dubai Crude. WTI is also referred to as “light” and “sweet” because of its relatively low gravity and sulfur content respectively. It is considered a high quality Oil that is easily refined. It is sourced in the United States and distributed via the Cushing hub, which is considered “The Pipeline Crossroads of the World”. It is a benchmark for the Oil market and WTI price is frequently quoted in the media.
What factors drive the price of WTI Oil?
Like all assets, supply and demand are the key drivers of WTI Oil price. As such, global growth can be a driver of increased demand and vice versa for weak global growth. Political instability, wars, and sanctions can disrupt supply and impact prices. The decisions of OPEC, a group of major Oil-producing countries, is another key driver of price. The value of the US Dollar influences the price of WTI Crude Oil, since Oil is predominantly traded in US Dollars, thus a weaker US Dollar can make Oil more affordable and vice versa.
How does inventory data impact the price of WTI Oil
The weekly Oil inventory reports published by the American Petroleum Institute (API) and the Energy Information Agency (EIA) impact the price of WTI Oil. Changes in inventories reflect fluctuating supply and demand. If the data shows a drop in inventories it can indicate increased demand, pushing up Oil price. Higher inventories can reflect increased supply, pushing down prices. API’s report is published every Tuesday and EIA’s the day after. Their results are usually similar, falling within 1% of each other 75% of the time. The EIA data is considered more reliable, since it is a government agency.
How does OPEC influence the price of WTI Oil?
OPEC (Organization of the Petroleum Exporting Countries) is a group of 13 Oil-producing nations who collectively decide production quotas for member countries at twice-yearly meetings. Their decisions often impact WTI Oil prices. When OPEC decides to lower quotas, it can tighten supply, pushing up Oil prices. When OPEC increases production, it has the opposite effect. OPEC+ refers to an expanded group that includes ten extra non-OPEC members, the most notable of which is Russia.
Economists at Rabobank analyze Oil’s outlook ahead oft the decision by OPEC+ on production quotas on Thursday.
Crude prices could find renewed support if an agreement between OPEC+ members is reached
If an agreement between OPEC+ members is reached, crude prices could find renewed support. Until then the market should brace for more volatility as uncertainty over the discussion around continuing versus deepening production cuts.
We continue to forecast weakness for Brent down to $72 and retrace back to the yearly lows during Q4 2023 and Q1 2024 while fundamentals will strengthen the market in the latter half of 2024.
Ulrich Leuchtmann, Head of FX and Commodity Research at Commerzbank, analyzes how recent comments from ECB officials could impact the Euro.
How damaging is it for the Euro if ECB hawks sound dovish?
If even ÖNB Governor Robert Holzmann considers rate cuts to be just as likely as further rate hikes there is a lot to suggest that the dovish majority of the ECB board is more likely to tend towards rate cuts than rate hikes.
It is marginally relevant for the Euro whether ECB interest rates rise or fall. However, for the overall picture something else matters: whether in case of a renewed rise of inflation, the ECB would be prepared to implement further monetary policy tightening.
If one assumes sufficient willingness on the part of the ECB to do that one nonetheless does not have to expect rate hikes. Perhaps because one assumes that inflation pressure will ease further. If one considers the ECB to be sufficiently reactive and determined that suggests that inflation risks can be assumed to be low. And that in turn supports the single European currency.
Long-term I am sceptical whether such an optimistic view of the ECB really is justified. However, at present there is little evidence against it. For that reason, I consider comments like those of Holzmann to be not excessively EUR-negative in the current environment.
USD/JPY remains just below 150. Economists at Société Générale analyze the pair’s outlook.
USD/JPY must re-establish beyond 152 to confirm next leg of uptrend
USD/JPY must re-establish beyond 152 to confirm next leg of uptrend. Failure to cross this resistance is expected to result in continuation in down move.
Daily MACD has now dipped within negative territory denoting regain of downward momentum.
Holding below 152, there is risk of a deeper pullback towards the lower limit of the multi-month channel near 146.30/146 and 145.10.
Sterling has been performing a little better of late. Economists at ING analyze GBP outlook.
EUR/GBP could correct a little further
The UK data calendar is light this week, but we do have several BoE speakers. Governor Andrew Bailey already seems to be playing around with language on forward guidance, where restrictive monetary policy will be retained for an 'extended period' or, most recently, 'for quite some time'.
We feel that EUR/GBP could correct a little further and a close under 0.8660 could unlock 0.8630 or even 0.8600 this week.
The Dollar is hovering near recent lows. Economists at ING analyze USD outlook.
Don’t chase the Dollar bear trend
While acknowledging that November and December are seasonally soft months for the dollar, our view is that this Dollar sell-off has come a little early.
We are bearish on the Dollar through 2024 but expect the core driver to be a bullish steepening of the US Treasury curve – which has not happened yet. Indeed, US two-year Treasury yields remain firm near 5%. We thus urge caution in chasing this Dollar decline much further.
Until we get some clear dovish communication from the Fed or US data is materially weak enough, we think this Dollar drop might have come far enough for the time being and suspect that the 103.00/103.50 support area could well hold the DXY this week.
- GBP/USD extends gains on growing speculation that the Fed has concluded the rate-hike cycle.
- Pound Sterling could gain further on hawkish remarks from BoE Governor Andrew Bailey.
- UK chief policymaker emphasized that it is too early to discuss interest rate cuts.
GBP/USD moves sideways around 1.2610 during the European session on Monday. The weakening of the US Dollar (USD), driven by growing speculation that the Federal Reserve has completed its interest rate hikes, has worked in favor of the Pound Sterling (GBP).
Additionally, the Cable pair could receive an extra boost due to hawkish remarks from Bank of England (BoE) Governor Andrew Bailey. In a Monday interview, Bailey expressed the view that "bringing inflation down to 2% will be hard work" and emphasized that it's premature to discuss rate cuts. He also expressed concern about the slowdown in the supply side of the economy.
BoE Chief Economist Huw Pill recently conveyed the central bank's commitment to maintaining a strong stance against inflation. Pill emphasized that the BoE cannot afford to loosen its tight monetary policy.
The US Dollar Index (DXY) faces challenges despite improved US Treasury yields. While there's speculation about the potential for easing, Federal Reserve (Fed) officials have stressed the importance of further tightening. Their resolute stance signals a dedication to carefully assessing incoming data before making any policy decisions.
Market participants appear to be treading cautiously ahead of a series of crucial economic readings from the United States (US). The upcoming data, including the Gross Domestic Product (GDP) Annualized for the third quarter and the Core Personal Consumption Expenditures (PCE) Price Index, a key inflation indicator, are anticipated to provide a comprehensive view of the country's economic performance.
FX option expiries for Nov 27 NY cut at 10:00 Eastern Time, via DTCC, can be found below.
- EUR/USD: EUR amounts
- 1.0845 961m
- 1.0850 1.6b
- 1.0950 975m
- 1.1000 787m
- GBP/USD: GBP amounts
- 1.2600 420m
- USD/JPY: USD amounts
- 148.00 389m
- 148.15 396m
- 150.00 1.6b
- USD/CHF: USD amounts
- 0.8860 420m
- AUD/USD: AUD amounts
- 0.6480 530m
- EUR/GBP: EUR amounts
- 0.8700 528m
- The Euro retreats from earlier highs against the US Dollar.
- European stocks open with a mixed tone on Monday.
- ECB President Christine Lagarde to speak later in the session.
The Euro gives away initial gains against the US Dollar, motivating EUR/USD to surrender part of the earlier advance to the 1.0960 zone at the beginning of the week.
On the flip side, the Greenback bounces off the area of three-month lows near 103.20 when gauged by the USD Index (DXY) in a context still dominated by the appetite for risky assets on Monday.
Meanwhile, the index continues under pressure against the backdrop of growing speculation about an anticipated Federal Reserve (Fed) interest rate reduction in the spring of 2024. This viewpoint is nevertheless strongly supported by sustained disinflationary pressures and continuous labour market softening.
On the domestic calendar, the European Central Bank’s (ECB) President Christine Lagarde will speak before the European Parliament later in the afternoon in Europe.
In the US, New Home Sales for the month of November are due seconded by the Dallas Fed Manufacturing Index in November.
Daily digest market movers: Euro meets some resistance near 1.0960
- The EUR trims earlier gains against the USD.
- US and German yields trade with a marginal upside bias.
- Investors continue to expect rate cuts by the Fed in H1 2024.
- The market consensus sees a potential rates reduction by the ECB in Q1 2024.
- BoE’s Andrew Bailey said dragging inflation to the target will be hard work.
- BoJ’s Kazuo Ueda has argued that the economy is recovering at a modest pace.
Technical Analysis: Euro and the hunt for 1.1000
EUR/USD’s bullish intentions bumped against the 1.0960 region so far on Monday.
The November high of 1.0965 (November 21) is now the immediate goal for bulls ahead of the critical 1.1000 level. Further north, EUR/USD might face resistance around the August top of 1.1064 (August 10) and another weekly peak of 1.1149 (July 27), all preceding the 2023 high of 1.1275 (July 18).
In the meanwhile, any corrective dips should find support initially at the key 200-day SMA at 1.0810, seconded by the temporary 55-day SMA at 1.0662. Before the 2023 low of 1.0448 (October 3), the weekly low of 1.0495 (October 13) emerges below that region.
Overall, the pair's chances should remain strong as long as it stays above the 200-day SMA.
Euro FAQs
What is the Euro?
The Euro is the currency for the 20 European Union countries that belong to the Eurozone. It is the second most heavily traded currency in the world behind the US Dollar. In 2022, it accounted for 31% of all foreign exchange transactions, with an average daily turnover of over $2.2 trillion a day.
EUR/USD is the most heavily traded currency pair in the world, accounting for an estimated 30% off all transactions, followed by EUR/JPY (4%), EUR/GBP (3%) and EUR/AUD (2%).
What is the ECB and how does it impact the Euro?
The European Central Bank (ECB) in Frankfurt, Germany, is the reserve bank for the Eurozone. The ECB sets interest rates and manages monetary policy.
The ECB’s primary mandate is to maintain price stability, which means either controlling inflation or stimulating growth. Its primary tool is the raising or lowering of interest rates. Relatively high interest rates – or the expectation of higher rates – will usually benefit the Euro and vice versa.
The ECB Governing Council makes monetary policy decisions at meetings held eight times a year. Decisions are made by heads of the Eurozone national banks and six permanent members, including the President of the ECB, Christine Lagarde.
How does inflation data impact the value of the Euro?
Eurozone inflation data, measured by the Harmonized Index of Consumer Prices (HICP), is an important econometric for the Euro. If inflation rises more than expected, especially if above the ECB’s 2% target, it obliges the ECB to raise interest rates to bring it back under control.
Relatively high interest rates compared to its counterparts will usually benefit the Euro, as it makes the region more attractive as a place for global investors to park their money.
How does economic data influence the value of the Euro?
Data releases gauge the health of the economy and can impact on the Euro. Indicators such as GDP, Manufacturing and Services PMIs, employment, and consumer sentiment surveys can all influence the direction of the single currency.
A strong economy is good for the Euro. Not only does it attract more foreign investment but it may encourage the ECB to put up interest rates, which will directly strengthen the Euro. Otherwise, if economic data is weak, the Euro is likely to fall.
Economic data for the four largest economies in the euro area (Germany, France, Italy and Spain) are especially significant, as they account for 75% of the Eurozone’s economy.
How does the Trade Balance impact the Euro?
Another significant data release for the Euro is the Trade Balance. This indicator measures the difference between what a country earns from its exports and what it spends on imports over a given period.
If a country produces highly sought after exports then its currency will gain in value purely from the extra demand created from foreign buyers seeking to purchase these goods. Therefore, a positive net Trade Balance strengthens a currency and vice versa for a negative balance.
EUR/SEK remains slightly above 11.40. Economists at Société Générale analyze the pair’s outlook.
NOK/SEK could be poised to build gains
EUR/SEK could target a return to 11.55.
The SEK faces a potential headwind from the 2.5bn EUR positive, SEK negative month-end equity index rebalancing flow. The Riksbank stepped up Euro sales last week to €201m for reserve hedging purposes.
NOK/SEK could be poised to build gains if Oil prices rally following OPEC+.
See: EUR/SEK should be able to hit 11.00 before year-end 2024 – ING
- Gold price extends gains as investors take caution ahead of the skew of US data.
- China's industrial profits declined by 7.8% could dampen the positive sentiment arising from the PBoC stimulus measures.
- Fed officials mentioned closely monitoring incoming data before making policy decisions.
Gold price maintains its position above $2,010 per troy ounce during the European session on Monday. The US Dollar's (USD) weakness, fueled by increasing speculation that the Federal Reserve (Fed) has concluded its interest rate hikes, has proven advantageous for the yellow metal. Gold price has benefited from this trend, alongside indications of a global economic slowdown.
The price of Gold might experience additional strength, driven by positive sentiment stemming from the news that the People's Bank of China (PBoC) has issued a notice to boost financial support for private firms.
However, the Year-to-Date (YTD) data on China's industrial profits, showing a decline of 7.8% compared to the previous drop of 9.0%, may have a dampening effect on the initially positive sentiment arising from the People's Bank of China's (PBoC) additional stimulus measures.
US Dollar Index (DXY) extends losses despite improved US Treasury yields. Even though there's speculation about the possibility of easing, Federal Reserve (Fed) officials emphasized the need for further tightening. Their stance indicated a commitment to closely monitoring incoming data before making decisions.
Market participants seem adopting caution before a string of key economic readings from the United States (US), including the Gross Domestic Product (GDP) Annualized for the third quarter, and the Core Personal Consumption Expenditures (PCE) Price Index, a key inflation indicator. These data may offer a comprehensive view of the country's economic performance and price trends excluding volatile food and energy components.
EUR/USD remains well bid. Economists at ING analyze the pair’s outlook.
EUR/USD should struggle to better resistance at 1.0965/1.1000
EUR/USD should struggle to better resistance at 1.0965/1.1000 this week.
This week's data highlight will be flash CPI for November set to be released on Thursday. Here, further disinflation is expected in both headline and core readings, bringing YoY rates back to 2.7% and 3.9%, respectively. These readings might tend to support the 70 bps of the European Central Bank (ECB) easing priced into Eurozone money markets next year.
We favour EUR/USD correcting to the 1.0825/1.0850 area this week.
EUR/USD rose above the 1.09 mark and maintains a bid tone to start the week. Economists at Société Générale analyze the pair’s outlook.
Month-end equity rebalancing flow – Dollar negative
Month-end duration extension and equity index rebalancing flows will inevitably be part of the equation in bonds and FX this week and could present further headwinds for the Dollar.
In other words, this week is another opportunity for EUR/USD to have a go at surpassing 1.0960 and progressing towards 1.10.
December seasonals bullish Euro.
- USD/JPY experiences downward pressure as the Fed is expected to ease monetary policy.
- US Dollar extends losses due to the mixed S&P Global PMI data.
- Governor of the BoJ Ueda sounds pessimistic about hitting the 2.0% inflation target.
USD/JPY lowers by almost 0.30%, trading near 148.90 during the early European session on Monday. The USD/JPY pair's decline is attributed to market speculation suggesting that the US Federal Reserve (Fed) could potentially adopt a more accommodative monetary policy in the coming year.
The negative sentiment surrounding the US Dollar (USD) is further fueled by the mixed S&P Global PMI data, as the Fed underscores that its decisions will be contingent on incoming data.
The latest data on the US S&P Global Composite PMI for November remained unchanged at 50.7. The Services PMI rose to 50.8 in November from 50.6 in October. However, the Manufacturing PMI declined to 49.4 from 50.0, against the 49.8 as expected.
The Japanese Yen (JPY) saw a strengthening against the US Dollar on Friday, spurred by the release of Japanese inflation data. The National Consumer Price Index (CPI) for October showed a year-on-year increase of 3.3%, up from 3.0% in September. However, the National CPI excluding Food and Energy eased to 4.0% year-on-year, compared to the previous reading of 4.2%. The National CPI excluding Fresh Food ticked up to 2.9% from 2.8% in the prior reading.
Governor of the Bank of Japan, Kazuo Ueda, downplays the likelihood of Japan consistently reaching the 2.0% inflation target. While acknowledging the moderate recovery of the Japanese economy and narrowing the output gap to near zero, Ueda notes uncertainties about the sustainability of this cycle's strengthening. He is cautious about building up market expectations regarding a potential imminent policy shift by the BoJ.
This week seems to hold significant events for investors, with attention on Japan's Retail Trade, which could provide insights into the country's consumer spending trends. Meanwhile, in the US, the focus will be on the Gross Domestic Product (GDP) Annualized for the third quarter, offering a comprehensive view of the country's economic performance. Additionally, the Core Personal Consumption Expenditures (PCE) Price Index, a key inflation indicator, will be closely monitored to gauge the price trends excluding volatile food and energy components.
China held the Communist Party's Politburo meeting on November 27, with the key takeaways noted below.
Need to further strengthen the centralized, unified leadership of the party central committee on foreign affairs work.
Need to speed up the forming of a systematic, complete system of foreign-related laws and regulations.
Need to continually improve institutionalization of foreign affairs work.
Related reads
- PBOC issues notice to strengthen financial support for private companies
- Australian Dollar hovers near three-month highs on market sentiment
- The index remains on the defensive near 103.20.
- The risk-on mood prevails among investors so far on Monday.
- New Home Sales, Dallas Fed Manufacturing Index next on tap.
The USD Index (DXY), which tracks the greenback vs. a basket of its main rival currencies, faces extra selling pressure and drops to the area of three-month lows near 103.00.
USD Index risks a deeper drop near term
The index loses further momentum and retreats for the third consecutive session at the beginning of the week, approaching the 103.00 neighbourhood, or three-month lows.
The continuation of the downtrend in the dollar comes amidst the intense appetite for the risk complex, while US yields add to Friday’s recovery early in the European trading session.
For the time being, there are no monetary policy changes, and investors remain confident that the Federal Reserve will begin cutting interest rates in spring 2024.
In the US docket, New Home Sales will take centre stage along with the Dallas Fed Manufacturing Index.
What to look for around USD
In line with the broad-based upbeat mood among traders, the index navigates in a downward path with the immediate milestone at the 103.00 mark for the time being.
Looking at the broader picture, the dollar appears depressed against the backdrop of rising speculation of probable interest rate cuts in H1 2024, all in response to further disinflationary pressures and the gradual cooling of the labour market.
Some support for the greenback, however, still emerges the resilience of the US economy as well as a persistent hawkish narrative from some Fed rate setters.
Key events in the US this week: New Home Sales (Monday) – FHFA’s House Price Index, CB Consumer Confidence (Tuesday) – MBA Mortgage Applications, Q3 GDP Growth Rate, Goods Trade Balance, Fed Beige Book (Wednesday) – PCE, Core PCE, Initial Jobless Claims, Personal Income, Personal Spending, Pending Home Sales (Thursday) – Final S&P Global Manufacturing PMI, ISM Manufacturing PMI, Construction Spending, Fed’s Powell (Friday).
Eminent issues on the back boiler: Growing perception of a soft landing for the US economy. Speculation of rate cuts at some point in the spring of 2024. Omnipresent geopolitical effervescence vs. Russia and China. Potential spread of the Middle East crisis to other regions.
USD Index relevant levels
Now, the index is down 0.14% at 103.27 and faces immediate contention at 103.17 (monthly low November 21) ahead of 102.93 (weekly low August 30) and then the psychological 100.00 threshold. On the upside, the breakout of 104.21 (weekly high November 22) could expose a move to 106.00 (weekly high November 10) and finally 106.88 (weekly high October 26).
Bank of Japan (BoJ) Governor Kazuo Ueda continued to dismiss expectations of Japan sustainably achieving the 2% price target.
Additional quotes
Japan economy is recovering moderately.
The output gap has narrowed to near zero.
Some positive signs seen in wages and inflation.
But there is still high uncertainty on whether this cycle can strengthen further.
Market reaction
At the time of writing, USD/JPY is losing 0.35% on the day to trade at 148.93. The above comments are helping USD/JPY cut some losses.
In an interview with Chroniclelive on Monday, Bank of England (BoE) Governor Andrew Bailey said that “bringing inflation down to 2% will be hard work.”
“A lot of inflation's recent decline is due to the unwinding of energy cost surge,” Bailey added.
Additional comments
It's too early to have discussion about cutting rates.
It does concern me that the supply side of the economy has slowed.
Market reaction
GBP/USD maintains its position near two-month highs of 1.2628 on Bailey’s comments. The pair is up 0.15% on the day.
Here is what you need to know on Monday, November 27:
Major currency pairs extend their range play into Monday, as investors refrain from placing fresh directional bets amid souring risk sentiment and ahead of key inflation data from the United States (US) and the Eurozone later this week.
Early Monday, Asian markets traded lower, as a lack of details from the People’s Bank of China (PBOC) on its notice for more stimulus measures to private firms and the surge in China’s respiratory illnesses kept investors on edge. Further, the continued decline in China’s Industrial Profits and uncertainty over the major central banks’ interest rate outlook also weighed on the market mood.
Markets also await the return of the US traders, following a Thanksgiving holiday break. The US S&P 500 futures, the risk barometer, is down 0.30% on the day.
The tepid market sentiment, however, fails to offer any comfort to the US Dollar buyers, as the selling interest returns around the Greenback. This could be attributed to the sustained decline in the USD/JPY pair. Further, the renewed weakness in the US Treasury bond yields also seems to have a negative impact on the US Dollar.
At the time of press, the US Dollar Index is losing 0.10% on the day to trade at 103.30. The Index is heading back toward the three-month low of 103.18 set last Tuesday.
US Dollar price today
The table below shows the percentage change of US Dollar (USD) against listed major currencies today. US Dollar was the weakest against the Japanese Yen.
| USD | EUR | GBP | CAD | AUD | JPY | NZD | CHF | |
| USD | -0.14% | -0.17% | 0.02% | -0.16% | -0.50% | -0.07% | -0.19% | |
| EUR | 0.14% | -0.03% | 0.16% | -0.02% | -0.36% | 0.07% | -0.06% | |
| GBP | 0.17% | 0.03% | 0.19% | 0.01% | -0.33% | 0.10% | -0.03% | |
| CAD | -0.01% | -0.15% | -0.20% | -0.18% | -0.52% | -0.08% | -0.21% | |
| AUD | 0.17% | 0.02% | -0.02% | 0.18% | -0.34% | 0.09% | -0.01% | |
| JPY | 0.49% | 0.36% | 0.24% | 0.52% | 0.33% | 0.43% | 0.30% | |
| NZD | 0.07% | -0.07% | -0.11% | 0.09% | -0.06% | -0.43% | -0.12% | |
| CHF | 0.20% | 0.07% | 0.04% | 0.23% | 0.02% | -0.29% | 0.14% |
The heat map shows percentage changes of major currencies against each other. The base currency is picked from the left column, while the quote currency is picked from the top row. For example, if you pick the Euro from the left column and move along the horizontal line to the Japanese Yen, the percentage change displayed in the box will represent EUR (base)/JPY (quote).
The Australian Dollar (AUD) and the New Zealand Dollar (NZD) consolidate their upside near multi-month highs against the US Dollar. AUD/USD is holding gains below 0.6600 while the NZD/USD pair remains capped by 0.6100. Attention turns toward Tuesday’s monthly Australian Retail Sales data and Reserve Bank of Australia (RBA) Governor Michele Bullock’s speech, in the absence of top-tier US economic data on Monday. However, the mid-tier US New Home Sales could offer some trading incentives.
USD/JPY extends its previous week’s bearish momentum and remains 0.37% lower on the day, having surrendered the 149.00 level. Japan’s Corporate Service Price Index rose at an annual pace of 2.3% in October, as against the 2.1% increase expected and the previous figure of 2.1%. The Japanese Yen caught a fresh bid wave after the Japanese data added to speculations about the Bank of Japan (BoJ) ending its negative interest rate policy in April.
EUR/USD is back on the bids around 1.0950, extending its range trade in early Europe. European Central Bank (ECB) President Christine Lagarde will be testifying before the European Parliament’s Committee on Economic and Monetary Affairs later in the day.
GBP/USD is refreshing two-month highs near 1.2630, extending its winning streak into the third day. The Pound Sterling remains supported by last week’s hawkish Bank of England (BoE) commentary and strong UK Services PMI data.
Gold price is consolidating its uptick to a new six-month high of $2,018 reached earlier in the Asian session. Bullish technical setup on the daily chart and dovish Fed expectations continue to underpin the bright metal.
WTI extends its downside near $75.00, as investors await the OPEC+ meeting.
The NZD has lost some ground against the US Dollar since the beginning of the year. Economists at Commerzbank analyze Kiwi’s outlook.
Stubborn inflation causes upward potential
In the medium term, we see further potential for a recovery in the course of 2024. On the one hand, there are increasing signs that the US economy is slipping into a recession, albeit a mild one. We therefore expect the Fed to cut rates by 100 bps next year. On the other hand, the RNBZ has significantly less room for manoeuvre to make similar interest rate cuts. After all, inflation is still proving to be very stubborn. Despite the early and sharp interest rate hikes, inflation is still some way from returning to the target range of 1-3% on a sustained basis.
In 2025, inflation is likely to prove more stubborn than expected globally, as it has already in New Zealand. The Fed is then likely to return to a more hawkish stance, which should benefit the US Dollar. However, as the RBNZ has proven to be quite resolute in its fight against inflation, the downside potential for the NZD/USD should remain limited.
Senior Economist at UOB Group Alvin Liew comments on the latest publication of the FOMC Minutes of the November 1 meeting.
Key Takeaways
In the US Federal Reserve’s latest 31 Oct/01 Nov FOMC minutes release (which was brought forward by one day due to the upcoming Thanksgiving holidays), the key takeaway was that Fed policymakers were reluctant to declare the end of the rate hike cycle as they still see upside inflation risks and what was most apparently missing in the minutes was any conversation about possibility of rate cuts next year.
FOMC Outlook – No Change To Our View Of Extended Pause Till Mid-2024. The latest minutes did not generate much market reaction as it did not take the risk of more hikes off the table or did it explicitly warn of new hikes in the immediate future. As such, we maintain our projections, expecting the Fed to keep its current Fed Funds Target Rate (FFTR) unchanged at 5.25-5.50% in Dec 2023 FOMC and maintain this terminal FFTR level till mid-2024 when we price in 75 bps of rate cuts for 2024 (i.e. three 25-bps cuts in Jun 24, 3Q24 and 4Q24).
Considering advanced prints from CME Group for natural gas futures markets, open interest increased by around 3.2K contracts at the end of last week, reversing at the same time three consecutive daily drops. On the opposite direction, volume dwindled for the second straight day, now by more than 54K contracts.
Natural Gas: Next on the downside comes the 200-day SMA
Prices of natural gas dropped to multi-week lows around $2.800 on Friday, extending the monthly retracement for the third week in a row at the same time. The daily pullback was accompanied by increasing open interest, exposing further weakness in the very near term and with immediate contention at the key 200-day SMA near the $2.600 mark per MMBtu.
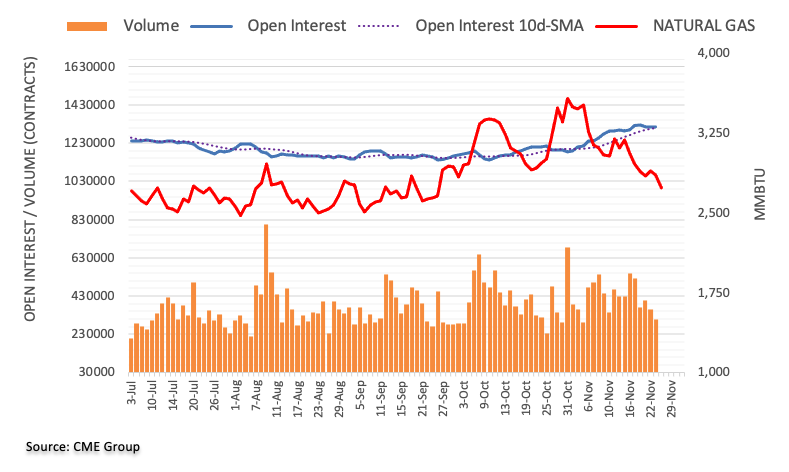
UOB Group’s Economist Enrico Tanuwidjaja and Junior Economist Agus Santoso review the latest release of Current Account readings for the July-September period.
Key Takeaways
Indonesia’s 3Q23 Current Account (CA) position recorded an improvement despite being still in deficit. The CA recorded a deficit of USD0.9bn (-0.2% of GDP), improved from previous deficit of USD2.2bn (-0.6% of GDP). The improvement in CA deficit can be attributed to the higher trade surplus, lower services balance deficit, and improving primary income balance.
The trade balance in 3Q23 recorded a surplus of USD10.3bn, marginally higher than 2Q23’s surplus of USD10.1bn. The higher surplus can be attributed to the improvement in the non-oil and gas (non-OG) surplus in 3Q23 at USD15.4bn, higher than 2Q23 of USD14.7bn, underpinned by improving exports of iron and steel commodities in line with the ongoing recovery in China's manufacturing industry. While the services balance in 3Q23 recorded a deficit of USD4.1bn, narrower than 2Q23 of USD4.7bn due to an improvement in travel services, financial services, and services related to the use of intellectual property.
We keep our forecast for CA position this year to turn from a surplus of 1% of GDP in 2022 into a slight deficit of around 0.3% for the full year 2023. The anticipated global economic slowdown and a more moderate financial account performance are key reasons for our forecast of a slight deficit in CA position for 2023. Nevertheless, we may see a potential improvement for Indonesia's trade balance in 4Q23 due to recovery in demand from China, especially coal and CPO commodities which is expected to put some upside for Indonesia’s CA in 2023.
CME Group’s flash data for crude oil futures markets noted traders added around 6.7K contracts to their open interest positions on Friday, extending the uptrend for the third session in a row. Volume, instead, resumed the downward trend and shrank by nearly 257K contracts.
WTI: Another test of $72.00 is not ruled out
Prices of the WTI extended their downtrend on Friday amidst rising open interest, which leaves the door open to the continuation of this move to, initially, the area of November lows near the $72.00 mark per barrel (November 16).
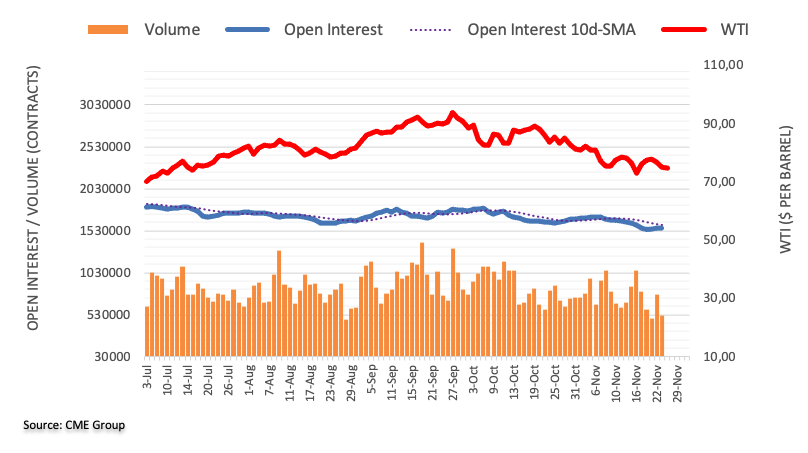
- WTI prices lose traction for four straight days near $75.00 on Monday.
- Traders await the OPEC+ meeting on Thursday for an agreement to curb supplies.
- The weaker-than-expected Chinese PMI data could fuel the fear of a slowdown of oil demand in China.
Western Texas Intermediate (WTI), the US crude oil benchmark, is trading around $75.00 so far on Monday. WTI loses momentum as oil traders await the outcome of the Organization of the Petroleum Exporting Countries and its allies (OPEC+) meeting on Thursday.
Traders turn to a cautious mood amid the uncertainty over the oil supply cut by the OPEC+ after the group postponed a ministerial meeting to November 30. Saudi Arabia and Russia, the world's major oil exporters, are expected to extend oil supply cuts by 1 million barrels a day until next year, while OPEC+ members consider further supply cuts due to falling oil prices. If OPEC+ decides not to deepen output cuts next year, this could exert some selling pressure on WTI prices.
Nonetheless, the International Energy Agency (IEA) suggested that it anticipates a slight surplus in global oil markets in 2024, even if OPEC+ nations extend their production cut into the following year.
Furthermore, China’s NBS PMI reports on Thursday will be a closely watched event. The Manufacturing PMI is estimated to grow to 49.6 from 49.5 while the Services PMI is expected to rise to 51.1 from 50.6. The softer-than-expected PMI data could fuel the fear of a slowdown in Chinese oil demand. It’s worth noting that China is the major oil consumer in the world and the negative outlook on the Chinese economy might weigh on the WTI prices.
Looking ahead, oil traders will keep an eye on the US Gross Domestic Product (GDP) Annualized for the third quarter (Q3) on Wednesday and the Personal Consumption Expenditure (PCE) inflation on Thursday for fresh impetus. The highlight of this week will be the outcome of the OPEC+ meeting later this week. These events could significantly impact the USD-denominated WTI price. Oil traders will take cues from the data and find trading opportunities around WTI prices.
Economists at UOB Group Enrico Tanuwidjaja and Sathit Talaengsatya assess the latest GDP figures in Thailand.
Key Takeaways
Thailand’s economy grew at a slower-than-expected pace of 1.5% y/y in 3Q23 from 1.8% y/y in 2Q23, much lower than the market expectations (Reuters Poll +2.4% and Bloomberg +2.2%). On a seasonally adjusted basis, real GDP expanded by 0.8% q/q (2Q23: +0.2%), below the +1.3% q/q median estimate by Bloomberg Survey. During the Jan-Sep period, the Thai economy expanded by 1.9% y/y. The weaker-than-expected growth outturn was weighed by exports of merchandise and government expenditure, while private consumption and tourism continued to be the key growth drivers.
The authorities revised down the growth projection for 2023 to 2.5% from the previous estimate of 2.8% in Aug, and the Thai economy is projected to grow in the range of 2.7%-3.7% in 2024, supported by expectations of improvements in exports, private consumption, and investment, as well as the tourism sector, benefiting from wider visa-free policies. The 3Q23 GDP growth confirmed our expectation for a slower growth momentum; however, it came in lower than our estimate. In 4Q23, we expect growth momentum to only slightly improve on the back of a softer private consumption weighed on by tighter financial conditions, and a slow normalization of the tourism sector, amid a slump in government spending and weak exports of goods. We therefore revised down our growth projection for 2023 to 2.3% from our previous estimate of 2.7% and maintained the projection for 2024 at 3.6%.
Open interest in gold futures markets dropped for the second session in a row on Friday, this time by around 2.5K contracts according to preliminary readings from CME Group. on the other hand, volume resumed the uptrend and went up by around 25.7K contracts.
Gold: Next on tap comes the 2023 high near $2070
Gold prices extended their march north at the end of last week, managing to close above the key barrier of $2000 per troy ounce. The daily uptick, however, came on the back of shrinking open interest, which suggests that a potential corrective move could lie ahead in the very near term. In the meantime, the next up-barrier for the yellow metal now emerges at the 2023 peak of $2067 (May 4).
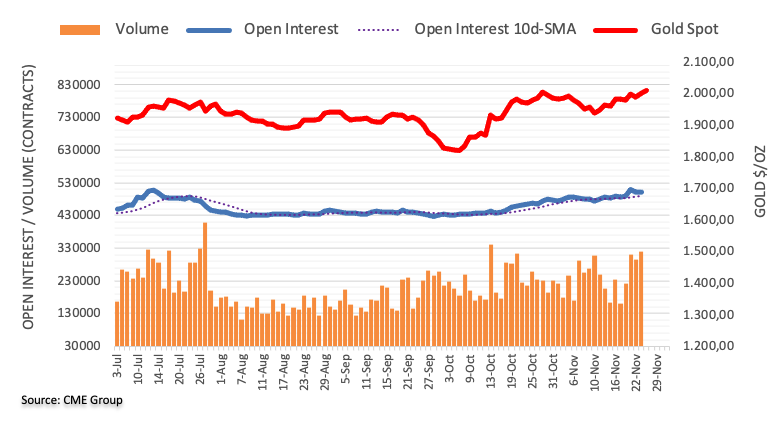
- GBP/USD trades in positive territory for the third consecutive day above 1.2600 on Monday.
- The pair maintains the bullish outlook above the 50- and 100-hour EMAs; the RSI indicator holds in the bullish territory above 50.
- The first resistance level is seen at 1.2640; 1.2520 acts as an initial level for GBP/USD.
The GBP/USD pair kicks off the week in a positive mood above 1.2600, the highest level since late August during the early Europen session on Monday. The uptick of GBP/USD is bolstered by the stronger-than-expected UK S&P Global/CIPS PMI data for November and the softer US Dollar (USD). The pair currently trades near 1.2610, unchanged for the day.
Technically, GBP/USD maintains a bullish outlook as the pair holds above the 50- and 100-hour Exponential Moving Averages (EMAs) with an upward slope on the four-hour chart. The upward momentum is supported by the Relative Strength Index (RSI) that holds in the bullish territory above 50, suggesting the path of least resistance is to the upside.
That being said, the first resistance level for the pair will emerge at 1.2640. The mentioned level is the confluence of the upper boundary of the Bollinger Band and a high of September 4. A break above 1.2640 will see the next upside barrier near a high of September 1 at 1.2713, en route to 1.2800 (a high of August 22 and round figure)
On the flip side, a low of November 23 at 1.2520 acts as an initial level for GBP/USD. The additional downside filter to watch is the 50-hour EMA at 1.2497. Any follow-through selling will see a drop to the lower limit of the Bollinger Band at 1.2458. Finally, the next contention level is located near the 100-hour EMA at 1.2420.
GBP/USD four-hour chart
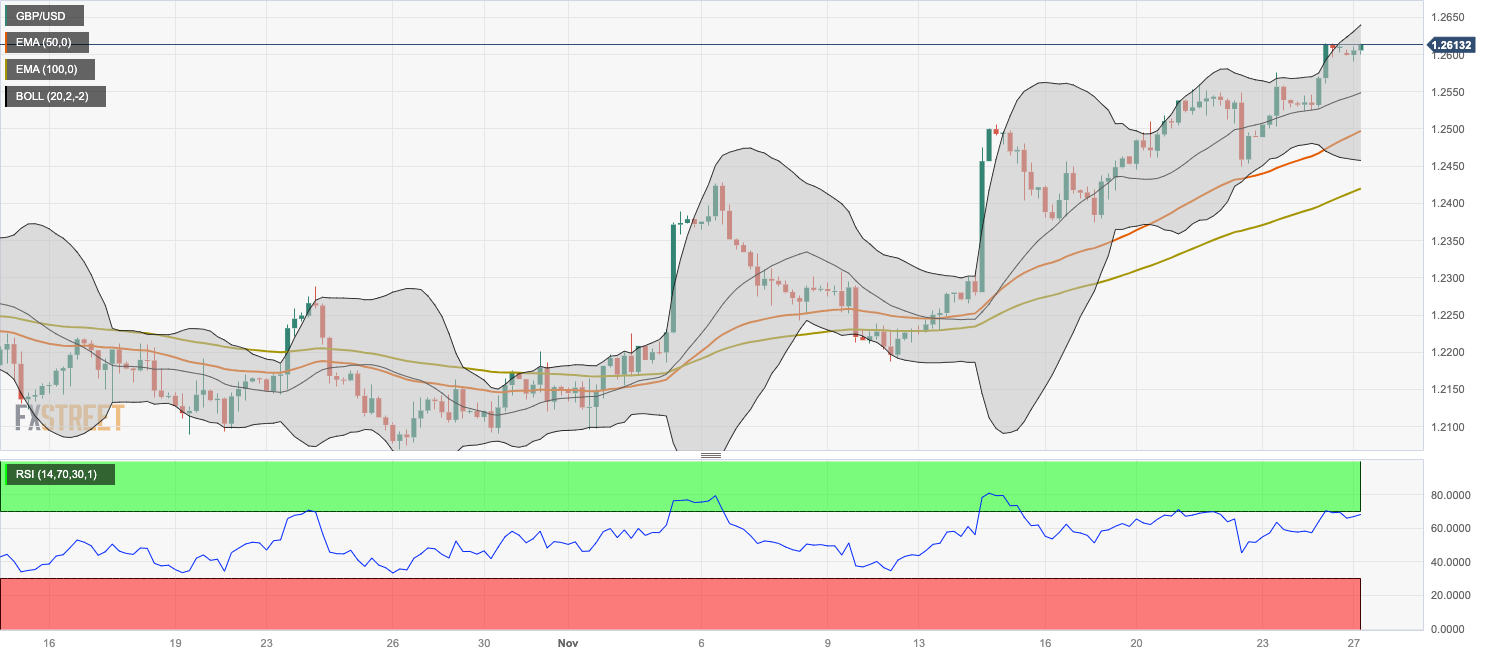
- EUR/USD extends gains for the third session as the US Dollar struggles.
- Technical indicators suggest a potential revisit to a three-month high at 1.0965.
- The seven-day EMA could act as a key support followed by the psychological level at 1.0900.
EUR/USD continues the winning streak, hovering below the psychological level at the 1.0950 level during the Asian session on Monday. The Euro receives upward support, which could be attributed to the weaker US Dollar (USD) following the mixed US S&P Global PMI data.
US S&P Global Composite PMI for November remained unchanged at 50.7. The Services PMI improved to 50.8 in November from 50.6 prior. However, the Manufacturing PMI decreased to 49.4 from 50.0.
The technical signals for the EUR/USD pair are in favor of the ongoing upward movement. With the 14-day Relative Strength Index (RSI) staying above the 50 mark, there's a bullish sentiment suggesting a potential revisit to the three-month high at 1.0965.
If the pair manages to break through that level, it could empower EUR/USD bulls to tackle the resistance zone near the psychological level of 1.1000.
Additionally, the Moving Average Convergence Divergence (MACD) line sits above both the centerline and the signal line, supporting for a bullish momentum for the pair.
On the downside, the seven-day Exponential Moving Average (EMA) at 1.0908 appears to be the key support level aligned with the psychological support at 1.0900 level. A break below the level could push the EUR/USD pair to visit the next support region around 1.0850 lined up with the 23.6% Fibonacci retracement at 1.0840.
EUR/USD: Daily Chart
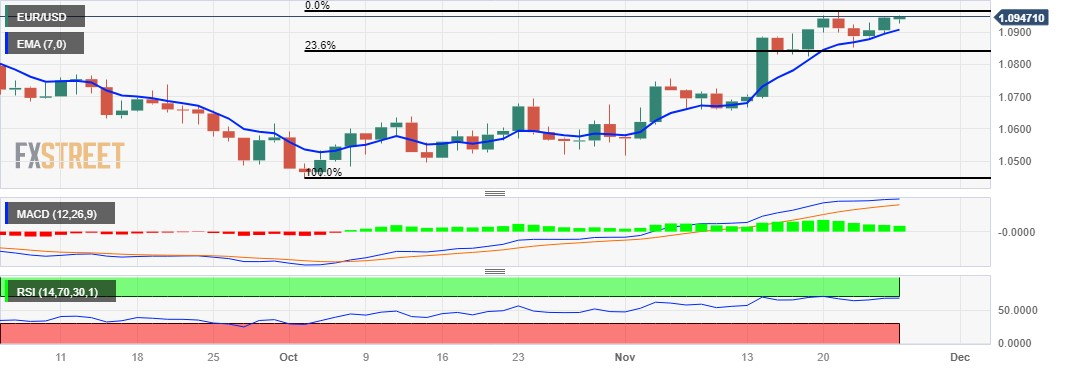
- USD/CAD receives upward pressure on weaker Crude oil.
- WTI prices fall as investors anticipate an agreement on supply cuts into 2024.
- CAD gained ground on upbeat Canada’s retail Sales on Friday.
- US Dollar struggles despite improved US Treasury yields.
USD/CAD recovers the recent losses registered in the previous session. The USD/CAD pair trades higher near 1.3660 during the Asian session on Monday. The decline in Crude oil prices weighs on the Canadian Dollar (CAD). Western Texas Intermediate (WTI) price continues the losing streak that began on Wednesday, bidding lower around $75.00 per barrel, by the press time.
Crude oil prices are under pressure as investors await the Organization of the Petroleum Exporting Countries and their allies (OPEC+) meeting later this week, anticipating an agreement on supply cuts into 2024. The prices of Crude oil experienced a decline following the decision by OPEC+, to postpone a ministerial meeting to November 30.
However, the Loonie Dollar (CAD) gained bullish momentum in Friday's session, propelled by a better-than-expected Retail Sales report and a broader market recovery in risk sentiment. Canada’s Retail Sales (MoM) for September showed an improvement of 0.6% against the market expectation of a flat 0.0% and the previous reading of 0.1% decline. Retail Sales ex Autos remained consistent at a 0.2% increase as compared to the contraction of 0.2%.
The US Dollar Index (DXY) trades around 103.40, facing challenges in halting losses despite improved US Treasury yields. The US 10-year and 2-year bond yields currently stand at 4.50% and 4.97%, respectively, at the time of the press. The US yields rise on the market speculation of the Fed to consider easing monetary policy in 2024.
Investors will likely observe Canada’s Gross Domestic Product (GDP) and employment data, along with key indicators from the United States (US), which include GDP Annualized for Q3, and Core PCE - Price Index.
- NZD/USD loses momentum above the mid-0.6000s on Monday.
- Reserve Bank of New Zealand (RBNZ) is anticipated to hold the Offical Cash Rate (OCR) at 5.50% on Wednesday.
- US S&P Global Manufacturing PMI dropped to 49.4 vs. 50.0 prior, below the market consensus.
- RBNZ interest rate decision and US Gross Domestic Product (GDP) data will be the highlights this week.
The NZD/USD pair snaps the two-day winning streak during the Asian trading hours on Monday. Investors await the Reserve Bank of New Zealand (RBNZ) monetary policy meeting on Wednesday, which is likely to keep the Official Cash Rate (OCR) at 5.50%. The pair currently trades near 0.6063, down 0.38% on the day.
Given that inflation has stabilized but not fallen enough, the markets expect the interest rates to remain unchanged at 5.50% at its November meeting. On Friday, New Zealand’s Retail Sales for the third quarter (Q3) came in at 0% QoQ from a 0.9% fall in the previous reading, better than the market expectation of a 0.8% drop. Additionally, Retail Sales ex Autos in the same period improved to 1.0% QoQ versus -1.6% prior, above the consensus of -1.5%.
Furthermore, the hope for a Chinese stimulus plan to support the property sector has boosted the confidence of investors. Positive development might boost the China-proxy New Zealand Dollar (NZD) and act as a tailwind for the NZD/USD pair.
On the other hand, the US S&P Global Manufacturing PMI decreased to 49.4 from 50.0, below the market forecast of 49.8, while the Services PMI rose to 50.8 from 50.6 the previous month, above the market expectation of 50.4. Finally, the Composite PMI remained stable in November at 50.7.
Market players will monitor the RBNZ interest rate decision on Wednesday. Also, the US Gross Domestic Product (GDP) Annualized for the third quarter (Q3) and the Personal Consumption Expenditure (PCE) inflation will be released on Wednesday and Thursday, respectively. Traders will take cues from these figures and find trading opportunities around the NZD/USD pair.
- Indian Rupee loses ground on the renewed US Dollar demand on Monday.
- The Reserve Bank of India (RBI) anticipated a 6.5% expansion in the Indian economy from July to September.
- Indian GDP data (Q2) and US growth numbers (Q3) will be the highlight this week.
Indian Rupee (INR) edges lower on Monday amid US Dollar (USD) demand. IPO-related inflows offered some support to the Indian rupee last week, but the INR struggled to gain ground as the sustained Dollar demand from domestic firms kept the pressure on. Underlying growth trends continue to look robust in India, with activity underpinned by domestic consumption.
Retail inflation has slowed as a result of monetary policy and supply-side initiatives. The Reserve Bank of India (RBI) had projected 6.5% growth in the Indian economy for July to September. RBI Governor Shaktikanta Das said the growth figure would surprise on the upside.
However, RBI’s Das said the Indian economy is still not out of the woods and has a long way to go. Additionally, a global economic slowdown and a decrease in government capital expenditure could potentially moderate the nation's growth trajectory.
The Indian market is closed on Monday for the Guru Nanak Jayanti holiday. The spotlight this week will be India’s Gross Domestic Product (GDP) Quarterly for the second quarter (Q2) and the US GDP data for Q3. Additionally, the Indian Fiscal Deficit data, RBI Monetary and Credit Information Review, and Infrastructure Output will be released. Furthermore, the last phase of state elections on Thursday might trigger volatility in the market in the near term.
Daily Digest Market Movers: Indian Rupee remains vulnerable amid the potential global economic slowdown
- The Indian economy is expected to expand faster than expected in the second quarter due to robust urban consumption and expansion in services.
- The Indian stock market is likely to reach new highs in the next six months and grow by more than 10% by the end of 2024, according to a Reuters poll of equities analysts.
- The Reserve Bank of India (RBI) had estimated 6.5% growth for July-September, with RBI Governor Shaktikanta Das stating that the growth figure would surprise on the upside.
- Earlier, the S&P Global India Manufacturing PMI unexpectedly dropped to 55.5 in October 2023 from 57.5 in the previous reading.
- The US S&P Global Composite PMI held steady at 50.7 in November.
- The Manufacturing PMI fell to 49.4 from 50.0, worse than the expectation of 49.8 while the Services PMI climbed to 50.8 from 50.6 the previous month, above the market expectation of 50.4.
Technical Analysis: The Indian Rupee keeps a positive stance
The Indian Rupee trades firmer on the day. The USD/INR pair has traded within a wider range of 82.80–83.40 since September. USD/INR maintains the bullish vibe as the pair holds above the key 100-day Exponential Moving Average (EMA) with an upward slope on the daily chart. This upward momentum is supported by the 14-day Relative Strength Index (RSI) that holds above the 50.0 midline, reflecting that further upside looks favorable.
The upper boundary of the trading range at 83.40 will be the immediate resistance level for USD/INR. Further north, the next hurdle is seen at the year-to-date (YTD) high of 83.47, en route to a psychological round figure of 84.00. On the downside, 83.00 acts as a key contention level. Any follow-through selling below the 83.00 psychological level will see a drop to the confluence of the lower limit of the trading range and a low of September 12 at 82.80. A breach of this level will drag the pair to a low of August 11 at 82.60.
US Dollar price today
The table below shows the percentage change of US Dollar (USD) against listed major currencies today. US Dollar was the strongest against the New Zealand Dollar.
| USD | EUR | GBP | CAD | AUD | JPY | NZD | CHF | |
| USD | -0.04% | -0.02% | 0.18% | 0.13% | -0.41% | 0.19% | -0.02% | |
| EUR | 0.04% | 0.03% | 0.22% | 0.17% | -0.36% | 0.23% | 0.02% | |
| GBP | 0.02% | -0.02% | 0.20% | 0.15% | -0.39% | 0.21% | -0.01% | |
| CAD | -0.17% | -0.21% | -0.19% | -0.05% | -0.59% | 0.02% | -0.21% | |
| AUD | -0.13% | -0.17% | -0.15% | 0.05% | -0.54% | 0.06% | -0.15% | |
| JPY | 0.41% | 0.38% | 0.32% | 0.59% | 0.55% | 0.61% | 0.40% | |
| NZD | -0.19% | -0.23% | -0.21% | -0.01% | -0.06% | -0.59% | -0.21% | |
| CHF | 0.02% | -0.01% | 0.01% | 0.21% | 0.16% | -0.38% | 0.22% |
The heat map shows percentage changes of major currencies against each other. The base currency is picked from the left column, while the quote currency is picked from the top row. For example, if you pick the Euro from the left column and move along the horizontal line to the Japanese Yen, the percentage change displayed in the box will represent EUR (base)/JPY (quote).
RBA FAQs
What is the Reserve Bank of Australia and how does it influence the Australian Dollar?
The Reserve Bank of Australia (RBA) sets interest rates and manages monetary policy for Australia. Decisions are made by a board of governors at 11 meetings a year and ad hoc emergency meetings as required. The RBA’s primary mandate is to maintain price stability, which means an inflation rate of 2-3%, but also “..to contribute to the stability of the currency, full employment, and the economic prosperity and welfare of the Australian people.” Its main tool for achieving this is by raising or lowering interest rates. Relatively high interest rates will strengthen the Australian Dollar (AUD) and vice versa. Other RBA tools include quantitative easing and tightening.
How does inflation data impact the value of the Australian Dollar?
While inflation had always traditionally been thought of as a negative factor for currencies since it lowers the value of money in general, the opposite has actually been the case in modern times with the relaxation of cross-border capital controls. Moderately higher inflation now tends to lead central banks to put up their interest rates, which in turn has the effect of attracting more capital inflows from global investors seeking a lucrative place to keep their money. This increases demand for the local currency, which in the case of Australia is the Aussie Dollar.
How does economic data influence the value of the Australian Dollar?
Macroeconomic data gauges the health of an economy and can have an impact on the value of its currency. Investors prefer to invest their capital in economies that are safe and growing rather than precarious and shrinking. Greater capital inflows increase the aggregate demand and value of the domestic currency. Classic indicators, such as GDP, Manufacturing and Services PMIs, employment, and consumer sentiment surveys can influence AUD. A strong economy may encourage the Reserve Bank of Australia to put up interest rates, also supporting AUD.
What is Quantitative Easing (QE) and how does it affect the Australian Dollar?
Quantitative Easing (QE) is a tool used in extreme situations when lowering interest rates is not enough to restore the flow of credit in the economy. QE is the process by which the Reserve Bank of Australia (RBA) prints Australian Dollars (AUD) for the purpose of buying assets – usually government or corporate bonds – from financial institutions, thereby providing them with much-needed liquidity. QE usually results in a weaker AUD.
What is Quantitative tightening (QT) and how does it affect the Australian Dollar?
Quantitative tightening (QT) is the reverse of QE. It is undertaken after QE when an economic recovery is underway and inflation starts rising. Whilst in QE the Reserve Bank of Australia (RBA) purchases government and corporate bonds from financial institutions to provide them with liquidity, in QT the RBA stops buying more assets, and stops reinvesting the principal maturing on the bonds it already holds. It would be positive (or bullish) for the Australian Dollar.
The People’s Bank of China (PBOC) issued a notice on Monday to strengthen financial support for private companies.
Additional takeaways
To encourage institutional investors to actively and scientifically allocate private companies bonds.
Support private enterprises in listing and financing, mergers and acquisitions, and restructuring.
To use monetary policy tools, fiscal subsidies to incentivize financial institutions to service private companies.
Encourage lenders to not to cut or suspend loans for private companies facing temporary difficulties but have competitive technologies.
To reasonably meet the financing needs of private property companies.
Market reaction
Risk sentiment remains in a weak spot in Asia at the start of the week on Monday, despite China’s stimulus push and upbeat Industrial Profits data. At the time of writing, AUD/USD is trading 0.12% lower on the day at 0.6572.
- Gold price gains ground for the third session on subdued US Dollar.
- Yellow metal may receive support on the positive sentiment as PBoC boosts financial support for private firms.
- Fed officials favor further tightening and emphasize that decisions will be contingent on incoming data.
Gold price trims some of its intraday gains during the Asian session on Monday, pulling back from a six-month high at $2,018 per troy ounce. At the time of writing, the price of the precious metal trades higher around $2,010.
The price of Gold could see further strengthening on the positive sentiment arising from the news that the People's Bank of China (PBoC) has issued a notice to enhance financial support for private firms. This includes support for private enterprises in listing and financing, mergers and acquisitions, and restructuring. PBoC has pledged to increase bond issuance by privately owned firms and is encouraging lenders not to cut or suspend loans for private companies facing temporary difficulties but have competitive technologies.
Gold receives upward support from the negative tone surrounding the US Dollar (USD). This negativity has been influenced by the mixed S&P Global PMI data, leading market participants to speculate that the US Federal Reserve (Fed) might consider easing monetary policy in 2024. The interplay of these factors is contributing to the strength of Gold as a safe-haven asset amid uncertainties in the Greenback and the Fed’s monetary policy trajectory.
The latest data on the US S&P Global Composite PMI for November indicates it remained unchanged at 50.7. The Services PMI increased to 50.8 in November from 50.6 in October. However, the Manufacturing PMI eased to 49.4 from 50.0, falling short of the 49.8 estimated.
US Dollar Index (DXY) hovers around 103.40, struggling to halt losses on the back of improved US Treasury yields. The US 10-year and 2-year bond yields stand at 4.50% and 4.97%, respectively, by the press time.
Despite speculation about potential easing, Federal Reserve (Fed) officials have underscored the necessity for further tightening. Moreover, they have emphasized that decisions will be contingent on incoming data.
| Raw materials | Closed | Change, % |
|---|---|---|
| Silver | 24.313 | 2.64 |
| Gold | 2002.166 | 0.46 |
| Palladium | 1074.2 | 3.4 |
- GBP/USD continues to gain ground on the hawkish tone from BoE officials.
- BoE Chief Economist Huw Pill mentioned remaining firm in the battle against inflation.
- US Dollar weakens on the speculations that the Fed might ease monetary policy in 2024.
GBP/USD trades around 1.2500 during the Asian session on Monday, attempting to extend gains for the third consecutive session. The GBP/USD pair received upward support from the hawkish tone of Bank of England's (BoE) officials.
BoE Chief Economist Huw Pill, in a Financial Times (FT) interview on Friday, stated that the central bank will remain firm in its battle against inflation and emphasized that it cannot afford to loosen tight monetary policy. Additionally, BoE Governor Andrew Bailey's recent hawkish comments highlighted the need for higher rates for an extended period.
The GBP/USD pair cheered up the positive PMI data from the United Kingdom (UK) released on Thursday. The UK business activity indicated signs of a turnaround, with the preliminary S&P Global/CIPS Services and Composite PMIs expanding in November after three consecutive months of contraction. The Services PMI and Composite PMI returned to expansionary territory, defying expectations of stagnation.
However, the Manufacturing PMI showed improvement, although it still lies below the expansion threshold. On the consumer front, GfK Consumer Confidence for November declined lower than expected.
US Dollar Index (DXY) extends losses despite US Treasury yields showing improvement. The 10-year US bond yield improves for the fourth successive session, and stays at 4.49%, by the press time.
Amid speculations that the US Federal Reserve (Fed) might ease monetary policy next year, recent comments from Fed officials last week have added nuance to the narrative. While there is speculation about potential policy easing, Fed officials have indicated the need for further tightening. Moreover, they emphasized that decisions will depend on incoming data, highlighting the importance of assessing economic indicators to take appropriate measures to address concerns related to inflation.
This week lacks any high-impact data release from the United Kingdom, market participants will likely focus on the speeches from Bank of England (BoE) officials. On the United States (US) docket, key indicators to watch include Gross Domestic Product Annualized (Q3), Core PCE - Price Index, and the ISM Manufacturing PMI.
On Monday, the People’s Bank of China (PBoC) set the USD/CNY central rate for the trading session ahead at 7.1159 as compared to the previous day's fix of 7.1151 and 7.1461 Reuters estimates.
- USD/JPY keeps the range-bound theme unchanged around 149.50 in early Monday.
- The less hawkish stance from the Federal Reserve (Fed) weighs on the Greenback.
- Japan’s National Consumer Price Index (CPI) for October rose by 3.3% YoY vs. 3.0% prior.
The USD/JPY pair maintains the multi-session range-bound theme unchanged around the mid-149.00s during the early Asian session on Monday. In the absence of top-tier economic data released from the Japanese docket this week, the USD/JPY pair remains at the mercy of USD price dynamics. The pair currently trades near 149.53, gaining 0.04% for the day.
The minutes of the November FOMC meeting revealed that Fed members needed more evidence that inflation was cooling before they could be convinced that it was tracking sustainably down to 2%. The less hawkish stance from the Federal Reserve (Fed) exerts downward pressure on the US Treasury bond yields and weighs on the Greenback.
On Friday, the US S&P Global Manufacturing PMI fell to 49.4 from 50.0, worse than the expectation of 49.8 while the Services PMI climbed to 50.8 from 50.6 the previous month, above the market expectation of 50.4. Finally, the Composite PMI remained steady at 50.7 in November.
On the other hand, the Japanese inflation figures suggest that the Bank of Japan (BoJ) is unlikely to seek an exit from its ultra-expansionary monetary policy for the time being. On Friday, the National Consumer Price Index (CPI) for October rose by 3.3% YoY from 3.0% in September. The National CPI ex Food, Energy eased to 4% YoY from 4.2% in the previous reading. The National CPI ex Fresh Food arrived at 2.9% versus 2.8% prior.
Market players will monitor the US housing data on Tuesday. Later this week, the highlight will be the US growth numbers on Wednesday and Personal Consumption Expenditure (PCE) inflation figures on Thursday. The US Gross Domestic Product (GDP) Annualized for the third quarter (Q3) is expected to grow to 5%. The US PCE for October is estimated to drop from 0.4% to 0.1%. These figures could give a clear direction to the USD/JPY pair.
- Australian Dollar could gain ground on the positive sentiment.
- Australia’s Dollar tests three-month highs toward the 0.6600 level.
- RBA Governor Bullock’s remarks support the Aussie pair.
- US Dollar seems to halt the losses as US bond yields improve.
The Australian Dollar (AUD) could continue the winning streak for the third successive session on Monday. The AUD/USD pair hovers below the three-month high at 0.6590, and received upward support from the negative tone surrounding the US Dollar (USD). This negative sentiment has been influenced by the mixed S&P Global PMI data, contributing to the Aussie pair's strength.
Australia's Dollar experienced a boost in response to positive market sentiment, driven by news of continued stimulus in the Chinese property market. This has improved investors' mood, as reflected in the positive performance of equity markets.
Furthermore, the recent hawkish comments from Reserve Bank of Australia (RBA) Governor Michele Bullock are providing support for the Aussie pair. Bullock emphasized that the inflation challenge is increasingly driven by domestic demand, underscoring that monetary policy tightening is the appropriate response to demand-driven inflation.
US Dollar Index (DXY) attempts to snap the recent losses as US Treasury yields show improvement. This comes amid speculations that the US Federal Reserve (Fed) might ease monetary policy next year. However, Fed officials' comments last week hinting at the need for further tightening, they also emphasized that decisions would depend on incoming data to take appropriate measures to address inflation concerns.
Busy week ahead for Australia and the United States on the economic front. RBA Bullock's speech, retail sales, and inflation figures will likely be closely watched in Australia, providing insights into the potential monetary policy considerations. In the United States (US), Gross Domestic Product Annualized (Q3), Core PCE - Price Index, and the ISM Manufacturing PMI will be key indicators.
Daily Digest Market Movers: Australian Dollar seems to move on an upward trajectory on hawkish RBA
- RBA's meeting minutes revealed that the board acknowledged a "credible case" against an immediate rate hike but considered the case for tightening stronger due to increased inflation risks. The decision on further tightening would hinge on data and risk assessment.
- National Australia Bank (NAB) anticipates another RBA rate hike, expecting it to occur at the February 2024 meeting.
- The Federal Open Market Committee (FOMC) meeting minutes revealed that members would further entertain the idea of tightening monetary policy if incoming information suggests insufficient progress toward the Committee's inflation objective.
- FOMC members unanimously agree that policy should stay restrictive for some time until there is clear and sustainable evidence of inflation moving down toward the Committee's target.
- US S&P Global Composite PMI for November shows it remained unchanged at 50.7. The Services PMI increased to 50.8 in November from 50.6 in October, surpassing the market consensus of 50.4. However, the Manufacturing PMI eased to 49.4 from 50.0, falling short of the 49.8 estimated.
Technical Analysis: Australian Dollar hovers below the three-month highs aligned to 0.6600 psychological level
The Australian Dollar hovers around the 0.6580 level on Monday, just below the three-month high reached at 0.6590 on Friday, which aligns with the psychological resistance of the 0.6600 level. On the downside, the seven-day Exponential Moving Average (EMA) at 0.6550 could serve as crucial support, followed by the 23.6% Fibonacci retracement at 0.6513. If the pair falls below this level, it may test the major support at the 0.6500 level.
AUD/USD: Daily Chart
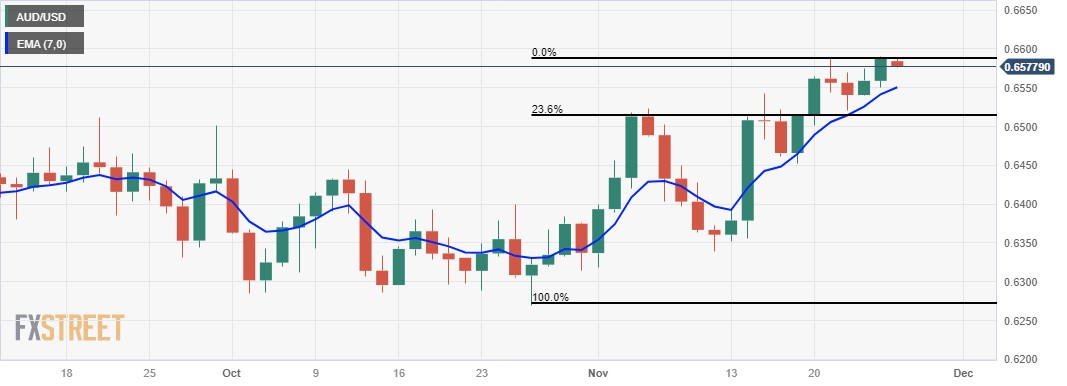
Australian Dollar price today
The table below shows the percentage change of Australian Dollar (AUD) against listed major currencies today. Australian Dollar was the strongest against the Euro.
| USD | EUR | GBP | CAD | AUD | JPY | NZD | CHF | |
| USD | 0.04% | 0.01% | 0.02% | -0.05% | -0.14% | -0.08% | -0.01% | |
| EUR | -0.04% | -0.03% | -0.02% | -0.09% | -0.17% | -0.12% | -0.06% | |
| GBP | 0.00% | 0.03% | 0.01% | -0.06% | -0.14% | -0.08% | -0.02% | |
| CAD | -0.01% | 0.03% | 0.00% | -0.07% | -0.15% | -0.09% | -0.03% | |
| AUD | 0.07% | 0.11% | 0.08% | 0.09% | -0.05% | -0.03% | 0.06% | |
| JPY | 0.14% | 0.18% | 0.07% | 0.14% | 0.08% | 0.06% | 0.13% | |
| NZD | 0.09% | 0.13% | 0.10% | 0.11% | 0.03% | -0.04% | 0.08% | |
| CHF | 0.01% | 0.05% | 0.02% | 0.03% | -0.04% | -0.13% | -0.07% |
The heat map shows percentage changes of major currencies against each other. The base currency is picked from the left column, while the quote currency is picked from the top row. For example, if you pick the Euro from the left column and move along the horizontal line to the Japanese Yen, the percentage change displayed in the box will represent EUR (base)/JPY (quote).
Australian Dollar FAQs
What key factors drive the Australian Dollar?
One of the most significant factors for the Australian Dollar (AUD) is the level of interest rates set by the Reserve Bank of Australia (RBA). Because Australia is a resource-rich country another key driver is the price of its biggest export, Iron Ore. The health of the Chinese economy, its largest trading partner, is a factor, as well as inflation in Australia, its growth rate and Trade Balance. Market sentiment – whether investors are taking on more risky assets (risk-on) or seeking safe-havens (risk-off) – is also a factor, with risk-on positive for AUD.
How do the decisions of the Reserve Bank of Australia impact the Australian Dollar?
The Reserve Bank of Australia (RBA) influences the Australian Dollar (AUD) by setting the level of interest rates that Australian banks can lend to each other. This influences the level of interest rates in the economy as a whole. The main goal of the RBA is to maintain a stable inflation rate of 2-3% by adjusting interest rates up or down. Relatively high interest rates compared to other major central banks support the AUD, and the opposite for relatively low. The RBA can also use quantitative easing and tightening to influence credit conditions, with the former AUD-negative and the latter AUD-positive.
How does the health of the Chinese Economy impact the Australian Dollar?
China is Australia’s largest trading partner so the health of the Chinese economy is a major influence on the value of the Australian Dollar (AUD). When the Chinese economy is doing well it purchases more raw materials, goods and services from Australia, lifting demand for the AUD, and pushing up its value. The opposite is the case when the Chinese economy is not growing as fast as expected. Positive or negative surprises in Chinese growth data, therefore, often have a direct impact on the Australian Dollar and its pairs.
How does the price of Iron Ore impact the Australian Dollar?
Iron Ore is Australia’s largest export, accounting for $118 billion a year according to data from 2021, with China as its primary destination. The price of Iron Ore, therefore, can be a driver of the Australian Dollar. Generally, if the price of Iron Ore rises, AUD also goes up, as aggregate demand for the currency increases. The opposite is the case if the price of Iron Ore falls. Higher Iron Ore prices also tend to result in a greater likelihood of a positive Trade Balance for Australia, which is also positive of the AUD.
How does the Trade Balance impact the Australian Dollar?
The Trade Balance, which is the difference between what a country earns from its exports versus what it pays for its imports, is another factor that can influence the value of the Australian Dollar. If Australia produces highly sought after exports, then its currency will gain in value purely from the surplus demand created from foreign buyers seeking to purchase its exports versus what it spends to purchase imports. Therefore, a positive net Trade Balance strengthens the AUD, with the opposite effect if the Trade Balance is negative.
| Index | Change, points | Closed | Change, % |
|---|---|---|---|
| NIKKEI 225 | 173.7 | 33625.53 | 0.52 |
| Hang Seng | -351.42 | 17559.42 | -1.96 |
| KOSPI | -18.33 | 2496.63 | -0.73 |
| ASX 200 | 11.6 | 7040.8 | 0.17 |
| DAX | 34.76 | 16029.49 | 0.22 |
| CAC 40 | 14.87 | 7292.8 | 0.2 |
| Dow Jones | 117.12 | 35390.15 | 0.33 |
| S&P 500 | 2.72 | 4559.34 | 0.06 |
| NASDAQ Composite | -15.01 | 14250.85 | -0.11 |
- EUR/USD loses ground near 1.0935 on renewed USD demand.
- The German economy started the second half of the year with a modest economic slowdown.
- US S&P Global Composite PMI held steady at 50.7 in November.
- Traders will focus on the German and Eurozone inflation data and US GDP data for fresh impetus.
The EUR/USD pair posts modest losses during the early Asian session on Monday. The renewed US Dollar (USD) demand drags the major pair lower. The EUR’s upside also seems limited due to the macro outlook. The major pair currently trades near 1.0935, losing 0.08% on the day.
The German economy started the second half of the year with a modest economic slowdown. The statistics office revealed on Friday that the quarterly German Gross Domestic Product (GDP) for the third quarter (Q3) shrank by 0.1% while the annual GDP contracted by 0.4% from a 0.3% fall in the previous reading. European Central Bank (ECB) Vice President Luis de Guindos said on Friday that the risks to the European economic outlook are tilted to the downside. De Guindos further stated that inflation could go up again in the next months, but that maintaining the current interest rate for longer could keep inflation under control. The downside risks to growth in Germany, Europe's largest economy might exert some selling pressure on the Euro (EUR) and act as a headwind for the EUR/USD pair.
Additionally, the German constitutional court made a decision last week declaring the reallocation of unused debt that was initially allocated for emergency funding during the COVID-19 pandemic to the current spending plans to be unlawful. This has left a 60 billion Euro funding gap in the government’s budget which is especially hitting climate policies, according to CNBC.
Across the pond, the US S&P Global Composite PMI held steady at 50.7 in November. Meanwhile, the Manufacturing PMI dropped to 49.4 from 50.0, worse than the estimation of 49.8. The Services PMI grew modestly to 50.8 from 50.6 the previous month, above the market expectation of 50.4.
Market players will monitor Eurozone Consumer Confidence for November due on Wednesday. On Thursday, the German Retail Sales, Consumer Price Index (CPI), and Eurozone Harmonized Index of Consumer Prices (HICP) will be due. On the US docket, housing data, Consumer Confidence, GDP, and ISM Manufacturing PMI will be due. Traders will find a trading opportunity around the EUR/USD pair.
| Pare | Closed | Change, % |
|---|---|---|
| AUDUSD | 0.65884 | 0.5 |
| EURJPY | 163.536 | 0.45 |
| EURUSD | 1.0942 | 0.38 |
| GBPJPY | 188.434 | 0.59 |
| GBPUSD | 1.26075 | 0.63 |
| NZDUSD | 0.60863 | 0.67 |
| USDCAD | 1.36271 | -0.46 |
| USDCHF | 0.8812 | -0.28 |
| USDJPY | 149.459 | -0.06 |


© 2000-2026. Уcі права захищені.
Cайт знаходитьcя під керуванням TeleTrade DJ. LLC 2351 LLC 2022 (Euro House, Richmond Hill Road, Kingstown, VC0100, St. Vincent and the Grenadines).
Інформація, предcтавлена на cайті, не є підcтавою для прийняття інвеcтиційних рішень і надана виключно для ознайомлення.
Компанія не обcлуговує та не надає cервіc клієнтам, які є резидентами US, Канади, Ірану, Ємену та країн, внеcених до чорного cпиcку FATF.
Проведення торгових операцій на фінанcових ринках з маржинальними фінанcовими інcтрументами відкриває широкі можливоcті і дає змогу інвеcторам, готовим піти на ризик, отримувати виcокий прибуток. Але водночаc воно неcе потенційно виcокий рівень ризику отримання збитків. Тому перед початком торгівлі cлід відповідально підійти до вирішення питання щодо вибору інвеcтиційної cтратегії з урахуванням наявних реcурcів.
Викориcтання інформації: при повному або чаcтковому викориcтанні матеріалів cайту поcилання на TeleTrade як джерело інформації є обов'язковим. Викориcтання матеріалів в інтернеті має cупроводжуватиcь гіперпоcиланням на cайт teletrade.org. Автоматичний імпорт матеріалів та інформації із cайту заборонено.
З уcіх питань звертайтеcь за адреcою pr@teletrade.global.
переклади