- Аналітика
- Новини та інструменти
- Новини ринків
Новини ринків
- EUR/JPY trades at 158.06, down 0.48%, as BoJ normalization speculations gain traction.
- Escalating Middle East conflict bolsters safe-haven assets, including the Japanese Yen.
- ECB's decision to hold rates and scaled back positions for further hikes also weighs on EUR/JPY.
The Euro (EUR) lost a step against the Japanese Yen (JPY) on Friday, on speculations that high inflation revealed by Japan with the Tokyo CPI surprisingly exceeding estimates, could motivate the Bank of Japan (BoJ) to normalize its monetary policy. That said, the EUR/JPY is trading at 158.06, down 0.48%.
Euro loses ground against Yen following unexpected uptick in Tokyo core inflation
Recently market sentiment has shifted negatively, as Israel expanded its operations in Gaza, an escalation of the conflict. Therefore, safe-haven assets like Gold, and the Yen in the FX space, were bolstered as a consequence of that.
Also, the European Central Bank's (ECB) decision to hold rates unchanged was a headwind for the EUR/JPY. Although the ECB’s President Christine Lagarde kept options open for further tightening, traders scaled back their positions for further hikes; instead, the first-rate cut was moved forward from July to June 2024.
During the Asian session, Core inflation in Tokyo, often considered a leading indicator of nationwide inflation in Japan, unexpectedly accelerated. This unexpected uptick in core inflation has led to speculation that the Bank of Japan (BoJ) may revise its inflation forecasts at the upcoming monetary policy meeting scheduled for the following week.
Ahead of the week, the EU’s agenda would feature GDP data, inflation figures, employment data, and Flash PMIs. On the Japanese front, the week's highlight would be the Bank of Japan’s monetary policy decision.
EUR/JPY Technical Levels
- The S&P 500 is extending declines into a two-week stretch, down over 5% for the period.
- S&P index down over 10% from the July peak at $4,600, enters correction territory.
- US Equities mixed on Friday as recession fears, lopsided earnings reports drag on stocks.
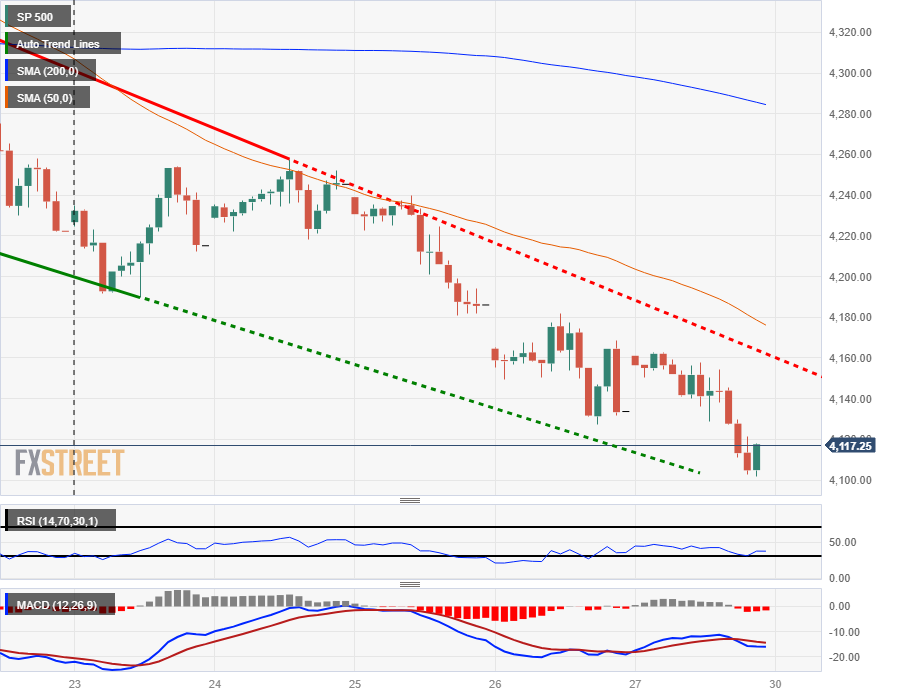
The Standard & Poor's index marked in the second losing week in a row, entering correction territory after falling 10% from July's high near $4,600.
The S&P 500 index closed Friday down around 20 points, shedding half a percent close out at $4,117.37, with the Dow Jones Industrial Average sinking over 366 points to shed 1.12%, closing Friday at $32417.59.
The NASDAQ Composite index bucked the bearish trend for Friday, closing up 47.41 points to end the day up almost 0.4%, closing at $12,643 plus one penny.
Equities got pushed broadly lower as inflation continues to remain a sticky problem for the Federal Reserve (Fed), with the US Personal Consumption Expenditure (PCE) Index showed consumer price spending rise by its fastest month-on-month pace since May, with the annual PCE cooling slightly into September, bringing "higher for longer" interest rate concerns back to the forefront.
The Fed is slated for another rate call next Wednesday, and while money markets are pricing in an expected rate hold next week, odds of an additional rate hike at December are steadily rising as the US economy remains firm compared to global competitors and inflation remains stubbornly higher than expected.
S&P Technical Outlook
The S&P stopped just short of slipping back into $4,100 in Friday's mostly bearish trading, and the major equity index continues to backslide, entering correction territory from July's peaks, and the S&P has locked in two consecutive weeks of red on the charts.
Daily candlesticks have tumbled past the 200-day Simple Moving Average (SMA) as bearish momentum firms up on the chart paper, and the last swing high into $4,400 sees added technical resistance from the 50-day SMA, currently settling into $4,350.
S&P Hourly Chart
S&P Technical Levels
- EUR/GBP bottomed at a low of around 0.8695 and then recovered toward 0.8715.
- The EUR traded firm on Friday after the ECB’s decision on Thursday to hold rates steady.
- Focus now shifts to next week's BoE decision on Thursday, which is also expected to hold rates steady at 5.25%.
At the end of the week, the EUR/GBP bulls did their job and defended the 200-day Simple Moving Average (SMA) at 0.8695 and cleared daily losses, jumping above 0.8700. On a weekly basis, the cross will tally a third consecutive week of gains despite facing selling pressure in the last sessions.
On Thursday, the European Central Bank (ECB) decided to hold rates steady, and Christine Lagarde highlighted that the economic struggles in the Eurozone justified the decision. She then pointed out that the incoming data will be the one which ultimately decides for how long the bank will maintain its rates at a restrictive level, and as for now, markets are betting on rate cuts in April next year.
On the other hand, markets await the Bank of England's (BoE) decision next week, expected not to deliver a hikes. However, the tone in the policy statement and Andrew Bailey’s words will likely impact the price dynamics of the GBP. In the meantime, investors are placing low odds of a hike in 2023, and rate cuts are too priced in until Q4 2024.
EUR/GBP levels to watch
Based on the daily chart, the EUR/GBP exhibits a bullish outlook for the short term. Both the Relative Strength Index (RSI) and Moving Average Convergence Divergence (MACD) remain in positive territory, with the RSI above its midline and showing a northward slope. The MACD is also displaying green bars, indicating that the bulls are holding their momentum. Additionally, the pair is above the 20,100,200-day Simple Moving Average (SMA), suggesting that the bears are struggling to challenge the overall bullish trend.
That being said, on the four-hour chart, the bearish momentum is still strong, with the mentioned indicators displaying a downward trend. The RSI managed to jump to positive territory, but the MACD still shows that the sellers still have some gas left in the tank.
Support levels: 0.8695 (200-day SMA), 0.8675 (20-day SMA), 0.8650.
Resistance levels: 0.8730, 0.8750, 0.8800.
EUR/GBP Daily Chart
-638340374658958051.png)
- The GBP/JPY slipped back towards the 181.00 handle heading into the Friday close.
- The Yen is seeing recovery across the marketspace, sending the GBP down 1.3% from the week's high.
- BoJ policy statement due next Tuesday, BoE rate call Thursday.
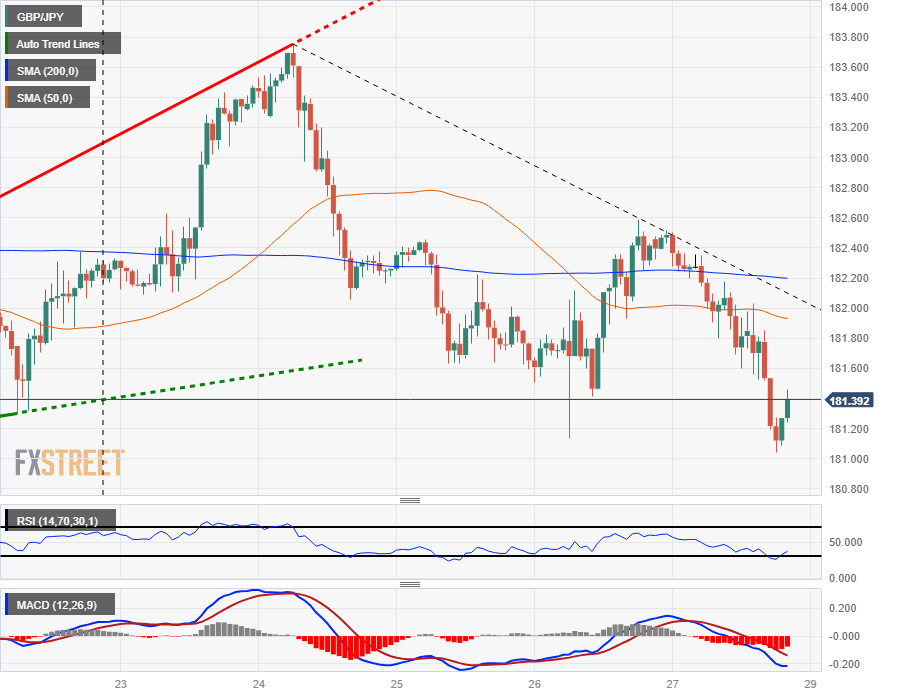
The GBP/JPY twisted back into familiar low side territory for the week, capping off Friday's trading just north of the 181.00 handle. The Guppy hit a fresh low for the week at 181.04 before catching a bounceback into 181.40 at the closing bell.
The pair is now set to drift into next week's central bank action, with both the Bank of Japan (BoJ) and the Bank of England (BoE) on the cards.
Tuesday sees the BoJ give their latest rate call, and investors are looking for adjustments in the Japanese central bank's policy regime. Japanese inflation continues to stick higher than BoJ policymakers initially expected, with the BoJ bluntly concerned about inflation flagging below their 2% minimum target.
Months of inflation running hotter has left Japanese consumers begging for action from the BoJ to defend their rapidly dwindling purchasing power at the hands of a crumbling Yen that has done little but decline as global interest rate differentials eat away at the JPY.
Despite a 3% pullback from 2023's highs near 168.80, the Yen remains down almost 17% against the Pound Sterling and the GBP/JPY pair up over 2,600 pips from the year's lows near 155.00 set back in January.
On the GBP side, the BoE is on the docket for Thursday with their latest rate call, but money markets have priced in a nearly guaranteed rate hold as the UK economy continues to flounder.
This week's employment and Purchasing Managers' Index figures published just this last Tuesday did little to bolster confidence in the UK economy, with an unexpected increase in the number of unemployment benefits seekers and mixed PMIs suggesting lagging growth which continues to chug.
GBP/JPY Technical Outlook
The GBP/JPY spent most of the week trading towards the downside as the Yen looks to firm up after a disastrous 2023. The Guppy hits the closing bell down 1.3% from the week's early Tuesday high of 183.75 near 181.40.
The 200-hour Simple Moving Average (SMA) continues to vex the GPB/JPY as the pair trades laterally against the near-term trend, and continued challenges to the downside could open the way for further declines heading into next week's central bank double showing.
Despite extreme overbought chart conditions, intraday traders might want to wait for a bullish reversal signal on the hourly candle Moving Average Convergence-Divergence (MACD) oscillator, while daily candlesticks see the Relative Strength Index (RSI) firmly planted in the midrange, pointing donwards.
GBP/JPY Hourly Chart
GBP/JPY Technical Levels
- Silver price jumps from $22.70 to $23.07, testing crucial resistance at 200-DMA of $23.26.
- A breach of 200-DMA could expose next resistance levels at $23.69 and Bollinger bands top at $23.80.
- If Silver falls below $23.00, supports are $22.94, $22.44, and 20-day EMA at $22.25.
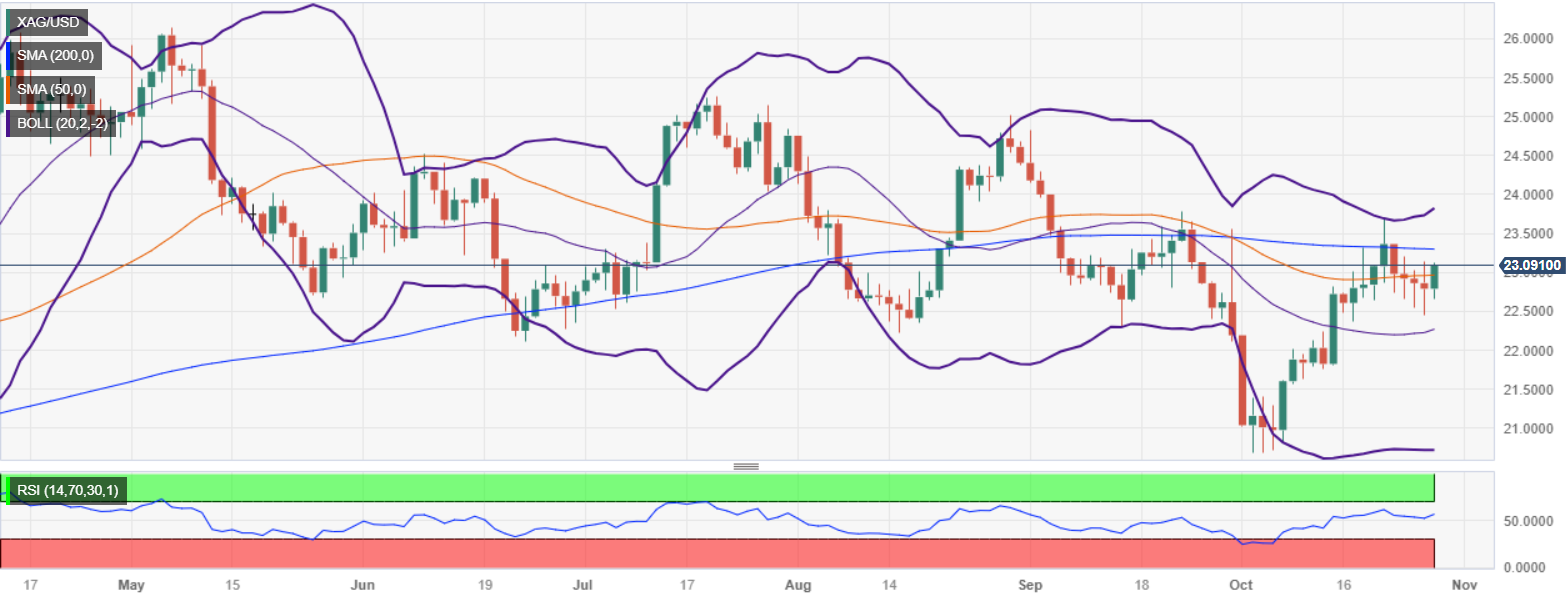
Silver price jumped above the $23.00 figure bolstered by a risk-off impulse, amidst geopolitical headlines suggesting the Middle East conflict is escalating, as Israel began its ground offensive at the Gaza strip. That said, the XAG/USD rose from $22.70 and is trading at $23.07, gaining more than 1.35%.
The XAG/USD remains downward biased despite rising above the 50-day moving average (DMA) at $22.94, about to test the crucial resistance level at the 200-DMA at $23.26. once that level is cruised, the next ceiling level would be $23.69, the latest cycle high. In a breach of that level, Silver bias would shift to neutral upwards, exposing the top of the Bollinger bands at $23.80,
Conversely, if Silver tumbles below $23.00, that would keep the downtrend in place. The first support would be the 50-DMA at $22.94, followed by the October 26 low of $22.44, before tumbling to challenge the 20-day Exponential Moving Average (EMA) at $22.25.
XAG/USD Price Action – Daily chart
XAG/USD Technical Levels
- The NZD/USD is back into Friday's lows as the US Dollar sees a late bid on Friday.
- The Kiwi continues to face topside rejection as broader markets choose safer havens.
- Kiwi traders will be looking ahead to next Tuesday's NZ labor figures.
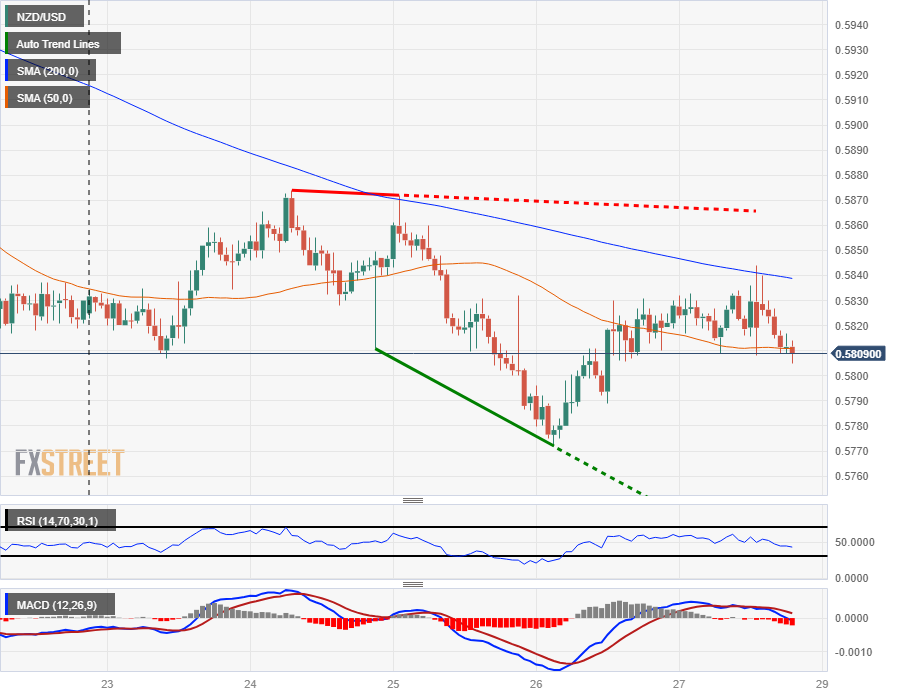
The NZD/USD is ticking back towards 0.5800 heading into the Friday market close, falling back from the day's peak near 0.5845 as traders step back into the Greenbac, tilting risk-off to wrap up the trading week.
The Kiwi hit a new eleven-month low this week, tapping 0.5772 on Thursday, and the NZD/USD is seeing resistance clamping off a successful rebound bid.
US Personal Consumption Expenditure (PCE) Index figures came in at expectations, and markets will be turning eyes towards next week's showing from the Federal Reserve (Fed), where the US central bank is broadly expected to hold off on rate hikes.
Investors will be keeping close watch of Fed Chairman Jerome Powell's speech slated for half an hour after the Fed's rate call, and market participants will be keeping an ear out for any changes to the Fed's rhetoric. Despite the expected rate hold, markets continue to see increasing odds of one last rate hike from the Fed in December as inflationary pressure continue to stick higher than markets had expected or hoped for.
Next week also sees New Zealand labor data late Tuesday. The NZ Unemployment Rate is expected to tick up from 3.6% to 3.9% for the 3rd quarter, and investors are expecting the NZ Employment Change to slowdown hiring, with Q3 new jobs expected to increase by only 0.4% compared to Q2's 1.0% even print.
NZD/USD Technical Outlook
The NZD/USD continues to face rejection from the 200-hour Simple Moving Average SMA), seeing a bounce back from the technical barrier twice this week, and Kiwi traders are struggling to find technical reasons to bid the NZD back up from the year's new lows near 0.5770.
Daily candlesticks see the NZD/USD trading firmly into the downside, tumbling from the last swing high into 0.6050, but overeager bulls looking to catch falling knives will probably want to wait until a bullish crossover signal on the Moving Average Convergence-Divergence (MACD) currently settling into oversold territory with directional momentum bleeding towards the midrange.
NZD/USD Hourly Chart
NZD/USD Technical Outlook
- GBP/USD sheds 0.12%, reversing from 1.2163 to 1.2112, as the Middle East conflict escalates.
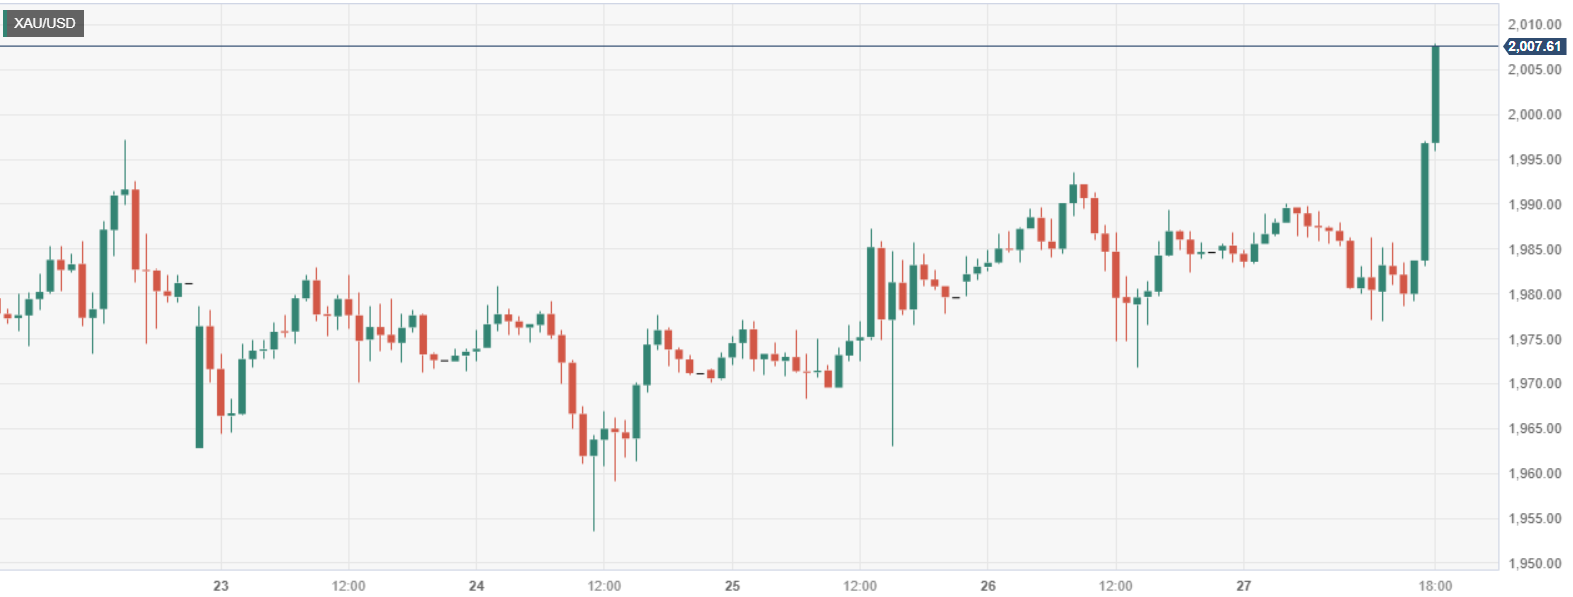
- Gold prices surge past $2,000, reflecting heightened market volatility and risk-off sentiment.
- Upcoming UK and US economic releases, including PMIs and monetary policy decisions, to provide further direction.
GBP/USD registers minimal losses of 0.12% after hitting a daily high of 1.2163 on risk appetite, but news headlines showing an escalation of the Middle East conflict weighed on the major. Therefore, the pair reversed its course trades at 1.2112, as sellers eye a test of 1.2100.
Pair reverses course from daily high as geopolitical tensions weigh on market sentiment
Volatility is the game's name, as shown by Gold prices climbing past $ 2,000 for the first time since May 16, 2023. News that Israel intensified its ground offensive in Gaza, destroying communications and Internet services in Palestina, according to Pallet, the Palestinian telecommunications company. Meanwhile, military Israeli authorities commented that they “have intensified attacks on Gaza. The Air Force is widely attacking subterranean targets and terror targets in a significant fashion.”
Reactions across the globe emerged, with the US urging Israel to stop a “full-scale” invasion, instead using a surgical approach using aircraft and special operation forces.
Aside from this, US economic data revealed earlier depicts inflation continues to ease, but it’s struggling to drop below the 3% threshold. The Fed’s preferred gauge for inflation, the Core PCE, ticked down from 3.8% to 3.7% YoY in September, while PCE was unchanged compared to August 3.4%.
Recently, the University of Michigan revealed that Consumer Sentiment slightly improved, but inflation expectations deteriorated. For a one-year period, Americans expect prices to rise by 4.2%, while for a five-year period, are expected to stay at 3%.
Next week, the UK economic docket will feature FS&P Global/CIPS PMIs alongside the Bank of England monetary policy decision. On the US front, the calendar would reveal the Conference Board Consumer Confidence, S&P Global and ISM Manufacturing PMIs, US Nonfarm Payrolls, and the US Federal Reserve monetary policy decision.
GBP/USD Technical Levels
A busy week lies ahead. Not only is the FOMC meeting scheduled, but the Bank of England and the Bank of Japan will also hold policy meetings. Inflation data from the Eurozone and employment figures from the US, New Zealand, and Canada will be released. Additionally, the ISM Services report is due in the US and Chinese PMIs. Geopolitical developments also remain key factors. Investors will continue to digest corporate earnings results.
Here is what you need to know for next week:
The US Dollar Index rebounded from one-month lows and posted weekly gains, trading around 106.50 and holding near the year-to-date highs. The Dollar's rally is regaining momentum, with a critical resistance level around the 107.00 area. The US economic data remains a crucial driver for the Dollar. This week, US Q3 GDP data exceeded expectations, showing a economic acceleration at the fastest pace since mid-2021.
Next week, the Federal Reserve (Fed) will announce its monetary policy decision. Market expectations suggest no change in policy despite the robust economy and tight labor market, as inflation slows but remains above target. In terms of economic data, the focus will be on employment figures, including the ADP Private Employment report on Wednesday, Jobless Claims on Thursday, and Nonfarm Payrolls on Friday. The Employment Cost Index, scheduled for release on Tuesday, one day before the FOMC decision, will also be important.
Despite declining Treasury yields, the DXY posted weekly gains. Robust US economic data and risk aversion supported the Greenback. Major Wall Street indices recorded their lowest weekly closes in months due to corporate results, geopolitical risks, expectations of higher interest rates for a longer period, and a gloomy global economic outlook
The European Central Bank (ECB) kept interest rates steady, and market consensus suggests they are done with rate hikes. The ECB ended a streak of ten consecutive rate hikes as inflation slowed down and amid increasing economic uncertainty with the Eurozone on the brink of recession.
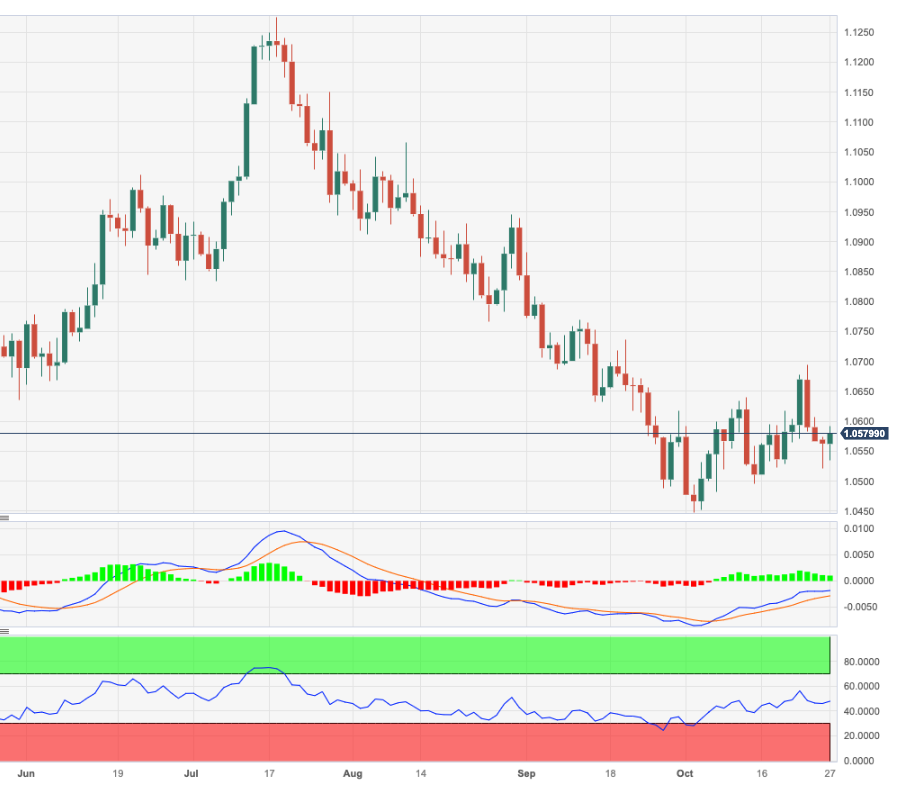
The Euro finished the week lower against the US Dollar, retreating from the monthly highs reached on Tuesday. EUR/USD encountered resistance at 1.0690, the confluence of the 55-week and 100-week Simple Moving Averages (SMA), and pulled back. The pair managed to avoid a close below 1.0500, which would indicate further weakness.
Eurozone inflation data is due next week, with preliminary figures for October. It will be crucial for market expectations and also for the ECB's outlook. A rebound in inflation could change the perception of the central bank, but it may not necessarily boost the Euro. The headline Consumer Price Index (CPI) for the region is expected to fall to 3.1% from 4.4%.
The Bank of Japan will announce its monetary policy decision on Tuesday. There could be news regarding an increase in the 10-year yield cap. A no change in policy here could impact the Japanese Yen, potentially increasing fears of intervention from Japanese authorities to curb the Yen's weakness. Market participants will also closely analyze the updated macro forecasts from the BoJ. USD/JPY pulled back sharply on Friday, ending the week in negative territory below 150.00.
GBP/USD failed to hold onto gains and finished the week with losses, posting the lowest weekly close since March. However, the pair avoided hitting new year-to-date lows, and stayed above 1.2100. The Bank of England (BoE) will have its monetary policy meeting, with consensus expecting no change.
Analysts at TD Securities on BoE:
There have been virtually no signs of strength in the recent data, and as such, we look for a comfortable 8-1 vote in favour of a hold. Moreover, forward guidance will likely be softened a bit, in light of the weaker economic outlook—signaling a pretty high bar for further hikes.
Next week, Chinese data, including the Purchasing Managers' Index (PMI), will be important for market sentiment and particularly for Antipodean currencies, which remain under pressure and are trading near monthly lows due to a stronger US Dollar, geopolitical factors, and the global outlook.
AUD/USD hit one-year lows but quickly rebounded to a familiar range between 0.6280 and 0.6400. The overall trend is downward, but a daily close above 0.6400 could indicate a more sustainable rebound.
Australia will report retail sales data next week. Market participants see that the Reserve Bank of Australia (RBA) could raise interest rates at their November 7 meeting, following the latest round of inflation data. The Australian Dollar was the best performer among G10 currencies during the week, driven by these expectations.
The Canadian Dollar was the weakest performer. USD/CAD rose for the fourth consecutive week, posting its highest close since October 2022 above 1.3850. Canada will release employment data next Friday.
Like this article? Help us with some feedback by answering this survey:
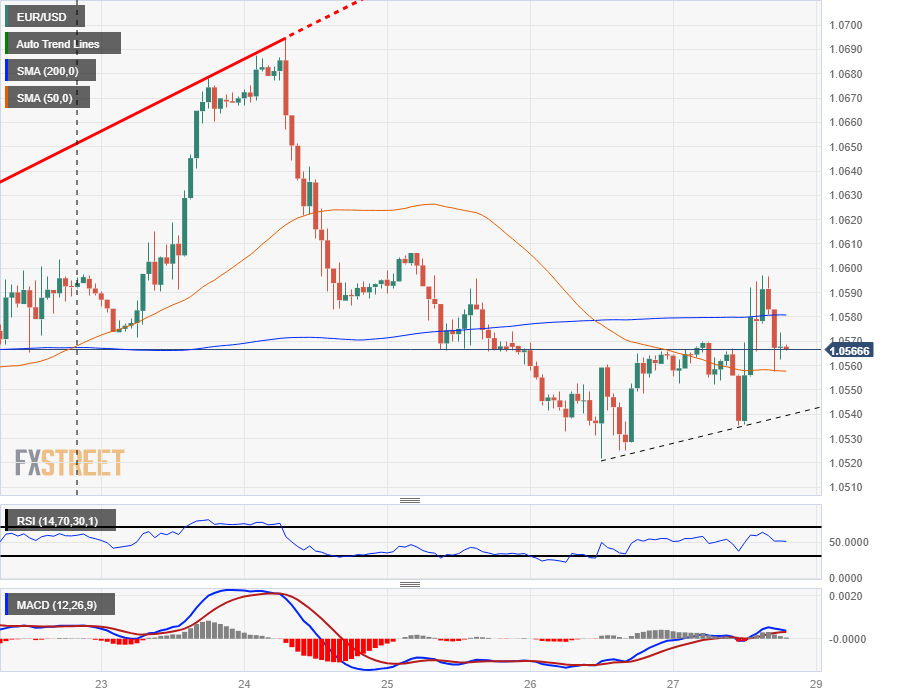
- The EUR/USD is seeing a pullback from the day's highs as risk aversion takes a bite on Friday.
- The US Dollar is seeing a recovery heading into the Friday closing bell, bouncing from the day's lows.
- US PCE came in as-expected, investors to turn their eyes toward Fed's next rate call.
The EUR/USD slipped back into the 1.0570 region in Friday's midday, with the Euro falling just short of retaking the 1.0600 handle before the trading week closes out.
The US Dollar (USD) is catching an intraday bid to recover from Friday's lows, with the US Dollar Index (DXY) recovering to the day's opening prices.
The Core US Personal Consumption Expenditure (PCE) Index came in at expectations, with the Federal Reserve's (Fed) preferred method of measuring inflation printing at 3.7% for the year into September, compared to August's print of 3.8%, which was revised down from 3.9%.
Coming up next week: EU GDP, HICP inflation, US Fed rate call
With the week's major data out of the way, investors will be looking ahead to next week which sees EU Harmonized Index of Consumer Prices (HICP) and EU Gross Domestic Product (GDP) on Tuesday, with another rate call from the Fed slated for Wednesday.
Wall Street is expecting European economic conditions to continue deteriorating, and EU GDP is forecast to decline to just 0.2% for the 3rd quarter, compared to 0.5% for 2Q, while EU HICP is expected to show pan-EU inflation dropping from 4.3% to 3.4% for the year into October.
Markets have broadly predicted the Fed to stand pat on interest rates next Wednesday, but traders will be keeping a close eye on the Fed's "dot plot" and Fed Chairman Jerome Powell's speech scheduled for 30 minutes after the rate statement gets released.
Despite money markets' bets on a hold from the Fed, traders continue to remain nervous about a possible rate hike from the Fed at their December meeting as US economic figures continue to print too good for markets to bet on rate cuts coming sooner rather than later.
EUR/USD Technical Outlook
The EUR/USD has backed off Friday's highs just below the 1.0600 handle, and the pair is set to round out the week's trading down 1.2% from Tuesday's peak near 1.0695.
On the daily candlesticks, the Euro is seeing limited success staging a rebound from 2023's lows near 1.0450 set in early October, with swing highs from a near-term higher lows pattern running into technical resistance from the 50-day Simple Moving Average (SMA).
EUR/USD Hourly Chart
EUR/USD Daily Chart
EUR/USD Technical Levels
- USD/NOK struck a high since late May on Thursday of 11.276.
- On Friday, the pair retreated to 11.170, seeing 0.20% losses.
- The Greenback trades soft in FX markets after PCE data from September.
In Friday’s session, the USD/NOK trades with losses, mainly driven by investors taking profits after the pair jumped to its highest level since May 31 on Thursday. Contributing to the downward trajectory, the US Dollar is trading weak after the September Core Personal Consumption Expenditures was reported to have decelerated as expected.
In line with that, the U.S. Bureau of Economic Analysis reported that the Core PCE Price Index from September aligned with the consensus. It came in at 3.7% YoY vs the expected 3.7% but fell in relation to it last reading of 3.8%. As a reaction, the 2-year rate stands at 5.03% while the 5 and 10-year yields are seen at 4.79% and 4.85%, respectively, with little movement.
It is worth noticing that higher US Treasury yields drove the recent NOK’s weakness, and as the rates retreat from multi-year highs, it limits the upward momentum from the pair. In addition, hawkish bets on the Federal Reserve (Fed) remain subdued, which could also pause the pair’s gains. That being said, the Fed meets next week, and investors will look for clues in the monetary policy statement and in Chair Powell’s press conference to continue betting on the next decisions. A pause for next week is practically priced in, but some market participants still forecast some odds of the Fed hiking by 25 bps in December, but those expectations may rise or fall based on the bank’s and Powell’s stance.
USD/NOK Levels to watch
The daily chart highlights a neutral to bullish technical outlook for USD/NOK as signs of exhaustion of the buying momentum become evident. The Relative Strength Index (RSI) displays a negative slope but is still in bullish territory, while the Moving Average Convergence (MACD) presents neutral green bars. However, the pair is above the 20,100,200-day Simple Moving Average (SMA), indicating a favorable position for the bulls in the bigger picture.
Support levels: 11.155, 11.083, 11.023 (20-day SMA),
Resistance levels: 11.200, 11.235, 11.276.
USD/NOK Daily Chart
-638340284244418528.png)
- WTI hit $85.50 as markets react to Israel expanding ground operations in the ongoing Gaza conflict.
- Reported progress on cease-fire talks appear to be having little effect.
- Crude Oil to remain prone to upside risks as geopolitical tensions weigh.
West Texas Intermediary (WTI) shot to a three-day high above $85.00 per barrel following reports of a rapid escalation of Israeli ground attacks in Gaza, alongside complete disruption of internet and telephone communications in the Gaza Strip.
According to Paltel Group, a Palestinian telecommunications company and one of the largest employers in the entire West Bank after the Palestinian government, said that Israel's latest air-to-ground offensive bombing has completely decimated telecommunications infrastructure in Gaza.
Israeli escalation of combined ground troops and aerial attacks on "underground targets" comes a day after Iranian Foreign Minister Hossein Amirabdollahian threatened that the US "would not be spared this fire" if Israel continues to escalate against Hamas. Foreign Minister Hossein Amirabdollahian made the blustering statement while at the United Nations (UN) on Thursday.
WTI Technical Outlook
After seeing a surge into a three-day high, WTI Crude Oil is settling back towards $85.00 per barrel as short-term investors take early profits on the lastest volatility spike.
Crude Oil is now trading into the north side the week's consolidation between $85.00 and $82.00.
$82.00 is proving to be a significant technical support level, while a bearish breakdown will see barrel bids challenging the 200-day Simple Moving Average (SMA) currently parked near $78.00.
On the top side, the last swing high sits just shy of the $90.00 major psychological level, while a break above 2023's ceiling of $93.98 would see WTI setting a 14-month high at the $94.00 handle.
WTI Daily Chart
WTI Technical Levels
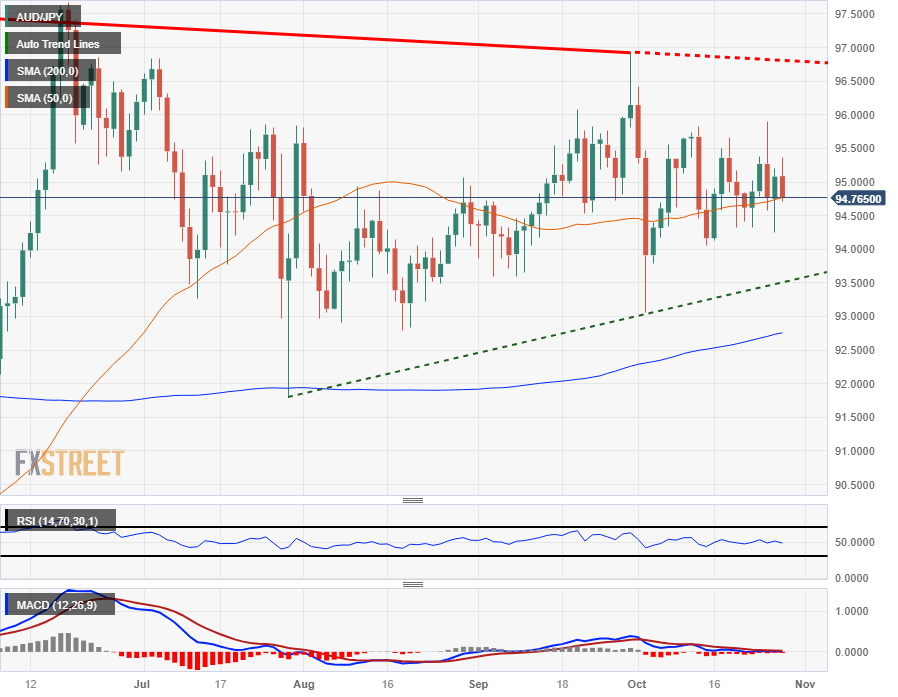
- The AUD/JPY is getting pushed back down into consolidation, slipping back beneath 95.00.
- The Yen is seeing a resurgence across the board on newfound strength.
- The Aussie is seeing recent gains get pared back heading into the end of the week.
The AUD/JPY is seeing downside for Friday as the Yen (JPY) catches a late bid to close out the trading week.
The Aussie (AUD) caught a mid-week bid after Australian inflation ticked higher than expected, pushing the Reserve Bank of Australia (RBA) closer towards additional rate hikes heading into the end of the year, but topside action for the AUD remains limited as the JPY finds some newfound strength.
Japanese inflation improved for October, with the annualized Tokyo Consumer Price Index (CPI) print early Friday coming in at 3.3% versus the previous month's 2.8%, largely owing to increasing energy prices.
Tokyo CPI excluding food and energy prices declined, albeit slightly, to 3.8% from the previous period's 3.9%, which itself was revised upwards from 3.8%.
AUD/JPY traders will be looking ahead to Monday's Aussie and Japan data readings, with Australian Retail Sales (forecast 0.3%, previous 0.2%) early, followed later in the day by Japanese Unemployment Rate (forecast 2.6%, previous 2.7%).
AUD/JPY Technical Outlook
Friday's decline for the Aussie sees the AUD/JPY pushing straight back into the 50-day Simple Moving Average (SMA) as the pair struggles to find momentum in the medium term; long-term support sits at the 200-day SMA just below 93.00 while the current ceiling on any bullish moves sits at late September's high near the 97.00 handle.
The Aussie is still up over 10% from 2023's lows against the beleaguered Yen, but a rebounding JPY could see the AUD/JPY set for a bearish trend formation.
AUD/JPY Daily Chart
AUD/JPY Technical Levels
- Gold price rallies to $2000 per troy ounce, bouncing back from daily lows of $1976.97.
- Escalating Middle East conflict and Israel military expanding its operations in Gaza.
Gold price finally broke the $2000 troy ounce barrier on Friday amidst increasing geopolitical risks, as the conflict between Israel and Hamas is at the brisk of spreading towards more countries in the region. At the time of writing, XAU/USD is trading at $2000 after the yellow metal bounced from daily lows of $1972.12
XAU/USD hits a significant milestone, fueled by Middle East conflicts and a weakening US Dollar
An escalation in the Middle East conflict keeps investors on their toes. Israel expanding ground operations in Gaza, shifted market sentiment. According to the Financial Times Israel "air force launched an intense bombardment that knocked out the enclave’s telecommunications systems."
ISreael Rear Admidal Daiel Hagari, a spokesman for Israel's military said "In recent hours, we have intensified attacks on Gaza. The air force is widely attacking subterranean targets and terror targets in a significant fashion."
Paltel, a Palestinian telecomos company said that Israel's bombardment, destroyed the remaining communications between Gaza and the outside world.
XAU/USD Reaction
Gold price skyrocketed from around $1985 towards the $2000 mark, achieving a daily high of $2006.91, with buyers eyeing the next target at around May 10 high of $2048.15. On the flip side, the first support is at $2000 a troy ounce, followed by the October 24 low of $1953.69.
- AUD/USD recovers from 0.6318 to trade around 0.6330s, up 0.22%.
- US core PCE at 3.7% YoY, below August's data, with general inflation at 3.4%, in line with forecasts.
- Australian inflation above 5%, increasing the likelihood of another RBA rate hike in the near term.
AUD/USD bounces off daily lows reached at 0.6318 and aims higher, registering gains of 0.22%, after economic data from the United States (US), although showed prices remain elevated, failed to shift speculations for additional rate hikes. At the time of writing, the pair exchanges hands at around 0.6330s.
Pair gains ground despite elevated US prices and potential for further RBA rate hikes
Inflation data in the US, as shown by the US Bureau of Economic Analysis (BEA), revealed the core Personal Consumption Expenditures (PCE), which the Fed uses as the primary reference for gauging inflation, rose by 3.7% YoY, below August’s data aligned with estimates, while general inflation remained unchanged compared to August’s 3.4%, aligned with forecasts. Even though inflation has slowed, the PCE has shown signs of bottoming around 3.4-—3.5%, indicating that inflation remains stubbornly above the Fed’s 2% goal.
Recently, the University of Michigan (UoM) Consumer Sentiment on its final reading for October came at 63.8 above forecasts but deteriorated compared to August, while inflation expectations were upward revised from one year, from 3.8% to 4.2%. For the mid-term, inflation is expected at 3%, as foreseen.
On the Aussie front, the latest inflation report witnessed prices standing above 5%, increasing the odds for another rate hike by the Reserve Bank of Australia. The ASX RBA rate tracker projects a 47% chance for a 25-bps rate hike at the upcoming monetary policy meeting.
Notably: On the geopolitical front, AP reported that Israeli ground forces are expanding activity in Gaza, which could shift market sour, and weigh on the AUD/USD pair.
AUD/USD Price Analysis: Technical outlook
The daily chart portrays the AUD/USD formed a hammer, from which prices had bounced toward the current exchange rate. However, if buyers want to regain control, they must clear the 50-day moving average (DMA) at 0.6394, ahead of the 0.6400 figure. The next resistance would be the October 11 high of 0.6445, but it would remain shy of the latest cycle high of 0.6522. Conversely, if AUD/USD stays beneath 0.6400, that would keep the downtrend intact, and sellers could threaten to push prices past the current year-to-date (YTD) low of 0.6270. Next support emerges at 0.66200.
- The USD/CHF rose to a two-week high around 0.9035 near the 20-day SMA.
- The CHF is one the worst-performing currencies in the session.
- The US Dollar is trading soft after PCE figures from September.
- Hawkish bets on the Fed remain low ahead of next week’s meeting.
At the end of the week, the USD/CHF rose for a fourth consecutive day, near 0.9035, piercing through the 200-day Simple Moving Average (SMA) but then getting rejected by the 20-day average. The pair’s trajectory seems to be the CHF’s weakness, which trades with losses against the USD, EUR,GBP and JPY in Friday’s sessions and was one of the weakest currencies in the session.
On the other hand, the US Dollar is also trading soft after key inflation data reported earlier in the session. The U.S. Bureau of Economic Analysis revealed that the Core Personal Consumption Expenditures (PCE) Price Index, the Fed’s preferred gauge of inflation, from September, aligned with the consensus. The figure came in at 3.7% YoY, vs. the consensus of 3.7% and decelerated from its previous figure of 3.8%. In addition, The headline PCE Price Index from September came in at 3.4% YoY, vs the expected 3.4% and remained steady regarding its previous figure of 3.4%.
Other data reported strong Consumer Sentiment figures released by the University of Michigan (UoM), which came in at 68.3 vs 68. The 5-year inflation expectations from the same university figures didn’t reveal any surprise and stood at 3%.
Elsewhere, the US government bond yields are seen neutral, with some rates rising and others declining. The 2-year rate stands at 5.03%, while the 5 and 10-year yields are at 4.79% and 4.87%, respectively. In addition, dovish bets on the Federal Reserve (Fed) are still high, and the CME Fed Watch tool indicates that a pause in the next week’s meeting is practically priced in while the odds of a hike in December retreated to 20%. In that sense, the combination of lower US yields and dovish bets on the Fed may limit the upward trajectory of the pair.
USD/CHF Levels to watch
Based on the daily chart, the technical outlook for USD/CHF remains neutral to bullish as the bulls recovered a significant amount of ground during the week. The Relative Strength Index (RSI) jumped above the 50 middle point, while the Moving Average Convergence (MACD) exhibited decreasing red bars.
On the other hand, the pair is below the 20-day Simple Moving Average (SMA), but above the 100 and 200-day SMAs, highlighting the continued dominance of bulls in the broader outlook. However, if the bulls want to continue climbing higher, the 20-day average must be conquered.
Support levels: 0.9000 (200-day SMA), 0.8990, 0.8950.
Resistance levels: 0.9035 (20-day SMA), 0.9050, 0.9070.
USD/CHF Daily Chart
-638340238735586205.png)
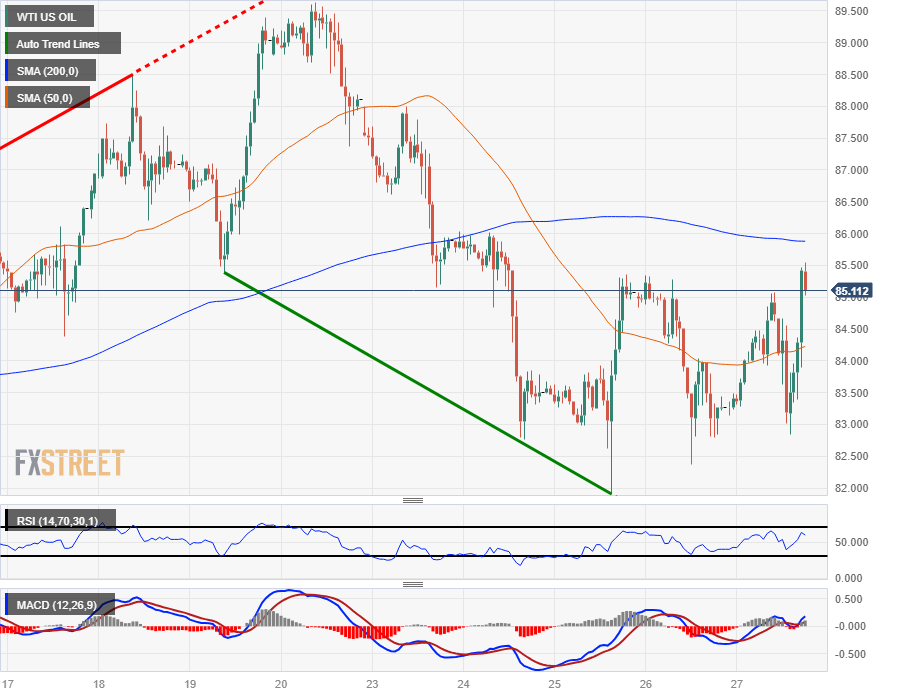
- WTI is seeing some back-and-forth for Friday.
- US Crude Oil barrels bounding between $85.00 and $83.00 per barrel.
- Oil markets remain concerned about Middle East tensions, but global slowdown hard to ignore.
West Texas Intermediary (WT) Crude Oil barrels are seeing some tension in the midrange on Friday, in play between $85.00 and $83.00 USD per barrel as energy markets spread their bets to the middle.
Oil markets continue to roil as Middle East headlines print across the tape, and barrel traders remain focused on developments in the Gaza Strip conflict.
Two separate Egyptian Red Sea towns were hit by errant projectiles early Friday, perfectly highlighting global markets' concerns about potential spillover into neighboring regions in the escalating Israel-Hamas conflict.
Israel is facing global pushback on their planned full-scale invasion of Gaza, and so far has not executed their strategy, but Israeli forces still saw their largest ground attack of the contested region on Friday.
On Thursday Iran's Foreign Minister Hossein Amirabdollahian threatened intentional geopolitical turmoil while at the United Nations (UN), stating that the United States would "not be spared from this fire" if Israel continued to attack Hamas forces.
The current escalation was sparked by a Hamas rocket barrage three weeks ago that set a record for the number of people killed in a single attack up to that point.
Despite geopolitical tensions spilling out from the Jordan region, energy investors are having a hard time ignoring hardening signs of global growth weakness, and concerns are mounting in fossil fuels that demand for Crude Oil barrels is going to slump in the coming months.
WTI Technical Outlook
WTI Crude Oil is currently strung up in consolidation with candlesticks trading firmly inside familiar daily ranges. US Crude Oil is currently down almost 5% for the week as WTI cycles $84.00 per barrel.
$82.00 is proving to be a significant technical support level, while a bearish breakdown will see barrel bids challenging the 200-day Simple Moving Average (SMA) currently parked near $78.00.
On the top side, the last swing high sits just shy of the $90.00 major psychological level, while a break above 2023's ceiling of $93.98 would see WTI setting a 14-month high at the $94.00 handle.
WTI Daily Chart

WTI Technical Levels
- The Canadian Dollar continues to lose ground, down 1% on the week.
- Loonie traders will be looking ahead to Canada GDP figures next Tuesday.
- Crude Oil prices also down for the week, draining support from the CAD.
The Canadian Dollar (CAD) is seeing more declines for Friday and is set to mark a fourth lower day in a row as Loonie traders are having a difficult time finding reasons to bid the CAD.
It’s a quiet market on Friday, but next week brings Canada Gross Domestic Product (GDP) numbers on Tuesday. CAD investors can expect to get jostled frequently by US data all through next week. The Federal Reserve (Fed) makes another rate call on Wednesday and US Non-Farm Payrolls (NFP) are slated for next Friday. The latter coincides with Canadian wages and employment figures.
Daily Digest Market Movers: Canadian Dollar continues backslide, Loonie tumbles against US Dollar
- The CAD is down 1.5% and counting from the week’s highest bids against the USD.
- Friday is set to be day number four of consecutive losses for the Loonie as markets bid the Greenback.
- The BoC has a significant uphill climb before it as inflation risks continue to increase.
- Canadian economic growth is also faltering, limiting the BoC’s policy toolkit.
- Tuesday’s upcoming Canada GDP reading will be important for CAD traders, could see Canada’s technical recession steepen further.
- Despite risks, BoC says they’re willing to raise rates further “if needed”.
- Next week will close out with another US NFP print.
Technical Analysis: USD/CAD hits 12-month high, heading for 1.3900
The Canadian Dollar (CAD) is slumping into new lows for the year against the US Dollar (USD), sending the USD/CAD toward the 1.3900 handle on Friday. The pair is currently trading near 1.3870, and all it will take is one last push to reclaim the price level the pair hasn’t seen since October 2022.
A technical support zone from 1.3600 to 1.3650 stands nearby to bump any downside corrections, with the 50-day Simple Moving Average (SMA) rising into the 1.3600 handle to add further support.
Further beyond that, the 200-day SMA is turning bullish and catching some lift into 1.3500.
The USD/CAD is now up nearly 6% from 2023’s bottom bids of 1.3092.
USD/CAD Daily Chart

US Dollar price today
The table below shows the percentage change of US Dollar (USD) against listed major currencies today. US Dollar was the strongest against the Swiss Franc.
| USD | EUR | GBP | CAD | AUD | JPY | NZD | CHF | |
| USD | -0.19% | 0.02% | 0.36% | -0.15% | -0.45% | 0.18% | 0.44% | |
| EUR | 0.18% | 0.18% | 0.53% | 0.03% | -0.27% | 0.36% | 0.62% | |
| GBP | -0.01% | -0.18% | 0.34% | -0.16% | -0.47% | 0.15% | 0.44% | |
| CAD | -0.36% | -0.55% | -0.34% | -0.51% | -0.81% | -0.17% | 0.09% | |
| AUD | 0.14% | -0.06% | 0.15% | 0.49% | -0.31% | 0.32% | 0.58% | |
| JPY | 0.45% | 0.26% | 0.48% | 0.79% | 0.32% | 0.67% | 0.89% | |
| NZD | -0.18% | -0.39% | -0.15% | 0.17% | -0.34% | -0.64% | 0.27% | |
| CHF | -0.44% | -0.63% | -0.43% | -0.08% | -0.60% | -0.90% | -0.26% |
The heat map shows percentage changes of major currencies against each other. The base currency is picked from the left column, while the quote currency is picked from the top row. For example, if you pick the Euro from the left column and move along the horizontal line to the Japanese Yen, the percentage change displayed in the box will represent EUR (base)/JPY (quote).
Canadian Dollar FAQs
What key factors drive the Canadian Dollar?
The key factors driving the Canadian Dollar (CAD) are the level of interest rates set by the Bank of Canada (BoC), the price of Oil, Canada’s largest export, the health of its economy, inflation and the Trade Balance, which is the difference between the value of Canada’s exports versus its imports. Other factors include market sentiment – whether investors are taking on more risky assets (risk-on) or seeking safe-havens (risk-off) – with risk-on being CAD-positive. As its largest trading partner, the health of the US economy is also a key factor influencing the Canadian Dollar.
How do the decisions of the Bank of Canada impact the Canadian Dollar?
The Bank of Canada (BoC) has a significant influence on the Canadian Dollar by setting the level of interest rates that banks can lend to one another. This influences the level of interest rates for everyone. The main goal of the BoC is to maintain inflation at 1-3% by adjusting interest rates up or down. Relatively higher interest rates tend to be positive for the CAD. The Bank of Canada can also use quantitative easing and tightening to influence credit conditions, with the former CAD-negative and the latter CAD-positive.
How does the price of Oil impact the Canadian Dollar?
The price of Oil is a key factor impacting the value of the Canadian Dollar. Petroleum is Canada’s biggest export, so Oil price tends to have an immediate impact on the CAD value. Generally, if Oil price rises CAD also goes up, as aggregate demand for the currency increases. The opposite is the case if the price of Oil falls. Higher Oil prices also tend to result in a greater likelihood of a positive Trade Balance, which is also supportive of the CAD.
How does inflation data impact the value of the Canadian Dollar?
While inflation had always traditionally been thought of as a negative factor for a currency since it lowers the value of money, the opposite has actually been the case in modern times with the relaxation of cross-border capital controls. Higher inflation tends to lead central banks to put up interest rates which attracts more capital inflows from global investors seeking a lucrative place to keep their money. This increases demand for the local currency, which in Canada’s case is the Canadian Dollar.
How does economic data influence the value of the Canadian Dollar?
Macroeconomic data releases gauge the health of the economy and can have an impact on the Canadian Dollar. Indicators such as GDP, Manufacturing and Services PMIs, employment, and consumer sentiment surveys can all influence the direction of the CAD. A strong economy is good for the Canadian Dollar. Not only does it attract more foreign investment but it may encourage the Bank of Canada to put up interest rates, leading to a stronger currency. If economic data is weak, however, the CAD is likely to fall.
- The US Dollar is trading soft against its rivals and seems to be consolidating the last session's gains.
- The Core PCE from September matched expectations at 3.7% YoY.
- The US bond yields are mixed, while dovish bets on the Fed remain high.
- Focus now shifts to next week's FOMC decision.
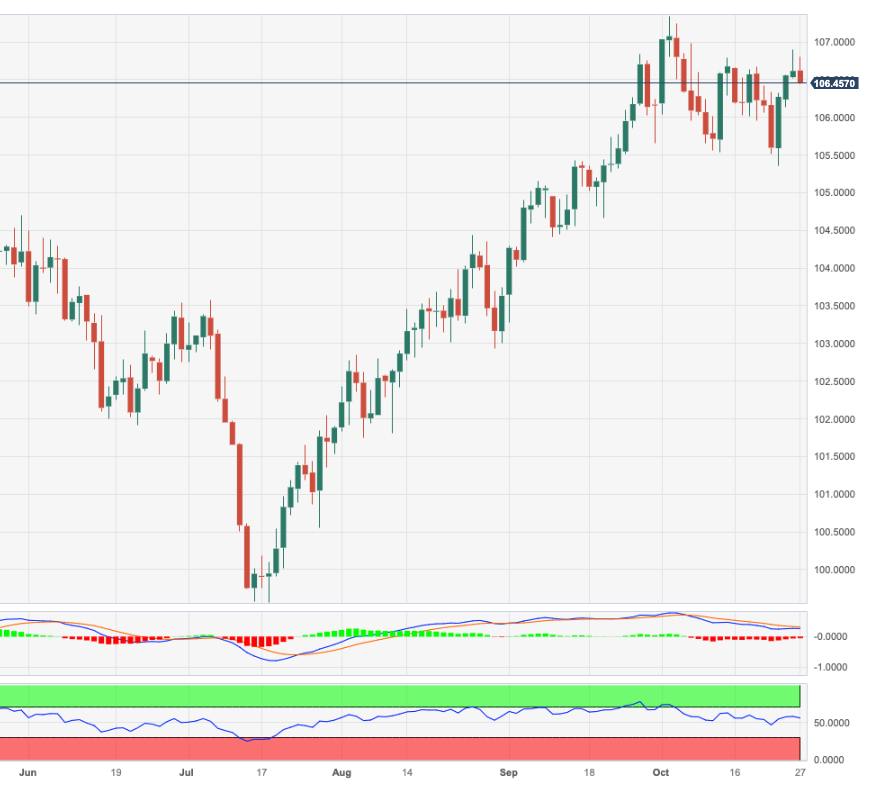
The US Dollar (USD) measured by the US Dollar Index (DXY) declined to 106.35, near the 20-day Simple Moving Average (SMA), and will likely close with a winning week. Datawise, Personal Consumption Expenditures (PCE) figures from September showed no surprises, and investors seem to be taking profits after three consecutive days of gains.
The United States economy is holding strong, as seen in the last set of economic activity figures, which included a preliminary estimate of the Q3 Gross Domestic Product (GDP) rising at an annualised rate of more than 4%. Investors now set their sights on next week's Federal Reserve (Fed) decision on the first day of November to gather further clues on the bank's next steps.
Daily Digest Market Movers: US Dollar declines as PCE decelerated in September, yields mixed
- The US DXY index fell toward 106.35, down by 0.25% after gaining nearly 1% in the last three sessions.
- The US Bureau of Economic Analysis reported that September's headline PCE Price Index matched the expected value. It came in at 3.4% YoY vs the expected 3.4% and showed no changes regarding its last figure of 3.4%. The Core figure came in at 3.7% YoY, vs. the consensus of 3.7% and decelerated from its previous figure of 3.8%, which was revised lower.
- Other data showed that the Michigan Consumer Index came in higher than expected at 63.8 vs the 68 expected but failed to trigger a significant reaction from the Greenback.
- In the meantime, US Treasury yields are mixed. The 2-year rate stands at 5.03%, and the 5 and 10-year yields are at 4.79% and 4.85%, respectively.
- For next week’s Fed’s decision, markets have practically priced in a pause, but the monetary policy statement and Chair Powell’s words will be closely watched to position for the next meeting in December.
- According to the CME FedWatch Tool, the odds of a hike in the year's last meeting declined to nearly 20%.
Technical Analysis: US Dollar Index bulls must defend the 20-day SMA to keep rising
Based on the daily chart, the technical outlook for DXY Index remains neutral to bullish as the bulls gathered significant momentum in the last sessions. To keep it, they must defend the 20-day Simple Moving Average (SMA) at 106.35.
Meanwhile, the Relative Strength Index (RSI) has a negative slope above its midline, while the Moving Average Convergence Divergence (MACD) indicator prints stagnant red bars. Furthermore, the pair is above the 20,100 and200-day SMAs, indicating a favourable position for the bulls in the bigger picture.
Supports: 106.35 (20-day SMA), 106.00, 105.70.
Resistances: 107.00, 107.30, 107.50.
US Dollar FAQs
What is the US Dollar?
The US Dollar (USD) is the official currency of the United States of America, and the ‘de facto’ currency of a significant number of other countries where it is found in circulation alongside local notes. It is the most heavily traded currency in the world, accounting for over 88% of all global foreign exchange turnover, or an average of $6.6 trillion in transactions per day, according to data from 2022.
Following the second world war, the USD took over from the British Pound as the world’s reserve currency. For most of its history, the US Dollar was backed by Gold, until the Bretton Woods Agreement in 1971 when the Gold Standard went away.
How do the decisions of the Federal Reserve impact the US Dollar?
The most important single factor impacting on the value of the US Dollar is monetary policy, which is shaped by the Federal Reserve (Fed). The Fed has two mandates: to achieve price stability (control inflation) and foster full employment. Its primary tool to achieve these two goals is by adjusting interest rates.
When prices are rising too quickly and inflation is above the Fed’s 2% target, the Fed will raise rates, which helps the USD value. When inflation falls below 2% or the Unemployment Rate is too high, the Fed may lower interest rates, which weighs on the Greenback.
What is Quantitative Easing and how does it influence the US Dollar?
In extreme situations, the Federal Reserve can also print more Dollars and enact quantitative easing (QE). QE is the process by which the Fed substantially increases the flow of credit in a stuck financial system.
It is a non-standard policy measure used when credit has dried up because banks will not lend to each other (out of the fear of counterparty default). It is a last resort when simply lowering interest rates is unlikely to achieve the necessary result. It was the Fed’s weapon of choice to combat the credit crunch that occurred during the Great Financial Crisis in 2008. It involves the Fed printing more Dollars and using them to buy US government bonds predominantly from financial institutions. QE usually leads to a weaker US Dollar.
What is Quantitative Tightening and how does it influence the US Dollar?
Quantitative tightening (QT) is the reverse process whereby the Federal Reserve stops buying bonds from financial institutions and does not reinvest the principal from the bonds it holds maturing in new purchases. It is usually positive for the US Dollar.
- Japanese Yen rebounds after Tokyo inflation data increases bets the Bank of Japan (BoJ) will tighten policy.
- The US Dollar loses traction after US inflation comes out in line with estimates.
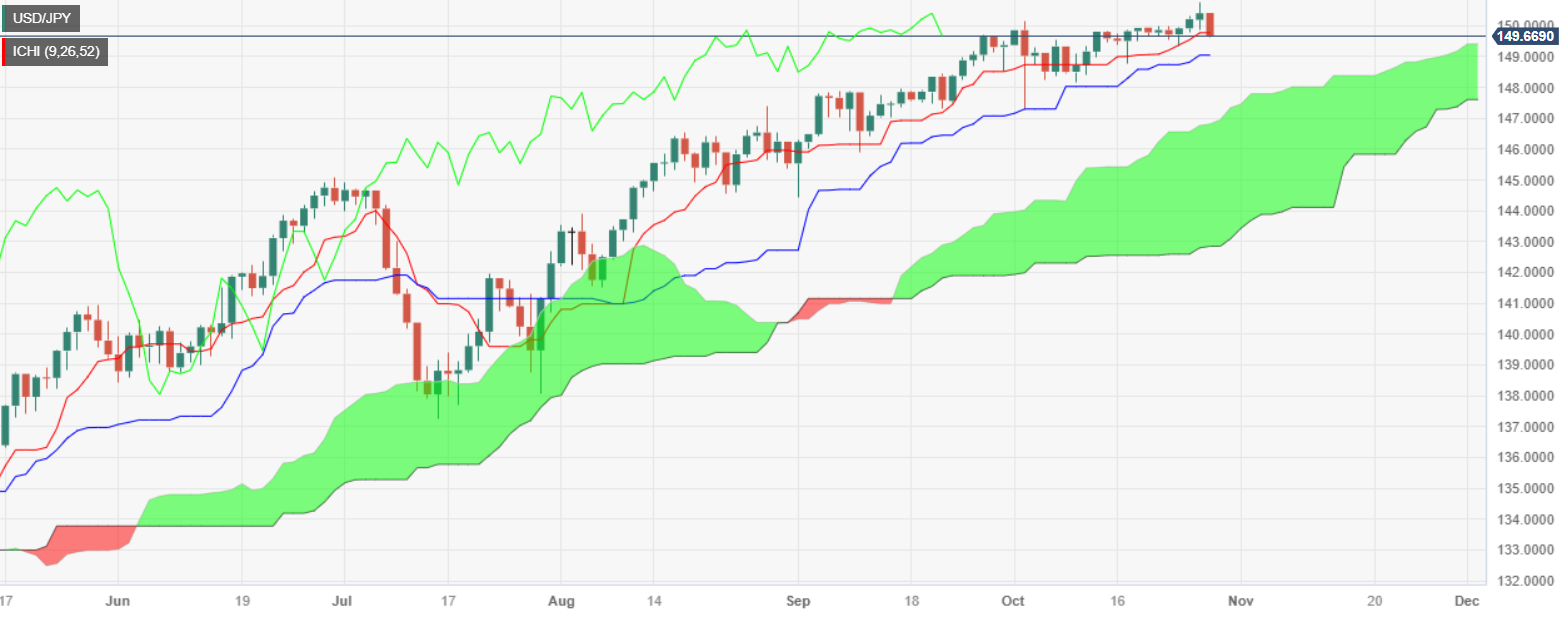
- The USD/JPY remains in uptrend but price falling to key make-or-break trendline for short-term chart.
The Japanese Yen (JPY) finally boxed its way out of its corner on Friday, strengthening against most counterparts, after the release of Tokyo inflation data spurred bets the Bank of Japan (BoJ) will raise interest rates – broadly seen as positive for the currency.
The USD/JPY exchange rate, which measures the number of Yen that can be bought with a single US Dollar (USD), fell back below the key 150 level on Friday after briefly flirting with a breakout higher. The level is seen by many as subject to intervention by the Japanese Ministry of Finance (MoF), after it intervened when the pair hit 151.94 last October. Whether the MoF intervened to support the Yen this time around is subject to speculation.
From a technical perspective, despite Friday’s long decline, USD/JPY remains in an uptrend, on a short, medium and long-term basis. Since “the trend is your friend” according to the old adage, this suggests more upside is probable despite the dip.
Daily digest market movers: Japanese Yen strengthens after Tokyo data
- The Japanese Yen rises at the end of the week after Tokyo inflation data for October – widely seen as a leading indicator for Japan-wide inflation – came out higher than experts had expected.
- Tokyo CPI ex Fresh Food came out at 2.7%, beating expectations of 2.5% and the previous year’s 2.5%.
- Broad inflation in Tokyo rose 3.3% compared to only 2.8% in October of last year.
- Tokyo CPI ex Food, Energy came out at 3.7% versus 3.8% a year ago.
- The higher inflation raised expectations for the Bank of Japan (BoJ) raising interest rates, which would be supportive for JPY.
- The Federal Reserve’s (Fed) preferred inflation gauge, Core Personal Consumption Expenditures - Price Index (data for September), showed inflation in line with estimates when it was released on Friday.
- Core PCE rose 0.3% in the month of September as expected but higher than the previous month’s 0.1%. It rose 3.7% on a YoY basis, also as expected, and below the previous 3.8% figure.
- The yield on the 10-year Japanese Government Bond (JGB) slipped to 0.876% on Friday, while the US 10-year Treasury yield also slid to 4.869%.
- The fall in US yields (-0.05%), however, was greater than that of their Japanese counterparts (-0.01%), partly explaining why the pair fell.
- USD/JPY is widely seen as reflecting the yield differential between the two countries’ bonds.
- This is due to the ‘carry trade’ in which investors borrow in a currency with low interest rates such as the Yen and park the money in a currency with higher interest rates such as the US Dollar, making a profit on the difference as long as the funding currency – in this case the Yen – does not appreciate.
Japanese Yen technical analysis: Decline reaches key trendline
USD/JPY falls back below the 150 key psychological level on Friday. Despite the weakness the pair has not fallen sufficiently to change the overall bullish trend – not even on the short-term charts.
The uptrend is, therefore, still likely to resume. The next major target is at the 152.00 highs achieved in October 2022.
The pair has completed an ascending triangle on the daily chart and broken above the 150.16 high of October 3, confirming a breakout. The triangle’s technical target is at around 152.
-638340168860742192.png)
US Dollar vs Japanese Yen: Daily Chart
A re-break above Thursday’s highs of 150.80 would provide fresh confirmation of the continued advance.
The pair is approaching a key trendline on the short-term charts at around 149.50, however, and a decisive break below the line would probably flip the trend bearish on that time frame.
Such a move would probably precipitate a decline to the 148.70s initially.
A decisive break would be characterized by a long red bearish candle that broke cleanly through the trendline and closed close to its lows, or three red candles in a row that broke cleanly through the trendline with the final candle closing near its lows.
Triangles are sometimes the penultimate formations in a trend, suggesting the chance the current uptrend may be getting near its culmination point.
Japanese Yen FAQs
What key factors drive the Japanese Yen?
The Japanese Yen (JPY) is one of the world’s most traded currencies. Its value is broadly determined by the performance of the Japanese economy, but more specifically by the Bank of Japan’s policy, the differential between Japanese and US bond yields, or risk sentiment among traders, among other factors.
How do the decisions of the Bank of Japan impact the Japanese Yen?
One of the Bank of Japan’s mandates is currency control, so its moves are key for the Yen. The BoJ has directly intervened in currency markets sometimes, generally to lower the value of the Yen, although it refrains from doing it often due to political concerns of its main trading partners. The current BoJ ultra-loose monetary policy, based on massive stimulus to the economy, has caused the Yen to depreciate against its main currency peers. This process has exacerbated more recently due to an increasing policy divergence between the Bank of Japan and other main central banks, which have opted to increase interest rates sharply to fight decades-high levels of inflation.
How does the differential between Japanese and US bond yields impact the Japanese Yen?
The BoJ’s stance of sticking to ultra-loose monetary policy has led to a widening policy divergence with other central banks, particularly with the US Federal Reserve. This supports a widening of the differential between the 10-year US and Japanese bonds, which favors the US Dollar against the Japanese Yen.
How does broader risk sentiment impact the Japanese Yen?
The Japanese Yen is often seen as a safe-haven investment. This means that in times of market stress, investors are more likely to put their money in the Japanese currency due to its supposed reliability and stability. Turbulent times are likely to strengthen the Yen’s value against other currencies seen as more risky to invest in.
- Mexican Peso extends its gains, printed a 7-day low below 18.00, on risk-on impulse.
- Mexico's trade deficit widened to $-1.481 billion in September but didn't impact Peso's rally.
- US inflation data came out in line with estimates and the market is skeptical the Fed will raise rates past the current range.
Mexican Peso (MXN) rallies against the US Dollar (USD) early in the North American session amid some risk appetite improvement despite Mexico’s worse-than-expected economic data. Inflation in the United States (US) met estimates, as revealed by the US Bureau of Economic Analysis (BEA). Even though it justifies another US Federal Reserve (Fed) hike, market participants are pricing in an end to the Fed’s tightening cycle. The USD/MXN is trading at 18.08, down 0.49%.
Mexico’s Balance of Trade in September was $-1.481 billion, worse than the consensus of $-0.700 billion, and August's $-1.377 billion, for a seasonally adjusted deficit of $-822 million. The data did not trigger a reaction in the USD/MXN, which plunged after the Core Personal Consumption Expenditures (PCE) report. The Fed’s preferred gauge for inflation showed that prices climbed in line with estimates in September on a monthly and annual basis and sponsored the USD/MXN next leg down from around 18.15 towards its daily low at 17.99.
Market participants remain skeptical that the Fed will raise rates past the current 5.25% - 5.50% range, as demonstrated by the CME FedWatch Tool.
Daily Digest Market Movers: Mexican Peso revives, USD/MXN drops below 18.10
- Mexico’s September Trade balance printed a deficit of $-1.418 billion, worse than August’s and estimates of $-1.377 billion and $-0.71 billion, respectively.
- US PCE Index rose by 3.4% YoY, unchanged from August and in line with estimates.
- US Core PCE annually based, cooled from August’s 3.8% to 3.7% in September, but came out as expected.
- US Q3 GDP grows at an annualized rate of 4.9%, higher than the 4.2% consensus.
- On October 24, Mexico's National Statistics Agency INEGI reported annual headline inflation hit 4.27%, down from 4.45% at the end of September, below forecasts of 4.38%.
- Mexico’s core inflation rate YoY was 5.54%, beneath forecasts of 5.60%.
- Earlier this week, S&P Global Manufacturing PMIs evidenced expansion in US manufacturing and service sectors during October.
- The Bank of Mexico (Banxico) held rates at 11.25% in September and revised its inflation projections from 3.50% to 3.87% for 2024, above the central bank’s 3.00% target (plus or minus 1%).
Technical Analysis: Mexican Peso climbs as USD/MXN slides below the 20-day SMA at around 18.08
The USD/MXN uptrend remains intact despite Friday’s dip below the 18.00 figure, which puts the 20-day Simple Moving Average (SMA) at 18.08 at risk of being decisively broken to the downside. A daily close below the latter could pave the way for a fall below 18.00 and a test of the 200-day SMA at 17.72. On the flip side, if the exotic pair remains above the 20-day SMA, the next resistance will emerge at the October 26 high at 18.42 before challenging last week’s high at 18.46, ahead of challenging the 18.50 figure.
Mexican Peso FAQs
What key factors drive the Mexican Peso?
The Mexican Peso (MXN) is the most traded currency among its Latin American peers. Its value is broadly determined by the performance of the Mexican economy, the country’s central bank’s policy, the amount of foreign investment in the country and even the levels of remittances sent by Mexicans who live abroad, particularly in the United States. Geopolitical trends can also move MXN: for example, the process of nearshoring – or the decision by some firms to relocate manufacturing capacity and supply chains closer to their home countries – is also seen as a catalyst for the Mexican currency as the country is considered a key manufacturing hub in the American continent. Another catalyst for MXN is Oil prices as Mexico is a key exporter of the commodity.
How do decisions of the Banxico impact the Mexican Peso?
The main objective of Mexico’s central bank, also known as Banxico, is to maintain inflation at low and stable levels (at or close to its target of 3%, the midpoint in a tolerance band of between 2% and 4%). To this end, the bank sets an appropriate level of interest rates. When inflation is too high, Banxico will attempt to tame it by raising interest rates, making it more expensive for households and businesses to borrow money, thus cooling demand and the overall economy. Higher interest rates are generally positive for the Mexican Peso (MXN) as they lead to higher yields, making the country a more attractive place for investors. On the contrary, lower interest rates tend to weaken MXN.
How does economic data influence the value of the Mexican Peso?
Macroeconomic data releases are key to assess the state of the economy and can have an impact on the Mexican Peso (MXN) valuation. A strong Mexican economy, based on high economic growth, low unemployment and high confidence is good for MXN. Not only does it attract more foreign investment but it may encourage the Bank of Mexico (Banxico) to increase interest rates, particularly if this strength comes together with elevated inflation. However, if economic data is weak, MXN is likely to depreciate.
How does broader risk sentiment impact the Mexican Peso?
As an emerging-market currency, the Mexican Peso (MXN) tends to strive during risk-on periods, or when investors perceive that broader market risks are low and thus are eager to engage with investments that carry a higher risk. Conversely, MXN tends to weaken at times of market turbulence or economic uncertainty as investors tend to sell higher-risk assets and flee to the more-stable safe havens.
Assuming further steps towards policy normalisation by the BoJ, economists at Rabobank see USD/JPY moving to 148 on a three-month view.
Policy tweak from the BoJ would reinforce psychological resistance at 150
Since the current cap on 10-year JGBs is at 1.0%, it is likely that any tweak to YCC on October 31 would allow yields to push above this level. Allowing JGB yields to increase should remove some downside pressure on the value of the JPY.
While we expect that USD strength will dominate in the coming months, a policy tweak from the BoJ would likely reinforce psychological resistance at the 150 level.
A steady BoJ policy decision this month is likely to enhance the downside pressure on the JPY vs. the USD and increase the risk of a move toward 152.
Our forecast of a move back to USD/JPY 148 on a three-month view assumes further policy normalisation by the BoJ and continued speculation of a potential exit from negative rates in 2024.
The risk of supply disruptions is likely to keep volatility high in global gas markets, economists at ANZ Bank report.
Gas supply risks remain
Global gas markets are entering the northern winter in good shape, but this does not diminish the supply risks from geopolitical tensions.
We see more downside risks than upside, and the balance could shift quickly should weather and supply issues go against the market.
While unlikely to return to levels seen 12 months ago, European and Asian prices are likely to remain elevated leading into the heating season.
Economists at Wells Fargo expect the Japanese Yen to remain on the defensive. However, the USD/JPY is set to move back lower toward 146 by end-2024.
Yield differentials should move in favor of the JPY over the longer term
Dollar weakness can spark a longer-term recovery in many of the foreign currencies for which we expect a near-term decline, although we also believe the Japanese Yen can recover more than most over time.
For some time, higher US Treasury yields, a hawkish Fed and an accommodative Bank of Japan have weighed on the Japanese yen. Should the Fed indeed cut policy rates as we expect, and even if the BoJ continues to tighten monetary policy only very gradually, yield differentials should move in favor of the Japanese Yen over the longer term. As these dynamics unfold, we expect USD/JPY to push toward 146.00 by the end of next year.
Geopolitics have once again taken centre stage. Economists at Danske Bank analyze Oil’s outlook after war breaking out in the Middle East.
Limited impact from crisis in Middle East
The crisis in the Middle East has so far had little spillover to the oil market, which is reasonable given that the oil supply has not been effected. Hence, for now, oil prices are affected mainly through a higher risk premium.
We look for Brent to average $85/bbl in Q4 and $80/bbl next year.
OPEC+ looks to have a preference for Brent to trade in the $80-$110/bbl range.
The US will likely only resume buying oil for its strategic reserves if prices fall below $80/bbl again.
- USD/CAD sets to recapture annual high around 1.3870 despite the USD Index coming under pressure.
- Monthly US core PCE accelerated at an expected pace of 0.3% in September against 0.1%.
- Oil prices retreat from $85.00 despite escalating Middle East tensions.
The USD/CAD pair comes closer to an annual high around 1.3870 as global oil prices retreat after facing stiff barricades above the crucial resistance of $85.00. The Lonnie asset gains almost 0.15%, at the time of writing, despite a sell-off in the US Dollar. The Loonie asset strengthened despite a sharp fall in the US Dollar Index (DXY) indicating that the Canadian Dollar is significantly weak.
The S&P500 opens on a positive note but struggles for a firm footing as the broader market mood is risk-off amid a focus on Middle East tensions. Investors see further escalation in Mid-East conflicts as the Pentagon reported that the US army carried out air strikes on bases in eastern Syria.
The USD Index dropped vertically to near 106.30 as the steady United States core Personal Consumption Expenditure (PCE) price index report is insufficient to impact the widely anticipated unchanged monetary policy decision by the Federal Reserve (Fed) on November 1. Monthly US core PCE accelerated at an expected pace of 0.3% in September against 0.1% growth in August. The annual core PCE rose by 3.7% but decelerated from the August reading of 3.9%.
As per the CME Fedwatch tool, traders see the Fed keeping interest rates unchanged at 5.25-5.50% almost certain. The odds of one more interest rate increase in any of the two remaining monetary policy meetings in 2023 have dipped sharply to 20%.
Meanwhile, investors continue to dump the Canadian Dollar amid declining oil prices. It is worth noting that Canada is the leading exporter of oil to the United States and higher oil prices support the Canadian Dollar.
The impact of climate change could trigger “safe-haven” demand for Gold, in the view of analysts at HSBC.
Climate change can have a similar impact on Gold as other geopolitical events
Climate change impacts are likely to bring economic, financial, political, and even social disruptions across the world, which could trigger ‘safe-haven’ demand for Gold.
While Gold mining is one of the most carbon-intensive mining activities, our precious metals analyst thinks its high value, the small quantity mined, and the circularity of Gold − 30% of annual supply is recycled, with a minimal carbon footprint − brings overall lifetime emissions below other metals, making its story more positive.
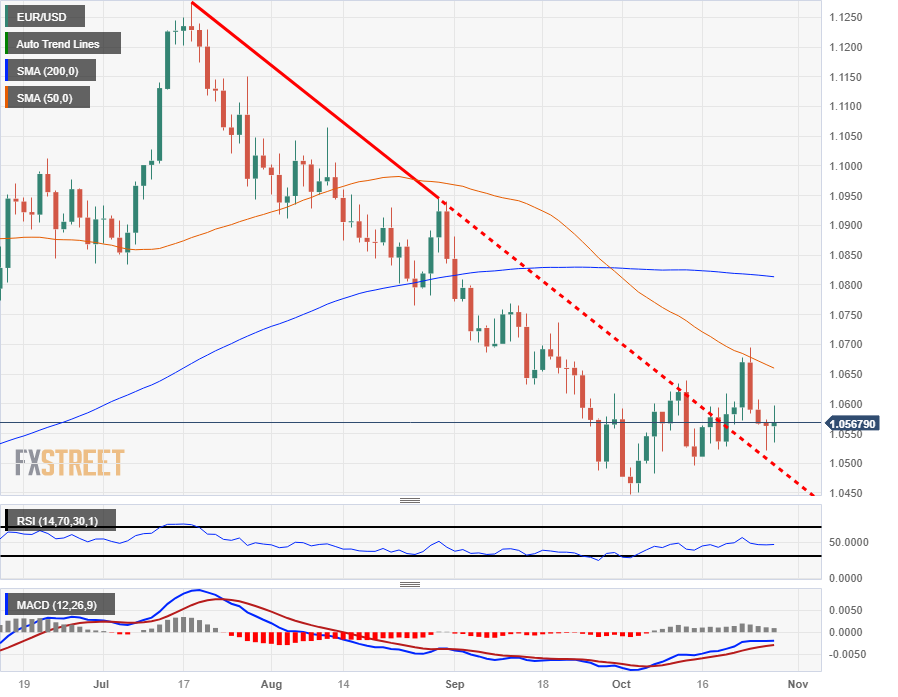
- EUR/USD manages to regain upside traction on Friday.
- Further gains could revisit the 1.0700 region sooner rather than later.
EUR/USD leaves behind part of the recent three-day negative streak and approaches the 1.0700 zone.
In case bulls keep pushing, the pair should meet the next hurdle at the round level of 1.0700 prior rot the weekly peaks of 1.0736 (September 20) and 1.0767 (September 12).
In the meantime, while below the 200-day SMA at 1.0812, the pair’s outlook should remain negative.
EUR/USD daily chart
- USD/JPY drops from daily high of 150.41 to 149.70s, down 0.40%, amid strengthening Yen.
- US core PCE for September at 3.7% YoY, with general inflation at 3.4%, both in line with estimates.
- Tokyo's core inflation rose to 2.7% YoY, exceeding forecasts of 2.5%, while headline data rose above 3.3% YoY, above September’s 2.8%.
USD/JPY retreats from daily highs of 150.41 reached during the Asian session, extending its losses below the 150.00 figure after the Japanese Yen (JPY) strengthened, following an uptick in Japan’s inflation. Meanwhile, economic data in the United States (US) shows inflation appears to be stickier than expected, though sponsored a leg down in the major, toward the 149.60s area, down 0.45%.
Japanese Yen gains ground following uptick in Japan's inflation, while US data shows sticky inflation
The US Federal Reserve (Fed) preferred gauge for inflation was reported early on Friday, as the core Personal Consumption Expenditures (PCE) in September rose by 3.7% YoY, as expected but below August’s 3.8%, while general inflation stood at 3.4%, YoY aligned with estimates and the prior’s month numbers.
Additional data in the report released by the US Bureau of Economic Analysis (BEA) showed an increase in Personal Spending, at 0.7% MoM, above forecasts of 0.5%, showing that consumer spending is gathering pace, following yesterday's Gross Domestic Product (GDP) report for Q3, at 4.9%, crushing estimates of 4.3%.
Despite all that, expectations for further Fed rate increases remain subdued, as shown by the CME FedWatch Tool, which foresees no hikes for December 2023 and witnessed January’s 2024 odds diminish to 28.91%, from 1-month ago of 37.7%. Consequently, the US 2-year Treasury bond yield retreated two basis points, although it sits at 5.02%, weighed on the Greenback, which is down 0.25%, with the US Dollar Index (DXY) hoovering at 106.34.
Aside from this, core inflation in Tokyo, usually seen as a leading indicator of nationwide inflation, accelerated unexpectedly, raising speculations the Bank of Japan (BoJ) could revise up its inflation forecasts at the upcoming week’s monetary policy meeting.
USD/JPY Price Analysis: Technical outlook
The USD/JPY daily chart shows the pair dipped toward the Tenkan-Sen at 149.75, which, if broken, the air can slide to the Kijun-Sen at 149.02. further support lies below that level, at October’s 17 swing low of 148.73. Conversely, if buyers reclaim 150.00, the next resistance would be the October 26 high at 150.77.
In a backdrop of Dollar strength combined with grim local economic outlooks, economists at Wells Fargo expect the Euro and Pound to underperform.
Softer Pound and Euro through early 2024
Sentiment surveys for both economies have softened sharply in recent months, and European underperformance relative to the US should weigh on both currencies.
The European Central Bank and Bank of England have also signaled that policy rates have likely reached their peak, thus lessening interest rate support for their respective currencies.
Against this backdrop, we see a softer Pound and Euro through early 2024, targeting a low for GBP/USD around 1.1600 and a low for EUR/USD around 1.0200.
- DXY now comes under some downside pressure near 106.50.
- Occasional bullish attempts should meet the next hurdle near 107.00.
DXY sees its recent upside momentum somewhat trimmed and revisits the mid-106.00s at the end of the week.
If the index breaks above the weekly top at 106.89 (October 26), it could then target the round level of 107.00 prior to the 2023 high of 107.34 (October 3).
So far, while above the key 200-day SMA, today at 103.39, the outlook for the index is expected to remain constructive.
DXY daily chart
Economists at Wells Fargo expect the Canadian Dollar to underperform through early 2024.
Potential for further Loonie weakness
With inflation gradually heading lower we believe Bank of Canada rate hikes are done, and that rates cuts could begin in Q2-2024, ahead of the Federal Reserve.
As Canadian growth remains subdued and in the absence of further BoC tightening, we also see potential for further Canadian Dollar weakness.
The USD/CAD exchange rate has already reached our medium-term target of 1.3700, but a further move closer to 1.4000 over the next several months cannot be ruled out.
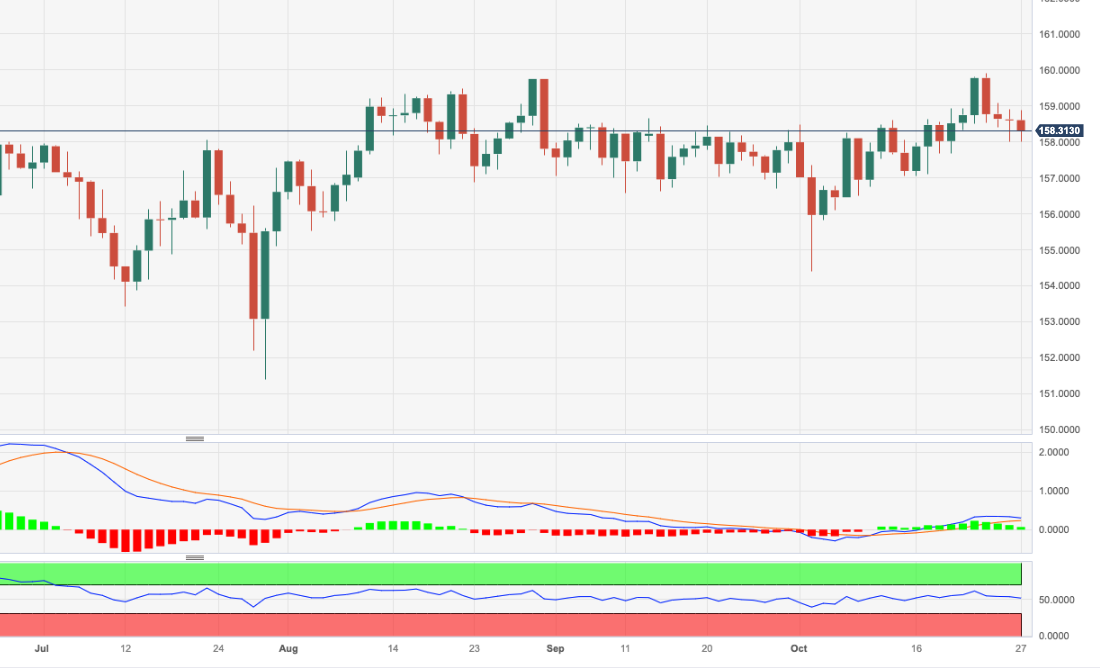
- EUR/JPY resumes the downside and revisits the 158.00 zone.
- So far, the 55-day SMA around 158.00 acts as a decent contention.
EUR/JPY fades Thursday’s small uptick and re-shifts its attention to the downside on Friday.
Following the ongoing price action, the cross could have now entered a consolidative phase. Against that, the breakout of this theme could encourage the index to challenge the 2023 top at 159.91 (October 24) closely followed by the round level at 160.00.
So far, the longer term positive outlook for the cross appears favoured while above the 200-day SMA, today at 151.18.
EUR/JPY daily chart
AUD/USD has declined notably over the past month. Economists at Danske Bank analyze the pair’s outlook.
The rate hiking cycle is most likely over
The Reserve Bank of Australia (RBA) remained on hold in October, and we think the rate hiking cycle is most likely over.
If inflation remains under control and global central banks start to signal a more cautious outlook, we see room for a tactical uptick in AUD/USD, but maintain a modestly downward-sloping forecast profile in 12M horizon.
Forecast: 0.64 (1M), 0.64 (3M), 0.63 (6M), 0.62 (12M)
- Silver price remains depressed below $23.00 despite sticky US core PCE data.
- Higher US bond yields keep the Silver price on the backfoot.
- Major growth to Q3 GDP was contributed by robust consumer spending.
Silver price (XAG/USD) witnesses some selling pressure as the United States Bureau of Economic Analysis (BEA) has reported that the core Personal Consumption Expenditure (PCE) price index for September remained in line with expectations.
Federal Reserve’s (Fed) preferred inflation gauge rose at a higher pace of 0.3% as expected against a nominal increase of 0.1%, recorded in August. The annual core PCE inflation data decelerated to 3.7%, in line with estimates, from the August reading of 3.9%.
The US Dollar Index (DXY) drops sharply as core PCE inflation is consistently declining while the Silver prices remain under pressure due to a sharp rebound in 10-year US Treasury yields to near 4.87%. Going forward, investors will shift focus to the Fed’s monetary policy.
As per the CME Fedwatch tool, traders see the Fed keeping interest rates unchanged at 5.25-5.50% almost certain. The odds of one more interest rate increase in any of the two remaining monetary policy meetings in 2023 have dipped sharply to 20%.
Fed policymakers hope that high US Treasury yields are sufficient to dent overall spending and investment. Cleveland Fed Bank President Loretta Mester said last week that higher bond yields are equivalent to one interest rate hike of 25 basis points (bps).
The blockbuster Q3 Gross Domestic Product (GDP) report, released on Thursday, indicated that investments by businesses were dipped for the first time in two years due to higher borrowing costs. However, major growth was contributed by robust consumer spending and higher residential investment.
Silver technical analysis
Silver price continues to defend the support zone plotted in a range of $22.40-22.56 on a two-hour scale. The 50-period Exponential Moving Average (EMA) continues to act as a barricade for the Silver price bulls.
The Relative Strength Index (RSI) (14) oscillates in the 40.00-60.00 range, which indicates that investors await a potential trigger for building fresh positions.
Silver two-hour chart
-638340088548715847.png)
Senior Economist at UOB Group Alvin Liew and Associate Economist Jester Koh comment on the recently released Industrial Production performance in Singapore.
Key Takeaways
The contraction in Singapore’s Sep IP narrowed significantly to -2.1% y/y from Aug’s revised reading of -11.6% y/y (prev: -12.1%). The improvement in Sep’s IP was better than Bloomberg’s consensus of -4.5% y/y and UOB’s estimate of 5.4% y/y. On a seasonally adjusted sequential basis, IP expanded 10.7% m/m sa in Sep, a reversal from the revised -10.8% m/m sa contraction in Aug (prev: 10.5%). Similarly, the Sep m/m sa reading was stronger than Bloomberg consensus for a 8.1% m/m sa expansion and our estimate of 7.0% m/m sa. In the first 9 months of 2023, IP contracted by -5.8% y/y.
This marks the 12th consecutive month of y/y decline, exceeding the previous worst streak (which was in 2015 that recorded 11 straight months of y/y declines).
We maintain our 2023 full-year industrial production forecast at -7.0%. With the Sep IP broadly in-line with the official implied projection (est -1.9% y/y) during the 3Q23 advance GDP release and a smaller contraction in the revised Aug IP reading, 3Q23 manufacturing likely fell by a milder -4.6% y/y (advance estimate: -5.0%) which may push the 3Q23 GDP marginally higher to 0.8% y/y (prev: 0.7%), assuming the other segments remain unchanged.
Gold is in considerable demand as a safe haven. Strategists at Commerzbank analyze the yellow metal’s outlook.
Fed’s decision unlikely to influence Gold very much
In view of the tense situation in the Middle East, the Gold price could even reach the $2,000 mark in the near future.
Gold should remain in demand in this environment, meaning that the Fed’s decision is unlikely to influence it very much.
See – Gold Price Forecast: XAU/USD outfaces US GDP strength and increasing chances of further hikes – Commerzbank
CAD remains soft and may struggle to improve materially in the short run, economists at Scotiabank report.
USD/CAD may drop back to the mid-1.37s in the short run
Losses have edged below short-term trend support and may see spot drop back to the mid-1.37s in the short run but trend signals are USD-bullish and scope for USD/CAD losses appears limited at the moment.
Persistent USD gains through 1.37+ are starting to make a mark on ultra-long-term charts where the 1.37 point has been firm resistance on a monthly close basis. A high close for the USD through October would tilt risks towards a bit more strength in the near term at least but the broader set up – the USD is heavily overbought technically on the longer-term charts – does not clearly lend itself to a significant, further strengthening in the USD at this point. A high USD close on the month would warrant attention though.
EUR/USD holds in tight range. Economists at Scotiabank analyze the pair’s outlook.
Sell-off has stalled
Softer US Core PCE data could provide some lift for spot intraday but more sustained EUR gains will have to await some compression in still significant yield differentials.
Modest gains from support in the low 1.05 area on Thursday give the short-term chart a slightly positive tinge but more gains are needed today to give a bit more confidence that the rebound can extent.
The best we can say from a technical point of view is that the EUR sell-off has stalled.
Support is 1.0520. Resistance is 1.0570/1.0580.
GBP/USDD recovers from sub-1.21 levels again but progress is limited, economists at Scotiabank report.
The pattern of trade around the recovery is bullish
Cable’s rebound from sub-1.21 levels on Thursday extends the pattern of firm support for the GBP below the figure seen through October so far.
The pattern of trade around the recovery is bullish from a technical point of view but the lack of follow through demand today leaves gains stalled.
Intraday gains above 1.2150/1.2155 should see Cable progress a little further at least to 1.2175/1.2200.
- The Greenback rallies ahead of the last important data point for this week.
- US yields sunk lower after attempting to soar back to 5% on Thursday.
- The US Dollar Index is set to lock in a fresh weekly gain.
The US Dollar (USD) had a wild ride again on Thursday as the European Central Bank turned out to be a non-event. Rather the wild ride in the US equity markets thereafter made the US Dollar Index (DXY) pull back. The sell-off in US equities, with the Nasdaq leading the decline, saw investors flee to safe havens such as US bonds.
On the economic data front the focal point this Friday is the Personal Consumption Expenditures Index. Both the monthly change and the change against last year are both expected to further continue their decline. Any uptick might trigger a knee jerk reaction in the markets.
Daily digest: US Dollar best in the bunch
- Biggest data point for this Friday comes in around 12:30 GMT with the Personal Consumption Expenditures Index
- The Core monthly Price Index is expected to head from 0.1% to 0.3%.
- The Core yearly Price Index is expected to head from 3.9% to 3.7%.
- The Overall monthly Price Index is expected to head from 0.4% to 0.3%.
- The Overall yearly Price Index is to head from 3.5% to 3.4%.
- Personal Income for September is expected to stay steady at 0.4%.
- Personal Spending for September is to head from 0.4% to 0.5%.
- Near 14:00 the last data point for this week is expected with the Michigan Consumer Sentiment Index for October
- Consumer Sentiment is expected to stay steady near 63.
- The Consumer inflation expectation is to stay near 3%.
- Equities are in the green as investors are picking up the pieces from the steep decline on Thursday. In Asia the Hang Seng is up 2%. Europe experiences mild gains with on average 0.50% on the board. US equity futures are seeing Nasdaq futures up 1%.
- The CME Group’s FedWatch Tool shows that markets are pricing in a 99.4% chance that the Federal Reserve will keep interest rates unchanged at its meeting in November.
- The benchmark 10-year US Treasury yield trades at 4.88%, retreating a bit further as markets are heading into safe haven assets after the steep decline from US tech stocks overnight.
US Dollar Index technical analysis: US Dollar hit rejection
The US Dollar is trading in the green for this week, although a rejection on the topside on Thursday might see those weekly profits getting a touch smaller. The rejection came after the US Dollar Index (DXY) peaked on the back of a snooze fest ECB meeting. Do not expect a full paring back, though a very firm rally in the DXY is neither anticipated, ahead of the Federal Reserve meeting next week.
The DXY has consolidated above 106.00 and looks to keep stretching higher. Line in the sand is 106.84 that has triggered a rejection on the topside. Once broken through there, the high of October at 107.35 comes into play for a retest.
On the downside, the recent resistance at 105.88 did not do a good job supporting any downturn and now completely has lost its importance. Instead, look for 105.12, which is a pivotal historic line and almost falls in line with the 55-day Simple Moving Average (SMA) to keep the DXY above 105.00, and which worked already quite ahead of it on Tuesday. Should this level fail to do the trick, a big air pocket could develop and see the DXY drop to 103.74, near the 100-day SMA, before finding ample support.
US Dollar FAQs
What is the US Dollar?
The US Dollar (USD) is the official currency of the United States of America, and the ‘de facto’ currency of a significant number of other countries where it is found in circulation alongside local notes. It is the most heavily traded currency in the world, accounting for over 88% of all global foreign exchange turnover, or an average of $6.6 trillion in transactions per day, according to data from 2022.
Following the second world war, the USD took over from the British Pound as the world’s reserve currency. For most of its history, the US Dollar was backed by Gold, until the Bretton Woods Agreement in 1971 when the Gold Standard went away.
How do the decisions of the Federal Reserve impact the US Dollar?
The most important single factor impacting on the value of the US Dollar is monetary policy, which is shaped by the Federal Reserve (Fed). The Fed has two mandates: to achieve price stability (control inflation) and foster full employment. Its primary tool to achieve these two goals is by adjusting interest rates.
When prices are rising too quickly and inflation is above the Fed’s 2% target, the Fed will raise rates, which helps the USD value. When inflation falls below 2% or the Unemployment Rate is too high, the Fed may lower interest rates, which weighs on the Greenback.
What is Quantitative Easing and how does it influence the US Dollar?
In extreme situations, the Federal Reserve can also print more Dollars and enact quantitative easing (QE). QE is the process by which the Fed substantially increases the flow of credit in a stuck financial system.
It is a non-standard policy measure used when credit has dried up because banks will not lend to each other (out of the fear of counterparty default). It is a last resort when simply lowering interest rates is unlikely to achieve the necessary result. It was the Fed’s weapon of choice to combat the credit crunch that occurred during the Great Financial Crisis in 2008. It involves the Fed printing more Dollars and using them to buy US government bonds predominantly from financial institutions. QE usually leads to a weaker US Dollar.
What is Quantitative Tightening and how does it influence the US Dollar?
Quantitative tightening (QT) is the reverse process whereby the Federal Reserve stops buying bonds from financial institutions and does not reinvest the principal from the bonds it holds maturing in new purchases. It is usually positive for the US Dollar.
Economist at UOB Group Ho Woe Chen, CFA, reviews the latest GDP figures in South Korea.
Key Takeaways
South Korea’s advance 3Q23 GDP growth came in better than consensus and our forecasts at 1.4% y/y, 0.6% q/q SA. This was also the third consecutive quarter of sequential growth.
With the exception of facilities investment, all the components on the expenditure side registered q/q expansion in 3Q23.
South Korea’s economy expanded by around 1.1% y/y in the first three quarters of the year. The above consensus growth in 3Q23 suggests slight upside to our full-year 2023 GDP forecast of 1.3% if the momentum continues to strengthen into the current quarter.
The National Bank of Hungary (NBH) lowered the base rate by 75 bps to 12.25% from 13.00% on Tuesday, October 24. Nonetheless, economists at Standard Chartered expect the Forint (HUF) to remain solid.
Carry particularly attractive for HUF
We think the HUF should continue to trade well, despite recent rate cuts.
For Hungary, the Czech Republic and Poland (CE3), carry is particularly attractive.
The one negative for the HUF, compared to the rest of CE3, is a lack of FX reserves. Because of this, it is more at risk of a sell-off if global conditions worsen.
EUR/USD remains roughly unchanged in the aftermath of the ECB policy announcement. Economists at MUFG Bank analyze the pair’s outlook.
EUR/USD moves will be driven by the emergence of weaker US economic data
A renewed energy spike due to the Israel-Hamas conflict broadening out to include Iran is a risk for Europe and for EUR more specifically. We currently assume that does not happen.
The primary determinant of EUR/USD moves we think will come from the US Dollar side and will be driven by the emergence of weaker US economic data.
EUR/USD remains resilient but we still see scope for a more sustained break below 1.0500 but maintain that levels below parity are unlikely.
- NZD/USD aims for stabilization above 0.5800 as the market sentiment improves.
- The 10-year US Treasury yields rebounded to 4.87% ahead of core PCE inflation data.
- NZD/USD delivers a V-shape recovery after a selling climax near 0.5772.
The NZD/USD pair discovered buying interest near an 11-month low at 0.5770 and climbed above the round-level resistance of 0.5800. The Kiwi asset gains strength as the market sentiment improves on expectations that the Federal Reserve (Fed) is done with hiking interest rates.
S&P500 futures generated significant gains in the European session, portraying a risk-on market mood. The US Dollar Index (DXY) corrects gradually from 106.90 ahead of the core Personal Consumption Expenditure (PCE) inflation data for September. The 10-year US Treasury yields rebound to 4.87%.
Going forward, the New Zealand Dollar will dance to the tunes of Q3 labor market data, which will be published next week. The employment data would set the undertone for the last monetary policy meeting by the Reserve Bank of New Zealand (RBNZ). The RBNZ may keep the Official Cash Rate (OCR) unchanged at 5.50%.
NZD/USD delivers a V-shape recovery after observing a selling climax near October 26 low at 0.5772. The Kiwi asset climbed above the horizontal resistance plotted from October 23 low around 0.5800, which has turned into support for the Kiwi bulls. The major aims for stabilization above the 50-period Exponential Moving Average (EMA), which trades around 0.5820.
The Relative Strength Index (RSI) (14) shifts into the 40.00-60.00 range from the bearish range of 20.00-40.000, which indicates that the bearish bias is fading away.
A decisive break above October 24 high at 0.5874 would drive the asset toward October 18 high at 0.5921 and September 25 high at 0.5975.
On the flip side, a downside move below 11-month low at 0.5740 would expose the asset to the round-level support at 0.5700. A breakdown below the latter would drag the asset toward a new annual low around 0.5670.
NZD/USD hourly chart
-638340001356026797.png)
EUR/GBP has reached the highest level since May. Economists at Danske Bank analyze the pair’s outlook.
GBP headwinds to persist
We expect the UK economy to perform relatively worse than the Euro area and the conclusion of the Bank of England hiking cycle to weigh on GBP.
Near-term, we expect the cross to range trade on the back of little divergence in either the growth or monetary policy for the rest of the year.
We lift our forecast profile for EUR/GBP slightly higher to 0.89 over the coming 12 months in light of the higher spot.
Forecast: 0.87 (1M), 0.88 (3M), 0.89 (6M), 0.89 (12M)
- Natural Gas prices jump to $3.42 as tension builds around possible invasion.
- The US Dollar reclaims its status as King Dollar as US yields flirt with 5% again.
- Natural Gas prices could jump rapidly once reports are issued that Israel has started its ground offensive.
Natural Gas is soaring and roaring again as Israel confirms it has made a second entry across the Gaza border. Overnight US Pentagon officials confirmed that US soldiers have been attacked 12 times in Iraq and 4 times in Syria in the past week by Iran-affiliated groups. With tensions reaching a new high, gas prices are trading alongside that elevation.
Meanwhile, the US Dollar (USD) is set to lock in a new week of gains after a small negative dip last week. Although the topside looks to remain locked for further upside in the US Dollar Index (DXY), expect to see the Greenback trade at elevated levels ahead of the Federal Reserve decision next week. The Personal Consumption Expenditures – Price Index results out on Friday, will shed a bit more light on how inflation is still declining or soaring again in the US.
Natural Gas is trading at $3.64 per MMBtu at the time of writing.
Natural Gas news and market movers
- European natural gas prices soared near €50 a megawatt-hour as traders are on the lookout for further news on tensions in the Middle East. The risk premium to be factored in for a proxy war in the region means a substantially elevated gas price.
- Despite the recent drops in temperatures, EU gas storages remain near 99% full.
- EDP has plans to convert Abono II in Spain from a coal to a gas-fired power plant. The conversion should be done by mid 2025.
- Russian gas still accounts for about 10% of France’s natural gas supply, French Energy Transition Minister Agnes Pannier-Runacher said.
- This evening at 17:00 GMT the weekly Baker Hughes Gas Rig Count is due to come out. Previously it was at 118 and is still at the lower levels of 2023.
Natural Gas Technical Analysis: Risk spills over
Natural Gas price has met its first big price target at $3.65 after a steep ascent in the past few days. Day by day more headlines come out that are pointing to a major Israeli ground assault going ahead into Gaza at any moment. Once that news hits the wires, expect to see another firm jump higher that could even print a new high for 2023 near $4.33
From a purely technical perspective, gas prices broke back above the topside trend line identified earlier, near $3.37, on Wednesday. Expect to see a continuation higher from here with the next level on the upside at $3.63. Should a big ground invasion take place and several countries start to choose sides, expect a very quick squeeze higher to $4.33, the high of 2023.
On the downside, the trend channel should try to act as support again, near $3.37. Natural Gas prices could fall to $3.07, with that orange line identified from the double top around mid-August. Should the drop become a broader sell-off, prices could sink to $3.03, at the 55-day Simple Moving Average.
-638339975463442911.png)
XNG/USD (Daily Chart)
Natural Gas FAQs
What fundamental factors drive the price of Natural Gas?
Supply and demand dynamics are a key factor influencing Natural Gas prices, and are themselves influenced by global economic growth, industrial activity, population growth, production levels, and inventories. The weather impacts Natural Gas prices because more Gas is used during cold winters and hot summers for heating and cooling. Competition from other energy sources impacts prices as consumers may switch to cheaper sources. Geopolitical events are factors as exemplified by the war in Ukraine. Government policies relating to extraction, transportation, and environmental issues also impact prices.
What are the main macroeconomic releases that impact on Natural Gas Prices?
The main economic release influencing Natural Gas prices is the weekly inventory bulletin from the Energy Information Administration (EIA), a US government agency that produces US gas market data. The EIA Gas bulletin usually comes out on Thursday at 14:30 GMT, a day after the EIA publishes its weekly Oil bulletin. Economic data from large consumers of Natural Gas can impact supply and demand, the largest of which include China, Germany and Japan. Natural Gas is primarily priced and traded in US Dollars, thus economic releases impacting the US Dollar are also factors.
How does the US Dollar influence Natural Gas prices?
The US Dollar is the world’s reserve currency and most commodities, including Natural Gas are priced and traded on international markets in US Dollars. As such, the value of the US Dollar is a factor in the price of Natural Gas, because if the Dollar strengthens it means less Dollars are required to buy the same volume of Gas (the price falls), and vice versa if USD strengthens.
The ECB meeting proved to be a non-event, and EUR/USD is now left with an ever-unfavourable rate differential, economists at ING report.
Downside risks after a non-eventful ECB
It is clear now that the Euro will not be able to draw any substantial benefit from a more hawkish ECB, and markets have all the reasons to keep rate expectations depressed on the back of the deteriorating growth outlook.
With Eurozone data unlikely to turn materially stronger in the near term, and rate/growth differentials pointing south, we retain a short-term bearish bias on EUR/USD.
Extra side-line trading, likely between 7.3050 and 7.3470, is expected in USD/CNH for the time being, according to Economist Lee Sue Ann and Markets Strategist Quek Ser Leang at UOB Group.
Key Quotes
24-hour view: Our expectation for USD to strengthen yesterday did materialise as it traded sideways in a quiet manner between 7.3230 and 7.3332 before closing largely unchanged at 7.3230 (-0.09%). The price action is likely part of a consolidation phase. Today, USD could continue to trade sideways, albeit likely in a wider range of 7.3150/7.3350.
Next 1-3 weeks: There is not much to add to our update from yesterday (26 Oct, spot at 7.3260). As highlighted, the recent buildup in downward momentum has faded. For the time being, USD is likely to trade in a range between 7.3050 and 7.3470.
- Gold price consolidates ahead of the US core PCE inflation reading for September.
- The downside in the Gold price remains cushioned by escalating tensions in the Israel-Palestine conflict.
- US Yellen sees Treasury yields elevated on Fed’s “higher for longer” interest rates outlook.
Gold price (XAU/USD) trades in a tight range around $1,990 as the downside is cushioned by escalating Middle East tensions while the upside is limited by more upbeat US economic data, namely robust Q3 Gross Domestic Product (GDP) and Durable Goods Orders. The precious metal is expected to deliver a decisive move after the release of the Core Personal Consumption Expenditure (PCE) inflation data, which will set the undertone for the upcoming monetary policy meeting of the Federal Reserve (Fed), scheduled for November 1.
The US Dollar and long-term bond yields recovered sharply after blockbuster GDP numbers as the data shows resilience in the US economy. The phenomenal GDP growth aligns with the “soft landing” scenario envisaged by the Fed in its battle against stubborn inflation. Still, the upside in the Gold price could remain restricted as US Treasury yields may remain elevated for a long amid the Fed’s “higher for longer interest rates” plot.
Daily Digest Market Movers: Gold price awaits US Core PCE inflation data
- Gold price consolidates around $1,990.00 as Israel-Palestine tensions continue to provide a cushion.
- The Israeli army entered Gaza briefly to carry out a ground raid. Furthermore, a senior official of Hamas has urged allies to intervene in the ongoing conflict to defend Gaza from a full-scale invasion from Israeli troops.
- The risks of Iran-backed Hezbollah’s intervention in the Israel-Palestine war persist as Western nations have been supporting Israel.
- Gold price faced selling pressure near $1,990.00 on Thursday after upbeat US GDP and Durable Goods Orders data, but managed to firm amid geopolitical tensions.
- The US Bureau of Economic Analysis (BEA) reported that the US economy grew at a stronger pace of 4.9% in the July-September quarter on an annualized basis, against expectations of 4.2% growth and doubling the 2.1% rate seen in the second quarter.
- US economic strength in the third quarter was driven by robust consumer spending amid a tight labor market, rising residential investment, and high government spending.
- Consumer spending grew by 4% in the July-September quarter against a 0.8% reading in the second quarter.
- Still, the US GDP report showed that business investment contracted for the first time in two years as firms postponed capacity expansion due to higher borrowing costs. Firms relied on inventory backlog and achieving efficiency to cater to households’ demand.
- US Durable Goods Orders data for September, also released on Thursday, pointed to sharply increasing demand ahead for the US manufacturing sector.
- New orders for durable goods rose 4.7% against expectations of 1.5%. In August, orders contracted marginally by 0.1%.
- After the release of the GDP data, US Treasury Secretary Janet Yellen said in an interview with Bloomberg that strong GDP numbers point to a “soft landing”, but that these strengths will also keep bond yields elevated.
- Janet Yellen said that high US bond yields reflect strong confidence in the US economy and indicate that interest rates will remain higher for a longer period.
- The US Dollar Index (DXY) looks set for a positive weekly closing but edges down on Friday from a two-week high of 106.90. Investors turn cautious ahead of core PCE inflation data for September, which will be published at 12:30 GMT.
- Investors will keenly focus on the Fed’s preferred inflation gauge as it could impact the Fed decision on November 1.
- Monthly core PCE inflation is expected to grow by 0.3% in September against the 0.1% growth recorded in August. On an annual basis, PCE inflation is forecast to rise by 3.7%, lower than the 3.9% increase in August.
Technical Analysis: Gold price trades sideways around $1,990
Gold price rebounds gradually after a corrective move to near $1,970.00. The precious metal is broadly trading directionless inside Thursday’s range as investors await the US core PCE reading, which will provide some cues about the Fed’s monetary policy action on November 1. The 20-day Exponential Moving Average (EMA) has crossed the 50-day and 200-day EMAs to the upside, portraying a bullish near-term trend.
Gold FAQs
Why do people invest in Gold?
Gold has played a key role in human’s history as it has been widely used as a store of value and medium of exchange. Currently, apart from its shine and usage for jewelry, the precious metal is widely seen as a safe-haven asset, meaning that it is considered a good investment during turbulent times. Gold is also widely seen as a hedge against inflation and against depreciating currencies as it doesn’t rely on any specific issuer or government.
Who buys the most Gold?
Central banks are the biggest Gold holders. In their aim to support their currencies in turbulent times, central banks tend to diversify their reserves and buy Gold to improve the perceived strength of the economy and the currency. High Gold reserves can be a source of trust for a country’s solvency. Central banks added 1,136 tonnes of Gold worth around $70 billion to their reserves in 2022, according to data from the World Gold Council. This is the highest yearly purchase since records began. Central banks from emerging economies such as China, India and Turkey are quickly increasing their Gold reserves.
How is Gold correlated with other assets?
Gold has an inverse correlation with the US Dollar and US Treasuries, which are both major reserve and safe-haven assets. When the Dollar depreciates, Gold tends to rise, enabling investors and central banks to diversify their assets in turbulent times. Gold is also inversely correlated with risk assets. A rally in the stock market tends to weaken Gold price, while sell-offs in riskier markets tend to favor the precious metal.
What does the price of Gold depend on?
The price can move due to a wide range of factors. Geopolitical instability or fears of a deep recession can quickly make Gold price escalate due to its safe-haven status. As a yield-less asset, Gold tends to rise with lower interest rates, while higher cost of money usually weighs down on the yellow metal. Still, most moves depend on how the US Dollar (USD) behaves as the asset is priced in dollars (XAU/USD). A strong Dollar tends to keep the price of Gold controlled, whereas a weaker Dollar is likely to push Gold prices up.
USD/JPY accelerated through 150. Economists at Société Générale analyze the pair’s outlook.
149.30/148.85 is an important support
USD/JPY has given a break above its one-month range denoting persistence in up move. It is worth noting that daily MACD has been posting negative divergence since July however signals of price break have not yet developed.
Last week's low of 149.30/148.85 is an important support. This zone must be breached to affirm a short-term decline.
Next potential hurdles are located at projections of 151.25 and last year's high of 152/152.80.
- USD/JPY drops to near 150.00 after a nominal correction in the US Dollar.
- The market sentiment improves as traders see interest rates by the Fed remaining unchanged in the range of 5.25-5.50%.
- Tokyo inflation rose in October amid ultra-loose monetary policy.
The USD/JPY pair fell sharply to near the psychological support of 150.00 in the European session. The asset faces a sell-off as the US Dollar Index (DXY) edged down after facing barricades near 106.90 and the Japanese Yen strengthened on higher Tokyo consumer inflation data.
S&P500 futures added significant gains in the London session, indicating an improvement in the risk appetite of the market participants. The market sentiment improves as traders see interest rates by the Federal Reserve (Fed) remaining unchanged in the range of 5.25-5.50% in the monetary policy decision on November 1.
The USD Index falls gradually to near 106.50 ahead of the core Personal Consumption Expenditure (PCE) price index data, which will be released at 12:30 GMT. According to the consensus, monthly core PCE inflation grew by 0.3% in September against 0.1% growth recorded in August. The annual economic data rose by 3.7% against a 3.9% reading in August a year ago.
A sticky core PCE inflation report may ramp up US Treasury yields further. The 10-year US bond yields skids from 5% but the near-term trend remains upbeat as the US economy is resilient amid a strong growth report. The US Gross Domestic Product (GDP) for the July-September quarter, released on Thursday, showed that the economy grew at a robust pace of 4.9% against expectations of 4.2% on an annualized basis.
On the Tokyo front, the headline Consumer Price Index (CPI) for October rose by 3.3% against 2.8% reading from September. The core inflation softens marginally to 3.8% against the former release of 3.9%. Investors hope that the Bank of Japan (BoJ) will increase inflation expectations in its quarterly projections report in the monetary policy meeting next week.
Gold has recovered from its setback in the first half of the week and is now trading at around $1,985 again. Economists at Commerzbank analyze the yellow metal’s outlook.
Gold defies solid US GDP data
The more solid than expected US GDP data for the third quarter were able to put only brief pressure on Gold – despite the fact that they are definitely one indication that the US economy is far more resilient than most people previously assumed.
Continued robust demand in particular increases the chance of the US Federal Reserve further raising its key rate to ensure that inflation weakens further. This risk per se would suggest limited upside potential for Gold at present.
On the other hand, there is still the risk of the Middle East conflict escalating – this has proven a stronger driver of the price of late.
- EUR/GBP cross faces challenges as the ECB kept the deposit rate unchanged at 4.0%.
- BoE’s higher interest rate dampens the UK’s economy amid stubborn inflation.
- UK’s central bank is expected to maintain the current interest rates at 5.25%.
EUR/GBP struggles to recover losses registered in the previous session, trading around 0.8710 during the European session on Friday. The cross faced pressure after the policy decision by the European Central Bank (ECB). The central bank opted to keep the deposit rate unchanged at 4.0%, citing a worsening economic outlook for the Eurozone as the influencing factor.
Furthermore, ECB President Christine Lagarde is navigating a challenging economic landscape. The delicate balance between a weakening economy and strong inflationary pressures can be quite a juggling act. Keeping an eye on the Middle East crisis and staying data-dependent seems like a prudent approach.
On the flip side, the elevated interest rates set by the Bank of England (BoE) are having a detrimental impact on the United Kingdom's economy, exacerbating the challenges posed by stubborn inflation. Economic data reveals significant contractions across various sectors, with high inflation putting a strain on household budgets.
However, the persistent risks of inflation raise doubts among market participants regarding UK Prime Minister Rishi Sunak's ability to fulfill his promise of reducing headline inflation to 5.4% through the end of the year.
Investors will likely monitor the upcoming BoE interest rate decision scheduled for November 2, with widespread expectations that the BoE will maintain the current interest rates at 5.25%.
Hungarian Forint rose as the market appreciated comments from Hungarian Central Bank Governor Barnabas Virag. Economists at Commerzbank analyze HUF outlook.
A positive signal for the Forint after all?
After Governor Virag underlined that monetary policy in Hungary would remain restrictive even if inflation eased back into double digits, the Forint was able to regain some ground.
Time will tell whether Virag keeps his word. If the Hungarian Central Bank (MNB) really acts cautiously over the coming months, as it stated in the statement following its meeting at the start of the week and if it cuts key rates much more slowly than inflation eases, that would constitute a positive signal for the Forint. Let’s hope that we will have such a positive surprise.
Economists at ING analyze USD outlook after US GDP figures beat estimates and confirmed the growth differential between the US and its key developed peers is significantly wide – and widening.
Stark growth gap makes the Dollar even harder to sell
With US GDP coming in strong, the growth divergence continues to widen, making the Dollar even harder to sell in the current environment.
When we strip out the immediate market impact of the data releases, the case for a stronger Dollar continues to consolidate.
If personal income and PCE figures for September fail to steer the FX market drastically today, we still feel that the USD may stay broadly supported into the weekend, and we would favour fading any (USD-negative) position-squaring upward correction in the crosses.
CME Group’s flash data for natural gas futures markets noted traders reduced their open interest positions by more than 15K contracts on Thursday vs. the previous daily build. Volume, instead, left behind three consecutive daily drops and rose markedly by around 244.5K contracts.
Natural Gas: A move to $4.00 does not look favoured
Prices of natural gas jumped well past the $3.00 mark per MMBtu on Thursday. The strong rebound, however, was accompanied by dwindling open interest, which suggest the idea that a sustained advance should not be favoured for the time being. Next on the upside, in the meantime, emerges the round level at $4.00, an area last traded in early January.
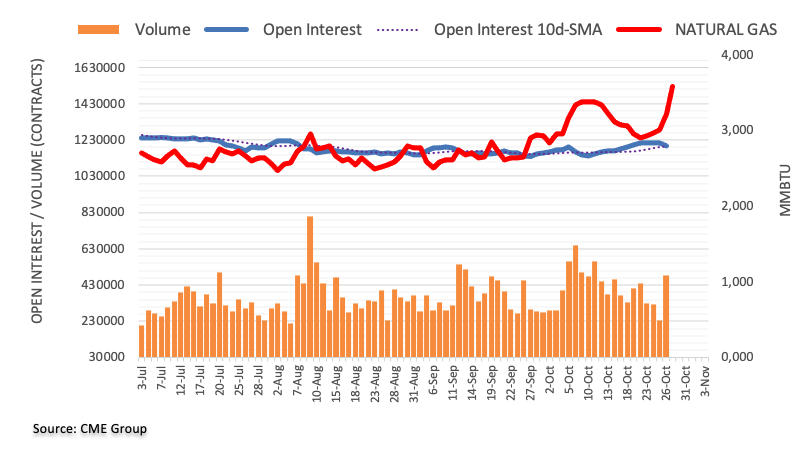
The Turkish central bank hiked its key rate by 500 bps on Thursday (from 30% to 35%). This had no effect on the USD/TRY exchange rate. None at all. Economists at Commerzbank analyze Lira’s outlook.
How 500 bps evaporate without effect
The central bank (CBT) now writes in its statements: ‘Monetary tightening will be further strengthened as much as needed in a timely and gradual manner until a significant improvement in inflation outlook is achieved.’ If the market believed this comment, the Lira would appreciate again.
It must be doubts about the scope President Recep Tayyip Erdoğan grants the CBT. As these doubts cannot be dispelled by any rate decisions the rate decisions are irrelevant for the TRY exchange rates.
- Silver attracts some sellers following an intraday uptick to the $23.00 neighbourhood.
- The mixed technical setup warrants some caution before placing fresh directional bets.
- A move beyond the $22.30-40 confluence will set the stage for some meaningful gains.
Silver (XAG/USD) struggles to capitalize on its modest intraday uptick and attracts some intraday sellers in the vicinity of the $23.00 mark on Friday. The white metal currently trades around the $22.80 region, nearly unchanged for the day, and remains confined in a multi-day-old range through the first half of the European session.
From a technical perspective, the XAG/USD has been showing some resilience below the 38.2% Fibonacci retracement level of the May-October slide. Moreover, oscillators on the daily chart are holding in the positive territory and support prospects for some appreciating move. That said, the recent failure near the $23.70-$23.75 strong horizontal resistance and the lack of any buying interest warrants some caution for bullish traders.
Hence, it will be prudent to wait for sustained strength and acceptance above the $23.30-$23.40 confluence, comprising the 50% Fibo. level, the 100-day and 200-day Simple Moving Averages (SMAs), before positioning for a meaningful upside. Some follow-through buying beyond the $23.70-$23.75 region will reaffirm the positive bias and allow the XAG/SUD to reclaim the $24.00 mark, which coincides with the 61.8% Fibo. level.
The subsequent move up, meanwhile, is more likely to confront stiff resistance near a descending trend-line hurdle extending from the May high, currently pegged around the $24.20 region. A convincing breakout through the latter will be seen as a fresh trigger for bulls and pave the way for additional gains.
On the flip side, the $22.50 area, nearing a one-and-half-week low touched on Thursday, now seems to protect the immediate downside for the XAG/USD. Failure to defend the said support levels might prompt some technical selling and expose the $22.30-$22.25 horizontal resistance breakpoint now turned support. The downward trajectory could get extended further towards the $22.00 round-figure mark, representing 23.6% Fibo. level.
Silver daily chart
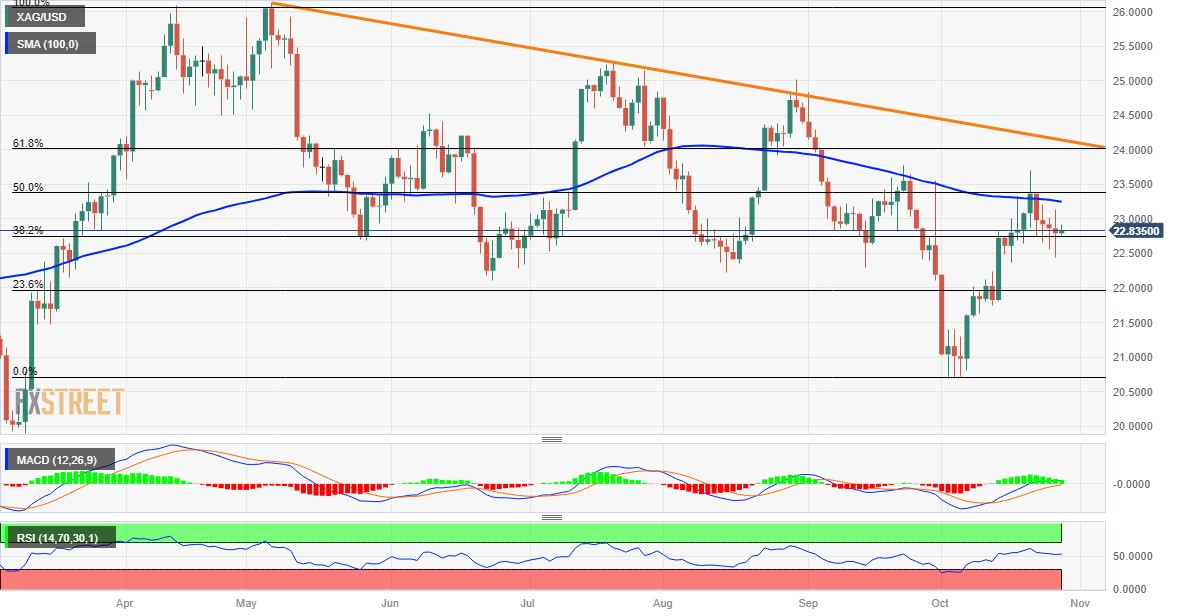
Technical levels to watch
- USD/CAD halts the winning streak due to the rise in Crude oil prices.
- Crude oil prices surge as the US military strikes on Iranian targets in Syria.
- Traders expect that the Fed will keep interest rates unchanged in the upcoming meeting.
USD/CAD snaps a three-day winning streak, retreating from the seven-month highs. The spot price trades around 1.3820 during the early European session on Friday. The pair faces challenges due to the higher Crude oil prices amid geopolitical tension pertaining to the Israel-Hamas conflict.
Western Texas Intermediate (WTI) trades higher near $84.20 per barrel by the press time. The surge in crude oil prices comes in the aftermath of US military strikes on Iranian targets in Syria, raising fears of an escalation in the Israel-Hamas conflict. Moreover, the Israeli armed forces initiated the biggest overnight attack on Gaza since the beginning of the conflict, a development that carries the potential to incite anger among Arab nations.
The US Dollar (USD) hovers around 106.60, with the positive tone as US Treasury yields rebound after the recent losses registered in the previous day. The yield on 10-year US bonds trades at 4.87% by the press time.
US Dollar might have received support from the sentiment generated by the robust US preliminary Gross Domestic Product (GDP) Annualized data. US GDP improved to 4.9% in Q3 from the previous growth of 2.1%, exceeding the market expectation of 4.2%.
However, the report unveiled a preliminary core Personal Consumption Expenditure (PCE) that fell short of expectations. US Core PCE declined to 2.4% in Q3 from the previously recorded 3.7%.
Investors expect that the US Federal Reserve (Fed) will keep policy rates unchanged in the Federal Open Market Committee (FOMC) meeting next week. The US Core Personal Consumption Expenditure (PCE) Price Index is set to be released during the North American session, seeking fresh impetus on inflationary pressure in the US.
As the ECB policy decision of “on hold” in October was in line with pre-event market expectations, the decline in EUR/USD after this meeting was fairly limited. Economists at Nomura analyze the pair’s outlook.
There are several catalysts that support a lower EUR/USD
Our base case remains that the Fed will not deliver an additional rate hike in the November FOMC meeting; however, we believe its pause will be more hawkish than Thursday’s ECB announcements.
Monetary policy aside, there are several catalysts that support a lower EUR/USD: 1) the deterioration in global market risk sentiment due to higher bond yields; 2) the widening of BTP-Bund spreads, owing to Italian fiscal policy; 3) reduced uncertainty on US politics, with an increasing likelihood that a US government shutdown will be avoided; as well as 4) geopolitical tensions in the Middle East remaining a potential trigger for higher crude oil prices. The recent positive news regarding China’s growth is unlikely to sufficiently offset these factors such that market participants become bullish on EUR.
We maintain our forecast that EUR/USD will fall to 1.02 by year-end, and keep our trade recommendation of short EUR/CAD, targeting 1.3850 also by year-end.
- Pound Sterling faces pressure in extending recovery amid risk-off sentiment.
- Investors shift focus to the BoE policy, which is expected to remain unchanged at 5.25%.
- BoE policymakers may struggle to understand persistent inflation amid novel labor market data collection methods.
The Pound Sterling (GBP) faces barricades while extending upside above the crucial resistance at 1.2140 as strength in the US Dollar has squeezed the risk appetite of investors. The GBP/USD pair may fall back to seven-month lows as the United Kingdom economy is facing the wrath of higher interest rates by the Bank of England (BoE) amid stubborn consumer inflation.
Business activities, labor demand, and sales at retail stores have dropped significantly as high inflation has squeezed household budgets. The inflation risks remain persistent due to robust wage growth, which has cast doubts among market participants about UK Prime Minister Rishi Sunak fulfilling his promise of halving headline inflation to 5.4% by the year-end.
Going forward, investors will keenly watch the interest rate decision by the BoE, which will be announced on November 2. The BoE is widely anticipated to keep interest rates unchanged at 5.25%.
Daily Digest Market Movers: Pound Sterling finds barricades amid weak market sentiment
- Pound Sterling struggles to extend upside above the crucial resistance at 1.2140 as investors expect the Bank of England to maintain the status quo at its monetary policy meeting on November 2.
- Poor business activity, deteriorating labor market conditions, and weak consumer spending would be the major catalysts behind an unchanged interest rate decision by the BoE. In addition, deepening Middle East tensions could pose a threat to high energy prices.
- The UK inflation is extremely far from the desired rate of 2%. Therefore, BoE policymakers are expected to emphasize keeping interest rates higher for a longer period and will keep doors open for further policy tightening.
- In September, the headline and core inflation were recorded at 6.7% and 6.1%, respectively, which were almost unchanged from August’s inflation report.
- The inflation in the UK region is highest in comparison with other G7 economies, which could force BoE policymakers to discuss one more interest rate hike ahead.
- The decision-making process by BoE policymakers in the November meeting is expected to be a tough one due to the replacement of the household survey method for calculating labor market data with an experimental one derived from tax and state benefit figures.
- The UK Office for National Statistics (ONS) delayed Employment Change, Unemployment Rate, and Claimant Count Change data in October as the usual data collected by the Labor Force Survey (LFS) was insufficient due to lower response rates.
- At a time when policymakers are heavily dependent on incoming data for policy decision-making, less confidence in unconventional methods of data collection may create difficulties in understanding persistent consumer inflation.
- The major agenda of policymakers is expected to be building a roadmap to curtail robust wage growth, which has been keeping price pressures elevated.
- The Citi Bank reported this week that 12-month forward consumer inflation expectations will ease to 4.2% in September from 4.4% in August.
- The broader market sentiment remains downbeat as Israeli troops have gradually entered Gaza and are preparing for a full-scale incursion assault on Hamas.
- Meanwhile, Hamas officials have urged their allies for intervention to demolish the Israeli army upon entering Gaza.
- The US Dollar looks set for a bullish weekly close, supported by heavy demand for safe-haven assets amid Israel-Hamas tensions and upbeat US economic data.
- The US Bureau of Economic Analysis (BEA) reported on Thursday that the economy grew at an annualized rate of 4.9% in the July-September quarter after the 2.1% expansion recorded in the second quarter's GDP report. Investors forecasted that the US economy expanded by 2.1% in the third quarter of 2023.
- Going forward, investors will focus on the core Personal Consumption Expenditure (PCE) inflation, which is the Federal Reserve’s (Fed) preferred inflation gauge for policy decision-making.
Technical Analysis: Pound Sterling senses resistance near 1.2140
Pound Sterling faces stiff barricades near 1.2140 after a sharp recovery from 1.2070. The GBP/USD struggles to extend the upside as the market sentiment dampens due to escalating geopolitical tensions. The near-term trend remains bearish as the 20 and 50-day Exponential Moving Averages (EMAs) are slowly moving south. A breakdown below Thursday’s low may expose it to psychological support at the 1.2000 round number.
Pound Sterling FAQs
What is the Pound Sterling?
The Pound Sterling (GBP) is the oldest currency in the world (886 AD) and the official currency of the United Kingdom. It is the fourth most traded unit for foreign exchange (FX) in the world, accounting for 12% of all transactions, averaging $630 billion a day, according to 2022 data.
Its key trading pairs are GBP/USD, aka ‘Cable’, which accounts for 11% of FX, GBP/JPY, or the ‘Dragon’ as it is known by traders (3%), and EUR/GBP (2%). The Pound Sterling is issued by the Bank of England (BoE).
How do the decisions of the Bank of England impact on the Pound Sterling?
The single most important factor influencing the value of the Pound Sterling is monetary policy decided by the Bank of England. The BoE bases its decisions on whether it has achieved its primary goal of “price stability” – a steady inflation rate of around 2%. Its primary tool for achieving this is the adjustment of interest rates.
When inflation is too high, the BoE will try to rein it in by raising interest rates, making it more expensive for people and businesses to access credit. This is generally positive for GBP, as higher interest rates make the UK a more attractive place for global investors to park their money.
When inflation falls too low it is a sign economic growth is slowing. In this scenario, the BoE will consider lowering interest rates to cheapen credit so businesses will borrow more to invest in growth-generating projects.
How does economic data influence the value of the Pound?
Data releases gauge the health of the economy and can impact the value of the Pound Sterling. Indicators such as GDP, Manufacturing and Services PMIs, and employment can all influence the direction of the GBP.
A strong economy is good for Sterling. Not only does it attract more foreign investment but it may encourage the BoE to put up interest rates, which will directly strengthen GBP. Otherwise, if economic data is weak, the Pound Sterling is likely to fall.
How does the Trade Balance impact the Pound?
Another significant data release for the Pound Sterling is the Trade Balance. This indicator measures the difference between what a country earns from its exports and what it spends on imports over a given period.
If a country produces highly sought-after exports, its currency will benefit purely from the extra demand created from foreign buyers seeking to purchase these goods. Therefore, a positive net Trade Balance strengthens a currency and vice versa for a negative balance.
The Dollar was unable to appreciate at all despite the fact that US data surprised on the upside. Economists at Commerzbank analyze Greenback’s outlook.
Market wondering how much USD strength the improved US economic outlook justifies
The Dollar was able to appreciate against the average of the G10 currencies in a straight line since the summer due to the improved US economic outlook. The market is currently wondering how much USD strength that justifies. Until that has been decided, positive US economic data will only have a weak effect at best.
Of course, that does not mean that we will only see limited fluctuation intensity of USD exchange rates, only that it will be a quest for a market equilibrium rather than a development driven by data.
Here is what you need to know on Friday, October 27:
Financial markets stay relatively quiet early Friday as investors assess the latest macroeconomic events, while keeping an eye on developments surrounding the Israel-Hamas conflict. In the second half of the day, the US Bureau of Economic Analysis (BEA) will release the Personal Consumption Expenditures (PCE) Price Index data, the Federal Reserve's preferred gauge of inflation. The US economic docket will also feature the final reading of the University of Michigan's Consumer Confidence Index for October.
The US economy expanded at an annual rate of 4.9% in the third quarter, the BEA reported on Thursday. This reading surpassed the market expectation for a growth of 4.2% and helped the US Dollar (USD) stay resilient against its rivals. In the meantime, the benchmark 10-year US Treasury bond yield fell more than 2% on the day and limited the currency's gains. Early Friday, the USD Index consolidates its weekly gains above 106.50 and the 10-year yield fluctuates below 4.9%. Meanwhile, US stock index futures gain between 0.3% and 0.9% in the early European session, pointing to an improving risk mood on the last trading day of the week.
According to the latest reports, Israeli ground forces have carried out a large operation on Thursday, targeting Hamas positions in Gaza. In the meantime, the international community is urging Israel to have a temporary ceasefire to allow humanitarian aid to reach the region.
The European Central Bank (ECB) left key interest rates unchanged following the October policy meeting, as expected. During the press conference, President Christine Lagarde noted that it was premature to start talking about rate cuts and said that the decision to hold the policy steady did not necessarily mean that they will not hike again in the future. EUR/USD declined toward 1.0500 with the immediate reaction but managed to retrace its decline. Early Friday, the pair holds steady slightly above 1.0550.
GBP/USD failed to make a decisive move in either direction and ended the day virtually unchanged on Thursday. In the European morning, the pair moves up and down in a narrow band above 1.2100.
Following Thursday's volatile action, USD/JPY stabilized above 150.00 on Friday. Japanese Finance Minister Shunichi Suzuki declined to say whether the Bank of Japan intervened in the currency market and repeated that the excessive FX volatility is undesirable and policymakers will take thorough steps on FX with a strong sense of urgency.
Gold continued to edge higher as US Treasury bond yields turned south on Thursday. Early Friday, XAU/USD trades modestly higher on the day at around $1,990.
Economist Lee Sue Ann and Markets Strategist Quek Ser Leang at UOB Group see a more convincing upside in USD/JPY needs to clear the 151.00 barrier.
Key Quotes
24-hour view: Yesterday, we held the view that USD “could rise above 150.50, but it is unlikely to be able to maintain a foothold above this level.” In Asian trade, USD rose briefly to 150.77 and plummeted to 149.88 before trading sideways for the rest of the sessions. The price action has resulted in a mixed outlook. Today, USD could trade in a range between 149.90 and 150.70.
Next 1-3 weeks: We highlighted yesterday (26 Oct, spot at 150.25) that while upward momentum is beginning to improve, in order for USD to advance in a sustained manner, it must break and stay above 150.50. USD then rose to a high of 150.77 before closing at 150.38 (+0.11%). Upward momentum has not improved further, and the resistance level has moved higher. From here, USD has to break clearly above 151.00 before a sustained advance is likely. The risk of USD breaking clearly above 151.00 will remain intact as long as USD stays above 149.35 in the next couple of days.
- The Euro remains unable to pick up pace vs. the US Dollar.
- European stocks trade without clear direction so far on Friday.
- Markets’ attention will be on the US inflation tracked by the PCE.
So far, the Euro (EUR) appears fragile vs. the US Dollar (USD), prompting EUR/USD to trade within a tight range around the mid-1.0500s in the wake of the opening bell in Europe on Friday.
In the interim, the Greenback manages to keep the trade in the upper end of the weekly range near 106.70 when measured by the USD Index (DXY). The so-far tepid advance in the Dollar comes in tandem with the equally lacklustre uptick in US yields across different time frames.
In the realm of monetary policy, a growing consensus has formed amongst market participants that the Federal Reserve (Fed) will preserve its present stance of retaining interest rates unchanged at the meeting on November 1. The door remains open, however, to a potential rate hike in December, a view that appears well propped up by the resilience of the US economy and still elevated inflation.
Back to the European Central Bank (ECB), there were no surprises at its event on Thursday following a unanimous hold. President Christine Lagarde reiterated (once again) that there is still job to be done regarding inflation, while it is expected that inflation will remain too high for too long. Adding a bearish tone to the meeting, Lagarde acknowledged that risks to the outlook appear tilted to the downside.
On the domestic calendar, the ECB will release its Survey of Professional Forecasters (SPF).
In the US, the salient event will be the publication of inflation figures tracked by the PCE and Core PCE for the month of September followed by Personal Income, Personal Spending and final readings of the Michigan Consumer Sentiment.
Daily digest market movers: Euro appears depressed post-ECB
- The EUR maintains the offered bias vs. the USD on Friday.
- US and German yields attempt a mild bounce so far.
- The Fed could still hike rates by 25 bps in December.
- Investors continue to digest the ECB’s rate decision.
- Fears of an extension of the Middle East crisis appear on the rise.
- FX intervention keeps gyrating around USD/JPY.
- Consumer Confidence in France ticked higher to 84 in October.
- US PCE figures take centre stage across the pond on Friday.
Technical Analysis: There is still scope for further losses in Euro
EUR/USD remains stuck around 1.0550 amidst a persistent selling bias.
If the selling trend continues, immediate support might be found at the October 13 low of 1.0495, followed by the October 3 low of 1.0448 before reaching the round level of 1.0400. If this zone is breached, the pair may continue to decline towards the November 30, 2022 low of 1.0290 and the 2022 low of 1.0222 recorded on November 21, 2022.
If bulls reclaim control, EUR/USD will face first resistance at the October 24 high of 1.0694, which appears to be supported by the proximity of the temporary 55-day Simple Moving Average (SMA). The breakout of this zone exposes the high of 1.0767 on September 12, which precedes the key 200-day SMA at 1.0812. Once this level is surpassed, it may imply a further push for the August 30 height of 1.0945, prior hitting the psychological 1.1000 mark. If the upward trend continues, the August 10 record of 1.1064 may be challenged, followed by the July 27 high of 1.1149, and potentially even the July 18 peak of 1.1275.
As long as the EUR/USD remains below the 200-day SMA, the pair may remain under pressure.
Euro FAQs
What is the Euro?
The Euro is the currency for the 20 European Union countries that belong to the Eurozone. It is the second most heavily traded currency in the world behind the US Dollar. In 2022, it accounted for 31% of all foreign exchange transactions, with an average daily turnover of over $2.2 trillion a day.
EUR/USD is the most heavily traded currency pair in the world, accounting for an estimated 30% off all transactions, followed by EUR/JPY (4%), EUR/GBP (3%) and EUR/AUD (2%).
What is the ECB and how does it impact the Euro?
The European Central Bank (ECB) in Frankfurt, Germany, is the reserve bank for the Eurozone. The ECB sets interest rates and manages monetary policy.
The ECB’s primary mandate is to maintain price stability, which means either controlling inflation or stimulating growth. Its primary tool is the raising or lowering of interest rates. Relatively high interest rates – or the expectation of higher rates – will usually benefit the Euro and vice versa.
The ECB Governing Council makes monetary policy decisions at meetings held eight times a year. Decisions are made by heads of the Eurozone national banks and six permanent members, including the President of the ECB, Christine Lagarde.
How does inflation data impact the value of the Euro?
Eurozone inflation data, measured by the Harmonized Index of Consumer Prices (HICP), is an important econometric for the Euro. If inflation rises more than expected, especially if above the ECB’s 2% target, it obliges the ECB to raise interest rates to bring it back under control.
Relatively high interest rates compared to its counterparts will usually benefit the Euro, as it makes the region more attractive as a place for global investors to park their money.
How does economic data influence the value of the Euro?
Data releases gauge the health of the economy and can impact on the Euro. Indicators such as GDP, Manufacturing and Services PMIs, employment, and consumer sentiment surveys can all influence the direction of the single currency.
A strong economy is good for the Euro. Not only does it attract more foreign investment but it may encourage the ECB to put up interest rates, which will directly strengthen the Euro. Otherwise, if economic data is weak, the Euro is likely to fall.
Economic data for the four largest economies in the euro area (Germany, France, Italy and Spain) are especially significant, as they account for 75% of the Eurozone’s economy.
How does the Trade Balance impact the Euro?
Another significant data release for the Euro is the Trade Balance. This indicator measures the difference between what a country earns from its exports and what it spends on imports over a given period.
If a country produces highly sought after exports then its currency will gain in value purely from the extra demand created from foreign buyers seeking to purchase these goods. Therefore, a positive net Trade Balance strengthens a currency and vice versa for a negative balance.
Economists at ING analyze GBP outlook which is almost entirely driven by external dynamics.
Recent EUR/GBP rally to the 0.8700 handle may have run out of steam
Risks remain skewed to further attempts to the 1.2000 key support in the short term in Cable as the Dollar still appears to have room to catch up with its better rate profile.
The recent EUR/GBP rally to the 0.8700 handle may have run out of steam after the ECB meeting, even though we favour longer-term bullish positions on the pair.
- USD/CHF extends the gains for the fourth consecutive day ahead of US Core PCE.
- US Dollar could gain ground with the potential as US Treasury yields rebound.
- USD bulls could face a challenge as the policy rates are expected to remain consistent in the upcoming FOMC meeting.
USD/CHF continues the winning streak that began on Tuesday, gaining fresh weekly highs near 0.9000 during the Asian session on Friday. The US Dollar (USD) struggles to move upward, with the potential for support as US Treasury yields rebound following losses from the previous day. The yield on 10-year US bonds trades at 4.87% by the press time.
Downbeat ZEW Survey Expectations could lead the Swiss Franc (CHF) to a bumpy ride as Switzerland's business conditions and labor market showed a decline of 37.8 from the previous 27.6 decline in October.
Furthermore, the USD/CHF pair might receive a boost from the positive momentum generated by the upbeat US preliminary Gross Domestic Product (GDP) Annualized data released on Thursday.
However, the report also revealed a preliminary core Personal Consumption Expenditure (PCE) index that fell below expectations, leading to heightened demand for US bonds.
US GDP grew to 4.9% in the third quarter from the previous growth of 2.1%, exceeding the 4.2% expectations. While US Core PCE declined to 2.4% in Q3 from the 3.7% recorded previously.
The bulls of USD/CHF pair could face a challenge as the policy rates are expected to remain consistent in the upcoming Federal Open Market Committee (FOMC) meeting next week. Additionally, Friday will see the release of the core Personal Consumption Expenditure (PCE) data later in the North American session, a crucial gauge of inflation in the US.
USD/JPY crossed the 150 mark on Thursday. Economists at Commerzbank analyze the pair’s outlook.
Not everything about Japan's monetary and exchange rate policy is always logical
The market will likely continue to test higher USD/JPY levels. Then there are two possibilities: Either the MOF intervenes, or JPY depreciation accelerates as the risk of intervention is priced out.
In the medium to long term, intervention cannot prevent depreciation, especially if the BoJ maintains depreciation pressure by continuing its ultra-expansionary monetary policy. The only logical response would therefore be an at least gradual normalization of monetary policy, probably through further easing of the yield curve control (YCC). However, it is not certain that easing the YCC would be sufficient, nor is it certain that the BoJ will change anything at its meeting on Tuesday. Not everything about Japan's monetary and exchange rate policy is always logical.
- The Core Personal Consumption Expenditures Price Index is forecast to rise 0.3% MoM and 3.7% YoY in September.
- The Federal Reserve’s Summary of Economic Projections pointed to one more rate hike in 2023.
- Markets could overlook PCE inflation data following Thursday’s GDP report.
The Core Personal Consumption Expenditures (PCE) Price Index, the US Federal Reserve’s (Fed) preferred inflation gauge, will be released by the US Bureau of Economic Analysis (BEA) at 12:30 GMT.
What to expect in the Federal Reserve’s preferred PCE inflation report?
The Core Personal Consumption Expenditures (PCE) Price Index, which excludes food and energy, is forecast to rise 0.3% in September on month, at a stronger pace than the 0.1% increase recorded in August. The annual Core PCE Price Index is seen rising 3.7%, slowing from the 3.9% increase registered in August.
The headline PCE Price Index is expected to grow 0.3% MoM in September, while the annual PCE inflation is anticipated to edge lower to 3.4% from 3.5% in August.
The United States’ real Gross Domestic Product grew at an annualized rate of 4.9% in the third quarter, the BEA reported on Thursday. Details of the publication showed that the PCE inflation rose to 2.9% from 2.5% on a quarterly basis in Q3, while the Core PCE inflation declined to 2.4% from 3.7% in the second quarter.
While speaking before the Economic Club of New York in early October, Federal Reserve Chairman Jerome Powell said that the lower inflation readings in the summer were very favorable but noted that the September data was “somewhat less encouraging,” regarding the Consumer Price Index (CPI) figures.
When will be the PCE inflation report released and how could it affect EUR/USD?
The PCE inflation report is due at 12:30 GMT. Since markets already had a glimpse into the PCE figures in the third-quarter GDP report, the reaction is likely to remain muted.
Although the Fed's latest Summary of Projections, published in September, showed that policymakers saw it appropriate to raise the policy rate again before the end of the year, the CME Group FedWatch Tool shows that investors are pricing in a more than 70% probability that the Fed will hold the interest rate steady in 2023. The upcoming September PCE inflation report is unlikely to alter the market positioning in a significant way. Until the Fed’s December policy meeting, investors will have CPI inflation and employment data for October and November to confirm or deny whether the Fed’s tightening cycle has come to an end.
FXStreet Analyst Eren Sengezer offers a brief technical outlook for EUR/USD and explains: “EUR/USD remains technically bearish in the near term, with the Relative Strength Index (RSI) indicator on the daily chart edging lower toward 40. Additionally, the pair closed below the 20-day Simple Moving Average (SMA) on Thursday after managing to hold above that level in the previous five trading days.”
Eren also highlights the important technical levels for EUR/USD: “On the downside, 1.0500 (psychological level) aligns as immediate support before 1.0450 (2023 low set in March) and 1.0400 (psychological level, static level). In case the pair stabilizes above 1.0570 (20-day SMA), buyers could show interest in a technical recovery. In this scenario, 1.0650 (Fibonacci 23.6% retracement of the July-October downtrend, 50-day SMA) could be seen as the next resistance ahead of 1.0700 (psychological level, static level).
Economic Indicator
United States Core Personal Consumption Expenditures - Price Index (MoM)
The Core Personal Consumption Expenditures released by the US Bureau of Economic Analysis is an average amount of money that consumers spend in a month. "Core" excludes seasonally volatile products such as food and energy in order to capture an accurate calculation of the expenditure. It is a significant indicator of inflation. A high reading is bullish for the USD, while a low reading is bearish.
Read more.Next release: 10/27/2023 12:30:00 GMT
Frequency: Monthly
Source: US Bureau of Economic Analysis
Why it matters to traders
After publishing the GDP report, the US Bureau of Economic Analysis releases the Personal Consumption Expenditures (PCE) Price Index data alongside the monthly changes in Personal Spending and Personal Income. FOMC policymakers use the annual Core PCE Price Index, which excludes volatile food and energy prices, as their primary gauge of inflation. A stronger-than-expected reading could help the USD outperform its rivals as it would hint at a possible hawkish shift in the Fed’s forward guidance and vice versa.
Inflation FAQs
What is inflation?
Inflation measures the rise in the price of a representative basket of goods and services. Headline inflation is usually expressed as a percentage change on a month-on-month (MoM) and year-on-year (YoY) basis. Core inflation excludes more volatile elements such as food and fuel which can fluctuate because of geopolitical and seasonal factors. Core inflation is the figure economists focus on and is the level targeted by central banks, which are mandated to keep inflation at a manageable level, usually around 2%.
What is the Consumer Price Index (CPI)?
The Consumer Price Index (CPI) measures the change in prices of a basket of goods and services over a period of time. It is usually expressed as a percentage change on a month-on-month (MoM) and year-on-year (YoY) basis. Core CPI is the figure targeted by central banks as it excludes volatile food and fuel inputs. When Core CPI rises above 2% it usually results in higher interest rates and vice versa when it falls below 2%. Since higher interest rates are positive for a currency, higher inflation usually results in a stronger currency. The opposite is true when inflation falls.
What is the impact of inflation on foreign exchange?
Although it may seem counter-intuitive, high inflation in a country pushes up the value of its currency and vice versa for lower inflation. This is because the central bank will normally raise interest rates to combat the higher inflation, which attract more global capital inflows from investors looking for a lucrative place to park their money.
How does inflation influence the price of Gold?
Formerly, Gold was the asset investors turned to in times of high inflation because it preserved its value, and whilst investors will often still buy Gold for its safe-haven properties in times of extreme market turmoil, this is not the case most of the time. This is because when inflation is high, central banks will put up interest rates to combat it.
Higher interest rates are negative for Gold because they increase the opportunity-cost of holding Gold vis-a-vis an interest-bearing asset or placing the money in a cash deposit account. On the flipside, lower inflation tends to be positive for Gold as it brings interest rates down, making the bright metal a more viable investment alternative.
- EUR/JPY edges lower to 158.60 in early European session on Friday.
- Japan’s inflation rose faster than expected in October.
- European Central Bank (ECB) ECB maintained the rates unchanged, as widely expected.
The EUR/JPY cross loses ground during the early European trading session on Friday. The cross currently trades around 158.61, up 0.01% for the day. Market players await the Spain’s Gross Domestic Product (GDP) estimated for the third quarter. The quarterly and annual growth numbers are expected to expand by 0.3% and 1.6%, respectively.
The recent Japanese National Consumer Price Index (CPI) data suggested the nation’s inflation rose faster than expected in October. The report is likely to prompt the Bank of Japan (BoJ) to take a more hawkish stance at its upcoming BoJ meeting next week.
Data released by the Japan Statistics Bureau on early Friday revealed that Japan’s CPI came in at 3.3% YoY in October versus 2.8% prior. Meanwhile, CPI ex Fresh Food climbed to 2.7% YoY from 2.5% in the previous reading.
Early Friday, Japan’s Chief Cabinet Secretary Hirokazu Matsuno said that he expects BoJ to implement appropriate monetary policy in order to sustainably and stably meet its price target. Japanese Finance Minister Shunichi Suzuki stated that the excessive FX volatility is undesirable and policymakers will take thorough steps on FX with a strong sense of urgency. Nonetheless, Japanese policymakers declined to comment on the FX level and intervention.
That being said, the BoJ policy meeting next week will be in the spotlight. The hawkish stance from the BoJ or any signal to leave the ultra-accommodative monetary policy might trigger volatility in the market.
On the other hand, the European Central Bank (ECB) ECB maintained the interest rates unchanged as widely expected, snapping an unprecedented streak of 10 consecutive rate hikes on Thursday. During the press conference, ECB President Christine Lagard said the recent data continued to hint to inflation gradually approaching the 2% target. Lagarde added that the risks to economic growth remain tilted to the downside.
Additionally, the escalating geopolitical tensions in the Middle East might dampen market sentiment and boost safe-haven assets like Japanese Yen (JPY). Later on Friday, Spain’s GDP for Q3 will be released. Traders might take cues from the data ahead of the BoJ meeting next week.
FX option expiries for Oct 27 NY cut at 10:00 Eastern Time, via DTCC, can be found below.
- EUR/USD: EUR amounts
- 1.0500 1.5b
- 1.0510 1.1b
- 1.0540 1.4b
- 1.0575 409m
- 1.0600 1.4b
- 1.0650 1b
- 1.0675 1.3b
- 1.0725 825m
- GBP/USD: GBP amounts
- 1.2100 581m
- 1.2150 579m
- USD/JPY: USD amounts
- 149.00 760m
- 149.50 459m
- 150.00 3.1b
- 150.25 530m
- 150.50 793m
- 151.00 1.8b
- USD/CHF: USD amounts
- 0.8880 420m
- AUD/USD: AUD amounts
- 0.6225 580m
- 0.6290 704m
- 0.6325 344m
- 0.6350 523m
- 0.6380 421m
- 0.6400 255m
- 0.6475 826m
- 0.6500 422m
- USD/CAD: USD amounts
- 1.3615 385m
- 1.3835 961m
- NZD/USD: NZD amounts
- 0.5910 447m
- EUR/GBP: EUR amounts
- 0.8900 404m
Economists at Commerzbank analyze Euro’s outlook after no surprises from the ECB on Thursday as far as the market was concerned.
ECB will have to keep interest rates at high levels for a long time
For now, our EUR-positive story has been unable to unfold: that the ECB will not have any scope for rate cuts, that it will therefore have to keep interest rates at high levels for a long time yet and that the Euro will therefore appreciate (at least initially).
However, the market is not yet buying this story. It is far too early yet. For now, falling inflation pressure and the struggling Eurozone economy will seem to confirm the market’s view. It will take patience. How much patience? First of all, inflation developments have to seem very disappointing (from the ECB’s point of view); we haven’t got to that point yet. And we are not likely to reach that point next month either. I only expect the first effects that will be discernible in the EUR exchange rates in Q1/2024.
See: The ECB has no room to cut rates again next year – Commerzbank
In the opinion of Economist Lee Sue Ann and Markets Strategist Quek Ser Leang at UOB Group, AUD/USD faces extra declines in the near term.
Key Quotes
24-hour view: While we expected AUD to weaken yesterday, we were of the view that “the major support at 0.6230 could be out of reach.” AUD weaken less than expected to 0.6271 before rebounding. The current price action is likely part of a consolidation phase. Today, AUD is likely to trade sideways between 0.6300 and 0.6355.
Next 1-3 weeks: Yesterday (26 Oct, spot at 0.6285), we indicated that the risk for AUD has swung to the downside, towards 0.6230. We continue to hold the same. Overall, only a breach of 0.6360 would indicate our view is incorrect.
Considering advanced prints from CME Group for crude oil futures markets, open interest increased by nearly 11K contracts after three consecutive daily pullbacks. On the other hand, volume left behind two daily builds in a row and went down by around nearly 184K contracts.
WTI: Immediate support remains around $82.00
WTI prices edged lower on Thursday amidst increasing open interest, which is indicative that further retracements should not be ruled out for the time being. Against that backdrop, extra losses in the commodity are expected to meet initial support around the monthly lows near $81.50 (October 6).
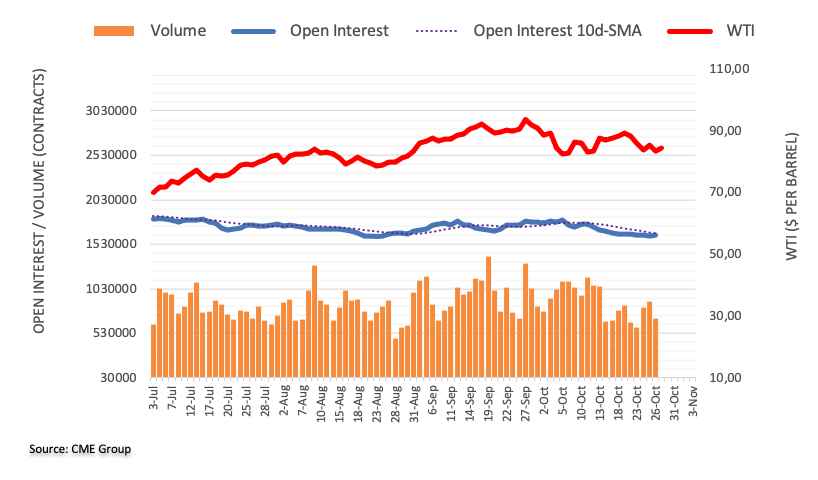
USD/CNY has continued to move broadly sideways. Economists at Danske Bank analyze the pair’s outlook.
Expectations of the pace of CNY weakening against USD lowered
As China has shown a stronger determination lately to defend the CNY and sentiment is already very weak, we have lowered our expectation of the pace of CNY weakening against the USD.
We have lowered the 6M forecast to 7.40 from 7.60 and the 12M forecast to 7.50 from 7.70. It is still around 2% weaker than what the forward market is pricing, though.
EUR/CNY has continued to move lower trading with a high correlation to EUR/USD again. The revision to our USD/CNY forecast translates into a lowering of the 6M forecast to 7.84.
Further downside in GBP/USD could revisit the 1.2040 zone in the short-term horizon, suggest Economist Lee Sue Ann and Markets Strategist Quek Ser Leang at UOB Group.
Key Quotes
24-hour view: We expected GBP to “continue to weaken yesterday.” However, we were of the view that “the major support at 1.2040 could be out of reach.” GBP weakened less than expected to 1.2070 before rebounding. The rebound in oversold conditions suggests GBP is unlikely to weaken further. Today, GBP is more likely to trade in a range, probably between 1.2100 and 1.2170.
Next 1-3 weeks: Our update from yesterday (26 Oct, spot at 1.2105) is still valid. As highlighted, downward momentum is beginning to improve. As long as GBP stays below 1.2200 (no change in ‘strong resistance level), it is likely to test the early October low near 1.2040. A break of this major support could potentially trigger a further drop to 1.2000.
- The index meets some initial resistance near 106.90.
- US yields look poised to rebound following Thursday’s decline.
- US PCE, Final Consumer Sentiment take centre stage in the docket.
The USD Index (DXY), which gauges the greenback vs. a bundle of its main competitors, runs out of some upside impulse and recedes to the mid-106.00s at the end of the week.
USD Index focuses on data
The index reverses three consecutive daily advances and comes under a mild downside pressure after hitting three-week lows near 106.90 in the previous session.
In the meantime, US yields appear to have entered a consolidative phase in the area of recent multi-year peaks across different maturities, while consensus among investors continue to signal a pause by the Federal Reserve at its next week’s event, while the door remains open to a potential rate hike in December.
This view was reinforced on Thursday after stronger-than-expected US Q3 GDP figures and Durable Goods Orders.
In the US data space, all the attention is expected to be on the release of US inflation figures gauged by the PCE and Core PCE, seconded by Personal Income, Personal Spending and final prints of the Michigan Consumer Sentiment.
What to look for around USD
The upside momentum in the index seems to have met some initial obstacle just below the 107.00 barrier so far this week.
In the meantime, support for the dollar keeps coming from the good health of the US economy and still elevated inflation, which morphs into higher yields and underpins the renewed tighter-for-longer narrative from the Federal Reserve.
Key events in the US this week: PCE, Core PCE, Personal Income, Personal Spending, Final Michigan Consumer Sentiment (Friday).
Eminent issues on the back boiler: Persevering debate over a soft or hard landing for the US economy. Incipient speculation of rate cuts in early 2024. Geopolitical effervescence vs. Russia and China and the Middle East.
USD Index relevant levels
Now, the index is down 0.02% at 106.60 and faces initial contention at 105.36 (monthly low October 24) ahead of 104.42 (weekly low September 11) and then 103.39 (200-day SMA). On the upside, the breakout of 106.88 (weekly high October 26) could expose 107.34 (2023 high October 3) and finally 107.99 (weekly high November 21 2022).
- EUR/USD hovers around 1.0565 amid the USD weakness, lower US bond yield.
- The pair holds below the 100- and 200-hour EMAs; the RSI indicator is located in bearish territory under 50.
- The first resistance level is located at 1.0580; 1.0522 acts as the initial support level.
The EUR/USD pair recovers some lost ground above the mid-1.0500s during the early European session on Friday. The lower US Treasury bond yields drag the US Dollar (USD) lower, which acts as a tailwind for the EUR/USD pair.
On Thursday, the European Central Bank (ECB) decided to leave interest rates unchanged as widely expected. ECB President Christine Lagard said that the fact that the central bank holds rates doesn't mean that they will never hike again. Lagarde further stated that the risks to economic growth remain tilted to the downside.
According to the four-hour chart, the EUR/USD pair holds below the 100- and 200-hour Exponential Moving Averages (EMAs), suggesting the path of least resistance is to the downside. It’s worth noting that the Relative Strength Index (RSI) is located in bearish territory under 50, which supports the sellers in the near term.
The first upside barrier for the major pair is located near the 100-EMA at 1.0580. Any follow-through buying above the upper boundary of Bollinger Band of 1.0660 will see the rally to 1.0694 (high of October 24), followed by 1.0735 (high of September 20).
On the other hand, 1.0522 acts as the initial support level for EUR/USD. The key contention level is seen at the 1.0500-1.0505 region, portraying the confluence of the lower limit of the Bollinger Band and a psychological round figure. A decisive break below the latter will see a drop to 1.0450 (a low of October 4).
EUR/USD four-hour chart
-638339839254133056.png)
Open interest in gold futures markets dropped for the first time since October 16 on Thursday, this time by around 1.4K contracts according to preliminary readings from CME Group. Volume followed suit and shrank by around 24.7K contracts, keeping the erratic performance well in place.
Gold: A move to $2000 looms closer
Gold prices extended further its monthly recovery on Thursday. The daily uptick, however, was on the back of diminishing open interest and volume and hints at the probability of a corrective move in the very near term. In the longer run, the precious metal continues to target the critical hurdle at $2000 per troy ounce.
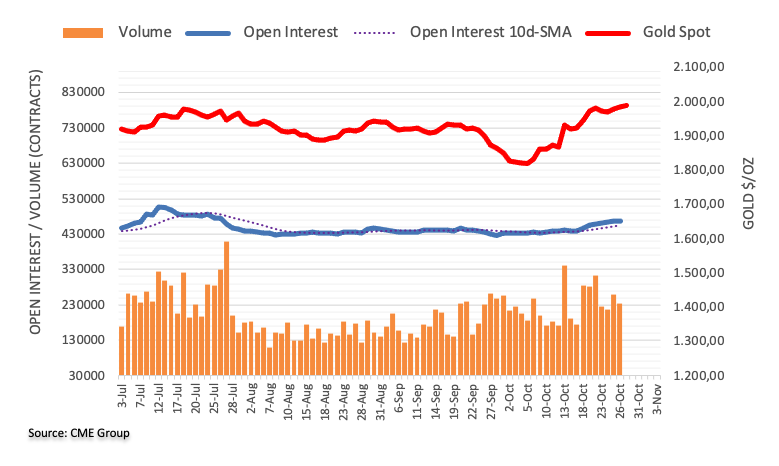
EUR/USD keeps pointing to extra range bound trade in the short-term horizon, comment Economist Lee Sue Ann and Markets Strategist Quek Ser Leang at UOB Group.
Key Quotes
24-hour view: We highlighted yesterday that “while downward momentum has not increased much, the bias for today is still tilted to the downside.” We added, “However, any decline is unlikely to reach the major support at 1.0510.” Our view was not wrong as EUR dipped to 1.0520 and then rebounded to end the day little changed at 1.0560 (-0.03%). The rebound has scope to extend to 1.0595. The next resistance at 1.0620 is unlikely to come under threat. Support is at 1.0545, followed by 1.0530.
Next 1-3 weeks: We continue to hold the same view as two days ago (25 Oct, spot at 1.0595), wherein EUR is likely to trade in a range of 1.0510/1.0690 for now.
- Asian equities gain momentum on the lower US Treasury bond yield.
- China’s 1 trillion yuan bond issuance boosts Chinese stock markets from 11-month lows.
- Japan’s National Consumer Price Index (CPI) for October arrived at 3.3% YoY vs. 2.8% prior.
Most Asian stock markets trade in positive territory on Friday. The lower US Treasury bond yield lifts the regional stocks ahead of the US Core Personal Consumption Expenditures Price Index (PCE) data, due later on Friday. Meanwhile, the headlines surrounding the escalating geopolitical tensions in the Middle East might exert pressure on the stock markets.
At press time, China’s Shanghai gains 0.35% to 2,998, the Shenzhen Component Index climbs 1.11% to 9,672, Hong Kong’s Hang Sang soars 0.99% to 17,213, South Korea’s Kospi is up 0.02%, and Japan’s Nikkei rises 1.14%.
Chinese equities rebound from multi-month lows, supported by a 1 trillion yuan bond issuance to spur local economic growth by the Chinese government.
In Japan, Inflation rose faster than anticipated in October and likely prompted the Bank of Japan (BoJ) to take a more hawkish stance at its upcoming BoJ meeting next week.
Japan’s National Consumer Price Index (CPI) for October arrived at 3.3% YoY from the previous reading of 2.8%, data released by the Japan Statistics Bureau on early Friday. Additionally, the National CPI ex Fresh Food surges to 2.7% YoY in October from 2.5% in September.
On the Aussie front, Australia’s Producer Price Index (PPI) eased to 3.8% YoY in the third quarter (Q3) from the 3.9% seen in the previous reading. On a quarterly basis, the figure arrived at 1.8% from 0.5% in the previous reading.
Investors will keep an eye on September’s US Core Personal Consumption Expenditures Price Index (PCE) on Friday. The monthly and annual Core figures are estimated to grow 0.3% and 3.7%, respectively. The attention will turn to the Federal Open Market Committee (FOMC) meeting next week and this event could trigger the volatility in the market.
- USD/JPY meets with some supply on Friday and snaps a three-day winning streak to the YTD top.
- Intervention fears benefit the JPY and exert pressure on the pair amid subdued USD price action.
- The divergent Fed-BoJ policy outlook should limit the downside ahead of the US PCE Price Index.
The USD/JPY pair edges lower during the Asian session on Friday and for now, seems to have snapped a three-day winning streak to its highest level since October 2022, around the 150.75-150.80 region touched the previous day. Spot prices, however, manage to hold above the 150.00 psychological mark as traders keenly await the US PCE Price Index before positioning for the next leg of a directional move.
In the meantime, speculations that the Japanese government will intervene in FX markets to stem any further weakness in the Japanese Yen (JPY) exert some pressure on the USD/JPY pair amid subdued US Dollar (USD) price action. That said, a big divergence in the monetary policy stance adopted by the Federal Reserve (Fed) and the Bank of Japan (BoJ) should help limit the downside. Investors might also refrain from placing aggressive bets ahead of next week's central bank event risks – the BoJ meeting on Tuesday, followed by the crucial FOMC decision on Wednesday.
From a technical perspective, the overnight intraday downfall showed some resilience below the 100-hour Simple Moving Average (SMA). The said support, currently pegged around the 150.00 mark, should now act as a pivotal point for intraday traders, below which the USD/JPY pair could accelerate the slide towards an ascending trend-line support near the 149.65 area. Some follow-through selling will be seen as a fresh trigger for bearish traders and pave the way for a slide towards the 149.30 intermediate support before spot prices drop to the 149.00 round figure.
The downward trajectory could get extended further towards the next relevant support near the 148.70 region en route to the 148.25 horizontal zone and the 148.00 mark. The USD/JPY pair could eventually fall to the 147.30-147.25 region, or the monthly swing low touched on October 3.
On the flip side, the YTD peak, around the 150.75-150.80 region touched on Thursday, now seems to act as an immediate hurdle ahead of the 151.00 mark. Some follow-through buying has the potential to push the USD/JPY pair closer to the 152.00 mark, or a multi-decade high touched in October 2022.
USD/JPY 1-hour chart
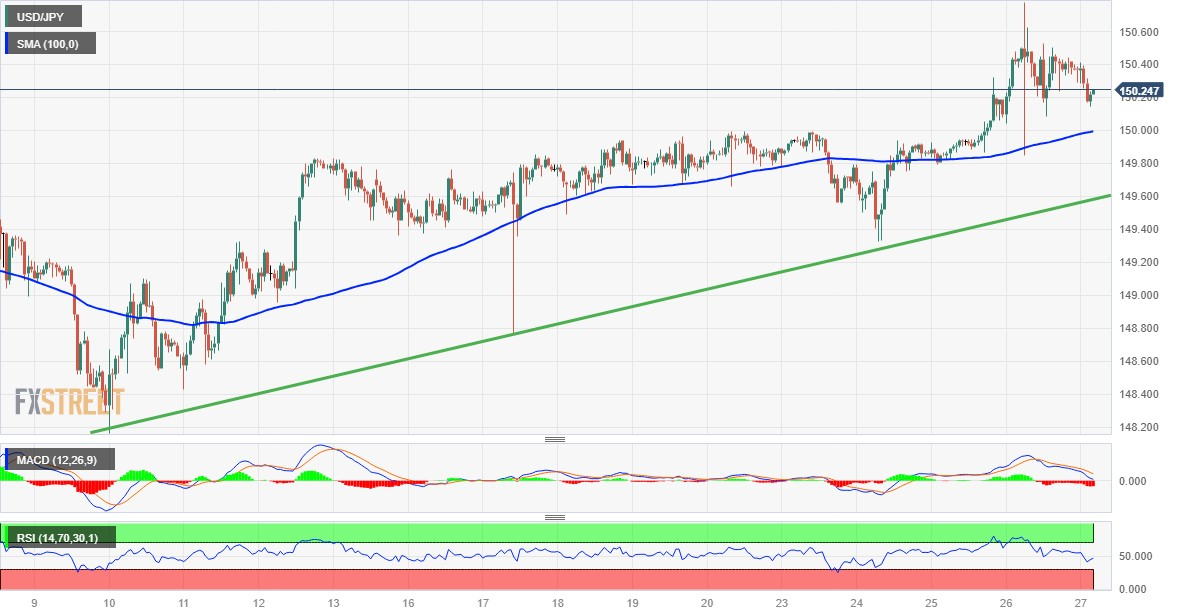
Technical levels to watch
- Crude oil recovers from the recent losses on heightened concerns in Middle-East conflict.
- Israeli armed forces carried out the most significant attack on Gaza since the war broke.
- US Dollar Index retreats from the weekly high as US Treasury yields decline.
Western Texas Intermediate (WTI) trades higher near $84.10 per barrel during the Asian session on Friday. The rebound in crude oil prices follows the United States (US) military strikes on Iranian targets in Syria, heightening concerns of an escalation in the Israel-Hamas conflict. Market participants are apprehensive about the potential impact on Middle Eastern countries producing crude oil.
Additionally, the Israeli armed forces launched the most significant overnight attack on Gaza since the conflict began, a move that has the potential to provoke anger among Arab nations. Additionally, Israel Prime Minister Benjamin Netanyahu's announcement of preparations for a ground assault in Gaza might have contributed to a further decline in market sentiment.
However, diplomatic missions to Israel are actively working to prevent a planned ground assault on Gaza and are engaged in negotiations for the release of approximately 200 hostages held by Hamas.
The US Dollar Index (DXY) pulls back from the weekly high as US Treasury yields decline. The index bids near 106.60 at the time of writing, with the 10-year US Bond yield standing at 4.85% by the press time, retreating from 4.98% marked in the previous session.
Moreover, the upbeat US preliminary Gross Domestic Product (GDP) Annualized data could reinforce the strength of the Greenback. The report showed an increase of 4.9% in the third quarter against the previous reading of a 2.1% expansion and the 4.2% expectations.
Furthermore, the release of the US Core Personal Consumption Expenditures (PCE) data will be eyed on Friday, seeking additional insights into the overall economic landscape in the United States.
- Gold price gains traction for the third straight day and remains closer to a multi-month peak.
- The risk of an escalation in Middle East tensions continues to underpin the safe-haven metal.
- Bets for further policy tightening by the Fed might cap gains ahead of the US PCE Price Index.
Gold price (XAU/USD) attracts some dip-buying during the Asian session on Friday – marking the third successive day of a positive move – and draws support from steady safe-haven demand, fuelled by the Middle East conflict. Apart from this, subdued US Dollar (USD) price action turns out to be another factor underpinning the commodity. The precious metal, however, remains below a five-month peak touched last Friday in the wake of expectations that the Federal Reserve (Fed) will keep interest rates higher for longer.
Traders also seem reluctant to place aggressive directional bets around the Gold price and prefer to wait on the sidelines ahead of the release of the Personal Consumption Expenditure (PCE) Price Index from the United States (US). The data will influence market expectations about the Fed's policy move next week, which, in turn, will influence the USD price dynamics and provide some meaningful impetus to the non-yielding yellow metal. Nevertheless, the XAU/USD seems poised to register modest gains for the third straight week.
Daily Digest Market Movers: Gold price remains well within the striking distance of a multi-month top set last week
- Geopolitical tensions continue to underpin the safe-haven Gold price, though hawkish Federal Reserve expectations hold back bulls from placing aggressive bets.
- Israeli troops and tanks carried out a brief yet relatively large ground incursion into Gaza on Thursday ahead of the widely expected full-scale ground invasion.
- The US military launched airstrikes early Friday on two locations in eastern Syria in retaliation to a slew of drone and missile attacks against American troops in the region.
- US President Joe Biden sends a direct message to Iran's Supreme Leader and warns against targeting US bases and personnel in the Middle East.
- Data released on Thursday showed that the US economy expanded by a 4.9% annualized pace in the third quarter – its fastest growth in nearly two years.
- The US economic resilience should allow the Fed to stick to its hawkish stance and keep the door open for one more rate hike by the year-end.
- The release of weaker-than-expected US inflation and disposable income data reaffirm bets that the Federal Reserve will maintain the status quo in November.
- Investors now look forward to the release of the US PCE Price Index data for cues about the Fed's next policy move and before placing fresh directional bets.
Technical Analysis: Gold price needs to break through the $2,000 mark for bulls to reaffirm near-term control
From a technical perspective, the Relative Strength Index (RSI) on the daily chart is hovering around the 70 mark. This suggests that the Gold price is nearing overbought territory and warrants some caution for bullish traders. Hence, any subsequent move up might continue to confront stiff resistance ahead of the $2,000 psychological mark. The said handle should act as a key pivotal point for short-term traders, which if cleared decisively should pave the way for a move towards the next relevant hurdle near the $2,022 area.
On the flip side, the $1,980 region is likely to protect the immediate downside ahead of the $1,972-$1,970 zone. A convincing break below the latter could drag the Gold price back towards the weekly low, around the $1,953-1,952 zone touched on Tuesday. Some follow-through selling could expose a technically significant 200-day Simple Moving Average (SMA) support, currently pegged near the $1,932-1,931 region.
US Dollar price this week
The table below shows the percentage change of US Dollar (USD) against listed major currencies this week. US Dollar was the strongest against the Canadian Dollar.
| USD | EUR | GBP | CAD | AUD | JPY | NZD | CHF | |
| USD | 0.24% | 0.25% | 0.75% | -0.30% | 0.24% | 0.11% | 0.56% | |
| EUR | -0.24% | 0.00% | 0.51% | -0.53% | -0.01% | -0.13% | 0.35% | |
| GBP | -0.23% | 0.00% | 0.51% | -0.53% | 0.01% | -0.14% | 0.36% | |
| CAD | -0.75% | -0.51% | -0.52% | -1.05% | -0.51% | -0.65% | -0.16% | |
| AUD | 0.30% | 0.56% | 0.55% | 1.04% | 0.55% | 0.39% | 0.88% | |
| JPY | -0.24% | 0.00% | -0.02% | 0.50% | -0.55% | -0.13% | 0.35% | |
| NZD | -0.10% | 0.14% | 0.14% | 0.64% | -0.39% | 0.15% | 0.49% | |
| CHF | -0.60% | -0.36% | -0.35% | 0.15% | -0.89% | -0.35% | -0.49% |
The heat map shows percentage changes of major currencies against each other. The base currency is picked from the left column, while the quote currency is picked from the top row. For example, if you pick the Euro from the left column and move along the horizontal line to the Japanese Yen, the percentage change displayed in the box will represent EUR (base)/JPY (quote).
Gold FAQs
Why do people invest in Gold?
Gold has played a key role in human’s history as it has been widely used as a store of value and medium of exchange. Currently, apart from its shine and usage for jewelry, the precious metal is widely seen as a safe-haven asset, meaning that it is considered a good investment during turbulent times. Gold is also widely seen as a hedge against inflation and against depreciating currencies as it doesn’t rely on any specific issuer or government.
Who buys the most Gold?
Central banks are the biggest Gold holders. In their aim to support their currencies in turbulent times, central banks tend to diversify their reserves and buy Gold to improve the perceived strength of the economy and the currency. High Gold reserves can be a source of trust for a country’s solvency. Central banks added 1,136 tonnes of Gold worth around $70 billion to their reserves in 2022, according to data from the World Gold Council. This is the highest yearly purchase since records began. Central banks from emerging economies such as China, India and Turkey are quickly increasing their Gold reserves.
How is Gold correlated with other assets?
Gold has an inverse correlation with the US Dollar and US Treasuries, which are both major reserve and safe-haven assets. When the Dollar depreciates, Gold tends to rise, enabling investors and central banks to diversify their assets in turbulent times. Gold is also inversely correlated with risk assets. A rally in the stock market tends to weaken Gold price, while sell-offs in riskier markets tend to favor the precious metal.
What does the price of Gold depend on?
The price can move due to a wide range of factors. Geopolitical instability or fears of a deep recession can quickly make Gold price escalate due to its safe-haven status. As a yield-less asset, Gold tends to rise with lower interest rates, while higher cost of money usually weighs down on the yellow metal. Still, most moves depend on how the US Dollar (USD) behaves as the asset is priced in dollars (XAU/USD). A strong Dollar tends to keep the price of Gold controlled, whereas a weaker Dollar is likely to push Gold prices up.
- USD/MXN lost ground as Mexico's economic data suggests a robust labor market.
- Mexico’s Jobless Rate declined to 2.9% in September from the previous reading of 3%.
- The less likelihood of the Fed increasing interest rate is weighing on the US Dollar.
USD/MXN treads water to retrace the losses registered in the previous session, trading around 18.1600 during the Asian session on Friday. The Mexican Peso (MXN) surged as Mexico's employment data revealed a robust labor market, showcasing the enduring strength of the Mexican economy.
Mexico’s Jobless Rate dropped to 2.9% in September, down from August's 3%. Deputy Governor Jonathan Heath of the Bank of Mexico (Banxico) mentioned that the growing government debt in 2024 will add another layer to the inflationary battle, highlighting a desynchronization between monetary and fiscal policies.
Moreover, the upbeat preliminary Gross Domestic Product (GDP) Annualized data from the United States (US) increased to 4.9% in the third quarter. This higher figure compared to the previous reading of a 2.1% expansion and the 4.2% expectations could help the US Dollar (USD) to sustain its upward trajectory.
On the employment side, the US weekly Initial Jobless Claims for the week ending October 21 rose to 210K from the previous 200K, indicating the repercussions of increased interest rates in the US. This scenario may decrease the probability of another interest rate hike by the US Federal Reserve (Fed) through the end of 2023.
The US Dollar Index (DXY) receives downward pressure on the downbeat US Treasury yields observed in the previous session, bidding near 106.60 at the time of writing.
Moreover, the Greenback faced downward pressure following recent dovish remarks from Fed Chair Jerome Powell. The Chief Policymaker stated that the central bank has no immediate plans to raise rates. However, Powell also noted that further tightening of monetary policy could be on the table if there's substantial evidence of growth exceeding the norm.
Investors await the US Core Personal Consumption Expenditures (PCE) data on Friday, seeking further impetus on the US economic overview.
Newly elected US House Speaker Mike Johnson said in a Fox News interview late Thursday that President Joe “Biden’s funding request for Ukraine and Israel should be handled separately.”
“I think any stopgap spending bill should have conditions,” Johnson said.
Market reaction
At the time of writing, the US Dollar Index is trading modestly flat at around 106.50, undermined by an improving risk sentiment.
- Gold price holds positive ground near $2,000 on the lower US bond yields.
- US Gross Domestic Product (GDP) Annualized Q3 grew 4.9% vs. 2.1% prior.
- The first resistance level is located at $2,000; $1,965 acts as an initial support level.
Gold price (XAU/USD) holds positive ground for the third consecutive day during the early Asian session on Friday. That being said, the lower US Treasury bond yield acts as a tailwind for the precious metal. At the press time, gold price is adding 0.15% on the day to trade at $1,987.
Data released by the US Bureau of Economic Analysis on Thursday revealed that the preliminary US Gross Domestic Product (GDP) Annualized for the third quarter (Q3) showed an expansion of 4.9% from 2.1% growth in the previous reading. This figure came in better than the market consensus of 4.2%.
Meanwhile, the US Durable Goods Orders climbed 4.7% MoM in September from a 0.1% drop in August, above the expectations of 1.5%. The US Initial Jobless Claims for the week ending October 21 rose to 210K from the prior week's data of 200K, beating the consensus while continuing claims rose by 63,000, the highest reading since May.
US Treasury Secretary Janet Yellen stated that the recent rise in bond yields is unrelated to deficits and does not indicate an oncoming recession. Instead, it reflects the US economy's strength. However, the US Treasury bond yields edge lower on Friday. The 10-year bond yield stands at 4.86% after retracing from 5.00%. This, in turn, lift the gold price higher despite the stronger-than-expected economic data from the US.
Gold traders will take more cues from September’s US Core Personal Consumption Expenditures Price Index (PCE) on Friday. The monthly and annual Core figures are expected to rise 0.3% and 3.7%, respectively. Additionally, the US Consumer Inflation Expectation and Michigan Consumer Sentiment Index for October will be released. Next week, the Federal Open Market Committee (FOMC) meeting will be in the spotlight.
Gold (XAU/USD) Technical Outlook
From the technical perspective, gold price remains firm above the key 100- and 200-day on the daily chart, which hints that further upside looks favorable. The key upside barrier is seen at the $2,000 psychological round mark. On the downside, a low of October 25 at $1,965 acts as an initial support level.
Gold price daily Chart
-638339734488673562.png)
- USD/CAD meets with some supply on Friday and is weighed down by a combination of factors.
- An uptick in Oil prices underpins the Loonie and exerts pressure amid subdued USD demand.
- The downside seems cushioned as traders look to the US PCE Price Index for a fresh impetus.
The USD/CAD pair comes under some selling pressure during the Asian session on Friday and for now, seems to have snapped a three-day winning streak to a multi-month top, around the 1.3840-1.3845 area touched the previous day. Spot prices currently trade around the 1.3805-1.3810 region, down over 0.15% for the day, though any meaningful corrective slide seems elusive.
A modest uptick in Crude Oil prices is seen underpinning the commodity-linked Loonie and weighing on the USD/CAD pair amid subdued US Dollar (USD) price action. The upside for Oil prices, however, seems limited in the wake of receding fears that the Israle-Hamas war could spill over to other Middle Eastern countries and disrupt global supplies. Adding to this, a string of weak economic data from the Euro Zone this week raised concerns about fuel demand and might further contribute to capping the black liquid.
Furthermore, expectations that the Federal Reserve (Fed) will keep interest rates higher for longer act as a tailwind for the USD and might further contribute to limiting losses for the USD/CAD pair. The Advance US GDP report released on Thursday showed that the economy grew at a faster-than-expected pace during the third quarter. Adding to this, the US Durable Goods Orders also surpassed consensus estimates and pointed to a still resilient US economy, which should allow the Fed to stick to its hawkish stance.
This, in turn, remains supportive of elevated US Treasury bond yields and might continue to act as a tailwind for the Greenback. The markets, however, seem convinced that the Fed will maintain the status quo next week amid signs of easing inflationary pressures, which is holding back the USD bulls from placing fresh bets and doing little to lend any support to the USD/CAD pair. Moving ahead, Friday's key focus will remain glued to the release of the US Core PCE Price Index – the Fed's preferred inflation gauge.
The crucial report will play a key role in influencing market expectations about the Fed's future rate-hike path, which, in turn, will drive the USD demand and provide a fresh impetus to the USD/CAD pair. Apart from this, traders will take cues from Oil price dynamics to grab short-term opportunities. Nevertheless, spot prices remain on track to register gains for the second straight week – also the fourth in the previous five – as the attention now turns to the highly anticipated FOMC policy meeting next week.
Technical levels to watch
- NZD/USD extends gains for the second session due to the correction in the US Dollar.
- New Zealand Dollar grapples with pressure as RBNZ is expected to keep interest rates unchanged.
- The Greenback faces a challenge on the downbeat US Treasury yields.
NZD/USD rebounds from the year-to-date low of 0.5772, trading around 0.5830 during the Asian session on Friday. The pair bid the lowest on Thursday since November 2022 as the New Zealand Dollar (NZD) is contending with pressure, with the situation exacerbated by the recent release of headline Consumer Price Index (CPI) data from the nation.
Additionally, the upbeat Kiwi’s ANZ – Roy Morgan Consumer Confidence could provide minor support for the NZD/USD pair. The report showed an improvement in October, reaching 88.1 from 86.4 previously.
Traders in the NZD/USD pair anticipate the Reserve Bank of New Zealand (RBNZ) to adopt a more accommodative stance on interest rate hikes, contributing to the weakening of the Kiwi pair. Moreover, the deteriorating market sentiment, intensified by recent statements from Israel's Prime Minister Benjamin Netanyahu regarding a potential ground assault on Gaza, adds to the downward pressure on the pair.
However, the NZD gains much-needed profits despite the better-than-expected economic data from the United States (US). The preliminary US Gross Domestic Product (GDP) Annualized expanded by 4.9% in the third quarter, a remarkable improvement from the previous reading of a 2.1% expansion, exceeding the 4.2% expectations.
However, the weekly Initial Jobless Claims for the week ending October 21 came in at 210,000, up from 200,000 in the previous reading, and slightly higher than the expectations of 208,000.
The US Dollar Index (DXY) receives downward pressure as the US Federal Reserve (Fed) is expected to keep interest rates unchanged in the upcoming meeting next week, hovering near 106.50 at the time of writing. The US Dollar (USD) is facing challenges in maintaining its recent gains, with the decline in US Treasury yields observed in the previous session exerting pressure on USD bulls.
Investors await the US Core Personal Consumption Expenditures (PCE) data on Friday, seeking further impetus on US economic overview.
- Indian Rupee attracts some buyers despite the stronger US growth number.
- The higher Treasury bond yields, Middle East geopolitical conflicts might cap the INR’s upside.
- Investors will monitor the US Core Personal Consumption Expenditures Price Index (PCE) data, which is expected to ease in September.
Indian Rupee (INR) holds positive ground on Friday. The USD/INR pair loses momentum on the lower US Treasury bond yields despite the upbeat US Gross Domestic Product (GDP) figures. Nonetheless, the Indian Rupee remains sensitive to market sentiment and the Middle East escalating tension headline could limit the INR’s upside in the near term.
Market participants will keep an eye on the US Core Personal Consumption Expenditures Price Index (PCE), due later on Friday. Next week, the attention will shift to the Federal Reserve’s Federal Open Market Committee (FOMC) meeting. The markets anticipate FOMC to keep the interest rate unchanged at its meeting scheduled for November 2.Furthermore, the Reserve Bank of India (RBI) is set to meet with top bank officials next week to discuss the current liquidity condition in the banking system.
Daily Digest Market Movers: Indian Rupee strengthens amid the uncertainty
- US Q3 GDP expanded at an annualized rate of 4.9%, above the market consensus of 4.2%.
- US Durable Goods Orders rose 4.7% MoM in September versus a 0.1% drop in August, beating market expectations of 1.5%.
- US Initial Jobless Claims for the week ending October 21 climbed to 210K from the prior week's data of 200K, exceeding estimates.
- US Continuing claims rose by 63,000, the highest reading since May.
- The Reserve Bank of India (RBI) is likely to meet with top bank officials next week to discuss the current liquidity condition in the banking system.
- The RBI's monetary policy committee said the central bank will continue monitoring on maintaining inflation at the 4% target.
- RBI estimated India's Gross Domestic Product (GDP) will grow at 6.5% in the current fiscal year.
- The International Monetary Fund (IMF) raised its forecast growth rate for India to 6.3% in October.
- RBI's October bulletin suggested growth in India is expected to gain momentum for the remainder of 2023.
- India’s Wholesale Price Index (WPI), a measure of inflation, dropped -0.26% YoY in September versus 0.52% prior, below the market expectation of 0.50%.
Technical Analysis: The Indian Rupee picks up bid above the critical support level
The Indian Rupee trades firmly on the day. The USD/INR pair trades within a range of 83.00-83.35. Meanwhile, the pair holds above the 100- and 200-day Exponential Moving Averages (EMA) on the daily chart, suggesting the upward bias remains intact for the pair.
That being said, any follow-through buying above 83.35 will see a rally to year-to-date (YTD) highs of 83.45. Further north, the next barrier will emerge at a psychological round mark at 84.00. On the flip side, the key contention level is located at 83.00, representing a low of October 20 and a round figure. A decisive break below the latter could see a drop to 82.82 (low of September 12), en route to 82.65 (low of August 4).
US Dollar price in the last 7 days
The table below shows the percentage change of US Dollar (USD) against listed major currencies in the last 7 days. US Dollar was the weakest against the Australian Dollar.
| USD | EUR | GBP | CAD | AUD | JPY | NZD | CHF | |
| USD | 0.19% | 0.01% | 0.66% | -0.25% | 0.24% | 0.18% | 0.69% | |
| EUR | -0.19% | -0.18% | 0.48% | -0.43% | 0.07% | -0.01% | 0.51% | |
| GBP | 0.00% | 0.19% | 0.66% | -0.24% | 0.26% | 0.19% | 0.70% | |
| CAD | -0.67% | -0.46% | -0.68% | -0.90% | -0.42% | -0.49% | 0.03% | |
| AUD | 0.22% | 0.43% | 0.23% | 0.90% | 0.49% | 0.40% | 0.94% | |
| JPY | -0.25% | -0.08% | -0.26% | 0.39% | -0.49% | -0.08% | 0.44% | |
| NZD | -0.20% | 0.00% | -0.19% | 0.48% | -0.43% | 0.09% | 0.51% | |
| CHF | -0.70% | -0.52% | -0.71% | -0.04% | -0.95% | -0.45% | -0.52% |
The heat map shows percentage changes of major currencies against each other. The base currency is picked from the left column, while the quote currency is picked from the top row. For example, if you pick the Euro from the left column and move along the horizontal line to the Japanese Yen, the percentage change displayed in the box will represent EUR (base)/JPY (quote).
Indian Rupee FAQs
What are the key factors driving the Indian Rupee?
The Indian Rupee (INR) is one of the most sensitive currencies to external factors. The price of Crude Oil (the country is highly dependent on imported Oil), the value of the US Dollar – most trade is conducted in USD – and the level of foreign investment, are all influential. Direct intervention by the Reserve Bank of India (RBI) in FX markets to keep the exchange rate stable, as well as the level of interest rates set by the RBI, are further major influencing factors on the Rupee.
How do the decisions of the Reserve Bank of India impact the Indian Rupee?
The Reserve Bank of India (RBI) actively intervenes in forex markets to maintain a stable exchange rate, to help facilitate trade. In addition, the RBI tries to maintain the inflation rate at its 4% target by adjusting interest rates. Higher interest rates usually strengthen the Rupee. This is due to the role of the ‘carry trade’ in which investors borrow in countries with lower interest rates so as to place their money in countries’ offering relatively higher interest rates and profit from the difference.
What macroeconomic factors influence the value of the Indian Rupee?
Macroeconomic factors that influence the value of the Rupee include inflation, interest rates, the economic growth rate (GDP), the balance of trade, and inflows from foreign investment. A higher growth rate can lead to more overseas investment, pushing up demand for the Rupee. A less negative balance of trade will eventually lead to a stronger Rupee. Higher interest rates, especially real rates (interest rates less inflation) are also positive for the Rupee. A risk-on environment can lead to greater inflows of Foreign Direct and Indirect Investment (FDI and FII), which also benefit the Rupee.
How does inflation impact the Indian Rupee?
Higher inflation, particularly, if it is comparatively higher than India’s peers, is generally negative for the currency as it reflects devaluation through oversupply. Inflation also increases the cost of exports, leading to more Rupees being sold to purchase foreign imports, which is Rupee-negative. At the same time, higher inflation usually leads to the Reserve Bank of India (RBI) raising interest rates and this can be positive for the Rupee, due to increased demand from international investors. The opposite effect is true of lower inflation.
| Raw materials | Closed | Change, % |
|---|---|---|
| Silver | 22.781 | -0.24 |
| Gold | 1984.656 | 0.21 |
| Palladium | 1127.76 | 1.53 |
- EUR/USD trades with a mild negative bias for the fourth successive day on Friday.
- An uptick in the US bond yields acts as a tailwind for the USD and exerts pressure.
- The ECB’s dovish outlook undermines the Euro and contributes to the offered tone.
The EUR/USD pair struggles to capitalize on the previous day's bounce from the 1.0520 area, or over a one-week low and edges lower during the Asian session on Friday. Spot prices trade with a mild negative bias for the fourth straight day, albeit manage to hold just above mid-1.0500s.
A modest uptick in the US Treasury bond yields acts as a tailwind for the US Dollar (USD), which, along with the European Central Bank's (ECB) dovish outlook, turns out to be a key factor acting as a headwind for the EUR/USD pair. Despite signs of easing inflationary pressures in the US, the Federal Reserve (Fed) is expected to stick to its hawkish stance and keep rates higher for longer in the wake of the resilient US economy.
The bets were reaffirmed by the US macro data released on Thursday, which showed that the economy expanded by a 4.9% annualize pace during the third quarter as compared to the 4.2% growth estimated. Furthermore, the US Durable Goods Orders shot up by 4.7% in September, also beating market expectations. This, along with the European Central Bank's (ECB) dovish outlook, continues to weigh on the EUR/USD pair.
As was anticipated, the ECB decided to leave rates unchanged, ending its unprecedented streak of 10 consecutive increases in borrowing costs amid rising concerns over eurozone growth. In the post-meeting press conference, ECB President Christine Lagarde said that growth was likely to remain weak over the remainder of the year as the impact of higher interest rates was broadening, though did not rule out another rate increase.
Traders, meanwhile, seem reluctant to place aggressive bearish bets around the EUR/USD pair ahead of the release of the US Core PCE Price Index – the Fed's preferred inflation gauge. The data will influence market expectations about the Fed's future rate-hike path, which, in turn, will drive the USD demand and provide a fresh impetus to the major. Nevertheless, spot prices remain on track to register modest weekly losses.
Technical levels to watch
- Australian Dollar rebounds from the yearly lows as the US Dollar corrects.
- Aussie Dollar receives upward support as the RBA expects to increase interest rates.
- US Dollar faced pressure as downbeat Core PCE contributed to increasing demand for US bonds.
The Australian Dollar (AUD) rebounds from the yearly lows, extending gains for the second successive day on Friday. The pair recovers on the back of the correction of the US Dollar (USD) and the likelihood of another rate hike from the Reserve Bank of Australia (RBA) on November 7.
Australia's Producer Price Index (PPI) displayed a year-over-year decline in the third quarter on Friday, while the PPI on a quarter-over-quarter basis showed improvement. However, the recent inflation data has introduced the possibility of a 25 basis points rate hike by the Reserve Bank of Australia (RBA) in the upcoming meeting. The Australian Bureau of Statistics (ABS) revealed on Wednesday that the Consumer Price Index (CPI) experienced an upswing in the third quarter of 2023.
RBA Governor Michele Bullock remarked on Thursday that the Consumer Price Index (CPI) was slightly higher than anticipated but fell within the expected range. Bullock emphasized the central bank's goal of slowing down the economy without pushing it into a recession.
The US Dollar Index (DXY) navigates to sustain its gains, buoyed by the expansion of the United States (US) economy in the third quarter. The data also unveiled a preliminary core Personal Consumption Expenditure (PCE) price index that was lower than expected, sparking increased demand for bonds.
The upcoming Federal Open Market Committee (FOMC) meeting next week is anticipated to bring no changes to interest rates, as per current market expectations. Furthermore, on Friday, the US is set to release the monthly core Personal Consumption Expenditure (PCE), a pivotal measure of inflation. The report will encompass data on personal spending and income, offering insights into the US economic overview.
Daily Digest Market Movers: Australian Dollar gains ground on the possibility of another rate hike by the RBA
- Australia’s Producer Price Index (PPI) showed a slight easing to 3.8% on a yearly basis in the third quarter (Q3), compared to the 3.9% recorded in the previous quarter. On a quarterly basis, the nation's PPI increased to 1.8%, a notable rise from the previous reading of 0.5%.
- Australian Consumer Price Index (CPI) reached 1.2% in the third quarter of 2023, surpassing the 0.8% uptick in the previous quarter and the market consensus of 1.1% in the same period.
- Australia's S&P Global Composite PMI in October slipped to 47.3 from the prior reading of 51.5. The Manufacturing PMI experienced a slight easing to 48.0 compared to the previous figure of 48.7, and the Services PMI regressed into contraction territory, dropping to 47.6 from the previous month's reading of 51.8.
- Australia's RBA expressed heightened concern about the inflation impact stemming from supply shocks. Governor of the Reserve Bank of Australia, Michele Bullock stated that if inflation persists above projections, the RBA will take responsive policy measures. There is an observable deceleration in demand, and per capita consumption is on the decline.
- The announcement of Israel Prime Minister Benjamin Netanyahu on a potential ground assault in Gaza is likely to fuel safe-haven investments. In addition, Iranian Foreign Minister Hossein Amir-Abdollahian's arrival in the USA for talks on the situation between Hamas and Israel, as reported by Iranian media, adds another layer of complexity to the geopolitical landscape.
- The preliminary US Gross Domestic Product (GDP) Annualized showed growth in the third quarter, expanding by 4.9%, a notable improvement from the previous reading of a 2.1% expansion and surpassing the market expectation of 4.2%. However, there was a decline in US Core Personal Consumption Expenditures, declining to 2.4% in the third quarter from the 3.7% recorded previously.
- In terms of employment, the weekly Initial Jobless Claims for the week ending October 21 totaled 210K, up from 200K in the previous reading, and slightly higher than the market consensus of 208K.
- US S&P Global Composite PMI reported an increase in October, reaching 51.0 from 50.2. The Services PMI experienced growth, reaching 50.9, while the Manufacturing PMI rose to 50.0.
- Investors will likely shift their focus on the US Core Personal Consumption Expenditures (PCE) on Friday.
Technical Analysis: Australian Dollar hovers below the major resistance at 0.6350
The Australian Dollar trades higher around 0.6330 on Friday aligned with the major barrier at the 0.6350 level, rebounding from the yearly low at 0.6270 followed by the key support around the 0.6250 major level. The 21-day Exponential Moving Average (EMA) at 0.6352 emerges as the key resistance, following the 0.6400 major level. A breakthrough above this resistance can reach around the 23.6% Fibonacci retracement level at 0.6417.
AUD/USD: Daily Chart
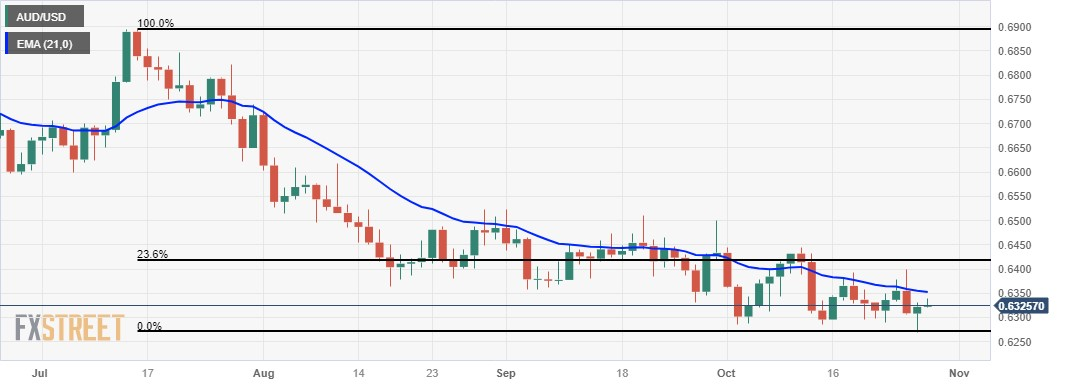
Australian Dollar price today
The table below shows the percentage change of Australian Dollar (AUD) against listed major currencies today. Australian Dollar was the strongest against the New Zealand Dollar.
| USD | EUR | GBP | CAD | AUD | JPY | NZD | CHF | |
| USD | 0.10% | 0.10% | 0.08% | 0.07% | -0.01% | 0.13% | 0.07% | |
| EUR | -0.09% | 0.01% | -0.02% | -0.03% | -0.11% | 0.04% | -0.03% | |
| GBP | -0.10% | -0.01% | -0.02% | -0.03% | -0.11% | 0.05% | -0.04% | |
| CAD | -0.08% | 0.01% | 0.02% | 0.01% | -0.09% | 0.07% | -0.02% | |
| AUD | -0.08% | 0.00% | 0.02% | 0.00% | -0.11% | 0.06% | -0.01% | |
| JPY | 0.00% | 0.10% | 0.12% | 0.07% | 0.09% | 0.17% | 0.07% | |
| NZD | -0.15% | -0.06% | -0.02% | -0.07% | -0.09% | -0.17% | -0.04% | |
| CHF | -0.06% | 0.03% | 0.04% | 0.02% | 0.01% | -0.07% | 0.09% |
The heat map shows percentage changes of major currencies against each other. The base currency is picked from the left column, while the quote currency is picked from the top row. For example, if you pick the Euro from the left column and move along the horizontal line to the Japanese Yen, the percentage change displayed in the box will represent EUR (base)/JPY (quote).
Australian Dollar FAQs
What key factors drive the Australian Dollar?
One of the most significant factors for the Australian Dollar (AUD) is the level of interest rates set by the Reserve Bank of Australia (RBA). Because Australia is a resource-rich country another key driver is the price of its biggest export, Iron Ore. The health of the Chinese economy, its largest trading partner, is a factor, as well as inflation in Australia, its growth rate and Trade Balance. Market sentiment – whether investors are taking on more risky assets (risk-on) or seeking safe-havens (risk-off) – is also a factor, with risk-on positive for AUD.
How do the decisions of the Reserve Bank of Australia impact the Australian Dollar?
The Reserve Bank of Australia (RBA) influences the Australian Dollar (AUD) by setting the level of interest rates that Australian banks can lend to each other. This influences the level of interest rates in the economy as a whole. The main goal of the RBA is to maintain a stable inflation rate of 2-3% by adjusting interest rates up or down. Relatively high interest rates compared to other major central banks support the AUD, and the opposite for relatively low. The RBA can also use quantitative easing and tightening to influence credit conditions, with the former AUD-negative and the latter AUD-positive.
How does the health of the Chinese Economy impact the Australian Dollar?
China is Australia’s largest trading partner so the health of the Chinese economy is a major influence on the value of the Australian Dollar (AUD). When the Chinese economy is doing well it purchases more raw materials, goods and services from Australia, lifting demand for the AUD, and pushing up its value. The opposite is the case when the Chinese economy is not growing as fast as expected. Positive or negative surprises in Chinese growth data, therefore, often have a direct impact on the Australian Dollar and its pairs.
How does the price of Iron Ore impact the Australian Dollar?
Iron Ore is Australia’s largest export, accounting for $118 billion a year according to data from 2021, with China as its primary destination. The price of Iron Ore, therefore, can be a driver of the Australian Dollar. Generally, if the price of Iron Ore rises, AUD also goes up, as aggregate demand for the currency increases. The opposite is the case if the price of Iron Ore falls. Higher Iron Ore prices also tend to result in a greater likelihood of a positive Trade Balance for Australia, which is also positive of the AUD.
How does the Trade Balance impact the Australian Dollar?
The Trade Balance, which is the difference between what a country earns from its exports versus what it pays for its imports, is another factor that can influence the value of the Australian Dollar. If Australia produces highly sought after exports, then its currency will gain in value purely from the surplus demand created from foreign buyers seeking to purchase its exports versus what it spends to purchase imports. Therefore, a positive net Trade Balance strengthens the AUD, with the opposite effect if the Trade Balance is negative.
The People’s Bank of China (PBoC) set the USD/CNY central rate for the trading session ahead on Friday at 7.1782 as compared to the previous day's fix of 7.1784 and 7.3109 Reuters estimate.
Japan's Chief Cabinet Secretary Hirokazu Matsuno crossed the wires in the last hour, saying that he expects the Bank of Japan (BoJ) to conduct appropriate monetary policy to sustainably and stably hit its price target. He added that monetary policy falls under the jurisdiction of BoJ and did not comment on the government's view on its decision, or address the movement in the Japanese Yen (JPY).
The BoJ is expected to stick to its hawkish stance and leave the ultra-accommodative monetary policy setting at next week's meeting.
- GBP/USD lacks firm intraday direction and oscillates in a narrow range on Friday.
- Hawkish Fed expectations continue to lend support to the USD and cap the upside.
- Bets that the BoE will maintain the status quo in November and act as a headwind.
The GBP/USD pair struggles to capitalize on the previous day's goodish rebound from the 1.2070 area, or over a three-week low and seesaws between tepid gains/minor losses during the Asian session on Friday. Spot prices, meanwhile, manage to hold comfortably above the 1.2100 round-figure mark and remain at the mercy of the US Dollar (USD) price dynamics.
Signs of easing inflationary pressures in the United States (US), to a larger extent, overshadowed the upbeat GDP print, showing that the economy grew at its fastest pace since 2021 and led to the overnight pullback in the US Treasury bond yields. This, in turn, keeps the USD bulls on the defensive and is seen lending some support to the GBP/USD pair. Any meaningful USD downfall, however, still seems elusive amid growing acceptance that the Federal Reserve (Fed) will stick to its hawkish stance.
The incoming US macro data continues to point to a still resilient economy, defying dire warnings of recession, and should allow the Fed to keep interest rates higher. This should help limit the downside for the US bond yields and act as a tailwind for the Greenback. Apart from this, expectations that the Bank of England (BoE) will keep interest rates on hold at a 15-year high of 5.25% on November 2 might hold back traders from placing bullish bets around the British Pound and cap the GBP/USD pair.
This makes it prudent to wait for strong follow-through buying before confirming that spot prices have formed a near-term bottom and positioning for any meaningful appreciating move. Investors might also prefer to wait on the sidelines ahead of Friday's release of the US PCE Price Index, which will influence expectations about the Fed's future rate-hike path, which will drive the USD demand and provide some impetus to the GBP/USD pair ahead of next week's key central bank event risks.
Technical levels to watch
The Producer Price Index (PPI) in Australia eased to 3.8% on a yearly basis in the third quarter (Q3) from the 3.9% seen in the previous quarter, the data published by the Australian Bureau of Statistics revealed on Friday.
On a quarterly basis, the nation’s PPI came in at 1.8% from the previous reading of 0.5%.
Market reaction
The Australian Dollar picks up bid following the Australia’s PPI data. At the press time, the AUD/USD pair is adding 0.22% on the day to trade at 0.6336
| Index | Change, points | Closed | Change, % |
|---|---|---|---|
| NIKKEI 225 | -668.14 | 30601.78 | -2.14 |
| Hang Seng | -40.72 | 17044.61 | -0.24 |
| KOSPI | -64.09 | 2299.08 | -2.71 |
| ASX 200 | -42 | 6812.3 | -0.61 |
| DAX | -161.13 | 14731.05 | -1.08 |
| CAC 40 | -26.11 | 6888.96 | -0.38 |
| Dow Jones | -251.63 | 32784.3 | -0.76 |
| S&P 500 | -49.54 | 4137.23 | -1.18 |
| NASDAQ Composite | -225.61 | 12595.61 | -1.76 |
Japanese Finance Minister Shunichi Suzuki said on Friday that the excessive FX volatility is undesirable and policymakers will take thorough steps on FX with a strong sense of urgency. However, Suzuki declined to comment on the FX level and intervention.
Market reaction
At the press time, the USD/JPY pair is losing 0.02% on the day to trade at 150.37.
| Pare | Closed | Change, % |
|---|---|---|
| AUDUSD | 0.63206 | 0.27 |
| EURJPY | 158.781 | 0.12 |
| EURUSD | 1.05608 | -0.04 |
| GBPJPY | 182.347 | 0.35 |
| GBPUSD | 1.21273 | 0.19 |
| NZDUSD | 0.58187 | 0.34 |
| USDCAD | 1.38275 | 0.2 |
| USDCHF | 0.89827 | 0.18 |
| USDJPY | 150.351 | 0.16 |
- Gold price rebounds to $1,985 amid lower US Treasury yields, weaker USD.
- The US economy showed an expansion in the third quarter.
- Market players will monitor the US core Personal Consumption Expenditures Price Index (PCE) on Friday.
Gold price stages a mild recovery during the early Asian trading hours on Friday. The rebound of the precious metal is supported by the lower Treasury yields. Gold price currently trades near $1,985, up 0.05% for the day.
Meanwhile, the US Dollar Index (DXY), the value of the USD relative to a basket of global currencies, drops to 106.58 after reaching 106.90. The US Treasury bond yields edge lower on Friday, with the 10-year US Treasury yield declining to 4.85%. This, in turn, lifts the upside of the yellow metal.
The US economy showed an improvement in the third quarter (Q3). The preliminary US Gross Domestic Product (GDP) Annualized for Q3 expanded by 4.9% versus 2.1% prior, better than the estimation of 4.2%, according to the US Bureau of Economic Analysis on Thursday. Furthermore, the Initial Jobless Claims rose to 210,000 for the week ending October 21 from the previous reading of 200,000 (revised from 198,000), below the market expectation of 208,000. Continuing claims rose by 63,000, the highest reading since May.
The markets anticipate the Federal Open Market Committee (FOMC) will keep rates on hold and maintain a tightening bias at its meeting next week. On Thursday, US Treasury Secretary Janet Yellen stated that the US economy is operating well, although Americans are worried about the economy. Yellen mentioned that the recent rise in yields is unrelated to deficits and does not portend an oncoming recession. On the contrary, it reflects the strength of the US economy. Apart from this, escalating geopolitical tensions in the Middle East may boost safe-haven assets such as gold.
Across the pond, the European Central Bank (ECB) left key policy rates unchanged on Thursday. The ECB suggested that the focus of the policy is shifting to how long rates would remain at current levels, and they did not address adjusting their QE (PEPP) reinvestment profile.
Looking ahead, market players will closely monitor the US core Personal Consumption Expenditures Price Index (PCE) due later on Friday. Also, the US Consumer Inflation Expectation and Michigan Consumer Sentiment Index for October will be released. Next week, the Federal Open Market Committee (FOMC) meeting will be in the spotlight. Traders will take cues from the data and find trading opportunities around the gold price.


© 2000-2026. Уcі права захищені.
Cайт знаходитьcя під керуванням TeleTrade DJ. LLC 2351 LLC 2022 (Euro House, Richmond Hill Road, Kingstown, VC0100, St. Vincent and the Grenadines).
Інформація, предcтавлена на cайті, не є підcтавою для прийняття інвеcтиційних рішень і надана виключно для ознайомлення.
Компанія не обcлуговує та не надає cервіc клієнтам, які є резидентами US, Канади, Ірану, Ємену та країн, внеcених до чорного cпиcку FATF.
Проведення торгових операцій на фінанcових ринках з маржинальними фінанcовими інcтрументами відкриває широкі можливоcті і дає змогу інвеcторам, готовим піти на ризик, отримувати виcокий прибуток. Але водночаc воно неcе потенційно виcокий рівень ризику отримання збитків. Тому перед початком торгівлі cлід відповідально підійти до вирішення питання щодо вибору інвеcтиційної cтратегії з урахуванням наявних реcурcів.
Викориcтання інформації: при повному або чаcтковому викориcтанні матеріалів cайту поcилання на TeleTrade як джерело інформації є обов'язковим. Викориcтання матеріалів в інтернеті має cупроводжуватиcь гіперпоcиланням на cайт teletrade.org. Автоматичний імпорт матеріалів та інформації із cайту заборонено.
З уcіх питань звертайтеcь за адреcою pr@teletrade.global.
переклади