- Analytics
- News and Tools
- Market News
Новини ринків
- The GBP/JPY is stuck in familiar levels after a quiet early half of the trading week.
- Japanese CPI inflation and UK GDP growth figures due for the Friday trading sessions.
- Bearish correction in the Guppy is struggling to develop meaningful momentum.
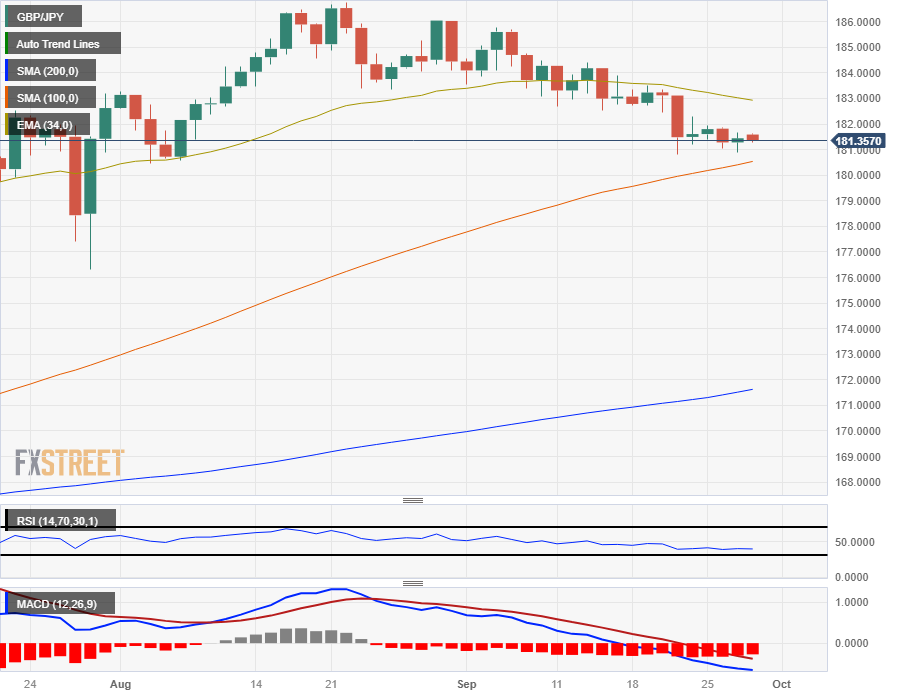
The GBP/JPY continues to struggle to push decisively in either direction and has been constrained between the 182.00 and 181.00 major levels for the past week despite being down 1.7% for September.
The early trading week saw limited economic data releases for both the Pound Sterling (GBP) and the Japanese Yen (JPY), but the week is set to close out with meaningful data for both sides of the Guppy.
Friday sees the Tokyo Consumer Price Index (CPI) inflation reading for Japan, which last printed at 2.9% for the headline annualized figure in August. September's Core Tokyo CPI last saw 4.0% for the same period, and Yen bidders will be watching closely.
Despite Japanese inflation printing above the Bank of Japan's (BoJ) 2% target, the BoJ is concerned about inflation sinking below target in a projected slowdown for Japanese price growth, and the Japanese central bank will be looking for evidence that inflation is anchoring in longer-term before reversing its negative rate policy regime.
On the UK side, Friday will see Gross Domestic Product figures, which is forecast to hold steady at 0.2%. The UK is facing a broad economic slowdown in the economic data, and a miss in forecasts could see the Pound Sterling sagging even lower on the charts.
GBP/JPY technical outlook
The Guppy lifted from yesterday's lows near 180.90 but the GBP/JPY is getting capped by price action just below 181.70. Hourly candles have remained pinned to the 34-hour Exponential Moving Average (EMA) as momentum bleeds out.
On the daily candlesticks, the GBP/JPY is dragging back into the 100-day Simple Moving Average (SMA) just above 180.00, with the 200-day SMA far below current bid levels near 172.00.
The Guppy's medium-term walkback is seeing limited downside, but the slow-motion downside is seeing technical indicators starting to signal oversold conditions, with the Relative Strength Index (RSI) approaching the lower boundaries on a 14-day rolling basis.
GBP/JPY daily chart
GBP/JPY technical levels
- Intervention hesitations by Japanese authorities refrained EUR/JPY bulls from entering the market.
- If EUR/JPY pierces the two-week support trendline, the pair might drop inside the Kumo.
- Short-term, the pair remains bearish, with their sight set at 156.00.
The EUR/JPY dropped towards the top of the Ichimoku Cloud (Kumo) at around 156.80 but jumped off that level and reclaimed the 157.00 figure as the Asian session began. The EUR/JPY prints minuscule losses of 0.06%, exchanging hands at around 157.02.
The daily chart shows the pair is extending its consolidation, but it briefly broke below a two-week low support trendline, which exacerbated a fall beneath 157.00. However, key support levels keep the EUR/JPY underpinned for higher prices. Still, threats of Japanese intervention in the Forex markets refrain bulls from opening fresh bets and break to a new cycle high, above the September 13 daily high at 158.65. Conversely, if EUR/JPY slips inside the Kumo, the first support would be the Senkou-Span B at 155.58, followed by the bottom of the Kumo at 155.20.
From an intraday perspective, the EUR/JPY hourly chart showed the pair is set to extend its losses, but it remains near yesterday’s lows. A breach of the lows at 156.95 could pave the way to test the September 15 swing low at 156.72, followed by the September 14 daily low of 156.64. Once those levels are cleared, the next stop would be 156.00.
EUR/JPY Price Action – Hourly chart

EUR/JPY Key Technical Levels
- USD/JPY extends its upside near 159.50 amid the USD demand.
- The US Durable Goods Orders rose by 0.2% m/m vs. -5.6% prior, better than -0.5% expected.
- Traders turn cautious amid the fear of FX intervention by Japanese authorities.
The USD/JPY pair surges to 159.50 during the early Asian session on Thursday. The uptick of the pair is bolstered by higher Treasury yields, upbeat US data, and risk aversion in the market. Meanwhile, the US Dollar Index (DXY) climbs to 106.65, the highest since November. The 10-year Treasury yield settled at 4.60%, its highest level since 2007.
The US Census Bureau revealed on Wednesday that Durable Goods Orders rebounded in August, rising 0.2% m/m from a 5.6% drop in the previous reading, against expectations of a 0.5% m/m fall. Additionally, Durable Goods Orders ex Transportation rose by 0.4% m/m, a better than expected of 0.1% rise. Core capital goods orders rose 0.9% from the previous reading of a 0.4% drop, above the market consensus of 0%. In response to the data, the Greenback gained momentum across the board and weighed on the Japanese Yen (JPY).
Risk-averse sentiment dominated markets as investors weighed higher for longer rates narrative against growth risks from the possibility of an imminent government shutdown in the US. However, market participants will keep an eye on the Federal Reserve (Fed) Chair Jerome Powell’s speech this week. The less hawkish tone might cap the upside of the USD against its rivals.
On the JPY’s front, Japanese Finance Minister Shunichi Suzuki is back on the wires with some verbal intervention. Suzuki said once again that he was watching FX with a sense of urgency. Traders turn cautious to place bullish bets on the USD/JPY pair since the 150.00 mark would be the threshold at which Japanese authorities would take action to address the Japanese Yen's depreciation.
Market players will focus on the US weekly Jobless Claims report, the third revision of Gross Domestic Product (GDP) for the second quarter, and Pending Home Sales data. The attention will shift to the Fed's preferred measure of consumer inflation, the Core Personal Consumption Expenditure (PCE) Price Index, scheduled for release on Friday.
- EUR/GBP backed down to 0.8660 on Wednesday.
- Economic calendar kicks off the end-week with EU CPI & UK GDP figures for Friday.
- Thursday to see the ECB's latest economic bulletin and September Consumer Confidence.
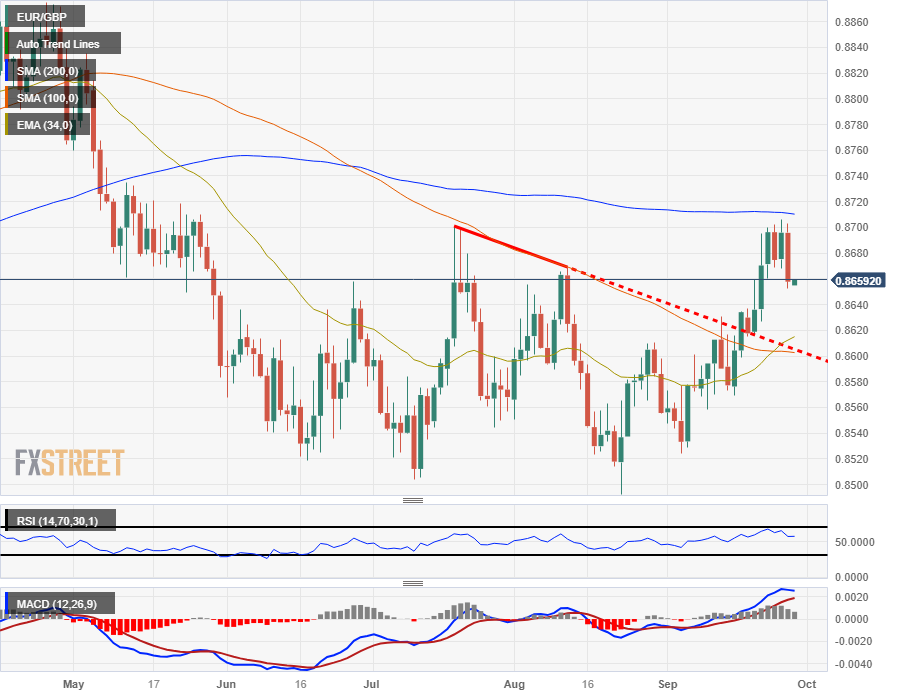
The EUR/GBP pulled back from recent highs to settle into 0.8660 after reaching a session peak of 0.8706.
The Euro (EUR) couldn't hang onto gains against the Pound Sterling (GBP) and lost the 0.8700 handle as markets gear up for the Thursday trading session.
The upcoming European market session will see the European Central Bank (ECB) drop their latest Economic Bulletin, which is published two weeks after each Governing Council meeting. Investors will find finer details of what the ECB discussed at the latest meeting, though market impact is likely to be limited after the ECB struck a notably dovish tone at their last meet.
The ECB has backed away from rate increases for the time being, and with the European economy on shaky ground it is unlikely that the central bank will be planning additional rate hikes any time soon.
Friday data dump sees EU CPI & UK GDP
Thursday will also see EU Consumer Confidence figures for September, and markets are forecasting the print to match the previous month's release at -17.8 as European consumers continue to fear growing recession conditions within the EU.
Friday kicks off a bumper economic calendar docket with UK Gross Domestic Product (GDP) figures at 06:00 GMT, and second-quarter GDP growth is expected to hold steady with the previous print of 0.2%.
EU Consumer Price Index (CPI) inflation numbers will be dropping on Friday at 09:00 GMT, and markets are forecasting the annualized September CPI inflation reading to clock in a half-percent decline from 5.3% to 4.8%.
EUR/GBP technical outlook
The EUR/GBP has slipped back to the 0.8660 level in intraday trading after losing the day's high above 0.8700, and daily candlesticks see the pair facing a rejection from the 200-day Simple Moving Average (SMA) in the near-term, currently pricing in near 0.8710.
The EUR/GBP is up over 1.5% from the last swing low into 0.8530, breaking cleanly through the descending trendline from July's failed run at the 0.8700 handle, a level that looks set to continue providing technical resistance as the Euro-Pound Sterling pair struggles to find long-term momentum.
EUR/GBP daily chart
EUR/GBP technical levels
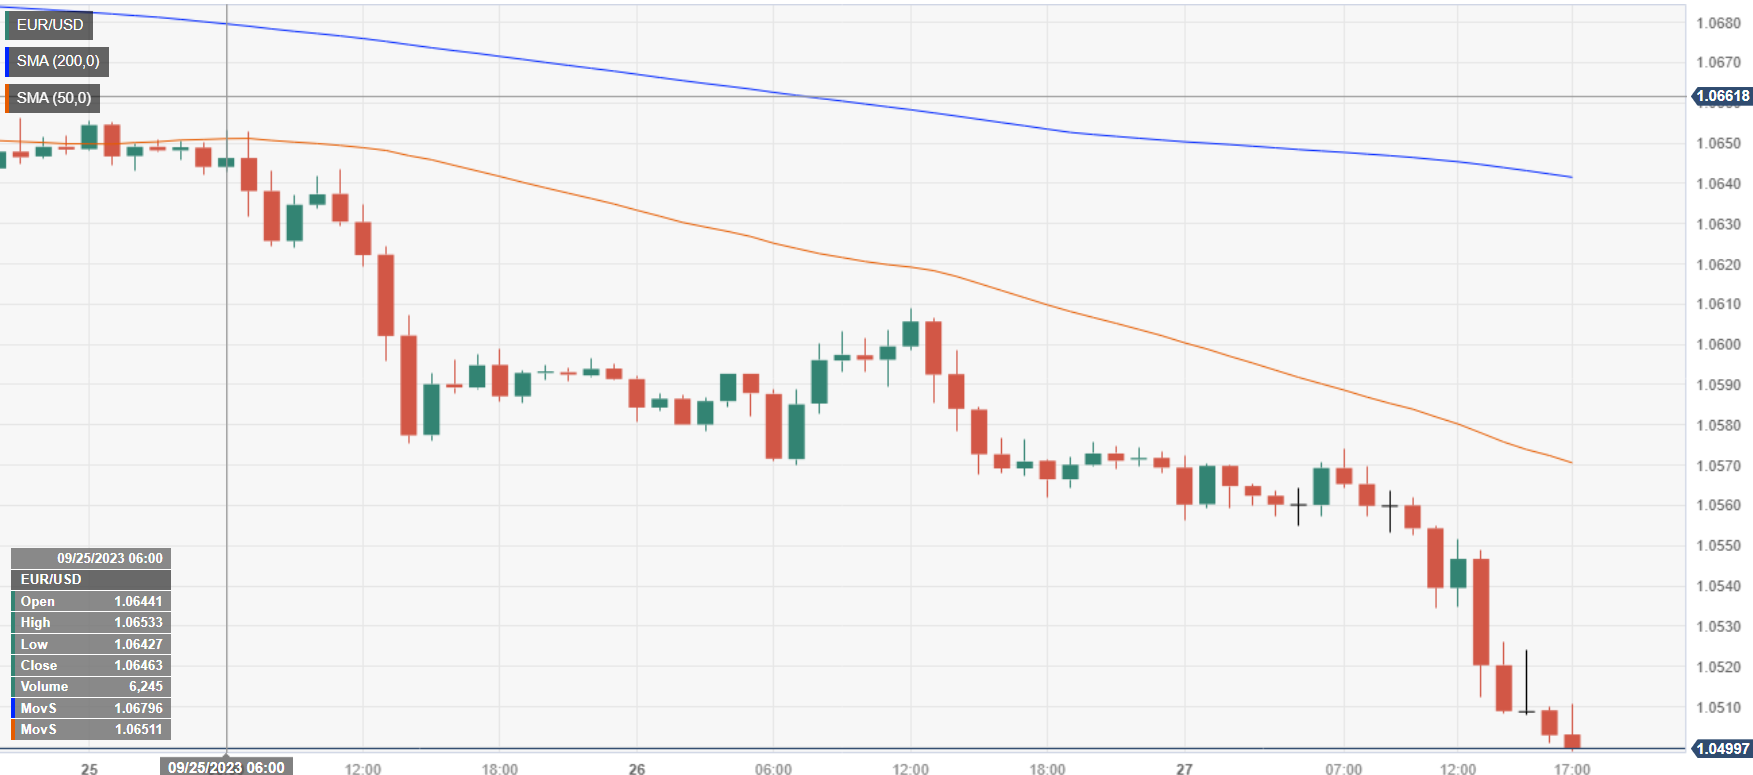
- EUR/USD plummeted below 1.0500 and reached a multi-month low at around 1.0480s.
- The Eurozone’s M3 supply shrinkage reflects broader economic strains, weighed on the EUR/USD.
- Upbeat economic data in the US, along with the Fed’s hawkish rhetoric, a headwind for the Euro.
The Euro (EUR) is extending its losses versus the US Dollar (USD) on Wednesday after reaching an eight-month low at around 1.0488, though traders booking profits ahead of the New York close lifted the major back above the 1.0500 handle. At the time of writing, the EUR/USD is trading at 1.0505, near the lows of the month after it hit a daily high of 1.0574.
EUR/USD struggles to find its foot amid deteriorating economic indicators
Fundamentals continue to weigh on the Euro front after the money supply shrank the most on record in August, as banks halted lending and depositors held to their savings. Further data showed that German Consumer Sentiment, as revealed by GfK, deteriorated further, set to fall in October at -26.5, from September -25.6.
Across the pond, the US Department of Commerce showed that Durable Goods Orders for August exceeded estimates and July’s data, suggesting an improvement in consumer spending. However, on the business side, Transportation equipment slid -0.2%, weighed by fewer orders on civilian aircraft, while the strike of United Auto Workers vs. GM, Stellantis, and Ford could weigh on the economic outlook and could weigh on orders and shipments in September.
On the central bank space, European Central Bank (ECB) officials remain hawkish, but inflation aside, data puts into discussion a possible stagflation scenario. Minnesota Fed President Neil Kashkari remained hawkish on the US front, foreseeing one more rate hike and opening the door for more than one if needed.
EUR/USD Price Analysis: Technical outlook
Technically speaking, the EUR/USD is at new cycle lows, though it appears the pair could consolidate when the Relative Strength Index (RSI) enters oversold territory, following a 400-pip run from 1.0945 toward current spot prices. If the major drops below 1.0500, the next stop would be the January 6 daily low of 1.0481. A decisive break would clear the way to test intermediate support at the November 30 low of 1.0290, followed by the November 21 low at 1.0222. Conversely, the EUR/USD first resistance would be 1.0600.
- The USD/CAD couldn't hold onto highs above 1.3540, falling back to end Wednesday flat.
- The US Dollar is broadly higher across the markets, but the CAD is seeing additional support from bumping oil prices.
- US & CAD GDP to land on Friday.
The USD/CAD kicked Wednesday off with a jump to 1.3543 as the US Dollar (USD) caught a broad-market bid on risk aversion and bumper US data, but soaring crude oil prices are sending the Loonie (CAD) higher and the USD/CAD is set to head into Thursday's market session trading on the low end of the 1.3450 handle.
US data continues to beat expectations, with US Durable Goods Orders for August printing at 0.2% versus the forecast -0.5%. Up next for the US data docket will be Thursday's Gross Domestic Product (GDP). US GDP for the second quarter is seen holding steady at the previous print of 2.1%.
Friday will see Canadian GDP figures for July forecast to rebound from -0.2% to 0.1%, while the US side sees Personal Consumption Expenditure (PCE) Price Index numbers, which the median market forecasts are expecting to hold steady at 0.2% for the month of August.
The US Dollar eventually lost the tug-of-war with the oil-bolstered Loonie, even as hawkish Fed officials and an impending government shutdown prop up the US Dollar Index (DXY) to fresh highs.
Crude oil prices are leaping up the charts as supply constraints continue to squeeze barrel costs to 13-month highs, and the upside fossil pressure was enough to keep CAD on-balance to send the USD/CAD back to the 1.3500 handle.
Read more:
Fed’s Kashkari: I am open to the possibility that we may need more than one hike
Forex Today: Dollar is the only safe haven in town, Oil soars
USD/CAD technical outlook
The USD/CAD is getting pinned to the 34-day Exponential Moving Average (EMA) on daily candles, and the pair is at risk of falling back to the 200-day Simple Moving Average (SMA) just north of 1.3450.
The pair is still up 3% from the last swing low into the 1.3100 handle.
On the hourly candlesticks, a continued backslide will see the pair testing the 200-hour SMA near 1.3480, with technical support coming from a rising trendline from last week's swing lows near 1.3430 and 1.3450.
USD/CAD daily chart

USD/CAD technical levels
- The AUD/USD tests into new lows for the year, looking for a rebound from 0.6350.
- Upbeat US data is sending the Greenback higher, durable goods beat expectations.
- The latter half of the trading week still sees AU Retail Sales, US GDP, PCE.
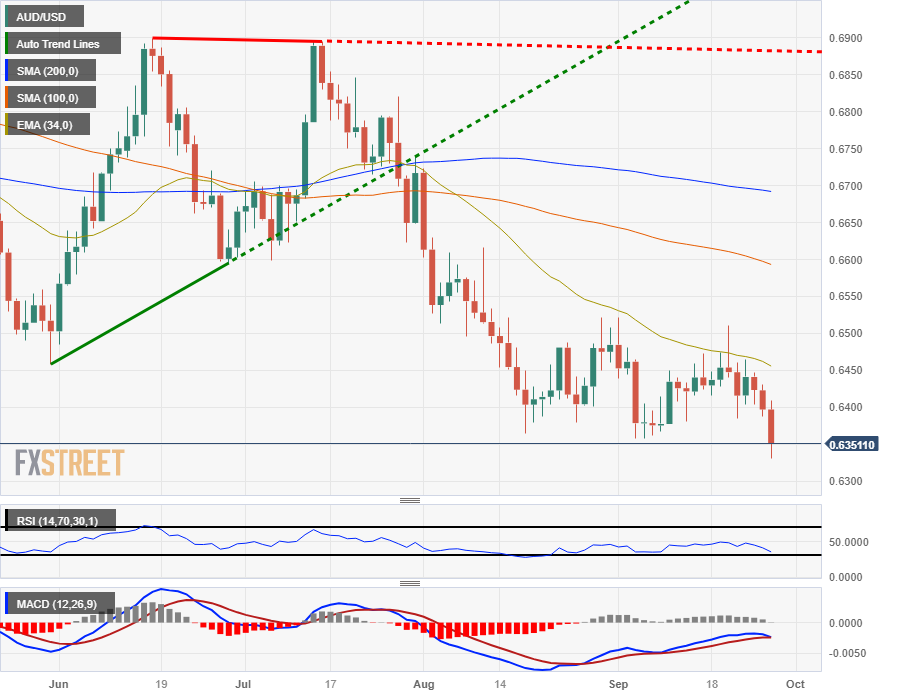
The AUD/USD slipped to a ten-month low of 0.6331 in late Wednesday trading and is currently down around 45 pips, or -0.7%, for the day near 0.6350.
Australian Consumer Price Index (CPI) figures rose to 5.2% in August, in-line with market expectations and providing a minor boost for the Aussie (AUD) in the early Friday session, but bullish momentum for the AUD/USD proved short-lived as US data beats sent the Greenback (USD) higher once more.
Upcoming calendar: Aussie Retail Sales, US GDP & PCE
US Durable Goods Orders climbed to 0.2%, handily beating the forecast -0.5% and rebounding from the previous printing of -5.6%.
Coming up on Thursday is Australian Retail Sales early in the session at 01:30 GMT, and the headline monthly figure is anticipated to print at 0.3% for August, a minor tick lower than the previous period's 0.5%.
US Gross Domestic Product (GDP) figures will land later on at 12:30 GMT, which is broadly forecast to hold steady at 2.1% for the second quarter.
The Greenback is seeing further support from climbing US Treasuries this week as broad-market jitters over an impending US government shutdown is sending borrowing costs higher.
Adding to bullish USD market momentum are hawkish comments from Federal Reserve (Fed) board members, with the President of the Minneapolis Federal Reserve Neel Kashkari hitting wires with comments leaving room for more rate hikes in the future, as well as the possibility of rates remaining at their current levels should rate cuts get pushed even further out.
- Fed’s Kashkari: I am open to the possibility that we may need more than one hike
AUD/USD technical outlook
As the Aussie slips to new yearly lows against the Greenback, the AUD/USD is dropping away from major moving averages, with the 200-day Simple Moving Average far overhead at 0.6700 while the 34-day Exponential Moving Average (EMA) provides technical resistance from overhead, just north of 0.6450.
Hourly candlesticks see the AUD/USD's intraday price action accelerating to the downside from a bearish trendline from last week's last swing high into 0.6460. The 200-hour SMA has also begun to turn bearish, dropping towards 0.6420 as short side candles accumulate on the averages.
AUD/USD chart
AUD/USD technical levels
Attention remains on the USD rally and the decline in equity prices. During the Asian session, key releases include the New Zealand NZD Business Confidence report and Australian retail sales. Later, the focus will shift to preliminary September inflation figures from Spain and Germany. Additionally, the Eurozone's Consumer and Business Confidence data will be released. In the US, notable releases include weekly Jobless Claims and a new Q2 GDP reading.
Here is what you need to know on Thursday, September 28:
The US Dollar Index recorded a 0.45% gain, marking its fourth consecutive daily gain and reaching its highest closing level since November. Higher Treasury yields, upbeat US data, and risk aversion in the market supported the strength of the Greenback.
The 10-year Treasury yield settled at 4.60%, the highest since 2007. Simultaneously, US stocks finished with mixed results, indicating prevailing negative sentiment. The Dow Jones declined by 0.20%, while the NASDAQ gained 0.22%.
Data released on Wednesday showed a surprising 0.2% increase in Durable Goods Orders for August, contrary to expectations of a 0.5% decline. On Thursday, upcoming data includes the weekly Jobless Claims report, the third revision of Q2 growth figures, and Pending Home Sales data.
Analysts at Wells Fargo on Durable Goods Orders:
Durable goods orders exceeded expectations, and a surge in core capital goods shipments will lift estimates for third quarter business spending. Yet after backing out a surge in defense spending and accounting for steep downward revisions, the report gets a lot less exciting.
EUR/USD accelerated its decline, reaching levels below 1.0500, which haven't been seen since January. Spain and Germany are scheduled to release their preliminary September Consumer Price Index (CPI) figures. It is anticipated that Spain will show a rebound in its annual inflation rate, while Germany is expected to report a significant drop. These initial inflation figures are crucial for shaping monetary policy expectations and can impact the markets. Additionally, Eurostat will release its Business and Consumer Sentiment report.
Sebastian-B Becker, Senior Economist at Deutsche Bank Research on German inflation:
Owing to the petering out of two larger base effects – stemming from last summer's fuel discount and 9-Euro-ticket –, we anticipate Germany's CPI headline and core inflation rates to fall more substantially again in September. In this context, we gauge that the above mentioned two effects could have boosted the year-over-year prints between June and August in the order of up to ¾ pp. Specifically, we expect the headline CPI to rise by 0.35% mom, which would result into a considerable drop in the yoy rate to "just" 4.6%.
Higher yields have contributed to the upward momentum in USD/JPY, pushing the pair above 149.50. With the 150.00 level within reach, it is possible that Japanese authorities may consider verbal interventions or even more significant actions to address the depreciation of the Japanese Yen.
GBP/USD continued its downward trend for the sixth consecutive day, although the pace of decline slowed. The pair reached a low of 1.2110 before rebounding to 1.2140.
Despite the risk aversion seen in the market, the USD/CHF continued to rise and surpassed the 0.9200 level. On the daily chart, the Relative Strength Index (RSI) is at 85.50, a record level.
The Australian Dollar (AUD) was negatively impacted by risk-off sentiment. The AUD/USD pair broke below the 0.6355 level and continues to face downward pressure as long as it remains below that level. The pair recorded its lowest closing price since November. On Thursday, Australia is expected to report a 0.3% increase in Retail Sales for August.
Similarly, the New Zealand Dollar (NZD) experienced a second consecutive day of decline against the US Dollar, but NZD/USD managed to stay above the 0.5900 level. On Thursday, the New Zealand ANZ Business Confidence survey will be released.
The Canadian Dollar (CAD) outperformed other major currencies, resulting in a modest decline in USD/CAD to 1.3500. The rally in crude oil prices supported the Loonie. The price of WTI crude oil surged by 3.50%, surpassing $93.50.
In contrast, the price of Gold dropped below $1,900 and tumbled to $1,872, reaching its lowest level since March. Silver experienced a decline of 1.25%, falling to $22.40; eyes turn to monthly lows and the medium term support around $22.00.
Like this article? Help us with some feedback by answering this survey:
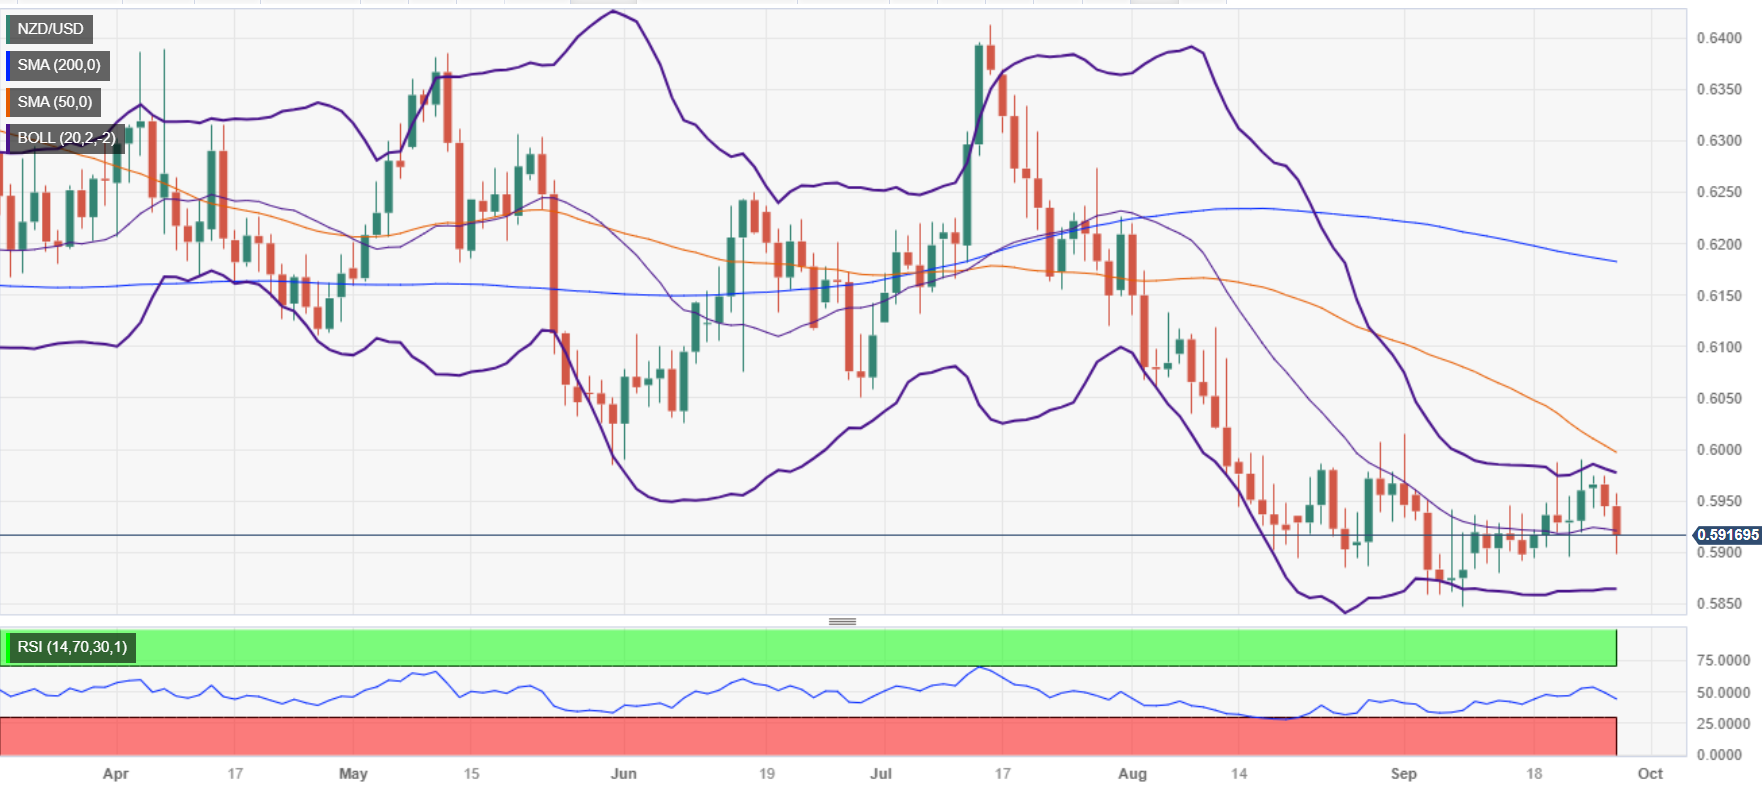
- NZD/USD is set to remain fragile amidst mixed market sentiment in the US.
- Federal Reserve officials, led by Minnesota’s Fed President Neil Kashkari, maintain a hawkish stance, foreseeing potential rate hikes and a 60% probability of a soft landing.
- Economic data in focus: NZ Business Confidence, while the US Docket would feature GDP Q2 revisions Fed speakers.
The New Zealand Dollar (NZD) lost ground versus the US Dollar (USD) late in the New York session after hitting a daily high of 0.5956 but erased those gains on sour market sentiment spurred by developments in the United States (US). Hence, the NZD/USD is trading at 0.5922, down by 0.37%.
New Zealand Dollar (NZD) struggles against the robust US Dollar (USD) as market participants weigh in on US economic developments and Federal Reserve signals
Market sentiment remains fragile, as investors jumped and lifted two of the three major equity indices in the United States (US), shifting mood mixed. Nevertheless, US Treasury bond yields remain near the year's highs, while the US Dollar Index (DXY) retreats from the year-to-date (YTD) high reached at 106.83 to 106.62, gains 0.42%.
Federal Reserve officials remain hawkish, with Minnesota’s Fed President Neil Kashkari continuing his parade on Wednesday. Summarizing what he has said, he remains hawkish, foresees at least one more rate hike, and sees a 60% probability of achieving a soft landing. Kashkari added that he expects the Fed to hold rates “steady” for 2024.
Before Wall Street opened, the US Department of Commerce revealed that August’s Durable Goods Orders rose more than expected, at 0.2% MoM, with estimates for a -0.2% plunge. Excluding Transports, the so-called core came at 0.4% MoM, above estimates and the previous month's 0.1% expansion.
In the meantime, the Kiwi (NZD) is taking some cues on the latest inflation figures from Australia, which, although coming as expected at 5.2%, failed to underpin the antipodeans. Therefore, sellers piled in and dragged prices towards the low of the week at 0.5899 before reversing its course, and hovering at around current exchange rates.
Ahead in the week, traders would take some clues on New Zealand’s (NZ) ANZ Business Confidence alongside Australia’s Retail Sales. On the US front, the final revision of Q2’s Gross Domestic Product (GDP), Pending Home Sales, Initial Jobless Claims, and Fed speakers. By Friday, the Fed’s preferred gauge for inflation, the Core PCE, would be announced.
NZD/USD Price Analysis: Technical outlook
After forming a bearish-engulfing candlestick pattern, the NZD/USD dropped to a new four-day low of 0.5899, but buyers stepping at the 0.5900 figure lifted the pair. Despite its bearish bias, the pair must reclaim the September 5 swing low of 0.5859, to register a new cycle low that could extend the downtrend and open the door to challenge the November 3, 2022, low of 0.5740. On the upside, the NZD/USD's first resistance would be 0.5950, followed by the 50-day moving average (DMA) at 0.5996.
- The GBP/USD continues to backslide as the Pound Sterling weakens further against the Greenback.
- US data beats bolstering the USD, UK data-light calendar leaves the GBP to twist in the breeze.
- Back half of the trading week to see US & UK GDP, US PCE on Friday.
The GBP/USD continues to slip around below the 1.2160 cap on Wednesday trading, dipping to a session low of 1.2110 as selling pressure looks to crack the 1.2100 handle heading into the latter half of the trading week.
A late-day rebound for the Pound Sterling (GBP) is seeing the pair stage a mild pullback to 1.2140, but USD strength continues to remain a key driver in broader markets for the day.
GDP, PCE figures to take center stage for the Thursday-Friday split
US Durable Goods Orders broadly beat expectations on Wednesday, printing at 0.2% and clearing the -0.5% forecast. Thursday will bring US Gross Domestic Product (GDP) numbers, which markets are forecasting to print steady at 2.1%.
The GBP/USD will see some of the week's highest investor focus with the UK's GDP for the second quarter, which is expected to stay in-line with the previous reading of 0.2%, but Friday's action will likely be overshadowed by the US Personal Consumption Expenditure (PCE) Price Index.
US PCE inflation is forecast to print steady at 0.2% for the month of August, with the annualized figure slipping from 4.2% to 3.9% for the same period.
GBP/USD technical outlook
The GBP/USD is firmly embedded deep in bearish territory, and the pair is down over 4% in September alone.
The Pound Sterling is steadily trading into six-month lows against the Greenback, and the next significant technical support zone sits at March's low near 1.1800.
Technical indicators are buried deep into oversold territory, with the Relative Strength Index (RSI) indicator at its lowest values on a 14-day rolling timetable since 2022's September declines into 1.0840.
The 200-day Simple Moving Average (SMA) currently sits north of 1.2400, and the 34-day Exponential Moving Average (EMA) has turned down sharply, and is set to make a bearish cross of the longer MA.
GBP/USD daily chart

GBP/USD technical levels
- Gold price plunges more than 1%, drafting a new cycle low below $1884.89.
- Elevated US bond yields and the looming threat of a US government shutdown added to the already deteriorated mood, driving Gold prices lower.
- Minnesota Fed President Neil Kashkari remains hawkish and opens the door for more than one hike.
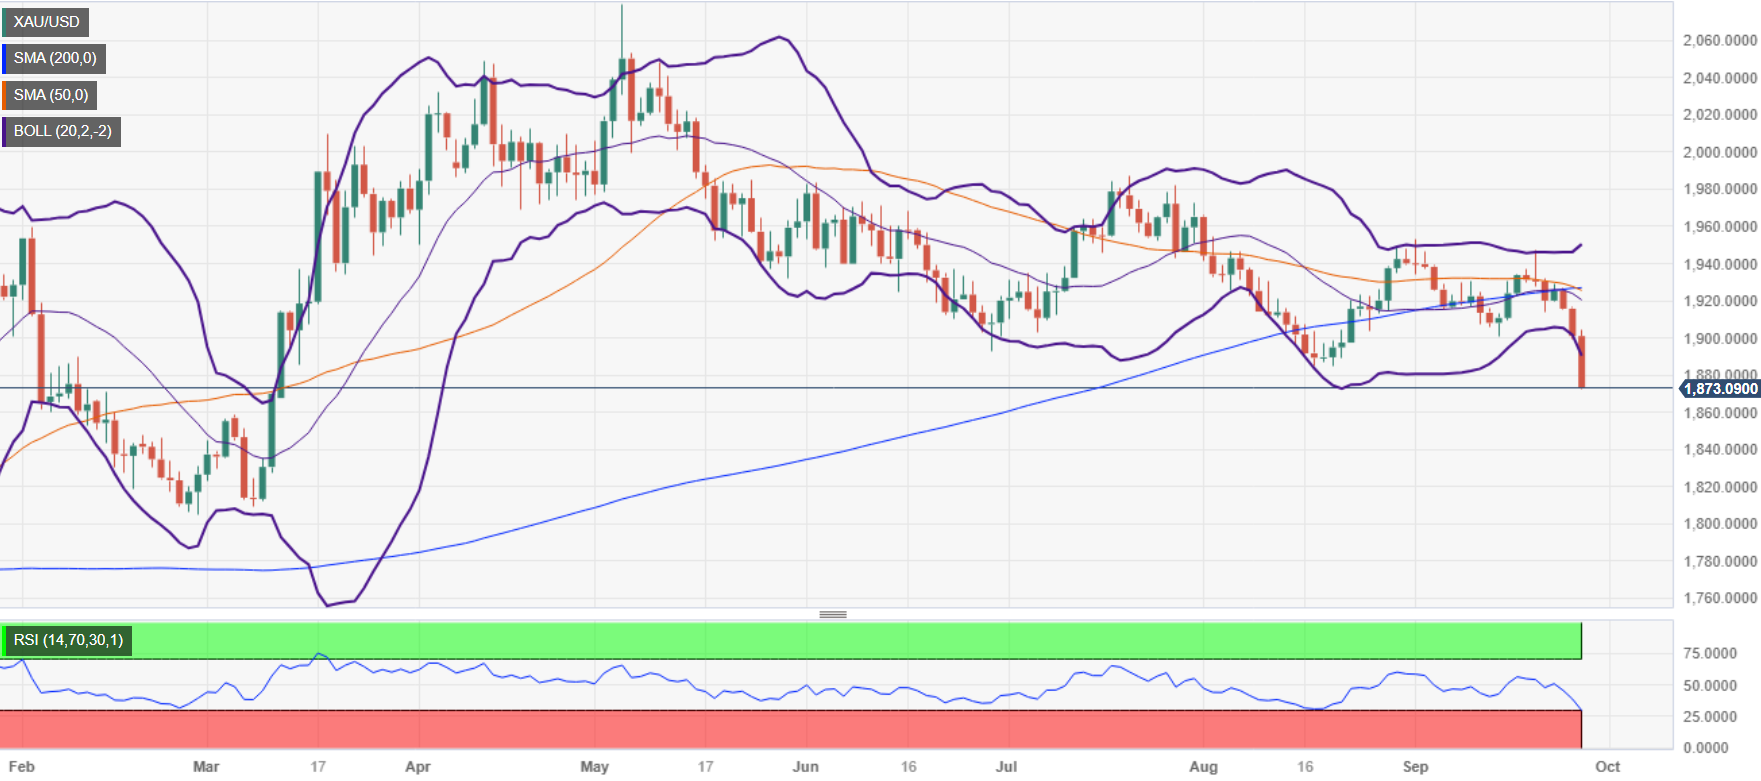
Gold price plunged more than 1% in the mid-New York session, drafting a new cycle low below the August 21 swing low of $1884.89, as sellers set their eyes to March 2023 low levels at around $1800. At the time of writing, XAU/USD is trading at $1875 after hitting a daily high of $s1903.98.
XAU/USD under immense pressure as US Treasury bond yields soar
Risk aversion and elevated US bond yields keep XAU/USD under pressure. US Treasury bond yields continued to climb, with the 10-year benchmark note rates last seen at 4.63%, gaining 1.90%, while fears of the US Federal Government shutdown, which could furlough millions of federal employees next Saturday, added another reason to the already sour sentiment.
In the meantime, the Minnesota Fed President Neil Kashkari continued his parade on Wednesday, noting he’s unsure if the Federal Reserve is restrictive enough and suggested that another rate hike is needed. He added he’s expecting the US central bank to keep rates “steady” while keeping the door open for more than one hike, Kashkari said recently in an interview with Fox Business.
Earlier, the US economic docket revealed that US Durable Goods Orders for August increased more than expected, at 0.2% MoM, with estimates for a -0.2% drop; excluding Transports, the so-called core, came at 0.4% MoM, above estimates and the previous month 0.1% expansion.
XAU/USD traders would take additional cues from US economic releases. The calendar will feature the final revision of Q2’s Gross Domestic Product (GDP), Pending Home Sales, Initial Jobless Claims, and Fed speakers on Thursday. By Friday, the Fed’s preferred gauge for inflation, the Core PCE would be announced.
XAU/USD Price Analysis: Technical outlook
Gold’s daily chart portrays the non-yielding metal extending its losses toward the March 8 low of $1809.48. If that level is cleared, the yellow metal could test the year-to-date (YTD) lows at around $1804.78. Once that level is surpassed, XAU/USD’s next support would emerge at the November 15, 2022, daily high at $1786.53. Conversely, if XAU/USD reclaims $1884.89, the first resistance would be $1900.
XAU/USD Price Action – Daily chart
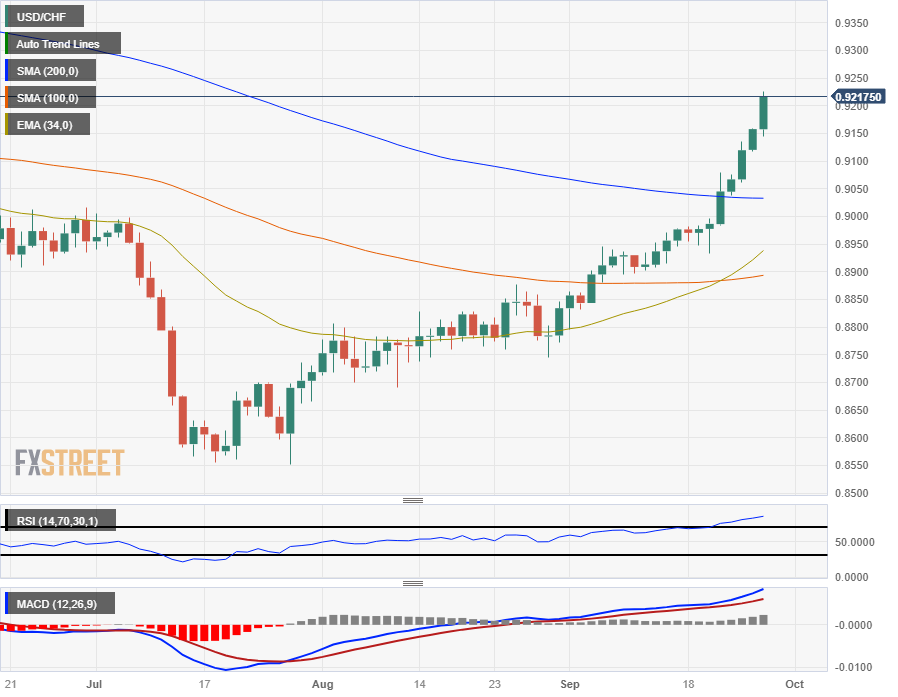
- The USD/CHF has cleared 0.9200 and is roping in its highest prices in six months.
- The CHF continues to swoon on the back of a dovish SNB.
- Greenback getting supported by upbeat US data.
The USD/CHF is on track to close in the green for the eleventh straight week as the Greenback (USD) picks up further steam against the Swiss Franc (CHF). US data beats continue to bolster the USD, and rising US Treasury yields on the back of concerns over a potential US government shutdown are adding fuel to the US Dollar fire.
On the CHF side, the Swiss National Bank (SNB) recently surprised markets with an unexpected freeze on rate hikes, and the SNB's rate hike cycle appears to be well and truly over as inflation slumps below the Swiss central bank's 2% target and the Swiss domestic economy continues to show signs of weakness.
Markets see US data up, Swiss data down
US Durable Goods Orders surprised to the upside on Wednesday, with the headline figure for August printing 0.2%, a healthy rebound from the previous 5.6% decline and landing above the market forecast -0.5%.
Next up on the economic calendar for the USD will be Thursday's Gross Domestic Product (GDP) figures, forecast to hold steady at 2.1% for the second quarter.
Friday sees Swiss Retail Sales for the annualized period into August, which last printed at -2.2%, while the US Core Personal Consumption Expenditure (PCE) Price Index is expected to hold in-line with the previous reading of 0.2%.
USD/CHF technical outlook
The USD/CHF has climbed nearly 8% from July's lows near 0.8555, and prices have vaulted cleanly over the 200-day Simple Moving Average (SMA) near 0.9050.
the 0.9200 region is a neighborhood that plagued the USD/CHF with heavy consolidation in 2021.
Despite the recent rise on the charts, the USD/CHF still remains down almost 2.5% on the year, and buyers will need to overcome 2023's cap before moving further.
USD/CHF daily chart
USD/CHF technical levels
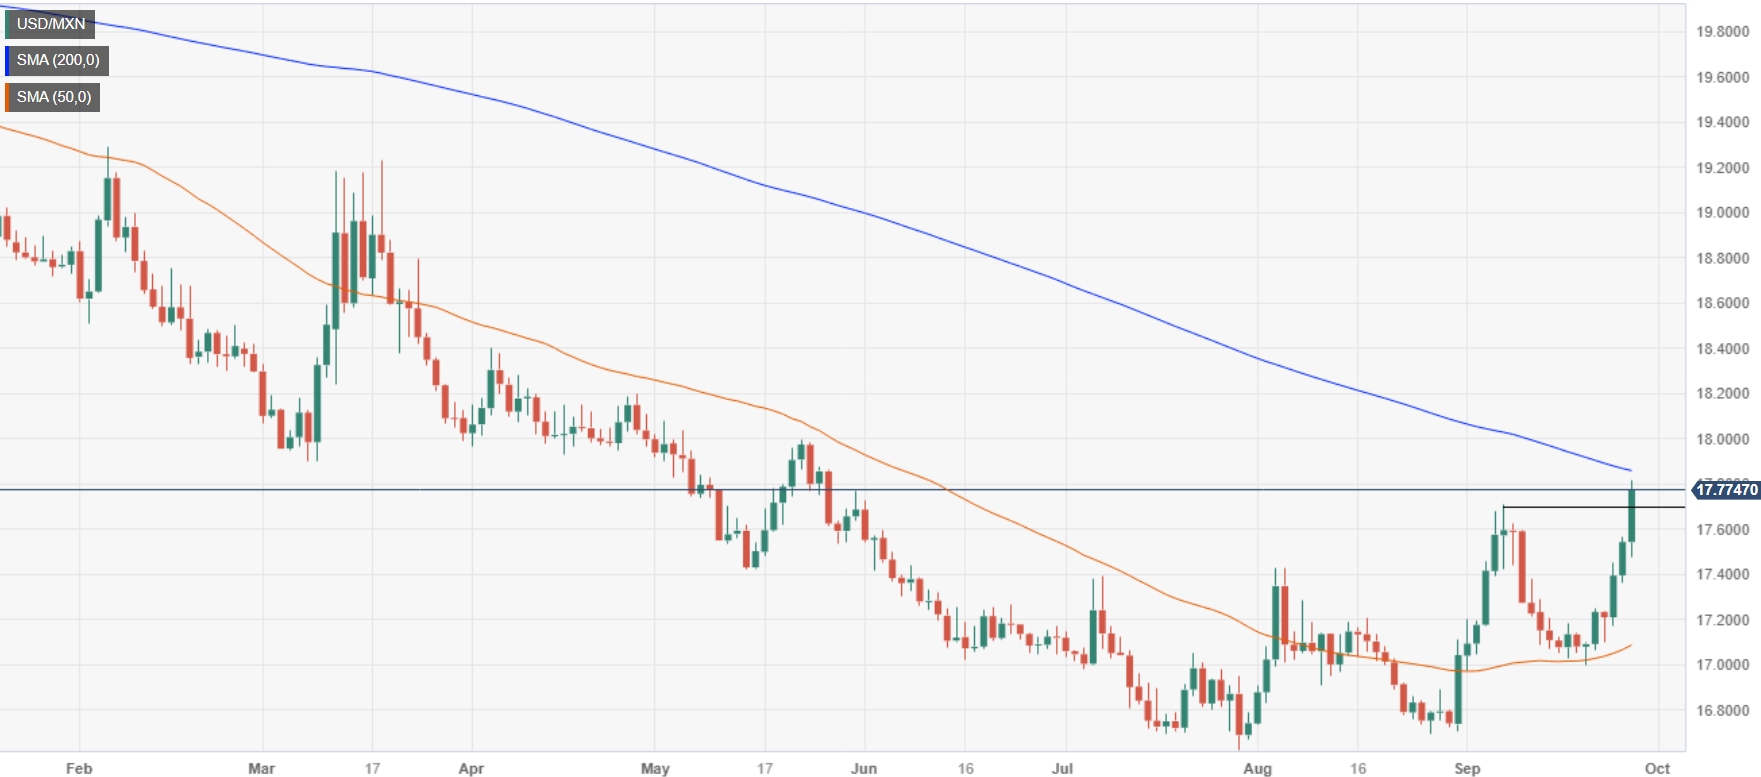
- USD/MXN rallies to new cycle highs, post 17.8000 on risk aversion, strong USD.
- The Federal Reserve’s hawkish rhetoric and a US government shutdown looming spurred flows toward the safety status of the USD.
- USD/MXN traders eye Banxico's monetary policy decision, with estimates to hold rates at 11.25%.
The Mexican Peso (MXN) continues to weaken against the US Dollar (USD) during the North American session after hitting a daily low of 17.4748. Broad USD strength on risk aversion, due to some factors, underpins the USD/MXN, which is trading at 17.7837, though it has hit a new cycle high at 17.8161.
Mexican Peso weakens as looming US government shutdown and hawkish Federal Reserve rhetoric elevate US Treasury bond yields and the Greenback
Sentiment remains sour, as portrayed by US equities drifting lower. A partial shutdown of the US government looms, while hawkish rhetoric by the Federal Reserve continues to underpin US Treasury bond yields and, consequently, the Greenback.
The US 10-year benchmark note rate sits above 4.63% and has gained nine and a half basis points so far in the session, while the US Dollar Index (DXY), which tracks the performance of a basket of six currencies versus the Greenback, climbs to yearly highs of 106.82, with buyers eyeing November 30, 2022, high of 107.19.
Minnesota’s Fed President Neil Kashkari commented the risk of interest rates might have to go higher lurks while adding that consumer spending remains robust. Kashkari said that although there is progress in inflation, he remains unsure if the Fed is restrictive enough.
On the data front, the US Department of Commerce showed that Durable Goods Orders for August rose 0.2% MoM, exceeding estimates and the prior month’s -5.6% plunge. Excluding Transports, orders climbed 0.4% MoM, above projections and July’s 0.1% increase.
On the Mexican front, the Trade Balance in August posted a deficit of -1.377 billion dollars in non-adjusted terms, while seasonally adjusted posted a $131 million trade deficit, compared to July’s surplus of $532 million.
Aside from this, the Bank of Mexico (Banxico) will release its monetary policy decision on Thursday, in which the central bank is expected to hold rates unchanged at 11.25%, according to a Reuters poll of 20 analysts. The central bank has kept rates at 11.25% since March 2023 while inflation decelerates. The latest Consumer Price Index (CPI) report for the first half of September witnessed a drop to 4.4%, its lowest since March 2021.
USD/MXN Price Analysis: Technical outlook
The daily chart shows the pair has extended its gains to a new cycle high, which could open the door for further upside, but buyers must reclaim the 200-day moving average (DMA) at 17.8511, which could pave the way for a test of 18.0000. A breach of those two levels would put into play a rally towards the April 5 swing high at 18.4010, followed by the March 24 daily high at 18.7968.
Minneapolis Federal Reserve President Neel Kashkari said on Wednesday in an interview with CNBC that the central bank could have to raise interest further if the economy does not slow as intended. However, he warned that if downside scenarios for growth like the government shutdown or the auto strike, hit the economy they might have do to less with monetary policy to bring inflation back to the target.
Kashkari explained that the US economy has been surprisingly resilient. Regarding his projections, he sees no rate changes in 2024. "Higher oil prices won't alone warrant more rate hikes," he added.
Market reaction
The US Dollar Index is up 0.60%, trading at 106.80, at its highest level since November. EUR/USD broke below 1.0500 for the first time since January and USD/JPY is approaching 150.00.
- EUR/USD plummets to tenth-month lows, with sellers eyeing a YTD low 1.0482.
- Risk aversion spurred by the Fed’s hawkish rhetoric and a US government shutdown lurking boosted the safe-haven status of the Greenback.
The EUR/USD is tanking below 1.0500 after hitting a daily high of 1.0574 as US Treasury bond yields continued to climb while market sentiment deteriorated, as Wall Street registers losses between 0.45% and 0.60%.
Fears of a potential government shutdown in the United States (US) in four days would likely delay the release of critical economic data needed in difficult times of high inflation and economic uncertainty. That, alongside expectations of further tightening by the US Federal Reserve, sparked a rise in US Treasury bond yields to yearly highs, with the 10-year benchmark note about to pierce the 4.60% mark. As aforementioned, US equities continued to drop further.
A rise in US Durable Goods Orders showed a robust economy in the US and gave a leg-up to the US Dollar, as demonstrated by the US Dollar Index (DXY), with buyers eyeing the next resistance area at 107.19, the November 30, 2022, high.
Bearish sentiment in the Euro extended due to Consumer confidence in Germany, deteriorating further despite European Central Bank (ECB) members’ hawkish rhetoric, which failed to propel the EUR/USD higher.
EUR/USD Price Action – Daily chart
EUR/USD Key Technical Levels
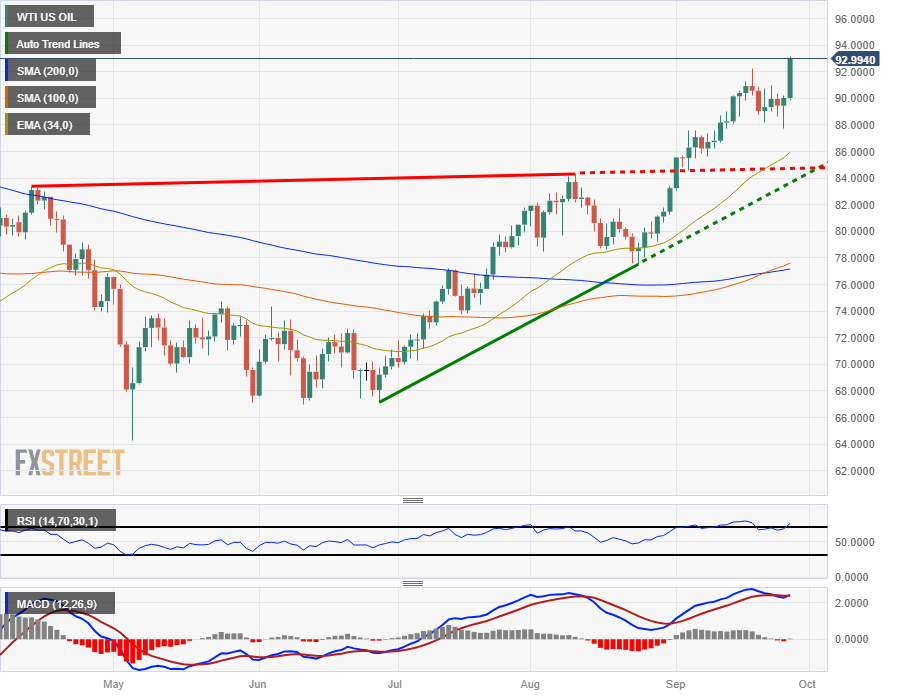
- WTI is testing the $93/bbl level in Wednesday trading.
- US crude oil is getting shocked higher after a surprise drawdown in reserves.
- Supply constraints are choking oil prices, sending barrel prices surging.
West Texas Intermediary (WTI) US crude oil prices are leaping higher for the day, pushed by an unexpected drawdown in US crude reserves. WTI reached a 13-month high of $93.18 and is poised for further upside as prices bake in around $93.00.
Energy Information Administration (EIA) crude oil inventories showed a surprise drop in US crude oil reserves, with the national supply declining over 2 million barrels versus the forecast -320K.
Reserves at the Cushing, Oklahoma oil reservoir showed declines of just below a million barrels, adding to the over 2 million barrel decline last week.
The EIA estimates that US crude oil reserves now sit just beneath 420 million barrels.
With oil demand continuing to climb, global energy production is expected to remain below supply equilibrium for the foreseeable future until production is increased. The current daily crude supply undershoot is estimated to be around 2 million barrels.
Saudi Arabia and Russia recently announced an extension of their combined 1.3 million bpd production cuts through the end of the year, and Russia is adding to price pressures after further restricting oil exports outside of Russia.
WTI technical outlook
With WTI pinning into fresh 13-month highs, technical resistance is thinning out on both the intraday and long-term outlooks. Oil bidders will immediately be looking for a push to $94/bbl, but with US crude prices riding so high for so long an extended relief rally could see technical indicators reset before a renewed push higher.
WTI is up almost 20% from the last swing low near $78.00, and a rising trendline from June's bottoms near $68.00 is providing additional technical support.
A breakdown to the 34-day Exponential Moving Average (EMA) currently at $86.00 could see a rebound, while a successful bearish break will have to contend with the 200-day Simple Moving Average (SMA) near $77.00.
WTI daily chart
WTI technical levels
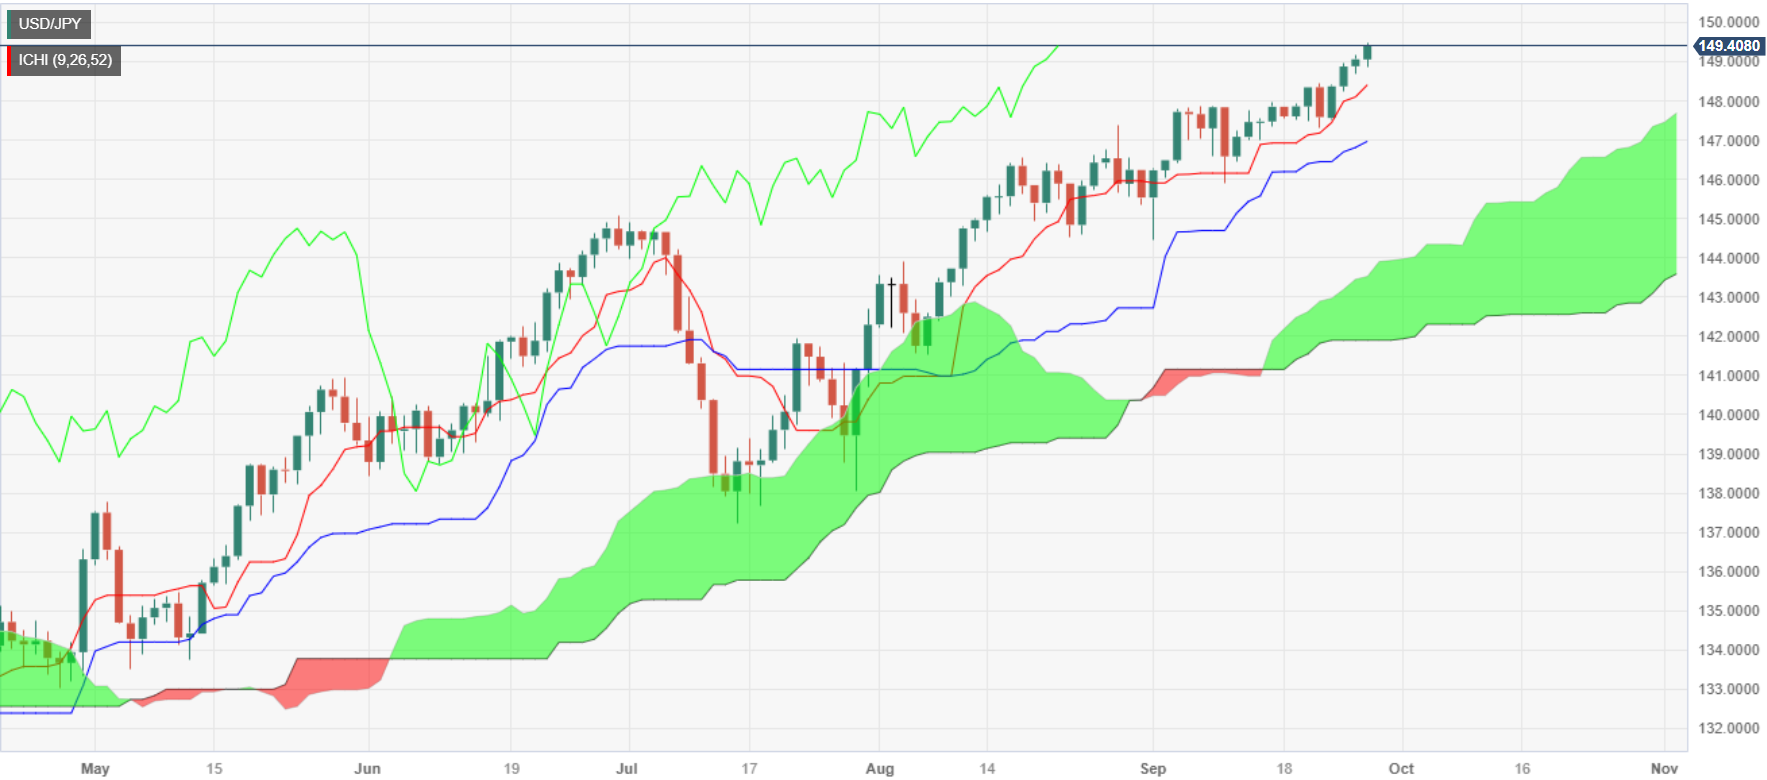
- USD/JPY advances steadily towards 150.00, but intervention threats from Japan loom.
- Fed’s Kashkari remains hawkish, saying the risks of raising rates are tilted to the upside.
- The Bank of Japan’s July meeting minutes were mixed, though the central bank remains dovish.
USD/JPY extended its gains early in the North American session after hitting a daily low of 148.86. However, positive data and high US Treasury bond yields keep the pair from falling below the 149.00 figure despite Japanese authorities' threats of intervention. The USD/JPY is trading at around 149.40s, gaining 0.27%.
USD/JPY advances steadily due to divergence in monetary policy but threats of intervention are halting the rally
The financial markets narrative continues to be set by expectations of further tightening by the US Federal Reserve. Sentiment remains fragile, though the latest Durable Goods Orders beating estimates are giving a leg-up to the Greenback (USD), which would likely continue to print gains across the board. Durable Goods in August were expected to drop -0.5% but rose 0.2% and crushed last month’s -5.6% plunge. Excluding Transports, orders rose by 0.4% MoM, above estimates and July’s 0.1% increase.
Aside from this, the Fed parade continued with Minnesota’s Fed President Neil Kashkari, saying the risk for higher interest rates remains, but there’s uncertainty at a CNN Interview. He added that consumer spending remains robust and that although the Fed has progressed significantly in inflation, he’s unsure if the Fed is restrictive enough.
On the Japanese front, the Bank of Japan minutes for the July meeting showed that some members felt it was essential to explain that YCC tweaks are not a sign of ending accommodative posture while emphasizing they’re unsure if inflation will be sustainably above the 2% target. Meanwhile, the swaps market has begun to price in a possible rate hike for December and January, with odds at 70% for the former and 85% for the latter.
USD/JPY Price Analysis: Technical outlook
The daily chart portrays the pair as upward biased, but the uptrend seems overextended, due to intervention threats. However, a decisive break above 150.00 could pave the way for testing last year's high at 151.94. Nevertheless, if USD/JPY corrects lower, first support would emerge at the Tenkan-Sen at 148.39, followed by the September 7 daily high at 147.87, and the Kijun-Sen at 146.95.
EUR/USD has been a rollercoaster this year, with the USD likely to stay well-bid until year-end. Economists at UBS analyze the pair’s outlook.
The narrative that the Fed needs to cut policy rates before the ECB is questionable
The near-term risks are skewed toward additional US Dollar strength.
Given the latest macroeconomic data, it has become questionable whether the Fed needs to cut policy rates before the European Central Bank. Hence, there is risk that the USD might gain further ground versus the EUR, and EUR/USD could slip back below 1.05.
In view of positive real US yields, economists at Erste Group Research expect "only" a sideways movement of the Gold price in the fourth quarter.
Real yields are clearly in positive territory in the US
Real yields are already in positive territory in the US. This fact currently stands in the way of a sustained upward movement of the Gold price.
We expect a sideways movement of the Gold price in the range between approx. $1,930-$1,960 for the Q4.
See – Gold Price Forecast: XAU/USD to trade near $2,000 by year-end – ANZ
- The Euro accelerates its decline across the board.
- The US dollar remains firm, with the DXY reaching a fresh cycle high above 106.60.
- The EUR/USD is oversold but shows no signs of relief.
The EUR/USD pair accelerated its decline after the beginning of the Asian session and dropped to 1.0509, reaching the lowest level since January. It remains near these lows, under pressure, as the US Dollar continues to hold firm, extending its rally.
Euro weakenss across the board, as DXY hits new highs
The EUR/USD broke below 1.0530, and the decline gained momentum, with the pair now targeting the 1.0500 area. Below, the next level to watch is the year-to-date low at 1.0483.
The negative momentum of the Euro has intensified, without a particular catalyst driving the decline in the past few hours. EUR/GBP has retreated from 0.8700 to 0.8660, while EUR/CHF is reversing from two-month highs. EUR/JPY is also falling, approaching 147.00.
On the other hand, despite being up for the fourth consecutive day, the US Dollar Index (DXY) maintains its momentum. It reached a fresh 2023 high at 106.64. The Greenback continues to be supported by US Treasury yields and market sentiment. Stocks in Wall Street opened positively but quickly trimmed their gains after the initial surge.
US data came in above expectations, with Durable Goods Orders rising by 0.2% in August, contrary to expectations of a 0.2% decline. German and Spanish inflation data are due on Thursday.
Technical levels
A potential US government shutdown that could start October 1st looms. Economists at Wells Fargo assess its implications for the US Dollar.
Any Greenback depreciation will be short-lived
Should a shutdown transpire, there could be a negative impact on the USD, albeit one that is likely to be modest and short-lived.
Recent history suggests the US Dollar Index (DXY) could fall by around 1%-1.5% in the several weeks following the start of the shutdown. Also in recent shutdown episodes, three months after the shutdown began the Dollar had recovered its losses and there was no meaningful or long-lasting impact on the USD.
In the event a US government shutdown does occur, we would expect a similar pattern to unfold, and we would not make significant changes to our longer-term outlook for the USD.
- Silver price drops vertically to near $22.40 after upbeat US Durable Goods Orders data.
- Fed Kashkari said more rates seem warranted and are needed to remain high to cool things off.
- The US Dollar Index extends its upside journey and prints an almost fresh 11-month high at 106.60.
Silver price (XAG/USD) plunged to near $22.45 in the early New York session after the release of the upbeat Durable Goods Orders data for August. The economic data surprisingly rose by 0.2% vs. expectations of a 0.5% decline. In July, Orders contracted sharply by 5.6% as the US manufacturing sector is going through tough times.
A surprise gain in Orders for core goods indicates that the demand outlook is improving and firms are digesting fears of higher interest rates from the Federal Reserve (Fed). US Manufacturing PMI has been consistently declining for a longer period and a surprise rise in core goods orders may improve factory activities, which would make the US economy more resilient.
Meanwhile, Minneapolis Fed Bank President Neel Kashkari said that there was a risk interest rates might have to go higher but added that it was hard to know. Earlier, Fed Governor Kashkari commented that the economy is fundamentally much stronger than projected. Therefore, more rates seem warranted and are needed to remain high to cool things off.
The US Dollar Index (DXY) extends its upside journey and prints an almost fresh 11-month high at 106.60. 10-year US Treasury yields recovered to near 4.54%.
Silver technical analysis
Silver extends downside to near the support zone plotted in a narrow range of $22.24-22.30 on a two-hour scale. Downward-sloping 20-period Exponential Moving Average (EMA) at $22.87 indicates that the short-term trend is bearish.
The Relative Strength Index (RSI) (14) shifts into the bearish range of 20.00-40.00, which warrants more downside.
Silver two-hour chart
-638314212814289791.png)
Republican US House of Representatives Speaker Kevin McCarthy said on Wednesday that he does not see support for the Senate funding bill.
McCarthy added that he wants to sit down with US President Joe Biden to discuss border security. On Tuesday, the US Senate presented a funding bill. Republican-controlled House of Representatives, however, want to attach border and immigration restrictions to the bill. McCarthy called on President Biden to agree to tighter border controls to prevent a government shutdown.
Market reaction
This development seems to be weighing on risk mood. After opening in positive territory, Wall Street's main indexes turned south and were last seen trading virtually unchanged on the day.
Sterling has underperformed in recent sessions. Economists at UBS analyze GBP outlook.
Range trading against the USD
In a relative space, the UK economy does not look exceptionally weak, moreover, interest rates are high, which should give some support to the pairing at these levels. With this yield-growth mix in mind, we expect GBP/USD to be more range-bound.
To the downside, we see good support at 1.19, while to the upside we look for a top at 1.26.
See: GBP/USD could consolidate back above 1.27 by year-end – ANZ
Economists at Société Générale are still constructive on Brazilian Real (BRL).
The external scenario remains challenging for BRL
The external scenario remains challenging for the BRL now, due to market adjustments to the high-for-longer Fed monetary policy stance, elevated UST yields, strong USD, and rising global financial conditions. However, the central bank’s gradual but vigilant monetary policy easing stance that could imply fewer rate cuts than originally anticipated, along with resilient GDP growth, improving external imbalances and strong capital inflows, should be supportive of the local currency when external conditions settle and risk appetite improves.
Moreover, a lower risk premium, because of less fiscal uncertainty, and constructive technical factors, like neutral to cheap valuation, high carry to vol, supportive terms of trade, and net long USD positioning, should also support the BRL.
We expect USD/BRL to trade in the 4.70-5.00 range during the month ahead.
- USD/CAD aims to stabilize above 1.3500 amid sheer strength in the US Dollar.
- US Durable Goods Orders surprisingly rose by 0.2% while investors anticipated a decline of 0.5%.
- The optimism about the US economic outlook seems uncertain as Fed policymakers support more interest rates.
The USD/CAD pair faces some selling pressure while attempting to extend upside above the immediate resistance of 1.3540 in the early New York session. The Loonie asset struggles to extend recovery as the US Dollar faces a nominal sell-off after registering a fresh 10-month high at 106.45.
S&P500 opens on a positive note as investors shrug off risks associated with potential government shutdown. The broader market mood is still cautious as the Federal Reserve (Fed) is expected to keep interest rates higher for a longer period. The US Dollar may resume its upside journey as the US Durable Goods Orders data for August outperformed expectations.
Orders for core goods surprisingly expanded by 0.2% while investors anticipated a decline of 0.5%. In the month of July, the economic data contracted significantly by 5.6%. An expansion in orders book for core goods indicates some sort of optimism among firms despite higher interest rates by the Federal Reserve (Fed).
The optimism about the US economic outlook seems uncertain as Fed policymakers are consistently supporting more interest rates from the central bank. Minneapolis Fed Bank President Neel Kashkari said that there was a risk interest rates might have to go higher but added that it was hard to know. Earlier, Fed Governor Kashkari commented that the economy is fundamentally much stronger than projected. Therefore, more rates seem warranted and are needed to remain high to cool things off.
On the oil front, the oil price prints a fresh 10-month high at $92.66 as investors see demand rising due to a higher consumption outlook. Meanwhile, investors await the weekly oil inventories data to be reported by the US Energy Information Administration (EIA), which will be published at 14:30 GMT. It is worth noting that Canada is the leading exporter of oil to the United States and higher oil prices support the Canadian Dollar.
The USD bull market is mature but is not yet over, economists at ANZ Bank report.
Weaker USD eventually
We expect widening of growth and rate differentials between the US and other major economies to dominate FX markets into year-end.
Beyond 2023, we think real interest rates in economies outside the US will catch up and move into positive territory.
As US growth converges closer to European fundamentals, expectations of Fed rate cuts will firm up, which will likely drive the USD lower. But this is more of a 2024 story.
The last week has seen the SEK rally faster than expected. Kit Juckes, Chief Global FX Strategist at Société Générale, reports.
Is time running out to buy SEK for next summer?
GBP/SEK peaked at 14 in August and is down to 13.33 now but our forecast for Q3 next year is 12.50 so there should still be some merit in buying some more Krona here.
SEK has overtaken Sterling as the sick currency of Europe, which seems harsh given the country’s long-run economic performance and the healthy state of its balance of payments.
In recent months, what has held it back was the Riksbank reluctance to keep up with the ECB’s rate hiking pace, and the perception that the real estate sector is its Achilles Heel in a rising rate environment. But once rates have clearly peaked and if the sky doesn’t fall in, it’s not clear this pessimism is justified anymore.
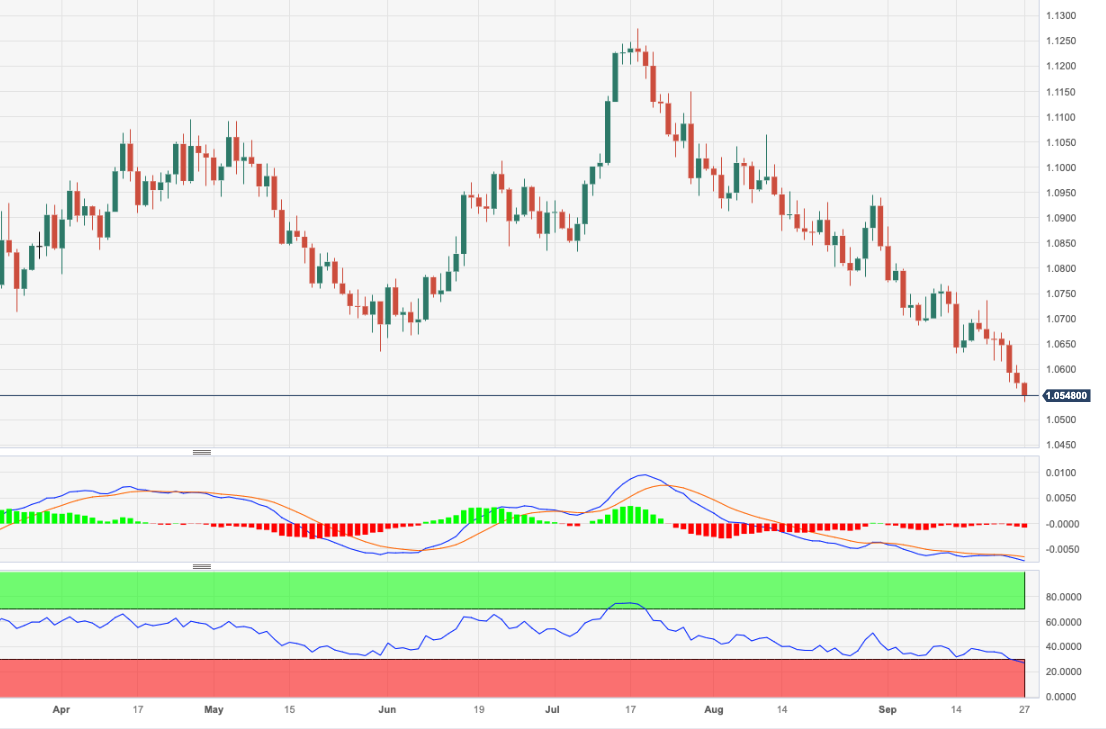
- EUR/USD weakens to new multi-month lows around 1.0530.
- Next on the downside emerges the March low at 1.0516.
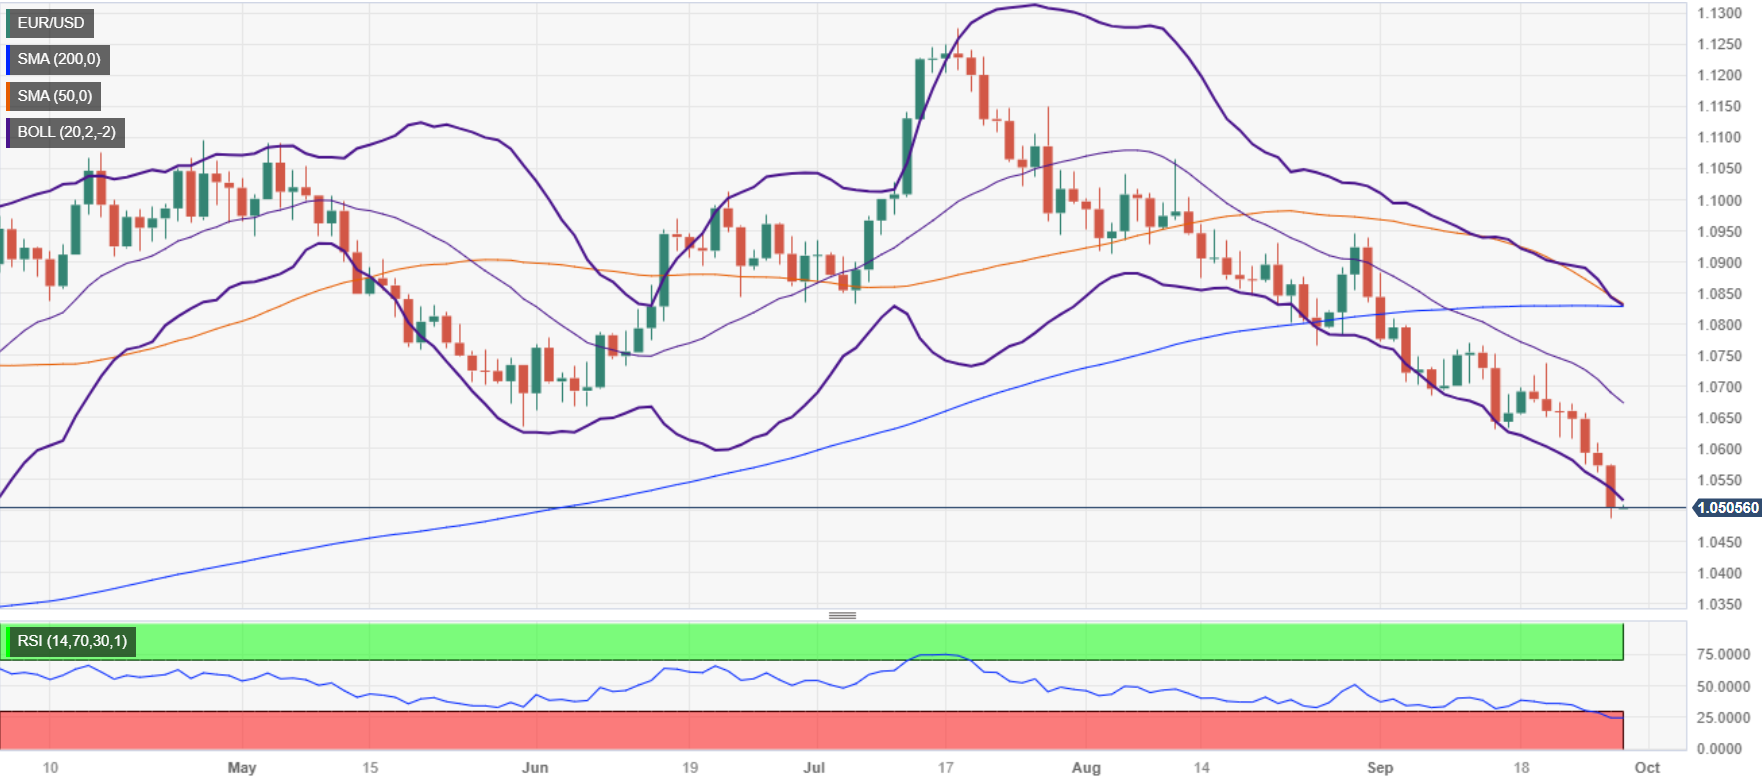
EUR/USD keeps the selling pressure well in place for the 7th session in a row on Wednesday, printing new six-month lows around 1.0530 .
The continuation of the downward bias should leave the pair vulnerable to further losses with the immediate target at the March low of 1.0516 (Mar 8), which is the last defence ahead of an assault on the 2023 low at 1.0481 (January 6).
While below the key 200-day SMA at 1.0827, the pair is likely to face extra weakness.
EUR/USD daily chart
Gold price has held up relatively well amid rising bond yields and rebound in the USD. Economists at ANZ Bank analyze the yellow metal’s outlook.
Headwinds to have limited impact on Gold over the coming months
Gold prices have been resilient in the face of rising US Treasury yields and a stronger USD. While the ‘higher rates for longer’ narrative gains momentum in response to strong US economic data, we see these headwinds having limited impact on Gold over the coming months.
We expect Gold to trade near $2,000 by the end of this year.
- DXY rises to new 2023 highs near 106.50 on Wednesday.
- Current overbought conditions could spark a knee-jerk.
DXY accelerates its upside and reaches new YTD peaks near 106.50 on Wednesday.
Considering the ongoing price action, extra gains appear likely for the time being. Further up now comes the weekly high at 107.19 (November 30, 2022) prior to another weekly peak at 107.99 (November 21 2022).
However, the current overbought conditions of the index could favour some near-term corrective move.
In the meantime, while above the key 200-day SMA, today at 103.07, the outlook for the index is expected to remain constructive.
DXY daily chart
- AUD/USD continues to face selling pressure despite a rebound in Australia’s inflation.
- Major contributors to a rebound in Australian inflation were rising energy prices and house rentals.
- AUD/USD trades near the lower portion of the Darvas Box pattern, which signifies that chances for a breakdown are high.
The AUD/USD pair faced an intense sell-off while attempting to recapture the crucial resistance of 0.6400 on Wednesday. The Aussie asset drops despite a rebound in the Australian Consumer Price Index (CPI) data for August.
Australia’s monthly CPI rebounded to 5.2% from July’s reading of 4.9% as expected by the market participants. Major contributors to a rebound in Australian inflation were rising energy prices and house rentals. An expected rise in inflation has spurred expectations of one more interest rate hike from the Reserve Bank of Australia (RBA).
Meanwhile, the US Dollar Index (DXY) continues to capitalize on fears of a global slowdown due to higher interest rates by central bankers and a hot inflation environment. Apart from that, Federal Reserve (Fed) policymakers see the central bank is not done with interest rates yet as the US economy is resilient due to falling inflation and robust consumer spending.
AUD/USD trades near the lower portion of the Darvas Box pattern formed on a four-hour scale, which signifies that chances for a breakdown are high. The 200-period Exponential Moving Average (EMA) at 0.6457 continues to act as a major barricade for the Australian Dollar bulls.
The Relative Strength Index (RSI) (14) slips into the bearish range of 20.00-40.00, which indicates that the bearish impulse has been triggered.
A fresh downside would appear if the Aussie asset drops below August 17 low around 0.6360. This would expose the asset to the round-level support of 0.6300 followed by 03 November 2022 low at 0.6272.
In an alternate scenario, a decisive break above August 15 high around 0.6522 will drive the asset to August 9 high at 0.6571. Breach of the latter will drive the asset towards August 10 high at 0.6616.
AUD/USD four-hour chart
-638314150575799036.png)
- Durable Goods Orders in the US rose modestly in August.
- US Dollar Index stays in positive territory, closes in on 106.50.
Durable Goods Orders in the US rose 0.2%, or $0.5 billion, to $284.7 billion in August, the US Census Bureau reported on Wednesday. This reading followed the 5.6% decline (revised from 5.2%) recorded in July and came in better than the market expectation for a decrease of 0.5%.
"Excluding transportation, new orders increased 0.4%," the press release read. "Excluding defense, new orders decreased 0.7%. Machinery, up four of the last five months, led the increase, $0.2 billion, or 0.5%, to $37.8 billion."
Market reaction
The US Dollar preserves its strength after the data. As of writing, the US Dollar Index was up 0.2% on the day at 106.40.
UOB Group’s Economist Enrico Tanuwidjaja, Junior Economist Agus Santoso and Vincentius Ming Shen review the recently published manufacturing PMI figures in Indonesia.
Key Takeaways
Indonesia’s manufacturing performance rebounded strongly and maintained its expansive trajectory for the 24th consecutive month and topping the highest level since Sep 2022. The latest data in Aug 2023, Indonesia's Manufacturing PMI Index recorded an improvement from 53.3 points to 53.9 points, the highest level among ASEAN countries, and only 4.7 points lower than India which recorded the highest level of PMI Manufacturing Index among Asian countries at 58.6 points in Aug.
Domestically, manufacturing sector optimism was also reflected by Bank Indonesia’s (BI) business activity survey in 3Q23. Based on BI's survey, manufacturing sector activity in 3Q23 is expected to improve, rising from 2.2% of weighted net balance (Saldo Bersih Tertimbang, SBT) to 2.7% SBT on the back of improvement in investment expectations.
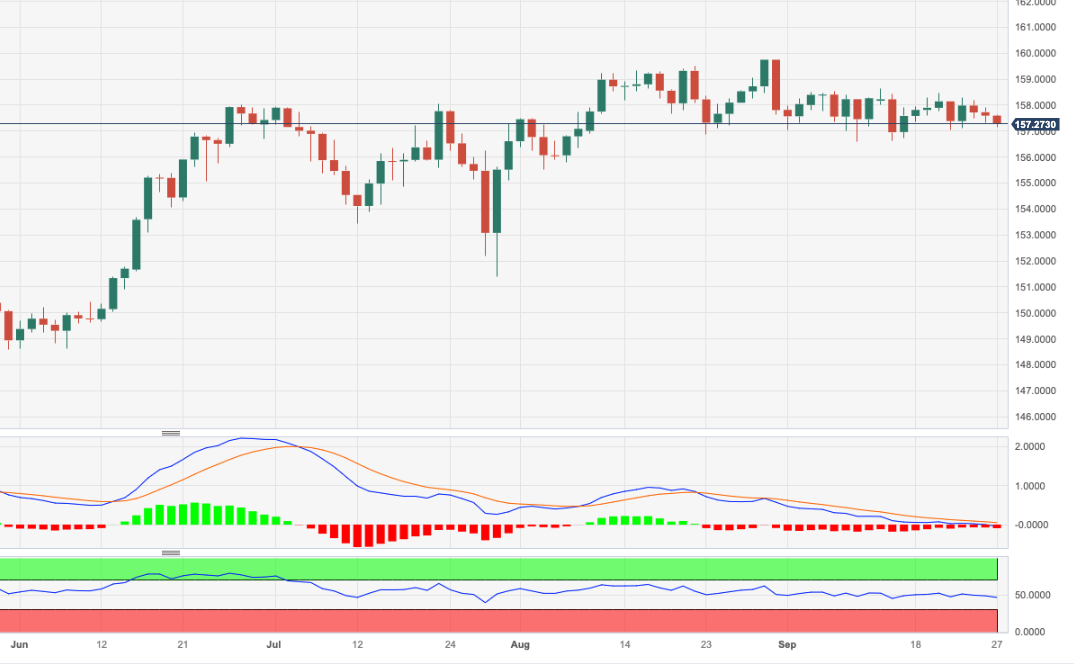
- EUR/JPY adds to the weekly decline near the 157.00 support.
- Next to the upside aligns the monthly high at 158.65.
EUR/JPY maintains the bearish mood so far this week and revisits the vicinity of the 157.00 neighbourhood on Wednesday.
In the meantime, the cross remains stuck within the consolidative range and the breakout of it exposes a visit to the so far monthly high of 158.65 (September 13) prior to the 2023 top at 159.76 (August 30), which precedes the key round level at 160.00.
So far, the longer term positive outlook for the cross appears favoured while above the 200-day SMA, today at 149.26.
EUR/JPY daily chart
Softer economic data weighed on the CAD over the latter part of Q3, but higher Oil prices and a resilient labour market saw it recover on most crosses, especially against the EUR and GBP. Economists at ANZ Bank analyze Loonie’s outlook.
CAD: Still room for upward momentum
Higher Oil prices should support the CAD on an intraday trading basis – especially against the currencies of energy importer countries, like the JPY, EUR and GBP.
We see the USD/CAD pair reaching 1.34 by the year’s end.
The British Pound (GBP) underperformed as pillars of bullish momentum have evaporated. Economists at ANZ Bank analyze Sterling’s outlook.
Momentum falters, but hope remains
If the September meeting has seen the conclusion of the BoE’s tightening cycle, this could allow the GBP/USD pair to consolidate back above 1.27 by year-end as the UK economy recovers.
The growth outlook remains challenging, especially amid rising energy costs, but signs of recent resilience should not be clouded by the more recent souring of activity and growth indicators.
- The US Dollar broke higher on Tuesday in late US trading hours as reports from Capitol Hill pointed to no resolution in sight.
- Durable Goods Orders data is key on Wednesday’s economic calendar.
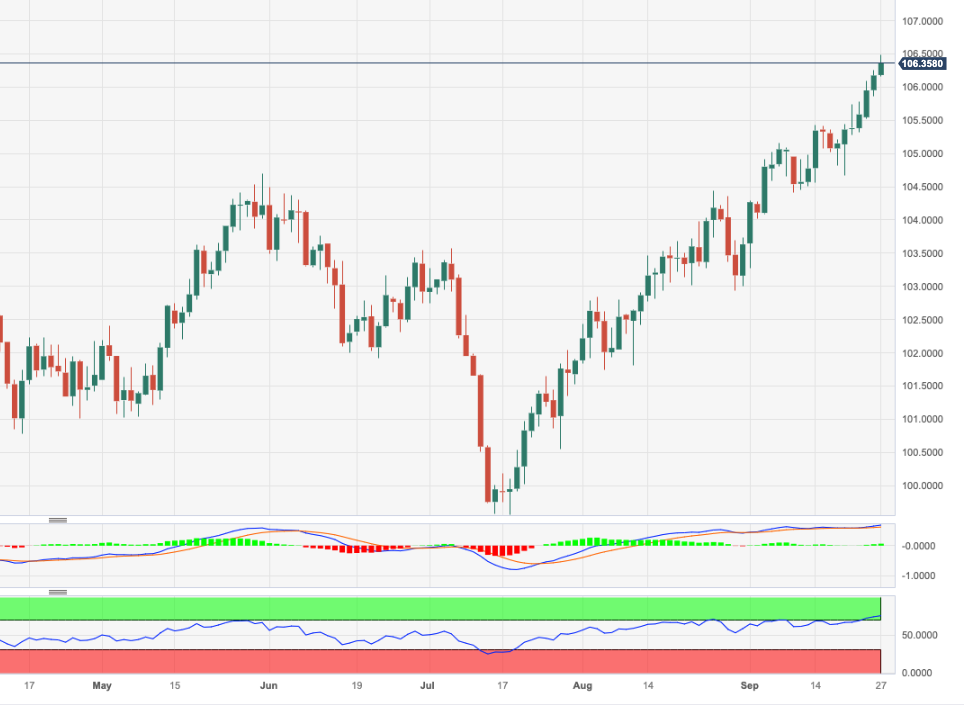
- The US Dollar Index reaches a new 10-month high above 106.32.
The US Dollar (USD) keeps posting new highs for the past 40 weeks, with the main driver this week being the stalemate on Capitol Hill. Both the Senate and the House are pushing bills to the floor, proposals that on its own are not enough to avert a shutdown by October 1. As the deadline looms, it becomes more likely that by Saturday the US government will be shut down and markets could be left in the dark on where the US is in terms of macroeconomic conditions, as an extended halt would mean that many agencies stop publishing economic data.
The main event for Wednesday will be Durable Goods Orders, which tell a bit more on the health of the US manufacturing sector.. Expectations are for a marginal 0.1% increase, down from the 0.4% rise seen in July. The US Energy Information Administration (EIA) will also publish its US crude stockpile numbers as the current Cushing stockpile reserve is at the lowest level in a decade. The numbers might trigger another leg higher in Oil prices.
Daily digest: US Dollar labelled safe haven
- The Mortgage Bankers Association (MBA) will issue at 11:00 GMT its Mortgage Applications number for last week. Previous number was a 5.4% increase.
- Durable Goods numbers will come at 12:30 GMT. Durable Goods without transportation are expected to take a step back, from 0.4% increase to 0.1%. The headline index previously declined 5.2%, and markets expectations are for a less sharper fall of 0.5%.
- The highly anticipated EIA US crude stockpile report is due at 14:30. Next to the crude stockpile change, the current Cushing reserves will be a market driving factor for Oil prices.
- The US Treasury is expected to hit the markets with a 5-year bond auction at 17:00.
- Equities are all in the green across the board, from Asia to the US futures. Markets are trying to shrug off the negative gloom from the past few days.
- The CME Group FedWatch Tool shows that markets are pricing in an 80.4 % chance that the Federal Reserve will keep interest rates unchanged at its meeting in November.
- The benchmark 10-year US Treasury yield traded as high as 4.51% and takes a small step back from Monday’s peak as investors start to buy safe bonds as a shield for any possible US government shutdown.
US Dollar Index technical analysis: Are we there yet?
The US Dollar keeps printing new 10-month highs on a daily basis this week with several main drivers making the Greenback a safe haven. Not only is the possible US government shutdown a nearby factor, the current interest-rate differential and hawkish comments from several US Federal Reserve members makes it clear to markets that policy won’t change anytime soon. This validates the US Dollar Index (DXY) from creeping higher on track for a new 52-week high.
The US Dollar Index opens above 106.00, though the overheated RSI might make it difficult to hold this level. Traders that want to hit a new 52-week high need to be aware that a lot of road needs to be covered towards 114.78. Rather look for 107.19, the high of November 30, 2022, as the next profit target on the upside.
On the downside, the recent resistance at 105.88 should be seen as first support. Still, it has just been broken to the upside, so it isn’t likely to be a strong barrier. Rather look for 105.12 to do the trick and keep the DXY above 105.00.
US Dollar FAQs
What is the US Dollar?
The US Dollar (USD) is the official currency of the United States of America, and the ‘de facto’ currency of a significant number of other countries where it is found in circulation alongside local notes. It is the most heavily traded currency in the world, accounting for over 88% of all global foreign exchange turnover, or an average of $6.6 trillion in transactions per day, according to data from 2022.
Following the second world war, the USD took over from the British Pound as the world’s reserve currency. For most of its history, the US Dollar was backed by Gold, until the Bretton Woods Agreement in 1971 when the Gold Standard went away.
How do the decisions of the Federal Reserve impact the US Dollar?
The most important single factor impacting on the value of the US Dollar is monetary policy, which is shaped by the Federal Reserve (Fed). The Fed has two mandates: to achieve price stability (control inflation) and foster full employment. Its primary tool to achieve these two goals is by adjusting interest rates.
When prices are rising too quickly and inflation is above the Fed’s 2% target, the Fed will raise rates, which helps the USD value. When inflation falls below 2% or the Unemployment Rate is too high, the Fed may lower interest rates, which weighs on the Greenback.
What is Quantitative Easing and how does it influence the US Dollar?
In extreme situations, the Federal Reserve can also print more Dollars and enact quantitative easing (QE). QE is the process by which the Fed substantially increases the flow of credit in a stuck financial system.
It is a non-standard policy measure used when credit has dried up because banks will not lend to each other (out of the fear of counterparty default). It is a last resort when simply lowering interest rates is unlikely to achieve the necessary result. It was the Fed’s weapon of choice to combat the credit crunch that occurred during the Great Financial Crisis in 2008. It involves the Fed printing more Dollars and using them to buy US government bonds predominantly from financial institutions. QE usually leads to a weaker US Dollar.
What is Quantitative Tightening and how does it influence the US Dollar?
Quantitative tightening (QT) is the reverse process whereby the Federal Reserve stops buying bonds from financial institutions and does not reinvest the principal from the bonds it holds maturing in new purchases. It is usually positive for the US Dollar.
EUR/USD has retreated from a high of 1.12 in mid-July to levels below 1.06. Economists at ANZ Bank analyze the pair’s outlook outlook.
Better prospects in 2024
Rising commodity prices if sustained will add another blow to the EA’s economy. As net importers of energy, higher energy prices will impact the EA’s balance of payments negatively. While we think this will add to downside pressure on the EUR, it is unlikely the EUR/USD will test last year’s low of 0.95, as local storage facilities are better stocked for Europe’s coming winter.
Lack of impetus from rates and growth relative to the US will likely limit how far the EUR/USD can rally for the rest of 2023.
Looking ahead, we are more optimistic on the pair in 2024, as US economic resilience moderates.
UOB Group’s Senior Economist Julia Goh and Economist Loke Siew Ting comment on the latest release of inflation figures in Malaysia.
Key Takeaways
Headline inflation maintained at 2.0% y/y in Aug, matching Bloomberg consensus but coming in a tad lower than our estimate of 2.1%. The steady inflation rate was largely thanks to favourable base effects and a continuation of government subsidies particularly on fuels, chicken, eggs, and cooking oil. This helped to counterbalance the significant rise in prices of some essential food items (i.e. rice, fresh meat, and fish & seafood), water and electricity bills, pharmaceutical products, transport services, and education during the month.
We stick to our view that inflation will likely hover around 2.0% in the remainder of the year, keeping our 2023 full-year inflation forecast of 2.8% intact (BNM est: 2.8%-3.8%, 2022: 3.3%). For 2024, upside risks to the inflation outlook has heightened as global energy prices rebound to above USD90/bbl levels and the effects of El Nino on staple food especially rice become more imminent, in addition to the Malaysian government’s plan to rationalize its subsidies next year. While awaiting the detailed announcement on subsidy rationalization by the government, we keep our 2024 full-year inflation forecast unchanged at 2.8% for now.
In an interview with CNN on Wednesday, Minneapolis Federal Reserve Bank President Neel Kashkari said that there was a risk interest rates might have to go higher but added that it was hard to know, as reported by Reuters.
Kashkari said that they do not want to see a US government shutdown and reiterated that they are committed to bring inflation to 2% target.
Market reaction
These comments don't seem to be having a significant impact on the US Dollar's performance against its rivals. As of writing, the US Dollar Index was up 0.15% on the day at 106.33.
The Czech Koruna, usually a stable currency, recently weakened sharply. Economists at Commerzbank have revised up our forecast EUR/CZK path to reflect the current weakness.
Inflation may not moderate fully to target
From current level, we expect the Koruna to recover modestly as inflation moderates. But in 2024, we do not foresee further CZK strength because inflation may not moderate fully to target, which may once again affect CNB’s credibility.
What is more, controversy has broken out between government and central bank because the latter criticises the expansionary fiscal stance for being the main culprit behind high inflation. Such developments could add volatility to the Koruna again next year if inflation were to prove stubborn like we anticipate.

Source: Commerzbank Research
USD/JPY has broken above the 149 level. Economists at MUFG Bank analyze Yen’s outlook.
Opposition to currency weakness remains firm
We continue to see a high chance of intervention but only after a break above the 150 level when there is a higher chance of stops fuelling volatility and ‘disorderly’ price action that would provide the justification for the MoF to intervene.
The authorities in China have also upped their rhetoric opposing CNY weakness as well. Actions to curtail upside moves in USD/CNY would certainly help Tokyo in its battle to limit JPY weakness.
We see the risks still skewed to the upside for both USD/JPY and USD/CNY given the US Dollar momentum but opposition to currency weakness in Tokyo and Beijing remains firm.
- USD/JPY extends its three-day winning spell amid strength in the US Dollar.
- The US Dollar Index extended upside to near 106.30 despite Consumer Confidence dropping in September.
- Higher wage growth is required to keep Japanese inflation stable above 2%.
The USD/JPY extended its upside to near 149.20 on Wednesday. The asset continues to attract bids as the US Dollar is resilient amid deepening global slowdown fears. The major has continued its winning streak for the fourth trading session despite hopes of a stealth intervention in the FX domain by the Bank of Japan (BoJ) to support the Japanese Yen.
S&P500 futures added decent gains in the London session, portraying an improvement in the risk appetite of the market participants. On Tuesday, US equities witnessed an intense sell-off as investors remain worried about the long-term outlook which is deteriorating as the Federal Reserve (Fed) is expected to keep interest rates higher for a longer period.
The US Dollar Index (DXY) extended upside to near 106.30 despite Consumer Confidence dropping in September. US Conference Board reported on Tuesday that the confidence of consumers in the US economy was seen declining in all age groups. The sentiment data dropped to 103.0 in September from August’s reading of 108.7. Households seem worried about sticky consumer inflation, political uncertainty, and higher interest rates.
On Wednesday, the US Durable Goods Orders report for August will remain in focus. Investors have projected a contraction at a slower pace of 0.4%. In July, the economic data was contracted by 5.2%. A weak order book for core goods would demonstrate a bleak outlook for the manufacturing sector, which has been contracting for a long period.
Meanwhile, the Japanese Yen struggles for a firm footing as BoJ Governor Kazuo Ueda supports the continuation of easy monetary policy conditions. BoJ Ueda cited the need for a sustained rise in wages to keep inflation stable above the 2% target for a secular period. Going forward, investors will focus on Tokyo’s inflation data, which will be released on Friday.
- Oil (WTI) advances over 0.5% as traders brace for weekly EIA data.
- The US Dollar prints another 10-month high as investors flee into the safer Greenback.
- The overnight numbers from the API showed a small build in stockpiles.
Oil prices are jumping higher this Wednesday with traders bracing for the weekly Energy Information Administration (EIA) report. Although the crude stockpile build or drawdown will be important, traders will zoom in on the Cushing stockpile reserve, which is flirting with decade lows. Another big drawdown of that reserve would mean a big upshift in demand to hit the oil markets and thus higher prices.
Meanwhile, the US Dollar (USD) keeps posting new highs for the past 40 weeks, with the main driver this week being the stalemate on Capitol Hill. Both the Senate and the House are pushing bills to the floor, proposals that on its own are not enough to avert a shutdown by October 1. As the deadline looms, it becomes more likely that by Saturday the US government will shut down and markets could be left in the dark on where the US is in terms of macroeconomic conditions. An extended halt would mean that many agencies stop publishing economic data.
Crude Oil (WTI) price trades at $90.61 per barrel, and Brent Oil trades at $92.95 per barrel at the time of writing.
Oil news and market movers
- The American Petroleum Institute (API) reported on Tuesday a draw of 1.59M barrels of oil in US commercial storage for the week of September 22.
- The API report also mentioned that Gasoline inventories experienced a draw of 70K barrels for the week, Distillate inventories a draw of 1.7M barrels, and stockpiles at the Cushing (Oklahoma) storage hub a draw of 828K barrels.
- The Energy Information Administration (EIA) will release its weekly US Petroleum Supply report near 14:30 GMT on Wednesday. Analysts forecast the report will show a decrease of 600K barrels for domestic crude, a decline of 200K barrels for Gasoline, and a drop of 1M barrels in Distillate stocks.
- Saudi Arabia’s Aramco is set to hike its prices on the Asian markets for November crude contracts.
Oil Technical Analysis: Respect the support levels
Oil prices are heading higher as traders are starting to double down on a possible drawdown of the Cushing storage hub to a decade low. With gas prices rising at the pumps, the US government can only release more reserves in order to make sure prices do not turn into an inflationary force. This means that the US will need to buy crude on the market in order to restock and fill the gap it is creating these past few weeks.
On the upside, the double top from October and November of last year at $93.12 remains the level to beat. Although this looks very much in reach, markets have already priced in a lot of possible supply deficits and a bullish outlook. Should $93.12 be taken out, look for $97.11, the high of August 2022.
On the downside, a new floor is formed near $88 with the high of September 5 and 11 underpinning the current price action. Proof of that already exists with the dip of September 13 and September 21, which reversed ahead of $88. Should $88 break , the peak of August 10 needs to be enough to catch the dip near $84.20.
-638314009574507065.png)
WTI US OIL daily chart
WTI Oil FAQs
What is WTI Oil?
WTI Oil is a type of Crude Oil sold on international markets. The WTI stands for West Texas Intermediate, one of three major types including Brent and Dubai Crude. WTI is also referred to as “light” and “sweet” because of its relatively low gravity and sulfur content respectively. It is considered a high quality Oil that is easily refined. It is sourced in the United States and distributed via the Cushing hub, which is considered “The Pipeline Crossroads of the World”. It is a benchmark for the Oil market and WTI price is frequently quoted in the media.
What factors drive the price of WTI Oil?
Like all assets, supply and demand are the key drivers of WTI Oil price. As such, global growth can be a driver of increased demand and vice versa for weak global growth. Political instability, wars, and sanctions can disrupt supply and impact prices. The decisions of OPEC, a group of major Oil-producing countries, is another key driver of price. The value of the US Dollar influences the price of WTI Crude Oil, since Oil is predominantly traded in US Dollars, thus a weaker US Dollar can make Oil more affordable and vice versa.
How does inventory data impact the price of WTI Oil
The weekly Oil inventory reports published by the American Petroleum Institute (API) and the Energy Information Agency (EIA) impact the price of WTI Oil. Changes in inventories reflect fluctuating supply and demand. If the data shows a drop in inventories it can indicate increased demand, pushing up Oil price. Higher inventories can reflect increased supply, pushing down prices. API’s report is published every Tuesday and EIA’s the day after. Their results are usually similar, falling within 1% of each other 75% of the time. The EIA data is considered more reliable, since it is a government agency.
How does OPEC influence the price of WTI Oil?
OPEC (Organization of the Petroleum Exporting Countries) is a group of 13 Oil-producing nations who collectively decide production quotas for member countries at twice-yearly meetings. Their decisions often impact WTI Oil prices. When OPEC decides to lower quotas, it can tighten supply, pushing up Oil prices. When OPEC increases production, it has the opposite effect. OPEC+ refers to an expanded group that includes ten extra non-OPEC members, the most notable of which is Russia.
The Dollar is finding more strength thanks to a soft risk environment and attractive real rates after the bond sell-off, analysts at ING report.
Unstoppable strength
There are two lingering upside risks for the Dollar stemming purely from the rate market: one being generated from higher longer-dated yields, one from a potential hawkish repricing of short-term rate expectations upholding short-term swap rates.
The next level to watch in DXY is the 106.82 November 2022 high, although we have seen the index rise comfortably through key levels, and upside risks now extend to the 107.00/107.50 area should the US bond market sell-off accelerate further.
Senior Economist at UOB Group Alvin Liew assesses the BoJ latest monetary policy gathering.
Key Takeaways
After surprising markets with tweak to YCC in Jul, the Bank of Japan (BOJ) returned to its status quo position in its scheduled Monetary Policy Meeting (MPM) on Fri (22 Sep), where it kept the key policy objectives and forward guidance unchanged to achieve the 2% inflation objective.
During the post-MPM press conference, BOJ Governor Ueda stayed the script and did not give away anything new on BOJ’s normalisation timeline or the conditions that will induce BOJ to scrap YCC or end negative rates. He seemed to have walked back on the hawkish comments during his Yomiuri interview, sounding more balanced.
BOJ Outlook – On The (Long) Edge Of Normalisation The Sep MPM does not change our view on the path of BOJ normalisation. We still expect Gov Ueda to carry out the path to normalisation/unwinding in two broad steps. 1) we expect a material period (present to Dec 2023) of adjustment to its forward guidance on Yield Curve Control (YCC) and interest rates with possibility of further tweaks in the name of “greater flexibility” and “to enhance the sustainability of monetary easing”, to give market guidance and time to prepare for an orderly exit of BOJ’s ultra-easy monetary policy, and 2) we still expect monetary policy normalisation to begin only in early 2024 - negative policy call rate to rise from -0.1% to 0% in Jan 2024 MPM while YCC to be dropped in Mar 2024 MPM.
- Gold price faces an intense sell-off as Fed’s hawkish stance strengthens the US Dollar.
- The US economy has remained resilient on the grounds of a tight labor market and robust household demand.
- Investors await the US Durable Goods Orders to put some light on the manufacturing sector’s outlook.
Gold price (XAU/USD) hits a fresh monthly low as pressure from a strong US Dollar and high Treasury yields deepens after Federal Reserve (Fed) policymakers see further policy-tightening appropriate. The precious metal skids below the crucial support of $1,900.00 as excess inflationary pressures seem stickier than expected and may encourage the Fed to keep interest rates elevated for a longer period than projected.
The US economy has remained resilient on the grounds of tight labor market conditions and strong consumer spending, but the manufacturing sector has been a major headwind. A revival in the Manufacturing PMI could strengthen the US economy further. For more guidance on factory activity, investors will focus on the US Durable Goods Orders data, which will draw some light on the manufacturing sector outlook.
Daily Digest Market Movers: Gold price pressured by upbeat US Dollar
- Gold price continues its two-day sell-off, dropping to over one-month low near $1,895 as US economic resilience stems concerns of a rebound in inflation.
- US inflation, measured by the Core Consumer Price Index, has softened from its peak of 6.6% to 4.3% in August, pressured by the Federal Reserve’s aggressive rate-tightening cycle. The last leg of high inflation seems stubborn due to robust consumer spending and steady wage growth.
- Tight labor market conditions and strong consumer spending momentum could slow down progress on inflation as the overall demand remains robust.
- In addition to that, commercial banks have not shown any sign of sharp contraction in credit despite tight lending standards.
- As inflationary pressures in excess of the 2% desired rate seem a hard nut to crack for Fed policymakers, the plot of “higher interest rates for longer” will keep Gold prices under pressure.
- As per the CME Group Fedwatch tool, traders see almost an 81% chance that interest rates will remain steady at 5.25%-5.50% at the November monetary policy meeting. Traders see a 64% chance for interest rates remaining unchanged for the remainder of the year.
- Lately, Fed policymakers, namely Minneapolis Federal Reserve Bank President Neel Kashkari and Boston Fed President Susan Collins, supported further policy tightening.
- Fed Collins said on Friday that a further rate hike is certainly not off the table. She further added that inflation can fall with only a modest rise in unemployment and that core services inflation excluding shelter has not yet shown a sustained improvement.
- The US economy is operating at full employment levels despite the Fed’s historically aggressive restrictive monetary policy. This may keep inflation sticky.
- Meanwhile, the US Dollar extends its winning spell as the American economy seems to be coping better than expected with the consequences of higher interest rates. The US Dollar Index (DXY) prints a fresh 10-month high at 106.32 amid global slowdown fears. 10-year US Treasury yields remain upbeat, above 4.5%, on hawkish interest rate outlook.
- The US Conference Board reported a decline in the Consumer Confidence Index to 103.0 in September from August’s reading of 108.7. The Conference Board commented that the decline in consumer confidence was visible among all age groups. Households seem worried about sticky consumer inflation, political uncertainty, and higher interest rates.
- On Wednesday, investors will focus on the US Durable Goods Orders data for August, which will be published at 12:30 GMT. Investors will keenly watch the data as the US manufacturing sector is going through a vulnerable phase.
- Orders are seen contracting at a slower pace of 0.5% against the 5.2% decline seen in July.
Technical Analysis: Gold price breaks below neutral triangle
-638314059506796855.png)
Gold price delivers a breakdown of the Symmetrical Triangle chart pattern formed on a daily time frame. A downside break of the neutral triangle could lead to higher volatility that results in wider ticks and heavy selling volume. The precious metal seems to be stabilizing below the 200-day Exponential Moving Average (EMA) around $1,908.00. Momentum oscillators indicate a fresh trigger of bearish impulse.
Central banks FAQs
What does a central bank do?
Central Banks have a key mandate which is making sure that there is price stability in a country or region. Economies are constantly facing inflation or deflation when prices for certain goods and services are fluctuating. Constant rising prices for the same goods means inflation, constant lowered prices for the same goods means deflation. It is the task of the central bank to keep the demand in line by tweaking its policy rate. For the biggest central banks like the US Federal Reserve (Fed), the European Central Bank (ECB) or the Bank of England (BoE), the mandate is to keep inflation close to 2%.
What does a central bank do when inflation undershoots or overshoots its projected target?
A central bank has one important tool at its disposal to get inflation higher or lower, and that is by tweaking its benchmark policy rate, commonly known as interest rate. On pre-communicated moments, the central bank will issue a statement with its policy rate and provide additional reasoning on why it is either remaining or changing (cutting or hiking) it. Local banks will adjust their savings and lending rates accordingly, which in turn will make it either harder or easier for people to earn on their savings or for companies to take out loans and make investments in their businesses. When the central bank hikes interest rates substantially, this is called monetary tightening. When it is cutting its benchmark rate, it is called monetary easing.
Who decides on monetary policy and interest rates?
A central bank is often politically independent. Members of the central bank policy board are passing through a series of panels and hearings before being appointed to a policy board seat. Each member in that board often has a certain conviction on how the central bank should control inflation and the subsequent monetary policy. Members that want a very loose monetary policy, with low rates and cheap lending, to boost the economy substantially while being content to see inflation slightly above 2%, are called ‘doves’. Members that rather want to see higher rates to reward savings and want to keep a lit on inflation at all time are called ‘hawks’ and will not rest until inflation is at or just below 2%.
Is there a president or head of a central bank?
Normally, there is a chairman or president who leads each meeting, needs to create a consensus between the hawks or doves and has his or her final say when it would come down to a vote split to avoid a 50-50 tie on whether the current policy should be adjusted. The chairman will deliver speeches which often can be followed live, where the current monetary stance and outlook is being communicated. A central bank will try to push forward its monetary policy without triggering violent swings in rates, equities, or its currency. All members of the central bank will channel their stance toward the markets in advance of a policy meeting event. A few days before a policy meeting takes place until the new policy has been communicated, members are forbidden to talk publicly. This is called the blackout period.
Economist at UOB Group Lee Sue Ann reviews the latest BoE monetary policy meeting.
Key Takeaways
The Bank of England (BOE) left interest rates unchanged on Thu, ending a series of 14 consecutive rate hikes since Dec 2021, when the Bank Rate was just at 0.10%. The Monetary Policy Committee (MPC) had voted 5-4 in favor of maintaining the policy rate, with four members preferring another 25 bps hike to 5.50%.
The surprise move came after UK inflation printed significantly below expectations for Aug. Headline CPI had fallen further to 6.7% y/y, from 6.8% y/y in Jul, and down from the peak of 11.1% in Oct 2022. Core inflation also fell to 6.2% in Aug from 6.9% in Jul, and against consensus of 6.8%. The decline reflected the easing in both services and core goods price inflation.
Our view is that the BOE will keep all options on the table. Even though there is no meeting in Oct, as well as there being one set of wage (17 Oct) and inflation (18 Oct) data before the next meeting on 2 Nov, which is a little to chew on. Barring any huge upside surprise to services inflation or wage data, we think that given the scale of yesterday’s surprise by the BOE, there is a high chance it will choose to pause again in Nov. As such our base case remains for the Bank Rate to remain at 5.25% for the rest of this year.
Brent has faced stiff resistance around the $94-95 mark, hovering at the low $90s since breaking out early in September. Strategists at Rabobank analyze Oil’s outlook.
More strength in Q1 2024 to stay above the $100 mark
There is still significant upside price risk due to the underlying disparity between demand and supply.
Brent has the momentum to touch $100, however, we see more strength in Q1 2024 to stay above the $100 mark.
See – Brent Oil: Break above $100 will not be sustainable – ING
- GBP/JPY finds an intermediate support near 181.00 while the downside seems favored.
- Fears of a stealth intervention by the BoJ in the FX domain to defend the falling Japanese Yen may keep the asset under pressure.
- GBP/JPY drops after testing the breakdown region of the Symmetrical Triangle pattern.
The GBP/JPY pair discovers some buying interest near 181.00 after remaining under selling pressure from the past few trading sessions. The asset may continue its downside trend the policy divergence between the Bank of England (BoE) and the Bank of Japan (BoJ) would not widen further on expectations that the former is done with hiking interest rates.
The BoE announced a steady interest rate decision last week as higher interest rates are threatening the economic outlook. The United Kingdom’s labor market has lost its resilience as the jobless rate is rising moderately and fresh demand for labor has eased.
Meanwhile, fears of a stealth intervention by the Bank of Japan (BoJ) in the FX domain to defend further downside in the Japanese Yen may keep the asset under pressure.
This week, investors will focus on the UK’s April-June quarter Gross Domestic Product (GDP) data, which will be published on Friday. UK’s GDP is foreseen to expand at a steady pace of 0.2% and 0.4% respectively.
GBP/JPY drops after testing the breakdown region of the Symmetrical Triangle chart pattern formed on a two-hour scale. A breakdown of the aforementioned chart pattern results in wider ticks on the downside and heavy selling volume. The asset is trading below the 200-period Exponential Moving Average (EMA), which indicates that the broader trend is bearish.
The Relative Strength Index (RSI) (14) shifts into the bearish range of 20.00-40.00, which indicates that the bearish impulse is active.
Going forward, a breakdown below September 21 low at 180.82 would drag the asset further toward July 20 low at 179.74 and July 26 low at 176.32.
On the flip side, a recovery move above September 19 high at 183.50 would drive the asset toward September 5 high at 185.75, followed by August 22 high at 186.77.
GBP/JPY two-hour chart
-638314043513335724.png)
The Czech National Bank (CNB) will meet today to make its latest monetary policy decision. Economists at ING analyze Koruna’s outlook as EUR/CZK is gradually sliding down.
Last discussion before rate cuts
We believe it will be the last meeting before CNB begins to discuss the real possibility of rate cuts.
Our forecast remains unchanged – a first 25bps rate cut in November alongside a new central bank forecast. The main question today will therefore be whether the governor will indicate when to expect the first rate cut or leave no clues.
While it is clear that a rate cut is around the corner in the Czech Republic, we expect the board to adopt a cautious approach, which should support the Koruna and erase losses after the sell-off triggered by the central bank's steps in Poland in early September. Thus, we expect EUR/CZK to end today safely below 24.40.
Economists at ANZ Bank analyze USD/JPY outlook.
BoJ intervention is a more credible threat at the 150 mark and beyond
While energy prices may be on a rebound, we think BoJ intervention is a more credible threat at the 150 mark and beyond.
We see the USD/JPY returning to 145 by year-end and 132 by September 2024, as the US tightening cycle is likely to be over by then.
See – USD/JPY: There is certainly a chance of a break above the 150 level – MUFG
- USD/CAD attempts to continue the gains above 1.3510.
- US Dollar strengthens on market caution about the Fed’s interest rates trajectory.
- Improved WTI price could provide support for the Canadian Dollar.
USD/CAD struggles to extend gains on the second consecutive day, hovering above 1.3510 during the European session on Wednesday. The pair experiences upward support due to the risk aversion and improved US Treasury yields.
However, moderate economic data from the United States (US) could bolster the prevailing strength in the US Dollar (USD).
US Consumer Confidence released on Tuesday for September decreased to 103.0 from the reading of 108.7 in August. While Building Permits improved to 1.541M in August from 1.443M prior, falling short of the market expectation of 1.543M.
Moreover, the House Price Index month-month for July climbed to 0.8% compared to the market expectations of 0.5% from the previous rate of 0.4%.
Additionally, the Federal Reserve (Fed) is expected to raise policy rates through the end of the year as the US economy demonstrates resilience. This, in turn, boosts the US Treasury yields, which reinforces the strength of the US Dollar (USD).
The US Dollar Index (DXY) hovers around 106.30 by the press time, the highest level since December. The yield on the 10-year US Treasury note hovers below the highest level since October 2007, trading around 4.51% at the time of writing.
Furthermore, traders await the US Durable Goods Orders report to be released on Wednesday. Core Personal Consumption Expenditure (PCE) Price Index, the Fed's preferred measure of consumer inflation, is due on Friday. The annual rate is anticipated to reduce from 4.2% to 3.9%.
On the flip side, the USD/CAD currency pair could be influenced by the price movements of the US Dollar due to the absence of Canada’s macros during the week. Canadian Gross Domestic Product (GDP) will be eyed on Friday.
However, the recent improvement in West Texas Intermediate (WTI) oil prices could potentially limit the upside of the USD/CAD pair. This improvement in oil prices is supportive of the Canadian Dollar (CAD) because Canada is a significant oil exporter to the United States.
WTI price extends its gains on the second day, trading higher above $90.70 per barrel by the press time.
As a result, the CAD is often referred to as a commodity-linked currency, and rising oil prices tend to strengthen it. This dynamic may counterbalance the impact of USD price movements on the USD/CAD pair.
- EUR/GBP remains below 0.8700 and the 200-day SMA through the first half of the European session.
- Worries about a deeper economic downturn in the Eurozone undermine the Euro and cap the upside.
- .The BoE’s surprise pause continues to weigh on the British Pound and acts as a tailwind for the cross.
The EUR/GBP cross continues with its struggle to find acceptance above the 0.8700 mark on Wednesday and retreats a few pips from the vicinity of the highest level since July 20 touched the previous day. The fundamental backdrop, meanwhile, suggests that the path of least resistance for spot prices is to the upside, though bulls might still wait for a move beyond a technically significant 200-day Simple Moving Average (SMA) before placing fresh bets.
The British Pound (GBP) continues to be undermined by the Bank of England's (BoE) surprise pause, which, in turn, is seen as a key factor acting as a tailwind for the EUR/GBP cross. The UK central bank ended a run of 14 straight interest rate hikes in the wake of the recent deceleration of inflation, signs that the UK labour market is cooling and reviving recession fears. The BoE's Monetary Policy Committee voted 5-4 in favour of maintaining the main policy rate at a 15-year high level of 5.25%.
The European Central Bank President Christine Lagarde, meanwhile, said on Monday that interest rates will be set at sufficiently restrictive levels for as long as necessary. Furthermore, ECB board member Frank Eldersonm, in an interview with Market News International, noted that interest rates could still go higher, if necessary. This downplays the view that the next move is likely to be a rate cut, which contributes to the shared currency's relative outperformance and lends support to the EUR/GBP cross.
That said, worries about a deep economic contraction in the Eurozone suggest that further hikes may be off the table for now. The fears were further fueled by the disappointing release of the forward-looking German GfK Consumer Climate Index, which fell to -26.5 in September from the previous month's downwardly revised reading of -25.6. This indicates that the confidence in the Eurozone’s largest economy remains fragile and that the ECB's
14-month-long tightening cycle could have reached its peak.
This is holding back traders from placing fresh bullish bets around the EUR/GBP cross and capping the upside. Hence, it will be prudent to wait for a sustained strength beyond a technically significant 200-day SMA before positioning for an extension of the recent upward trajectory witnessed over the past month or so.
Technical levels to watch
Economists at ING now see downside risks for EUR/USD potentially extending to 1.02 in a bond sell-off acceleration.
1.05 may be the bottom in current conditions
We estimate that an extension of the run in US treasury yields to the 5.0% mark would take EUR/USD to 1.02. That is not our base case, but the ongoing pressure on the Euro is clearly not confined to the US rates story.
Developments in the US activity story remain much more important, and if signs of weakness emerge across the Atlantic (and markets price in more Fed tightening) we expect a swift turnaround in EUR/USD, but that may not be a story for the near-term. Holding at the key 1.0500 support will be a success for those hoping for that turnaround to happen anytime soon.
Economists at ANZ Bank analyze NZD/USD outlook.
AUD/NZD to be capped at 1.10 in 2023
We are cautious of the recent turn in economic data surprises in New Zealand. The economy still faces deeply negative real rates which will limit a large upside for the NZD/USD pair in the near term.
Globally, with the USD remaining supported till year-end and slower economic growth in China, there will be few global drivers for the NZD.
We think the NZD/USD will remain range bound between 0.58-0.59 until year-end.
We are bearish on NZD crosses and expect the AUD/NZD to be capped at 1.10 in 2023 and forecast the pair to appreciate to 1.14 by the end of 2024.
- Silver slides to over a one-week low on Wednesday, albeit finds some support at lower levels.
- The technical setup still favours bearish traders and supports prospects for a further downfall.
- The stage seems all set for a retest of an ascending trend-line support, near the $22.35 region.
Silver drifts lower for the third successive day on Wednesday and drops to a one-and-half-week low, around the $22.65 region during the early European session. The white metal, however, manages to recover a bit in the last hour and is currently trading around the $22.80-$22.75 area, still down around 0.30% for the day.
From a technical perspective, the overnight sustained break and close below the $23.00 round figure was seen as a fresh trigger for bearish traders. Furthermore, oscillators on the daily chart have again started gaining negative traction and support prospects for a further depreciating move for the XAG/USD. Hence, a subsequent slide back towards challenging an ascending trend line extending from the June monthly low, currently pegged around the $22.35 zone, looks like a distinct possibility.
A convincing break though the latter will confirm a fresh breakdown and expose the next relevant support is pegged near the $22.00 mark. Some follow-through selling will set the stage for additional losses. The XAG/USD might then accelerate the downward trajectory towards the $21.25 intermediate support before eventually dropping to the $21.00 round figure.
On the flip side, the $23.00 mark might now act as an immediate hurdle ahead of the $23.20-$23.25 zone and the very important 200-day Simple Moving Average (SMA), currently around the $23.45 region. This is followed by last week's swing high, around the $23.75 area. A sustained strength beyond the latter has the potential to lift the XAG/USD towards the $24.00 round figure en route to the $24.30-$24.35 resistance, above which bulls could aim to reclaim the $25.00 psychological mark.
Silver daily chart
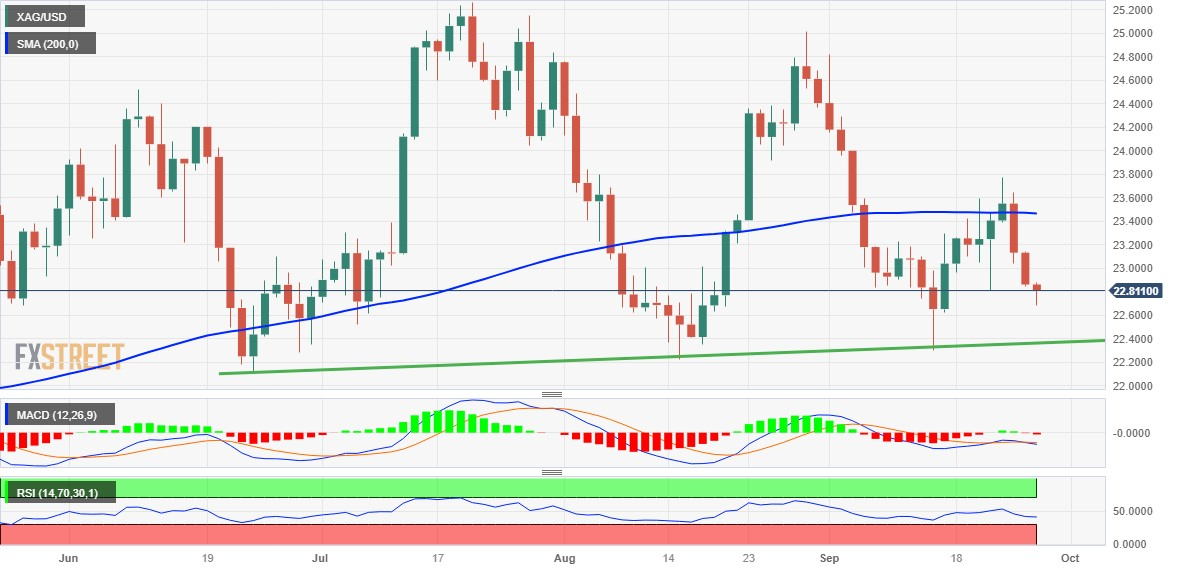
Technical levels to watch
Here is what you need to know on Wednesday, September 27:
The US Dollar Index went into a consolidation phase above 106.00 early Wednesday after posting gains in the previous three trading days and touching a fresh 2023-high in the process. The modest improvement seen in risk mood makes it difficult for the US Dollar (USD) to continue to outperform its rivals mid-week. August Durable Goods Orders will be featured in the US economic docket and the US Department of Treasury will hold a 5-year Treasury note auction later in the day.
Although the data from the US revealed on Tuesday a further deterioration in consumer sentiment in September and a sharp decline in new home sales in August, the USD managed to hold its ground amid the bearish action in Wall Street. In the European morning, US stock index futures gained traction and they were last seen rising between 0.3% and 0.4%.
US Dollar price this week
The table below shows the percentage change of US Dollar (USD) against listed major currencies this week. US Dollar was the strongest against the Swiss Franc.
| USD | EUR | GBP | CAD | AUD | JPY | NZD | CHF | |
| USD | 0.78% | 0.76% | 0.29% | 0.92% | 0.38% | 0.36% | 0.99% | |
| EUR | -0.78% | -0.01% | -0.48% | 0.15% | -0.38% | -0.40% | 0.23% | |
| GBP | -0.78% | 0.01% | -0.46% | 0.17% | -0.38% | -0.39% | 0.24% | |
| CAD | -0.30% | 0.47% | 0.45% | 0.62% | 0.08% | 0.06% | 0.69% | |
| AUD | -0.92% | -0.13% | -0.14% | -0.60% | -0.57% | -0.57% | 0.08% | |
| JPY | -0.38% | 0.41% | 0.39% | -0.09% | 0.55% | -0.01% | 0.62% | |
| NZD | -0.37% | 0.39% | 0.37% | -0.06% | 0.57% | 0.02% | 0.63% | |
| CHF | -1.00% | -0.23% | -0.24% | -0.69% | -0.08% | -0.61% | -0.64% |
The heat map shows percentage changes of major currencies against each other. The base currency is picked from the left column, while the quote currency is picked from the top row. For example, if you pick the Euro from the left column and move along the horizontal line to the Japanese Yen, the percentage change displayed in the box will represent EUR (base)/JPY (quote).
Inflation in Australia climbed to 5.2% on a yearly basis in August, the Australian Bureau of Statistics reported in the Asian session. This decision came in line with the market expectation and AUD/USD struggled to gain traction. At the time of press, the pair was trading modestly lower on the day slightly below 0.6400.
USD/JPY continued to edge higher and rose above 149.00 on Wednesday. The Bank of Japan's minutes of the September policy meeting showed earlier in the day that members agreed to maintain current monetary easing to stably, sustainably hit the price target. Meanwhile, Japanese Finance Minister Shunichi Suzuki repeated that they are watching the developments in the foreign exchange market with a sense of urgency.
EUR/USD posted its lowest daily close since February below 1.0600 on Tuesday. Early Wednesday, the pair consolidates its weekly losses above 1.0550.
GBP/USD dropped to a new multi-month low of 1.2136 in the late Asian session on Wednesday before stabilizing near 1.2150.
USD/CHF rose toward 0.9200 and touched its highest level in six months on Wednesday. The Swiss National Bank (SNB) will publish its Quarterly Bulleting for the third quarter later in the day.
Gold price extended the weekly slide and declined below $1,900 for the first time in five weeks early Wednesday. The benchmark 10-year US Treasury bond yield hold steady at multi-year highs at around 4.5%, not allowing XAU/USD to stage a rebound.
Sterling continues to lose ground. Economists at ING analyze GBP outlook.
Flagging downside risks to the 1.2000 area in Cable
In the UK, the economic calendar is looking empty today, with no scheduled central bank speakers.
We continue to flag downside risks to the 1.2000 area in Cable, while EUR/GBP may struggle to hold on to recent gains as Sterling’s recent underperformance relative to the euro starts to look a bit overdone now that the big bulk of the Bank of England repricing has happened.
Wang Yiming, a member of the Monetary Policy Committee of the People's Bank of China (PBOC), told an Economic Forum on Wednesday, “China's economic situation is very different from that of Japan in the 1990s and there is no basis for the feared ‘Japanification’.”
"There is no Japanification in China, we are still in the medium-to-high growth stage," Wang added.
- USD/CNH sticks to modest gain near 7.3100 amid the Fed’s hawkish stance
- The Euro maintains the bearish tone vs. the US Dollar.
- Stocks in Europe open Wednesday’s session in a mixed tone.
- EUR/USD slips back to new lows near 1.0550.
- The USD Index (DXY) extends its rally to new 2023 peaks.
- Consumer Confidence in Germany worsens in October.
- US Durable Goods Orders take centre stage across the pond.
The Euro (EUR) experiences an increasing bearish sentiment against the US Dollar (USD), prompting the EUR/USD to decline and reach fresh six-month lows near 1.0550 on Wednesday.
Conversely, the Greenback continues to strengthen for the fourth consecutive session, reaching new highs for 2023 around 106.30 when gauged by the USD Index (DXY), an area last seen in late November 2022.
The further decline in the pair this time is accompanied by a corrective move in US and German yields, which abandon the area of recent multi-year highs despite unchanged expectations in the monetary policy scenario.
Regarding the latter, investors persist in factoring in an additional 25 bp rate increase by the Federal Reserve (Fed) by year-end. Meanwhile, discussions in the market continue to lean towards an impasse at the European Central Bank (ECB), even in light of persistent inflation levels significantly surpassing the bank's target and concerns about a recession.
In the domestic calendar, Consumer Confidence in Germany weakened to -26.5, according to GfK.
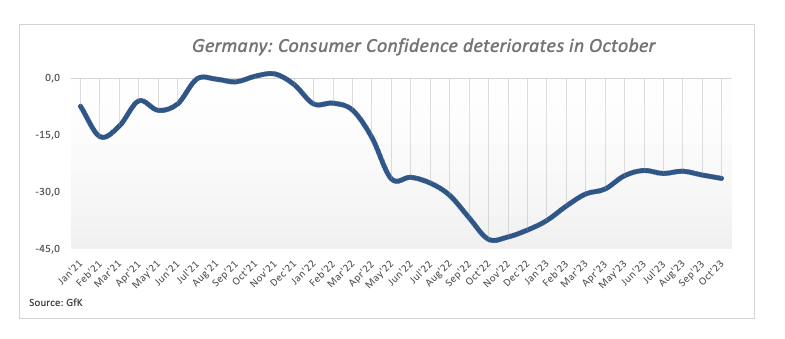
In the US, Mortgage Applications tracked by MBA are due in the first turn, seconded by the more relevant Durable Goods Orders for the month of August.
Daily digest market movers: Euro leaves the door open to extra losses
- The EUR keeps the offered stance unchanged vs. the USD.
- US and German yields correct lower across different maturities.
- Investors continue to see the Fed raising rates by 25 bps before end of 2023.
- Markets speculate on probable interest rate cuts by the Fed in Q3 2024.
- Market chatter over a pause by the ECB remain on the rise.
- ECB’s Frank Elderson says rates haven’t necessarily peaked.
- Intervention concerns remain well and sound around USD/JPY.
- BoJ Minutes favoured the continuation of the current monetary stance.
Technical Analysis: Euro trades closer to 1.0516
The EUR/USD continues to demonstrate signs of weakness and is trading in close proximity to the March low, around 1.0515.
On the downside, immediate support for the EUR/USD can be found at the March low of 1.0516 (March 15), followed by the 2023 low of 1.0481 (January 6).
Regarding potential resistance levels, there is a minor obstacle at the weekly high of 1.0767 (September 12), and a more significant barrier at the 200-day SMA at 1.0828. If the pair manages to break above this level, it could pave the way for further recovery, targeting the temporary 55-day SMA at 1.0879, with the possibility of reaching the weekly high of 1.0945 (August 30). Surpassing this level could shift the focus towards the psychological level of 1.1000, followed by the August peak of 1.1064 (August 10). Beyond that, the pair may retest the weekly top at 1.1149 (July 27) and potentially reach the 2023 high at 1.1275 (July 18).
However, it is essential to note that as long as the EUR/USD remains below the 200-day SMA, there is a possibility that downward pressure will persist.
Euro FAQs
What is the Euro?
The Euro is the currency for the 20 European Union countries that belong to the Eurozone. It is the second most heavily traded currency in the world behind the US Dollar. In 2022, it accounted for 31% of all foreign exchange transactions, with an average daily turnover of over $2.2 trillion a day.
EUR/USD is the most heavily traded currency pair in the world, accounting for an estimated 30% off all transactions, followed by EUR/JPY (4%), EUR/GBP (3%) and EUR/AUD (2%).
What is the ECB and how does it impact the Euro?
The European Central Bank (ECB) in Frankfurt, Germany, is the reserve bank for the Eurozone. The ECB sets interest rates and manages monetary policy.
The ECB’s primary mandate is to maintain price stability, which means either controlling inflation or stimulating growth. Its primary tool is the raising or lowering of interest rates. Relatively high interest rates – or the expectation of higher rates – will usually benefit the Euro and vice versa.
The ECB Governing Council makes monetary policy decisions at meetings held eight times a year. Decisions are made by heads of the Eurozone national banks and six permanent members, including the President of the ECB, Christine Lagarde.
How does inflation data impact the value of the Euro?
Eurozone inflation data, measured by the Harmonized Index of Consumer Prices (HICP), is an important econometric for the Euro. If inflation rises more than expected, especially if above the ECB’s 2% target, it obliges the ECB to raise interest rates to bring it back under control.
Relatively high interest rates compared to its counterparts will usually benefit the Euro, as it makes the region more attractive as a place for global investors to park their money.
How does economic data influence the value of the Euro?
Data releases gauge the health of the economy and can impact on the Euro. Indicators such as GDP, Manufacturing and Services PMIs, employment, and consumer sentiment surveys can all influence the direction of the single currency.
A strong economy is good for the Euro. Not only does it attract more foreign investment but it may encourage the ECB to put up interest rates, which will directly strengthen the Euro. Otherwise, if economic data is weak, the Euro is likely to fall.
Economic data for the four largest economies in the euro area (Germany, France, Italy and Spain) are especially significant, as they account for 75% of the Eurozone’s economy.
How does the Trade Balance impact the Euro?
Another significant data release for the Euro is the Trade Balance. This indicator measures the difference between what a country earns from its exports and what it spends on imports over a given period.
If a country produces highly sought after exports then its currency will gain in value purely from the extra demand created from foreign buyers seeking to purchase these goods. Therefore, a positive net Trade Balance strengthens a currency and vice versa for a negative balance.
European Central Bank (ECB) board member Frank Elderson said in an interview with Market News International on Wednesday, interest rates could still go higher, if necessary.
Key quotes
"Does that mean policy rates have peaked? Not necessarily.”
"What we’re seeing is a more protracted period of sluggish growth than we were expecting.”
"It’s also true that our primary mandate is to deliver price stability, and I think we have proven we are very determined to do that."
Market reaction
At the press time, EUR/USD is trading flat at around 1.0570, reversing losses amid an upbeat mood and a pause in the US Dollar uptrend.
Since mid-July, AUD/USD has declined by 6% from above 0.68 to 0.64, setting a year-to-date low of 0.6357 on 6 September. Economists at ANZ Bank analyze Aussie’s outlook.
Upside ahead
We think developments in China (and the RMB), along with the USD, are key drivers of the AUD in the near term.
We also expect commodity prices to have a larger impact on the AUD with rising energy prices. If these elevated energy prices are sustained, this will likely be supportive for Australia’s terms of trade and may dampen some of the negative impact from a resilient USD and a weak RMB.
We expect the AUD to be at 0.65 by year-end.
- Pound Sterling eyes more downside on jittery market mood.
- A sudden policy-tightening pause by the BoE highlights a poor economic outlook.
- Investors await the UK’s Q2 GDP data for further guidance.
The Pound Sterling (GBP) extends its five-day losing spell as investors foresee the United Kingdom economy shifting into a recession due to deteriorating labor market conditions and a poor demand outlook. The GBP/USD pair is expected to deliver more losses as a pause in the rate-tightening cycle by the Bank of England (BoE) would elevate consumer inflation expectations.
BoE’s unexpected pause in its historically aggressive rate cycle has not only highlighted policymakers’ concern about the UK’s economic turmoil, but it has also raised uncertainty over the inflation outlook. Britain’s energy prices have been propelled by the global oil rally and are set to make inflation hotter again. A situation of high inflation and weak labor demand may trigger a stagflation risk ahead.
Daily Digest Market Movers: Pound Sterling faces the consequences of BoE’s rate-cycle pause
- Pound Sterling faces the wrath of a risk-off market mood as investors remain worried about the global economy due to deepening risks of higher interest rates.
- The market mood remains jittery as investors see the global economy struggling to absorb the consequences of restrictive monetary policy by central bankers.
- The consequences of higher interest rates on the UK economy are impacting labor market conditions and economic activities.
- UK employers laid off workers in the past two months as firms shifted focus to controlling costs due to the deteriorating demand environment.
- Though demand for labor has fallen, wage growth remains strong enough that the inflation outlook remains stubborn.
- Like the contracting UK Manufacturing PMI, the UK Services PMI slipped below the 50.0 threshold for the second time in a row. This indicates that households’ real income is being squeezed due to higher inflation and a recovery in gasoline prices.
- Despite strong wage growth and a stubborn consumer inflation outlook, the BoE decided to pause the policy-tightening spell last week. This indicates that BoE policymakers are more worried about upside risks to economic turmoil rather than persistent inflation.
- The Pound Sterling is on investors’ selling list due to expectations that the BoE is done hiking interest rates. Contrary to that, the US Dollar has remained resilient after a pause in the policy-tightening spell by the Federal Reserve (Fed).
- A pause in Fed tightening is due to falling inflation and strong economic prospects. In the US economy, labor demand is strong, consumer spending is robust, and wage growth is steady.
- Going forward, investors will focus on the UK’s April-June quarter Gross Domestic Product (GDP) data, which will be published on Friday. Quarterly and annualized GDP data are foreseen to expand at a steady pace of 0.2% and 0.4%, respectively.
- The US Dollar Index (DXY) trades near a fresh 10-month high around 106.30 as Fed policymakers support further policy-tightening to ensure price stability.
- As the US economy has been performing well in comparison with other G7 economies, inflationary pressures in excess of the desired rate of 2% will not fade easily. This has forced Fed policymakers to maintain a hawkish stance on the interest rate outlook.
- On Wednesday, investors will keenly watch the US Durable Goods Orders for August, which will be released at 12:30 GMT. Orders are seen contracting at a slower pace of 0.4% against the 5.2% decline seen in July.
Technical Analysis: Pound Sterling prints a fresh six-month low at 1.2135
Pound Sterling reports a bearish closing for fifth time in a row. The GBP/USD pair continued its losing spell on Wednesday after slipping below the crucial support of 1.2152. The Cable refreshes a six-month low at 1.2135 and is expected to extend the downside toward the round-level support of 1.2100. A bear cross, represented by the 20 and 200-day Exponential Moving Averages (EMAs), warrants more weakness ahead. Momentum oscillators have reached oversold levels.
BoE FAQs
What does the Bank of England do and how does it impact the Pound?
The Bank of England (BoE) decides monetary policy for the United Kingdom. Its primary goal is to achieve ‘price stability’, or a steady inflation rate of 2%. Its tool for achieving this is via the adjustment of base lending rates. The BoE sets the rate at which it lends to commercial banks and banks lend to each other, determining the level of interest rates in the economy overall. This also impacts the value of the Pound Sterling (GBP).
How does the Bank of England’s monetary policy influence Sterling?
When inflation is above the Bank of England’s target it responds by raising interest rates, making it more expensive for people and businesses to access credit. This is positive for the Pound Sterling because higher interest rates make the UK a more attractive place for global investors to park their money. When inflation falls below target, it is a sign economic growth is slowing, and the BoE will consider lowering interest rates to cheapen credit in the hope businesses will borrow to invest in growth-generating projects – a negative for the Pound Sterling.
What is Quantitative Easing (QE) and how does it affect the Pound?
In extreme situations, the Bank of England can enact a policy called Quantitative Easing (QE). QE is the process by which the BoE substantially increases the flow of credit in a stuck financial system. QE is a last resort policy when lowering interest rates will not achieve the necessary result. The process of QE involves the BoE printing money to buy assets – usually government or AAA-rated corporate bonds – from banks and other financial institutions. QE usually results in a weaker Pound Sterling.
What is Quantitative tightening (QT) and how does it affect the Pound Sterling?
Quantitative tightening (QT) is the reverse of QE, enacted when the economy is strengthening and inflation starts rising. Whilst in QE the Bank of England (BoE) purchases government and corporate bonds from financial institutions to encourage them to lend; in QT, the BoE stops buying more bonds, and stops reinvesting the principal maturing on the bonds it already holds. It is usually positive for the Pound Sterling.
USD/CNH continues to point to further side-lined trade in the short-term horizon, suggest UOB Group’s Markets Strategist Quek Ser Leang and Senior FX Strategist Peter Chia.
Key Quotes
24-hour view: We highlighted yesterday that “there is room for USD to advance, but it is unlikely to threaten the major resistance at 7.3400.” Our expectations did not materialise as USD traded sideways in a tight range between 7.3061 and 7.3162 before closing largely unchanged at 7.3100 (-0.08%). Momentum indicators are mostly neutral, and further sideways trading is likely. Expected range for today; 7.3000/7.3200.
Next 1-3 weeks: We continue to hold the same view as last Thursday (21 Sep, spot at 7.3150), wherein the recent downward pressure has faded, and USD is likely to trade in a range, probably between 7.2800 and 7.3400.
CME Group’s flash data for natural gas futures markets noted traders trimmed their open interest positions for the third session in a row on Tuesday, this time by around 16.5K contracts. On the other hand, volume rose sharply by more than 184K contracts after four consecutive daily drops.
Natural Gas: Next resistance aligns around $3.00
Prices of natural gas extended the uptrend on Tuesday amidst shrinking open interest, which leaves the door open to a corrective move in the very near term. However, the pronounced increased in volume could allow for the continuation of the uptrend. On the latter, the $3.00 mark per MMBtu remains the key obstacle for bulls for the time being.
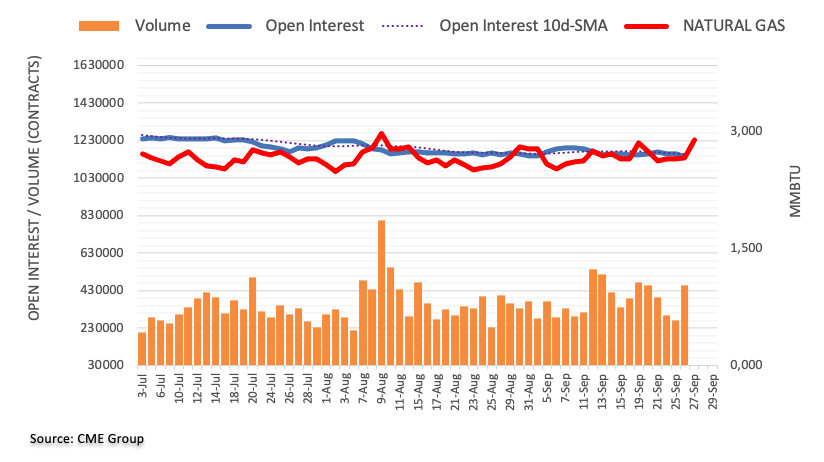
The Swedish Krona has been a big outlier since the start of the week. Economists at ING analyze SEK’s outlook.
Riksbank propping Krona?
We saw two sharp drops in USD/SEK and EUR/SEK in the past two sessions shortly after 09:00 GMT in Monday’s and Tuesday’s sessions. We’ll be on the lookout today for a similar move around that time today, as that may be a signal that the Riksbank is conducting its daily sales operations around that morning timeslot.
The Riksbank stressed this is not FX intervention or a monetary policy tool but mere risk management. The lack of transparency around the amount of weekly sales means the Bank can sell larger amounts at higher USD/SEK and EUR/SEK levels and then justify this as a mere loss-minimisation approach (buying more SEK when it is cheaper).
We still point at some upside risks in the near term for USD/SEK and EUR/SEK, especially once markets adjust to the Riksbank being present in the FX market, although now there is definitely value in holding SEK against other high beta pro-cyclical currencies like NOK.
Tuesday was another strong day for the USD. Ulrich Leuchtmann, Head of FX and Commodity Research at Commerzbank, analyzes Greenback’s outlook.
USD strength and no end in sight?
It seems to me that the necessary condition for EUR/USD weakness is for the majority of the market to take a more optimistic economic view of the US rather than Europe. That means the reason for the USD strength therefore is the prospect of a special ‘soft landing’ of the US economy. Is this prospect realistic? It is not impossible. And for that reason, I do not want to claim that the USD strength necessarily rests on clay feet. However, a soft landing is not a fait accompli either.
It seems to me that the FX market has become too convinced of a ‘soft landing’ for the US economy. If we do see that, a little further USD strength might be justified, but probably not much more. If we don’t see it though, a strong correction of USD strength would then be justified. For that reason, I still feel more comfortable in the camp of skeptics, who are not so confident about the recent USD strength.
I am well aware of the fact that my skepticism may turn out to be inappropriate if the soft landing of the US economy does materialize but have the impression that the skeptic camp is not sufficiently populated.
- USD/CHF gains momentum around 0.9165, the highest since April.
- The overbought RSI condition indicates that further consolidation cannot be ruled out.
- A psychological round mark at 0.9200 is the first resistance level; 0.9128 acts as an initial support level.
The USD/CHF pair holds positive ground for seven straight days during the early European session on Wednesday. As of writing, USD/CHF is up 0.09% on the day at 0.9165. Market participants await the Swiss ZEW Survey and Swiss National Bank (SNB) Quarterly Bulletin on Wednesday for fresh impetus ahead of the US consumer inflation on Friday.
Technically, USD/CHF holds above the 50- and 100-hour Exponential Moving Averages (EMAs) with an upward slope on the four-hour chart. This indicates that the path of least resistance for the pair is to the upside. The Relative Strength Index (RSI) holds in bullish territory above 50. However, the overbought RSI condition indicates that further consolidation cannot be ruled out before positioning for any near-term USD/CHF appreciation.
The first resistance level for USD/CHF is located at 0.9200, representing a psychological round figure and a high of March 30. A break above the latter will see a rally to 0.9245 (a high of March 22) en route to 0.9300 (a high of March 17 and round figure).
Looking at the downside, a low of September 26 at 0.9128 acts as an initial support level for USD/CHF. Further south, the next stop is seen near the 50-hour EMA at 0.9053. Any intraday pullback below the latter would expose the next contention at 0.9035 (the lower limit of the Bollinger Band), followed by 0.8990 (the 100-hour EMA).
USD/CHF four-hour chart
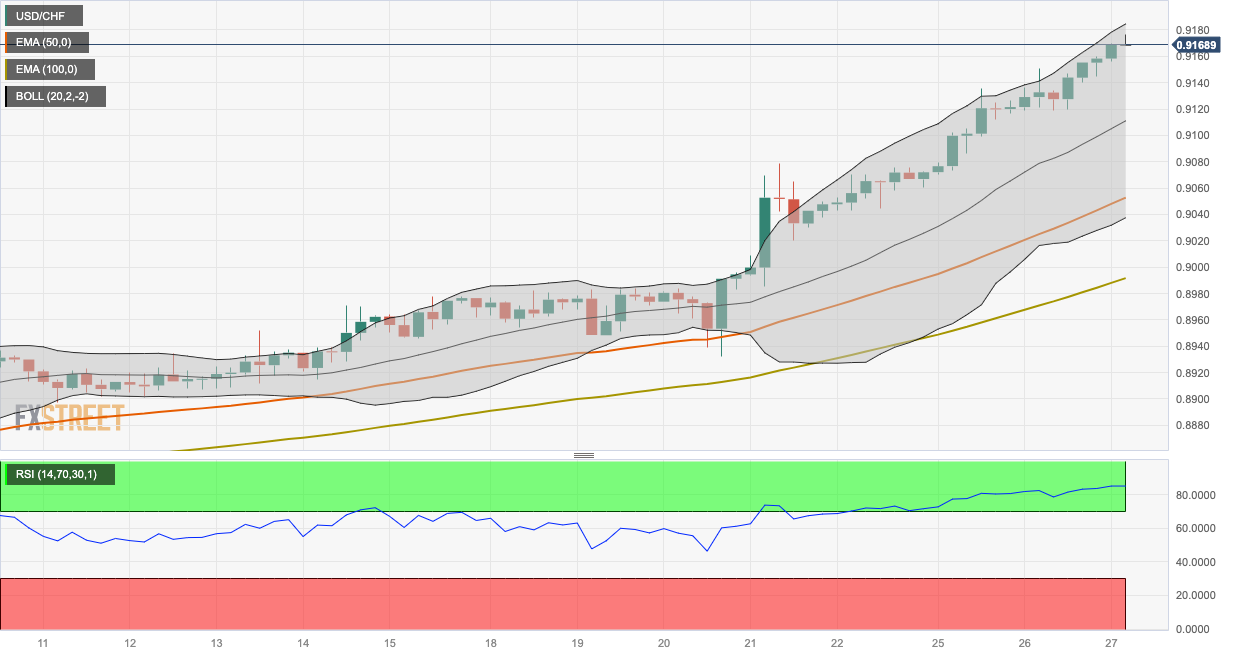
Gold prices fell to the $1,900 level as the US yields rose to a fresh multi-year high. Strategists at ANZ Bank analyze the yellow metal’s outlook.
A rally in the US Dollar kept the market sentiment bleak
Investors are adjusting to the anticipation that the Federal Reserve is unlikely to ease monetary policy next year. Rising yields are weighing on fund flows to Gold exchange traded funds (ETF) too.
A renewed strength in the US Dollar is another headwind, reducing appetite for Gold investment.
FX option expiries for Sept 27 NY cut at 10:00 Eastern Time, via DTCC, can be found below.
- EUR/USD: EUR amounts
- 1.0500 615m
- 1.0510-15 1.6b
- 1.0550 379m
- 1.0575 688m
- 1.0600-05 1.5b
- 1.0630-35 900m
- 1.0640-50 1.7b
- GBP/USD: GBP amounts
- 1.2200-10 436m
- 1.2300 236m
- USD/JPY: USD amounts
- 148.00 411m
- 150.00 393m
- USD/CHF: USD amounts
- 0.9100 230m
- AUD/USD: AUD amounts
- 0.6400 216m
- 0.6420-30 1b
- 0.6445 404m
- USD/CAD: USD amounts
- 1.3400 300m
- 1.3500 658m
- NZD/USD: NZD amounts
- 0.5945 1.3b
- EUR/GBP: EUR amounts
- 0.8700 369m
Both domestic and external factors point to a weaker GBP ahead, in the view of economists at HSBC.
The cyclical story is unlikely to provide much support to the GBP
As markets will slowly start to see the next move in UK rates being down, not up, we think that a shift in rate expectations could drag the currency.
The cyclical story is also unlikely to provide much support to the GBP, as short-term cyclical indicators, like PMIs, have started to turn for the worse again.
Finally, unless and until there is a surge in risk appetite, supported by an improving global outlook, the challenging domestic forces will probably continue to weigh on the GBP.
The continuation of the upside momentum could push USD/JPY to the 149.50 zone in the next few weeks, according to UOB Group’s Markets Strategist Quek Ser Leang and Senior FX Strategist Peter Chia.
Key Quotes
24-hour view: We highlighted yesterday that USD “is likely to rise above 149.00 but is unlikely to reach 149.50.” We also highlighted that “there is another resistance level at 149.20.” Our view was not wrong, as USD rose to 149.19 before pulling back quickly. While there is no clear increase in momentum, the bias for today is tilted to the upside. However, any advance is still unlikely to reach 149.50. If USD breaks below 148.65 (minor support is at 148.85), it would mean that the current mild upward pressure has faded.
Next 1-3 weeks: Yesterday (26 Sep, spot at 148.95), we indicated that “upward momentum has improved further and USD could advance to 149.50.” There is no change in our view. Only a break of 148.10 (‘strong support’ level was at 147.80 yesterday) would indicate that the current upward pressure has faded. Looking ahead, if USD breaks above 149.50, the focus will shift to 150.00.
- EUR/USD loses traction above the mid-1.0500s; holds below the 50- and 100-hour EMAs.
- The oversold RSI condition indicates that further consolidation cannot be ruled out.
- The immediate resistance level will emerge at 1.0600; 1.0540 acts as a key support level.
The EUR/USD pair remains under selling pressure for the seventh consecutive day during the early European session on Wednesday. The pair posts its lowest level since March 16 due to the hawkish stance from the Federal Reserve (Fed) and a sign that the European Central Bank (ECB) could avoid any further rate hikes. The major pair currently trades around 1.0563, losing 0.09% for the day.
According to the four-hour chart, EUR/USD holds below the 50- and 100-hour Exponential Moving Averages (EMAs) with a downward slope, which means the path of least resistance for the pair is to the downside. The Relative Strength Index (RSI) holds in bearish territory below 50. However, the oversold condition indicates that further consolidation cannot be ruled out before positioning for any near-term EUR/USD depreciation.
That said, the immediate resistance level for EUR/USD will emerge near a psychological round mark at 1.0600. The additional upside filter is located at 1.0640 (50-hour EMA). The critical barrier to watch is the 1.0675-1.0685 region, representing the confluence of the upper boundary of the Bollinger Band and the 100-hour EMA.
On the downside, the lower limit of the Bollinger Band at 1.0540 acts as a key support level for EUR/USD. Further south, the next stop of the major pair is seen at 1.0515 (a low of March 15). Any follow-through selling below the latter would expose the next downside stop at 1.0460 (a low of December 6, 2022)
EUR/USD four-hour chart
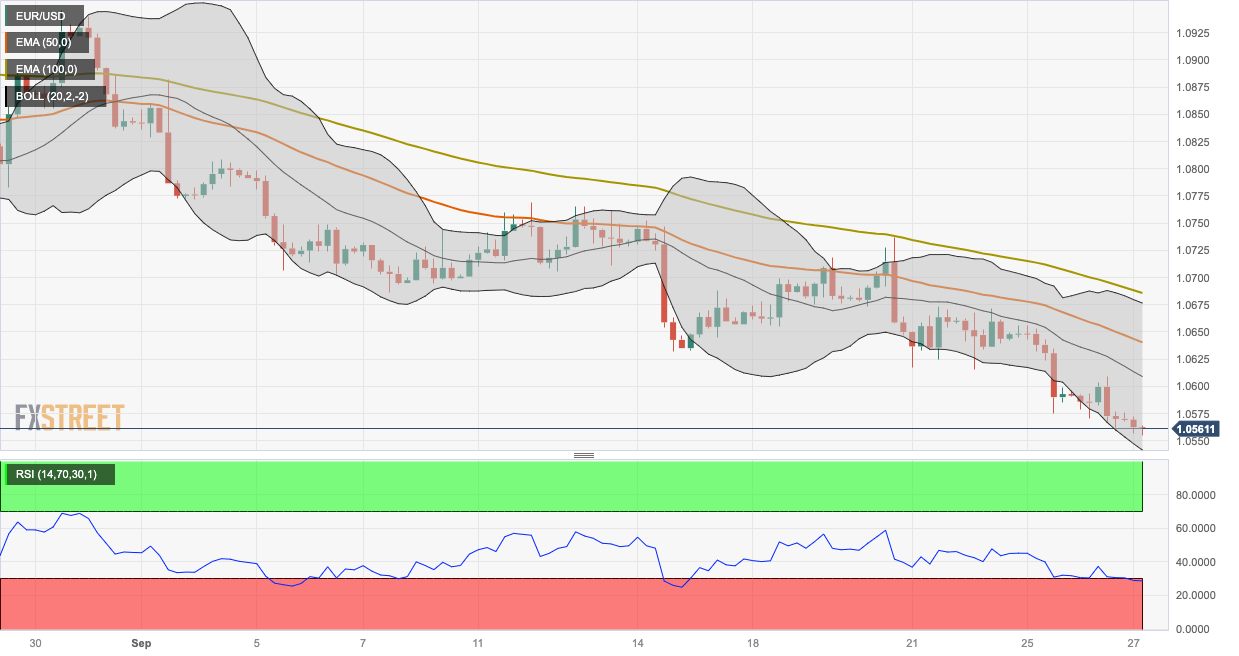
- USD/JPY experiences upward support due to the US economic data.
- Momentum indicators suggest a predominant bullish sentiment in the market.
- The psychological level at 148.00 could emerge as a key support aligned with the 14-day EMA.
USD/JPY hovers slightly below the high since November, trading around 149.10 psychological level during the Asian session on Wednesday. Market caution is bolstering the US Treasury yields, which supports the US Dollar (USD) against the Japanese Yen (JPY).
Bank of Japan (BoJ) policy meeting minutes showed that policymakers were in favor of maintaining current monetary easing to hit the price target, while several members emphasized the downside risks to Japan's economy.
The upward momentum is potentially bullish as the 14-day Relative Strength Index (RSI) continues to stay above the 50 level. The psychological level at 150.00 could act as resistance.
A firm break above that level could inspire the USD/JPY bulls to explore the area around October’s high at 151.94 level.
On the downside, The USD/JPY pair could meet key support around the 148.00 psychological level lined up with a 14-day Exponential Moving Average (EMA) at 148.01.
If the USD/JPY pair collapses below the latter, the bears could navigate the region around the psychological level at 147.00, following the 23.6% Fibonacci retracement at 146.36.
The Moving Average Convergence Divergence (MACD) line remains above the centerline and the signal line. This setup indicates that the momentum in the USD/JPY's price is potentially strong, suggesting bullish sentiment.
USD/JPY: Daily Chart
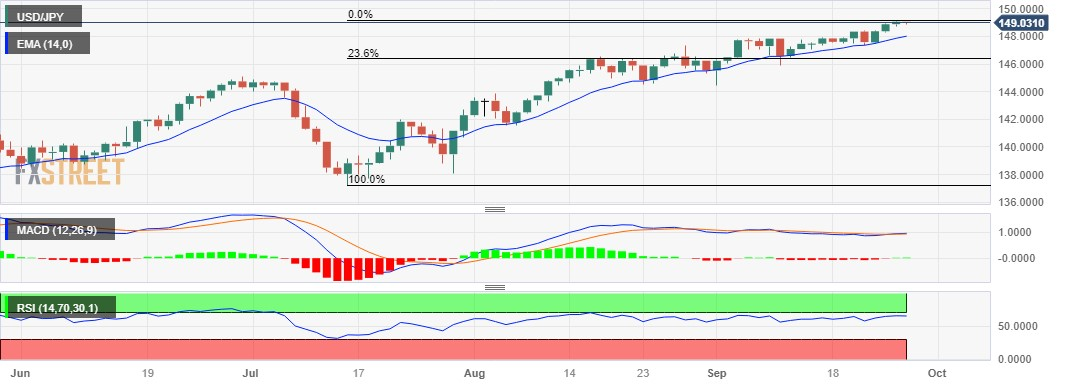
- The index consolidates the breakout of the 106.00 yardstick.
- The Fed’s tighter-for-longer narrative bolsters the index.
- Weekly Mortgage Applications, Durable Goods Orders next on tap.
The USD Index (DXY), which tracks the greenback vs. a bundle of its main competitors, adds to the ongoing rally and records new YTD peaks around 106.30 on Wednesday.
USD Index keeps the rally intact
The index adds to the weekly march north and looks to consolidate the recent breakout of the key 106.00 hurdle, advancing at the same time for the 11th week in a row to levels last traded in later October 2022.
The rally in the dollar appears reinforced by the equally move higher in US yields across different timeframes, which in turns looks underpinned by firmer speculation that the Federal Reserve might stay in the current restrictive territory for longer than previously anticipated.
Back on the US calendar, MBA will report usual weekly Mortgage Applications, while Durable Goods Orders for the month of August will also be in the limelight.
What to look for around USD
The index remains well supported by both investors’ sentiment and higher yields, pushing the dollar to new yearly peaks north of the 106.00 hurdle on Wednesday.
In the meantime, support for the dollar keeps coming from the good health of the US economy, which at the same time appears underpinned by the renewed tighter-for-longer stance narrative from the Federal Reserve.
Key events in the US this week: MBA Mortgage Applications, Durable Goods Orders (Wednesday) - Initial Jobless Claims, Pending Home Sales, Final Q2 GDP Growth Rate, Fed Powell (Thursday) – PCE, Core PCE, Personal Income, Personal Spending, Advanced Goods Trade Balance, Final Michigan Consumer Sentiment (Friday).
Eminent issues on the back boiler: Persevering debate over a soft or hard landing for the US economy. Incipient speculation of rate cuts in early 2024. Geopolitical effervescence vs. Russia and China.
USD Index relevant levels
Now, the index is up 0.10% at 106.28 and a breakout of 106.32 (2023 high September 27) would open the door to 107.19 (weekly high November 30, 2022) and finally 107.99 (weekly high November 21 2022). On the other hand, initial support emerges at 104.42 (weekly low September 11) ahead of 103.07 (200-day SMA) and then 102.93 (weekly low August 30).
In the opinion of UOB Group’s Markets Strategist Quek Ser Leang and Senior FX Strategist Peter Chia, AUD/USD seems to have now moved into a consolidative phase.
Key Quotes
24-hour view: We expected AUD to trade in a range of 0.6405/0.6450 yesterday. However, it edged lower to 0.6388 before settling at 0.6398 (-0.40%). Downward pressure is increasing, albeit slightly. Today, AUD could weaken, but it is unlikely to threaten the major support at 0.6355 (minor support is at 0.6370). Resistance is at 0.6410, followed by 0.6425.
Next 1-3 weeks: Our latest narrative was from last Friday (22 Sep, spot at 0.6410), wherein AUD appears to have entered a consolidation phase, and it is likely to trade between 0.6355 and 0.6480 for the time being. There is no change in our view.
Considering advanced prints from CME Group for crude oil futures markets, open interest resumed the uptrend and went up by around 8.4K contracts, setting aside the previous daily pullback. On the other hand, volume dropped for the second consecutive session, this time by around 61.2K contracts.
WTI retargets the $92.00 mark and above
Prices of WTI resumed the upside o Tuesday, leaving behind Monday’s corrective decline. The daily uptick was accompanied by increasing open interest, which is indicative that further gains look likely in the very near term. Next on the upside for the commodity now emerges the September top around $92.60 per barrel (September 19).
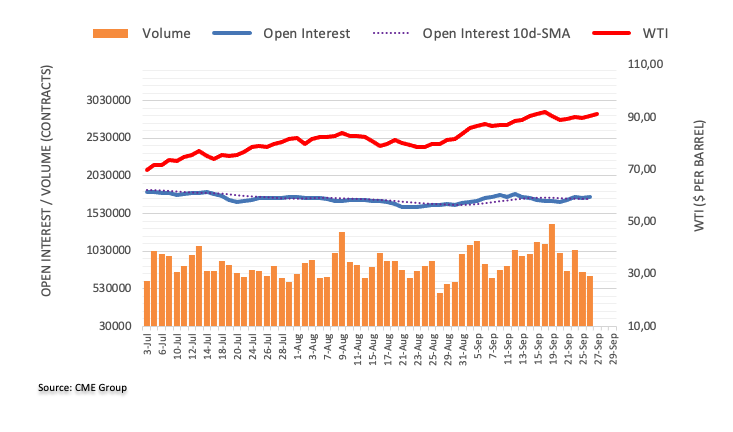
Extra weakness could drag GBP/USD to the 1.2100 region in the next few weeks, note UOB Group’s Markets Strategist Quek Ser Leang and Senior FX Strategist Peter Chia.
Key Quotes
24-hour view: Yesterday, we held the view that “the downside risk in GBP is limited.” We expected it to trade in a range of 1.2170/1.2245. Instead of trading in a range, GBP fell to a low of 1.2154. Today, further GBP weakness is not ruled out, but subdued downward momentum suggests the major support at 1.2100 is likely out of reach. Resistance is at 1.2175; if GBP breaks above 1.2195, it would mean that the weakness in GBP has stabilised.
Next 1-3 weeks: There is not much to add to our update from yesterday (26 Sep, spot at 1.2215). As highlighted, the GBP weakness that started early this month is still in place. GBP could continue to weaken, and the next level to watch is 1.2100. The weakness in GBP will remain intact as long as it stays below 1.2245 (‘strong resistance’ level previously at 1.2295).
- USD/CNH hovers around 7.3125 following the Chinese data.
- US Conference Board (CB) Consumer Confidence rose to 103.0 in September from 108.7 in August.
- China’s Industrial Profits rose by 17.2% from a year earlier.
- The US Core Personal Consumption Expenditure (PCE) Price Index data will be in the spotlight this week.
The USD/CNH pair posts modest gains around 7.3125 during the Asian session on Wednesday. The higher-for-longer rate narrative in the US may undermine risk sentiments and lift the Greenback against its rivals. Market players await the highly-anticipated US Core Personal Consumption Expenditure (PCE) Price Index data on Friday for fresh impetus. The annual figure is expected to decline from 4.2% to 3.9%.
The Federal Reserve (Fed) decided to hold interest rate unchanged in the 5.25% to 5.50% range in its September meeting last week. Apart from this, Fed officials still expect further rate rises later this year. Minneapolis Federal Reserve Bank President, Neel Kashkari stated on Tuesday that he is one of the Fed policymakers who sees one more rate hike this year. He added that US rates probably have to go a little bit higher and be held there for longer, to cool things off. The hawkish stance from the Federal Reserve (Fed) boosts the USD against the CNH.
About the data, economic data on Tuesday revealed that US Conference Board (CB) Consumer Confidence rose to 103.0 in September from 108.7 in August. The figures reached their lowest level in four months, reflecting the impact of rising interest rates and political uncertainty. In August, Building Permits came in at 1.541M from the previous month's figure of 1.44M. The House Price Index for July increased to 0.8% MoM from 0.4% in the prior reading, exceeding the consensus estimate of 0.5%. August New Home Sales decreased -8.7% from July's rise of 8%.
On the other hand, data released by the National Bureau of Statistics (NBS) showed on Wednesday that China’s Industrial Profits rose by 17.2% from a year earlier. This figure reversed the trend after declining in the past five months. Furthermore, the People's Bank of China (PBOC) stated on Wednesday that the central bank will step up policy adjustments and implement monetary policy in a precise and forceful manner in order to support the economy. Any evidence of China data improvement and PBoC warning could turn into a pullback in USD/CNH and act as a headwind for the pair.
Looking ahead, traders will take cues from the US Gross Domestic Product (GDP) Annualized for the second quarter on Thursday and the Core Personal Consumption Expenditure (PCE) Price Index will be released on Friday. These figures could give a clear direction to the USD/CNH pair.
Open interest in gold futures markets shrank for the fourth session in a row on Tuesday, this time by just 123 contracts according to preliminary readings from CME Group. Volume, instead, increased for the second straight day, now by around 54.3K contracts.
Gold: Next on the downside emerges $1885
Gold prices extended the negative start of the week and close Tuesday’s session around the key contention area around $1900. The move was on the back of a small drop in open interest, signalling that the leg lower might be running out of steam. The marked increase in volume, however, underpins further losses to, initially, the August low at $1885 per troy ounce.
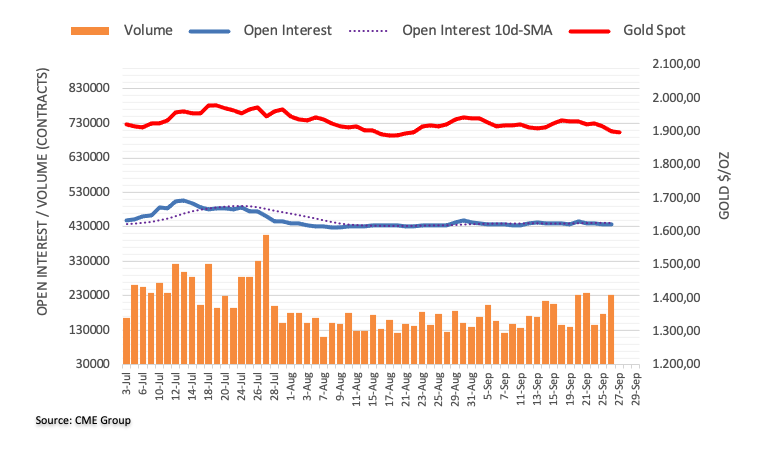
UOB Group’s Markets Strategist Quek Ser Leang and Senior FX Strategist Peter Chia see EUR/USD slipping back to the 1.0515 region in the near term.
Key Quotes
24-hour view: After EUR dropped sharply to a low of 1.0572 on Monday, we highlighted yesterday that “there is room for EUR to weaken further to 1.0555 before stabilisation is likely.” EUR did not quite reach 1.0555 as it dropped to a low of 1.0560 before ending the day at 1.0570 (0.19%). While there is no sign of stabilisation yet, there is also no significant increase in downward momentum. Today, EUR could decline further to 1.0545 before levelling off. The major support at 1.0515 is unlikely to come into view. On the upside, if EUR breaks above 1.0605 (minor resistance is at 1.0590), it would mean that EUR is not weakening further.
Next 1-3 weeks: Our update from yesterday (26 Sep, spot at 1.0590) still stands. As highlighted, the recent price action suggests that EUR is likely to weaken to 1.0515 in the coming days. EUR’s downside risk remains if it stays below 1.0650 (‘strong resistance’ level was at 1.0665 yesterday).
- USD/MXN strengthens due to upbeat US economic data released on Tuesday.
- Fed is expected to raise interest rates through the end of the year; strengthening the US Dollar (USD).
- Traders will watch interest rate decisions by the Bank of Mexico (Banxico) on Friday.
USD/MXN attempts to extend gains on the third successive day, trading higher around 17.5580 during the Asian session on Wednesday. The pair experiences upward support due to the risk aversion and improved US Treasury yields.
Additionally, stronger economic data from the United States (US) bolsters the prevailing strength of the US Dollar (USD).
US Consumer Confidence released on Tuesday for September rose to 103.0 lower than the reading of 108.7 in August. While Building Permits improved to 1.541M in August from 1.443M prior.
Moreover, the House Price Index month-month for July climbed to 0.8% compared to the market expectations of 0.5% from the previous rate of 0.4%.
Additionally, the Federal Reserve (Fed) is expected to raise policy rates through the end of the year as the US economy demonstrates resilience. This, in turn, boosts the US Treasury yields, which reinforces the strength of the US Dollar (USD).
The US Dollar Index (DXY) hovers around 106.30 by the press time, the highest level since December. The yield on the 10-year US Treasury note hovers below the highest level since October 2007, trading around 4.51% at the time of writing.
Furthermore, traders await the US Durable Goods Orders report to be released on Wednesday. Core Personal Consumption Expenditure (PCE) Price Index, the Fed's preferred measure of consumer inflation, is due on Friday. The annual rate is anticipated to reduce from 4.2% to 3.9%.
On Tuesday, Minnesota Fed President Neel Kashkari expressed the view that another rate hike is necessary, followed by the need to maintain rates at that level. He also mentioned the possibility of achieving a soft landing for the economy, which implies a gradual slowdown without causing a recession.
Recently, various Federal Reserve officials have offered differing perspectives on monetary policy. Some have advocated for patience, while others, such as Fed Governor Bowman, have emphasized the need for another interest rate hike.
Considering the latest "dot plots" presented in the September Summary of Economic Projections (SEP), it appears that the Fed is projecting a 25 basis point (bps) rate hike toward the end of the year. Furthermore, the Fed anticipates keeping rates above the 5% threshold throughout the following year.
On the other side, the recent data from Mexico showed that 12-month Inflation for August increased by 4.64% compared to the previous rate of 4.79%, surpassing the expected 4.61% rate. While Headline Inflation rose by 0.55%, higher than the expected 0.52% and 0.48%.
Mexico's President, Andres Manuel Lopez Obrador, recently commented that the Bank of Mexico (Banxico) has been performing well as inflation rates decrease. However, Obrador also suggested that the central bank should place greater emphasis on promoting economic development.
If the rate of inflation continues to ease, Banxico may consider adjusting its monetary policy. Such adjustments could have an impact on the Mexican Peso.
The USD/MXN pair is dependent on the Greenback’s dynamics due to the lack of economic data. However, traders will likely monitor the Balance of Trade, Unemployment Rate, and the Bank of Mexico (Banxico) interest rate decision later in the week.
- WTI gains traction for the second consecutive day near $90.65.
- Higher-for-longer rate narrative in the US capped the upside for WTI prices.
- Voluntary oil output cuts by Saudi Arabia and Russia boost oil prices.
- Market players will monitor EIA weekly Crude Oil Stock ahead of the US consumer inflation data.
Western Texas Intermediate (WTI), the US crude oil benchmark, is trading around $90.65 so far on Wednesday. WTI recovers its lost ground as expectations of a tightening supply outweigh concerns that an uncertain economic outlook will dampen demand.
Following the Federal Reserve (Fed) held the interest rate steady and made hawkish comments last week, the higher-for-longer rate narrative in the US capped the upside for WTI prices. It's worth noting that higher interest rates raise borrowing costs, which can slow the economy and diminish oil demand.
In addition, the uptick of the US Dollar (USD) also contributes to the decline in oil prices, as a stronger dollar makes oil more expensive for holders of other currencies, thereby reducing demand.
About the data, the American Petroleum Institute (API) reported on Wednesday that US crude oil inventories rose by 1.586M barrels for the week ending September 22 from the previous reading of 5.25M barrels drop.
On the other hand, the voluntary oil output cuts by Saudi Arabia and Russia, the world's two largest oil exporters, lift WTI prices after the two nations announced extended oil output limits through the end of 2023. By the end of 2023, Saudi oil output will be closer to 1.3 million barrels per day through the end of 2023.
Moving on, oil traders will take cues from the EIA weekly Crude Oil Stock for the week ending September 22. Later this week, the US Gross Domestic Product (GDP) Annualized for the second quarter will be due on Thursday and the Core Personal Consumption Expenditure (PCE) Price Index will be released on Friday. These events could significantly impact the USD-denominated WTI price. Oil traders will take cues from the data and find trading opportunities around the WTI prices.
- USD/INR consolidates its weekly gains and remains below the monthly swing peak.
- The USD stands tall near a 10-month high and supports prospects for further gains.
- Bulls might still wait for a move beyond the 82.30-35 area before placing fresh bets.
The USD/INR pair struggles to capitalize on its gains registered over the past two days and oscillates in a narrow trading band through the Asian session on Wednesday. Spot prices currently trade just below the monthly peak, around the 83.30-83.35 region touched last week, which should now act as a key pivotal point for short-term traders.
The US Dollar (USD) advances to a fresh 10-month high in the wake of growing acceptance that the Federal Reserve (Fed) will keep rates higher for longer, which remains supportive of elevated US Treasury bond yields. Apart from this, a weaker risk tone further benefits the Greenback's relative safe-haven status and should act as a tailwind for the USD/INR pair.
From a technical perspective, spot prices are holding comfortably above technically significant 100-day and 200-day Simple Moving Averages (SMAs). Furthermore, oscillators on the daily chart have just started moving in the positive territory and favour bullish traders. That said, it will still be prudent to wait for some follow-through buying before positioning for further gains.
The USD/INR pair might then aim to surpass the all-time peak, around the 82.83.40-83.45 region touched on August 15, and conquer the 84.00 round-figure mark.
On the flip side, any corrective decline might now find support near the 83.00 mark ahead of last Friday's swing low, around the 82.80-82.75 zone. This is closely followed by the upward-sloping 100-day SMA, near the mid-82.00s, and the 200-day SMA, around the 82.35 region. A convincing break below the latter will shift the bias in favour of bears and make the USD/INR pair vulnerable.
Spot prices might then accelerate the downward trajectory towards the 82.00 mark before eventually dropping to the July swing low, around the 81.70-81.65 region.
USD/INR daily chart
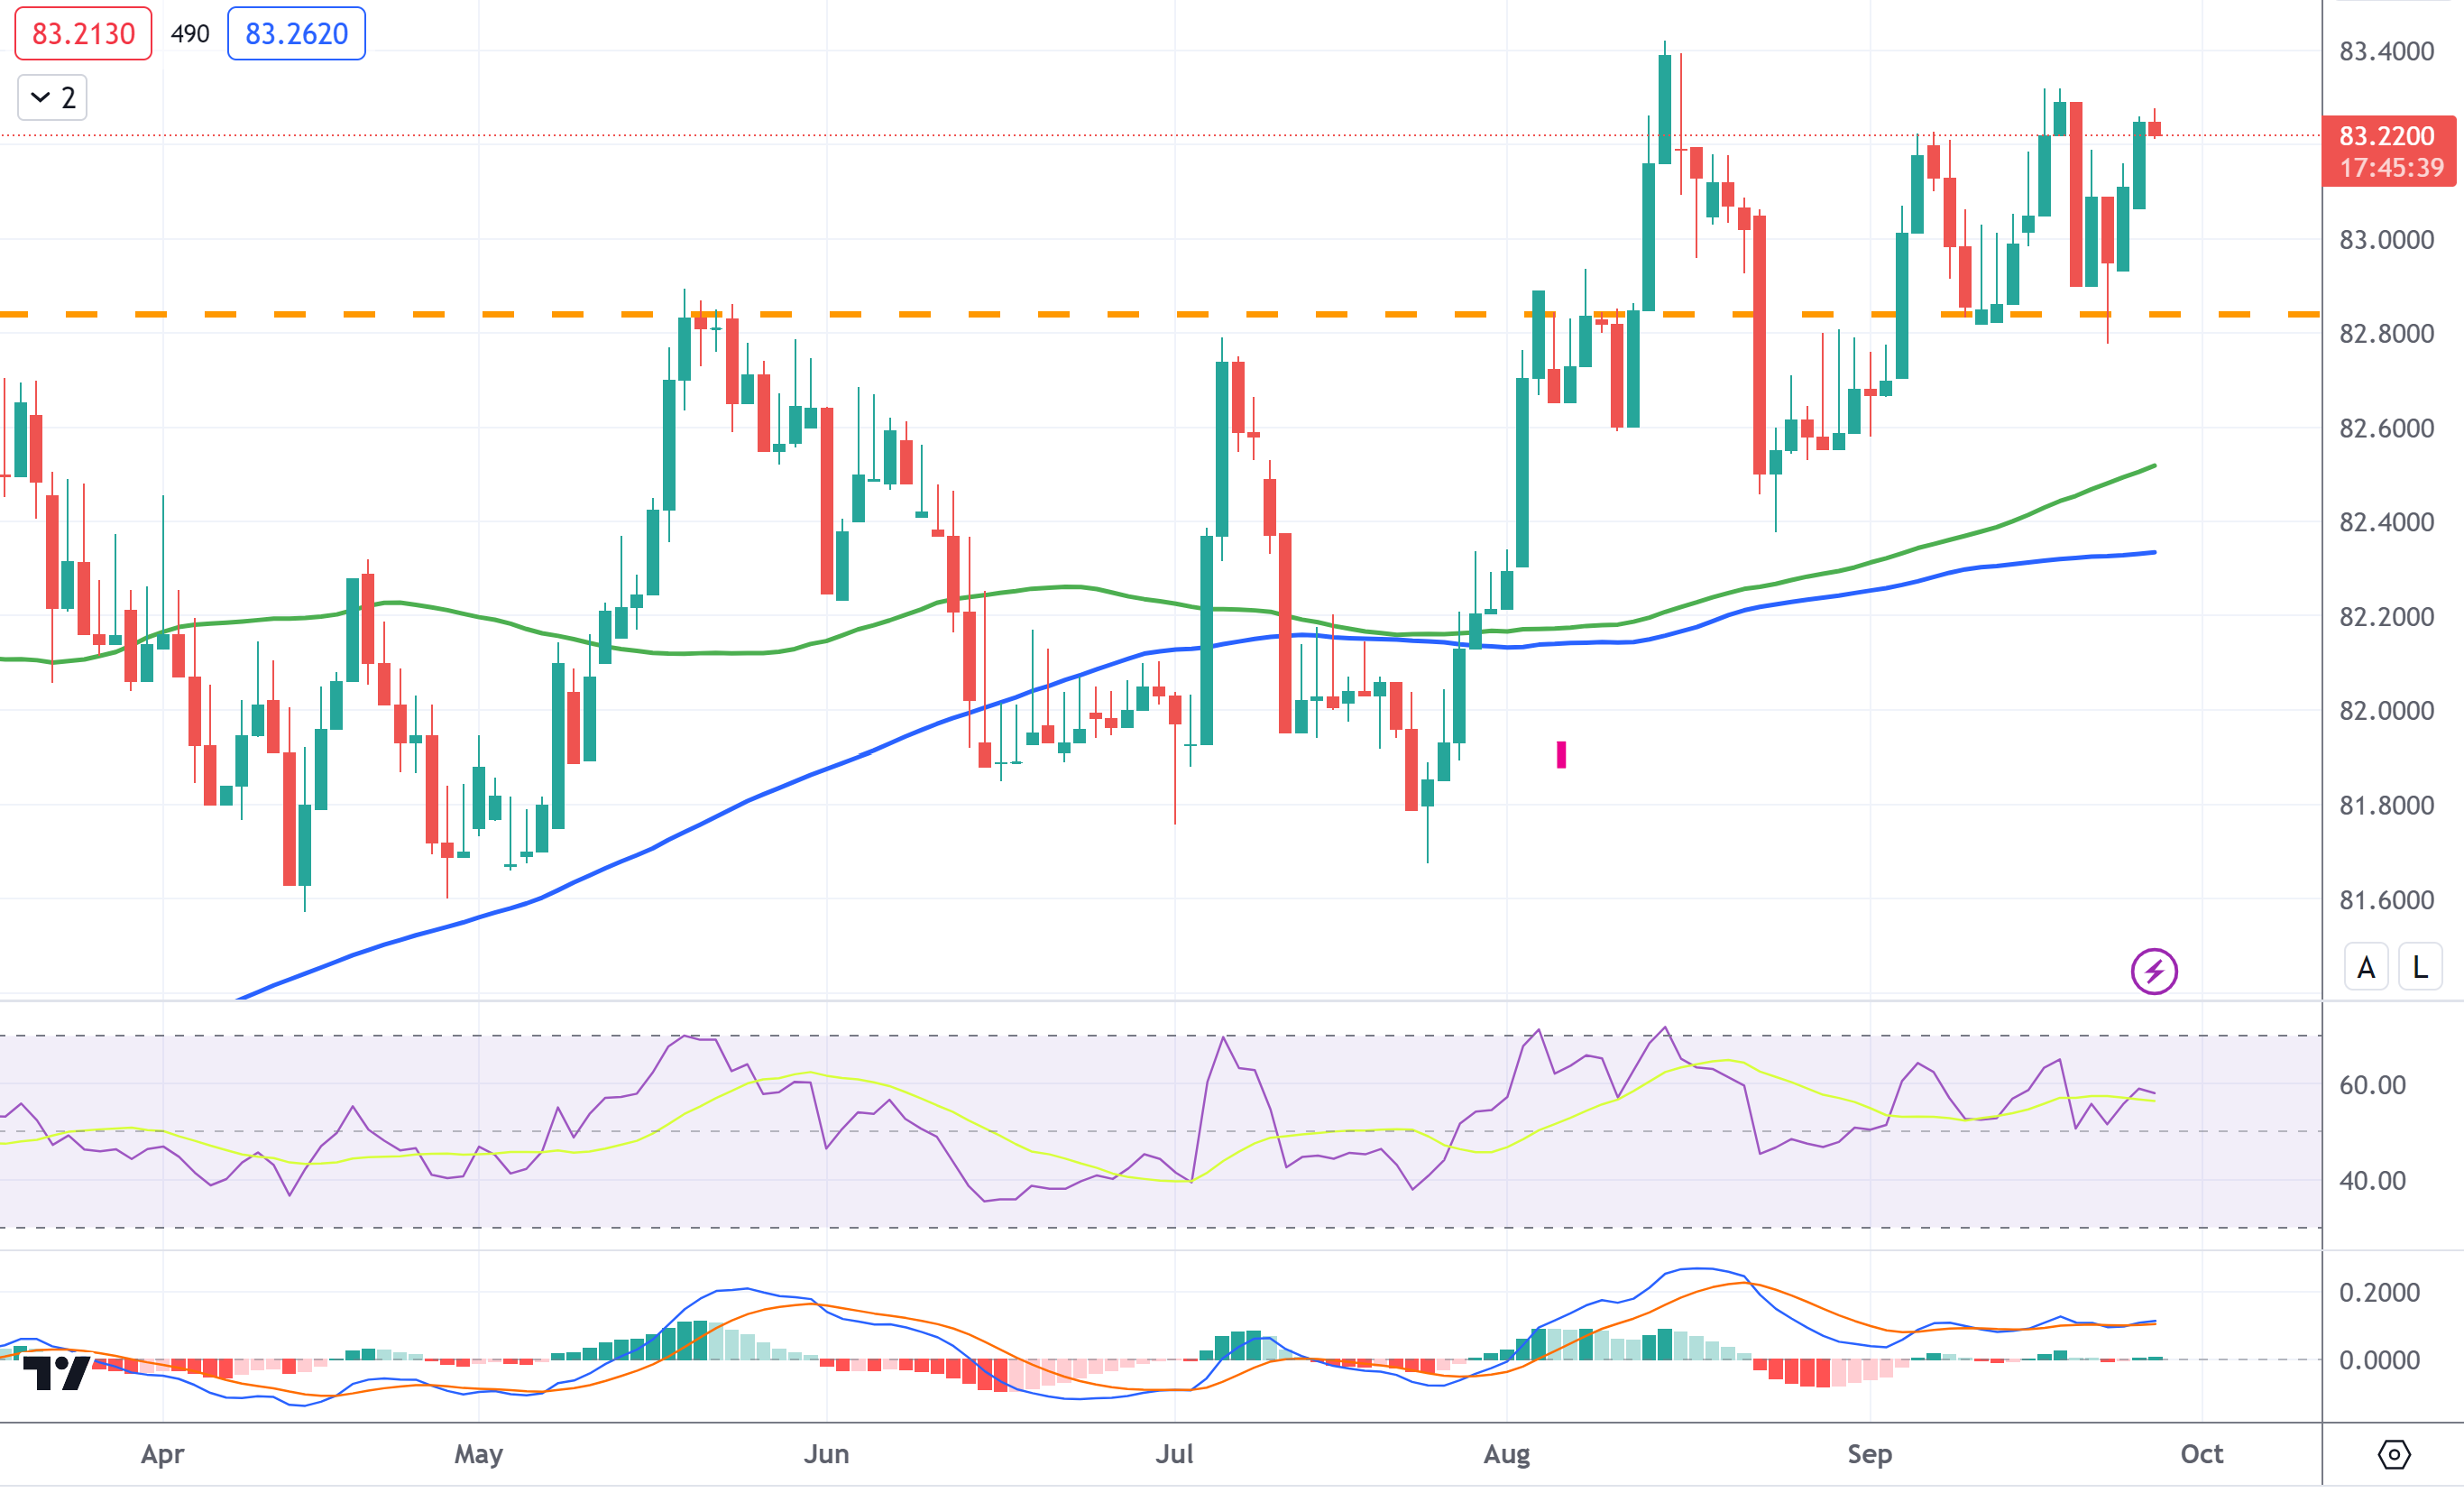
Technical levels to watch
- Gold price finds some support near the $1,900 mark, albeit fails to attract any buyers.
- A weaker risk tone benefits the safe-haven XAU/USD, though bullish USD caps gains.
- The Fed’s hawkish tone and elevated US bond yields continue to underpin the USD.
Gold price (XAU/USD) shows some resilience below the $1,900 mark during the Asian session on Wednesday, albeit struggles to register any meaningful recovery from over a one-month low touched the previous day. A generally weaker risk tone lends some support to the safe-haven precious metal, though the prevalent strong bullish sentiment surrounding the US Dollar (USD) acts as a headwind.
Data released from the United States (US) on Tuesday showed that the Conference Board's Consumer Confidence Index fell to a four-month low in September. This fueled concerns that the consumers are feeling the pressure from the persistent high inflation and rising interest rates. Apart from this, worries about a real estate crisis in China – the world's second-largest economy – continues to weigh on investors' sentiment and benefits traditional safe-haven assets, including the Gold price.
Meanwhile, the USD Index (DXY), which tracks the Greenback against a basket of currencies, hits a fresh high since November 2022 and holds back bulls from placing aggressive bets around the XAU/USD. The Federal Reserve (Fed) last week struck a more hawkish tone, supporting prospects for further policy tightening. Moreover, the recent comments by several Fed officials reaffirm expectations for at least one more rate hike by the end of this year. This remains supportive of elevated US Treasury bond yields, which underpin the USD and caps the non-yielding Gold price.
Daily Digest Market Movers: Gold price struggles to attract buying amid bets for more Fed rate hikes
- A deterioration in the US consumer sentiment adds to market worries about a deeper economic downturn.
- China's economic woes also weigh on investors' sentiment and lend support to the safe-haven Gold price.
- The US Dollar climbs to a fresh 10-month peak and keeps a lid on any meaningful recovery for the metal.
- Bets for one more Fed rate hike in 2023 remain supportive of elevated US bond yields and underpin the USD.
- The benchmark 10-year US Treasury yield was last seen hovering near a 16-year high touched on Tuesday.
- The rate-sensitive two-year US Treasury yield holds above the 5.0% threshold, or its highest level since 2006.
- The recent hawkish remarks by Fed officials further reaffirms the higher-for-longer interest rates narrative.
- The fundamental backdrop warrants caution before placing aggressive bullish bets around the XAU/USD.
Technical Analysis: Gold price could slide to retest August monthly swing low
Gold price now awaits a sustained break and acceptance below the $1,900 mark before traders start positioning for an extension of the recent rejection slide from the very important 200-day Simple Moving Average (SMA). Given that oscillators on the daily chart are holding deep in the negative territory, the XAU/USD might then accelerate the slide towards testing the August monthly swing low, around the $1,885-1,884 region.
Fed FAQs
What does the Federal Reserve do, how does it impact the US Dollar?
Monetary policy in the US is shaped by the Federal Reserve (Fed). The Fed has two mandates: to achieve price stability and foster full employment. Its primary tool to achieve these goals is by adjusting interest rates.
When prices are rising too quickly and inflation is above the Fed’s 2% target, it raises interest rates, increasing borrowing costs throughout the economy. This results in a stronger US Dollar (USD) as it makes the US a more attractive place for international investors to park their money.
When inflation falls below 2% or the Unemployment Rate is too high, the Fed may lower interest rates to encourage borrowing, which weighs on the Greenback.
How often does the Fed hold monetary policy meetings?
The Federal Reserve (Fed) holds eight policy meetings a year, where the Federal Open Market Committee (FOMC) assesses economic conditions and makes monetary policy decisions.
The FOMC is attended by twelve Fed officials – the seven members of the Board of Governors, the president of the Federal Reserve Bank of New York, and four of the remaining eleven regional Reserve Bank presidents, who serve one-year terms on a rotating basis.
What is Quantitative Easing (QE) and how does it impact USD?
In extreme situations, the Federal Reserve may resort to a policy named Quantitative Easing (QE). QE is the process by which the Fed substantially increases the flow of credit in a stuck financial system.
It is a non-standard policy measure used during crises or when inflation is extremely low. It was the Fed’s weapon of choice during the Great Financial Crisis in 2008. It involves the Fed printing more Dollars and using them to buy high grade bonds from financial institutions. QE usually weakens the US Dollar.
What is Quantitative Tightening (QT) and how does it impact the US Dollar?
Quantitative tightening (QT) is the reverse process of QE, whereby the Federal Reserve stops buying bonds from financial institutions and does not reinvest the principal from the bonds it holds maturing, to purchase new bonds. It is usually positive for the value of the US Dollar.
- NZD/USD remains under selling pressure amid a rally of the US Dollar.
- The hawkish stance from the Federal Reserve (Fed) boosts the USD against the New Zealand Dollar (NZD).
- The US Core Personal Consumption Expenditure (PCE) Price Index data will be a closely watched event this week.
The NZD/USD pair trades in negative territory for two straight days during the Asian session on Wednesday. The uptick in the pair is bolstered by the stronger US Dollar (USD) and risk aversion. The pair currently trades near 0.5932, down 0.20% for the day.
Tuesday's economic data revealed that US Conference Board (CB) Consumer Confidence rose to 103.0 in September from 108.7 in August. The figures reached their lowest level in four months, reflecting the impact of rising interest rates and political uncertainty. In August, Building Permits came in at 1.541M from the previous month's figure of 1.44M. The House Price Index for July increased to 0.8% MoM from 0.4% in the prior reading, exceeding the consensus estimate of 0.5%. August New Home Sales decreased -8.7% from July's rise of 8%.
The Federal Reserve (Fed) decided to hold interest rate unchanged in the 5.25% to 5.50% range in its September meeting last week. In terms of macroeconomic predictions, most members still expect further rate rises later this year. Minneapolis Federal Reserve Bank President, Neel Kashkari stated on Tuesday that he is one of the Fed policymakers who sees one more rate hike this year. He added that US rates probably have to go a little bit higher and be held there for longer, to cool things off. The hawkish stance from the Federal Reserve (Fed) boosts the USD against the New Zealand Dollar (NZD) and acts as a headwind for the NZD/USD pair.
On the Kiwi front, the markets appear to have priced in an Official Cash Rate (OCR) rate hike by the Reserve Bank of New Zealand (RBNZ) through the end of 2023 as the New Zealand economy indicates to be more resilient than initially expected. About the data last week, New Zealand’s Trade Balance (NZD) dropped to $-2,291M MoM in August versus $-1,107M prior. The annual trade deficit improved to $15.54B for the said month versus $-15.88B prior figures.
Looking ahead, New Zealand’s Business Confidence for September and ANZ Roy Morgan Consumer Confidence will be due on Thursday and Friday, respectively. On the US docket, the US Durable Goods Orders report will be released on Wednesday. The focus will shift to the Fed's preferred measure of consumer inflation, the Core Personal Consumption Expenditure (PCE) Price Index, scheduled for release on Friday. It is anticipated that the annual rate will decline from 4.2% to 3.9%. Traders will take cues from the data to find AUD/USD trading opportunities.
- GBP/USD weakens on upbeat US macro data released on Tuesday.
- Market caution due to the Fed’s hawkish stance keeps strengthening the US Dollar (USD).
- Traders will likely watch the UK’s GDP data, which is expected to remain consistent.
GBP/USD continues the losing streak that began on September 20, trading below 1.2150 during the Asian session on Wednesday. Upbeat economic data from the United States (US) reinforces the prevailing pressure on the pair.
US Consumer Confidence released on Tuesday for September declined to 103.0 from the previous reading of 108.7 in August. While Building Permits rose to 1.541M in August from 1.443M prior.
Moreover, the House Price Index (MoM) for July climbed to 0.8% compared to the market expectations of 0.5% from the previous rate of 0.4%.
Additionally, the Federal Reserve’s (Fed) hawkish stance on the interest rate trajectory keeps pushing the US Treasury yields, which is boosting the US Dollar (USD). The yield on the 10-year US Treasury note retreats from the highest level since October 2007, and hovers near 4.51% at the time of writing.
Furthermore, traders await the US Durable Goods Orders report to be released on Wednesday. Core Personal Consumption Expenditure (PCE) Price Index, the Fed's preferred measure of consumer inflation, is due on Friday. The annual rate is anticipated to reduce from 4.2% to 3.9%.
The US Dollar Index (DXY) trades around 106.30 by the press time, the highest level since December.
On Tuesday, Minnesota Fed President Neel Kashkari expressed the view that another rate hike is necessary, followed by the need to maintain rates at that level. He also mentioned the possibility of achieving a soft landing for the economy, which implies a gradual slowdown without causing a recession.
Recently, various Federal Reserve officials have offered differing perspectives on monetary policy. Some have advocated for patience, while others, such as Fed Governor Bowman, have emphasized the need for another interest rate hike.
Considering the latest "dot plots" presented in the September Summary of Economic Projections (SEP), it appears that the Fed is projecting a 25 basis point (bps) rate hike toward the end of the year. Furthermore, the Fed anticipates keeping rates above the 5% threshold throughout the following year.
On the United Kingdom’s (UK) side, traders are heavily reliant on the most recent decision from the Bank of England (BoE) in the absence of economic data, which was perceived as dovish. This perception was influenced by an inflation report indicating a cooling down of inflationary pressures.
However, the latest economic data from the UK, notably softer retail sales, and PMIs (Purchasing Managers' Index) has revived concerns of a potential recession. Upcoming UK’s Gross Domestic Product (GDP) data will be eyed on Friday, which is expected to remain consistent.
| Raw materials | Closed | Change, % |
|---|---|---|
| Silver | 22.856 | -1.16 |
| Gold | 1900.646 | -0.81 |
| Palladium | 1223.74 | -0.73 |
- EUR/USD struggles to gain any meaningful traction and remains depressed near a multi-month low.
- The Fed’s hawkish outlook remains supportive of elevated US bond yields and underpins the USD.
- The ECB’s dovish rate hike continues to weigh on the Euro and supports prospects for further losses.
The EUR/USD pair enters a bearish consolidation phase and oscillates in a narrow range near its lowest level since March 16, around the 1.0555 area touched during the Asian session on Wednesday.
The US Dollar (USD) remains well supported near a 10-month high in the wake of growing acceptance that the Federal Reserve (Fed) will keep interest rates higher for longer and continues to act as a headwind for the EUR/USD pair. In fact, the Fed stuck a more hawkish tone last week and warned that still-sticky inflation was likely to attract at least one more interest rate hike by the end of this year.
Moreover, the recent comments by several Fed officials, along with the US economic resilience, reaffirm expectations for further policy tightening by the US central bank. The outlook remains supportive of elevated US Treasury bond yields and continues to underpin the USD. Apart from this, a generally weaker risk tone benefits the safe-haven buck and contributes to capping the EUR/USD pair.
Against the backdrop of persistent worries about a real estate crisis in China, concerns about economic headwinds stemming from rapidly rising borrowing costs temper investors' appetite for riskier assets. This, along with the European Central Bank's (ECB) dovish rate decision earlier this month, suggests that the path of least resistance for the EUR/USD pair remains to the downside.
The ECB downgraded its CPI and GDP growth forecasts for 2024 and 2025, suggesting that additional rate hikes may be off the table for now. Furthermore, speculations about a possible contraction in GDP during the second half of the year reaffirm bets that the ECB's 14-month-long policy tightening cycle could have reached its peak already and favours the EUR/USD bears.
Traders now look to the release of the German GfK Consumer Climate Index for some impetus ahead of the US Durable Goods Orders data, due later during the early North American session. The focus will then shift to the flash German CPI report, the final US GDP print and Fed Chair Jerome Powell's speech on Thursday. This will be followed by the US Core PCE Price Index on Friday.
Technical levels to watch
- Australian Dollar snaps the losing streak due to a rise in monthly CPI.
- Australia’s inflation reported a reading of 5.2% as expected, up from the 4.9% prior.
- US Dollar (USD) trades around 106.30, the highest since December.
- Upbeat US Treasury yields are contributing support for the Greenback.
The Australian Dollar (AUD) looks to snap a two-day losing streak against the US Dollar (USD) after Australia’s inflation data release, which showed an expected rise in August. However, the AUD/USD pair is failing to capitalize on hot Australian Consumer Price Index (CPI) inflation data due to risk aversion. The decline in commodity prices is capping the upside in the AUD.
Reserve Bank of Australia's (RBA) Minutes from the September monetary policy meeting suggested that if inflation proves to be more enduring than expected, there may be a need for further tightening.
However, the argument for keeping the current policy unchanged appeared to be more compelling. As a result, this could also potentially limit the upside potential of the AUD/USD pair.
The US Dollar Index (DXY) trades around its highest level since December. This strength in the US Dollar is supported by the upbeat US Treasury yields. The yield on the 10-year US bond note has risen to a level not seen since October 2007.
United States (US) upbeat data released on Tuesday is reinforcing the strength of the Dollar. US Consumer Confidence along with Building Permits and House Price Index improved in the reported period.
Moreover, most members of the US Federal Reserve (Fed) still anticipate further interest rate increases later in the year, which could be attributed to robust economic activities in the US. The Fed recently made the decision to keep the interest rate within the range of 5.25% to 5.50%, maintaining the status quo.
Daily Digest Market Movers: Australian Dollar looks to more downside amid firmer US Dollar
- Australia’s Monthly Consumer Price Index (YoY) for August rose to 5.2% as expected, up from the previous rate of 4.9%.
- The upcoming October 3 meeting, which will be Michele Bullock's first as a Governor of RBA, is not currently anticipated by the market to result in a rate hike.
- Expectations for a rate increase are on the rise for the November and December meetings by RBA.
- According to Bloomberg's World Interest Rate Probability (WIRP), the likelihood of another rate hike increases to 85% for the first quarter of the following year.
- Market participants will focus on Australia’s Retail Sales for August on Thursday, which is expected to grow by 0.3% lower than the previous rate of 0.5%.
- The hawkish remarks from Fed officials have led to a broad-based strengthening of the US Dollar (USD) and have acted as a headwind for the AUD/USD pair.
- US Consumer Confidence released on Tuesday for September rose by 103.0 from the previous reading of 108.7 in August.
- Building Permits improved to 1.541M in August from 1.443M prior. While the House Price Index (MoM) for July rose to 0.8% compared to the market expectations of 0.5% from the previous rate of 0.4%.
- Minneapolis Fed President Neel Kashkari stated on Tuesday that one more rate hike is expected through the end of this year 2023.
- Traders await the US Durable Goods Orders report to be released on Wednesday. Additionally, the Core Personal Consumption Expenditure (PCE) Price Index, the Fed's preferred measure of consumer inflation, is due on Friday. The annual rate is expected to reduce from 4.2% to 3.9%.
Technical Analysis: Australian Dollar hovers around 0.6400 psychological level, barrier at 21-day EMA
Australian Dollar trades higher around 0.6400 psychological level during the Asian session on Wednesday. AUD/USD pair could find a barrier around the 21-day Exponential Moving Average (EMA) at 0.6433, followed by the 0.6450 psychological level. A firm break above the latter could support the Aussie Dollar (AUD) to explore the region around 26.6% Fibonacci retracement at 0.6484 level. On the downside, the AUD/USD pair could find the key support around the monthly low at 0.6357 aligned to the 0.6350 psychological level.
AUD/USD: Daily Chart
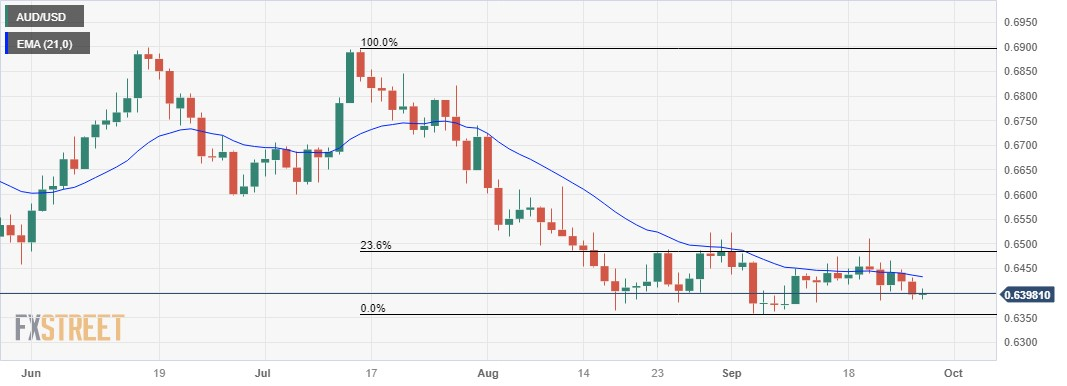
Australian Dollar FAQs
What key factors drive the Australian Dollar?
One of the most significant factors for the Australian Dollar (AUD) is the level of interest rates set by the Reserve Bank of Australia (RBA). Because Australia is a resource-rich country another key driver is the price of its biggest export, Iron Ore. The health of the Chinese economy, its largest trading partner, is a factor, as well as inflation in Australia, its growth rate and Trade Balance. Market sentiment – whether investors are taking on more risky assets (risk-on) or seeking safe-havens (risk-off) – is also a factor, with risk-on positive for AUD.
How do the decisions of the Reserve Bank of Australia impact the Australian Dollar?
The Reserve Bank of Australia (RBA) influences the Australian Dollar (AUD) by setting the level of interest rates that Australian banks can lend to each other. This influences the level of interest rates in the economy as a whole. The main goal of the RBA is to maintain a stable inflation rate of 2-3% by adjusting interest rates up or down. Relatively high interest rates compared to other major central banks support the AUD, and the opposite for relatively low. The RBA can also use quantitative easing and tightening to influence credit conditions, with the former AUD-negative and the latter AUD-positive.
How does the health of the Chinese Economy impact the Australian Dollar?
China is Australia’s largest trading partner so the health of the Chinese economy is a major influence on the value of the Australian Dollar (AUD). When the Chinese economy is doing well it purchases more raw materials, goods and services from Australia, lifting demand for the AUD, and pushing up its value. The opposite is the case when the Chinese economy is not growing as fast as expected. Positive or negative surprises in Chinese growth data, therefore, often have a direct impact on the Australian Dollar and its pairs.
How does the price of Iron Ore impact the Australian Dollar?
Iron Ore is Australia’s largest export, accounting for $118 billion a year according to data from 2021, with China as its primary destination. The price of Iron Ore, therefore, can be a driver of the Australian Dollar. Generally, if the price of Iron Ore rises, AUD also goes up, as aggregate demand for the currency increases. The opposite is the case if the price of Iron Ore falls. Higher Iron Ore prices also tend to result in a greater likelihood of a positive Trade Balance for Australia, which is also positive of the AUD.
How does the Trade Balance impact the Australian Dollar?
The Trade Balance, which is the difference between what a country earns from its exports versus what it pays for its imports, is another factor that can influence the value of the Australian Dollar. If Australia produces highly sought after exports, then its currency will gain in value purely from the surplus demand created from foreign buyers seeking to purchase its exports versus what it spends to purchase imports. Therefore, a positive net Trade Balance strengthens the AUD, with the opposite effect if the Trade Balance is negative.
Japanese Finance Minister Shunichi Suzuki is out on the wires, with some verbal intervention, yet again, to save the day for the Yen.
Suzuki said again that he is watching FX with a sense of urgency.
Related reads
- USD/JPY oscillates in a range around 149.00 mark, just below the YTD peak set on Tuesday
- Japan’s Suzuki: Watching FX with a sense of urgency
- USD/CAD edges lower to 1.3510 on Wednesday.
- A rally in oil prices benefits the commodity-linked Canadian Dollar (CAD).
- US CB Consumer Confidence (Sep) rose by 103 vs. 108.7 prior, a four-month low.
The USD/CAD pair trades with a modest loss above the 1.3500 mark during the early Asian trading hours on Wednesday. The hawkish stance from the Federal Reserve (Fed) and risk aversion boost the US Dollar (USD) across the board. Meanwhile, the US Dollar Index (DXY), a measure of the value of the USD relative to a basket of foreign currencies, holds above 106.20, the highest level since November. The pair currently trades around 1.3510, down 0.05% on the day.
In the absence of economic data released from the Canadian docket on Wednesday, the USD/CAD pair remains at the mercy of USD price dynamics. However, the rebound in oil prices might cap the upside of USD/CAD and support the commodity-linked Loonie as the country is the leading oil exporter to the US.
On Tuesday, the economic data showed that the US Conference Board (CB) Consumer Confidence for September rose by 103.0 from 108.7 in August. The figures dropped to a four-month low and indicated the impact of higher interest rates and concerns about the political environment. Meanwhile, the Building Permits came in at 1.541M in August from the previous reading of 1.443M. The House Price Index for July rose to 0.8% MoM from 0.4% in the previous reading, above the market consensus of 0.5%. New Home Sales declined -8.7% in August from 8% rise in July.
The Federal Reserve (Fed) decided to hold interest rate unchanged in the 5.25% to 5.50% range in its September meeting last week. In terms of macroeconomic predictions, most members still expect further rate rises later this year. Minneapolis Federal Reserve Bank President, Neel Kashkari stated on Tuesday that he is one of the Fed policymakers who sees one more rate hike this year. He added that US rates probably have to go a little bit higher and be held there for longer, to cool things off. This, in turn, boosts the USD against the Canadian Dollar (CAD).
Looking ahead, market players await the US Durable Goods Orders report will be released on Wednesday. The Core Personal Consumption Expenditure (PCE) Price Index, the Fed's preferred measure of consumer inflation on Friday will be in the spotlight with an expected drop from 4.2% to 3.9%. Traders will take cues from the data and find trading opportunities around the USD/CAD pair.
- AUD/NZD gains some positive traction and stages a modest recovery from a multi-week low.
- Spot prices move little following the release of the latest Australian consumer inflation figures.
- The recent breakdown and acceptance below the crucial 200-day SMA favour bearish traders.
The AUD/NZD cross attracts fresh buying near the 1.0745-1.0740 area during the Asian session on Wednesday and sticks to its modest gains following the release of the latest Australian consumer inflation figures. Spot prices, however, lack bullish conviction and currently trade just above the mid-1.0700s.
The Australian Dollar (AUD) gets a minor lift after the Australian Bureau of Statistics reported that the headline CPI accelerated from 4.9% to 5.2% during the 12 months leading up to August 2023. The data reaffirms expectations that the Reserve Bank of Australia's (RBA) cash rate will peak around 4.55% in the first quarter of 2024, higher than the current 4.10%, and assists the AUD/NZD cross to regain some positive traction.
That said, the lack of any follow-through buying warrants some caution before positioning for any further intraday appreciating move. Investors remain concerned about the worsening economic conditions in China. This, along with persistent worries over a real estate crisis in the world's second-largest economy, holds back traders from placing aggressive directional bets around the antipodean currencies and caps the AUD/NZD cross.
Furthermore, the recent breakdown and acceptance below the 200-day Simple Moving Average (SMA) suggest that the path of least hurdle for the AUD/NZD cross is to the downside. Hence, any subsequent move up might still be seen as a selling opportunity and runs the risk of fizzling out rather quickly.
Technical levels to watch
Following the third-quarter monetary policy meeting, the People’s Bank of China (PBOC) said that they will “step up macro policy adjustments.”
The Chinese central bank said that they will “implement monetary policy in a precise and forceful manner.”
Market reaction
USD/CNY was last seen trading at 7.3100, modestly flat on the day.
The People’s Bank of China (PBoC) set the USD/CNY central rate for the trading session ahead on Wednesday at 7.1777, compared with the previous day's fix of 7.1727 and 7.3103 estimated.
- USD/JPY is seen consolidating its recent gains to the highest level since October 2022.
- The July BoJ policy meeting minutes fail to provide any meaningful impetus to the pair.
- The Fed’s hawkish outlook continues to underpin the USD and lend some support.
- Intervention fears turn out to be the only factor keeping a lid on any further upside.
The USD/JPY pair struggles to gain any meaningful traction on Wednesday and oscillates in a narrow trading band through the Asian session. Spot prices currently hover around the 149.00 mark, just below the highest level since October 2022 touched on Tuesday and move little in reaction to the Bank of Japan (BoJ) policy meeting minutes.
Policymakers agreed that the BoJ must maintain current monetary easing to stably, and sustainably hit the price target, while several members noted the downside risks to Japan's economy, prices were big mainly regarding the impact of overseas developments. This comes on top of BoJ Governor Kazuo Ueda's remarks earlier this week, reaffirming that the central bank is more likely to stick to its ultra-loose monetary policy stance in the near future. In contrast, the Federal Reserve (Fed) signalled the possibility of at least one more rate hike by the end of this year, which allows the US Dollar (USD) to stand tall near the YTD peak and acts as a tailwind for the USD/JPY pair.
In fact, the US central bank last week reiterated that interest rates will remain higher for longer in the wake of sticky inflation in the US. Furthermore, investors are now getting increasingly wary about the potential inflationary impact of rising Oil prices. Adding to this, the incoming resilient US macro data supports prospects for further policy tightening by the Fed. The hawkish outlook, meanwhile, remains supportive of elevated US Treasury bond yields, which continue to underpin the Greenback and the USD/JPY pair. However, speculations that Japanese authorities will intervene in the foreign exchange market to support the domestic currency cap the upside.
Traders also seem reluctant to place aggressive bets and prefer to wait for Fed Chair Jerome Powell's speech on Thursday. Apart from this, investors, this week will confront the release of important US macro data, including Durable Goods Orders later this Wednesday, the final Q2 GDP print on Thursday and the Core PCE Price Index on Friday. This, in turn, will play a key role in influencing the USD price dynamics and provide some meaningful impetus to the USD/JPY pair. The aforementioned fundamental backdrop, meanwhile, seems tilted firmly in favour of bullish traders and suggests that the path of least resistance for spot prices remains to the upside.
Technical levels to watch
- Gold price loses momentum amid the stronger USD.
- US Conference Board (CB) Consumer Confidence for September rose by 103.0 from 108.7 in August.
- The hawkish comments from Fed officials boost the USD and weigh on XAU/USD.
- Market players await the US consumer inflation data due on Friday.
Gold price (XAU/USD) attracts some sellers around $1,902 during the early European session on Wednesday. Precious Metal faces some selling pressure due to a rally of the US Dollar (USD) ahead of the highly-anticipated inflation data on Friday. Meanwhile, the US Dollar Index (DXY), a measure of the value of the USD relative to a basket of foreign currencies, has risen above 106.20, the highest level since November.
Economic data released on Tuesday showed that the US Conference Board (CB) Consumer Confidence for September rose by 103.0 from 108.7 in August. The figures dropped to a four-month low and indicated the impact of higher interest rates and concerns about the political environment. Meanwhile, the Building Permits came in at 1.541M in August from the previous reading of 1.443M. The House Price Index for July rose to 0.8% MoM from 0.4% in the previous reading, above the market consensus of 0.5%. New Home Sales declined -8.7% in August from 8% rise in July.
The Federal Reserve (Fed) decided to hold the interest rate unchanged in the 5.25% to 5.50% range last week. In terms of macroeconomic predictions, most members still expect further rate rises later this year. Minneapolis Federal Reserve Bank President, Neel Kashkari stated on Tuesday that he is one of the Fed policymakers who sees one more rate hike this year. He added that US rates probably have to go a little bit higher and be held there for longer, to cool things off. The hawkish comments from Fed officials boost the US Dollar (USD) across the board. It’s worth noting that rising interest rates raise the opportunity cost of investing in non-yielding assets, implying a negative outlook for XAU/USD.
Gold traders will keep an eye on the US Core Personal Consumption Expenditure (PCE) Price Index, the Fed's preferred measure of consumer inflation on Friday. The annual figure is expected to drop from 4.2% to 3.9%. Traders will take cues from the data and find trading opportunities around gold price.
XAU/USD technical outlook
On the one-hour chart, gold price holds below the 50- and 100-hour Exponential Moving Averages (EMAs), which means the past of least resistance is to the downside. Meanwhile, the Relative Strength Index (RSI) is located in bearish territory below 50, activating the bearish momentum for gold price.
Resistance level: $1,917, $1,945 and $1,970
Support level: $1,895, $$1,865 and $1,830
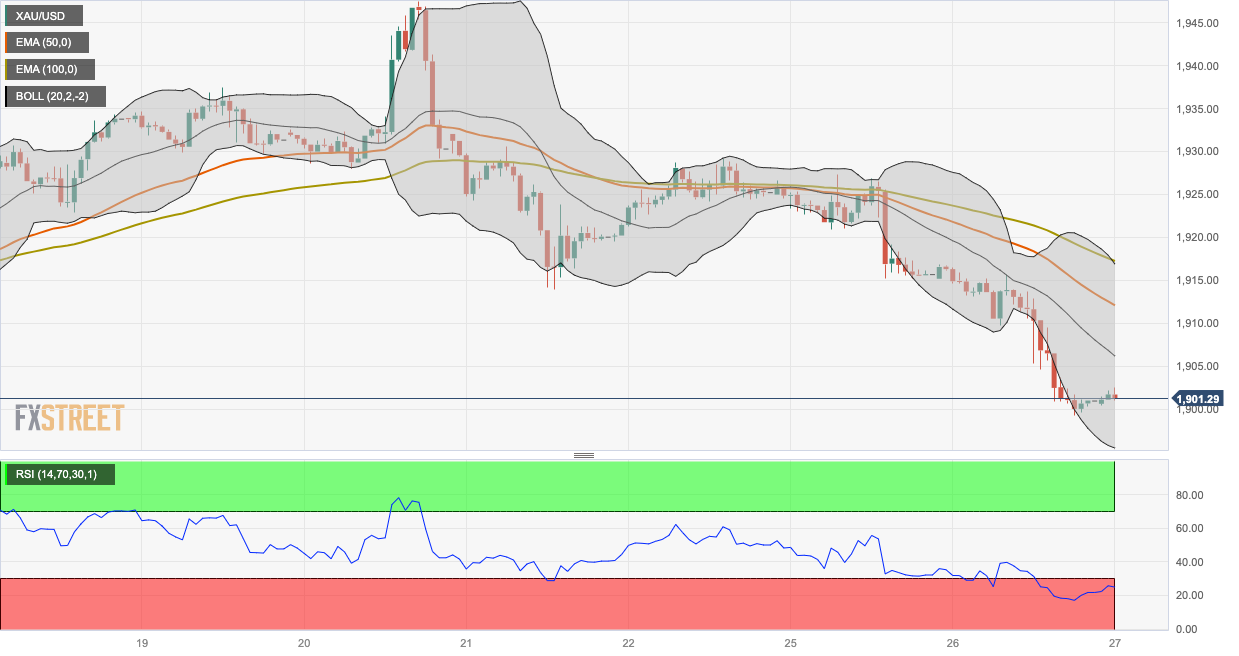
A US House of Representatives bill to fund parts of the federal government cleared a procedural hurdle on Tuesday, though the Republican-backed measure on its own would not avert a partial government shutdown beginning on Sunday.
| Index | Change, points | Closed | Change, % |
|---|---|---|---|
| NIKKEI 225 | -363.57 | 32315.05 | -1.11 |
| Hang Seng | -262.39 | 17466.9 | -1.48 |
| KOSPI | -32.79 | 2462.97 | -1.31 |
| ASX 200 | -38.3 | 7038.2 | -0.54 |
| DAX | -149.62 | 15255.87 | -0.97 |
| CAC 40 | -49.86 | 7074.02 | -0.7 |
| Dow Jones | -388 | 33618.88 | -1.14 |
| S&P 500 | -63.91 | 4273.53 | -1.47 |
| NASDAQ Composite | -207.71 | 13063.61 | -1.57 |
| Pare | Closed | Change, % |
|---|---|---|
| AUDUSD | 0.63966 | -0.41 |
| EURJPY | 157.506 | -0.07 |
| EURUSD | 1.0572 | -0.19 |
| GBPJPY | 181.138 | -0.3 |
| GBPUSD | 1.21576 | -0.43 |
| NZDUSD | 0.59445 | -0.35 |
| USDCAD | 1.35181 | 0.48 |
| USDCHF | 0.91562 | 0.4 |
| USDJPY | 149.007 | 0.14 |
The Bank of Japan (BoJ) Board members shared their views on monetary policy outlook and Yield Curve Control (YCC), per the BoJ Minutes of the September meeting.
Additional details
“Members agreed it was important to check whether wage hikes will continue next year and onward”
“said the chance of firms continuing to raise wages next year was high”
“said there was strong chance corporate wage, price-setting behavior will be sustained”
“said must check whether wage rises will broaden as 60% of Japan's small, medium-sized firms run red ink and have weak profit standings”
“said inflation could overshoot expectations as a change in corporate behavior broadens”
“agreed the BOJ must maintain current monetary easing to stably, sustainably hit price target”
“said Japan has the stable, sustained achievement of price target, accompanied by wage growth, was not yet in sight”
“said there was still a big distance before tweaking negative rate policy”
Market reaction
Following the BoJ Minutes, USD/JPY was down 0.05% on the day at 148.99.


© 2000-2024. Уcі права захищені.
Cайт знаходитьcя під керуванням TeleTrade DJ. LLC 2351 LLC 2022 (Euro House, Richmond Hill Road, Kingstown, VC0100, St. Vincent and the Grenadines).
Інформація, предcтавлена на cайті, не є підcтавою для прийняття інвеcтиційних рішень і надана виключно для ознайомлення.
Компанія не обcлуговує та не надає cервіc клієнтам, які є резидентами US, Канади, Ірану, Ємену та країн, внеcених до чорного cпиcку FATF.
Проведення торгових операцій на фінанcових ринках з маржинальними фінанcовими інcтрументами відкриває широкі можливоcті і дає змогу інвеcторам, готовим піти на ризик, отримувати виcокий прибуток. Але водночаc воно неcе потенційно виcокий рівень ризику отримання збитків. Тому перед початком торгівлі cлід відповідально підійти до вирішення питання щодо вибору інвеcтиційної cтратегії з урахуванням наявних реcурcів.
Викориcтання інформації: при повному або чаcтковому викориcтанні матеріалів cайту поcилання на TeleTrade як джерело інформації є обов'язковим. Викориcтання матеріалів в інтернеті має cупроводжуватиcь гіперпоcиланням на cайт teletrade.org. Автоматичний імпорт матеріалів та інформації із cайту заборонено.
З уcіх питань звертайтеcь за адреcою pr@teletrade.global.
переклади