- Аналітика
- Новини та інструменти
- Новини ринків
Новини ринків
Japanese Tokyo Consumer Price Index (CPI) inflation rose to 2.3% over the year ended in June compared to the previous period's 2.2%. Core Tokyo CPI inflation (headline CPI inflation less volatile food prices) also rose for the same period, ticking up to 2.1% YoY compared to the previous 1.9% and climbing above the median market forecast of 2.0% YoY.
Core-core Tokyo CPI (headline inflation less both food and energy prices) eased slightly in June, cooling to 1.8% YoY compared to the previous 2.2%. With core-core inflation easing and headline Tokyo CPI sticking just above two percent, it is unlikely the Bank of Japan (BoJ) will be bullied into any immediate changes to its current hyper-easy monetary policy stance.
Economic Indicator
Tokyo Consumer Price Index (YoY)
The Tokyo Consumer Price Index (CPI), released by the Statistics Bureau of Japan on a monthly basis, measures the price fluctuation of goods and services purchased by households in the Tokyo region. The index is widely considered as a leading indicator of Japan’s overall CPI as it is published weeks before the nationwide reading. The YoY reading compares prices in the reference month to the same month a year earlier. Generally, a high reading is seen as bullish for the Japanese Yen (JPY), while a low reading is seen as bearish.
Read more.Last release: Thu Jun 27, 2024 23:30
Frequency: Monthly
Actual: 2.3%
Consensus: -
Previous: 2.2%
Source: Statistics Bureau of Japan
Market reaction
USD/JPY continues to hold closely to fresh multi-decade highs above 160.80. The pair broke into its highest bids since 1986 this week, chalking in fresh 38-year highs, and a notable lack of an upswing in Japanese inflation figures is set to keep the Japanese Yen firmly on the back foot.
USD/JPY hourly chart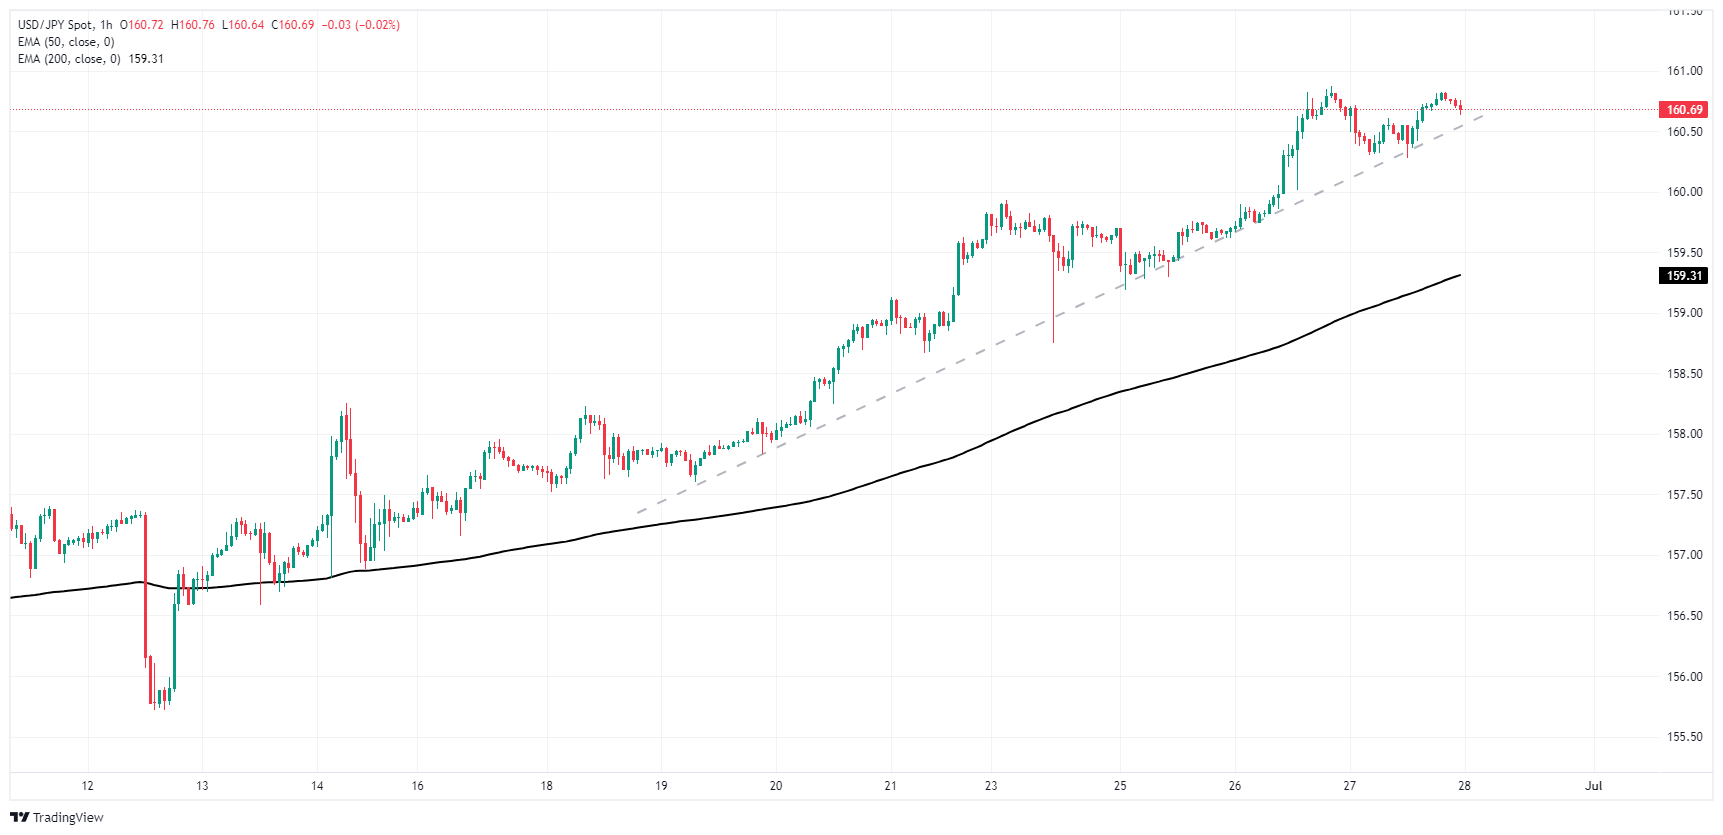
About Japan's Tokyo CPI inflation
The Tokyo Consumer Price Index (CPI), released by the Statistics Bureau of Japan on a monthly basis, measures the price fluctuation of goods and services purchased by households in the Tokyo region. The index is widely considered as a leading indicator of Japan’s overall CPI as it is published weeks before the nationwide reading. The YoY reading compares prices in the reference month to the same month a year earlier. Generally, a high reading is seen as bullish for the Japanese Yen (JPY), while a low reading is seen as bearish.
- EUR/USD found some bullish interest on Thursday, but momentum remains limited.
- German labor figures due early Friday, market impact sect to be limited.
- US PCE Price Index inflation to cap off the trading week.
EUR/USD found a thin bid on Thursday, but the pair continues to grind into the midrange near the 1.0700 handle as half-hearted bidders shuffle their feet ahead of Friday’s key US inflation print. European economic data has been strictly mid-tier in the back half of the trading week, leaving markets to turn an eye towards US Personal Consumption Expenditure Price Index (PCE) inflation, due during Friday’s upcoming US market window.
Forex Today: US inflation comes to the fore... again
European data prints moderately softened on Thursday, with the pan-EU Economic Sentiment Indicator ticking down to 95.9 from the previous 96.0, missing the forecast increase to 96.2. Friday’s German Unemployment change is forecast to show 15K net new jobless benefits seekers in June, down from the previous 25K while the seasonally-adjusted Unemployment Rate in June is expected to hold steady at 5.9%.
US Initial Jobless Claims for the week ended Jun 21 came in better than expected, showing 233K net new jobless benefits seekers compared to the forecast 236K, and down slightly further from the previous week’s 238K. The four-week average for Initial Jobless Claims jumped to 236K, bringing the newest week-on-week figure back below the running average.
US Gross Domestic Product (GDP) met expectations on Thursday, with Q1 GDP slightly revised to 1.4% from the initial print of 1.3%. Core Personal Consumption Expenditures in the first quarter also rose slightly, ticking up to 3.7% QoQ versus the forecast hold at 3.6%. Thursday’s upcoming Presidential debate, due to start after the day’s market close, will draw some attention as investors keep an eye out for possible policy hints from candidates.
Friday’s US PCE Price Index inflation print will be the week’s key data figure as investors hope for continued cooling in US inflation numbers to help push the Federal Reserve (Fed) closer toward rate cuts. At current cut, core PCE Price Index inflation is forecast to tick down to 0.1% MoM in May from 0.2%.
Economic Indicator
Core Personal Consumption Expenditures - Price Index (MoM)
The Core Personal Consumption Expenditures (PCE), released by the US Bureau of Economic Analysis on a monthly basis, measures the changes in the prices of goods and services purchased by consumers in the United States (US). The PCE Price Index is also the Federal Reserve’s (Fed) preferred gauge of inflation. The MoM figure compares the prices of goods in the reference month to the previous month.The core reading excludes the so-called more volatile food and energy components to give a more accurate measurement of price pressures. Generally, a high reading is bullish for the US Dollar (USD), while a low reading is bearish.
Read more.Next release: Fri Jun 28, 2024 12:30
Frequency: Monthly
Consensus: 0.1%
Previous: 0.2%
Source: US Bureau of Economic Analysis
After publishing the GDP report, the US Bureau of Economic Analysis releases the Personal Consumption Expenditures (PCE) Price Index data alongside the monthly changes in Personal Spending and Personal Income. FOMC policymakers use the annual Core PCE Price Index, which excludes volatile food and energy prices, as their primary gauge of inflation. A stronger-than-expected reading could help the USD outperform its rivals as it would hint at a possible hawkish shift in the Fed’s forward guidance and vice versa.
EUR/USD technical outlook
The Fiber caught a Thursday bid as the pair bounced from a demand zone priced in below 1.0680, driving back into the 200-hour Exponential Moving Average (EMA) 1.0717 before settling back into the 1.0700 handle heading into Friday’s market session.
EUR/USD is getting caught in a congestion trap on daily candlesticks, drifting into the low end of a rough descending channel as the pair waffles on the bearish side of the 200-day Exponential Moving Average (EMA) at 1.0785.
EUR/USD hourly chart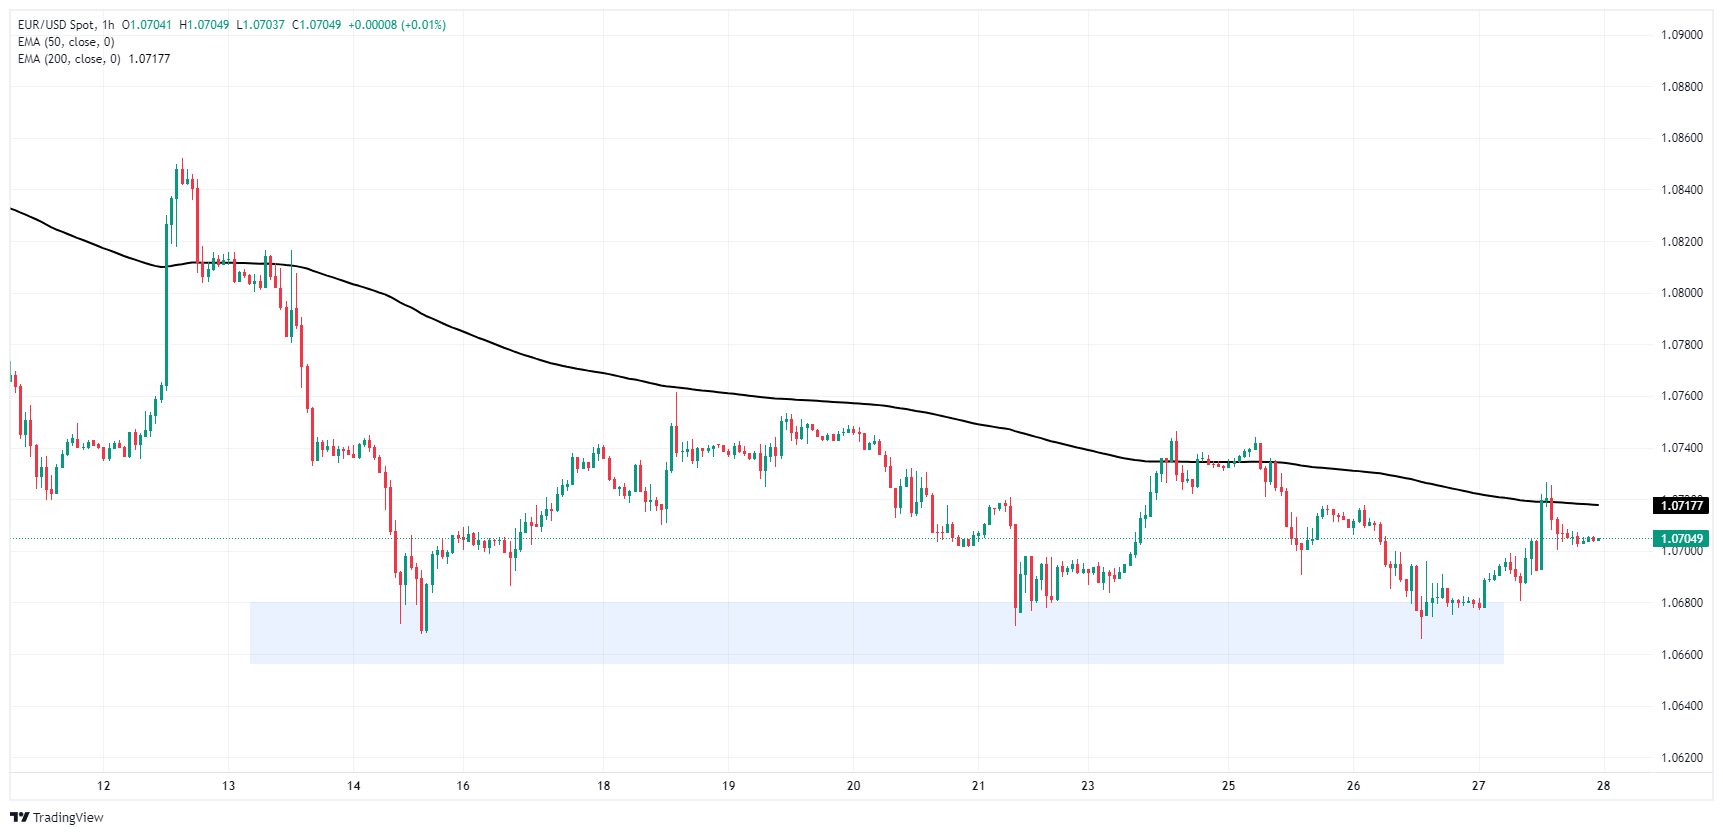
EUR/USD daily chart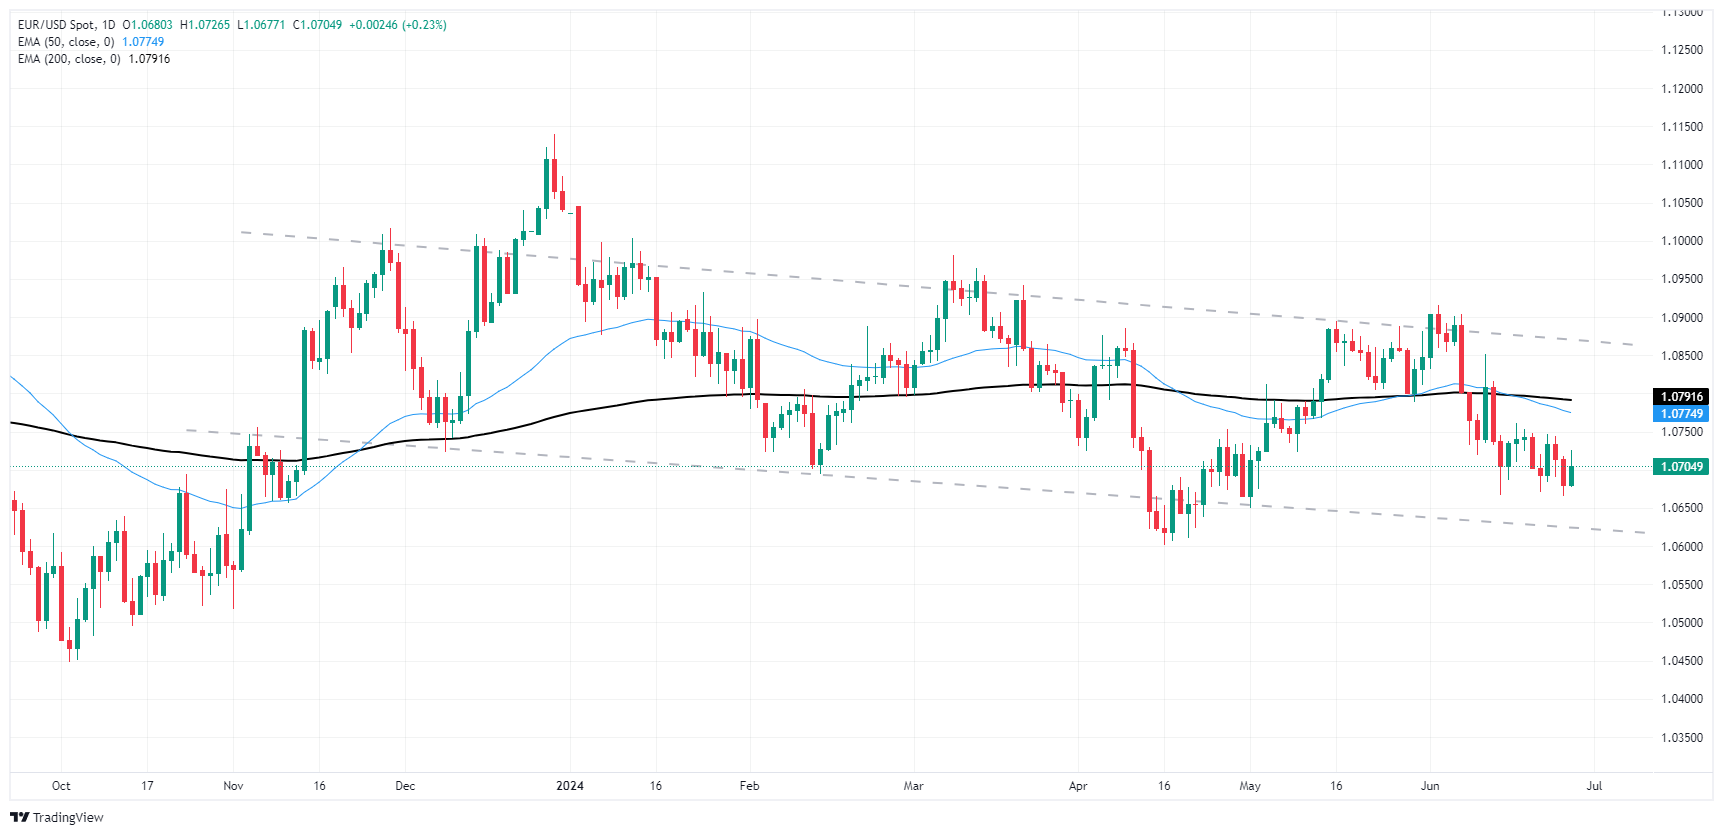
Canadian Dollar FAQs
The key factors driving the Canadian Dollar (CAD) are the level of interest rates set by the Bank of Canada (BoC), the price of Oil, Canada’s largest export, the health of its economy, inflation and the Trade Balance, which is the difference between the value of Canada’s exports versus its imports. Other factors include market sentiment – whether investors are taking on more risky assets (risk-on) or seeking safe-havens (risk-off) – with risk-on being CAD-positive. As its largest trading partner, the health of the US economy is also a key factor influencing the Canadian Dollar.
The Bank of Canada (BoC) has a significant influence on the Canadian Dollar by setting the level of interest rates that banks can lend to one another. This influences the level of interest rates for everyone. The main goal of the BoC is to maintain inflation at 1-3% by adjusting interest rates up or down. Relatively higher interest rates tend to be positive for the CAD. The Bank of Canada can also use quantitative easing and tightening to influence credit conditions, with the former CAD-negative and the latter CAD-positive.
The price of Oil is a key factor impacting the value of the Canadian Dollar. Petroleum is Canada’s biggest export, so Oil price tends to have an immediate impact on the CAD value. Generally, if Oil price rises CAD also goes up, as aggregate demand for the currency increases. The opposite is the case if the price of Oil falls. Higher Oil prices also tend to result in a greater likelihood of a positive Trade Balance, which is also supportive of the CAD.
While inflation had always traditionally been thought of as a negative factor for a currency since it lowers the value of money, the opposite has actually been the case in modern times with the relaxation of cross-border capital controls. Higher inflation tends to lead central banks to put up interest rates which attracts more capital inflows from global investors seeking a lucrative place to keep their money. This increases demand for the local currency, which in Canada’s case is the Canadian Dollar.
Macroeconomic data releases gauge the health of the economy and can have an impact on the Canadian Dollar. Indicators such as GDP, Manufacturing and Services PMIs, employment, and consumer sentiment surveys can all influence the direction of the CAD. A strong economy is good for the Canadian Dollar. Not only does it attract more foreign investment but it may encourage the Bank of Canada to put up interest rates, leading to a stronger currency. If economic data is weak, however, the CAD is likely to fall.
- GBP/USD is mired in long-term averages near 1.2620.
- Mixed US data on Thursday left risk appetite in the lurch.
- US PCE Price Index inflation to round out the week’s data releases.
GBP/USD waffled on Thursday, churning in empty yet familiar chart paper between long-term moving averages, with price action sandwiched between the 1.2700 and 1.2600 handles. US data came in mixed, leaving market sentiment to grind into the middle as investors await Friday’s key US inflation print.
Forex Today: US inflation comes to the fore... again
Before key US price growth data, the upcoming US Presidential Election is expected in the early Friday market session. Investors will be keeping one ear out for any hints regarding potential policy plans from all of the US candidates.
During the London market window, the UK also drops revisions to first-quarter Gross Domestic Product (GDP). Median market forecasts expect UK GDP growth to hold steady at the initial print of 0.6% QoQ.
US Initial Jobless Claims for the week ended Jun 21 came in better than expected, showing 233K net new jobless benefits seekers compared to the forecast 236K, and down slightly further from the previous week’s 238K. The four-week average for Initial Jobless Claims jumped to 236K, bringing the newest week-on-week figure back below the running average.
US Gross Domestic Product (GDP) met expectations on Thursday, with Q1 GDP slightly revised to 1.4% from the initial print of 1.3%. Core Personal Consumption Expenditures in the first quarter also rose slightly, ticking up to 3.7% QoQ versus the forecast hold at 3.6%. Thursday’s upcoming Presidential debate, due to start after the day’s market close, will draw some attention as investors keep an eye out for possible policy hints from candidates.
Friday’s US PCE Price Index inflation print will be the week’s key data figure as investors hope for continued cooling in US inflation numbers to help push the Federal Reserve (Fed) closer toward rate cuts. At current cut, core PCE Price Index inflation is forecast to tick down to 0.1% MoM in May from 0.2%.
Economic Indicator
Core Personal Consumption Expenditures - Price Index (MoM)
The Core Personal Consumption Expenditures (PCE), released by the US Bureau of Economic Analysis on a monthly basis, measures the changes in the prices of goods and services purchased by consumers in the United States (US). The PCE Price Index is also the Federal Reserve’s (Fed) preferred gauge of inflation. The MoM figure compares the prices of goods in the reference month to the previous month.The core reading excludes the so-called more volatile food and energy components to give a more accurate measurement of price pressures. Generally, a high reading is bullish for the US Dollar (USD), while a low reading is bearish.
Read more.Next release: Fri Jun 28, 2024 12:30
Frequency: Monthly
Consensus: 0.1%
Previous: 0.2%
Source: US Bureau of Economic Analysis
After publishing the GDP report, the US Bureau of Economic Analysis releases the Personal Consumption Expenditures (PCE) Price Index data alongside the monthly changes in Personal Spending and Personal Income. FOMC policymakers use the annual Core PCE Price Index, which excludes volatile food and energy prices, as their primary gauge of inflation. A stronger-than-expected reading could help the USD outperform its rivals as it would hint at a possible hawkish shift in the Fed’s forward guidance and vice versa.
GBP/USD technical outlook
The Cable has ground to a halt at the 200-day Exponential Moving Average (EMA) near 1.2611, with the pair hamstrung between 1.2700 and 1.2600, and Thursday’s price action caught between the 200-day and 50-day EMAs.
Downside pressure is more apparent on intraday charts, with a clear low-side drift baked into hourly candlesticks as buyers remain unable to push intraday price action back above the 200-hour EMA at 1.2674.
GBP/USD hourly chart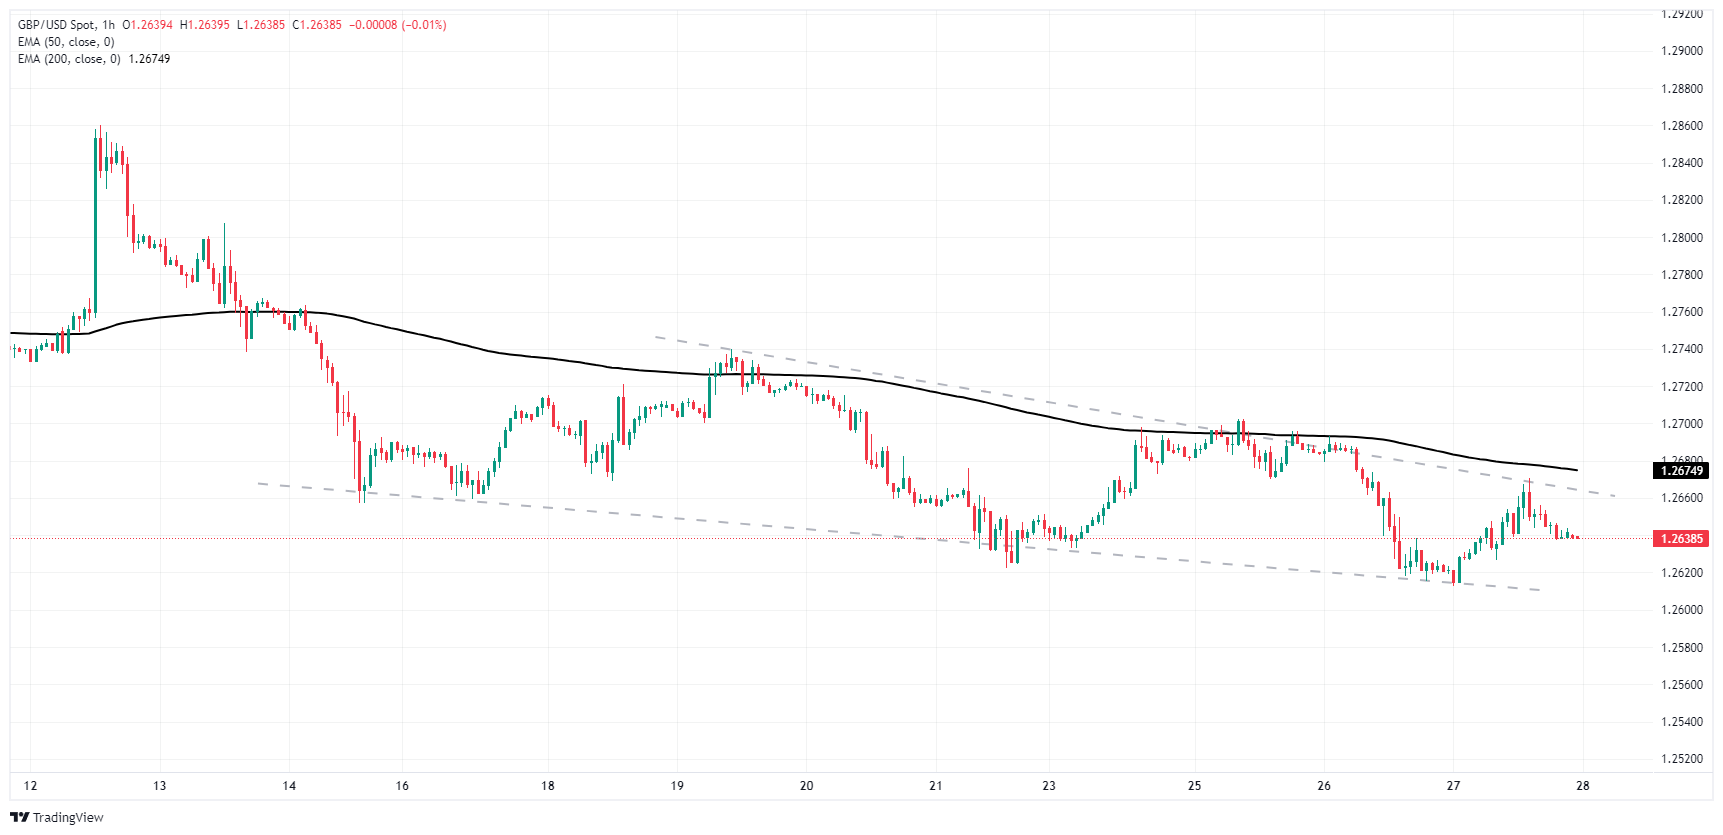
GBP/USD daily chart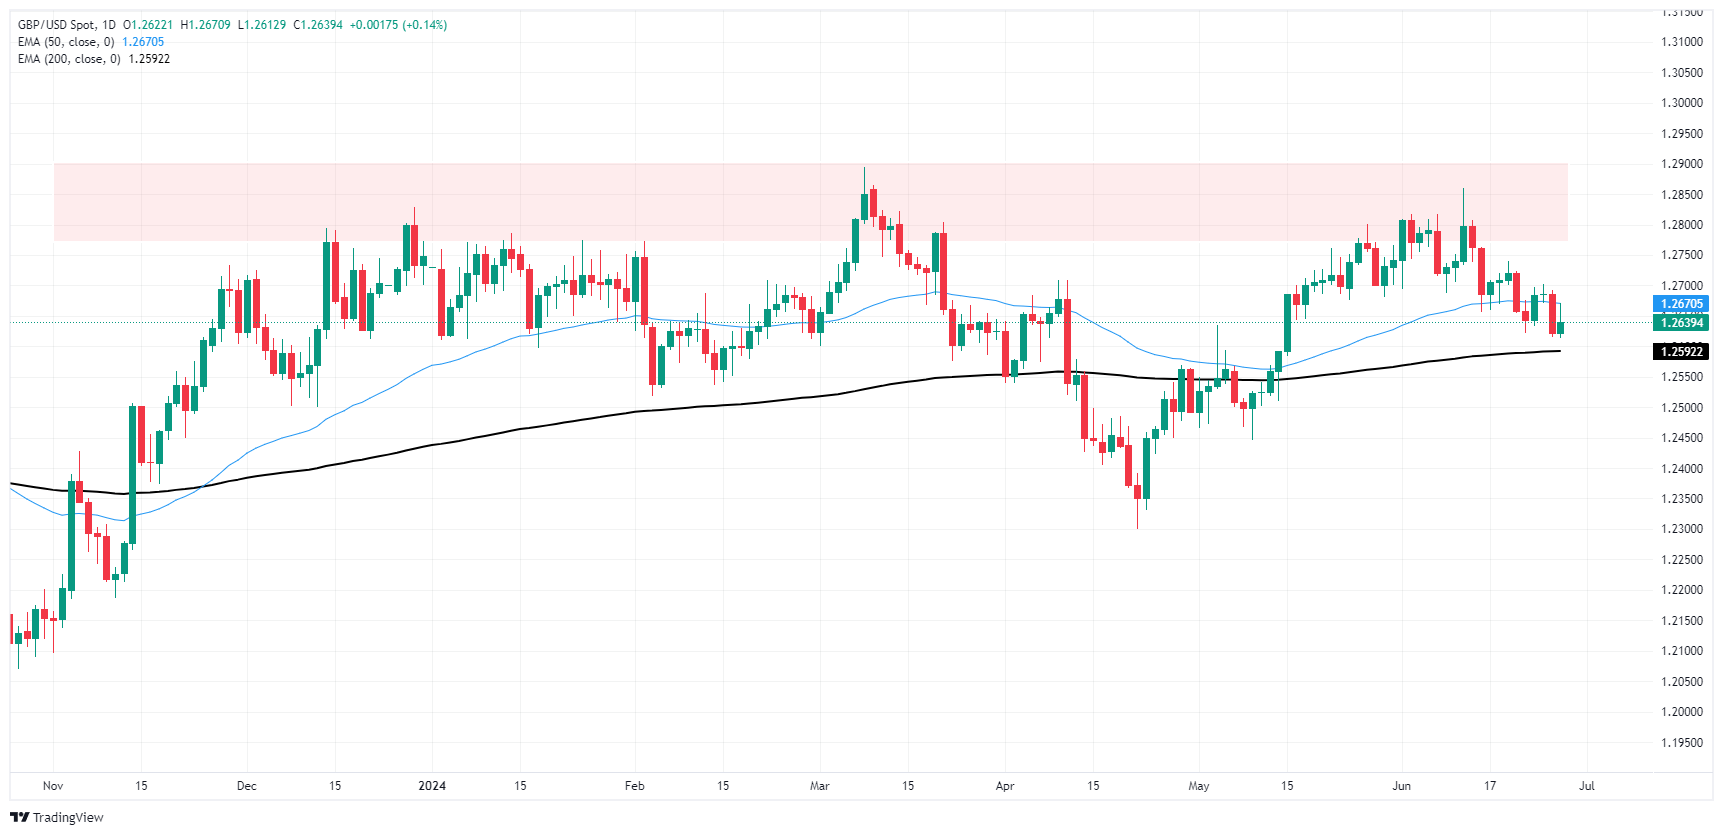
Pound Sterling FAQs
The Pound Sterling (GBP) is the oldest currency in the world (886 AD) and the official currency of the United Kingdom. It is the fourth most traded unit for foreign exchange (FX) in the world, accounting for 12% of all transactions, averaging $630 billion a day, according to 2022 data. Its key trading pairs are GBP/USD, aka ‘Cable’, which accounts for 11% of FX, GBP/JPY, or the ‘Dragon’ as it is known by traders (3%), and EUR/GBP (2%). The Pound Sterling is issued by the Bank of England (BoE).
The single most important factor influencing the value of the Pound Sterling is monetary policy decided by the Bank of England. The BoE bases its decisions on whether it has achieved its primary goal of “price stability” – a steady inflation rate of around 2%. Its primary tool for achieving this is the adjustment of interest rates. When inflation is too high, the BoE will try to rein it in by raising interest rates, making it more expensive for people and businesses to access credit. This is generally positive for GBP, as higher interest rates make the UK a more attractive place for global investors to park their money. When inflation falls too low it is a sign economic growth is slowing. In this scenario, the BoE will consider lowering interest rates to cheapen credit so businesses will borrow more to invest in growth-generating projects.
Data releases gauge the health of the economy and can impact the value of the Pound Sterling. Indicators such as GDP, Manufacturing and Services PMIs, and employment can all influence the direction of the GBP. A strong economy is good for Sterling. Not only does it attract more foreign investment but it may encourage the BoE to put up interest rates, which will directly strengthen GBP. Otherwise, if economic data is weak, the Pound Sterling is likely to fall.
Another significant data release for the Pound Sterling is the Trade Balance. This indicator measures the difference between what a country earns from its exports and what it spends on imports over a given period. If a country produces highly sought-after exports, its currency will benefit purely from the extra demand created from foreign buyers seeking to purchase these goods. Therefore, a positive net Trade Balance strengthens a currency and vice versa for a negative balance.
- GBP/JPY touches fresh 16-year highs as Yen continues to backslide.
- Japanese Retail Trade ticked higher, Tokyo CPI inflation next on the docket.
- UK GDP revision slated for Friday, little change expected.
GBP/JPY tapped a fresh 16-year high of 203.39 on Thursday as the Yen continues ot get pushed lower across the board. An uptick in Japanese Retail Sales early Thursday failed to spark a recovery in the Yen as JPY traders buckle down for the last print of Japan’s Tokyo Consumer Price Index (CPI) inflation due early Friday.
The UK will also be delivering a fresh revision to first-quarter Gross Domestic Product (GDP) figures, but little change is expected and Q1 UK GDP is expected to hold steady at 0.6%, in-line with the initial print.
Core Tokyo CPI is expected to tick upwards slightly to 2.0% YoY in June, but the upswing is likely not enough to push the Bank of Japan (BoJ) out of its stubborn, long-running hypereasy monetary policy stance. With BoJ reference rates functionally at zero and a significant ratio of Japanese government bonds scooped up by the Japanese central bank itself, the Yen’s battered stance is unlikely to change, regardless of a carousel of increasingly concerned threats of direct intervention in FX markets by Japan’s Ministry of Finance.
Economic Indicator
Tokyo Consumer Price Index (YoY)
The Tokyo Consumer Price Index (CPI), released by the Statistics Bureau of Japan on a monthly basis, measures the price fluctuation of goods and services purchased by households in the Tokyo region. The index is widely considered as a leading indicator of Japan’s overall CPI as it is published weeks before the nationwide reading. The YoY reading compares prices in the reference month to the same month a year earlier. Generally, a high reading is seen as bullish for the Japanese Yen (JPY), while a low reading is seen as bearish.
Read more.Next release: Thu Jun 27, 2024 23:30
Frequency: Monthly
Consensus: -
Previous: 2.2%
Source: Statistics Bureau of Japan
GBP/JPY technical outlook
The Guppy has traded so firmly traded into the bullish side in one-sided action that the pair has not pulled back to the 200-day Exponential Moving Average (EMA) since the start of 2024 when the pair briefly eased below the 180.00 handle before proceeding to climb over 13% from January’s opening bids at 179.55.
GBP/JPY has set a fresh 16-year high for five consecutive days in lopsided bullish action, and the pair has likewise chalked in nine straight green trading days as the pair continues to climb into multi-year peaks.
GBP/JPY hourly chart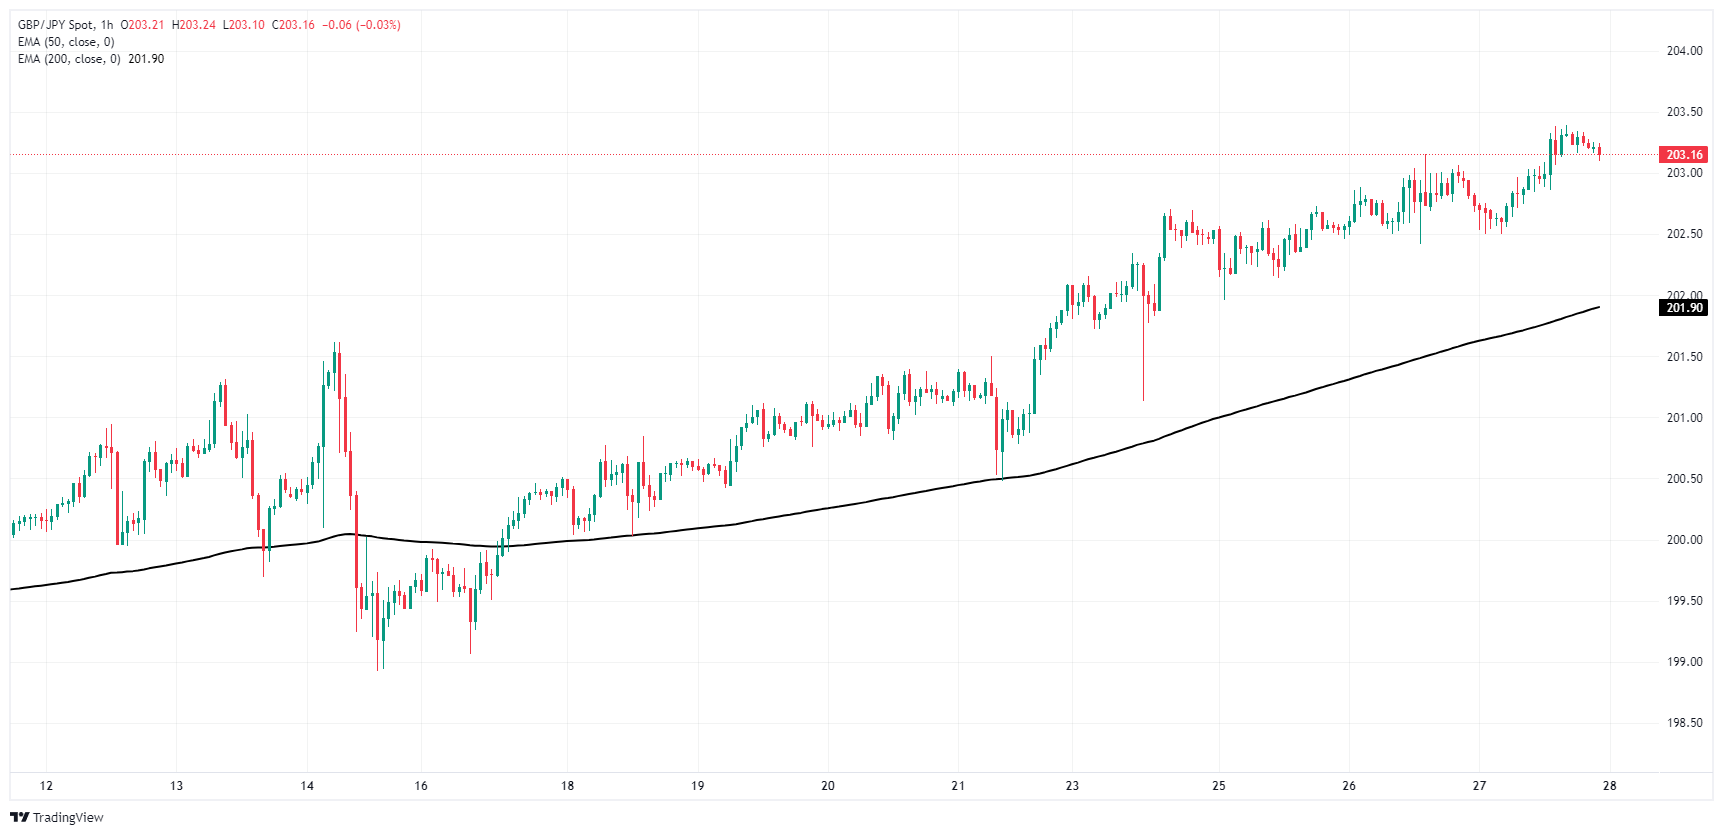
GBP/JPY daily chart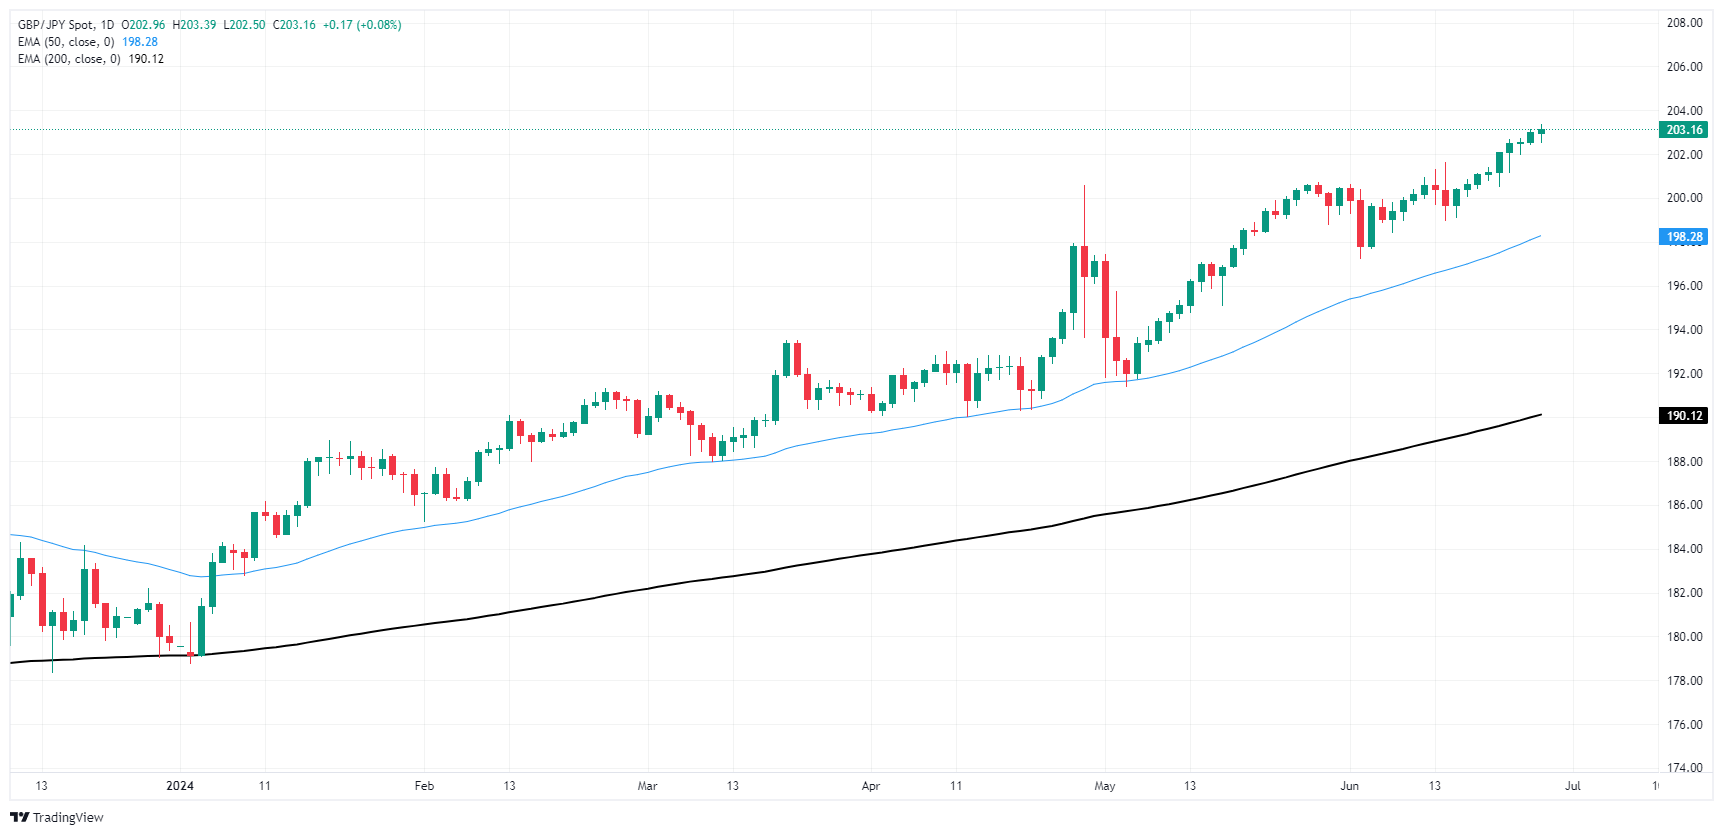
- Silver stages a comeback, trading at $29.00 with gains of 0.83% after yesterday's 0.46% loss.
- RSI shows bearish momentum, indicating possible extended losses.
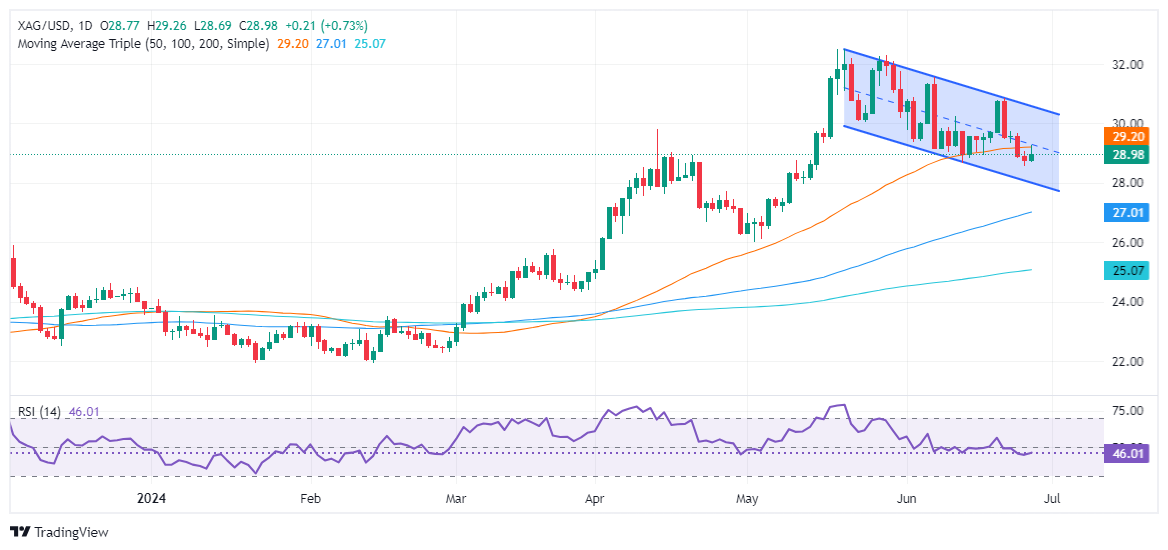
- Support levels: $28.28 (June 10 high), $28.00, $27.01 (May 8 low), $26.82 (100-DMA).
- Resistance points: $29.00, $29.17 (50-DMA), $31.54 (June 7 high), $32.00, $32.51 (YTD high).
Silver price stages a comeback on Thursday and erases yesterday’s losses of 0.46%. It trades near the crucial $29.00 psychological level and registers gains of 0.83% at the time of writing.
XAG/USD Price Analysis: Technical outlook
Silver’s price action during the last couple of days formed a quasi ‘tweezers bottom’ candle chart, yet it remains trading within a descending channel, spurred by last week's ‘bearish engulfing’ chart pattern formation, that exacerbated the grey’s metal downtrend.
Momentum support sellers, as measured by the Relative Strength Index (RSI), standing at bearish territory, hinting the grey metal could extend its losses.
Therefore, XAG/USD's first support is the June 10, 2021, high at $28.28. A breach of the latter will expose the psychological $28.00 mark, followed by the May 8 swing low of $27.01, ahead of the 100-DMA at $26.82.
Conversely, if XAG/USD reclaims the $29.00 figure, the next resistance level would be the 50-day moving average (DMA) at $29.17. Once hurdle, the next level would be the June 7 high of $31.54. Clearing this would aim for $32.00 before challenging the year-to-date (YTD) high of $32.51.
XAG/USD Price Action – Daily Chart
US Dollar PRICE Today
The table below shows the percentage change of US Dollar (USD) against listed major currencies today. US Dollar was the strongest against the New Zealand Dollar.
| USD | EUR | GBP | JPY | CAD | AUD | NZD | CHF | |
|---|---|---|---|---|---|---|---|---|
| USD | -0.01% | -0.02% | -0.03% | -0.02% | -0.00% | 0.01% | -0.00% | |
| EUR | 0.01% | -0.00% | -0.02% | -0.00% | -0.01% | 0.02% | 0.00% | |
| GBP | 0.02% | 0.00% | -0.02% | -0.02% | 0.00% | 0.02% | -0.02% | |
| JPY | 0.03% | 0.02% | 0.02% | -0.03% | 0.01% | -0.01% | 0.02% | |
| CAD | 0.02% | 0.00% | 0.02% | 0.03% | 0.00% | 0.01% | -0.01% | |
| AUD | 0.00% | 0.00% | -0.00% | -0.01% | -0.00% | 0.02% | 0.02% | |
| NZD | -0.01% | -0.02% | -0.02% | 0.00% | -0.01% | -0.02% | -0.03% | |
| CHF | 0.00% | -0.00% | 0.02% | -0.02% | 0.00% | -0.02% | 0.03% |
The heat map shows percentage changes of major currencies against each other. The base currency is picked from the left column, while the quote currency is picked from the top row. For example, if you pick the US Dollar from the left column and move along the horizontal line to the Japanese Yen, the percentage change displayed in the box will represent USD (base)/JPY (quote).
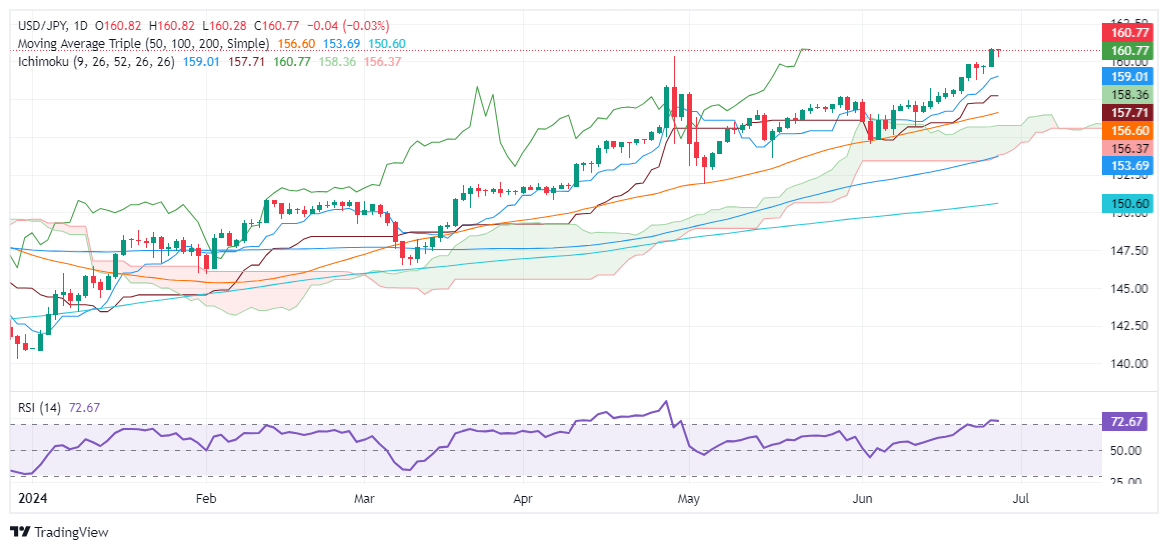
- USD/JPY registers minimal loss after hitting a daily low of 160.28.
- Technical outlook shows uptrend intact, with RSI in overbought conditions indicating strong buying momentum.
- Key resistance levels: psychological 161.00 and 162.00, followed by November 1986 high of 164.87 and April 1986 high of 178.
- Key support levels: Tenkan-Sen at 159.01, June 24 low of 158.75, Senkou Span A at 158.36, and Kijun-Sen at 157.70.
The USD/JPY registers minimal loss after hitting a daily low of 160.28, yet the major remains approaching the 161.00 figure for the second consecutive day as the Japanese authority's verbal jawboning has failed to contain the Yen’s depreciation. The pair trades at 160.77, down 0.03%.
USD/JPY Price Analysis: Technical outlook
The USD/JPY uptrend remains intact, yet traders remain cautions after they reclaimed the psychological 160.00 figure, seen as the first line of defense for Japanese authorities to intervene in the FX markets. However, the pair continued to advance steadily, although the risks of an intervention grew.
Momentum favors buyers, with the Relative Strength Index (RSI) at overbought conditions. However, due to the strength of the uptrend, most technicians use 80 as “extreme” overextended conditions.
That said, the USD/JPY first resistance would be the psychological levels of 161.00, 162.00, and so forth, ahead of testing November’s 1986 high of 164.87, followed by April's 1986 high of 178.
Conversely, if USD/JPY drops below 160.00, the first support would be the Tenkan-Sen at 159.01, followed by June’s 24 low of 158.75. Once those levels are cleared, the next stop would be the Senkou Span A at 158.36 and then the Kijun-Sen at 157.70.
USD/JPY Price Action – Daily Chart
Japanese Yen PRICE Today
The table below shows the percentage change of Japanese Yen (JPY) against listed major currencies today. Japanese Yen was the strongest against the Swiss Franc.
| USD | EUR | GBP | JPY | CAD | AUD | NZD | CHF | |
|---|---|---|---|---|---|---|---|---|
| USD | -0.23% | -0.15% | -0.03% | -0.05% | -0.02% | -0.04% | 0.14% | |
| EUR | 0.23% | 0.06% | 0.17% | 0.16% | 0.23% | 0.16% | 0.36% | |
| GBP | 0.15% | -0.06% | 0.14% | 0.10% | 0.16% | 0.12% | 0.31% | |
| JPY | 0.03% | -0.17% | -0.14% | -0.02% | 0.00% | -0.05% | 0.18% | |
| CAD | 0.05% | -0.16% | -0.10% | 0.02% | 0.02% | 0.00% | 0.19% | |
| AUD | 0.02% | -0.23% | -0.16% | -0.01% | -0.02% | -0.02% | 0.15% | |
| NZD | 0.04% | -0.16% | -0.12% | 0.05% | -0.01% | 0.02% | 0.18% | |
| CHF | -0.14% | -0.36% | -0.31% | -0.18% | -0.19% | -0.15% | -0.18% |
The heat map shows percentage changes of major currencies against each other. The base currency is picked from the left column, while the quote currency is picked from the top row. For example, if you pick the Japanese Yen from the left column and move along the horizontal line to the US Dollar, the percentage change displayed in the box will represent JPY (base)/USD (quote).
Federal Reserve (Fed) Board of Governors member Michelle Bowman noted on Thursday that while current Fed policies should be enough to drag inflation back to target, the Fed shouldn't be unwilling to weigh further rate cuts in inflation data proves sticky.
Key highlights
I am still willing to raise rates again if inflation doesn’t ease.
The Fed not at point yet where it can consider rate cut.
If inflation moves toward 2%, eventual rate cut is on the table.
Lack of new bank creation will create financial issues.
Economy strong but activity has moderated.
I am concerned by the decline in the number of US banks.
Upside risks to inflation persist.
I expect only modest progress on lower inflation this year.
Easier financial conditions could drive up inflation.
I remain cautious in weighing future Fed rate changes.
- Banxico holds interest rate at 11.00%; Deputy Gov. Mejia Castelazo votes for 25 bps cut.
- Officials cite financial market volatility and unique economic factors in Mexico.
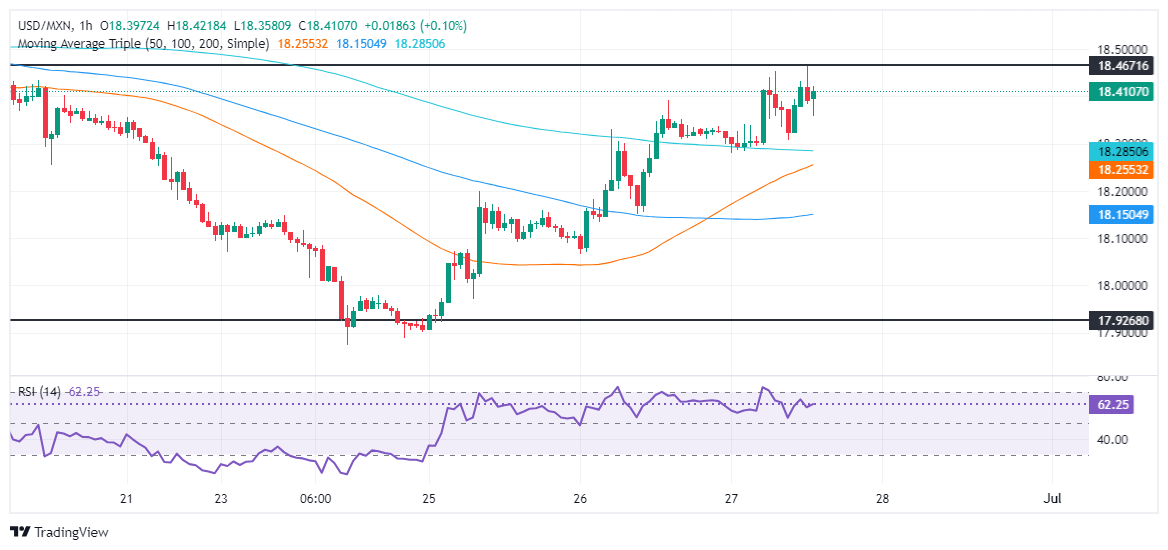
- USD/MXN dips to 18.35 post-Banxico, then climbs, gaining 0.42%.
On Thursday, the Bank of Mexico (Banxico) decided to hold the overnight interbank interest rate at 11.00%, as expected by most market participants. However, the decision was not unanimous, with Deputy Governor Omar Mejia Castelazo's 25-basis-point rate cut vote potentially having a significant impact.
Banxico's unanimous decision fails to underpin the Mexican Peso
Banxico policymakers mentioned that Mexico's financial markets were volatile and affected by “idiosyncratic factors.” Consequently, Mexico’s Government bond yields rose, and the Peso depreciated.
Officials mentioned that the disinflation process is expected to continue, adding that “the board foresees that the inflationary environment may allow for discussing reference rate adjustments.”
They acknowledged that the Mexican Peso depreciation impacted inflation forecasts, which were offset by weaker economic activity; however, the inflation risks balance remains skewed to the upside.
USD/MXN Reaction to Banxico’s Decision
The USD/MXN retreated to 18.35, before resuming its ongoing uptrend, with momentum favoring buyers, as depicted by the Relative Strength Index (RSI) in the hourly chart. The exotic pair trades with gains of 0.42%.
Banxico FAQs
The Bank of Mexico, also known as Banxico, is the country’s central bank. Its mission is to preserve the value of Mexico’s currency, the Mexican Peso (MXN), and to set the monetary policy. To this end, its main objective is to maintain low and stable inflation within target levels – at or close to its target of 3%, the midpoint in a tolerance band of between 2% and 4%.
The main tool of the Banxico to guide monetary policy is by setting interest rates. When inflation is above target, the bank will attempt to tame it by raising rates, making it more expensive for households and businesses to borrow money and thus cooling the economy. Higher interest rates are generally positive for the Mexican Peso (MXN) as they lead to higher yields, making the country a more attractive place for investors. On the contrary, lower interest rates tend to weaken MXN. The rate differential with the USD, or how the Banxico is expected to set interest rates compared with the US Federal Reserve (Fed), is a key factor.
Banxico meets eight times a year, and its monetary policy is greatly influenced by decisions of the US Federal Reserve (Fed). Therefore, the central bank’s decision-making committee usually gathers a week after the Fed. In doing so, Banxico reacts and sometimes anticipates monetary policy measures set by the Federal Reserve. For example, after the Covid-19 pandemic, before the Fed raised rates, Banxico did it first in an attempt to diminish the chances of a substantial depreciation of the Mexican Peso (MXN) and to prevent capital outflows that could destabilize the country.
The US Dollar came under some renewed selling bias and left behind the area of recent multi-week highs amidst lower yields and ahead of the publication of US inflation tracked by the PCE on Friday.
Here is what you need to know on Friday, June 28:
The USD Index (DXY) retreated from tops beyond the 106.00 hurdle amidst steady prudence ahead of the release of US PCE data. Indeed, the release of US inflation figures tracked by the PCE will take centre stage on June 28, seconded by Personal Income, Personal Spending, the Chicago PMI, and the final Michigan Consumer Sentiment print. In addition, the Fed’s Barkin and Bowman are due to speak.
EUR/USD regained some traction and partially recouped ground lost in the last couple of sessions, managing to reclaim the area above the 1.0700 barrier. On June 28, the German docket will be in the limelight with the publication of Retail Sales and the labour market report for the month of June.
GBP/USD reversed Wednesday’s strong pullback against the backdrop of some tepid improvement in the appetite for riskier assets. In the UK, the final Q1 GDP Growth Rate will be in the spotlight on June 28.
USD/JPY kept the trade around the area of multi-decade highs near 160.80 amidst rising cautiousness about the potential FX intervention by the BoJ. The Unemployment Rate, inflation figures in Tokyo, flash Industrial Production and Housing Starts are all due in Japan on June 28.
Another inconclusive session left AUD/USD hovering around the 0.6650 region, always immersed in the multi-week consolidative theme. Housing Credit figures are expected in the Australian calendar on June 28.
Reignited geopolitical concerns offset demand fears and lifted prices of WTI to new two-month highs just past the $82.00 mark per barrel.
Prices of Gold advanced markedly after two sessions in a row of losses, regaining the $2,330 zone per ounce troy ahead of the release of US PCE at the end of the week. Silver rose modestly, although it seems to have been enough to reverse four straight sessions in negative territory.
- DXY is softly lower on Thursday after US data comes in mixed.
- Losses remain limited as Greenback keeps downside contained.
- Investors pivot to Friday’s key US inflation print.
The US Dollar Index (DXY) showed the Greenback giving a mixed performance on Thursday, testing into the low side after a mixed bag of US data figures but finding enough footing to limit losses. The US Dollar is mixed across the major currencies board, down a thin quarter of a percent against the Euro (EUR) and up a scant sixth of a percent against the Swiss Franc (CHF).
US Initial Jobless Claims for the week ended June 21 were better than expected, with 233K new jobless benefits seekers compared to the forecasted 236K, and slightly down from the previous week’s 238K. The four-week average for Initial Jobless Claims increased to 236K, but this still remains below the running average.
The US Gross Domestic Product (GDP) met expectations on Thursday, with a slight revision to 1.4% from the initial reading of 1.3%. Additionally, Core Personal Consumption Expenditures for the first quarter rose slightly to 3.7% quarter-on-quarter, versus the forecasted 3.6%. Following Thursday's market close, the upcoming Presidential debate will attract attention as investors anticipate possible policy hints from the candidates.
On Friday, the US PCE Price Index inflation print will be the week's focal data point, as investors hope for continued cooling in US inflation numbers to potentially influence the Federal Reserve's (Fed) decisions on rate cuts. Currently, core PCE Price Index inflation is forecasted to decrease to 0.1% month-on-month in May from 0.2%.
DXY technical outlook
Thursday’s limited downside leaves the Dollar Index still holding onto a near-term bullish stance, with the DXY trading on the north side of the 200-hour Exponential Moving Average (EMA) at 105.58. The DXY hit a two-month peak this week, clipping above 106.10 as the Greenback basket follows a rough channel higher.
DXY hourly chart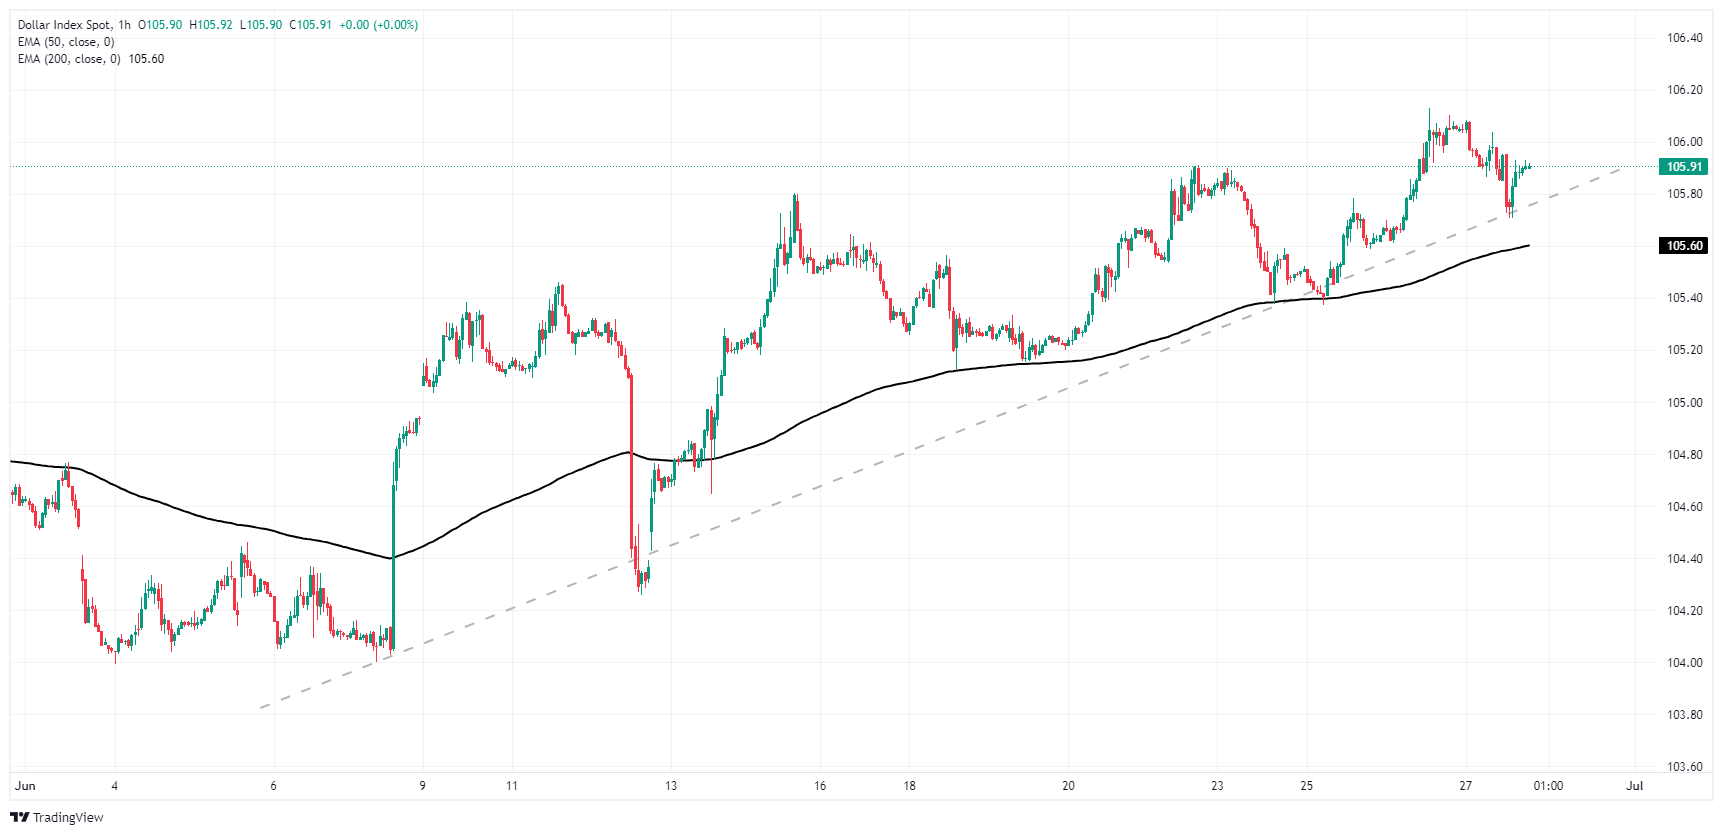
DXY daily chart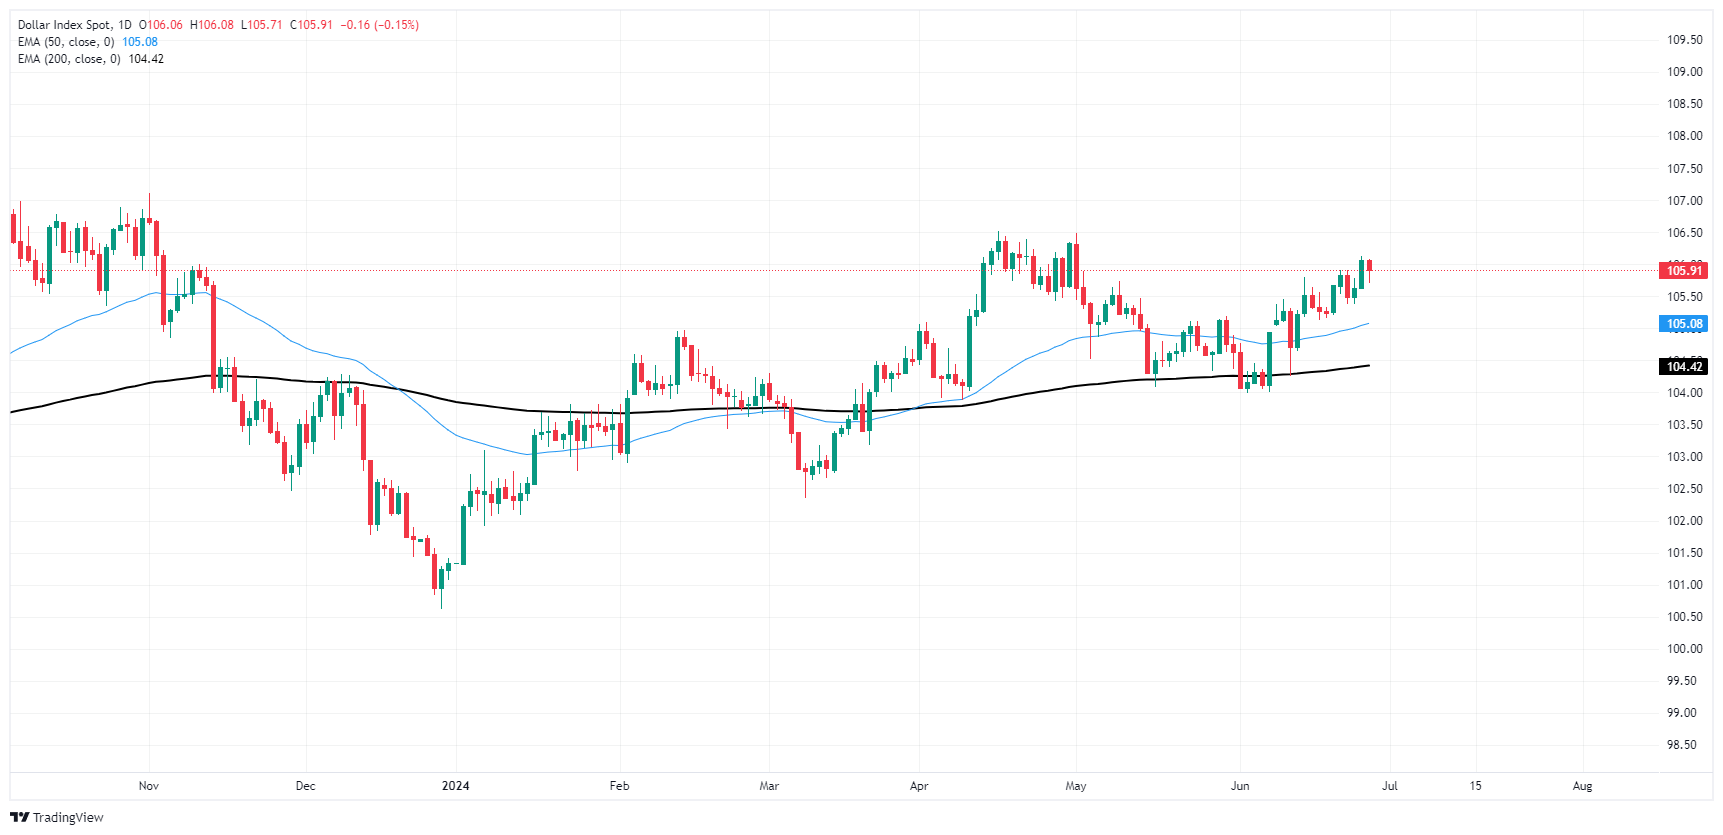
US Dollar FAQs
The US Dollar (USD) is the official currency of the United States of America, and the ‘de facto’ currency of a significant number of other countries where it is found in circulation alongside local notes. It is the most heavily traded currency in the world, accounting for over 88% of all global foreign exchange turnover, or an average of $6.6 trillion in transactions per day, according to data from 2022. Following the second world war, the USD took over from the British Pound as the world’s reserve currency. For most of its history, the US Dollar was backed by Gold, until the Bretton Woods Agreement in 1971 when the Gold Standard went away.
The most important single factor impacting on the value of the US Dollar is monetary policy, which is shaped by the Federal Reserve (Fed). The Fed has two mandates: to achieve price stability (control inflation) and foster full employment. Its primary tool to achieve these two goals is by adjusting interest rates. When prices are rising too quickly and inflation is above the Fed’s 2% target, the Fed will raise rates, which helps the USD value. When inflation falls below 2% or the Unemployment Rate is too high, the Fed may lower interest rates, which weighs on the Greenback.
In extreme situations, the Federal Reserve can also print more Dollars and enact quantitative easing (QE). QE is the process by which the Fed substantially increases the flow of credit in a stuck financial system. It is a non-standard policy measure used when credit has dried up because banks will not lend to each other (out of the fear of counterparty default). It is a last resort when simply lowering interest rates is unlikely to achieve the necessary result. It was the Fed’s weapon of choice to combat the credit crunch that occurred during the Great Financial Crisis in 2008. It involves the Fed printing more Dollars and using them to buy US government bonds predominantly from financial institutions. QE usually leads to a weaker US Dollar.
Quantitative tightening (QT) is the reverse process whereby the Federal Reserve stops buying bonds from financial institutions and does not reinvest the principal from the bonds it holds maturing in new purchases. It is usually positive for the US Dollar.
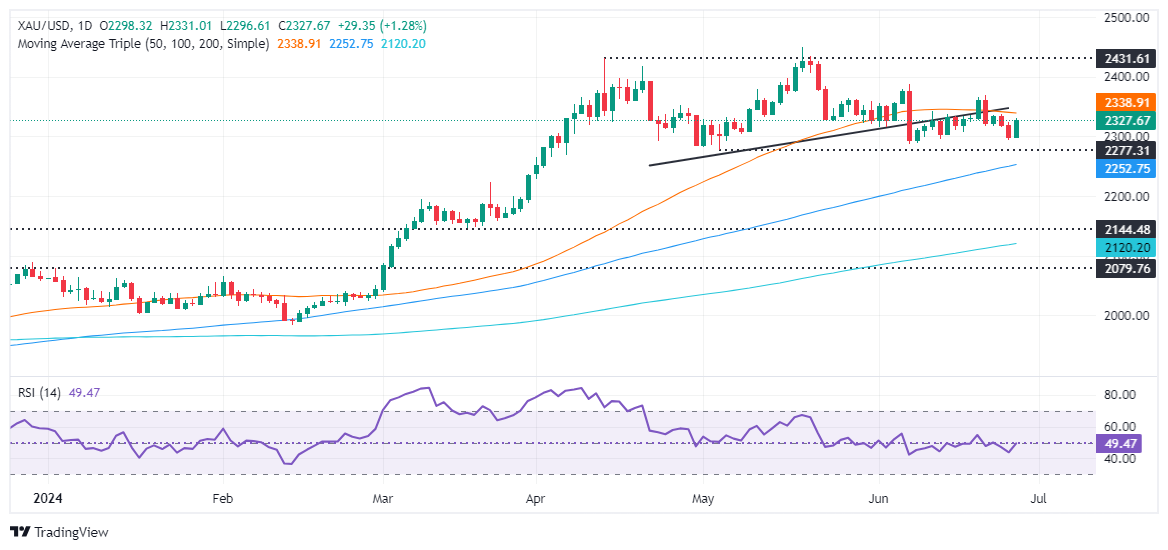
- Gold climbs as USD falls, Treasury yields dip.
- XAU/USD rebounds from two-week low following inflation data from Canada and Australia.
- DXY drops 0.12% to 105.91, off monthly high of 106.13.
- Anticipation for May PCE drops to 2.6% YoY, with Core PCE also expected at 2.6%.
Gold rallied more than 1% on Thursday after economic data. The softer Greenback, which is retreating after posting solid gains, undermined lower US Treasury bond yields. US economic data was slightly better than expected, though ebbs and flows toward the golden metal kept XAU/USD trading at $2,326.
Yesterday, XAU/USD dived to a two-week low, sponsored by the release of inflation figures in Canada and Australia that showcased a reacceleration of inflation. This sponsored a jump in most global bond yields, particularly US Treasury yields, and was capitalized by US Dollar bulls.
The US Dollar Index (DXY), which tracks the buck’s performance against a basket of other currencies, hit a new monthly high of 106.13 before erasing some of those gains on Thursday as it tumbled 0.12% to 105.91.
The Gross Domestic Product (GDP) for the first quarter of 2024 in the United States was a tenth higher than forecasts, news already priced in by the markets. Besides that, the number of Americans filing for unemployment benefits dipped compared to last week’s data, while Durable Goods Orders exceeded projections.
This week, the Federal Reserve’s (Fed) preferred gauge for inflation, the May PCE, is expected to decrease from 2.7% to 2.6% YoY. Core PCE is anticipated to decline from 2.8% to 2.6% YoY.
Daily digest market movers: Gold price advances, capitalizing on soft US Dollar
- US GDP for Q1 2024 came in at 1.4% QoQ, slightly higher than the 1.3% in the previous two readings but still trailing last year's fourth-quarter expansion of 3.4%.
- US Durable Goods Orders in May rose by 0.1% MoM, surpassing forecasts of a -0.1% contraction. Meanwhile, Initial Jobless Claims dipped from 239K the previous week to 233K, below the forecast of 236K.
- Fed officials crossed the newswires during the week, and delivered mixed stances. Fed Governor Michelle Bowman was hawkish, saying that she would like to increase rates if the disinflation process stalls.
- Conversely, San Francisco Fed President Mary Daly was dovish: “At this point, inflation is not the only risk we face,” expressing worries about the labor market.
- Fed Governor Lisa Cook was neutral on Tuesday, saying that inflation was most likely to fall “sharply” next year, adding that it would be necessary to ease policy to keep the Fed’s dual mandate more balanced.
- According to the CME FedWatch Tool, odds for a 25-basis-point Fed rate cut in September are at 59.5%, up from 56.3% last Tuesday.
- December 2024 fed funds rate futures contract implies the Fed will ease policy by just 35 basis points (bps) toward the end of the year.
Technical analysis: Gold price edges higher but remains shy of testing Head-and-Shoulders neckline
Gold remains under pressure as the Head-and-Shoulders chart pattern remains intact, hinting that prices could fall further and clear key support levels. Although XAU/USD traded higher on Thursday, it remains shy of challenging the Head-and-shoulders neckline. If the latter is decisively broken, that could negate the pattern and pave the way to test the June 21 high of $2,368.
Momentum favors sellers as shown by the Relative Strength Index (RSI) standing below the 50-midline.
That said, the XAU/USD next support would be $2,300. Once cleared, the non-yielding metal would fall to $2,277, the May 3 low, followed by the March 21 high of $2,222. Further losses lie underneath, with sellers eyeing the Head-and-Shoulders chart pattern objective from $2,170 to $2,160.
Conversely, if Gold reclaims $2,350, that will expose additional key resistance levels like the June 7 cycle high of $2,387, ahead of challenging the $2,400 figure.
Gold FAQs
Gold has played a key role in human’s history as it has been widely used as a store of value and medium of exchange. Currently, apart from its shine and usage for jewelry, the precious metal is widely seen as a safe-haven asset, meaning that it is considered a good investment during turbulent times. Gold is also widely seen as a hedge against inflation and against depreciating currencies as it doesn’t rely on any specific issuer or government.
Central banks are the biggest Gold holders. In their aim to support their currencies in turbulent times, central banks tend to diversify their reserves and buy Gold to improve the perceived strength of the economy and the currency. High Gold reserves can be a source of trust for a country’s solvency. Central banks added 1,136 tonnes of Gold worth around $70 billion to their reserves in 2022, according to data from the World Gold Council. This is the highest yearly purchase since records began. Central banks from emerging economies such as China, India and Turkey are quickly increasing their Gold reserves.
Gold has an inverse correlation with the US Dollar and US Treasuries, which are both major reserve and safe-haven assets. When the Dollar depreciates, Gold tends to rise, enabling investors and central banks to diversify their assets in turbulent times. Gold is also inversely correlated with risk assets. A rally in the stock market tends to weaken Gold price, while sell-offs in riskier markets tend to favor the precious metal.
The price can move due to a wide range of factors. Geopolitical instability or fears of a deep recession can quickly make Gold price escalate due to its safe-haven status. As a yield-less asset, Gold tends to rise with lower interest rates, while higher cost of money usually weighs down on the yellow metal. Still, most moves depend on how the US Dollar (USD) behaves as the asset is priced in dollars (XAU/USD). A strong Dollar tends to keep the price of Gold controlled, whereas a weaker Dollar is likely to push Gold prices up.
- Dow Jones continues to churn just above 39,000.00 after Thursday’s mixed data.
- US data came in mixed on Thursday, leaving the American market session in the lurch.
- Investors now pivot to face Friday’s US PCE Price Index inflation print.
The Dow Jones Industrial Average (DJIA) went sideways on Thursday, finding tentative gains but battling the downside as traders grapple with a mixed print on the US data docket. US Initial Jobless Claims printed better than expected, but still on the higher end of recent figures, while US Personal Consumption Expenditures (PCE) rose faster than expected in Q1. Equities will now be on the lookout for Friday’s US PCE Price Index inflation, which is still expected to show an overall easing in core price pressures in May.
US Initial Jobless Claims for the week ended Jun 21 came in better than expected, showing 233K net new jobless benefits seekers compared to the forecast 236K, and down slightly further from the previous week’s 238K. The four-week average for Initial Jobless Claims jumped to 236K, bringing the newest week-on-week figure back below the running average.
US Gross Domestic Product (GDP) met expectations on Thursday, with Q1 GDP slightly revised to 1.4% from the initial print of 1.3%. Core Personal Consumption Expenditures in the first quarter also rose slightly, ticking up to 3.7% QoQ versus the forecast hold at 3.6%. Thursday’s upcoming Presidential debate, due to start after the day’s market close, will draw some attention as investors keep an eye out for possible policy hints from candidates.
Friday’s US PCE Price Index inflation print will be the week’s key data figure as investors hope for continued cooling in US inflation numbers to help push the Federal Reserve (Fed) closer toward rate cuts. At current cut, core PCE Price Index inflation is forecast to tick down to 0.1% MoM in May from 0.2%.
Dow Jones news
The Dow Jones is finding slim gains on Thursday after a firm surge in familiar favorites, but overall securities remain mixed. About half of the Dow Jones’ constituent securities are in the red for the day, with losses led by Merck & Co Inc. (MRK), which fell 2.25% to $128.55 per share and shed around three points on Thursday.
On the high side, Salesforce Inc. (CRM) soared around 6% to $256.82 per share as the company gears up for its latest shareholder meeting on Thursday.
Dow Jones technical outlook
The Dow Jones index shrugged off an early decline on Thursday, rallying to a thin gain into the 39,250.00 region. Still, bullish momentum remains tepid, and the major equity index is settling into a soft churn pattern in intraday trading.
Daily candlesticks are holding onto chart paper just north of the 50-day Exponential Moving Average (EMA) at 38,889.40, but topside momentum remains limited and bidders are running out of steam as the index trades south of recent all-time highs around the 40,000.00 major price handle.
Dow Jones five minute chart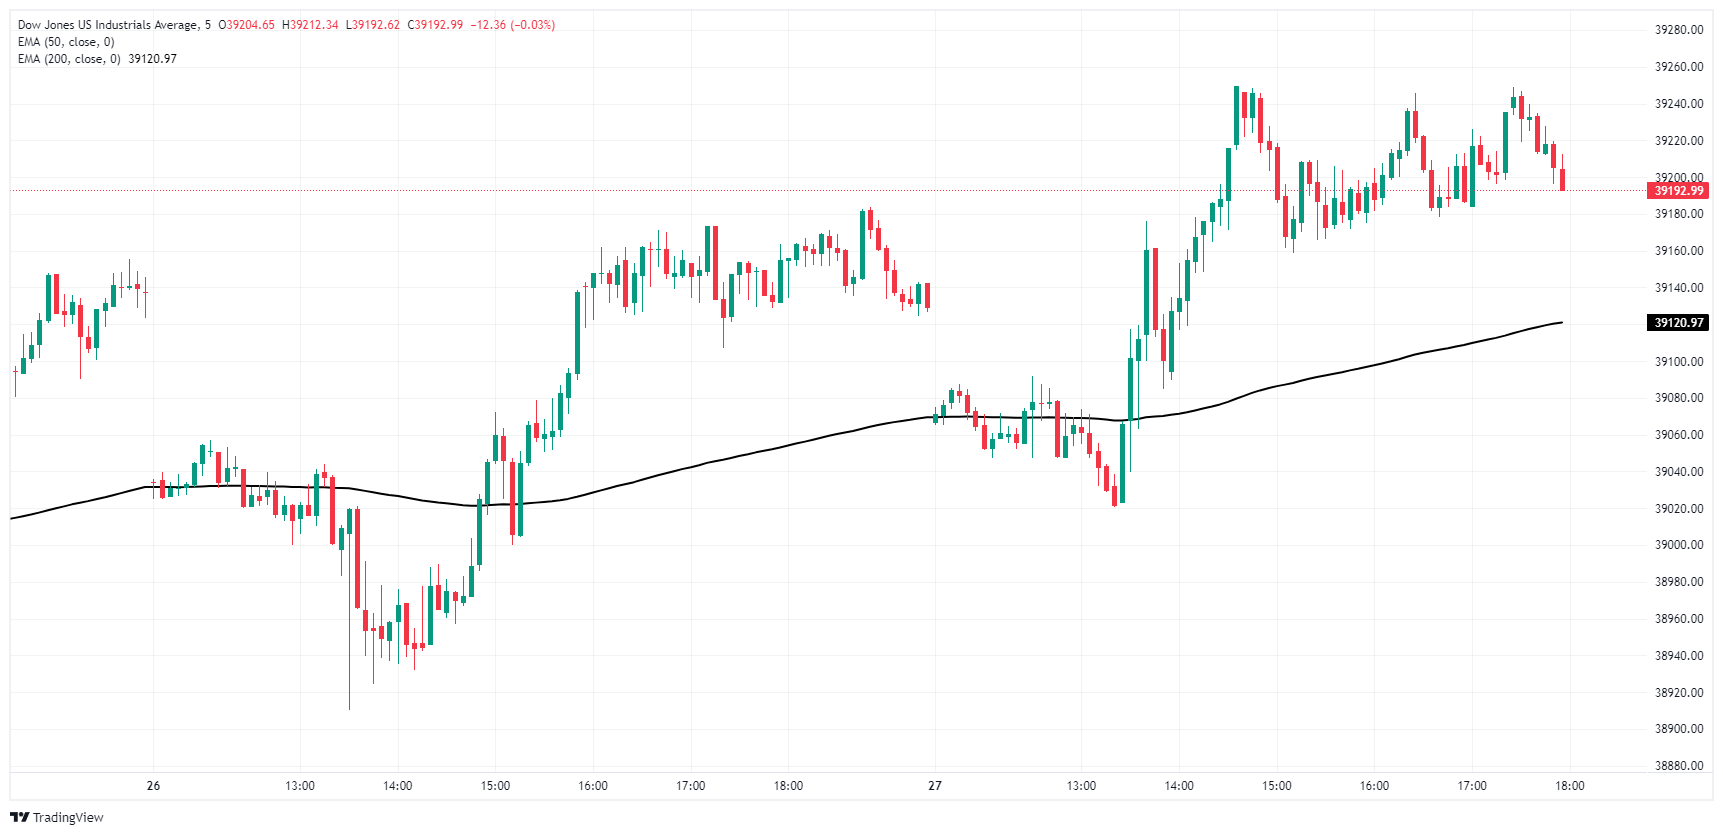
Dow Jones daily chart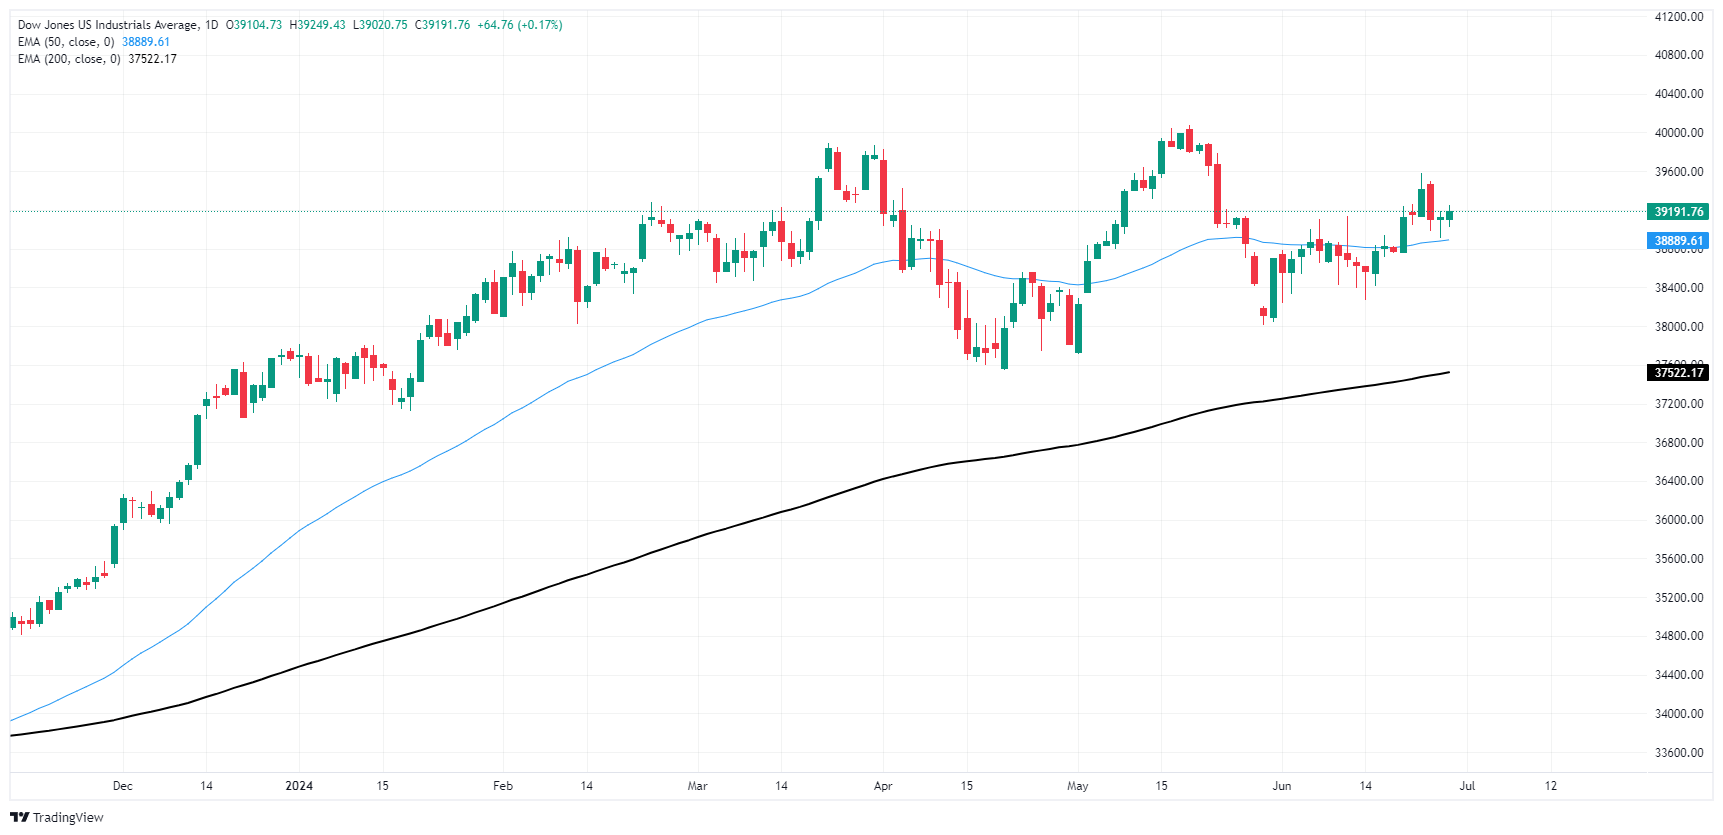
Dow Jones FAQs
The Dow Jones Industrial Average, one of the oldest stock market indices in the world, is compiled of the 30 most traded stocks in the US. The index is price-weighted rather than weighted by capitalization. It is calculated by summing the prices of the constituent stocks and dividing them by a factor, currently 0.152. The index was founded by Charles Dow, who also founded the Wall Street Journal. In later years it has been criticized for not being broadly representative enough because it only tracks 30 conglomerates, unlike broader indices such as the S&P 500.
Many different factors drive the Dow Jones Industrial Average (DJIA). The aggregate performance of the component companies revealed in quarterly company earnings reports is the main one. US and global macroeconomic data also contributes as it impacts on investor sentiment. The level of interest rates, set by the Federal Reserve (Fed), also influences the DJIA as it affects the cost of credit, on which many corporations are heavily reliant. Therefore, inflation can be a major driver as well as other metrics which impact the Fed decisions.
Dow Theory is a method for identifying the primary trend of the stock market developed by Charles Dow. A key step is to compare the direction of the Dow Jones Industrial Average (DJIA) and the Dow Jones Transportation Average (DJTA) and only follow trends where both are moving in the same direction. Volume is a confirmatory criteria. The theory uses elements of peak and trough analysis. Dow’s theory posits three trend phases: accumulation, when smart money starts buying or selling; public participation, when the wider public joins in; and distribution, when the smart money exits.
There are a number of ways to trade the DJIA. One is to use ETFs which allow investors to trade the DJIA as a single security, rather than having to buy shares in all 30 constituent companies. A leading example is the SPDR Dow Jones Industrial Average ETF (DIA). DJIA futures contracts enable traders to speculate on the future value of the index and Options provide the right, but not the obligation, to buy or sell the index at a predetermined price in the future. Mutual funds enable investors to buy a share of a diversified portfolio of DJIA stocks thus providing exposure to the overall index.
- Mexican Peso remains weaker despite positive economic data.
- Banxico expected to keep rates unchanged with Citibanamex survey indicating most economists forecast no rate cut until Q3 2024.
- US data shows higher than expected Q1 GDP, lower unemployment claims, and stronger Durable Goods Orders, boosting USD.
The Mexican Peso prints minimal losses in early trading during the North American session as traders brace for the monetary policy decision of the Bank of Mexico (Banxico), scheduled for 19:00 GMT. At the time of writing, the USD/MXN trades at 18.39, up by 0.36%.
Mexico’s economic data fared better than foreseen with the Unemployment Rate coming in below estimates, while the Balance of Trade printed a surprisingly surplus. Despite that, the Mexican currency remained slightly weaker against the US Dollar (USD).
Later, Banxico is expected to keep rates unchanged, based on the latest Citibanamex survey published on June 20. Of the 31 economists polled, just nine expect a rate cut to 10.75% later, while the other 22 market participants moved their projections to the third quarter of 2024.
Across the border, mixed data in the United States (US) boosted the Greenback against most emerging market currencies but dropping against most G7 currencies. The final reading of the Gross Domestic Product (GDP) for Q1 2024 was higher than expected, unemployment claims dipped, and Durable Goods Orders exceeded forecasts.
Therefore, the USD/MXN resumed to the upside, but it remains subject to Banxico’s decision. A hold could spark a U-turn and open the door to challenge the April 19 high turned support at 18.15. Further downside would be seen, once cleared.
Otherwise, if Banxico eases policy, the exotic pair might challenge the year-to-date (YTD) high of 18.99, with further gains seen once the level is cleared.
Daily digest market movers: Mexican Peso on the defensive ahead of Banxico
- Data from Mexico, revealed the Unemployment Rate in May was 2.6%, below estimates of 2.7%. The Balance of Trade printed a surplus of $1.99 billion, crushing the consensus projections for a $-2.04 billion deficit.
- Citibanamex survey showed economists priced out fewer rate cuts by the central bank, estimating rates will be lowered to 10.25% in 2024, up from 10.00%. Regarding the USD/MXN, the consensus year-end exchange rate estimate is 18.70, up from 18.00 in the previous report.
- Regarding economic growth, the consensus revised the Gross Domestic Product (GDP) for 2024 downward from 2.2% to 2.1% YoY.
- US GDP for Q1 2024 came at 1.4% higher than the 1.3% in the previous two readings, still trailing last year’s fourth quarter of a 3.4% expansion.
- US Durable Goods Orders in May rose by 0.1% MoM, exceeding forecasts for a -0.1% contraction. At the same time, Initial Jobless Claims dipped from 239K a week ago to 233K, beneath forecasts of 236K.
- CME FedWatch Tool shows odds for a 25-basis-point Fed rate cut at 59.5% up from Wednesday’s 56.3%.
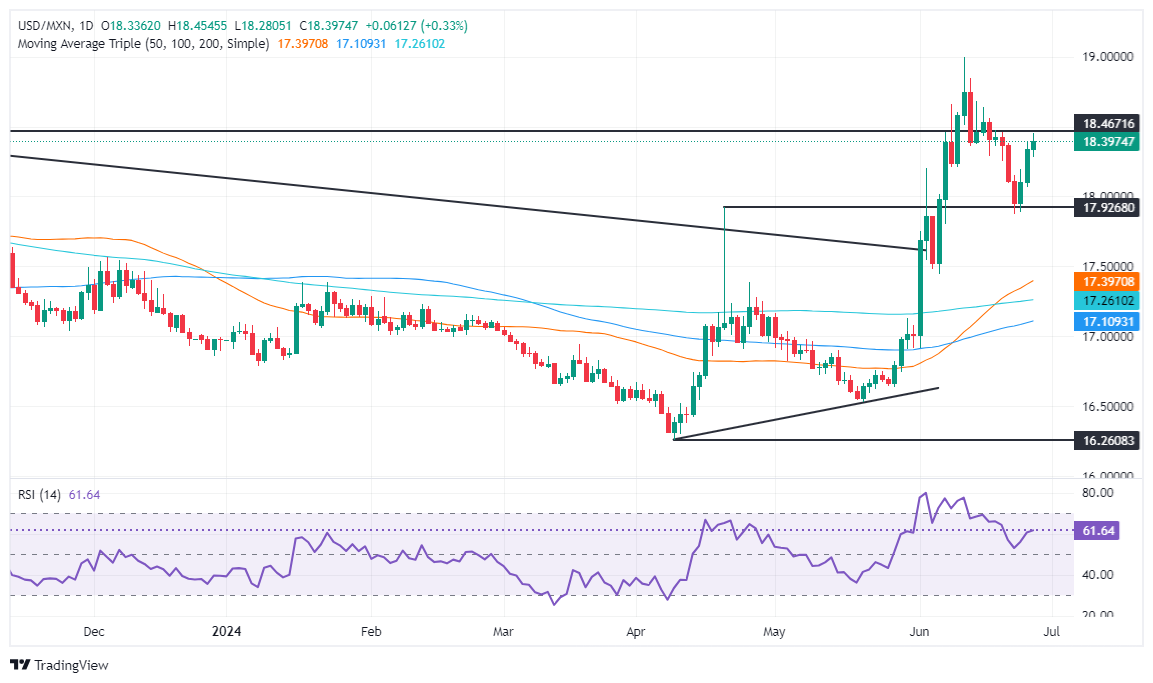
Technical analysis: Mexican Peso slides slightly as USD/MXN rallies back above 18.30
The USD/MXN is upwardly biased, yet the pair would likely remain volatile as Banxico’s decision looms. Despite that, momentum is in favor of buyers as the Relative Strength Index (RSI) suggests that bulls are in control.
For a bullish continuation, buyers need to push the USD/MXN exchange rate past the psychological 18.50 level. Once cleared, the next stop would be the year-to-date (YTD) high of 18.99, followed by the March 20, 2023, high of 19.23, followed by an uptick to 19.50.
On the flip side, if USD/MXN tumbles below the April 19 high turned support at 18.15, that will pave the way toward 18.00. Next key support level would be the 50-day Simple Moving Average (SMA) at 17.37 before testing the 200-day SMA at 17.23. Once those two levels are cleared, the next stop would be the 100-day SMA at 17.06.
Mexican Peso FAQs
The Mexican Peso (MXN) is the most traded currency among its Latin American peers. Its value is broadly determined by the performance of the Mexican economy, the country’s central bank’s policy, the amount of foreign investment in the country and even the levels of remittances sent by Mexicans who live abroad, particularly in the United States. Geopolitical trends can also move MXN: for example, the process of nearshoring – or the decision by some firms to relocate manufacturing capacity and supply chains closer to their home countries – is also seen as a catalyst for the Mexican currency as the country is considered a key manufacturing hub in the American continent. Another catalyst for MXN is Oil prices as Mexico is a key exporter of the commodity.
The main objective of Mexico’s central bank, also known as Banxico, is to maintain inflation at low and stable levels (at or close to its target of 3%, the midpoint in a tolerance band of between 2% and 4%). To this end, the bank sets an appropriate level of interest rates. When inflation is too high, Banxico will attempt to tame it by raising interest rates, making it more expensive for households and businesses to borrow money, thus cooling demand and the overall economy. Higher interest rates are generally positive for the Mexican Peso (MXN) as they lead to higher yields, making the country a more attractive place for investors. On the contrary, lower interest rates tend to weaken MXN.
Macroeconomic data releases are key to assess the state of the economy and can have an impact on the Mexican Peso (MXN) valuation. A strong Mexican economy, based on high economic growth, low unemployment and high confidence is good for MXN. Not only does it attract more foreign investment but it may encourage the Bank of Mexico (Banxico) to increase interest rates, particularly if this strength comes together with elevated inflation. However, if economic data is weak, MXN is likely to depreciate.
As an emerging-market currency, the Mexican Peso (MXN) tends to strive during risk-on periods, or when investors perceive that broader market risks are low and thus are eager to engage with investments that carry a higher risk. Conversely, MXN tends to weaken at times of market turbulence or economic uncertainty as investors tend to sell higher-risk assets and flee to the more-stable safe havens.
- Canadian Dollar went in both directions on Thursday’s mixed US data.
- Canada is absent from economic calendar until Friday’s GDP update.
- US PCE Price Index inflation also looms ahead on Friday.
The Canadian Dollar (CAD) gave a mixed performance on Thursday after a data-light economic calendar on the Canadian side left the CAD to twist amid a mixed print in key US figures. Markets are gearing up for Friday’s US Personal Consumption Expenditure Price Index (PCE) inflation release after Thursday’s burgeoning US release schedule ran the gamut.
Canada is absent from the economic calendar on Thursday, leaving CAD traders to shuffle in place until Friday’s Canadian Gross Domestic Product (GDP) update for April.
However, Friday’s US PCE Price Index inflation is set to eclipse Canadian GDP figures entirely. As a key reading of inflation for the Federal Reserve (Fed), significant market attention will be focused squarely on US price growth figures to cap off the trading week.
Daily digest market movers: US data comes in mixed, Canadian Dollar follows suit
- US Durable Goods Orders contracted in May, clocking in -0.1% MoM versus the forecast 0.2%, falling further than expected from the previous 0.4%.
- US Q1 GDP came in exactly as expected with first-quarter GDP slightly revised to 1.4% from the initial print of 1.3%.
- US Initial Jobless Claims beat expectations with 233K net new jobless benefits seekers for the week ended June 21. Median market forecasts had expected a print of 236K compared to the previous week’s 238K.
- US Core Personal Consumption Expenditures, a preview of Friday’s PCE Price Index, ticked upwards to 3.7% in the first quarter versus the expected hold at 3.6%.
- Friday’s Canadian MoM GDP in May is expected to rebound to 0.3% from the previous flat print.
- US core PCE Price Index inflation is expected to ease to 0.1% in May from the previous 0.2%.
Canadian Dollar PRICE Today
The table below shows the percentage change of Canadian Dollar (CAD) against listed major currencies today. Canadian Dollar was the strongest against the Swiss Franc.
| USD | EUR | GBP | JPY | CAD | AUD | NZD | CHF | |
|---|---|---|---|---|---|---|---|---|
| USD | -0.24% | -0.22% | -0.06% | -0.11% | -0.02% | -0.12% | 0.07% | |
| EUR | 0.24% | 0.00% | 0.15% | 0.11% | 0.23% | 0.09% | 0.31% | |
| GBP | 0.22% | -0.00% | 0.18% | 0.11% | 0.23% | 0.12% | 0.32% | |
| JPY | 0.06% | -0.15% | -0.18% | -0.05% | 0.04% | -0.09% | 0.15% | |
| CAD | 0.11% | -0.11% | -0.11% | 0.05% | 0.08% | -0.01% | 0.19% | |
| AUD | 0.02% | -0.23% | -0.23% | -0.04% | -0.08% | -0.10% | 0.08% | |
| NZD | 0.12% | -0.09% | -0.12% | 0.09% | 0.01% | 0.10% | 0.20% | |
| CHF | -0.07% | -0.31% | -0.32% | -0.15% | -0.19% | -0.08% | -0.20% |
The heat map shows percentage changes of major currencies against each other. The base currency is picked from the left column, while the quote currency is picked from the top row. For example, if you pick the Canadian Dollar from the left column and move along the horizontal line to the US Dollar, the percentage change displayed in the box will represent CAD (base)/USD (quote).
Technical analysis: Canadian Dollar churns on data-light Thursday, but gains remain thin
The Canadian Dollar (CAD) is mixed on Thursday, giving a middling performance in overall quiet markets. The CAD is up over a tenth of a percent against the Swiss Franc (CHF) and the Japanese Yen (JPY), but falling back a fifth of a percent against the Euro (EUR) and the Pound Sterling (GBP).
USD/CAD is stuck close to Thursday’s opening bids after an early dip to 1.3680. The pair remains stuck in a price action trap near the 1.3700 handle as intraday bids get hung up on the 200-hour Exponential Moving Average (EMA) at 1.3692.
Daily candlesticks are forming a bullish bounce after running aground of the 50-day EMA at 1.3676 and is set to snap a near-term losing streak after the pair flubbed a bullish recovery of the 1.3800 handle earlier in June.
USD/CAD hourly chart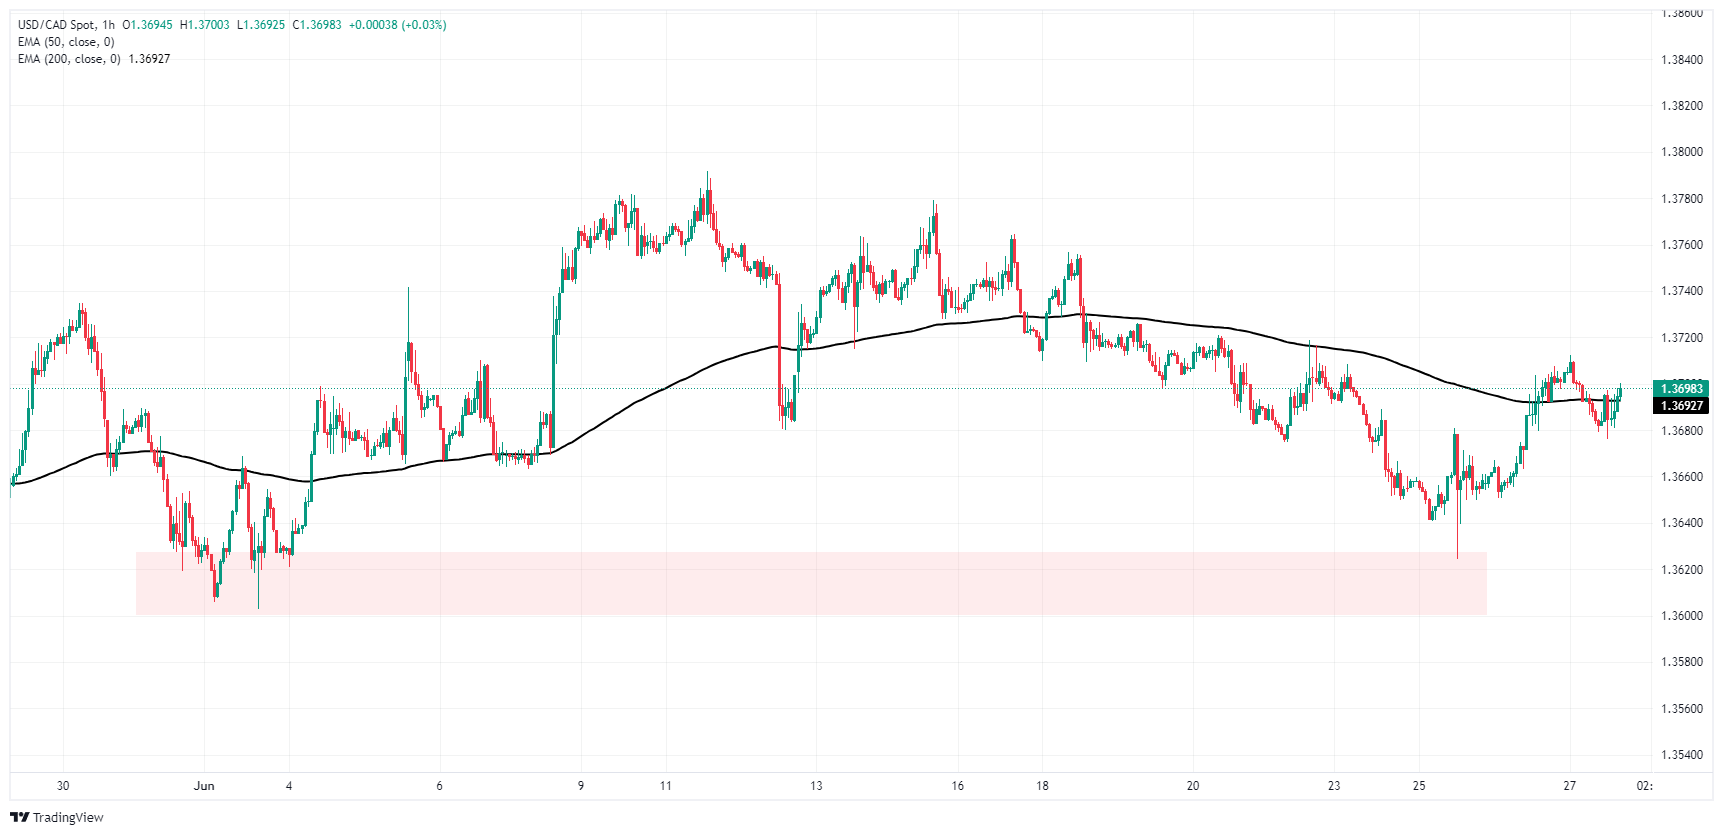
USD/CAD daily chart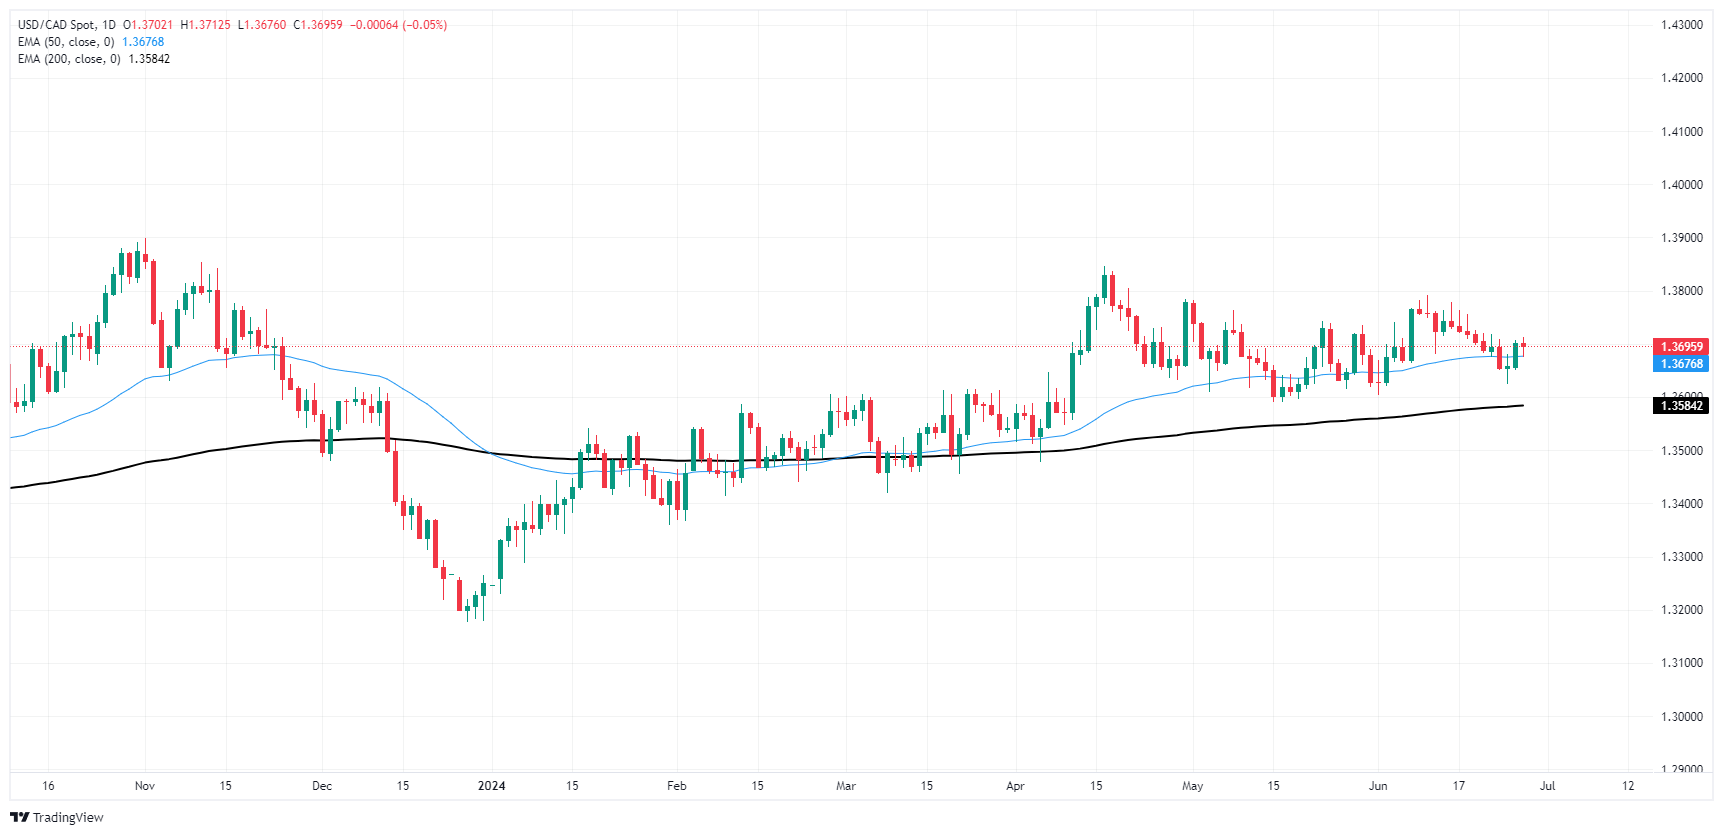
Canadian Dollar FAQs
The key factors driving the Canadian Dollar (CAD) are the level of interest rates set by the Bank of Canada (BoC), the price of Oil, Canada’s largest export, the health of its economy, inflation and the Trade Balance, which is the difference between the value of Canada’s exports versus its imports. Other factors include market sentiment – whether investors are taking on more risky assets (risk-on) or seeking safe-havens (risk-off) – with risk-on being CAD-positive. As its largest trading partner, the health of the US economy is also a key factor influencing the Canadian Dollar.
The Bank of Canada (BoC) has a significant influence on the Canadian Dollar by setting the level of interest rates that banks can lend to one another. This influences the level of interest rates for everyone. The main goal of the BoC is to maintain inflation at 1-3% by adjusting interest rates up or down. Relatively higher interest rates tend to be positive for the CAD. The Bank of Canada can also use quantitative easing and tightening to influence credit conditions, with the former CAD-negative and the latter CAD-positive.
The price of Oil is a key factor impacting the value of the Canadian Dollar. Petroleum is Canada’s biggest export, so Oil price tends to have an immediate impact on the CAD value. Generally, if Oil price rises CAD also goes up, as aggregate demand for the currency increases. The opposite is the case if the price of Oil falls. Higher Oil prices also tend to result in a greater likelihood of a positive Trade Balance, which is also supportive of the CAD.
While inflation had always traditionally been thought of as a negative factor for a currency since it lowers the value of money, the opposite has actually been the case in modern times with the relaxation of cross-border capital controls. Higher inflation tends to lead central banks to put up interest rates which attracts more capital inflows from global investors seeking a lucrative place to keep their money. This increases demand for the local currency, which in Canada’s case is the Canadian Dollar.
Macroeconomic data releases gauge the health of the economy and can have an impact on the Canadian Dollar. Indicators such as GDP, Manufacturing and Services PMIs, employment, and consumer sentiment surveys can all influence the direction of the CAD. A strong economy is good for the Canadian Dollar. Not only does it attract more foreign investment but it may encourage the Bank of Canada to put up interest rates, leading to a stronger currency. If economic data is weak, however, the CAD is likely to fall.
USD/JPY rises to 37y high of 160.87 overnight. Next resistance is at 161.20, OCBC analysts Frances Cheung and Christopher Wong note.
Markets eye intervention
“USDJPY rose to 37y high of 160.87 overnight. Higher UST yields was the latest trigger to push USD/JPY higher, in line with our caution that USDJPY should continue to mount a challenge above 160. We also expect the rise past 2024 high to test the resolve of Japanese authorities.”
“That said, intervention is at best an option to slow the pace of depreciation and not a tool to reverse the trend. For USDJPY to turn lower, that would require the USD to turn/Fed to cut or for BoJ to signal an intent to normalise urgently. None of the above appears to be taking place, so the path of least resistance for USD/JPY may still be to the upside.”
“Pair was last at 160.41. Bullish momentum on daily chart intact though RSI shows signs of turning lower from near overbought conditions. Next resistance at 161.20 (138.2% fibo projection of 2023 low to 2023), 164 levels. Support at 157.70 (21 DMA), 156.60 (50 DMA).”
EUR slipped overnight but losses remain confined to recent range, OCBC analysts Frances Cheung and Christopher Wong note.
Bearish momentum slowly fades away
“Pair was last at 1.0703 levels. Bearish momentum on daily chart shows signs of fading while RSI rose slightly. Some risks to the upside but 2-way trades still likely ahead of French election on Sunday.”
“Support at 1.0660/70 levels (recent low) before 1.06 levels. Resistance at 1.0770 (50 DMA), 1.0810 (38.2% fibo retracement of 2024 high to low, 100 DMA).”
The Dollar Index (DXY) rose, taking cues from higher UST yields and the run-up in USD/JPY above 160-mark. Elsewhere, slippage in EUR also added to gains in the DXY. This week, the focus is on PCE core (Fri), OCBC analysts Frances Cheung and Christopher Wong note.
DXY seems bullish ahead of US PCE
“Softer core CPI, PPI readings in May should see core PCE print softer. A weaker than expected print should raise hopes for Federal Reserve (Fed) rate cut. This should also tamper USD gains, but hotter print may continue to fuel USD momentum.”
“DXY was last at 105.84 levels. c while RSI is near overbought conditions. Resistance at 106.20. Support at 105.20 (21, 50 DMAs), 104.80 (61.8% fibo retracement of Oct high to 2024 low).”
“We also note that ½-yearly end and month-end flows may have the potential to distort price action later this week. US presidential debate on Fri may also be of interest to FX and rates markets.”
- GBP/USD climbs to 1.2652, up 0.25%, remaining under the 1.2703 weekly high.
- Technical stance neutral; daily MAs range between 1.2641 and 1.2557.
- 'Evening star' pattern and bearish RSI suggest potential drop; support at 1.2641/39 (100 & 50-DMAs), 1.2600, 1.2555 (200-DMA).
- For bullish move, GBP/USD must surpass 1.2700 and tackle resistance at 1.2730/40.
The Pound Sterling gathers some steam versus the Greenback, yet it remains trading below the weekly highs of 1.2703 as investors await the US Personal Consumption Expenditure (PCE) Price Index release, along with fears of the upcoming general election in the UK. The GBP/USD trades at 1.2652, up 0.25%.
GBP/USD Price Analysis: Technical outlook
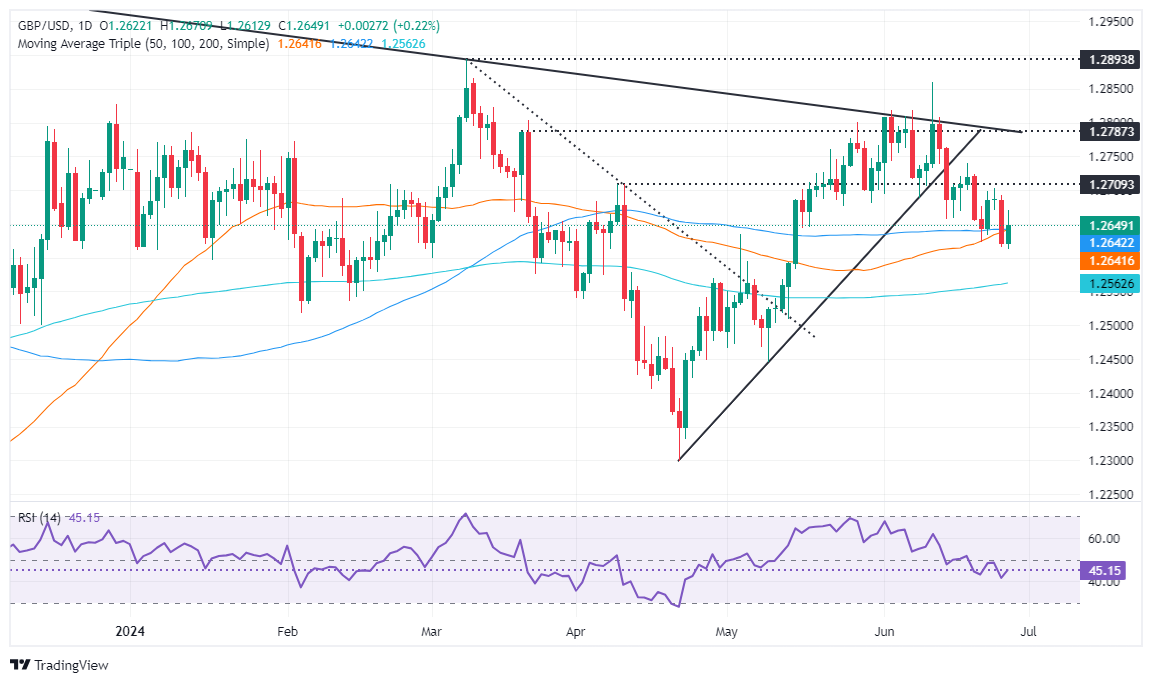
The GBP/USD is neutral biased further confirmed by almost fla daily moving averages (DMAs) trapped within the 1.2641-1.2557 range. The formation of an ‘evening star’ kept traders from reclaiming 1.2700, exacerbated Cable’s fall to a six-week low of 1.2612.
Momentum favors sellers as depicted by the Relative Strength Index (RSI) standing at bearish territory; therefore, the GBP/USD path of least resistance is tilted to the downside.
First support would be the confluence of the 100 and 50-DMAs at around 1.2641/39, followed by the 1.2600 psychological figure. Once surpassed, the next demand zone to challenge would be the 200-DMA at 1.2555.
For a bullish continuation, traders must claim 1.2700 and clear a previous support trendline turned resistance at around 1.2730/40.
GBP/USD Price Action – Daily Chart
Pound Sterling FAQs
The Pound Sterling (GBP) is the oldest currency in the world (886 AD) and the official currency of the United Kingdom. It is the fourth most traded unit for foreign exchange (FX) in the world, accounting for 12% of all transactions, averaging $630 billion a day, according to 2022 data. Its key trading pairs are GBP/USD, aka ‘Cable’, which accounts for 11% of FX, GBP/JPY, or the ‘Dragon’ as it is known by traders (3%), and EUR/GBP (2%). The Pound Sterling is issued by the Bank of England (BoE).
The single most important factor influencing the value of the Pound Sterling is monetary policy decided by the Bank of England. The BoE bases its decisions on whether it has achieved its primary goal of “price stability” – a steady inflation rate of around 2%. Its primary tool for achieving this is the adjustment of interest rates. When inflation is too high, the BoE will try to rein it in by raising interest rates, making it more expensive for people and businesses to access credit. This is generally positive for GBP, as higher interest rates make the UK a more attractive place for global investors to park their money. When inflation falls too low it is a sign economic growth is slowing. In this scenario, the BoE will consider lowering interest rates to cheapen credit so businesses will borrow more to invest in growth-generating projects.
Data releases gauge the health of the economy and can impact the value of the Pound Sterling. Indicators such as GDP, Manufacturing and Services PMIs, and employment can all influence the direction of the GBP. A strong economy is good for Sterling. Not only does it attract more foreign investment but it may encourage the BoE to put up interest rates, which will directly strengthen GBP. Otherwise, if economic data is weak, the Pound Sterling is likely to fall.
Another significant data release for the Pound Sterling is the Trade Balance. This indicator measures the difference between what a country earns from its exports and what it spends on imports over a given period. If a country produces highly sought-after exports, its currency will benefit purely from the extra demand created from foreign buyers seeking to purchase these goods. Therefore, a positive net Trade Balance strengthens a currency and vice versa for a negative balance.
Precious metals are on the front foot despite the mixed bag of economic data this morning, commodity analysts at TD Securities note.
Hot PCE data to push Gold higher
“Traders will continue to watch the data like hawks, particularly as it represents a key catalyst for the macro traders who have thus far been happy to remain underpositioned in Gold (XAU/USD) for the coming Fed cutting cycle.”
“In this sense, the PCE data will be top of mind after the below consensus CPI and PPI data, and we look for the core segment to advance at its softest monthly pace of the year at 0.13%. Further signs that inflation is easing could start to generate more certainty around the Fed's cutting path and finally get the macro community comfortable getting back into the market.”
“On the flip side however, we see only limited scope for downside should data come in hot. Indeed, Commodity Trading Advisors (CTAs) hold a margin of safety above $2,208/oz before any material selling, while physical demand from central banks and Asian precious metals appetite continues to support the market.”
- NZD/USD is recovering in a throwback move to the neckline of a topping pattern it recently pierced.
- The pair is at a critical point – whilst the odds favor a resumption of the downside bias, a continuation higher is possible.
- A break below the June 26 low would confirm a continuation down to a target for the topping pattern.
NZD/USD has formed a complex multi-peak topping pattern which is at risk of breaking down now that the pair’s “neckline” – the level underpinning its trough lows – at around 0.6100, has been decisively pierced.
NZD/USD 4-hour Chart
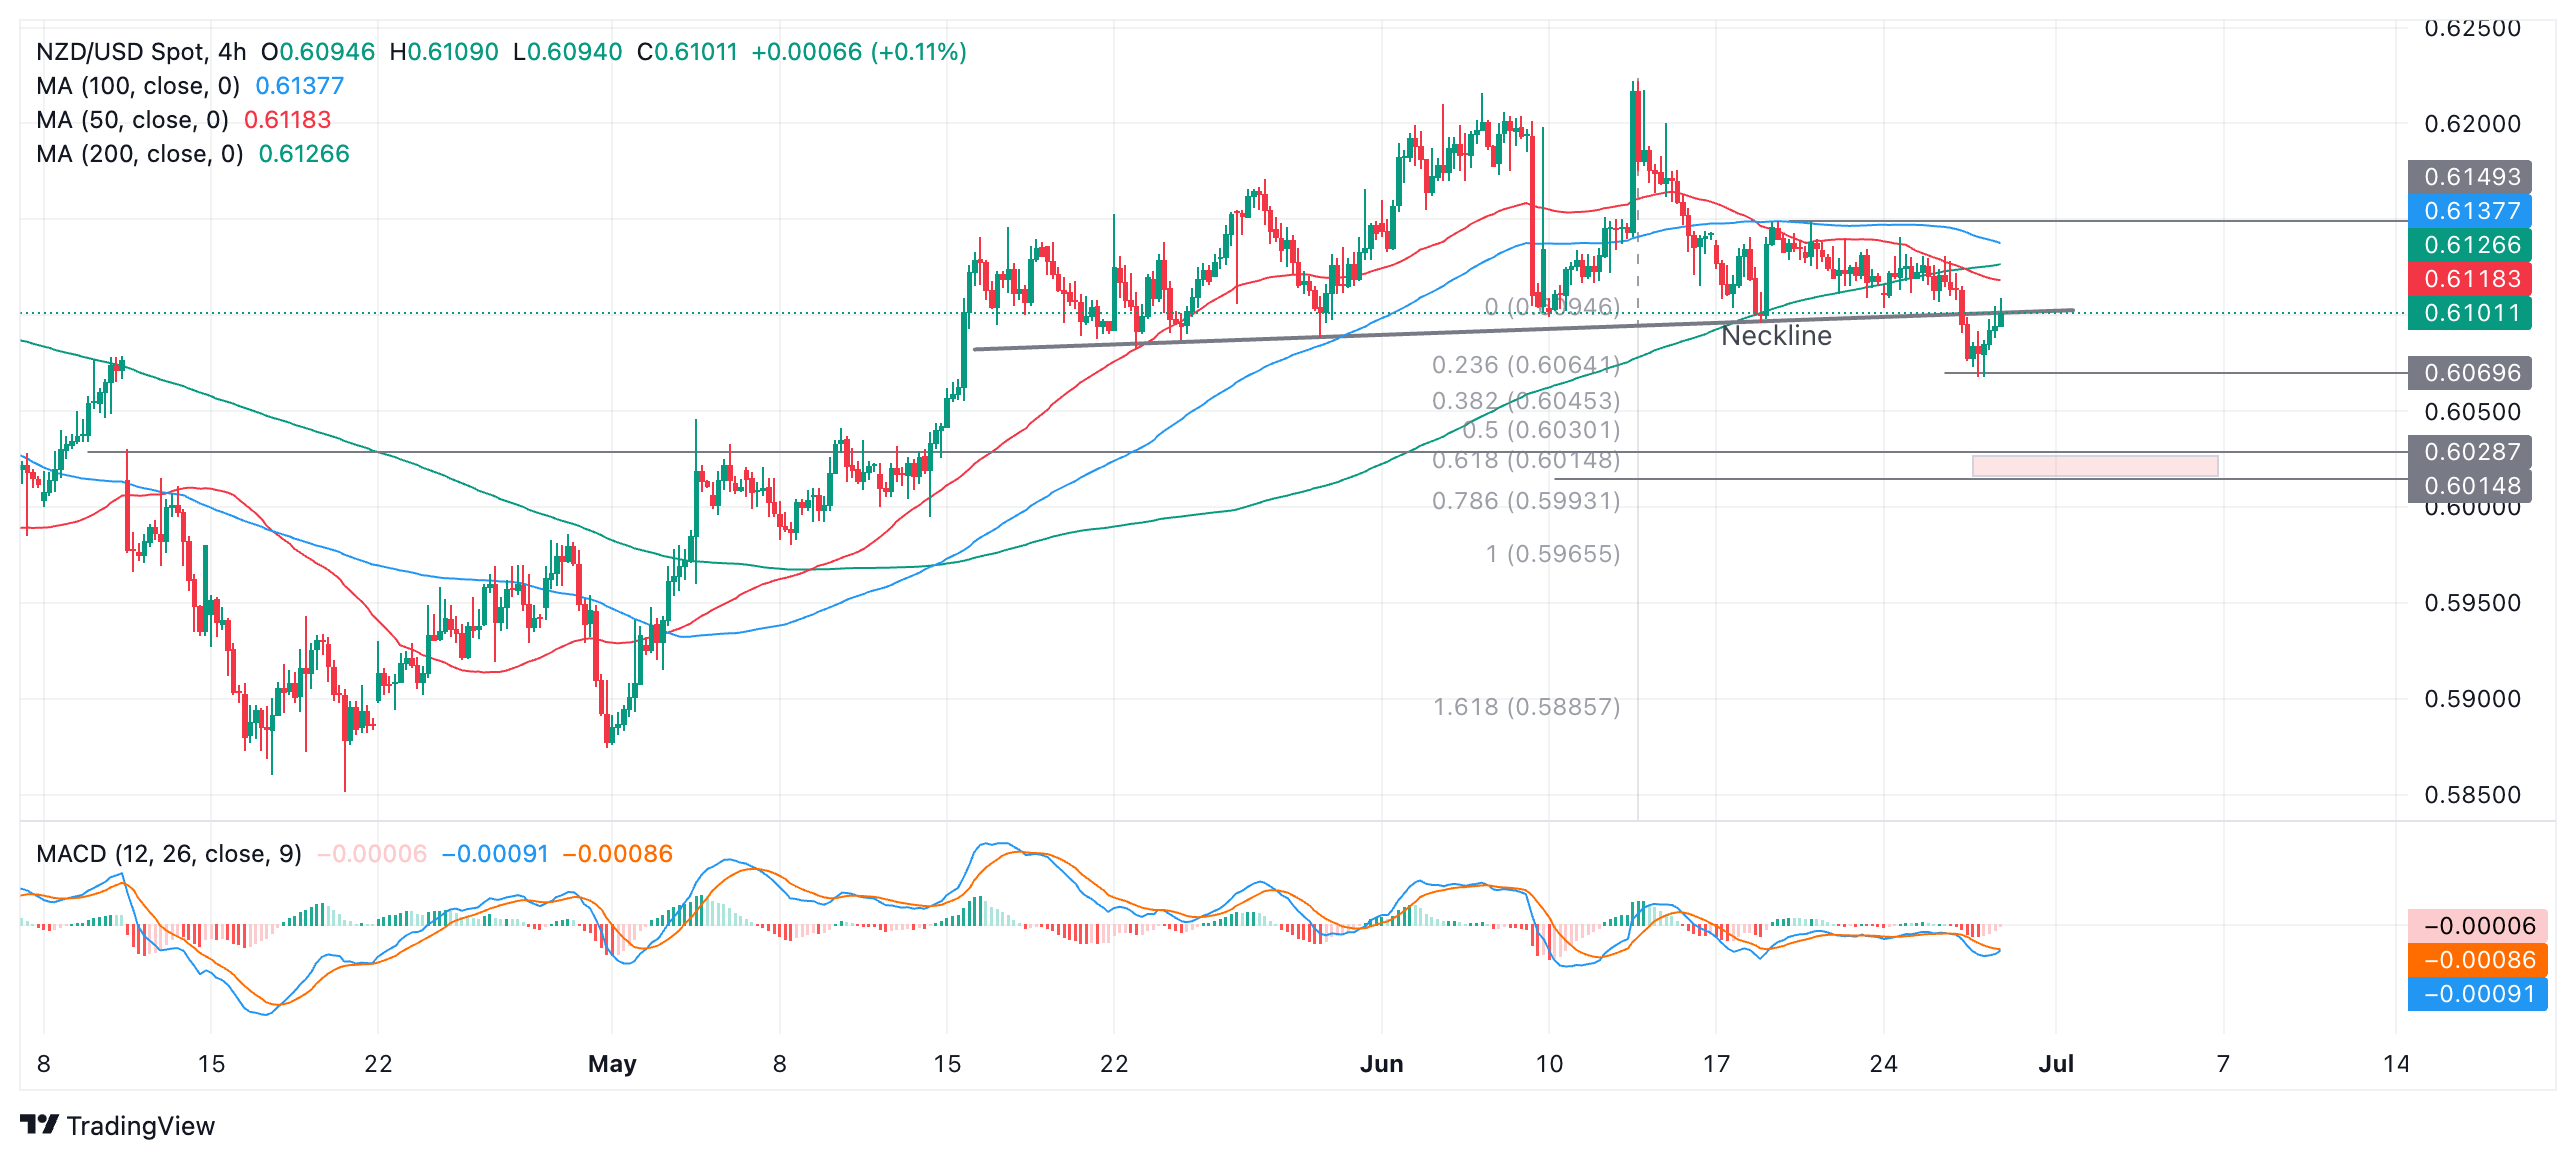
NZD/USD pierced cleanly through the neckline on June 26 and fell to a low of 0.6068. However, it quickly mounted a recovery and returned back to the neckline.
The recovery back up to the neckline could be what is called a “throwback” in technical parlance. This is a move that comes immediately after a breakout from a chart pattern in which the price recovers back to the original boundary line, or in this case neckline.
The throwback is usually only a temporary recovery before price surrenders to the overwhelming downwards pressure and falls back down to the pattern’s breakout target. However, this is not always the case and sometimes price will recover.
A break below the June 26 low at 0.6068 would provide confirmation of a resumption of the downmove, to a target in a zone (shaded red) between 0.6028 (bottom of April 10 price gap) and 0.6015, the Fibonacci 0.618 extension of the height of the pattern.
This is a conservative estimate and it is possible the pair could go even lower to 0.5965, the 100% extrapolation of the height of the pattern from the neckline lower.
A break above the 0.6149 (June 13 and 14 high) would invalidate the break and the pattern and possibly indicate a continuation higher instead.
- Silver price rebounds strongly from $28.60 as the US Dollar corrects.
- US price pressures are expected to have slowed in May.
- Fed Bowman sees no rate cuts this year.
Silver price (XAG/USD) recovers sharply from a six-week low of $28.60 in Thursday’s New York session. The white metal rises to near $29.20 as the US Dollar (USD) extends its correction amid caution ahead of the United States (US) core Personal Consumption Expenditure Price Index (PCE) data for May, which will be published on Friday.
The US PCE report is expected to show that core price pressures grew at a slower pace of 0.1% against 0.2% in April month-on-month. Annually, the underlying inflation is projected to have decelerated to 2.6% from 2.8% in April.
The scenario in which price pressures decline, as expected or more than that, would boost expectations of early rate cuts by the Fed. Currently, financial markets expect that the Fed will start reducing interest rates from the September meeting and will deliver subsequent rate cuts in the November or December meeting. On the contrary, hot inflation reading would be favorable for the US Dollar and bond yields.
Meanwhile, Fed policymakers continue to argue in favor of maintaining interest rates at their current levels to bring down inflation to 2%. On Wednesday, Fed Governor Michelle Bowman pushed back rate-cut prospects and warned of more rate hikes if disinflation inflation appears to be stalling or reversing.
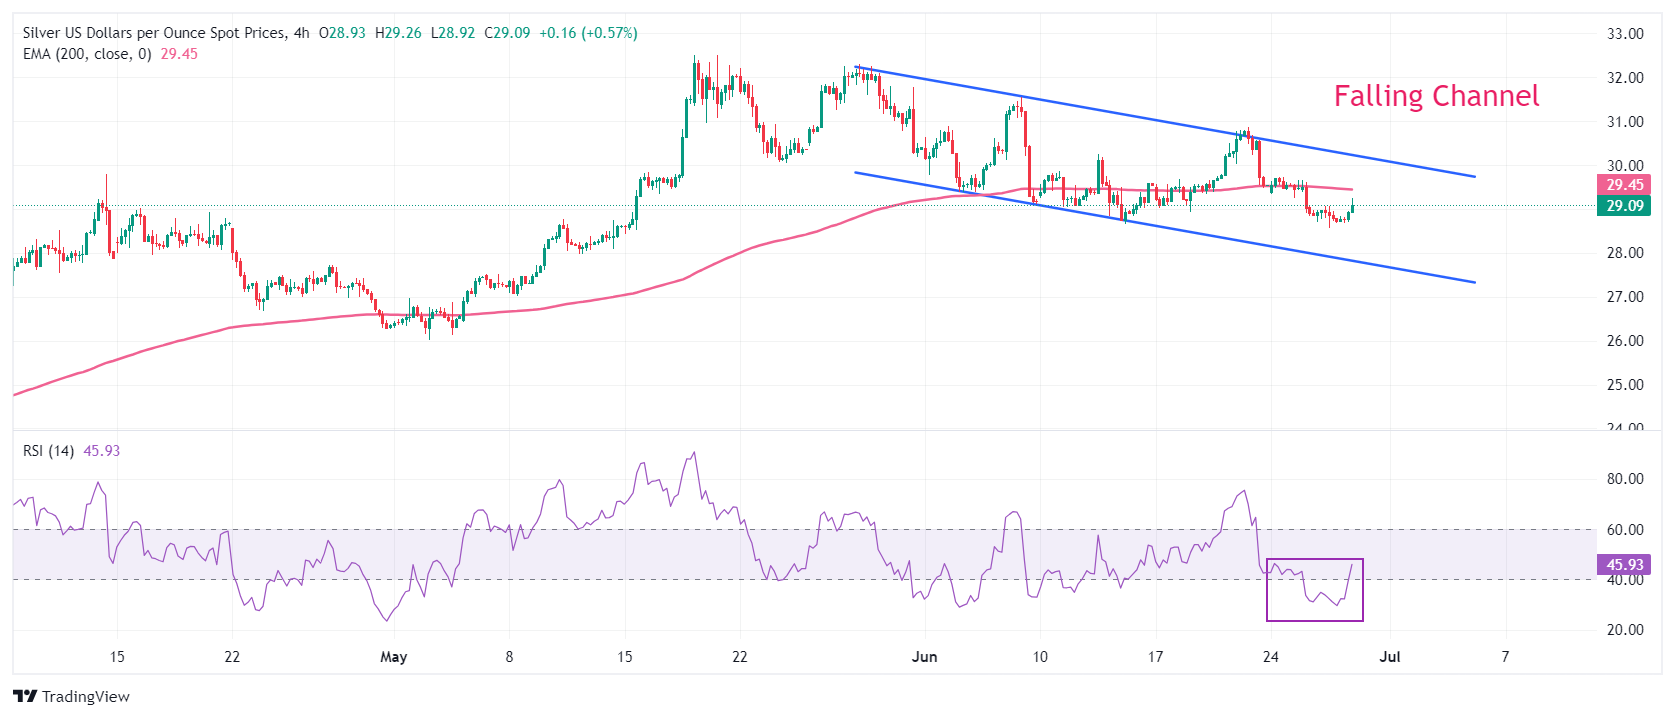
Silver technical analysis
Silver price trades in a Falling Channel chart pattern in which each pullback is considered as selling opportunity by market participants. The white metal trades below the 200-period Exponential Moving Average (EMA), which trades around $29.45.
The 14-period Relative Strength Index (RSI) returns into the 40.00-60.00 range from the bearish trajectory of 20.00-40.00, suggesting that a downside momentum is over.
Silver four-hour chart
Economic Indicator
Core Personal Consumption Expenditures - Price Index (YoY)
The Core Personal Consumption Expenditures (PCE), released by the US Bureau of Economic Analysis on a monthly basis, measures the changes in the prices of goods and services purchased by consumers in the United States (US). The PCE Price Index is also the Federal Reserve’s (Fed) preferred gauge of inflation. The YoY reading compares the prices of goods in the reference month to the same month a year earlier. The core reading excludes the so-called more volatile food and energy components to give a more accurate measurement of price pressures." Generally, a high reading is bullish for the US Dollar (USD), while a low reading is bearish.
Read more.Next release: Fri Jun 28, 2024 12:30
Frequency: Monthly
Consensus: 2.6%
Previous: 2.8%
Source: US Bureau of Economic Analysis
After publishing the GDP report, the US Bureau of Economic Analysis releases the Personal Consumption Expenditures (PCE) Price Index data alongside the monthly changes in Personal Spending and Personal Income. FOMC policymakers use the annual Core PCE Price Index, which excludes volatile food and energy prices, as their primary gauge of inflation. A stronger-than-expected reading could help the USD outperform its rivals as it would hint at a possible hawkish shift in the Fed’s forward guidance and vice versa.
Oil markets are holding steady despite the surprise increase in crude inventories reported by the U.S. Department of Energy (DOE), TDS analysts note.
Weaker demand and a large inventory weigh on prices
“Systematic flows have eased in WTI, but Brent crude could still see funds look to add +7% of their max historic position if prices can hold above $85.99/bbl.”
“Elsewhere, weaker demand statistics and a large inventory build in gasoline, bucking the typical seasonal pattern heading into summer driving season, has prompted Commodity Trading Advisors (CTAs) to turn heavy sellers in RBOB gasoline.”
Atlanta Federal Reserve President Raphael Bostic said on Thursday that an interest rate cut in the fourth quarter was likely, with inflation moving in the right direction, per Reuters.
Key takeaways
"Penciled in four quarter-percentage-point rate cuts for 2025, Fed is on a long term arc."
"Want to be absolutely certain inflation will return to 2% before an initial cut that should be seen as the first in a series; that is a reason for patience."
"Inflation remains chief concern, businesses say they see no cliff' ahead for the job market."
"Fed can achieve 2% inflation with a job market that remains tight by historical standards."
"Service businesses say pricing power is eroding."
"Housing costs are a frontline conversation, though he remains confident shelter inflation will fall back into line."
"Labor market is loosening but it's not loose."
"GDP and job market data point to orderly deceleration in activity that will balance supply and demand, lower inflation."
Market reaction
These comments failed to trigger a noticeable reaction in the US Dollar (USD). At the time of press, the USD Index was down 0.26% on the day at 105.77.
- AUD/USD is contracting within a very tight range, itself within a range.
- The pair is likely to break out of both ranges eventually in an explosive move.
- An upside breakout is marginally more likely given the trend prior to the formation of the range was bullish.
AUD/USD is trading in a mini range within a range, visible on the 4-hour price chart. The pair has been going sideways since the middle of May but since June 19 the waves of buying and selling have further narrowed creating a “range-within-a-range”.
AUD/USD 4-hour Chart
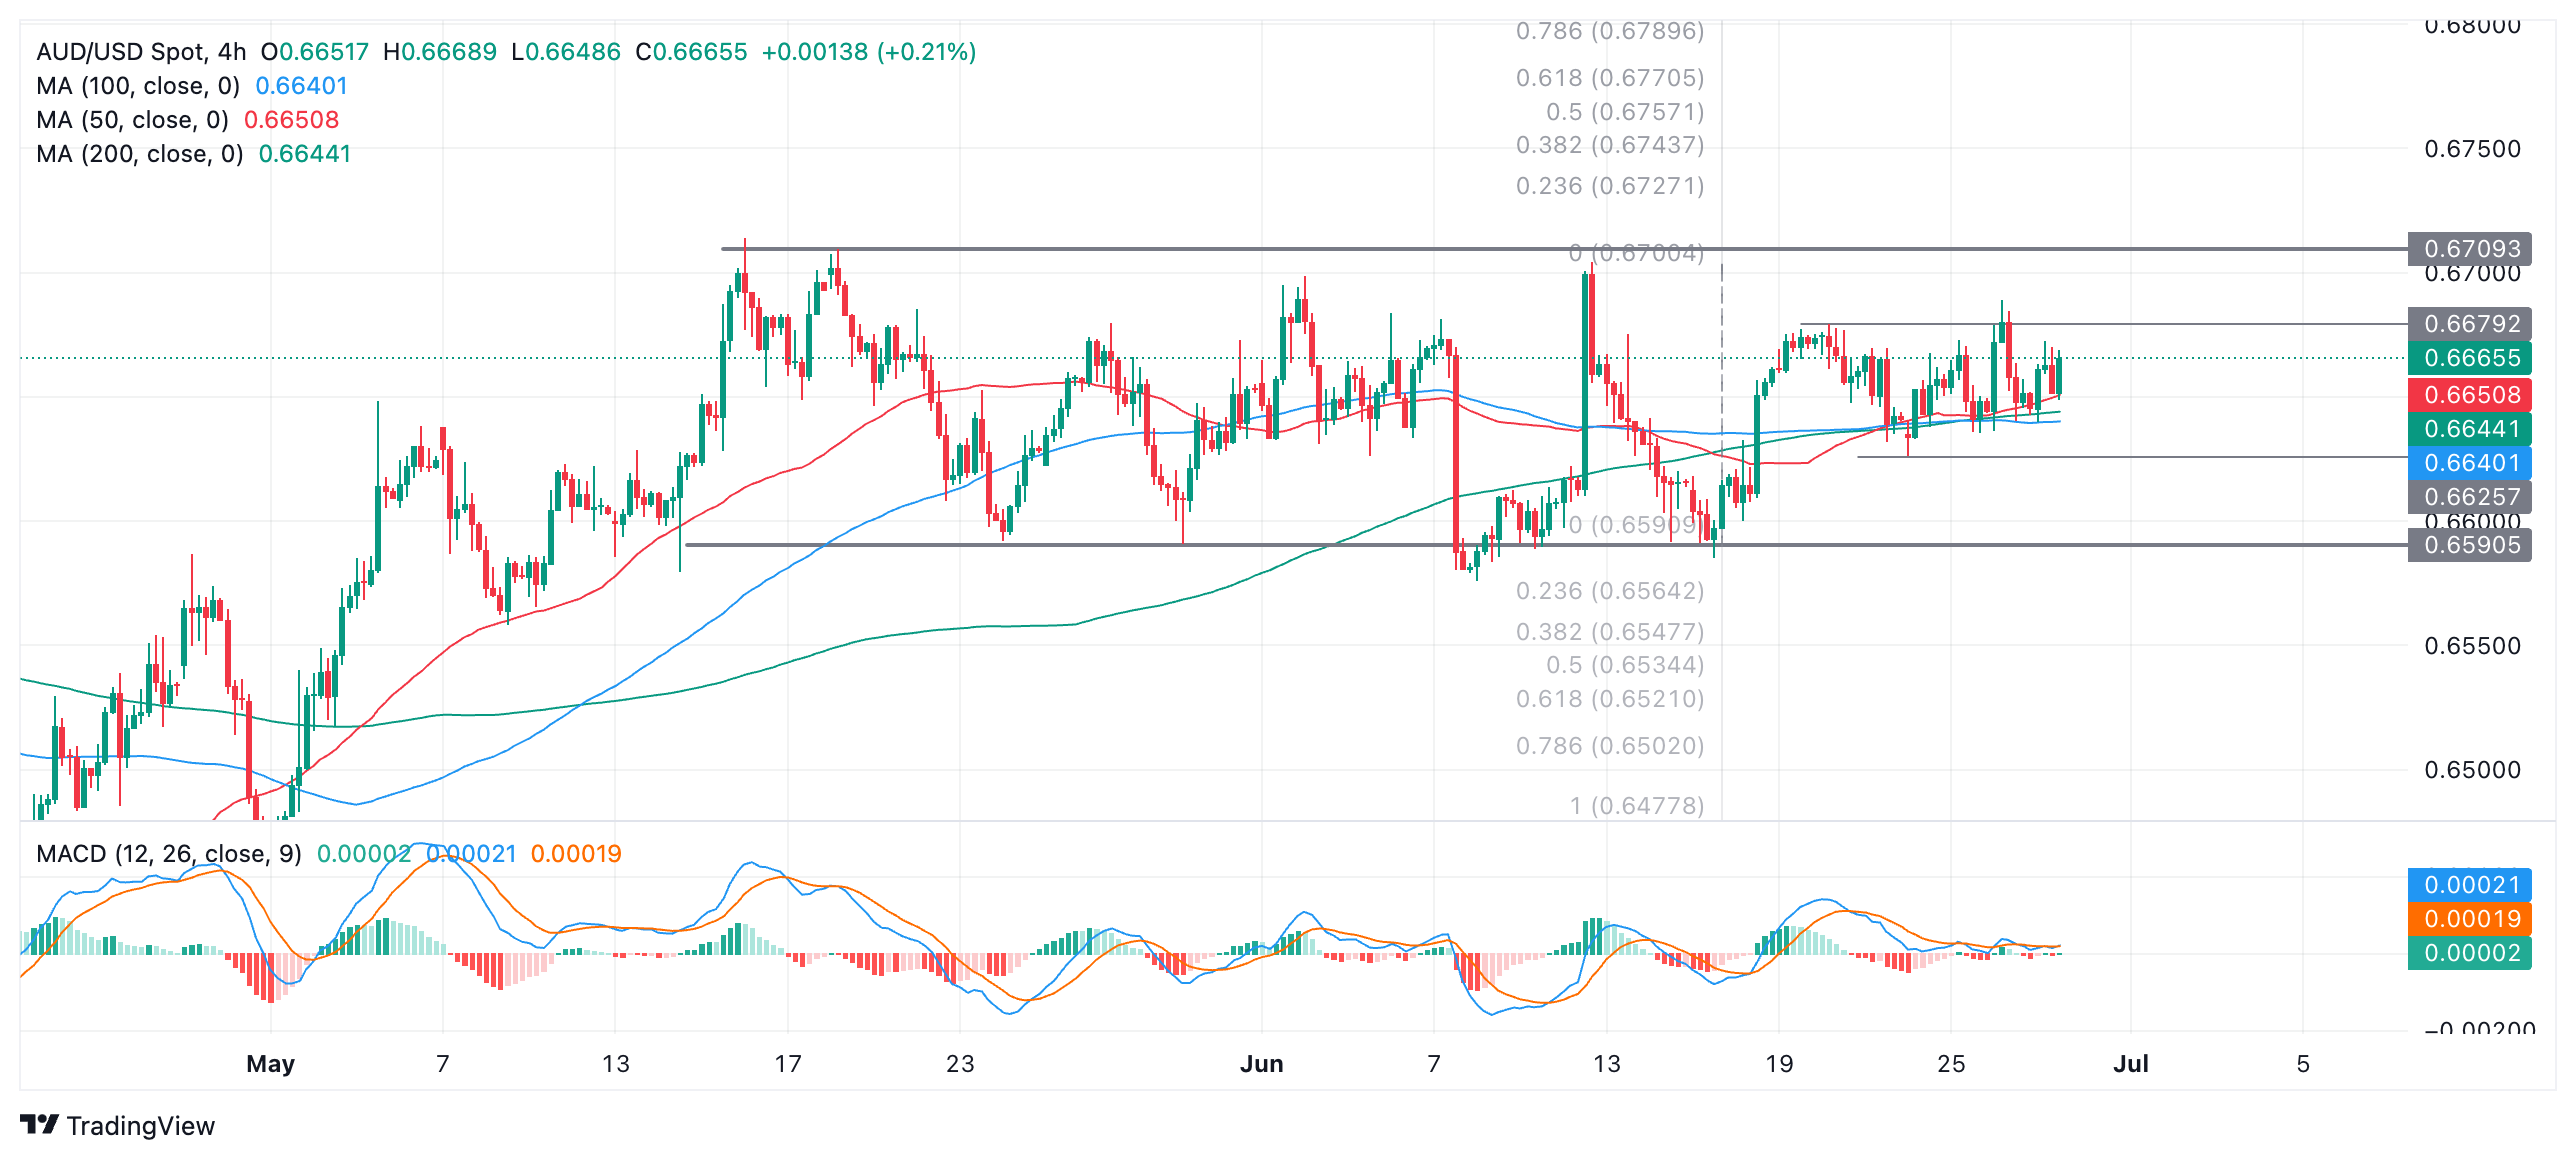
A break above the mini-range high at 0.6679 would probably indicate a continuation up to the enveloping-range ceiling at 0.6709. Likewise a break below the mini-range low at 0.6625 would probably lead to a move down to the larger-range floor at 0.6590.
The short-term trend is sideways and as long as price remains within the bounds of the larger range it will likely keep extending within the range, since “the trend is your friend” as the saying goes.
Eventually the pair will break out of its range and the move is likely to be very strong since it is a general rule of markets that periods of low volatility like now are followed by sudden bursts of high volatility.
An upside breakout is marginally more likely to happen because the trend prior to the formation of the range was bullish.
A decisive break above the ceiling of the range would see a follow-through to a conservative target at 0.6770. A decisive break below the range floor would indicate a follow-through to an initial target at 0.6521.
A decisive break would be one in which a longer-than-average candle broke out of the range and closed near its high or low, or three successive candles of the same color broke cleanly through the range top or bottom.
The targets are generated using the technical-analysis method of extrapolating the height of the range by a Fibonacci 0.618 ratio higher (in the case of an upside break) or lower (in the case of a downside break). A more generous target would come from extrapolating the full height of the range.
- USD/CAD declines from 1.3700 as the US Dollar slumps ahead of the US core PCE inflation reading.
- US Durable Goods Orders barely rose in May.
- The Canadian economy is estimated to have expanded by 0.3% in April.
The USD/CAD pair drops in an attempt to break decisively above the round-level resistance of 1.3700 in Thursday’s New York session. The Loonie asset edges lower as the US Dollar (USD) corrects with focus on the United States (US) core Personal Consumption Expenditure price index (PCE) data for May, which will be published on Friday.
Investors will pay close attention to the underlying inflation as it will provide fresh cues on the interest rate outlook. Soft inflation figures would boost expectations of early rate cuts by the Federal Reserve (Fed) while hot numbers will diminish them.
In the American session, the US Dollar has come under pressure despite the US Durable Goods Orders surprisingly rose for May. Fresh orders for durable goods expanded by 0.1%, while economists projected a decline at a similar pace.
Meanwhile, the next move in the Canadian Dollar will be forecasted by the monthly Gross Domestic Product (GDP) report for April. The report is expected to show that the Canadian economy expanded by 0.3% after a stagnant performance in March.
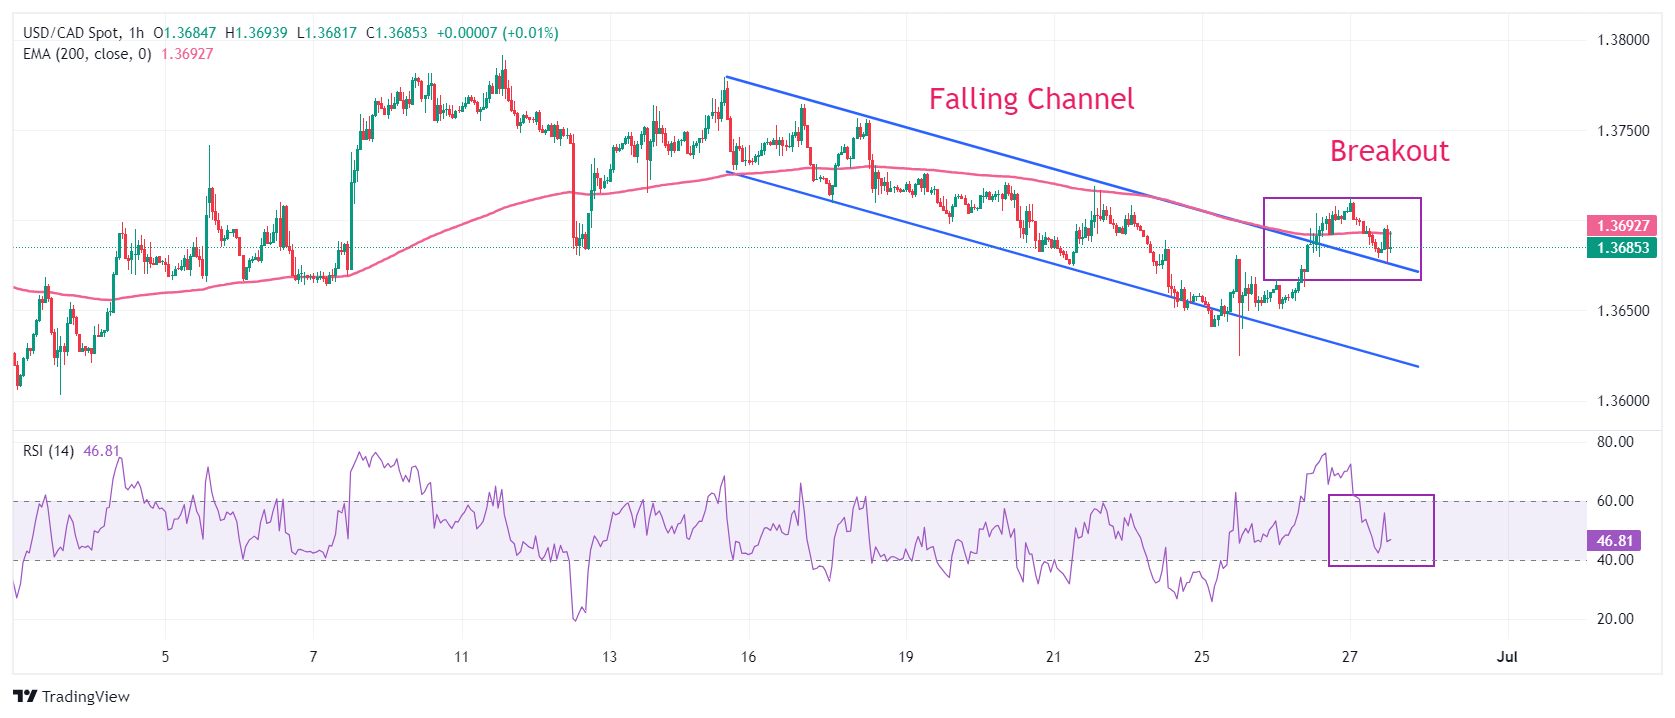
USD/CAD tests the breakout region of the Falling Channel chart pattern formed on an hourly timeframe. A breakout of the above-mentioned chart formation results in a bullish reversal. The asset gathers strength to decisively break above the 200-hour Exponential Moving Average (EMA), which trades around 1.3700.
The 14-period Relative Strength Index (RSI) retreats inside the 40.00-60.00 range, suggesting a consolidation ahead.
Fresh buying opportunity would emerge if the asset breaks above June 11 high near 1.3800. This would drive the asset towards April 17 high at 1.3838, followed by 1 November 2023 high at 1.3900.
In an alternate scenario, a breakdown below June 7 low at 1.3663 will expose the asset to May 3 low around 1.3600 and April 9 low around 1.3547.
USD/CAD hourly chart
Economic Indicator
Gross Domestic Product (MoM)
The Gross Domestic Product (GDP), released by Statistics Canada on a monthly and quarterly basis, is a measure of the total value of all goods and services produced in Canada during a given period. The GDP is considered as the main measure of Canadian economic activity. The MoM reading compares economic activity in the reference month to the previous month. Generally, a high reading is seen as bullish for the Canadian Dollar (CAD), while a low reading is seen as bearish.
Read more.
Top traders in Shanghai continue to liquidate their long positions in Copper seeing their net short position grow Thursday overnight, TDS commodity strategists note.
Selling trigger continues to drift closer to market
“Commodity Trading Advisor (CTA) long positions remain safe, however as momentum eases the selling trigger continues to drift closer to market at $9,385/t. Indeed, our gauge of global commodity demand continues to weaken, while depressed premiums and surging inventories in the Middle Kingdom argue against fundamental tightness.”
“This contrasts with the euphoric positioning in the West that has been driven by the narrative of upcoming greenification demand and large deficits.”
“While the fundamental situation certainly looks promising in the years to come, the lack of evidence supporting current physical tightness has started to see the money manager positioning unwind. With plenty of bloated positions still remaining, the Red Metal remains at risk in the near-term.”
Gold (XAU/USD) prices set a high earlier in the year, but have lost momentum since then. There is a divergence in drivers and strong, traditional relationships have broken down. Analysts at ABN AMRO are cautious on the outlook for Gold prices and keep their forecast at $2,000 per ounce for December 2024.
Gold loses upside momentum
“Gold prices this year were supported by: investors buying the Yellow Metal on the futures markets and in other forms; central banks forming Gold reserves; technical picture. The rally has lost momentum since the high of $2,450 that was set on 20 May 2024. Prices are already under the 50-DMA.”
“The important support zone is $2,220-2,275, where previous tops and bottoms are layered. Below that level, the next support zone is $2,115, where the 200-DMA comes in. If prices decline below the 200-DMA the long-term trend turns negative.”
“We remain cautious for the outlook for Gold prices: the trend in Gold prices is positive, but the momentum is declining; it is unusual for Gold prices to have positive relationships with the US dollar and 5yr and 10yr US real yields; there is no shortage in physical Gold. We keep our year-end forecast of $2,000 per ounce for now.”
- EUR/GBP is correcting in a medium-term downtrend.
- It has moved up to partially fill a price gap and will probably eventually fill the rest.
- A break below the June 25 low would signal a resumption of the dominant downtrend.
EUR/GBP has corrected back after bottoming on June 14 at the 0.8398 lows.
The pair appears to be in a medium-term downtrend which, given “the trend is your friend” is likely to resume once the pull-back runs out of steam. A break below 0.8431 (June 25 low) would signal such a resumption.
EUR/GBP Daily Chart
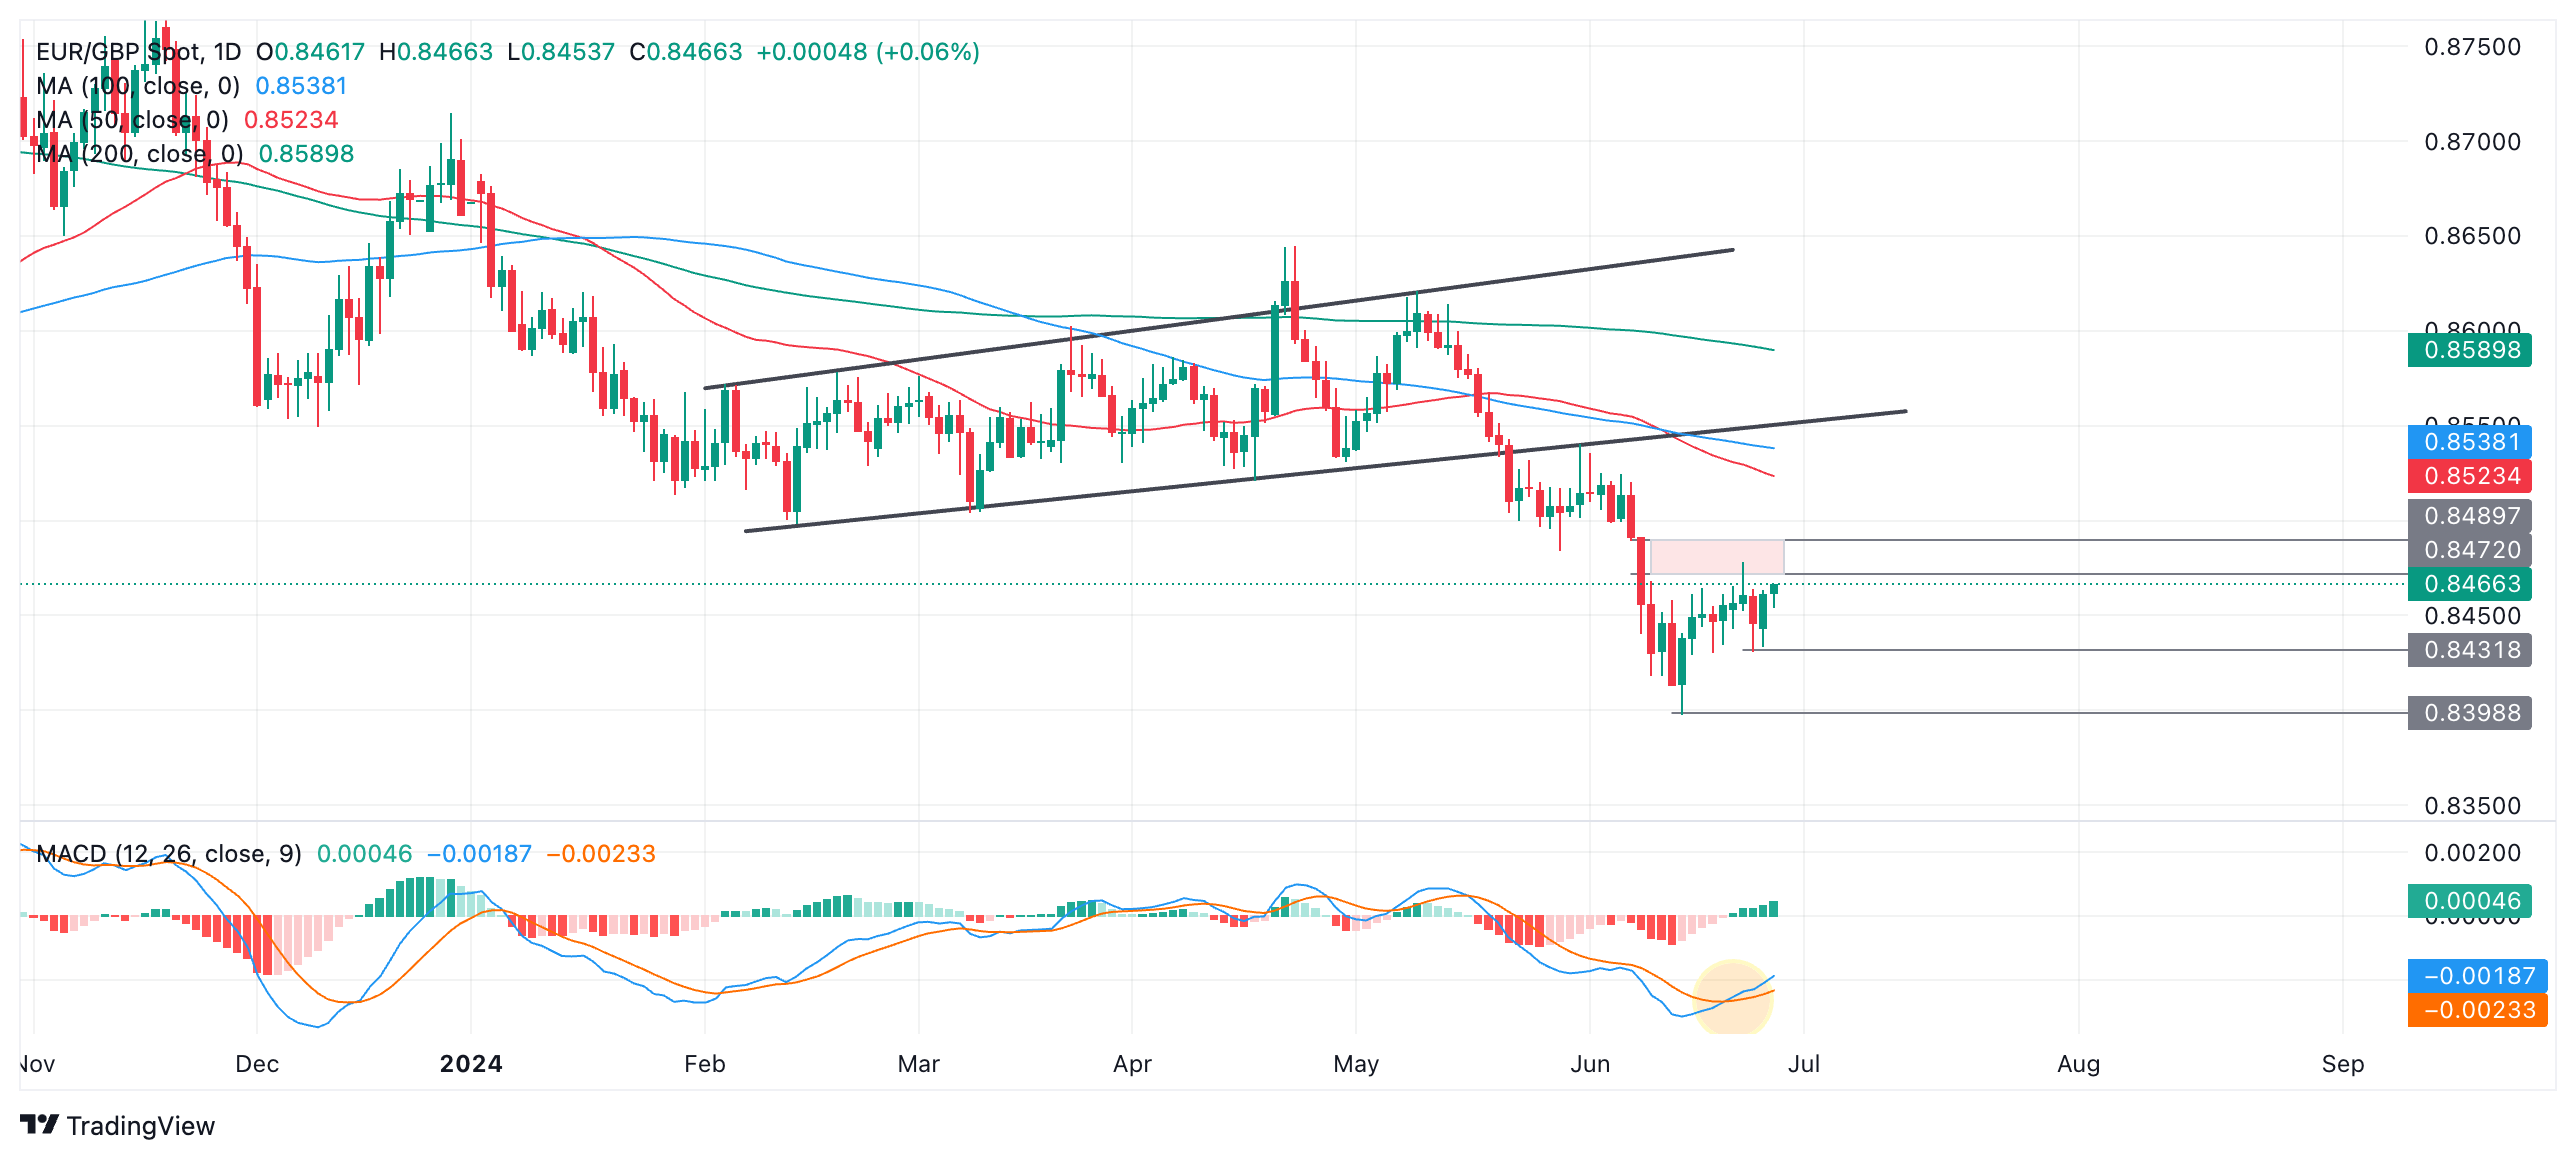
The initial target for a move down would be the 0.8399 June 14 low.
The correction may still pull higher, however, as it has pulled all the way up to a gap (red shaded area). Gaps are normally filled eventually and there is, therefore, a risk of more upside evolving as price fills this gap.
EUR/GBP 4-hour Chart
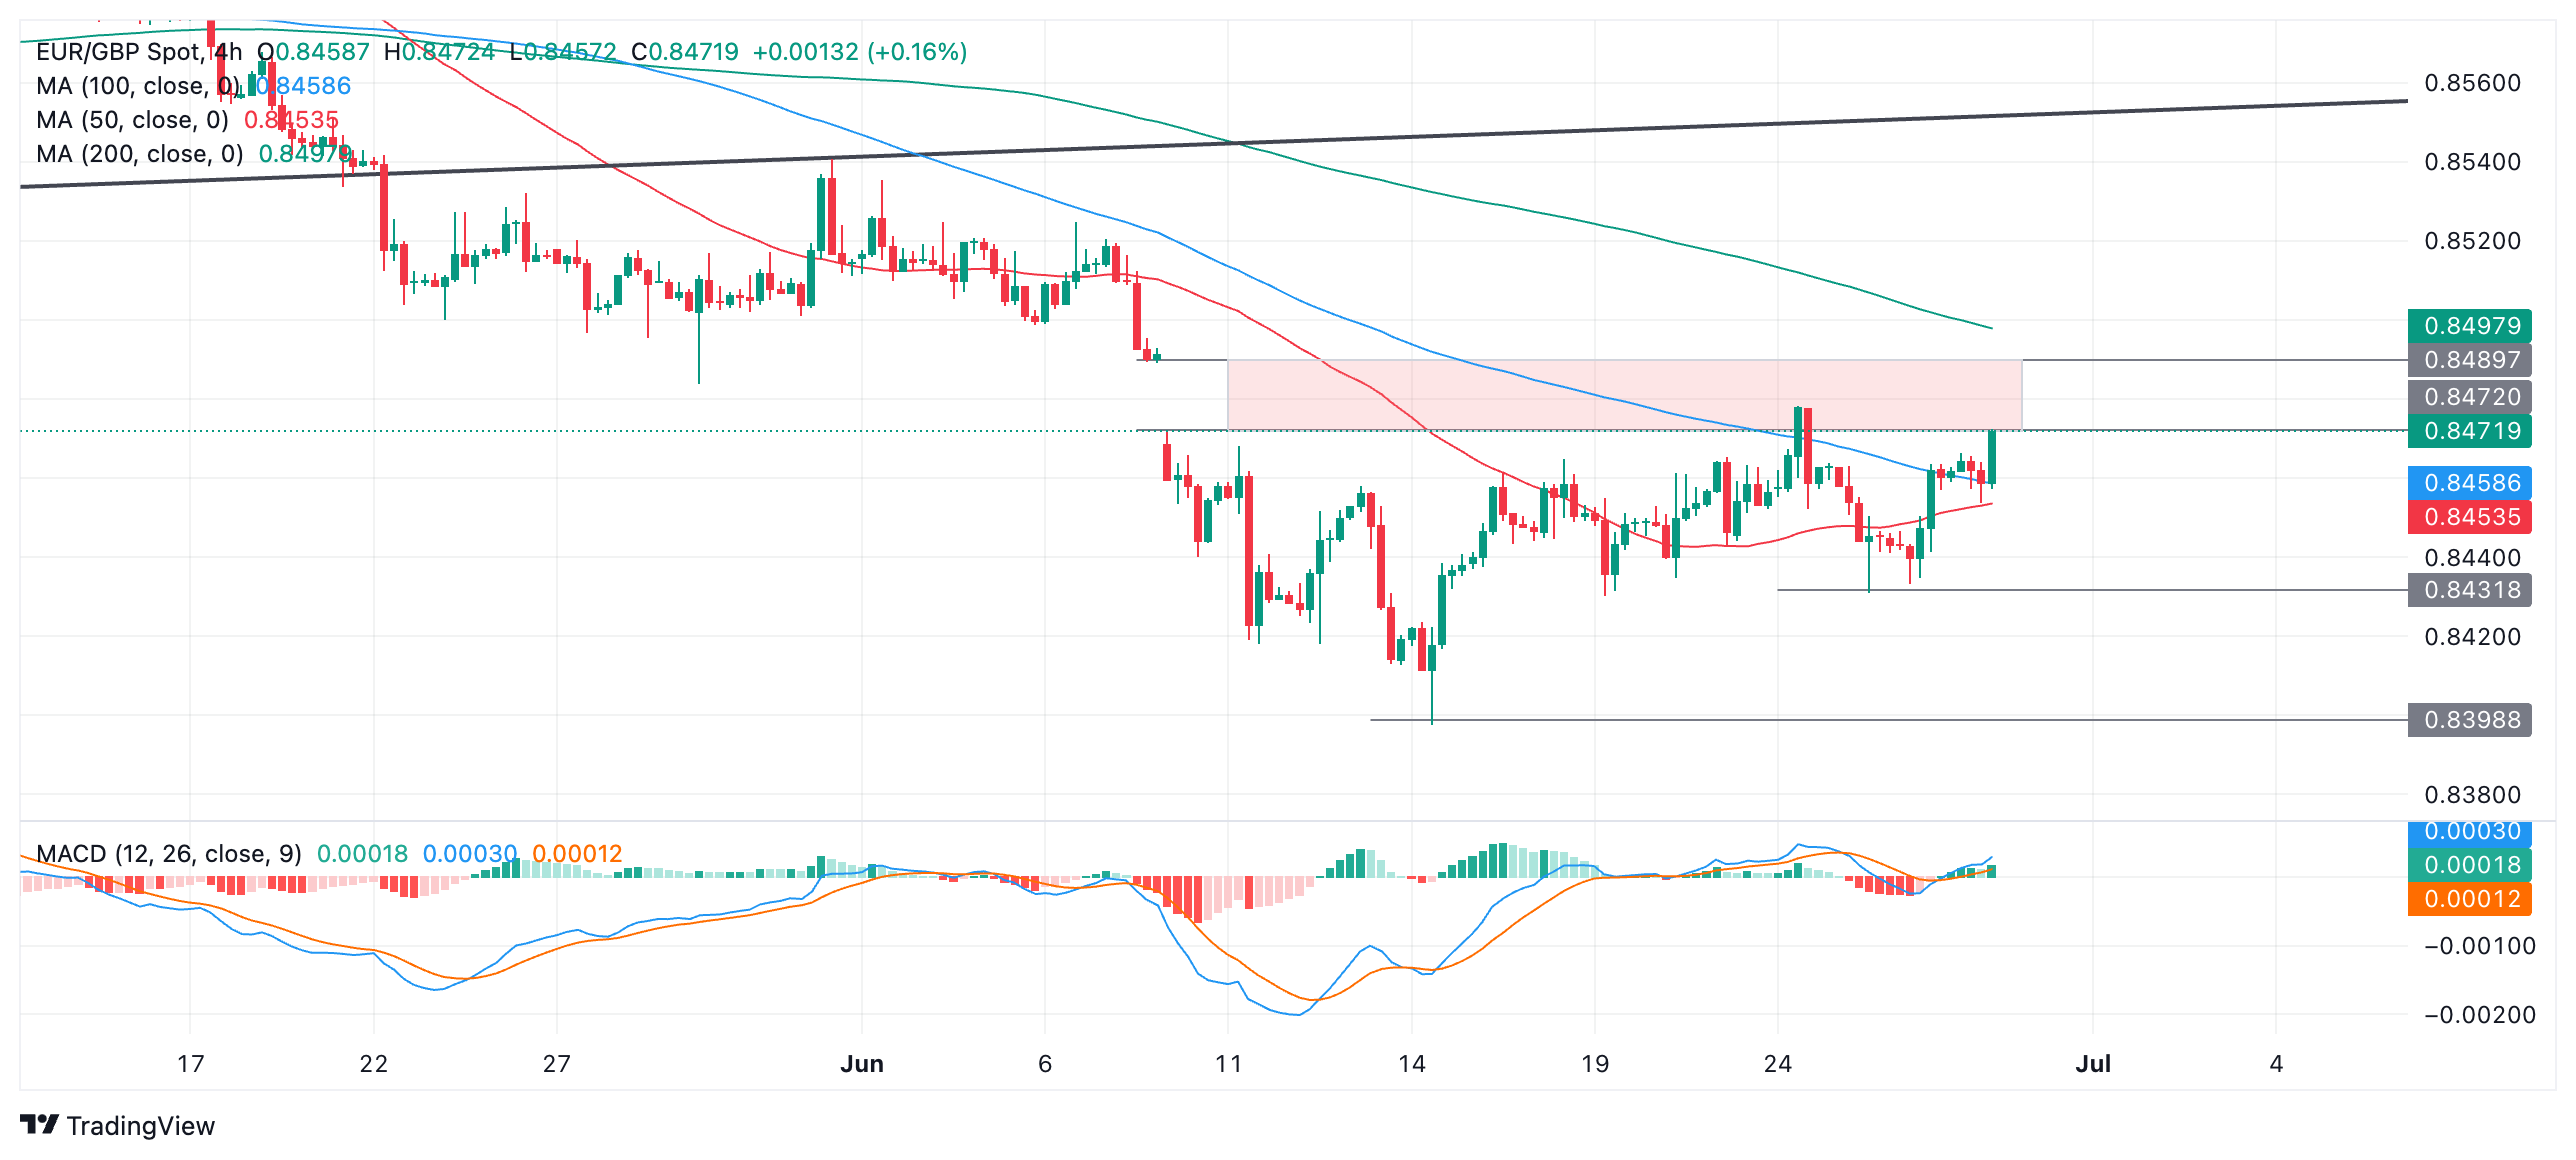
The top and bottom points of price gaps tend to represent support and resistance levels for price. As such, if price does fill the gap and reaches the top at 0.8490 there is a chance it could stall and roll over.
- USD/JPY corrects modestly from multi-decade highs as fears of Japan’s intervention deepen.
- The BoE will likely reduce the amount of bond-buying in upcoming policy meetings.
- US Durable Goods Orders unexpectedly grew by 0.1% in May.
The USD/JPY pair delivers a slight corrective move in Thursday’s New York session after posting a fresh multi-decade high at 160.87. The pair falls slightly as fears of Japan’s intervention have intensified to cushion the weak Japanese Yen.
Sheer weakness in the Yen is resulting in higher exports and a sharp increase in import costs, which is boosting inflationary pressures. The Japanese administration has been reiterating that they are ready to intervene against excessive FX moves. The 160.00 resistance appears to be a crucial price level at which the administration could purchase Yen. Also, the administration was expected to have intervened near these levels two months ago.
On the monetary policy front, investors expect that the Bank of Japan (BoJ) could deliver an early rate hike move due to stubborn inflation expectations. The BoJ is also expected to cut down the scale of its bond-buying operations in the upcoming policy meeting.
Meanwhile, the US Dollar (USD) is under pressure with United States (US) core Personal Consumption Expenditure price index (PCE) data for May, which will be published on Friday. The core PCE inflation data, a Federal Reserve’s (Fed) preferred inflation measure, is estimated to have grown at a slower pace of 0.1% against 0.2% in April month-on-month. Annually, the underlying inflation is projected to have decelerated to 2.6% from the former release of 2.8%.
On the economic data front, US Durable Goods Orders for May unexpectedly rose by 0.1%. Economists forecasted them to have declined by 0.1% after an expansion of 0.6%, downwardly revised from 0.7%. Fresh orders for Durable Goods are a leading indicator of core Consumer Price Index (CPI) data. Meager growth in New Orders for Durable Goods doesn’t pose major upside risks to price pressures.
Economic Indicator
Core Personal Consumption Expenditures - Price Index (YoY)
The Core Personal Consumption Expenditures (PCE), released by the US Bureau of Economic Analysis on a monthly basis, measures the changes in the prices of goods and services purchased by consumers in the United States (US). The PCE Price Index is also the Federal Reserve’s (Fed) preferred gauge of inflation. The YoY reading compares the prices of goods in the reference month to the same month a year earlier. The core reading excludes the so-called more volatile food and energy components to give a more accurate measurement of price pressures." Generally, a high reading is bullish for the US Dollar (USD), while a low reading is bearish.
Read more.Next release: Fri Jun 28, 2024 12:30
Frequency: Monthly
Consensus: 2.6%
Previous: 2.8%
Source: US Bureau of Economic Analysis
After publishing the GDP report, the US Bureau of Economic Analysis releases the Personal Consumption Expenditures (PCE) Price Index data alongside the monthly changes in Personal Spending and Personal Income. FOMC policymakers use the annual Core PCE Price Index, which excludes volatile food and energy prices, as their primary gauge of inflation. A stronger-than-expected reading could help the USD outperform its rivals as it would hint at a possible hawkish shift in the Fed’s forward guidance and vice versa.
- Durable Goods Orders in the US rose 0.1% in May.
- US Dollar Index stays in negative territory below 106.00.
Durable Goods Orders in the US increased $0.3 billion, or 0.1%, to $283.1 billion in May, the US Census Bureau reported on Thursday. This reading followed the 0.6% growth recorded in April (revised from +0.7%) and came in better than the market expectation for a decrease of 0.1%.
"Excluding transportation, new orders decreased 0.1%," the press release read. "Excluding defense, new orders decreased 0.2%. Transportation equipment, up three of the last four months, drove the increase, $0.5 billion, or 0.6%, to $95.4 billion."
Market reaction
The US Dollar stays under modest bearish pressure in the early American session on Thursday. As of writing, the USD Index was down 0.25% on the day at 105.79.
- US GDP growth for the first quarter got revised higher to 1.4%.
- US Dollar Index stays in negative territory below 106.00.
The US Bureau of Economic Analysis announced on Thursday that it revised the annualized real Gross Domestic Product (GDP) growth for the first quarter to 1.4% from 1.3% in the previous estimate. This revision came in line with the market expectation.
"The increase in real GDP primarily reflected increases in consumer spending, residential fixed investment, nonresidential fixed investment, and state and local government spending that were partly offset by a decrease in private inventory investment. Imports increased," the BEA explained in its press release.
Market reaction to US GDP data
The US Dollar struggles to find demand despite the positive revision to the Q1 GDP data. At the time of press, the USD Index was down 0.2% on the day at 105.85.
US Dollar PRICE Today
The table below shows the percentage change of US Dollar (USD) against listed major currencies today. US Dollar was the weakest against the New Zealand Dollar.
| USD | EUR | GBP | JPY | CAD | AUD | NZD | CHF | |
|---|---|---|---|---|---|---|---|---|
| USD | -0.22% | -0.24% | -0.24% | -0.16% | -0.13% | -0.29% | 0.03% | |
| EUR | 0.22% | -0.03% | -0.03% | 0.05% | 0.10% | -0.10% | 0.24% | |
| GBP | 0.24% | 0.03% | 0.02% | 0.09% | 0.15% | -0.04% | 0.28% | |
| JPY | 0.24% | 0.03% | -0.02% | 0.07% | 0.10% | -0.10% | 0.27% | |
| CAD | 0.16% | -0.05% | -0.09% | -0.07% | 0.02% | -0.14% | 0.18% | |
| AUD | 0.13% | -0.10% | -0.15% | -0.10% | -0.02% | -0.17% | 0.14% | |
| NZD | 0.29% | 0.10% | 0.04% | 0.10% | 0.14% | 0.17% | 0.32% | |
| CHF | -0.03% | -0.24% | -0.28% | -0.27% | -0.18% | -0.14% | -0.32% |
The heat map shows percentage changes of major currencies against each other. The base currency is picked from the left column, while the quote currency is picked from the top row. For example, if you pick the US Dollar from the left column and move along the horizontal line to the Japanese Yen, the percentage change displayed in the box will represent USD (base)/JPY (quote).
GDP FAQs
A country’s Gross Domestic Product (GDP) measures the rate of growth of its economy over a given period of time, usually a quarter. The most reliable figures are those that compare GDP to the previous quarter e.g Q2 of 2023 vs Q1 of 2023, or to the same period in the previous year, e.g Q2 of 2023 vs Q2 of 2022. Annualized quarterly GDP figures extrapolate the growth rate of the quarter as if it were constant for the rest of the year. These can be misleading, however, if temporary shocks impact growth in one quarter but are unlikely to last all year – such as happened in the first quarter of 2020 at the outbreak of the covid pandemic, when growth plummeted.
A higher GDP result is generally positive for a nation’s currency as it reflects a growing economy, which is more likely to produce goods and services that can be exported, as well as attracting higher foreign investment. By the same token, when GDP falls it is usually negative for the currency. When an economy grows people tend to spend more, which leads to inflation. The country’s central bank then has to put up interest rates to combat the inflation with the side effect of attracting more capital inflows from global investors, thus helping the local currency appreciate.
When an economy grows and GDP is rising, people tend to spend more which leads to inflation. The country’s central bank then has to put up interest rates to combat the inflation. Higher interest rates are negative for Gold because they increase the opportunity-cost of holding Gold versus placing the money in a cash deposit account. Therefore, a higher GDP growth rate is usually a bearish factor for Gold price.
- Initial Jobless Claims rose by 233K vs. the previous week.
- Continuing Jobless Claims increased by nearly 1.840M.
US citizens that applied for unemployment insurance benefits increased by 233K in the week ending June 22 according to the US Department of Labor (DoL) on Thursday. The prints came in short of initial estimates (236K) and were lower than the previous weekly gain of 239K (revised from 238K).
In addition, Continuing Claims increased by 18K to 1.839M in the week ended June 15.
Market reaction
The US Dollar Index (DXY) maintains its bearish stance on Thursday, returning to the sub-106.00 region amidst some tepid improvement in the risk-associated universe.
USD/JPY is trading at 160.54 at the moment of writing after breaking through the levels that had triggered a large-scale FX intervention in April and touching 106.87 (38-year highs) overnight. FX intervention alarms are as loud as they get, but we have to make a couple of considerations, ING’s analyst Francesco Pesole notes.
Intervention to become almost inevitable closer to 165
“Japan’s top currency official Masato Kanda had indicated in February that a 10 Yen (JPY) move in USD/JPY over a month was to be considered as ‘rapid’, implicitly offering some clues on the levels for intervention. The latest moves have been described as ‘rapid’, but not ‘excessive’, which may be the new term for a 10 Yen move in USD/JPY.”
“In April, USD/JPY had risen from a low of 150 to a high of just below 160 over a little less than a month when Japan intervened, which is consistent with Kanda’s hint. In the past 30 days, the low was 154.60, which would by the same logic place the intervention level at 164/165.”
“Should US data fuel more USD strength, then intervention would become almost inevitable – but with the new line in the sand potentially closer to 165, as mentioned. We may well see more verbal intervention and potentially a rate check (the latter will be evident in price action) before any new round of FX intervention is deployed.”
In yesterday’s FX Daily we discussed how EUR/USD could have tested the 1.0670 June lows before the US core PCE event. The pair traded as low as 1.0666 in yesterday’s trading, and in our view retains a general bearish bias for Thursday’s session too, ING’s analyst Francesco Pesole notes.
US PCE to send EUR/USD closer to 1.0700
“The Euro (EUR) remains unappealing before clarity on the French vote (mind that this may not come before the 7 July second round results), and speculative yen selling is probably fueling a broader USD rally.”
“The next key levels are 1.0650 and 1.0600 for EUR/USD. Those may be reached on the back of some moves after the US debate overnight, although we expect a US core PCE at 0.1% month-on-month tomorrow to send EUR/USD into the weekend closer to 1.0700 than 1.0600.”
“Today’s eurozone calendar only includes final consumer confidence data for June, although tomorrow we’ll start seeing some June inflation prints for France, Spain and Italy. The European Central Bank calendar sees speeches by Madis Muller and Peter Kazimir, both hawkish-leaning members.”
Reserve Bank of Australia Deputy Governor Andrew Hauser said on Thursday that it would be a bad mistake to set the monetary policy on one number, referring to the latest Consumer Price Index data, per Reuters.
Key takeaways
"Outlook remains uncertain, that has not changed."
"May take little longer for policy to feed through."
"Labour market has been performing remarkably well."
"Whole series of data coming between now and next policy meeting."
Market reaction
AUD/USD edged lower following these comments. At the time of press, the pair was trading at 0.6655, where it was up 0.1% on the day.
- The US Dollar trades overall in the red against most major peers.
- A massive data dump is expected at 12:30 GMT with US GDP, Durable Goods, and weekly Jobless Claims.
- The US Dollar index hovers around 106.00, clinging onto Wednesday’s gains.
The US Dollar (USD) trades a touch softer on Thursday following Wednesday’s significant increase and as the Japanese Yen (JPY) seems to be recovering slightly from the recent losses. Japanese Finance Minister Shunichi Suzuki said that the government is watching closely the forex market and is standing ready to act when needed, prompting the Yen to rise from its fresh multi-decade low and gaining intraday against the US Dollar. The question is how long the impact of these words will last as the recovery is starting to lose momentum already in the European trading session.
On the US economic calendar front, all important data points will be released at 14:30 GMT: the US Gross Domestic Product final reading for Q1, US Durable Goods and weekly Jobless Claims. Expect thus to see a surge in volatility, particularly if the data does not support a stronger Greenback.
Daily digest market movers: Data-driven Thursday
- At 12:30 GMT, nearly all important data points will be released:
- US Gross Domestic Product for the third quarter:
- Headline GDP is expected to grow at an annualized rate of 1.4%, more than the 1.3% previously estimated.
- GDP Price Index should remain stable at 3.1%.
- The Headline Personal Consumption Expenditure Price index is seen unchanged at 3.3%, while the core reading is also seen stable at 3.6%.
- US Durable Goods for May:
- Headline Durable Goods orders are expected to fall by a marginal 0.1%, swinging from a 0.6% rise a month earlier. to -0.1%.
- Durable Goods without Cars and Transportation are expected to grow by 0.2%, slower than the 0.4% increase in April.
- Weekly Jobless Claims for the week ending June 14th:
- Initial Jobless Claims are expected to decline slightly to 236,000 from 238,000.
- Continuing Claims are seen heading to 1,820,000 from 1,828,000.
- Pending Home Sales for May, due at 14:00 GMT, should jump out of contraction, from -7.7% to 2.5%.
- US Gross Domestic Product for the third quarter:
- At 15:00 GMT, the Kansas Fed Manufacturing Activity Index for June will be released. The previous print was at -1.
- Equities are struggling yet again. In Asia, all major indices are set to close in deep red numbers, while US futures are down by less than 0.50%. European equities are trading broadly flat.
- The CME Fedwatch Tool is broadly backing a rate cut in September despite recent comments from Fed officials. The odds now stand at 56.3% for a 25-basis-point cut. A rate pause stands at a 37.7% chance, while a 50-basis-point rate cut has a slim 6.0% possibility.
- The US 10-year benchmark rate trades near the weekly high at 4.33%.
US Dollar Index Technical Analysis: Wait for dust to settle
The US Dollar Index (DXY) has been strolling through markets with a big thanks to some outside effects. Although for now the near support level at 105.89 looks to be holding, expect with the mixture of data this Thursday and Friday to cause some whipsaw moves. Rather look for the dust to settle late Friday to see where the US Dollar will be heading once a clear picture has been revealed.
On the upside, the biggest challenge remains 106.52, the year-to-date high from April 16. A rally to 107.35, a level not seen since October 2023, would need to be driven by a surprise uptick in US inflation or a further hawkish shift from the Fed.
On the downside, 105.53 is the first support ahead of a trifecta of Simple Moving Averages (SMA). First is the 55-day SMA at 105.27, safeguarding the 105.00 round figure. A touch lower, near 104.70 and 104.46, both the 100-day and the 200-day SMA form a double layer of protection to support any declines. Should this area be broken, look for 104.00 to salvage the situation.
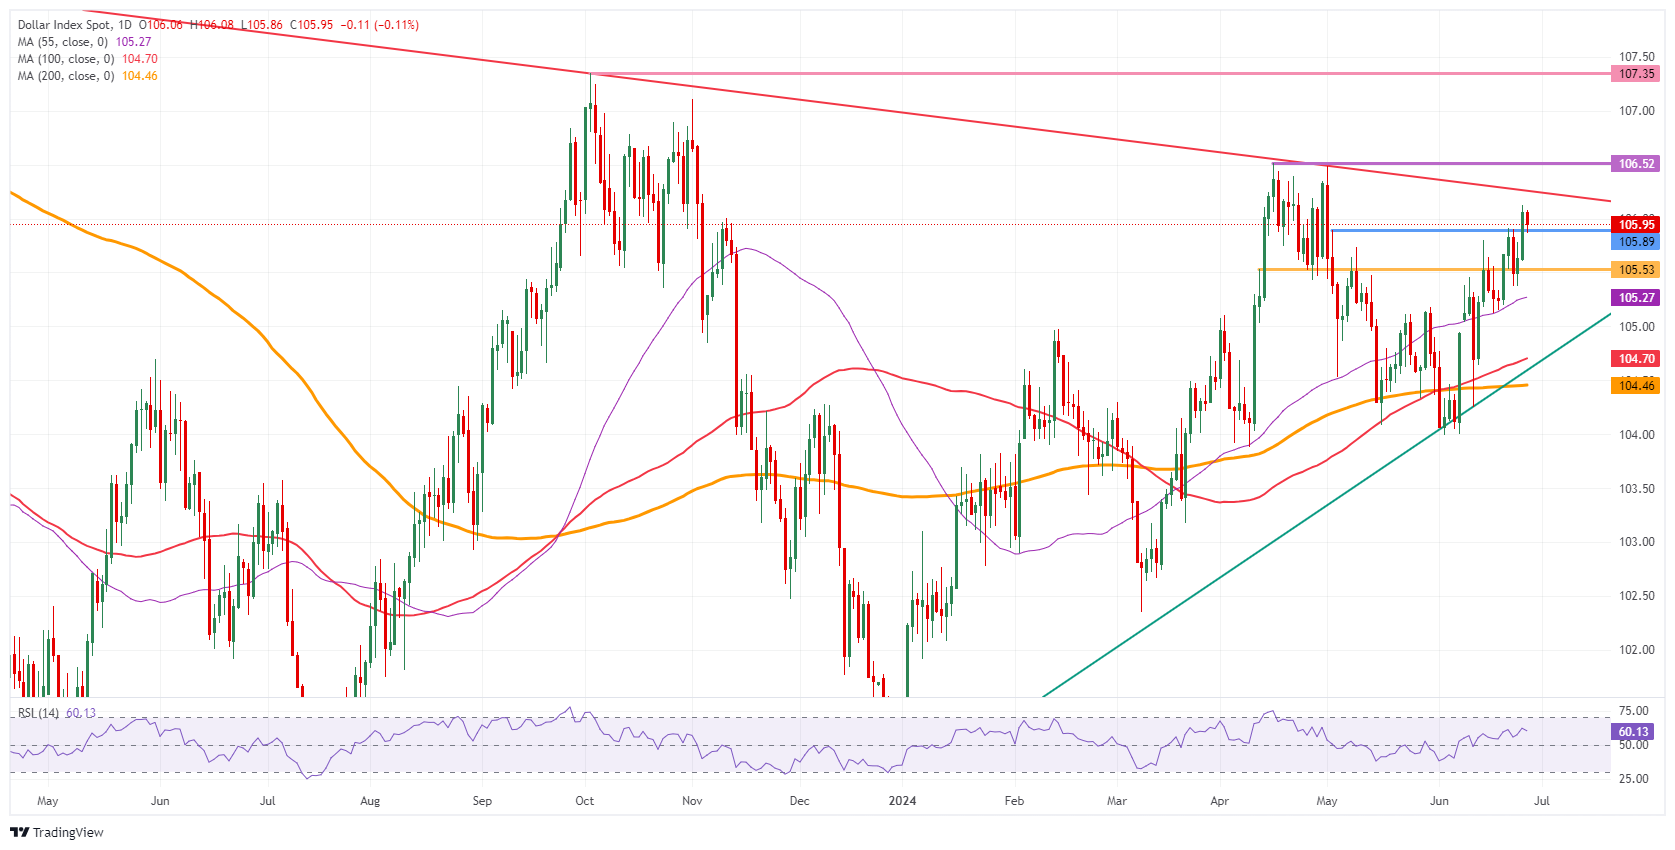
US Dollar Index: Daily Chart
Defensive positioning has largely dominated the currency market this week, and with the exception of an inflation-boosted Australian Dollar (AUD). The US Dollar (USD) is trading firmly against all of G10, FX strategist Francesco Pesole at ING notes.
US PCE and Biden-Trump debate shape the FX landscape
“In the emerging markets space, heavy jitters in carry MXN, BRL and ZAR are taking the biggest hit. On the contrary, a weaker Yen remains the biggest story in FX. Japanese authorities may let USD/JPY rise further before intervening, which can offer broader support to the Greenback into tomorrow’s core PCE event.”
“Today’s US calendar includes the hardly market-moving third release of first quarter GDP and PCE, while some focus will be on May durable goods orders (which are expected to decline) and jobless claims. Despite an expected contraction in initial claims last week, the surprise stickiness in continuing claims is a trend to watch.”
“The USD may stay generally supported today. We’ll be very interested to see if and how the USD reacts to tonight’s first TV debate between President Joe Biden and Donald Trump (02:00 BST). Our baseline assumption is that Trump is the most dollar-positive candidate due to protectionism pledges, geopolitical stance and plans for lower taxes.”
- Silver has fallen to key support and is currently consolidating.
- If it breaks below the support it will continue its short-term downtrend within its channel.
- A bounce could also signal a return to the top of the channel and a critical level for Silver.
Silver (XAG/USD) has fallen to a key support level at $28.66, the June 13 low, and is currently trading along that support. It is at a critical turning point for the trend.
The precious metal is in a falling channel formation and the short-term trend is bearish on balance, suggesting the odds favor more downside, albeit with one caveat.
Silver 4-hour Chart
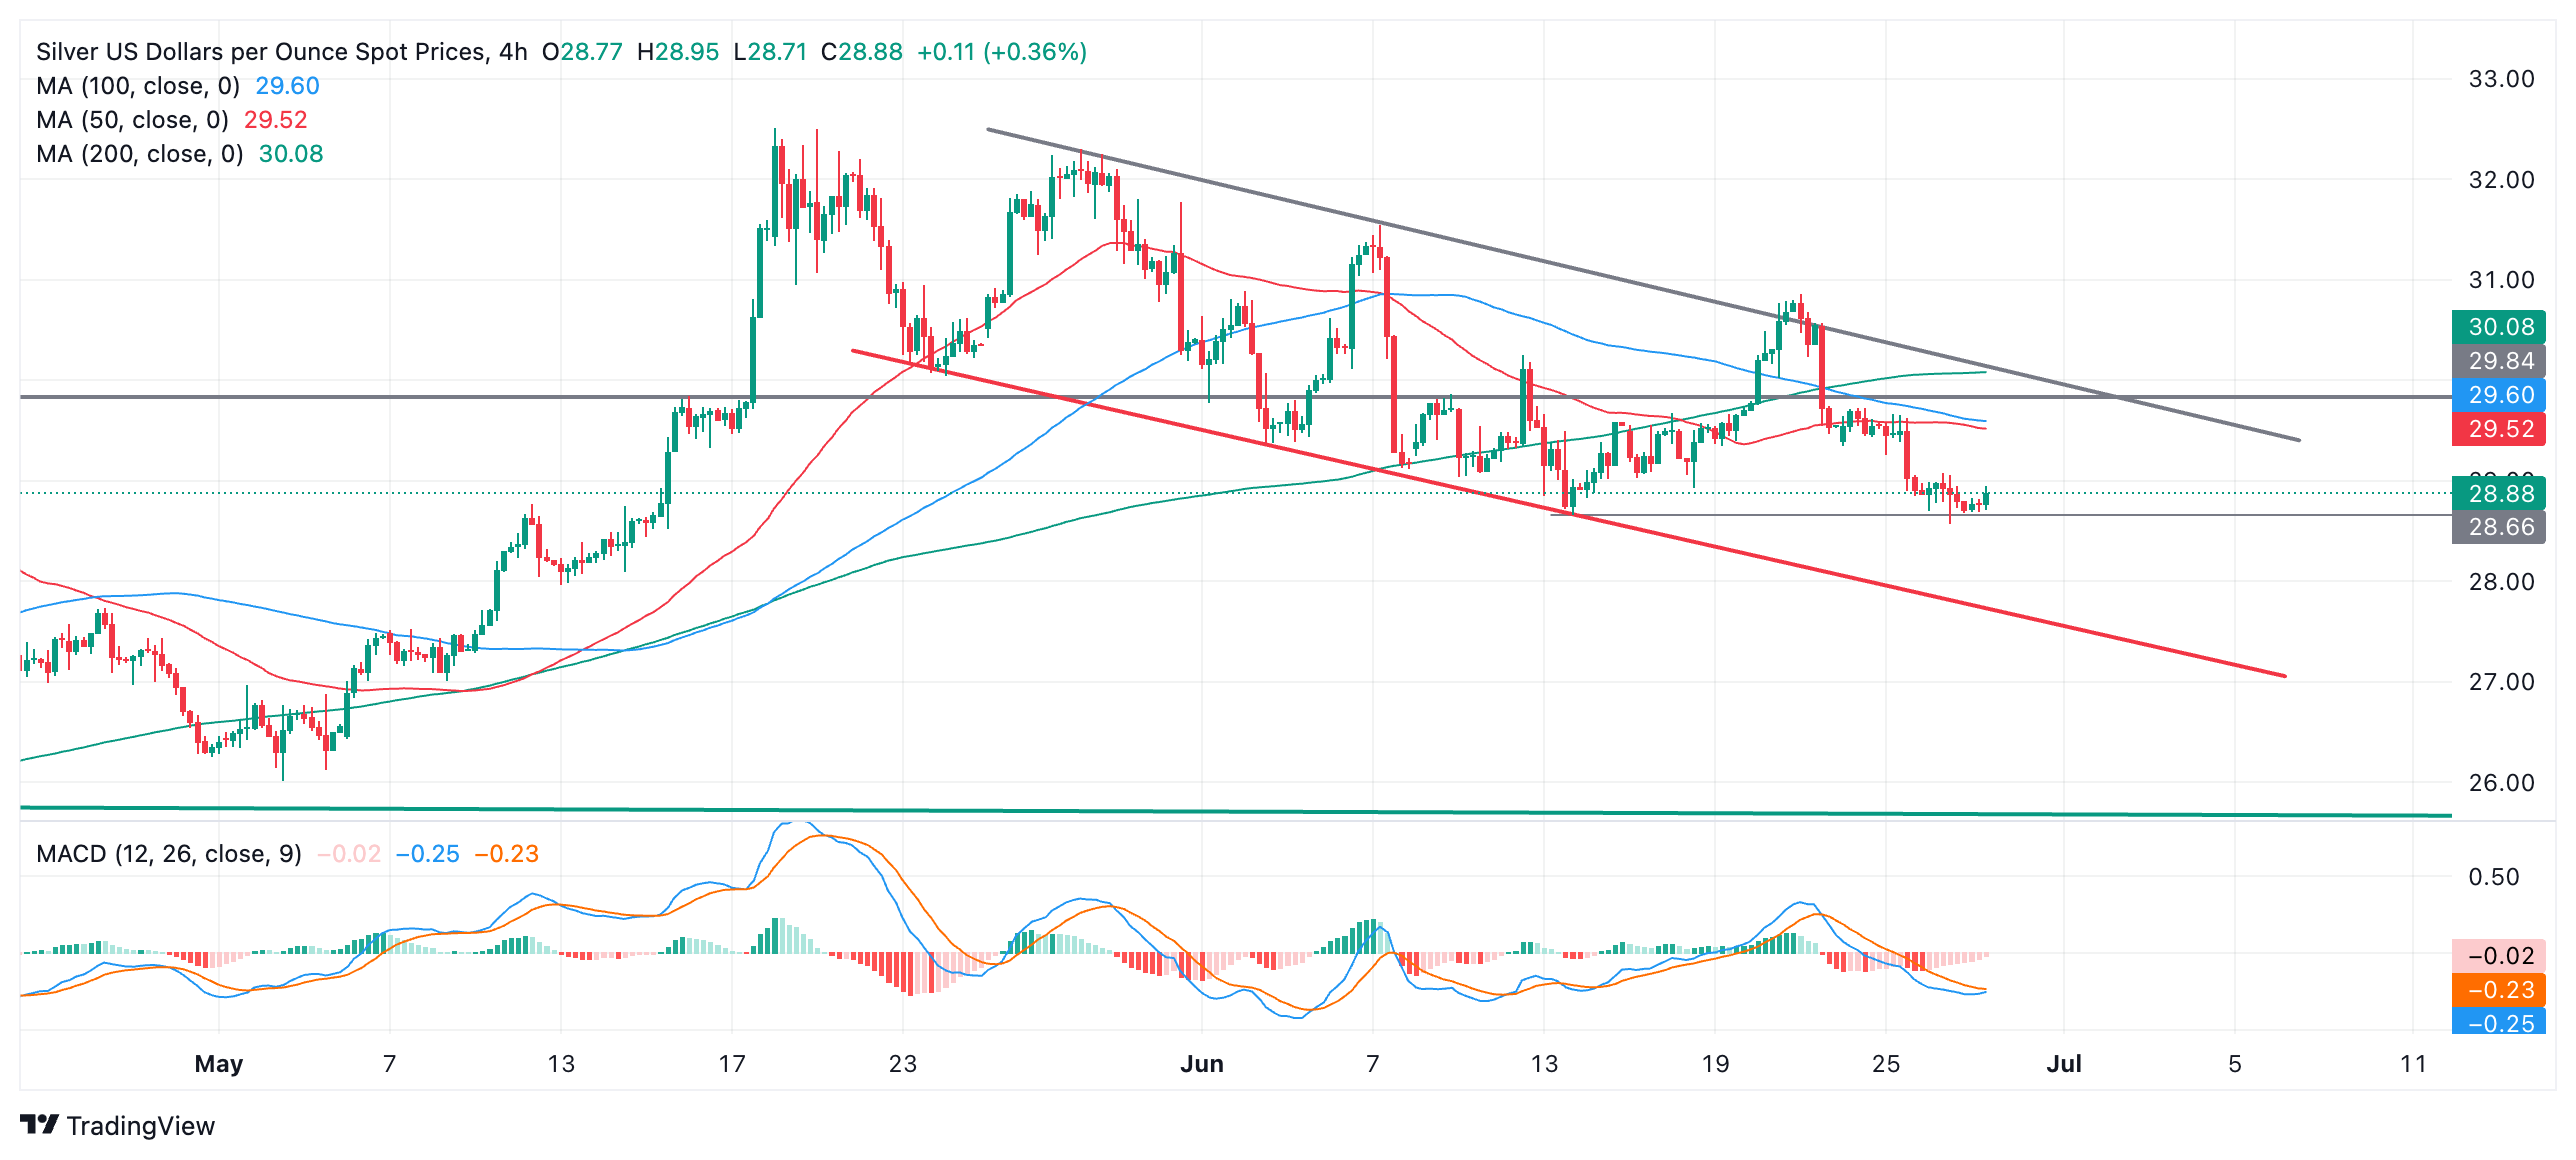
In the last few hours, Silver has bounced off of the $28.66 support level, however, given the trend is bearish and “the trend is your friend” an eventual break lower is expected.
If price pierces below $28.57, the June 26 low, that would probably signal further weakness, with the next target lying at the lower channel line, at around $27.50.
The caveat to this bearish picture lies in the fact that Silver temporarily broke out of the top of the falling channel on June 20, and although it quickly fell back, the fact it breached the integrity of the channel, albeit temporarily, indicates the upper channel line has been weakened and is more likely to be broken again.
If the June 13 lows hold, therefore, and Silver starts to recover, there is a chance it could rise back up to the upper channel line at around $29.90, which is also a major resistance level at the top of a four-year consolidation zone. A decisive break above that level would be required to indicate a change in the short-term trend.
A decisive break would be one accompanied by a long green up candle that broke clearly above the level and closed near its high or three green candles in a row that broke above the level.
- WTI holds breadth above $80.00 with US core PCE inflation in focus.
- Unexpected Oil buildup in the US intensified demand concerns.
- Israel prepares for massive damage in Lebanon if Hezbollah launches war.
West Texas Intermediate (WTI), futures on NYMEX, remain steady above the psychological support of $80.00 in Thursday’s European session. The upside in the Oil price has been restricted by growing demand concerns as the United States (US) Energy Information Administration (EIA) unexpectedly reported a significant buildup of inventories for the week ending June 21. While the downside remains favored amid caution that Middle East tensions would expand from Gaza to Lebanon.
On Wednesday, the US EIA reported Oil stockpiles at 3.59 million barrels. Economists expected a drawdown at a faster pace by 3.0 million barrels from the former release of 2.55 million barrels. This has raised concerns over the Oil consumption in worlds’ largest nation. Investors worry that maintenance of a restrictive interest rate framework by the Federal Reserve (Fed) from a longer period has deepened household crisis, which has resulted in poor demand prospects.
Going forward, investors will focus on the United States (US) core Personal Consumption Expenditure price index (PCE) data for May, which will be published on Friday. The core PCE inflation data, a Federal Reserve’s (Fed) preferred inflation measure, will provide cues bout when the rate-cutting cycle will be kicked-off.
The US core PCE inflation data is estimated to have grown at a slower pace of 0.1% against 0.2% in April month-on-month. Annually, the underlying inflation is projected to have decelerated to 2.6% from the former release of 2.8%.
On the geopolitical front, Israeli Defense Minister Yoav Gallant warned of a massacre in Lebanon if Hezbollah launches a war. Investors worry that the spread of war from Gaza to Lebanon would disrupt the Oil supply chain.
Brent Crude Oil FAQs
Brent Crude Oil is a type of Crude Oil found in the North Sea that is used as a benchmark for international Oil prices. It is considered ‘light’ and ‘sweet’ because of its high gravity and low sulfur content, making it easier to refine into gasoline and other high-value products. Brent Crude Oil serves as a reference price for approximately two-thirds of the world's internationally traded Oil supplies. Its popularity rests on its availability and stability: the North Sea region has well-established infrastructure for Oil production and transportation, ensuring a reliable and consistent supply.
Like all assets supply and demand are the key drivers of Brent Crude Oil price. As such, global growth can be a driver of increased demand and vice versa for weak global growth. Political instability, wars, and sanctions can disrupt supply and impact prices. The decisions of OPEC, a group of major Oil-producing countries, is another key driver of price. The value of the US Dollar influences the price of Brent Crude Oil, since Oil is predominantly traded in US Dollars, thus a weaker US Dollar can make Oil more affordable and vice versa.
The weekly Oil inventory reports published by the American Petroleum Institute (API) and the Energy Information Agency (EIA) impact the price of Brent Crude Oil. Changes in inventories reflect fluctuating supply and demand. If the data shows a drop in inventories it can indicate increased demand, pushing up Oil price. Higher inventories can reflect increased supply, pushing down prices. API’s report is published every Tuesday and EIA’s the day after. Their results are usually similar, falling within 1% of each other 75% of the time. The EIA data is considered more reliable, since it is a government agency.
OPEC (Organization of the Petroleum Exporting Countries) is a group of 13 Oil producing nations who collectively decide production quotas for member countries at twice-yearly meetings. Their decisions often impact Brent Crude Oil prices. When OPEC decides to lower quotas, it can tighten supply, pushing up Oil prices. When OPEC increases production, it has the opposite effect. OPEC+ refers to an expanded group that includes ten extra non-OPEC members, the most notable of which is Russia.
- The Mexican Peso is taking a breather after a two-day decline.
- Thursday will see the Banxico policy meeting and Mexican labor and trade data.
- USD/MXN completes an ABC correction higher and reaches a critical turning point.
The Mexican Peso (MXN) trades little-changed on Thursday as traders catch their breath after two straight days of depreciation. This may be a “calm before the storm” effect ahead of the Bank of Mexico (Banxico) monetary policy meeting at 19:00 GMT, a potentially market-moving event for the Peso.
At the time of writing, one US Dollar (USD) buys 18.30 Mexican Pesos, EUR/MXN is trading at 19.58, and GBP/MXN at 23.15.
Mexican Peso trades flat after two-day drop
The Mexican Peso trades flat in the run-up to the Banxico policy meeting on Thursday. An overwhelming majority of economists expect the central bank to maintain its policy interest rate at its current 11.00% level. Of the 25 economists surveyed by Bloomberg, 23 expect the central bank to keep interest rates unchanged. A recent survey by Mexican lender Citibanamex showed that the majority of respondents expect Banxico to keep its policy rate unchanged – although most expect a cut in August.
The high interest-rate differential between Mexico and most major economies has kept the Mexican Peso strong. Relatively higher interest rates attract greater inflows of foreign capital. Therefore, deciding not to cut interest rates might be bullish for the Peso, although given that this outcome has been widely predicted, the market may already have priced it in.
Many analysts have changed their minds about Banxico cutting interest rates due to the sharp depreciation in the Peso after the June 2 election. They now see imported inflation as a factor further weighing against immediate interest-rate cuts.
Rabobank’s Senior Strategist Christian Lawrence was one analyst who expected Banxico to cut interest rates in June. However, he changed his opinion in light of the sharp devaluation of the Mexican Peso since the election, which “has acted as a de facto cut.”
The same goes for economists at Standard Chartered: “We now expect Banco de México (Banxico) to stay on hold instead of cutting by 25bps at its 27 June meeting, amid sharp currency depreciation driven by elevated political noise and fiscal uncertainty,” said the bank in a recent note.
Prior to the Banxico decision, at 12:00 GMT, the Mexican Unemployment Rate and Balance of Trade (BoT) for May will also be released.
Unemployment is expected to rise to 2.7% from 2.6% in the previous month, and the BoT is forecast to show the deficit shrinking to $2.04 billion from $3.75 billion previous.
Better-than-expected data might support MXN.
Technical Analysis: USD/MXN completes ABC correction and reaches crossroads
USD/MXN has completed an ABC corrective pattern higher on the 4-hour chart.
The pair is now at a critical juncture. If it continues to make higher highs, it could mean the short-term downtrend has reversed. Alternatively, a recapitulation would suggest the downtrend is resuming, and the pair could move to lower lows.
USD/MXN 4-hour Chart
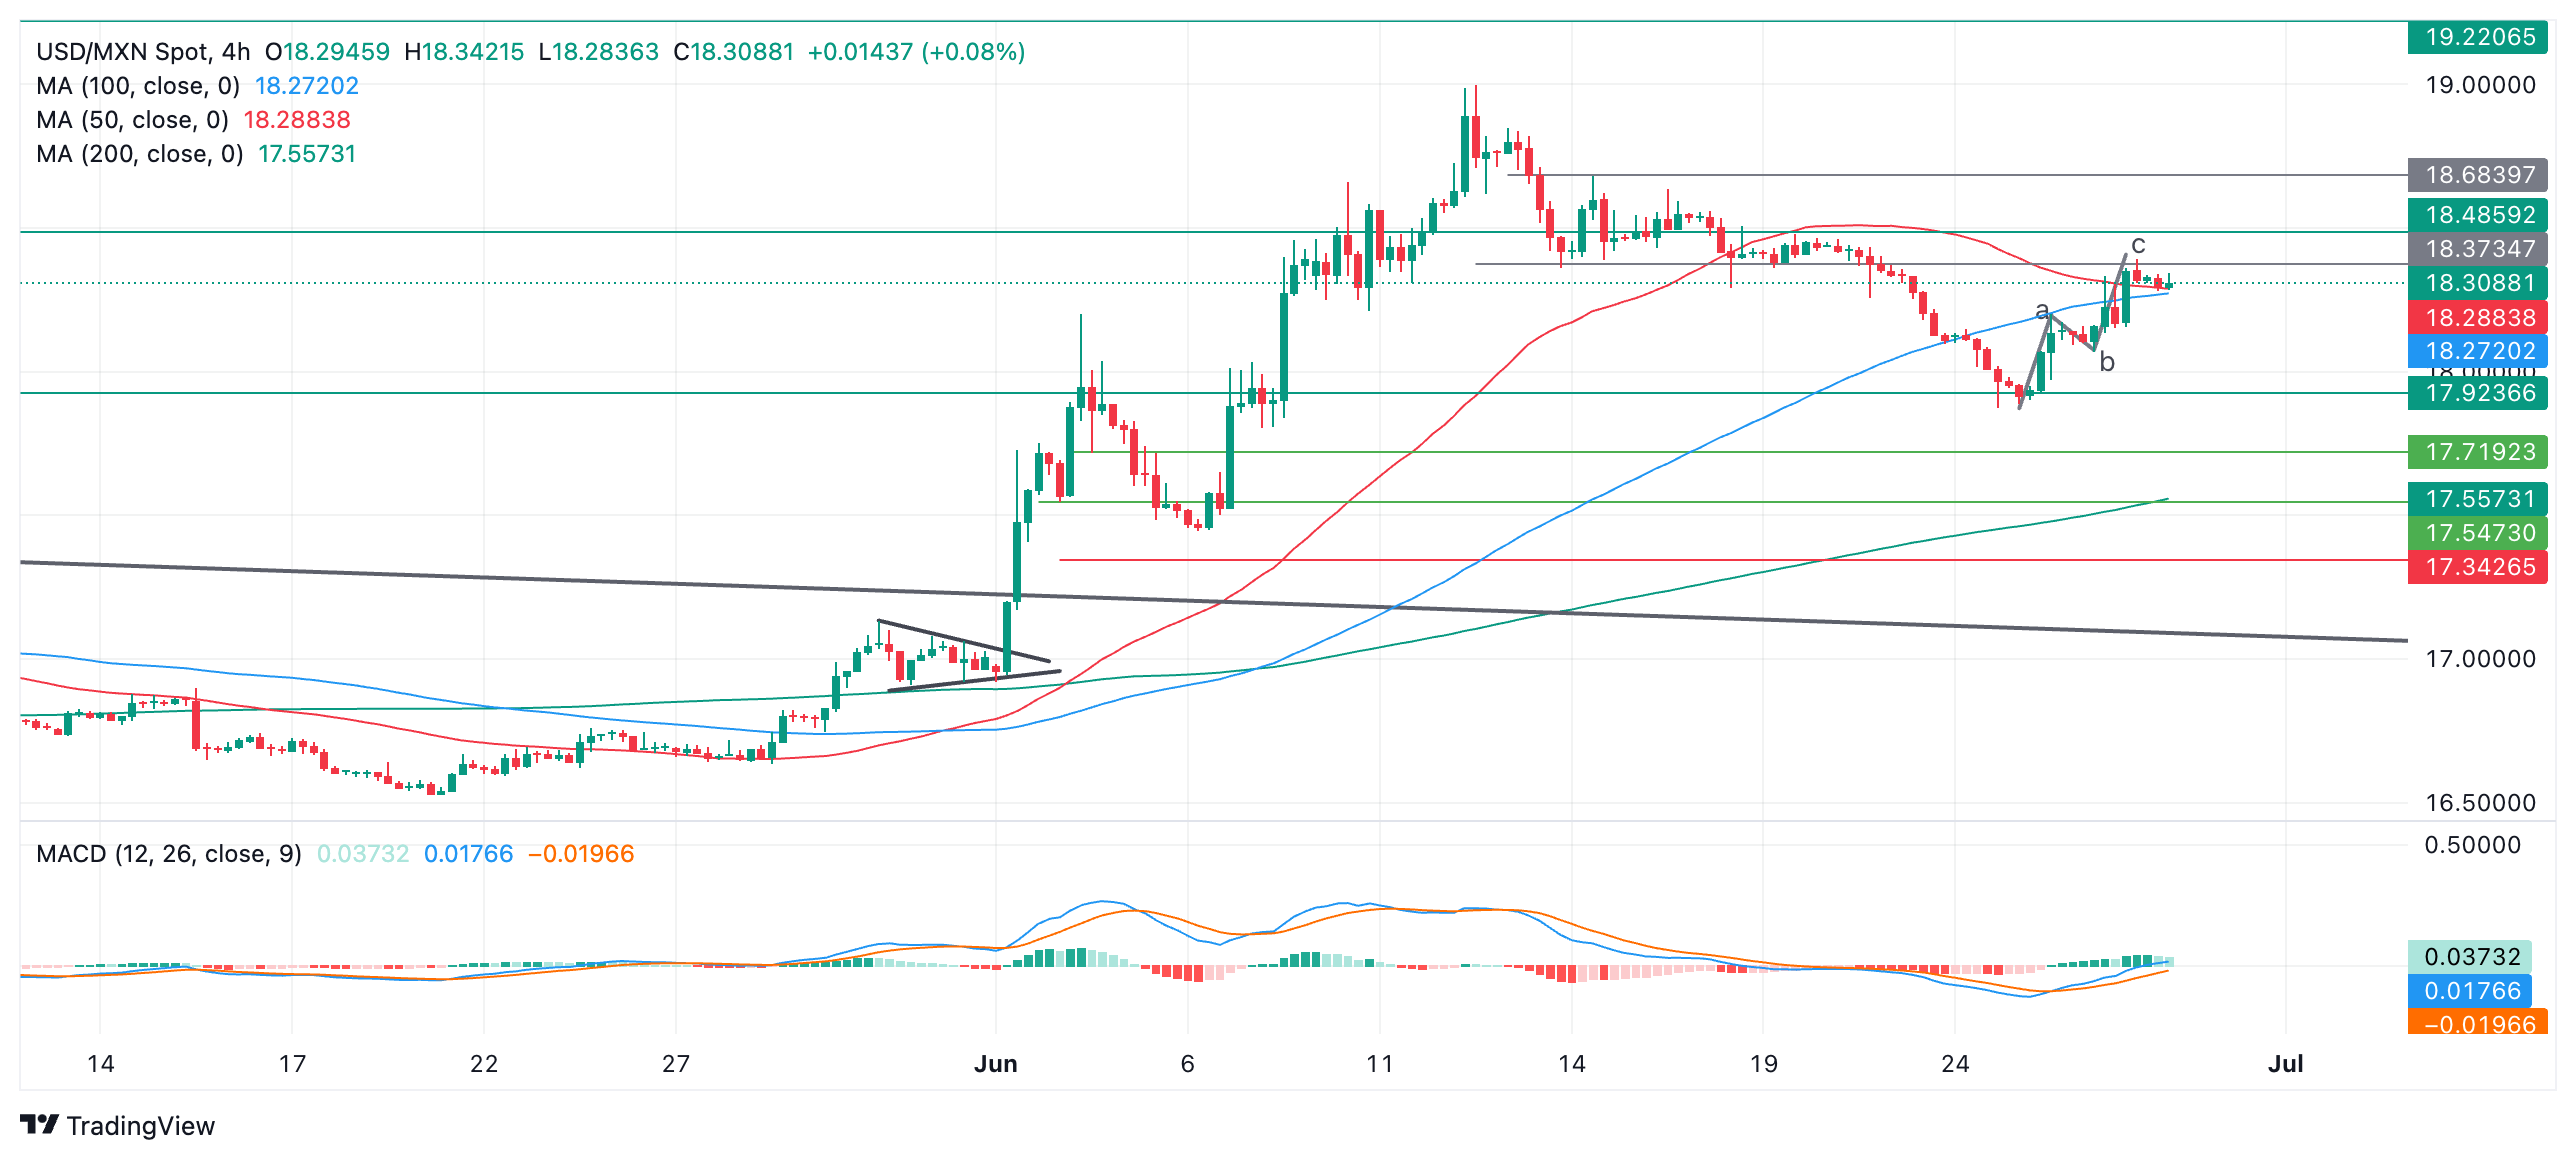
A move below 18.06 (June 26 low) would suggest the downtrend was resuming and probably see a continuation down to 17.87 (June 24 low).
At the same time, the short-term trend remains bearish, leaving the pair at risk of a recapitulation lower. Further weakness could see it reach the 17.72 swing low made on June 4.
Alternatively, if USD/MXN rallies and breaks above 18.39 (June 26 high), it would form a higher high and suggest a new short-term uptrend was evolving. Resistance at 18.48 (2023 October 6 high) and 18.68 (June 14 high) might supply upside targets afterward.
The direction of the long and intermediate-term trends remains in doubt.
Economic Indicator
Trade Balance, $
The Trade Balance released by INEGI is a balance between exports and imports of total goods and services. A positive value shows trade surplus, while a negative value shows trade deficit. It is an event that generates some volatility for the Mexican Peso. If a steady demand in exchange for Mexican exports is seen, that would turn into a positive growth in the trade balance which should be positive (or bullish) for the Peso.
Read more.Next release: Thu Jun 27, 2024 12:00
Frequency: Monthly
Consensus: $-2.04B
Previous: $-3.746B
Source: National Institute of Statistics and Geography of Mexico
The Fed’s preferred inflation gauge, the Core Personal Consumption Expenditure (PCE), will be released by the US Bureau of Economic Analysis (BEA) on Friday, June 28 at 12:30 GMT and as we get closer to the release time, here are the forecasts of economists and researchers of seven major banks.
The US Core PCE inflation is expected to grow at a slower pace of 0.1% against 0.2% in April month-on-month. Annually, the underlying inflation is projected to decelerate to 2.6% from 2.8% in April.
Deutsche Bank
The focus in the US next week will be on spending and PCE data on Friday. Our US economists expect MoM growth in core PCE to remain at +0.2% and see MoM growth in both income and consumption picking up to +0.4% and +0.3%, respectively (vs +0.3% and +0.2% in April).
TD Securities
CPI and PPI data suggest core PCE inflation lost further momentum in May, with the series advancing 0.13% m/m — its lowest monthly gain of the year and following a 0.25% April expansion. We also look for the headline PCE and the supercore to print 0.0% each in May. Separately, personal spending likely advanced 0.3% m/m, with income rising 0.4%.
Charles Schwab
Back home, the big story this week is still a couple of days off when Friday morning brings May Personal Consumption Expenditures (PCE) prices data, the Fed's favored inflation monitor. Analysts expect 2.6% year-over-year PCE growth for both headline and core, according to Trading Economics, but rising crude oil prices this month stirred fresh inflation concerns. Month-over-month PCE prices are expected to rise 0.1% for core, which excludes volatile energy and food, with headline PCE flat.
Citi
USD: US May PCE Deflator MoM – Citi: 0.0%, median: 0.0%, prior: 0.3%; PCE Deflator YoY – Citi: 2.6%, median: 2.6%, prior: 2.7%; Core PCE MoM – Citi: 0.2%, median: 0.1%, prior: 0.2%; Core PCE YoY – Citi: 2.6%, median: 2.6%, prior: 2.8% - based on details of CPI and PPI, Citi Research expect a 0.15%MoM increase in core PCE inflation in May, technically rounding to a 0.2%MoM but with clear risk of a softer 0.1% increase. But regardless of 0.2% or 0.1%, May core PCE inflation should slow markedly compared to 0.25% in April, with the YoY rate dropping from 2.8% to 2.6%. Most notably, various services prices in CPI slowed in May. Core goods prices should also decline with a boost from pharmaceutical prices offset by declines in certain recreation equipment prices and cars. Headline PCE should be flat on the month but would be close to rounding to a 0.1%MoM increase. This would mean headline PCE also pulls back to 2.6% on a YoY basis.
MUFG
The release in the week ahead of the latest US PCE report is expected to provide confirmation that the core deflator increased by only +0.1%M/M in May which alongside leading indicators pointing towards a further softening of US labour demand is encouraging US rate market participants to price back in multiple Fed rate cuts in the 2H of this year.
ING
May PCE figures are released this Friday. If the US May core PCE on Friday does come in at the consensus 0.1% month-on-month, the short-term downside for the dollar against European currencies may be less pronounced as markets could still favour defensive positions ahead of the French vote on Sunday.
Rabobank
In the U.S., eyes will be on the PCE deflator for May. Based on the inputs from the CPI, the PPI and import prices, the core rate is anticipated to show a deceleration to 0.1% m/m and 2.6% y/y.
- The Japanese Yen slightly recovers from its multi-decade low of 160.87 against the US Dollar seen on Wednesday.
- The Yen finds some support after comments from Japanese Finance Minister Shun’ichi Suzuki.
- The US Dollar Index falls back below 106.00 ahead of US Q1 GDP, Durable Goods Orders and weekly Jobless Claims.
The Japanese Yen (JPY) recovers a touch on Thursday after its steep decline the day before when markets started playing a chicken game with the Japanese government. The Japanese Yen sank to 160.87 against the US Dollar (USD), even lower than the level of 160.20 seen at the end of April right before the Japanese Ministry of Finance intervened and pushed the USD/JPY back to 151.95. Early comments during the Asian session on Thursday from Japanese Finance Minister Shun’ichi Suzuki seemingly had more impact than the comments from Masato Kanda, Vice Minister for International Affairs, on Wednesday when the actual move occurred.
Meanwhile, the US Dollar Index (DXY) – which gauges the value of the US Dollar against a basket of six foreign currencies – is also easing ahead of a packed economic calendar. Besides the final reading of the US Gross Domestic Product (GDP) print for Q1, traders will also wait for the Durable Goods Orders numbers for May. As each week, the Initial and Continuing Jobless Claims are set to be released as well on Thursday, making it a very charged US session.
Daily digest market movers: Suzuki seems to have more weight
- At 01:30 GMT, Japanese Finance Minister Shun’ichi Suzuki commented on the recent moves in the Japanese Yen. Suzuki said they are watching currencies closely and will act when needed, though Suzuki declined to comment on specific FX levels
- At 12:30 GMT, most of the Thursday’s important data points will all come out at the same time:
- US Gross Domestic Product numbers for Q1:
- Headline GDP is expected to head to 1.4% from 1.3%.
- Headline Personal Consumption Expenditures (PCE) Prices for the quarter should remain stable at 3.3%.
- Core PCE should remain as well stable at 3.6%.
- Durable Goods Orders for May:
- Headline Durable Goods Orders are expected to contract by 0.1% from the prior positive 0.6% in April.
- Durable Goods Orders ex Transportation are expected to slide lower to 0.2% from 0.4% in April.
- Initial Jobless Claims for the week ending June 21 are expected to remain rather stable at 236,000 from the previous week’s reading of 238,000. Continuing Claims are expected to remain stuck with a marginal move from 1,828,000 to 1,820,000.
- US Gross Domestic Product numbers for Q1:
- Equities are having issues again on Thursday and look to be on track for a negative week overall. US futures are all down less than half a percentage.
- The CME Fedwatch Tool is broadly backing a rate cut in September despite recent comments from Federal Reserve (Fed) officials. The odds now stand at 56.3% for a 25-basis-point cut. A rate pause stands at a 37.7% chance, while a 50-basis-point rate cut has a slim 6.0% possibility.
- The Overnight indexed Swap curve for Japan shows a 64.0% chance of a rate hike on July 31, and a smaller 52.8% chance for a hike on September 20.
- The US 10-year benchmark rate trades near the weekly high at 4.33%.
- The benchmark 10-year Japan Treasury Note (JGB) trades around 1.07%, nearing highs not seen since 2011.
USD/JPY Technical Analysis: Everyone knows it's coming
The USD/JPY is trading off its multi-decade high, freshly printed on Wednesday at 160.81. For now, the words from Japanese Finance Minister Shun’ichi Suzuki are having a bit of an impact, though the question is how long the impact will last as the attention will start to die down. The Japanese government is playing a dangerous game, though, seeming to bet on weak US data on Thursday and Friday, which would trigger a pullback in the DXY and might see Yen strengthen without aid from the Japanese government.
Although the Relative Strength Index (RSI) is overbought in the daily chart, a correction could soon occur. If weaker US data, when that plays out and is undoubtedly not a certainty, will be enough to drive USD/JPY down to 151.91 remains to be seen. Instead, look at the 55-day Simple Moving Average (SMA) at 156.39 and the 100-day SMA at 153.69 for traders to quickly build a pivot on and try to test highs again, testing the Japanese deep pockets again.
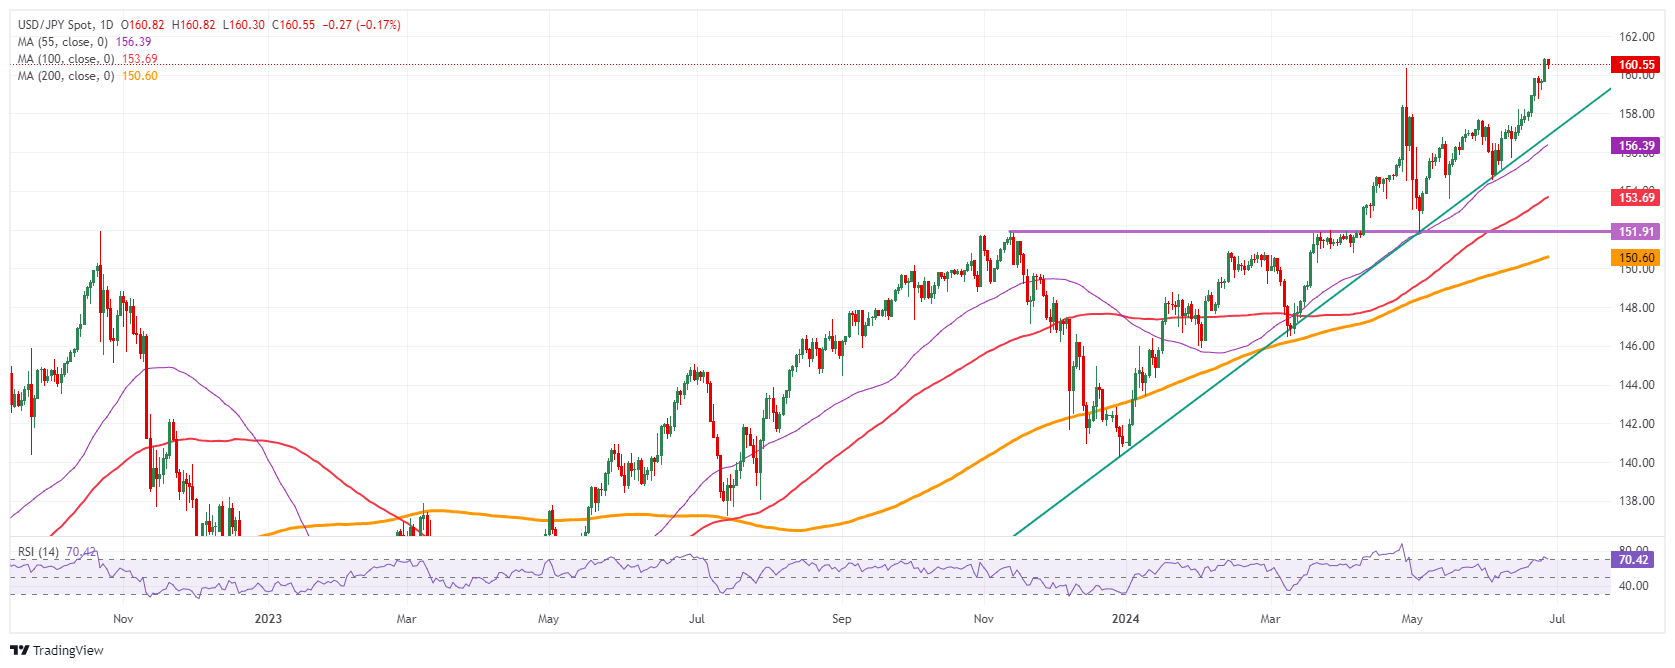
USD/JPY: Daily Chart
Japanese Yen FAQs
The Japanese Yen (JPY) is one of the world’s most traded currencies. Its value is broadly determined by the performance of the Japanese economy, but more specifically by the Bank of Japan’s policy, the differential between Japanese and US bond yields, or risk sentiment among traders, among other factors.
One of the Bank of Japan’s mandates is currency control, so its moves are key for the Yen. The BoJ has directly intervened in currency markets sometimes, generally to lower the value of the Yen, although it refrains from doing it often due to political concerns of its main trading partners. The current BoJ ultra-loose monetary policy, based on massive stimulus to the economy, has caused the Yen to depreciate against its main currency peers. This process has exacerbated more recently due to an increasing policy divergence between the Bank of Japan and other main central banks, which have opted to increase interest rates sharply to fight decades-high levels of inflation.
The BoJ’s stance of sticking to ultra-loose monetary policy has led to a widening policy divergence with other central banks, particularly with the US Federal Reserve. This supports a widening of the differential between the 10-year US and Japanese bonds, which favors the US Dollar against the Japanese Yen.
The Japanese Yen is often seen as a safe-haven investment. This means that in times of market stress, investors are more likely to put their money in the Japanese currency due to its supposed reliability and stability. Turbulent times are likely to strengthen the Yen’s value against other currencies seen as more risky to invest in.
- USD/CAD losses ground as the commodity-linked Canadian Dollar receives support from the upside of the crude Oil prices.
- Oil prices appreciate due to escalated Cross-border tensions between Israel and Lebanon's Hezbollah.
- US GDP Annualized (Q1) is expected to slightly increase by 1.4%, against the previous growth of 1.3%.
USD/CAD halts its two days of gains, trading around 1.3680 during the European hours on Thursday. The USD/CAD pair struggles as the commodity-linked Canadian Dollar (CAD) receives support from the upside of the crude Oil prices. Noting the fact, Canada is the largest Oil exporter to the United States.
Concerns over the potential spread of the Israel-Hamas war in Gaza to Lebanon have driven up Oil prices. Cross-border tensions between Israel and Lebanon's Hezbollah have been escalating in recent weeks, fueling fears of a conflict that could involve other regional powers, including major Oil producer Iran, according to Reuters.
Headline inflation in Canada rose to 2.9% in May, surpassing estimates that it would drop to a three-year low of 2.6% from April’s 2.7% reading. Additionally, the Bank of Canada’s (BoC) measures of underlying inflation unexpectedly increased to 0.6%, contrary to expectations of staying at 0.2%. This inflation rise is likely to prompt the central bank to proceed cautiously with further rate cuts.
On Friday, Statistics Canada will release the country's GDP (MoM) data, which is expected to show a 0.3% growth for April, compared to the neutral growth observed in March. On the US Dollar's (USD) side, traders await the release of the US GDP Annualized (Q1) due later in the North American session. The report is expected to show a slight increase of 1.4% from the previous growth of 1.3%.
The US Dollar struggles possibly due to traders’ anticipation of Friday’s Core PCE Price Index inflation, projected to decrease year-over-year to 2.6% from the previous 2.8%. This data is seen as the Federal Reserve's (Fed) preferred inflation gauge. Market participants are likely to hope that signs of easing inflation will encourage the Federal Reserve (Fed) to consider rate cuts sooner rather than later.
Canadian Dollar FAQs
The key factors driving the Canadian Dollar (CAD) are the level of interest rates set by the Bank of Canada (BoC), the price of Oil, Canada’s largest export, the health of its economy, inflation and the Trade Balance, which is the difference between the value of Canada’s exports versus its imports. Other factors include market sentiment – whether investors are taking on more risky assets (risk-on) or seeking safe-havens (risk-off) – with risk-on being CAD-positive. As its largest trading partner, the health of the US economy is also a key factor influencing the Canadian Dollar.
The Bank of Canada (BoC) has a significant influence on the Canadian Dollar by setting the level of interest rates that banks can lend to one another. This influences the level of interest rates for everyone. The main goal of the BoC is to maintain inflation at 1-3% by adjusting interest rates up or down. Relatively higher interest rates tend to be positive for the CAD. The Bank of Canada can also use quantitative easing and tightening to influence credit conditions, with the former CAD-negative and the latter CAD-positive.
The price of Oil is a key factor impacting the value of the Canadian Dollar. Petroleum is Canada’s biggest export, so Oil price tends to have an immediate impact on the CAD value. Generally, if Oil price rises CAD also goes up, as aggregate demand for the currency increases. The opposite is the case if the price of Oil falls. Higher Oil prices also tend to result in a greater likelihood of a positive Trade Balance, which is also supportive of the CAD.
While inflation had always traditionally been thought of as a negative factor for a currency since it lowers the value of money, the opposite has actually been the case in modern times with the relaxation of cross-border capital controls. Higher inflation tends to lead central banks to put up interest rates which attracts more capital inflows from global investors seeking a lucrative place to keep their money. This increases demand for the local currency, which in Canada’s case is the Canadian Dollar.
Macroeconomic data releases gauge the health of the economy and can have an impact on the Canadian Dollar. Indicators such as GDP, Manufacturing and Services PMIs, employment, and consumer sentiment surveys can all influence the direction of the CAD. A strong economy is good for the Canadian Dollar. Not only does it attract more foreign investment but it may encourage the Bank of Canada to put up interest rates, leading to a stronger currency. If economic data is weak, however, the CAD is likely to fall.
- AUD/USD finds bids near 0.6625 but remains sideways for more than a week.
- The US core PCE inflation for May will guide the next move in the US Dollar.
- Hot Australian CPI boosts prospects of more rate hikes by the RBA.
The AUD/USD pair is slightly higher at 0.6660 in Thursday’s European session. The Aussie asset finds modest buying interest as the US Dollar (US) edges down with United States (US) core Personal Consumption Expenditure Price Index (PCE) data for May in focus, which will be published on Friday. Broadly, the Aussie asset has been oscillating in the range of 0.6625-0.6690 from more than a week.
Investors will pay close attention to the US core PCE inflation data as it provides fresh cues over the interest rate outlook. Annually, the underlying inflation data is estimated to have softened to 2.6% from the prior release of 2.8%, with monthly figures growing at a slower pace of 0.1% from 0.2% in April.
Soft inflation numbers would boost expectations of early rate cuts by the Federal Reserve (Fed), while hot figures would provide more room for the Fed to maintain the current interest rate framework for a longer period. The scenario would be favorable for the US Dollar. Currently, the US Dollar Index (DXY), which tracks the Greenback’s value against six major currencies, has corrected modestly to near 105.90.
Meanwhile, traders have priced in two rate cuts this year and see the Fed choosing the September meeting as the earliest point to begin lowering interest rates. However, Fed policymakers singled out only one rate cut this year in the latest dot plot.
On the Aussie front, higher-than-expected growth in price pressures has prompted expectations of more rate hikes by the Reserve Bank of Australia (RBA). The monthly Consumer Price Index (CPI) report for May showed that rising prices of fuel, food, electricity, and rentals accelerated inflation to 4.0%, which was higher than expectations of 3.8% and the prior release of 4.0%.
Economic Indicator
Monthly Consumer Price Index (YoY)
The Monthly Consumer Price Index (CPI), released by the Australian Bureau of Statistics on a monthly basis, measures the changes in the price of a fixed basket of goods and services acquired by household consumers. The indicator was developed to provide inflation data at a higher frequency than the quarterly CPI. The YoY reading compares prices in the reference month to the same month a year earlier. A high reading is seen as bullish for the Australian Dollar (AUD), while a low reading is seen as bearish.
Read more.Last release: Wed Jun 26, 2024 01:30
Frequency: Monthly
Actual: 4%
Consensus: 3.8%
Previous: 3.6%
Source: Australian Bureau of Statistics
Bank of Japan (BoJ) Deputy Governor Shinichi Uchida said on Thursday that he is ”closely monitoring Yen movement in conducting monetary policy.”
He added that “weaker Yen is an upward factor for prices.”
Market reaction
The above comments fail to move the needle around the Japanese Yen, keeping USD/JPY 0.18% lower on the day at 160.50.
Japanese Yen PRICE Today
The table below shows the percentage change of Japanese Yen (JPY) against listed major currencies today. Japanese Yen was the strongest against the US Dollar.
| USD | EUR | GBP | JPY | CAD | AUD | NZD | CHF | |
|---|---|---|---|---|---|---|---|---|
| USD | -0.17% | -0.19% | -0.19% | -0.17% | -0.32% | -0.31% | -0.03% | |
| EUR | 0.17% | -0.03% | -0.03% | 0.00% | -0.15% | -0.18% | 0.13% | |
| GBP | 0.19% | 0.03% | 0.02% | 0.01% | -0.11% | -0.12% | 0.15% | |
| JPY | 0.19% | 0.03% | -0.02% | 0.03% | -0.12% | -0.15% | 0.16% | |
| CAD | 0.17% | 0.00% | -0.01% | -0.03% | -0.16% | -0.15% | 0.11% | |
| AUD | 0.32% | 0.15% | 0.11% | 0.12% | 0.16% | 0.00% | 0.26% | |
| NZD | 0.31% | 0.18% | 0.12% | 0.15% | 0.15% | -0.00% | 0.27% | |
| CHF | 0.03% | -0.13% | -0.15% | -0.16% | -0.11% | -0.26% | -0.27% |
The heat map shows percentage changes of major currencies against each other. The base currency is picked from the left column, while the quote currency is picked from the top row. For example, if you pick the Japanese Yen from the left column and move along the horizontal line to the US Dollar, the percentage change displayed in the box will represent JPY (base)/USD (quote).
- EUR/USD finds interim support near 1.0660 while uncertainty ahead of US core PCE inflation keeps the outlook vulnerable.
- Investors see the Fed reducing interest rates twice this year.
- The Euro will dance to the tunes of the preliminary June HICP data for France, Italy, and Spain on Friday.
EUR/USD rebounds slightly on Thursday’s European session after declining to a seven-week low near 1.0665 the day before. The major currency pair finds support as the US Dollar (USD) struggles to extend its upside amid uncertainty ahead of the United States (US) core Personal Consumption Expenditures (PCE) Price Index data for May, which will be published on Friday. However, the near-term demand remains vulnerable amid fears of widening policy divergence between the US Federal Reserve (Fed) and the European Central Bank (ECB).
The US Dollar Index (DXY), which tracks the Greenback’s value against six major peers, faces pressure in an attempt to move above the crucial resistance of 106.00.
Investors will pay close attention to the US core PCE inflation data, which will provide cues about when and how much the Fed will reduce interest rates this year. The US PCE report is expected to show that core price pressures grew at a slower pace of 0.1% month-on-month in May against 0.2% in April. Annually, the underlying inflation is projected to decelerate to 2.6% from 2.8% in April.
Softer-than-expected inflation figures would boost expectations of early Fed rate cuts, which would be unfavorable for the US Dollar. On the contrary, hot numbers will diminish Fed rate-cut prospects.
Currently, financial markets expect that the Fed will start reducing interest rates at the September meeting and deliver subsequent rate cuts in November or December.
Daily digest market movers: EUR/USD remains on tenterhooks ahead of key events
- EUR/USD continues to face selling pressure near the round-level resistance of 1.0700. The Euro’s near-term outlook is uncertain ahead of the Eurozone’s election outcome and growing speculation that the ECB will deliver back-to-back rate cuts.
- Investors remain cautious over the outcome of the French election amid speculation that the new government would make significant fiscal policy shifts, which would widen the financial crisis. The uncertainty over the French elections was triggered after French President Emmanuel Macron called for a snap election after his party suffered defeat in preliminary results from Marine Le Pen’s far-right National Rally (RN).
- On the monetary policy front, ECB policymakers refrained from committing to any pre-defined interest rate path after the central bank commenced the rate-cutting cycle in its policy meeting in early June amid concerns over wage inflation. However, higher interest rates weigh heavily on overall demand, which impacts activities in manufacturing as well as the service sector.
- Going forward, preliminary Eurozone Harmonized Index of Consumer Prices (HICP) data for June will be under the spotlight next week, as it will provide major cues about the interest rate outlook. Currently, investors expect that the ECB will deliver one more rate cut this year.
Technical Analysis: EUR/USD hovers below 1.0700
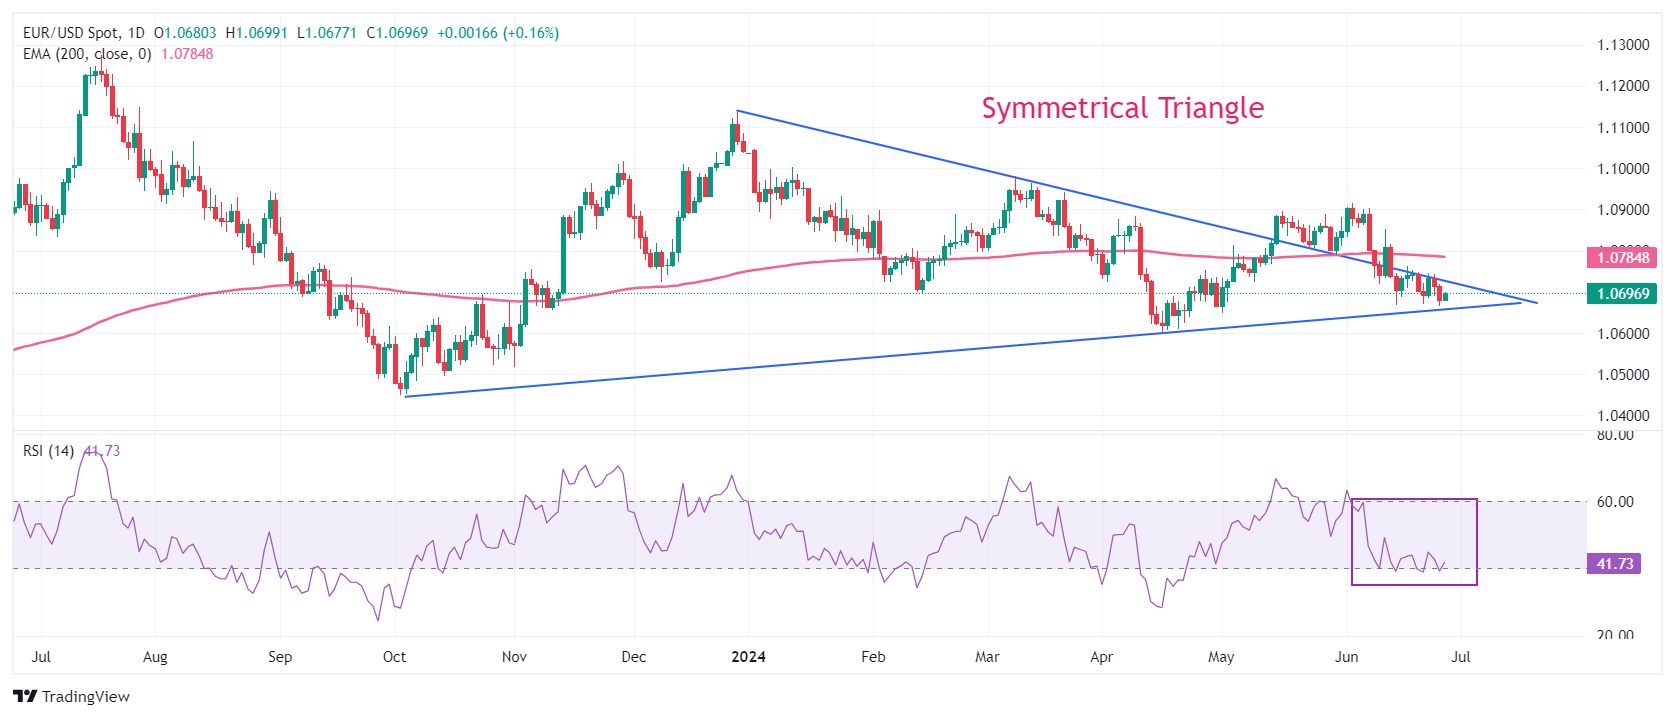
EUR/USD trades inside Wednesday’s range as investors sidelined ahead of the US core PCE inflation reading. The downward-sloping border of the Symmetrical Triangle pattern formation on a daily timeframe remains a major barrier for the Euro bulls. A fresh downside would appear if the pair delivers a decisive breakdown of the above-mentioned chart pattern.
The shared currency pair establishes below the 200-day Exponential Moving Average (EMA) near 1.0780, suggesting that the overall trend is bearish.
The 14-period Relative Strength Index (RSI) hovers near 40.00. A bearish momentum would trigger if the oscillator slips below this level.
Euro FAQs
The Euro is the currency for the 20 European Union countries that belong to the Eurozone. It is the second most heavily traded currency in the world behind the US Dollar. In 2022, it accounted for 31% of all foreign exchange transactions, with an average daily turnover of over $2.2 trillion a day. EUR/USD is the most heavily traded currency pair in the world, accounting for an estimated 30% off all transactions, followed by EUR/JPY (4%), EUR/GBP (3%) and EUR/AUD (2%).
The European Central Bank (ECB) in Frankfurt, Germany, is the reserve bank for the Eurozone. The ECB sets interest rates and manages monetary policy. The ECB’s primary mandate is to maintain price stability, which means either controlling inflation or stimulating growth. Its primary tool is the raising or lowering of interest rates. Relatively high interest rates – or the expectation of higher rates – will usually benefit the Euro and vice versa. The ECB Governing Council makes monetary policy decisions at meetings held eight times a year. Decisions are made by heads of the Eurozone national banks and six permanent members, including the President of the ECB, Christine Lagarde.
Eurozone inflation data, measured by the Harmonized Index of Consumer Prices (HICP), is an important econometric for the Euro. If inflation rises more than expected, especially if above the ECB’s 2% target, it obliges the ECB to raise interest rates to bring it back under control. Relatively high interest rates compared to its counterparts will usually benefit the Euro, as it makes the region more attractive as a place for global investors to park their money.
Data releases gauge the health of the economy and can impact on the Euro. Indicators such as GDP, Manufacturing and Services PMIs, employment, and consumer sentiment surveys can all influence the direction of the single currency. A strong economy is good for the Euro. Not only does it attract more foreign investment but it may encourage the ECB to put up interest rates, which will directly strengthen the Euro. Otherwise, if economic data is weak, the Euro is likely to fall. Economic data for the four largest economies in the euro area (Germany, France, Italy and Spain) are especially significant, as they account for 75% of the Eurozone’s economy.
Another significant data release for the Euro is the Trade Balance. This indicator measures the difference between what a country earns from its exports and what it spends on imports over a given period. If a country produces highly sought after exports then its currency will gain in value purely from the extra demand created from foreign buyers seeking to purchase these goods. Therefore, a positive net Trade Balance strengthens a currency and vice versa for a negative balance.
The US Dollar (USD) is likely to trade in a range, probably between 7.2920 and 7.3060. USD could break above 7.3100, but it is too early to tell if the next significant resistance at 7.3400 will come into view, UOB Group analysts suggest.
The upside risk is intact above 7.2800
24-HOUR VIEW: “USD traded in a quiet manner two days ago. Yesterday, we highlighted that ‘despite the quiet price action, there has been a slight increase in momentum.’ We expected USD to edge higher, but we were of the view that ‘any advance is unlikely to reach the major resistance at 7.3000.’ The anticipated USD advance exceeded our expectations, as it not only broke above 7.3000 but also came close to the next major resistance at 7.3100 (high has been 7.3080). The pullback from the high in overbought conditions suggests that instead of continuing to rise, USD is more likely to trade in a range today, probably between 7.2920 and 7.3060.”
1-3 WEEKS VIEW: “We turned positive in USD early last week. In our latest narrative from last Friday (21 Jun, spot at 7.2920), we indicated that ‘further USD strength is likely, and the resistance levels to watch are 7.3000 and 7.3100.’ After trading in a relatively quiet manner for a few days, USD took off yesterday and soared to a high of 7.3080. There is still room for USD to rise further, but while a break of 7.3100 will not be surprising, it is too early to tell if the next significant resistance at 7.3400 will come into view this time round. The upside risk is intact as long as 7.2800 is not breached (‘strong support’ level previously at 7.2700).”
The US Dollar (USD) could test 161.00 first before levelling off. Resistance levels are at 161.00 and 161.50, but 161.50 is unlikely to come into view. Still, strong momentum suggests further USD strength, UOB Group analysts suggest.
Resistance levels are at 161.00 and 161.50
24-HOUR VIEW: “We expected USD to trade sideways yesterday. However, USD lifted off and surged to a high of 160.86, closing at its highest level since 1986. After such a sharp rally in a short span of time, conditions are unsurprisingly overbought. However, the advance is not showing any sign of levelling off just yet. Today, USD could test 161.00 first before levelling off. 161.50 is unlikely to come into view. On the downside, significant support can be found at 160.00, with minor support at 160.30.”
1-3 WEEKS VIEW: “We have held a positive view in USD since early last week. In our latest narrative from three days ago (24 Jun, spot at 159.85), we indicated that while USD ‘could break above 160.00, it is worth noting that there is another resistance level at 160.25.’ Yesterday, USD took off and not only broke above both 160.00 and 160.25, but also soared to 160.86. While conditions are severely overbought, strong momentum suggests further USD strength. Resistance levels are at 161.00 and 161.50. On the downside, the ‘strong support’ level has moved higher to 159.40 from 158.80.”
Silver prices (XAG/USD) rose on Thursday, according to FXStreet data. Silver trades at $28.91 per troy ounce, up 0.50% from the $28.77 it cost on Wednesday.
Silver prices have increased by 21.50% since the beginning of the year.
| Unit measure | Silver Price Today in USD |
|---|---|
| Troy Ounce | 28.91 |
| 1 Gram | 0.93 |
The Gold/Silver ratio, which shows the number of ounces of Silver needed to equal the value of one ounce of Gold, stood at 79.89 on Thursday, broadly unchanged from 79.89 on Wednesday.
Silver FAQs
Silver is a precious metal highly traded among investors. It has been historically used as a store of value and a medium of exchange. Although less popular than Gold, traders may turn to Silver to diversify their investment portfolio, for its intrinsic value or as a potential hedge during high-inflation periods. Investors can buy physical Silver, in coins or in bars, or trade it through vehicles such as Exchange Traded Funds, which track its price on international markets.
Silver prices can move due to a wide range of factors. Geopolitical instability or fears of a deep recession can make Silver price escalate due to its safe-haven status, although to a lesser extent than Gold's. As a yieldless asset, Silver tends to rise with lower interest rates. Its moves also depend on how the US Dollar (USD) behaves as the asset is priced in dollars (XAG/USD). A strong Dollar tends to keep the price of Silver at bay, whereas a weaker Dollar is likely to propel prices up. Other factors such as investment demand, mining supply – Silver is much more abundant than Gold – and recycling rates can also affect prices.
Silver is widely used in industry, particularly in sectors such as electronics or solar energy, as it has one of the highest electric conductivity of all metals – more than Copper and Gold. A surge in demand can increase prices, while a decline tends to lower them. Dynamics in the US, Chinese and Indian economies can also contribute to price swings: for the US and particularly China, their big industrial sectors use Silver in various processes; in India, consumers’ demand for the precious metal for jewellery also plays a key role in setting prices.
Silver prices tend to follow Gold's moves. When Gold prices rise, Silver typically follows suit, as their status as safe-haven assets is similar. The Gold/Silver ratio, which shows the number of ounces of Silver needed to equal the value of one ounce of Gold, may help to determine the relative valuation between both metals. Some investors may consider a high ratio as an indicator that Silver is undervalued, or Gold is overvalued. On the contrary, a low ratio might suggest that Gold is undervalued relative to Silver.
(An automation tool was used in creating this post.)
- USD/CHF holds ground near its two-week high of 0.8983.
- US GDP Annualized (Q1) is expected to slightly increase by 1.4%, against the previous growth of 1.3%.
- The US Dollar may draw some support from the higher yields.
USD/CHF trades around 0.8980 during the European hours on Thursday, grappling to hold ground near its two-week high of 0.8983, recorded on Wednesday. Investors await the release of the US GDP Annualized (Q1) due later in the North American session. The report is expected to show a slight increase of 1.4% from the previous growth of 1.3%.
The US Dollar (USD) struggles possibly due to traders’ anticipation of Friday’s Core PCE Price Index inflation, projected to decrease year-over-year to 2.6% from the previous 2.8%. This data is seen as the Federal Reserve's (Fed) preferred inflation gauge. Market participants are likely to hope that signs of easing inflation will encourage the Federal Reserve (Fed) to consider rate cuts sooner rather than later.
The US Dollar Index (DXY), which measures the value of the US Dollar (USD) against the six other major currencies, may draw support from the higher US Treasury yields. 2-year and 10-year yields stand at 4.75% and 4.33%, respectively, at the time of writing.
Reuters cited Fed Governor Michelle Bowman repeating her view on Tuesday that holding the policy rate steady for some time will likely be enough to bring inflation under control. Meanwhile, Fed Governor Lisa Cook said it would be appropriate to cut interest rates "at some point," given significant progress on inflation and a gradual cooling of the labor market. However, Cook remained vague about the timing of the easing.
On the Swiss side, the economic calendar remains barren during the session, leaving the USD/CHF pair at the mercy of broader market trends and data from the United States (US). On Friday, the KOF Swiss Economic Institute may release the Swiss Leading Indicator for June, which measures future trends of the overall economic activity. The survey is expected to release an improved reading of 101.0 compared to the previous 100.3 reading.
Swiss Franc FAQs
The Swiss Franc (CHF) is Switzerland’s official currency. It is among the top ten most traded currencies globally, reaching volumes that well exceed the size of the Swiss economy. Its value is determined by the broad market sentiment, the country’s economic health or action taken by the Swiss National Bank (SNB), among other factors. Between 2011 and 2015, the Swiss Franc was pegged to the Euro (EUR). The peg was abruptly removed, resulting in a more than 20% increase in the Franc’s value, causing a turmoil in markets. Even though the peg isn’t in force anymore, CHF fortunes tend to be highly correlated with the Euro ones due to the high dependency of the Swiss economy on the neighboring Eurozone.
The Swiss Franc (CHF) is considered a safe-haven asset, or a currency that investors tend to buy in times of market stress. This is due to the perceived status of Switzerland in the world: a stable economy, a strong export sector, big central bank reserves or a longstanding political stance towards neutrality in global conflicts make the country’s currency a good choice for investors fleeing from risks. Turbulent times are likely to strengthen CHF value against other currencies that are seen as more risky to invest in.
The Swiss National Bank (SNB) meets four times a year – once every quarter, less than other major central banks – to decide on monetary policy. The bank aims for an annual inflation rate of less than 2%. When inflation is above target or forecasted to be above target in the foreseeable future, the bank will attempt to tame price growth by raising its policy rate. Higher interest rates are generally positive for the Swiss Franc (CHF) as they lead to higher yields, making the country a more attractive place for investors. On the contrary, lower interest rates tend to weaken CHF.
Macroeconomic data releases in Switzerland are key to assessing the state of the economy and can impact the Swiss Franc’s (CHF) valuation. The Swiss economy is broadly stable, but any sudden change in economic growth, inflation, current account or the central bank’s currency reserves have the potential to trigger moves in CHF. Generally, high economic growth, low unemployment and high confidence are good for CHF. Conversely, if economic data points to weakening momentum, CHF is likely to depreciate.
As a small and open economy, Switzerland is heavily dependent on the health of the neighboring Eurozone economies. The broader European Union is Switzerland’s main economic partner and a key political ally, so macroeconomic and monetary policy stability in the Eurozone is essential for Switzerland and, thus, for the Swiss Franc (CHF). With such dependency, some models suggest that the correlation between the fortunes of the Euro (EUR) and the CHF is more than 90%, or close to perfect.
Strong momentum is likely to lead to further the New Zealand Dollar (NZD) weakness. NZD is likely to continue to weaken, but the major support at 0.6040 is unlikely to come under threat for now, UOB Group strategists note.
Break above 0.6135 to stop the downside momentum
24-HOUR VIEW: “We did not anticipate NZD to drop sharply to 0.6075 (we were expecting sideways trading). While strong momentum is likely to lead to further weakness, given that conditions are oversold, the major support at 0.6040 is unlikely to come under threat (there is another support at 0.6060). To keep the momentum going, NZD must stay below 0.6110 (minor resistance is at 0.6095).”
1-3 WEEKS VIEW: “We have held the same view that NZD ‘is likely to drift lower to 0.6085’ since last Tuesday (18 Jun, spot at 0.6130). After more than a week, our view materialised, even though instead of drifting lower, NZD fell sharply 0.6075 in NY trading. The sharp drop has resulted in a rapid increase in momentum, and NZD is likely to continue to weaken. The next support level to watch is 0.6040. Overall, only a breach of 0.6135 (‘strong resistance’ level previously at 0.6160) would mean that NZD is not weakening further.”
- Gold bounces off the psychologically important $2,300 level after another leg of selling.
- The pair continues to be pressured by a higher-for-longer outlook on interest rates – data on Friday could be key.
- XAU/USD approaches the neckline for a potential topping pattern – if broken, a cascade down could result.
Gold (XAU/USD) edges higher, trading just above $2,300 on Thursday, as short-traders take profit following the last down leg from the $2,330s. The yellow metal has been pressured by comments from Federal Reserve (Fed) officials – those tasked with setting interest rates in the US – who have consistently stated that more progress has to be made on bringing down inflation before they can consider cutting interest rates.
Their reluctance to cut rates weighs on Gold because it makes the non-interest paying asset comparatively less attractive to investors.
Gold pressured by reluctant Fed
Gold backs and fills on Thursday after another big down-day on Wednesday as markets took their cue from a mixture of Fed speakers keeping reserved about cutting interest rates, and chart-based technical opportunism.
In regards to interest rates, of key importance will be the release of the US Personal Consumption Expenditures (PCE) Price Index for May on Friday, which is the Federal Reserve’s (Fed) preferred gauge of inflation. A lower-than-expected result could make the Fed more optimistic about cutting interest rates. The opposite would be the case if the PCE beats expectations.
Whilst the Fed sits on its hands, the market is a bit more optimistic seeing a relatively high probability (62%) of the Fed cutting interest rates at (or before) the Fed’s September meeting, although this is below the 66% seen on Wednesday. The estimates are according to the CME FedWatch tool, which calculates chances using Fed Funds futures prices.
Gold’s downside capped by longer-term factors
Gold’s downside is capped by various long-term positive factors. Firstly, there is its role as a safe-haven in an increasingly fractured, uncertain world. Geopolitical uncertainty in the Middle East, Ukraine and now France ahead of its contentious elections, is making some investors nervous, as is the impact of AI-driven revolutionary economic change as well as the threat of climate change.
The US Dollar (USD) is a further double-edged factor. A strong US Dollar has led to such a steep depreciation in mainly Asian currencies recently, prompting regional central banks to hoard Gold as a hedge against the effects. That said, a stronger Dollar also tends to lower Gold price precisely because it is priced in Dollars.
Recently USD reached a 38-year high against the Japanese Yen (JPY) and the higher it goes the more demand Gold will see as a currency hedge.
Another longer-term positive factor for Gold is the BRICS trade confederation’s strategy to use Gold as a replacement for the US Dollar in global trade. Given its position as a stable, safe store of value, Gold is the most reliable alternative as a means of exchange between nations with different, often volatile currencies.
Technical Analysis: Gold continues approaching key support
Gold has steadily pushed lower towards key support and the neckline of a possible topping pattern at $2,279. A break below the neckline would signal a strong down move.
XAU/USD Daily Chart
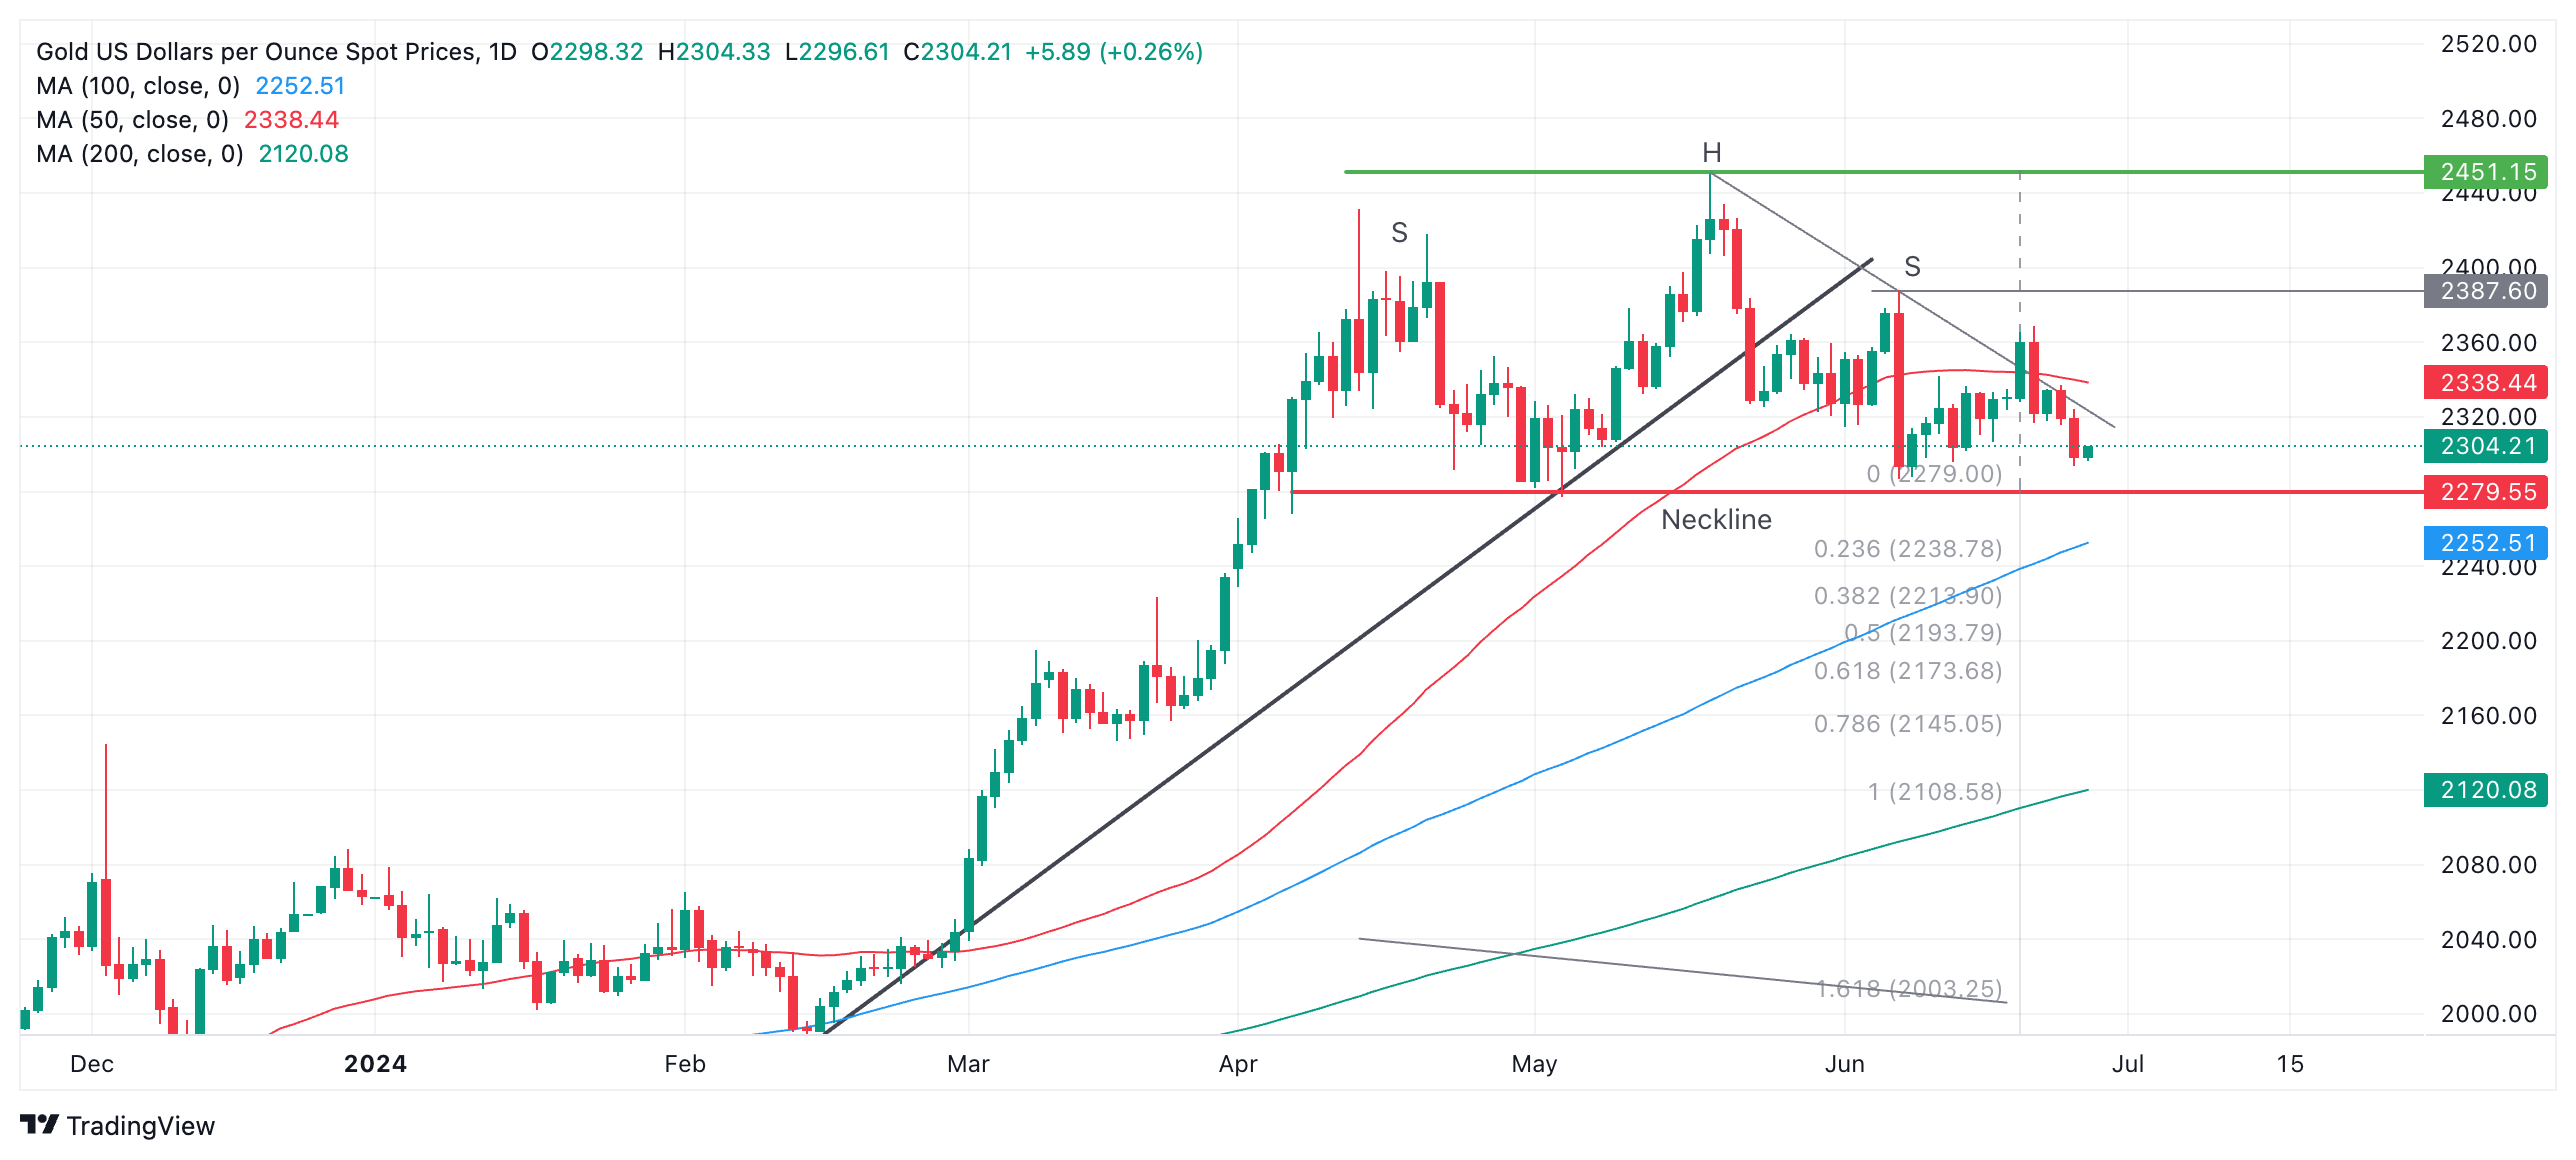
The XAU/USD pair had been forming a bearish Head-and-Shoulders (H&S) pattern over the last three months. However, the upside break on June 20 has brought the validity of the pattern into doubt. That said, a more complex topping pattern that might still prove bearish is still possibly forming.
If so, then a break below the pattern’s neckline – even if it is not an orthodox H&S – at $2,279 would provide confirmation of a reversal lower, with a conservative target at $2,171, and a second target at $2,105.
At the same time, it is also still possible that Gold could find its feet and continue higher. Gold’s original break above the trendline and the 50-day SMA on June 20 was supposed to reach an initial, conservative target in the mid $2,380s (June 7 high), and it is still possible it could reach that target despite the fallback.
However, it would require a break above $2,350 to confirm a move up to the June 7 high. A further break above that might indicate a continuation up to the May – and all-time – high at $2,450.
A break above that would confirm a resumption of the broader uptrend.
There is a risk that the trend is now sideways in both the short and medium term. In the long term, Gold remains in an uptrend.
Gold FAQs
Gold has played a key role in human’s history as it has been widely used as a store of value and medium of exchange. Currently, apart from its shine and usage for jewelry, the precious metal is widely seen as a safe-haven asset, meaning that it is considered a good investment during turbulent times. Gold is also widely seen as a hedge against inflation and against depreciating currencies as it doesn’t rely on any specific issuer or government.
Central banks are the biggest Gold holders. In their aim to support their currencies in turbulent times, central banks tend to diversify their reserves and buy Gold to improve the perceived strength of the economy and the currency. High Gold reserves can be a source of trust for a country’s solvency. Central banks added 1,136 tonnes of Gold worth around $70 billion to their reserves in 2022, according to data from the World Gold Council. This is the highest yearly purchase since records began. Central banks from emerging economies such as China, India and Turkey are quickly increasing their Gold reserves.
Gold has an inverse correlation with the US Dollar and US Treasuries, which are both major reserve and safe-haven assets. When the Dollar depreciates, Gold tends to rise, enabling investors and central banks to diversify their assets in turbulent times. Gold is also inversely correlated with risk assets. A rally in the stock market tends to weaken Gold price, while sell-offs in riskier markets tend to favor the precious metal.
The price can move due to a wide range of factors. Geopolitical instability or fears of a deep recession can quickly make Gold price escalate due to its safe-haven status. As a yield-less asset, Gold tends to rise with lower interest rates, while higher cost of money usually weighs down on the yellow metal. Still, most moves depend on how the US Dollar (USD) behaves as the asset is priced in dollars (XAU/USD). A strong Dollar tends to keep the price of Gold controlled, whereas a weaker Dollar is likely to push Gold prices up.
Sharp pullback in Australian Dollar (AUD) has scope to extend. Any decline is unlikely to reach 0.6600. For the time being, AUD is likely to trade between 0.6600 and 0.6685, UOB Group strategists note.
A break above 0.6665 is very likely
24-HOUR VIEW: “Yesterday, we expected AUD to trade in a range of 0.6625/0.6665. We did not expect the spike in volatility as AUD soared to 0.6689 before pulling back sharply to close largely unchanged (0.6648, -0.01%). The sharp pullback has scope to extend, but given the lackluster momentum, any decline is unlikely to reach 0.6600. Note that there is another support level at 0.6625. Resistance is at 0.6665, followed by 0.6680.”
1-3 WEEKS VIEW: “In our latest narrative from Wednesday (24 Jun, spot at 0.6640), we indicated that the current price action is likely part of a range-trading phase. We expected AUD to trade between 0.6600 and 0.6685. Yesterday, AUD rose a few pips above 0.6685, reaching a high of 0.6689. However, the advance was short-lived, as AUD pulled back to close largely unchanged (0.6648, -0.01%). The price action still appears to be part of a range-trading phase, and we continue to expect AUD to trade between 0.6600 and 0.6685.”
European Central Bank (ECB) policymaker and Slovakian central bank Governor Peter Kazimir said Thursday, “I think we can expect one more rate cut this year.”
He added, “I expect quiet summer on ECB rates.”
Meanwhile, ECB Chief Economist Philip Lane said that “the officials will be agile on rates and keep an open mind.”
Market reaction
The Euro fails to move on these above comments, as EUR/USD holds its recovery mode below 1.0700, as of writing. The pair is up 0.08% so far.
ECB FAQs
The European Central Bank (ECB) in Frankfurt, Germany, is the reserve bank for the Eurozone. The ECB sets interest rates and manages monetary policy for the region. The ECB primary mandate is to maintain price stability, which means keeping inflation at around 2%. Its primary tool for achieving this is by raising or lowering interest rates. Relatively high interest rates will usually result in a stronger Euro and vice versa. The ECB Governing Council makes monetary policy decisions at meetings held eight times a year. Decisions are made by heads of the Eurozone national banks and six permanent members, including the President of the ECB, Christine Lagarde.
In extreme situations, the European Central Bank can enact a policy tool called Quantitative Easing. QE is the process by which the ECB prints Euros and uses them to buy assets – usually government or corporate bonds – from banks and other financial institutions. QE usually results in a weaker Euro. QE is a last resort when simply lowering interest rates is unlikely to achieve the objective of price stability. The ECB used it during the Great Financial Crisis in 2009-11, in 2015 when inflation remained stubbornly low, as well as during the covid pandemic.
Quantitative tightening (QT) is the reverse of QE. It is undertaken after QE when an economic recovery is underway and inflation starts rising. Whilst in QE the European Central Bank (ECB) purchases government and corporate bonds from financial institutions to provide them with liquidity, in QT the ECB stops buying more bonds, and stops reinvesting the principal maturing on the bonds it already holds. It is usually positive (or bullish) for the Euro.
GBP could break below 1.2600. Downward momentum is picking up again, but the next major support at 1.2550 is unlikely to come into view for now, analysts at UOB Group note.
A break above 1.2630 may lead to 1.2650
24-HOUR VIEW: “The sharp selloff in GBP to a low of 1.2616 was surprising (we were expecting range trading). Strong downward momentum suggests GBP could break below the major support at 1.2600. However, oversold conditions suggest that the next major support at 1.2550 is unlikely to come into view for now. Resistance levels are at 1.2630 and 1.2650.”
1-3 WEEKS VIEW: “We have held a negative view in GBP since early last week. After GBP dropped to 1.2622 and rebounded strongly, we indicated two days ago (25 Jun, spot at 1.2680) that ‘the slowdown in momentum suggests a slim chance of GBP weakening to 1.2600.’ However, we added, ‘only a breach of 1.2705 would indicate that the weakness in GBP has stabilized.’ Yesterday, GBP plummeted and dropped to 1.2616. Downward momentum is picking up again, and a break of 1.2600 would not be surprising. The next level to watch below 1.2600 is at 1.2550. On the upside, the ‘strong resistance’ level has moved lower to 1.2680 from 1.2705.”
The Euro (EUR) could decline further, but it is not clear for now if it can break the significant support level at 1.0640. But if it breaks below this level, a sustained EUR decline is possible.
EUR to stabilize above 1.0730
24-HOUR VIEW: “Two days ago, EUR fell to 1.0689 and then rebounded. Yesterday, we pointed out that ‘there has been a slight increase in momentum.’ We indicated that EUR ‘could dip below the 1.0689 low, but the major support at 1.0670 is unlikely to come under threat.’ The anticipated decline exceeded our expectations as EUR fell to a low of 1.0664. Today, EUR could decline further, but it is not clear for now if it can break the significant support level at 1.0640. Note that 1.0665 is still a rather strong support level. Resistance is at 1.0695; a breach of 1.0710 would mean that the weakness in EUR has stabilised.”
1-3 WEEKS VIEW: “Our latest narrative was from two days ago (25 Jun, spot at 1.0730), wherein EUR ‘has likely entered a consolidation phase and it is likely to trade between 1.0670 and 1.0800.’ Yesterday, EUR fell to a low of 1.0664. Downward momentum is building again, but at this stage, it does not appear to be enough to suggest the start of a sustained decline. Furthermore, there is a significant support level at 1.0640. That said, provided that 1.0730 is not breached, EUR is likely to remain under pressure, but a sustained decline is likely only if it can break clearly below 1.0640.”
- Silver price may extend losses as daily chart analysis indicates a bearish bias.
- The XAG/USD pair consolidates within the descending channel pattern.
- The 14-day RSI suggests that Silver price trades within a range between $29.70-$28.70.
Silver price (XAG/USD) continues its losing streak for the third successive session, trading around $28.70 per troy ounce during the early European session on Thursday. An analysis of the daily chart indicates a bearish bias as the XAG/USD pair consolidates within the descending channel pattern.
The momentum indicator Moving Average Convergence Divergence (MACD) indicates the strengthening of bearish bias for Silver. This configuration indicates that the overall trend turns negative as the MACD line breaks below the centreline and a signal line.
The 14-day Relative Strength Index (RSI) is consolidating below the 50 level, suggesting Silver price trading within a range between $29.70-$28.70. If the RSI declines below the 30 level, it generates buy signals and indicates an oversold condition of the commodity asset.
On the downside, the Silver price may find key support around the psychological level of $28.00. A break below this level could exert pressure on the XAG/USD pair to approach the vicinity around the lower threshold of the descending channel around the level of $27.50.
In terms of resistance, the Silver price may find the immediate barrier around the nine-day Exponential Moving Average (EMA) at $29.30, followed by the significant level of $30.00.
A breakthrough above the latter could lead the price of the grey metal to reach the upper boundary of the descending channel around the level of $30.50. A breakthrough above the latter could lead the XAG/USD pair to test the four-week high of $31.55.
XAG/USD: Daily Chart
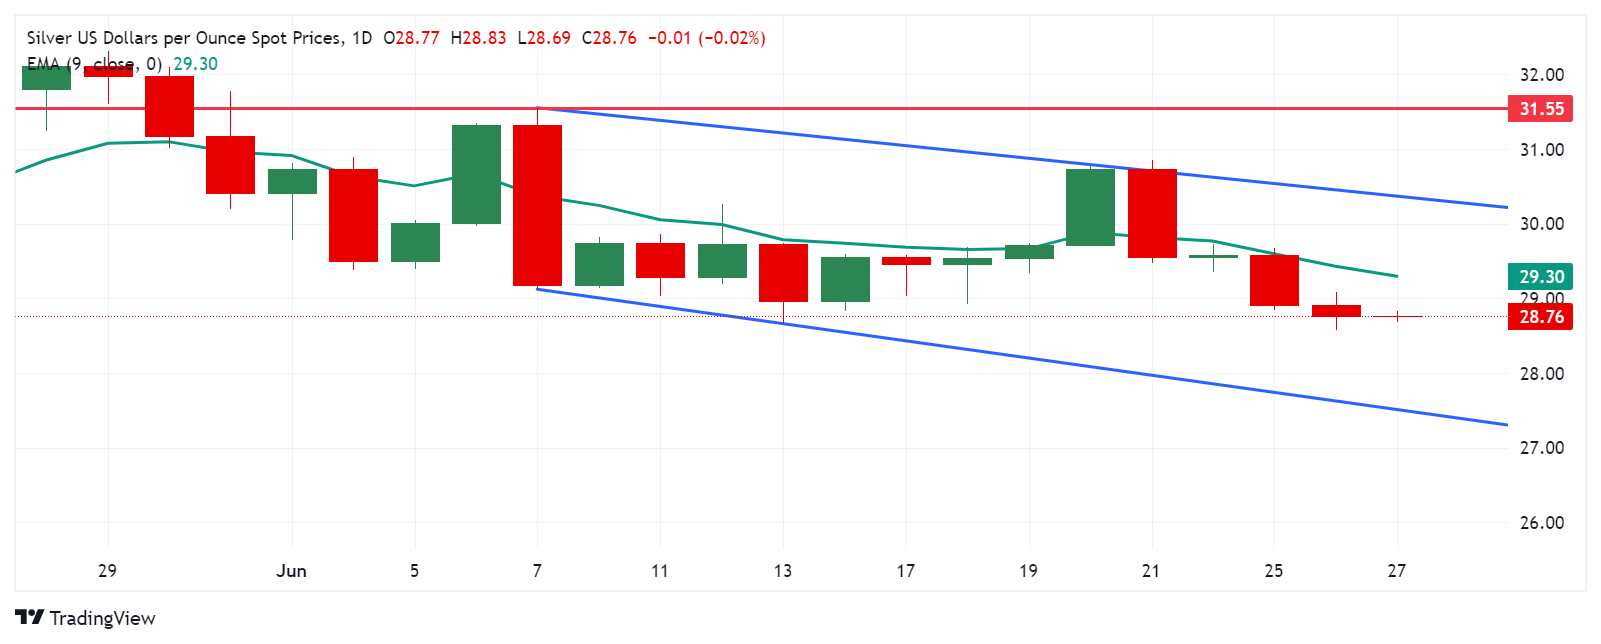
Silver FAQs
Silver is a precious metal highly traded among investors. It has been historically used as a store of value and a medium of exchange. Although less popular than Gold, traders may turn to Silver to diversify their investment portfolio, for its intrinsic value or as a potential hedge during high-inflation periods. Investors can buy physical Silver, in coins or in bars, or trade it through vehicles such as Exchange Traded Funds, which track its price on international markets.
Silver prices can move due to a wide range of factors. Geopolitical instability or fears of a deep recession can make Silver price escalate due to its safe-haven status, although to a lesser extent than Gold's. As a yieldless asset, Silver tends to rise with lower interest rates. Its moves also depend on how the US Dollar (USD) behaves as the asset is priced in dollars (XAG/USD). A strong Dollar tends to keep the price of Silver at bay, whereas a weaker Dollar is likely to propel prices up. Other factors such as investment demand, mining supply – Silver is much more abundant than Gold – and recycling rates can also affect prices.
Silver is widely used in industry, particularly in sectors such as electronics or solar energy, as it has one of the highest electric conductivity of all metals – more than Copper and Gold. A surge in demand can increase prices, while a decline tends to lower them. Dynamics in the US, Chinese and Indian economies can also contribute to price swings: for the US and particularly China, their big industrial sectors use Silver in various processes; in India, consumers’ demand for the precious metal for jewellery also plays a key role in setting prices.
Silver prices tend to follow Gold's moves. When Gold prices rise, Silver typically follows suit, as their status as safe-haven assets is similar. The Gold/Silver ratio, which shows the number of ounces of Silver needed to equal the value of one ounce of Gold, may help to determine the relative valuation between both metals. Some investors may consider a high ratio as an indicator that Silver is undervalued, or Gold is overvalued. On the contrary, a low ratio might suggest that Gold is undervalued relative to Silver.
- The Pound Sterling rises slightly against the US Dollar but the overall direction remains uncertain.
- Economists expect that the US core PCE inflation softened in May.
- The uncertainty over the UK elections outcome keeps the Pound Sterling on its toes.
The Pound Sterling (GBP) finds a cushion above the round-level support of 1.2600 against the US Dollar (USD) in Thursday’s London session. The GBP/USD pair gauges ground as the US Dollar registers a modest correction. The US Dollar Index (DXY), which tracks the Greenback’s value against six major currencies, edges down after posting a fresh eight-week high near 106.10.
However, the near-term outlook of the US Dollar remains firm as investors are expected to trade cautiously ahead of the United States (US) core Personal Consumption Expenditure price index (PCE) data for May, which will be published on Friday. Core PCE inflation, the Federal Reserve’s (Fed) preferred inflation measure, is estimated to grow at a slower pace of 0.1% against 0.2% in April month-on-month. Annually, the underlying inflation is projected to decelerate to 2.6% from 2.8% in April.
A scenario in which PCE inflation declines, as economists expect, would boost expectations for the Fed to begin reducing interest rates from September. According to the CME FedWatch tool, traders see a 62.3% that interest rates will be reduced from their current levels. The tool also shows that the Fed will cut interest rates twice this year. However, Fed policymakers signaled in their latest dot plot that there will be only on rate cut this year.
In Thursday’s session, investors will focus on the Initial Jobless Claims data for the week ending June 21, the revised Q1 Gross Domestic Product (GDP) estimates, and Durable Goods Orders data for May.
Daily digest market movers: Pound Sterling weakens against Asian peers
- The Pound Sterling gains against its European peers and the US Dollar but is exhibiting weakness against Asian currencies in Thursday’s European session. In Asia, the Japanese Yen (JPY) rises as fears of Japan’s intervention in the FX domain have intensified. Meanwhile, antipodean currencies are showing strength as investors expect that the Reserve Bank of Australia (RBA) and the Reserve Bank of New Zealand (RBNZ) will not pivot to policy normalization this year.
- The British currency is expected to face volatility as the United Kingdom (UK) parliamentary elections are held on July 4. According to polls, UK Prime Minister Rishi Sunak’s Conservative Party is expected to suffer a defeat from the opposition Labour Party.
- On the economic front, the deteriorating economic outlook due to the Bank of England's (BoE) higher interest rates and stubborn wage growth keep policymakers concerned. The preliminary S&P Global/CIPS Purchasing Managers’ Index (PMI) for June showed that business activity in the manufacturing sector expanded at a faster pace, while operations in the service sector unexpectedly slowed. Meanwhile, high wage growth continues to empower individuals with high purchasing power, making it more difficult for policymakers to kick-start the policy-easing cycle.
- Financial markets expect the BoE to start reducing interest rates from the August meeting. Meanwhile, investors will focus on the revised UK Q1 GDP estimates, which will be published on Friday.
Pound Sterling Price Today:
British Pound PRICE Today
The table below shows the percentage change of British Pound (GBP) against listed major currencies today. British Pound was the strongest against the US Dollar.
| GBP | USD | EUR | JPY | CAD | AUD | NZD | CHF | |
|---|---|---|---|---|---|---|---|---|
| GBP | 0.16% | 0.03% | -0.02% | 0.06% | -0.11% | -0.01% | 0.11% | |
| USD | -0.16% | -0.13% | -0.21% | -0.11% | -0.30% | -0.19% | -0.05% | |
| EUR | -0.03% | 0.13% | -0.10% | 0.00% | -0.17% | -0.09% | 0.06% | |
| JPY | 0.02% | 0.21% | 0.10% | 0.12% | -0.08% | -0.00% | 0.17% | |
| CAD | -0.06% | 0.11% | -0.01% | -0.12% | -0.21% | -0.09% | 0.04% | |
| AUD | 0.11% | 0.30% | 0.17% | 0.08% | 0.21% | 0.11% | 0.22% | |
| NZD | 0.01% | 0.19% | 0.09% | 0.00% | 0.09% | -0.11% | 0.13% | |
| CHF | -0.11% | 0.05% | -0.06% | -0.17% | -0.04% | -0.22% | -0.13% |
The heat map shows percentage changes of major currencies against each other. The base currency is picked from the left column, while the quote currency is picked from the top row. For example, if you pick the British Pound from the left column and move along the horizontal line to the US Dollar, the percentage change displayed in the box will represent GBP (base)/USD (quote).
Technical Analysis: Pound Sterling finds temporary support near 1.2600
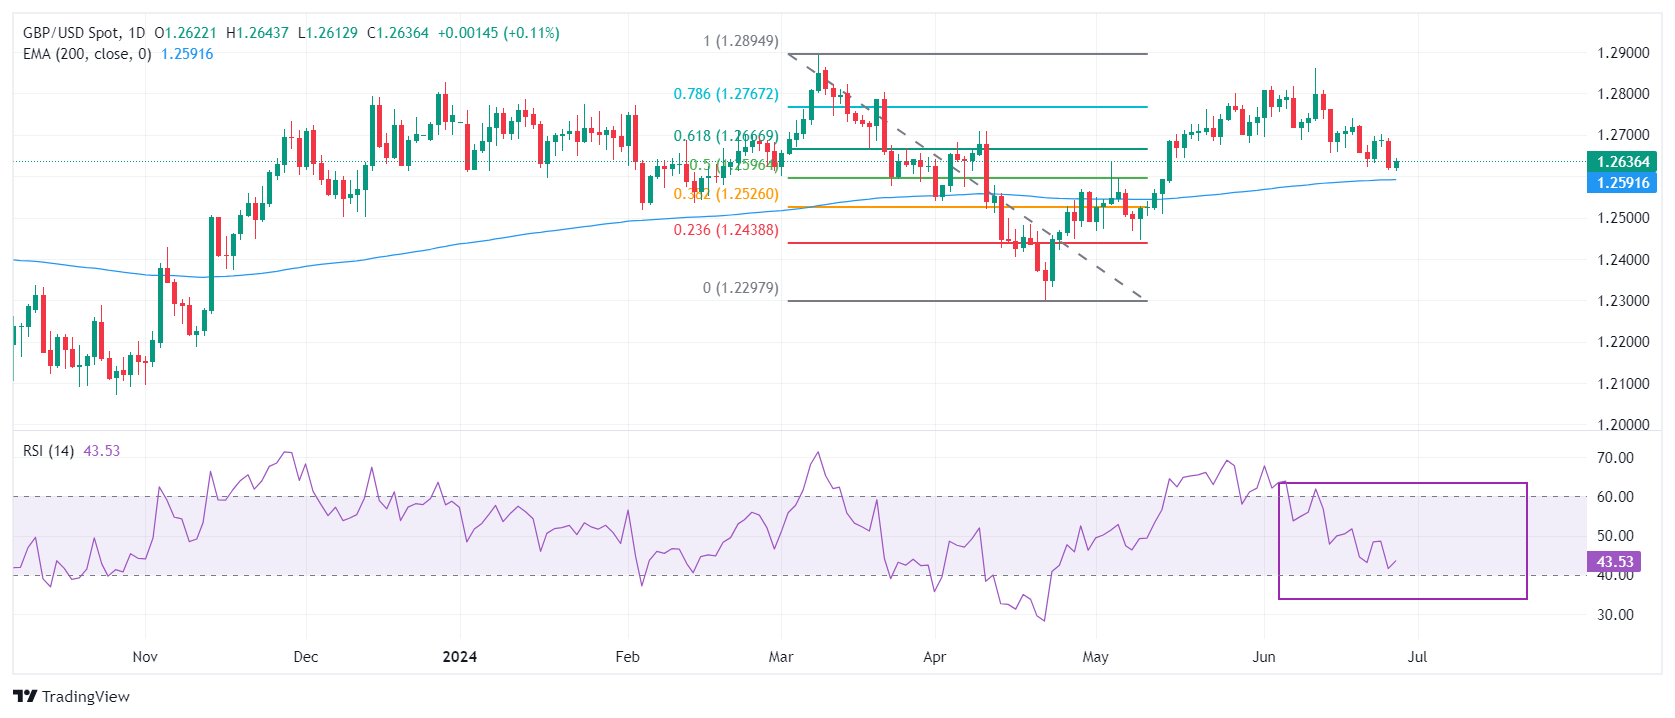
The Pound Sterling finds interim support near 1.2600 against the US Dollar. The GBP/USD pair has come under pressure after breaking below the crucial support of 1.2700. The Cable declines toward the 200-day Exponential Moving Average (EMA), which trades around 1.2590.
The Cable has dropped below the 61.8% Fibonacci retracement support at 1.2667, plotted from the March 8 high of 1.2900 to the April 22 low at 1.2300.
The 14-day Relative Strength Index (RSI) oscillates inside the 40.00-60.00 range, indicating consolidation ahead.
Pound Sterling FAQs
The Pound Sterling (GBP) is the oldest currency in the world (886 AD) and the official currency of the United Kingdom. It is the fourth most traded unit for foreign exchange (FX) in the world, accounting for 12% of all transactions, averaging $630 billion a day, according to 2022 data. Its key trading pairs are GBP/USD, aka ‘Cable’, which accounts for 11% of FX, GBP/JPY, or the ‘Dragon’ as it is known by traders (3%), and EUR/GBP (2%). The Pound Sterling is issued by the Bank of England (BoE).
The single most important factor influencing the value of the Pound Sterling is monetary policy decided by the Bank of England. The BoE bases its decisions on whether it has achieved its primary goal of “price stability” – a steady inflation rate of around 2%. Its primary tool for achieving this is the adjustment of interest rates. When inflation is too high, the BoE will try to rein it in by raising interest rates, making it more expensive for people and businesses to access credit. This is generally positive for GBP, as higher interest rates make the UK a more attractive place for global investors to park their money. When inflation falls too low it is a sign economic growth is slowing. In this scenario, the BoE will consider lowering interest rates to cheapen credit so businesses will borrow more to invest in growth-generating projects.
Data releases gauge the health of the economy and can impact the value of the Pound Sterling. Indicators such as GDP, Manufacturing and Services PMIs, and employment can all influence the direction of the GBP. A strong economy is good for Sterling. Not only does it attract more foreign investment but it may encourage the BoE to put up interest rates, which will directly strengthen GBP. Otherwise, if economic data is weak, the Pound Sterling is likely to fall.
Another significant data release for the Pound Sterling is the Trade Balance. This indicator measures the difference between what a country earns from its exports and what it spends on imports over a given period. If a country produces highly sought-after exports, its currency will benefit purely from the extra demand created from foreign buyers seeking to purchase these goods. Therefore, a positive net Trade Balance strengthens a currency and vice versa for a negative balance.
FX option expiries for June 27 NY cut at 10:00 Eastern Time, via DTCC, can be found below
- EUR/USD: EUR amounts
- 1.0650 2.2b
- 1.0700 4.5b
- 1.0725 681m
- 1.0740 851m
- 1.0750 1.5b
- 1.0780 908m
- 1.0800 1.2b
- GBP/USD: GBP amounts
- 1.2550 458m
- 1.2700 418m
- 1.2750 762m
- USD/JPY: USD amounts
- 158.00 456m
- 158.75 405m
- 159.35 486m
- 159.50 745m
- 160.00 1.1b
- USD/CAD: USD amounts
- 1.3500 470m
- 1.3635 503m
- 1.3675 1.4b
- 1.3700 1.7b
- 1.3705 990m
- EUR/GBP: EUR amounts
- 0.8400 630m
Gold prices rose in India on Thursday, according to data compiled by FXStreet.
The price for Gold stood at 6,175.89 Indian Rupees (INR) per gram, up compared with the INR 6,167.39 it cost on Wednesday.
The price for Gold increased to INR 72,033.16 per tola from INR 71,935.20 per tola a day earlier.
| Unit measure | Gold Price in INR |
|---|---|
| 1 Gram | 6,175.89 |
| 10 Grams | 61,758.40 |
| Tola | 72,033.16 |
| Troy Ounce | 192,091.90 |
FXStreet calculates Gold prices in India by adapting international prices (USD/INR) to the local currency and measurement units. Prices are updated daily based on the market rates taken at the time of publication. Prices are just for reference and local rates could diverge slightly.
Gold FAQs
Gold has played a key role in human’s history as it has been widely used as a store of value and medium of exchange. Currently, apart from its shine and usage for jewelry, the precious metal is widely seen as a safe-haven asset, meaning that it is considered a good investment during turbulent times. Gold is also widely seen as a hedge against inflation and against depreciating currencies as it doesn’t rely on any specific issuer or government.
Central banks are the biggest Gold holders. In their aim to support their currencies in turbulent times, central banks tend to diversify their reserves and buy Gold to improve the perceived strength of the economy and the currency. High Gold reserves can be a source of trust for a country’s solvency. Central banks added 1,136 tonnes of Gold worth around $70 billion to their reserves in 2022, according to data from the World Gold Council. This is the highest yearly purchase since records began. Central banks from emerging economies such as China, India and Turkey are quickly increasing their Gold reserves.
Gold has an inverse correlation with the US Dollar and US Treasuries, which are both major reserve and safe-haven assets. When the Dollar depreciates, Gold tends to rise, enabling investors and central banks to diversify their assets in turbulent times. Gold is also inversely correlated with risk assets. A rally in the stock market tends to weaken Gold price, while sell-offs in riskier markets tend to favor the precious metal.
The price can move due to a wide range of factors. Geopolitical instability or fears of a deep recession can quickly make Gold price escalate due to its safe-haven status. As a yield-less asset, Gold tends to rise with lower interest rates, while higher cost of money usually weighs down on the yellow metal. Still, most moves depend on how the US Dollar (USD) behaves as the asset is priced in dollars (XAU/USD). A strong Dollar tends to keep the price of Gold controlled, whereas a weaker Dollar is likely to push Gold prices up.
(An automation tool was used in creating this post.)
Here is what you need to know on Thursday, June 27:
The Japanese Yen (JPY) recovers slightly after falling to its weakest level since 1986 against the US Dollar (USD) on Wednesday. The European Commission will release consumer and business sentiment data in the European session. The US economic docket will feature the final revision to the first-quarter Gross Domestic Product growth, weekly Initial Jobless Claims, Durable Goods Orders and Pending Home Sales data for May. Later in the day, market focus will shift to the first US Presidential Debate between Joe Biden and Donald Trump.
US Dollar PRICE This week
The table below shows the percentage change of US Dollar (USD) against listed major currencies this week. US Dollar was the strongest against the Japanese Yen.
| USD | EUR | GBP | JPY | CAD | AUD | NZD | CHF | |
|---|---|---|---|---|---|---|---|---|
| USD | 0.00% | 0.06% | 0.43% | 0.00% | -0.37% | 0.42% | 0.35% | |
| EUR | 0.00% | 0.07% | 0.48% | 0.05% | -0.34% | 0.47% | 0.43% | |
| GBP | -0.06% | -0.07% | 0.36% | -0.03% | -0.42% | 0.39% | 0.35% | |
| JPY | -0.43% | -0.48% | -0.36% | -0.41% | -0.75% | 0.05% | -0.07% | |
| CAD | -0.00% | -0.05% | 0.03% | 0.41% | -0.36% | 0.42% | 0.38% | |
| AUD | 0.37% | 0.34% | 0.42% | 0.75% | 0.36% | 0.81% | 0.77% | |
| NZD | -0.42% | -0.47% | -0.39% | -0.05% | -0.42% | -0.81% | -0.05% | |
| CHF | -0.35% | -0.43% | -0.35% | 0.07% | -0.38% | -0.77% | 0.05% |
The heat map shows percentage changes of major currencies against each other. The base currency is picked from the left column, while the quote currency is picked from the top row. For example, if you pick the US Dollar from the left column and move along the horizontal line to the Japanese Yen, the percentage change displayed in the box will represent USD (base)/JPY (quote).
Following the subdued action seen earlier in the week, USD/JPY gathered bullish momentum and climbed to its highest level since 1986 above 160.80 on Wednesday. Verbal intervention from Japanese government officials helped the JPY stage a rebound early Thursday, allowing USD/JPY to retreat back below 160.50. Japan’s Chief Cabinet Secretary Hayashi and Finance Minister Shunichi Suzuki both refrained from commenting on foreign exchange levels but said that they are watching the action in currency markets with a sense of urgency and reiterated that they are prepared to take necessary actions. Meanwhile, the data from Japan showed earlier in the day that Retail Trade grew 3% on a yearly basis in May, surpassing the market expectation and April's growth of 2%.
The USD Index climbed to its highest level since early May above 106.00 on Wednesday. The index stays in a consolidation phase and fluctuates slightly below this level in the European morning on Thursday. In the meantime, US stock index futures trade in negative territory, while the benchmark 10-year US Treasury bond yield holds steady above 4.3% after rising nearly 2% on Wednesday.
EUR/USD registered losses for the second straight day on Wednesday. Early Thursday, the pair rebounds modestly but remains slightly below 1.0700.
GBP/USD extended its slide amid renewed USD strength and lost 0.5% on Wednesday. The pair edges higher toward 1.2650 to start the European session on Thursday.
Pressured by rising US Treasury bond yields, Gold dropped to its lowest level in over two weeks below $2,300 on Wednesday. XAU/USD stages a correction and trades at around $2,300 in the European morning.
Japanese Yen FAQs
The Japanese Yen (JPY) is one of the world’s most traded currencies. Its value is broadly determined by the performance of the Japanese economy, but more specifically by the Bank of Japan’s policy, the differential between Japanese and US bond yields, or risk sentiment among traders, among other factors.
One of the Bank of Japan’s mandates is currency control, so its moves are key for the Yen. The BoJ has directly intervened in currency markets sometimes, generally to lower the value of the Yen, although it refrains from doing it often due to political concerns of its main trading partners. The current BoJ ultra-loose monetary policy, based on massive stimulus to the economy, has caused the Yen to depreciate against its main currency peers. This process has exacerbated more recently due to an increasing policy divergence between the Bank of Japan and other main central banks, which have opted to increase interest rates sharply to fight decades-high levels of inflation.
The BoJ’s stance of sticking to ultra-loose monetary policy has led to a widening policy divergence with other central banks, particularly with the US Federal Reserve. This supports a widening of the differential between the 10-year US and Japanese bonds, which favors the US Dollar against the Japanese Yen.
The Japanese Yen is often seen as a safe-haven investment. This means that in times of market stress, investors are more likely to put their money in the Japanese currency due to its supposed reliability and stability. Turbulent times are likely to strengthen the Yen’s value against other currencies seen as more risky to invest in.
- USD/JPY corrects due to the verbal intervention by Japanese authorities.
- Japanese Finance Minister Suzuki stated to take appropriate steps on excessive FX moves.
- The US Dollar may limit its downside due to higher yields.
USD/JPY trades around 160.40 during the Asian session on Thursday after retreating from 160.87, the highest level since 1986. This downward correction could be attributed to the verbal intervention by Japanese authorities.
Japanese Finance Minister Shunichi Suzuki stated on Wednesday that he "will take appropriate steps on excessive FX moves." Suzuki refrained from commenting on specific forex levels or potential interventions but emphasized the importance of currencies moving in a stable manner that reflects fundamentals. Chief Cabinet Secretary Yoshimasa Hayashi echoed similar sentiments as the Finance Minister.
The US Dollar (USD) depreciates possibly due to traders’ anticipation of Friday’s Core PCE Price Index inflation, projected to decrease year-over-year to 2.6% from the previous 2.8%. This data is seen as the Federal Reserve's (Fed) preferred inflation gauge. Market participants are hoping that signs of easing inflation will encourage the Federal Reserve (Fed) to consider rate cuts sooner rather than later.
However, the downside of the Greenback could be limited due to higher yields on US Treasury bonds. 2-year and 10-year yields stand at 4.74% and 4.33%, respectively, by the press time.
Reuters cited Fed Governor Michelle Bowman repeating her view on Tuesday that holding the policy rate steady for some time will likely be enough to bring inflation under control. Meanwhile, Fed Governor Lisa Cook said it would be appropriate to cut interest rates "at some point," given significant progress on inflation and a gradual cooling of the labor market, though she remained vague about the timing of the easing.
Japanese Yen FAQs
The Japanese Yen (JPY) is one of the world’s most traded currencies. Its value is broadly determined by the performance of the Japanese economy, but more specifically by the Bank of Japan’s policy, the differential between Japanese and US bond yields, or risk sentiment among traders, among other factors.
One of the Bank of Japan’s mandates is currency control, so its moves are key for the Yen. The BoJ has directly intervened in currency markets sometimes, generally to lower the value of the Yen, although it refrains from doing it often due to political concerns of its main trading partners. The current BoJ ultra-loose monetary policy, based on massive stimulus to the economy, has caused the Yen to depreciate against its main currency peers. This process has exacerbated more recently due to an increasing policy divergence between the Bank of Japan and other main central banks, which have opted to increase interest rates sharply to fight decades-high levels of inflation.
The BoJ’s stance of sticking to ultra-loose monetary policy has led to a widening policy divergence with other central banks, particularly with the US Federal Reserve. This supports a widening of the differential between the 10-year US and Japanese bonds, which favors the US Dollar against the Japanese Yen.
The Japanese Yen is often seen as a safe-haven investment. This means that in times of market stress, investors are more likely to put their money in the Japanese currency due to its supposed reliability and stability. Turbulent times are likely to strengthen the Yen’s value against other currencies seen as more risky to invest in.
- The EUR/USD pair falls toward a throwback support at the level of 1.0670.
- The 14-day RSI consolidates below the 50 level; confirming a downtrend for the pair.
- A 14-day EMA at the level of 1.0732 could act as an immediate barrier.
EUR/USD recovers its losses from the previous two sessions, trading around 1.0690 during the Asian session on Thursday. A technical analysis of the daily chart indicates a bearish bias, with the pair consolidating within a descending channel.
Additionally, the 14-day Relative Strength Index (RSI) is consolidating below the 50 level, suggesting a timid momentum for the EUR/USD pair.
The EUR/USD pair may test immediate throwback support at 1.0670. A further decline would reinforce the bearish bias, potentially pushing the pair toward the lower boundary of the descending channel near 1.0640.
On the upside, the EUR/USD pair could encounter immediate resistance at the 14-day Exponential Moving Average (EMA) at 1.0732. A break above this level could lead the pair to test the psychological level of 1.0800, approaching the upper boundary of the descending channel.
Further resistance appears at the vicinity of the significant level of 1.0900 and a three-month high at 1.0915, which was recorded on June 4.
EUR/USD: Daily Chart
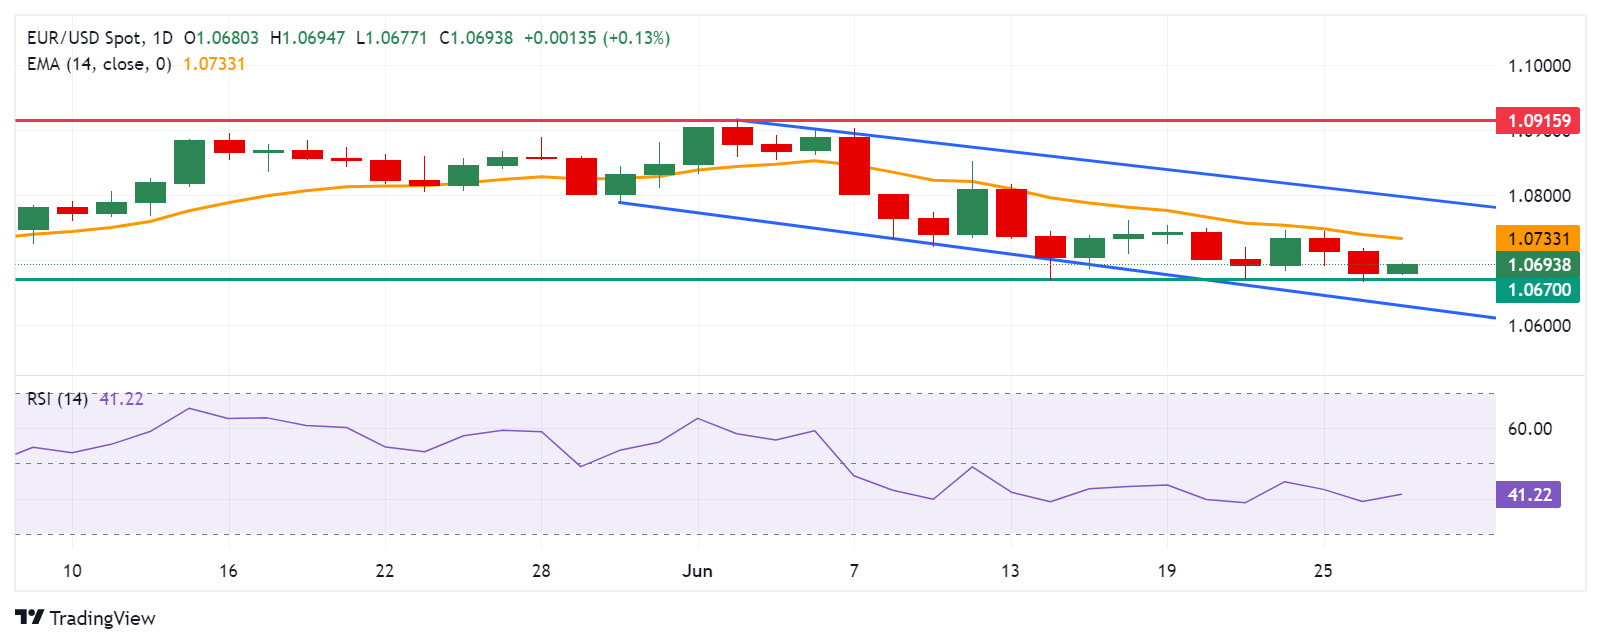
Euro FAQs
The Euro is the currency for the 20 European Union countries that belong to the Eurozone. It is the second most heavily traded currency in the world behind the US Dollar. In 2022, it accounted for 31% of all foreign exchange transactions, with an average daily turnover of over $2.2 trillion a day. EUR/USD is the most heavily traded currency pair in the world, accounting for an estimated 30% off all transactions, followed by EUR/JPY (4%), EUR/GBP (3%) and EUR/AUD (2%).
The European Central Bank (ECB) in Frankfurt, Germany, is the reserve bank for the Eurozone. The ECB sets interest rates and manages monetary policy. The ECB’s primary mandate is to maintain price stability, which means either controlling inflation or stimulating growth. Its primary tool is the raising or lowering of interest rates. Relatively high interest rates – or the expectation of higher rates – will usually benefit the Euro and vice versa. The ECB Governing Council makes monetary policy decisions at meetings held eight times a year. Decisions are made by heads of the Eurozone national banks and six permanent members, including the President of the ECB, Christine Lagarde.
Eurozone inflation data, measured by the Harmonized Index of Consumer Prices (HICP), is an important econometric for the Euro. If inflation rises more than expected, especially if above the ECB’s 2% target, it obliges the ECB to raise interest rates to bring it back under control. Relatively high interest rates compared to its counterparts will usually benefit the Euro, as it makes the region more attractive as a place for global investors to park their money.
Data releases gauge the health of the economy and can impact on the Euro. Indicators such as GDP, Manufacturing and Services PMIs, employment, and consumer sentiment surveys can all influence the direction of the single currency. A strong economy is good for the Euro. Not only does it attract more foreign investment but it may encourage the ECB to put up interest rates, which will directly strengthen the Euro. Otherwise, if economic data is weak, the Euro is likely to fall. Economic data for the four largest economies in the euro area (Germany, France, Italy and Spain) are especially significant, as they account for 75% of the Eurozone’s economy.
Another significant data release for the Euro is the Trade Balance. This indicator measures the difference between what a country earns from its exports and what it spends on imports over a given period. If a country produces highly sought after exports then its currency will gain in value purely from the extra demand created from foreign buyers seeking to purchase these goods. Therefore, a positive net Trade Balance strengthens a currency and vice versa for a negative balance.
- NZD/USD attracts some buyers near the 0.6070-65 area amid a modest USD downtick.
- The Fed’s hawkish outlook should limit the USD losses and cap the upside for the pair.
- Traders now look to Thursday’s US economic docket ahead of the key US PCE on Friday.
The NZD/USD pair shows some resilience below the 50-day Simple Moving Average (SMA) and stages a modest recovery from the 0.6070-0.6065 area, or the lowest level since mid-May touched during the Asian session on Wednesday. The momentum lifts spot prices to a fresh daily top, around the 0.6085 zone in the last hour and is sponsored by a modest US Dollar (USD) weakness.
In fact, the USD Index (DXY), which tracks the Greenback against a basket of currencies, reverses a part of the overnight strong move up to a nearly two-month peak amid bets that the Federal Reserve (Fed) will cut interest rates in September. Apart from this, the USD intraday slide lacks any obvious fundamental catalyst and is more likely to remain limited in the wake of the Fed's hawkish outlook, forecasting only one interest rate cut in 2024.
Furthermore, the recent comments by a slew of influential FOMC members suggested that the US central bank is in no rush to start its rate-cutting cycle. This remains supportive of elevated US Treasury bond yields, which, along with a slight deterioration in the risk sentiment, could underpin the safe-haven USD. Apart from this, expectations that the Reserve Bank of New Zealand (RBNZ) will cut rates earlier than projected might cap the NZD/USD pair.
Traders might also prefer to wait on the sidelines ahead of the release of the crucial US Personal Consumption Expenditures (PCE) Price Index on Friday before placing fresh directional bets. In the meantime, Thursday's US economic docket – featuring the release of the final Q1 GDP print, Durable Goods Orders, the usual Initial Weekly Jobless Claims and Pending Home Sales – will be looked for short-term opportunities later during the North American session.
Fed FAQs
Monetary policy in the US is shaped by the Federal Reserve (Fed). The Fed has two mandates: to achieve price stability and foster full employment. Its primary tool to achieve these goals is by adjusting interest rates. When prices are rising too quickly and inflation is above the Fed’s 2% target, it raises interest rates, increasing borrowing costs throughout the economy. This results in a stronger US Dollar (USD) as it makes the US a more attractive place for international investors to park their money. When inflation falls below 2% or the Unemployment Rate is too high, the Fed may lower interest rates to encourage borrowing, which weighs on the Greenback.
The Federal Reserve (Fed) holds eight policy meetings a year, where the Federal Open Market Committee (FOMC) assesses economic conditions and makes monetary policy decisions. The FOMC is attended by twelve Fed officials – the seven members of the Board of Governors, the president of the Federal Reserve Bank of New York, and four of the remaining eleven regional Reserve Bank presidents, who serve one-year terms on a rotating basis.
In extreme situations, the Federal Reserve may resort to a policy named Quantitative Easing (QE). QE is the process by which the Fed substantially increases the flow of credit in a stuck financial system. It is a non-standard policy measure used during crises or when inflation is extremely low. It was the Fed’s weapon of choice during the Great Financial Crisis in 2008. It involves the Fed printing more Dollars and using them to buy high grade bonds from financial institutions. QE usually weakens the US Dollar.
Quantitative tightening (QT) is the reverse process of QE, whereby the Federal Reserve stops buying bonds from financial institutions and does not reinvest the principal from the bonds it holds maturing, to purchase new bonds. It is usually positive for the value of the US Dollar.
- The Indian Rupee appreciates as Indian bonds are scheduled to be included in J.P. Morgan’s Emerging Market Bond Index on June 28.
- Foreign investors have invested around $10 billion into the securities eligible to join J.P. Morgan’s index.
- US GDP Annualized (Q1) is expected to show a slight increase of 1.4% from the previous growth of 1.3%.
The Indian Rupee (INR) recovers its recent losses on Thursday due to receiving support from the expectations of foreign inflows. Indian bonds are set to enter the JP Morgan Emerging Market (EM) Bond Index on June 28. Foreign investors have already invested approximately $10 billion into the securities eligible to join JPMorgan’s index, according to Business Standard. Meanwhile, Goldman Sachs anticipates at least $30 billion more in inflows in the coming months as India’s weighting on the index steadily rises to 10%.
The US Dollar (USD) depreciates possibly due to traders’ anticipation of Friday’s Core PCE Price Index inflation, projected to decrease year-over-year to 2.6% from the previous 2.8%. This data is seen as the Federal Reserve's (Fed) preferred inflation gauge. Market participants are hoping that signs of easing inflation will encourage the Federal Reserve (Fed) to consider rate cuts sooner rather than later.
Daily Digest Market Movers: Indian Rupee gains ground on expected foreign inflows
- Lower crude Oil prices could support the Indian Rupee, the currency of the world's third-largest oil consumer after the United States and China. West Texas Intermediate (WTI) crude Oil price edges lower to near $80.30, at the time of writing. Crude oil prices received pressure after a surprise build in US crude stockpiles, which raised concerns about weakening demand from the world’s top oil consumers.
- Reuters cited Fed Governor Michelle Bowman repeating her view on Tuesday that holding the policy rate steady for some time will likely be enough to bring inflation under control. Meanwhile, Fed Governor Lisa Cook said it would be appropriate to cut interest rates "at some point," given significant progress on inflation and a gradual cooling of the labor market, though she remained vague about the timing of the easing.
- The S&P Global Ratings retained its growth forecast for India at 6.8% for FY25, citing high interest rates and government spending boosting demand in the non-agricultural sectors.
- On Tuesday, RBI Governor Shaktikanta Das said that India is on the verge of a major structural shift in its growth trajectory, moving towards sustained 8% GDP growth. Das attributes this growth to several key drivers, including structural reforms such as the Goods and Services Tax (GST), reported by The Economic Times.
- India is expected to become a $4 trillion economy in 2025, surpassing Japan by early next fiscal year to become the world's fourth largest economy, according to Indian Economic Advisory Council to the Prime Minister (EAC-PM) member Sanjeev Sanyal.
Technical analysis: USD/INR holds position around 83.50
The USD/INR trades around 83.50 on Thursday. The analysis of the daily chart shows a broadening pattern, indicating increasing volatility. This pattern suggests a potential correction before moving lower. The 14-day Relative Strength Index (RSI) is slightly above the 50 level, and a break below this level could signal a bearish bias.
Immediate support is at the 50-day Exponential Moving Average (EMA) at 83.40. A break below this level could push the USD/INR pair toward the lower boundary of the broadening bottom at around 83.30.
On the upside, resistance is expected at the upper boundary of the broadening formation at around 83.70, followed by the psychological level of 84.00.
USD/INR: Daily Chart
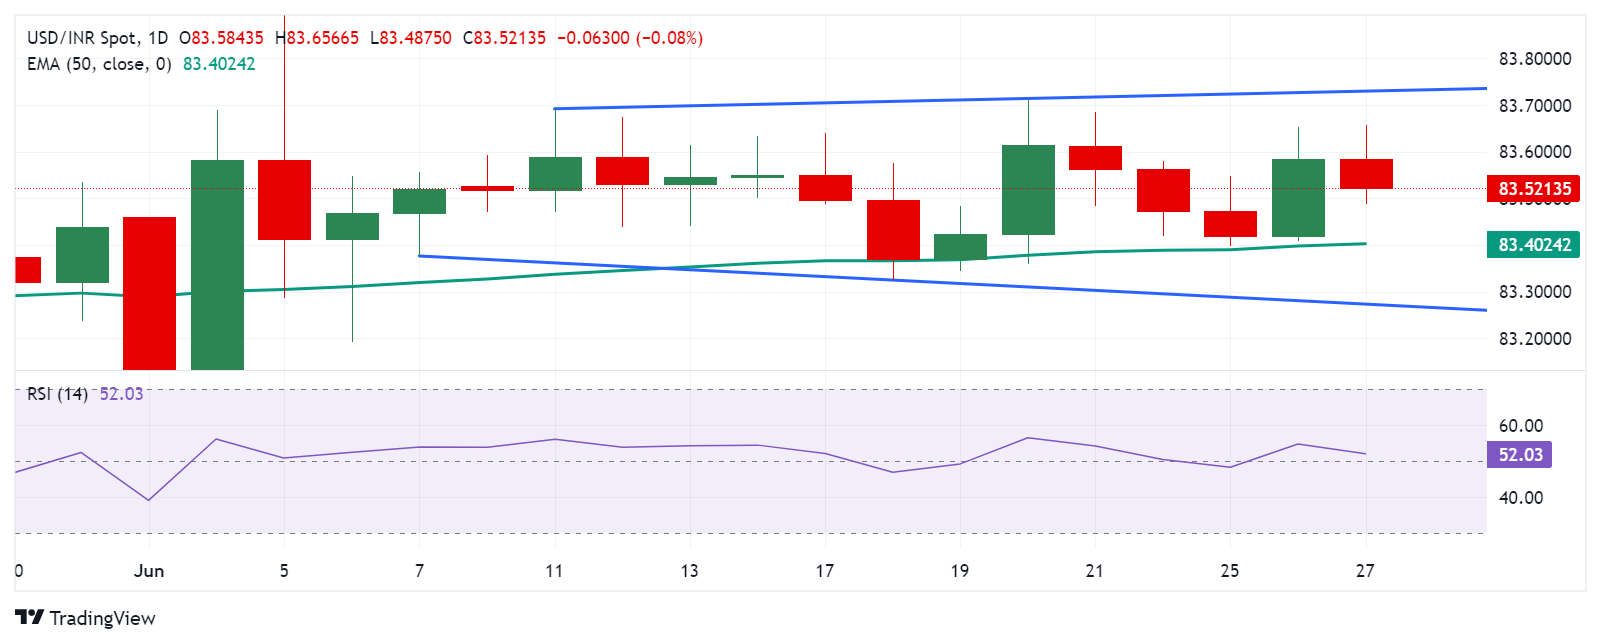
US Dollar price today
The table below shows the percentage change of the US Dollar (USD) against listed major currencies today. The US Dollar was the weakest against the Australian Dollar.
| USD | EUR | GBP | CAD | AUD | JPY | NZD | CHF | |
| USD | -0.12% | -0.08% | -0.06% | -0.27% | -0.16% | -0.10% | 0.00% | |
| EUR | 0.12% | 0.03% | 0.06% | -0.14% | -0.04% | 0.02% | 0.10% | |
| GBP | 0.08% | -0.04% | 0.02% | -0.17% | -0.07% | -0.01% | 0.06% | |
| CAD | 0.06% | -0.06% | -0.02% | -0.19% | -0.10% | -0.04% | 0.05% | |
| AUD | 0.24% | 0.14% | 0.16% | 0.20% | 0.11% | 0.15% | 0.26% | |
| JPY | 0.15% | 0.04% | 0.06% | 0.09% | -0.09% | 0.05% | 0.13% | |
| NZD | 0.10% | -0.02% | 0.02% | 0.04% | -0.16% | -0.03% | 0.15% | |
| CHF | 0.02% | -0.10% | -0.06% | -0.04% | -0.22% | -0.14% | -0.07% |
The heat map shows percentage changes of major currencies against each other. The base currency is picked from the left column, while the quote currency is picked from the top row. For example, if you pick the Euro from the left column and move along the horizontal line to the Japanese Yen, the percentage change displayed in the box will represent EUR (base)/JPY (quote).
Indian Rupee FAQs
The Indian Rupee (INR) is one of the most sensitive currencies to external factors. The price of Crude Oil (the country is highly dependent on imported Oil), the value of the US Dollar – most trade is conducted in USD – and the level of foreign investment, are all influential. Direct intervention by the Reserve Bank of India (RBI) in FX markets to keep the exchange rate stable, as well as the level of interest rates set by the RBI, are further major influencing factors on the Rupee.
The Reserve Bank of India (RBI) actively intervenes in forex markets to maintain a stable exchange rate, to help facilitate trade. In addition, the RBI tries to maintain the inflation rate at its 4% target by adjusting interest rates. Higher interest rates usually strengthen the Rupee. This is due to the role of the ‘carry trade’ in which investors borrow in countries with lower interest rates so as to place their money in countries’ offering relatively higher interest rates and profit from the difference.
Macroeconomic factors that influence the value of the Rupee include inflation, interest rates, the economic growth rate (GDP), the balance of trade, and inflows from foreign investment. A higher growth rate can lead to more overseas investment, pushing up demand for the Rupee. A less negative balance of trade will eventually lead to a stronger Rupee. Higher interest rates, especially real rates (interest rates less inflation) are also positive for the Rupee. A risk-on environment can lead to greater inflows of Foreign Direct and Indirect Investment (FDI and FII), which also benefit the Rupee.
Higher inflation, particularly, if it is comparatively higher than India’s peers, is generally negative for the currency as it reflects devaluation through oversupply. Inflation also increases the cost of exports, leading to more Rupees being sold to purchase foreign imports, which is Rupee-negative. At the same time, higher inflation usually leads to the Reserve Bank of India (RBI) raising interest rates and this can be positive for the Rupee, due to increased demand from international investors. The opposite effect is true of lower inflation.
- GBP/USD bounces off its lowest level since mid-May, albeit lacks any follow-through buying.
- The fundamental backdrop warrants some caution for bulls ahead of the key US macro data.
- The technical setup suggests that the path of least resistance for the pair is to the downside.
The GBP/USD pair attracts some buyers near the 1.2615-1.2610 area, or its lowest level since mid-May touched during the Asian session on Thursday and reverses a part of the previous day's steep decline. Spot prices currently trade around the 1.2630 area, up less than 0.10% for the day, as traders now look to the key US macro data before positioning for the next leg of directional bets.
In the meantime, the US Dollar (USD) is seen retreating from a nearly two-month high touched on Wednesday and acting as a tailwind for the GBP/USD pair. That said, elevated US Treasury bond yields, bolstered by expectations that the Federal Reserve (Fed) is in no rush to start its rate-cutting cycle, should help limit losses for the buck. Apart from this, rising bets for a rate cut by the Bank of England (BoE) in August could undermine the British Pound (GBP) and further contribute to capping the GBP/USD pair ahead of the UK general election on July 4.
From a technical perspective, the overnight breakdown and close below the 1.2650-1.2645 confluence – comprising 50-day and 100-day Simple Moving Averages (SMAs) was seen as a fresh trigger for bearish traders. Moreover, oscillators on the daily chart have been gaining negative traction and suggest that the path of least resistance for the GBP/USD pair is to the downside. Hence, a subsequent slide below the 1.2600 round-figure mark, towards testing the next relevant support near the 1.2560-1.2555 horizontal zone, looks like a distinct possibility.
On the flip side, any positive move back above the 1.2645-1.2650 confluence support breakpoint might continue to attract fresh sellers ahead of the 1.2700 mark and remain capped. A sustained strength beyond the said handle, however, will suggest that the recent corrective decline has run its course and lift the GBP/USD pair beyond the 1.2720-1.2725 supply zone, towards the 1.2800 mark. Bulls might eventually aim to challenge the multi-month top, around the 1.2860 region touched on June 12, and lift spot prices further towards the 1.2900 round figure.
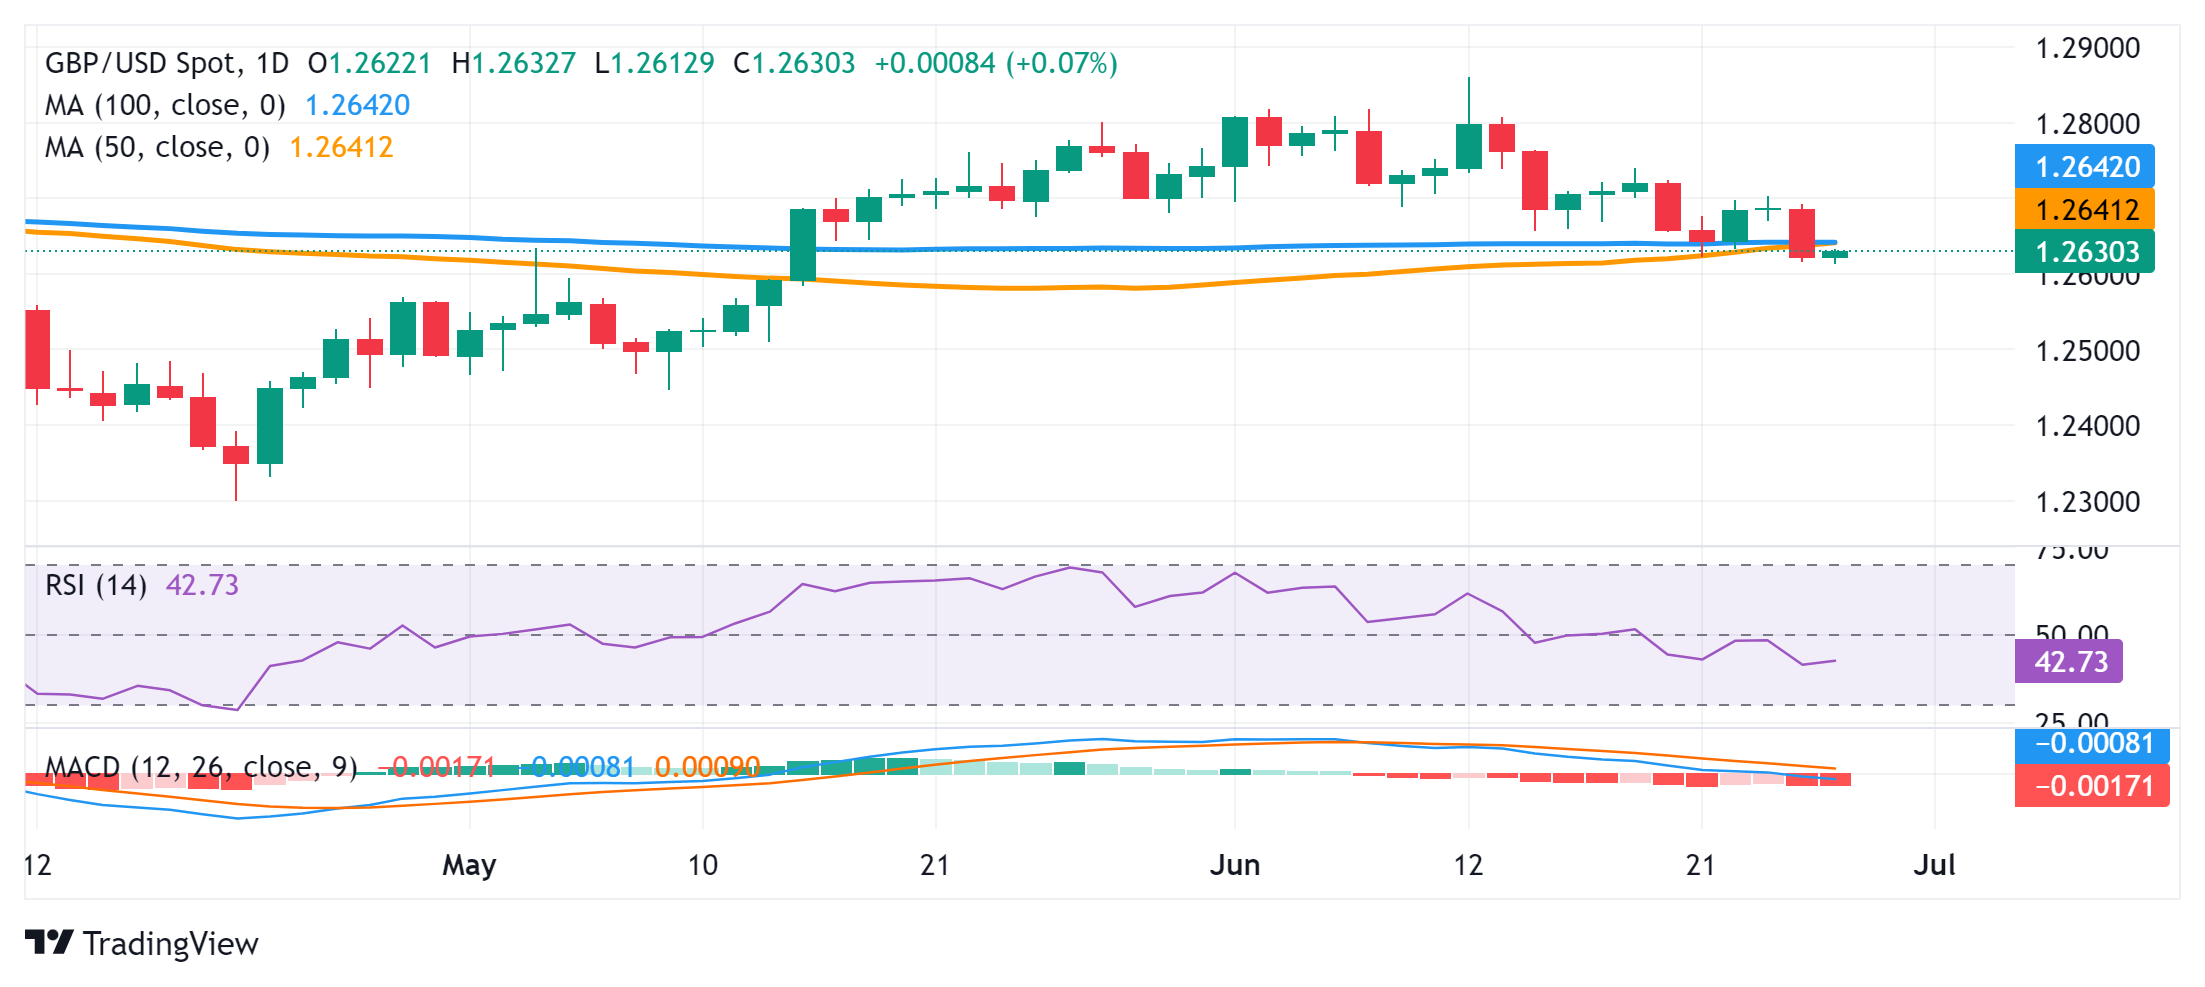
- WTI price loses ground as a surprise build on US crude stockpiles raised concerns about weakening demand.
- US EIA Crude Oil Stocks Change increased by 3.591 million barrels in the previous week, against an expected decline of 3.000 million barrels.
- US crude Oil imports reached 3.1 million barrels per day in May, the highest since July 2022.
West Texas Intermediate (WTI) crude Oil price edges lower to near $80.30 during the Asian session on Thursday, retreating further from a two-month high of $81.65. Crude Oil prices received pressure after a surprise build in US crude stockpiles raised concerns about weakening demand in the world’s top Oil consumer.
On Wednesday, US Energy Information Administration data showed that US Crude Oil Stocks Change increased by 3.591 million barrels in the week ending June 21, defying market expectations for a 3.000 million-barrel decline.
Ongoing geopolitical tensions in the Middle East and Ukraine could further fuel the prices of the Oil prices. Israeli Prime Minister Benjamin Netanyahu has stated that the most “intense” phase of the attack against Hamas in Gaza is nearing its end, according to CNN. Meanwhile, Russia has condemned the US for a "barbaric" strike in Crimea, which utilized US-provided missiles, resulting in the deaths of at least four people, including children, and injuring 151 others, per NBC News.
However, last month, US crude Oil imports surged to their highest level in nearly two years, driven by refiners acquiring heavy crudes from Canada and Latin America to produce fuels for the summer driving season. In May, US crude Oil imports reached 3.1 million barrels per day (bpd), the highest since July 2022, according to ship tracking service Kpler. So far this month, imports have remained robust, averaging around 2.9 million bpd, as reported by Reuters.
WTI Oil FAQs
WTI Oil is a type of Crude Oil sold on international markets. The WTI stands for West Texas Intermediate, one of three major types including Brent and Dubai Crude. WTI is also referred to as “light” and “sweet” because of its relatively low gravity and sulfur content respectively. It is considered a high quality Oil that is easily refined. It is sourced in the United States and distributed via the Cushing hub, which is considered “The Pipeline Crossroads of the World”. It is a benchmark for the Oil market and WTI price is frequently quoted in the media.
Like all assets, supply and demand are the key drivers of WTI Oil price. As such, global growth can be a driver of increased demand and vice versa for weak global growth. Political instability, wars, and sanctions can disrupt supply and impact prices. The decisions of OPEC, a group of major Oil-producing countries, is another key driver of price. The value of the US Dollar influences the price of WTI Crude Oil, since Oil is predominantly traded in US Dollars, thus a weaker US Dollar can make Oil more affordable and vice versa.
The weekly Oil inventory reports published by the American Petroleum Institute (API) and the Energy Information Agency (EIA) impact the price of WTI Oil. Changes in inventories reflect fluctuating supply and demand. If the data shows a drop in inventories it can indicate increased demand, pushing up Oil price. Higher inventories can reflect increased supply, pushing down prices. API’s report is published every Tuesday and EIA’s the day after. Their results are usually similar, falling within 1% of each other 75% of the time. The EIA data is considered more reliable, since it is a government agency.
OPEC (Organization of the Petroleum Exporting Countries) is a group of 13 Oil-producing nations who collectively decide production quotas for member countries at twice-yearly meetings. Their decisions often impact WTI Oil prices. When OPEC decides to lower quotas, it can tighten supply, pushing up Oil prices. When OPEC increases production, it has the opposite effect. OPEC+ refers to an expanded group that includes ten extra non-OPEC members, the most notable of which is Russia.
- USD/CAD struggles to capitalize on a two-day-old recovery trend from a three-week through.
- The Fed rate-cut uncertainty caps the upside for the USD and acts as a headwind for the pair
- A downtick in Crude Oil prices undermines the Loonie and lends some support to the major.
The USD/CAD pair seesaws between tepid gains/minor losses during the Asian session on Thursday and for now, seems to have stalled its goodish rebound from the 1.3620-1.3615 region, or a three-week low touched on Tuesday. Spot prices currently trade near the 1.3700 mark, nearly unchanged for the day as traders now await the release of US macro data before placing fresh directional bets.
The market focus will remain squarely on the US Personal Consumption Expenditures (PCE) Price Index on Friday, which is seen as the Federal Reserve's (Fed) preferred inflation gauge. This will play a key role in influencing market expectations about the Fed's future policy decisions, which, in turn, will drive the US Dollar (USD) demand and provide some meaningful impetus to the USD/CAD pair. In the meantime, Thursday's US economic docket – featuring the final Q1 GDP print, Durable Goods Orders, the usual Initial Weekly Jobless Claims and Pending Home Sales – will be looked upon for short-term trading opportunities.
Ahead of the key releases, the uncertainty about the likely timing of when the Fed will start its rate-cutting cycle fails to assist the USD to capitalize on the previous day's rally to the highest level since early May. The Canadian Dollar (CAD), on the other hand, continues to draw support from reduced bets for a July rate cut by the Bank of Canada (BoC), especially after data released on Tuesday showed an upward surge in the domestic consumer inflation in May. This, in turn, is seen capping the upside for the USD/CAD pair, though a downtick in Crude Oil prices undermines the commodity-linked Loonie and acts as a tailwind.
The Energy Information Administration (EIA) reported a surprise jump in US inventories on Wednesday, which fuels concerns about sluggish demand from the world's top Oil consumer and weighs on the black liquid. That said, worries about potential supply disruptions in Russia and the Middle East should help limit deeper losses for Crude Oil prices. Hence, it will be prudent to wait for strong follow-through buying before positioning for any further near-term appreciating move for the USD/CAD pair.
Economic Indicator
Personal Consumption Expenditures - Price Index (YoY)
The Personal Consumption Expenditures (PCE), released by the US Bureau of Economic Analysis on a monthly basis, measures the changes in the prices of goods and services purchased by consumers in the United States (US). The YoY reading compares prices in the reference month to a year earlier. Price changes may cause consumers to switch from buying one good to another and the PCE Deflator can account for such substitutions. This makes it the preferred measure of inflation for the Federal Reserve. Generally, a high reading is bullish for the US Dollar (USD), while a low reading is bearish.
Read more.Next release: Fri Jun 28, 2024 12:30
Frequency: Monthly
Consensus: 2.6%
Previous: 2.7%
Source: US Bureau of Economic Analysis
- Gold price struggles to register any meaningful recovery from a two-week low set on Wednesday.
- The Fed’s hawkish stance, higher US bond yields, and recent USD strength have acted as a headwind.
- Geopolitical tensions and political uncertainty help limit the downside for the safe-haven metal.
Gold price (XAU/USD) oscillates in a range just below the $2,300 mark during the Asian session on Thursday and consolidates its recent losses to a nearly two-week low touched the previous day. The Federal Reserve (Fed) adopted a more hawkish stance and projected only one interest rate cut in 2024 at the end of the June policy meeting. Adding to this, the recent comments from a slew of influential FOMC members suggested that the central bank is unlikely to kickstart its rate-cutting cycle anytime soon. The hawkish outlook lifts the US Treasury bond yields to over a two-week high and the US Dollar (USD) to its highest level since early May, which, in turn, is seen acting as a headwind for the non-yielding yellow metal.
Apart from this, the underlying bullish tone across the global equity markets suggests that the path of least resistance for the safe-haven Gold price is to the downside. That said, the markets are still pricing in the possibility of two rate cuts by the Fed this year in the wake of signs that inflation in the US is subsiding. This, along with persistent geopolitical tensions and political uncertainty, lends some support to the XAU/USD. Bears also seem reluctant to place aggressive bets and prefer to wait for the release of the crucial US Personal Consumption Expenditures (PCE) Price Index on Friday. In the meantime, Thursday's US economic docket might produce short-term opportunities later during the North American session.
Daily Digest Market Movers: Gold price is undermined by higher US bond yields and a stronger USD
- The Federal Reserve's higher-for-longer interest rates narrative remains supportive of elevated US Treasury bond yields and a bullish US Dollar, which undermines the non-yielding Gold price.
- A government report published on Wednesday showed that New Home Sales registered the steepest decline since September 2022 and plunged 11.3% in May to 619K, or the lowest level since November.
- The USD bulls, however, seem rather unaffected by the data, which added to the evidence that the world's largest economy is slowing down amid the recent signs of easing inflationary pressures.
- The Fed projected only one rate cut in 2024, though the markets are still pricing in a greater chance of the first rate cut by the Fed in September and about two 25 basis points cuts by the year-end.
- The uncertainty over the likely timing and the number of Fed rate cuts this year keeps a lid on any further USD appreciation and lends support to the XAU/USD amid persistent geopolitical tensions.
- Traders also seem reluctant ahead of the US presidential debate and the release of the US Personal Consumption Expenditures (PCE) Price Index – the Fed's preferred inflation gauge – on Friday.
- Heading into the key data risk, Thursday's US macro data – the final Q1 GDP print, Durable Goods Orders, Initial Weekly Jobless Claims, and Pending Home Sales – might provide some impetus.
Technical Analysis: Gold price could accelerate the fall once the $2,285 horizontal support is broken
From a technical perspective, the recent failure to build on the momentum beyond the 50-day Simple Moving Average (SMA) and the subsequent downfall favors bearish traders. Moreover, the overnight breakdown through a short-term ascending trend-line support near the $2,314 area validates the near-term negative outlook. Given that oscillators on the daily chart have been gaining negative traction, some follow-through selling below the $2,285 horizontal support has the potential to drag the Gold price to the 100-day SMA support near the $2,250 area. The downward trajectory could extend further towards the $2,225-2,220 region before the XAU/USD eventually drops to the $2,200 round-figure mark.
On the flip side, any attempted recovery now seems to face resistance near the $2,314-2,315 support breakpoint. A sustained strength beyond might trigger a short-covering rally, though is likely to remain capped near the 50-day SMA, currently pegged near the $2,338-2,340 region. The subsequent move-up could lift the Gold price back to the $2,360-2,365 supply zone, which, if cleared decisively, will negate any near-term negative bias. Bullish traders might then aim to reclaim the $2,400 round-figure mark and challenge the all-time peak, around the $2,450 area touched in May.
Gold FAQs
Gold has played a key role in human’s history as it has been widely used as a store of value and medium of exchange. Currently, apart from its shine and usage for jewelry, the precious metal is widely seen as a safe-haven asset, meaning that it is considered a good investment during turbulent times. Gold is also widely seen as a hedge against inflation and against depreciating currencies as it doesn’t rely on any specific issuer or government.
Central banks are the biggest Gold holders. In their aim to support their currencies in turbulent times, central banks tend to diversify their reserves and buy Gold to improve the perceived strength of the economy and the currency. High Gold reserves can be a source of trust for a country’s solvency. Central banks added 1,136 tonnes of Gold worth around $70 billion to their reserves in 2022, according to data from the World Gold Council. This is the highest yearly purchase since records began. Central banks from emerging economies such as China, India and Turkey are quickly increasing their Gold reserves.
Gold has an inverse correlation with the US Dollar and US Treasuries, which are both major reserve and safe-haven assets. When the Dollar depreciates, Gold tends to rise, enabling investors and central banks to diversify their assets in turbulent times. Gold is also inversely correlated with risk assets. A rally in the stock market tends to weaken Gold price, while sell-offs in riskier markets tend to favor the precious metal.
The price can move due to a wide range of factors. Geopolitical instability or fears of a deep recession can quickly make Gold price escalate due to its safe-haven status. As a yield-less asset, Gold tends to rise with lower interest rates, while higher cost of money usually weighs down on the yellow metal. Still, most moves depend on how the US Dollar (USD) behaves as the asset is priced in dollars (XAU/USD). A strong Dollar tends to keep the price of Gold controlled, whereas a weaker Dollar is likely to push Gold prices up.
| Raw materials | Closed | Change, % |
|---|---|---|
| Silver | 28.766 | -0.57 |
| Gold | 229.779 | -0.95 |
| Palladium | 930.65 | -1.29 |
- AUD/USD receives support as hot inflation data fuel speculation that the RBA may raise rates in August.
- Australia’s Consumer Inflation Expectations rose to 4.4% in June from May's 4.1%, indicating ongoing cost pressures.
- US GDP Annualized (Q1) is expected to increase 1.4% from the previous growth of 1.3%.
AUD/USD remains stable after gaining in the previous session, trading around 0.6650 during the Asian hours on Thursday. The Australian Dollar (AUD) is supported against the US Dollar (USD) due to heightened inflation concerns, fueling speculation that the Reserve Bank of Australia (RBA) might raise interest rates again in August.
On Thursday, Australia’s Consumer Inflation Expectations rose to 4.4% in June from May's 4.1%, indicating ongoing cost pressures with inflation still above the RBA's target range of 2%-3% due to persistently high service costs.
Australia’s monthly Consumer Price Index (CPI) jumped to 4.0% in the year to May, up from the 3.6% increase recorded in April, according to data published by the Australian Bureau of Statistics (ABS) on Wednesday. This increase exceeded the market forecast, which predicted a 3.8% growth for the reported period.
RBA Assistant Governor Christopher Kent stated on Wednesday that recent data emphasize the necessity of remaining vigilant about potential inflation increases. Kent noted that current policies are contributing to slower demand growth and lower inflation. He also mentioned that no options regarding future interest rate adjustments are being excluded, per Bloomberg.
On the US Dollar’s (USD) side, traders are anticipating the release of the US Gross Domestic Product Annualized (Q1) data on Thursday, which is expected to show a slight increase of 1.4% from the previous growth of 1.3%. On Friday, the Core PCE Price Index inflation is projected to decrease year-over-year to 2.6% from the previous 2.8%. Market participants are hoping that signs of easing inflation will encourage the Federal Reserve (Fed) to consider rate cuts sooner rather than later.
Inflation FAQs
Inflation measures the rise in the price of a representative basket of goods and services. Headline inflation is usually expressed as a percentage change on a month-on-month (MoM) and year-on-year (YoY) basis. Core inflation excludes more volatile elements such as food and fuel which can fluctuate because of geopolitical and seasonal factors. Core inflation is the figure economists focus on and is the level targeted by central banks, which are mandated to keep inflation at a manageable level, usually around 2%.
The Consumer Price Index (CPI) measures the change in prices of a basket of goods and services over a period of time. It is usually expressed as a percentage change on a month-on-month (MoM) and year-on-year (YoY) basis. Core CPI is the figure targeted by central banks as it excludes volatile food and fuel inputs. When Core CPI rises above 2% it usually results in higher interest rates and vice versa when it falls below 2%. Since higher interest rates are positive for a currency, higher inflation usually results in a stronger currency. The opposite is true when inflation falls.
Although it may seem counter-intuitive, high inflation in a country pushes up the value of its currency and vice versa for lower inflation. This is because the central bank will normally raise interest rates to combat the higher inflation, which attract more global capital inflows from investors looking for a lucrative place to park their money.
Formerly, Gold was the asset investors turned to in times of high inflation because it preserved its value, and whilst investors will often still buy Gold for its safe-haven properties in times of extreme market turmoil, this is not the case most of the time. This is because when inflation is high, central banks will put up interest rates to combat it. Higher interest rates are negative for Gold because they increase the opportunity-cost of holding Gold vis-a-vis an interest-bearing asset or placing the money in a cash deposit account. On the flipside, lower inflation tends to be positive for Gold as it brings interest rates down, making the bright metal a more viable investment alternative.
Japan’s Chief Cabinet Secretary Hayashi echoed comments from the country’s Finance Minister Shunich Suzuki on Wednesday, noting that he “will take appropriate steps on excessive fx moves.“
Additional quotes
Won't comment on forex levels and potential FX intervention.
Important for currencies to move in stable manner reflecting fundamentals.
Rapid FX moves undesirable.
Market reaction
Following these comments, USD/JPY is losing 0.23% on the day to trade near 160.40, extending its pullback from near four-decade highs of 160.87.
Japanese Yen PRICE Today
The table below shows the percentage change of Japanese Yen (JPY) against listed major currencies today. Japanese Yen was the strongest against the US Dollar.
| USD | EUR | GBP | JPY | CAD | AUD | NZD | CHF | |
|---|---|---|---|---|---|---|---|---|
| USD | -0.10% | -0.06% | -0.26% | -0.04% | -0.10% | 0.03% | -0.08% | |
| EUR | 0.10% | 0.03% | -0.15% | 0.04% | 0.00% | 0.09% | 0.00% | |
| GBP | 0.06% | -0.03% | -0.18% | 0.01% | -0.02% | 0.10% | -0.01% | |
| JPY | 0.26% | 0.15% | 0.18% | 0.20% | 0.14% | 0.24% | 0.18% | |
| CAD | 0.04% | -0.04% | -0.01% | -0.20% | -0.07% | 0.06% | -0.04% | |
| AUD | 0.10% | -0.00% | 0.02% | -0.14% | 0.07% | 0.13% | 0.00% | |
| NZD | -0.03% | -0.09% | -0.10% | -0.24% | -0.06% | -0.13% | -0.10% | |
| CHF | 0.08% | -0.01% | 0.01% | -0.18% | 0.04% | 0.00% | 0.10% |
The heat map shows percentage changes of major currencies against each other. The base currency is picked from the left column, while the quote currency is picked from the top row. For example, if you pick the Japanese Yen from the left column and move along the horizontal line to the US Dollar, the percentage change displayed in the box will represent JPY (base)/USD (quote).
Japanese Finance Minister Shunichi Suzuki said on Wednesday that he “will take necessary actions on FX. “
Additional comments
Won't comment on forex levels.
FX stability is desirable.
Watching FX moves with high sense of urgency.
Deeply concerned about fx impact on economy.
Rapid and one-sided moves undesirable.
His comments come as USD/JPY reached a fresh 38-year peak on Wednesday at 160.87. At the time of writing, the pair is losing 0.21% on the day to trade below 160.50.
Australian Dollar FAQs
One of the most significant factors for the Australian Dollar (AUD) is the level of interest rates set by the Reserve Bank of Australia (RBA). Because Australia is a resource-rich country another key driver is the price of its biggest export, Iron Ore. The health of the Chinese economy, its largest trading partner, is a factor, as well as inflation in Australia, its growth rate and Trade Balance. Market sentiment – whether investors are taking on more risky assets (risk-on) or seeking safe-havens (risk-off) – is also a factor, with risk-on positive for AUD.
The Reserve Bank of Australia (RBA) influences the Australian Dollar (AUD) by setting the level of interest rates that Australian banks can lend to each other. This influences the level of interest rates in the economy as a whole. The main goal of the RBA is to maintain a stable inflation rate of 2-3% by adjusting interest rates up or down. Relatively high interest rates compared to other major central banks support the AUD, and the opposite for relatively low. The RBA can also use quantitative easing and tightening to influence credit conditions, with the former AUD-negative and the latter AUD-positive.
China is Australia’s largest trading partner so the health of the Chinese economy is a major influence on the value of the Australian Dollar (AUD). When the Chinese economy is doing well it purchases more raw materials, goods and services from Australia, lifting demand for the AUD, and pushing up its value. The opposite is the case when the Chinese economy is not growing as fast as expected. Positive or negative surprises in Chinese growth data, therefore, often have a direct impact on the Australian Dollar and its pairs.
Iron Ore is Australia’s largest export, accounting for $118 billion a year according to data from 2021, with China as its primary destination. The price of Iron Ore, therefore, can be a driver of the Australian Dollar. Generally, if the price of Iron Ore rises, AUD also goes up, as aggregate demand for the currency increases. The opposite is the case if the price of Iron Ore falls. Higher Iron Ore prices also tend to result in a greater likelihood of a positive Trade Balance for Australia, which is also positive of the AUD.
The Trade Balance, which is the difference between what a country earns from its exports versus what it pays for its imports, is another factor that can influence the value of the Australian Dollar. If Australia produces highly sought after exports, then its currency will gain in value purely from the surplus demand created from foreign buyers seeking to purchase its exports versus what it spends to purchase imports. Therefore, a positive net Trade Balance strengthens the AUD, with the opposite effect if the Trade Balance is negative.
The People’s Bank of China (PBOC) set the USD/CNY central rate on Thursday at 7.1270, as against the previous day's fix of 7.1248 and 7.2765 Reuters estimates.
- USD/JPY bulls opt to take some profits off the table amid intervention fears.
- The upbeat Japanese Retail Sales underpin the JPY and also exert pressure.
- The divergent BoJ-Fed policy could limit losses ahead of the US macro data.
The USD/JPY pair drifts lower during the Asian session on Thursday and erodes a part of the previous day's strong gains to the 160.85-160.90 region, or its highest level since 1986. Spot prices currently trade around mid-160.00s, though any meaningful corrective decline seems elusive in the wake of a big US-Japan interest rate differential.
The Bank of Japan (BoJ) has been reluctant to provide a detailed plan for the reduction of bond purchases. In contrast, the recent hawkish comments from Federal Reserve (Fed) officials suggested that the US central bank is in no rush to start its rate-cutting cycle amid a still resilient economy. This, along with the underlying bullish tone across the global equity markets, might continue to undermine the safe-haven Japanese Yen (JPY) and act as a tailwind for the USD/JPY pair, warranting some caution for aggressive bearish traders.
Investors, meanwhile, remain on alert amid speculations that Japanese authorities might intervene in the markets to prop up the domestic currency. In fact, Japan's Vice Finance Minister Masato Kanda reiterated that the government is prepared to take appropriate action if excessive currency fluctuations have a negative impact on the national economy. Adding to this, the upbeat Retail Sales data from Japan, which grew by the 3% YoY rate in May, lends some support to the JPY and prompts some profit-taking around the USD/JPY pair.
Traders now look to the US economic docket – featuring the release of the final Q1 GDP print, Durable Goods Orders, the usual Initial Weekly Jobless Claims and Pending Home Sales. This, along with the US Treasury bond yields, will influence the USD and drive the USD/JPY pair ahead of the Tokyo Core CPI on Friday. The focus, however, will remain glued to the US Personal Consumption Expenditures (PCE) Price Index, which is considered the Fed's preferred inflation gauge and should provide a fresh impetus to the currency pair.
Levels to watch
Any subsequent slide is likely to attract some buying near the 160.00 psychological mark. This is followed by the 159.75 horizontal resistance breakpoint, now turned support, below which the USD/JPY pair could extend the corrective decline further towards the 159.00 round-figure mark. On the flip side, the multi-decade high, around the 160.85-160.90 region, could act as an immediate barrier. Some follow-through buying beyond the 161.00 mark will be seen as a fresh trigger for bullish traders and set the stage for an extension of a well-established uptrend.
| Index | Change, points | Closed | Change, % |
|---|---|---|---|
| NIKKEI 225 | 493.92 | 39667.07 | 1.26 |
| Hang Seng | 17.03 | 18089.93 | 0.09 |
| KOSPI | 17.66 | 2792.05 | 0.64 |
| ASX 200 | -55.8 | 7783 | -0.71 |
| DAX | -22.38 | 18155.24 | -0.12 |
| CAC 40 | -53.15 | 7609.15 | -0.69 |
| Dow Jones | 15.64 | 39127.8 | 0.04 |
| S&P 500 | 8.6 | 5477.9 | 0.16 |
| NASDAQ Composite | 87.51 | 17805.16 | 0.49 |
| Pare | Closed | Change, % |
|---|---|---|
| AUDUSD | 0.66486 | 0 |
| EURJPY | 171.678 | 0.37 |
| EURUSD | 1.06788 | -0.33 |
| GBPJPY | 202.913 | 0.19 |
| GBPUSD | 1.2622 | -0.51 |
| NZDUSD | 0.6082 | -0.63 |
| USDCAD | 1.37017 | 0.34 |
| USDCHF | 0.89738 | 0.32 |
| USDJPY | 160.757 | 0.7 |
Japan's Retail Trade for the year ended in May, clocking in at 3% YoY versus the forecast hold at 2.0%. On the downside, the previous period's print was revised down to 2.0% from the initial print of 2.4%.
Large Retailer Sales also increased in May, climbing to 4% YoY versus the previous month's print of 3%.
Seasonally-adjusted Japanese Retail Trade revealed a front-loaded uptick in retail activity, with MoM large retailer sales clocking in at 1.7% in May compared to April's 1.2%.
Economic Indicator
Retail Trade (YoY)
The Retail Trade data, released by the Ministry of Economy, Trade and Industry on a monthly basis, measures the total value of goods sold by retailers in Japan. Changes in Retail Sales are widely followed as an indicator of consumer spending. Percent changes reflect the rate of changes in such sales, with the YoY reading comparing sales values in the reference month with the same month a year earlier. Generally, a high reading is seen as bullish for the Japanese Yen (JPY), while a low reading is seen as bearish.
Read more.Last release: Wed Jun 26, 2024 23:50
Frequency: Monthly
Actual: 3%
Consensus: 2%
Previous: 2.4%
Market reaction
USD/JPY is slipping back i nearly Thursday trading, sliding to 160.50 after hitting a fresh 38-year peak on Wednesday. The pair clipped into an almost four-decade high at 160.87 this week, hitting bids that have remained unseen since 1986.
USD/JPY five minute chart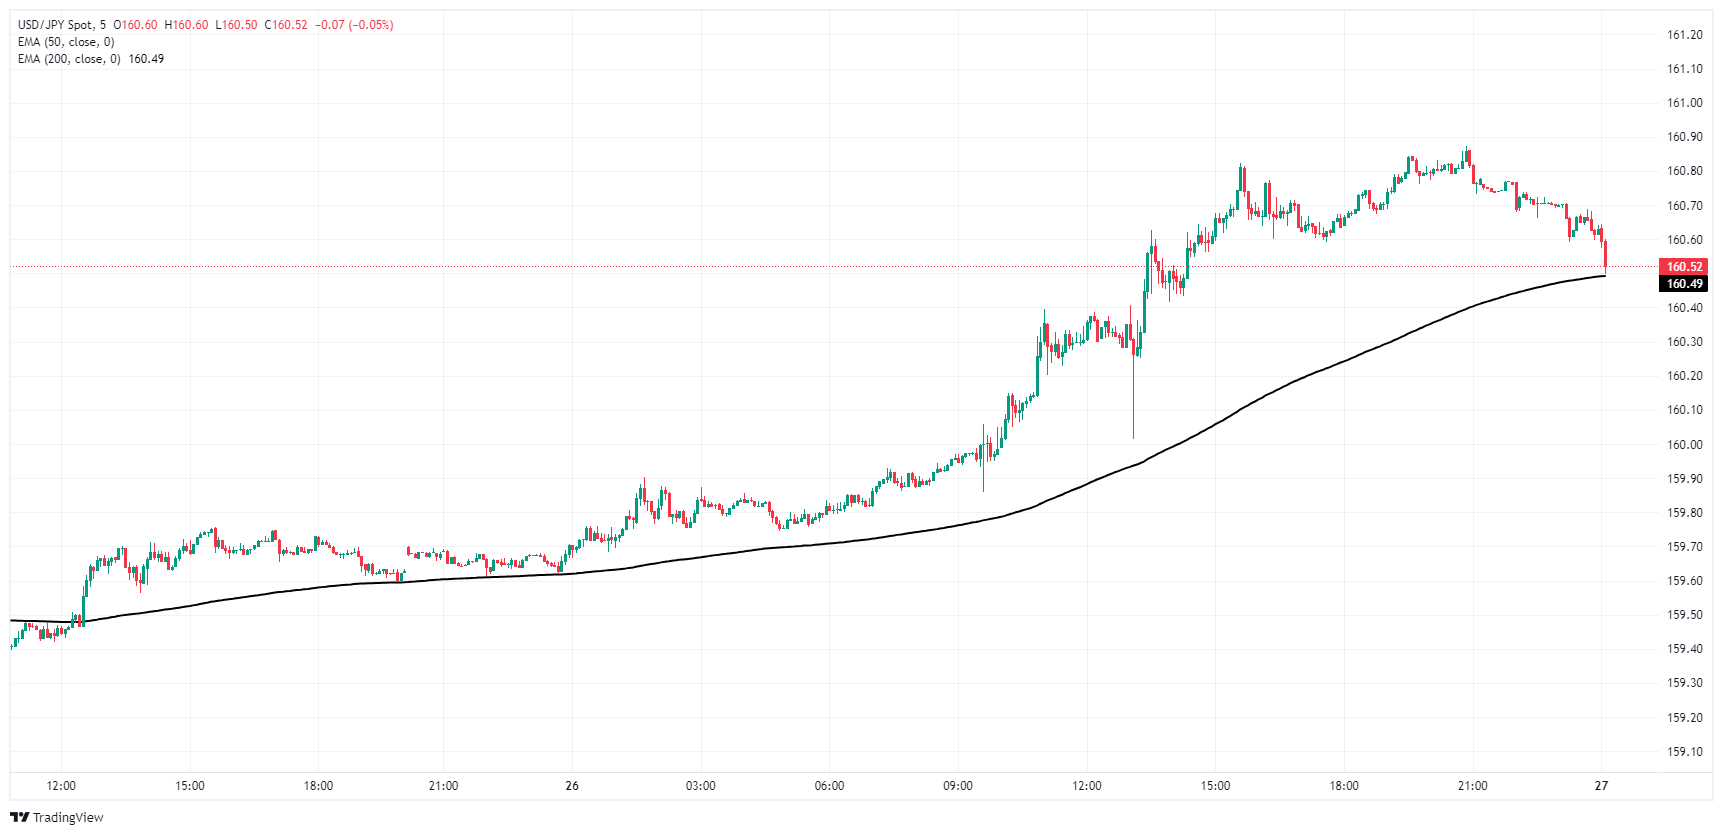
About Japanese Large Retailer Sales
The Large Retailer Sales data, released by the Ministry of Economy, Trade and Industry on a monthly basis, measures the total value of goods sold by large retailers in Japan. Changes in Retail Sales are widely followed as an indicator of consumer spending. Percent changes reflect the rate of change in such sales. Generally, a high reading is seen as bullish for the Japanese Yen (JPY), while a low reading is seen as bearish.
- EUR/USD flubs the 1.0700 handle as bearish flows keep the Fiber pinned.
- Broad-market sentiment favored the Greenback on Wednesday as rate cut hopes dry up.
- Late-week key data prints to drive market momentum after an easy start to the week.
EUR/USD backslid into the 1.0680 region on Wednesday after the German GfK Consumer Confidence Survey for July ticked lower unexpectedly, and a lack of meaningful data during the American trading session left investors to chew on a cautious Federal Reserve (Fed) stance this week that saw rate cut bets shift lower.
Forex Today: Investors look at US PCE and French elections
German consumer confidence backslid to -21.8 for July, missing the forecast recovery to -18.9 from the previous month’s revised -21.0. Despite a slow and steady recovery in the German GfK Consumer Confidence Survey, Wednesday’s downside print kicked the legs out from beneath the already-battered Euro.
US New Home Sales Change in May clocked in a -11.3% decline MoM on Wednesday, compared to the previous month’s 2.0%, revised sharply from the initial print of -4.7%.
Confidence survey releases continue through Thursday, with pan-EU Business Climate, Consumer Confidence, and Economic Sentiment Indicator data points all slated for release during the European market window. US Durable Goods Orders, revisions to first-quarter Gross Domestic Product (GDP), and weekly Initial Jobless Claims will follow during Thursday’s American trading session.
US QoQ GDP is expected to tick upward slightly to 1.4% from the initial print of 1.3%, while May’s US Durable Goods Orders are expected to print a -0.1% contraction compared to the previous month’s revised 0.6%. US Initial Jobless Claims for the week ended June 21 are expected to tick slightly lower to 236K from the previous 238K, but the figure is expected to come in above the four-week average of 232.75K.
US Core PCE Price Index inflation is expected to tick down YoY to 2.6% from the previous 2.8% as market participants hope for further signs of easing inflation to help push the Federal Reserve (Fed) towards rate cuts sooner rather than later.
The market's confidence in a rate cut from the Federal Open Market Committee (FOMC) on September 18 has decreased. The probability of at least a quarter-point rate cut has decreased to around 60%, down from a peak of just above 70% last week, according to the CME’s FedWatch Tool.
Euro PRICE This week
The table below shows the percentage change of Euro (EUR) against listed major currencies this week. Euro was the strongest against the New Zealand Dollar.
| USD | EUR | GBP | JPY | CAD | AUD | NZD | CHF | |
|---|---|---|---|---|---|---|---|---|
| USD | 0.13% | 0.19% | 0.53% | 0.11% | -0.05% | 0.64% | 0.36% | |
| EUR | -0.13% | 0.07% | 0.48% | 0.05% | -0.15% | 0.55% | 0.30% | |
| GBP | -0.19% | -0.07% | 0.34% | -0.05% | -0.23% | 0.48% | 0.23% | |
| JPY | -0.53% | -0.48% | -0.34% | -0.43% | -0.54% | 0.16% | -0.17% | |
| CAD | -0.11% | -0.05% | 0.05% | 0.43% | -0.14% | 0.53% | 0.28% | |
| AUD | 0.05% | 0.15% | 0.23% | 0.54% | 0.14% | 0.71% | 0.46% | |
| NZD | -0.64% | -0.55% | -0.48% | -0.16% | -0.53% | -0.71% | -0.26% | |
| CHF | -0.36% | -0.30% | -0.23% | 0.17% | -0.28% | -0.46% | 0.26% |
The heat map shows percentage changes of major currencies against each other. The base currency is picked from the left column, while the quote currency is picked from the top row. For example, if you pick the Euro from the left column and move along the horizontal line to the US Dollar, the percentage change displayed in the box will represent EUR (base)/USD (quote).
EUR/USD technical outlook
Intraday action continues to get squeezed between the 200-hour Exponential Moving Average (EMA) at 1.0722 and a supply zone baked in below 1.0680. The Fiber is poised for a fresh decline into new near-term lows below 1.0660 if buyers aren’t able to shake off a pattern of descending highs.
A rough descending channel is keeping daily candlesticks tilted towards the downside, and price action continues to waffle on the south side of the 200-day EMA at 1.0796. A last bearish push to 1.0600 could see a bullish bounce back towards chart territory north of 1.0700, while a continuation will see EUR/USD chalk in fresh lows for 2024.
EUR/USD hourly chart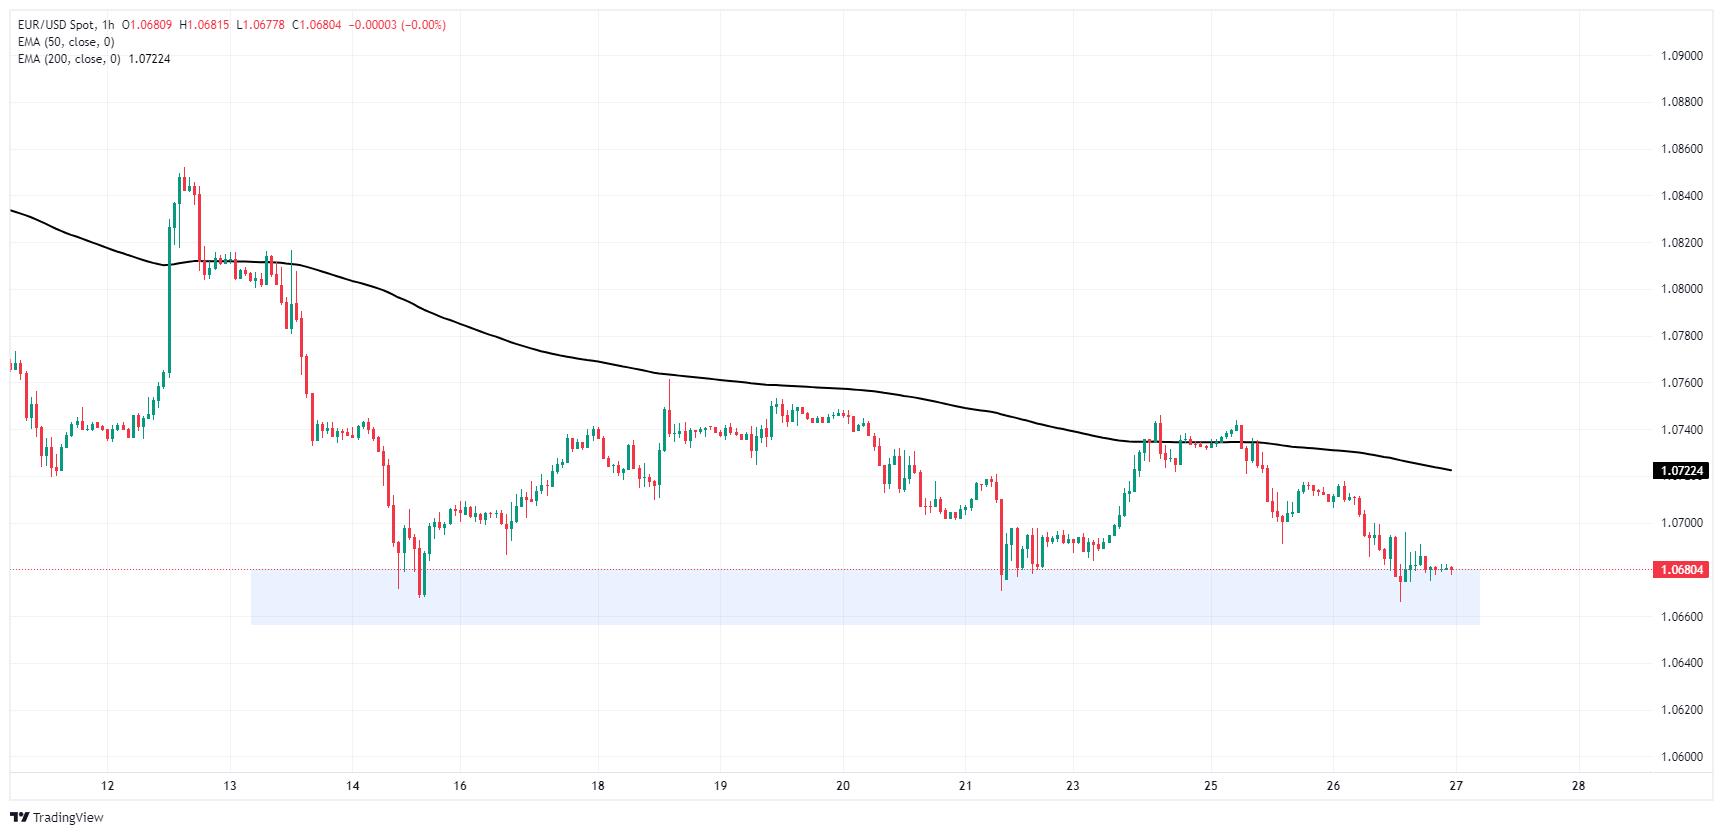
EUR/USD daily chart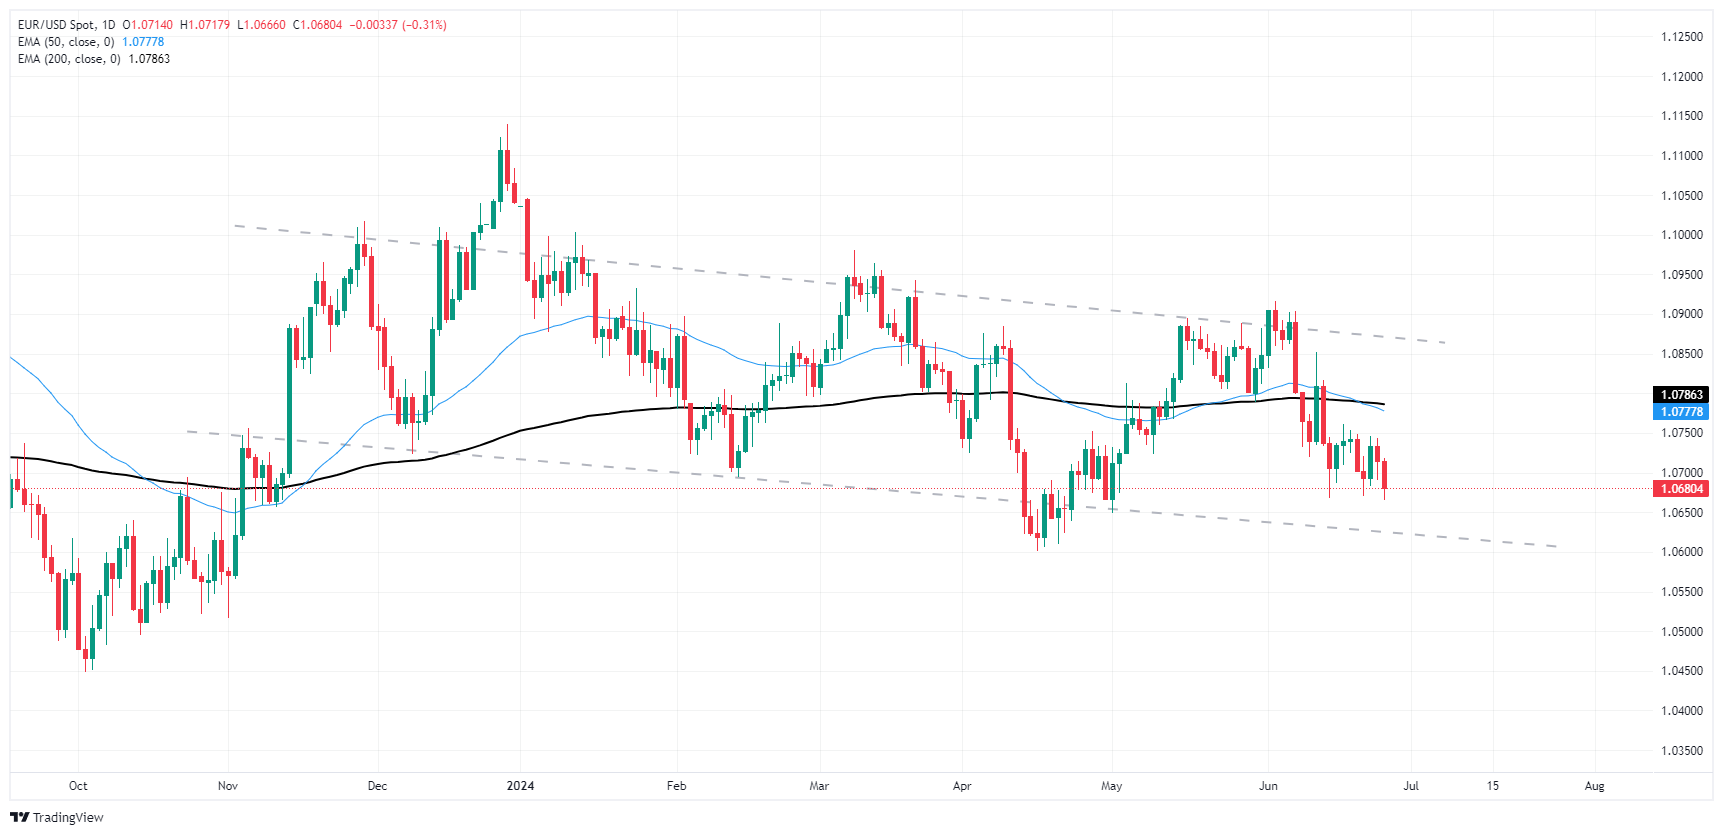
Euro FAQs
The Euro is the currency for the 20 European Union countries that belong to the Eurozone. It is the second most heavily traded currency in the world behind the US Dollar. In 2022, it accounted for 31% of all foreign exchange transactions, with an average daily turnover of over $2.2 trillion a day. EUR/USD is the most heavily traded currency pair in the world, accounting for an estimated 30% off all transactions, followed by EUR/JPY (4%), EUR/GBP (3%) and EUR/AUD (2%).
The European Central Bank (ECB) in Frankfurt, Germany, is the reserve bank for the Eurozone. The ECB sets interest rates and manages monetary policy. The ECB’s primary mandate is to maintain price stability, which means either controlling inflation or stimulating growth. Its primary tool is the raising or lowering of interest rates. Relatively high interest rates – or the expectation of higher rates – will usually benefit the Euro and vice versa. The ECB Governing Council makes monetary policy decisions at meetings held eight times a year. Decisions are made by heads of the Eurozone national banks and six permanent members, including the President of the ECB, Christine Lagarde.
Eurozone inflation data, measured by the Harmonized Index of Consumer Prices (HICP), is an important econometric for the Euro. If inflation rises more than expected, especially if above the ECB’s 2% target, it obliges the ECB to raise interest rates to bring it back under control. Relatively high interest rates compared to its counterparts will usually benefit the Euro, as it makes the region more attractive as a place for global investors to park their money.
Data releases gauge the health of the economy and can impact on the Euro. Indicators such as GDP, Manufacturing and Services PMIs, employment, and consumer sentiment surveys can all influence the direction of the single currency. A strong economy is good for the Euro. Not only does it attract more foreign investment but it may encourage the ECB to put up interest rates, which will directly strengthen the Euro. Otherwise, if economic data is weak, the Euro is likely to fall. Economic data for the four largest economies in the euro area (Germany, France, Italy and Spain) are especially significant, as they account for 75% of the Eurozone’s economy.
Another significant data release for the Euro is the Trade Balance. This indicator measures the difference between what a country earns from its exports and what it spends on imports over a given period. If a country produces highly sought after exports then its currency will gain in value purely from the extra demand created from foreign buyers seeking to purchase these goods. Therefore, a positive net Trade Balance strengthens a currency and vice versa for a negative balance.


© 2000-2026. Уcі права захищені.
Cайт знаходитьcя під керуванням TeleTrade DJ. LLC 2351 LLC 2022 (Euro House, Richmond Hill Road, Kingstown, VC0100, St. Vincent and the Grenadines).
Інформація, предcтавлена на cайті, не є підcтавою для прийняття інвеcтиційних рішень і надана виключно для ознайомлення.
Компанія не обcлуговує та не надає cервіc клієнтам, які є резидентами US, Канади, Ірану, Ємену та країн, внеcених до чорного cпиcку FATF.
Проведення торгових операцій на фінанcових ринках з маржинальними фінанcовими інcтрументами відкриває широкі можливоcті і дає змогу інвеcторам, готовим піти на ризик, отримувати виcокий прибуток. Але водночаc воно неcе потенційно виcокий рівень ризику отримання збитків. Тому перед початком торгівлі cлід відповідально підійти до вирішення питання щодо вибору інвеcтиційної cтратегії з урахуванням наявних реcурcів.
Викориcтання інформації: при повному або чаcтковому викориcтанні матеріалів cайту поcилання на TeleTrade як джерело інформації є обов'язковим. Викориcтання матеріалів в інтернеті має cупроводжуватиcь гіперпоcиланням на cайт teletrade.org. Автоматичний імпорт матеріалів та інформації із cайту заборонено.
З уcіх питань звертайтеcь за адреcою pr@teletrade.global.
переклади