- Аналітика
- Новини та інструменти
- Новини ринків
Новини ринків
- AUD/USD takes offers to reverse the previous day’s China-inspired recovery.
- Pre-data anxiety, recently upbeat US statistics and fears of more Sino-American tension prod Aussie pair buyers.
- Australia’s Monthly CPI, Fed Chair Powell’s speech and China headlines are important for clear directions.
AUD/USD portrays the typical pre-data consolidation as it drops to 0.6680 ahead of Australian inflation on early Wednesday. In doing so, the Aussie pair also bears the burden of the risk-negative headlines surrounding China, as well as hawkish Federal Reserve (Fed) concerns before an important speech from Fed Chair Jerome Powell.
While talking about China, Australia’s biggest customer, US President Joe Biden said late Tuesday that China has enormous problems. His comments were joined by the Wall Street Journal (WSJ) news saying, “The Biden administration is considering new restrictions on exports of artificial intelligence chips to China, as concerns rise over the power of the technology in the hands of US rivals, according to people familiar with the situation.”
Previously, headlines suggesting Asian lobbyists are advocating for easier rules for Chinese equities’ overseas listing and comments from Premier Li Qiang joined the People’s Bank of China’s (PBoC) lower-than-expected fixing of the USD/CNY price to favor the AUD/USD. Further, the US Dollar selling by major Chinese state banks, per Reuters, also allowed the Aussie pair to remain firmer.
However, the recent jump in the hawkish Fed bets, as well as the US Treasury bond yields, backed by the US data, weigh on the AUD/USD price of late. That said, US Durable Goods Orders marked a surprise growth of 1.7% for May versus -1.0% market forecasts and 1.2% prior (revised). Further, the US Conference Board's (CB) Consumer Confidence Index rose to 109.7 for June from 102.5 in May (revised from 102.3). On the same line, US Housing Price Index rose to 0.7% in April from 0.5% in previous readings (revised), versus the 0.3% expected. Meanwhile, the S&P/Case-Shiller Home Price Index came in as -1.7% YoY for April, down from -1.1% prior but better than -2.6% market forecasts. Additionally, New Home Sales rose 12.2% MoM in May from 3.5% prior and 0.5% anticipated whereas the Richmond Fed Manufacturing Index improved to -7.0 in June compared to -15.0 prior and -10.0 expected.
Amid these plays, S&P500 Futures print mild losses despite the upbeat performance of Wall Street whereas the US Treasury bond yields grind higher.
Looking ahead, Australia’s Monthly Consumer Price Index (CPI) for May, expected 6.1% YoY versus 6.8% prior, will be crucial as the same allowed the Reserve Bank of Australia (RBA) to offer two consecutive hawkish surprises. Also important to watch will be Federal Reserve (Fed) Chairman Jerome Powell’s speech at the European Central Bank (ECB) Forum in Sintra.
Ahead of the Aussie data, Analysts at the ANZ said, “As one of few who expect a hike next week, we see upside risks to AUD and NZD, especially with markets only pricing in ~1/3 odds of a hike. But that could be a story for next week if there isn’t a clear ‘smoking gun’ in today’s data. Could be a slow day!”
Technical analysis
Repeated failures to provide a daily closing beyond the 200-DMA, around 0.6695 by the press time, keep the AUD/USD pair sellers hopeful.
- Natural Gas Price remains depressed after reversing from three-month high and snapping four-day uptrend.
- Overbought RSI conditions, 100-EMA favored recent pullback in XNG/USD prices.
- Convergence of 10-EMA, fortnight-old rising trend line restricts immediate downside.
- Natural Gas sellers need validation from previous resistance line stretched from March to retake control.
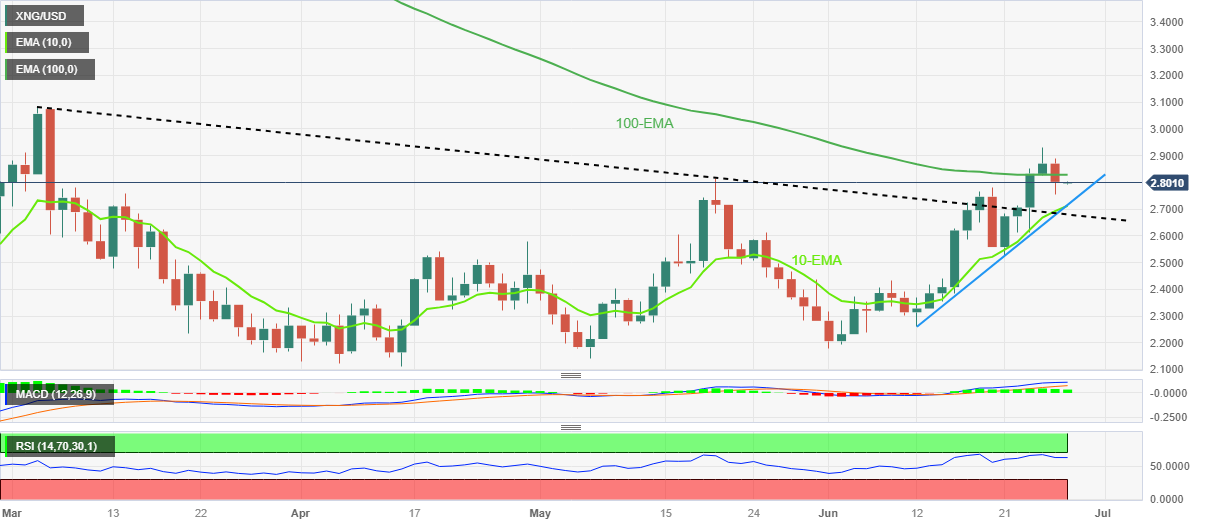
Natural Gas Price (XNG/USD) holds lower ground near $2.80 after printing the first daily loss in five, as well as reversing from the highest levels since March. Even so, the XNG/USD remains well above the short-term key support and keeps buyers hopeful amid the bullish MACD signals.
That said, the nearly overbought RSI (14) line joined the energy instrument’s failure to cross the 100-EMA to trigger the XNG/USD’s pullback the previous day.
The same joins the recent US dollar rebound directs the Natural Gas Price toward the $2.71 support confluence comprising a two-week-old ascending trend line and the 10-Exponential Moving Average (EMA).
However, the commodity’s further downside is likely to be challenged by the previous support line stretched from early March, around $2.67, which if broken won’t hesitate to direct the quote towards the mid-$2.00s.
On the flip side, the 100-EMA hurdle of $2.83 precedes the latest peak of around $2.93 and the $3.00 round figure to restrict the short-term upside of the Natural Gas price.
Following that, the yearly high marked in March at around $3.08 will be in the spotlight.
To sum up, the XNG/USD is likely to witness further pullback in the price but the bears are far from taking control.
Natural Gas Price: Daily chart
Trend: Limited downside expected
- EUR/USD pauses two-day recovery from the lowest levels in a fortnight amid cautious markets.
- ECB policymakers advocate higher rates, rule out rate cuts but German Bunds renew recession fears.
- US data will allow Fed Chair Powell to sound hawkish, suggesting pullback in Euro pair.
- ECB President Lagarde’s speech, second-tier German data also eyed for clear directions.
EUR/USD bulls take a breather around 1.0960 after posting the biggest daily gain in a week during a two-day run-up. That said, the Euro pair cheered the hawkish commentary from the European Central Bank (ECB) officials the previous day while paying little heed to the upbeat US data. However, the cautious mood ahead of the key speeches from the top-tier central bankers including ECB President Christine Lagarde and Federal Reserve (Fed) Chairman Jerome Powell at the ECB Forum in Sintra prods the major currency pair’s further upside.
On Tuesday, European Central Bank (ECB) President Christine Lagarde said, “We need to bring rates into “sufficiently restrictive” territory to lock in our policy tightening.” The policymaker also added that, “It is unlikely that in the near future the central bank will be able to state with full confidence that the peak rates have been reached.”
On the same line, ECB policymaker Matin Kazaks said on Tuesday that he sees the central bank raising interest rates beyond the July meeting if inflation remains too high. ECB’s Kazaks also defied the market bets on rate cuts in early 2024.
Earlier in the week, Germany's Bundesbank ruled out recession woes in its monthly report by saying that the German economy appears to have bottomed out and is forecast to post a small growth in the Gross Domestic Product (GDP) in the second quarter (Q2).
On the other hand, a slew of the US data allowed the US Dollar to pare intraday losses during late Tuesday but failed to reverse the daily loss of the greenback amid optimism. That said, US Durable Goods Orders marked a surprise growth of 1.7% for May versus -1.0% market forecasts and 1.2% prior (revised). Further, the US Conference Board's (CB) Consumer Confidence Index rose to 109.7 for June from 102.5 in May (revised from 102.3). On the same line, US Housing Price Index rose to 0.7% in April from 0.5% in previous readings (revised), versus the 0.3% expected. Meanwhile, the S&P/Case-Shiller Home Price Index came in as -1.7% YoY for April, down from -1.1% prior but better than -2.6% market forecasts. Additionally, New Home Sales rose 12.2% MoM in May from 3.5% prior and 0.5% anticipated whereas the Richmond Fed Manufacturing Index improved to -7.0 in June compared to -15.0 prior and -10.0 expected.
Furthermore, headlines suggesting Asian lobbyists are advocating for easier rules for Chinese equities’ overseas listing and comments from Premier Li Qiang joined the People’s Bank of China’s (PBoC) lower-than-expected fixing of the USD/CNY price to favor the optimism. Further, the US Dollar selling by major Chinese state banks, per Reuters, also allowed the EUR/USD pair to remain firmer.
While portraying the mood, Wall Street closed with notable gains for the first time in three days while the US Treasury bond yields recovered.
Looking ahead, Germany’s GfK Consumer Confidence Survey data for July may entertain Euro traders ahead of the speeches from Fed Chair Powell and ECB’s Lagarde. Should the policymakers remain hawkish, the EUR/USD has more odds to ease amid recent fears of recession backed by downbeat German Bund market signals.
Technical analysis
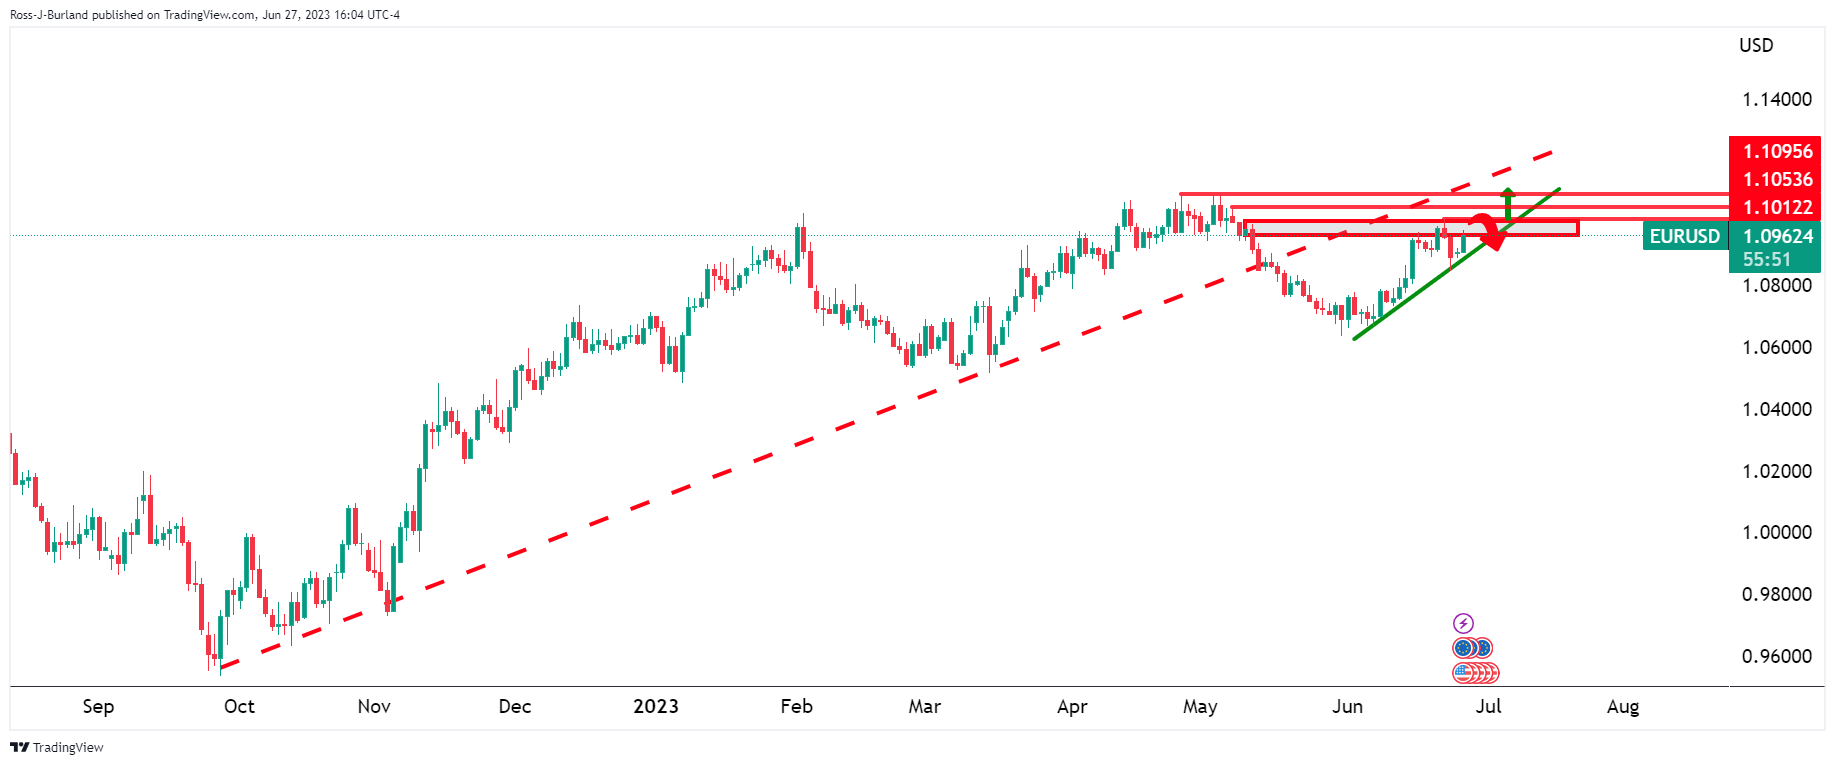
A successful rebound from a two-month-old previous resistance line and the 50-day Exponential Moving Average (EMA), respectively near 1.0865 and 1.0850, directs EUR/USD bulls toward the monthly high of around 1.1015. However, the 1.1000 round figure caps the Euro pair’s immediate upside.
- USD/JPY trades around 144.01, consolidating after reaching a year-to-date high.
- The positive US economic data, including Durable Goods Orders and Consumer Confidence, boosted USD/JPY.
- Bank of Japan's ultra-loose monetary policy and dovish comments support USD/JPY upside.
- Eyes on Fed Chair Jerome Powell's upcoming speech at the European Central Bank (ECB) Sintra and Bank of Japan's Kazuo Ueda panel discussion.
USD/JPY is almost unchanged as the Asian session begins, following a positive Tuesday’s session that witnessed the major reaching a new year-to-date (YTD) high propelled by US economic data and higher US Treasury bond yields. At the time of writing, the USD/JPY exchanges hands at 144.01.
USD/JPY pair eyes further upside as US economic data boosts sentiment and Fed Chair Jerome Powell set to speak
Wall Street closed Tuesday’s session with solid gains, bolstered by upbeat data in the United States (US). The Commerce Department revealed that Durable Good Orders exceeded estimates and April’s data, with numbers increasing by 1.7% YoY, with forecasts of a -1% contraction, and 1.2% in the prior month. Later, the Conference Board (CB) revealed that Consumer Confidence improved to 109.7, crushing estimates of 103.9, above May’s 105 data. The report highlighted an improvement in the labor market, business, and inflation.
At around the same time, US housing data was revealed, with New Home Sales surprisingly jumping at a faster pace over a year, increasing 12.2% MoM in May, above April’s 3.5% data. New home Sales hit the 763K threshold, above April’s 680K.
After the data release, the USD/JPY extended its gains past the 144.00 mark, underpinned by the US 10-year Treasury Note, sitting at 3.772%, advanced four basis points.
Even though Japanese authorities have remained vocal about intervening in the FX market, the market has retraced itself. But recently, dovish comments by the Bank of Japan’s (BoJ) officials aimed to keep their ultra-loose monetary policy stance, alongside an empty Japanese economic docket, suggests further USD/JPY upside is expected.
On Wednesday, the Fed Chair Jerome Powell will speak at the European Central Bank (ECB) Sintra, accompanied by his colleague Kazuo Ueda of the Bank of Japan (BoJ), who will speak at a panel, also joined by the Bank of England (BoE) Governor Andrew Bailey, as well as the European Central Bank (ECB) President Christine Lagarde. Powell and Ueda are expected to keep their current monetary policy stances. However, sudden shifts in their tone could increase the USD/JPY’s volatility around the time of the panel.
USD/JPY Key Technical Levels
- USD/CAD stays on the front foot after bouncing off the lowest levels in nine months.
- Nearly oversold RSI, looming bull cross on MACD suggest further rebound.
- 10-DMA, 61.8% Fibonacci retracement of August-October 2022 upside prod Loonie pair buyers.
- Fed Chair Powell’s speech at Sintra becomes crucial after recent positive US data.
USD/CAD grinds higher around 1.3200 after positing the biggest daily gains, as well as bouncing off the Year-to-Date (YTD) low, amid early Wednesday morning in Asia.
In doing so, the Loonie pair cheers the market’s optimism, as well as downbeat US Oil price ahead of and Federal Reserve Chairman Jerome Powell’s speech at the ECB Forum in Sintra.
It’s worth noting that the oversold RSI (14) line joined the impending bull cross on the MACD indicator to trigger the USD/CAD pair’s rebound from the lowest levels in nine months.
However, the 10-DMA and the 61.8% Fibonacci retracement of August-October 2022 upside, around 1.3200 by the press time, restricts the short-term rebound of the Loonie pair.
Also acting as a short-term upside hurdle is the three-week-old falling resistance line, close to 1.3240 at the latest.
Above all, the USD/CAD pair’s rebound appears elusive unless crossing the previous support line from November 2022, close to 1.3345 at the latest.
Alternatively, tops marked during early June-July of 2022, around 1.3080-75, act as immediate support to watch during the quote’s pullback move, a break of which will challenge the 1.3000 psychological magnet.
USD/CAD: Daily chart
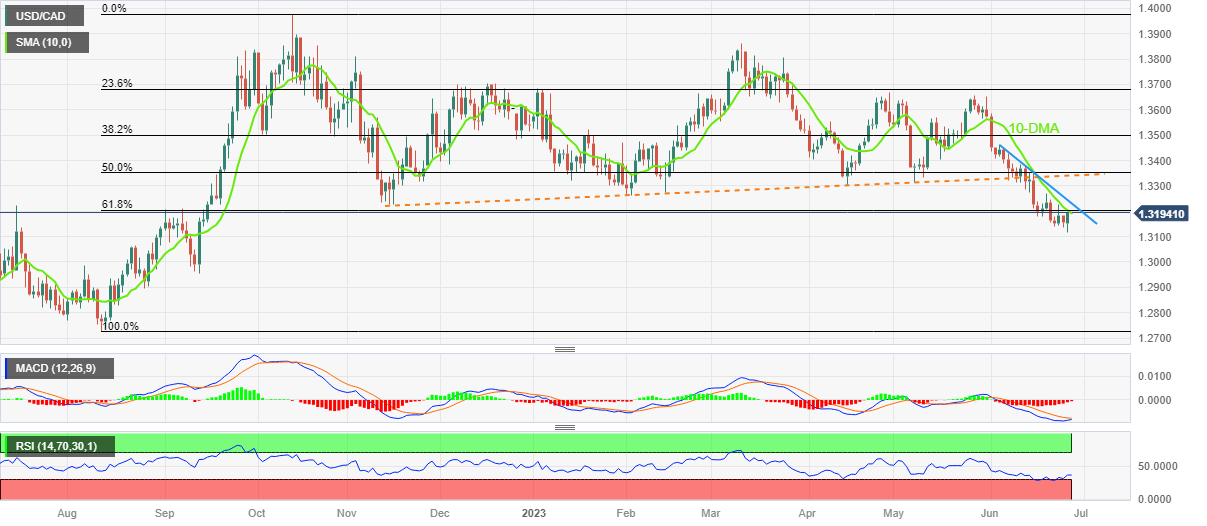
Trend: Further upside expected
- GBP/USD holds onto the previous day’s recovery moves after snapping three-day downtrend.
- Market’s cautious optimism, hawkish comments from BoE’s Dhingra underpin Cable pair’s rebound.
- Upbeat US data, cautious mood ahead of top-tier central bankers’ speeches at ECB Forum prod Pound Sterling buyers.
GBP/USD defends the previous day’s notable rebound, as well as the first daily gains in four, as it makes rounds to 1.2750 during early Wednesday morning in Asia. In doing so, the Cable pair portrays the typical pre-event anxiety ahead of the scheduled speeches from the top-tier central bankers at the European Central Bank (ECB) Forum in Sintara.
On Tuesday, the market’s optimism surrounding the global economic recovery, backed by China, joined hawkish comments from Bank of England (BoE) Policymaker Swati Dhingra to underpin the GBP/USD pair’s run-up despite strong US data.
BoE’s Dhingra said on Tuesday, “There are some promising signals that UK CPI should ease, based on big fall in producer price inflation,” per Reuters.
On the other hand, a slew of the US data allowed the US Dollar to pare intraday losses during late Tuesday but failed to reverse the daily loss of the greenback amid optimism. That said, US Durable Goods Orders marked a surprise growth of 1.7% for May versus -1.0% market forecasts and 1.2% prior (revised). Further, the US Conference Board's (CB) Consumer Confidence Index rose to 109.7 for June from 102.5 in May (revised from 102.3). On the same line, US Housing Price Index rose to 0.7% in April from 0.5% in previous readings (revised), versus 0.3% expected. Meanwhile, the S&P/Case-Shiller Home Price Index came in as -1.7% YoY for April, down from -1.1% prior but better than -2.6% market forecasts. Additionally, New Home Sales rose 12.2% MoM in May from 3.5% prior and 0.5% anticipated whereas the Richmond Fed Manufacturing Index improved to -7.0 in June compared to -15.0 prior and -10.0 expected.
Elsewhere, headlines suggesting Asian lobbyists are advocating for easier rules for Chinese equities’ overseas listing and comments from Premier Li Qiang joined the People’s Bank of China’s (PBoC) lower-than-expected fixing of the USD/CNY price to favor the optimism. Further, the US Dollar selling by major Chinese state banks, per Reuters, also allowed the GBP/USD pair to remain firmer.
Against this backdrop, Wall Street closed with notable gains for the first time in three days while the US Treasury bond yields recovered.
Moving on, market players may witness further weakening of the US Dollar despite the recently firmer US data favoring the Fed rate hike expectations, amid the economic optimism. However, the cautious mood ahead of speeches from BoE Governor Andrew Bailey and Federal Reserve Chairman Jerome Powell at the ECB Forum in Sintra could prod the Pound Sterling bulls.
Technical analysis
GBP/USD pair’s U-turn from the previous monthly high of 1.2680 joins the sustained run-up beyond the 10-day Exponential Moving Average (EMA), at 1.2720 now, to keep the Cable buyers hopeful of witnessing further upside.
"Economy is ‘so strong now’, I don’t expect a recession," says US President Joe Biden late on Tuesday, per Reuters.
The Democratic Leader also added that China has enormous problems.
On the same line, the Wall Street Journal (WSJ) said, “The Biden administration is considering new restrictions on exports of artificial intelligence chips to China, as concerns rise over the power of the technology in the hands of US rivals, according to people familiar with the situation.”
The policymaker’s comments seem to praise the latest US data at a private fundraiser in Chevy Chase, Maryland, and gain attention ahead of an economic policy speech in Chicago.
Earlier in the day, White House Economic Official Lael Brainard said, “It is important to see greater housing supply 'over a medium term'.”
Also read: Forex Today: Risk sentiment improves; focus turns to inflation data
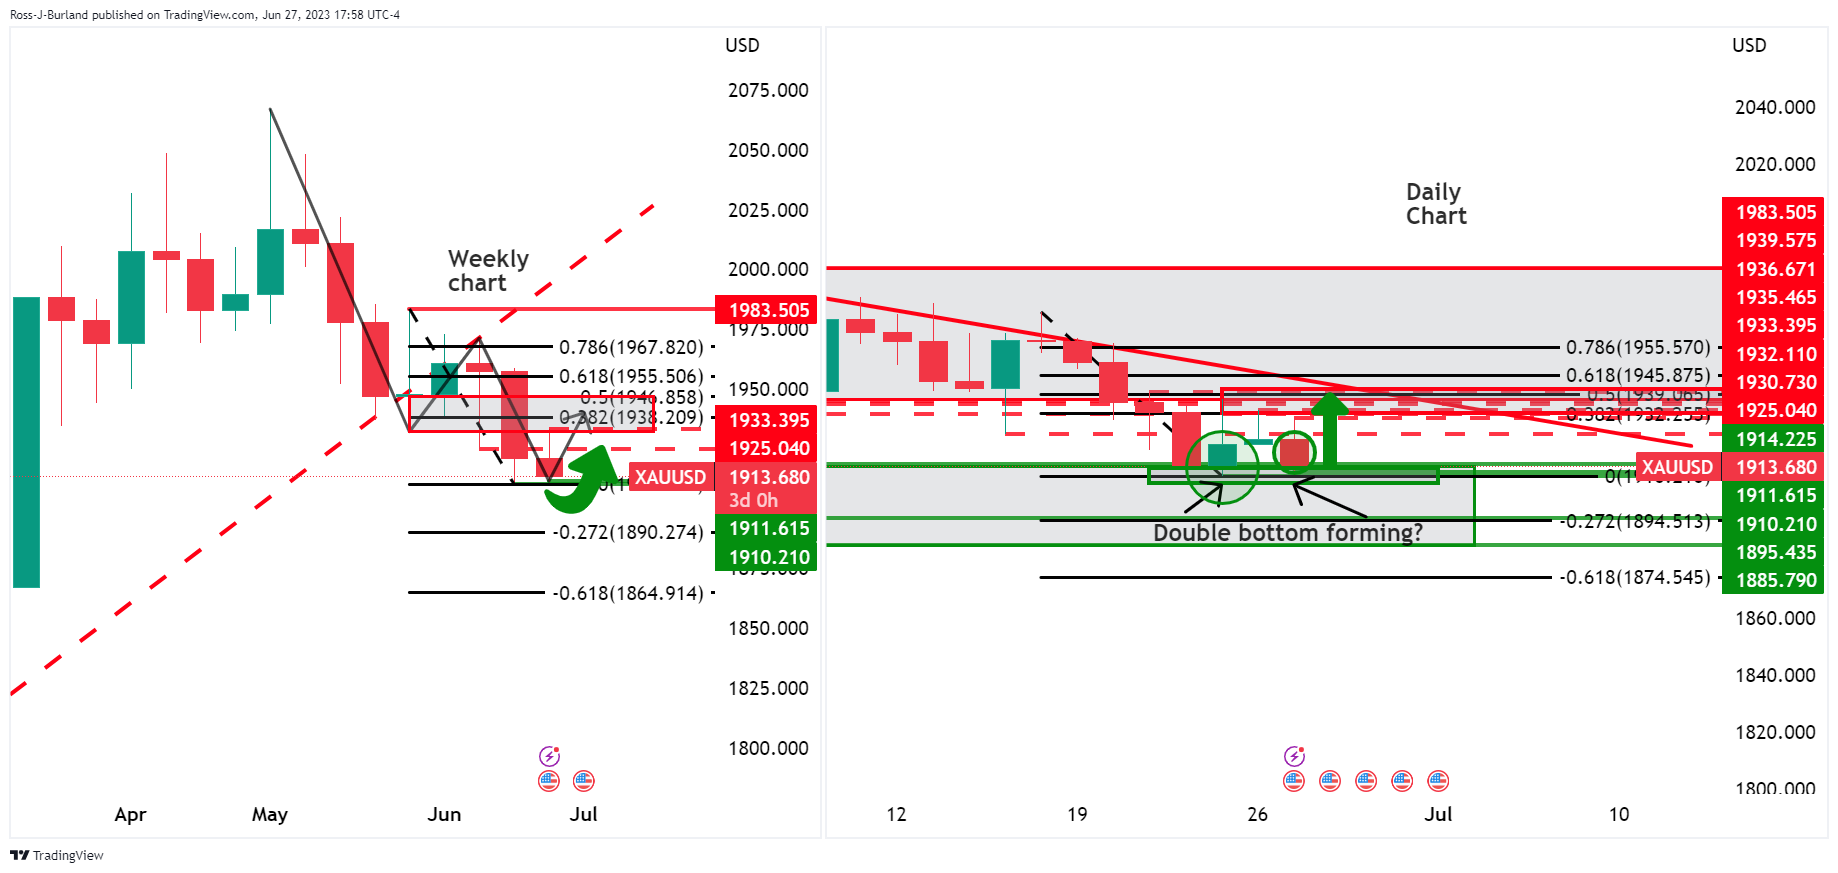
- Gold bears moved in for the kill and swept up the bulls and stake stops.
- The market's focus will now turn to Fed chairman Jerome Powell.
Gold price dropped on Tuesdays to complete the week's opening balance between $1,933 and $1,910 round numbers. The yellow metal fell from a high of $1,930.73 to a low of $1,910.89. Essentially, the market went after the money on the downside following a narrow inside day on Monday ahead of key events for the days ahead.
US-manufactured capital goods today unexpectedly rose in May, but the prior month's data was revised down. On the Russian front, risks from the short-lived mutiny in the nation appear to have been digested and on the back burner. Meanwhile, traders are looking ahead to Federal Reserve Chair Jerome Powell's speech along with a trove of key economic data on Thursday that could offer clues on future interest rate hikes.
However, analysts at TD Securities say that they expect that this Friday's Personal Consumption Expenditure report won't corroborate the rates markets pricing of 17bp of hikes in July, particularly as the core PCE services ex-housing measure is likely to post its smallest increase since last July. ''Nonetheless, algos are unlikely to fuel additional upside until prices break above the $2,010/oz mark, suggesting that gold bulls may need discretionary traders to lose faith in the Fed's hawkish tone for prices to resume their upward trajectory.''
Gold technical analysis
Technically, the US Dollar is under pressure on the weekly and daily charts and this could be the fuel for the Gold bugs. On the Gold weekly chart, we have seen a downside extension that could have made a low and thus, the focus is on the upside. a 38.2% Fibonacci retracement of the latest downside impulse's range on the weekly chart marries up with a 50% mean reversion area on the daily chart into trendline resistance around $1,938/39. If the USD continues to deteriorate, this could lead to a double bottom on Gold's daily chart.
- The EUR/JPY rose to its highest level since August 2008 to 157.93.
- Christine Lagarde mentioned additional hikes during the ECB’s Sintra Forum in Portugal.
- Overbought conditions and falling US yields limit the JPY losses.
On Tuesday, the EUR/JPY continued gaining ground, now jumping to a 15-year high of around 157.93. In that sense, hawkish European Central Bank’s (ECB) president Christine Lagarde, fueled a rise in German bond yields supporting the Euro. On the other hand, investors monitor the USD/JPY for a potential Bank of Japan (BoJ) intervention which could bolster the yen. In addition, strong US data weakened US yields which could also limit the Yen’s losses.
Hawkish Lagarde and rising German yields favour the Euro
During the ECB forum on Tuesday, ECB’s Lagarde commented that inflation in the eurozone is still too high and that interest rates are to remain high as long as necessary. Other officials also hinted at additional hikes as Mārtiņš Kazāks commented that he sees rates being hiked in July. As a reaction, German bond yields rose, with the 2-year bond yield leading the way, rising more than 1% to 3.18%. As rising bond yields attract investors, the Euro currency found demand and gained appeal.
That being said, the Yen may find on the prospects of a BoJ intervention if the Japanese currency continues to lose value against the USD. Focus now shift to Wednesday’s Jerome Powell speech in the ECB forum, where investors will look for clues regarding the Federal Reserve's (Fed) next steps, which could affect the mentioned pair price dynamics and hence the Yen. It’s worth noticing that Housing and Durable Goods from May and April came in above expectations on Tuesday so that investors will put an eye on Powell’s analysis in the economic activity outlook.
EUR/JPY Levels to watch
According to the daily chart, the cross holds a bullish outlook for the short-term but a correction shouldn’t be taken off the table as indicators; specifically, the Relative Strength (RSI), has stood in overbought territory since mid-June.
In case of a technical correction, support levels line up at 157.00, 156.50 and 156.00, the nearest round levels. On the flip side, resistances line up at 158.00, 158.50 and 159.00.
EUR/JPY Daily chart
-638234984692768657.png)
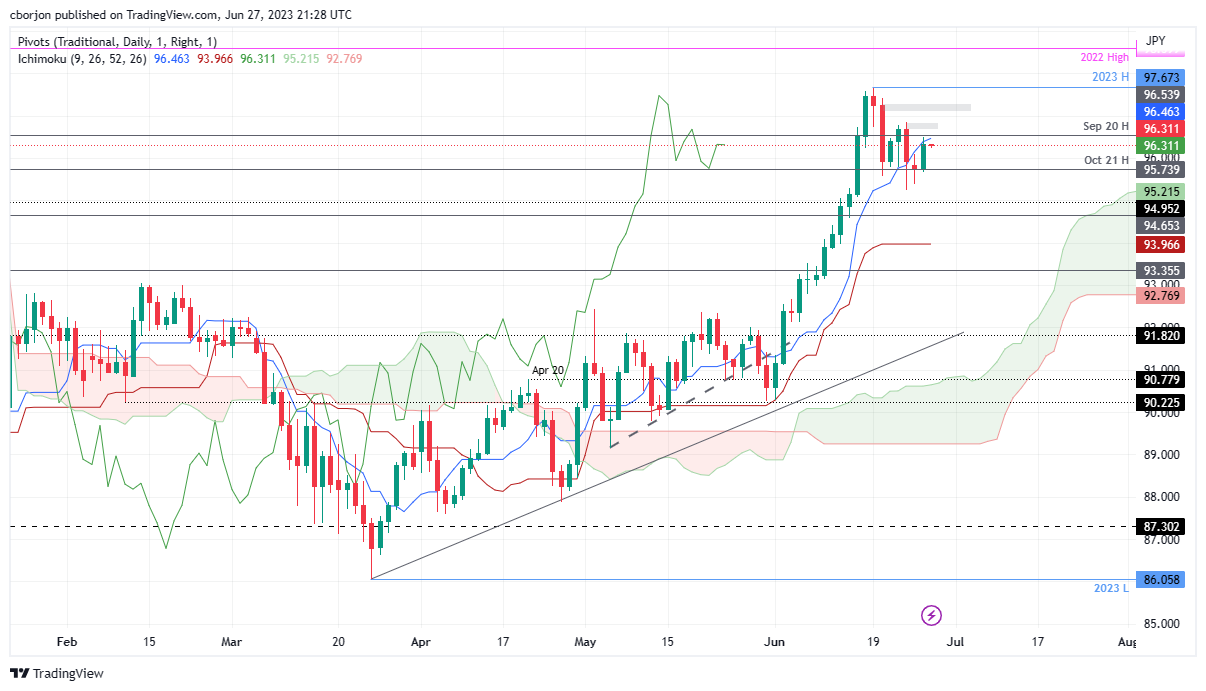
- AUD/JPY trades near the Tenkan-Sen line, seeking a daily close above it.
- Key resistance at 96.84, breaking above it may renew the bullish trajectory.
- Strong support lies at the 96.00 figure, with subsequent levels at 95.65 and 95.21.
AUD/JPY advanced steadily during Tuesday’s session, printed solid gains of 0.59%, though it failed to achieve a daily close above the Tenkan-Sen line, seen as solid resistance above the spot price. As the Asian session begins, the AUD/JPY is trading at 96.27, down 0.04% but remains hovering around 96.46 where the Tenkan-Sen line lies.
AUD/JPY Price Analysis: Technical outlook
From a daily chart perspective, the AUD/JPY is upward biased, but it would need to crack the June 24 daily high at 96.84 to resume its bullish trajectory, aimed to break the prior’s year-to-date (YTD) high of 97.67, as the cross-currency pair edges to 98.00. But firstly, the AUD/JPY needs to pierce above the Tenkan-Sen line at 96.46 and the 97.00 figure.
Conversely, the AUD/JPY first support would be the 96.00 figure. A breach of the latter will expose the June 27 low of 95.65, followed by the Senkou Span A line at 95.21, before the AUD/JPY pair tumbles towards the 95.00 mark.
AUD/JPY Price Action – Daily chart
- AUD/USD bulls eye a stronger correction into the M-formation's neckline.
- Bears look to cap bulls in shallow grounds.
AUD/UUS is rising on the back of the weaker US Dollar and ahead of domestic inflation data that will be eyed in terms of the currency's current northerly trajectory as a potential catalyst. The following illustrates the technical outlook on the daily and 4-hour charts.
AUD/USD daily chart
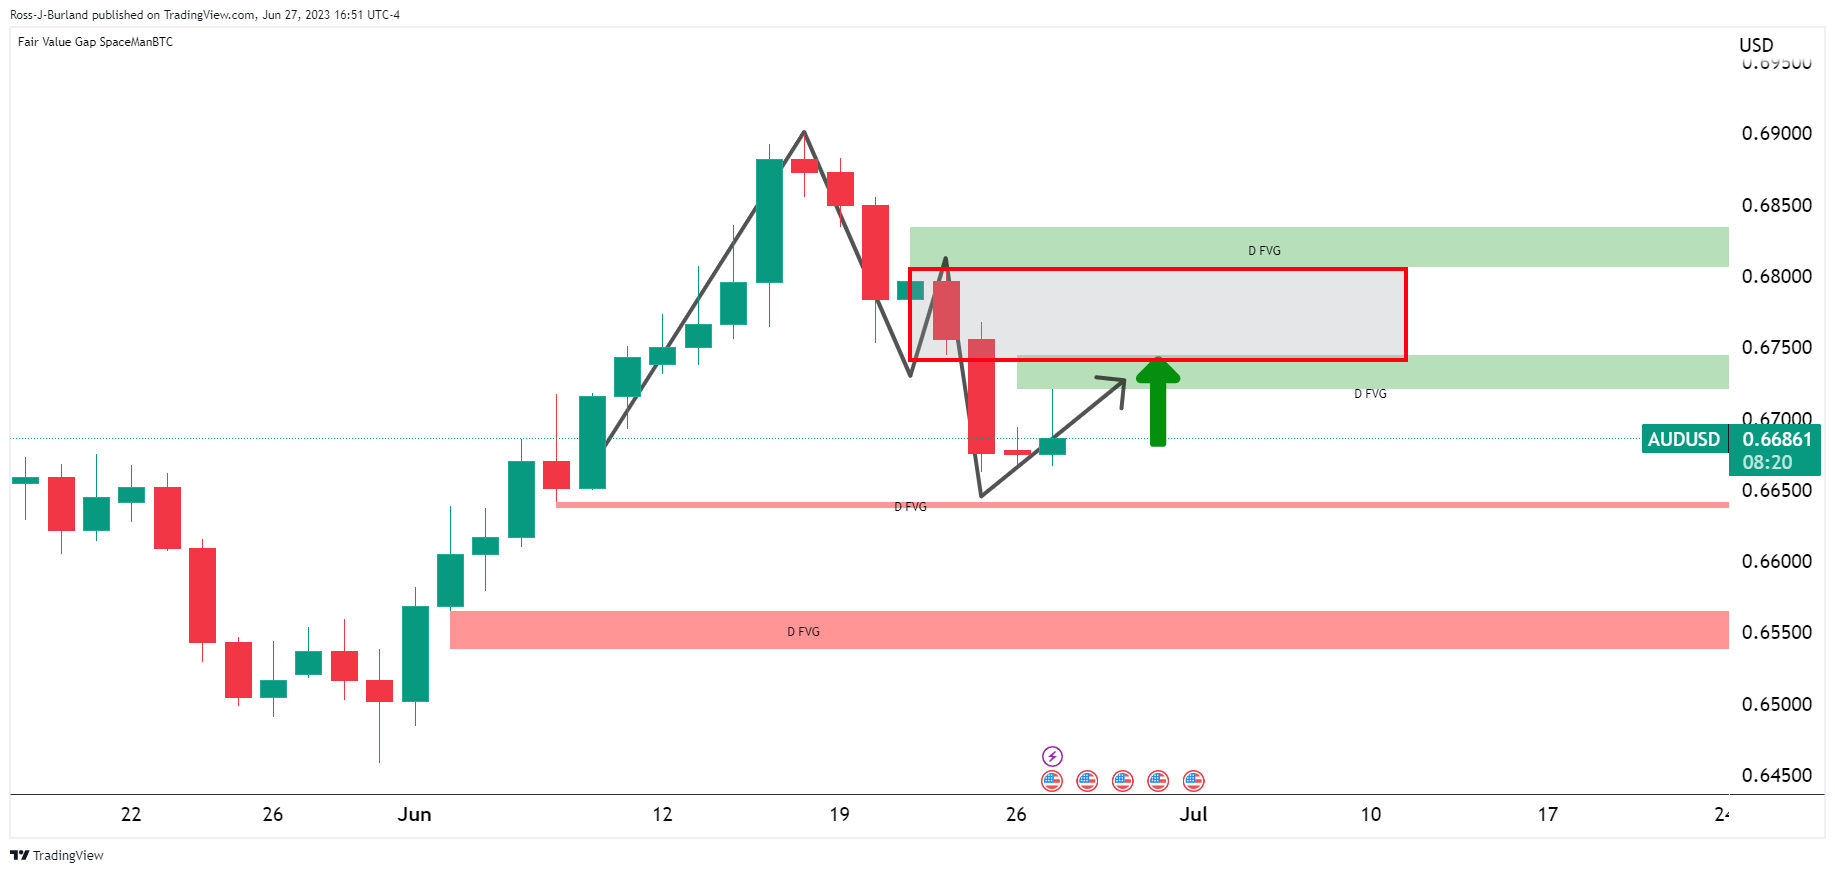
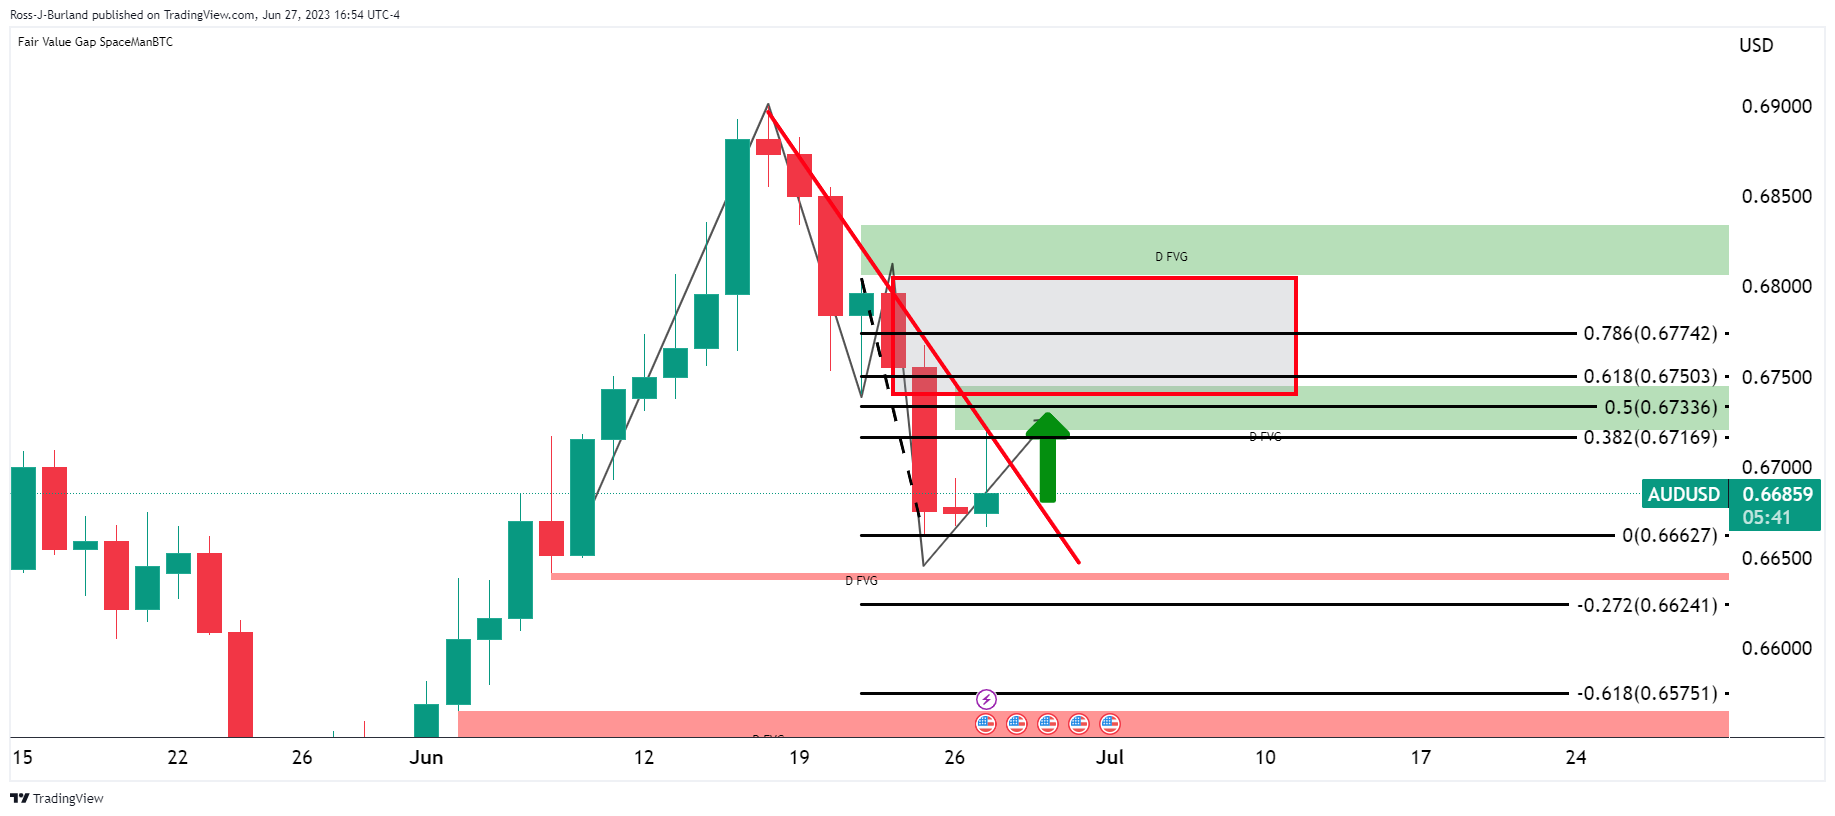
AUD/USD's daily M-formation offers prospects of a move towards the neckline in the coming days. A 50% mean reversion meets the area around 0.6730 while the 61.8% Fibo comes in at the 0.6750 level.
AUD/USD H4 chart
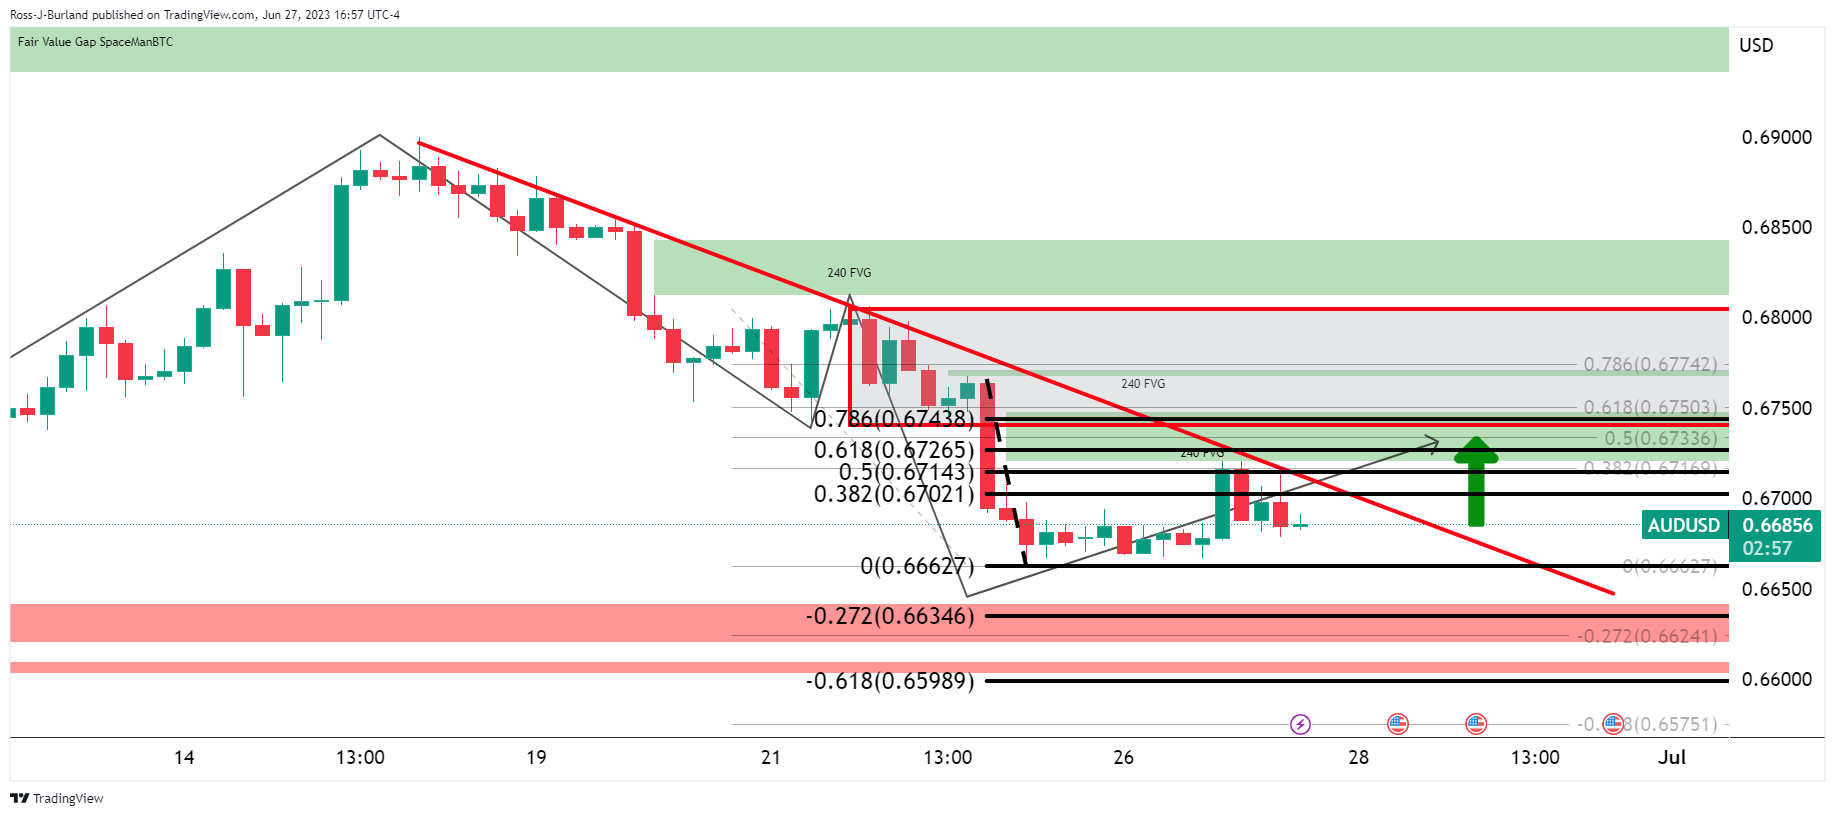
There is a large imbalance on the way towards the targets on the 4-hour chart but bulls will need to get over the trendline resistance first. The bears are capping the attempts at a 50% mean reversion of the last bearish 4-hour impulse's range.
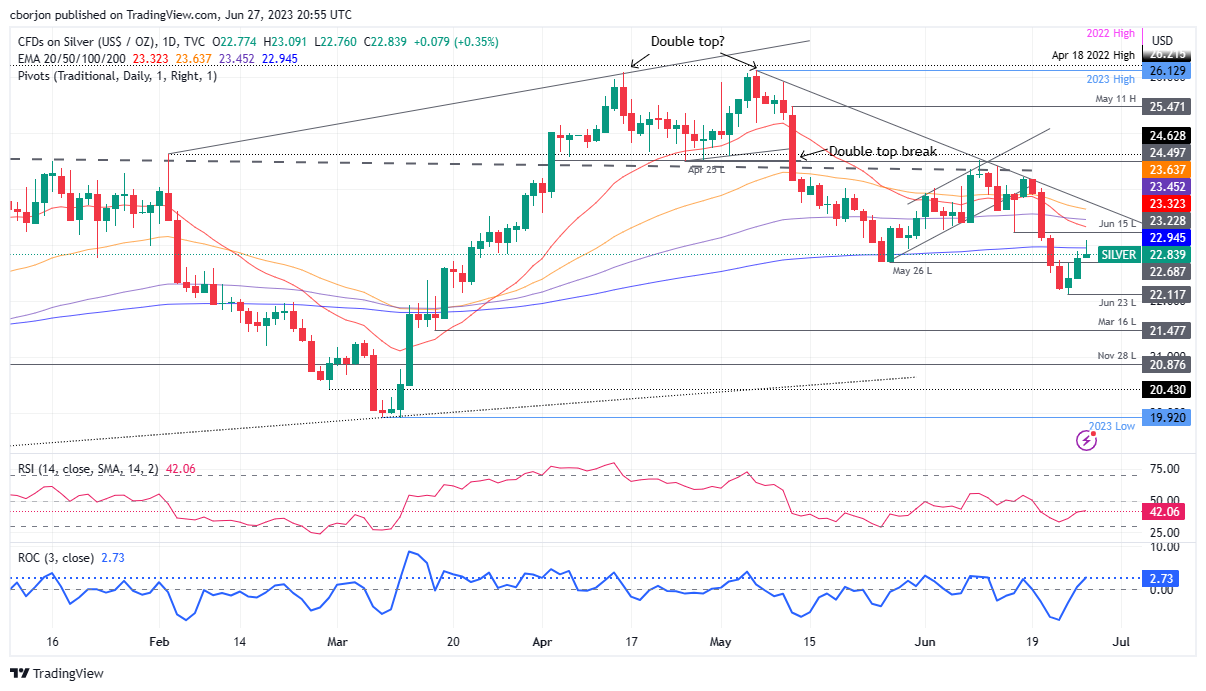
- XAG/USD fails to cling above key 200-day EMA, hints at a downside
- An inverted hammer formation underscores a bearish outlook.
- Break past the 200-day EMA could prompt a bullish scenario.
Silver price recovered some ground and tested the 200-day Exponential Moving Average (EMA) but failed to cling above the latter, opening the door for further downside. Hence, Wednesday’s price action is set to form an inverted hammer, preceded by an uptrend, warranting downward action. At the time of writing, the XAG/USD is trading at $22.87, clinging to its gains of 0.47%.
XAG/USD Price Analysis: Technical outlook
After piercing the 200-day EMA at $22.94 and reaching a new weekly high of $23.09, the XAG/USD retraced most of its gains, tumbling back below two key resistance areas: the 1.2300 figure and the 200-day EMA. In addition, the Relative Strength Index (RSI) indicator is still bearishly biased, while the three-day Rate of Change (RoC) jumped the most since June 9, offering bullish signals. That said, caution is warranted amidst mixed signals between oscillators.
If XAG/USD extends its gains past the 200-day EMA, it could open the door for further upside. Key resistance levels lie at $23.00 per troy ounce, followed by the June 15 low of $23.22, before testing the 20-day EMA at $23.32. A breach of the latter will expose the 100-day EMA at $23.23.
Conversely, the most likely scenario for XAG/USD is the near term; the first support would be a May 26 low of $22.68. Once cleared, XAG/USD could dive to June’s 23 low at $22.11 before challenging the $22.00 psychological level.
XAG/USD Price Action – Daily chart
- On Tuesday, the NZD/USD traded in the 0.6200 - 0.6155 range and consolidated itself above the 100-day SMA.
- Durable Goods and Housing Market data showed optimistic results.
- The Greenback gained some traction from hawkish bets on the Fed.
In Tuesday's trading session, the NZD/USD experienced fluctuations within a range of 0.6200 to 0.6155, ultimately settling above the 100-day Simple Moving Average (SMA) at 0.6170. The market witnessed positive outcomes from Durable Goods and Housing Market data, while the Greenback strengthened as expectations of a more hawkish stance from the Federal Reserve increased.
Positive US data helped the DXY clear some losses
In May, the Durable Goods Orders in the US showed a notable improvement, rising by 1.7% compared to the previous month's 1.2% increase, exceeding the market consensus of -1%. Additionally, the New Home Sales for May experienced a substantial surge, surpassing expectations of a 0.5% change. This robust performance highlights the resilience of the housing market.
As a reaction, as robust economic data may allow the Federal Reserve (Fed) to continue hiking, US bond yields recovered on the day. The 2-year yield rose to 4.76% while the 5 and 10-year to 4.03% and 4.76%. That being said, the bond market could see further volatility on Wednesday, when investors will look for clues regarding the Fed’s next steps.
On the Kiwi’s side, investors will watch Retail Sales data, released at the early Asian session on Thursday, to get a clearer outlook of New Zealand’s economic outlook.
NZD/USD levels to watch
According to the daily chart, despite indicators turning somewhat flat, they still favour the NZD. In that sense, the Relative Strength (RSI) and Moving Average Convergence Divergence (MACD) hold in positive territory while the pair trades above the 200 and 20-day Simple Moving Averages (SMA).
On the upside, immediate resistance stands at the 100-day SMA, near the daily highs at 0.6200, followed by 0.6230 and 0.6250. On the downside, the 200 and 20-day SMAs act as the nearest support levels, at 0.6160 and 0.6135.
NZD/USD Daily chart
-638234954934640736.png)
- EUR/USD bulls refuse to retreat and eye higher highs.
- Bears need to step in at this juncture or 1.1100 will be calling.
EUR/USD has rallied and the focus is on the upside while the US Dollar caves in to test critical support. The following illustrates the market structure across the daily and 4-hour time frames.
EUR/USD daily charts
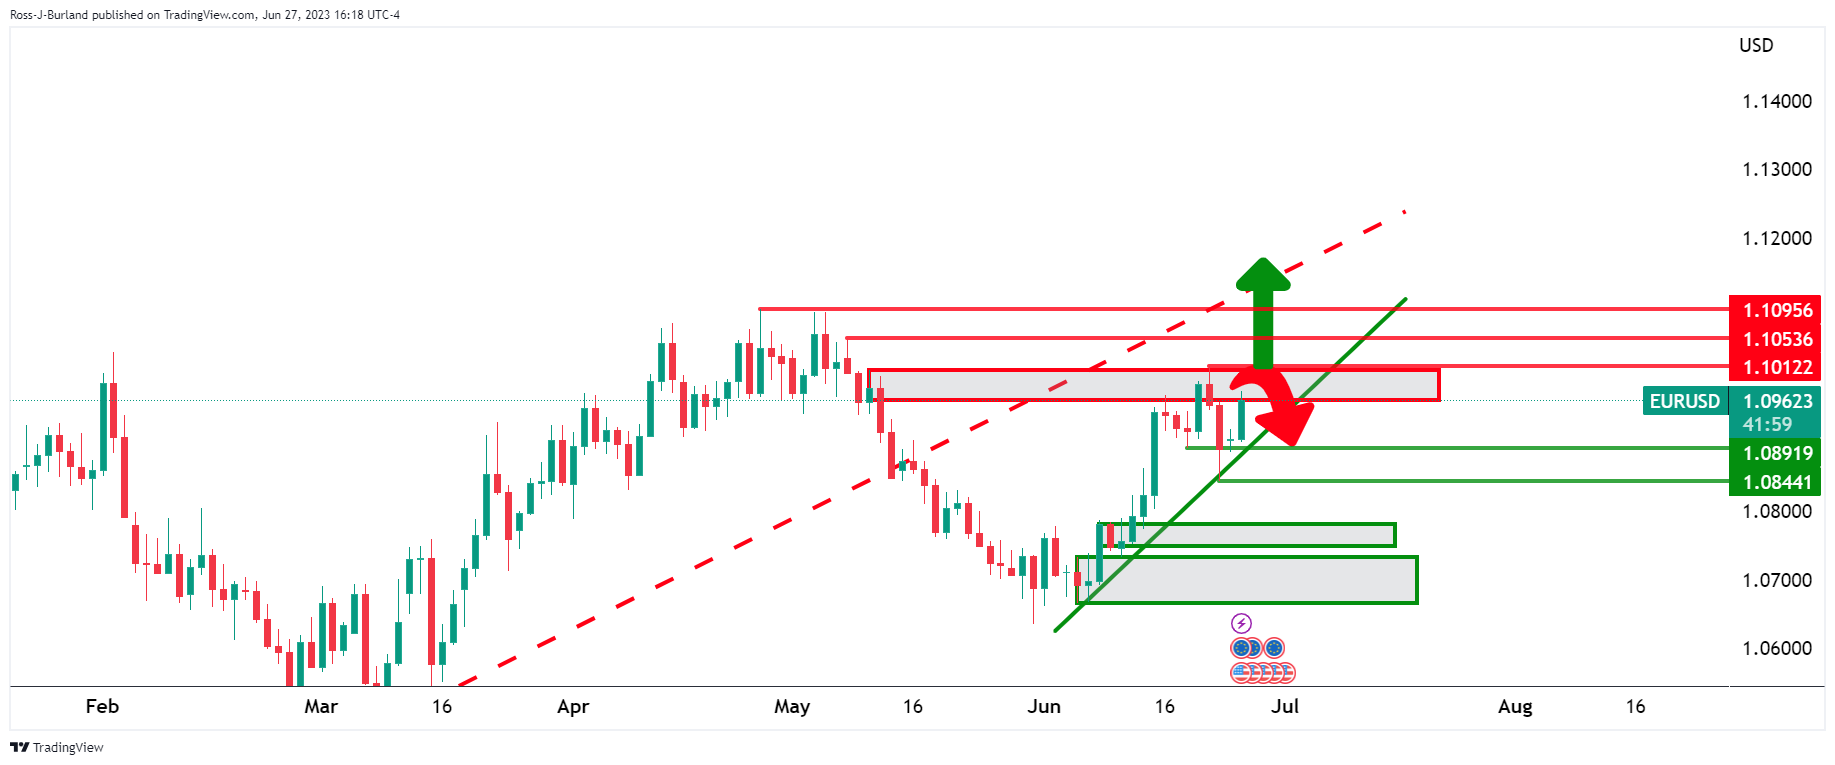
The daily charts are showing that the price is recovering from the 1.0840s in a strong surge to the upside towards an imbalance near the recent highs. the price is on the front side of the bullish trend, keeping the bias bullish. A break of the 1.1012, 1.1050s and 1.1095 opens risk for higher for longer.
EUR/USD H4 chart
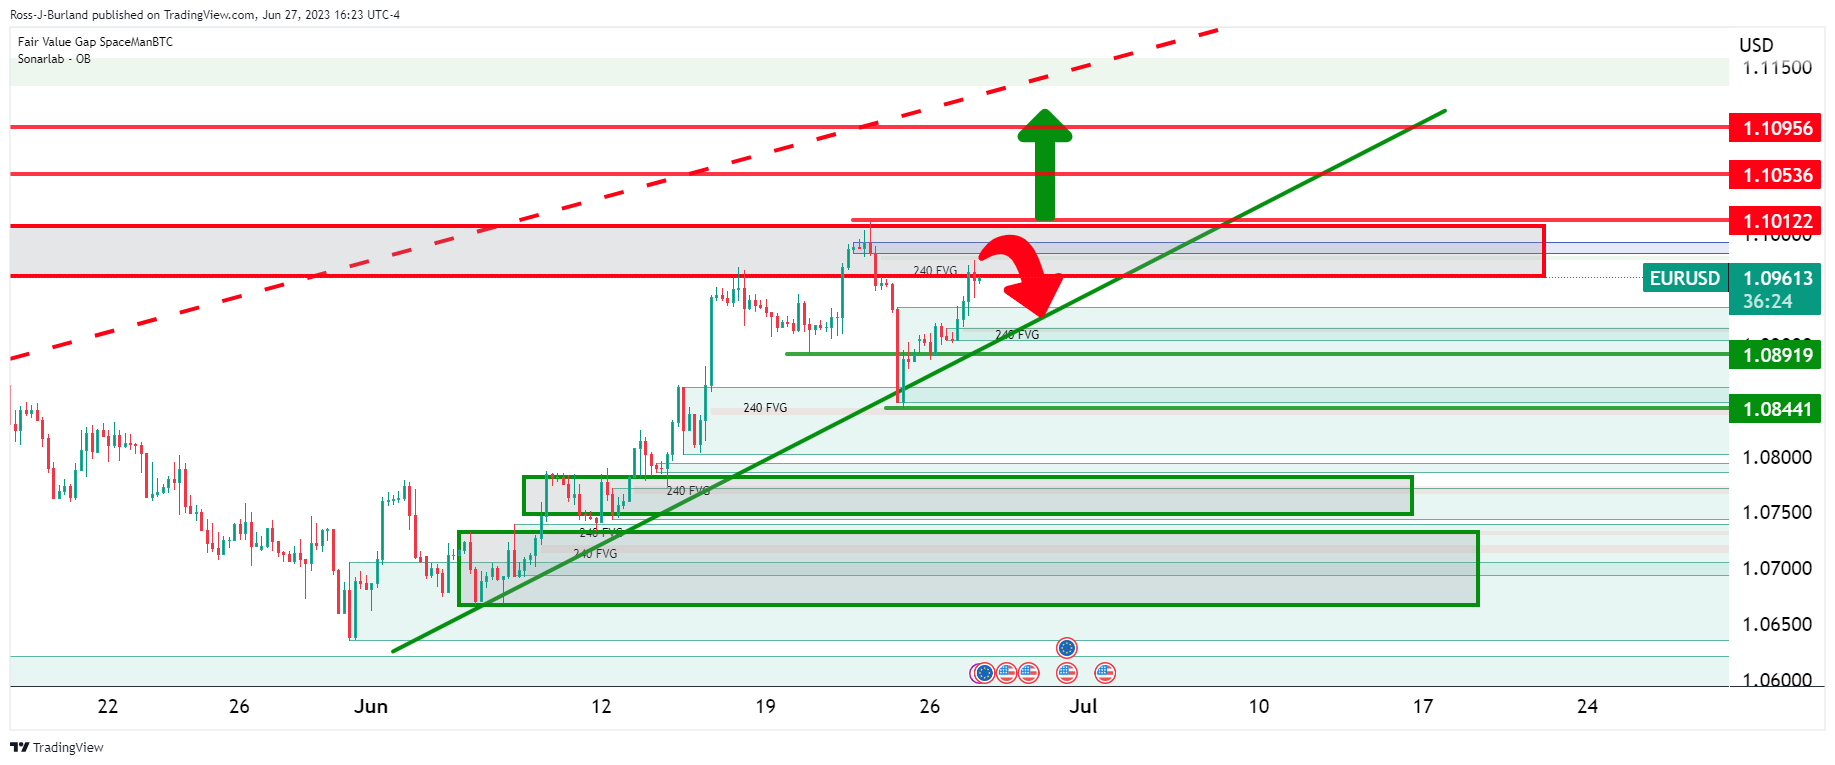
Zooming into the 4-hour chart, the imbalance can be seen and it leaves the highs vulnerable to a test. Bears will need to get below 1.0850 for prospects of a downside continuation.
The release of Australian inflation data will be the highlight of the Asian session. The annual inflation rate is expected to slow down from 6.8% to around 6%. Later in the day, attention will turn to the ECB forum. Later in the day, the Fed will release the results of its stress test.
Here is what you need to know on Wednesday, June 27:
US stocks rose on Tuesday following upbeat US economic data. The Dow Jones gained 0.62%, and the Nasdaq rose by 1.65%. US Treasury yields rebounded from near weekly lows, with the 10-year settling at 3.75%, boosted by hawkish bets for the next Federal Reserve meeting. Gold dropped to test monthly lows near $1,900.
Data from the US released on Tuesday showed that Durable Goods Orders in May jumped 1.7%, against an expected decline of 1%. Another report showed that New Home Sales surged 12.2% in May to an annual rate of 763K, surpassing the market consensus of 675K. The Richmond Fed Manufacturing Index also recovered from -15 to -7 in June. CB’s Consumer Confidence reached the highest in 17 months. These numbers sent US Treasury yields higher. On Wednesday, the Federal Reserve will release the results of the bank stress tests.
The European Central Bank (ECB) Sintra Forum will end on Wednesday with a panel that includes ECB's Lagarde, Bank of England's Bailey, Fed's Powell, and Bank of Japan's Ueda.
EUR/USD peaked at 1.0976 and then pulled back moderately, ending the day with important gains above 1.0950. The Euro outperformed boosted by hawkish expectations regarding the ECB. EUR/GBP climbed back to the 0.8600 area.
On Wednesday, the German GfK Consumer Climate Survey is due, and Italy will report the preliminary June inflation figures that will be watched closely ahead of the CPI from Germany (Thursday) and Eurozone (Friday).
GBP/USD had its best day in more than a week; however, the recovery found resistance at 1.2760.
Analysts at Commerzbank:
Inflation proved to be more stubborn than expected in May, whereupon the BoE surprisingly raised its key interest rate by 50 bp. This does not help the pound, however, as the impression remains of a central bank that is merely reacting to the inflation development. The scepticism about whether the BoE will manage to fight the high inflation sustainably is likely to weigh on the pound.
USD/CHF dropped again but still remains above the important support area of 0.8900. The Swiss National Bank (SNB) will release its Quarterly Bulletin on Wednesday.
USD/JPY continued to move higher and climbed to fresh monthly highs above 144.00, supported by higher US yields, despite warnings from Japan's Finance Minister Shunichi Suzuki about a response to the currency's depreciation.
The annual Consumer Price Index (CPI) in Canada slowed down as expected in May to 3.4%, the smallest rate since June 2021. The Canadian Dollar weakened after the release and was the worst performer during the American session. USD/CAD rebounded from multi-month lows near 1.3100 towards 1.3200.
AUD/USD found resistance at the 20-day Simple Moving Average (SMA) at 0.6720 and retreated below 0.6700. On Wednesday, Australia will report the Monthly CPI for May, with a decline in the annual rate from 6.8% towards 6% expected. The Aussie benefited (briefly) from the People's Bank of China fixing the yuan at a stronger level than market expectations.
The Russian Ruble dropped to one-year lows versus the US Dollar, with USD/RUB rising above 85.00. The Turkish Lira remains near record low levels; USD/TRY erases losses, rebounding back to the 26.00.
Like this article? Help us with some feedback by answering this survey:
- GBP/USD bears are licking their lips around daily resistance.
- Bears eye a long squeeze for fresh lows of the week.
GBP has been the market's darling this week so far as the initial balance extends higher and higher. However, as the following charts illustrate, there could be a turnaround on the cards soon.
GBP/USD monthly chart
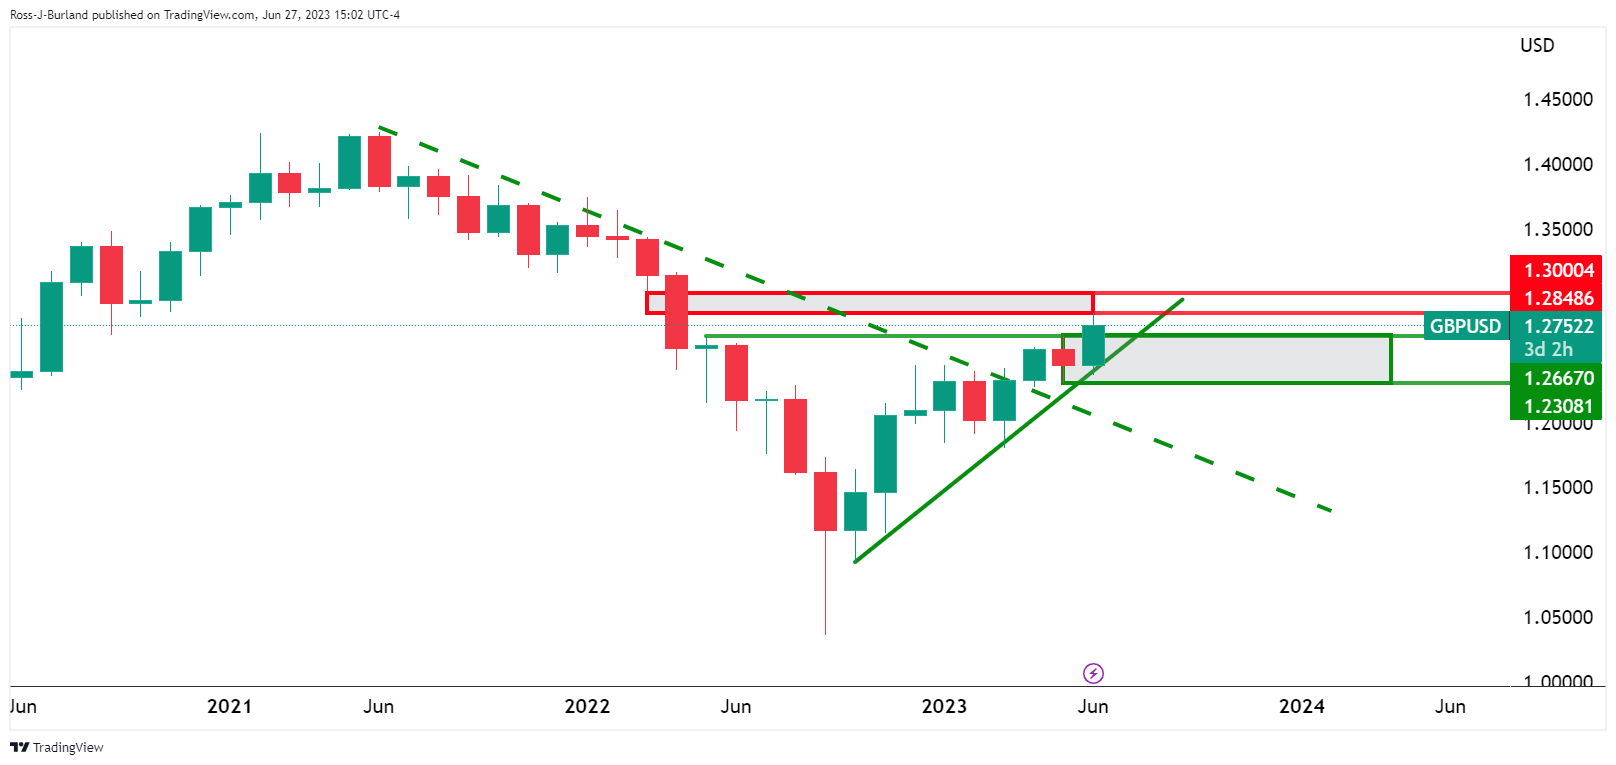
The bulls are in the market with plenty of upside potential left in the price's current trajectory with eyes on a break of 1.2850 to open risk to 1.3000.
GBP/USD weekly chart
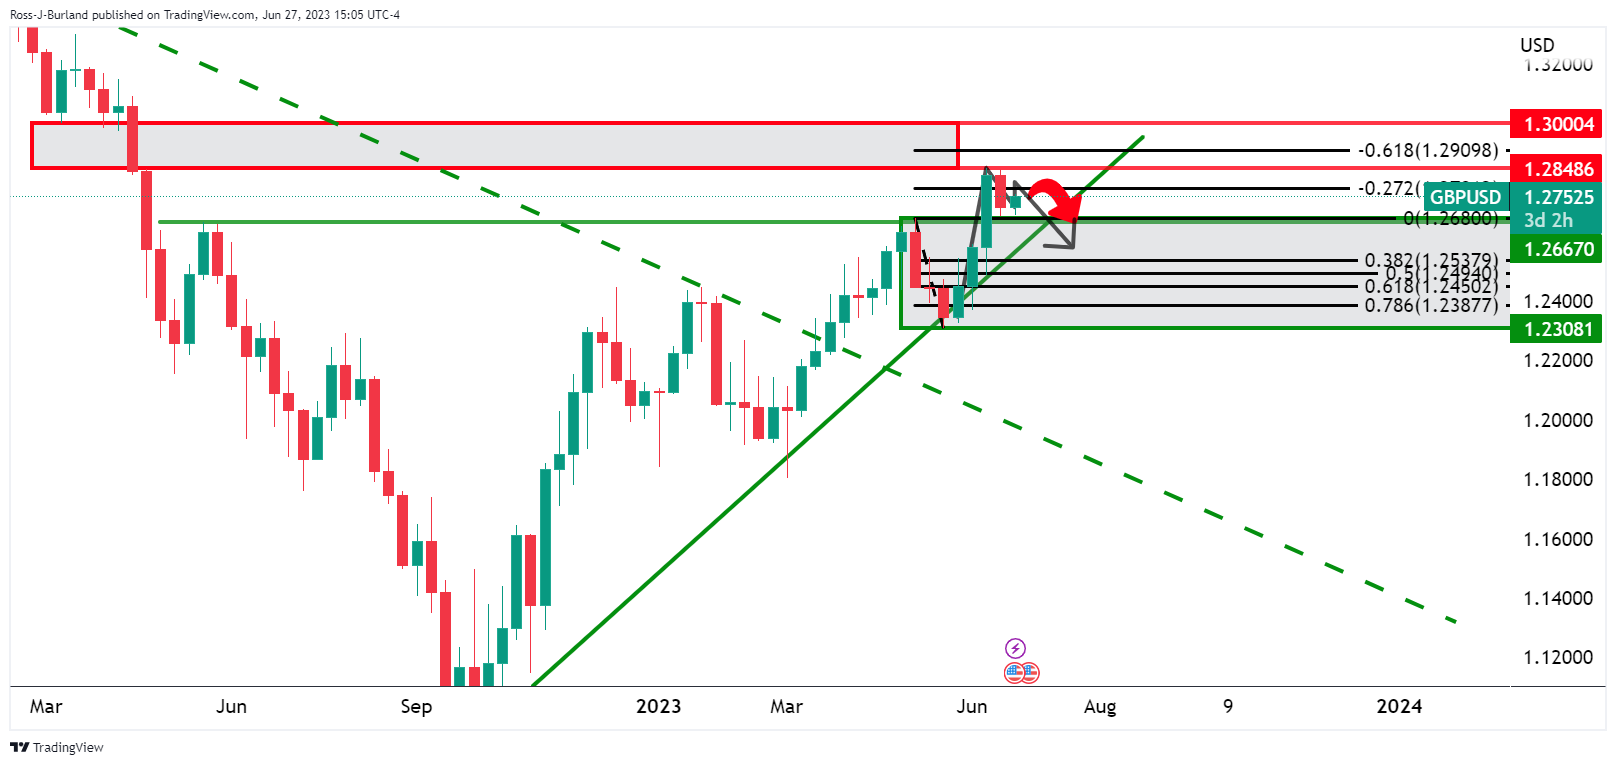
The weekly chart is starting to look exhausted the bid, however, after already extending the move into a -272% Fibonacci of the prior bearish correction. Last week was a first red week and the move inside of the range to the upside could be shortlived and met by sellers in the coming days if not next week if this week closes inside as an inside bar.
GBP/USD daily chart
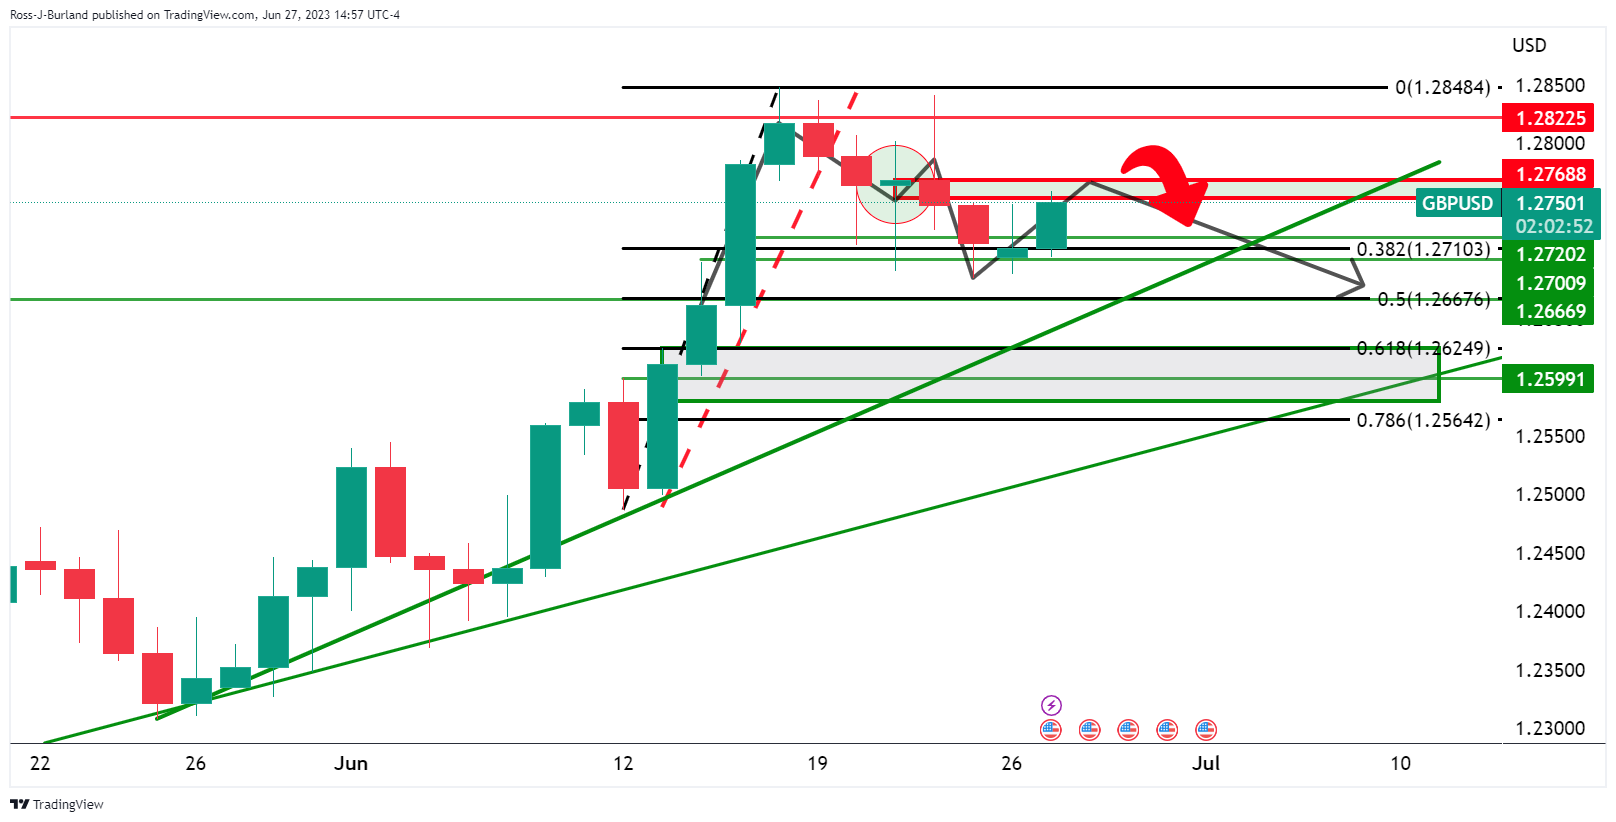
Meanwhile, the daily chart shows the price structure as an M-formation. The neckline is regarded as a resistance area around 1.2770/1.2800. Wednesday could be stacking up to be a sell-off to below the lows of the week's initial balance which leaves trendline support vulnerable looking ahead.
- USD/CHF holds above crucial support despite the second-day drop
- The USD buyers struggle to recapture the 0.9000 mark.
- Triple-bottom pattern hints at a potential bullish reversal.
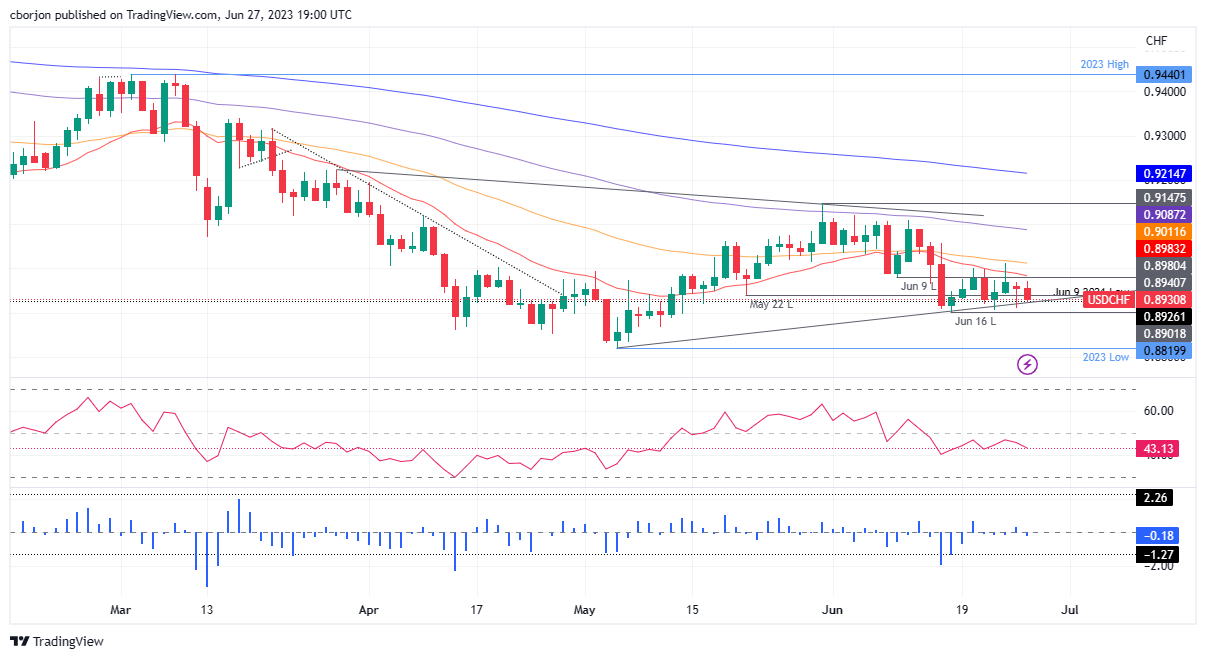
USD/CHF drops for the second straight day but remains above a one-month-old upslope support trendline amidst buyers’ failure to reclaim the 0.9000 figure on a risk-on mood environment. At the time of writing, the USD/CHF exchanges hands at 0.8933, losses 0.26% after reaching a daily high of 0.8970.
USD/CHF Price Analysis: Technical outlook
Although the USD/CHF remains downward biased in the short term, the downtrend remains suspect, as sellers couldn’t break below 0.8900 to test the year-to-date (YTD) low of 0.8819. That, alongside subsequent failure tests of USD/CHF sellers to surpass the 0.8920 area, formed a triple-bottom chart pattern, which warrants further upside.
If the above scenario plays out, the USD/CHF first resistance would be the 20-day Exponential Moving Average (EMA) at 0.8983, followed by the 50-day EMA at 0.9011. A breach of the latter, and the USD/CHF could rally towards the 100-day EMA at 0.9087 before challenging the 0.9100 figure.
Conversely, and the path of least resistance as oscillators remain in bearish territory, the USD/CHF first support would be 0.8920. Once cleared, the next support would be 0.8900, ahead of plunging toward the YTD low of 0.8819.
USD/CHF Price Action – Daily chart
- WTI's price declined more than 1% to a low of $67.78.
- Markets remain cautious ahead of Powell’s speech on Wednesday.
- Strong economic data from the US fueled hawkish bets on the Fed.
On Tuesday, the West Texas Intermediate (WTI) barrel fell to a low of $67.78 and then stabilized at $68.23. A reprieve from potential Russia turmoil was probably the main factor weighing on Oil price after supply fears eased following Wagner Group’s decision to give up its march on Moscow.
Optimistic Durable Goods and Housing sector data have increased hawkish bets on the Federal Reserve ahead of Wednesday’s speech by Jerome Powell at the European Central Bank (ECB) Forum in Sintra. This led to a recovery in the US Dollar, a further positive factor for Oil, although overall the Greenback is still down on the day, according to the US Dollar Index (DXY)
US Bond yields rise after strong US data.
The US Census Bureau reported the Durable Goods Orders from the US for May, increased by 1.7% concerning the previous 1.2% and above the consensus of -1%. Furthermore, there was a significant increase in New Home Sales during May, surpassing market expectations of a 0.5% change, and this surge demonstrated the housing market's resilience.
Consequently, the DXY index recovered from a daily low of 102.32 to 102.50. The recovery in the US bond yields was also observed due to the strong economic activity, which suggests the possibility of a more aggressive approach by the Federal Reserve as more economic activity tends to be correlated with more inflationary pressures. Specifically, the 2-year rate rose from a low of 4.65% to 4.75%, and the 5-year and 10-year yields experienced an increase, reaching 4.00% and 3.76% respectively.
For the rest of the session, the American Petroleum Institute will release Crude Oil Stocks for the week ending on June 23, which could have an additional impact on the black gold’s price dynamics.
WTI Levels to watch
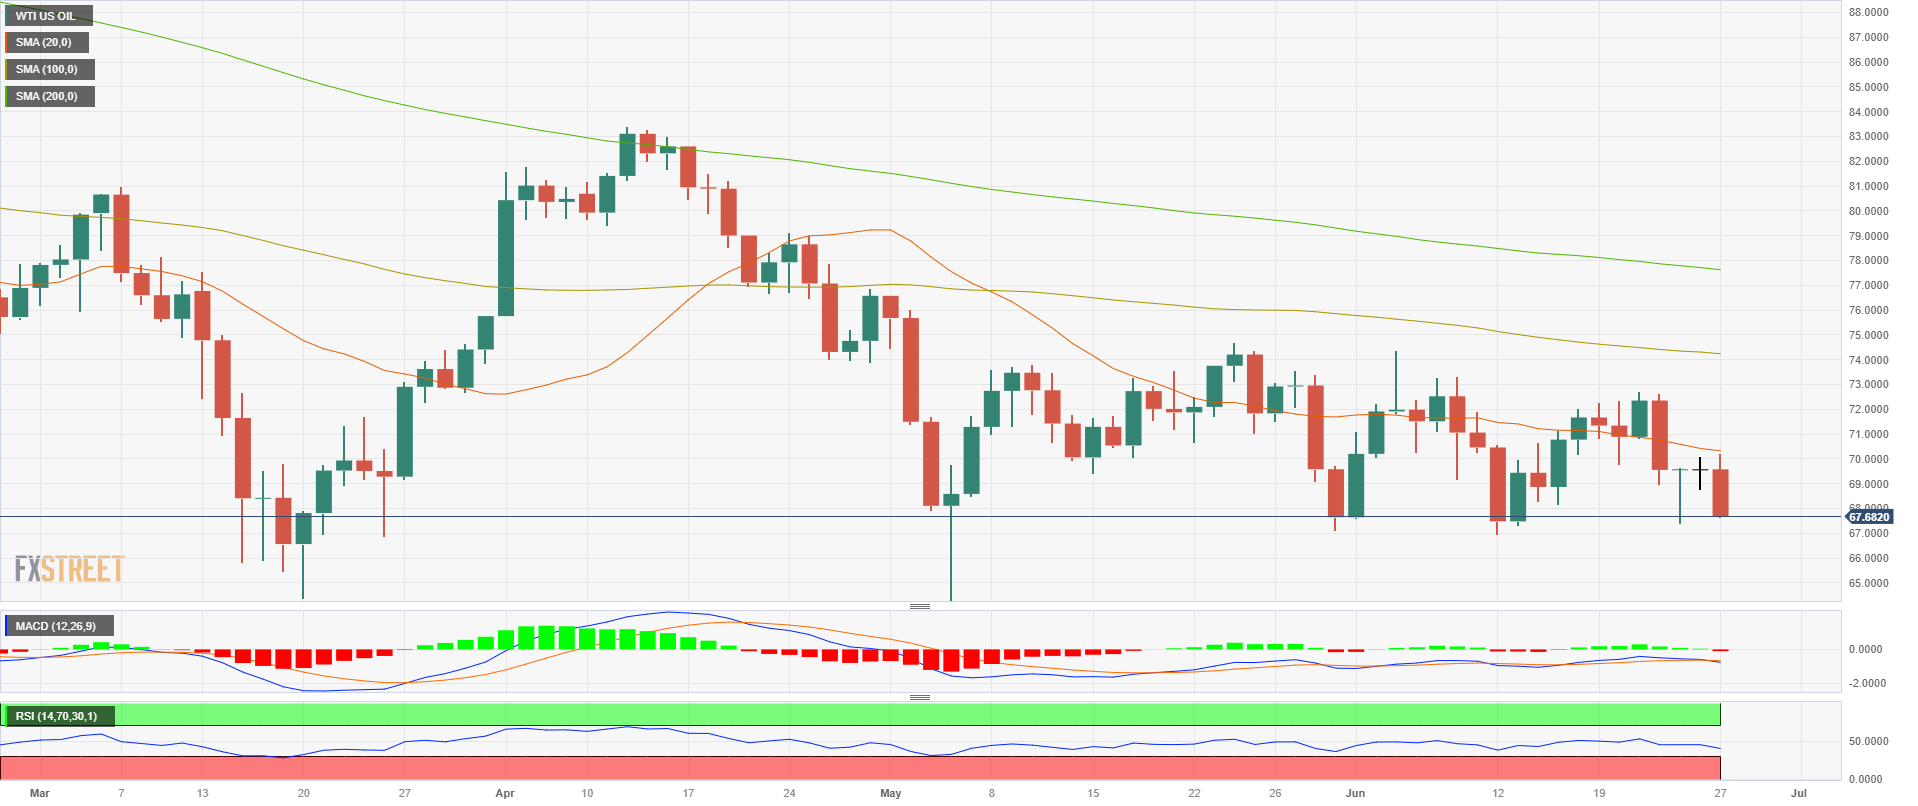
According to the daily chart, the technical outlook for the WTI appears to be bearish for the short tem. In that sense, the Relative Strength (RSI) and Moving Average Convergence Divergence (MACD) suggest that the bulls have given up and that the sellers are now in control.
On the downside, support levels are seen at $67.80 followed by the $67.40 area and the $67.20 zone. On the upside, resistances line up at the 20-day Simple Moving Average (SMA) at $70.24 followed by the $70.50 area and the $71.00 psychological mark.
WTI Daily chart
- Mexican Peso is resilient despite Banxico keeping rates unchanged.
- USD/MXN loses ground amidst robust US economic data.
- Powell’s upcoming speech to determine USD/MXN direction.
The Mexican Peso (MXN) shrugs off the second interest rate pause by the Bank of Mexico (Banxico), advancing against the US Dollar (USD) as the USD/MXN trades with a negative tone, down 0.15%. The USD/MXN trades with losses after hitting a daily high of 17.1400, exchanging hands at 17.070.
US Durable Good Order, Consumer Confidence, fails to halt the USD/MXN downtrend
Market sentiment is upbeat, as portrayed by Wall Street climbing after posting back-to-back days with losses. Positive data from the United States (US) could not derail the USD/MXN downtrend, as the emerging market currency remains one of the strongest peers trading against the US Dollar, with the USD/MXN posting losses of -12.18%.
Data from the US Department of Commerce showed that Durable Good Orders edged above estimates and crushed April’s data, which was revised, with figures coming at 1.7% MoM, above forecasts of a -1% plunge and April’s 1.2% expansion. Meanwhile, US New Home Sales surprisingly climbed at the fastest pace over one year, up at 12.2% MoM in Ma, compared to April’s 3.5% expansion. New home Sales hit the 763K threshold, above April’s 680K.
The Conference Board (CB) revealed that Consumer Confidence in June improved to 109.7, crushing estimates of 104 and above May’s 10.5 figures. The survey showed an improvement in the labor market, with inflation slowing and income expectations downtick.
In the meantime, the lack of economic data from Mexico keeps investors weighing the latest monetary decision of Banxico, with the central bank keeping rates at 11.25%, unchanged for back-to-back monetary policy meetings. Banxico’s Deputy Governor Jonathan Heath said the bank would do all necessary to bring inflation to its 3% +/- target while emphasizing the need to keep rates high for a prolonged period.
Given the fundamental backdrop, USD/MXN traders will look for Federal Reserve (Fed) Chair Jerome Powell’s speech at a European Central Bank (ECB) event on Wednesday and Thursday. Market participants estimate Powell to keep the FOMC-s press conference tone, leaning towards a neutral stance.
USD/MXN Price Analysis: Technical outlook
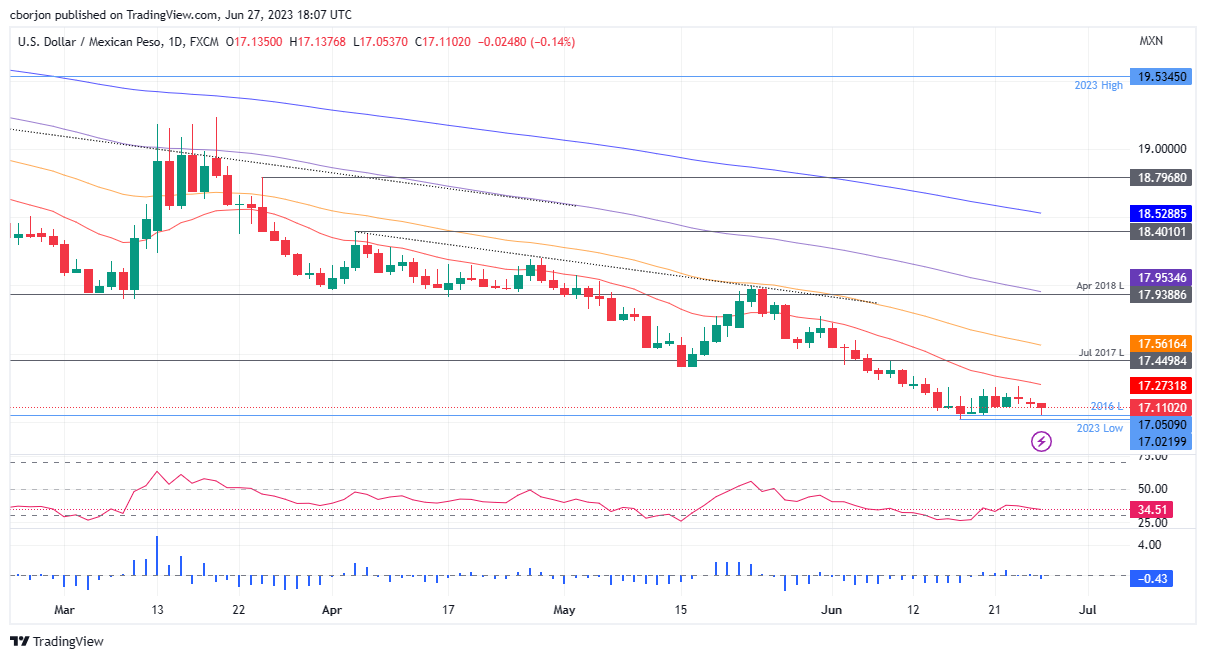
From a technical perspective, the USD/MXN remains downward biased, but sellers are losing steam and unable to break the 17.00 figure. If USD/MXN breaks below the latter, the following support to emerge would be the October 2015 daily low of 16.3267 before the 16.00 psychological level emerges. On the flip side, the USD/MXN buyers must reclaim the 20-day Exponential Moving Average (EMA) at 17.2731 before challenging the May 16 swing low of 17.4039 to have a chance to shift the pair bias.
- The GBP/JPY rose to 183.70, its highest since December 2015.
- GBP gained appeal on the back of rising Gilts ahead of BoE Bailey's speech on Wednesday.
- All eyes will also be set on Governor Ueda and Jerome Powell’s words on Wednesday.
The GBP/JPY pair soared to its highest level since December 2015 at 183.70 on Tuesday. The appreciation of GBP can be attributed to several key factors, including the rise in Gilts ahead of the upcoming speeches by prominent figures such as Governor Andrew Bailey, Governor Kazuo Ueda, and Chairman Jerome Powell. Investors will look for clues regarding the main central banks’ next steps in their respective monetary policy movements.
Ahead of Bailey’s speech, the British 2-year Bond yield rose to multi-year highs
After the Bank of England (BoE) surprised markets by announcing a 50 basis points hike and hinting at more rises in 2023, the Sterling gained significant interest. However, investors are worrying about the UK sliding into a recession, so any forward guidance or clues regarding the BoE’s next steps may generate volatility in Sterling’s price dynamics.
As for now, the 2-year British Bond yield rose to 5.23%, its highest since 2008 making the Pound trade with gains against some of its major rivals including the USD, CHF and JPY.
On the flip side, market participants will be watching Bank of Japan (BoJ) Governor Ueda’s Wednesday speech with interest. In the last June meeting, the BoJ maintained its ultra-dovish stance as their objective is to see wages increase rather than rein in inflation. In that sense, yield divergence and the BoJ stance made the JPY lose interest and weaken against most of its rivals.
GBP/JPY Levels to watch
According to the daily chart, the technical outlook for the GBP/JPY is clearly bullish in the short term. However, the cross tallied a fifth consecutive day of gains and its technical indicators continue to point at overbought conditions suggesting that a downwards correction may be on the horizon.
Resistance levels to watch: 184.00,184.50,185.00.
Support levels to watch: 182.50 ,181.70, 180.00.
GBP/JPY Daily chart
-638234835647613745.png)
- AUD/USD retreats from weekly highs amidst strong US economic performance.
- Upcoming Australian CPI data and Fed Chair Powell’s speech to sway AUD/USD.
- Investors bet on softened CPI, weighing the AUD further.
AUD/USD remains in positive territory but retreats from weekly highs of 0.6720, falls below the 0.6700 figure, after upbeat economic data from the United States (US) further cements the case for a rate hike in July, ahead of Federal Reserve (Fed) Chair Jerome Powell speech at Sintra. The AUD/USD is trading at 0.6680, clinging to its minuscule gains of 0.08%.
Solid US data paves the way for a rate hike, pressures AUD/USD
Investors’ sentiment remains positive after a tranche of US data showed the economy’s resilience amidst 500 basis points of tightening. The US Department of Commerce revealed that Durable Good Orders rose above estimates and crushed April’s data, which was upward revised. The figures came at 1.7% MoM, above forecasts of a -1% plunge and April’s 1.2% expansion.
Of late, US New Home Sales grew at the fastest pace over one year, climbing 12.2% MoM in May vs. 3.5% expansion in April. New home Sales hit the 763K threshold, above April’s 680K. At the same time, the Conference Board (CB) revealed that Consumer Confidence in June improved to 109.7, crushing estimates of 104 and above May’s 10.5 figures. The survey showed an improvement in the labor market, with inflation slowing and income expectations downtick.
Given the fundamental backdrop, the AUD/USD erased part of its earlier gains that lifted the major toward its daily/weekly high. Two catalysts that can move the AUD/USD are looming, with Australia’s Consumer Price Index (CPI) release, before Fed Chair Jerome Powell’s speech at Sintra.
Australia’s CPI is expected to soften to 6.1% YoY, lower than April’s 6.8%. Any upward surprises on inflation would dictate the Reserve Bank of Australia’s (RBA) next movement after increasing rates in June to 4.10%. Money market futures portrays a 23% chance the RBA will raise rates to 4.35%.
On Wednesday, Fed Chair Jerome Powell will speak at the European Central Bank (ECB) Sintra event and is expected to reiterate the US central bank eyes two additional rate hikes, but no surprises are on the docket. Despite the Fed dot plots revision of peak rates above 5.50%, the CME FedWatch Tool shows market participants do not believe the Fed will raise rates past the 5.25%-5.50% range.
AUD/USD Price Analysis: Technical outlook
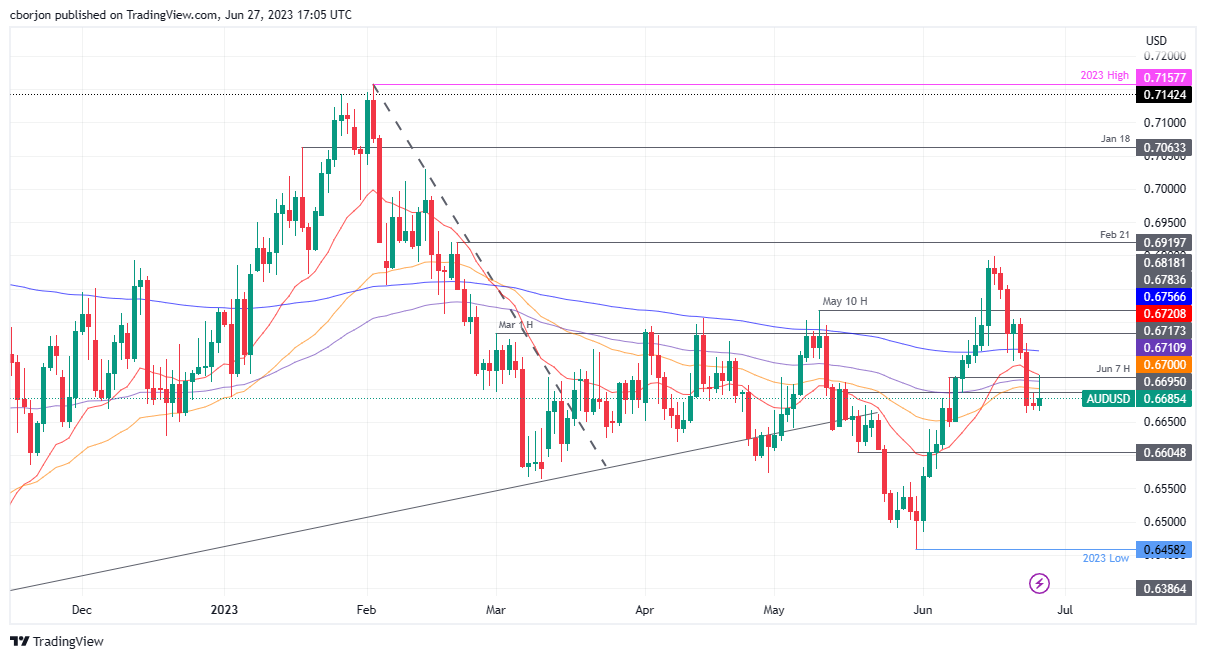
The AUD/USD is neutral to downward biased after diving below the 200-day Exponential Moving Average (EMA), with the fall extending past the 100, 50, and 20-day EMAs. AUD buyers must reclaim 0.6700 to keep their hopes for higher prices. Otherwise, the AUD/USD path of least resistance will accelerate its downtrend once sellers surpass the June 23 low of 0.6662. After that, the AUD/USD next demand area would be the May 18 low of 0.6605 before dropping to the 0.6500 handle.
Citing sources familiar with the matter, Reuters reported on Tuesday that European Central Bank (ECB) policymakers see a little chance of a pause in rate hikes in July or September amid stubborn inflation.
"Conversations with seven rate-setters at the ECB's annual forum in Sintra, Portugal, showed most expected to increase borrowing costs again at both its July and September meetings despite signs the euro zone economy is flagging," Reuters noted.
Market reaction
EUR/USD clings to its strong daily gains above 1.0950 following this headline.
- USD/JPY soared to its highest level since November 2022 at 144.17.
- Durable Goods and Housing data figures came in above expectations.
- US bond yields rise ahead of Powell’s speech on Wednesday.
On Tuesday, the USD/JPY jumped to a fresh multi-month high at 144.17 following optimistic economic activity data. The Greenback gained traction on the back of rising US Treasury Bond yields ahead of Jerome Powell’s speech on Wednesday. Governor Ueda from the Bank of Japan (BoJ) will also deliver a speech, potentially impacting the JPY price dynamics.
US Bond yields rise after US economic data
The US Census Bureau reported that Durable Goods Orders rose by 1.7% from May, while the markets expected a 1% contraction. Orders excluding Transportation rose by 0.6% and the ones excluding defense, by 3%. In addition, New Home Sales rose by 12% in May, way above the 0.5% variation foreseen by the markets, and signaled resilience in the housing market.
As a reaction, the DXY Index found support at a daily low of 102.32 and recovered to 102.50. US bond yields also recovered as strong economic activity may hint at a more aggressive Federal Reserve (Fed) tightening in the future. The 2-year rate rebounded from a low of 4.65% to 4.75%, while the 5 and 10-year yields increased to 4.01% and 3.75%. In addition, the bond market may see volatility on Wednesday, when Jerome Powell will deliver a speech at the European Central Bank Forum in Sintra, Portugal.
That being said, the Yen may rise on prospects of a BoJ intervention if the Japanese currency continues to lose value against the USD, as the pair approaches 145.00. Governor Ueda will also speak at the ECB Forum where investors will look for clues for both a potential intervention in the JPY and the next steps for their monetary policy.
USD/JPY: Levels to watch
According to the daily chart, the USD/JY holds a bullish outlook for the short term but a correction shouldn’t be taken off the table as indicators; specifically, the Relative Strength (RSI) has stood in overbought territory for almost a week. Moreover, the Moving Average Convergence Divergence (MACD) prints rising green bars while the pair trades above the 20,100 and 200-day Simple Moving Averages (SMA).
Support levels to watch: 143.00,142.30, 142.00
Resistance levels to watch:144.00,144.50,145.00
USD/JPY Daily chart
-638234801441266085.png)
- Positive US durable goods orders and consumer confidence data dampen Gold’s appeal.
- Surge in new home sales and climbing treasury yields add to Gold’s woes.
- Market participants closely monitor Fed Chair Powell’s upcoming remarks.
Gold price retreats after hitting a daily high of $1930.66 due to overall upbeat data from the United States (US), which portrays the economy’s resilience, despite higher borrowing costs set by the US Federal Reserve (Fed). US Treasury bond yields edge up a headwind for the yellow metal. The XAU/USD is trading at $1919, with losses of 0.18%.
XAU/USD under pressure as US and US Treasury yields surge
XAU/USD remains under pressure as market sentiment shifts positively. Durable Good Orders in the US surprised market participants by rising 1.7% MoM in May, above estimates of a -1% plunge, and 0.5% above April’s 1.2% data. Data eases fears for a hard landing in the US, as witnessed by Gold prices sliding, which is usually sought as a safe-haven asset in times of global economic slowdown.
In additional data, excluding transports, orders climbed 0.6%, above estimates for a -0.1% contraction, and topped April’s -0.6% fall.
The Conference Board (CB) recently revealed that Consumer Confidence in June improved to 109.7, crushing estimates of 104 and above May’s 10.5 figures. Comments made by Dana Peterson, Chief Economist at the Conference Board, showed that Americans’ mood is positive regarding finding a job, even though income expectations shrank slightly; at the same time, consumers see a decline in inflation ahead.
In other data, US New Home Sales advanced in May to their fastest rhythm in over one year, bolstering the US Dollar (USD), which continued to strengthen against precious metals prices. New Home Sales jumped 12.2% MoM vs. 3.5% in April and were at a seasonally adjusted annualized rate of 763K homes, as the US Department of Commerce revealed.
Meanwhile, the US Dollar Index (DXY), which tracks the buck’s value against a basket of peers, drops 0.20%, at 102.552; but US Treasury bond yields advance. The US 10-year Treasury note yields 3.772%, gains 4.2 basis points, and underpins US real yields from Monday’s close of 1.54%, to 1.592%, a headwind for XAU/USD.
Given the backdrop, and with the US Federal Reserve (Fed) Chair Jerome Powell speaking at the European Central Bank (ECB) Sintra event, it would likely keep XAU/USD’s prices within a narrow range as traders dissect Powell’s comments. Of late, the Fed Chair remained neutral to hawkish, though it has repeated that two more rate hikes are on the table, even though the CME FedWatch Tool shows market participants do not believe the Fed will raise rates past the 5.25%-5.50% range.
XAU/USD Price Analysis: Technical outlook
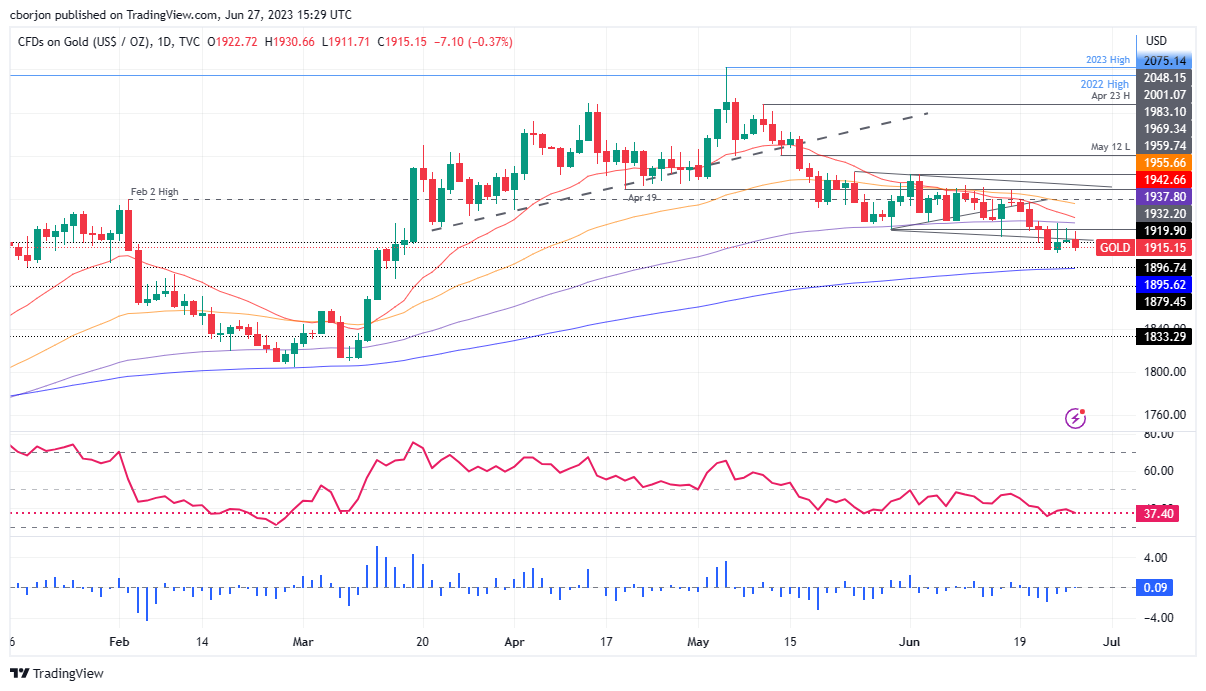
XAU/USD remains neutral-to-downward biased after a bearish cross happened on June 7, with the 20-day Exponential Moving Average (EMA) dropping below the 50-day EMA. At the time of writing, the 20-day EMA is closing the distance related to the 100-day EMA, which sits at $1937.88 and acts as strong dynamic support, with XAU’s buyers unable to crack the level. If XAU/USD extends its losses past $1900, the next support level will be the 200-day EMA at $1895.65. A breach of the latter and XAU/USD could slide towards the next swing low, the March 8 daily low of $1809.48.
Gold lacks direction following rebellion in Russia. Economists at Commerzbank analyze XAU/USD outlook.
Yesterday’s rapid correction of the Gold price seems justified
As far as the Gold price is concerned, the key question is the extent to which the internal tensions within Russia or any potential toppling of the government might affect global monetary policy. In this context, the response of commodities prices would presumably play an important role, and whether potentially marked price fluctuations were viewed more as an economic or inflation risk. Since this is almost impossible to predict at the current time, yesterday’s rapid correction of the Gold price seems justified.
What is more, the expectations of further rate hikes, above all in the US, are likely to continue to dampen sentiment on the Gold market. This situation is unlikely to improve for the time being as during the central bank conference that is taking place in the Portuguese city of Sintra this week, the central bank governors (Powell speaking tomorrow) will probably continue to adopt more of a hawkish tone.
Economists at OCBC Bank expect a still Hawkish ECB and somewhat resilient Euro-area growth to underpin the Euro.
Supported on ECB-Fed policy divergence
On net, still-resilient growth in EU, somewhat hawkish ECB (vs. Fed possibly undertaking rate cut first) and potentially a moderate-to-soft USD profile should support EUR’s recovery.
Risks remain: (1) EU’s growth momentum; (2) any re-escalation in Russian-Ukraine – energy and inflation risks; (3) if USD strength returns with a vengeance (global risk-off, or Fed resumes aggressive tightening); (4) ECB unexpectedly signals dovish tilt.
The monthly CPI, due out on Wednesday, is one of the last data points before the next interest RBA rate decision. Economists at Commerzbank analyze how the figures could impact the Aussie.
RBA is likely to pause again in early July
As the RBA now appears to be approaching the peak of the current interest rate cycle, and with the RBA's preferred quarterly inflation data due next month, the central bank is likely to pause again in early July.
However, if the inflation figures continue to point to rising inflationary pressures, another rate hike could well follow in August. As a result, the Australian Dollar is likely to gain if tomorrow's data surprises to the upside.
See – Australia CPI Preview: Forecasts from five major banks, easing annual inflation
- New Home Sales in the US rose at a much stronger pace than expected in May.
- US Dollar Index recovered from daily lows after this data.
Sales of new single‐family houses rose 12.2% in May to a seasonally adjusted annual rate of 763,000, the data published jointly by the US Census Bureau and the Department of Housing and Urban Development showed on Tuesday.
This reading followed the 3.5% growth (revised from +4.1%) recorded in April and came in much higher than the market expectation for an increase of 0.5%.
Median sale price in the same period stood at $416,300, down 7.6% from $450,700 in May 2022.
Market reaction
The US Dollar Index recovered modestly from daily lows after this data and was last seen losing 0.25% on the day at 102.50.
- Consumer sentiment in the US strenghtened in June.
- US Dollar Index stays in negative territory near 102.50.
Consumer sentiment in the US improved in June with the Conference Board's Consumer Confidence Index rising to 109.7 from 102.5 in May (revised from 102.3).
Further details of the publication revealed that the Present Situation Index rose to 155.3 from 148.9 and the Consumer Expectations Index climbed to 79.3 from 71.5.
Finally, the one-year consumer inflation expectations stood virtually unchanged at 6% in June.
Market reaction
The US Dollar Index stays in negative territory at around 102.50 after this data.
Economists at ABN Amro have changed their Fed view and also their US Dollar view.
Aggressive rate cuts in 2024
We now expect a recession to start in Q4 and rate cuts to come in Q1 2024. We expect the last rate hike of 25 bps at the Fed’s July meeting and no rate cuts this year. We still forecast aggressive rate cuts in 2024. We now have a total of 175 bps of rate cuts in 2024.
As a result of the change in our Fed view, we have upgraded our view on the US Dollar. We no longer have a rate cut for the Fed this year and fewer total rate cuts in 2023-2024. This is a positive for the US Dollar. Our view is roughly in line with the market.
Mexico is poised to ride the nearshoring wave, economists at Morgan Stanley report.
Further upside for domestic companies in the next five years
If US manufacturing is to be less dependent on China, we think the path will be via Mexico. Nearshoring is expected to be a long and sustained race that could help build new ecosystems in Mexico’s existing manufacturing hubs.
As Mexico’s GDP and manufacturing grow, so too should corporate profits, especially in the financials, industrials and consumer sectors. In fact, during periods of above-average GDP growth, Mexican equities have tended to outperform in terms of valuation, profitability and operating performance.
The nearshoring trend has already driven a rerating of Mexican stocks, and strategists see further upside for domestic companies in the next five years as the second wave of nearshoring growth gathers momentum.
Economists at ABN Amro have downgraded their forecasts for EUR/USD due to four reasons.
Speculative positions in the Euro are extremely large
First, we no longer have a rate cut for the Fed this year and fewer total rate cuts in 2023-2024. This is a positive for the US Dollar.
Second, if the ECB starts cutting rates already in December the euro will suffer. Third, aggressive rate cuts by the ECB in 2024 will put more downward pressure on the Euro than Fed cuts will on the Dollar. This is because markets have already anticipated large rate cuts by the Fed but not by the ECB.
Fourth, the speculative positions in the Euro are extremely large.
Our new forecasts are 1.08 (end 2023) and 1.05 end 2024.
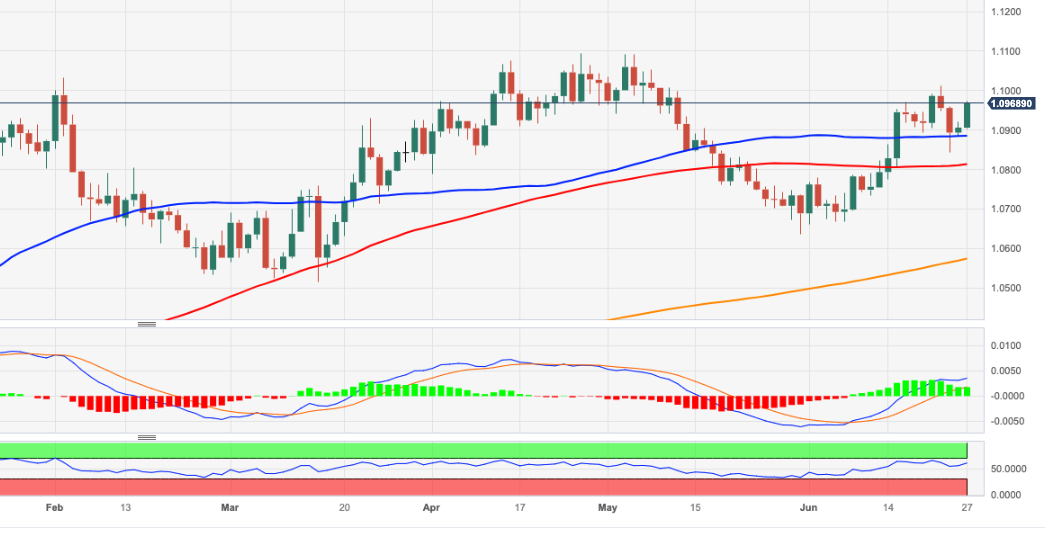
- EUR/USD keeps the optimism well in place on Tuesday.
- Further upside could see the 1.1000 barrier revisited.
EUR/USD adds to Monday’s advance and climbs to 3-day highs in the 1.0970/75 band on Tuesday.
Price action around the pair looks firmer for the time being. That said, the next resistance level of note comes at the psychological 1.1000 barrier ahead of the June peak at 1.1012 (June 22). North from here, the pair is expected to embark on a move to the 2023 top just below 1.1100 (April 26).
Looking at the longer run, the positive view remains unchanged while above the 200-day SMA, today at 1.0572.
EUR/USD daily chart
- House prices in the US continued to rise in April.
- US Dollar Index continues to stretch lower below 102.50.
House prices in the US rose by 0.7% on a monthly basis in April, the monthly data published by the US Federal Housing Finance Agency showed on Tuesday. This reading followed the 0.5% increase recorded in March and came in better than the market expectation of +0.3%.
Meanwhile, the S&P/Case-Shiller Home Price Index arrived at -1.7% on a yearly basis in April, down from -1.1% recorded in March.
Market reaction
The US Dollar Index continues to trade deep in negative territory below 102.50 after this data.
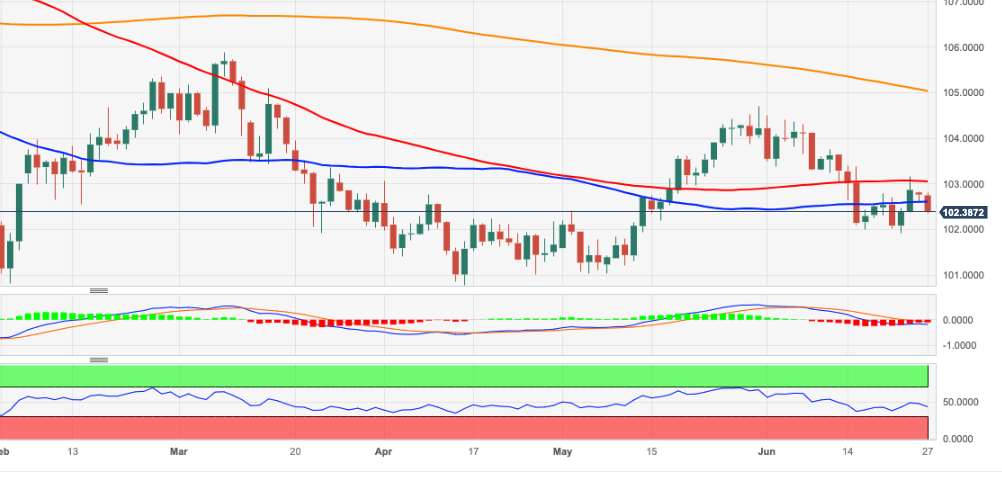
- DXY adds to the weekly leg lower and approaches 102.40.
- Next on the downside emerges the 102.00 zone.
DXY keeps the weekly bearish note unchanged and retreats to the 102.40/35 band on Tuesday.
The index came under renewed downside pressure following last week’s tops past the 103.00 hurdle. Against that, there is still room for the index to revisit June lows in the 102.00 region, while a sustainable breach of this level could expose a deeper decline to April/May lows near 101.00. Dow from here emerges the 2023 low around 100.80 recorded on April 14.
Looking at the broader picture, while below the 200-day SMA at 105.03 the outlook for the index is expected to remain negative.
DXY daily chart
- Gold price has shown a confident recovery from $1,920.00 despite US Durables having outperformed consensus.
- US Census Bureau has reported that Durable data have expanded by 1.7% while the street was anticipating a contraction of 1%.
- The US Dollar Index has extended its downside to near 102.40 despite fears of more interest rate hikes from the Fed.
Gold price (XAU/USD) has displayed a recovery move from $1,920.00 in the early New York session. The precious metal has attracted significant bets despite the United States Durable Goods Orders data (May) having landed better than expectations.
US Census Bureau has reported that Durable Goods Orders have expanded by 1.7% while the street was anticipating a contraction of 1%. May’s Durables data has outperformed April’s figure of 1.2%. Durables data excluding defense orders have expanded by 3.0% against expectations of a stagnant performance. This indicates that demand for consumer durables was resilient and conveys that core inflation could turn out persistent further.
Upbeat US Durables data has propelled chances of one more interest rate hike by the Federal Reserve (Fed) for its July meeting. As per the CME Fedwatch tool, around 77% chances are in favor of a 25 basis point (bp) interest rate hike from the Fed for the July meeting.
Meanwhile, S&P500 futures have surrendered half of their gains amid a cautious market mood. The upcoming quarterly result season has kept investors on their toes.
The US Dollar Index (DXY) has extended its downside to near 102.40 despite fears of more interest rate hikes from the Fed. Fed chair Jerome Powell has confirmed that the central bank will continue tightening monetary policy but at a ‘careful pace’.
Gold technical analysis
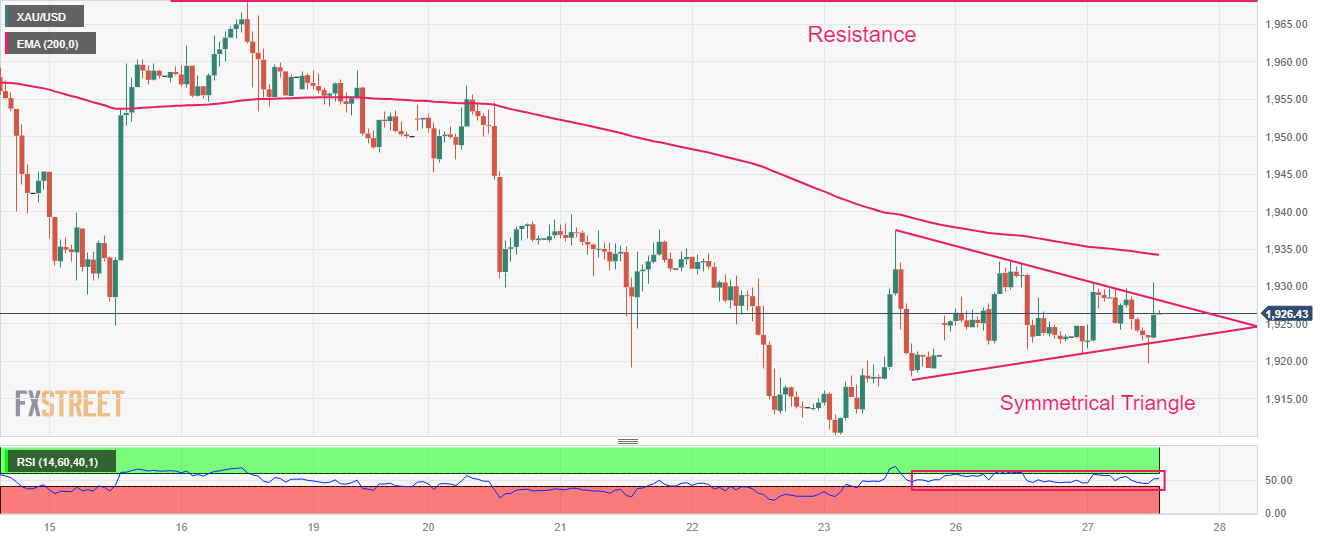
Gold price is attempting an upside break of the Symmetrical Triangle chart pattern formed on an hourly scale. An upside break will trigger an explosion in the volatility contraction, which will result in wider ticks and heavy volume.
The precious metal is trading below the 200-period Exponential Moving Average (EMA) at $1,934.50, which indicates that the long-term trend is bearish.
Meanwhile, the Relative Strength Index (RSI) (14) is oscillating in the 40.00-60.00 range, portraying a lackluster performance.
Gold hourly chart
Australian Monthly Consumer Price Index (CPI) figures will be released on Wednesday, June 28 at 01:30 GMT and as we get closer to the release time, here are forecasts from economists and researchers of five major banks regarding the upcoming inflation data.
Headline is seen softening to 6.1% year-on-year vs. the prior release of 6.8% in April. Forecasts in the Bloomberg Survey are clustered at 5.9%-6.2%. Data will set the backdrop for the RBA’s July meeting.
ANZ
We expect the monthly CPI indicator for May to show an annual lift of 6.0%, though expected increases in electricity and housing costs pose upside risks thereafter.
SocGen
We expect monthly headline inflation to decline from 6.8% to 6.1% in May, which would reverse the pickup from 6.3% to 6.8% in April. Again, the main driver for the changes in headline inflation should be auto fuel prices as they rose in April and then declined in May following that of crude oil prices.
Citi
The Citi Research forecast based on high-frequency indicators suggests that monthly headline inflation decelerated sharply in May from 6.8% to 6.1%, implying a MoM increase of 0.1%. However, markets should ignore the monthly headline price movements and instead focus on the components because not every expenditure class is measured monthly. In May, 64% of services and 76% of goods prices are updated. Overall, 71% of the basket was measured in May. The details will still point to hawkish risks outside volatile categories, and the RBA will likely hike again by 25 bps in July and August.
NAB
For the Monthly CPI indicator, we pencil in 5.9% YoY from 6.8% as base effects from fuel price drive the headline lower. and a 6.1 median. The magnitude of the drop is likely to paint an overly rosy picture of the pace of disinflation given it is base effect driven and we expect the full Q2 CPI on 26 July to print above the May Indicator. The excl. fuel, fruit/veg, and travel number is likely to show much less moderation from April’s 6.5%.
TDS
We expect May monthly CPI to print at 5.8% YoY, a big drop from the 6.8% YoY in April in part due to the high base last year. A notable decline in petrol prices (-6.1% MoM) is also another contributor to the lower May CPI print while we could also see recreational prices give back some gains over the month after the Easter holidays. Given a red-hot labour market and the RBA's increasingly hawkish message on inflation, we think another 25 bps make sense at the July meeting as the monthly inflation print still remains far above the RBA 2-3% inflation target.
- Natural Gas price trades little changed on Tuesday after geopolitical risk surrounding Russia eases with Wagner coup U-turn.
- The summer heatwave in much of North America and Europe continues to drive demand for Natural Gas to power air conditioning.
- Price has climbed towards a significant level around $3.000 MMBtu where the longer-term downtrend could be at risk of reversing.
Natural Gas price trades flat at the start of the US Session on Tuesday after posting four consecutive days of gains. Traders had been bidding up the commodity on the back of fears political turmoil in Russia could disrupt supply, and as higher-than-average temperatures in much of the Western World increase demand for Natural Gas used in air conditioning.
XNG/USD is trading in the $2.800s MMBtu on Tuesday, as America wakes up.
Natural Gas news and market movers
- Natural Gas trades flat after the Wagner mutiny suddenly grinds to a halt, easing concerns Russian supply might suffer in the event of civil war, according to CNN.
- Analysts also believe the market is pricing in a greater risk premium after the failed coup over the weekend.
- Demand for Natural Gas to power air conditioning continues to be high as much of the US and Europe experience hotter-than-usual temperatures for this time of year, according to Natural Gas Intelligence.
- The market may be reaching a temporary top as recent gains have been accompanied by falling participation in the Gas futures market, according to FXStreet Senior Analyst and Editor Pablo Piovano, in a report analyzing CME data on Monday.
- Norwegian supply concerns, after outages at the Hammerfest LNG export terminal and the processing plants at Nyhamna and Kollsnes, continue to underpin prices. Norway has taken over from Russia as Europe’s main source of Natural Gas.
- Weaker demand from faltering global growth, however, has offset the threat to supplies, according to an analysis by ANZ Bank cited on MarketWatch.
- Last week’s Purchasing Manager Index data was on the whole poor for most of Europe and the US, potentially indicating a weaker global economic growth trajectory.
Natural Gas Technical Analysis: Recovery nears significant trend-determination level
Natural Gas price is trading just below a key trend-determination level on longer-term charts. Although the commodity remains in a long-term downtrend since turning lower at the August 2022 peak, bearish momentum has tapered off considerably.
The Relative Strength Index (RSI) momentum indicator is converging bullishly with price on the weekly chart, something that occurs when price makes new lows but RSI does not.
A break above the last lower high of the long-term downtrend at $3.079 MMBtu would indicate a reversal in the broader downtrend.
-638234664746458842.png)
Natural Gas: Weekly Chart
Given this level has not been breached yet, however, the downtrend remains intact and a break below the $2.110 year-to-date lows would provide a confirmation of a continuation down to a target at $1.546. This target is the 61.8% Fibonacci extension of the height of the roughly sideways consolidation range that has been unfolding during 2023 (marked 161.8% on charts).
On the daily chart, price has been climbing within a roughly sideways market, although it has broken above both the 50 and not the 100-day Simple Moving Averages (SMA).
-638234665573110757.png)
Natural Gas: Daily Chart
Nevertheless, a break above the last lower high of the long-term downtrend at $3.079 MMBtu would be required to indicate a reversal in the broader trend.
Such a move might then see prices rally higher to the next key resistance level at the 200-week SMA, situated at $3.813.
Until that happens however, price will probably continue to consolidate within its range or even go lower.
Natural Gas FAQs
What fundamental factors drive the price of Natural Gas?
Supply and demand dynamics are a key factor influencing Natural Gas prices, and are themselves influenced by global economic growth, industrial activity, population growth, production levels, and inventories. The weather impacts Natural Gas prices because more Gas is used during cold winters and hot summers for heating and cooling. Competition from other energy sources impacts prices as consumers may switch to cheaper sources. Geopolitical events are factors as exemplified by the war in Ukraine. Government policies relating to extraction, transportation, and environmental issues also impact prices.
What are the main macroeconomic releases that impact on Natural Gas Prices?
The main economic release influencing Natural Gas prices is the weekly inventory bulletin from the Energy Information Administration (EIA), a US government agency that produces US gas market data. The EIA Gas bulletin usually comes out on Thursday at 14:30 GMT, a day after the EIA publishes its weekly Oil bulletin. Economic data from large consumers of Natural Gas can impact supply and demand, the largest of which include China, Germany and Japan. Natural Gas is primarily priced and traded in US Dollars, thus economic releases impacting the US Dollar are also factors.
How does the US Dollar influence Natural Gas prices?
The US Dollar is the world’s reserve currency and most commodities, including Natural Gas are priced and traded on international markets in US Dollars. As such, the value of the US Dollar is a factor in the price of Natural Gas, because if the Dollar strengthens it means less Dollars are required to buy the same volume of Gas (the price falls), and vice versa if USD strengthens.
- USD/CAD has moved swiftly towards 1.3180 as Canadian inflation has decelerated as expected by investors.
- Canada's annualized headline and core inflation have decelerated to 3.4% and 3.7% respectively.
- Weak oil prices have heavily weighed on the Canadian Dollar.
The USD/CAD pair has climbed swiftly to near 1.3180 as Statistics Canada has reported a decline in the Consumer Price Index (CPI) data (May) as expected by the market participants. Monthly headline CPI has registered a pace of 0.4% while the street was estimating a pace of 0.5%. Last month, headline CPI showed a velocity of 0.7%.
Annualized headline inflation has decelerated to 3.4% as expected by the market participants. Monthly core CPI that excludes volatile oil and food prices has also slowed to 0.4% vs. expectations of 0.5%. On an annual basis, core inflation has softened to 3.7% against the consensus of 3.9% and the former release of 4.1%.
Investors should note that Canada’s May Employment data was also weaker than expected. However, one-time weak labor market and soft inflation data are insufficient to force the Bank of Canada (BoC) to skip the policy-tightening spell.
Meanwhile, oil prices have dropped sharply as the impact of political instability in Russia is fading away. The oil price has surrendered their entire gains inspired by Moscow vs. Mercenary group clash as spot fundamentals are still weak. Fears of global recession have not faded as the battle against stubborn inflation is far from over.
It is worth noting that Canada is the leading exporter of oil to the United States and weak oil prices are impacting the Canadian Dollar.
Stellar gains added in early Europe by the S&P500 futures have eased now and the 500-stocks basket is expected to open on a marginally positive note. The risk-appetite theme has faded significantly.
The US Dollar Index (DXY) has printed a fresh day’s low at 102.45 as investors are awaiting the speech from Federal Reserve (Fed) chair Jerome Powell for the interest rate guidance.
- Durable Goods Orders in the US rose unexpectedly in May.
- US Dollar Index stays in negative territory at around 102.50.
Durable Goods Orders in the US increased 1.7%, or $4.9 billion, in May to $288.2 billion, the US Census Bureau reported on Tuesday. This reading followed the 1.2% increase recorded in April and came in better than the market expectation for a decrease of 1%.
"Excluding transportation, new orders increased 0.6%," the publication further read. "Excluding defense, new orders increased 3.0%. Transportation equipment, also up three consecutive months, led the increase, $3.9 billion, or 3.9%, to $102.6 billion."
Market reaction
The US Dollar Index stays on the back foot despite the upbeat data and was last seen losing 0.25% on the day at 102.50.
- Annual inflation in Canada declined from 4.4% in April to 3.4% in May.
- The annual rate is the lowest since June 2021.
- USD/CAD rises after Canadian and US economic data to fresh high above 1.3160.
Annual inflation in Canada, as measured by the Consumer Price Index (CPI), declined to 3.4% in May from 4.4% in April, Statistics Canada reported on Tuesday. This reading came in line with market expectations and is the lowest since June 2021. "The slowdown was largely driven by lower year-over-year prices for gasoline (-18.3%) resulting from a base-year effect. Excluding gasoline, the CPI rose 4.4% in May following a 4.9% increase in April."
On a monthly basis, CPI rose 0.4% in May, compared to analysts' estimate of 0.5%. "The largest contributors to the month-over-month increase were mortgage interest costs and travel services, which includes traveller accommodation and travel tours. On a seasonally adjusted monthly basis, the CPI rose 0.1%", reported Statistics Canada.
Additionally, the Bank of Canada's Core CPI, which excludes volatile food and energy prices, dropped to 3.7% on a yearly basis from 4.1% in April, below the 3.9% of market consensus.
Market reaction
The Canadian Dollar weakened after the report. USD/CAD edged higher after the report, reaching a fresh daily high at 1.3172.
Economists at Scotiabank analyze EUR/USD technical outlook.
Broader trend higher remains intact
EUR gains are more of a grind off of last week’s low but the fact that the 40-Day Moving Average support (1.0845) held the EUR slide is meaningful and suggests the broader trend higher remains intact, even if oscillators are somewhat mixed.
Gains should be able to extend towards the 1.10 area again if intraday gains can push through minor resistance at 1.0950.
See – EUR/USD: ECB’s clearly hawkish policy approach contrasts with the Fed and should support the Euro – Scotiabank
- USD/JPY has sensed selling pressure around 144.00, however, the upside seems favored.
- Market sentiment has turned sour as investors are getting cautious ahead of the second quarter result season.
- A poll from Reuters showed that BoJ officials could intervene if USD/JPY climbs to 145.00.
The USD/JPY pair has faced selling pressure near the crucial resistance of 144.00 in the late London session. The asset has dropped marginally, however, the upside bias is still solid as the US Dollar Index (DXY) is well-supported around 102.50 ahead of United States Durable Goods Orders data.
S&P500 futures have surrendered the majority of gains as the risk appetite of the market participants have trimmed dramatically. Market sentiment has turned sour as investors are getting cautious ahead of the second quarter result season. The investing community is not confident about the corporate profits as technology stocks are expected to deliver weak guidance due to higher interest rates by the Federal Reserve (Fed) while Net Interest Income (NII) for banks could remain under pressure due to tight credit conditions.
The US Dollar Index (DXY) is consistently showing a non-directional performance ahead of the US Durable Goods Orders data. As per the preliminary report, the economic data is seen contracting by 1.0% vs. an expansion of 1.1%. Durable Goods Orders excluding defense are seen as stagnant against a contraction of 0.7%. The yields offered on 10-year US Treasury bonds have dropped sharply to near 3.72%.
Meanwhile, the Japanese Yen is broadly facing pressure as the Bank of Japan (BoJ) will continue the ultra-dovish policy. Sheer depreciation in the Japanese Yen has propelled hopes of a stealth intervention by the BoJ. A poll from Reuters showed that BoJ officials could intervene if USD/JPY climbs to 145.00. Also, Japanese Finance Minister Shunichi Suzuki said that he “will respond appropriately if FX moves become excessive.”
- EUR/JPY reverses two sessions in a row with losses.
- The cross climbs to fresh 2023 peaks well past 157.00.
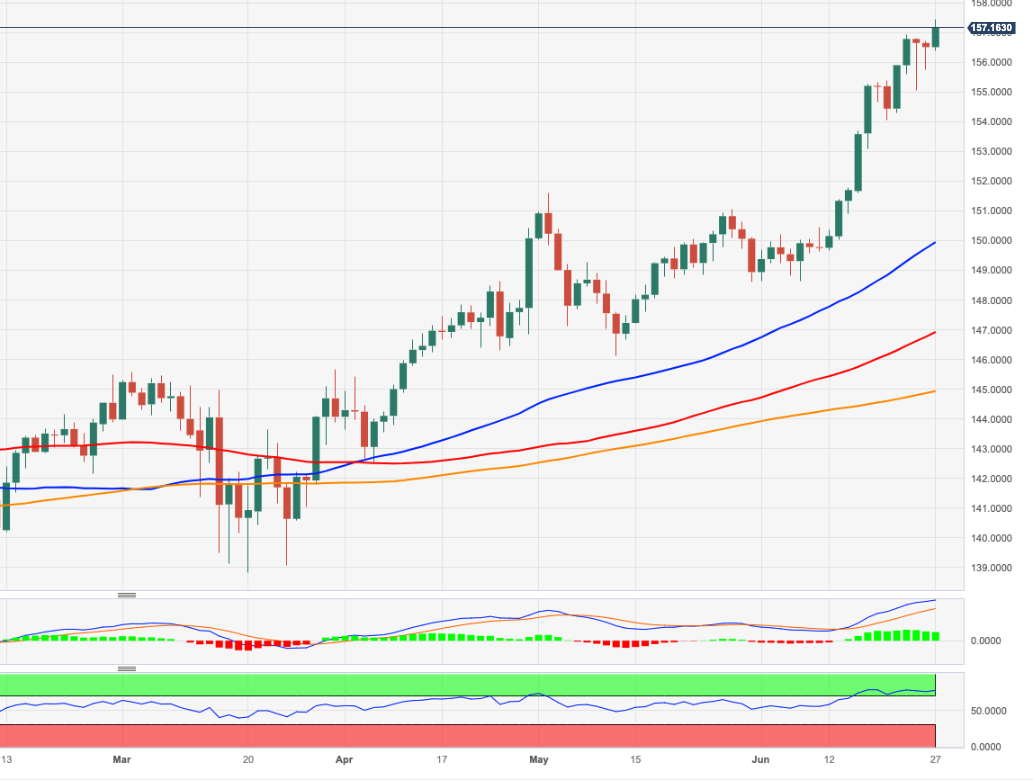
EUR/JPY resumes the upside after a 2-day hiccup and advances to fresh YTD tops past 157.00 the figure on Tuesday.
Considering the ongoing price action, further gains appear on the cards in the very near term. That said, the continuation of the uptrend should meet the next hurdle of note at the weekly high of 163.09 (August 22 2008).
The ongoing overbought conditions of the cross, however, are indicative that a deeper knee-jerk should not be ruled out at some point in the short-term horizon.
So far, further upside looks favoured while the cross trades above the 200-day SMA, today at 144.89.
EUR/JPY daily chart
GBP/USD is off earlier high but supported on dips. Economists at Scotiabank analyze the pair’s technical outlook.
Solid support is apparent on dips to 1.2695
Cable is trading in an extended consolidation range after last week’s test and rejection of 1.2850. Solid support is apparent on dips to 1.2695, however, and the short-term charts do suggest that markets are steadily accumulating the GBP on dips below the figure.
Consistent demand on minor dips under 1.27 is bullish from a short-term point of view at least.
Resistance is 1.2750/55 ahead of a return to 1.28+.
Economists at Scotiabank analyze USD/CAD technical outlook.
Limited scope or potential for the USD to strengthen
Spot’s move off the intraday low reached earlier in London trade puts a mildly positive spin on short-term price action but the broader downtrend in USD/CAD persists and remains deeply entrenched across short, medium, and long-term charts. From a technical perspective, there is limited scope or potential for the USD to strengthen and minor gains remain a sell as the downtrend persists.
Resistance is 1.3175/80 and, firmer, at 1.3200/25.
Support is 1.31 and 1.2980/90.
EUR/USD steadily regains ground as Lagarde stresses rate hike outlook, economists at Scotiabank report.
Door is clearly being left purposefully open to the rate cycle extending beyond July
ECB President Lagarde spoke at the central bank’s policy forum earlier and reiterated a hawkish perspective for rates, noting that – barring any major changes – the bank will tighten rates again in July and that it was unlikely that policymakers would be able ‘to state with full confidence that peak rates have been reached’ anytime soon. The door is clearly being left purposefully open to the rate cycle extending beyond July.
The ECB’s clearly hawkish policy approach – not pausing or ‘stretching out’ hikes – contrasts with the Fed and should support the EUR in the coming weeks.
Senior Economist at UOB Group Alvin Liew reviews the latest Industrial Production figures in Singapore.
Key Takeaways
Singapore’s industrial production (IP) again contracted more than forecast in May, affirming the weak manufacturing outlook. IP contracted by -3.9% m/m, 10.8% y/y in May, worse than Bloomberg’s median forecast of +2.6% m/m, -7.3% y/y but slightly closer to our forecasts of -1.0% m/m SA, -11.1% y/y. Meanwhile, the Apr IP was revised higher to -1.6% m/m, -6.5% y/y (versus the prelim estimates of -1.9% m/m, -6.9% y/y). This was the eighth consecutive month of y/y decline, the deepest contraction in the current downcycle, and marked the worst streak since 2015 (11 months of y/y declines).
IP Outlook – While we continue to be heartened by the re-accelerating growth in the transport engineering components of aerospace and marine & offshore, the latest May IP print also affirms our downbeat manufacturing outlook due to the worsening electronics downcycle and weaker external demand, and it has yet to find a bottom in the current cycle yet. We maintain our forecast for Singapore 2023 manufacturing to contract by 5.4%. We still expect Singapore’s full year GDP growth at 0.7% in 2023 (lower end of the official growth forecast range) reflecting our more cautious external outlook. We reiterate our view that there is a substantial risk for Singapore to enter a technical recession in 1H 2023, largely driven by the weakness in manufacturing.
USD/CAD tests low 1.31 area ahead of Canadian CPI report. Economists at Scotiabank analyze the pair’s outlook.
Trends remain CAD-positive
May CPI data is expected to show a 0.4% (consensus) gain in the month (Scotia 0.5% MoM) for a 3.4% rise over the year.
While the deceleration in the YoY pace of inflation will be gratifying for policymakers – to some extent – monthly headline price gains remain chunky and, more particularly, progress on core inflation has been slow.
The core median measure is expected to slow only to 4.0% in May, from 4.2% in April and higher frequency measure of core prices have recently suggested that core pressures are, in fact, picking up again. These are details that may not be immediately obvious with the headline release which may mean any CAD sell-off on a cooling headline print will be short-lived and likely reverse if the core measures remain elevated.
CAD trends look positive on the crosses and there is potential for further, broader gains in the CAD in the near term.
See – Canada CPI Preview: Forecasts from six major banks, inflation expected to decelerate sharply in May
- AUD/USD has faced stiff barriers around 0.6720 as the focus shifts to Australian monthly inflation.
- A deceleration is expected in the Australian inflation to 6.1%, which could allow the RBA to skip policy-tightening in July.
- AUD/USD has shown some strength after dropping to near the 50% Fibonacci retracement at 0.6680.
The AUD/USD pair has retreated after a short-lived recovery to near 0.6720 in the European session. The Aussie asset has faced selling pressure as investors have shifted their focus toward the release of the monthly Australian Consumer Price Index (CPI) data, which will release on Wednesday.
A deceleration is expected in the Australian inflation to 6.1% from the former release of 6.8%, which could allow the Reserve Bank of Australia (RBA) to skip policy-tightening in July. However, a one-time softening of monthly inflation might not be sufficient enough as labor market conditions have tightened.
The US Dollar Index (DXY) looks well-supported around 102.50 ahead of the United States Durable Goods Orders data (May). The economic data is expected to contract by 1.1% against an expansion of 1.1% reported last month.
AUD/USD has shown some strength after dropping to near the 50% Fibonacci retracement (plotted from May 31 low at 0.6458 to June 16 high at 0.6900) at 0.6680 on a two-hour scale. The 50-period Exponential Moving Average (EMA) at 0.6720 is still acting as a barricade for the Australian Dollar bulls.
The Relative Strength Index (RSI) (14) has rebounded into the 40.00-60.00 range from the bearish range of 20.00-40.00, portraying an attempt of a bullish reversal.
A decisive break below the 50% Fibo retracement at 0.6680 would expose the asset to 61.8% Fibo retracement at 0.6628 followed by June 05 low at 0.6579.
On the flip side, a confident break above the round-level resistance of 0.6800 would expose the asset to June 20 high at 0.6855. A break above the latter would drive the asset toward June 16 high at 0.6900.
AUD/USD two-hour chart
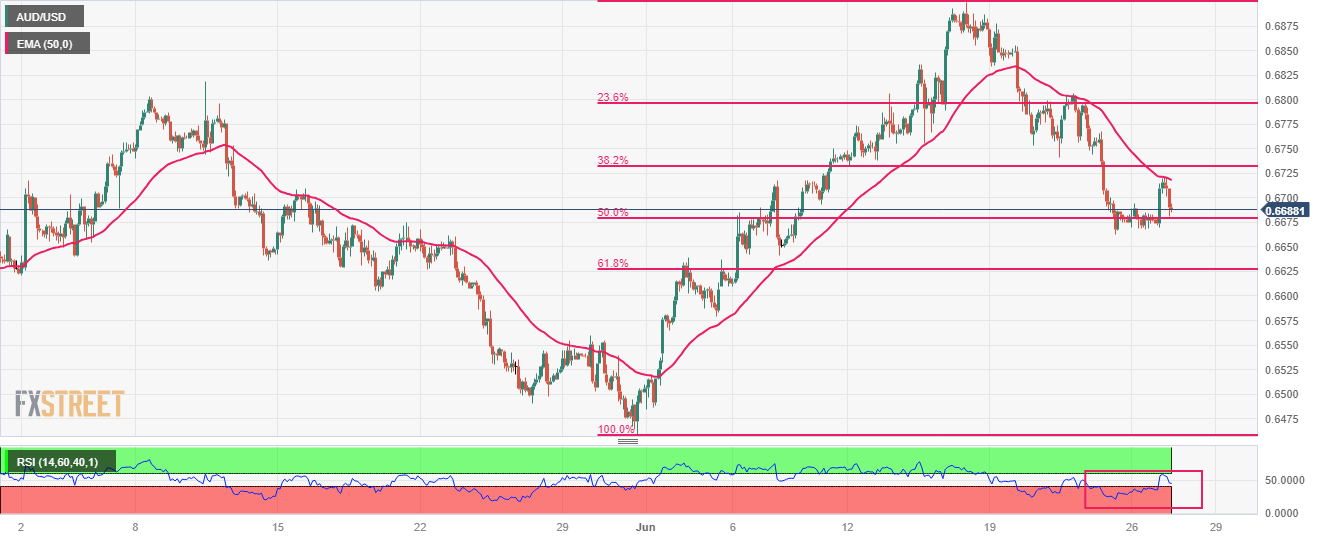
Economists at OCBC Bank maintain a neutral-to-mild constructive outlook on the British Pound and note the risks to watch.
Receding recession fears in the UK supportive of GBP’s recovery
Neutral-mild constructive outlook as domestic credibility is restored, softer energy prices offer relief to finances and the Bank of England is still hawkish.
Risks to watch if stagflation concerns materialize as growth momentum could come under pressure if the BoE over-tightens to fight stubborn inflation.
See: Very inverted yield curve may help the Pound – ING
Economists at Société Générale analyze USD/CNH technical outlook.
A pause is not ruled out
USD/CNH has experienced a relentless uptrend after breakout from a range-bound consolidation last month. It has reached the potential resistance of 7.25/7.26 representing the peak of November 2022 which is also the upper limit of a steep ascending channel. Daily MACD has turned flat; this is not a reversal signal however a pause is not ruled out.
The 20-DMA near 7.16 should be a potential support. Only if the pair fails to defend it, there could be risk of a short-term downtrend.
Today’s inflation data in Canada will be key to driving market expectations for the BoC’s July decision. Economists at ING analyze CAD outlook.
Inflation numbers in focus
Consensus is looking for a rather substantial slowdown in headline inflation from 4.4% to 3.4%, while the core measure should decelerate to around 4.0%. We are still inclined to think that the BoC will go for another hike in July, and it may take a sub-consensus read in underlying inflation today to convince them not to.
Either way, with the Fed still threatening to tighten more, it seems hard to fully price out BoC tightening down the road, and CAD – which has the best volatility-adjusted carry in G10 – may not fall out of markets’ favours just yet.
We still target sub-1.30 levels in the third quarter.
See – Canada CPI Preview: Forecasts from six major banks, inflation expected to decelerate sharply in May
- The US Dollar is retreating against several currencies after the PBoC fixed its Yuan lower.
- Tuesday’s focus is on US Durable Goods Orders,Consumer Confidence data.
- The US Dollar Index is in the red and ekes out more losses.
The US Dollar (USD) is on the back foot against most pairs on Tuesday after the Chinese central bank, the People's Bank of China (PBoC), fixed the USD/CNH a few figures stronger than expected. This triggered a wave of pressure on the Greenback, particularly against the Canadian Dollar as the USD/CAD pair trades at 1.3125, a six-month low. Polish Zloty, Japanese Yen, Euro, Pound Sterling and Scandinavian coins are all trading in profit against the US Dollar.
Economic data on Tuesday could bring some turnaround. At 12:30 GMT, Durable Goods Orders data is set to hit the markets with expectations of stagnation or declines on all fronts. Another important number that could influence the Greenback’s performance is the Conference Board’s Consumer Confidence Index for June, which is expected to rise from 102.30 to 104.00, an outcome that should help lift sentiment in the US Dollar.
Daily digest: US Dollar ready for its first batch of data
- European Central Bank President Christine Lagarde held opening remarks at the ECB’s symposium in Sintra, Portugal. She remained hawkish by saying that it is unlikely that the ECB can say soon that the interest-rate peak has been reached.
- China’s PBoC fixed the Yuan at 7.2098 instead of 7.2209 estimated. This triggered a spike in Chinese equities and a sharp drop for the Greenback.
- Durable Goods Orders will be published at 12:30 GMT. Monthly Core Durable Goods, excluding transportation, is expected to jump from -0.2% previous to -0.1% for May. Overall Durable Goods Orders are expected to contract 1% for the month, swinging from a 1.1% expansion in April.
- Moreover, the Redbook Index – which gauges store sales in the US – is due at 12:55 GMT. It increased 0.9% a week earlier. S&P/Case-Shiller Home Price Indices numbers for the monthly and yearly performance in April will come out at 13:00 GMT. The monthly House Price Index is set to slow from 0.6% to 0.3%. On a yearly basis, the index is expected to show that prices fell 2.6% in April, more than the 1.1% decline seen in March.
- At 14:00 GMT, New Home Sales are expected to cool down from 683K to 675K. The Conference Board Consumer Confidence index is expected to jump from 102.30 to 104.00. Traders can also look at the Richmond Fed Manufacturing Index, which should pick up as well from -15 to -10 for June. Richmond Fed Services Index should be seen tilting up as well, from -10 to 7, as activity picks up again.
- Finally to close this day off in terms of data, at 14:30 GMT the Dallas Fed Services Revenues Index for June is expected to come out a touch softer, from 6.9 to 6.0, and the Texas Services Sector Outlook should move higher from -17.3 but no expectations are forecasted here.
- The US Treasury set to head to the markets to sell $43 billion notes of 5-year maturity.
- No Fed speakers expected.
- With the jump in Chinese equities, Iron Ore Futures are up 2.4% at sessions’ high level at $825 on the assumption that demand from China could pick up again.
- Asian equities are having a field day. The Chinese Hang Seng index is rallying near 2% as the closing bell for that session approaches. Meanwhile, European stock markets have reversed a big part of earlier gains, but are still in the green.
- The CME Group FedWatch Tool shows that markets are pricing in a 76.9% chance of a 25 basis points (bps) interest-rate hike on July 26th. The certainty of one more hike has increased as US Fed Chairman Jerome Powell remained hawkish in the recent two hearings, though markets remain reluctant to price in that second rate hike.
- The benchmark 10-year US Treasury bond yield trades at 3.72% and sees yields climbing while bond prices fall. Markets are quickly unwinding their risk bets after the events over the weekend in Russia.
US Dollar Index technical analysis: PBoC outpaces Greenback
The US Dollar is being tripped by the PBoC move, which has set back the Greenback against several pairs. The six-month-low against the Canadian Dollar, its northern neighbour, is to be noticed. This filters into the US Dollar Index, which struggles to find any green counterweights in this weaker US Dollar session.
On the upside, the 100-day Simple Moving Average (SMA) briefly touched at 103.05 remains as the level to break above and hold. That attempt failed last week, and could demand more conviction from the Greenback in order to head and stay above that level. Once that happens, look for 103.50 as the next key level to the upside.
On the downside, the 55-day SMA near 102.61 is being breached again, losing its importance after being chopped up several times last week.Rather look for 102.50 to check if it holds support. In case the DXY slips below 102.50, more weakness is expected with a full slide to 102.00 and a retest of June’s low at 101.92.
What is US Dollar Index (DXY)?
The US Dollar Index, also known as DXY or USDX, is a benchmark index that was established by the US Federal Reserve in 1973. DXY is widely used as a tool measuring the US Dollar (USD) value in global markets. The index is calculated by measuring the US Dollar’s performance against a basket of six foreign currencies, the Euro, the Japanese Yen (JPY), Swedish Krona (SEK), the British Pound (GBP), the Swiss Franc (CHF) and the Canadian Dollar (CAD).
With 57.6%, the Euro has the biggest weight in the index followed by the JPY (13.6%), GBP (11.9%), CAD (9.1%), SEK (4.2%), and CHF (3.6%). Hence, a sharp decline in the EUR/USD pair could help the US Dollar Index rise even if the US Dollar weakens against some of the other currencies in the basket.
After the weaker Eurozone PMIs had put pressure on EUR on Friday the single currency was able to cope better with the stronger fall of the ifo business climate yesterday. Economists at Commerzbank discuss EUR/USD outlook.
It is not the economy that is decisive for the ECB’s monetary policy decisions but inflation developments
It is not the economy that is decisive for the ECB’s monetary policy decisions but inflation developments. From Wednesday the first estimates for June from Eurozone countries will be published, with the overall inflation rate for the Eurozone following on Friday.
There are concerns that core inflation will remain stubborn. Against this background, it is likely to be premature from the market’s point of view to bet on an imminent pause in the ECB rate cycle at this stage. For that reason, the data might provide support for EUR this week.
USD/CNH is likely to see its upward momentum surpass the 7.2500 level in the near term, note Economist Lee Sue Ann and Markets Strategist Quek Ser Leang at UOB Group.
Key Quotes
24-hour view: We did not anticipate the strong rise in USD that sent it soaring to a high of 7.2460 (we were expecting it to trade in a range). While severely overbought, the USD advance is not showing any signs of reversing just yet. In other words, USD is likely to rise further even though the major resistance at 7.2800 is unlikely to come under threat (minor resistance is at 7.2650). In order to keep the momentum going, USD must stay above 7.2280 (minor support is at 7.2350).
Next 1-3 weeks: Yesterday (26 Jun, spot at 7.2120), we indicated that “while momentum has not improved much, USD could rise further, albeit at a slower pace.” We added, “The next level to watch above 7.2300 is 7.2500.” We did not anticipate the rapid rise as USD rose to 7.2460. Despite the advance, we still do not detect a clear increase in momentum. That said, USD could break above 7.2500, but remains to be seen if 7.2800 will come into view. On the downside, a breach of 7.1980 (‘strong support’ level was at 7.1700 yesterday) would suggest USD is not rising further.
- NZD/USD has sensed selling interest around 0.6200 as the US Dollar Index (DXY) has found intermediate support.
- S&P500 futures have trimmed gains added in early Europe as fears of global recession have elevated again.
- NZD/USD is auctioning in a Falling Channel in which each pullback is considered a selling opportunity by the market participants.
The NZD/USD pair has witnessed selling pressure while attempting to stretch the rally above the round-level resistance of 0.6200 in the London session. The Kiwi asset has dropped to near 0.6170 as the US Dollar Index (DXY) has shown stability after correcting to near 102.50.
S&P500 futures have trimmed gains added in early Europe as fears of global recession have elevated again. The commentary from European Central Bank (ECB) President Christine Lagarde that the current monetary policy is not sufficiently restrictive supports more interest rate hikes ahead.
Earlier, the New Zealand Dollar showed strength as investors are hoping that the Reserve Bank of New Zealand (RBNZ) will continue to raise interest rates as Kiwi inflation is extremely persistent.
NZD/USD is auctioning in a Falling Channel in which each pullback is considered a selling opportunity by the market participants. On a broader horizon, potential resistances are placed from May 19 high at 0.6306 and May 11 high at 0.6385.
The 200-period Exponential Moving Average (EMA) at 0.6160 is providing some cushion to the New Zealand Dollar.
Contrary to that, the Relative Strength Index (RSI) (14) is oscillating in the bearish range of 20.00-60.00.
A confident break above May 17 high at 0.6261 will drive the Kiwi asset toward May 19 high at 0.6306 followed by May 08 high around 0.6360.
Alternatively, a downside move below the June 16 low at 0.6116 will expose the asset to June 05 low at 0.6041. A slippage below the latter would expose the asset to psychological support at 0.6000.
NZD/USD two-hour chart
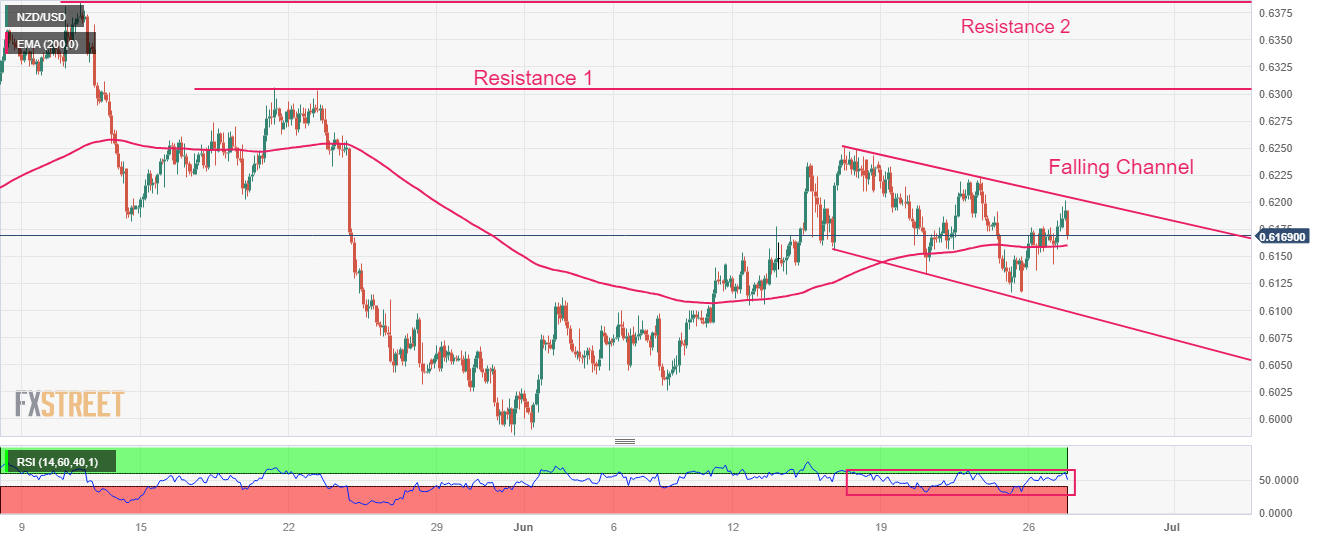
The week has started on a rather quiet tone across most asset classes. Economists at ING discuss the USD outlook.
Low likelihood of a dovish turn by Fed Chair Jerome Powell at his Sintra speech
The Conference Board consumer confidence data today will be the highlight of the day, although some focus will also be on May’s Durable goods orders and new home sales, and on June’s Richmond Fed Manufacturing index. Consensus expectations point to a relatively firm set of numbers, and we see no reasons to strongly disagree.
Considering the low likelihood of a dovish turn by Fed Chair Jerome Powell at his Sintra speech tomorrow, an acceleration in the Dollar decline does not seem very likely.
- Silver scales higher for the third straight day, albeit fails to find acceptance above $23.00.
- The mixed hourly/daily oscillators warrant some caution before placing any directional bets.
- A sustained break back below the $22.65 confluence will negate prospects for further gains.
Silver gains some positive traction for the third successive day on Tuesday and climbs to a four-day high during the early part of the European session, though struggles to capitalize on the momentum or find acceptance above the $23.00 mark.
Against the backdrop of the overnight break through the 100-hour Simple Moving Average (SMA), for the first time since last Tuesday, bullish technical indicators on hourly charts support prospects for further intraday gains. However, oscillators on the daily chart - though have been recovering from lower levels - are yet to confirm a positive outlook and warrant some caution before placing fresh bullish bets around the XAG/USD.
In the meantime, any meaningful downside now seems to find some support near the $22.65 region, or the 100-hour SMA. The said area nears the 23.6% Fibonacci retracement level of the downfall witnessed over the past week or so, which if broken will shift the near-term bias back in favour of bearish traders. The XAG/USD might then turn vulnerable to retest the multi-month low, around the $22.10 region touched last week.
Some follow-through selling below the $22.00 mark will make the XAG/USD vulnerable to accelerate the fall further towards the $21.70-$21.65 support zone. The downward trajectory could get extended towards the next relevant support near the $21.25 area en route to the $21.00 round-figure mark.
On the flip side, any subsequent move beyond the $23.00 mark is likely to confront a stiff barrier near the $23.20-$23.25 confluence, comprising the 61.8% Fibo. level and the 200-hour SMA. This is followed by 61.8% Fibo. level, around the $23.40 region, which if cleared decisively will confirm that the XAG/USD has formed a bottom ahead of the $22.00 mark and pave the way for a further near-term appreciating move.
Silver 1-hour chart
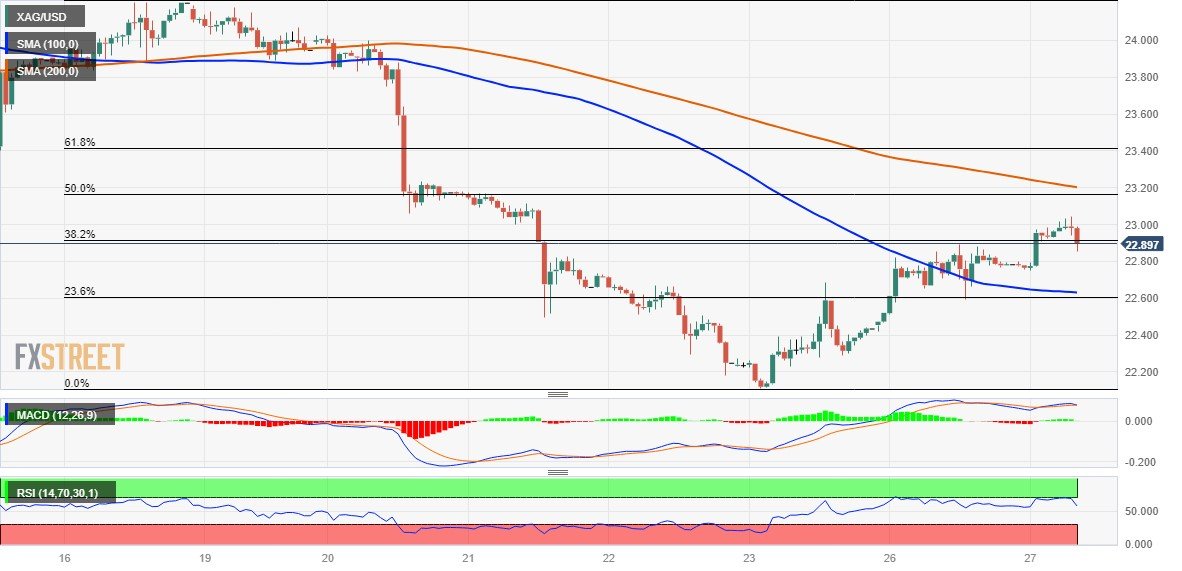
Key levels to watch
Economists at OCBC Bank expect the USD/JPY pair to remain firm in the near term. But in the medium term, the JPY is set to recover as BoJ moves away from YCC regime at some stage while Fed pauses or pivots policy.
A story of yield differentials
Sizeable USD carry could keep the pair supported until the market expectations on Fed shifts less hawkish or BoJ shifts.
The recent sharp rise in USDJPY to 143 heightens the risk of policymakers engaging in leaning against wind activities. Such activities will only serve to slow the pace of USD/JPY upticks especially if the uptrend remains intact. A reversal in the trend would require market dynamics to change (i.e. USD to turn or yield differentials to narrow, etc.).
Looking out, we expect USD/JPY to trade lower on the back of a moderate-to-soft USD profile (as Fed tightening stretches into late cycle and that USD can fall when pause or pivot comes into play) and expectation for BoJ to shift towards policy normalisation amid higher inflationary pressures in Japan.
- EUR/GBP has jumped to near 0.8600 after hawkish commentary from ECB Lagarde at the ECB forum of Central Banking.
- ECB Kazaks cleared that there are strong risks of persistence in inflation and that expectations of rate cuts in early 2024 are wrong.
- The Pound Sterling is facing pressure as elevated inflation in the UK is threatening their economic outlook.
The EUR/GBP pair has climbed to near the round-level resistance of 0.8600 in the London session. The cross has picked strength as European Central Bank (ECB) President Christine Lagarde has delivered hawkish remarks in the ECB forum of Central Banking.
ECB Lagarde has conveyed that inflation in Eurozone is extremely high and the central bank is required to make monetary policy sufficiently restrictive to tame price pressures. She further added the effect on inflation from rising wages has recently been amplified. Christine Lagarde also stated that the ECB is ensuring that inflation expectations remain anchored as the wage catch-up process plays out.
About ECB monetary policy outlook, ECB policymaker Matin Kazaks said on Tuesday that he sees the central bank raising interest rates beyond the July meeting if inflation remains too high. ECB Kazaks cleared that there are strong risks of persistence in inflation and that expectations of rate cuts in early 2024 are wrong.
Meanwhile, the Pound Sterling is facing pressure as elevated inflation in the United Kingdom is threatening their economic outlook. Higher interest rates by the Bank of England (BoE) are going to decline credit disbursals by commercial banks as firms would prefer to avoid higher interest obligations.
UK’s core inflation has jumped to fresh highs of 7.1%, which is making BoE Governor Andrew Bailey uncomfortable. Investors are anticipating that BoE Bailey is failing in achieving price stability.
Considering advanced prints from CME Group for natural gas futures markets, open interest shrank for yet another session on Monday, this time by around 4.3K contracts. Volume followed suit and resumed the downtrend by dropping around 48.5K contracts.
Natural Gas: Next on the upside appears $3.00
Natural gas prices rose for the fourth session in a row on Monday. The uptick, however, was on the back of shrinking open interest and volume and opens the door to a probable corrective knee-jerk sooner rather than later. In the meantime, a more serious bullish move is expected to face a tough barrier around the March top just above the $3.00 mark per MMBtu.
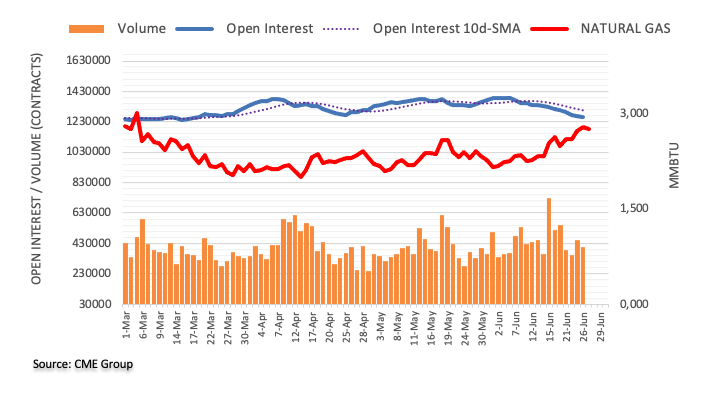
Bank of England (BoE) policymaker Swati Dhingra said on Tuesday, “wages are responding to inflation with a lag.”
“The external shock has not totally worn off,” she added.
Economists at ING analyze EUR/GBP outlook.
No pushback against aggressive expectations
The Sonia curve is pricing in a 6.15-6.20% peak rate as of this morning around the turn of the year, and keeping the option of a 50 bps hike in August very much on the table (44 bps priced in).
Data may argue against such aggressive action down the road, but the majority of Bank of England officials look unlikely to vehemently push back against tightening expectations for now.
EUR/GBP does not have huge downside room, but a rebound to 0.88 will likely be very gradual.
- USD/CAD drifts lower for the second straight day and is pressured by a combination of actors.
- An uptick in Oil prices underpins the Loonie and exerts pressure amid a modest USD weakness.
- Investors now look to the Canadian CPI and the US macro data for some meaningful impetus.
The USD/CAD pair now seems to have entered a bearish consolidation phase and is seen oscillating in a narrow band around the 1.3120-1.3125 area, just above its lowest level since September 2022 touched this Tuesday.
A combination of factors lends some support to Crude Oil prices, which, in turn, underpins the commodity-linked Loonie and drags the USD/CAD pair lower for the second straight day amid the prevalent US Dollar (USD) selling bias. Political instability in Russia raised concerns about possible supply disruptions. Furthermore, China's Premier Li Qiang said that domestic economic growth is expected to reach the annual projected target of around 5%. This, in turn, lifts hopes for a pickup in fuel demand ahead of the summer driving season in the US and acts as a tailwind for the black liquid.
The latest optimism, meanwhile, is evident from a modest recovery in the global risk sentiment and a generally positive tone around the equity markets. The risk-on flow is seen denting the Greenback's relative safe-haven status and exerting additional downward pressure on the USD/CAD pair. That said, the Federal Reserve's (Fed) hawkish outlook helps limit losses for the USD. Traders also seem reluctant to place aggressive bets and prefer to wait for the release of the latest Canadian consumer inflation figures, due later during the North American session, for a fresh impetus.
Consensus estimates point to a sharp deceleration in the Canadian headline CPI, from a 4.4% YoY rate to 3.4% in May. Moreover, the Bank of Canada's (BoC) Core CPI is projected to ease to 3.9% from 4.1% in April. The markets, however, have been pricing in a greater chance of another 25 bps BoC rate hike in July. Hence, a larger drop in headline CPI is unlikely to diminish the odds for the anticipated lift-off, though might still infuse some volatility around the USD/CAD pair. Apart from this, traders will take cues from a slew of important US macro data to grab short-term opportunities.
Tuesday's US economic docket features Durable Goods Orders, the Conference Board's Consumer Confidence Index, New Home Sales and Richmond Manufacturing Index, which might influence the USD. Apart from this, Oil price dynamics will be looked up for some meaningful impetus to the USD/CAD pair. Nevertheless, the aforementioned fundamental backdrop suggests that the path of least resistance for spot prices is to the downside. Hence, any attempted recovery might still be seen as a selling opportunity and runs the risk of fizzling out rather quickly.
Technical levels to watch
- USD/CHF is trading back and forth in a limited range as investors are mixed about Fed’s monetary outlook.
- S&P500 futures have surrendered some gains, however, the overall market mood is quite bullish.
- USD/CHF is making efforts for keeping itself above the 61.8% Fibonacci retracement at 0.8946.
The USD/CHF pair is showing topsy-turvy moves in a range of 0.8940-0.8960 in the European session. The Swiss Franc asset has turned non-directional amid uncertainty about the monetary policy outlook by the Federal Reserve (Fed).
S&P500 futures have surrendered some gains, however, the overall market mood is quite bullish as investors are shifting their focus from fears of global recession to the upcoming quarterly result season.
The US Dollar Index (DXY) is in a correction phase and has dropped to near 102.50. Investors should note that the downside momentum in the USD Index is weak, portraying that investors are awaiting a fresh trigger for further guidance.
USD/CHF is making efforts for keeping itself above the 61.8% Fibonacci retracement (plotted from May 04 low at 0.8820 to May 31 high at 0.9148) at 0.8946 on a four-hour scale. The 50-period Exponential Moving Average (EMA) at 0.8967 is acting as a barricade for the US Dollar bulls.
A range oscillation in the 40.00-60.00 territory by the Relative Strength Index (RSI) (14) indicates a sideways performance.
Going forward, a breakdown below May 12 low around 0.8900 would expose the Swiss Franc asset to April 13 low at 0.8860 followed by the ultimate support plotted from May 04 low at 0.8820.
In an alternate scenario, an upside move above the psychological resistance of 0.9000 would fade the bearish bias and will drive the asset toward June 06 low at 0.9033 and May 30 high at 0.9084.
USD/CHF four-hour chart
-638234501675228173.png)
European Central Bank (ECB) President Christine Lagarde is delivering introductory remarks on day two of the ECB Forum on Central Banking, in Sintra, on Tuesday.
Also read: Lagarde speech: Need to bring rates into ‘sufficiently restrictive’ territory to lock in our policy tightening
Key quotes
We must ensure that inflation expectations remain anchored as the wage catch-up process plays out.
We have not yet seen the full impact of the cumulative rate hikes we have decided on since last July.
if firms were to regain 25% of the lost profit margin that our projections foresee, inflation in 2025 would be substantially higher than the baseline – at almost 3%.
It is unlikely that in the near future the central bank will be able to state with full confidence that the peak rates have been reached.
This is why our policy needs to be decided meeting by meeting and has to remain data-dependent.
Rates are to stay elevated for as long as necessary.
Market reaction
EUR/USD holds higher ground near 1.0940 on Lagarde’s hawkish remarks, up 0.32% so far.
ECB's President Lagarde will speak at Sintra forum on Tuesday. Economists at Société Générale analyze EUR/USD outlook.
Lagarde to talk the talk in Sintra, warn on inflation and interest rates
We think perseverance today means undoubtedly raising rates by 25 bps in July, possibly in September, and not wavering in ‘our commitment to ensure that inflation returns to 2% over the medium term.’
The effectiveness of tighter policy is debatable when real rates are negative and unit labour costs are growing at twice the rate of the inflation target. Since her last visit to the Garden of the Feitoria da Condessa – and following a stretch of 400 bps of hikes – core inflation has mushroomed from 3.7% to 5.3%. If our economists are right, it will accelerate to 5.6% when the June data is published on Friday.
EUR/USD fell 0.7% during her speech last year. The 10y EUR IRS rose 8 bps. A repeat today would pin EUR/USD back below 1.09 and help 10y swaps to fend off the receiving pressure around the 200-DMA at 2.95%.
- The index loses further momentum and tests 102.50.
- US yields extend the decline in the short end of the curve.
- CB Consumer Confidence, Durable Goods Orders next on tap.
The greenback extends the pessimism seen at the beginning of the week and drops to 2-day lows in the 102.50 when tracked by the USD Index (DXY) on turnaround Tuesday.
USD Index looks at data, risk appetite
The index retreats for the second session in a row on the back of the improved sentiment in the risk-linked galaxy, while the lack of a clear direction in US yields also fail to provide some support for the greenback.
In the meantime, the broad consensus among investors continue to see the Federal Reserve resuming its tightening campaign at the July meeting, while the probability of a 25 bps rate hike nearing 80% measured by CME Group’s FedWatch Tool.
In the US data space, all the attention will be on the release of the Consumer Confidence measured by the Conference Board seconded by Durable Goods Orders, New Home Sales and the FHFA House Price Index.
What to look for around USD
The index remains on the defensive and extends further its rejection from weekly peaks past the 103.00 hurdle seen in past sessions.
Meanwhile, the likelihood of another 25 bps hike at the Fed's upcoming meeting in July remains high, supported by the continued strength of key US fundamentals such as employment and prices.
This view was further bolstered by comments from Fed Chief Powell at the June FOMC event, who referred to the July meeting as "live" and indicated that most of the Committee is prepared to resume the tightening campaign as early as next month.
Key events in the US this week: Durable Goods Orders, FHFA House Price Index, CB Consumer Confidence, New Home Sales (Tuesday) – MBA Mortgage Applications, Advanced Goods Trade Balance, Fed Powell (Wednesday) – Final Q1 Growth Rate, Initial Jobless Claims (Thursday) – PCE, Core PCE, Personal Income/Spending, Final Michigan Consumer Sentiment (Friday).
Eminent issues on the back boiler: Persistent debate over a soft/hard landing of the US economy. Terminal Interest rate near the peak vs. speculation of rate cuts in late 2023/early 2024. Fed’s pivot. Geopolitical effervescence vs. Russia and China. US-China trade conflict.
USD Index relevant levels
Now, the index is losing 0.23% at 102.51 and faces the next contention at 101.92 (monthly low June 16) followed by 100.78 (2023 low April 14) and finally 100.00 (round level). On the other hand, the breakout of 103.16 (weekly high June 23) would open the door to 104.69 (monthly high May 31) and then 105.03 (200-day SMA).
European Central Bank (ECB) President Christine Lagarde is delivering introductory remarks on day two of the ECB Forum on Central Banking, in Sintra, on Tuesday.
Key quotes
Inflation in the euro area is too high
We are committed to reaching inflation goal come what may.
Monetary policymakers need to address this dynamic decisively to ensure that it does not lead to a self-fulfilling spiral
We cannot waver, and we cannot declare victory yet.
We need to bring rates into “sufficiently restrictive” territory to lock in our policy tightening.
The second phase of the inflation process is now starting to become stronger.
We need to communicate clearly that we will stay at those levels for as long as necessary.
The effect on inflation from rising wages has recently been amplified
Seeing labour hoarding by firms in a context of labour shortages.
Market reaction
EUR/USD is testing daily highs near 1.0945 on Lagarde’s comments, adding 0.35% on the day.
AUD is a highly sensitive currency to global growth cycles, Fed tightening, commodity demand and RMB, economists at OCBC Bank report.
Constructive outlook but Fed, RMB may restraint gains in the interim
Near term: Another 1-2 Fed hikes, lingering RMB softness and emerging global growth concerns may temporarily undermine AUD.
Broader term: Expect AUD to trade higher as Fed gets closer to end of tightening cycle, eventual China turnaround on expectations of stimulus and possibly warmer ties between Australia and China (i.e. timber, coal imports from AU resumed; barley, wine, hay, meat, crayfish potentially next while AU PM is likely to visit Beijing). Tourism, education and property sectors in Australia could benefit if relations between China and Australia further warm up, and this can be a positive for AUD.
Downside risks: 1/ extent of CNH swings; 2/ if USD strength or Fed tightening cycle unexpectedly extends; 3/ global growth outlook – if slowdown deteriorates; 4/ any market risk-off event or unexpected dovish tilt from RBA.
Economists at Commerzbank discuss CAD's outlook ahead of Canadian inflation data.
Uncertainty about inflation developments is high
Uncertainty about inflation developments is high, as the recent surprises in data publications – not just in Canada – have shown. Against this background, it makes sense to remain flexible. That means that the data publications play an important role, as they will affect future monetary policy actions decidedly.
If today’s inflation data surprises to the upside like the April data, speculation about a further rate hike in July is likely to increase. At present this step is not yet priced in completely. That might provide additional support to CAD against USD, as the market is a little more skeptical regarding further Fed rate hikes compared with the BoC.
See – Canada CPI Preview: Forecasts from six major banks, inflation expected to decelerate sharply in May
Here is what you need to know on Tuesday, June 27:
There is a positive shift in risk mood early Tuesday as investors, with the US stock index futures trading in positive territory following the sharp decline seen in Wall Street's main indexes on Monday. European Central Bank (ECB) President Christine Lagarde will deliver an introductory speech at the 2023 ECB Forum on Central Banking and several ECB policymakers will speak on policy and inflation later in the day. The US economic docket will feature Durable Goods Orders and New Home Sales for May and CB Consumer Confidence Index for June.
During the Asian trading hours, Chinese Premier Li Qiang said that China was still on track to reach its annual growth target of around 5.0% for the year. "China will introduce more pragmatic measures to expand domestic demand and stimulate market vitality," Li added. Shanghai Composite and Hang Seng indexes both gained more than 1% on Tuesday. Reflecting the negative impact of improving risk mood on the US Dollar's (USD) performance, the US Dollar Index (DXY) declines toward 102.50.
EUR/USD closed flat near 1.0900 on Monday but regained its traction early Tuesday. The pair was last seen rising toward 1.0950.
Supported by the renewed USD weakness, GBP/USD edges higher toward 1.2750 in the European morning. Bank of England MPC Member Silvana Tenreyro will present a paper titled “Monetary policy in the face of supply shocks: the role of inflation expectations” at the ECB event.
USD/CAD stays on the back foot and trades at its lowest level since September below 1.3130. Statistics Canada will publish Consumer Price Index (CPI) data for May in the early NA session.
AUD/USD gathered bullish momentum in the Asian trading hours and climbed above 0.6700, fuelled by China optimism.
USD/JPY continues to move sideways at around 143.50 as the Japanese Yen finds it difficult to find demand in the risk-positive market environment. Japanese Finance Minister Shunichi Suzuki reiterated on Tuesday that they “will respond appropriately if FX moves become excessive.”
Gold price ended the day virtually unchanged on Monday, with the modest rebound witnessed in the US Treasury bond yield limiting XAU/USD's upside. The pair clings to small recovery gains at around $1,930 early Tuesday.
Bitcoin stays in its tight consolidation channel above $30,000 for the fourth straight day on Tuesday. Following Monday's 2% decline, Ethereum recovers toward $1,900 in the European morning.
- Gold price is anticipating a range expansion amid a further decline in the US Dollar Index.
- Mixed responses from Fed policymakers have kept investors on their toes.
- Gold price is auctioning in a Symmetrical Triangle chart pattern, which indicates a decline in volatility.
Gold price (XAU/USD) is demonstrating signs of volatility contraction below $1,930.00 in the European session. The precious metal is looking to deliver gains as the US Dollar Index (DXY) has come under pressure due to the risk-appetite theme.
S&P500 futures have posted decent gains in London as investors are shrugging-off uncertainty associated with the upcoming quarterly result season. The USD Index has refreshed its day’s low at 102.49 amid positive market sentiment. Meanwhile, upbeat US Yields have been restricting the upside in the Gold price. The 10-year US Treasury yields have jumped to near 3.74%.
Mixed responses from Federal Reserve (Fed) policymakers have kept investors on their toes. Atlanta Fed Bank President Raphael Bostic favored the continuation of a steady policy as further restrictions could damage the strength of the economy. On the contrary, San Francisco Fed Bank President Mary Daly suggested that two more rate hikes this year are a “very reasonable” projection, supporting similar commentary from Fed chair Jerome Powell.
For further actions, the United States Durable Goods Orders data will be in focus. As per the consensus, the economic data is seen contracting by 1.0% vs. an expansion of 1.1%. Durable Goods Orders excluding defense are seen as stagnant against a contraction of 0.7%.
Gold technical analysis
Gold price is auctioning in a Symmetrical Triangle chart pattern on an hourly scale, which indicates a decline in volatility but is followed by an explosion in the same. Horizontal support is plotted from the previous week’s low at $1,910.18.
A straight 50-period Exponential Moving Average (EMA) at $1,926.00 portrays a non-directional performance.
The Relative Strength Index (RSI) (14) is oscillating in the 40.00-60.00 range, which indicates that investors await a potential trigger.
Gold hourly chart
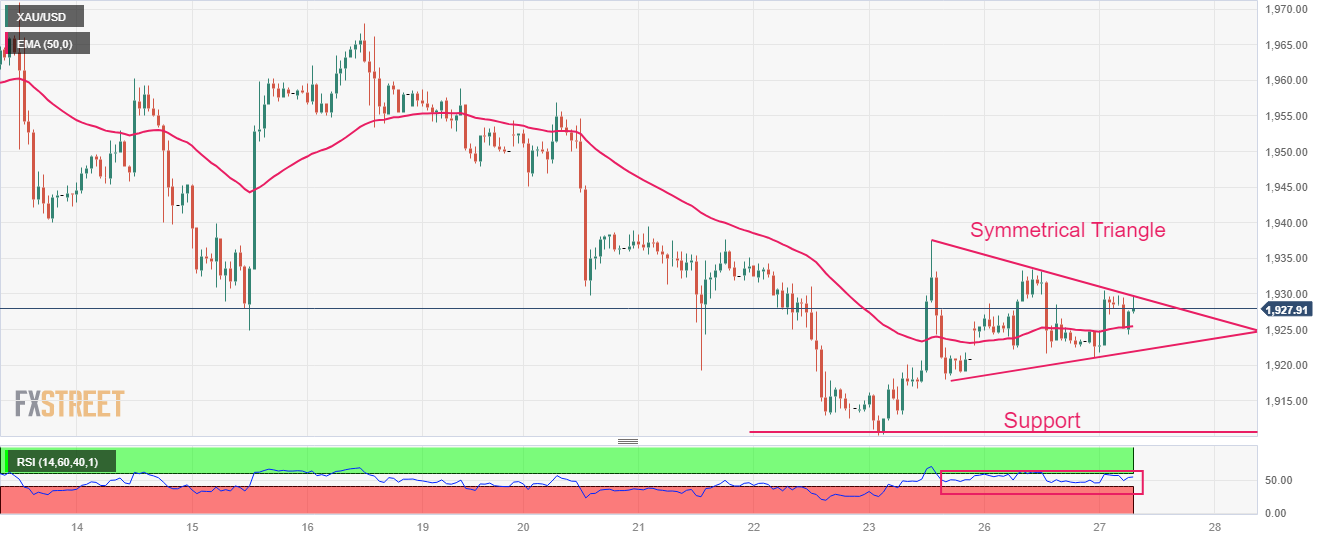
The continuation of the upside momentum could encourage USD/JPY to revisit the 144.00 region, comment Economist Lee Sue Ann and Markets Strategist Quek Ser Leang at UOB Group.
Key Quotes
24-hour view: After USD soared to a high of 143.91 last Friday and pulled back, we indicated yesterday that “severely overbought conditions combined with tentative signs of slowing momentum suggest USD could pullback further.” We added, “However, any decline is unlikely to break below 142.75.” In London trade, USD fell to a low of 142.93, and then recovered. USD appears to have moved into a consolidation phase and it is likely to trade between 142.80 and 143.80 today.
Next 1-3 weeks: Our most recent narrative was from last Friday (23 Jun, spot at 143.10) wherein USD is likely to continue to rise and the next level to watch is 144.00. There is no change in our view. However, short-term momentum has waned somewhat, but only a breach of 142.30 (no change in ‘strong support’ level) would indicate the USD strength that started about 1-1/2 weeks ago has come to an end.
CME Group’s flash data for crude oil futures markets note traders increased their open interest positions by around 6.6K contracts at the beginning of the week. On the other hand, volume went down for the second session in a row, this time by around 148K contracts.
WTI: Immediate hurdle comes at $72.00
WTI prices started the week on a positive mood, although a convincing breakout of the $70.00 mark per barrel remained elusive. The uptick was accompanied by rising open interest, which suggests the likelihood of a near-term bounce. Next on the upside for the commodity emerges the recent weekly tops beyond the $72.00 yardstick.

- GBP/JPY touches a fresh multi-year top on Tuesday, albeit lacks follow-through.
- The BoJ’s dovish stance, a positive risk tone undermine the JPY and lends support.
- Looming recession risks act as a headwind for the GBP and cap gains for the cross.
The GBP/JPY cross climbs to a fresh high since December 2015 during the early European session on Tuesday, with bulls now awaiting a sustained move beyond the 183.00 mark before placing fresh bets.
The Japanese Yen (JPY) continues with its relative underperformance in the wake of a big divergence in the monetary policy stance adopted by the Bank of Japan (BoJ) and other major central banks. In fact, the markets seem convinced that BoJ's negative interest-rate policy will remain in place at least until next year. Moreover, BoJ Governor Kazuo Ueda recently ruled out the possibility of any change in ultra-loose policy settings. The, along with a generally positive risk tone, further undermines the safe-haven JPY and acts as a tailwind for the GBP/JPY cross.
Investors turned optimistic after China's Premier Li Qiang told delegates at the World Economic Forum in Tianjin that economic growth in the second quarter will be higher than the first and is expected to reach the annual projected target of around 5%. Apart from this, a modest pickup in demand for the British Pound (GBP), bolstered by the prevalent US Dollar (USD) selling, turns out to be another factor lending support to the GBP/JPY cross. The upside, however, remains capped on the back of fears that the British economy is heading for a recession.
The market concerns mounted sharply following a surprise 50 bps rate hike by the Bank of England (BoE) last Thursday. Investors also seem worried that further increases in rates to combat high inflation will spark a mortgage crisis and raise borrowing costs for government debt. This is holding back traders from placing aggressive bullish bets around the Sterling. Apart from this, speculations that Japanese authorities may intervene again to support the domestic currency further contribute to keeping a lid on any further gains for the GBP/JPY cross.
It is worth recalling that Japan's top currency diplomat Masato Kanda stepped up warnings against the recent weakness in the JPY. Adding to this, Japanese Finance Minister Shunichi Suzuki said we will continue to watch the forex market with a sense of urgency and would respond appropriately if currency moves became excessive. This is holding back traders from placing aggressive bullish bets around the GBP/JPY cross. Nevertheless, the aforementioned fundamental suggests that the path of least resistance for spot prices is to the upside.
Technical levels to watch
The ECB Symposium in Sintra starts today, with an introductory speech by Lagarde plus remarks from other ECB members. Economists at ING analyze the EUR outlook.
Hawkish comments in Sintra expected
Most importantly, the ECB has appeared primarily focused on inflation concerns as opposed to the growth discussion. Sintra was the stage for pivots in the monetary policy message in past editions, but this year, the message may be a reiteration of the hawkish tone we heard after the latest policy meeting: a hike in July is necessary, one in September is up for debate.
President Christine Lagarde delivers her introductory speech this morning, and then we’ll hear from Panetta (a dove) and Schnabel (a hawk).
Ultimately, EUR/USD may not be trading far from 1.0900 at the end of the Sintra summit.
- AUD/USD is aiming to extend its recovery above 0.6720 as the market sentiment is upbeat.
- Investors are hoping that the Fed could pause its policy-tightening spell after hiking interest rates in July.
- Australia’s monthly inflation is seen softening to 6.1% from the prior release of 6.8%.
The AUD/USD pair is looking to stretch its recovery above 0.6720 in the early London session. The Aussie asset has picked strength as investors are hoping that the Chinese economy will report a solid recovery in the second quarter.
S&P500 futures have generated stellar gains in Europe despite recognizing negative cues on Tuesday. The overall market mood has turned extremely positive as investors have started shrugging-off fears of global recession due to higher interest rates from central banks.
The US Dollar Index (DXY) is hovering near day’s low around 102.55 as investors are hoping that the Federal Reserve (Fed) could pause its policy-tightening spell after hiking interest rates in July. However, the investing community is still mixed about the monetary outlook.
Analysts at Rabobank expect the Fed to hike in July, a more moderate pace would imply skipping September and that would leave us with November as the meeting for the second hike.
Meanwhile, the Australian Dollar has shown stellar strength as investors are confident about economic recovery in the second quarter in China after commentary from China's Premier Li Qiang. China’s Li cited that economic growth in the second quarter will be higher than the first and is expected to reach the annual economic growth target of around 5% at the World Economic Forum, as reported by Reuters. He further added we will launch more practical and effective measures in expanding the potential of domestic demand.
It is worth noting that Australia is the leading trading partner of China and an economic recovery in China would also strengthen the Australian Dollar.
Going forward, investors will keep focus on the release of Australia’s monthly Consumer Price Index (CPI) data. As per the expectations, inflation is seen softening to 6.1% from the prior release of 6.8%. This might allow the Reserve Bank of Australia (RBA) to keep monetary policy stable.
The Turkish Lira slid past the 26.00 mark at one point yesterday. Economists at Commerzbank discuss TRY's outlook.
President Tayyip Erdogan’s unilateral powers stand in the way of the confidence fairy
From an international trade partner’s point of view, the policy surrounding forced conversion of exporters’ FX earnings would be a more interesting topic. Of course, banks had to abide by strict limits, and easing those limits will likely mean that they will immediately make use of larger permitted long-FX positions. The hypothesis that this will not happen – that instead, net foreign capital will flow into Turkish assets – because of the ‘confidence fairy’ can only be tested in the medium-term, and that too only if it looks like real, irreversible reforms are being implemented.
Time will tell. But President Tayyip Erdogan’s unilateral powers in this regard, his ability to reverse these new initiatives at any time he chooses, combined with his demonstrated lack of patience with conventional policy, stands in the way of the confidence fairy.
Meanwhile, the Lira is adding to the inflation rate of future months at an alarming rate.
NZD/USD risks a deeper pullback once it breaches 0.6100, according to Economist Lee Sue Ann and Markets Strategist Quek Ser Leang at UOB Group.
Key Quotes
24-hour view: After NZD rebounded from a low of 0.6118 last Friday, we indicated yesterday that “the rebound in oversold conditions suggests NZD is unlikely to weaken further.” We expected NZD to consolidate and trade in a range of 0.6130/0.6190. In line with our expectations, NZD consolidated, albeit in a narrower range than anticipated (0.6139/0.6177). Today, NZD could continue to consolidate, likely between 0.6135 and 0.6180.
Next 1-3 weeks: We highlighted yesterday (26 Jun, spot at 0.6150) that “downward momentum has improved a tad but NZD has to break clearly below 0.6100 before a sustained decline is likely.” We added, “the chance of NZD breaking clearly below 0.6100 is not high for now but it would remain intact as long as NZD stays below 0.6210 (‘strong resistance’ level) in the next few days.” We continue to hold the same view.
- USD/INR prints the first daily loss in three, stays pressured around intraday low of late.
- China induces Asia-Pacific markets’ risk-on mood and weighs on US Dollar.
- Firmer Oil Price, anxiety ahead of ECB Forum and US data prod Indian Rupee buyers.
USD/INR returns to the bear’s radar, following a two-day absence, as it slides to 81.95 heading into Tuesday’s European session. In doing so, the Indian Rupee (INR) pair benefits from optimism in Asia, as well as the US Dollar’s positioning for the key data/events.
That said, the market sentiment remains mildly positive due to the risk-positive headlines surrounding China. Earlier in the day, the People’s Bank of China (PBoC) fixed a lower-than-expected USD/CNY price to weigh on the US Dollar and push back the chatters about the dragon nation’s economic weakness. On the same line was news was the alleged selling of the US Dollar by the Chinese state banks in the offshore currency markets, as well as the Asian lobbyists’ push for easies rules for Chinese equities’ overseas listing.
Furthermore, headlines suggesting an end to fears surrounding Moscow’s mutiny allow the traders to remain optimistic.
Alternatively, firmer Oil price joins the previous day’s upbeat US data and hawkish Fed signals to challenge the USD/INR bears.
WTI crude oil prints the biggest daily gains in three around $70.00 by the press time as hopes of more demand from China jostle with chatters of a Russia-inflicted supply crunch.
Elsewhere, US Dallas Fed Manufacturing Business Index for June improved to -23.2 versus -26.5 expected and -29.1 previous readings. During the last week, the US Core inflation for May allowed Fed Chairman Jerome Powell to remain hawkish but the Purchasing Managers’ Indexes for June weren’t impressive enough. Even so, Federal Reserve Bank of San Francisco President Mary Daly signaled on Friday that two more interest rate increases this year would be a "very reasonable projection."
Against this backdrop, S&P500 Futures print mild gains but the MSCI’s Index of Asia-Pacific shares outside Japan rises 0.80% intraday low while bouncing off the three-week low marked the previous day.
Looking ahead, multiple central bankers’ speeches from the European Central Bank (ECB) Forum will be important to watch for intraday market directions. Also, US Durable Goods Orders for May, expected -at 1.0% versus 1.1% prior, as well as the US Conference Board’s (CB) Consumer Confidence for June, expected to arrive at 103.90 versus 102.30 prior, shouldn’t be missed for intraday USD/INR guide.
Technical analysis
A one-week-old symmetrical triangle, currently between 81.90 and 82.10, restricts immediate USD/INR moves amid sluggish oscillators. It’s worth noting, however, that the pair’s sustained trading below the 200-DMA, around 82.15 by the press time, keeps the bears hopeful.
Economists at ANZ Bank expect the AUD to lead the Kiwi this week ahead of key AU data and next week’s RBA decision.
Another muted session
With no local or AU data scheduled today, it is likely to be another muted session, with the focus on AU CPI data due tomorrow, which will be a key input into next week’s RBA decision, which in turn, is important for the Kiwi by correlation (and clearly crucial for NZD/AUD).
The next 7 days look like they’ll be shaped and led by the AUD given other data due there like Retail Sales, and given how barren the NZ data schedule is, and with the RBNZ on hold.
- EUR/JPY regains upside momentum around the highest levels since September 2008, ECB President Christine Lagarde speech eyed.
- Rising trend channel since early March sustained trading below immediate DMA lures buyers.
- Pullback remains elusive until the quote breaks 151.00 support confluence.
- Overbought RSI conditions may trigger pullback from 157.40 hurdle, if not then 160.00 will be in the spotlight.
EUR/JPY remains on the front foot as it pares the two-day losses at the highest levels since September 2008 heading into Tuesday’s European session. In doing so, the cross-currency pair grinds higher within a rising trend channel established since early March.
That said, the quote prints mild gains around 156.85 by the press time, printing the first daily gains in three, as traders brace for the key speeches from European Central Bank (ECB) Forum, including from President Christine Lagarde.
Hence, the bullish trend channel and hawkish comments from ECB policymaker Matin Kazaks join the broad Euro run-up to favor the pair buyers. However, the overbought RSI (14) line challenges the quote’s further upside as it prods the stated channel’s top line, close to 157.50 by the press time.
If at all the EUR/JPY bulls manage to keep the reins past 157.50, the odds of witnessing a rally toward the 160.00 round figure can’t be ruled out.
On the contrary, pullback moves need validation from the 5-DMA support of 156.55, a break of which can drag the quote to the 154.00 threshold.
However, a convergence of the previously stated bullish channel’s bottom line and a two-month-old horizontal support zone, around 151.00, quickly followed by the 150.00 psychological magnet, will challenge the EUR/JPY bears past 154.00.
Overall, EUR/JPY remains on the bull’s radar ahead of a speech from ECB’s Lagarde even as the upside room appears limited.
EUR/JPY: Daily chart

Trend: Limited upside expected
Economists at ANZ Bank share their USD/CNY forecasts.
Fed’s hiking cycle will be done in the latter part of the year
We do not see the current Yuan weakness as structural.
In the latter part of the year, the Fed’s hiking cycle will be done, and markets will start to price in rate cuts, eroding support for the USD.
The current bout of pessimism towards China’s growth will ease, and we expect portfolio flows to resume. This will set the stage for the Yuan to recover.
USD/CNY (end of period) – 2023 6.80 2024 6.60 2025 6.50
- GBP/USD is showing signs of volatility contraction despite the risk-on mood.
- Cable’s upside is restricted as UK’s high inflation has dampened its outlook while the downside is supported due to USD Index’s correction.
- BoE Bailey is expected to remain hawkish as UK’s core inflation has printed a fresh high of 7.1%.
The GBP/USD pair is trading back and forth in a narrow range of 1.2700-1.2750 in the early London session. The upside in the Cable is restricted as higher inflationary pressures in the United Kingdom have dampened its economic outlook while the downside is supported due to correction in the US Dollar Index (DXY).
The US Dollar Index is hovering near 102.60 as investors are divided about the monetary outlook by the Federal Reserve (Fed). Fed chair Jerome Powell conveyed last week that the central bank will continue tightening interest rates but at a careful pace.
Going forward, the speech from Bank of England (BoE) Governor Andrew Bailey will remain in focus. BoE Bailey is expected to remain hawkish as UK’s core inflation has printed a fresh high of 7.1%.
GBP/USD delivered a steep fall after forming a Double Top chart pattern on an hourly scale around 1.2848. The Cable is showing signs of volatility contraction around 1.2750, which indicates non-directional performance but is followed by wider ticks and heavy volume after a breakout move.
The 200-period Exponential Moving Average (EMA) at 1.2723 has turned straight, portraying a lackluster performance.
Also, the Relative Strength Index (RSI) (14) is oscillating in a 40.00-60.00 range, which indicates that investors await a potential trigger for further action.
Bullish bias for the Cable would strengthen if it manages to climb above the fresh annual high around 1.2850. The upside move would expose the asset to 28 September 2020 high at 1.2930 followed by psychological resistance at 1.3000.
The bullish bias could fade if Cable drops below the previous month’s high around 1.2669, which would drag the asset toward June 12 high at 1.2600. A slippage below the latter would expose the asset to June 09 low at 1.2534.
GBP/USD hourly chart
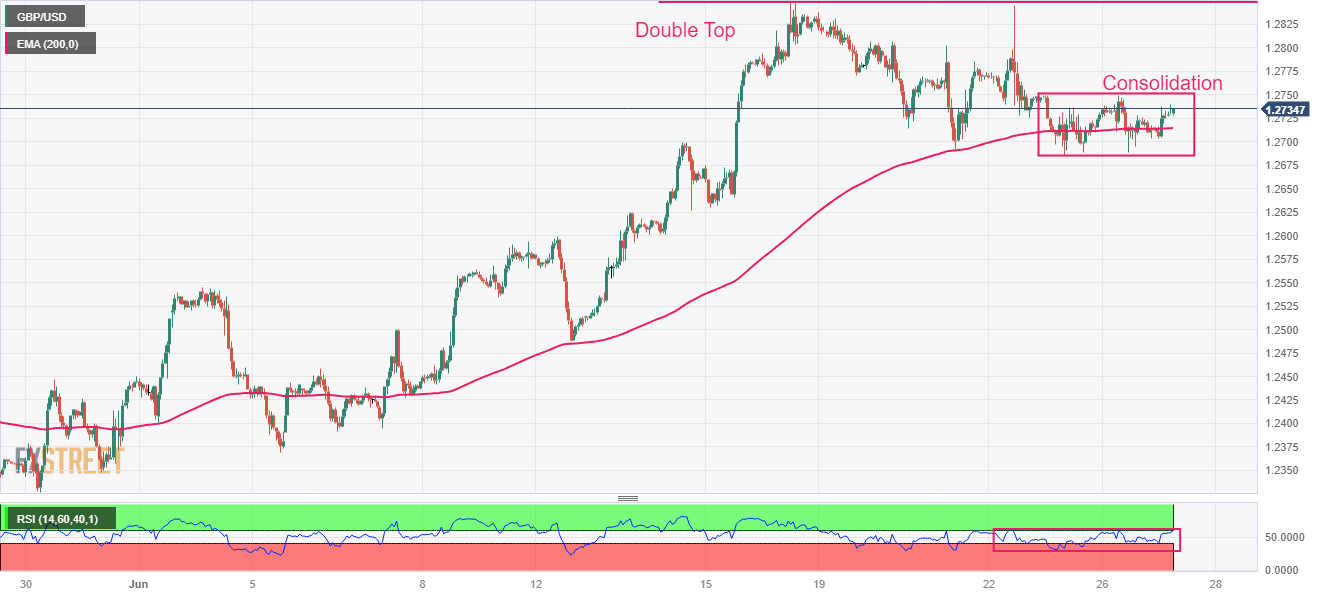
In the view of Economist Lee Sue Ann and Markets Strategist Quek Ser Leang at UOB Group, GBP/USD seems to have now moved into a consolidative phase.
Key Quotes
24-hour view: We highlighted yesterday that “the price movements are likely part of a consolidation phase” and we expected GBP to trade in a range between 1.2690 and 1.2760. GBP then traded in a range of 1.2689/1.2748 before closing little changed at 1.2712 (-0.03%). The price actions offer no fresh clues and we continue to expect GBP to trade in a range, likely between 1.2685 and 1.2750.
Next 1-3 weeks: Our most recent narrative was from last Thursday (22 Jun, spot at 1.2770) wherein the recent GBP strength has ended and it is likely to trade between 1.2650 and 1.2850 for now. Our view was not wrong, as GBP traded in a relatively quiet manner over the past few days. While the underlying tone has softened somewhat, there are no early signs that GBP is ready to head lower in a sustained manner. In other words, we continue to hold the same view for now.
Open interest in gold futures markets increased by around 1.2K contracts on Monday, keeping the erratic performance well and sound, according to preliminary readings from CME Group. Volume, instead, resumed the downtrend and shrank by nearly 42K contracts.
Gold faces interim hurdle above $1940
Gold prices added to recent gains amidst rising open interest on Monday, which is indicative that extra gains lie ahead for the yellow metal in the very near term. Against that, there is an interim hurdle at the 100-day SMA at $1943.
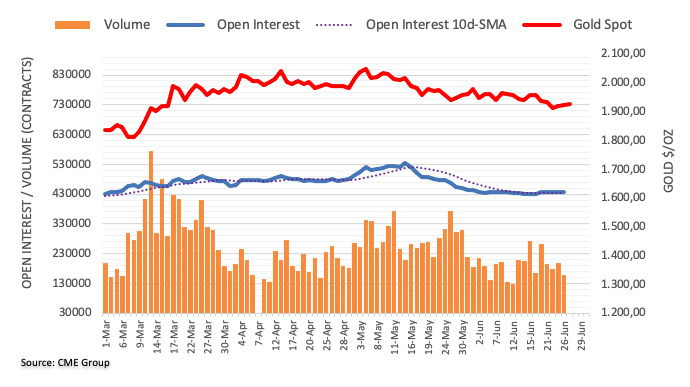
- EUR/USD grinds near intraday high, extends week-start recovery ahead of key catalysts.
- Risk-on mood, China market intervention weigh on US Dollar and favor Euro buyers.
- Hawkish comments from ECB’s Kazaks, Bundesbank’s optimism can help Lagarde to defend rate hikes.
- US Durable Goods Orders, CB Consumer Confidence also eyed for clear directions.
EUR/USD defends the week-start rebound as Euro bulls occupy the driver’s seat heading into Tuesday’s European session. In doing so, the major currency pair remains firmer around 1.0925 as it makes rounds to the intraday top ahead of the key catalysts from the old continent, as well as from the US.
That said, the market’s cautious optimism and the softer US Dollar adds strength to the Euro pair’s upside momentum as the European Central Bank (ECB) Forum kick-starts with the key speeches, after an uneventful official beginning on Monday. Additionally, hawkish comments from the ECB official and optimism by the German bank also allow the EUR/USD bulls to keep the reins.
US Dollar Index (DXY) drops for the second consecutive day, down 0.16% intraday near 102.60 by the press time. That said, the greenback’s gauge versus the six major currencies bears the burden of China-inspired risk-on mood and money market adversaries.
People’s Bank of China’s (PBoC) lower-than-expected fixing of the USD/CNY price joined the alleged selling of the US Dollar by the Chinese state banks in the offshore currency markets to weigh on the USD. Additionally, news the Asian lobbyists are advocating for easies rules for Chinese equities’ listing and headlines suggesting an end to fears surrounding Moscow’s mutiny allow the traders to remain optimistic.
At home, European Central Bank (ECB) policymaker Matin Kazaks recently said that he sees the central bank raising interest rates beyond the July meeting if inflation remains too high. On Monday, Germany's Bundesbank ruled out recession woes in its monthly report by saying that the German economy appears to have bottomed out and is forecast to post a small growth in the Gross Domestic Product (GDP) in the second quarter (Q2).
Against this backdrop, S&P500 Futures print the first daily gains in three by bouncing off the lowest levels in eight days, up 0.30% intraday near 4,382 at the latest, whereas the US 10-year and two-year Treasury bond yields grind higher of late but fail to underpin the USD rebound.
On the contrary, Monday’s upbeat US activity data from Dallas Fed joins the geopolitical fears emanating from Russia, due to Moscow’s tactical flight exercises over the Baltic Sea, weighing on the EUR/USD pair.
It’s worth noting that the looming recession woes on the bloc and the comparatively upbeat US data, as well as the Fed, can challenge the pair buyers should ECB President Christine Lagarde fail to impress the hawks during her speech at the ECB Forum. Additionally, strong US statistics may also exert pressure on the quote. That said, US Durable Goods Orders for May, expected -at 1.0% versus 1.1% prior, as well as the US Conference Board’s (CB) Consumer Confidence for June, expected to arrive at 103.90 versus 102.30 prior, will be important to watch.
Technical analysis
EUR/USD justifies a U-turn from the 50-day Exponential Moving Average (EMA), around 1.0850 by the press time, as well as the bullish MACD signal and upbeat RSI (14) line, to aim for the resistance area surrounding 1.0950 and 1.1000 comprising multiple levels marked since early April.
- USD/JPY is making efforts for a range expansion as BoJ to remain dovish.
- S&P500 futures have added significant gains as investors are digesting fears associated with expectations of higher interest rates from the Fed.
- The US Dollar Index is oscillating around the immediate support of 102.60 ahead of US Durable Goods Orders.
The USD/JPY pair is demonstrating back-and-forth action around 143.50 in the early European session. The asset is expected to deliver a strong upside above 144.00 as investors are hoping that the Bank of Japan (BoJ) will continue to keep the monetary policy dovish in order to attain sustainable 2% inflation.
S&P500 futures have added significant gains in the Asian session as investors are digesting fears associated with expectations of higher interest rates from the Federal Reserve (Fed). US equities faced selling pressure on Monday amid caution inspired by the upcoming quarterly result season. Investors are worried that higher interest rates by the Federal Reserve (Fed) are weighing heavily on economic prospects, which could impact quarterly numbers.
The US Dollar Index (DXY) is oscillating around the immediate support of 102.60. A power-pack action is expected in the USD Index ahead of the release of the United States Durable Goods Orders data (May). As per the consensus, the economic data is seen contracting by 1.0% vs. an expansion of 1.1%. Durable Goods Orders excluding defense is seen stagnant against a contraction of 0.7%.
Scrutiny of the forward economic data indicates that fewer defense orders are going to impact the economic data.
Contrary to the USD Index, the 10-year US Treasury yields have rebounded firmly to 3.74% as investors are hoping that the Fed will continue lifting interest rates as the journey towards 2% inflation is far from over.
Meanwhile, the Japanese Yen is likely to dance to the tunes of the speech from BoJ Governor Kazuo Ueda. A dovish stance is expected from BoJ Ueda as the impact of higher import prices is fading away and the central bank is needed to elevate demand through firmer wages to keep inflation stably above 2%.
Economist Lee Sue Ann and Markets Strategist Quek Ser Leang at UOB Group suggest EUR/USD still risks further downside in the near term.
Key Quotes
24-hour view: After EUR dropped to 1.0841 last Friday and then rebounded, we indicated yesterday that “the sharp rebound from the low in severely oversold conditions suggest EUR is unlikely to weaken further.” We expected EUR to consolidate and trade in a range of 1.0870/1.0940. Our view for EUR to consolidate was not wrong, even though it traded in a much narrower range than expected (1.0886/1.0920). The 34 pips range is the smallest 1-day range this year. Momentum indicators are neutral and today, EUR could continue to consolidate, likely between 1.0890 and 1.0940.
Next 1-3 weeks: There is not much to add to our update from yesterday (26 Jun, spot at 1.0900). As highlighted, the recent 2-week EUR strength has ended. The sharp drop from last Friday suggests EUR is likely to trade with a downward bias. However, 1.0840 is a solid support level and might not be easy to break. It is worth noting that there is another solid support near 1.0805. On the upside, a breach of 1.0970 (no change in ‘strong resistance’ level) would indicate the downward bias has faded.
FX option expiries for June 27 NY cut at 10:00 Eastern Time, via DTCC, can be found below.
- EUR/USD: EUR amounts
- 1.0810 300m
- 1.0835 367m
- 1.0875 592m
- 1.0900 717m
- 1.0915 919m
- 1.1000 612m
- USD/CHF: USD amounts
- 0.9000 469m
- AUD/USD: AUD amounts
- 0.6680-90 638m
- USD/CAD: USD amounts
- 1.3250 460m
- EUR/GBP: EUR amounts
- 0.8600 316m
- 0.8650 401m
- 0.8700 313m
Chinese Premier Li Qiang said on Tuesday, China was still on track to reach its annual growth target of around 5.0% for the year.
Additional quotes
China will introduce more pragmatic measures to expand domestic demand and stimulate market vitality.
China's Q2 growth to be faster than in Q1.
Related reads
- China's state banks seen selling US Dollars offshore to slow Yuan drop – Reuters
- USD/CNH retreats from YTD high to sub-7.2300 as PBoC, Asian lobbyists trigger China optimism
European Central Bank (ECB) policymaker Matin Kazaks said on Tuesday that he sees the central bank raising interest rates beyond the July meeting if inflation remains too high.
He added that market bets on rate cuts in early 2024 are wrong.
Additional comments
Softness of the economy is unlikely to deal with inflation.
There are still strong risks of persistence in inflation.
Don't think that in July we'll be comfortable enough to say "we're done".
Market reaction
EUR/USD is holding the rebound near 1.0925 on Kazaks’ hawkish remarks, adding 0.20% on the day.
- Gold Price remains on the front foot for the third consecutive day.
- XAU/USD bulls attack short-term key hurdle amid softer US Dollar, risk-on mood.
- China manages to propel sentiment and weigh on US Dollar ahead of mid-tier data.
- Upbeat US statistics, hawkish Fedspeak needed to stop the Gold buyers.
Gold Price (XAU/USD) clings to mild gains around the intraday high as it prints a three-day winning streak amid cautiously optimistic markets. In doing so, the precious metal cheers the US Dollar’s positioning for the key data, as well as the risk-positive headlines from China, amid dicey trading hours on Tuesday.
People’s Bank of China’s (PBoC) lower-than-expected fixing of the USD/CNY price joined the alleged selling of the US Dollar by the Chinese state banks in the offshore currency markets to weigh on the USD and propel the Gold Price. Additionally, news the Asian lobbyists are advocating for easies rules for Chinese equities’ listing and headlines suggesting an end to fears surrounding Moscow’s mutiny allow the traders to remain optimistic and favor the Gold Price.
However, Monday’s US activity numbers and hawkish comments from the Fed officials, as well as the last week’s upbeat testimony from Fed Chair Jerome Powell, challenge the Gold buyers. Hence, US Durable Goods Orders for May, expected -1.0% versus 1.1% prior, as well as the US Conference Board’s (CB) Consumer Confidence for June, expected to arrive at 103.90 versus 102.30 prior, will be in the spotlight for intraday directions of the Gold price.
Also read: Gold Price Forecast: XAU/USD buyers needs validation from key resistance near $1,940
Gold Price: Key levels to watch
As per our Technical Confluence Indicator, the Gold Price remains tight-lipped within a short-term trading range even if the bulls occupy the driver’s seat of late.
That said, a convergence of the 5-DMA and Fibonacci 61.8% on one-day puts a floor under the XAU/USD price around $1,925 while Pivot Point one-day R2 and Fibonacci 23.6% on one-day caps the bullion’s immediate upside.
It’s worth noting that the previous monthly low of around $1,932 acts as an extra upside filter to watch for the Gold buyers before challenging the key $1,942 hurdle encompassing the Fibonacci 61.8% in one week. Furthermore, Pivot Point one-week R1 acts as the final defense of the XAU/USD bears around $1,950.
On the flip side, the Gold Price weakness past $1,925 could poke the joint of the Fibonacci 23.6% in one week and the middle band of the Bollinger in four-hour, around $1,921.
In a case where the XAU/USD remains bearish past $1,921, Fibonacci 161.8% on one-day joins Pivot Point one-day S2 and the lower band of the Bollinger on four-hour to offer the final fight to the Gold buyers near $1,910.
Here is how it looks on the tool
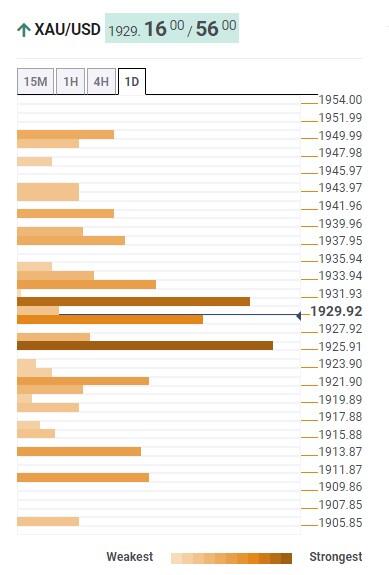
About Technical Confluences Detector
The TCD (Technical Confluences Detector) is a tool to locate and point out those price levels where there is a congestion of indicators, moving averages, Fibonacci levels, Pivot Points, etc. If you are a short-term trader, you will find entry points for counter-trend strategies and hunt a few points at a time. If you are a medium-to-long-term trader, this tool will allow you to know in advance the price levels where a medium-to-long-term trend may stop and rest, where to unwind positions, or where to increase your position size.
- NZD/USD is looking to recapture 0.6200 amid a recovery in the risk-on mood.
- The USD Index had come under pressure as investors are making assessments of economic outlook of the US and monetary outlook by the Fed.
- Fed Powell conveyed that the central bank will continue tightening rates at a ‘careful pace’.
The NZD/USD pair has jumped to near its crucial resistance of 0.6190 in the Asian session. The Kiwi asset is expected to recapture the round-level resistance of 0.6200 as the US Dollar Index (DXY) has continued its correction for the second trading session.
S&P500 futures have added significant gains in Asia, portraying a recovery in the risk appetite of the market participants. US equities witnessed a steep fall on Tuesday as investors were cautious ahead of the quarterly result season which will start sooner. A sell-off in US equities was propelled by weakness in technology stocks as investors are anticipating poor guidance from them.
The US Dollar Index is making efforts for keeping its auction stable above 102.60. The USD Index is going through a rough phase as investors are making an assessment of the economic outlook of the United States and the monetary outlook by the Federal Reserve (Fed).
Where Atlanta Fed Bank President Raphael Bostic favored a continuation of a steady policy as further restriction could damage the strength of the economy, San Francisco Fed Bank President Mary Daly suggested that two more rate hikes this year are a “very reasonable” projection.
While Fed chair Jerome Powell conveyed that the central bank will continue tightening rates at a ‘careful pace’. US manufacturing activities are consistently contracting for the past seven months and no recovery is expected yet.
On the New Zealand Dollar front, New Zealand Minister of Finance (FinMin) Grant Robertson announced a renewal of the Reserve Bank of New Zealand’s (RBNZ) remit and charter on Tuesday. He further added, “MPC now required to achieve and maintain inflation between 1% and 3% rather than keep.”
- WTI crude oil grinds near intraday high after two indecisive daily performances.
- PBoC moves, Asian lobbyist’s favor to Chinese companies and Dollar selling from Beijing favor sentiment and commodities.
- Russia-inflicted supply crunch woes add strength to energy prices.
- API crude oil inventories, US Durable Goods Orders and CB Consumer Confidence will be important to watch for clear directions.
WTI crude oil clings to mild gains near $69.80 amid early Tuesday morning in Europe, after portraying the energy market’s indecision in the last two days. In doing so, the black gold cheers the risk-positive headlines from China, as well as the downbeat US Dollar, ahead of the key US data and weekly private oil inventory numbers from the American Petroleum Institute (API).
The People’s Bank of China’s (PBoC) lower-than-expected fixing of the USD/CNY price joined the alleged selling of the US Dollar by the Chinese state banks in the offshore currency markets triggering the latest risk-on mood, as well as weighing on the US Dollar.
Additionally, headlines from Reuters suggesting the Asian lobby group's push for an easing of Chinese companies' overseas listing also underpins the market's latest optimism about China. “China's new offshore listing rules for domestic companies have left bankers and lawyers who work on listings unsure how to take on liabilities and how to avoid breaching tightened confidentially rules, Asia's largest financial lobby group said on Tuesday,” said Reuters. “Lobby group ASIFMA (the Asia Securities Industry and Financial Markets Association) counts leading global investment banks Goldman Sachs, JPMorgan Chase & Co, and UBS Group among more than 170 financial firms who are association members,” added the news.
On the other hand, the easing of the Russia-linked geopolitical concerns, after the Wagner Group drops Moscow’s mutiny and President Vladimir Putin’s appreciation of the mercenary's decision to retreat also underpin the market’s upbeat sentiment and propel the Oil price. However, fears that Moscow may take steps to push back the doubts about its military strength, especially after the latest mutiny attempt, raise fears of an oil supply crunch and put a floor under the energy benchmark’s price. That said, earlier in the day, the Russian Defense Ministry crossed wires, via Reuters, while confirming tactical flight exercises over the Baltic Sea.
While portraying the mood, S&P500 Futures print the first daily gains in three by bouncing off the lowest levels in eight days, up 0.20% intraday near 4,380 at the latest. That said, the US 10-year and two-year Treasury bond yields remain depressed at around 3.73% and 4.69% by the press time.
Moving forward, US Durable Goods Orders for May, expected -1.0% versus 1.1% prior, as well as the US Conference Board’s (CB) Consumer Confidence for June, expected to arrive at 103.90 versus 102.30 prior, will direct intraday moves of the Oil price. Also important will be the API Weekly Crude Oil Stock, prior -1.246M, for the period ended on June 23.
Technical analysis
Doji candlesticks in the last two days portray the Oil traders’ indecision. As a result, the commodity is likely to remain sidelined between the convergence of the 21-DMA and 10-DMA, around $70.40-45, and the horizontal support zone comprising lows marked since May 31, close to $67.00.
- USD/CHF meets with a fresh supply on Tuesday and is pressured by a modest USD downtick.
- Economic woes, along with geopolitical risks, benefit the CHF and also contribute to the fall.
- The Fed’s hawkish outlook helps limit any deeper USD losses and lends support to the major.
The USD/CHF pair struggles to capitalize on the previous day's goodish rebound from the vicinity of the 0.8900 mark and meets with a fresh supply during the Asian session on Tuesday. Spot prices currently trade around the 0.8950 area and remain below the 50-day Simple Moving Average (SMA) immediate strong hurdle.
The Wagner group's attempted mutiny in Russia over the weekend raises concerns about political instability in the country, which, along with worries about a global economic downturn, continue to underpin the safe-haven Swiss Franc (CHF). The US Dollar (USD), on the other hand, remains on the defensive for the second successive day and turns out to be another factor exerting some pressure on the USD/CHF pair.
That said, the Federal Reserve's (Fed) hawkish outlook is holding back traders from placing aggressive bearish bets around the USD. In fact, the Fed had signalled that borrowing costs may still need to rise as much as 50 bps by the end of this year. Adding to this, Fed Chair Jerome Powell said that the US central bank doesn't see rate cuts happening any time soon and will wait until it is confident that inflation is moving down to the 2% target.
Hence, the market focus remains glued to Powell's remarks at a panel discussion in Sintra on Wednesday, which will be followed by the release of the US Core PCE Price Index - the Fed's preferred inflation gauge on Friday. This, in turn, should play a key role in influencing expectations about the next policy move by the US central bank, which, in turn, will drive the USD demand and provide a fresh directional impetus to the USD/CHF pair.
In the meantime, traders will take cues from Tuesday's US economic docket - featuring Durable Goods Orders, the Conference Board's Consumer Confidence Index, New Home Sales and Richmond Manufacturing Index. Apart from this, the broader risk sentiment might produce short-term trading opportunities around the USD/CHF pair. Meanwhile, the recent repeated failures to find acceptance above the 50-day SMA favour bearish traders.
Technical levels to watch
- Silver price pares intraday gains at the highest level in a week during three-day uptrend.
- Overbought RSI prods XAG/USD bulls below $23.30-25 resistance confluence.
- Sellers need validation from three-day-old resistance line, 100-HMA.
Silver Price (XAG/USD) remains on the front foot at around $22.95 as it remains firmer for the third consecutive day despite the latest retreat from the intraday high. The quote’s latest pullback could be linked to the overbought RSI (14).
However, the looming bull cross on the MACD and the XAG/USD’s sustained trading beyond the 100-Hour Moving Average (HMA), as well as an ascending trend line from Friday, keeps the Silver buyers hopeful.
As a result, the XAG/USD bulls are all set to prod the convergence of the 200-HMA and a three-week-old horizontal resistance area surrounding $23.30.
Following that, the June 13 swing low of around $23.60 and a downward-sloping resistance line from June 09, close to $23.85 at the latest, could challenge the Silver buyers before directing them to the monthly high of around $24.55.
On the contrary, the aforementioned rising support line from Friday, near $22.80 by the press time, restricts the immediate downside of the Silver price. Also acting as a short-term downside filter is the 100-HMA surrounding $22.60.
In a case where the Silver bears keep the reins past $22.60, the odds of witnessing a slump towards the monthly low of near $22.10 and then to the $22.00 round figure can’t be ruled out.
Silver Price: Hourly chart
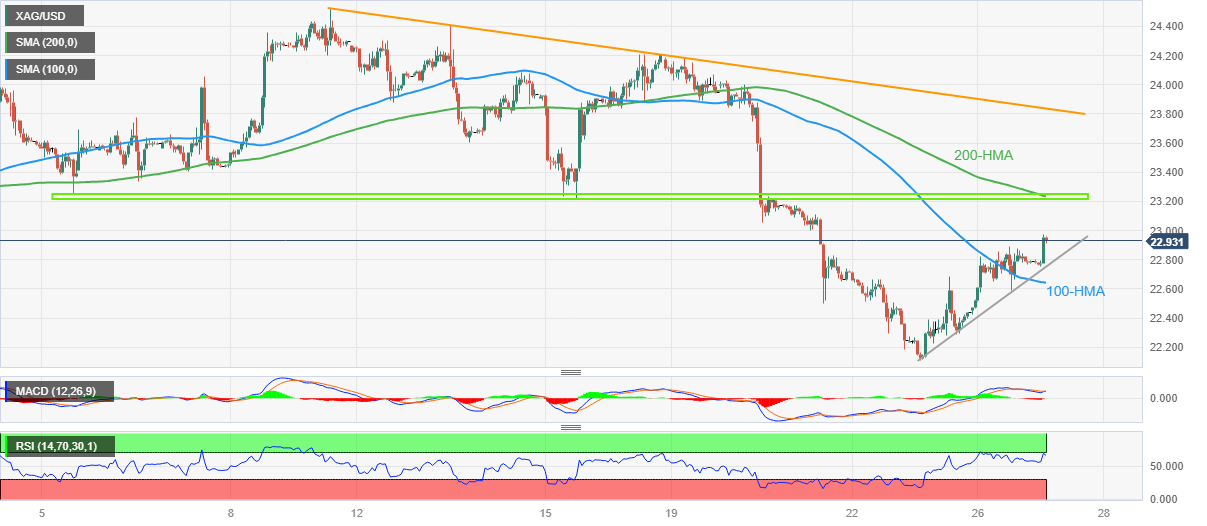
Trend: Limited upside expected
- USD/CAD drifts lower for the second straight day and drops to a fresh YTD low on Tuesday.
- An uptick in Crude Oil prices underpins the Loonie and exerts pressure amid a softer USD.
- Traders now look to the Canadian CPI report and the US macro data for a fresh impetus.
The USD/CAD pair remains under some selling pressure for the second successive day on Tuesday and drops to the 1.3120 area, or its lowest level since September 2022 during the Asian session.
Crude Oil prices edge higher amid worries about potential supply disruptions, led by political instability in Russia, which, to a larger extent, help offset concerns that a global economic downturn will dent fuel demand. This, in turn, is seen underpinning the commodity-linked Loonie, which, along with a modest US Dollar (USD) weakness, exerts some downward pressure on the USD/CAD pair.
The USD Index (DXY), which tracks the Greenback against a basket of currencies, continues with its struggle to make it through the 50-day Simple Moving Average (SMA) and drifts lower for the second straight day. That said, the Federal Reserve's (Fed) hawkish outlook, signalling that borrowing costs may still need to rise as much as 50 bps by the end of this year, lends some support to the buck.
Apart from this, looming recession risks might further contribute to limiting losses for the safe-haven Greenback and act as a tailwind for the USD/CAD pair. Traders might also refrain from placing aggressive bets and prefer to wait for the release of the latest consumer inflation figures from Canada. The crucial CPI report will influence the Bank of Canada's policy outlook and drive the Canadian Dollar.
The US economic docket, meanwhile, features Durable Goods Orders, the Conference Board's Consumer Confidence Index, New Home Sales and Richmond Manufacturing Index. This, along with the broader risk sentiment, could provide a fresh impetus to the safe-haven USD. Apart from this, Oil price dynamics should allow traders to grab short-term opportunities around the USD/CAD pair.
Technical levels to watch
Citing four sources with knowledge of the matter, Reuters reported on Tuesday, China's major state-owned banks reportedly sold US Dollars in the offshore spot foreign exchange market, as authorities sought to steam the recent slide in the Chinese Yuan.
The sources said, "The 7.25 (yuan per dollar) level remains a key threshold," adding that “a breach of the level could quickly send the Yuan to lows last seen in 2022.”
Earlier this Tuesday, the People's Bank of China (PBOC) set the daily Yuan fixing rate stronger than market expectations for the second day in a row.
Related reads
- USD/CNH retreats from YTD high to sub-7.2300 as PBOC, Asian lobbyists trigger China optimism
- S&P Global cuts China 2023 growth forecast to 5.2% from 5.5%
New Zealand (NZ) Minister of Finance (FinMin) Grant Robertson announced a renewal of the Reserve Bank of New Zealand’s (RBNZ) remit and charter on Tuesday.
Key takeaways
“Only minor changes to the monetary policy framework.”
“MPC now required to achieve and maintain inflation between 1% and 3% rather than keep.”
“MPC should communicate key considerations of its decisions with regard to financial risks.”
Speaking on Monday, Japanese Finance Minister Shunichi Suzuki said that he “will respond appropriately if FX moves become excessive.”
Additional quotes
FX should move stably reflecting fundamentals.
Recent FX moves are sharp, one-sided.
Market reaction
The Japanese Yen seems to have found some support from the above comments, as USD/JPY holds lower ground near 140.35, losing 0.10% on the day.
- EUR/USD attracts fresh buying on Tuesday and draws support from a modest USD weakness.
- The lack of follow-through buying beyond the 1.0930-35 confluence warrants some caution.
- A break below last week’s swing low is needed to support prospects for any meaningful slide.
The EUR/USD pair regains some positive traction following the previous day's directionless price moves and spikes to a three-day peak, around the 1.0935 area during the Asian session on Tuesday. Spot prices, however, struggle to capitalize on the move beyond the 100-hour Simple Moving Average (SMA) and retreat a few pips in the last hour.
The US Dollar (USD) remains on the defensive for the second successive day and turns out to be a key factor acting as a tailwind for the EUR/USD pair. That said, the Federal Reserve's (Fed) hawkish outlook helps limit the downside for the USD and caps the upside for the major. Traders also seem reluctant to place aggressive bets around the shared currency in the wake of worries about economic headwinds stemming from rapidly rising borrowing costs. The fears were fueled by the disappointing release of flash Eurozone PMIs on Friday, which now leaves the European Central Bank (ECB) in a policy dilemma.
From a technical perspective, the 100-hour SMA coincides with the 50% Fibonacci retracement level of the recent corrective decline from the monthly peak touched last week. This makes it prudent to wait for sustained strength and acceptance above the 1.0930-1.0935 confluence before positioning for any further gains. With oscillators on the daily chart holding comfortably in the positive territory, the EUR/USD pair might then climb back to the 1.1000 psychological mark. Some follow-through buying has the potential to lift spot prices towards the next relevant hurdle near the 1.1080-1.1090 supply zone.
On the flip side, the 1.0900 mark now seems to protect the immediate downside ahead of the 23.6% Fibo. level, around the 1.0880 region. This is followed by last week's swing low, around the 1.0845 zone. A convincing break below the latter might prompt some technical selling and accelerate the fall towards 100-day SMA, currently around the 1.0810-1.0800 area. Failure to defend the said support levels will shift the bias in favour of bearish traders and make the EUR/USD pair vulnerable to weaken further below the 1.0765-1.0760 intermediate support, towards challenging the 1.0700 round-figure mark.
EUR/USD 1-hour chart
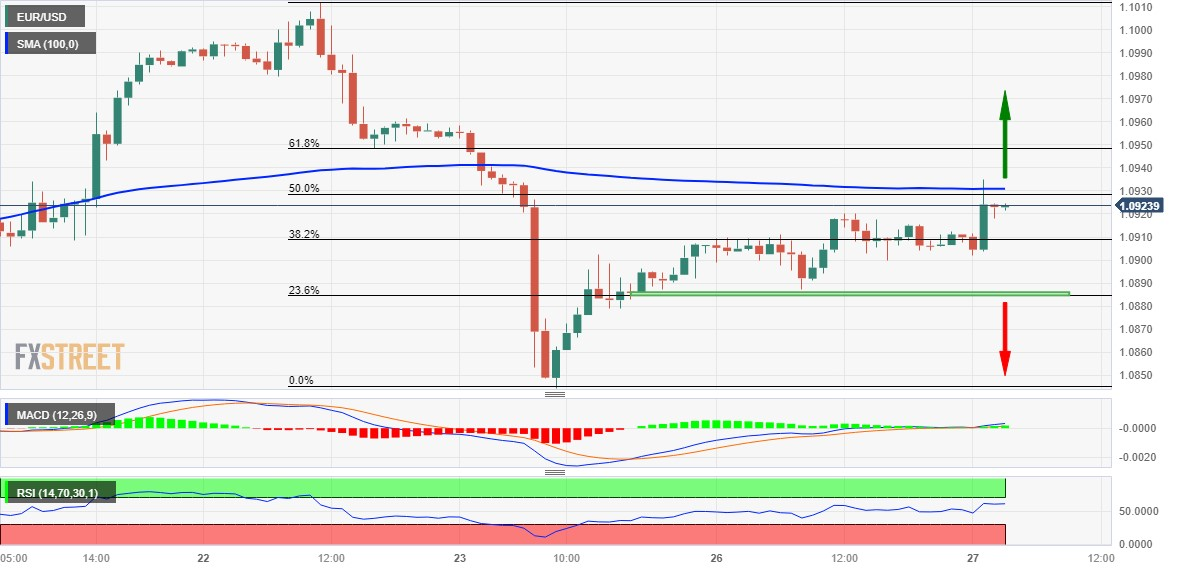
Key levels to watch
- GBP/USD attracts some buying on Tuesday and draws support from a modest USD downtick.
- The Fed’s hawkish outlook helps limit losses for the buck and acts as a headwind for the pair.
- The BoE’s aggressive rate hike fuels recession fears and contributes to capping the Sterling.
The GBP/USD pair continues to show some resilience below the 1.2700 round-figure mark and regains some positive traction during the Asian session on Tuesday. Spot prices, however, lack any follow-through buying or bullish conviction and currently trade around the 1.2720-1.2725 region, up less than 0.10% for the day.
The US Dollar (USD) edges lower for the second successive day and remains below the 50-day Simple Moving Average (SMA) barrier, which, in turn, is seen as a key factor acting as a tailwind for the GBP/USD pair. That said, the Federal Reserve's (Fed) hawkish outlook could act as a tailwind for the buck and cap the major, at least for the time being. It is worth recalling that the Fed earlier this month decided to pause its year-long rate-hiking cycle, though signalled that borrowing costs may still need to rise as much as 50 bps by the end of this year.
Furthermore, Fed Chair Jerome Powell reiterated that the central bank will likely raise interest rates again this year, albeit at a "careful pace", to contain high inflation. Powell, during his two-day semi-annual congressional testimony, added that the Fed doesn't see rate cuts happening any time soon and is going to wait until it is confident that inflation is moving down to the 2% target. Apart from this, worries about a global economic downturn might continue to benefit the Greenback's relative safe-haven status and keep a lid on the GBP/USD pair.
Furthermore, fears that the British economy is heading for recession mounted sharply following a surprise 50 bps rate hike by the Bank of England (BoE) last Thursday. Investors also seem worried that further increases in interest rates to combat high inflation will spark a mortgage crisis and raise borrowing costs for government debt. This might further hold back traders from placing aggressive bullish bets around the British Pound, warranting some caution before positioning for any meaningful appreciating move for the GBP/USD pair, at least for the time being.
There isn't any relevant market-moving economic data due for release from the UK on Tuesday. Meanwhile, the US economic docket features Durable Goods Orders, the Conference Board's Consumer Confidence Index, New Home Sales and Richmond Manufacturing Index. The data might influence the USD price dynamics and provide some impetus to the GBP/USD pair later during the early North American session. The focus will then shift to speeches by Fed Chair Jerome Powell and BoE Governor Andrew Bailey at a panel discussion in Sintra on Wednesday.
Technical levels to watch
- USD/CNH reverses from seven-month high, prints the first daily loss in four.
- Lower-than-expected PBoC USD/CNY Fix, push for easing of Chinese companies’ offshore listing rules propel market sentiment.
- US Durable Goods Orders, CB Consumer Confidence will decorate economic calendar.
- Cautious optimism underpins Yuan buying despite looming economic fears about China growth.
USD/CNH remains pressured around the intraday low of 7.2138, near 7.2240 by the press time, as it prints the first daily loss in three while reversing from the highest level since November 2022 during early Tuesday.
In doing so, the offshore Chinese Yuan (CNH) pair benefits from the People’s Bank of China’s (PBoC) latest move, as well as optimism about China's economy, as well as the risk-positive headlines from the Asian lobbyists.
That said, PBoC’s lower-than-expected fixing of the USD/CNY price recently pushed back the fears surrounding the world’s second-biggest economy. That said, the PBoC set the USD/CNY central rate at 7.2098 on Tuesday, versus the previous fix of 7.2056 and market expectations of 7.2194. It's worth noting that the USD/CNY closed near 7.2425 the previous day. With this, the Chinese central bank sets the onshore Yuan (CNY) rate at the lowest level since November 2022.
On the same line, headlines from Reuters suggesting the Asian lobby group's push for an easing of Chinese companies' overseas listing also underpins the market's latest optimism about China, which in turn weighs on the USD/CNH price.
“China's new offshore listing rules for domestic companies have left bankers and lawyers who work on listings unsure how to take on liabilities and how to avoid breaching tightened confidentially rules, Asia's largest financial lobby group said on Tuesday,” said Reuters.
“Lobby group ASIFMA (the Asia Securities Industry and Financial Markets Association) counts leading global investment banks Goldman Sachs, JPMorgan Chase & Co, and UBS Group among more than 170 financial firms who are association members,” added the news.
Elsewhere, the easing of the Russia-linked geopolitical concerns, after the Wagner Group drops Moscow’s mutiny and President Vladimir Putin praised the mercenary's decision to retreat, also allow traders to remain optimistic and weigh on the USD/CNH price.
Amid these plays, S&P500 Futures print the first daily gains in three by bouncing off the lowest levels in eight days, up 0.20% intraday near 4,380 at the latest. That said, the US 10-year and two-year Treasury bond yields remain depressed at around 3.73% and 4.69% by the press time.
Looking forward, US Durable Goods Orders for May, expected -1.0% versus 1.1% prior, as well as the US Conference Board’s (CB) Consumer Confidence for June, expected to arrive at 103.90 versus 102.30 prior, will direct intraday moves of the USD/CNH pair. Additionally, important will be European Central Bank (ECB) President Christine Lagarde’s speech at the ECB Forum.
Technical analysis
Although the overbought RSI conditions challenge the USD/CNH buyers below the late 2022 peak of around 7.2600, a two-month-old rising trend channel, currently between 7.2640 and 7.1690, suggests further upside of the offshore Chinese Yuan pair.
| Raw materials | Closed | Change, % |
|---|---|---|
| Silver | 22.785 | 1.61 |
| Gold | 1923.08 | 0.01 |
| Palladium | 1307.5 | 1.57 |
- Market sentiment remains dicey as traders struggles for clear directions amid light calendar, mixed news about China, Russia.
- S&P500 Futures rebound from one-week low to print the first daily gains in three.
- US Treasury bond yields drop after China markets’ open.
- Traders brace for US Durable Goods Orders, CB Consumer Confidence and ECB President Lagarde’s speech.
Risk appetite remains dicey, slightly positive, as market players seek more clues after a sluggish start of the week. That said, the recent opening of Chinese markets for Tuesday’s trading, however, weighed on the US Treasury bond yields and the US Dollar as markets prepare for a busy day ahead.
While portraying the mood, S&P500 Futures print the first daily gains in three by bouncing off the lowest levels in eight days, up 0.20% intraday near 4,380 at the latest. That said, the US 10-year and two-year Treasury bond yields remain depressed at around 3.73% and 4.69% by the press time.
It should be noted that the US Dollar Index (DXY) remains pressured for the second consecutive day, mildly offered near 102.60 at the latest, whereas prices of Gold and Crude Oil print minor gains around $1,930 and $70.00 amid cautious optimism at the latest.
People’s Bank of China’s (PBoC) lower-than-expected fixing of the USD/CNY price recently pushed back the fears surrounding the world’s second-biggest economy. Furthermore, the easing of the Russia-linked geopolitical concerns, after the Wagner Group drops Moscow’s mutiny and President Vladimir Putin praises the mercenaries decision to retreat. Additionally, headlines from Reuters suggesting the Asian lobby group's push for easing of Chinese companies' overeseas listing also underpins the market's latest optimism.
Apart from that, the trader’s preparations for the key US Durable Goods Orders for May, expected -1.0% versus 1.1% prior, as well as the US Conference Board’s (CB) Consumer Confidence for June, expected to arrive at 103.90 versus 102.30 prior, also seem to have favored the optimists of late. Also important will be European Central Bank (ECB) President Christine Lagarde’s speech at the ECB Forum.
The reason could also be linked to the previous day’s upbeat US data and hawkish Fed signals. That said, US Dallas Fed Manufacturing Business Index for June improved to -23.2 versus -26.5 expected and -29.1 previous readings. During the last week, the US Core inflation for May allowed Fed Chairman Jerome Powell to remain hawkish but the Purchasing Managers’ Indexes for June weren’t impressive enough. Even so, Federal Reserve Bank of San Francisco President Mary Daly signaled on Friday that two more interest rate increases this year would be a "very reasonable projection."
Contrary to the aforementioned catalysts, the fears of higher rates and economic slowdown seem to check the optimists amid a dicey Asian session.
Also read: Forex Today: Steady markets ahead of central bankers and inflation data
- AUD/USD regains positive traction on Tuesday and draws support from a softer USD.
- Repeated failures to find acceptance below the 50% Fibo. level warrant caution for bears.
- A sustained strength beyond the 0.6730 area will negate any near-term negative outlook.
The AUD/USD pair once again find some support near the 50% Fibonacci retracement level of the May-June rally and attracts fresh buying during the Asian session on Tuesday. Spot prices surge back above the 0.6700 round figure in the last hour, though any meaningful upside still seems elusive.
The US Dollar (USD) continues with its struggle to make it through the 50-day Simple Moving Average (SMA) and remains on the defensive for the second straight day, which, in turn, is seen lending some support to the AUD/USD pair. That said, the Federal Reserve's (Fed) hawkish outlook, along with worries about a global economic downturn, could act as a tailwind for the safe-haven buck and cap gains for the risk-sensitive Aussie.
From a technical perspective, bearish traders need to wait for a sustained break and acceptance below the 50% Fibo. level before placing fresh bets. Given that oscillators on the daily chart are holding in the negative territory, the AUD/USD pair might then accelerate the fall towards the 61.8% Fibo. support, around the 0.6625 region. This is followed by the 0.6600 mark, which if broken decisively will set the stage for a further depreciating move.
On the flip side, any subsequent move up is more likely to confront stiff resistance near the 38.2% Fibo. level, around the 0.6730 zone. A sustained strength beyond will suggest that the recent corrective decline from the 0.6900 mark, or a nearly four-month high, has run its course and shift the bias in favour of bullish traders. The AUD/USD pair might then aim to reclaim the 0.6800 round figure, which coincides with the 23.6% Fibo. level.
AUD/USD daily chart
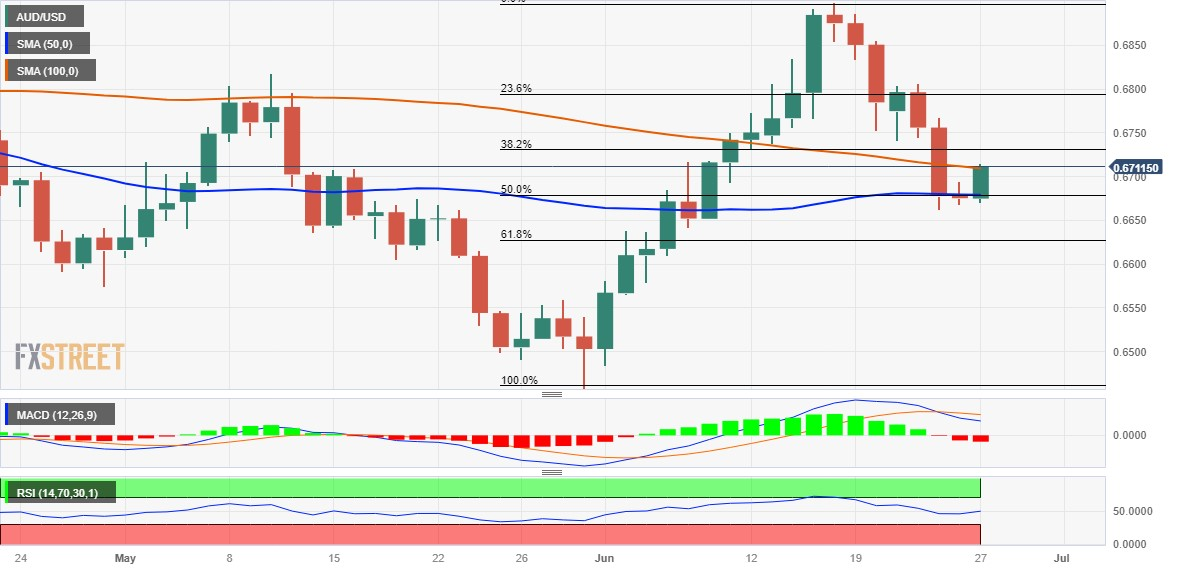
Key levels to watch
- Natural Gas Price seesaws as bulls take a breather at the highest levels since March.
- Overbought RSI, looming bear cross on MACD suggests XNG/USD profit-booking.
- Previous resistance line, $2.70 support confluence challenge XNG/USD bears.
Natural Gas Price (XNG/USD) seesaws at the highest levels since early March, probing a four-day uptrend as it prints energy trader’s indecision around $2.87 amid early Tuesday.
In doing so, the energy instrument justifies the overbought RSI (14), as well as the impending bear cross on the MACD indicator, while teasing the short-term sellers of the Natural Gas.
However, the XNG/USD remains within a 13-day-old bullish trend channel, as well as prints a successful upside break of the previous resistance line stretched from May 19. Additionally keeping the Natural Gas buyers hopeful is the commodity’s sustained trading beyond the 200-SMA.
Hence, the quote’s latest inaction around $2.87 may tease the intraday sellers amid downbeat oscillators, namely the RSI and MACD, but the Natural Gas price remains on the buyer’s radar unless the quote drops below the 200-SMA support of $2.49.
That said, the short-term sellers may take entry on a clear downside break of the previous day’s low surrounding $2.82.
Following that, the resistance-turned-support line of near $2.75 can challenge the XNG/USD bears before directing them to the convergence of the aforementioned bullish channel’s bottom line and the 50-SMA, around $2.70 at the latest.
Meanwhile, the latest peak of $2.93 and the $3.00 round figure can lure immediate Natural Gas buyers. However, the previously stated rising channel’s top line near $3.02 can challenge the XNG/USD bulls afterward.
Natural Gas Price: Four-hour chart
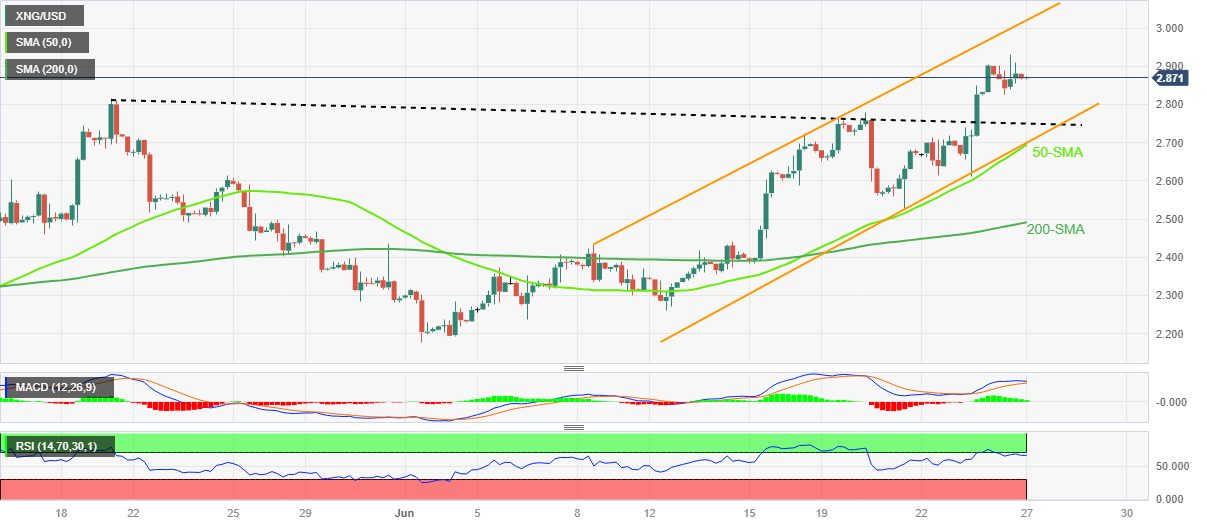
Trend: Pullback expected
- Gold price remains confined in a narrow range just above the multi-month low set last week.
- More hawkish central banks continue to act as a headwind for the non-yielding yellow metal.
- Economic woes lend some support to the safe-haven XAU/USD and help limit the downside.
Gold price struggles to gain any meaningful traction on Tuesday and oscillates in a narrow trading band, just above the $1,920 level through the Asian session. The XAU/USD, meanwhile, remains well within the striking distance of over a three-month low touched last Friday and seems vulnerable to below the 100-day Simple Moving Average (SMA).
Hawkish major central banks cap the upside for Gold price
The initial market reaction to the aborted mutiny by armed mercenaries in Russia over the weekend turns out to be short-lived in the wake of the hawkish stance adopted by major central banks, which continues to cap the non-yielding Gold price. It is worth recalling that the Reserve Bank of Australia (RBA) and the Bank of Canada (BoC) delivered a surprise 25 basis points (bps) rate hike earlier this month, while the European Central Bank (ECB) last week lifted rates to the highest level in 22 years. Moreover, the Bank of England (BoE), the Swiss National Bank (SNB) and Norges Bank hiked their benchmark interest rates last Thursday.
Focus shifts to the US PCE Price Index on Friday
The Federal Reserve (Fed) has also signalled that borrowing costs may still need to rise as much as 50 bps by the end of this year. Adding to this, Fed Chair Jerome Powell, during his two-day congressional testimony last week, said that the US central bank doesn't see rate cuts happening any time soon and will wait until it is confident that inflation is moving down to the 2% target. Hence, the focus will remain glued to the release of the United States (US) Personal Consumption Expenditures (PCE) Price Index, or the Fed's preferred inflation gauge on Friday, which might influence expectations about the next policy move.
US macro data eyed for fresh impetus ahead of central bank speakers
Investors this week will further take cues from speeches by ECB President Christine Lagarde, BoE Governor Andrew Bailey, Fed Chair Jerome Powell and Bank of Japan (BoJ) Governor Kazuo Ueda at a panel discussion in Sintra on Wednesday. In the meantime, Tuesday's US economic docket - featuring Durable Goods Orders, the Conference Board's Consumer Confidence Index, New Home Sales and Richmond Manufacturing Index - will be looked upon for some impetus around Gold price. The downside, meanwhile, seems limited in the wake of looming recession risks, which tend to benefit the safe-haven XAU/USD.
Looming recession risks help limit losses for Gold price
Market participants seem worried about economic headwinds stemming from rapidly rising borrowing costs. The fears were further fueled by the fact that S&P Global on Sunday said that it has cut its 2023 growth forecast for China to 5.2% from 5.5%. The rating agency expects a recovery in Asia's largest economy to continue, albeit at an "uneven" pace. This, in turn, might hold back traders from placing aggressive bearish bets around the Gold price, at least for the time being. Nevertheless, the lack of any meaningful buying suggests that the recent downtrend might still be far from being over and favours bearish traders.
Gold price technical outlook
From a technical perspective, nothing seems to have changed much for the Gold price and the near-term bias still seems tilted in favour of bearish traders. That said, it will still be prudent to wait for some follow-through selling below the multi-month low, around the $1,910 area touched on Friday, before positioning for any further losses. The XAU/USD might then slide below the $1,900 round-figure mark, towards testing the very important 200-day SMA around the $1,840 region, with some intermediate support near the $1,876-$1,875 zone.
On the flip side, any meaningful recovery is more likely to attract fresh sellers and remain capped near the 100-day SMA support breakpoint, currently pegged around the $1,942-$1,943 region. This should now act as a pivotal point, which if cleared decisively might trigger a short-covering rally. The Gold price might then accelerate the momentum towards the $1,962-$1,964 region. This is closely followed by the $1,970-$1,972 resistance zone and the $1,983-$1,985 hurdle, above which the XAU/USD might aim to surpass the $2,000 psychological mark and climb to the $2,010-$2,012 barrier.
Key levels to watch
People’s Bank of China (PBoC) set the USD/CNY central rate at 7.2098 on Tuesday, versus previous fix of 7.2056 and market expectations of 7.2194. It's worth noting that the USD/CNY closed near 7.2425 the previous day. With this, the Chinese central bank sets the onshore Yuan (CNY) rate at the lowest levels since November 2022.
Together with the USD/CNY fix, the PBoC also said that it will inject 219 billion Yuan via 7-Day Reverse Repos at 1.9% in Open Market Operations (OMOs).
Earlier in the day, Reuters conveyed that the Chinese central bank will conduct five bullion Yuan 3-month central bank bill swap on June 27.
About PBOC fix
China maintains strict control of the yuan’s rate on the mainland.
The onshore yuan (CNY) differs from the offshore one (CNH) in trading restrictions, this last one is not as tightly controlled.
Each morning, the People’s Bank of China (PBOC) sets a so-called daily midpoint fix, based on the yuan’s previous day's closing level and quotations taken from the inter-bank dealer.
- US Dollar Index picks up bids to reverse the week-start losses amid sluggish session.
- Market’s cautious mood ahead of the key US data, mixed geopolitical concerns underpin US Dollar demand.
- Fed talks, speech from ECB President Lagarde and second-tier US data also eyed for clear directions.
- Downbeat prints of US Durable Goods Orders, CB Consumer Confidence can allow DXY to pare the first weekly gain in four.
US Dollar Index (DXY) picks up bids to refresh its intraday high near 102.80 as it pares the previous day’s losses amid a sluggish Tuesday morning in Asia. In doing so, the greenback’s gauge versus the six major currencies portrays the market’s preference for the haven assets amid mixed concerns while also suggesting the cautious mood ahead of the key US data.
While portraying the mood, S&P500 Futures print mild gains despite the downbeat closing of the Wall Street benchmarks and the US Treasury bond yields. That said, the bond coupons are mostly sluggish of late.
Apart from the trader’s rush towards the US Dollar amid the market’s indecision, the previous day’s upbeat US data and optimism surrounding the Federal Reserve (Fed) also underpin the DXY’s run-up. On Monday, US Dallas Fed Manufacturing Business Index for June improved to -23.2 versus -26.5 expected and -29.1 previous readings. During the last week, the US Core inflation for May allowed Fed Chairman Jerome Powell to remain hawkish but the Purchasing Managers’ Indexes for June weren’t impressive enough. Even so, Federal Reserve Bank of San Francisco President Mary Daly signaled on Friday that two more interest rate increases this year would be a "very reasonable projection."
It’s worth noting that market fears emanating from Russia and China join broad pessimism about the concerns that the global economic recovery will fade to also allow the US Dollar Index to grind higher.
Looking ahead, the US Dollar Index traders should closely watch the US Durable Goods Orders for May, expected -1.0% versus 1.1% prior, as well as the US Conference Board’s (CB) Consumer Confidence data for June, expected to arrive at 103.90 versus 102.30 prior, for clear directions. Also important will be European Central Bank (ECB) President Christine Lagarde’s speech at the ECB Forum. Should the US data arrive as softer and ECB’s Lagarde manage to convince the policy hawks, the DXY may witness a pullback.
Technical analysis
A sustained break of a three-week-old descending resistance line, now support around 102.30, directs US Dollar Index (DXY) toward the 100-DMA hurdle surrounding 103.10.
- NZD/USD struggles to defend the previous day’s recovery within one-week-old bearish channel, stays below 50-SMA.
- Steady MACD, failure to keep the bounce off monthly support line tease Kiwi pair sellers.
- Bulls remain off the table unless witnessing clear break of 0.6230.
NZD/USD edges lower past 0.6200 despite the week-start rebound, pressured around 0.6165 amid Tuesday’s Asian session. In doing so, the Kiwi pair stays within a one-week-old bearish channel, as well as remains below the 50-SMA hurdle, while fading the previous week’s rebound from the monthly support line.
It’s worth noting that the steady conditions of the RSI (14) line around 50.0 levels also keep the Kiwi pair sellers hopeful despite the latest corrective bounce.
That said, an upward-sloping trend line from May 31, close to 0.6135 at the latest, appears immediate support for the NZD/USD sellers to watch during the quote’s fresh downside.
Following that, the stated channel’s bottom line surrounding 0.6110 and the 0.6100 round figure may prod the bears.
In a case where the Kiwi pair drops below 0.6100, multiple supports around 0.6030-25 may prod the sellers before directing them to the 0.6000 psychological magnet and the yearly low marked in May around 0.5985.
On the contrary, the 50-SMA and the aforementioned bearish channel’s top line, respectively near 0.6185 and 0.6210 restrict the short-term recovery of the NZD/USD pair.
However, the Kiwi buyers should remain cautious unless witnessing a clear upside break of the descending resistance line from May 19, close to 0.6230 at the latest.
NZD/USD: Four-hour chart
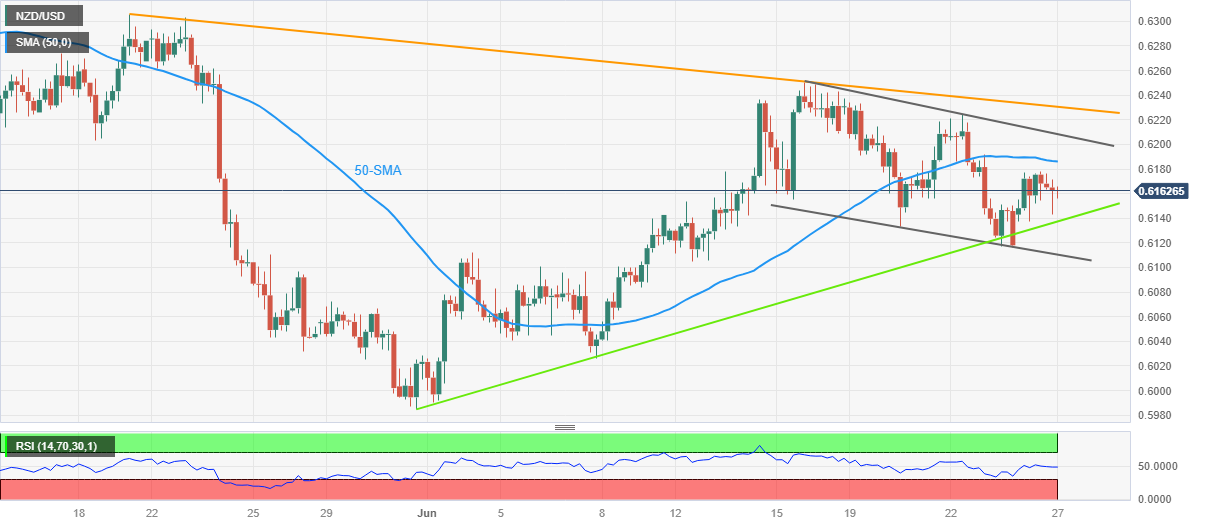
Trend: Bearish
- USD/JPY struggles to gain traction and oscillates in a range for the second straight day on Tuesday.
- Intervention fears, economic woes benefit the safe-haven JPY and act as a headwind for the pair.
- The Fed-BoJ policy divergence continues to lend support and limit the downside, at least for now.
The USD/JPY pair extends its sideways consolidative price move for the second successive day on Tuesday and oscillates in a narrow band through the Asian session. Spot prices, however, remain well within the striking distance of the YTD peak touched last Friday and currently trade just below mid-143.00s.
The Japanese Yen (JPY) continues to draw some support from speculations that authorities will respond to any excessive moves in the currency market. Apart from this, worries about a global economic downturn benefit the JPY's relative safe-haven status, which, along with subdued US Dollar (USD) demand, acts as a headwind for the USD/JPY pair. The downside, however, remains cushioned in the wake of a big divergence in the monetary policy stance adopted by the Bank of Japan (BoJ) and other major central banks, including the Federal Reserve (Fed).
It is worth recalling that BoJ Governor Kazuo Ueda recently ruled out the possibility of any change in ultra-loose policy settings. In contrast, Fed Chair Jerome Powell, during his two-day congressional testimony last week, reiterated that the central bank will likely raise interest rates again this year, albeit at a "careful pace", to contain high inflation. Powell added that the Fed doesn't see rate cuts happening any time soon and is going to wait until it is confident that inflation is moving down to the 2% target. This, in turn, is seen lending support to the USD/JPY pair.
Traders, however, seem reluctant to place aggressive bullish bets, rather prefer to wait on the sidelines ahead of speeches by Fed Chair Jerome Powell and BoJ Governor Kazuo Ueda on Wednesday. Investors this week will also confront the release of the US Core PCE Price Index - the Fed's preferred inflation gauge on Friday. In the meantime, Tuesday's US economic docket - featuring Durable Goods Orders, the Conference Board's Consumer Confidence Index, New Home Sales and Richmond Manufacturing Index - will be looked upon for some impetus around the USD/JPY pair.
Technical levels to watch
| Index | Change, points | Closed | Change, % |
|---|---|---|---|
| NIKKEI 225 | -82.73 | 32698.81 | -0.25 |
| Hang Seng | -95.84 | 18794.13 | -0.51 |
| KOSPI | 12.1 | 2582.2 | 0.47 |
| ASX 200 | -20.5 | 7078.7 | -0.29 |
| DAX | -16.88 | 15813.06 | -0.11 |
| CAC 40 | 20.93 | 7184.35 | 0.29 |
| Dow Jones | -12.72 | 33714.71 | -0.04 |
| S&P 500 | -19.51 | 4328.82 | -0.45 |
| NASDAQ Composite | -156.74 | 13335.78 | -1.16 |
“The Bank of England (BoE) will raise borrowing costs 50 basis points (bps) higher than was thought only two weeks ago, in two quarter-point moves, as elevated inflation proves tricker to bring down than had been expected,” per the latest survey of 52 economists by Reuters.
It’s worth noting that the June 14 poll suggested that the BoE policymakers will draw a halt at 5.00% next quarter.
“A cut in borrowing costs was not expected until the second quarter of next year,” added the survey respondents.
Key findings
Markets are now pricing in a terminal rate of 6.00% and while that is higher than the poll median, the vast majority of respondents to an extra question, 31 of 34, said the bigger risk to their terminal forecast was that it peaked higher than they currently expect.
Only one economist had a 6.00% peak as their base case.
Over 95% of common contributors to this poll and the June 14 survey, 43 of 45, raised their Q3 forecasts.
Forty of 52 poll participants said the Bank would dial down the pace to 25 basis points on August 3 but gave a high median 40% chance of another 50 basis point lift.
Also read: GBP/USD Price Analysis: Slides towards 1.2690 horizontal support within weekly triangle
| Pare | Closed | Change, % |
|---|---|---|
| AUDUSD | 0.66732 | -0.05 |
| EURJPY | 156.446 | -0.1 |
| EURUSD | 1.0906 | 0.03 |
| GBPJPY | 182.333 | -0.22 |
| GBPUSD | 1.27106 | -0.09 |
| NZDUSD | 0.61618 | 0.28 |
| USDCAD | 1.31502 | -0.22 |
| USDCHF | 0.89517 | -0.09 |
| USDJPY | 143.458 | -0.12 |
USD/MXN stays defensive around 17.13, despite recently picking up bids amid the early hours of Tuesday’s Asian session. It’s worth noting that the Mexican Peso (MXN) pair dropped in the last two consecutive days to reverse the mid-June recovery from the lowest levels since 2016.
In doing so, the Mexican Peso (MXN) pair justifies the options market signals as traders brace for the US Durable Goods Orders for May and Conference Board’s (CB) Consumer Confidence data.
That said, the one-month Risk Reversal (RR) of the USD/MXN pair, a measure of the spread between call and put prices, drops for the fourth consecutive day to -0.043 by the end of Monday’s North American trading session. On the same line, the weekly RR has been down for the last five consecutive weeks.
The Mexican Peso pair’s latest consolidation might have also taken clues from the pre-event consolidation, as well as the market’s latest risk-off mood that underpinned the US Dollar’s haven demand.
Also read: USD/MXN stumbles further amidst strong Mexican Peso, Fed Rate cut bets cool off


© 2000-2026. Уcі права захищені.
Cайт знаходитьcя під керуванням TeleTrade DJ. LLC 2351 LLC 2022 (Euro House, Richmond Hill Road, Kingstown, VC0100, St. Vincent and the Grenadines).
Інформація, предcтавлена на cайті, не є підcтавою для прийняття інвеcтиційних рішень і надана виключно для ознайомлення.
Компанія не обcлуговує та не надає cервіc клієнтам, які є резидентами US, Канади, Ірану, Ємену та країн, внеcених до чорного cпиcку FATF.
Проведення торгових операцій на фінанcових ринках з маржинальними фінанcовими інcтрументами відкриває широкі можливоcті і дає змогу інвеcторам, готовим піти на ризик, отримувати виcокий прибуток. Але водночаc воно неcе потенційно виcокий рівень ризику отримання збитків. Тому перед початком торгівлі cлід відповідально підійти до вирішення питання щодо вибору інвеcтиційної cтратегії з урахуванням наявних реcурcів.
Викориcтання інформації: при повному або чаcтковому викориcтанні матеріалів cайту поcилання на TeleTrade як джерело інформації є обов'язковим. Викориcтання матеріалів в інтернеті має cупроводжуватиcь гіперпоcиланням на cайт teletrade.org. Автоматичний імпорт матеріалів та інформації із cайту заборонено.
З уcіх питань звертайтеcь за адреcою pr@teletrade.global.
переклади