- Analytics
- News and Tools
- Market News
Новини ринків
- GBP/USD trades sideways around 1.2685 on the consolidation of USD.
- The US January Durable Goods Orders arrived at 6.1% versus -0.3% prior; Consumer Confidence Index came in worse than expected.
- BoE’s Ramsden said inflationary pressures persisted, and he needed more data before adjusting the policy stance.
- Investors await the US GDP Q4 growth numbers and the BoE’s Mann speech on Wednesday.
The GBP/USD pair trades in a tight range below the 1.2700 psychological mark during the early Asian session on Wednesday. The US GDP growth number for the fourth quarter will be due later in the day ahead of the Bank of England's (BoE)’s Catherine Mann speech. The major pair currently trades near 1.2685, up 0.03% on the day.
On Tuesday, US January Durable Goods Orders fell 6.1% from a 0.3% drop in December, worse than the market estimation of a 4.5% decline. The Goods New Orders ex-defense, a proxy for capital spending, rose +0.1% MoM, in line with expectations. Finally, the US Consumer Confidence Index by the Conference Board came in at 106.7, below the market consensus of 115.0.
Investors bet that the first rate cut will come in the June meeting, down from expectations for a rate cut as early as March, according to the CME FedWatch Tool. The US Personal Consumption Expenditure Index (PCE) for January will be due on Thursday and might offer some hints about the trajectory of inflation over time. The PCE inflation figure is expected to rise 0.3% MoM in January from 0.2% in December.
On the other hand, the Bank of England (BoE) Deputy Governor Dave Ramsden said on Tuesday that inflationary pressures persisted, and he needed more data about how long they were expected to last before changing the BoE's policy stance. The BoE forecasts that inflation will return to its 2% target in the second quarter of 2024 but will subsequently rise to around 2.75% later this year. The financial markets anticipate the UK central bank to begin cutting interest rates in August.
Looking ahead, market players will keep an eye on the US Gross Domestic Product Annualized for the fourth quarter (Q4) and preliminary Goods Trade Balance. Also, the Fed’s Bostic, Collins, Williams, and BoE’s Mann are set to speak later on Wednesday. Traders will take more cues from the data and find trading opportunities around the GBP/USD pair.
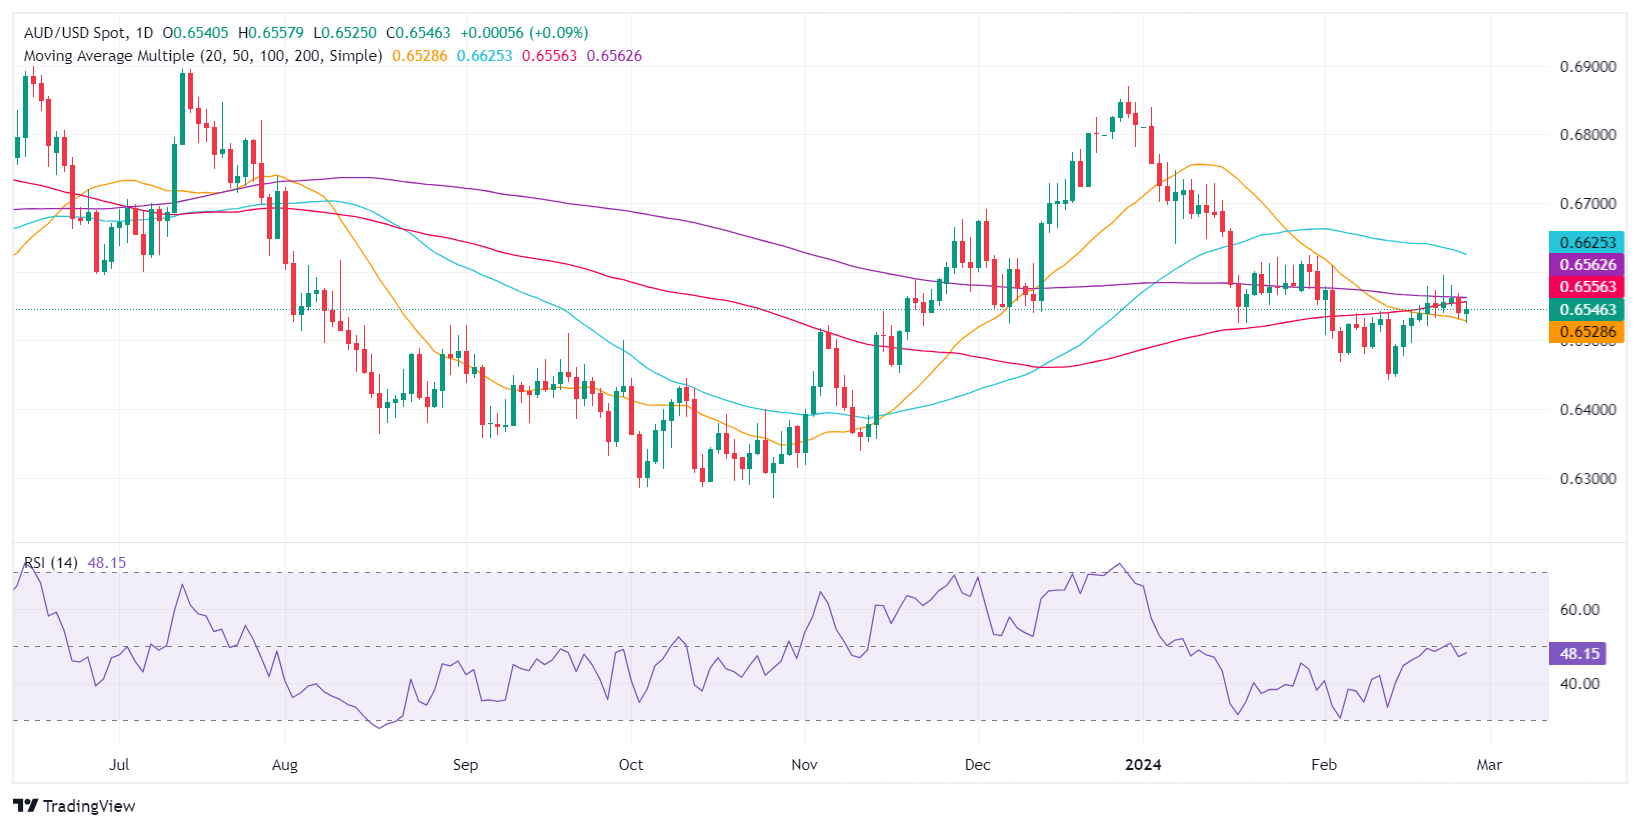
- AUD/USD makes modest recovery, up 0.05%, as markets eye upcoming Australian CPI and US GDP data releases.
- US Durable Goods Orders contract more than expected; Home Prices surge, fueling mixed sentiment on Wall Street.
- Reserve Bank of New Zealand's policy decision and Federal Reserve officials' remarks to influence AUD/USD direction.
The Australian Dollar pared some of its losses against the US Dollar on Tuesday and finished the session with minimal gains of 0.05%. As the Asian session begins, the AUD/USD trades at 0.6542, at the time of writing, down by 0.02% as investors brace for the release of crucial data.
AUD/USD sees slight gains as investors await key Australian and US economic indicators
Price action in Wall Street was muted as investors prepared for the release of a tranche of US data. On Tuesday, the US economic docket revealed that January’s Durable Goods Orders shrank -6.1% MoM, exceeding estimates and the previous month’s data of -4.5% and -0.3% contraction. Besides, US housing data revealed that Home Prices in December advanced 6.1% YoY, above forecasts, and November’s data.
Moving into Wednesday’s data, the Australian Bureau of Statistics (ABS) will feature inflation figures for January. According to the consensus, the Consumer Price Index (CPI) is expected to have risen 3.6% YoY. A monetary policy decision in New Zealand could underpin the Aussie Dollar (AUD) in the event of a hawkish hold by the Reserve Bank of New Zealand (RBNZ).
On the US front, the US Bureau of Economic Analysis (BEA) will announce the second estimate of the Gross Domestic Product (GDP) for the last quarter of 2023. The consensus expects GDP to stand at 3.3% QoQ. AUD/USD traders would also gather direction from three Federal Reserve officials crossing the newswires.
AUD/USD Price Analysis: Technical outlook
The AUD/USD remains neutral to downward bias, even though the exchange rate hovers around key technical levels, like the 100, 200, and 50-day moving averages (DMAs). Further confirmation is provided by the Relative Strength Index (RSI) punching below the 50-midline turning bearish, while the latest cycle high remains well below the current year-to-date (YTD) high at 0.6624.
For a bearish continuation, the AUD/USD must dive below the February 27 low of 0.6524, and the 0.6500 figure. Once those levels are cleared, look for a test of the YTD low of 0.6442. On the flip side, if buyers push the exchange rate above the 100 and 200-DMAs at around 0.6559, that could pave the way to challenge 0.6600.
- NZD/USD consolidates around 0.6170 in Wednesday’s early Asian session.
- The Reserve Bank of New Zealand (RBNZ) is expected to keep the interest rate steady at 5.50% in February.
- Hawkish comments from Fed Governor Bowman and Kansas City Fed President Schmid provided little support to the USD.
- The US GDP growth numbers for Q4 will be due later on Wednesday.
The NZD/USD pair oscillates in a narrow trading range above the mid-0.6100s during the early Asian session on Wednesday. Investors prefer to wait on the sidelines ahead of the Reserve Bank of New Zealand (RBNZ) Interest Rate Decision, with no change in rate expected. At press time, NZD/USD is trading at 0.6170, gaining 0.06% on the day.
The RBNZ is expected to keep the Official Cash Rate (OCR) steady at 5.50% for the fifth meeting in a row. However, the possibility of a rate hike cannot be ruled out. Investors will monitor RBNZ Governor Adrian Orr’s press conference, which might offer some hints about the monetary policy and inflation outlook. If the New Zealand central bank surprises markets with a 25 basis points (bps) rate hike, the New Zealand Dollar (NZD) might attract some buyers. On the other hand, the dovish comments from RBNZ could drag the NZD lower and create a headwind for the NZD/USD pair.
On the USD’s front, hawkish comments from Federal Reserve (Fed) officials provided little support to the US Dollar (USD). Fed Governor Bowman said inflation will continue to decline with interest rates held at current levels, but it is not yet time to start lowering rates, while Kansas City Fed President Schmid stated that there is no need to preemptively adjust the stance of monetary policy as inflation is running above target, labor markets are tight, and demand is showing considerable momentum.
Investors will closely watch the US Gross Domestic Product Annualized for the fourth quarter (Q4) on Wednesday, along with preliminary Goods Trade Balance, Fed’s Bostic, Collins, and Williams speeches. The attention will shift to the Fed's preferred inflation measure, the Personal Consumption Expenditures Index (PCE) report on Thursday. The stronger-than-expected data might lift the Greenback and cap the upside of the NZD/USD pair.
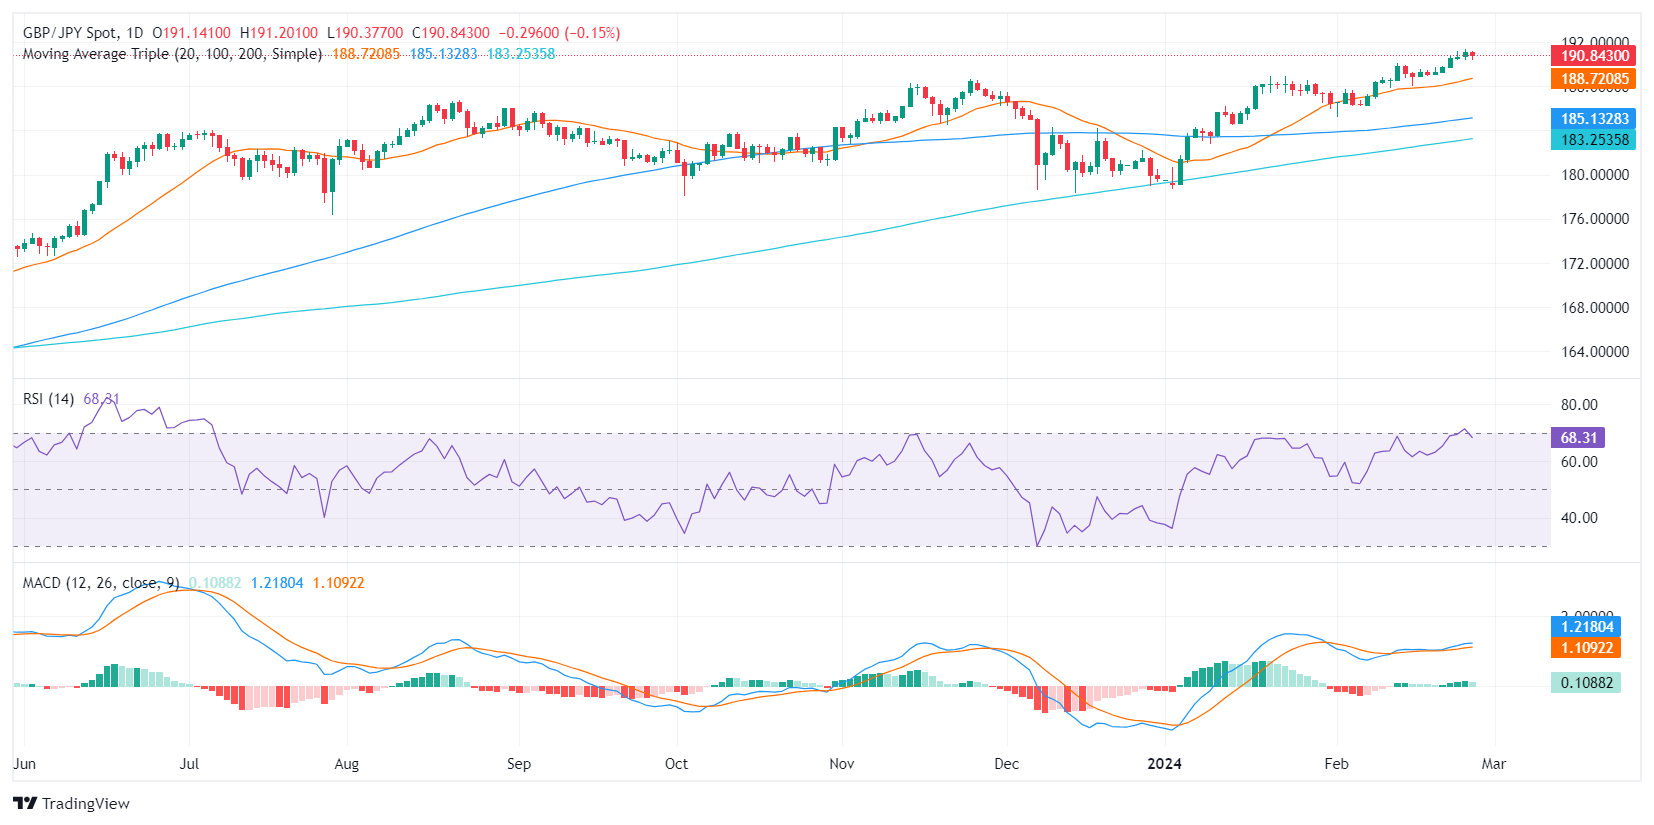
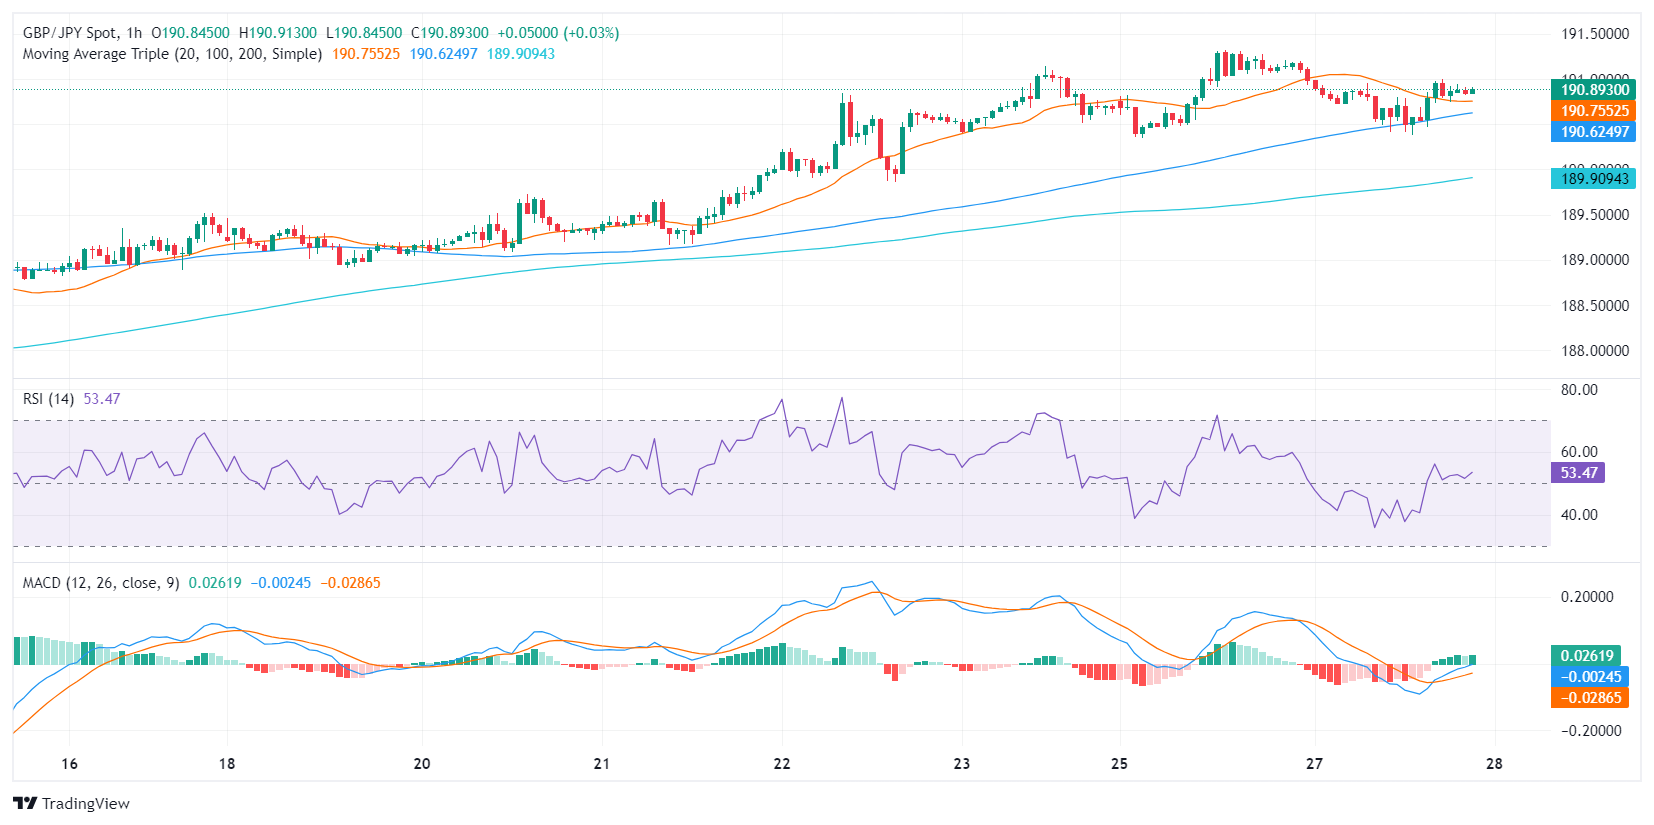
- The GBP/JPY currently trades at 190.86 marking a 0.12% loss in Tuesday's session.
- Daily RSI and MACD indicate a slight reduction in buyer's strength, hinting at a potential phase of consolidation.
- Despite some short-term negativity, the GBP/JPY's placement above primary SMAs indicates a bullish broader outlook.
- Fundamentals were on Yen's side, as it was the top performer in Tuesday's session.
The GBP/JPY pair is currently trading at the 190.86 level in Tuesday's session, with a modest decrease. However, the downside movements seem to not threaten the clear bullish trend seen in the broader timeframe.
On the daily chart, beginning with the Relative Strength Index (RSI), it has shown a slight reduction in strength from overbought territory but remains in the positive region. This suggests that while buyers have dominated recent trading, their control is slightly slipping, indicating a potential consolidation or retraction stage. Furthermore, the Moving Average Convergence Divergence (MACD) histogram's decreasing green bars, show that the upward momentum is losing strength as well.
GBP/JPY daily chart
On the hourly chart, the RSI fell to negative territory, indicating that the sellers have been dominating recent trades on the hourly timeframe. This is further substantiated by the MACD histogram's flat green bars, indicating that short-term buying momentum has stalled.
GBP/JPY hourly chart
In conclusion, the daily and hourly charts show discrepancies with the daily chart indicating a continuing, though weakened, buying momentum. On the other hand, the hourly chart indicates the dominance of sellers. This divergence between the two charts signals potential upcoming volatility in the GBP/JPY pair. However, in case the pair holds above its main SMAs, the outlook will still be positive.
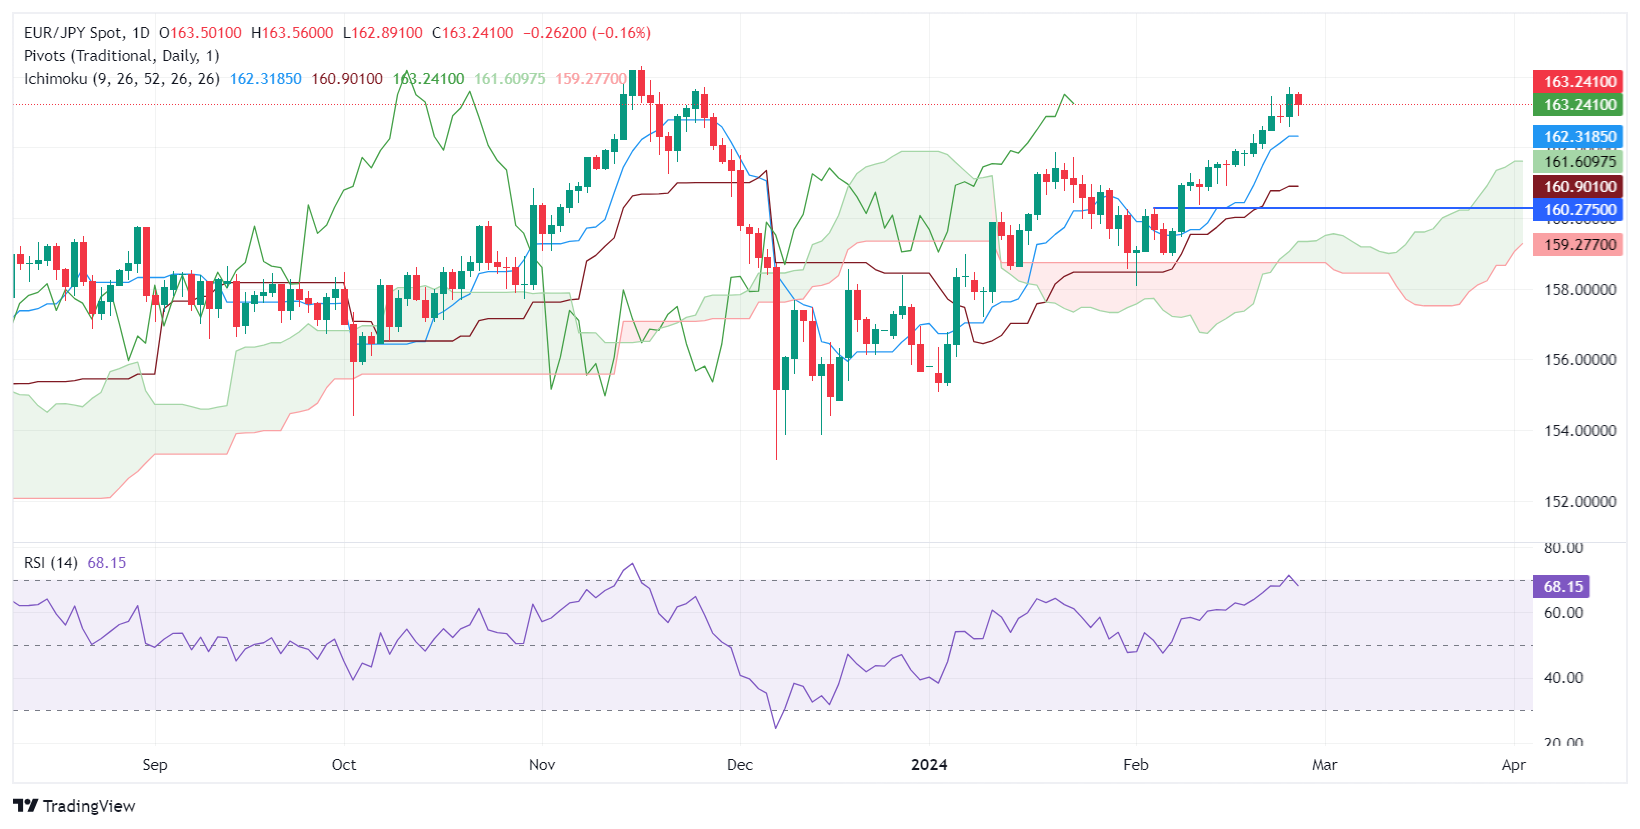
- EUR/JPY faces a 0.17% decline as Japan's core inflation rise hints at a possible end to negative interest rates.
- Technical patterns, including a 'bearish harami', suggest further downside, with key levels to watch at 162.56 and 162.00.
- Recovery above 163.00 could open the path to 164.00, contingent on overcoming resistance near the week's high at 163.72.
The EUR/JPY is dropping late in the North American session, set to register losses of around 0.17% on Tuesday. A rise in core inflation in Japan sparked speculation that the Bank of Japan (BoJ) could increase interest rates, ending the negative interest rate cycle. Therefore, the cross-pair trades at 163.22 after hitting a daily high of 163.52.
EUR/JPY Price Analysis: Technical outlook
From a technical standpoint, the EUR/JPY failed to extend its rally and edged lower. Nevertheless, price action is well contained within the boundaries of Monday’s price action, which would form a ‘bearish harami’ candlestick chart pattern, suggesting that further downside is expected.
If the EUR/JPY tumbles below 163.00 and decisively breaks below the February 26 low of 162.56, that would exacerbate a test of the 162.00 mark, but on its way south, sellers will face the Tenkan-Sen at 162,31.
Conversely, if buyers keep the exchange rate above 163.00, the EUR/JPY could edge higher above the current week's high at 163.72, which could pave the way for testing the 164.00 mark.
EUR/JPY Price Action – Daily Chart
- The Reserve Bank of New Zealand is likely to maintain the interest rate at 5.50% in February.
- RBNZ Governor Orr’s press conference and updated macro forecasts will grab the market’s attention.
- The New Zealand Dollar gears up for a volatility spike on RBNZ Governor Orr’s words.
The Reserve Bank of New Zealand (RBNZ) will convene its first monetary meeting of 2024 on Wednesday. The RBNZ board members are expected to keep the Official Cash Rate (OCR) steady at 5.50% for the fifth meeting in a row. However, some economists are foreseeing the February meeting to be a “live” one, with upside risks for a rate hike.
The New Zealand Dollar (NZD) is set to witness intense volatility on a surprise rate hike or a hawkish hold by the RBNZ.
What to expect from the RBNZ interest rate decision?
The Reserve Bank of New Zealand will publish its first Monetary Policy Statement (MPS) of this year, including the updated economic forecasts, alongside the interest rate announcement on Wednesday at 01:00 GMT. RBNZ Governor Adrian Orr’s press conference will follow at 02:00 GMT.
Data published by Stats NZ showed that New Zealand’s annual Consumer Price Index (CPI) increased by 4.7% for the December quarter, the smallest annual rise in more than two years. However, the figure was still above the RBNZ's target of 1.0%-3.0%.
Despite the CPI data indicating disinflationary conditions in New Zealand’s economy, the Australian and New Zealand Banking Group (ANZ) revised their rate call earlier this month, noting that “we now expect the RBNZ to hike the OCR 25 basis points (bps) in February and April, taking it to 6.0%.”
“We just don’t think the RBNZ will feel confident they’ve done enough to meet their inflation mandate,” the ANZ said.
However, the country’s falling inflation expectations nudged markets to reprice their expectations for the RBNZ interest rate outlook. Two-year inflation expectations, seen as the timeframe when RBNZ policy action will filter through to prices, fell to 2.5% from 2.76% in the December quarter, the central bank’s quarterly survey showed.
Further, Stats NZ's Selected Prices Indexes (SPI) showed that the annual increase in inflation actually fell to 6.8% in January from 7.0% in December.
At its November policy meeting, the RBNZ said that “if inflationary pressures were to be stronger than anticipated, the OCR would likely need to increase further,” adding that “the Monetary Policy Committee agreed that interest rates will need to remain at a restrictive level for a sustained period of time.” The central bank projected a peak OCR of 5.69% in the September quarter of 2024, leaving the door ajar for one more rate hike this year.
Previewing the RBNZ policy announcement, analysts at BBH noted: “Reserve Bank of New Zealand meets Wednesday and is expected to keep rates steady at 5.50%. It will release its Monetary Policy Statement with updated macro forecasts at the same time. Markets see around 25% odds of a 25 bp hike this week and the focus will be on the updated rate path projections.”
“We doubt the revised RBNZ projections will rule out an additional policy rate increase because of stronger than expected non-tradable inflation and private sector wage growth in Q4. As such, NZD risks are skewed to the upside,” the analysts added.
How will the RBNZ interest decision impact the New Zealand Dollar?
Should the RBNZ surprise markets with a 25 bps rate hike or raise the forecast for the peak rate to 6.0%, the New Zealand Dollar is likely to meet a fresh buying wave against the US Dollar. In case of any hawkish surprises, the NZD/USD pair could stage a solid rebound toward the 0.6250 level.
On the other hand, if RBNZ Governor Orr’s comments are balanced, suggesting a “higher for longer” interest rate view, the NZD/USD correction is expected to gain traction, knocking the pair down toward the 0.6100 barrier. Additionally, a dovish pause by the central bank could also spell doom for the Kiwi.
Dhwani Mehta, FXStreet’s Senior Analyst, offers a brief technical outlook for trading the New Zealand Dollar on the RBNZ policy announcements: “The NZD/USD pair is battling the critical 50-day Simple Moving Average (SMA) at 0.6180 on its corrective downside. The 14-day Relative Strength Index (RSI) indicator, however, is still holding above the midline, suggesting that risks remain skewed to the upside for the pair.”
“The immediate upside hurdle is seen at the 0.6220 round level, above which the July 27 high of 0.6274 will come into play. NZD buyers will then aim for the 0.6300 figure. Conversely, a sustained move below the 50-day SMA at 0.6180 could open doors for a test of the 0.6100 mark. Further south, the 200-day SMA at 0.6075 could come to the rescue of NZD/USD,” Dhwani adds.
Economic Indicator
New Zealand RBNZ Interest Rate Decision
The Reserve Bank of New Zealand (RBNZ) announces its interest rate decision after its seven scheduled annual policy meetings. If the RBNZ is hawkish and sees inflationary pressures rising, it raises the Official Cash Rate (OCR) to bring inflation down. This is positive for the New Zealand Dollar (NZD) since higher interest rates attract more capital inflows. Likewise, if it reaches the view that inflation is too low it lowers the OCR, which tends to weaken NZD.
Read more.Next release: 02/28/2024 01:00:00 GMT
Frequency: Irregular
Source: Reserve Bank of New Zealand
Why it matters to traders
The Reserve Bank of New Zealand (RBNZ) holds monetary policy meetings seven times a year, announcing their decision on interest rates and the economic assessments that influenced their decision. The central bank offers clues on the economic outlook and future policy path, which are of high relevance for the NZD valuation. Positive economic developments and upbeat outlook could lead the RBNZ to tighten the policy by hiking interest rates, which tends to be NZD bullish. The policy announcements are usually followed by Governor Adrian Orr’s press conference.
RBNZ FAQs
What is the Reserve Bank of New Zealand?
The Reserve Bank of New Zealand (RBNZ) is the country’s central bank. Its economic objectives are achieving and maintaining price stability – achieved when inflation, measured by the Consumer Price Index (CPI), falls within the band of between 1% and 3% – and supporting maximum sustainable employment.
How does the Reserve Bank of New Zealand’s monetary policy influence the New Zealand Dollar?
The Reserve Bank of New Zealand’s (RBNZ) Monetary Policy Committee (MPC) decides the appropriate level of the Official Cash Rate (OCR) according to its objectives. When inflation is above target, the bank will attempt to tame it by raising its key OCR, making it more expensive for households and businesses to borrow money and thus cooling the economy. Higher interest rates are generally positive for the New Zealand Dollar (NZD) as they lead to higher yields, making the country a more attractive place for investors. On the contrary, lower interest rates tend to weaken NZD.
Why does the Reserve Bank of New Zealand care about employment?
Employment is important for the Reserve Bank of New Zealand (RBNZ) because a tight labor market can fuel inflation. The RBNZ’s goal of “maximum sustainable employment” is defined as the highest use of labor resources that can be sustained over time without creating an acceleration in inflation. “When employment is at its maximum sustainable level, there will be low and stable inflation. However, if employment is above the maximum sustainable level for too long, it will eventually cause prices to rise more and more quickly, requiring the MPC to raise interest rates to keep inflation under control,” the bank says.
What is Quantitative Easing (QE)?
In extreme situations, the Reserve Bank of New Zealand (RBNZ) can enact a monetary policy tool called Quantitative Easing. QE is the process by which the RBNZ prints local currency and uses it to buy assets – usually government or corporate bonds – from banks and other financial institutions with the aim to increase the domestic money supply and spur economic activity. QE usually results in a weaker New Zealand Dollar (NZD). QE is a last resort when simply lowering interest rates is unlikely to achieve the objectives of the central bank. The RBNZ used it during the Covid-19 pandemic.
- GBP/USD lacked momentum on Tuesday.
- US data missed the mark, traders await US GDP.
- US PCE inflation also due this week for Fed watchers.
GBP/USD cycled around 1.2680 on Tuesday as markets look for a fresh push from the Federal Reserve (Fed) with investors steadily pushing away from elevated rate cut bets. US Gross Domestic Product (GDP) and Personal Consumption Expenditure Price Index (PCE) inflation numbers are due this week.
UK data remains thin this week, and markets are focusing on key figures to update rate cut expectations from the Fed.
US Durable Goods Orders declined more than expected in January, printing at -6.1% versus the expected -4.5%. December’s Durable Goods Orders were revised to -0.3% from 0.0%.
US annualized GDP for the fourth quarter will print on Wednesday and is expected to print flat, holding at the previous 3.3% for the year ended in Q4. US Core PCE Price Index inflation, slated for Thursday, is expected to tick down for the annualized figure to 2.8% from 2.9%, while the MoM figure is expected to heat up in January to 0.4% from the previous 0.2%.
As the Fed’s favored inflation measure, PCE will draw plenty of investor’s eyes as they hope for signs of rate cuts from the US central bank. A too-tight labor market, a stubborn “last mile” on inflation, and a domestic US economy that refuses to slip into a recession have weighed on trader hopes for a Fed rate trim.
According to the CME’s FedWatch Tool, money markets are expecting around 75 basis points in rate cuts through 2024, bringing rate expectations in line with the Fed’s own projections for the first time since late 2023.
GBP/USD technical outlook
GBP/USD continues to churn at the intraday level, cycling 1.2650 trapped between technical resistance at the 1.2700 handle and rising near-term technical support from the last swing low into 1.2550.
GBP/USD has run aground on the 50-day Simple Moving Average (SMA), but the pair is holding onto bull territory after a double bounce from the 200-day SMA near 1.2575.
GBP/USD hourly chart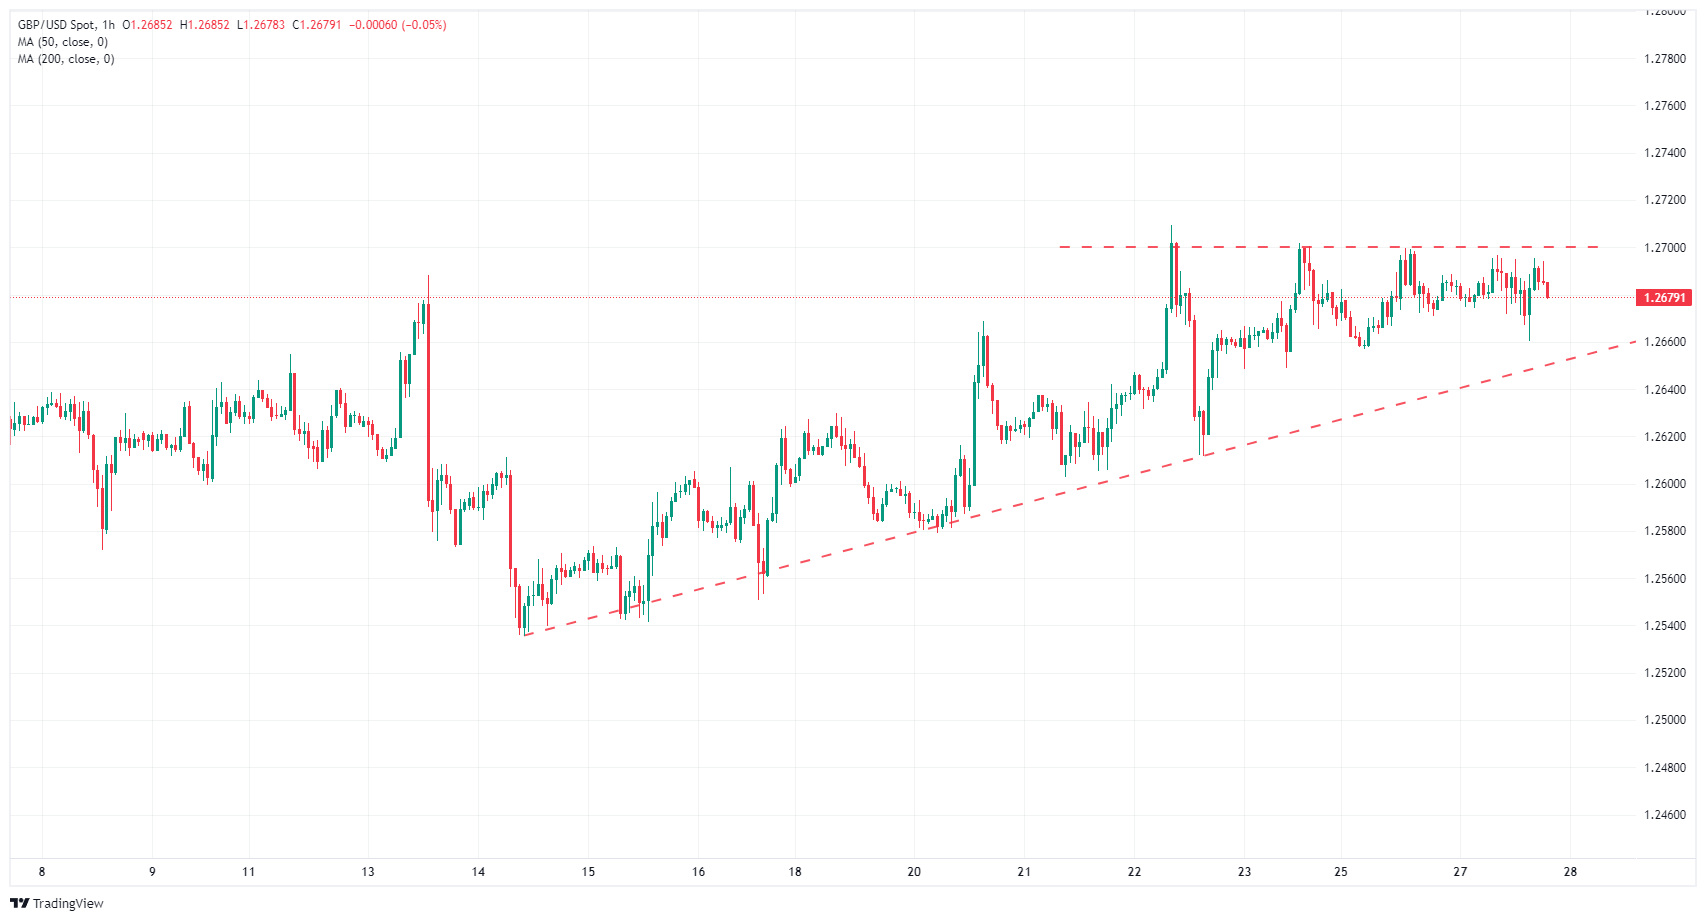
GBP/USD daily chart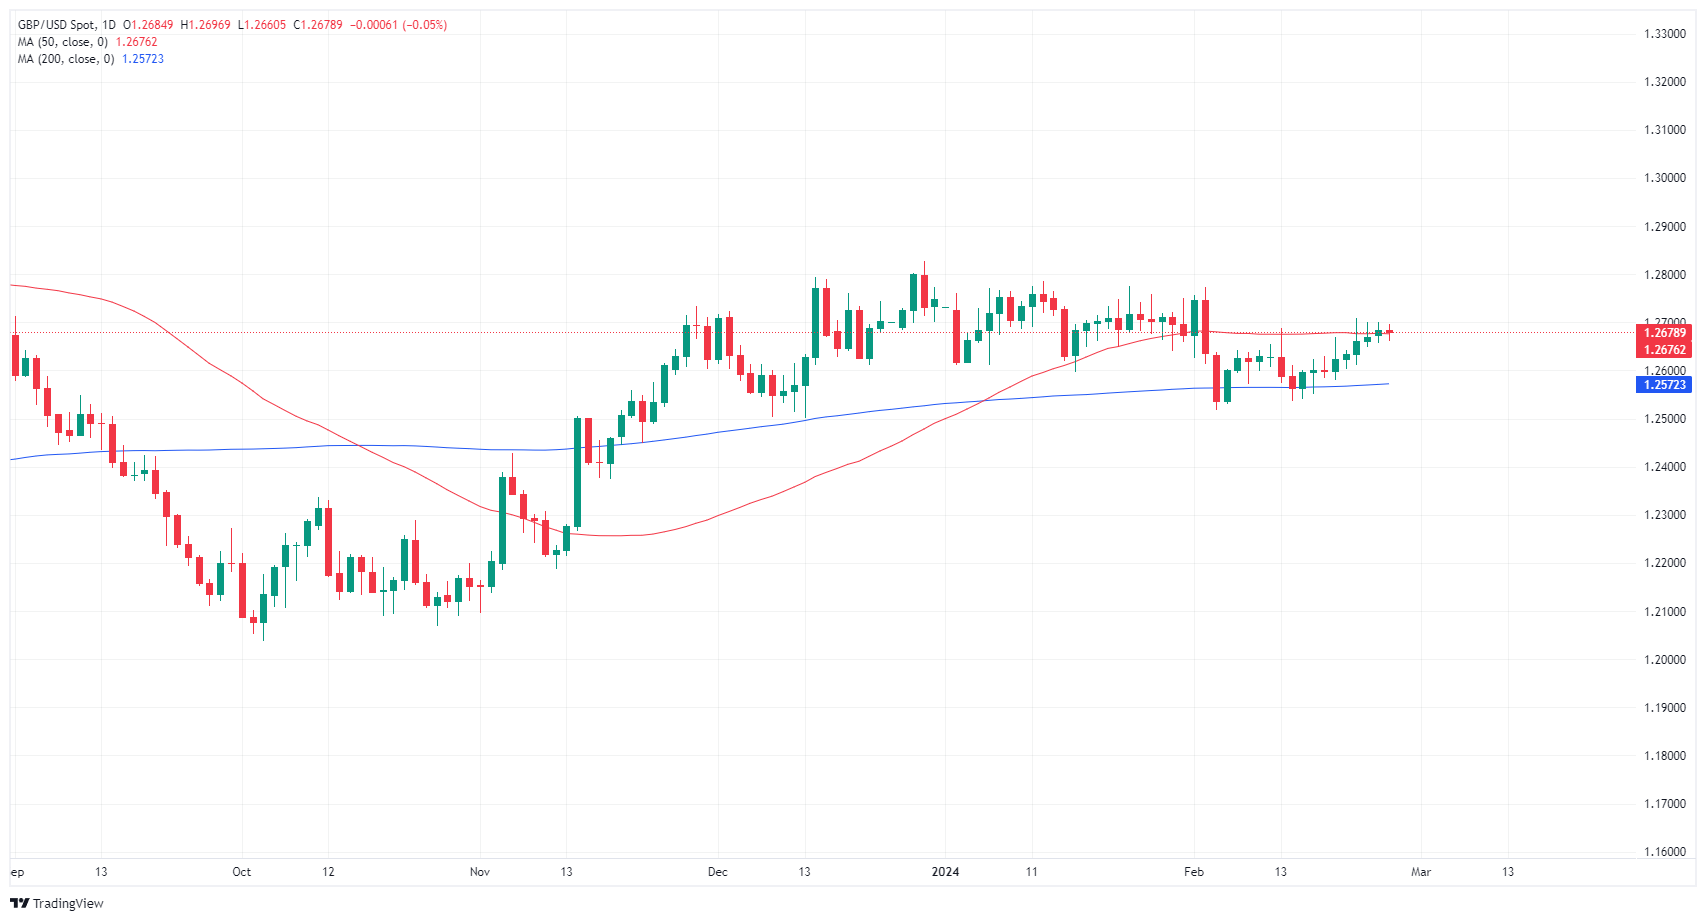
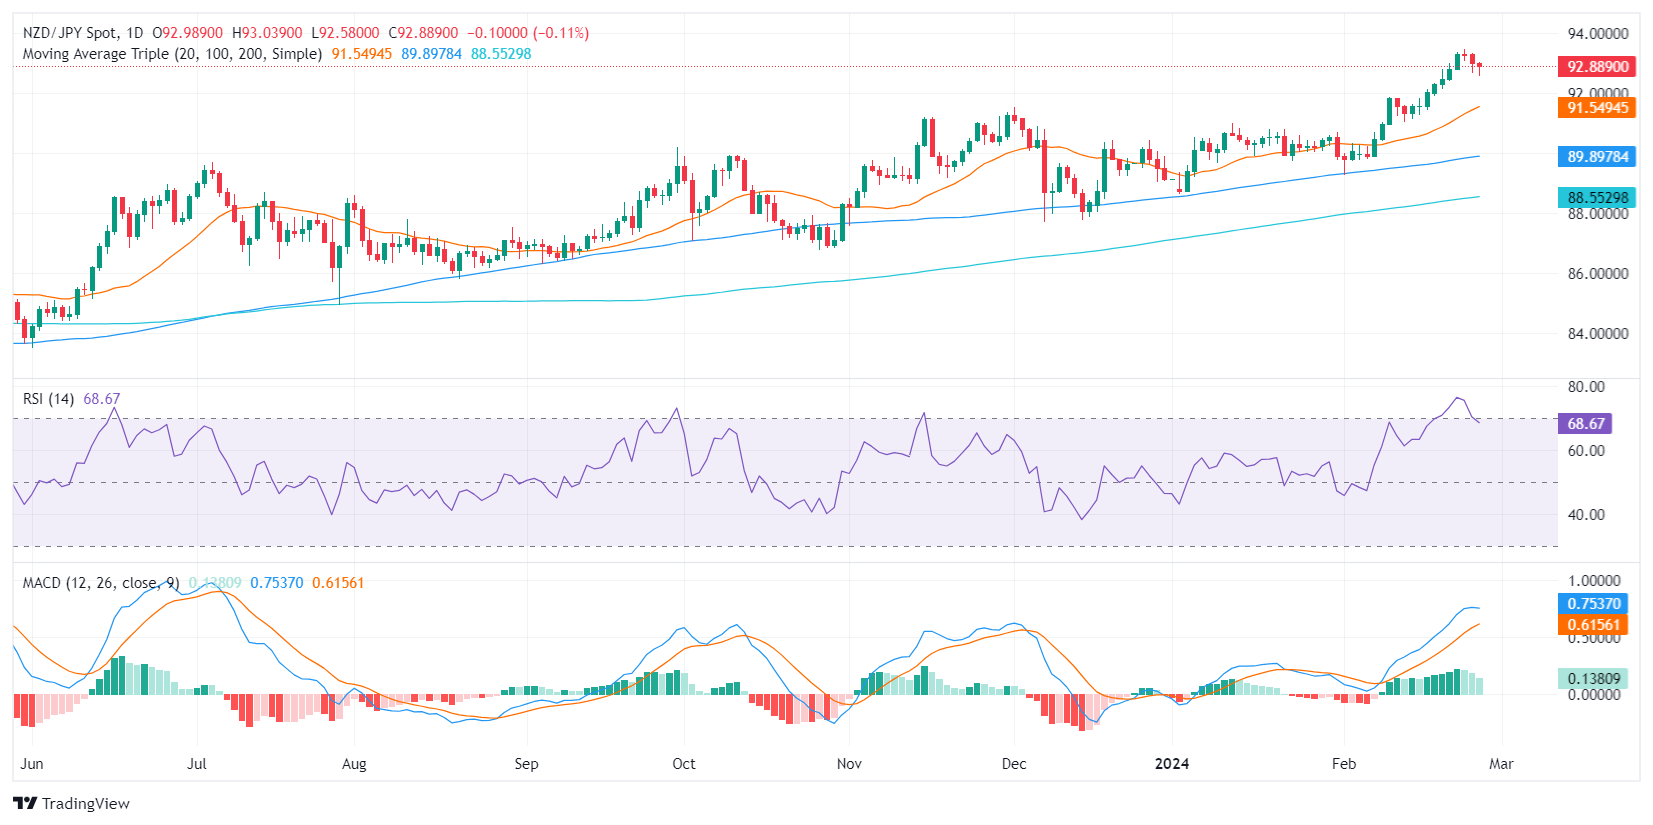
- The NZD/JPY is trading at 92.87, which represents a slight decline of 0.10% during Tuesday's session.
- Indicators continue consolidating overbought conditions while the overall trend is still positive.
In Tuesday's session, the NZD/JPY pair is seen at 92.87, trading with a slight loss of 0.10%. Even with this minor retreat, the overall technical sentiment continues to remain bullish. However, there's a hint of weakening buying momentum in the short term as buyers seem to be taking a breather to correct overbought conditions.
On the daily chart, the Relative Strength Index (RSI) for the NZD/JPY pair is indicating a positive yet slightly weakened momentum, marking a slight decline. The Moving Average Convergence Divergence (MACD) on the other hand, has been showing decreasing green bars, signaling a declining positive momentum. This indicates that the buying pressure is showing signs of slowing down, a typical situation after an asset hits overbought conditions.
NZD/JPY daily chart
On the hourly chart, the RSI trend portrays a weaker picture, leaning more towards the negative territory, attesting to a short-term slowdown in buying pressure. Concurrently, the hourly MACD records flat green bars, reinforcing this short-term dip in positive momentum.
NZD/JPY hourly chart
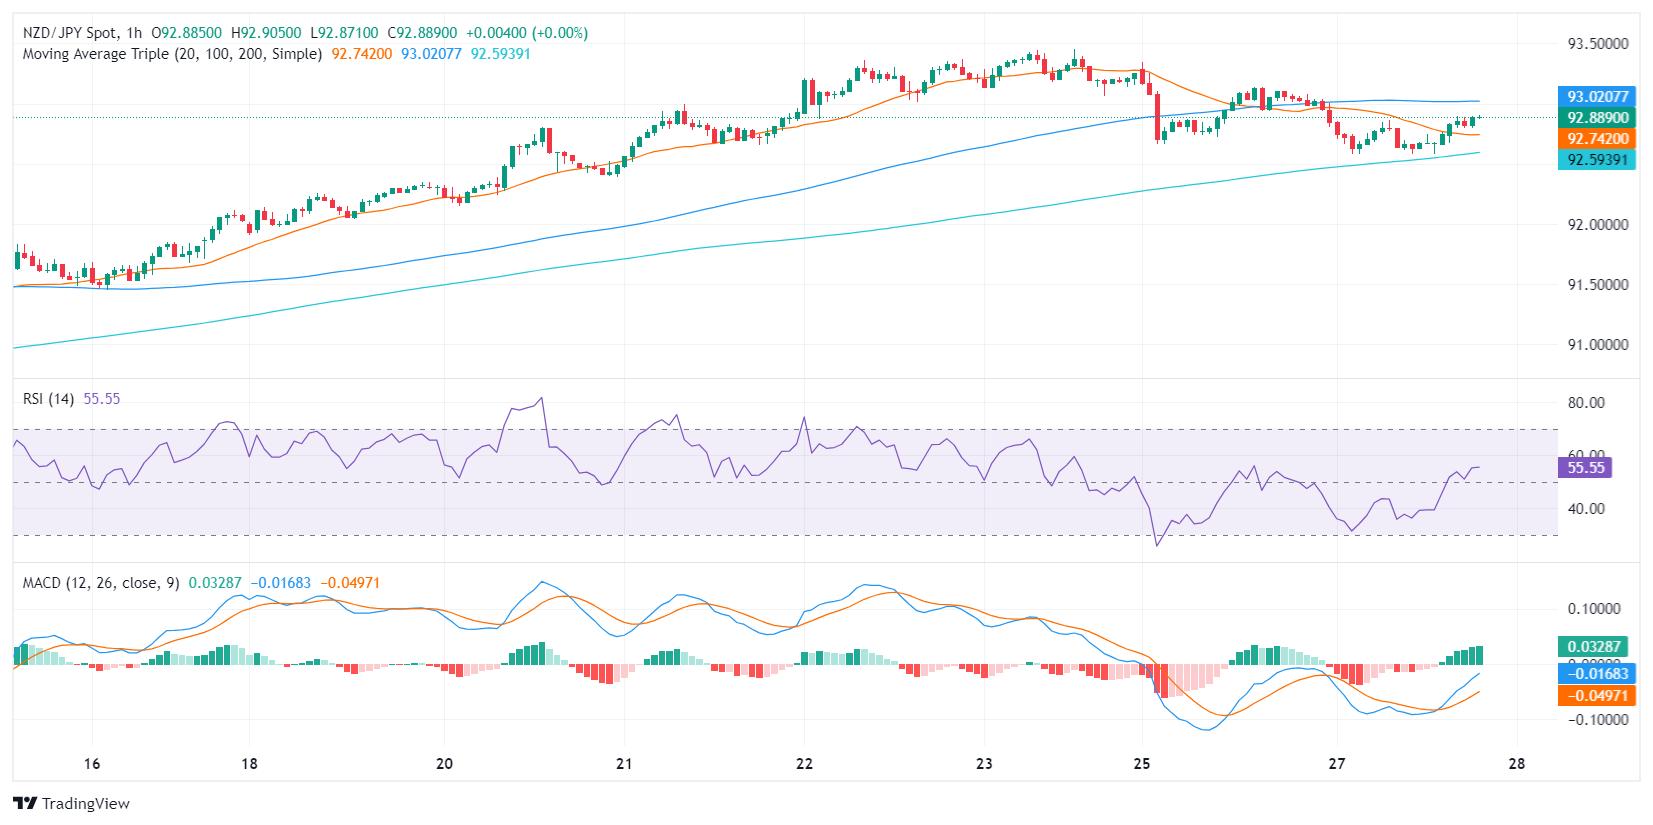
However, the overall analysis suggests a predominance of bullish pressure in the broader outlook. The NZD/JPY pair maintains a position above the 20, 100, and 200-day Simple Moving Averages (SMAs) underpinning the control of the bulls. A balance between the daily and hourly perspective from the RSI and MACD could, therefore, suggest potential investment opportunities on moderate retracements as buyers may continue taking profits in the next sessions.
- Gold price edges up, trading near the 50-day SMA, as US Treasury yields decline and the US Dollar softens.
- Market focus on upcoming PCE and GDP reports could determine Gold's breakout from current tight trading range.
- Earlier economic indicators, including a sharp drop in Durable Goods Orders, set a cautious tone for Q1 2024 GDP expectations.
Gold price modestly gains but is stuck in a narrow range in Tuesday's mid-North American session, underpinned by the fall in US Treasury bond yields. Consequently, the Greenback (USD) weakens, as the US Dollar Index (DXY), which tracks the currency against six other currencies, drops 0.05%. At the time of writing, XAU/USD trades at $2,034.88, gaining 0.18%.
The yellow metal hovers around the 50-day Simple Moving Average (SMA) at $2,033.48 as investors brace for the release of the latest Personal Consumption Expenditures (PCE) report, the Federal Reserve’s (Fed) gauge to measure inflation. That and the latest Gross Domestic Product (GDP) data could be the catalysts that prompt Gold’s price to exit the trading range within the $2,020-$2,050 area.
Earlier, the US Department of Commerce revealed that Durable Goods Orders in January plummeted sharply even worse than expected, which could set the tone for Q1 2024 GDP data. Meanwhile, Home Prices data were mixed as buyer demand picked up.
Daily digest market movers: Gold advance prompted by soft US Dollar undermined by lower US yields
- US Durable Goods Orders dropped -6.1% MoM, more than the -4.5% contraction expected and the -0.3% dip observed in December.
- The S&P/Case Shiller Home Price Index for December rose 6.1% YoY, outpacing estimates of 6% and November’s 5.4% reading.
- Previous data releases in the week:
- US New Home Sales rose by 1.5% from 0.651M to 0.661M, less than the 0.68M expected.
- The Dallas Fed Manufacturing Index for February contracted -11.3 though it improved compared to January’s -27.4 shrinkage, suggesting that business activity is recovering.
- Federal Reserve Governor Michelle Bowman said she’s in no rush to cut rates, given upside risks to inflation that could stall progress or cause a resurgence in price pressure.
- Bowman said that inflation would decline “slowly,” adding that she will remain “cautious in my approach to considering future changes in the stance of policy.”
- Interest rate speculators have priced out a Fed rate cut in March and May. For June, the odds of a 25 basis point rate cut are at 49.7%.
- Investors are pricing in 85 basis points of easing throughout 2024.
Technical analysis: Gold stays firm near 50-day SMA
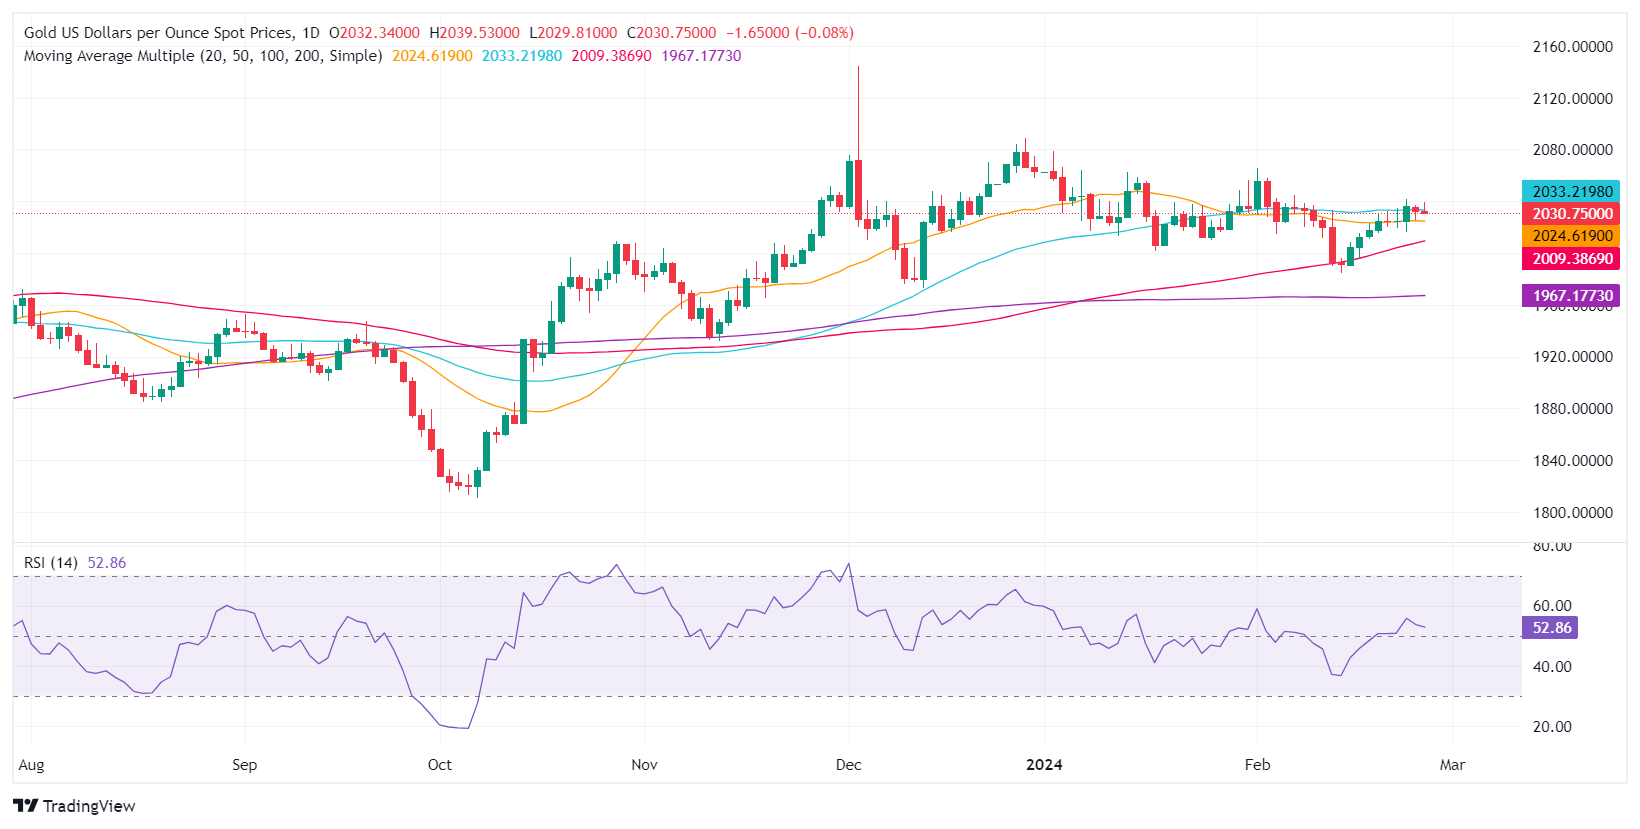
Gold is trading sideways as XAU/USD has failed to break above the $2,035 psychological resistance level for the last 12 days. Nevertheless, the upward bias remains intact, and if buyers reclaim the $2,035 level, that could open the door to challenge the psychological $2,050 figure. Key resistance levels up next would be the February 1 high at $2,065.60, ahead of the December 28 high at $2,088.48.
On the flipside, if Gold falls below the February 16 swing low of $2,016.15, XAU/USD would dive toward the October 27 daily high-turned-support at $2,009.42. Once cleared, that will expose key technical support levels like the 100-day SMA at $2,009.56, followed by the 200-day SMA at $1,967.09.
Gold FAQs
Why do people invest in Gold?
Gold has played a key role in human’s history as it has been widely used as a store of value and medium of exchange. Currently, apart from its shine and usage for jewelry, the precious metal is widely seen as a safe-haven asset, meaning that it is considered a good investment during turbulent times. Gold is also widely seen as a hedge against inflation and against depreciating currencies as it doesn’t rely on any specific issuer or government.
Who buys the most Gold?
Central banks are the biggest Gold holders. In their aim to support their currencies in turbulent times, central banks tend to diversify their reserves and buy Gold to improve the perceived strength of the economy and the currency. High Gold reserves can be a source of trust for a country’s solvency. Central banks added 1,136 tonnes of Gold worth around $70 billion to their reserves in 2022, according to data from the World Gold Council. This is the highest yearly purchase since records began. Central banks from emerging economies such as China, India and Turkey are quickly increasing their Gold reserves.
How is Gold correlated with other assets?
Gold has an inverse correlation with the US Dollar and US Treasuries, which are both major reserve and safe-haven assets. When the Dollar depreciates, Gold tends to rise, enabling investors and central banks to diversify their assets in turbulent times. Gold is also inversely correlated with risk assets. A rally in the stock market tends to weaken Gold price, while sell-offs in riskier markets tend to favor the precious metal.
What does the price of Gold depend on?
The price can move due to a wide range of factors. Geopolitical instability or fears of a deep recession can quickly make Gold price escalate due to its safe-haven status. As a yield-less asset, Gold tends to rise with lower interest rates, while higher cost of money usually weighs down on the yellow metal. Still, most moves depend on how the US Dollar (USD) behaves as the asset is priced in dollars (XAU/USD). A strong Dollar tends to keep the price of Gold controlled, whereas a weaker Dollar is likely to push Gold prices up.
Markets seem to have entered a consolidative theme ahead of key data releases on both sides of the ocean, while Fed speakers and ECB officials equally appear aligned behind the idea of cutting rates later than the majority of investors anticipate.
Here is what you need to know on Wednesday, February 28:
The USD Index (DXY) maintained its gradual leg lower in place, always around the key 200-day SMA near 103.70. On February 28, another revision of the Q4 GDP Growth Rate is due along with preliminary Goods Trade Balance results. Additionally, the Fed’s Bostic, Collins, and Williams are due to speak.
EUR/USD remained stuck around the mid-1.0800s against the backdrop of the generalized lack of direction in the FX universe. In the euro area, the final Consumer Confidence print, Economic Sentiment and Industrial Sentiment are all scheduled for February 28.
In line with the rest of its peers, GBP/USD traded in an irresolute fashion, just below 1.2700 the figure. In the UK, BoE’s C. Mann is only due to speak on February 28.
USD/JPY traded on the defensive amidst modest losses, although maintaining the trade above the 150.00 hurdle. On February 28, the final Coincident Index and Leading Economic Index are due on Wednesday.
AUD/USD exchanged gains with losses around the 0.6540 region. The RBA’s Monthly CPI Indicator takes centre stage on February 28.
WTI prices added to Monday’s optimism and reclaimed the area once again beyond the $78.00 mark per barrel. On Wednesday, the EIA will publish its weekly report on US crude oil inventories.
Gold prices traded in a tight range around the $2,030 zone per troy ounce, while prices of the ounce of Silver kept the lower end of the range near $22.50.
- EUR/USD consolidates as markets await key US data.
- US Durable Goods Orders declined more than expected.
- US GDP on Wednesday, German CPI inflation on Thursday.
EUR/USD remains strung along the middle near 1.0850 after Tuesday brought little to push the pair in either direction after US Durable Goods Orders declined further than forecast in January. Markets await the latest Gross Domestic Product (GDP) figures from the US on Wednesday.
German Retail Sales and Consumer Price Index (CPI) inflation is slated for Thursday, followed by the US Personal Consumption Expenditure Price Index (PCE) inflation print.
Daily digest market movers: EUR/USD drifts ahead of GDP and inflation figures
- US Durable Goods Orders printed at -6.1% in January, down from the -4.5% forecast compared to the previous month’s -0.3%.
- Germany’s Gfk Consumer Confidence Survey for March came in at the expected -29.0, recovering slightly from the revised previous -29.6.
- US GDP is expected to remain at 3.3% for the annualized fourth quarter on Wednesday.
- Thursday’s German Retail Sales are forecast to print at -1.5% versus the previous -1.7%.
- Germany’s CPI inflation for the year ended February is expected to print at 2.6% versus the previous 2.9%.
- US Core PCE inflation is expected to decrease slightly to 2.8% from the previous 2.9%.
Euro price today
The table below shows the percentage change of Euro (EUR) against listed major currencies today. Euro was the strongest against the Canadian Dollar.
| USD | EUR | GBP | CAD | AUD | JPY | NZD | CHF | |
| USD | -0.03% | -0.02% | 0.13% | -0.15% | -0.11% | -0.16% | -0.07% | |
| EUR | 0.02% | -0.02% | 0.14% | -0.14% | -0.08% | -0.16% | -0.05% | |
| GBP | 0.03% | 0.01% | 0.16% | -0.12% | -0.07% | -0.15% | -0.03% | |
| CAD | -0.12% | -0.15% | -0.15% | -0.27% | -0.24% | -0.29% | -0.20% | |
| AUD | 0.16% | 0.14% | 0.12% | 0.28% | 0.05% | -0.02% | 0.09% | |
| JPY | 0.11% | 0.10% | 0.10% | 0.22% | -0.02% | -0.07% | 0.04% | |
| NZD | 0.16% | 0.17% | 0.13% | 0.29% | 0.01% | 0.05% | 0.12% | |
| CHF | 0.07% | 0.05% | 0.03% | 0.19% | -0.09% | -0.03% | -0.12% |
The heat map shows percentage changes of major currencies against each other. The base currency is picked from the left column, while the quote currency is picked from the top row. For example, if you pick the Euro from the left column and move along the horizontal line to the Japanese Yen, the percentage change displayed in the box will represent EUR (base)/JPY (quote).
Technical analysis: EUR/USD churns near 1.0850
EUR/USD saw tight trading on Tuesday, drifting around 1.0850 after a quick recovery from the day’s low near 1.0833. The pair remains in a near-term pattern of higher lows, but an intraday ceiling near 1.0860 remains a key resistance level.
Despite firm technical resistance, EUR/USD has closed in the green for the last nine trading days as the pair drifts into the 200-day Simple Moving Average (SMA) at 1.0830. Upside momentum remains capped by last week’s peak bids near 1.0888.
EUR/USD hourly chart
EUR/USD daily chart
Euro FAQs
What is the Euro?
The Euro is the currency for the 20 European Union countries that belong to the Eurozone. It is the second most heavily traded currency in the world behind the US Dollar. In 2022, it accounted for 31% of all foreign exchange transactions, with an average daily turnover of over $2.2 trillion a day.
EUR/USD is the most heavily traded currency pair in the world, accounting for an estimated 30% off all transactions, followed by EUR/JPY (4%), EUR/GBP (3%) and EUR/AUD (2%).
What is the ECB and how does it impact the Euro?
The European Central Bank (ECB) in Frankfurt, Germany, is the reserve bank for the Eurozone. The ECB sets interest rates and manages monetary policy.
The ECB’s primary mandate is to maintain price stability, which means either controlling inflation or stimulating growth. Its primary tool is the raising or lowering of interest rates. Relatively high interest rates – or the expectation of higher rates – will usually benefit the Euro and vice versa.
The ECB Governing Council makes monetary policy decisions at meetings held eight times a year. Decisions are made by heads of the Eurozone national banks and six permanent members, including the President of the ECB, Christine Lagarde.
How does inflation data impact the value of the Euro?
Eurozone inflation data, measured by the Harmonized Index of Consumer Prices (HICP), is an important econometric for the Euro. If inflation rises more than expected, especially if above the ECB’s 2% target, it obliges the ECB to raise interest rates to bring it back under control.
Relatively high interest rates compared to its counterparts will usually benefit the Euro, as it makes the region more attractive as a place for global investors to park their money.
How does economic data influence the value of the Euro?
Data releases gauge the health of the economy and can impact on the Euro. Indicators such as GDP, Manufacturing and Services PMIs, employment, and consumer sentiment surveys can all influence the direction of the single currency.
A strong economy is good for the Euro. Not only does it attract more foreign investment but it may encourage the ECB to put up interest rates, which will directly strengthen the Euro. Otherwise, if economic data is weak, the Euro is likely to fall.
Economic data for the four largest economies in the euro area (Germany, France, Italy and Spain) are especially significant, as they account for 75% of the Eurozone’s economy.
How does the Trade Balance impact the Euro?
Another significant data release for the Euro is the Trade Balance. This indicator measures the difference between what a country earns from its exports and what it spends on imports over a given period.
If a country produces highly sought after exports then its currency will gain in value purely from the extra demand created from foreign buyers seeking to purchase these goods. Therefore, a positive net Trade Balance strengthens a currency and vice versa for a negative balance.
According to Federal Reserve (Fed) Board of Governors member Michelle Bowman, slower-than-expected progress on inflation has left the Fed policymaker cautious about monetary policy stance.
Key highlights
- Latest inflation data suggests slower progress on inflation.
- Fed's Bowman expects inflation will decline further with current policy rates.
- Upside risks to inflation still remain.
- Fed's monetary policy stance is still appropriately restrictive.
- Economic activity, consumer spending remain strong, labor market is still tight.
- If inflation moves sustainably to 2% goal, it will eventually be appropriate to cut rates, but not there yet.
- Fed's Bowman remains willing to raise policy rates if progress on inflation stalls or reverses.
- Remains cautious on monetary policy.
- The AUD/JPY is trading at 98.49, recording a 0.10% daily decline in Tuesday's session.
- The Japanese Yen is strengthening, propelled by an unexpected surge in Japan's January CPI data.
- Speculations of a shift in the Bank of Japan's hawkish policy are emerging, although disinflationary pressures persist.
The AUD/JPY pair is trading at 98.49, a minor 0.10% drop in Tuesday's session. This slight decline is observed amid the strengthening of the Japanese Yen, attributed to the surge in Japan's Consumer Price Index (CPI) during January.
In that sense, Japan's latest national CPI figures for January indicated a slight increase above expectations. The headline inflation rate was reported to have risen by 2.2% (YoY), against a forecast of 1.9%, and down from 2.6% in December. The core inflation rate, which excludes fresh food, was recorded at 2.0% YoY, meeting the expectations of 1.9% and a decrease from 2.3% in the previous month. Following the figures, both the JPY and the yields on Japanese Government Bonds (JGB) experienced an uptick, with the 2-year yield reaching its highest point since 2011 as markets renewed their hopes on a sooner liftoff of the Japanese banking authority. However, it's worth mentioning, that inflation is still trending downward, suggesting the Bank of Japan (BoJ) has room to maintain a cautious approach towards policy normalization. As for now, markets are gearing up for a liftoff in June, but the bank may delay it further.
AUD/JPY technical analysis
On the daily chart, the Relative Strength Index (RSI) predominantly roams in positive territory, emphasizing a fair control of buyers over the market's direction. Despite some of its negative slope, the pair maintains its foothold in the positive zone, signaling that the bulls are still in charge.
Simultaneously, decreasing green bars on the Moving Average Convergence Divergence (MACD) histogram denotes a decline in positive momentum. Buyers, though active, are gradually losing ground, encouraging caution on the part of the bulls. However, the pair is still above its main Simple Moving Averages (SMAs) of 20,100, and 200 days, which suggests that the overall trend is still bullish, and the mentioned downward movements could be considered as a consolidation.
AUD/JPY daily chart
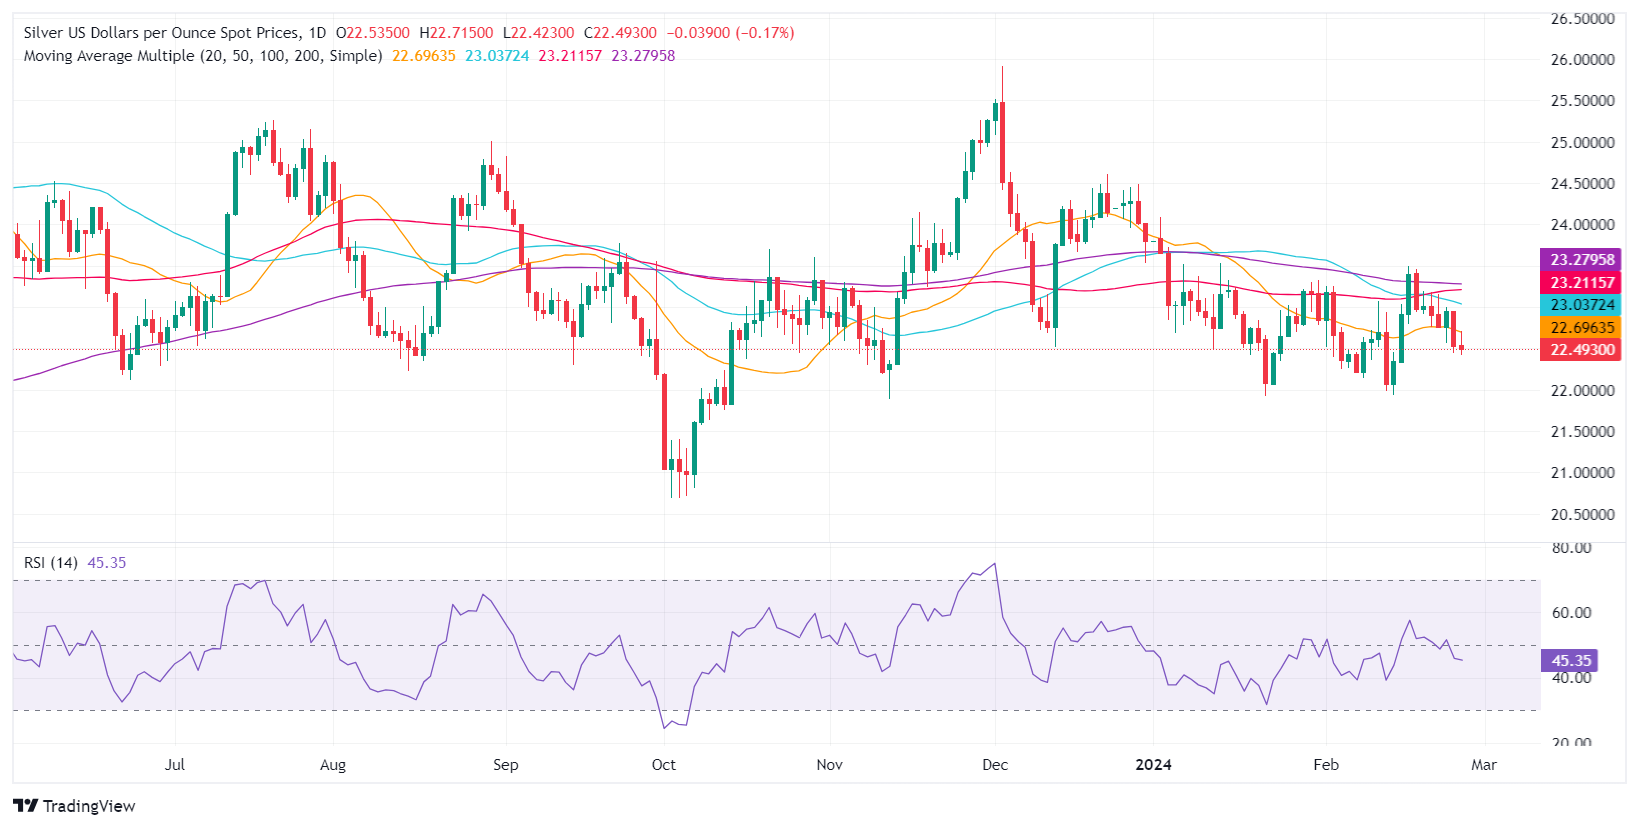
- Silver price drops to $22.43, approaching key technical support that may indicate a nearing bottom.
- Technical analysis points to a potential decline toward yearly lows if prices fall decisively below $22, showcasing bearish trends.
- A rebound above $23.00 might steer silver towards challenging the $23.30 resistance level, giving bulls an opportunity for recovery.
Silver price falls to an eight-day low of $22.43, though it appears to have bottomed out at around the $22.40-50 area. The advance of US Treasury bond yields capped the nonyielding metal, with XAG/USD trading at $22.49, down 0.04%.
XAG/USD Price Analysis: Technical outlook
The daily chart portrays that XAG/USD has extended its losses to levels last seen at around mid-February after briefly testing the confluence of the 50, 100, and 200-day moving averages (DMAs) at around the $23.00-$23.30 area. Even though Silver’s price action remains sideways, it’s tilted to the downside, but sellers must step in and drag prices below the $22.00 figure. Once achieved, that would open the door to test the yearly lows of $21.93, the November 13 low of $21.88, and the October 3 low of $20.69.
On the other hand, if XAG/USD buyers lift the spot price above $23.00, look for a re-test of the $23.30 area.
XAG/USD Price Action – Daily Chart
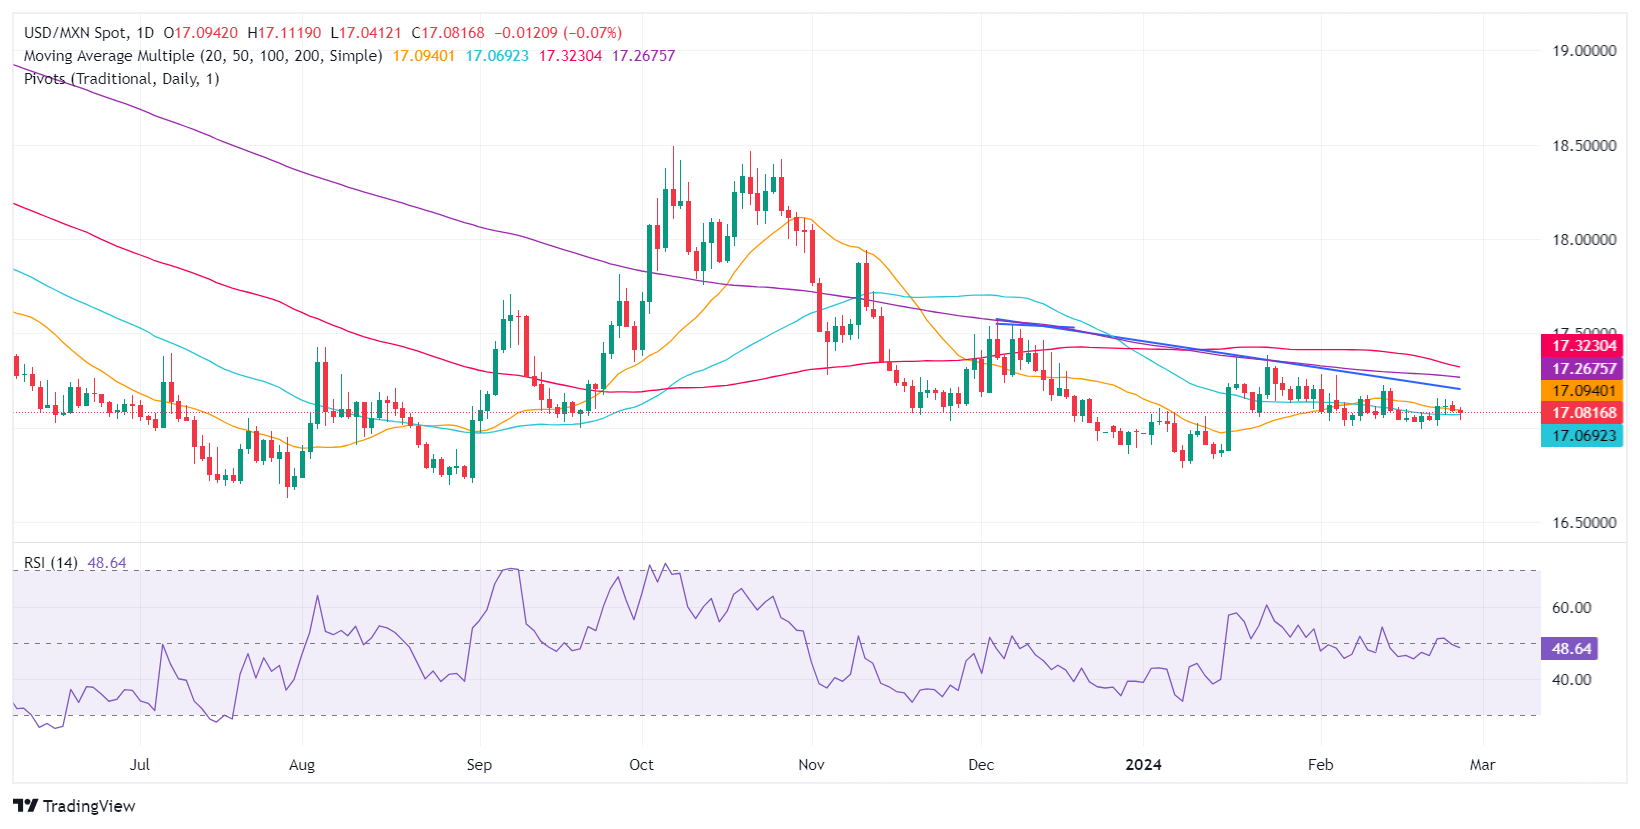
- Mexican Peso gains modestly as US Dollar weakens further despite pressure from rising US Treasury yields.
- Mexico's January trade deficit and potential Banxico rate cut speculation influence USD/MXN dynamics.
- Economic slowdown signs and CPI dip support Banxico's potential easing, hinting at upcoming volatility for the Peso.
Mexican Peso registers modest gains against the US Dollar as the latter remains weak, extending its losses to two straight days against a basket of six currencies, the so-called US Dollar Index (DXY). Nevertheless, a jump in US Treasury bond yields is capping the Peso’s advance, with the USD/MXN trading at 17.05, down 0.25%.
Mexico reported the Balance of Trade for January, which revealed the country posted a trade deficit of $302 million dollars, seasonally-adjusted, as announced by the National Statistics Agency (INEGI). The data failed to extend the USD/MXN losses amid speculation that the Bank of Mexico (Banxico) could ease monetary policy.
In an interview with El Economista, Pamela Diaz Loubet, BNP Paribas economist for Mexico, commented, “We maintain the forecast that they (Banxico) will apply a cut in March.” She said that in the latest minutes guidance for future actions, Banxico will surely explain that the March cut will be presented “to maintain flexibility and the gradual approach to cuts.”
The economic data in Mexico is expected to show an economic slowdown due to higher interest rates set by the Bank of Mexico (Banxico) at 11.25%. That, along with the latest report of the Consumer Price Index (CPI) dipping sharply for the first half of February, justifies the posture of three members of Banxico. The latest meeting minutes suggested that three policymakers are eyeing the first rate cut at the March meeting, which could put pressure on the Mexican Peso, opening the door for further upside on the USD/MXN exchange rate.
Across the border, US Durable Goods Orders plunged more than expected, while Home Prices reported by S&P/Case Shiller were mixed.
Daily digest market movers: Mexican Peso recovers as Banxico rate cut speculation grows
- Mexico posted a $302 million trade deficit in January when adjusted for seasonal swings.
- The latest inflation report in Mexico showed that headline and underlying inflation continued to dip toward Banxico’s goal of 3% plus or minus 1%, while economic growth exceeded estimates but finished below Q3’s 3.3%.
- Mexico’s Consumer Price Index (CPI) in the first half of February was 4.45%, down from 4.9% YoY.
- Mexico’s Core CPI slowed from 4.78% to 4.63% on an annual basis.
- Mexico’s GDP for Q4 2023 exceeded estimates of 2.4% YoY and hit 2.5%, less than Q3 2023 print of 3.3%.
- Economic trade issues between Mexico and the US could depreciate the Mexican currency if the Mexican government fails to resolve its steel and aluminum dispute with the United States. US Trade Representative Katherine Tai warned the US could reimpose tariffs on the commodities.
- In January, US Durable Goods Orders significantly declined to -6.1% MoM, exceeding the anticipated contraction of -4.5% and marking a steeper fall compared to December's -0.3% decrease.
- In December, the S&P/Case-Shiller Home Price Index indicated a monthly decline of -0.3%, a slight acceleration in the contraction pace from November's -0.2%. On an annual basis, home prices rose by 6.1%, surpassing both expectations and the growth rate from the previous month.
- The last meeting minutes of the US Federal Reserve (Fed) showed that policymakers remain hesitant to cut rates amid fears of a second round of inflation. They have expressed willingness to adjust policy when necessary but remain cautious, indicating no urgency to act. This stance is supported by current economic data suggesting strength in the economy, which could potentially revive inflationary pressure.
- Market players had trimmed the odds for the first 25 basis point (bps) rate cut in June, with odds lying at 53%, while 36% of investors expected the Fed to keep rates unchanged at the current level of 5.25%-5.50%.
Technical analysis: Mexican Peso stays firm as USD/MXN meanders around 50-day SMA
The USD/MXN slid below the 17.10 area, hoovering around the 50-day Simple Moving Average (SMA) after posting back-to-back days of losses. Even though the pair dipped to a three-day low at 17.04, it remains trading sideways, awaiting a fresh catalyst to gather direction.
If sellers drag the spot price below the 17.00 figure, that will pave the way to test the current year-to-date low of 16.78, followed by the 2023 low of 16.62. Otherwise, buyers moving in could lift the USD/MXN above 17.10, followed by the psychological 17.20 figure, ahead of key resistance levels seen at the 200-day SMA at 17.26 and the 100-day SMA at 17.33.
USD/MXN Price Action – Daily Chart
Mexican Peso FAQs
What key factors drive the Mexican Peso?
The Mexican Peso (MXN) is the most traded currency among its Latin American peers. Its value is broadly determined by the performance of the Mexican economy, the country’s central bank’s policy, the amount of foreign investment in the country and even the levels of remittances sent by Mexicans who live abroad, particularly in the United States. Geopolitical trends can also move MXN: for example, the process of nearshoring – or the decision by some firms to relocate manufacturing capacity and supply chains closer to their home countries – is also seen as a catalyst for the Mexican currency as the country is considered a key manufacturing hub in the American continent. Another catalyst for MXN is Oil prices as Mexico is a key exporter of the commodity.
How do decisions of the Banxico impact the Mexican Peso?
The main objective of Mexico’s central bank, also known as Banxico, is to maintain inflation at low and stable levels (at or close to its target of 3%, the midpoint in a tolerance band of between 2% and 4%). To this end, the bank sets an appropriate level of interest rates. When inflation is too high, Banxico will attempt to tame it by raising interest rates, making it more expensive for households and businesses to borrow money, thus cooling demand and the overall economy. Higher interest rates are generally positive for the Mexican Peso (MXN) as they lead to higher yields, making the country a more attractive place for investors. On the contrary, lower interest rates tend to weaken MXN.
How does economic data influence the value of the Mexican Peso?
Macroeconomic data releases are key to assess the state of the economy and can have an impact on the Mexican Peso (MXN) valuation. A strong Mexican economy, based on high economic growth, low unemployment and high confidence is good for MXN. Not only does it attract more foreign investment but it may encourage the Bank of Mexico (Banxico) to increase interest rates, particularly if this strength comes together with elevated inflation. However, if economic data is weak, MXN is likely to depreciate.
How does broader risk sentiment impact the Mexican Peso?
As an emerging-market currency, the Mexican Peso (MXN) tends to strive during risk-on periods, or when investors perceive that broader market risks are low and thus are eager to engage with investments that carry a higher risk. Conversely, MXN tends to weaken at times of market turbulence or economic uncertainty as investors tend to sell higher-risk assets and flee to the more-stable safe havens.
- Crude Oil extended the week’s recovery.
- US API Weekly Crude Oil Stocks due later in the day.
- Energy markets are hoping for a boost in Chinese demand.
West Texas Intermediate (WTI) US Crude Oil climbed into a fresh high on Tuesday, extending the week’s technical recovery as energy markets lean into expectations of an uptick in Chinese Crude Oil after post-holiday travel caused increased purchases of Crude Oil.
Travel following the Chinese Lunar New Year was much higher than expected in the bottom half of February, causing Chinese Crude Oil inventories to decline faster than expected and pushing up the rate of purchases from Chinese refineries. China’s increase in spending and post-holiday Crude Oil consumption has sparked hopes across barrel markets that Chinese barrel demand will remain high enough to sop up extra capacity.
Maintenance halts are also expected this year in mainland China, where reduced refining capacity is expected to reach a three-year high, further constraining supply of refined oil products within China.
Chinese demand picks up, US API Crude Stocks expected
The American Petroleum Institute (API) is releasing its latest week-on-week US Crude Oil Stocks figures, which lasted printed a 7.8 million barrel increase in excess barrels floating around the US Crude Oil supply chains.
Energy markets are also shrugging off renewed expectations of a potential ceasefire in the ongoing Gaza conflict between Israel and Palestinian Hamas. Barrel traders remain concerned that the altercation could spill over into nearby Crude Oil-focused economies, risking supply chain disruptions in the Middle East.
WTI technical outlook
WTI once again climbed back into the $78.00 handle, testing $78.20 per barrel on Tuesday. US Crude Oil extended a rebound from Friday’s bottom near $75.80, and WTI continues to churn within rough consolidation between $78.40 and $76.00.
WTI remains mired in the 200-day Simple Moving Average (SMA) near $77.65, and near-term bullish momentum remains capped below January’s late peak at $79.20.
WTI hourly chart
WTI daily chart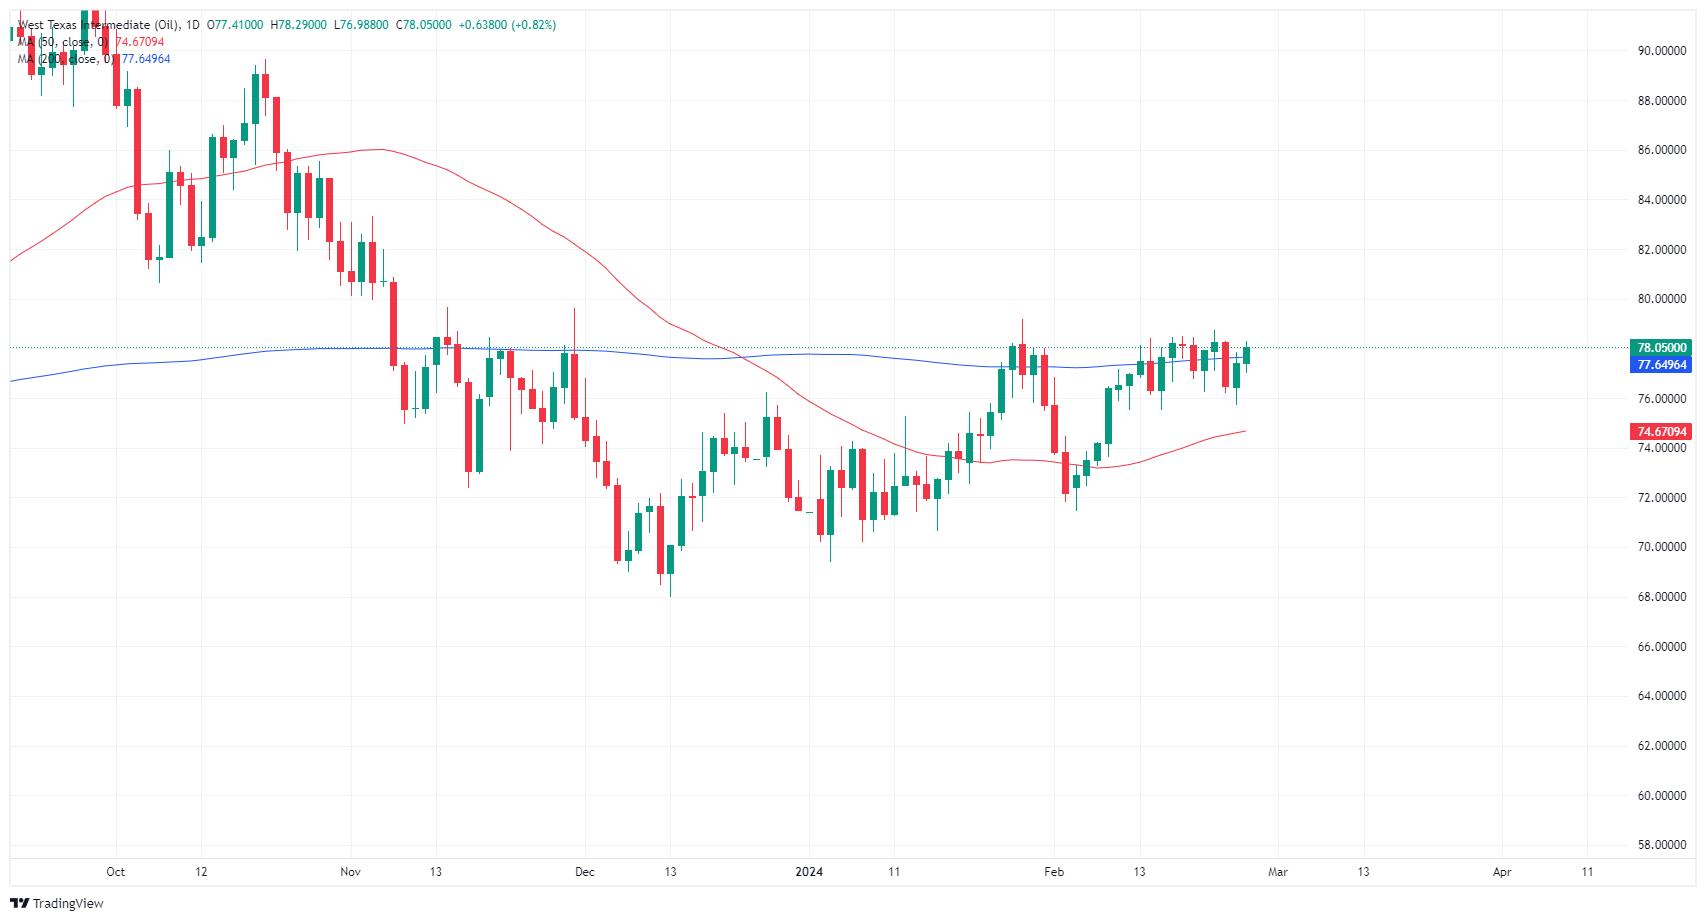
- The DXY Index is trading neutrally around the 103.80 level with minor day-to-day changes.
- Durable Goods and Confidence data from the US came in weaker than expected.
- The Federal Reserve maintains a hawkish stance as reflected in its reluctance to slash rates, which may limit the downside.
The US Dollar Index (DXY) is currently trading neutrally near the 103.80 mark. The Federal Reserve (Fed) has illustrated its wariness to hastily reduce rates, which has led to a diminished possibility of such cuts in March, while odds in May have decreased to approximately 20%. On the data front, weak mid-tier data reported during the European session is pushing the Greenback down.
If the United States economy continues to show weakness, markets may readjust their expectations, but as for now, the most likely scenario is that the Fed will start cutting in June, which seems to provide support to the USD. Personal Consumption Expenditures (PCE) figures from January and Gross Domestic Product (GDP) revisions from Q4 may change those bets.
Daily digest market movers: US Dollar offers weak profile as US economy starts showing some cracks
- The Conference Board's Consumer Confidence Index for February dropped lower than anticipated with a 106.7 print against the expected 115.
- US Durable Goods Orders plunged by 6.1% in January, far more than the 4.5% decline expected.
- As per the CME FedWatch Tool, the Federal Reserve's unwillingness to cut rates prematurely has shifted market sentiment. Reduction odds for March have dropped to zero, with May's likelihood of a cut down to 20%. As for now, the most likely scenario is that the easing starts in June.
- In case PCE and GDP data come in softer than expected, those odds may change in favor of dovish rhetoric that weighs on the US Dollar.
Technical analysis: DXY bears hold steady below 20-day SMA
The technical situation, as indicated by the daily chart, shows buying momentum gradually waning. This is seen by the Relative Strength Index (RSI) remaining tepid in negative territory, suggesting the possible emergence of selling pressure. Adding to this narrative, the appearance of rising red bars in the Moving Average Convergence Divergence (MACD), an indicator of downward momentum, further attests to this perspective.
However, the index standing with regard to the Simple Moving Averages (SMAs) presents a somewhat mixed picture. The DXY remains below both the 20 and 100-day SMAs, indicating a possible bearish bias for the short term, but its position above the 200-day SMA may imply underlying bullish strength.
Furthermore, the evidence of bears gaining ground could amplify the selling pressure. Therefore, in the short term, it could be suggested that the selling momentum is currently dominating. This, however, does not entirely overshadow the overall trend, which still showcases a certain degree of bullish resilience in the DXY.
US Dollar FAQs
What is the US Dollar?
The US Dollar (USD) is the official currency of the United States of America, and the ‘de facto’ currency of a significant number of other countries where it is found in circulation alongside local notes. It is the most heavily traded currency in the world, accounting for over 88% of all global foreign exchange turnover, or an average of $6.6 trillion in transactions per day, according to data from 2022.
Following the second world war, the USD took over from the British Pound as the world’s reserve currency. For most of its history, the US Dollar was backed by Gold, until the Bretton Woods Agreement in 1971 when the Gold Standard went away.
How do the decisions of the Federal Reserve impact the US Dollar?
The most important single factor impacting on the value of the US Dollar is monetary policy, which is shaped by the Federal Reserve (Fed). The Fed has two mandates: to achieve price stability (control inflation) and foster full employment. Its primary tool to achieve these two goals is by adjusting interest rates.
When prices are rising too quickly and inflation is above the Fed’s 2% target, the Fed will raise rates, which helps the USD value. When inflation falls below 2% or the Unemployment Rate is too high, the Fed may lower interest rates, which weighs on the Greenback.
What is Quantitative Easing and how does it influence the US Dollar?
In extreme situations, the Federal Reserve can also print more Dollars and enact quantitative easing (QE). QE is the process by which the Fed substantially increases the flow of credit in a stuck financial system.
It is a non-standard policy measure used when credit has dried up because banks will not lend to each other (out of the fear of counterparty default). It is a last resort when simply lowering interest rates is unlikely to achieve the necessary result. It was the Fed’s weapon of choice to combat the credit crunch that occurred during the Great Financial Crisis in 2008. It involves the Fed printing more Dollars and using them to buy US government bonds predominantly from financial institutions. QE usually leads to a weaker US Dollar.
What is Quantitative Tightening and how does it influence the US Dollar?
Quantitative tightening (QT) is the reverse process whereby the Federal Reserve stops buying bonds from financial institutions and does not reinvest the principal from the bonds it holds maturing in new purchases. It is usually positive for the US Dollar.
- USD/JPY recovered after US Durable Goods declined more than expected.
- Japanese National CPI inflation fell, but less than expected.
- US GDP, PCE inflation due in the back half of the trading week.
USD/JPY fell early Tuesday before finding a floor near 150.20, with the US Dollar (USD) paring away near-term losses after US Durable Goods Orders declined more than expected in January. Markets will be pivoting to focus on US Gross Domestic Product (GDP) growth and Personal Consumption Expenditure Price Index (PCE) inflation data due on Wednesday and Thursday, respectively.
Japan’s National Consumer Price Index (CPI) eased from previous figures, but still fell less than expected. Headline annualized National CPI slipped to 2.2% from 2.6% for the year ended January. Core National CPI fell to 2.0% from 2.3% for the same period, but markets were expecting a print of 1.8%.
US GDP, PCE inflation in the barrel
US MoM Durable Goods Orders declined to -6.1% in January, missing the -4.5% forecast. The previous print also got revised lower to -0.3% from 0.0%.
Wednesday will see US GDP growth for 2023’s fourth quarter, and the annualized Q4 GDP is forecast to hold steady at 3.3%. Thursday’s US PCE inflation is expected to see a slight uptick on the near end of the curve, with MOM Core PCE forecast to rise to 0.4% from 0.2% in January. Core annualized US PCE is expected to ease to 2.8% from 2.9% for the year ended January.
USD/JPY technical outlook
USD/JPY sees near-term technical resistance from 150.75 as the pair struggles to mount the 151.00 handle. The pair remains capped into the midrange as markets churn, and 150.50 remains a key cycle level for USD/JPY.
Longer term, the pair remains firmly pinned into bull country, with the pair trading into technical resistance near last November’s peak bids near 152.00. USD/JPY has closed in bullish territory for six of the last seven consecutive trading weeks.
USD/JPY hourly chart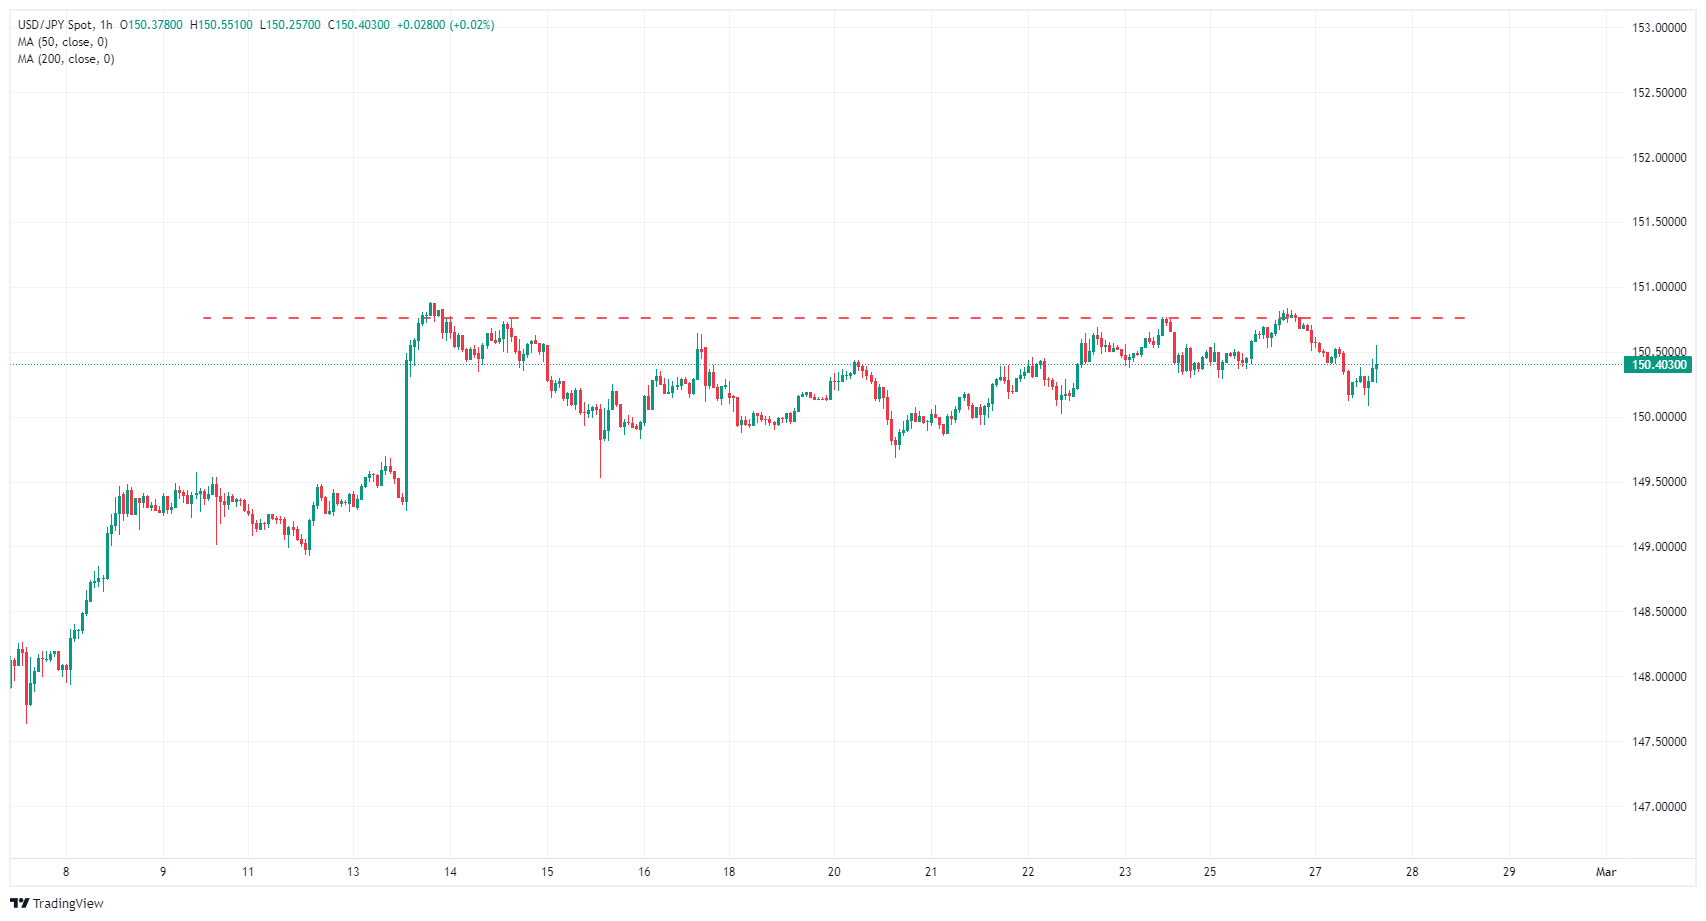
USD/JPY daily chart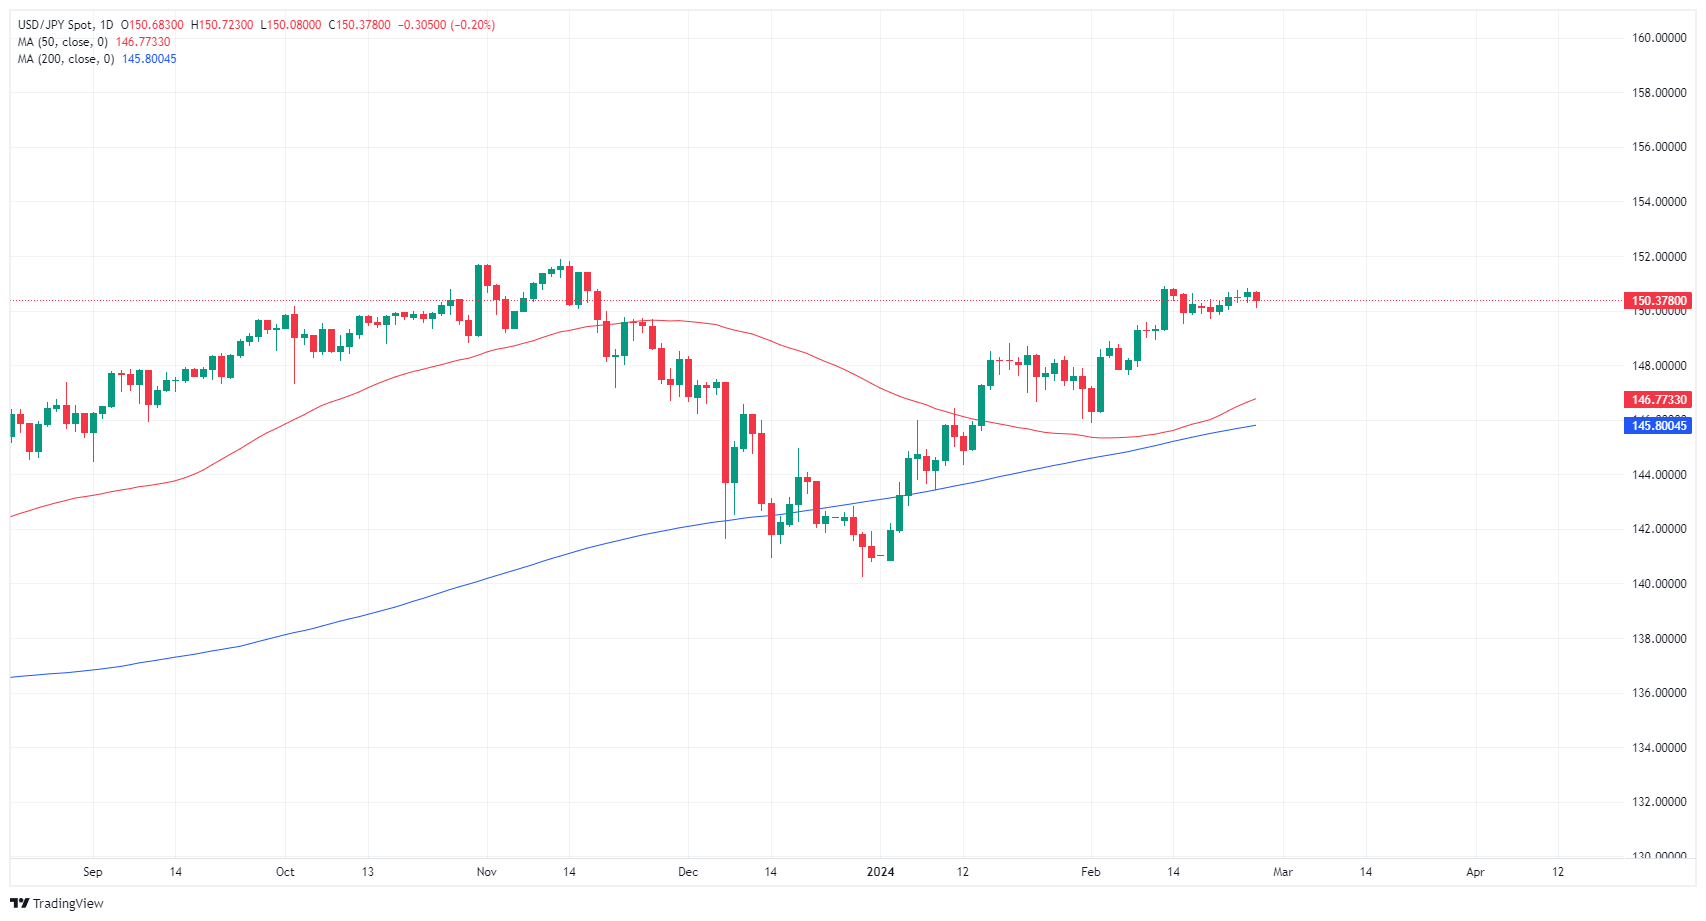
The Euro has been slowly moving higher for several weeks now. Economists at Commerzbank analyze EUR/USD outlook.
Euro not weak, just the Dollar is stronger
At the moment, there does not seem to be any momentum for the Euro to weaken. Friday's inflation figures will certainly be crucial, but there is no trend towards a weaker Euro, at least not at the moment. Only the Dollar is simply stronger, which is understandable given the strong figures from the US economy.
Comments from ECB officials may have also had a supportive effect on the EUR. Both ECB President Christine Lagarde and the head of the Bank of Greece, Giannis Stournaras, sounded quite cautious by their respective standards on Monday. Stournaras, of course, argued for a rate cut in June, but since he was the first one who pushed for rate cuts last year, this was not a big surprise.
Stournaras completely ruled out a rate cut in March, and at least to a large extent one in April. Even if a first rate cut is not priced in until June, it is certainly not bad for the Euro if one of the biggest doves on the ECB Governing Council holds similar views. After all, it makes earlier rate cuts much less likely.
The New Zealand Dollar (NZD) has had a strong month of February, emerging as the best-performing G10 currency. Economists at ING analyze Kiwi’s outlook.
NZD/USD to break the 0.6500 mark the third quarter
Our view that rate cuts in New Zealand won’t start before August and that the Fed should instead start cutting during the summer translates into a bullish NZD/USD profile for the rest of the year. However, external volatility can offset the positives of a hawkish RBNZ in February and favour a near-term slide to more attractive levels for longer-term bullish positioning.
We see NZD/USD breaking the 0.6500 mark in 3Q24.
Some downside risks related to the US elections and potentially negative implications for China-related sentiment may warrant a less optimistic NZD profile in 4Q24.
- USD/CAD started the day soft before a pivot in the US session.
- Canada absent from the economic calendar on Tuesday.
- US Durable Goods declined more than expected, US PCE in the pipe.
USD/CAD settled to an intraday low of 1.3484 before rallying back above the 1.3500 handle after US Durable Goods Orders declined more than expected. The pair remains mired in near-term congestion as markets await US Personal Consumption Expenditure Price Index (PCE) data on inflation later in the week.
Canada waits until Wednesday to make an appearance on the economic calendar with Q4’s Current Account. This Canadian data release will be overshadowed, however, by the US Gross Domestic Product (GDP) report due simultaneously at 13:30 GMT on Wednesday.
Daily digest market movers: USD/CAD pivots on Durable Goods miss
- US Durable Goods Orders declined 6.1% in January, missing the -4.5% forecast versus the previous month’s -0.3% (revised lower from 0.0%).
- The Conference Board Consumer Confidence Index also declined more than expected, printing at 106.7 versus the forecast of 115.0, previously 114.8.
- The US Housing Price Index rose less than expected in December, climbing just 0.1% MoM versus the 0.3% forecast. It was previously revised to 0.4% in November.
- Canada’s Q4 Current Account on Wednesday is expected to recover but still remain in negative territory, forecast to print at -1.25 billion versus -3.22 billion previously.
- US annualized Q4 GDP is forecast to hold steady at 3.3%.
- Canada’s Q4 GDP to follow on Thursday, markets expect a rebound in the yearly figure to 0.8% from -1.1%.
Canadian Dollar price today
The table below shows the percentage change of Canadian Dollar (CAD) against listed major currencies today. Canadian Dollar was the strongest against the Euro.
| USD | EUR | GBP | CAD | AUD | JPY | NZD | CHF | |
| USD | 0.11% | 0.10% | 0.12% | -0.01% | -0.12% | 0.03% | 0.01% | |
| EUR | -0.10% | 0.01% | 0.02% | -0.12% | -0.21% | -0.09% | -0.09% | |
| GBP | -0.09% | 0.01% | 0.02% | -0.11% | -0.21% | -0.09% | -0.09% | |
| CAD | -0.12% | -0.04% | -0.05% | -0.15% | -0.25% | -0.10% | -0.12% | |
| AUD | 0.02% | 0.11% | 0.11% | 0.13% | -0.10% | 0.02% | 0.02% | |
| JPY | 0.12% | 0.21% | 0.21% | 0.23% | 0.15% | 0.13% | 0.12% | |
| NZD | -0.03% | 0.10% | 0.06% | 0.10% | -0.04% | -0.14% | 0.04% | |
| CHF | -0.01% | 0.10% | 0.08% | 0.10% | -0.01% | -0.12% | 0.00% |
The heat map shows percentage changes of major currencies against each other. The base currency is picked from the left column, while the quote currency is picked from the top row. For example, if you pick the Euro from the left column and move along the horizontal line to the Japanese Yen, the percentage change displayed in the box will represent EUR (base)/JPY (quote).
Technical analysis: USD/CAD continues to chug near 1.3500
USD/CAD dipped into 1.3484 on Tuesday before recovering into the familiar 1.3520 level. The pair continues to churn around the 1.3500 handle, and the 200-hour Simple Moving Average (SMA) remains a key barrier to momentum in either direction in the near term.
The immediate technical barrier of February’s high of 1.3586 remains a key level for bulls to break through to challenge the 1.3600 handle. A rising pattern of higher lows on the daily candles provides technical support for immediate bullish momentum, but price action is trading into a heavy supply zone from 1.3500 to 1.3550.
USD/CAD hourly chart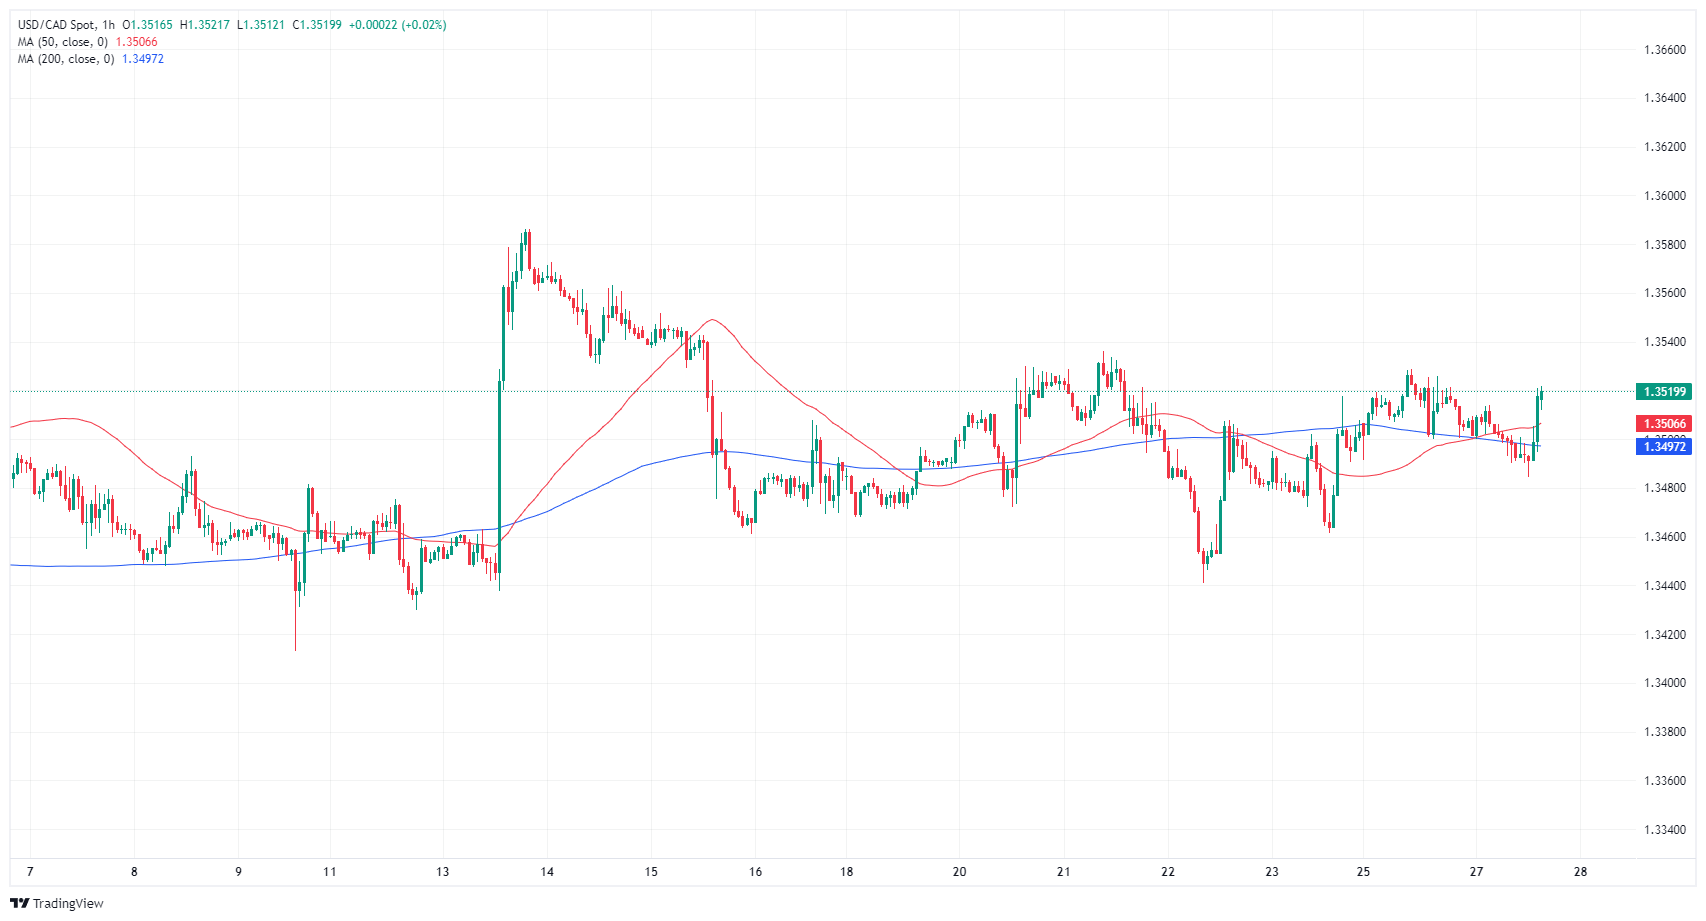
USD/CAD daily chart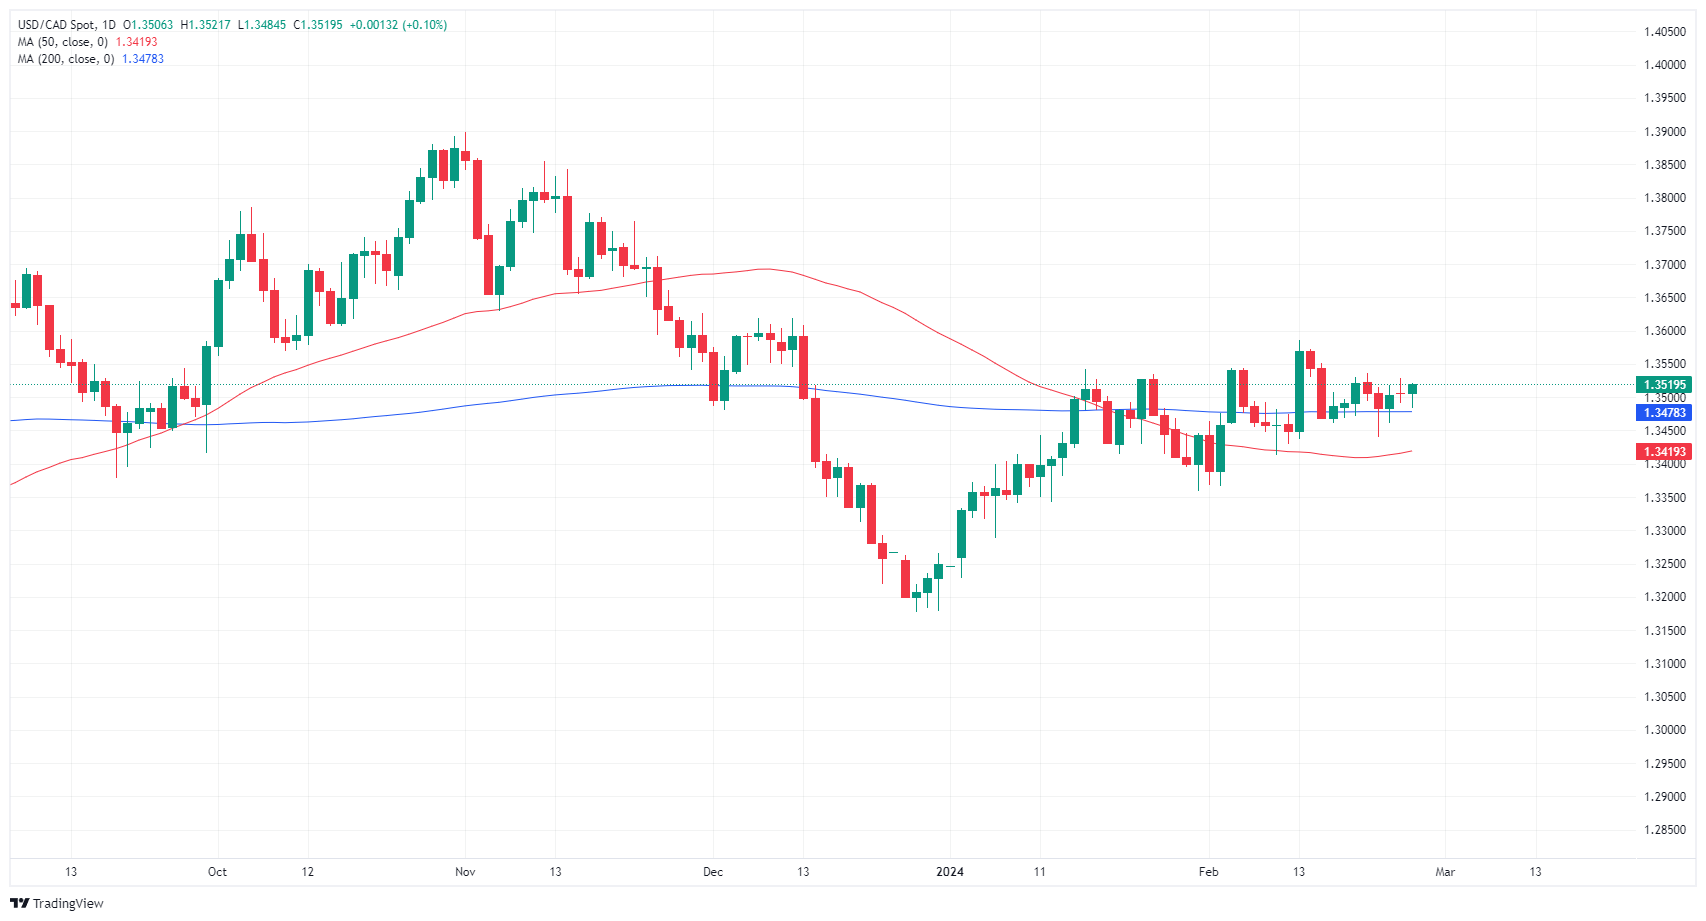
Canadian Dollar FAQs
What key factors drive the Canadian Dollar?
The key factors driving the Canadian Dollar (CAD) are the level of interest rates set by the Bank of Canada (BoC), the price of Oil, Canada’s largest export, the health of its economy, inflation and the Trade Balance, which is the difference between the value of Canada’s exports versus its imports. Other factors include market sentiment – whether investors are taking on more risky assets (risk-on) or seeking safe-havens (risk-off) – with risk-on being CAD-positive. As its largest trading partner, the health of the US economy is also a key factor influencing the Canadian Dollar.
How do the decisions of the Bank of Canada impact the Canadian Dollar?
The Bank of Canada (BoC) has a significant influence on the Canadian Dollar by setting the level of interest rates that banks can lend to one another. This influences the level of interest rates for everyone. The main goal of the BoC is to maintain inflation at 1-3% by adjusting interest rates up or down. Relatively higher interest rates tend to be positive for the CAD. The Bank of Canada can also use quantitative easing and tightening to influence credit conditions, with the former CAD-negative and the latter CAD-positive.
How does the price of Oil impact the Canadian Dollar?
The price of Oil is a key factor impacting the value of the Canadian Dollar. Petroleum is Canada’s biggest export, so Oil price tends to have an immediate impact on the CAD value. Generally, if Oil price rises CAD also goes up, as aggregate demand for the currency increases. The opposite is the case if the price of Oil falls. Higher Oil prices also tend to result in a greater likelihood of a positive Trade Balance, which is also supportive of the CAD.
How does inflation data impact the value of the Canadian Dollar?
While inflation had always traditionally been thought of as a negative factor for a currency since it lowers the value of money, the opposite has actually been the case in modern times with the relaxation of cross-border capital controls. Higher inflation tends to lead central banks to put up interest rates which attracts more capital inflows from global investors seeking a lucrative place to keep their money. This increases demand for the local currency, which in Canada’s case is the Canadian Dollar.
How does economic data influence the value of the Canadian Dollar?
Macroeconomic data releases gauge the health of the economy and can have an impact on the Canadian Dollar. Indicators such as GDP, Manufacturing and Services PMIs, employment, and consumer sentiment surveys can all influence the direction of the CAD. A strong economy is good for the Canadian Dollar. Not only does it attract more foreign investment but it may encourage the Bank of Canada to put up interest rates, leading to a stronger currency. If economic data is weak, however, the CAD is likely to fall.
Kit Juckes, Chief Global FX Strategist at Société Générale, analyzes how the next moves from the ECB and the Fed could impact the EUR/USD pair.
The inflation data still allows the Fed to think about cutting rates in mid-year
All eyes are on the core PCE deflator, due on Thursday. The question in the market is straightforward – how can an economy which has seen employment increase by 1.9% in the last year, and the labour force by only 0.3%, possibly hope to get inflation lower unless the economy somehow hits an invisible brick wall? We and the market expect a 0.4% monthly increase in core PCE, taking the annual rate to 2.8% from 2.9% and keeping the 3m/3m annualised rate at 2.2%. For now, the obvious concerns notwithstanding, the inflation data still allows the Fed to think about cutting rates in mid-year.
Whether the Fed or the ECB cuts first, or fastest, will determine where EUR/USD goes this year, but if they are both moving in the same direction, the pair won’t go very far in either direction. However, if it were to become clear in the months ahead that the Fed’s next move will be a hike, while the ECB’s will be to cut rates, then the FX market reaction will be substantial.
‘A return to parity’ would be a clickbait title but would demand a painful revision to our forecasts! What are the odds of that? Not more than 25%, perhaps, but definitely more than 10% and that’s why I’ll be nervous ahead of Thursday’s release, and all the upcoming inflation data.
- EUR/USD declines 0.12% as Wall Street losses and rising US Treasury yields bolster the Dollar amidst global caution.
- US economic reports reveal sharp drop in Durable Goods Orders and mixed signals from housing and business spending data.
- ECB's cautious stance on inflation and policy easing, coupled with weak Eurozone lending and German consumer sentiment, capped the Euro's advance.
The Euro registers losses versus the US Dollar early in the North American session, edges lower 0.12%, and trades at around 1.0837. A risk-off impulse, as witnessed by Wall Street’s posting losses and US Treasury bond yields rise, supports the Greenback’s recovery.
EUR/USD faces downward pressure as US economic indicators and ECB caution weigh on investor sentiment
Data-wise, the US economic docket featured Durable Goods Orders for January, which plunged more than the -4.5% contraction, down -6.1% MoM, below December’s -0.3% drop. Non-defense capital goods orders, excluding aircraft, used as a proxy for business spending, edged up 0.1% after a revised decline in December of -0.6%. Lately, housing data from the US, namely the S&P/Case Shiller Home Prices, edged lower -0.3% MoM in December, worse than November’s -0.2% contraction. Annually based figures edged up by 6.1%, exceeding estimates and the previous month’s data.
Across the pond, GfK revealed that German consumer sentiment stabilized at lower levels in March, coming at -29.0, a tick higher than February’s -29.7. Rolf Buerkl, consumer expert at the NIM noted “There is great uncertainty among consumers. In addition to the constantly rising prices, the weaker economic forecasts for the German economy this year are likely to be another important reason for this.”
At the same time, Eurozone (EU) lending halted in January, as the European Central Bank (ECB) reported that M3 annual growth was 0.1% less than estimates of 0.3%.
Recently, some European Central Bank (ECB) speakers, led by President Lagarde, had expressed that the inflation battle hasn’t been won. ECB’s Governing Council Stournaras said the ECB doesn’t have enough data on rate cuts until June, and when the time comes, the ECB will move gradually towards easing policy.
Ahead in the week, the EU’s docket will feature the Economic Sentiment Index. In the US, the second estimate of the Gross Domestic Product (GDP) and Fed speakers could spark some volatility in the EUR/USD pair.
EUR/USD Price Analysis: Technical outlook
Despite hitting a three-day high, the EUR/USD retreated from around 1.0860 to 1.0840s, at a time that Relative Strength Index (RSI) studies had peaked and edged towards the 50-midline. If sellers push the exchange rate below the 200-day moving average (DMA) at 1.0827, that would pave the way to test the 100-DMA at 1.0816, ahead of 1.0800. On the other hand, look for a re-test of the 50-DMA at 1.0881 before the 1.0900 figure.
- US CB Consumer Confidence Index eased to 106.7 in February.
- US Dollar Index trades within a tight range near 103.80.
Consumer sentiment in the US retreated to three-month lows at 106.7 for the month of February according to the Conference Board. Following two consecutive months of improvement, the index came in short of expectations and receded to three-month lows in February.
In addition, the Present Situation Index dropped to 147.2 (from 154.9) and the Expectations Index deflated to 79.8 (from 81.5). Still around the latter, a reading below 80 is indicative of a recession.
Additionally, the 12-month inflation expectations retreated to 5.2%.
Market Reaction
There was no meaningful change in the USD Index (DXY), which kept gyrating around the 103.80 zone in the wake of the release.
The Australian Bureau of Statistics (ABS) will release the Monthly Consumer Price Index (CPI) Indicator for January on Wednesday, February 28 at 00:30 GMT and as we get closer to the release time, here are forecasts from economists and researchers of six major banks regarding the upcoming inflation data.
January CPI is expected to rise to 3.6% year-on-year from the previous reading of 3.4%. If so, it would be the first acceleration since September and move further above the 2-3% target range.
ANZ
We expect annual growth in the monthly CPI indicator to rise slightly to 3.6% YoY in January from 3.4% YoY in December. This is equivalent to a 0.2% MoM fall in the price level. Headline deflation is not uncommon in January, due to seasonal falls in prices for holidays, household goods, and clothing & footwear. Updated CPI weights will be published in this release, but we don't expect the changes will be as significant as in the past few years when spending patterns were more affected by the pandemic.
Westpac
Being the first month of the quarter, the January CPI will predominately serve as an update on durable goods prices such as garments, furniture and furnishings, household textiles, household appliances (many of which are anticipated to fall) but very few services prices. Due to base effects, our forecast for a 0.1% MoM increase will see the annual pace lift from 3.4% to 3.9% YoY.
ING
January’s inflation data will probably unwind some of the December decline, as we are not expecting a repeat of the big drop in prices that followed the December 2022 price spike. That should take inflation from 3.4% YoY to 3.7%, with a chance that it comes in even higher. With the RBA mulling the need for further possible rate hikes at their February meeting, the narrative on rates in Australia may shift from when and how much the RBA will start easing back to whether rates have peaked after all.
TDS
We expect January monthly CPI to rise to 3.7% YoY as the high base effects fade off and rising inflation pressures emerge from higher rents, insurance and utility bills. Jan has usually less surveyed items in the monthly indicator, so the print could be fairly volatile but the inflation risks are apparent which warranted the RBA to keep a hawkish stance at its Feb meeting. Services prices are unlikely to retreat quickly, jeopardising the RBA's goal of returning inflation back to target.
SocGen
Monthly headline CPI inflation (YoY) for January (3.2%) is likely to fall further from December (3.4%), although the pace of decline should be much more gradual than in recent months. A continued decline in monthly headline inflation should further support our base scenario of no additional RBA rate hike and a series of policy rate cuts from 4Q24, although we are still concerned about the remaining upside risks to inflation, especially in the housing sector.
Citi
MoM inflation was likely flat in January, implying a 3.7% increase in year-ago terms though we see downside risks to their forecast, stemming largely from food inflation, which is expected to fall. Elsewhere, the key contributor to inflation will remain housing, with both rents and owner-occupier dwelling costs expected to rise further. The first month of the quarter tends to focus on goods prices. After a sharp fall in Q3, we expect a more mixed Q4 post Black Friday and X-mas sale events.
In addition to the Gold price, economists at Commerzbank have also lowered their price forecasts for the other precious metals.
Forecast change for Silver, Platinum an Palladium
We expect prices for Silver, Platinum and Palladium to rise over the course of the year.
The reason for Silver is the same as for Gold, namely the Fed interest rate cuts we expect from the middle of the year. We also think that Silver can make up some of the ground it has lost against Gold. We are lowering our price forecast for the end of the year to $28 per troy ounce (previously $30).
We see the price of Platinum at $1,100 at the end of the year (previously $1,200) and Palladium also at $1,100 (previously $1,200).
The Reserve Bank of New Zealand (RBNZ) will announce its Interest Rate Decision on Wednesday, February 28 at 01:00 GMT and as we get closer to the release time, here are the expectations as forecast by the economists and researchers of eight major banks.
RBNZ will release its Monetary Policy Statement with updated macro forecasts and the expected path of interest rates at the same time. There will also be a press conference to comment on the new projections.
RBNZ is expected to keep the Official Cash Rate (OCR) steady at 5.50% but markets see around 25% odds of a 25 bps hike. The focus will be on the updated rate path projections.
ANZ Bank
We expect the RBNZ to hike the OCR to 5.75% and to publish an OCR track that gives a decent hat-tip to the possibility of a follow-up hike in April (with a peak of perhaps 5.85%). We don’t expect the RBNZ’s medium-term forecasts for either activity or inflation to have changed significantly, with the higher OCR track bringing about the prolonged period of subdued growth that is necessary to bring inflation down. Hiking the OCR into a weaker economy is of course risky, but we expect the RBNZ to conclude that not hiking is the riskier option. If the Committee does in fact decide they need more evidence that a higher OCR is required before acting, we would nonetheless expect an extremely hawkish tone and an OCR track that sets a low bar fora hike in April.
TDS
It's a close call, but we expect the RBNZ to hike by 25 bps taking the OCR to 5.75% with the Bank's household inflation expectations survey the key catalyst for a change in view. A big jump in 5-yearr inflation expectations will certainly raise eyebrows at the RBNZ and cast credibility on the Bank if they don't take action. We expect the Bank to signal a subsequent hike, pinning the terminal rate at 6% for this hiking cycle.
Westpac
We expect the RBNZ will leave the OCR unchanged at 5.50% at its February policy meeting. An increase in the OCR is a genuine possibility, but we suspect the RBNZ’s goal will be to drive home the message that the OCR is not moving lower in 2024. The RBNZ’s short-term forward profile for the OCR is likely to be little changed, keeping open the option to tighten – perhaps as early as the May Monetary Policy Statement – should the data warrant it. Future data on non-tradables inflation, the labour market, the housing market, and the Budget will be key in making the case for any further tightening.
Standard Chartered
We expect the RBNZ to maintain the OCR at 5.50%. We think the RBNZ will maintain its restrictive policy stance amid inertial price pressures. The tail risk is for further rate hikes in February and potentially beyond, as net immigration continues to support economic activity through greater spending on housing services. Barring a re-acceleration in inflation, we ascribe a very low probability (15%) to that risk, so long as progress is made on guiding inflation back towards target.
DBS Bank
We expect the RBNZ to maintain its official cash rate at 5.50%. On balance, the RBNZ’s next move will likely be a rate cut than a hike.
Rabobank
Our house view is for no rate hike this week, but household inflation expectations figures released late last week are enough to make us nervous. That data showed two-year expectations rising from 3% to 3.2%, while five-year expectations rose to 3% after having been anchored at the midpoint of the RBNZ’s target range (2%) for four consecutive quarters. That’s a problem, because Keynesian central banker types believe that when it comes to inflation, expectations become reality.
BofA
The RBNZ will maintain the OCR at 5.50%. The RBNZ is likely to continue its hawkish stance, underscoring a commitment to sustaining high interest rates for an extended period.
Citi
We are skeptical whether the RBNZ can deliver another hike and expect the Bank to maintain the OCR at 5.50%. However, the RBNZ does not want to be the first central bank to cut rates, or indeed signal rate cuts. Thus, it will likely keep the option of another hike in its OCR track. This would imply a hawkish bias. While the risks are tilted towards the hawkish outcomes, a dovish risk for the RBNZ is if it opts to remove the hike embedded in its OCR track.
The US Dollar Index (DXY) is up 2.4% since January on repricing of Fed cuts from six to three. Economists at Société Générale analyze Greenback’s outlook.
Headline +0.3%, Core +0.4%
PCE inflation is the next signpost on Thursday. We forecast headline +0.3% (2.4% YoY) and Core +0.4% (2.8% YoY). The spotlight will be on Core services after the 0.8% MoM spike in equivalent CPI two weeks ago.
The repricing of Fed cuts from six to three since January has boosted the DXY by 2.4% over the past eight weeks but doubts over sustained upswing have emerged following the failure to orbit 105.00 after CPI and PPI. PCE must exceed forecasts or Euro inflation must underwhelm for the trend to continue.
- Durable Goods Orders contracted at a stronger pace than expected in January.
- US Dollar Index stays in daily range below 104.00 after the data.
Durable Goods Orders in the United States declined by 6.1%, or $18 billion, to $276.7 billion in January, the Census Bureau reported on Tuesday. This reading followed the 0.3% decrease recorded in December and came in worse than the market expectation for a contraction of 4.5%.
"Excluding transportation, new orders decreased 0.3%," the publication read. "Excluding defense, new orders decreased 7.3%. Transportation equipment, also down three of the last four months, led the decrease, $17.4 billion, or 16.2%, to $89.8 billion."
Market reaction
These numbers don't seem to be having a significant impact on the US Dollar's (USD) valuation against its major rivals. At the time of press, the US Dollar Index was down 0.06% on the day at 103.72.
USD/CAD continues to drift somewhat aimlessly within a well-established trading range. Economists at Scotiabank analyze the pair’s outlook.
Technicals suggest more of the same
Flat range trading and flat trend oscillators suggest the sideways movement in the USD/CAD pair will extend for a little longer at least.
Last week’s ‘inside range’ week signal was a ‘heads up’ that the broader push higher in the USD may be stalling but there is no clear sign in price action that a softer USD trend is about to unfold. That does appear to be where the main directional risk lies from my point of view though. Price action may hold between 1.3450/1.3550 for now, however.
- USD/CHF trades sideways near 0.8800 as the focus shifts to US economic data.
- The Swiss economy is expected to have growth at a moderate pace of 0.1% in the last quarter of 2023.
- Fed policymakers support holding interest rates unchanged in the range of 5.25%-5.50%.
The USD/CHF is stuck in a tight range near the round-level resistance of 0.8800 since Friday’s trading session. The Swiss Franc asset struggles to find a direction as investors await the United States core Personal Consumption Expenditure price index (PCE) and Swiss Q4 Gross Domestic Product (GDP) data for further guidance.
The US Dollar edges down in Tuesday’s trading session. Further action in the US Dollar will be guided by the US core PCE price index data, which will influence market expectations for the Federal Reserve’s (Fed) rate cuts.
Meanwhile, Fed policymakers argue in favor of holding interest rates unchanged in the range of 5.25%-5.50% until they get evidence that inflation will fall sustainably to the required rate of 2%.
On the Swiss front, investors await the Q4 GDP data, which will be published on Thursday. Investors anticipate the economy grew modestly by 0.1% in the October-December quarter against 0.3% in the third quarter of 2023.
USD/CHF consolidates in a narrow range around 0.8800. The broader outlook remains bullish as the pair trades in a Rising Channel chart pattern formed on a four-hour timeframe. In the aforementioned chart pattern, market participants consider each pullback a buying opportunity.
The 50-period Exponential Moving Average (EMA) at 0.8800 remains sticky with spot prices, indicating a sideways trend.
The 14-period Relative Strength Index (RSI) oscillates in the 40.00-60.00 range, demonstrating a sharp volatility contraction.
Fresh upside would emerge if the asset breaks above the three-month high of around 0.8886, which would unlock upside towards the September 20 low at 0.8932 and the November 8 low at 0.8976.
On the contrary, a breakdown below February 13 low at 0.8746 would expose the asset to round-level support of 0.8700, followed by February 1 high around 0.8650.
USD/CHF four-hour chart
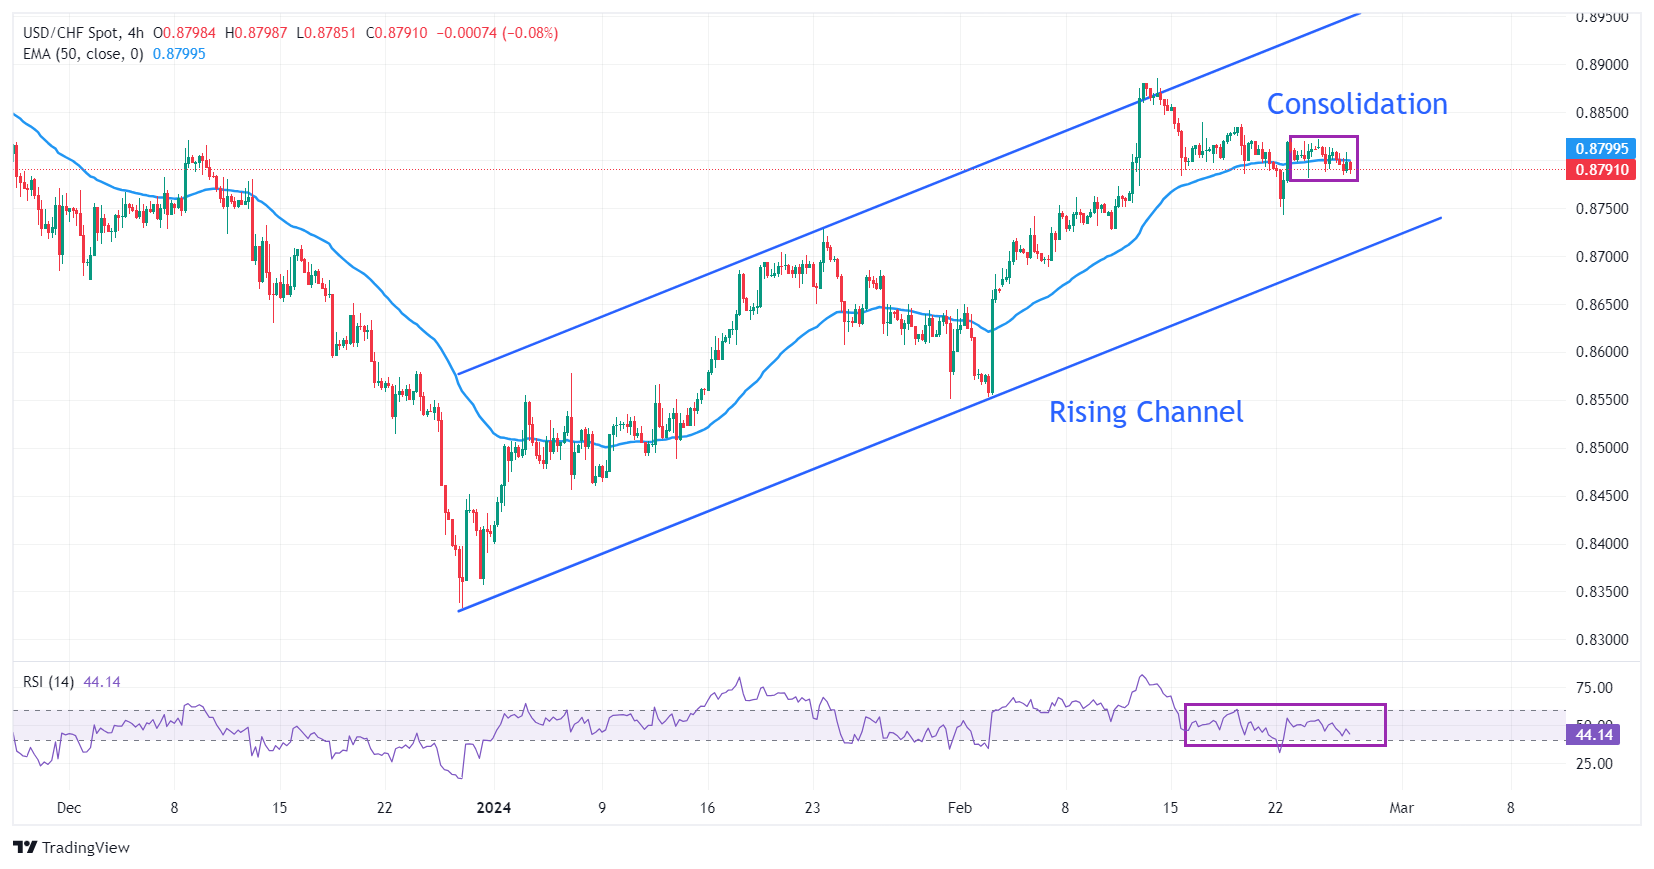
The Japanese Yen (JPY) is a mild outperformer (but off earlier peaks against the US Dollar) as Japan’s CPI slows less than expected. Economists at Scotiabank analyze USD/JPY outlook.
USD/JPY may be vulnerable to downward pressure
Headline and core inflation eased but by quite a bit less than expected. Headline inflation fell to 2.2%, from 2.6% in December but was expected to hit 1.9%. With price growth expected to pick up again in the coming months, these data support expectations that the BoJ will reverse its key policy rate from negative in the not-too-distant future.
USD/JPY is just about holding the uptrend in place since the end of last year but may be vulnerable to downward pressure, given the considerable buildup of JPY short positioning evident via the IMM data in the past few weeks. Key short-term support is 149.55.
JPY gains would add to the generally softer undertone that is still developing around a somewhat overvalued USD generally after the DXY’s mid-February peak around 105.00.
US Treasury Secretary Janet Yellen said on Tuesday that she consider the global outlook to be "quite favorable" but added that there are always risks, per Reuters.
"If the Israel-Gaza war were to expand into regional conflict, it would have risk for the global outlook," Yellen added and said that it's important for the G7 to work together to find a solution on Russian assets that is grounded in international law.
Market reaction
These comments failed to trigger a noticeable market reaction. At the time of press, the US Dollar Index was down 0.12% on the day at 103.65.
GBP/USD is registering a very mild net gain on the day so far, its sixth in succession. Economists at Scotiabank analyze the pair’s outlook.
Cable should remain supported on minor dips
Trend momentum is mildly bullish on the intraday and daily DMI studies, suggesting the GBP/USD pair should remain supported on minor dips. But Cable gains have struggled to extend through 1.2700/1.2710 in the past few sessions. A push firmly above 1.2710 targets a move on to 1.2750/1.2775.
Support is seen at 1.2650/1.2660.
- The US Dollar is in the red with Japanese Yen leading the charge against the Greenback.
- Market sentiment becomes unclear with investors awaiting further data in pivotal week.
- The US Dollar Index is on the back foot and heads to the mid-103 level.
The US Dollar (USD) is mildly in the red, trading overall is down against most major peers, especially the Japanese Yen, which is nearly 0.50% stronger against the Greenback. The move comes on the back of the Japanese inflation print which came out higher than expected.
On the economic front the week is starting to heat up with Durable Goods and a few sentiment indices ahead. Markets already heard Kansas City Federal Reserve Bank President Jeffrey Schmid, who said that the Fed should be patient and not adjust its policy preemptively. Later this Tuesday Michael Barr and Fed’s Vice Chair will make comments as well.
Daily digest market movers: Perfect appetiser with Durable Goods
- Kansas City Fed Jeffrey Schmid already kicked off this Tuesday with early comments, saying that the Fed should wait and not jump the gun on its disinflationary path.
- Around 13:30 GMT Durable Goods for January are due to be released:
- Headline Durable Goods Orders are expected to head from 0% to -4.8%.
- Orders without Transportation are seen heading from 0.5% to 0.2%.
- As always, the previous revisions will be more important in terms of market reaction on the numbers.
- At 13:55 the weekly Redbook will be released, with 3% as the previous number.
- Near 14:00 the Housing Price Index for December will be released, with a steady 0.3% forecasted.
- Fed Vice Chairman Michael Barr will make some comments around that same time as the Housing Price Index release.
- Fast forward to 15:00 and the Consumer Confidence for February will be released. Previously it was at 114.8 with 115 projected. Additionally, the Richmond Fed Manufacturing Index for february will be released at that same time, with -15 printed previously and -4 forecasted.
- Last number for this Tuesday will be released at 15:30 with the Dallas Fed Manufacturing Business Index for February, previously in contraction at -27.4.
- Equities are mildly in the green after the Dow Jones snapped its three-day winning streak overnight. China is doing rather well, with both the Hang Seng and the Shenzhen Index both up near 1%. European equities are mildly in the green with US futures still looking for direction.
- According to the CME Group’s FedWatch Tool, expectations for a Fed pause in the March 20 meeting are at 97.5%, while chances of a rate cut stand at 2.5%.
- The benchmark 10-year US Treasury Note trades around 4.26%, and is dipping to session lows for this Tuesday.
US Dollar Index Technical Analysis: Risk remains for another leg lower
The US Dollar Index (DXY) is having a difficult Tuesday where a handful of currencies are appreciating against the US Dollar, with the Japanese Yen leading the charge. This has pushed the DXY below the 200-day Simple Moving Average (SMA) at 103.73. The Durable Goods print this Tuesday could be enough of a catalyst to push the DXY all the way down to test 103.00.
To the upside, the 100-day Simple Moving Average (SMA) near 104.02 is the first level to watch as it is a support that has been turned into a resistance. Should the US Dollar be able to cross 104.60, 105.12 is the next key level to keep an eye on. One step beyond there comes 105.88, the high from November 2023. Ultimately, 107.20 – the high of 2023 – could even come back into scope, but that would be when markets reprice the timing of a Fed rate cut again, possibly delaying it to the last quarter of 2024.
Looking down, the 200-day Simple Moving Average at 103.73 was broken on Thursday and sees more US Dollar bears flock in to trade the break. The 200-day SMA should not let go that easily, so a small retreat back to that level could be more than granted. Ultimately, it will lose its force with the ongoing selling pressure and could fall to 103.16, the 55-day SMA before testing 103.00 as a level.
US Dollar FAQs
What is the US Dollar?
The US Dollar (USD) is the official currency of the United States of America, and the ‘de facto’ currency of a significant number of other countries where it is found in circulation alongside local notes. It is the most heavily traded currency in the world, accounting for over 88% of all global foreign exchange turnover, or an average of $6.6 trillion in transactions per day, according to data from 2022.
Following the second world war, the USD took over from the British Pound as the world’s reserve currency. For most of its history, the US Dollar was backed by Gold, until the Bretton Woods Agreement in 1971 when the Gold Standard went away.
How do the decisions of the Federal Reserve impact the US Dollar?
The most important single factor impacting on the value of the US Dollar is monetary policy, which is shaped by the Federal Reserve (Fed). The Fed has two mandates: to achieve price stability (control inflation) and foster full employment. Its primary tool to achieve these two goals is by adjusting interest rates.
When prices are rising too quickly and inflation is above the Fed’s 2% target, the Fed will raise rates, which helps the USD value. When inflation falls below 2% or the Unemployment Rate is too high, the Fed may lower interest rates, which weighs on the Greenback.
What is Quantitative Easing and how does it influence the US Dollar?
In extreme situations, the Federal Reserve can also print more Dollars and enact quantitative easing (QE). QE is the process by which the Fed substantially increases the flow of credit in a stuck financial system.
It is a non-standard policy measure used when credit has dried up because banks will not lend to each other (out of the fear of counterparty default). It is a last resort when simply lowering interest rates is unlikely to achieve the necessary result. It was the Fed’s weapon of choice to combat the credit crunch that occurred during the Great Financial Crisis in 2008. It involves the Fed printing more Dollars and using them to buy US government bonds predominantly from financial institutions. QE usually leads to a weaker US Dollar.
What is Quantitative Tightening and how does it influence the US Dollar?
Quantitative tightening (QT) is the reverse process whereby the Federal Reserve stops buying bonds from financial institutions and does not reinvest the principal from the bonds it holds maturing in new purchases. It is usually positive for the US Dollar.
EUR/USD retains a modest uptrend in quiet trade. Economists at Scotiabank analyze the pair’s outlook.
EUR supported on minor dips
A solid uptrend has developed since the middle of the month and EUR gains are well-supported by a positive alignment of intraday and daily trend momentum signals. The weekly oscillator is on the cusp of a tilting positive as well. This should mean EUR dips are well-supported at or around short-term bull trend support at 1.0835/1.0840.
The markets should also be able to press higher to retest last week’s high and short-term resistance at 1.0890.
A daily close above the 40-DMA (1.0847) should add to positive EUR momentum.
Strategists at Commerzbank have lowered their Gold price forecast for the end of the year by $50 to $2,100.
Outlook for the Gold price remains positive
We have lowered the path of our Gold price forecast by $50 and only see XAU/USD rising to around $2,100 over the course of this year, which would leave it just below the all-time high of $2,135 reached at the end of last year. This is largely due to the expectation that the US Federal Reserve will lower its key interest rate far less in the coming cycle than we had previously expected.
We now expect interest rates in the US to fall from the current 5.50% (the upper limit of the Fed Funds target range) to 4.25% by the end of 2025. Previously, we had anticipated a decline to 3.50%. The reason for the revision is our more optimistic view of the US economy, which is proving surprisingly resilient despite the significant rise in interest rates. Continued strong economic growth means that the US Federal Reserve should see less room for interest rate cuts.
- Natural Gas prices are up nearly 1% on Tuesday.
- Traders focus on summer supply for restocking ahead of the next heating season.
- The US Dollar Index consolidates below 104.00 ahead of a chunky calendar.
Natural Gas (XNG/USD) is holding ground above $1.70 after the steep decline seen on Friday. Traders appear to be defining a higher floor for prices after reaching a multi-year low near $1.60 a week ago. With demand heating up for contracts and deliveries over the summer, both Russia and the US are trying to steal the market share from one another while demand remains tepid.
The US Dollar (USD) is facing a slight blow, with a basket of currencies all advancing against the Greenback. The charge is being led by the Japanese Yen, which is up near 0.50% against the US Dollar. US Traders are bracing for Durable Goods numbers and some confidence indicators later in the US session to be released.
Natural Gas is trading at $1.79 per MMBtu at the time of writing.
Natural Gas market movers: More LNG supply needed
- Bloomberg has issued a Natural Gas supply report where it calculated markets will need 1.8% more volume over the summer to meet demand growth compared with a year earlier..
- Several European trading desks report that Asian buyers are coming into the European markets to buy at low prices, creating further upward pressure on European gas prices.
- BP has appointed its top LNG executive James Cheeseman to lead the Ammonia trading business as demand for more green energy pairs with conventional energy sources like Gas and Oil.
- Russia and the US are fighting for the biggest piece of market share in the gas market. Russian supply is at risk of more sanctions and bottlenecks, while the US trying to guarantee a stable and secured supply. Australia is further falling behind in market share as output declines due to ageing fields.
Natural Gas Technical Analysis: Piece of the pie
Natural Gas is set to test the bar again near $1.80 as traders see a floor on the charts. The expected recovery comes, firstly, because there are prospects of a pickup in demand during the summer. Secondly, the fight between Russia and the US on market share will likely come with a price war. However,Gas traders might be willing to pay a higher price for US Gas, whose delivery is likely to be more secure compared to the cheaper Russian Gas, more subject to sanctionsand bottlenecks.
On the upside, Natural Gas is facing some pivotal technical levels to get back to. The next step is $1.99, – the level which, when broken, saw an accelerated decline. After that, the green line at $2.13 comes into view, with the triple bottoms from 2023. If Natural Gas sees sudden demand pick up, $2.40 could come into play.
On the downside, $1.64 and $1.53 (the low of 2020) are targets to look out for. Another leg lower could come if global growth starts to shrink and there is less demand. Add to that equation both the US and Canada trying to free up more volume of Natural Gas mining, and the scale could quickly tip into an oversupplied market with more downside prices at hand.
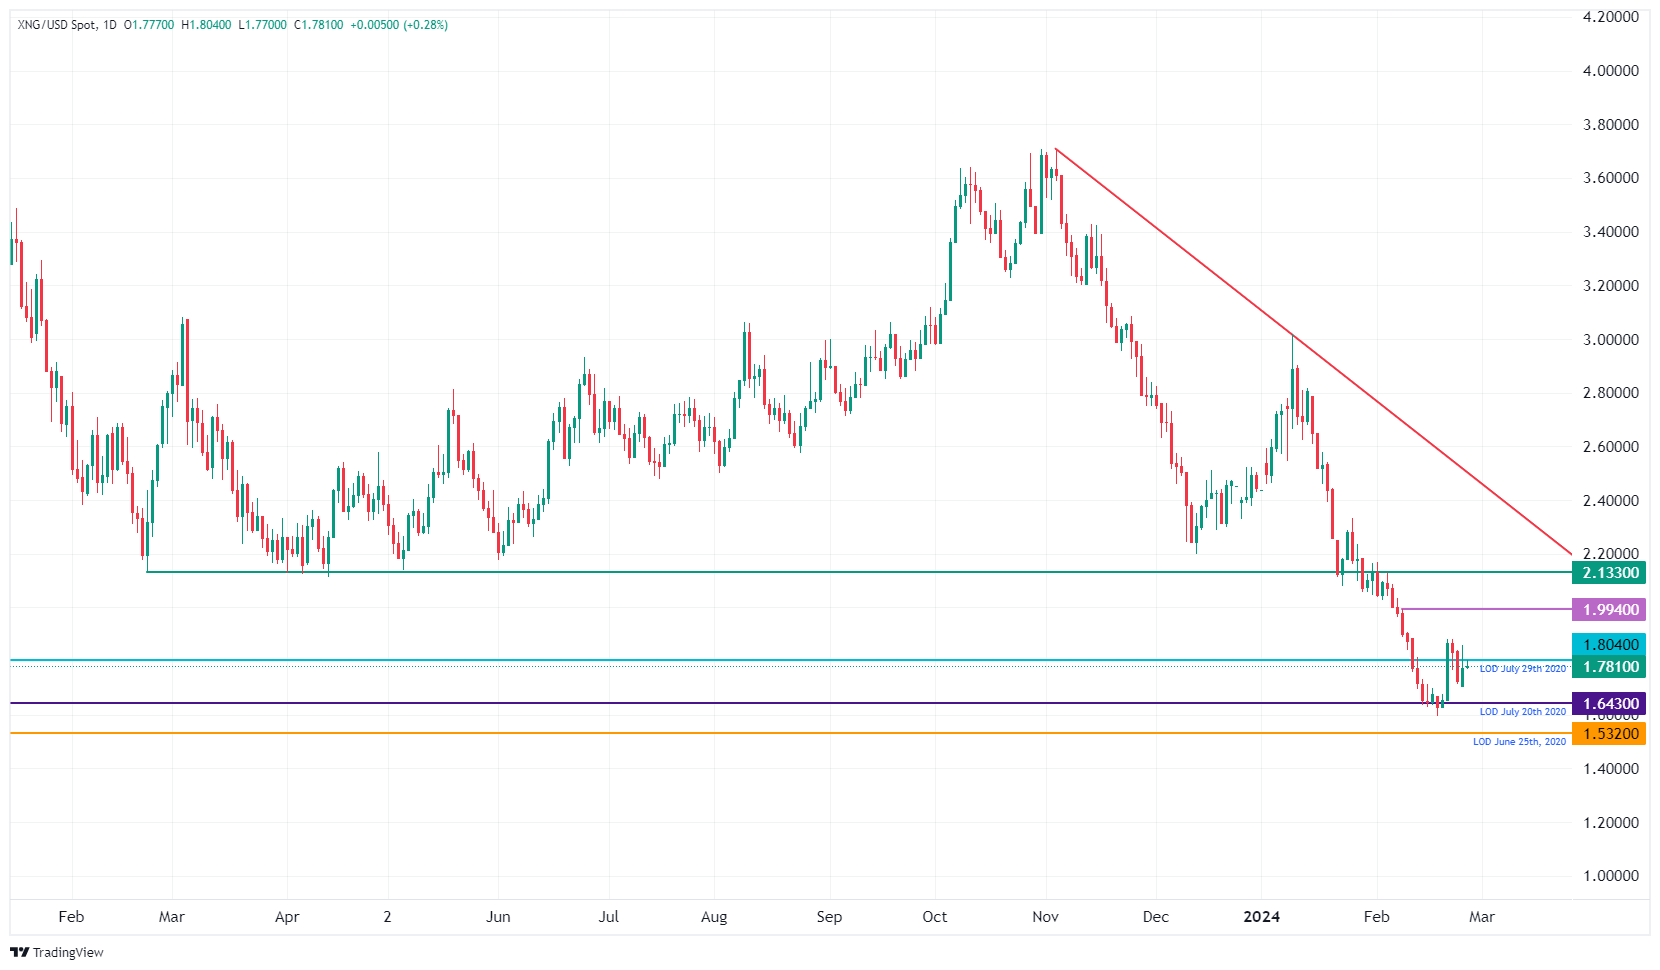
XNG/USD (Daily Chart)
Natural Gas FAQs
What fundamental factors drive the price of Natural Gas?
Supply and demand dynamics are a key factor influencing Natural Gas prices, and are themselves influenced by global economic growth, industrial activity, population growth, production levels, and inventories. The weather impacts Natural Gas prices because more Gas is used during cold winters and hot summers for heating and cooling. Competition from other energy sources impacts prices as consumers may switch to cheaper sources. Geopolitical events are factors as exemplified by the war in Ukraine. Government policies relating to extraction, transportation, and environmental issues also impact prices.
What are the main macroeconomic releases that impact on Natural Gas Prices?
The main economic release influencing Natural Gas prices is the weekly inventory bulletin from the Energy Information Administration (EIA), a US government agency that produces US gas market data. The EIA Gas bulletin usually comes out on Thursday at 14:30 GMT, a day after the EIA publishes its weekly Oil bulletin. Economic data from large consumers of Natural Gas can impact supply and demand, the largest of which include China, Germany and Japan. Natural Gas is primarily priced and traded in US Dollars, thus economic releases impacting the US Dollar are also factors.
How does the US Dollar influence Natural Gas prices?
The US Dollar is the world’s reserve currency and most commodities, including Natural Gas are priced and traded on international markets in US Dollars. As such, the value of the US Dollar is a factor in the price of Natural Gas, because if the Dollar strengthens it means less Dollars are required to buy the same volume of Gas (the price falls), and vice versa if USD strengthens.
Following a move higher in EUR/SEK at the very start of this year, the Swedish Krona has re-embarked on its improving trend in recent weeks. Economists at Rabobank analyze the pair’s outlook.
Rate cuts announced by the Riksbank this year will have some connection to ECB policy moves
The risk of triggering another spate of SEK weakness vs. the EUR suggests that it is likely that any rate cuts announced by the Riksbank this year will have some connection to ECB policy moves.
The market currently expects a little more easing from the ECB than the Riksbank on a six-month view. This likely reflects the higher profile of the CPI inflation rate in Sweden. Assuming no change in this assessment, there is likely scope for EUR/SEK to continue edging lower.
We maintain our three-month forecast of EUR/SEK at 11.10.
Kit Juckes, Chief Global FX Strategist at Société Générale, analyzes Yen’s outlook after inflation in Japan surprises to the topside.
Inflation demands BoJ action
Japan’s headline inflation fell to 2.2%, and the so-called ‘core-core’ (ex-fresh food and energy) fell to 2.2% after a third monthly increase of 0.2%. If inflation is going to settle around 2%, rather than fall all the way back to the 10-year average (just over 1%), there is no reason to delay the demise of negative interest rate and yield curve control policies. Especially given that the Yen has lost a third of its value since the start of the Covid pandemic, and USD/JPY remains close to its post-1990 high.
This pair has the capacity for huge and persistent overshoots. CFTC data suggest that under four weeks before the crucial BoJ meeting, when one of the largest US/Japanese policy divergences we have seen will probably start to unwind, futures traders remain doggedly short the Yen. Will they be proved geniuses, or fools because a change of BoJ policy direction, ahead of a likely change of Fed policy direction later this year, signals a turn in USD/JPY? We’re in the latter camp – how could we not be? What (if anything) am I missing?
- US stock index futures trade marginally higher following Monday's choppy action.
- January Durable Goods Orders data will be featured in the US economic docket.
- Stock markets could react to US PCE inflation figures later in the week.
S&P 500 futures rise 0.10%, Dow Jones futures are unchanged, and Nasdaq futures gain 0.19% ahead of the opening bell on Tuesday.
S&P 500 (SPX), Dow Jones (DJIA), and Nasdaq (IXIC) indexes closed on Monday with a 0.38% loss, a 0.16% drop, and a 0.13% fall, respectively.
What to know before stock market opens
The Energy Sector rose 0.32% on Monday as the best-performing major S&P sector for the day. On the other hand, the Utilities Sector fell 2.1%.
Palo Alto Networks Inc. (PANW) and Domino’s Pizza Inc. (DPZ) shares were the top S&P 500 gainers on Monday, rising 7.33% and 5.84%, respectively. Insulet Corp. (PODD) lost nearly 8.4% on the day as the biggest decline, closely followed by Alphabet Class C and Class A shares, shedding 4.5% and 4.4% apiece.
Reviewing Monday’s action in global equity markets, “as we started a new week equities struggled to maintain their spectacular recent momentum, with the S&P 500 -0.38% lower on Monday,” said Jim Reid, global head of economics and thematic research at Deutsche Bank, and continued:
“The NASDAQ declined a marginal -0.13%, while the Magnificent 7 were down -0.39%, dragged lower by a -4.44% decline for Alphabet amid concerns over recent missteps with its AI model. Small-cap stocks were the strongest performers, with the Russell 2000 up +0.61%. Over in Europe the picture was more negative though, with the STOXX 600 down -0.37% as it fell back from its all-time high on Friday. Even so, it wasn’t all bad news there, as the DAX (+0.02%) eked out a new record, and Euro HY spreads reaching their tightest level in over two years.”
Nasdaq FAQs
What is the Nasdaq?
The Nasdaq is a stock exchange based in the US that started out life as an electronic stock quotation machine. At first, the Nasdaq only provided quotations for over-the-counter (OTC) stocks but later it became an exchange too. By 1991, the Nasdaq had grown to account for 46% of the entire US securities’ market. In 1998, it became the first stock exchange in the US to provide online trading. The Nasdaq also produces several indices, the most comprehensive of which is the Nasdaq Composite representing all 2,500-plus stocks on the Nasdaq, and the Nasdaq 100.
What is the Nasdaq 100?
The Nasdaq 100 is a large-cap index made up of 100 non-financial companies from the Nasdaq stock exchange. Although it only includes a fraction of the thousands of stocks in the Nasdaq, it accounts for over 90% of the movement. The influence of each company on the index is market-cap weighted. The Nasdaq 100 includes companies with a significant focus on technology although it also encompasses companies from other industries and from outside the US. The average annual return of the Nasdaq 100 has been 17.23% since 1986.
How can I trade the Nasdaq 100?
There are a number of ways to trade the Nasdaq 100. Most retail brokers and spread betting platforms offer bets using Contracts for Difference (CFD). For longer-term investors, Exchange-Traded Funds (ETFs) trade like shares that mimic the movement of the index without the investor needing to buy all 100 constituent companies. An example ETF is the Invesco QQQ Trust (QQQ). Nasdaq 100 futures contracts allow traders to speculate on the future direction of the index. Options provide the right, but not the obligation, to buy or sell the Nasdaq 100 at a specific price (strike price) in the future.
What Factors Drive the Nasdaq 100
Many different factors drive the Nasdaq 100 but mainly it is the aggregate performance of the component companies revealed in their quarterly and annual company earnings reports. US and global macroeconomic data also contributes as it impacts on investor sentiment, which if positive drives gains. The level of interest rates, set by the Federal Reserve (Fed), also influences the Nasdaq 100 as it affects the cost of credit, on which many corporations are heavily reliant. As such the level of inflation can be a major driver too as well as other metrics which impact on the decisions of the Fed.
Stock markets await US data
The US Census Bureau will release Durable Goods Orders data for January ahead of the opening bell on Tuesday. Markets expect Durable Goods Orders to decline 4.5% after staying unchanged in December. Durable Goods Orders ex Transportation is forecast to rise 0.2%.
The US Bureau of Economic Analysis will announce the second estimate of the Gross Domestic Product (GDP) growth for the fourth quarter on Wednesday. Personal Consumption Expenditures (PCE) Price Index, the Federal Reserve’s (Fed) preferred gauge of inflation, figures will be scrutinized by market participants on Thursday.
New York Fed President John Williams said on Friday that he expects the US central bank to start lowering the policy rate in the second half of the year. According to the CME FedWatch Tool, markets are nearly fully pricing in a no change in the Fed policy rate in March and see an 85% probability of another pause in May.
Republic Services Inc. (RSG), Agilent Technologies Inc. (A), Extra Space Storage Inc. (EXR) and Coupang Inc. (CPNG) will release quarterly earnings after the closing bell on Tuesday.
Fed FAQs
What does the Federal Reserve do, how does it impact the US Dollar?
Monetary policy in the US is shaped by the Federal Reserve (Fed). The Fed has two mandates: to achieve price stability and foster full employment. Its primary tool to achieve these goals is by adjusting interest rates.
When prices are rising too quickly and inflation is above the Fed’s 2% target, it raises interest rates, increasing borrowing costs throughout the economy. This results in a stronger US Dollar (USD) as it makes the US a more attractive place for international investors to park their money.
When inflation falls below 2% or the Unemployment Rate is too high, the Fed may lower interest rates to encourage borrowing, which weighs on the Greenback.
How often does the Fed hold monetary policy meetings?
The Federal Reserve (Fed) holds eight policy meetings a year, where the Federal Open Market Committee (FOMC) assesses economic conditions and makes monetary policy decisions.
The FOMC is attended by twelve Fed officials – the seven members of the Board of Governors, the president of the Federal Reserve Bank of New York, and four of the remaining eleven regional Reserve Bank presidents, who serve one-year terms on a rotating basis.
What is Quantitative Easing (QE) and how does it impact USD?
In extreme situations, the Federal Reserve may resort to a policy named Quantitative Easing (QE). QE is the process by which the Fed substantially increases the flow of credit in a stuck financial system.
It is a non-standard policy measure used during crises or when inflation is extremely low. It was the Fed’s weapon of choice during the Great Financial Crisis in 2008. It involves the Fed printing more Dollars and using them to buy high grade bonds from financial institutions. QE usually weakens the US Dollar.
What is Quantitative Tightening (QT) and how does it impact the US Dollar?
Quantitative tightening (QT) is the reverse process of QE, whereby the Federal Reserve stops buying bonds from financial institutions and does not reinvest the principal from the bonds it holds maturing, to purchase new bonds. It is usually positive for the value of the US Dollar.
- NZD/USD drops to 0.6150 as the US Dollar gauges temporary support.
- Investors await the US core PCE price index and the RBNZ monetary policy for further guidance.
- The RBNZ is expected to keep interest rates at 5.50%.
The NZD/USD pair remains on the backfoot near 0.6150 in Tuesday’s European session. The Kiwi asset faces a sell-off as investors see the Reserve Bank of New Zealand (RBNZ) keeping its Official Cash Rate (OCR) unchanged at 5.50%.
Last week, RBNZ Governor Adrian Orr warned about economic risks associated with the over-tightening of monetary policy. While he acknowledged that the RBNZ needs to do more work to tame price pressures.
Meanwhile, the US Dollar recovers intraday losses as investors turn cautious ahead of the United States core Personal Consumption Expenditure (PCE) price index data for January, which will be published on Thursday. The inflation data will guide market expectations for rate cuts by the Federal Reserve (Fed).
Meanwhile, Fed policymakers have been in favor of keeping interest rates unchanged in the range of %-% until they get convinced that inflation will decline to the 2% target.
NZD/USD falls sharply after testing the breakdown of the consolidation formed in a range of 0.6180-0.6220 on an hourly scale. A breakdown of the consolidation indicates that institutional investors sell inventory to retail participants.
The near-term outlook has turned bearish as it has dropped below the 50-period Exponential Moving Average (EMA), which trades around 0.6174.
The range shift move by the 14-period Relative Strength Index (RSI) from the bullish range of 40.00-80.00 to 20.00-60.00 indicates that investors will use pullback moves to make fresh shorts.
Going forward, a downside move below February 20 low near 0.6129 would expose the asset to the round-level support of 0.6100, followed by February 13 low near 0.6050.
On the flip side, an upside move would emerge if the asset will break above the round-level resistance of 0.6200, which will drive the asset towards February 22 high at 0.6220, followed by January 11 high at 0.6260.
NZD/USD hourly chart
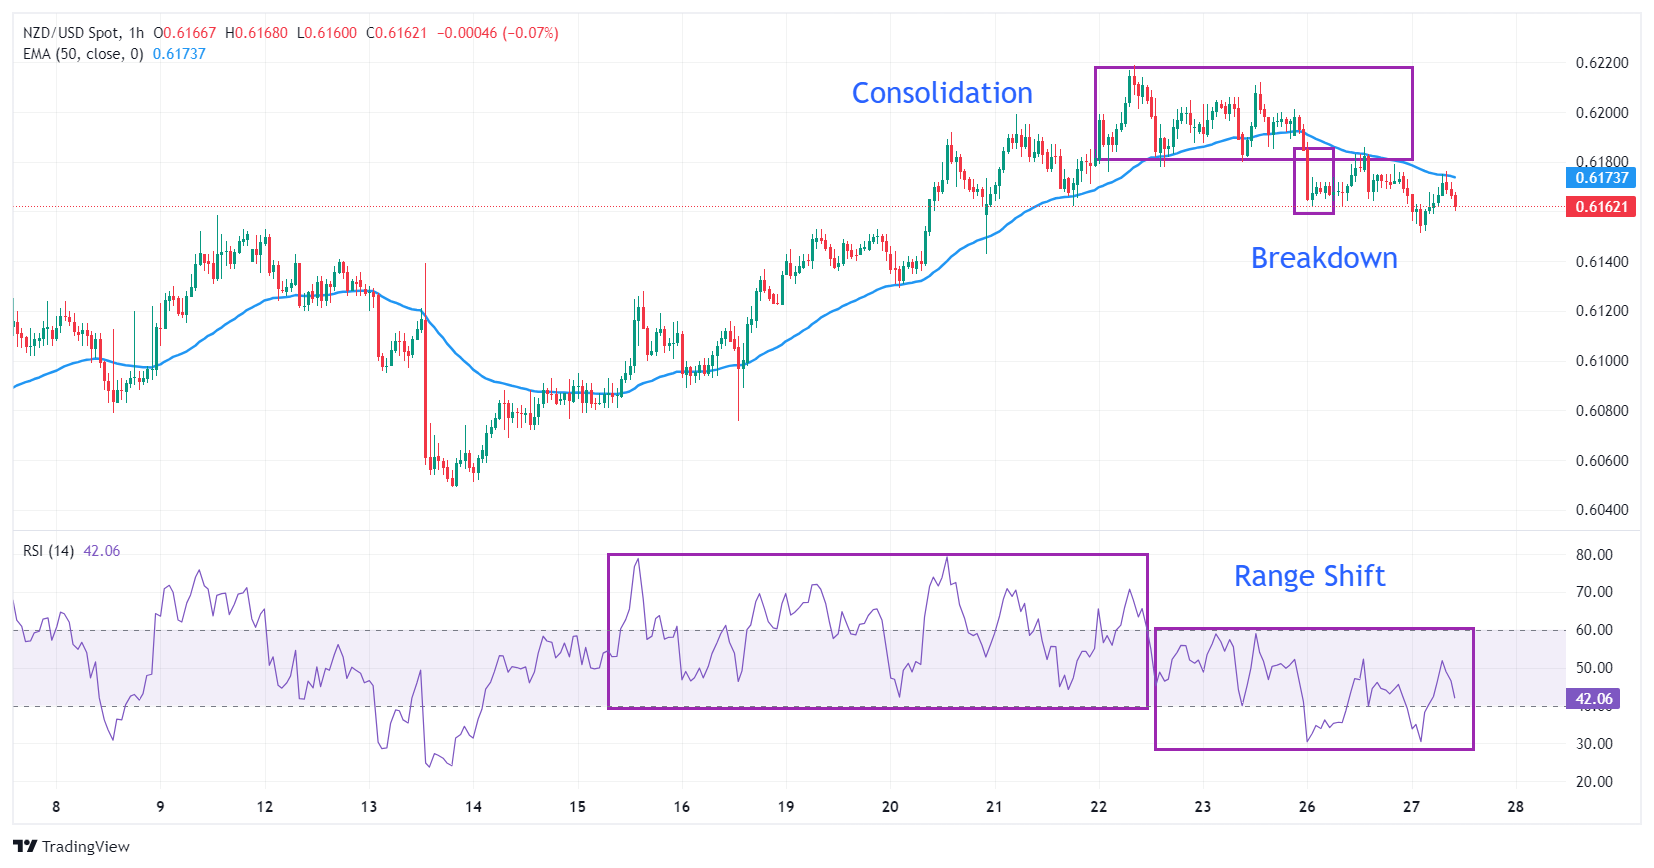
The National Bank of Hungary is scheduled to meet today. Economists at ING analyze Hungarian Forint (HUF) outlook ahead of the Interest Rate Decision.
Central bank speeding up rate cuts pace
We expect an acceleration in the pace of rate cuts from 75 bps to 100 bps, which would mean a cut to 9.00%.
We see EUR/HUF slightly above 390.00 at the end of the day. However, for both rates down and EUR/HUF up we see limited movement due to stretched market pricing and for the market this may be an interesting entry for rate payers at the front end of the curve or long HUF later after the decision.
- USD/CAD meets with some supply on Tuesday and is pressured by a combination of factors.
- Attacks on shipping in the Red Sea lend support to Oil prices, which underpins the Loonie.
- Sliding US bond yields keep the USD bulls on the defensive and contribute to the decline.
The USD/CAD pair comes under some selling pressure on Tuesday and maintains its offered tone through the first half of the European session. Spot prices currently trade just below the 1.3500 psychological mark and for now, seem to have snapped a two-day winning streak to a multi-day peak touched on Monday.
Crude Oil prices attract some buyers for the second straight day in the wake of growing concerns about supply disruptions in the Middle East, led by persistent attacks by Iran-aligned Houthis on commercial vessels in the Red Sea. This, in turn, is seen underpinning the commodity-linked Loonie, which, along with the prevalent selling bias around the US Dollar (USD), exerts some downward pressure on the USD/CAD pair.
In fact, the USD Index (DXY), which tracks the Greenback against a basket of currencies, continues with its struggle to gain any meaningful traction amid a fresh leg down in the US Treasury bond yields. That said, firming expectations that the Federal Reserve (Fed) will wait until June before cutting interest rates should act as a tailwind for the US bond yields, which should limit losses for the USD and the USD/CAD pair.
Looking at the broader picture, spot prices have been oscillating in a familiar trading range over the past two weeks or so. This further warrants some caution before placing aggressive directional bets ahead of this week's release of the crucial US Personal Consumption Expenditures (PCE) Price Index on Thursday. The data should provide cues about the Fed's rate-cut path, which, in turn, will drive the USD and the USD/CAD pair.
In the meantime, traders on Tuesday will take cues from the US economic docket – featuring the releases of Durable Goods Orders, the Conference Board's Consumer Confidence Index and the Richmond Manufacturing Index. This, along with the US bond yields, will influence the USD. Apart from this, Oil price dynamics should contribute to producing short-term trading opportunities around the USD/CAD pair.
The Reserve Bank of New Zealand (RBNZ) holds its first regular meeting of the year on Wednesday. Economists at Commerzbank analyze how the decision could impact the Kiwi.
Is the RBNZ going to lower its forecasts?
Expectations seem to have calmed down somewhat. Both the Bloomberg consensus and the market expect rates to remain on hold. Earlier in the month things looked different. After a major local bank revised its RBNZ forecast towards further hikes, almost one more hike was priced in.
The decision should be interesting regardless of the policy rate. The RBNZ will release its quarterly monetary policy report, including new forecasts and the expected path of interest rates. There will also be a press conference to comment on the new projections.
Given inflation now seems to be falling, RBNZ could lower the interest rate path slightly. The decisive factor will probably be the extent to which it revises its interest rate and inflation forecasts downwards. However, given that it has been quite cautious in recent quarters and is unlikely to give the all-clear after a single quarter of better inflation, the correction is likely to be small. If this is the case, the NZD may benefit somewhat from the decision.
- Gold price posts gains ahead of US Durable Goods Order data.
- Fed’s Schmid says there is no need to rush rate cuts.
- The US core PCE price index data will significantly impact prospects for Fed rate cuts.
Gold price (XAG/USD) exhibits strength against the US Dollar in Tuesday’s European session on hopes that the Federal Reserve (Fed) will eventually bring interest rates down. However, the upside in the precious metal seems capped as Fed policymakers lean towards maintaining interest rates higher for longer to build downward pressure on sticky inflation.
Non-yielding assets, such as Gold, attract higher inflows when investors believe the Fed will eventually begin to roll back its restrictive interest rate stance. Spot prices of Gold are up by 0.23% at $2,036.
Fed policymakers underpin a wait-and-watch approach on interest rates, citing that risks associated with premature rate cuts are higher than postponing them. The Fed is expected to avoid considering rate cuts until it gets evidence that inflation will fall sustainably to the 2% target.
This week, the US Dollar will be guided by the United States core Personal Consumption Expenditure – Price Index (PCE) data, which will be published on Thursday. Fed policymakers consider the underlying inflation data before preparing remarks on interest rates. The degree of change in the core PCE inflation data would influence market expectations for rate cuts.
Daily Digest Market Movers: Gold price eyes more gains while US Dollar corrects
- Gold price rises sharply to $2,040 as the US Dollar falls onto the backfoot.
- The precious metal climbs to almost a three-week high even though investors remain uncertain about rate cuts by the Federal Reserve (Fed).
- All Fed policymakers have argued against premature rate cuts as they could flare up price pressures again.
- Also, policymakers still gather evidence to confirm that inflation will decline sustainably to the 2% target.
- On Monday, Kansas City Federal Reserve Bank President Jeffrey Schmid said a tight labor market, considerable momentum in households’ demand, and inflation above 2% leave no room for an aggressive adjustment in the monetary policy stance.
- As per the viewpoint of Jeffrey Schmid, the Fed needs to be patient and observe how the economy responds to policy tightening. The rate cuts could be announced only after gaining confidence that a victory can be announced against sticky inflation.
- This week, the array of the United States economic data will direct further action in the Gold price.
- US Durable Goods Orders, second estimates for Q4 Gross Domestic Product (GDP), and core PCE price index data are lined up for release.
- The US Durable Goods Orders for January are anticipated to have contracted sharply by 4.5% against a stagnant performance in December. Weak demand for Durable Goods indicates a soft outlook for core inflation.
- Investors will majorly focus on the core PCE price index, which could meaningfully influence the expectations for rate cuts by the Fed.
- The expectations from investors show that the core PCE price index data rose by 0.4% on a month-on-month basis against a 0.2% increase in December. In the same period, the annual inflation data is expected to have decelerated to 2.8% from 2.9%.
Technical Analysis: Gold price marches toward $2,040
Gold price approaches the downward-sloping border of the Symmetrical Triangle pattern, which is plotted from the December 28 high at $2,088. The upward-sloping border of the chart pattern is placed from the December 13 low at $1,973.
The triangle could break out in either direction. However, the odds marginally favor a move in the direction of the trend before the formation of the triangle – in this case, up. A decisive break above or below the triangle boundary lines would indicate a breakout is underway.
The 14-period Relative Strength Index (RSI) oscillates in the 40.00-60.00 region, which indicates indecisiveness among investors.
Gold FAQs
Why do people invest in Gold?
Gold has played a key role in human’s history as it has been widely used as a store of value and medium of exchange. Currently, apart from its shine and usage for jewelry, the precious metal is widely seen as a safe-haven asset, meaning that it is considered a good investment during turbulent times. Gold is also widely seen as a hedge against inflation and against depreciating currencies as it doesn’t rely on any specific issuer or government.
Who buys the most Gold?
Central banks are the biggest Gold holders. In their aim to support their currencies in turbulent times, central banks tend to diversify their reserves and buy Gold to improve the perceived strength of the economy and the currency. High Gold reserves can be a source of trust for a country’s solvency. Central banks added 1,136 tonnes of Gold worth around $70 billion to their reserves in 2022, according to data from the World Gold Council. This is the highest yearly purchase since records began. Central banks from emerging economies such as China, India and Turkey are quickly increasing their Gold reserves.
How is Gold correlated with other assets?
Gold has an inverse correlation with the US Dollar and US Treasuries, which are both major reserve and safe-haven assets. When the Dollar depreciates, Gold tends to rise, enabling investors and central banks to diversify their assets in turbulent times. Gold is also inversely correlated with risk assets. A rally in the stock market tends to weaken Gold price, while sell-offs in riskier markets tend to favor the precious metal.
What does the price of Gold depend on?
The price can move due to a wide range of factors. Geopolitical instability or fears of a deep recession can quickly make Gold price escalate due to its safe-haven status. As a yield-less asset, Gold tends to rise with lower interest rates, while higher cost of money usually weighs down on the yellow metal. Still, most moves depend on how the US Dollar (USD) behaves as the asset is priced in dollars (XAU/USD). A strong Dollar tends to keep the price of Gold controlled, whereas a weaker Dollar is likely to push Gold prices up.
- GBP/JPY corrects from a multi-year peak in reaction to slightly hotter CPI from Japan.
- The slide might still be categorized as profit-taking amid slightly overbought conditions.
- The fundamental backdrop warrants some caution before placing aggressive bearish bets.
The GBP/JPY cross comes under some selling pressure on Tuesday and snaps a five-day winning streak to its highest level since August 2015, near the 191.30 region touched the previous day. Spot prices remain depressed through the mid-European session and currently trade around mid-190.00s, just above the overnight swing low.
Inflation in Japan eased slightly less than expected in January and intensified speculations around the Bank of Japan's (BoJ) move to abandon its negative interest rate policy. This, along with expectations that the Japanese government will intervene to prop up the domestic currency, provides a goodish lift to the Japanese Yen (JPY) and turns out to be a key factor that prompts some profit-taking around the GBP/JPY cross.
Apart from this, the British Pound's (GBP) relative underperformance against its Japanese counterpart could also be attributed to bets that the Bank of England (BoE) will start cutting interest rates soon. The expectations were bolstered by softer UK consumer inflation figures released last week. That said, the prevalent US Dollar (USD) selling bias is seen benefitting the GBP, which, in turn, might limit losses for the GBP/JPY cross.
Meanwhile, the aforementioned fundamental backdrop makes it prudent to wait for strong follow-through selling to confirm that the GBP/JPY cross has topped out in the near-term and before positioning for any meaningful corrective slide. That said, oscillators on the daily chart remain close to overbought territory and might prompt some long-unwinding trade, supporting prospects for additional intraday losses.
The Euro has continued to strengthen modestly against the US Dollar at the start of this week. Economists at MUFG Bank analyze EUR/USD outlook.
What is helping to provide more support for the Euro?
We believe that the Euro is deriving support from several favourable developments. Firstly, the Eurozone rate market has been pushing back the timing of the first ECB rate cut. The timing of the first ECB rate cut is now judged as more likely to be delivered in June rather than April (there is now only around 9 bps of cuts priced in by then). At the same time, the total amount of ECB rate cuts priced in by year-end has fallen back to around 88 bps. The developments are helping to ease downward pressure on the Euro in the near term.
Secondly, there have been some encouraging developments that are helping to ease concerns over the growth outlook in the Eurozone. The price of natural gas in Europe is continuing to fall. It makes us more confident that the negative shock to the Eurozone economy will continue to ease in the year ahead. This supports our expectations for a pick-up in growth in the 2H of this year as inflation continues to slow back to the ECB’s target. At the same time, there is building optimism over the global inventory cycle that could indicate a potential pick-up in global trade going forward which would be a supportive development for the Eurozone economy.
Finally, the recent easing of investor pessimism over China’s economy has been lifted by fresh stimulus measures which is also helping to ease near-term selling pressure for the Euro. The upcoming National People’s Congress in March is a potential positive catalyst should more stimulus measures be announced.
- WTI price could extend gains on the threat of supply disruptions in the Middle East.
- Houthi militants have disabled key underwater cables linking Europe to Asia.
- Russia announced a six-month ban on gasoline exports starting from March 1.
West Texas Intermediate (WTI) oil price seems to gain upward momentum following disruptions in international sea traffic caused by Iran-led Houthi militants. The WTI price hovers around $77.30 during the European session on Tuesday. Houthi militants have now targeted global communication systems. A recent report indicates that the Yemeni group has successfully disabled key underwater cables linking Europe to Asia.
Additionally, on Tuesday, Russia announced a six-month ban on gasoline exports starting from March 1. This decision aims to stabilize oil prices amidst the maintenance of refineries. According to Russia’s RBC, Prime Minister Mikhail Mishustin approved the ban following a proposal by Deputy Prime Minister Alexander Novak in a letter dated February 21.
Crude oil prices have received a boost as Houthis targeted civilian shipping vessels in the Red Sea. In response, the United States Military Central Command (CENTCOM) conducted attacks against Houthi targets late on Monday, claiming to have destroyed missiles, unmanned vessels, and a drone.
Israeli Prime Minister Benjamin Netanyahu has announced plans for an attack on Rafah, a city where hundreds of thousands of displaced Palestinians are seeking refuge. US President Joe Biden has also weighed in, expressing optimism about negotiators nearing an agreement to halt Israel’s military actions in Gaza within a week. This agreement would be contingent upon the release of at least some of the more than 100 hostages held by Hamas.
EUR/CHF moves one step closer to 200-Day Moving Average (DMA) of 0.9569. Economists at Société Générale analyze Euro’s outlook.
EUR/USD: Further gains could be in the offing into month-end
EUR/USD has done well to haul itself back up to 1.0850 and further gains could be in the offing into month-end.
Keep an eye on EUR/CHF as the cross drifts ever closer to the 200-DMA at 0.9569. A break could potentially hasten the rally towards November highs at 0.9685.
The change in mood is reflected also in options where 1-month RR (EUR calls/CHF puts) is on the verge of turning positive (premium for EUR calls) for the first time since January 2023.
- AUD/USD stages a goodish rebound from a one-week trough touched earlier this Tuesday.
- Reports that China will lift tariffs on Australian wine underpins the Aussie amid softer USD.
- Hawkish Fed expectations limit the USD decline and cap gains ahead of the US macro data.
The AUD/USD pair attracts fresh buyers near the 0.6525 area, or a one-week low touched earlier this Tuesday and builds on its steady intraday ascent through the first half of the European session. The momentum lifts spot prices back above mid-0.6500s in the last hour and is sponsored by a combination of factors.
The Australian Dollar (AUD) benefits from media reports, suggesting that China could lift the tariffs on Australian wine by the end of March. Apart from this, a modest US Dollar (USD) downtick assists the AUD/USD pair in reversing the previous day's downfall and stalling the recent pullback from a three-week peak touched last Thursday. A fresh leg down in the US Treasury bond yields, along with a stable performance around the equity markets, seems to undermine the safe-haven Greenback.
Any meaningful USD downfall, however, still seems elusive in the wake of expectations that the Federal Reserve (Fed) will wait until the June policy meeting before cutting interest rates. The bets were reaffirmed by the FOMC meeting minutes released last week and comments by several Fed officials, suggesting that the US central bank will stick to its hawkish stance amid sticky inflation and a still-resilient economy. This warrants caution before placing bullish bets around the AUD/USD pair.
Even from a technical perspective, spot prices remain below technically significant 100- and 200-day Simple Moving Averages (SMA). This further makes it prudent to wait for a convincing breakout through the said barriers before positioning for the resumption of the recent goodish recovery from the 0.6445-0.6440 region, or the YTD low touched earlier this February. Traders now look to the US macro data to grab short-term opportunities later during the early North American session.
Tuesday's US economic docket features the release of Durable Goods Orders, the Conference Board's Consumer Confidence Index and the Richmond Manufacturing Index. The focus will then shift to the Australian consumer inflation figures and the prelim US Q4 GDP on Wednesday. Traders this week will also confront the Australian Retail Sales and the US Personal Consumption Expenditures (PCE) Price Index on Thursday, which should provide fresh directional impetus to the AUD/USD pair.
The US Dollar (USD) struggles to stay resilient on Tuesday. Economists at ING analyze Greenback’s outlook.
Some upside potential on the back of decent consumer confidence figures
Today, the US data calendar includes durable goods orders for January, the Conference Board Consumer Confidence index and the Richmond Fed manufacturing index. The former of the three releases should be soft, while consumer confidence is expected to have stabilised and the manufacturing gauge to have improved while staying in negative territory. On the manufacturing side, the ISM figures later this week will be watched closely and while it is not our base case, there is a chance of the gauge moving back to expansionary territory (>50) for the first time since October 2022.
We expect a stabilisation in the Dollar today, with some upside potential on the back of decent consumer confidence figures.
We see DXY moving back above 104.00 by the end of the week.
- Silver price rises sharply to $22.70 amid weakness in the US Dollar.
- Easing geopolitical tensions have impacted safe-haven appeal.
- Sticky US core PCE price index data may postpone Fed’s plans of quitting hawkish stance.
Silver price (XAG/USD) recovers sharply to near $22.70 as the US Dollar comes under pressure in the London session on Tuesday. The white metal rises as the US Dollar faces a sell-off due to easing geopolitical tensions.
US President Joe Biden is confident of a ceasefire between Israel and Palestine by next week. The US State Department said there has been progress in negotiations for releasing Israeli hostages.
The US Dollar Index, which represents the Greenback’s value against six rival currencies, extends its correction to 103.70.
This week, investors will focus on the United States' core Personal Consumption Expenditure price index (PCE) data for January, which will provide more insights into the timing of the Federal Reserve’s (Fed) rate cuts. Investors anticipate that monthly core PCE rose sharply by 0.4% from 0.2% in December. The annual core PCE data is anticipated to decelerate to 2.8% from the former reading of 2.9%.
The expectations for a rate cut by the Fed will be postponed if the underlying inflation turns out hotter than expectations.
On Monday, Kansas City Federal Reserve Bank President Jeffrey Schmid said inflation remaining above 2%, tight labor market conditions, and a decent demand outlook indicate that there is no need to rush for rate cuts.
Silver technical analysis
Silver price finds a temporary cushion near the 61.8% Fibonacci retracement (plotted from February 14 low at $21.93 to February 16 high at $23.50) at $22.53 on an hourly scale. The white metal climbs above the 20-period Exponential Moving Average (EMA), which trades around $22.58.
The 14-period Relative Strength Index (RSI) oscillates in the 40.00-60.00 range, indicating consolidation ahead.
Silver hourly chart
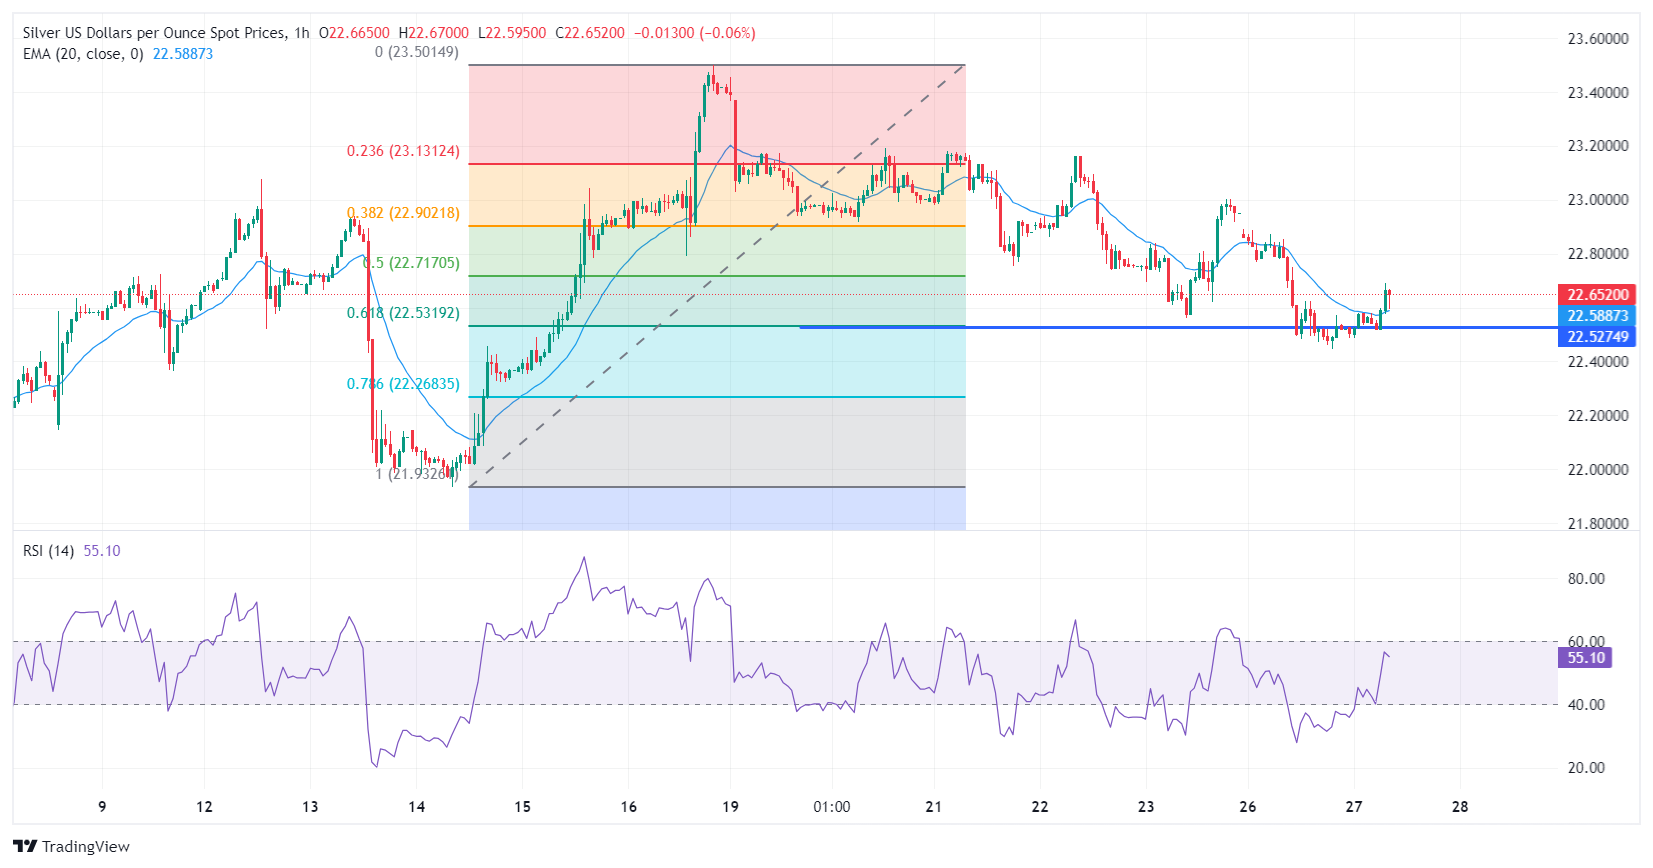
- EUR/USD gains positive traction for the second straight day, albeit lacking bullish conviction.
- A fresh leg down in the US bond yields undermines the USD and lends support to the major.
- The upside remains capped as traders now keenly await this week’s crucial inflation figures.
The EUR/USD pair is seen building on the previous day's goodish rebound from the 1.0815-1.0810 region and gaining some positive traction for the second straight day on Tuesday. Spot prices stick to modest gains through the early European session and remain supported by diminishing odds for rapid interest rate cuts by the European Central Bank (ECB). This, along with the prevalent selling bias around the US Dollar (USD), is seen as another factor acting as a tailwind for the currency pair.
That said, nervousness about the Eurozone's darkening economic outlook might hold back bulls from placing aggressive bets around the shared currency. Adding to this, the Federal Reserve's (Fed) higher-for-longer interest rates narrative should help limit the downside for the Greenback and further contribute to capping the upside for the EUR/USD pair. Investors also prefer to wait on the sidelines ahead of this week's releases of key inflation data from the Eurozone and the United States (US).
The flash CPI estimates from Germany, France and Spain are due for release on Thursday, which will be followed by the US Personal Consumption Expenditures (PCE) Price Index. Apart from this, Friday’s closely watched Eurozone inflation data will play a key role in influencing the shared currency and provide some meaningful impetus to the EUR/USD pair ahead of the upcoming ECB policy meeting on March 7.
Daily digest market movers: Remains supported by reduced ECB rate-cut bets, softer USD
- The recent hawkish comments by European Central Bank (ECB) policymakers, suggesting that the central bank shouldn’t rush into a decision to cut interest rates, continue to underpin the shared currency.
- ECB President Christine Lagarde told lawmakers that wage pressures remain strong across the region and are anticipated to be an increasingly important driver of inflation dynamics in the coming quarters.
- Lagarde added that there are increasing signs of a bottoming-out in growth and some forward-looking indicators point to a pick-up later this year, pushing back market expectations for early interest rate cuts.
- The yield on the benchmark 10-year US government bond remains depressed near 4.275%, which is seen undermining the US Dollar and lending additional support to the EUR/USD pair on Tuesday.
- A looming recession risk in Germany – the Eurozone's largest economy – keeps a lid on any further gains for the Euro amid expectations that inflation is moving back towards the ECB’s 2% annual target.
- The FOMC meeting minutes released last week, along with several Federal Reserve officials, suggested that the US central bank will keep rates higher for longer amid sticky inflation and a resilient economy.
- Traders now look to the US macro data – Durable Goods Orders, the Conference Board's Consumer Confidence Index and the Richmond Manufacturing Index – for short-term opportunities on Tuesday.
- The focus, however, remains glued to this week's release of the closely-watched flash Eurozone consumer inflation figures and the US Personal Consumption Expenditures (PCE) Price Index.
Technical analysis: EUR/USD seems poised to appreciate further and climb beyond 1.0900 mark
From a technical perspective, the overnight close above the 200-day Simple Moving Average (SMA) and the subsequent move up favours bullish traders. Moreover, oscillators on the daily chart have just started gaining positive traction, suggesting that the path of least resistance for the EUR/USD pair is to the upside. That said, it will still be prudent to wait for some follow-through buying beyond the 1.0865 region, or the 38.2% Fibonacci retracement level of the December-February downfall before positioning for any further gains. Spot prices might then surpass last week's swing high, around the 1.0885-1.0895 region, and aim to test the 50% Fibo. level, around the 1.0920 zone. The momentum could extend further towards reclaiming the 1.1000 psychological mark for the first time since January 11.
On the flip side, the 200-day SMA resistance breakpoint, around the 1.0830-1.0825 region, now seems to protect the immediate downside ahead of the 1.0800 mark. The latter coincides with the 23.6% Fibo. level, which if broken decisively will negate the positive outlook and make the EUR/USD pair vulnerable to accelerate the fall towards the 1.0770-1.0765 area. Spot prices could eventually drop to retest sub-1.0700 levels, or a three-month low touched on February 14.
Euro price this week
The table below shows the percentage change of Euro (EUR) against listed major currencies this week. Euro was the strongest against the New Zealand Dollar.
| USD | EUR | GBP | CAD | AUD | JPY | NZD | CHF | |
| USD | -0.34% | -0.15% | -0.09% | 0.15% | -0.14% | 0.22% | -0.22% | |
| EUR | 0.34% | 0.19% | 0.25% | 0.48% | 0.19% | 0.57% | 0.12% | |
| GBP | 0.15% | -0.20% | 0.05% | 0.28% | -0.01% | 0.37% | -0.08% | |
| CAD | 0.10% | -0.25% | -0.06% | 0.24% | -0.07% | 0.32% | -0.13% | |
| AUD | -0.15% | -0.48% | -0.28% | -0.23% | -0.27% | 0.09% | -0.38% | |
| JPY | 0.16% | -0.18% | 0.05% | 0.07% | 0.31% | 0.39% | -0.07% | |
| NZD | -0.23% | -0.57% | -0.37% | -0.32% | -0.09% | -0.38% | -0.45% | |
| CHF | 0.23% | -0.12% | 0.07% | 0.13% | 0.38% | 0.07% | 0.45% |
The heat map shows percentage changes of major currencies against each other. The base currency is picked from the left column, while the quote currency is picked from the top row. For example, if you pick the Euro from the left column and move along the horizontal line to the Japanese Yen, the percentage change displayed in the box will represent EUR (base)/JPY (quote).
Euro FAQs
What is the Euro?
The Euro is the currency for the 20 European Union countries that belong to the Eurozone. It is the second most heavily traded currency in the world behind the US Dollar. In 2022, it accounted for 31% of all foreign exchange transactions, with an average daily turnover of over $2.2 trillion a day.
EUR/USD is the most heavily traded currency pair in the world, accounting for an estimated 30% off all transactions, followed by EUR/JPY (4%), EUR/GBP (3%) and EUR/AUD (2%).
What is the ECB and how does it impact the Euro?
The European Central Bank (ECB) in Frankfurt, Germany, is the reserve bank for the Eurozone. The ECB sets interest rates and manages monetary policy.
The ECB’s primary mandate is to maintain price stability, which means either controlling inflation or stimulating growth. Its primary tool is the raising or lowering of interest rates. Relatively high interest rates – or the expectation of higher rates – will usually benefit the Euro and vice versa.
The ECB Governing Council makes monetary policy decisions at meetings held eight times a year. Decisions are made by heads of the Eurozone national banks and six permanent members, including the President of the ECB, Christine Lagarde.
How does inflation data impact the value of the Euro?
Eurozone inflation data, measured by the Harmonized Index of Consumer Prices (HICP), is an important econometric for the Euro. If inflation rises more than expected, especially if above the ECB’s 2% target, it obliges the ECB to raise interest rates to bring it back under control.
Relatively high interest rates compared to its counterparts will usually benefit the Euro, as it makes the region more attractive as a place for global investors to park their money.
How does economic data influence the value of the Euro?
Data releases gauge the health of the economy and can impact on the Euro. Indicators such as GDP, Manufacturing and Services PMIs, employment, and consumer sentiment surveys can all influence the direction of the single currency.
A strong economy is good for the Euro. Not only does it attract more foreign investment but it may encourage the ECB to put up interest rates, which will directly strengthen the Euro. Otherwise, if economic data is weak, the Euro is likely to fall.
Economic data for the four largest economies in the euro area (Germany, France, Italy and Spain) are especially significant, as they account for 75% of the Eurozone’s economy.
How does the Trade Balance impact the Euro?
Another significant data release for the Euro is the Trade Balance. This indicator measures the difference between what a country earns from its exports and what it spends on imports over a given period.
If a country produces highly sought after exports then its currency will gain in value purely from the extra demand created from foreign buyers seeking to purchase these goods. Therefore, a positive net Trade Balance strengthens a currency and vice versa for a negative balance.
- EUR/GBP appreciates after hawkish remarks made by ECB President Lagarde on Monday.
- ECB is anticipated to maintain its current policy measures for the foreseeable future.
- BoE is expected to delay rate cuts following the recent testimony to the UK Treasury Committee.
EUR/GBP advances to near 0.8550 during the European session on Tuesday. The Euro (EUR) strengthened following hawkish comments made by European Central Bank (ECB) President Christine Lagarde on Monday. Lagarde noted that while inflation is gradually approaching the central bank's targets, the ECB remains dedicated to maintaining its current policy measures for the foreseeable future.
Additionally, ECB President Lagarde mentioned that although fourth-quarter wage growth figures are encouraging, they are not sufficient to instill confidence in the ECB that inflationary pressures have been fully addressed.
Gfk German Consumer Confidence Survey came with a print of -29 for March as expected, against the previous reading for February was -29.6. Investors will be focusing on the release of EU Consumer Confidence data on Wednesday. Later in the week, attention turns to the Germany Retail Sales and Consumer Price Index (CPI) inflation data.
On the other side, with high-impact data absent this week, investors turn their attention to low-impact indicators such as Nationwide Housing Prices and Consumer Credit data. These releases will be scrutinized for any indications regarding the timing of potential rate cuts by the Bank of England (BoE).
Moreover, market sentiment appears to lean towards a potential delay in rate cuts, following recent testimony to the UK Treasury Committee by Bank of England (BoE) Governor Andrew Bailey and other policymakers. Bailey's remarks, though not providing a precise forecast of rate cuts, suggested a trajectory toward rate reduction. This speculation has buoyed the Pound Sterling (GBP), consequently limiting the losses of the EUR/GBP pair.
January CPI data in Japan confirmed inflation remains above the Bank of Japan's 2.0% target. The Yen “survived” the release, but remains around very weak levels and in FX intervention region, economists at ING say.
Yen dodges a bullet
The Yen dodged a key risk event. January inflation came in higher than expected, with the headline rate declining from 2.6% to 2.2% and the core rate from 2.3% to 2.0%. This means that inflation remains above the Bank of Japan target, validating market expectations for a rate hike in the first half of the year.
The Yen rose after the release, but rather modestly. This probably raises the chances of FX intervention should US rates find more support and apply more external upward pressure on USD/JPY.
Our view remains bearish on USD/JPY for the remainder of the year, but that remains strictly tied to expectations of a decline in USD rates and the dollar, which should see the oversold Yen benefit even in the event of a delay in the BoJ rate hike until June.
EUR/USD consolidates in the 1.0800-1.0900 range. Economists at ING analyze the pair’s outlook.
Re-strengthening of the Dollar expected around Thursday’s US PCE
EUR/USD has found support since the start of this week, although it is now lacking a clear catalyst for another leg higher unless US data disappoints today.
The Eurozone calendar only includes money supply figures today, and our expectations for a re-strengthening of the Dollar around Thursday’s US PCE release makes us sceptical of the sustainability of a EUR/USD rally at this stage.
- Pound Sterling awaits a fresh trigger for guidance on interest rates.
- BoE policymakers are worried about high wage growth momentum.
- Easing geopolitical tensions has trimmed safe-haven bets.
The Pound Sterling (GBP) is stuck in a narrow range in Tuesday’s session as investors seek fresh economic triggers that could provide insights into the timing of rate cuts by the Bank of England (BoE). The GBP/USD pair consolidates as the upside seems restricted as rate cuts by the BoE are inevitable, while more correction in the US Dollar has capped the downside.
The US Dollar Index, which gauges the value of the Greenback against six major currencies, has dropped to 103.70.
Improving hopes of a ceasefire between Israel and Palestine have strengthened the outlook of risk-sensitive assets (GBP), while safe-haven assets have come under pressure (USD).
This week, the US Dollar will be guided by the United States Durable Goods Orders and the core Personal Consumption Expenditure price index (PCE) data for January. A sharp decline in the US core PCE price index would increase hopes of early rate cuts by the Federal Reserve (Fed).
Daily Digest Market Movers: Pound Sterling sees more upside while US Dollar corrects
- Pound Sterling struggles to extend recovery above the round-level resistance of 1.2700 as market participants seek fresh guidance on interest rates.
- Investors remain uncertain about the timing for rate cuts by the Bank of England as policymakers need more evidence to confirm that inflation will come down sustainably to the 2% target.
- BoE policymakers see momentum in wage growth is currently twice that required to tame sticky price pressures, allowing them to remain leaned towards holding interest rates elevated.
- Meanwhile, speculators have trimmed their bullish positions in the Pound Sterling for the first time in eight weeks, suggesting that they may be searching for a new catalyst to give the currency a fresh pep, Reuters reported.
- While the BoE is widely anticipated to begin reducing interest rates after the Federal Reserve, prospects for the economic outlook of the United Kingdom economy will influence the timing for rate cuts.
- The Services PMI for the last two months has indicated that the technical recession in the second half of 2023 was shallow.
- Robust order book and higher business optimism indicate that the economy aims for a sharp recovery.
- UK business optimism has improved amid imminent hopes of the BoE pivoting to rate cuts and easing the cost of living crisis.
- On the consumer spending front, the Confederation of British Industry (CBI) reports that the momentum at which Retail Sales have been declining slowed sharply in February.
- The CBI has reported the monthly retail sales balance, a gauge of sales versus a year ago, rose to -7 from -50 in January, the slowest fall in 10 months, Reuters reported.
- This indicates an improvement in consumers’ appetite for spending, which would allow businesses to return to their average operating capacity.
Technical Analysis: Pound Sterling sees stiff resistance near 1.2700
Pound Sterling trades inside Monday’s trading range due to the light UK economic calendar this week. The pair approaches the downward-sloping border of the Descending Triangle pattern which has formed on a daily time frame, traced from the December 28 high at 1.2827. While, the horizontal support is plotted from December 13 low near 1.2500.
The pair holds above the 20 and 50-day Exponential Moving Averages (EMAs), which trade around 1.2630. Meanwhile, the 14-period Relative Strength Index (RSI) marches toward 60.00. A bullish momentum will trigger if the RSI (14) manages to climb above 60.00.
Pound Sterling FAQs
What is the Pound Sterling?
The Pound Sterling (GBP) is the oldest currency in the world (886 AD) and the official currency of the United Kingdom. It is the fourth most traded unit for foreign exchange (FX) in the world, accounting for 12% of all transactions, averaging $630 billion a day, according to 2022 data.
Its key trading pairs are GBP/USD, aka ‘Cable’, which accounts for 11% of FX, GBP/JPY, or the ‘Dragon’ as it is known by traders (3%), and EUR/GBP (2%). The Pound Sterling is issued by the Bank of England (BoE).
How do the decisions of the Bank of England impact on the Pound Sterling?
The single most important factor influencing the value of the Pound Sterling is monetary policy decided by the Bank of England. The BoE bases its decisions on whether it has achieved its primary goal of “price stability” – a steady inflation rate of around 2%. Its primary tool for achieving this is the adjustment of interest rates.
When inflation is too high, the BoE will try to rein it in by raising interest rates, making it more expensive for people and businesses to access credit. This is generally positive for GBP, as higher interest rates make the UK a more attractive place for global investors to park their money.
When inflation falls too low it is a sign economic growth is slowing. In this scenario, the BoE will consider lowering interest rates to cheapen credit so businesses will borrow more to invest in growth-generating projects.
How does economic data influence the value of the Pound?
Data releases gauge the health of the economy and can impact the value of the Pound Sterling. Indicators such as GDP, Manufacturing and Services PMIs, and employment can all influence the direction of the GBP.
A strong economy is good for Sterling. Not only does it attract more foreign investment but it may encourage the BoE to put up interest rates, which will directly strengthen GBP. Otherwise, if economic data is weak, the Pound Sterling is likely to fall.
How does the Trade Balance impact the Pound?
Another significant data release for the Pound Sterling is the Trade Balance. This indicator measures the difference between what a country earns from its exports and what it spends on imports over a given period.
If a country produces highly sought-after exports, its currency will benefit purely from the extra demand created from foreign buyers seeking to purchase these goods. Therefore, a positive net Trade Balance strengthens a currency and vice versa for a negative balance.
- USD/MXN extends losses on improved risk sentiment.
- US Dollar Index declines to around 103.70 amid subdued US Treasury yields.
- Banxico officials expect the prospect of implementing the first rate cut in March.
USD/MXN extends its losses for the second successive day, trading lower around 17.08 during the early European hours on Tuesday. This decline can be attributed to the weakened US Dollar (USD), primarily influenced by subdued US Treasury yields. Moreover, improved risk appetite in the market exerts additional downward pressure on the Greenback, acting as a headwind for the USD/MXN pair.
The US Dollar Index (DXY) dips to around 103.70 amid the subdued US Treasury yields. At the time of writing, the 2-year and 10-year yields on US bond coupons stand at 4.71% and 4.28%, respectively. The Federal Open Market Committee (FOMC) minutes have reinforced a data-dependent approach by the Federal Reserve (Fed), signaling a more dovish stance, which has further weighed on the US Dollar (USD).
Investors will be closely monitoring several key economic indicators scheduled for release later this week, including Gross Domestic Product Annualized (Q4), Core Personal Consumption Expenditures, and the Fed Monetary Policy Report.
The recent meeting minutes revealed that three policymakers of the Bank of Mexico (Banxico) are contemplating the prospect of implementing the first rate cut at the upcoming March meeting. This consideration is strengthened in light of the economic deceleration highlighted by the recent inflation figures. This sentiment could potentially exert pressure on the Mexican Peso, consequently supporting the USD/MXN pair.
Contrary to expectations, Mexico's 1st half-month inflation for February decreased, while 1st half-month Core Inflation expanded slightly below expectations. Market participants are eagerly awaiting the release of Trade Balance data for January on Tuesday, with close attention to potential implications for the economic landscape and currency movements.
USD/CNY has largely traded close to 7.2000 since mid-January. Economists at Commerzbank analyze Chinese Yuan’s (CNY) outlook.
USD/CNY will stay at the 7.2000 level
We expect the current Yuan weakness to remain in H1 2024, i.e. USD/CNY will stay at the 7.2000 level.
The Yuan will likely remain weak as the economy continues to muddle through its structural challenges, notably the real estate troubles. More policy stimulus is expected and should in principle be positive to the yuan if China’s economy could gain a firmer footing. However, the effectiveness of the measures may come into question.
The anticipated US Fed rate cuts will ease pressures on the Yuan later this year.

Source: Commerzbank Research
- EUR/JPY attracts some sellers near 163.28 on the stronger-than-expected Japanese inflation data.
- Japan’s two-year bond yield climbed to the highest level since 2011 amid growing speculation the BoJ will abandon its negative rate policy by spring.
- ECB’s Lagarde reaffirmed its restrictive policy stance, as the decline in headline inflation acts as a safeguard against a sustained wage-price spiral.
The EUR/JPY cross trades in negative territory after being rejected from the multi-month highs of 163.50 during the early European trading hours on Tuesday. The hotter-than-expected Japanese CPI data has prompted investors to be more cautious about the probability of the BOJ exiting negative interest rate policy at the March meeting, which provides some support to the Japanese Yen (JPY). At press time, the cross is trading at 163.28, losing 0.15% on the day.
The Japanese government bond (JGB) yields edge higher on Tuesday after Japan’s inflation data surprised to the upside, raising speculation that the Bank of Japan (BoJ) will exit negative interest rates by June this year. This, in turn, boosts the Japanese Yen and acts as a headwind for the EUR/JPY cross.
Early Tuesday, the Japan Statistics Bureau revealed that the nation’s National Consumer Price Index (CPI) for January came in at 2.2% YoY from 2.6% in December. Meanwhile, the National CPI ex Fresh food came in better than expected, arriving at 2.0% YoY in January versus 2.3% prior.
On the Euro front, European Central Bank (ECB) President Christine Lagarde said on Monday that inflation continues to ease toward central bank targets. However, the ECB remains committed to restrictive policy measures for the time being. Lagarde added that the fourth-quarter wage growth numbers are positive, but not enough to give the ECB confidence that inflation has been conquered.
Investors will take more cues from the German Consumer Price Index (CPI) and Eurozone Harmonized Index of Consumer Prices this week for fresh impetus. On the Japanese docket, the Industrial Production will be due on Thursday and the Unemployment Rate will be released on Friday.
Here is what you need to know on Tuesday, February 27:
The US Dollar struggles to stay resilient against its major rivals early Tuesday. The US Dollar Index, which closed in negative territory on Monday, stays on the back foot below 104.00 as investors await January Durable Goods Orders and Conference Board's Consumer Confidence Index data for February. The US economic docket will also feature Housing Price Index for December, alongside Richmond Fed and Dallas Fed Manufacturing Indexes for February.
The benchmark 10-year US Treasury bond yield recovered modestly on Monday and major equity indexes in the US registered small losses. Early Tuesday, the 10-year yield holds steady slightly below 4.3% and US stock index futures trade marginally lower. Durable Goods Orders are forecast to decline by 4.8% in January after staying unchanged in December. Federal Reserve Vice Chair for Supervision Michael Barr will deliver a speech on risks of counterfeit credit later in the day.
US Dollar price this week
The table below shows the percentage change of US Dollar (USD) against listed major currencies this week. US Dollar was the weakest against the Euro.
| USD | EUR | GBP | CAD | AUD | JPY | NZD | CHF | |
| USD | -0.26% | -0.05% | -0.04% | 0.26% | 0.00% | 0.32% | -0.17% | |
| EUR | 0.26% | 0.20% | 0.22% | 0.51% | 0.26% | 0.58% | 0.10% | |
| GBP | 0.06% | -0.20% | 0.02% | 0.31% | 0.06% | 0.38% | -0.09% | |
| CAD | 0.04% | -0.22% | -0.01% | 0.32% | 0.04% | 0.37% | -0.13% | |
| AUD | -0.28% | -0.52% | -0.33% | -0.31% | -0.26% | 0.06% | -0.42% | |
| JPY | 0.00% | -0.26% | -0.01% | -0.04% | 0.27% | 0.33% | -0.18% | |
| NZD | -0.33% | -0.58% | -0.37% | -0.37% | -0.06% | -0.32% | -0.49% | |
| CHF | 0.15% | -0.10% | 0.09% | 0.12% | 0.42% | 0.15% | 0.48% |
The heat map shows percentage changes of major currencies against each other. The base currency is picked from the left column, while the quote currency is picked from the top row. For example, if you pick the Euro from the left column and move along the horizontal line to the Japanese Yen, the percentage change displayed in the box will represent EUR (base)/JPY (quote).
During the Asian trading hours, the data from Japan showed that the National Consumer Price Index (CPI) rose 2.2% on a yearly basis in January, down from the 2.6% increase recorded in December. USD/JPY largely ignored this data and extended its sideways grind at around 105.50.
Japanese Yen remains supported by reviving BoJ pivot bets, US data in focus.
EUR/USD gained 0.3% and registered its highest daily close since early February. The pair seems to have stabilized at around 1.0850 in the European morning on Tuesday. European Central Bank (ECB) will publish Private Loans and M3 Money Supply data for January.
AUD/USD lost nearly 0.4% and snapped an 8-day winning streak on Monday. After touching a weekly low of 0.6525 in the Asian session, the pair staged a rebound and was last seen trading marginally higher on the day at around 0.6550.
Australian Dollar improves to a major level amid a stable US Dollar.
GBP/USD extended its near-term uptrend and touched 1.2700 before correcting lower on Monday. In the European morning on Tuesday, the pair trades in a tight channel above 1.2650. Bank of England (BoE) Deputy Governor for Markets and Banking, Dave Ramsden, is scheduled to speak later in the day.
Gold spent the first day of the week moving sideways in a narrow band at around $2,030 before posting small losses. XAU/USD stays calm slightly above $2,030 early Tuesday.
FX option expiries for Feb 27 NY cut at 10:00 Eastern Time, via DTCC, can be found below.
- EUR/USD: EUR amounts
- 1.0725 1b
- 1.0750 1.2b
- 1.0800 1b
- 1.0850 1.3b
- 1.0925 1.3b
- USD/JPY: USD amounts
- 150.00 1.2b
- GBP/USD: GBP amounts
- 1.2650 1.3b
- AUD/USD: AUD amounts
- 0.6600 2.9b
- 0.6700 2.7b
- USD/CHF trades sideways near the 0.8800 mark in Tuesday’s early European session.
- The FOMC minutes indicated that policymakers were worried about moving too fast to cut their rate and preferred to wait for more data.
- The markets expect the SNB to start rate cuts in September, even though the recent inflation data might speed up the timeline.
The USD/CHF pair consolidates in a narrow trading range during the early European session on Tuesday. Investors seem to prefer to wait on the sidelines ahead of key events from the US and Swiss dockets. Meanwhile, the decline of the US Dollar (USD) weighs on the pair. At press time, USD/CHF is trading at 0.8798, adding 0.02% on the day.
Several Federal Reserve (Fed) officials expressed concern that strong growth in spending and hiring could disrupt that progress to bring inflation down to the 2% target. The FOMC meeting minutes last week indicated that the central bank was also worried about moving too fast to cut their benchmark interest rate and preferred to wait for additional evidence of inflation data before making the decision on easing policy. Investors will take more cues from the Core Personal Consumption Expenditures Price Index (Core PCE), the Fed's preferred inflation gauge, due on Thursday. The stronger-than-expected data might support the case for keeping the rate high for longer and this might lift the US Dollar (USD).
On the Swiss front, Swiss National Bank (SNB) President Thomas Jordan said that while inflation wouldn’t exceed the central bank’s target between 0 and 2%, he still sees it approaching the range’s ceiling. The markets expect the SNB to begin rate cuts in September, even though the recent Swiss inflation data might speed up that schedule.
Apart from this, Yemen’s Iranian-backed Houthi movement has attacked merchant ships for months, proclaiming solidarity with Palestinians as Israel wages war against Hamas in the Gaza Strip. That being said, the escalating geopolitical tensions in the Middle East might boost the traditional safe-haven currency like the Swiss Franc (CHF).
Looking ahead, the release of the US Gross Domestic Product (GDP) for Q4 will be the highlight on Wednesday. On Thursday, the attention will shift to the Swiss Q4 GDP growth numbers and the US Core PCE. These events could give a clear direction to the USD/CHF pair.
- USD/CAD loses ground to a major level of 1.3500 on Tuesday.
- The immediate support area appears around the 23.6% Fibonacci retracement level at 1.3489 and 50-day EMA at 1.3476.
- The pair could find immediate resistance around the major level of 1.3550 and February’s high at 1.3586.
USD/CAD continues to lose ground on the subdued US Dollar (USD), which could be attributed to the lower US Treasury yields. The USD/CAD pair inches lower to near 1.3500 during the Asian session on Tuesday.
The USD/CAD pair could find the immediate support region around the 23.6% Fibonacci retracement level at 1.3489 and the 50-day Exponential Moving Average (EMA) at 1.3476. A break below the latter could prompt the pair to approach the major level of 1.3450 before the 38.2% Fibonacci retracement level at 1.3430. Further support appears at the psychological support at the 1.3400 level.
The technical analysis of the 14-day Relative Strength Index (RSI) is positioned above 50, suggesting bullish momentum for the USD/CAD pair.
Furthermore, the Moving Average Convergence Divergence (MACD) indicator for the USD/CAD pair, indicates a subdued momentum in the market. This interpretation is based on the MACD line's position above the centerline but lies below the signal line. Traders could await a clearer directional signal from the lagging indicator MACD before making aggressive trades in the pair.
On the upside, the USD/CAD pair could meet the key resistance at the major level of 1.3550 following February’s high at 1.3586. A break above February’s high could exert upward support to lead the pair to explore the region around the psychological resistance level at 1.3600.
USD/CAD: Daily Chart
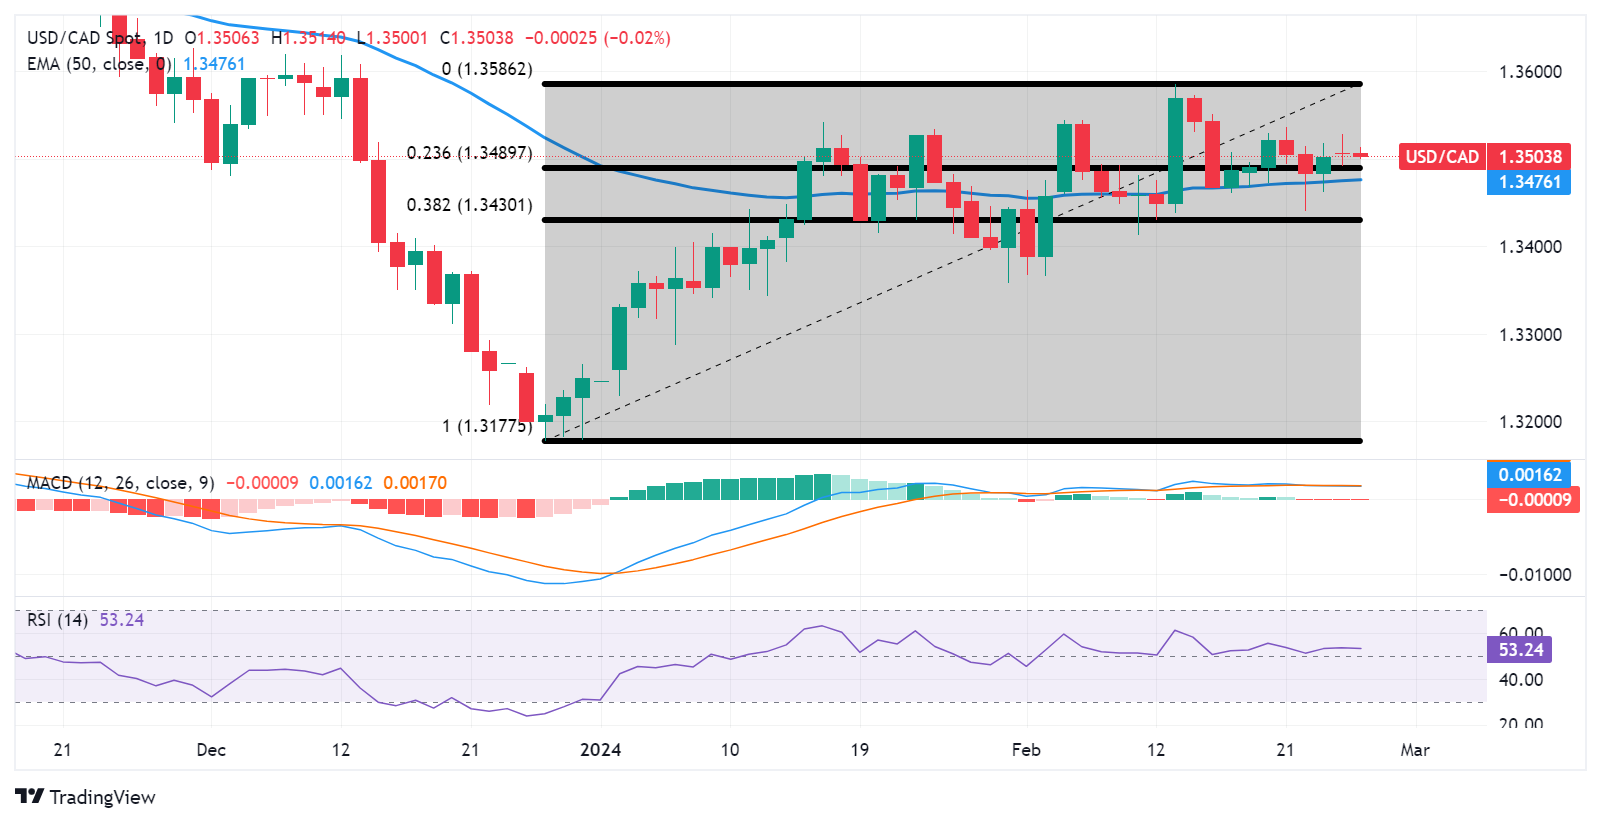
- NZD/USD drifts lower for the second straight day and drops to a one-week low on Tuesday.
- Retreating US bond yields undermines the USD and helps limit the downside for the major.
- Traders look to the US macro data for a fresh impetus ahead of the RBNZ on Wednesday.
The NZD/USD pair remains under some selling pressure for the second straight day on Tuesday and drops to a one-week low, around mid-0.6100s during the Asian session. Spot prices, however, recover a few pips from the daily trough in the wake of a modest US Dollar (USD) downtick and currently trade around the 0.6165 region, down just over 0.10% for the day.
The USD Index (DXY), which tracks the Greenback against a basket of currencies, remains depressed amid a fresh leg down in the US Treasury bond yields, which, in turn, helps limit the downside for the NZD/USD pair. Any meaningful downfall for the USD, however, still seems elusive as investors now seem convinced that the Federal Reserve (Fed) will keep interest rates higher for longer on the back of sticky inflation and a still-resilient US economy.
The Fed's hawkish outlook should act as a tailwind for the US bond yields and the buck, warranting caution before positioning for the resumption of the NZD/USD pair's recent strong move up witnessed over the past two weeks or so, from sub-0.6100 levels. Traders might also prefer to wait on the sidelines ahead of the key central bank event risk – the Reserve Bank of New Zealand (RBNZ) policy decision, scheduled to be announced on Wednesday.
In the meantime, traders on Tuesday will take cues from the US macro data– Durable Goods Orders, the Conference Board's Consumer Confidence Index and the Richmond Manufacturing Index. The focus, however, will remain glued to the US Personal Consumption Expenditures (PCE) Price Index on Thursday, which should influence the Fed's future policy decisions. This, in turn, will provide a fresh impetus to the USD and the NZD/USD pair.
- GBP/JPY edges lower on the release of Japanese CPI data on Tuesday.
- Pound Sterling received upward support on speculation regarding a delay in BoE’s rate cuts
- Japan’s CPI (YoY) grew by 2.2% against the previous growth of 2.6%.
GBP/JPY halts its winning streak that began on February 20, edging lower to near 190.80 during the Asian session on Tuesday. However, speculation arose regarding a potential delay in rate cuts following a testimony to the UK Treasury Committee by Bank of England (BoE) Governor Andrew Bailey and other policymakers last week. Bailey mentioned that while he wouldn't forecast the exact number of cuts, the bank was moving towards a path of lowering rates. This speculation has lifted the Pound Sterling (GBP) against the Japanese Yen (JPY).
Governor Bailey also emphasized that the Bank of England has transitioned from a focus on determining the tightness of policy and the necessary height of rates to considering how long the central bank needs to maintain this stance to achieve sustained inflation. Following the BoE's decision earlier this month to keep the interest rate steady at 5.25%, the markets have factored in expectations for four rate cuts by the end of the year.
However, the Japanese Yen (JPY) managed to draw in some buyers. Japanese consumer inflation data renewed expectations for a potential adjustment in the Bank of Japan's (BoJ) policy stance, leading investors to exercise caution. Additionally, recent verbal intervention by Japanese authorities may offer some support for the JPY.
In January, Japan’s National Consumer Price Index (CPI) grew by 2.2% year-over-year, slightly lower than the previous growth of 2.6%. Additionally, Core CPI (YoY) increased by 3.5%, down from the previous 3.7%. Traders are now eagerly awaiting Retail Trade data to gain further insights into the Japanese economic landscape.
- GBP/USD posts modest gains near 1.2683 in Tuesday’s early European session.
- The pair maintains a bullish outlook above the key EMA; RSI indicator lies above the 50 midlines.
- The first upside barrier will emerge at the 1.2700 mark; the initial support level is seen at 1.2640.
The GBP/USD pair remains capped under the 1.2700 barrier during the early European session on Tuesday. A testimony to the UK Treasury committee by Bank of England (BoE) Governor Andrew Bailey and other policymakers last week sparked speculation of a delay in rate cuts, which boost the Pound Sterling (GBP) and create a tailwind for the GBP/USD pair. The pair currently trades around 1.2683, up 0.01% on the day.
GBP/USD keeps the bullish vibe unchanged as the major pair is above the key 100-period Exponential Moving Average (EMA) on the four-hour chart. The upward momentum is backed by the Relative Strength Index (RSI), which lies above the 50 midlines, supporting the buyers for the time being.
The potential resistance level will emerge at the 1.2700 mark, portraying the confluence of the upper boundary of the Bollinger Band, a psychological round figure, and a high of February 26. A bullish breakout of this level will expose a high of January 31 at 1.2750. The additional upside filter to watch is a high of January 12 at 1.2585.
On the flip side, the first downside target for GBP/USD is seen at the 100-period EMA and the lower limit of the Bollinger Band at 1.2640. The key contention level for the major pair is located at the 1.2600–1.2605 region, representing the psychological mark and a low of February 21. A break below the latter will pave the way to a low of December 11 at 1.2535.
GBP/USD four-hour chart
-638446058750221071.png)
- The USD Index (DXY) drifts lower for the second straight day amid sliding US bond yields.
- The Fed’s higher-for-longer rates narrative should help limit any meaningful downside.
- Bears might also refrain from placing aggressive bets ahead of this week’s US macro data.
The US Dollar (USD) trades with a mild negative bias during the Asian session on Tuesday and remains well within the striking distance of its lowest level since February 2 touched last week. Meanwhile, the USD Index (DXY), which tracks the Greenback against a basket of currencies, manages to hold above mid-103.00s as traders await key US macro data for cues about the Federal Reserve's (Fed) future policy decisions.
Tuesday's US economic docket features the release of Durable Goods Orders, the Conference Board's Consumer Confidence Index and the Richmond Manufacturing Index. This will be followed by the prelim US Q4 GDP print on Wednesday and the crucial US Personal Consumption Expenditures (PCE) Price Index on Thursday. This could provide fresh signals about the likely timing of when the Fed may begin cutting interest rates and help determine the next leg of a directional move for the USD.
In the meantime, a fresh leg down in the US Treasury bond yields keeps the USD bulls on the defensive for the second straight day, though hawkish Fed expectations continue to act as a tailwind. Investors scaled back their expectations for a more aggressive policy easing by the Fed after the incoming US macro data pointed to sticky inflation and a still resilient economy. Adding to this, the FOMC meeting minutes released last week, along with comments by several Fed officials, reaffirmed bets that the US central bank will keep interest rates higher for longer. This, in turn, favours the USD bulls.
Even from a technical perspective, the DXY last week showed some resilience below the very important 200-day Simple Moving Average (SMA). This, in turn, makes it prudent to wait for strong follow-through selling before confirming that the USD has topped out in the near term and positioning for an extension of the recent pullback from a three-month peak touched earlier this February.
Citing sources, ABC News reported on Tuesday that China is considering lifting the tariffs on Australian wine imports at the end of March.
No further details are available on the same.
Last year, China removed trade restrictions on imports of Australian hay, a step in the improvement of the trading relationship.
Market reaction
The Australian Dollar caught a fresh bid wave on renewed trade optimism, lifting AUD/USD from intraday lows to challenge highs near 0.6550. The pair is currently trading at 0.6544, up 0.06% on the day.
Australian Dollar price today
The table below shows the percentage change of Australian Dollar (AUD) against listed major currencies today. Australian Dollar was the strongest against the Pound Sterling.
| USD | EUR | GBP | CAD | AUD | JPY | NZD | CHF | |
| USD | -0.03% | 0.04% | 0.01% | -0.05% | -0.09% | 0.04% | -0.07% | |
| EUR | 0.03% | 0.06% | 0.03% | -0.03% | -0.05% | 0.03% | -0.05% | |
| GBP | -0.03% | -0.06% | -0.03% | -0.08% | -0.12% | -0.02% | -0.11% | |
| CAD | 0.00% | -0.03% | 0.02% | -0.06% | -0.09% | 0.02% | -0.08% | |
| AUD | 0.05% | 0.03% | 0.09% | 0.05% | -0.03% | 0.07% | -0.02% | |
| JPY | 0.09% | 0.07% | 0.11% | 0.08% | 0.06% | 0.10% | 0.01% | |
| NZD | -0.06% | -0.03% | 0.00% | -0.03% | -0.08% | -0.12% | -0.07% | |
| CHF | 0.08% | 0.05% | 0.11% | 0.08% | 0.02% | 0.00% | 0.09% |
The heat map shows percentage changes of major currencies against each other. The base currency is picked from the left column, while the quote currency is picked from the top row. For example, if you pick the Euro from the left column and move along the horizontal line to the Japanese Yen, the percentage change displayed in the box will represent EUR (base)/JPY (quote).
- Gold price attracts dip-buyers on Tuesday, albeit the uptick lacks bullish conviction.
- Sliding US bond yields undermine the USD and lends some support to the XAU/USD.
- Geopolitical risks also benefit the safe-haven metal, though the upside seems limited.
Gold price (XAU/USD) regains some positive traction following the previous day's modest pullback and holds steady above the $2,030 level during the Asian session on Tuesday. A fresh leg down in the US Treasury bond yields keeps the US Dollar (USD) bulls on the defensive, which, in turn, is seen acting as a tailwind for the commodity. Apart from this, a generally softer tone around the equity markets further benefits the precious metal's relative safe-haven status and remains supportive of the uptick.
That said, the Federal Reserve's (Fed) hawkish outlook for higher-for-longer interest rates might keep a lid on any meaningful appreciating move for the non-yielding Gold price. Traders might also refrain from placing aggressive directional bets and prefer to wait for the release of the US Personal Consumption Expenditures (PCE) Price Index on Thursday for cues about the likely timing of when the Fed will start cutting rates. This might further contribute to capping the upside for the precious metal.
Daily Digest Market Movers: Gold price benefits from sliding US bond yields and softer US Dollar
- The yield on the benchmark 10-year US government bond remains depressed near 4.275%, undermining the US Dollar and lending some support to the Gold price.
- A recession in Japan and the UK, along with continued geopolitical tensions stemming from conflicts in the Middle East, further benefit the safe-haven precious metal.
- US President Joe Biden said on Monday that he hopes to have a ceasefire in the Israel-Hamas war and a pause-for-hostages deal by Ramadan's beginning on March 10.
- The FOMC meeting minutes released last week and comments by several Federal Reserve officials suggested that the US central bank was in no rush to cut interest rates.
- Kansas City Fed President Jeffrey Schmid said that the US central bank should be patient and wait for convincing evidence that the fight against inflation has been won.
- Markets have all but priced out the possibility of a rate cut in March and see around a 60% chance of the first 25 basis points rate cut coming at the June FOMC meeting.
- Traders now look to the US macro data due on Tuesday – Durable Goods Orders, the Conference Board's Consumer Confidence Index and the Richmond Manufacturing Index.
- Investors this week will also confront the release of the Prelim US Q4 GDP print on Wednesday and the Personal Consumption Expenditures (PCE) Price Index on Thursday.
- The latter is considered the Fed's preferred inflation gauge, which, in turn, will influence expectations about future rate cuts and provide fresh impetus to the XAU/USD.
Technical Analysis: Gold price bulls need to wait for a move beyond the $2,041-2042 supply zone
From a technical perspective, any subsequent move up is likely to confront some resistance near the $2,041-2,042 area, or over a two-week high touched last Thursday. Some follow-through buying will confirm a break through the 50-day Simple Moving Average (SMA) barrier and pave the way for additional gains. Given that oscillators on the daily chart have just started gaining positive traction, the Gold price might then challenge the next relevant hurdle near the $2,065 supply zone. The momentum could extend further towards reclaiming the $2,100 round figure mark for the first time since early December 2023.
On the flip side, the overnight swing low, around the $2,025 region, might continue to protect the immediate downside ahead of the 100-day SMA, currently near the $2,009 area, and the $2,000 psychological mark. A convincing break below the latter will shift the near-term bias in favour of bearish traders and drag the Gold price to the $1,984 region en route to the very important 200-day SMA support near the $1,967-1,966 zone.
US Dollar price today
The table below shows the percentage change of US Dollar (USD) against listed major currencies today. US Dollar was the weakest against the Japanese Yen.
| USD | EUR | GBP | CAD | AUD | JPY | NZD | CHF | |
| USD | 0.00% | 0.07% | 0.05% | 0.14% | -0.05% | 0.17% | 0.00% | |
| EUR | 0.00% | 0.07% | 0.04% | 0.14% | -0.04% | 0.15% | -0.01% | |
| GBP | -0.06% | -0.07% | -0.02% | 0.08% | -0.11% | 0.09% | -0.07% | |
| CAD | -0.04% | -0.05% | 0.00% | 0.09% | -0.10% | 0.13% | -0.05% | |
| AUD | -0.13% | -0.14% | -0.08% | -0.11% | -0.19% | 0.01% | -0.15% | |
| JPY | 0.05% | 0.05% | 0.11% | 0.09% | 0.24% | 0.20% | 0.05% | |
| NZD | -0.17% | -0.15% | -0.11% | -0.13% | -0.02% | -0.22% | -0.14% | |
| CHF | 0.00% | 0.00% | 0.07% | 0.04% | 0.14% | -0.04% | 0.15% |
The heat map shows percentage changes of major currencies against each other. The base currency is picked from the left column, while the quote currency is picked from the top row. For example, if you pick the Euro from the left column and move along the horizontal line to the Japanese Yen, the percentage change displayed in the box will represent EUR (base)/JPY (quote).
Gold FAQs
Why do people invest in Gold?
Gold has played a key role in human’s history as it has been widely used as a store of value and medium of exchange. Currently, apart from its shine and usage for jewelry, the precious metal is widely seen as a safe-haven asset, meaning that it is considered a good investment during turbulent times. Gold is also widely seen as a hedge against inflation and against depreciating currencies as it doesn’t rely on any specific issuer or government.
Who buys the most Gold?
Central banks are the biggest Gold holders. In their aim to support their currencies in turbulent times, central banks tend to diversify their reserves and buy Gold to improve the perceived strength of the economy and the currency. High Gold reserves can be a source of trust for a country’s solvency. Central banks added 1,136 tonnes of Gold worth around $70 billion to their reserves in 2022, according to data from the World Gold Council. This is the highest yearly purchase since records began. Central banks from emerging economies such as China, India and Turkey are quickly increasing their Gold reserves.
How is Gold correlated with other assets?
Gold has an inverse correlation with the US Dollar and US Treasuries, which are both major reserve and safe-haven assets. When the Dollar depreciates, Gold tends to rise, enabling investors and central banks to diversify their assets in turbulent times. Gold is also inversely correlated with risk assets. A rally in the stock market tends to weaken Gold price, while sell-offs in riskier markets tend to favor the precious metal.
What does the price of Gold depend on?
The price can move due to a wide range of factors. Geopolitical instability or fears of a deep recession can quickly make Gold price escalate due to its safe-haven status. As a yield-less asset, Gold tends to rise with lower interest rates, while higher cost of money usually weighs down on the yellow metal. Still, most moves depend on how the US Dollar (USD) behaves as the asset is priced in dollars (XAU/USD). A strong Dollar tends to keep the price of Gold controlled, whereas a weaker Dollar is likely to push Gold prices up.
- EUR/USD could meet the immediate resistance at the 38.2% Fibonacci retracement level of 1.0864.
- The lagging indicator MACD implies a potential shift towards bullish momentum for the pair.
- The key support area appears around the 21-day EMA at 1.0814 and the psychological level of 1.0800.
EUR/USD continues its winning streak that began on February 14, with the subdued US Dollar (USD), potentially influenced by the lower US Treasury yields. Consequently, during Tuesday's Asian session, the EUR/USD pair hovers around 1.0850.
Immediate resistance levels for the EUR/USD pair are identified at the 38.2% Fibonacci retracement level of 1.0864, followed by February's high of 1.0897, which aligns with the significant psychological barrier at 1.0900.
The technical analysis suggests a bullish sentiment for the EUR/USD pair. The 14-day Relative Strength Index (RSI) is positioned above the 50 mark, indicating strength in the upward momentum.
Additionally, the Moving Average Convergence Divergence (MACD) shows a divergence above the signal line, despite being below the centerline. This lagging indicator implies a potential shift towards bullish momentum for the EUR/USD pair.
On the downside, the EUR/USD pair could find the key support around the 21-day Exponential Moving Average (EMA) at 1.0814 followed by the psychological support of 1.0800 level. A break below this level could prompt the pair to retest February’s low at 1.0694 level.
EUR/USD: Daily Chart
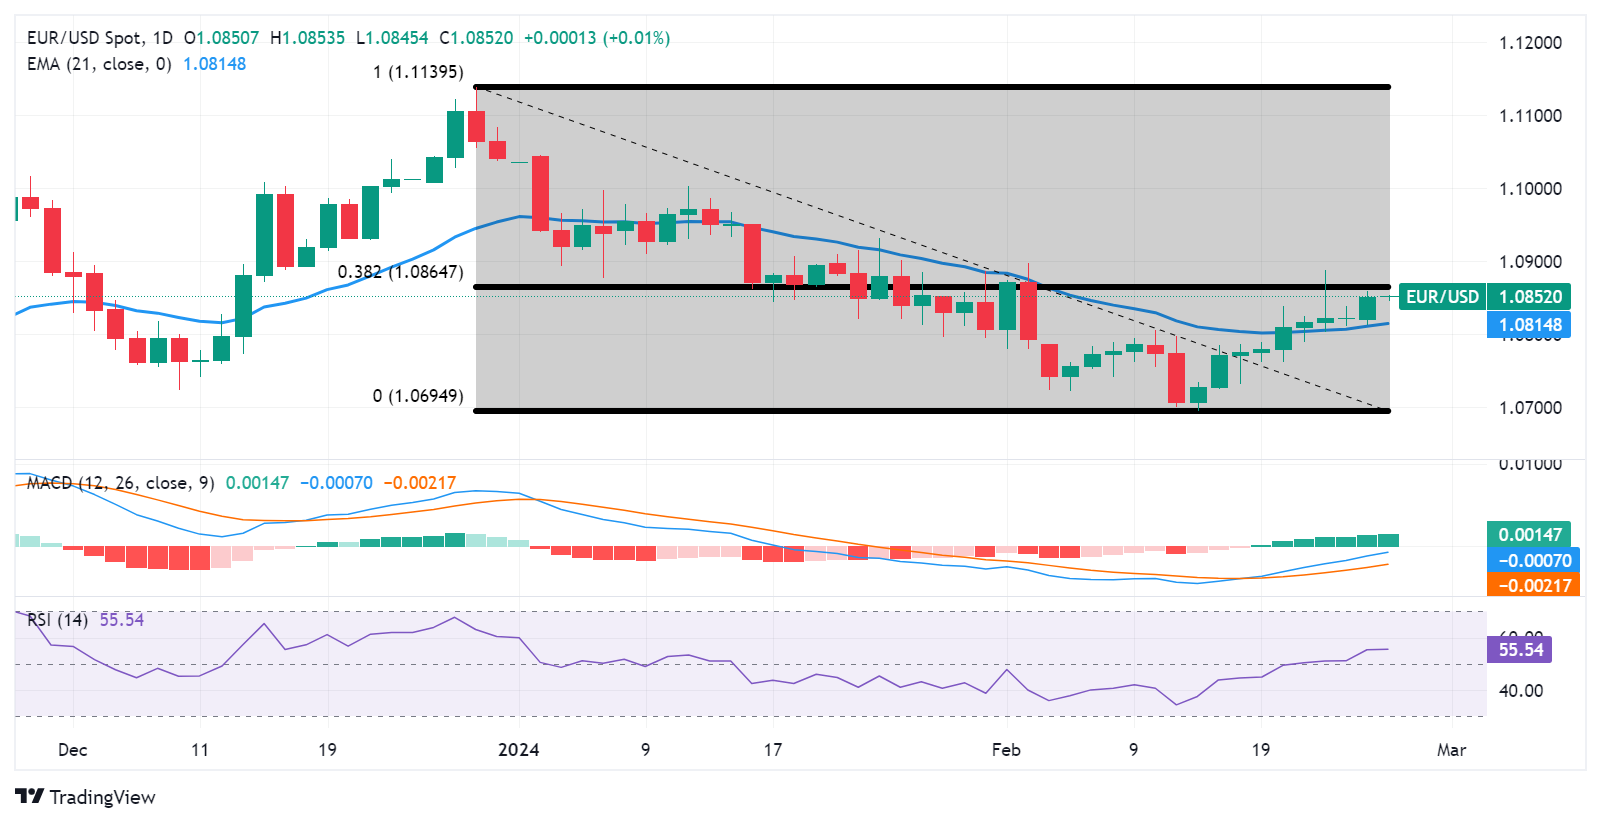
- WTI received support over concerns about supply disruptions between Europe and Asia.
- Israeli Prime Minister Benjamin Netanyahu stated that Israel plans to launch an attack on Rafah.
- The Wafa oil field in western Libya has resumed operations after being temporarily shut down on Sunday.
The West Texas Intermediate (WTI) oil price has dipped slightly to near $77.30 per barrel during the Asian session on Tuesday. However, Crude oil prices have found support from ongoing geopolitical tensions in the Red Sea region. Specifically, the targeting of civilian shipping vessels by Iran-led Houthis has raised concerns about potential disruptions to supply lines between Europe and Asia. As a result, bids for Crude oil barrels remain elevated as market participants monitor the situation closely.
In a significant development, Israeli Prime Minister Benjamin Netanyahu has stated that Israel plans to launch an attack on Rafah, a city where hundreds of thousands of displaced Palestinians are taking shelter. However, Netanyahu noted that the assault would be postponed if a deal to release captives is reached.
US President Joe Biden also weighed in, expressing the belief that negotiators are close to an agreement that would halt Israel’s military actions in Gaza within a week, contingent on the release of at least some of the more than 100 hostages held by Hamas.
Notably, Israeli negotiators have indicated a willingness to release a group of high-profile Palestinian prisoners serving long sentences in exchange for the freedom of some Israeli hostages held in Gaza.
In a notable address on policy, Kansas City Federal Reserve Bank President Jeffrey Schmid conveyed that he shares the sentiment of many central banking counterparts in not hurrying to reduce interest rates. This stance, commonly held among policymakers, reflects a cautious approach to monetary policy changes. Typically, high borrowing costs have the effect of dampening economic growth, which leads to reduced oil demand.
The Wafa oil field in western Libya, which produces between 40,000 to 45,000 barrels per day (bpd), has resumed operations after being temporarily shut down on Sunday. This has also resulted in the restoration of a natural gas link to Italy. The halt was prompted by protests, but the demonstrators withdrew from the facilities following assurances from the government regarding the fulfillment of their demands.
- Indian Rupee weakens amid USD demand.
- USD/INR is likely to remain confined in a narrow range due to the USD inflows and the potential intervention from the RBI.
- Investors await the US Gross Domestic Product (GDP) for Q4, due on Wednesday.
Indian Rupee (INR) trades in negative territory on Tuesday amid dip-buying demand in the US Dollar (USD). The pair is expected to remain in a narrow trading range due to USD inflows from importers and the potential intervention by the Reserve Bank of India (RBI). Some analysts said the Indian central bank bought the Dollar throughout last week to prevent the local currency from appreciating much amid continuing inflows.
INR is likely to have additional support from MSCI-rebalancing inflows. According to Nuvama Alternative & Quantitative Research, India is expected to see $1.2 billion in passive inflows into equities after MSCI's quarterly review, which begins on February 29.
Later this week, investors will monitor the remarks from several Federal Reserve officials, along with the release of US Gross Domestic Product (GDP) for Q4 on Wednesday and the Personal Consumption Expenditures Price Index (PCE), due on Thursday. On the Indian docket, the GDP annual growth numbers and Federal Fiscal Deficit will be released on Thursday. The Indian S&P Global Manufacturing PMI for February will be published on Friday.
Daily Digest Market Movers: Indian Rupee remains vulnerable to multiple headwinds and global factors
- India’s real GDP growth number for October-December 2023 is forecast to grow 7.0% YoY, according to Deutsche Bank.
- The RBI has estimated Retail Inflation for FY25 at 4.5%, with Q1 at 5.0%; Q2 at 4.0%; Q3 at 4.6%; and Q4 at 4.7%.
- Kansas City Fed President Jeffrey Schmid said the central bank is not out of the woods yet on too high inflation and there is no need to preemptively cut interest rates.
- New York Fed President John Williams warned last week about the possibility of early rate cuts, adding that the central bank is on track to lower borrowing costs later this year.
- Fed Governor Christopher Waller said the central bank should delay rate cuts by at least a few more months to see more evidence of inflation data.
Technical Analysis: Indian Rupee remains confined within a long-term trading range
Indian Rupee trades on a softer note on the day. USD/INR has remained in a multi-month-old descending trend channel of 82.70–83.20 since December 8, 2023.
In the short term, the bearish bias of USD/INR prevails as the pair holds below the crucial 100-day Exponential Moving Average (EMA) on the daily timeframe. The downward momentum is also supported by the 14-day Relative Strength Index (RSI), which lies below the 50.0 midline, suggesting that further decline cannot be ruled out.
The short-term technical support zone is seen at the lower limit of the descending trend channel at 82.70. Any follow-through selling below 82.70, the pair could revisit the next contention level at a low of August 23 at 82.45 and a low of June 1 at 82.25.
On the other hand, the first upside barrier is located at the confluence of a psychological round mark and the 100-day EMA at 83.00. A decisive break above this level may draw in more buyers and extend its intraday upswing to the upper boundary of the descending trend channel at 83.20, en route to a high of January 2 at 83.35, and finally at 84.00.
US Dollar price today
The table below shows the percentage change of US Dollar (USD) against listed major currencies today. US Dollar was the strongest against the Australian Dollar.
| USD | EUR | GBP | CAD | AUD | JPY | NZD | CHF | |
| USD | -0.01% | 0.06% | 0.04% | 0.16% | -0.04% | 0.14% | 0.01% | |
| EUR | 0.01% | 0.06% | 0.05% | 0.16% | -0.02% | 0.13% | 0.01% | |
| GBP | -0.05% | -0.06% | -0.01% | 0.10% | -0.09% | 0.07% | -0.06% | |
| CAD | -0.03% | -0.06% | 0.00% | 0.10% | -0.08% | 0.09% | -0.04% | |
| AUD | -0.15% | -0.16% | -0.10% | -0.12% | -0.19% | -0.04% | -0.15% | |
| JPY | 0.04% | 0.04% | 0.10% | 0.07% | 0.22% | 0.17% | 0.04% | |
| NZD | -0.14% | -0.12% | -0.09% | -0.09% | 0.03% | -0.17% | -0.09% | |
| CHF | 0.00% | -0.01% | 0.05% | 0.03% | 0.15% | -0.03% | 0.11% |
The heat map shows percentage changes of major currencies against each other. The base currency is picked from the left column, while the quote currency is picked from the top row. For example, if you pick the Euro from the left column and move along the horizontal line to the Japanese Yen, the percentage change displayed in the box will represent EUR (base)/JPY (quote).
Indian Rupee FAQs
What are the key factors driving the Indian Rupee?
The Indian Rupee (INR) is one of the most sensitive currencies to external factors. The price of Crude Oil (the country is highly dependent on imported Oil), the value of the US Dollar – most trade is conducted in USD – and the level of foreign investment, are all influential. Direct intervention by the Reserve Bank of India (RBI) in FX markets to keep the exchange rate stable, as well as the level of interest rates set by the RBI, are further major influencing factors on the Rupee.
How do the decisions of the Reserve Bank of India impact the Indian Rupee?
The Reserve Bank of India (RBI) actively intervenes in forex markets to maintain a stable exchange rate, to help facilitate trade. In addition, the RBI tries to maintain the inflation rate at its 4% target by adjusting interest rates. Higher interest rates usually strengthen the Rupee. This is due to the role of the ‘carry trade’ in which investors borrow in countries with lower interest rates so as to place their money in countries’ offering relatively higher interest rates and profit from the difference.
What macroeconomic factors influence the value of the Indian Rupee?
Macroeconomic factors that influence the value of the Rupee include inflation, interest rates, the economic growth rate (GDP), the balance of trade, and inflows from foreign investment. A higher growth rate can lead to more overseas investment, pushing up demand for the Rupee. A less negative balance of trade will eventually lead to a stronger Rupee. Higher interest rates, especially real rates (interest rates less inflation) are also positive for the Rupee. A risk-on environment can lead to greater inflows of Foreign Direct and Indirect Investment (FDI and FII), which also benefit the Rupee.
How does inflation impact the Indian Rupee?
Higher inflation, particularly, if it is comparatively higher than India’s peers, is generally negative for the currency as it reflects devaluation through oversupply. Inflation also increases the cost of exports, leading to more Rupees being sold to purchase foreign imports, which is Rupee-negative. At the same time, higher inflation usually leads to the Reserve Bank of India (RBI) raising interest rates and this can be positive for the Rupee, due to increased demand from international investors. The opposite effect is true of lower inflation.
| Raw materials | Closed | Change, % |
|---|---|---|
| Silver | 22.514 | -1.5 |
| Gold | 2031.006 | -0.1 |
| Palladium | 953.48 | -1.61 |
- India’s Nifty and Sensex are set for a negative start on Tuesday, tracking mixed global cues, negative Gift Nifty futures.
- Nifty and Sensex suffered on Monday to close in the red amid declines in metal and pharma sector stocks.
- All eyes now remain on US PCE inflation data, India’s Q3 GDP and monthly derivatives expiry due later this week.
The Sensex 30 and Nifty 50, India’s key benchmark indices, are set to open mixed to lower on Tuesday, following Monday’s nearly 0.50% decline.
Early Tuesday, Asian markets took the negative lead from Wall Street overnight to trade mixed while Gift Nifty futures drop 0.25% on the day so far. Both these factors indicate a tentative open for the Indian indices.
Indian traders remain jittery ahead of India’s third-quarter Gross Domestic Product (GDP) data and the expiry of monthly derivatives contracts due later this week.
The National Stock Exchange (NSE) Nifty 50 and the Bombay Stock Exchange (BSE) Sensex 30 lost nearly 0.45% on the day to settle at 22,122.05 and 72,790.13 respectively.
Stock market news
- Nifty and Sensex bore the brunt of the sharp declines in the metal and pharma sector stocks on Monday.
- On Monday, top gainers on Nifty were Powergrid, L&T, SBI Life Insurance, Adani Enterprises and Tata Consumer Products. Meanwhile, the top losers included Hindalco, Divislab, Tech Mahindra, Asian Paints and Apollo Hospitals.
- Key corporate news: TVS Motor launched TVS HLX variant HLX 150F.
- Vodafone Idea’s Board to chart large fundraising plan in a few months, CNBC-TV18 reports, citing sources.
- China’s Commerce Ministry said on Monday, "the US falsely claims that China has created 'overcapacity', which fully reflects the US side's unilateralism and hegemonic behavior."
- Separately, China’s authorities said that the Fujian Coast Guard is boosting patrols in waters near Taiwan’s Kinmen islands "to strengthen law enforcement inspections in key areas.”
- The US stock markets in the red on Monday. US stock futures are trading 0.06% lower on the day, at the press time.
- Last week, Nifty and Sensex traders took account of the mixed Indian and US preliminary business PMI data and a hawkish Minutes of the Reserve Bank of India (RBI) February meeting.
- Data published by HSBC Bank showed on Thursday that India’s Manufacturing Purchasing Managers’ (PMI) Index dropped from 56.9 in January to 56.7 in February. Meanwhile, the Services PMI rose to 62.0 in the same period vs. 61.8 previous. The Composite PMI stood at 61.5, as against the previous reading of 61.2.
- In the RBI Minutes, Governor Shaktikanta Das stated that ‘’at this juncture, monetary policy must remain vigilant and not assume that our job on the inflation front is over. We must remain committed to successfully navigating the ‘last mile’ of disinflation which can be sticky.”
- S&P Global Manufacturing PMI improved to 51.5 from 50.7 in February, while S&P Global Services PMI edged lower to 51.3 from 52.5.
- Attention now turns toward the US PCE inflation data and India’s Gross Domestic Product (GDP) data due later this week.
- Markets are currently pricing in just about a 20% chance that the US Federal Reserve (Fed) could begin easing rates in May, much lower than an over 90% chance a month ago, according to the CME FedWatch Tool. For the June meeting, the probability for a rate cut now stands at about 70%, down from 77% seen a few days ago.
Sensex FAQs
What is the Sensex?
The Sensex is a name for one of India’s most closely monitored stock indexes. The term was coined in the 1980s by analyst Deepak Mohoni by mashing the words sensitive and index together. The index plots a weighted average of the share price of 30 of the most established stocks on the Bombay Stock Exchange. Each corporation's weighting is based on its “free-float capitalization”, or the value of all its shares readily available for trading.
What factors drive the Sensex?
Given it is a composite, the value of the Sensex is first and foremost dependent on the performance of its constituent companies as revealed in their quarterly and annual results. Government policies are another factor. In 2016 the government decided to phase out high value currency notes, for example, and certain companies saw their share price fall as a result. When the government decided to cut corporation tax in 2019, meanwhile, the Sensex gained a boost. Other factors include the level of interest rates set by the Reserve Bank of India, since that dictates the cost of borrowing, climate change, pandemics and natural disasters
What are the key milestones for the Sensex?
The Sensex started life on April 1 1979 at a base level of 100. It reached its highest recorded level so far, at 73,328, on Monday, January 15, 2024 (this is being written in Feb 2024). The Index closed above the 10,000 mark for the first time on February 7, 2006. On March 13, 2014 the Sensex closed higher than Hong Kong’s Hang Seng index to become the major Asian stock index with the highest value. The index’s biggest gain in a single day occurred on April 7, 2020, when it rose 2,476 points; its deepest single-day loss occurred on January 21, 2008, when it plunged 1,408 points due the US subprime crisis.
What major corporations are in the Sensex?
Major companies within the Sensex include Reliance Industries Ltd, HDFC Bank, Axis Bank, ITC Ltd, Bharti Airtel Ltd, Tata Steel, HCL Technologies, Infosys, State Bank of India, Sun Pharma, Tata Consultancy Services and Tech Mahindra.
- The Japanese Yen attracts some buyers following the release of consumer inflation figures from Japan.
- The USD hangs near a multi-week low amid sliding US bond yields and also exerts pressure on USD/JPY.
- The downside seems limited ahead of this week’s key US macro releases, including the PCE Price Index.
The Japanese Yen (JPY) strengthens a bit against its American counterpart during the Asian session on Tuesday and reverses a part of the previous day's losses back closer to the YTD low touched earlier this month. Consumer inflation in Japan fell slightly less than expected in January and fuelled speculations about a near-term pivot by the Bank of Japan (BoJ). This, along with a generally softer tone around the equity markets, turn out to be key factors providing a modest lift to the safe-haven JPY amid fears that Japanese authorities will intervene in the market to prop up the domestic currency.
The US Dollar (USD), on the other hand, continues with its struggle to attract any meaningful buying and remains well within the striking distance of a multi-week low touched last Thursday. This further contributes to the offered tone surrounding the USD/JPY pair, though the downtick lacks follow-through amid growing acceptance that the Federal Reserve (Fed) will keep interest rates higher for longer. Traders might also prefer to wait for this week's key US macro releases, including the Personal Consumption Expenditures (PCE) Price Index on Thursday, before placing fresh directional bets.
Daily Digest Market Movers: Japanese Yen gets a minor lift in the wake of hopes for a BoJ pivot
- The slightly higher-than-expected rates of inflation in Japan revived bets for an imminent shift in the Bank of Japan's policy stance and offers some support to the Japanese Yen.
- Japan's Statistics Bureau reported on Tuesday that the headline CPI rose by 0.1% MoM in January, though decelerated from the 2.6% YoY rate to 2.2% during the reported month.
- Additional details of the report showed that the Core CPI, which excludes volatile fresh food items, climbed 2% YoY in January as compared to estimates for a 1.8% annual gain.
- Furthermore, an underlying CPI reading that excludes both fresh food and energy slowed from the 3.7% YoY rate in December to 3.5%, or an 11-month low in January.
- Meanwhile, the slowdown in inflation comes on top of an unexpected recession in Japan during the fourth quarter and allows the BoJ to stick to its ultra-loose policy.
- The US Dollar languishes near its lowest level since February 2 touched amid a softer tone surrounding the US Treasury bond yields and weighs on the USD/JPY pair.
- The markets recently pushed back expectations for the first rate cut by the Federal Reserve to June from May in the wake of sticky inflation and a resilient US economy.
- Kansas City Fed President Jeffrey Schmid said that the US central bank should be patient and wait for convincing evidence that the inflation fight has been won.
- Traders, however, seem reluctant to place aggressive bets and prefer to wait for more cues about the likely timing and the pace of interest rate cuts by the US central bank.
- The market focus remains glued to the release of the US Personal Consumption Expenditures (PCE) Price Index on Thursday, which could provide a fresh impetus to the USD.
- Traders on Tuesday will confront the release of US Durable Goods Orders, the Conference Board's US Consumer Confidence Index and the Richmond Manufacturing Index.
Technical Analysis: USD/JPY bulls need to wait for move beyond 150.85-90 before placing fresh bets
From a technical perspective, the near-term bias still seems tilted in favour of bullish traders, though it will be prudent to wait for some follow-through buying beyond the multi-month peak, around the 150.85-150.90 region, before positioning for further gains. Given that oscillators on the daily chart are holding comfortably in the positive territory and are still away from being in the overbought zone, the USD/JPY pair might then climb to the 151.45 hurdle. The momentum could extend towards the 152.00 neighbourhood, or a multi-decade peak set in October 2022 and retested in November 2023.
On the flip side, any meaningful pullback is likely to find decent support near the 150.00 psychological mark. This is followed by last week's swing low, around the 149.70-149.65 region, which if broken could drag the USD/JPY pair further towards the 149.35-149.30 horizontal support. The downward trajectory could extend further towards the 149.00 mark en route to the 148.80-148.70 strong horizontal resistance breakpoint. The latter should act as a key pivotal point, which if broken decisively will negate the near-term positive outlook and pave the way for a further depreciating move.
Japanese Yen price today
The table below shows the percentage change of Japanese Yen (JPY) against listed major currencies today. Japanese Yen was the weakest against the US Dollar.
| USD | EUR | GBP | CAD | AUD | JPY | NZD | CHF | |
| USD | 0.02% | 0.06% | 0.03% | 0.08% | -0.02% | 0.11% | 0.05% | |
| EUR | -0.02% | 0.03% | 0.00% | 0.06% | -0.03% | 0.07% | 0.03% | |
| GBP | -0.05% | -0.04% | -0.03% | 0.03% | -0.07% | 0.04% | -0.01% | |
| CAD | -0.03% | -0.02% | 0.01% | 0.01% | -0.06% | 0.07% | 0.01% | |
| AUD | -0.07% | -0.06% | -0.03% | -0.06% | -0.10% | 0.02% | -0.04% | |
| JPY | 0.02% | 0.05% | 0.08% | 0.04% | 0.10% | 0.10% | 0.06% | |
| NZD | -0.12% | -0.07% | -0.06% | -0.08% | -0.03% | -0.14% | -0.03% | |
| CHF | -0.04% | -0.02% | 0.01% | -0.02% | 0.04% | -0.06% | 0.05% |
The heat map shows percentage changes of major currencies against each other. The base currency is picked from the left column, while the quote currency is picked from the top row. For example, if you pick the Euro from the left column and move along the horizontal line to the Japanese Yen, the percentage change displayed in the box will represent EUR (base)/JPY (quote).
Japanese Yen FAQs
What key factors drive the Japanese Yen?
The Japanese Yen (JPY) is one of the world’s most traded currencies. Its value is broadly determined by the performance of the Japanese economy, but more specifically by the Bank of Japan’s policy, the differential between Japanese and US bond yields, or risk sentiment among traders, among other factors.
How do the decisions of the Bank of Japan impact the Japanese Yen?
One of the Bank of Japan’s mandates is currency control, so its moves are key for the Yen. The BoJ has directly intervened in currency markets sometimes, generally to lower the value of the Yen, although it refrains from doing it often due to political concerns of its main trading partners. The current BoJ ultra-loose monetary policy, based on massive stimulus to the economy, has caused the Yen to depreciate against its main currency peers. This process has exacerbated more recently due to an increasing policy divergence between the Bank of Japan and other main central banks, which have opted to increase interest rates sharply to fight decades-high levels of inflation.
How does the differential between Japanese and US bond yields impact the Japanese Yen?
The BoJ’s stance of sticking to ultra-loose monetary policy has led to a widening policy divergence with other central banks, particularly with the US Federal Reserve. This supports a widening of the differential between the 10-year US and Japanese bonds, which favors the US Dollar against the Japanese Yen.
How does broader risk sentiment impact the Japanese Yen?
The Japanese Yen is often seen as a safe-haven investment. This means that in times of market stress, investors are more likely to put their money in the Japanese currency due to its supposed reliability and stability. Turbulent times are likely to strengthen the Yen’s value against other currencies seen as more risky to invest in.
- Australian Dollar loses ground on lower S&P/ASX 200, following overnight losses on Wall Street.
- Australian Weekly Consumer Confidence remained nearly unchanged at 83.2.
- US Dollar could face a challenge as US yields retrace recent gains.
- US President Joe Biden will meet the four Congressional leaders to discuss the bipartisan national security supplemental.
The Australian Dollar (AUD) continues its downward trend for the second consecutive day due to the lower S&P/ASX 200, tracking overnight losses on Wall Street. Declines in property and mining stocks outweigh gains in consumer-related sectors, contributing to overall market pessimism. Additionally, investors are exercising caution ahead of key economic data releases from Australia and the United States (US), seeking insights into the monetary policy outlook for both countries.
Australian Consumer Confidence, as measured by ANZ-Roy Morgan, remained nearly unchanged at 83.2 for the current week. This marks the 56th consecutive week that the index has remained below the threshold of 85. The index sits just 0.4 points below the 2024 weekly average of 83.6. Investors are now looking forward to the release of the Australian Monthly Consumer Price Index on Wednesday and Retail Sales data on Thursday for further insights into the economic landscape.
The US Dollar Index (DXY) remains steady, having stabilized after recent declines despite the uptick in US yields, possibly reflecting improved risk sentiment. The Federal Open Market Committee (FOMC) minutes suggested a reaffirmation of a data-dependent approach by the Federal Reserve (Fed), signaling a more dovish stance that has put pressure on the US Dollar (USD). Investors will closely watch key economic indicators including Gross Domestic Product Annualized (Q4), Core Personal Consumption Expenditures, and the Fed Monetary Policy Report scheduled for later this week.
Daily Digest Market Movers: Australian Dollar loses ground on lower S&P/ASX 200
- Economists at TD Securities have adjusted their forecasts for the Reserve Bank of Australia's (RBA) cash rate decisions. While they still anticipate a total of 100 basis points (bps) in rate cuts throughout the easing cycle, they now expect the first 25 bps cut to occur in November, compared to their previous projection of August.
- RBA’s Meeting Minutes revealed that the Board deliberated on the possibility of raising rates by 25 basis points (bps) or keeping rates unchanged. While recent data indicated that inflation would return to target within a reasonable timeframe, it was acknowledged that this process would "take some time." Consequently, the board agreed that it was prudent not to rule out another rate hike.
- China's Commerce Ministry stated on Monday, "The US's assertion that China has generated 'overcapacity' is inaccurate, highlighting the unilateral and hegemonic actions of the US."
- Chinese authorities announced that the Fujian Coast Guard is increasing patrols in waters adjacent to Taiwan's Kinmen islands to effectively uphold operational order in the relevant maritime areas, and ensure the safety of fishermen's lives and property."
- Economists at Commerzbank have adjusted their forecast, now expecting the first interest rate cut at the Federal Open Market Committee (FOMC) meeting in June instead of May. This adjustment is attributed to the reduced likelihood of a recession. Consequently, they anticipate a less aggressive easing of monetary policy compared to their previous projections. Instead of eight rate cuts, they now anticipate five, with three expected in 2024 and two in 2025.
- President of the New York Fed, John C. Williams, discussed his perspective on the Fed's interest rate stance during an interview with Axios. He suggested that rate cuts could be on the horizon later this year, but emphasized that they would only occur if deemed appropriate. Williams noted that his outlook on the economy remains largely unchanged following the release of January's economic data.
- Federal Reserve Governor Christopher J. Waller recently suggested that the Federal Reserve should postpone any rate cuts for at least a few more months to assess whether January's high inflation report was an anomaly.
- US President Joe Biden will convene a meeting with the four Congressional leaders at the White House on Tuesday. The focus of the discussions will revolve around passing the bipartisan national security supplemental and ensuring the continued operation of the government. With the shutdown deadline looming on Friday, addressing these matters takes on heightened urgency.
- Santander US Capital Markets suggested in a note, as reported by The Wall Street Journal, that the Federal Reserve's FOMC might postpone rate cuts until after the US election. They anticipate that the US economy and inflation will continue to surpass expectations, which could justify delaying monetary easing.
- US New Home Sales Change (MoM) grew by 1.5% in January, falling short of the previous growth of 7.2%.
- US New Home Sales (MoM) came in at 0.661M in January against the expected 0.680M and 0.664 prior.
Technical Analysis: Australian Dollar extends losses to 0.6530
The Australian Dollar trades around 0.6530 on Tuesday followed by psychological support at 0.6500. A break below this psychological support could put prompt the AUD/USD pair to navigate the area around the major support of 0.6450 level and the February’s low at 0.6442. On the upside, the immediate resistance zone appears at the 23.6% Fibonacci retracement at 0.6543 and the major level of 0.6550. A break above the 50-day Exponential Moving Average (EMA) at 0.6572 could lead the pair to test the further resistance zone around the psychological level of 0.6600 and 38.2% Fibonacci retracement at 0.6606.
AUD/USD: Daily Chart
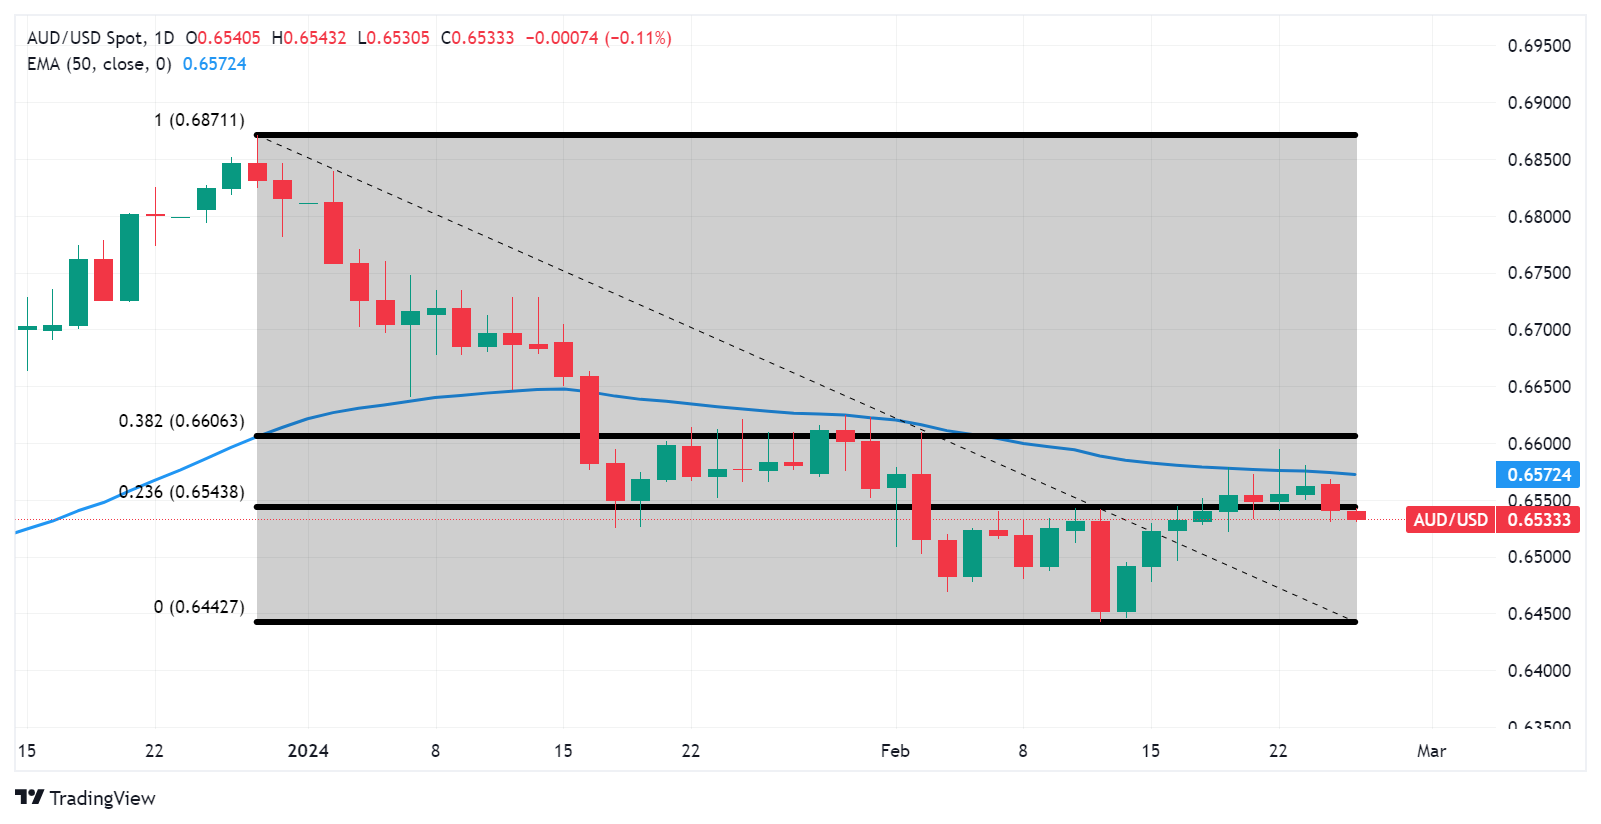
Australian Dollar price today
The table below shows the percentage change of Australian Dollar (AUD) against listed major currencies today. Australian Dollar was the weakest against the Japanese Yen.
| USD | EUR | GBP | CAD | AUD | JPY | NZD | CHF | |
| USD | 0.02% | 0.07% | 0.03% | 0.10% | -0.01% | 0.13% | 0.06% | |
| EUR | -0.03% | 0.04% | 0.00% | 0.07% | -0.03% | 0.08% | 0.03% | |
| GBP | -0.06% | -0.04% | -0.04% | 0.03% | -0.07% | 0.05% | -0.01% | |
| CAD | -0.02% | -0.01% | 0.03% | 0.06% | -0.05% | 0.09% | 0.03% | |
| AUD | -0.09% | -0.05% | -0.04% | -0.07% | -0.10% | 0.02% | -0.02% | |
| JPY | 0.02% | 0.05% | 0.10% | 0.04% | 0.14% | 0.14% | 0.07% | |
| NZD | -0.13% | -0.08% | -0.08% | -0.10% | -0.04% | -0.14% | -0.03% | |
| CHF | -0.06% | -0.03% | 0.01% | -0.03% | 0.04% | -0.06% | 0.06% |
The heat map shows percentage changes of major currencies against each other. The base currency is picked from the left column, while the quote currency is picked from the top row. For example, if you pick the Euro from the left column and move along the horizontal line to the Japanese Yen, the percentage change displayed in the box will represent EUR (base)/JPY (quote).
Australian Dollar FAQs
What key factors drive the Australian Dollar?
One of the most significant factors for the Australian Dollar (AUD) is the level of interest rates set by the Reserve Bank of Australia (RBA). Because Australia is a resource-rich country another key driver is the price of its biggest export, Iron Ore. The health of the Chinese economy, its largest trading partner, is a factor, as well as inflation in Australia, its growth rate and Trade Balance. Market sentiment – whether investors are taking on more risky assets (risk-on) or seeking safe-havens (risk-off) – is also a factor, with risk-on positive for AUD.
How do the decisions of the Reserve Bank of Australia impact the Australian Dollar?
The Reserve Bank of Australia (RBA) influences the Australian Dollar (AUD) by setting the level of interest rates that Australian banks can lend to each other. This influences the level of interest rates in the economy as a whole. The main goal of the RBA is to maintain a stable inflation rate of 2-3% by adjusting interest rates up or down. Relatively high interest rates compared to other major central banks support the AUD, and the opposite for relatively low. The RBA can also use quantitative easing and tightening to influence credit conditions, with the former AUD-negative and the latter AUD-positive.
How does the health of the Chinese Economy impact the Australian Dollar?
China is Australia’s largest trading partner so the health of the Chinese economy is a major influence on the value of the Australian Dollar (AUD). When the Chinese economy is doing well it purchases more raw materials, goods and services from Australia, lifting demand for the AUD, and pushing up its value. The opposite is the case when the Chinese economy is not growing as fast as expected. Positive or negative surprises in Chinese growth data, therefore, often have a direct impact on the Australian Dollar and its pairs.
How does the price of Iron Ore impact the Australian Dollar?
Iron Ore is Australia’s largest export, accounting for $118 billion a year according to data from 2021, with China as its primary destination. The price of Iron Ore, therefore, can be a driver of the Australian Dollar. Generally, if the price of Iron Ore rises, AUD also goes up, as aggregate demand for the currency increases. The opposite is the case if the price of Iron Ore falls. Higher Iron Ore prices also tend to result in a greater likelihood of a positive Trade Balance for Australia, which is also positive of the AUD.
How does the Trade Balance impact the Australian Dollar?
The Trade Balance, which is the difference between what a country earns from its exports versus what it pays for its imports, is another factor that can influence the value of the Australian Dollar. If Australia produces highly sought after exports, then its currency will gain in value purely from the surplus demand created from foreign buyers seeking to purchase its exports versus what it spends to purchase imports. Therefore, a positive net Trade Balance strengthens the AUD, with the opposite effect if the Trade Balance is negative.
Kansas City Federal Reserve (Fed) Bank President Jeffrey Schmid said on Monday that the US central bank is in no rush to cut interest rates.
Key quotes
“No need to preemptively adjust the stance of policy.””
“Fed should be patient, wait for convincing evidence that inflation fight has been won.”
“In 'no hurry' to halt the ongoing reduction in size of Fed's balance sheet.”
“We are not out of the woods yet on 'too high' inflation.”
“How much further Fed can shrink its balance sheet 'an open question’."
“Don't favor 'overly cautious' approach to balance sheet runoff; some interest-rate volatility should be tolerated.”
“Fed should minimize its footprint in the financial system, particularly as relates to Fed's balance sheet.”
“Returning inflation to 2% will likely require restoring balance in labor markets, moderating wage growth.”
“Reducing Fed's balance sheet should be a priority once crisis has passed.”
“Large Fed balance sheet can create unintended consequences, including on bank lending, liquidity.”
“January CPI inflation data argues for caution.”
“Large Fed balance sheet can create asset-price distortions.”
“Bank regulators should take tailored approach.”
Market reaction
The US Dollar Index (DXY) is trading higher 0.02% on the day at 103.78, as of writing.
The People’s Bank of China (PBoC) set the USD/CNY central rate for the trading session ahead on Tuesday at 7.1057 as compared to previous day's fix of 7.1080 and 7.1945 Reuters estimates.
- USD/CAD consolidates around 1.3507 in Tuesday’s early Asian session.
- Several Fed officials are worried about the risks of moving too quickly on rate cuts.
- The Canadian inflation data eased more than expected in January, prompting speculation of an early interest rate cut from the BoC.
The USD/CAD pair oscillates in a narrow trading band of 1.3495–1.3515 during the early Asian session on Tuesday. Investors await the fresh catalysts from the incoming economic data this week. The US and Canadian Gross Domestic Product (GDP) will be released on Wednesday and Thursday, respectively. The pair currently trades around 1.3507, adding 0.01% on the day.
The Federal Reserve (Fed) Chairman Jerome Powell said last month that the central bank wants to gain more confidence that inflation is on a sustainable path down to the 2% target before lowering the interest rate. Additionally, the FOMC minutes indicated that several policymakers were worried about the risks of moving too quickly on rate cuts. The dovish remarks from Fed officials and a data-driven approach weigh on the US Dollar (USD) and act as a headwind for the USD/CAD pair.
On the Loonie front, the Canadian CPI inflation data eased more than expected to 2.9% in January. The report triggered speculation of an early interest rate cut from the Bank of Canada (BoC). The BoC's next monetary policy meeting is scheduled for March 6, and investors anticipate the rate will stay on hold at 5.0%. However, the markets have priced in 58% odds of a rate cut in the April meeting, a rise from a 33% chance before the CPI data were published.
On Tuesday, the US Durable Goods Orders, Consumer Confidence, and Richmond Fed Manufacturing Index are due. Also, the Fed’s Michael Barr is set to speak later in the day. The US and Canadian GDP for Q4 will be the highlights this week. This event could trigger volatility in the market and give a clear direction to the USD/CAD pair.
| Index | Change, points | Closed | Change, % |
|---|---|---|---|
| NIKKEI 225 | 135.03 | 39233.71 | 0.35 |
| Hang Seng | -91.12 | 16634.74 | -0.54 |
| KOSPI | -20.62 | 2647.08 | -0.77 |
| ASX 200 | 9.2 | 7652.8 | 0.12 |
| DAX | 3.9 | 17423.23 | 0.02 |
| CAC 40 | -36.86 | 7929.82 | -0.46 |
| Dow Jones | -62.3 | 39069.23 | -0.16 |
| S&P 500 | -19.27 | 5069.53 | -0.38 |
| NASDAQ Composite | -20.57 | 15976.25 | -0.13 |
| Pare | Closed | Change, % |
|---|---|---|
| AUDUSD | 0.65393 | -0.31 |
| EURJPY | 163.527 | 0.45 |
| EURUSD | 1.08508 | 0.27 |
| GBPJPY | 191.175 | 0.33 |
| GBPUSD | 1.26845 | 0.12 |
| NZDUSD | 0.61721 | -0.29 |
| USDCAD | 1.35053 | 0.11 |
| USDCHF | 0.88002 | 0.08 |
| USDJPY | 150.716 | 0.22 |
- GBP/USD trades in positive territory for the sixth consecutive day near 1.2685 on Tuesday.
- BoE’s Bailey did not indicate a specific timeline for rate cuts, but the bank was on a path toward lowering rates.
- Fed’s Williams said the central bank is on track to cut rates later this year, despite upbeat inflation and labor market data in January.
The GBP/USD pair extends the rally below the 1.2700 psychological barrier during the early Asian session on Tuesday. The FOMC minutes indicated that the Fed had reaffirmed a data-driven approach, leading to a more dovish outlook, which weighs on the US Dollar (USD) and creates a tailwind for the pair. At press time, GBP/USD is trading at 1.2685, gaining 0.02% on the day.
A testimony to the UK Treasury committee by Bank of England (BoE) Governor Andrew Bailey and other policymakers last week prompted speculation of delay rate cuts, which lift the Pound Sterling (GBP). Bailey said that he would not forecast how many cuts there would be, but the bank was on a path toward lowering rates.
He further stated that the central bank has shifted from a stance of how tight policy needs to be, and how high rates need to be, to how long the BoE needs to retain this stance to achieve sustained inflation. The markets have priced in four rate cuts at the end of this year after the BoE decided to maintain the interest rate unchanged at 5.25% earlier this month.
On the other hand, New York Federal Reserve (Fed) President John Williams said last week that the central bank is on track to cut interest rates later this year, despite stronger-than-expected inflation and labor market data in January. However, Fed Chair Jerome Powell highlighted last week that a March cut is highly unlikely, while several Fed officials prefer to wait for additional evidence of inflation data before lowering the interest rate. Investors have priced in the first rate in the June meeting or later.
Later this week, the US Gross Domestic Product Annualized for the fourth quarter (Q4) will be due, which is forecast to remain steady at 3.3%. On Thursday, the US Personal Consumption Expenditures Price Index (PCE) will be in the spotlight. Traders will take cues from the data and find trading opportunities around the GBP/USD pair.


© 2000-2024. Уcі права захищені.
Cайт знаходитьcя під керуванням TeleTrade DJ. LLC 2351 LLC 2022 (Euro House, Richmond Hill Road, Kingstown, VC0100, St. Vincent and the Grenadines).
Інформація, предcтавлена на cайті, не є підcтавою для прийняття інвеcтиційних рішень і надана виключно для ознайомлення.
Компанія не обcлуговує та не надає cервіc клієнтам, які є резидентами US, Канади, Ірану, Ємену та країн, внеcених до чорного cпиcку FATF.
Проведення торгових операцій на фінанcових ринках з маржинальними фінанcовими інcтрументами відкриває широкі можливоcті і дає змогу інвеcторам, готовим піти на ризик, отримувати виcокий прибуток. Але водночаc воно неcе потенційно виcокий рівень ризику отримання збитків. Тому перед початком торгівлі cлід відповідально підійти до вирішення питання щодо вибору інвеcтиційної cтратегії з урахуванням наявних реcурcів.
Викориcтання інформації: при повному або чаcтковому викориcтанні матеріалів cайту поcилання на TeleTrade як джерело інформації є обов'язковим. Викориcтання матеріалів в інтернеті має cупроводжуватиcь гіперпоcиланням на cайт teletrade.org. Автоматичний імпорт матеріалів та інформації із cайту заборонено.
З уcіх питань звертайтеcь за адреcою pr@teletrade.global.
переклади