- Аналітика
- Новини та інструменти
- Новини ринків
Новини ринків
Japan’s National Consumer Price Index (CPI) for October came in at 3.3% YoY from 2.8% in September, according to the latest data released by the Japan Statistics Bureau on Friday,
Further details unveil that the National CPI ex Fresh Food climbed to 2.7% YoY in October versus 2.5% prior.
Market reaction
Following the Japan inflation data, the USD/JPY pair is down 0.02% on the day at 150.37.
About Japan’s National CPI
The National Consumer Price Index is released by the Statistics Bureau and it's a measure of price movements obtained by comparison of the retail prices of a representative shopping basket of goods and services. CPI is the most significant way to measure changes in purchasing trends. The purchase power of JPY is dragged down by inflation. Generally a high reading is seen as positive for the JPY.
- The USD/JPY is trading into the high side above the 150.00 handle as markets dare the BoJ to intervene.
- Japanese Tokyo CPI inflation is forecast to hold steady.
- Friday to close out the week with US PCE Index figures.
The USD/JPY is trading into 150.40 as Japan's Tokyo Consumer Price Index (CPI) rounds the corner.
Tokyo Core CPI is expected to hold steady for the year into October at 2.5%, with the headline CPI inflation reading last showing 2.8 for the same period.
https://www.fxstreet.com/news/forex-today-dollar-stays-cool-despite-hot-us-economy-202310262041
The USD/JPY continues to trade into a price level that has seen the Bank of Japan (BoJ) take defensive measures in the past, and markets are keeping the Yen pinned to the floorboards as investors dare the BoJ to take action to defend the JPY.
The trading week will close out with Friday's US Personal Consumption Expenditure (PCE) Price Index, which is expected to tick upwards from 0.1% to 0.3% for the month-on-month figure for September.
USD/JPY Technical Outlook
On Thursday, the USD/JPY currency pair exhibited notable strength by surpassing the significant psychological threshold of 150. This extension of the prevailing upward trajectory underscores the bullish sentiment across various time frames, including the long-term, intermediate, and short-term perspectives.
The absence of discernible reversal signals in the market further supports the prevailing uptrend, instilling confidence in the probability of continued upward momentum. Notably, the next prominent price target resides at the 152.00 level, a level previously achieved in October 2022.
A technical analysis of the daily chart reveals the completion of what appears to be an ascending triangle pattern, followed by a breakthrough above the 150.16 highs recorded on October 3. It is worth noting that the breakout, as observed on Thursday, was not decisively pronounced, as indicated by the formation of a 'Doji' candlestick, reflecting a degree of market indecision. However, the overarching upward trend lends support to the expectation of a subsequent price appreciation.
In light of the technical analysis, the triangle's projected target is positioned approximately at the 152.00 level.
USD/JPY Technical Levels
- AUD/USD recovers its recent losses on the softer USD.
- The preliminary US Q3 GDP rose 4.9%, Continuing claims rose to the highest reading since May.
- The markets anticipate the potential additional rate hike from the RBA at the November meeting.
- Investors will focus on Australian PPI, and US monthly core Personal Consumption Expenditures Price Index (PCE) data.
The AUD/USD pair holds above 0.6300 after bouncing off the year-to-date (YTD) lows at 0.6270 during the early Asian session on Friday. A modest recovery of the pair is bolstered by the correction of the US Dollar (USD) and the possibility of more rate hikes from the Reserve Bank of Australia (RBA) at its November meeting. The pair currently trades around 0.6325, gaining 0.06% on the day.
The preliminary US Gross Domestic Product (GDP) Annualized for the third quarter (Q3) expanded by 4.9% from the previous reading of 2.1% expansion, better than the market expectation of 4.2%. Additionally, the weekly Initial Jobless Claims for the week ending October 21 totaled 210,000 from 200,000 (revised from 198,000) in the previous reading, worse than the market consensus of 208,000. Continuing claims rose to the highest reading since May, by climbing by 63,000.
In response to the data, The Greenback initially gains traction and then reversed its course due to a decline in US Treasury yields. US Treasury Secretary Janet Yellen said on Thursday that the US economy is operating well, although Americans are worried about the economy. Yellen also noted that the recent rise in yields is unrelated to deficits and does not portend an oncoming recession. On the contrary, it reflects the US economy's strength.
On the Aussie front, Reserve Bank of Australia (RBA) Governor Michele Bullock commented on Thursday that CPI was a little higher than expected, but it was about where we thought it would come. Bullock added that the central bank aims to slow the economy without tipping it into recession. The markets anticipate the potential additional rate hike from the RBA on November 7, as the latest inflation figures in Australia were in line with policymakers' expectations.
Market participants will keep an eye on the Australian Producer Price Index (PPI) later on Friday’s early Asian session. Also, the US monthly core Personal Consumption Expenditures Price Index (PCE) will be released. These figures could give a clear direction to the AUD/USD pair.
- The NZD/USD caught some much-needed lift on Thursday after setting a new eleven-month low.
- NZ's Roy Morgan Consumer Confidence for October improved slightly.
- Markets are turning towards Friday's US PCE Index release to close out the trading week.
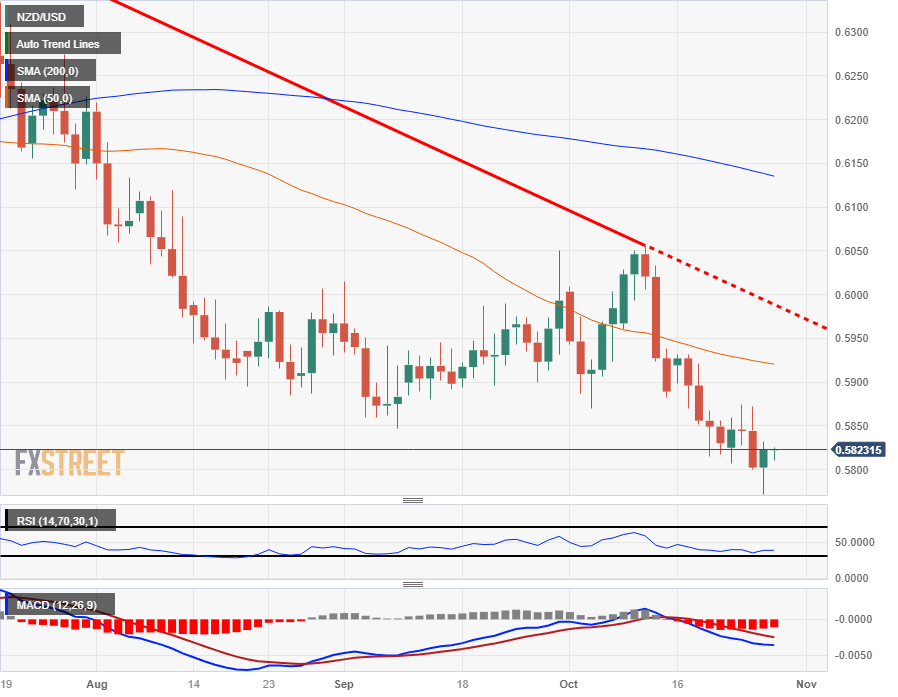
The NZD/USD set a fresh low of 0.5772 for 2023, the pair's lowest bid since November of last year. After chalking in a new yearly low, the Kiwi (NZD) caught a much-needed rebound and heads into the Friday Asia market session trading near 0.5820.
US Gross Domestic Product (GDP) figures broadly beat market estimates, printing at 4.9% for the 3rd quarter compared to the previous reading of 2.1%, soundly thumping the market estimates of 4.2%.
Forex Today: Dollar stays cool despite hot US economy
Despite the bumper US data read, the US Dollar (USD) gave up some ground against the NZD after etching in a new high against the Antipodean.
New Zealand Consumer Confidence for October increased slightly, helping to give some minor intraday lift to the Kiwi, with the Roy Morgan sentiment measure coming in at 88.1 compared to September's 86.4.
The broader market now turns towards Friday's US Personal Consumption Expenditure (PCE) Price Index reading for September. The PCE Index, as the Federal Reserve's favored measure of inflation, will be closely watched by traders hoping for signs that the Fed will be pushed into a rate-cut cycle sooner rather than later.
NZD/USD Technical Outlook
With the NZD/USD trading into eleven-month lows, the way below is primed for the Kiwi to face off against swing lows from back in November of 2022, near 0.5740.
Technical resistance is mounting on the NZD/USD with the 50-day Simple Moving Average (SMA) dropping into 0.5925 and the last significant swing high sitting near 0.6050.
On the bullish side, the Relative Strength Index (RSI) is testing close to the oversold barrier, indicating there could be buying opportunities from extreme lows, though indicator traders may want to wait for a fast-line bullish crossover on the Moving Average Convergence-Divergence (MCAD) oscillator.
NZD/USD Daily Chart
NZD/USD Technical Levels
- The AUD/NZD is seeing downside play after peaking near 1.0920 in the mid-week.
- The pair has rallied from a low near 1.0640, but topside momentum appears to have emptied the tank.
- Aussie-Kiwi prices are set to continue cycling the 200-day SMA with a lack of long-term momentum.
The AUD/NZD is trading into 1.0860 after Thursday's market session saw the pair pull back towards the 200-day Simple Moving Average (SMA), tipping into a daily low of 1.0828 as the recent bullish upswing runs out of momentum.
The pair hit a one-month high of 1.0915 on Wednesday after rebounding 2.75% from October's low near 1.0620.
The AUD/NZD has been steadily cycling the 200-day SMA for the majority of the year as the Aussie (AUD) and the Kiwi (NZD) battle it out for supremacy, with neither Antipodean gaining a firm technical foothold on the other.
The Relative Strength Index (RSI) is beginning to rotate downwards once more after losing momentum just shy of the signal line for overbought technical conditions, and the pair could be ripe for a late-stage bullish extension if Aussie traders find new data to chew on.
On the low side, the 50-day SMA continues to consolidate near the 200-day SMA, implying recent moves only had a temporary momentum effect, and the pair is set to see a return to chart paper near 1.0750.
AUD/NZD Hourly Chart

AUD/NZD Daily Chart

AUD/NZD Technical Levels
- The GBP/JPY has recovered once again into the midrange, near the 200-hour SMA.
- Japan's Tokyo CPI inflation reading due in the early Friday Asia market session.
- The Guppy continues to push into consolidation ranges as the flounders.
The GBP/JPY is bouncing back from a near-term low of 181.13 set in early Thursday trading, and the Guppy is now pushing back safely into the midrange of consolidation that has plagued the pair since the Yen (JPY) skidded to a multi-year low of 186.00 against the Pound Sterling (GBP) back in August.
The chronically discounted JPY has been floundering on the floorboards for the entire back half of 2023, drumrolling against the 182.00 handle on a regular basis since the GBP/JPY first rose to the level in mid-June.
Yen traders will now be looking towards Japan's Tokyo Consumer Price Index (CPI) inflation reading due in the early Asia market session for Friday.
Tokyo CPI inflation is expected to hold steady at previous figures, with the Tokyo CPI Core reading for October forecast to print at 2.5%, in-line with the figure given in September.
A miss for Tokyo CPI could see the JPY face another bout of firm selling pressure despite the Bank of Japan's (BoJ) recent threats to defend the Yen's rates in FX markets. With the BoJ's negative rate regime leaving the rate differential between the JPY and all other currencies increasingly widening as global central banks rase rates to combat inflation, the JPY has very little choice but to keep declining.
A miss for CPI inflation would mean the BoJ is likely to keep waffling on ending their negative rate regime with the central bank petrified of Japanese inflation slumping below their 2% target.
GBP/JPY Technical Outlook
The GBP/JPY continues to remain pinned close to the 50-day Simple Moving Average (SMA) as the pair drifts into the midrange with momentum completely drained out of the charts.
The 200-day SMA is slowly closing the distance on price action as the Guppy drifts sideways between 180.00 and 184.00, and the long-term moving average is pushing upwards into 174.00.
The last meaningful high sits at 186.77, a level that many investors are unlikely to gather the courage to break past as markets weigh the chances of a full-scale market intervention to protect the JPY.
In the meantime, the GBP/JPY is up nearly 18% from 2023's lows that were set near 155.35 back in January.
GBP/JPY Daily Chart

GBP/JPY Technical Levels
- EUR/USD bottomed at a daily low of 1.0521 and recovered towards the 20-day SMA, around 1.0560.
- The Euro faced selling pressure after the ECB held rates steady, and Lagarde acknowledged the Eurozone’s economic struggles.
- The USD gained momentum on strong Q3 GDP data, but lower US yields limited the upwards momentum.
- Focus shifts to PCE data from the US from September.
In Thursday’s session, the EUR/USD dropped to a low of 1.0521 and then stabilised around 1.0560, clearing all of its daily losses.
During the European session, the European Central Bank (ECB) announced that they will hold rates steady, maintaining the interest rates on the main refinancing operations and the marginal lending and deposit facility at 4.50%, 4.75% and 4.00%, respectively. What weakened the Euro was the acknowledgement of Christine Lagarde, who pointed out that the Eurozone’s economy is likely to remain “weak for the rest of the year” and that the labour market is starting to see weakness. Regarding the next decisions, due to the economic outlook, the ECB won’t likely deliver any hikes and instead hold rates at the mentioned levels to combat inflation.
On the US side, the Gross Domestic Product (GDP) Q3 preliminary estimate was reported to have expanded at an annualised rate of 4.9%, beating the 4.2%, and as a reaction, the US DXY index rose to monthly highs around 106.90. That being said, the US Treasury yields are sharply declining and limited the pair’s momentum during the session. On Friday, the US will report Personal Consumption Expenditures (PCE) figures from September, which will likely have an impact on the US bond market and on the expectations of the next Federal Reserve (Fed) decisions.
EUR/USD Levels to watch
The technical analysis of the daily chart points to a neutral to bearish outlook for EUR/USD, indicating the potential for further bearish movement. Displaying a negative slope below 50, the Relative Strength Index (RSI) indicates a potential continuation of bearish momentum, while the Moving Average Convergence (MACD) displays shorter green bars. In that sense, the bull will have difficulty holding above the 20-day Simple Moving Average (SMA) as the bearish momentum intensifies.
Support levels: 1.0550, 1.0520, 1.0500.
Resistance levels: 1.0580, 1.0600, 1.0630.
EUR/USD Daily Chart

During the Asian session, the Tokyo Consumer Price Index is due. The Australian Producer Price Index (PPI) will also be closely watched, especially after the strong CPI data reported on Wednesday. Later in the day, market focus will shift to the US Core Personal Consumption Expenditure price index.
Here is what you need to know on Friday, October 27:
During the Asian session, the US Dollar lost momentum, primarily driven by a decline in US Treasury yields, despite positive economic data. The Dollar Index (DXY) ended the session around 106.60. The 10-year US Treasury yield dropped from 4.96% to 4.84%, while the 2-year yield decreased from 5.15% to 5.02%.
The US economy expanded at an annualized rate of 4.9% during the third quarter, surpassing market consensus of 4.2%. The report also revealed a lower-than-expected core Personal Consumption Expenditure (PCE) price index, which increased demand for bonds. Other data showed a rise in Continuing Jobless claims to 1.79 million, reaching the highest level in months.
Next week, the Federal Open Market Committee (FOMC) meeting will take place, and the market expectations suggest no change in interest rates. On Friday, the US will release the monthly core PCE, a key inflation measure. The report will also include personal spending and income data.
Wells Fargo on US GDP data:
U.S. economic growth accelerated in the third quarter to a 4.9% annualized pace, signaling the economy remains resilient in the face of higher rates and still-elevated prices. While persistent strength in demand could put the inflation descent in jeopardy, we do not anticipate this report changes much for policymakers, and we expect the FOMC to leave rates unchanged at next week's meeting.
On Thursday, the Euro underperformed following the European Central Bank (ECB) meeting. As anticipated, the central bank kept interest rates unchanged, marking the first time since June last year. Market participants interpreted the meeting as leaning towards a dovish stance, as the ECB signaled that it is unlikely to raise rates again.
EUR/USD hit a weekly low at 1.0521 but then rebounded, supported by a weaker US Dollar, rising towards 1.0565.
Analysts at Rabobank on ECB:
Today’s pause does not necessarily mean the end of the hiking cycle. Yet, policymakers seem to have little desire to tighten further. The ECB appeared somewhat more concerned about the growth outlook than in September. Lagarde provided no clear reaction function to a potential new energy shock.
GBP/USD fell to weekly lows at 1.2068 but then rebounded to the upside, rising towards the 1.2130 area. The pair continues to trade above October lows, avoiding further deterioration. The Bank of England is expected to extend its pause next week, likely with a divided vote.
USD/JPY is heading towards a daily close well above 150.00. The pair held that mark despite lower Treasury yields and risk-off sentiment. It appears that markets are challenging Japanese authorities. The Tokyo Consumer Price Index is due on Friday.
AUD/USD reached fresh year-to-date lows at 0.6269 but rose above the key 0.6280 area. The recovery is driven by the correction of the US Dollar, which shows limited conviction even as markets consider the possibility of another rate hike from the Reserve Bank of Australia (RBA) on November 7. The Producer Price Index is due on Friday.
USD/CAD continued to move higher, breaking above 1.3800. The pair posted its highest daily close in a year. The Canadian Dollar was the weakest performer among G10 currencies on Thursday.
Gold finished modestly higher around $1,985 as the yellow metal benefited only modestly from lower Treasury yields. Silver experienced volatile trading. XAG/USD ended hovering around $22.80 after briefly trading above $23.00 during European hours and bottoming below $22.50 after US data.
Like this article? Help us with some feedback by answering this survey:
- EUR/CHF rebounds from a daily low of 0.9456 to trade at 0.9491, up 0.17%.
- Resistance awaits at the October 17 high of 0.9533, followed by 50-DMA at 0.9585.
- Support is seen at 0.9450, with further floors at the October 20 low of 0.9417 and September 26 low of 0.9403.
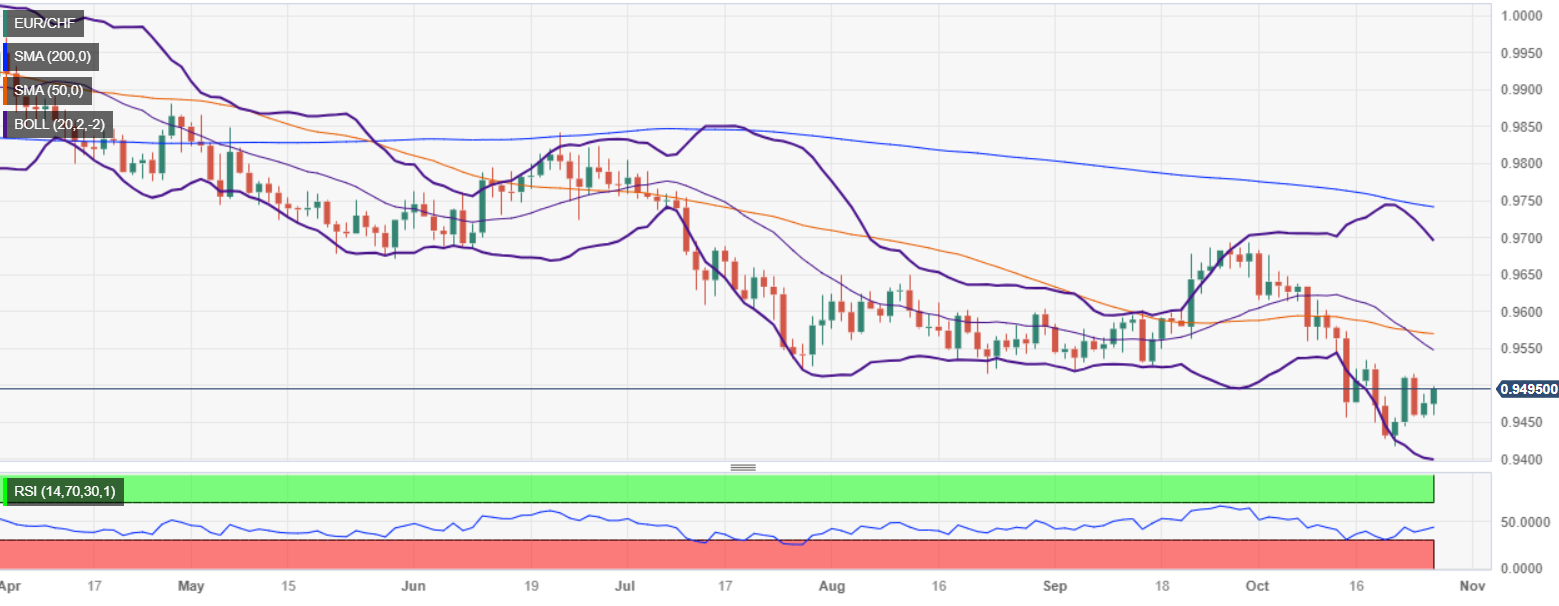
EUR/CHF jumped from daily lows of around 0.9456 after the European Central Bank (ECB) decided to hold rates, initially tumbling the pair. Nevertheless, the cross paired its losses late in the North American session and climbed 0.17%, trading at 0.9491.
The daily chat portrays the pair as downward biased, though the ongoing upward correction will face a solid resistance level at the October 17 swing high at 0.9533, which, if cleared, could pave the way for the cross to test the 50-day moving average (DMA) at 0.9585. A breach of the latter, and the psychological 0.9600 figure, would be up next.
On the other hand, and the path of least resistance, the EUR/CHF first support is seen at 0.9450. If the pair slips past that level, the next floor would be the October 20 low of 0.9417, ahead of the September 26, 2022 low of 0.9403.
EUR/CHF Price Action - Daily chart
EUR/CHF Technical Level
- USD/SEK jumped to a high around 11.212 and then settled at around 11.180, seeing 0.35% gains.
- Despite strong GDP data, US Treasury yields and hawkish bets on the Fed are declining.
- All eyes are now on PCE data from September from the US on Friday.
On Thursday, the USD/SEK gained further ground, tallying a five-day winning streak and jumping to its highest level since September 22 at 11.212. Strong data reported from the US is the main responsible for the Greenback outperforming its rivals but as US yields retreat, the upside is limited.
The U.S. Bureau of Economic Analysis reported that the Gross Domestic Product (GDP) Growth Rate preliminary estimate from Q3 came in above the consensus. It showed that the economy grew at an annualised rate of 4.9% QoQ vs the expected 4.2% and rose from its previous figure of 2.1%. On the negative side, the U.S. Department of Labor revealed that the Initial Jobless Claims from the week ending on October 21 exceeded expectations. The headline figure came in at 210,000, above the consensus of 208,000, and rose from its previous figure of 200,000.
Despite the strong GDP figures, investors focus on Jobless Claims accelerating as US Treasury yields fall. The 2,5, and 10-year yields fell towards 5.04%,4.80% and 4.84%, respectively, limiting the USD’s gains during the sessions. Another factor that could limit the pair's upward trajectory is investors betting on higher of the Federal Reserve (Fed) not hiking again in 2023. The CME FedWatch Tool suggests that the odds of a 25 basis points hike in December fell to 20% and that a pause in November is nearly priced in.
However, Personal Consumption Expenditures (PCE) from September are due on Friday, which could impact the pair’s dynamics as that metric is the Fed’s preferred inflation gauge.
USD/SEK Levels to watch
The daily chart analysis indicates a bullish outlook for the USD/SEK in the short term. The Relative Strength Index (RSI) is above its midline in positive territory, aligning with the positive signal from the Moving Average Convergence Divergence (MACD), which displays green bars, reinforcing the strong bullish sentiment. Also, the pair is above the 20,100,200-day Simple Moving Average (SMA), indicating a favourable position for the bulls in the bigger picture.
Support levels: 11.145, 11.087, 11.055.
Resistance levels: 11.200, 11.242, 11.265
USD/SEK Daily Chart
-638339463960745578.png)
- Silver price seesaw from daily high of $23.69 to low of $22.88, closing at $22.81.
- Key resistance levels at 50-DMA of $22.94 and 200-DMA of $23.29 cap potential rally attempts.
- Downside support at $23.00, with further levels at the October 26 low of $22.44 and 20-day EMA of $22.21.
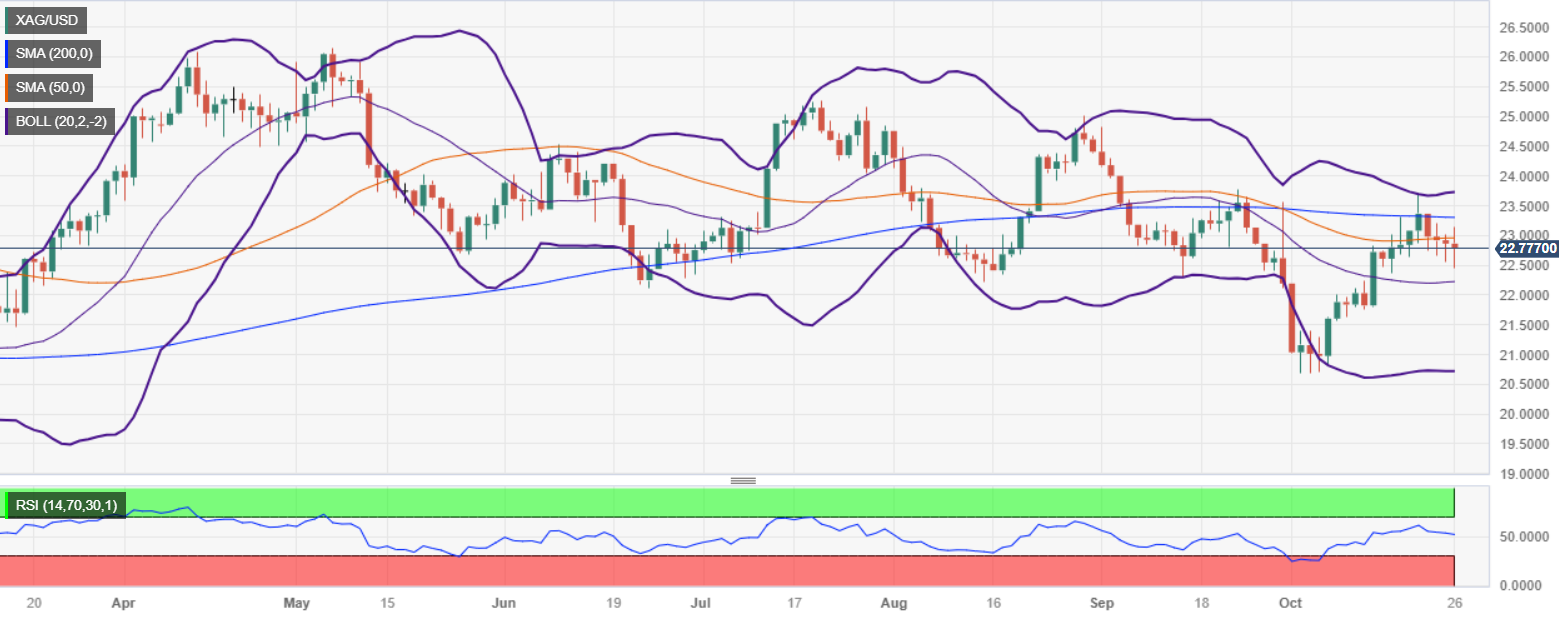
Silver price (XAG/USD) is almost flat during Thursday’s session after seesawing in a volatile day, reaching a daily high of $23.69 before diving towards its low of $22.88. As the Wall Street close looms, the XAG/USD trades at $22.81, registering losses of 0.12%.
The daily chart portrays the pair as neutral to downward biased, as the XAG/USD sits below the 50 and 200-day moving averages (DMAs), which would cap any rallies intents at $22.94 (50-DMA) and $23.29 (200-DMA). If those two levels are cleared, the next stop would be the top of the Bollinger-Band at $23.71, followed by $24.00.
On the downside, the first key support level lies at $23.00, followed by the October 26 low of $22.44. A breach of the latter would expose the 20-day Exponential Moving Average (EMA) at $22.21, before challenging the $22.00 mark.
XAG/USD Price Action – Daily chart
XAG/USD Technical Levels
- Spot Gold continues to grind towards the upside, though regular downside pullbacks muddling the picture.
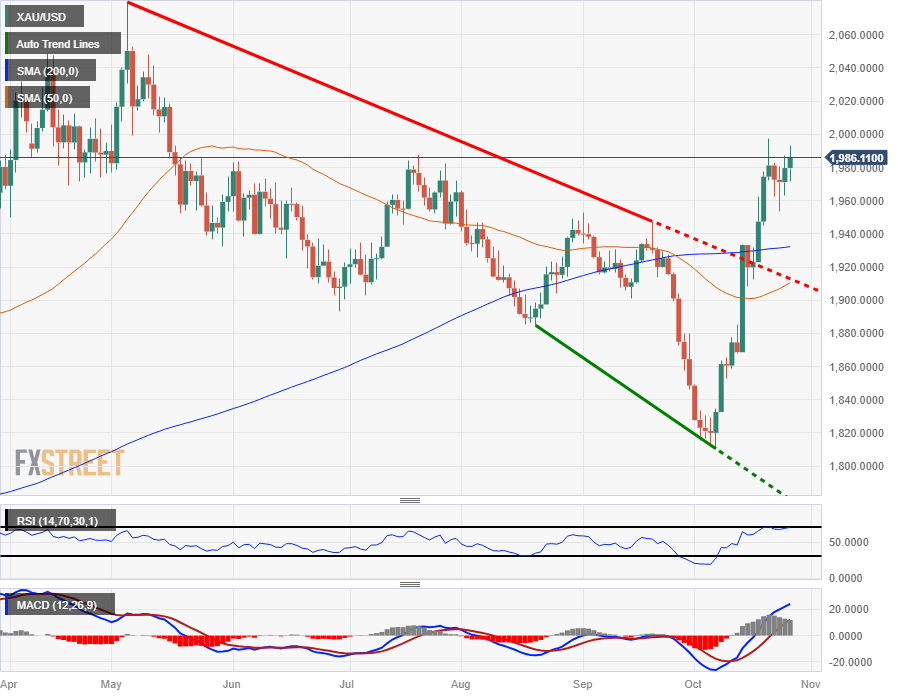
- XAU/USD hit a high of $1,993.55 for the week in early Thursday trading before slipping to $1,971.
- A bumper US GDP reading has Gold reaching higher once more as investors fear more inflation.
The XAU/USD chart is looking topside once more as spot Gold prices find a floor after US Gross Domestic Product (GDP) figures beat the street, and a firm US economy is set to keep the Federal Reserve (Fed) at bay on future rate cuts.
Despite a slight miss in unemployment claims, the US economy continues to churn out better-than-expected economic figures, and a notable lack of meaningful downturn indicators means the Fed will have to keep rates higher for longer. Investors hoping for a quick return to rate cuts by the Fed continue to be disappointed by the resilient US economy.
US GDP expands at an annual rate of 4.9% in Q3 vs. 4.2% expected
US data still isn't done beating up investors for the week, with the Personal Consumption Expenditure (PCE) Price Index set to print on Friday. Markets are expecting the PCE Index for September to come in at 0.3%, a step above August's 0.1%, and the annualized figure is expected to tick down from 3.9% to 3.7%. As the Fed's preferred method of measuring inflation, the PCE Index indicator will be closely watched as investors try to draw a bead on when the Fed could potentially start considering rate cuts.
The Fed "dot plot" currently has interest rates on hold until well into 2024.
XAU/USD Technical Outlook
Spot Gold prices continue to gear for a run at the $2,000 handle in an attempt to reclaim the level that was lost back in May of this year, and Gold has seen an almost 10% rally from October's lows near $1,810.
XAU/USD bids continue to struggle at the medium-term price ceiling around $1,980 that constrained topside momentum back in July. A break higher will see Gold set for a challenge of 2023's peak bids near $2,079.76 from May, while a bearish reversal will see XAU/USD back into the 200-day Simple Moving Average (SMA) currently building out a floor from $1,932.
XAU/USD Daily Chart
XAU/USD Technical Levels
- GBP/USD rebounds from 1.2069 to 1.2128, despite downbeat market sentiment and strong Greenback.
- US GDP growth at 4.9% and soaring durable goods orders fuel speculation of further Fed rate hikes.
- UK retail sales hit worst October level, reflecting households' struggle with inflation and slow growth.
The British Pound (GBP) is recovering some ground against the US Dollar (USD) late in the North American session on Thursday after dipping to a daily low of 1.2069. GBP/USD buyers stepped in around the latter and lifted the pair to its current exchange rate of 1.2128, registering gains of 0.16%.
Pound gains against the Dollar, finding support in falling US Treasury bond yields
Wall Street continues to trade with losses, portraying a downbeat market sentiment. The GBP/USD remains underpinned by the drop in US Treasury bond yields, as the Greenback continues to remain strong, as shown by the US Dollar Index (DXY) gaining 0.07%, up at 106.61.
Data from the United States (US) sponsored the GBP/USD leg down, as the economy in the third quarter grew at a 4.9% QoQ, the fastest pace in almost two years. That, along with upbeat Durable Goods Orders in September, soaring 4.7%, smashing forecasts and the latest month’s figures at 1.7% and -0.1% contraction, underpinned the US Dollar on speculations that the US central bank would raise rates once more.
Aside from this, unemployment claims for the latest week ending October 21, rose above the forecast of 208K, and jumped to 210K, an indicator of the labor market easing.
On the UK front, the Confederation of British Industry (CBI) revealed that retail sales reported their worst October for sales, as households struggle amid difficult economic times, with high inflation and economic growth slumping. Sales plunged -36, well below the -16 contraction estimated by analysts
GBP/USD Price Analysis: Technical outlook
From a technical perspective, volatility in the GBP/USD pairs continues to shrink, as the Average True Range (ATR) has the pair moving 92 pips. With that in mind, the pair’s direction is downwards after a death cross was formed nine days ago, opening the door for further losses. The GBP/USD first support would be today’s low of 1.2069, followed by the October 4 low of 1.2037. A breach of the latter would pave the way toward 1.1800, the next support level. On the contrary, the major could challenge the 1.2300 figure once buyers reclaim the October 24 high of 1.2288.
- The US Dollar traded strongly against its rivals on Thursday, and the DXY index rose to monthly highs.
- GDP and Durable Goods data came in higher than expected as well as the weekly Initial Jobless Claims.
- Despite strong data, US bond yields and hawkish bets on the Fed declined.
The US Dollar (USD) measured by the US Dollar Index (DXY) rose toward 106.90, its highest level since early October, seeing nearly a 0.3% gain and then settled at 106.60 on Thursday. Since Tuesday, the DXY index has gained more than 1%, and the Greenback is outperforming its rivals as strong economic data increases its demand. However, dovish bets on the Federal Reserve (Fed) may limit those gains.
The United States economy is holding resilient and has yet to show signs of weakness from the Fed’s aggressive monetary tightening. During this week, the US reported that the S&P PMIs from October came in higher than expected, and the preliminary estimation of the Q3 Gross Domestic Product (GDP) also trounced consensus. On Friday, the US will release Personal Consumption Expenditures (PCE) figures from September, which may have an additional impact on the Greenback’s price dynamics.
Daily Digest Market Movers: US Dollar outperforms its rivals as Q3 GDP came in strong
- The DXY index continued climbing higher to a high of around 106.90 and then stabilized at 106.60, holding onto daily gains.
- On the data front, the Q3 GDP preliminary estimate showed that the economy grew at an annualised rate of 4.9%, higher than the 4.2% expected.
- In addition, The U.S. Census Bureau reported that Durable Goods Orders from September exceeded expectations. It came in at 4.7% MoM vs the expected 1.5%.
- On the negative side, weekly Initial Jobless Claims arrived at 210,000 vs the 208,000 expected.
- Meanwhile, US bond yields are falling. The 2-year rate fell to 5.04%, while the longer-term 5 and 10-year rates retreated toward 4.79% and 4.85%, respectively, contributing to the USD losing momentum.
- According to the CME FedWatch Tool, the odds of a 25-basis-point hike in December are still low, around 20%. In addition, the CME Group data suggests that a pause in November is nearly priced in.
- Investors await the Personal Consumption Expenditures figure from September on Friday to continue modelling their expectations on the next Fed decisions.
Technical Analysis: US Dollar Index continues gaining ground above the 20-day SMA
According to the daily chart, the technical outlook for the DXY Index remains neutral to bullish as the bulls are recovering ground and assert themselves above the 20-day Simple Moving Average (SMA). The Relative Strength Index (RSI) exhibits a positive slope above the 50 threshold, while the Moving Average Convergence (MACD) displays lower red bars. To add to that, the pair is above the 20,100 and 200-day SMAs, suggesting that the bulls are firmly in control of the bigger picture.
Supports: 106.35 (20-day SMA), 106.00, 105.70.
Resistances: 107.00, 107.30, 107.50.
US Dollar FAQs
What is the US Dollar?
The US Dollar (USD) is the official currency of the United States of America, and the ‘de facto’ currency of a significant number of other countries where it is found in circulation alongside local notes. It is the most heavily traded currency in the world, accounting for over 88% of all global foreign exchange turnover, or an average of $6.6 trillion in transactions per day, according to data from 2022.
Following the second world war, the USD took over from the British Pound as the world’s reserve currency. For most of its history, the US Dollar was backed by Gold, until the Bretton Woods Agreement in 1971 when the Gold Standard went away.
How do the decisions of the Federal Reserve impact the US Dollar?
The most important single factor impacting on the value of the US Dollar is monetary policy, which is shaped by the Federal Reserve (Fed). The Fed has two mandates: to achieve price stability (control inflation) and foster full employment. Its primary tool to achieve these two goals is by adjusting interest rates.
When prices are rising too quickly and inflation is above the Fed’s 2% target, the Fed will raise rates, which helps the USD value. When inflation falls below 2% or the Unemployment Rate is too high, the Fed may lower interest rates, which weighs on the Greenback.
What is Quantitative Easing and how does it influence the US Dollar?
In extreme situations, the Federal Reserve can also print more Dollars and enact quantitative easing (QE). QE is the process by which the Fed substantially increases the flow of credit in a stuck financial system.
It is a non-standard policy measure used when credit has dried up because banks will not lend to each other (out of the fear of counterparty default). It is a last resort when simply lowering interest rates is unlikely to achieve the necessary result. It was the Fed’s weapon of choice to combat the credit crunch that occurred during the Great Financial Crisis in 2008. It involves the Fed printing more Dollars and using them to buy US government bonds predominantly from financial institutions. QE usually leads to a weaker US Dollar.
What is Quantitative Tightening and how does it influence the US Dollar?
Quantitative tightening (QT) is the reverse process whereby the Federal Reserve stops buying bonds from financial institutions and does not reinvest the principal from the bonds it holds maturing in new purchases. It is usually positive for the US Dollar.
US Treasury Secretary Janet Yellen, stated on Thursday that she wouldn't be surprised if the economy grows by 2.5% in 2023. Data released earlier showed that during the third quarter, the Gross Domestic Product expanded at an annualized rate of 4.9%, above the 4.2% of market consensus.
During an interview with Bloomberg TV, Yellen said the economy is performing well, with strong consumer spending. However, she acknowledged that many Americans are concerned about the economy, noting that a significant portion of the population has not experienced meaningful income growth.
Regarding yields, Yellen mentioned that the recent surge is not connected to deficits and does not indicate an impending recession. Instead, it reflects the strength of the US economy.
When asked about the fiscal deficit, Yellen expressed that plans should keep the deficit manageable.
Market reaction
Yellen's comments did not trigger a significant market reaction. The US Dollar is trading with mixed performance across the board following US data that included positive growth figures and Jobless Claims. The US Dollar Index (DXY) is up by 0.12%, but it remains far from its daily highs, hovering around 106.65.
- AUD/USD rebounds from 0.6270 to 0.6316, with Aussie showing resilience against the Greenback.
- US GDP growth at 4.9%, and durable goods orders surge, setting the stage for a Fed rate hike.
- Inflation figures and RBA Governor's comments increase Australia's likelihood of a rate hike.
AUD/USD turns green in the day trades with gains of 0.17% after hitting a daily low of 0.6270, but upbeat growth data from the United States (US) bolstered the Greenback (USD), a headwind for the Aussie (AUD). Nevertheless, the Aussie’s (AUD) remained strong as the pair exchanges hands at 0.6316.
Aussie gains ground even as robust US data could prompt Fed tightening
The US Bureau of Economic Analysis (BEA) revealed the economy grew at the fastest pace in almost two years, as the third quarter Gross Domestic Product (GDP) exceeded the 4.3% projected, coming at 4.9%. Additionally, Durable Goods Orders for September surged by 4.7%, significantly exceeding the consensus forecast of 1.7%. Given the solid state of the economy, the US Federal Reserve (Fed) has the perfect excuse to raise rates, as the economy continues to grow above trend.
Other data witnessed the US Bureau of Labor Statistics (BLS) releasing the Initial Jobless Claims for the week ending October 21, which increased by 210,000. This figure was higher than both the forecasts and the previous week's numbers (208,000 and 200,000, respectively), indicating a potential loosening of the job market.
Aside from this, the latest inflation figures in Australia increased the odds for a hike by the Reserve Bank of Australia (RBA)¸ which has remained on hold, but with a data-dependent approach. The latest remarks by the RBA’s Governor Michelle Bullock have faded those assumptions, saying the Consumer Price Index (CPI) report was in line with policymakers' expectations, while they assess the chances that would warrant a rate hike.
Ahead of the week, the Aussie’s economic docket will feature the PPI for the third quarter. On the US front, the Fed’s preferred gauge for inflation, the Core PCE, will be revealed, along with the Consumer Sentiment of the University of Michigan.
AUD/USD Price Analysis: Technical outlook
The AUD/USD downtrend remains intact, even though it bottomed out at around the 0.6300 mark, as the 50 and 200-day moving averages (DMAs) remain bearishly orderly. For a bearish continuation, the pair needs to surpass the 0.6300 mark, followed by the current year-to-date (YTD) low of 0.6270. Once those two levels are breached, up next would be the October 21, 2022, low of 0.6210. On the other hand, if buyers want to regain control, they need to lift prices above the 50-DMA at 0.6395.
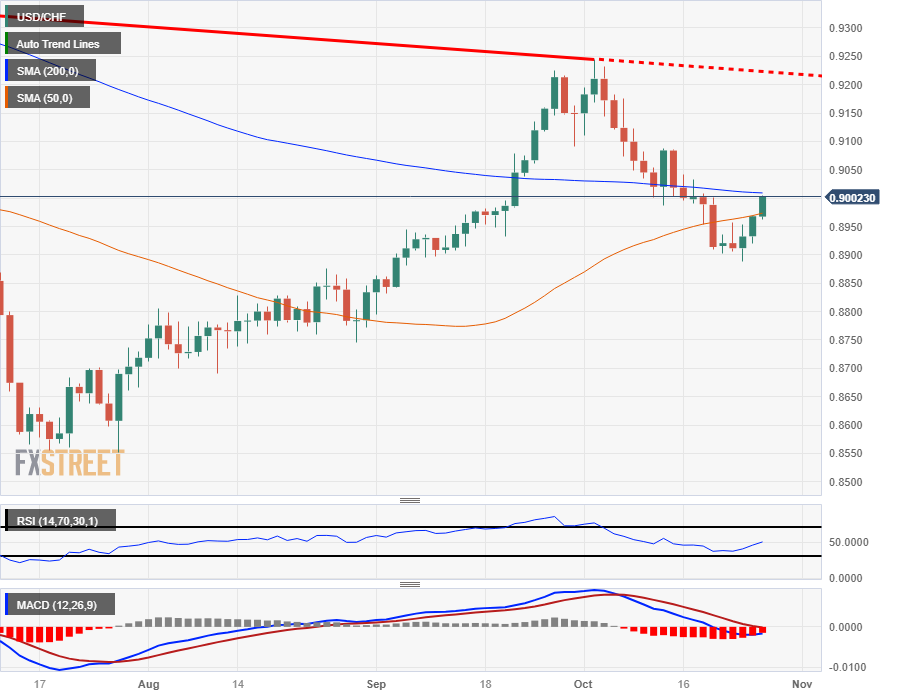
- The USD/CHF is toying with 0.9000 as the Greenback gets bid into a third straight day of gains.
- Little of note for the Franc on the economic calendar until next Tuesday's Swiss Retail Sales.
- US Durable Goods, GDP figures soundly trounce market expectations, though labor data sees more unemployed.
The USD/CHF is trading directly into the 0.9000 major handle as US data beats drive the US Dollar (USD) higher against the Swiss Franc (CHF) for Thursday.
US Gross Domestic Product (GDP) and Durable Goods Orders both firmly beat the street, vaulting over forecasts and sparking a bid in the Greenback, despite a soft miss for US labor figures that saw an uptick in Continuing & Initial Jobless Claims.
Next Tuesday will see Swiss Retail Sales figures. In the meantime, there's little Swiss economic calendar data for CHF traders to chew on following Wednesday's miss in the ZEW business conditions expectations survey, which slipped from -27.6 to -37.8.
US GDP expands at an annual rate of 4.9% in Q3 vs. 4.2% expected
US GDP printed at a stellar 4.9% for the annualized 3rd quarter, handily beating market forecasts of 4.2% and vaulting over the previous quarter's 2.1% printing.
US Durable Goods Orders for September likewise came in well above the waterline, growing 4.7% for the month compared to August's downward-revised -0.1% (originally printed at 0.2%).
US Initial Jobless Claims bucked the trend to come in below expectations, showing an additional 210K new jobless benefits seekers for the week into October 20th, compared to the previous week's 200K (revised upwards from 198K).
USD/CHF Technical Outlook
The US Dollar is testing into the long side of 0.9000 against the Franc after slipping from the price level last week, and is trading back into the 200-day Simple Moving Average (SMA).
The pair is catching some technical support from the 50-day SMA currently lifting into 0.8974, trapping bids in the midrange and squeezing the USD/CHF higher.
Last week's swing low into the 0.8900 level etches in near-term support, with the technical ceiling resting at early October's swing high bids near0.9250.
USD/CHF Daily Chart
USD/CHF Technical Levels
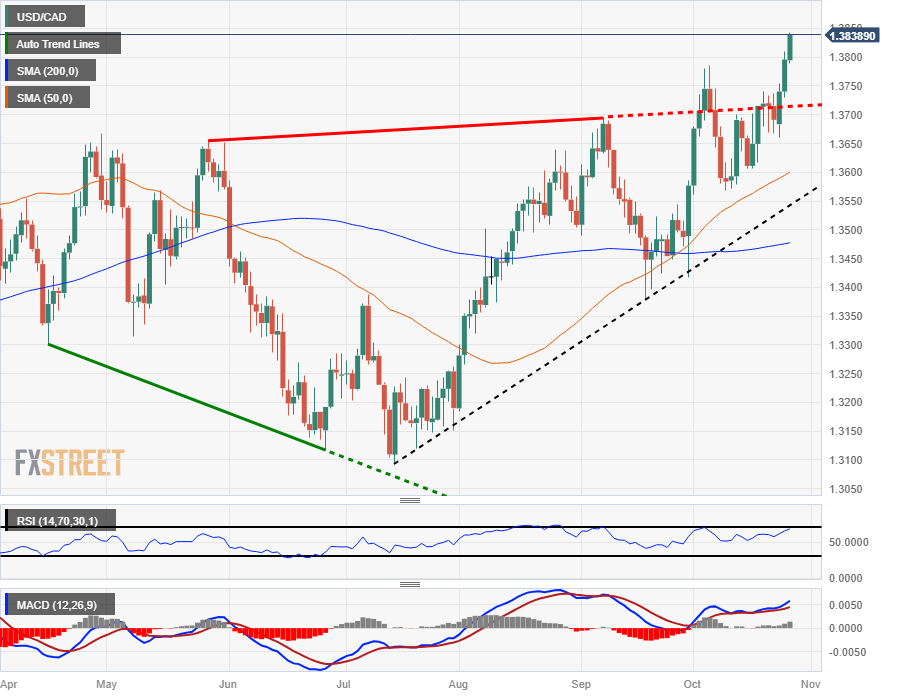
- The Canadian Dollar is sinking into the lowest bids of the year as the Greenback rises.
- No economic calendar data for Canada until next Tuesday’s GDP print.
- The US Dollar is bounding higher after a thumper US GDP, Durable Goods order data reading.
The Canadian Dollar (CAD) is setting a new seven-month low against the US Dollar (USD) following a solid print for US economic data on Thursday. US Durable Goods and Gross Domestic Product (GDP) figures soundly trounced forecasts, and the Greenback is pushing higher on the headline data beats, despite a sliver of red from unemployment figures that came in worse than expected.
Canada-centric economic data is left off the calendar until next Tuesday when the latest round of Canadian GDP growth numbers come in. However, market flows are likely to be dominated by the US Federal Reserve (Fed) by that point as traders will be looking ahead to their latest rate decision and whether or not Fed Chairman Jerome Powell and company will raise rates in the face of robust growth numbers.
Daily Digest Market Movers: Canadian Dollar steps back once more as US Dollar gains
-
Thursday markets are fully focused on US data beats.
- Annualized US GDP printed at a solid 4.9% for the third quarter, compared to the forecast of 4.2% and far firmer than the previous quarter’s 2.1%.
- US Durable Goods solidly thumped forecasts, coming in at 4.7% for September, shredding the 1.5% expectation and firmly rebounding from August’s -0.1% (revised down from 0.2%).
- Weak points appeared in US labor and spending data: Core Personal Consumption Expenditures (PCE) for the third quarter came in at 2.4%, below the 2.5% forecast and steepening the decline from the second quarter’s 3.7%.
- US Initial Jobless claims also rose: 210K new jobless benefits applicants were recorded for the week of October 20, more than the forecasted 208K and a step higher on the previous week’s 200K (revised upwards from 198K).
- Crude Oil is on the back foot for Thursday, sapping support for the CAD.
- USD/CAD traders will be pivoting to focus on Friday’s US Core PCE Price Index reading for September.
- The MoM PCE Price Index figure is expected to show an uptick to 0.3% in September after August’s 0.1%.
Technical Analysis: Canadian Dollar inching toward new lows for 2023 as markets broadly bid the Greenback
The Canadian Dollar (CAD) is struggling to find a foothold against its close neighbor and currency counterpart as markets pile into the US Dollar (USD) across the board. The USD/CAD is extending Wednesday’s break of the 1.3800 handle, and the pair is now making a run at 2023’s high bid of 1.3861.
If US Dollar bulls can successfully push the USD/CAD into the 1.3900 level, that will leave the charts open for a challenge of 2022’s peaks of 1.3978 set back in October of last year.
The USD/CAD continues to trend firmly upward on the daily candlesticks with a firm pattern of higher lows and a rising trendline from July’s swing low into 1.3100.
The last meaningful swing low sits just below 1.3600, while additional technical support is coming from the 50-day Simple Moving Average (SMA) just north of that same level.
USD/CAD Daily Chart
Canadian Dollar FAQs
What key factors drive the Canadian Dollar?
The key factors driving the Canadian Dollar (CAD) are the level of interest rates set by the Bank of Canada (BoC), the price of Oil, Canada’s largest export, the health of its economy, inflation and the Trade Balance, which is the difference between the value of Canada’s exports versus its imports. Other factors include market sentiment – whether investors are taking on more risky assets (risk-on) or seeking safe-havens (risk-off) – with risk-on being CAD-positive. As its largest trading partner, the health of the US economy is also a key factor influencing the Canadian Dollar.
How do the decisions of the Bank of Canada impact the Canadian Dollar?
The Bank of Canada (BoC) has a significant influence on the Canadian Dollar by setting the level of interest rates that banks can lend to one another. This influences the level of interest rates for everyone. The main goal of the BoC is to maintain inflation at 1-3% by adjusting interest rates up or down. Relatively higher interest rates tend to be positive for the CAD. The Bank of Canada can also use quantitative easing and tightening to influence credit conditions, with the former CAD-negative and the latter CAD-positive.
How does the price of Oil impact the Canadian Dollar?
The price of Oil is a key factor impacting the value of the Canadian Dollar. Petroleum is Canada’s biggest export, so Oil price tends to have an immediate impact on the CAD value. Generally, if Oil price rises CAD also goes up, as aggregate demand for the currency increases. The opposite is the case if the price of Oil falls. Higher Oil prices also tend to result in a greater likelihood of a positive Trade Balance, which is also supportive of the CAD.
How does inflation data impact the value of the Canadian Dollar?
While inflation had always traditionally been thought of as a negative factor for a currency since it lowers the value of money, the opposite has actually been the case in modern times with the relaxation of cross-border capital controls. Higher inflation tends to lead central banks to put up interest rates which attracts more capital inflows from global investors seeking a lucrative place to keep their money. This increases demand for the local currency, which in Canada’s case is the Canadian Dollar.
How does economic data influence the value of the Canadian Dollar?
Macroeconomic data releases gauge the health of the economy and can have an impact on the Canadian Dollar. Indicators such as GDP, Manufacturing and Services PMIs, employment, and consumer sentiment surveys can all influence the direction of the CAD. A strong economy is good for the Canadian Dollar. Not only does it attract more foreign investment but it may encourage the Bank of Canada to put up interest rates, leading to a stronger currency. If economic data is weak, however, the CAD is likely to fall.
- NZD/USD rebounds from 0.5773 to 0.5807, despite lack of significant economic data from New Zealand.
- US GDP growth at 4.9% and soaring durable goods orders may lead to another Fed rate hike.
- Geopolitical tensions and upcoming economic releases are crucial in the pair's dynamics.
NZD/USD bounces off new year-to-date (YTD) lows reached at 0.5773 after US economic growth exceeded estimates, which could warrant additional tightening by the US Federal Reserve (Fed). Nevertheless, the pair made a U-turn and trades at 0.5807, gaining a decent 0.10%.
US economic growth and Durable Goods Orders could prompt further Fed tightening.
The US Commerce Department revealed that the economy in the United States (US) grew 4.9% in the above estimates of 4.3%, in the advance estimate. Additional data showed that Durable Goods Orders for September soared 4.7%, crushing the 1.7% consensus, and along with GDP’s data, could justify the Fed's need for another rate hike.
Regarding US labor market data, the US Bureau of Labor Statistics (BLS) released the Initial Jobless Claims for the week ending October 21, which rose by 210K, above forecasts and last week{'s 208K and 200K, respectively, portraying the jobs market is loosening.
On the New Zealand front, the lack of economic data left NZD/USD traders adrift to market sentiment and US Dollar dynamics. On the geopolitical sphere, words from Israeli Prime Minister Benjamin Netanyahu, suggesting they are preparing for a ground offensive, sent oil prices higher, along with safe-haven peers, like the Greenback.
Ahead of the week, the New Zealand economic agenda will feature the ANZ Roy organ Consumer Confidence. On the US front, the Fed’s preferred gauge for inflation, the Core Personal Consumption Expenditures (PCE) would be released, along with the Consumer Sentiment, reported by the University of Michigan.
NZD/USD Price Analysis: Technical outlook
The NZD/USD has reclaimed the 0.5800 figure, after hitting a new year-to-date (YTD) low at 0.5773. Even though the pair has recovered some ground, the downtrend remains intact but could be at risk, if buyers reclaim the 50-day moving average (DMA) At 0.5921. For a bearish continuation, the NZD/USD sellers need to break support at 0.5800, which would expose the YTD low, which once cleared, could open the door to test last November’s low of 0.5740, ahead of 0.5700.
- USD/JPY rose to a high of around 150.77, it highest level since late October 2022.
- US Q3 GDP preliminary estimates beat expectations, as well as Durable Goods orders from September.
- Jobless Claims from the third week of September came a tick higher than the expectations.
- The USD holds its foot despite lower US yields and dovish bets on the Fed.
In Thursday's session, the USD/JPY continued gaining ground, rising to a high of around 150.77 and then settling at 150.35. The US Dollar is trading strong against its rivals, with the DXY index rising to monthly highs and keeping its momentum despite the US Treasury yields retreating. Despite robust economic activity data, markets continue to bet on higher odds of the Federal Reserve not hiking again in 2023.
On the data front, the Gross Domestic Product (GDP) preliminary estimate from Q3 grew at an annualised rate of 4.9%, higher than the expected 4.3% and increased in relation to its last reading of 2.1%. In addition, Durable Goods Orders from September rose by 4.7% MoM in September, way higher than the 1.5% expected. On the negative front, Jobless Claims from the week ending on October 21 came in at 210,000, above the expected 208,000 and increased in relation to its last reading of 200,000.
Meanwhile, the US bond yields are falling. The 2-year rate declined to 5.05% while the longer-term 5 and 10-year rates fell towards 4.84% and 4.90%, limiting the USD upward trajectory. In line with that, according to the CME FedWatch Tool, the odds of a 25 basis points hike in December declined to 20%, and it also suggests that a pause in November is nearly priced in. As long as investors refrain from placing bets on one more hike by the Fed, the upward momentum of the USD/JPY will be limited and as the speculation of a policy tweak of the Bank of Japan (BoJ) accompanied by rising Japanese Government yields, the pair could face some downwards pressure.
Focus now shifts to Friday's Consumption Expenditures (PCE) figures from the US from September, whose outcome could affect the expectations on the next Fed's decisions.
USD/JPY Levels to watch
The USD/JPY daily chart signals a bullish sentiment for the short term. The Relative Strength Index (RSI) is favourably positioned in positive territory above its midline, reflecting an upward movement. Similarly, Moving Average Convergence Divergence (MACD) depicts green bars, affirming the bullish momentum. Additionally, the pair is above the 20,100,200-day Simple Moving Average (SMAs), indicating that the buyers are commanding the broader perspective.
Support levels: 150.00, 149.50, 148.00.
Resistance levels: 150.50, 150.70, 151.00
USD/JPY Daily Chart
-638339303948117597.png)
- ECB keeps deposit rate unchanged at 4%, citing concerns over Eurozone's economic outlook.
- Despite UK's stagflation fears, Pound Sterling appreciates against the Euro, trading at 0.8700.
- Retail sales in the UK hit their lowest October level, reflecting households' struggle with inflation and slow growth.
EUR/GBP reversed its course on Thursday after the European Central Bank (ECB) kept rates on hold due to a deteriorating economic outlook for the bloc. Even though the economic perspective in the United Kingdom (UK) is not encouraging, as data reignited fears of stagflation, the Pound Sterling (GBP) appreciates against the Euro (EUR). The pair trades at 0.8692, down 0.36%.
Pound Sterling gains ground vs. the Euro after ECB’s cautious stance.
Earlier, the ECB decided to pause its tightening cycle, holding the deposit rate unchanged at 4%, while mentioning that it could be enough to curb inflation towards its 2% target if it remains at current levels for a longer time.
Following the bank’s decision, the ECB’s President Christine Lagarde said the Eurozone (EU) economy is weakening but added that inflationary pressures remain strong and could be aggravated due to the Middle East crisis. She added the ECB would remain data-dependent. Regarding a balance sheet reduction, Lagarde said there have not been discussions of an early reduction of the Pandemic Emergency Purchase Program (PEPP).
On the UK front, the Confederation of British Industry (CBI) revealed that retail sales reported their worst October for sales, as households struggle amid difficult economic times, with high inflation and economic growth slumping. Sales plunged -36, well below the -16 contraction estimated by analysts
EUR/GBP Price Analysis: Technical outlook
At the time of writing, the EUR/GBP is briskly testing the 200-day moving average (DMA) at 0.8992. A clear break would expose the current week’s low of 0.8682, followed by the 50-DMA at 0.8625. Further downside is seen at 0.8600. On the contrary, if the EUR/GBP stays above 0.8700, that could open the door to challenge the October 20 high at 0.8740, ahead of 0.8800.
- Mexican Peso (MXN) trims recent losses against the US Dollar (USD) after a weak start.
- Mexico's Unemployment Rate for September aligns with estimates, dipping to 2.9% from August's 3%.
- Banxico's Deputy Governor Jonathan Heath highlights concerns over the desynchronization between monetary and fiscal policy in 2024.
Mexican Peso (MXN) climbs against the US Dollar (USD) on Thursday, trimming some of the last two days' losses after economic data from Mexico showed the labor market remains tight, portraying a resilient economy. Across the border, the United States (US) economy reported its fastest GDP growth rate in almost two years during the third quarter, a bad sign for inflation, which could justify the US Federal Reserve (Fed) need for further tightening. The USD/MXN is trading at 18.20, down 0.66% on the day.
Mexico revealed the Unemployment Rate for September slowed compared to August’s 3% figure, and data was aligned with estimates of 2.9%, informed the National Statistics Agency, INEGI. Aside from economic data, the Bank of Mexico (Banxico) Deputy Governor Jonathan Heath said the desynchronization between monetary and fiscal policy due to the government's increasing debt in 2024 will add “noise” to the inflationary fight.
On the US front, Q3 GDP grew above expectations, while Durable Goods Orders for September more than tripled forecasts. On the other hand, Initial Jobless Claims rose above forecasts, suggesting the labor market is easing.
Daily Digest Market Movers: Mexican Peso comes back to life as the USD/MXN drops below 18.30
- Mexico’s September Unemployment Rate was 2.9%, aligned with estimates, but below August’s 3%.
- US Q3 GDP grows at an annualized rate of 4.9%, higher than the 4.2% consensus.
- Durable Goods Orders for September in the US rose 4.7% MoM, crushing forecasts of 1.5%, well above August’s 0.1% plunge.
- US Initial Jobless Claims for the week ending October 21 rose to 210K, exceeding estimates and prior week data of 208K and 200K, respectively.
- On October 24, Mexico's National Statistics Agency INEGI reported annual headline inflation hit 4.27%, down from 4.45% at the end of September, below forecasts of 4.38%.
- Mexico’s core inflation rate YoY was 5.54%, beneath forecasts of 5.6%.
- Earlier this week, S&P Global Manufacturing PMIs evidenced expansion in US manufacturing and service sectors during October.
- On Friday, the US will release September's Core PCE Price Index – Federal Reserve's preferred gauge of inflation – which could affect monetary policy expectations.
- The Bank of Mexico (Banxico) held rates at 11.25% in September and revised its inflation projections from 3.50% to 3.87% for 2024, above the central bank’s 3.00% target (plus or minus 1%).
Technical Analysis: Mexican Peso at the brink of further depreciation if USD/MXN climbs above 18.50
The USD/MXN upward bias remains intact, though Thursday’s price action led to a daily high of 18.42 but the pair failed to break last week’s high at 18.46, exacerbating the ongoing pullback to current exchange rates. If sellers want to re-test the psychological 18.00 figure, they must reclaim the 20-day Simple Moving Average (SMA) at 18.06. On the other hand, if the pair finds support at around 18.20, that could keep buyers hopeful of challenging October’s high 18.48, ahead of 18.50.
Mexican Peso FAQs
What key factors drive the Mexican Peso?
The Mexican Peso (MXN) is the most traded currency among its Latin American peers. Its value is broadly determined by the performance of the Mexican economy, the country’s central bank’s policy, the amount of foreign investment in the country and even the levels of remittances sent by Mexicans who live abroad, particularly in the United States. Geopolitical trends can also move MXN: for example, the process of nearshoring – or the decision by some firms to relocate manufacturing capacity and supply chains closer to their home countries – is also seen as a catalyst for the Mexican currency as the country is considered a key manufacturing hub in the American continent. Another catalyst for MXN is Oil prices as Mexico is a key exporter of the commodity.
How do decisions of the Banxico impact the Mexican Peso?
The main objective of Mexico’s central bank, also known as Banxico, is to maintain inflation at low and stable levels (at or close to its target of 3%, the midpoint in a tolerance band of between 2% and 4%). To this end, the bank sets an appropriate level of interest rates. When inflation is too high, Banxico will attempt to tame it by raising interest rates, making it more expensive for households and businesses to borrow money, thus cooling demand and the overall economy. Higher interest rates are generally positive for the Mexican Peso (MXN) as they lead to higher yields, making the country a more attractive place for investors. On the contrary, lower interest rates tend to weaken MXN.
How does economic data influence the value of the Mexican Peso?
Macroeconomic data releases are key to assess the state of the economy and can have an impact on the Mexican Peso (MXN) valuation. A strong Mexican economy, based on high economic growth, low unemployment and high confidence is good for MXN. Not only does it attract more foreign investment but it may encourage the Bank of Mexico (Banxico) to increase interest rates, particularly if this strength comes together with elevated inflation. However, if economic data is weak, MXN is likely to depreciate.
How does broader risk sentiment impact the Mexican Peso?
As an emerging-market currency, the Mexican Peso (MXN) tends to strive during risk-on periods, or when investors perceive that broader market risks are low and thus are eager to engage with investments that carry a higher risk. Conversely, MXN tends to weaken at times of market turbulence or economic uncertainty as investors tend to sell higher-risk assets and flee to the more-stable safe havens.
The Fed’s preferred inflation gauge, the Core Personal Consumption Expenditure (PCE), will be released by the US Bureau of Economic Analysis (BEA) on Friday, October 27 at 12:30 GMT and as we get closer to the release time, here are the forecasts of economists and researchers of six major banks.
Headline is expected at 3.4% year-on-year vs. 3.5% in August. Meanwhile, Core PCE is seen at 3.7% YoY vs. the prior release of 3.9%. On a monthly basis, it is expected to accelerate to 0.3% from 0.1%.
ING
Energy prices will lift the headline rate and we are not as optimistic that core inflation will rise just 0.2% MoM or 3.7% YoY as the market expects. We fear slight upside risks, and this combination of elevated inflation and strong growth could be the catalyst for the 10Y Treasury yield to clearly break above 5%.
TDS
Core PCE inflation accelerated in September to its fastest MoM pace since May at 0.24% MoM, though that'd be still below the core CPI's 0.32% gain. We also look for the headline PCE to advance 0.30% MoM. We also look the PCE's supercore measure to jump to 0.4% MoM.
NBF
The annual core PCE deflator may have progressed 0.2% MoM in September, a result which should translate into a two-tick decline of the 12-month rate to 3.7%. Although still high, this would still be the lowest rate observed in 28 months.
SocGen
The PCE deflators are taken from the CPI that was reported up 0.4% for the headline and 0.3% for the core pace. We project a slightly less robust PCE headline increase since the rent component that was up significantly in the CPI has less relative weighting in the PCE deflator. The projection, however, is razor thin, with a rounding down to 0.3%.
Wells Fargo
Factoring in our expectation for the headline and core PCE deflators to increase 0.3% during the month, real consumer spending likely rose around 0.2%.
Citi
Core PCE inflation should rise 0.28% MoM and 3.7% YoY in September based on elements of CPI and PPI. Shelter prices should pick up, consistent with the surprising reacceleration in owners’ equivalent rent in CPI, although these prices receive half the weight in PCE as in CPI. Medical services prices should rise by more than in August, but still a somewhat modest ~0.2% MoM. With medical services prices receiving a much larger weight in PCE than CPI, this is the key difference leading to softer 0.28% core PCE compared to 0.32% core CPI. Other elements of PCE should be similar to CPI, although with a stronger increase in airfares, which rose by around 2% in PPI data but a modest 0.3% in CPI. Another large decline in used car prices in September will also weigh on core PCE somewhat less than in CPI. Headline PCE inflation should similarly rise 0.3% MoM and moderate only slightly to 3.4% YoY.
EUR/USD was more or less unaffected by the ECB decision, trading in the mid 1.0500-1.0600 range. Economists at Danske Bank analyze the pair’s outlook.
Turnaround in the exceptional run of positive US economic data surprises to weigh on the USD
We make no changes to our long-term EUR/USD forecast and therefore, we maintain our strategic case for a lower EUR/USD based on relative terms of trade, real rates and relative unit labour costs.
We forecast the cross at 1.06/1.03 in 6/12M.
In the near term, we stick to our topside risk call in EUR/USD. We expect a turnaround in the exceptional run of positive US economic data surprises to weigh on the USD. Additionally, we believe that peak policy rates, improvements in the struggling manufacturing sector, and a bottoming out of China pessimism will provide some support to EUR/USD in the near term.
The risks primarily consist of an escalation in the Middle East, leading to both a risk-off sentiment and higher energy prices, resulting in a stronger USD.
- Japanese Yen declines against the US Dollar due to broad risk aversion on Israel-Palestine tensions.
- FX market intervention from the Japanese authorities may have propped up the weakening Yen as USD/JPY passed the 150 threshold.
- In the US session, USD weakens after a raft of US data releases, including GDP and Jobless Claims.
The Japanese Yen (JPY) yo-yos in a wide range versus the US Dollar (USD) on Thursday, as numerous factors impact the pair, from increasing tensions on the Gaza strip to the release of key US data and the rumored intervention of Japanese authorities in the FX markets.
The Yen weakened initially versus the USD, which benefited from safe-haven flows and higher US yields. JPY was later supported by probable intervention from the Japanese Ministry of Finance (MoF) after the USD/JPY rate crossed the 150 defensive line – a level traditionally defended by the MoF.
US data on Thursday shows an unexpected rise in America’s GDP to 4.9% in Q3 on an annualized basis, solidly beating consensus estimates of 4.2%. US Durable Goods Orders rose 4.7% versus estimates of 1.5% and Initial Jobless Claims increased to 210K versus 208K expected. Despite being mostly positive, the data fails to help the Dollar, and the US Dollar Index (DXY) registers a drop after the data, with DXY down a 10th of a percentage point just over an hour after the releases.
Daily digest market movers: Japanese Yen
- The Japanese Yen weakens versus USD on Thursday amid increased risk aversion due to intensifying Middle East tensions.
- The US Dollar also finds support from a rise in the highly-correlated US 10-year Treasury yield, which reaches to within a hair’s breadth of 5.00%, as a result of improving US business activity data.
- The USD/JPY pair briefly shoots to 150.80 in the early European session but then abruptly reverses, possibly as a result of Japanese MoF intervention.
- USD/JPY then encounters further volatility after the release of US data showing unexpected rises in GDP and US Durable Goods Orders.
- Initial Jobless Claims rise more than expected to 210K but the figure is still at historic lows.
- The yield on the 10-year Japanese Government Bond (JGB) also rises again to trade at 0.885% on Thursday. This is closer to the Bank of Japan’s Yield Curve Control (YCC) threshold of 1.0%, which if touched will likely lead to the BoJ implementing further easing. This will probably have a negative impact on the Yen but be bullish for USD/JPY.
Japanese Yen technical analysis: Breaking above 150 but lacking momentum
USD/JPY has broken above the key 150 psychological level on Thursday as the overall uptrend extends. The pair is bullish on a long-term, intermediate, and short-term basis.
The uptrend is biased to continue given the absence of reversal signs and the next major target is at the 152.00 highs achieved in October 2022.
The pair has completed what appears to be an ascending triangle on the daily chart and broken above the 150.16 highs of October 3, confirming a breakout. Although it has not been a particularly decisive breakout – Thursday’s breakout candle is a ‘Doji’ indicating indecision – price will, nevertheless, probably continue higher, given the overarching uptrend. The triangle’s technical target is at around 152.
-638339268793476649.png)
US Dollar vs Japanese Yen: Daily Chart
The Moving Average Convergence Divergence (MACD) momentum indicator is showing bearish divergence with price when compared with the October 3 high. This happens when price makes a higher high, but momentum fails to follow suit. This is indicative of underlying weakness in the upmove. This nuances the bullish analysis and increases the risk the triangle breakout may be ‘false’.
A re-break above Thursday’s highs of 150.80 would provide fresh confirmation of the continued advance.
Triangles are sometimes the penultimate formations in a trend, suggesting the chance the current uptrend may be getting near to its culmination point.
Japanese Yen FAQs
What key factors drive the Japanese Yen?
The Japanese Yen (JPY) is one of the world’s most traded currencies. Its value is broadly determined by the performance of the Japanese economy, but more specifically by the Bank of Japan’s policy, the differential between Japanese and US bond yields, or risk sentiment among traders, among other factors.
How do the decisions of the Bank of Japan impact the Japanese Yen?
One of the Bank of Japan’s mandates is currency control, so its moves are key for the Yen. The BoJ has directly intervened in currency markets sometimes, generally to lower the value of the Yen, although it refrains from doing it often due to political concerns of its main trading partners. The current BoJ ultra-loose monetary policy, based on massive stimulus to the economy, has caused the Yen to depreciate against its main currency peers. This process has exacerbated more recently due to an increasing policy divergence between the Bank of Japan and other main central banks, which have opted to increase interest rates sharply to fight decades-high levels of inflation.
How does the differential between Japanese and US bond yields impact the Japanese Yen?
The BoJ’s stance of sticking to ultra-loose monetary policy has led to a widening policy divergence with other central banks, particularly with the US Federal Reserve. This supports a widening of the differential between the 10-year US and Japanese bonds, which favors the US Dollar against the Japanese Yen.
How does broader risk sentiment impact the Japanese Yen?
The Japanese Yen is often seen as a safe-haven investment. This means that in times of market stress, investors are more likely to put their money in the Japanese currency due to its supposed reliability and stability. Turbulent times are likely to strengthen the Yen’s value against other currencies seen as more risky to invest in.
The ECB did not raise its key interest rates further at its meeting today. The deposit rate should remain at 4.0% next year, in the view of economists at Commerzbank.
No rate cuts in 2024
At today's press conference, the ECB again signaled that it will probably not raise its key interest rates further. However, we do not share the market's view that the ECB will lower its rates significantly again as early as next year.
Rate cuts would be risky anyway because the deposit rate of 4.0% is not very high in view of the underlying inflation problem.
- USD/CAD aims to shift the auction above 1.3800 as oil price corrects further and the BoC keeps policy unchanged.
- The US Dollar falls marginally after upbeat US Q3 GDP data.
- Oil prices extend losses despite deepening Middle East tensions.
The USD/CAD pair aims for stability above the round-level resistance of 1.3800 in the New York session. The Loonie asset continues to move higher amid multiple tailwinds of declining oil prices, unchanged monetary policy by the Bank of Canada (BoC), and broader strength in the US Dollar.
The S&P500 opens on a bearish note amid deepening Middle East tensions. The US Dollar Index (DXY) delivered a small correction from 106.88 after the release of the upbeat Q3 Gross Domestic Product (GDP) data. The US economy grew by 4.9% in the July-September quarter from expectations of 4.1% on an annualized basis. In the April-June quarter, the US economy recorded a growth rate of 2.1%.
An upbeat US GDP carries the potential of elevating bets in favor of one more interest rate increase from the Federal Reserve (Fed) in the remainder of 2023. Apart from the US GDP data, upbeat Durable Goods Orders have also prompted hopes of more interest rates from the Fed. New orders for core goods grew at a stronger rate of 4.7% in September versus expectations of a 1.5% increase.
Meanwhile, the Canadian Dollar faces an intense sell-off as the Bank of Canada (BoC) kept interest rates unchanged at 5% on Wednesday. BoC Governor Tiff Macklem kept doors open for further policy-tightening citing that overall inflationary pressures have increased and consumer inflation could remain above the desired target of 2% for another two years.
ECB came in line with expectations and markets quickly turned their attention to the US data releases. Economists at TD Securities analyze market’s outlook.
ECB statement did not come with much new information
The ECB offered no new information and was not a market mover.
In this data dependent and geopolitically driven world, CBs will continue to sound vigilant but ultimately remain tied to data outcomes. Accordingly, attention quickly turned to US data where signs of moderating inflation and good growth helped moderate US yields and the USD.
A resilient US economy coupled with a soft landing ex-US (with China fiscal impulse and growth upgrades) can set the ground for risk taking in the coming weeks and a weaker USD.
Economists at CIBC Capital Markets expect NZD/USD to weaken to 0.57 through Q4 of this year
NZD/USD to rebound towards the 0.63 level by Q4 2024
We continue to disagree with the full hike priced for the RBNZ by April 2024, and instead think that the RBNZ will begin cutting rates in Q2 2024 in order to keep real rates from becoming too restrictive. These headwinds support our call for NZD/USD to trade towards 0.57 by year-end.
We expect NZD/USD to rebound towards the 0.63 level by Q4 2024, as the USD comes off overvalued levels and the terms of trade support the currency. El Nino is likely already impacting New Zealand’s terms of trade, and it will continue to boost the NZD as it strengthens into next year.
US Real GDP grew somewhat more strongly than expected in the third quarter. Economists at Commerzbank analyze how growth figures could guide the next Federal Reserve actions.
The Fed is still waiting for the economy to slow down
The US economy grew strongly in the third quarter, with real GDP up 4.9%. The strong growth in the third quarter had already been flagged by high-frequency data. The GDP release will thus not cause a change of monetary policy at next week's FOMC meeting.
The Fed is likely to keep key rates unchanged. For the Fed, however, it is important that growth slows down soon in order to reduce demand pressure. Otherwise, it is hard to imagine inflation weakening further toward the Fed's target.
If the data of the next few weeks point to renewed strong growth in the fourth quarter – which we do not expect – a rate hike in December would then be on the table.
- Silver price drops sharply below $23.00 after stronger-than-projected US GDP data in the July-September quarter.
- The US economy grew by 4.9% against expectations of 4.2% and the former release of 2.1%.
- Silver price consolidates near the horizontal support plotted near $22.65.
Silver price (XAG/USD) fell sharply below $23.00 after the United States Bureau of Economic Analysis (BEA) reported that the economy grew by 4.9% in the third quarter of 2023 against a 2.1% growth rate recorded in the April-June quarter. Economists anticipated a growth rate of 4.1%.
The appeal for bullions has impacted sharply while the near-term demand for the white metal is still upbeat amid escalating tensions in the Middle East. Israeli Prime Minister Benjamin Netanyahu reiterated on Wednesday that their military troops are preparing for a ground incursion to eliminate Hamas in Gaza with the goal of ‘saving the nation’.
The US Dollar Index (DXY) faces some selling pressure from a two-week high at 106.85. 10-year US Treasury yields edged down to 4.94%. Apart from the US GDP data, Durable Goods Orders for September have also been released. The US Census Bureau has reported that new core goods orders rose significantly by 4.7% against expectations of a 1.5% increase. In August, the economic data contracted by 0.1%.
After the US Q3 GDP data, investors shifted focus to the Fed’s preferred inflation gauge for September, which will be announced on Friday.
Silver technical analysis
Silver price consolidates near the horizontal support plotted from October 19 low at $22.65 on a two-hour scale. The 50-period Exponential Moving Average (EMA) around $23.00 remains sticky to the Silver price, indicating a sideways performance. The Relative Strength Index (RSI) (14) oscillates in the 40.00-60.00 range, which indicates that investors await a potential trigger.
Silver two-hour chart
-638339244900974183.png)
USD/JPY hit the highest level since 21st October last year. Economists at MUFG Bank analyze the pair’s outlook.
Intervention risks elevated ahead of BoJ meeting next week
A lack of intervention into the BoJ meeting next Tuesday would raise expectations of a policy change at that meeting – a scenario that is seen as increasingly possible.
There remains a high risk that we see some sharp stop-loss buying that fuels a bigger move that could then offer the Japanese authorities the opportunity to intervene.
Finance Minister Suzuki has also blurred the lines on what constitutes ‘excessive’ moves while domestically there is increasing incentive to be seen to act.
The LDP performed poorly in recent by-elections with voters unhappy with government policy to protect households from the cost of living crisis. Standing aside and allowing ongoing Yen depreciation would only reinforce PM Kishida’s current unpopularity.
Christine Lagarde, President of the European Central Bank (ECB), explains the ECB's decision to leave the key interest rates unchanged in October and responds to questions from the press.
Key quotes
"Premature to debate rate cuts."
"The rise in yields is spillover we take into account, helps bring inflation down"
"Transmission will unfold through the first quarter of 2024, possibly longer."
"Policy hold doesn't mean we won't ever hike again."
"We don't have a purpose to show profits or cover losses."
About ECB's press conference
Following the ECB´s monetary policy decisions, the ECB President delivers a prepared statement and responds to questions from the press on the policy outlook. Her comments may influence the volatility of EUR and determine a short-term positive or negative trend. Her hawkish view is considered as positive, or bullish for the EUR, whereas her dovish view is considered as negative, or bearish.
Caught in the twin grip of elevated US yields and a stronger USD, Gold may be on the defensive over the near term unless geopolitical risks escalate, economists at HSBC report.
Increasing geopolitical risks could help sustain Gold price
We are not convinced the rally can be sustained beyond the near term. Oil prices have eased for three days in a row (Bloomberg, 24 October 2023). This may be key, as it is difficult to envisage much greater geopolitical risk-led demand for Gold if Oil prices are easing.
Gold is historically sensitive to US real yields and, while there could be a disconnect in this relationship, it has re-emerged and is likely to weigh further on Gold.
As we expect ongoing USD strength, this will likely limit Gold rallies and may even act to press XAU/USD lower.
Escalating geopolitical and trade risks are playing an increasingly supportive role in Gold prices, engineering rallies that are likely to stay high in 2024.
Christine Lagarde, President of the European Central Bank (ECB), explains the ECB's decision to leave the key interest rates unchanged in October and responds to questions from the press.
Key quotes
"Domestic price pressures remain strong."
"Most measures of longer-term inflation expectations currently stand at around 2%."
"Some inflation expectation indicators are elevated and need to be monitored closely."
"Risks to economic growth are skewed to the downside."
"We did not discuss remuneration of reserves."
"Now is not the time for forward guidance."
About ECB's press conference
Following the ECB´s monetary policy decisions, the ECB President delivers a prepared statement and responds to questions from the press on the policy outlook. Her comments may influence the volatility of EUR and determine a short-term positive or negative trend. Her hawkish view is considered as positive, or bullish for the EUR, whereas her dovish view is considered as negative, or bearish.
Christine Lagarde, President of the European Central Bank (ECB), explains the ECB's decision to leave the key interest rates unchanged in October and responds to questions from the press.
Key quotes
"Euro area economy remains weak."
"The service sector is weakening further."
"The economy is likely to remain weak for the rest of the year."
"The economy should strengthen over the coming years as real incomes rise."
"There are signs the labour market is weakening."
"Inflation is likely to come down further in the near term."
About ECB's press conference
Following the ECB´s monetary policy decisions, the ECB President delivers a prepared statement and responds to questions from the press on the policy outlook. Her comments may influence the volatility of EUR and determine a short-term positive or negative trend. Her hawkish view is considered as positive, or bullish for the EUR, whereas her dovish view is considered as negative, or bearish.
- EUR/USD drops for the third session in a row and retests 1.0520.
- Extra decline could see the pair accelerate losses to the 1.0500 zone.
EUR/USD maintains the offered bias and printed new lows in the 1.0520 region on Thursday.
If bears push harder, then the pair could drop to the weekly low of 1.0495 (October 13) prior to the 2023 low of 1.0448 (October 3). The loss of the later could put a probable visit to the round level of 1.0400 back on the radar in the not-so-distant future.
In the meantime, while below the 200-day SMA at 1.0813, the pair’s outlook should remain negative.
EUR/USD daily chart
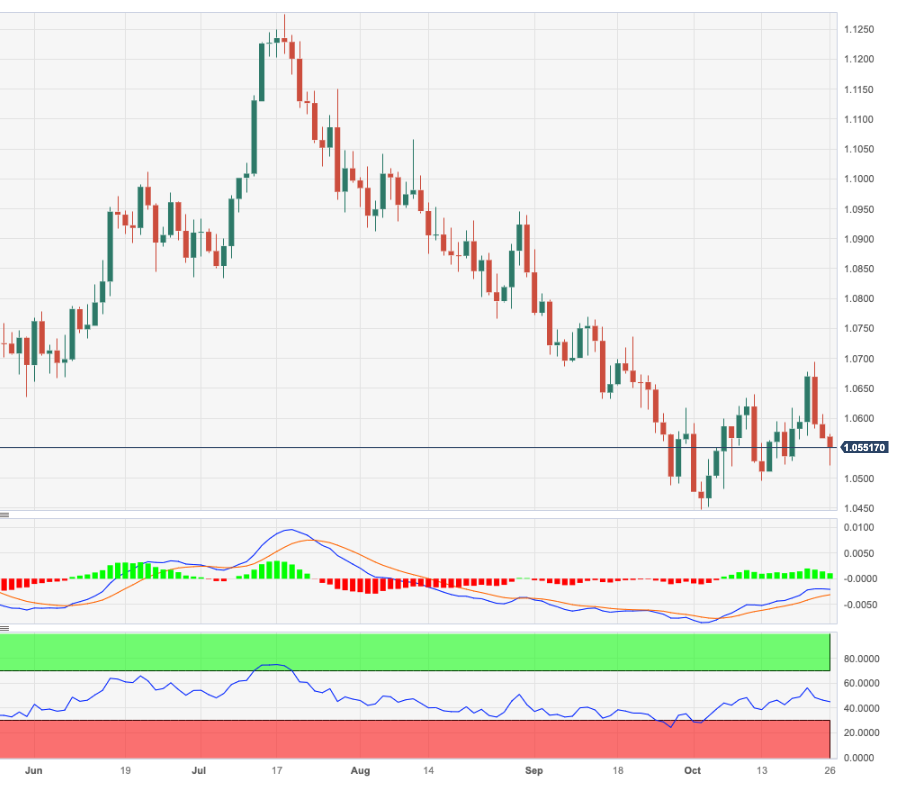
- Initial Jobless Claims in the US increased by 10,000 in the week ending October 21.
- Continuing Claims increased by 63,000 in the week ending October 14.
- US Dollar Index pulled back modestly after Q3 GDP data and Jobless Claims.
There were 210,000 initial jobless claims in the week ending October 21, the weekly data published by the US Department of Labor (DOL) showed on Thursday. This reading follows last week’s print of 200,000 (revised from 198,000) and came in slightly worse than the market expectation of 208,000. The 4-week moving average was 207,500, an increase of 1,250 from the previous week's revised average.
Continuing claims rose by 63,000 in the week ending October 14 to 1.79 million, above market expectations of 1.74 million. It is the highest reading since May.
Market reaction
At the same time, the US Q3 GDP report was released. The US Dollar pulled back modestly rose across the board. The US Dollar Index held in positive territory for the day, but if moved off highs toward 106.70, as US Treasury yields slid.
- DXY climbs to three-week highs near 106.90 on Thursday.
- Bulls could now see the YTD high near 107.30 revisited.
DXY climbs further and reaches new multi-week tops in the 106.85/90 band on Thursday.
If the index breaks above the ongoing consolidative theme it could initially target the round level of 107.00 prior to the 2023 high of 107.34 (October 3).
So far, while above the key 200-day SMA, today at 103.37, the outlook for the index is expected to remain constructive.
DXY daily chart
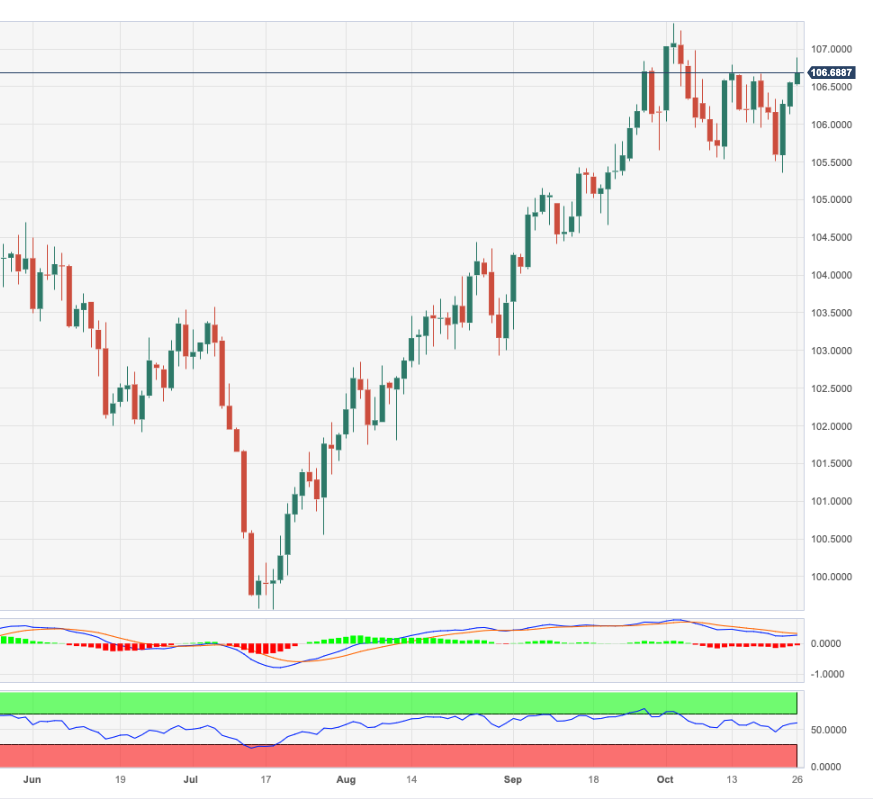
CAD holds losses around 1.38 against the US Dollar but under tone remains soft, economists at Scotiabank report.
Underlying trend momentum remains bullish
The 6-hour chart reflects a minor bearish outside range signal which implies a minor high at 1.3820.
The USD is quite heavily overbought on the basis of the intraday and daily stochastics but underlying trend momentum remains bullish.
A more forceful turn lower in the USD is needed to put a ceiling on gains.
Support is 1.3740/1.3750 intraday.
- EUR/JPY comes to further downside pressure on Thursday.
- The corrective knee-jerk meets contention around 158.00.
EUR/JPY corrects further down and adds to the ongoing rejection from Tuesday’s 2023 peaks.
Despite the ongoing decline, further upside appears in the pipeline for the cross in the short-term horizon. Against that, the immediate hurdle emerges at the 2023 top at 159.91 (October 24) closely followed by the round level at 160.00.
So far, the longer term positive outlook for the cross appears favoured while above the 200-day SMA, today at 151.09.
EUR/JPY daily chart
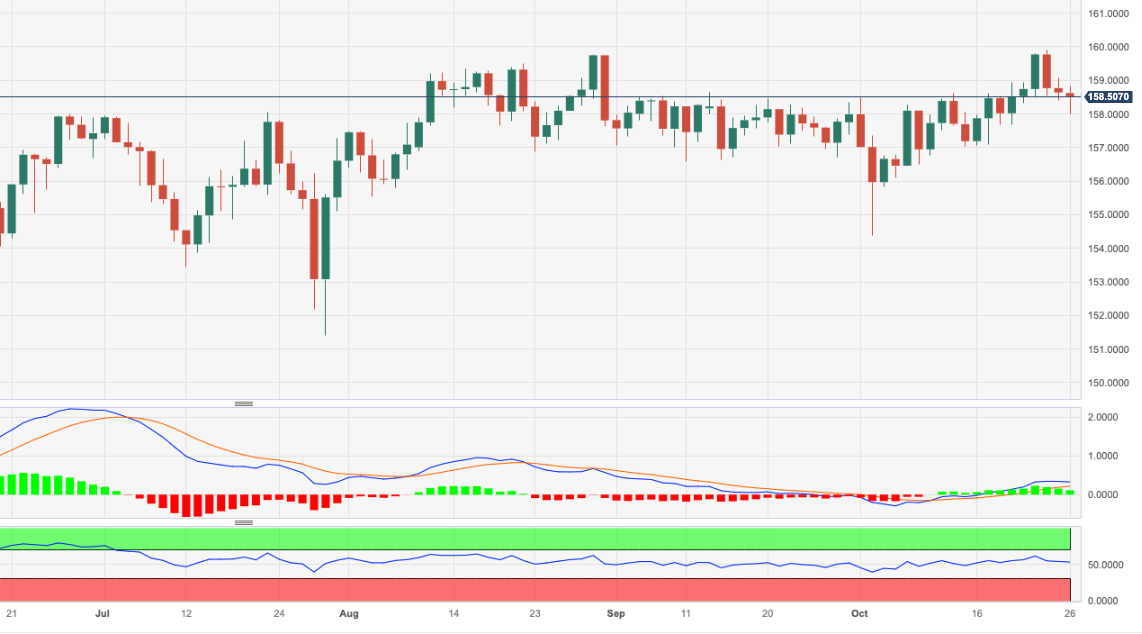
- EUR/JPY juggles around 158.50 as the ECB kept its refinancing operations rate unchanged at 4.5%.
- The ECB was expected to maintain a status quo as inflation in Eurozone is consistently easing.
- Investors doubt that the sharp spike in early Europe was BoJ’s intervention.
The EUR/JPY pair remains unchanged near 158.50 after the announcement of the European Central Bank (ECB) monetary policy. ECB President Christine Lagarde announced that policymakers decided to keep the rate of refinancing operations unchanged at 4.5%.
The ECB has also kept the rate on deposit facility steady at 4%. An unchanged interest rate decision from the ECB was widely anticipated as the Eurozone economy is struggling for a firm footing amid geopolitical tensions and a soft demand outlook.
The business activities in Eurozone have been dampened due to soft demand by households as higher price pressures have squeezed their real income. The economic activities in the Eurozone economy have been contracting for a significant period as firms are operating at lower capacity due to weak demand.
Meanwhile, risks of higher energy prices outlook have dented market sentiment. Deepening Middle East tensions amid conflicts between Israel and Palestine are expected to disrupt the oil supply chain, which will raise energy prices in the shared continent. This could elevate headline inflation expectations.
On the Japanese Yen front, investors expect that a spike move in the EUR/JPY pair in the early London session was the stealth intervention in the FX domain. An intervention from the Bank of Japan (BoJ) or Japan’s Ministry of Finance (MoF) was expected as the Japanese yen depreciated to 150.00 against the US Dollar.
EUR/USD losses have steadied in the low/mid 1.05s. Economists at Scotiabank analyze the pair’s outlook.
Scope for gains looks limited
The EUR appears heavily oversold on the intraday oscillators, which may account for the minor improvement off the daily low, but scope for gains looks limited in the short run.
The EUR remains vulnerable to pressure on supports at 1.0490 and 1.0520.
Resistance is 1.0595.
See – ECB Preview: Unlikely to be much direct support for the EUR from the policy decision itself – Scotiabank
EUR/USD slips to low 1.05s ahead of ECB decision. Economists at Scotiabank analyze the pair’s outlook.
ECB is expected to leave its policy rate on hold
The ECB is expected to leave its policy rate on hold at 4.00%, a move which likely heralds an extended pause following the September hike.
Messaging from ECB President Christine Lagarde at press conference may echo her comments on Wednesday that the inflation fight is not over but there is unlikely to be much direct support for the EUR from the policy decision itself.
- The Turkish currency depreciates to record lows vs. the greenback.
- The CBR hiked rates by 500 bps at its event on Thursday.
- The bank keeps the inflation target at 5.00%.
Further selling pressure hurts the Turkish lira and lifts USD/TRY to a new all-time high around 28.1500 on Thursday.
USD/TRY accelerates the move higher despite the CBRT hike
USD/TRY extends its advance and looks to consolidate the recent breakout of the 28.00 hurdle despite the fact that the Turkish central bank (CBRT) raised the One-Week Repo Rate by 500 bps to 35.00% (from 30.00%), matching the broad consensus.
That said, the central bank raised its key policy rate by 500 bps for the second consecutive meeting, while the lira has already depreciated more than 28% vs. the US dollar since January.
The central bank justified its decision to extend the tightening cycle in light of still-highly elevated inflation and potential upside risks stemming from higher crude oil prices and geopolitical concerns.
In addition, the CBRT maintains its inflation target at 5.00% in the medium term and stands ready to further tighten its monetary conditions accordingly.
USD/TRY key levels
So far, the pair is gaining 0.35% to 28.1440 and faces the next up-barrier at 28.1551 (all-time high October 26) ahead of 29.0000 (round level). On the downside, a break below 27.2064 (55-day SMA) would expose 26.5841 (100-day SMA) and finally 25.2143 (monthly low August 24).
The USD is trading firmly, but a little off its best levels, ahead of US Gross Domestic Product (GDP) data. Economists at Scotiabank analyze Greenback’s outlook.
Expectations of bullish Q3 GDP
Bonds are little changed, however, and crude oil has drifted a bit while G-10 commodity FX is outperforming, if only very modestly, so the risk-off narrative does not fully explain intraday developments on the face of it.
Part of the story is perhaps that the USD is simply better bid ahead of what is expected to be a solid US Q3 GDP report. Estimates suggest growth is in the region of 4.5% (SAAR), up from 2.1% in Q2. The data is also expected to reflect a sharp slowing in the core PCE data, however (2.5%, from Q2’s 3.7%).
Slowing price data may take some of the edge off strong growth momentum – as perhaps might the realization that this could be about as good as it gets for the US economy for quite some time. And, of course, a weaker-than-expected headline growth number would weigh on the USD and perhaps force some of the freshly minted longs put on after Monday’s USD drop to liquidate.
GBP/USD pressures support below 1.21. Economists at Scotiabank analyze the pair’s outlook.
CBI survey reflects weak retail backdrop
The CBI’s Distributive Trades Surveys for October reflected a sharp deterioration in retail activity this month. Retailers’ prospects look soft ahead of year-end.
Sterling looks oversold on the basis of the intraday oscillator studies and it has found steady support on dips under 1.21 since the start of the month. But price action looks soft and a push to the low 1.20s appears to be the main, short-term risk for Cable.
Resistance is 1.2120 and 1.2155.
- The Greenback rallies for a third straight day this week.
- US yields continue to increase, nearing the 5% threshold again.
- The US Dollar Index edges up after breaking back above 106.00.
The US Dollar (USD) keeps churning higher this week after having a small and brief retreat on Monday. The biggest catalyst for this recovery is the bond market. Still, all eyes will be across the Atlantic on Thursday with the European Central Bank (ECB) set to issue its latest monetary policy decision, which possibly is going to trigger further US Dollar strength.
On the economic data front, no less than thirteen data points are set to be issued all at the same time, at 12:30 GMT. Amidst all that, the ECB will release its interest rate decision and statement and ECB President Christine Lagarde will give a press conference. Expect plenty of headlines to come out and very volatile moves in the US Dollar Index (DXY), in the EUR/USD pair and other major crosses where the Greenback is involved.
Daily digest: US Dollar steps up to the plate
- The European Central Bank (ECB) is set to release its Interest Rate Decision at 12:15 GMT, together with a written statement. Economists expect the ECB to keep rates unchanged after ten consecutive hikes.
- At 12:30 GMT, a big batch of US data will be released:
- Initial Jobless Claims are expected to head from 198,000 to 208,000. Continuing Claims are expected to head a little bit higher, from 1,734,000 to 1,743,000.
- Personal Consumption Expenditures (PCE) Price Index for the third quarter are due to come out, with the Core Index expected to drop from 3.7% to 2.5%.
- Gross Domestic Product (GDP) data for the third quarter: the Price Index component is expected to soar from 1.7% to 2.5%. The Annualised growth rate is to head from 2.1% to 4.2%.
- Durable Goods preliminary reading for September are to come out as well:: The headline index is expected to head from 0.1% to 1.5%. The component without transportation is expected to slow from 0.4% to 0.2%.
- Just 15 minutes later, at 12:45 GMT, ECB President Christine Lagarde is due to give a press conference with Q&A.
- During that same press conference from the ECB, around 13:00 GMT, headlines or comments are expected from the Federal Reserve member Christopher Waller.
- US housing data around 14:00 GMT, with Pending Home Sales: Sales are expected to decline 1.5% in September compared with the previous month, less than the 7.1% plunge seen in August. On an annual basis, Pending Home Sales declined 18.3% in August.
- The Kansas City Fed Manufacturing Index for October is expected around 15:00 GMT. The previous reading came at -13.
- The US Treasury will try to refund two tenors this Thursday: at 15:30 a 4-week bill to be auctioned, and at 17:00 GMT a 7-year note to be allocated.
- Equities are seeing investors flee ahead of the volatility this Thursday: Asian equities are sinking over 1% in Japan and Chinese equities are down by 0.5%. European equities are not expecting any help from the ECB this Thursday, and are sliding more than 1% . In the US, Nasdaq futures fall by 1.5%, while Dow Jones and S&P 500 futures are down by 1%.
- The CME Group’s FedWatch Tool shows that markets are pricing in a 97.1% chance that the Federal Reserve will keep interest rates unchanged at its meeting in November.
- The benchmark 10-year US Treasury yield trades at 4.98%, popping back to that feared 5% level. The million Dollar question here is what will happen once the benchmark breaks back above 5%.
US Dollar Index technical analysis: All hail king Dollar
The US Dollar is climbing the ladder again after being in the gutter at the start of the week. The Greenback is on its way back to its throne as the DXY US Dollar Index is shooting higher and might even stretch further. Risk element hanging over a possible implosion of the DXY hangs in the balance, with the US 10-year yield flirting again with 5%.
The DXY has consolidated above 106.00 and looks to keep stretching higher. Look for a possible jump above 106.92. If this level can be reclaimed by US Dollar bulls, then look for 107.00 on the topside again.
On the downside, the recent resistance at 105.88 did not do a good job supporting any downturn and now completely has lost its importance. Instead, look for 105.12, which is a pivotal historic line and almost falls in line with the 55-day Simple Moving Average (SMA) to keep the DXY above 105.00, and which worked already quite ahead of it on Tuesday. Should this level fail to do the trick, a big air pocket could develop and see the DXY drop to 103.74, near the 100-day SMA, before finding ample support.
US Dollar FAQs
What is the US Dollar?
The US Dollar (USD) is the official currency of the United States of America, and the ‘de facto’ currency of a significant number of other countries where it is found in circulation alongside local notes. It is the most heavily traded currency in the world, accounting for over 88% of all global foreign exchange turnover, or an average of $6.6 trillion in transactions per day, according to data from 2022.
Following the second world war, the USD took over from the British Pound as the world’s reserve currency. For most of its history, the US Dollar was backed by Gold, until the Bretton Woods Agreement in 1971 when the Gold Standard went away.
How do the decisions of the Federal Reserve impact the US Dollar?
The most important single factor impacting on the value of the US Dollar is monetary policy, which is shaped by the Federal Reserve (Fed). The Fed has two mandates: to achieve price stability (control inflation) and foster full employment. Its primary tool to achieve these two goals is by adjusting interest rates.
When prices are rising too quickly and inflation is above the Fed’s 2% target, the Fed will raise rates, which helps the USD value. When inflation falls below 2% or the Unemployment Rate is too high, the Fed may lower interest rates, which weighs on the Greenback.
What is Quantitative Easing and how does it influence the US Dollar?
In extreme situations, the Federal Reserve can also print more Dollars and enact quantitative easing (QE). QE is the process by which the Fed substantially increases the flow of credit in a stuck financial system.
It is a non-standard policy measure used when credit has dried up because banks will not lend to each other (out of the fear of counterparty default). It is a last resort when simply lowering interest rates is unlikely to achieve the necessary result. It was the Fed’s weapon of choice to combat the credit crunch that occurred during the Great Financial Crisis in 2008. It involves the Fed printing more Dollars and using them to buy US government bonds predominantly from financial institutions. QE usually leads to a weaker US Dollar.
What is Quantitative Tightening and how does it influence the US Dollar?
Quantitative tightening (QT) is the reverse process whereby the Federal Reserve stops buying bonds from financial institutions and does not reinvest the principal from the bonds it holds maturing in new purchases. It is usually positive for the US Dollar.
Today's main event is the ECB meeting. Economists at OCBC Bank analyze how the Monetary Policy Statement could impact the FX market.
ECB to remain on hold
It is widely expected for the ECB to remain on hold. In fact, our house view is that the ECB is done tightening for current cycle. It is likely ECB may potentially start a debate on how they want to tackle excess liquidity in next stage of inflation fight.
Discussion on how to reduce excess liquidity will focus on three areas: 1/ the amount of reserves banks must keep at the ECB; 2/ the unwinding of its bond-buying programmes and 3/ a new framework for steering short-term interest rates. These imply that raising minimum RR should not be ruled out.
Overall, the ECB meeting is likely a non-event for FX.
In the past few days, EUR/USD has travelled from a recent high around 1.0694 back to the 1.0540 area. Economists at Rabobank analyze the pair’s outlook.
USD to remain well-supported
The USD will likely continue to be buffered by the movement in US yields in the weeks ahead. That said, we would expect any surge in safe-haven demand to benefit the USD, even if this also drives down treasury yields.
Despite the anticipated efforts by the ECB to promote a higher for longer outlook for European rates, in our view, the weakness of the Eurozone economy suggests scope for further downside pressure on the EUR.
We maintain a forecast of EUR/USD 1.02 on a three-month view.
Safe-haven flows dominate the action early Thursday. Economists at OCBC Bank analyze market’s outlook.
USD may stay supported in the near term
While geopolitics uncertainty can keep the bid for safe-haven proxies, we need to highlight that geopolitical developments can be fluid. As much as risk-off can fuel Gold upside, easing tensions can quickly reverse the sharp rise as well. Not forgetting real rates are still high. That said, in absence of any signs of de-escalation, USD may stay supported in the near term.
Looking out, while the chance for another Fed hike remains, we believe the Fed is done for current cycle. Restrictive rates and signs of inflation and expectations coming off should justify an extended hold and a potential pivot eventually. When that happens, USD can ease lower. This week, the focus is on 3Q GDP (today) and Core PCE data (Fri). Softer print, in particular PCE core can weigh on USD.
EUR vs. BTP/Bund spread is a downside risk for the shared currency, economists at MUFG Bank report.
The window for USD strength remains open
The sharp EUR/USD sell-off after the rally on Monday suggests FX positioning is skewed toward a dovish tilt today and/or possibly some ECB-induced BTP selling.
After the EUR/USD bounce on Monday, the move now looks more like a false breakout with the technical picture increasingly looking bearish for EUR/USD over the short term.
The window for USD strength that looked to be closing at the start of the week remains open for now.
- USD/CHF finds offers near 0.9000 as focus shifts to US GDP data.
- The upbeat GDP report would impact the decision-making of Fed policymakers for the November meet.
- USD/CHF delivered a bullish reversal after a breakout of the Inverse H&S chart pattern.
The USD/CHF pair faced some selling pressure after printing a four-day high near the psychological resistance of 0.9000 in the European session. The Swiss Franc asset corrected gradually as the US Dollar struggled for upside ahead of the US Q3 Gross Domestic Product (GDP) data, which will be published at 12:30 GMT.
Analysts at Wells Fargo have forecasted the real GDP to expand at a 5.0% annualized rate in Q3. If realized, economic growth will be up 3.0% on a YoY basis, roughly half a percentage point ahead of its pre-pandemic average.
The upbeat GDP report would also impact the decision-making of Federal Reserve (Fed) policymakers for the monetary policy meeting scheduled for November 1. It is widely anticipated that the Fed will keep interest rates unchanged in the range of 5.25-5.50% due to higher long-term bond yields.
This week, the Swiss Franc remained under pressure amid weak ZEW Expectations-Survey data. The sentiment indicator showed that business and employment conditions deteriorated further in October.
USD/CHF delivered a bullish reversal after a breakout of the Inverse Head and Shoulder chart pattern formed on an hourly scale. The Swiss franc asset has reached to near the horizontal resistance plotted from October 19 high plotted around 0.9000. Upward-sloping 20-period Exponential Moving Average (EMA) indicates that the near-term trend is bullish.
The Relative Strength Index (RSI) (14) trades in the bullish range of 60.00-80.00, which warrants more upside ahead.
A fresh upside would appear if the Swiss Franc asset delivers a confident break above the psychological resistance of 0.9000. This would drive the asset toward October 17 high at 0.9032, followed by October 10 high at 0.9083.
In an alternate scenario, a downside move below October 25 low at 0.8920 would expose the asset to October 24 low at 0.8888. Further breakdown below the latter would drag the asset toward September 5 low around 0.8830.
USD/CHF hourly chart
-638339134393568908.png)
- Natural Gas prices jump to $3.42 as tension builds around possible invasion.
- The US Dollar reclaims its status as King Dollar as US yields flirt with 5% again.
- Natural Gas prices could jump rapidly once reports are issued that Israel has started its ground offensive.
Natural Gas has recovered in the wake of rumours and now firm confirmation that Israel is ready to go ahead with its ground assault. Despite several visits from a variety of world leaders asking for more time to have a human corridor, Israel has drawn up plans and is positioning troops and material. For Gas prices it means that the previous risk premium that got priced out over the past few days, now needs to be priced in again, and gas prices could be sent soaring towards $3.60 again and possibly higher.
Meanwhile, the US Dollar (USD) is raking in investors’ money again as a flight to safe haven is happening. Although US yields are soaring back to 5%, it looks as if markets are getting adjusted to these high rates and are rather dealing with the pain of high yields instead of having their money safely tucked away in case the Israeli ground offensive sparks a wider war in the region. This means the US Dollar Index (DXY) will remain elevated for longer.
Natural Gas is trading at $3.41 per MMBtu at the time of writing.
Natural Gas news and market movers
- Israeli Prime Minister Benjamin Netanyahu confirmed a ground invasion into Gaza is prepared. This comes despite the request from US President Joe Biden to delay a full incursion in the region.
- Recent weather models and extrapolations into the EU gas storage facilities, shows that the EU could end the winter with still 44% of gas reserves left.
- The weekly US Natural Gas Storage Change for last week is due to be released from the Energy Information Administration (EIA) around 14:30 GMT. Expectations are for a draw down to 79 from 97.
- With rumours mounting of an Israeli invasion, together with a drawdown in US gas storages, some short term bullish support in Natural Gas prices could send nearterm futures soaring higher in price.
Natural Gas Technical Analysis: Potential risk of squeeze higher
Natural Gas was sinking lower the past few days, pricing out the risk premium that was valued for any possible ground invasion that could pressure the whole Middle Eastern area and enlarge any proxy war possibilities. Overnight Israeli Prime Minister Netanyahu had put the ground offensive back on the table, which means gas prices need to scramble to price back in the risk premium. Expect with headlines around this topic, to see quick sprints higher in gas prices over the coming days and weeks.
From a purely technical perspective, gas prices broke back above the topside trend line identified earlier, near $3.37, on Wednesday. Expect to see a continuation higher from here with the next level on the upside at $3.60. Should a big ground invasion take place and several countries start to choose sides, expect a very quick squeeze higher to $4.32, the high of 2023.
On the downside, the trend channel should try to act as support again, near $3.37. Natural Gas prices could fall to $3.07, with that orange line identified from the double top around mid-August. Should the drop become a broader sell-off, prices could sink to $3.03, at the 55-day Simple Moving Average.
-638339073026003373.png)
XNG/USD (Daily Chart)
Natural Gas FAQs
What fundamental factors drive the price of Natural Gas?
Supply and demand dynamics are a key factor influencing Natural Gas prices, and are themselves influenced by global economic growth, industrial activity, population growth, production levels, and inventories. The weather impacts Natural Gas prices because more Gas is used during cold winters and hot summers for heating and cooling. Competition from other energy sources impacts prices as consumers may switch to cheaper sources. Geopolitical events are factors as exemplified by the war in Ukraine. Government policies relating to extraction, transportation, and environmental issues also impact prices.
What are the main macroeconomic releases that impact on Natural Gas Prices?
The main economic release influencing Natural Gas prices is the weekly inventory bulletin from the Energy Information Administration (EIA), a US government agency that produces US gas market data. The EIA Gas bulletin usually comes out on Thursday at 14:30 GMT, a day after the EIA publishes its weekly Oil bulletin. Economic data from large consumers of Natural Gas can impact supply and demand, the largest of which include China, Germany and Japan. Natural Gas is primarily priced and traded in US Dollars, thus economic releases impacting the US Dollar are also factors.
How does the US Dollar influence Natural Gas prices?
The US Dollar is the world’s reserve currency and most commodities, including Natural Gas are priced and traded on international markets in US Dollars. As such, the value of the US Dollar is a factor in the price of Natural Gas, because if the Dollar strengthens it means less Dollars are required to buy the same volume of Gas (the price falls), and vice versa if USD strengthens.
Today, the Central Bank of Türkiye (CBT) announces its policy decision. Economists at ING analyze Lira’s outlook ahead of the announcement.
CBT currently has the TRY locked in a managed depreciation regime
The vast majority of economists, ourselves included, expect a 500 bps hike. There is a minority, however, looking for a smaller 250 bps hike. A smaller hike might initially hit the Turkish Lira on the view that the CBT is reluctant to take real rates into positive territory.
However, we suspect there will be demand for Lira through the forwards market were the year-end outright to be priced substantially above 30.00. We say this because it looks like the CBT currently has the TRY locked in a managed depreciation regime, with a seeming target of around 30.00 at year-end.
Economist at UOB Group Lee Sue Ann says recent higher-than-expected inflation figures in Australia could encourage the RBA to hike its OCR at the November meeting.
Key Takeaways
Headline CPI came in at 1.2% q/q for 3Q23, a tad higher than expectations of 1.1% q/q, and against a reading of 0.8% q/q in 2Q23. Compared to the same period a year ago, CPI rose 5.4% y/y in 3Q23, continuing to ease from the previous print of 6.0% y/y in 2Q23, though a tad higher than expectations of 5.3% y/y.
Meanwhile, the jobless rate fell from 3.7% in Aug to 3.6% last month even as employers shed 39,900 full-time positions. The swing factor was the drop in the participation rate, easing 0.3ppt to 66.7% in Sep from a record-high of 67.0% in Aug.
We have been penciling a chance of the Reserve Bank of Australia (RBA) hiking one last time this year, taking the cash rate target to a peak of 4.35%. In terms of timing, we believe this will occur at the 7 Nov meeting, following today’s release of the 3Q23 CPI.
SEK has regained renewed tailwind following the Riksbank initiating its hedging of the FX reserve. Economists at Danske Bank analyze Krona’s outlook.
EUR/SEK to move towards 11.80 in 12M
We flagged that if the Riksbank opts for a frontloaded FX reserves hedging program it could be the straw that breaks the camel’s back. They did. And it was. However, we see this as a transitory effect unless other investors follow suit (see Flows section). With structural and cyclical, including monetary policy, headwinds still in place we foresee no major turnaround in the SEK over the medium term.
Short term, we note that EUR/SEK is slightly (one standard deviation) above rates-implied fair value (downside magnet currently around 11.50) as risk appetite has deteriorated. We deem it unlikely that a resolution is reached between Hamas and Israel in the near term. This alongside any further gains in US yields could have adverse effects on risk and global growth prospects and by extension pose an upside risk to EUR/SEK.
Forecast 11.60 (1M), 11.50 (3M), 11.70 (6M), 11.80 (12M)
- Gold price extends gains as Middle East tensions escalate.
- The demand for US Dollar and bond yields strengthens ahead of the Q3 GDP data.
- Market sentiment remains downbeat amid geopolitical tensions and global slowdown fears.
Gold price (XAU/USD) prints a fresh three-day high as confirmation from Israeli Prime Minister Benjamin Netanyahu that the Israeli army is prepared for the ground assault in Gaza, increases the appeal of safe-haven assets.
The demand for bullions remains upbeat despite a surge in the US Dollar and long-term US bond yields following strong US business activity in October. Meanwhile, investors await the US Q3 Gross Domestic Product (GDP) and core Personal Consumption Expenditure (PCE) inflation data for September, which carries the potential to impact the decision-making of the Federal Reserve (Fed) in its monetary policy meeting scheduled for November 1.
Daily Digest Market Movers: Gold price refreshes three-day high amid Middle East tensions
- Gold price refreshes a three-day high near $1,990.00 on safe-haven demand after a statement from Israeli Prime Minister Benjamin Netanyahu escalated fears of a ground assault in Gaza.
- The tensions in the Middle East have escalated as Benjamin Netanyahu said that the army is preparing for the ground attack but won’t share the exact timing or strategy.
- Netanyahu said that the military’s goal is to save their nation from Hamas. He clarified that the ground assault to destroy Palestine's military troops will start soon.
- The demand for bullions firms again despite a sharp recovery in long-term US bond yields and the US Dollar.
- The US Dollar Index (DXY) refreshed a two-week high above 106.80 after a private sector survey from S&P Global showed that business activities in the US economy remained upbeat in October despite high interest rates by the Federal Reserve.
- The US business activity survey showed that the private sector Manufacturing PMI tested the 50.0 threshold for the first time in six months. An uptick in the US factory activity at the start of the last quarter of 2023 is good news for the economy.
- S&P Global reported that business sentiment has improved on hopes that the Fed is done with hiking interest rates amid easing price pressures.
- The appeal of the US Dollar improves as investors pare investments in risk-sensitive assets due to escalated global slowdown fears.
- The 10-year US Treasury yields rose to 4.96% ahead of the Q3 US GDP data, which will be published at 12:30 GMT. The Bureau of Economic Analysis (BEA) is expected to show an expansion of the US economy at an annualized rate of 4.2% after the 2.1% expansion recorded in the second quarter's GDP report.
- An upbeat GDP report could result in a notable increase in bond yields and the US Dollar as it elevates the odds of one more interest rate increase from the Fed in the remainder of 2023.
- Apart from the US GDP data, investors will watch Durable Goods Orders for September. As per the estimates, the demand for core goods is expected to have risen by 1.5% against a nominal increase of 0.1% in August. An upbeat core goods demand report would elevate consumer inflation expectations and hopes of further policy tightening by the Fed.
- Considering recent statements from Fed policymakers, a steady interest rate decision is widely anticipated from the Fed in its monetary policy meeting on November 1. A majority of Fed policymakers along with Chair Jerome Powell commented that at this time high US bond yields are equivalent to one interest rate hike of 25 basis points (bps).
- As per the CME Fedwatch tool, traders see the Fed keeping interest rates unchanged at 5.25-5.50% almost certain. The odds of one more interest rate increase in any of the two remaining monetary policy meetings in 2023 have increased to 29%.
Technical Analysis: Gold price jumps close to $1,990
Gold price climbed close to $1,990 on Wednesday after concluding the corrective move, which dragged it to near $1,953. The precious metal resumes its upside journey and is aiming to surpass the psychological resistance at $2,000. The near-term trend turns bullish as the 20 and 50-day Exponential Moving Averages (EMAs) have delivered a bull cross. Momentum oscillators trade in a bullish range, which indicates that the upside momentum is intact.
Gold FAQs
Why do people invest in Gold?
Gold has played a key role in human’s history as it has been widely used as a store of value and medium of exchange. Currently, apart from its shine and usage for jewelry, the precious metal is widely seen as a safe-haven asset, meaning that it is considered a good investment during turbulent times. Gold is also widely seen as a hedge against inflation and against depreciating currencies as it doesn’t rely on any specific issuer or government.
Who buys the most Gold?
Central banks are the biggest Gold holders. In their aim to support their currencies in turbulent times, central banks tend to diversify their reserves and buy Gold to improve the perceived strength of the economy and the currency. High Gold reserves can be a source of trust for a country’s solvency. Central banks added 1,136 tonnes of Gold worth around $70 billion to their reserves in 2022, according to data from the World Gold Council. This is the highest yearly purchase since records began. Central banks from emerging economies such as China, India and Turkey are quickly increasing their Gold reserves.
How is Gold correlated with other assets?
Gold has an inverse correlation with the US Dollar and US Treasuries, which are both major reserve and safe-haven assets. When the Dollar depreciates, Gold tends to rise, enabling investors and central banks to diversify their assets in turbulent times. Gold is also inversely correlated with risk assets. A rally in the stock market tends to weaken Gold price, while sell-offs in riskier markets tend to favor the precious metal.
What does the price of Gold depend on?
The price can move due to a wide range of factors. Geopolitical instability or fears of a deep recession can quickly make Gold price escalate due to its safe-haven status. As a yield-less asset, Gold tends to rise with lower interest rates, while higher cost of money usually weighs down on the yellow metal. Still, most moves depend on how the US Dollar (USD) behaves as the asset is priced in dollars (XAU/USD). A strong Dollar tends to keep the price of Gold controlled, whereas a weaker Dollar is likely to push Gold prices up.
- EUR/GBP rises to near 0.8730 ahead of the monetary policy announcement by the ECB.
- The ECB is expected to keep the refinancing rate unchanged at 4.5% amid a poor outlook.
- Investors doubt that UK PM Rishi Sunak would fulfill his promise of halving headline inflation to 5.4% by the year-end.
The EUR/GBP pair prints a fresh three-day high at 0.8730 in the European session. The cross strengthens ahead of the interest rate decision by the European Central Bank (ECB), which will be announced at 12:15 GMT.
Analysts at ING expect the ECB to keep rates on hold and to basically stick to a hawkish bias, keeping the door open to yet another rate hike in December. Currently, the rate at which the ECB is refinancing operations is 4.5%. The reasoning behind higher neutral ECB bets seems the slowdown fears not easing price pressures.
This week, a survey from S&P Global and Hamburg Commercial Bank (HCOB) showed that the Manufacturing PMI of the private sector dropped to 43.0 in October against September’s reading of 43.4. Investors anticipated a higher reading at 43.7. The Eurozone factory activities have been failing to meet the 50.0 threshold for more than a year. Eurozone Services PMI at 47.8, dropped sharply from the former reading and expectations of 48.7.
Investors see more downside in the Eurozone economy as deepening Middle East tensions could ramp up energy prices, which could fuel price pressures and squeeze the real income of households.
Meanwhile, the Pound Sterling faces selling pressure as investors expect that United Kingdom Prime Minister Rishi Sunak would fail to fulfill his promise of halving headline inflation to 5.4% by the year-end. The labor market conditions in the UK economy have been impacted heavily by the deteriorating demand environment as employers shed jobs for the third time in a row.
The past 24 hours have seen a further strengthening of the Dollar. Economists at ING analyze Greenback’s outlook.
Dollar is at risk of some technical corrections
Third-quarter advanced GDP figures are released and should come in strong, with the consensus centred around 4.5% quarter-on-quarter annualised growth. A strong US GDP figure could further strengthen the Dollar.
The Dollar retains the negatives of an overbought currency and is therefore at risk of some technical corrections, but the growth and rate fundamentals are building a stronger floor for the USD.
We see a greater risk that Japanese Yen interventions drag the Dollar lower if anything.
See – US GDP Preview: Forecasts from 10 major banks, surging economic activity
- NZD/USD pulls back from an 11-month low at 0.5773.
- The pair inclines toward the weaker sentiment suggested by the technical indicators.
- Nine-day EMA appears to be the barrier lined up with the 0.5850 psychological level.
NZD/USD dropped to an 11-month low at 0.5773 on Thursday. However, the pair has retraced the daily losses during the European session, struggling to halt a two-day losing streak.
The Moving Average Convergence Divergence (MACD) line persists below both the centerline and the signal line, setting a bearish tone for the NZD/USD pair, as echoed by market sentiment. Investors will likely watch the Kiwi’s Consumer Confidence on Friday, a key indicator for gauging sentiment and economic outlook.
The pair trades around the 0.5800 psychological level followed by the nine-day Exponential Moving Average (EMA) at 0.5849, which emerges as the key resistance lined up with the 0.5850 major level.
A firm break above the level could contribute support for the NZD/USD pair to explore the next psychological region around 0.5900 level following the 23.6% Fibonacci retracement at 0.5920.
On the downside, the region around the intraday low could act again as the immediate support followed by November’s low at 0.5740.
Furthermore, the NZD/USD duo reveals a subdued momentum, with the 14-day Relative Strength Index (RSI) showcasing a clear inclination towards weakness, dipping below the 50 level.
NZD/USD: Daily Chart

Economist at UOB Group Enrico Tanuwidjaja and Junior Economist Agus Santoso assess the latest investment figures in Indonesia.
Key Takeaways
Indonesia attracted a strong investment realization of IDR374.4tn in 3Q23, up 21.6% y/y from IDR307.8tn. The robust investment growth can be attributed to higher investment in the base metals industry, mining, transportation, storage, and communication.
Foreign Direct Investment (FDI) contributed IDR196.2tn or 52.4% of total investment, while Domestic Direct Investment (DDI) contributed IDR168.9tn or 47.6%.
The downstream sector attracted investment of IDR114.6tn or representing 30.6% of total investment in 3Q23. Robust investment growth is a catalyst for Indonesia's economic growth amid global uncertainty which resulted in exports contraction. Along with the government's program that still focuses on infrastructure development and downstreaming, going forward we expect investment will continue to grow positively, even higher than the target set by the government. All in all, stronger investment coupled with higher labor absorption will drive an improvement in people's purchasing power and consumption further.
The Central Bank of Türkiye (CBT) is set to announce its Interest Rate Decision today. Economists at Société Générale analyze Lira’s outlook.
Lira to further weaken
The economists surveyed on Bloomberg are pencilling in 250 bps to 500 bps of rate hikes today and the median consensus is for a 500bp hike to 35.0%. Our house call is for a smaller 300 bps hike today to be followed by more, as we see the key rate rising all the way to 40% by 1Q24.
On the tightening front, the CBRT underdelivered twice in June/July, over-delivered in August and was in line in September, so with such widely negative real yields, we don’t think the quantum of hikes will change the outcome of more lira weakening yet to come.
We expect the Lira to further weaken and USD/TRY to be around 34.00 in the next 12 months.
- USD/CAD pulls back a bit after rising to a seven-month high earlier this Thursday.
- Weaker Crude Oil prices and a bullish USD supports prospects for additional gains.
- Traders now look to the US Q3 GDP and other US macro data for a fresh impetus.
The USD/CAD pair retreats a few pips from its highest level since March touched during the early part of the European session and currently trades just below the 1.3800 mark, unchanged for the day.
The intraday pullback could be attributed to some profit-taking, especially after a strong rally of over 150 pips from the weekly low, around the 1.3660 region touched on Tuesday and ahead of important US economic data. The downside, however, remains cushioned in the wake of the underlying bullish sentiment surrounding the US Dollar (USD) and a modest downtick in Crude Oil prices, which tends to undermine the commodity-linked Loonie.
Growing acceptance that the Federal Reserve (Fed) will stick to its hawkish stance and keep interest rates higher for longer remains supportive of elevated US Treasury bond yields. In fact, the yield on the benchmark 10-year US government bond climbs back closer to a 16-year peak, around the 5% threshold breached earlier this week. Apart from this, the risk-off mood benefits the safe-haven buck, which, in turn, is lending support to the USD/CAD pair.
Against the backdrop of concerns that the raging Israel-Hamas war could spill over to the wider Middle East region, worries about economic headwinds stemming from rapidly rising borrowing costs temper investors' appetite for riskier assets. The looming recession risk, meanwhile, raises doubts over a strong global fuel demand and weighs on Crude Oil prices. This, along with the Bank of Canada's (BoC) relatively dovish outlook, undermines the Canadian Dollar.
The Canadian central bank held its benchmark interest rates unchanged at a 22-year high of 5.0% for the second straight month in light of a slowing economy and lowered its 2023 growth estimate to 1.2% from 1.8% in July. The BoC, meanwhile, sees inflation staying above the 2% target and averaging around 3.5% through mid-2024. This left the door open for more rate hikes, which, in turn, is seen holding back bulls from placing fresh bets around the USD/CAD pair.
Investors also prefer to wait on the sidelines ahead of Thursday's key US macro releases – the Advance Q3 GDP print. This will be accompanied by Durable Goods Orders and the usual Weekly Initial Jobless Claims, followed by Pending Home Sales data. This, along with Fed Governor Christopher Waller's scheduled speech, will influence the USD demand. Apart from this, Oil price dynamics should provide short-term trading impetus to the USD/CAD pair.
Technical levels to watch
- EUR/JPY recovered its intraday losses before the ECB policy decision.
- ECB is expected to keep the deposit rate unchanged at 4.0%.
- ECB might have intervened in the FX market to support the Japanese Yen.
EUR/JPY cross has almost recovered its intraday losses, struggling below the session’s opening bid at 158.71 during the European trading hours on Thursday. The cross receives upward support ahead of the Monetary Policy Statement from the European Central Bank (ECB) due to be released later in the day.
This Eurozone’s inflation levels surpass the ECB's target and mounting concerns about the risk of a slowdown or stagflation in the European zone. Hence, the ECB is expected to discontinue further policy tightening, which puts pressure on the Euro.
ECB President Christine Lagarde on Wednesday emphasized that underlying inflation remains sturdy, and wage growth is sustaining historically high levels. This could play a significant role in shaping the ongoing narrative influencing the performance of the Euro.
Investors will shift their attention to the Tokyo Consumer Price Index (CPI) and Core CPI for October on Friday, seeking the potential impact on market sentiment concerning the inflation scenario in Japan.
The Yen exhibited improvement against the US Dollar during the European session, but the extent and rapidity of the decline raise suspicions, prompting consideration that it might make more sense for Tokyo to intervene.
Earlier in the day, Japan’s Deputy Chief Cabinet Secretary Murai Hideki took center stage, communicating through Reuters that maintaining stable currency movements aligned with fundamentals is of utmost importance. He voices dissatisfaction with excessive foreign exchange (FX) volatility and maintains silence on the topic of currency intervention. Hideki underscores a commitment to taking fully appropriate measures in handling FX matters.
The ECB holds its regular monetary policy meeting today. The actual rate decision is unlikely to provide much of a surprise, economists at Commerzbank report.
ECB widely expected to keep rates on hold
All 51 economists polled by Bloomberg – just like our economists – expect unchanged rates.
There were some officials who were considering an early end to the PEPP reinvestments – at present, this is projected for late 2024. At first glance, it might not make that much sense why this would be relevant for the Euro. However, concerns regarding national finances have been on the rise globally. If the Eurosystem increasingly withdraws as a buyer of government bonds, that is likely to intensify the problems that would affect the EUR. In view of these issues, the ECB will probably want to avoid a premature decision.
There is a lot to suggest that the ECB meeting will be much quieter than was the case over the past months. That does not mean though that individual statements at the press conference will not cause increased volatility, as the ECB provided some surprises every so often over the past months that came unexpected to most market participants.
Positive data surprises do not seem to have much of an effect on the Dollar, economists at Commerzbank report.
The expectations of a soft landing are largely priced in
The expectations of a soft landing are largely priced in now and there is very little scope for Dollar appreciation. If this assumption is correct the solid data today is unlikely to cause much of a reaction.
However, the experience of the past weeks illustrates that we have to remain cautious when it comes to US data, as it often did provide a surprise.
Here is what you need to know on Thursday, October 26:
Markets remain on edge on Thursday and safe-haven flows dominate the action as geopolitical tensions re-escalate. The European Central Bank (ECB) will announce monetary policy decisions later in the day and President Christine Lagarde will speak on the policy outlook and respond to questions afterward. The US economic docket will feature the first estimate of the third-quarter Gross Domestic Product (GDP) data alongside September Durable Goods Orders and weekly Initial Jobless Claims.
Israel ramped up airstrikes in Gaza and Prime Minister Benjamin Netanyahu said late Wednesday that the air assault was "just the beginning" as they were preparing for a ground incursion into the region. Reflecting the risk-averse market atmosphere, US stock index futures were last seen losing between 0.3% and 1.25% on the day.
Meanwhile, the US Dollar Index stays in positive territory above 106.50 after posting gains for the second consecutive day on Wednesday, while the benchmark 10-year US Treasury bond yield holds comfortably above 4.9%. The US economy is forecast to expand at an annual rate of 4.2% in Q3.
US Dollar price this week
The table below shows the percentage change of US Dollar (USD) against listed major currencies this week. US Dollar was the strongest against the Canadian Dollar.
| USD | EUR | GBP | CAD | AUD | JPY | NZD | CHF | |
| USD | 0.38% | 0.60% | 0.67% | 0.15% | 0.34% | 0.44% | 0.53% | |
| EUR | -0.38% | 0.23% | 0.29% | -0.23% | -0.04% | 0.07% | 0.19% | |
| GBP | -0.59% | -0.23% | 0.08% | -0.46% | -0.25% | -0.16% | -0.05% | |
| CAD | -0.67% | -0.29% | -0.09% | -0.53% | -0.34% | -0.25% | -0.10% | |
| AUD | -0.15% | 0.25% | 0.47% | 0.53% | 0.19% | 0.27% | 0.42% | |
| JPY | -0.31% | 0.05% | 0.26% | 0.35% | -0.21% | 0.11% | 0.22% | |
| NZD | -0.44% | -0.06% | 0.18% | 0.25% | -0.27% | -0.09% | 0.14% | |
| CHF | -0.56% | -0.18% | 0.04% | 0.11% | -0.42% | -0.21% | -0.11% |
The heat map shows percentage changes of major currencies against each other. The base currency is picked from the left column, while the quote currency is picked from the top row. For example, if you pick the Euro from the left column and move along the horizontal line to the Japanese Yen, the percentage change displayed in the box will represent EUR (base)/JPY (quote).
US GDP Q3 Preview: When is the preliminary US GDP report, and how could it affect EUR/USD?
The ECB is widely expected to leave key rates unchanged following the October policy meeting. Market participants will pay close attention to the statement language and Lagarde's comments, given the loss of momentum in the European economic activity and growing concerns over the uncertainty surrounding the growth and inflation outlook. Ahead of the ECB event, EUR/USD stays relatively quiet at around 1.0550.
European Central Bank Preview: ECB expected to hold interest rates for first time in current tightening cycle.
USD/JPY broke above its horizontal trading range and climbed to its highest level in a year above 150.50 on Thursday. The pair, however, lost nearly 100 pips in a matter of minutes after touching 150.80, pointing to a possible currency intervention by the Bank of Japan. Earlier in the day, Japanese Prime Minister Fumio Kishida said that the FX intervention was not a contradiction of the policy of shifting money away from savings towards investment.
GBP/USD closed in negative territory on Wednesday and continued to push lower in the Asian session on Thursday. At the time of press, the pair was trading in the red slightly below 1.2100.
Gold benefited from the strong safe-haven demand and climbed to the $1,990 area early Thursday.
- Silver attracts fresh buyers on Thursday and snaps a three-day losing streak to over a one-week low.
- The mixed technical setup warrants caution for bulls and before positioning for any further move-up.
- Acceptance below the 38.2% Fibo. might prompt technical selling and pave the way for deeper losses.
Silver (XAG/USD) builds on the previous day's bounce from the vicinity of mid-$22.00s, or over a one-week low and scales higher through the early part of the European session on Thursday. The white metal, for now, seems to have snapped a three-day losing streak and currently trades around the $23.00 round figure, up nearly 1% for the day.
From a technical perspective, the XAG/USD has been showing some resilience below the 38.2% Fibonacci retracement level of the May-October slide. Moreover, oscillators on the daily chart are holding in the positive territory and support prospects for a further appreciating move. That said, any subsequent move up is more likely to confront stiff resistance near the $23.30-$23.40 confluence, comprising the 50% Fibo. level, the 100-day and 200-day Simple Moving Averages (SMAs).
This is followed by the $23.70-$23.75 strong horizontal barrier, above which a bout of a short-covering move could lift the XAG/USD towards the $24.00 mark, which coincides with the 61.8% Fibo. level. Some follow-through buying will expose a descending trend-line hurdle extending from the May high, currently pegged around the $24.20 region. A convincing breakout through the latter will be seen as a fresh trigger for bullish traders and set the stage for some meaningful upside.
On the flip side, the 38.2% Fibo. level, around the $22.75 area, now seems to protect the immediate downside ahead of the overnight swing low, near the $22.55 zone. Failure to defend the said support levels might prompt some technical selling and drag the XAG/USD to the $22.30-$22.25 horizontal resistance breakpoint now turned support. The downward trajectory could get extended further towards the $22.00 round-figure mark, representing 23.6% Fibo. level.
Silver daily chart
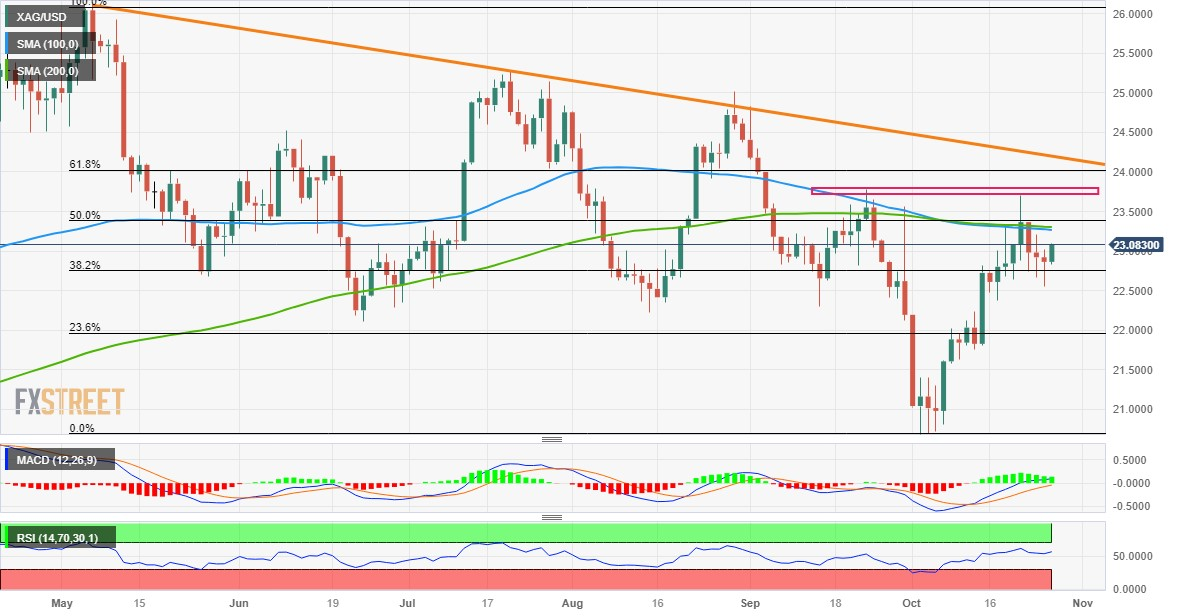
Technical levels to watch
Economists at ING anlayze EUR/USD outlook ahead of today’s ECB meeting.
Room for a hawkish surprise
The ECB announces policy today, and we expect both a hold and an attempt to divert the focus away from rate-based guidance to non-rate monetary policy discussions.
There is some room for a hawkish surprise, but we would have some doubts – given the rate and growth differentials – that markets will have the appetite to chase EUR/USD rallies beyond 1.060/1.0630 for much longer after the ECB announcement.
All in all, we don’t think this will be a game-changing event for EUR/USD.
- The Euro remains on the defensive vs. the US Dollar.
- Stocks in Europe open with marked losses on Thursday.
- EUR/USD deflates to weekly lows near 1.0530.
- The USD Index (DXY) extends the upside and approaches 107.00.
Currently, the Euro (EUR) is extending its vulnerability against the US Dollar (USD), resulting in EUR/USD shedding further ground to weekly lows around 1.0540 following the opening bell in the old continent on Thursday.
In the meantime, the Greenback is in the process of regaining further balance after extra gains on Wednesday, leading the USD Index (DXY) to the proximity of the key hurdle at 107.00 the figure. The so-far daily advance in the Dollar appears once again bolstered by higher US yields in the belly and the long end of the curve.
In the realm of monetary policy, there is a growing consensus among market participants that the Federal Reserve (Fed) will maintain its current stance of keeping interest rates unchanged at the meeting on November 1. This view has been reinforced by remarks made by Fed Chair Jerome Powell in his recent speech at the Economic Club of New York (October 19).
Meanwhile, investors are contemplating the possibility of the European Central Bank (ECB) discontinuing its policy of tightening, even though inflation levels have exceeded the bank's target and concerns are emerging regarding the risk of an economic slowdown or stagflation in the Eurozone. On this, the ECB is widely anticipated to leave its interest rates unchanged at its meeting later in the session.
Data-wise, in the US, the flash Q3 GDP Growth Rate will be at the centre of the debate, seconded by weekly Initial Jobless Claims, Pending Home Sales, Durable Goods Orders and preliminary Goods Trade Balance.
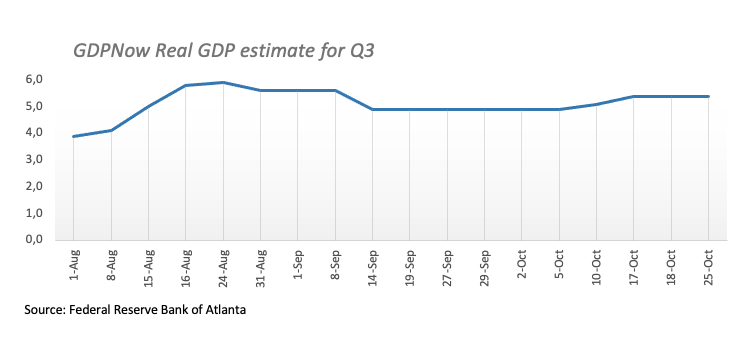
Daily digest market movers: Euro loses the grip and retargets 1.0500
- The EUR’s decline picks up extra pace vs. the USD on Thursday.
- US and German yields trade in a mixed fashion early in the European session.
- A 25 bps rate hike by the Fed remains on the table at the December event.
- The ECB is seen entering a (protracted?) pause at its meeting on Thursday.
- Geopolitical concerns in the Middle East remain steady.
- The move above 150.00 in USD/JPY reignites intervention talk.
- Investors’ attention will also be on Lagarde’s press conference.
- US GDP figures are expected to show further resilience of the economy.
Technical Analysis: Euro still risks a deeper pullback near term
EUR/USD extends the bearish note to fresh weekly lows and shifts its attention to a potential visit to the 1.0500 neighbourhood.
If the selling trend continues, immediate support may be located near the weekly low of 1.0495 (October 13), followed by the 2023 low of 1.0448 (October 3) before hitting the round level of 1.0400. If this zone is crossed, the pair may continue to fall towards the weekly lows of 1.0290 (November 30, 2022) and 1.0222 (November 21, 2022).
If bulls retake control, EUR/USD will find initial resistance around the October top of 1.0694 (October 25), which looks underpinned by the vicinity of the temporary 55-day SMA. The breakout of this zone reveals the weekly high of 1.0767 (September 12), which precedes the significant 200-day SMA at 1.0813. Once this level is cleared, it might signal a further push towards the weekly peaks of 1.0945 (August 30), prior to the psychological milestone of 1.1000. If the rising trend continues, the August peak of 1.1064 (August 10) might be challenged, seconded by the weekly high of 1.1149 (July 27), and possibly even the 2023 top of 1.1275 (July 18).
It is vital to note that as long as the EUR/USD continues below the 200-day SMA, the pair may face persistent negative pressure.
Euro FAQs
What is the Euro?
The Euro is the currency for the 20 European Union countries that belong to the Eurozone. It is the second most heavily traded currency in the world behind the US Dollar. In 2022, it accounted for 31% of all foreign exchange transactions, with an average daily turnover of over $2.2 trillion a day.
EUR/USD is the most heavily traded currency pair in the world, accounting for an estimated 30% off all transactions, followed by EUR/JPY (4%), EUR/GBP (3%) and EUR/AUD (2%).
What is the ECB and how does it impact the Euro?
The European Central Bank (ECB) in Frankfurt, Germany, is the reserve bank for the Eurozone. The ECB sets interest rates and manages monetary policy.
The ECB’s primary mandate is to maintain price stability, which means either controlling inflation or stimulating growth. Its primary tool is the raising or lowering of interest rates. Relatively high interest rates – or the expectation of higher rates – will usually benefit the Euro and vice versa.
The ECB Governing Council makes monetary policy decisions at meetings held eight times a year. Decisions are made by heads of the Eurozone national banks and six permanent members, including the President of the ECB, Christine Lagarde.
How does inflation data impact the value of the Euro?
Eurozone inflation data, measured by the Harmonized Index of Consumer Prices (HICP), is an important econometric for the Euro. If inflation rises more than expected, especially if above the ECB’s 2% target, it obliges the ECB to raise interest rates to bring it back under control.
Relatively high interest rates compared to its counterparts will usually benefit the Euro, as it makes the region more attractive as a place for global investors to park their money.
How does economic data influence the value of the Euro?
Data releases gauge the health of the economy and can impact on the Euro. Indicators such as GDP, Manufacturing and Services PMIs, employment, and consumer sentiment surveys can all influence the direction of the single currency.
A strong economy is good for the Euro. Not only does it attract more foreign investment but it may encourage the ECB to put up interest rates, which will directly strengthen the Euro. Otherwise, if economic data is weak, the Euro is likely to fall.
Economic data for the four largest economies in the euro area (Germany, France, Italy and Spain) are especially significant, as they account for 75% of the Eurozone’s economy.
How does the Trade Balance impact the Euro?
Another significant data release for the Euro is the Trade Balance. This indicator measures the difference between what a country earns from its exports and what it spends on imports over a given period.
If a country produces highly sought after exports then its currency will gain in value purely from the extra demand created from foreign buyers seeking to purchase these goods. Therefore, a positive net Trade Balance strengthens a currency and vice versa for a negative balance.
Since the surprise interest rate hike on August 24, which gave the Lira a tidy 6% boost, the Turkish currency has been depreciating as if on a string. Economists at Commerzbank analyze TRY outlook ahead of the Turkish Central Bank (CBT) Interest Rate Decision.
CBT's restrictive monetary policy is only a necessary condition for a Lira recovery
If the CBT disappoints today, the Lira is likely to suffer. Because then all the analysts (including me!) will be speculating whether President Recep Tayyip Erdoğan had his fingers in the pie again. But if the CBT raises rates as expected or more, there is little chance of a sustained Lira recovery.
Unfair? Well, the CBT's restrictive monetary policy is – to use mathematicians' jargon – only a necessary condition for a Lira recovery. Turkey's policy mix would only be sufficient if the president's monetary turnaround were more credible to the market and to the public than it is at present.
- USD/CHF extends gains on the back of surging US Bond yields
- Investors await the releases of US GDP and Core PCE figures, seeking the current state of the US economy.
- US Dollar gains ground on stronger US housing data and improved risk aversion.
USD/CHF moves upward for the third successive day, marking weekly highs around 0.8990 during the Asian session on Thursday. The US Dollar (USD) continues to gain value on the back of surging US Bond yields, which provides support to underpinning the USD/CHF pair.
Investors will likely observe the US Q3 Gross Domestic Product (GDP) figures and Core Personal Consumption Expenditures (PCE) on Thursday and Friday, respectively, which may provide a crucial snapshot of economic performance in the United States.
The US Dollar Index (DXY) extends its winning streak for the third consecutive day, hovering around 106.90 at the time of writing. The US Dollar receives support from the stronger US housing data and improved risk aversion.
US Census Bureau reported the New Home Sales for September on Wednesday, which have surpassed expectations significantly. The headline figure stands at 0.759 million, outperforming the consensus forecast of 0.68 million and marking an increase from the previous reading of 0.676 million. This positive deviation indicates a robust performance in the housing sector, potentially influencing market sentiment.
USD/CHF pair might encounter some resistance as expectations dwindle regarding another rate hike by the Federal Reserve (Fed) by the end of 2023. Investors followed recent diverse comments from Fed officials, including Chairman Jerome Powell's assertion that the central bank currently has no intentions to raise interest rates.
The US Dollar (USD) rides high on the recent upswing in US Treasury yields, with aspirations to surpass the 5.0% mark. At present, the 10-year Treasury note is holding steady at 4.98%, contributing to the strengthened position of the USD.
Swiss Franc could be in for a turbulent journey, given the ZEW Survey Expectations on Wednesday. There is a decline in Switzerland's business conditions and labor market, dropping from 27.6 to 37.8 in October.
Middle-East conflict initially supported the Swiss Franc (CHF) as risk sentiment faltered. However, the latest development appears to be steering investors towards the Greenback. Earlier on Thursday, Israeli Prime Minister Benjamin Netanyahu expressed readiness for a ground assault on Gaza. This has triggered a shift towards a risk-off sentiment, boosting strength for the pair.
Investors await fresh updates on further developments as Iran Foreign Minister Hossein Amir-Abdollahian travels to the US to discuss the Israel-Hamas conflict.
- Pound Sterling is declining toward a seven-month low as Israel-Palestine tensions dampen the market mood.
- Labor demand in the UK has started facing the repercussions of poor business activity.
- A steady interest rate decision is anticipated from the BoE to avoid a recession.
The Pound Sterling (GBP) continues to face intense selling pressure as dismal market sentiment due to escalating tensions in the Middle East combines with a poor economic outlook for the United Kingdom. The GBP/USD pair continues its losing streak for the third trading session in a row as labor market conditions and business activity in the UK region are deteriorating due to a decline in new business orders.
A string of weak economic indicators from the UK economy have dented expectations of more interest rate hikes from the Bank of England (BoE). The central bank is expected to keep interest rates unchanged at 5.25% to avoid further economic casualties. The BoE is widely anticipated to keep interest rates unchanged as a further increase in borrowing costs could push the economy into a recession.
Daily Digest Market Movers: Pound Sterling extends losing streak amid risk-off mood
- Pound Sterling extends its losing spell for the third session in a row as the market sentiment turns sour.
- The broader market mood turns risk-off as Israeli Prime Minister Benjamin Netanyahu reiterated on Wednesday that his troops are preparing for a ground incursion to eliminate Hamas in Gaza with the goal of ‘saving the nation’.
- Benjamin Netanyahu further added that he won’t share the details of when the incursion will begin but that the army will destroy the Palestinian military group.
- Escalated risks of widening the Israel-Palestine conflict have dampened the appeal of risk-perceived assets.
- In addition to the dismal market mood, the deteriorating outlook of the UK economy has resulted in an intense sell-off in the Pound Sterling.
- A survey from S&P Global in October showed that UK business activity remains in the contraction phase as firms are operating at lower capacity due to poor demand in the domestic and overseas market.
- UK firms are heavily relying on inventory backlog to cater current needs of customers due to pessimism over the demand outlook.
- “The UK economy continued to flirt with a recession in October, as the increased cost of living, higher interest rates, and falling exports were widely blamed on a third month of falling output, according to Chris Williamson, Chief Business Economist at S&P Global Market Intelligence.
- The repercussions of weak business activity are impacting visibly on the labor market as UK employers shed jobs for the third time in a row. The UK Office for National Statistics (ONS) reported that 82K employees lost jobs in August. Also, the Claimant Count Change rose sharply by 20.4K in September.
- Going forward, investors will focus on the interest rate decision by the Bank of England (BoE), which will be announced on November 2.
- Due to weak consumer spending, poor business activity, and deteriorating labor market conditions, BoE policymakers are expected to keep interest rates unchanged at 5.25% for the second time.
- Investors remain worried about the inflation outlook with three months left for the UK Prime Minister to fulfill his promise of halving inflation to 5.4% by the year-end.
- Meanwhile, the US Dollar refreshes a two-week high at 106.86 as the appeal for safe-haven assets improves due to geopolitical tensions.
- The demand for the US Dollar strengthens as the US economy is resilient despite higher interest rates by the Federal Reserve (Fed), unlike other economies that are struggling for a firm footing in a high-interest rate environment.
- The S&P Global survey showed that US business activity in the private sector reported an uptick in October. The business sentiment improved on expectations that the Fed is done with hiking interest rates.
- In the meantime, investors await the Q3 Gross Domestic Product (GDP) data, which will be published at 12:30 GMT. Economists have forecasted that the US economy grew by 4.2% on an annualized basis, against 2.1% growth recorded last year in the same period.
Technical Analysis: Pound Sterling falls toward seven-month low at 1.2040
Pound Sterling declines toward a seven-month low at around 1.2040 on downbeat market sentiment. The GBP/USD pair is exposed to the psychological support at the key round number 1.2000 as the overall trend is bearish. The near-term trend for Cable is bearish as the 20 and 50-day Exponential Moving Averages (EMAs) are sloping south. Momentum oscillators have slipped into the bearish range again, which indicates that a fresh downside cycle has started.
Pound Sterling FAQs
What is the Pound Sterling?
The Pound Sterling (GBP) is the oldest currency in the world (886 AD) and the official currency of the United Kingdom. It is the fourth most traded unit for foreign exchange (FX) in the world, accounting for 12% of all transactions, averaging $630 billion a day, according to 2022 data.
Its key trading pairs are GBP/USD, aka ‘Cable’, which accounts for 11% of FX, GBP/JPY, or the ‘Dragon’ as it is known by traders (3%), and EUR/GBP (2%). The Pound Sterling is issued by the Bank of England (BoE).
How do the decisions of the Bank of England impact on the Pound Sterling?
The single most important factor influencing the value of the Pound Sterling is monetary policy decided by the Bank of England. The BoE bases its decisions on whether it has achieved its primary goal of “price stability” – a steady inflation rate of around 2%. Its primary tool for achieving this is the adjustment of interest rates.
When inflation is too high, the BoE will try to rein it in by raising interest rates, making it more expensive for people and businesses to access credit. This is generally positive for GBP, as higher interest rates make the UK a more attractive place for global investors to park their money.
When inflation falls too low it is a sign economic growth is slowing. In this scenario, the BoE will consider lowering interest rates to cheapen credit so businesses will borrow more to invest in growth-generating projects.
How does economic data influence the value of the Pound?
Data releases gauge the health of the economy and can impact the value of the Pound Sterling. Indicators such as GDP, Manufacturing and Services PMIs, and employment can all influence the direction of the GBP.
A strong economy is good for Sterling. Not only does it attract more foreign investment but it may encourage the BoE to put up interest rates, which will directly strengthen GBP. Otherwise, if economic data is weak, the Pound Sterling is likely to fall.
How does the Trade Balance impact the Pound?
Another significant data release for the Pound Sterling is the Trade Balance. This indicator measures the difference between what a country earns from its exports and what it spends on imports over a given period.
If a country produces highly sought-after exports, its currency will benefit purely from the extra demand created from foreign buyers seeking to purchase these goods. Therefore, a positive net Trade Balance strengthens a currency and vice versa for a negative balance.
UOB Group’s Economist Lee Sue Ann and Markets Strategist Quek Ser Leang argue that USD/CNH is now expected to navigate between 7.3050 and 7.3470 in the short term.
Key Quotes
24-hour view: We expected USD to trade in a range between 7.3020 and 7.3240 yesterday. However, after dipping to a low of 7.3074, USD rose strongly to a high of 7.3308. The rapid rise has scope to advance there does not appear to have enough momentum for USD to reach 7.3470 today (there is another resistance at 7.3350). Support is at 7.3220, followed by 7.3150.
Next 1-3 weeks: Two days ago (24 Oct, spot at 7.3080), we indicated that “downward momentum is building, but USD has to break clearly below 7.2850 before a sustained decline is likely.” We added, “the chance of USD breaking clearly below 7.2850 will remain intact as long as it stays below 7.3260 in the next few days.” Yesterday, USD rose above 7.3250 (high has been 7.3308). The momentum buildup has faded. USD is likely to trade in a range for the time being, likely between 7.3050 and 7.3470.
Gold threatened to break through $2,000 as investors flocked to haven assets. Strategists at ANZ Bank analyze the yellow metal’s outlook.
Further gains also hinge on the Fed’s rate cycle nearing an end
The precious metal has gained more than 8% since Hamas attacked Israel. While the war will continue to drive haven flows toward Gold, further price gains also hinge on the Fed’s rate cycle nearing an end. This will result in retreating US yields, reducing the opportunity cost of Gold.
Demand from the physical market is also strong, from both central banks and consumers.
- The index extends the advance and approaches 107.00.
- The march north in the dollar appears bolstered by US yields.
- US flash Q3 GDP, weekly Claims, Durable Goods Orders next on tap.
The greenback, when gauged by the USD Index (DXY), maintains the bullish bias well in place and already trades at shouting distance from the key 107.00 barrier.
USD Index now looks at key US data
The index advances for the third consecutive session on Thursday, always propped up by the persistent weakness in the risk complex and the intense rally in US yields across different timeframes.
On the latter, the relentless sell-off in the US bond market comes pari passu with expectations of another pause at the Fed’s November 1 meeting, while speculation of a December rate hike remains steady for the time being.
In the meantime, all the attention is expected to be on the release of advanced prints of the Q3 GDP figures, as the resilience of the economy has been closely watched by the Fed and remains one of the pillars of the anticipated tighter-for-longer stance from the central bank.

Additional data will include the usual weekly Initial Claims, Pending Home Sales, Durable Goods Orders and preliminary Goods Trade Balance.
Other than the US calendar, market participants are expected to watch the interest rate decision by the ECB, which is predicted to maintain its rates intact according to the broad consensus.
What to look for around USD
The index keeps the recovery well and sound and retargets the key 107.00 hurdle in the near term.
In the meantime, support for the dollar keeps coming from the good health of the US economy and still elevated inflation, which morphs into higher yields and underpins the renewed tighter-for-longer narrative from the Federal Reserve.
Key events in the US this week: Initial Jobless Claims, Durable Goods Orders, Advanced Goods Trade Balance, Flash Q4 GDP Growth Rate (Thursday) – PCE, Core PCE, Personal Income, Personal Spending, Final Michigan Consumer Sentiment (Friday).
Eminent issues on the back boiler: Persevering debate over a soft or hard landing for the US economy. Incipient speculation of rate cuts in early 2024. Geopolitical effervescence vs. Russia and China and the Middle East.
USD Index relevant levels
Now, the index is up 0.23% at 106.78 and the breakout of 106.88 (weekly high October 26) could expose 107.34 (2023 high October 3) and finally 107.99 (weekly high November 21 2022). On the downside, the next support emerges at 105.36 (monthly low October 24) ahead of 104.42 (weekly low September 11) and then 103.37 (200-day SMA).
The Bank of Canada (BoC) left interest rates unchanged as widely expected. Economists at Commerzbank analyze Loonie’s outlook after the Interest Rate Decision.
The BoC is in an uncomfortable dilemma
On the one hand, the return of inflation to target has again been slightly postponed to the second half of 2025 instead of mid-2025. As far as inflation is concerned, the new projections do not exactly give the all-clear. On the other hand, expected growth has also been revised downwards. Weaker economic growth increases the risk that the BoC will ultimately go too far with further rate hikes.
This dilemma casts doubt on whether the BoC will follow up with another rate hike. The CAD therefore has little to offer against the US Dollar for the time being. After all, the Fed is perceived as much more hawkish and the US economy as much more robust – at least for the time being.
- United States' Gross Domestic Product is forecast to grow at an annual rate of 4.2% in Q3.
- The US Dollar is in a bearish corrective phase ahead of the release.
- After data released by the US Bureau of Economic Analysis, the market sentiment will determine USD direction.
The Gross Domestic Product (GDP) report for the third quarter, to be released by the Bureau of Economic Analysis (BEA) on October 26th, is expected to show an expansion of the US economy at an annualized rate of 4.2% after the 2.1% expansion recorded in the second quarter's GDP report.
The US Dollar (USD) has been easing against its major rivals after reaching fresh year tops in early October on the back of speculation the Federal Reserve (Fed) will refrain from hiking rates any further. Policymakers, Fed Chairman Jerome Powell included, had suggested that high government bond yields are tightening monetary conditions enough to prevent them from acting. Even further, Powell noted that a recession is no longer a base case scenario for the central bank when he announced the September monetary policy decision. However, financial markets remain concerned about economic progress, and the recent war between Israel and the Palestinian group Hamas has revived concerns about global growth.
US Gross Domestic Product forecast: What numbers could tell us
Thursday's US economic docket highlights the release of the preliminary GDP print for the third quarter, scheduled at 12:30 GMT. The first estimate is expected to show that the world's largest economy expanded by 4.2% in the three months to September, more than doubling the previous quarter’s reading.
If that’s the case, financial markets will likely feel more optimistic. The US Dollar may strengthen, but its gains could be limited by a risk-on mood, boosting demand for high-yielding assets.
However, how positive would substantial growth be? Investors should consider the Federal Reserve (Fed) factor before rushing into trading the news.
Fed Chairman Jerome Powell has said the central bank needs below-trend growth for inflation to return to the 2% target. So far, the American economy has remained resilient, with the labor market barely loosening. Hence, substantial growth is playing against the case of taming inflation. There are good chances the figures result even better than anticipated, given continued job growth and increased consumer spending. Financial markets could initially welcome the news, but in the long run, growth momentum needs to decelerate to balance the economy.
“The US economy continued to show remarkable resilience over the summer with surprisingly robust job growth and an unexpected consumer spending spree that likely propelled real GDP growth above 5% annualized in (the third quarter),” Gregory Daco, chief economist at EY-Parthenon, wrote in an analyst note.
When is the GDP print released, and how can it affect EUR/USD?
The US GDP report will be released at 12:30 GMT on Thursday. Ahead of the event, the US Dollar is in a corrective slide after achieving extreme overbought conditions, particularly against the Euro.
EUR/USD slid continuously throughout the quarter, peaking for the year at 1.1275 in July, with the subsequent run south establishing a 2023 low at 1.0447 early in October. Financial markets turned optimistic as the odds for additional Fed rate hikes plummeted following the September announcement. Furthermore, multiple Fed officials noted that soaring government bond yields somehow tightened monetary conditions and further helped them to stay pat.
US Dollar losses, however, had been contained. This was partially due to the poor performance of other major economies and, lately, due to the unexpected Middle East conflict between Hamas and Israel.
Back to GDP figures, an upbeat figure will likely boost the market’s optimism, limiting the USD's near-term bullish potential. On the other hand, a much worse-than-expected reading could fuel concerns benefiting the USD.
Valeria Bednarik, Chief Analyst at FXStreet, notes about EUR/USD: “Despite the recent bottom and the following 250 pips recovery, EUR/USD retains the long-term bearish bias. This week's sharp retracement from near 1.0700 hints at still-high selling interest. Still, additional declines are limited by uncertainty about future economic performance at both shores of the Atlantic.”
She adds: “The 1.0520 provides near-term support, with a break through 1.0490 required for a steeper decline, with a test of the year low at sight. A break below the latter should spook buyers and open the door for a slide towards the 1.0320/40 price zone. The focus will be on a potential run through 1.0700 if the pair gains upward traction with the news. The next relevant resistance and potential bullish target comes in the 1.0770 region.”
Economic Indicator
United States Gross Domestic Product Annualized
The Gross Domestic Product Annualized released by the US Bureau of Economic Analysis shows the monetary value of all the goods, services and structures produced within a country in a given period of time. GDP Annualized is a gross measure of market activity because it indicates the pace at which a country's economy is growing or decreasing. Generally speaking, a high reading or a better than expected number is seen as positive for the USD, while a low reading is negative.
Read more.Next release: 10/26/2023 12:30:00 GMT
Frequency: Quarterly
Source: US Bureau of Economic Analysis
Why it matters to traders
The US Bureau of Economic Analysis (BEA) releases the Gross Domestic Product (GDP) growth on an annualized basis for each quarter. After publishing the first estimate, the BEA revises the data two more times, with the third release representing the final reading. Usually, the first estimate is the main market mover and a positive surprise is seen as a USD-positive development while a disappointing print is likely to weigh on the greenback. Market participants usually dismiss the second and third releases as they are generally not significant enough to meaningfully alter the growth picture.
After a consistent underperformance over the past months, the EUR/USD decline has stalled. Economists at Danske Bank analyze the pair’s outlook.
Still upside risk in the near term
We maintain the strategic case for a lower EUR/USD based on relative terms of trade, real rates (growth prospects) and relative unit labour costs. Hence, we maintain our 12M forecast at 1.03.
Nonetheless, in the near term, we think there is a possibility of EUR/USD tailwinds due to several factors. These include US economic data starting to disappoint after an exceptional run of positive surprises, a slight rebound in the struggling manufacturing sector, and a bottoming out of China pessimism. Escalating geopolitical tensions are a risk.
Forecast: 1.08 (1M), 1.06 (3M), 1.05 (6M), 1.03 (12M)
Extra gains remain on the cards for USD/JPY once the 150.50 hurdle is cleared, according to UOB Group’s Economist Lee Sue Ann and Markets Strategist Quek Ser Leang.
Key Quotes
24-hour view: Yesterday, we highlighted that “the rebound in USD could extend above 150.00.” We also highlighted that “the major resistance at 150.50 is unlikely to come under threat.” Our threat was not wrong as USD rose to a high of 150.31. Today, USD could rise above 150.50. As upward momentum has not increased much, it is unlikely to be able to maintain a foothold above this level. USD is also unlikely to threaten the next resistance at 151.00. Support is at 149.95; a breach of 149.75 would mean that the current upward pressure has faded.
Next 1-3 weeks: Our latest narrative was from two days ago (24 Oct, spot at 149.70), wherein USD is likely to trade in a range of 149.00/150.50 for the time being. Yesterday, USD rose to a high of 150.31. Upward momentum is beginning to improve. However, in order for USD to advance in a sustained manner, it must break and stay above 150.50. The next resistance is at 151.00. The risk of USD breaking clearly above 150.50 will remain intact as long as USD stays above 149.35 in the next couple of days.
Considering advanced prints from CME Group for natural gas futures markets, open interest resumed the uptrend, rising by around 2.4K contracts, on Wednesday. On the other hand, volume retreated for the third straight session, this time by around 83.8K contracts.
Natural Gas: Further gains need to clear $3.00
Prices of natural gas extended the rebound and flirted with the key $3.00 mark per MMBtu on Wednesday. The move was in tandem with rising open interest and favours the continuation of the rebound in the very near term. Above the $3.00 mark, there are no resistance levels of note until the October highs near $3.50 (October 9).
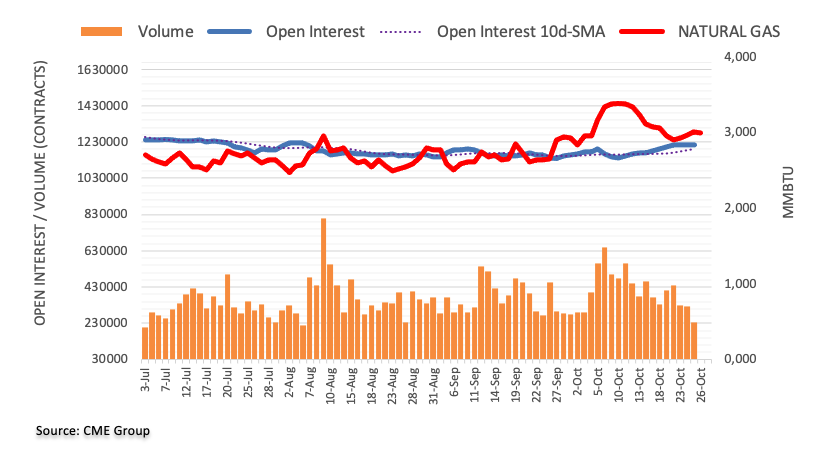
USD/JPY has now been trading above the 150 psychological level for several hours. Economists at Commerzbank analyze the pair’s outlook.
The next few days are going to be exciting
Given the fundamental reasons for a higher USD/JPY, such as the divergence in monetary policy, the market is likely to be aiming for much higher levels. The larger moves in the last few hours after the level was breached support this view.
It is also possible that this is just a new confusion tactic by the MoF. It is possible that the MoF will only intervene at higher levels. This would probably significantly increase the losses of market participants. However, given the large number of confusing decisions by the BoJ and the Japanese Ministry of Finance (MoF) in recent months, such a tactic would no longer surprise me.
But one thing is for sure, the next few days are going to be exciting.
- The European Central Bank is set to keep key interest rates steady on Thursday after ten consecutive hikes.
- ECB’s Lagarde could strike a hawkish tone amid upside risks to inflation on Middle East strife.
- The Euro volatility will likely spike up on the ECB decision and Lagarde’s presser.
Ten meetings later and after an unprecedented 450 basis points increase in interest rates in less than two years, the European Central Bank (ECB) is set to keep borrowing costs steady on Thursday. The decision will be announced at 12:15 GMT, followed by ECB President Christine Lagarde’s press conference at 12:45 GMT. There will be no publication of the updated staff projections at this meeting.
European Central Bank interest rate decision: What to know in markets on Thursday
- EUR/USD is sitting at the lowest level so far this week near 1.0550, courtesy of risk aversion fueled by Mideast tensions and surging US Treasury bond yields.
- The benchmark 10-year US Treasury bond yield is closing in on the 5.0% level yet again,
- In a televised statement late Wednesday, Israeli Prime Minister Benjamin Netanyahu said that Israel is preparing a ground invasion of Gaza.
- US S&P 500 futures trade with sizeable losses, as a result of global flight to safety.
- Germany’s IFO Business Climate Index for October came in higher than expected at 86.9 on Wednesday, beating the market forecast of 85.9. This was the first monthly increase after five consecutive declines.
- On Tuesday, HCOB's flash Eurozone Composite Purchasing Managers' Index (PMI), compiled by S&P Global, fell to 46.5 in October from September's 47.2, its lowest since November 2020.
- The ECB event is expected to provide a fresh directional impetus to the EUR/USD pair, with attention turning toward next week’s Fed policy announcements.
What is expected from the next ECB meeting and how will it impact EUR/USD?
Economists are widely expecting the European Central Bank (ECB) to announce a pause on Thursday, keeping the Deposit Rate steady at 4% while maintaining the Refinancing operations lending rate at 4.5%.
Despite a steady interest rate decision, markets are betting on a hawkish message from ECB President Christine Lagarde at the press conference, keeping hopes alive for an interest rate hike in December. Renewed geopolitical threat, emanating from the Hamas-Israel military conflict, poses upside risks to the Eurozone’s inflation outlook, which could make it difficult for the central bank to reach its 2.0% target by end-2025, as previously projected. As a net energy importer, the region is directly impacted by rising Oil and Gas prices amidst escalating Middle East tensions.
However, the debate for the next interest rate hike is for the December policy meeting. For this week’s gathering, ECB policymakers could discuss the non-interest rate monetary policy tools, including minimum reserves, reversed tiering and a possible earlier unwinding of the reinvestment of bond purchases under the Pandemic Emergency Purchase Programme (PEPP).
Last month, Reuters reported, citing six sources, that ECB officials “want to soon start discussing how to tackle the multi-trillion-Euro pool of excess liquidity sloshing around banks, with raising reserve requirements a possible first move.”
But the central bank could refrain from tightening financial conditions further, as they assess the lag effect of their interest rate hikes on the economy and inflation prospects. The central bank for over 20 countries that use the Euro has already raised interest rates 10 times to record levels, increasing stagflation risks.
Eurozone’s annual inflation fell to 4.3% in September, cooling to its lowest level since October 2021. The contraction in the Eurozone business activity deepened in October, a survey showed, suggesting the old continent could slip into recession. These data supported the case for an ECB pause on Thursday.
Analysts at BBH noted: “European Central Bank meets Thursday and is expected to keep rates steady. While there are still a handful of hawkish holdouts, most ECB policymakers have acknowledged that the tightening cycle is over.”
“The bank is expected to discuss modifications to reserve requirements as well as how to shrink its PEPP holdings but no decisions are expected until next year. Updated macro forecasts won’t come until the December 14 meeting. Of note, WIRP suggests no odds of a hike this week, rising to top out at only 10% for December 14. A rate cut is nearly priced in for June 6,” BBH analysts added.
If the ECB holds rates and President Lagarde delivers a hawkish message, leaving the door ajar for a December rate hike, EUR/USD could extend its recovery toward 1.0800. On the contrary, an ECB pause combined with a dismissal of potential upside risks to inflation expectations could be viewed as a dovish pause. In this case, the EUR/USD pair could resume its downtrend toward 1.0500.
Dhwani Mehta, Asian Session Lead Analyst at FXStreet, offers a brief technical outlook for the major and explains: “EUR/USD has breached the short-term critical 21-day Simple Moving Average (SMA) on its three-day downtrend that extends into Thursday. The 14-day Relative Strength Index (RSI), however, is pointing lower below the 50 level, indicating that downside risks remain intact for the pair.”
Outlining important technical levels to trade the EUR/USD pair, Dhwani notes: “The immediate support is aligned at the previous week’s low of 1.0511. A sustained break below the latter will put the focus back on the multi-month trough of 1.0448. The last line of defense for Euro buyers is seen at the 1.0400 round level. Conversely, buyers need acceptance above 1.0600 to revive the uptrend toward the 50-day SMA at 1.0665. The next topside target is pegged at the 1.0700 threshold.”
Economic Indicator
European Monetary Union ECB Rate On Deposit Facility
ECB Rate On Deposit Facility, announced by European Central Bank, is the interest rate paid on the surplus liquidity that credit institutions may deposit overnight in an account with a national central bank that is part of the Eurosystem.
Read more.Next release: 10/26/2023 12:15:00 GMT
Frequency: Irregular
Source: European Central Bank
The USD/JPY pair falls from 150.70 to 149.90 during the early European session on Thursday.
More to come…
The continuation of the selling pressure could drag NZD/USD to the 0.5730 area in the next few weeks, suggest UOB Group’s Economist Lee Sue Ann and Markets Strategist Quek Ser Leang.
Key Quotes
24-hour view: Our view for NZD to trade in range between 0.5820 and 0.5865 was incorrect. NZD dropped sharply to 0.5801 in late NY trade and extended its decline in Asian trade today. Further NZD weakness appears likely, even though it does not appear to have enough momentum to reach the major support at 0.5730 today (there is another support at 0.5760). In order to maintain the momentum, NZD must not break above 0.5830 (minor resistance is at 0.5810).
Next 1-3 weeks: Our latest narrative was from two days ago (24 Oct, spot at 0.5845), when we highlighted that “there is room for NZD to weaken further, even though any decline is expected to face strong support at 0.5800.” NZD fell to a low of 0.5801 in NY before extending its decline today. The surge in momentum suggests NZD could continue to decline to 0.5730. On the upside, if NZD breaks above 0.5855 (‘strong resistance’ level previously at 0.5895), it would mean that the weakness in NZD has stabilised.
- EUR/GBP gains ground above the 0.8700 mark ahead of the European Central Bank (ECB) rate decision.
- Markets are pricing the ECB to hold the rate unchanged for the rest of the year.
- The downbeat UK economic data weigh on the GBP amid growing worries about a recession.
- ECB monetary policy meeting will be a closely watched event.
The EUR/GBP cross holds positive ground for the second consecutive day during the early European trading hours on Thursday. Investors will closely monitor the European Central Bank (ECB) interest rate decision later on Thursday, which is anticipated to hold the rate unchanged. The cross currently trades around 0.8726, gaining 0.02% on the day.
Markets are pricing ECB policy rates largely unchanged for the rest of the year, ending its hiking cycle. However, ECB President Lagarde is likely to signal a tightening bias compared to the Bank of England (BoE). This, in turn, might lift the Euro (EUR) against the Pound Sterling (GBP).
Furthermore, ECB President Lagarde said on Wednesday that the central bank will carefully monitor the unfolding crisis in the Middle East and the impact it may have on the eurozone economy.
On the other hand, the disappointing UK economic data exert pressure on the GBP. As reported by S&P Global, the Manufacturing PMI remains in the recessionary zone, while employment data shows that the labor market is easing. These figures might convince the BoE to maintain interest rates steady at 5.25% at its November 2 meeting amid growing worries about a recession.
Moving on, the ECB monetary policy meeting will be in the spotlight. Following the rate decision, the ECB Press Conference will be closely watched by traders. Market players will take cues from these events ahead of the BoE rate decision next week.
EUR/NOK breached the 11.80 mark despite commodity prices rising over the past month, highlighting the importance of the global backdrop. Economists at Danske bank analyze the pair’s outlook.
No near-term turnaround in store for NOK
We still think NOK first and foremost should be treated as a high beta derivative of the global investment environment and in an environment of weakening growth, tight global monetary conditions and a strong USD, the NOK very rarely performs.
Additionally, the recent rise in long-end yields significantly increases the risk of a hard landing for the global economy. In that light, we also lift the long end of the forecast profile, which entails that we no longer embed a stronger NOK in our 12M forecast horizon. We still think NOK is fundamentally undervalued but we do not see the trigger for a turnaround in the next 12M.
Forecast: 11.90 (1M), 12.10 (3M), 12.10 (6M), 12.00 (12M)
Economists at TD Securities discuss the European Central Bank (ECB) Interest Rate Decision and their implications for the EUR/USD pair.
Hawkish (25%)
The GC delivers a well-expected hold but makes a slight hawkish shift in language. In particular, the GC emphasizes that geopolitical instability could warrant further hikes if the subsequent inflation shock is large enough to feed through persistently into inflation expectations. EUR/USD +0.45%.
Base Case (65%)
The GC delivers a well-expected hold and keeps language roughly unchanged relative to September. As such, while the GC does not close the door to further hikes, it essentially implies that they are highly unlikely. EUR/USD -0.10%.
Dovish (10%)
The GC delivers a well-expected hold and explicitly states that the end of the tightening cycle has most likely been reached. EUR/USD -0.30%.
Open interest in crude oil futures markets shrank for the third consecutive session on Wednesday, now by around 4.3K contracts according to preliminary readings from CME Group. Volume, instead, increased for the second session in a row, this time by around 63.1K contracts.
WTI: Another drop to $80.00 should not be ruled out
WTI prices rebounded markedly after three consecutive daily pullbacks on Wednesday. The bounce in prices of the commodity was amidst shrinking open interest, indicating that the continuation of the recovery could face some headwinds in the very near term. On the downside, the key contention emerges at the $80.00 mark per barrel for the time being.
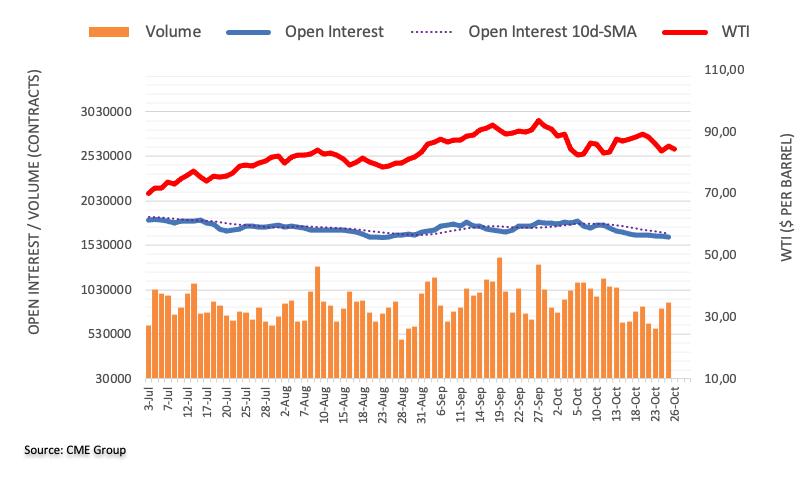
In the view of UOB Group’s Economist Lee Sue Ann and Markets Strategist Quek Ser Leang, GBP/USD risks further retracements in the short-term horizon.
Key Quotes
24-hour view: Yesterday, when GBP was trading at 1.2165, we indicated that “as long as GBP stays below 1.2220, it could dip to 1.2135 before stabilisation is likely.” We added, “The next support at 1.2095 is highly unlikely to come under threat.” Our view for GBP to weaken was not wrong, even though the decline was stronger than expected as GBP dropped to a low of 1.2109. GBP continues to trade on a soft tone in early Asian trade today, and it is likely to weaken further. However, the major support at 1.2040 could be out of reach. Resistance is at 1.2135, followed by 1.2155.
Next 1-3 weeks: We indicated yesterday (25 Oct, spot at 1.2165) that GBP “is likely to consolidate between 1.2095 and 1.2285 for the time being.” We did not anticipate GBP to approach 1.2095 so soon. Downward momentum is beginning to improve. From here, as long as GBP stays below 1.2200, it is likely to test the early October low near 1.2040. A break of this major support could potentially trigger a further drop to 1.2000.
- EUR/USD trades in negative territory for three straight days on Thursday.
- The pair holds below the key 100-hour EMA; the RSI indicator is located in bearish territory under 50.
- The first resistance level will emerge at 1.0582; 1.0522 acts as an initial support level.
The EUR/USD pair loses traction near 1.0545 during the early European session on Thursday. The major pair faces some sell-off on the firmer US Dollar (USD) and the downbeat Eurozone economic data. Furthermore, recent tensions in the Middle East have also prompted worries about the region's dwindling growth prospects. Market players await the European Central Bank (ECB) interest rate decision on Thursday, which is expected to hold the rate unchanged at its October meeting.
Technically, the EUR/USD pair's downward bias remains intact as the major pair holds below the key 100-hour Exponential Moving Average (EMA) on the four-hour chart. Additionally, the Relative Strength Index (RSI) is located in bearish territory under 50, suggesting the path of least resistance is to the downside.
The immediate upside barrier to watch is near the 100-EMA at 1.0582. The key resistance level is seen at the 1.0600-1.0606 region, representing a high of October 25 and a psychological round mark. A decisive break above the latter will see a rally to the upper boundary of Bollinger Band at 1.0685, en route to a high of September 20 at 1.0735.
On the flip side, the initial support level for EUR/USD is located at 1.0522. The mentioned level is the confluence of a lower limit of the Bollinger Band and a low of October 18. Further south, a round figure at 1.0500 will be the next downside stop. A breach of the latter will see a drop to 1.0450 (a low of October 4).
EUR/USD four-hour chart
-638338972978872362.png)
FX option expiries for Oct 26 NY cut at 10:00 Eastern Time, via DTCC, can be found below.
- EUR/USD: EUR amounts
- 1.0470 481m
- 1.0500 893m
- 1.0525 385m
- 1.0540 1.1b
- 1.0550 740m
- 1.0600 1b
- 1.0610 690m
- 1.0700 1b
- GBP/USD: GBP amounts
- 1.2000 364m
- 1.2125 617m
- 1.2185 773m
- 1.2190 473m
- 1.2220 536m
- USD/JPY: USD amounts
- 149.00 433m
- 150.00 1.8b
- 150.20 674m
- 150.35 479m
- 150.75 500m
- 151.00 549m
- USD/CHF: USD amounts
- 0.9000 514m
- AUD/USD: AUD amounts
- 0.6450 372m
- USD/CAD: USD amounts
- 1.3600 679m
- 1.3800 1.1b
- 1.3810 543m
- NZD/USD: NZD amounts
- 0.5800 1.1b
- 0.5875 461m
CME Group’s flash data for gold futures markets noted traders added more than 6K contracts to their open interest positions on Wednesday, extending further the ongoing uptrend. Volume followed suit and went up by nearly 43K contracts after two consecutive daily pullbacks.
Gold: Next on the upside comes $2000
Gold prices resumed the upside and revisited the $1980 region on Wednesday. The daily uptick was on the back of increasing open interest and volume, paving the way for the continuation of the uptrend in the very near term. That said, the next resistance of note emerges at the critical $2000 mark per troy ounce.
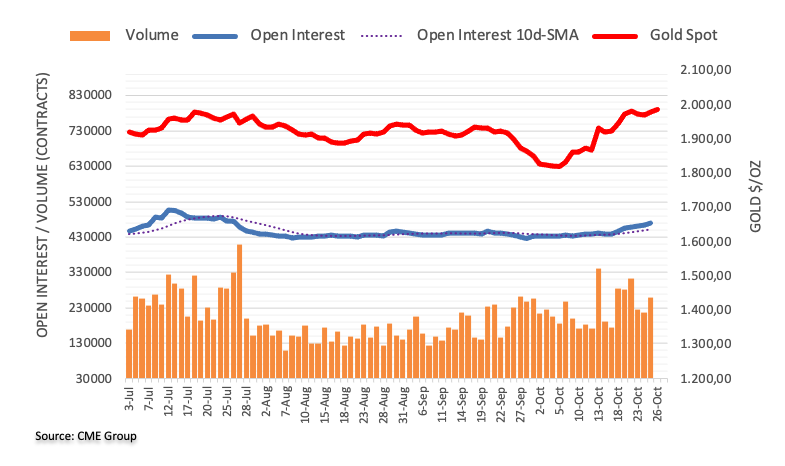
Further consolidation in EUR/USD appears on the cards for the time being, note UOB Group’s Economist Lee Sue Ann and Markets Strategist Quek Ser Leang.
Key Quotes
24-hour view: Yesterday, we held the view that “there is room for EUR to edge lower, but any decline is unlikely to break clearly below 1.0560.” Our view was not wrong, as EUR dipped to a low of 1.0563 in late NY trade. While downward momentum has not increased much, the bias for today is still tilted to the downside. However, today, any decline is unlikely to reach the major support at 1.0510. Note that there is another support at 1.0535. Resistance is at 1.0585, followed by 1.0605.
Next 1-3 weeks: We continue to hold the same view as yesterday (25 Oct, spot at 1.0595), wherein EUR is likely to trade in a range of 1.0510/1.0690 for now. While the underlying tone has weakened somewhat, EUR has to break below the major support at 1.0510 before a sustained decline is likely. At this stage, the likelihood of EUR breaking clearly below 1.0510 is not high.
- NZD/USD weakens as investors ease expectations for a rate hike by the RBNZ.
- Geopolitical uncertainties weigh on the New Zealand Dollar.
- Risk sentiment worsens on Israel's PM Netanyahu's statement about a ground assault in Gaza.
- The surge in US Treasury yields reinforces the US Dollar.
NZD/USD marks an 11-month low, hovering around 0.5790 during the Asian session on Thursday. The pair could reach November’s low during the session.
The Kiwi Dollar grapples with pressure, a predicament exacerbated by the recent release of headline Consumer Price Index (CPI) data. This sentiment is prompting investors to ease their expectations for an interest rate hike by the Reserve Bank of New Zealand (RBNZ).
New Zealand’s third-quarter CPI rose to 1.8%, falling short of the anticipated 2.0%. The yearly rate experienced a deceleration to 5.6% from the previous quarter's 6.0%, further undershooting consensus estimates of a 5.9% reading.
Geopolitical uncertainties cast a shadow on the New Zealand Dollar, as risk sentiment takes a hit. The latest trigger seems to be Israel's Prime Minister Benjamin Netanyahu's statement about a potential ground assault in Gaza, with the timing contingent on consensus. This reinforces the prevailing risk-off sentiment, contributing to the downward pressure on the NZD/USD pair.
Additionally, Iran's Foreign Minister Hossein Amir-Abdollahian visited the US to discuss the conflict between Hamas and Israel, according to Iranian media.
The US Dollar Index (DXY) continues to gain ground, bidding higher around 106.80 at the time of writing. The US Dollar (USD) is bolstered by the recent surge in US Treasury yields, aiming to revisit above 5.0%. By the press time, the 10-year Treasury note stood at 4.97%.
However, the NZD/USD pair's losses might find some limitation amid the varied comments from US Federal Reserve (Fed) officials in the previous days, concerning the trajectory of interest rates. Atlanta Fed President Raphael Bostic indicated that a rate cut before the middle of next year is improbable, and Fed Philadelphia President Patrick Harker voiced a preference for keeping interest rates unchanged.
US Q3 Gross Domestic Product (GDP) figures could provide a crucial snapshot of economic performance later in the North American session. Following that, Friday unveils the Core Personal Consumption Expenditures (PCE) data, offering insights into changes in the prices of goods and services in the United States. In the Kiwi realm, all eyes are on Friday's Consumer Confidence, a key indicator for gauging sentiment and economic outlook.
Japanese Prime Minister Fumio Kishida said on Thursday that the “FX intervention is not a contradiction of policy of shifting money away from savings towards investment.”
Additional quotes
BOJ holds ETFs, JGBs as part of monetary policy
It is up to the BOJ to decide whether to sell its ETF holdings
Market reaction
At the time of writing, USD/JPY is prodding one-year highs at 150.49, up 0.16% on the day, with risks of an FX intervention growing.
- WTI is seen consolidating the previous day’s goodish recovery gains from a nearly two-week trough.
- The Israel-Gaza conflict continues to fuel concerns about supply disruptions and lend some support.
- Looming recession risks and stronger USD cap gains for the commodity ahead of the US Q3 GDP.
West Texas Intermediate (WTI) Crude Oil prices struggle to capitalize on the previous day's goodish rebound from sub-$82.00 levels, or a near two-week low and oscillates in a narrow trading band through the Asian session on Thursday. The commodity currently trades around the $85.00/barrel mark, nearly unchanged for the day, as investors keep a close eye on developments surrounding the Israel-Haman war.
Israel’s commitment to a ground assault on Hamas targets in Gaza has raised the risk of an escalation in the conflict to the wider Middle East region, which could disrupt crude supplies. This, in turn, is seen as a key factor acting as a tailwind for WTI Crude Oil prices. The upside, however, remains capped in the wake of doubts over a strong global fuel demand, amid looming recession risks, and a rise in US crude inventories.
The weak PMI data from the Euro Zone released on Tuesday revived fears about a deeper global economic downturn, which could potentially dent fuel demand. Adding to this, the Energy Information Administration reported on Wednesday that US crude inventories rose by 1.4 million barrels to 421.1 million barrels in the week to October 20, well above consensus estimates. This pointed to some cooling of fuel demand in the US.
The aforementioned mixed fundamental backdrop is holding back traders from placing aggressive directional bets around Crude Oil prices and leading to subdued rage-bound price action. Investors also prefer to wait on the sidelines ahead of the Advance US Q3 GDP print, due later during the early North American session. A stronger US economy gives the Federal Reserve (Fed) more headroom to keep rates higher for longer. This might continue to underpin the US Dollar (USD) and cap the upside for the US Dollar-denominated commodities, including Oil prices.
Technical levels to watch
- Gold price attracts some buyers for the second straight day amid geopolitical concerns.
- Bulls seem rather unaffected by rising US Treasury bond yields and a stronger US Dollar.
- Investors look to the Advance US Q3 GDP growth figures for some meaningful impetus.
Gold price (XAU/USD) gains some positive traction for the second successive day on Thursday and trades around the $1,985 region, up nearly 0.30% during the Asian session. The precious metal remains well within the striking distance of a five-month top touched last Friday and continues to benefit from the risk of a further escalation of the Israel–Gaza conflict. The uptick seem unaffected by elevated US Treasury bond yields and a stronger US Dollar (USD), bolstered by hawkish Federal Reserve (Fed), which tends to undermine the non-yielding yellow metal.
Investors now look forward to key macro data from the United States for cues on the Fed's future rate-hike path, which will play a key role in determining the near-term trajectory for the Gold price. Thursday's US economic docket highlights the release of the Advance Q3 GDP print, Durable Goods Orders, the usual Weekly Initial Jobless Claims, followed by Pending Home Sales data. This, along with Fed Governor Christopher Waller's scheduled speech and the US bond yields, should influence the USD price dynamics and provide some impetus to the XAU/USD.
Daily Digest Market Movers: Gold price remains supported by the Israel-Hamas war, despite stronger US bond yields and US Dollar
- Geopolitical concerns continue to support the Gold price, despite rising US Treasury bond yields and some follow-through US Dollar (USD) buying interest.
- Israel’s military intensified its bombing on Hamas targets in Gaza and is prepared for a ground invasion, increasing the risk of a spillover to the wider Middle East region.
- A slew of international powers have been making diplomatic efforts to de-escalate the raging conflict between Israel and Palestinian militant group Hamas.
- Hawkish Federal Reserve expectations allow the benchmark 10-year US Treasury yield to hold steady near a 16-year top, around the 5% threshold breached earlier this week.
- The XAU/USD bulls, meanwhile, seem rather unaffected by the recent strong US Dollar recovery move from a one-month low touched on Tuesday.
- The preliminary estimate of the US GDP print is expected to show that the economy expanded by 4.2% annualized pace during the third quarter as compared to a 2.1% growth in Q2.
- The market attention will then shift to the US PCE Price Index, which will provide some meaningful impetus ahead of the FOMC meeting next week.
Technical Analysis: Gold price might continue to confront resistance ahead of $2,000 psychological mark
From a technical perspective, the emergence of fresh buying near the $1,953-1,952 resistance breakpoint, turned support, and the subsequent move up favours bullish traders. That said, the Relative Strength Index (RSI) on the daily chart is on the verge of breaking into overbought territory. This, in turn, suggests that the Gold price might continue to confront stiff barrier near the $2,000 psychological mark. A sustained strength beyond, however, has the potential to lift the XAU/USD further towards the next relevant hurdle near the $2,022 area.
On th flip side, the Asian session low, around the $1,980 level, now seems to protect the immediate downside ahead of the $1,971-1,970 region. Some follow-through selling might expose the weekly trough, around the $1,953-1,952 zone touched on Tuesday. The latter represents a strong horizontal resistance breakpoint and should act as a key pivotal point. A convincing break below will make the Gold price vulnerable to accelerate the fall back towards challenging the 200-day Simple Moving Average (SMA), currently pegged near the $1,932-1,931 region.
US Dollar price in the last 7 days
The table below shows the percentage change of US Dollar (USD) against listed major currencies in the last 7 days. US Dollar was the strongest against the New Zealand Dollar.
| USD | EUR | GBP | CAD | AUD | JPY | NZD | CHF | |
| USD | -0.07% | 0.51% | 0.71% | 0.87% | 0.44% | 1.29% | -0.08% | |
| EUR | 0.07% | 0.59% | 0.78% | 0.93% | 0.51% | 1.35% | -0.01% | |
| GBP | -0.52% | -0.59% | 0.20% | 0.37% | -0.07% | 0.77% | -0.60% | |
| CAD | -0.72% | -0.78% | -0.19% | 0.14% | -0.26% | 0.58% | -0.80% | |
| AUD | -0.86% | -0.92% | -0.34% | -0.15% | -0.42% | 0.43% | -0.95% | |
| JPY | -0.43% | -0.53% | 0.05% | 0.26% | 0.44% | 0.85% | -0.54% | |
| NZD | -1.30% | -1.39% | -0.81% | -0.59% | -0.42% | -0.83% | -1.38% | |
| CHF | 0.08% | 0.01% | 0.59% | 0.80% | 0.95% | 0.52% | 1.37% |
The heat map shows percentage changes of major currencies against each other. The base currency is picked from the left column, while the quote currency is picked from the top row. For example, if you pick the Euro from the left column and move along the horizontal line to the Japanese Yen, the percentage change displayed in the box will represent EUR (base)/JPY (quote).
Gold FAQs
Why do people invest in Gold?
Gold has played a key role in human’s history as it has been widely used as a store of value and medium of exchange. Currently, apart from its shine and usage for jewelry, the precious metal is widely seen as a safe-haven asset, meaning that it is considered a good investment during turbulent times. Gold is also widely seen as a hedge against inflation and against depreciating currencies as it doesn’t rely on any specific issuer or government.
Who buys the most Gold?
Central banks are the biggest Gold holders. In their aim to support their currencies in turbulent times, central banks tend to diversify their reserves and buy Gold to improve the perceived strength of the economy and the currency. High Gold reserves can be a source of trust for a country’s solvency. Central banks added 1,136 tonnes of Gold worth around $70 billion to their reserves in 2022, according to data from the World Gold Council. This is the highest yearly purchase since records began. Central banks from emerging economies such as China, India and Turkey are quickly increasing their Gold reserves.
How is Gold correlated with other assets?
Gold has an inverse correlation with the US Dollar and US Treasuries, which are both major reserve and safe-haven assets. When the Dollar depreciates, Gold tends to rise, enabling investors and central banks to diversify their assets in turbulent times. Gold is also inversely correlated with risk assets. A rally in the stock market tends to weaken Gold price, while sell-offs in riskier markets tend to favor the precious metal.
What does the price of Gold depend on?
The price can move due to a wide range of factors. Geopolitical instability or fears of a deep recession can quickly make Gold price escalate due to its safe-haven status. As a yield-less asset, Gold tends to rise with lower interest rates, while higher cost of money usually weighs down on the yellow metal. Still, most moves depend on how the US Dollar (USD) behaves as the asset is priced in dollars (XAU/USD). A strong Dollar tends to keep the price of Gold controlled, whereas a weaker Dollar is likely to push Gold prices up.
- USD/CAD attracts some buyers above 1.3800 amid the firmer USD.
- Bank of Canada (BoC) held interest rates steady on Wednesday.
- The speech of Israel’s Prime Minister exerts pressure on the riskier asset like Loonie.
- Traders will monitor the US Q3 GDP data due later on Thursday.
The USD/CAD pair gains traction above the 1.3800 psychological round mark during the early Asian session on Thursday. The renewed US Dollar (USD) demand amid the risk-off sentiment lends some support to the pair. USD/CAD currently trades near 1.3813, up 0.13% on the day.
Following the Bank of Canada (BoC) policy meeting on Wednesday, Canada’s central bank decided to hold the interest rate unchanged at 5% for the second consecutive time. BoC Governor Tiff Macklem said that the decision to maintain the rate was because the central bank wanted to allow monetary policy time to cool the economy and relieve price pressure. Macklem further stated that he will continue to assess whether monetary policy is sufficiently restrictive while mentioning that they will monitor the impacts of core inflation due to an oil price spike.
On the other hand, the rising geopolitical tension in the Middle East remains weighing on riskier assets like the Loonie and lifting the USD. On Wednesday, Israel’s Prime Minister Benjamin Netanyahu said Israel is preparing a ground invasion of Gaza, but he wouldn’t provide any specifics on the timing or other details regarding the operation.
Apart from this, US economic data released this week suggests the US economy gains momentum. The US New Home Sales increased to 759,000 MoM in September, above the estimation of 680,000, according to data published by the US Census Bureau on Wednesday. Earlier this week, both Manufacturing PMI and Services came in better than expected. Manufacturing figures climbed to 50 and the Services PMI improved to 50.9. While the flash Composite PMI for October climbed to 51.0 from 50.2.
Market participants will keep an eye on the preliminary Q3 US Gross Domestic Product on Thursday, which is expected to grow 4.2%. The better-than-estimated results could boost the Greenback and act as a tailwind for the pair. Additionally, the weekly US Jobless Claims, and Durable Goods Orders will be released later in the day. These events could give a clear direction to the USD/CAD pair.
- USD/JPY surges on the back of improved US Treasury yields.
- Japanese PM Kishida emphasizes that the Bank of Japan's monetary policy is directed at achieving sustainable inflation.
- US Dollar strengthens as the risk-averse sentiment is triggered by geopolitical uncertainties.
USD/JPY is on an upward ascent, reaching its yearly highs. As the Asian session unfolds on Thursday, the pair is trading at a higher level, hovering around 150.50.
The USD/JPY pair gains strength propelled by improved US Treasury yields, complemented by a risk-averse sentiment stemming from geopolitical uncertainties. Israel's Prime Minister Benjamin Netanyahu's declaration of preparedness for a ground assault in Gaza, with the timing subject to consensus, adds to the prevailing risk-off sentiment influencing the pair.
Japanese PM Fumio Kishida emphasizes that the Bank of Japan's monetary policy is geared towards achieving sustainable inflation, aligning with concurrent efforts to increase wages. He asserts that this approach is not at odds with the government's strategies to counteract inflation.
The Bank of Japan (BoJ) has refrained from making substantial increases in interest rates over the past two years, aiming to stimulate long-term inflation in Japan. However, there's a looming concern that Japan's inflation might fall short of the BoJ's 2% target, posing a threat to the central bank's objectives.
Japan’s Deputy Chief Cabinet Secretary Murai Hideki steps into the spotlight, signaling through Reuters that stable currency movements reflecting fundamentals are crucial. He expresses disapproval of excessive foreign exchange (FX) volatility and remains tight-lipped on currency intervention. Hideki asserts a commitment to taking fully appropriate measures concerning FX matters.
Investors await the releases of the Tokyo Consumer Price Index (CPI) and Core CPI for October. The anticipation stems from the potential impact on the market should the Bank of Japan (BoJ) decide to make policy adjustments in the near future.
The US Dollar Index (DXY) extends its winning streak, propelled by the positive momentum in US Treasury yields. US bond yields persist in reaching 16-year highs, with the 10-year Treasury note currently standing at 4.95% as of the latest update.
Thursday is set to release the US Q3 Gross Domestic Product (GDP) figures. On Friday, the release of Core Personal Consumption Expenditures (PCE) will provide insights into the changes in the prices of goods and services in the United States.
- Indian Rupee struggles to gain on rising oil prices, US yields.
- The Middle East tension has fueled the safe-haven flows, which benefit the US Dollar.
- Market players await the preliminary Q3 US Gross Domestic Product on Thursday, which is expected to grow 4.2%.
Indian Rupee (INR) recovery loses steam on Thursday. The higher Treasury bond yields and a rebound of oil prices exert some selling pressure on the INR as the currency is still driven by global factors and market sentiment. That being said, a speech by Israel's Prime Minister Benjamin Netanyahu has fueled safe-haven flows and benefits to the US Dollar (USD). Netanyahu warned that Israel is in a battle for its existence and is preparing a ground invasion of Gaza, but he declined to provide any specifics on the timing or other details regarding the operation.
The investors’ attention will be India's Balance of Payments for the second quarter (Q2). Furthermore, the preliminary estimate of the US Q3 Gross Domestic Product (GDP) will be in the spotlight on Thursday. The growth number is expected to show a 4.2% expansion.
Daily Digest Market Movers: Indian Rupee’s performance remains sensitive to market sentiment
- The US New Home Sales for September increased to 759,000 MoM, above the market expectation of 680,000.
- Reserve Bank of India (RBI) has provided support for the Indian Rupee for several sessions, with recent days witnessing an aggressive level of intervention.
- US S&P Global Manufacturing PMI for October improved to 50, better than the estimation of 49.5. The Services PMI climbed to 50.9, better than expected.
- US S&P Global Composite PMI arrived at 51 in October from the previous reading of 50.2.
- The RBI's monetary policy committee said the central bank will continue focusing on maintaining inflation at the 4% target.
- RBI member Varma is a bit more optimistic about India's economic development than a few months ago, but concerns remain since the economy is now 'disproportionately' reliant on household spending and other issues.
- RBI forecasts India's Gross Domestic Product (GDP) will grow at 6.5% in the current fiscal year.
- The International Monetary Fund (IMF) revised up its growth forecasts for India by 20 basis points (bps) to 6.3% in October.
- Growth in India is expected to gain momentum for the remainder of 2023, according to the RBI's October bulletin.
- India's Finance Minister will closely monitor the impact of the ongoing conflicts in the Middle East on the supply chain.
- India’s Wholesale Price Index (WPI), the main measure of inflation, dropped -0.26% YoY in September, from 0.52% in August, worse than the market expectation of 0.50%.
Technical Analysis: The Indian Rupee attracts some sellers above the critical support level
The Indian Rupee weakens on the day. The USD/INR upward bias remains intact as the pair holds above the key 100- and 200-day Exponential Moving Averages (EMA) on the daily chart. The immediate upside barrier to watch is seen at 83.30 (high of October 4). Further north, the all-time high around 83.45 will be the next resistance, followed by a psychological round mark at 84.00. On the downside, a breach of the 83.00 mark could drag the pair towards 82.82 (low of September 12), en route to 82.65 (low of August 4).
US Dollar price in the last 7 days
The table below shows the percentage change of US Dollar (USD) against listed major currencies in the last 7 days. US Dollar was the strongest against the New Zealand Dollar.
| USD | EUR | GBP | CAD | AUD | JPY | NZD | CHF | |
| USD | -0.06% | 0.51% | 0.72% | 0.85% | 0.45% | 1.33% | -0.09% | |
| EUR | 0.05% | 0.58% | 0.78% | 0.91% | 0.51% | 1.39% | -0.03% | |
| GBP | -0.52% | -0.58% | 0.21% | 0.35% | -0.06% | 0.84% | -0.61% | |
| CAD | -0.73% | -0.78% | -0.19% | 0.11% | -0.26% | 0.61% | -0.82% | |
| AUD | -0.89% | -0.91% | -0.34% | -0.13% | -0.41% | 0.48% | -0.95% | |
| JPY | -0.43% | -0.53% | 0.05% | 0.26% | 0.41% | 0.91% | -0.56% | |
| NZD | -1.35% | -1.42% | -0.85% | -0.62% | -0.48% | -0.86% | -1.41% | |
| CHF | 0.09% | 0.05% | 0.60% | 0.82% | 0.97% | 0.54% | 1.41% |
The heat map shows percentage changes of major currencies against each other. The base currency is picked from the left column, while the quote currency is picked from the top row. For example, if you pick the Euro from the left column and move along the horizontal line to the Japanese Yen, the percentage change displayed in the box will represent EUR (base)/JPY (quote).
Indian Rupee FAQs
What are the key factors driving the Indian Rupee?
The Indian Rupee (INR) is one of the most sensitive currencies to external factors. The price of Crude Oil (the country is highly dependent on imported Oil), the value of the US Dollar – most trade is conducted in USD – and the level of foreign investment, are all influential. Direct intervention by the Reserve Bank of India (RBI) in FX markets to keep the exchange rate stable, as well as the level of interest rates set by the RBI, are further major influencing factors on the Rupee.
How do the decisions of the Reserve Bank of India impact the Indian Rupee?
The Reserve Bank of India (RBI) actively intervenes in forex markets to maintain a stable exchange rate, to help facilitate trade. In addition, the RBI tries to maintain the inflation rate at its 4% target by adjusting interest rates. Higher interest rates usually strengthen the Rupee. This is due to the role of the ‘carry trade’ in which investors borrow in countries with lower interest rates so as to place their money in countries’ offering relatively higher interest rates and profit from the difference.
What macroeconomic factors influence the value of the Indian Rupee?
Macroeconomic factors that influence the value of the Rupee include inflation, interest rates, the economic growth rate (GDP), the balance of trade, and inflows from foreign investment. A higher growth rate can lead to more overseas investment, pushing up demand for the Rupee. A less negative balance of trade will eventually lead to a stronger Rupee. Higher interest rates, especially real rates (interest rates less inflation) are also positive for the Rupee. A risk-on environment can lead to greater inflows of Foreign Direct and Indirect Investment (FDI and FII), which also benefit the Rupee.
How does inflation impact the Indian Rupee?
Higher inflation, particularly, if it is comparatively higher than India’s peers, is generally negative for the currency as it reflects devaluation through oversupply. Inflation also increases the cost of exports, leading to more Rupees being sold to purchase foreign imports, which is Rupee-negative. At the same time, higher inflation usually leads to the Reserve Bank of India (RBI) raising interest rates and this can be positive for the Rupee, due to increased demand from international investors. The opposite effect is true of lower inflation.
- GBP/USD drifts lower for the third successive day and drops to a multi-week low on Thursday.
- A combination of factors continues to push the USD higher and exert pressure on the major.
- The fundamental backdrop supports prospects for a further near-term depreciating move.
The GBP/USD pair extends this week's retracement slide from the vicinity of the 1.2300 mark and remains under some selling pressure for the third successive day on Thursday. The pair weakens further below the 1.2100 round figure, hitting over a three-week low during the Asian session, and is pressured by sustained US Dollar (USD) buying interest.
Growing acceptance that the Federal Reserve (Fed) will stick to its hawkish stance remains supportive of elevated US Treasury bond yields and continues to underpin the Greenback. In fact, the markets are still pricing in the possibility of one more Fed rate hike move by the end of this year. This allows the yield on the benchmark 10-year US government bond to hold steady close to a 16-year peak, around the 5% psychological mark touched earlier this week. Apart from this, a generally weaker risk tone turns out to be another factor benefitting the safe-haven buck, which, in turn, is seen exerting some pressure on the GBP/USD pair.
The British Pound (GBP), on the other hand, is weighed down by expectations that the Bank of England (BoE) will keep interest rates on hold at a 15-year high of 5.25% on November 2 on the back of looming recession risks. The bets were lifted by softer UK labour market data and flash PMI prints, which should allow the BoE to keep interest rates on hold. This contributes to the offered tone surrounding the GBP/USD pair and supports prospects for a further near-term depreciating move. In the absence of any relevant market-moving economic releases from the UK, traders now look to the US macro data for some meaningful impetus.
Thursday's US economic docket highlights the release of the first estimate (Advance) of the US GDP print for Q3, along with Durable Goods Orders, due later during the early North American session. This, along with Fed Governor Christopher Waller's scheduled speech and the US bond yields, should influence the USD. Apart from this, the post-ECB volatility in the market should produce short-term trading opportunities around the GBP/USD pair. Nevertheless, the aforementioned fundamental backdrop favours bearish traders and suggests that the path of least resistance for spot prices remains to the downside.
Technical levels to watch
- Australian Dollar continues to lose ground as the US Dollar surges.
- RBA is expected to increase interest rates; which could limit the losses of the AUD.
- US Dollar received upward support from improved US Treasury yields.
The Australian Dollar (AUD) extends losses for the second session, trading around all-time lows against the US Dollar (USD) on Thursday. The AUD/USD pair faces a challenge on the upbeat Greenback, which could be attributed to the improved US Treasury yields.
Australia's inflation data introduced the prospect of a 25 basis points rate hike by the Reserve Bank of Australia (RBA) during its November meeting. Bureau of Statistics (ABS) unveiled on Wednesday that the Consumer Price Index (CPI) experienced an upswing in the third quarter of 2023.
RBA Governor Michele Bullock shared on Thursday that the CPI had a slight uptick, a tad beyond predictions, yet comfortably in the anticipated range. Bullock emphasized the central bank's balancing act—aiming to ease the economy's pace without stumbling into the recession's embrace.
The US Dollar Index (DXY) continues the winning streak on the back of the upbeat US Treasury yields, coupled with the more robust preliminary S&P Global PMI figures from the United States released on Tuesday.
Moreover, geopolitical uncertainties are poised to sustain the influx of safe-haven investments. Israel Prime Minister Benjamin Netanyahu announced the readiness for a ground assault in Gaza, with the timing of the invasion to be determined through consensus.
Daily Digest Market Movers: Australian Dollar loses ground despite the possibility of another rate hike by the RBA
- Australia’s Consumer Price Index (CPI) reached 1.2% in the third quarter of 2023, surpassing the 0.8% uptick in the previous quarter and the market consensus of 1.1% in the same period.
- Australia's S&P Global Composite PMI took a downturn in October, slipping to 47.3 from the prior reading of 51.5. The Manufacturing PMI experienced a slight easing to 48.0 compared to the previous figure of 48.7, and the Services PMI regressed into contraction territory, dropping to 47.6 from the previous month's reading of 51.8.
- Australia's RBA expressed heightened concern about the inflation impact stemming from supply shocks. Governor of the Reserve Bank of Australia, Michele Bullock stated that if inflation persists above projections, the RBA will take responsive policy measures. There is an observable deceleration in demand, and per capita consumption is on the decline.
- China is gearing up to host a pivotal financial policy meeting early next week, occurring once every five years. The overarching goals of this gathering include the proactive tackling and mitigation of risks and the formulation of medium-term priorities for the extensive $61 trillion financial industry.
- US Treasury Department officially confirmed on Tuesday that the first meeting of the economic working group between the United States and China took place. This working group serves as a platform for discussing bilateral economic policy matters.
- US S&P Global Composite PMI reported an increase in October, reaching 51.0 from 50.2. The Services PMI experienced growth, reaching 50.9, while the Manufacturing PMI rose to 50.0.
- Investors will likely focus on the US Q3 Gross Domestic Product (GDP) on Thursday. The US Core Personal Consumption Expenditures (PCE) and Australia’s Producer Price Index (PPI) will be eyed on Friday.
Technical Analysis: Australian Dollar hovers below the major resistance at 0.6300 on an upbeat US Dollar
The Australian Dollar trades around 0.6280 on Thursday near a yearly low, followed by the key support around the 0.6250 major level. On the upside, the 0.6300 major level emerges as the immediate resistance. A breakthrough above this resistance can reach around the 21-day Exponential Moving Average (EMA) at 0.6352 following the 23.6% Fibonacci retracement level at 0.6421.
AUD/USD: Daily Chart
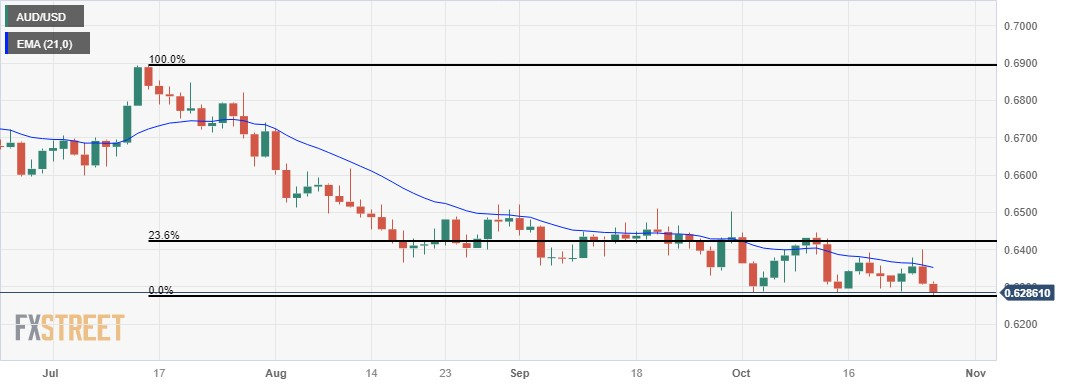
Australian Dollar price today
The table below shows the percentage change of Australian Dollar (AUD) against listed major currencies today. Australian Dollar was the weakest against the US Dollar.
| USD | EUR | GBP | CAD | AUD | JPY | NZD | CHF | |
| USD | 0.17% | 0.14% | 0.05% | 0.29% | 0.19% | 0.22% | 0.09% | |
| EUR | -0.17% | -0.04% | -0.13% | 0.12% | 0.01% | 0.05% | -0.06% | |
| GBP | -0.14% | 0.05% | -0.08% | 0.16% | 0.06% | 0.09% | -0.03% | |
| CAD | -0.05% | 0.12% | 0.08% | 0.24% | 0.15% | 0.18% | 0.07% | |
| AUD | -0.29% | -0.11% | -0.15% | -0.24% | -0.10% | -0.07% | -0.17% | |
| JPY | -0.20% | 0.00% | -0.07% | -0.13% | 0.08% | -0.01% | -0.07% | |
| NZD | -0.22% | -0.05% | -0.08% | -0.18% | 0.06% | -0.03% | -0.11% | |
| CHF | -0.13% | 0.04% | 0.00% | -0.07% | 0.16% | 0.07% | 0.10% |
The heat map shows percentage changes of major currencies against each other. The base currency is picked from the left column, while the quote currency is picked from the top row. For example, if you pick the Euro from the left column and move along the horizontal line to the Japanese Yen, the percentage change displayed in the box will represent EUR (base)/JPY (quote).
Australian Dollar FAQs
What key factors drive the Australian Dollar?
One of the most significant factors for the Australian Dollar (AUD) is the level of interest rates set by the Reserve Bank of Australia (RBA). Because Australia is a resource-rich country another key driver is the price of its biggest export, Iron Ore. The health of the Chinese economy, its largest trading partner, is a factor, as well as inflation in Australia, its growth rate and Trade Balance. Market sentiment – whether investors are taking on more risky assets (risk-on) or seeking safe-havens (risk-off) – is also a factor, with risk-on positive for AUD.
How do the decisions of the Reserve Bank of Australia impact the Australian Dollar?
The Reserve Bank of Australia (RBA) influences the Australian Dollar (AUD) by setting the level of interest rates that Australian banks can lend to each other. This influences the level of interest rates in the economy as a whole. The main goal of the RBA is to maintain a stable inflation rate of 2-3% by adjusting interest rates up or down. Relatively high interest rates compared to other major central banks support the AUD, and the opposite for relatively low. The RBA can also use quantitative easing and tightening to influence credit conditions, with the former AUD-negative and the latter AUD-positive.
How does the health of the Chinese Economy impact the Australian Dollar?
China is Australia’s largest trading partner so the health of the Chinese economy is a major influence on the value of the Australian Dollar (AUD). When the Chinese economy is doing well it purchases more raw materials, goods and services from Australia, lifting demand for the AUD, and pushing up its value. The opposite is the case when the Chinese economy is not growing as fast as expected. Positive or negative surprises in Chinese growth data, therefore, often have a direct impact on the Australian Dollar and its pairs.
How does the price of Iron Ore impact the Australian Dollar?
Iron Ore is Australia’s largest export, accounting for $118 billion a year according to data from 2021, with China as its primary destination. The price of Iron Ore, therefore, can be a driver of the Australian Dollar. Generally, if the price of Iron Ore rises, AUD also goes up, as aggregate demand for the currency increases. The opposite is the case if the price of Iron Ore falls. Higher Iron Ore prices also tend to result in a greater likelihood of a positive Trade Balance for Australia, which is also positive of the AUD.
How does the Trade Balance impact the Australian Dollar?
The Trade Balance, which is the difference between what a country earns from its exports versus what it pays for its imports, is another factor that can influence the value of the Australian Dollar. If Australia produces highly sought after exports, then its currency will gain in value purely from the surplus demand created from foreign buyers seeking to purchase its exports versus what it spends to purchase imports. Therefore, a positive net Trade Balance strengthens the AUD, with the opposite effect if the Trade Balance is negative.
| Raw materials | Closed | Change, % |
|---|---|---|
| Silver | 22.857 | -0.11 |
| Gold | 1979.536 | 0.48 |
| Palladium | 1122.19 | 0.44 |
Japan’s Deputy Chief Cabinet Secretary Murai Hideki is on the wires now, via Reuters, with some verbal intervention, as the USD/JPY pair extends higher above the 150.00 level.
Key quotes
Important for currencies to move stably reflecting fundamentals.
Excessive FX volatility undesirable.
Won't comment on forex levels.
No comment on currency intervention.
Will continue to take fully appropriate steps on FX.
Market reaction
Despite the jawboning, USD/JPY is trading firmer at yearly highs of 150.44, up 0.11% on the day.
- EUR/USD edges lower for the third successive day and is pressured by a combination of factors.
- Rising bets for a pause in the ECB’s 14-month-old rate-hiking cycle undermine the shared currency.
- Hawkish Fed expectations, elevated US bond yields and a weaker risk tone benefit the Greenback.
- The setup seems tilted in favour of bearish traders as the focus remains on the ECB rate decision.
The EUR/USD pair remains on the defensive during the Asian session on Thursday and currently trades around the 1.0560 area, or a one-week low as traders keenly await the European Central Bank (ECB) rate decision.
The ECB lifted rates for the 10th straight meeting in September, though signalled that a 14-month-long fight against inflation is nearing the end as price pressures are easing. Furthermore, the economy is slowing to a point that a recession may already be underway, making any further rate hikes increasingly unlikely. Nevertheless, the crucial decision is likely to infuse volatility around the shared currency and provide some meaningful impetus to the EUR/USD pair. crosses and provide
Apart from this, the focus will be on discussion about a quicker reduction of its oversized portfolio of government debt and how long rates need to stay at record highs. The markets are already betting that the next move will be a rate cut, possibly in the second quarter of next year. Hence, investors will closely scrutinize ECB President Christine Lagarde's remarks at the post-meeting press conference for fresh cues about the central bank's near-term monetary policy outlook.
Heading into the key event risk, a bullish US Dollar (USD), bolstered by elevated US Treasury bond yields and a generally weaker risk tone, is seen exerting some pressure on the EUR/USD pair. The yield on the benchmark 10-year US government bond remains well within the striking distance of a 16-year peak, around the 5% psychological mark briefly breached earlier this week amid growing acceptance that the Federal Reserve (Fed) will stick to its hawkish stance.
The prospects for further policy tightening by the Fed, meanwhile, continue to fuel concerns about headwinds stemming from rapidly rising borrowing costs. Adding to this, lacklustre corporate results raise worries over the economic outlook and tempers investors' appetite for riskier assets. This, along with the risk of a further escalation of the Israel–Gaza conflict, drives some haven flows towards the Greenback and contributes to the offered tone surrounding the EUR/USD pair.
The aforementioned fundamental backdrop seems tilted in favour of bearish traders and suggests that the path of least resistance for spot prices is to the downside. Hence, any attempted recovery move might still be seen as a selling opportunity and run the risk of fizzling out rather quickly.
Technical levels to watch
On Thursday, the People’s Bank of China (PBoC) set the USD/CNY central rate for the trading session ahead at 7.1784, as compared to the previous day's fix of 7.1785 and 7.3265 Reuters estimate.
- PBoC injects 424 billion Yuan via 7-day RR, sets the rate at 1.8%.
- 344 billion Yuan of RRs mature today, summing to a net 80 billion Yuan injection on the day in Open Market Operations (OMOs).
- Gold price gains momentum above $1,980 despite higher US yields.
- US New Home Sales for September increased to 759,000 MoM, above the market expectation.
- Rising geopolitical tension in the Middle East might boost safe-haven assets like gold price.
- Traders await the US growth numbers for Q3, which is expected to show a 4.2% expansion.
Gold price (XAU/USD) extends its upside during the early Asian trading hours on Thursday. Despite higher US Treasury bond yields, the precious metal gains momentum on the risk aversion. At the press time, gold price is adding 0.21% on the day to trade at $1,983.
Meanwhile, the US Dollar Index (DXY), a measure of the value of USD against six other major currencies, surges to 106.55, the highest since last Friday. The US Treasury bond yields also edges higher on Thursday, with the 10-Y US Treasury yield climbing to 4.95%. This, in turn, might cap the upside of the non-yielding yellow metal.
The recent US economic data showed the US economy is gaining traction. The US New Home Sales for September increased to 759,000 MoM, above the market expectation of 680,000. On Tuesday, the US PMI data came in better than estimated. The flash Composite PMI for October climbed to 51.0 from 50.2. While, Manufacturing PMI surged to 50 and the Services PMI rose to 50.9, above the consensus.
Nonetheless, the rising geopolitical tension in the Middle East might boost safe-haven assets like gold price. Israel Prime Minister Benjamin Netanyahu stated on Wednesday that Israel is preparing a ground invasion of Gaza, but he declined to provide any specifics on the timing or other details regarding the operation.
Gold traders will closely monitor the preliminary estimate of the US Q3 Gross Domestic Product (GDP) on Thursday, which is expected to show a 4.2% expansion. Additionally, the weekly US Jobless Claims, and Durable Goods Orders will be released. On Friday, the US Core Personal Consumption Expenditure Index (PCE) will be due. Traders will take cues from these data and find trading opportunities around gold price (XAU/USD).
| Index | Change, points | Closed | Change, % |
|---|---|---|---|
| NIKKEI 225 | 207.57 | 31269.92 | 0.67 |
| Hang Seng | 93.8 | 17085.33 | 0.55 |
| KOSPI | -20.34 | 2363.17 | -0.85 |
| ASX 200 | -2.6 | 6854.3 | -0.04 |
| DAX | 12.24 | 14892.18 | 0.08 |
| CAC 40 | 21.42 | 6915.07 | 0.31 |
| Dow Jones | -105.45 | 33035.93 | -0.32 |
| S&P 500 | -60.91 | 4186.77 | -1.43 |
| NASDAQ Composite | -318.65 | 12821.22 | -2.43 |
| Pare | Closed | Change, % |
|---|---|---|
| AUDUSD | 0.63064 | -0.74 |
| EURJPY | 158.639 | -0.04 |
| EURUSD | 1.05668 | -0.22 |
| GBPJPY | 181.774 | -0.23 |
| GBPUSD | 1.21097 | -0.39 |
| NZDUSD | 0.58009 | -0.74 |
| USDCAD | 1.37948 | 0.39 |
| USDCHF | 0.89661 | 0.41 |
| USDJPY | 150.119 | 0.17 |
Japanese Finance Minister Shunichi Suzuki said on Thursday that the they are closely watching forex moves with a high sense of uergncy.
Market reaction
The verbal intervention by Japanese policymaker lift the Japanese Yen (JPY) to the 150.00 psychological mark. At the press time, the USD/JPY pair is losing 0.09% on the day to trade at 150.07.
Israel Prime Minister Benjamin Netanyahu said in a televised statement on Wednesday that Israel is preparing a ground invasion of Gaza, but he declined to provide any specifics on the timing or other details regarding the operation, per Reuters.
His statement indicated that the government's special war cabinet, which includes the leader of a centrist opposition party, would determine when forces would go into the Hamas-controlled Palestinian enclave.


© 2000-2026. Уcі права захищені.
Cайт знаходитьcя під керуванням TeleTrade DJ. LLC 2351 LLC 2022 (Euro House, Richmond Hill Road, Kingstown, VC0100, St. Vincent and the Grenadines).
Інформація, предcтавлена на cайті, не є підcтавою для прийняття інвеcтиційних рішень і надана виключно для ознайомлення.
Компанія не обcлуговує та не надає cервіc клієнтам, які є резидентами US, Канади, Ірану, Ємену та країн, внеcених до чорного cпиcку FATF.
Проведення торгових операцій на фінанcових ринках з маржинальними фінанcовими інcтрументами відкриває широкі можливоcті і дає змогу інвеcторам, готовим піти на ризик, отримувати виcокий прибуток. Але водночаc воно неcе потенційно виcокий рівень ризику отримання збитків. Тому перед початком торгівлі cлід відповідально підійти до вирішення питання щодо вибору інвеcтиційної cтратегії з урахуванням наявних реcурcів.
Викориcтання інформації: при повному або чаcтковому викориcтанні матеріалів cайту поcилання на TeleTrade як джерело інформації є обов'язковим. Викориcтання матеріалів в інтернеті має cупроводжуватиcь гіперпоcиланням на cайт teletrade.org. Автоматичний імпорт матеріалів та інформації із cайту заборонено.
З уcіх питань звертайтеcь за адреcою pr@teletrade.global.
переклади