- Analytics
- News and Tools
- Market News
Новини ринків
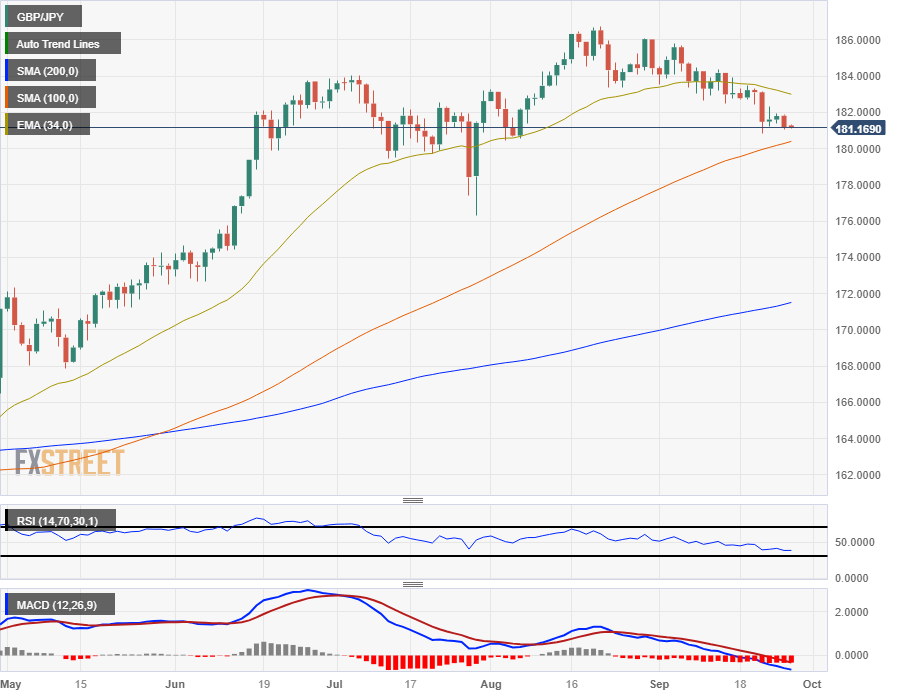
- The GBP/JPY consolidated in the back half of Tuesday trading, pinned to the low side just above 181.00.
- The Guppy is down from Tuesday's opening bids near 181.80.
- Broader market risk appetite burst into flames on Tuesday, but Yen traders are leery ahead of Japan inflation figures.
The GBP/JPY is down nearly 80 pips heading into the Wednesday market session, with the Pound Sterling (GBP) continuing to flag against the Japanese Yen (JPY). The pair is down almost 1.3% from last week's peak, and in the red over 3.0% from August's peak of 186.77.
The mid-week is thin on the economic calendar for the Guppy, and traders will be looking ahead to Thursday's Tokyo Consumer Price Index (CPI) reading on Thursday, which will be followed by Friday's Gross Domestic Product (GDP) figures for the UK.
The Bank of Japan (BoJ) is determined to see Japanese inflation remain above 2% in a meaningful way before stepping away from its hyper-easy monetary policy regime. Japanese interest rates are currently at -0.1%, and despite inflation being over the BoJ's 2% target, fears of an inflation collapse are plaguing the BoJ.
Investors will be keeping a close eye on Thursday's Tokyo CPI reading for September, which last printed at 2.9% for the annualized period into August.
Japan's Tokyo CPI data drops late Thursday at 23:30 GMT.
Friday will bring an end-of-week juggle for the GBP, with UK GDP figures in the pipe; laboring economic growth remains a key sticking point for the Bank of England (BoE), and UK GDP is forecast to hold steady at 0.2% for the second quarter.
GBP/JPY technical outlook
Intraday action for the GPB/JPY is decidedly bearish, with prices slumping away from the 34-hour Exponential Moving Average (EMA) near 181.40 and the 200-hour Simple Moving Average (SMA) well above current price action at 182.40.
Daily candlesticks see the Guppy on the downside as well, with the pair drifting into the 100-day SMA just above the 180.00 major handle. Despite recent bearish momentum, the GBP/JPY has soared in the medium-term and still remains almost 17% higher for the year.
Technical indicators are drifting into oversold territory thanks to the last six weeks' gradual decline, and the Relative Strength Index (RSI) is set to ping the lower boundary indicating overextended selling pressure.
GBP/JPY daily chart
GBP/JPY technical levels
- AUD/USD attracts some sellers amid the risk aversion and stronger USD.
- The US CB Consumer Confidence (Sep) rose by 103 vs. 108.7 prior, a four-month low.
- The annual Australian Consumer Price Index (CPI) data for August is expected to rise from 4.9% to 5.2%.
The AUD/USD pair remains under selling pressure and drops below 0.6400 during the early Asian session on Wednesday. The pair is weighed by the negative sentiment and a decline in commodity prices. The pair currently trades around 0.6394, losing 0.03% on the day.
Meanwhile, the US Dollar Index (DXY), a measure of the value of the USD relative to a basket of foreign currencies, hovers around 106.17 after retreating from the highest level since November of 106.26.
On Tuesday, the US Consumer Confidence released by the Conference Board (CB) for September rose by 103.0 from 108.7 in August. The data indicated the impact of higher interest rates and concerns about the political environment. The Building Permits came in at 1.541M in August versus 1.443M prior. Additionally, the House Price Index for July climbed to 0.8% MoM from 0.4% in the previous reading, better than expected at 0.5%. New Home Sales dropped -8.7% in August from an 8% increase in July.
The Federal Reserve (Fed) decided to hold the interest rate unchanged in the 5.25% to 5.50% range last week. In terms of macroeconomic predictions, most members still expect further rate rises later this year. Minneapolis Federal Reserve Bank President, Neel Kashkari stated on Tuesday that he is one of the fed policymakers who sees one more rate hike this year. He added that US rates probably have to go a little bit higher and be held there for longer, to cool things off. The hawkish comments from Fed officials boost the US Dollar (USD) across the board and act as a headwind for the AUD/USD pair.
On the other hand, the Aussie attracts some sellers due to risk aversion. The release of Australian Consumer Price Index (CPI) data will be a closely watched event. The release of the Reserve Bank of Australia's (RBA) Minutes on the September monetary policy meeting revealed that additional tightening may be necessary if inflation proves more persistent than anticipated. But the case for maintaining the status quo was stronger. This, in turn, might cap the upside of the Aussie and weigh on the AUD/USD pair.
Market participants will closely watch the Australian Consumer Price Index (CPI) data for August due later on Wednesday. The annual figure is expected to rise from 4.9% to 5.2%. Also, the US Durable Goods Orders report will be released on Wednesday. The attention will shift to the Core Personal Consumption Expenditure (PCE) Price Index, the Fed's preferred measure of consumer inflation, due on Friday. The annual figure is expected to drop from 4.2% to 3.9%. Traders will take cues from the data and find trading opportunities around the AUD/USD pair.
- EUR/JPY registered slim losses, capped by broad Japanese Yen weakness.
- Downside risks emerge at the daily chart if EUR/JPY drops below 156.70 inside the Ichimoku Cloud.
- Short term, the EUR/JPY is downward biased, as it trades below key resistance levels; sellers eye 156.00.
EUR/JPY failed to gain traction past the 158.00 figure, instead retreated towards the 157.50s area, and recorded losses of 0.07% on Tuesday. As Wednesday’s Asian session begins, the cross-pair is trading at 157.57, almost unchanged.
From a daily chart perspective, the EUR/JPY is set to extend its losses but has failed to do so on overall Japanese Yen (JPY) weakness. Nevertheless, once the pair drops inside the Ichimoku Cloud (Kumo) at around 156.70, that would exacerbate the pair’s drop. Subsequent support would emerge at the Senkou Span B at 155.58, before slumping toward the July 28 low of 151.40.
The EUR/JPY hourly chart shows the pair is trading below key resistance levels, with the Tenkan-Sen at 157.55 and the bottom of the Kumo at around 157.60. If those areas are cleared, the next stop would be the September 26 daily high at 157.92. However, the path of least resistance is to the downside.
That said, the EUR/JPY first support would be the September 26 low at 157.31, followed by the 157.00 figure. The pair’s next floor level would be the September 15 daily low at 156.72, followed by the September 14 swing low at 156.63.
EUR/JPY Price Action – Hourly chart
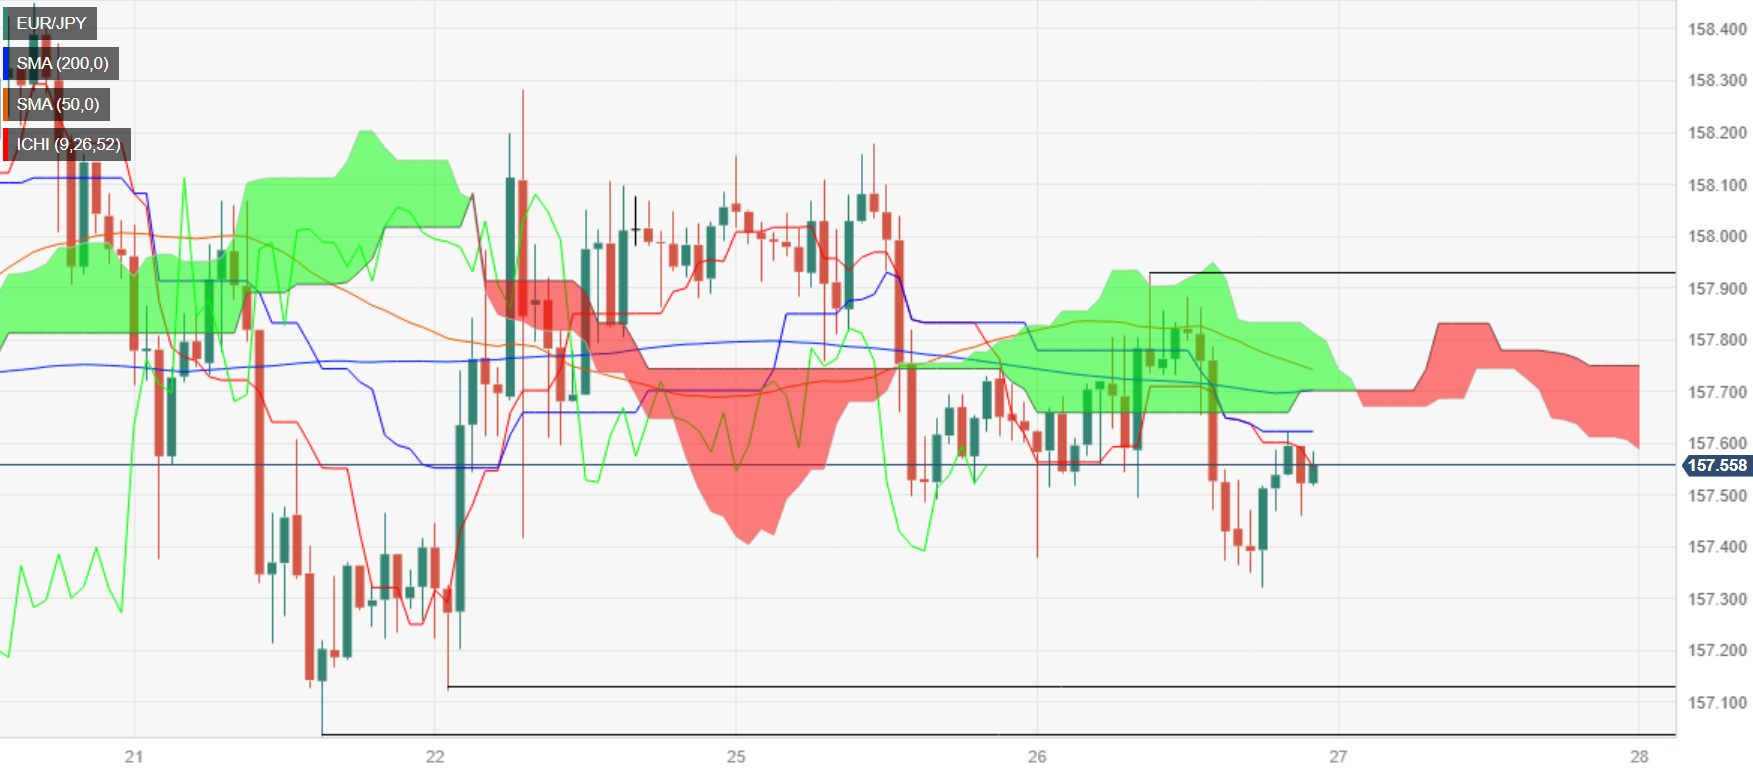
EUR/JPY Key Technical Levels
- The Australian Monthly Consumer Price Index is forecast to rise 5.2% YoY in August, up from the 4.9% increase recorded in July.
- CPI inflation is expected to show its first reacceleration since April.
- Soaring petrol prices in Australia are likely to push inflation higher.
The Australian Monthly Consumer Price Index (CPI) inflation data for August will be published by the Australian Bureau of Statistics (ABS) on Wednesday at 01:30 GMT. The data could be critical for the Australian Dollar (AUD) and the Reserve Bank of Australia (RBA), which will hold its October monetary policy meeting next week.
Inflation in Australia (AU) peaked in December 2022, when the Monthly CPI showed an 8.4% year-on-year increase. Since then, it has been trending lower, with only a rebound observed in April. Last month, the inflation number surprised with a lower-than-expected reading, reinforcing the expectation that the RBA would maintain interest rates unchanged in September as it did. Another soft reading looks unlikely in August as petrol prices have risen considerably, leading experts to anticipate a potential reacceleration in inflation.
What to expect from Australia’s August inflation rate?
A rebound in the inflation rate in Australia in August could increase the expectation of another rate hike from the RBA, although not necessarily at the upcoming meeting next week. The quarterly Consumer Price Index remains the most important measure of household inflation. Since the monthly data is derived from the available data from the quarterly CPI, a rebound in August is likely to anticipate a hotter Q3 CPI reading, which will be released on October 25.
The market does not favor a rate hike at the October 3 meeting, which will be Michele Bullock's first meeting as a Governor. The expectation for a rate hike increases for the November and December meetings. According to Bloomberg's World Interest Rate Probability (WIRP), the odds of another rate hike rise to 85% for the first quarter of next year. Interest rate futures indicate that the market expects the cash rate to peak around 4.55% in the first quarter of 2024, higher than the current 4.10%.
An analyst at TD Securities explained that a significant upside surprise in the monthly CPI “adds scrutiny to the Q3 CPI printout in late October. “We can't discount the odds of an insurance hike in November, especially given the risk of an inflation resurgence after the march higher in commodity and energy prices.”
If the Consumer Price Index shows inflation not slowing down and, on the contrary, accelerating further above the 2%-3% target range, the Australian Dollar could receive a boost as markets would consider further tightening ahead. However, if the Monthly CPI comes in below expectations, it could hurt the Australian Dollar, but it will be positive news for the Australian economy.
When will the Monthly Consumer Price Index report be released, and how could it affect AUD/USD?
The Monthly Consumer Price Index inflation data for August is scheduled to be published at 01:30 GMT on Wednesday. Since August, the AUD/USD pair has been trading within a range between 0.6500 and 0.6350, reaching the lowest levels of the year. The pair's decline can be attributed not only to a weaker Australian Dollar but mainly to a stronger US Dollar driven by higher Treasury yields and the strong performance of the US economy. The CPI figures could have a limited impact on the pair, particularly if they come in line with expectations. A significant surprise in the data may be required for the AUD/USD to approach the limits of the current range or even break out of it.
Expectations of another rate hike from the RBA could potentially boost the AUD/USD pair in the near term. However, it is unclear how long-lasting the impact would be. The combination of higher inflation and monetary tightening at a time when the economy is facing challenges may limit the upside potential for the Australian Dollar and could ultimately have a negative impact.
The AUD/USD pair is following a bearish trend, finding support around the 0.6350 area, while the rebound has been limited around the 0.6500 area. The future direction of the pair largely depends on a consolidation outside of these two levels. A convincing break above 0.6500 could open the doors to a more sustainable appreciation, but it would likely require improvements in economic data and a positive outlook for China.
On the contrary, negative market sentiment and a worsening economic outlook could continue to put pressure on the pair around 0.6350, and a break below this level could lead to a downward acceleration, targeting 0.6300. The next medium-term support level stands at the 0.6260 zone.
Australian Dollar FAQs
What key factors drive the Australian Dollar?
One of the most significant factors for the Australian Dollar (AUD) is the level of interest rates set by the Reserve Bank of Australia (RBA). Because Australia is a resource-rich country another key driver is the price of its biggest export, Iron Ore. The health of the Chinese economy, its largest trading partner, is a factor, as well as inflation in Australia, its growth rate and Trade Balance. Market sentiment – whether investors are taking on more risky assets (risk-on) or seeking safe-havens (risk-off) – is also a factor, with risk-on positive for AUD.
How do the decisions of the Reserve Bank of Australia impact the Australian Dollar?
The Reserve Bank of Australia (RBA) influences the Australian Dollar (AUD) by setting the level of interest rates that Australian banks can lend to each other. This influences the level of interest rates in the economy as a whole. The main goal of the RBA is to maintain a stable inflation rate of 2-3% by adjusting interest rates up or down. Relatively high interest rates compared to other major central banks support the AUD, and the opposite for relatively low. The RBA can also use quantitative easing and tightening to influence credit conditions, with the former AUD-negative and the latter AUD-positive.
How does the health of the Chinese Economy impact the Australian Dollar?
China is Australia’s largest trading partner so the health of the Chinese economy is a major influence on the value of the Australian Dollar (AUD). When the Chinese economy is doing well it purchases more raw materials, goods and services from Australia, lifting demand for the AUD, and pushing up its value. The opposite is the case when the Chinese economy is not growing as fast as expected. Positive or negative surprises in Chinese growth data, therefore, often have a direct impact on the Australian Dollar and its pairs.
How does the price of Iron Ore impact the Australian Dollar?
Iron Ore is Australia’s largest export, accounting for $118 billion a year according to data from 2021, with China as its primary destination. The price of Iron Ore, therefore, can be a driver of the Australian Dollar. Generally, if the price of Iron Ore rises, AUD also goes up, as aggregate demand for the currency increases. The opposite is the case if the price of Iron Ore falls. Higher Iron Ore prices also tend to result in a greater likelihood of a positive Trade Balance for Australia, which is also positive of the AUD.
How does the Trade Balance impact the Australian Dollar?
The Trade Balance, which is the difference between what a country earns from its exports versus what it pays for its imports, is another factor that can influence the value of the Australian Dollar. If Australia produces highly sought after exports, then its currency will gain in value purely from the surplus demand created from foreign buyers seeking to purchase its exports versus what it spends to purchase imports. Therefore, a positive net Trade Balance strengthens the AUD, with the opposite effect if the Trade Balance is negative.
- US equities down across the board as risk aversion takes a bite out of stocks.
- Deterioration in consumer sentiment and sliding new home sales is reigniting fears about the health of the US economy.
- US equities indexes broadly down over a full percentage point for Tuesday.
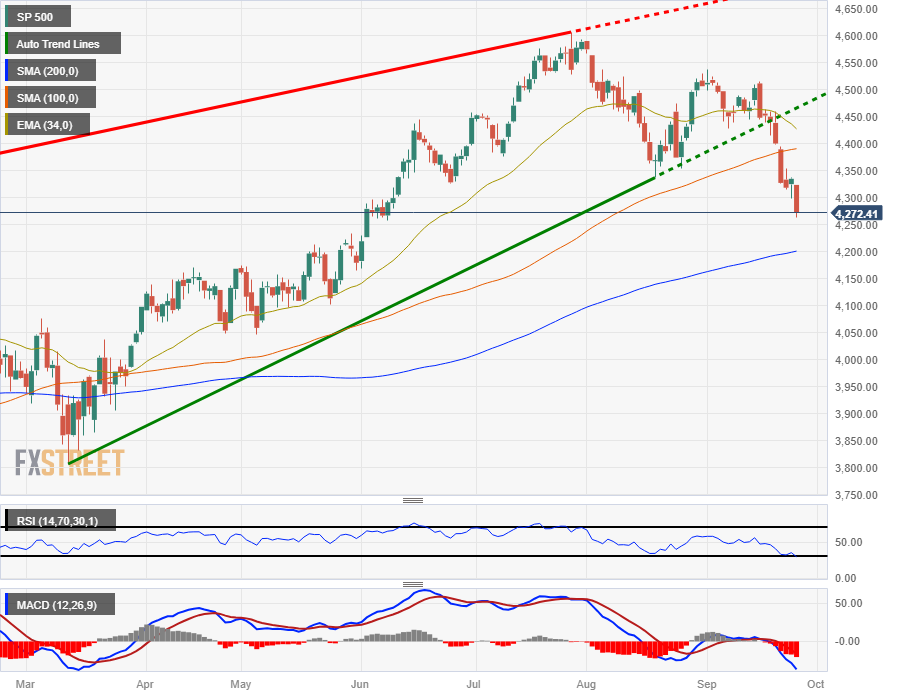
The Standard & Poor's (S&P 500 equity index declined in Tuesday's market session, sliding 64 points to close at $4,273.53. The Dow Jones Industrial Average (DJIA) declined 388 points to end the day in the red 1.14% at $33,618.88. The NASDAQ composite index also shed almost 208 points, closing -1.57% into $13,063.61.
The DJIA saw its worst single-day decline since March while the S&P saw its lowest close since early June.
US new home sales broadly missed expectations, declining 8.7% from July.
US consumer confidence also declined, with the Conference Board Consumer Confidence Index printing 103 for September, a nearly six-point decline from August's 108.7.
Backsliding economic health indicators for the US economy saw all eleven sectors in the S&P 500 close in the red for Tuesday.
September is on pace to reinforce its reputation as a poor month for equities: the S&P is down almost 7% for the month, while the DJIA and the NASDAQ are off the month's opening prices by 5% and 3% respectively.
With the Federal Reserve (Fed) seeing less rate cuts next year than markets initially hoping for, and Fed officials plaguing investors with hawkish comments that could see the Fed raising rates even more than markets have forecast, equities are swooning heading into the tail end of September.
Adding fuel to the short-side fire, the US is still facing down investor jitters as the US government barrels towards a potential government shutdown, and rumors of a potential bipartisan deal are doing little to quell the market rattles.
S&P 500 technical outlook
The S&P 500 is tumbling for Tuesday, sliding into $4,272.00 and well off last week's late swing high of $4,460.00 and is down 7.25% from late July's peak near $4,600.00.
Daily candlesticks see the S&P 500 skidding toward the 200-day Simple Moving Average (SMA) at the $4,200.00 handle, and there is little long-term technical support if equities continue to sell off.
The S&P 500's last meaningful bottom is priced in far below current price action near $3,800.00 from back in March.
S&P 500 daily chart
S&P 500 technical levels
- GBP/USD prints losses of 0.46%, on risk-off, after last week’s BoE’s decision.
- The Federal Reserve’s “higher-for-longer” mantra continues to underpin the Greenback, with several Fed speakers emphasizing the need for another rate hike and sustained high rates.
- The last Bank of England’s decision weighs on the Pound Sterling, set to continue to weaken.
The British Pound (GBP) still trades on the back foot against the US Dollar (USD) slumps below the 1.2200 psychological level, with sellers setting their sights on the 1.2000 figure. The GBP/USD is trading at 1.2159 after hitting a daily high of 1.2215.
British Pound trades on a weaker note against the US Dollar, with sellers eyeing the 1.2000 mark as risk aversion dominates the market
Wall Street finished the session with losses as risk aversion continues to dominate the financial markets narrative. Traders bracing for the “higher-for-longer” Federal Reserve’s mantra has kept the Greenback rallying due to high US bond yields.
On Tuesday, Minnesota Fed President Neil Kashkari said that another rate hike is needed, and then it would be necessary to hold rates at that level while adding that a soft landing is possible.
Recently, other Fed speakers commented that the US central bank needs patience, while others like Fed Governor Bowman stressed that another interest rate hike is needed. Hence, based on the latest “dot plots” reported in September’s Summary of Economic Projections (SEP), the Fed would hike 25 bps toward the end of the year and would keep rates above the 5% threshold through all the next year.
On the UK front, the lack of data leaves traders leaning on the latest Bank of England’s (BoE) decision, perceived as a dovish one, following an inflation report showing that inflation is cooling down. Nevertheless, the latest UK economic data, particularly softer retail sales, PMIs, and GDP clinging to positive territory, has reignited recessionary fears.
GBP/USD Price Analysis: Technical outlook
The GBP/USD is downward biased, and after dropping below the May 25 low of 1.2308 – also the last cycle low, it opened the door for further losses. Before cracking that level, the pair showed signs of selling strength once it broke below the 200-day moving average (DMA) at 1.2432. As of writing, the major hovers in the mid 1.2100/1.2200 figure, though a breach below 1.2100 could open the door to test the March 15 daily low of 1.2010. before testing the 1.2000 figure.
During the Asian session, Australia will release the Monthly Consumer Price Index, and Japan the Leading Economic Index. The Bank of Japan will publish the minutes of its recent meeting. Later in the day, the US will release the Durable Goods Orders report.
Here is what you need to know on Wednesday, September 27:
The US Dollar Index (DXY) continued its upward trend for the third consecutive day. The rise was primarily driven by risk aversion, resulting in the index posting its highest daily close since November of the previous year, surpassing 106.10.
Despite the negative sentiment, US Treasury yields were not pushed lower, with the 10-year yield remaining around 4.54%. Meanwhile, the Dow Jones declined by 1.15% and the Nasdaq dropped by 1.54%.
US economic data released on Tuesday showed a deterioration in consumer sentiment and a larger-than-expected decline in New Home Sales. On Wednesday, upcoming US data includes the Durable Goods Orders report, while the focus is on consumer inflation figures to be released on Friday.
The deterioration in market sentiment has added fuel to the Dollar's rally, but a correction is overdue, particularly for the Euro and the Pound.
Analysts at Wells Fargo on Consumer Confidence:
Soft confidence in recent years has not always translated into spending declines partly because consumers were flush with cash and had easy access to affordable credit. But with savings running dry and credit now scarce and costlier, the biggest monthly decline in consumer confidence since 2020 could be more impactful on actual spending.
EUR/USD failed to hold above 1.0600 and hit a fresh monthly low near 1.0560. The bias remains to the downside, with no signs of a correction and technical indicators showing oversold readings. The German Gfk Consumer Confidence Survey is due on Wednesday, and the European Central Bank (ECB) will release monetary base indicators.
GBP/USD consolidates below 1.2200, looking for a new support level. Despite oversold conditions, the path of least resistance remains to the downside. EUR/GBP rose to 0.8700.
USD/CHF surged above 0.9150, reaching its highest level since April. The Swiss Franc also lost ground against the Euro. The Swiss National Bank (SNB) will release the Q3 Quarterly Bulletin.
USD/JPY rose above 149.00 as the divergence between the Federal Reserve (Fed) and the Bank of Japan (BoJ) continues, and investors appear to have no fears of intervention from Japanese authorities. Japan will release the Leading Economic Index, and the Bank of Japan will publish meeting minutes.
AUD/USD was impacted by negative sentiment and declining commodity prices, causing it to slide below 0.6400 and approach the September lows at 0.6355. The August Monthly Consumer Price Index is due on Wednesday, with a rebound in the annual rate expected from 4.9% to 5.2%.
USD/CAD rose to weekly highs above 1.3500 but remained below the 20-day Simple Moving Average (1.3540). A daily close well below 1.3450 would indicate further weakness ahead.
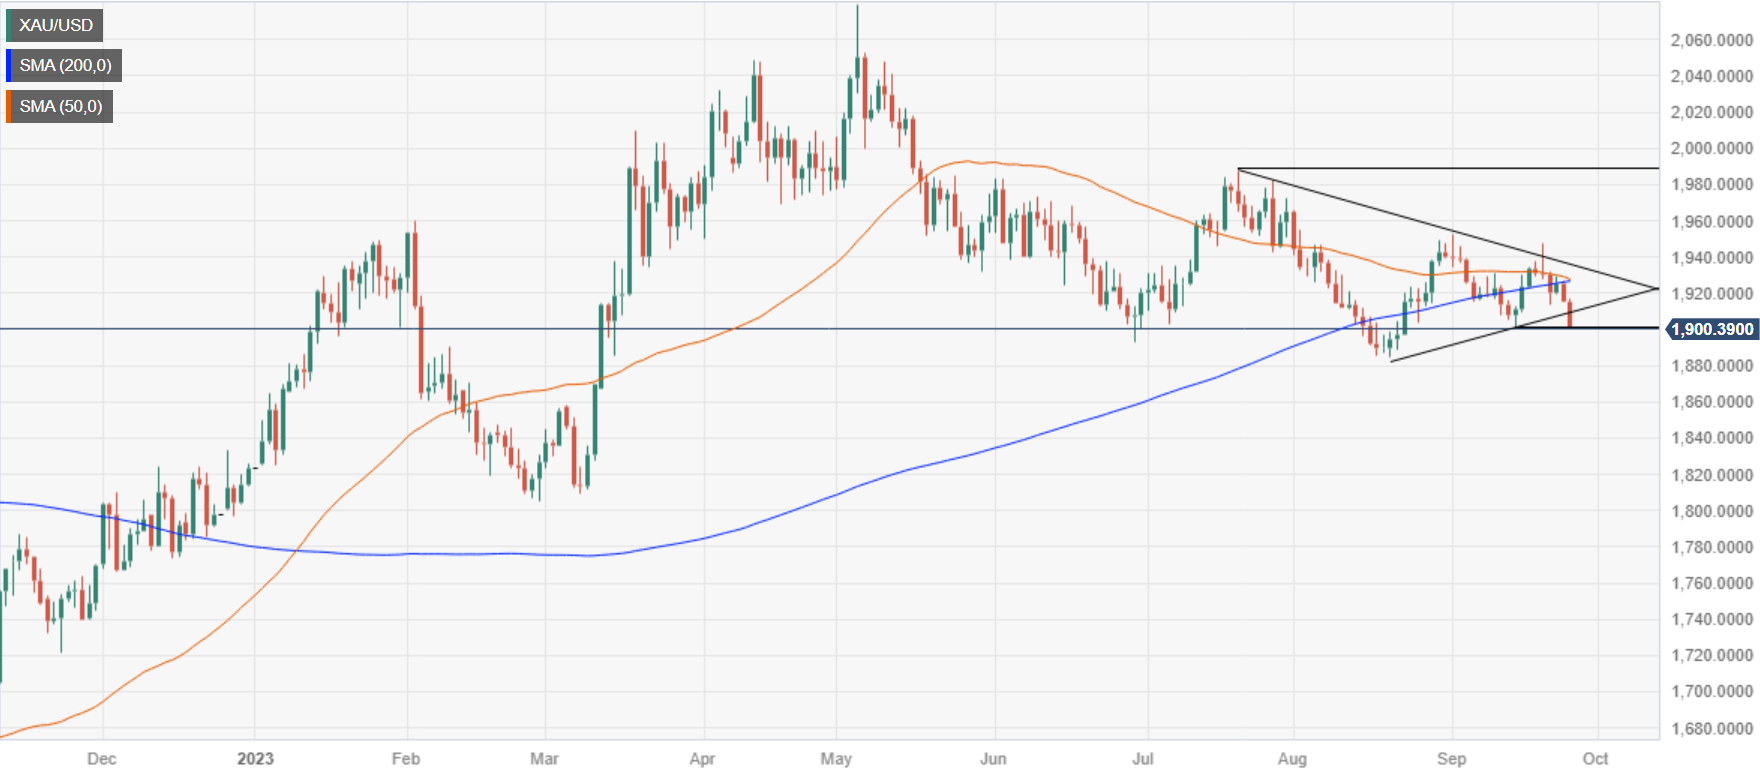
Gold accelerated its downside momentum, hitting levels below $1,900 for the first time in a month. The yellow metal remains under pressure as US yields stay elevated. Silver also experienced a significant drop below $23.00.
Like this article? Help us with some feedback by answering this survey:
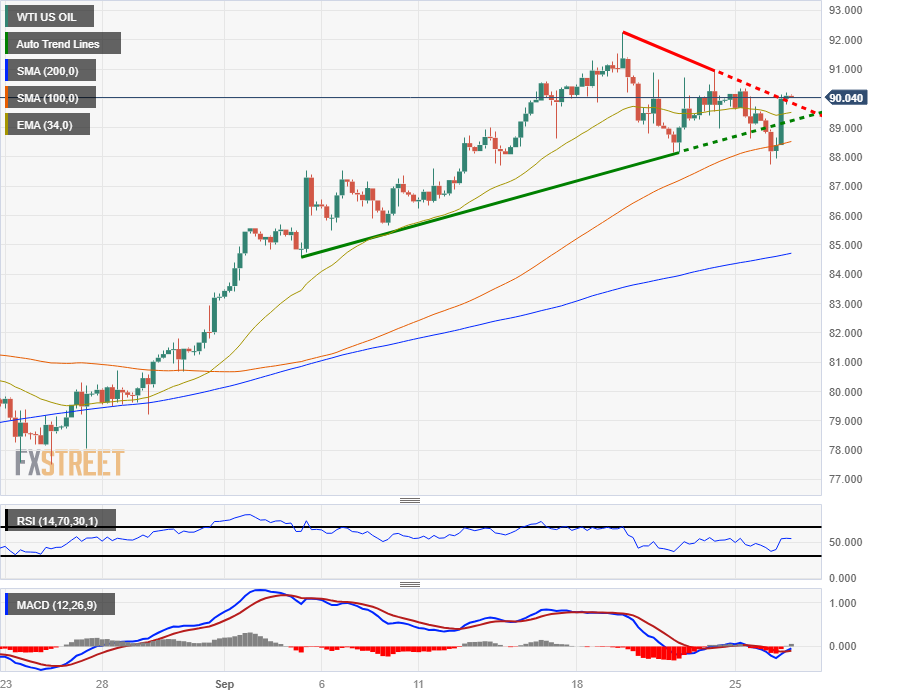
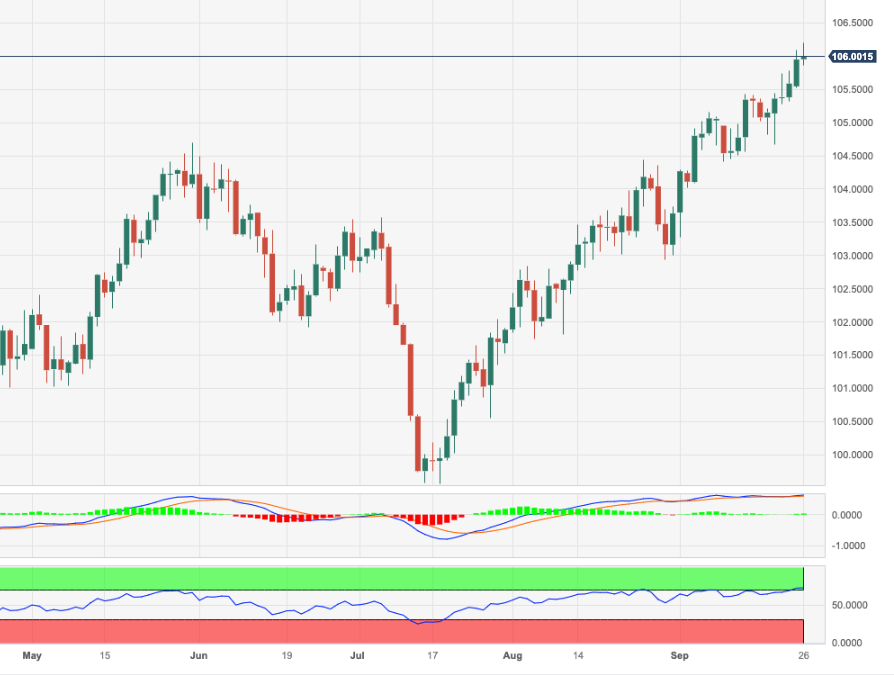
- WTI recovered to $90.00 in Tuesday trading after dipping to a session low of $87.73.
- Crude oil prices remain well-bid as supply constraint fears bolster barrel costs.
- Broad-market risk aversion preventing further climbs up the chart for WTI.
West Texas Intermediary (WTI) US crude oil prices have reclaimed the $90/bbl handle in Tuesday's trading window after hitting a two-week low early in the day of $87.74.
US crude reserves are rapidly dwindling in the face of a global supply deficit of nearly 2 million bpd. The major crude reservoir at Cushing, Oklahoma has reached 14-year lows, and declining reserve supplies will provide further upside price pressures for WTI.
Cushing reserves have reversed rapidly; the facility hit a two-year reserve high in June of 43 million barrels and is now sitting just below 23 million barrels, its lowest stock supply since last July.
Despite broad-market risk aversion sending risk assets lower on the day, WTI US crude has caught a bump on the charts.
Despite ongoing supply constraints on the heels of Saudi Arabia and Russia's 1.3 million bpd production cut extensions through the end of the year, upside pressure on oil prices could see a ceiling sooner than many analysts expect.
US crude production has been ramping up as of late, and despite a declining number of active oil rigs and wells, efficiency in the crude sector is steadily rising, and US oil production continues to creep higher.
US crude production in September is expected to hit production levels on par with 2019's record-setting 13 million bpd.
WTI technical outlook
US crude oil is up over 2.5% from Tuesday's lows, remounting the $90/bbl handle and poised for further gains as long as crude bulls can keep the bid line over the 200-hour Simple Moving Average (SMA) currently priced in at $89.90.
On the daily candlesticks, crude prices remain firmly on the topside, with technical indicators breaking down as they remain pinned firmly in overbought territory. The Relative Strength Index (RSI) has been at or near overbought territory for nearly a month straight on a 14-day rolling basis.
The 200-day SMA remains well below current price action, turning mildly bullish from $77.00, and the 34-day Exponential Moving Average (EMA) is providing technical support from just beneath the $86.00 handle.
WTI 4-hour chart
WTI technical levels
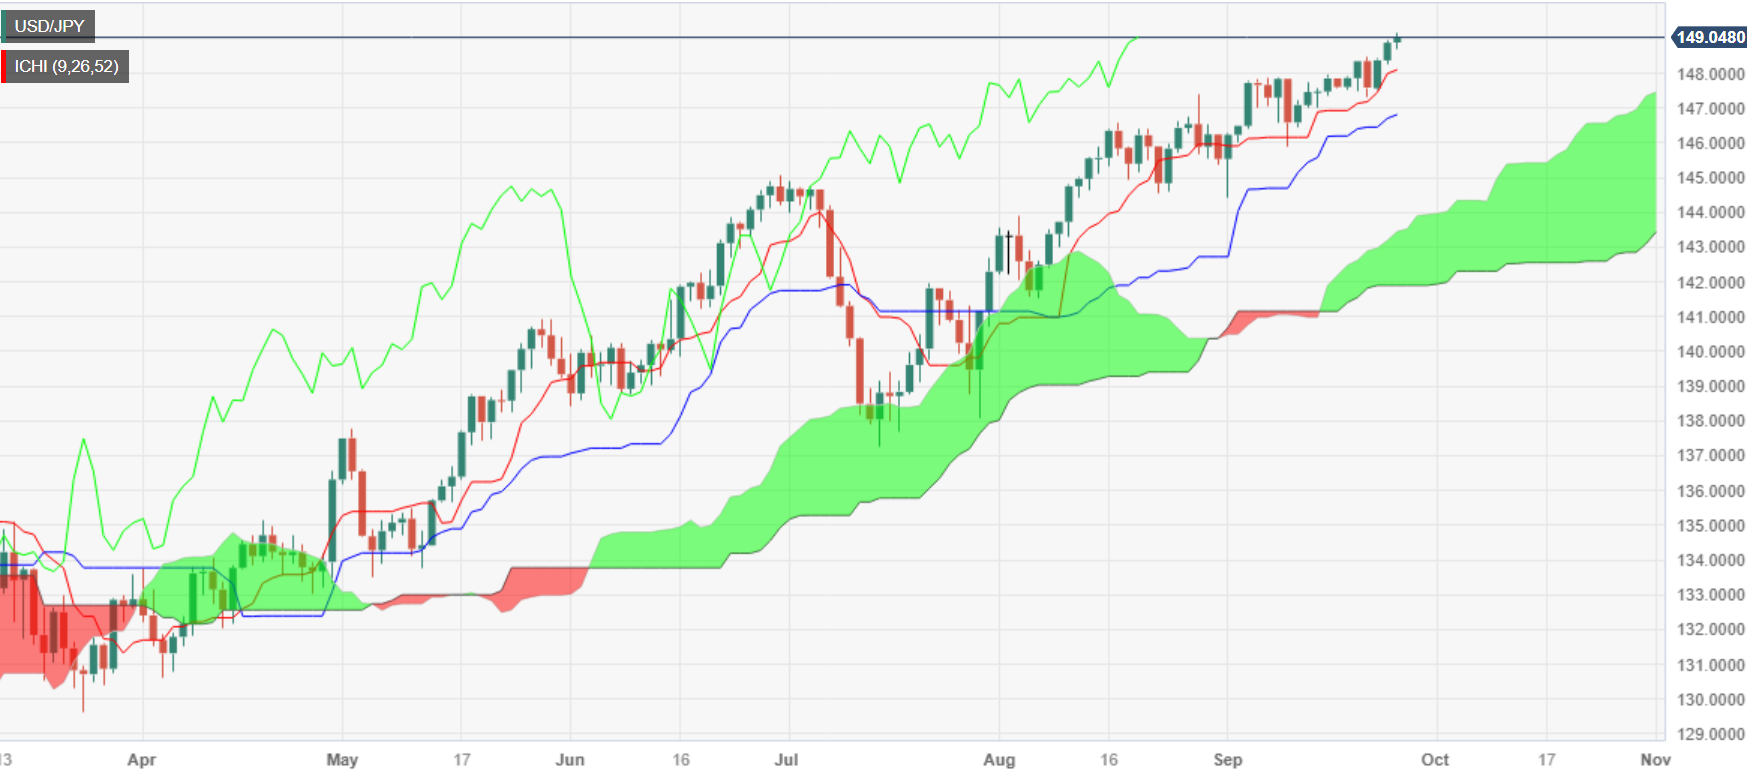
- USD/JPY reaches a new year-to-date high at 149.18, underpinned by high US yields.
- The Federal Reserve’s upward revision to the Federal Funds rate (FFR) next year has boosted the USD to new yearly highs.
- Japanese authorities are concerned over 'excessive volatility,' led by Prime Minister Fumio Kishida and Finance Minister Shunichi Suzuki.
USD/JPY pushes to a new year-to-date (YTD high of 149.18, though traders remain cautious given Japanese authorities' expressions about “undesirable” and “excessive” moves in the Forex markets. Nevertheless, the Greenback remains in the driver’s seat, underpinned by elevated US Treasury bond yields. The pair continues to trade above the 149.00 mark, registering minuscule gains of 0.12%.
The Yen weakens but remains boosted by Japanese authorities' verbal intervention
The Japanese Yen (JPY) fall remains cushioned by expressions of Japanese authorities, as its Finance Minister Shunichi Suzuki commented, “Excessive volatility is undesirable.” The latest Japanese official that talk up the Yen was Prime Minister Fumio Kishida, who also ordered his cabinet to prepare a new economic package to ease inflation's pain, including food and energy.
Aside from this, the Greenback extended its gains, as US Treasury bond yields remain underpinned by expectations that interest rates would be “higher for longer,” as said by the US Federal Reserve Chair Jerome Powell. Given the Fed reviewed its forecast for 2024 to hold rates above the 5% threshold, investors reacted accordingly, lifting US bond yields higher; therefore, the US Dollar rose.
After the Fed’s decision, some of its policymakers said the US central bank needs to be patient, but the majority foresees an additional rate hike toward the end of 2023.
US Consumer Confidence deteriorated in September on the data front, as the Conference Board (CB) revealed. The CB Consumer Confidence slowed to 103 from 108.7 in August and missed estimates of 105.5, as Americans remain pessimistic about the economy.
Further housing data revealed was mixed, with Building Permits increasing while Home Sales plummeted, spurred by higher mortgage rates.
USD/JPY Price Analysis: Technical outlook
From a technical standpoint, the USD/JPY is set to test the 150.00 waters in the near term, but intervention threats could suggest a nimble approach to that level. A breach of that area, the next resistance would be the October 21 high at 151.94, followed by the 152.00 mark. Conversely, if the major drops below the Tenkan-Sen at 148.10, that could pave the way toward the latest cycle low witnessed at 144.44, the September 1 swing low. However, on its way south, sellers would face key support levels, like the Kijun-Sen at 146.82, followed by the 145.00 psychological level.
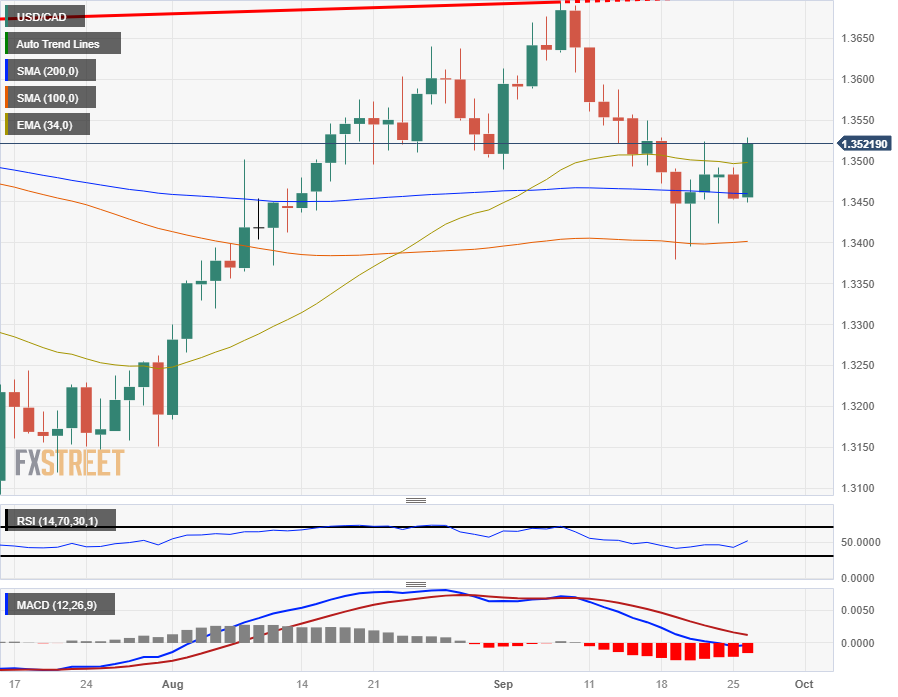
- The USD/CAD had cleared the 1.3500 handle in Tuesday trading.
- The oil-backed Loonie is unable to find gains as the DXY captures the broader market.
- US data to feature heavily in the back half of the week.
The USD/CAD has decisively reclaimed the 1.3500 major handle for Tuesday. The US Dollar Index (DXY) is pumping higher across the entire market, bolstered by a hawkish Fed and risk aversion taking a bite out of the market's appetite for riskier assets.
The broad US Dollar Index (DXY) is at its highest levels since last November, and the Greenback (USD) is taking a step higher. Even with oil prices rising for Tuesday which would normally prop up the Loonie (CAD), the USD is still the clear winner on the charts.
US Treasury yields are knocking on multi-year highs with the 10-year Treasury yield holding above 4.5%, pushing the USD higher. US markets are increasingly concerned about a potential US government shutdown looming, knocking risk appetite even further back.
Economic calendar: US figures in focus
On the data docket it's notably CAD-thin, leaving investors to focus almost entirely on US data for this week.
Tuesday saw US Housing Price Index figures cleanly beat expectations, printing at 0.8%, leaping over the forecast 0.5% and doubling the previous reading of 0.4%.
Wednesday will bring US Durable Goods Orders (forecast: -0.5%, previous -5.2%), and investors will be focusing on US Gross Domestic Product (GDP) figures due on Thursday. Median market forecasts are anticipating a steady print at an annualized 2.1% for the second quarter.
The trading week will close out with US Personal Consumption Expenditure (PCE) Price Index data on Friday. PCE, the Federal Reserve's (Fed) preferred US inflation measure, is expected to hold steady at 0.2% for the month of August.
A data beat could see the Greenback clear even further ground with Fed policymakers already leaning towards the potential for further rate hikes in the future if inflation refuses to bed down.
USD/CAD technical outlook
The Greenback is up 0.3% against the Loonie in Tuesday's market session, vaulting the 1.3500 mark and poised to extend further beyond the 200-hour Simple Moving Average (SMA) currently chalked in near 1.3480.
Near-term resistance is coming from last week's swing high near 1.3525, and intraday bullish momentum might find a covering pullback from here.
On the daily candlesticks, the USD/CAD is geared for a decisive split from the 200-day SMA, which has constrained price action for several days and is currently settling just north of 1.3450. An extended bull run will see the pair set for a re-challenge of early September's peak of 1.3695.
USD/CAD daily chart
USD/CAD technical levels
- Gold prices tumble as high US bond yields, and a strengthening US Dollar create a challenging environment for the precious metal.
- The US 10-year TIPS yield, indicative of real yields, has reached fourteen-year highs at 2.236%, last seen in July 2009, further pressuring gold prices.
- Speculations of the Federal Reserve maintaining higher interest rates for an extended period continue negatively impacting Gold.
Gold price tumbled towards $1900 on Tuesday, weighed by high US bond yields underpinning the Greenback (USD) as traders brace for the Fed’s mantra that would keep rates “higher for longer.” Therefore, XAU/USD is falling after hitting a daily high of $1916.89 and is trading at $1901.16, down 0.76%.
Gold prices face downward pressure as traders anticipate prolonged high-interest rates, with XAU/USD trading at $1901.16, marking a 0.76% decline
Wall Street is trading in red territory, while US bond yields advance. One of the main drivers of Gold weakness is the US 10-year TIPS (Treasury Inflation-Protected Securities) yield, a proxy for real yields, which rose to new fourteen-year highs at 2.236%, a level last seen in July 2009. At the same time, the US Dollar Index, which tracks the performance of six currencies against the US Dollar, climbs to 106.17, up 0.21%, after hitting a new year-to-date (YTD) high of 106.20.
Last week’s Fed's decision to hold rates unchanged but upward revising interest rates in the United States (US) in 2024 from 4.6% to 5.1% caught off guard traders, expecting rate cuts by the Fed at around July of next year. Hence, as they scramble through the doors, they are beginning to price in a scenario of higher rates, as could be seen by the financial markets’ reaction.
Additionally, although Fed officials stressed that patience is required, the majority is ready to raise rates again, as inflation, per the latest report, increased to 3.7%, as shown by the Consumer Price Index (CPI). It should be said the recent rally in oil prices, could pave the way for another inflation spiral, as West Texas Intermediate (WTI), the US crude oil benchmark, is trading near the $90,00 per barrel mark.
Data-wise, the Conference Board (CB) reported that consumer Confidence reached a four-month low, as the index declined to 103 from 108.7 in August, and below estimates of 105.5. The decline is attributed to a deteriorating economic outlook for the overall economy.
Earlier, housing data was revealed, as August’s Building Permits in the US increased from July's 1.443 million to 1.541 million, indicating continued growth in construction. However, the housing market shows signs of weakness as New Home Sales plummeted by -8.7% compared to the 8% increase in July. The decline is mainly due to higher mortgage rates, as the Federal Reserve embarked on an aggressive tightening cycle that witnessed interest rates hit the 5.25%-5.505 area.
Ahead of the week, the US economic docket would feature the release of Durable Goods Orders, Initial Jobless Claims, GDP, the Fed’s inflation gauge, and the core PCE alongside Fed speakers.
XAU/USD Price Analysis: Technical outlook
The XAU/USD daily chart portrays the yellow metal is set to extend its losses though pending to pierce below the $1900 figure, which could open the door to test August 21, the last cycle low at $1884.89, before extending its losses towards the next support seen in March 8 daily low of $1809.48. Conversely, if XAU/USD stands above $1900, that could open the door to reclaiming September’s 20 high at $1947.39.
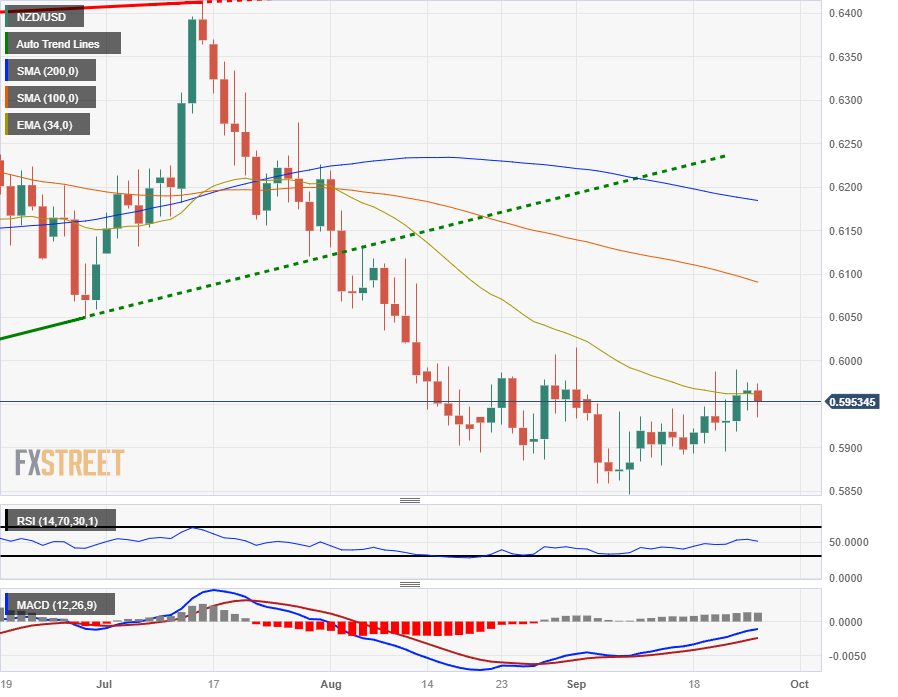
- The NZD/USD is drifting around 0.5950 for Tuesday after recovering from a knockback to 0.5935.
- The economic calendar is notably Kiwi-light this week.
- US GDP and PCE inflation figures to dominate headlines through the mid-week.
The NZD/USD is trading back and forth for Tuesday, capped by the 0.5970 level as markets spread their Kiwi (NZD) bets ahead of a US data-heavy calendar for the back half of the trading week.
The Kiwi hit an intraday high just shy of 0.5975 in the early Tuesday trading session before slumping to a low of 0.5935. The pair has since recovered to somewhere near the middle as traders wait for a reason to find some momentum.
The US Housing Price Index printed at 0.8%, a clear beat of the market-expected 0.5% and doubling the previous figure of 0.4%.
Despite the bumper housing price reading, housing data for the US came in mixed, capping off potential USD gains. New Home Sales for the month of August recorded an 8.7% decline, a significant backstep from the previous 4.4% gain.
Wednesday will see US Durable Goods Order for August, which are forecast to rebound from -5.2% -0.5%, an improvement but still in negative territory,
Greenback traders will be looking closely at US Gross Domestic Product (GDP) figures on Thursday, which is expected to hold steady at an annualized 2.1% for the second quarter.
Thursday's GDP print will be followed by a speech by the Federal Reserve's (Fed) Chair Jerome Powell.
The trading week will close out with US Personal Consumption Expenditure (PCE) Price Index figures, the Fed's preferred measure of inflation.
The US PCE inflation reading for August is forecast to hold steady at 0.2%.
NZD/USD technical outlook
The NZD/USD is seeing mild consolidation on the hourly candles, and prices are cycling the 34-hour Exponential Moving Average (EMA) with technical support from the 200-hour Simple Moving Average (SMA) near 0.5935.
Daily candlesticks see the NZD/USD pinned to the 34-day EMA currently settling into 0.5960, and a significant break higher will run into the 100- and 200-day SMAs, near 0.6080 and 0.6180 respectively.
Despite finding a technical floor from early September's swing low into 0.5850, the NZD/USD remains notably bearish, down -7.2% from July's peak near 0.6415. Technical indicators are beginning to spread to the middle as directional momentum bleeds out of the pair, and the Relative Strength Index (RSI) is stuck in no man's land near the 50.0 level.
NZD/USD daily chart
NZD/USD technical level
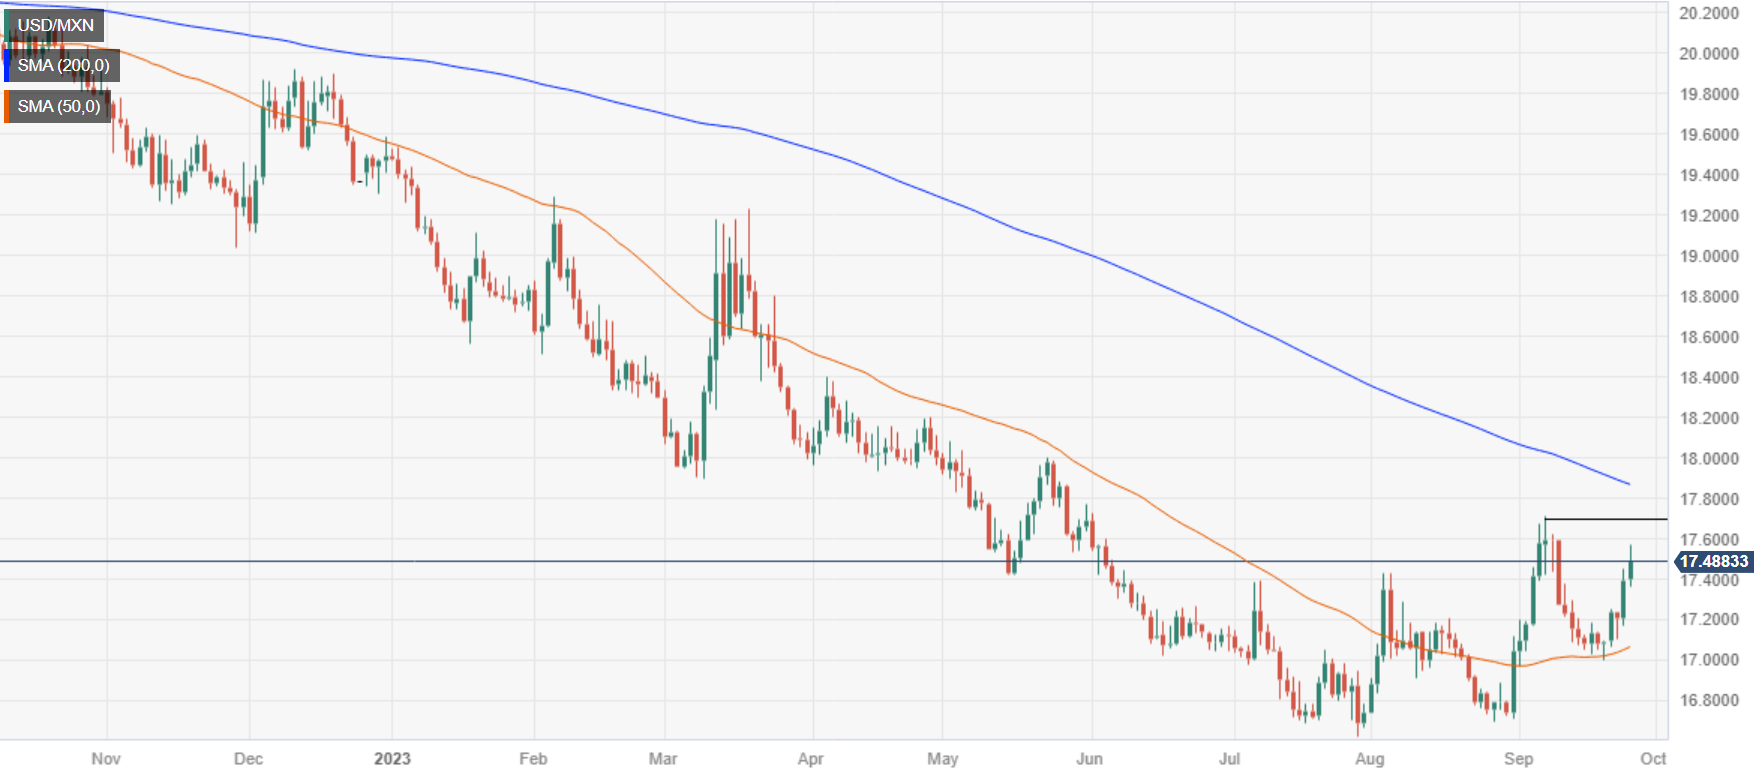
- USD/MXN is on an uptrend, with the pair trading at 17.4904, driven by the hawkish stance of the US Federal Reserve.
- US Federal Reserve's projections indicate higher interest rates in the coming years, with rates expected to be 5.6% in 2023 and 5.1% in 2024.
- USD/MXN traders are eyeing Thursday's Bank of Mexico (Banxico) interest rate decision.
The Mexican Peso (MXN) slips further against the US Dollar (USD) amid risk aversion and high US bond yields, driving price action in the Forex markets. Expectations that interest rates in the United States (US) would remain higher for an extended period underpins the USD. The USD/MXN is trading at 17.4904 after hitting a new two-week high.
USD/MXN hits a new two-week high on the Fed’s hawkish stance, while Banxico is set to keep rates unchanged
The USD/MXN resumed its uptrend after the US Federal Reserve (Fed), despite holding rates unchanged, delivered a hawkish hold, as revealed by the “dot-plots” in the Summary of Economic Projections. Fed officials foresee rates at 5.6% in 2023 and 5.1% in 2024, higher than the 4.6% projected in June 2023.
Consequently, US Treasury bond yields have skyrocketed since Wednesday, with the US 10-year benchmark note rate gaining 4.34% or 19 basis points, currently at 4.548%. Although the CME FedWatch Tool does not price in another hike by the US central bank, Fed’s policymakers emphasized that curbing inflation towards its 2% goal is their primary objective.
Source: CME FedWatch Tool
Recently, Fed officials stressed that although a soft landing could be achieved, further tightening is needed, as the Minnesota Fed President Neil Kashkari expressed on Tuesday. He said, “After potentially one more 25-basis-point federal funds rate increase later this year, the FOMC holds policy at this level long enough to bring inflation back to target in a reasonable period of time.”
Data-wise, Consumer Confidence, as the Conference Board (CB) reported, reached a four-month low. This decline is attributed to a deteriorating economic outlook for the overall economy.
Earlier, housing data was revealed, as August’s Building Permits in the US increased from July's 1.443 million to 1.541 million, indicating continued growth in construction. However, the housing market shows signs of weakness as New Home Sales plummeted by -8.7% compared to the 8% increase in July. The decline is mainly due to higher mortgage rates, as the Federal Reserve embarked on an aggressive tightening cycle that witnessed interest rates hit the 5.25%-5.505 area.
On the Mexican front, the lack of economic data left USD/MXN traders adrift to US Dollar dynamics. However, ahead of the week, the agenda will feature the Balance of Trade, Unemployment Rate, and the Bank of Mexico (Banxico) interest rate decision. On the US front, the docket would feature Fed speakers led by Bowman, Durable Goods Orders, GDP, Initial Jobless Claims, and the Fed’s preferred gauge for inflation, Core PCE.
USD/MXN Price Analysis: Technical outlook
From a technical standpoint, the USD/MXN is neutral-biased but slightly tilted to the upside, but it remains shy of registering a break to a new cycle high. That would be achieved with the exotic pair claiming the September 7 high of 17.7074, exposing the 200-day moving average (DMA) on the upside at 17.8604, followed by the psychological 18.0000 figure. Once cleared, the next resistance would emerge at the April 5 high at 18.4010, followed by the March 24 high at 18.7968.
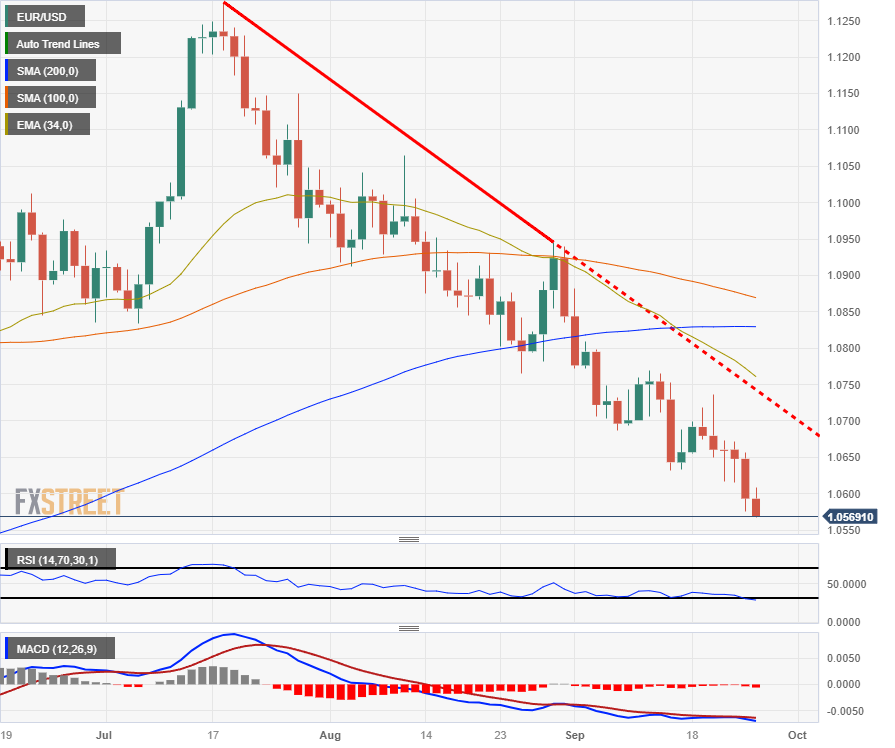
- The EUR/USD is drooping into new six-month lows for Tuesday.
- The Euro initially rallied to a session high of 1.0610 before running out of steam, heading back into the day's lows.
- Markets will be looking ahead to US GDP figures on Thursday.
The Euro (EUR) caught a small lift against the Greenback (USD) in early Tuesday trading before reversing direction and heading back into bearish territory and is now probing into the EUR/USD pair's lowest prices in half a year.
The broad US Dollar Index (DXY) is seeing a healthy bid across the markets, bolstered by a jump in US Treasury yields.
German 10-year Bund yields are also receding from 12-year highs above 2.80%, exacerbating the Euro's backslide.
Adding to the EUR's woes is a rate cycle logjam within the European Central Bank (ECB). Voting members of the ECB have reached a consensus that it's best to avoid any further rate hikes as the central bank waits for evidence that current rates are having the desired effect.
Inflation still remains above target for the European Union's domestic economy, but policymakers fear leaning on rates too fast and choking out what little economic growth currently exists. Markets are broadly anticipating a continued slowdown in the EU's economy, with jobs growth evaporating and economic activity remaining sluggish.
US data in the pipe, Friday to see EU CPI & US PCE
The US Housing Price Index for July came in above expectations, printing 0.8% to vault over the forecast 0.5% and doubling the previous reading of 0.4%.
Wednesday will see US Durable Goods Orders for August, which is forecast to print at -0.5%, a rebound from the previous reading of -5.2%.
Thursday will bring the ECB's latest Economic Bulletin, while the Federal Reserve's (Fed) Chair Jerome Powell will be making a public statement at 20:00 GMT.
Before Powel though, US Gross Domestic Product (GDP) for the second quarter will be dropping, and the headline annualized reading is forecast to hold steady at 2.1%.
Investors will be watching closely for Friday's double feature, where the EU's Consumer Price Index (CPI) and the US' Personal Consumption Expenditure (PCE) Price Index data publishes.
EU CPI is expected to decline to 4.8% from 5.3% for the annualized period into September.
US PCE inflation for the month of August is forecast to hold steady at the previous figure of 0.2%.
EUR/USD technical outlook
The EUR/USD saw a clean rejection of the 34-hour Exponential Moving Average (EMA) early Tuesday near 1.0605, and the pair is now testing into new six-month lows on the south side of 1.0570.
On the daily candlesticks, the EUR/USD is notably bearish, continuing to fall from the 200-day Simple Moving Average (SMA) currently turning bearish just below 1.0850, with dynamic resistance from a descending trendline from July's swing high above 1.1250.
Technical indicators are fully pinned into oversold territory, but bidders will want to wait for a confirmed recovery pattern before attempting to catch this particular falling knife.
EUR/USD daily chart
EUR/USD technical levels
- AUD/USD trades at 0.6418, down 0.08%, with sellers targeting the 0.6400 figure and a potential break below a crucial two-and-a-half-year support trendline.
- The Greenback remains strong, touching a new YTD high of 106.20 on the US Dollar Index (DXY), fueled by elevated US Treasury bond yields and risk aversion in the market.
- Upcoming data releases, including Australia's Monthly Consumer Price Index (CPI) and several US economic indicators, are keenly awaited by traders for further market direction cues.
The Australian Dollar (AUD) prolonged its losses against the US Dollar (USD) early in the North American session after hitting a daily high of 0.6430. Sellers are eyeing the 0.6400 figure and a break below a two-and-a-half-year support trendline that could cement a weaker outlook for the major. The AUD/USD is trading at 0.6418, down 0.08%.
AUD/USD remains under pressure, eyeing the 0.6400 figure, as higher US Treasury bond yields and deteriorating consumer confidence in the US impact market sentiment
The AUD/USD remains pressured due to risk aversion, higher US Treasury bond yields, and the interest rate difference between Australia and the United States (US). Although US Treasury bond yields retraced somewhat from multi-year highs, the Greenback (USD) remains in the front foot after touching a new year-to-date (YTD) high of 106.20, as revealed by the US Dollar Index (DXY).
On the data front, Building Permits in the US grew more than July’s 1.443M, and came at 1.541M in August, while home prices continued to rise due to higher mortgage rates in the US. Nevertheless, New Home Sales plunged -8.7%, compared to July's 8% increase, signaling the housing market is weakening amidst 525 basis points of tightening by the US Federal Reserve.
Further data showed that Consumer Confidence revealed by the Conference Board (CB) slid to a four-month low, blamed on a deterioration in the economic outlook for the economy. The CB Consumer Sentiment index rose by 103 from August 108.7, as data shows. Dana Peterson, the chief economist, commented that consumers are worried about rising prices in general, particularly food and gasoline, and expressed concerns about higher interest rates and the political situation.
What to watch?
Australia would feature its Monthly Consumer Price Index (CPI) for August, with inflation foreseen to jump from 4.9% to 5.2%. The US economic agenda would feature Fed speakers led by Bowman, Durable Goods Orders, GDP, Initial Jobless Claims, and the Fed’s preferred gauge for inflation, Core PCE.
AUD/USD Price Analysis: Technical outlook
The daily chart is neutral to downward biased, as the pair consolidated at around the year’s lows and is testing a multi-year support trendline. A breach of the latter could pave the way to test the year-to-date (YTD) low of 0.6357, followed by a drop to the November 22 swing low of 0.6272. Conversely, buyers must reclaim 0.6500 and the 50-day moving average (DMA) at 0.6506 to remain hopeful for higher prices.
USD rose for a 10th consecutive week. Economists at OCB Bank analyze Greenback’s outlook.
There will still be some room for USD upticks
We retain our view for a moderate-to-soft USD profile as Fed is likely done with tightening for current cycle. But as rates remain high for longer in the interim, any USD dips may be shallow for now especially when a dovish pivot is still yet in sight.
The point of USD inflection would come when market narrative shifts into trading the expectations for ‘more rate cuts in 2024’ and this is highly dependent on how data pans out. A more entrenched disinflation trend and more material easing of labour market tightness, activity data should bring about the shift and for the USD to trade softer.
For now, USD still retain a significant yield advantage and is a safe haven proxy to some extent. As such, there will still be some room for USD upticks especially if global, China growth momentum stay subdued.
Oil prices are currently up by more than 25% this quarter. Economists at ING expect Brent to break above $100 in the near term. However, they do not believe such a move will be sustainable.
Oil price rally likely to continue, but not sustainable in the longer run
We expect Oil prices to break above $100 in the near term as supply cuts by OPEC+ countries more than offset weaker demand due to the global economy’s slowdown.
However, we don’t see Oil prices remaining above $100 for long as weaker demand and political pressure to increase supply should help to bring Oil prices back to levels slightly above $90.
- Silver price drops sharply amid fears of more interest rates from the Fed.
- The US Dollar Index remains in the grip of bulls as the global economy is on the cusp of a slowdown.
- Silver price faces selling pressure near the 50% Fibonacci retracement at $23.66.
Silver price (XAG/USD) drops to near $23.00 in the early New York session. The white metal faces a sell-off as the US Dollar resumes its upside journey after a mild correction to near 105.90. The appeal for the US Dollar improved as Federal Reserve (Fed) policymakers delivered a hawkish commentary on the interest rate outlook.
The S&P500 opens on a bearish note as investors remain worried about government shutdown risks. The US Dollar Index remains in the grip of bulls as the global economy is on the cusp of a slowdown. European economies are struggling to bear the consequences of higher interest rates by the European Central Bank (ECB) while the Chinese economy is facing deflation risks.
On the contrary, the US economy has absorbed the pitfalls of higher interest rates by the Fed efficiently, making the US Dollar resilient in comparison with other G7 economies.
Meanwhile, US New Home Sales demand dropped to 675K vs. expectations of 700K and the former release of 714K. The demand for new homes dropped due to higher borrowing costs. The US Conference Board reported Consumer Confidence Index declined to 103.00 from 108.7 in August as households worry about the Fed’s ‘higher for longer’ interest rates plot.
Silver technical analysis
Silver price faces selling pressure near the 50% Fibonacci retracement (plotted from August 30 high at $25.00 to September 14 low at $22.30) at $23.66 on a two-hour scale. The white metal drops below the 50-period Exponential Moving Average (EMA) at $23.25 indicating that the short-term trend has turned bearish.
The Relative Strength Index (RSI) (14) skids into the bearish range of 20.00-40.00, which indicates that a bearish impulse has been activated now.
Silver two-hour chart
-638313349707885832.png)
Dollar whirlwind gathers force. Kit Juckes, Chief Global FX Strategist at Société Générale, analyzes FX market outlook.
An opportunity to buy SEK and possibly more NOK
The current period of Dollar strength is triggering a bit of a bounce in volatility, albeit from very depressed levels for some pairs. I’m hoping this will give us an opportunity to get buy SEK and possibly more NOK, in the coming days. I really don’t want to get left behind, failing to take advantage of the two Scandinavians’ relative cheapness.
I also don’t want to get left behind as EUR/GBP breaks above 0.87. Sterling’s interest rate support has been cut back and while there’s still scope for the economy to perform less badly than consensus (gloomy) expectations, that won’t prevent a gradual drift up to 0.90 and beyond over time.
As for AUD, NZD, and JPY, all sitting at psychologically interesting levels, I don’t have the stomach to buy any of them here.
USD/CNY is edging slowly back up and a break above early-Sep highs would spill over to the rest of the region.
- CB Consumer Confidence Index in the US continued to decline in September.
- US Dollar Index holds steady at around 106.00.
Consumer sentiment in the US continued to weaken in September, with the Conference Board's Consumer Confidence Index declining to 103.00 from 108.7 in August (revised from 106.1).
Further details of the publication revealed that the Present Situation Index edged higher to 147.1 from 146.7 and the Consumer Expectations Index declined to 73.7 from 83.3.
"Notably, average 12-month inflation expectations have held steady over the past three months despite ongoing complaints about higher prices," the publication read.
Market reaction
These figures don't seem to be having a significant impact on the US Dollar's performance against its major rivals. As of writing, the US Dollar Index was up 0.05% on the day at 106.00.
- New Home Sales in the US tumbled 8.7% in August.
- US Dollar Index continues to hover around 106.00 after data.
Sales of new single‐family houses tumbled 8.7% in August to a seasonally adjusted annual rate of 675,000, the data published jointly by the US Census Bureau and the Department of Housing and Urban Development showed on Tuesday.
This reading followed the 4.4% growth recorded in July and came in worse than the market expectation of a modest decline to an annual rate of 700,000.
The median sales price of new houses sold in August 2023 was $430,300, and the average sales price was $514,000, the publication revealed.
Market reaction
The US Dollar Index (DXY) remained around 106.00, trading near monthly highs, marginally higher for the day.
The EUR has been trending lower against the USD for most of the third quarter. Economists at MUFG Bank analyze EUR/USD outlook.
USD to lose upward momentum
We expect the USD to lose upward momentum as EUR/USD moves closer to the bottom of the 1.0500 to 1.1000 trading range.
Absent another negative shock for the Eurozone economy such as the price of Oil surging back above $100/barrel, we expect the pair to find it harder to break out below the bottom of the 1.0500 to 1.1000 trading range in the month ahead.
CAD/MXN shows signs of a reversal. Economists at Scotiabank analyze the pair’s outlook.
Bullish above 12.95
CAD/MXN continues to show signs of developing technical strength.
A push above 12.95 implies upside risk towards 13.65 over the next 2-4 months. Longer-term charts are also leaning more CAD-bullish; a high monthly close for the CAD in September (at or near current levels) would be bullish (forming the third leg of a ‘morning star’ pattern on the monthly chart).
Short-term trend momentum is bullish and we note a pick up weekly momentum in the CAD’s favour (albeit at still very low levels).
CAD support is 12.80/12.82 and 12.70.
- USD/CAD prints a fresh two-day high nominally above 1.3500 as the US Dollar resumes its upside journey.
- An extended correction in the oil price builds pressure on the Canadian Dollar.
- USD/CAD trades near the downward-sloping trendline of the Symmetrical Triangle chart pattern around 1.3550.
The USD/CAD pair consolidates near the psychological resistance of 1.3500 in the early New York session. The Loonie asset strengthens as an extended correction in the oil price builds pressure on the Canadian Dollar.
The S&P500 opened on a negative note as Federal Reserve (Fed) policymakers delivered hawkish interest rate guidance. The US Dollar Index (DXY) delivers a nominal correction after printing a fresh 10-month high near 106.20.
Fed policymakers: Minneapolis Federal Reserve Bank President Neel Kashkari and Boston Fed President Susan Collins, supported for further policy-tightening as robust consumer spending could rebound inflationary pressures. Meanwhile, investors await the US Consumer Confidence and New Home Sales data.
USD/CAD trades near the downward-sloping trendline of the Symmetrical Triangle chart pattern, which is plotted from September 15 high around 1.3550. The upward-sloping trendline of the aforementioned chart pattern is placed from September 19 low at 1.3380. Advancing 20-period Exponential Moving Average (EMA) at 1.3485 indicates that the short-term trend is bullish.
The Relative Strength Index (RSI) (14) aims to shift into the bullish range of 60.00-80.00. A sustained RSI (14) movement in the bullish range would trigger a bullish impulse.
A decisive break above September 21 high at 1.3524 would drive the asset towards September 11 low around 1.3560, followed by the round-level resistance at 1.3600.
In an alternate scenario, a breakdown below September 25 low around 1.3450 would drag the asset toward September 20 low near 1.3400. A further breakdown could expose the asset to a six-week low near 1.3356.
USD/CAD hourly chart
-638313325542096148.png)
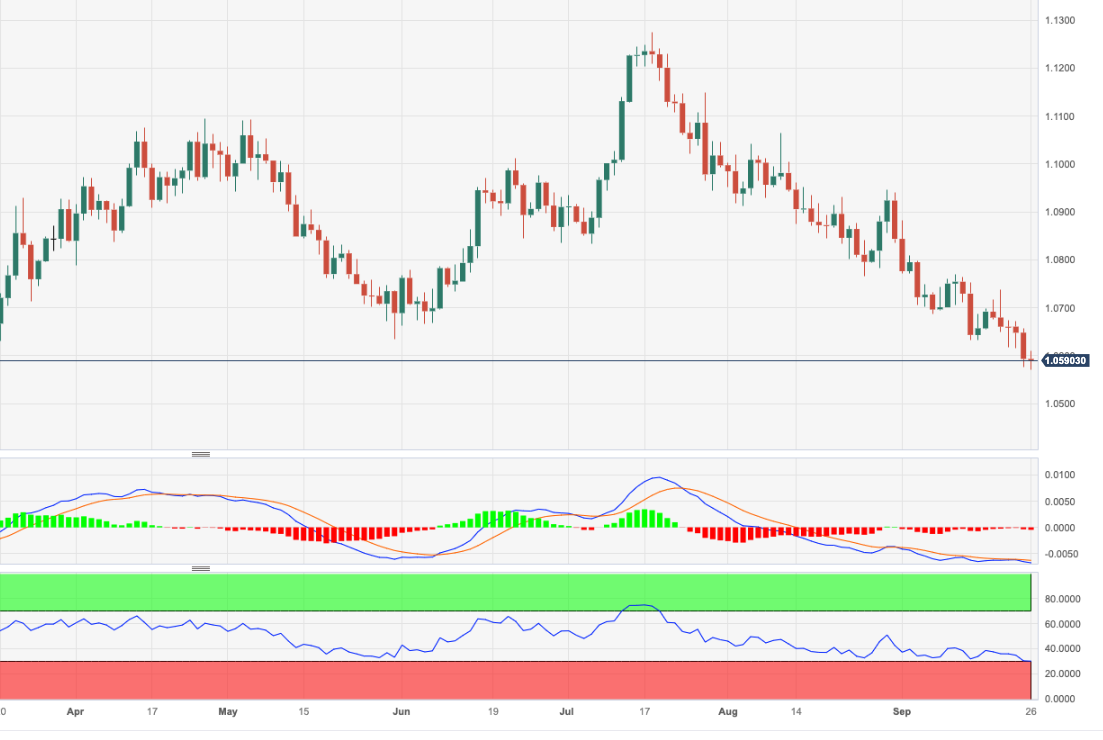
- EUR/USD drops to new multi-month lows around 1.0570.
- Extra losses could extend to the March low near 1.0515.
EUR/USD maintains the bearish pressure well in place and prints new six-month lows in the 1.0570/65 band on Tuesday.
If the pair breaches this level in the short-term horizon, it could then open the door to a potential retracement to the March low of 1.0516 (Mar 8), which is the last defence ahead of an assault on the 2023 low at 1.0481 (January 6).
While below the key 200-day SMA at 1.0828, the pair is likely to face extra weakness.
EUR/USD daily chart
The Dollar rose for a 10th successive week. Economists at Société Générale analyze Greenback’s outlook.
Bullish seasonality
Western and Eastern European currencies have struggled this month compared to the dollar bloc, and the ZAR and (most of) Latam in EM. The performance corroborates with the seasonality of the last four years.
Profit-taking cannot be ruled out this week on bond/equity portfolio rebalancing before month end. Dollar dips may attract buying into Q4 unless incoming US inflation and employment data disappoint.
The decline in EUR/USD and USD/JPY volatility after the passing of Fed and BoJ rate decisions last week suggest the current FX theme of Dollar strength may have further to run into Q4 and may provoke further jawboning by Japanese currency officials and the MoF.
- DXY climbs to new 2023 peaks north of 106.00 on Tuesday.
- Further upside looks favoured while above the 200-day SMA.
The upside momentum in DXY remains well and sound and lifts the index to new yearly peaks near 106.20 on Tuesday.
In light of the ongoing price action, extra gains appear likely for the time being. Further up now comes the weekly high at 107.19 (November 30, 2022) prior to another weekly peak at 107.99 (November 21 2022).
While above the key 200-day SMA, today at 103.06, the outlook for the index is expected to remain constructive.
DXY daily chart
The recovery in the Peso stalled at 17.00. Economists at Société Générale analyze USD/MXN outlook.
Risk of a deeper downtrend only if July low at 16.60 gets violated
USD/MXN has so far carved out a higher trough near 17.00 as compared to the one in July near 16.60. It has gradually established above the 50-DMA denoting receding downward momentum. This is also highlighted by daily MACD which has crossed above equilibrium line.
Defence of 17.00 could result in a short-term bounce towards 17.42 and recent pivot high at 17.64/17.70 which is also a multi-month descending trend line. This is a crucial resistance.
Only if July low at 16.60 gets violated would there be risk of a deeper downtrend.
- House prices in the US continued to rise in July.
- US Dollar Index consolidates gains slightly below 106.00.
House prices in the US rose by 0.8% on a monthly basis in July, the monthly data published by the US Federal Housing Finance Agency showed on Tuesday. This reading followed the 0.4% increase recorded in June and came in higher than the market expectation for a 0.5% growth.
Meanwhile, the S&P/Case-Shiller Home Price Index arrived at 0.1% on a yearly basis in July, up from -2.2% in June.
Market reaction
The US Dollar Index showed no immediate reaction to these data and was last seen trading flat on the day at 105.95.
Gold price remains under pressure after Fed meeting. Economists at Commerzbank analyze the yellow metal’s outlook.
Upside potential for XAU/USD in the medium term
The main factor weighing on Gold is presumably the expectation of interest rates remaining higher for longer after the Fed made fairly hawkish remarks last week. This is also evident in the marked appreciation of the USD. However, we are still sceptical about whether the Fed will in fact hike its interest rates even further in the autumn on the one hand, and on the other whether the current view of many market participants, namely that the US economy will experience a ‘soft landing’, will prove accurate.
We continue to see upside potential if anything for XAU/USD in the medium term. In the short term, however, Gold may well make a renewed bid for the $1,900 mark if inflation fears increase in response to the recent sharp rise in oil and gasoline prices again and if at the same time, the US economy continues to perform fairly robustly for now.
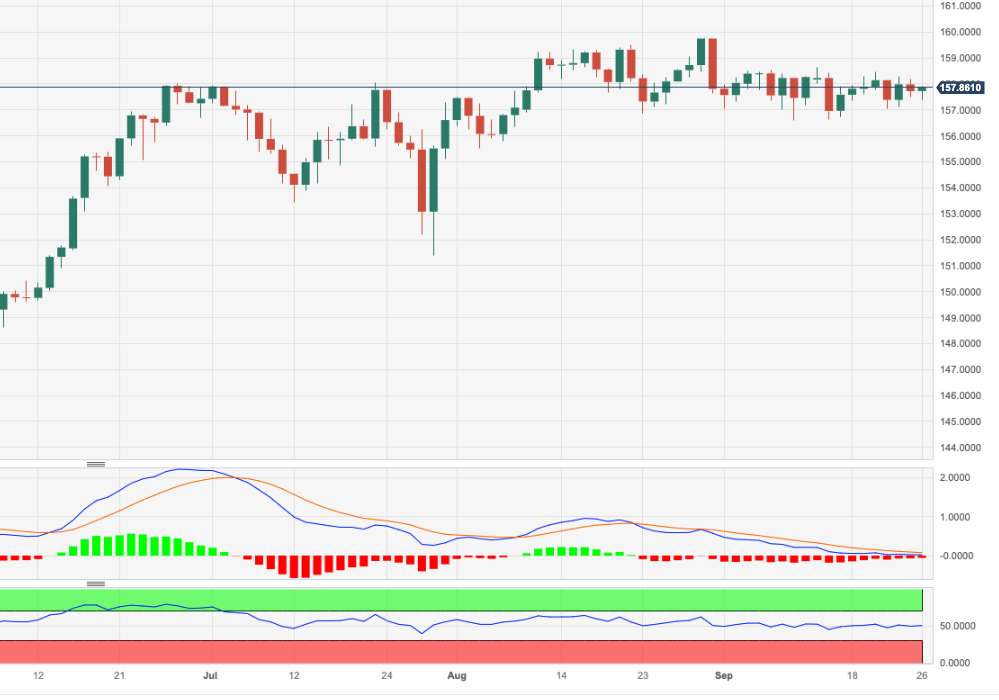
- EUR/JPY reverses Monday’s downtick and retests the vicinity of 158.00.
- Immediately to the upside comes the monthly peak at 158.65.
EUR/JPY reverses the negative start of the week and advances to the area near the 158.00 hurdle on Tuesday.
In the meantime, the cross remains stuck within the consolidative range and the breakout of it exposes a visit to the so far monthly high of 158.65 (September 13) prior to the 2023 top at 159.76 (August 30), which precedes the key round level at 160.00.
The surpass of the latter should not see any resistance level of note until the 2008 high at 169.96 (July 23).
So far, the longer term positive outlook for the cross appears favoured while above the 200-day SMA, today at 149.18.
EUR/JPY daily chart
S&P 500 concluded last week at 4,320. Economists at Société Générale analyze the index’s outlook.
4,200 is crucial support
S&P 500 carved out a lower high near 4,540 as compared to the one in July near 4,610 resulting in a deeper pullback. Break below August trough denotes persistence in downward momentum; this is also highlighted by daily MACD which has dipped below equilibrium line.
The index could drift towards projections of 4,270/4,240, also the lower band of an ascending channel.
Confluence of graphical levels and the 200-DMA near 4,200 is an important support. In case the index establishes below this, there would be risk of an extended downtrend.
- USD/JPY aims to extend the rally to 150.00 as the BoJ continues to favor a dovish interest rate policy.
- Unlike global slowdown fears, the US economy is resilient due to falling inflation and upbeat labor market conditions.
- Investors await the US Durable Goods Orders data which is seen contracting at a slower pace of 0.4%.
The USD/JPY pair faces a less-confident resistance near 149.20 but is expected to resume its upside move toward the crucial resistance of 150.00. The asset has been capitalizing on dovish interest rate guidance from Bank of Japan (BoJ) Governor Kazuo Ueda and strong US Dollar amid a cautious market mood.
S&P500 futures posted significant losses in the London session as investors worried about the consequences of higher interest rates by the Federal Reserve (Fed), which is expected to remain elevated for a longer period.
The US Dollar Index (DXY) refreshes a 10-month high around 106.20 as Fed policymakers favored further tightening of monetary policy to ensure price stability. Unlike global slowdown fears, the US economy is resilient due to falling inflation and upbeat labor market conditions. While US inflation has been softening, robust consumer spending could trigger upside risks to inflation. This could encourage Fed policymakers to support one more interest rate hike.
Meanwhile, investors await the US Durable Goods Orders data for August. Orders are seen contracting at a slower pace of 0.4% against the 5.2% decline seen in July. The US manufacturing sector is already going through a vulnerable phase. The US Manufacturing PMI has been contracting for a long period and a weak new order book indicates that factory activity will remain in contraction.
On the Japanese Yen front, BoJ Ueda supports for extending the expansionary monetary policy as 2% inflation is not in sight. Kazuo Ueda cited that a moderate rise in inflation backed by wage growth would be a real victory for the central bank.
Japan Finance Min Suzuki said Japan is at a critical stage whether to spur consumption, wage growth; Reiterated excessive FX moves are not desirable, watching FX moves with a high sense of urgency.
Cable is soft but off earlier lows. Economists at Scotiabank analyze GBP/USD outlook.
Perhaps oversold in the short run
Cable price signals are reflecting a tentative and perhaps only short-term base for the GBP developing on intraday chart.
The GBP sell-off does look somewhat overextended so a minor relief rally would not be a surprise at this point.
Gains through 1.2200 intraday would be a minor positive for the GBP and perhaps trigger a squeeze to the 1.23 area where firmer short-term resistance should emerge.
Intraday support is 1.2160/1.2170. Broader risks are tilted towards a drop back to the 1.20/1.21 area.
USD/CAD edges up to test 1.35. Economists at Scotiabank analyze the pair’s outlook.
Weak risk appetite and some further drift in crude oil prices are headwinds for the CAD
Weak risk appetite and some further drift in crude oil prices are headwinds for the CAD, in addition to the general strength in the USD.
USD/CAD continues to consolidate in a bear wedge/flag pattern between support at 1.3425 (ahead of key support at 1.3395) and resistance in the 1.3510/1.3520 zone (40-DMA at 1.3515 today).
The CAD has lost a little of the technical initiative that seemed to be developing on the charts as range trading is weakening the downside momentum behind the USD that had been developing over the past few sessions.
The Dollar is flat as the relentless rally takes a breather. Economists at Scotiabank analyze Greenback’s outlook.
Markets prone to a USD downswing in the event of adverse fundamental news or even a US government shutdown
The risk of more, at least short-term strength in the USD is high, given momentum, but there is a risk that positioning and sentiment are shifting too far, too quickly, leaving markets prone to a USD downswing in the event of adverse fundamental news – a weak data print or two – or even a US government shutdown.
Short term price signals suggest a brief pause perhaps in the broader USD rise.
Further upside momentum appears unchanged around USD/IDR, notes Markets Strategist Quek Ser Leang at UOB Group.
Key Quotes
We highlighted last Monday (18 Sep, spot at 15,370) that “upward momentum has not improved much, but USD/IDR could test 15,400 before easing.” We added, “the next resistance at 15,425 is not expected to come into view.” Our view was not wrong, as USD/IDR rose to 15,410 and then eased to end the week at 15,370 (+0.13%).
While upward momentum has not improved much, USD/IDR could test 15,425 this week before the risk of a deeper pullback increases. The next resistance at 15,445 is unlikely to come under threat. Support is at 15,360; if USD/IDR breaks below 15,325, it would mean that the current upward pressure has faded
- The US Dollar broke higher on Tuesday against most currencies in another rate differential push.
- Tuesday’s US economic docket will feature housing market data.
- The US Dollar Index makes a new 10-month high above 106.00.
The US Dollar (USD) rolls yet again through the markets as concerns start to mount on what this could mean for markets in the latter part of 2023. With US bond yields rising again to new highs, the rate differential is clearly the main driver between the Dollar and other currencies. As stocks are starting to decline, bonds are being sold, questions arise if this is the start of a feared recession and hard landing for the US economy.
Plenty of data to dig in this Tuesday from the US housing sector, where the tighter and higher credit conditions are still awaited to filter in.. The Housing Price Index and Consumer Confidence Index will both likely be market moving for the Greenback. Headlines from Capitol Hill could be a game changer as well as a stopgap bill will be brought to the House floor later onTuesday.
Daily digest: US Dollar keeps pressing
- Minneapolis Federal Reserve President Neel Kashkari called for another interest-rate hike this year. Meanwhile, JP Morgan CEO Jamie Dimon has warned that US rates could head to 7%.
- On the economic data front, Tuesday will start with the US Redbook Index at 12:55 GMT for the week of September 22. In the prior week, the index rose 3.6%.
- The Housing Price Index for July is expected at 13:00 GMT. The monthly measure is expected to increase 0.1%, less than the 0.3% rise seen in June. The yearly figure is expected to show that prices declined 0.5%, less than the previous 1.2% fall.
- US Consumer Confidence data for September is expected at 14:00 GMT..
- Also at 14:00, the New Home Sales data for August will be published. In July, sales of new homes in the US increased 4.4% on month.
- The Richmond Fed Manufacturing Index for September will come in as well at 14:00 GMT. The index is expected to edge up marginally but to remain in negative, from -7 to -6.
- To close off, Michelle Bowman from the US Federal Reserve Board of Governors is expected to speak at 17:30 GMT.
- The US Treasury is to auction a 2-year note near 17:00 GMT.
- All red across the board in equity markets as investors’ mood soured after news that Evergrande missed an interest payment to foreign investors on Monday. Meanwhile, the stronger US Dollar and the bond sell-off is not helping risk sentiment to recover.
- The CME Group FedWatch Tool shows that markets are pricing in a 81.5% chance that the Federal Reserve will keep interest rates unchanged at its meeting in November. The probability for an unchanged stance increased by the day as strikes at auto plants and a US potential government shutdown loom.
- The benchmark 10-year US Treasury yield traded as high as 4.54% and takes a small step back from Monday’s peak.
US Dollar Index technical analysis: Long way to new 52-week high
The US Dollar pushes the Relative Strength Index (RSI) into overbought territory after its outperformance on Monday. Traders remain focused and worried on the current and possibly persistent rate differential between the US Fed and other main central banks, which might keep the US Dollar stronger for longer. The US Dollar Index (DXY), which tracks the Greenback against a basket of other major currencies, broke above 106.00 and posted a new 10-month high.
The US Dollar Index opens above 106.00, though the overheated RSI might make it difficult to hold there. Traders that want to hit that new 52-week high need to be aware that a lot of road needs to be covered, towards 114.78. Rather look for 107.19, the high of November 30, 2022, as the next profit target on the upside.
On the downside, the recent resistance at 105.88 should be seen as first support. Still, it has just been broken to the upside, so it isn’t likely to be a strong barrier. . Rather look for 105.12 to do the trick and keep the DXY above 105.00.
US Dollar FAQs
What is the US Dollar?
The US Dollar (USD) is the official currency of the United States of America, and the ‘de facto’ currency of a significant number of other countries where it is found in circulation alongside local notes. It is the most heavily traded currency in the world, accounting for over 88% of all global foreign exchange turnover, or an average of $6.6 trillion in transactions per day, according to data from 2022.
Following the second world war, the USD took over from the British Pound as the world’s reserve currency. For most of its history, the US Dollar was backed by Gold, until the Bretton Woods Agreement in 1971 when the Gold Standard went away.
How do the decisions of the Federal Reserve impact the US Dollar?
The most important single factor impacting on the value of the US Dollar is monetary policy, which is shaped by the Federal Reserve (Fed). The Fed has two mandates: to achieve price stability (control inflation) and foster full employment. Its primary tool to achieve these two goals is by adjusting interest rates.
When prices are rising too quickly and inflation is above the Fed’s 2% target, the Fed will raise rates, which helps the USD value. When inflation falls below 2% or the Unemployment Rate is too high, the Fed may lower interest rates, which weighs on the Greenback.
What is Quantitative Easing and how does it influence the US Dollar?
In extreme situations, the Federal Reserve can also print more Dollars and enact quantitative easing (QE). QE is the process by which the Fed substantially increases the flow of credit in a stuck financial system.
It is a non-standard policy measure used when credit has dried up because banks will not lend to each other (out of the fear of counterparty default). It is a last resort when simply lowering interest rates is unlikely to achieve the necessary result. It was the Fed’s weapon of choice to combat the credit crunch that occurred during the Great Financial Crisis in 2008. It involves the Fed printing more Dollars and using them to buy US government bonds predominantly from financial institutions. QE usually leads to a weaker US Dollar.
What is Quantitative Tightening and how does it influence the US Dollar?
Quantitative tightening (QT) is the reverse process whereby the Federal Reserve stops buying bonds from financial institutions and does not reinvest the principal from the bonds it holds maturing in new purchases. It is usually positive for the US Dollar.
EUR/USD edges off low to regain 1.06. Economists at Scotiabank analyze the pair’s outlook.
Short-term low may be developing in EUR/USD
Intraday charts suggest a tentative, short-term low may be developing in EUR/USD.
The 1 and 6-hour charts reflect bullish price signals developing over the past few hours.
Whether the EUR can develop any significant upside movement in the near-term remains to be seen though.
Resistance is likely to develop around 1.0635/1.0645. Support is 1.0535.
See: EUR/USD could sink into the 1.0480/1.0510 support area – ING
- Oil (WTI) slides lower and starts flirting with first important support near $88.
- The US Dollar value keeps increasing as markets price in a possible persistent rate differential between USD and other currencies.
- Higher Oil prices have negative implications even for Oil producers.
Oil prices are falling for a second day in a row, with US Western Texas Intermediate (WTI) breaking below the $90 level, on the back of a strengthening US Dollar. Although higher Oil prices should be a good thing for Oil-producing companies, the recent spike has triggered a 5.3% sell-off in an oil producers index. It looks like energy traders are reaching the pain point where demand could start to diminish, which means less income for oil producers.
Meanwhile, the US Dollar (USD) is crushing the markets again. The US Dollar Index (DXY), which tracks the USD against a basket of other main currencies, trades above 106.00, whereas the EUR/USD pair breaks lower to 1.05. It looks like a stronger US Dollar is here to stay as it benefits from the so-called rate differential story, or the fact that the US Federal Reserve (Fed) is expected to keep interest rates at a higher level than other central banks. This strengthens the Dollar as it attracts more foreign capital inflows.This sentiment has triggered a flight to safety across the board as higher interest rates for a longer period could mean a recession and therefore lower demand for Oil.
Crude Oil (WTI) price trades at $88.28 per barrel, and Brent Oil trades at $90.95 per barrel at the time of writing.
Oil news and market movers
- Recent reports show Russia is still relying on European demand for Oil. Over half of the exported Russian crude makes its way to Europe despite the price cap breach.
- The CEO of Continental Resources Doug Lawler asked the US government to explore more in domestic crude production. Otherwise, WTI Crude could be heading to $150 if the current pace of drawdowns in stockpiles is maintained throughout the rest of 2023, he said.
- The global decline in equity markets and concerns on the healthiness of the US consumer might trigger a step back in demand for Oil.
- Similar issues from China, where real estate conglomerate Evergrande missed interest payments on its debt..
- The stronger US Dollar backed by the steady-for-longer elevated rate stance of the Fed could act as a cap on demand globally for Oil.
Oil Technical Analysis: respect the supports
Oil prices are heading into a small correction phase, which is more than granted after the fierce rally since the end of August. The Relative Strength Index (RSI) is still very elevated and any cooldown is more than welcomed from a technical perspective, as crude Oil was trading in an overbought situation. Expect to see pressure built on several lower pivotal levels, which should be able to provide ample support and underpin prices.
On the upside, the double top from October and November of last year at $93.12 remains the level to beat. Although this looks very much in reach, markets have already priced in a lot of possible supply deficits and a bullish outlook. Should $93.12 be taken out, look for $97.11, the high of August 2022.
On the downside, a new floor is formed near $88 with the high of September 5 and 11 underpinning the current price action. Proof of that already exists with the dip of September 13 and September 21, which reversed ahead of $88. Should $88 break , the peak of August 10 needs to be enough to catch the dip near $84.20.
-638313143406230248.png)
WTI US OIL daily chart
WTI Oil FAQs
What is WTI Oil?
WTI Oil is a type of Crude Oil sold on international markets. The WTI stands for West Texas Intermediate, one of three major types including Brent and Dubai Crude. WTI is also referred to as “light” and “sweet” because of its relatively low gravity and sulfur content respectively. It is considered a high quality Oil that is easily refined. It is sourced in the United States and distributed via the Cushing hub, which is considered “The Pipeline Crossroads of the World”. It is a benchmark for the Oil market and WTI price is frequently quoted in the media.
What factors drive the price of WTI Oil?
Like all assets, supply and demand are the key drivers of WTI Oil price. As such, global growth can be a driver of increased demand and vice versa for weak global growth. Political instability, wars, and sanctions can disrupt supply and impact prices. The decisions of OPEC, a group of major Oil-producing countries, is another key driver of price. The value of the US Dollar influences the price of WTI Crude Oil, since Oil is predominantly traded in US Dollars, thus a weaker US Dollar can make Oil more affordable and vice versa.
How does inventory data impact the price of WTI Oil
The weekly Oil inventory reports published by the American Petroleum Institute (API) and the Energy Information Agency (EIA) impact the price of WTI Oil. Changes in inventories reflect fluctuating supply and demand. If the data shows a drop in inventories it can indicate increased demand, pushing up Oil price. Higher inventories can reflect increased supply, pushing down prices. API’s report is published every Tuesday and EIA’s the day after. Their results are usually similar, falling within 1% of each other 75% of the time. The EIA data is considered more reliable, since it is a government agency.
How does OPEC influence the price of WTI Oil?
OPEC (Organization of the Petroleum Exporting Countries) is a group of 13 Oil-producing nations who collectively decide production quotas for member countries at twice-yearly meetings. Their decisions often impact WTI Oil prices. When OPEC decides to lower quotas, it can tighten supply, pushing up Oil prices. When OPEC increases production, it has the opposite effect. OPEC+ refers to an expanded group that includes ten extra non-OPEC members, the most notable of which is Russia.
USD/JPY has moved steadily higher since July. Economists at MUFG Bank analyze the pair’s outlook.
Increased volatility and higher trading ranges are likely if on a break through 150
We would need to see a break of the 150 level in order to spark greater market volatility that could be used to justify intervention. That implies we could see a sharp bounce above 150 initially but then a reversal as Japan intervenes to halt Yen weakness.
We have a neutral bias for the period ahead for USD/JPY reflecting the potential for an upside move initially but also reflecting the unlikelihood that a break higher would be sustained for long.
Increased volatility and higher trading ranges are likely if USD/JPY does break higher through the 150 level.
AUD/USD decline has stalled near 0.6360. However, it has failed to reclaim recent pivot high at 0.6525. Economists at Société Générale analyze the pair’s outlook.
Struggling to reclaim recent pivot high at 0.6525
AUD/USD decline paused after touching the line since March at 0.6360. A large bounce hasn’t materialized; recent pivot high at 0.6525 is expected to be first layer of resistance near term.
Holding below 0.6525, there would be risk of one more down leg. Below 0.6360, next potential support is located at projections and October 2022 low of 0.6200/0.6170.
Extra range bound appears on the table for USD/MYR in the near term, according to Markets Strategist Quek Ser Leang at UOB Group.
Key Quotes
Last Monday (18 Sep, spot at 4.6835), we highlighted that “there is room for USD/MYR to edge above June’s high of 4.6880.” We also highlighted that “The next major resistance at 4.7000 is unlikely to come into view.” Our view was not wrong, as USD/MYR rose to a high of 4.6960. Despite the advance, there is no increase in momentum, and USD/MYR is unlikely to rise further.
This week, USD/MYR is more likely to trade in a range, probably between 4.6650 and 4.6960.
EUR/USD broke below 1.06 for the first time since mid-March. Economists at ING analyze the pair’s outlook.
Falling world trade does not help
Not helping the Euro has been data released showing that world merchandise trade volumes fell another 0.6% month-on-month in July. As a relatively open economy, the Eurozone suffers from a declining trade environment, as does the Euro.
Without support from extreme under-valuation or existing heavy short positioning, the EUR/USD pair looks as though it could sink into the 1.0480/1.0510 support area.
- EUR/JPY eyes 158.00 as BoJ Ueda expects a 2% inflation achievement far from sight.
- A moderate rise in inflation backed by wage growth would be the real victory for the BoJ.
- The ECB vowed to keep interest rates sufficiently high for a longer period until the achievement of price stability.
The EUR/JPY pair comes out of the woods and aims to recapture the crucial resistance of 158.00 in the London session. The cross attracts bids as Bank of Japan (BoJ) Governor Kazuo Ueda expects an achievement of comfortable 2% inflation is still out of sight.
BoJ Ueda cited that Japan's economy is at a critical stage on whether it can achieve a positive wage-inflation cycle. A moderate rise in inflation backed by wage growth would be a real victory for the central bank. Kazuo Ueda is worried about a slow pick-up in the Chinese economy as it could lead to a slowdown in the overall Asian economy.
The BoJ is expected to keep a dovish policy stance further, therefore, the odds of a potential intervention by the Japanese central bank in the FX moves are high.
Meanwhile, the Euro is expected to remain strong as the European Central Bank (ECB) vowed to keep interest rates sufficiently high for a longer period until the achievement of price stability. On Monday, ECB President Christine Lagarde said that despite progress on inflation it is seen too high for too long as the labor market has so far remained resilient.
About the interest rate outlook, ECB policymaker Madis Muller said on Tuesday, “As things stand, not expecting any more rate hikes.” Last week, ECB Muller cited that higher inflation could yet warrant another rate hike.
This week, investors will keenly focus on the Eurozone preliminary Harmonized Index of Consumer Prices (HICP) for September. The headline and core inflation are seen softening to 4.5% and 4.8% respectively. Decelerating inflation data despite rising energy prices may provide some relief for ECB policymakers.
Dollar is probing November 2022 highs after tenth successively weekly gain. Kit Juckes, Chief Global FX Strategist at Société Générale, analyzes Greenback’s outlook.
US to slip into recession in 2024
Shutdown and downgrade concerns, month and quarter-end, talk of the US economy growing forever and forcing the Fed to do more and inflation worries have all been cited as reasons for the latest lurch higher in US yields, but I’ll go on favouring the need to offer higher yields to attract sufficient money to finance an endless stream of Treasury auctions.
The world must reallocate more of its capital to US bonds, and higher yields do the work, which then results in a stronger Dollar as more money either stays in the US or is attracted from abroad. This will provide the conditions for the US to slip into recession in 2024 and for the Dollar to weaken once the dust settles. In the meantime, the data are robust, and the Dollar is strong.
The meeting of the National Bank of Hungary (NBH) is on the agenda today. Economists at ING analyze Forint’s outlook ahead of the Interest Rate Decision.
NBH to stress caution for the rest of the year
Today's meeting seems like a done deal – the effective interest rate and the key interest rate will be merged at 13%, and monetary policy will thus enter the second phase of normalisation.
The question is what to expect in October and how much today's press conference will indicate. In any case, a cautious and hawkish tone can be expected. The hawkish tone should be an impetus for the market to reassess expectations, especially at the short end of the curve, and support the Forint back to levels safely below 390 EUR/HUF.
- Gold price seeks potential support but it is pressured by a strong US Dollar and increasing Treasury yields.
- Fed’s higher for longer interest-rate stance keeps Gold price under pressure.
- US Durable Goods Orders are seen contracting at a slower pace in August.
Gold price (XAU/USD) looks for a cushion after facing a sell-off as Federal Reserve (Fed) policymakers continue to favor further policy tightening due to the resilient United States economy. The precious metal struggles for a firm footing as Fed policymakers expect that additional efforts will likely be needed to bring inflation back to the desired rate as decent labor demand and robust consumer spending momentum keep price pressures high.
While fears of a global slowdown continue to build pressure on risk-sensitive assets, the US Dollar and Treasury yields remain upbeat on the Fed’s “higher for longer” interest-rate stance. Going forward, investors will focus on the US Durable Goods Orders data on Wednesday, which will provide guidance about the health of the country’s manufacturing sector.
Daily Digest Market Movers: Gold price pressured by higher US Yields
- Gold price finds an interim support near $1,910.00 after an intense sell-off. The broader trend remains weak as Federal Reserve policymakers continue to support the “higher for longer” plot to ensure that inflation softens to 2%.
- The broader trend in the Gold price is directionless as the downside is also supported by expectations of no more interest rate hikes in the last quarter of 2023.
- As per the CME Group Fedwatch tool, traders see almost an 82% chance that interest rates will remain steady at 5.25%-5.50% at the November monetary policy meeting. For the remainder of 2023, the possibility for steady interest rates is at 61%.
- On Monday, Gold price was pressured by hawkish remarks from Fed policymakers, namely from Minneapolis Federal Reserve Bank President Neel Kashkari and Boston Fed President Susan Collins.
- Fed Governor Kashkari said that the central bank will likely need to raise interest rates further and keep them elevated for some time to bring down inflation to 2%. "If the economy is fundamentally much stronger than we realized, on the margin, that would tell me rates probably have to go a little bit higher, and then be held higher for longer to cool things off," he added, as reported by Reuters.
- About rate cut expectations, Fed Kashkari cited that if inflation softens in 2024, the Fed will cut rates to avoid too much tightening.
- Fed’s Collins said on Friday that a further rate hike is certainly not off the table. She further added that inflation can fall with only a modest rise in unemployment and that core services inflation excluding shelter has not yet shown a sustained improvement.
- Contrary to hawkish Fed policymakers, Morgan Stanley’s Chief US Economist Ellen Zentner believes that the Fed is done hiking rates.
- The US Dollar Index (DXY) consolidates near a fresh 10-month high at 106.20 as incoming data continues to point to a resilient US economy and upbeat labor market conditions. . 10-year US Treasury yields rose sharply to 4.55%.
- While the US Dollar and Treasury yields have increased significantly, the pace of decline in the Gold price is slow, indicating a supported downside on expectations that the Fed is done with hiking interest rates.
- For further action, investors await the Durable Goods Orders report for August, which will be released on Wednesday. Orders are seen contracting at a slower pace of 0.4% against the 5.2% decline seen in July.
- The US manufacturing sector is already going through a vulnerable phase. The US Manufacturing PMI has been contracting for a long period and a weak new order book indicates that factory activity will remain in contraction.
Technical Analysis: Gold price trades directionless
Gold price discovers an intermediate support near $1,910.00 but the overall trend is sideways amid uncertainty over the interest rate outlook. On a daily chart, the precious metal auctions in a Symmetrical Triangle chart pattern, which demonstrates a volatility compression. The 200-day Exponential Moving Average (EMA) around $1,910.00 continues to act as a major support for Gold price, while the 50-day EMA near $1,927.00 is acting as a major resistance.
Fed FAQs
What does the Federal Reserve do, how does it impact the US Dollar?
Monetary policy in the US is shaped by the Federal Reserve (Fed). The Fed has two mandates: to achieve price stability and foster full employment. Its primary tool to achieve these goals is by adjusting interest rates.
When prices are rising too quickly and inflation is above the Fed’s 2% target, it raises interest rates, increasing borrowing costs throughout the economy. This results in a stronger US Dollar (USD) as it makes the US a more attractive place for international investors to park their money.
When inflation falls below 2% or the Unemployment Rate is too high, the Fed may lower interest rates to encourage borrowing, which weighs on the Greenback.
How often does the Fed hold monetary policy meetings?
The Federal Reserve (Fed) holds eight policy meetings a year, where the Federal Open Market Committee (FOMC) assesses economic conditions and makes monetary policy decisions.
The FOMC is attended by twelve Fed officials – the seven members of the Board of Governors, the president of the Federal Reserve Bank of New York, and four of the remaining eleven regional Reserve Bank presidents, who serve one-year terms on a rotating basis.
What is Quantitative Easing (QE) and how does it impact USD?
In extreme situations, the Federal Reserve may resort to a policy named Quantitative Easing (QE). QE is the process by which the Fed substantially increases the flow of credit in a stuck financial system.
It is a non-standard policy measure used during crises or when inflation is extremely low. It was the Fed’s weapon of choice during the Great Financial Crisis in 2008. It involves the Fed printing more Dollars and using them to buy high grade bonds from financial institutions. QE usually weakens the US Dollar.
What is Quantitative Tightening (QT) and how does it impact the US Dollar?
Quantitative tightening (QT) is the reverse process of QE, whereby the Federal Reserve stops buying bonds from financial institutions and does not reinvest the principal from the bonds it holds maturing, to purchase new bonds. It is usually positive for the value of the US Dollar.
Markets Strategist Quek Ser Leang at UOB Group suggests USD/THB is likely to navigate between 35.68 and 36.35 in the next few sessions.
Key Quotes
The strong surge in USD/THB that sent it to a high of 36.35 came as a surprise (we were expecting it to trade sideways). USD/THB pulled back from the high in overbought conditions.
While further USD/THB is not ruled out at later stage, USD/THB is more likely to consolidate in a range of 35.68/36.35 this week.
The Pound continues to struggle as September draws to a close. Economists at Société Générale analyze GBP outlook.
Heading towards 1.2170/1.2100
GBP/USD confirmed a Head and Shoulders and subsequently gave up the 200-DMA resulting in steady decline.
Daily MACD is now within deep negative territory denoting a stretched move however signals of reversal are not yet visible.
The pair is expected to drift towards target of the formation near 1.2170/1.2100. Achievement of these objectives could result in a bounce. However, reclaiming the 200-DMA near 1.2430 would be essential to affirm a meaningful uptrend. Holding below this MA, the phase of downtrend is likely to persist.
- AUD/USD rebounds from below 0.6400 as the USD Index fails to extend the rally.
- Investors await the Australian inflation data, which is seen accelerating to 5.2% vs. July’s reading of 4.9%.
- The Aussie asset is forming a Descending Triangle chart pattern, which demonstrates a volatility contraction.
The AUD/USD pair attempts recovery after discovering buying interest near the round-level support of 0.6400 in the European session. The Aussie asset finds support as the US Dollar Index (DXY) struggles to extend a rally above a fresh 10-month high near 106.20.
S&P500 futures generated significant losses in the London session, portraying strength in the risk-aversion theme. The US Dollar is expected to remain on tenterhooks as investors await the United States Durable Goods Orders data for August, which will be released on Wednesday. The economic data is seen contracting at a slower pace of 0.4% vs. July’s contraction of 5.2%.
Meanwhile, the Australian Dollar is expected to remain on the tenterhooks ahead of the monthly Consumer Price Index (CPI) data for August. The Australian inflation is seen accelerating to 5.2% vs. July’s reading of 4.9%. A rebound in Australian inflation could be the outcome of the rising energy prices due to the global oil rally.
AUD/USD rebounds after testing September 21 low near 0.6385 on an hourly scale. The downward-sloping trendline from September 20 high at 0.6511 continues to act as a major barricade for the Australian Dollar bulls. The Aussie asset is forming a Descending Triangle chart pattern, which demonstrates a volatility contraction.
The 20-period Exponential Moving Average (EMA) at 0.6416 is acting as a major barricade for the Aussie bulls.
Meanwhile, the Relative Strength Index (RSI) (14) manages to defend slipping completely into the bearish range of 20.00-40.00.
A decisive break above August 15 high around 0.6522 will drive the asset to August 9 high at 0.6571. Breach of the latter will drive the asset towards August 10 high at 0.6616.
On the flip side, a fresh downside would appear if the Aussie asset drops below August 17 low around 0.6360. This would expose the asset to the round-level support of 0.6300 followed by 03 November 2022 low at 0.6272.
AUD/USD two-hour chart
-638313171862873252.png)
- Crude oil prices recover some of the intraday losses after reaching a two-week lowest level.
- Investors expect that improved oil prices will drive an increase in US crude oil production despite the reduction in rig count.
- US bond yields are improved on the Fed’s hawkish stance, strengthening the US Dollar (USD).
Crude oil prices retrace some of its intraday losses, although, trading lower around $88.20 per barrel during the European session on Tuesday. Russia has decided to ease its fuel export ban, initially implemented to stabilize the domestic market. This move is expected to alleviate pressure on crude oil prices.
Additionally, Saudi Arabia and Russia, the two leading global oil exporters, have played a role in pushing up WTI crude oil prices. Both nations have jointly announced an extension of their oil production cuts until the conclusion of 2023.
The economic unrest in China, the world's top crude importer is affecting sentiment regarding the demand for Crude oil. However, the latest macro data suggested economic stabilization, which could provide minor support for the liquid gold.
The oil and gas rig count declined to a total of 630 during the week ending on September 22. This marks the lowest count since February 2022. Specifically, the number of US oil rigs decreased by eight to 507, which is the lowest level recorded since February 2022, while gas rigs decreased by three to 118.
Despite the decrease in rig count, there is an expectation that higher oil prices will drive an increase in US crude oil production.
According to projections from the Energy Information Administration (EIA), US crude production is anticipated to rise from 11.9 million barrels per day (bpd) in 2022 to 12.8 million bpd in 2023 and further to 13.2 million bpd in 2024.
Market caution and upbeat US Treasury yields are underpinning the strength of the US Dollar (USD), which is putting pressure on the West Texas Intermediate (WTI) oil prices.
The US Dollar Index (DXY) trims its intraday gains and reverses from the highest level since November. However, it continues to trade higher around 106.00 by the press time.
US Federal Reserve’s (Fed) hawkish stance on interest rates trajectory reinforces the US Treasury yields, which is boosting the Greenback. The yield on the 10-year US Treasury note hovers near 4.51%, slightly below its highest level since October 2007.
Investors will likely watch key macro releases later in the week, including US Consumer Confidence, Durable Goods Orders, Initial Jobless Claims, and the Core Personal Consumption Expenditures (PCE) Price Index, which is the Federal Reserve's preferred measure of inflation.
These key events will provide important insights into inflationary pressures in the US economy and could help in shaping the trading decisions involving the Greenback, which may impact the Crude oil prices.
JPY continued its downtrend against USD on Monday. Economists at Commerzbank analyze Yen’s outlook.
A weaker JPY seems fundamentally justified
If JPY were to depreciate further, it is quite possible that there will be further interventions. These are unlikely to have much of an effect though. Since the BoJ does not want to move away from its ultra-expansionary monetary policy despite comparatively high inflation rates, a weaker JPY seems fundamentally justified.
A weaker USD would improve the situation, but at present the market seems to be betting on a stronger USD. The solid US economy and hawkish comments by Fed members support USD at present. Everything all told, there is a lot pointing towards higher levels in USD/JPY.
European Central Bank (ECB) policymaker Madis Muller said on Tuesday, “as things stand, not expecting any more rate hikes.”
On Friday, Muller said that “higher inflation could yet warrant another hike.”
Market reaction
At the time of writing, EUR/USD is flirting with 1.0600 on its road to recovery. The pair is up 0.09% on the day.
Japanese Finance Minister Shunichi Suzuki crossed the wires again on Tuesday, reiterating that he is “closely watching FX moves with a great sense of urgency.”
Earlier in the day, Suzuki said that he “won't rule out any steps to respond to disorderly FX moves.”
Market reaction
At the time of writing, USD/JPY is trading modestly flat at 148.94, consolidating the latest uptick to 11-month highs of 149.19
The downside for the USD in the scenario of weakening activity data for the US economy is set to be limited by declining risk appetite amid concerns around global growth, economists at Rabobank report.
USD strength could remain in play into 2024
The US is still likely to experience technical recession early next year as monetary tightening increasingly takes effect.
Understandably, many commentators are of the view that slowdown risks threaten to take the shine off the outlook for the USD. However, this assumes that investors see more opportunity elsewhere. It is our view that the Eurozone will suffer technical recession in H2 this year and that the region will only be able to muster very soft growth in 2024. China is also experiencing a slowdown in growth.
Even if the US economy is headed for a slowdown, the USD could find support on the back of haven demand given broad-based concerns over weak global growth.
AUD rose briefly above 0.65 handle last week but broad USD strength post-hawkish FOMC outcome reversed Ausse’s gains. Economists at OCBC Bank analyze AUD/USD outlook.
Two-way risks
AUD/USD may remain under pressure as US rates staying higher for longer poses risks to global growth, undermine sentiments and support the USD. These will be the key drivers for now until US economic data starts to show signs of softening.
We also keep a lookout on US data, in particular core PCE on Friday. Softer data print here can slow the pace of USD uptrend and provide a breather. But apart from paying attention to USD trend, we also need to watch developments in RMB and China PMI data later this week. Lingering weakness in real estate market may be another factor weighing on AUD but with much bad news in the price, we also keep a look out if there is any turnaround in China data softness. Improvement in China data can somewhat partially mitigate against AUD softness.
Next key support at 0.6370 levels (rising trendline support, double bottom). If we do get a clean break, then bearish pressure can gather traction. Next support at 0.6190, 0.61 levels (76.4% fibo). However, if AUD manages to reclaim 0.6460 (61.8% fibo), then we could still see a bounce towards 0.65 levels (50 DMA), 0.6570.
Here is what you need to know on Tuesday, September 26:
The US Dollar (USD) continues to outperform its rivals early Tuesday amid souring market mood and rising US Treasury bond yield. The USD Index trades at its highest level since November above 106.00 after closing in positive territory on Monday and the 10-year US yield holds at multi-year highs above 4.5%. August New Home Sales and Conference Board's Consumer Confidence Index for September will be featured in the US economic docket.
US Dollar price this week
The table below shows the percentage change of US Dollar (USD) against listed major currencies this week. US Dollar was the strongest against the Australian Dollar.
| USD | EUR | GBP | CAD | AUD | JPY | NZD | CHF | |
| USD | 0.58% | 0.52% | 0.00% | 0.74% | 0.28% | 0.21% | 0.72% | |
| EUR | -0.59% | -0.05% | -0.44% | -0.02% | -0.27% | -0.50% | 0.08% | |
| GBP | -0.60% | 0.06% | -0.44% | 0.03% | -0.25% | -0.38% | 0.13% | |
| CAD | -0.08% | 0.59% | 0.45% | 0.59% | 0.38% | 0.00% | 0.53% | |
| AUD | -0.66% | -0.01% | -0.11% | -0.58% | -0.17% | -0.49% | 0.10% | |
| JPY | -0.44% | 0.26% | 0.15% | -0.40% | 0.29% | -0.19% | 0.37% | |
| NZD | -0.22% | 0.43% | 0.50% | 0.09% | 0.49% | 0.17% | 0.64% | |
| CHF | -0.72% | -0.09% | -0.13% | -0.51% | -0.13% | -0.28% | -0.59% |
The heat map shows percentage changes of major currencies against each other. The base currency is picked from the left column, while the quote currency is picked from the top row. For example, if you pick the Euro from the left column and move along the horizontal line to the Japanese Yen, the percentage change displayed in the box will represent EUR (base)/JPY (quote).
Reflecting the risk-averse market atmosphere, US stock index futures are down between 0.5% and 0.8% in the early European session and the Euro Stoxx 50 Index was last seen falling nearly 1% on the day. Meanwhile, Bloomberg reported earlier in the day that Senate Republican And Democrat negotiators were closing in on a deal on a short-term spending measure to avoid a government shutdown. This development, however, failed to help the mood improve.
EUR/USD lost more than 50 pips on Monday and dropped below 1.0600 for the first time since early March. On Tuesday, the pair fluctuates in a tight channel near Monday's closing level. While speaking before the European Parliament's Committee on Economic and Monetary Affairs, European Central Bank (ECB) President Christine Lagarde noted that recent indicators point to a further weakness in the economic activity in the third quarter.
GBP/USD extended its slide in the Asian session on Tuesday and touched a fresh multi-month low below 1.2170 before recovering modestly toward 1.2200.
USD/JPY rallied above 149.00 on Tuesday but made a sharp U-turn afterward. Investors remain on edge amid the possibility of the Bank of Japan intervening in the foreign exchange markets. Japan’s newly appointed Economy Minister Yoshitaka Shindo reiterated on Tuesday that it was important for currencies to move in a stable manner reflecting fundamentals. "Weak Yen has various effects on economy such as raising import costs for consumers, improving competitiveness of exporters," Shindo added.
Pressured by rising US yields, Gold price registered losses on Monday and fell below $1,910 early Tuesday. XAU/USD, however, managed to erase its daily losses and was last seen moving sideways at around $1,915.
EUR/GBP traded above 0.87 for the first time since March. Economists at ING analyze Sterling’s outlook.
GBP/USD: Little support can be expected before the 1.2000/2075 area
With one-month implied yields at 5.20%, Sterling is an expensive sell.
We think EUR/GBP may continue to trade in the 0.86-0.87 range for the time being rather than continue to march higher.
GBP/USD is a different story where the ongoing strength of the Dollar and the softening risk environment warn that little support can be expected before the 1.2000/2075 area.
- USD/CHF extends the gains to a five-month high amid market caution ahead of US data.
- US bond yields are improved due to the Fed’s hawkish stance, strengthening the US Dollar (USD).
- SNB’s surprising decision to halt the rate-hiking cycle weakened the Swiss Franc (CHF).
USD/CHF continues the winning streak that began on September 19 and reached the five-month high. The spot price is trading near 0.9140 during the early trading hours of the European session on Tuesday.
Market caution and upbeat US Treasury yields are underpinning the strength of the pair. US Federal Reserve’s (Fed) hawkish stance on interest rate trajectory keeps pushing the US Treasury yields, which is boosting the US Dollar (USD).
The US Dollar Index (DXY) continues to trade higher around 106.10 by the press time. The yield on the 10-year US Treasury note hovers near 4.55%, the highest level since October 2007.
However, the warnings from US President Joe Biden and a senior adviser regarding the potential consequences of a federal government shutdown have heightened market concerns. They have emphasized the potential difficulties that could arise, particularly affecting low-income women and children who may lose food benefits.
While there was an agreement between President Biden and House Speaker Kevin McCarthy on government spending levels, the Republican-controlled House of Representatives may attempt to push through substantial budget cuts this week.
These proposed cuts would need approval from the Democratic-controlled Senate, which is expected to reject them. The failure to reach an agreement between both houses could lead to a partial government shutdown by the upcoming Sunday.
Investors will likely watch key macro releases later in the week, including US Consumer Confidence, Durable Goods Orders, Initial Jobless Claims, and the Core Personal Consumption Expenditures (PCE) Price Index, which is the Federal Reserve's preferred measure of inflation.
These key events will provide important insights into inflationary pressures in the US economy and could influence trading decisions involving the US Dollar.
On the Swiss side, the Swiss National Bank (SNB) has made a surprising decision to halt its rate-hiking cycle, a move that contrasts with its previous actions since March 2022. The central bank's decision is attributed to the observation that inflation has subsided. As a result, this decision is putting pressure on the Swiss Franc (CHF).
Swiss data ZEW Survey – Expectations and SNB Quarterly Bulletin will be eyed by the investors to gain further cues on Switzerland’s economic situation and business trends in this quarter.
Economists at Commerzbank analyze how the “higher for longer” interest rate theme is convincing markets to boost the Dollar.
USD strength might turn out to be excessive
At the moment the central bankers’ ‘higher for longer’ is mainly supported by data in the US, which means that the Fed’s statements seem more convincing. It can be assumed though that the restrictive monetary policy will have an effect on the US economy, with the economy cooling further. Whether the ‘higher for longer’ will then still convince is obviously questionable and the USD strength might turn out to be excessive.
Of course, it remains to be seen when the data might cause doubts amongst market participants. US consumer confidence due for publication today is not likely to cause that as it should continue to point to solid consumption. The data due for publication over the rest of the week is unlikely to provide much new (negative) information either.
Consumer price data from the Eurozone, due for publication at the end of the week, on the other hand, might point towards easing price pressure. That means EUR/USD might remain under depreciation pressure for now.
USD/CNH is now expected to navigate within the 7.2800-7.3400 range in the next few weeks, note Markets Strategist Quek Ser Leang and Senior FX Strategist Peter Chia at UOB Group.
Key Quotes
24-hour view: Our view for USD to edge lower yesterday was incorrect. Instead of edging lower, USD rose to a high of 7.3175. The advance lacks momentum. While there is room for USD to advance today, it is unlikely to threaten the major resistance at 7.3400 (there is another resistance at 7.3280). On the downside, a breach of 7.3000 (minor support is at 7.3080) would indicate that the current mild upward pressure has faded.
Next 1-3 weeks: We continue to hold the same view as last Thursday (21 Sep, spot at 7.3150), wherein the recent downward pressure has faded, and USD is likely to trade in a range, probably between 7.2800 and 7.3400.
- Pound Sterling faces an intense sell-off as the UK economy is exposed to a possible recession.
- The BoE seems done with hiking interest rates as UK Services PMI contracts.
- The market mood remains downbeat as central bankers are expected to keep interest rates higher for a longer period.
The Pound Sterling (GBP) remains on a bearish trajectory as investors worry about the UK’s economic outlook. The GBP/USD pair weakens further as a persistent Consumer Price Index (CPI) and a restrictive interest rate policy by the Bank of England (BoE) continue to accelerate the burden on households. The outlook for the GBP/USD pair worsened further as the UK’s Services PMI remained below the 50.0 threshold for the second straight month in September in an S&P Global preliminary PMI report.
Like the Federal Reserve (Fed), the BoE vowed to keep interest rates sufficiently high for a longer period. Unlike the US Dollar, the Pound Sterling is facing an intense sell-off as risks of a recession in the UK economy are skewed to the upside. Market participants expect UK PM Rishi Sunak to fail to keep his promise of halving inflation to 5.3% by year-end as the BoE seems done with hiking interest rates.
Daily Digest Market Movers: Pound Sterling faces pressure amid potential UK slowdown risks
- Pound Sterling continues a four-day losing spell as investors rush for safe-haven assets as uncertainty over global economic prospects deepens due to persistent inflation.
- Upside risks to a slowdown in the UK economy have forced investors to dump the Pound Sterling.
- In addition to potential slowdown risks, the likelihood of a rebound in inflation has improved as the Bank of England has paused the policy-tightening spell after raising them 14 consecutive times.
- Rising energy prices due to the global oil rally could accelerate headline inflationary pressure, but their impact seems limited.
- Last week, BoE policymakers unexpectedly skipped the interest rate hike, while investors anticipated a 25 basis point (bp) rate increase. Apart from falling inflation, squeezing labor demand, and contracting Manufacturing and Services PMIs seem major factors behind a pause in the rate-tightening spell.
- A sudden pause in the BoE’s rate-hiking regime indicates that the central bank is done with hiking rates and will keep them higher long enough until the achievement of price stability.
- Unlike the resilient US Dollar, the Pound Sterling is expected to remain under pressure for a longer period. The Fed is also keeping interest rates unchanged, but their decision is backed by falling inflation and a stronger economy while the UK economy is going through a vulnerable phase.
- UK manufacturing activities have been contracting over a longer period. The Service sector has started following the footprints of factory activities and remained below the 50.0 threshold for the second time in a row.
- The release of UK Manufacturing and Services PMI below the 50.0 threshold indicates that overall economic activities are contracting, signaling a vulnerable economic outlook.
- Big Four accounting firm KPMG projected that the UK economy is set to slow in the second half of 2023 due to high-interest rates and policy uncertainty before the general elections.
- Later this week, investors will keenly watch the final April-June quarter Gross Domestic Product (GDP) numbers. The final annual GDP data is seen maintaining a steady growth rate of 0.4%.
- The market mood remains cautious as investors are worried about the global economic outlook as central bankers are expected to keep interest rates sufficiently high for a longer period.
- The US Dollar Index (DXY) prints a fresh 10-month high around 106.20 as investors see the US economy remaining resilient despite the Fed vowing to keep interest rates sufficiently restrictive until inflation comes down to 2%.
- On Monday, a hawkish commentary from Minneapolis Federal Reserve Bank President Neel Kashkari infused strength in the US Dollar and Treasury yields. Fed Governor Kashkari supports further policy-tightening by the central bank due to a resilient US economy.
Technical Analysis: Pound Sterling extends four-day losing spell
Pound Sterling extended a four-day losing spell on Tuesday as the risk appetite of market participants weakened amid deepening UK slowdown fears. The GBP/USD pair drops below the round-level support of 1.2200, printing a fresh six-month low near 1.2170. The pair is expected to deliver more weakness. A bear cross, represented by the 20 and 200-day Exponential Moving Averages (EMAs), warrants more weakness ahead. Momentum oscillators have reached oversold levels.
BoE FAQs
What does the Bank of England do and how does it impact the Pound?
The Bank of England (BoE) decides monetary policy for the United Kingdom. Its primary goal is to achieve ‘price stability’, or a steady inflation rate of 2%. Its tool for achieving this is via the adjustment of base lending rates. The BoE sets the rate at which it lends to commercial banks and banks lend to each other, determining the level of interest rates in the economy overall. This also impacts the value of the Pound Sterling (GBP).
How does the Bank of England’s monetary policy influence Sterling?
When inflation is above the Bank of England’s target it responds by raising interest rates, making it more expensive for people and businesses to access credit. This is positive for the Pound Sterling because higher interest rates make the UK a more attractive place for global investors to park their money. When inflation falls below target, it is a sign economic growth is slowing, and the BoE will consider lowering interest rates to cheapen credit in the hope businesses will borrow to invest in growth-generating projects – a negative for the Pound Sterling.
What is Quantitative Easing (QE) and how does it affect the Pound?
In extreme situations, the Bank of England can enact a policy called Quantitative Easing (QE). QE is the process by which the BoE substantially increases the flow of credit in a stuck financial system. QE is a last resort policy when lowering interest rates will not achieve the necessary result. The process of QE involves the BoE printing money to buy assets – usually government or AAA-rated corporate bonds – from banks and other financial institutions. QE usually results in a weaker Pound Sterling.
What is Quantitative tightening (QT) and how does it affect the Pound Sterling?
Quantitative tightening (QT) is the reverse of QE, enacted when the economy is strengthening and inflation starts rising. Whilst in QE the Bank of England (BoE) purchases government and corporate bonds from financial institutions to encourage them to lend; in QT, the BoE stops buying more bonds, and stops reinvesting the principal maturing on the bonds it already holds. It is usually positive for the Pound Sterling.
- The Euro remains offered vs. the US Dollar.
- Stocks in Europe start the day well on the defensive.
- EUR/USD loses ground and revisits multi-month lows around 1.0570.
- The USD Index (DXY) reaches fresh yearly highs north of 106.00.
- US Consumer Confidence will take centre stage later in the NA session.
The bearish sentiment surrounding the Euro (EUR) gathers further steam against the US Dollar (USD), motivating EUR/USD to slip back to new six-month lows around 1.0570 on Tuesday.
On the other hand, the Greenback advances for the third consecutive session and clinches new 2023 peaks in levels last traded in late November 2022 past the 106.00 barrier when measured by the USD Index (DXY).
The sharp downside in the pair comes amidst the intense rally in US yields across different time frames, while the German 10-year bund yields trade in twelve-year peaks north of 2.80%.
Looking at the macro scenario, the dollar’s sharp upside momentum remains propped up by expectations of the Fed’s tighter-for-longer stance, which was particularly exacerbated at the latest FOMC event on September 20.
In the vicinity of the European Central Bank (ECB), recent Board members found shared agreement following a prior inclination towards a potential prolonged impasse in its hiking cycle, despite the ongoing presence of inflation significantly exceeding the bank's target.
In the US docket, the Conference Board’s Consumer Confidence gauge will be in the limelight, followed by New Home Sales, the FHFA’s House Price Index and the speech by FOMC’s permanent voter, Michelle Bowman (hawk).
Daily digest market movers: Euro remains under heavy pressure
- The EUR extends the decline vs. the USD.
- US and German yields navigate the area of multi-year peaks.
- Markets expect the Fed to hike rates by 25 bps before end of 2023.
- Investors see potential interest rate cuts by the Fed in Q3 2024.
- Talks of a pause by the ECB remain on the rise.
- Intervention fears surround the price action around USD/JPY.
Technical Analysis: Euro risks a drop to 1.0516
The selling pressure around EUR/USD remains everything but abated for yet another session, leaving the door wide open to further retracement in the short-term horizon.
On the downside, EUR/USD faces immediate support at the March low of 1.0516 (March 15), followed by the 2023 low of 1.0481 (January 6).
In terms of potential resistance levels, a minor hurdle lies at the weekly high of 1.0767 (September 12), followed by a more significant barrier at the 200-day SMA at 1.0828. A break above this level could open the path for further recovery, targeting the temporary 55-day SMA at 1.0890, with the possibility of reaching the weekly high of 1.0945 (August 30). Surpassing this level could shift the focus to the psychological level of 1.1000, prior to the August peak of 1.1064 (August 10). Beyond that, the pair may retest the weekly top at 1.1149 (July 27) and potentially reach the 2023 high at 1.1275 (July 18).
However, it is important to note that as long as EUR/USD remains below the 200-day SMA, there is a possibility that downward pressure will persist.
Euro FAQs
What is the Euro?
The Euro is the currency for the 20 European Union countries that belong to the Eurozone. It is the second most heavily traded currency in the world behind the US Dollar. In 2022, it accounted for 31% of all foreign exchange transactions, with an average daily turnover of over $2.2 trillion a day.
EUR/USD is the most heavily traded currency pair in the world, accounting for an estimated 30% off all transactions, followed by EUR/JPY (4%), EUR/GBP (3%) and EUR/AUD (2%).
What is the ECB and how does it impact the Euro?
The European Central Bank (ECB) in Frankfurt, Germany, is the reserve bank for the Eurozone. The ECB sets interest rates and manages monetary policy.
The ECB’s primary mandate is to maintain price stability, which means either controlling inflation or stimulating growth. Its primary tool is the raising or lowering of interest rates. Relatively high interest rates – or the expectation of higher rates – will usually benefit the Euro and vice versa.
The ECB Governing Council makes monetary policy decisions at meetings held eight times a year. Decisions are made by heads of the Eurozone national banks and six permanent members, including the President of the ECB, Christine Lagarde.
How does inflation data impact the value of the Euro?
Eurozone inflation data, measured by the Harmonized Index of Consumer Prices (HICP), is an important econometric for the Euro. If inflation rises more than expected, especially if above the ECB’s 2% target, it obliges the ECB to raise interest rates to bring it back under control.
Relatively high interest rates compared to its counterparts will usually benefit the Euro, as it makes the region more attractive as a place for global investors to park their money.
How does economic data influence the value of the Euro?
Data releases gauge the health of the economy and can impact on the Euro. Indicators such as GDP, Manufacturing and Services PMIs, employment, and consumer sentiment surveys can all influence the direction of the single currency.
A strong economy is good for the Euro. Not only does it attract more foreign investment but it may encourage the ECB to put up interest rates, which will directly strengthen the Euro. Otherwise, if economic data is weak, the Euro is likely to fall.
Economic data for the four largest economies in the euro area (Germany, France, Italy and Spain) are especially significant, as they account for 75% of the Eurozone’s economy.
How does the Trade Balance impact the Euro?
Another significant data release for the Euro is the Trade Balance. This indicator measures the difference between what a country earns from its exports and what it spends on imports over a given period.
If a country produces highly sought after exports then its currency will gain in value purely from the extra demand created from foreign buyers seeking to purchase these goods. Therefore, a positive net Trade Balance strengthens a currency and vice versa for a negative balance.
The Dollar continues its grind higher. Economists at ING analyze Greenback’s outlook.
Higher US yields may push USD/JPY close to 150
The continued rise in US yields is making for a less benign environment and favours risk reduction. Whilst higher US yields may push USD/JPY close to 150, they also increase the risk of an equity setback. That is why we think an instrument like the one-month USD/JPY downside risk reversal may be too conservatively priced.
And in general, we would say commodity currencies remain vulnerable, especially those like the South African Rand and Latam currencies – this latter group were hit hard during the early August sell-off in Treasuries.
DXY can probably stay bid through this if activity currencies come under pressure and technical analysts will be dusting off calls for a move to the 107.20 area.
In the view of Markets Strategist Quek Ser Leang and Senior FX Strategist Peter Chia at UOB Group, extra gains could push USD/JPY to the mid-149.00s sooner rather than later.
Key Quotes
24-hour view: After USD rebounded to a high of 148.43 last Friday, we indicated yesterday that “the rebound in USD has scope to extend, but it is unlikely to break clearly above 149.00.” In line with our expectations, USD rose but did not break 149.00 (high of 148.97). Upward momentum has improved, albeit not much. Today, USD is likely to advance above 149.00. However, the major resistance at 149.50 is likely out of reach (there is another resistance at 149.20). Support is at 148.60; a breach of 148.30 would mean that USD is not advancing further.
Next 1-3 weeks: Yesterday (25 Sep, spot at 148.40), we indicated that while upward momentum has improved, it is not enough to indicate that USD is ready to advance in a sustained manner. We also indicated that USD has to break and stay above 149.00 before further advance is likely. In NY trade, USD rose to a high of 148.97. While there is no clear break of 149.00, upward momentum has improved further. From here, as long as USD stays above 147.80 (‘strong support’ level was at 147.40 yesterday), it could advance to 149.50.
Hungary's National Bank (MNB) will announce its Monetary Policy Decision today. Economists at Commerzbank analyze Forint’s outlook ahead of the meeting.
MNB to continue with rate corridor reduction amidst political volatility
MNB is set to continue lowering its interest rate corridor at this month’s MPC meeting. It has become usual over the past few meetings for the central bank to lower its emergency rate corridor by 100 bps – the same is expected today. But, this meeting assumes additional significance because the one-day depo rate will drop (from 14% to 13%) to the same level as the base rate. The MPC may repeat that it will maintain a cautious approach until inflation has moderated decisively.
We expect the Forint to underperform CE3 peers in the coming months, but the degree of reaction to rate cuts will depend on how clearly and unambiguously inflation moderates during this timeframe. Of course, the weakness of the real economy in Germany and the CEE can become a supportive factor for lower interest rates, but we doubt that this justifies a stronger Forint.
What is more, at his parliament address on Monday, PM Viktor Orban raised the stakes by announcing that ‘the government had taken over the task and responsibility of fighting inflation, … This is a novelty as usually it is central banks and not governments which have inflation targets’ – such remarks will only serve to boost policy uncertainty and are surely negative for the exchange rate.
- The index extends the march north past the 106.00 mark.
- Higher US yields continue to underpin the rally in the dollar.
- US housing data, Consumer Confidence, Fed’s Bowman next on tap.
The greenback, in terms of the USD Index (DXY), adds to the ongoing rally and surpasses the 106.00 hurdle to print new 2023 peaks on turnaround Tuesday.
USD Index looks at yields, data
The index advances for the third session in a row on Tuesday and reclaims the area above the 106.00 barrier on the back of the intense buying interest around the greenback, higher US yields across the curve and further weakness in the risk complex.
The perception that the Federal Reserve might remain in the restrictive territory for longer than anticipated continue to underpin the rally in the greenback, while the equally strong upside bias in US yields across different time frames also contributes to the upbeat mood around the index.
Later in the US data space, Consumer Confidence tracked by the Conference Board should be in the limelight seconded by FHFA’s House Price Index, New Home Sales and the speech by FOMC Governor M. Bowman (permanent voter, hawk).
What to look for around USD
The index remains well supported by both investors’ sentiment and higher yields, pushing the dollar to new yearly peaks north of the 106.00 hurdle on Tuesday.
In the meantime, support for the dollar keeps coming from the good health of the US economy, which at the same time appears underpinned by the renewed tighter-for-longer stance narrative from the Federal Reserve.
Key events in the US this week: House Price Index, New Home Sales, CB Consumer Confidence (Tuesday) – MBA Mortgage Applications, Durable Goods Orders (Wednesday) - Initial Jobless Claims, Pending Home Sales, Final Q2 GDP Growth Rate, Fed Powell (Thursday) – PCE, Core PCE, Personal Income, Personal Spending, Advanced Goods Trade Balance, Final Michigan Consumer Sentiment (Friday).
Eminent issues on the back boiler: Persevering debate over a soft or hard landing for the US economy. Incipient speculation of rate cuts in early 2024. Geopolitical effervescence vs. Russia and China.
USD Index relevant levels
Now, the index is up 0.22% at 106.18 and a breakout of 107.19 (weekly high November 30, 2022) would open the door to 107.99 (weekly high November 21 2022) and finally 113.14 (monthly high November 3, 2022). On the other hand, initial support emerges at 104.42 (weekly low September 11) ahead of 103.06 (200-day SMA) and then 102.93 (weekly low August 30).
- USD/CAD posts modest gains amid the USD demand and a decline in oil prices.
- The pair holds below the 50- and 100-hour EMAs.
- Relative Strength Index (RSI) is located in the 40-60 zone, indicating a non-directional movement.
- The key resistance level for the pair is seen at the 1.3505-1.3515 region; 1.3443 acts as an initial support level.
The USD/CAD pair recovers its recent losses during the early European trading hours on Tuesday. The pair currently trades near 1.3487, gaining 0.25% for the day.
The hawkish stance from the Federal Reserve (Fed) officials and a decline in oil prices are the main drivers for the pair. Market players await the Canadian GDP numbers and the US Core Personal Consumption Expenditure (PCE) Price Index data on Friday for fresh impetus.
From the technical perspective, USD/CAD holds below the 50- and 100-hour Exponential Moving Averages (EMAs) with a downward slope on the four-hour chart, which supports the sellers for the time being. Meanwhile, the Relative Strength Index (RSI) is located in the 40-60 zone, indicating a non-directional movement in the USD/CAD pair.
The critical resistance level for the pair is seen near the confluence of the upper boundary of the Bollinger Band and 100-hour EMA at the 1.3505-1.3515 zone. The additional upside filter to watch is near a high of September 15 at 1.3550. Any follow-through buying above the latter will pave the way to a high of September 13 at 1.3586, followed by a psychological round figure at 1.3600.
On the downside, a break below the lower limit of the Bollinger Band of 1.3443 will see a drop to a key contention at 1.3400. The mentioned level represents a psychological figure and a low of August 11. Further south, the next downside stop will emerge at 1.3380 (a low of September 19).
USD/CAD four-hour chart
-638313082455343736.png)
Gold prices weathered the Fed’s hawkish signal in the latest meeting. Strategists at TD Securities analyze the yellow metal’s outlook.
Economic data will be instrumental in determining Gold's direction
Chair Powell delivered a hawkish surprise, reiterating the ‘higher for longer’ narrative that has been the worst fear for the Gold bugs.
Looking forward the economic data will be instrumental in determining Gold's direction. At the same time, strong physical markets continue to provide an offset to traditional macroeconomic relationships, underscoring the resilience of the yellow metal's prices against the sharp rise in yields.
Considering advanced prints from CME Group for natural gas futures markets, open interest dropped for the second session in a row on Monday, this time by just 732 contracts. In the same line, volume went down for the fourth straight session, now by around 23.8K contracts.
Natural Gas: Initial support emerges around $2.60
Prices of natural gas added to Friday’s uptick at the beginning of the week against the backdrop of declining open interest and volume. That said, further upside now appears unlikely, giving way to further range bound trade in the very near term and with initial contention around the $2.60 region per MMBtu.
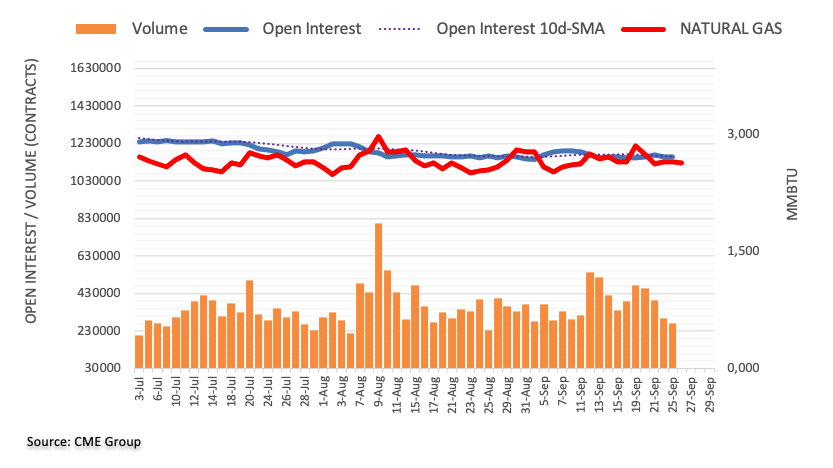
Further gains in NZD/USD need to clear the 0.6015 level, suggest Markets Strategist Quek Ser Leang and Senior FX Strategist Peter Chia at UOB Group.
Key Quotes
24-hour view: Yesterday, NZD traded between 0.5944 and 0.5973, narrower than our expected range of 0.5930/0.5985. There is still no clear directional bias, and we continue to expect NZD to trade in a range, probably between 0.5940 and 0.5985.
Next 1-3 weeks: Our update from yesterday (25 Sep, spot at 0.5955) is still valid. As highlighted, while upward momentum has improved slightly, NZD must break and stay above 0.6015 before a sustained advance is likely. The chance of NZD breaking clearly above 0.6015 will remain intact as long as it remains above the ‘strong support’ level, currently at 0.5905.
CME Group’s flash data for crude oil futures market noted traders reduced their open interest positions by almost 4K contracts at the beginning of the week, reversing two consecutive daily builds. Volume followed suit and shrank by around 283.3K contracts following Friday’s build.
WTI: Gains appear limited near $93.00
Monday’s pullback in prices of the barrel of WTI was amidst shrinking open interest and volume, removing some strength from extra retracement in the very near term. So far, occasional bullish moves in the commodity face a decent resistance around monthly tops near $92.60.
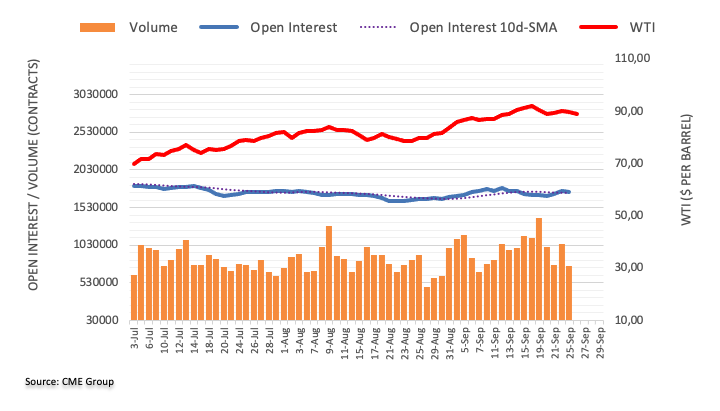
Economic differential is putting pressure on EUR/USD. The growth outlook is likely to be decisive, in the view of economists at Commerzbank.
Increasing divergence
Anyone betting on continued Dollar strength or even appreciation should realise that this is a bet on the performance of the US economy, which results in increased susceptibility of the Dollar against weaker economic data.
Against this background, we continue to see the likelihood of a correction of the current Dollar strength, simply because a lot of US optimism seems to be priced into the USD. However, the likelihood of this happening falls with increasing signs that the economic differential between the US and the Eurozone is increasing.
Markets Strategist Quek Ser Leang and Senior FX Strategist Peter Chia at UOB Group see GBP/USD facing extra downside in the short-term horizon.
Key Quotes
24-hour view: Yesterday, we highlighted that “while downward momentum has waned somewhat, there is room for GBP to dip to 1.2200 today before the risk of a more sustained rebound increases.” Our view that GBP would weaken was not wrong, as it dropped to a low of 1.2195. While the weakness has not quite stabilised yet, severely oversold conditions coupled with tentative signs of slowing momentum suggest limited downside risk. Overall, GBP is likely to trade in a lower range of 1.2170/1.2245. In other words, GBP is unlikely to break clearly below 1.2170 or above 1.2245.
Next 1-3 weeks: In our latest narrative from last Friday (22 Sep, spot at 1.2290), we indicated that “while the outlook for GBP is still negative, any weakness may not have much room to go before stabilisation is likely.” We also indicated that “the next level to watch is 1.2200.” Yesterday (25 Sep), GBP fell to a low of 1.2195. While there is no sign of stabilisation yet, there is no significant improvement in downward momentum either. Overall, the weakness in GBP will remain in place as long as GBP stays below 1.2295 (‘strong resistance’ level previously at 1.2330). A breach of 1.2295 would indicate that the weakness in GBP that started early this month has ended. On the downside, the next level to watch is 1.2100.
Open interest in gold futures markets dropped for the third session in a row on Monday, this time by more than 2K contracts according to preliminary readings from CME Group. Volume, instead, went up by nearly 31K contracts, partially reversing the previous daily pullback.
Gold: Next support expected at $1900
Gold kicked off the week on the back foot and extended further the recent breach of the key 200-day SMA. The daily downtick was on the back of shrinking open interest and is indicative that a sustained retracement appears out of favour in the very near term. Against that, there is a decent contention area around the $1900 mark per troy ounce for the time being.
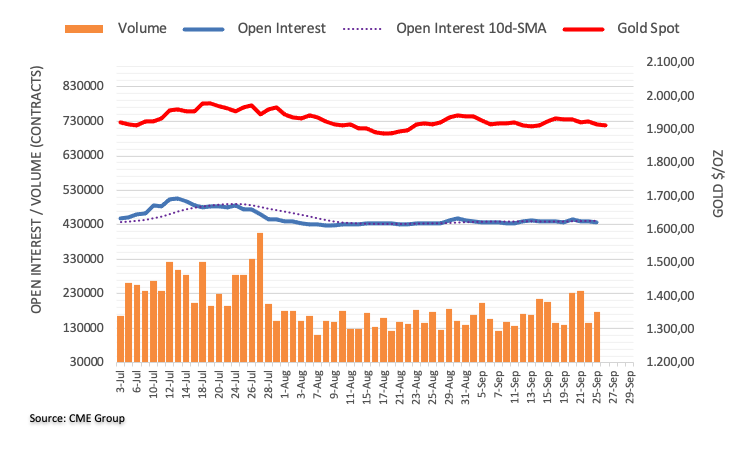
In its monthly assessment report, the Japanese Cabinet Office maintained the overall view on the economy for September, saying it is ‘recovering moderately’.
“Japan raises view on corporate profits in September for the first time since March 2022, citing it is ‘improving as a whole’,” the report said.
Market reaction
USD/JPY is holding steady near 11-month highs of 148.99, little changed after the publication of the above report.
Further downside could drag EUR/USD to the 1.0515 region in the next few weeks, according to Markets Strategist Quek Ser Leang and Senior FX Strategist Peter Chia at UOB Group.
Key Quotes
24-hour view: We did not anticipate the sharp selloff that sent EUR plummeting to a low of 1.0572. The sharp drop is, unsurprisingly, oversold, but EUR could drop further to 1.0555 before stabilisation is likely. The major support at 1.0515 is unlikely to be tested today. On the upside, if EUR breaks above 1.0635 (minor resistance is at 1.0615), it would mean that the weakness in EUR has stabilised.
Next 1-3 weeks: Our most recent narrative was from last Thursday (21 Sep, spot at 1.0655), wherein EUR is likely to trade in a range of 1.0590/1.0730 for now. We were also of the view that “if EUR breaks clearly below 1.0590, it will likely lead to a sustained decline towards the major support at 1.0515.” Yesterday (25 Sep), EUR broke below 1.0590, dropped to 1.0572, and then closed at 1.0590 (-0.58%). The price action suggests that EUR is likely to weaken to 1.0515 in the coming days. EUR’s downside risk remains if it stays below the ‘strong resistance’ level, currently at 1.0665.
FX option expiries for Sept 26 NY cut at 10:00 Eastern Time, via DTCC, can be found below.
- EUR/USD: EUR amounts
- 1.0520 1.2b
- 1.0575 515m
- 1.0600 1.7b
- 1.0650 1.1b
- 1.0700 1.8b
- GBP/USD: GBP amounts
- 1.2170 302m
- AUD/USD: AUD amounts
- 0.6400 648m
- 0.6455 789m
- USD/CAD: USD amounts
- 1.3500 1.3b
- EUR/USD reverses toward 1.0600, recovering from intraday losses.
- ECB President Christine Lagarde has emphasized that interest rates will remain restrictive for as long as necessary.
- Investors adopt caution ahead of upcoming economic data releases, seeking inflationary pressures in both economies.
- 10-year US bond yield has risen to 4.56%, boosting the US Dollar (USD).
EUR/USD recovers its intraday losses, trading around 1.0590 during the Asian trading session on Tuesday. This pair faced challenges despite comments from European Central Bank (ECB) President Christine Lagarde stating that interest rates will remain restrictive for an extended period.
However, Lagarde also noted that inflation is expected to stay "too high for too long." However, the ECB is facing a difficult situation as it seeks to balance the need to address rising inflation while not adversely affecting the Eurozone's uneven domestic economy. This delicate balancing act is likely contributing to the downward pressure on the euro against the US dollar (USD).
The US Dollar Index (DXY) holds ground near 106.00, although it's close to its recent high since November. The US Dollar (USD) continues to display strength, driven in part by a combination of cautious market sentiment and rising US Treasury yields.
The yield on the 10-year US Treasury note has climbed to 4.55%, a level not seen since October 2007.
The expectation of higher interest rates being sustained for an extended period is based on the resilience of the US economy. Moreover, the US Federal Reserve (Fed) signaled further interest rate hikes, if necessary, reinforcing the strengthening of the buck.
Recent warnings from US President Joe Biden and a senior adviser about the potential consequences of a federal government shutdown have also added to market concerns. They highlighted the possible widespread difficulties that could arise from a shutdown, including the loss of food benefits for nearly 7 million low-income women and children.
While there was a prior agreement between President Biden and House Speaker Kevin McCarthy on government spending levels, the Republican-controlled House of Representatives may attempt to pass significant budget cuts this week.
These proposed cuts would require approval by the Democratic-controlled Senate, which is expected to reject them. Failure to reach an agreement between both houses could result in a partial government shutdown by the following Sunday.
Investors will likely monitor the release of key economic data, including the US Federal Reserve's preferred inflation gauge, the Core Personal Consumption Expenditures (PCE) Price Index, and the Eurozone's Core Harmonized Index of Consumer Prices (HICP), scheduled for Friday.
These datasets are expected to provide crucial insights into inflationary pressures in both economies and may influence trading decisions in the EUR/USD pair.
- GBP/USD loses momentum around 1.2200 amid a rally of the USD.
- The hawkish comments from the Federal Reserve (Fed) lift the US Dollar against GBP.
- UK Gross Domestic Product (GDP) Q2, US Core Personal Consumption Expenditure (PCE) Price Index will be the highlight this week.
The GBP/USD pair remains under selling pressure and trades in negative territory for the fourth consecutive week during the early European session on Tuesday. The major pair currently trades near 1.2203, losing 0.07% on the day.
The Bank of England (BoE) decided to maintain the benchmark rate unchanged at a 15-year high level of 5.25%, halting a run of 14 consecutive rate hikes since December 2021. This, in turn, might weigh on the British Pound (GBP) against the US Dollar. The BoE official stated that further meetings are possible, indicating that the BoE could raise or halt interest rates if necessary.
On the other hand, the hawkish stance from the Federal Reserve (Fed) lifts the US Dollar and acts as a headwind for the GBP/USD pair. Early Tuesday, Minneapolis Federal Reserve Bank President, Neel Kashkari stated that he is one of the Fed policymakers who sees one more rate hike this year. He added that US rates probably have to go a little bit higher and be held there for longer, to cool things off. Earlier, the Federal Reserve Banks of Boston and San Francisco Presidents, Susan Collins and Mary Daly stressed that although inflation is slowing, future rate rises are likely. While Chicago Fed President Austan Goolsbee said that a soft landing is possible, inflation risks remain elevated, and the Fed should be fully committed to bringing inflation to 2%.
Meanwhile, the US Dollar Index (DXY), a measure of the value of the USD relative to a basket of foreign currencies, holds above the 106.00 mark, near the highest level since November. Additionally, the 10-year yield climbed to 4.546%, a level not seen since October 2007.
Market participants will monitor US CB Consumer Confidence for September and New Home Sales due later on Tuesday. The attention will shift to the UK Gross Domestic Product (GDP) for the second quarter and the US Core Personal Consumption Expenditure (PCE) Price Index released on Friday.
- USD/INR scales higher for the second straight day and touches a multi-day top on Tuesday.
- The technical setup warrants some caution for bulls and before positioning for further gains.
- Any corrective decline towards the 83.00 mark could now be seen as a buying opportunity.
The USD/INR pair gains some positive traction for the second successive day on Tuesday and climbs to a multi-day peak during the Asian session. Spot prices currently trade around the 83.20 area, up 0.15% for the day, and remain well within the striking distance of the monthly peak touched last week.
The prospects for further policy tightening by the Federal Reserve (Fed) continue to push the US Treasury bond yields higher and underpin the US Dollar (USD). Apart from this, the risk-off impulse – as depicted by a weaker tone around the equity markets – assists the safe-haven Greenback to stand tall near its highest level since December 2022 touched on Monday. This, in turn, is seen as a key factor that continues to act as a tailwind for the USD/INR pair.
From a technical perspective, oscillators on the daily chart are yet to gain any meaningful positive traction and warrant caution for aggressive bullish traders. Hence, it will be prudent to wait for some follow-through buying beyond the 82.30 area, or the monthly top, before positioning for further appreciating move. The USD/INR pair might then surpass the all-time peak, around the 83.40-83.45 region touched on August 15, and aim to conquer the 84.00 round figure.
On the flip side, any corrective decline might now find some support near the 83.00 mark ahead of Friday's swing low, around the 82.80-82.75 region. This is closely followed by the upward-sloping 100-day Simple Moving Average (SMA), currently pegged near the mid-82.00s, and the 200-day SMA, around the 82.35 region. The latter should act as a key pivotal point for the USD/INR pair, which if broken decisively will be seen as a fresh trigger for bearish traders.
Spot prices might then turn vulnerable to accelerate the downfall towards the 82.00 mark. The downward trajectory could get extended further and eventually drag the USD/INR pair to the July swing low, around the 81.70-81.65 region.
USD/INR daily chart
Techincal levels to watch
- Gold price drops to over a one-week low and seems vulnerable to extending its descending trend.
- The Fed's hawkish outlook continues to push the US bond yields higher and exerts pressure on Gold price.
- The US Dollar hits a fresh YTD peak and contributes to driving flows away from the XAU/USD.
Gold price remains under some selling pressure for the second successive day on Tuesday – also marking the fifth day of a negative move in the previous six – and drops to a one-and-half-week low during the Asian session. The XAU/USD currently trades just below the $1,915 level, down over 0.10% for the day, and seems vulnerable to weaken further in the wake of growing acceptance that the Federal Reserve (Fed) will keep interest rates higher for longer. In fact, the Fed warned last week that still-sticky inflation in the United States (US) was likely to attract at least one more interest rate hike by the end of this year. Moreover, a majority of Fed policymakers now see only two rate cuts in 2024 as compared to four projected previously.
The US Dollar (USD), meanwhile, hit a 10-month high on Monday on the back of a further rise in the US Treasury bond yields and further undermines the Gold price. The incoming resilient US macro data and hawkish comments by influential Fed officials suggest the US central bank will continue tightening its monetary policy. This, in turn, leads to an extended selloff in the US fixed-income market, pushing the yield on the rate-sensitive two-year US government bond to a 17-year top. Moreover, the benchmark 10-year US Treasury note climbs beyond the 4.50% threshold for the first time since 2006, which continues to underpin the USD and validates the negative outlook for the non-yielding yellow metal. That said, the possibility of a US government shutdown could limit losses.
Daily Digest Market Movers: Gold price seems vulnerable amid hawkish Fed expectations
- Gold price slides to over a one-week low in the wake of rising bets for further policy tightening by the Fed.
- Comments by influential FOMC members back the case for one more 25 basis points (bps) lift-off in 2023.
- The US economic resilience should allow the Fed to stick to its hawkish stance and continue raising rates.
- The benchmark 10-year US Treasury yield touches a fresh 16-year top and the US Dollar hits a 10-month top.
- Surging bond yields and a stronger USD support prospects for a further depreciating move for the yellow metal.
- Concerns about a possible US government shutdown could lend support to the XAU/USD and help limit losses.
Technical Analysis: Gold price is likely to retest monthly low around the $1,900 mark
Gold price faced rejection near the very important 200-day Simple Moving Average (SMA) on Monday and the subsequent downfall favours bearish traders. Moreover, oscillators on the daily chart have just started gaining negative traction and suggest that the path of least resistance for the XAU/USD is to the downside. Hence, some follow-through weakness back towards retesting the monthly swing low, around the $1,900 round figure, looks like a distinct possibility. Some follow-through selling will be seen as a fresh trigger for bearish traders and pave the way for a further near-term depreciating move.
Fed FAQs
What does the Federal Reserve do, how does it impact the US Dollar?
Monetary policy in the US is shaped by the Federal Reserve (Fed). The Fed has two mandates: to achieve price stability and foster full employment. Its primary tool to achieve these goals is by adjusting interest rates.
When prices are rising too quickly and inflation is above the Fed’s 2% target, it raises interest rates, increasing borrowing costs throughout the economy. This results in a stronger US Dollar (USD) as it makes the US a more attractive place for international investors to park their money.
When inflation falls below 2% or the Unemployment Rate is too high, the Fed may lower interest rates to encourage borrowing, which weighs on the Greenback.
How often does the Fed hold monetary policy meetings?
The Federal Reserve (Fed) holds eight policy meetings a year, where the Federal Open Market Committee (FOMC) assesses economic conditions and makes monetary policy decisions.
The FOMC is attended by twelve Fed officials – the seven members of the Board of Governors, the president of the Federal Reserve Bank of New York, and four of the remaining eleven regional Reserve Bank presidents, who serve one-year terms on a rotating basis.
What is Quantitative Easing (QE) and how does it impact USD?
In extreme situations, the Federal Reserve may resort to a policy named Quantitative Easing (QE). QE is the process by which the Fed substantially increases the flow of credit in a stuck financial system.
It is a non-standard policy measure used during crises or when inflation is extremely low. It was the Fed’s weapon of choice during the Great Financial Crisis in 2008. It involves the Fed printing more Dollars and using them to buy high grade bonds from financial institutions. QE usually weakens the US Dollar.
What is Quantitative Tightening (QT) and how does it impact the US Dollar?
Quantitative tightening (QT) is the reverse process of QE, whereby the Federal Reserve stops buying bonds from financial institutions and does not reinvest the principal from the bonds it holds maturing, to purchase new bonds. It is usually positive for the value of the US Dollar.
- USD/JPY trades around an 11-month high on the back of robust growth in US Dollar (USD).
- Investors are pricing in the Fed’s hawkish stance on interest rates trajectory.
- 10-year US bond yield has risen to 4.56%, the highest level since October 2007.
- Japanese Finance Minister Shunichi Suzuki emphasized that the country has to choose between stimulating consumption or promoting wage growth.
USD/JPY trades near 148.90 close to an 11-month high during the Asian session on Tuesday. The US Dollar (USD) continues to strengthen, partly due to cautious market sentiment and higher US Treasury yields.
The US Dollar Index (DXY) trades higher above 106.00, marking its highest level since November. This strength in the US Dollar is supported by the upbeat US Treasury yields. The yield on the 10-year US bond note, which has risen to 4.56% by the press time, is a level not seen since October 2007.
The expectation of high-interest rates persisting for an extended period is driven by the resilience of the US economy. Moreover, the US Federal Reserve (Fed) signaled further interest rate hikes, if necessary, reinforcing the strengthening of the buck.
Additionally, there are concerns about the potential consequences of a federal government shutdown, as both US President Joe Biden and a senior adviser have warned about the widespread difficulties it could cause, including the loss of food benefits for nearly 7 million low-income women and children.
While there was a prior agreement between President Biden and House Speaker Kevin McCarthy on government spending levels, the Republican-controlled House of Representatives may seek to pass significant budget cuts, which would require approval by the Democratic-controlled Senate.
These proposed cuts would require approval by the Democratic-controlled Senate, which is expected to reject them. If both houses fail to reach an agreement on government spending, it could lead to a partial government shutdown by the following Sunday.
Investors will likely watch key data releases later in the week, including US Consumer Confidence, Durable Goods Orders, Initial Jobless Claims, and the Core Personal Consumption Expenditures (PCE) Price Index, which is the Federal Reserve's preferred measure of inflation.
These datasets will provide important insights into inflationary pressures in the US economy and could influence trading decisions involving the US Dollar.
On the other side, the Japanese Yen (JPY) faces downward pressure after the Bank of Japan (BoJ) made no adjustment to its ultra-low monetary policy on Friday. BoJ has chosen to continue supporting the economy until inflation sustainably reaches its 2% target. This decision suggests that the central bank is in no hurry to phase out its massive stimulus program.
On Tuesday, Japanese Finance Minister Shunichi Suzuki commented on Japan's economic situation, emphasizing that the country is at a critical juncture where it needs to decide between stimulating consumption or promoting wage growth. Suzuki also noted that it is challenging to predict whether fiscal spending alone would lead to an increase in prices.
Moreover, Japan's newly appointed Economy Minister Yoshitaka Shindo has stated that it is crucial for currencies to exhibit stability in their movements, reflecting the underlying economic fundamentals.
On Monday, BoJ Governor Ueda highlighted the importance of taking more time to assess data before considering raising interest rates. Additionally, Deputy Governor Shinichi Uchida has emphasized the need for the central bank to continue monetary easing patiently and closely monitor currency market movements.
These dovish comments could undermine the Yen and may contribute to the support for the USD/JPY pair.
- USD/MXN attracts some buyers on Tuesday amid the USD demand.
- Mexico’s headline inflation came in at 4.64% for for the first half of September from 4.64% at the end of August.
- Minneapolis Federal Reserve Bank President said he sees one more rate hike this year.
- Market players will closely monitor Banxico interest rate decision, US Core Personal Consumption Expenditure (PCE) Price Index this week.
The Mexican Peso (MXN) gains traction for the second consecutuve day against the US Dollar (USD) during the early Asian trading hours on Tuesday. A stonger US Dollar (USD) and higher US Treasury bond yields is supported the pair. USD/MXN currently trades around 17.47, up 0.46% on the day.
Data from statistics agency INEGI showed that Mexico’s headline inflation came in at 4.64% for for the first half of September from 4.64% at the end of August. Mexico President Andres Manuel Lopez Obrador stated last week that Banxico was doing well as inflation slows but the central bank should concentrate more on fostering economic development. However, if the rate of inflation ease, Banxico may adjust its monetary policy and could weigh on the Mexican Peso.
On the USD’s front, the higher for longer rate narrative in the US boosts the Greenback broadly. Early Tuesday, Minneapolis Federal Reserve Bank President, Neel Kashkari stated that he is one of the fed policymakers who sees one more rate hike this year. He added that US rates probably have to go a little bit higher, be held there for longer, to cool things off. This, in turn, lift the USD against the Mexican Peso and acts as a tailwind for the USD/MXN pair.
Later this week, the US CB Consumer Confidence for September and New Home Sales will be due later on Tuesday. The closely watched event will be the US Core Personal Consumption Expenditure (PCE) Price Index on Friday. On the Mexican docket, Trade Balance for August will be released on Wednesday and Banxico Interest Rate Decision will be scheduled on Thursday.
- Gold price looks to lose ground toward $1,900 amid US Dollar strengthens.
- Traders are still pricing in the likelihood of the Fed's policy rates to be higher for an extended period.
- Upbeat US Treasury yields are contributing support for the potential of the Greenback.
Gold price moves downward, trading lower around $1,910 per troy ounce during the Asian session on Tuesday. The US Dollar (USD) continues to strengthen, partly due to cautious market sentiment and higher US Treasury yields.
The US Dollar Index (DXY) hovers near 106.00 at the time of writing. The index marked its highest level on Monday since November. The yield on the 10-year US Treasury note improved to 4.55%, a level that hasn't been observed since October 2007.
Moreover, the likelihood of high-interest rates persisting for a prolonged period is based on the resilience of the United States (US) economy, which is putting pressure on non-yielding assets like Gold.
According to Reuters, both US President Joe Biden and one of his senior advisers have issued warnings regarding the potential ramifications of a federal government shutdown. They expressed concerns that such a shutdown could result in widespread difficulties, including the loss of food benefits for nearly 7 million low-income women and children.
The statement suggests that there was a prior agreement between President Joe Biden and House Speaker Kevin McCarthy regarding government spending levels. However, it is noted that the Republican-controlled House of Representatives may attempt to pass significant budget cuts this week.
These proposed cuts would require approval by the Democratic-controlled Senate, which is expected to reject them. If both houses fail to reach an agreement on government spending, it could lead to a partial government shutdown by the following Sunday.
Investors will likely watch the macro releases such as US Consumer Confidence, Durable Goods Orders, Initial Jobless Claims and Federal Reserve's (Fed) preferred inflation gauge, the Core Personal Consumption Expenditures (PCE) Price Index, which are scheduled to be released later in the week.
These datasets may provide crucial insights into the inflationary pressures in the US economy and could impact the Fed's monetary policy, which could influence the price of Gold.
Bloomberg reported on Tuesday, “Senate Republican And Democrat negotiators are nearing a deal on a short-term spending measure intended to keep the government open after October 1.”
No further details are provided about the same, as yet.
Market reaction
The US Dollar is flirting with ten-month highs just above 106.00, underpinned by the hawkish Fed outlook on interest rates.
Japan’s newly appointed Economy Minister Yoshitaka Shindo said on Tuesday, “it is important for currencies to move in a stable manner reflecting fundamentals.“
Further comments
Must carefully monitor whether output gap to remain in growth territory.
Japan's consumption turned to contraction due to inflation, seen unstable.
Won't comment on forex levels.
Weak Yen has various effects on economy such as raising import costs for consumers, improving competitiveness of exporters.
Related reads
- Japan’s Suzuki: Japan at a critical stage whether to spur consumption, wage growth
- USD/JPY consolidates its gains below 149.00 amid the cautious mood, fear of intervention
| Raw materials | Closed | Change, % |
|---|---|---|
| Silver | 23.117 | -1.88 |
| Gold | 1915.966 | -0.53 |
| Palladium | 1231.1 | -1.71 |
- AUD/USD continues to find support near 0.6400, though remains confined in a familiar range.
- The USD stands by the YTD peak amid the Fed's hawkish outlook and caps gains for the pair.
- Worries about a property crisis in China also hold back the Aussie bulls from placing fresh bets.
The AUD/USD pair attracts some dip-buying in the vicinity of the 0.6400 round-figure mark during the Asian session on Tuesday and touches a fresh daily high in the last hour. Spot prices currently trade around the 0.6425 regio, up less than 0.10% for the day, and remain confined in a familiar range held over the past two weeks or so.
The US Dollar (USD) takes a brief pause following the recent rally to its highest level since December 2022 and turns out to be a key factor lending some support to the AUD/USD pair. That said, the Federal Reserve's (Fed) hawkish outlook favours the USD bulls, which, along with concerns about a property market crisis in China, should keep a lid on any meaningful recovery for the major. The US central bank last week reiterated that interest rates will remain higher for longer and backed the case for at least one more 25 bps rate hike by the end of this year.
The bets were reaffirmed by comments from influential FOMC members, saying that borrowing costs will need to remain elevated for an extended period to bring inflation back to the 2% target. Furthermore, investors are now getting increasingly wary about the potential inflationary impact of rising Oil prices. Adding to this, the incoming resilient US macro data should allow the Fed to stick to its hawkish stance. Meanwhile, policymakers see just two rate cuts in 2024 as compared to four projected previously and continue to push the US Treasury bond yields higher.
In fact, the yield on the rate-sensitive two-year US government bond jumps to a 17-year high and the benchmark 10-year Treasury yield climbs beyond the 4.50% threshold for the first time since 2007. This, in turn, suggests that the path of least resistance for the USD is to the upside, suggesting that any attempted recovery around the AUD/USD pair is more likely to get sold into. Traders now look to the US economic docket – featuring the Conference Board's Consumer Confidence Index, New Home Sales and the Richmond Manufacturing Index – for a fresh impetus.
Technical levels to watch
“Japan at a critical stage whether to spur consumption or wage growth,” Japanese Finance Minister Shunichi Suzuki said on Tuesday.
Suzuki added that it is “hard to say fiscal spending may push up prices.”
Additional comments
Currency rates should be set by the market.
Rapid fx moves undesirable.
Share view with international authorities that excessive FX volatility is undesirable.
Closely watching FX moves with a great sense of urgency.
Won't rule out any steps to respond to disorderly FX moves.
Nothing new to add now to what i say on currencies.
Market reaction
At the time of writing, USD/JPY is trading better bid just shy of the 11-month high of 148.99.
- EUR/GBP extends losses following the ECB President Christine Lagarde’s speech at the European Parliament.
- ECB’s interest rates will remain restrictive for as long as necessary.
- Investors await the Eurozone’s HICP, seeking insights into the inflationary pressures in the bloc.
EUR/GBP extends its losses on the second successive day, trading lower around 0.8670 during the Asian session on Tuesday. The pair is facing downward pressure following the European Central Bank's (ECB) President Christine Lagarde’s remarks at the European Parliament.
Lagarde observed a general deceleration in economic momentum across the European Union (EU), accompanied by a gradual moderation in job creation. However, the policymaker also highlighted that inflation is expected to remain "too high for too long" and emphasized that rates will remain restrictive for as long as necessary.
ECB confronts a complex predicament, as it must delicately manage the fine line between addressing inflationary forces and avoiding detrimental effects on the disparate domestic economies within the Eurozone.
Investors await the data release of the Eurozone’s Harmonized Index of Consumer Prices (HICP), which is scheduled for Friday.
These datasets may provide crucial insights into the inflationary pressures in the bloc and could impact trading decisions involving the Euro.
In the United Kingdom (UK), the Bank of England (BoE) opted not to move forward with a widely expected interest rate increase on Thursday. This decision was based on inflation figures for the UK economy that fell generally below expectations.
The surprising pause in the BoE's rate hike cycle has added to the British Pound's (GBP) relative underperformance. It is also seen as a factor exerting downward pressure on the EUR/GBP pair. Notably, the UK central bank had previously implemented 14 consecutive interest rate hikes.
- WTI struggles to gain and hovers around $89.25 as the USD attracts some buyers.
- Higher for longer rate narrative in the US weigh on WTI prices.
- Traders will monitor the weekly Crude Oil Stock, the US Core Personal Consumption Expenditure (PCE) Price Index for fresh impetus.
Western Texas Intermediate (WTI), the US crude oil benchmark, is trading around the $89.25 mark so far on Tuesday. WTI prices snap their three-week winning streak as investors concerned about higher interest rates and oil demand outlook,
The higher-for-longer rate narrative in the US caps the upside for WTI prices after the Federal Reserve (Fed) held the interest rate unchanged and delivered hawkish comments last week. It's worth noting that higher interest rates raise borrowing costs, which can slow the economy and diminish oil demand. Additionally, the stronger US Dollar (USD) is another factor contributing to the decline in oil prices, as a stronger greenback makes oil more expensive for holders of other currencies, thereby reducing demand.
On the other hand, Saudi Arabia and Russia, the world's two largest oil exporters boosted WTI prices as two nations announced prolonged oil output curbs until the end of 2023. Saudi oil output will be closer to 1.3 million barrels per day through the end of 2023. Furthermore, Russia's temporary ban on gasoline and diesel exports to the majority of nations, announced last week, was anticipated to significantly tighten supply.
Looking ahead, oil traders will take cues from the API and EIA weekly Crude Oil Stock for the week ending September 22. The US Consumer Confidence for September and housing data will be due later on Tuesday. Later this week, the US Gross Domestic Product (GDP) Annualized for the second quarter will be due on Thursday and the Core Personal Consumption Expenditure (PCE) Price Index will be released on Friday. These events could significantly impact the USD-denominated WTI price. Oil traders will take cues from the data and find trading opportunities around the WTI prices.
Minneapolis Federal Reserve Bank President, Neel Kashkari, said early Tuesday, “I am one of the fed policymakers who sees one more rate hike this year.“
Additional comments
Still more work to do on services inflation.
Fed can definitely get back to 2% inflation.
May need to cut rates if real rates are tightening.
US rates probably have to go a little bit higher, be held there for longer, to cool things off -- remarks made earlier on Monday and now posted on the Minneapolis Fed website.
Falling inflation next year might justify backing off Federal funds rate to stop if from getting tighter.
Balance sheet runoff will continue for the foreseeable future.
Effects of balance sheet runoff may not be fully felt yet.
Market reaction
The US Dollar Index is seeing a fresh uptick on the above comments, currently trading at 106.01, modestly flat on the day.
- USD/CHF stands tall near a multi-month top and remains well supported by a combination of factors.
- The SNB's surprise pause last week undermines the CHF and acts as a tailwind amid a bullish USD.
- The extremely overbought RSI (14) on the daily chart is holding back bulls from placing fresh bets.
The USD/CHF pair consolidates its recent strong gains to the highest level since late May touched the previous day and oscillates in a narrow band during the Asian session on Tuesday. Spot prices currently trade around the 0.9125 region and seem poised to prolong a two-month-old upward trajectory.
The Swiss National Bank (SNB) surprised markets last Thursday and decided to pause its rate-hiking cycle for the first time since March 2022, noting that inflation has subsided. This, in turn, continues to undermine the Swiss Franc (CHF), which, along with the underlying bullish sentiment surrounding the US Dollar (USD), is seen acting as a tailwind for the USD/CHF pair. In fact, the USD Index (DXY), which tracks the Greenback against a basket of currencies, stood by the 10-month peak touched on Monday and remains well supported by the Federal Reserve's (Fed) hawkish outlook.
The US central bank reiterated its higher-for-longer interest rates narrative and warned that still-sticky inflation was likely to attract at least one more hike by the end of this year. Furthermore, investors are now getting increasingly wary about the potential inflationary impact of rising Oil prices. This, along with the incoming resilient US macro data, should allow the Fed to stick to its hawkish stance. The outlook, meanwhile, leads to an extended selloff in the US fixed incoming market, pushing the yield on the rate-sensitive two-year government bond to its highest level since 2006.
The benchmark 10-year US Treasury yield also climbs to a 16-year peak, further beyond the 4.50% threshold, and continues to underpin the Greenback. That said, the extremely overbought Relative Strength Index (RSI) on the daily chart is holding back traders from placing fresh bullish bets around the USD/CHF pair. The recent breakout through a technically significant 200-day Simple Moving Average (SMA), meanwhile, suggests that the path of least resistance for spot prices is to the upside and any meaningful corrective pullback is more likely to get bought into.
Market participants now look to the US economic docket – featuring the release of the Conference Board's Consumer Confidence Index, New Home Sales and the Richmond Manufacturing Index. This, along with the US bond yields, will influence the USD price dynamics and produce short-trading opportunities around the USD/CHF pair. Bulls, however, might wait for some near-term consolidation before positioning for any further appreciating move.
Technical levels to watch
On Tuesday, the People’s Bank of China (PBoC) set the USD/CNY central rate for the trading session ahead at 7.1727, compared with the previous day's fix of 7.1727 and 7.3174 estimated.
- EUR/USD trades around 1.0580 close to the lowest levels since March.
- ECB President Christine Lagarde stated that rates will remain restrictive for as long as necessary.
- Investors focus on upcoming economic data releases, seeking inflationary pressures in both economies.
- Cautious market sentiment and higher US Treasury yields are contributing support for the potential of the US Dollar (USD).
EUR/USD continues to move on the downward path, trading lower around 1.0580 during the early trading hours of the Asian session on Tuesday.
The pair has posted the lowest close on Monday since March despite the European Central Bank (ECB) President Christine Lagarde's statement at the European Parliament that rates will remain restrictive for as long as necessary.
However, Lagarde has also highlighted that inflation is expected to remain "too high for too long." However, the ECB faces a challenging situation, as it must carefully navigate the delicate balance between addressing inflationary pressures and not harming an uneven domestic economy in the Eurozone.
The US Dollar Index (DXY) hovers near 106.00 at the time of writing, although it's below its highest level since November. The US Dollar (USD) is maintaining its strength, partly due to cautious market sentiment and higher US Treasury yields.
The yield on the 10-year US Treasury note improved to 4.55%, a level that hasn't been observed since October 2007. The expectation of high-interest rates persisting for an extended period is rooted in the resilience of the US economy.
As per Reuters, US President Joe Biden and one of his senior advisers have issued warnings about the potential consequences of a federal government shutdown. They expressed concerns that such a shutdown could lead to widespread difficulties, including the loss of food benefits for nearly 7 million low-income women and children.
The statement indicates that there was a prior agreement between President Joe Biden and House Speaker Kevin McCarthy on government spending levels. However, it's noted that the Republican-controlled House of Representatives may attempt to pass significant budget cuts this week.
These cuts would be subject to approval by the Democratic-controlled Senate, which is expected to reject them. If both houses fail to reach an agreement on government spending, it could lead to a partial government shutdown by the following Sunday.
Investors await the release of the US Federal Reserve's (Fed) preferred inflation gauge, the Core Personal Consumption Expenditures (PCE) Price Index, and the Eurozone’s Core Harmonized Index of Consumer Prices (HICP), which are scheduled for Friday.
These datasets may provide crucial insights into the inflationary pressures in both economies and could impact trading decisions on the EUR/USD pair.
- USD/CAD consolidates in a narrow trading band near 1.3458 on Tuesday.
- The downtick in oil prices undermines the commodity-linked Loonie.
- Most Fed officials still anticipate further rate hikes later this year.
- Market players will monitor the Canadian GDP and, the US Core Personal Consumption Expenditure (PCE) Price Index on Friday.
The USD/CAD pair oscillates in a narrow range during the early Asian session on Tuesday. The weakening of the Loonie is weighed by the downtick in oil prices while the higher for longer narrative in the US lifts the US Dollar (USD) across the board. As of writing, USD/CAD is trading around 1.3457, gaining 0.02% on the day.
The US Dollar Index (DXY), a measure of the value of the USD relative to a basket of foreign currencies, hovers around 105.95 after retreating from the highest level since November of 106.09 amid the USD demand and a rising of the US 10-year yield to the highest level since October 2007.
That said, the oil price edges lower for two straight days on Tuesday, which undermines the commodity-linked Loonie and might cap the upside for the USD/CAD pair as the country is the leading oil exporter to the US.
Most Fed officials still anticipate further rate hikes later this year. Susan Collins and Mary Daly, Presidents of the Federal Reserve Banks of Boston and San Francisco, stressed that, although inflation is slowing, future rate rises are likely. While Chicago Fed President Austan Goolsbee said that a soft landing is possible, inflation risks remain elevated, and the Fed should be fully committed to bringing inflation to 2%. These hawkish comments from Fed officials boost the USD and act as a tailwind for the USD/CAD pair.
Moving on, the US Consumer Confidence for September and housing data will be due later on Tuesday. On Thursday, the US Gross Domestic Product (GDP) Annualized for the second quarter will be released. The closely watched event will be the Core Personal Consumption Expenditure (PCE) Price Index, the Fed's preferred measure of consumer inflation, due on Friday. The annual figure is expected to drop from 4.2% to 3.9%. Also, Canadian GDP numbers will be due on Friday. Market players will take cues from these figures and find a clear direction in the USD/CAD pair.
- GBP/USD languishes near a multi-month low and is undermined by a combination of factors.
- The USD sits near the YTD top amid the Fed's hawkish outlook and elevated US bond yields.
- The BoE's surprise pause last week continues to weigh on the GBP and contributes to capping.
The GBP/USD pair enters a bearish consolidation phase during the Asian session on Tuesday and oscillates in a range just above its lowest level since March 17 touched the previous day. Spot prices currently trade around the 1.2220 area, though the fundamental backdrop favours bearish traders and supports prospects for an extension of the well-established downtrend witnessed over the past two months or so.
The US Dollar (USD) stands tall near the YTD peak set on Monday and is seen as a key factor that continues to act as a headwind for the GBP/USD pair. The Federal Reserve (Fed) stuck to its hawkish stance at the September policy meeting last week and reiterated the 'higher-for-longer' interest rates narrative. In fact, the US central bank warned that still-sticky inflation was likely to attract at least one more interest rate hike by the end of this year. Furthermore, policymakers see just two rate cuts in 2024 as compared to four projected previously.
Furthermore, the incoming resilient US macro data supports prospects for further policy tightening by the Fed, which remains supportive of the recent blowout rally in the US Treasury bond yields and underpins the Greenback. The yield on the rate-sensitive two-year US government bond touched a 17-year peak and the benchmark 10-year Treasury yield climbed beyond the 4.50% threshold for the first time since 2007. Apart from this, the Bank of England's (BoE) surprise pause last Thursday turns out to be another factor weighing on the GBP/USD pair.
The UK central bank decided to keep the main policy rate unchanged, at a 15-year high level of 5.25%, ending a run of 14 straight hikes since December 2021 in the wake of the recent deceleration of inflation and signs that economic growth is slowing. This, in turn, supports prospects for a further depreciating move for the GBP/USD pair, though the extremely oversold Relative Strength Index (RSI) on the daily chart holds back bearish traders from placing fresh bets. Hence, it will be prudent to wait for some consolidation or a modest bounce before the next leg down.
There isn't any relevant market-moving economic data due for release from the UK on Tuesday, leaving the GBP/USD pair at the mercy of the USD price dynamics. Later during the early North American session, traders will take cues from the US economic docket – featuring the release of the Conference Board's Consumer Confidence Index, New Home Sales data and the Richmond Manufacturing Index – to grab short-term opportunities.
Technical levels to watch
| Index | Change, points | Closed | Change, % |
|---|---|---|---|
| NIKKEI 225 | 276.21 | 32678.62 | 0.85 |
| Hang Seng | -328.16 | 17729.29 | -1.82 |
| KOSPI | -12.37 | 2495.76 | -0.49 |
| ASX 200 | 7.7 | 7076.5 | 0.11 |
| DAX | -151.8 | 15405.49 | -0.98 |
| CAC 40 | -60.94 | 7123.88 | -0.85 |
| Dow Jones | 43.04 | 34006.88 | 0.13 |
| S&P 500 | 17.38 | 4337.44 | 0.4 |
| NASDAQ Composite | 59.51 | 13271.32 | 0.45 |
| Pare | Closed | Change, % |
|---|---|---|
| AUDUSD | 0.64222 | -0.32 |
| EURJPY | 157.628 | -0.22 |
| EURUSD | 1.0591 | -0.54 |
| GBPJPY | 181.729 | 0.08 |
| GBPUSD | 1.22093 | -0.25 |
| NZDUSD | 0.59645 | 0.09 |
| USDCAD | 1.34542 | -0.13 |
| USDCHF | 0.91182 | 0.55 |
| USDJPY | 148.845 | 0.34 |
A major credit agency, Moody's said on Monday that the US government shutdown would harm the country's credit. A severe warning comes only one month after Fitch downgraded the United States by one notch due to a debt ceiling crisis, per Reuters.
Key quotes
"A shutdown would be credit negative for the US sovereign,"
"In particular, it would demonstrate the significant constraints that intensifying political polarization put on fiscal policymaking at a time of declining fiscal strength, driven by widening fiscal deficits and deteriorating debt affordability."
“The longer the shutdown lasts, the more negative it would be”
It's worth noting that Fitch downgraded the US in August, citing the debt limit dispute as one of the reasons. Moody's is the only major credit rating firm that has a top credit rating for the US.
Market reaction
These comments did not trigger a noticeable market reaction. As of writing, the US Dollar Index (DXY) was unchanged on the day at 105.95.


© 2000-2024. Уcі права захищені.
Cайт знаходитьcя під керуванням TeleTrade DJ. LLC 2351 LLC 2022 (Euro House, Richmond Hill Road, Kingstown, VC0100, St. Vincent and the Grenadines).
Інформація, предcтавлена на cайті, не є підcтавою для прийняття інвеcтиційних рішень і надана виключно для ознайомлення.
Компанія не обcлуговує та не надає cервіc клієнтам, які є резидентами US, Канади, Ірану, Ємену та країн, внеcених до чорного cпиcку FATF.
Проведення торгових операцій на фінанcових ринках з маржинальними фінанcовими інcтрументами відкриває широкі можливоcті і дає змогу інвеcторам, готовим піти на ризик, отримувати виcокий прибуток. Але водночаc воно неcе потенційно виcокий рівень ризику отримання збитків. Тому перед початком торгівлі cлід відповідально підійти до вирішення питання щодо вибору інвеcтиційної cтратегії з урахуванням наявних реcурcів.
Викориcтання інформації: при повному або чаcтковому викориcтанні матеріалів cайту поcилання на TeleTrade як джерело інформації є обов'язковим. Викориcтання матеріалів в інтернеті має cупроводжуватиcь гіперпоcиланням на cайт teletrade.org. Автоматичний імпорт матеріалів та інформації із cайту заборонено.
З уcіх питань звертайтеcь за адреcою pr@teletrade.global.
переклади