- Аналітика
- Новини та інструменти
- Новини ринків
Новини ринків
- WTI trades in positive territory for the third consecutive day near $76.75 in Tuesday’s early Asian session.
- Libya's shutdown of production and exports fuelled fresh supply concerns, boosting the WTI price.
- The sluggish Chinese economy and oil demand concerns might cap the black gold’s upside.
West Texas Intermediate (WTI), the US crude oil benchmark, is trading around $76.75 on Tuesday. The WTI price extends its recovery on the back of a production halt in Libya, adding to supply fears fuelled by reports of escalating conflict in the Middle East.
Libya’s eastern government in Benghazi said Monday that crude oil production and exports would shut down amid a dispute with the internationally recognized western government in Tripoli over who should lead the central bank, per Bloomberg.
Libya produces around 1.2 million barrels per day, with more than 1 million bpd exported to the global market, said Matt Smith, lead oil analyst for the Americas at Kpler. The developments surrounding Libya's output cuts have triggered further supply concerns and boosted WTI prices.
"The biggest risk for the oil market is probably a further drop in Libyan oil production due to political tensions in the country, with a risk that production could fall from current levels of 1 million barrels per day to zero," noted Giovanni Staunovo, UBS analyst.
Furthermore, firmer expectations that the US Federal Reserve (Fed) will cut interest rates in its upcoming September meeting lift the WTI price. On Monday, San Francisco Fed President Mary Daly said that she believes it’s appropriate for the Fed to begin cutting interest rates. Lower interest rates generally support the WTI price as it reduces the cost of borrowing, which can boost economic activity, and oil demand.
However, the upside for black gold might be limited. China’s oil imports in July were down 12% from June and 3% from July 2023, raising fears of the country's economic health and future oil demand as China is the world’s largest importer of oil.
WTI Oil FAQs
WTI Oil is a type of Crude Oil sold on international markets. The WTI stands for West Texas Intermediate, one of three major types including Brent and Dubai Crude. WTI is also referred to as “light” and “sweet” because of its relatively low gravity and sulfur content respectively. It is considered a high quality Oil that is easily refined. It is sourced in the United States and distributed via the Cushing hub, which is considered “The Pipeline Crossroads of the World”. It is a benchmark for the Oil market and WTI price is frequently quoted in the media.
Like all assets, supply and demand are the key drivers of WTI Oil price. As such, global growth can be a driver of increased demand and vice versa for weak global growth. Political instability, wars, and sanctions can disrupt supply and impact prices. The decisions of OPEC, a group of major Oil-producing countries, is another key driver of price. The value of the US Dollar influences the price of WTI Crude Oil, since Oil is predominantly traded in US Dollars, thus a weaker US Dollar can make Oil more affordable and vice versa.
The weekly Oil inventory reports published by the American Petroleum Institute (API) and the Energy Information Agency (EIA) impact the price of WTI Oil. Changes in inventories reflect fluctuating supply and demand. If the data shows a drop in inventories it can indicate increased demand, pushing up Oil price. Higher inventories can reflect increased supply, pushing down prices. API’s report is published every Tuesday and EIA’s the day after. Their results are usually similar, falling within 1% of each other 75% of the time. The EIA data is considered more reliable, since it is a government agency.
OPEC (Organization of the Petroleum Exporting Countries) is a group of 13 Oil-producing nations who collectively decide production quotas for member countries at twice-yearly meetings. Their decisions often impact WTI Oil prices. When OPEC decides to lower quotas, it can tighten supply, pushing up Oil prices. When OPEC increases production, it has the opposite effect. OPEC+ refers to an expanded group that includes ten extra non-OPEC members, the most notable of which is Russia.
- EUR/USD failed to capture 1.1200 on Monday as markets pare back risk flows.
- Economic calendar remains tepid after blustery showing last week.
- EU inflation, US PCE inflation to dominate the late-week data docket.
EUR/USD pared back recent gains on Monday, slipping back from 1.1200 as traders ease off the gas pedal in broad-market Dollar-negative flows that sent Fiber into its highest bids in 13-months last week. Market risk appetite remains on balance to get the new trading week fired up, but Greenback pressure caught a relief as investors gear up for the long wait to key inflation figures due late this week.
Forex Today: A September rate cut now looks at US data releases
Preliminary EU Harmonized Index of Consumer Prices (HICP) inflation is slated for release on Friday, with little else of note in the way until then. Pan-EU core HICP inflation is forecast to tick down to 2.8% from 2.9% for the year ended in August.
Most of the trading week will be a quiet affair on the economic calendar. Q2 US Gross Domestic Product (GDP) figures are slated for Thursday, but are broadly expected to hold steady at 2.8% on an annualized basis. Friday could be a kicker for markets that are increasingly focused on the timing and pace of rate cuts from the Fed, with July’s US core Personal Consumption Expenditure - Price Index (PCE) inflation print set to hold steady at 0.2% MoM. The YoY PCE inflation figure is actually expected to tick upwards to 2.7% from 2.6%, but investors are confident that inflation has made enough progress towards the Fed’s 2% target that it will count as “close enough” to still keep the way open to a first rate cut on September 18.
What happened on Monday?
US Durable Goods Order in July rallied a surprising 9.9% MoM, well above the forecast 4.0% and entirely reversing the previous month’s revised -6.9% contraction.
Despite the upswing on Durable Goods Orders, some trepidation remains; excluding Transportation spending, Durable Goods Orders actually contracted -0.2% MoM, worse than the forecast 0.0% and the previous month’s tepid 0.1%, which was revised down from 0.5%.
EUR/USD price forecast
EUR/USD is on pace for its best single-month performance since November of 2022, up over 3.1% just in the month of August. Despite Monday’s technical exhaustion pullback, Fiber has gained ground for four consecutive trading weeks, and is bidding well above the 200-day Exponential Moving Average (EMA) at 1.0832.
Despite a healthy bid deep into bull country, Fiber is running a deep exposure to a bearish pullback, and a lack of topside momentum could see price action tumble all the way back to the 50-day EMA at 1.0925.
EUR/USD daily chart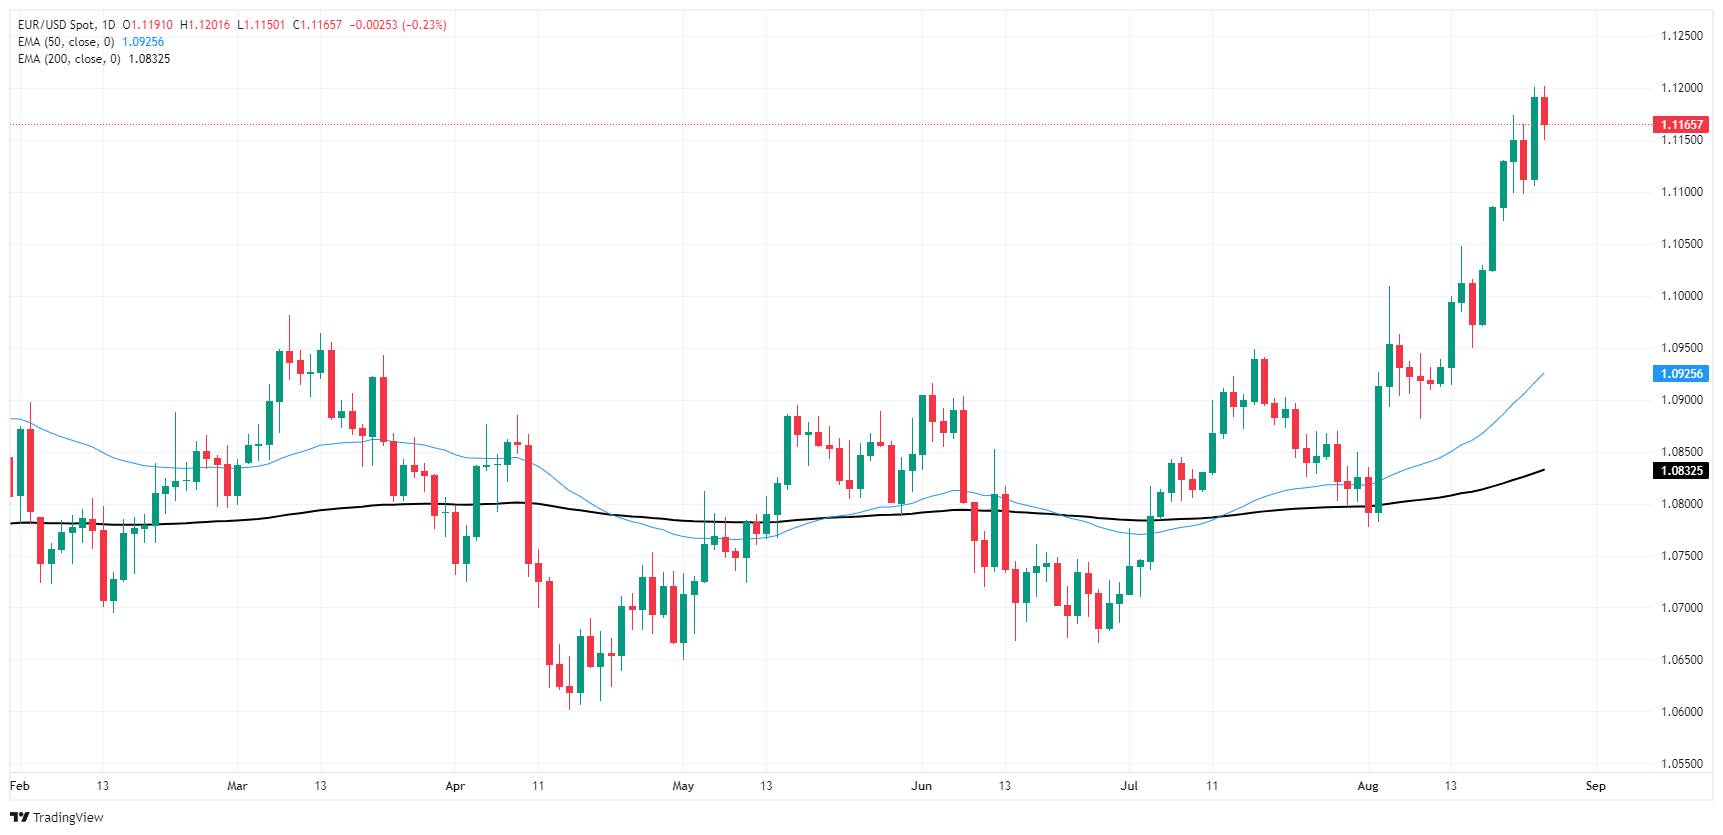
Euro FAQs
The Euro is the currency for the 20 European Union countries that belong to the Eurozone. It is the second most heavily traded currency in the world behind the US Dollar. In 2022, it accounted for 31% of all foreign exchange transactions, with an average daily turnover of over $2.2 trillion a day. EUR/USD is the most heavily traded currency pair in the world, accounting for an estimated 30% off all transactions, followed by EUR/JPY (4%), EUR/GBP (3%) and EUR/AUD (2%).
The European Central Bank (ECB) in Frankfurt, Germany, is the reserve bank for the Eurozone. The ECB sets interest rates and manages monetary policy. The ECB’s primary mandate is to maintain price stability, which means either controlling inflation or stimulating growth. Its primary tool is the raising or lowering of interest rates. Relatively high interest rates – or the expectation of higher rates – will usually benefit the Euro and vice versa. The ECB Governing Council makes monetary policy decisions at meetings held eight times a year. Decisions are made by heads of the Eurozone national banks and six permanent members, including the President of the ECB, Christine Lagarde.
Eurozone inflation data, measured by the Harmonized Index of Consumer Prices (HICP), is an important econometric for the Euro. If inflation rises more than expected, especially if above the ECB’s 2% target, it obliges the ECB to raise interest rates to bring it back under control. Relatively high interest rates compared to its counterparts will usually benefit the Euro, as it makes the region more attractive as a place for global investors to park their money.
Data releases gauge the health of the economy and can impact on the Euro. Indicators such as GDP, Manufacturing and Services PMIs, employment, and consumer sentiment surveys can all influence the direction of the single currency. A strong economy is good for the Euro. Not only does it attract more foreign investment but it may encourage the ECB to put up interest rates, which will directly strengthen the Euro. Otherwise, if economic data is weak, the Euro is likely to fall. Economic data for the four largest economies in the euro area (Germany, France, Italy and Spain) are especially significant, as they account for 75% of the Eurozone’s economy.
Another significant data release for the Euro is the Trade Balance. This indicator measures the difference between what a country earns from its exports and what it spends on imports over a given period. If a country produces highly sought after exports then its currency will gain in value purely from the extra demand created from foreign buyers seeking to purchase these goods. Therefore, a positive net Trade Balance strengthens a currency and vice versa for a negative balance.
- USD/CAD remains on the defensive near 1.3485 in Tuesday’s early Asian session.
- Fed’s Daly believes it’s appropriate for the Fed to begin cutting interest rates.
- Higher crude oil prices support the CAD and create a headwind for USD/CAD.
The USD/CAD pair extends downside around 1.3485 during the early Asian session on Tuesday. Escalating geopolitical tensions in the Middle East provide some support to the commodity-linked Canadian Dollar (CAD) and weigh on USD/CAD. Later on Tuesday, the US Conference Board’s Consumer Confidence is due.
Federal Reserve (Fed) Bank of San Francisco President Mary Daly’s remarks on Monday echoed comments from Fed Chair Jerome Powell at the Jackson Hole symposium, who said that he has gained confidence that inflation is on course to the 2% target and “the time has come for policy to adjust.” Fed’s Daly noted that she believes it’s appropriate for the Fed to begin cutting interest rates. This, in turn, continues to undermine the US Dollar (USD) against the Loonie.
According to the CME FedWatch Tool, the markets have fully priced in a 25 basis points (bps) rate cut, while the possibility of a deeper rate cut stands at 30%, down from 36.5 % last Friday.
Elsewhere, data released by the US Census Bureau on Monday showed that the US Durable Goods Orders climbed to 9.9% MoM in July from a -6.9% contraction in June. This figure came in better than the estimation of a 4% increase and registered the most significant gain since May 2020. The Greenback posted modest gains in an immediate reaction to the upbeat data.
On the Loonie front, the fear of wider conflicts in the Middle East and prospects of supply disruptions in Libya boost the crude oil prices and lift the CAD. It's worth noting that higher crude oil prices are likely to underpin the Loonie for the time being, as Canada is the leading exporter of Oil to the United States.
Canadian Dollar FAQs
The key factors driving the Canadian Dollar (CAD) are the level of interest rates set by the Bank of Canada (BoC), the price of Oil, Canada’s largest export, the health of its economy, inflation and the Trade Balance, which is the difference between the value of Canada’s exports versus its imports. Other factors include market sentiment – whether investors are taking on more risky assets (risk-on) or seeking safe-havens (risk-off) – with risk-on being CAD-positive. As its largest trading partner, the health of the US economy is also a key factor influencing the Canadian Dollar.
The Bank of Canada (BoC) has a significant influence on the Canadian Dollar by setting the level of interest rates that banks can lend to one another. This influences the level of interest rates for everyone. The main goal of the BoC is to maintain inflation at 1-3% by adjusting interest rates up or down. Relatively higher interest rates tend to be positive for the CAD. The Bank of Canada can also use quantitative easing and tightening to influence credit conditions, with the former CAD-negative and the latter CAD-positive.
The price of Oil is a key factor impacting the value of the Canadian Dollar. Petroleum is Canada’s biggest export, so Oil price tends to have an immediate impact on the CAD value. Generally, if Oil price rises CAD also goes up, as aggregate demand for the currency increases. The opposite is the case if the price of Oil falls. Higher Oil prices also tend to result in a greater likelihood of a positive Trade Balance, which is also supportive of the CAD.
While inflation had always traditionally been thought of as a negative factor for a currency since it lowers the value of money, the opposite has actually been the case in modern times with the relaxation of cross-border capital controls. Higher inflation tends to lead central banks to put up interest rates which attracts more capital inflows from global investors seeking a lucrative place to keep their money. This increases demand for the local currency, which in Canada’s case is the Canadian Dollar.
Macroeconomic data releases gauge the health of the economy and can have an impact on the Canadian Dollar. Indicators such as GDP, Manufacturing and Services PMIs, employment, and consumer sentiment surveys can all influence the direction of the CAD. A strong economy is good for the Canadian Dollar. Not only does it attract more foreign investment but it may encourage the Bank of Canada to put up interest rates, leading to a stronger currency. If economic data is weak, however, the CAD is likely to fall.
- GBP/USD pulled back on Monday, snapping a seven-day win streak.
- UK market flows were crimped with an extended weekend.
- Investors forced to wait until the end of the week for meaningful data.
GBP/USD trimmed recent gains to kick off the new trading week, slipping back below the 1.3200 handle on Monday and wrapping up a seven-day winning streak that took the pair up over 3% from 1.2800 to a 29-month high of 1.3230.
Forex Today: A September rate cut now looks at US data releases
UK markets were shuttered on Monday for a banking holiday, leaving Pound Sterling flows thin and giving the Greenback a further boost. Markets are paring back recent risk appetite after a splurge on the heels of the Federal Reserve all but confirming that rate cuts were coming in September, barring any drastic shifts in economic data.
The economic calendar for the upcoming trading week is expected to be relatively quiet. On Thursday, Q2 US Gross Domestic Product (GDP) figures are expected to remain steady at 2.8% on an annualized basis. On Friday, the focus will be on July’s US core Personal Consumption Expenditure - Price Index (PCE) inflation, which is forecasted to hold steady at 0.2% MoM. The YoY PCE inflation figure is anticipated to increase to 2.7% from 2.6%. Despite this, investors believe that inflation is close enough to the Fed’s 2% target to potentially lead to a rate cut in September.
In July, US Durable Goods Orders unexpectedly rose by 9.9% MoM, surpassing the forecast of 4.0% and reversing the previous month’s revised -6.9% contraction.
However, concerns persist as excluding transportation spending, Durable Goods Orders actually decreased by -0.2% MoM, worse than the anticipated 0.0% and the previous month’s 0.1%, which was revised down from 0.5%.
GBP/USD price forecast
Cable pulled back after a stellar run up the charts, chalking in nearly 4.5% growth over a mere eleven trading days. Monday looks set to bry the latest bull run, with prices wobbling at the top of an extreme overextension.
The immediate hurdle for short sellers will be to drag GBP/USD bids back down to the 50-day Exponential Moving Average (EMA) at 1.2860, and it might take a few extra attempts to kick off a bearish trend firm enough to bring price action back down to the 200-day EMA near 1.2700.
GBP/USD daily chart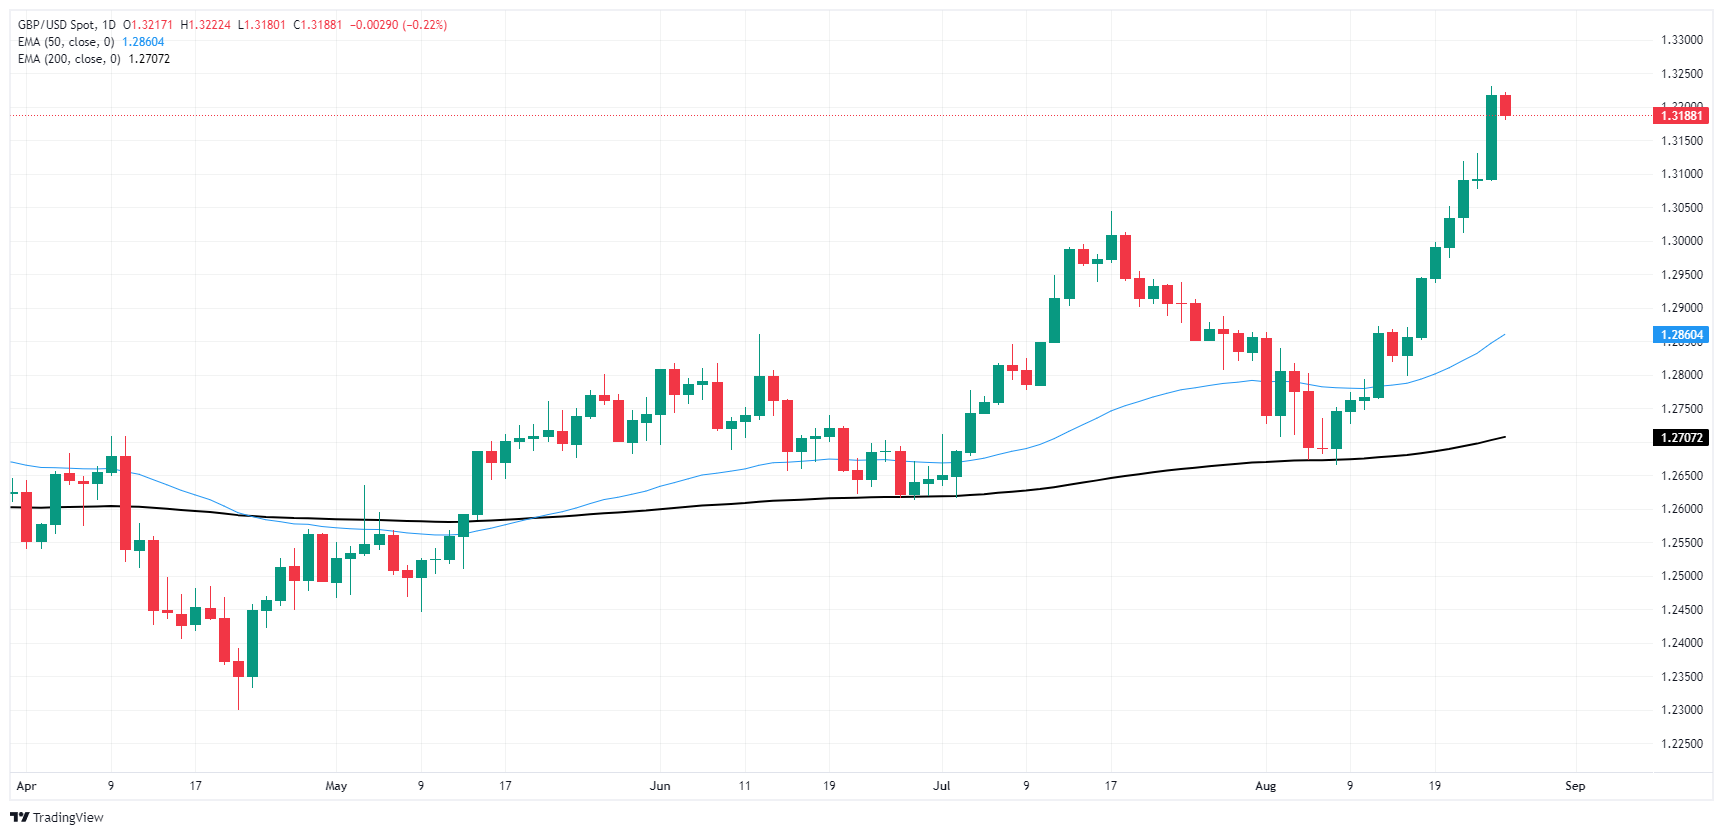
Pound Sterling FAQs
The Pound Sterling (GBP) is the oldest currency in the world (886 AD) and the official currency of the United Kingdom. It is the fourth most traded unit for foreign exchange (FX) in the world, accounting for 12% of all transactions, averaging $630 billion a day, according to 2022 data. Its key trading pairs are GBP/USD, aka ‘Cable’, which accounts for 11% of FX, GBP/JPY, or the ‘Dragon’ as it is known by traders (3%), and EUR/GBP (2%). The Pound Sterling is issued by the Bank of England (BoE).
The single most important factor influencing the value of the Pound Sterling is monetary policy decided by the Bank of England. The BoE bases its decisions on whether it has achieved its primary goal of “price stability” – a steady inflation rate of around 2%. Its primary tool for achieving this is the adjustment of interest rates. When inflation is too high, the BoE will try to rein it in by raising interest rates, making it more expensive for people and businesses to access credit. This is generally positive for GBP, as higher interest rates make the UK a more attractive place for global investors to park their money. When inflation falls too low it is a sign economic growth is slowing. In this scenario, the BoE will consider lowering interest rates to cheapen credit so businesses will borrow more to invest in growth-generating projects.
Data releases gauge the health of the economy and can impact the value of the Pound Sterling. Indicators such as GDP, Manufacturing and Services PMIs, and employment can all influence the direction of the GBP. A strong economy is good for Sterling. Not only does it attract more foreign investment but it may encourage the BoE to put up interest rates, which will directly strengthen GBP. Otherwise, if economic data is weak, the Pound Sterling is likely to fall.
Another significant data release for the Pound Sterling is the Trade Balance. This indicator measures the difference between what a country earns from its exports and what it spends on imports over a given period. If a country produces highly sought-after exports, its currency will benefit purely from the extra demand created from foreign buyers seeking to purchase these goods. Therefore, a positive net Trade Balance strengthens a currency and vice versa for a negative balance.
- NZD/JPY declined on Tuesday's session to settle around 89.70.
- The RSI is hovering near the 50 midline, suggesting a neutral bias.
- The MACD is flat green, indicating a lack of clear momentum.
The NZD/JPY currency pair is facing renewed selling pressure on Tuesday, declining by 0.30% to trade around 89.70. Technical indicators display mixed signals, suggesting that the pair is likely to remain range-bound in the near term.
The Relative Strength Index (RSI) is fluctuating around the 50 midline at 46, indicating that neither buyers nor sellers have a clear advantage. This reading suggests that the pair is likely to continue its sideways movement within the current range. The Moving Average Convergence Divergence (MACD) is also showing a neutral bias, with flat green bars indicating that the bullish momentum is neither gaining nor losing strength.
NZD/JPY daily chart
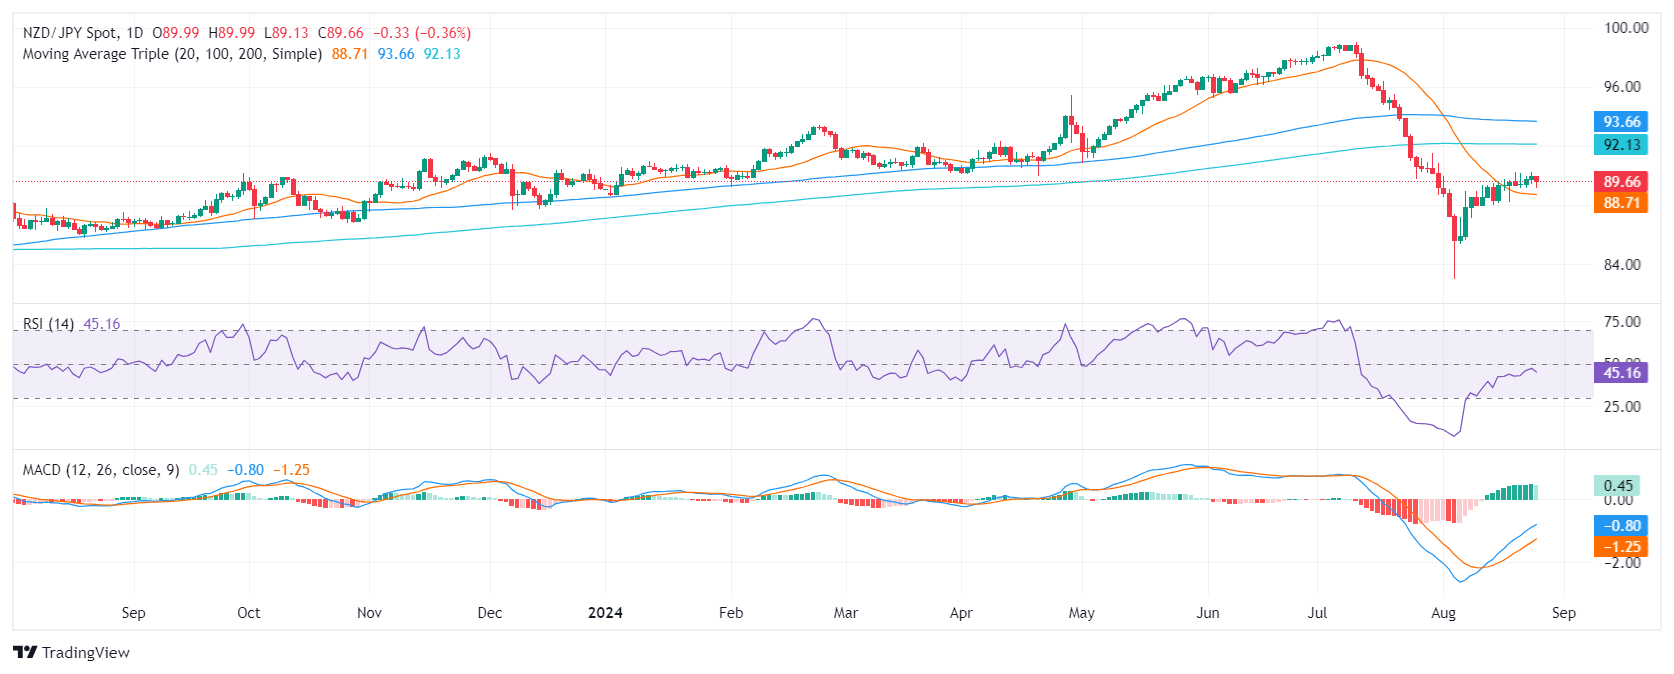
As the pair seems to be stuck in a consolidation period and with indicators flat, the cross might continue trading in the 88.00-90.00 channel. A break above or below these levels might set the pace for the short term.
- USD/JPY stays under Ichimoku Cloud and 200-DMA at 151.22, maintaining downtrend with easing selling pressure.
- RSI trends upward, suggesting a potential short-term rally if USD/JPY surpasses 145.00.
- Resistance levels at 146.42 (Tenkan-Sen), 147.91 (Senkou Span A), and 149.39 (August 15 high).
- Below 144.00, key support at 141.69; further drop could target psychological 140.00 level.
The Japanese Yen (JPY) lost ground against the Greenback on Monday as the USD/JPY pair edged up 0.13% amid an uptick in US Treasury bond yields. At the time of writing, the pair was at 144.59 after bouncing off daily lows of 143.44.
USD/JPY Price Forecast: Technical outlook
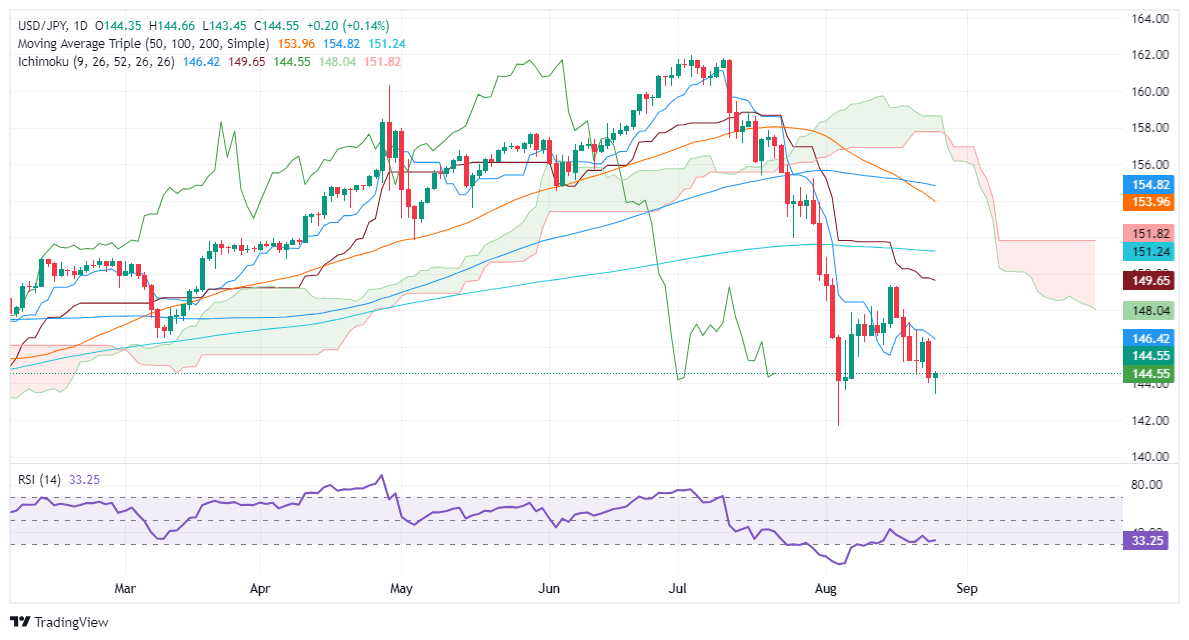
The USD/JPY downtrend is intact as the exchange rate remains below the Ichimoku Cloud and the 200-day moving average (DMA) at 151.22. Nevertheless, sellers are losing some momentum, as depicted by the Relative Strength Index (RSI), remaining bearish, yet aiming up. That could pave the way for a leg-up before testing lower prices.
If USD/JPY clears 145.00, the next resistance emerges at the Tenkan-Sen at 146.42, followed by the Senkou Span A at 147.91. Further upside is seen at the confluence of the Kijun-Sen and the August 15 daily high of 149.39.
Conversely, if USD/JPY slumps below the 144.00 figure and the pair could tumble towards the latest cycle low seen at 141.69, before challenging 140.00.
USD/JPY Price Action – Daily Chart
Japanese Yen PRICE Today
The table below shows the percentage change of Japanese Yen (JPY) against listed major currencies today. Japanese Yen was the strongest against the US Dollar.
| USD | EUR | GBP | JPY | CAD | AUD | NZD | CHF | |
|---|---|---|---|---|---|---|---|---|
| USD | -0.02% | 0.00% | 0.01% | -0.01% | 0.00% | -0.00% | -0.01% | |
| EUR | 0.02% | 0.03% | 0.03% | -0.00% | 0.04% | -0.01% | -0.01% | |
| GBP | -0.01% | -0.03% | 0.02% | 0.00% | -0.02% | -0.02% | -0.05% | |
| JPY | -0.01% | -0.03% | -0.02% | -0.06% | -0.02% | -0.05% | -0.02% | |
| CAD | 0.01% | 0.00% | -0.00% | 0.06% | 0.03% | 0.00% | -0.01% | |
| AUD | -0.01% | -0.04% | 0.02% | 0.02% | -0.03% | -0.04% | -0.02% | |
| NZD | 0.00% | 0.00% | 0.02% | 0.05% | -0.00% | 0.04% | -0.03% | |
| CHF | 0.01% | 0.01% | 0.05% | 0.02% | 0.00% | 0.02% | 0.03% |
The heat map shows percentage changes of major currencies against each other. The base currency is picked from the left column, while the quote currency is picked from the top row. For example, if you pick the Japanese Yen from the left column and move along the horizontal line to the US Dollar, the percentage change displayed in the box will represent JPY (base)/USD (quote).
- NZD/USD declined on Monday to 0.62000, testing crucial support levels.
- The MACD indicator is printing flat green bars, suggesting that the rally might have come to an end.
- The RSI points south suggesting a mounting selling traction.
In Monday's session, the NZD/USD pair declined by 0.40% to 0.6200, as buyers seem to be taking a breather, and the pair seems to have entered a consolidation period. It's worth noticing that the pair approached highs since January above 0.6230.
The Moving Average Convergence Divergence (MACD) indicator is printing flat green bars, which suggests that the consolidation is likely to continue in the short term. The Relative Strength Index (RSI) scaped overbought conditions and is now pointing downwards suggesting that the bulls are taking a breather.
NZD/USD daily chart
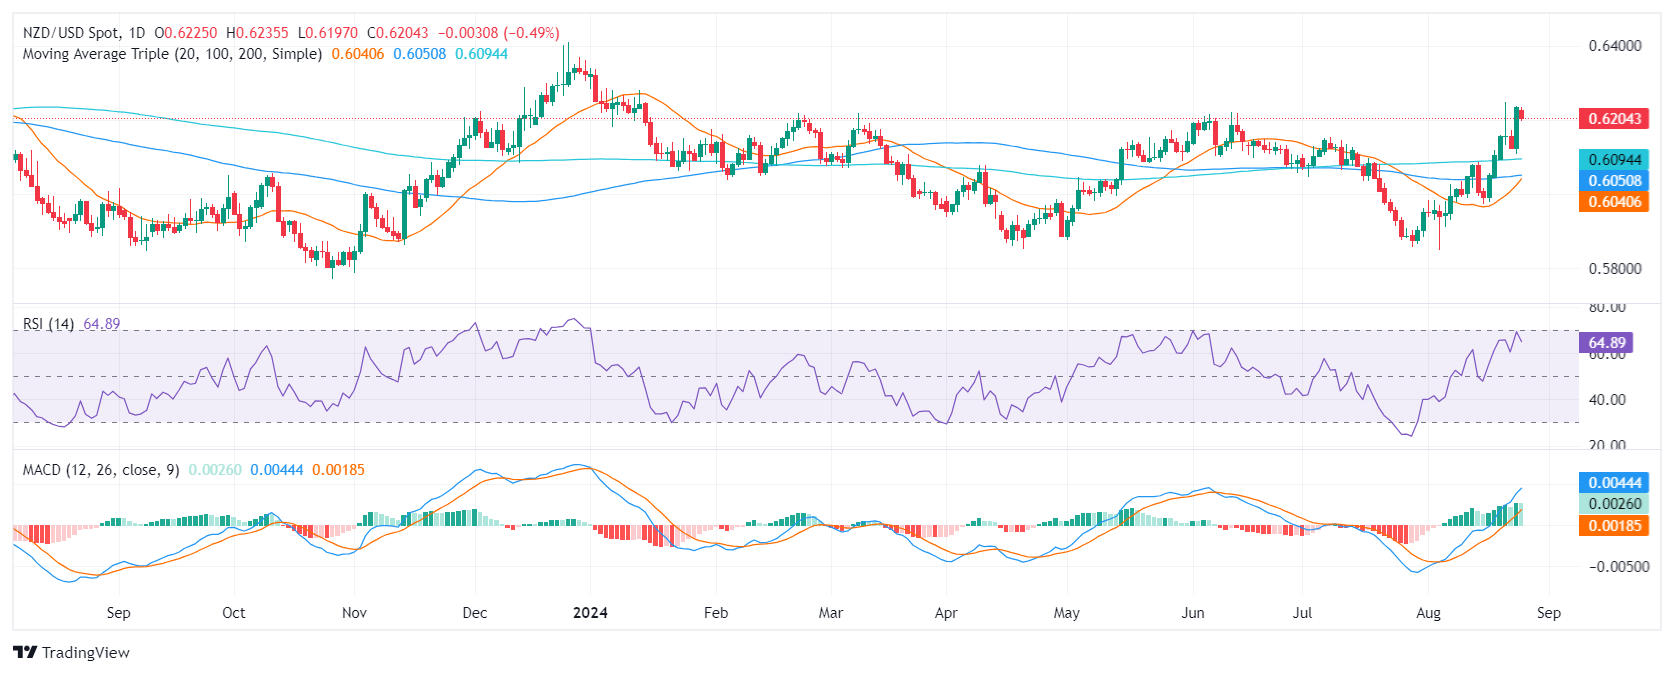
The NZD/USD pair faces immediate support at 0.6200 and 0.6150. A break below 0.6150 could lead to a further decline towards 0.6100, which is a major support level. On the upside, immediate resistance can be found at 0.6255. A consolidation above this level could pave the way for a further rally to retest the 0.6300 zone.
- AUD/USD declines amidst rising risk-off sentiment.
- China's PBOC keeps its 1-year MLF rate steady at 2.30%, which failed to trigger movements on the AUD.
- The RBA's hawkish stance supports the Australian Dollar.
The AUD/USD declined by 0.30% to 0.6775 in Monday's session as the Australian Dollar (AUD) edged lower despite hovering around a seven-month high near 0.6800. The decline was primarily attributed to a broad USD recovery and a cautious market sentiment.
Amidst a volatile economic backdrop in Australia, the Reserve Bank of Australia's (RBA) aggressive stance against rising inflation has dampened market expectations regarding multiple cuts, which has benefitted the Aussie.
Daily digest market movers: Australian Dollar declines due to USD strength, lower commodities weigh
- AUD/USD multi-day rally faces resistance around 0.6760 due to weak copper prices, despite a recovery in iron ore prices.
- AUD's recent strength was driven by a weaker US Dollar and improved risk appetite.
- In addition, monetary policy divergence between the RBA and the Federal Reserve (Fed) catalyzed the pair.
- On the Chinese front, China's PBOC kept its 1-year MLF rate unchanged at 2.30%, but further stimulus is anticipated as the economy struggles.
- July industrial profits in China may provide insights into the persisting weaknesses in the mainland economy.
- Any signs of weakness in the Chinese economy might weigh on the Aussie
AUD/USD technical outlook: Bullish momentum eases, support at 0.6750
The AUD/USD pair faced further downside pressure on Monday, as buyers are taking a breather. The Relative Strength Index (RSI) is at 62 with a downward tendency, while the Moving Average Convergence Divergence (MACD) presents decreasing green bars, suggesting a decrease in bullish momentum. Volume has been relatively stable, indicating a lack of significant buying or selling pressure.
Overall, the technical outlook for AUD/USD remains neutral. The RSI is still above its midpoint, and the MACD shows decreasing bullish momentum. Further consolidation or a reversal could be in play.
Immediate support levels can be seen at 0.6750, 0.6700 and 0.6650, while resistance levels may be encountered at 0.6800, 0.6850 and 0.6900.
Australian Dollar FAQs
One of the most significant factors for the Australian Dollar (AUD) is the level of interest rates set by the Reserve Bank of Australia (RBA). Because Australia is a resource-rich country another key driver is the price of its biggest export, Iron Ore. The health of the Chinese economy, its largest trading partner, is a factor, as well as inflation in Australia, its growth rate and Trade Balance. Market sentiment – whether investors are taking on more risky assets (risk-on) or seeking safe-havens (risk-off) – is also a factor, with risk-on positive for AUD.
The Reserve Bank of Australia (RBA) influences the Australian Dollar (AUD) by setting the level of interest rates that Australian banks can lend to each other. This influences the level of interest rates in the economy as a whole. The main goal of the RBA is to maintain a stable inflation rate of 2-3% by adjusting interest rates up or down. Relatively high interest rates compared to other major central banks support the AUD, and the opposite for relatively low. The RBA can also use quantitative easing and tightening to influence credit conditions, with the former AUD-negative and the latter AUD-positive.
China is Australia’s largest trading partner so the health of the Chinese economy is a major influence on the value of the Australian Dollar (AUD). When the Chinese economy is doing well it purchases more raw materials, goods and services from Australia, lifting demand for the AUD, and pushing up its value. The opposite is the case when the Chinese economy is not growing as fast as expected. Positive or negative surprises in Chinese growth data, therefore, often have a direct impact on the Australian Dollar and its pairs.
Iron Ore is Australia’s largest export, accounting for $118 billion a year according to data from 2021, with China as its primary destination. The price of Iron Ore, therefore, can be a driver of the Australian Dollar. Generally, if the price of Iron Ore rises, AUD also goes up, as aggregate demand for the currency increases. The opposite is the case if the price of Iron Ore falls. Higher Iron Ore prices also tend to result in a greater likelihood of a positive Trade Balance for Australia, which is also positive of the AUD.
The Trade Balance, which is the difference between what a country earns from its exports versus what it pays for its imports, is another factor that can influence the value of the Australian Dollar. If Australia produces highly sought after exports, then its currency will gain in value purely from the surplus demand created from foreign buyers seeking to purchase its exports versus what it spends to purchase imports. Therefore, a positive net Trade Balance strengthens the AUD, with the opposite effect if the Trade Balance is negative.
- Gold rises post-Powell's Jackson Hole comments on potential September policy easing.
- Powell cites inflation control, labor market concerns; Daly echoes rate cut expectations.
- US Durable Goods Orders jump 9.9% in July, showing economic strength; Middle East tensions boost Gold's appeal.
- US 10-year yields reach 3.81%; traders scale back on 50 bps cut bets, await Nonfarm Payrolls for more insights.
Gold extended its gains on Monday amid increasing bets that the US Federal Reserve (Fed) will begin to ease policy in September. This is a certainty following Fed Chair Jerome Powell's speech at Jackson Hole, when he said, “The time has come for policy to adjust." The XAU/USD trades at $2,516 per troy ounce, up by a minimal 0.16%.
Last Friday, Jerome Powell said that he was confident that inflation was on its way toward the Fed’s 2% goal and expressed worries about a weaker labor market, indicating that employment risks were skewed to the upside.
Powell gave the green light on interest rate cuts, adding that further cooling in the labor market is unwelcome.
Powell’s comments were echoed by San Francisco Fed President Mary Daly, who said, “The time to adjust policy is upon us. It's hard to imagine anything could derail a September rate cut.”
Daly added that it’s premature to know the size of interest rate cuts, yet stated that if the economy weakens “more than anticipated, we will need to be more aggressive.”
US Durable Goods Orders jumped from a -6.9% contraction in June to a 9.9% MoM expansion in July, exceeding the forecast for a 4% increase. This was the most significant gain since May 2020, hinting the economy is still resilient despite showing some signs of slowing down.
Bullion prices got a lifeline from rising tensions in the Middle East as the Israel-Hezbollah conflict escalated over the weekend. Fears that the conflict could broaden would be positive for the golden metal.
US Treasury bond yields had recovered as the US 10-year benchmark note climbed one basis point to 3.81%. Meanwhile, traders decreased their bets that the Fed would cut rates by 50 bps at the September meeting.
The CME FedWatch Tool shows that market participants had fully priced in a 25 bps cut, while odds for a larger size stand at 30%, down from 36.5 % last Friday.
Now, with the Fed shifting toward the jobs market, the August Nonfarm Payrolls report will be the last piece of the puzzle to determine the size of the cut.
Daily digest market movers: Gold price advances ahead of next week’s US inflation report
- If US economic data continues to be soft, the Gold price uptrend will remain, which would increase speculation about a bigger rate cut.
- On Tuesday, the US Conference Board will reveal Consumer Confidence for August, which is expected to improve from 100.3 to 100.6.
- Gross Domestic Product (GDP) figures for Q2 in the second estimate are expected to improve from 1.4% to 2.8%.
- On Friday, the Fed’s favorite inflation gauge, the Core Personal Consumption Expenditures (PCE) Price Index, will be revealed. It is expected to rise from 2.6% to 2.7% YoY.
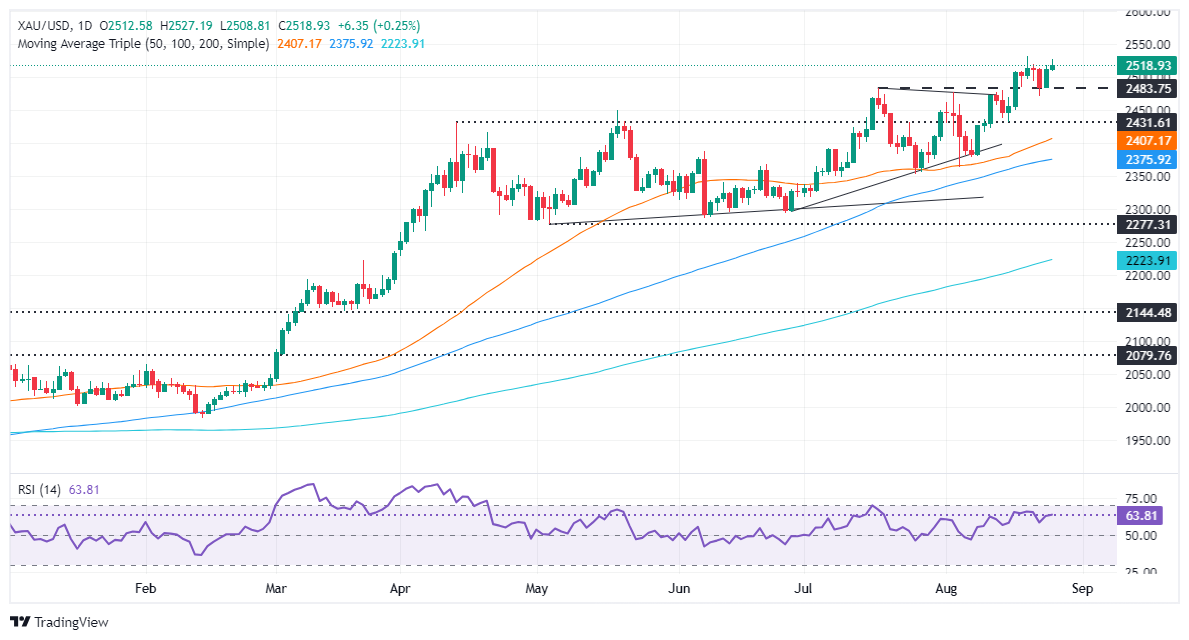
Technical outlook: Gold’s uptrend is intact as buyers eye $2,550
Gold’s uptrend remains in play, yet buyers have failed to reclaim the all-time high (ATH) of $2,531. A breach of the latter will expose the $2,550 mark, followed by the $2,600 mark.
On the flip side, if Gold achieves a daily close below $2,500, this will sponsor a test of the previous all-time high (ATH) of $2,483. If surpassed, Gold’s next support would be the May 20 peak of $2,450, followed by the 50-day Simple Moving Average (SMA) at $2,406.
Gold FAQs
Gold has played a key role in human’s history as it has been widely used as a store of value and medium of exchange. Currently, apart from its shine and usage for jewelry, the precious metal is widely seen as a safe-haven asset, meaning that it is considered a good investment during turbulent times. Gold is also widely seen as a hedge against inflation and against depreciating currencies as it doesn’t rely on any specific issuer or government.
Central banks are the biggest Gold holders. In their aim to support their currencies in turbulent times, central banks tend to diversify their reserves and buy Gold to improve the perceived strength of the economy and the currency. High Gold reserves can be a source of trust for a country’s solvency. Central banks added 1,136 tonnes of Gold worth around $70 billion to their reserves in 2022, according to data from the World Gold Council. This is the highest yearly purchase since records began. Central banks from emerging economies such as China, India and Turkey are quickly increasing their Gold reserves.
Gold has an inverse correlation with the US Dollar and US Treasuries, which are both major reserve and safe-haven assets. When the Dollar depreciates, Gold tends to rise, enabling investors and central banks to diversify their assets in turbulent times. Gold is also inversely correlated with risk assets. A rally in the stock market tends to weaken Gold price, while sell-offs in riskier markets tend to favor the precious metal.
The price can move due to a wide range of factors. Geopolitical instability or fears of a deep recession can quickly make Gold price escalate due to its safe-haven status. As a yield-less asset, Gold tends to rise with lower interest rates, while higher cost of money usually weighs down on the yellow metal. Still, most moves depend on how the US Dollar (USD) behaves as the asset is priced in dollars (XAU/USD). A strong Dollar tends to keep the price of Gold controlled, whereas a weaker Dollar is likely to push Gold prices up.
- The Canadian Dollar rose another quarter percent against the Greenback.
- Canada has a fresh GDP update looming ahead later in the week.
- Markets are recovering their composure after a Fed splurge last week.
The Canadian Dollar (CAD) is broadly higher on Monday, kicking off the new trading week with an across-the-board recovery thanks to easing bidding pressure in other categories rather than any bullish tilt within the CAD itself. The CAD rallied one quarter of one percent against the Greenback, tipping into a fresh multi-month high.
Canada remains absent from the economic calendar in any meaningful capacity until Friday. Canadian Gross Domestic Product (GDP) figures are due at the end of the week, but market flows are likely to get swamped out by a fresh print of US Personal Consumption Expenditure (PCE) inflation figures due at the same time.
Daily digest market movers
- The CAD rallied across the board on Monday, extending recent gains against the Greenback into a fourth straight week.
- CAD GDP figures are slated for Friday, with a quiet week on the cards in the meantime.
- US Durable Goods Orders gave an unexpected surge on Monday, keep risk appetite well-bid and limiting a Greenback rally.
- Despite topside risk flows, markets remain tepid as investors recover from a rate-cut splurge after Federal Reserve (Fed) Chairman Jerome Powell all but confirmed an initial rate cut on September 18.
- US PCE inflation figures are due to drop on markets on Friday, and forecasts are currently expecting the pace of consumer inflation pressures to hold steady at current levels.
Canadian Dollar price forecast
The Canadian Dollar (CAD) has found a fresh bullish push against the Greenback on Monday, kicking off a fourth straight week of gains against the US Dollar. USD/CAD traded into its lowest bids since March of this year as the CAD continues to gain ground against the USD, extending a fundamentals-based tailspin down the charts even further below the 200-day Exponential Moving Average (EMA) at 1.3625.
USD/CAD has ground its way through most of early 2024’s congestion zone between 1.3600 and 1.3400. If short momentum is unable to remain on top of things, a resurgence in bidders could see the pair climb quickly back into July’s price range above 1.3600.
USD/CAD daily chart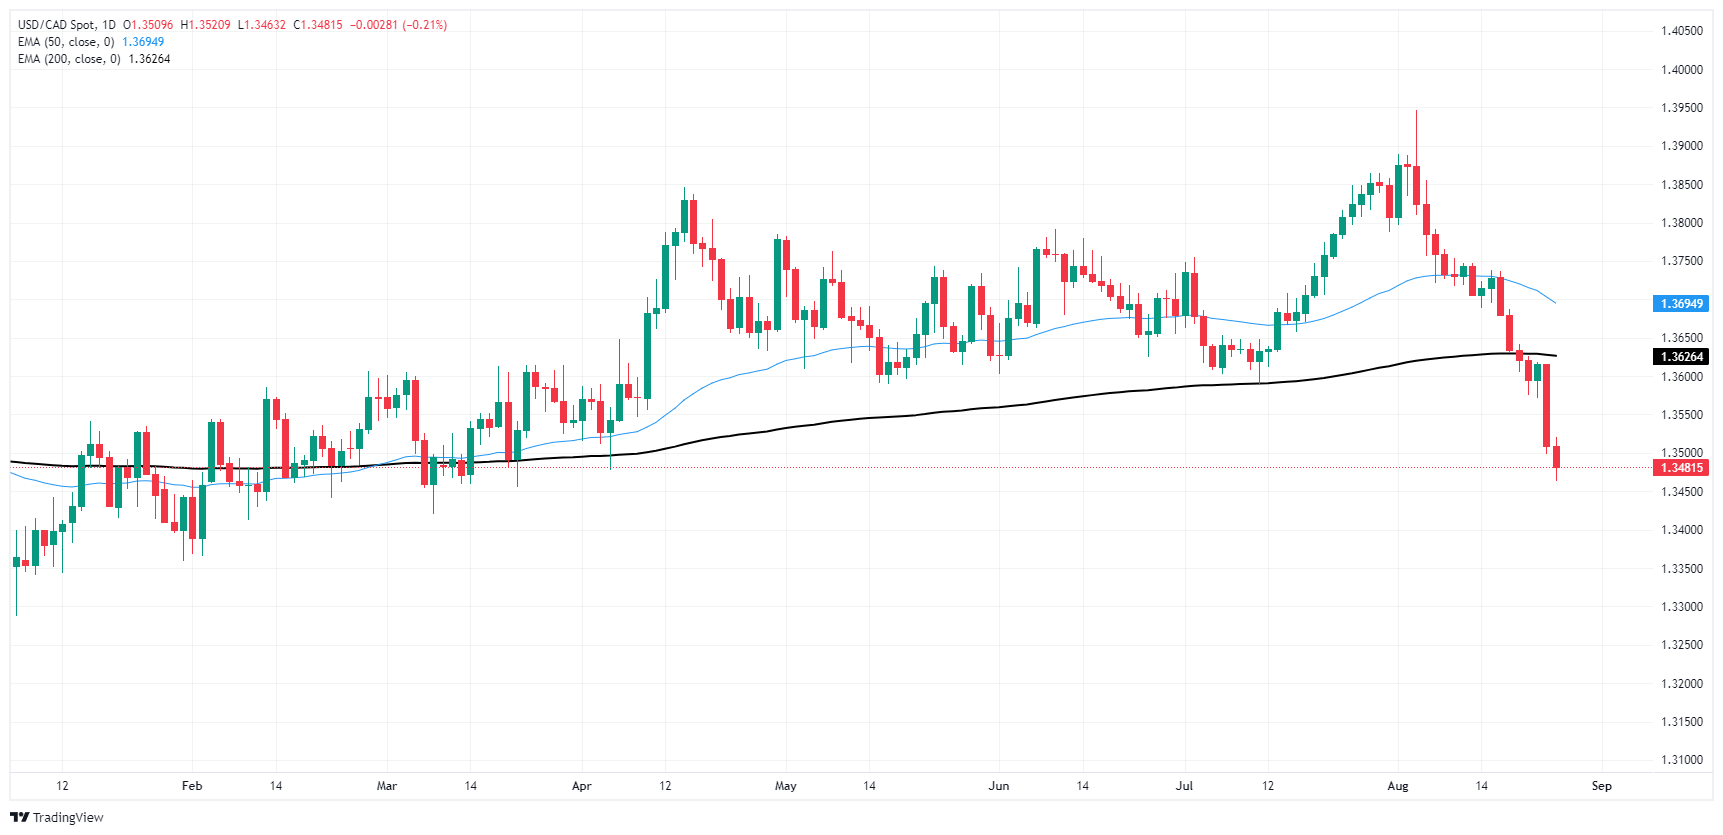
Canadian Dollar FAQs
The key factors driving the Canadian Dollar (CAD) are the level of interest rates set by the Bank of Canada (BoC), the price of Oil, Canada’s largest export, the health of its economy, inflation and the Trade Balance, which is the difference between the value of Canada’s exports versus its imports. Other factors include market sentiment – whether investors are taking on more risky assets (risk-on) or seeking safe-havens (risk-off) – with risk-on being CAD-positive. As its largest trading partner, the health of the US economy is also a key factor influencing the Canadian Dollar.
The Bank of Canada (BoC) has a significant influence on the Canadian Dollar by setting the level of interest rates that banks can lend to one another. This influences the level of interest rates for everyone. The main goal of the BoC is to maintain inflation at 1-3% by adjusting interest rates up or down. Relatively higher interest rates tend to be positive for the CAD. The Bank of Canada can also use quantitative easing and tightening to influence credit conditions, with the former CAD-negative and the latter CAD-positive.
The price of Oil is a key factor impacting the value of the Canadian Dollar. Petroleum is Canada’s biggest export, so Oil price tends to have an immediate impact on the CAD value. Generally, if Oil price rises CAD also goes up, as aggregate demand for the currency increases. The opposite is the case if the price of Oil falls. Higher Oil prices also tend to result in a greater likelihood of a positive Trade Balance, which is also supportive of the CAD.
While inflation had always traditionally been thought of as a negative factor for a currency since it lowers the value of money, the opposite has actually been the case in modern times with the relaxation of cross-border capital controls. Higher inflation tends to lead central banks to put up interest rates which attracts more capital inflows from global investors seeking a lucrative place to keep their money. This increases demand for the local currency, which in Canada’s case is the Canadian Dollar.
Macroeconomic data releases gauge the health of the economy and can have an impact on the Canadian Dollar. Indicators such as GDP, Manufacturing and Services PMIs, employment, and consumer sentiment surveys can all influence the direction of the CAD. A strong economy is good for the Canadian Dollar. Not only does it attract more foreign investment but it may encourage the Bank of Canada to put up interest rates, leading to a stronger currency. If economic data is weak, however, the CAD is likely to fall.
Federal Reserve (Fed) Bank of San Francisco Mary Daly hit newswires on Monday, cautioning that despite the clear signs of the need for rate adjustments, markets shouldn't run too far, too fast with expectations about the size and frequency.
Key highlights
The time to adjust policy is upon us. It's hard to imagine anything could derail sept rate cut.
I don't want to keep making policy tighter, as inflation comes down.
The labor market is completely in balance.
I am not hearing signs that firms are poised for layoffs.
I don't see signs of abrupt weakening in the labor market.
I don't see warning signs of weakness, but I want to be sure to adjust policy as we go.
It is too early to know how big rate cuts will be.
The most likely outcome is that we continue to get gradual inflation slowing, and a sustainable pace of labor market growth.
It is reasonable to adjust policy at normal cadence if the economy develops as expected.
If the economy weakens more than anticipated, we would need to be more aggressive.
It is reasonable to adjust policy at normal cadence if the economy develops as expected.
If the economy weakens more than anticipated, we would need to be more aggressive.
I do not want to see the labor market weaken further.
We want the labor market to stay about where it is. We need to adjust policy rate to keep it there.
I don't want to declare we are on the path to neutral.
We could see the neutral real rate to be as high as 1%.
We have a long way to go, and even after cutting rates we will be restrictive.
I expect growth to be at or a little below trend.
We are far from declaring victory, but we will get inflation to the goal.
The Greenback managed to regain composure and leave behind part of the recent multi-day bearish move, which was accentuated following Chair Powell’s speech at Jackson Hole. While an interest rate cut by the Fed in September looks largely priced in, there are still significant data releases that could either reinforce that move or undermine it.
Here is what you need to know on Tuesday, August 27:
The US Dollar Index (DXY) retreated to new lows near 100.50 earlier on Monday, just to reverse that move and rebound to the proximity of the 101.00 barrier later in the day. The Conference Board will publish its Consumer Confidence gauge on August 27, seconded by the FHFA’s House Price Index.
The Greenback’s mild rebound seems to have been enough to spark a corrective knee-jerk in EUR/USD to the 1.1150 zone at the beginning of the week. On August 27, the final Q2 GDP Growth Rate in Germany is due.
GBP/USD traded within a tight range, eventually settling around the 1.3200 neighbourhood following a multi-day steep advance. The CBI Distributive Trades will be published on August 27.
USD/JPY alternated gains with losses after briefly dropping to three-week lows near 143.40 on the back of rising US yields and a decent bounce in the US Dollar. The next data release on the Japanese docket will be the final Coincident Index and Leading Economic Index on August 28.
The resurgence of the upside impulse in the Greenback favoured some selling pressure in the risk-associated space, motivating AUD/USD to give away some of its sharp advance seen last Friday. The next key event in Australia will be the RBA’s Monthly CPI Indicator, due on August 28.
Escalating geopolitical concerns and prospects of supply disruptions in Libya underpinned the continuation of the rebound in prices of WTI beyond the $77.00 mark per barrel on Monday.
Gold prices traded at shouting distance from their recent record levels, maintaining the trade above the $2,500 mark per ounce troy amidst rising geopolitical fears in the Middle East and hopes of rate cuts by the Fed in September. Silver prices surpassed the $30.00 mark per ounce to clinch new six-week highs.
- Dow Jones taps a new record high despite thin volumes.
- Moves in equities remain limited as investors recover from Fed splurge.
- Key US inflation data looms large at the end of the week.
The Dow Jones Industrial Average (DJIA) slipped higher to test a new record high of 41,419.65 on Monday, but investors are still recovering from last Friday’s surge after the Federal Reserve (Fed) all but confirmed that a new rate-cutting cycle would kick off in September.
US Durable Goods Orders helped to keep physical production stocks bid on Monday despite a general decline in the usual darling tech sector. US Durable Goods Order in July rallied a surprising 9.9% MoM, well above the forecast 4.0% and entirely reversing the previous month’s revised -6.9% contraction.
Despite the upswing on Durable Goods Orders, some trepidation remains; excluding Transportation spending, Durable Goods Orders actually contracted -0.2% MoM, worse than the forecast 0.0% and the previous month’s tepid 0.1%, which was revised down from 0.5%.
Most of the trading week will be a quiet affair on the economic calendar. Q2 US Gross Domestic Product (GDP) figures are slated for Thursday, but are broadly expected to hold steady at 2.8% on an annualized basis. Friday could be a kicker for markets that are increasingly focused on the timing and pace of rate cuts from the Fed, with July’s US core Personal Consumption Expenditure - Price Index (PCE) inflation print set to hold steady at 0.2% MoM. The YoY PCE inflation figure is actually expected to tick upwards to 2.7% from 2.6%, but investors are confident that inflation has made enough progress towards the Fed’s 2% target that it will count as “close enough” to still keep the way open to a first rate cut on September 18.
Dow Jones news
Caterpillar (CAT) is moving higher on Monday in sharp contrast to the wider market. The NASDAQ and S&P 500 sold off on Monday morning, while Caterpillar and a number of other Dow Jones index stocks gained ground. The Dow, in fact, reached yet another all-time high at 41,420 on Monday, following last week's decent Dow performance.
Read more: Caterpillar helps Dow Jones buck tide at start of eventful week
Dow Jones price forecast
Intraday price action sees some churn on an overall quiet Monday. Bids managed to clip into a fresh all-time high above 41,400.00 to kick off the new trading week, but the overall day is still tilted toward the low side as bulls try to run on empty.
The Dow Jones has chalked in an impressive 7.9% win streak since the first week of August, climbing from a swing low to 38,382.90 to etch in a fresh all-time high at 41,419.65. Despite the impressive run that tilted entirely into the bullish side, momentum is set to drain out of the index quickly as bidders run out of runway. The Dow Jones is poised for a relief pullback towards the 50-day Exponential Moving Average (EMA) at 39,946.29.
Dow Jones daily chart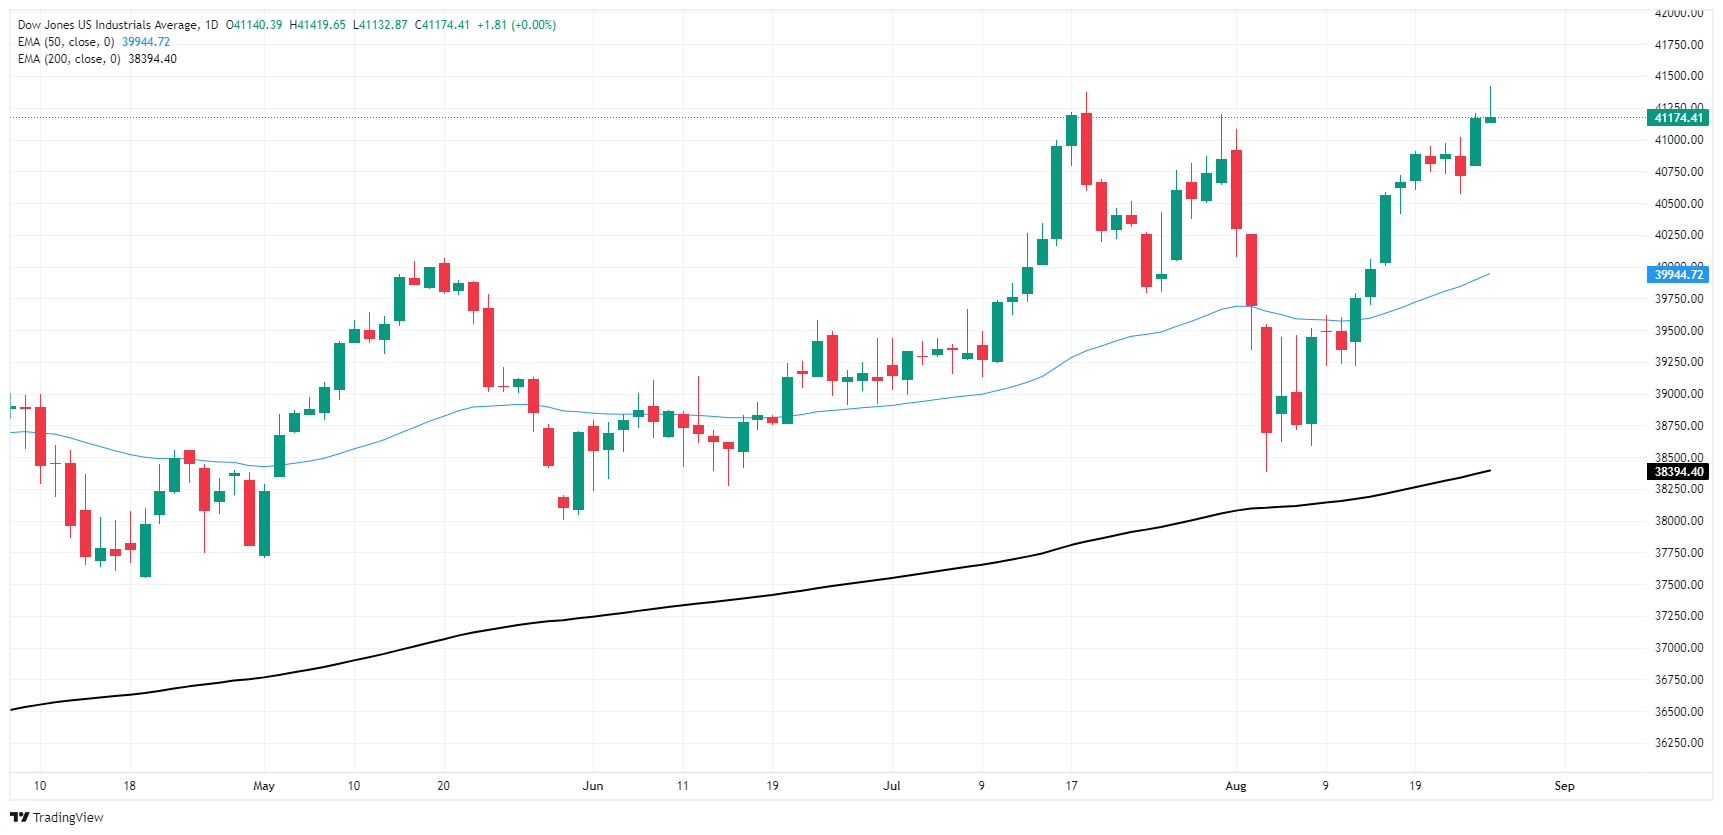
Dow Jones FAQs
The Dow Jones Industrial Average, one of the oldest stock market indices in the world, is compiled of the 30 most traded stocks in the US. The index is price-weighted rather than weighted by capitalization. It is calculated by summing the prices of the constituent stocks and dividing them by a factor, currently 0.152. The index was founded by Charles Dow, who also founded the Wall Street Journal. In later years it has been criticized for not being broadly representative enough because it only tracks 30 conglomerates, unlike broader indices such as the S&P 500.
Many different factors drive the Dow Jones Industrial Average (DJIA). The aggregate performance of the component companies revealed in quarterly company earnings reports is the main one. US and global macroeconomic data also contributes as it impacts on investor sentiment. The level of interest rates, set by the Federal Reserve (Fed), also influences the DJIA as it affects the cost of credit, on which many corporations are heavily reliant. Therefore, inflation can be a major driver as well as other metrics which impact the Fed decisions.
Dow Theory is a method for identifying the primary trend of the stock market developed by Charles Dow. A key step is to compare the direction of the Dow Jones Industrial Average (DJIA) and the Dow Jones Transportation Average (DJTA) and only follow trends where both are moving in the same direction. Volume is a confirmatory criteria. The theory uses elements of peak and trough analysis. Dow’s theory posits three trend phases: accumulation, when smart money starts buying or selling; public participation, when the wider public joins in; and distribution, when the smart money exits.
There are a number of ways to trade the DJIA. One is to use ETFs which allow investors to trade the DJIA as a single security, rather than having to buy shares in all 30 constituent companies. A leading example is the SPDR Dow Jones Industrial Average ETF (DIA). DJIA futures contracts enable traders to speculate on the future value of the index and Options provide the right, but not the obligation, to buy or sell the index at a predetermined price in the future. Mutual funds enable investors to buy a share of a diversified portfolio of DJIA stocks thus providing exposure to the overall index.
- US Dollar recovers after declining on Friday due to Powell's dovish remarks.
- Markets anticipate 100 bps of easing by year-end and 200 bps total over the next 12 months.
- Focus turns to PCE data later this week.
The US Dollar, measured by the US Dollar Index (DXY), regained some ground on Monday, hovering around 101.00 after it had plummeting last week. Friday’s decline was attributed to Federal Reserve (Fed) Chair Jerome Powell's dovish remarks at the Jackson Hole Symposium, hinting at a potential shift toward a looser monetary policy stance by the central bank. This, in turn, caused the 10-year US yield to dip beneath 3.8%, which weighed heavily on the USD.
Despite positive economic growth that exceeds expectations, the market's eagerness for aggressive monetary easing appears misplaced. The current situation warrants caution, as the totality of data points toward a disconnect between economic fundamentals and market pricing.
Daily digest market movers: US Dollar remains vulnerable following Powell's dovish remarks
- Markets digest Powell’s dovish Jackson Hole speech with further easing expected.
- Powell signaled a shift in Fed policy, stating that "the time has come for policy to adjust."
- He also emphasized the importance of the labor market, noting an "unmistakable" slowdown.
- 100 bps of easing is predicted by year-end, with 200 bps total over the next 12 months.
- Odds of a 50 bps cut in September are 30-35%, contingent on upcoming data.
- Market participants await the August NFP report for further guidance on the Fed's path.
- This Friday’s Personal Consumption Expenditures (PCE) figures from July will be key.
DXY technical outlook: DXY finds support, bullish momentum might build
The DXY index has found support at its lowest levels since December, indicating a temporary pause in selling pressure. The Relative Strength Index (RSI) remains deep in oversold territory, suggesting that there is potential for further upward corrective movements.
The Moving Average Convergence Divergence (MACD) is exhibiting steady red bars, aligning with the RSI and providing additional evidence of potential upward momentum as there is more room to correct. That being said, there are no clear signs of a reversal and the DXY is exposed for further downside.
Key support levels to monitor are 100.50, 100.30 and 100.00, while resistance levels to watch are 101.00, 101.50 and 101.80.
US Dollar FAQs
The US Dollar (USD) is the official currency of the United States of America, and the ‘de facto’ currency of a significant number of other countries where it is found in circulation alongside local notes. It is the most heavily traded currency in the world, accounting for over 88% of all global foreign exchange turnover, or an average of $6.6 trillion in transactions per day, according to data from 2022. Following the second world war, the USD took over from the British Pound as the world’s reserve currency. For most of its history, the US Dollar was backed by Gold, until the Bretton Woods Agreement in 1971 when the Gold Standard went away.
The most important single factor impacting on the value of the US Dollar is monetary policy, which is shaped by the Federal Reserve (Fed). The Fed has two mandates: to achieve price stability (control inflation) and foster full employment. Its primary tool to achieve these two goals is by adjusting interest rates. When prices are rising too quickly and inflation is above the Fed’s 2% target, the Fed will raise rates, which helps the USD value. When inflation falls below 2% or the Unemployment Rate is too high, the Fed may lower interest rates, which weighs on the Greenback.
In extreme situations, the Federal Reserve can also print more Dollars and enact quantitative easing (QE). QE is the process by which the Fed substantially increases the flow of credit in a stuck financial system. It is a non-standard policy measure used when credit has dried up because banks will not lend to each other (out of the fear of counterparty default). It is a last resort when simply lowering interest rates is unlikely to achieve the necessary result. It was the Fed’s weapon of choice to combat the credit crunch that occurred during the Great Financial Crisis in 2008. It involves the Fed printing more Dollars and using them to buy US government bonds predominantly from financial institutions. QE usually leads to a weaker US Dollar.
Quantitative tightening (QT) is the reverse process whereby the Federal Reserve stops buying bonds from financial institutions and does not reinvest the principal from the bonds it holds maturing in new purchases. It is usually positive for the US Dollar.
- Mexican Peso slips as investors worry about the potential approval of controversial judiciary reforms, which could increase political risks.
- Morena's supermajority in Congress heightens fears of constitutional changes, leading to greater concentration of power and higher risk premiums.
- Dovish comments from Banxico Deputy Governor Galia Borja add pressure.
The Mexican Peso begins the week on the back foot, reversing most of last Friday’s gains. Losses of over 1.80% are seen in the Peso amid fears that the Mexican Congress could approve the Judiciary Reform bill and dovish comments from Deputy Governor Galia Borja. At the time of writing, the USD/MXN trades at 19.42 after bouncing off a daily low of 19.08.
Last Friday, the Instituto Nacional Electoral (INE) approved the Morena ruling party's supermajority in the Mexican Congress, raising investors' concerns that approving controversial changes to the Mexican Constitution could increase the country’s risks.
This is one of Monday's main drivers of USD/MXN price action. Now that Morena controls the lower house, the risks of the judiciary reform being approved have heightened, weighing on the Mexican Peso. Some analysts cited by El Financiero asserted that constitutional changes could lead to a greater concentration of power in the executive and impact the state of law.
Last week, Morgan Stanley recommended to its clients not to invest in shares in Mexico, citing fears that the judiciary reform could increase risk premiums in the country.
On Monday, Bank of Mexico Deputy Governor Galia Borja was interviewed by El Economista. She said that since June’s decision when the Governing Council left rates unchanged at 11.00%, they already had some elements about an economic slowdown in the second quarter.
“In the August decision, it was confirmed that economic activity was weakening compared to what we expected, which was effectively confirmed with the GDP data for the 2nd quarter,” said Borja.
She said that March and August rate cuts do not imply the abandonment of restrictive policy. Borja added that “the fact that we are adjusting it as has happened in March and August (of 2024) does not mean that we are going to the neutral or accommodative territory. That will take some time. So, from now on, there will still be another period in which the restrictive monetary stance will continue.”
Mexico’s economic docket will remain light. The Balance of Trade is expected to be released on August 27.
Across the border, Federal Reserve (Fed) Chair Jerome Powell, giving the green light last week to begin easing monetary policy, hurt the Greenback against most G7 FX currencies. Nevertheless, the US Dollar has gained some ground against the emerging market Mexican Peso.
Daily digest market movers: Mexican Peso depreciates also on geopolitical risks
- Another driver that weakened the Peso was the escalation of the Israel-Hezbollah conflict in the Middle East.
- Mexico's Balance of Trade is expected to show a deficit of $-1.47 billion in July, wider than June’s $-1.03 billion.
- Traders will eye the release of US Conference Board Consumer Confidence for August, Fed speakers, the release of Q2’s 2024 GDP, and the Fed’s preferred inflation gauge, the Core Personal Consumption Expenditures Price Index (PCE).
- Data from the Chicago Board of Trade (CBOT) suggests the Fed will cut at least 97 basis points (bps) according to the fed funds rate futures contract for December 2024.
Technical outlook: Mexican Peso weakens as USD/MXN jumps above 19.30
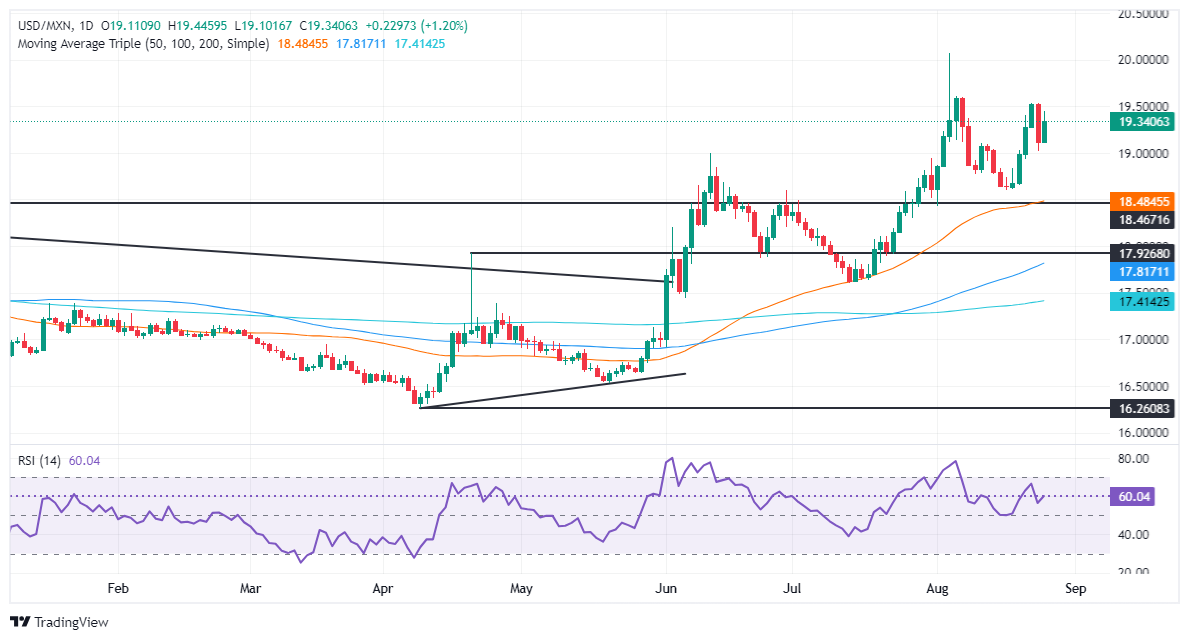
The USD/MXN daily chart suggests the uptrend remains intact, though buyers need to lift the exchange rate above last week’s peak at 19.53, which could exacerbate a rally to the 20.00 psychological figure. If those levels are cleared, the next stop would be the year-to-date (YTD) high at 20.22.
Conversely, if USD/MXN tumbles below 19.00, this could pave the way for a leg-down. The first support would be the August 19 low of 18.59, followed by the 50-day Simple Moving Average (SMA) at 18.48.
Mexican Peso FAQs
The Mexican Peso (MXN) is the most traded currency among its Latin American peers. Its value is broadly determined by the performance of the Mexican economy, the country’s central bank’s policy, the amount of foreign investment in the country and even the levels of remittances sent by Mexicans who live abroad, particularly in the United States. Geopolitical trends can also move MXN: for example, the process of nearshoring – or the decision by some firms to relocate manufacturing capacity and supply chains closer to their home countries – is also seen as a catalyst for the Mexican currency as the country is considered a key manufacturing hub in the American continent. Another catalyst for MXN is Oil prices as Mexico is a key exporter of the commodity.
The main objective of Mexico’s central bank, also known as Banxico, is to maintain inflation at low and stable levels (at or close to its target of 3%, the midpoint in a tolerance band of between 2% and 4%). To this end, the bank sets an appropriate level of interest rates. When inflation is too high, Banxico will attempt to tame it by raising interest rates, making it more expensive for households and businesses to borrow money, thus cooling demand and the overall economy. Higher interest rates are generally positive for the Mexican Peso (MXN) as they lead to higher yields, making the country a more attractive place for investors. On the contrary, lower interest rates tend to weaken MXN.
Macroeconomic data releases are key to assess the state of the economy and can have an impact on the Mexican Peso (MXN) valuation. A strong Mexican economy, based on high economic growth, low unemployment and high confidence is good for MXN. Not only does it attract more foreign investment but it may encourage the Bank of Mexico (Banxico) to increase interest rates, particularly if this strength comes together with elevated inflation. However, if economic data is weak, MXN is likely to depreciate.
As an emerging-market currency, the Mexican Peso (MXN) tends to strive during risk-on periods, or when investors perceive that broader market risks are low and thus are eager to engage with investments that carry a higher risk. Conversely, MXN tends to weaken at times of market turbulence or economic uncertainty as investors tend to sell higher-risk assets and flee to the more-stable safe havens.
USD/JPY plunged 2.2% to 144.37 last week. Bank of Japan Governor Kazuo Ueda stood by the decision to keep hiking rates, DBS Senior FX Strategist Philip Wee notes.
Ueda stands by the decision to keep hiking rates
“USD/JPY plunged 2.2% to 144.37 last week, opening the door to retesting the 141.70 low in early August.”
“At the special parliamentary hearing on August 23, Bank of Japan Governor Kazuo Ueda stood by the decision to keep hiking rates if the central bank’s median economic forecasts were met or exceeded.”
“Ueda attributed the brief market volatility from July 11 to August 5 to rising fears of a US recession from the Fed’s rate cut bias on rising joblessness, not the BOJ’s rate hike.”
- EUR/GBP continues weak, bears eye the 0.8450 support.
- RSI flattened around 42, indicating an easing selling momentum.
- MACD shows rising red bars, suggesting a steady bearish pressure.
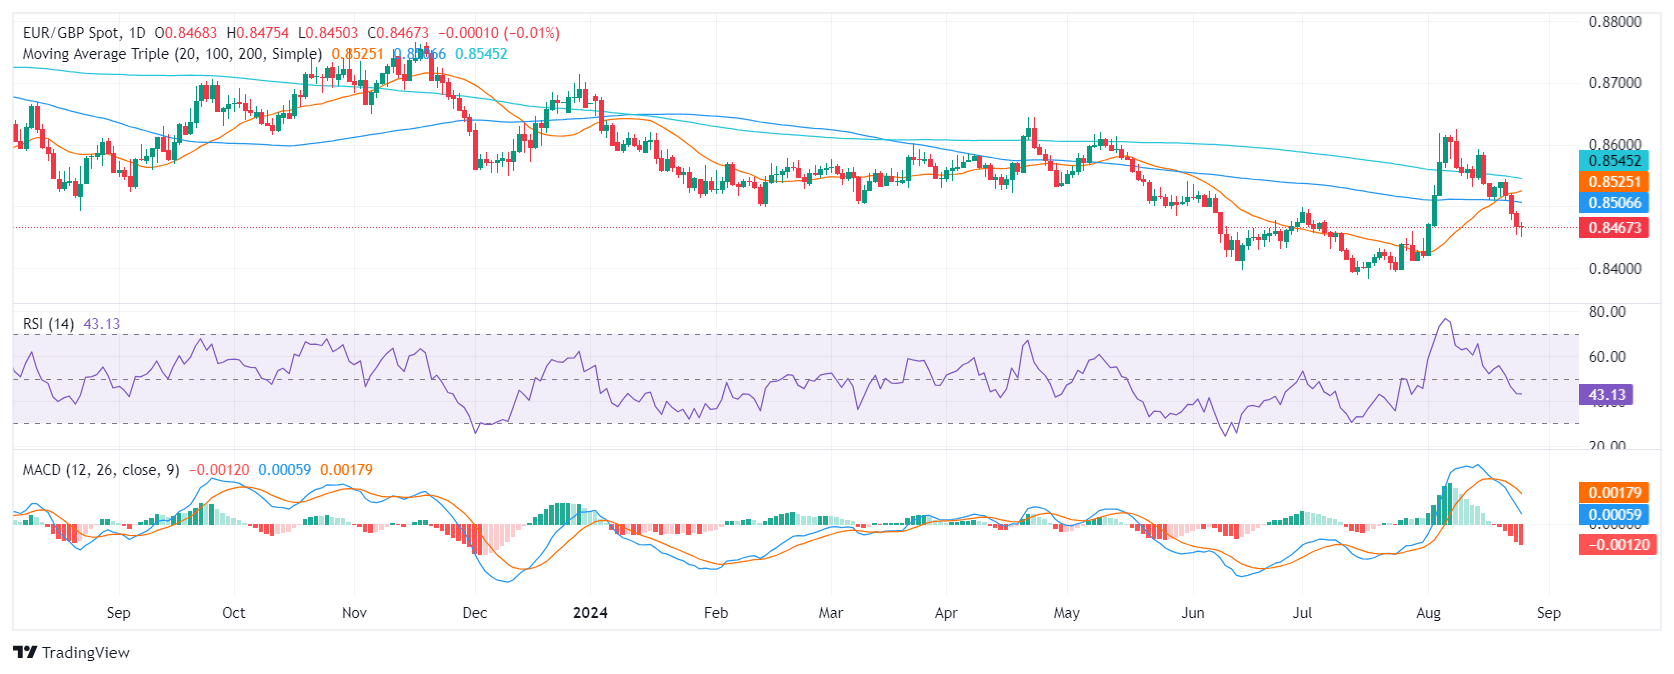
In Monday's session, the EUR/GBP pair extended its losses, dipping further below the 0.8500 support level to land at 0.8460.
The daily Relative Strength Index (RSI) has fallen to 42, indicating a shift in favor of the sellers but its slope flattened. The Moving Average Convergence Divergence (MACD) is printing rising red bars, suggesting that the bearish pressure is steady.
Volume has declined in recent sessions, indicating a lack of conviction among market participants. On the other hand, the pair has formed a series of lower lows suggesting that the bears are currently in command but seem to be struggling around the 0.8450-08500 area. In that sense after four sessions of losses and with momentum flattening, the pair might enter into consolidation as the sellers take a breather.
EUR/GBP daily chart
USD/JPY fell in response to Powell’s dovish remarks last Fri and extended its decline this morning following the escalation in geopolitical tensions between Israel and Hezbollah over the weekend, OCBC FX strategist Frances Cheung and Christopher Wong note.
Remain bias for downside play in USD/JPY
“Bullish momentum on daily chart faded while RSI fell. Risks skewed to the downside. Support at 142, 140.40 (61.8% fibo). Resistance at 144.50 (50% fibo retracement of 2023 low to 2024 high), 147.20 levels (21 DMA). We remain bias for downside play in USD/JPY.”
“Governor Ueda’s comments in parliament last Fri reinforced the view that BoJ rate hikes remain on the table while Powell’s ‘time has come’ speech at Jackson Hole reinforced the view that Fed’s next move is a cut.”
“Broader direction of travel for USD/JPY has changed as Fed-BoJ policies shifted from divergence to convergence and this should continue to underpin the downside for USD/JPY. In addition, geopolitical concerns is another factor that could add to support for safe-haven JPY.”
- Exhaustion signals as GBP/USD stalls after a 400-pip rally, with RSI indicating overbought conditions.
- A daily close below 1.3200 could trigger a pullback, with support levels at 1.3130, 1.3100, and further down at 1.3043.
- If the pair breaks above 1.3230, resistance levels to watch are 1.3250 and the psychological 1.3300 mark.
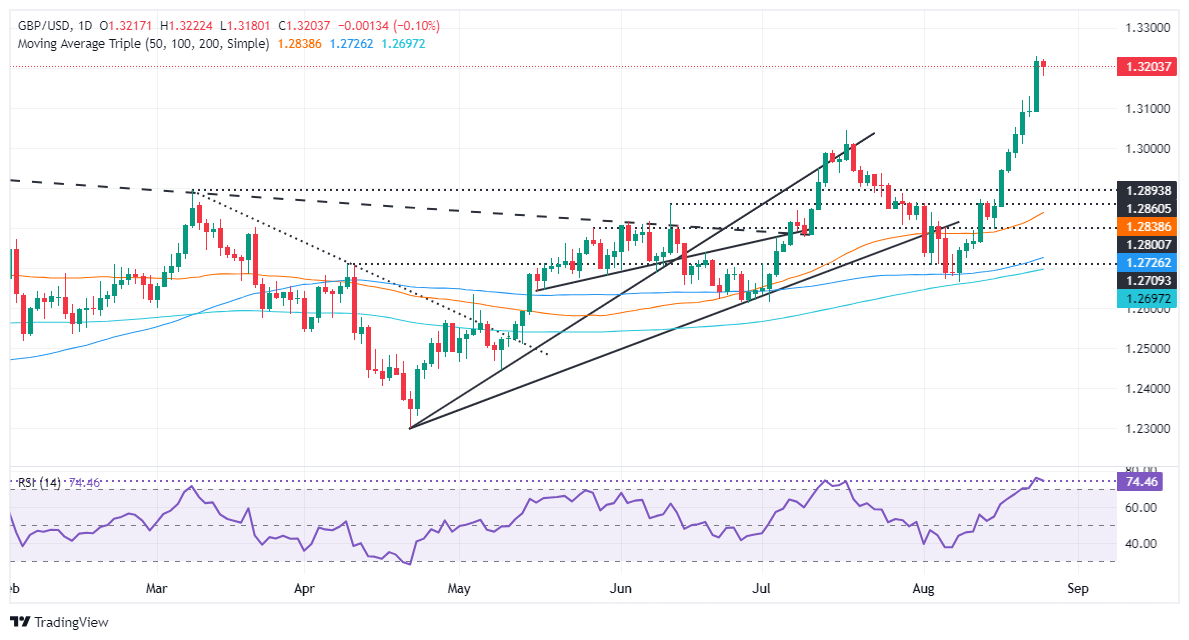
The Pound Sterling begins the week on a positive note, yet remains hovering around the 1.3200 figure, unable to break last Friday new year-to-date (YTD) high of 1.3230, and trades at 1.3204 almost flat.
GBP/USD Price Forecast: Technical outlook
Exhaustion is the name of the game for the GBP/USD. After achieving a 400-pip run that started on August 15th, the pair has failed to extend its gains after hitting a multi-year peak at 1.3230. Today’s price action is forming a ‘doji,’ which indicates indecision amongst buyers and sellers.
Momentum shows buyers are losing steam as the Relative Strength Index (RSI) remains overbought. Therefore, if the GBP/USD achieves a daily close below 1.3200, that could pave the way for a deeper pullback.
In that outcome, the first support would be the August 22 high at 1.3130 before the pair slides to 1.3100. In further weakness, the GBP/USD might hit 1.3043, and July’s 17 daily high turned support.
On the other hand, if GBP/USD rises past 1.3230, the next resistance would be 1.3250, followed by the 1.3300 mark.
GBP/USD Price Action – Daily Chart
British Pound PRICE Today
The table below shows the percentage change of British Pound (GBP) against listed major currencies today. British Pound was the strongest against the New Zealand Dollar.
| USD | EUR | GBP | JPY | CAD | AUD | NZD | CHF | |
|---|---|---|---|---|---|---|---|---|
| USD | 0.12% | 0.09% | -0.04% | -0.32% | 0.22% | 0.21% | -0.14% | |
| EUR | -0.12% | -0.09% | -0.15% | -0.43% | 0.00% | 0.10% | -0.25% | |
| GBP | -0.09% | 0.09% | -0.17% | -0.40% | 0.09% | 0.13% | -0.22% | |
| JPY | 0.04% | 0.15% | 0.17% | -0.26% | 0.34% | 0.47% | -0.02% | |
| CAD | 0.32% | 0.43% | 0.40% | 0.26% | 0.53% | 0.59% | 0.17% | |
| AUD | -0.22% | -0.01% | -0.09% | -0.34% | -0.53% | 0.09% | -0.26% | |
| NZD | -0.21% | -0.10% | -0.13% | -0.47% | -0.59% | -0.09% | -0.36% | |
| CHF | 0.14% | 0.25% | 0.22% | 0.02% | -0.17% | 0.26% | 0.36% |
The heat map shows percentage changes of major currencies against each other. The base currency is picked from the left column, while the quote currency is picked from the top row. For example, if you pick the British Pound from the left column and move along the horizontal line to the US Dollar, the percentage change displayed in the box will represent GBP (base)/USD (quote).
Fed cut expectations sent the DXY Index to 100.72 last Friday, near December’s 100.62 low, but was still above the 99.58 low in July 2023, DBS Senior FX Strategist Philip Wee notes.
Still above the 99.58 low in July 2023
“Fed Chair Jerome Powell announced at Jackson Hole that the time has come to adjust monetary policy. Powell was crystal about the Fed’s shift from pulling down inflation from its peak towards preventing a further cooling in the labour market, adding that the Fed had ample room to respond to any risks here.”
“In the short term, the oversold DXY could consolidate on surprises in this week’s US data, especially the PCE deflator on August 30, pushing back the futures market’s bet for a 50 bps cut. However, we will assess the DXY’s prospects to trade below 100 over the medium term. The US monthly jobs report on September 6 will be critical.”
“Apart from the telegraphed rate cut in September, the Fed’s revisions to the Summary of Economic Projections will be significant. In June, the Fed projected 1-2 rate cuts in 2H24, followed by 200 bps of cuts over 2025-2026.”
- AUD/USD drops from 0.6800 with Aussie inflation under the spotlight.
- The Fed seems prepared to begin reducing interest rates from September.
- The near-term outlook of the US Dollar remains weak.
The AUD/USD pair falls from the monthly high of 0.6800 in Monday’s American session. The Aussie asset drops as the US Dollar (USD) edges higher. While the near-term outlook of the US Dollar remains vulnerable as the Federal Reserve (Fed) is widely anticipated to start reducing interest rates from the September meeting.
The US Dollar Index (DXY), which tracks the Greenback’s value against six major currencies, rises slightly to near 100.90 from the annual low of 100.53.
While the Fed seems certain to cut interest rates in September, traders remain split over the likely size. According to the CME FedWatch tool, 30-day Federal Funds futures pricing data shows that the likelihood of a 50-basis point (bps) interest-rate reduction is 36.5%, while rest of the bets are in favor of a 25-bps rate cut.
Meanwhile, the Australian Dollar (AUD) will be influenced by the monthly Consumer Price Index (CPI) data for July, which will be published on Wednesday. Economists estimated that price pressures declined sharply to 3.4% from 3.8% in June. An expected decline in the inflation data would bring expectations of interest rate cuts to the table.
AUD/USD trades close to the monthly high of 0.6800 on a daily timeframe. The near-term outlook of the Aussie asset remains firm as the 10-day Moving Average (EMA) near 0.6700 is sloping higher. The 14-period Relative Strength Index (RSI) oscillates in the bullish range of 60.00-80.00, suggesting a strong upside momentum.
For a fresh upside, a decisive move above the round-level resistance of 0.6800 will push the asset higher to 0.6840, the higher level seen this year. A breach of the latter would drive the asset towards December 2023 high of 0.6870.
In an alternate scenario, a downside move below August 19 low of 0.6660 will expose the asset to June 28 low of 0.6620 and June 17 low of 0.6585.
AUD/USD daily chart

Australian Dollar FAQs
One of the most significant factors for the Australian Dollar (AUD) is the level of interest rates set by the Reserve Bank of Australia (RBA). Because Australia is a resource-rich country another key driver is the price of its biggest export, Iron Ore. The health of the Chinese economy, its largest trading partner, is a factor, as well as inflation in Australia, its growth rate and Trade Balance. Market sentiment – whether investors are taking on more risky assets (risk-on) or seeking safe-havens (risk-off) – is also a factor, with risk-on positive for AUD.
The Reserve Bank of Australia (RBA) influences the Australian Dollar (AUD) by setting the level of interest rates that Australian banks can lend to each other. This influences the level of interest rates in the economy as a whole. The main goal of the RBA is to maintain a stable inflation rate of 2-3% by adjusting interest rates up or down. Relatively high interest rates compared to other major central banks support the AUD, and the opposite for relatively low. The RBA can also use quantitative easing and tightening to influence credit conditions, with the former AUD-negative and the latter AUD-positive.
China is Australia’s largest trading partner so the health of the Chinese economy is a major influence on the value of the Australian Dollar (AUD). When the Chinese economy is doing well it purchases more raw materials, goods and services from Australia, lifting demand for the AUD, and pushing up its value. The opposite is the case when the Chinese economy is not growing as fast as expected. Positive or negative surprises in Chinese growth data, therefore, often have a direct impact on the Australian Dollar and its pairs.
Iron Ore is Australia’s largest export, accounting for $118 billion a year according to data from 2021, with China as its primary destination. The price of Iron Ore, therefore, can be a driver of the Australian Dollar. Generally, if the price of Iron Ore rises, AUD also goes up, as aggregate demand for the currency increases. The opposite is the case if the price of Iron Ore falls. Higher Iron Ore prices also tend to result in a greater likelihood of a positive Trade Balance for Australia, which is also positive of the AUD.
The Trade Balance, which is the difference between what a country earns from its exports versus what it pays for its imports, is another factor that can influence the value of the Australian Dollar. If Australia produces highly sought after exports, then its currency will gain in value purely from the surplus demand created from foreign buyers seeking to purchase its exports versus what it spends to purchase imports. Therefore, a positive net Trade Balance strengthens the AUD, with the opposite effect if the Trade Balance is negative.
- USD/CHF steadies below 0.8500 as the Fed looks all set to cut interest rates in September.
- The US Dollar fails to recover strongly despite upbeat US Durable Goods Orders data for July.
- Swiss Q2 Employment Level rose to 5.499 million.
The USD/CHF pair hovers below the psychological resistance of 0.8500 in Monday’s American session. The Swiss Franc asset remains in the bearish trajectory as Federal Reserve (Fed) September interest rate cuts have been fully priced in by market participants, which have weighed on the US Dollar (USD) and have improved the appeal of risky assets.
The S&P 500 opens a bullish note on Monday. The US Dollar Index (DXY), which tracks the Greenback’s value against six major currencies, edges higher from the annual low of 100.53. However, its near-term outlook remains bearish.
The confidence of investors that the Fed will begin reducing interest rates in September increased after the speech from Fed Chair Jerome Powell at the Jackson Hole (JH) Symposium on Friday indicated that the central bank is prepared to pivot to policy normalization. Jerome Powell said, “The time has come for policy to adjust.” Fed officials gear up for cutting interest rates as they worry that downside risks to the United States (US) labor market have increased. While policymakers remain confident that inflation is on track to sustainably return to the desired rate of 2%.
Meanwhile, upbeat US Durable Goods Orders data for July failed to prompt a strong recovery in the US Dollar. New orders for Durable Goods that drive core inflation rose at a robust pace of 9.9% from the estimates of 4%. In June, the economic data contracted sharply by 6.9%.
On the Swiss Franc front, the Q2 Employment Level rose to 5.499 million from the prior release of 5.481 million. Though the labor market swelled, it is less likely to impact market speculation for the continuation of interest rate cuts by the Swiss National Bank (SNB) in September.
Swiss Franc FAQs
The Swiss Franc (CHF) is Switzerland’s official currency. It is among the top ten most traded currencies globally, reaching volumes that well exceed the size of the Swiss economy. Its value is determined by the broad market sentiment, the country’s economic health or action taken by the Swiss National Bank (SNB), among other factors. Between 2011 and 2015, the Swiss Franc was pegged to the Euro (EUR). The peg was abruptly removed, resulting in a more than 20% increase in the Franc’s value, causing a turmoil in markets. Even though the peg isn’t in force anymore, CHF fortunes tend to be highly correlated with the Euro ones due to the high dependency of the Swiss economy on the neighboring Eurozone.
The Swiss Franc (CHF) is considered a safe-haven asset, or a currency that investors tend to buy in times of market stress. This is due to the perceived status of Switzerland in the world: a stable economy, a strong export sector, big central bank reserves or a longstanding political stance towards neutrality in global conflicts make the country’s currency a good choice for investors fleeing from risks. Turbulent times are likely to strengthen CHF value against other currencies that are seen as more risky to invest in.
The Swiss National Bank (SNB) meets four times a year – once every quarter, less than other major central banks – to decide on monetary policy. The bank aims for an annual inflation rate of less than 2%. When inflation is above target or forecasted to be above target in the foreseeable future, the bank will attempt to tame price growth by raising its policy rate. Higher interest rates are generally positive for the Swiss Franc (CHF) as they lead to higher yields, making the country a more attractive place for investors. On the contrary, lower interest rates tend to weaken CHF.
Macroeconomic data releases in Switzerland are key to assessing the state of the economy and can impact the Swiss Franc’s (CHF) valuation. The Swiss economy is broadly stable, but any sudden change in economic growth, inflation, current account or the central bank’s currency reserves have the potential to trigger moves in CHF. Generally, high economic growth, low unemployment and high confidence are good for CHF. Conversely, if economic data points to weakening momentum, CHF is likely to depreciate.
As a small and open economy, Switzerland is heavily dependent on the health of the neighboring Eurozone economies. The broader European Union is Switzerland’s main economic partner and a key political ally, so macroeconomic and monetary policy stability in the Eurozone is essential for Switzerland and, thus, for the Swiss Franc (CHF). With such dependency, some models suggest that the correlation between the fortunes of the Euro (EUR) and the CHF is more than 90%, or close to perfect.
BoE Governor Bailey’s comments at Jackson Hole Friday reflected a cautious near-term policy outlook, Scotiabank’s Chief FX Strategist Shaun Osborne notes.
BoE Gov Bailey maintains cautious policy outlook
“Bailey said it was too early to declare victory over inflation with price growth not sustainably back to target. The remarks support market pricing that suggests policymakers are likely to await more data before easing rates again late this year (November). GBP has drifted marginally lower in quiet trade, with UK markets closed for the bank holiday.”
“Cable losses are marginal from Friday’s 1.3230 high (highest since early 2022). Spot is consolidating ahead of minor trend support at 1.3178; weakness below trend support today could prompt a deeper correction in Cable but trend dynamics here remain bullish, suggesting limited scope for weakness for now—and the potential for gains to extend to 1.3330 moving ahead.”
“Cable support looks firm at 1.3125/30.”
EUR rose amid broad USD softness, OCBC FX strategists Frances Cheung and Christopher Wong note.
Potential rising wedge in the making
“Euro was last seen at 1.1164 levels. Bullish momentum on daily chart intact but RSI is in overbought conditions. Potential rising wedge in the making – typically associated with a bearish reversal. We do not rule out the risk of a pullback. Support seen at 1.1140, 1.1090. Resistance at 1.12, 1.1280 levels.”
“On recent ECB speaks, Holzmann said Sep cut is not a foregone conclusion while Chief Economist Lane said that a return to 2% inflation target is not secure yet.”
- EUR/GBP continues declining within a falling channel.
- It has reached oversold levels and could be poised for a recovery.
EUR/GBP continues trickling lower in a falling channel. The declining sequence of peaks and troughs indicates the pair is in a short-term downtrend, and given “the trend is your friend” this biases prices to further weakness.
EUR/GBP 4-hour Chart
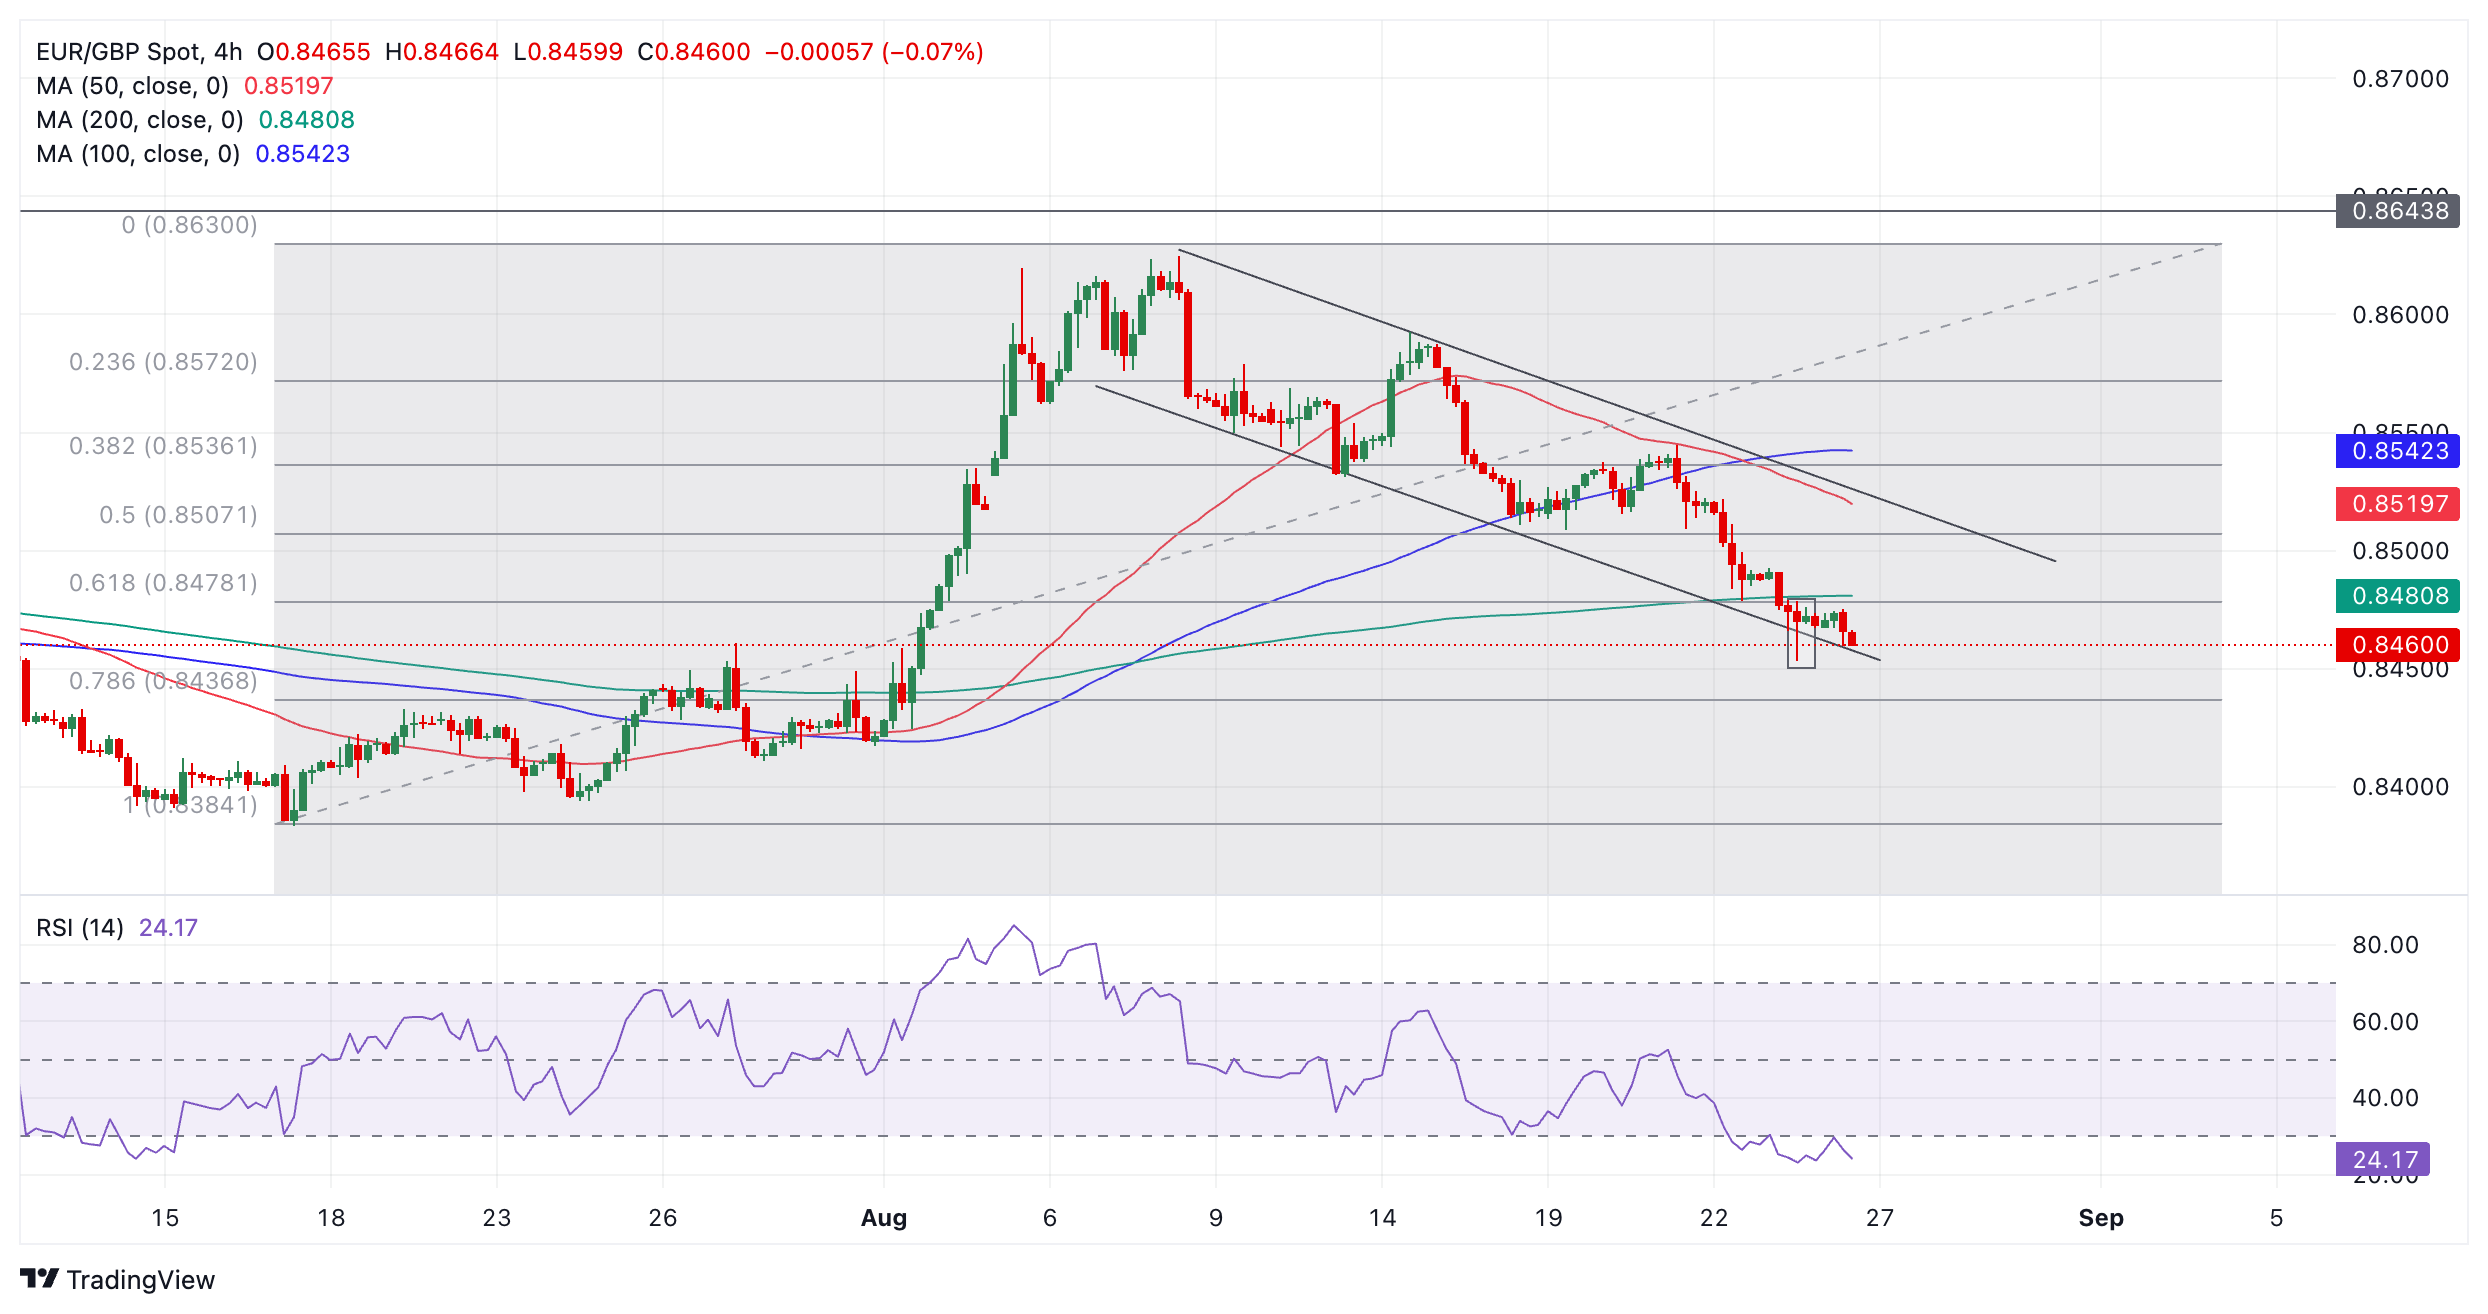
The pair has touched down on the lower channel line, a historical support level that previously provided the launch pad for counter-trend reactions higher. There is a chance the same thing could happen again.
The Relative Strength Index (RSI) is heavily oversold indicating traders should not add to their short positions as there is a greater risk of a recovery. RSI can remain oversold for long periods whilst prices continue falling but EUR/GBP has now been oversold for 14 periods on the 4-hour chart which is already quite long. Traders should wait for RSI to exit oversold on a closing basis and re-enter neutral territory before placing buy orders.
EUR/GBP has now broken below the 200-period Simple Moving Average (SMA) and the 0.618 Fibonacci retracement level of the late-June and early-August rally – both bearish signs. On the daily chart (not shown) it is trading just below the key 50-day SMA but it is difficult to determine whether it has decisively broken below the 50-day, which could still offer support for a rebound.
The price itself formed a bullish Hammer Japanese candlestick reversal pattern on August 23 (bold rectangle on chart above). This occurred after it briefly fell below the channel line then recovered in the same 4-hour period. The pattern was followed by a green up candle providing bullish confirmation of a near-term recovery. However, the price has so far failed to rise. If EUR/GBP breaks below the Hammer candle’s lows at 0.8453 it will signal further downside. If the low holds hope of a recovery remains alive.
Given the downtrend in the short-term, EUR/GBP there is still a chance of another break below the channel line. A decisive break below the lower channel line would validate such a breakout. It would be a very bearish sign but the move lower would be unlikely to last long. Such moves are often signs of exhaustion.
A decisive break would be one accompanied by a longer-than-average red candlestick which closed below the channel line near its low, or three red candlesticks in a row that broke below the level.
The long-term trend (weekly chart) is still bearish whilst the medium-term trend is bullish.
EUR/USD is consolidating just under 1.12, Friday’s high and the highest for EURUSD since July 2023, which was retested briefly in overnight trade, Scotiabank’s Chief FX Strategist Shaun Osborne notes.
Bulls may try to test 1.12
“Note that EZ/US 2Y spreads are also the narrowest since mid-2023, providing the essential support for the EUR. Germany’s IFO Business Confidence eased to 86.6 this month, down from July but slightly better than forecast. Details reflected weakness across most sectors of the economy outside of services. The index is weak and backsliding but remains well above recessionary levels.”
“Short-term trading patterns suggest the EUR may have peaked in overnight trade after forming a bearish “evening star” pattern on the 6-hour charts. Minor losses through quiet European trade tend to confirm that development. But losses are likely to remain limited in the short run at least.”
“Trend dynamics remain bullish across short, medium and long-term DMI oscillators and that should limit EUR losses to the low/mid 1.11s. Key short-term support is 1.1100/10.”
- USD/CAD slides further to near 1.3500 amid a strong Oil price rally.
- The Fed is widely anticipated to start reducing interest rates in September.
- US Durable Goods Orders grew at a robust pace of almost 10% in July.
The USD/CAD pair extends its downside to near the psychological support of 1.3500 in Monday’s New York session. The Loonie asset weakens as a stellar upside move in the Oil price has strengthened the Canadian Dollar (CAD). The Oil price on NYMEX has gained more than 7% since Thursday amid escalating tensions between Iran and Israel in the Middle East. Growing tensions in the Middle East have prompted fears of Oil supply disruptions.
Meanwhile, the US Dollar (USD) delivered a mild recovery move after the release of the upbeat United States (US) Durable Goods Orders data for July. New orders for Durable Goods rose at a robust pace of 9.9% from the estimates of 4%. The economic data contracted significantly in June. The US Dollar Index (DXY), which tracks the Greenback’s value against six major currencies, recovers mildly after posting a fresh year-to-date (YTD) low of 100.53.
However, the near-term outlook of the US Dollar remains vulnerable as market participants appear to be confident about the Federal Reserve (Fed) to begin reducing interest rates from the September meeting.
The confidence of investors for Fed rate cuts in September has increased after Fed Chair Jerome Powell unambiguously said in his speech at the Jackson Hole (JH) Symposium on Friday, “The time has come for policy,” given that the central bank is now worried about growing risks to labor market. Powell added, " We will do everything we can to support a strong labor market." While the confidence of the Fed that price pressures sustainably return to banks’ target of 2% has increased.
For fresh cues on interest rates, investors will focus on the US core Personal Consumption Expenditure Price Index (PCE) data for July, which will be published on Friday. The underlying inflation data will significantly influence market expectations for the likely size of Fed interest rate cuts in September.
Canadian Dollar FAQs
The key factors driving the Canadian Dollar (CAD) are the level of interest rates set by the Bank of Canada (BoC), the price of Oil, Canada’s largest export, the health of its economy, inflation and the Trade Balance, which is the difference between the value of Canada’s exports versus its imports. Other factors include market sentiment – whether investors are taking on more risky assets (risk-on) or seeking safe-havens (risk-off) – with risk-on being CAD-positive. As its largest trading partner, the health of the US economy is also a key factor influencing the Canadian Dollar.
The Bank of Canada (BoC) has a significant influence on the Canadian Dollar by setting the level of interest rates that banks can lend to one another. This influences the level of interest rates for everyone. The main goal of the BoC is to maintain inflation at 1-3% by adjusting interest rates up or down. Relatively higher interest rates tend to be positive for the CAD. The Bank of Canada can also use quantitative easing and tightening to influence credit conditions, with the former CAD-negative and the latter CAD-positive.
The price of Oil is a key factor impacting the value of the Canadian Dollar. Petroleum is Canada’s biggest export, so Oil price tends to have an immediate impact on the CAD value. Generally, if Oil price rises CAD also goes up, as aggregate demand for the currency increases. The opposite is the case if the price of Oil falls. Higher Oil prices also tend to result in a greater likelihood of a positive Trade Balance, which is also supportive of the CAD.
While inflation had always traditionally been thought of as a negative factor for a currency since it lowers the value of money, the opposite has actually been the case in modern times with the relaxation of cross-border capital controls. Higher inflation tends to lead central banks to put up interest rates which attracts more capital inflows from global investors seeking a lucrative place to keep their money. This increases demand for the local currency, which in Canada’s case is the Canadian Dollar.
Macroeconomic data releases gauge the health of the economy and can have an impact on the Canadian Dollar. Indicators such as GDP, Manufacturing and Services PMIs, employment, and consumer sentiment surveys can all influence the direction of the CAD. A strong economy is good for the Canadian Dollar. Not only does it attract more foreign investment but it may encourage the Bank of Canada to put up interest rates, leading to a stronger currency. If economic data is weak, however, the CAD is likely to fall.
The Canadian Dollar (CAD) is barely changed over the weekend, Scotiabank’s Chief FX Strategist Shaun Osborne notes.
USD wobbles around 1.35
“Trading so far today leaves spot more or less exactly where it was late Friday, with spot holding a 20 pip range through quiet European trade. Somewhat narrower short-term rate spreads, firmer crude and positive equity markets are factors in keeping the CAD tone positive. USD/CAD fair value has shifted lower to 1.3530 today.”
“With USD losses stretching under retracement support in the mid/upper 1.35s, spot looks to have a date with major trend/ retracement support at 1.3475 in the next week or two. USD/CAD rebounds from here may not be able to make it much above 1.3575/1.3625 for now.”
Powell’s ‘time has come’ keynote speech last Fri at Jackson Hole gave markets greater conviction to put on risks while selling the USD. His speech was clear in establishing a rate cut cycle though he left out specifics in terms of magnitude and pace of cuts, OCBC FX strategists Frances Cheung and Christopher Wong note.
Clean break below puts 99.60 in focus
“Focus has clearly tilted towards supporting labour market and that policy decision remains data dependent. This puts greater focus on payrolls report (6 Sep) while this week, we have core PCE (Fri).
“DXY was last at 100.84. Bearish momentum on daily chart intact while RSI is near oversold conditions. Support at 100.60 levels. Clean break puts 99.60 in focus. Resistance at 101, 101.50 and 102.20 (23.6% fibo).”
“Over the weekend, geopolitical tensions escalated after Israel-Hezbollah were engaged in major missile exchange. While risk assets, except oil appeared immune at this point, it is worth taking a prudent stance to watch out for signs if geopolitical risks further escalate as this may temporary derail momentum seen in risk-on proxies and bearish USD (especially with RSI near oversold).”
- Durable Goods Orders in the US rose sharply in July.
- US Dollar Index clings to daily recovery gains, stays below 101.00.
Durable Goods Orders in the US increased $26.1 billion, or 9.9%, to $289.6 billion in July, the US Census Bureau reported on Monday. This reading followed the 6.9% contraction (revised from -6.6%) recorded in June and came in better than the market expectation for an increase of 4%.
"Excluding transportation, new orders decreased 0.2%. Excluding defense, new orders increased 10.4%," the press release read. "Transportation equipment, up two of the last three months, drove the increase, $26.4 billion or 34.8% to $102.2 billion."
Market reaction
The US Dollar Index clings to modest daily recover gains near 101.80 following the upbeat data.
- USD/JPY extends its downtrend as markets diggest Fed Chairman Powell’s speech and its implications.
- Expectations are for major cuts to US interest rates over the next year and a half as the US economy contracts.
- The Japanese Yen benefits from the further unwinding of the carry trade.
USD/JPY falls to the 144.10s on Monday, continuing its recent downtrend from the August 15 highs of 149.40. This means one US Dollar (USD) buys five less Japanese Yen (JPY) than it did 11 days ago.
USD’s recent depreciation is due to increasing expectations that US interest rates are set to fall. The expectation of lower interest rates is negative for the Dollar because it lowers foreign capital inflows.
On Friday, at a speech given in Jackson Hole where global central bankers met for their yearly roundtable, the Chairman of the Federal Reserve (Fed) Jerome Powell gave his clearest signal yet that the Fed was about to cut interest rates. High interest rates were negative for employment, he said, and since inflation was now coming down in a more sustainable fashion the time was right to start cutting. “Upside risks to inflation have diminished, downside risks to employment have increased,” said Powell. USD/JPY fell over 1.3% as a result.
In Japan deflation rather than inflation has been a problem, leading the Bank of Japan (BoJ) to keep interest rates ultra low – now 0.25% – and the Yen historically weak.
Despite efforts by the government to encourage higher wages, inflation remains stubbornly low. Recent inflation data showed headline inflation at 2.8% in July YoY, the same level as June, and inflation ex fresh food at 2.7% – up from 2.6% in the previous month, a rise which was in line with forecasts. Inflation with both fresh food and energy taken out meanwhile fell to 1.9% from 2.2% in the previous month, which is below the BoJ’s 2.0% target for core inflation.
This suggests the BoJ will not have a strong mandate to raise interest rates any higher and as a consequence the Yen will remain pressured. Even the fairly high 2.8% headline and ex-food inflation figures, it has been argued, were only high because of government energy subsidies which are to be canceled in September. This suggests a risk that after September inflation will also fall.
That said, economists seem to broadly agree that the BoJ will still make one more interest rate hike of 0.25%, bringing interest rates to 0.50%, before the end of the year. Advisory service Capital Economics believes the hike will happen in October. After that the view is that for the whole of 2025 inflation will remain subdued and the BoJ will not be able to raise interest rates any further.
In contrast markets are now pricing in 1.00% of cuts in 2024 and 1.30% of interest rate cuts by the Federal Reserve 2025, which if it were to happen would bring the Fed’s official interest rate down from a range of 5.50 - 5.25% to 3.20% - 2.95%. This would suggest that at the same time as US interest rates are falling by an aggregate of 2.3% over the next 16 months, Japanese Interest rates would be rising by 0.25% leading to an acute convergence of the current differential between the two. This partly explains the sudden fall in USD/JPY.
Another factor is that now the Yen has established a firmer uptrend it is becoming less attractive as a funding currency in the carry trade. This is an investment strategy in which traders borrow in a currency where interest rates are low – like the Japanese Yen (JPY) – and purchase a currency where interest rates are high – like the US Dollar, or the Mexican Peso.
Assuming no change in the exchange rate, traders stand to pocket the difference between the interest they have to pay on the loan and the interest they earn from the investment. However, given the Japanese Yen (JPY) is now trending higher and most of its favored carry counterparts are weakening, the carry trade is not as profitable as it used to be, and this “unwind” in long held carry positions is further propelling USD/JPY lower.
The ‘strong resistance’ level for the US Dollar (USD) has moved lower to 7.1460 from 7.1750, UOB Group FX strategists Quek Ser Leang and Lee Sue Ann note.
USD may try to come back to 7.1460
24-HOUR VIEW: “USD plummeted last Friday, and it continues to decline today. While oversold, USD could drop further towards 7.0900 before stabilisation can be expected. The next support at 7.0636 is unlikely to come into view. Resistance levels are at 7.1200 and 7.1300.”
1-3 WEEKS VIEW: “Last Thursday (22 Aug, spot at 7.1300), we highlighted that ‘the recent price action has resulted in an increase in downward momentum, albeit not much.’ We added, ‘as long as USD remains below 7.1750, it is likely to edge lower in the coming days.’ However, we noted that ‘given the mild downward pressure, any decline is unlikely to reach July’s low of 7.0636.’ Last Friday, USD fell by 0.42% (NY close of 7.1163). Downward momentum has increased sharply, suggesting that there is potential for USD to decline to 7.0636. On the upside, the ‘strong resistance’ level has moved lower to 7.1460 from 7.1750.”
Strong momentum suggests the US Dollar (USD) could decline further, potentially reaching 142.80. And, there’s also the chance of it reaching 141.66, UOB Group FX strategists Quek Ser Leang and Lee Sue Ann note.
Bears may try to reach 142.80 short term
24-HOUR VIEW: “Our view for USD to edge higher last Friday was incorrect. Instead of edging higher, it sold off sharply in NY trade, plummeting to a low of 144.04. USD continues to decline in early Asian trade today. Strong momentum indicates USD could potentially reach 142.80. The major support at 141.66 is unlikely to come under threat. To keep the momentum going, USD must remain below 145.00 (minor resistance is at 144.40).”
1-3 WEEKS VIEW: “In our most recent narrative from last Thursday (22 Aug, spot at 145.25), we held the view that USD ‘is under pressure.’ However, we indicated that ‘it does not appear to have sufficient momentum to threaten 141.66, the low registered early this month.’ Last Friday, USD fell sharply, closing lower by 1.29% (144.37). There has been an increase in momentum and USD remains under pressure. Given the increase in momentum, the chance of USD dropping to 141.66 has increased as well. Overall, only a breach of 146.50 (‘strong resistance’ level previously at 148.00) would indicate that the current downward pressure has faded.”
ECB chief economist Philip Lane also spoke in Jackson Hole. The most important message for the currency market was probably: ‘The return to target is not yet secure.’ If you read this passage in context, Lane seems to be trying to show that there are risks on both sides. He goes on to say that ‘A rate path that is too high for too long would deliver chronically below-target inflation over the medium term and would be inefficient in terms of minimizing the side effects on output and employment’, Commerzbank’s Head of FX and Commodity Research Ulrich Leuchtmann notes.
There are risks on both sides
“Lanes' comments would only justify EUR optimism if one had to assume that he considers the former risk (too rapid interest rate cuts) to be greater than the second (too high-interest rate level). However, Lane's speech was actually about evaluating the effectiveness of monetary policy. The effectiveness is by no means obvious. Perhaps monetary policymakers would be better advised to have more self-doubt.”
“Their activities are beyond the control of politicians. But this also means that there is no political corrective mechanism to ensure that a policy that has become bogged down in misconceptions is corrected in the long run. In my opinion, where this corrective mechanism is lacking, it is all the more necessary for the monetary policy actors to proceed with humility and self-criticism.”
“For me as an FX analyst, this is relevant because when evaluating exchange rates, we naturally have to ask ourselves, among other things, how likely it is that central banks will make mistakes. They may be in a cycle of interest rate cuts, even though inflation might not been sufficiently combated yet. In the past, the ECB has done a lot of things that, in retrospect, were wrong. Sometimes I wonder whether at least some of these mistakes could have been avoided if the players in the Frankfurt ECB tower had been more aware of their own fallibility.”
Market pricing of end-2024 Fed Funds fell from 4.66% (67bp below the current level) before the July labour market data were released, to 3.85% just before the (stronger) ISM services data were released. Jay Powell’s comments on Friday have taken end-year pricing back down to 4.2%, but the market remains doubtful they will cut by 50bp in September, Société Générale’s FX strategist Kit Juckes notes.
Probably, the US slowdown really has started
“The market is pricing rates at a little above 3% in 3 years’ time, not quite as low as it was at the start of the month. It’s pretty much the same level we saw in 1992, when inflation expectations were significantly higher. The speed of the decline, however, is inly justifiable if the wheels come off the US economy pretty spectacularly. Market participants got excited about rate cuts at the start of 2023 and the end of 2023.”
“In Chair Powell’s view, the key lies with the labour market, which he mentioned 20 times in his speech on Friday. But while the labour market is clearly loosening there’s still huge uncertainty about how much it will slow. On that basis, while I doubt the market-implied terminal rate will head back up much now, the front end of the rates curve has too many rate cuts priced in over the next 6 month, unless the economy slows pretty sharply.”
“For rates/equities/credit folks, the speed and full extent of the slowdown are very important, but for the FX market, after the dollar climbed so high, the mere fact of the slowdown will continue to see long dollar positions reduced. A slower/smaller slowdown would benefit Latin American currencies more than a deep recession would, for example, but the other G10 currencies will probably rise further against the dollar however soft the US and is, as long as there IS a landing.”
- Oil pops above $75.00 with Israel and Hezbollah entering into tit-for-tat attacks.
- The recent uprising in tensions and violence might put negotiations for a ceasefire deal in Gaza on loose screws.
- The US Dollar Index trades back to 101.00 after its steep decline last week.
Oil prices are pumping higher on Monday after violence picked up in the Gaza region and Israel and Hezbollah exchanged heavy fire, with several bombings and drone attacks from both sides during the weekend. The major escalation in the region could not come at a worse time as a ceasefire deal for Gaza is still being negotiated. This violence could put any potential accord on loose screws and might even expand the conflict to other countries in the region.
The US Dollar Index (DXY) is licking its wounds after posting one of its worst weekly performances in over a year. US Federal Reserve Chairman Jerome Powell confirmed on Friday that an interest-rate cut is coming in September, but markets seem to be heading too far ahead of themselves by pricing in big rate cuts before the year ends. If the Fed wants to obtain a soft landing, it needs to cut gradually and slowly, not by big heaps as markets are expecting.
At the time of writing, Crude Oil (WTI) trades at $75.60 and Brent Crude at $79.21.
Oil news and market movers: Mayhem helps hedge funds
- Bloomberg reports that Citigroup sees a big risk to a Libyan Oil disruption considering the recent local turmoil picking up with Israel.
- The above element is reflected in the Brent-Dubai spread in Crude prices, which is widening substantially.
- Meanwhile, Libya’s Waha Oil has said to start cutting its output gradually, Bloomberg reports, under a blockade of exports.
- China’s largest Crude refiner, Sinopec, is facing headwinds as the country’s economic slowdown weighs on its profits. The demand for Diesel especially remained poor, Reuters reports.
Oil Technical Analysis: It got a bit too bearish
Oil is in good condition at the start of the week. The feared sell-off from hedge funds last week did not take place, and with the recent rally at hand, more positioning could take place. The recent violence over the weekend might even put question marks on the feasibility of a ceasefire deal taking place between Israel and Hamas. Should any headline in that direction be reported, expect to see another steep surge in Crude prices.
On the upside, the double level at $77.65, which aligns with both a descending trendline and the 200-day Simple Moving Average (SMA). In case bulls are able to break above it, the 100-day SMA at $78.45 could trigger a rejection.
On the downside, the low from August 5 at $71.17 is working its magic as it was able to eke out a bounce that now enters its third day. Under $70.00, the $68.00 big figure is the first level to watch followed by $67.11, which is the lowest point from the triple bottom seen back in June 2023.
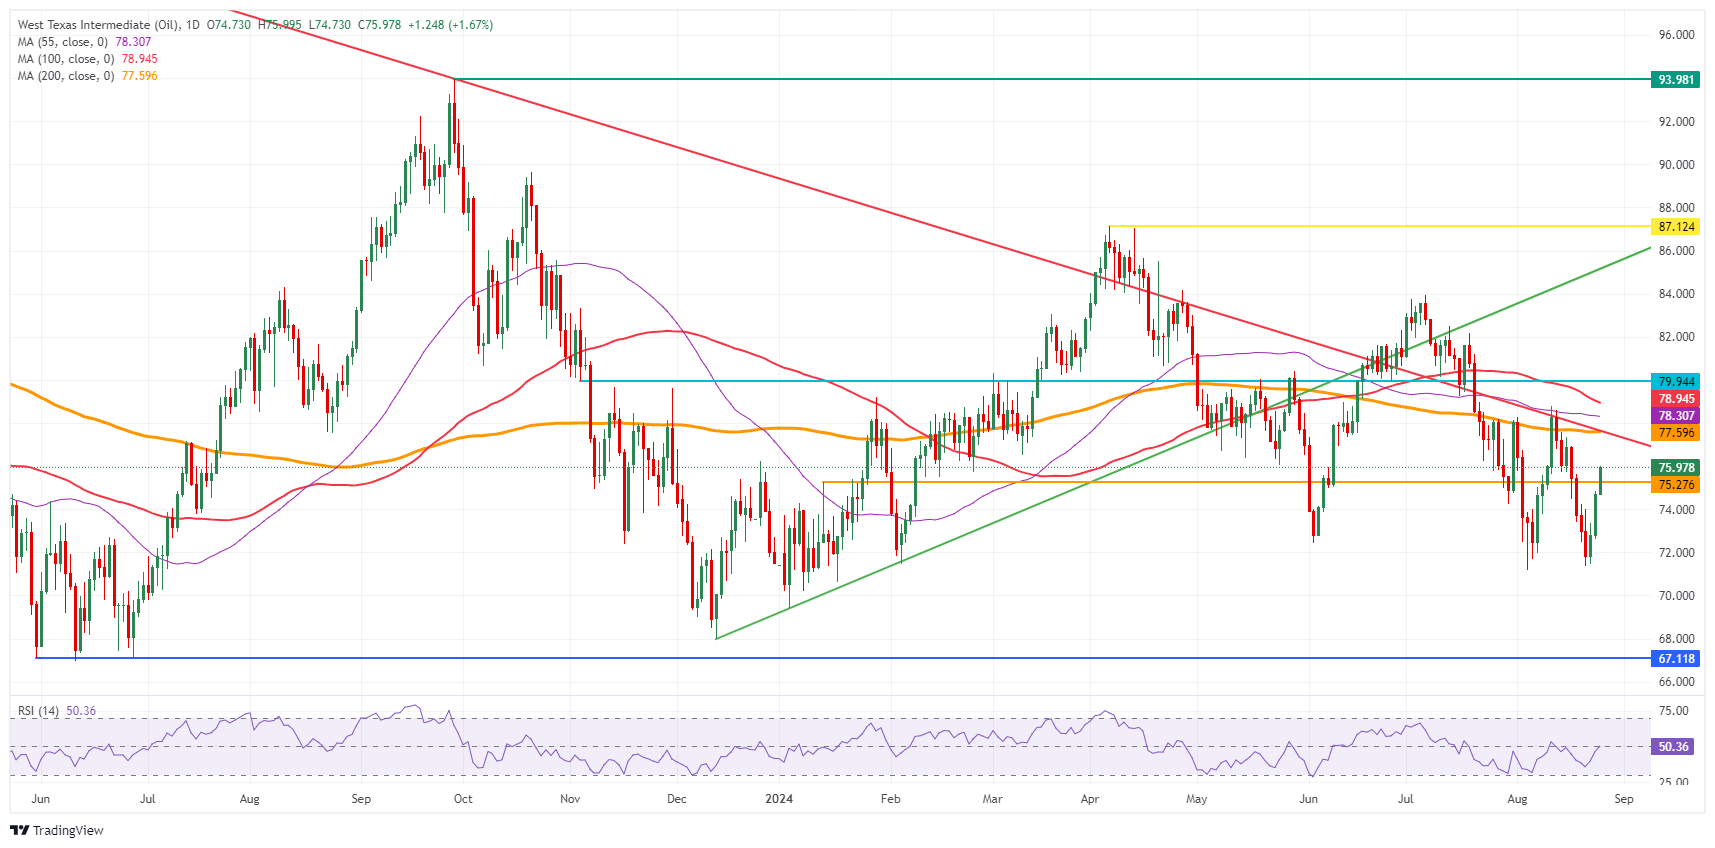
US WTI Crude Oil: Daily Chart
WTI Oil FAQs
WTI Oil is a type of Crude Oil sold on international markets. The WTI stands for West Texas Intermediate, one of three major types including Brent and Dubai Crude. WTI is also referred to as “light” and “sweet” because of its relatively low gravity and sulfur content respectively. It is considered a high quality Oil that is easily refined. It is sourced in the United States and distributed via the Cushing hub, which is considered “The Pipeline Crossroads of the World”. It is a benchmark for the Oil market and WTI price is frequently quoted in the media.
Like all assets, supply and demand are the key drivers of WTI Oil price. As such, global growth can be a driver of increased demand and vice versa for weak global growth. Political instability, wars, and sanctions can disrupt supply and impact prices. The decisions of OPEC, a group of major Oil-producing countries, is another key driver of price. The value of the US Dollar influences the price of WTI Crude Oil, since Oil is predominantly traded in US Dollars, thus a weaker US Dollar can make Oil more affordable and vice versa.
The weekly Oil inventory reports published by the American Petroleum Institute (API) and the Energy Information Agency (EIA) impact the price of WTI Oil. Changes in inventories reflect fluctuating supply and demand. If the data shows a drop in inventories it can indicate increased demand, pushing up Oil price. Higher inventories can reflect increased supply, pushing down prices. API’s report is published every Tuesday and EIA’s the day after. Their results are usually similar, falling within 1% of each other 75% of the time. The EIA data is considered more reliable, since it is a government agency.
OPEC (Organization of the Petroleum Exporting Countries) is a group of 13 Oil-producing nations who collectively decide production quotas for member countries at twice-yearly meetings. Their decisions often impact WTI Oil prices. When OPEC decides to lower quotas, it can tighten supply, pushing up Oil prices. When OPEC increases production, it has the opposite effect. OPEC+ refers to an expanded group that includes ten extra non-OPEC members, the most notable of which is Russia.
Further New Zealand Dollar (NZD) strength is not ruled out; severely overbought conditions suggest any advance is likely limited to a test of 0.6260, UOB Group FX strategists Quek Ser Leang and Lee Sue Ann note.
NZD may try to test 0.626
24-HOUR VIEW: “Our view of sideways trading last Friday was incorrect, as NZD surged to a high of 0.6236, closing on a strong note at 0.6233 (+1.51%). While further advance is not ruled out, severely overbought conditions suggest any advance is likely limited to a test of 0.6260. The major resistance at 0.6320 is not expected to come under threat. Support levels are 0.6205 and 0.6180.”
1-3 WEEKS VIEW: “We highlighted last Thursday (22 Aug, spot at 0.6160) that ‘overbought advance doesn’t seem to be losing steam yet.’ We held the view that NZD could potentially reach June’s 2023 high of 0.6223.’ Last Friday, NZD broke above 0.6223, surging by 1.51% (NY close of 0.6233). From here, we continue to expect NZD to advance. The next significant resistance lies at the year-to-date high of 0.6320. As conditions are severely overbought, it remains to be seen if this level is within reach. To sustain the overbought momentum, NZD must not break below 0.6140 (‘strong support’ level previously at 0.6090).”
- Silver resumes short-term uptrend.
- The precious metal breaks to new monthly highs of $30.19.
Silver (XAG/USD) resumes the short-term uptrend it has been in since early August and breaks to new monthly highs. Given “the trend is your friend” it will probably continue rising.
Silver resumed its uptrending bias after completing a three-wave, abc correction. The precious metal then broke above resistance at the top of wave “b” of the correction at $29.74, providing bullish confirmation of further upside.
Silver 4-hour Chart
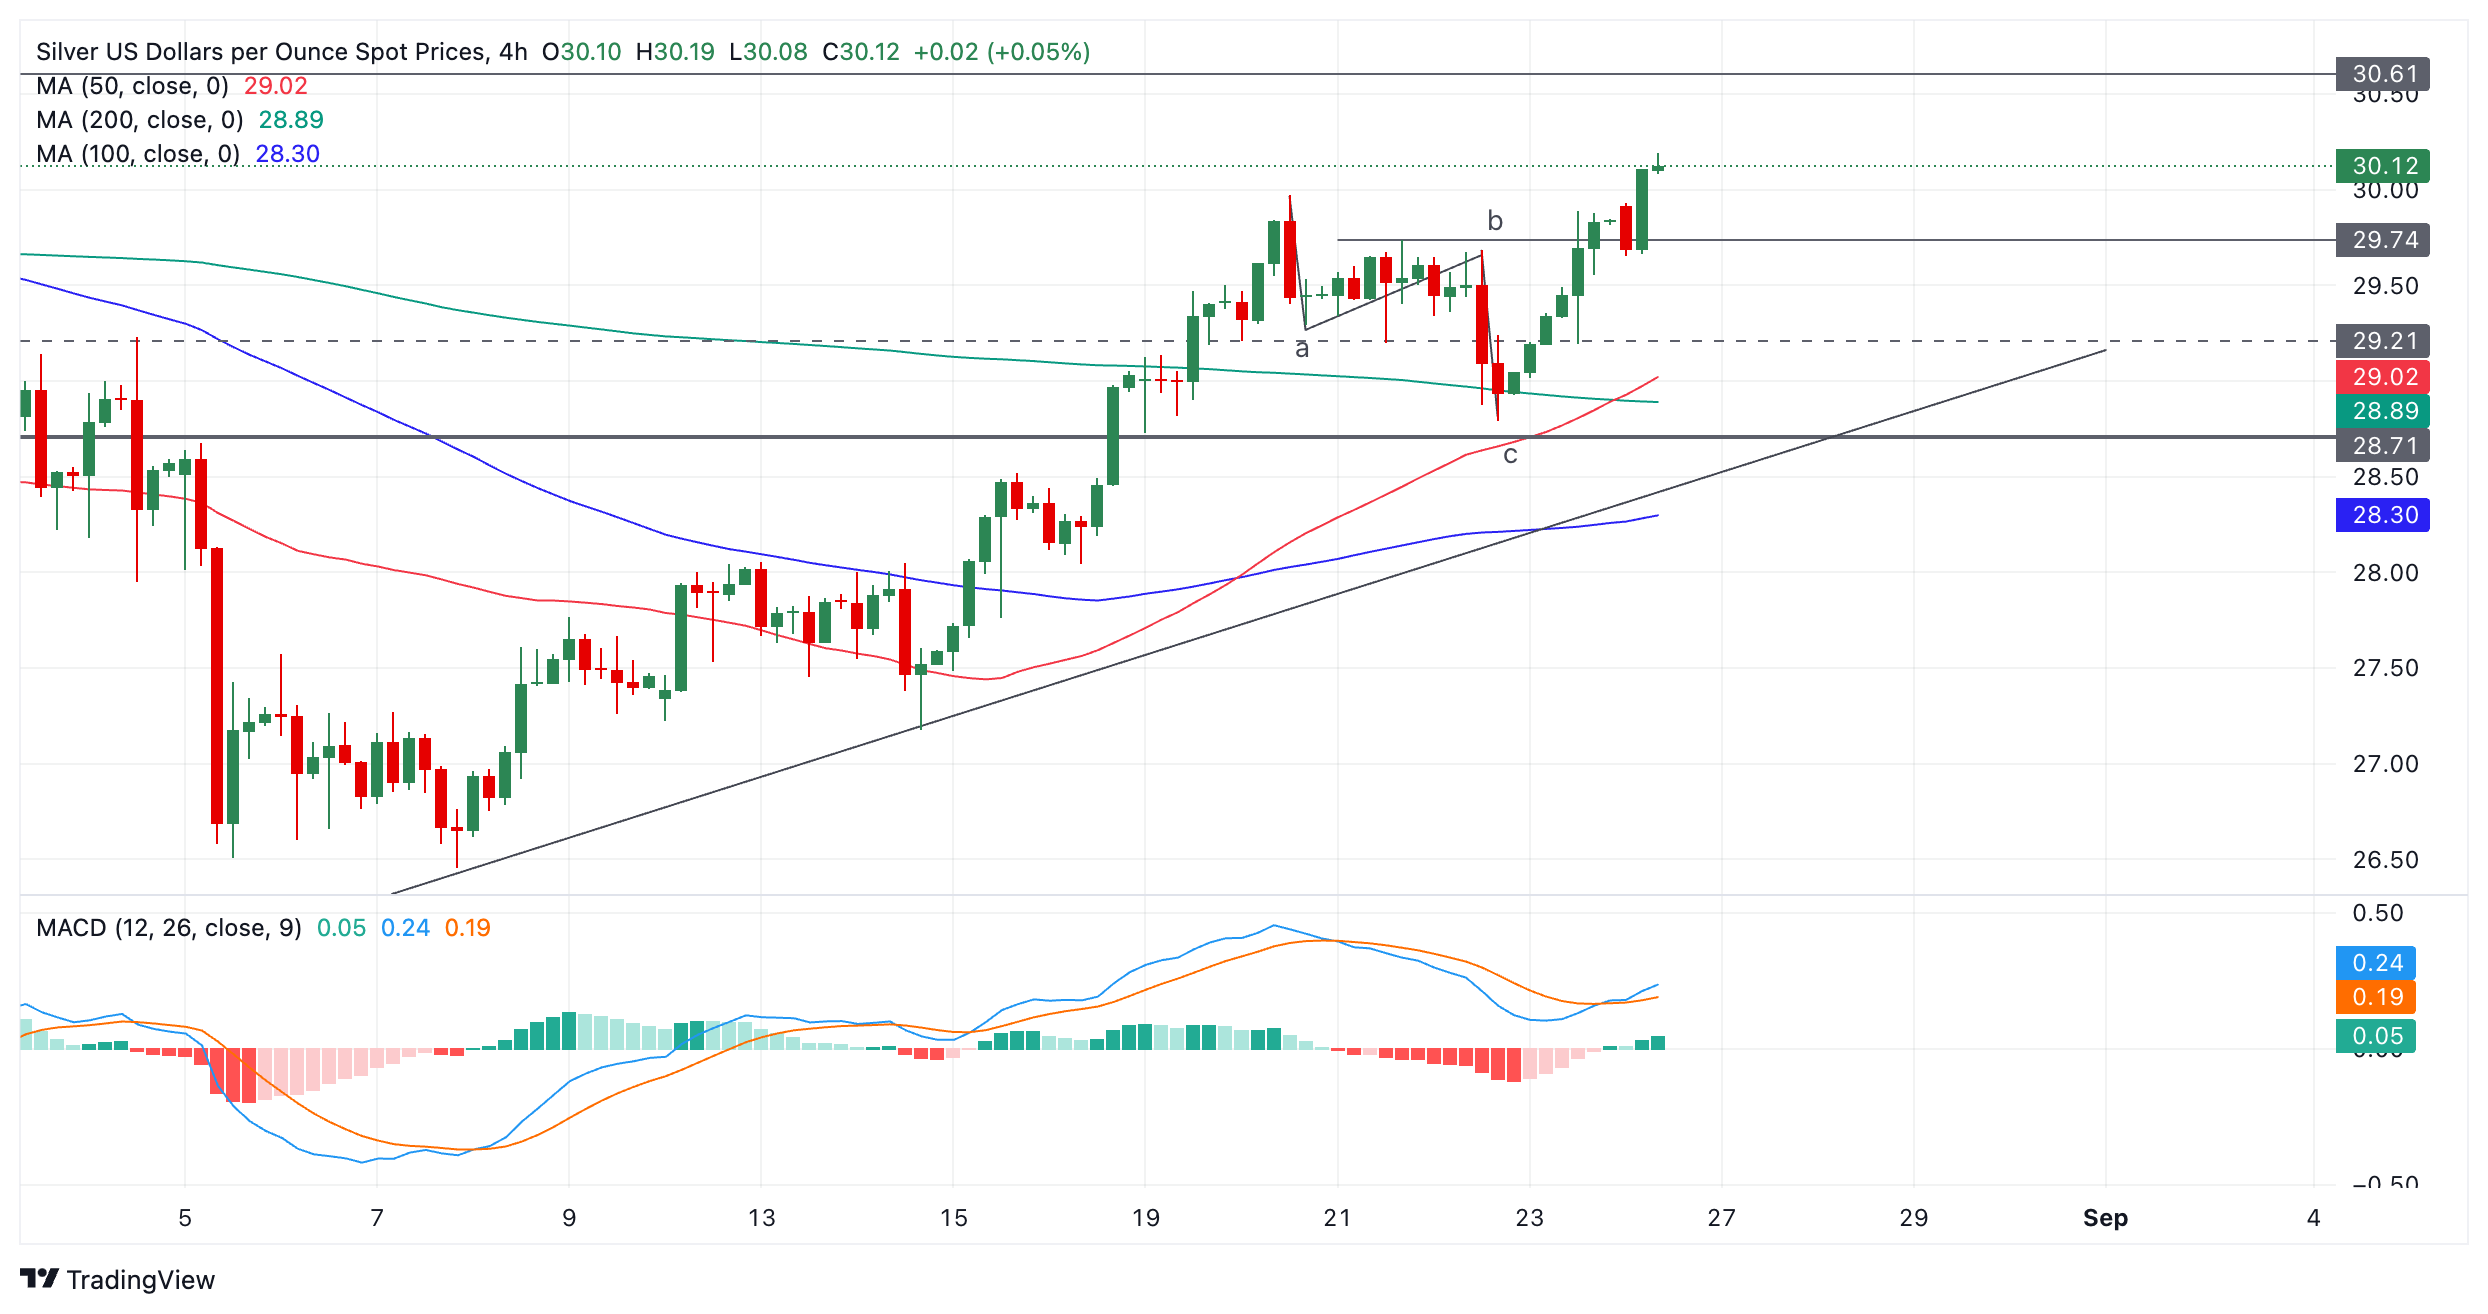
Silver has risen up to a high of $30.19 on Friday but it will likely go higher, eventually reaching the next upside target at the $30.61 resistance high (July 18 swing high). A break above $30.19 would help confirm more upside.
The trend on the medium and longer-term charts is unclear and therefore probably sideways, indicating little directional bias from higher time frames.
Conditions are severely overbought, but there appears to be enough momentum for the Australian Dollar (AUD) break clearly above 0.6800, but, given the overbought conditions, it remains to be seen if 0.6870 is within reach, UOB Group FX strategists Quek Ser Leang and Lee Sue Ann note.
A break above 0.6800 is getting more unlikely
24-HOUR VIEW: “We did not expect AUD to jump by 1.37% (NY close of 0.9797) last Friday. The 1.37% gain is the biggest 1-day advance this year. Predictably, after such a strong surge in a short span of time, conditions are severely overbought. However, there appears to be enough momentum for AUD to break clearly above 0.6800. The next resistance at 0.6870 is highly unlikely to come into view today. There is another resistance at 0.6830. On the downside, any pullback is not expected to threaten the support at 0.6745 with minor support at 0.6760.”
1-3 WEEKS VIEW: “In our most recent narrative was from last Thursday (22 Aug, spot at 0.6750), we indicated that ‘while upward momentum has slowed somewhat, it is too early to call for an end to the advance in AUD.’ We added, “provided that the ‘strong support’ level at 0.6660 is not taken out, AUD could continue to advance, possibly to last month’s high, near 0.6800.’ Last Friday, AUD jumped to within one pip of 0.6800, reaching a high of 0.6799. The outsized advance continues to suggest further AUD strength. However, given the overbought conditions, it remains to be seen if 0.6870 is within reach in the next 1 to 2 weeks. On the downside, the ‘strong support’ level has moved higher to 0.6710 from 0.6660.”
At Jackson Hole, Fed Chair Powell gave a clear signal for a rate cut in September, Rabobank’s macro analyst Philip Marey notes.
More rate cut on the way
“Fed Chair Powell gave a clear signal for a rate cut in September, but he did not give any hint about the size of the September cut, or the pace and size of the rate cuts after September. The Fed remains data-dependent, but Powell made clear that the cutting cycle is about to start.”
“We expect the labor market to deteriorate further in the remainder of the year, leading to four consecutive rate cuts of 25 bps each in the upcoming four scheduled FOMC meetings: September, November, December and January.”
“What happens after January will to a large extent depend on the economic policies of the next administration. A Trump victory would likely lead to a universal tariff and a rebound in inflation that should stop the Fed’s cutting cycle in its tracks. A Harris victory would likely be less inflationary and give scope for additional rate cuts in 2025.”
As long as 1.3160 is not breached, there is room for GBP to test 1.3250, after which the advance might pause, UOB Group FX strategists Quek Ser Leang and Lee Sue Ann note.
The 1.3250 resistance is the next target
24-HOUR VIEW: “We did not anticipate GBP to soar last Friday (we were expecting range trading). The sharp and swift rise during NY trade seems to be running ahead of itself. However, as long as 1.3160 is not breached, there is room for GBP to test 1.3250, after which the advance might pause. The next major resistance at 1.3300 is unlikely to come into view. To keep the momentum going, GBP must not break below 1.3165 (minor support is at 1.3185).”
1-3 WEEKS VIEW: “The level to monitor is 1.3320. Last Thursday (22 Aug, spot at 1.3090), we indicated that ‘the recent price action suggests there is scope for GBP to rise to, and potentially break above the 2023 peak of 1.3144.’ We added, ‘the next level to monitor above 1.3144 is 1.3200.’ While our view of a higher GBP was correct, the speed of its advance exceeded our expectations, as it surged by 0.94% last Friday (NY close of 1.3216) and closed at its highest level since February 2022. Not surprisingly, the sharp and rapid rise is coupled with strong momentum. In other words, we continue to expect GBP to rise. The next level to monitor is 1.3320. We will maintain our view of a higher GBP provided that 1.3105 (‘strong support’ level was at 1.2970 last Friday) is not breached.”
- The US Dollar steadies on Monday after a steep 1.76% sell-off last week, the worst in more than a year.
- Fed Chairman Jerome Powell committed to a September interest-rate cut in its Jackson Hole speech.
- The US Dollar index trades above 100.00 with US data underway this week.
The US Dollar (USD) is trading broadly flat on Monday after printing one of its worst weekly performances since June 2023. The US Dollar Index – which weighs the value of the US Dollar against a bucket of other currencies – shed 1.75% last week, with the latter part of those losses driven by US Federal Reserve (Fed) Chairman Jerome Powell’s words in Jackson Hole. Now that Powell has committed to a rate cut in September, markets could start to speculate over what this means for the Fed’s meeting in November and further down the line.
Concerns could already start to pick up on Monday as the economic calendar features the often market-moving Durable Goods Orders numbers. Should overall US data remain resilient or even pick up pace, what would it mean for the Fed’s commitment to cut in September? Strong data could bring the scenario of a one-and-done rate cut, which would be taken by markets as a very cold shower.
Daily digest market movers: Left in the dark
- Tensions grew over the weekend between Israel and Hezbollah with several attacks from both sides.
- The United Kingdom is on a bank holiday this Monday, which means reduced flows during the European trading session.
- In the US economic calendar, the Durable Goods Orders data for July are due to come out at 12:30 GMT:
- Headline Durable Goods Orders are expected to rebound to a 4% increase from the 6.7% plunge seen a month earlier
- Durable Goods without Transportation are expected to be unchanged following the prior month’s 0.4% increase..
- Revisions to the previous month’s data could be more market-moving than the actual number.
- Equities trade on the backfoot this Monday as traders engage in profit taking after the steep surge from Friday, which was caused by the dovish message from Fed Chairman Powell.
- The CME Fedwatch Tool shows a 61.5% chance of a 25 basis points (bps) interest rate cut by the Fed in September against a 38.5% chance for a 50 bps cut. Another 25 bps cut (if September is a 25 bps cut) is expected in November by 36.3%, while there is a 47.9% chance that rates will be 75 bps (25 bps + 50 bps) below the current levels and a 15.8% probability of rates being 100 (25 bps + 75 bps) basis points lower.
- The US 10-year benchmark rate trades at 3.78%, a fresh three-week low.
Economic Indicator
Durable Goods Orders
The Durable Goods Orders, released by the US Census Bureau, measures the cost of orders received by manufacturers for durable goods, which means goods planned to last for three years or more, such as motor vehicles and appliances. As those durable products often involve large investments they are sensitive to the US economic situation. The final figure shows the state of US production activity. Generally speaking, a high reading is bullish for the USD.
Read more.Next release: Mon Aug 26, 2024 12:30
Frequency: Monthly
Consensus: 4%
Previous: -6.6%
Source: US Census Bureau
US Dollar Index Technical Analysis: The beginning of the end
The US Dollar Index (DXY) saw a substantial move lower last week, snapping several important support levels, as markets are pricing in aggressive rate cuts by November. Expectations could be going too far, as the Fed appears unlikely to start cutting by 50 bps or more in the current scenario of a soft landing for the US economy.
For a recovery, the DXY faces a long road ahead. First, 101.90 is the level to reclaim. A steep 2% uprising would be needed to get the index to 103.18 from the current 101.00. A very heavy resistance level near 104.00 not only holds a pivotal technical value, but it also bears the 200-day Simple Moving Average (SMA) as the second heavyweight to cap price action.
On the downside, 100.62 (the low from December 28) tries to hold support, although it looks rather feeble. Should it break, the low from July 14, 2023, at 99.58 will be the ultimate level to look out for. Once that level gives way, early levels from 2023 are coming in near 97.73.
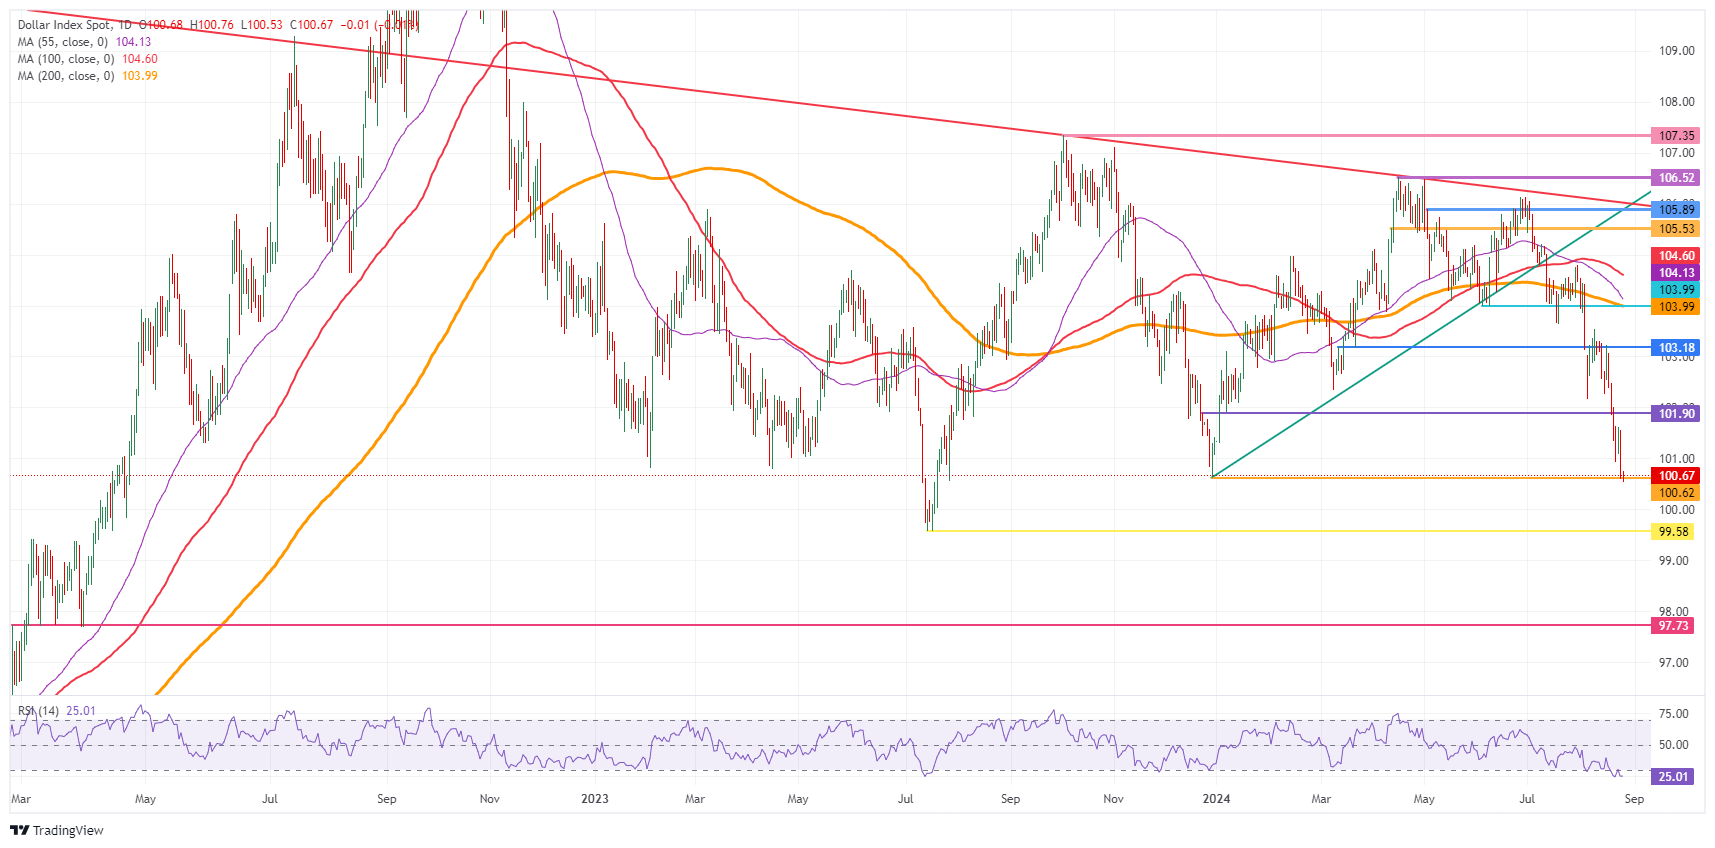
US Dollar Index: Daily Chart
US Dollar FAQs
The US Dollar (USD) is the official currency of the United States of America, and the ‘de facto’ currency of a significant number of other countries where it is found in circulation alongside local notes. It is the most heavily traded currency in the world, accounting for over 88% of all global foreign exchange turnover, or an average of $6.6 trillion in transactions per day, according to data from 2022. Following the second world war, the USD took over from the British Pound as the world’s reserve currency. For most of its history, the US Dollar was backed by Gold, until the Bretton Woods Agreement in 1971 when the Gold Standard went away.
The most important single factor impacting on the value of the US Dollar is monetary policy, which is shaped by the Federal Reserve (Fed). The Fed has two mandates: to achieve price stability (control inflation) and foster full employment. Its primary tool to achieve these two goals is by adjusting interest rates. When prices are rising too quickly and inflation is above the Fed’s 2% target, the Fed will raise rates, which helps the USD value. When inflation falls below 2% or the Unemployment Rate is too high, the Fed may lower interest rates, which weighs on the Greenback.
In extreme situations, the Federal Reserve can also print more Dollars and enact quantitative easing (QE). QE is the process by which the Fed substantially increases the flow of credit in a stuck financial system. It is a non-standard policy measure used when credit has dried up because banks will not lend to each other (out of the fear of counterparty default). It is a last resort when simply lowering interest rates is unlikely to achieve the necessary result. It was the Fed’s weapon of choice to combat the credit crunch that occurred during the Great Financial Crisis in 2008. It involves the Fed printing more Dollars and using them to buy US government bonds predominantly from financial institutions. QE usually leads to a weaker US Dollar.
Quantitative tightening (QT) is the reverse process whereby the Federal Reserve stops buying bonds from financial institutions and does not reinvest the principal from the bonds it holds maturing in new purchases. It is usually positive for the US Dollar.
The Ifo business climate deteriorated further in August, falling from 87.0 to 86.6. Companies are increasingly giving up their hopes of an economic upturn. On the contrary, they now realize that the economy has weakened as of late. This does not bode well for the German economy in the coming months, Commerzbank Senior Economist Dr. Ralph Solveen notes.
German economy set to stagnate for the year as a whole
“More bad news for the German economy: the Ifo business climate fell from 87.0 to 86.6 in August, continuing the downward trend that began in the spring. This means that the indicator's increase in the first few months of this year has proved to be a false signal. A recovery of the German economy in the coming months is becoming increasingly unlikely.”
“A look at the sub-components shows that the decline in August is primarily due to an (even) worse assessment of the current situation. However, expectations have also deteriorated further, having already fallen significantly in recent months. They are now only slightly more positive than at the start of the year. While there have been ups and downs in expectations over the past two years, the assessment of the situation has shown a clear downward trend for almost three years.”
“The current renewed disappointment among companies is more difficult to explain. The adjustment to the higher interest rate level may take longer than expected and the uncertainty among consumers seems to be lasting longer. Added to this are the numerous structural problems in the German economy, which are slowing down the underlying momentum of the economy. This suggests that the German economy will barely grow in the second half of this year and will at best stagnate for the year as a whole. We expect a meagre increase of 0.5% for 2025.”
- AUD/USD drops from 0.6800 with Aussie inflation in focus.
- The monthly Australian CPI is expected to have declined to 3.4% in July from 3.8% in June.
- Investors see the Fed starting to reduce interest rates in September.
The AUD/USD pair slides from the monthly high of 0.6800 in Monday’s European session. The Aussie asset drops as the Australian Dollar (AUD) weakens amid uncertainty ahead of the monthly Consumer Price Index (CPI) data for July, which will be published on Wednesday.
The inflation data is expected to show that the annual CPI decelerated to 3.4% from 3.8% in June, which will prompt expectations that the Reserve Bank of Australia (RBA) could consider interest rate cuts this year.
The recent release of the RBA minutes indicated that the RBA is unlikely to cut its Official Cash Rate (OCR) in the remaining year as it will remain vigilant to upside risks to inflation.
Meanwhile, upbeat market sentiment fails to uplift the Australian Dollar. The market mood seems favorable for risky assets as traders have fully priced in the Federal Reserve (Fed) interest rate cuts in September. S&P 500 futures have posted decent gains in the European session. The US Dollar Index (DXY), which tracks the Greenback’s value against six major currencies, edges high after posting a fresh year-to-date (YTD) low of 100.53.
Market speculation for Fed interest rate cuts appears to be certain as Fed Chair Jerome Powell said in his speech at the Jackson Hole (JH) Symposium on Friday, “The time has come for policy to adjust.”
Going forward, investors will focus on the US Durable Goods Orders data for July, which will be published at 12:30 GMT. New Orders for Durable Goods, a key measure of core consumer inflation, is estimated to have grown at a robust pace of 4% after a significant decline in June.
Australian Dollar FAQs
One of the most significant factors for the Australian Dollar (AUD) is the level of interest rates set by the Reserve Bank of Australia (RBA). Because Australia is a resource-rich country another key driver is the price of its biggest export, Iron Ore. The health of the Chinese economy, its largest trading partner, is a factor, as well as inflation in Australia, its growth rate and Trade Balance. Market sentiment – whether investors are taking on more risky assets (risk-on) or seeking safe-havens (risk-off) – is also a factor, with risk-on positive for AUD.
The Reserve Bank of Australia (RBA) influences the Australian Dollar (AUD) by setting the level of interest rates that Australian banks can lend to each other. This influences the level of interest rates in the economy as a whole. The main goal of the RBA is to maintain a stable inflation rate of 2-3% by adjusting interest rates up or down. Relatively high interest rates compared to other major central banks support the AUD, and the opposite for relatively low. The RBA can also use quantitative easing and tightening to influence credit conditions, with the former AUD-negative and the latter AUD-positive.
China is Australia’s largest trading partner so the health of the Chinese economy is a major influence on the value of the Australian Dollar (AUD). When the Chinese economy is doing well it purchases more raw materials, goods and services from Australia, lifting demand for the AUD, and pushing up its value. The opposite is the case when the Chinese economy is not growing as fast as expected. Positive or negative surprises in Chinese growth data, therefore, often have a direct impact on the Australian Dollar and its pairs.
Iron Ore is Australia’s largest export, accounting for $118 billion a year according to data from 2021, with China as its primary destination. The price of Iron Ore, therefore, can be a driver of the Australian Dollar. Generally, if the price of Iron Ore rises, AUD also goes up, as aggregate demand for the currency increases. The opposite is the case if the price of Iron Ore falls. Higher Iron Ore prices also tend to result in a greater likelihood of a positive Trade Balance for Australia, which is also positive of the AUD.
The Trade Balance, which is the difference between what a country earns from its exports versus what it pays for its imports, is another factor that can influence the value of the Australian Dollar. If Australia produces highly sought after exports, then its currency will gain in value purely from the surplus demand created from foreign buyers seeking to purchase its exports versus what it spends to purchase imports. Therefore, a positive net Trade Balance strengthens the AUD, with the opposite effect if the Trade Balance is negative.
The time is ripe for interest rate cuts – that was Fed Chair Jay Powell's key message on Friday in Jackson Hole. How fast and how far the interest rate cut cycle will go? Powell could only say: It depends on the data, Commerzbank’s Head of FX and Commodity Research Ulrich Leuchtmann notes.
USD weakness after Powell's speech in Jackson Hole
“The USD sell-off continued forcefully. Even without any surprising dovishness of the chairman. The market's expectations (those implicit in the fed funds futures) of what the Fed will do in September, November and December have hardly changed as a result of Powell's speech. They had already fallen after the last US labor market report.”
“The only thing that helps here is to understand exchange rate changes as shifts in risk premiums for one currency or another. Anyone selling USD today must be aware of the risk that the Fed will eventually switch back to a more restrictive monetary policy and that the long-term US real interest rate expectations that are priced in today will turn out to be wrong.”
“For USD exchange rates, this means that this ‘first-cut effect’ currently prevails: the market's increasing confidence in its expectation of lower USD interest rates (in the long term) is more important than the question of where exactly interest rates are expected. However, the market cannot be more than fully convinced. Once it is, it comes down to how low US interest rates are expected to be.”
The Euro (EUR) is likely to strengthen against the US Dollar (USD) further towards 1.1225, but the significant resistance level at 1.1275 is unlikely to come into view today, UOB Group FX strategists Quek Ser Leang and Lee Sue Ann note.
EUR targets the 2023 high of 1.1275
24-HOUR VIEW: “Last Friday, we expected EUR to trade in a range between 1.1085 and 1.1155. EUR traded sideways until NY trade, when it lifted off and touched 1.1200. EUR closed on a strong note at 1.1190 (+0.70%). While conditions are overbought, strong upward momentum suggests further EUR strength, likely towards 1.1225. The significant resistance level of 1.1275 is unlikely to come into view today. Support levels are at 1.1165 and 1.1145.”
1-3 WEEKS VIEW: “In our most recent narrative from last Thursday (22 Aug, spot at 1.1155), we indicated that ‘solid momentum after the recent price action indicates further EUR strength is likely.’ However, we noted that ‘it remains to be seen whether the 2023 high of 1.1275 is within reach in the next couple of weeks.’ Last Friday, EUR soared to a high of 1.1200. The boost in momentum has increased the likelihood of EUR reaching 1.1275. Overall, we will continue to hold a positive EUR view provided that the ‘strong support’ level at 1.1105 (level previously at 1.1045) is not breached.”
- NZD/USD is testing the ceiling of its range and is poised to break higher.
- A move above the August 20 high would probably confirm a bullish breakout.
- Such a move could well see the pair reach the 0.6400s.
NZD/USD is testing the ceiling of its sideways range. A break above the August 20 high would probably confirm an upside breakout with substantial gains on the horizon.
NZD/USD 4-hour Chart
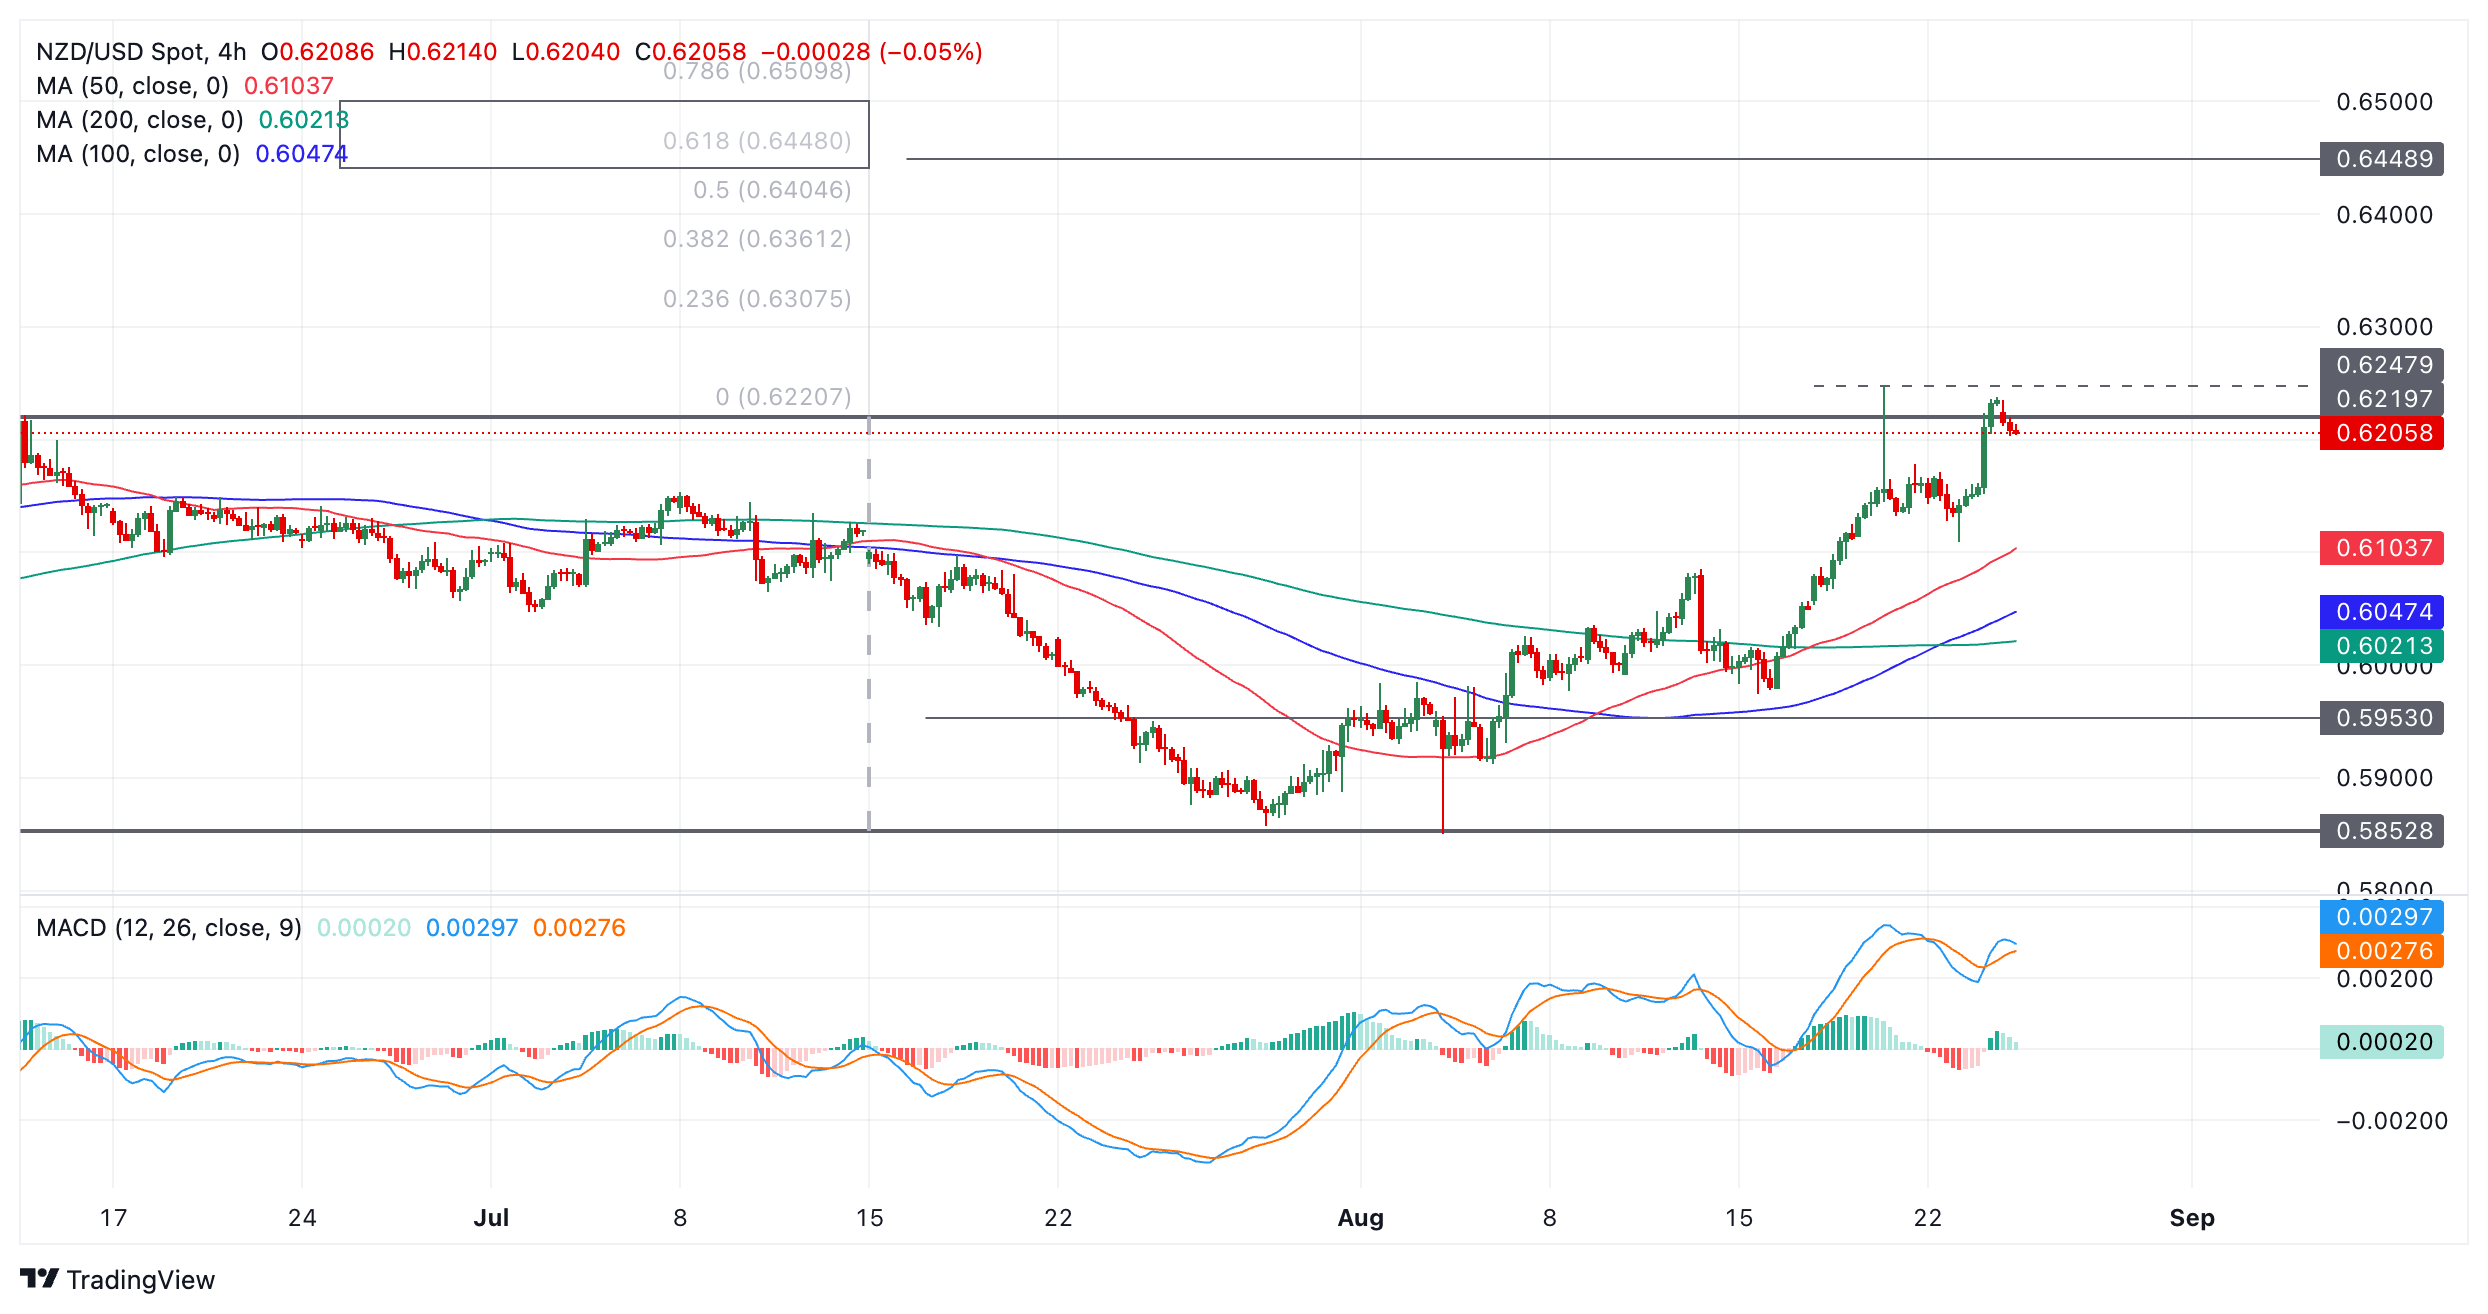
The pair temporarily breached the ceiling of its range on August 20 when it rose up to a high of 0.6248 before rapidly falling back down and forming a bearish Gravestone Doji candlestick in the process. This was followed by only a short period of weakness down to the 0.6109 August 22 swing low, however, before the pair recovered and broke back out of the range again on August 23.
Since then, NZD/USD has pulled back down slightly a break above the 0.6248 August 20 highs, achieving a higher high would probably signal a decisive breakout. Such a breakout would activate the upside target, calculated as the 0.618 ratio of the height of the range extrapolated higher. This gives an upside target of 0.6448 (bold rectangle). Another, more conservative target lies at 0.6409 (December 2023 high).
Such a move would probably also change the short-term trend from sideways to bullish.
A break below the 0.6109 swing low, however, would reconfirm the sideways trend as intact and likely to extend, with a probable down move towards the range lows in the 0.5850s.
The observed exchange rates of the Ruble against the US Dollar (USD) and Euro (EUR) are entirely artificial and detached from fundamentals since the US sanctioning of the Moscow Exchange, which ended trading in these currencies. We retain our forecast that the underlying value of the Ruble against hard currencies such as the Euro or the USD will decline over the longer term as Russia's current account surplus will narrow down progressively, Commerzbank’s FX analyst Tatha Ghose notes.
Technical USD/RUB fix to keep rising
“Even before the US sanctioning of the Moscow exchange (MOEX) and the EU announcing its 14th sanctions package on Russia, USD/RUB and EUR/RUB exchange rates had mainly been ‘technical fixes’ as Russia’s own central bank (CBR) is blocked from transacting in dollars or euros. Now, after USD can no longer be traded on MOEX either, the USD/RUB exchange rate has become even more ‘theoretical’.”
“The published rates are indirectly deduced from OTC and other market sources by CBR – for example, using the cross rate between rouble and CNY. We view such exchange rate quotes as unreliable, and their day-to-day movements probably fictitious. USD/RUB and EUR/RUB exchange rates are set to clear the market for a narrow group of traded items, mainly energy and commodities, for which some counterparties are still free to transact in hard currencies.”
“In the longer-term, we forecast USD/RUB and EUR/RUB to drift up gradually because we expect Russia’s current-account surplus to narrow down. The current-account is only a counterpart to the (shut) capital-account – when one is shut, the other is likely to progressively shut down also, which means that the technical USD/RUB fix will keep rising.”
- EUR/USD struggles to extend its upside above 1.1200 as the ECB is expected to cut interest rates again in September.
- Fed’s Chairman Jerome Powell gives green signal to an interest-rate cut in September.
- Investors await the US core PCE inflation data for July and flash Eurozone HICP for August.
EUR/USD corrects slightly from 1.1200, the highest level seen in more than a year, in Monday’s European session. Still, the broader outlook for the major currency pair is positive as the US Dollar (USD) remains on the backfoot as a Fed rate cut in September is fully priced in.
The US Dollar Index (DXY), which tracks the Greenback’s value against six major currencies, struggles to gain ground after posting a fresh year-to-date (YTD) low of 100.53.
Market expectations for Fed interest rate cuts in September appear to be certain as Fed Chair Jerome Powell said in his speech at the Jackson Hole (JH) Symposium on Friday that “the time has come for policy to adjust”.. Powell’s speech suggested that the central bank is more concerned about growing risks in the labor market, while it is gaining confidence that inflation is sustainably on track to the desired rate of 2%. "We will do everything we can to support a strong labor market, Powell added"
Even though the Fed is widely anticipated to deliver an interest rate cut in September, traders remain split over its size. According to the CME FedWatch tool, 30-day Federal Funds futures pricing data shows that the likelihood of a 50-basis point (bps) interest-rate reduction is at 36.5%, while the remaining 63.5% points to a smaller 25 bps cut.
On the economic data front, investors await the United States (US) Durable Goods Orders data for July, which will be published at 12:30 GMT. Economists estimate that fresh orders for Durable Goods rose by 4% after contracting by 6.7% in June.
This week, the major trigger for the US Dollar will likely be the US core Personal Consumption Expenditure Price Index (PCE) data for July, which will be published on Friday. The Fed’s preferred inflation measure is estimated to have grown at a steady pace of 0.2% month-over-month.
Daily digest market movers: EUR/USD corrects mildly on ECB rate cut bets
- EUR/USD trades close to a fresh YTD high of 1.1200 in European trading hours. The major currency pair edges lower as the Euro (EUR) underperforms its major peers amid growing speculation that the European Central Bank (ECB) will reduce interest rates again in the September meeting. The ECB is also expected to deliver one more interest rate cut in the last quarter of this year.
- Market expectations for ECB interest rate cuts in September have increased due to rising uncertainty over the Eurozone economic outlook and easing wage growth. Economic activity in the Eurozone surprisingly rose in August, as shown by the flash HCOB PMI report, but this rebound was largely driven by strong demand in France due to the Olympics in Paris. Economists considered it a one-time event and not a structural change.
- On the contrary, ECB Chief Economist Philip Lane said at the JH Symposium on Saturday that the monetary policy needs to be restrictive. Lane acknowledged that the ECB has made some progress in inflation but also said that the success over inflation is not assured, Reuters reported.
- For more cues on the interest rate guidance, investors will focus on the preliminary German and Eurozone Harmonized Index of Consumer Prices (HICP) data for August, which will be published on Thursday and Friday, respectively. Eurozone annual headline and core HICP, which excludes volatile items, are estimated to have decelerated to 2.3% and 2.8% respectively.
- Meanwhile, the IFO Institute reported on Monday that the German Business Climate, Current Assessment, and Expectations of August beat expectations but remained lower than July’s readings. The reading failed to provide any significant impetus to the EUR/USD pair.
Technical Analysis: EUR/USD delivers fresh swing high at 1.1200
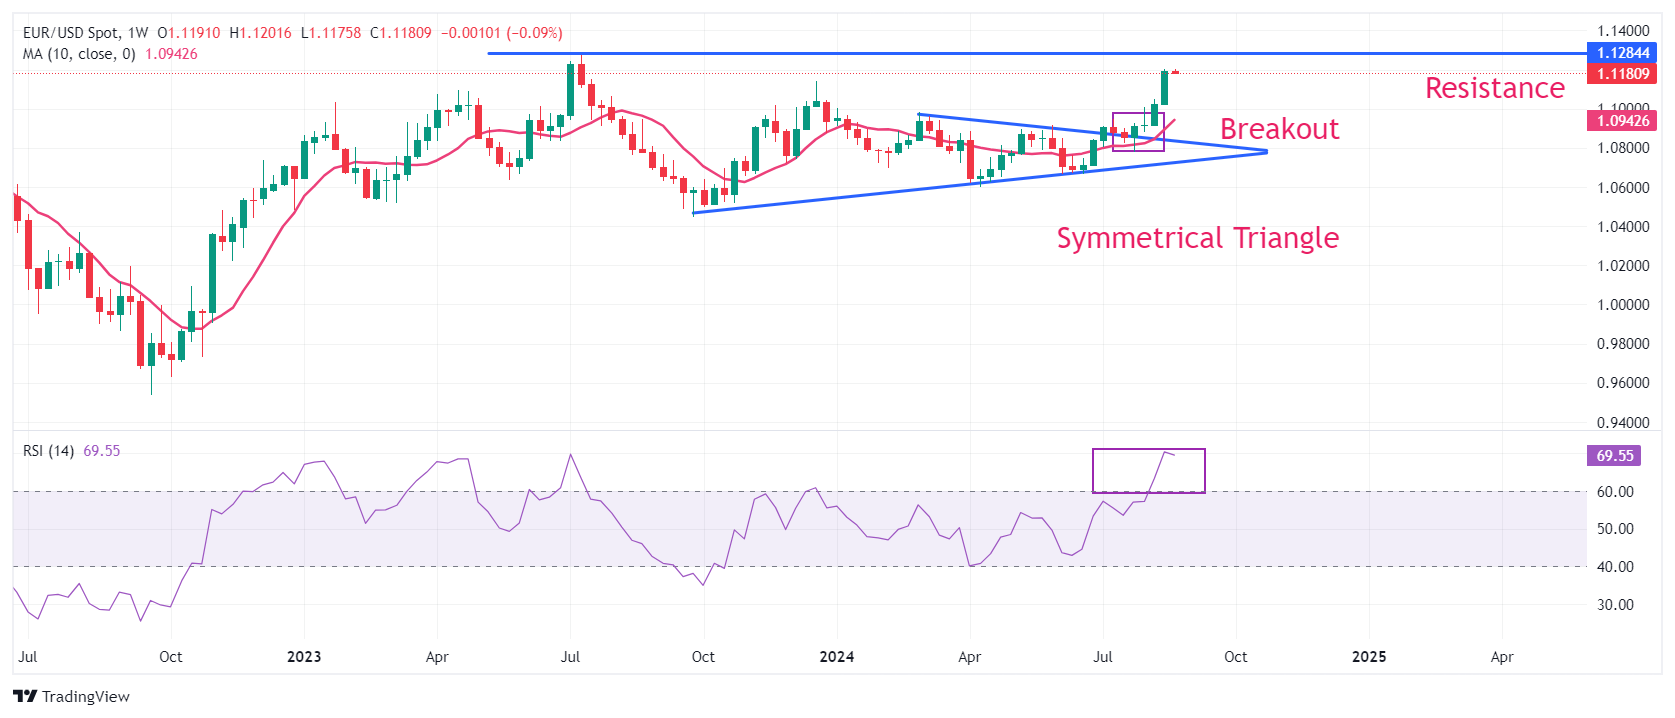
EUR/USD posted a fresh swing high at 1.1200 on the weekly timeframe, suggesting a bullish reversal. The major currency pair strengthened after a breakout of the Symmetrical Triangle chart pattern. The upward-sloping 10-week Exponential Moving Average (EMA) near 1.0940 warrants more upside ahead.
The 14-period Relative Strength Index (RSI) oscillates in the bullish range of 60.00-80.00, suggesting a strong upside momentum. Still, it has reached overbought levels at around 70.00, increasing the chances of a corrective pullback. On the upside, the July 2023 high at 1.1275 will be the next target for the Euro bulls.
Euro FAQs
The Euro is the currency for the 20 European Union countries that belong to the Eurozone. It is the second most heavily traded currency in the world behind the US Dollar. In 2022, it accounted for 31% of all foreign exchange transactions, with an average daily turnover of over $2.2 trillion a day. EUR/USD is the most heavily traded currency pair in the world, accounting for an estimated 30% off all transactions, followed by EUR/JPY (4%), EUR/GBP (3%) and EUR/AUD (2%).
The European Central Bank (ECB) in Frankfurt, Germany, is the reserve bank for the Eurozone. The ECB sets interest rates and manages monetary policy. The ECB’s primary mandate is to maintain price stability, which means either controlling inflation or stimulating growth. Its primary tool is the raising or lowering of interest rates. Relatively high interest rates – or the expectation of higher rates – will usually benefit the Euro and vice versa. The ECB Governing Council makes monetary policy decisions at meetings held eight times a year. Decisions are made by heads of the Eurozone national banks and six permanent members, including the President of the ECB, Christine Lagarde.
Eurozone inflation data, measured by the Harmonized Index of Consumer Prices (HICP), is an important econometric for the Euro. If inflation rises more than expected, especially if above the ECB’s 2% target, it obliges the ECB to raise interest rates to bring it back under control. Relatively high interest rates compared to its counterparts will usually benefit the Euro, as it makes the region more attractive as a place for global investors to park their money.
Data releases gauge the health of the economy and can impact on the Euro. Indicators such as GDP, Manufacturing and Services PMIs, employment, and consumer sentiment surveys can all influence the direction of the single currency. A strong economy is good for the Euro. Not only does it attract more foreign investment but it may encourage the ECB to put up interest rates, which will directly strengthen the Euro. Otherwise, if economic data is weak, the Euro is likely to fall. Economic data for the four largest economies in the euro area (Germany, France, Italy and Spain) are especially significant, as they account for 75% of the Eurozone’s economy.
Another significant data release for the Euro is the Trade Balance. This indicator measures the difference between what a country earns from its exports and what it spends on imports over a given period. If a country produces highly sought after exports then its currency will gain in value purely from the extra demand created from foreign buyers seeking to purchase these goods. Therefore, a positive net Trade Balance strengthens a currency and vice versa for a negative balance.
- Gold extends its rally from Fed Chair Powell’s speech on Friday as Middle East tensions ratcheted up over the weekend.
- The precious metal was already rallying after the Fed chair’s speech signaled the beginning of a lower interest-rate regime.
- Technically, XAU/USD resumes its overall uptrending bias and edges towards its next target at $2,550.
Gold (XAU/USD) trades up into the $2,520s on Monday, as a combination of safe-haven demand sparked by rising geopolitical tensions in the Middle East, and increased confidence US interest rates will track lower in the medium-to-long term, make the non-interest paying asset more attractive to investors.
Gold edges higher as risk aversion helps safe-haven demand
Gold trades higher on Monday as geopolitical risk aversion increases investor demand for safe-havens, of which Gold is a notable example.
Rising tensions in the Middle East are a factor, after the Israelis launched a mass pre-emptive strike on Hezbollah positions in Lebanon over the weekend. Hezbollah then retaliated with a hail of missiles and drone strikes in northern Israel. Fears Iran could enter the conflict after weeks of threats also persist.
Powell speech drives Gold higher after sea change in language
Gold rose over a percentage point on Friday after the Chairman of the Federal Reserve (Fed) Jerome Powell made a speech at the Jackson Hole central banking symposium, in which he gave the clearest signals yet that the Fed is going to cut interest rates.
Powell raised concerns that the US labor market is slowing down due to the impact of continuously high interest rates, which have remained at a peak range of 5.25%-5.50% since July 2023. Whilst these had successfully reduced inflation, they were now having a negative impact on company hiring.
“Upside risks to inflation have diminished, downside risks to employment have increased,” said Powell, adding that “Labor market cooling is unmistakable, no longer overheated."
US government bond yields, which reflect investors' outlook for inflation and interest rates, fell after his speech. The yellow metal tends to appreciate when yields drop as it reduces the opportunity cost of holding non-interest paying Gold.
The US Dollar Index (DXY), which measures the strength of the Dollar against a trade-weighted basket, – and is negatively correlated to Gold – sank to a new year-to-date low of 100.53 on Monday morning as traders continued to digest Powell’s comments.
Gold has benefited from elevated expectations that the Fed will make a “mega” 0.50% interest-rate cut in September – double the usual 0.25% reduction. From a probability in the mid-20% prior to his speech, the chances of such a bumper cut have risen back up to the mid-30% afterward, according to the CME FedWatch tool, which uses the price of 30-day fed fund futures in its calculations.
Technical Analysis: Gold extends bounce from top of old range
Gold (XAU/USD) extends the rebound from support at the top of its old range. Despite trading sideways recently, the pair remains in an uptrend and given “the trend is your friend” this continues to favor longs over shorts.
XAU/USD Daily Chart
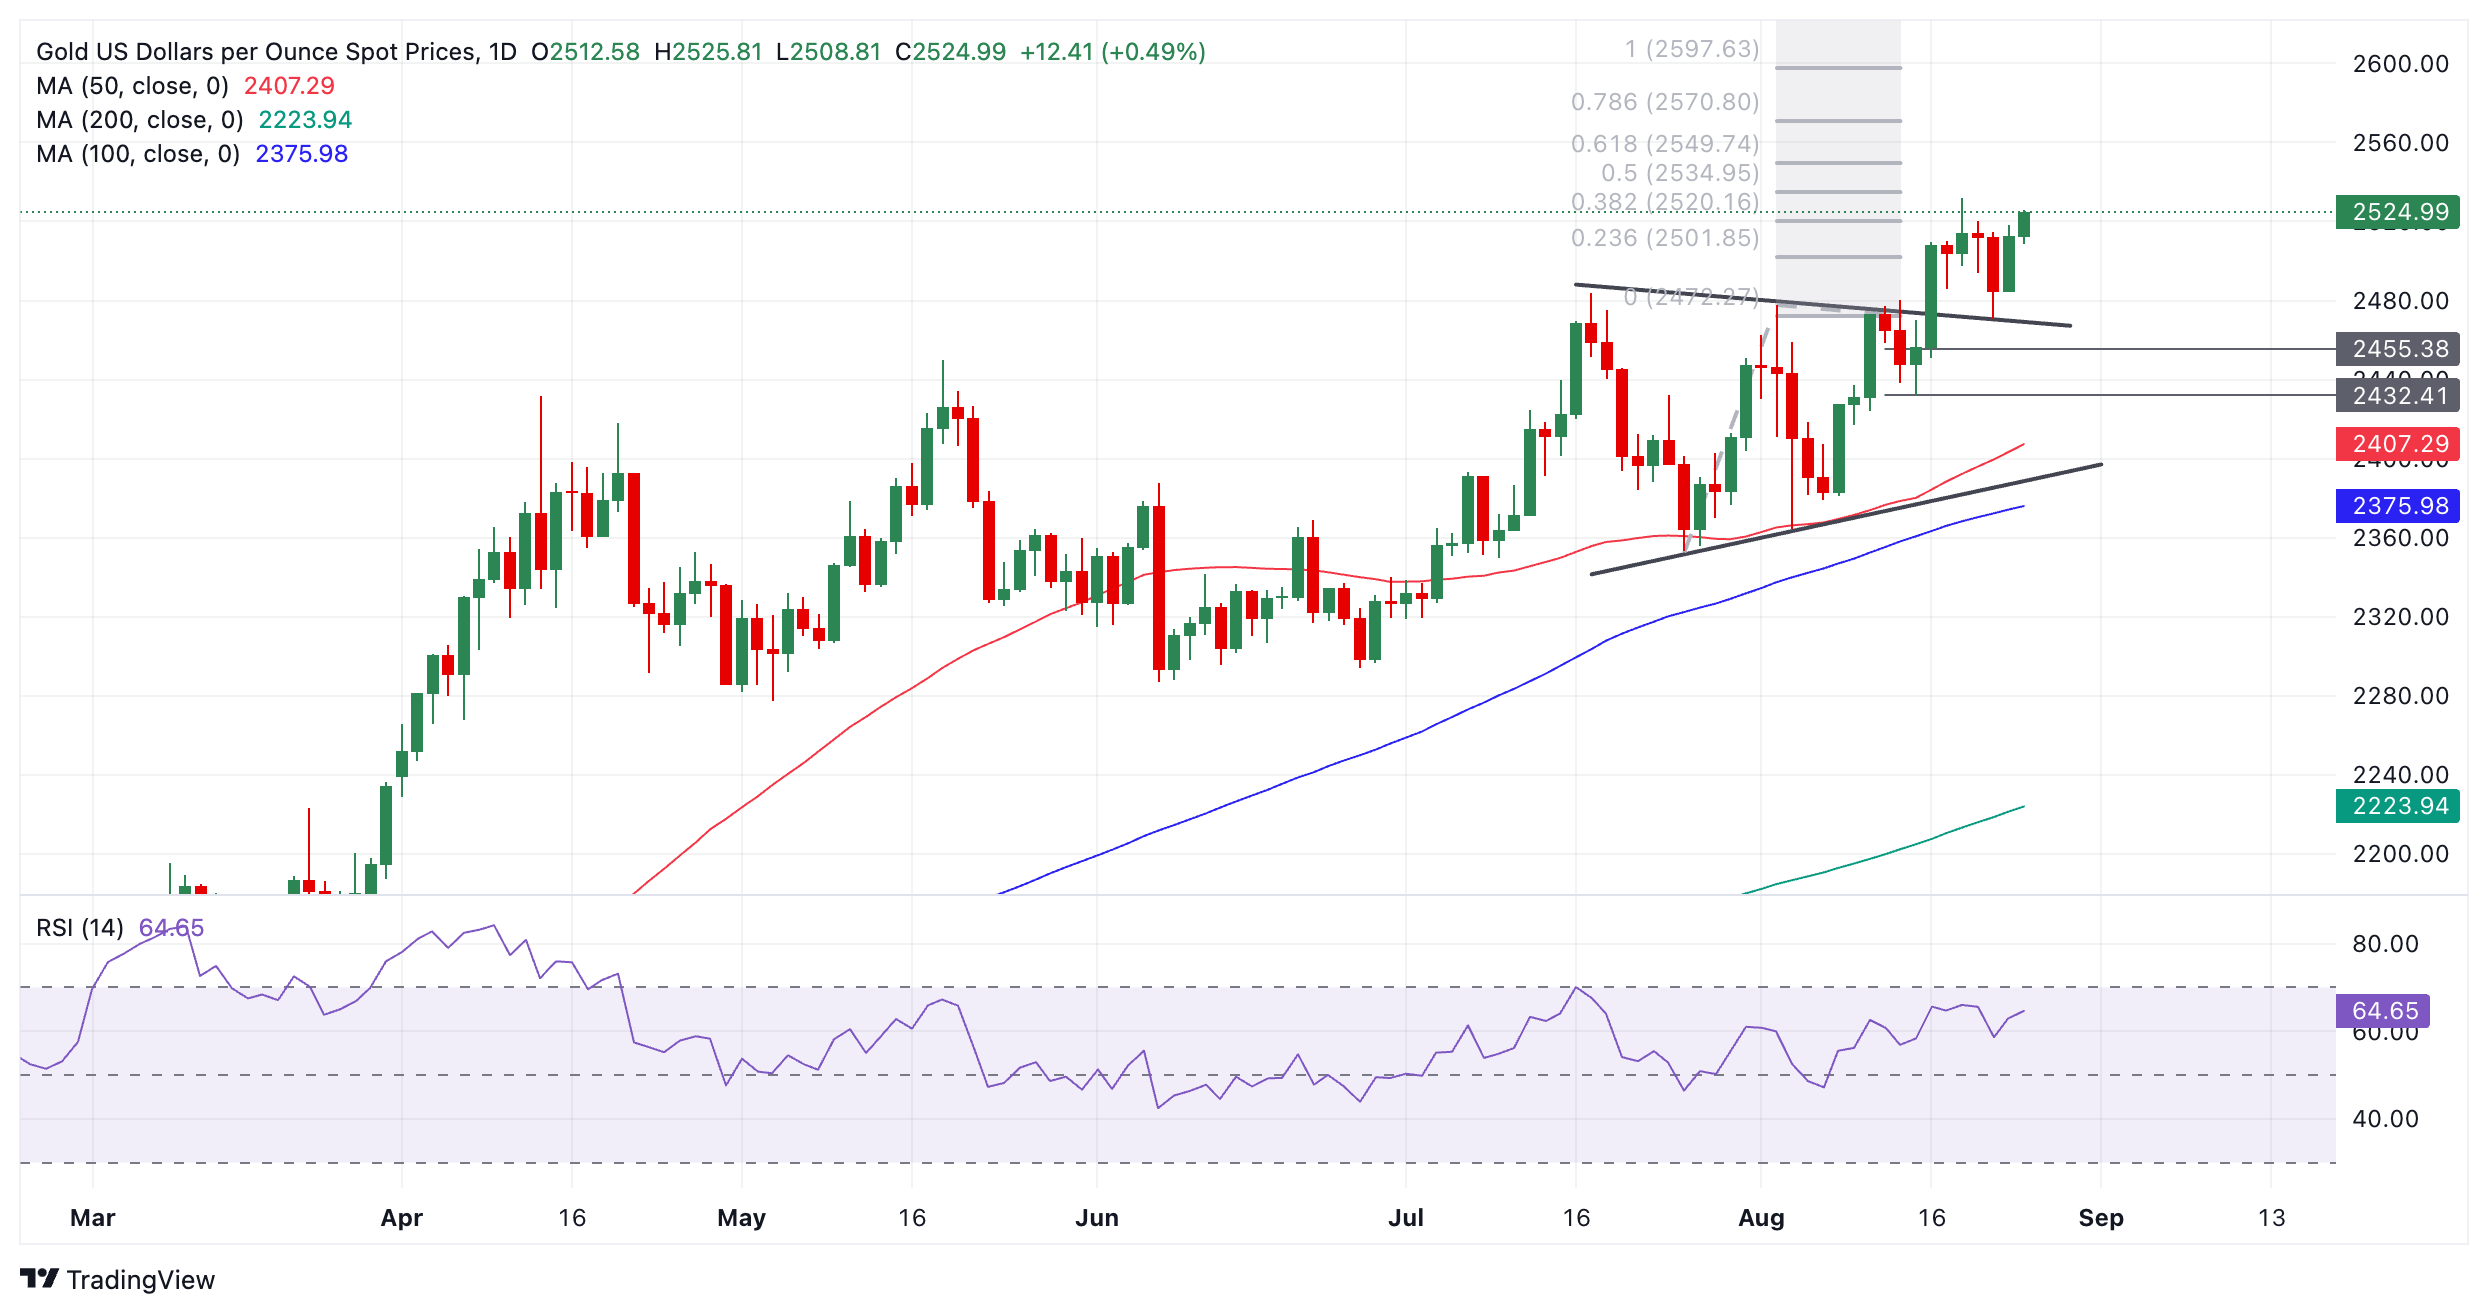
The breakout of the range on August 14 generated an upside target at roughly $2,550, calculated by taking the 0.618 Fibonacci ratio of the range’s height and extrapolating it higher. This target is the minimum expectation for a follow-through after a breakout based on principles of technical analysis.
A break above the $2,531 all-time high from August 20 would provide added confirmation of a continuation higher towards the $2,550 target.
Alternatively, a break back inside the range would negate the upside projected target. Such a move would be confirmed on a close below $2,470 (August 22 low). It would change the picture for Gold and bring the short-term uptrend into doubt.
Gold is in a broad uptrend on medium and long-term time frames, however, which further supports an overall bullish outlook for the precious metal.
Economic Indicator
Fed's Chair Powell speech
Jerome H. Powell took office as a member of the Board of Governors of the Federal Reserve System on May 25, 2012, to fill an unexpired term. On November 2, 2017, President Donald Trump nominated Powell to serve as the next Chairman of the Federal Reserve. Powell assumed office as Chair on February 5, 2018.
Read more.Last release: Fri Aug 23, 2024 14:00
Frequency: Irregular
Actual: -
Consensus: -
Previous: -
Source: Federal Reserve
Silver prices (XAG/USD) rose on Monday, according to FXStreet data. Silver trades at $30.10 per troy ounce, up 0.87% from the $29.84 it cost on Friday.
Silver prices have increased by 26.48% since the beginning of the year.
| Unit measure | Silver Price Today in USD |
|---|---|
| Troy Ounce | 30.10 |
| 1 Gram | 0.97 |
The Gold/Silver ratio, which shows the number of ounces of Silver needed to equal the value of one ounce of Gold, stood at 83.89 on Monday, down from 84.22 on Friday.
Silver FAQs
Silver is a precious metal highly traded among investors. It has been historically used as a store of value and a medium of exchange. Although less popular than Gold, traders may turn to Silver to diversify their investment portfolio, for its intrinsic value or as a potential hedge during high-inflation periods. Investors can buy physical Silver, in coins or in bars, or trade it through vehicles such as Exchange Traded Funds, which track its price on international markets.
Silver prices can move due to a wide range of factors. Geopolitical instability or fears of a deep recession can make Silver price escalate due to its safe-haven status, although to a lesser extent than Gold's. As a yieldless asset, Silver tends to rise with lower interest rates. Its moves also depend on how the US Dollar (USD) behaves as the asset is priced in dollars (XAG/USD). A strong Dollar tends to keep the price of Silver at bay, whereas a weaker Dollar is likely to propel prices up. Other factors such as investment demand, mining supply – Silver is much more abundant than Gold – and recycling rates can also affect prices.
Silver is widely used in industry, particularly in sectors such as electronics or solar energy, as it has one of the highest electric conductivity of all metals – more than Copper and Gold. A surge in demand can increase prices, while a decline tends to lower them. Dynamics in the US, Chinese and Indian economies can also contribute to price swings: for the US and particularly China, their big industrial sectors use Silver in various processes; in India, consumers’ demand for the precious metal for jewellery also plays a key role in setting prices.
Silver prices tend to follow Gold's moves. When Gold prices rise, Silver typically follows suit, as their status as safe-haven assets is similar. The Gold/Silver ratio, which shows the number of ounces of Silver needed to equal the value of one ounce of Gold, may help to determine the relative valuation between both metals. Some investors may consider a high ratio as an indicator that Silver is undervalued, or Gold is overvalued. On the contrary, a low ratio might suggest that Gold is undervalued relative to Silver.
(An automation tool was used in creating this post.)
- AUD/JPY edges lower following the hawkish speech by the BoJ Governor Ueda in Parliament.
- The BoJ could raise interest rates further if its economic projections are accurate.
- The downside of the Aussie Dollar may be limited due to the hawkish RBA.
AUD/JPY halts its three-day winning streak, trading around 97.50 during the European hours on Monday. The Japanese Yen (JPY) gained ground against the Australian Dollar (AUD) as Bank of Japan (BoJ) Governor Kazuo Ueda delivered a hawkish speech in Parliament on Friday.
BoJ Governor Ueda said that the central bank could raise interest rates further if its economic projections are accurate. Additionally, recent Japan’s inflation data reinforced the BoJ’s hawkish stance on its policy outlook.
Japan's National Consumer Price Index (CPI) rose by 2.8% year-on-year in July, maintaining this rate for the third consecutive month and holding steady at its highest level since February. The National CPI excluding Fresh Food also rose by 2.7%, matching expectations and reaching its highest level since February.
However, the downside of the AUD/JPY cross could be limited as the Australian Dollar may gain ground due to the rising market optimism following the dovish speech from the US Federal Reserve (Fed) Chairman Jerome Powell at the Jackson Hole Symposium on Friday.
The Aussie Dollar may also receive support from the hawkish sentiment surrounding the Reserve Bank of Australia (RBA) regarding its policy outlook. the recent RBA Minutes showed that the board members agreed that a rate cut is unlikely soon. Additionally, RBA Governor Michele Bullock expressed that the Australian central bank will not hesitate to raise rates again to combat inflation if needed.
Australian Dollar PRICE Today
The table below shows the percentage change of Australian Dollar (AUD) against listed major currencies today. Australian Dollar was the weakest against the Japanese Yen.
| USD | EUR | GBP | JPY | CAD | AUD | NZD | CHF | |
|---|---|---|---|---|---|---|---|---|
| USD | 0.09% | 0.15% | -0.27% | -0.04% | 0.30% | 0.29% | -0.25% | |
| EUR | -0.09% | -0.01% | -0.35% | -0.12% | 0.11% | 0.20% | -0.31% | |
| GBP | -0.15% | 0.00% | -0.47% | -0.17% | 0.11% | 0.14% | -0.36% | |
| JPY | 0.27% | 0.35% | 0.47% | 0.26% | 0.65% | 0.79% | 0.13% | |
| CAD | 0.04% | 0.12% | 0.17% | -0.26% | 0.32% | 0.36% | -0.19% | |
| AUD | -0.30% | -0.11% | -0.11% | -0.65% | -0.32% | 0.09% | -0.42% | |
| NZD | -0.29% | -0.20% | -0.14% | -0.79% | -0.36% | -0.09% | -0.51% | |
| CHF | 0.25% | 0.31% | 0.36% | -0.13% | 0.19% | 0.42% | 0.51% |
The heat map shows percentage changes of major currencies against each other. The base currency is picked from the left column, while the quote currency is picked from the top row. For example, if you pick the Australian Dollar from the left column and move along the horizontal line to the US Dollar, the percentage change displayed in the box will represent AUD (base)/USD (quote).
Interest rates FAQs
Interest rates are charged by financial institutions on loans to borrowers and are paid as interest to savers and depositors. They are influenced by base lending rates, which are set by central banks in response to changes in the economy. Central banks normally have a mandate to ensure price stability, which in most cases means targeting a core inflation rate of around 2%. If inflation falls below target the central bank may cut base lending rates, with a view to stimulating lending and boosting the economy. If inflation rises substantially above 2% it normally results in the central bank raising base lending rates in an attempt to lower inflation.
Higher interest rates generally help strengthen a country’s currency as they make it a more attractive place for global investors to park their money.
Higher interest rates overall weigh on the price of Gold because they increase the opportunity cost of holding Gold instead of investing in an interest-bearing asset or placing cash in the bank. If interest rates are high that usually pushes up the price of the US Dollar (USD), and since Gold is priced in Dollars, this has the effect of lowering the price of Gold.
The Fed funds rate is the overnight rate at which US banks lend to each other. It is the oft-quoted headline rate set by the Federal Reserve at its FOMC meetings. It is set as a range, for example 4.75%-5.00%, though the upper limit (in that case 5.00%) is the quoted figure. Market expectations for future Fed funds rate are tracked by the CME FedWatch tool, which shapes how many financial markets behave in anticipation of future Federal Reserve monetary policy decisions.
- EUR/GBP holds ground after the release of positive German figures on Monday.
- German IFO – Business Climate came in at 86.6 for August, exceeding the expected reading of 86.5.
- BoE Governor Bailey suggested the possibility of accelerating rate cuts during his speech at the Jackson Hole symposium.
EUR/GBP attempts to halt its three-day losing streak following key economic data from Germany released on Monday, trading around 0.8470 during Monday’s European session.
The German IFO Business Climate index for August came in at 86.6, slightly above the market expectations of 86.5. However, this was a decrease from the previous month's reading of 87.0. Meanwhile, the IFO Current Assessment matched expectations with a reading of 86.5, down from 87.1 in the previous month.
On Friday, European Central Bank (ECB) Governing Council member Olli Rehn suggested that the recent drop in inflation, combined with economic weakness in the Eurozone, strengthens the argument for lowering borrowing costs next month, Bloomberg reports.
The sluggish growth outlook in Europe, especially in the manufacturing sector, further reinforces the case for a rate cut in September. Additionally, markets are assessing how the increasing expectations of Federal Reserve rate cuts might impact borrowing costs in Europe.
At the Jackson Hole symposium, Bank of England (BoE) Governor Andrew Bailey hinted at the possibility of faster rate cuts, pointing to a quicker-than-expected decrease in inflation. However, Bailey emphasized the need for caution until inflation consistently meets targets, following last month’s rate reduction from 5.25% to 5.0%.
However, speculation that the BoE’s policy-easing cycle may proceed more slowly than those of other major central banks is lending some support to the Pound Sterling (GBP).
Euro PRICE Today
The table below shows the percentage change of Euro (EUR) against listed major currencies today. Euro was the strongest against the New Zealand Dollar.
| USD | EUR | GBP | JPY | CAD | AUD | NZD | CHF | |
|---|---|---|---|---|---|---|---|---|
| USD | 0.08% | 0.16% | -0.29% | -0.04% | 0.25% | 0.22% | -0.19% | |
| EUR | -0.08% | 0.02% | -0.34% | -0.11% | 0.08% | 0.15% | -0.25% | |
| GBP | -0.16% | -0.02% | -0.47% | -0.19% | 0.05% | 0.06% | -0.34% | |
| JPY | 0.29% | 0.34% | 0.47% | 0.25% | 0.60% | 0.71% | 0.17% | |
| CAD | 0.04% | 0.11% | 0.19% | -0.25% | 0.28% | 0.29% | -0.16% | |
| AUD | -0.25% | -0.08% | -0.05% | -0.60% | -0.28% | 0.06% | -0.33% | |
| NZD | -0.22% | -0.15% | -0.06% | -0.71% | -0.29% | -0.06% | -0.41% | |
| CHF | 0.19% | 0.25% | 0.34% | -0.17% | 0.16% | 0.33% | 0.41% |
The heat map shows percentage changes of major currencies against each other. The base currency is picked from the left column, while the quote currency is picked from the top row. For example, if you pick the Euro from the left column and move along the horizontal line to the US Dollar, the percentage change displayed in the box will represent EUR (base)/USD (quote).
- German IFO Business Climate Index beats estimates 86.6 with in August.
- The IFO Current Economic Assessment Index eased to 86.5 in the reported month.
The headline German IFO Business Climate Index arrived at 86.6 in August, easing from the July figure of 87.0. The market consensus was 86.5.
Meanwhile, the Current Economic Assessment Index declined to 86.5 in the same period from 87.1 in July, matching the expected 86.5 print.
The IFO Expectations Index – indicating firms’ projections for the next six months, dropped to 86.8 in August vs. 87.0 in July and 86.5 expected.
Market reaction to the German IFO Survey
EUR/USD fails to find any inspiration from the mixed German IFO survey. At the time of writing, the pair is trading 0.08% lower on the day at 1.1180, awaiting the US Durable Goods Orders data.
About German IFO
The headline IFO business climate index was rebased and recalibrated in August after the IFO Research Institute changed the series from the base year of 2000 to the base year of 2005 as of August 2011 and then changed series to include services as of August 2018. The survey now includes 9,000 monthly survey responses from firms in the manufacturing, service sector, trade and construction.
- The Mexican Peso is trading lower in key pairs on risk aversion from the escalating Middle East conflict.
- Carry-trade outflows on the back of a strengthening Yen are further headwinds.
- Technically, USD/MXN pulls back within a rising channel.
The Mexican Peso (MXN) is trading about half a percent lower in its most-traded pairs on Monday morning as traders arrive at their desks after the weekend break.
Fears of an escalation in the Middle East after a bloody exchange between Israel and Hezbollah is weighing on riskier assets, including the MXN, and the continued appreciation of the Japanese Yen (JPY) suggests more outflows from the carry-trade, of which the Peso has been a key beneficiary.
Mexican Peso benefits from Fed Powell’s Jackson Hole speech
The Mexican Peso experienced a temporary recovery on Friday, triggered by a speech from the Chairman of the Federal Reserve (Fed) Jerome Powell at the Jackson Hole banking symposium, in which he confirmed the Fed would be cutting interest rates. Powell said a noted slowdown in the US labor market was a key reason to lower borrowing costs.
“The timing and pace of rate cuts will depend on incoming data,” said Powell, adding, "upside risks to inflation have diminished, downside risks to employment have increased."
His comments sent the US Dollar (USD) lower in its pairs since the expectation of lower interest rates is negative for a currency as it usually results in a fall in foreign capital inflows. USD/MXN ended the day down over two percent. EUR/MXN and GBP/MXN also fell, but to a lesser degree.
After Powell’s speech other Fed officials chimed in with similar opinions. Chicago Fed President Austan Goolsbee said attention needed to be given to the cooling job market since inflation was now on its way sustainably lower, in an interview with Bloomberg News. Philadelphia Fed’s Patrick Harker said the Fed needed to be methodical in its approach to reducing interest rates, cautioning, perhaps, against any large step-decreases in interest rates.
Overall the Mexican Peso is in a downtrend, and despite Friday’s recovery rally still ended the week substantially weaker in its key pairs. A combination of factors, including cooler-than-expected Mexican inflation data for August, weaker retail sales in July and resurfacing concerns regarding the impact of proposed changes to the Mexican constitution by the new government, have been posited as factors weighing on the currency.
Carry-trade outflows a headwind
The carry trade – which benefited the Peso with high inflows of foreign capital for several years – is unwinding, adding a further negative background factor for MXN. The investment operation involves traders borrowing in a currency where interest rates are low – like the Japanese Yen (JPY) – in order to purchase a currency where interest rates are high – like the Peso.
Assuming no change in the exchange rate, traders pocket the difference between the interest they have to pay on the loan and the interest they earn from the investment. However, given the Japanese Yen (JPY) is now trending higher and the Mexican Peso lower, the carry trade is not as profitable as it used to be, and this is causing outflows from MXN.
Part of the reason for the popularity of the Peso in the carry trade is the relatively high interest rates in Mexico. These, which are set by the Banco de Mexico (Banxico), peaked at 11.25% in 2023. However, the bank has since cut them to 10.75% in two 0.25% reductions.
In August, Banxico surprised markets by cutting rates by 0.25%. The release of the August Banxico meeting Minutes last week, however, shows the decision was only narrowly agreed on, with two of the members of the five-person Banxico board voting against a cut. This suggests further rate cuts may be delayed or implemented at a more leisurely pace – a mildly supportive counterfactor for MXN.
At the time of writing, one US Dollar (USD) buys 19.23 Mexican Pesos, EUR/MXN trades at 21.52, and GBP/MXN at 25.40.
Technical Analysis: USD/MXN pulls back within rising channel
USD/MXN is in a broad uptrend within a rising channel, which overall favors longs over shorts.
After Friday’s decline, however, the short-term trend is unclear and despite the overall bullish technical position there is a risk of more weakness, perhaps back down to the lower channel line at around 18.55. A break below 19.00 would confirm more downside.
USD/MXN Daily Chart
That said, the overall trend on the medium and longer-term time frames is arguably up, suggesting a bullish backdrop. This could easily stimulate a quick recovery and continuation of the up leg seen since August 19, towards a target at the channel highs at circa 20.50.
A break above the 19.53 swing high of August 22 would provide additional confirmation of the continuation of the up leg.
Mexican Peso FAQs
The Mexican Peso (MXN) is the most traded currency among its Latin American peers. Its value is broadly determined by the performance of the Mexican economy, the country’s central bank’s policy, the amount of foreign investment in the country and even the levels of remittances sent by Mexicans who live abroad, particularly in the United States. Geopolitical trends can also move MXN: for example, the process of nearshoring – or the decision by some firms to relocate manufacturing capacity and supply chains closer to their home countries – is also seen as a catalyst for the Mexican currency as the country is considered a key manufacturing hub in the American continent. Another catalyst for MXN is Oil prices as Mexico is a key exporter of the commodity.
The main objective of Mexico’s central bank, also known as Banxico, is to maintain inflation at low and stable levels (at or close to its target of 3%, the midpoint in a tolerance band of between 2% and 4%). To this end, the bank sets an appropriate level of interest rates. When inflation is too high, Banxico will attempt to tame it by raising interest rates, making it more expensive for households and businesses to borrow money, thus cooling demand and the overall economy. Higher interest rates are generally positive for the Mexican Peso (MXN) as they lead to higher yields, making the country a more attractive place for investors. On the contrary, lower interest rates tend to weaken MXN.
Macroeconomic data releases are key to assess the state of the economy and can have an impact on the Mexican Peso (MXN) valuation. A strong Mexican economy, based on high economic growth, low unemployment and high confidence is good for MXN. Not only does it attract more foreign investment but it may encourage the Bank of Mexico (Banxico) to increase interest rates, particularly if this strength comes together with elevated inflation. However, if economic data is weak, MXN is likely to depreciate.
As an emerging-market currency, the Mexican Peso (MXN) tends to strive during risk-on periods, or when investors perceive that broader market risks are low and thus are eager to engage with investments that carry a higher risk. Conversely, MXN tends to weaken at times of market turbulence or economic uncertainty as investors tend to sell higher-risk assets and flee to the more-stable safe havens.
- The Pound Sterling holds strength against the US Dollar to near 1.3200 driven by the Fed’s Powell dovish guidance on interest rates.
- Fed Powell’s comments suggested he remains concerned over downside risks to the US labor market.
- BoE’s Governor Andrew Bailey refrained from committing a specific interest-rate cut path.
The Pound Sterling (GBP) trades close to an almost two-and-a-half-year high near 1.3200 against the US Dollar (USD) in Monday’s London session. The GBP/USD pair aims to extend its seven-day winning streak as the US Dollar weakens after the unambiguous announcement from Federal Reserve (Fed) Chair Jerome Powell, who said that the central bank will start cutting interest rates in September.
The US Dollar Index (DXY), which tracks the Greenback’s value against six major currencies, hovers near a fresh year-to-day (YTD) low of 100.53.
In the speech at the Jackson Hole (JH) Symposium on Friday, Fed Powell said: “The time has come for policy to adjust.” However, he refrained from committing to a preset interest-rate cut path and preferred to remain data-dependent, saying that "the direction of travel is clear, and the timing and pace of rate cuts will depend on incoming data, the evolving outlook, and the balance of risks."
Powell’s comments indicated that the central bank is now more worried about deteriorating labor market conditions and that he is confident that price pressures will return to the desired target of 2%. He commented that upside risks to inflation have diminished and downside risks to the labor market have increased. “We will do everything we can to support a strong labor market as we make further progress toward price stability," Powell added.
This week, the major trigger for the US Dollar will be the United States (US) core Personal Consumption Expenditure Price Index (PCE) data for July, which will be published on Friday. Month-over-month, PCE inflation is estimated to have grown steadily by 0.2%.
In Monday’s session, investors will focus on the US Durable Goods Orders data for July, which will be published at 12:30 GMT. New Orders for Durable Goods, a key measure of core consumer inflation, is estimated to have grown at a robust pace of 4% after a significant decline in June. Nothing will come from the Pound Sterling side as the United Kingdom (UK) is on a bank holiday.
Daily digest market movers: Pound Sterling capitalizes on optimism over BoE’s gradual policy easing
- The Pound Sterling performs strongly against its major peers, except for Asia-Pacific currencies, at the start of the week. The British currency gains as the Bank of England (BoE) is reluctant to offer a preset rate-cut path given that the victory over inflation in the UK is far from over.
- BoE Governor Andrew Bailey signaled in his speech at the JH Symposium on Friday that the second-round effects of inflationary pressures could be smaller than expected, but added that the central bank should not rush for more interest rate cuts, Reuters reported. The BoE would "be careful not to cut interest rates too quickly or by too much," Bailey said.
- Andrew Bailey also ruled out the risks of a potential recession and assured that the steady disinflation in the UK is aligned with the aim of achieving a soft landing for the economy.
- This week, the Pound Sterling will be guided by the market speculation for BoE interest rate cuts amid an absence of top-tier economic data in the UK. Currently, market participants expect that the BoE will deliver one more interest-rate cut this year. The BoE opted for a cut on August 1, with a close 5-4 split among its Monetary Policy Committee members. However, a slew of upbeat economic data, including stronger-than-expected flash S&P Global/CIPS PMI for August, has weighed on expectations for another rate cut in September.
Technical Analysis: Pound Sterling posts fresh two-and-a-half year high near 1.3200
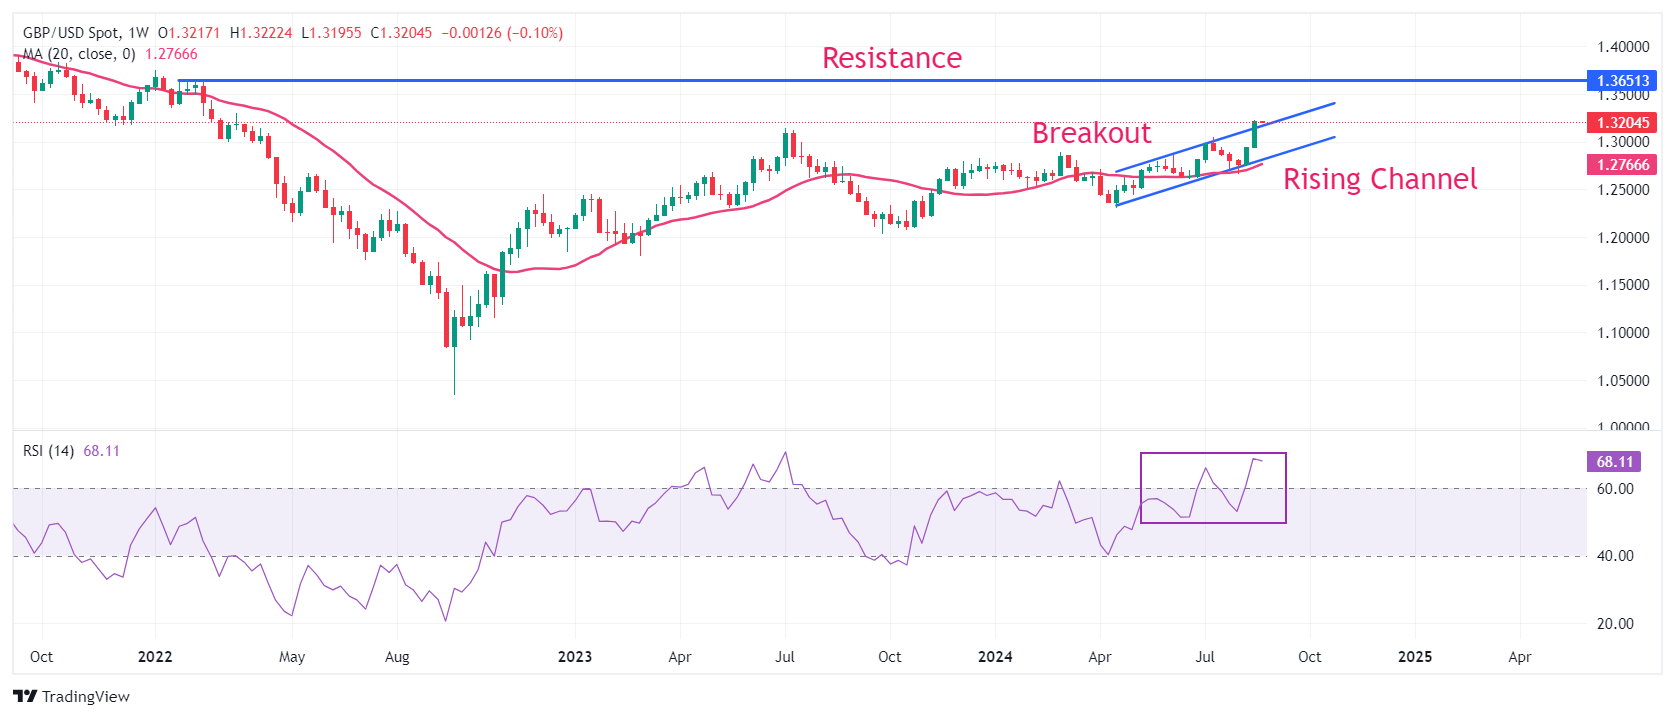
The Pound Sterling softens slightly against the US Dollar but remains close to 1.3200 after delivering a breakout of the Rising Channel chart formation on the weekly time frame. The GBP/USD pair posts a fresh, almost two-and-a-half-year high, and it is expected to extend its upside towards the February 4, 2022, high of 1.3640.
The upward 20-week Exponential Moving Average (EMA) near 1.2766 suggests a strong upside trend.
The 14-period Relative Strength Index (RSI) oscillates in the bullish range of 60.00-80.00, suggesting a strong upside momentum. Still, it has reached overbought levels at around 70.00, increasing the chances of a corrective pullback. On the downside, the psychological level of 1.3000 will be the crucial support for the Pound Sterling bulls.
Pound Sterling FAQs
The Pound Sterling (GBP) is the oldest currency in the world (886 AD) and the official currency of the United Kingdom. It is the fourth most traded unit for foreign exchange (FX) in the world, accounting for 12% of all transactions, averaging $630 billion a day, according to 2022 data. Its key trading pairs are GBP/USD, aka ‘Cable’, which accounts for 11% of FX, GBP/JPY, or the ‘Dragon’ as it is known by traders (3%), and EUR/GBP (2%). The Pound Sterling is issued by the Bank of England (BoE).
The single most important factor influencing the value of the Pound Sterling is monetary policy decided by the Bank of England. The BoE bases its decisions on whether it has achieved its primary goal of “price stability” – a steady inflation rate of around 2%. Its primary tool for achieving this is the adjustment of interest rates. When inflation is too high, the BoE will try to rein it in by raising interest rates, making it more expensive for people and businesses to access credit. This is generally positive for GBP, as higher interest rates make the UK a more attractive place for global investors to park their money. When inflation falls too low it is a sign economic growth is slowing. In this scenario, the BoE will consider lowering interest rates to cheapen credit so businesses will borrow more to invest in growth-generating projects.
Data releases gauge the health of the economy and can impact the value of the Pound Sterling. Indicators such as GDP, Manufacturing and Services PMIs, and employment can all influence the direction of the GBP. A strong economy is good for Sterling. Not only does it attract more foreign investment but it may encourage the BoE to put up interest rates, which will directly strengthen GBP. Otherwise, if economic data is weak, the Pound Sterling is likely to fall.
Another significant data release for the Pound Sterling is the Trade Balance. This indicator measures the difference between what a country earns from its exports and what it spends on imports over a given period. If a country produces highly sought-after exports, its currency will benefit purely from the extra demand created from foreign buyers seeking to purchase these goods. Therefore, a positive net Trade Balance strengthens a currency and vice versa for a negative balance.
Here is what you need to know on Monday, August 26:
The US Dollar (USD) holds steady against its major rivals early Monday after having suffered heavy losses in the previous week. IFO sentiment data from Germany will be featured in the European docket. Later in the day, Durable Goods Orders data for July and Dallas Fed Manufacturing Business Index data for August from the US will be watched closely by market participants.
US Dollar PRICE Last 7 days
The table below shows the percentage change of US Dollar (USD) against listed major currencies last 7 days. US Dollar was the weakest against the Japanese Yen.
| USD | EUR | GBP | JPY | CAD | AUD | NZD | CHF | |
|---|---|---|---|---|---|---|---|---|
| USD | -1.37% | -1.89% | -2.67% | -1.25% | -1.53% | -2.61% | -2.14% | |
| EUR | 1.37% | -0.60% | -1.29% | 0.12% | -0.24% | -1.42% | -0.81% | |
| GBP | 1.89% | 0.60% | -0.85% | 0.70% | 0.35% | -0.76% | -0.21% | |
| JPY | 2.67% | 1.29% | 0.85% | 1.38% | 1.14% | 0.18% | 0.40% | |
| CAD | 1.25% | -0.12% | -0.70% | -1.38% | -0.31% | -1.30% | -0.94% | |
| AUD | 1.53% | 0.24% | -0.35% | -1.14% | 0.31% | -1.03% | -0.57% | |
| NZD | 2.61% | 1.42% | 0.76% | -0.18% | 1.30% | 1.03% | 0.49% | |
| CHF | 2.14% | 0.81% | 0.21% | -0.40% | 0.94% | 0.57% | -0.49% |
The heat map shows percentage changes of major currencies against each other. The base currency is picked from the left column, while the quote currency is picked from the top row. For example, if you pick the US Dollar from the left column and move along the horizontal line to the Japanese Yen, the percentage change displayed in the box will represent USD (base)/JPY (quote).
The USD came under heavy selling pressure on Friday after Federal Reserve (Fed) Chairman Jerome Powell delivered a dovish speech. Powell said that the time has come for the monetary policy to adjust while delivering opening remarks at the annual Jackson Hole Economic Symposium. "We will do everything we can to support a strong labor market as we make further progress toward price stability," he added. The USD Index fell 0.8% on Friday and lost 1.7% for the week, while the benchmark 10-year US Treasury bond yield fell nearly 1.5% following Powell's speech. Early Monday, the 10-year yield stays in negative territory below 3.8% and the USD Index fluctuates in a tight channel at around 100.70.
Reuters reported over the weekend that Hezbollah launched hundreds of rockets and drones at Israel early on Sunday, as Israel's military said it carried out a wave of pre-emptive strikes across southern Lebanon to thwart a large-scale rocket and drone attack by Hezbollah. US stock index futures trade marginally lower on the day in the European morning on Monday.
EUR/USD gathered bullish momentum ahead of the weekend and reached its highest level in over a year at 1.1200. The pair stays in a consolidation phase early Monday and was last seen trading at around 1.1180.
GBP/USD extended its weekly rally on Friday and rose above 1.3200 for the first time since March 2022. The pair retreats slightly in the European morning and trades a few pips below 1.3200.
USD/JPY stays under bearish pressure to start the week after losing over 1% on Friday and trades deep in the red below 144.00. Earlier in the day, the data from Japan showed that the Leading Economic Index edged higher to 109.0 in June from 108.6 in May.
Gold surged higher on Friday and closed the week above $2,500. XAU/USD continues to stretch higher in the European morning and closes in on $2,520.
Fed FAQs
Monetary policy in the US is shaped by the Federal Reserve (Fed). The Fed has two mandates: to achieve price stability and foster full employment. Its primary tool to achieve these goals is by adjusting interest rates. When prices are rising too quickly and inflation is above the Fed’s 2% target, it raises interest rates, increasing borrowing costs throughout the economy. This results in a stronger US Dollar (USD) as it makes the US a more attractive place for international investors to park their money. When inflation falls below 2% or the Unemployment Rate is too high, the Fed may lower interest rates to encourage borrowing, which weighs on the Greenback.
The Federal Reserve (Fed) holds eight policy meetings a year, where the Federal Open Market Committee (FOMC) assesses economic conditions and makes monetary policy decisions. The FOMC is attended by twelve Fed officials – the seven members of the Board of Governors, the president of the Federal Reserve Bank of New York, and four of the remaining eleven regional Reserve Bank presidents, who serve one-year terms on a rotating basis.
In extreme situations, the Federal Reserve may resort to a policy named Quantitative Easing (QE). QE is the process by which the Fed substantially increases the flow of credit in a stuck financial system. It is a non-standard policy measure used during crises or when inflation is extremely low. It was the Fed’s weapon of choice during the Great Financial Crisis in 2008. It involves the Fed printing more Dollars and using them to buy high grade bonds from financial institutions. QE usually weakens the US Dollar.
Quantitative tightening (QT) is the reverse process of QE, whereby the Federal Reserve stops buying bonds from financial institutions and does not reinvest the principal from the bonds it holds maturing, to purchase new bonds. It is usually positive for the value of the US Dollar.
- USD/CAD grapples to hold ground after rebounding from a five-month low of 1.3498, recorded on Monday.
- The US Dollar depreciated due to Fed Chair Powell’s dovish speech at the Jackson Hole Symposium.
- The commodity-linked CAD may advance further due to the higher crude Oil prices.
USD/CAD rebounds from its five-month low of 1.3498, recorded on Monday, currently hovering around 1.3510 during the early European session on Monday. This upside could be attributed to the improved US Dollar (USD) amid increased risk aversion. However, the Greenback may receive downward pressure from the rising odds of a Federal Reserve (Fed) rate cut in September.
Fed is highly expected to deliver atleast a 25-basis point rate cut in September. According to the CME FedWatch Tool, markets are now fully anticipating at least a quarter-basis point (bps) rate cut by the Federal Reserve at its September meeting.
At the Jackson Hole Symposium on Friday, Fed Chairman Jerome Powell remarked, "The time has come for policy to adjust." While he did not provide specific details on the timing or scale of potential rate cuts, Powell highlighted that risks in the job market have risen, whereas inflation risks have diminished.
The commodity-linked Canadian Dollar (CAD) received support from the higher crude Oil prices. West Texas Intermediate (WTI) price extends its gains for the third consecutive day, trading around $75.20 per barrel at the time of writing. Crude Oil prices appreciate due to rising supply fears over geopolitical tensions in the Middle East.
Hezbollah launched hundreds of rockets and drones into Israel on Sunday, prompting a response from the Israeli military, which deployed around 100 jets to strike Lebanon in an effort to prevent a larger assault. This escalation heightens concerns that the ongoing Gaza conflict could expand into a broader regional conflict, potentially involving Hezbollah's supporter, Iran, and Israel's primary ally, the United States, according to Reuters.
However, the dovish stance of the Bank of Canada (BoC) regarding its policy outlook may limit the upside of the CAD and underpin the USD/CAD pair. The BoC has already commenced its cutting cycle to address growth concerns and a moderating labor market domestically.
Canadian Dollar FAQs
The key factors driving the Canadian Dollar (CAD) are the level of interest rates set by the Bank of Canada (BoC), the price of Oil, Canada’s largest export, the health of its economy, inflation and the Trade Balance, which is the difference between the value of Canada’s exports versus its imports. Other factors include market sentiment – whether investors are taking on more risky assets (risk-on) or seeking safe-havens (risk-off) – with risk-on being CAD-positive. As its largest trading partner, the health of the US economy is also a key factor influencing the Canadian Dollar.
The Bank of Canada (BoC) has a significant influence on the Canadian Dollar by setting the level of interest rates that banks can lend to one another. This influences the level of interest rates for everyone. The main goal of the BoC is to maintain inflation at 1-3% by adjusting interest rates up or down. Relatively higher interest rates tend to be positive for the CAD. The Bank of Canada can also use quantitative easing and tightening to influence credit conditions, with the former CAD-negative and the latter CAD-positive.
The price of Oil is a key factor impacting the value of the Canadian Dollar. Petroleum is Canada’s biggest export, so Oil price tends to have an immediate impact on the CAD value. Generally, if Oil price rises CAD also goes up, as aggregate demand for the currency increases. The opposite is the case if the price of Oil falls. Higher Oil prices also tend to result in a greater likelihood of a positive Trade Balance, which is also supportive of the CAD.
While inflation had always traditionally been thought of as a negative factor for a currency since it lowers the value of money, the opposite has actually been the case in modern times with the relaxation of cross-border capital controls. Higher inflation tends to lead central banks to put up interest rates which attracts more capital inflows from global investors seeking a lucrative place to keep their money. This increases demand for the local currency, which in Canada’s case is the Canadian Dollar.
Macroeconomic data releases gauge the health of the economy and can have an impact on the Canadian Dollar. Indicators such as GDP, Manufacturing and Services PMIs, employment, and consumer sentiment surveys can all influence the direction of the CAD. A strong economy is good for the Canadian Dollar. Not only does it attract more foreign investment but it may encourage the Bank of Canada to put up interest rates, leading to a stronger currency. If economic data is weak, however, the CAD is likely to fall.
- EUR/JPY trades softer near 160.70 in Monday’s early European session, down 0.50% on the day.
- BoJ’s hawkish remarks support the JPY and cap the upside for the cross.
- ECB’s Rehn said disinflation and a weak economy support the case for a September rate cut.
The EUR/JPY cross trades in negative territory around 160.70 during the early European session on Monday. The hawkish comments from the Bank of Japan (BoJ) Governor Kazuo Ueda provide some support to the Japanese Yen (JPY) and weigh on the cross. The Eurozone's flash Harmonized Index of Consumer Prices (HICP) for August will take centre stage on Friday.
The BoJ Governor Kazuo Ueda on Friday reaffirmed his resolve to raise interest rates if inflation stayed on course to sustainably hit the 2% target. A majority of economists expect the Japanese central bank to hike rates again this year, but more see the possibility of it occurring in December rather than October, according to the Reuters poll. The growing speculation of more rate hikes from the BoJ boosts the JPY against the Euro (EUR).
On the Euro front, investors await its first estimate of inflation data for August, which might offer some hints about the European Central Bank (ECB) interest rate decision in September. Consensus suggests that inflation will cool down to 2.3% YoY in August, prompting expectations for the ECB to continue cutting interest rates for the remainder of the year. This, in turn, exerts some selling pressure on the shared currency.
The ECB Governing Council member Olli Rehn said on Friday that the slowdown in inflation alongside weakness in the Eurozone economy strengthened arguments for cutting the borrowing costs next month.
Japanese Yen FAQs
The Japanese Yen (JPY) is one of the world’s most traded currencies. Its value is broadly determined by the performance of the Japanese economy, but more specifically by the Bank of Japan’s policy, the differential between Japanese and US bond yields, or risk sentiment among traders, among other factors.
One of the Bank of Japan’s mandates is currency control, so its moves are key for the Yen. The BoJ has directly intervened in currency markets sometimes, generally to lower the value of the Yen, although it refrains from doing it often due to political concerns of its main trading partners. The current BoJ ultra-loose monetary policy, based on massive stimulus to the economy, has caused the Yen to depreciate against its main currency peers. This process has exacerbated more recently due to an increasing policy divergence between the Bank of Japan and other main central banks, which have opted to increase interest rates sharply to fight decades-high levels of inflation.
The BoJ’s stance of sticking to ultra-loose monetary policy has led to a widening policy divergence with other central banks, particularly with the US Federal Reserve. This supports a widening of the differential between the 10-year US and Japanese bonds, which favors the US Dollar against the Japanese Yen.
The Japanese Yen is often seen as a safe-haven investment. This means that in times of market stress, investors are more likely to put their money in the Japanese currency due to its supposed reliability and stability. Turbulent times are likely to strengthen the Yen’s value against other currencies seen as more risky to invest in.
- EUR/USD drifts lower to near 1.1185 in Monday’s early European session.
- Constructive bias of the pair prevails above the 100-day EMA, but the overbought RSI condition might cap its upside.
- The immediate resistance level emerges at 1.1223; the key support level to watch is the 1.1100 round figure.
The EUR/USD pair weakens near 1.1185 during the early European session on Monday. The modest recovery of the US Dollar (USD) drags the major pair lower. However, the downside of EUR/USD might be limited as US Federal Reserve (Fed) Chair Powell gave a clear signal for a rate cut in September.
According to the daily chart, EUR/USD keeps the bullish vibe unchanged as the major pair holds above the key 100-day Exponential Moving Averages (EMA). The 14-day Relative Strength Index (RSI) stands above the midline near 72.70, indicating the overbought RSI condition. This suggests that further consolidation cannot be ruled out before positioning for any near-term EUR/USD appreciation.
The first upside barrier for the major pair emerges at 1.1223, the upper boundary of the Bollinger Band. Further north, the next hurdle is seen at 1.1275 (high of July 18) en route to 1.1360 (high of December 16). The additional upside filter to watch is 1.1483 (high of January 14).
On the downside, the crucial support level is located at the 1.1100 psychological level. A breach of this level will see a drop to 1.0940 (high of July 18), followed by 1.0873 (the 100-day EMA).
EUR/USD daily chart
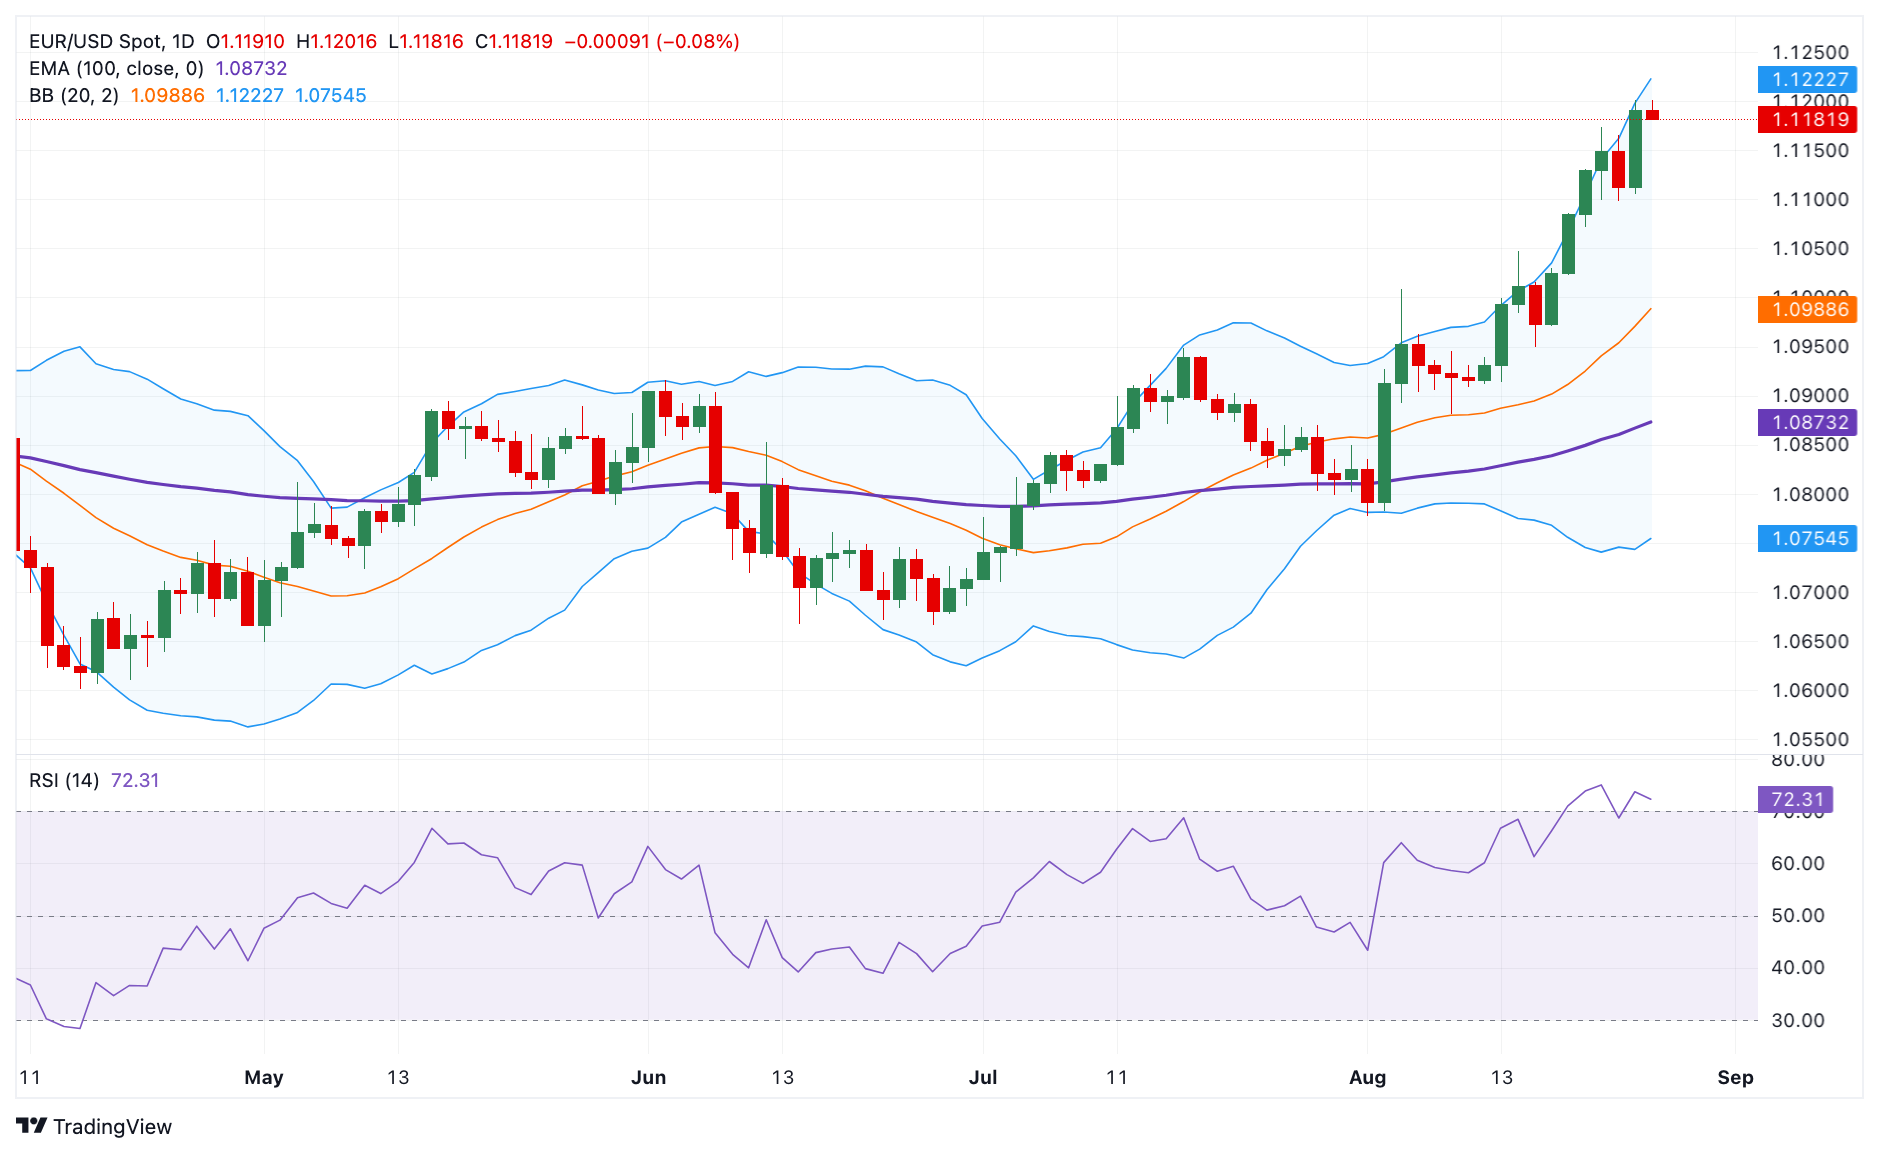
Euro FAQs
The Euro is the currency for the 20 European Union countries that belong to the Eurozone. It is the second most heavily traded currency in the world behind the US Dollar. In 2022, it accounted for 31% of all foreign exchange transactions, with an average daily turnover of over $2.2 trillion a day. EUR/USD is the most heavily traded currency pair in the world, accounting for an estimated 30% off all transactions, followed by EUR/JPY (4%), EUR/GBP (3%) and EUR/AUD (2%).
The European Central Bank (ECB) in Frankfurt, Germany, is the reserve bank for the Eurozone. The ECB sets interest rates and manages monetary policy. The ECB’s primary mandate is to maintain price stability, which means either controlling inflation or stimulating growth. Its primary tool is the raising or lowering of interest rates. Relatively high interest rates – or the expectation of higher rates – will usually benefit the Euro and vice versa. The ECB Governing Council makes monetary policy decisions at meetings held eight times a year. Decisions are made by heads of the Eurozone national banks and six permanent members, including the President of the ECB, Christine Lagarde.
Eurozone inflation data, measured by the Harmonized Index of Consumer Prices (HICP), is an important econometric for the Euro. If inflation rises more than expected, especially if above the ECB’s 2% target, it obliges the ECB to raise interest rates to bring it back under control. Relatively high interest rates compared to its counterparts will usually benefit the Euro, as it makes the region more attractive as a place for global investors to park their money.
Data releases gauge the health of the economy and can impact on the Euro. Indicators such as GDP, Manufacturing and Services PMIs, employment, and consumer sentiment surveys can all influence the direction of the single currency. A strong economy is good for the Euro. Not only does it attract more foreign investment but it may encourage the ECB to put up interest rates, which will directly strengthen the Euro. Otherwise, if economic data is weak, the Euro is likely to fall. Economic data for the four largest economies in the euro area (Germany, France, Italy and Spain) are especially significant, as they account for 75% of the Eurozone’s economy.
Another significant data release for the Euro is the Trade Balance. This indicator measures the difference between what a country earns from its exports and what it spends on imports over a given period. If a country produces highly sought after exports then its currency will gain in value purely from the extra demand created from foreign buyers seeking to purchase these goods. Therefore, a positive net Trade Balance strengthens a currency and vice versa for a negative balance.
Gold prices remained broadly unchanged in India on Monday, according to data compiled by FXStreet.
The price for Gold stood at 6,769.35 Indian Rupees (INR) per gram, broadly stable compared with the INR 6,774.09 it cost on Friday.
The price for Gold was broadly steady at INR 78,956.00 per tola from INR 79,011.67 per tola on friday.
| Unit measure | Gold Price in INR |
|---|---|
| 1 Gram | 6,769.35 |
| 10 Grams | 67,693.19 |
| Tola | 78,956.00 |
| Troy Ounce | 210,549.50 |
FXStreet calculates Gold prices in India by adapting international prices (USD/INR) to the local currency and measurement units. Prices are updated daily based on the market rates taken at the time of publication. Prices are just for reference and local rates could diverge slightly.
Gold FAQs
Gold has played a key role in human’s history as it has been widely used as a store of value and medium of exchange. Currently, apart from its shine and usage for jewelry, the precious metal is widely seen as a safe-haven asset, meaning that it is considered a good investment during turbulent times. Gold is also widely seen as a hedge against inflation and against depreciating currencies as it doesn’t rely on any specific issuer or government.
Central banks are the biggest Gold holders. In their aim to support their currencies in turbulent times, central banks tend to diversify their reserves and buy Gold to improve the perceived strength of the economy and the currency. High Gold reserves can be a source of trust for a country’s solvency. Central banks added 1,136 tonnes of Gold worth around $70 billion to their reserves in 2022, according to data from the World Gold Council. This is the highest yearly purchase since records began. Central banks from emerging economies such as China, India and Turkey are quickly increasing their Gold reserves.
Gold has an inverse correlation with the US Dollar and US Treasuries, which are both major reserve and safe-haven assets. When the Dollar depreciates, Gold tends to rise, enabling investors and central banks to diversify their assets in turbulent times. Gold is also inversely correlated with risk assets. A rally in the stock market tends to weaken Gold price, while sell-offs in riskier markets tend to favor the precious metal.
The price can move due to a wide range of factors. Geopolitical instability or fears of a deep recession can quickly make Gold price escalate due to its safe-haven status. As a yield-less asset, Gold tends to rise with lower interest rates, while higher cost of money usually weighs down on the yellow metal. Still, most moves depend on how the US Dollar (USD) behaves as the asset is priced in dollars (XAU/USD). A strong Dollar tends to keep the price of Gold controlled, whereas a weaker Dollar is likely to push Gold prices up.
(An automation tool was used in creating this post.)
- Silver price pares its intraday gains despite a dovish sentiment surrounding the US Fed.
- Fed’s Powell indicated that the time for rate cuts has arrived, but did not provide the extent of the reductions.
- The grey metal received support from the safe-haven flows amid rising Middle-East tensions.
Silver (XAG/USD) price edges lower to near $29.70 per troy ounce during the Asian session on Monday. However, the non-yielding Silver also attracts investors as the Federal Reserve (Fed) is highly expected to deliver atleast a 25-basis point rate cut in September. According to the CME FedWatch Tool, markets are now fully anticipating at least a quarter-basis point (bps) rate cut by the Federal Reserve at its September meeting.
Additionally, Fed Chairman Jerome Powell stated at the Jackson Hole Symposium on Friday, "The time has come for policy to adjust." Although Powell did not specify when rate cuts would begin or their potential size, he noted that job market risks have increased while inflation risks have decreased.
The price of the safe-haven Silver gained ground due to concerns about escalating conflict in the Middle East. Hezbollah launched hundreds of rockets and drones into Israel on Sunday, prompting a response from the Israeli military, which deployed around 100 jets to strike Lebanon to prevent a larger assault. This escalation heightens concerns that the ongoing Gaza conflict could expand into a broader regional conflict, potentially involving Hezbollah's supporter, Iran, and Israel's primary ally, the United States, according to Reuters.
Silver demand could be impacted by recent data from China’s National Bureau of Statistics, which indicates a struggling economy in the world’s largest manufacturing hub. As Silver plays a crucial role in various industrial applications, this downturn in industrial activity could pose significant challenges to its demand.
Silver FAQs
Silver is a precious metal highly traded among investors. It has been historically used as a store of value and a medium of exchange. Although less popular than Gold, traders may turn to Silver to diversify their investment portfolio, for its intrinsic value or as a potential hedge during high-inflation periods. Investors can buy physical Silver, in coins or in bars, or trade it through vehicles such as Exchange Traded Funds, which track its price on international markets.
Silver prices can move due to a wide range of factors. Geopolitical instability or fears of a deep recession can make Silver price escalate due to its safe-haven status, although to a lesser extent than Gold's. As a yieldless asset, Silver tends to rise with lower interest rates. Its moves also depend on how the US Dollar (USD) behaves as the asset is priced in dollars (XAG/USD). A strong Dollar tends to keep the price of Silver at bay, whereas a weaker Dollar is likely to propel prices up. Other factors such as investment demand, mining supply – Silver is much more abundant than Gold – and recycling rates can also affect prices.
Silver is widely used in industry, particularly in sectors such as electronics or solar energy, as it has one of the highest electric conductivity of all metals – more than Copper and Gold. A surge in demand can increase prices, while a decline tends to lower them. Dynamics in the US, Chinese and Indian economies can also contribute to price swings: for the US and particularly China, their big industrial sectors use Silver in various processes; in India, consumers’ demand for the precious metal for jewellery also plays a key role in setting prices.
Silver prices tend to follow Gold's moves. When Gold prices rise, Silver typically follows suit, as their status as safe-haven assets is similar. The Gold/Silver ratio, which shows the number of ounces of Silver needed to equal the value of one ounce of Gold, may help to determine the relative valuation between both metals. Some investors may consider a high ratio as an indicator that Silver is undervalued, or Gold is overvalued. On the contrary, a low ratio might suggest that Gold is undervalued relative to Silver.
- NZD/USD retreats from a seven-week high of 0.6236, reached on Friday.
- The downside of the pair could be restrained due to the rising odds of a Fed rate cut in September.
- Fed Chair Powell stated at the Jackson Hole Symposium, "The time has come for policy to adjust.”
NZD/USD trades around 0.6210 after pulling back from a seven-month high of 0.6236, marked on Friday. However, the downside of the NZD/USD pair could be limited due to the dovish sentiment surrounding the US Federal Reserve (Fed) regarding its policy outlook.
Fed Chairman Jerome Powell stated at the Jackson Hole Symposium on Friday, "The time has come for policy to adjust." Although Powell did not specify when rate cuts would begin or their potential size, markets anticipate the US central bank will announce a 25-basis points rate cut at the September meeting.
Additionally, Philadelphia Fed President Patrick Harker stated on Friday that the US central bank's approach to interest rate adjustments needs to be "methodical," signaling that policymakers are planning a series of rate cuts throughout the remainder of 2024 as the US central bank prepares for a dovish shift, according to Bloomberg.
However, the New Zealand Dollar (NZD) could face downward pressure as markets have fully factored in additional 25 basis point cuts by the Reserve Bank of New Zealand (RBNZ) for October and November. The RBNZ has already begun its easing cycle, reducing its Official Cash Rate (OCR) to 5.25% in August.
Traders will likely watch the ANZ – Roy Morgan Consumer Confidence for August and the seasonally adjusted Building Permits (MoM) data for July later this week, as these figures could offer new insights into New Zealand's economic activity.
New Zealand Dollar FAQs
The New Zealand Dollar (NZD), also known as the Kiwi, is a well-known traded currency among investors. Its value is broadly determined by the health of the New Zealand economy and the country’s central bank policy. Still, there are some unique particularities that also can make NZD move. The performance of the Chinese economy tends to move the Kiwi because China is New Zealand’s biggest trading partner. Bad news for the Chinese economy likely means less New Zealand exports to the country, hitting the economy and thus its currency. Another factor moving NZD is dairy prices as the dairy industry is New Zealand’s main export. High dairy prices boost export income, contributing positively to the economy and thus to the NZD.
The Reserve Bank of New Zealand (RBNZ) aims to achieve and maintain an inflation rate between 1% and 3% over the medium term, with a focus to keep it near the 2% mid-point. To this end, the bank sets an appropriate level of interest rates. When inflation is too high, the RBNZ will increase interest rates to cool the economy, but the move will also make bond yields higher, increasing investors’ appeal to invest in the country and thus boosting NZD. On the contrary, lower interest rates tend to weaken NZD. The so-called rate differential, or how rates in New Zealand are or are expected to be compared to the ones set by the US Federal Reserve, can also play a key role in moving the NZD/USD pair.
Macroeconomic data releases in New Zealand are key to assess the state of the economy and can impact the New Zealand Dollar’s (NZD) valuation. A strong economy, based on high economic growth, low unemployment and high confidence is good for NZD. High economic growth attracts foreign investment and may encourage the Reserve Bank of New Zealand to increase interest rates, if this economic strength comes together with elevated inflation. Conversely, if economic data is weak, NZD is likely to depreciate.
The New Zealand Dollar (NZD) tends to strengthen during risk-on periods, or when investors perceive that broader market risks are low and are optimistic about growth. This tends to lead to a more favorable outlook for commodities and so-called ‘commodity currencies’ such as the Kiwi. Conversely, NZD tends to weaken at times of market turbulence or economic uncertainty as investors tend to sell higher-risk assets and flee to the more-stable safe havens.
- The Japanese Yen appreciates due to the hawkish speech by the BoJ Governor Ueda in Parliament.
- The USD/JPY pair loses ground due to differing policy outlooks between the two central banks.
- The US Dollar lost ground following the dovish stance of the Fed Chair Powell at the Jackson Hole Symposium.
The Japanese Yen (JPY) continues to strengthen for the second consecutive day as Bank of Japan Governor Kazuo Ueda's hawkish remarks contrast with Federal Reserve Chair Jerome Powell's dovish stance.
BoJ Governor Ueda stated in Parliament on Friday that the central bank could raise interest rates further if its economic projections are accurate. Additionally, July’s National Consumer Price Index (CPI) inflation data remained at its highest level since February, reinforcing the BoJ’s hawkish stance on its policy outlook.
The US Dollar (USD) depreciates due to rising odds of a rate cut in September. Fed Chair Jerome Powell stated at the Jackson Hole Symposium, "The time has come for policy to adjust." Although, Powell did not specify when rate cuts would begin or their potential size.
Traders anticipate the US central bank may reduce rates by atleast 25 basis points in September. According to the CME FedWatch Tool, markets are now fully anticipating at least a 25 basis point (bps) rate cut by the Federal Reserve at its September meeting.
Daily Digest Market Movers: Japanese Yen rises due to a hawkish statement by BoJ Ueda
- Bloomberg reported on Friday that Philadelphia Fed President Patrick Harker emphasized the need for the US central bank to lower interest rates gradually. Meanwhile, Reuters reported Chicago Fed President Austan Goolsbee noted monetary policy is currently at its most restrictive, with the Fed now focusing on achieving its employment mandate.
- Bank of Japan (BoJ) Governor Kazuo Ueda addressed the Japanese parliament on Friday, stating that he is “not considering selling long-term Japanese government bonds (JGBs) as a tool for adjusting interest rates.” He noted that any reduction in JGB purchases would only account for about 7-8% of the balance sheet, which is a relatively small decrease. Ueda added that if the economy aligns with their projections, there could be a phase where they might adjust interest rates slightly further.
- Japan’s National Consumer Price Index increased by 2.8% year-on-year in July, maintaining this rate for the third consecutive month and remaining at its highest level since February. Additionally, the National CPI excluding Fresh Food rose by 2.7%, the highest reading since February, aligning with expectations.
- The US Composite PMI edged down to 54.1 in August, a four-month low, from 54.3 in July, but remained above market expectations of 53.5. This indicates continued expansion in US business activity, marking 19 consecutive months of growth.
- FOMC Minutes for July’s policy meeting indicated that most Fed officials agreed last month that they would likely cut their benchmark interest rate at the upcoming meeting in September as long as inflation continued to cool.
Technical Analysis: USD/JPY depreciates to near 144.00
USD/JPY trades around 143.90 on Friday. Analysis of the daily chart shows that the pair is positioned below a downtrend line, suggesting a bearish bias. However, the 14-day Relative Strength Index (RSI) remains slightly above 30, indicating that the bearish trend may continue.
On the downside, the USD/JPY pair may navigate the region around the seven-month low of 141.69, which was recorded on August 5. A break below this level could drive the pair toward the throwback support level at 140.25.
In terms of resistance, the USD/JPY pair may test the immediate barrier at the downtrend line around the psychological level of 145.00, followed by the nine-day Exponential Moving Average (EMA) at the 145.74 level. A breakthrough above the nine-day EMA could support the pair to explore the region around the throwback-turned-resistance at 154.50 level.
USD/JPY: Daily Chart
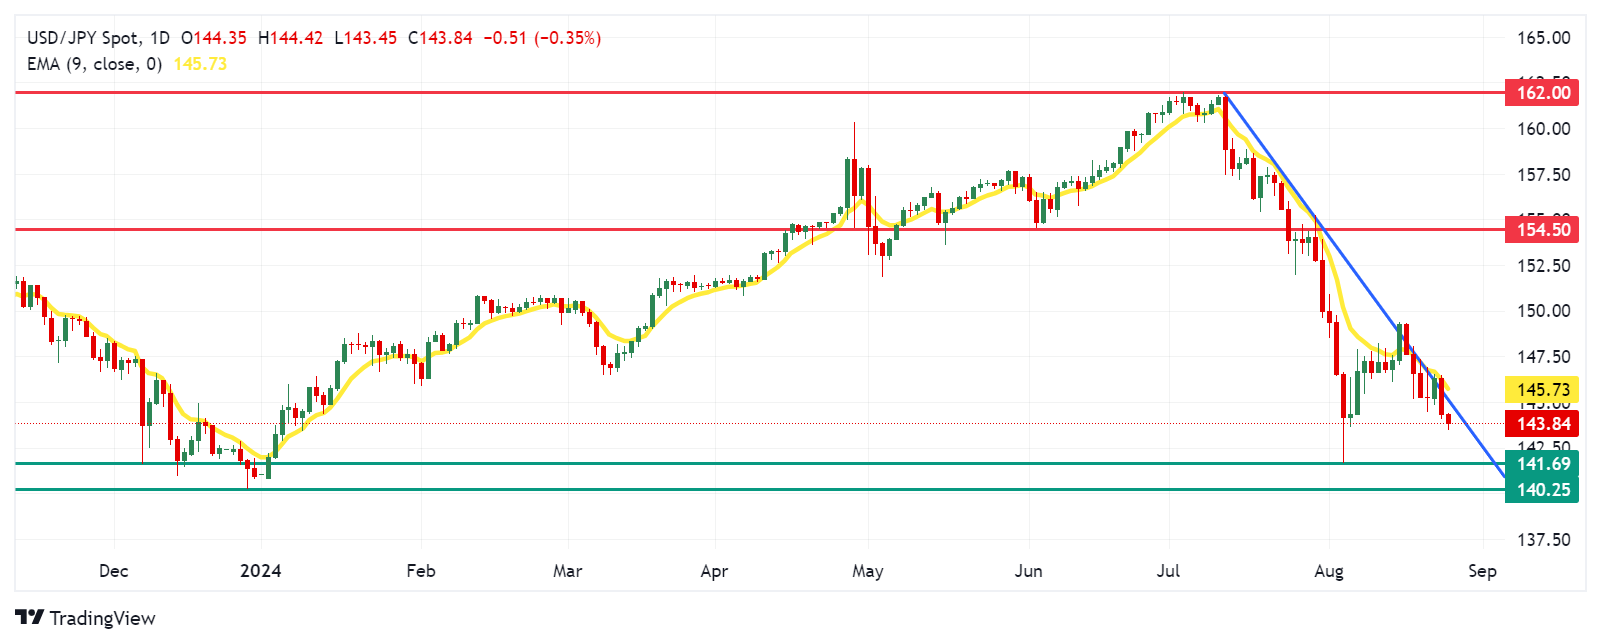
Japanese Yen PRICE Today
The table below shows the percentage change of Japanese Yen (JPY) against listed major currencies today. Japanese Yen was the strongest against the New Zealand Dollar.
| USD | EUR | GBP | JPY | CAD | AUD | NZD | CHF | |
|---|---|---|---|---|---|---|---|---|
| USD | 0.06% | 0.11% | -0.23% | 0.01% | 0.24% | 0.16% | -0.08% | |
| EUR | -0.06% | -0.02% | -0.29% | -0.04% | 0.09% | 0.10% | -0.12% | |
| GBP | -0.11% | 0.02% | -0.38% | -0.06% | 0.10% | 0.05% | -0.17% | |
| JPY | 0.23% | 0.29% | 0.38% | 0.27% | 0.57% | 0.62% | 0.26% | |
| CAD | -0.01% | 0.04% | 0.06% | -0.27% | 0.22% | 0.18% | -0.09% | |
| AUD | -0.24% | -0.09% | -0.10% | -0.57% | -0.22% | 0.00% | -0.22% | |
| NZD | -0.16% | -0.10% | -0.05% | -0.62% | -0.18% | -0.01% | -0.23% | |
| CHF | 0.08% | 0.12% | 0.17% | -0.26% | 0.09% | 0.22% | 0.23% |
The heat map shows percentage changes of major currencies against each other. The base currency is picked from the left column, while the quote currency is picked from the top row. For example, if you pick the Japanese Yen from the left column and move along the horizontal line to the US Dollar, the percentage change displayed in the box will represent JPY (base)/USD (quote).
Japanese Yen FAQs
The Japanese Yen (JPY) is one of the world’s most traded currencies. Its value is broadly determined by the performance of the Japanese economy, but more specifically by the Bank of Japan’s policy, the differential between Japanese and US bond yields, or risk sentiment among traders, among other factors.
One of the Bank of Japan’s mandates is currency control, so its moves are key for the Yen. The BoJ has directly intervened in currency markets sometimes, generally to lower the value of the Yen, although it refrains from doing it often due to political concerns of its main trading partners. The current BoJ ultra-loose monetary policy, based on massive stimulus to the economy, has caused the Yen to depreciate against its main currency peers. This process has exacerbated more recently due to an increasing policy divergence between the Bank of Japan and other main central banks, which have opted to increase interest rates sharply to fight decades-high levels of inflation.
The BoJ’s stance of sticking to ultra-loose monetary policy has led to a widening policy divergence with other central banks, particularly with the US Federal Reserve. This supports a widening of the differential between the 10-year US and Japanese bonds, which favors the US Dollar against the Japanese Yen.
The Japanese Yen is often seen as a safe-haven investment. This means that in times of market stress, investors are more likely to put their money in the Japanese currency due to its supposed reliability and stability. Turbulent times are likely to strengthen the Yen’s value against other currencies seen as more risky to invest in.
- USD/CAD remains on the defensive near 1.3510 in Monday’s Asian session.
- Powell’s dovish Jackson Hole speech weighs on the US Dollar.
- Canadian Retail Sales dropped by 0.3% MoM in June vs. -0.8% prior, in line with the market consensus.
The USD/CAD pair remains under some selling pressure around 1.3510 on Monday during the Asian trading hours. The US Dollar (USD) edges lower after Federal Reserve (Fed) Chair Jerome Powell signalled that time has come for interest rate cuts starting this September.
Most Fed officials delivered dovish messages, supporting the case for rate cuts in September. This, in turn, undermines the Greenback broadly in the precious sessions. Fed’s Powell noted, ”The time has come for policy to adjust.” Powell further stated, “The direction of travel is clear, and the timing and pace of rate cuts will depend on incoming data, the evolving outlook and the balance of risks.”
Meanwhile, Philadelphia Fed President Patrick Harker emphasized that he supports two or three interest rate cuts in 2024, barring any substantial changes to US economic data. Chicago Fed President Austan Goolsbee stated that monetary policy is currently at its most restrictive level, and the Fed’s focus is now shifting towards achieving its employment mandate. According to the CME FedWatch Tool, traders are now fully priced in a 25 basis points (bps) rate in September, while the odds for a deeper cut stand at 36.5%, up from 24% last week.
Data released by Statistics Canada showed that Canadian Retail Sales declined by 0.3% MoM in June from a fall of 0.8% in the previous reading, in line with the market consensus. Retail Sales excluding automobiles, unexpectedly rose by 0.3% MoM in June, better than the estimation of a decline of 0.2%. Market players will keep an eye on the Canadian Gross Domestic Product (GDP) for the second quarter on Friday. Meanwhile, the Bank of Canada (BoC) is expected to cut an additional 75 basis points (bps) by year-end.
Canadian Dollar FAQs
The key factors driving the Canadian Dollar (CAD) are the level of interest rates set by the Bank of Canada (BoC), the price of Oil, Canada’s largest export, the health of its economy, inflation and the Trade Balance, which is the difference between the value of Canada’s exports versus its imports. Other factors include market sentiment – whether investors are taking on more risky assets (risk-on) or seeking safe-havens (risk-off) – with risk-on being CAD-positive. As its largest trading partner, the health of the US economy is also a key factor influencing the Canadian Dollar.
The Bank of Canada (BoC) has a significant influence on the Canadian Dollar by setting the level of interest rates that banks can lend to one another. This influences the level of interest rates for everyone. The main goal of the BoC is to maintain inflation at 1-3% by adjusting interest rates up or down. Relatively higher interest rates tend to be positive for the CAD. The Bank of Canada can also use quantitative easing and tightening to influence credit conditions, with the former CAD-negative and the latter CAD-positive.
The price of Oil is a key factor impacting the value of the Canadian Dollar. Petroleum is Canada’s biggest export, so Oil price tends to have an immediate impact on the CAD value. Generally, if Oil price rises CAD also goes up, as aggregate demand for the currency increases. The opposite is the case if the price of Oil falls. Higher Oil prices also tend to result in a greater likelihood of a positive Trade Balance, which is also supportive of the CAD.
While inflation had always traditionally been thought of as a negative factor for a currency since it lowers the value of money, the opposite has actually been the case in modern times with the relaxation of cross-border capital controls. Higher inflation tends to lead central banks to put up interest rates which attracts more capital inflows from global investors seeking a lucrative place to keep their money. This increases demand for the local currency, which in Canada’s case is the Canadian Dollar.
Macroeconomic data releases gauge the health of the economy and can have an impact on the Canadian Dollar. Indicators such as GDP, Manufacturing and Services PMIs, employment, and consumer sentiment surveys can all influence the direction of the CAD. A strong economy is good for the Canadian Dollar. Not only does it attract more foreign investment but it may encourage the Bank of Canada to put up interest rates, leading to a stronger currency. If economic data is weak, however, the CAD is likely to fall.
- WTI price extends the rally to near $76.15 in Monday’s Asian session, gaining 0.45% on the day.
- Fed’s dovish stance and rising geopolitical tensions in the Middle East further boost the WTI price.
- The weaker demand outlook in China could weigh on the black gold.
West Texas Intermediate (WTI), the US crude oil benchmark, is trading around $76.15 on Monday. WTI price edges higher on the back of firmer expectations that the Federal Reserve (Fed) will cut interest rates in its upcoming September meeting.
WTI gains ground after the dovish comments by Fed Chair Jerome Powell indicated the US central bank was preparing to cut interest rates. Fed’s Powell gave a clear signal on Friday at the Jackson Hole symposium that it’s time to start cutting the target range for the federal funds rate at the next meeting on September 17-18. Lower interest rates generally support the WTI price as it reduces the cost of borrowing, which can boost economic activity and oil demand.
The fears that wider conflict in the Middle East could disrupt regional oil supplies have lifted the WTI price in the previous sessions. Reuters reported that Hezbollah launched hundreds of rockets and drones at Israel early on Sunday, as Israel's military said it carried out a wave of pre-emptive strikes across southern Lebanon to thwart a large-scale rocket and drone attack by Hezbollah.
On the other hand, a sluggish economy and slowing oil demand in China might drag the black gold lower as China is the world’s top oil importer. China's oil demand increased by 200,000 barrels per day in the first half of 2024 compared to the previous year, which was three times below the average rise of 600,000 bpd from 2016 to 2019, noted Daan Struyven, head of oil research at Goldman Sachs.
WTI Oil FAQs
WTI Oil is a type of Crude Oil sold on international markets. The WTI stands for West Texas Intermediate, one of three major types including Brent and Dubai Crude. WTI is also referred to as “light” and “sweet” because of its relatively low gravity and sulfur content respectively. It is considered a high quality Oil that is easily refined. It is sourced in the United States and distributed via the Cushing hub, which is considered “The Pipeline Crossroads of the World”. It is a benchmark for the Oil market and WTI price is frequently quoted in the media.
Like all assets, supply and demand are the key drivers of WTI Oil price. As such, global growth can be a driver of increased demand and vice versa for weak global growth. Political instability, wars, and sanctions can disrupt supply and impact prices. The decisions of OPEC, a group of major Oil-producing countries, is another key driver of price. The value of the US Dollar influences the price of WTI Crude Oil, since Oil is predominantly traded in US Dollars, thus a weaker US Dollar can make Oil more affordable and vice versa.
The weekly Oil inventory reports published by the American Petroleum Institute (API) and the Energy Information Agency (EIA) impact the price of WTI Oil. Changes in inventories reflect fluctuating supply and demand. If the data shows a drop in inventories it can indicate increased demand, pushing up Oil price. Higher inventories can reflect increased supply, pushing down prices. API’s report is published every Tuesday and EIA’s the day after. Their results are usually similar, falling within 1% of each other 75% of the time. The EIA data is considered more reliable, since it is a government agency.
OPEC (Organization of the Petroleum Exporting Countries) is a group of 13 Oil-producing nations who collectively decide production quotas for member countries at twice-yearly meetings. Their decisions often impact WTI Oil prices. When OPEC decides to lower quotas, it can tighten supply, pushing up Oil prices. When OPEC increases production, it has the opposite effect. OPEC+ refers to an expanded group that includes ten extra non-OPEC members, the most notable of which is Russia.
| Raw materials | Closed | Change, % |
|---|---|---|
| Silver | 29.817 | 2.96 |
| Gold | 251.183 | 1.07 |
| Palladium | 958.48 | 3.21 |
- The Australian Dollar declines despite a risk-on sentiment following the dovish Fed Chair Powell.
- The downside of the AUD may be restrained due to the hawkish mood surrounding the RBA.
- The US Dollar loses ground due to rising expectations of a 25 basis points rate cut in September.
The Australian Dollar (AUD) edges lower, still hovering around a seven-month high of 0.6798 on Monday. However, the AUD/USD pair gained ground due to the rising risk-on sentiment following the dovish speech from the US Federal Reserve (Fed) Chairman Jerome Powell at the Jackson Hole Symposium on Friday.
The Aussie Dollar also received support from the hawkish sentiment surrounding the Reserve Bank of Australia (RBA) regarding its policy outlook. the recent RBA Minutes showed that the board members agreed that a rate cut is unlikely soon. Additionally, RBA Governor Michele Bullock expressed that the Australian central bank will not hesitate to raise rates again to combat inflation if needed.
The US Dollar (USD) depreciates due to rising odds of a rate cut in September. According to the CME FedWatch Tool, markets are now fully anticipating at least a 25 basis point (bps) rate cut by the Federal Reserve at its September meeting.
Fed Chair Jerome Powell stated at the Jackson Hole Symposium "The time has come for policy to adjust." However, Powell did not specify when rate cuts would begin or their potential size.
Daily Digest Market Movers: Australian Dollar edges lower despite the hawkish RBA
- Philadelphia Fed President Patrick Harker stated on Friday that the US central bank's approach to interest rate adjustments needs to be "methodical," signaling that policymakers are planning a series of rate cuts throughout the remainder of 2024 as the US central bank prepares for a dovish shift, according to Bloomberg.
- Chicago President Austan Goolsbee noted on Friday that the Fed has seen broad success in achieving its goals and that inflation should continue to head toward the US central bank's target range. Policy is now at its tightest point of the entire hike cycle. Everything we wanted to happen to get rates down, has happened, per Reuters.
- The US Composite PMI dipped slightly to 54.1 in August, a four-month low, down from 54.3 in July, yet remained above market expectations of 53.5. This suggests that US business activity continues to expand, marking 19 straight months of growth.
- Australia's Judo Bank Composite Purchasing Managers Index (PMI) rose to 51.4 in August, up from 49.9 in July. This increase marks the fastest expansion in three months, driven by a stronger performance in the services sector, despite a more pronounced contraction in manufacturing production.
- FOMC Minutes for July’s policy meeting indicated that most Fed officials agreed last month that they would likely cut their benchmark interest rate at the upcoming meeting in September as long as inflation continued to cool.
- On Tuesday, the RBA Minutes suggested that the board members had considered a rate hike earlier this month before ultimately deciding that maintaining current rates would better balance the risks. Additionally, RBA members agreed that a rate cut is unlikely soon.
Technical Analysis: Australian Dollar rises to seven-month highs around 0.6800
The Australian Dollar trades around 0.6790 on Monday. Daily chart analysis shows the AUD/USD pair has returned to the ascending channel, suggesting reinforcing a bullish bias. However, the 14-day Relative Strength Index (RSI) reaches near the 70 mark, supporting the ongoing bullish momentum.
In terms of resistance, the AUD/USD pair tests the seven-month high of 0.6798. A break above this level could lead the pair to explore the region around the upper boundary of the ascending channel at the 0.6910 level.
On the downside, the AUD/USD pair may find support around the lower boundary of the ascending channel at the 0.6770 level, followed by the nine-day Exponential Moving Average (EMA) at the 0.6718 level. A break below the nine-day EMA could weaken the bullish bias and put downward pressure on the pair to navigate the region around the throwback level at 0.6575, followed by another throwback level at 0.6470.
AUD/USD: Daily Chart
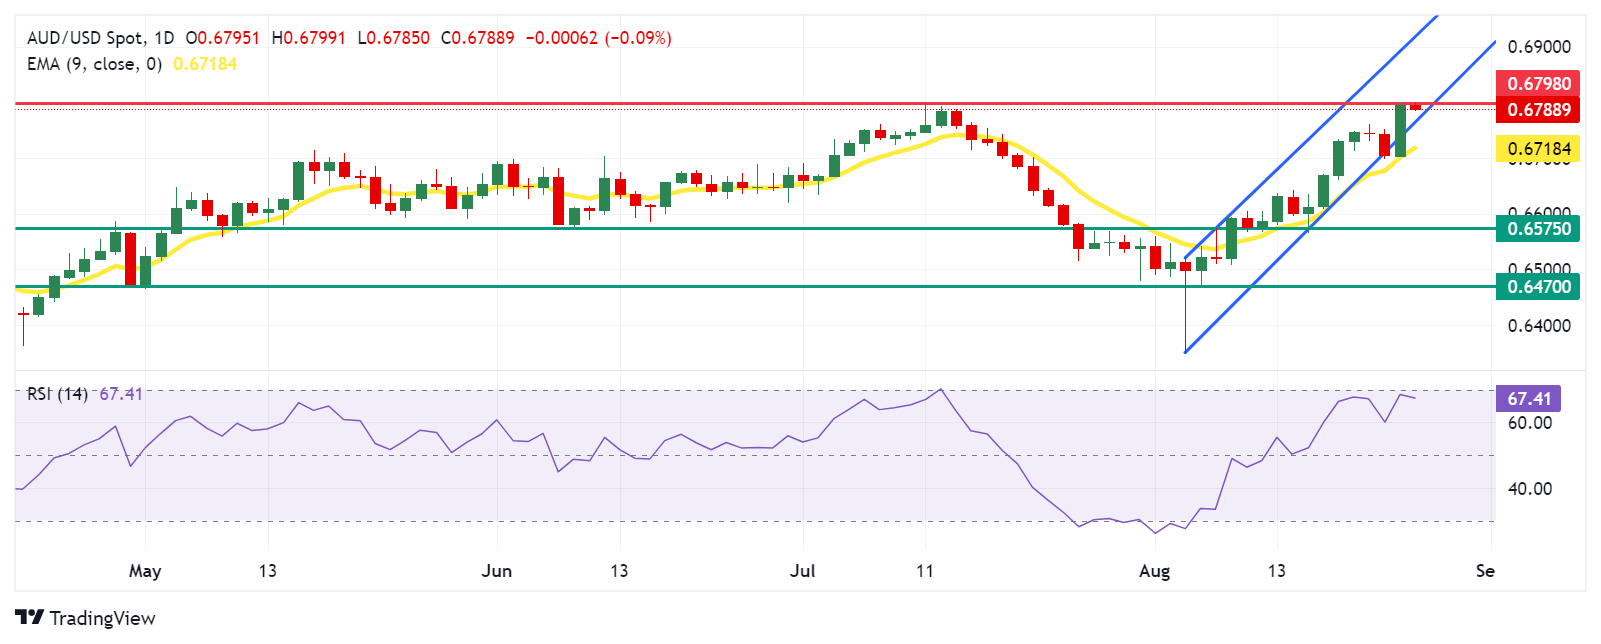
Australian Dollar PRICE Today
The table below shows the percentage change of Australian Dollar (AUD) against listed major currencies today. Australian Dollar was the weakest against the Japanese Yen.
| USD | EUR | GBP | JPY | CAD | AUD | NZD | CHF | |
|---|---|---|---|---|---|---|---|---|
| USD | -0.00% | 0.04% | -0.33% | -0.03% | 0.11% | 0.00% | -0.15% | |
| EUR | 0.00% | -0.02% | -0.32% | -0.01% | 0.02% | 0.02% | -0.12% | |
| GBP | -0.04% | 0.02% | -0.42% | -0.06% | 0.03% | -0.03% | -0.17% | |
| JPY | 0.33% | 0.32% | 0.42% | 0.33% | 0.53% | 0.57% | 0.29% | |
| CAD | 0.03% | 0.01% | 0.06% | -0.33% | 0.12% | 0.07% | -0.12% | |
| AUD | -0.11% | -0.02% | -0.03% | -0.53% | -0.12% | -0.00% | -0.15% | |
| NZD | -0.01% | -0.02% | 0.03% | -0.57% | -0.07% | 0.00% | -0.15% | |
| CHF | 0.15% | 0.12% | 0.17% | -0.29% | 0.12% | 0.15% | 0.15% |
The heat map shows percentage changes of major currencies against each other. The base currency is picked from the left column, while the quote currency is picked from the top row. For example, if you pick the Australian Dollar from the left column and move along the horizontal line to the US Dollar, the percentage change displayed in the box will represent AUD (base)/USD (quote).
Australian Dollar FAQs
One of the most significant factors for the Australian Dollar (AUD) is the level of interest rates set by the Reserve Bank of Australia (RBA). Because Australia is a resource-rich country another key driver is the price of its biggest export, Iron Ore. The health of the Chinese economy, its largest trading partner, is a factor, as well as inflation in Australia, its growth rate and Trade Balance. Market sentiment – whether investors are taking on more risky assets (risk-on) or seeking safe-havens (risk-off) – is also a factor, with risk-on positive for AUD.
The Reserve Bank of Australia (RBA) influences the Australian Dollar (AUD) by setting the level of interest rates that Australian banks can lend to each other. This influences the level of interest rates in the economy as a whole. The main goal of the RBA is to maintain a stable inflation rate of 2-3% by adjusting interest rates up or down. Relatively high interest rates compared to other major central banks support the AUD, and the opposite for relatively low. The RBA can also use quantitative easing and tightening to influence credit conditions, with the former AUD-negative and the latter AUD-positive.
China is Australia’s largest trading partner so the health of the Chinese economy is a major influence on the value of the Australian Dollar (AUD). When the Chinese economy is doing well it purchases more raw materials, goods and services from Australia, lifting demand for the AUD, and pushing up its value. The opposite is the case when the Chinese economy is not growing as fast as expected. Positive or negative surprises in Chinese growth data, therefore, often have a direct impact on the Australian Dollar and its pairs.
Iron Ore is Australia’s largest export, accounting for $118 billion a year according to data from 2021, with China as its primary destination. The price of Iron Ore, therefore, can be a driver of the Australian Dollar. Generally, if the price of Iron Ore rises, AUD also goes up, as aggregate demand for the currency increases. The opposite is the case if the price of Iron Ore falls. Higher Iron Ore prices also tend to result in a greater likelihood of a positive Trade Balance for Australia, which is also positive of the AUD.
The Trade Balance, which is the difference between what a country earns from its exports versus what it pays for its imports, is another factor that can influence the value of the Australian Dollar. If Australia produces highly sought after exports, then its currency will gain in value purely from the surplus demand created from foreign buyers seeking to purchase its exports versus what it spends to purchase imports. Therefore, a positive net Trade Balance strengthens the AUD, with the opposite effect if the Trade Balance is negative.
- Gold price gains traction in Monday’s Asian session.
- Fed’s rate cut expectation and ongoing geopolitical tensions continue to underpin Gold price.
- The US July Durable Goods Orders are due later on Monday.
The Gold price (XAU/USD) holds positive ground above the $2,500 psychological support on Monday. The uptick in the precious metal is bolstered by the rising expectations that the US Federal Reserve (Fed) will begin lowering borrowing costs in September. The expectation of lower interest rates is generally positive for Gold as it reduces the opportunity cost of holding the non-interest paying asset.
Furthermore, the escalating geopolitical tensions in the Middle East and the economic uncertainty are likely to boost the safe-haven demand, benefiting Gold price. On the other hand, the sluggish demand in the Chinese economy might undermine the yellow metal as China is the largest producer and consumer of gold worldwide. Later on Monday, the US July Durable Goods Orders are due. The highlights for this week will be the preliminary US Gross Domestic Product Annualized (GDP) for the second quarter and the Personal Consumption Expenditures-Price Index (PCE) for July, which will be released on Thursday and Friday, respectively.
Daily Digest Market Movers: Gold price remains strong amid firmer Fed rate cut expectations
- Fed Chair Powell said on Friday at the Kansas City Fed's annual economic symposium in Jackson Hole, "The time has come for policy to adjust.”
- The July FOMC Minutes released last week indicated a “vast majority” of Fed officials believe a September cut will be appropriate so long as there are no data surprises.
- Philadelphia Fed President Patrick Harker said that he supports two or three interest rate cuts in 2024, barring any substantial changes to US economic data.
- Chicago Fed President Austan Goolsbee stated that monetary policy is currently at its most restrictive level, and the Fed’s focus is now shifting towards achieving its employment mandate.
- Hezbollah launched hundreds of rockets and drones at Israel early on Sunday, as Israel's military said it carried out a wave of pre-emptive strikes across southern Lebanon to thwart a large-scale rocket and drone attack by Hezbollah, per Reuters.
Technical Analysis: Gold price continues its long-term bullish momentum
Gold price trades in positive territory on the day. The precious metal has traded within a five-month-old ascending trend channel. However, the overall bullish environment for the yellow metal remains intact as it holds above the key 100-day Exponential Moving Average (EMA) on the daily chart. Additionally, the 14-day Relative Strength Index (RSI) stands in the bullish zone near 62.70, suggesting that the trend is still in favor of the bulls.
If Gold prints a couple more bullish candlesticks, we could see a rally to the $2,530-$2535 region, the record high and the upper boundary of the trend channel. A decisive break above this level may draw in more buyers who could sustain an upswing all the way to the $2,600 psychological barrier.
On the flip side, the initial support level emerges at $2,470, the low of August 22. If XAU/USD sees more bearish candlesticks below the mentioned level, then the yellow metal could draw in enough sellers to drag it down to the $2,432, the low of August 15. The crucial contention level is seen in the $2,350-$2,360 zone, the lower limit of the trend channel and the 100-day EMA.
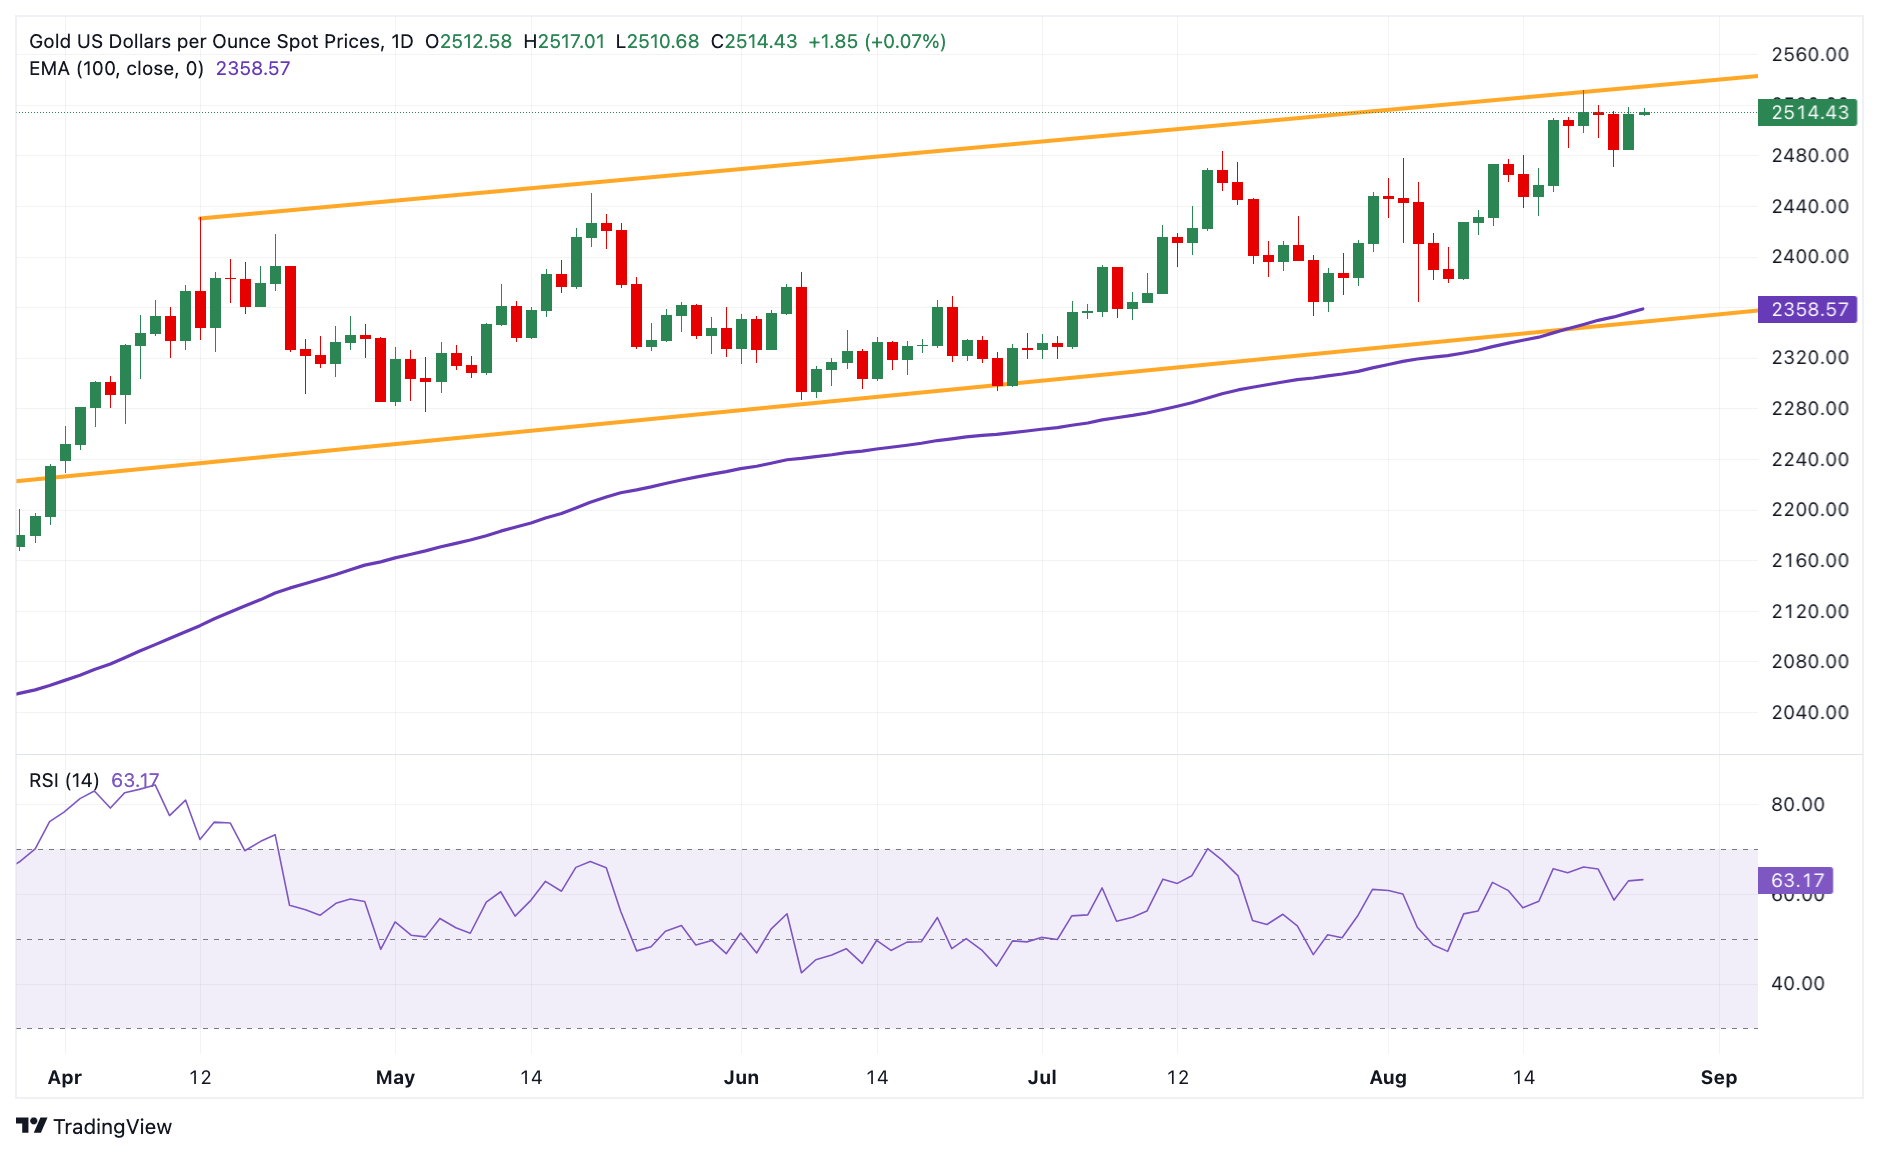
Gold FAQs
Gold has played a key role in human’s history as it has been widely used as a store of value and medium of exchange. Currently, apart from its shine and usage for jewelry, the precious metal is widely seen as a safe-haven asset, meaning that it is considered a good investment during turbulent times. Gold is also widely seen as a hedge against inflation and against depreciating currencies as it doesn’t rely on any specific issuer or government.
Central banks are the biggest Gold holders. In their aim to support their currencies in turbulent times, central banks tend to diversify their reserves and buy Gold to improve the perceived strength of the economy and the currency. High Gold reserves can be a source of trust for a country’s solvency. Central banks added 1,136 tonnes of Gold worth around $70 billion to their reserves in 2022, according to data from the World Gold Council. This is the highest yearly purchase since records began. Central banks from emerging economies such as China, India and Turkey are quickly increasing their Gold reserves.
Gold has an inverse correlation with the US Dollar and US Treasuries, which are both major reserve and safe-haven assets. When the Dollar depreciates, Gold tends to rise, enabling investors and central banks to diversify their assets in turbulent times. Gold is also inversely correlated with risk assets. A rally in the stock market tends to weaken Gold price, while sell-offs in riskier markets tend to favor the precious metal.
The price can move due to a wide range of factors. Geopolitical instability or fears of a deep recession can quickly make Gold price escalate due to its safe-haven status. As a yield-less asset, Gold tends to rise with lower interest rates, while higher cost of money usually weighs down on the yellow metal. Still, most moves depend on how the US Dollar (USD) behaves as the asset is priced in dollars (XAU/USD). A strong Dollar tends to keep the price of Gold controlled, whereas a weaker Dollar is likely to push Gold prices up.
- GBP/USD trades in positive territory for the eighth consecutive day near 1.3215 in Monday’s early Asian session.
- Fed’s Powell signalled for a September rate cut but did not mention about the size and pace of the rate cut.
- BoE’s Bailey said it’s still too early to declare victory on inflation.
The GBP/USD pair trades on a stronger note around 1.3215 during the early Asian session on Monday. The signal that the US Federal Reserve (Fed) will start easing its monetary policy in September drags the Greenback lower and supports GBP/USD. Market players await the US Durable Goods Orders for July, which are due later on Monday.
At Jackson Hole on Friday, Fed Chair Jerome Powell gave a clear signal that the FOMC will cut the target range for the Federal Funds Rate at their next meeting on September 17-18 as inflation is on a sustainable path back to the 2% target. Nonetheless, Powell did not want to provide a hint about the size of the rate cut in September and the pace of the rate cut this year as the Fed remains data-dependent.
The firmer bets of the Fed rate cuts continue to undermine the Greenback and create a tailwind for GBP/USD. Rabobank analysts noted that they expect the labor market to worsen further in the remainder of the year, triggering four consecutive rate cuts of 25 basis points (bps) each in the September, November, December and January meetings.
On the other hand, the speculation that the Bank of England’s (BoE) policy-easing cycle will be slower than that of other major central banks provides some support to the Pound Sterling (GBP). BoE Governor Andrew Bailey said late Friday that inflation remains a major concern for the UK central bank, although many pricing pressures have eased quicker than expected. Bailey noted that it is premature to declare victory on inflation.
Pound Sterling FAQs
The Pound Sterling (GBP) is the oldest currency in the world (886 AD) and the official currency of the United Kingdom. It is the fourth most traded unit for foreign exchange (FX) in the world, accounting for 12% of all transactions, averaging $630 billion a day, according to 2022 data. Its key trading pairs are GBP/USD, aka ‘Cable’, which accounts for 11% of FX, GBP/JPY, or the ‘Dragon’ as it is known by traders (3%), and EUR/GBP (2%). The Pound Sterling is issued by the Bank of England (BoE).
The single most important factor influencing the value of the Pound Sterling is monetary policy decided by the Bank of England. The BoE bases its decisions on whether it has achieved its primary goal of “price stability” – a steady inflation rate of around 2%. Its primary tool for achieving this is the adjustment of interest rates. When inflation is too high, the BoE will try to rein it in by raising interest rates, making it more expensive for people and businesses to access credit. This is generally positive for GBP, as higher interest rates make the UK a more attractive place for global investors to park their money. When inflation falls too low it is a sign economic growth is slowing. In this scenario, the BoE will consider lowering interest rates to cheapen credit so businesses will borrow more to invest in growth-generating projects.
Data releases gauge the health of the economy and can impact the value of the Pound Sterling. Indicators such as GDP, Manufacturing and Services PMIs, and employment can all influence the direction of the GBP. A strong economy is good for Sterling. Not only does it attract more foreign investment but it may encourage the BoE to put up interest rates, which will directly strengthen GBP. Otherwise, if economic data is weak, the Pound Sterling is likely to fall.
Another significant data release for the Pound Sterling is the Trade Balance. This indicator measures the difference between what a country earns from its exports and what it spends on imports over a given period. If a country produces highly sought-after exports, its currency will benefit purely from the extra demand created from foreign buyers seeking to purchase these goods. Therefore, a positive net Trade Balance strengthens a currency and vice versa for a negative balance.
The People’s Bank of China (PBOC) set the USD/CNY central rate for the trading session ahead on Monday at 7.1139, as against the previous day's fix of 7.1358 and 7.1132 Reuters estimates.
- EUR/USD gains ground due to rising expectations of a Fed rate cut in September.
- Fed Chair Powell stated at the Jackson Hole Symposium, "The time has come for policy to adjust.”
- ECB official Olli Rehn stated that the recent slowdown in inflation bolsters the case for a rate cut next month.
EUR/USD extends its gains for the second session, trading around 1.1190 during the Asian session on Monday. This upside of the EUR/USD pair is attributed to the lower US Dollar (USD) following the dovish speech from the US Federal Reserve (Fed) Chairman Jerome Powell at the Jackson Hole Symposium on Friday.
Fed Chair Jerome Powell stated, "The time has come for policy to adjust." Although Powell did not specify when rate cuts would begin or their potential size, markets anticipate the US central bank will announce a 25-basis points rate cut at the September meeting.
Additionally, Philadelphia Fed President Patrick Harker emphasized on Friday the need for the US central bank to lower interest rates gradually. Meanwhile, Chicago Fed President Austan Goolsbee noted that monetary policy is currently at its most restrictive, with the Fed now focusing on achieving its employment mandate.
On the EUR side, European Central Bank (ECB) Governing Council member Olli Rehn said on Friday that the slowdown in inflation alongside weakness in the Eurozone economy strengthened arguments to lower borrowing costs next month, per Bloomberg. The growth outlook in Europe, especially manufacturing, is rather subdued, which enforces the case for a rate cut in September.
Additionally, Rabobank’s Senior FX Strategist, Jane Foley, remarked on Friday that the EUR/USD pair is expected to trade at 1.1200 on a three-month horizon. Foley noted that the recent breakout and the beginning of a new policy cycle for the Fed indicate that a new trading range is emerging. However, Foley also mentioned that if key US data released in early September comes in stronger than market forecasts, there could be potential pullbacks to around 1.1000 for the pair.
Euro FAQs
The Euro is the currency for the 20 European Union countries that belong to the Eurozone. It is the second most heavily traded currency in the world behind the US Dollar. In 2022, it accounted for 31% of all foreign exchange transactions, with an average daily turnover of over $2.2 trillion a day. EUR/USD is the most heavily traded currency pair in the world, accounting for an estimated 30% off all transactions, followed by EUR/JPY (4%), EUR/GBP (3%) and EUR/AUD (2%).
The European Central Bank (ECB) in Frankfurt, Germany, is the reserve bank for the Eurozone. The ECB sets interest rates and manages monetary policy. The ECB’s primary mandate is to maintain price stability, which means either controlling inflation or stimulating growth. Its primary tool is the raising or lowering of interest rates. Relatively high interest rates – or the expectation of higher rates – will usually benefit the Euro and vice versa. The ECB Governing Council makes monetary policy decisions at meetings held eight times a year. Decisions are made by heads of the Eurozone national banks and six permanent members, including the President of the ECB, Christine Lagarde.
Eurozone inflation data, measured by the Harmonized Index of Consumer Prices (HICP), is an important econometric for the Euro. If inflation rises more than expected, especially if above the ECB’s 2% target, it obliges the ECB to raise interest rates to bring it back under control. Relatively high interest rates compared to its counterparts will usually benefit the Euro, as it makes the region more attractive as a place for global investors to park their money.
Data releases gauge the health of the economy and can impact on the Euro. Indicators such as GDP, Manufacturing and Services PMIs, employment, and consumer sentiment surveys can all influence the direction of the single currency. A strong economy is good for the Euro. Not only does it attract more foreign investment but it may encourage the ECB to put up interest rates, which will directly strengthen the Euro. Otherwise, if economic data is weak, the Euro is likely to fall. Economic data for the four largest economies in the euro area (Germany, France, Italy and Spain) are especially significant, as they account for 75% of the Eurozone’s economy.
Another significant data release for the Euro is the Trade Balance. This indicator measures the difference between what a country earns from its exports and what it spends on imports over a given period. If a country produces highly sought after exports then its currency will gain in value purely from the extra demand created from foreign buyers seeking to purchase these goods. Therefore, a positive net Trade Balance strengthens a currency and vice versa for a negative balance.
| Index | Change, points | Closed | Change, % |
|---|---|---|---|
| NIKKEI 225 | 153.26 | 38364.27 | 0.4 |
| Hang Seng | -28.9 | 17612.1 | -0.16 |
| KOSPI | -5.98 | 2701.69 | -0.22 |
| ASX 200 | -3.1 | 8023.9 | -0.04 |
| DAX | 139.71 | 18633.1 | 0.76 |
| CAC 40 | 52.93 | 7577.04 | 0.7 |
| Dow Jones | 462.3 | 41175.08 | 1.14 |
| S&P 500 | 63.97 | 5634.61 | 1.15 |
| NASDAQ Composite | 258.44 | 17877.79 | 1.47 |
Hezbollah launched hundreds of rockets and drones at Israel early on Sunday, as Israel's military said it carried out a wave of pre-emptive strikes across southern Lebanon to thwart a large-scale rocket and drone attack by Hezbollah, per Reuters.
Israel's foreign minister said the country did not seek a full-scale war, but Prime Minister Benjamin Netanyahu cautioned that "this is not the end of the story."
Meanwhile, Hamas rejected new Israeli conditions in Gaza ceasefire talks, casting doubt on the prospects for a breakthrough in US-backed attempts to end the 10-month-old conflict.
Market reaction
At the time of writing, the gold price (XAU/USD) is trading 0.11% higher on the day to trade at $2,515.
Risk sentiment FAQs
In the world of financial jargon the two widely used terms “risk-on” and “risk off'' refer to the level of risk that investors are willing to stomach during the period referenced. In a “risk-on” market, investors are optimistic about the future and more willing to buy risky assets. In a “risk-off” market investors start to ‘play it safe’ because they are worried about the future, and therefore buy less risky assets that are more certain of bringing a return, even if it is relatively modest.
Typically, during periods of “risk-on”, stock markets will rise, most commodities – except Gold – will also gain in value, since they benefit from a positive growth outlook. The currencies of nations that are heavy commodity exporters strengthen because of increased demand, and Cryptocurrencies rise. In a “risk-off” market, Bonds go up – especially major government Bonds – Gold shines, and safe-haven currencies such as the Japanese Yen, Swiss Franc and US Dollar all benefit.
The Australian Dollar (AUD), the Canadian Dollar (CAD), the New Zealand Dollar (NZD) and minor FX like the Ruble (RUB) and the South African Rand (ZAR), all tend to rise in markets that are “risk-on”. This is because the economies of these currencies are heavily reliant on commodity exports for growth, and commodities tend to rise in price during risk-on periods. This is because investors foresee greater demand for raw materials in the future due to heightened economic activity.
The major currencies that tend to rise during periods of “risk-off” are the US Dollar (USD), the Japanese Yen (JPY) and the Swiss Franc (CHF). The US Dollar, because it is the world’s reserve currency, and because in times of crisis investors buy US government debt, which is seen as safe because the largest economy in the world is unlikely to default. The Yen, from increased demand for Japanese government bonds, because a high proportion are held by domestic investors who are unlikely to dump them – even in a crisis. The Swiss Franc, because strict Swiss banking laws offer investors enhanced capital protection.
IMF chief economist Pierre-Olivier Gourinchas spoke at the Jackson Hole annual economic symposium on Friday. Gourinchas said that the Japanese central bank can continue to raise rates gradually, at a data-dependent pace, per Reuters.
Key quotes
Inflation is higher than the bank's 2% target.
Inflation expectations have started to move "maybe even a little bit above" that target
BOJ's beginning to normalize monetary policy is "certainly something that we think is a good development for Japan.
Market reaction
At the time of writing, USD/JPY is trading 0.40% lower on the day to trade at 143.78.
Japanese Yen FAQs
The Japanese Yen (JPY) is one of the world’s most traded currencies. Its value is broadly determined by the performance of the Japanese economy, but more specifically by the Bank of Japan’s policy, the differential between Japanese and US bond yields, or risk sentiment among traders, among other factors.
One of the Bank of Japan’s mandates is currency control, so its moves are key for the Yen. The BoJ has directly intervened in currency markets sometimes, generally to lower the value of the Yen, although it refrains from doing it often due to political concerns of its main trading partners. The current BoJ ultra-loose monetary policy, based on massive stimulus to the economy, has caused the Yen to depreciate against its main currency peers. This process has exacerbated more recently due to an increasing policy divergence between the Bank of Japan and other main central banks, which have opted to increase interest rates sharply to fight decades-high levels of inflation.
The BoJ’s stance of sticking to ultra-loose monetary policy has led to a widening policy divergence with other central banks, particularly with the US Federal Reserve. This supports a widening of the differential between the 10-year US and Japanese bonds, which favors the US Dollar against the Japanese Yen.
The Japanese Yen is often seen as a safe-haven investment. This means that in times of market stress, investors are more likely to put their money in the Japanese currency due to its supposed reliability and stability. Turbulent times are likely to strengthen the Yen’s value against other currencies seen as more risky to invest in.
| Pare | Closed | Change, % |
|---|---|---|
| AUDUSD | 0.67966 | 1.38 |
| EURJPY | 161.574 | -0.58 |
| EURUSD | 1.11926 | 0.74 |
| GBPJPY | 190.784 | -0.35 |
| GBPUSD | 1.32175 | 0.97 |
| NZDUSD | 0.62344 | 1.57 |
| USDCAD | 1.35078 | -0.77 |
| USDCHF | 0.8476 | -0.53 |
| USDJPY | 144.361 | -1.3 |
European Central Bank (ECB) Governing Council member Olli Rehn said on Friday that the slowdown in inflation alongside weakness in the Eurozone economy strengthened arguments to lower borrowing costs next month, per Bloomberg.
Key quotes
The growth outlook in Europe, especially manufacturing, is rather subdued.
In my eyes, this enforces the case for a rate cut in September.
We already have plenty of data to make our decision in September.
Disinflation and a weak economy support a September cut.
Downtrend in inflation is on track.
We are still seeing strong services inflation.
The disinflationary process has been ongoing since autumn 2022 and it's still going on.
Asked about 50 bps, says they always have to be open.
Says he doesn't want to commit to anything, data-dependent.
Market reaction
At the time of press, the EUR/USD pair was down 0.02% on the day at 1.1188.
ECB FAQs
The European Central Bank (ECB) in Frankfurt, Germany, is the reserve bank for the Eurozone. The ECB sets interest rates and manages monetary policy for the region. The ECB primary mandate is to maintain price stability, which means keeping inflation at around 2%. Its primary tool for achieving this is by raising or lowering interest rates. Relatively high interest rates will usually result in a stronger Euro and vice versa. The ECB Governing Council makes monetary policy decisions at meetings held eight times a year. Decisions are made by heads of the Eurozone national banks and six permanent members, including the President of the ECB, Christine Lagarde.
In extreme situations, the European Central Bank can enact a policy tool called Quantitative Easing. QE is the process by which the ECB prints Euros and uses them to buy assets – usually government or corporate bonds – from banks and other financial institutions. QE usually results in a weaker Euro. QE is a last resort when simply lowering interest rates is unlikely to achieve the objective of price stability. The ECB used it during the Great Financial Crisis in 2009-11, in 2015 when inflation remained stubbornly low, as well as during the covid pandemic.
Quantitative tightening (QT) is the reverse of QE. It is undertaken after QE when an economic recovery is underway and inflation starts rising. Whilst in QE the European Central Bank (ECB) purchases government and corporate bonds from financial institutions to provide them with liquidity, in QT the ECB stops buying more bonds, and stops reinvesting the principal maturing on the bonds it already holds. It is usually positive (or bullish) for the Euro.
- Gold price gains momentum around $2,515 in Monday’s early Asian session.
- Fed’s Powell said "the time has come" for the US Fed to begin lowering interest rates.
- The escalating tensions in the Middle East might further boost safe-haven assets like Gold.
Gold price (XAU/USD) holds positive near $2,515 an ounce during the early Asian session on Monday amid the weaker US Dollar (USD) and dovish comments from the Federal Reserve (Fed). The uptick of the yellow metal is bolstered by the speech by Fed Chair Jerome Powell, signalling that time has come for interest rate cuts starting this September.
Fed Chair Jerome Powell delivered the dovish message at the Kansas City Fed's annual economic symposium in Jackson Hole on Friday, which has weighed on the USD broadly. Fed’s Powell said that "the time has come" for the central bank to begin lowering interest rates. Powell acknowledged recent softness in the labor market in his speech and stated that the Fed did not "seek or welcome further cooling in labor market conditions.”
Financial markets have fully priced in a 25 basis points (bps) rate cut, while the chance for a deeper cut stands at 36.5%, up from 24% last week, according to the CME FedWatch Tool. The growing expectations of easing monetary policy by the Fed might further support the precious metal as it makes gold more attractive for other currency holders.
Furthermore, Hezbollah launched hundreds of rockets and drones at Israel early on Sunday, as Israel's military said it carried out a wave of pre-emptive strikes across southern Lebanon to thwart a large-scale rocket and drone attack by Hezbollah, per Reuters. The ongoing geopolitical tensions in the Middle East might boost the safe-haven asset demand, benefiting the Gold price.
Gold FAQs
Gold has played a key role in human’s history as it has been widely used as a store of value and medium of exchange. Currently, apart from its shine and usage for jewelry, the precious metal is widely seen as a safe-haven asset, meaning that it is considered a good investment during turbulent times. Gold is also widely seen as a hedge against inflation and against depreciating currencies as it doesn’t rely on any specific issuer or government.
Central banks are the biggest Gold holders. In their aim to support their currencies in turbulent times, central banks tend to diversify their reserves and buy Gold to improve the perceived strength of the economy and the currency. High Gold reserves can be a source of trust for a country’s solvency. Central banks added 1,136 tonnes of Gold worth around $70 billion to their reserves in 2022, according to data from the World Gold Council. This is the highest yearly purchase since records began. Central banks from emerging economies such as China, India and Turkey are quickly increasing their Gold reserves.
Gold has an inverse correlation with the US Dollar and US Treasuries, which are both major reserve and safe-haven assets. When the Dollar depreciates, Gold tends to rise, enabling investors and central banks to diversify their assets in turbulent times. Gold is also inversely correlated with risk assets. A rally in the stock market tends to weaken Gold price, while sell-offs in riskier markets tend to favor the precious metal.
The price can move due to a wide range of factors. Geopolitical instability or fears of a deep recession can quickly make Gold price escalate due to its safe-haven status. As a yield-less asset, Gold tends to rise with lower interest rates, while higher cost of money usually weighs down on the yellow metal. Still, most moves depend on how the US Dollar (USD) behaves as the asset is priced in dollars (XAU/USD). A strong Dollar tends to keep the price of Gold controlled, whereas a weaker Dollar is likely to push Gold prices up.


© 2000-2026. Уcі права захищені.
Cайт знаходитьcя під керуванням TeleTrade DJ. LLC 2351 LLC 2022 (Euro House, Richmond Hill Road, Kingstown, VC0100, St. Vincent and the Grenadines).
Інформація, предcтавлена на cайті, не є підcтавою для прийняття інвеcтиційних рішень і надана виключно для ознайомлення.
Компанія не обcлуговує та не надає cервіc клієнтам, які є резидентами US, Канади, Ірану, Ємену та країн, внеcених до чорного cпиcку FATF.
Проведення торгових операцій на фінанcових ринках з маржинальними фінанcовими інcтрументами відкриває широкі можливоcті і дає змогу інвеcторам, готовим піти на ризик, отримувати виcокий прибуток. Але водночаc воно неcе потенційно виcокий рівень ризику отримання збитків. Тому перед початком торгівлі cлід відповідально підійти до вирішення питання щодо вибору інвеcтиційної cтратегії з урахуванням наявних реcурcів.
Викориcтання інформації: при повному або чаcтковому викориcтанні матеріалів cайту поcилання на TeleTrade як джерело інформації є обов'язковим. Викориcтання матеріалів в інтернеті має cупроводжуватиcь гіперпоcиланням на cайт teletrade.org. Автоматичний імпорт матеріалів та інформації із cайту заборонено.
З уcіх питань звертайтеcь за адреcою pr@teletrade.global.
переклади