- Аналітика
- Новини та інструменти
- Новини ринків
Новини ринків
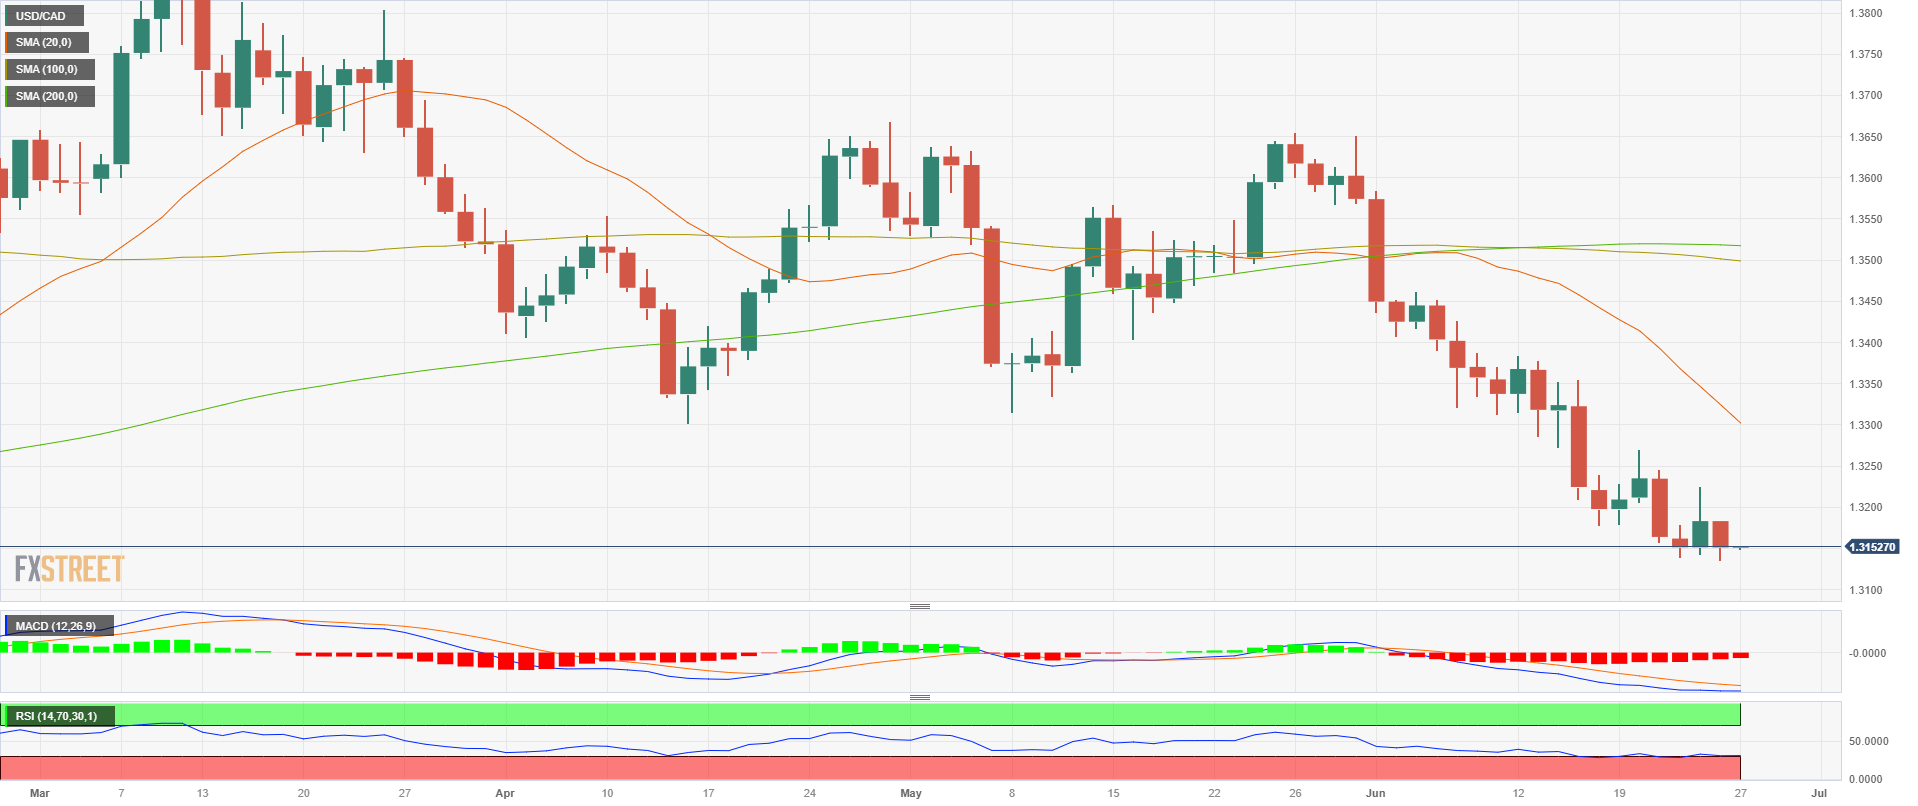
- USD/CAD remains pressured at the lowest levels in nine months.
- Immediate triangle restricts Loonie pair’s intraday moves amid sluggish oscillators.
- Likely softer Canada inflation can propel USD/CAD prices toward 1.3200 resistance confluence.
- Bulls need acceptance beyond 1.3230 to keep the reins, downside break of 1.3135 will have 1.3080 as additional support.
USD/CAD fades bounces off the lowest levels since September 2022 as it retreats to 1.3150 amid early hours of Tuesday. In doing so, the Loonie pair portrays the market’s optimism about the Canadian inflation data ahead of the release. That said, the quote refreshed a multi-month low the previous day before bouncing off 1.3136.
It should be noted the technical details aren’t supporting the bears as the bottom line of a one-week-old bullish descending triangle joins the sluggish MACD signals and the below 50.0 levels of the RSI (14) line suggest bottom-picking of the Loonie pair.
The same highlights a one-week-old horizontal resistance area surrounding 1.3180 as the immediate hurdle for the USD/CAD buyers to cross to convince markets.
Even so, a convergence of the 50-SMA and the aforementioned triangle’s top line, near 1.3205 at the latest, could challenge the bulls.
Following that, a downward-sloping resistance line from June 05, close to 1.3230, will act as the last defense of the USD/CAD bears.
Meanwhile, the recent lows marked around 1.3140-35, forming part of the previously stated triangle, limit the short-term downside of the Loonie pair.
Following that, tops marked during early May and July of 2022 highlight the 1.3085-80 support zone as an extra filter toward the south.
In a case where the USD/CAD pair remains bearish past 1.3080, the odds of witnessing a slump to the 1.3000 psychological magnet can’t be ruled out.
USD/CAD: Four-hour chart
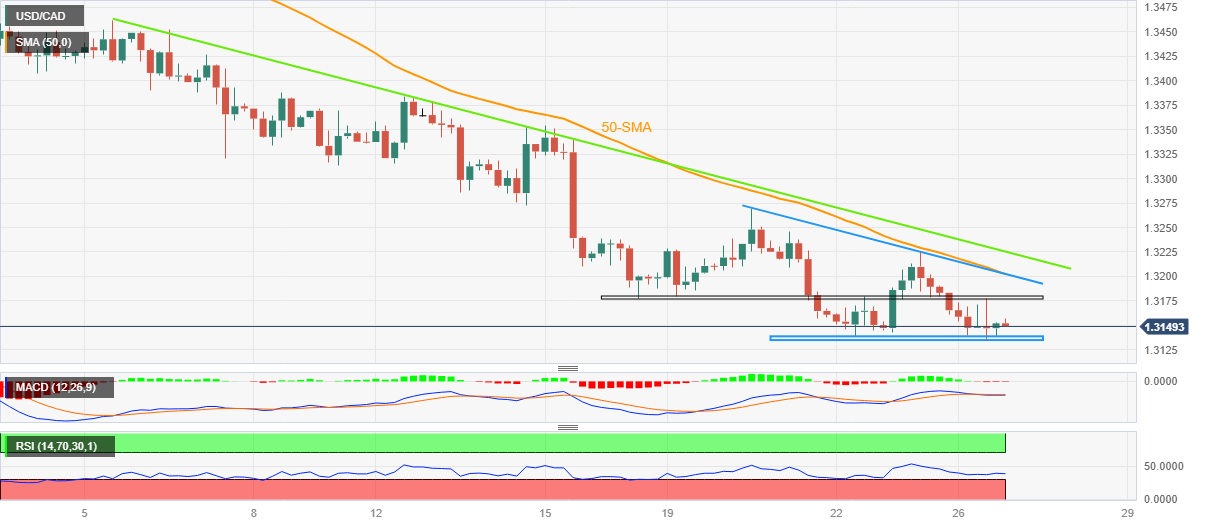
Trend: Corrective bounce expected
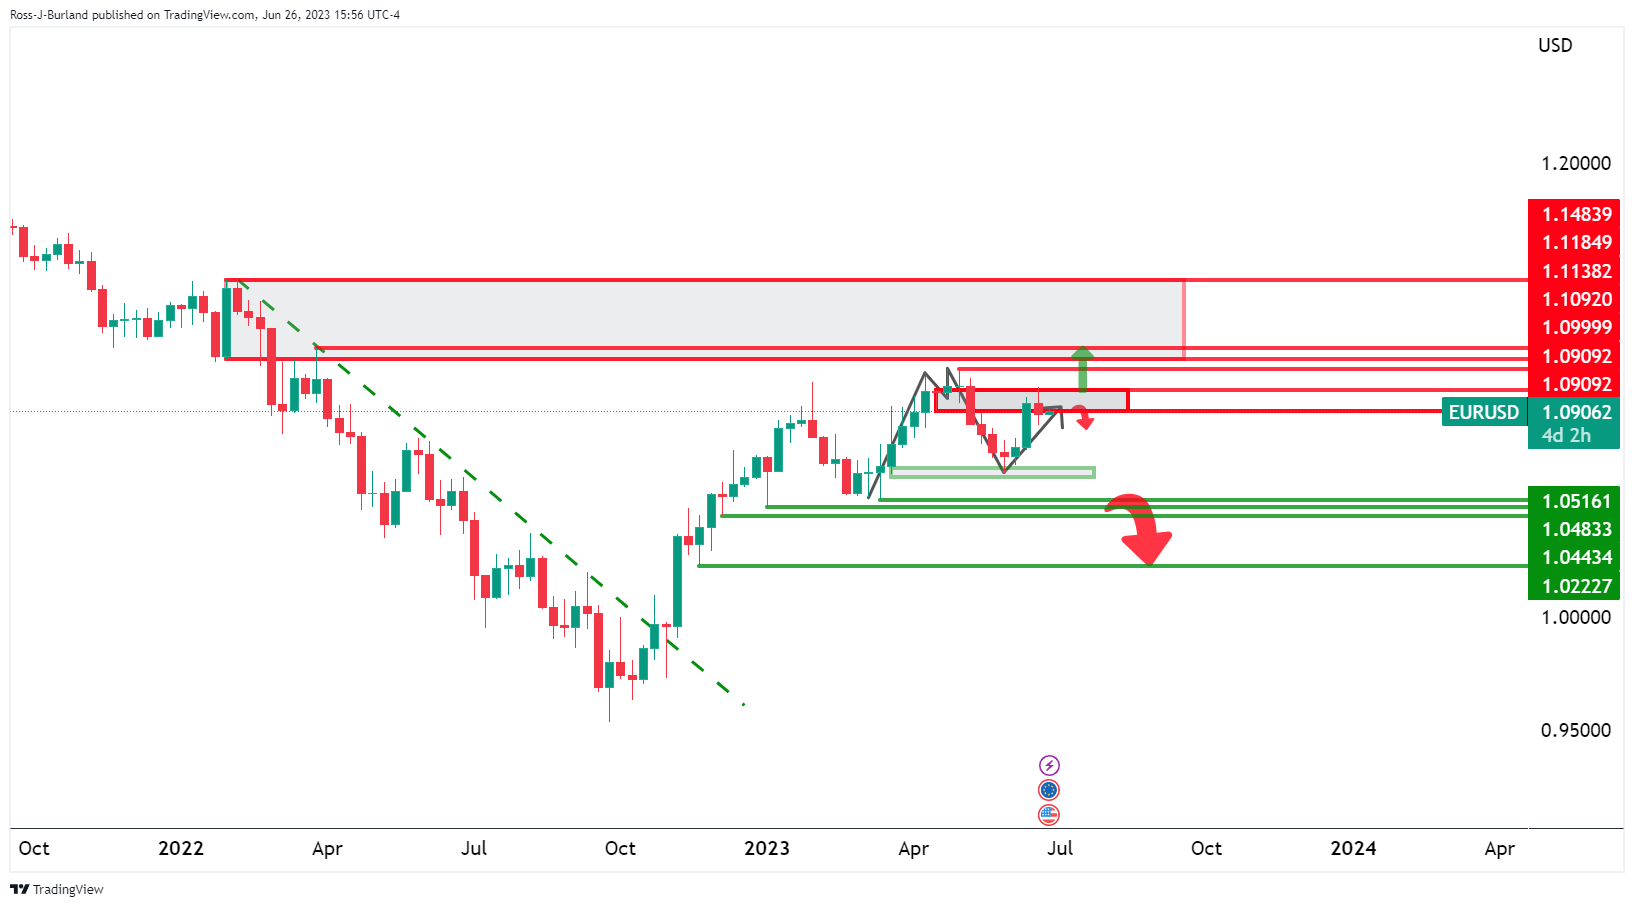
- EUR/USD struggles to defend the week-start rebound ahead of top-tier data/events.
- Euro buyers ignore upbeat US data versus downbeat German IFO figures as ECB President Lagarde’s speech looms.
- US Dollar bulls stay hopeful after Fed Chair Powell’s hawkish testimony, seek validation of upside bias from data.
- US Durable Goods Orders for May, CB Consumer Confidence for June eyed for clear directions.
EUR/USD treads water around 1.0900 as bulls seek fresh clues to defend the week-start rebound amid the early hours of Tuesday’s Asian session. That said, the Euro pair began the week on a front foot by snapping a two-day losing streak around the lowest levels since June 15. In doing so, the major currency pair ignored downbeat German economics, as well as firmer US data.
On Monday, Germany’s IFO Business Climate Index fell to 88.5 for June versus 91.5 in May (revised from 91.7) and the market expectation of 90.7. Further, the Current Economic Assessment Index also edged lower to 93.7 from 94.8 but arrived higher than the market expectation of 93.5. Additionally, the Expectations Index – indicating firms’ projections for the next six months, declined to 83.6 from 88.3.
Following the downbeat German IFO data, the institute’s Economist Klaus Wohlrabe said that the “likelihood that German economy will shrink again in Q2 has increased.”
However, Germany's Bundesbank said in its monthly report that the German economy appears to have bottomed out and is forecast to post a small growth in the Gross Domestic Product (GDP) in the second quarter (Q2).
On the other hand, US Dallas Fed Manufacturing Business Index for June improved to -23.2 versus -26.5 expected and -29.1 previous readings. During the last week, the US Core inflation for May allowed Fed Chairman Jerome Powell to remain hawkish but the Purchasing Managers’ Indexes for June weren’t impressive enough. Even so, Federal Reserve Bank of San Francisco President Mary Daly signaled on Friday that two more interest rate increases this year would be a "very reasonable projection."
Elsewhere, market fears emanating from Russia and China join broad pessimism about the concerns that the global economic recovery will fade to challenge the EUR/USD bulls, via the US Dollar’s haven demand. While portraying the mood, S&P500 Futures print mild gains despite the downbeat closing of the Wall Street benchmarks and the US Treasury bond yields.
Moving on, European Central Bank (ECB) President Christine Lagarde is scheduled to speak at the ECB Forum and will be observed closely for clear directions. Additionally, the US Durable Goods Orders for May, expected -1.0% versus 1.1% prior, as well as the second-tier activity and housing data can also entertain the EUR/USD pair traders. Also important to watch will be the US Confederation Board’s (CB) Consumer Confidence data for June, expected to arrive at 103.90 versus 102.30 prior. While ECB’s Lagarde is likely to defend the hawkish bias, downbeat US data can help the Euro bulls to keep the reins.
Technical analysis
A clear bounce off the 50-day Exponential Moving Average (EMA), around 1.0850 by the press time, joins the bullish MACD signal and upbeat RSI (14) line, the EUR/USD buyers are likely to keep the reins.
- AUD/USD stays defensive at the lowest levels in 13 days, grinds higher of late.
- US Dollar’s struggle to keep the buyers on board prod Aussie pair sellers.
- Upbeat US data, light calendar elsewhere joins mixed catalysts to restrict AUD/USD moves.
- US Durable Goods Orders, headlines surrounding China, Russia can entertain traders.
AUD/USD skates on thin ice around 0.6670-80 as it tries to push back the bears amid a sluggish week, so far, due to the lack of major data/events, as well as mixed risk catalysts. Also restricting the Aussie pair’s moves on early Tuesday in Asia is the cautious mood ahead of the US Durable Goods Orders for May, as well as Wednesday’s Monthly Consumer Price Index (CPI) for Australia.
Global markets dwindle as headlines from Russia suggest geopolitical fears aren’t off the table despite the Wagner Group’s retreat. On the same line were concerns that China’s economic recovery may lose momentum and can negatively affect the Antipodeans and commodities.
While the deal to end the alleged coup was struck between Russian authorities and the mercenary group, the boss of Russia's Wagner group, two days after leading an aborted mutiny, said he never intended to overthrow the government, per Reuters. On the same line, Russian President Vladimir Putin thanked Wagner fighters who stood down. The same eased the market’s fears a bit but the global leaders, including those from the UK and the US, have flagged concerns about Vladimir Putin’s hold onto Moscow, which in turn teases the Russian leader to take action and prove the world wrong, suggesting more geopolitical drama ahead.
On the other hand, Chinese analysts came out with the push for more and sooner stimulus to defend the economy from slipping back into the recession. The same joined Beijing’s previous readiness for more fiscal measures to propel the spending, which in turn puts a floor under the Gold price. However, the global rating giant S&P cut China’s Gross Domestic Product (GDP) growth forecasts for 2023 to 5.2% from 5.5% previous estimations. On the same line are concerns suggesting major investors’ pause in China investment.
It should be noted that US Dallas Fed Manufacturing Business Index for June improved to -23.2 versus -26.5 expected and -29.1 previous readings. During the last week, the US Core inflation for May allowed Fed Chairman Jerome Powell to remain hawkish but the Purchasing Managers’ Indexes for June weren’t impressive enough. Even so, Federal Reserve Bank of San Francisco President Mary Daly signaled on Friday that two more interest rate increases this year would be a "very reasonable projection." Hence, the hawkish Fed concerns gain support from the US data and weigh on the AUD/USD price.
Elsewhere, Bank for International Settlements (BIS) General Manager Agustin Carstens warned in the BIS annual report published Sunday, “The world economy was now at a crucial point as countries struggle to rein in inflation.” The same propelled the economic fears and prod the AUD/USD price due to the pair’s risk-barometer status.
Looking ahead, AUD/USD traders will pay attention to the risk catalysts amid a lack of major data/events ahead of the US Durable Goods Orders for May, expected -1.0% versus 1.1% prior, as well as the second-tier activity and housing data. Should the US statistics keep coming in upbeat, the Aussie pair can resume the downtrend. Also important to watch will be the US Confederation Board’s (CB) Consumer Confidence data for June, expected 103.90 versus 102.30 prior.
Technical analysis
Monday’s bullish Doji candlestick on the daily chart needs validation from the 200-SMA level of 0.6695, as well as the 0.6700 round figure, to convince the AUD/USD buyers.
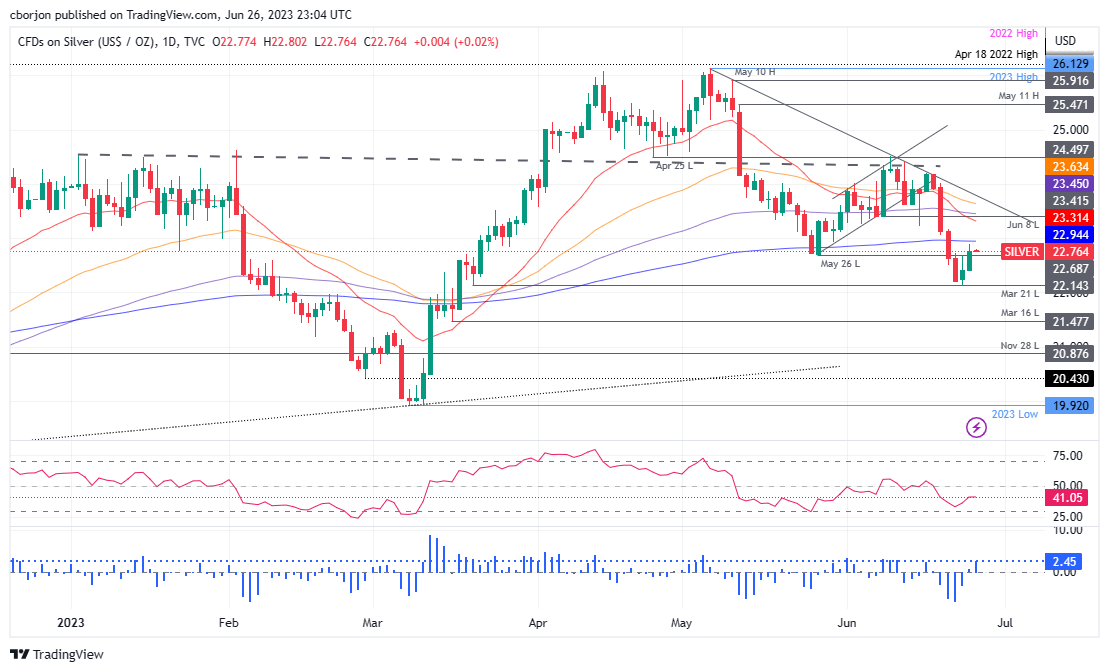
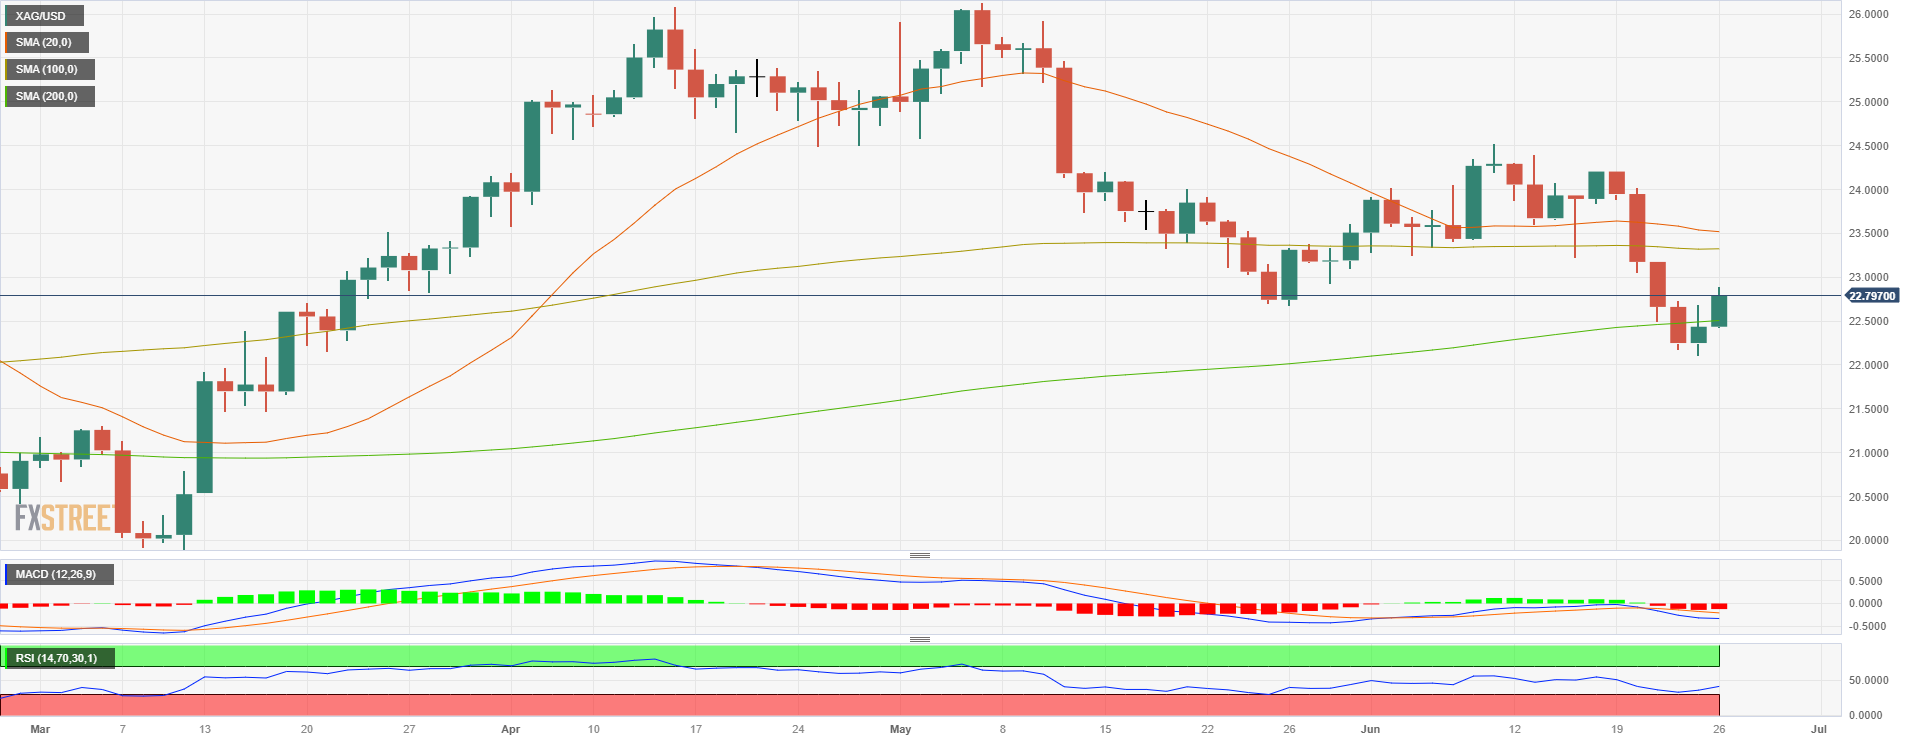
- Silver struggles below the 200-day EMA, trading nearly flat.
- Bearish indicators suggest downward potential despite some buying pressure.
- A daily close above 200-day EMA could spark a rebound to $23.00.
Silver price advances sharply during the week, though as the Asian session begins, the XAG/USD is facing solid resistance at the 200-day Exponential Moving Average (EMA) at $22.94. That said, the Silver (XAG/USD) spot is trading at $22.77, almost flat, at the time of writing.
XAG/USD Price Analysis: Technical outlook
XAG/USD shifted bearish once it fell below the 200-day EMA and beneath the May 26 daily low of $22.68. Even though XAG/USD hovers above the latter, a daily close above it’s required to keep buyers hopeful of reclaiming higher prices, like the 200-day EMA, ahead of the $23.00 barrier.
Nevertheless, the XAG/USD’s path of least resistance is downward biased, as shown by the Relative Strength Index (RSI) indicator, at bearish territory. At the same time, the three-day Rate of Change (RoC) portrays some buying pressure lifted the XAG/USD.
That said, the XAG/USD first support would be $22.68. A breach of the latter will expose the XAG/USD last week’s low of $22.11 before dropping beneath the $22.00 mark. Conversely, if XAG/USD achieves a daily close above the 200-day EMA, the XAG/USD could challenge $23.00 as the first resistance. Break above will expose the 20-day EMA at $23.31, followed by the 100-day EMA at $23.45.
XAG/USD Price Action – Daily chart
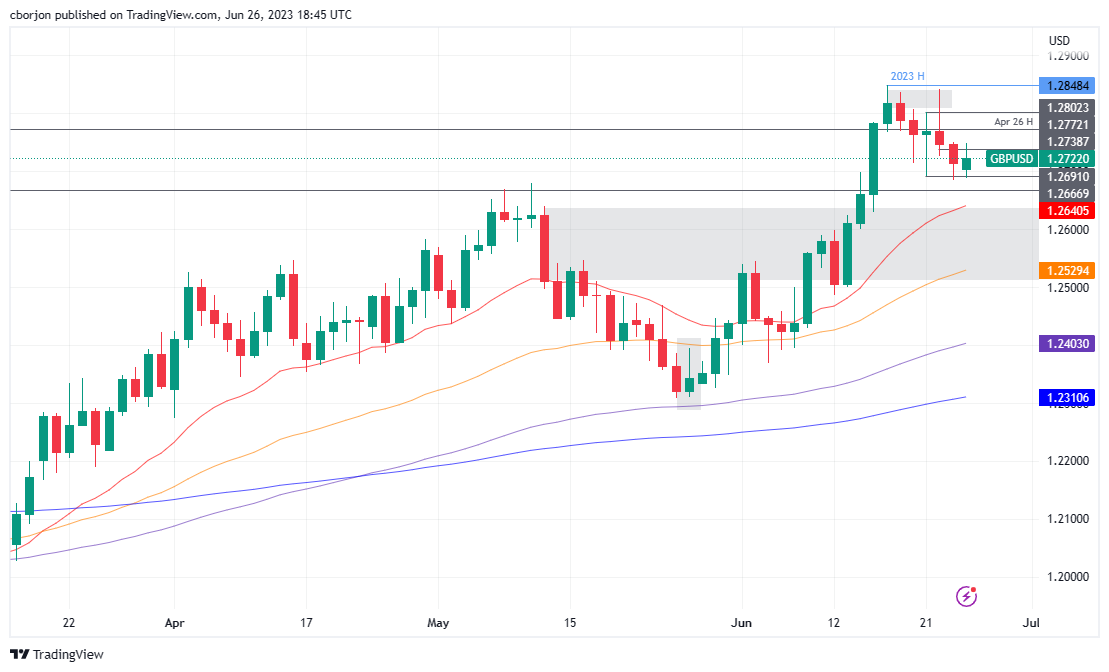
- GBP/USD remains depressed within a one-week-old bullish triangle.
- Downbeat oscillators, failure to cross 200-HMA keep Cable bears hopeful.
- Upside break of 1.2765 confirms bullish chart formation suggesting fresh monthly high.
GBP/USD remains defensive within a one-week-old bullish triangle formation, sidelined near 1.2710 amid early hours of Tuesday’s Asian session.
That said, the bullish triangle formation lures the Cable buyers. However, multiple failures to cross the 200-Hour Moving Average (HMA) joins the bearish MACD signals and the steady RSI (14) line to keep the GBP/USD sellers hopeful of breaking the stated triangle’s support line, close to 1.2690 by the press time.
Following that, the 61.8% Fibonacci retracement of June 12 to 22 uptrend, near 1.2625, will precede the 1.2600 round figure to restrict further downside of the GBP/USD price.
In a case where the Pound Sterling remains bearish past 1.2600, the month-start swing high of near 1.2545 will be in the spotlight.
On the contrary, the 200-HMA and the stated triangle’s top line, respectively near 1.2750 and 1.2765, restrict immediate upside of the GBP/USD pair.
It’s worth noting that the Pound Sterling rise past 1.2765 confirms the bullish chart formation and will direct the GBP/USD price towards the theoretical target of 1.2850.
Overall, GBP/USD fades upside momentum but the sellers need validation from 1.2690 to welcome the bears.
GBP/USD: Hourly chart

Trend: Downside expected
- Gold Price fades bounce off key Fibonacci retracement support ahead of United States Durable Goods Orders.
- Doubts about China's recovery, geopolitical fears emanating from Russia prod XAU/USD bulls.
- US data, hawkish Federal Reserve signals put a floor under the US Dollar, weighing on the Gold Price.
- Risk catalysts, US data eyed for clear directions as XAU/USD bears seek fresh entry.
Gold Price (XAU/USD) lacks upside momentum on a sluggish week-start, despite defending the previous week’s rebound from the key Fibonacci retracement support amid mixed catalysts. That said, the XAU/USD eases to $1,923 amid early hours of Tuesday’s Asian session, following a two-day winning streak around the lowest levels since mid-March.
The precious metal began the week on a front foot amid receding geopolitical fears from Russia and hopes of stimulus from China. However, the doubts that Moscow may retaliate the attempts to mutiny by Wagner mercenaries and S&P’s cut in China’s growth forecasts joined upbeat United States data to prod the XAU/USD bulls afterward.
Gold Price eases amid mixed markets
Gold Price offered a softer start to the week after geopolitical fears escalated during the weekend on news suggesting a short-lived mutiny to Moscow. While the deal to end the alleged coup was struck, the boss of Russia's Wagner mercenary group, two days after leading an aborted mutiny, on Monday said he never intended to overthrow the government, per Reuters. On the same line, Russian President Vladimir Putin thanked Wagner fighters who stood down. With this, the easing geopolitical tensions surrounding Russia seemed to have prod the XAU/USD bulls after an ephemeral support.
Elsewhere, Chinese analysts came out with the push for more and sooner stimulus to defend the economy from slipping back into the recession. The same joined Beijing’s previous readiness for more fiscal measures to propel the spending, which in turn puts a floor under the Gold price. However, the global rating giant S&P cut China’s Gross Domestic Product (GDP) growth forecasts for 2023 to 5.2% from 5.5% previous estimations. On the same line are concerns suggesting major investors’ pause in China investment. With this, the XAU/USD bears the burden of the bad news as China is one of the world’s biggest Gold consumers.
Talking about the United States data and the Gold Price, US Dallas Fed Manufacturing Business Index for June improved to -23.2 versus -26.5 expected and -29.1 previous readings. During the last week, the US Core inflation for May allowed Fed Chairman Jerome Powell to remain hawkish but the Purchasing Managers’ Indexes for June weren’t impressive enough. Even so, Federal Reserve Bank of San Francisco President Mary Daly signaled on Friday that two more interest rate increases this year would be a "very reasonable projection." Hence, the hawkish Fed concerns weigh on the Gold Price.
On a different page, Bank for International Settlements (BIS) General Manager Agustin Carstens warned in the BIS annual report published Sunday, “The world economy was now at a crucial point as countries struggle to rein in inflation.”
Amid these plays, the market sentiment remains sour and challenges the XAU/USD bulls. While portraying the mood, the Wall Street benchmarks closed negative while the US Treasury bond yields remain downbeat.
Moving on, risk catalysts about China and Russia will join the headlines about the Federal Reserve (Fed) will be important to watch. Additionally, the US Durable Goods Orders for May will also be important to watch for clear directions.
Gold Price Technical analysis
Gold Price (XAU/USD) fails to defend the previous week’s corrective bounce off the 61.8% Fibonacci retracement, also known as the golden Fibonacci ratio, of its February-May upside, near $1,910.
The XAU/USD weakness also takes clues from the bearish signals from the Moving Average Convergence and Divergence (MACD) indicator. However, the below 50.0 levels of the Relative Strength Index (RSI) line, placed at 14, suggests the bottom-picking of the Gold Price.
As a result, the downside break of $1,910 appears less likely. Even if the XAU/USD slips below $1,910, the $1,900 round figure, February 09 swing high near $1,890 and the 78.6% Fibonacci retracement level of $1,863 can challenge the Gold sellers afterward.
On the contrary, the Gold buyers remain off the table unless breaking the $1,943 resistance confluence comprising the 100-SMA and 50% Fibonacci retracement level.
Following that, a three-week-long descending resistance line, close to $1,953 at the latest, will be in the spotlight as it holds the key to the XAU/USD’s run-up towards the monthly high surrounding $1,983-84.
Overall, the Gold Price is likely to remain weak but the road towards the south appears bumpy.
Gold Price: Daily chart
-27062023-638234149973303272.png)
Trend: Further downside expected
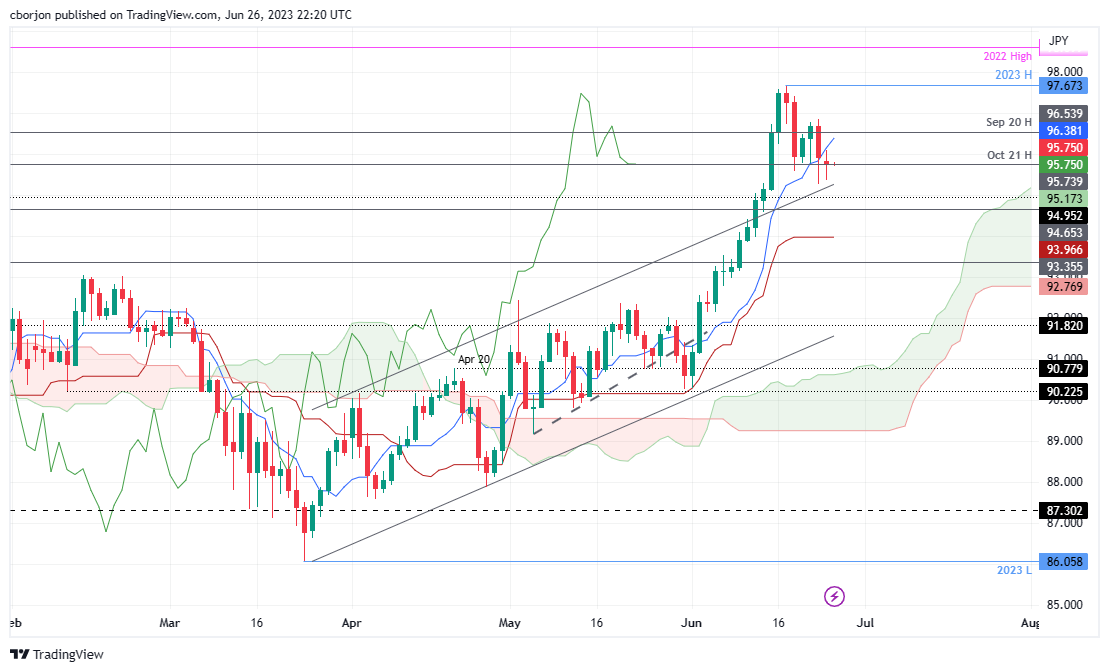
- AUD/JPY recovers, trading above last week’s low of 95.25.
- Monday’s bullish harami formation suggests a potential uptrend.
- The technical outlook presents resistance at 96.00 and 96.38.
The AUD/JPY begins the Tuesday Asian session positively after printing a 0.17% loss on Monday due to risk-aversion and Japanese authorities’ language intervention in the Forex markets. The AUD/JPY is trading at 95.78, slightly above last week’s low of 95.25.
AUD/JPY Price Analysis: Technical outlook
From a technical perspective, the AUD/JPY is upward biased, but since peaking at the year-to-date (YTD) high at 97.67, it has lost 2%. However, Monday’s price action contracted and formed a two-candlestick pattern named a bullish harami. The AUD/JPY could be set to resume its uptrend, but it would lean on market sentiment and dovish comments by the Bank of Japan (BoJ) officials.
The AUD/JPY first resistance would be the 96.00 figure, followed by the Tenkan Sen line at 96.38. A breach of the latter will expose the 97.00 figure, ahead of challenging the YTD high at 97.67. Conversely, if AUD/JPY dives below the Senkou Span A support at 95.17, it will expose the 95.00 figure. A drop below that level will expose the November 16 high at 94.65 before dropping toward the Kijun-Sen line at 93.96.
AUD/JPY Price Action – Daily chart
- EUR/GBP may see further downside as the 100- and 200-day SMAs bearish crossover seems imminent at the 0.8750 area.
- For the immediate short-term, indicators favour the Euro over the dollar.
- The 20-day SMA provides strong support on the downside.
On Monday, the EUR/GBP closed with slight gains near de 0.8580, just above the 20-day Simple Moving Average (SMA) area after bouncing from a daily low of 0.8540.
Upside potential for the EUR/GBP limited by bearish SMA cross
The Relative Strength Index (RSI) remains in negative territory but with a positive slope, indicating that bulls are gaining traction. The Moving Average Convergence Divergence (MACD) stands in positive territory, printing rising green bars, suggesting that the sellers are losing some steam. However, a bearish cross between the 100- and 200-day SMAs near the 0.8750 level could confirm the negative outlook for the short term and reignite selling momentum.
Levels to watch
The 20-day SMA at 0.8578 acts as a strong support which in case of being lost, the 0.8545 and the 0.8530 area would be exposed for a retest. On the upside, the 0.8600 psychological mark stands as the nearest resistance to retake before the 0.8635 and 0.8650 areas.
-638234138056678226.png)
- Political turmoil in Russia and concerns of global recession partially fuel WTI’s rebound.
- Weak business climate in Germany and China’s decelerating growth threaten oil demand.
- Saudi Arabia’s crude output adjustments might spur WTI’s recovery toward $70 per barrel.
Western Texas Intermediate (WTI), the US crude oil benchmark, snaps two days of losses and climbs more than 0.50% amidst global economic concerns of an impending recession and political turmoil in Russia. Therefore, WTI is trading at $69.49 per barrel late in the North American session after hitting a daily low of $68.71.
US crude oil climbs 0.50% late in the Noth American session as it shrugs off global economic jitters
During the weekend, a conflict erupted between Moscow and the Russian mercenary private group Wagner which withdrew from the south of Russia, marched towards Moscow but halted their advance, but stalled due to an agreement between its leader and Russian President Vladimir Putin.
Regarding the worldwide economic outlook, last Friday’s release of Eurozone (EU) and North American business activity indicators, known as PMIs, pointed to slower economic growth. Therefore, WTI slid 0.60% on Friday, closing below the $70.00 per barrel figure, on concerns that demand would shrink.
Even though WTI recovered some ground, the rally stalled on the back foot of a weaker business climate in Germany, as the Ifo survey showed signs the country’s Gross Domestic Product (GDP) would shrink in Q2.
Moreover, recent rate cuts by the People’s Bank of China (PBoC) showed China’s struggling to keep its pace of growth, which has been downward revised by some Wall Street banks. That, alongside decelerating business activity in China, threatens to hurt oil demand.
Oil got a lifeline as future US supply numbers fell for the eighth week in a row, for the first time since July 2020, with oil rigs falling 6 to 546 the latest week, its lowest since April 2022, while gas rigs held steady at 130.
Given the fundamental backdrop, WTI fell 3.6% during the last week, but Saudi Arabia’s crude output adjustments could trigger WTI’s recovery at least towards the $70.00 mark.
WTI Price Analysis: Technical outlook
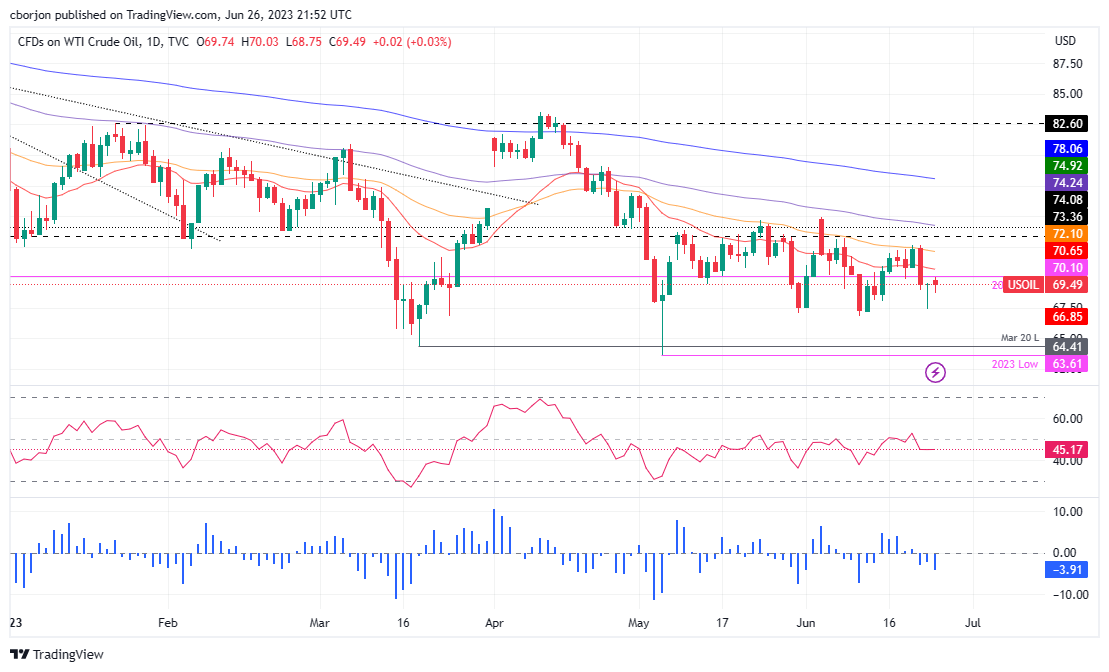
From a daily chart perspective, WTI remains trading sideways, consolidating at around $68-$70.50 per barrel, capped on the upside by several daily Exponential Moving Averages (EMAs). The 20-day EMA sits at $70.65, followed by the 50-day EMA at $72.10. If WTI buyers conquer those two-level, that will open the door to challenge the 100-day EMA at $74.24. Conversely, if WTI drops below June’s 23 daily low of $67.40, that would pave the way to test the year-to-date (YTD) low of $63.61.
- NZD/USD bulls moved in from trendline support.
- NZD/USD bears need to show up at key neckline resistance.
NZD/USD is flat on the day so far following a rally from the lows of 0.6117 to the highs of 0.6177. The pair move into a resistance area in the initial balance for the week but was jittery on the back of weekend political stress related to Russia.
The short-lived uprising in Russia had little impact on oil prices but has pushed up wheat prices, a makeup of the commodities complex that the Kiwi trades as a proxy to.
''The Kiwi is little changed this morning after a quiet night on global FX markets and with bond yields and equity indices reasonably range-bound too,'' analysts at ANZ Bank explained.
''With no local or Aussie data scheduled today, it is likely to be another muted session, with the focus on the Australia Consumer Price Index, CPI, data due tomorrow, which will be a key input into next week’s Reserve Bank of Australia decision, which in turn, is important for the Kiwi by correlation (and clearly crucial for AUD/NZD),'' the analysts added.
''In fact, the next 7 days look like they’ll be shaped and led by the AUD given other data due there like retail sales, and given how barren the NZ data schedule is, and with the Reserve Bank of New Zealand on hold.'
NZD/USD technical analysis

NZD/USD has left an M-formation on the chart on the front side of the bullish trendline. The price has rallied into the neckline of the formation in an almost 61.8% Fibonacci retracement from near 0.6120 support. If the bears commit now, then the trendline will come under pressure.
- The USD/CAD traded in the 1.3136 - 1.3184 range, setting a new low since September 2022.
- Canadian Core inflation is expected to fall to 3.9% YoY in May.
- Eyes on Jerome Powell’s speech at ECB’s forum on Wednesday.
The USD/CAD pair faced downward pressure as the US Dollar weakened, declining to a low of 1.3136, its lowest level since September 2022. Furthermore, the focus shifts to the release of Canadian inflation figures on Tuesday, which are expected to have decelerated in May. Moreover, investors await Jerome Powell's upcoming speech at the ECB's forum on Wednesday, which could provide further direction for the market.
Canadian inflation figures and Powell’s Speech to set short-term trajectory
On Tuesday, the Bank of Canada will release inflation figures for May, which are expected to show a deceleration. The headline inflation per the Consumer Price Index (CPI) is seen falling to 3.4% YoY while the Core measures to 3.9% YoY. The CPI measure is a key gauge of inflation for central banks, which tends to influence monetary policy decisions. Hot figures are usually associated with interest rate hikes.
On the other hand, investors will look for clues in Wednesday’s speech by Jerome Powell in the ECB’s forum. The markets are eagerly trying to decipher the fact that Federal Open Market (FOMC) members as per the revised dot plots, are seeing an additional 50 basis points (bps) hike in 2023. In that sense, any hawkish surprise will give a boost to the US Dollar whose DXY index is currently trading with losses at the 102.78 area.
In addition, mid-tier economic data released on Tuesday, including Durable Goods data from May may have an impact on the Greenback’s price dynamics.
USD/CAD Levels to watch
Technically speaking, the USD/CAD maintains a bearish outlook for the short term, as per indicators on the daily chart. The Relative Strength Index (RSI) and Moving Average Convergence Divergence (MACD) are both showing weakness, standing in negative territory approaching oversold conditions. Moreover, the pair trades below its main moving averages, indicating that the sellers have the upper hand.
On the downside, the next support levels to watch are the daily low at 1.3136, followed by the 1.3115 zone and the psychological mark at 1.3100. Conversely, upcoming resistance for the pair is seen at the 1.3170 level, followed by the 1.3190 and 1.3200 areas.
USD/CAD Daily chart
No key reports are due during the Asian session. Later in the day, the US will report Durable Goods Orders and Canada will release inflation data. The ECB Forum will gather attention with many central bankers due to speak on Tuesday ahead of a panel on Wednesday that will include Powell, Bailey, and Lagarde. Geopolitics is also on the agenda.
Here is what you need to know on Tuesday, June 26:
Wall Street finished lower on Monday with the Nasdaq falling 1.16%, and Treasury yields declined. The US Dollar Index dropped modestly, closing around 102.75, on a quiet day for currencies. Market participants await new data and speeches from central bankers from the European Central Bank (ECB) forum.
Data released on Monday showed that the US Dallas Fed Manufacturing Index decreased in June from -29.1 to -23.2. On Tuesday, the US May Durable Goods Orders report is due, as well as housing data with the S&P/Case-Shiller and the FHFA Price Index and New Home Sales. The key number this week from the US will be on Friday with the Core Personal Consumption Expenditures.
EUR/USD moved sideways near 1.0900, away from Friday's low. The pair remains steady, showing no clear signs. The German Ifo survey declined more than expected. On Tuesday, the focus will be on ECB speakers at the Sintra conference. On Wednesday, Lagarde will be part of a policy panel with Bailey, Powell, and Ueda.
Analysts at Commerzbank:
The Ifo business climate has slumped for the second month in a row (88.5 after 91.5). The other leading indicators for the manufacturing sector are also pointing clearly downwards. We feel confirmed in our forecast that the German economy will shrink again in the second half of the year. The still too optimistic economic forecasts of many economists are likely to be revised further downwards. This is also true for the ECB.
The Pound lagged on Monday, still affected by last week's developments. GBP/USD held above recent lows and finished slightly above 1.2700. Bank of England's Tenreyro will speak on Tuesday.
USD/JPY pulled back modestly from multi-month highs amid cautious markets and lower US yields but held above 143.00.
The Canadian dollar continued to outperform. USD/CAD reached the lowest intraday level since mid-September at 1.3136 and then bounced toward 1.3150, trimming losses. Crucial data will be released on Tuesday with the May Consumer Price Index, which is expected to slow down from an annual rate of 4.4% to 3.4%.
AUD/USD moved sideways around 0.6675 on Monday, consolidating last week's losses. The attention regarding data is set on Wednesday with Australia's Consumer Price Index for May ahead of next week's Reserve Bank of Australia (RBA) meeting.
NZD/USD rebounded from the 20-day Simple Moving Average (SMA) and climbed above 0.6150. New Zealand Prime Minister Hipkins is on a state visit to China.
The Turkish Lira continued to decline and hit fresh record lows, with USD/TRY reaching levels above 26.00.
Gold prices peaked at $1,937 and then pulled back toward $1,920. Silver rose 1.50% and approached $23.00. Cryptocurrencies fell modestly, with Bitcoin holding above $30,000.
Like this article? Help us with some feedback by answering this survey:
- EUR/USD bullish correction has started to decelerate at resistance and there are prospects of a move lower.
- EUR/USD bears eye 1.0905 as the first structural horizontal support that guards the 1.0880s support.
EUR/USD has traded between a low of 1.0887 and a high of 1.0920 on the day so far, correcting from the lows but well below the six-week peak of 1.100 touched on June 22. The potential economic consequences of higher interest rates within the Eurozone have trumped the hawkish tilt at the European Central Bank following the recently released PMI data from Friday that showed a notable deceleration in private sector growth across the Eurozone in June. Technically, the following illustrates a bearish bias while below the key resistance structure.
EUR/USD weekly chart
The weekly chart's M-formation has seen a reversion into the neckline resistance that would be expected to hold the bulls off, for now.
EUR/USD daily chart
The daily M-formation is also in play but there is a price imbalance that could be filled as high as the 61.8% Fibonacci retracement level.
EUR/USD H1 chart
Meanwhile, the market is still on the front side of the hourly correction, at the extreme as illustrated in the chart above. However, it has started to decelerate at resistance and there are prospects of a move lower with 1.0905 as the first structural horizontal support that guards the 1.0880s support area as last defence for a move towards the lows, in the 1.0840s.
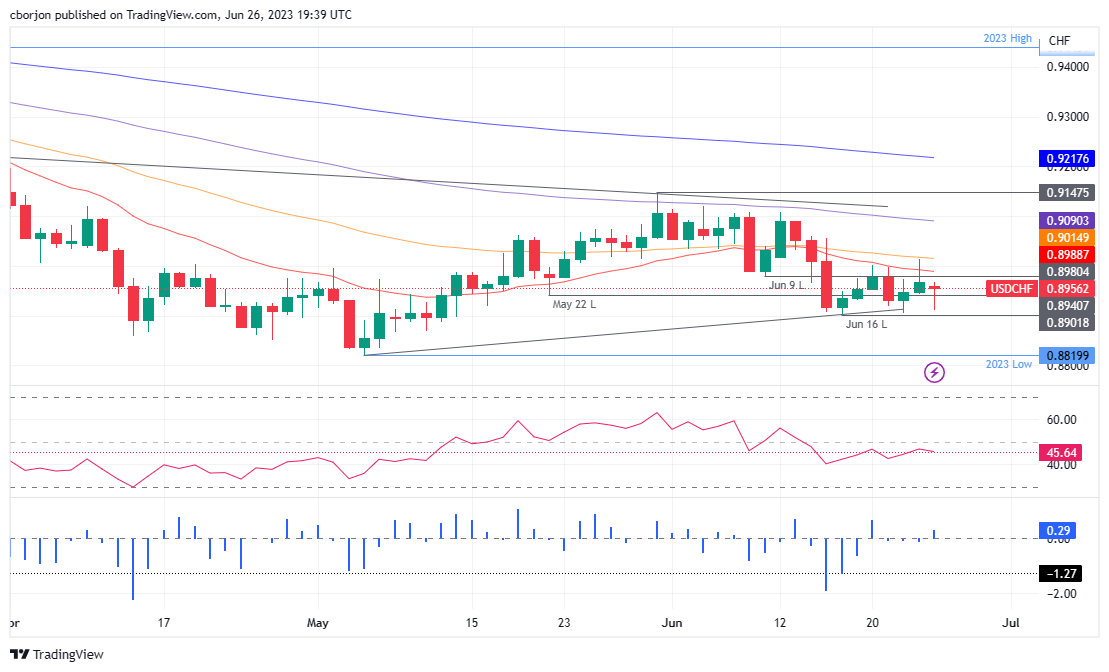
- USD/CHF hovers near 0.8950 and eyes 20-day and 50-day EMA resistance at 0.8988 and 0.9014.
- RSI nearing 50 midlines, suggesting potential bullish movement.
- Bearish continuation requires a break below 0.8900, revealing a YTD low of 0.8820.
USD/CHF trims some of its last Friday’s gains thought remains firm nearby 0.8950s after bouncing from daily lows reached early in the European session at around 0.8911. At the time of writing, the USD/CHF exchanges hands at 0.8952, down 0.17%, after failing to crack under the 0.8900 mark.
USD/CHF Price Analysis: Technical outlook
From a daily chart perspective, the USD/CHF remains neutral to downward biased but at the brisk of surpassing resistance levels like the 20 and 50-day Exponential Moving Averages (EMAs) at 0.8988 and 0.9014, respectively. Of note, the Relative Strength Index (RSI) indicator is closing into the 50-midline, which, once crossed, would trigger a buy signal. The three-day Rate of Change (RoC) depicts that buyers moved into the 0.8900 figure, as it prints its biggest gain, snapping three days of negative readings.
Therefore, the USD/CHF firsT resistance would be the 20-day EMA, followed by the 0.9000 figure. Break above will expose the 50-day EMA, followed by the 100-day EMA at 0.9090, ahead of 0.9100. On the flip side, the USD/CHF must break below 0.8900 for a bearish continuation, exposing the year-to-date (YTD) low of 0.8820, ahead of 0.8800.
USD/CHF Price Action – Daily chart
- AUD/USD meets a support structure on the daily chart.
- AUD/USD bulls eye a significant correction to the upside.
AUD/USD has travelled between a low of 0.6667 and 0.6694 on the day so far, stuck in a holding pattern on Monday, after suffering a major sell-off last week on global growth concerns.
The markets are now awaiting domestic inflation data for clues on the July rate move now that the weekend mutiny by Russian mercenaries news has been digested into the price that had otherwise been a risk-off theme for the Aussie that trades high beta to the stock market. Investors were waiting for more clarity about that situation.
The Antipodean currency was tumbling 2.8% last week, the biggest since August last year, to 0.6663. Technically, the price is in a bearish scenario:
AUD/USD monthly chart
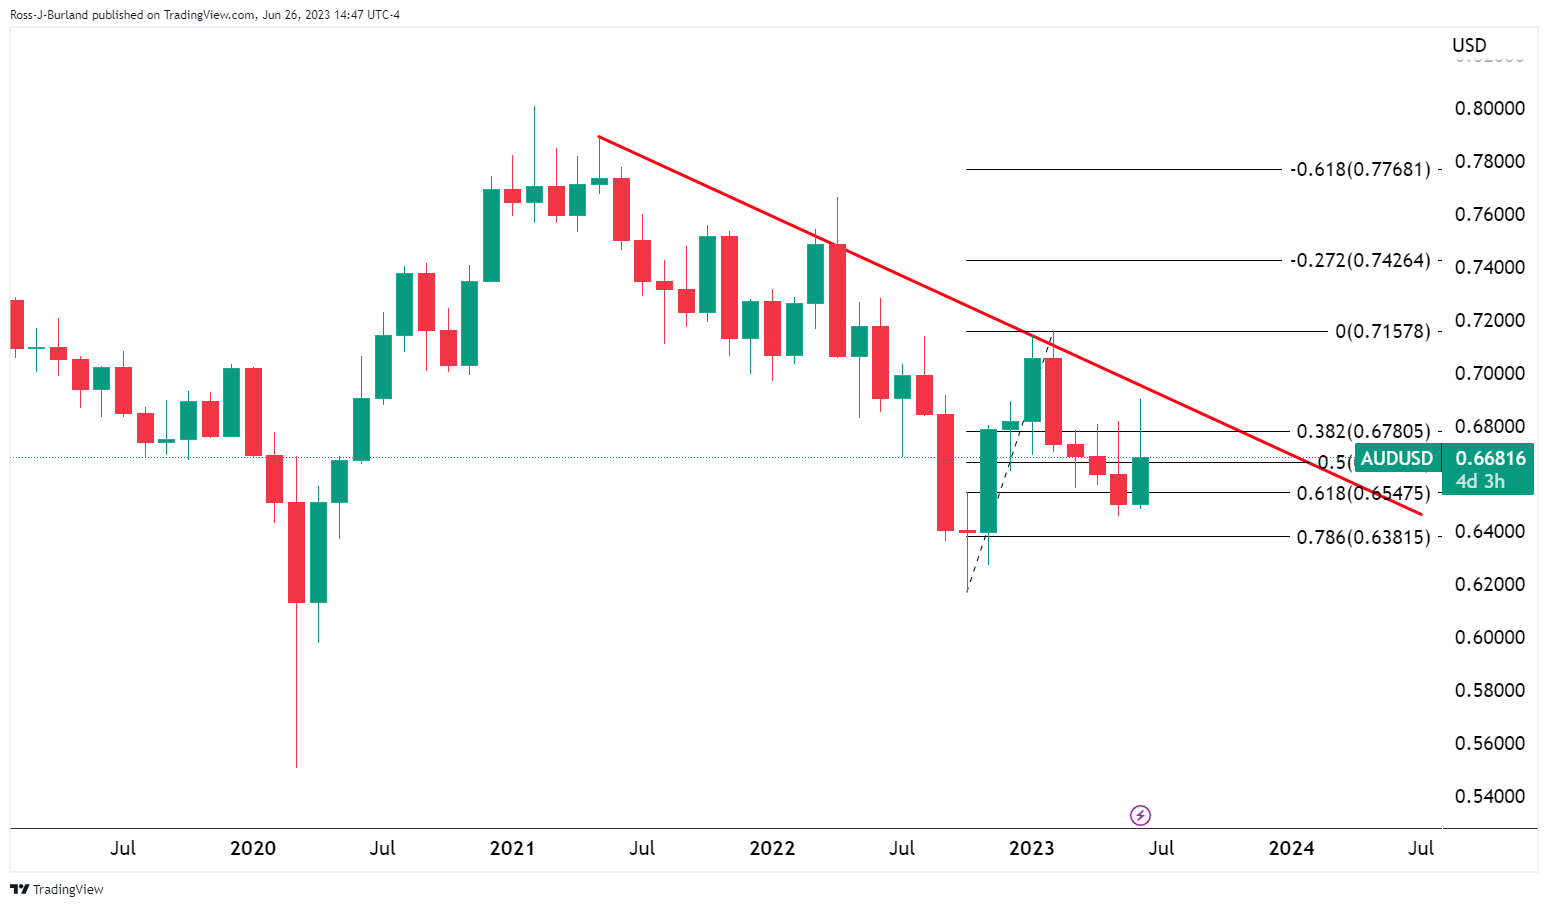
The 61.8% Fibo is so far holding up the monthly price action.
AUD/USD weekly chart
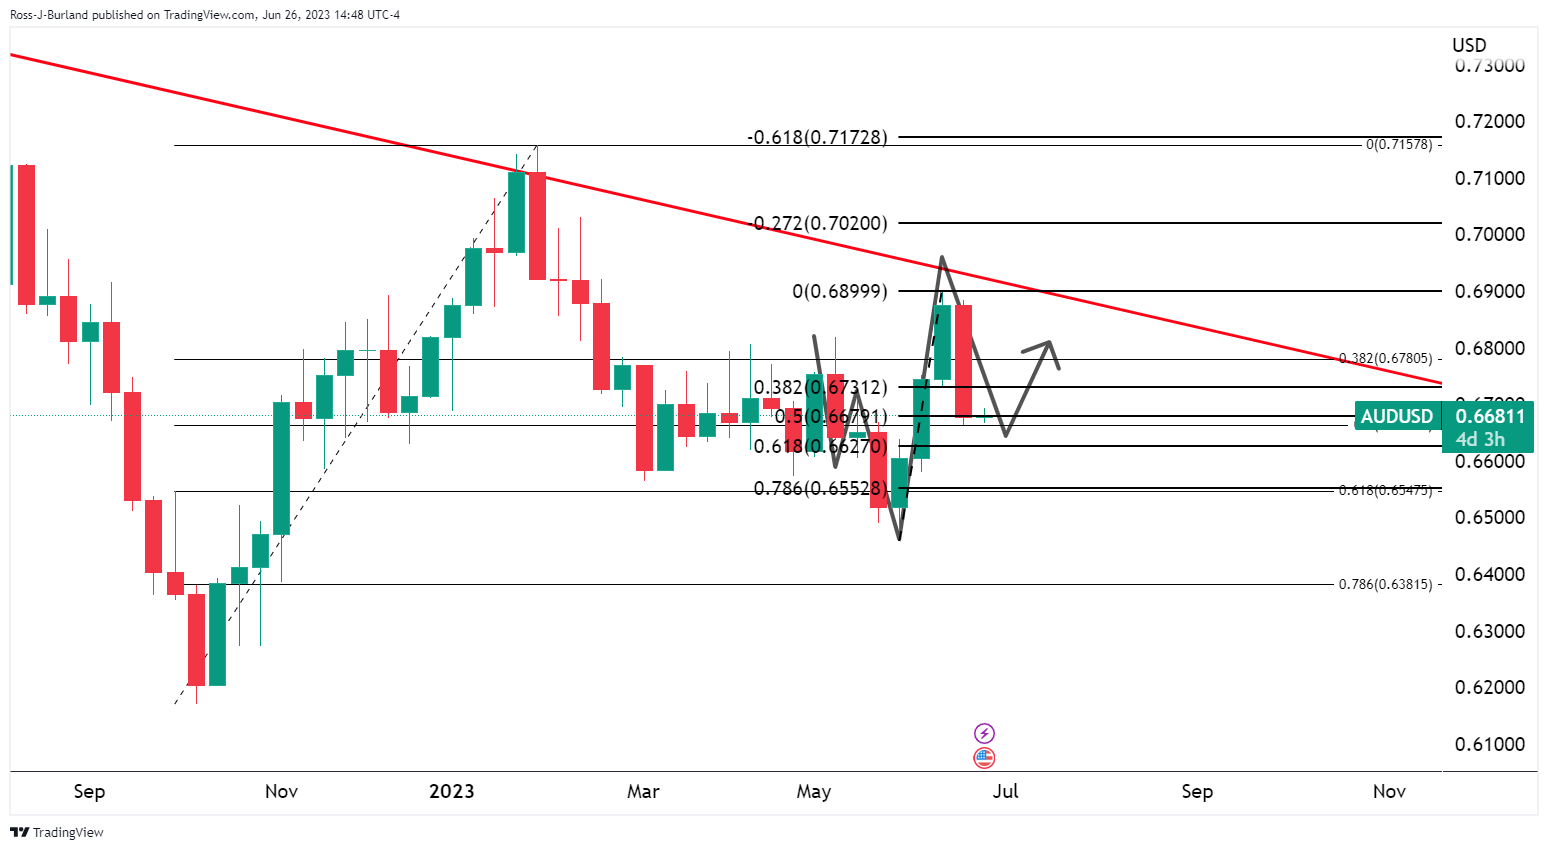
We have a move into the weekly W-formation.
AUD/USD daily chart
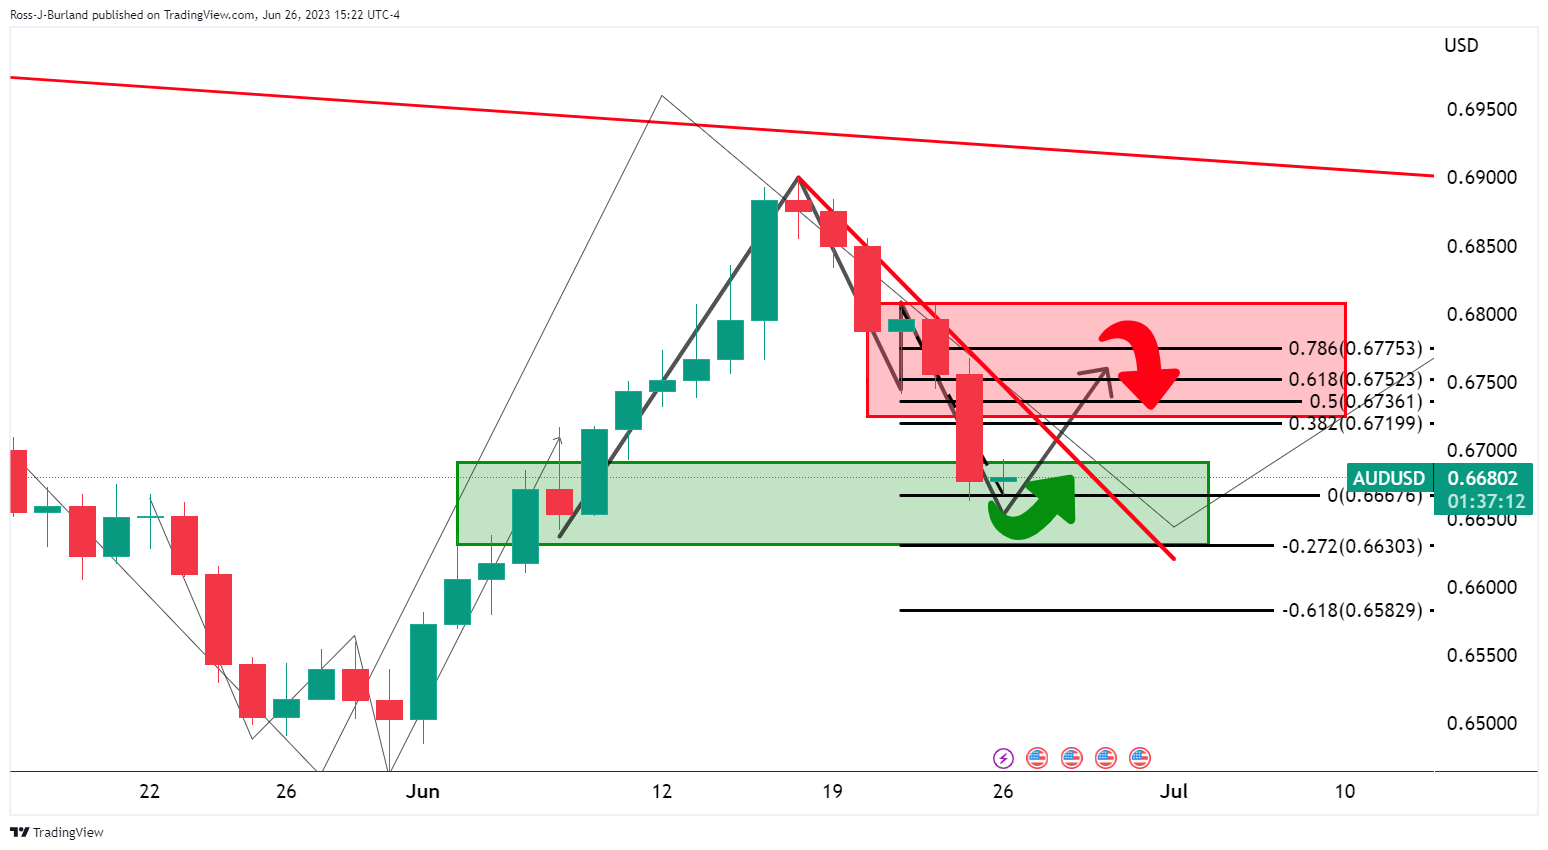
Meeting daily support, we now have prospects of a move higher towards the neckline area of the daily M-formation where the key Fibonaccis are aligned as illustrated above.
- EUR/JPY retreated below 156.30 area and then recovered to 156.55.
- Germany reported weak IFO index data making German Bond yields decline.
- Investors turn their attention to the European Central Bank's annual Forum in Sintra, Portugal.
At the beginning of the week, the EUR/JPY stabilized at 156.55. German IFO data from June came in below the consensus while investors' focus shifted to Wednesday’s speeches of main central bankers at the European Central Bank's (ECB) annual Forum in Sintra, Portugal. In that sense, most participants will look for clues regarding the next steps of the main bank's monetary policies.
Lower IFO data from Germany weakened the Euro. All eyes are now on the possible intervention of the BoJ.
The CESifo Group released IFO survey data from Germany in June, which acts as an early indicator of current conditions and business expectations for the next six months.he Business Climate Index came in at 88.5 vs the 90.7 expected, while the Expectations Index at 83.6 vs the 88 expected. The Current assessment lived up to expectations, coming in at 93.7, above the consensus of 93.5, but was lower than the previous month’s print.
As a result, German yields have weakened across the curve as investors have taken refuge in Bonds. The 10-year Bund yield fell to 2.31%, while the 2-year yield now sits at 3.14% and the 5-year is yielding 2.48%, after a 1.69% slide, respectively. On Tuesday and Wednesday, Christine Lagarde will deliver speeches, where investors will look to decipher the next steps of the ECB’s monetary policy.
On the other hand, according to a Reuters’ poll, the majority of the economists interviewed believe that the Bank of Japan (BoJ) will intervene to stop the Yen’s fall if the USD/JPY reaches 145.00. As for now, the pair trades at 143.15, and the JPY weakens amid soft inflation figures and the ultra-dovish stance by the BoJ.
EUR/JPY Levels to watch
Technically speaking, the EUR/JPY maintains a bullish outlook for the short term, as per indicators on the daily chart, but indicators still point at overbought conditions. The Relative Strength Index (RSI) holds a negative slope above 70, while the Moving Average Convergence Divergence (MACD) prints green but decreasing bars in its histogram.
A move above the 156.90 area would suggest a continuation of the bullish trend for EUR/JPY, with the next resistances at the 157.50 zone and psychological mark at 158.00. On the other hand, on the downside, the next support levels to watch are the 155.50 zone, followed by the 155.00 area and the 154.00 level.
EUR/JPY Daily chart
-638234023223929478.png)
- GBP/USD surpasses 1.2700 mark amidst broad USD weakness and risk aversion.
- Despite BoE’s recent rate hike, market fears of a potential UK recession persist.
- Investors expect a further 50 bps rate hike by BoE in late 2023 amidst stubborn inflation.
GBP/USD climbs after dropping to a last week’s low of 1.2685, surpassing the 1.2700 figure amidst a risk-off impulse and broad US Dollar (USD) weakness across the board. The previous week’s Bank of England (BoE) 50 bps rate hike weakened the Pound Sterling (GBP) on fears that higher rates could spur a recession in the UK. Nevertheless, the GBP/USD clings to its 0.03% gains, trading at 1.2718.
Pound regains ground despite fearful market sentiment; rate hike expectations taper off
The GBP/USD is clinging to its gains as the greenback weakens on risk aversion. A light economic calendar in the United States (US) left traders adrift to last week’s data and Fed speakers hitting the wires during the weekend. The New York Fed President John Williams noted that “restoring price stability is of paramount importance because it is the foundation of sustained economic and financial stability. Price stability is not an either/or, it’s a must have.”
In the early morning, the Dallas Fed Manufacturing Index for June came at -23.2, exceeding forecasts yet still in recessionary territory, portraying a US economic slowdown. Even though it contracted, it improved the most in the last three months.
Market participants mainly ignored the data, as the GBP/USD reaction was muted. Speculators slashed their bets for a Federal Reserve (Fed) rate cut in 2023; they expect a 25 bps rate hike through the remainder of 2023, according to CME FedWatch Tool data. Policymakers revised the Federal Funds Rate (FFR) above 5.50%, but investors do not believe the Fed would surpass 5.50%, as shown by the swaps market.
The US Dollar Index (DXY), which measures the performance of six currencies vs. the American Dollar (USD), slides 0.17%, down to 102.696, undermined by falling US Treasury bond yields.
Across the pond, the UK economic calendar was absent, though a Reuters poll showed investors expect the Bank of England (BoE) to increase borrowing costs by 50 basis points towards the end of 2023. The latest week’s inflation data in the UK opened the door for a surprising 50 bps rate hike by the BoE while increasing the odds for further tightening amidst stubbornly high inflation.
Even though a rate hike will usually appreciate the currency of a country that raised borrowing costs, in the UK happened, the opposite as the economy continues to deteriorate and mortgage rates rose. That spurred fears the UK’s economy would be tipped into a recession. Therefore, speculators piled in a sold the GBP/USD.
GBP/USD Price Analysis: Technical outlook
From a technical perspective, the GBP/USD remains upward biased, but to continue its uptrend, buyers must achieve a daily close above the June 23 high of 1.2749. In that outcome, the GBP/USD could extend its gains past 1.2800 and re-test the year-to-date (YTD) high of 1.2748. Conversely, that will exacerbate the GBP/USD fall toward the 1.2600 handle, exposing the 20-day Exponential Moving Average (EMA) at 1.2641 as the first resistance. Breach or the latter will expose the psychological 1.2600 figure.
- USD/MXN dips as Banxico holds rates steady, despite global economic concerns.
- Fed rate cut expectations cool off, enhancing MXN’s performance against USD.
- Economic Activity in Mexico beats estimates, further fueling MXN’s appreciation.
USD/MXN extend its losses toward last Friday’s daily low of 17.1308 after last Thursday’s Bank of Mexico (Banxico) monetary policy decision to hold rates unchanged at 11.25%, its second pause after May’s decision. A risk-off impulse was no excuse for the Mexican Peso (MXN) to continue its strong advance against the US Dollar (USD). At the time of writing, the USD/MXN is trading at 17.1363, down 0.21%.
Banxico’s steady rates and positive economic data propel MXN; risk a grips Wall Street
Wall Street remains trading negatively. Risk aversion is the primary driver of the markets amidst a light economic calendar in the United States (US). The Dallas Fed Manufacturing Index for June contracted to -23.2, above estimates, yet still in recessionary territory, portraying an economic slowdown. Even though it contracted, it improved the most in the last three months.
Meanwhile, market participants lowered their bets for a possible rate cut by the US Federal Reserve (Fed), as shown by the CME Fed Watch Tool, after Fed officials revised the Federal Funds Rate (FFR) peak to 5.6%. Nevertheless, money market futures do not believe the Fed will raise rates twice, with only one 25 bps increase, toward the end of the year.
That helped the Mexican Peso (MXN) to prolong its appreciation, despite developments in Russia, with the Russian private group Wagner set to enter Moscow amid an ongoing disagreement with Russian commanders, which according to Yevgeny Prigozhin, the leader of the group, botched Russia’s military campaign in Ukraine.
The US Dollar Index (DXY) tracks the performance of six currencies vs. the American Dollar (USD), which tumbled 0.12%, down to 102.737, undermined by falling US Treasury bond yields.
Across the border, last week’s Banxico decision did not help USD/MXN buyers, as the pair halted its rally and made a U-turn at around 17.2644. Monday-s Mexican agenda featured General Economic Activity in May rose by 2.5%, exceeding estimates of 2.3%, according to Reuters. Meanwhile, month-over-month (MoM) readings rose by 0.8%, exceeding March’s contraction of -0.2%.
USD/MXN Price Analysis: Technical outlook
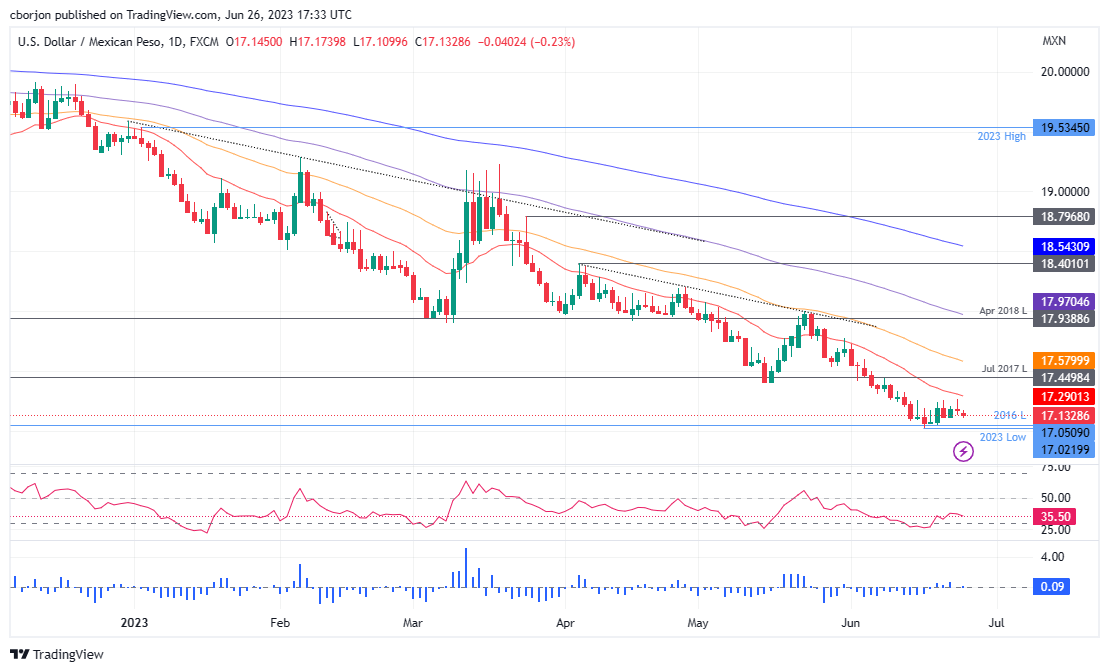
The USD/MXN is downward biased, set to continue to fall at around the 17.00 figure. As the 20-day Exponential Moving Average (EMA) emerged around 17.2897, further continuation is expected below 17.1000. A breach of the latter will expose the year-to-date (TD) low of 17.0219 before surpassing the 17.00 handle. On the flip side, if USD/MXN buyers claim the 20-day EMA, that could lift the USD/MXN spot price higher, at least to the 50-day EMA at 17.5799.
- XAG/USD sets a second day in a row of gains, jumping to a four-day high of $22.88.
- A cautious market mood ahead of central bankers' speeches at the ECB’s Forum gives the Silver traction.
- Falling US yields make precious metals find demand.
On Monday, XAG/USD reclaimed the 200-day Simple Moving Average (SMA) at $22.52 and soared to a high of $22.88. This surge in Silver prices can be attributed to a cautious market sentiment preceding the upcoming speeches from central bankers at the European Central Bank (ECB) Forum at Sintra. Furthermore, the declining US yields have led to increased demand for precious metals, further supporting Silver's upward momentum.
Falling yields ahead of ECB’s forum favor the commodities prices
The ECB Forum at Sintra kicked off, and Christine Lagarde will deliver a speech on Monday. On Wednesday, it will be the turn of Federal Reserve (Fed) Jerome Powell and Bank of England (BoE) Governor Andrew Bailey. Investors will be looking for clues regarding forward guidance for each bank's respective monetary policies, and as non-yielding precious metals tend to be negatively correlated with higher interest rates, hawkish clues may apply downward pressure on the Silver.
In the meantime, the 10-year US Bond yield and the DXY Index declined, making the XAG/USD find demand. That being said, the mentioned yield retreated 0.54% to 3.71% while the Dollar Index rose to 102.75 saw slight losses.
XAG/USD Levels to watch
According to the daily chart, the technical outlook for the XAG/USD remains neutral to bearish for the short term. The Relative Strength Index (RSI) and Moving Average Convergence Divergence (MACD) both gained some traction in negative territory but on the bigger picture the sellers are in charge.
Support levels to watch: $22.52 (200-day SMA), $22.40, $22.10 (low since March)
Resistance levels to watch: $23.00, $23.34 (100-day SMA), $23.52 (20-day SMA)
XAG/USD Daily chart
- GBP/JPY sees some gains at the 182.55 area.
- ECB’s Banking Forum in Sintra on Wednesday, the highlight of the week.
- Reuters poll reveals that the BoJ will intervene if USD/JPY reaches 145.00.
At the start of the week, the GBP lost ground against most of its rivals, including the USD, EUR, and CHF. A cautious market mood and investors consolidating gains which took the pair to a high since 2015 make it difficult for the Sterling to find demand. In addition, political tensions in the British public sector are encouraging investors to stay away from the Pound.
UK government to ignore public sector wage increases
The British government is said to be considering disregarding certain recommendations from pay review bodies regarding increases in public sector wages. This decision is reported to be motivated by concerns over the potential negative impact on the economy, specifically on inflation. In that sense, uncertainty regarding the possibilities of union strikes clashing amid this decision made the GBP lose interest.
That being said, investors will look for additional clues on the Bank of England's (BoE) next steps regarding monetary policy, on Wednesday, at the European Central Bank Forum in Sintra, Portugal.
Last Thursday, the BoE opted for a hawkish surprise, hiking rates by 50 basis points while markets expected 25 bps, and the statement hinted at additional increases this year. The surprise hike as well as Governor Bailey’s commentary from Wednesday may continue to have an impact on Sterling’s price dynamics.
Most economists polled by Reuters predict that the Bank of Japan (BoJ) will step in to halt the Yen's decline if the USD/JPY reaches 145.00. In the meantime, the JPY is currently weakening due to soft inflation figures and the BoJ's dovish stance.
GBP/JPY Levels to watch
Technically speaking, the GBP/JPY maintains a bullish outlook for the short term, as per indicators on the daily chart. The Relative Strength Index (RSI) and Moving Average Convergence Divergence (MACD) are both showing strength, standing in positive territory, and the pair trades above its main moving averages, suggesting that the buyers are in charge. However, both indicate overbought conditions so further downside should not be taken off the table.
If GBP/JPY manages to move higher, the next resistances to watch are at the 183.00 zone, followed by the 183.50 zone and the 184.00 area. On the other hand, the 181.20 level remains the key support level for the cross. If broken, the 180.00 zone and 179.00 level could come into play.
GBP/JPY Daily chart
-638233938708666812.png)
- USD/JPY trades lower as concerns over the global economy and geopolitical events linger.
- Market anticipates a single Fed rate hike, contrary to officials’ double prediction.
- Declining US Treasury yields and official comments bolster JPY, pressing USD/JPY lower.
USD/JPY stays firm at around the 143.40s area after diving towards a daily low of 142.93 on renewed concerns of a global economic slowdown amidst over-the-weekend geopolitical events weighed on investors’ mood. At the time of writing, the USD/JPY exchanges hand at 143.46, down 0.16%.
Market apathy towards Fed rate cut; Dallas Fed Manufacturing Index improved, but still flashes a “hard landing”
US equities shifted negatively, while the Japanese Yen (JPY) strengthened on Japanese authorities’ comments regarding excessive currency moves. A light Monday economic calendar in the United States (US), with the release of the Dallas Fed Manufacturing Index in June plunging to -23.2, showed some improvement but remained in recessionary territory. Although it continues to contract, it was the most significant advance in three months.
In the meantime, traders disregarded the chance for a US Federal Reserve (Fed) interest rate cut, as shown by the CME FedWatch Tool. Nonetheless, market players expect one interest rate increase of a quarter of a percentage point, contrary to two foreseen by Fed officials, with July odds at 74.4%, as shown in the CME FedWatch Tool.
Meanwhile, tussles between Russian mercenaries and Putin’s military ended on Sunday after the Wagner Group army stopped its advance to Moscow, threatening to remove incompetent and corrupt Russian commanders that he blames for botching the war.
Aside from this, the Vice Finance Minister for Internation Affairs, Masato Kanda, commented the recent Yen weakening was too “rapid and one-sided.” That helped offset previous Yen losses and sent the USD/JPY tumbling toward its low of 142.93 before recovering some lost ground.
In addition, falling US Treasury bond yields lent a lifeline to the JPY, as the 10-year Treasury note yields 3.717%, down two and a half basis points (bps), a headwind for the greenback, and the USD/JPY. The US Dollar Index, a basket of six currencies against the US Dollar (USD), drops 0.17% to 102.699.
USD/JPY Price Analysis: Technical outlook
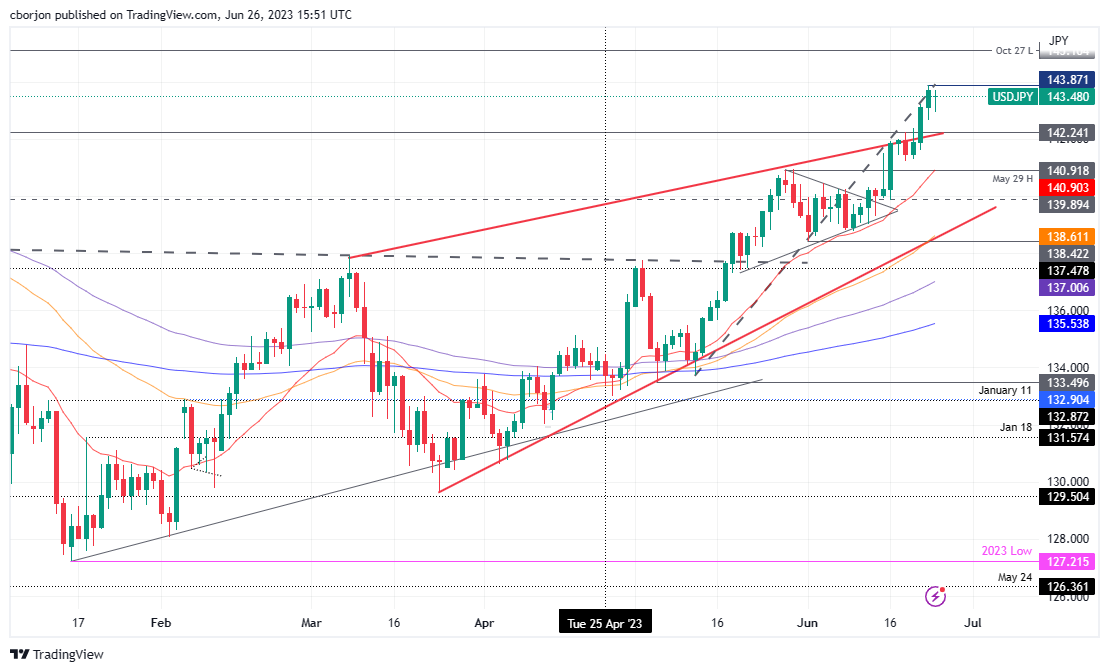
From a technical perspective, the USD/JPY is set to record additional gains after breaching resistance at the November 22 daily high of 142.24. That exacerbated the USD/JPY rise above 143.00 toward a year-to-date (YTD) high of 143.878. But verbal intervention by Japanese authorities triggered a correction. Nevertheless, if USD/JPY surpasses 144.00, the next stop would be last year-s October 27 daily low of 145.10, ahead of rallying to the November 10 daily high at 146.59. Conversely, the USD/JPY must fall below 143.00 and 142.24 to prolog its losses towards sold support at the 20-day Exponential Moving Average (EMA) at 140.90.
Strategists at Société Générale feel there is a real likelihood of nominal rates decoupling from real rates to push Gold prices higher.
Wait for it… Gold rally is not over yet
We see 10-year US rate forecasts moderating significantly by the end of 2024 and with the low-hanging fruit in the fight against inflation already picked, we anticipate that the gold market will have to adjust its forward CPI projections upwards.
We see Gold appreciating to $2,200 by the end of this year in lumpy moves as forward inflation expectations adjust with the macro newsflow.
As an additional bullish driver, in our anticipated scenario of moderating US rates, we see the USD weakening – which, together with other USD-denominated assets, should buoy Gold.
Statistics Canada will release May Consumer Price Index (CPI) data on Tuesday, June 27 at 12:30 and as we get closer to the release time, here are the forecasts by the economists and researchers of six major banks regarding the upcoming Canadian inflation data.
Inflation should look better in May. Headline CPI is seen declining to 3.4% year-on-year vs. the prior release of 4.4%. On a monthly basis, it is expected to show a pace of 0.5% vs. the former release of 0.7%. Meanwhile, Core CPI is seen softening to 3.9% vs. 4.1% in April.
TDS
We look for CPI to fall 0.9pp to 3.5% YoY in May with a 0.5% MoM increase offset by base effects. Energy will exert a modest drag, but we expect large contributions from food along with rents and MIC. We also look for broad strength elsewhere, which should translate into another 0.4% MoM increase for core measures, leaving CPI-trim/median trending above 4% on a 3m ann. Basis.
RBC Economics
We look for ‘headline’ price growth to slow – falling to 3.6% annually from 4.4% in April. Lower energy prices (gasoline and fuel oil prices were down 18% and 36%, respectively, from year-ago levels in May) explain most of that slowdown. And food price inflation is expected to edge lower again after peaking in January.
NBF
A slight decline in gasoline prices, coupled with further moderation in the food segment, could have translated into a 0.3% increase in the consumer price index in May (before seasonal adjustment). If we’re right, the 12-month rate of inflation should come down from 4.4% to a two-year low of 3.2%. The core measures preferred by the Bank of Canada should decrease as well.
ING
We remain hopeful that inflation will moderate to some extent, with core CPI potentially dropping below 4%. However, as with the Fed, this probably won’t be enough to prevent a final 25 bps hike in July.
CIBC
Canadian inflation will look a lot tamer in May, albeit mainly because of base effects as gasoline prices this year are compared to the peaks seen in 2022. The headline inflation rate of 3.3% would be the lowest since June 2021, although it would still sit above the upper end of the Bank of Canada’s target bound. Moreover, core measures of inflation likely saw little progress, with ex food/energy expected to decelerate more modestly to 4.0% YoY, versus 4.3% in the previous month. The reweighting of the inflation basket, which increases the weight of services such as air transport and travel tours, could bring a slightly stronger monthly price increase in May compared to the old weights.
Citi
We expect a 0.4% MoM increase in headline CPI in May, with base effects leading the YoY reading to drop substantially to 3.4%. After a stronger-than-expected increase in April CPI, there remain upside risks to May inflation. While the YoY headline CPI will decline substantially in May after an unexpected pick-up in April, the most important element of May inflation data will be the 3-month trend in the core inflation measures. The average 3-month run rate of CPI-trim and CPI-median unexpectedly reaccelerated in April from 3.4% to 3.7%. While “base effects” will likely also lead the annual rates of core inflation to moderate slightly further in May, the 3-month pace of core inflation remaining stable in a 3.5-4% range since August 2022 will imply the annual rate of core inflation likely also stabilizes in this range soon. We expect that with the 3-month core inflation rate remaining at 3.7% or rising, this would all but solidify another 25 bps rate hike in July. Core CPI would have to slow substantially, likely to below 3.4% in order to substantially reduce the probability of a hike in July.
CAD is, quietly, the top G10 currency this month. Economists at Société Générale analyze USD/CAD outlook.
Loonie tends to do well when Fed rates peak
The top G10 currency in June is the Canadian Dollar. It tends to do well when Fed rates peak, and while the outlook for Fed Funds is cloaked in plenty of uncertainty, we’re in the final stage of this tightening cycle.
With the FOMC still warning of further hikes and wildfires likely to affect Canadian growth data, the fall back to the mid-1.20s won’t be in a straight line, but we think that’s where we are heading.
Central bank policy divergence in the months ahead should see a stronger EUR, in the view of economists at HSBC.
More strength ahead
We expect the ECB to deliver two more 25 bps rate hikes through the summer, vs just one more 25 bps hike by the Fed (albeit with upside risks). As such, the balance of risks from a short-term rate dynamic should continue to support the EUR over the near term.
Beyond short-term assessments of meeting-to-meeting central bank decisions, we believe there are structural reasons for more EUR strength ahead. The broader shift by the ECB into positive nominal rate territory and towards Quantitative Tightening (QT) has driven a bigger underlying change in portfolio flow dynamics. The last year has seen notable bond and equity inflows, which are unlikely to reverse any time soon and which should be EUR-positive.
Other external flows should also support the EUR. Over the past few years, the EUR’s performance can be explained to a certain extent by current account dynamics. Improving terms of trade are likely to support an ongoing current account surplus in the region, justifying a stronger EUR.
Economists at Danske Bank try to understand what has happened in Russia over the weekend, what could be the motives behind it, and discuss potential implications.
Central banks still need to stick to their inflation mandates
We think geopolitical uncertainty has again become an important market driver, and although an escalation has been avoided for now, market volatility is likely to increase going forward.
Risky assets could suffer in the short term and rates markets could take a hit as well, even though we think central banks still need to stick to their inflation mandates. However, if spreads widen and equity markets correct lower enough to compensate for lower yields so that overall financial conditions tighten (as a result from rising geopolitical risk), there is no conflict for central banks.
Dave Adams, Head of G10 Foreign Exchange Strategy at Morgan Stanley talks about their outlook for the US Dollar and why it may prove an important driver of investor returns this year.
US Dollar may prove to be a handy asset moving forward
We think the US Dollar is going to keep rallying, rising about 5% or so by the end of the year. Central bankers are likely to keep their feet on the brakes in order to tackle inflation. And in doing so, growth is likely to remain anemic, with risks skewed to the downside.
There are plenty of potential risks on the horizon to keep investors worried; banking sector volatility, geopolitical risks, and sticky inflation, just to name a few. As the investment outlook remains cloudy and hazy, the USD is a handy asset to keep in the portfolio as a positive carry insurance hedge.
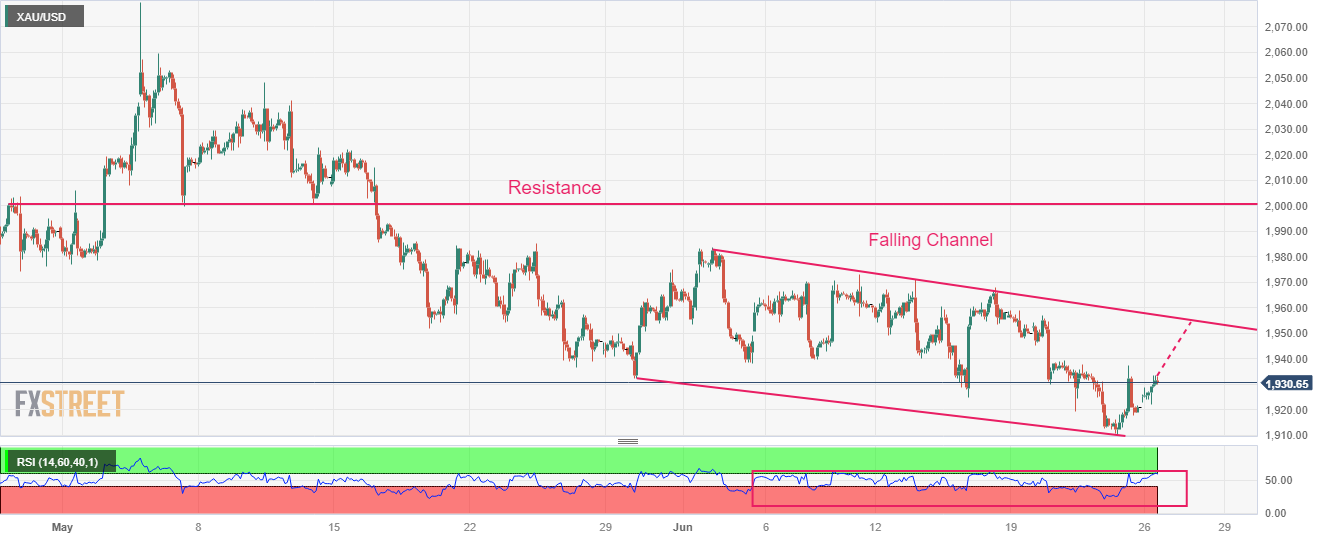
- Gold price is looking for stabilization above $1,930.00 amid a sell-off in the USD Index.
- S&P500 futures have recovered the majority of losses, portraying a recovery in the risk appetite.
- Gold price is approaching the upper portion of the Falling Channel chart pattern.
Gold price (XAU/USD) has climbed marginally above the crucial resistance of $1,930.00 in the London session. The precious metal is looking for stability above $1,930.00 as the US Dollar Index (DXY) is facing pressure. The USD Index has corrected to near 102.63 as the investing community is mixed about further monetary policy by the Fed.
S&P500 futures have recovered the majority of losses, portraying a recovery in the risk appetite of the market participants. US 500 basket is expected to open on a cautious note as investors are worried about the quarterly result season, which will kick-start sooner.
The yellow metal is also showing some resilience due to severe correction in the US Treasury yields. The 10-year US Treasury yields have dropped sharply to near 3.68%. Analysts at Rabobank expect the Fed to hike in July, a more moderate pace would imply skipping September and that would leave us with November as the meeting for the second hike.
The street will keep the focus on the labor market and inflation data for June as further resilience would propel the need for more restrictive monetary policy. Going forward, US Durables Goods Orders data will remain in the spotlight.
Gold technical analysis
Gold price is approaching the upper portion of the Falling Channel chart pattern on a two-hour scale in which each pullback is considered as a selling opportunity by the market participants. Horizontal resistance is plotted from May 05 low around $2,000.00.
The Relative Strength Index (RSI) (14) is widely oscillating in the bearish range of 20.00-60.00 in which an oscillation near 60.00 would trigger gold sellers.
Gold two-hour chart
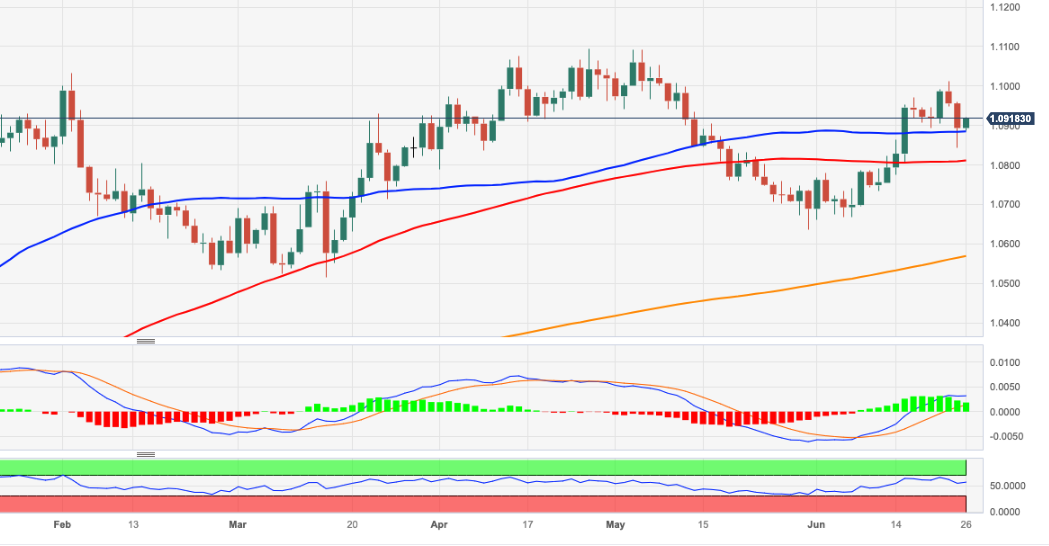
- EUR/USD reverses part of the recent weakness and regains 1.0900.
- So far, there is decent contention around 1.0840.
EUR/USD starts the week on the positive foot and reclaims the area beyond 1.0900 the figure on Monday.
The inability of the pair to regain the area of recent peaks around 1.1010 (June 22) could motivate sellers to return to the market and open the door to a potential revisit to recent weekly lows near 1.0840 (June 23).
The loss of the latter should face the next support of note around the round level of 1.0800, which also appears reinforced by the 100-day SMA (1.0809).
Looking at the longer run, the positive view remains unchanged while above the 200-day SMA, today at 1.0568.
EUR/USD daily chart
The S&P 500 is up 14% YTD. Economists at Société Générale analyze the index outlook.
AI momentum will build further in H2
We think the AI momentum will build further in H2 and the 500 pts gain in the S&P will not reverse. Consequently, we raise our S&P 500 year-end target from 3,800 to 4,300.
We believe that profit margin reversal, credit weakness and sharply rising recession risk will most likely be visible in 1H24, bringing the S&P 500 back to 3,800 (our S&P 500 recession estimate).
Ultimately, the new broad-based bull market is likely to start with a mild recession, Fed rate cuts and/or a positive yield curve.
UOB Group’s Senior Economist Julia Goh and Economist Loke Siew Ting comment on the recently published CPI results in Malaysia.
Key Quotes
Headline inflation came off further to 2.8% y/y in May (3.3% in Apr), reaffirming a ninth straight month of deceleration and the lowest reading since Apr 2022. This came in below ours and market consensus of 3.0%. The moderation was mainly due to lower food and non-alcoholic beverages, furnishing and household equipment, transport, and communication. The easing trend is also due to rising base effects while subsidies and easing input costs have helped to contain cost of living
A slower-than-expected headline inflation in May alongside slower core CPI and services inflation indicates a continued disinflation trend that is expected to extend for the remaining months of the year.
With year-to-date inflation average of 3.4% and projections for further disinflation in 2H23, our full-year inflation forecast of 2.8% remains on track (BNM est: 2.8%-3.8%, 2022: 3.3%). Real interest rates turned positive for the first time in more than two years. Given moderating inflation trends and growth uncertainties, we continue to expect BNM to keep the Overnight Policy Rate (OPR) unchanged at 3.00% for the rest of the year. We take a more cautious view on the OPR path in view of weaker economic data points in Apr, lagged effects of past rate hikes, and easing inflation.
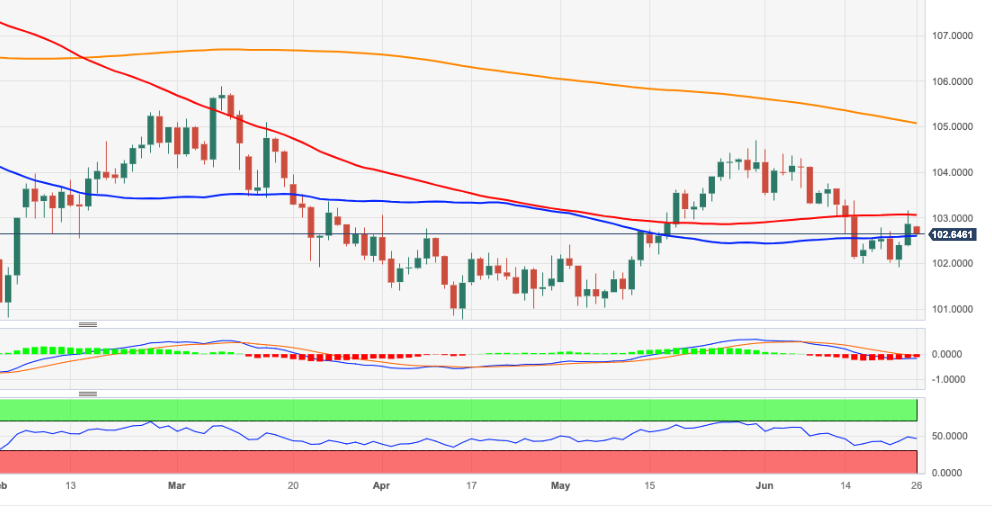
- DXY comes under pressure and returns to the sub-103.00 area.
- Further weakness could revisit recent lows around 102.00.
DXY fades part of the recent 2-day advance and slips back to the area below the 103.00 hurdle at the beginning of the week.
Despite the ongoing rebound, the index could still face headwinds on its way up. That said, there is still room for the index to revisit June lows in the 102.00 region, while a sustainable breach of this level could expose a deeper decline to April/May lows near 101.00. Dow from here emerges the 2023 low around 100.80 recorded on April 14.
Looking at the broader picture, while below the 200-day SMA at 105.07 the outlook for the index is expected to remain negative.
DXY daily chart
- USD/CAD is looking vulnerable above 1.3140 amid a risk-off mood.
- The USD Index has refreshed its day’s low at 102.64 as investors have digested consequences of higher interest rates by the Fed.
- Canada’s annualized inflation is seen softening to 3.4% vs. the former release of 4.4%.
The USD/CAD pair is struggling in maintaining its auction above the immediate support of 1.3140 in the European session. The Loonie asset is expected to deliver more downside as the US Dollar Index (DXY) has refreshed its day’s low at 102.64.
S&P500 futures are holding losses as investors turn cautious among investors ahead of the quarterly result season. The US Dollar Index is facing pressure as investors have started shrugging off risks associated with chances of more interest rate hikes from the Federal Reserve (Fed).
The US Dollar Index has delivered a breakdown of the consolidation formed in a range of below 102.80. Also, the US Treasury yields have faced immense pressure. The yields offered on 10-year US government bonds have dropped to near 3.69%.
Going forward, investors will keep the focus on the United States Durables Goods Orders data (May). As per the consensus, the economic data is seen contracting by 1.0% vs. an expansion of 1.1%. Durable Goods Orders excluding defense are seen as stagnant against a contraction of 0.7%. Scrutiny of the forward economic data indicates that fewer defense orders impacted the economic indicator.
Meanwhile, the Canadian Dollar is showing resilience ahead of the Consumer Price Index (CPI) data (May). As per the consensus, monthly inflation showed a pace of 0.5% vs. a velocity of 0.7%. Annualized inflation is seen softening to 3.4% vs. the former release of 4.4%. And, core inflation is expected to decelerate to 3.7% against the former release of 4.1%.
The release of the expected inflation report would provide luxury to the Bank of Canada (BoC) for keeping monetary policy steady.
USD/CAD retains a weak technical undertone, economists at Scotiabank report.
Support is 1.31 and 1.30
Unlike some other major currencies’ technical situation, the CAD’s position looks technically ‘cleaner’ – the broader bear trend in the USD remains uninterrupted and backed by a bearish alignment of trend oscillators which will limit the USD’s ability to rally and maintain focus on the downside for now.
USD/CAD resistance is 1.3205/10 on the intraday chart today and I expect solid USD resistance if gains do extend a bit higher (though the mid/upper 1.32s).
Support is 1.31 and 1.30; technically, I think a test of the upper 1.29s is reachable in the next few weeks.
Senior Economist at UOB Group Alvin Liew assesses the latest inflation figures in Singapore.
Key Quotes
Singapore’s headline inflation rose by 5.1% y/y in May, easing from 5.9% y/y in Apr, coming off more than expected (UOB est 5.9% y/y, Bloomberg est 5.4%). That said, core inflation also eased but at a smaller magnitude, coming in at 4.7% y/y in May, from 5.0% y/y in Apr and exactly in line with UOB and Bloomberg median estimates.
Official inflation outlook unchanged: The Monetary Authority of Singapore (MAS) kept its inflation forecasts (that were first made in the 14 Oct 2022 MPS) unchanged in the May CPI report, as the Authority expects that in 2023, after taking into account all factors including the GST increase, core inflation will be at 3.5–4.5% on average over the year, and CPI-All Items inflation at 5.5–6.5%. Even after excluding the one-off effects of the GST increase early next year, core inflation would be at 2.5–3.5% and headline inflation at 4.5–5.5%. The MAS expects core Inflation “to moderate further in H2 2023” and again it did not give a year-end point forecast. (Previously, the MAS mentioned that “MAS Core Inflation is projected to reach around 2.5% y-o-y by the end of 2023”.) The MAS continued to cite both upside and downside risks to inflation.
- Natural Gas makes higher highs as record temperatures mean more demand for use in powering air conditioning.
- Natural Gas futures data shows bullish interest waning, however, indicating the rally may be running out of steam.
- As price nears the key $3.000 MMBtu watershed, the entrenched long-term downtrend loses significance.
Natural Gas price trades a touch higher on Monday after pulling back from its highs. The commodity continues to be supported by hotter-than-usual weather in most of the US and Europe, which increases demand for Natural Gas used to power air conditioning. Gas prices may lack the energy to go much higher, however, as data from the futures market suggest falling market participation in the rally.
XNG/USD is trading in the $2.800s MMBtu at the start of the US session on Monday.
Natural Gas news and market movers
- Natural Gas price rises in the short-term due to increased demand for air conditioning as much of the US and Europe experience hotter-than-usual temperatures for this time of year.
- Gains may be limited, however, according to FXStreet Senior Analyst and Editor Pablo Piovano, who says the rise is accompanied by falling participation in the Gas futures market.
- “Natural Gas prices extended the recovery and advanced to multi-week highs past $2.70 on Friday. The strong uptick was accompanied by declining open interest, which pours some cold water over the likelihood of further gains in the very near term.” Said Piovano in a report analyzing CME data on Monday morning.
- Norwegian supply concerns, after outages at the Hammerfest LNG export terminal and the processing plants at Nyhamna and Kollsnes, had been supporting prices. However, the effect has been offset by projected weaker demand from faltering global growth, according to an analysis by ANZ bank cited on MarketWatch.
- Last week’s Purchasing Manager Index data was on the whole poor for most of Europe and the US, potentially indicating a weaker economic growth trajectory.
- Supply constraints also need to be read within the context of robust existing stocks, according to data from Gas Infrastructure Europe, cited by CNN, last week. A milder-than-expected spring has allowed stocks to accumulate, and European storage facilities remain relatively high, at roughly 73% full – a much higher level than the 56% average at the same time of the year over the past five years.
- Japan and South Korea have recorded much higher Gas stores recently. This, combined with concerns about Chinese growth, suggest Asian demand may not be as high as expected.
Natural Gas Technical Analysis: Recovery nears significant trend-determination level within downtrend
Natural Gas price has recovered to close to a key trend-determination level on longer-term charts. Although the commodity remains in a long-term downtrend since turning lower at the August 2022 peak, bearish momentum has tapered off considerably.
The Relative Strength Index (RSI) momentum indicator is converging bullishly with price on the weekly chart, something that occurs when price makes new lows but RSI fails to copy.
A break above the last lower high of the long-term downtrend at $3.079 MMBtu would indicate a reversal in the broader trend.
-638233787559697189.png)
Natural Gas: Weekly Chart
Given this level has not been breached yet, however, the downtrend remains intact and a break below the $2.110 year-to-date lows would provide a confirmation of a continuation down to a target at $1.546. This target is the 61.8% Fibonacci extension of the height of the roughly sideways consolidation range that has been unfolding during 2023.
On the daily chart, price has been climbing within a roughly sideways market, although it has broken above both the 50 and not the 100-day Simple Moving Averages (SMA), which is a significant bullish sign.
-638233788074148408.png)
Natural Gas: Daily Chart
Nevertheless, a break above the last lower high of the long-term downtrend at $3.079 MMBtu would be required to indicate a reversal in the broader trend.
Such a move might then see prices rally higher to the next key resistance level at the 200-week SMA, situated at $3.813.
Natural Gas FAQs
What fundamental factors drive the price of Natural Gas?
Supply and demand dynamics are a key factor influencing Natural Gas prices, and are themselves influenced by global economic growth, industrial activity, population growth, production levels, and inventories. The weather impacts Natural Gas prices because more Gas is used during cold winters and hot summers for heating and cooling. Competition from other energy sources impacts prices as consumers may switch to cheaper sources. Geopolitical events are factors as exemplified by the war in Ukraine. Government policies relating to extraction, transportation, and environmental issues also impact prices.
What are the main macroeconomic releases that impact on Natural Gas Prices?
The main economic release influencing Natural Gas prices is the weekly inventory bulletin from the Energy Information Administration (EIA), a US government agency that produces US gas market data. The EIA Gas bulletin usually comes out on Thursday at 14:30 GMT, a day after the EIA publishes its weekly Oil bulletin. Economic data from large consumers of Natural Gas can impact supply and demand, the largest of which include China, Germany and Japan. Natural Gas is primarily priced and traded in US Dollars, thus economic releases impacting the US Dollar are also factors.
How does the US Dollar influence Natural Gas prices?
The US Dollar is the world’s reserve currency and most commodities, including Natural Gas are priced and traded on international markets in US Dollars. As such, the value of the US Dollar is a factor in the price of Natural Gas, because if the Dollar strengthens it means less Dollars are required to buy the same volume of Gas (the price falls), and vice versa if USD strengthens.
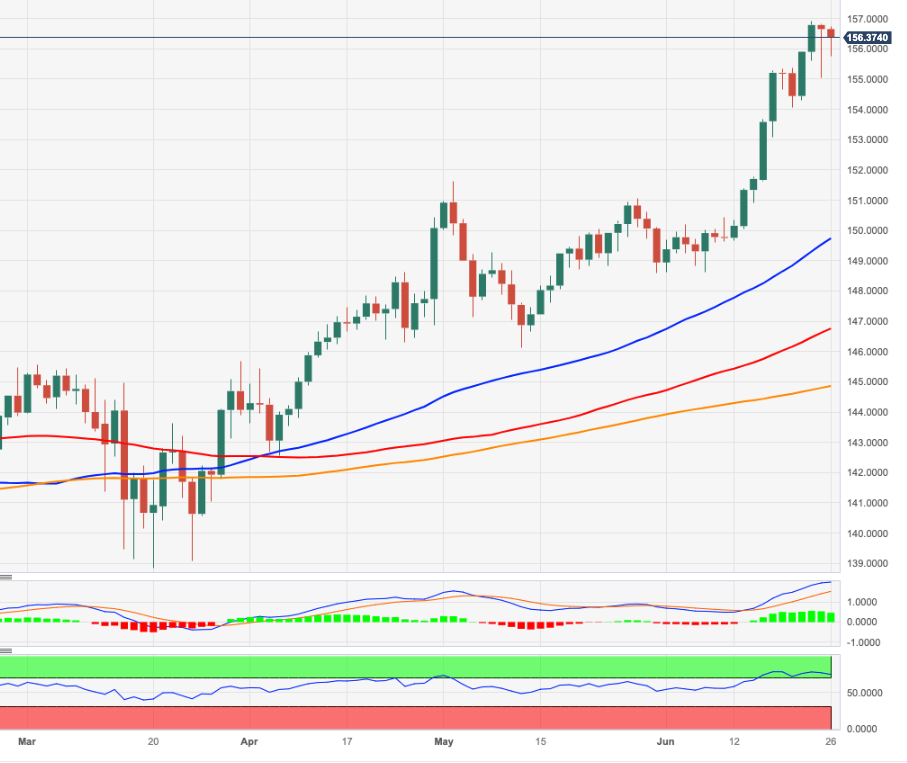
- EUR/JPY adds to Friday’s pullback around 156.40.
- Further upside could target the weekly top past 163.00.
EUR/JPY faces some renewed downside pressure and retreats from recent multi-year peaks in levels just shy of the 157.00 barrier.
In the meantime, further gains appear on the cards, while a clear breakout of the 2023 high at 156.93 (June 22) should meet the next relevant hurdle not before the weekly high of 163.09 (August 22 2008).
The ongoing overbought conditions of the cross, however, are indicative that a deeper knee-jerk should not be ruled out at some point in the short-term horizon.
So far, further upside looks favoured while the cross trades above the 200-day SMA, today at 144.82.
EUR/JPY daily chart
GBP/USD is supported on dips but still consolidating, economists at Scotiabank report.
Signs of demand below 1.26 are encouraging from a short-term support point of view
Minor Cable gains today are running against the trend of a modestly weaker Pound from its mid-June peak.
GBP/USD is still consolidating in effect and while signs of demand below 1.26 are encouraging from a short-term support point of view, the Pound is still trading well short of levels that would imply more, sustainable technical strength (above 1.2850).
EUR/USD holds in a tight range around 1.09. Shaun Osborne, Chief FX Strategist at Scotiabank, analyzes the pair’s outlook.
Hard to rule out more weakness
Any change in the hawkish ECB policy outlook drumbeat after the weak, preliminary PMI data from the Eurozone last week will hurt the EUR. I don’t expect any change at this point and there is little sign of concern in markets where 22 bps of tightening in July are still being priced in.
Gains are limited and the short-term pattern of trade retains a soft undertone that makes it hard to rule out more weakness absent more solid EUR gains (above 1.0950 at least).
Economists at MUFG Bank discuss USD outlook.
A period of elevated uncertainty could potentially undermine investor confidence further in Europe
Weak PMI data last Friday in Europe has reinforced the expectations that global growth is set to remain fragile and this in turn is likely to help provide the Dollar with ongoing support over the near term.
The brief mutiny in Russia over the weekend has not had much initial financial market impact but that will be watched closely by investors – the unseating of President Putin may fuel speculation of a sooner end to the invasion of Ukraine but that might not be the case depending on how that would unfold and needless to say, a period of elevated uncertainty could potentially undermine investor confidence further in Europe, which could reinforce USD strength.
Ulrich Leuchtmann, Head of FX and Commodity Research at Commerzbank, analyzes TRY outlook following last week’s Turkish central bank (CBRT) policy decision.
The only option left is a harsh version of capital controls, combined with currency rationing
What's left now? Last Thursday's 650 bps rate hike art weighed in the balances, and art found wanting. There's nothing left – one might think – that could prevent a complete collapse of the Lira.
If my fear is correct – that a credible sustainable turnaround in monetary policy is no longer possible – then the only option left is a harsh version of capital controls, combined with currency rationing. I sincerely hope it is my lack of imagination that I cannot think of a more benign development.
Economist at UOB Group Lee Sue Ann reviews the latest interest rate decision by the BoE (June 22).
Key Takeaways
In a surprise move, the Bank of England’s (BOE) Monetary Policy Committee (MPC) voted by a majority of 7-2 to increase the Bank Rate by 50bps to 5.00%. Similar to the previous two meetings, the MPC kept the statement, “If there were to be evidence of more persistent pressures, then further tightening in monetary policy would be required”.
Latest inflation data for the UK came in hotter than expected. Headline CPI rose by an annual 8.7%, unchanged from the previous month, but higher than consensus of 8.4%. Core inflation gained by an annual 7.1%, up from 6.8% in Apr, and the highest rate since Mar 1992.
Given the latest BOE’s decision and inflation backdrop, we believe the BOE is on track to hike by a further 25bps at each of its next two meetings (3 Aug and 21 Sep). The risks to our view are to the upside, and we will review our rate call following the Aug decision.
The German economy appears to have bottomed out and is forecast to post a small growth in the Gross Domestic Product (GDP) in the second quarter, Germany's Bundesbank said in its monthly report published on Monday.
Regarding the inflation outlook, German central bank noted that inflation rate is expected to slow further in coming months but added that price pressure are likely to remain very high.
"Thanks to strongly rising wages, the real disposable incomes of private households are stabilising despite inflation remaining very high," the report further read.
Market reaction
EUR/USD edged higher following this publication and was last seen trading a few pips above 1.0900.
CAD rally stalls, losses should remain limited, in the view of economists at Scotiabank.
The Canadian economy remains relatively robust
For the first time since the start of June, factors may be pointing a little more clearly to the potential for some consolidation in recent gains. Still, the potential for CAD softness looks relatively limited.
The CAD remains close to fair value and has been tracking factor inputs a bit more closely in the past couple of weeks. There is no obvious sign of misalignment in the CAD’s estimated fundamental fair value at this point.
The Canadian economy remains relatively robust – in contrast to a backdrop of slowing global growth momentum as tighter monetary policy bears down on activity – and the potential for tighter BoC policy in July remains real.
- The US Dollar is near key levels against a few of its most important currencies.
- Main focus for this week will be on Powell and US Gross Domestic Product for Q1.
- The US Dollar Index is in a Catch-22 between two important levels.
The US Dollar (USD) is in a very mixed tone at the start of this week, with a very small pattern to draw as conclusion from its performance against most major currencies. The US Dollar trades at key peak levels against the Australian Dollar and the Chinese Yuan, both very much dependent on one another because Australia is the biggest supplier to China in terms of commodities. On most other fronts, the US Dollar is retracing a bit, coming off its peak performance of last week, making the US Dollar Index (DXY) very mixed and trading rather sideways at the moment.
This week traders will not be able to already start planning for their summer holidays as a few big events are set to take place. Big attention for the European equivalent of the US Federal Reserve’s Jackson Hole Symposium, as the European Central Bank (ECB) is organising its symposium in Syntra, Portugal. US Fed Chairman Jerome Powell will deliver two speeches on that event on Wednesday and Thursday, while markets can feast on data points like the Durable Goods on Tuesday at 12:30 GMT, the final estimate of the US Gross Domestic Product (GDP) on Thursday at 12:30 GMT and the Personal Consumption Expenditure (PCE) Price Index at 12:30 GMT on Friday.
Daily digest: US Dollar faces an uneventful monday in an eventful week
- Japan's vice finance minister for international affairs Masato Kanda said that the recent FX moves have been rapid and excessive and he does not rule out any options on interventions in FX. This could point to possible FX interventions from Japan’s Finance Ministry in order to appreciate the Japanese Yen.
- US President Joe Biden announced he will deliver remarks on his Economic plan on Wednesday.
- A very light data calendar for the US on Monday, with only GMT the Dallas Fed Manufacturing Activity Index on the docket at 14:30 GMT. Previous was at -29.1 with the expected number to come out at -26.5.
- The US Treasury is heading to markets for some short-term tenors with a 3-month, 6-month and a 2-year bond auction.
- No Fed speakers expected.
- Western Texas Intermediate (WTI) Crude Oil jumps on the back of geopolitical news over the weekend where the Wagner Group was on its way to Moscow.. Chances, or at least the idea, that this chokehold war could come to an end, could help the global recovery and thus might lead in a pickup to demand. Crude Oil jumped briefly to $70.11 at the start of the session but is now back at its opening rice near $69.20.
- Equities are continuing their sell-off as all indices are back in the red this Monday with Japan’s Topix closing this first trading day of the week at -0.20%. Meanwhile, European stock markets are all in the red and US equity futures are pointing to a red opening.
- The CME Group FedWatch Tool shows that markets are pricing in a 71.9% chance of a 25 basis points (bps) interest-rate hike on July 26th. The certainty of one more hike has increased as US Fed Chairman Powell remained hawkish in the recent two hearings, though markets remain reluctant to price in that second rate hike.
- The benchmark 10-year US Treasury bond yield trades at 3.68% and heads lower as bonds are bid on Monday. The move is to be noted in other regions as well as for example German Bonds are seeing higher prices as well.
US Dollar Index technical analysis: Wait and hold
The US Dollar is advancing this Monday against the Australian Dollar and the Chinese Yuan while on other fronts the Greenback is pairing back some of its gains from last week. The reason for this could be seen as that Australia is very dependent on the demand from China toward commodities and the lacklustre reopening story from China is hurting the Australian economy, making investors and traders short both currencies. This makes the US Dollar Index (DXY) very mixed as only two notable weak underperformers stand over a bulk of stronger currencies, making the DXY trading sideways to lower.
On the upside, the 100-day Simple Moving Average (SMA) briefly touched at 103.06, remains as level to break above and hold. That attempt failed last week, and could demand more conviction from the Greenback in order to head and stay above that level. Once that happens, look for 103.50 as the next key level to the upside.
On the downside, the 55-day SMA near 102.60 should normally be back into support-mode. Though, it has been chopped up quite a bit last week, so it starts to lose its importance a bit. Rather keep in mind 102.50 and 102.00 as downside supports to look for.
How does Fed’s policy impact US Dollar?
The US Federal Reserve (Fed) has two mandates: maximum employment and price stability. The Fed uses interest rates as the primary tool to reach its goals but has to find the right balance. If the Fed is concerned about inflation, it tightens its policy by raising the interest rate to increase the cost of borrowing and encourage saving. In that scenario, the US Dollar (USD) is likely to gain value due to decreasing money supply. On the other hand, the Fed could decide to loosen its policy via rate cuts if it’s concerned about a rising unemployment rate due to a slowdown in economic activity. Lower interest rates are likely to lead to a growth in investment and allow companies to hire more people. In that case, the USD is expected to lose value.
The Fed also uses quantitative tightening (QT) or quantitative easing (QE) to adjust the size of its balance sheet and steer the economy in the desired direction. QE refers to the Fed buying assets, such as government bonds, in the open market to spur growth and QT is exactly the opposite. QE is widely seen as a USD-negative central bank policy action and vice versa.
- USD/CHF has stretched its downside to near 0.8950 amid a lack of conviction in the USD Index for a recovery.
- Investors are taking caution ahead of the second quarterly result season in the United States for the financial year 2023.
- Scrutiny of Tuesday’s US Durables preliminary report indicates that fewer defense orders are going to impact the economic data.
The USD/CHF pair has dropped further to near 0.8950 in the European session. The Swiss Franc asset has faced an immense sell-off amid weakness in the US Dollar Index (DXY). The USD Index has turned sideways after correcting from 103.16 as investors have started digesting the consequences of higher interest rates from the global central banks.
S&P500 futures are holding nominal losses in London, portraying a risk-off mood, as investors are taking caution ahead of the second quarterly result season in the United States for the financial year 2023. Investors are expecting weak numbers from banking stocks due to tight credit conditions and weak guidance from technology stocks amid a high-interest rate environment.
The USD Index is oscillating in a narrow range of around 102.76 after a corrective move. Sheer volatility is anticipated after the release of the US Durable Goods Orders data (May). As per the consensus, the economic data is seen contracting by 1.0% vs. an expansion of 1.1%. Durable Goods Orders excluding defense are seen as stagnant against a contraction of 0.7%.
Scrutiny of the forward economic data indicates that fewer defense orders are going to impact the economic indicator.
On the Swiss Franc front, the Swiss National Bank raised interest rates by 25 basis points (bps) last week to 1.75% in order to keep inflation restricted below or around 2%. SNB Chairman Thomas J. Jordan believes that the consequences of an inflated environment are higher than a nation with low inflation. SNB Jordan kept doors open for more interest rate hikes.
Economists at MUFG Bank discuss GBP outlook.
Investors believe the BoE is acting aggressively enough to hit growth and potentially bring inflation lower
The 2s10s UK Gilt curve has inverted sharply of late and this is the strongest indication that investors now, for the first time in this tightening cycle, believe the BoE is acting aggressively enough to hit growth and potentially bring inflation lower.
The much weaker-than-expected PMIs from Europe last week may mean there is better scope for GBP gains versus EUR than versus the Dollar given the broader global growth concerns remain elevated.
USD/IDR is seen picking up pace in the near term, suggests Markets Strategist Quek Ser Leang at UOB Group.
Key Quotes
We highlighted last Monday (19 Jun, spot at 14,975) that USD/IDR “is likely to rise further to 15,015.” We added, “The next resistance at 15,045 is unlikely to come under threat.” The anticipated USD/IDR strength exceeded our expectations as it rose to a high of 15,050. Despite the advance, upward momentum has not improved much.
That said, there is room for USD/IDR to rise further even though the odds for it to break clearly above 15,100 are not high (there is another resistance at 15,070). Support is at 14,975, followed by 14,925.
In the view of Markets Strategist Quek Ser Leang at UOB Group, further upside in USD/MYR could revisit the 4.7000 key barrier.
Key Quotes
Last Monday (19 Jun, spot at 4.6170), we indicated that “while upward momentum has not increased much, we see chance of USD/MYR testing 4.6360 this week before the risk of a more sustained pullback increases.” We did not expect the surge in momentum as USD/MYR blew past 4.6360 and surged to a high of 4.6750.
USD/MYR continues to rise in Asian trade today (26 Jun), and the risk for this week remains on the upside. Resistance levels are 4.7000 and 4.7470. The latter level, which is last year’s high is likely out of reach this week. In order to keep the momentum going, USD/MYR must stay above 4.6420 (next support is at 4.6100).
Economists at Société Générale analyze EUR outlook. The shared currency is desperately seeking better data.
The Euro remains anchored by poor growth data
Friday’s PMI data took almost all the wind out of its sails and it badly needs the economic outlook to improve.
Our economics team has cut its Eurozone growth forecast for this year to 0.9%, which remains above consensus. They downplay the significance of the PMI data but for now, EUR/USD continues to track short term rate expectations absurdly closely and the PMI data definitely had an impact on those.
The EUR/USD danger is that it gets stuck in a tight range for a while longer, but if you can’t resist the urge to sell it, we’d recommend doing so against the CAD.
- The oil price is looking to recover from $69.00 amid fears of instability in Russia.
- Investors believe that Russia's thing is for the short-term and spot fundamentals are still not supportive.
- Fears of recessions are elevating as central banks are restricting monetary policy further.
West Texas Intermediate (WTI), futures on NYMEX, have sensed buying interest near $69.00 in the European session. A recovery in the oil price seems favored as the clash between Moscow and the Mercenary group in Russia has stemmed the risk of political instability.
On the weekend, mutiny, led by the Wagner mercenary group and its leader Yevgeny Prigozhin, was called off quickly after negotiation with Belarusian President Alexander Lukashenko, as reported by Newswires. This has fueled supply concerns as instability in the Russian economy is expected to disrupt the current demand-supply mechanism.
Analysts at Goldman Sachs said markets could price a moderately higher probability of domestic volatility in Russia leading to supply disruptions. Giant investment banking firm further added that the impact could be limited because spot fundamentals have not changed.
Spot fundamentals that have not changed in oil are weak demand outlook due to accelerating fears of a global recession. Central banks in large economies are consistently hiking interest rates as the battle against stubborn inflation is getting more complicated.
Last week, the Bank of England (BoE) was forced to raise interest rates by 50 basis points (bps) to 5% as the core Consumer Price Index (CPI) printed a fresh high of 7.1%. UK administration and BoE policymakers are not feeling comfortable due to current inflationary pressures in the United Kingdom.
Economists at ING discuss the Chinese Yuan outlook and analyze the USD/CNY pair.
Near-term targets of USD/CNY 7.30 looks plausible and in line with the 2022 highs
There is a chance that the Chinese government will come out with a broader package of support measures than it has done so far, and that will likely see the CNY rally. That said, we aren't looking for a bazooka from the authorities, more of a shot-gun approach of smaller measures, and believe that any uplift may be short-lived.
One-way traffic in the currency is not something the PBoC will want to see either, but we don't believe they will be totally averse to seeing the CNY weaken further if it does so in a controlled fashion, especially as we doubt that they are done with cutting rates just yet.
Market forecasters are toying with near-term targets of USD/CNY 7.30 which looks plausible and in line with the 2022 highs. 7.40 would take the CNY into territory that it has not visited since 2007 and seems a step too far at this juncture, though not something we would rule out.
- Silver gains strong traction for the second straight day and recovers further from a multi-month low.
- The intraday technical setup favours bullish traders and supports prospects for additional gains.
- Weakness back below the 23.6% Fibo. will negate the positive bias and expose the $22.00 mark.
Silver builds on Friday's modest bounce from the $22.10 area, or its lowest level since March 17 and gains strong follow-through traction on the first day of a new week. The upward trajectory remains unabated through the early part of the European session and lifts the white metal to a three-day high, around the $22.85 region in the last hour.
From a technical perspective, the XAG/USD has now moved back above the 100-hour Simple Moving Average (SMA) and is currently placed around the 38.2% Fibonacci retracement level of the downfall witnessed over the past week or so. A sustained strength beyond might trigger a fresh bout of a short-covering rally and lift the commodity beyond the $23.00 mark, towards testing the 50% Fibo. level, around the $23.15 region.
The recovery could get extended to the $23.35-$23.40 confluence, comprising the 200-hour SMA and the 61.8% Fibo. level, which should now act as a pivotal point. Given that oscillators on the daily chart are still holding in the negative territory, bulls might wait for some follow-through buying beyond the said barrier before confirming that the XAG/USD has formed a bottom ahead of the $22.00 mark and positioning for any further gains.
On the flip side, weakness back below the 23.6% Fibo. level, around the $22.60 area, will expose the multi-month low, around the $22.10 region. Some follow-through selling below the $22.00 mark will be seen as a fresh trigger for bearish traders and make the XAG/USD accelerate the slide towards the $21.70-$21.65 support zone. The downward trajectory could get extended further towards the $21.25 support en route to the $21.00 round figure.
The next relevant support is pegged near the $20.50 area, below which the XAG/USD might eventually aim towards challenging the YTD low, levels just below the $20.00 psychological mark touched in March.
Silver 1-hour chart
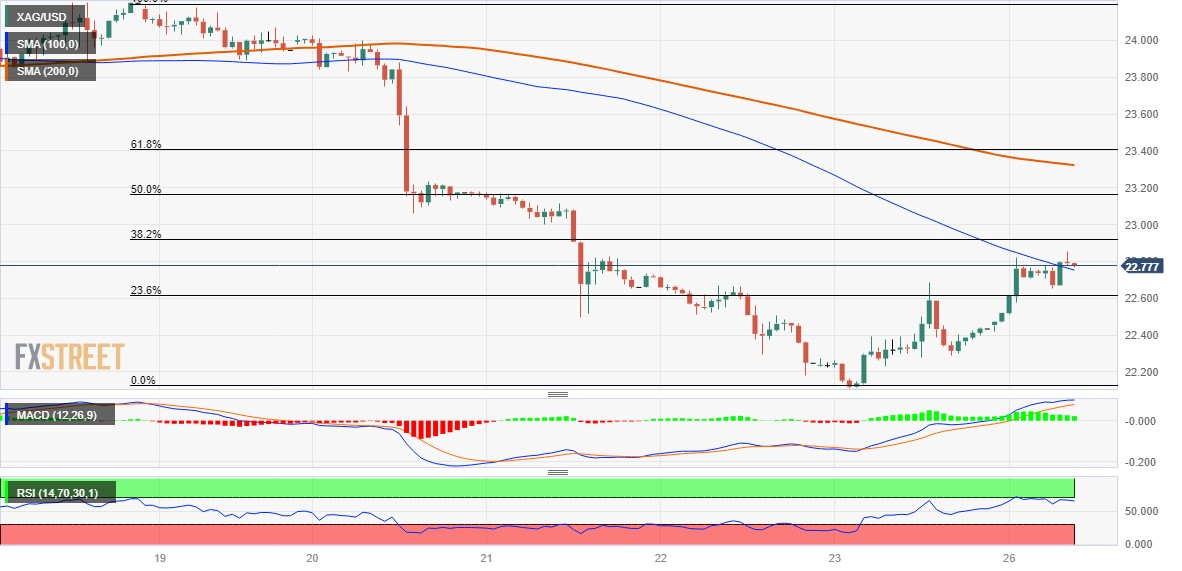
Key levels to watch
- Pound Sterling is looking for a range expansion as the UK government aims for wage cuts in public sector in the battle against persistent inflation.
- United Kingdom authority urges industry regulators to bring down profit margins and considers wage cuts.
- Bank of England kept doors open for further rate hikes as journey of achieving 2% inflation is far from over.
The Pound Sterling (GBP) is aiming to stretch recovery as the United Kingdom’s government is looking to inculcate fiscal tools in the battle against stubborn inflation. The GBP/USD pair recovered after remaining well-supported near 1.2700, after the British administration announced new fiscal measures such as cutting wages of public sector employees. The British government also asked companies to bring down profit margins to tame sticky inflation, which might help trim fears of a bleak economic outlook.
Last week, hotter-than-expected headline United Kingdom’s headline inflation and fresh highs in the core Consumer Price Index (CPI) forced the Bank of England (BoE) to announce a fat rate hike of 50 basis points. Headline inflation remained higher than anticipation as upbeat sales of second-hand automobiles offset a decline in energy prices.
Daily digest market movers: Pound Sterling rebounds as more rate hikes are expected
- United Kingdom’s economic outlook is in danger as BoE Governor Andrew Bailey raised interest rates surprisingly by 50 basis points (bps) to 5%.
- BoE policymakers were forced to announce massive rate hikes as United Kingdom inflation turned out to be more persistent than expected.
- United Kingdom’s headline inflation landed at 8.7% as rising prices for recreational cultural goods and services, air travel, and second-hand cars were sufficient to offset the marginal decline in historic high food inflation and falling gasoline prices.
- The core inflation is moving in the wrong direction, printed fresh highs at 7.1% despite consistent policy-tightening measures by the central bank.
- Last week, UK Retail Sales also beat expectations. Monthly economic data expanded by 0.3% while the street was anticipating a contraction by 0.2%. Annualized Retail Sales contracted by 2.1% but remained better as investors were hoping for a contraction of 2.6%.
- BoE Governor Andrew Bailey has kept doors open for further interest rate hikes as the journey of achieving price stability is far from over.
- More interest rate hikes by the BoE are expected to threaten economic outlooks adversely.
- The consequences of persistent UK inflation is the dampening image of the Conservative Party as Finance Minister Jeremy Hunt rolled back the promise of tax cuts, citing that its execution could propel inflationary pressures and offset the efforts yet made by the central bank to bring down inflation.
- The image of Britain’s Conservative Party could dampen further as UK FM Jeremy Hunt is in discussions with industry regulators that businesses must not raise profit margins, benefitting from upbeat demand, so-called greedflation, as reported by Bloomberg.
- In addition to greedflation, the UK government is stepping up efforts for taming inflation by cutting wages in the public sector.
- The broader market mood is demonstrating a risk-aversion theme as global equities are showing lofty valuations and the quarterly result season is at the doorstep.
- The US Dollar Index is rebounding after a corrective move as an interest rate hike in July by the Federal Reserve (Fed) is widely anticipated.
- Analysts at Rabobank expect the Fed to hike in July but also forecast a more moderate pace of rate hikes which would imply skipping September, with November being the meeting for a potential second hike.
- This week, investors will keep an eye on the United States Durable Goods Orders data, which is scheduled for Tuesday at 12:30 GMT.
Technical Analysis: Pound Sterling looks to surpass the 1.2740 resistance
Pound Sterling is gathering strength for a confident move above the immediate resistance of 1.2740. The Cable is consistently getting decent support near the round-level support of 1.2700, however, efforts could be in vain as the US Dollar Index (DXY) is recovering from a corrective move.
The Pound Sterling is in a mean-reversion mode and is expected to find support near the 20-period daily Exponential Moving Average (DEMA). Downside bias in the Cable could strengthen if it fails to keep supported around 1.2700. While Pound Sterling bulls could come back in action if Cable climbs above 1.2800.
BoE FAQs
What does the Bank of England do and how does it impact the Pound?
The Bank of England (BoE) decides monetary policy for the United Kingdom. Its primary goal is to achieve ‘price stability’, or a steady inflation rate of 2%. Its tool for achieving this is via the adjustment of base lending rates. The BoE sets the rate at which it lends to commercial banks and banks lend to each other, determining the level of interest rates in the economy overall. This also impacts the value of the Pound Sterling (GBP).
How does the Bank of England’s monetary policy influence Sterling?
When inflation is above the Bank of England’s target it responds by raising interest rates, making it more expensive for people and businesses to access credit. This is positive for the Pound Sterling because higher interest rates make the UK a more attractive place for global investors to park their money. When inflation falls below target, it is a sign economic growth is slowing, and the BoE will consider lowering interest rates to cheapen credit in the hope businesses will borrow to invest in growth-generating projects – a negative for the Pound Sterling.
What is Quantitative Easing (QE) and how does it affect the Pound?
In extreme situations, the Bank of England can enact a policy called Quantitative Easing (QE). QE is the process by which the BoE substantially increases the flow of credit in a stuck financial system. QE is a last resort policy when lowering interest rates will not achieve the necessary result. The process of QE involves the BoE printing money to buy assets – usually government or AAA-rated corporate bonds – from banks and other financial institutions. QE usually results in a weaker Pound Sterling.
What is Quantitative tightening (QT) and how does it affect the Pound Sterling?
Quantitative tightening (QT) is the reverse of QE, enacted when the economy is strengthening and inflation starts rising. Whilst in QE the Bank of England (BoE) purchases government and corporate bonds from financial institutions to encourage them to lend; in QT, the BoE stops buying more bonds, and stops reinvesting the principal maturing on the bonds it already holds. It is usually positive for the Pound Sterling.
Geopolitics is back on the agenda. Economists at Commerzbank analyze what is happening in Russia and RUB outlook.
Russia after the coup attempt
The weekend's events remind us of two things: If the current president is replaced, it seems at least not unlikely that the successor will be even more radical, even more bellicose. Besides the status quo and a change of power, there is a third scenario: the disintegration of the Russian state. Either way, a return of Russia's economic foreign relations to normality before February 2022 or even before March 2014 would be unthinkable.
Those who praise autocracies because they are supposedly more politically stable and therefore supposedly provide an attractive environment for economic profit-making fail to realize one thing: when autocracies wobble, they do so violently.
A return to a reasonably normal RUB market cannot be ruled out in the foreseeable future, but it is highly unlikely.
USD/THB could challenge and even break above the 35.40 level in the near term, according to Markets Strategist Quek Ser Leang at UOB Group.
Key Quotes
The strong surge in USD/THB that sent it to a high of 35.28 came as a surprise (we were expecting it to trade in a range of 34.50/34.90). The rapid increase in momentum is likely to lead to further USD/THB strength towards March’s high near 35.40.
A break of this level is not ruled out, but for this week, the next major resistance at 35.75 is unlikely to come under threat. In order to keep the momentum going, USD/THB must stay above 34.85 (minor support is at 35.05).
- NZD/USD has gauged intermediate support near 0.6140, however, more downside seems favored amid uncertainty.
- Investors should note that core inflation in the US economy has remained extremely persistent.
- NZD/USD has formed a Head and Shoulder chart pattern on a two-hour scale, which indicates a prolonged consolidation.
The NZD/USD pair has found intermediate support near 0.6140 in the European session. The Kiwi asset is expected to show a volatile action as the US Dollar Index (DXY) is looking to conclude its corrective move.
S&P500 futures have posted losses in London, portraying a further decline in the risk appetite of the market participants. The risk of global recession is driving market mood and has trimmed the appeal for risk-sensitive assets.
The US Dollar will remain in action ahead of the release of the Durable Goods Orders data. Investors should note that core inflation in the United States economy has remained extremely persistent due to rising prices for services and durable goods.
NZD/USD has formed a Head and Shoulder chart pattern on a two-hour scale, which indicates a prolonged consolidation. A breakdown of the same confirms a bearish reversal. The neckline of the aforementioned chart pattern is plotted from June 14 low at 0.6142.
The Kiwi asset is struggling to maintain an auction above the 200-period Exponential Moving Average (EMA) at 0.6159, which indicates that the long-term trend is not bullish.
Meanwhile, the Relative Strength Index (RSI) (14) is oscillating in the 40.00-60.00 range, indicating a non-directional performance.
A downside move below the June 16 low at 0.6116 will expose the asset to June 05 low at 0.6041. A slippage below the latter would expose the asset to psychological support at 0.6000.
Alternatively, a confident break above May 17 high at 0.6261 will drive the Kiwi asset toward May 19 high at 0.6306 followed by May 08 high around 0.6360.
NZD/USD two-hour chart

- Gold price gains some positive traction for the second successive day on Monday.
- Geopolitical risks and a modest US Dollar weakness lend support to the XAU/USD.
- Hawkish major central banks might hold back bullish from placing aggressive bets.
Gold price attracts some buying for the second successive day on Monday and trades with a mild positive bias through the early European session. The XAU/USD is currently placed just above the $1,930 level, up nearly 0.60% for the day, though remains well within Friday's broader trading range and below the 100-day Simple Moving Average (SMA) support breakpoint.
Against the backdrop of worries about a global economic slowdown, a revolt by Russian mercenaries over the weekend raised concerns about political instability in the country and lends some support to the safe-haven Gold price. It is worth recalling that a clash between Moscow and the Russian mercenary group Wagner was averted on Saturday after the heavily armed mercenaries withdrew from the southern Russian city of Rostov under a deal that halted their rapid advance on the capital. Apart from this, the emergence of some selling around the US Dollar (USD) turns out to be another factor acting as a tailwind for the XAU/USD.
Following two days of goodish recovery from the lowest level since May 11, the USD kicks off the new week on a softer note in the wake of a modest downtick in the US Treasury bond yields. That said, the Federal Reserve's (Fed) signal that borrowing costs may still need to rise as much as 50 bps by the end of this year should limit the downside for the US bond yields and the USD. Apart from this, a more hawkish stance adopted by global major central banks might further contribute to capping gains for the non-yielding Gold price and warrants some caution before positioning for any further near-term appreciating move.
In the absence of any relevant market-moving economic releases on Monday, the aforementioned fundamental backdrop makes it prudent to wait for strong follow-through buying before confirming that the XAU/USD has formed a near-term bottom. Traders might also refrain from placing aggressive bets ahead of Fed Chair Jerome Powell's speech on Wednesday. Investors this week will further confront the release of important US macro data, including the Core PCE Price Index (the Fed's preferred inflation gauge). This will influence Fed rate-hike expectations and provide a fresh directional impetus to Gold price.
Technical levels to watch
Following the release of the German IFO Business Survey, the institute’s Economist Klaus Wohlrabe said that the “likelihood that German economy will shrink again in Q2 has increased.”
Additional quotes
Storm clouds are forming for the German economy.
Weak demand for industry, order backlog falling.
Industry export expectations are noticeably down, global rate hikes dampen demand.
Share of companies that want to raise prices has decreased further in June.
Likelihood that german economy will shrink again in Q2 has increased.
Market reaction
EUR/USD was last seen trading at 1.0891, modestly flat on the day.
- Euro appears side-lined after two consecutive daily pullbacks.
- Stocks in Europe open the session on the back foot.
- EUR/USD bounces off lows near 1.0840 (June 23).
- Germany’s Business Climate surprises to the downside in June.
- Markets’ attention now shifts to the ECB Forum in Portugal.
After two consecutive daily retracements, the Euro (EUR) has regained some stability and rebounded from last week's lows near 1.0840 against the US Dollar, with its initial target being the key 1.0900 level. This positive start to the week for EUR/USD is in line with the renewed selling pressure on the Greenback, which has caused the USD Index (DXY) to retreat from its multi-day highs above 103.00 seen towards the end of last week.
Market participants are expected to closely monitor the annual ECB Forum on Central Banking in Sintra, Portugal, as well as a series of speeches by ECB officials, including President Christine Lagarde.
Regarding the ECB, investors are still anticipating another 25 bps rate hike in July, while the Federal Reserve is widely expected to follow suit, according to recent comments and testimony by Chair Jerome Powell.
On the broader macroeconomic front, the potential next steps by both the Federal Reserve and the European Central Bank in normalizing their monetary policies are the subject of ongoing debate, against the backdrop of increasing speculation of an economic slowdown on both sides of the Atlantic.
From the latest CFTC Positioning Report, speculators trimmed their net long exposure in EUR to levels last seen in early April around 144.6K contracts in the week leading to June 20, a period including the 25 rate hike by the ECB at its gathering on June 15.
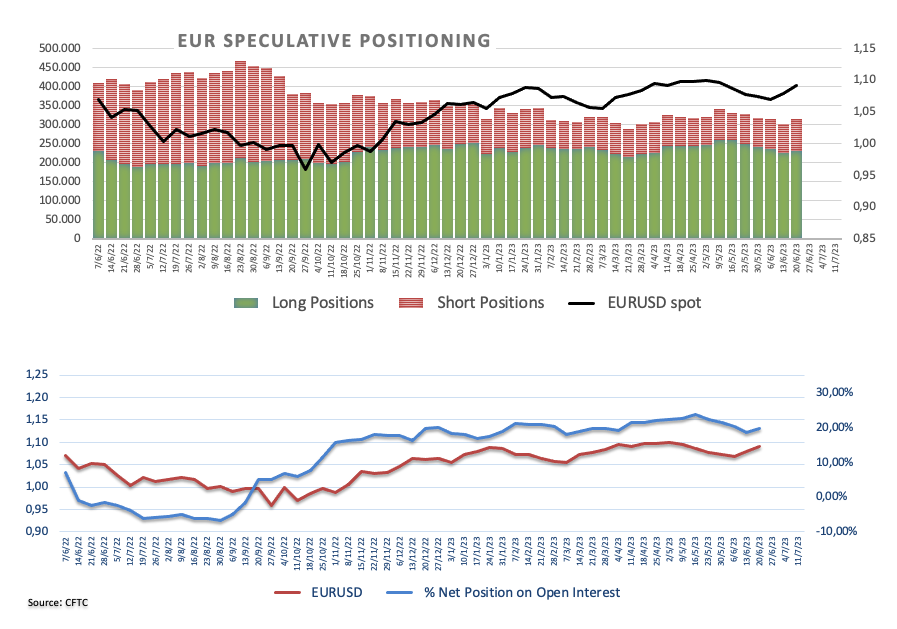
In terms of data, the IFO Institute reported that the Business Climate in Germany fell to 88.4 in June from 91.7.

Across the Atlantic, the only scheduled release will be the Dallas Fed Manufacturing Index for June.
Daily digest market movers: All the attention now shifts to Portugal
- The EUR picks up pace on renewed USD weakness.
- Germany’s Business Climate came in short of expectations in June.
- ECB Lagarde and other policymakers speak in Sintra this week.
- ECB-speakers are expected to gather all the attention this week.
- US, German yields extend the decline in early trading.
Technical Analysis: Euro needs to regain 1.1000 and beyond
EUR/USD remains under pressure, and the breakdown of the June low at 1.0844 (June 23) could open the door to a probable test of the interim 100-day SMA at 1.0809. The loss of the latter exposes a deeper pullback to the May low of 1.0635 (May 31) ahead of the March low of 1.0516 (March 15) and the 2023 low of 1.0481 (January 6).
If bulls regains the upper hand, the next hurdle is then expected at the June peak of 1.1012 (June 22) prior to the 2023 high of 1.1095 (April 26), which is closely followed by the round level of 1.1100. North from here emerges the weekly top of 1.1184 (March 31, 2022), which is supported by the 200-week SMA at 1.1181, just before another round level at 1.1200.
The constructive view of EUR/USD appears unchanged as long as the pair trades above the crucial 200-day SMA, today at 1.0567.
Euro FAQs
What is the Euro?
The Euro is the currency for the 20 European Union countries that belong to the Eurozone. It is the second most heavily traded currency in the world behind the US Dollar. In 2022, it accounted for 31% of all foreign exchange transactions, with an average daily turnover of over $2.2 trillion a day.
EUR/USD is the most heavily traded currency pair in the world, accounting for an estimated 30% off all transactions, followed by EUR/JPY (4%), EUR/GBP (3%) and EUR/AUD (2%).
What is the ECB and how does it impact the Euro?
The European Central Bank (ECB) in Frankfurt, Germany, is the reserve bank for the Eurozone. The ECB sets interest rates and manages monetary policy.
The ECB’s primary mandate is to maintain price stability, which means either controlling inflation or stimulating growth. Its primary tool is the raising or lowering of interest rates. Relatively high interest rates – or the expectation of higher rates – will usually benefit the Euro and vice versa.
The ECB Governing Council makes monetary policy decisions at meetings held eight times a year. Decisions are made by heads of the Eurozone national banks and six permanent members, including the President of the ECB, Christine Lagarde.
How does inflation data impact the value of the Euro?
Eurozone inflation data, measured by the Harmonized Index of Consumer Prices (HICP), is an important econometric for the Euro. If inflation rises more than expected, especially if above the ECB’s 2% target, it obliges the ECB to raise interest rates to bring it back under control.
Relatively high interest rates compared to its counterparts will usually benefit the Euro, as it makes the region more attractive as a place for global investors to park their money.
How does economic data influence the value of the Euro?
Data releases gauge the health of the economy and can impact on the Euro. Indicators such as GDP, Manufacturing and Services PMIs, employment, and consumer sentiment surveys can all influence the direction of the single currency.
A strong economy is good for the Euro. Not only does it attract more foreign investment but it may encourage the ECB to put up interest rates, which will directly strengthen the Euro. Otherwise, if economic data is weak, the Euro is likely to fall.
Economic data for the four largest economies in the euro area (Germany, France, Italy and Spain) are especially significant, as they account for 75% of the Eurozone’s economy.
How does the Trade Balance impact the Euro?
Another significant data release for the Euro is the Trade Balance. This indicator measures the difference between what a country earns from its exports and what it spends on imports over a given period.
If a country produces highly sought after exports then its currency will gain in value purely from the extra demand created from foreign buyers seeking to purchase these goods. Therefore, a positive net Trade Balance strengthens a currency and vice versa for a negative balance.
The US Dollar rebounded on Friday and was stronger over the week as well. Economists at MUFG Bank analyze USD outlook.
USD sustained strength unlikely
Moves back and forth between strength and weakness may well persist going forward. We have arrived at a point in tightening cycles where determining how much further tightening is required is more difficult to know and hence central banks and markets will be more sensitive to incoming economic data.
Friday was a case in point with sharp EUR depreciation following weak PMIs. But data in the US could also start to weaken and we maintain it is more likely than not that the FOMC will continue with its pause in tightening – if we are correct we see that as an influence in weakening the Dollar, assuming we do not get a dramatic deterioration in growth outside of the US.
So US Dollar gains could reverse if upcoming economic data from the US backs up the case for the FOMC extending its pause in tightening policy further.
- German IFO Business Climate Index continued to decline in June.
- EUR/USD clings to small daily gains near 1.0900 early Monday.
The headline German IFO Business Climate Index fell to 88.5 in June from 91.5 in May (revised from 91.7). This reading came in weaker than the market expectation of 90.7.
Meanwhile, the Current Economic Assessment Index edged lower to 93.7 from 94.8 but arrived higher than the market expectation of 93.5. Finally, the Expectations Index – indicating firms’ projections for the next six months, declined to 83.6 from 88.3.
Market reaction
EUR/USD showed no immediate reaction to this report and was last seen posting small daily gains near 1.0900.
About German IFO
The headline IFO business climate index was rebased and recalibrated in April after the IFO Research Institute changed the series from the base year of 2000 to the base year of 2005 as of May 2011 and then changed the series to include services as of April 2018. The survey now includes 9,000 monthly survey responses from firms in the manufacturing, service sector, trade and construction.
Economists at Société Générale analyze USD/ZAR technical outlook.
A short-term up move towards 19.02 and 19.23 is not ruled out
USD/ZAR has staged an initial bounce after approaching interim support zone of 18.10/18.00 representing the 200-DMA and the ascending trend line drawn since April 2022. Interestingly, this MA has cushioned multiple declines in recent uptrend and is expected to be a crucial support.
A short-term up move towards 19.02 and 19.23, the 61.8% retracement of the pullback is not ruled out.
Only a break below 18.10/18.00 would denote risk of a deeper down move.
Extra gains in USD/CNH could retest the 7.2500 level in the next few weeks, comment UOB Group’s Economist Lee Sue Ann and Markets Strategist Quek Ser Leang.
Key Quotes
24-hour view: We expected USD to trade with an upward bias last Friday. However, we were of the view that “a sustained rise above 7.2200 is unlikely.” USD then soared to 7.2285 before pulling back to end the day at 7.2149 (+0.30%). The pullback in overbought conditions suggests USD is unlikely advance much further. Today, USD is more likely to trade in a range of 7.1950/7.2300.
Next 1-3 weeks: Last Friday (23 Jun, spot at 7.1960), we noted that “upward momentum has improved a tad”, and we held the view that “there is room for USD to edge higher to 7.2300.”. USD then rose to 7.2285 and then pulled back. While momentum has not improved much, USD could rise further, albeit at a slower pace. The next level to watch above 7.2300 is 7.2500. On the downside, a breach of 7.1700 (‘strong support’ level previously at 7.1580) would indicate USD is not advancing further.
- AUD/USD is expected to resume its downside journey below 0.6670 amid a risk-off mood.
- The US Durable Goods Orders data is expected to contract by 1.0%, against an expansion of 1.1%.
- The expectations for more rate hikes from the RBA are higher as risks of upside inflation are elevated.
The AUD/USD pair is consolidating above 0.6670 in the European session. The Aussie asset is expected to resume its downside journey as the US Dollar Index (DXY) has stabilized after a corrective move to near 102.70.
S&P500 futures have generated some losses on Monday, carry-forwarded negative cues witnessed on Friday. The overall market mood is indicating that the risk-aversion theme is getting strengthened further as fears of global recession are accelerating due to higher interest rates by the central banks. Also, the upcoming quarterly reason has kept investors on their toes.
The US Dollar Index has shown a corrective move from a weekly high of 103.17 as investors have started digesting fears of more interest rate hikes from the Federal Reserve (Fed). Fed chair Jerome Powell has already confirmed that the central bank will continue tightening rates at a ‘careful pace.
Analysts at Rabobank expect the Fed to hike in July but also forecast a more moderate pace of rate hikes which would imply skipping September, with November being the meeting for a potential second hike.
Going forward, US Durable Goods Orders data will be keenly watched. As per the consensus, May’s data is expected to contract by 1.0%, against an expansion of 1.1% reported earlier.
On the Australian Dollar front, investors are awaiting the release of the monthly Consumer Price Index (CPI) data (May). Australian inflation turned out hotter in April and landed at 6.8% as labor market conditions remained upbeat. The expectations for more rate hikes from the Reserve Bank of Australia (RBA) are higher as risks of upside inflation are elevated.
Here is what you need to know on Monday, June 26:
Markets remain relatively quiet to start the week as investors turn their attention to the European Central Bank's annual Forum on Central Banking in Sintra that will kick off with ECB President Christine Lagarde's speech at 1730 GMT. The US economic docket will feature the Federal Reserve Bank of Dallas' Texas Manufacturing Survey. Germany's IFO Institute will also release business sentiment data for June.
Over the weekend, tensions between the Wagner mercenary group and Russian President Vladimir Putin eased after the sides reached an agreement late Saturday. Meanwhile, “China needs to step up measures as soon as possible to bolster a faltering post-COVID recovery in the world's second-largest economy,” said Ning Jizhe, deputy head of the economic committee of the Chinese People's Political Consultative Conference (CPPCC). Nevertheless, S&P Global announced that it lowered its forecast for China’s Gross Domestic Product (GDP) growth to 5.2% from 5.5% this year. Following these developments, investors seem to have adopted a cautious stance early Monday, with US stock index futures trading modestly lower on the day.
The ECB's forum is entitled “Macroeconomic stabilisation in a volatile inflation environment.” Many prominent central bankers, including FOMC Chairman Jerome Powell and Bank of England President Andrew Bailey, will be speaking at this event later in the week.
The US Dollar Index, which snapped a three-week losing streak on the back of a strong rebound seen in the second half of the week, stays in a consolidation phase below 103.00 and the 10-year US Treasury bond yield is down more than 1% below 3.7% in the European morning.
EUR/USD holds steady at around 1.0900 early Monday after having registered small losses last week.
GBP/USD came within a touching distance of 1.2700 during the Asian trading hours on Monday but managed to stage a rebound toward 1.2750.
The Summary of Opinions of Bank of Japan’s (BoJ) June policy meeting showed that policymakers thought that the BoJ must consider reviewing the Yield Curve Control strategy at an early stage, while maintaining easy monetary policy. USD/JPY stays under modest bearish pressure early Monday and trades in negative territory at around 143.00.
Gold price benefits from retreating US yields and rises toward $1,930 in the European session after having lost nearly 2% last week.
Bitcoin edged lower over the weekend but managed to hold comfortably above $30,000. Ethereum stays in a consolidation phase near $1,900 on Monday following last week's rally that saw ETH/USD gain more than 10%.
- The index starts the week slightly offered below 103.00.
- The improvement in the risk complex weighs on the greenback.
- The Dallas Fed Manufacturing Index will be the sole release on Monday.
On Monday, the USD Index (DXY), which monitors the performance of the greenback against a basket of its primary rival currencies, began the week on a weaker note, retreating from the previous week's highs beyond the 103.00 level.
USD Index looks to risk trends, ECB
As a result of some decent recovery in the risk-linked market, the index is currently experiencing some selling pressure, causing it to retreat to the 102.70 level, while market participants take profits after the two-day strong rebound at the start of the week.
Investors are still predicting a 25 bps rate hike by the Federal Reserve at the July 26 event, while the US money market show some consolidation in yields across the curve following recent peaks.
On another front, speculative net longs in the USD climbed to levels last seen in late January in the week ended on June 20 as per the latest CFTC Positioning Report, as investors were digesting the FOMC gathering on June 14.
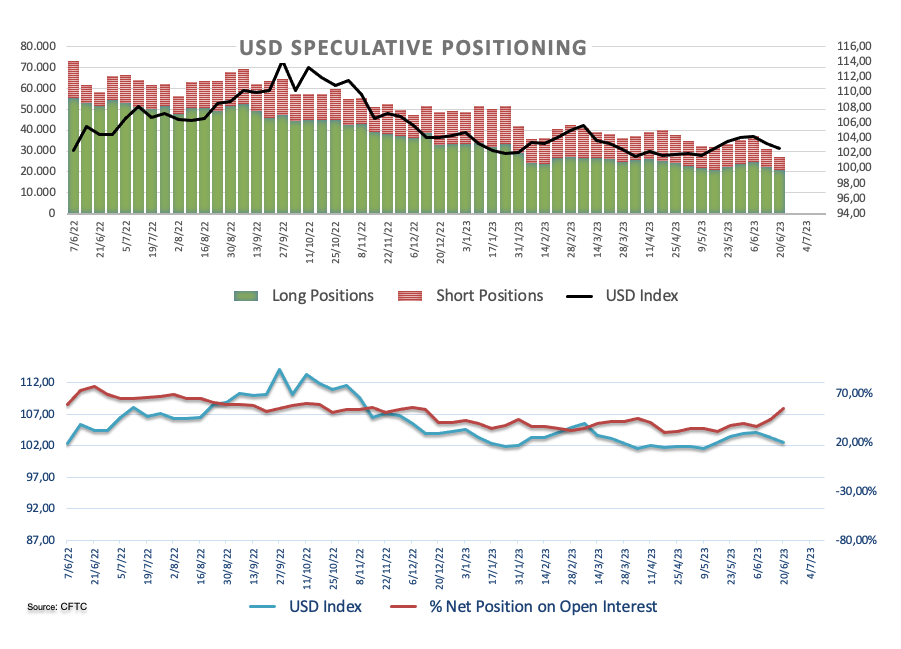
The NA session will only see one release, the Dallas Fed Manufacturing Index for June, while the ECB Forum in Sintra, Portugal, will also attract attention in the first half of the week.
What to look for around USD
The index gives away part of the recent gains and slips back below the key 103.00 region at the beginning of the week.
Meanwhile, the likelihood of another 25 bps hike at the Fed's upcoming meeting in July remains high, supported by the continued strength of key US fundamentals such as employment and prices.
This view was further bolstered by comments from Fed Chief Powell at the June FOMC event, who referred to the July meeting as "live" and indicated that most of the Committee is prepared to resume the tightening campaign as early as next month.
Key events in the US this week: Durable Goods Orders, FHFA House Price Index, CB Consumer Confidence, New Home Sales (Tuesday) – MBA Mortgage Applications, Advanced Goods Trade Balance, Fed Powell (Wednesday) – Final Q1 Growth Rate, Initial Jobless Claims (Thursday) – PCE, Core PCE, Personal Income/Spending, Final Michigan Consumer Sentiment (Friday).
Eminent issues on the back boiler: Persistent debate over a soft/hard landing of the US economy. Terminal Interest rate near the peak vs. speculation of rate cuts in late 2023/early 2024. Fed’s pivot. Geopolitical effervescence vs. Russia and China. US-China trade conflict.
USD Index relevant levels
Now, the index is losing 0.15% at 102.71 and faces the next contention at 101.92 (monthly low June 16) followed by 100.78 (2023 low April 14) and finally 100.00 (round level). On the other hand, the breakout of 103.16 (weekly high June 23) would open the door to 104.69 (monthly high May 31) and then 105.07 (200-day SMA).
- EUR/JPY remains under some selling pressure for the second straight day on Monday.
- Friday’s disappointing Eurozone PMIs undermine the Euro and act as a headwind.
- Intervention warning boosts the JPY and contributes to the modest intraday losses.
- The BoJ-ECB policy divergence should limit losses and warrants caution for bears.
The EUR/JPY cross struggles to capitalize on Friday's goodish intraday bounce from the 155.00 psychological mark and kicks off the new week on a softer note. The selling bias picks up pace during the early European session and drags spot prices back below the 156.00 mark in the last hour.
Friday's disappointing flash Eurozone PMIs added to worries about economic headwinds stemming from rising borrowing costs and could leave the European Central Bank (ECB) in a policy dilemma. This, in turn, is seen as a key factor behind the shared currency's relative underperformance, which, along with a pickup in demand for the Japanese Yen (JPY), turn out to be key factors exerting some pressure on the EUR/JPY cross.
Japan's top currency diplomat Masato Kanda stepped up warnings against the recent weakness in the JPY and told reporters that Japan will not rule out any options available to respond appropriately to excessive currency moves. Furthermore, Japanese Finance Minister Shunichi Suzuki said that we will continue to watch the forex market with a sense of urgency, fueling speculations that authorities could intervene to stem JPY's weakness.
Moreover, the Bank of Japan (BoJ), in the Summary of Opinions from the June policy meeting, noted that there is a strong chance that inflation will moderate toward the middle of the current fiscal year, but won't slow back below 2%. Moreover, one of the board members said that the BoJ should discuss revising its controversial yield curve control (YCC) policy at an early stage. This further benefits the JPY and weighs on the EUR/JPY cross.
However, expectations that BoJ's negative interest-rate policy will remain in place at least until next year might hold back traders from placing aggressive bullish bets around the EUR/JPY cross. It is worth recalling that BoJ Governor Kazuo Ueda recently ruled out the possibility of any change in ultra-loose policy settings. This marks a big divergence in comparison to the ECB's hawkish stance and should lend support to the EUR/JPY cross.
Apart from this, a generally positive tone around the equity markets could undermine the safe-haven JPY and contribute to limiting any meaningful corrective decline in the absence of any relevant market-moving data from the Eurozone. This makes it prudent to wait for strong follow-through selling around the EUR/JPY cross before confirming that the recent rally to the highest level since September 2008 has run out of steam.
Technical levels to watch
Economists at ANZ Bank analyze USD/SGD outlook.
MAS to keep their monetary policy stance unchanged for the rest of 2023
With the MAS on hold, the Singdollar will not benefit from any upward re-centring of the policy band like last year. But with its appreciation path still in place, we expect the S$NEER to continue drifting higher and stay in the upper half of the policy band. Singapore continues to attract capital inflows, which the MAS has partly been absorbing via increases in their FX reserves.
The strong correlation between SGD and the DXY means that the key driver will be from the Dollar side. With the US Federal Reserve close to ending their tightening cycle, we see the DXY falling over the second half of the year, which will help push the SGD stronger.
We forecast USD/SGD at 1.31 by year-end.
- Pound Sterling has faced pressure as the UK government aims for wage cuts in public sector in the battle against persistent inflation.
- United Kingdom authority urges industry regulators to bring down profit margins and considers wage cuts.
- Bank of England kept doors open for further rate hikes as journey of achieving 2% inflation is far from over.
The Pound Sterling (GBP) has surrendered the majority of gains made after a recovery move as the United Kingdom’s government is looking to inculcate fiscal tools in the battle against stubborn inflation. The GBP/USD pair recovered after remaining well-supported near 1.2700, after the British administration announced new fiscal measures such as cutting wages of public sector employees. The British government also asked companies to bring down profit margins to tame sticky inflation, which might help trim fears of a bleak economic outlook.
Last week, hotter-than-expected headline United Kingdom’s headline inflation and fresh highs in the core Consumer Price Index (CPI) forced the Bank of England (BoE) to announce a fat rate hike of 50 basis points. Headline inflation remained higher than anticipation as upbeat sales of second-hand automobiles offset a decline in energy prices.
Daily digest market movers: Pound Sterling reacts to the vulnerable economic outlook
- United Kingdom’s economic outlook is in danger as BoE Governor Andrew Bailey raised interest rates surprisingly by 50 basis points (bps) to 5%.
- BoE policymakers were forced to announce massive rate hikes as United Kingdom inflation turned out to be more persistent than expected.
- United Kingdom’s headline inflation landed at 8.7% as rising prices for recreational cultural goods and services, air travel, and second-hand cars were sufficient to offset the marginal decline in historic high food inflation and falling gasoline prices.
- The core inflation is moving in the wrong direction, printed fresh highs at 7.1% despite consistent policy-tightening measures by the central bank.
- Last week, UK Retail Sales also beat expectations. Monthly economic data expanded by 0.3% while the street was anticipating a contraction by 0.2%. Annualized Retail Sales contracted by 2.1% but remained better as investors were hoping for a contraction of 2.6%.
- BoE Governor Andrew Bailey has kept doors open for further interest rate hikes as the journey of achieving price stability is far from over.
- More interest rate hikes by the BoE are expected to threaten economic outlooks adversely.
- The consequences of persistent UK inflation is the dampening image of the Conservative Party as Finance Minister Jeremy Hunt rolled back the promise of tax cuts, citing that its execution could propel inflationary pressures and offset the efforts yet made by the central bank to bring down inflation.
- The image of Britain’s Conservative Party could dampen further as UK FM Jeremy Hunt is in discussions with industry regulators that businesses must not raise profit margins, benefitting from upbeat demand, so-called greedflation, as reported by Bloomberg.
- In addition to greedflation, the UK government is stepping up efforts for taming inflation by cutting wages in the public sector.
- The broader market mood is demonstrating a risk-aversion theme as global equities are showing lofty valuations and the quarterly result season is at the doorstep.
- The US Dollar Index is rebounding after a corrective move as an interest rate hike in July by the Federal Reserve (Fed) is widely anticipated.
- Analysts at Rabobank expect the Fed to hike in July but also forecast a more moderate pace of rate hikes which would imply skipping September, with November being the meeting for a potential second hike.
- This week, investors will keep an eye on the United States Durable Goods Orders data, which is scheduled for Tuesday at 12:30 GMT.
Technical Analysis: Pound Sterling looks faces barricades around 1.2740
Pound Sterling has sensed immense pressure while attempting to cross the immediate resistance of 1.2740. The Cable is consistently getting decent support near the round-level support of 1.2700, however, efforts could be in vain as the US Dollar Index (DXY) is recovering from a corrective move.
The Pound Sterling is in a mean-reversion mode and is expected to find support near the 20-period daily Exponential Moving Average (DEMA). Downside bias in the Cable could strengthen if it fails to keep supported around 1.2700. While Pound Sterling bulls could come back in action if Cable climbs above 1.2800.
Pound Sterling FAQs
What is the Pound Sterling?
The Pound Sterling (GBP) is the oldest currency in the world (886 AD) and the official currency of the United Kingdom. It is the fourth most traded unit for foreign exchange (FX) in the world, accounting for 12% of all transactions, averaging $630 billion a day, according to 2022 data.
Its key trading pairs are GBP/USD, aka ‘Cable’, which accounts for 11% of FX, GBP/JPY, or the ‘Dragon’ as it is known by traders (3%), and EUR/GBP (2%). The Pound Sterling is issued by the Bank of England (BoE).
How do the decisions of the Bank of England impact on the Pound Sterling?
The single most important factor influencing the value of the Pound Sterling is monetary policy decided by the Bank of England. The BoE bases its decisions on whether it has achieved its primary goal of “price stability” – a steady inflation rate of around 2%. Its primary tool for achieving this is the adjustment of interest rates.
When inflation is too high, the BoE will try to rein it in by raising interest rates, making it more expensive for people and businesses to access credit. This is generally positive for GBP, as higher interest rates make the UK a more attractive place for global investors to park their money.
When inflation falls too low it is a sign economic growth is slowing. In this scenario, the BoE will consider lowering interest rates to cheapen credit so businesses will borrow more to invest in growth-generating projects.
How does economic data influence the value of the Pound?
Data releases gauge the health of the economy and can impact the value of the Pound Sterling. Indicators such as GDP, Manufacturing and Services PMIs, and employment can all influence the direction of the GBP.
A strong economy is good for Sterling. Not only does it attract more foreign investment but it may encourage the BoE to put up interest rates, which will directly strengthen GBP. Otherwise, if economic data is weak, the Pound Sterling is likely to fall.
How does the Trade Balance impact the Pound?
Another significant data release for the Pound Sterling is the Trade Balance. This indicator measures the difference between what a country earns from its exports and what it spends on imports over a given period.
If a country produces highly sought-after exports, its currency will benefit purely from the extra demand created from foreign buyers seeking to purchase these goods. Therefore, a positive net Trade Balance strengthens a currency and vice versa for a negative balance.
The drop in EUR/USD by close to 1% on Friday highlighted the greater FX sensitivity to incoming economic data that increasingly influence short-term rate expectations. Economists at MUFG Bank analyze the pair’s outlook.
Incoming data increasingly dictate FX moves
We suspect that incoming economic data will increasingly dictate FX moves now that we are approaching the end of tightening cycles. In that context, the PCE inflation, ISM, NFP and CPI data from the US in the coming weeks will determine whether this EUR/USD drop extends further or recovers.
Other data suggests weak data is plausible allowing the FOMC to maintain its pause, which would imply an end to the Fed’s tightening cycle – a much more important development than last Friday’s PMI data.
Japanese Chief Cabinet Hirokazu Matsuno repeated on Monday, they are “closely watching FX moves with a high sense of urgency.”
Additional quotes
“Important for FX to move stably reflecting econ fundamentals.”
“Sudden and one-sided moves seen in FX market.”
Market reaction
At the time of writing, USD/JPY is holding lower ground near 143.20, down 0.20% on the day.
Economists at ANZ Bank share their USD/INR forecasts.
RBI will likely build its FX reserves further
We expect the Rupee to appreciate on the back of a softer US Dollar by the end of 2023 and an overall balance of payment surplus in FY24. However, we expect these gains to be limited, as the RBI will likely build its FX reserves further.
Using its two-way intervention, the RBI has lowered the INR’s volatility, which in the face of Dollar softness, has led to a depreciating nominal effective exchange rate. This, in our view, ties well with the government’s manufacturing and export campaigns. However, with lowered volatility and stable macro conditions, INR offers a decent carry play in the Asian complex.
USD/INR (end of period) – 2023 81 2024 79.30 2025 79
Further gains in USD/JPY are expected to challenge the 144.00 region sooner rather than later, according to UOB Group’s Economist Lee Sue Ann and Markets Strategist Quek Ser Leang.
Key Quotes
24-hour view: We highlighted last Friday that USD “is likely to strengthen further”, however, we held the view that “the next major resistance at 144.00 is highly unlikely to come into view.” We added, “In order to keep the momentum going, USD must stay above 142.35 (minor support is at 142.70).” In NY trade, USD dipped briefly to 142.74, surged to 143.91 and then pulled back. Severely overbought conditions combined with tentative signs of slowing momentum suggest USD could pullback further. However, any decline is unlikely to break below 142.75 (minor support is at 143.00). Resistance is at 143.65, followed by 144.00. The latter level is still unlikely to come into view.
Next 1-3 weeks: Last Friday (23 Jun, spot at 143.10), we held the view that USD is likely to continue to rise and the next level to watch is 144.00. USD then rose to 143.91 and pulled back. There is no change in our view. However, short-term momentum has waned somewhat, but only a breach of 142.30 (‘strong support’ level previously at 141.60) would indicate the USD strength that started about 1-1/2 weeks ago has come to an end.
After staging a strong rebound through the first half of this month, the NOK corrected sharply lower again over the past week. At the same time, the SEK hit a new record low against the EUR. Economists at MUFG Bank discuss Scandi currencies' outlook.
Hawkish central bank updates failing to turn the tide
The Scandi currencies of the NOK and SEK both remain vulnerable to further weakness in the near term.
The hawkish policy updates from the Norges Bank and Riksbank are not sufficient on their own to trigger a sustained reversal of the weakening trends that have driven both currencies to deeply undervalued levels this year.
- USD/CAD portrays failed recovery from nine-month low, within weekly bearish channel.
- 200-HMA, fortnight-old descending resistance line act as additional upside filters.
- Immediate rising support line can offer intermediate rest to Loonie pair sellers.
USD/CAD stays on the back foot around 1.3160 heading into Monday’s European session, fading the previous day’s corrective bounce off the nine-month low. In doing so, the Loonie pair fades bounce off a three-day-old rising support line within a one-week-old bearish trend channel.
It’s worth noting that the below 50.0 levels of the RSI (14) joins bearish MACD signals to support the downward grind of the USD/CAD price.
However, the immediate rising support line and the stated bearish channel’s bottom, respectively near 1.3150 and 1.3110, can allow the USD/CAD traders to portray bottom-picking. Also acting as the downside filter is the 1.3100 round figure.
It’s worth noting that the rejection of the immediate bearish chart formation, by a successful upside break of the 1.3215 hurdle isn’t enough for the USD/CAD bulls to retake control.
The reason could be linked to the 200-Hour Moving Average (HMA) and a downward-sloping resistance line from June 12, close to 1.3225 and 1.3265 in that order.
Overall, USD/CAD is likely to continue its southward trajectory with intermediate bounces.
Apart from the technical details, the volatile Oil prices and the US Dollar’s retreat also tease the Loonie pair sellers.
Also read: USD/CAD slips below 1.3200 as US Dollar retreats ahead of US/Canada inflation, ignores downbeat Oil Price
USD/CAD: Hourly chart

Trend: Bearish
Open interest in natural gas futures markets prolonged the downtrend for yet another session on Friday, this time dropping by around 5.8K contracts according to preliminary readings from CME Group. Volume, instead, increased by nearly 100K contracts after two daily pullbacks in a row.
Natural Gas: Next target emerges at $3.00
Natural Gas prices extended the recovery and advanced to multi-week highs past $2.70 on Friday. The strong uptick was accompanied by declining open interest, which pours some cold water over the likelihood of further gains in the very near term. The next target on the upside appears at the March top just beyond the key $3.00 mark per MMBtu.
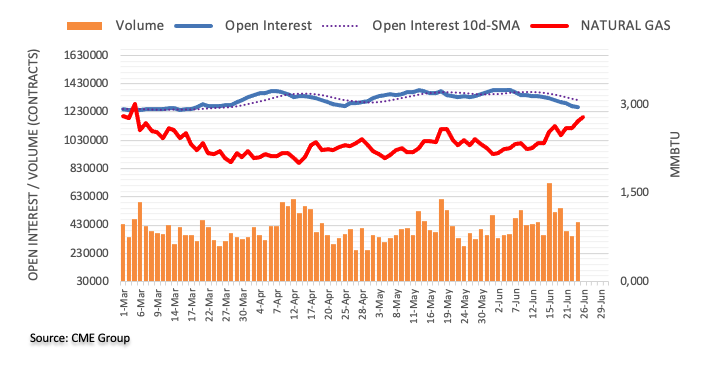
EUR/USD reacted sharply to disappointing Eurozone PMI data. Economists at Commerzbank analyze the pair’s outlook.
The market may not yet be fully convinced that the ECB would mutate into a hawk
The Euro's fairly significant weakness in response to Friday's weak PMIs shows that despite the EUR's strength after the Fed and ECB meetings, the market may not yet be fully convinced that the ECB, known for its large dove camp, would mutate into a hawk in an increasingly challenging economic environment. We see things differently.
Our economists believe that, unlike the Fed, the ECB will not cut its key rate next year despite a slowing economy, which should prove the market wrong and boost the Euro.
- USD/RUB remains firmer at the highest levels since April 2022, pares the first weekly loss in four.
- Wagner mercenaries retreat towards Belarus after a deal with Moscow to avoid mutiny.
- Softer Oil price also exerts downside pressure on Ruble.
- US Dollar struggles to defend the weekly gains ahead of inflation clues, central bankers’ speeches.
USD/RUB picks up bids to extend the previous day’s rebound from the 50-DMA support heading into Monday’s European session. With this, the Russian Ruble (RUB) pair justifies the market’s lack of confidence in Russian President Vladimir Putin even after a mercenary group dropped their mutiny towards Moscow. Also weighing on the RUB price could be the downbeat performance of the Oil price, Russia’s main export item.
“Russia sought to restore calm on Monday after an aborted mutiny by Wagner Group mercenaries over the weekend, while Western allies assessed how President Vladimir Putin might reassert authority and what it could mean for the war in Ukraine,” said Reuters. The news also states that the Wagner fighters withdrew from the southern Russian city of Rostov and headed back to their bases late on Saturday under a deal that guaranteed their safety.
On the other hand, WTI crude oil remains indecisive around $69.50, after posting the biggest weekly loss since early May, amid fears of China’s economic growth, despite risk-positive headlines suggesting more stimulus from Beijing. That said, global rating agency S&P recently cut China’s Gross Domestic Product (GDP) growth forecasts for 2023 to 5.2% from 5.5% previous estimations. In doing so, the black gold ignores hopes of more Oil demand and supply crunch, backed by OPEC and Russia catalysts.
Elsewhere, US Dollar Index (DXY) pares the first weekly gain in four around 102.70 as it bears the burden of mild optimism surrounding China and receding geopolitical fears from Russia. Furthermore, consolidation ahead of this week’s US inflation clues and central bankers’ speeches also exerts downside pressure on the DXY.
It’s worth noting that Fed Chair Jerome Powell’s testimony during the previous week renewed hawkish bias about the US Federal Reserve’s (Fed) move. On the same line were upbeat US PMIs and comments favoring two rate hikes from Federal Reserve Bank of San Francisco President Mary Daly.
While portraying the market’s mood, the S&P500 Futures rebound from the lowest levels in a week toward regaining the 4,400 round figure, up 0.20% intraday near 4,398 at the latest. That said, the US 10-year Treasury bond yields remain sidelined near 3.73%, after snapping a two-week downtrend, whereas the two-year counterpart braces for the fourth consecutive weekly winning streak near 4.74% by the press time.
Looking ahead, geopolitical headlines will join the US inflation clues and multiple central bankers’ speeches at the European Central Bank (ECB) Forum to determine weekly moves of the USD/RUB pair.
Technical analysis
A clear U-turn from the 50-DMA support of around 80.90 joins bullish MACD signals to direct USD/RUB bulls toward refreshing the yearly peak, currently near 85.50.
Agustin Carstens, Bank for International Settlements (BIS) general manager, warned in the organization's annual report published on Sunday, the world economy was now at a crucial point as countries struggle to rein in inflation.
Key quotes
Moving forward, monetary and fiscal policies need to be more realistic in their ambitions.
Unrealistic expectations about degree and persistence of monetary and fiscal support need to be corrected.
There is a material risk that an inflation psychology will take hold.
There is material risk of further financial stress.
Related reads
- Asian Stock Market: Fears of recession and upcoming result season weigh, oil attempts recovery
- Slow start following an eventful weekend
In the first half of the year, the CNY corrected in particular from May. Economists at Natixis expect the Yuan to recover later in the year.
The CNY will recover in the second half
In the short term, the USD/CNY could continue to appreciate to 7.25.
Thereafter, the expected improvement in Chinese growth in the second half of the year, the continued depreciation of the Dollar and the expected fall in US long-term interest rates will favour a return of the USD/CNY to around 7.00 by the end of the year.
The continuation of the downtrend seems a probable scenario for AUD/USD in the short-term horizon, suggest UOB Group’s Economist Lee Sue Ann and Markets Strategist Quek Ser Leang.
Key Quotes
24-hour view: Last Friday, we indicated that AUD “is under mild downward pressure” and while we expected it to trade lower, we were of the view that it “is unlikely to threaten the major support at 0.6700.” However, AUD broke below 0.6700 and plunged to a low of 0.6663. Not surprisingly, after the sharp and swift decline, conditions are severely oversold. However, as long as AUD stays below 0.6715 (minor resistance is at 0.6700), it could dip to 0.6650 before a more sustained rebound is likely. The next support at 0.6620 is highly unlikely to come under threat.
Next 1-3 weeks: We shifted from a positive to neutral stance in AUD last Wednesday (21 Jun, spot at 0.6790) and we held the view that AUD “is likely to trade in a range between 0.6700 and 0.6880 for now.” We did not expect the sharp selloff on Friday as AUD plunged by 1.14% (NY close of 0.6680), its biggest 1-day drop since early March. Further AUD weakness appears likely but the sharp decline appears to be running ahead of itself and it might take a while before 0.6620 comes into view. In order to maintain the rapid buildup in momentum, AUD must stay below the ‘strong resistance’ level, currently at 0.6755.
- USD/CHF clings to mild losses during the first negative day in three.
- Market sentiment dwindles amid mixed headlines about China, US.
- Risk catalysts can entertain Swiss France traders ahead of US inflation clues, central bank traders.
USD/CHF holds lower grounds at the intraday bottom surrounding 0.8950 as bears defend the first daily loss in three heading into Monday’s European session. In doing so, the Swiss Franc (CHF) pair sellers cheer the broad US Dollar retreat amid cautiously optimistic markets.
US Dollar Index (DXY) pares the first weekly gain in four around 102.70 as it bears the burden of mild optimism surrounding China and receding geopolitical fears from Russia. Furthermore, consolidation ahead of this week’s US inflation clues and central bankers’ speeches also exerts downside pressure on the DXY.
That said, the weekend headlines suggesting sooner China stimulus join doubts about Russian President Vladimir Putin’s power in Moscow to underpin mildly positive sentiment. Alternatively, S&P’s recent downbeat China GDP forecasts and hawkish Fed concerns prod the market’s risk-on mood.
It should be noted that Fed Chair Jerome Powell’s testimony during the previous week renewed hawkish bias about the US Federal Reserve’s (Fed) move. On the same line were upbeat US PMIs and comments favoring two rate hikes from Federal Reserve Bank of San Francisco President Mary Daly.
Alternatively, Swiss National Bank (SNB) Chairman Thomas Jordan said in an interview aired by Swiss broadcaster SRF on Saturday, per Reuters, that SNB's recent interest rate hike was ‘very likely not quite’ enough to get a grip on inflation in Switzerland.
Against this backdrop, the S&P500 Futures rebound from the lowest levels in a week toward regaining the 4,400 round figure, up 0.20% intraday near 4,398 at the latest. That said, the US 10-year Treasury bond yields remain sidelined near 3.73%, after snapping a two-week downtrend, whereas the two-year counterpart braces for the fourth consecutive weekly winning streak near 4.74% by the press time.
Looking ahead, a light calendar in India emphasizes the US inflation data and the speeches of the top-tier central bankers at the European Central Bank (ECB) Forum as the key catalysts.
Technical analysis
USD/CHF extends the previous day’s U-turn from a two-week-old descending resistance line, around 0.9010 by the press time. Additionally favoring the Swiss France buyers past 0.9010 is the 200-Hour Moving Average (HMA), close to 0.8970, as well as the bearish MACD signals.
Considering advanced prints from CME Group for crude oil futures, open interest shrank by around 2.3K contracts after three consecutive daily builds. In the same line, volume remained choppy and drop by nearly 397K contracts.
WTI could revisit the $67.00 zone
Prices of WTI rebounded from the $67.00 region to close with marginal losses on Friday. The rebound was in tandem with shrinking open interest and volume and removes strength from a probable move higher in the very near term. That said, another pullback to the monthly lows near the $67.00 mark per barrel remains on the cards.
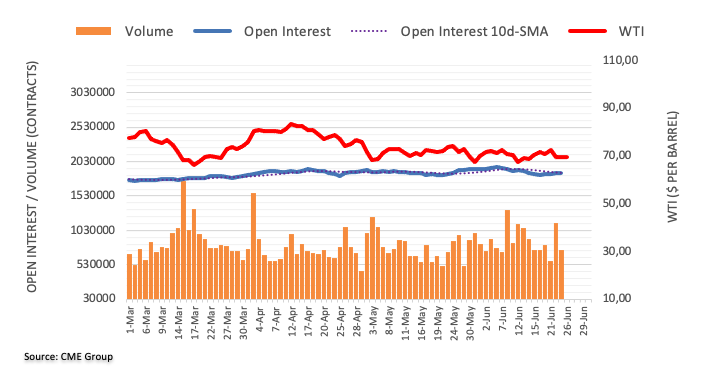
In the opinion of UOB Group’s Economist Lee Sue Ann and Markets Strategist Quek Ser Leang, GBP/USD is still seen trading within the 1.2650-1.2850 range.
Key Quotes
24-hour view: We noted last Friday that the “outlook for GBP is mixed” and we expected it to trade in a range between 1.2680 and 1.2790. GBP then traded in a relatively choppy manner, but in a narrower range than we expected (1.2685/1.2750). The price movements are likely part of a consolidation phase. Today, we expect GBP to trade in a range, likely between 1.2690 and 1.2760.
Next 1-3 weeks: Our most recent narrative was from last Thursday (22 Jun, spot at 1.2770) wherein the recent GBP strength has ended and it is likely to trade between 1.2650 and 1.2850 for now. There is no change in our view.
FX option expiries for June 26 NY cut at 10:00 Eastern Time, via DTCC, can be found below.
- EUR/USD: EUR amounts
- 1.0815 472m
- 1.0855 491m
- AUD/USD: AUD amounts
- 0.6675 300m
- USD/CAD: USD amounts
- 1.3210 306m
- EUR/USD struggles to defend the first daily gains in three, fades bounce off one-week low.
- 200-HMA, comparatively upbeat US data than from Eurozone keeps Euro pair sellers hopeful.
- Lagarde will speak at ECB Forum, multiple central bankers’ speeches due on the platform during the week.
EUR/USD bulls appear running out of steam around the 1.0900 round figure as they fail to extend the bounce off a one-week low beyond the 200-Hour Moving Average (HMA) heading into Monday’s European session. In doing so, the Euro pair justifies the trader’s cautious mood ahead of a speech from the European Central Bank (ECB) President Christine Lagarde at the ECB Forum, the key platform where multiple central bankers are up for speaking during the week.
Also read: EUR/USD pares recent losses around 1.0900 with eyes on EU/US inflation, ECB Forum
It’s worth noting that the cautious sentiment and the 200-HMA, around 1.0915 at the latest, aren’t the only challenges for the EUR/USD bulls as a convergence of the 50-HMA and the previous support line from June 06, close to .0930 at the latest, also prod the Euro pair buyers.
Additionally, a horizontal area comprising multiple tops marked since June 16, close to 1.0945-50, acts as the last defense of the EUR/USD bears.
On the contrary, the mid-June swing high around 1.0860 precedes the 50% Fibonacci retracement level of June 06-22 upside, near 1.0840, to limit the short-term downside of the EUR/USD pair.
It’s worth noting that the early June swing high of around 1.0785-90 appears the final battle place for the Euro buyers.
EUR/USD: Hourly chart
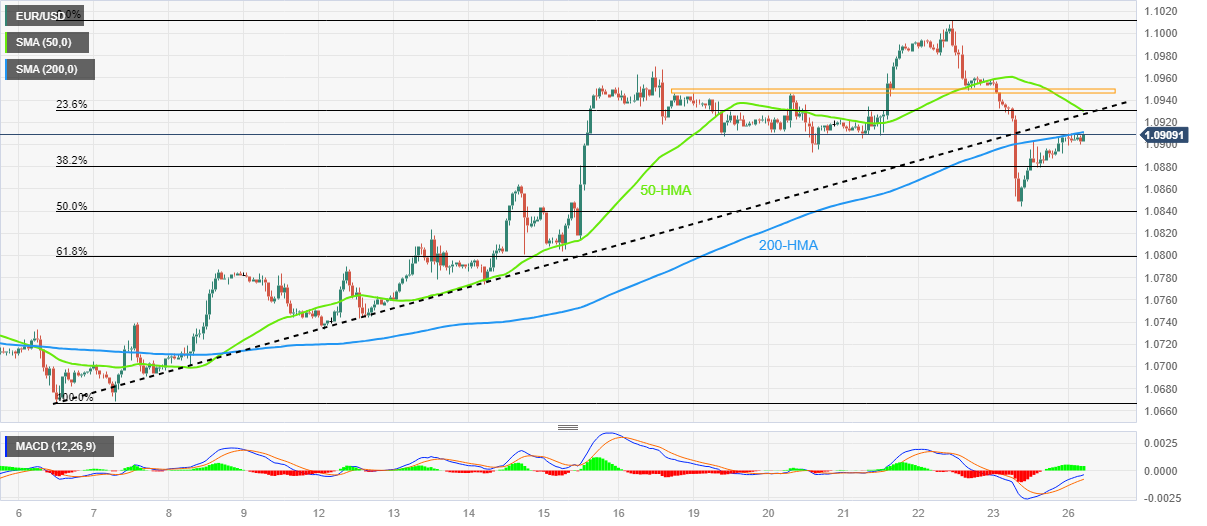
Trend: Pullback expected
CME Group’s flash data for gold futures markets noted traders scaled back their open interest positions by around 1.3K contracts on Friday. Volume, instead, went up by around 19.3K contracts after two consecutive daily pullbacks.
Gold appears supported around $1910
Friday’s rebound in gold prices came on the back of diminishing open interest and suggests that the continuation of the rebound appears unlikely for the time being. In the meantime, the yellow metal remains bolstered by the $1910 per troy ounce for the time being.
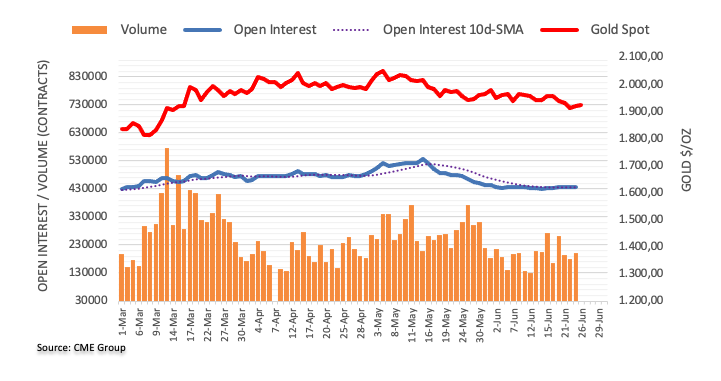
- GBP/JPY is oscillating in a narrow range above 182.00 despite a dovish BoJ Summary of Opinions.
- BoJ Summary of Opinions conveyed that it is premature to shift policy as smaller firms becoming keen to hike wages and invest more.
- UK’s core inflation is in the wrong direction despite consistent policy-tightening by the central bank.
The GBP/JPY pair has turned sideways above 182.00 despite the release of the Bank of Japan (BoJ) Summary of Opinions conveyed that further monetary policy easing is highly required to achieve inflation steadily above 2%.
As per the BoJ Summary of Opinions, it is premature to shift policy as smaller firms become keen to hike wages and invest more, as reported by Reuters. The BoJ needs to focus on wage-push inflation rather than banking upon cost-push inflation to achieve sustainable 2% inflation. However, one of the policymakers favored an early revision of the Yield Curve Control (YCC) citing the need to prevent sharp fluctuations in interest rates. The statement looks contrary to BoJ Governor Kazuo Ueda who believes no tweak in current interest rate policy for now to achieve stable 2% inflation.
Meanwhile, further upside in the Pound Sterling is widely anticipated as the Bank of England (BoE) raised interest rates by a hefty percentage last week to tame inflationary pressures. May’s headline inflation remained higher than expected as food inflation is still near 45-year high levels. While core inflation hit fresh highs at 7.1%, supported by tight labor market conditions.
UK PM Rishi Sunak and BoE Governor Andrew Bailey turned uncomfortable as core inflation is in the wrong direction despite consistent policy-tightening by the central bank. Investors are anticipating that the promise of halving United Kingdom inflation by year-end given UK Rishi Sunak would be missed.
UOB Group’s Economist Lee Sue Ann and Markets Strategist Quek Ser Leang note EUR/USD now faces tough support levels at 1.0840 ahead of 1.0805 in the near term.
Key Quotes
24-hour view: The sudden lurch lower that sent EUR tumbling to 1.0841 came as a surprise (we were expecting EUR to trade in a range). The sharp rebound from the low in severely oversold conditions suggest EUR is unlikely to weaken further. Today, EUR is more likely to consolidate and trade in a range of 1.0870/1.0940.
Next 1-3 weeks: We have held a positive EUR view since early in the month. After EUR rose to 1.1011 and retreated, we highlighted last Friday (23 Jun, spot at 1.0955) that “the current EUR strength could not afford to pause, or the risk of a reversal will increase rapidly.” However, we did not anticipate the sharp selloff as EUR plummeted to a low of 1.0841. The breach of our ‘strong support’ level at 1.0900 indicates that the 2-week EUR strength has ended. While the sharp drop suggests there is room for EUR to weaken further, 1.0840 is a solid support level and might not be easy to break. It is worth noting that there is another solid support near 1.0805. Overall, we expect EUR to trade with a downward bias as long as it stays below 1.0970 (‘strong resistance’ level) in the next few days.
- Gold Price extends recovery from 14-week low but bulls struggle to find acceptance of late.
- Mixed concerns about China economic recovery join geopolitical concerns about Russia to prod XAU/USD buyers.
- Inflation clues will be important for Gold traders as multiple central bankers will speak at ECB forum.
- XAU/USD buyers should cross $1,951 resistance confluence to avoid odds favoring pullback to multi-day bottom.
Gold Price (XAU/USD) struggles to defend the corrective bounce off a three-month low marked in the last week, retreating from intraday top of late, amid mixed concerns about Russia and China. Also challenging the XAU/USD buyers is the cautious mood ahead of this week’s top-tier inflation signals from the US and Europe, as well as central bankers’ speeches at the European Central Bank (ECB) Forum and the US Banking Stress Test results.
That said, hopes of more China stimulus defend the Gold Price amid the US Dollar’s retreat as Russia’s short-lived mutiny portrays mildly positive sentiment in the market. However, the S&P’s downward revision of China’s growth forecasts and global fears that the Dragon Nation is off the track of recovery prod the XAU/USD bulls. Further, fears that Russia may take harsh steps to prove its geopolitical strength joins the downbeat concerns about “higher for longer” interest rates to challenge the Gold buyers. It should be noted that the comparatively upbeat US PMIs join the hawkish Fed signals to act as an extra upside filter for the XAU/USD price.
Moving on, mid-tier data may entertain the Gold traders but major attention will be given to inflation clues and geopolitical news for clear directions.
Also read: Gold Price Forecast: XAU/USD recovers on growth and geopolitical fears, $1,943 holds the key
Gold Price: Key levels to watch
Our Technical Confluence Indicator signals a slow grind in the Gold Price towards the $1,951 key resistance comprising Pivot Point one-week R1, the middle band of the Bollinger on onda-day and Pivot Point one-day R2.
Ahead of that, a convergence of the 5-DMA, Fibonacci 23.6% on one-day and upper band of the Bollinger on the hourly chart will challenge the Gold buyers near $1,933.
It should be noted that the 10-DMA, Fibonacci 61.8% on one-week and 200-HMA, close to $1,943 by the press time, act as an extra upside filter ahead of highlighting the $1,951 hurdle.
Alternatively, Fibonacci 23.6% on one-week highlights $1,922 as immediate support for the Gold sellers to watch during the quote’s fresh fall.
Following that, the lower band of the Bollinger on the one-day, near $1,918, will precede the Pivot Point one-day S1, close to $1,908, to challenge the Gold bears.
Above all, the Gold sellers remain confused unless the quote stays beyond the $1,904 support encompassing the Pivot Point one-month S1.
Here is how it looks on the tool
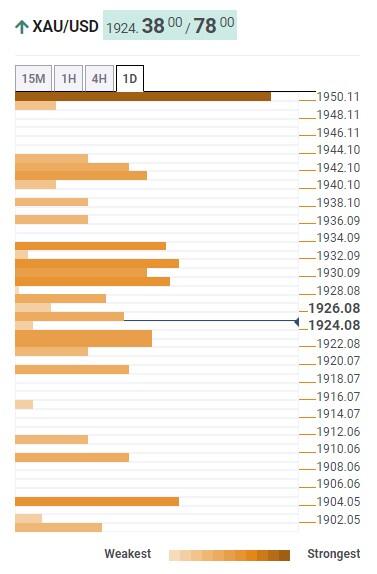
About Technical Confluences Detector
The TCD (Technical Confluences Detector) is a tool to locate and point out those price levels where there is a congestion of indicators, moving averages, Fibonacci levels, Pivot Points, etc. If you are a short-term trader, you will find entry points for counter-trend strategies and hunt a few points at a time. If you are a medium-to-long-term trader, this tool will allow you to know in advance the price levels where a medium-to-long-term trend may stop and rest, where to unwind positions, or where to increase your position size.
- Asian stocks are facing the heat of negative market sentiment due to deepening fears of global recession.
- Japanese stocks have come under pressure as BoJ Summary of Opinions showed that one of the policymakers favored an early revision of the YCC.
- Chinese firms are reluctant to tap credit despite rate cuts by the PBoC.
Markets in the Asian domain are facing severe pressures as fears of a recession in the global economy have climbed the rooftop due to extremely restrictive interest rate policies by giant economies. In the battle against stubborn inflation, higher interest rates by central banks are dampening the world economic outlook.
The appeal for equities has turned vulnerable following negative cues from US markets. S&P500 was heavily sold on Friday as investors are cautious due to lofty valuations. The Refinitiv Datastream showed that US 500 stock basket is trading at 19 times its expected 12-month earnings, well above its historic average of 15.6x.
At the press time, Japan’s Nikkei 225 slipped 0.24%, ChinaA50 tumbled 1.13%, Hang Seng dropped 0.20% and Nifty50 remained flat.
Japanese stocks have come under pressure as the Bank of Japan (BoJ) Summary of Opinions showed that one of the policymakers favored an early revision of the Yield Curve Control (YCC) citing the need to prevent sharp fluctuations in interest rates. The statement looks contrary to BoJ Governor Kazuo Ueda who believes no tweak in current interest rate policy for now to achieve stable 2% inflation.
Meanwhile, Chinese equities are facing pressure as investors are expecting that the administration should announce stimulus sooner if wants to save economic prospects. Chinese firms are reluctant to tap credit despite rate cuts by the People’s Bank of China (PBoC). The overall demand is extremely poor keeping consumer and producer inflation at ground levels.
On the oil front, oil prices have attempted a recovery after a mild correction to near $69.00. Minor strength in the oil price has come from some sell-off in the US Dollar Index (DXY) on early Monday.
- NZD/USD kicks off the new week on a positive note and snaps a two-day losing streak.
- A combination of factors undermines the USD and lends some support to the major.
- The Fed’s hawkish outlook should limit USD losses and keep a lid on any further gains.
The NZD/USD pair gains strong positive traction during the Asian session on Monday and climbs to the 0.6175 region in the last hour, snapping a two-day losing streak to a one-and-half-week low.
The US Dollar (USD) comes under some selling pressure on the first day of a new week and for now, seems to have stalled its recent recovery from the lowest level since May 11 touched last Thursday. A modest downtick in the US Treasury bond yields is seen as a key factor weighing on the Greenback and lending support to the NZD/USD pair. Apart from this, a positive tone around the US equity futures further seems to undermine the safe-haven buck and benefits the risk-sensitive Kiwi.
That said, worries about a global economic downturn, particularly in China, should keep a lid on any optimism. The fears were further fueled by the fact that S&P Global trimmed its forecasts for China’s GDP to 5.2% from 5.5% this year. This comes on the back of the recent downgrades by many global banking giants such as Nomura, Citibank, UBS and Goldman Sachs. Apart from this, the Federal Reserve's (Fed) hawkish outlook should limit the USD losses and keep a lid on the NZD/USD pair.
It is worth recalling that the Fed earlier this month decided to pause its rate-hiking cycle but signalled that borrowing costs may still need to rise as much as 50 bps by the end of this year. Furthermore, Fed Chair Jerome Powell reiterated that the central bank will raise interest rates again this year, albeit at a "careful pace", to contain high inflation. Powell added that the Fed doesn't see rate cuts happening any time soon and will wait until it is confident that inflation is moving down to the 2% target.
Apart from this, the Reserve Bank of New Zealand's (RBNZ) explicit signal that it was done with its most aggressive hiking cycle since 1999 warrants caution before placing aggressive bullish bets around the NZD/USD pair. In the absence of any relevant macro data from the US, this makes it prudent to wait for strong follow-through buying to confirm that the recent sharp pullback from the vicinity of mid-0.6200s, or the monthly swing high, has run its course. Market participants now look to this week's important release of the US Core PCE Price Index - the Fed's preferred inflation gauge on Friday.
Technical levels to watch
- GBP/USD grinds near intraday high as it snaps two-day losing streak.
- Three-week-old ascending trend line restricts immediate downside amid price-positive RSI conditions.
- Bearish MACD signals, descending trend line from June 16 guard immediate upside.
GBP/USD keeps the late Friday’s corrective bounce off the short-term key support line near 1.2730 amid early Monday in London. In doing so, the Pound Sterling cheers the broad US Dollar retreat during sluggish markets with mixed catalysts. However, the technical details are upside and hence buyers approach a short-term key resistance on their way to refresh the yearly top marked earlier in the month.
Also read: S&P500 Futures lick the wounds, yields dribble despite cautious optimism about China, Russia
That said, the RSI (14) line’s rebound from the oversold territory finally hits the 50.0 level and hence suggests the buyer’s acceptance of the Cable pair’s latest U-turn from an upward-sloping support line from June 05, close to 1.2700 by the press time.
As a result, the GBP/USD bulls are on their way to prod a one-week-old descending resistance line, near 1.2760.
However, downbeat MACD signals and hopes of the US Dollar’s recovery, amid hawkish Fed signals, challenge the Pound Sterling buyers afterward.
In a case where the quote rises past 1.2760, the 1.2800 round figure and the monthly high of near 1.2850, also the highest levels since April 2022, will be in the spotlight.
Meanwhile, a downside break of the 1.2700 support, comprising the previously mentioned rising trend line, isn’t an open invitation to the GBP/USD bears as a horizontal area comprising multiple levels marked since early May, near 1.2640-50, becomes crucial to watch before welcoming the sellers.
Also acting as a short-term downside filter is the 100-SMA and an upward-sloping support line from May 25, respectively near 1.2625 and 1.2500.
GBP/USD: Four-hour chart
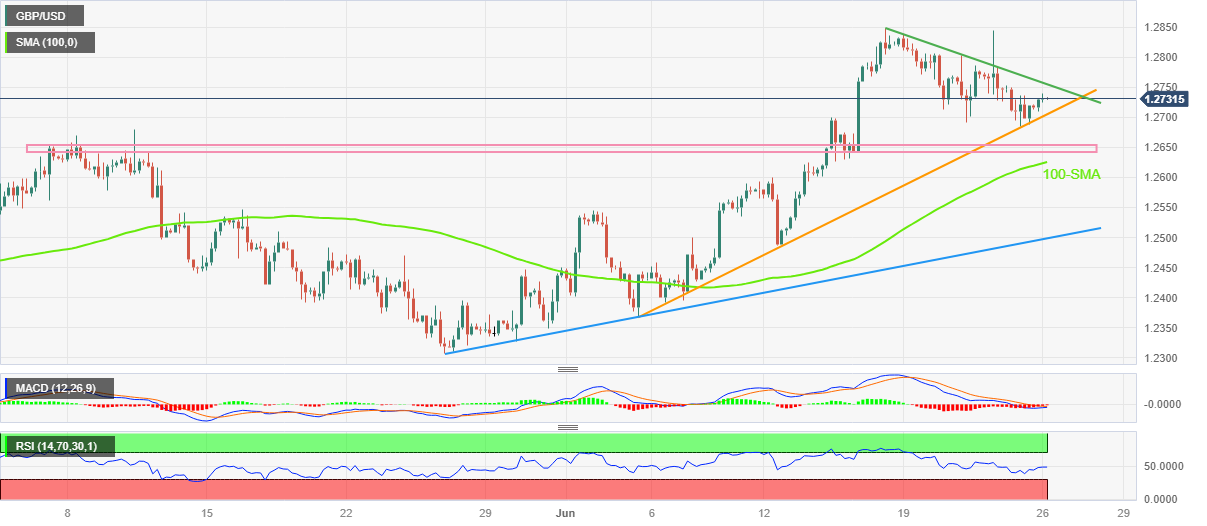
Trend: Further recovery expected
- USD/INR takes offers to reverse the previous day’s corrective bounce.
- Hopes of more investment in India, cautious optimism in Asia underpin India Rupee recovery.
- Oil’s struggle, US Dollar’s retreat add strength to the USD/INR pullback.
- US Inflation clues, central bankers’ speeches at ECB Forum eyed for clear directions.
USD/INR renews its intraday low near 81.95 as it cheers the broadly softer US Dollar amid cautious optimism in the Asia-Pacific zone during early Monday. In doing so, the Indian Rupee (INR) pair also benefits from the downbeat Oil price, as well as hopes of more investment into India.
Following Prime Minister Narendra Modi’s US visit, speculations rallied that a slew of tech giants including Amazon, Twitter and Facebook, will follow in the footsteps of Apple to increase their investment in India. The same optimism gains momentum investors push back plans to jump in Beijing after recently softer China data.
Elsewhere, WTI crude oil takes offers to refresh intraday low near $69.50 amid fears of China’s economic growth, despite risk-positive headlines suggesting more stimulus from Beijing. That said, global rating agency S&P recently cut China’s Gross Domestic Product (GDP) growth forecasts for 2023 to 5.2% from 5.5% previous estimations. In doing so, the black gold ignores hopes of more Oil demand and supply crunch, backed by OPEC and Russia catalysts.
Considering India’s heavy imports of Oil, as well as its rivalry with China, the USD/INR becomes vulnerable to headlines about energy prices and Beijing.
On a different page, geopolitical concerns about Beijing and Russia join hawkish Fed chatters to put a floor under the US Dollar.
It should be noted that the mostly US PMIs keep the Fed hawks on the table even as some at the S&P criticize rate hikes. That said, US S&P Global PMIs for June came in mixed as the Manufacturing PMI dropped to 46.3 from 48.4 prior, versus 48.5 expected, whereas the Services PMI improved to 54.1 from 54.0 expected despite being lesser than the 54.9 previous monthly figure. With this, the Composite PMI declined to 53.0 versus 54.4 market forecasts and 54.3 prior. Following the mixed US PMIs, Chris Williamson, Chief Business Economist at S&P Global Market Intelligence said, “Any further rate hikes will of course have a further dampening effect on this sector (services) which is especially susceptible to changes in borrowing costs." That said, Federal Reserve Bank of San Francisco President Mary Daly told Reuters on Friday that two more interest rate increases this year would be a "very reasonable projection."
While portraying the mood, the S&P500 Futures rebound from the lowest levels in a week toward regaining the 4,400 round figure, up 0.20% intraday near 4,398 at the latest. That said, the US 10-year Treasury bond yields remain sidelined near 3.73%, after snapping a two-week downtrend, whereas the two-year counterpart braces for the fourth consecutive weekly winning streak near 4.74% by the press time.
Moving on, a light calendar in India emphasizes the US inflation data and the speeches of the top-tier central bankers at the European Central Bank (ECB) Forum as the key catalysts.
Technical analysis
Despite the latest hesitance to break an upward-sloping support line from mid-April, close to 81.90 by the press time, the USD/INR pair remains on the bear’s radar unless crossing the 200-DMA hurdle surrounding 82.15.
- The USD meets with a fresh supply on Monday and stalls its recovery from over a two-month low.
- Friday’s failure near the 100-day SMA and the 38.2% Fibo. confluence warrants caution for bulls.
- A convincing break below the 102.00 mark is needed to support prospects for additional losses.
The US Dollar (USD) Index (DXY), which tracks the Greenback against a basket of currencies, comes under some selling pressure on the first day of a new week and drops to the daily low, around the 102.70 area in the last hour. The Index, for now, seems to have snapped a two-day winning streak and stalled its recent recovery from the lowest level since May 11 touched last Thursday.
From a technical perspective, the DXY on Friday faced rejection near the 103.05-103.10 confluence hurdle - comprising the 100-day Simple Moving Average (SMA) and the 38.2% Fibonacci retracement level of the downfall from the May swing high. The said barrier should now act as a pivotal point, which if cleared decisively could trigger a fresh bout of a short-covering move and pave the way for some meaningful appreciating move.
The DXY might then aim to surpass the 50% Fibo. level, around the 103.35 region, and climb to the 103.65-103.70 resistance zone, over the 61.8% Fibo. level. Some follow-through buying will shift the bias back in favour of bullish traders and allow the index to reclaim the 104.00 mark. The momentum could get extended further towards the 104.40 supply zone en route to the 104.70 area, or a nearly three-month peak touched on May 31.
On the flip side, sustained weakness below the 23.6% Fibo. level, around the 102.60-102.55 region, will expose the 102.15-102.10 horizontal support. This is followed by the monthly low, just below the 102.00 mark, below which the DXY could accelerate the fall towards testing the next relevant support near the 101.30-101.25 region. The index could eventually drop to the 101.00 mark en route to the 100.80-100.75 area, or the April swing low.
US Dollar Index (DXY) daily chart
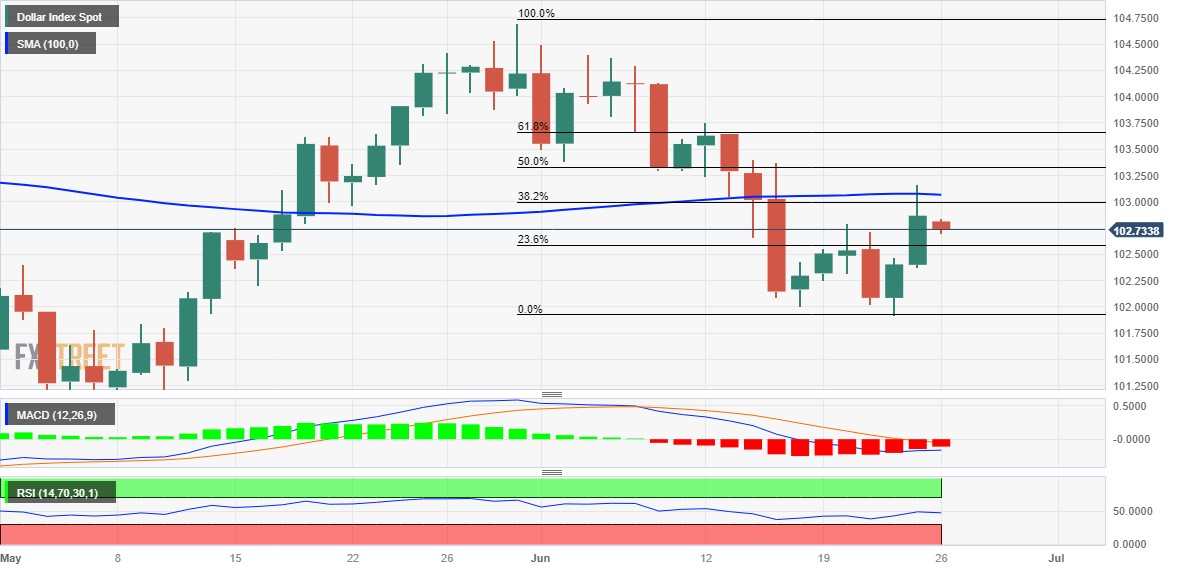
Key levels to watch
- AUD/USD gains some positive traction on Monday and draws support from a modest USD weakness.
- The Fed’s hawkish outlook and economic woes should limit the USD losses and cap gains for the pair.
- Traders now look to Australian CPI report on Wednesday and the US Core PCE Price Index on Friday.
The AUD/USD pair attracts some buying on the first day of a new week and recovers a part of Friday's heavy losses to its lowest level since June 8. Spot prices climb back closer to the 0.6700 round-figure mark during the Asian session, though the uptick lacks bullish conviction and runs the risk of fizzling out rather quickly.
A modest decline in the US Treasury bond yields prompts some selling around the US Dollar (USD), which, in turn, is seen as a key factor lending some support to the AUD/USD pair. Apart from this, a generally positive tone around the US equity futures further undermines the safe-haven Greenback and benefits the risk-sensitive Aussie. That said, worries about a global economic slowdown, particularly in China, might keep a lid on any optimism and keep a lid on any meaningful gains for the China-proxy Australian Dollar.
Apart from this, the Federal Reserve's (Fed) hawkish outlook should help limit the USD losses and further contribute to capping the upside for the AUD/USD pair. It is worth recalling that the Fed earlier this month decided to pause its year-long rate-hiking cycle, though signalled that borrowing costs may still need to rise as much as 50 bps by the end of this year. Adding to this, Fed Chair Jerome Powell reiterated that the central bank will raise interest rates again this year, albeit at a "careful pace", to contain high inflation.
Powell added that the Fed doesn't see rate cuts happening any time soon and is going to wait until it is confident that inflation is moving down to the 2% target. This, along with a slew of interest rate hikes by other major central banks this month, adds to worries about economic headwinds stemming from rising borrowing costs. This, in turn, might hold back traders from placing bearish bets around the USD, making it prudent to wait for strong follow-through buying before confirming that the AUD/USD pair has bottomed out.
There isn't any relevant market-moving economic data due for release on Monday, leaving spot prices at the mercy of the USD demand and the broader risk sentiment. The focus, however, will remain glued to the latest consumer inflation figures from Australia, due on Wednesday. Apart from this, investors this week will also confront the release of the US Core PCE Price Index - the Fed's preferred inflation gauge on Friday. The crucial inflation data will play a key role in determining the next leg of a directional move for the AUD/USD pair.
Technical levels to watch
Speaking to the Jiji news agency on Monday, Japanese Finance Minister Shunichi Suzuki said that “we will continue to watch the forex market with a sense of urgency.”
Suzuki said that they will respond appropriately if there are excessive moves.
Related reads
- USD/JPY Price Analysis: Mildly bid within immediate bullish channel around 143.50
- BoJ June meeting Summary of Opinions: Appropriate to maintain current monetary easing
- USD/JPY fades bounce off intraday low inside three-day-old rising trend channel.
- Overbought RSI prods Yen pair buyers at multi-day top.
- Bullish MACD signals, key technical supports keep pair buyers hopeful.
USD/JPY rebounds from intraday low but fails to gain upside momentum around 143.50 during early Monday. In doing so, the Yen pair prints the first daily loss in three while retreating from the highest levels since November 2022.
That said, the risk-barometer pair’s pullback from the Year-To-Date (YTD) high could be linked to overbought RSI conditions. However, an upward-sloping trend channel from the last Wednesday joins bullish MACD signals to keep the USD/JPY buyers hopeful.
Even if the pair sellers defy the bullish channel pattern by breaking the 143.20 immediate support, a fortnight-long ascending trend line, close to 142.40, acts as the additional downside filter.
It’s worth noting that an upward-sloping support line from early May and the 200-SMA, respectively near 140.80 and 139.40 are the extra checks for the USD/JPY bears before taking control.
On the flip side, an eight-week-old rising trend line, near 144.30 at the latest, restricts the immediate upside of the USD/JPY pair.
Following that, the aforementioned ascending channel’s top line of near 144.45 could act as the last defense of the USD/JPY bears.
In a case where the USD/JPY remains firmer past 144.45, the pair’s run-up towards the September 2022 high near 145.90 can’t be ruled out.
Overall, USD/JPY remains on the buyer’s radar despite the latest retreat.
USD/JPY: Four-hour chart
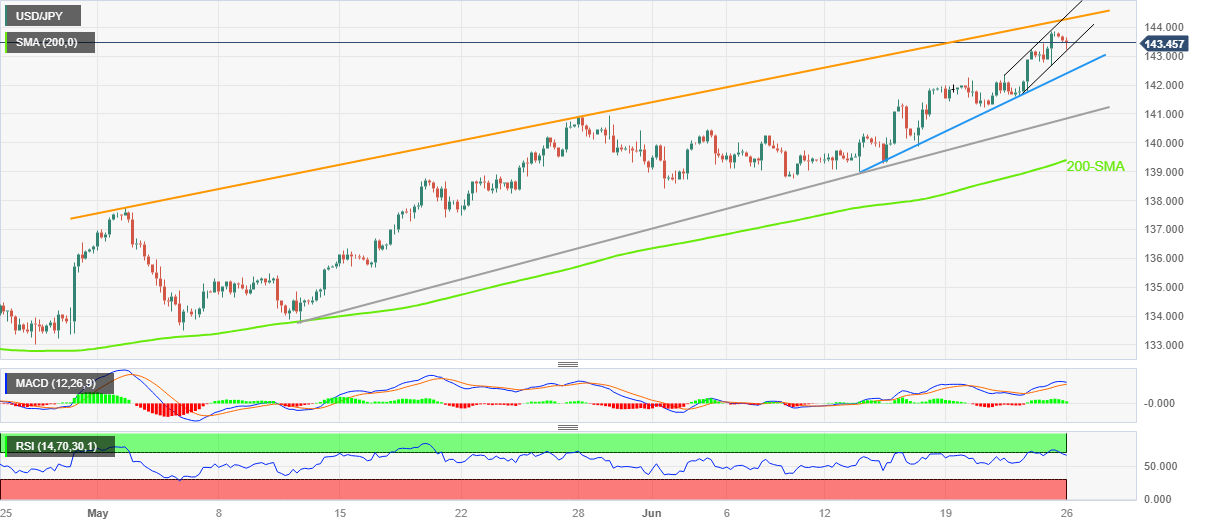
Trend: Further downside expected
- WTI crude oil fades bounce off two-week low amid mixed catalysts.
- OPEC Secretary General, Aramco Official signal upbeat Oil demand.
- Mixed concerns about Russian fears to energy supplies put a floor under the black gold price.
- Fears about China’s economic slowdown, higher rates challenge energy buyers.
WTI crude oil remains depressed around the intraday low, mildly offered near $69.45 by the press time of the mid-Asian session on Monday, as the energy market flashes mixed signals.
That said, hopes of more Oil demand and supply crunch, backed by OPEC and Russia catalysts, contrast with the fears of slower economic growth in the world’s biggest commodity user China.
Recently, Haitham Al Ghais, the Secretary-General of the Organization of the Petroleum Exporting Countries (OPEC), raised hopes of higher Oil demand while saying, “OPEC sees global oil demand rising to 110mn barrels per day (bpd) by 2045.” On the same line were comments from Saudi Aramco CEO Amin Nasser who said, “Oil markets fundamentals remain generally sound for the rest of the year.”
Also read: OPEC’s Al Ghais: OPEC sees global oil demand rising to 110mn bpd by 2045
Previously, headlines suggesting the geopolitical turmoil surrounding Russia and hopes of China stimulus allowed the Oil price to keep the rebound from the lowest level in two weeks, marked the previous day.
Also read: Weekend News: Russia, China and SNB’s Jordan were in focus
However, news suggesting that the global rating giant S&P cut China’s Gross Domestic Product (GDP) growth forecasts for 2023 to 5.2% from 5.5% previous estimations weigh on the Oil price. On the same line are concerns suggesting major investors’ pause in China investment, hawkish comments from the Fed officials and comparatively upbeat US data.
Amid these plays, the US Dollar Index (DXY) remains pressured around the intraday low of 102.70, paring the biggest weekly gain in four, whereas the S&P500 Futures print mild gains.
Moving on, headlines surrounding China and Russia may entertain Oil traders but major attention will be given to the US inflation and central bankers’ speeches at the European Central Bank (ECB) Forum, as well as the US Bank Stress Tests.
Technical analysis
Friday’s bullish Doji candlestick challenges WTI Crude Oil sellers unless the quote slips beneath the one-month-old horizontal support zone near $67.00.
- EUR/USD attracts some buyers on Monday, albeit the intraday uptick lacks bullish conviction.
- A modest downtick in the US bond yields weighs on the USD and lends support to the major.
- Economic woes, the Fed’s hawkish outlook limits the USD losses and keeps a lid on the pair.
The EUR/USD pair kicks off the new week on a positive note and moves further away from over a one-week high - levels just below mid-1.0800s touched on Friday. Spot prices trade with a mild positive bias around the 1.0900 mark through the Asian session, albeit lacks any follow-through buying or a bullish conviction.
The US Dollar (USD) struggles to capitalize on its recovery gains registered over the past two days, from the lowest level since May 11, and meet with some supply on Monday, which, in turn, is seen lending some support to the EUR/USD pair. The S&P Global reported on Friday that business activity in the US fell to a three-month low in June as services growth eased for the first time this year and the contraction in the manufacturing sector deepened. This, along with a modest downtick in the US Treasury bond yields and a positive tone around the US equity futures, undermine the safe-haven Greenback.
That said, the Federal Reserve's (Fed) hawkish outlook could act as a tailwind for the buck and cap the EUR/USD pair. In fact, the Fed earlier this month decided to pause its year-long rate-hiking cycle, though signalled that borrowing costs may still need to rise as much as 50 bps by the end of this year. Adding to this, Fed Chair Jerome Powell reiterated that the central bank will raise interest rates again this year, albeit at a "careful pace", to contain high inflation. Powell added that the Fed doesn't see rate cuts happening any time soon and is going to wait until it is confident that inflation is moving down to the 2% target.
Traders also seem reluctant to place aggressive bullish bets around the shared currency in the wake of Friday's disappointing release of Eurozone PMI prints, which deepens a policy dilemma for the European Central Bank (ECB). It is worth recalling that S&P Global's preliminary report pointed to a sharp slowdown in business activity in France and Germany - the Eurozone's two largest economies. Furthermore, HCOB's flash Composite Eurozone PMI sank to a five-month low, which adds to worries about economic headwinds stemming from rising borrowing costs and contributes to keeping a lid on the EUR/USD pair.
In the absence of any relevant market-moving economic data, either from the Eurozone or the US, traders on Monday will look to ECB President Christine Lagarde's speech for some impetus. Apart from this, the USD price dynamics should produce short-term opportunities around the EUR/USD pair. The focus, however, remains on the release of the US Core PCE Price Index - the Fed's preferred inflation gauge on Friday, which will play a key role in driving the USD and help determine the next leg of a directional move for spot prices.
Technical levels to watch
| Raw materials | Closed | Change, % |
|---|---|---|
| Silver | 22.422 | 0.8 |
| Gold | 1921.35 | 0.37 |
| Palladium | 1285.1 | -0.36 |
- Market sentiment improves amid sluggish session, takes clues from China, Russia.
- S&P500 Futures pare the first weekly loss in six, US Treasury bond yields lack clear directions.
- Concerns about China stimulus, growth forecasts and Russia geopolitics allow traders to tame previous fears.
- US inflation clues, central bankers eyed for clear directions.
The risk appetite remains mildly positive early Monday, after witnessing a slew of central bank moves and geopolitical concerns about China weighed on the sentiment. However, the weekend headlines suggesting sooner China stimulus join doubts about Russian President Vladimir Putin’s power in Moscow to underpin the cautious optimism. Alternatively, S&P’s recent downbeat China GDP forecasts and hawkish Fed concerns prod the market’s risk-on mood.
Amid these plays the S&P500 Futures rebound from the lowest levels in a week toward regaining the 4,400 round figure, up 0.20% intraday near 4,398 at the latest. That said, the US 10-year Treasury bond yields remain sidelined near 3.73%, after snapping a two-week downtrend, whereas the two-year counterpart braces for the fourth consecutive weekly winning streak near 4.74% by the press time.
Recently, global rating giant S&P cut China’s Gross Domestic Product (GDP) growth forecasts for 2023 to 5.2% from 5.5% previous estimations. On the same line are concerns suggesting major investors’ pause in China investment, hawkish comments from the Fed officials and comparatively upbeat US data.
Alternatively, Ning Jizhe, deputy head of the economic committee of the Chinese People's Political Consultative Conference (CPPCC) and a former vice head of the National Development and Reform Commission (NDRC) flagged concerns about sooner stimulus from China and favored the risk-on mood earlier in the day. On the same line are chatters that the Russian geopolitical woes may help ease the war between Moscow and Kyiv. “Heavily armed Russian mercenaries withdrew from the southern Russian city of Rostov under a deal that halted their rapid advance on Moscow but raised questions on Sunday about President Vladimir Putin's grip on power,” said Reuters in this regard.
That said, US S&P Global PMIs for June came in mixed as the Manufacturing PMI dropped to 46.3 from 48.4 prior, versus 48.5 expected, whereas the Services PMI improved to 54.1 from 54.0 expected despite being lesser than the 54.9 previous monthly figure. With this, the Composite PMI declined to 53.0 versus 54.4 market forecasts and 54.3 prior. Following the mixed US PMIs, Chris Williamson, Chief Business Economist at S&P Global Market Intelligence said, “Any further rate hikes will of course have a further dampening effect on this sector (services) which is especially susceptible to changes in borrowing costs." That said, Federal Reserve Bank of San Francisco President Mary Daly told Reuters on Friday that two more interest rate increases this year would be a "very reasonable projection."
Amid these plays, the US Dollar Index (DXY) pare recent gains but the WTI crude oil struggles to cheer the downbeat USD and cautious optimism. That said, the Gold Price prints mild gains whereas Antipodeans also edge higher.
Looking forward, the US inflation numbers will join the speeches of the top-tier central bankers at the European Central Bank (ECB) Forum to entertain market players. Additionally, US Durable Goods Orders and Bank Stress Tests are additional catalysts to observe.
Also read: Weekend News: Russia, China and SNB’s Jordan were in focus
Haitham Al Ghais, the Secretary-General of the Organization of the Petroleum Exporting Countries (OPEC), said Monday, “OPEC sees global oil demand rising to 110mn barrels per day (bpd) by 2045.”
Meanwhile, Saudi Aramco CEO Amin Nasser said that “oil markets fundamentals remain generally sound for rest of the year.”
Additional quotes
“Developing countries, especially China and India, driving oil demand growth of more than 2mln bpd this year.”
“China's transport and petrochemical sectors are still showing signs of growth despite economic headwinds.”
Market reaction
Despite the upbeat comments from the energy leaders, WTI is trading 0.1% lower on the day at $69.50, as of writing.
- Natural Gas Price seesaws around the highest levels since March after refreshing the multi-day top.
- The first daily closing beyond 100-EMA since November 2022 favor bulls to approach March’s peak.
- 16-week-old previous resistance line acts as additional downside filter.
Natural Gas Price (XNG/USD) remains on the front foot at the highest levels since March, up 1.60% near $2.87 amid early Monday, as the quote justifies the upside break of the previous key technical hurdles despite mixed oscillators.
That said, a clear upside break of the 100-day Exponential Moving Average (EMA), around $2.83 by the press time, allows the Natural Gas Price to aim for March’s peak of around $3.0820.
However, the overbought RSI (14) conditions may prod the XNG/USD near the $3.0 round figure.
In a case where the Natural Gas Price remains firmer past $3.08, the odds of witnessing a run-up towards the $4.0 round figure and then to the yearly top surrounding $4.30 can’t be ruled out.
On the flip side, the 100-EMA and previous resistance line from March, respectively near $2.83 and $2.71, restrict the short-term downside of the Natural Gas price.
Following that, a four-month-old horizontal support zone around $2.10, quickly followed by the $2.00 psychological magnet, will challenge the XNG/USD bears.
Overall, the Natural Gas Price appears lucrative for the CNG/USD bulls even if $3.08 seems a short-term peak.
Natural Gas Price: Daily chart
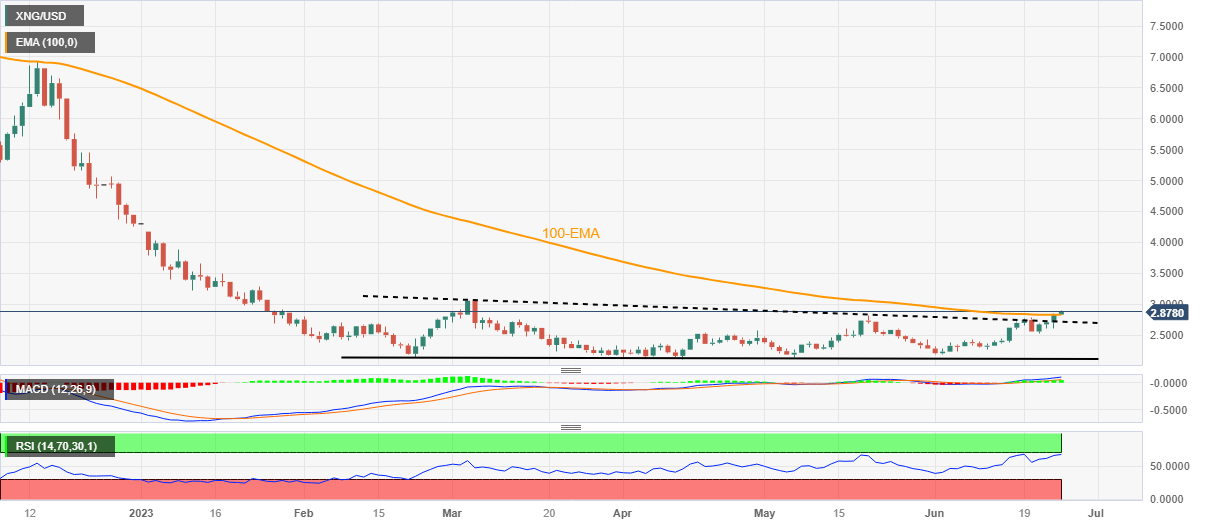
Trend: Further upside expected
- Gold price gains some positive traction for the second straight day, though lacks follow-through.
- A modest US Dollar weakness is seen as a key factor lending some support to the precious metal.
- A hawkish outlook by major central banks caps the XAU/USD and warrants caution for bulls.
Gold price kicks off the new week on a positive note and looks to build on Friday's modest bounce from the $1,910 area, or its lowest level since March 16. The XAU/USD trades around the $1,927 area, up nearly 0.35% for the day, though lacks follow-through and remains well below the 100-day Simple Moving Average (SMA) through the Asian session.
Modest US Dollar weakness lends support to Gold price
The US Dollar (USD) struggles to capitalize on its recovery move witnessed over the past two days, from the lowest level since May 11 and meets with some supply on Monday amid a modest downtick in the US Treasury bond yields. This, along with worries about ripple effects from the aborted mutiny in Russia, lends some support to the safe-haven Gold price. In fact, Russian mercenaries seized the southern city of Rostov on Saturday and advanced on Moscow, though withdrew after striking a deal guaranteeing their safety and the exile of their leader, Yevgeny Prigozhin, to Belarus.
Hawkish central banks cap gains for XAU/USD
The markets, however, react little to the latest geopolitical development, which is evident from a generally positive tone around the US equity futures and might cap gains for the safe-haven Gold price. Apart from this, a more hawkish stance adopted by major central banks might further contribute to keeping a lid on the non-yielding yellow metal. It is worth recalling that the Reserve Bank of Australia (RBA) and the Bank of Canada (BoC) delivered a surprise 25 basis points (bps) rate hike this month, while the European Central Bank (ECB) lifted rates to the highest level in 22 years.
Furthermore, the Bank of England (BoE), the Swiss National Bank (SNB) and Norges Bank all hiked their benchmark interest rates last Thursday. Meanwhile, the Federal Reserve (Fed) signalled that borrowing costs may still need to rise as much as 50 bps by the end of this year. Furthermore, Fed Chair Jerome Powell, during his two-day congressional testimony last week, reiterated that the central bank will likely raise interest rates again this year, albeit at a "careful pace", to combat stubbornly high inflation. This should limit the USD losses and act as a headwind for the Gold price.
Focus now shifts to US Core PCE Price Index on Friday
Traders might also prefer to wait for the release of the Fed's preferred inflation gauge - the Core Personal Consumption and Expenditure (PCE) price Index on Friday. The data will play a key role in influencing market expectations about the Fed's next policy move, which, in turn, will drive the USD demand and provide some meaningful impetus to the US Dollar-denominated Gold price. This makes it prudent to wait for strong follow-through buying before confirming that the XAU/USD has formed a near-term bottom and positioning for any meaningful appreciating move.
Gold price technical outlook
From a technical perspective, any subsequent move-up is more likely to attract fresh sellers and remain capped near the 100-day SMA, currently pegged around the $1,942-$1,943 region. The said barrier should act as a pivotal point, which if cleared decisively might trigger a short-covering rally. The Gold price might then accelerate the momentum towards the $1,962-$1,964 region. This is closely followed by the $1,970-$1,972 resistance zone and the $1,983-$1,985 barrier, which if cleared should allow the XAU/USD to surpass the $2,000 psychological mark and climb to the $2,010-$2,012 hurdle.
On the flip side, the multi-month low, around the $1,910 area touched on Friday, now seems to protect the immediate downside ahead of the $1,900 round-figure mark. Some follow-through selling will expose the very important 200-day SMA around the $1,840 region, with some intermediate support near the $1,876-$1,875 zone.
Key levels to watch
- USD/CAD takes offers to reverse the previous day’s corrective bounce off the lowest level since September 2022.
- WTI crude oil fails to cheer risk-positive headlines surrounding China, supply fears from Russia.
- US Dollar Index retreats after positing the first weekly gain in four amid market’s consolidation amid light calendar.
- Inflation clues from Canada, US will be important to watch for clear directions.
USD/CAD clings to mild losses around 1.3160 while reversing the previous day’s corrective bounce off the nine-month low during early Monday. In doing so, the Loonie pair ignores downbeat Oil prices while cheering the US Dollar’s weakness amid cautious optimism in the market.
WTI crude oil takes offers to refresh intraday low near $69.50 amid fears of China’s economic growth, despite risk-positive headlines suggesting more stimulus from Beijing. That said, global rating agency S&P recently cut China’s Gross Domestic Product (GDP) growth forecasts for 2023 to 5.2% from 5.5% previous estimations.
Apart from the S&P news, headlines suggesting major investors’ pause in China optimism join hawkish comments from the Fed officials and comparatively upbeat US data to weigh on the Oil price.
However, news signaling sooner stimulus from China and doubts about Russian President Vladimir Putin’s power in Moscow favor sentiment and put a floor under the WTI crude oil price, as well as weigh on the US Dollar.
Ning Jizhe, deputy head of the economic committee of the Chinese People's Political Consultative Conference (CPPCC) and a former vice head of the National Development and Reform Commission (NDRC) flagged concerns about sooner stimulus from China. “Heavily armed Russian mercenaries withdrew from the southern Russian city of Rostov under a deal that halted their rapid advance on Moscow but raised questions on Sunday about President Vladimir Putin's grip on power,” said Reuters in this regard.
On Friday, US S&P Global PMIs for June came in mixed as the Manufacturing PMI dropped to 46.3 from 48.4 prior, versus 48.5 expected, whereas the Services PMI improved to 54.1 from 54.0 expected despite being lesser than the 54.9 previous monthly figure. With this, the Composite PMI declined to 53.0 versus 54.4 market forecasts and 54.3 prior.
Following the mixed US PMIs, Chris Williamson, Chief Business Economist at S&P Global Market Intelligence said, “Any further rate hikes will of course have a further dampening effect on this sector (services) which is especially susceptible to changes in borrowing costs." That said, Federal Reserve Bank of San Francisco President Mary Daly told Reuters on Friday that two more interest rate increases this year would be a "very reasonable projection."
While portraying the mood, S&P500 Futures rise 0.20% intraday near 4,400 despite witnessing a downbeat week for Wall Street and gains of the US Treasury bond yields.
Looking forward, inflation numbers from the US and Canada, as well as speeches of the top-tier central bankers at the European Central Bank (ECB) Forum, will be important to watch for the USD/CAD traders. Additionally, US Durable Goods Orders and Bank Stress Tests are additional catalysts to observe.
Technical analysis
A U-turn from the two-week-old descending resistance line, around 1.3185 by the press time, directs USD/CAD bears towards the latest multi-month trough surrounding 1.3140.
S&P Global released its latest outlook report on the Chinese economy, citing a cut to the 2023 growth forecast for China.
The agency trimmed forecasts for China’s Gross Domestic Product (GDP) to 5.2% from 5.5% this year.
“China's recovery should continue but at an uneven pace, S&P Global added.
The S&P Global downgrade comes in line with many global banking giants such as Nomura, Citibank, UBS and Goldman Sachs.
Market reaction
Despite the above headlines, AUD/USD is trading better bid at around 0.6688, tracking the S&P 500 futures higher.
- USD/MXN clings to mild losses around intraday low after snapping four-week downtrend.
- Market’s cautious optimism weigh on US Dollar but Fed vs. Banxico concerns allow Mexican Peso buyers to take a breather.
- Risk catalysts, US inflation clues and central bankers eyed for clear directions amid absence of major data from Mexico.
USD/MXN remains on the back foot around 17.14-15 as it pares the biggest weekly gains in five amid Monday’s sluggish Asian session. In doing so, the Mexican Peso (MXN) pair cheers broad US Dollar pullback amid mildly positive sentiment. However, a lack of major data from Mexico and a cautious mood ahead of this week’s top-tier US inflation clues, as well as central bankers’ speeches, challenge the pair sellers.
Market sentiment improves after the weekend news raised doubts about Russian President Vladimir Putin’s power in Moscow and hopes of major stimulus from China allowed trades to witness cautious optimism and weighed on the US Dollar. “Heavily armed Russian mercenaries withdrew from the southern Russian city of Rostov under a deal that halted their rapid advance on Moscow but raised questions on Sunday about President Vladimir Putin's grip on power,” said Reuters in this regard.
Additionally, Ning Jizhe, deputy head of the economic committee of the Chinese People's Political Consultative Conference (CPPCC) and a former vice head of the National Development and Reform Commission (NDRC) flagged concerns about sooner stimulus from China and allowed the USD/MXN to drop. “China needs to step up measures as soon as possible to bolster a faltering post-COVID recovery in the world's second-largest economy,” said China’s Ning Jizhe per Reuters.
Even so, the Banxico inaction versus the Fed’s hawkish signals, as well as upbeat US PMIs, challenge the USD/MXN bears.
That said, the central bank of Mexico (Banxico) kept its benchmark rate unchanged the last week while the Fed policymakers appear hawkish after witnessing upbeat data at home.
On Friday, US S&P Global PMIs for June came in mixed as the Manufacturing PMI dropped to 46.3 from 48.4 prior, versus 48.5 expected, whereas the Services PMI improved to 54.1 from 54.0 expected despite being lesser than the 54.9 previous monthly figure. With this, the Composite PMI declined to 53.0 versus 54.4 market forecasts and 54.3 prior.
Following the mixed US PMIs, Chris Williamson, Chief Business Economist at S&P Global Market Intelligence said, “Any further rate hikes will of course have a further dampening effect on this sector (services) which is especially susceptible to changes in borrowing costs." That said, Federal Reserve Bank of San Francisco President Mary Daly told Reuters on Friday that two more interest rate increases this year would be a "very reasonable projection."
Moving on, the risk-positive headlines from China and Russia can weigh on the USD/MXN price for intraday. However, the US Dollar bulls remain hopeful unless witnessing a clear rejection of the risk aversion from the US inflation numbers and speeches of the top-tier central bankers at the European Central Bank (ECB) Forum, as well as the US Bank Stress Test results.
Technical analysis
Friday’s Doji joins a downside break of a one-week-old ascending support line, around 17.16 by the press time, to keep the USD/MXN bears hopeful.
People’s Bank of China (PBoC) set the USD/CNY central rate at 7.2056 on Monday, versus previous fix of 7.1795 and market expectations of 7.2095. It's worth noting that the USD/CNY closed near 7.1821 the previous day. With this, the Chinese central bank sets the onshore Yuan (CNY) rate at the lowest levels since November 2022.
Apart from the fix, the Chinese central bank (PBoC) also shared details of the money market operations by saying that the PBoC invests a total of 155 billion Yuan in Open Market Operations (OMO).
About PBOC fix
China maintains strict control of the yuan’s rate on the mainland.
The onshore yuan (CNY) differs from the offshore one (CNH) in trading restrictions, this last one is not as tightly controlled.
Each morning, the People’s Bank of China (PBOC) sets a so-called daily midpoint fix, based on the yuan’s previous day's closing level and quotations taken from the inter-bank dealer.
- GBP/USD kicks off the new week on a positive note and draws support from a weaker USD.
- The Fed’s hawkish outlook should help limit any meaningful downside for the Greenback.
- Worries that the BoE’s aggressive rate hike could cause economic damage cap the major.
The GBP/USD pair attracts some buyers on the first day of a new week and reverses a major part of Friday's slide to sub-1.2700 levels, stalling its recent corrective decline from a 14-month peak. Spot prices currently trade around the 1.2730-1.2735 region, up 0.15% for the day, any meaningful appreciating move seems elusive.
The US Dollar (USD) struggles to capitalize on its recovery gains registered over the past two days, from the lowest level since May 11 touched last Thursday and meets with some support on the first day of a new week. This, in turn, is seen as a key factor lending some support to the GBP/USD pair. The S&P Global reported on Friday that business activity in the US fell to a three-month low in June as services growth eased for the first time this year and the contraction in the manufacturing sector deepened. This, along with a modest downtick in the US Treasury bond yields and a positive tone around the US equity markets, seem to undermine the safe-haven Greenback.
That said, the Federal Reserve's (Fed) hawkish outlook could act as a tailwind for the buck and cap the GBP/USD pair, at least for now. It is worth recalling that the Fed earlier this month, although decided to pause its year-long rate-hiking cycle, signalled that borrowing costs may still need to rise as much as 50 bps by the end of this year. Furthermore, Fed Chair Jerome Powell reiterated that the central bank will likely raise interest rates again this year, albeit at a "careful pace", to contain high inflation. Powell added that the Fed doesn't see rate cuts happening any time soon and is going to wait until it is confident that inflation is moving down to the 2% target.
Hence, the market focus now shifts to this week's release of the US Core PCE Price Index - the Fed's preferred inflation gauge on Friday. The data might influence market expectations about the Fed's next policy move, which, in turn, will drive the USD demand and provide a fresh directional impetus to the GBP/USD pair. In the meantime, worries about economic headwinds stemming from a more aggressive policy tightening by the Bank of England (BoE) might hold back traders from placing bullish bets around the British Pound. In the absence of any relevant market-moving macro data, either from the UK or the US, this might further contribute to keeping a lid on spot prices.
Technical levels to watch
- Silver Price takes the bids to refresh intraday high, extends previous day’s recovery from 14-week low.
- Horizontal support from mid-March joins bullish MACD signals, RSI rebound from oversold territory to favor XAG/USD buyers.
- Three-month-old support-turned-resistance line precedes 200-SMA, descending trend line from May to challenge Silver bulls.
Silver Price (XAG/USD) picks up bids to renew its intraday high near $22.60 as it extends the previous day’s rebound from the lowest levels since mid-March amid early Monday. In doing so, the XAG/USD bounces off a 14-week-old horizontal support zone.
Apart from the Silver Price rebound from the key horizontal support zone, the commodity’s upside break of the 61.8% Fibonacci retracement of March-May upside joins bullish MACD signals and the RSI (14) line’s recovery from the oversold territory to favor the XAG/USD bulls.
However, the previous support line stretched from March 21, as well as the 50% Fibonacci retracement, will challenge the Silver Price recovery close to the $23.00 round figure.
Even if the XAG/USD rises past $23.00, the 200-SMA and a seven-week-old falling resistance line, respectively near $23.60 and $23.90, will prod the upside momentum before giving control to the Silver bulls.
On the flip side, the aforementioned 61.8% Fibonacci retracement level and the horizontal support zone, respectively near $22.30 and $22.15-10, restrict the immediate downside of the Silver Price.
Following that, the lows marked in mid-March near $21.50 precede the early March swing high of near $21.30 to challenge the further Silver Price downside.
Silver Price: Four-hour chart
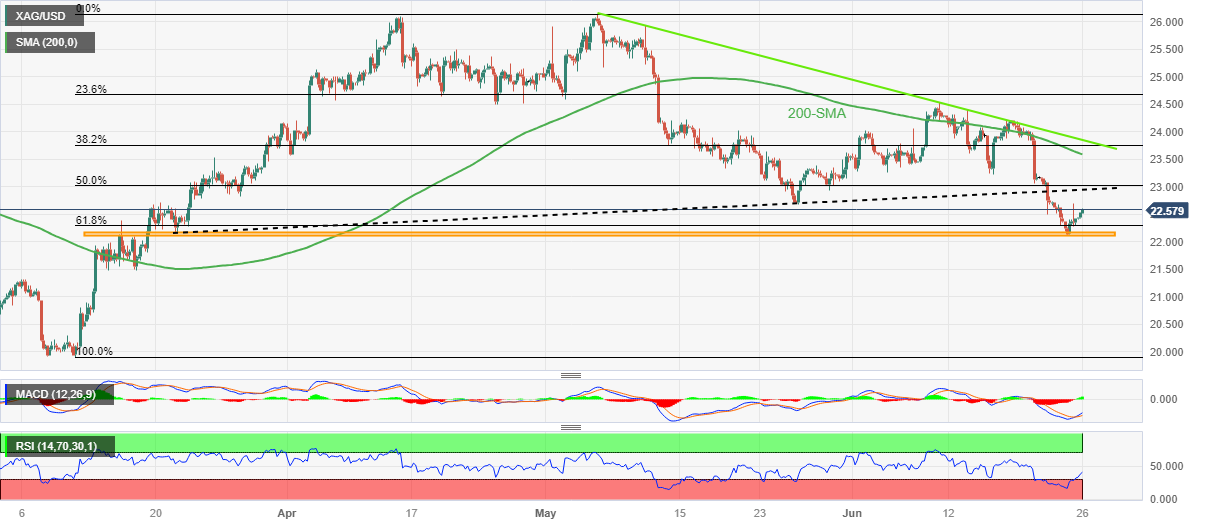
Trend: Limited recovery expected
- USD/JPY edges lower on Monday and snaps a three-day winning streak to a fresh YTD peak.
- Fresh intervention fears benefit the JPY and exert pressure amid a modest USD weakness.
- The Fed’s hawkish outlook should act as a tailwind for the USD and limit losses for the pair.
The USD/JPY pair kicks off the new week on a softer note and erodes a part of Friday's gains to the 144.00 neighbourhood, or a fresh high since November 2022. Spot prices trade around the 143.30 area during the Asian session, down just over 0.15% for the day, and for now, seems to have snapped a three-day winning streak.
The Japanese Yen (JPY) strengthens a bit in reaction to Japan’s top currency diplomat Masato Kanda warning that recent moves in the domestic currency were "rapid" and that authorities will respond to any excessive moves in the currency market. Adding to this, the Bank of Japan (BoJ), in the Summary of Opinions from the latest monetary policy meeting held in June, noted that there is strong chance consumer inflation will moderate, but won't slow back below 2%, toward the middle of current fiscal year. This, in turn, fuels speculations that the BoJ might cut back on its super-easy policy and lends additional support to the JPY. Apart from this, a modest US Dollar (USD) downtick exerts prompts bulls to take some profits off the table and exerts some downward pressure on the USD/JPY pair.
The S&P Global reported on Friday that business activity in the US fell to a three-month low in June as services growth eased for the first time this year and the contraction in the manufacturing sector deepened. This, in turn, is seen as a key factor that weighs on the Greenback. The overall picture, however, indicated that the US economic growth ticked up a notch in the second quarter. This, along with the Federal Reserve's (Fed) hawkish outlook, might hold back traders from placing aggressive bearish bets around the USD and help limit any meaningful corrective decline for the USD/JPY pair, at least for now. It is worth recalling that the Fed earlier this month, though decided to pause its year-long rate-hiking cycle, signalled that borrowing costs may still need to rise as much as 50 bps by the end of this year.
Furthermore, Fed Chair Jerome Powell, during his two-day congressional testimony last week, reiterated that the central bank will likely raise interest rates again this year, albeit at a "careful pace", to combat stubbornly high inflation. Powell added that the Fed doesn't see rate cuts happening any time soon and is going to wait until it is confident that inflation is moving down to the 2% target. Hence, the market focus now shifts to this week's release of the US Core PCE Price Index - the Fed's preferred inflation gauge on Friday. The data might influence market expectations about the Fed's next policy move, which, in turn, will drive the USD demand and provide a fresh directional impetus to the USD/JPY pair. This makes it prudent to wait for some follow-through selling before confirming that spot prices have topped out in the near term.
Technical levels to watch
- US Dollar Index consolidates the first weekly gain in four around intraday low.
- Cautious optimism about global growth concerns, risk-positive headlines from China, Russia also prod DXY bulls.
- US inflation data, US Bank Stress Test and central bankers’ speeches from ECB Forum will be crucial for clear directions.
US Dollar Index (DXY) takes offers to pare the biggest weekly gains in four around 102.70 amid early Monday morning in Asia. In doing so, the US Dollar’s gauge versus the six major currencies consolidates the latest run-up amid slightly positive sentiment, as well as the market’s preparations for this week’s top-tier US data and speeches from the key central bankers.
It’s worth noting that the doubts about Russian President Vladimir Putin’s power in Moscow and hopes of major stimulus from China allowed trades to witness cautious optimism and weighed on the US Dollar. “Heavily armed Russian mercenaries withdrew from the southern Russian city of Rostov under a deal that halted their rapid advance on Moscow but raised questions on Sunday about President Vladimir Putin's grip on power,” said Reuters in this regard.
Additionally, Ning Jizhe, deputy head of the economic committee of the Chinese People's Political Consultative Conference (CPPCC) and a former vice head of the National Development and Reform Commission (NDRC) flagged concerns about sooner stimulus from China and allowed the AUD/USD to rebound, due to its business ties with Beijing. “China needs to step up measures as soon as possible to bolster a faltering post-COVID recovery in the world's second-largest economy,” said China’s Ning Jizhe per Reuters.
Though, headlines suggesting major investors’ pause in China optimism join hawkish comments from the Fed officials and comparatively upbeat US data to keep the DXY buyers hopeful.
“Investors are waiting for a big burst of stimulus from China before they make more aggressive bets on a recovery, having spent the past few months disappointed by economic data and a lack of meaningful policy response from Beijing, said Reuters.
It should be noted that the Fed officials rush towards suggesting two more rate hikes from the US after witnessing upbeat data. On Friday, US S&P Global PMIs for June came in mixed as the Manufacturing PMI dropped to 46.3 from 48.4 prior, versus 48.5 expected, whereas the Services PMI improved to 54.1 from 54.0 expected despite being lesser than the 54.9 previous monthly figure. With this, the Composite PMI declined to 53.0 versus 54.4 market forecasts and 54.3 prior.
Following the mixed US PMIs, Chris Williamson, Chief Business Economist at S&P Global Market Intelligence said, “Any further rate hikes will of course have a further dampening effect on this sector (services) which is especially susceptible to changes in borrowing costs." That said, Federal Reserve Bank of San Francisco President Mary Daly told Reuters on Friday that two more interest rate increases this year would be a "very reasonable projection."
Against this backdrop, S&P500 Futures rise 0.20% intraday near 4,400 despite witnessing a downbeat week for Wall Street and gains of the US Treasury bond yields.
Although the risk-positive headlines from China and Russia weigh on the US Dollar Index (DXY), the DXY bulls remain hopeful unless witnessing a clear rejection of the risk aversion from the US inflation numbers and speeches of the top-tier central bankers at the European Central Bank (ECB) Forum, as well as the US Bank Stress Test results.
Also read: Weekly outlook and review: Inflation is front and centre in the final full week of June
Technical analysis
US Dollar Index remains sidelined between the 100-DMA and a 10-week-old rising support line, respectively near 103.10 and 102.10.
| Index | Change, points | Closed | Change, % |
|---|---|---|---|
| NIKKEI 225 | -483.34 | 32781.54 | -1.45 |
| Hang Seng | -328.38 | 18889.97 | -1.71 |
| KOSPI | -23.6 | 2570.1 | -0.91 |
| ASX 200 | -96.3 | 7099.2 | -1.34 |
| DAX | -158.22 | 15829.94 | -0.99 |
| CAC 40 | -39.86 | 7163.42 | -0.55 |
| Dow Jones | -219.28 | 33727.43 | -0.65 |
| S&P 500 | -33.56 | 4348.33 | -0.77 |
| NASDAQ Composite | -138.09 | 13492.52 | -1.01 |
- USD/CHF prints the first daily loss in three, seesaws near intraday low of late.
- Bearish MACD signals, U-turn from fortnight-old resistance line favors Swiss Franc sellers.
- RSI conditions suggest bottom-picking from weekly support line.
USD/CHF holds lower ground near the intraday bottom of around 0.8955 during the first loss-making day in three amid early Monday. In doing so, the major currency pair justifies hawkish remarks from Swiss National Bank (SNB) Chairman Thomas Jordan, as well as the broad cautious optimism in the market.
That said, “SNB's recent interest rate hike was ‘very likely not quite’ enough to get a grip on inflation in Switzerland,” said SNB’s Jordan in an interview aired by Swiss broadcaster SRF on Saturday, per Reuters.
Also read: Weekend News: Russia, China and SNB’s Jordan were in focus
With this, the Swiss Franc (CHF) pair extends the previous day’s U-turn from a two-week-old descending resistance line, around 0.9010 by the press time.
Additionally favoring the USD/CHF bears is the quote’s downside past the 200-Hour Moving Average (HMA), close to 0.8970, as well as the bearish MACD signals.
With this, the USD/CHF pair is likely declining towards a one-week-old rising support line surrounding 0.8930.
However, the monthly low of near the 0.8900 round figure will join the below-50.0 levels of the RSI (14) to challenge the bears afterward.
Meanwhile, a clear upside break of the aforementioned resistance line close to 0.9010, can direct the USD/CHF bulls to aim for the 0.9100 round figure before targeting the monthly top surrounding 0.9120.
USD/CHF: Hourly chart

Trend: Further downside expected
| Pare | Closed | Change, % |
|---|---|---|
| AUDUSD | 0.6676 | -1.18 |
| EURJPY | 156.568 | -0.1 |
| EURUSD | 1.08939 | -0.56 |
| GBPJPY | 182.749 | 0.24 |
| GBPUSD | 1.27157 | -0.22 |
| NZDUSD | 0.61429 | -0.57 |
| USDCAD | 1.31804 | 0.24 |
| USDCHF | 0.8967 | 0.24 |
| USDJPY | 143.716 | 0.45 |


© 2000-2026. Уcі права захищені.
Cайт знаходитьcя під керуванням TeleTrade DJ. LLC 2351 LLC 2022 (Euro House, Richmond Hill Road, Kingstown, VC0100, St. Vincent and the Grenadines).
Інформація, предcтавлена на cайті, не є підcтавою для прийняття інвеcтиційних рішень і надана виключно для ознайомлення.
Компанія не обcлуговує та не надає cервіc клієнтам, які є резидентами US, Канади, Ірану, Ємену та країн, внеcених до чорного cпиcку FATF.
Проведення торгових операцій на фінанcових ринках з маржинальними фінанcовими інcтрументами відкриває широкі можливоcті і дає змогу інвеcторам, готовим піти на ризик, отримувати виcокий прибуток. Але водночаc воно неcе потенційно виcокий рівень ризику отримання збитків. Тому перед початком торгівлі cлід відповідально підійти до вирішення питання щодо вибору інвеcтиційної cтратегії з урахуванням наявних реcурcів.
Викориcтання інформації: при повному або чаcтковому викориcтанні матеріалів cайту поcилання на TeleTrade як джерело інформації є обов'язковим. Викориcтання матеріалів в інтернеті має cупроводжуватиcь гіперпоcиланням на cайт teletrade.org. Автоматичний імпорт матеріалів та інформації із cайту заборонено.
З уcіх питань звертайтеcь за адреcою pr@teletrade.global.
переклади