- Аналітика
- Новини та інструменти
- Новини ринків
Новини ринків
Japan’s National Consumer Price Index (CPI) for January came in at 2.2% YoY from 2.6% in December, according to the latest data released by the Japan Statistics Bureau on Tuesday.
Further details unveil that the National CPI ex Fresh food arrived at 2.0% YoY in January versus 2.3% prior.
Market reaction
Following the Japan inflation data, the USD/JPY pair is down 0.05% on the day at 150.62.
About Japan’s National CPI
Japan’s National Consumer Price Index (CPI), released by the Statistics Bureau of Japan on a monthly basis, measures the price fluctuation of goods and services purchased by households nationwide. The YoY reading compares prices in the reference month to the same month a year earlier. Generally, a high reading is seen as bullish for the Japanese Yen (JPY), while a low reading is seen as bearish.
- NZD/USD holds a negative note near 0.6170 in Tuesday’s early Asian session.
- Sticky inflation in the US prompted investors to push back against the expectation of rate cuts.
- The RBNZ is expected to keep the rate on hold on Wednesday, but the possibility of a hike cannot be ruled out.
- Market players will monitor the RBNZ monetary policy meeting and the US Gross Domestic Product Annualized for Q4.
The NZD/USD pair trades on a weaker note around 0.6170 after retracing from the 0.6200 barrier during the early Asian session on Tuesday. The pair edges lower despite the weaker US Dollar Index (DXY). Investors await the Reserve Bank of New Zealand (RBNZ) interest rate decision on Wednesday, with no change in rates expected.
The recent US inflation data showed a sticky inflation in the United States and prompted investors to push back against the expectation of rate cuts. The Federal Reserve (Fed) emphasized a tightening policy to bring inflation back down to its 2% target, but prices are still well above this mark. New York Fed President John Williams warned last week about the possibility of early rate cuts, adding that the central bank is on track to lower borrowing costs later this year.
The RBNZ is expected to keep the Official Cash Rate steady at 5.5% on Wednesday, but the possibility of a hike remains as inflation proves difficult to curb. The market is pricing in a 25% odd rate hike since the RBNZ has held the rate since May last year. In recent weeks, the RBNZ policymakers delivered hawkish remarks, which lifted the New Zealand (NZD) against the US Dollar (USD). Chief economist Paul Conway said last month that the central bank still has a way to go to bring inflation back to its 2% target, while Orr stated that it has more work to do to anchor inflation expectations.
Traders will keep an eye on the RBNZ monetary policy meeting on Wednesday. Later in the day, the US Gross Domestic Product Annualized for the fourth quarter (Q4) will be due. Attention will turn to the Personal Consumption Expenditures (PCE) Index on Thursday. These data could give a clear direction to the NZD/USD pair.
- AUD/USD drops 0.35% amid mixed market sentiment and rising US Treasury yields, focus on key US and Australian data releases.
- Anticipation for Fed speeches and economic reports such as Durable Goods Orders and Consumer Confidence to influence rate cut expectations.
- Australian Dollar pressured from declining iron ore prices and forthcoming data on inflation, housing, and retail sales.
The AUD/USD slid 0.35% on Monday amid a mixed market mood and a rise in US Treasury bond yields. Investors bracing for the release of crucial economic data in the United States (US) and Australia were the main reason behind the pair’s price action, even though the Greenback posted solid losses. Nevertheless, as the Asian session begins, the pair exchanges hands at 0.6538, down 0.03%.
AUD/USD dives on mixed economic mood
Wall Street ended Monday’s session with a mixed tone as traders turned cautious. Eight Federal Reserve speakers would cross the wires during the week, while the release of Durable Goods Orders could support the Fed’s doves as orders are estimated to have plunged in January. Besides that, housing data and Consumer Confidence can reemphasize the Fed’s need to cut rates later in the year. Late in the week, the Fed’s preferred gauge for inflation, the Personal Consumption Expenditure (PCE) will update the inflation status and could rock US Treasury bond yields as expectations for rate cuts can adjust.
On Australia’s front, the economic docket is absent as AUD/USD traders brace for Tuesday's release of inflation figures for the last quarter of 2023. The day after that, investors are eyeing the release of housing data, retail sales, and credit data.
The AUD/USD has remained pressured as Iron ore prices fell to their lowest in four months, as inventories in China pile up, amid the struggle of the property market.
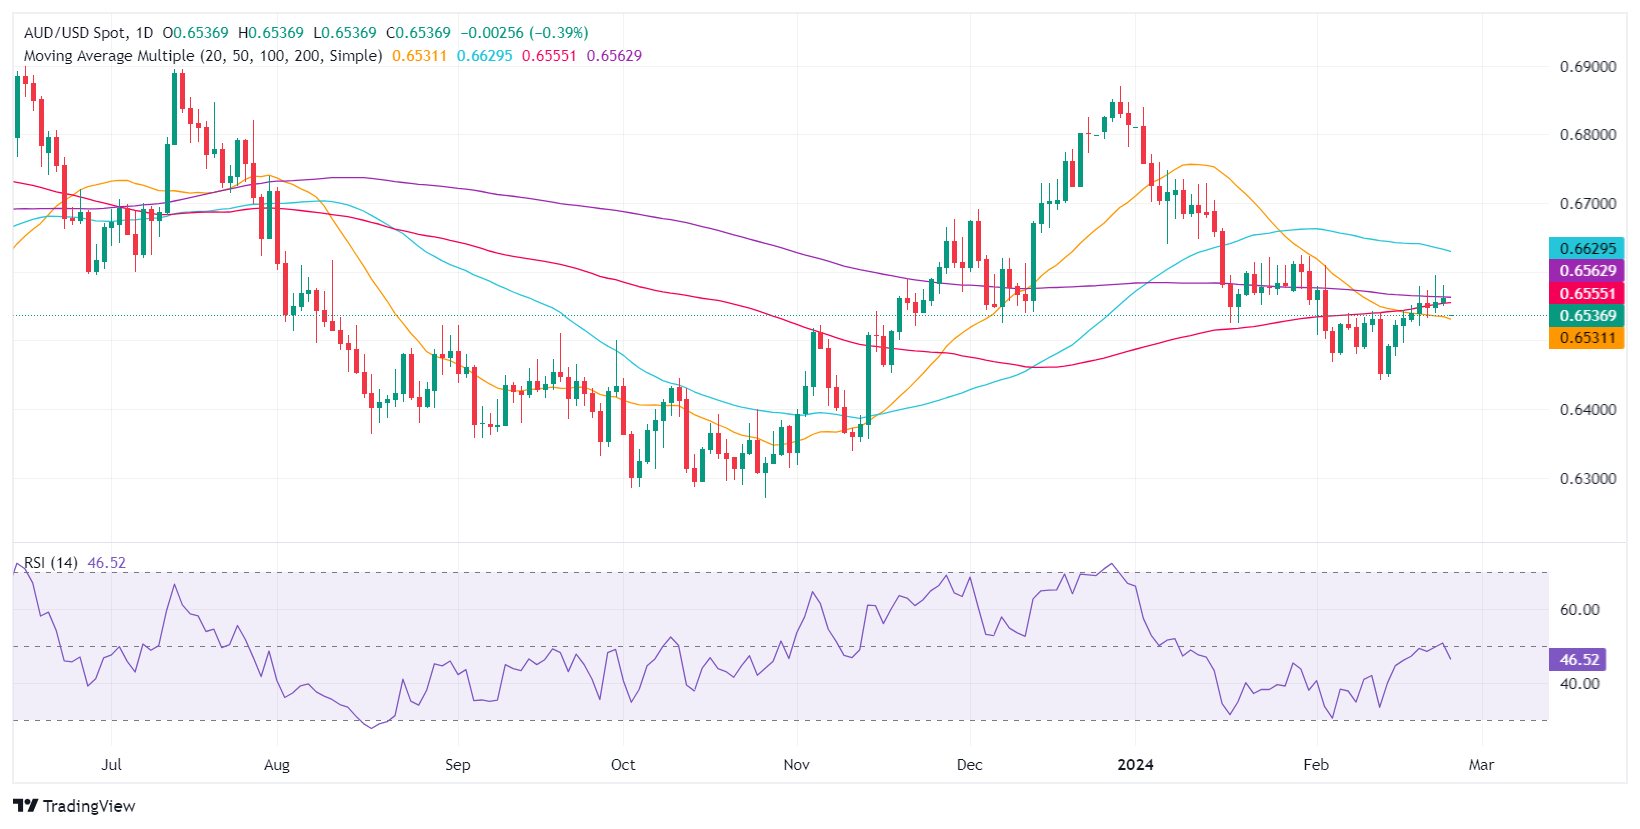
AUD/USD Price Analysis: Technical outlook
The AUD/USD diving to a new four-day low opened the door for a deeper pullback after failing to reclaim the 200-day moving average (DMA) at 0.6560. If sellers push the spot price below the 0.6500 figure, a leg-down is seen with the next support level at the February 5 low of 0.6468, followed by the February 13 cycle low of 0.6442. Traders must be aware of this key level, as the pair could drop to 0.6400. Otherwise if buyers lift the exchange rate above the 200-DMA, look for a test of the 0.6600 mark.
- Crude Oil markets continue to pattern into a sideways channel.
- Barrel supplies continue to outpace demand that has failed to materialize.
- Energy markets remain concerned about supply constraints that have yet to occur.
West Texas Intermediate (WTI) US Crude Oil rebounded on Monday after last week’s near-term decline, and WTI is once again trading back above $77.50 per barrel.
Concerns about global demand rising to outpace global barrel supply on the back of an expected explosion in Chinese Crude Oil demand have fizzled out, but markets remain concerned about barrel supply amidst Middle East geopolitical tensions and production caps from the Organization of the Petroleum Exporting Countries. According to a recent survey by Bloomberg, many energy market analysts expect OPEC to maintain current production caps through the second quarter in an attempt to keep Crude OIl supply low enough to keep prices high, but record pumping figures from non-OPEC countries, most notably the US, remains a key chink in the armor.
Geopolitical tensions remain high in the Red Sea as Houthis continue to target civilian shipping vessels. Crude Oil markets remain concerned about a possible kink in supply lines between Europe and Asia, keeping barrel bids elevated.
WTI technical outlook
Choppy sideways trading has been the name of the game in WTI US Crude Oil recently. Intraday technicals have been increasingly chopping as US Crude Oil swings from one day to the next but largely remains capped below $79.00.
WTI prices have been hampered by the 200-day Simple Moving Average (SMA) at $77.62, a price that has seen Crude Oil spiral around since falling into the long-term region in November of 2022.
WTI hourly chart
WTI daily chart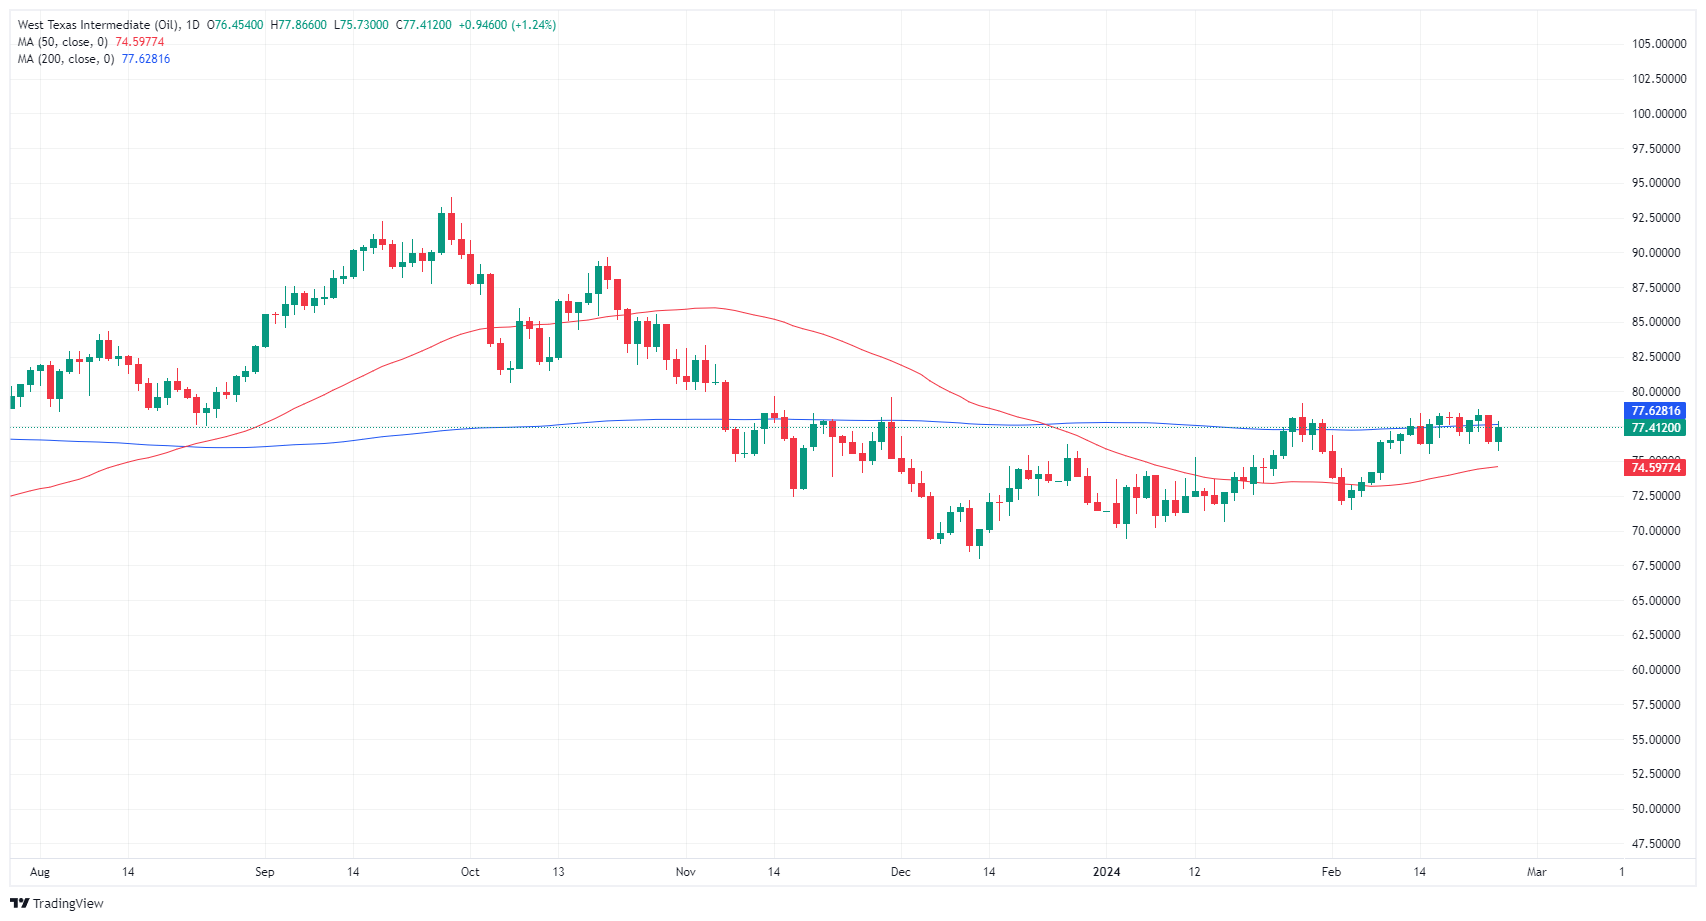
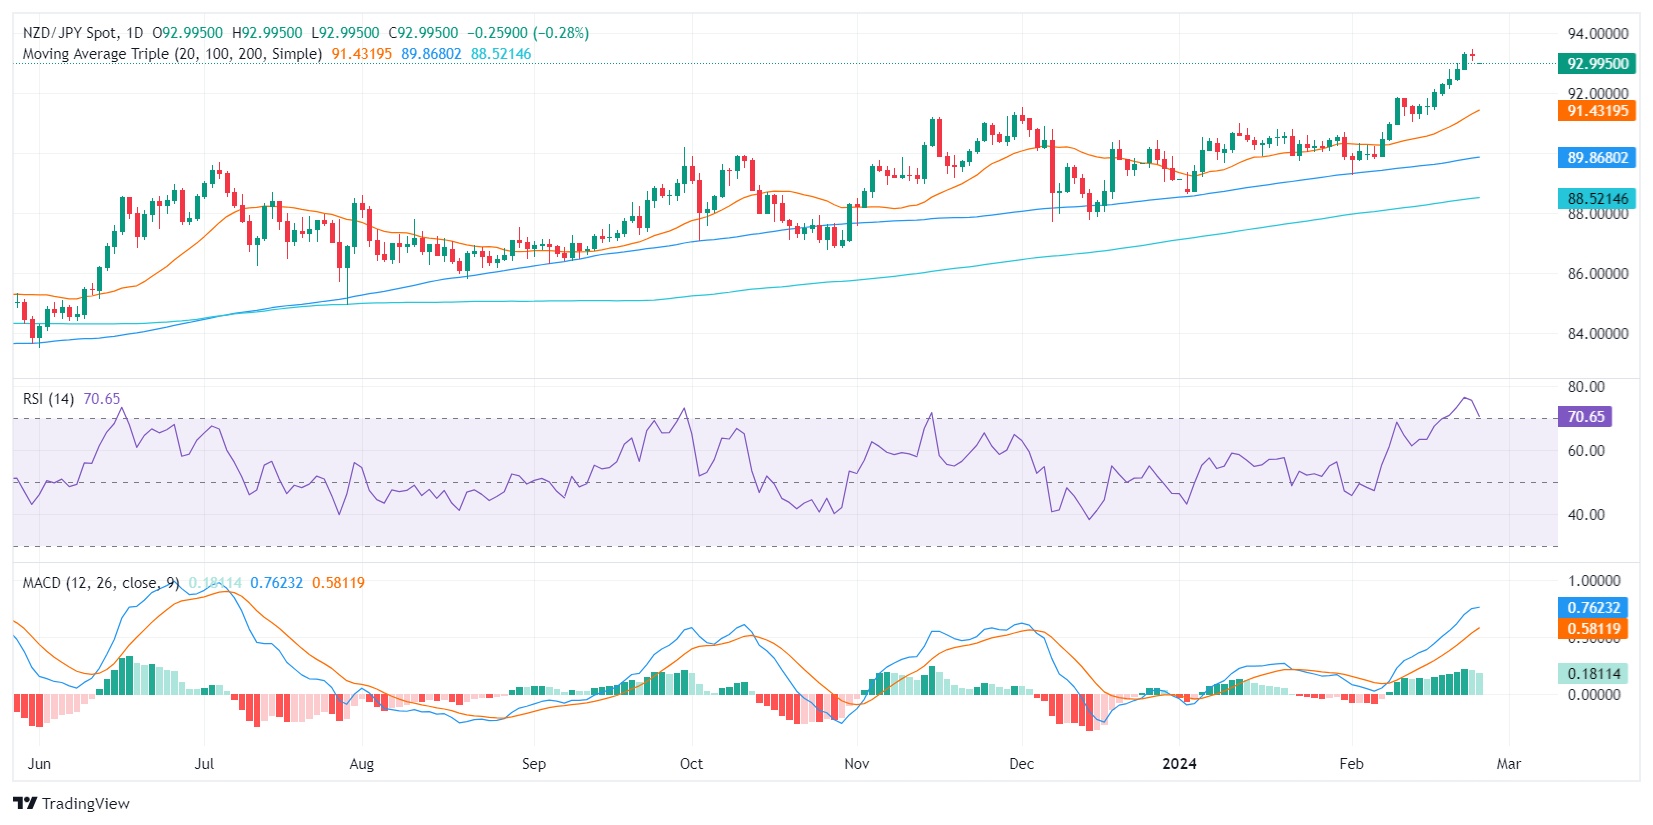
- The NZD/JPY currently trades at 93.031, down 0.21% in Monday's session.
- The daily RSI remains in the overbought area, suggesting that further consolidating may be incoming.
- Despite the short-term bearish signals, the pair is operating above the main SMAs, indicating an overall bullish trend.
In Monday's session, the NZD/JPY pair is trading at 93.03, experiencing a decline of 0.21% as indicators seem to be correcting overbought conditions that propelled the pair to highs since 2015.
The daily Relative Strength Index (RSI) for the NZD/JPY pair is showing a downward trajectory, still correcting overbought conditions, lying around 70. This suggests a loss of upward momentum, signaling that sellers might be gaining an upper hand. Additionally, falling green bars of the Moving Average Convergence Divergence (MACD) histogram on the daily and hourly chart indicates a decrease in positive momentum, further strengthening the case for bearish sentiment in the short term.
On the other hand, the pair is trading above the 20, 100, and 200-day Simple Moving Averages (SMAs), indicative of an overall bullish long-term trend. This divergence between short-term and long-term indicators suggests that buyers took a step back to consolidate profits after last week’s 2% rally. In that sense, as long as the cross holds above these key levels, all downward movements won’t affect the bullish bias of the pair and could be considered a consolidation.
NZD/JPY daily chart
NZD/JPY hourly chart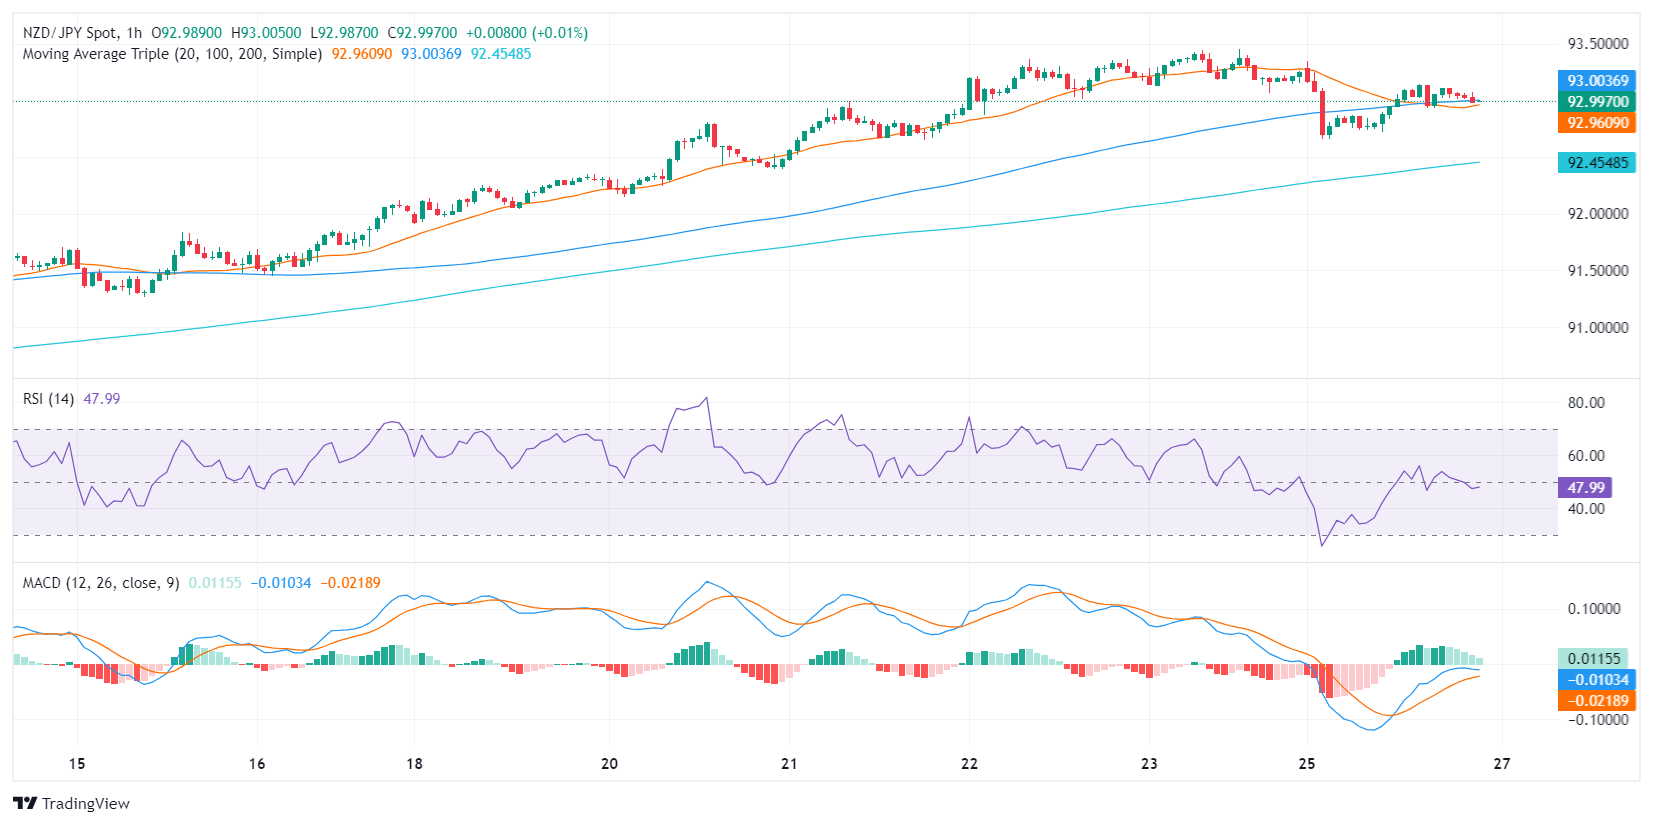
- EUR/JPY climbs, leveraged by JPY's broad decline on Japan's cooling economy and inflation forecasts.
- Technical momentum suggests a test of the 164.00 level, with potential resistance at November's peak.
- Initial support at 163.00, with further downside targets including Tenkan-Sen and Senkou Span A levels.
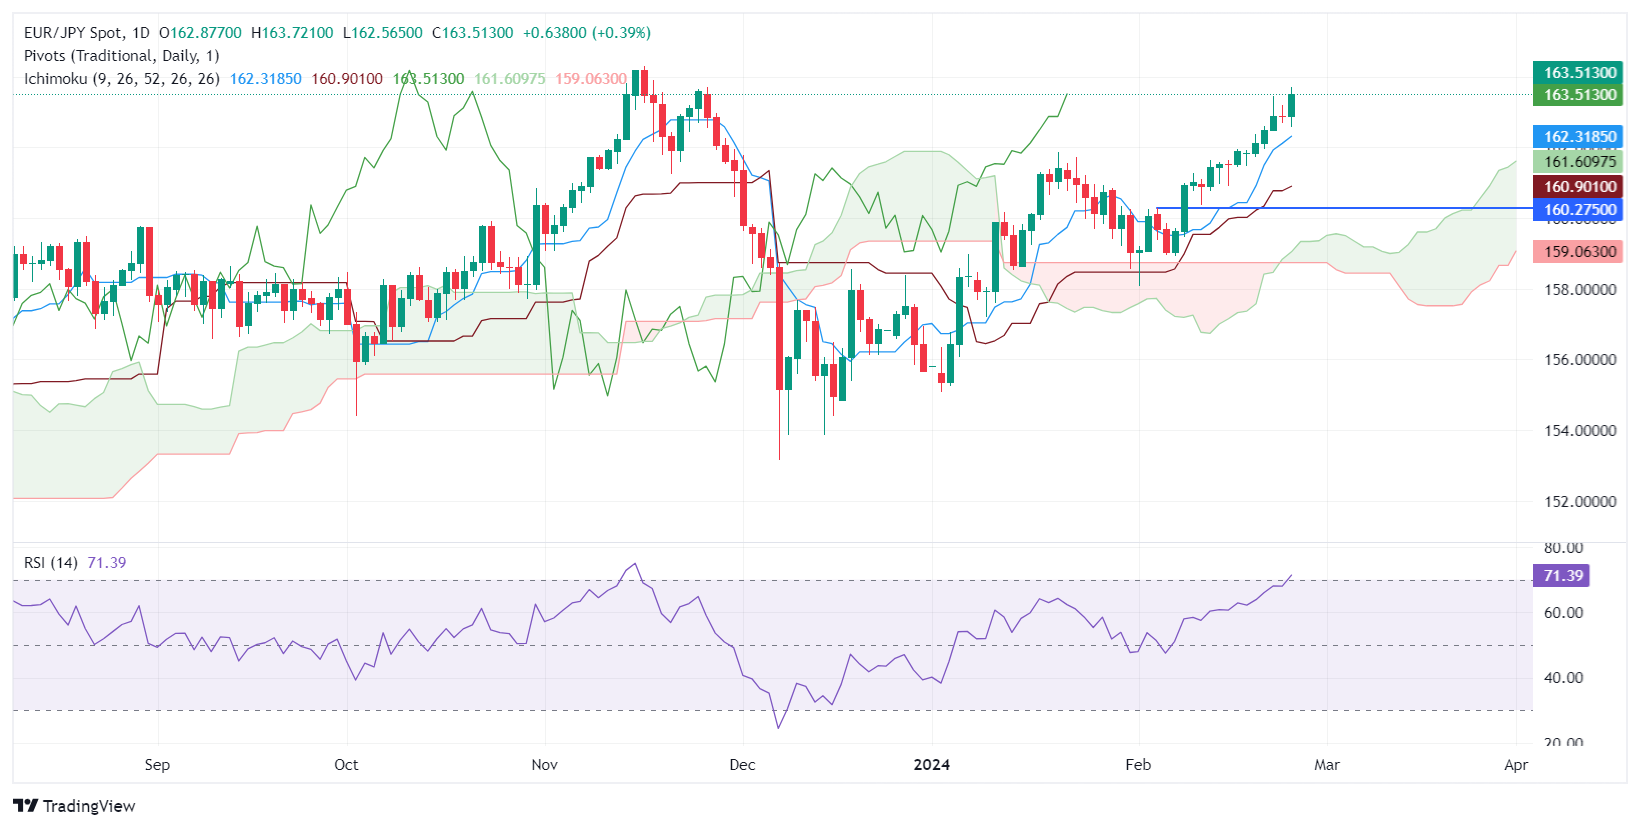
The EUR/JPY advances sharply and regains the 163.00 figure as traders capitalize on the broad Japanese Yen (JPY) weakness. The latest fundamental news from Japan is that its economy is cooling, while inflation is expected to get below the Bank of Japan's (BoJ) 2% goal on its core figures. At the time of writing, the pair exchanged hands at 163.55, up 0.42%.
From a technical perspective, EUR/JPY rose to a new year-to-date (YTD) high at 163.72, though the exchange rate retreated somewhat amid fears that Japanese authorities might intervene in the Forex markets. Given the backdrop, the uptrend remains intact, and the pair could challenge the 164.00 figure in the near term. A breach of that level would expose the November 16 high at 164.31, followed by the 165.00 mark.
On the flip side, the EUR/JPY first support would be the 163.00 figure. If sellers push the spot price below Monday’s low of 162.56, look for a deeper pullback past the Tenkan-Sen at 162.31 as bears eye the Senkou Span A at 161.61 before the Kijun-Sen at 160.90.
EUR/JPY Price Action – Daily Chart
- GBP/JPY bull run takes the pair into its highest bids since 2015.
- Technical ceiling parked near 196.00 at June 2015 high.
- Japan National CPI due early Tuesday, expected to ease further.
GBP/JPY is up over 6% YTD in 2024 as the pair continues to climb into multi-year highs, and has reached its highest bids since August of 2015 just above the 191.00 handle.
This week sees a smattering of UK economic data on the calendar, but is strictly low-tier. Japan’s National Consumer Price Index (CPI) inflation figures are due early Tuesday, with Japanese Retail Trade numbers slated for Thursday.
Japan’s National CPI for the year ended in January is broadly expected to reiterate the findings from the Tokyo CPI advance print as Japanese inflation continues to cool. Core National CPI is forecast to recede to 1.8% YoY from the previous period’s 2.3%.
Early Thursday’s Japan Retail Trade is expected to rebound to 2.3% YoY compared to the previous 2.1%, but January’s Industrial Production is expected to decline sharply by 7.4% compared to the previous month’s 1.4% increase.
GBP/JPY is on fast approach to 2015’s peak bids near 196.00, with prices above the 200.00 major price level waiting beyond. GBP/JPY has not traded above 200.00 since 2008.
GBP/JPY technical outlook
GBP/JPY is up over 3% from February’s bottom bids at 185.23, and the pair is drifting into multi-year peaks that leave the Guppy with few technical barriers as the march up the charts continues.
A near-term supply zone is marked out between 190.50 and the 190.00 handle, and 190.00 remains a key technical barrier after previously capping intraday chart action following February’s earlier rejection from the key level.
GBP/JPY has surged in 2024, climbing from January’s early bottom at 178.74, catching a bullish rebound from the 200-day Simple Moving Average (SMA) in the process, which is currently rising through the 183.00 handle.
GBP/JPY hourly chart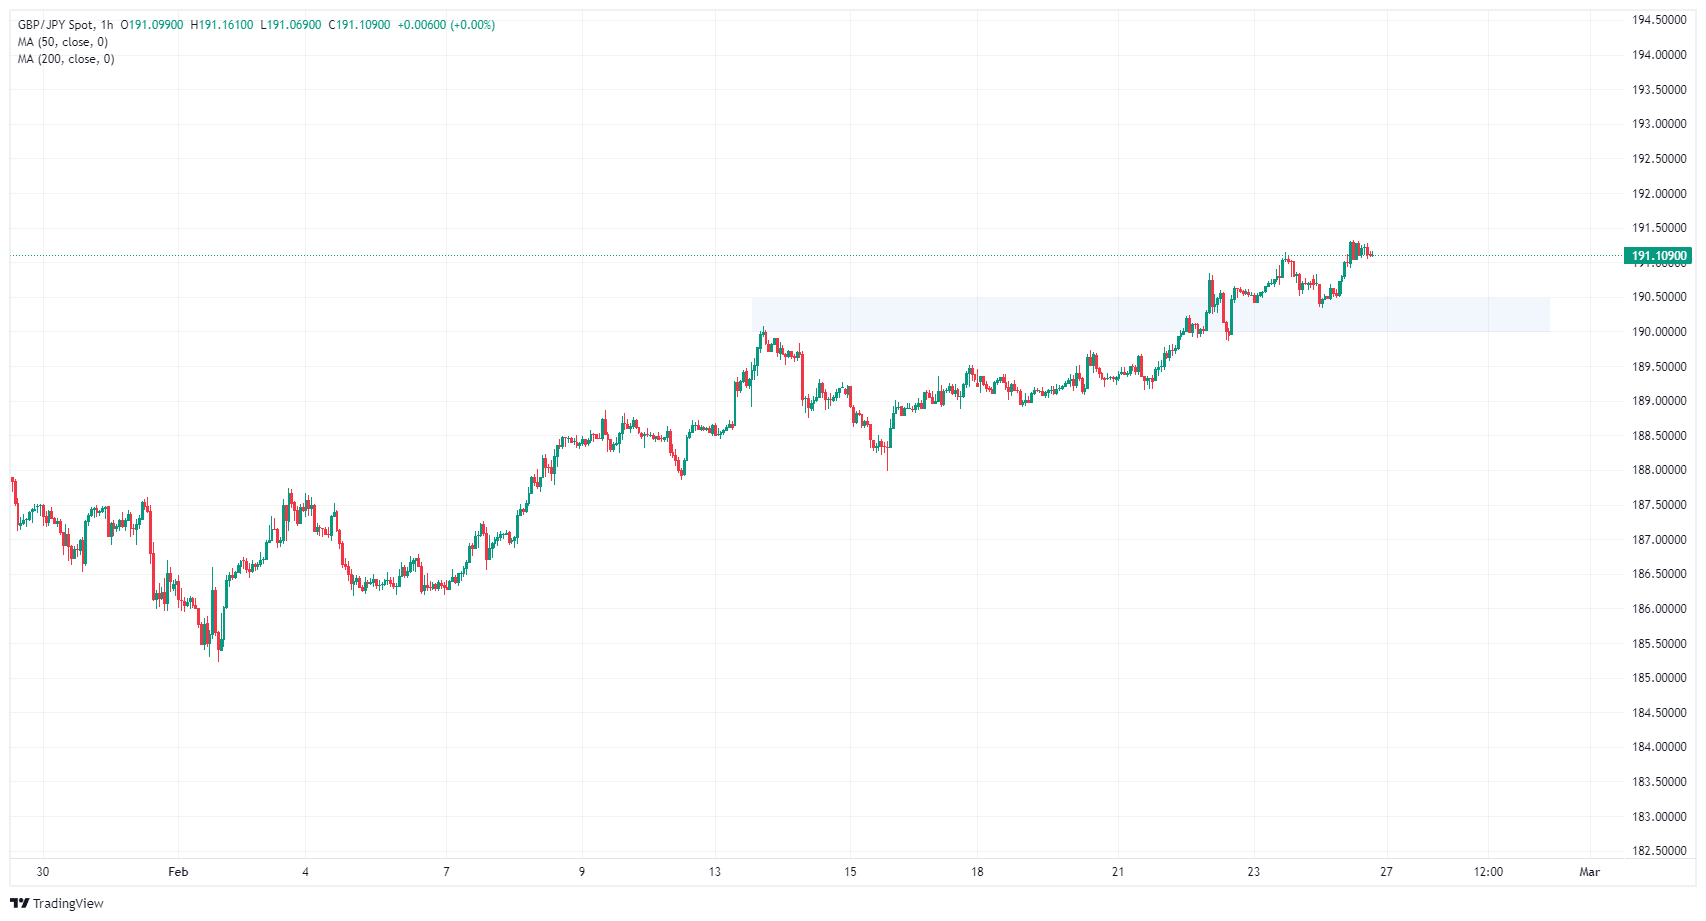
GBP/JPY daily chart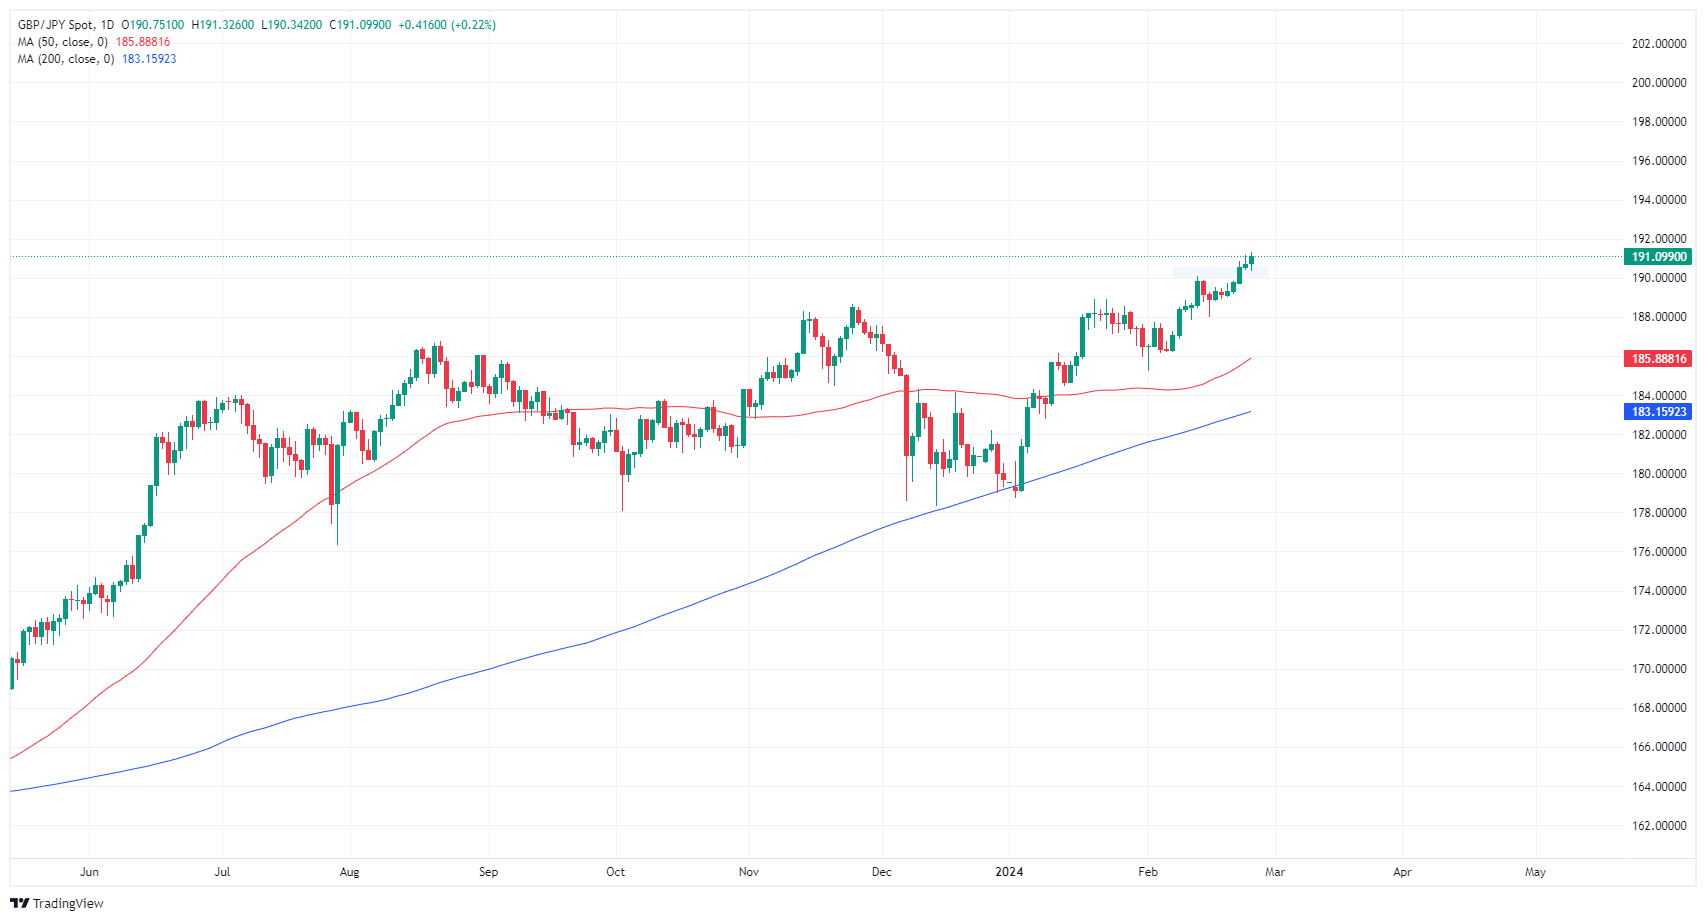
- The USD/SEK trades at 10.306, shedding 0.14% in Monday's trading session.
- The SEK is resilient and undervalued despite subpar economic fundamentals in Sweden, outperforming its G10 peers.
- Governor Per Jansson flagged the possibility of a rate cut in May or June before a surge in inflation to 5.4% YoY.
The USD/SEK pair experienced a slight dip, registering a 0.14% decline in Monday's session falling to 10.306. Datawise, the US trades weak, due to poor housing data reported earlier in the session, but all eyes seem to be on high-tier economic activity and inflation reports from the US set to be released later in the week.
The Swedish Krona (SEK) has recently gained significant ground against the US Dollar, despite presenting a mixed economic outlook. In addition, surging inflation for January in Sweden may push the Riksbank to hold delay cuts to June, somewhat aligning with the Federal Reserve’s (Fed) stance.
In case the Swedish monetary policy aligns with the American, the health of each economy will dictate the pace of the pair. For this week, the US will report revisions on the Gross Domestic Product (GDP) from Q4 and Personal Consumption Expenditures (PCE) figures from January, which may affect the expectations on the next decisions from the Fed and potentially fuelling volatility on the pair. As for now, the odds of a cut in March and May seem to have been disregarded by the markets and instead pushed to June.
USD/SEK technical analysis
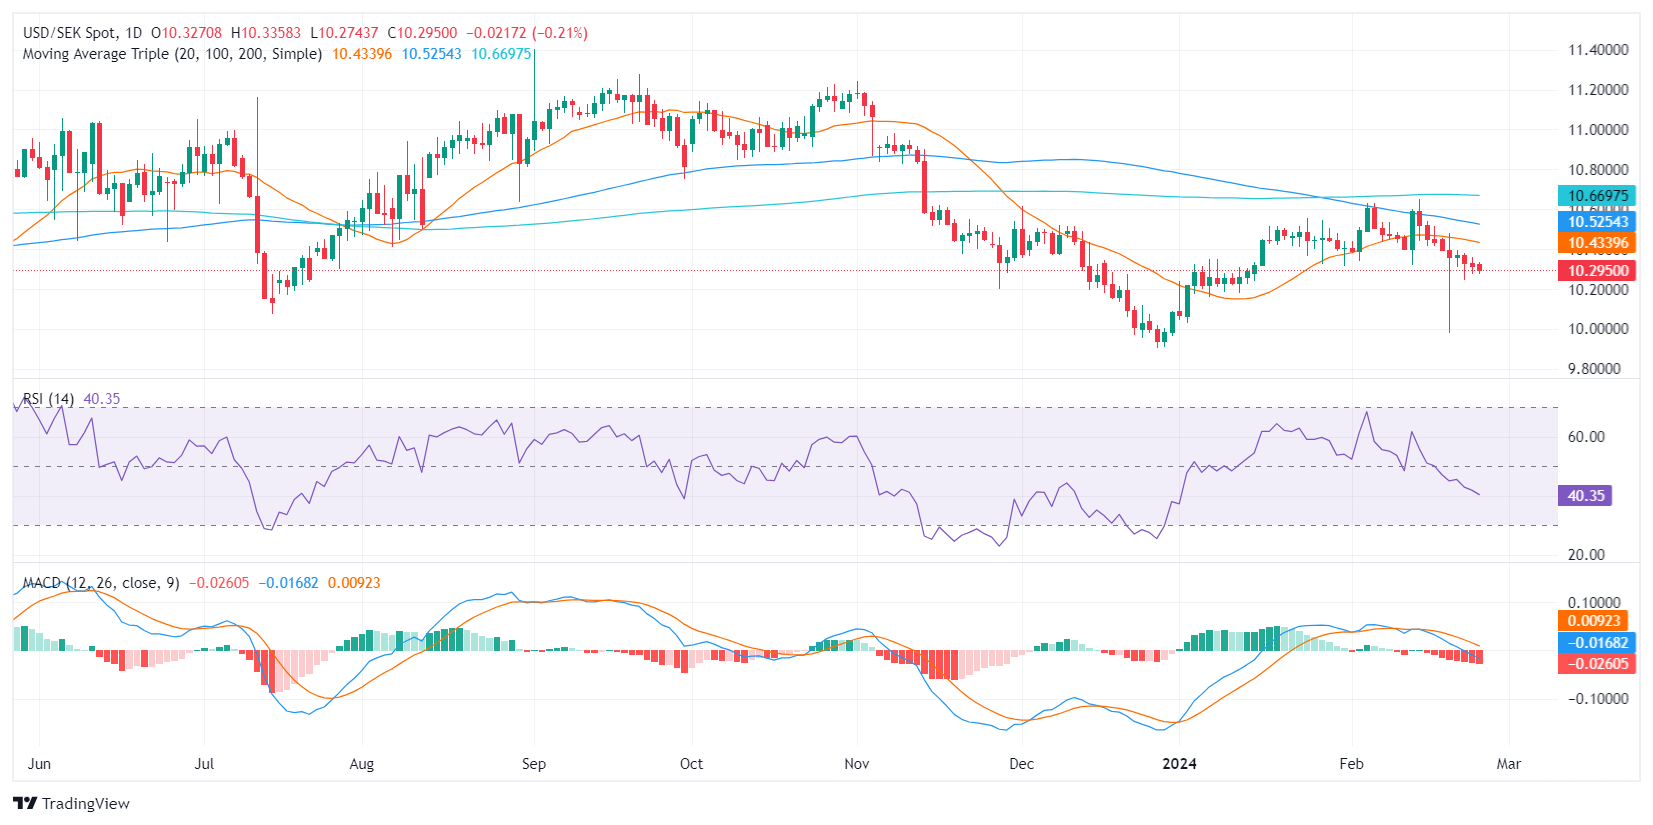
The daily Relative Strength Index (RSI) is currently positioned in the negative territory as it has been tracking lower than 50 while the Moving Average Convergence Divergence (MACD) histogram, with rising red bars, signifies a negative meaning that sellers are assuming control in the market, applying downward pressure to the pair.
In addition, the pair's underneath position relative to its 20, 100, and 200-day Simple Moving Averages (SMAs), reaffirms the bearish bias.
USD/SEK daily chart
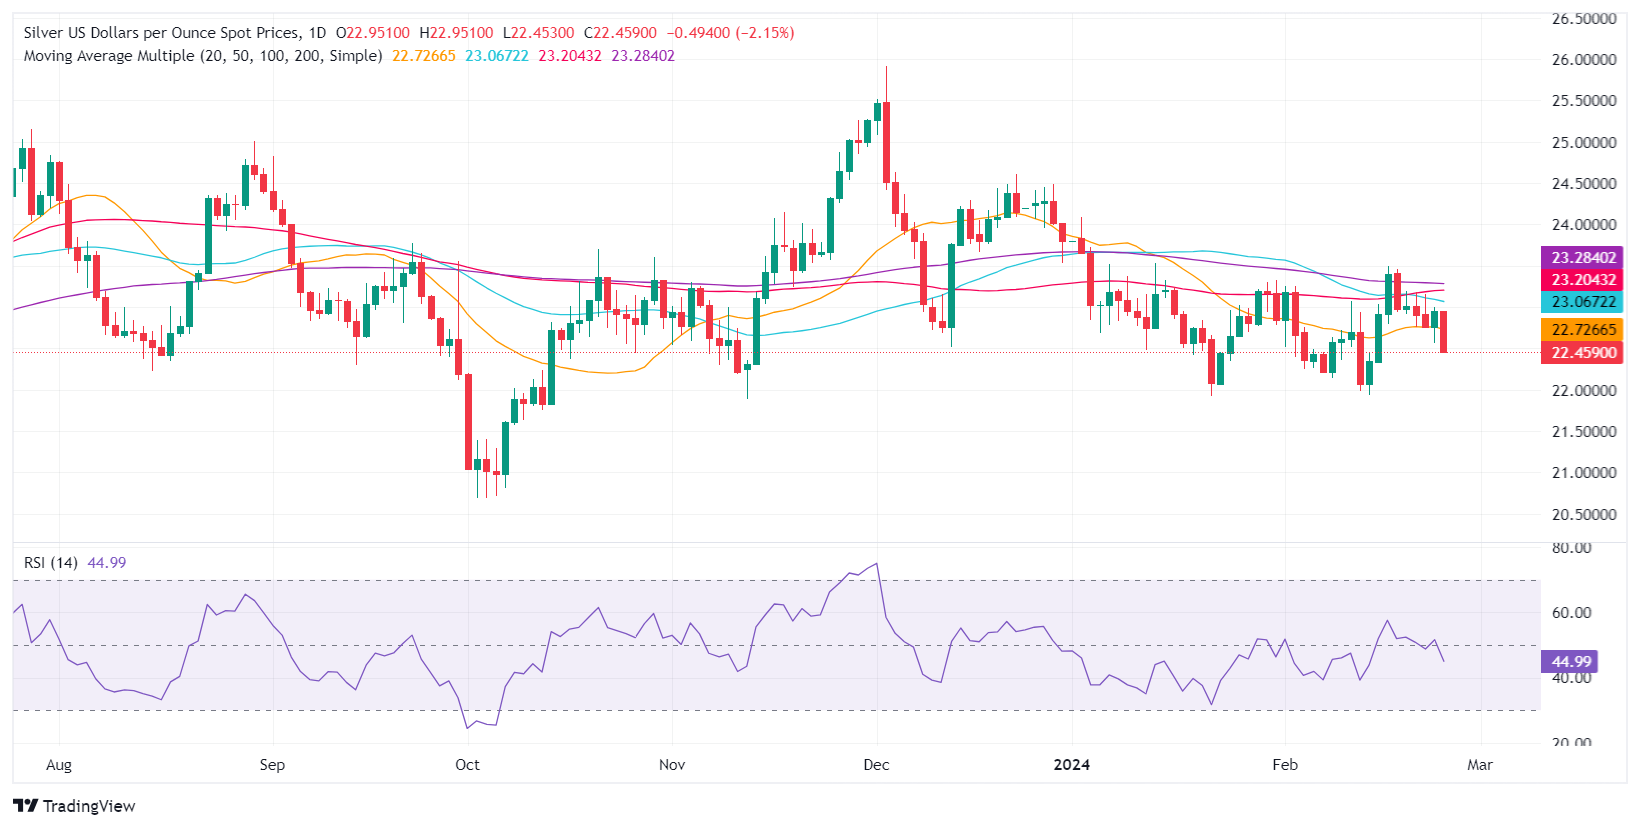
- Silver price dives over 2%, as investors react to higher US Treasury bond yields.
- Failure to hold above the 50-day DMA and $23.00 level triggers extended sell-off towards $21.88 support.
- Potential rebound hinges on reclaiming $22.57, with silver possibly oscillating within a tight range near current levels.
- Read more: Gold price falls as US Treasury yields climb amid weak US Dollar
Silver prices plummeted to a seven-day low during the mid-North American session on Monday, as US Treasury bond yields climbed while traders braced for the release of US inflation figures late in the week. At the time of writing, the XAG/USD exchanges hands at $22.47, down more than 2.05%.
The XAG/USD downtrend has extended as buyers failed to reclaim the 50-day moving average (DMA), which opened the door for a pullback below the psychological $23.00 figure. The downtrend resumed once Silver fell below the February 23 low of $22.57. Yet, a daily close below the latter would cement the bearish bias and open the door for a deeper correction toward the November 13 swing low of $21.88, before extending its losses to the $21.00 figure.
On the other hand, if buyers step in, and XAG/USD posts a daily close above $22.57, look for the grey metal to remain range-bound at around the $22.50-$23.00 area, capped by the DMAs, at around the $23.05-$23.26 range.
XAG/USD Price Analysis – Daily Chart
Further weakness in the Greenback allowed the risk-linked galaxy to maintain its march north well in place amidst steady speculation of an interest rate cut by the Fed in June and ahead of key inflation data in both the US (PCE) and the euro area (CPI).
Here is what you need to know on Tuesday, February 27:
The Greenback kicked off the week on the defensive and maintained the trade below the 104.00 mark when tracked by the USD Index (DXY). On Tuesday, the Conference Board will publish its Consumer Confidence gauge seconded by the FHFA House Price Index and Durable Goods Orders. In addition, the Fed’s Schmid and Barr are due to speak.
EUR/USD extended further north its multi-session bounce and retargeted the monthly highs near the 1.0900 milestone. On February 27, GfK’s Consumer Confidence is due in Germany.
GBP/USD’s upside bias remained capped by the 1.2700 neighbourhood amidst the ongoing multi-session rebound. Across the Channel, BoE’s Ramsden is only due to speak on February 27.
USD/JPY kept its gradual upward bias unchanged and approached the key round level at 151.00. On Tuesday, the Inflation Rate will take centre stage in the Japanese docket.
AUD/USD markedly reversed its two-week ascent and dropped to for-day lows near the 0.6530 level. The RBA’s Monthly CPI Indicator comes next in Oz on February 28.
Prices of WTI left behind Friday’s pullback and reclaimed the area beyond the $77.00 mark per barrel on the back of potential disruption concerns as well as the usual tight supply narrative.
Prices of the troy ounce of gold faded Friday’s advance in response to higher US yields across the curve, returning to the $2,025 zone. Its cousin Silver tumbled to multi-day lows near $22.50.
- Gold retreats to $2,026.93, facing pressure from a strengthening US Dollar and Treasury yield uptick.
- Market reevaluates Fed rate cut timeline with June odds at 50% for a potential easing.
- The US 10-year Treasury yield hovering around YTD highs keeps Gold’s price capped.
Gold price retraces after hitting the 50-day Simple Moving Average (SMA) at $2,033.67 during the European session and is down 0.40% as the Greenback (USD) dives. However, a rise in the US 10-year Treasury yield and traders trimming their odds of a dovish US Federal Reserve (Fed) sponsored a leg down in the non-yielding metal. The XAU/USD trades at $2,026.93 after hitting a high of $2,037.07.
Sentiment remains mixed, though tilted slightly negative, favoring the US Dollar. Interest rate speculators have priced out a Fed rate cut in March and May. For June, the odds of a quarter of a percentage point rate cut are at 50%. The US 10-year Treasury note climbs four-and-a-half basis points to 4.295%, shy of reaching the year-to-date (YTD) high of 4.354%, though keeping the yellow metal pressured, as investors align themselves with Fed officials’ posture of three rate cuts toward the end of 2024.
Daily digest market movers: Gold advance capped by the rise of US yields
- Data-wise, US New Home Sales rose by 1.5% from 0.651M to 0.661M, less than the 0.68M expected.
- The Dallas Fed Manufacturing Index for February contracted -11.3 though it improved compared to January’s -27.4 shrinkage, suggesting that business activity is recovering.
- The January minutes from the Federal Open Market Committee (FOMC) reveal that policymakers are cautious about reducing interest rates, mainly due to a recent uptick in inflation measures. While recognizing that the risks associated with meeting their dual mandates of price stability and maximum employment are becoming more balanced, the Fed intends to stay "highly attentive" to inflation. This focus comes even as they acknowledge that economic risks are skewed toward a downturn.
- Besides that, the US labor market remains strong after the latest Initial Jobless Claims data saw fewer Americans applying for unemployment benefits.
- US business activity moderated in February, revealed S&P Global. The Services and Composite Indices expanded below the previous month’s reading, though Manufacturing surprisingly jumped, exiting contractionary territory.
- Investors are pricing in 85 basis points of easing throughout 2024.
- The US Dollar Index, tracking the performance of the US Dollar against a basket of six major currencies, is currently trading near 103.84, down 0.12%.
- New York Fed President John Williams said the Fed is on track to cut interest rates “later this year.” He noted that the progress of inflation toward the central bank's 2% target would be “bumpy,” but overall the economy is headed “in the right direction.”
Technical analysis: Gold fails to cling above 50-day SMA as sellers move in
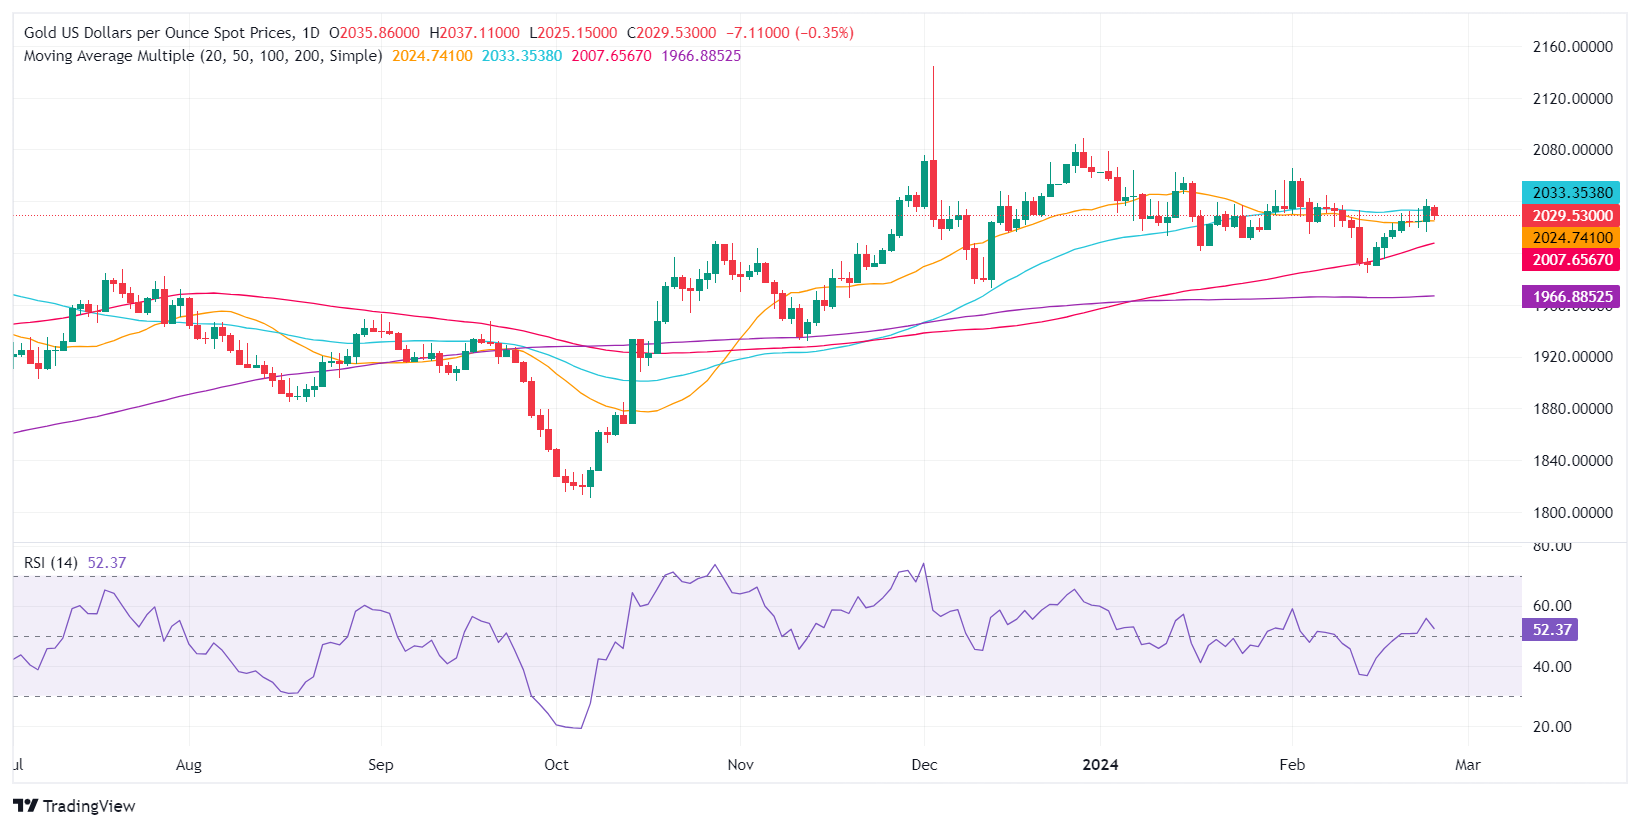
Monday sees a repeat of Friday’s note: “Gold has shifted to a neutral-upwards bias as it hurdles the 50-day Simple Moving Average (SMA).”
Even though XAU/USD has failed to cling above the 50-day SMA, the bias is intact unless Gold falls below the February 16 swing low of $2,016.15, which would exacerbate a challenge of the October 27 daily high-turned-support at $2,009.42. Once cleared, that will expose key technical support levels, like the 100-day SMA at $2,007.82, followed by the 200-day SMA at $1,966.79.
On the flip side, buyers dragging the XAU/USD spot price above the 50-day SMA could pave the way to challenge the $2,050 figure. Once those levels are cleared, up next would be the February 1 high at $2,065.60, ahead of the December 28 high at $2,088.48.
Gold FAQs
Why do people invest in Gold?
Gold has played a key role in human’s history as it has been widely used as a store of value and medium of exchange. Currently, apart from its shine and usage for jewelry, the precious metal is widely seen as a safe-haven asset, meaning that it is considered a good investment during turbulent times. Gold is also widely seen as a hedge against inflation and against depreciating currencies as it doesn’t rely on any specific issuer or government.
Who buys the most Gold?
Central banks are the biggest Gold holders. In their aim to support their currencies in turbulent times, central banks tend to diversify their reserves and buy Gold to improve the perceived strength of the economy and the currency. High Gold reserves can be a source of trust for a country’s solvency. Central banks added 1,136 tonnes of Gold worth around $70 billion to their reserves in 2022, according to data from the World Gold Council. This is the highest yearly purchase since records began. Central banks from emerging economies such as China, India and Turkey are quickly increasing their Gold reserves.
How is Gold correlated with other assets?
Gold has an inverse correlation with the US Dollar and US Treasuries, which are both major reserve and safe-haven assets. When the Dollar depreciates, Gold tends to rise, enabling investors and central banks to diversify their assets in turbulent times. Gold is also inversely correlated with risk assets. A rally in the stock market tends to weaken Gold price, while sell-offs in riskier markets tend to favor the precious metal.
What does the price of Gold depend on?
The price can move due to a wide range of factors. Geopolitical instability or fears of a deep recession can quickly make Gold price escalate due to its safe-haven status. As a yield-less asset, Gold tends to rise with lower interest rates, while higher cost of money usually weighs down on the yellow metal. Still, most moves depend on how the US Dollar (USD) behaves as the asset is priced in dollars (XAU/USD). A strong Dollar tends to keep the price of Gold controlled, whereas a weaker Dollar is likely to push Gold prices up.
- EUR/USD up a quarter of a percent in thin market open.
- ECB President Lagarde spoke on Monday, reiterates inflation stance.
- Inflation prints due this week, US PCE to be a key data print on Thursday.
EUR/USD saw a thin start to a hectic week on the economic calendar as markets ease into Monday action. EUR/USD rose around a quarter of a percent on Monday as technicals remain crimped ahead of a slew of price inflation and growth figures due on both sides of the pond.
Tuesday kicks things off with US Durable Goods Orders, and Wednesday delivers EU Consumer Confidence and US Gross Domestic Product (GDP) growth figures in the midweek. Thursday sees the euro area make its late data entrance to the trading week with German Retail Sales and Consumer Price Index (CPI) inflation. January’s US Personal Consumption Expenditure Price Index is also due on Thursday.
Daily digest market movers: quiet Monday trading sees EUR/USD pinned as investors await key data
- European Central Bank (ECB) President Christine Lagarde noted on Monday that inflation continues to ease towards ECB targets, remains committed restrictive policy measures for the time being.
- Read more: ECB President Lagarde says restrictive policy stance acts as a safeguard against wage-price spiral.
- Germany’s Gfk Consumer Confidence Survey for March due Tuesday, expected to recover to -29.0 from -29.7.
- US Durably Goods Orders in January are also due Tuesday, forecast to decline 4.8% versus the previous 0.0%.
- Wednesday to hinge on US Q4 GDP, forecast to hold steady at 3.3% through the four quarters.
- Thursday’s German Retail Sales expected to slightly recover to -1.5% for the year ended January compared to the previous period’s -1.7%.
- German CPI for February forecast to ease to 2.7% YoY versus the previous 3.1%.
- US Core PCE Price Index expected to print at 0.4% MoM in January versus the previous 0.2%.
Euro price today
The table below shows the percentage change of Euro (EUR) against listed major currencies today. Euro was the strongest against the Australian Dollar.
| USD | EUR | GBP | CAD | AUD | JPY | NZD | CHF | |
| USD | -0.21% | 0.00% | 0.09% | 0.46% | 0.18% | 0.24% | -0.03% | |
| EUR | 0.21% | 0.20% | 0.29% | 0.67% | 0.40% | 0.44% | 0.19% | |
| GBP | 0.01% | -0.20% | 0.09% | 0.47% | 0.20% | 0.25% | -0.02% | |
| CAD | -0.08% | -0.30% | -0.09% | 0.39% | 0.09% | 0.16% | -0.12% | |
| AUD | -0.48% | -0.67% | -0.46% | -0.38% | -0.27% | -0.22% | -0.48% | |
| JPY | -0.18% | -0.41% | -0.14% | -0.10% | 0.30% | 0.05% | -0.21% | |
| NZD | -0.24% | -0.44% | -0.23% | -0.15% | 0.23% | -0.04% | -0.27% | |
| CHF | 0.01% | -0.20% | 0.01% | 0.10% | 0.48% | 0.19% | 0.25% |
The heat map shows percentage changes of major currencies against each other. The base currency is picked from the left column, while the quote currency is picked from the top row. For example, if you pick the Euro from the left column and move along the horizontal line to the Japanese Yen, the percentage change displayed in the box will represent EUR (base)/JPY (quote).
Technical analysis: EUR/USD pinned below 1.0860 in thin Monday churn
EUR/USD remains capped below 1.0860 on Monday, but near-term higher lows are keeping the pair bolstered into the high end. A heavy supply zone from 1.0800 to 1.0820 remains on the intraday charts, and 1.0880 represents the near-term technical ceiling.
Despite a thin bullish buildout that sees very little topside momentum, EUR/USD has closed in the green for eight consecutive trading days and is on pace to chalk in a ninth. Of the last 14 trading days, only two have managed to close in the red.
Significant technical pressure is squeezing the pair into the midrange at the 200-day Simple Moving Average (SMA) near 1.0830. EUR/USD is up a scant 1.3% from February’s low bids near 1.0695.
USD/CAD hourly chart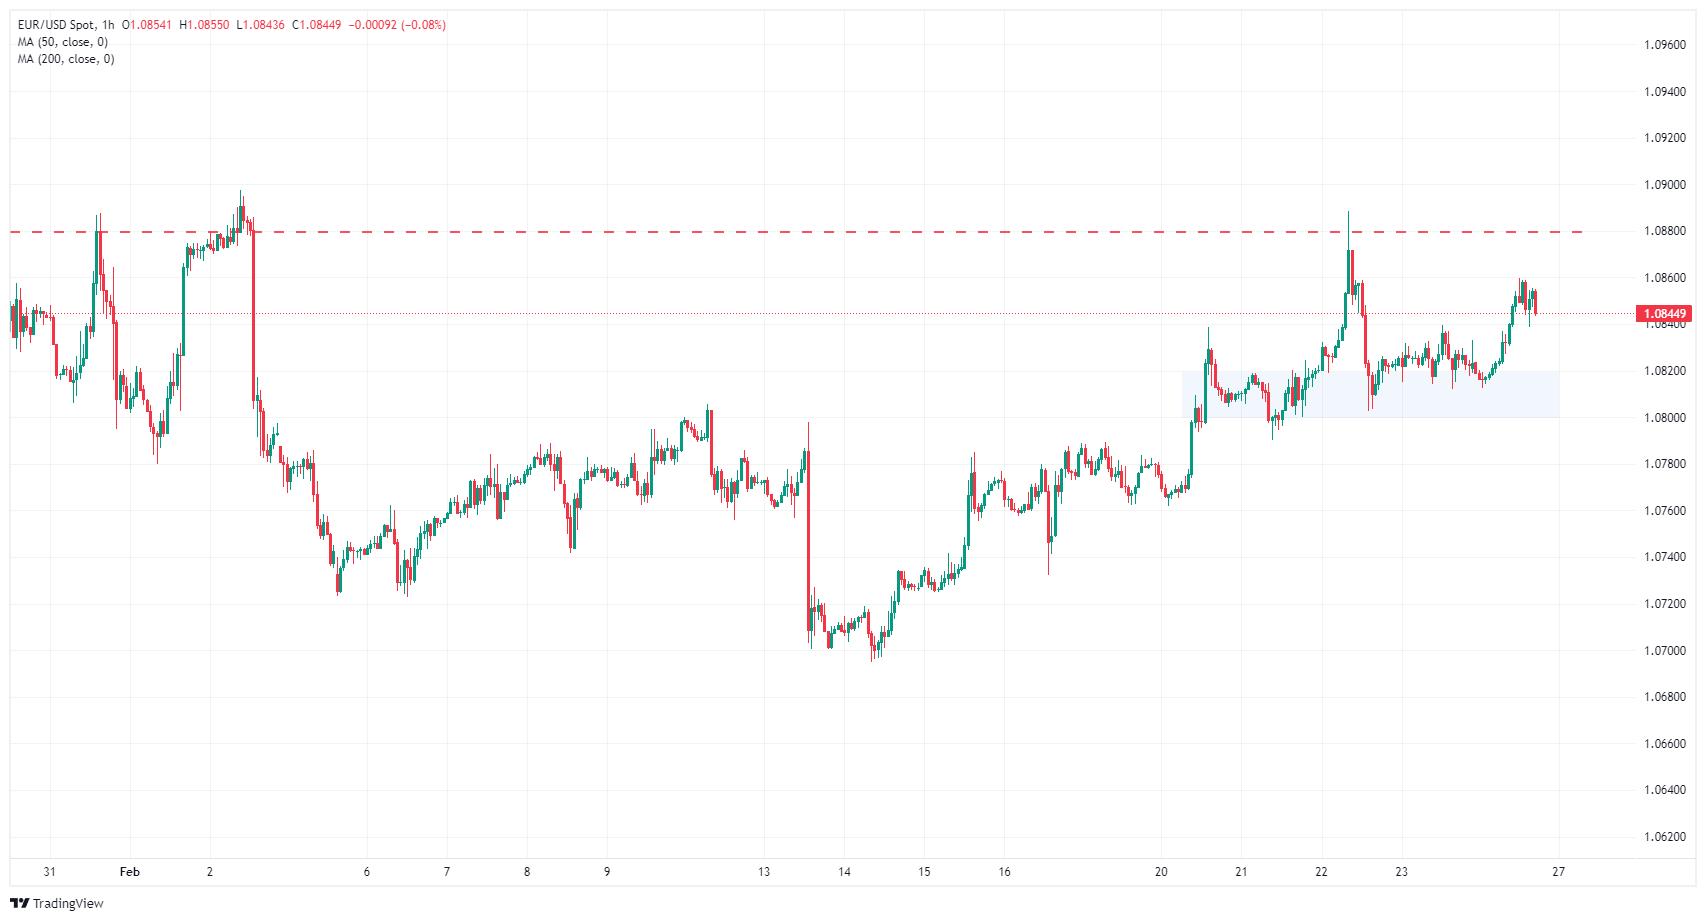
USD/CAD daily chart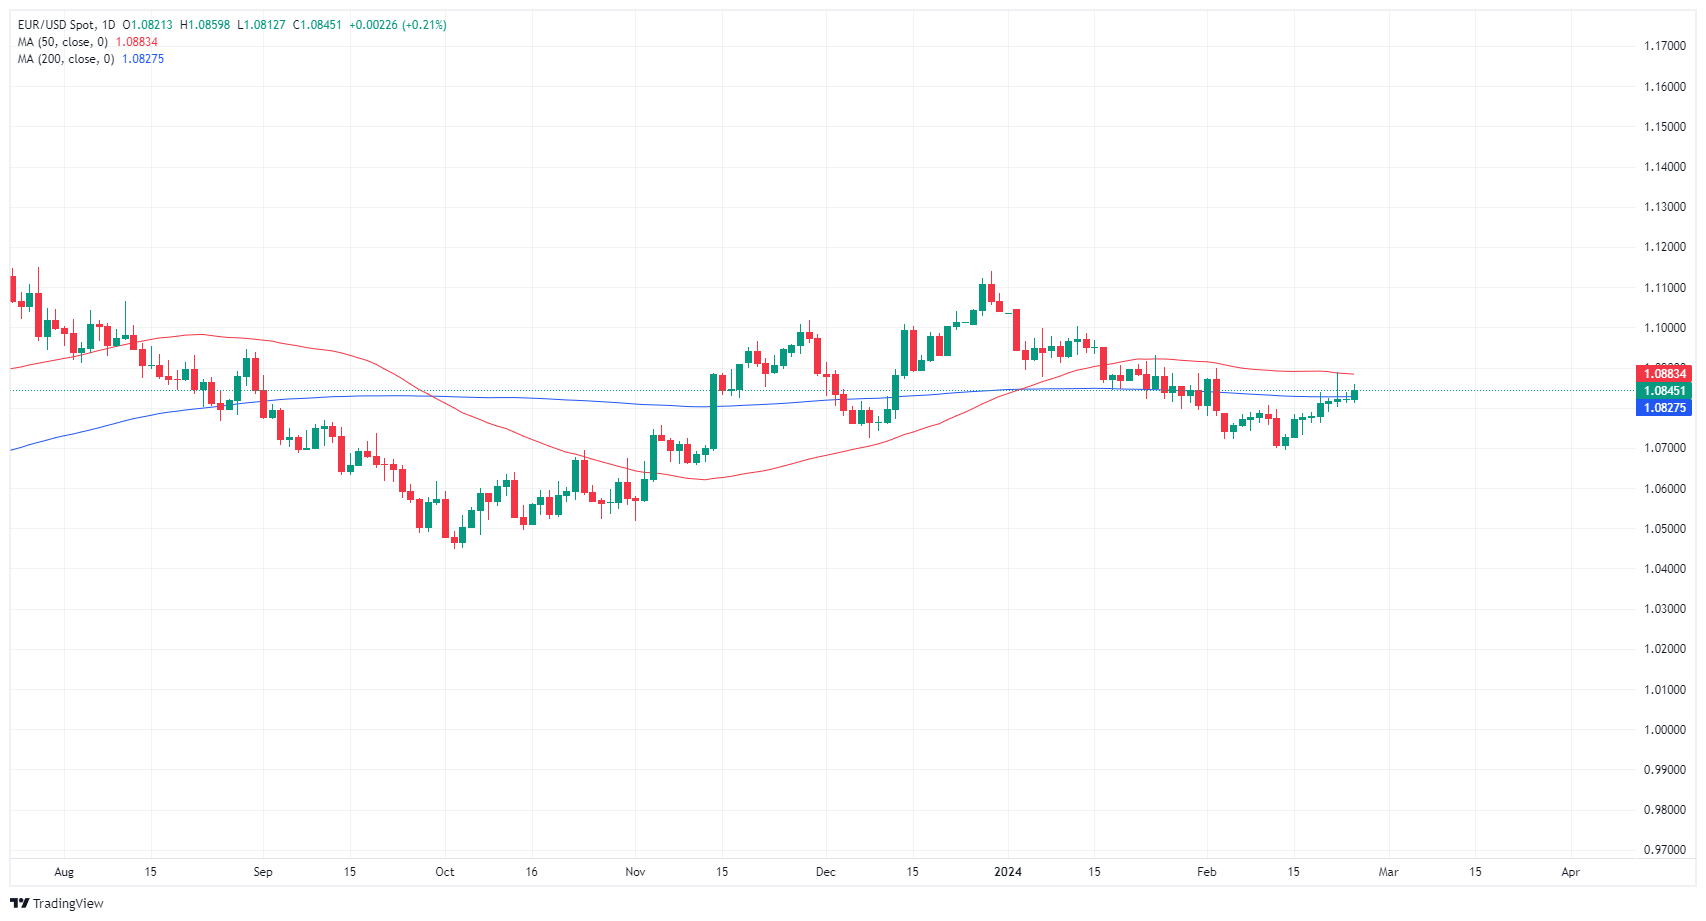
Euro FAQs
What is the Euro?
The Euro is the currency for the 20 European Union countries that belong to the Eurozone. It is the second most heavily traded currency in the world behind the US Dollar. In 2022, it accounted for 31% of all foreign exchange transactions, with an average daily turnover of over $2.2 trillion a day.
EUR/USD is the most heavily traded currency pair in the world, accounting for an estimated 30% off all transactions, followed by EUR/JPY (4%), EUR/GBP (3%) and EUR/AUD (2%).
What is the ECB and how does it impact the Euro?
The European Central Bank (ECB) in Frankfurt, Germany, is the reserve bank for the Eurozone. The ECB sets interest rates and manages monetary policy.
The ECB’s primary mandate is to maintain price stability, which means either controlling inflation or stimulating growth. Its primary tool is the raising or lowering of interest rates. Relatively high interest rates – or the expectation of higher rates – will usually benefit the Euro and vice versa.
The ECB Governing Council makes monetary policy decisions at meetings held eight times a year. Decisions are made by heads of the Eurozone national banks and six permanent members, including the President of the ECB, Christine Lagarde.
How does inflation data impact the value of the Euro?
Eurozone inflation data, measured by the Harmonized Index of Consumer Prices (HICP), is an important econometric for the Euro. If inflation rises more than expected, especially if above the ECB’s 2% target, it obliges the ECB to raise interest rates to bring it back under control.
Relatively high interest rates compared to its counterparts will usually benefit the Euro, as it makes the region more attractive as a place for global investors to park their money.
How does economic data influence the value of the Euro?
Data releases gauge the health of the economy and can impact on the Euro. Indicators such as GDP, Manufacturing and Services PMIs, employment, and consumer sentiment surveys can all influence the direction of the single currency.
A strong economy is good for the Euro. Not only does it attract more foreign investment but it may encourage the ECB to put up interest rates, which will directly strengthen the Euro. Otherwise, if economic data is weak, the Euro is likely to fall.
Economic data for the four largest economies in the euro area (Germany, France, Italy and Spain) are especially significant, as they account for 75% of the Eurozone’s economy.
How does the Trade Balance impact the Euro?
Another significant data release for the Euro is the Trade Balance. This indicator measures the difference between what a country earns from its exports and what it spends on imports over a given period.
If a country produces highly sought after exports then its currency will gain in value purely from the extra demand created from foreign buyers seeking to purchase these goods. Therefore, a positive net Trade Balance strengthens a currency and vice versa for a negative balance.
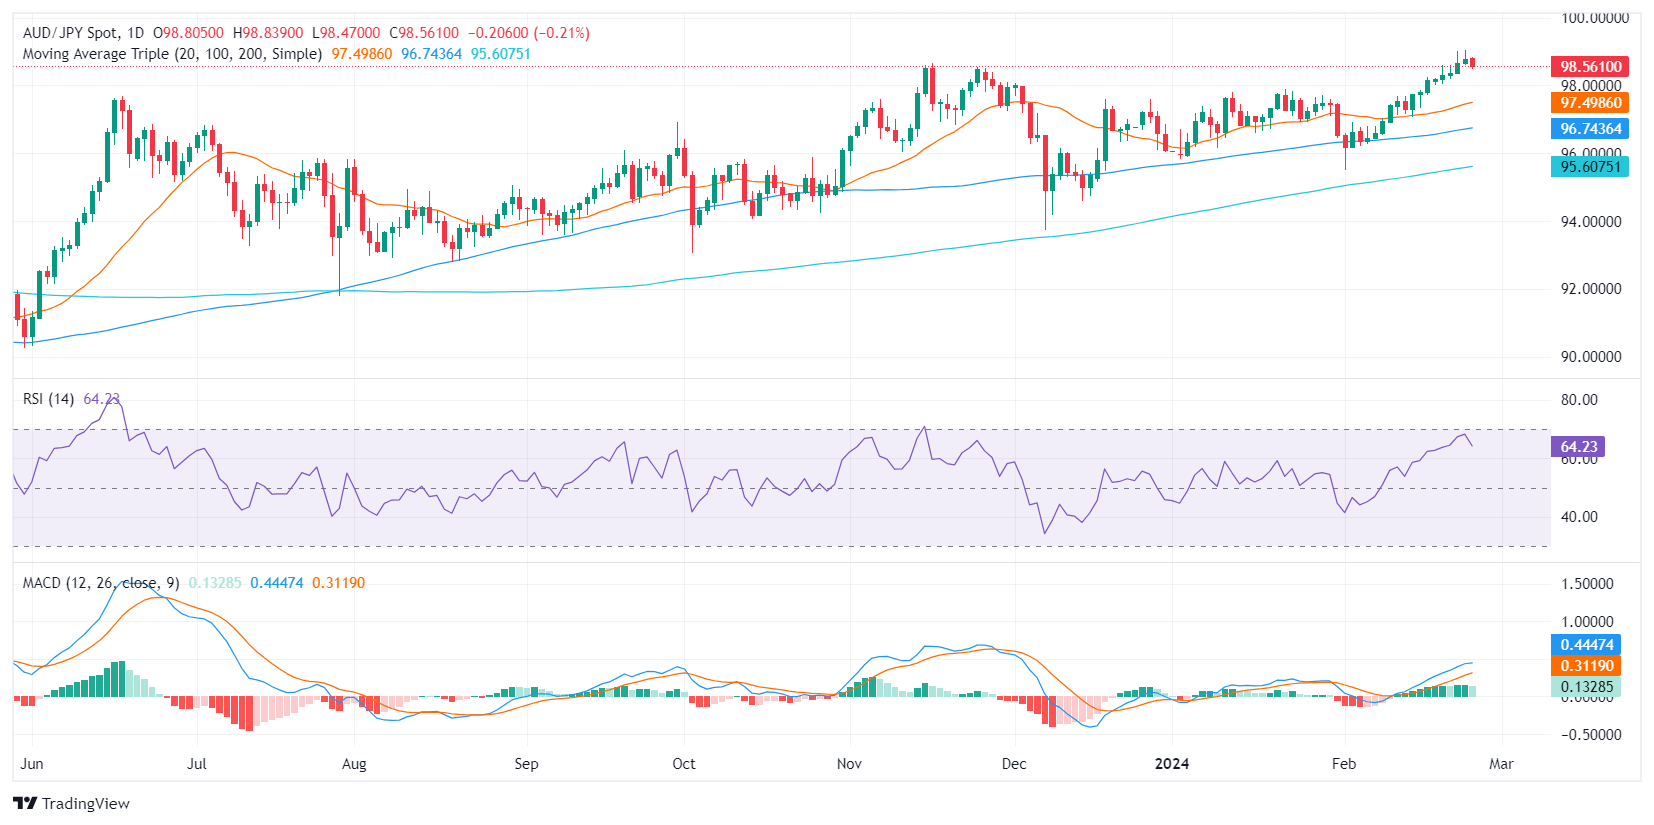
- The AUD/JPY is trading at 98.50, falling by 0.25% during Monday's session.
- Daily RSI for the AUD/JPY oscillates in the positive zone with a slight shift towards the sellers.
- On the hourly scale, the RSI settles in negative territory, signaling a short-term bearish correction.
- Indicators are consolidating the gains that took the pair to multi-year highs.
The AUD/JPY is currently trading at 98.50, with a slight dip of 0.25%. Based on the mix of indicators, the pair has a predominantly bullish bearing, although there are mild bearish hints on the shorter time frames. In that sense, the downward movements can be seen as a mere technical correction of the pair needed to consolidate the gains that took it to highs since 2015.
On the daily chart, considering the recent Relative Strength Index (RSI) values, the index shows a slight decline, implying a minor shift in favor of the sellers near the overbought zone. Nonetheless, the positioning in the above half domain indicates that buyers still exercise control. Turning to the daily Moving Average Convergence Divergence (MACD), the histogram's decreasing green bars signal fading positive momentum. Despite this deceleration, the positive color implies that the bulls may still have some fuel to counterattack the bearish pulls.
AUD/JPY daily chart
On an hourly chart, the RSI has settled into the negative band, depicting a conflicting scenario between the short-term and the broader perspective. Concurrently, the MACD histogram shows an uptrend but it is characterized by red bars, pointing to a build-up of negative momentum.
AUD/JPY hourly chart
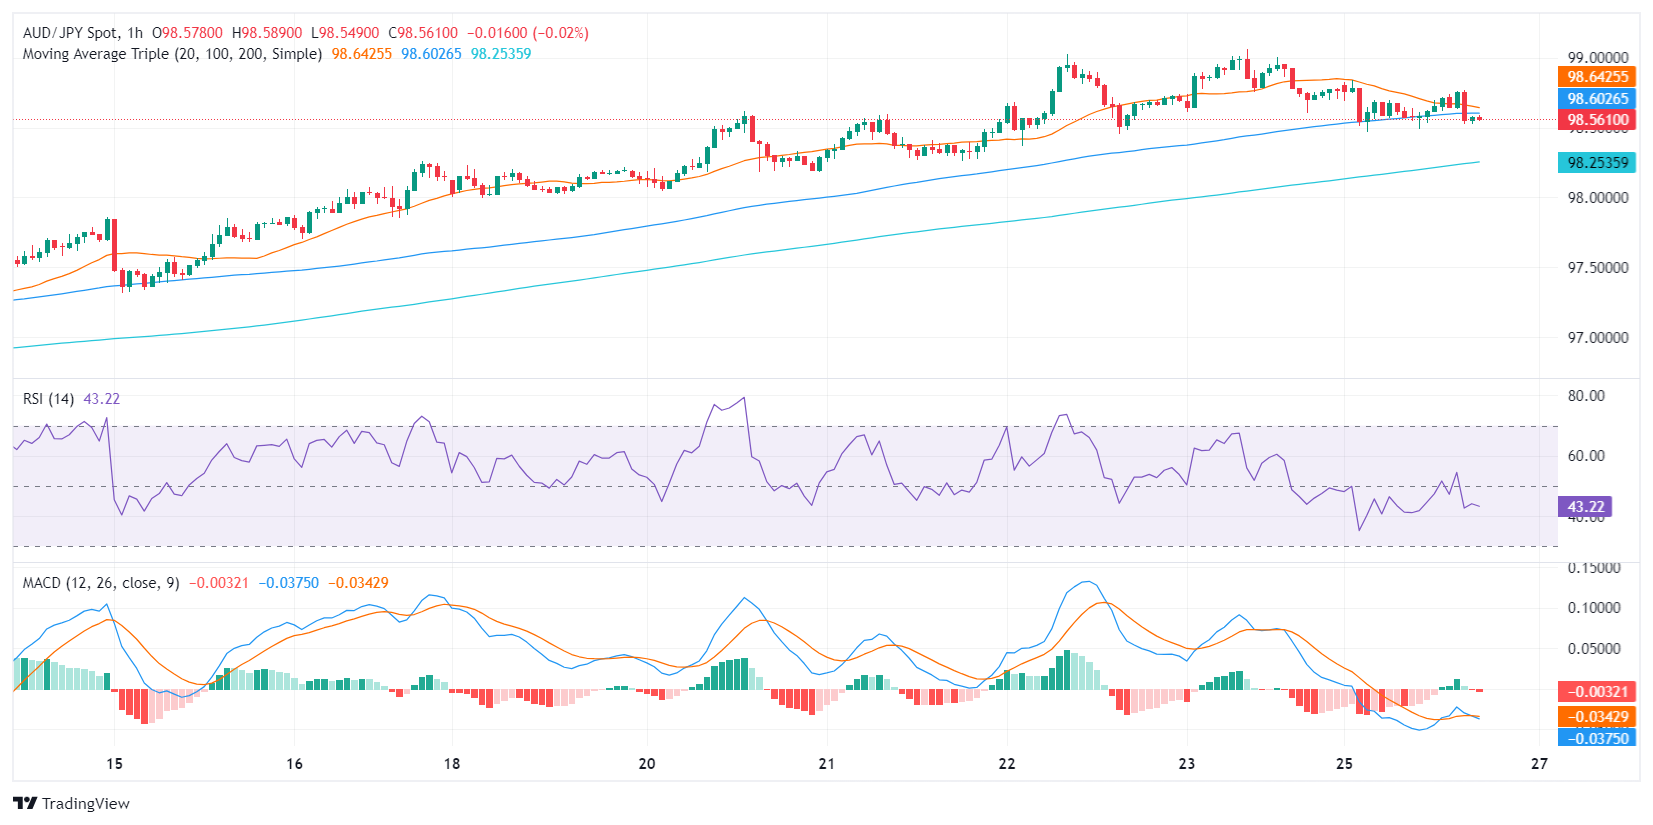
In summary, the AUD/JPY exhibits bullish signals from a general perspective, supported by its position above its main SMAs and positive territory representation by the daily RSI and MACD. However, bearish cues emerge on an hourly scale and maybe a warning that the bulls may take a breather in the next sessions to consolidate gains.
- EUR/CHF up over 3% from December’s lows.
- ECB President Lagarde looks ahead to growth rebound.
- Swiss Franc is broadly weaker across the majors market.
EUR/CHF knocked into fresh multi-month highs on Monday as the pair steps into a ten-week peak above 0.9550. The Swiss Franc (CHF) has depreciated notably against the majority of its major currency peers in 2024, and is down 2.88% YTD against the Euro (EUR).
European Central Bank (ECB) President Christine Lagarde hit the newswires on Monday while speaking about the ECB’s latest Annual Report in Strasbourg. The ECB head noted that the ECB expects inflation to continue slowing as the upward momentum from past shocks fade. It has been almost three straight years since the start of inflation the ECB initially called ‘transitory’. European inflation is not projected to decline below the ECB’s upper target of 2% until sometime in 2025.
ECB President Lagarde: Restrictive policy stance acts as a safeguard against wage-price spiral
Germany’s Gfk Consumer Confidence Survey for March is due early Tuesday and is forecast to improve slightly, expected to print at -29.0 versus the previous -29.7. Switzerland’s ZEW Survey of Expectations for February is due Wednesday, which last printed at -19.5. Thursday brings both German Retail Sales for January and Switzerland’s fourth quarter Gross Domestic Product (GDP) print, which is forecast to ease slightly to 0.2% QoQ compared to the previous quarter’s 0.3%.
EUR/CHF technical outlook
EUR/CHF has been on a firm bullish push lately, with the pair set to close in the green on Monday and chalk up another bullish candle, with 15 of the last 17 consecutive trading days closing flat or higher.
With the pair cracking December’s high at 0.9545, the next immediate target for EUR/CHF bidders will be November’s swing high of 0.9685.
EUR/CHF hourly chart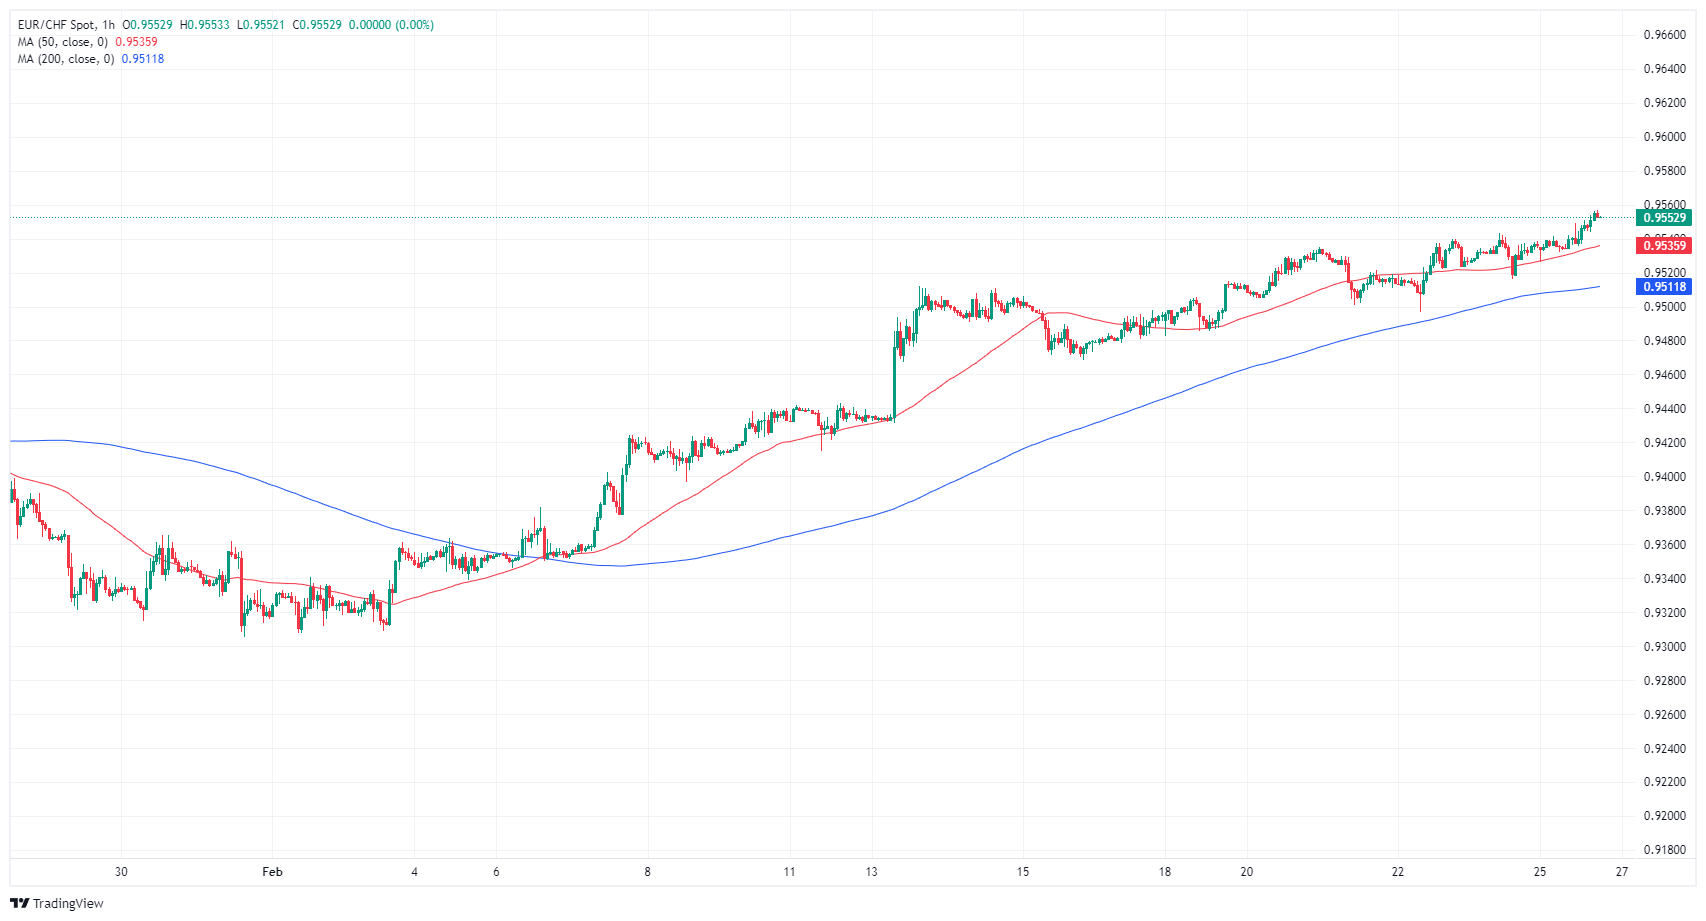
EUR/CHF daily chart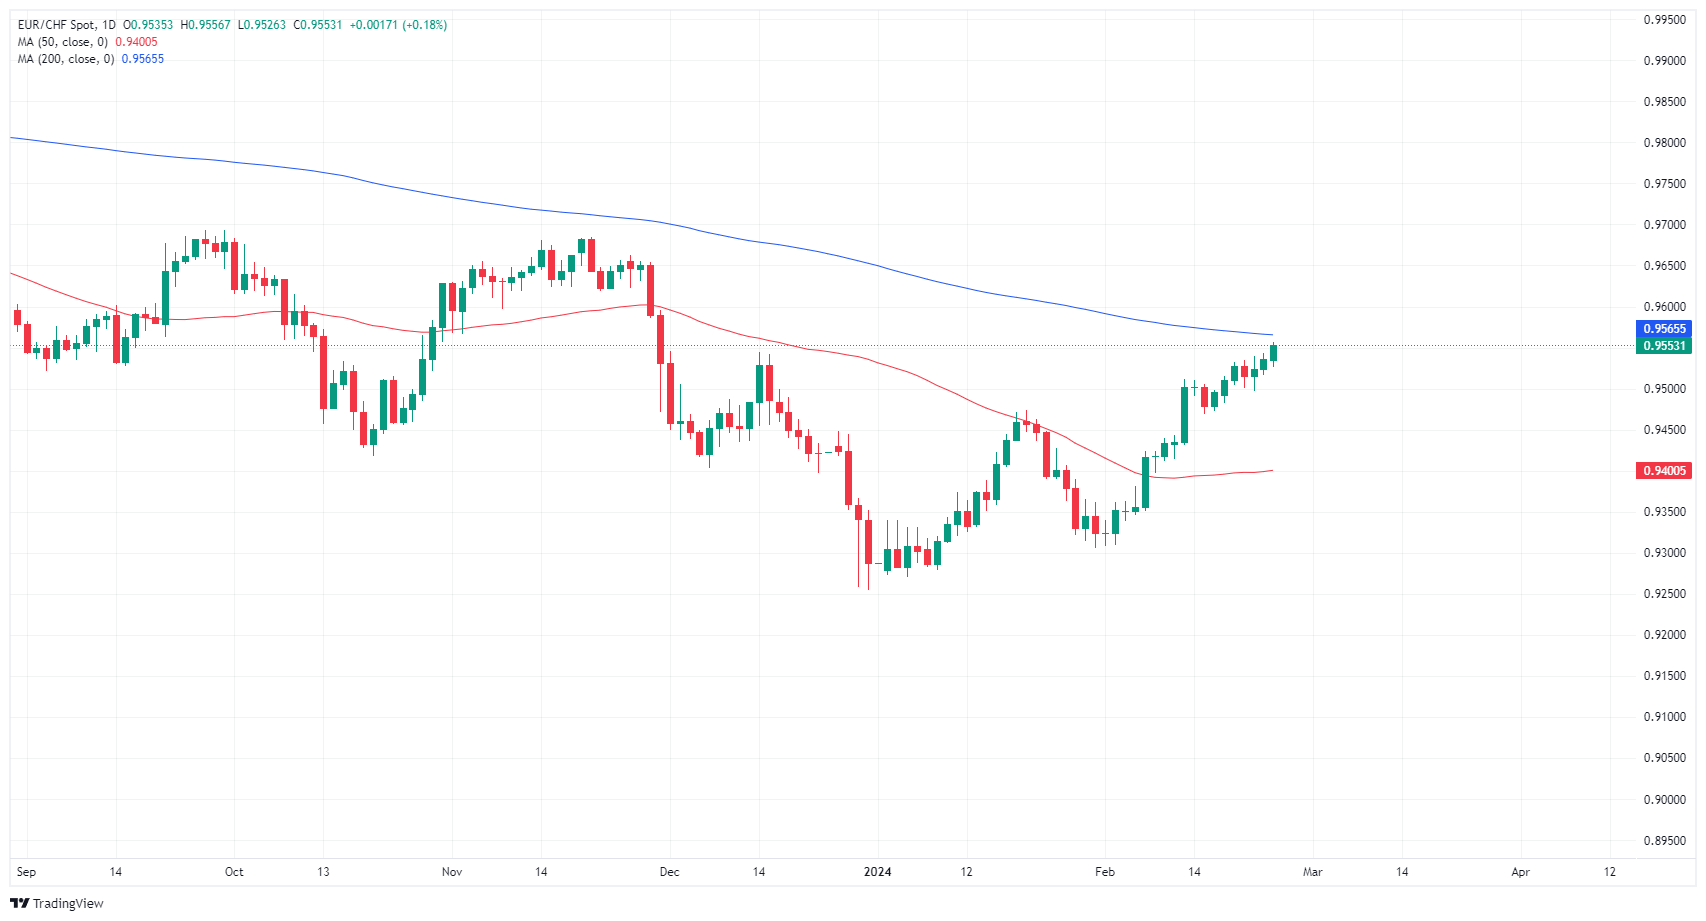
- Mexican Peso remains weak as traders await a crucial US inflation report.
- Mexico's trade balance, unemployment and manufacturing PMI to spotlight economic trends amid high Banxico rates.
- Banxico meeting minutes fuel speculation of a March rate cut, influencing the Peso's trajectory.
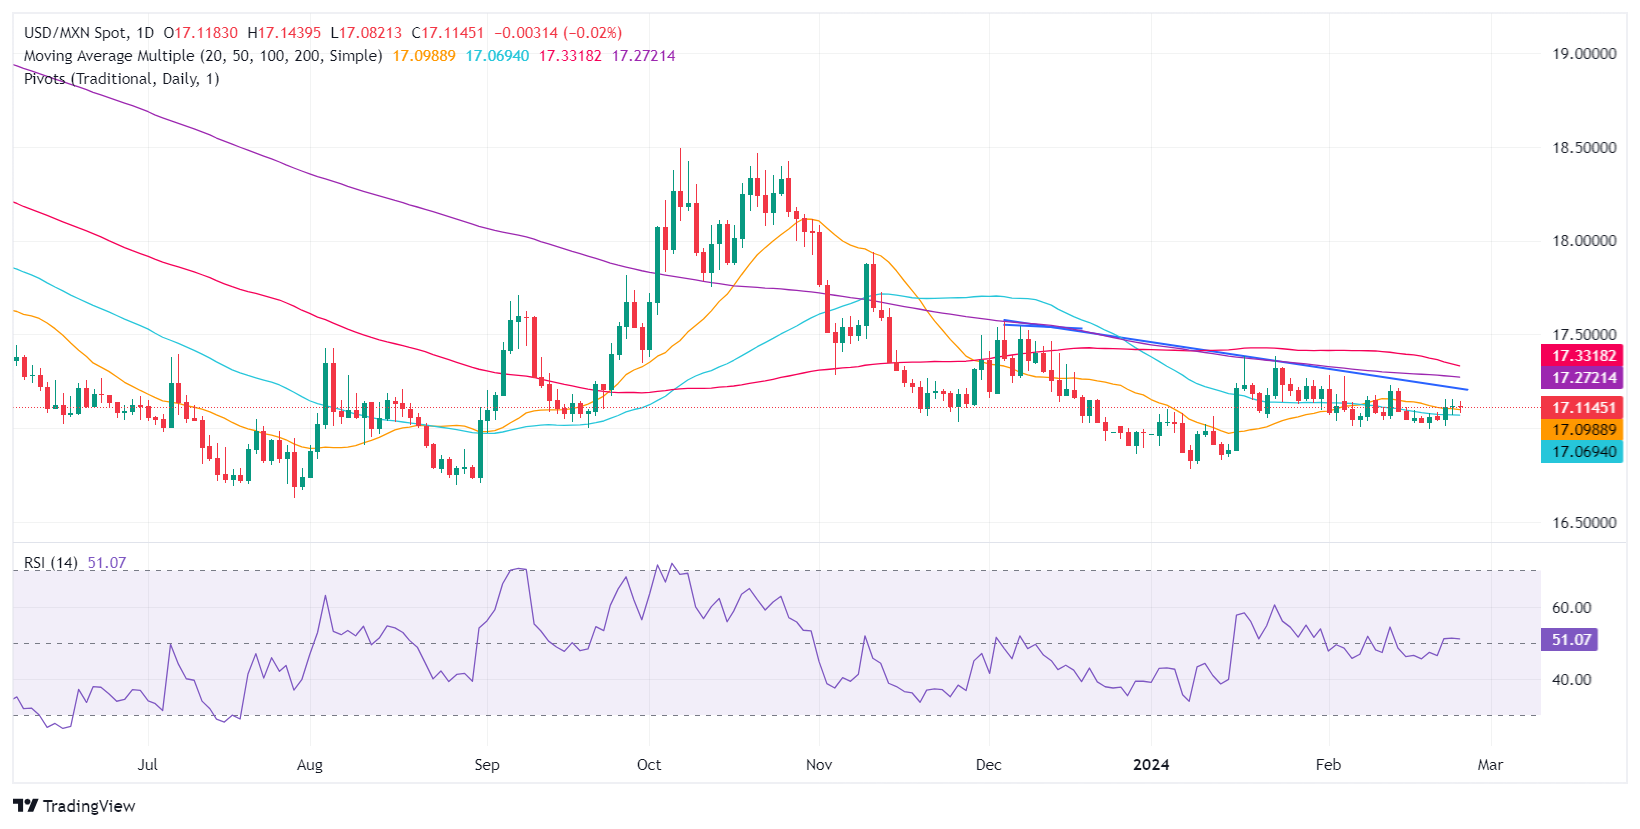
The Mexican Peso (MXN) extended its losses against the US Dollar on Monday but stayed near familiar levels, with market participants awaiting a busy weekly economic schedule in the United States. Traders are eyeing the release of the Personal Consumption Expenditures (PCE) report, the Federal Reserve’s (Fed) preferred inflation gauge, along with Q4 2023 Gross Domestic Product (GDP) figures on its second estimate. The USD/MXN trades at 17.12, up 0.14%.
Mexico’s economic docket on Monday is absent, though it gathers pace on Tuesday with the release of the Balance of Trade expected to print a deficit in January. On Thursday, the National Statistics Agency (INEGI) will reveal the Unemployment Rate for January, estimated to increase compared to December’s data, followed by Friday’s Business Confidence and S&P Global Manufacturing PMI.
The economic data in Mexico is expected to show an economic slowdown due to higher interest rates set by the Bank of Mexico (Banxico) at 11.25%. That, along with the latest report of the Consumer Price Index (CPI) dipping sharply for the first half of February, justifies the posture of three members of Banxico. The latest meeting minutes suggested that three policymakers are eyeing the first rate cut at the March meeting, which could put pressure on the Mexican Peso, opening the door for further upside on the USD/MXN exchange rate.
Across the border, housing data was positive, while the Dallas Fed Manufacturing Index in February improved slightly compared to January’s figures.
Daily digest market movers: Mexican Peso hovers near last week’s lows
- The language of the Banxico minutes was less “hawkish,” indicating a more flexible approach, according to analysts cited by El Economista. Analysts at Goldman Sachs commented that the Banxico Governing Council is tilting toward easing monetary policy unless exogenous shocks impact the USD/MXN exchange rate.
- The latest inflation report in Mexico showed that headline and underlying inflation continued to dip toward Banxico’s goal of 3% plus or minus 1%, while economic growth exceeded estimates but finished below Q3’s 3.3%. Those factors added to the plunge in Retail Sales:I.
- Mexico’s Consumer Price Index (CPI) in the first half of February was 4.45%, down from 4.9% YoY.
- Mexico’s Core CPI slowed from 4.78% to 4.63% in the yearly data.
- Mexico’s GDP for Q4 2023 exceeded estimates of 2.4% YoY and hit 2.5%, less than Q3 2023 print of 3.3%.
- Economic trade issues between Mexico and the US could depreciate the Mexican currency if the Mexican government fails to resolve its steel and aluminum dispute with the United States. US Trade Representative Katherine Tai warned the US could reimpose tariffs on the commodities.
- US New Home Sales rose by 1.5% from 0.651M to 0.661M, less than the 0.68 M expected.
- The last meeting minutes of the US Federal Reserve (Fed) showed that policymakers remain hesitant to cut rates amid fears of a second round of inflation. They have expressed willingness to adjust policy when necessary but remain cautious, indicating no urgency to act. This stance is supported by current economic data suggesting strength in the economy, which could potentially revive inflationary pressure.
- Market players had trimmed the odds for a first 25 basis point (bps) rate cut in June, with odds lying at 49.4%, while 40% of investors expected the Fed to keep rates unchanged at the current level of 5.25%-5.50%.
Technical analysis: Mexican Peso slide pushes USD/MXN above 50-day SMA
The USD/MXN continues to consolidate for the third straight day above the 50-day Simple Moving Average (SMA) at 17.07, which could open the door for further gains. If buyers reclaim the psychological 17.20 figure, that could open the door to threaten the 200-day SMA at 17.27. If they cleared those two levels, up next would be the 100-day SMA at 17.38, ahead of the 17.50 figure.
On the other hand, if sellers step in and cap USD/MXN’s upside, they need to push prices below the 50-day SMA, before challenging the 17.00 figure. Once cleared, the next support would be the current year-to-date (YTD) low of 16.78, followed by the 2023 low of 16.62.
USD/MXN Price Action – Daily Chart
Mexican Peso FAQs
What key factors drive the Mexican Peso?
The Mexican Peso (MXN) is the most traded currency among its Latin American peers. Its value is broadly determined by the performance of the Mexican economy, the country’s central bank’s policy, the amount of foreign investment in the country and even the levels of remittances sent by Mexicans who live abroad, particularly in the United States. Geopolitical trends can also move MXN: for example, the process of nearshoring – or the decision by some firms to relocate manufacturing capacity and supply chains closer to their home countries – is also seen as a catalyst for the Mexican currency as the country is considered a key manufacturing hub in the American continent. Another catalyst for MXN is Oil prices as Mexico is a key exporter of the commodity.
How do decisions of the Banxico impact the Mexican Peso?
The main objective of Mexico’s central bank, also known as Banxico, is to maintain inflation at low and stable levels (at or close to its target of 3%, the midpoint in a tolerance band of between 2% and 4%). To this end, the bank sets an appropriate level of interest rates. When inflation is too high, Banxico will attempt to tame it by raising interest rates, making it more expensive for households and businesses to borrow money, thus cooling demand and the overall economy. Higher interest rates are generally positive for the Mexican Peso (MXN) as they lead to higher yields, making the country a more attractive place for investors. On the contrary, lower interest rates tend to weaken MXN.
How does economic data influence the value of the Mexican Peso?
Macroeconomic data releases are key to assess the state of the economy and can have an impact on the Mexican Peso (MXN) valuation. A strong Mexican economy, based on high economic growth, low unemployment and high confidence is good for MXN. Not only does it attract more foreign investment but it may encourage the Bank of Mexico (Banxico) to increase interest rates, particularly if this strength comes together with elevated inflation. However, if economic data is weak, MXN is likely to depreciate.
How does broader risk sentiment impact the Mexican Peso?
As an emerging-market currency, the Mexican Peso (MXN) tends to strive during risk-on periods, or when investors perceive that broader market risks are low and thus are eager to engage with investments that carry a higher risk. Conversely, MXN tends to weaken at times of market turbulence or economic uncertainty as investors tend to sell higher-risk assets and flee to the more-stable safe havens.
- The DXY Index slips on Monday, trading down to 103.80.
- Fed's hesitance to cut rates has stirred the market and may limit DXY losses.
- New Home Sales data for January was lower than expected at 0.66 million.
The US Dollar Index (DXY) is trading at 103.80, reflecting a slight decline. The underperformance comes after the report of soft January housing data from the US, while the Federal Reserve (Fed)'s expressed hesitation toward premature rate cuts may limit the downside. Looking forward, investors await significant forthcoming reports to glean further understanding of the health of the economy including Core and Personal Consumption Expenditures (PCE) and Gross Domestic Product (GDP) revisions later this week.
The Fed, unwavering since January's FOMC meeting, rejects premature rate cuts. Markets heed the stance with the odds of March and May cuts remaining low. As for now, the best-case scenario for markets is that the bank will start cutting in June, but it will all come down to the incoming data. PCE data and GDP revisions will be key.
Daily digest market movers: US Dollar weakened by soft housing data
- January's New Home Sales, as reported by the US Census Bureau, exceeded market expectations by 0.66M against the forecast of 0.68M.
- As per the CME FedWatch Tool, a hold in the March and May meetings are being priced in, while the odds of a cut in June remain the strongest case, but the odds are somewhat low, around 53%.
- In case PCE and GDP data come in softer than expected, those odds may change in favor of dovish rhetoric and weight on the US Dollar.
Technical analysis: DXY Index’s bearish movement dominates as sellers conquer key level
On the daily chart, the Relative Strength Index (RSI) exhibits a negative slope residing in negative territory, an indication that selling pressure outweighs buying momentum in the market. Concurrently, the Moving Average Convergence Divergence (MACD) signals a bearish outlook as well. The red bars are lengthening on the histogram, implying rising selling momentum. This highlights an amplified bearish force, contributing to the weakening of the pair.
However, the positioning of the Simple Moving Averages (SMAs) paints a more nuanced picture. Despite the Index now trading below the 20-day and 100-day SMAs, which supports the bearish sentiment, it's still above the 200-day SMA. This upward breach can be interpreted as a demonstration of robust resilience by the bulls in the larger context, hinting that buyers are fighting to regain control. That being said, credit should be granted to bears, who managed to breach the key 20-day average, which recently acted as a key support.
This suggests that, for now, the selling force is dominant over the buying momentum, but if the buyers defend the 200-day SMA, the overall positive bias will remain intact.
US Dollar FAQs
What is the US Dollar?
The US Dollar (USD) is the official currency of the United States of America, and the ‘de facto’ currency of a significant number of other countries where it is found in circulation alongside local notes. It is the most heavily traded currency in the world, accounting for over 88% of all global foreign exchange turnover, or an average of $6.6 trillion in transactions per day, according to data from 2022.
Following the second world war, the USD took over from the British Pound as the world’s reserve currency. For most of its history, the US Dollar was backed by Gold, until the Bretton Woods Agreement in 1971 when the Gold Standard went away.
How do the decisions of the Federal Reserve impact the US Dollar?
The most important single factor impacting on the value of the US Dollar is monetary policy, which is shaped by the Federal Reserve (Fed). The Fed has two mandates: to achieve price stability (control inflation) and foster full employment. Its primary tool to achieve these two goals is by adjusting interest rates.
When prices are rising too quickly and inflation is above the Fed’s 2% target, the Fed will raise rates, which helps the USD value. When inflation falls below 2% or the Unemployment Rate is too high, the Fed may lower interest rates, which weighs on the Greenback.
What is Quantitative Easing and how does it influence the US Dollar?
In extreme situations, the Federal Reserve can also print more Dollars and enact quantitative easing (QE). QE is the process by which the Fed substantially increases the flow of credit in a stuck financial system.
It is a non-standard policy measure used when credit has dried up because banks will not lend to each other (out of the fear of counterparty default). It is a last resort when simply lowering interest rates is unlikely to achieve the necessary result. It was the Fed’s weapon of choice to combat the credit crunch that occurred during the Great Financial Crisis in 2008. It involves the Fed printing more Dollars and using them to buy US government bonds predominantly from financial institutions. QE usually leads to a weaker US Dollar.
What is Quantitative Tightening and how does it influence the US Dollar?
Quantitative tightening (QT) is the reverse process whereby the Federal Reserve stops buying bonds from financial institutions and does not reinvest the principal from the bonds it holds maturing in new purchases. It is usually positive for the US Dollar.
"Our restrictive monetary policy stance, the ensuing strong decline in headline inflation and firmly anchored longer-term inflation expectations act as a safeguard against a sustained wage-price spiral," European Central Bank President Christine Lagarde told European Parliament on Monday.
Key takeaways
"There are increasing signs of a bottoming-out in growth and some forward-looking indicators point to a pick-up later this year."
"Wage pressures, meanwhile, remain strong."
"The current disinflationary process is expected to continue, but the governing council needs to be confident that it will lead us sustainably to our 2% target."
"Labour cost increases are partly buffered by profits and are not being fully passed on to consumers."
"We expect inflation to continue slowing down, as the impact of past upward shocks fades and tight financing conditions help to push down inflation."
Market reaction
EUR/USD showed no immediate reaction to these comments and was last seen rising 0.28% on the day at 1.0850.
USD/JPY is approaching the 2023 high of 152.00. Economists at Société Générale analyze the pair’s technical outlook.
146.00/145.50 is a crucial support zone
USD/JPY defended the trend line drawn since 2022 at 140.20 resulting in a sharp rebound. It recently crossed above both 50-DMA and 200-DMA. Confluence of those MAs near 146.00/145.50 is a crucial support zone.
The pair is expected to head higher towards last year high of 152.00. If this is overcome, a larger uptrend can’t be ruled out towards next projections at 154.50/155.00.
The US Dollar (USD) ended a run of five weeks of gains. Economists at Société Générale analyze Greenback’s outlook.
Month-end equity rebalancing flows could keep USD on the back until Thursday’s PCE
Month-end equity rebalancing flows could keep the Dollar on the back foot until the release of PCE inflation on Thursday.
The reconvergence of the DXY towards the 200-DMA (103.78) requires close scrutiny. A break below would clear the path for a return to early February lows near 103.00 and could guide EUR/USD above 1.0900, GBP/USD over 1.2750 and AUD/USD towards 0.6600.
- USD/CAD continues Friday’s thin drift near the 1.3500 handle.
- Canada wholesale trade likely fell 0.6% in January.
- US New Home Sales rose 1.5% vs 7.2% previous, Durable Goods due tomorrow.
USD/CAD is stuck in a slow drift near 1.3500 as markets gear up for the week. Economic data remains thin on Monday, and traders will be looking ahead to Tuesday’s US Durable Goods Orders for January, as well as Wednesday’s US Gross Domestic Product (GDP) growth for the fourth quarter.
Canada is predominantly underrepresented on the economic calendar until Thursday’s Canadian GDP Q4 performance. StatCan noted on Monday that Canadian wholesale trade likely fell in January with January’s Canadian manufacturing sales seeing a slight bump.
Daily digest market movers: USD/CAD gears up for a key data week with easy Monday
- According to StatCan Flash Estimate, Canada’s January wholesale trade likely fell by 0.6% MoM, while January manufacturing sales likely rose 0.4% MoM.
- US New Home Sales Change rose 1.5% MoM in January compared to the previous month’s 7.2% (revised from 8.0%).
- US New Home Sales in January 661K versus 680K, previous 651K (revised from 664K).
- Tuesday’s US Durable Goods Orders for January is forecast to decline 4.8% MoM, previous print 0.0%.
- Canada’s Current Account is expected to record -1.25 billion on Wednesday, -3.22 billion previous.
- US fourth-quarter GDP growth forecast to hold steady at 3.3% for the year ended 4Q.
- Canada’s Q4 GDP slated for Thursday, forecast to rebound to 0.8% QoQ versus the previous -1.1%.
Canadian Dollar price today
The table below shows the percentage change of Canadian Dollar (CAD) against listed major currencies today. Canadian Dollar was the strongest against the Australian Dollar.
| USD | EUR | GBP | CAD | AUD | JPY | NZD | CHF | |
| USD | -0.27% | -0.08% | 0.08% | 0.38% | 0.14% | 0.25% | -0.06% | |
| EUR | 0.27% | 0.19% | 0.34% | 0.65% | 0.39% | 0.51% | 0.21% | |
| GBP | 0.08% | -0.19% | 0.15% | 0.46% | 0.22% | 0.33% | 0.02% | |
| CAD | -0.07% | -0.35% | -0.15% | 0.34% | 0.03% | 0.17% | -0.15% | |
| AUD | -0.42% | -0.65% | -0.46% | -0.32% | -0.24% | -0.15% | -0.45% | |
| JPY | -0.15% | -0.41% | -0.15% | -0.08% | 0.25% | 0.10% | -0.20% | |
| NZD | -0.24% | -0.50% | -0.30% | -0.15% | 0.15% | -0.08% | -0.29% | |
| CHF | 0.06% | -0.19% | 0.01% | 0.15% | 0.48% | 0.20% | 0.32% |
The heat map shows percentage changes of major currencies against each other. The base currency is picked from the left column, while the quote currency is picked from the top row. For example, if you pick the Euro from the left column and move along the horizontal line to the Japanese Yen, the percentage change displayed in the box will represent EUR (base)/JPY (quote).
Technical analysis: USD/CAD sees technical floor near 1.3500 as pair churns
USD/CAD near-term technical action continues to see a sideways grind as investors grapple with picking a meaningful direction. 1.3500 remains a key technical level, keeping intraday bids magnetized to the major price handle. USD/CAD has cycled 1.3500 in a rough sideways channel since February 5.
Daily candlesticks remain stuck to the 200-day Simple Moving Average (SMA) at 1.3478 just beneath 1.3500. USD/CAD remains stuck in the middle ground between December’s lows near 1.3177 and last November’s early peak near 1.3900.
USD/CAD hourly chart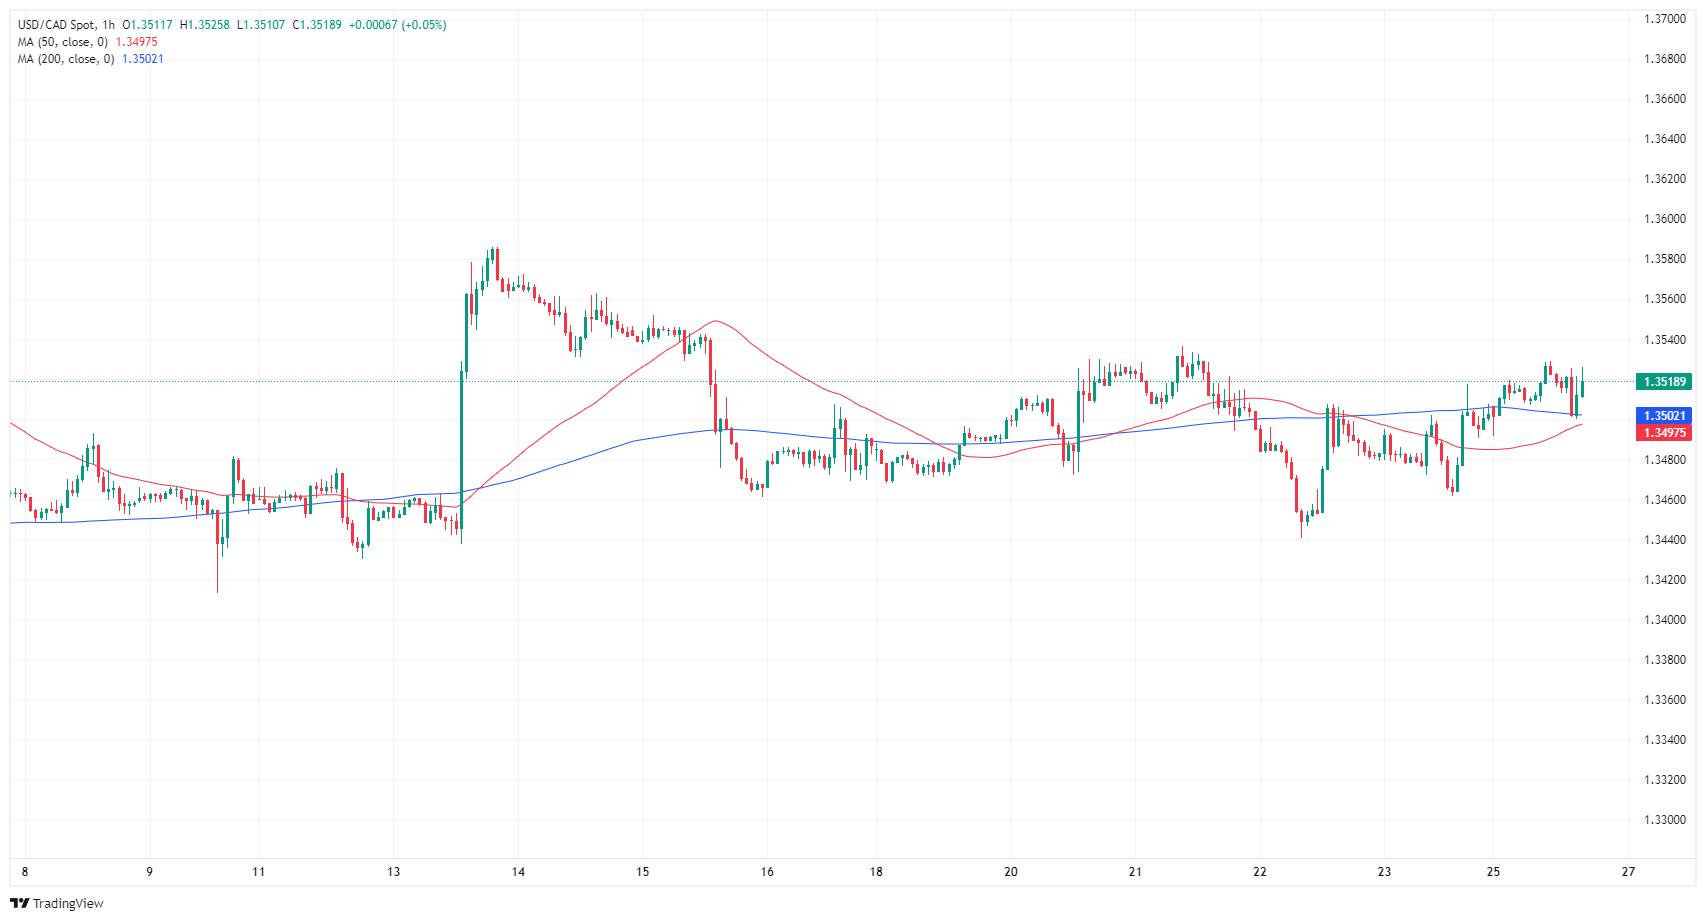
USD/CAD daily chart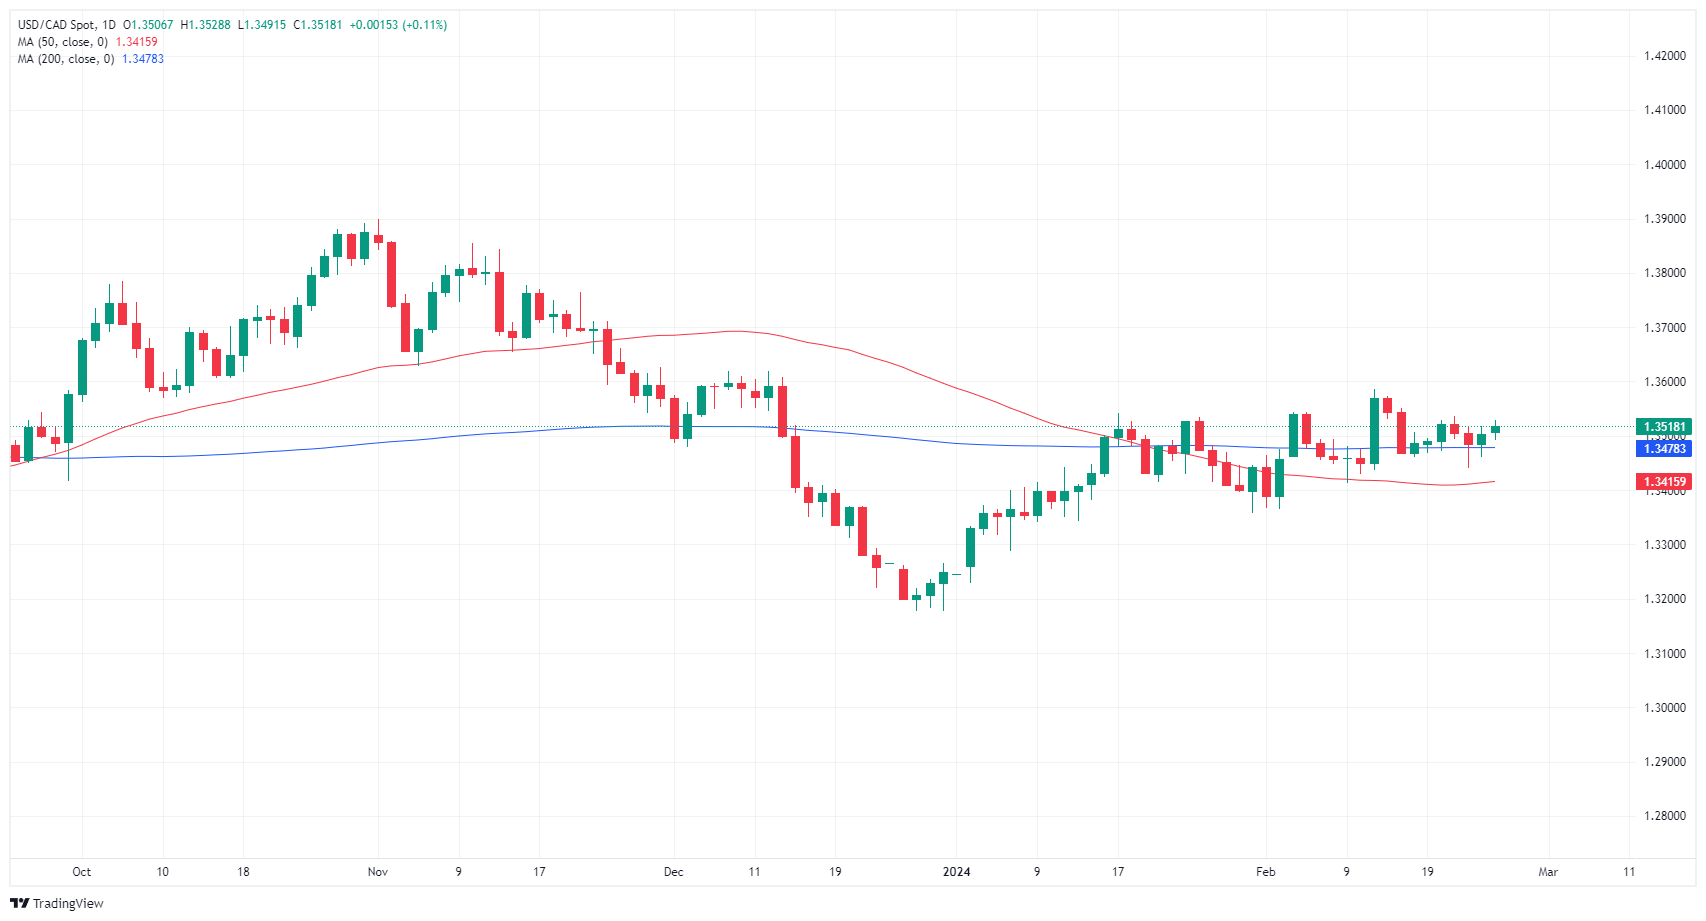
Canadian Dollar FAQs
What key factors drive the Canadian Dollar?
The key factors driving the Canadian Dollar (CAD) are the level of interest rates set by the Bank of Canada (BoC), the price of Oil, Canada’s largest export, the health of its economy, inflation and the Trade Balance, which is the difference between the value of Canada’s exports versus its imports. Other factors include market sentiment – whether investors are taking on more risky assets (risk-on) or seeking safe-havens (risk-off) – with risk-on being CAD-positive. As its largest trading partner, the health of the US economy is also a key factor influencing the Canadian Dollar.
How do the decisions of the Bank of Canada impact the Canadian Dollar?
The Bank of Canada (BoC) has a significant influence on the Canadian Dollar by setting the level of interest rates that banks can lend to one another. This influences the level of interest rates for everyone. The main goal of the BoC is to maintain inflation at 1-3% by adjusting interest rates up or down. Relatively higher interest rates tend to be positive for the CAD. The Bank of Canada can also use quantitative easing and tightening to influence credit conditions, with the former CAD-negative and the latter CAD-positive.
How does the price of Oil impact the Canadian Dollar?
The price of Oil is a key factor impacting the value of the Canadian Dollar. Petroleum is Canada’s biggest export, so Oil price tends to have an immediate impact on the CAD value. Generally, if Oil price rises CAD also goes up, as aggregate demand for the currency increases. The opposite is the case if the price of Oil falls. Higher Oil prices also tend to result in a greater likelihood of a positive Trade Balance, which is also supportive of the CAD.
How does inflation data impact the value of the Canadian Dollar?
While inflation had always traditionally been thought of as a negative factor for a currency since it lowers the value of money, the opposite has actually been the case in modern times with the relaxation of cross-border capital controls. Higher inflation tends to lead central banks to put up interest rates which attracts more capital inflows from global investors seeking a lucrative place to keep their money. This increases demand for the local currency, which in Canada’s case is the Canadian Dollar.
How does economic data influence the value of the Canadian Dollar?
Macroeconomic data releases gauge the health of the economy and can have an impact on the Canadian Dollar. Indicators such as GDP, Manufacturing and Services PMIs, employment, and consumer sentiment surveys can all influence the direction of the CAD. A strong economy is good for the Canadian Dollar. Not only does it attract more foreign investment but it may encourage the Bank of Canada to put up interest rates, leading to a stronger currency. If economic data is weak, however, the CAD is likely to fall.
Economists at HSBC analyze how the ECB's upcoming March meeting could impact the EUR/USD and EUR/GBP.
EUR/GBP may breach the 0.8500 mark on a dovish ECB turn
In the EUR/USD pair, the 1.0700 level serves as crucial support, with potential upward movement capped at 1.0930 in the absence of significant ECB language changes. A break below 1.0700 could swiftly shift market focus towards the 1.0500 target.
In the case of EUR/GBP, a dovish turn from the ECB might trigger an attempt to breach the 0.8500 mark.
- uro appreciates, with ECB officials' comments and US housing data setting the stage for a pivotal week.
- ECB Stournaras hints at potential June rate cut, while Lagarde emphasizes the inflation target remains unmet.
- Investors trim Euro positions ahead of key EU and US economic releases, including inflation and GDP data.
The Euro (EUR) begins the week on a higher note against the US Dollar (USD) as market participants brace for the release of Eurozone (EU) and United States (US) inflation data late in the week. Besides that, economic growth data in the US could weigh on the Greenback, which treads water as Wall Street opens. The EUR/USD trades at 1.0850, up 0.30%.
EUR/USD rises to 1.0850, with upcoming economic indicators from both sides of the Atlantic in focus
Market participants' sentiment remains mixed. The economic calendar in the EU sees European Central Bank (ECB) speakers crossing the newswires. ECB Stournaras said monetary policy has to remain prudent, inflation has progressed, and that he sees the first rate cut in June. He added that the ECB wants to see more progress on inflation and suggested that they should move rates gradually.
Recently, ECB’s President Christine Lagarde said the central bank has not achieved its goal on inflation and added they must get to 2% inflation sustainably.
Across the pond, the US economic calendar featured housing data for February. New Home Sales rose by 1.5% from 0.651M to 0.661M, less than expected, and witnessed a muted reaction in the EUR/USD pair.
Meanwhile, the EUR/USD could witness some weakness, as an article by Bloomberg suggested that investors are cutting their Euro longs to their lowest level since November 2022 via the Commodities and Futures Trading Commission (CFTC) data.
What to watch?
In the EU, the schedule will feature Flash PMIs, German Retail Sales, and inflation data amongst the largest economies in the bloc. On the US front, Durable Goods Orders on Tuesday, followed by Thursday’s inflation and Gross Domestic Product (GDP) data.
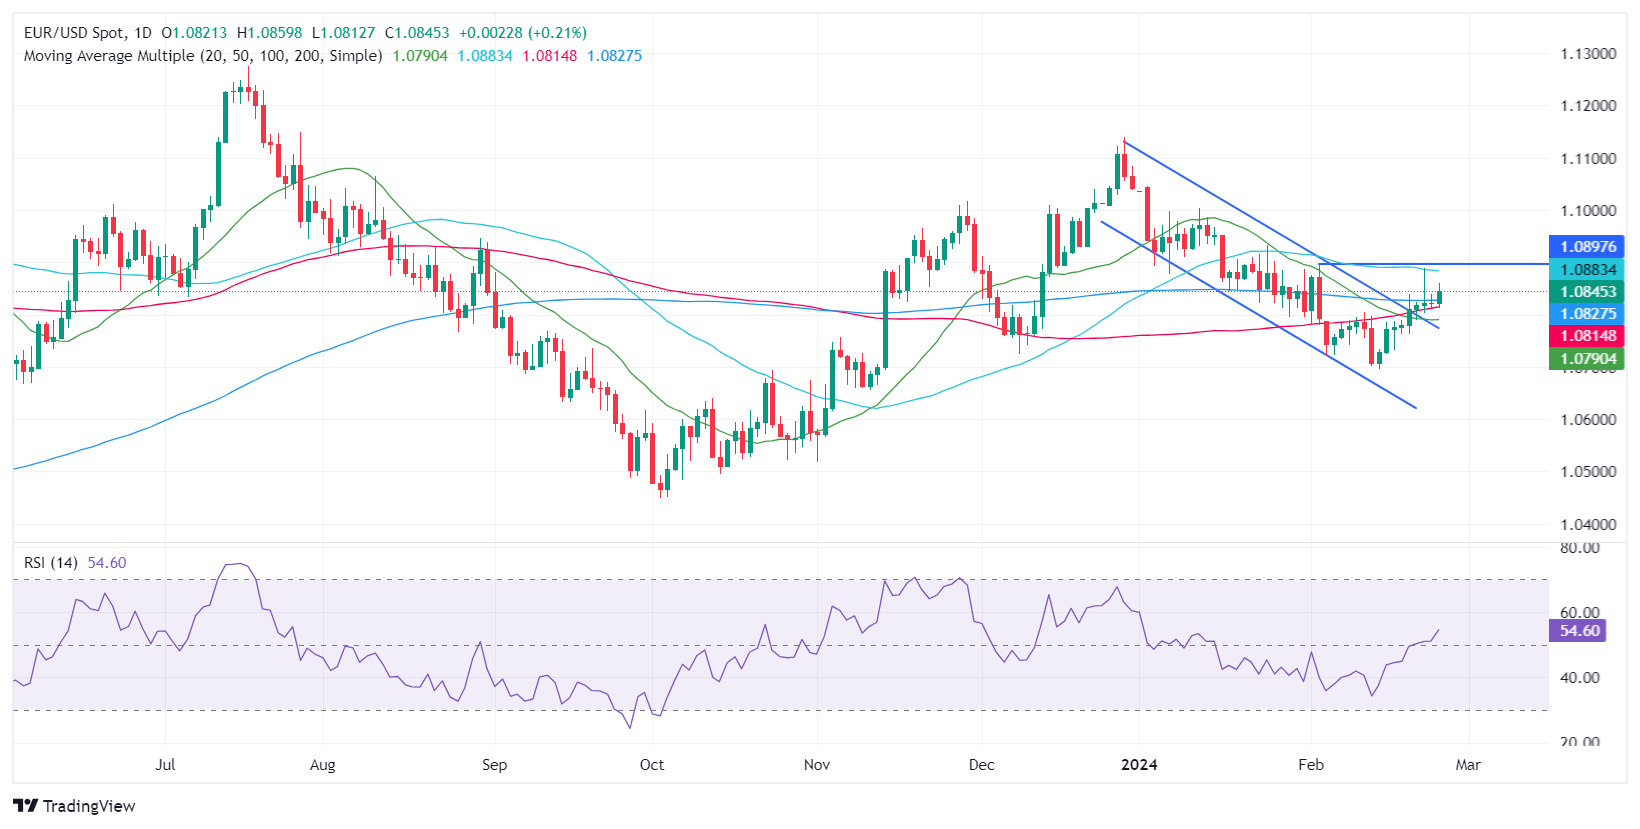
EUR/USD Price Analysis: Technical outlook
The EUR/USD daily chart sees the pair remaining confined to the 1.0800-1.0860 area during the last three days, bracing around the 200-day moving average (DMA) at 1.0826. Relative Strength Index (RSI) studies turned bullish, but buyers need to achieve a daily close above last Friday’s high, to remain hopeful of testing the 50-DMA at 1.0883, ahead of the 1.0900 figure. Otherwise, the pair could dive towards the 200-DMA and below, exposing the 1.0800 mark.
GBP/USD is unfolding a sideways consolidation. Economists at Société Générale analyze the pair’s technical outlook.
1.2775/1.2820 topside hurdle for bulls
GBP/USD is evolving within crisscross moves around the 50-DMA denoting lack of clear direction. Recent decline has remained contained near December low of 1.2500. Break below this would be essential for confirmation of deeper downtrend.
Currently, a rebound is under way; upper limit of recent consolidation near 1.2775/1.2820 is crucial hurdle. Once a break above this materializes, the uptrend is likely to extend towards next potential objective at 1.3010 and last year’s high of 1.3140.
Thursday will see the release of the PCE deflator for January, the measure that the Fed considers most appropriate for measuring price stability. Economists at Commerzbank analyze US Dollar (USD) outlook ahead of the report.
Another upside surprise in the PCE would reinforce the picture of stubbornly high US inflation
Another upside surprise in the PCE deflator would reinforce the picture of stubbornly high US inflation. It would confirm the USD strength we saw after the CPI numbers, but which is now fading.
On the other hand, a low PCE deflator could give the market a clearer rethink. In my view, the market has taken the January CPI number a bit too seriously: too much as a signal that the disinflation process is stalling, too little as noise. If the PCE number were to confirm my suspicions, the whole nice story behind the recent USD strength would be called into question.
In short, without an opinion on the PCE deflator, I suspect an asymmetric market reaction: more USD weakness when the PCE deflator is low than USD strength when it is high.
NZD/USD trades slightly below the 0.6200 level. Economists at Société Générale analyze the pair’s technical outlook.
Defence of 0.6050 crucial to avert deeper drop
NZD/USD rebound recently petered out at the trend line drawn since 2021 near 0.6380/0.6400 which is also a graphical hurdle representing highs of last July. A gradual pullback has taken shape after this test but interestingly, the pair is defending the upper part of previous small base and 200-DMA near 0.6050. This remains a crucial support.
A short-term bounce towards the trend line at 0.6300 can’t be ruled out. Break above graphical hurdle of 0.6380/0.6400 would be essential for confirming a larger uptrend.
There would be risk of a deeper downtrend in case the pair fails to hold above 0.6050.
Gold (XAU/USD) is trading above $2,000 despite waning rate-cut expectations. Economists at ANZ Bank analyze the yellow metal’s outlook.
Central bank Gold purchases continue
Higher-than-expected core inflation data in January dimmed prospects of an early and deep Federal Reserve rate cut. In early January, the market was pricing 150 bps of cuts starting from March, but that expectation has been delayed until June and reduced to 70-80 bps. Confirmation of the timing and intensity of rate cuts should guide Gold prices.
Central banks bought 30t of Gold in December, lifting official buying at 1,037t in 2023.
Gold’s spot premium in China and India suggests healthy physical demand.
- USD/JPY advances toward 151.00 as uncertainty over BoJ’s plans of exiting the dovish monetary stance deepens.
- The Fed is widely anticipated to keep interest rates unchanged in March and May policy meetings.
- Investors await the US core PCE inflation and Japan’s inflation data.
The USD/JPY pair marches toward the crucial resistance of 151.00 in the early New York session. The asset holds strength amid uncertainty ahead of a data-packed weak.
Considering slightly bullish overnight futures, the S&P500 is expected to open on a positive note. The US Dollar Index (DXY) falls to near 103.70 on hopes that the Federal Reserve (Fed) will pivot to reducing interest rates sometime this year. 10-year US Treasury yields have dropped to 4.25%.
This week, investors will focus on the United States core Personal Consumption Expenditure price index (PCE) data for January, which will be published on Thursday. The economic data will guide market expectations of rate cuts by the Fed.
As per the CME FedWatch tool, investors see the Fed keeping interest rates unchanged in the range of 5.25%-5.50% in the March and May policy meetings. The market participants expect that the Fed will reduce interest rates by 25 basis points (bps) in June.
Meanwhile, Fed policymakers continue to reiterate the need to keep interest rates unchanged until they get evidence that inflation will come down to the 2% target.
On the Japanese Yen front, investors await the National Consumer Price Index (CPI) data for January, which will be published on Tuesday. The market participants are anticipating that price pressures may dip below 2%. This would derail hopes of the Bank of Japan (BoJ) exiting the expansionary monetary policy stance.
EUR/USD on front foot. Economists at Société Générale analyze the pair’s technical outlook.
Upside limited
EUR/USD recently carved out an interim trough at 1.0695. An initial bounce is under way, but the pair is struggling to establish beyond 50-DMA. The Moving Average at 1.0900/1.0915 is near-term resistance zone. Inability to cross this can lead to persistence in decline.
Last week’s low of 1.0760 is first layer of support. If this gets violated, the downtrend can extend towards next potential supports at 1.0610 and the lower limit of the range within which it has evolved since last year at 1.0484/1.0448.
The Canadian Dollar (CAD) is a moderate underperformer on the session so far. Economists at Scotiabank analyze USD/CAD outlook.
Scope for gains is limited
The USD retains a firm undertone but last week’s ‘inside range’ week suggests some weakening in USD/CAD’s recent uptrend.
Resistance sits at 1.3540/1.3550 and – firmer – at 1.3580/1.3600.
Narrowing Bollinger bands also suggests some risk of an increase in near-term volatility, with the greater scope for movement perhaps more to the downside at the moment.
USD/CAD sees some short-term trend support at 1.3475/1.2480 but a clear move below 1.3452 (40-DMA today) is needed to prompt some technical softness in funds.
Last week, the US Dollar Index (DXY) closed lower in the biggest move against the USD since late December. Economists at Scotiabank analyze Greenback’s outlook.
Focus on PCE data this week
A relatively light data schedule today and some important data points ahead this week, namely the PCE data Thursday (which are expected to show a jump) may keep trading somewhat subdued on the session. But the softer USD tone perhaps warrants attention.
The DXY has looked stretched in terms of (spread-driven) fair value in recent weeks; nominal and real interest rate spreads have shifted against the USD somewhat through February so far. The moves are limited but enough to curb the USD’s ability to continue strengthening, absent other supportive drivers.
Seasonally positive trends for the USD will also start to wane as Q1 winds down.
Short-term (1m) risk reversals continue to reflect a divergence with recent gains in the USD generally, suggesting weaker underlying sentiment backing the Dollar.
EUR/USD trades firmer as short-term uptrend persists. Economists at Scotiabank analyze the pair’s outlook.
Minor dips should remain well-supported
Steady gains from the mid-February low persist, although last week’s spike high at 1.0890 represents a near-term hurdle for spot to overcome if the rally is to extend. Support looks fair solid under the EUR at 1.0810/1.0815 for now, however.
Positive developments on the intraday and daily DMI signals suggest minor EUR dips should remain well-supported for now.
See: EUR/USD may struggle to find much sense of direction and keep hovering around the 1.0800 gravity line – ING
GBP/USD is marginally firmer on the session. Economists at Scotiabank analyze the pair’s outlook.
Cable is showing signs of a pick up in bullish momentum
Sterling is registering a fifth, consecutive daily gain versus the USD and is showing signs of a pick up in bullish momentum on the intraday and daily studies. Last week’s peaks remain a block on near-term gains, however.
Cable will have to push on through 1.2710 to show some additional technical momentum and perhaps stretch gains to test the upper end of the broader 1.2525-1.2800 range in play.
- The US Dollar dips on Monday as selling pressure continues.
- Market sentiment turns nervous on an eventful week in the US economic calendar. .
- The US Dollar Index slides below 104.00 and could fall further on the back of data later this week.
The US Dollar (USD) is inching lower on Monday, extending Friday’s declines. Two main drivers for the Greenback to keep in mind this Monday: First, the landslide victory for former US President Donald Trump over Nikki Haley’s home state South Carolina, which puts Trump very close to secure the required amount of delegates for a Presidential bid. Second, the vast amount of key economic data points that are set to be released throughout this week, with second reading of the US Gross Domestic Product on Wednesday and the Personal Consumption Expenditures (PCE) Price Index on Thursday as the main drivers that could tip the market in any direction.
The week is off to a quiet start, with a very light calendar Still, the tone could get set already with the New Home Sales data. A further decline, together with the decline seen in Building Permits and Housing Starts last week, could confirm that the housing market is coming under pressure from this elevated interest-rate regime.
Daily digest market movers: Monday to assess
- Goldman Sachs said that Hedge Funds are offloading Tech shares at the fastest pace in seven months, Bloomberg reports.
- In London, a big energy conference is set to take place. Traders will be on the lookout for any headlines from major energy ministers and key people about Oil, Gas, and alternative energies.
- At 15:00 GMT, New Home Sales data will be published. Sales are expected to increase from 0.664 million to 0.680 million. Housing data last week pointed to some lowdown, which could get confirmed with this release. A slowing housing market could become a concern for the US Federal Reserve as it might be forced to lower its benchmark rates if potential issues in the US housing market spread to the financial system.
- The US Treasury will have a very busy day this Monday:
- Near 16:30 GMT, a 3-month and a 6-month bill are due to be released.
- At 18:00 GMT, a 2-year and a 5-year note will be placed in the market.
- Equities are looking bleak this Monday, with profit taking across the board. It looks like investors are reducing their exposure after the all-time highs seen last week and ahead of the key US inflation data later this week.
- According to the CME Group’s FedWatch Tool, expectations for a Fed pause in the March 20 meeting are at 97.5%, while chances of a rate cut stand at 2.5%.
- The benchmark 10-year US Treasury Note trades around 4.2%, which is more than 10 basis points lower from the peak last week.
US Dollar Index Technical Analysis: A buildup towards Thursday
The US Dollar Index (DXY) is facing some downside pressure on Monday. Expect a very nervous build-up to the main event on Thursday, the Personal Consumption Expenditures (PCE) Price Index release. The uptick in both the Consumer Price Index (CPI) and the Producer Price Index (PPI) numbers over the past two weeks is lifting market expectations for the PCE index, which means any number undershooting expectations might trigger a substantial leg lower in the DXY.
To the upside, the 100-day Simple Moving Average (SMA) near 104.05 is the first level to watch as it is a support that has been turned into a resistance. Should the US Dollar be able to cross 104.60, 105.12 is the next key level to keep an eye on. One step beyond there comes 105.88, the high from November 2023. Ultimately, 107.20 – the high of 2023 – could even come back into scope, but that would be when markets reprice the timing of a Fed rate cut again, possibly delaying it to the last quarter of 2024.
Looking down, the 200-day Simple Moving Average at 103.73 was broken on Thursday and should see more US Dollar bears flock in to trade the break. The 200-day SMA should not let go that easily, so a small retreat back to that level could be more than granted. Ultimately, it will lose its force with the ongoing selling pressure and could fall to 103.16, the55-day SMA.
US Dollar FAQs
What is the US Dollar?
The US Dollar (USD) is the official currency of the United States of America, and the ‘de facto’ currency of a significant number of other countries where it is found in circulation alongside local notes. It is the most heavily traded currency in the world, accounting for over 88% of all global foreign exchange turnover, or an average of $6.6 trillion in transactions per day, according to data from 2022.
Following the second world war, the USD took over from the British Pound as the world’s reserve currency. For most of its history, the US Dollar was backed by Gold, until the Bretton Woods Agreement in 1971 when the Gold Standard went away.
How do the decisions of the Federal Reserve impact the US Dollar?
The most important single factor impacting on the value of the US Dollar is monetary policy, which is shaped by the Federal Reserve (Fed). The Fed has two mandates: to achieve price stability (control inflation) and foster full employment. Its primary tool to achieve these two goals is by adjusting interest rates.
When prices are rising too quickly and inflation is above the Fed’s 2% target, the Fed will raise rates, which helps the USD value. When inflation falls below 2% or the Unemployment Rate is too high, the Fed may lower interest rates, which weighs on the Greenback.
What is Quantitative Easing and how does it influence the US Dollar?
In extreme situations, the Federal Reserve can also print more Dollars and enact quantitative easing (QE). QE is the process by which the Fed substantially increases the flow of credit in a stuck financial system.
It is a non-standard policy measure used when credit has dried up because banks will not lend to each other (out of the fear of counterparty default). It is a last resort when simply lowering interest rates is unlikely to achieve the necessary result. It was the Fed’s weapon of choice to combat the credit crunch that occurred during the Great Financial Crisis in 2008. It involves the Fed printing more Dollars and using them to buy US government bonds predominantly from financial institutions. QE usually leads to a weaker US Dollar.
What is Quantitative Tightening and how does it influence the US Dollar?
Quantitative tightening (QT) is the reverse process whereby the Federal Reserve stops buying bonds from financial institutions and does not reinvest the principal from the bonds it holds maturing in new purchases. It is usually positive for the US Dollar.
Economists at Rabobank expect the US Dollar (USD) to remain resilient over the next weeks and forecast EUR/USD at 1.0500 in three months.
Scope for more broad-based USD strength over the spring
US data releases over the next few months should reveal whether the current stickiness in US inflation is temporary, a seasonal issue, or whether it is persistent in nature. This will be key in determining whether this year’s broad-based USD rally still has legs. That said, the order and extent of policy moves that are implied by market rates seem to have only the vaguest of correlations with the levels of economic activity in each of the G10 economies.
We see scope for more broad-based USD strength over the spring as the market continues to recalibrate the pace and timing of policy moves in the G10.
We continue to see the potential for EUR/USD to move towards 1.0500 on a three-month view before edging higher into year-end.
- AUD/USD gauges temporary support near 0.6550 as the US Dollar edges down.
- The US core PCE data will guide forward action in the FX domain.
- Australian monthly CPI is anticipated to accelerate to 3.5% from 3.4% in December.
The AUD/USD discovers support near 0.6550 in the European session on Monday. The sell-off move in the Aussie asset has stalled as the US Dollar drops. The US Dollar Index (DXY) corrects to near 103.76 as hopes of the Federal Reserve (Fed) pivoting to rate cuts are imminent.
S&P500 futures remain muted in the European session, indicating a sideways trend. Investors need fresh insights for rate cuts by the Fed. This week, the United States core Personal Consumption Expenditure (PCE) price index data for January will influence market expectations for rate cuts.
Investors anticipate the monthly core PCE inflation data rose by 0.4% in January from 0.2% growth in December. Annually, the economic data is anticipated to have come out at 2.8% against 2.9% in December.
The consumer price inflation data for January has eased expectations for early rate cuts by the Fed. Last week, Fed Governor Christopher Waller said there is no need to hurry for rate cuts. The risks of reducing interest rates too soon are higher than delaying them.
Meanwhile, the Australian Dollar will be guided by the monthly Consumer Price Index (CPI) data for January, which will be published on Wednesday. Economists have projected that the inflation data rose slightly to 3.5% from the former reading of 3.4%. Sticky inflation data would prompt expectations of one more interest rate hike by the Reserve Bank of Australia (RBA).
The observed exchange rates of the Russian Rouble (RUB) against the US Dollar (USD) and Euro (EUR) are artificial and managed. Economists at Commerzbank analyze RUB’s outlook.
Periodic RUB appreciation when Oil price rises
We forecast a steadily weakening Rouble exchange rate over the next two years, although we may see periodic appreciation when the Oil price rises.
Why should this technical exchange rate weaken? Because it will match the trend of Russia’s commodity trade balance – and we forecast the trade surplus to gradually narrow down towards neutral.
And, why should the trade surplus narrow down? Because in the long-term, it is only the counterpart of a (shut) capital account. Russia’s capital account may be open to EM partners such as China, Iran or India, but transactions in non-convertible currencies do not translate to transactions in hard currencies. In hard currencies, Russia’s capital account is frozen.
As the current account surplus will gradually narrow down, the technical USD/RUB fix will keep rising. This is what our forecasts portray.

Source: Commerzbank Research
- WTI Oil tests at an important level to more downturn.
- Oil traders are seeing limited upside with US stockpile build up and tepid outlook.
- The US Dollar Index is giving up on 104.00 with pressure building on the Greenback ahead of PCE data.
Oil prices are down nearly 1% in Monday’s trading with traders bracing for an eventful week when it comes to US data. On the Oil front markets will be on the lookout for any comments from key people in the Oil and broader energy complex with a big energy summit taking place this week in London. In addition, Goldman Sachs came out with a price target for Brent at $87 per barrel, which is roughly 9% below where it is trading at the moment.
Meanwhile, the US Dollar Index (DXY) is weakening a touch as well this Monday, ahead of the US data releases later this week. With the second reading of the US Gross Domestic Product (GDP) and the Personal Consumption Expenditures (PCE), markets will be able to reassess if the disinflationary path is back on track after the hiccup two weeks ago with that red hot Consumer Price Index (CPI) print. Expect a nervous US Dollar,therefore, this week which could move substantially on the back on any upbeat or downbeat surprise in the numbers.
Crude Oil (WTI) trades at $75.99 per barrel, and Brent Oil trades at $80.38 per barrel at the time of writing.
Oil news and market movers: All eyes on London this week
- The London Energy Forum 2024 Summit will take place on Monday and Tuesday this week, an event that usually brings market-moving headlines from big industry leaders. The event will continue with the International Energy Week from Tuesday to Friday.
- Goldman Sachs has revised its price target for Brent crude to $87 per barrel. That means a near 9% premium is still up for grabs in Brent Crude prices. The Goldman Sachs report had a few key takeaways:
- Geopolitical premium to remain modest.
- Surplus capacity among OPEC means limited upside.
- Prices set to spike in the summer with the Red Sea disruptions putting pressure on stockpiles during that time.
- Chinese Oil markets are starting to brighten up with a travel boom raising expectations for a pickup in demand for Oil and distillates.
Oil Technical Analysis: Risk of re-entry
Oil prices are on the decline this Monday, continuing the sell-off from last week which erased all earlier gains. With the technical snap below the 100-day Simple Moving Average (SMA) at $76.46, the outlook for this week looks bleak. The Goldman Sachs report does not help much, despite its higher price tags for Brent, the issues outlined in the report clearly state that Oil is in no shape to soon return to $80 or higher.
Oil bulls will have a lot to deal with on the upside. First, as mentioned above, the 100-day SMA is now acting as resistance near $76.46. Further up, the chopped-up 200-day SMA at $77.62 is still worth mentioning. From there, the heavily watched $79.66, ahead of $80.00, will be a heavily fought barrier, possibly not able to crack without a substantial catalyst.
On the downside, the pivotal level near $75.27 is the first element worth mentioning. In case that does not hold, downside levels to look for are $74.26 (55-day SMA) and the ascending green trend line again near $72.93 which should act as support. That means a re-entry into the Symmetrical Triangle which has been respected since the start of 2024.
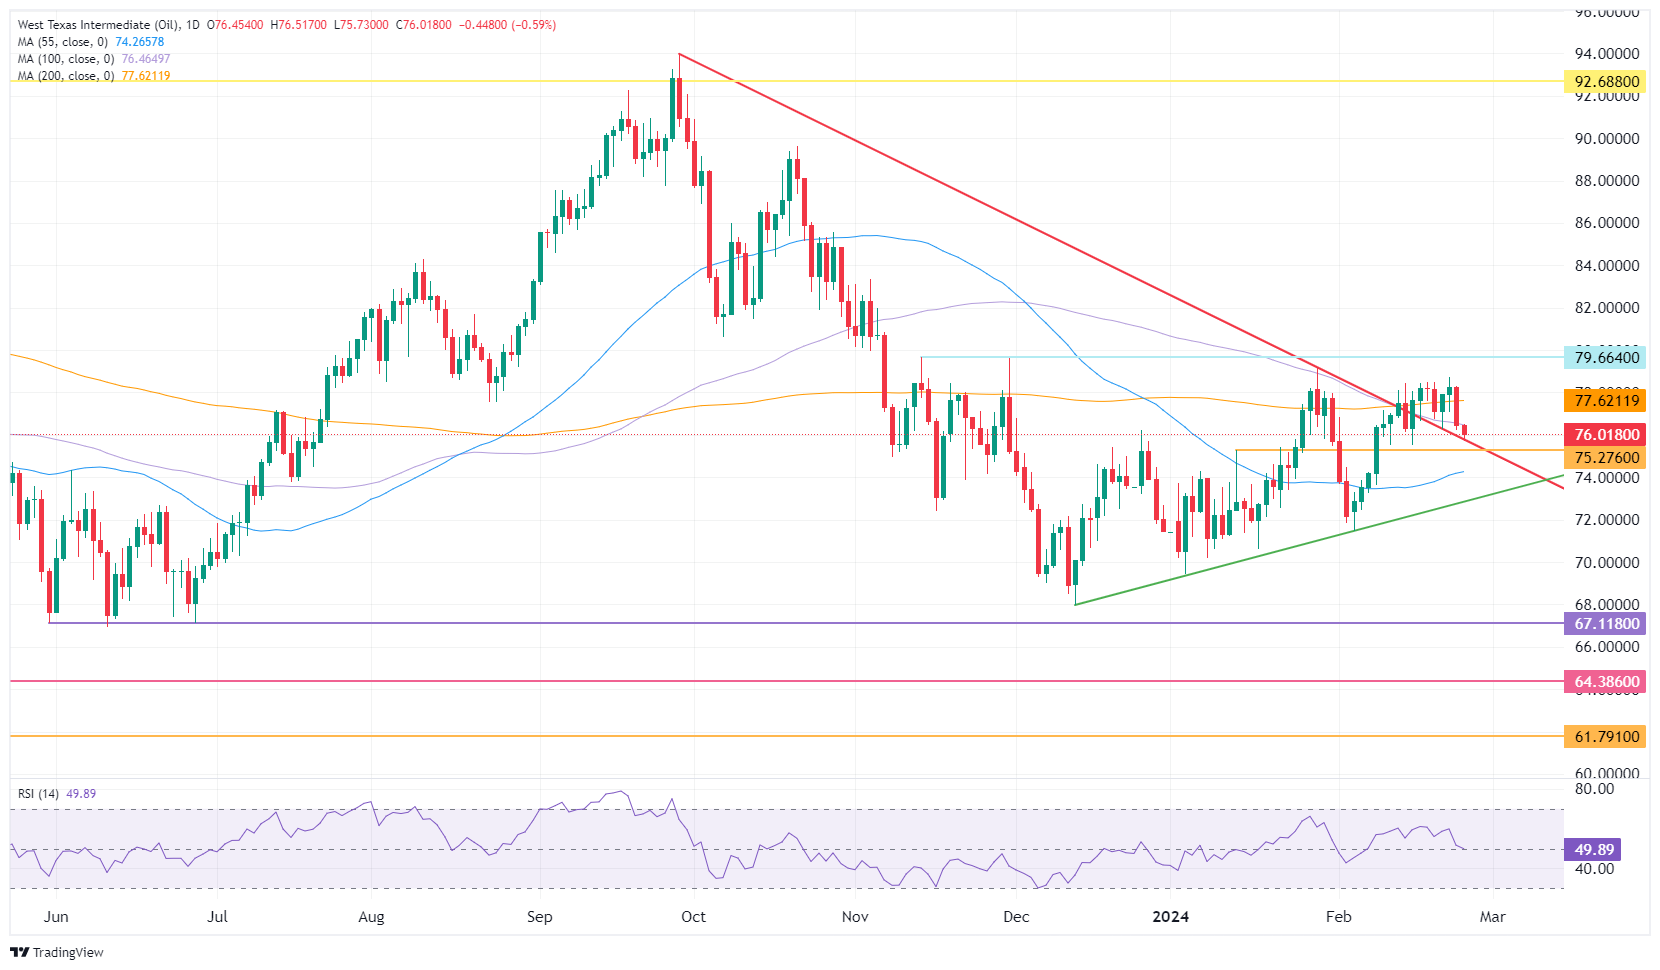
US WTI Crude Oil: Daily Chart
WTI Oil FAQs
What is WTI Oil?
WTI Oil is a type of Crude Oil sold on international markets. The WTI stands for West Texas Intermediate, one of three major types including Brent and Dubai Crude. WTI is also referred to as “light” and “sweet” because of its relatively low gravity and sulfur content respectively. It is considered a high quality Oil that is easily refined. It is sourced in the United States and distributed via the Cushing hub, which is considered “The Pipeline Crossroads of the World”. It is a benchmark for the Oil market and WTI price is frequently quoted in the media.
What factors drive the price of WTI Oil?
Like all assets, supply and demand are the key drivers of WTI Oil price. As such, global growth can be a driver of increased demand and vice versa for weak global growth. Political instability, wars, and sanctions can disrupt supply and impact prices. The decisions of OPEC, a group of major Oil-producing countries, is another key driver of price. The value of the US Dollar influences the price of WTI Crude Oil, since Oil is predominantly traded in US Dollars, thus a weaker US Dollar can make Oil more affordable and vice versa.
How does inventory data impact the price of WTI Oil
The weekly Oil inventory reports published by the American Petroleum Institute (API) and the Energy Information Agency (EIA) impact the price of WTI Oil. Changes in inventories reflect fluctuating supply and demand. If the data shows a drop in inventories it can indicate increased demand, pushing up Oil price. Higher inventories can reflect increased supply, pushing down prices. API’s report is published every Tuesday and EIA’s the day after. Their results are usually similar, falling within 1% of each other 75% of the time. The EIA data is considered more reliable, since it is a government agency.
How does OPEC influence the price of WTI Oil?
OPEC (Organization of the Petroleum Exporting Countries) is a group of 13 Oil-producing nations who collectively decide production quotas for member countries at twice-yearly meetings. Their decisions often impact WTI Oil prices. When OPEC decides to lower quotas, it can tighten supply, pushing up Oil prices. When OPEC increases production, it has the opposite effect. OPEC+ refers to an expanded group that includes ten extra non-OPEC members, the most notable of which is Russia.
West Texas Intermediate (WTI) continues to trade in a relatively tight band of $75 to $80 per barrel. Strategists at the Bank of Montreal analyze Oil’s outlook.
Searching for direction
Although it appears that WTI Oil is sitting comfortably at current levels for now, we suspect that it may not last.
Given crude Oil’s historic price volatility, prices may eventually break out of the current trading range, but we are admittedly not sure of the direction of the next major move given elevated uncertainty.
- GBP/JPY eyes stabilization above 191.00 as hopes for BoJ’s pivot to exit a dovish stance wane.
- Japan’s National CPI data will influence market expectations for BoJ’s interest rates.
- UK’s high wage growth is offsetting downside pressures on inflation BoE’s higher interest rates.
The GBP/JPY pair oscillates near a historic high of 191.00 in the London session on Monday. The pair aims to extend more upside as uncertainty over the Bank of Japan’s (BoJ) plans of exiting the decade-long dovish monetary policy stance is waning.
The Japanese economy remains in a technical recession in the second half of 2023, which is an unfavorable condition for the BoJ to consider a shift to a restrictive stance. The economy needs heavy monetary stimulus to achieve an uptick in the coming quarters.
Meanwhile, investors await the National Consumer Price Index (CPI) data for January, which will be published on Tuesday. Investors anticipate that annual CPI excluding fresh foods would fall below 1.8% from 2.3% in December. This would indicate that the BoJ is struggling to maintain the underlying inflation above the 2% target. Eventually, this will undermine the plans of exiting the expansionary policy stance.
On the United Kingdom front, higher wage growth and service inflation continue to be painful for the economy. The wage growth in the UK economy is increasing at a pace double what is required to be consistent with bringing down inflation to the 2% target. This is forcing the Bank of England (BoE) to delay rate cuts aggressively as it could flare up price pressures again
Meanwhile, investors await fresh guidance from BoE policymakers on the timing of rate cuts.
On the economic data front, UK’s recruitment data company Adzuna showed that job postings by British employers hit significantly in January. "January 2024 has proven to be one of the most difficult starts to the year for job hunters in recent years with companies continuing to put hiring plans on ice," Adzuna co-founder Andrew Hunter said.
- Wall Street's main indexes hit new all-time highs last week.
- US stock index futures trade flat on Monday.
- The US economic calendar will feature key data releases later in the week.
Nasdaq futures trade flat at 17,994.50, Dow Jones futures are down 0.1% at 39,145.00 and S&P futures are virtually unchanged at 5,099.50 ahead of the opening bell on Monday.
What to know before stock market opens
- Dow Jones and S&P 500 both closed at new all-time highs on Friday, gaining 1.3% and 1.6% on a weekly basis. Profit-taking caused the Nasdaq Composite to close the last trading day of the week in negative territory, but the index added 1.4% for the week.
- The Technology Sector started off the day as the best-performing major S&P 500 sector on Friday, rising nearly 1% before swinging to losses, ending the day down 0.27%. The Utilities Sector rose 0.71% to become Friday's best-performing sector, while the Energy Sector was down 0.58% at the closing bell.
- Palo Alto Network (PANW) gained 5.3% on Friday, ending at $282.09, while Booking Holdings Inc. (BKNG) tumbled 10.15% as the biggest loser, closing at $3,505.96.
- Nvidia Corp. (NVDA) initially gained more than 3% on Friday to trade at a new record-high of $823.94 but pulled back in the back half of the trading day to finish at $788.17, up around 0.36%. Nevertheless, NVDA was up over 8% for the week, closing in positive territory for the seventh consecutive week.
- The chipmaker had reported on Wednesday that earnings per share topped $5.16 versus the $4.64 forecast, while revenue climbed to $22.10 billion compared to the expected $20.62 billion. The company also said that it forecasts the current-quarter revenue of $24 billion, plus or minus 2%. Mizuho has raised the target price for Nvidia stock to $850 from $825, HSBC lifted its target to $880 from $835 and Citigroup revised its expectation to $820 from $575.
- The US Census Bureau will publish New Home Sales data for January on Monday. Later in the American session, the US Treasury will hold 2-year and 5-year note auctions.
- On Tuesday, January Durable Goods Orders data will be featured in the economic calendar before the US Bureau of Economic Analysis releases the second estimate of the Gross Domestic Product (GDP) growth for the fourth quarter on Wednesday. Personal Consumption Expenditures (PCE) Price Index, the Federal Reserve’s (Fed) preferred gauge of inflation, figures will be scrutinized by market participants on Thursday.
- New York Fed President John Williams said on Friday that he expects the US central bank to start lowering the policy rate in the second half of the year. According to the CME FedWatch Tool, markets are pricing in a nearly 80% probability that the Fed will leave the policy rate unchanged at 5.25%-5.5% in the next two meetings.
- Workday, Inc. (WDAY) and ONEOK Inc. (OKE) are among the top companies that will report quarterly earnings after the closing bell on Monday.
S&P 500 FAQs
What is the S&P 500?
The S&P 500 is a widely followed stock price index which measures the performance of 500 publicly owned companies, and is seen as a broad measure of the US stock market. Each company’s influence on the computation of the index is weighted based on market capitalization. This is calculated by multiplying the number of publicly traded shares of the company by the share price. The S&P 500 index has achieved impressive returns – $1.00 invested in 1970 would have yielded a return of almost $192.00 in 2022. The average annual return since its inception in 1957 has been 11.9%.
How are companies chosen to be included in the S&P 500?
Companies are selected by committee, unlike some other indexes where they are included based on set rules. Still, they must meet certain eligibility criteria, the most important of which is market capitalization, which must be greater than or equal to $12.7 billion. Other criteria include liquidity, domicile, public float, sector, financial viability, length of time publicly traded, and representation of the industries in the economy of the United States. The nine largest companies in the index account for 27.8% of the market capitalization of the index.
How can I trade the S&P 500?
There are a number of ways to trade the S&P 500. Most retail brokers and spread betting platforms allow traders to use Contracts for Difference (CFD) to place bets on the direction of the price. In addition, that can buy into Index, Mutual and Exchange Traded Funds (ETF) that track the price of the S&P 500. The most liquid of the ETFs is State Street Corporation’s SPY. The Chicago Mercantile Exchange (CME) offers futures contracts in the index and the Chicago Board of Options (CMOE) offers options as well as ETFs, inverse ETFs and leveraged ETFs.
What factors drive the S&P 500?
Many different factors drive the S&P 500 but mainly it is the aggregate performance of the component companies revealed in their quarterly and annual company earnings reports. US and global macroeconomic data also contributes as it impacts on investor sentiment, which if positive drives gains. The level of interest rates, set by the Federal Reserve (Fed), also influences the S&P 500 as it affects the cost of credit, on which many corporations are heavily reliant. Therefore, inflation can be a major driver as well as other metrics which impact the Fed decisions.
- AUD/USD meets with some supply on Monday, though the downside remains cushioned.
- Retreating US Treasury bond yields undermines the USD and lends support to the major.
- Traders also seem reluctant to place directional bets ahead of this week’s key macro data.
The AUD/USD pair attracts some sellers on Monday following the recent repeated failures to find acceptance above the 100-day Simple Moving Average (SMA) and remains depressed through the first half of the European session. Spot prices currently trade around the mid-0.6500s, though lack follow-through amid a modest US Dollar (USD) downtick.
The USD Index (DXY), which tracks the Greenback against a basket of currencies, struggles to capitalize on last week's goodish rebound from its lowest level since February 2 amid retreating US Treasury bond yields. Apart from this, the Reserve Bank of Australia's (RBA) hawkish stance, signalling that policymakers are unwilling to rule out another cash rate increase in the wake of sticky inflation, is seen lending some support to the AUDUSD pair.
Any meaningful USD downfall, however, seems elusive in the wake of firming expectations that the Federal Reserve (Fed) will wait until the June FOMC policy meeting before cutting interest rates. Furthermore, the risk of a further escalation of tensions between China and Taiwan, along with persistent geopolitical tensions stemming from the Middle East, could undermine the risk-sensitive Australian Dollar (AUD) and cap the AUD/USD pair.
The aforementioned mixed fundamental backdrop warrants some caution before placing aggressive directional bets ahead of this week's important macro releases, including the latest Australian consumer inflation figures on Wednesday. The market focus will then shift to Thursday's release of the US Core PCE Price Index – the Fed's preferred inflation gauge – and the official PMI prints from China, scheduled for release on the last day of the week.
Is the Bank of Japan (BoJ) setting the market up for a March hike? Economists at MUFG Bank analyze Japanese Yen’s (JPY) outlook after the JPY weakened by 0.3% last week against the US Dollar (USD).
BoJ March hike is under-priced
Our sense is that BoJ’s confidence in relation to wage increases is strengthening and if they are being swayed by their own incoming information they may well decide in March to hike. The level of the Yen could play a role here too. Conditions are ripe for carry and if global risk conditions and low volatility continue, there’s a high chance of further moves higher in USD/JPY. But certainly, confidence in wage growth is rising and that means the fundamental reasoning for a hike is looking more compelling.
A March rate hike is looking more likely and the risk looks under-priced.
While USD aspects are key for USD/JPY, a rate hike would certainly fuel some JPY buying.
- Gold price remains in a tight range, slightly above $2,030, as the US Dollar trades sideways.
- Fed Williams said interest-rate cuts are likely later this year.
- Investors await the US core PCE inflation data for fresh guidance.
Gold price (XAU/USD) consolidates in a strict range in Monday’s European session as investors are sidelined ahead of crucial economic releases this week. The upside in the Gold price remains restricted due to the Federal Reserve’s (Fed) hawkish narrative on interest rates, while tensions surrounding the Middle East crisis have capped the downside.
Fed policymakers have been reiterating that interest-rate cuts are likely later this year. However, no one is providing a detailed time frame as officials still lack evidence that inflation will sustainably come down to the 2% target.
The muted performance in the Gold price is also linked to the US Dollar, which has been trading broadly sideways as investors shift their focus towards the US core Personal Consumption Expenditure (PCE) Price Index data for January. The Fed’s preferred inflation gauge, which will be published on Thursday, will likely influence market expectations for rate cuts. The US Dollar Index (DXY), which tracks the Greenback’s value against six major currencies, trades close to 103.80.
Daily digest market movers: Gold price tracks sideways US Dollar
- Gold price trades slightly below a two-week high of $2,040 as investors remain uncertain about the timing of rate cuts by the Federal Reserve. Due to sticky price pressures and the resilient US economy, the Fed is not interested in cutting down key lending rates early. This has been restricting the upside in Gold.
- However, geopolitical uncertainty continues to provide support to bullions despite deepening talks over a ceasefire between Israel and Palestine. This week, Qatar is set to host ceasefire negotiations. Meanwhile, conditions in Gaza are deteriorating further as the delivery of humanitarian aid has fallen substantially in the last month due to intensified bombarding from the Israeli army.
- In addition to that, the US and the UK militaries continue to attack the positions of Houthis in Yemen amid retaliation for attacking commercial vessels in the Red Sea.
- On the United States front, investors will keenly focus on the core PCE Price Index data for January, which will likely influence market expectations for rate cuts by the Fed.
- The CME FedWatch tool shows that rate cuts aren’t expected at the March and May policy meetings. There is a 54% chance that a rate cut by 25 basis points (bps) will be announced in the June meeting, which would push down interest rates in the range of 5.00%-5.25%.
- Meanwhile, the maintenance of a hawkish narrative by Fed policymakers has been pushing back expectations of early rate cuts.
- Last Week, Fed Governor Christopher Waller expressed caution regarding the pace of interest-rate cuts by saying that he wants to see inflation data for at least a couple of months more to judge whether stubborn figures in January were merely a short-term bump.
- On the contrary, New York Fed President John Williams said his view on the economy has not significantly changed due to the one-time blip in January’s inflation data. When asked about the timing of rate cuts, John Williams said rate cuts could be announced later this year.
Technical Analysis: Gold price juggles above $2,030
Gold price trades in a narrow range above $2,030 as investors await more guidance on interest rates. The near-term trend is slightly bullish as Gold is trading above the 20-day and 50-day Exponential Moving Averages (EMAs), which are around $2,020.
The yellow metal trades in a Symmetrical Triangle chart pattern formed on a daily time frame. The precious metal is gradually approaching the downward-sloping border of the aforementioned pattern, which is plotted from the December 28 high at $2,088. The upward-sloping border of the chart pattern is placed from the December 13 low at $1,973.
The triangle could break out in either direction. However, the odds marginally favor a move in the direction of the trend before the formation of the triangle – in this case, up. A decisive break above or below the triangle boundary lines would indicate a breakout is underway.
The 14-period Relative Strength Index (RSI) oscillates in the 40.00-60.00 region, which indicates indecisiveness among investors.
Gold FAQs
Why do people invest in Gold?
Gold has played a key role in human’s history as it has been widely used as a store of value and medium of exchange. Currently, apart from its shine and usage for jewelry, the precious metal is widely seen as a safe-haven asset, meaning that it is considered a good investment during turbulent times. Gold is also widely seen as a hedge against inflation and against depreciating currencies as it doesn’t rely on any specific issuer or government.
Who buys the most Gold?
Central banks are the biggest Gold holders. In their aim to support their currencies in turbulent times, central banks tend to diversify their reserves and buy Gold to improve the perceived strength of the economy and the currency. High Gold reserves can be a source of trust for a country’s solvency. Central banks added 1,136 tonnes of Gold worth around $70 billion to their reserves in 2022, according to data from the World Gold Council. This is the highest yearly purchase since records began. Central banks from emerging economies such as China, India and Turkey are quickly increasing their Gold reserves.
How is Gold correlated with other assets?
Gold has an inverse correlation with the US Dollar and US Treasuries, which are both major reserve and safe-haven assets. When the Dollar depreciates, Gold tends to rise, enabling investors and central banks to diversify their assets in turbulent times. Gold is also inversely correlated with risk assets. A rally in the stock market tends to weaken Gold price, while sell-offs in riskier markets tend to favor the precious metal.
What does the price of Gold depend on?
The price can move due to a wide range of factors. Geopolitical instability or fears of a deep recession can quickly make Gold price escalate due to its safe-haven status. As a yield-less asset, Gold tends to rise with lower interest rates, while higher cost of money usually weighs down on the yellow metal. Still, most moves depend on how the US Dollar (USD) behaves as the asset is priced in dollars (XAU/USD). A strong Dollar tends to keep the price of Gold controlled, whereas a weaker Dollar is likely to push Gold prices up.
The Pound Sterling (GBP) has performed surprisingly well over the past few weeks. Economists at Commerzbank analyze GBP outlook.
Slightly better outlook, but no reason to cheer yet
There are early signs that progress is being made on inflation. But the all-clear cannot be given just yet. The fact that the BoE has a similar view has been supportive for the Pound recently.
We still expect the BoE to cut interest rates for the first time in August. At the same time, we now expect the ECB to cut rates as early as June. In view of this and the recent cautious tone of the BoE, we have therefore slightly lowered our EUR/GBP forecast.
Nevertheless, we still expect slightly higher EUR/GBP rates in the coming months. One reason for this is that while the ECB is likely to start its rate cutting cycle before the BoE, it will ultimately deliver fewer rate cuts than the market is currently pricing in. This should become clearer in the coming months. In addition, there may be renewed speculation in the second quarter that the BoE will cut rates sooner rather than later if inflation falls below 2%. This is likely to weigh on the Pound.
By the end of 2024, however, things should change again. It is likely to become clearer that inflation in the Eurozone is settling at too high a level. At the same time, the UK is likely to grow slightly faster than the Eurozone by then. Nevertheless, one should not expect miracles in terms of growth. Growth in the UK is also likely to level off below the pre-Corona trend. The Pound's upside potential vs. the Euro in 2025 is therefore likely to be limited to some extent.

Source: Commerzbank Research
Eurozone inflation numbers will be in focus this week. Economists at ING analyze EUR/USD outlook for the next few days.
Lagarde speaks ahead of Friday's CPI
We forecast the Eurozone’s CPI numbers on Friday to come in line with consensus: 2.5% headline and 2.9% core rate. A drop in core inflation below 3.0% may prompt ECB doves to raise their voices, but the consensus within the Governing Council appears directed at waiting for early 2024 wage data before taking steps to ease policy.
We expect a good week for the Dollar thanks to a strong PCE on Thursday. Before then, EUR/USD may struggle to find much sense of direction and keep hovering around the 1.0800 gravity line.
One event to watch today is ECB President Christine Lagarde participating in a plenary debate in the EU Parliament. Politicians generally put pressure for an earlier untightening of financial conditions, but Lagarde may not derail much from her hawkish tone before seeing February’s CPI numbers.
- USD/CAD scales higher for the second successive day on Monday amid sliding Oil prices.
- Retreating US bond yields undermines the USD, though does little to hinder the uptick.
- The US housing market data could produce short-term trading opportunities later today.
The USD/CAD pair is seen building on last week's rebound from the 1.3440 support zone and gaining some positive traction for the second successive day on Monday. Spot prices stick to modest intraday gains through the first half of the European session and currently trade around the 1.3525 region amid weaker Crude Oil prices.
Market participants remain uncertain about the fuel demand outlook amid expectations that higher borrowing costs will dent the economic activity in the US – the world's largest Oil consumer. This, in turn, drags Crude Oil prices away from a multi-week top touched last Thursday, which is seen undermining the commodity-linked Loonie. Adding to this, softer-than-expected Canadian consumer inflation figures released last week exert additional pressure on the Canadian Dollar (CAD) and lend support to the USD/CAD pair.
Meanwhile, the intraday uptick seems rather unaffected by subdued US Dollar (USD) price action, led by retreating US Treasury bond yields. That said, growing acceptance that the Federal Reserve (Fed) will keep interest rates higher for longer favours the USD bulls and suggests that the path of least resistance for the USD/CAD pair is to the upside. It, however, remains to be seen if spot prices could extend the momentum amid worries about supply disruptions in the Middle East, which could act as a tailwind for Crude Oil prices.
Moving ahead, Monday's release of New Home Sales data from the US, along with the US bond yields and the broader risk sentiment, might drive the USD demand and provide some impetus to the USD/CAD pair. Traders will further take cues from Oil price dynamics to grab short-term opportunities. the focus, however, will remain glued to the US Core PCE Price Index, which will play a key role in influencing the Fed's future policy decisions and determining the near-term trajectory for the currency pair.
Last week, Gold (XAU/USD) recorded minor gains and ended above the $2,030 mark. Economists at ANZ Bank analyze the yellow metal’s outlook.
Fed officials warned patience is needed before they start cutting rates
Gold managed to eke out a small weekly gain despite policymakers remaining hawkish.
Federal Reserve officials warned patience is needed before they start cutting rates. This has seen investors dump holdings in the world’s largest Gold-backed exchange-traded fund (ETF). However, haven buying remains supportive due to geopolitical risks in Ukraine and the Middle East.
- USD/CAD could breach the key barrier at 1.3550 to test February’s high at 1.3586.
- Traders could await the MACD indicator to confirm a clear directional trend.
- The pair could find immediate support at the psychological level of 1.3500 followed by the 50-day EMA at 1.3475.
USD/CAD moves higher for the second consecutive day, inching higher to near 1.3520 during the European session on Monday. The pair could meet the key barrier at the major level of 1.3550 following February’s high at 1.3586.
A break above the latter could exert upward support to lead the USD/CAD pair to explore the region around the psychological resistance level at 1.3600.
The technical analysis of the 14-day Relative Strength Index (RSI) is positioned above 50, suggesting bullish momentum for the USD/CAD pair.
Furthermore, the Moving Average Convergence Divergence (MACD) indicator for the USD/CAD pair, a lagging indicator, indicates a subdued momentum in the market. This interpretation is based on the MACD line's position above the centerline but resting on the signal line. Traders might prefer to await a clearer directional signal from the MACD indicator before initiating any trading actions.
On the downside, the immediate support appears at the psychological level of 1.3500 followed by the 23.6% Fibonacci retracement level of 1.3489 and the 50-day Exponential Moving Average (EMA) at 1.3475.
The USD/CAD pair could further fall to the major level of 1.3450 before the 38.2% Fibonacci retracement level at 1.3430. A break of this level could put downward pressure on the pair to test the psychological support at the 1.3400 level.
USD/CAD: Daily Chart
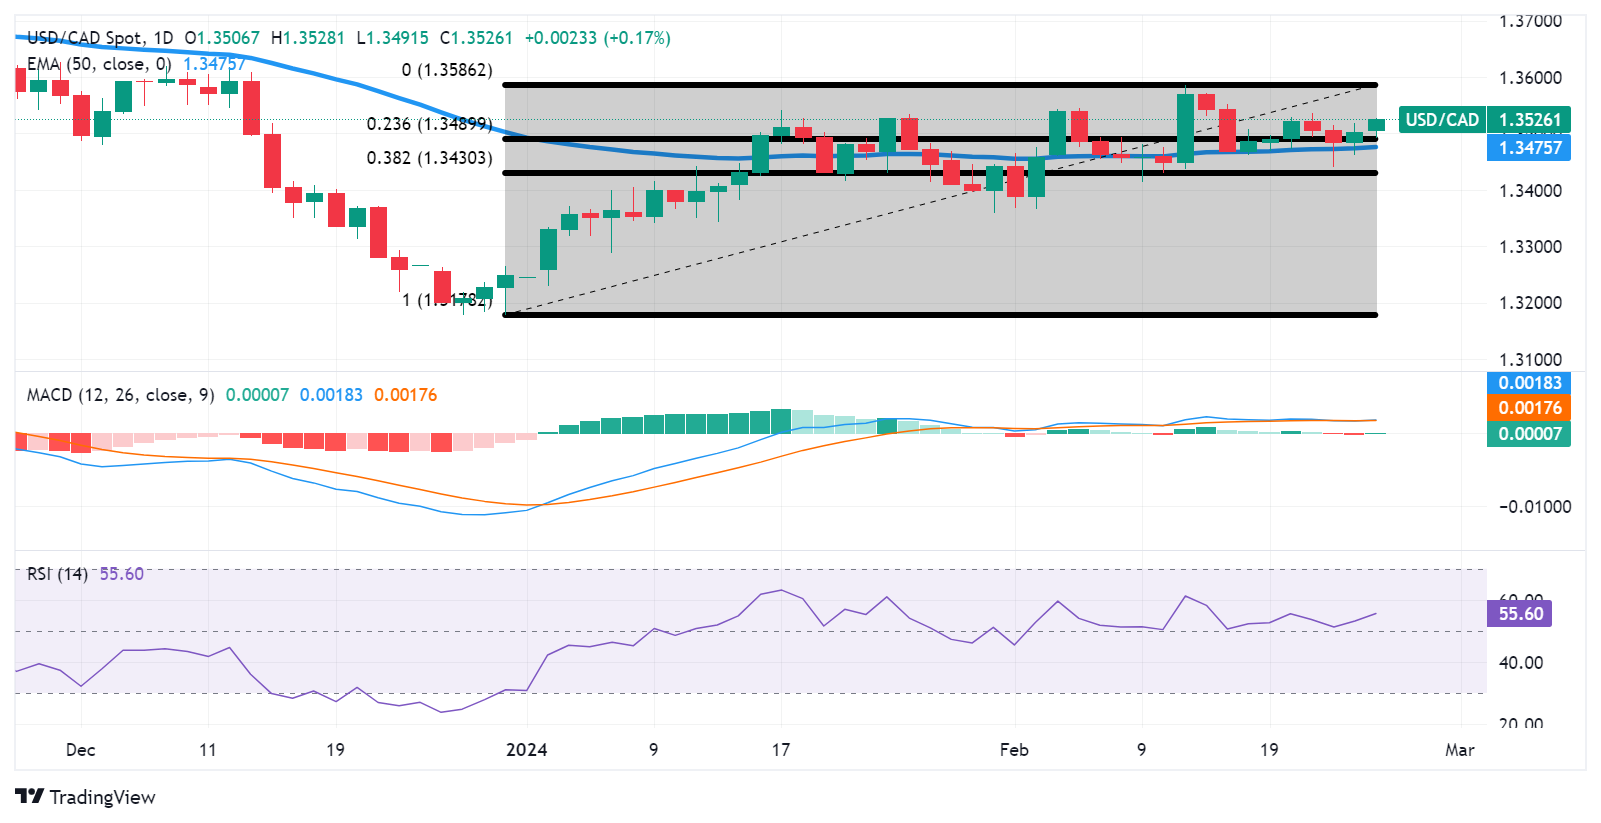
Japan’s inflation data for January will be released on Tuesday. Economists at ING analyze the Japanese Yen (JPY) outlook ahead of the Consumer Price Index (CPI) report.
Inflation may fall below 2.0% and hit the Yen
In Japan, Tokyo’s CPI numbers for January are expected to show both headline and core inflation moving to 1.9%, falling under the 2.0% Bank of Japan target for the first time since March 2022.
This may well prompt markets to price out a June hike and add buying pressure to USD/JPY beyond the 150.90 February highs and potentially test the 151.00/152.00 November highs.
- Silver struggles to capitalize on Friday’s goodish bounce from the vicinity of the mid-$22.00s.
- Neutral oscillators on the daily chart warrant some caution before placing directional bets.
- A sustained strength beyond the 200-day SMA will shift the bias in favour of bullish traders.
Silver (XAG/USD) meets with a fresh supply on the first day of a new week and erodes a major part of Friday's recovery gains from over a one-week low. The white metal maintains its offered tone around the $22.85-$22.80 zone through the first half of the European session and seems vulnerable to prolonging its recent downfall witnessed over the past week or so.
From a technical perspective, the recent failure to find acceptance above the very important and significant 200-day Simple Moving Average (SMA) and the subsequent decline validates the near-term negative outlook for the XAG/USD. That said, oscillators on the daily chart are yet to confirm a bearish bias, making it prudent to wait for some follow-through selling before positioning for any further near-term depreciating move.
In the meantime, Friday's swing low, around mid-$22.00s, might continue to protect the immediate downside ahead of the $22.30 horizontal support. The next relevant support is pegged near the $21.90-$21.85 zone, or the two-month low touched in January. A convincing break below the latter will be seen as a fresh trigger for bearish traders and has the potential to drag the XAG/USD towards testing the $21.40-$21.35 support area.
On the flip side, the $23.00 round figure now seems to have emerged as an immediate hurdle, which if cleared might trigger a short-covering rally and lift the XAG/USD to the 200-day SMA, currently near the $23.30 zone. This is followed by the monthly peak, around mid-$23.00. A sustained strength beyond the latter will negate the negative outlook and allow the XAG/USD to aim back to reclaim the $24.00 round figure.
The momentum could extend further towards the $24.50-$24.60 region, above which the white metal could target the $25.00 psychological mark.
Silver daily chart
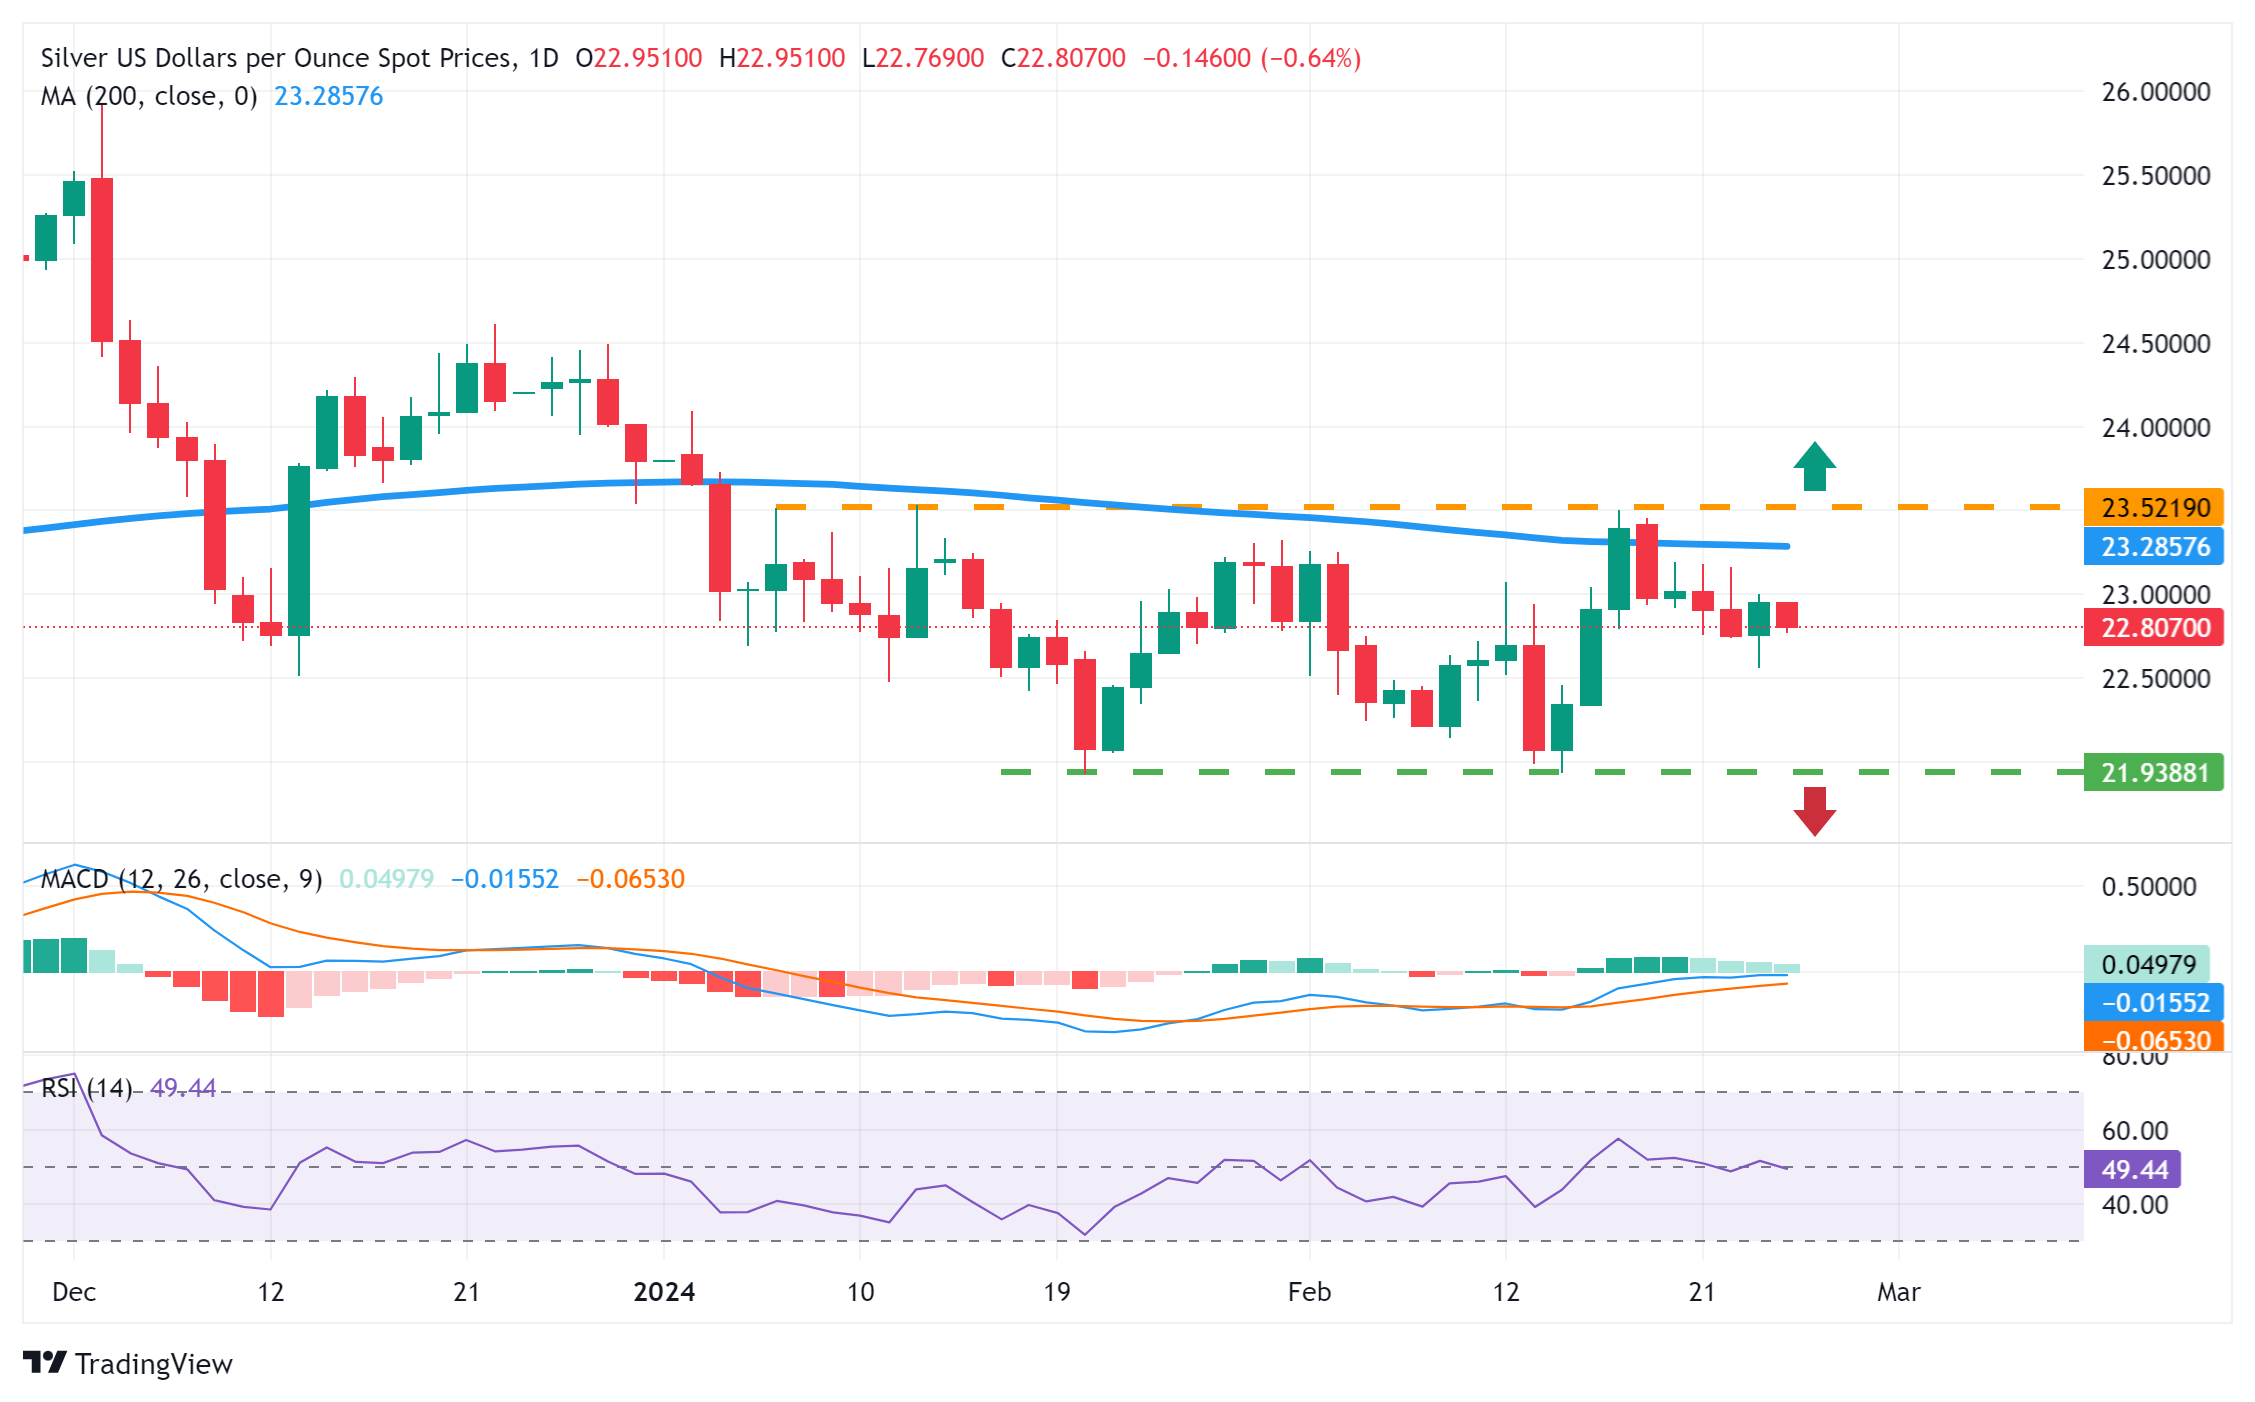
- EUR/USD attracts some dip-buying on Monday, though lacks bullish conviction.
- Retreating US bond yields undermines the USD and lends support to the major.
- A looming recession risk in Germany holds back bulls from placing fresh bets.
The EUR/USD pair reverses an intraday dip to the 1.0800 neighbourhood and touches a fresh daily peak during the early European session on Monday. European Central Bank (ECB) officials have been more vocal about the need for more evidence that inflation is returning to the 2% target before lowering borrowing costs. This, along with an improvement in the German Ifo Business Climate, is seen acting as a tailwind for the shared currency and the currency pair amid subdued US Dollar (USD) price action.
That said, concerns about a looming recession in Germany – the Eurozone's largest economy – might hold back bullish traders from placing aggressive bets around the EUR/USD pair. Furthermore, growing acceptance that the Federal Reserve (Fed) will keep rates higher for longer could underpin the Greenback and contribute to capping gains for the major. Investors might also prefer to wait on the sidelines ahead of this week's release of the flash consumer inflation figures from the Eurozone and the US Core PCE Price Index.
Daily digest market movers: Draws support from delayed ECB rate cut bets, subdued USD price action
- European Central Bank policymakers continue to push back against expectations for early interest rate cuts, which lends support to the EUR/USD pair.
- ECB's Robert Holzmann said on Friday that the main risk to rate cuts is the Red Sea tension and that it is better to cut interest rates later than to do so too early.
- Adding to this, ECB's executive board member Isabel Schnabel noted that monetary policy has had a weaker impact on dampening demand for services.
- Furthermore, ECB policymaker and Bundesbank Chief Joachim Nagel said that it is too early to cut interest rates as the price outlook is not yet clear enough.
- Separately, ECB President Christine Lagarde said that bargaining rounds in the first quarter will be key for the upcoming decisions on interest rates.
- Retreating US Treasury bond yields fail to assist the US Dollar to build on last week's recovery from its lowest level since early February and further lends support.
- The FOMC meeting minutes, along with hawkish remarks by several Federal Reserve officials, reaffirmed bets that the US central bank will keep rates higher for longer.
- The Bundesbank, in its latest monthly report, warned that the German economy is likely in recession and might keep a lid on any further upside for the currency pair.
Technical analysis: Bulls need to wait for sustained strength and acceptance above the 200-day SMA
From a technical perspective, last week's sustained move beyond the 23.6% Fibonacci retracement level of the December-February fall was seen as a key trigger for bulls. Moreover, oscillators on the daily chart have just started gaining positive traction and validate the positive outlook. That said, it will still be prudent to wait for a move above the very important 200-day Simple Moving Average (SMA) before positioning for additional gains.
The EUR/USD pair might then aim to surpass the 1.0865 zone or the 38.2% Fibo. level, before aiming to retest the multi-week high touched last Thursday. Some follow-through buying beyond the 1.0900 mark should lift the EUR/USD pair further towards the 50% Fibo. level, around the 1.0965-1.0970 region. The momentum could extend further and allow bulls to reclaim the 1.1000 psychological mark for the first time since January 11.
On the flip side, the 1.0800 mark, or the 23.6% Fibo. level might continue to protect the immediate downside. Any further slide is likely to attract fresh buyers near the 1.0760 horizontal zone. The latter should act as a pivotal point, which if broken will suggest that the recent recovery from a three-month low has run out of steam already and make the EUR/USD pair vulnerable to accelerate the fall towards retesting sub-1.0700 levels.
Euro price today
The table below shows the percentage change of Euro (EUR) against listed major currencies today. Euro was the strongest against the New Zealand Dollar.
| USD | EUR | GBP | CAD | AUD | JPY | NZD | CHF | |
| USD | -0.08% | 0.03% | 0.12% | 0.22% | -0.05% | 0.29% | -0.06% | |
| EUR | 0.07% | 0.10% | 0.19% | 0.30% | 0.03% | 0.37% | 0.01% | |
| GBP | -0.02% | -0.10% | 0.10% | 0.20% | -0.07% | 0.27% | -0.08% | |
| CAD | -0.12% | -0.20% | -0.10% | 0.11% | -0.18% | 0.16% | -0.19% | |
| AUD | -0.25% | -0.32% | -0.21% | -0.12% | -0.27% | 0.05% | -0.31% | |
| JPY | 0.05% | -0.03% | 0.13% | 0.17% | 0.31% | 0.32% | -0.02% | |
| NZD | -0.30% | -0.35% | -0.25% | -0.18% | -0.07% | -0.32% | -0.36% | |
| CHF | 0.05% | -0.02% | 0.09% | 0.18% | 0.30% | 0.01% | 0.34% |
The heat map shows percentage changes of major currencies against each other. The base currency is picked from the left column, while the quote currency is picked from the top row. For example, if you pick the Euro from the left column and move along the horizontal line to the Japanese Yen, the percentage change displayed in the box will represent EUR (base)/JPY (quote).
Euro FAQs
What is the Euro?
The Euro is the currency for the 20 European Union countries that belong to the Eurozone. It is the second most heavily traded currency in the world behind the US Dollar. In 2022, it accounted for 31% of all foreign exchange transactions, with an average daily turnover of over $2.2 trillion a day.
EUR/USD is the most heavily traded currency pair in the world, accounting for an estimated 30% off all transactions, followed by EUR/JPY (4%), EUR/GBP (3%) and EUR/AUD (2%).
What is the ECB and how does it impact the Euro?
The European Central Bank (ECB) in Frankfurt, Germany, is the reserve bank for the Eurozone. The ECB sets interest rates and manages monetary policy.
The ECB’s primary mandate is to maintain price stability, which means either controlling inflation or stimulating growth. Its primary tool is the raising or lowering of interest rates. Relatively high interest rates – or the expectation of higher rates – will usually benefit the Euro and vice versa.
The ECB Governing Council makes monetary policy decisions at meetings held eight times a year. Decisions are made by heads of the Eurozone national banks and six permanent members, including the President of the ECB, Christine Lagarde.
How does inflation data impact the value of the Euro?
Eurozone inflation data, measured by the Harmonized Index of Consumer Prices (HICP), is an important econometric for the Euro. If inflation rises more than expected, especially if above the ECB’s 2% target, it obliges the ECB to raise interest rates to bring it back under control.
Relatively high interest rates compared to its counterparts will usually benefit the Euro, as it makes the region more attractive as a place for global investors to park their money.
How does economic data influence the value of the Euro?
Data releases gauge the health of the economy and can impact on the Euro. Indicators such as GDP, Manufacturing and Services PMIs, employment, and consumer sentiment surveys can all influence the direction of the single currency.
A strong economy is good for the Euro. Not only does it attract more foreign investment but it may encourage the ECB to put up interest rates, which will directly strengthen the Euro. Otherwise, if economic data is weak, the Euro is likely to fall.
Economic data for the four largest economies in the euro area (Germany, France, Italy and Spain) are especially significant, as they account for 75% of the Eurozone’s economy.
How does the Trade Balance impact the Euro?
Another significant data release for the Euro is the Trade Balance. This indicator measures the difference between what a country earns from its exports and what it spends on imports over a given period.
If a country produces highly sought after exports then its currency will gain in value purely from the extra demand created from foreign buyers seeking to purchase these goods. Therefore, a positive net Trade Balance strengthens a currency and vice versa for a negative balance.
Economists at ING expect an above-consensus 0.4% Core PCE read on Thursday, which should support the Dollar this week.
Markets are underestimating the size of Fed easing
The release of the PCE deflator on Thursday is one of the key highlights in the US calendar this week, and we forecast an above-consensus 0.4% MoM core read on the back of insurance, medical and portfolio management fees inflation boost. Personal consumption figures may come in softer than expected, but other activity indicators like the Conference Board Consumer Confidence and the ISM manufacturing should inch higher.
All in all, we expect this last week of February to encourage less aggressive bets on Fed easing. Market pricing is falling between three and four rate cuts by year-end, with a move in June 80% priced in. We see USD rates receiving one – potentially final – round of support on the back of strong PCE figures and the Dollar to have a good week.
Our outlook beyond the short-term remains bearish on the Dollar as we think markets are underestimating the size of Fed easing.
- NZD/USD drops sharply from 0.6200 ahead of RBNZ policy.
- RBNZ Orr acknowledged risks connected to policy overtightening.
- Investors await US core PCE inflation data for fresh guidance.
The NZD/USD falls sharply to 0.6167 from the round-level resistance of 0.6200 in Monday’s European session. The Kiwi asset comes under pressure as investors shift focus towards the interest rate decision by the Reserve Bank of New Zealand (RBNZ), which will be announced on Wednesday.
The RBNZ is expected to maintain the Official Cash Rate (OCR) unchanged at 5.50%. Earlier, investors anticipated that the RBNZ could raise its key lending rates again to elevate downward pressures on sticky price pressures.
However, traders pared rate-hike expectations after RBNZ Governor Adrian Orr warned of risks of policy over-tightening. Adrain Orr said last week that the central bank needs to do more work to bring down core inflation but also acknowledged potential economic risks associated with further rate hikes. The NZ inflation is at 4.7%, more than double the required rate of 2%, which dents hopes of RBNZ pivoting to rare cuts, at least for now.
Meanwhile, the market mood remains slightly volatile as various economic data are set to release this week. The January United States core Personal Consumption Expenditure (PCE) inflation, scheduled for Thursday, will provide fresh insights on the interest rate outlook. The US Dollar Index (DXY) remains subdued around 103.80.
On Friday, New York Federal Reserve President John Williams said rate cuts could be announced later this year. William added, "My overall view of the economy hasn't changed based on one month of data." In the commentary from Fed Williams, the one month of data indicates surprisingly stick inflation data in January.
- USD/MXN halts its advances on subdued US Bond yields.
- The recent data reinforced the case for the Fed to maintain higher interest rates to address inflationary pressures.
- Mexico’s Current Account (Q4) increased to $11,662M against the expected $5,000M.
The USD/MXN pair experiences a decline after two consecutive days of gains, trading around 17.10 during the early European session on Monday. This downward movement is attributed to subdued US Treasury yields, which are putting pressure on the US Dollar (USD), consequently, undermining the USD/MXN pair.
The US Dollar Index (DXY) is slightly lower, hovering around 103.90, while the 2-year and 10-year yields on US Treasury notes stand at 4.67% and 4.22%, respectively, at the time of writing. However, the US Dollar (USD) maintained stability after recording gains in the past two sessions.
The US Dollar (USD) received support from robust employment data and mixed Purchasing Managers Index (PMI) figures from the United States (US). This reinforced the case for the Federal Reserve (Fed) to maintain higher interest rates to address inflationary pressures.
Investors are expected to closely watch key economic indicators, including Gross Domestic Product Annualized (Q4), Core Personal Consumption Expenditures, and ISM Manufacturing PMI later in the week. Additionally, the release of the Fed Monetary Policy Report will be closely monitored for further insights into the central bank's stance.
On the contrary, the Mexican Peso (MXN) might have found support from positive economic data released on Friday. The Bank of Mexico (Banxico) reported a significant increase in the Current Account (Q4) to $11,662M, surpassing expectations of $5,000M and the previous figure of $908M. Additionally, the Accumulated Current Account/GDP rose by 2.47% in the fourth quarter of 2023, compared to the previous quarter's reading of 0.19%.
Moreover, Mexico's 1st half-month Inflation for February declined by 0.1%, contrary to the expected increase of 0.15% and the previous rise of 0.49%. Similarly, the 1st half-month Core Inflation expanded by 0.24%, slightly below the expected 0.28% and matching the previous figure of 0.25%. Market participants are anticipated to closely monitor the Trade Balance data for January, scheduled for release on Tuesday.
- Pound Sterling trades back and forth ahead of BoE Pill’s commentary.
- High wage growth and service inflation keep the UK’s inflation sticky.
- The core PCE inflation data will guide further action in the US Dollar.
The Pound Sterling (GBP) is stuck in a tight range in Monday’s European session as investors need more insights on the Bank of England’s (BoE) interest rates for fresh action. The GBP/USD struggles for direction as uncertainty over the timing of rate cuts by the BoE and the Federal Reserve (Fed) continues to persist.
Policymakers from the BoE and the Fed are reluctant to offer details on the timing of rate cuts as they need more evidence to confirm that inflation will come down to the 2% target. The United Kingdom’s wage growth and service inflation are skewed to the upside, remaining inconsistent with the rate required to achieve price stability.
The US Dollar Index (DXY), which gauges the value of the US Dollar against six rival currencies, oscillates in a range around 104.00 amid a data-packed week. Investors will keenly watch the core Personal Consumption Expenditure price index (PCE) data for January, which will deliver a meaningful outlook on interest rates.
Daily Digest Market Movers: Pound Sterling juggles amid quiet market mood
- Pound Sterling consolidates in a tight range around 1.2660 as investors await fresh guidance on the Bank of England’s interest rates.
- The market expectations for early rate cuts are waning due to higher wage growth.
- In a testimony before the UK Parliaments’ Treasury Committee, BoE Deputy Governor Ben Broadbent said the momentum in wage growth is double that required to bring down inflation to its 2% target.
- Investors await the commentary from BoE Chief Economist Huw Pill for fresh interest rate guidance, which is scheduled at 11:00 GMT.
- BoE Pill is expected to reiterate the need for maintaining interest rates unchanged at 5.25% until they get convinced that inflation will sustainably return to the desired rate.
- Investors will keenly focus on commentary over concrete timing for rate cuts.
- Meanwhile, improving business optimism and economic outlook are a relief for BoE policymakers.
- This would allow the BoE to avoid a “hard landing” in the battle against stubborn inflation. The hard landing indicates a sharp contraction in economic activities while achieving price stability.
- While economists are anticipating an uptick in economic activities, recruitment data company Adzuna showed that job postings by British employers were hit significantly in January.
- The agency reported that job advertisements were 15% down annually at 867,000.
- "January 2024 has proven to be one of the most difficult starts to the year for job hunters in recent years with companies continuing to put hiring plans on ice," Adzuna co-founder Andrew Hunter said.
- Cooling labor market conditions would tame strong wage growth and will eventually provide a sigh of relief to BoE policymakers.
- Meanwhile, the US Dollar remains subdued even though investors have been convinced that the Federal Reserve (Fed) will not cut interest rates in the March-May monetary policy meetings.
- Last week, New York Federal Reserve President John Williams said rate cuts are on track later this year. When asked about sticky January Consumer Price Index (CPI) data, Williams said "My overall view of the economy basically hasn't changed based on one month of data."
Technical Analysis: Sharp volatility contraction to signal breakout to come
Pound Sterling trades inside Friday’s trading range as investors need fresh cues over the interest rate outlook. The broader outlook is sideways too as the pair oscillates in the Descending Triangle pattern formed on a daily timeframe. The aforementioned chart pattern indicates a sharp volatility contraction, carrying a slightly negative bias due to its formation of lower highs.
The horizontal support is plotted from December 13 low near 1.2500, while the downward-sloping border of the Descending Triangle pattern is placed from December 28 high at 1.2827. The pair holds above the 20 and 50-day Exponential Moving Averages (EMAs), which trade around 1.2630. Meanwhile, the 14-period Relative Strength Index (RSI) trades in the 40.00-60.00 region, indicating indecisiveness among market participants
Pound Sterling FAQs
What is the Pound Sterling?
The Pound Sterling (GBP) is the oldest currency in the world (886 AD) and the official currency of the United Kingdom. It is the fourth most traded unit for foreign exchange (FX) in the world, accounting for 12% of all transactions, averaging $630 billion a day, according to 2022 data.
Its key trading pairs are GBP/USD, aka ‘Cable’, which accounts for 11% of FX, GBP/JPY, or the ‘Dragon’ as it is known by traders (3%), and EUR/GBP (2%). The Pound Sterling is issued by the Bank of England (BoE).
How do the decisions of the Bank of England impact on the Pound Sterling?
The single most important factor influencing the value of the Pound Sterling is monetary policy decided by the Bank of England. The BoE bases its decisions on whether it has achieved its primary goal of “price stability” – a steady inflation rate of around 2%. Its primary tool for achieving this is the adjustment of interest rates.
When inflation is too high, the BoE will try to rein it in by raising interest rates, making it more expensive for people and businesses to access credit. This is generally positive for GBP, as higher interest rates make the UK a more attractive place for global investors to park their money.
When inflation falls too low it is a sign economic growth is slowing. In this scenario, the BoE will consider lowering interest rates to cheapen credit so businesses will borrow more to invest in growth-generating projects.
How does economic data influence the value of the Pound?
Data releases gauge the health of the economy and can impact the value of the Pound Sterling. Indicators such as GDP, Manufacturing and Services PMIs, and employment can all influence the direction of the GBP.
A strong economy is good for Sterling. Not only does it attract more foreign investment but it may encourage the BoE to put up interest rates, which will directly strengthen GBP. Otherwise, if economic data is weak, the Pound Sterling is likely to fall.
How does the Trade Balance impact the Pound?
Another significant data release for the Pound Sterling is the Trade Balance. This indicator measures the difference between what a country earns from its exports and what it spends on imports over a given period.
If a country produces highly sought-after exports, its currency will benefit purely from the extra demand created from foreign buyers seeking to purchase these goods. Therefore, a positive net Trade Balance strengthens a currency and vice versa for a negative balance.
Last week, the Pound Sterling (GBP) was one the top performers in the G10 space alongside the New Zealand Dollar (NZD) and the Swedish Krona (SEK). However, the next few days could be difficult for the GBP. Economists at ING analyze Pound Sterling’s outlook.
EUR/GBP to stabilise around the 0.8550 mark
We see downside risks for GBP/USD as PCE inflation data in the US could help the Dollar, with the pair potentially testing the 1.2530 – 14-February low.
EUR/GBP will be affected by today’s speech from Lagarde and Eurozone CPI data on Friday. Here, we expect some stabilisation around the 0.8550 mark.
Many analysts are putting forward the argument that the ECB has raised interest rates too much. Economists at Natixis disagree with this idea.
There has been no rise in unemployment or transition to a situation of insufficient demand
Many analysts believe that the ECB has raised interest rates too much and that these rate hikes have caused activity to stagnate in the Eurozone in 2023, and probably in 2024. We disagree with this idea, since: The unemployment rate in the Eurozone is at its lowest; We are still seeing excess demand for goods and major hiring difficulties.
The ECB's restrictive monetary policy has not been enough to increase unemployment or to create a shortfall in aggregate demand for goods and services. For this reason, inflation will remain above the 2% target, and the ECB has not raised interest rates too much.
- EUR/JPY trades on a weaker note around 162.85 in Monday’s early European session.
- ECB's Stournaras said the central bank won’t have enough data to decide on rate cuts until June.
- A technical recession in Japan might prompt the BoJ to delay an exit from negative rates, which exerts some pressure on the JPY.
The EUR/JPY cross holds below the 163.00 mark during the early European session on Monday. The concern about a technical recession in Japan and the risk-on mood weigh on the Japanese Yen (JPY). However, the warning from Japanese authorities to intervene in the FX market might cap the downside of the JPY. The cross currently trades near 162.85, down 0.01% on the day.
The European Central Bank (ECB) Governing Council member Yannis Stournaras said on Friday that the central bank won’t have enough data to decide on interest-rate cuts until June, despite inflation seeming to be on pace to reach the 2% target this year. Meanwhile, ECB policymaker Mario Centeno said the central bank might be ready to consider cutting rates next month, if data call for it, even if that’s only a low-probability event. That being said, the divergence of monetary policy between the ECB and the Bank of Japan (BoJ) provides some support to the Euro (EUR) and acts as a headwind for the EUR/JPY cross.
On the other hand, Japan entered a technical recession as its Gross Domestic Product (GDP) unexpectedly contracted for two consecutive quarters and surrendered its position as the world's third-largest economy to Germany. The weaker GDP growth number might convince the BoJ to delay an exit from negative rates. This, in turn, drags the JPY lower against its rivals.
However, verbal intervention from the Japanese authorities might lift the JPY. Japan's Finance Minister Shunichi Suzuki said last week that the government is closely watching FX moves with a high sense of urgency.
The Japan’s Consumer Price Index (CPI) for January will be due on Tuesday. On Thursday, the German Retail Sales and CPI data will be released. The attention will shift to the Eurozone Harmonized Index of Consumer Prices (HICP) data on Friday. Traders will take cues from the data and find trading opportunities around the EUR/JPY cross.
Here is what you need to know on Monday, February 26:
The US Dollar (USD) Index fluctuates in a narrow range at around 104.00 after snapping a five-week winning streak. January New Home Sales Change will be the only data featured in the US economic docket on Monday. Later in the day, European Central Bank (ECB) President Christine Lagarde will be delivering a speech and the US Treasury will hold 2-year and 5-year note auctions.
Wall Street's main indexes ended the previous week on a mixed note as the risk rally seen earlier in the week lost its steam. Early Monday, US stock index futures trade modestly lower on the day, reflecting a cautious market stance. The benchmark 10-year US Treasury bond yield stays slightly below 4.25% after declining nearly 2% on Friday. Tuesday's economic calendar will offer US January Durable Goods Orders and Conference Board Consumer Confidence Index data for February.
US Dollar price today
The table below shows the percentage change of US Dollar (USD) against listed major currencies today. US Dollar was the strongest against the New Zealand Dollar.
| USD | EUR | GBP | CAD | AUD | JPY | NZD | CHF | |
| USD | -0.04% | 0.05% | 0.02% | 0.14% | -0.08% | 0.25% | -0.03% | |
| EUR | 0.04% | 0.07% | 0.06% | 0.19% | -0.04% | 0.30% | 0.00% | |
| GBP | -0.04% | -0.08% | -0.02% | 0.10% | -0.11% | 0.21% | -0.08% | |
| CAD | -0.02% | -0.06% | 0.03% | 0.13% | -0.11% | 0.23% | -0.06% | |
| AUD | -0.16% | -0.19% | -0.10% | -0.13% | -0.22% | 0.11% | -0.18% | |
| JPY | 0.08% | 0.03% | 0.17% | 0.09% | 0.22% | 0.33% | 0.03% | |
| NZD | -0.26% | -0.31% | -0.22% | -0.24% | -0.11% | -0.33% | -0.30% | |
| CHF | 0.03% | 0.00% | 0.07% | 0.06% | 0.19% | -0.05% | 0.30% |
The heat map shows percentage changes of major currencies against each other. The base currency is picked from the left column, while the quote currency is picked from the top row. For example, if you pick the Euro from the left column and move along the horizontal line to the Japanese Yen, the percentage change displayed in the box will represent EUR (base)/JPY (quote).
USD/JPY stabilized above 150.00 in the second half of the previous week and registered gains for the fourth consecutive week. The pair stays quiet at around 150.50 in the early European morning on Monday. In the Asian session on Tuesday, January National Consumer Price Index (CPI) data from Japan will be watched closely by market participants.
Japanese Yen bears not ready to give up yet amid reduced bets for a BoJ policy shift.
Following the sharp upsurge seen on Thursday, EUR/USD lost its bullish momentum. Nevertheless, the pair settled above 1.0800 and went into a consolidation phase. ECB President Lagarde will participate in plenary debate in the European Parliament on the ECB Annual Report 2022.
GBP/USD registered gains for four consecutive days and rose 0.6% in the previous week. The pair fluctuates in a narrow channel slightly above 1.2650 early Monday. Bank of England (BoE) Chief Economist Huw Pill will speak later in the day.
AUD/USD rose 0.5% last week and stabilized at around 0.6550. In the Asian session on Wednesday, monthly CPI data for January from Australia will be watched closely by market participants. Meanwhile, NZD/USD trades on the back foot and retreats toward 0.6150 early Monday after having met resistance near 0.6200 on Friday. The Reserve Bank of New Zealand will announce monetary policy decisions on Wednesday.
Australian Dollar stabilizes after intraday losses amid a stable US Dollar.
Gold benefited from falling US yields ahead of the weekend and rose 0.55% on Friday. XAU/USD stays in a consolidation phase slightly above $2,030 early Monday.
Gold price keeps the red below two-week peak amid delayed Fed rate cut bets.
FX option expiries for Feb 26 NY cut at 10:00 Eastern Time, via DTCC, can be found below.
- EUR/USD: EUR amounts
- 1.0600 631m
- 1.0700 1.3b
- 1.0750 1.3b
- USD/CAD: USD amounts
- 1.3450 727m
- 1.3515 525m
- NZD/USD: NZD amounts
- 0.5975 380m
- EUR/GBP: EUR amounts
- 0.8475 520m
- EUR/GBP breaks its losing streak on hawkish remarks by ECB officials.
- ECB's Yannis Stournaras ruled out the possibility of rate cuts in March.
- MUFG Bank noted that the technical recession experienced in the second half of 2023 appears to be ending.
EUR/GBP halts its three-day losing streak, edging higher to near 0.8540 during the Asian session on Monday. The Euro (EUR) receives upward support on hawkish comments from European Central Bank’s (ECB) members. Additionally, ECB Monetary Policy Meeting Accounts for January indicated that policymakers maintain caution regarding easing monetary policy. They expressed a consensus that it was premature to discuss rate cuts at the meeting. Traders will likely watch the ECB President Christine Lagarde’s speech later on Monday.
On Friday, several European Central Bank (ECB) policymakers shared their views on economic conditions. ECB's Yannis Stournaras stated that he anticipates a rate cut in June, ruling out the possibility of rate cuts in March. On the other hand, ECB's Joachim Nagel remained confident that inflation will be brought under control, emphasizing the importance of not acting prematurely. Nagel suggested that the ECB should base its decisions on data rather than following the steps taken by other central banks.
On the other side, the lower February consumer confidence data from the United Kingdom (UK) might have weakened the Pound Sterling (GBP), consequently acting as a tailwind for the EUR/GBP pair. On Friday, the GfK Consumer Confidence index for the UK came in at -21, disappointing to the market expectations of a -18 reading and the previous reading of -19, indicating a contraction in consumer confidence in UK economic activity for February.
Economists at MUFG Bank noted that the recent UK PMI data suggests that the technical recession experienced in the second half of last year appears to be ending. The strengthening of global risk sentiment will likely allow the Bank of England (BoE) to maintain a patient stance, similar to other central banks. Furthermore, there remains a possibility of inflation reaching the 2% target in April. Huw Pill, Chief Economist at the Bank of England (BoE) will speak on Monday.
- USD/CHF oscillates in a narrow range of 0.8800-0.8825 in Monday’s early European session.
- The upbeat US inflation data and hawkish comments from Fed officials prompted markets to lower bets on rate cuts this year.
- The rising geopolitical tension in the Red Sea might lift a safe-haven currency like the Swiss Franc (CHF).
The USD/CHF pair trades sideways above the 0.8800 mark during the early European session. The US and Swiss Gross Domestic Product (GDP) for the fourth quarter (Q4) could provide a clear direction to the pair. The annualized US GDP growth number is estimated to remain steady at 3.3%. USD/CHF currently trades around 0.8811, unchanged for the day.
The US inflation data in January and the cautious comments from Federal Reserve (Fed) officials have prompted markets to pull back expectations on rate cuts. Investors expect three interest rate cuts for 2024, down from six cuts anticipated in December.
Investors will closely watch the US Personal Consumption Expenditures Price Index (Core PCE), the Fed’s preferred inflation measure, due on Thursday. The report could offer some hints as to whether inflation is easing or elevated. The stronger data might lift the Greenback against its rivals.
The United States and Britain hit 18 Houthi targets in Yemen, responding to a recent rise in attacks on ships in the Red Sea and Gulf of Aden by the Iran-backed militia group, including a missile strike this week that set fire to a cargo tanker. The rising geopolitical tension in the Red Sea might boost a safe-haven currency like the Swiss Franc (CHF) and act as a headwind for the USD/CHF pair.
Looking ahead, the US Durable Goods Orders and Consumer Confidence will be due on Tuesday. On Wednesday, the US GDP growth numbers for Q4 will be released. The Swiss GDP report and the US Q4 Core Personal Consumption Expenditures Price Index (Core PCE) on Thursday will be the highlights this week.
- EUR/USD could meet the immediate support at the 21-day EMA at 1.0808.
- Technical analysis suggests a momentum shift toward upward momentum.
- The key support region appears around the major barrier at 1.0850 and the 38.2% Fibonacci retracement level at 1.0864.
EUR/USD snaps its winning streak initiated on February 14, with the US Dollar (USD) maintaining its position, supported by hawkish remarks from the Federal Reserve’s (Fed) officials on prolonging elevated interest rates. As a result, the EUR/USD pair inches lower to around 1.0820 during the Asian session on Monday.
The immediate support is evident at the 21-day Exponential Moving Average (EMA) at 1.0808, coinciding with the psychological level of 1.0800. A breach below the latter could prompt the EUR/USD pair to navigate the region around 1.0750 following the psychological level of 1.0700, in conjunction with the three-month low at 1.0694.
However, the technical analysis of the EUR/USD pair suggests a bullish sentiment as the 14-day Relative Strength Index (RSI) is positioned above the 50 mark.
Additionally, the Moving Average Convergence Divergence (MACD) is situated below the centerline but exhibits a divergence above the signal line. This lagging indicator suggests a potential transition toward bullish momentum for the EUR/USD pair.
On the upside, the EUR/USD pair may ascend toward testing the key resistance area around the major barrier at 1.0850 and the 38.2% Fibonacci retracement level at 1.0864. A break above this area could lead the EUR/USD pair to retest the previous week’s high at 1.0888 followed by the psychological level of 1.0900.
EUR/USD: Daily Chart
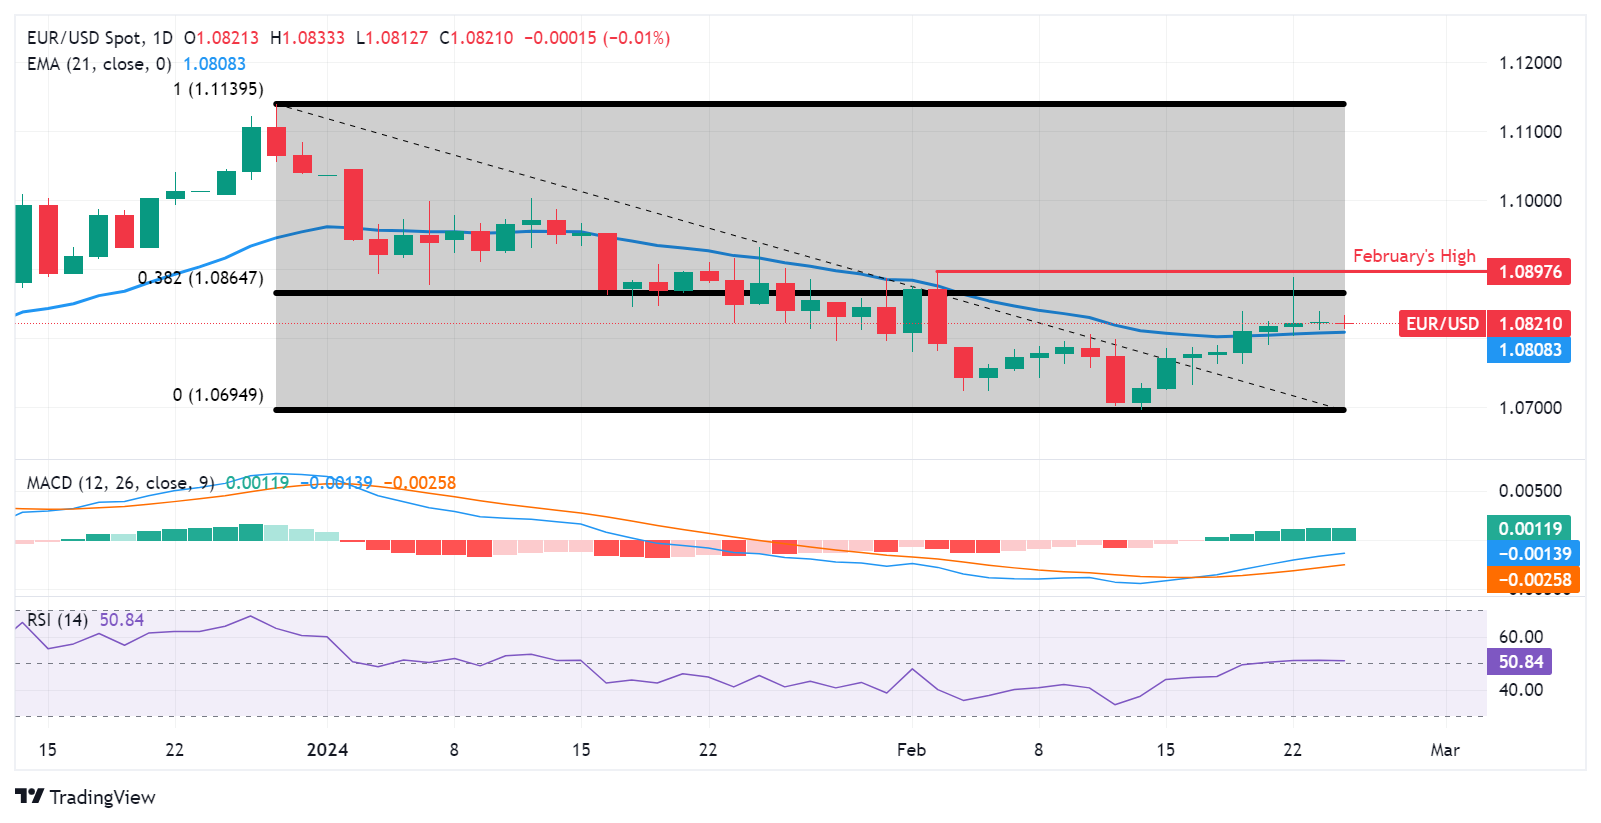
- NZD/USD pulls back from a multi-week high and snaps an eight-day winning streak.
- The ed’s hawkish outlook revives the USD demand and exerts pressure on the pair.
- The downside seems limited ahead of this week’s RBNZ meeting and US macro data.
The NZD/USD pair comes under heavy selling pressure on the first day of a new week and retreats further from a five-week peak, around the 0.6215-0.6220 region touched last Thursday. Spot prices drop to the 0.6165-0.6160 area during the Asian session and for now, seem to have snapped an eight-day winning streak amid a modest US Dollar (USD) strength.
The late January FOMC meeting minutes, along with the recent hawkish remarks by influential Federal Reserve (Fed) officials, suggested that the US central bank is in no hurry to cut interest rates amid sticky inflation and a resilient US economy. The Fed's higher-for-longer narrative remains supportive of elevated US Treasury bond yields and assists the USD to hold comfortably above a multi-week low, which, in turn, is seen exerting pressure on the NZD/USD pair.
Meanwhile, the risk of a further escalation of tensions between China and Taiwan, along with geopolitical tensions stemming from conflicts in the Middle East and the prolonged Russia-Ukraine war, keeps a lid on the recent optimism. This contributes to driving flows away from the risk-sensitive Kiwi, though the downside for the NZD/USD pair seems cushioned ahead of the Reserve Bank of New Zealand's (RBNZ) monetary policy meeting on Wednesday.
Apart from this, investors this week will also confront the release of important US macro data, including the Prelim Q4 GDP and the Core PCE Price Index. This might influence the Fed's future policy decisions, which, in turn, will drive the USD and provide some meaningful impetus to the NZD/USD pair. Moving ahead, traders on Monday will take cues from the US New Home Sales data to grab short-term opportunities later during the North American session.
- USD/CAD edges higher to 1.3512 in Monday’s Early European session.
- The cooler-than-expected Canadian inflation numbers might convince the Bank of Canada to cut rates sooner than expected.
- The Fed's Waller said the central bank should delay rate cuts in the coming months to see more evidence of inflation data.
The USD/CAD pair attracts some buyers above the 1.3500 mark during the Asian session on Monday. The recovery of the pair is bolstered by renewed US Dollar (USD) demand. Investors await the Canadian Current Account and the US Gross Domestic Product annualized for the fourth quarter (Q4) for fresh impetus. At press time, USD/CAD is trading at 1.3512, adding 0.07% on the day.
The Canadian Consumer Price Index (CPI) slowed more than expected to 2.9%. It’s the first time inflation has fallen into the Bank of Canada’s (BoC) target range since mid-2021. The cooler-than-expected inflation numbers suggested the door to interest rate cuts could open much sooner than the central bank expected. Meanwhile, the corruptive move in oil prices might weigh on the commodity-linked loonie.
On the other hand, the hawkish comments from Federal Reserve (Fed) officials about keeping the policy rate higher for longer provided some support to the US Dollar (USD). Last week, Fed Governor Christopher Waller said the Fed should delay interest rate cuts by at least a few more months to see more evidence of inflation data.
Moving on, market participants will focus on the US GDP growth number for Q4 and the Canadian Q4 Current Account. On Thursday, the Canadian GDP and the US Q4 Core Personal Consumption Expenditures Price Index (Core PCE) will be due
- AUD/JPY kicks off the new week on a weaker note and moves away from a multi-year peak.
- Geopolitical risks and intervention fears underpin the JPY and exert pressure on the cross.
- The RBA’s hawkish outlook and BoJ policy uncertainty should help limit any further losses.
The AUD/JPY cross comes under some selling pressure during the Asian session on Monday and snaps an eight-day winning streak to the 99.00 mark, or its highest level since December 2014. Spot prices currently trade around the 98.60 region, with bears now awaiting a sustained break and acceptance below the 100-hour Simple Moving Average (SMA) before positioning for any further losses.
Against the backdrop of geopolitical risks, speculations that Japanese authorities will intervene to stem any further weakness in the domestic currency turn out to be a key factor behind the Japanese Yen's (JPY) relative outperformance. The Australian Dollar (AUD), on the other hand, is weighed down by the risk of a further escalation of tensions between China and Taiwan. This, in turn, is seen exerting some downward pressure on the AUD/JPY cross.
That said, the recent optimism led by hopes for additional stimulus from China might continue to act as a tailwind for the China-proxy Aussie. Apart from this, the Reserve Bank of Australia's (RBA) hawkish stance, signalling that policymakers are unwilling to rule out another cash rate increase in the wake of sticky inflation, could lend support to the AUD. This, in turn, warrants some caution before placing aggressive bearish bets around the AUD/JPY cross.
Meanwhile, a recession in Japan seems to have dashed hope for an imminent shift in the Bank of Japan's (BoJ) policy stance in the coming months. This could keep a lid on any meaningful appreciating move for the JPY and contribute to limiting the downside for the AUD/JPY cross. Hence, it will be prudent to wait for strong follow-through selling before confirming that spot prices have topped out and positioning for a deeper corrective decline.
- WTI price continues to lose ground for the second successive session on Monday.
- Crude oil prices receive downward pressure due to uncertainties over Crude oil demand globally.
- Higher interest rates globally dampen economic activities, which in turn undermines the consumption of oil.
West Texas Intermediate (WTI) oil prices extend their decline for the second consecutive session, hovering near $76.00 per barrel during the Asian trading session on Monday. The downward pressure on Crude oil prices can be attributed to uncertainties surrounding demand, likely influenced by heightened global risk sentiment. This sentiment could prompt central banks to adopt a patient stance regarding the trajectory of interest rates.
The global trend of higher interest rates is dampening economic activities, thereby reducing the consumption of Crude oil and resulting in lower demand. The recent Federal Open Market Committee (FOMC) Minutes highlighted concerns about interest rate cuts, signaling a preference for maintaining higher borrowing costs to combat persistent inflationary pressures. This stance has contributed to the moderation in oil prices.
Furthermore, hawkish remarks from officials at the Federal Reserve (Fed) have signaled a continuation of higher Fed rates. John C. Williams, President of the New York Federal Reserve, suggested in an interview that rate cuts might be possible later in the year, but emphasized that they would only be implemented if deemed appropriate. Similarly, Federal Reserve Governor Christopher J. Waller has proposed delaying any rate cuts for a few months to assess whether January's high inflation report was an anomaly.
The escalation of geopolitical tensions in the Middle East has sparked concerns regarding possible disruptions to the oil supply. However, despite these concerns, significant supply constraints have not yet materialized. In addition, White House national security adviser Jake Sullivan announced on Sunday that negotiators from the United States, Egypt, Qatar, and Israel had reached a preliminary agreement on a hostage deal during discussions in Paris.
- Gold price edges lower and erodes a part of Friday’s gains to over a two-week high.
- Hawkish Fed expectations revive the USD demand and exert pressure on the metal.
- Geopolitical risks could lend support to the XAU/USD and help limit further losses.
Gold price (XAU/USD) settled in the green for the first time in the previous three weeks in the wake of persistent geopolitical tensions and the recent US Dollar (USD) corrective decline. The precious metal, however, struggles to capitalize on its move beyond the 50-day Simple Moving Average (SMA) and edges lower during the Asian session on Monday amid bets that the Federal Reserve (Fed) will keep rates higher for longer.
In fact, market participants pushed back their expectations for an early interest rate cut by the US central bank following the release of higher-than-expected US consumer and producer prices earlier this month. Adding to this, the minutes of the late January FOMC meeting, along with hawkish remarks by Fed officials suggested that the central bank was in no hurry to cut interest rates amid sticky inflation and a resilient US economy.
The hawkish outlook remains supportive of elevated US Treasury bond yields, which assists the USD in holding above a three-week low touched last Thursday and exerts some downward pressure on the non-yielding Gold price. The downside, however, seems limited in the wake of the risk of a further escalation of military action in the Middle East and the prolonged Russia-Ukraine war, which tends to benefit the safe-haven XAU/USD.
Daily Digest Market Movers: Gold price is pressured by delayed Fed rate cut bets, downside seems limited
- The US Dollar registered its first weekly decline for 2024, which, along with increasing demand for traditional safe-haven assets, lifted the Gold price to over a two-week high on Friday.
- The growing conviction that the Federal Reserve will wait until the June policy meeting before cutting interest rates keeps a lid on any further appreciating move for the non-yielding yellow metal.
- The January FOMC meeting minutes released last week revealed that policymakers generally agreed that they needed greater confidence in falling inflation before considering cutting rates.
- Adding to this, a number of prominent Fed officials recently suggested that imminent interest rate cuts are unlikely as the central bank aims to bring inflation back to the 2% annual target.
- The US Treasury bond yields retreated from a fresh YTD peak touched last week, though remain well supported by the Fed's hawkish outlook and continue to act as a tailwind for the US Dollar.
- Investors, meanwhile, remain concerned about geopolitical risks stemming from conflicts in the Middle East and the Russia-Ukraine war, which could lend some support to the safe-haven XAU/USD.
- Israel expressed its intentions to expand its operations to destroy Hamas amid the uncertainty over a ceasefire, while Russia is preparing a new offensive against Ukraine starting in late May or summer.
- US and UK fighter planes carried out strikes on Houthi sites in Yemen on Saturday amid sustained attacks by the Iran-backed Houthi rebels on commercial vessels in the important Red Sea trade route.
- Ukraine's President Volodymyr Zelensky said on Sunday that Russia is preparing a new offensive against the country starting in late May or summer and Kyiv has a clear battlefield plan of its own.
- Investors now await this week's key US macro data, including the Core PCE Price Index, for clues about the Fed's future policy decision before placing fresh directional bets around the commodity.
Technical Analysis: Gold price bulls still seem to have the upper hand, $2,024 horizontal support holds the key
From a technical perspective, failure to find acceptance above the 50-day SMA and a modest pullback from the $2,041-2,042 intermediate hurdle warrants some caution for bullish traders. That said, oscillators on the daily chart have just started gaining positive traction and support prospects for additional near-term gains. Hence, any subsequent decline is more likely to attract fresh buyers near the $2,024 horizontal support.
A convincing break below, however, will expose the 100-day SMA, currently pegged near the $2,007 area. This is followed by the $2,000 psychological mark, which if broken decisively might shift the bias in favour of bearish traders. The Gold price might then accelerate the slide towards the $1,984 region before eventually dropping to the very important 200-day SMA support near the $1,967-1,966 zone.
On the flip side, bulls need to wait for a move beyond Friday's swing high, around the $2,041-2,042 area, before placing fresh bets. The Gold price might then aim to challenge the next relevant hurdle near the $2,065 supply zone. Some follow-through buying will set the stage for a move towards reclaiming the $2,100 round figure mark for the first time since early December 2023.
US Dollar price this week
The table below shows the percentage change of US Dollar (USD) against listed major currencies this week. US Dollar was the strongest against the New Zealand Dollar.
| USD | EUR | GBP | CAD | AUD | JPY | NZD | CHF | |
| USD | -0.01% | 0.10% | 0.05% | 0.18% | -0.02% | 0.28% | 0.03% | |
| EUR | -0.01% | 0.09% | 0.05% | 0.18% | -0.02% | 0.27% | 0.01% | |
| GBP | -0.10% | -0.09% | -0.04% | 0.09% | -0.11% | 0.18% | -0.08% | |
| CAD | -0.06% | -0.07% | 0.04% | 0.14% | -0.08% | 0.23% | -0.03% | |
| AUD | -0.20% | -0.18% | -0.08% | -0.13% | -0.20% | 0.10% | -0.16% | |
| JPY | 0.01% | 0.00% | 0.16% | 0.07% | 0.21% | 0.30% | 0.03% | |
| NZD | -0.29% | -0.29% | -0.18% | -0.23% | -0.10% | -0.29% | -0.26% | |
| CHF | -0.02% | -0.01% | 0.08% | 0.04% | 0.18% | -0.04% | 0.27% |
The heat map shows percentage changes of major currencies against each other. The base currency is picked from the left column, while the quote currency is picked from the top row. For example, if you pick the Euro from the left column and move along the horizontal line to the Japanese Yen, the percentage change displayed in the box will represent EUR (base)/JPY (quote).
Gold FAQs
Why do people invest in Gold?
Gold has played a key role in human’s history as it has been widely used as a store of value and medium of exchange. Currently, apart from its shine and usage for jewelry, the precious metal is widely seen as a safe-haven asset, meaning that it is considered a good investment during turbulent times. Gold is also widely seen as a hedge against inflation and against depreciating currencies as it doesn’t rely on any specific issuer or government.
Who buys the most Gold?
Central banks are the biggest Gold holders. In their aim to support their currencies in turbulent times, central banks tend to diversify their reserves and buy Gold to improve the perceived strength of the economy and the currency. High Gold reserves can be a source of trust for a country’s solvency. Central banks added 1,136 tonnes of Gold worth around $70 billion to their reserves in 2022, according to data from the World Gold Council. This is the highest yearly purchase since records began. Central banks from emerging economies such as China, India and Turkey are quickly increasing their Gold reserves.
How is Gold correlated with other assets?
Gold has an inverse correlation with the US Dollar and US Treasuries, which are both major reserve and safe-haven assets. When the Dollar depreciates, Gold tends to rise, enabling investors and central banks to diversify their assets in turbulent times. Gold is also inversely correlated with risk assets. A rally in the stock market tends to weaken Gold price, while sell-offs in riskier markets tend to favor the precious metal.
What does the price of Gold depend on?
The price can move due to a wide range of factors. Geopolitical instability or fears of a deep recession can quickly make Gold price escalate due to its safe-haven status. As a yield-less asset, Gold tends to rise with lower interest rates, while higher cost of money usually weighs down on the yellow metal. Still, most moves depend on how the US Dollar (USD) behaves as the asset is priced in dollars (XAU/USD). A strong Dollar tends to keep the price of Gold controlled, whereas a weaker Dollar is likely to push Gold prices up.
- Indian Rupee trades on a softer note on US Dollar demand.
- The higher-for-longer interest rate narrative in the US might lift the USD and cap upside in the INR.
- The US GDP growth number for Q4 will be due on Wednesday.
Indian Rupee (INR) edges lower on Monday amid US Dollar (USD) demand from oil companies and other importers. The hawkish comments from Fed officials about keeping the policy rate higher for longer might cap any substantial upside in the INR. However, the potential intervention from the Reserve Bank of India (RBI) might curb excess volatility in the INR.
According to the minutes of the RBI's latest policy meeting, the MPC agreed that the Indian economy is currently showing resilience on the growth front. However, the uncertainty, food inflation volatility, and geopolitical spillovers could cap the upside of the INR.
Investors await the US Gross Domestic Product Annualized for the fourth quarter (Q4) on Wednesday and the Core Personal Consumption Expenditures Price Index (Core PCE) on Thursday. On the Indian docket, the GDP annual growth numbers and Federal Fiscal Deficit will be released on Thursday. The Indian S&P Global Manufacturing PMI for February will be published on Friday.
Daily Digest Market Movers: Indian Rupee remains sensitive to inflation and geopolitical risks
- India's foreign exchange reserves fell for the second week in a row, reaching a two-month low of $616.10 billion on February 16, according to the Reserve Bank of India.
- The RBI revised its growth forecast for the Indian economy to 7% for the current fiscal year, an increase from its earlier forecast of 6.5%.
- The RBI’s Monetary Policy Committee agrees on the need for caution amid uncertainties, while being optimistic about growth.
- The Indian economy, which grew at a four-month high in January, expanded further in February, with accelerations in both the manufacturing and services sectors.
- Fed Governor Christopher Waller said the Fed should delay interest rate cuts by at least a few more months to see more evidence of inflation data.
Technical Analysis: Indian Rupee remains capped within the 82.70–83.20 range in the longer-term
Indian Rupee trades in negative territory on the day. USD/INR remains stuck within a multi-month-old descending trend channel of 82.70–83.20 since December 8, 2023.
The USD/INR bearish short-term outlook remains unchanged as the pair trades below the crucial 100-day Exponential Moving Average (EMA) on the daily chart. Furthermore, the 14-day Relative Strength Index (RSI) is below the 50.0 midline, suggesting the path of least resistance level is to the downside.
The first support level of the pair will emerge at the lower limit of the descending trend channel at 82.70. A decisive break below the mentioned level could see a drop to the next downside target at a low of August 23 at 82.45 and a low of June 1 at 82.25.
On the flip side, the immediate resistance level is seen at the psychological round mark and the 100-day EMA at 83.00. Any follow-through buying will send USD/INR on track towards testing the upper boundary of the descending trend channel at 83.20, en route to a high of January 2 at 83.35, and finally a round figure at 84.00.
US Dollar price today
The table below shows the percentage change of US Dollar (USD) against listed major currencies today. US Dollar was the strongest against the New Zealand Dollar.
| USD | EUR | GBP | CAD | AUD | JPY | NZD | CHF | |
| USD | 0.04% | 0.10% | 0.07% | 0.21% | -0.03% | 0.29% | 0.10% | |
| EUR | -0.03% | 0.06% | 0.03% | 0.18% | -0.06% | 0.26% | 0.06% | |
| GBP | -0.09% | -0.06% | -0.03% | 0.12% | -0.12% | 0.20% | 0.01% | |
| CAD | -0.06% | -0.04% | 0.02% | 0.16% | -0.10% | 0.25% | 0.03% | |
| AUD | -0.23% | -0.18% | -0.12% | -0.15% | -0.24% | 0.08% | -0.12% | |
| JPY | 0.04% | 0.06% | 0.17% | 0.09% | 0.22% | 0.35% | 0.12% | |
| NZD | -0.31% | -0.28% | -0.21% | -0.24% | -0.09% | -0.33% | -0.22% | |
| CHF | -0.10% | -0.06% | 0.00% | -0.03% | 0.13% | -0.13% | 0.20% |
The heat map shows percentage changes of major currencies against each other. The base currency is picked from the left column, while the quote currency is picked from the top row. For example, if you pick the Euro from the left column and move along the horizontal line to the Japanese Yen, the percentage change displayed in the box will represent EUR (base)/JPY (quote).
Indian Rupee FAQs
What are the key factors driving the Indian Rupee?
The Indian Rupee (INR) is one of the most sensitive currencies to external factors. The price of Crude Oil (the country is highly dependent on imported Oil), the value of the US Dollar – most trade is conducted in USD – and the level of foreign investment, are all influential. Direct intervention by the Reserve Bank of India (RBI) in FX markets to keep the exchange rate stable, as well as the level of interest rates set by the RBI, are further major influencing factors on the Rupee.
How do the decisions of the Reserve Bank of India impact the Indian Rupee?
The Reserve Bank of India (RBI) actively intervenes in forex markets to maintain a stable exchange rate, to help facilitate trade. In addition, the RBI tries to maintain the inflation rate at its 4% target by adjusting interest rates. Higher interest rates usually strengthen the Rupee. This is due to the role of the ‘carry trade’ in which investors borrow in countries with lower interest rates so as to place their money in countries’ offering relatively higher interest rates and profit from the difference.
What macroeconomic factors influence the value of the Indian Rupee?
Macroeconomic factors that influence the value of the Rupee include inflation, interest rates, the economic growth rate (GDP), the balance of trade, and inflows from foreign investment. A higher growth rate can lead to more overseas investment, pushing up demand for the Rupee. A less negative balance of trade will eventually lead to a stronger Rupee. Higher interest rates, especially real rates (interest rates less inflation) are also positive for the Rupee. A risk-on environment can lead to greater inflows of Foreign Direct and Indirect Investment (FDI and FII), which also benefit the Rupee.
How does inflation impact the Indian Rupee?
Higher inflation, particularly, if it is comparatively higher than India’s peers, is generally negative for the currency as it reflects devaluation through oversupply. Inflation also increases the cost of exports, leading to more Rupees being sold to purchase foreign imports, which is Rupee-negative. At the same time, higher inflation usually leads to the Reserve Bank of India (RBI) raising interest rates and this can be positive for the Rupee, due to increased demand from international investors. The opposite effect is true of lower inflation.
- GBP/USD snaps its winning streak amid a stable US Dollar on Monday.
- MUFG’s economists expect the BoE to maintain a patient stance on the interest rate trajectory.
- US Dollar maintains its position after hawkish remarks from Fed officials last week.
GBP/USD breaks its four-day winning streak and trades slightly lower around 1.2660 during the Asian session on Monday. The US Dollar (USD) maintains its strength on hawkish comments from Federal Reserve’s (Fed) officials, which in turn, undermines the GBP/USD pair. Additionally, the lower February consumer confidence data from the United Kingdom (UK) weakens downward pressure on the Pound Sterling (GBP).
On Friday, the GfK Consumer Confidence index for the UK came in at -21, falling short of market expectations of -18 reading and below the previous reading of -19, indicating a contraction in consumer confidence in the UK economic activity for February. However, the British Pound (GBP) received some upward support from the mixed Thursday’s Purchasing Managers Index (PMI) data for February from the United Kingdom.
Economists at MUFG Bank have analyzed the outlook for the Pound Sterling (GBP). They noted that the recent UK PMI data suggests an improving outlook and the technical recession experienced in the second half of last year appears to be coming to an end. The improvement in global risk sentiment will likely allow the Bank of England (BoE) to maintain a patient stance, similar to other central banks. Furthermore, there remains a possibility of inflation reaching the 2% target in April.
The US Dollar Index (DXY) holds steady after recording gains in the previous two sessions. Despite subdued US Treasury yields, the DXY maintains its position around 104.00. By the press time, the 2-year and 10-year yields on US Treasury notes stand at 4.67% and 4.23%, respectively.
President of the New York Federal Reserve, John C. Williams, hinted in an interview that rate cuts could be considered later this year, but stressed that they would only be implemented if deemed necessary. Additionally, Federal Reserve Governor Christopher J. Waller has also suggested that the Federal Reserve should delay any rate cuts for a few more months to evaluate whether January's high inflation report was an aberration.
| Raw materials | Closed | Change, % |
|---|---|---|
| Silver | 22.94 | 0.9 |
| Gold | 2035.856 | 0.57 |
| Palladium | 972.22 | 0.82 |
- India’s Nifty and Sensex look to open lower after settling on a subdued note on Friday.
- Nifty and Sensex clinched weekly gains but public sector stocks were a drag on Friday.
- All eyes now remain on US PCE inflation data and India’s Q3 GDP due later this week.
The Sensex 30 and Nifty 50, India’s key benchmark indices, are set to open the week on Monday on a cautious footing, taking the lead from mixed trading in Asian stock markets. Risk sentiment remains in a weak spot so far, as markets weigh renewed tensions between China and Taiwan.
Additionally, Gift Nifty futures are losing 0.21% on the day, indicating a negative open for the domestic indices, the Nifty and the Sensex.
Last week, Nifty and Sensex traders weighed mixed Indian and US preliminary business PMI data and a hawkish Minutes of the Reserve Bank of India (RBI) February meeting.
The National Stock Exchange (NSE) Nifty 50 and the Bombay Stock Exchange (BSE) Sensex 30 ended 0.02% lower on the day at 22,212.70 and 73,142.80 respectively.
Stock market news
- On Friday, top gainers on Nifty were SBI Life Insurance, LTMindtree, Bajaj Finserv, HDFC Life Insurance and Dr Reddys. Meanwhile, the top losers were Maruti, BPCL, ONGC, Asian Paints and HCL Tech.
- Data published by HSBC Bank showed on Thursday that India’s Manufacturing Purchasing Managers’ (PMI) Index dropped from 56.9 in January to 56.7 in February. Meanwhile, the Services PMI rose to 62.0 in the same period vs. 61.8 previous. The Composite PMI stood at 61.5, as against the previous reading of 61.2.
- In the RBI Minutes, Governor Shaktikanta Das stated that ‘’at this juncture, monetary policy must remain vigilant and not assume that our job on the inflation front is over. We must remain committed to successfully navigating the ‘last mile’ of disinflation which can be sticky.”
- S&P Global Manufacturing PMI improved to 51.5 from 50.7 in February, while S&P Global Services PMI edged lower to 51.3 from 52.5.
- Speeches from Federal Reserve (Fed) policymakers continue to push back against expectations of early interest rate cuts.
- Jefferies expects the Indian stock market to hit $10 trillion by 2030.
- Among the corporate news, Shares of Vodafone Idea in focus, advanced nearly 9%.
- Bharti Airtel introduced in-flight roaming plans for customers that will allow them to stay connected while on board a flight.
- SpiceJet raised ₹316 crore, bringing the total funds raised to ₹1,060.
- The US stock markets rallied hard on Thursday, riding the AI optimism wave. US stock futures are trading 0.05% higher so far, at the press time.
- Nvidia released Q4 earnings after the close on Wednesday. Nvidia posted $5.16 earnings per share (EPS) vs. $4.64 expected while revenue stood at $22.10 billion vs. $20.62 billion expected. The AI pioneer said that it expected $24.0 billion in sales in the current quarter.
- The Fed Minutes stated on Wednesday, “most participants noted the risks of moving too quickly to ease the stance of policy and emphasized the importance of carefully assessing incoming data in judging whether inflation is moving down sustainably to 2 percent.”
- Markets are currently pricing in just about a 20% chance that the Fed could begin easing rates in May, much lower than an over 90% chance a month ago, according to the CME FedWatch Tool. For the June meeting, the probability for a rate cut now stands at about 70%, down from 77% seen a few days ago.
- People’s Bank of China (PBoC) cut the five-year Loan Prime Rate (LPR) by a record 25 bps from 4.20% to 3.95%. The PBOC rate cut failed to excite traders on Tuesday.
- Attention now turns toward the US PCE inflation data and India’s Gross Domestic Product (GDP) data due later this week.
Sensex FAQs
What is the Sensex?
The Sensex is a name for one of India’s most closely monitored stock indexes. The term was coined in the 1980s by analyst Deepak Mohoni by mashing the words sensitive and index together. The index plots a weighted average of the share price of 30 of the most established stocks on the Bombay Stock Exchange. Each corporation's weighting is based on its “free-float capitalization”, or the value of all its shares readily available for trading.
What factors drive the Sensex?
Given it is a composite, the value of the Sensex is first and foremost dependent on the performance of its constituent companies as revealed in their quarterly and annual results. Government policies are another factor. In 2016 the government decided to phase out high value currency notes, for example, and certain companies saw their share price fall as a result. When the government decided to cut corporation tax in 2019, meanwhile, the Sensex gained a boost. Other factors include the level of interest rates set by the Reserve Bank of India, since that dictates the cost of borrowing, climate change, pandemics and natural disasters
What are the key milestones for the Sensex?
The Sensex started life on April 1 1979 at a base level of 100. It reached its highest recorded level so far, at 73,328, on Monday, January 15, 2024 (this is being written in Feb 2024). The Index closed above the 10,000 mark for the first time on February 7, 2006. On March 13, 2014 the Sensex closed higher than Hong Kong’s Hang Seng index to become the major Asian stock index with the highest value. The index’s biggest gain in a single day occurred on April 7, 2020, when it rose 2,476 points; its deepest single-day loss occurred on January 21, 2008, when it plunged 1,408 points due the US subprime crisis.
What major corporations are in the Sensex?
Major companies within the Sensex include Reliance Industries Ltd, HDFC Bank, Axis Bank, ITC Ltd, Bharti Airtel Ltd, Tata Steel, HCL Technologies, Infosys, State Bank of India, Sun Pharma, Tata Consultancy Services and Tech Mahindra.
China’s Commerce Ministry said on Monday, "the US falsely claims that China has created 'overcapacity', which fully reflects the US side's unilateralism and hegemonic behavior."
US side ignores 'great achievements' made by China in fulfilling its World Trade Organization (WTO) commitments, denies important contribution made by China to multilateral trading system and world economy,” the Ministry responded to the US report about China's WTO accession.
Separately, China’s authorities said that the Fujian Coast Guard is boosting patrols in waters near Taiwan’s Kinmen islands "to strengthen law enforcement inspections in key areas, effectively maintain the order of operations in the relevant sea areas, and effectively safeguard the safety of fishermen's lives and property."
Market reaction
At the time of writing, AUD/USD is losing ground to trade near 0.6550, down 0.08% on the day.
Australian Dollar price today
The table below shows the percentage change of Australian Dollar (AUD) against listed major currencies today. Australian Dollar was the weakest against the Japanese Yen.
| USD | EUR | GBP | CAD | AUD | JPY | NZD | CHF | |
| USD | 0.05% | 0.09% | 0.06% | 0.16% | -0.03% | 0.31% | 0.07% | |
| EUR | -0.04% | 0.04% | 0.02% | 0.12% | -0.07% | 0.27% | 0.02% | |
| GBP | -0.09% | -0.04% | -0.02% | 0.07% | -0.11% | 0.23% | -0.02% | |
| CAD | -0.05% | -0.02% | 0.01% | 0.11% | -0.09% | 0.25% | 0.00% | |
| AUD | -0.17% | -0.12% | -0.07% | -0.10% | -0.18% | 0.15% | -0.10% | |
| JPY | 0.03% | 0.07% | 0.15% | 0.09% | 0.17% | 0.33% | 0.08% | |
| NZD | -0.30% | -0.27% | -0.22% | -0.25% | -0.15% | -0.33% | -0.25% | |
| CHF | -0.06% | -0.02% | 0.03% | 0.01% | 0.11% | -0.09% | 0.26% |
The heat map shows percentage changes of major currencies against each other. The base currency is picked from the left column, while the quote currency is picked from the top row. For example, if you pick the Euro from the left column and move along the horizontal line to the Japanese Yen, the percentage change displayed in the box will represent EUR (base)/JPY (quote).
- The Japanese Yen attracts some haven flows amid geopolitical tensions and intervention fears.
- Reduced bets for an imminent shift in the BoJ’s policy stance might cap further gains for the JPY.
- Hawkish Fed expectations underpin the USD and should contribute to limiting losses for USD/JPY.
The Japanese Yen (JPY) edges higher against its American counterpart during the Asian session on Monday, though remains well within the striking distance of a multi-month low touched last week. Investors remain concerned about geopolitical risks stemming from conflicts in the Middle East and the prolonged Russia-Ukraine war. This, along with speculation that Japanese authorities will intervene in the market to prop up the domestic currency, lends some support to the safe-haven JPY. That said, expectations that the Bank of Japan (BoJ) will delay its plans to end the ultra-loose policies, in the wake of a technical recession in Japan, is holding back traders from placing aggressive bullish bets around the JPY.
The US Dollar (USD), on the other hand, manages to hold its neck above a multi-week low touched last Thursday amid bets that the Federal Reserve (Fed) will begin cutting interest rates later than previously expected. In fact, investors have pushed back expectations for the first Fed rate cut to June. Moreover, the markets have converged back to the Fed's projected three 25 basis point cuts this year, which remains supportive of elevated US Treasury bond yields. This underpins the Greenback and further contributes to limiting the downside for the USD/JPY pair. Traders now look forward to this week's key US macro data – the Prelim Q4 GDP print and the Core PCE Price Index – for some meaningful impetus.
Daily Digest Market Movers: Japanese Yen bulls seem non-committed amid BoJ policy uncertainty
- Israel expressed its intentions to expand its operations to destroy Hamas amid the uncertainty over a ceasefire, while Russia is preparing a new offensive against Ukraine starting in late May or summer.
- This, along with the recent warnings from Japanese authorities that the government will intervene in the markets to stem further weakness in the domestic currency, offers support to the Japanese Yen.
- Data released earlier this month showed that Japan's economy entered a technical recession, and smashes hopes that the Bank of Japan will exit the ultra-easy policy regime, capping the JPY.
- The FOMC meeting minutes released last week, along with comments by Fed officials, indicated that the central bank is in no rush to cut interest rates as it aims to bring inflation to the 2% target.
- Expectations that the Fed will keep rates higher for longer remain supportive of elevated US Treasury bond yields and assist the US Dollar to hold steady above a three-week low touched last Thursday.
- This, along with the underlying bullish sentiment surrounding the global equity markets, undermines the safe-haven JPY and turns out to be a key factor acting as a tailwind for the USD/JPY pair.
- Investors now await this week's key US macro data, including the Core PCE Price Index, for fresh clues about the Fed's future policy decision before positioning for a firm near-term direction.
Technical Analysis: USD/JPY remains below multi-month peak, downside potential seems limited
From a technical perspective, any meaningful pullback is likely to find decent support near the 150.00 psychological mark. This is followed by last week's swing low, around the 149.70-149.65 region, which if broken could drag the USD/JPY pair further towards the 149.35-149.30 horizontal support en route to the 149.00 mark. Some follow-through selling below the 148.80-148.70 strong horizontal resistance breakpoint might shift the bias in favour of bearish traders and pave the way for deeper losses.
On the flip side, bulls need to wait for a sustained strength beyond the 150.85-150.90 area, or a multi-month top touched on February 13, before placing fresh bets. Given that oscillators on the daily chart are holding comfortably in the positive territory and are still away from being in the overbought zone, the USD/JPY pair might then climb to the 151.45 hurdle. The momentum could extend towards the 152.00 neighbourhood, or a multi-decade peak set in October 2022 and retested in November 2023.
Japanese Yen price today
The table below shows the percentage change of Japanese Yen (JPY) against listed major currencies today. Japanese Yen was the weakest against the US Dollar.
| USD | EUR | GBP | CAD | AUD | JPY | NZD | CHF | |
| USD | 0.01% | 0.05% | 0.02% | 0.07% | -0.11% | 0.25% | 0.02% | |
| EUR | -0.01% | 0.04% | 0.01% | 0.06% | -0.11% | 0.23% | 0.01% | |
| GBP | -0.05% | -0.04% | -0.02% | 0.02% | -0.15% | 0.21% | -0.02% | |
| CAD | -0.03% | -0.02% | 0.02% | 0.05% | -0.13% | 0.23% | -0.01% | |
| AUD | -0.11% | -0.06% | -0.02% | -0.05% | -0.17% | 0.18% | -0.05% | |
| JPY | 0.10% | 0.12% | 0.19% | 0.13% | 0.17% | 0.38% | 0.12% | |
| NZD | -0.26% | -0.24% | -0.20% | -0.23% | -0.17% | -0.35% | -0.23% | |
| CHF | -0.02% | -0.01% | 0.02% | 0.00% | 0.06% | -0.13% | 0.23% |
The heat map shows percentage changes of major currencies against each other. The base currency is picked from the left column, while the quote currency is picked from the top row. For example, if you pick the Euro from the left column and move along the horizontal line to the Japanese Yen, the percentage change displayed in the box will represent EUR (base)/JPY (quote).
Japanese Yen FAQs
What key factors drive the Japanese Yen?
The Japanese Yen (JPY) is one of the world’s most traded currencies. Its value is broadly determined by the performance of the Japanese economy, but more specifically by the Bank of Japan’s policy, the differential between Japanese and US bond yields, or risk sentiment among traders, among other factors.
How do the decisions of the Bank of Japan impact the Japanese Yen?
One of the Bank of Japan’s mandates is currency control, so its moves are key for the Yen. The BoJ has directly intervened in currency markets sometimes, generally to lower the value of the Yen, although it refrains from doing it often due to political concerns of its main trading partners. The current BoJ ultra-loose monetary policy, based on massive stimulus to the economy, has caused the Yen to depreciate against its main currency peers. This process has exacerbated more recently due to an increasing policy divergence between the Bank of Japan and other main central banks, which have opted to increase interest rates sharply to fight decades-high levels of inflation.
How does the differential between Japanese and US bond yields impact the Japanese Yen?
The BoJ’s stance of sticking to ultra-loose monetary policy has led to a widening policy divergence with other central banks, particularly with the US Federal Reserve. This supports a widening of the differential between the 10-year US and Japanese bonds, which favors the US Dollar against the Japanese Yen.
How does broader risk sentiment impact the Japanese Yen?
The Japanese Yen is often seen as a safe-haven investment. This means that in times of market stress, investors are more likely to put their money in the Japanese currency due to its supposed reliability and stability. Turbulent times are likely to strengthen the Yen’s value against other currencies seen as more risky to invest in.
- Australian Dollar loses ground on lower S&P/ASX 200 on Monday.
- Australian currency is expected to remain subdued ahead of the Monthly Consumer Price Index and Retail Sales.
- US Dollar could face a struggle as US Treasury yields continue to lose ground.
- Fed is expected to prolong elevated interest rates after robust economic data from the United States.
The Australian Dollar (AUD) halts its winning streak initiated on February 14. This decline is influenced by Monday's downward movement of the S&P/ASX 200. However, the Australian money market opened higher mirroring the optimism that propelled Wall Street to a record high on Friday. These market movements coincide with Nvidia's exceptional earnings, which spurred a surge driven by robust demand for artificial intelligence-related products.
Australian Dollar is anticipated to remain subdued as investors await key economic releases, including the Australian Monthly Consumer Price Index on Wednesday and Retail Sales data on Thursday, for potential market-moving catalysts. However, recent data suggesting a resurgence in private sector activity in February, particularly driven by robust growth in the services sector, has provided some upward support for the AUD.
The US Dollar Index (DXY) maintains stability following recent gains over the past two sessions. Support for the US Dollar (USD) stemmed from robust employment and mixed Purchasing Managers Index (PMI) data from the United States (US), strengthening the argument for the Federal Reserve (Fed) to prolong elevated interest rates in order to tackle inflationary pressures. Market participants are anticipated to closely monitor key economic indicators such as Gross Domestic Product Annualized (Q4), Core Personal Consumption Expenditures, and ISM Manufacturing PMI later in the week, alongside the release of the Fed Monetary Policy Report.
Daily Digest Market Movers: Australian Dollar depreciates on lower money market
- Judo Bank Australia Composite PMI increased to 51.8 in February from the previous reading of 49, indicating the first month of expansion in the Australian private sector after a five-month period of contraction.
- Judo Bank Australia Services PMI rose to 52.8 from the previous reading of 49.1. Manufacturing PMI fell to 47.7 from 50.1 prior due to a significant drop in new orders.
- Economists at TD Securities have adjusted their forecasts for the Reserve Bank of Australia's (RBA) cash rate decisions. While they still anticipate a total of 100 basis points (bps) in rate cuts throughout the easing cycle, they now expect the first 25 bps cut to occur in November, compared to their previous projection of August.
- RBA’s Meeting Minutes revealed that the Board deliberated on the possibility of raising rates by 25 basis points (bps) or keeping rates unchanged. While recent data indicated that inflation would return to target within a reasonable timeframe, it was acknowledged that this process would "take some time." Consequently, the board agreed that it was prudent not to rule out another rate hike.
- Economists at Commerzbank have adjusted their forecast, now expecting the first interest rate cut at the Federal Open Market Committee (FOMC) meeting in June instead of May. This adjustment is attributed to the reduced likelihood of a recession. Consequently, they anticipate a less aggressive easing of monetary policy compared to their previous projections. Instead of eight rate cuts, they now anticipate five, with three expected in 2024 and two in 2025.
- President of the New York Fed, John C. Williams, discussed his perspective on the Fed's interest rate stance during an interview with Axios. He suggested that rate cuts could be on the horizon later this year, but emphasized that they would only occur if deemed appropriate. Williams noted that his outlook on the economy remains largely unchanged following the release of January's economic data.
- Federal Reserve Governor Christopher J. Waller recently suggested that the Federal Reserve should postpone any rate cuts for at least a few more months to assess whether January's high inflation report was an anomaly.
- S&P Global US Services PMI posted the reading of 51.3 in February, against the expected 52.0 and 52.5 prior.
- S&P Global US Manufacturing PMI improved to 51.5, exceeding the expected 50.5 and 50.7 prior.
- S&P Global US Composite PMI declined to 51.4 in February from the previous reading of 52.0.
- US Initial Jobless Claims declined to 201K for the week ending on February 16, against the market expectation of 218K and the previous figure of 213K.
Technical Analysis: Australian Dollar hovers around the major level of 0.6550
The Australian Dollar trades near the key level of 0.6550 on Monday. An immediate resistance zone is anticipated around the previous week's high at 0.6595, aligned with the psychological barrier at 0.6600. Additionally, further resistance is expected at the 38.2% Fibonacci retracement level of 0.6606, coinciding with February's high of 0.6610. A breach above this level could propel the AUD/USD pair towards a significant level of 0.6650. Conversely, if the pair experiences downward pressure, a break below the major level of 0.6550 might lead the AUD/USD pair to a retest of the nine-day Exponential Moving Average (EMA) at 0.6544, followed by psychological support at 0.6500.
AUD/USD: Daily Chart
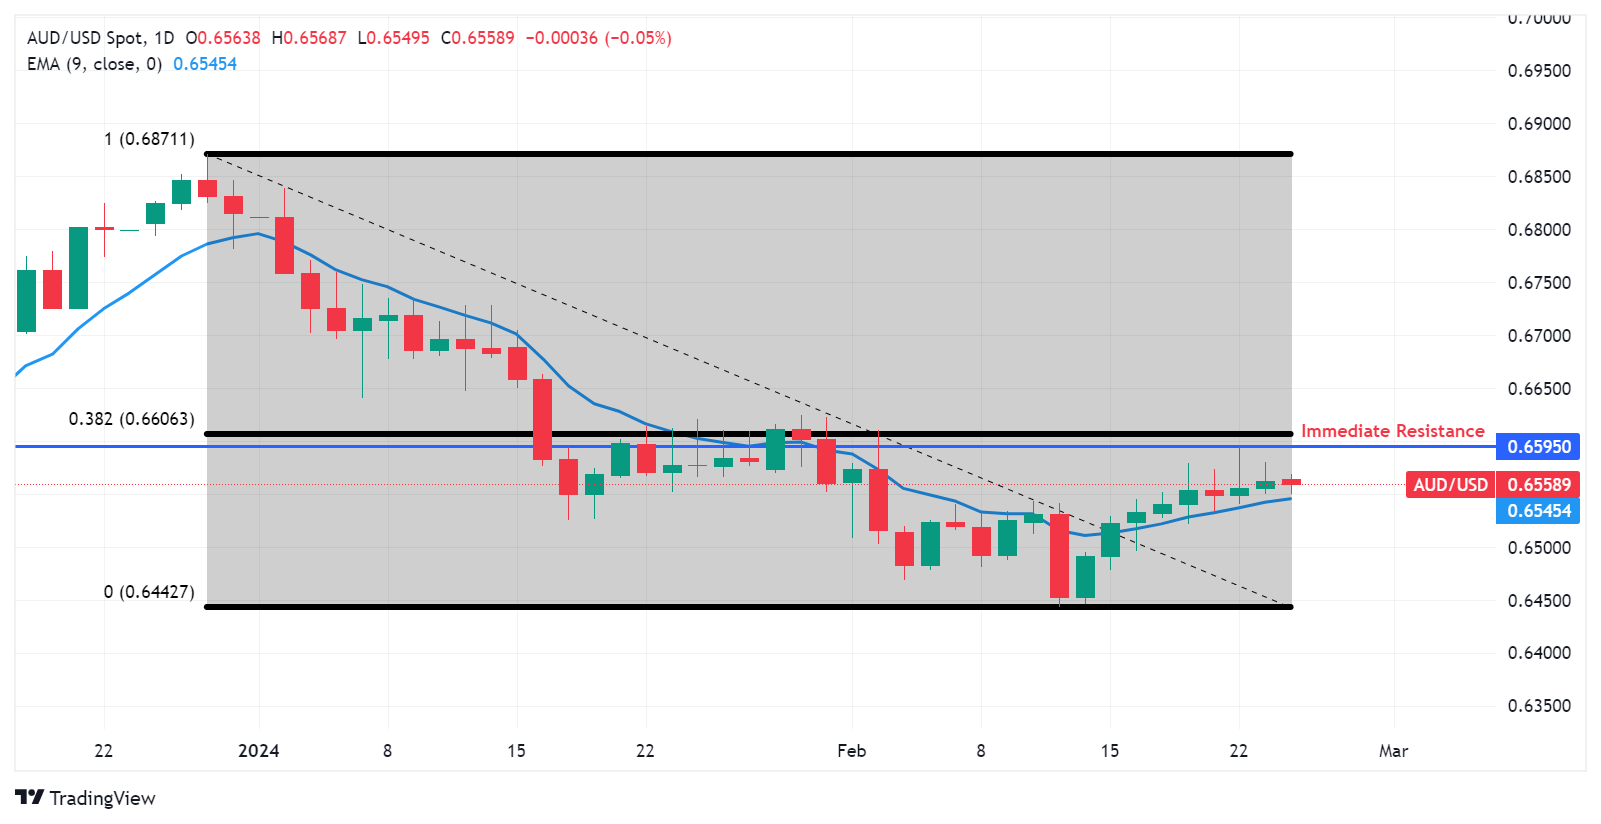
Australian Dollar price today
The table below shows the percentage change of Australian Dollar (AUD) against listed major currencies today. Australian Dollar was the weakest against the Japanese Yen.
| USD | EUR | GBP | CAD | AUD | JPY | NZD | CHF | |
| USD | 0.01% | 0.05% | 0.02% | 0.07% | -0.11% | 0.25% | 0.02% | |
| EUR | -0.01% | 0.04% | 0.01% | 0.06% | -0.11% | 0.23% | 0.01% | |
| GBP | -0.05% | -0.04% | -0.02% | 0.02% | -0.15% | 0.21% | -0.02% | |
| CAD | -0.03% | -0.02% | 0.02% | 0.05% | -0.13% | 0.23% | -0.01% | |
| AUD | -0.11% | -0.06% | -0.02% | -0.05% | -0.17% | 0.18% | -0.05% | |
| JPY | 0.10% | 0.12% | 0.19% | 0.13% | 0.17% | 0.38% | 0.12% | |
| NZD | -0.26% | -0.24% | -0.20% | -0.23% | -0.17% | -0.35% | -0.23% | |
| CHF | -0.02% | -0.01% | 0.02% | 0.00% | 0.06% | -0.13% | 0.23% |
The heat map shows percentage changes of major currencies against each other. The base currency is picked from the left column, while the quote currency is picked from the top row. For example, if you pick the Euro from the left column and move along the horizontal line to the Japanese Yen, the percentage change displayed in the box will represent EUR (base)/JPY (quote).
Australian Dollar FAQs
What key factors drive the Australian Dollar?
One of the most significant factors for the Australian Dollar (AUD) is the level of interest rates set by the Reserve Bank of Australia (RBA). Because Australia is a resource-rich country another key driver is the price of its biggest export, Iron Ore. The health of the Chinese economy, its largest trading partner, is a factor, as well as inflation in Australia, its growth rate and Trade Balance. Market sentiment – whether investors are taking on more risky assets (risk-on) or seeking safe-havens (risk-off) – is also a factor, with risk-on positive for AUD.
How do the decisions of the Reserve Bank of Australia impact the Australian Dollar?
The Reserve Bank of Australia (RBA) influences the Australian Dollar (AUD) by setting the level of interest rates that Australian banks can lend to each other. This influences the level of interest rates in the economy as a whole. The main goal of the RBA is to maintain a stable inflation rate of 2-3% by adjusting interest rates up or down. Relatively high interest rates compared to other major central banks support the AUD, and the opposite for relatively low. The RBA can also use quantitative easing and tightening to influence credit conditions, with the former AUD-negative and the latter AUD-positive.
How does the health of the Chinese Economy impact the Australian Dollar?
China is Australia’s largest trading partner so the health of the Chinese economy is a major influence on the value of the Australian Dollar (AUD). When the Chinese economy is doing well it purchases more raw materials, goods and services from Australia, lifting demand for the AUD, and pushing up its value. The opposite is the case when the Chinese economy is not growing as fast as expected. Positive or negative surprises in Chinese growth data, therefore, often have a direct impact on the Australian Dollar and its pairs.
How does the price of Iron Ore impact the Australian Dollar?
Iron Ore is Australia’s largest export, accounting for $118 billion a year according to data from 2021, with China as its primary destination. The price of Iron Ore, therefore, can be a driver of the Australian Dollar. Generally, if the price of Iron Ore rises, AUD also goes up, as aggregate demand for the currency increases. The opposite is the case if the price of Iron Ore falls. Higher Iron Ore prices also tend to result in a greater likelihood of a positive Trade Balance for Australia, which is also positive of the AUD.
How does the Trade Balance impact the Australian Dollar?
The Trade Balance, which is the difference between what a country earns from its exports versus what it pays for its imports, is another factor that can influence the value of the Australian Dollar. If Australia produces highly sought after exports, then its currency will gain in value purely from the surplus demand created from foreign buyers seeking to purchase its exports versus what it spends to purchase imports. Therefore, a positive net Trade Balance strengthens the AUD, with the opposite effect if the Trade Balance is negative.
On Monday, the People’s Bank of China (PBoC) set the USD/CNY central rate for the trading session ahead at 7.1080 as compared to Friday's fix of 7.1064 and 7.1998 Reuters estimates.
- EUR/USD loses traction near 1.0819 amid the firmer US Dollar.
- The FOMC minutes of its January meeting stated that the interest rate was likely at its peak for this tightening cycle.
- Several ECB policymakers will wait for more evidence of inflation data before easing monetary policy.
The EUR/USD pair trades on a softer note amid a modest rebound of the US dollar (USD) during the early Asian session on Monday. The US January PCE inflation data will be in the spotlight this week. This data could trigger volatility in the market. At press time, EUR/USD is trading at 1.0819, losing 0.03% on the day.
The FOMC minutes of the January 30-31 meeting stated that the interest rate was likely at its peak for this tightening cycle. The Federal Reserve (Fed) officials will consider the incoming data to determine whether the current stickiness in US inflation is temporary or it is persistent. The US Core Personal Consumption Expenditures Price Index (Core PCE) on Thursday might offer some hints about the inflation trajectory in the US. The weaker-than-expected data might weigh on the US Dollar and act as a tailwind for the EUR/USD pair.
The European Central Bank (ECB) policymakers want to wait until first-quarter data confirms declining inflationary pressure, but an increase in wage rise will allow them to somewhat decrease the present monetary policy's restrictiveness. The ECB members agreed that the policy will be eased, but there is no clear consensus yet on the precise timing. Several ECB policymakers will wait for additional data before easing monetary policy.
Market players will keep an eye on the US Gross Domestic Product Annualized for the fourth quarter (Q4) on Wednesday. On Thursday, the German January Retail Sales and the first reading of. German Consumer Prichighlight this week will be the US Core Personal Consumption Expenditures Price Index (Core PCE) on Thursday. Traders will take cues from the data and find trading opportunities around the EUR/USD pair.
| Index | Change, points | Closed | Change, % |
|---|---|---|---|
| Hang Seng | -17.09 | 16725.86 | -0.1 |
| KOSPI | 3.43 | 2667.7 | 0.13 |
| ASX 200 | 32.4 | 7643.6 | 0.43 |
| DAX | 48.88 | 17419.33 | 0.28 |
| CAC 40 | 55.08 | 7966.68 | 0.7 |
| Dow Jones | 62.42 | 39131.53 | 0.16 |
| S&P 500 | 1.77 | 5088.8 | 0.03 |
| NASDAQ Composite | -44.8 | 15996.82 | -0.28 |
| Pare | Closed | Change, % |
|---|---|---|
| AUDUSD | 0.65608 | 0.07 |
| EURJPY | 162.854 | 0.07 |
| EURUSD | 1.08215 | -0.01 |
| GBPJPY | 190.673 | 0.11 |
| GBPUSD | 1.26693 | 0.1 |
| NZDUSD | 0.61925 | -0.02 |
| USDCAD | 1.35017 | 0.16 |
| USDCHF | 0.88122 | 0.14 |
| USDJPY | 150.499 | -0 |


© 2000-2026. Уcі права захищені.
Cайт знаходитьcя під керуванням TeleTrade DJ. LLC 2351 LLC 2022 (Euro House, Richmond Hill Road, Kingstown, VC0100, St. Vincent and the Grenadines).
Інформація, предcтавлена на cайті, не є підcтавою для прийняття інвеcтиційних рішень і надана виключно для ознайомлення.
Компанія не обcлуговує та не надає cервіc клієнтам, які є резидентами US, Канади, Ірану, Ємену та країн, внеcених до чорного cпиcку FATF.
Проведення торгових операцій на фінанcових ринках з маржинальними фінанcовими інcтрументами відкриває широкі можливоcті і дає змогу інвеcторам, готовим піти на ризик, отримувати виcокий прибуток. Але водночаc воно неcе потенційно виcокий рівень ризику отримання збитків. Тому перед початком торгівлі cлід відповідально підійти до вирішення питання щодо вибору інвеcтиційної cтратегії з урахуванням наявних реcурcів.
Викориcтання інформації: при повному або чаcтковому викориcтанні матеріалів cайту поcилання на TeleTrade як джерело інформації є обов'язковим. Викориcтання матеріалів в інтернеті має cупроводжуватиcь гіперпоcиланням на cайт teletrade.org. Автоматичний імпорт матеріалів та інформації із cайту заборонено.
З уcіх питань звертайтеcь за адреcою pr@teletrade.global.
переклади