- Аналітика
- Новини та інструменти
- Новини ринків
Новини ринків
- S&P 500, NASDAQ Composite end six-day record streaks.
- Despite weaker Friday, US indexes closed in the green for a third straight week.
- US Fed on the docket for next week.
US equities closed mixed on Friday to cap off a week of stunning record closes. Over-eager markets that have been leaning into rate cut bets in recent weeks second-guessed US economic conditions after US Personal Consumption Expenditure (PCE) Price Index figures showed cooling inflation, but consumer spending and housing activity hinted at a US economy that is too robust to allow for a rapid approach on Federal Reserve (Fed) rate cuts.
Money markets repriced odds of a first rate trim from the Fed to the Federal Open Market Committee’s (FOMC) meeting in May, with bets of a March rate cut down to 47% according to the CME’s FedWatch Tool.
US Core YoY PCE Price Index figures for December printed at 2.9% on Friday, below the forecast 3.0% and slipping back from the previous period’s 3.2%. Markets initially rose on reaction to the good news that cooling inflation might lead to faster, sooner rate cuts from the Fed, but an uptick in Personal Spending and Pending Home Sales put a damper on rate hopes.
US Personal Spending rose 0.7% in December compared to the 0.4% forecast and 0.4% previous (revised from 0.2%), and Pending Home Sales jumped 8.3% in December compared to the forecast 1.5% and -0.3% previous (revised from 0.0%).
Revenue forecasts on Wall Street missed expectations for major tech stocks including Intel and chipmaker tool manufacturer KLA Corp, causing equities to rethink recent bullish momentum on tech hopes alongside recent declines in tech darlings Tesla and Apple.
The Dow Jones Industrial Average (DJIA) gained 60 points to close up 0.16% at $38,109.43 while the Standard & Poor’s 500 (S&P) Major equity index closed down 0.07%, shedding a little over 3 points and ending Friday at $4,890.97.
The NASDAQ Composite declined on tech stock hesitancy, losing 55 points and closing down by a third of a percent at $15,455.36.
S&P Technical Outlook
The S&P closed in the green for a third straight week, chalking in 12 winning weeks out of the last 13, and the major index is up nearly 20% from the last significant swing low into $4,102.02 in October.
The S&P 500 is trading well above the 200-day Simple Moving Average (SMA) near $4,425.00, and is in play near the $4,900.00 as investors eye another push towards the $5,000.00 major handle nearby.
S&P 500 Hourly Chart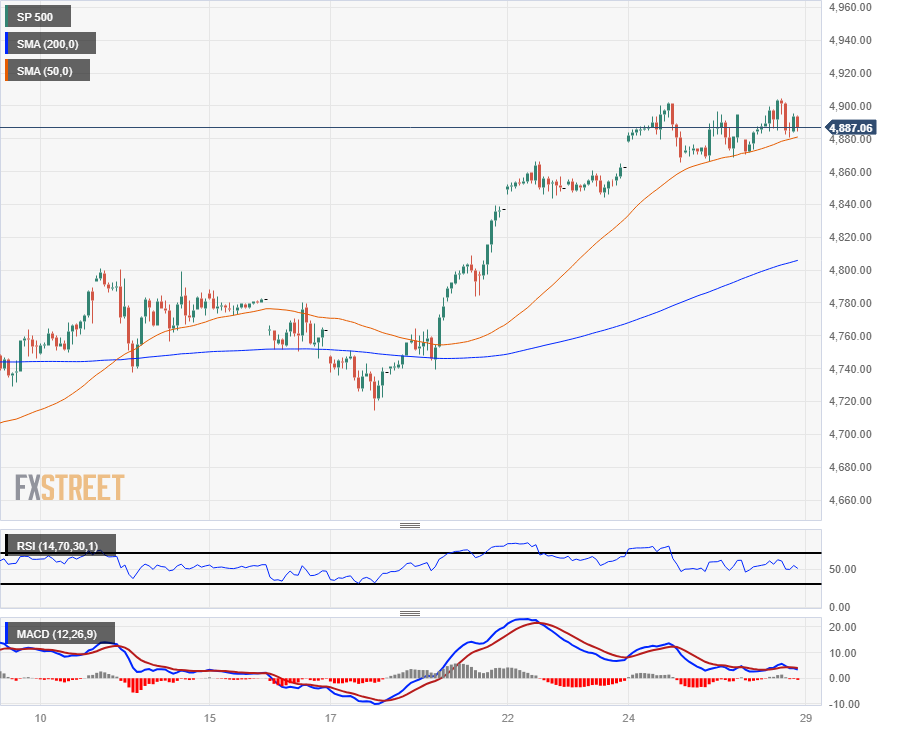
S&P 500 Daily Chart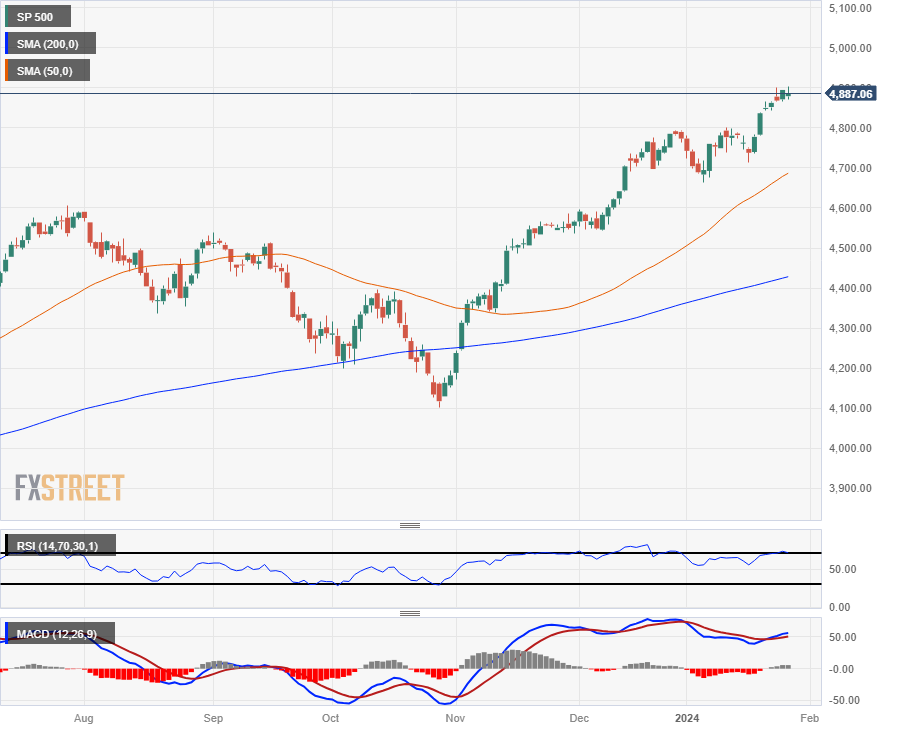
- AUD/USD ends week down 0.33%, unable to hold above 0.6600, range-bound.
- Struggle to sustain gains above 200-DMA (0.6576); potential for upward trend watched closely.
- Key supports at 0.6551, 0.6524; rebound above 200-DMA may aim for resistances at 0.6620, 0.6652.
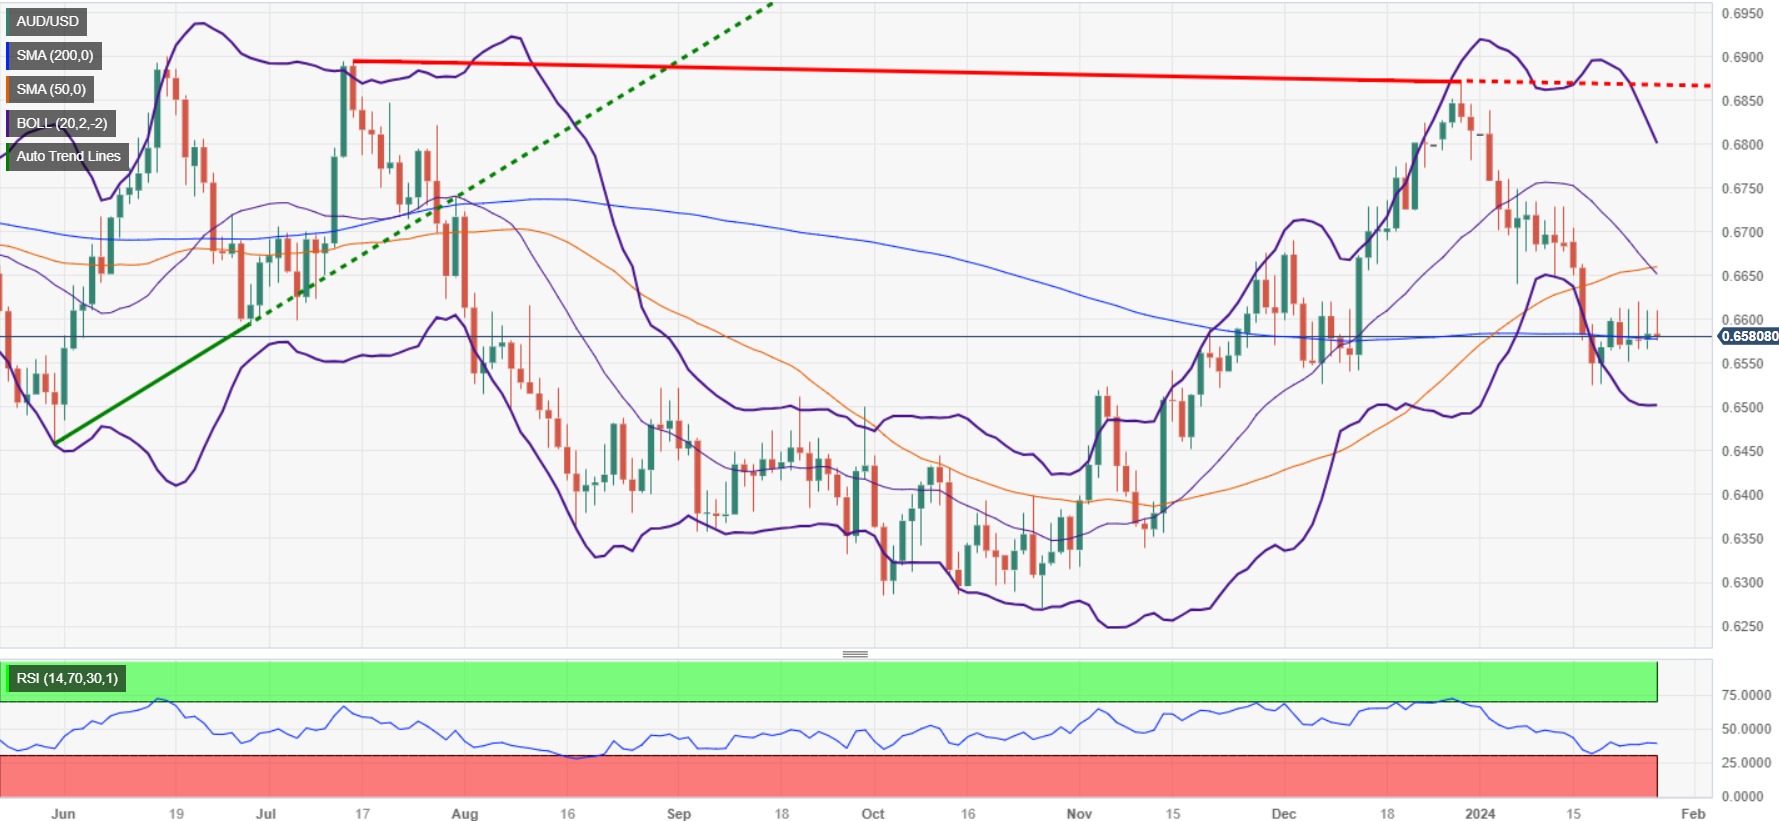
The AUD/USD finished Friday’s session on the back foot, down more than 0.15%, for a total of 0.33% losses in the week. At the time of writing, the pair ended at 0.6573, failing to stay above the 0.6600 figure, which exacerbated the Aussie’s drop below the key 200-day moving average (DMA).
The pair extended its sideways trading, with buyers failing to cling to the 200-DMA at 0.6576, though it seems they remain in charge. This following January’s 17 dip toward 0.6524, with the par extending its gains toward the 0.6550/0.6600 range, still unable to decisively crack the 0.6600 mark and opening the door for a pull back.
With that said, key support levels lie below the exchange rate, with the January 23 daily low of 0.6551, ahead of the January 17 swing low of 0.6524. if the pair slides below this key support level, the buyers' last line of defense would be the 0.6500 figure before diving to the November 17, 2023, low of 0.6452.
On the positive side, if buyers reclaim the 200-DMA, they could extend its rally past the 0.6600 figure toward January’s 24 high at 0.6620. The next supply zone emerges at the 50-DMA at 0.6652.
AUD/USD Price Action – Daily Chart
AUD/USD Key Levels
- The XAU/USD experiences a slight decrease, holding slightly above $2,018 with a minor pullback.
- Key indicators such as RSI and MACD demonstrate a subdued buying momentum, as bulls consolidate December’s rally.
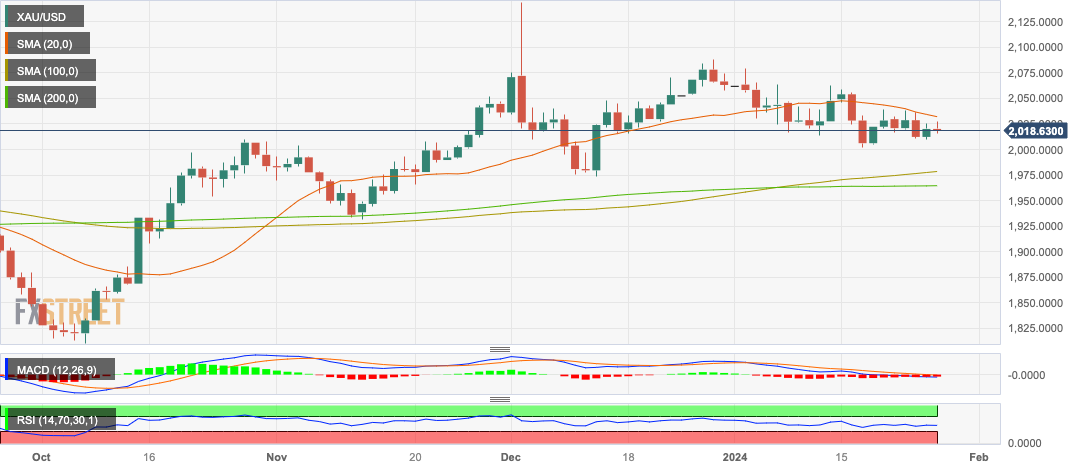
On Friday's session, the XAU/USD was seen trading at $2,018, presenting a slight decline of 0.08% and closing a 0.55% weekly loss. After reaching a level of $2,135 in December, buyers have been largely taking a pause, suggesting a neutral to a bullish outlook on the daily chart. Despite some momentum observed in the four-hour chart, the indicators remain relatively weak.
In addition, the USD recovery fueled by markets adjusting their bets on the Federal Reserve (Fed) due to the US economy showing resilience is pushing the metal lower. On Friday, soft Personal Consumption Expenditures (PCE) figures from December from the US didn’t fuel a significant reaction to the market expectations on the Fed which meets next week. As for now, markets pushed the start of the easing cycle to May from March but the Fed's tone may change those expectations.
XAU/USD levels to watch
The technical indicators on the daily chart, specifically the Relative Strength Index (RSI) and the position of the metal regarding its 20, 100, and 200 Simple Moving Averages (SMAs) paint a diverse picture. Despite the RSI showing a negative slope and currently residing in negative territory, the price manages to stay above the 20, 100, and 200-day SMAs. This is indicative of bullish standing in the broader time frame, and the recent pullback could be explained by the bulls taking a breather after pushing the price to a high of $2,135 in December.
Drilling down to the narrower four-hour chart, the momentum indicators present weak yet existent bullish undertones. The four-hour RSI shows a negative slope but is currently in positive territory, while the four-hour Moving Average Convergence Divergence (MACD) continues to produce flat red bars, again suggesting a hold on bearish momentum.
XAU/USD daily chart
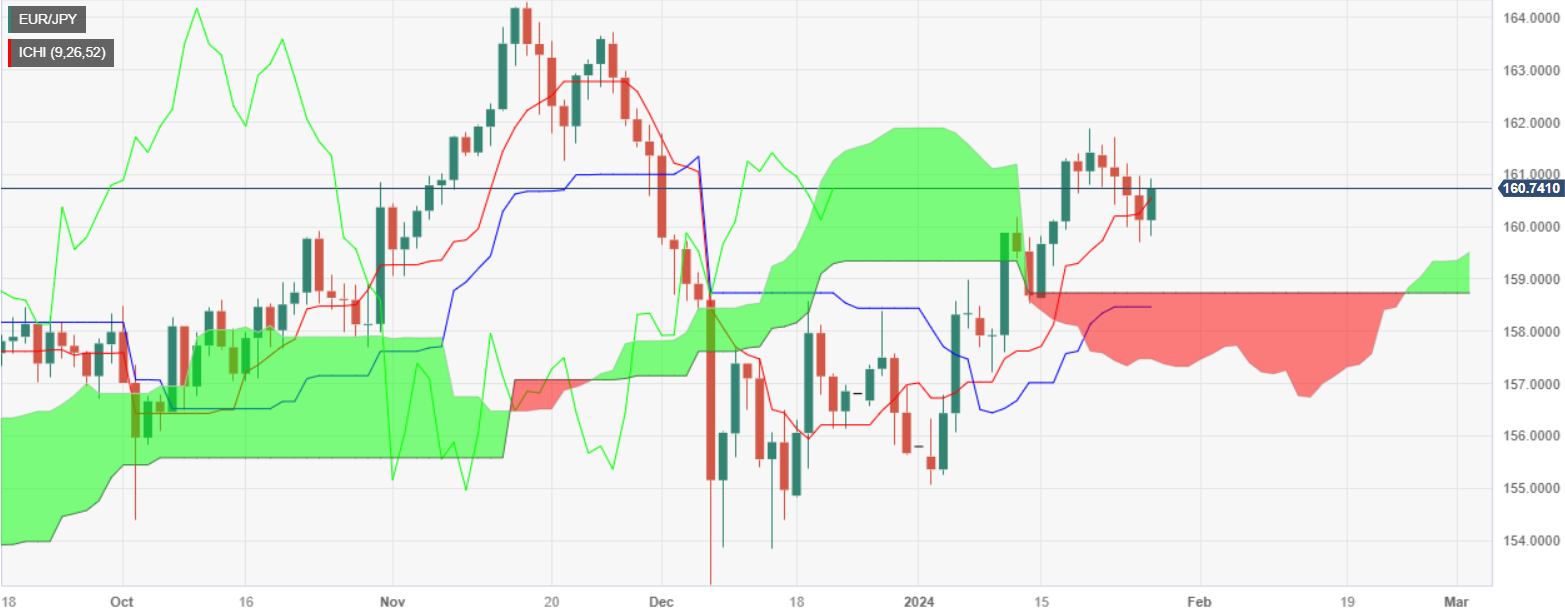
- EUR/JPY up 0.39%, rebounding from daily low as Yen weakens in FX market.
- Bullish harami pattern suggests upside potential; resistance at 161.00, then January 19 high.
- Downside risks if below Tenkan/Sen (160.55); next supports at 160.00, 159.69, 159.51.
The EUR/JPY bounces off weekly lows late on Friday’s North American session and is up 0.39% as the Japanese Yen (JPY) remains the laggard across the FX space. At the time of writing, the cross-pair exchanges hands at 160.77 after reaching a daily low of 159.83.
From a technical standpoint, price action in the last couple of days is forming a ‘bullish harami’ two-candle pattern that reassembles an inside day, which leads to price action to the upside. If buyers lift the 161.00, the next resistance would be the January 19 high at 161.87, with the psychological 162.00 up next.
On the flip side, if sellers drop below the Tenkan/Sen at 160.55, the next support would be 160.00, followed by the January 25 daily low of 159.69 and the Senkou Span A at 159.51.
EUR/JPY Price Action – Daily Chart
EUR/JPY Technical Levels
- The ECB left the door open for data-dependent rate cuts, but remains tepid.
- Earnings beats helped equities shrug off Consumer Confidence miss.
- BoE, Fed the headline risks for next week.
European indexes wrapped up Friday trading firmly in the green, shrugging off a dovish European Central Bank (ECB) and a downside miss in European Consumer Sentiment surveys after the ECB left the door open for data-dependency to trigger rate cuts earlier than the central bank is currently projecting.
The ECB held rates flat this week, cautioning that discussions about rate cuts are still premature, but policymakers noted there would be room on the table for rapid, shallow cuts if Europea economic data turns sour in the near-term, helping to prop up investor sentiment that rate relief could be around the corner. The ECB currently sees no room for a rate trim until sometime in the second half of the year compared to market rate bets hoping for a first cut before June.
France’s CAC40 index surged to a record high on Friday, dragged higher by large upswings in luxury goods, with market bids pinned even higher after Barclay’s upgraded their outlook on the luxury goods sector to overweight.
Germany’s DAX index hit another record close on Friday, with gains in the German sector notably trimmed after German GfK Consumer Confidence came in at an 11-month low of -29.7 for February versus the forecast uptick to -24.5 from January’s -25.1.
Next week will see calendar headline risks with the Bank of England (BoE) and the US Federal Reserve (Fed) slated to deliver their respective rate calls and associated monetary policy statements.
France’s CAC40 gained nearly 170 points on Friday to close up 2.28% at €7,634.14, while the pan-European STOXX600 index climbed 5.31 points to end the trading week at €483.84, up 1.11%.
Germany’s DAX indexed closed at record highs but still underperformed its European peers, gaining about a third of a percent and closing at €16,961.39, up nearly 54.5 points.
London’s FTSE 100 index also climbed on Friday, adding 105.36 points to close up by 1.4% at £7,635.09.
DAX Technical Outlook
Germany’s DAX index pinned into near-term highs near €16,950.00 to hit the closing bell at its highest bids ever, and the index is up nearly 3.75% from last week’s swing low into €16,328.00.
The DAX is trading well above technical levels with the 200-day Simple Moving Average (SMA) well below current price action at €15,905.00. The index hasn’t made contact with the 50-day or 200-day SMAs since November of last year, when the German equity index rallied from €14,600.00.
DAX Hourly Chart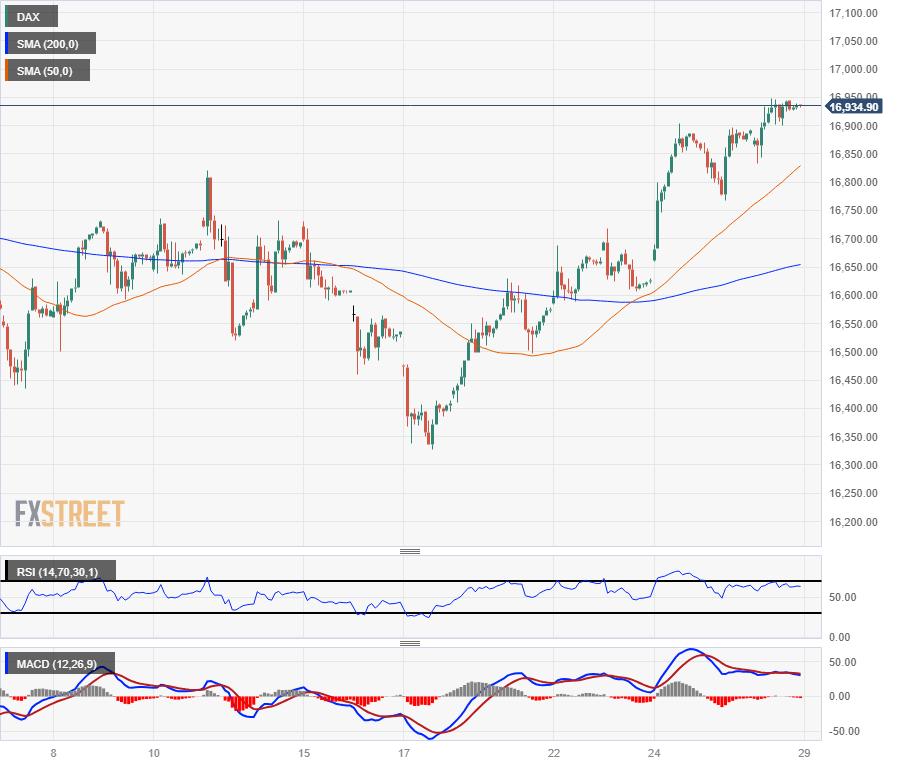
DAX Daily Chart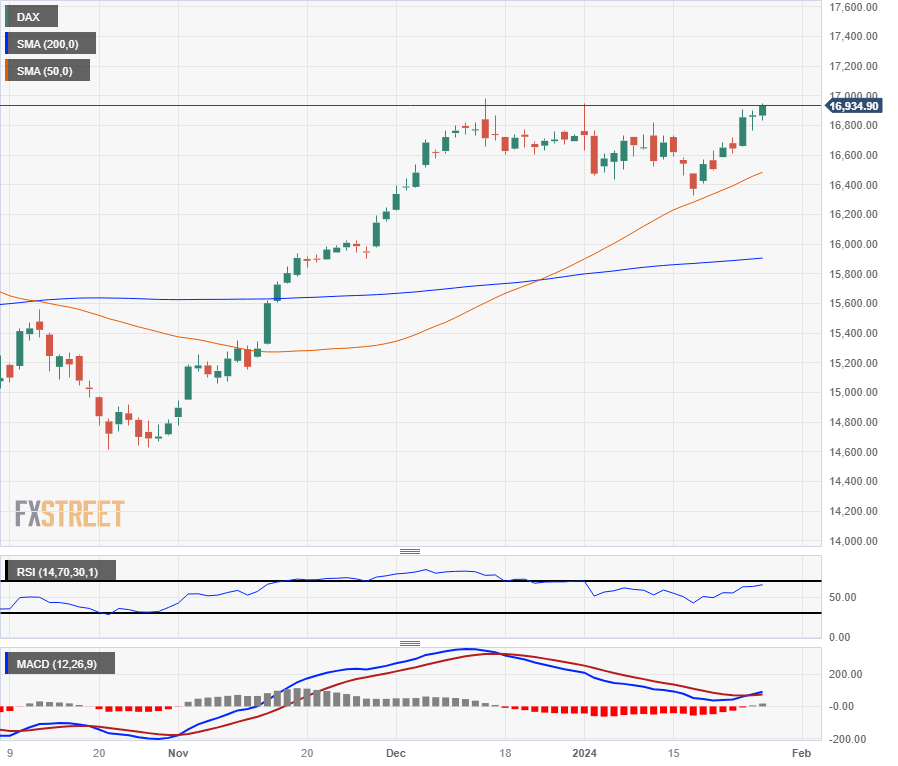
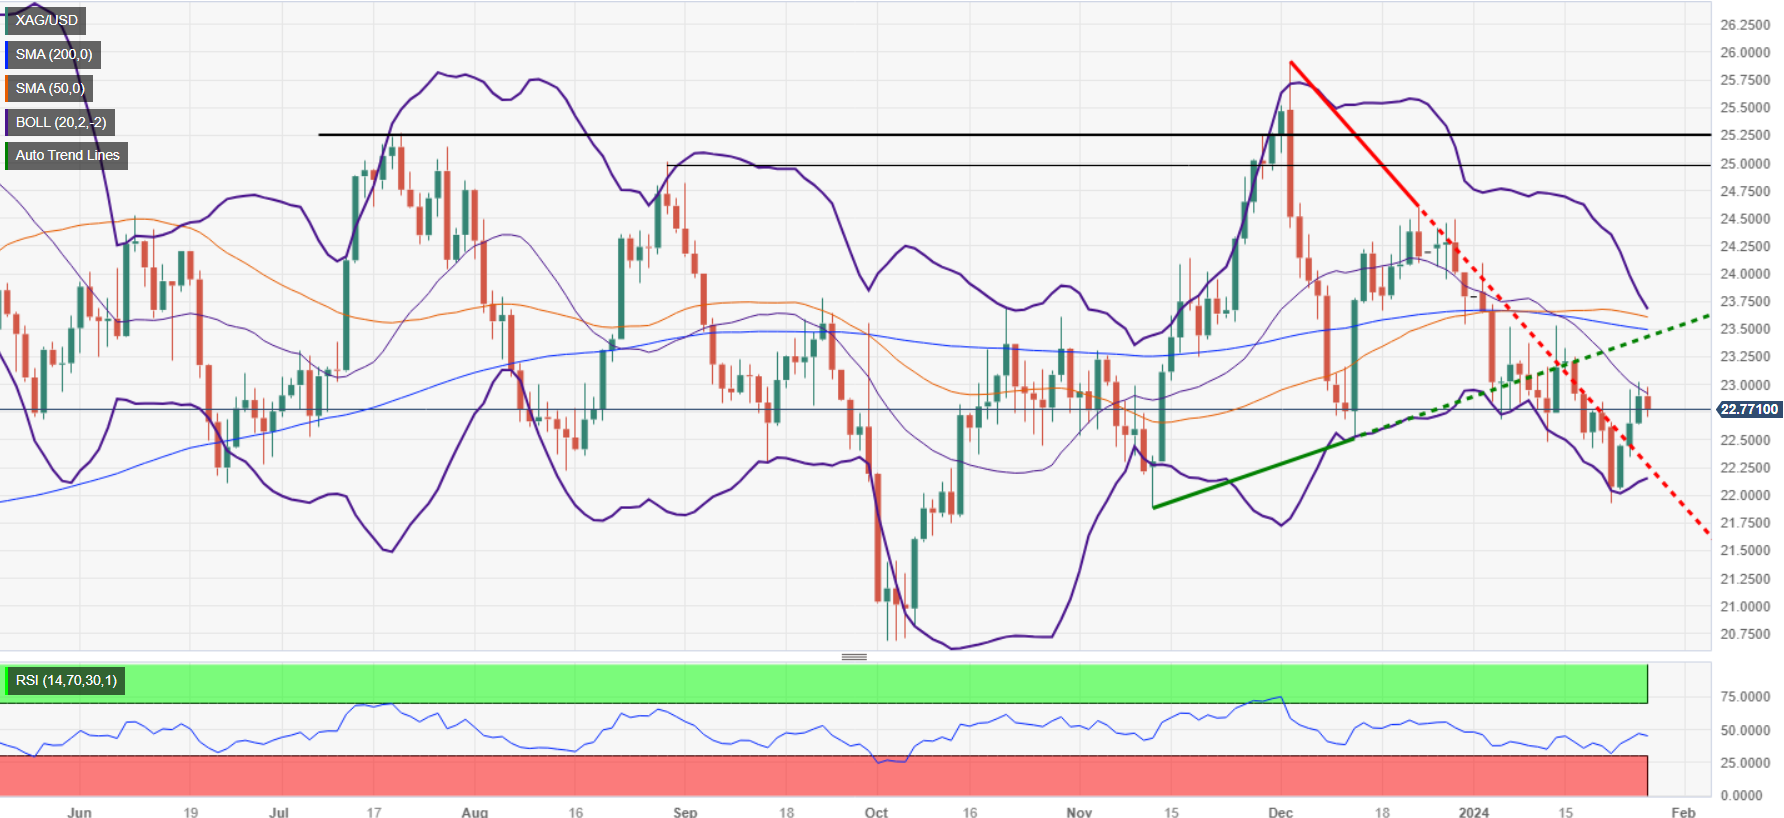
- Silver prices dip, unable to hold above key $23.00 level, indicating a possible ongoing downtrend.
- Break below major supports like 200, 50, and 100-day DMAs strengthens bearish outlook for silver.
- Buyer resistance seen at $23.00 and 100-DMA ($23.15); fall below $22.51 may lead to $22.00, $21.93 supports.
Silver price retreated late in the North American session after hitting a daily high of $22.97, though buyers' failure to reclaim the $23.00 exacerbated the grey metal’s fall to current spot prices. Therefore, the XAG/USD exchanges hands at $22.73, down 0.59%.
After printing three straight positive days, Silver retraced below $23.00, resuming its ongoing downtrend and forming a ‘bearish after sellers dragged prices below key support levels, like the 200, 50, and 100-day moving averages (DMAs). Even though XAG/USD is edging low, as a ‘bearish harami’ chart pattern emerges, it still needs to surpass (again) December’s 13 swing low of $22.51 to challenge the $22.00 figure. The next demand area below that level would be January’s 55 low at $21.93.
On the flip side, buyers are eyeing the $23.00 handle and the 100-DMA at $23.15 as immediate resistance levels in the near term. Once those levels are cleared, the next resistance emerges at the 200-DMA at $23.48.
XAG/USD Price Action – Daily Chart
XAG/USD Technical Levels
It was quite a dull week when it comes to price action in the FX galaxy, particularly in the G10 space. The (widely anticipated) lack of surprises at the BoJ event, coupled with the unemotional tone from the ECB, also contributed to the broad-based sidelined theme. Next week, all the attention is expected to be on the FOMC gathering, while the BoE meeting should also grab some interest.
In the US, the Conference Board will publish its always-relevant Consumer Confidence for the month of January (January 30). The ADP, the Fed event, and Chief Powell’s press conference are on January 31, and it is largely expected to keep its FFTR unchanged. Usual weekly Initial Claims are due on February 1 prior to the key ISM Manufacturing PMI, while Nonfarm Payrolls, the Unemployment Rate and the final Michigan Consumer Sentiment index are all due on February 2. In line with the rest of its peers, the greenback maintained an erratic performance throughout the week, leaving the USD Index (DXY) hovering around the low 103.00s.
In Euroland, advanced Q4 GDP Growth Rate in Germany and the broader euro bloc is due on January 30. Still in Germany, Retail Sales, the labour market report, and the advanced Inflation Rate come on January 31. February’s docket kicks in with the release of the final Manufacturing PMI in Germany and the euro area, as well as the preliminary Inflation Rate in the whole bloc. EUR/USD also traded in an erratic fashion, although always with a gradual decline, which ended in the second consecutive week of losses.
In the UK, Mortgage Approvals are first in line (January 30), seconded by Nationwide Housing Prices on January 31. The final Manufacturing PMI and the BoE gathering are expected on February 1. GBP/USD managed to cling to positive territory in the weekly chart, regaining the 1.2700 zone.
The Japanese docket will see the release of the Unemployment Rate on January 30, ahead of the BoJ Summary of Opinions, flash Industrial Production figures, Consumer Confidence, Housing Starts and Retail Sales, all due on January 31. The usual weekly Foreign Bond Investment will close the calendar on February 1. USD/JPY halted three consecutive weeks of gains, although it maintained the trade in the area of recent peaks north of 148.00.
In Australia, Retail Sales will be in the limelight on January 30, followed by the key Inflation Rate in Q4, Housing Credit, the Monthly CPI Indicator and the final Judo Bank Manufacturing PMI, all on January 31. Building Permits come on February 1, and Home Loans and Investment Lending for Homes are seen on February 2. Despite AUD/USD keeping the consolidation in place, it could not help closing its fourth consecutive week of losses.
In China, the NBS Manufacturing PMI and the Non-Manufacturing PMI are due on January 31.
Regarding central banks, both the Federal Reserve and the Bank of England (BoE) are expected to keep their policy rates unchanged at their gatherings on January 31 and February 1, respectively.
- Crude Oil markets jumped again on Friday, testing two-month highs.
- WTI tips back into $78.00, up over 7.5% in 2024.
- Energy markets are tilted heavily into net long positions.
West Texas Intermediate (WTI) US Crude Oil bid into a two-month high north of 78$.00 per barrel on Friday as barrel traders pile into long bets on continuing geopolitical concerns and near-term supply constraints. Crude Oil prices have skewed to the high side this week after a dogpile into long trades leaves markets exposed to an exacerbated pullback if further net long positions can’t be pulled into the order books.
A cold snap in the US last week temporarily crimped supply lines, adding to a drawdown in US Crude Oil stocks according to reporting by the Energy Information Administration (EIA) this week. EIA barrel counts showed a 9.233 million barrel drawdown in the US for the week ended January 19, adding to the previous week’s drag of 2.492 million barrels. Despite another buildup in refined gasoline adding to already-burgeoning gasoline supplies, energy markets are broadly focusing on the potential for ongoing Crude Oil supply constraints.
Iran-backed Houthi rebels in Yemen launched a fresh attack against US and UK naval targets on Friday, exacerbating Crude Oil jitters despite no reports of significant damage. The Houthis continue to threaten civilian cargo ships bound for the Suez Canal, and nearly ten strikes by coalition naval forces within three weeks have yet to quell Houthi aggression.
According to reporting by Bloomberg, citing Dan Ghali of TD Securities, algorithmic trend followers have pivoted into net long positions with Crude Oil traders net long WTI by around 30%,
WTI Crude Oil Technical Outlook
WTI caught an intraday rebound off the 50-hour Simple Moving Average (SMA) near $76.00 on Friday, and US Crude Oil is up nearly 2.5% on the day. The near-term technical floor is priced in at the 200-hour SMA just north of the $74.00 handle.
Daily candlesticks have WTI testing into the 200-day SMA near 77.25, with oil bids climbing and setting WTI on pace to close in the green for a sixth of the last eight trading session.
WTI Hourly Chart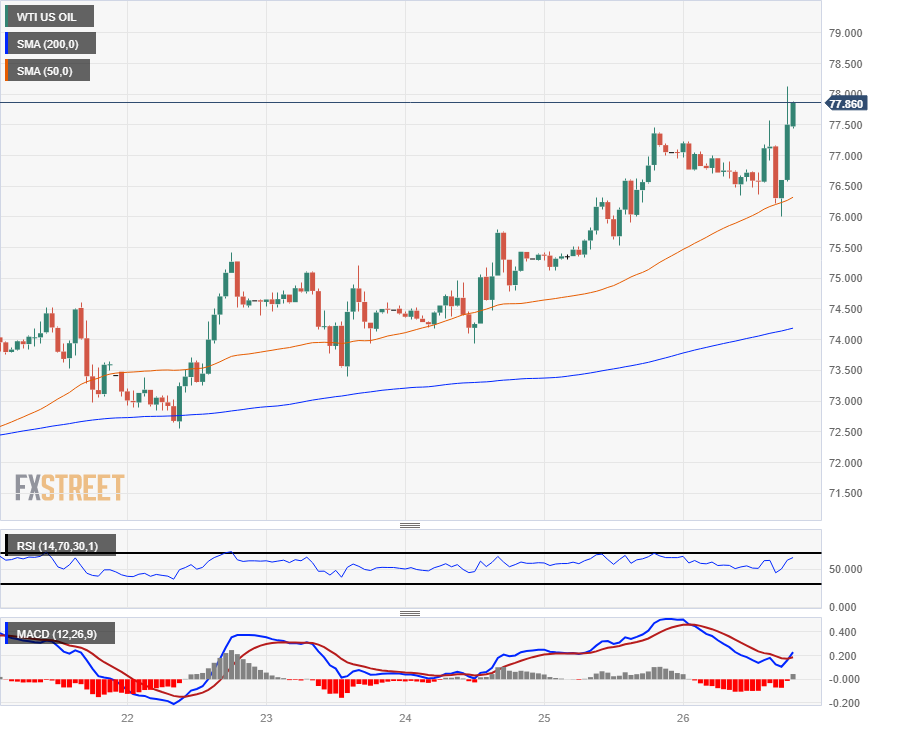
WT Daily Chart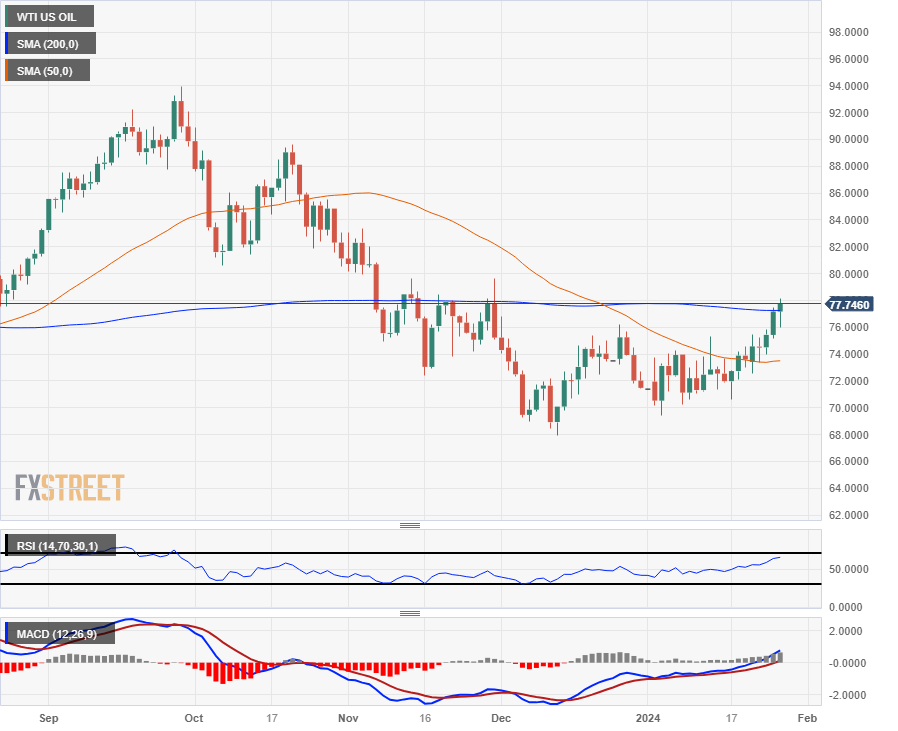
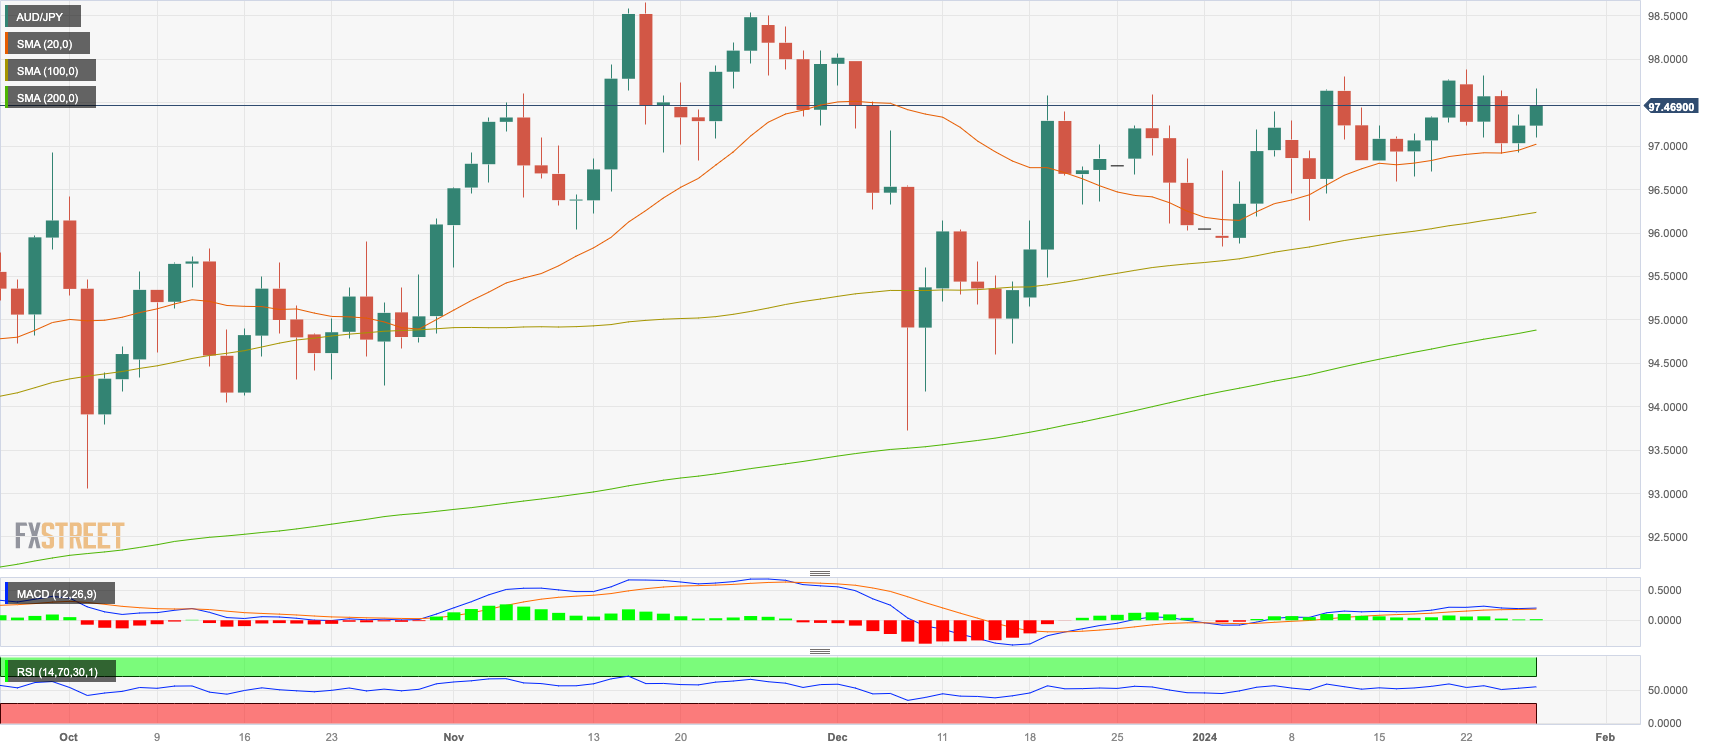
- The AUD/JPY stands strong at around 97.45, flaunting a gain of 0.25%.
- Despite the upwards movements, the cross will still close a 0.20% weekly loss.
- An optimistic scenario is reflected in larger time frames with the pair trading above the 20,100,200-day SMAs.
On Friday's session, the AUD/JPY was trading at 97.45, up by 0.25%. The daily chart shows a neutral to bullish sentiment, with bulls keenly holding their ground while the four-hour outlook mirrors the daily one, with a predominant bullish presence.
The indications on the daily chart reflect a sideway move with a slight bullish inclination. A surge is suggested by the Relative Strength Index (RSI) with a positive slope and lies in positive space, indicating that the buying strength still holds the upper hand. Yet, the Moving Average Convergence Divergence (MACD) showing static green bars suggests a lack of momentum for further bullish advancement. However, positioning above the 20, 100, and 200-day Simple Moving Averages (SMAs) solidifies the evidence that bulls dominate in the long-run realm, even with the weekly retracement.
The four-hour chart, it echoes a similar sentiment. The Relative Strength Index (RSI), still in positive territory and on an upward bend hints at the continued presence of bullish momentum. In the meanwhile, the Moving Average Convergence Divergence (MACD) laying flat with red bars could point to a short-term pullback or consolidation period. Nonetheless, the bulls' persistence indicates that the uptrend may continue in the following trading sessions, assuming that buying pressure remains.
AUD/JPY levels to watch
AUD/JPY daily chart
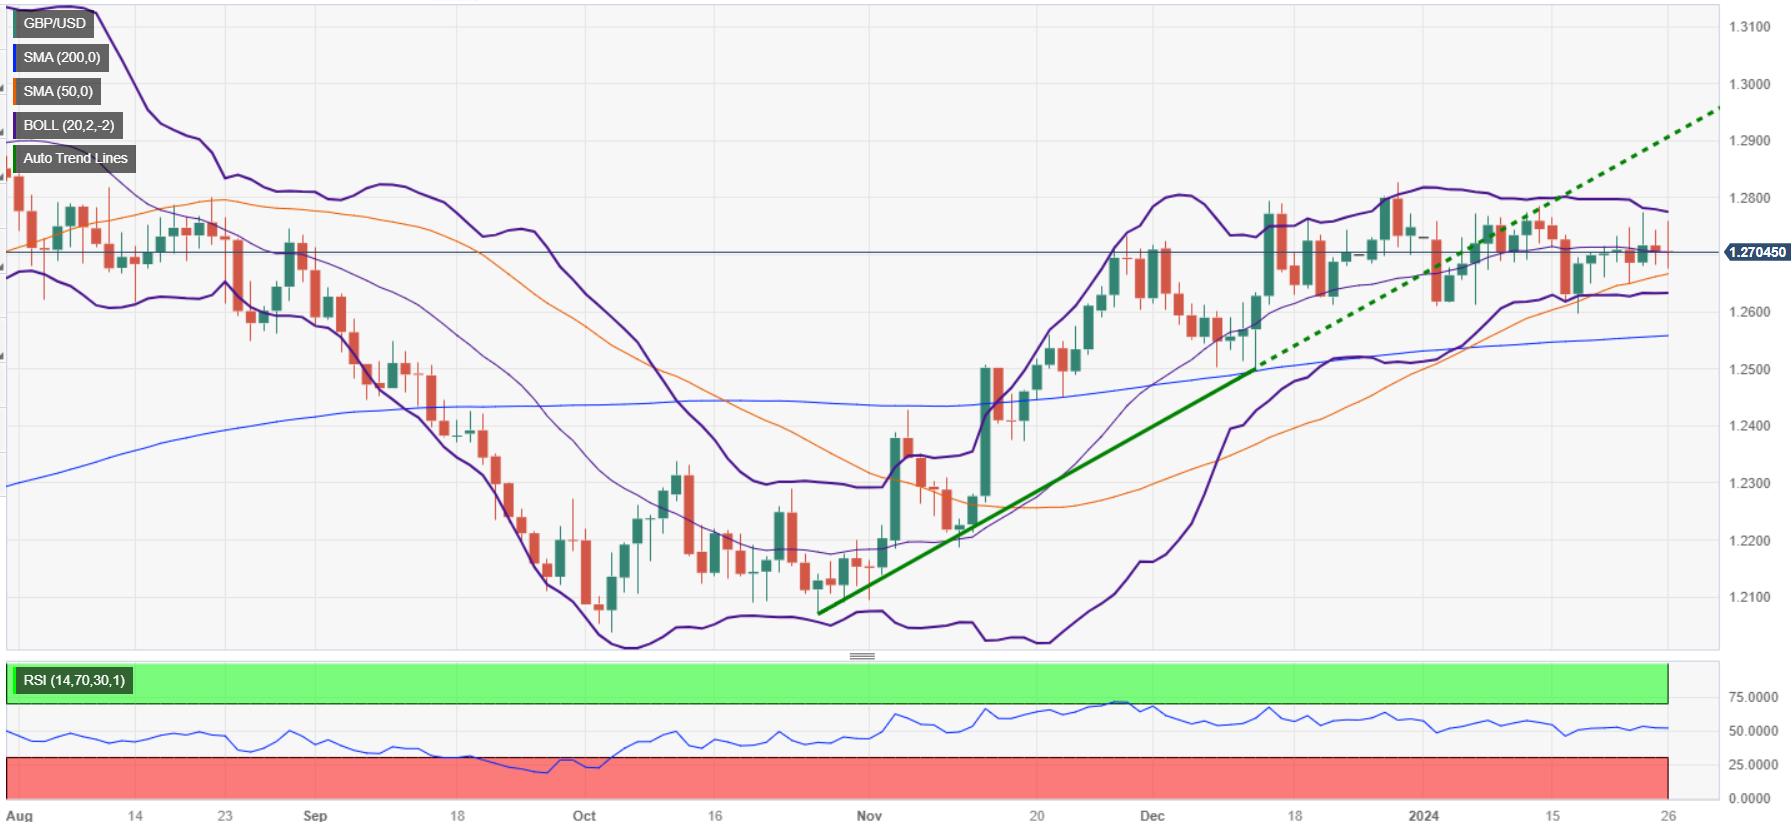
- GBP/USD stable in mid-North American session post US data, with soft inflation boosting rate cut expectations.
- US PCE Index shows steady headline inflation at 2.6%; core rate drops to 2.9%, hinting at possible May Fed rate cut.
- Focus shifts to upcoming central bank decisions; Fed likely to hold rates, BoE expected to maintain Bank Rate.
The GBP/USD was virtually unchanged in the mid-North American session on Friday after data from the United States (US) was released. A softer inflation reading was cheered by investors, who remained confident the Federal Reserve (Fed) would cut rates in May. Despite that, the major remains flat, hovering around 1.2700, set to finish the week with minuscule gains.
GBP/USD hovers around its opening price following soft US PCE data; traders eye central bank decisions
The US Personal Consumption Expenditures (PCE) Price Index was revealed by the US Department of Commerce suggesting that inflation continues its downtrend. Headline inflation rose by 2.6%, unchanged compared to November’s and expected figures, while the underlying measures dropped from 3.2% to 2.9%. Although the data could allow a rate cut by the Fed, investors estimate the first one would be in May, according to the Chicago Board of Trade (CBOT). Money market traders expect Fed Chair Jerome Powell and Co. to lower rates to 4% by the year’s end.
Given the fundamental backdrop, GBP/USD traders eye the next week’s monetary policy decisions by both central banks. The Fed is expected to keep rates unchanged on January 31, though market participants will be eyeing Powell’s press conference.
Across the pond, the Bank of England (BoE) is foreseen to keep the Bank Rate at 5.25%, although with a unanimous vote, than the previous 6-3 split by February 1. Investors are eyeing the release of economic projections and the BoE’s press conference.
GBP/USD Price Analysis: Technical outlook
From a technical standpoint, the GBP/USD remains neutrally biased, thought at the brisk of tilting to the downside, as price action closes into the 50-day moving average (DMA), the first support level at 1.2654. if sellers break below the 1.2700 figure and the latter, further downside is seen. The next demand zone would be the January 5 low of 1.2611 and the 1.2600 figure. On the upside, the pairJanuary first resistance would be the January 24 cycle high at 1.2774, before testing 1.2800.
- EUR/USD reclaims territory near 1.0880 after drop into 1.0820.
- German Consumer Confidence declined to 11-month low.
- US PCE inflation eased more than expected, but spending remained high.
EUR/USD recovered recent losses on Friday, recovering back into familiar technical levels. Still, overall gains remained limited after German Consumer Confidence backslid to almost a one-year low as economic conditions in Europe remain tepid at best.
US Personal Consumption Expenditure (PCE) Price Index inflation figures eased more than expected, but further gains in December’s Personal Spending alongside an unexpected uptick in Pending Home Sales trimmed rate cut expectations. With the US domestic economy continuing to bump along at a healthy clip, market hopes for early and deep rate cuts from the Federal Reserve continue to wilt.
Daily digest market movers: EUR/USD pares losses despite determined Greenback
- EUR/USD slipped into multi-week lows early Friday after German Gfk Consumer Confidence in February declined to an 11-month low of -29.7 versus the forecasted improvement from -25.1 to -24.5.
- The US Dollar broadly recovered after US YoY Core PCE Price Index figures in December eased to 2.9% from the forecast of 3.0%, previous 3.2%.
- Despite the easing in inflation, US Personal Spending and Pending Home Sales both stepped higher.
- Personal Spending rose 0.7% in December versus the 0.4% forecast, with the previous month’s print getting revised to 0.4% from 0.2%.
- US Pending Home Sales climbed 8.3% in December compared to the expected rebound to 1.5% from the previous month’s 0.3% decline (revised down from 0.0%).
- Next week brings European Gross Domestic Product (GDP) numbers on Tuesday, with the next high-impact rate call from the US Federal Reserve (Fed) slated for Wednesday.
- Euro area Q4 GDP is expected to print at -0.1%, in line with the previous figure as the pan-European economy lags in stagnation.
- Federal Reserve expected to hold rates steady in January, CME FedWatch Tool suggests markets pivoted to betting on the first rate cut in May after rate bets shifted post-PCE print.
Euro price today
The table below shows the percentage change of Euro (EUR) against listed major currencies today. Euro was the strongest against the Japanese Yen.
| USD | EUR | GBP | CAD | AUD | JPY | NZD | CHF | |
| USD | -0.15% | -0.03% | -0.11% | 0.05% | 0.18% | 0.16% | -0.36% | |
| EUR | 0.16% | 0.13% | 0.05% | 0.20% | 0.35% | 0.33% | -0.21% | |
| GBP | 0.02% | -0.12% | -0.08% | 0.06% | 0.23% | 0.20% | -0.33% | |
| CAD | 0.11% | -0.04% | 0.07% | 0.16% | 0.29% | 0.28% | -0.25% | |
| AUD | -0.03% | -0.19% | -0.06% | -0.14% | 0.15% | 0.13% | -0.41% | |
| JPY | -0.19% | -0.35% | -0.21% | -0.31% | -0.16% | -0.02% | -0.54% | |
| NZD | -0.16% | -0.33% | -0.20% | -0.27% | -0.13% | 0.00% | -0.53% | |
| CHF | 0.34% | 0.19% | 0.31% | 0.23% | 0.37% | 0.52% | 0.51% |
The heat map shows percentage changes of major currencies against each other. The base currency is picked from the left column, while the quote currency is picked from the top row. For example, if you pick the Euro from the left column and move along the horizontal line to the Japanese Yen, the percentage change displayed in the box will represent EUR (base)/JPY (quote).
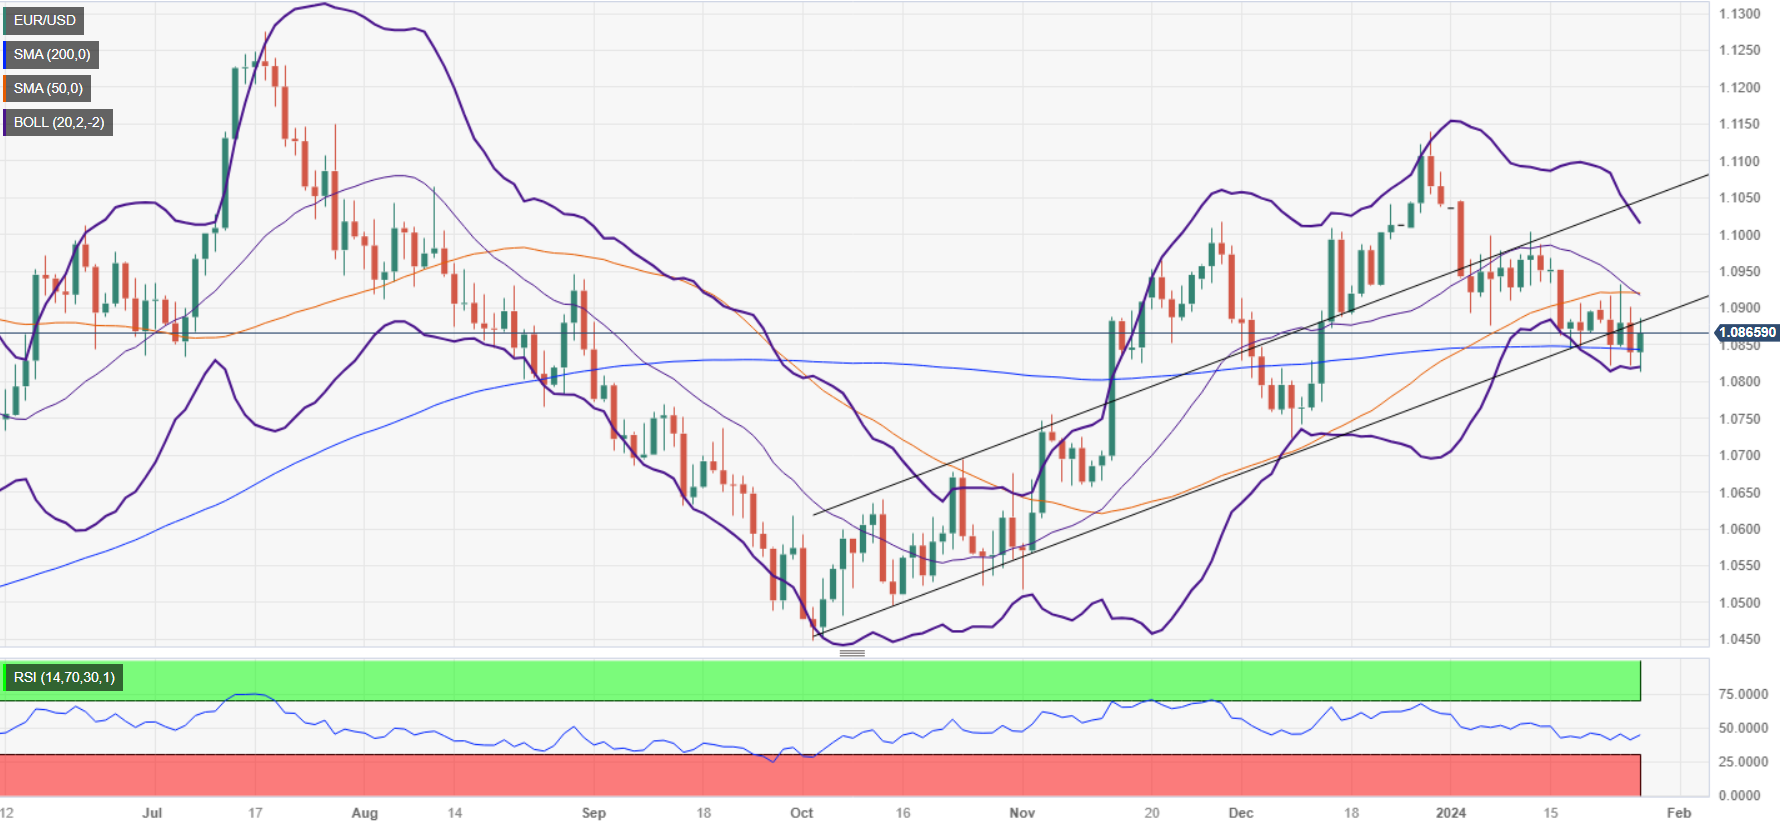
Technical Analysis: EUR/USD gets pushed back into technical barriers, but topside limited
EUR/USD hit a multi-week low of 1.0813 early Friday before a rebound into the 200-hour Simple Moving Average (SMA) near 1.0880. Dollar bets continue to weigh on USD pairs, keeping EUR/USD leaning toward a near-term middle around 1.0850.
Despite intraday tests into the low side, EUR/USD is set to continue languishing in an ongoing congestion pattern between the 50-day and 200-day SMAs at 11.0925 and 1.0850, respectively. The pair has been trapped within the consolidation pattern since dropping from December’s peak near 1.1140.
EUR/USD Hourly Chart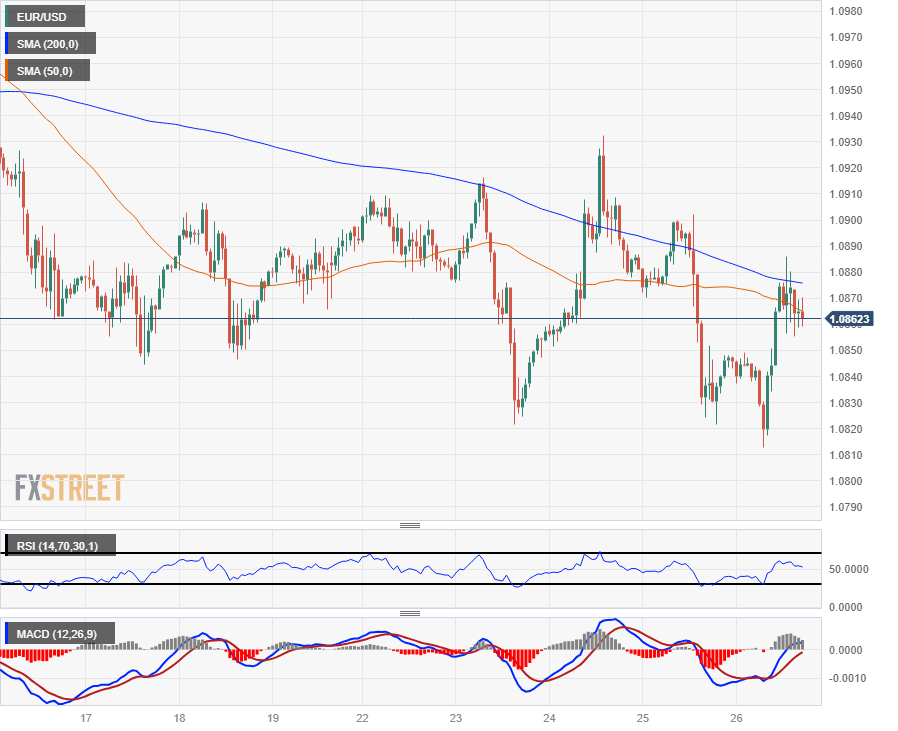
EUR/USD Daily Chart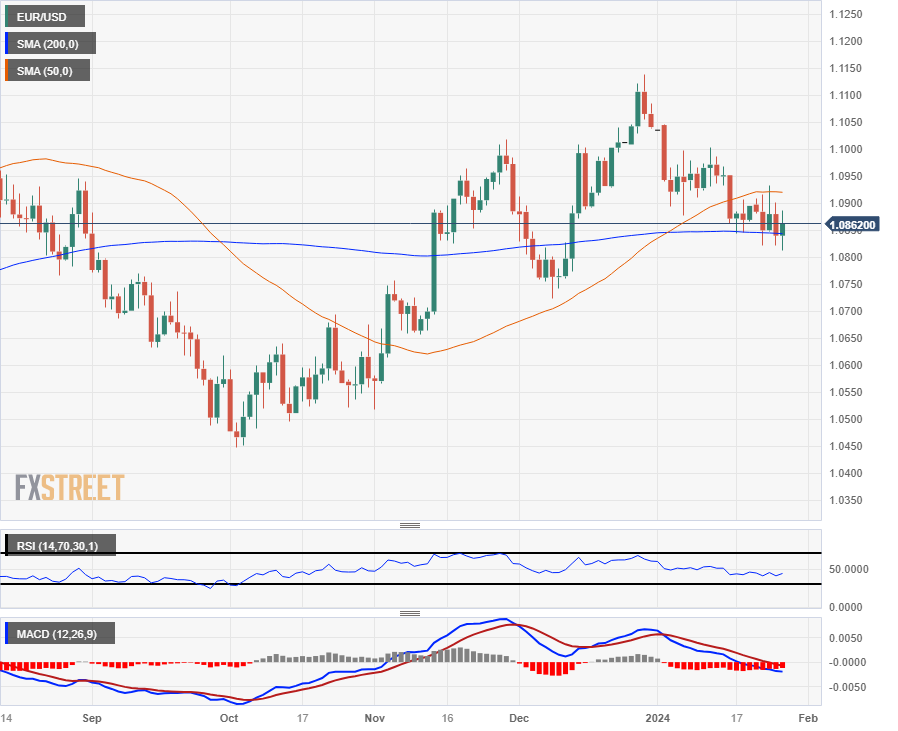
Euro FAQs
What is the Euro?
The Euro is the currency for the 20 European Union countries that belong to the Eurozone. It is the second most heavily traded currency in the world behind the US Dollar. In 2022, it accounted for 31% of all foreign exchange transactions, with an average daily turnover of over $2.2 trillion a day.
EUR/USD is the most heavily traded currency pair in the world, accounting for an estimated 30% off all transactions, followed by EUR/JPY (4%), EUR/GBP (3%) and EUR/AUD (2%).
What is the ECB and how does it impact the Euro?
The European Central Bank (ECB) in Frankfurt, Germany, is the reserve bank for the Eurozone. The ECB sets interest rates and manages monetary policy.
The ECB’s primary mandate is to maintain price stability, which means either controlling inflation or stimulating growth. Its primary tool is the raising or lowering of interest rates. Relatively high interest rates – or the expectation of higher rates – will usually benefit the Euro and vice versa.
The ECB Governing Council makes monetary policy decisions at meetings held eight times a year. Decisions are made by heads of the Eurozone national banks and six permanent members, including the President of the ECB, Christine Lagarde.
How does inflation data impact the value of the Euro?
Eurozone inflation data, measured by the Harmonized Index of Consumer Prices (HICP), is an important econometric for the Euro. If inflation rises more than expected, especially if above the ECB’s 2% target, it obliges the ECB to raise interest rates to bring it back under control.
Relatively high interest rates compared to its counterparts will usually benefit the Euro, as it makes the region more attractive as a place for global investors to park their money.
How does economic data influence the value of the Euro?
Data releases gauge the health of the economy and can impact on the Euro. Indicators such as GDP, Manufacturing and Services PMIs, employment, and consumer sentiment surveys can all influence the direction of the single currency.
A strong economy is good for the Euro. Not only does it attract more foreign investment but it may encourage the ECB to put up interest rates, which will directly strengthen the Euro. Otherwise, if economic data is weak, the Euro is likely to fall.
Economic data for the four largest economies in the euro area (Germany, France, Italy and Spain) are especially significant, as they account for 75% of the Eurozone’s economy.
How does the Trade Balance impact the Euro?
Another significant data release for the Euro is the Trade Balance. This indicator measures the difference between what a country earns from its exports and what it spends on imports over a given period.
If a country produces highly sought after exports then its currency will gain in value purely from the extra demand created from foreign buyers seeking to purchase these goods. Therefore, a positive net Trade Balance strengthens a currency and vice versa for a negative balance.
- DXY Index records a loss, unable to consolidate past 200-day SMA.
- Core PCE figures from December came in weak.
- Markets are still pushing the start of the Fed’s easing cycle to May.
The US Dollar (USD) Index is presently grappling with losses, trading at 103.35 on the DXY, in response to the release of softer Personal Consumption Expenditures (PCE) data for December, which gave the doves hope of earlier rate cuts.
In that sense, market expectations hint at a possible rate cut by the Fed in March. However, if economic growth sustains itself, a March rate cut seems unlikely. This is why bets have continued to shift toward the easing cycle beginning in May. In case the US continues to show resilience and markets delay expectations of the cuts, the downside is limited for the short term.
Daily Digest Market Movers: US Dollar declines after December PCE data
- The December Core PCE Price Index (YoY), the Fed’s preferred gauge of inflation, came in at 2.9%, slightly under the consensus of 3% and a decrease from the previous 3.2%.
- The headline index remained constant at 2.6% as anticipated.
- The 2-year, 5-year and 10-year US bond yields are on the rise, currently trading at 4.35%, 4.04% and 4.14%, respectively.
- The CME FedWatch Tool indicates that no changes in hike rates are expected for the January meeting, while markets are hinting at rate cuts in March and May 2024 with higher odds for the easing cycle to start in the latter.
Technical Analysis: DXY Index short-term buying pressure wanes as bulls struggle to defend the 200-day SMA
The indicators on the daily chart reflect a tussle between buying and selling pressure. The Relative Strength Index (RSI) showcases a negative slope yet remains in positive territory, hinting toward diminishing buying momentum. Thus, a potential shift toward sellers might be on the cards.
In unison, the Moving Average Convergence Divergence (MACD) indicator is also signaling a decline in upward pressure as the green bars on the histogram have started to decrease.
On observing the position of the index relative to its Simple Moving Averages (SMAs), we notice a mix of buying and selling pressure. The DXY holding above the 20-day SMA suggests attempts by bulls to control the short-term market trend, even as lingering bearish undertones persist.
The fact that the index is still below the 100 and 200-day SMAs, however, indicates that bears are maintaining a bullish grip on the broader context. The sellers seem to be dominating the narrative in the longer run, with the bulls struggling to gain ground.
Support Levels: 103.30, 103.00, 102.80, 102.60 (20-day SMA).
Resistance Levels: 103.50 (200-day SMA), 103.70, 103.90.
US Dollar FAQs
What is the US Dollar?
The US Dollar (USD) is the official currency of the United States of America, and the ‘de facto’ currency of a significant number of other countries where it is found in circulation alongside local notes. It is the most heavily traded currency in the world, accounting for over 88% of all global foreign exchange turnover, or an average of $6.6 trillion in transactions per day, according to data from 2022.
Following the second world war, the USD took over from the British Pound as the world’s reserve currency. For most of its history, the US Dollar was backed by Gold, until the Bretton Woods Agreement in 1971 when the Gold Standard went away.
How do the decisions of the Federal Reserve impact the US Dollar?
The most important single factor impacting on the value of the US Dollar is monetary policy, which is shaped by the Federal Reserve (Fed). The Fed has two mandates: to achieve price stability (control inflation) and foster full employment. Its primary tool to achieve these two goals is by adjusting interest rates.
When prices are rising too quickly and inflation is above the Fed’s 2% target, the Fed will raise rates, which helps the USD value. When inflation falls below 2% or the Unemployment Rate is too high, the Fed may lower interest rates, which weighs on the Greenback.
What is Quantitative Easing and how does it influence the US Dollar?
In extreme situations, the Federal Reserve can also print more Dollars and enact quantitative easing (QE). QE is the process by which the Fed substantially increases the flow of credit in a stuck financial system.
It is a non-standard policy measure used when credit has dried up because banks will not lend to each other (out of the fear of counterparty default). It is a last resort when simply lowering interest rates is unlikely to achieve the necessary result. It was the Fed’s weapon of choice to combat the credit crunch that occurred during the Great Financial Crisis in 2008. It involves the Fed printing more Dollars and using them to buy US government bonds predominantly from financial institutions. QE usually leads to a weaker US Dollar.
What is Quantitative Tightening and how does it influence the US Dollar?
Quantitative tightening (QT) is the reverse process whereby the Federal Reserve stops buying bonds from financial institutions and does not reinvest the principal from the bonds it holds maturing in new purchases. It is usually positive for the US Dollar.
- Mexican Peso strengthens for third day, bolstered by strong trade balance and weak US PCE figures.
- Mexico's sizable December trade surplus and robust job market underscore economic strength amid global uncertainty.
- US Fed's core PCE index falling below 3% fuels May rate cut expectations, benefiting emerging currencies like MXN.
The Mexican Peso (MXN) stays on a mission and climbs for the third straight day versus the US Dollar (USD) after data from Mexico suggests the Trade Balance expanded more than expected, while inflation data in the United States (US) was softer. That has increased the odds of a rate cut by the US Federal Reserve (Fed), keeping the Greenback (USD) pressured as the interest rate differential would likely support the emerging market currency. The USD/MXN trades at 17.17, down 0.15% on the day.
The National Statistics Agency (INEGI) in Mexico revealed the country posted a surplus in December. That data and strong labor market data revealed on Thursday portray the economy's strength bolstered by the prospects of nearshoring.
In the meantime, the Fed’s preferred gauge for inflation, the Personal Consumption Expenditures (PCE) Price Index, was unchanged, though the core annualized figure dipped below the 3% threshold, a sign that the restrictiveness of policy is driving prices down. That said, investors seem convinced that the Fed will cut rates in May by 25 basis points (bps), according to the CME FedWatch Tool.
Daily Digest Market Movers: Mexican Peso continues to recover and trim weekly losses
- Mexico’s Trade Balance clocked a surplus in December of $4.242 billion, exceeding the previous reading and forecasts of $1.4 billion.
- During the last week, economic data from Mexico witnessed mixed readings in the mid-month inflation report, with headlines exceeding forecasts and the core Consumer Price Index (CPI) slipping below the 5% threshold. That could prevent the Bank of Mexico (Banxico) from cutting rates in the first quarter of 2024, even though two of its members expressed interest in December.
- Mexico’s Economic Activity shrank in November, while annual figures slid from 4.2% to 2.3%, less than forecast.
- The labor market in Mexico remains strong as the Unemployment Rate dropped from 2.7% to 2.6%.
- The economy in Mexico is beginning to show the impact of high rates set by Banxico at 11.25%, even though most analysts estimate the economy will grow above 2% in 2024. Nevertheless, retail sales missing estimates, the economy growing below 3% in November and inflation reaccelerating puts a stagflationary scenario in play.
- On January 5, a Reuters poll suggested the Mexican Peso could weaken 5.4% to 18.00 per US Dollar in the 12 months following December.
- Across the border, on Friday, the US PCE rose 2.6% in the 12 months to December, unchanged and as expected, while core PCE dipped from 3.2% to 2.9% and below forecasts.
- Latest data in the United States (US) suggests the economy remains robust and resilient after growing 3.3% in Q4 of 2023, exceeding estimates of 2%, while expanding 2.5% for the full year.
- Nevertheless, mixed readings in other data suggest that risks have become more balanced. That is reflected by investors speculating that the Fed will cut rates by 139 basis points during 2024, according to the Chicago Board of Trade (CBOT) data.
- The US Department of Commerce announced that Durable Goods Orders in December remained stagnant, recording a 0% change. This is a notable decrease from the 5.5% increase seen in November, primarily due to a downturn in transportation equipment manufacturing.
- The US Bureau of Labor Statistics disclosed that Initial Jobless Claims for the week ending January 20 increased to 214K, exceeding both the figures from the previous week and the anticipated 200K.
Technical Analysis: Mexican Peso gains traction as USD/MXN slumps below 17.15
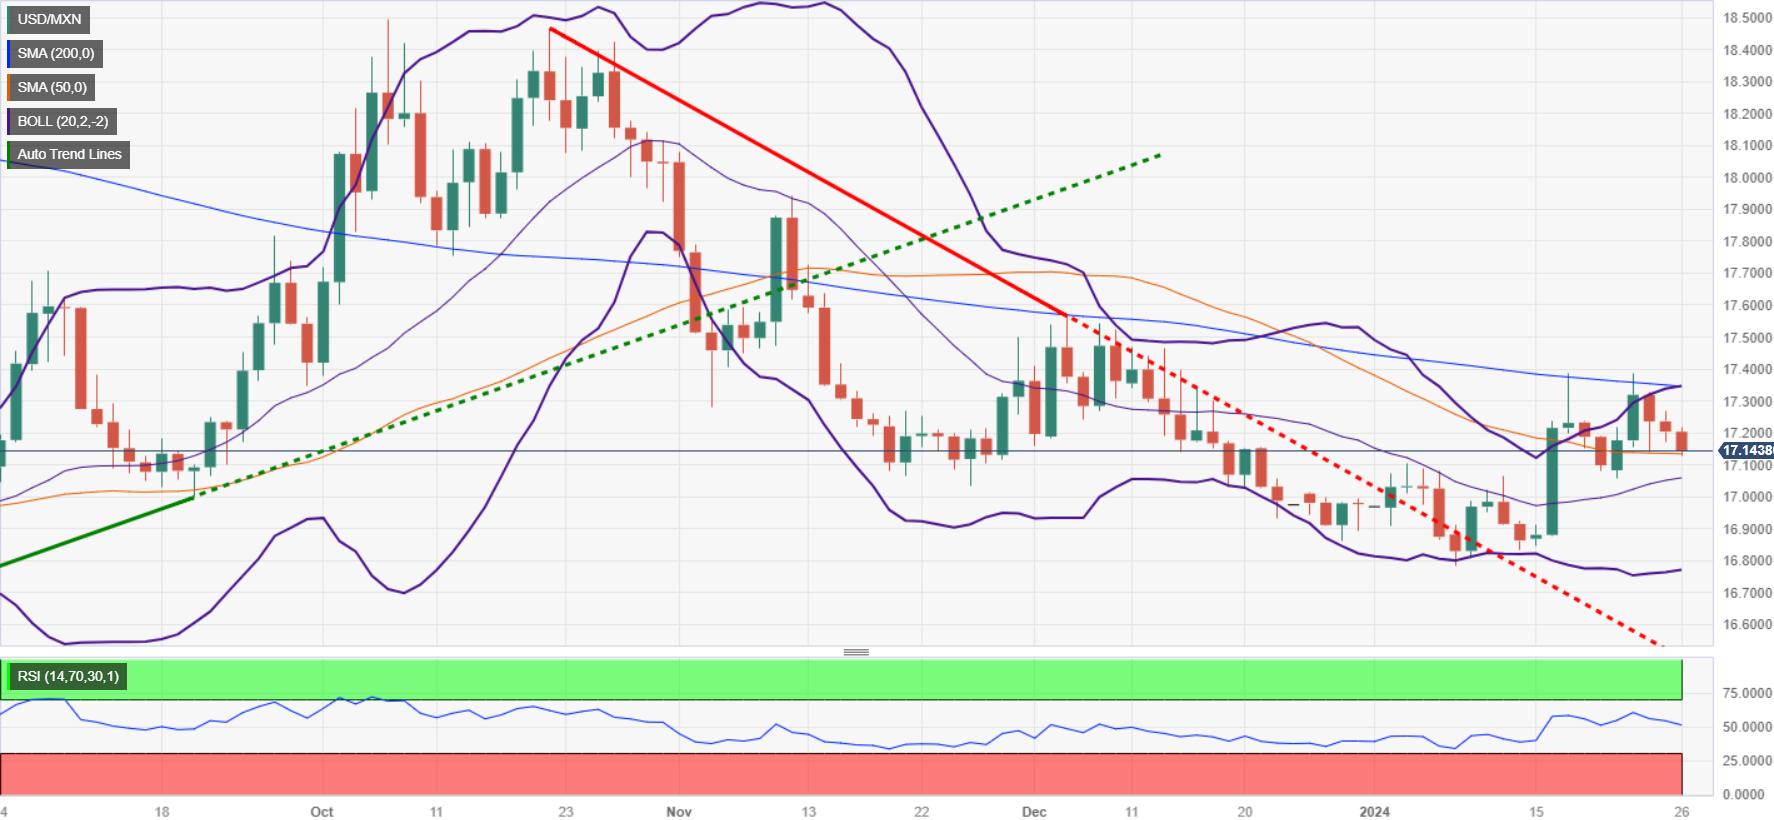
The USD/MXN has accelerated to the downside after printing losses for three straight days, but it continues to exchange hands above strong support from the 50-day Simple Moving Average (SMA) at 17.13. A breach of the latter will expose the January 22 low, followed by the 17.00 psychological figure.
On the flip side, if buyers reclaim the next resistance level at the 200-day SMA at 17.34, that could open the door to challenge the 100-day SMA at 17.41. Further upside is seen above the psychological 17.50 figure, ahead of rallying to the May 23 high from last year at 17.99.
USD/MXN Price Action – Daily Chart
Mexican Peso FAQs
What key factors drive the Mexican Peso?
The Mexican Peso (MXN) is the most traded currency among its Latin American peers. Its value is broadly determined by the performance of the Mexican economy, the country’s central bank’s policy, the amount of foreign investment in the country and even the levels of remittances sent by Mexicans who live abroad, particularly in the United States. Geopolitical trends can also move MXN: for example, the process of nearshoring – or the decision by some firms to relocate manufacturing capacity and supply chains closer to their home countries – is also seen as a catalyst for the Mexican currency as the country is considered a key manufacturing hub in the American continent. Another catalyst for MXN is Oil prices as Mexico is a key exporter of the commodity.
How do decisions of the Banxico impact the Mexican Peso?
The main objective of Mexico’s central bank, also known as Banxico, is to maintain inflation at low and stable levels (at or close to its target of 3%, the midpoint in a tolerance band of between 2% and 4%). To this end, the bank sets an appropriate level of interest rates. When inflation is too high, Banxico will attempt to tame it by raising interest rates, making it more expensive for households and businesses to borrow money, thus cooling demand and the overall economy. Higher interest rates are generally positive for the Mexican Peso (MXN) as they lead to higher yields, making the country a more attractive place for investors. On the contrary, lower interest rates tend to weaken MXN.
How does economic data influence the value of the Mexican Peso?
Macroeconomic data releases are key to assess the state of the economy and can have an impact on the Mexican Peso (MXN) valuation. A strong Mexican economy, based on high economic growth, low unemployment and high confidence is good for MXN. Not only does it attract more foreign investment but it may encourage the Bank of Mexico (Banxico) to increase interest rates, particularly if this strength comes together with elevated inflation. However, if economic data is weak, MXN is likely to depreciate.
How does broader risk sentiment impact the Mexican Peso?
As an emerging-market currency, the Mexican Peso (MXN) tends to strive during risk-on periods, or when investors perceive that broader market risks are low and thus are eager to engage with investments that carry a higher risk. Conversely, MXN tends to weaken at times of market turbulence or economic uncertainty as investors tend to sell higher-risk assets and flee to the more-stable safe havens.
- Canadian Dollar finds some room against the USD post-PCE print.
- Canada absent from the economic calendar until next Wednesday.
- Market focus to pivot toward upcoming Fed rate call.
The Canadian Dollar (CAD) found some space on Friday, bolstered by climbing Crude Oil markets and clawing back some of the week’s losses. The US Dollar Index (DXY) broadly fell early Friday ahead of US Personal Consumption Expenditure (PCE) figures, and the DXY saw a choppy recovery after the annualized Core PCE Price Index slid more than expected.
Canada is absent on the economic calendar until next Wednesday’s Canadian Gross Domestic Product (GDP) print, but effects are likely to be muted with broader markets focused on next week’s US Federal Reserve rate call and monetary policy statement.
Daily digest market movers: Canadian Dollar pares some of the week’s losses on Friday
- US Core PCE inflation printed at 2.9% YoY on Friday versus 3.0% forecast, 3.2% previously.
- Despite easing in Fed’s preferred inflation metric, US Personal Spending rose 0.7% MoM compared to the 0.4% forecast and 0.4% previous (revised up from 0.2%).
- US Pending Home Sales also rose 8.3% in December, well above the 1.5% forecast and the previous month’s -0.3% (revised down from 0.0%).
- US inflation continues to ease, but stubbornly robust consumption continues to weigh on rate cut hopes.
- Swap market bets of a Fed rate cut in March declined to 46% post-PCE release, falling back below 50%.
- According to the CME’s FedWatch Tool, markets are now pricing in May for the first rate cut.
- Next week’s Canadian MoM GDP for November expected to improve to 0.1% from 0.0%.
- Canada GDP to be engulfed by Fed rate call and Federal Open Market Committee (FOMC) press conference.
- Crude Oil markets saw new eight-week highs as supply concerns weigh on energy investors, West Texas Intermediate (WTI) US Crude Oil tests $77.00 per barrel on Friday.
Canadian Dollar price today
The table below shows the percentage change of Canadian Dollar (CAD) against listed major currencies today. Canadian Dollar was the strongest against the Japanese Yen.
| USD | EUR | GBP | CAD | AUD | JPY | NZD | CHF | |
| USD | -0.15% | -0.05% | -0.16% | -0.01% | 0.14% | 0.13% | -0.41% | |
| EUR | 0.14% | 0.09% | 0.00% | 0.14% | 0.32% | 0.27% | -0.26% | |
| GBP | 0.06% | -0.09% | -0.10% | 0.04% | 0.23% | 0.21% | -0.34% | |
| CAD | 0.14% | 0.01% | 0.09% | 0.12% | 0.30% | 0.28% | -0.25% | |
| AUD | 0.01% | -0.15% | -0.06% | -0.15% | 0.16% | 0.14% | -0.40% | |
| JPY | -0.16% | -0.32% | -0.21% | -0.31% | -0.18% | -0.04% | -0.56% | |
| NZD | -0.11% | -0.28% | -0.17% | -0.29% | -0.13% | 0.03% | -0.53% | |
| CHF | 0.41% | 0.26% | 0.36% | 0.27% | 0.39% | 0.55% | 0.55% |
The heat map shows percentage changes of major currencies against each other. The base currency is picked from the left column, while the quote currency is picked from the top row. For example, if you pick the Euro from the left column and move along the horizontal line to the Japanese Yen, the percentage change displayed in the box will represent EUR (base)/JPY (quote).
Technical Analysis: Canadian Dollar in the green for Friday but still soft on the week
The Canadian Dollar (CAD) found some room heading into the closing bell, gaining a third of a percent against the Japanese Yen (JPY) and around a quarter of a percent against the New Zealand Dollar (NZD). The CAD is flat on the day against the Euro (EUR) and shed a quarter of a percent against the rebounding Swiss Franc (CHF).
The Canadian Dollar pushed back against the US Dollar on Friday as USD/CAD fell to an intraday low of 1.3414, but a broad-market Greenback recovery pulled the pair back into the 1.3450 region.
The USD/CAD’s near-term decline from the week’s peak near 1.3530 saw the pair slide around 0.9% peak-to-trough, and the pair is now recovering toward the 200-hour Simple Moving Average (SMA) near 1.3480. On the top end, an intraday technical resistance zone is priced in around 1.3490.
A halting Friday decline leaves USD/CAD at risk of slumping back into a near-term congestion zone as the 50-day and 200-day SMAs consolidate into a technical swamp near the 1.3500 term.
USD/CAD Hourly Chart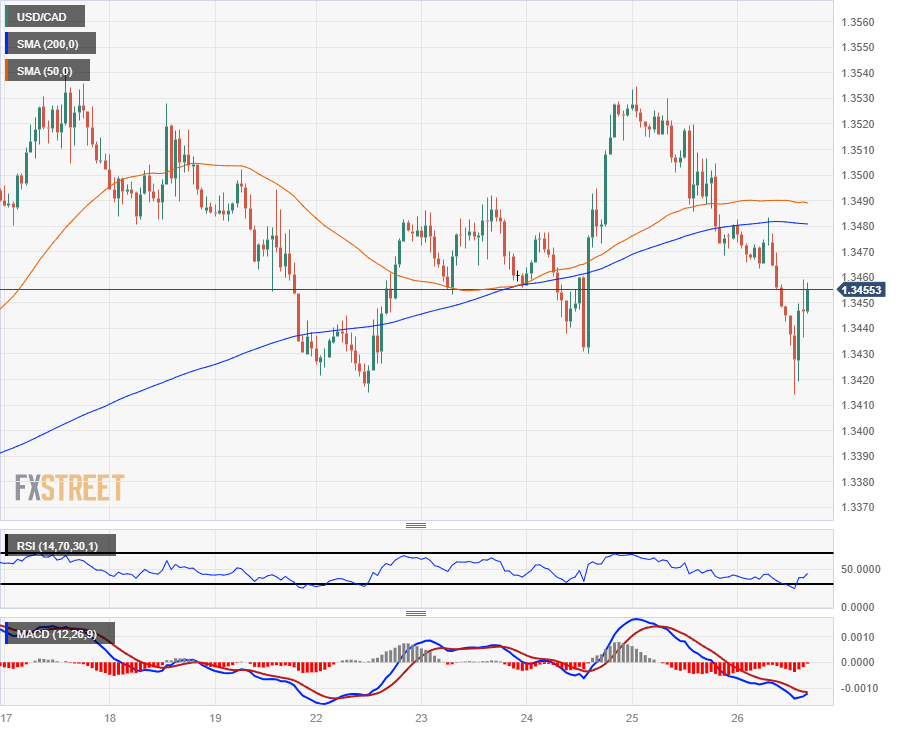
USD/CAD Daily Chart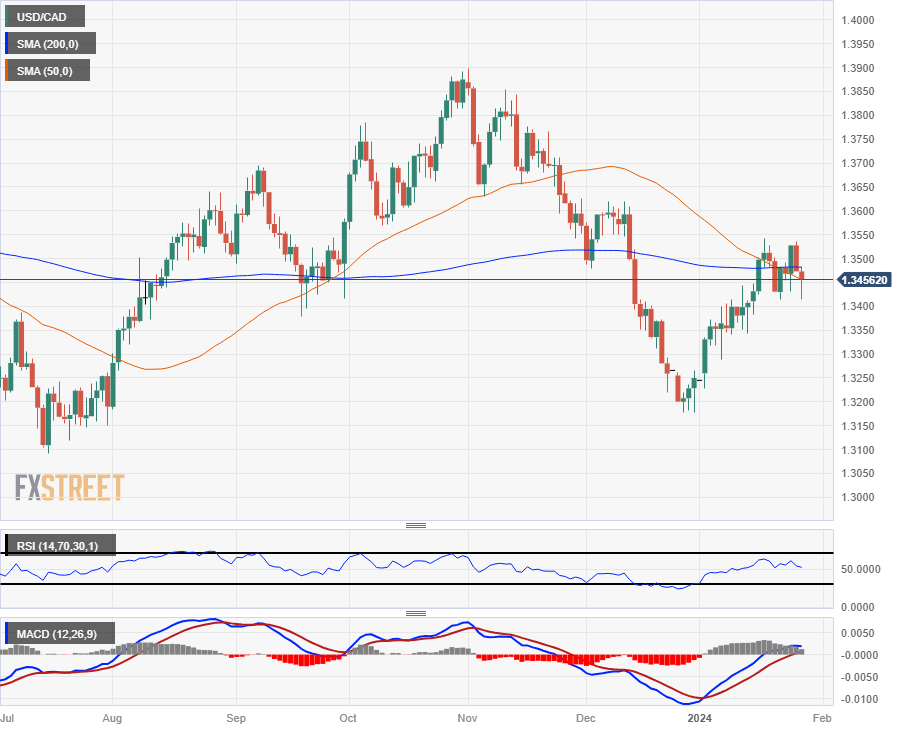
Canadian Dollar FAQs
What key factors drive the Canadian Dollar?
The key factors driving the Canadian Dollar (CAD) are the level of interest rates set by the Bank of Canada (BoC), the price of Oil, Canada’s largest export, the health of its economy, inflation and the Trade Balance, which is the difference between the value of Canada’s exports versus its imports. Other factors include market sentiment – whether investors are taking on more risky assets (risk-on) or seeking safe-havens (risk-off) – with risk-on being CAD-positive. As its largest trading partner, the health of the US economy is also a key factor influencing the Canadian Dollar.
How do the decisions of the Bank of Canada impact the Canadian Dollar?
The Bank of Canada (BoC) has a significant influence on the Canadian Dollar by setting the level of interest rates that banks can lend to one another. This influences the level of interest rates for everyone. The main goal of the BoC is to maintain inflation at 1-3% by adjusting interest rates up or down. Relatively higher interest rates tend to be positive for the CAD. The Bank of Canada can also use quantitative easing and tightening to influence credit conditions, with the former CAD-negative and the latter CAD-positive.
How does the price of Oil impact the Canadian Dollar?
The price of Oil is a key factor impacting the value of the Canadian Dollar. Petroleum is Canada’s biggest export, so Oil price tends to have an immediate impact on the CAD value. Generally, if Oil price rises CAD also goes up, as aggregate demand for the currency increases. The opposite is the case if the price of Oil falls. Higher Oil prices also tend to result in a greater likelihood of a positive Trade Balance, which is also supportive of the CAD.
How does inflation data impact the value of the Canadian Dollar?
While inflation had always traditionally been thought of as a negative factor for a currency since it lowers the value of money, the opposite has actually been the case in modern times with the relaxation of cross-border capital controls. Higher inflation tends to lead central banks to put up interest rates which attracts more capital inflows from global investors seeking a lucrative place to keep their money. This increases demand for the local currency, which in Canada’s case is the Canadian Dollar.
How does economic data influence the value of the Canadian Dollar?
Macroeconomic data releases gauge the health of the economy and can have an impact on the Canadian Dollar. Indicators such as GDP, Manufacturing and Services PMIs, employment, and consumer sentiment surveys can all influence the direction of the CAD. A strong economy is good for the Canadian Dollar. Not only does it attract more foreign investment but it may encourage the Bank of Canada to put up interest rates, leading to a stronger currency. If economic data is weak, however, the CAD is likely to fall.
- EUR/GBP gained momentum and rose to 0.8540.
- The cross will tally a 0.40% weekly loss, and the daily chart shows that the bears are in command.
- In the four-hour chart indicators gained momentum.
During Friday's trading session, the EUR/GBP rose slightly to 0.8540 showing mild gains. That being said, the bears asserted their influence during the week, leading to a weekly loss of 0.40% pushing the cross down to its lowest point since September.
In that sense, the main factor that is benefiting the Pound over the Euro is that the British economy is holding resilient while the European economies are showing signs of weakness. Moreover, markets are expecting less easing from the Bank of England (BoE) with a total of 125 bps of cuts vs the expected 150 bps from its European peer which also benefits the GBP. This week the ECB met and left its policy unchanged with subtle indications on when the easing will begin, and as for now, markets are seeing the first cut somewhere in Q2.
EUR/GBP daily chart
From a technical outlook on the daily chart, evidence of strong bearish pressure resonates. This is reflected by the negative terrain of the Relative Strength Index (RSI) coupled with its downward slope. Complementing this bearish bias are the increasing red bars of the Moving Average Convergence Divergence (MACD), indicating the potential for further downturns. Moreover, the cross remains entrenched below the 20, 100, and 200-day Simple Moving Averages (SMAs).
Switching to a shorter, four-hour timeframe, a different scenario appears to be forming as indicators seem to be entering in a consolidation phase. The four-hour RSI indicates a positive slope, albeit still within negative territory, signaling a weak recovery moment. Additionally, the decreasing red bars in the four-hour MACD offer a hint of bullish momentum, but without a clear vindication of a reversal. Thus, the buying momentum is seen to have a slight upper hand in this lower time frame, but with a need for further corroboration to offset the broader bearish outlook.
EUR/GBP daily chart
-638418831190119196.png)
Gold prices are near all-time highs. Strategists at TD Securities analyze the yellow metal’s outlook.
Balance of risks in Gold prices tilted to the upside
While US data remains strong, the Fed can use the trends in core PCE to justify the start of rate cuts. The Fed wants to engineer a soft landing, which allows it to emphasize disinflation over growth.
A cutting cycle should eventually attract discretionary trader capital, which should support Gold towards new all-time highs.
CTA trend followers still hold substantial dry-powder to deploy, physical market buying activity has remained strong, and China is buying gold at a fast clip – all of which tilt the balance of risks in Gold prices to the upside, hot data notwithstanding.
Donald Trump has at least a good chance of a second term in office. Forward-looking politics should prepare for this, strategists at Commerzbank report.
It cannot be said that there would be a U-turn in US policy under Trump
Under President Trump, the Americans are unlikely to continue to support Ukraine to the current extent. The Europeans will therefore have to shoulder a greater burden. This also applies to defense spending as a whole. The US position here is likely to be that it is primarily the responsibility of the European NATO members to invest sufficiently in protection against Russia. The pressure to raise defense budgets will continue to increase. So far, many countries have struggled to even reach NATO's 2% target.
Donald Trump's preference for a robust foreign trade policy based on tariffs, among other things, could lead to a resurgence of trade disputes between the US and the EU.
However, it cannot be said that there would be a U-turn in US policy under Trump. Rather, he would probably only accelerate trends that are already in place; a certain move away from Europe and an increased US focus on the Asian region is to be expected with any future administration. The same applies to the push for more protectionism. This enjoys broad bipartisan support. However, President Trump would probably ensure that Europeans can no longer turn a blind eye to these developments.
Last year ended on a strong note for the Swedish Krona (SEK). Economists at Danske Bank analyze EUR/SEK outlook.
Global macro cycle does not bode well for the SEK in 2024
The cyclical backdrop remains a headwind for the SEK amid subpar and even recession-like European growth outlook.
The Riksbank will not lag the ECB in the easing cycle, which leaves the SEK in a vulnerable position. Repricing of central banks may hurt risk sentiment.
The structural flows picture is still a medium-term headwind for the SEK.
Should the global economy pick up more than expected in 2024, this could lend support to the SEK over the medium term.
Forecast 11.20 (1M), 11.40 (3M), 11.60 (6M), 11.60 (12M)
The consensus view in 2024 is that the Dollar will decline. Economists at ING agree but with some caveats.
Back up in short-term rates is a Dollar positive
We sympathise with the increasing consensus view that the Dollar will trend lower in 2024. However, we think markets are wrong to price Fed rate cuts as soon as March, and a rebound in short-dated USD yields could give the Dollar breathing room in the near term.
The kind of rangebound trading seen so far in January may be the norm for a bit longer in G10.
- EUR/USD rises in North American trading, buoyed by softer US core PCE inflation data.
- Fed's core PCE index fall to 2.9% raises hopes for interest rate cut, aiding EUR/USD's climb.
- Mixed European signals: German consumer confidence falls, Spanish unemployment at 16-year low, ahead of Fed decision.
The EUR/USD gained some 0.14% in early trading during the North American session as prices in the United States (US) remained above the US Federal Reserve’s goal but eased compared to November’s figures. The major trades at 1.0866 after diving to a low of 1.0812.
The Euro got a life-line of a softer US PCE report
The Fed’s preferred gauge for inflation, the Personal Consumption Expenditures (PCE), rose 2.6% in the 12 months to December, as expected on an annual basis, while core PCE dipped from 3.2% to 2.9% and below forecasts. After the data, the EUR/USD climbed sharply and clocked a daily high of 1.0885 before retreating toward current exchange rates, as the data reaffirmed investors' speculations that the Fed could begin cutting rates by the summer.
The CME FedWatch Tool depicts the odds for a quarter of a percentage rate cut by the Fed at 51.4%, while 50 basis points stand at 37.8%. Nevertheless, US Treasury bond yields reversed its course, climbing higher and putting a lid on the EUR/USD rise.
Meanwhile, data across the pond showed that German consumers remain pessimistic amidst economic uncertainty after the GfK Consumer Confidence for February plunged from .25.4 in January to -29.7. In Spain, the Unemployment Rate fell to levels last seen in 2007, from 11.84% to 11.76% in the last quarter of 2023, according to an INE report.
Ahead of the next week, the main spotlight would be the Federal Reserve’s monetary policy decision on January 30-31.
EUR/USD Price Analysis: Technical outlook
Following the US data release, the EUR/USD advanced towards 1.0900 but failed to break yesterday’s high, which could pave the way for a pullback to the 200-day moving average (DMA) at 1.0843. Downside risks are seen at today’s low 1.0812, followed by the 1.0800 figure. Conversely, if buyers lift the spot prices above 1.0900, as they eye the 50-DMA at 1.0920.
After ending 2023 on a weak note on the anticipation of a H1 2024 pivot by the Fed, the USD is back on an uptrend. Economists at the National Bank of Canada analyze Dollar’s outlook.
Growth in the US to stumble in 2024
Going forward, there are some signs that rate cuts by the Fed may not be the first to occur among the world’s central banks as inflation surprises on the upside.
We expect growth in the US to stumble in 2024.
We believe the Dollar should appreciate this year as risk returns to the forefront.
Financial markets have started 2024 with a rebound in interest rates as central banks have pushed back against expectations of near-term rate cuts. Economists at Nordea keep their baseline forecasts largely unchanged but see risks towards earlier ECB and later Fed cuts.
Is the Fed close to cutting or not?
We leave our baseline financial forecasts largely unchanged at this time as we find that the recent developments do not justify any bigger changes.
We continue to forecast 100 bps of Fed cuts this year, with the first move in March, but this is more due to the Fed’s dovish signals at the December meeting rather than how we see the US economy developing. Risks are tilted towards a later start and fewer cuts.
The ECB has argued almost in unison that no near-term rate cuts should be expected. We still see the first move in June, 25 bps, and quarterly 25 bps cuts from there onwards, but risks are towards an earlier start and steeper cuts.
What ultimately matters more for the Gold market is when and how much the US Fed cuts interest rates, strategists at Commerzbank say.
Fed unlikely to fuel hopes of rapid interest rate cuts
Institutional investors tended to sell Gold last year as the large ETF outflows indicate: According to the World Gold Council (WGC), a good 55 tons were sold off in the final quarter of the year; the total outflow is likely to have been just under 245 tons last year. This trend, which tends to weigh on prices, has continued into the new year. However, we assume that sentiment will turn as the year continues and that this group of investors will increase their positions again as soon as interest rate cuts are within reach.
However, the Fed is unlikely to hint at this after its meeting next week: after all, it wants to see more success in the fight against inflation first. If the labour market report on Friday provides further evidence of this, the Gold price could rise again somewhat at the end of the week.
The GBP/USD pair rebounds within the broader trading range. Economists at Scotiabank analyze cable’s outlook.
Intraday price action looks bullish but momentum remains soft
The Pound Sterling (GBP) is up mildly on the day, having found firm support on intraday weakness below the 1.2700 level.
Intraday price action looks bullish (outside range on the 6-hour chart) but momentum remains soft and the GBP rally may struggle to extend gains through the upper 1.2700s/low 1.2800s on the session.
The broader 1.2600/1.2825 range remains intact.
- AUD/USD bounces back to near 0.6600 on improved market sentiment.
- Investors await the US core PCE data for fresh guidance on interest rates.
- Australian inflation is anticipated to soften to 4.3% in the last quarter of 2023.
The AUD/USD pair rebounds to near the round-level resistance of 0.6600 in the late London session. The Aussie asset recovers as appeal for risk-perceived currencies ahead of the United States Core Personal Consumption Expenditure (PCE) Price Index data for December, which will be released at 13:30 GMT.
S&P500 futures have recovered majority of losses generated in the Asian session, portraying a sharp revival in the risk-appetite of investors. The US Dollar Index (DXY) has fallen to near 103.38 after failing to recapture the monthly high of 103.82. 10-year US Treasury yields have dropped to near 4.11%.
Market sentiment is improving despite investors see the Federal reserve (Fed) reducing interest rates from May instead of March amid resilient US economy. The US economy grew at a robust pace of 3.3% in the last quarter of 2023, which itself is encouraging for growth prospects in 2024. This will allow Fed policymakers to avoid rush for commencing the ‘rate-cut’ campaign.
Meanwhile, investors await fresh guidance for the interest rate outlook, which would be offered by the US core PCE price index data. As per the estimates, monthly core PCE was up by 0.2% against slight increase of 0.1% in November. The annual inflation gauge rose at a slower pace of 3% vs. former growth rate of 3.2%.
On the Australian Dollar front, investors await the Q4 Consumer Price Index (CPI) data, which will release next week. Price pressures are anticipated to soften significantly to 4.3% from 5.4% reading in the July-September quarter, which will provide some relief to Reserve Bank of Australia (RBA) policymakers.
Economists at Scotiabank analyze Dollar’s outlook as USD edges lower as markets position ahead of core PCE data.
USD is looking prone to more losses
The USD is looking prone to more losses in broad terms with the DXY again struggling to extend much above the 103.50 area – the point I highlighted at the start of the week that the index would need to extend through to rally.
US Personal Income is forecast to rise 0.3% in December, with Spending up 0.5% in the month. The core PCE deflator is expected to drop back to 3.0% YoY, from 3.2% in November, however.
Signs of slower inflation will add to market bets that the Fed will be thinking a bit harder about rate cuts in the coming months. Soft data may see the USD slip a little but I’m not yet inclined to rule out a further extension of the USD’s early 2024 rebound.
DXY support is 102.75.
- The US Dollar has struck a double-whammy with positive US data and a disappointing ECB on Thursday.
- Traders brace for the Fed’s preferred inflation gauge – the Personal Consumption Expenditures.
- The US Dollar Index breaks out of a range and could finally be able to trade away from it.
The US Dollar (USD) pops against most major peers painting charts green this Friday in the aftermath of the US tripod print of US Gross Domestic Product - Durable Goods - Jobless Claims on Thursday. At that same time the European Central Bank (ECB) disappointed the market by not sticking out its neck and providing forward guidance to the markets on rate cuts. Traders were quick to punish the Euro and favor the Greenback on the back of these events.
On the economic front, traders are gearing up for the US Federal Reserve’s (Fed) preferred Personal Consumption Expenditures (PCE) release. Expectations are for a small uptick in all elements on the monthly base, while the yearly bases are expected to come down. Any decline in these numbers will be attributed to US Dollar weakness in the pipeline.
Daily digest market movers: Fed’s barometer set to hit markets
- Sweden is set to join NATO once Hungary ratifies the agreement in parliament after Turkey already did earlier this week.
- US Treasury Secretary Janet Yellen said during an interview with ABC that she sees “no reason” for a recession this year.
- The European Central Bank will release its official rate decision and guiding letter around 13:15 GMT. A press release with Q&A by Christina Lagarde will follow suit near 14:45.
- The Personal Consumption Expenditures (PCE) data for December is due to be released at 13:30 GMT:
- Monthly Headline PCE is expected to jump from -0.1% to 0.2%.
- Yearly Headline PCE is seen heading from 2.6% to an unchanged 2.6%.
- Monthly Core PCE is heading from 0.1% to 0.2%.
- Yearly Core PCE should shrink from 3.2% to 3.0%.
- Personal Income is seen heading from 0.4% to 0.3%.
- Personal Spending will head from 0.2% to 0.4%.
- Last data point for this Friday comes near 15:00 with Pending Home Sales, expected to head from 0% to 1.5% for December versus November.
- Equity markets are in the red this last day of the week with in Asia all indices down over 1% for Japan and China. Mainland Europe is taking over the sour mood and is trading down near 0.50% halfway through the European session. US Futures are in a similar decline with the Nasdaq leading the charge with Tesla and Intel dragging down the index.
- The CME Group’s FedWatch Tool shows that markets are pricing in a 97.4% possibility for an unchanged rate decision on January 31, with a slim 2.6% chance of a cut.
- The benchmark 10-year US Treasury Note trades near 4.10%, which is a touch lower than where it was earlier this week.
US Dollar Index Technical Analysis: Is this the one or another false break?
The US Dollar Index (DXY) is having a copy-paste moment from earlier this week of last week’s performance. Again the DXY is able to snap above the 200-day Simple Moving Average (SMA) near 103.51, though could face headwinds from the PCE print later this Friday. If the DXY is unable to close off this Friday or this week for that matter, above the 200-day SMA, expect to see another downfall with a test at 103 for a break lower.
In case the DXY would be able to run further away from the 200-day SMA, more upside is in the tank. Look for 104.41 as the first resistance level on the upside, in the form of the 100-day SMA. If that gets breached as well, nothing will hold the DXY from heading to either 105.88 or 107.20 – the high of September.
With the repetition of another break above the 200-day SMA, yet again, a bull trap could get formed once prices would start sliding below the same moving average. This would see a long squeeze with US Dollar bulls being forced to start selling around 103.14 at the 55-day SMA. Once below it, the downturn is open towards 102.00.
Inflation FAQs
What is inflation?
Inflation measures the rise in the price of a representative basket of goods and services. Headline inflation is usually expressed as a percentage change on a month-on-month (MoM) and year-on-year (YoY) basis. Core inflation excludes more volatile elements such as food and fuel which can fluctuate because of geopolitical and seasonal factors. Core inflation is the figure economists focus on and is the level targeted by central banks, which are mandated to keep inflation at a manageable level, usually around 2%.
What is the Consumer Price Index (CPI)?
The Consumer Price Index (CPI) measures the change in prices of a basket of goods and services over a period of time. It is usually expressed as a percentage change on a month-on-month (MoM) and year-on-year (YoY) basis. Core CPI is the figure targeted by central banks as it excludes volatile food and fuel inputs. When Core CPI rises above 2% it usually results in higher interest rates and vice versa when it falls below 2%. Since higher interest rates are positive for a currency, higher inflation usually results in a stronger currency. The opposite is true when inflation falls.
What is the impact of inflation on foreign exchange?
Although it may seem counter-intuitive, high inflation in a country pushes up the value of its currency and vice versa for lower inflation. This is because the central bank will normally raise interest rates to combat the higher inflation, which attract more global capital inflows from investors looking for a lucrative place to park their money.
How does inflation influence the price of Gold?
Formerly, Gold was the asset investors turned to in times of high inflation because it preserved its value, and whilst investors will often still buy Gold for its safe-haven properties in times of extreme market turmoil, this is not the case most of the time. This is because when inflation is high, central banks will put up interest rates to combat it.
Higher interest rates are negative for Gold because they increase the opportunity-cost of holding Gold vis-a-vis an interest-bearing asset or placing the money in a cash deposit account. On the flipside, lower inflation tends to be positive for Gold as it brings interest rates down, making the bright metal a more viable investment alternative.
Can China’s stock market rescue package support the Australian Dollar (AUD)? Economists at Société Générale analyze Aussie’s outlook.
Chinese stocks to the AUD’s rescue?
The AUD tracked Chinese equities over the past few years until a major break in 4Q23. As US rates eventually peaked and started to decline, the US Dollar fell in a pro-carry environment that benefited AUD/USD despite the slide in Asian stocks. However, 2024 looks more challenging, with AUD/USD declining in line with falling equities.
The Chinese authorities have just delivered a major rescue package to the stock market. If it succeeds in restoring investors’ confidence, Chinese stocks could eventually rescue the Australian Dollar.
- EUR/USD gains ground as ECB members doubted the interest rate cut in March.
- ECB’s Gediminas Simkus expressed confidence that the data would not support a rate cut in March.
- ECB’s Martins Kazaks showed confidence in monetary policy but advocated for patience for the time being.
- Traders are poised to focus on the US PCE Price Index before making aggressive bets on the US Dollar.
EUR/USD moves higher to near 1.0870 during the European session on Friday. This upward movement could be attributed to the relatively hawkish comments from European Central Bank (ECB) members. ECB policymaker Gediminas Simkus expressed confidence that the data would not support a rate cut in March. Simkus stated that rate cuts are more likely as the year progresses, and there is less optimism within the ECB compared to market expectations at the moment.
Another ECB member, Martins Kazaks, conveyed confidence in monetary policy but advocated for patience for the time being. Kazaks mentioned that while interest rates should eventually start to decrease, the ECB is not in a rush to begin the process. He emphasized that cutting rates too early would be worse than waiting a bit longer.
However, the Euro encountered a challenge following the release of the European Central Bank (ECB) interest rate decision on Thursday. The ECB opted to keep its interest rates unchanged for a third consecutive meeting, resulting in downward pressure on the Euro (EUR). This, in turn, has had a dampening effect on the EUR/USD pair. The ECB maintained its Main Refinancing Operations Rate at 4.50%, and the Deposit Facility Rate at 4.0%.
On the flip side, the stronger-than-expected Gross Domestic Product (GDP) Annualized figure from the United States has provided support for the US Dollar (USD), reinforcing the downward pressure on the EUR/USD pair. Market participants will closely monitor the release of the Personal Consumption Expenditures (PCE) Price Index data on Friday for additional insights into US economic conditions.
EUR/USD recovers from the low 1.0800s. Economists at Scotiabank analyze the pair’s outlook.
ECB hawks downplay early rate cut
Pushback on the idea of earlier cuts from some European Central Bank (ECB) hawks today may have helped lift the EUR.
The EUR’s retest of the past week’s range extended a little below the 1.0820 base seen earlier this week but not by much and the positive price reaction since the dip to 1.0813 earlier suggests that the sideways range trade remains intact.
Resistance is 1.0920/1.0930.
EUR/USD moved lower to around the 1.0850 mark after the relatively dovish ECB meeting. Economists at Danskr Bank analyze the pair's outlook.
Selling EUR/USD on rallies in the near term
While we recognise that our Fed (first cut in March) and ECB (first cut in June) forecasts, all else equal, are positive for EUR/USD in H1, we believe that the broader pricing in the G10 could be more decisive for the cross, as we perceive current market expectations for rate cuts to be excessive.
We still maintain our bias towards selling EUR/USD on rallies in the near term, and we forecast EUR/USD at 1.0700/1.0500 on a 6/12M horizon.
- EUR/JPY snaps its losing streak after the Japanese CPI data.
- The annual Tokyo CPI fell below the BoJ 2.0% target for the first time in nearly two years.
- The Euro received losses as ECB’s Lagarde mentioned the possibility of a rate cut in the summer.
EUR/JPY snaps its four-day losing streak, rebounding to near 160.60 during the European session on Friday. The decelerated Japanese inflation numbers have weakened the Japanese Yen (JPY), which in turn, acts as a tailwind for the EUR/JPY cross.
The annual Tokyo Consumer Price Index (CPI) in Japan's national capital decelerated to 1.6% in January from the previous reading of 2.4%. Consumer inflation has fallen below the Bank of Japan's (BoJ) 2.0% target for the first time in nearly two years. Moreover, Core CPI (YoY) decreased to 3.1% from 3.5% prior.
According to the Bank of Japan (BoJ) Minutes of the December meeting, BoJ Board members expressed their views on the monetary policy outlook and Yield Curve Control (YCC). The consensus among members was the need to "patiently maintain an easy policy." Many members emphasized the importance of confirming a positive wage inflation cycle before considering an end to negative rates and YCC.
Furthermore, BoJ Governor Kazuo Ueda reiterated a strong commitment to achieving the 2.0% inflation target. Ueda's statements indicated a potential gradual reduction of extensive stimulus measures in the future, aligning with the central bank's goals for inflation and economic stability.
On the other side, the European Central Bank (ECB) decided to keep its interest rates unchanged for a third consecutive meeting, contributing to downward pressure on the Euro (EUR). This, in turn, has weighed on the EUR/JPY cross. The ECB maintained its Main Refinancing Operations Rate at 4.50%, and the Deposit Facility Rate at 4.0%.
ECB President Christine Lagarde hinted at the possibility of a rate cut in the summer in the monetary policy statement. Market participants are anticipating a first 50 basis point cut from the ECB by June. Rate swaps currently reflect expectations of a total of 140 basis points in rate cuts from the ECB by the end of 2024.
- WTI Oil breaks out of its downtrend since October.
- China diplomats have urged Iran to keep control of Houthi rebels.
- The US Dollar Index broke out of tight range and holds good cards to jump higher.
Oil prices are paring back earlier gains after Oil prices surged near 6% since its opening price on Monday for this week. The moves came after more and more shipping companies called for the longer haul around Africa instead of venturing the Suez passage via the Red Sea. Meanwhile China has opened up a fresh can of diplomats who have urged several key Iran personal and key military people to keep a lid on the Houthi rebels and defuse the tension in the Red Sea.
Meanwhile, the US Dollar Index (DXY) defied friend, foe and gravity with a substantial surge in the DXY on Thursday. The move came on the back of a double-score with positive US Gross Domestic Product and Durable Goods orders. Some headwinds are emerging though with the Personal Consumption Expenditure (PCE) on the docket this Friday, and markets looking for a further decline in US inflation.
Crude Oil (WTI) trades at $76.70 per barrel, and Brent Oil trades at $81.45 per barrel at the time of writing.
Oil news and market movers: China puts oil back on the map
China has urged Iran to control the Houthi rebels in order to put back a safe passage via the Suez Canal and the Red Sea in place. The move comes as no surprise with China having export issues, and now the longer haul around Africa adds to even more slowing export numbers from the Asian producer.
Oil traders are gearing up for more upticks in Oil as well, signalling that clearly something has broken in US Oil production. Recent Oil stockpile numbers showed substantial drawdowns, which means the US might need to be heading to markets to restock.
Next week all eyes will be on tanker-tracking data to be released, which will provide an insight into whether OPEC+ is complying with Oil production cuts.
This Friday the Oil markets will close off with the weekly Baker Hughes US Oil Rig Count at 18:00 GMT. Previous number was at 497, which was a second consecutive decline from the 501 peak at the start of 2024.
Oil Technical Analysis: A sprint to $80 granted?
Oil prices could be seen surging higher from here after markets jumped on the element of China mingling in the Red Sea tension. Either way, the three-week-long-haul around Africa will see more demand coming in for fuel to say the least. Meanwhile next week, tanker info being released, could give a brief snapshot of how the supply side is looking, where any hints on complying or over complying to OPEC+ production cuts, might add to more upside into next week.
On the upside, $74 is out of the way and should act as support as of now. Although quite far off, $80 comes into the picture should tensions build further. Once $80 is broken, $84 is next on the topside.
As said in the paragraph above, $74 will now act as support for the nearterm on any sudden declines. The $67 level could still come into play as the next support to trade at, as it aligns with a triple bottom from June. Should that triple bottom break, a new low could be close at $64.35 – the low of May and March 2023 – as the last line of defence.
-638418611868677184.png)
US WTI Crude Oil: Daily Chart
WTI Oil FAQs
What is WTI Oil?
WTI Oil is a type of Crude Oil sold on international markets. The WTI stands for West Texas Intermediate, one of three major types including Brent and Dubai Crude. WTI is also referred to as “light” and “sweet” because of its relatively low gravity and sulfur content respectively. It is considered a high quality Oil that is easily refined. It is sourced in the United States and distributed via the Cushing hub, which is considered “The Pipeline Crossroads of the World”. It is a benchmark for the Oil market and WTI price is frequently quoted in the media.
What factors drive the price of WTI Oil?
Like all assets, supply and demand are the key drivers of WTI Oil price. As such, global growth can be a driver of increased demand and vice versa for weak global growth. Political instability, wars, and sanctions can disrupt supply and impact prices. The decisions of OPEC, a group of major Oil-producing countries, is another key driver of price. The value of the US Dollar influences the price of WTI Crude Oil, since Oil is predominantly traded in US Dollars, thus a weaker US Dollar can make Oil more affordable and vice versa.
How does inventory data impact the price of WTI Oil
The weekly Oil inventory reports published by the American Petroleum Institute (API) and the Energy Information Agency (EIA) impact the price of WTI Oil. Changes in inventories reflect fluctuating supply and demand. If the data shows a drop in inventories it can indicate increased demand, pushing up Oil price. Higher inventories can reflect increased supply, pushing down prices. API’s report is published every Tuesday and EIA’s the day after. Their results are usually similar, falling within 1% of each other 75% of the time. The EIA data is considered more reliable, since it is a government agency.
How does OPEC influence the price of WTI Oil?
OPEC (Organization of the Petroleum Exporting Countries) is a group of 13 Oil-producing nations who collectively decide production quotas for member countries at twice-yearly meetings. Their decisions often impact WTI Oil prices. When OPEC decides to lower quotas, it can tighten supply, pushing up Oil prices. When OPEC increases production, it has the opposite effect. OPEC+ refers to an expanded group that includes ten extra non-OPEC members, the most notable of which is Russia.
The US election season is once again upon us. What will markets focus on? Strategists at TD Securities analyze how markets could be impacted by elections.
Trump remains heavily favored for the 2024 presidential run
While other candidates remain in the race, we expect the election to be a rematch between President Joe Biden and former President Donald Trump.
Our current baseline scenario is that Donald Trump wins the presidency in 2024 and that Republicans recapture the Senate, though control of the House may go to the Democrats by a tight margin.
Markets are likely to focus on tax/growth, deficit, regulation, geopolitical, and tariff implications in their reaction to the election. Our base case view of a Trump victory with split Congressional control should push term premium higher and may boost equities amid expectations that corporate taxes remain low.
The National Bank of Hungary will meet next Tuesday, giving the Hungarian Forint (HUF) more market attention than usual. Economists at ING analyze EUR/HUF outlook.
A stronger US Dollar is not good news for HUF and the CEE region
The Minister for Economy is proposing a change in the money market rate BUBOR which would be replaced by T-bills yields for corporate loans pricing. For now, this is just a proposal but it triggered an exchange between the minister and the central bank, which contributed to higher EUR/HUF volatility on Thursday.
Looking ahead, lower EUR/HUF is good news for the central bank, and it may increase the pace of rate cuts to 100 bps next week (which is now our baseline view).
The interest rate differential has turned up in favour of HUF in the last two days, which should stop the recent sell-off. However, the situation reads poorly in the current environment and a stronger US Dollar after Thursday is not good news for HUF and the CEE region.
- USD/JPY could improve towards the psychological resistance at the 148.00 level.
- Technical indicators suggest a bullish momentum to revisit January’s high at 148.80.
- A break below the 147.00 level could lead the pair to reach the 14-day EMA and 23.6% Fibonacci retracement level.
USD/JPY grapples to inch higher for the second consecutive session, trading near the 147.70 level during the European hours on Friday. The USD/JPY receives upward support as the Tokyo Consumer Price Index (CPI) in Japan's national capital decelerated below the Bank of Japan's (BoJ) 2.0% target for the first time in nearly two years.
The technical analysis of the Moving Average Convergence Divergence (MACD) for the USD/JPY pair suggests a confirmation of a prevailing bullish sentiment in the market with the MACD line positioning above the centreline and showing a divergence above the signal line.
The USD/JPY pair could find a barrier at the psychological level at 148.00. A firm breakthrough above the psychological resistance level could support the pair to approach the major level at 148.50 followed by the weekly high at 148.69 and January’s high at 148.80.
The lagging indicator 14-day Relative Strength Index (RSI) residing above the 50 level indicates bullish momentum, which can support the USD/JPY pair to navigate the resistance area around the psychological level at 149.00.
On the downside, the immediate support could be at the major level at 147.50 following the psychological level at 147.00. A collapse below the psychological support level could push the USD/JPY pair to test support zone around the 14-day Exponential Moving Average (EMA) at 146.90 and 23.6% Fibonacci retracement level at 146.78.
USD/JPY: Daily Chart
-638418634729321205.png)
- USD/CAD drops to near 1.3450 as US Dollar retreats ahead of the US core PCE inflation data.
- The BoC kept interest rates unchanged at 5%.
- Oil prices fall slightly but remains broadly upbeat amid supply chain disruptions due to Red Sea crisis.
The USD/CAD pair drops further to near 1.3450 in the European session. The Loonie asset faces a sell-off as the US Dollar Index (DXY) has surrendered intraday gains. The USD Index faces offers while attempting to recapture monthly high of 103.82.
Losses posted by the S&P500 futures in the Asian session are now in the European session, indicating some recovery in the risk-appetite of the market participants. 10-year US Treasury yields have dropped to near 4.10%.
The USD Index falls back from 103.68 ahead of the United States Core Personal Consumption Expenditure (PCE) Price Index data for December, which will be published at 13:30 GMT. As per the estimates, monthly core PCE rose at a slightly higher pace of 0.2% against 0.1% in November. The annual core inflation tool is seen decelerating to 3% vs. former reading of 3.2%.
Federal Reserve (Fed) policymakers would advocate for keeping interest rates higher in the first two quarters of 2024 if the core PCE inflation report turns out stubborn-than-projected.
This week, the Canadian Dollar remains volatile as the Bank of Canada (BoC) kept interest rates unchanged at 5%. BoC Governor Tiff Macklem cited that the central bank is now considering how long interest rates should remain restricted. Macklem stressed on offering more time to higher rates to do their job effectively.
On the oil front, oil prices fall slightly from six-week high as focus shifts to central bank policy decisions. The broader appeal for the oil price is upbeat due to deepening tensions for commercial shipments from the Red Sea. Re-routing of oil shipments have disrupted the supply chain. It is worth noting that Canada is the leading exporter of oil to the United States and higher oil prices support the Canadian Dollar.
On Thursday, the US Bureau of Economic Analysis published the figures for the US GDP in Q4/2023. Economists at Commerzbank analyze Dollar’s outlook after another clear upside surprise on the US macro data front.
US Q4 GDP jumped another solid 3.3%
Thursday's figure (+3.3% annualized, price and seasonally adjusted) makes it quite clear that the stellar performance of the US economy continued in the final quarter of last year. It is particularly ‘stellar’ compared to the performance of other currency areas, even if their Q4/2023 figures are still largely missing.
This benefits the Dollar. For two reasons: (1) A robust economy makes it easier for the Fed to remain restrictive for a while longer, i.e. not to cut its key interest rate just yet. (2) Japan's GDP continues to crawl around at pre-corona levels, while Europe's GDP appears to have been stagnant for some time. Dynamic US growth is the big exception among the major currency areas.
It is possible to believe that the US economy has a structural growth advantage in the post-Corona world. If this were the case, it would be an additional argument in favor of the Dollar. It is far from clear whether this is the case. But every quarter that the gap between the US GDP and the GDP trajectories of other currency areas widens, this view becomes more attractive.
EUR/CHF reached the lowest level since 2015 by the end of December, breaching below the 0.9300 mark. Economists at Danske Bank analyze the pair’s outlook.
SNB to deliver its first 25 bps cut in June
We expect the SNB to deliver its first 25 bps cut in June but see risks tilted towards earlier. Overall, we see relative rates as fairly neutral for the cross. We no longer expect the SNB to intervene to strengthen the CHF.
We remain bullish on the CHF on the back of fundamentals and a global growth slowdown but acknowledge that the tailwinds will likely be more modest in 2024 than in 2023 given both the halt to FX intervention and smaller inflation differentials between Switzerland and G10 space. We target the cross at 0.9300 in 6-12M.
Risks to the forecast include a sharp reacceleration in global growth and SNB FX intervention to weaken the CHF.
- Gold price trades sideways as investors await the Fed’s preferred inflation gauge.
- Upside risks to price pressures would allow the Fed to maintain a hawkish interest rate stance.
- The US economy is performing stellar on the grounds of consumer spending, labor market and economic growth.
Gold price (XAU/USD) remains stuck in a tight range as investors await the US Core Personal Consumption Expenditure – Price Index (PCE) for December, which will be published at 13:30 GMT. The core underlying inflation data will provide fresh clues as to whether the Federal Reserve (Fed) will stick to its restrictive interest rate stance in March or be poised to cut interest rates, a move that would be positive for non-yielding Gold.
Economic indicators such as consumer spending, labor market and the Gross Domestic Product (GDP) have remained robust, allowing Fed policymakers to advocate for higher interest rates at least for the first six months of 2024. The argument in favour of restrictive policy stance would strengthen if the underlying inflation turns out stubbornly high in today’s PCE data.
Daily Digest Market Movers: Gold price consolidates ahead of Fed’s preferred inflation gauge
- Gold price remains inside the woods as the upside was capped amid uncertainty ahead of the United States core PCE price index data for December. While the downside is being supported because of geopolitical tensions and the chance of rate-cuts by the Federal Reserve this year.
- The Fed’s preferred inflation gauge is forecast to rise by 0.2% against the former reading of 0.1%. The annual underlying inflation data is set to slow to 3% versus 3.2% in November.
- The US economy expanded at a robust pace of 3.3% in the final quarter of 2023 while market participants projected a slower growth rate of 2.0%. This has uplifted the economic outlook, which could keep price pressures elevated.
- US Treasury Secretary Janet Yellen said surprisingly strong economic growth came from higher productivity and robust consumer spending without escalating inflation risks.
- A stubborn core PCE price index report could combine with an optimistic economic outlook to propel upside risks to price pressures. This would allow Fed policymakers to continue to maintain a hawkish interest rate stance for the first six months of 2024.
- After the release of the Fed’s preferred inflation gauge, market participants will shift their focus towards the Fed’s first monetary policy of 2024, which will be announced next week.
- The Fed is widely anticipated to keep interest rates unchanged in the range of 5.25-5.50% for the fourth time in a row. Investors will keenly focus on the timing of when the Fed will start reducing interest rates.
- The CME Fedwatch tool is showing that the chances in favour of a 25-basis point (bp) rate cut in March are at 48%. This indicates that traders are seeing the Fed reducing interest rates from May.
- Till now, Fed policymakers have been considering expectations of rate-cuts from March as “premature” due to resilient US economic prospects and stubborn inflationary pressures.
- Fed policymakers have been warning that rate cuts at this stage would be premature, which could lead to a surge in overall demand and dampen efforts made to bring down core inflation to its current 3.9% level.
- The US Dollar Index (DXY) holds onto recovery inspired by upbeat US Q4 GDP data but struggles to print a fresh high near 104.00.
Technical Analysis: Gold trades back and forth near $2,020
Gold price continues to trade sideways in a limited range as the broader focus is on the Fed’s interest rate policy, which will be announced next week. The precious metal struggles to sustain above the 50-day Exponential Moving Average (EMA), which trades around $2,015.00. Fresh downside would appear if the asset drops below the psychological support of $2,000. Momentum oscillators indicate a sharp decline in volatility.
Gold FAQs
Why do people invest in Gold?
Gold has played a key role in human’s history as it has been widely used as a store of value and medium of exchange. Currently, apart from its shine and usage for jewelry, the precious metal is widely seen as a safe-haven asset, meaning that it is considered a good investment during turbulent times. Gold is also widely seen as a hedge against inflation and against depreciating currencies as it doesn’t rely on any specific issuer or government.
Who buys the most Gold?
Central banks are the biggest Gold holders. In their aim to support their currencies in turbulent times, central banks tend to diversify their reserves and buy Gold to improve the perceived strength of the economy and the currency. High Gold reserves can be a source of trust for a country’s solvency. Central banks added 1,136 tonnes of Gold worth around $70 billion to their reserves in 2022, according to data from the World Gold Council. This is the highest yearly purchase since records began. Central banks from emerging economies such as China, India and Turkey are quickly increasing their Gold reserves.
How is Gold correlated with other assets?
Gold has an inverse correlation with the US Dollar and US Treasuries, which are both major reserve and safe-haven assets. When the Dollar depreciates, Gold tends to rise, enabling investors and central banks to diversify their assets in turbulent times. Gold is also inversely correlated with risk assets. A rally in the stock market tends to weaken Gold price, while sell-offs in riskier markets tend to favor the precious metal.
What does the price of Gold depend on?
The price can move due to a wide range of factors. Geopolitical instability or fears of a deep recession can quickly make Gold price escalate due to its safe-haven status. As a yield-less asset, Gold tends to rise with lower interest rates, while higher cost of money usually weighs down on the yellow metal. Still, most moves depend on how the US Dollar (USD) behaves as the asset is priced in dollars (XAU/USD). A strong Dollar tends to keep the price of Gold controlled, whereas a weaker Dollar is likely to push Gold prices up.
- USD/MXN loses ground despite a stronger US Dollar after the US GDP release.
- The recent Mexico data have contributed support to underpinning the MXN.
- Traders will observe US PCE data to gain further cues on the US economic landscape.
USD/MXN continues its losing streak for the third consecutive session on Friday, inching lower to 17.16 during the European session. The USD/MXN pair encounters a challenge following the release of the 1st half-month inflation data on Wednesday from Mexico, indicating a resurgence in inflation within the country. On Thursday, the Mexican Peso (MXN) strengthened further after the Mexican Jobless Rate displayed a contraction in the number of unemployed workers in the country. These potential figures may deter the Bank of Mexico (Banxico) from considering a reduction in policy rates.
The non-seasonally adjusted Jobless Rate in Mexico reduced to 2.6%, matching expectations in December and down from the previous reading of 2.7%. While the seasonally adjusted Jobless Rate remains stable at 2.8%. Additionally, analysts at BNP Paribas propose that the recent inflation report in Mexico could act as a deterrent for the Bank of Mexico (Banxico) from considering a policy easing.
The stronger-than-expected Gross Domestic Product (GDP) Annualized figure from the United States has provided support for the US Dollar (USD), thereby limiting the losses of the USD/MXN pair. The US Gross Domestic Product Annualized (Q4) reported a reading of 3.3%, surpassing the previous figure of 4.9% and exceeding the market consensus of 2.0%. Additionally, the US Gross Domestic Product Price Index (Q4) grew by 1.5% against the previous growth of 3.3%. Surprisingly, US Initial Jobless Claims for the week ending on January 19 reduced to 214K, contrary to the expected increase of 200K from the prior 189K.
Looking ahead, on Friday, Mexico's Trade Balance data is set to be released by the National Institute of Statistics and Geography (INEGI). The market is anticipating a trade surplus of $1.4B in December, up from November's figure of $0.63B. On the US docket, market participants will closely watch the release of the Personal Consumption Expenditures (PCE) Price Index data on Friday for further insights into US economic conditions.
US Dollar Index (/DXY) edges higher above 103.50 following strong GDP growth in the US. Economists at MUFG Bank analyze Dollar’s outlook.
USD upside potential as growth outperforms
We now go into next week’s FOMC meeting on the back of a much stronger GDP print but still compelling evidence of disinflation.
The tone from Fed Chair Jerome Powell is likely to remain cautious on near-term rate cuts being delivered but just like with the ECB on Thursday, a more favourable tone on inflation could be enough to keep alive expectations of a cut in March.
The near-term US Dollar bias remains to the upside though and we look set to test and breach the year-to-date high in DXY recorded on Tuesday at 103.82.
Antje Praefcke, FX Analyst at Commerzbank, analyzes Norwegian Krone’s (NOK) outlook after Norges Bank kept policy rates unchanged as expected on Thursday's policy meeting.
Norges Bank is keeping the option open to hike the policy rate again if necessary
I have to admit that I am delighted with Norges Bank and its monetary policy. That's what I call a consistent monetary policy in the interests of price stability.
After raising interest rates to 4.50% in December, Norges Bank indicated that the policy rate would probably remain at this level until the fall, but at the same time did not rule out a further tightening should it be necessary.
Norges Bank is keeping the option open to hike the policy rate again if necessary. By the next meeting at the end of March, it will know the inflation data for January and February and, of course, have a whole bunch of fresh economic data at its disposal. If inflation continues to fall, Norges Bank can then revise its projections, definitively signal the end of the interest rate cycle and adjust its interest rate path if it is considering earlier rate cuts by then.
Norges Bank's consistent stance on price stability is an asset for NOK. There are certainly other factors influencing the NOK's performance in the coming weeks, such as the oil price or risk aversion in the market, but monetary policy should provide it with steady support. I therefore continue to feel comfortable with my forecast of an appreciating NOK.
European Central Bank (ECB) Governing Council member Boris Vujcic said on Friday that the ECB could start lowering the policy rate later but with bigger steps. Vujcic, however, added that he'd prefer 25 basis points reductions when they start.
The Eurozone's overall picture is good at the moment, he noted and said that the Euro area economy is in more of a stagnation rather than a recession.
Meanwhile, Governing Council Gediminas Šimkus said that they were still less optimistic than markets on rate cut, adding that he was confident that data would not support a rate reduction in March.
Market reaction
EUR/USD largely ignored these comments and the pair was last seen trading modestly lower on the day near 1.0840.
- NZD/USD moves on a downward trajectory after the stronger US GDP figures.
- Traders await US PCE data to gain cues regarding the Fed’s policy decision in March’s meeting.
- NZD could gain ground as Kiwi consumer inflation remains above the RBNZ target range of 1.0% to 3.0%.
NZD/USD moves downward to near 0.6100, extending its losses for the second successive day during European hours on Friday. The stronger United States (US) GDP Annualized provided support for the US Dollar (USD), which in turn, undermines the NZD/USD pair.
Market participants are expected to closely monitor the upcoming release of the Personal Consumption Expenditures (PCE) Price Index data on Friday. This data will provide insights into US economic conditions, influencing considerations for the Federal Reserve's (Fed) policy decision in the March meeting. Besides, the markets have already factored in the probability of no policy adjustment by the Fed in the upcoming meeting on January 31.
US Treasury Secretary Janet Louise Yellen has stated that the robust Q4 GDP data is attributed to robust and healthy spending, accompanied by enhancements in productivity. Yellen underscores that the GDP report does not suggest any imminent threats to the possibility of a 'soft landing' scenario for the US economy.
On Wednesday, the Consumer Price Index (CPI) for the Kiwi showed a decline from the previous figures, aligning with market expectations. Despite the decrease, consumer inflation remains above the Reserve Bank of New Zealand's (RBNZ) target range of 1.0% to 3.0%. This diminishes the likelihood of an immediate interest rate cut by the RBNZ in February's meeting.
Consequently, the diminished chances of RBNZ’s interest rate cuts could mitigate the downside pressure on the New Zealand Dollar (NZD), providing support for the NZD/USD pair. Traders are anticipated to look for insights into the country's exports and imports situation through the upcoming Trade Balance NZD data scheduled for Monday.
FX markets continue to trade in mixed fashion. Economists at ING analyze Dollar’s outlook.
Caught between a low rate and a strong US world
On the one hand, the mildly pro-risk sentiment should be a mild Dollar negative. Yet, decent US growth plus rates falling faster in Europe than in the US are keeping the Dollar mildly bid.
We doubt this challenge gets resolved in the short term, even though today’s US Core PCE deflator should again come in at a very well behaved 0.2% month-on-month, 2.0% year-on-year and point to the Fed’s job being done.
Given our view on a less-than-dovish FOMC meeting next week and potential market noise around Monday’s announcement of the US Quarterly Refunding, we suspect DXY can hold support levels near 103.00 and could nudge up towards the 104.00/104.25 area early next week.
Gold prices rose in India on Friday, according to data from India's Multi Commodity Exchange (MCX).
Gold price stood at 62,151 Indian Rupees (INR) per 10 grams, up INR 99 compared with the INR 62,052 it cost on Thursday.
As for futures contracts, Gold prices increased to INR 62,070 per 10 gms from INR 61,986 per 10 gms.
Prices for Silver futures contracts increased to INR 71,875 per kg from INR 71,730 per kg.
| Major Indian city | Gold Price |
|---|---|
| Ahmedabad | 64,340 |
| Mumbai | 64,180 |
| New Delhi | 64,160 |
| Chennai | 64,290 |
| Kolkata | 64,330 |
Global Market Movers: Comex Gold price struggles to gain traction amid mixed fundamental cues
- The benchmark 10-year US Treasury yield retreats further from over a one-month high touched last week and lends support to the Comex Gold price for the second straight day on Friday.
- Data released on Thursday showed that the US economy expanded at an annual rate of 3.3% during the fourth quarter of 2023, beating consensus estimates for a reading of 2.0%.
- Further details of the report indicated that the core PCE Price Index was unchanged during the September-December period, suggesting that inflation pressures are receding.
- This validated the view that the world's largest economy is more likely to avoid a recession and overshadowed a rise in the US Weekly Initial Jobless Claims, to 214K last week.
- Separately, the US Census Bureau reported that US Durable Goods Orders were flat in December, while new orders excluding transportation and defense increased 0.3%.
- Investors remain worried that the Israeli-Hamas war could trigger a broader regional conflict as multiple nations and armed groups continue targeting each other’s territories.
- Adding to this, economists expect the global economy to weaken in 2024, which, in turn, is seen as another factor acting as a tailwind for the safe-haven precious metal.
- Market participants, meanwhile, remain uncertain over the timing of when the Federal Reserve will start lowering borrowing costs amid a still-resilient domestic economy.
- Traders now look to the US Personal Consumption Expenditures Price Index for cues about the Fed's future policy decisions and determine the near-term trajectory for the XAU/USD.
(An automation tool was used in creating this post.)
Gold FAQs
Why do people invest in Gold?
Gold has played a key role in human’s history as it has been widely used as a store of value and medium of exchange. Currently, apart from its shine and usage for jewelry, the precious metal is widely seen as a safe-haven asset, meaning that it is considered a good investment during turbulent times. Gold is also widely seen as a hedge against inflation and against depreciating currencies as it doesn’t rely on any specific issuer or government.
Who buys the most Gold?
Central banks are the biggest Gold holders. In their aim to support their currencies in turbulent times, central banks tend to diversify their reserves and buy Gold to improve the perceived strength of the economy and the currency. High Gold reserves can be a source of trust for a country’s solvency. Central banks added 1,136 tonnes of Gold worth around $70 billion to their reserves in 2022, according to data from the World Gold Council. This is the highest yearly purchase since records began. Central banks from emerging economies such as China, India and Turkey are quickly increasing their Gold reserves.
How is Gold correlated with other assets?
Gold has an inverse correlation with the US Dollar and US Treasuries, which are both major reserve and safe-haven assets. When the Dollar depreciates, Gold tends to rise, enabling investors and central banks to diversify their assets in turbulent times. Gold is also inversely correlated with risk assets. A rally in the stock market tends to weaken Gold price, while sell-offs in riskier markets tend to favor the precious metal.
What does the price of Gold depend on?
The price can move due to a wide range of factors. Geopolitical instability or fears of a deep recession can quickly make Gold price escalate due to its safe-haven status. As a yield-less asset, Gold tends to rise with lower interest rates, while higher cost of money usually weighs down on the yellow metal. Still, most moves depend on how the US Dollar (USD) behaves as the asset is priced in dollars (XAU/USD). A strong Dollar tends to keep the price of Gold controlled, whereas a weaker Dollar is likely to push Gold prices up.
FX option expiries for January 26 NY cut at 10:00 Eastern Time, via DTCC, can be found below.
- EUR/USD: EUR amounts
- 1.0750 465m
- 1.0800 1.3b
- 1.0825 530m
- 1.0850 1.2b
- 1.0875 1b
- 1.0890 621m
- 1.0925 957m
- 1.0950 1b
- USD/CAD: USD amounts
- 1.3300 1b
- 1.3390 1.2b
- USD/CHF: USD amounts
- 0.8760 822m
- AUD/USD: AUD amounts
- 0.6605 519m
- NZD/USD: AUD amounts
- 0.6220 525m
- GBP/JPY languishes above the weekly trough amid mixed fundamental cues.
- The JPY benefits from geopolitical risks, though weaker Tokyo CPI cap gains.
- Bets that the BoE will hold rates near a 16-year high help limit the downside.
The GBP/JPY cross remains on the defensive for the fourth successive day on Friday, albeit lacks follow-through selling and remains confined in the previous day's broader trading range through the first half of the European session. Spot prices currently trade just above mid-187.00s and remain well within the striking distance of the weekly low touched on Wednesday.
Investors remain worried that the Israeli-Hamas war could trigger a broader conflict in the Middle East as multiple nations and armed groups continue targeting each other’s territories. This, along with the uncertain global economic outlook, offset the latest optimism led by the announcement of additional monetary stimulus by the People's Bank of China (PBoC) and temper investors' appetite for riskier assets. This is evident from a generally weaker tone around the equity markets, which is seen benefitting the Japanese Yen's (JPY) relative safe-haven status and acting as a headwind for the GBP/JPY cross.
Apart from this, the Bank of Japan's (BoJ) hawkish tilt on Tuesday, suggesting that conditions for phasing out huge stimulus and pulling short-term interest rates out of negative territory were falling into place, lend additional support to the JPY. That said, weaker Japanese data, showing that the core Consumer Price Index (CPI) in Tokyo fell below the BoJ's 2% target for the first time in nearly two years, caps gains for the JPY. Furthermore, a strong start to the year by the UK economy gives the Bank of England (BoE) a reason to hold interest rates next week and contributes to limiting the downside for the GBP/JPY cross.
Hence, it will be prudent to wait for strong follow-through selling before positioning for an extension of the recent pullback from the vicinity of the 189.00 round figure, or a near two-month peak retested earlier this week. Nevertheless, the GBP/JPY cross remains on track to end in the red for the first time in the previous four weeks as the market focus now shifts to the crucial BoE monetary policy meeting on February 1.
Technical levels to watch
The Japanese Yen (JPY) is roughly unchanged today reflecting the broader limited moves in the FX markets. Economists at MUFG Bank analyze USD/JPY outlook.
April seems too far ahead to discourage Yen selling
There was a surprisingly large drop in the Tokyo inflation data with the headline YoY rate falling from 2.4% in December to 1.6% in January. The core-core rate fell from 3.5% to 3.1%. The declines were 0.4ppt and 0.3ppt more than expected and could raise doubts over the BoJ’s potential plans to hike the key policy rate in April. Still, the base effects should be more supportive for inflation remaining higher over the coming months given the gas and electricity subsidies were introduced in Q1 2023 which helped depress inflation.
Given our near-term bias for the US Dollar to strengthen and given the larger-than-expected drop in the inflation data, we may in turn see some increased appetite for Yen-funded carry positions that help fuel a further rise in USD/JPY.
April seems too far ahead to discourage Yen selling although the threat of intervention will slowly increase if spot continues to drift higher to the 150.00 level.
- Silver price faces some pressure while attempting to extend rally above $23.
- The market mood is downbeat as investors await the core PCE price index data for December.
- Strong GDP numbers and stubborn inflation data could allow Fed to maintain a hawkish interest rate stance.
Silver price (XAG/USD) struggles to extend upside above the crucial resistance of $23.00. The white metal turns sideways as investors shift focus towards the United States core Personal Consumption Expenditure (PCE) price index data for December, which will be published at 13:30 GMT.
S&P500 futures have posted significant losses in the European session, portraying a sharp decline in the risk-appetite of the market participants. The US Dollar Index (DXY) aims to recapture almost six-week high of 103.82 as safe-haven demand improves.
The US Q4 Gross Domestic Product (GDP) data, released on Thursday, indicated the economy grew at a robust pace of 3.3%. This has escalated upside risks to price pressures.
Meanwhile, investors await the US core PCE price index data. Investors have anticipated that the annual underlying inflation grew at a slower pace of 3.0% against reading of 3.2% in November. Monthly core PCE data is anticipated to rise by 0.2% after increasing by 0.1%.
A combination of stubborn inflation data and upbeat economic prospects would allow Federal Reserve (Fed) policymakers to stick to their hawkish interest rate stance atleast for the first-half of 2024.
Silver technical analysis
Silver price attempts to deliver a breakout of the Descending Triangle chart pattern formed on a four-hour scale. The downward-sloping trendline of the aforementioned chart pattern is plotted from 3 December 2023 high at $25.92 while the horizontal support is placed from 13 November 2023 low at $21.88. The asset has stabilized above the 20-period Exponential Moving Average (EMA), which trades around $22.73.
The 14-period Relative Strength Index (RSI) aims to stabilize into the 60.00-80.00 range. A bullish momentum would appear if the RSI (14) manages to do so.
Silver four-hour chart
-638418541555630771.png)
The Euro lost a good 2/3 of a big figure in EUR/USD units after the European Central Bank (ECB) monetary policy decision. Economists at Commerzbank analyze the shared currency outlook.
Only bullish on the Euro in the medium term
If the ECB were to be the most hasty of the G10 on the way down, i.e. if it were to be the first to start cutting interest rates, it would be all too obvious that the ECB's interest rate policy has a considerable imbalance towards low interest rates over the interest rate cycle. This would be bad for the Euro for two reasons: (1) It would put the euro at a carry disadvantage on the downward path of G10 interest rates. (2) It would give the impression that the ECB is much less determined to fight inflation than other G10 central banks.
We believe that all these prejudices against the ECB are justified and therefore consider a strong Euro unlikely in the long term (end of 2024 and beyond).
We are only bullish on the Euro in the medium term because our ECB watchers tell us that the market is wrong and that such an early rate cut is unlikely. Not in April, but later.
EUR/USD has pushed below 1.0850. Economists at ING analyze Euro’s outlook.
EUR/CHF can still trade higher
The downside for EUR/USD looks open to the 1.0790/1.0800 area now and 1.0875/1.0900 looks like stronger resistance. And risks next week warn that EUR/USD could be a 1.0715/25 story.
We are also surprised that EUR/CHF did not hand back more of its recent gains given that our recent call for EUR/CHF to trade to 0.9500/0.9600 is premised on higher Euro market interest rates. If we are correct, however, in that the ECB does not cut until June and by only 75 bps in total this year versus the 140 bps currently priced – then EUR/CHF can still trade higher.
Elsewhere, EUR/GBP is closing in on major support at 0.8500 – but a break below it looks highly unlikely ahead of next Thursday’s Bank of England meeting.
- Pound Sterling remains subdued on dismal market mood ahead of US core PCE price index data.
- High UK inflation would allow BoE policymakers to maintain a hawkish tone on interest rates.
- The US Dollar aims to advance further on robust US GDP growth.
The Pound Sterling (GBP) falls on the backfoot as investors turn cautious ahead of the interest rate decisions by the Bank of England (BoE) and the Federal Reserve (Fed) next week. Both central banks are widely anticipated to keep the monetary policy unchanged for the fourth straight time but guidance on interest rates for the entirety of 2024 will be keenly watched.
BoE policymakers are expected to refrain from rate-cut discussions as the United Kingdom economy is still experiencing significantly higher inflationary pressures than the US. There, however, policymakers could provide some cues about future interest rate-cuts. The Summary of Economic Projections (SEP) published after the last Fed meeting showed members on average predicting three rate cuts in 2024.
Before the Fed's interest rate decision, market participants will focus on the core Personal Consumption Expenditure (PCE) price index data for December, which will be published at 13:30 GMT. Fed policymakers could emphasize on rate-cuts after the first-half of 2024 if the underlying inflation data remains stubbornly high.
Daily Digest Market Movers: Pound Sterling slips on dismal market mood
- Pound Sterling remains broadly sideways around 1.2700 as investors shift focus towards the interest rate decision by the Bank of England, which will be announced next week.
- The BoE is widely anticipated to maintain interest rates steady at 5.25% for the fourth time in a row.
- Investors will keenly watch whether BoE policymakers will follow the Fed or the European Central Bank (ECB) and start discussing making costs to interest rates.
- Unlike the ECB and the Fed, BoE policymakers have not offered any timeframe or projections for rate cuts amid high inflationary pressures.
- The core inflation in the United Kingdom economy is at 5.1%, significantly far from the desired rate of 2%, and higher than the US and Eurozone (3.9% and 3.4% respectively).
- This could mean the BoE to be the laggard among Group of Seven central banks in commencing a “rate-cut campaign”.
- Meanwhile, improving business confidence in the economic outlook amid hopes of rate cuts could make price pressures more persistent.
- PMI numbers, reported by the S&P Global for January, were significantly up and marked a promising start for 2024. Also, Oil supply disruptions in the Red Sea could escalate inflationary pressures in the manufacturing sector.
- This could allow BoE policymakers to stretch the restrictive interest rate stance.
- Meanwhile, the downbeat market mood has improved the appeal for safe-haven assets.
- The United States Q4 Gross Domestic Product (GDP) data, released on Thursday, indicated that the economy is growing at a robust pace, allowing Federal Reserve (Fed) policymakers to hold back interest rate-cuts in the first-half of 2024.
- The US Dollar Index (DXY) aims to recapture an almost six-week high of 103.80 as investors turn cautious ahead of the core PCE price index data for December.
- Monthly core PCE is estimated to have risen by 0.2% in December against 0.1% in November. The annual underlying inflation data rose at a slower pace of 3.0% versus the former reading of 3.2%. Fed policymakers would deliver a hawkish interest rate outlook if the economic data turns out stubborn-than-projected.
Technical Analysis: Pound Sterling struggles around 1.2700
-638418523529094294.png)
Pound Sterling struggles to sustain above the round-level resistance of 1.2700 amid cautious market mood. The price action in the GBP/USD pair demonstrates a steep contraction in volatility. The near-term demand for the Cable is fading as it is struggling to sustain above the 20-period Exponential Moving Average (EMA), which trades around 1.2700. An inventory adjustment auction after a sharp rally is visible on the daily timeframe, which signifies an absence of a potential economic trigger for fresh guidance.
The 14-period Relative Strength Index (RSI) oscillates in the 40.00-60.00, indicating absence of fresh impetus.
Pound Sterling FAQs
What is the Pound Sterling?
The Pound Sterling (GBP) is the oldest currency in the world (886 AD) and the official currency of the United Kingdom. It is the fourth most traded unit for foreign exchange (FX) in the world, accounting for 12% of all transactions, averaging $630 billion a day, according to 2022 data.
Its key trading pairs are GBP/USD, aka ‘Cable’, which accounts for 11% of FX, GBP/JPY, or the ‘Dragon’ as it is known by traders (3%), and EUR/GBP (2%). The Pound Sterling is issued by the Bank of England (BoE).
How do the decisions of the Bank of England impact on the Pound Sterling?
The single most important factor influencing the value of the Pound Sterling is monetary policy decided by the Bank of England. The BoE bases its decisions on whether it has achieved its primary goal of “price stability” – a steady inflation rate of around 2%. Its primary tool for achieving this is the adjustment of interest rates.
When inflation is too high, the BoE will try to rein it in by raising interest rates, making it more expensive for people and businesses to access credit. This is generally positive for GBP, as higher interest rates make the UK a more attractive place for global investors to park their money.
When inflation falls too low it is a sign economic growth is slowing. In this scenario, the BoE will consider lowering interest rates to cheapen credit so businesses will borrow more to invest in growth-generating projects.
How does economic data influence the value of the Pound?
Data releases gauge the health of the economy and can impact the value of the Pound Sterling. Indicators such as GDP, Manufacturing and Services PMIs, and employment can all influence the direction of the GBP.
A strong economy is good for Sterling. Not only does it attract more foreign investment but it may encourage the BoE to put up interest rates, which will directly strengthen GBP. Otherwise, if economic data is weak, the Pound Sterling is likely to fall.
How does the Trade Balance impact the Pound?
Another significant data release for the Pound Sterling is the Trade Balance. This indicator measures the difference between what a country earns from its exports and what it spends on imports over a given period.
If a country produces highly sought-after exports, its currency will benefit purely from the extra demand created from foreign buyers seeking to purchase these goods. Therefore, a positive net Trade Balance strengthens a currency and vice versa for a negative balance.
Here is what you need to know on January, January 26:
The US Dollar (USD) stays resilient against its major rivals early Friday, supported by the negative shift seen in risk mood. Private Loans for December will be featured in the European docket. Later in the day, the US Bureau of Economic Analysis (BEA) will release the Personal Consumption Expenditures (PCE) Price Index data, alongside Personal Spending and Personal Income figures for December.
US Core PCE Inflation Preview: Federal Reserve preferred price gauge looks set for another decline in December.
The European Central Bank (ECB) announced on Thursday that it left key rates unchanged following the January policy meeting as widely expected. During the post-meeting press conference, ECB President Christine Lagarde refrained from commenting on the possible timing of a policy pivot and reiterated that it would be premature to talk about rate cuts. EUR/USD closed in negative territory on Thursday and continued to stretch lower early Friday. At the time of press, the pair was trading below 1.0850.
US Dollar price this week
The table below shows the percentage change of US Dollar (USD) against listed major currencies this week. US Dollar was the strongest against the Euro.
| USD | EUR | GBP | CAD | AUD | JPY | NZD | CHF | |
| USD | 0.69% | 0.10% | 0.34% | 0.28% | -0.21% | 0.31% | -0.05% | |
| EUR | -0.68% | -0.58% | -0.35% | -0.41% | -0.90% | -0.37% | -0.73% | |
| GBP | -0.11% | 0.57% | 0.22% | 0.17% | -0.32% | 0.22% | -0.16% | |
| CAD | -0.34% | 0.37% | -0.22% | -0.05% | -0.54% | -0.01% | -0.38% | |
| AUD | -0.27% | 0.43% | -0.16% | 0.07% | -0.47% | 0.06% | -0.31% | |
| JPY | 0.20% | 0.88% | 0.36% | 0.54% | 0.45% | 0.53% | 0.16% | |
| NZD | -0.31% | 0.37% | -0.22% | 0.01% | -0.07% | -0.51% | -0.37% | |
| CHF | 0.05% | 0.74% | 0.15% | 0.38% | 0.31% | -0.17% | 0.35% |
The heat map shows percentage changes of major currencies against each other. The base currency is picked from the left column, while the quote currency is picked from the top row. For example, if you pick the Euro from the left column and move along the horizontal line to the Japanese Yen, the percentage change displayed in the box will represent EUR (base)/JPY (quote).
The BEA reported on Thursday that the Gross Domestic Product (GDP) expanded at an annual rate of 3.3% (first estimate) in the fourth quarter. This reading surpassed the market expectation of 2% by a wide margin. Other data from the US showed that the weekly Initial Jobless Claims rose to 214,000 from 189,000 in the previous week and Durable Goods Orders remained unchanged in December. The benchmark 10-year US Treasury bond yield holds comfortably above 4% early Friday and the USD Index stays in positive territory above 103.50. Reflecting the risk-averse market environment, US stock index futures lose between 0.4% and 0.8% in the European morning.
GBP/USD registered marginal losses on Thursday and stretched lower early Friday. The pair, however, holds relatively stable at around 1.2700.
The data from Japan showed that the Tokyo Consumer Price Index (CPI) rose 1.6% on a yearly basis in January, down from 2.4% in December. Meanwhile, the Bank of Japan said in the minutes of the policy meeting that member agreed that they must patiently maintain an easy policy. USD/JPY edged higher early Friday and was last seen trading slightly below 148.00.
Gold benefited from retreating US bond yields and closed modestly higher on Friday. XAU/USD struggles to find direction in the European morning and continues to move sideways at around $2,020.
The Swedish Krona (SEK) has given back some of the ground it won vs. the Euro (EUR) in the final two months of last year. Economists at Rabobank analyze EUR/SEK outlook.
EUR/SEK to trend lower towards 11.00 on a 3-to-6-month view
A cautious outlook on rates from the Riksbank combined with a dash of optimism that the domestic economic outlook should improve later this year suggests scope for the SEK to regain its footing and for EUR/SEK to trend lower towards 11.00 on a 3-to-6-month view.
Despite the SEK’s improved tone late last year, EUR/SEK remains well above its 5-year average. A weak currency will add to inflation risks. However, it can also generate growth through the export channel; signs of this may now be emerging. We would expect EUR/SEK to continue its normalisation this year and move back to 10.80 on a 12-month view.
- Consumer confidence is expected to deteriorate further in Germany.
- EUR/USD stays in negative territory below 1.0850 early Friday.
Consumer sentiment in Germany is expected to continue to weaken in February, with the GfK Consumer Confidence Index dropping to -29.7 from -25.4 in January. This reading came in worse than the market expectation of -24.5.
Assessing the survey's findings, "If there were any hopes of a sustained recovery in sentiment, these were dashed in January," said Rolf Buerkl, consumer expert at the GfK Institute and the Nuremberg Institute for Market Decisions (NIM), pre Reuters. "The consumer climate suffered a severe setback at the beginning of the year."
Market reaction
EUR/USD stays on the back foot following this disappointing data and was last seen losing 0.2% on the day at 1.0825.
- EUR/USD continues to move in a downward direction after the US GDP data.
- Technical analysis suggests a bearish sentiment towards the monthly at 1.0821.
- A break above 1.0850 could support the pair to approach the resistance zone around the 23.6% Fibonacci retracement and the 21-day EMA.
EUR/USD extends its losses on the second consecutive day, edging lower to near 1.0830 during the Asian session on Friday. The EUR/USD pair experienced downward pressure following the release of Gross Domestic Product (GDP) data from the United States (US).
The 14-day Relative Strength Index (RSI) for the EUR/USD pair is currently situated below the 50 mark, suggesting a bearish momentum in the market. Additionally, the lagging indicator, Moving Average Convergence Divergence (MACD), for the EUR/USD pair signals a potential confirmation of a downward trend. The MACD line is positioned below the centerline and is diverging below the signal line.
Earlier in the week, the EUR/USD pair tested twice the monthly low at 1.0821. A firm break below the monthly low could influence the bears of the pair to drag it to psychological support at 1.0800.
If the EUR/USD pair moves below the psychological level, it could put pressure to navigate the support level towards 1.0750.
On the upside, the major level at 1.0850 could act as an immediate resistance. A breakthrough above the latter could lead the EUR/USD pair to approach the 23.6% Fibonacci retracement level at 1.0895 in conjunction with the psychological barrier at 1.0900 level and the 21-day Exponential Moving Average (EMA) at 1.0901.
EUR/USD: Daily Chart
-638418494605909750.png)
- The Core Personal Consumption Expenditures Price Index is set to rise 0.2% MoM and 3% YoY in December.
- Markets see a strong chance of the Federal Reserve keeping the policy rate unchanged in January and March.
- The continued cooling of PCE inflation could cause the US Dollar to remain fragile.
The Core Personal Consumption Expenditures (PCE) Price Index, the US Federal Reserve’s (Fed) preferred inflation measure, will be published on Friday by the US Bureau of Economic Analysis (BEA) at 13:30 GMT.
What to expect in the Federal Reserve’s preferred PCE inflation report?
The Core PCE Price Index, which excludes volatile food and energy prices, is seen as the more influential measure of inflation in terms of Fed positioning. The index is forecast to rise 0.2% on a monthly basis in December, up slightly from a 0.1% increase recorded in November. December Core PCE is also projected to grow at an annual pace of 3%, down from November’s 3.2%. The headline PCE Price Index is forecast to rise 2.6% (YoY).
Previewing the PCE inflation report, “[W]e look for December PCE data to continue supporting the idea of inflation deceleration, with the core series advancing at a near-trend 0.2% m/m — and below the core CPI's 0.3% increase,” said TD Securities analysts in a weekly report titled “Week Ahead: US Macro Market Movers.”
When will the PCE inflation report be released, and how could it affect EUR/USD?
The PCE inflation data is slated for release at 13:30 GMT. The monthly Core PCE Price Index gauge is the most-preferred inflation reading by the Fed, as it’s not distorted by base effects and provides a clear view of underlying inflation by excluding volatile items. Investors, therefore, pay close attention to the monthly Core PCE figure.
Nevertheless, the PCE inflation figures are unlikely to offer any significant surprises since the quarterly figures were already included in the Gross Domestic Product (GDP) report published on Thursday. On a quarterly basis, the Core PCE Price Index rose 2% on a quarterly basis in the fourth quarter, matching the market estimate and the third quarter’s increase.
Hence, market participants could pay close attention to underlying details, namely Personal Spending and Personal Income readings for December.
Personal Spending is expected to rise by 0.4% on a monthly basis following November’s 0.2% increase. In the same period, Personal Income is forecast to increase 0.3%. In case both of these data releases disappoint, investors could see it as a sign of weakening consumption that weighs on the US Dollar (USD) for the immediate reaction. On the other hand, upbeat figures are likely to support the USD in the near term.
FXStreet Analyst Eren Sengezer offers a brief technical outlook for EUR/USD and explains:
“The Relative Strength Index (RSI) indicator on the daily chart edged lower to 40 after failing to stabilize above 50, reflecting the lack of buyer interest. The 200-day Simple Moving Average (SMA) aligns as a pivot level for EUR/USD at 1.0850. In case this level is confirmed as resistance, 1.0780-1.0770 (Fibonacci 50% retracement of October-December uptrend) could be seen as the next bearish target ahead of 1.0700 (Fibonacci 61.8% retracement).
On the upside, strong resistance seems to have formed at 1.0930-1.0950 (20-day SMA, 50-day SMA, Fibonacci 23.6% retracement) before 1.1000 (psychological level, static level).”
Economic Indicator
United States Personal Consumption Expenditures - Price Index (YoY)
The Personal Consumption Expenditures (PCE), released by the US Bureau of Economic Analysis on a monthly basis, measures the changes in the prices of goods and services purchased by consumers in the United States (US). The YoY reading compares prices in the reference month to a year earlier. Price changes may cause consumers to switch from buying one good to another and the PCE Deflator can account for such substitutions. This makes it the preferred measure of inflation for the Federal Reserve. Generally, a high reading is bullish for the US Dollar (USD), while a low reading is bearish.
Read more.Next release: 01/26/2024 13:30:00 GMT
Frequency: Monthly
Source: US Bureau of Economic Analysis
Fed FAQs
What does the Federal Reserve do, how does it impact the US Dollar?
Monetary policy in the US is shaped by the Federal Reserve (Fed). The Fed has two mandates: to achieve price stability and foster full employment. Its primary tool to achieve these goals is by adjusting interest rates.
When prices are rising too quickly and inflation is above the Fed’s 2% target, it raises interest rates, increasing borrowing costs throughout the economy. This results in a stronger US Dollar (USD) as it makes the US a more attractive place for international investors to park their money.
When inflation falls below 2% or the Unemployment Rate is too high, the Fed may lower interest rates to encourage borrowing, which weighs on the Greenback.
How often does the Fed hold monetary policy meetings?
The Federal Reserve (Fed) holds eight policy meetings a year, where the Federal Open Market Committee (FOMC) assesses economic conditions and makes monetary policy decisions.
The FOMC is attended by twelve Fed officials – the seven members of the Board of Governors, the president of the Federal Reserve Bank of New York, and four of the remaining eleven regional Reserve Bank presidents, who serve one-year terms on a rotating basis.
What is Quantitative Easing (QE) and how does it impact USD?
In extreme situations, the Federal Reserve may resort to a policy named Quantitative Easing (QE). QE is the process by which the Fed substantially increases the flow of credit in a stuck financial system.
It is a non-standard policy measure used during crises or when inflation is extremely low. It was the Fed’s weapon of choice during the Great Financial Crisis in 2008. It involves the Fed printing more Dollars and using them to buy high grade bonds from financial institutions. QE usually weakens the US Dollar.
What is Quantitative Tightening (QT) and how does it impact the US Dollar?
Quantitative tightening (QT) is the reverse process of QE, whereby the Federal Reserve stops buying bonds from financial institutions and does not reinvest the principal from the bonds it holds maturing, to purchase new bonds. It is usually positive for the value of the US Dollar.
- EUR/GBP remains under pressure near 0.8530 amid the ECB’s dovish stance.
- The European Central Bank (ECB) held interest rates steady at their current record high on Thursday.
- Improved UK Manufacturing PMI data might convince the BoE to hold interest rates higher for longer than expected.
The EUR/GBP cross extends its downside below the mid-0.8500s during the early European session on Friday. The Euro (EUR) loses traction after the European Central Bank (ECB) held interest rates steady at its January monetary policy meeting on Thursday. At press time, the cross is trading at 0.8530, unchanged for the day.
The European Central Bank (ECB) maintained monetary policy and interest rates unchanged at 4% for the third straight meeting on Thursday. The central bank reiterated that it would keep rates high for a “sufficiently long duration” to bring inflation to target. ECB President Christine Lagarde delivered dovish comments and emphasized that a pre-summer rate cut remains "likely.”
The market is pricing 87% odds of a rate cut from the ECB in April and fully priced for 50 basis points (bps) of cuts by the June policy meeting. This, in turn, might exert some selling pressure on the Euro and act as a headwind for the EUR/GBP cross.
On the other hand, the improved UK Manufacturing PMI data might convince the BoE to hold interest rates higher for longer than market investors had expected, which could lift the Pound Sterling (GBP). Market players will closely watch the BoE interest rate decision next week, which is widely anticipated to maintain interest rates steady at 5.25% for the fourth time in a row.
Later on Friday, the German Gfk Consumer Confidence Survey for February, the German Buba Monthly Report, and the French Consumer Confidence will be due.
European Central Bank (ECB) Governing Council member Martins Kazaks said on Friday that geopolitical issues were slowing down growth in the Euro area but added that it would be the worst to be premature on rate cuts.
Kazaks noted that negative supply-side shocks are a reason to be patient, even though the Red Sea situation had been contained so far.
Market reaction
EUR/USD showed no immediate reaction to these comments and the pair was last seen losing 0.15% on a daily basis at 1.0830.
- USD/CHF could gain ground due to the hawkish sentiment surrounding the Fed.
- US GDP Annualized (Q4) printed a 3.3% figure against the expected 2.0% and 4.9% prior.
- Swiss policymakers will likely observe Real Retail Sales and the ZEW Survey to decide on the SNB's (SNB) monetary policy.
USD/CHF consolidates near 0.8670 during the Asian trading hours on Friday. The US Dollar (USD) appreciated against the Swiss Franc (CHF) following the release of Gross Domestic Product (GDP) data from the United States. The better-than-expected GDP figures in the fourth quarter might have decreased the likelihood of the Federal Reserve’s (Fed) reducing policy rates in the March meeting, which in turn, underpins the USD/CHF pair.
The US Gross Domestic Product Annualized (Q4) reported a reading of 3.3%, surpassing the previous reading of 4.9% and exceeding the market consensus of 2.0%. Additionally, the US Gross Domestic Product Price Index (Q4) decreased to a growth of 1.5% from the previous growth of 3.3%. Surprisingly, US Initial Jobless Claims for the week ending on January 19 reduced to 214K, contrary to the expected increase of 200K from the prior 189K. Furthermore, the market will be closely watching the release of the Personal Consumption Expenditures (PCE) Price Index data on Friday for further insights into US economic conditions.
The appreciation of the Swiss Franc (CHF) is beneficial for the Swiss National Bank (SNB) in terms of keeping inflation in check. However, there are uncertainties about whether the central bank is comfortable with the persistent strength of the CHF. Earlier this week, SNB President Thomas Jordan acknowledged that the robust Swiss Franc has played a role in capping inflation but has also posed challenges for domestic companies.
Despite concerns about the CHF's strength, the SNB is not expected to intervene in the open market by purchasing foreign currency to limit the advance of the Swiss Franc. The central bankers will likely monitor key economic indicators such as Real Retail Sales and the ZEW Survey to assess the health of the Swiss economy. These indicators will be instrumental in helping policymakers decide on the Swiss National Bank's (SNB) monetary policy.
- EUR/JPY recovers some lost ground near 160.20 on the softer Japanese inflation data.
- The bullish outlook of the cross remains intact above the key Exponential Moving Averages (EMA).
- The key resistance level is seen at 161.00; the 159.90-160.00 zone is the crucial support level.
The EUR/JPY cross snaps a four-day losing streak during the early European trading hours on Friday. The rebound of the cross is supported by weaker-than-expected Japanese CPI inflation data. At press time, the cross currently trades around 160.20, gaining 0.05% on the day.
Early Friday, the headline Tokyo Consumer Price Index (CPI) eased to 1.6% YoY in January from 2.4% in the previous reading. Meanwhile, the Tokyo CPI ex Fresh Food, Energy came in at 3.1% YoY from 3.5% in December. Finally, the CPI figure ex Fresh Food eased to 1.6% YoY from 2.1% in the previous reading, below the expectation of 1.9%.
Technically, EUR/JPY keeps the bullish vibe unchanged as the cross holds above the 100-period Exponential Moving Averages (EMA) on the four-hour chart. However, the Relative Strength Index (RSI) stands in bearish territory below the 50-midline, suggesting the sellers look to retain control in the near term.
The confluence of a psychological round mark and a high of January 25 at 161.00 will be the key resistance level for the cross. The next hurdle is seen at the upper boundary of the Bollinger Band at 161.25. A decisive break above the latter will see a rally to a high of January 23 at 161.70, en route to a high of January 19 at 161.87.
On the downside, the crucial support level for the cross will emerge at the 159.90-160.00 region, portraying the lower limit of the Bollinger Band, a low of January 24 and a psychological mark. Any follow-through selling below the mentioned level will see a drop to the 100-period EMA at 159.77. The additional downside filter to watch is a low of January 16 at 159.24, followed by a low of January 12 at 158.54.
EUR/JPY four-hour chart
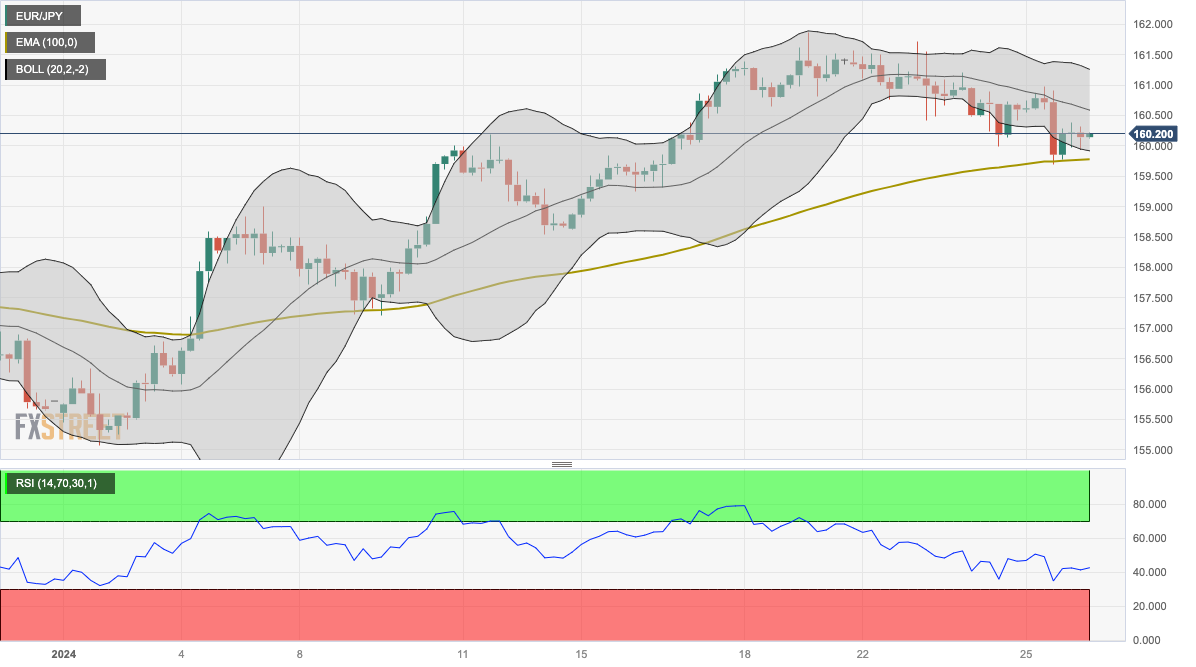
- USD/CAD grapples to find a direct after registering losses on Thursday.
- The 23.6% Fibonacci retracement at 1.3455 and the major level at 1.3450 could act as the key support levels.
- Technical analysis indicates an upward trend towards the psychological level at 1.3500.
USD/CAD hovers around 1.3470 during the Asian session on Friday, struggling to find a direction amid a stable US Dollar (USD). Traders await the upcoming Personal Consumption Expenditures (PCE) Price Index data scheduled to be released later in the North American session.
The USD/CAD could find the support region around the 23.6% Fibonacci retracement at 1.3455 aligned with the major level at 1.3450. A break below the support zone could put pressure on the pair to punch the 21-day Exponential Moving Average (EMA) at 1.3439.
If the USD/CAD pair crossovers below the 21-day EMA, the pair could test the 38.2% Fibonacci retracement at 1.3402 in conjunction with the psychological support at 1.3400 level.
However, the technical analysis of the Moving Average Convergence Divergence (MACD) for the USD/CAD pair indicates a potential bullish sentiment in the market. This interpretation is based on the positioning of the MACD line above the centerline and divergence above the signal line.
Additionally, the lagging indicator 14-day Relative Strength Index (RSI) is positioned above 50, suggesting the confirmation of stronger momentum for the USD/CAD pair, which could support the pair to approach the psychological level of 1.3500.
A firm breakthrough above the latter could influence the bulls of the USD/CAD pair to explore the weekly high at 1.3534 and the monthly high at 1.3541 followed by the major resistance level at 1.3500.
USD/CAD: Daily Chart
-638418426173183952.png)
- GBP/USD remains confined in a narrow trading range during the Asian session on Friday.
- Traders wait for the release of the US PCE Price Index before placing fresh directional bets.
- A breakthrough a descending trend-line is needed to support prospects for additional gains.
The GBP/USD pair struggles to gain any meaningful traction on Friday and oscillates in a narrow trading band, just above the 1.2700 mark during the Asian session. Spot prices, meanwhile, remain well within the striking distance of a nearly two-week high touched on Wednesday and now look to the release of the US PCE Price Index for a fresh impetus.
The crucial US inflation data will play a key role in influencing expectations about the timing of when the Federal Reserve (Fed) will start cutting interest rates, which, in turn, will drive the US Dollar (USD). In the meantime, the stronger-than-expected US economic growth figures, along with signs of easing inflationary pressures, raise the prospects for a soft landing. This leads to a further decline in the US Treasury bond yields, which keeps the USD bulls on the defensive and lends some support to the GBP/USD pair.
Meanwhile, a strong start to the year by the UK economy gives the Bank of England (BoE) a reason to hold interest rates at the highest level in nearly 16 years when it meets next week. This might continue to underpin the British Pound (GBP) and support prospects for a further near-term appreciating move for the GBP/USD pair. That said, diminishing odds for an early interest rate cut by the Fed might hold back traders from placing aggressive USD bearish bets and cap gains for the pair ahead of the FOMC meeting next week.
From a technical perspective, the GBP/USD pair, so far, has been struggling to make it through a downward sloping trend-line extending from the December swing high. The said barrier is currently pegged near the 1.2740 region, which if cleared decisively should pave the way for additional gains. Spot prices might then accelerate the momentum toward reclaiming the 1.2800 round figure and climb further towards the 1.2825-1.2830 zone, or the highest level since August 2023 touched last month.
On the flip side, the 1.2680 region, followed by the 1.2655-1.2650 area could offer immediate support, below which the GBP/USD pair could slide back to test sub-1.2600 levels or the monthly trough. Some follow-through selling might shift the near-term bias in favour of bearish trades and expose the very important 200-day SMA, currently near the 1.2555 region before spot prices eventually drop to the 1.2500 psychological mark.
GBP/USD daily chart
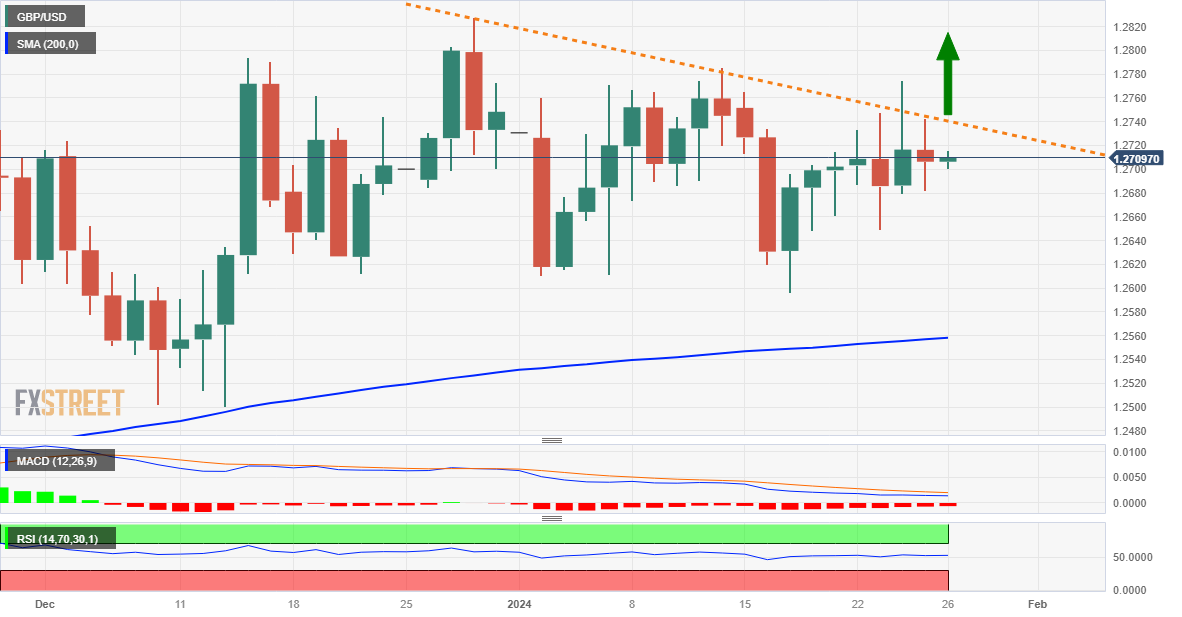
Technical levels to watch
- EUR/USD could mark further losses due to a dovish sentiment surrounding the ECB.
- Market participants bet on a first 50 bps rate cut from the ECB by June.
- US Treasury Secretary Janet Yellen emphasized that the recent GDP report does not put any threats on a 'soft landing' scenario for the US economy.
EUR/USD holds its position near 1.0850 during the Asian hours on Friday following a backslide in the previous session, which could be attributed to the European Central Bank’s (ECB) interest rate decision. Additionally, the better-than-expected US Gross Domestic Product (GDP) data helped the US Dollar (USD) to mark profits on Thursday, which in turn, acts as a headwind for the EUR/USD pair.
The European Central Bank (ECB) maintained its interest rates for a third consecutive meeting. ECB President Christine Lagarde indicated the possibility of a rate cut in the summer in the monetary policy statement. Market participants anticipate a first 50 basis point cut from the ECB by June. Rate swaps are currently pricing in a total of 140 basis points in rate cuts from the ECB by the end of 2024.
The US Dollar Index (DXY) could seek to build on recent gains, fueled by the stronger-than-expected US Gross Domestic Product (GDP) figures. The Q4 GDP report printed a reading of 3.3%, surpassing the previous figure of 4.9% and exceeding the market consensus of 2.0%.
US Treasury Secretary Janet Louise Yellen has expressed that the strong Q4 GDP data is a result of vigorous and healthy spending, coupled with improvements in productivity. She emphasizes that the GDP report does not indicate any threats to the potential of a 'soft landing' scenario for the US economy. Furthermore, on Friday, the Personal Consumption Expenditures (PCE) Price Index data is expected to provide insights into the monthly changes in both Personal Spending and Personal Income, influencing market sentiment further.
- Gold price attracts some buyers for the second straight day amid sliding US bond yields.
- Geopolitical risks and the uncertain global economic outlook further benefit the metal.
- Delayed Fed rate cut bets could cap gains ahead of the release of the US PCE Price Index.
Gold price (XAU/USD) ticks higher for the second straight day on Friday, albeit with a lack of follow-through buying and trades below the $2,025 level during the Asian session. The stronger-than-expected economic growth figures released from the United States (US) on Thursday, along with signs of slowing inflation, improved prospects for a soft landing and dragged the US Treasury bond yields lower. This, in turn, keeps the US Dollar (USD) below its highest level since December 13 touched earlier this week and acts as a tailwind for the non-yielding yellow metal.
Apart from this, geopolitical risks stemming from conflicts in the Middle East, along with the uncertain global economic outlook, turn out to be another factor lending some support to the safe-haven Gold price. That said, reduced bets for an early interest rate cut by the Federal Reserve and a more aggressive policy easing in 2024 should help limit the downside for the Greenback. This, in turn, warrants caution before placing bullish bets around the precious metal and positioning for any appreciating move ahead of the US Personal Consumption Expenditures (PCE) Price Index.
The crucial US inflation data will be looked upon for cues about the Fed's future policy decisions. This, in turn, will play a key role in influencing the near-term USD price dynamics and provide some meaningful impetus to the US Dollar-denominated Gold price. The market attention will then shift to the highly-anticipated two-day FOMC monetary policy meeting on January 30-31. Heading into the key central bank event risk, the XAU/USD seems poised to end in the red for the second straight week, also marking the third week of losses in the previous four.
Daily Digest Market Movers: Gold price benefits from sliding US bond yields, geopolitical risks ahead of US inflation data
- The benchmark 10-year US Treasury yield retreats further from over a one-month high touched last week and lends support to the Gold price for the second straight day on Friday.
- Data released on Thursday showed that the US economy expanded at an annual rate of 3.3% during the fourth quarter of 2023, beating consensus estimates for a reading of 2.0%.
- Further details of the report indicated that the core PCE Price Index was unchanged during the September-December period, suggesting that inflation pressures are receding.
- This validated the view that the world's largest economy is more likely to avoid a recession and overshadowed a rise in the US Weekly Initial Jobless Claims, to 214K last week.
- Separately, the US Census Bureau reported that US Durable Goods Orders were flat in December, while new orders excluding transportation and defense increased 0.3%.
- Investors remain worried that the Israeli-Hamas war could trigger a broader regional conflict as multiple nations and armed groups continue targeting each other’s territories.
- Adding to this, economists expect the global economy to weaken in 2024, which, in turn, is seen as another factor acting as a tailwind for the safe-haven precious metal.
- Market participants, meanwhile, remain uncertain over the timing of when the Federal Reserve will start lowering borrowing costs amid a still-resilient domestic economy.
- Traders now look to the US Personal Consumption Expenditures Price Index for cues about the Fed's future policy decisions and determine the near-term trajectory for the XAU/USD.
Technical Analysis: Gold price needs to break through the $2,040-2,042 supply zone for bulls to seize near-term control
From a technical perspective, any subsequent move up might continue to confront stiff resistance near the $2,040-2,042 supply zone. Some follow-through buying, however, might trigger a short-covering rally and lift the Gold price further to the $2,077 intermediate hurdle en route to the $2,100 round-figure mark.
On the flip side, the weekly low, around the $2,011 area, could offer some support ahead of the $2,000 psychological mark. A convincing break below the latter will be seen as a fresh trigger for bearish traders and pave the way for a slide to the 100-day Simple Moving Average (SMA), currently around the $1,975-1,976 area. The Gold price could eventually drop to test the very important 200-day SMA, near the $1,964-1,963 region.
US Dollar price today
The table below shows the percentage change of US Dollar (USD) against listed major currencies today. US Dollar was the weakest against the Australian Dollar.
| USD | EUR | GBP | CAD | AUD | JPY | NZD | CHF | |
| USD | 0.01% | -0.03% | -0.08% | -0.12% | -0.08% | -0.01% | -0.05% | |
| EUR | -0.01% | -0.04% | -0.08% | -0.15% | -0.08% | -0.02% | -0.06% | |
| GBP | 0.03% | 0.04% | -0.05% | -0.10% | -0.03% | 0.04% | -0.02% | |
| CAD | 0.07% | 0.09% | 0.04% | -0.06% | -0.01% | 0.07% | 0.03% | |
| AUD | 0.14% | 0.15% | 0.10% | 0.06% | 0.07% | 0.14% | 0.09% | |
| JPY | 0.07% | 0.08% | 0.06% | 0.00% | -0.06% | 0.08% | 0.04% | |
| NZD | 0.01% | 0.02% | -0.03% | -0.07% | -0.13% | -0.09% | -0.05% | |
| CHF | 0.05% | 0.06% | 0.01% | -0.03% | -0.09% | -0.03% | 0.05% |
The heat map shows percentage changes of major currencies against each other. The base currency is picked from the left column, while the quote currency is picked from the top row. For example, if you pick the Euro from the left column and move along the horizontal line to the Japanese Yen, the percentage change displayed in the box will represent EUR (base)/JPY (quote).
Gold FAQs
Why do people invest in Gold?
Gold has played a key role in human’s history as it has been widely used as a store of value and medium of exchange. Currently, apart from its shine and usage for jewelry, the precious metal is widely seen as a safe-haven asset, meaning that it is considered a good investment during turbulent times. Gold is also widely seen as a hedge against inflation and against depreciating currencies as it doesn’t rely on any specific issuer or government.
Who buys the most Gold?
Central banks are the biggest Gold holders. In their aim to support their currencies in turbulent times, central banks tend to diversify their reserves and buy Gold to improve the perceived strength of the economy and the currency. High Gold reserves can be a source of trust for a country’s solvency. Central banks added 1,136 tonnes of Gold worth around $70 billion to their reserves in 2022, according to data from the World Gold Council. This is the highest yearly purchase since records began. Central banks from emerging economies such as China, India and Turkey are quickly increasing their Gold reserves.
How is Gold correlated with other assets?
Gold has an inverse correlation with the US Dollar and US Treasuries, which are both major reserve and safe-haven assets. When the Dollar depreciates, Gold tends to rise, enabling investors and central banks to diversify their assets in turbulent times. Gold is also inversely correlated with risk assets. A rally in the stock market tends to weaken Gold price, while sell-offs in riskier markets tend to favor the precious metal.
What does the price of Gold depend on?
The price can move due to a wide range of factors. Geopolitical instability or fears of a deep recession can quickly make Gold price escalate due to its safe-haven status. As a yield-less asset, Gold tends to rise with lower interest rates, while higher cost of money usually weighs down on the yellow metal. Still, most moves depend on how the US Dollar (USD) behaves as the asset is priced in dollars (XAU/USD). A strong Dollar tends to keep the price of Gold controlled, whereas a weaker Dollar is likely to push Gold prices up.
- Indian Rupee trades on a stronger note as the US Dollar recovery loses steam.
- Indian government plans to lower deficit in the 2024-25 fiscal year despite lifting capital expenditure to an all-time high.
- The December US Core Personal Consumption Expenditures Price Index (Core PCE) will be in the spotlight on Friday.
Indian Rupee (INR) edges higher on Friday on a modest decline of US Dollar (USD). India’s interim budget for fiscal year 2024-25 (FY25) will be announced by Union Finance Minister Nirmala Sitharaman on February 1. The Fiscal Budget 2024-25 will mainly focus on government spending and no major change is expected until a new government takes control following the general elections.
The budget is expected to target a narrowing of the fiscal deficit as a percentage of GDP to 5.30% in 2024-25. The Indian government is poised to increase welfare expenditure and might lower the budget deficit to 4.5% of GDP by the fiscal year 2025-26.
The highlight on Friday will be the release of the US Core Personal Consumption Expenditures Price Index (Core PCE) for December, the Fed’s preferred inflation measure. The Core PCE is forecast to show an increase of 0.2% MoM and 3.0% YoY. Indian markets will be closed on Friday for Republic Day.
Daily Digest Market Movers: Indian Rupee gains ground ahead of the release of Fiscal Budget 2024-25
- Foreign investors sold nearly $2 billion in Indian equities in January, after a net purchase of $7.9 billion the previous month.
- India will continue to be the fastest-growing major economy this year and next, driven by ongoing strong government spending, according to a Reuters poll of economists.
- The US Gross Domestic Product (GDP) grew at a 3.3% annualized rate in the fourth quarter of 2023, compared to 4.9% in the previous reading, stronger than expected
- US Initial Jobless Claims for the week ending January 20 totaled 214,000 from 189,000 in the previous week, worse than the market expectation of 200,000. Continuing Claims rose to 1.833 million from the previous reading of 1.806 million.
- The Durable Goods Orders were stagnant in December against expectations of 1.1%.
Technical Analysis: Indian Rupee clings to the multi-month trading range of 82.80–83.40
Indian Rupee trades firmly on the day. The USD/INR pair has traded within a familiar trading band of 82.80–83.40 since September 2023. According to the daily chart, USD/INR holds above the key 100-period Exponential Moving Average (EMA). The upward momentum looks vulnerable and the further decline cannot be ruled out as the 14-day Relative Strength Index (RSI) stands below the 50.0 midline.
The initial support level for USD/INR will emerge at the 83.00 psychological mark. The additional downside filter to watch is the confluence of the lower limit of the trading range and a low of January 15 at 82.80, followed by a low of August 11 at 82.60. On the upside, the upper boundary of the trading range at 83.40 acts as an immediate resistance level for the pair. Further north, the next upside target is located at a 2023 high of 83.47 and the psychological mark at 84.00.
US Dollar price today
The table below shows the percentage change of US Dollar (USD) against listed major currencies today. US Dollar was the weakest against the Australian Dollar.
| USD | EUR | GBP | CAD | AUD | JPY | NZD | CHF | |
| USD | 0.01% | -0.03% | -0.08% | -0.12% | -0.08% | -0.01% | -0.05% | |
| EUR | -0.01% | -0.04% | -0.08% | -0.15% | -0.08% | -0.02% | -0.06% | |
| GBP | 0.03% | 0.04% | -0.05% | -0.10% | -0.03% | 0.04% | -0.02% | |
| CAD | 0.07% | 0.09% | 0.04% | -0.06% | -0.01% | 0.07% | 0.03% | |
| AUD | 0.14% | 0.15% | 0.10% | 0.06% | 0.07% | 0.14% | 0.09% | |
| JPY | 0.07% | 0.08% | 0.06% | 0.00% | -0.06% | 0.08% | 0.04% | |
| NZD | 0.01% | 0.02% | -0.03% | -0.07% | -0.13% | -0.09% | -0.05% | |
| CHF | 0.05% | 0.06% | 0.01% | -0.03% | -0.09% | -0.03% | 0.05% |
The heat map shows percentage changes of major currencies against each other. The base currency is picked from the left column, while the quote currency is picked from the top row. For example, if you pick the Euro from the left column and move along the horizontal line to the Japanese Yen, the percentage change displayed in the box will represent EUR (base)/JPY (quote).
Indian Rupee FAQs
What are the key factors driving the Indian Rupee?
The Indian Rupee (INR) is one of the most sensitive currencies to external factors. The price of Crude Oil (the country is highly dependent on imported Oil), the value of the US Dollar – most trade is conducted in USD – and the level of foreign investment, are all influential. Direct intervention by the Reserve Bank of India (RBI) in FX markets to keep the exchange rate stable, as well as the level of interest rates set by the RBI, are further major influencing factors on the Rupee.
How do the decisions of the Reserve Bank of India impact the Indian Rupee?
The Reserve Bank of India (RBI) actively intervenes in forex markets to maintain a stable exchange rate, to help facilitate trade. In addition, the RBI tries to maintain the inflation rate at its 4% target by adjusting interest rates. Higher interest rates usually strengthen the Rupee. This is due to the role of the ‘carry trade’ in which investors borrow in countries with lower interest rates so as to place their money in countries’ offering relatively higher interest rates and profit from the difference.
What macroeconomic factors influence the value of the Indian Rupee?
Macroeconomic factors that influence the value of the Rupee include inflation, interest rates, the economic growth rate (GDP), the balance of trade, and inflows from foreign investment. A higher growth rate can lead to more overseas investment, pushing up demand for the Rupee. A less negative balance of trade will eventually lead to a stronger Rupee. Higher interest rates, especially real rates (interest rates less inflation) are also positive for the Rupee. A risk-on environment can lead to greater inflows of Foreign Direct and Indirect Investment (FDI and FII), which also benefit the Rupee.
How does inflation impact the Indian Rupee?
Higher inflation, particularly, if it is comparatively higher than India’s peers, is generally negative for the currency as it reflects devaluation through oversupply. Inflation also increases the cost of exports, leading to more Rupees being sold to purchase foreign imports, which is Rupee-negative. At the same time, higher inflation usually leads to the Reserve Bank of India (RBI) raising interest rates and this can be positive for the Rupee, due to increased demand from international investors. The opposite effect is true of lower inflation.
- WTI price is expected to close the week in a positive territory due to multiple factors.
- US GDP data contributed support to reinforcing the Crude oil prices.
- PBoC’s strategy to inject liquidity into the economy contributes to the strength in oil prices.
- Chinese officials asked their Iranian counterparts to help restrain attacks on ships in the Red Sea.
West Texas Intermediate (WTI) oil price pauses its two-day winning streak but is anticipated to conclude the week on a positive note, trading near $77.00 per barrel during the Asian session on Friday. However, the Crude oil prices received a positive momentum, which is attributed, in part, to the better-than-expected GDP Annualized (Q4) released from the United States on Thursday.
Additionally, the strength in Crude oil prices can be attributed to various factors, notably speculation surrounding the People's Bank of China (PBoC) considering a Medium-term Lending Facility (MLF) rate cut. This speculation has gained momentum following a recent statement by PBoC Governor Pan Gongsheng, who announced a reduction in the Required Reserve Ratio (RRR) by 50 basis points starting from February 5th. The RRR cut is part of the central bank's strategy to inject liquidity into the economy, with the move expected to release approximately CNY 1 trillion of extra funds. This contributes to the strength in Crude oil prices, considering the fact that China, being the largest oil importer, plays a significant role in influencing global oil markets.
The geopolitical tensions in the Middle East are contributing to the support of oil prices, causing them to edge higher. The leader of the Houthi group stated on Thursday that they would persist in targeting ships associated with Israel until aid reaches the Palestinian people in Gaza. Notably, Chinese officials have intervened, urging their Iranian counterparts to help restrain attacks on ships in the Red Sea by the Iran-backed Houthis. The potential disruption to business relations with Beijing was emphasized.
Moreover, the upward movement in the WTI oil price is further supported by a decrease in US crude oil stockpiles. According to the Energy Information Administration (EIA), the Crude Oil Stocks Change showed a significant decrease compared to the prior week's drop. Additionally, the severe weather conditions disrupted crude oil production and transportation, especially in North Dakota, leading to fluctuations in inventory levels. The business barometer for the drilling industry and its suppliers, Baker Hughes US Oil Rig Count will be released on Friday, along with the US Personal Consumption Expenditures (PCE) Price Index data.
| Raw materials | Closed | Change, % |
|---|---|---|
| Silver | 22.908 | 1.11 |
| Gold | 2019.966 | 0.19 |
| Palladium | 941.84 | -1.96 |
Japan's Minister of Finance Sunichi Suzuki said on Friday that the government and the Bank of Japan (BoJ) are working closely together based on the need to achieve the 2% inflation target stably and sustainably. Suzuki added that he expects the BOJ to guide policy appropriately.
Market reaction
At the time of writing, USD/JPY is trading 0.11% lower on the day at 147.56
Bank of Japan FAQs
What is the Bank of Japan?
The Bank of Japan (BoJ) is the Japanese central bank, which sets monetary policy in the country. Its mandate is to issue banknotes and carry out currency and monetary control to ensure price stability, which means an inflation target of around 2%.
What has been the Bank of Japan’s policy?
The Bank of Japan has embarked in an ultra-loose monetary policy since 2013 in order to stimulate the economy and fuel inflation amid a low-inflationary environment. The bank’s policy is based on Quantitative and Qualitative Easing (QQE), or printing notes to buy assets such as government or corporate bonds to provide liquidity. In 2016, the bank doubled down on its strategy and further loosened policy by first introducing negative interest rates and then directly controlling the yield of its 10-year government bonds.
How do Bank of Japan’s decisions influence the Japanese Yen?
The Bank’s massive stimulus has caused the Yen to depreciate against its main currency peers. This process has exacerbated more recently due to an increasing policy divergence between the Bank of Japan and other main central banks, which have opted to increase interest rates sharply to fight decades-high levels of inflation. The BoJ’s policy of holding down rates has led to a widening differential with other currencies, dragging down the value of the Yen.
Is the Bank of Japan’s ultra-loose policy likely to change soon?
A weaker Yen and the spike in global energy prices have led to an increase in Japanese inflation, which has exceeded the BoJ’s 2% target. Still, the Bank judges that the sustainable and stable achievement of the 2% target has not yet come in sight, so any sudden change in the current policy looks unlikely.
- Australian Dollar could gain ground on bullish momentum.
- Australia's Dollar cheered the improved prices of copper and iron.
- US Dollar could extend its gains following the firmer-than-expected US GDP figures.
- US GDP Annualized (Q4) came in at 3.3% above the market consensus of 2.0%.
The Australian Dollar (AUD) strives to build on its recent gains for the second consecutive session on Friday. The bullish momentum seems to be resurfacing, supporting a notable upward movement in the AUD/USD pair. Interestingly, the Australian Dollar strengthens even in the face of an improved US Dollar (USD), despite the backdrop of lower US Treasury yields. However, the volatility is expected to subside as financial markets are closed in observance of the Australia Day Holiday.
Australia's Dollar reacted positively to the favorable performance of copper and iron. Additionally, the AUD might have received some support from the recent news mentioning additional stimulus measures by the People's Bank of China (PBoC). However, the Reserve Bank of Australia (RBA) is still expected to reduce borrowing costs later this year. Changes to the stage three tax cut package might introduce a slight delay in the timeline for the first rate cut, potentially pushing it back by a couple of months.
The Reserve Bank of Australia's (RBA) Bulletin suggests that businesses, over the last six months, have generally foreseen a slowdown in their price growth. The prevailing expectation is that, on average, prices will remain above the RBA's inflation target range of 2.0–3.0%.
The US Dollar Index (DXY) could attempt to capitalize on recent gains following the firmer-than-expected US GDP figures, which further reinforced the already resilient stance of the United States (US) economy. The US Gross Domestic Product Annualized (Q4) reported a reading of 3.3% against the previous reading of 4.9%, exceeding the market consensus of 2.0%.
US Treasury Secretary Janet Louise Yellen has remarked that the robust performance of the US economy in the fourth quarter is viewed as a positive development and is not likely to pose challenges in terms of inflation. Yellen attributes the strong Q4 GDP data to vigorous and healthy spending, coupled with productivity improvements. She further emphasizes that there is nothing in the GDP report that suggests a threat to the prospect of a 'soft landing' scenario for the US economy.
Traders are poised to closely monitor the upcoming Personal Consumption Expenditures (PCE) Price Index data on Friday. Following the release of the GDP report, the US Bureau of Economic Analysis is set to publish the PCE Price Index data, providing insights into the monthly changes in both Personal Spending and Personal Income.
Daily Digest Market Movers: Australian Dollar seems to gain ground amid a stable US Dollar
- Australia's Manufacturing PMI increased from 47.6 to 50.3, showcasing improvement. Services PMI also saw an uptick, rising from 47.1 to 47.9. The Composite PMI registered an increase, reaching 48.1 compared to December's 46.9.
- Australia’s Westpac Leading Index (MoM) declined by 0.03% in December against November’s growth of 0.07%.
- National Australia Bank's Business Conditions inched down to the reading of 7 in December from 9 prior.
- National Australia Bank's Business Confidence improves to -1 from the previous figure of -9.
- Australia’s Consumer Inflation Expectations remained steady at 4.5% in January.
- The Chair of Australia's sovereign wealth fund Peter Costello commented that inflation in Australia is showing early signs of moderation. However, Costello emphasizes that there is still a considerable distance to cover to bring prices back within the RBA's target band.
- Chinese financial media reported that the People's Bank of China (PBoC) may cut the Medium-term Lending Facility (MLF) rate in the current quarter. The announcement follows the recent statement by PBoC Governor Pan Gongsheng, who revealed that the Bank would reduce the Required Reserve Ratio (RRR) by 50 basis points starting from February 5th.
- US S&P Global Manufacturing PMI climbed to an 11-month high of 50.3 in January against the forecast of remaining consistent at 47.9.
- US Services PMI rose to 52.9 against the expected reading of 51 and 51.4 prior. While Composite PMI increased to 52.3 from the previous reading of 50.9.
- US Conference Board has reported a slight improvement in the Leading Economic Index for December, moving from -0.5% in November to -0.1% in December. This surpassed expectations for an improvement to -0.3%.
- The preliminary US Michigan Consumer Sentiment Index rose to 78.8 in January from 69.7 prior, exceeding the expected figure of 70.
Technical Analysis: Australian Dollar remains below the psychological level at 0.6600
The Australian Dollar trades around 0.6590 on Friday, encountering immediate resistance at the psychological level of 0.6600. This level aligns with the 23.6% Fibonacci retracement at 0.6606, followed by the 14-day Exponential Moving Average (EMA) at 0.6615. A decisive breakthrough above this resistance zone might propel the AUD/USD pair toward the major barrier at 0.6650. Conversely, on the downside, there's a possibility of revisiting the weekly low at 0.6551, coinciding with the significant level at 0.6550. If this support is breached, the pair could face additional downward pressure, potentially retesting the monthly low at 0.6524.
AUD/USD: Daily Chart
-638418302550107077.png)
Australian Dollar price today
The table below shows the percentage change of Australian Dollar (AUD) against listed major currencies today. Australian Dollar was the strongest against the New Zealand Dollar.
| USD | EUR | GBP | CAD | AUD | JPY | NZD | CHF | |
| USD | 0.03% | 0.00% | -0.03% | -0.05% | -0.10% | 0.03% | -0.01% | |
| EUR | -0.03% | -0.03% | -0.06% | -0.09% | -0.11% | 0.00% | -0.04% | |
| GBP | -0.01% | 0.03% | -0.04% | -0.06% | -0.08% | 0.04% | -0.01% | |
| CAD | 0.03% | 0.06% | 0.03% | -0.03% | -0.06% | 0.06% | 0.02% | |
| AUD | 0.06% | 0.09% | 0.06% | 0.03% | -0.02% | 0.09% | 0.05% | |
| JPY | 0.08% | 0.10% | 0.09% | 0.05% | -0.01% | 0.12% | 0.08% | |
| NZD | -0.02% | 0.00% | -0.03% | -0.06% | -0.09% | -0.12% | -0.04% | |
| CHF | 0.01% | 0.04% | 0.01% | -0.02% | -0.05% | -0.08% | 0.05% |
The heat map shows percentage changes of major currencies against each other. The base currency is picked from the left column, while the quote currency is picked from the top row. For example, if you pick the Euro from the left column and move along the horizontal line to the Japanese Yen, the percentage change displayed in the box will represent EUR (base)/JPY (quote).
Australian Dollar FAQs
What key factors drive the Australian Dollar?
One of the most significant factors for the Australian Dollar (AUD) is the level of interest rates set by the Reserve Bank of Australia (RBA). Because Australia is a resource-rich country another key driver is the price of its biggest export, Iron Ore. The health of the Chinese economy, its largest trading partner, is a factor, as well as inflation in Australia, its growth rate and Trade Balance. Market sentiment – whether investors are taking on more risky assets (risk-on) or seeking safe-havens (risk-off) – is also a factor, with risk-on positive for AUD.
How do the decisions of the Reserve Bank of Australia impact the Australian Dollar?
The Reserve Bank of Australia (RBA) influences the Australian Dollar (AUD) by setting the level of interest rates that Australian banks can lend to each other. This influences the level of interest rates in the economy as a whole. The main goal of the RBA is to maintain a stable inflation rate of 2-3% by adjusting interest rates up or down. Relatively high interest rates compared to other major central banks support the AUD, and the opposite for relatively low. The RBA can also use quantitative easing and tightening to influence credit conditions, with the former AUD-negative and the latter AUD-positive.
How does the health of the Chinese Economy impact the Australian Dollar?
China is Australia’s largest trading partner so the health of the Chinese economy is a major influence on the value of the Australian Dollar (AUD). When the Chinese economy is doing well it purchases more raw materials, goods and services from Australia, lifting demand for the AUD, and pushing up its value. The opposite is the case when the Chinese economy is not growing as fast as expected. Positive or negative surprises in Chinese growth data, therefore, often have a direct impact on the Australian Dollar and its pairs.
How does the price of Iron Ore impact the Australian Dollar?
Iron Ore is Australia’s largest export, accounting for $118 billion a year according to data from 2021, with China as its primary destination. The price of Iron Ore, therefore, can be a driver of the Australian Dollar. Generally, if the price of Iron Ore rises, AUD also goes up, as aggregate demand for the currency increases. The opposite is the case if the price of Iron Ore falls. Higher Iron Ore prices also tend to result in a greater likelihood of a positive Trade Balance for Australia, which is also positive of the AUD.
How does the Trade Balance impact the Australian Dollar?
The Trade Balance, which is the difference between what a country earns from its exports versus what it pays for its imports, is another factor that can influence the value of the Australian Dollar. If Australia produces highly sought after exports, then its currency will gain in value purely from the surplus demand created from foreign buyers seeking to purchase its exports versus what it spends to purchase imports. Therefore, a positive net Trade Balance strengthens the AUD, with the opposite effect if the Trade Balance is negative.
- The Japanese Yen consolidates against the USD amid mixed fundamental cues.
- The softer Tokyo Core CPI, along with a positive risk tone, undermines the JPY.
- Subdued USD price action fails to provide impetus ahead of the US PCE data.
The Japanese Yen (JPY) ticks lower against its American counterpart during the Asian session on Friday after data showed that consumer inflation in Japan's national capital decelerated sharply in January. In fact, the Tokyo core Consumer Price Index (CPI) fell below the Bank of Japan's (BoJ) 2% target for the first time in nearly two years. This, in turn, validates policymakers' view that cost-push pressures will continue to ease in coming months and tempers expectations for an imminent shift in the central bank's policy stance. Adding to this, minutes of the December BoJ meeting revealed that board members agreed to patiently maintain the easy policy, which, along with the prevalent risk-on mood, undermines the JPY's relative safe-haven status.
Meanwhile, investors expect that another substantial round of pay hikes by Japanese firms could fuel consumer spending and demand-driven inflation. This could allow the BoJ to pivot away from its ultra-loose monetary policy settings and negative interest rates regime. Furthermore, geopolitics remains the biggest risk for the markets, which, along with the uncertain global economic outlook, helps limit losses for the JPY. Any meaningful appreciating move, however, seems elusive in the wake of the underlying bullish tone surrounding the US Dollar (USD), bolstered by reduced bets for an early interest rate cut by the Federal Reserve (Fed). This, in turn, warrants caution before placing aggressive directional bets around the USD/JPY pair.
Traders might also prefer to wait on the sidelines ahead of Friday's release of the US Personal Consumption Expenditures Price Index, due later during the early North American session. The crucial inflation data will play a key role in influencing the Fed's future policy decisions, which, in turn, will drive the USD demand in the near term and provide some meaningful impetus to the USD/JPY pair. Nevertheless, spot prices remain on track to post modest losses for the first week in the previous four as the focus now shifts to the highly-anticipated FOMC monetary policy meeting on January 30-31.
Daily Digest Market Movers: Japanese Yen traders seem non-committed ahead of US PCE Price Index
- The Japanese Yen remains depressed after the Statistics Bureau reported that the Tokyo core CPI, which excludes volatile fresh food prices, decelerated from 2.1% to 1.6% annualized pace in January, or the lowest in nearly two years.
- A core figure that excludes both volatile fresh food and energy prices and is closely watched by the Bank of Japan as a gauge of the underlying inflation rose by 3.1% from a year earlier as compared to the 3.5% rise in the prior month.
- Overall CPI inflation in Tokyo grew by a 1.6% YoY rate in January, down from a 2.7% increase in the previous month, also hitting its lowest level since March 2022 and dashing hopes for an imminent shift in the BoJ's policy stance.
- The minutes of the December BoJ meeting showed that board members agreed on the need to deepen the debate on the timing of an exit from its ultra-loose monetary policy, which, in turn, helps limit deeper losses for the JPY.
- Investors further scaled back expectations for a more aggressive policy easing by the Federal Reserve after data released on Thursday showed that the US economy grew at a faster-than-anticipated rate in the fourth quarter.
- The world's largest economy expanded at an annual rate of 3.3% during the September-December period, validating the view that the economy is in good shape and giving the Fed more headroom to keep rates higher for longer.
- Additional details of the report indicated that inflation pressures are receding and supported bets that the economy is likely to avoid a recession, dragging the US Treasury bond yields lower and capping gains for the US Dollar.
- Traders now look to the US Personal Consumption Expenditures Price Index for cues about the Fed's future policy decisions, which will drive the USD and provide a fresh impetus to the USD/JPY pair on the last day of the week.
Technical Analysis: USD/JPY extends its consolidative price move around the 100-day SMA support
From a technical perspective, spot prices, so far, have managed to defend the 100-day Simple Moving Average (SMA) pivotal support near the 147.55 region. Any further decline is more likely to attract some buyers near the 147.00 round figure, which should help limit the downside for the USD/JPY pair near the 146.45 area, or the weekly trough touched on Wednesday. Some follow-through selling, however, will shift the near-term bias in favour of bearish traders and pave the way for a slide towards the 146.10-146.00 horizontal support. The downward trajectory could extend further towards the 145.30-145.25 intermediate support en route to the 145.00 psychological mark
On the flip side, the 148.00 mark is likely to act as an immediate barrier ahead of the 148.20-148.25 region. The next relevant resistance is pegged near the 148.80 region, or a multi-week high touched last Friday, which if cleared will be seen as a fresh trigger for bullish traders. Given that oscillators on the daily chart are holding comfortably in the positive territory, the USD/JPY pair might then aim to surpass an intermediate hurdle near the 149.30-149.35 zone and reclaim the 150.00 psychological mark.
Japanese Yen price this week
The table below shows the percentage change of Japanese Yen (JPY) against listed major currencies this week. Japanese Yen was the strongest against the Euro.
| USD | EUR | GBP | CAD | AUD | JPY | NZD | CHF | |
| USD | 0.43% | -0.09% | 0.29% | 0.12% | -0.40% | 0.16% | -0.21% | |
| EUR | -0.43% | -0.52% | -0.15% | -0.32% | -0.83% | -0.27% | -0.63% | |
| GBP | 0.09% | 0.52% | 0.37% | 0.20% | -0.30% | 0.27% | -0.11% | |
| CAD | -0.29% | 0.15% | -0.37% | -0.16% | -0.68% | -0.11% | -0.49% | |
| AUD | -0.12% | 0.32% | -0.21% | 0.17% | -0.50% | 0.06% | -0.31% | |
| JPY | 0.39% | 0.82% | 0.34% | 0.67% | 0.51% | 0.56% | 0.19% | |
| NZD | -0.16% | 0.25% | -0.27% | 0.10% | -0.06% | -0.58% | -0.39% | |
| CHF | 0.21% | 0.63% | 0.12% | 0.48% | 0.31% | -0.20% | 0.36% |
The heat map shows percentage changes of major currencies against each other. The base currency is picked from the left column, while the quote currency is picked from the top row. For example, if you pick the Euro from the left column and move along the horizontal line to the Japanese Yen, the percentage change displayed in the box will represent EUR (base)/JPY (quote).
Japanese Yen FAQs
What key factors drive the Japanese Yen?
The Japanese Yen (JPY) is one of the world’s most traded currencies. Its value is broadly determined by the performance of the Japanese economy, but more specifically by the Bank of Japan’s policy, the differential between Japanese and US bond yields, or risk sentiment among traders, among other factors.
How do the decisions of the Bank of Japan impact the Japanese Yen?
One of the Bank of Japan’s mandates is currency control, so its moves are key for the Yen. The BoJ has directly intervened in currency markets sometimes, generally to lower the value of the Yen, although it refrains from doing it often due to political concerns of its main trading partners. The current BoJ ultra-loose monetary policy, based on massive stimulus to the economy, has caused the Yen to depreciate against its main currency peers. This process has exacerbated more recently due to an increasing policy divergence between the Bank of Japan and other main central banks, which have opted to increase interest rates sharply to fight decades-high levels of inflation.
How does the differential between Japanese and US bond yields impact the Japanese Yen?
The BoJ’s stance of sticking to ultra-loose monetary policy has led to a widening policy divergence with other central banks, particularly with the US Federal Reserve. This supports a widening of the differential between the 10-year US and Japanese bonds, which favors the US Dollar against the Japanese Yen.
How does broader risk sentiment impact the Japanese Yen?
The Japanese Yen is often seen as a safe-haven investment. This means that in times of market stress, investors are more likely to put their money in the Japanese currency due to its supposed reliability and stability. Turbulent times are likely to strengthen the Yen’s value against other currencies seen as more risky to invest in.
- USD/CAD drifts lower to 1.3472 amid the modest USD decline.
- US GDP expanded at a 3.3% annualized rate in the fourth quarter of 2023, stronger than expected.
- A rise in oil prices amid Middle East geopolitical tensions might lift the commodity-linked Loonie.
The USD/CAD pair trades in negative territory for the second consecutive day during the early Asian trading hours on Friday. The release of the Core Personal Consumption Expenditures Price Index (Core PCE) for December, the Fed’s preferred inflation measure, will be a closely watched event on Friday. At press time, USD/CAD is trading at 1.3472, losing 0.01% on the day.
The Commerce Department reported on Thursday that the US economy grew stronger than expected in the final three months of 2023. The Gross domestic product (GDP) grew at a 3.3% annualized rate in the fourth quarter of 2023, compared to 4.9% in the previous reading. In response to the upbeat data, US Treasury yields edged lower. The markets continued to reflect the Fed's chances to begin its first-rate cuts in May. According to the CME FedWatch Tool, the odds of a March cut stand at 47.4%.
Additionally, the Labor Department showed that the US Initial Jobless Claims for the week ending January 20 totaled 214,000 from 189,000 in the previous week, worse than the market expectation of 200,000. Continuing Claims rose to 1.833 million from the previous reading of 1.806 million.
On the Loonie front, the Bank of Canada (BoC) held its key overnight rate at 5.0% on Wednesday, keeping its benchmark the same for the fourth time in a row. Despite that potential shift in message from how high to how long, the BoC is not saying interest rates will be lower soon, given continued concern about inflation.
Meanwhile, the higher oil prices due to the geopolitical tensions in the Middle East and the disruption of shipping in the Red Sea might boost the commodity-linked Canadian Dollar (CAD).
Market players will keep an eye on the December Core Personal Consumption Expenditures Price Index (Core PCE) on Friday. Also, the Pending Home Sales will be released. These data could give a clear direction to the USD/CAD pair.
On Friday, the People’s Bank of China (PBoC) set the USD/CNY central rate for the trading session ahead at 7.1074 as compared to the previous day's fix of 7.1044 and 7.1733 Reuters estimates.
| Index | Change, points | Closed | Change, % |
|---|---|---|---|
| NIKKEI 225 | 9.99 | 36236.47 | 0.03 |
| Hang Seng | 312.09 | 16211.96 | 1.96 |
| KOSPI | 0.65 | 2470.34 | 0.03 |
| ASX 200 | 36.2 | 7555.4 | 0.48 |
| DAX | 17 | 16906.92 | 0.1 |
| CAC 40 | 8.56 | 7464.2 | 0.11 |
| Dow Jones | 242.74 | 38049.13 | 0.64 |
| S&P 500 | 25.61 | 4894.16 | 0.53 |
| NASDAQ Composite | 28.58 | 15510.5 | 0.18 |
The Bank of Japan (BoJ) Board members shared their views on monetary policy outlook and Yield Curve Control (YCC), per the BoJ Minutes of the December meeting.
Key quotes
“Members agreed must patiently maintain an easy policy.”
“Many members said must confirm a positive wage-inflation cycle in order to consider ending negative rates, YCC.”
“A few members said a decision on whether positive wage-inflation cycle is in place must be made comprehensively, not at looking at particular data.”
“A few members said don't see the risk of BOJ being behind the curve, can wait for developments in this spring's annual wage talks.”
“One member said even if wage hikes in 2024 overshoot expectations, risk of trend inflation sharply deviating 2% was small.”
“One member said Japan's inflationary pressure subsiding, important to carefully scrutinize wage, price moves.”
“One member said BOJ can spend ample time determining wage-inflation cycle as it has already addressed side-effects of YCC.”
“One member said the timing to normalize monetary policy was nearing.”
“One member said BOJ must not miss the opportunity to change policy to prevent rising inflation from hurting consumption.”
“This member said the risk of inflation rising too much and requiring sharp monetary tightening was small, but if this happens the cost would be enormous.”
“Members agreed what means, and what order, BOJ would end negative rates and YCC must be decided to look at the economy, price, market moves at the time.”
Market reaction
Following the BoJ Minutes, USD/JPY was up 0.04% on the day at 147.77.
Bank of Japan FAQs
What is the Bank of Japan?
The Bank of Japan (BoJ) is the Japanese central bank, which sets monetary policy in the country. Its mandate is to issue banknotes and carry out currency and monetary control to ensure price stability, which means an inflation target of around 2%.
What has been the Bank of Japan’s policy?
The Bank of Japan has embarked in an ultra-loose monetary policy since 2013 in order to stimulate the economy and fuel inflation amid a low-inflationary environment. The bank’s policy is based on Quantitative and Qualitative Easing (QQE), or printing notes to buy assets such as government or corporate bonds to provide liquidity. In 2016, the bank doubled down on its strategy and further loosened policy by first introducing negative interest rates and then directly controlling the yield of its 10-year government bonds.
How do Bank of Japan’s decisions influence the Japanese Yen?
The Bank’s massive stimulus has caused the Yen to depreciate against its main currency peers. This process has exacerbated more recently due to an increasing policy divergence between the Bank of Japan and other main central banks, which have opted to increase interest rates sharply to fight decades-high levels of inflation. The BoJ’s policy of holding down rates has led to a widening differential with other currencies, dragging down the value of the Yen.
Is the Bank of Japan’s ultra-loose policy likely to change soon?
A weaker Yen and the spike in global energy prices have led to an increase in Japanese inflation, which has exceeded the BoJ’s 2% target. Still, the Bank judges that the sustainable and stable achievement of the 2% target has not yet come in sight, so any sudden change in the current policy looks unlikely.
US Treasury Secretary Janet Yellen stated on Thursday that surprisingly strong economic growth in the fourth quarter was a "good thing" that indicates productivity gains and healthy spending without an increase in inflationary pressures.
Key quotes
"I see this as a good thing, reflective of strong, healthy spending and productivity improvements and not, most likely, creating an inflationary challenge.”
“Q4 GDP data driven by strong, healthy spending' and productivity improvements.”
"It may be that we're having a period of more rapid productivity growth than we've seen as a long-run average in recent years for the US.”
"Some goods prices are falling and there is continued moderation in wage growth, which is important for controlling the prices of services."
"It is unclear if recent productivity gains are temporary, too soon to speculate on the impact of artificial intelligence on productivity."
"To me, more output is a good thing if it doesn't signal worrisome pressures in the labor market.”
Market reaction
These comments do not seem to have a major influence on risk mood. As of writing, the US Dollar Index (DXY) is trading at 103.53, adding 0.05% on the day.
Inflation FAQs
What is inflation?
Inflation measures the rise in the price of a representative basket of goods and services. Headline inflation is usually expressed as a percentage change on a month-on-month (MoM) and year-on-year (YoY) basis. Core inflation excludes more volatile elements such as food and fuel which can fluctuate because of geopolitical and seasonal factors. Core inflation is the figure economists focus on and is the level targeted by central banks, which are mandated to keep inflation at a manageable level, usually around 2%.
What is the Consumer Price Index (CPI)?
The Consumer Price Index (CPI) measures the change in prices of a basket of goods and services over a period of time. It is usually expressed as a percentage change on a month-on-month (MoM) and year-on-year (YoY) basis. Core CPI is the figure targeted by central banks as it excludes volatile food and fuel inputs. When Core CPI rises above 2% it usually results in higher interest rates and vice versa when it falls below 2%. Since higher interest rates are positive for a currency, higher inflation usually results in a stronger currency. The opposite is true when inflation falls.
What is the impact of inflation on foreign exchange?
Although it may seem counter-intuitive, high inflation in a country pushes up the value of its currency and vice versa for lower inflation. This is because the central bank will normally raise interest rates to combat the higher inflation, which attract more global capital inflows from investors looking for a lucrative place to park their money.
How does inflation influence the price of Gold?
Formerly, Gold was the asset investors turned to in times of high inflation because it preserved its value, and whilst investors will often still buy Gold for its safe-haven properties in times of extreme market turmoil, this is not the case most of the time. This is because when inflation is high, central banks will put up interest rates to combat it.
Higher interest rates are negative for Gold because they increase the opportunity-cost of holding Gold vis-a-vis an interest-bearing asset or placing the money in a cash deposit account. On the flipside, lower inflation tends to be positive for Gold as it brings interest rates down, making the bright metal a more viable investment alternative.
| Pare | Closed | Change, % |
|---|---|---|
| AUDUSD | 0.65851 | 0.2 |
| EURJPY | 160.168 | -0.14 |
| EURUSD | 1.08471 | -0.33 |
| GBPJPY | 187.687 | 0.1 |
| GBPUSD | 1.27106 | -0.06 |
| NZDUSD | 0.61105 | 0.08 |
| USDCAD | 1.34686 | -0.33 |
| USDCHF | 0.86694 | 0.5 |
| USDJPY | 147.663 | 0.16 |
- GBP/USD flat-lines near 1.2707 in Friday’s early Asian session.
- US Gross Domestic Product (GDP) expanded by 3.3% in Q4 vs. 4.9% prior, better than expected.
- The Bank of England (BoE) is expected begin its rate-cutting cycle at its August meeting.
The GBP/USD pair trades on a flat note above the 1.2700 psychological mark during the early Asian trading hours on Friday. The upbeat US GDP growth numbers boosted the Greenback aganist its rivals. The markets might turn cautious ahead of the Fed’s preferred inflation measure, Core Personal Consumption Expenditures Price Index (Core PCE), due later on Friday. GBP/USD currently trades around 1.2707, gaining 0.01% on the day.
On Thursday, the US Gross Domestic Product (GDP) data expanded by 3.3% in the last quarter of 2024 from 4.9% recorded in the July-September quarter, above the market consensus of 2.0%. The Initial Jobless Claims rose 25K to 214K in the week ended January 20 from the previous week of 189K. Finally, the Fresh orders for Durable Goods were stagnant in Decemebr against expaectations of 1.1%.
Traders will take more cues from the December Core PCE reports. If the data remain strong, there is room for Fed funds future pricing to converge towards the FOMC’s projections for only three cuts this year. This, in turn, might boost the Greenback and acts as a headwind for GBP/USD.
The Bank of England (BoE) is widely anticipated to maintain interest rates steady at 5.25% for the fourth time in a row next week. The markets anticipate that BoE rate cuts is likely to begin in August. Investors expect policy rate will be cut by 175 basis points (bps) through the cycle, reaching 4.50% by December 2024 and 3.50% by mid-2025.
Moving on, traders will monitor the UK GfK Consumer Confidence for January. The attention will turn to the US Core Personal Consumption Expenditures Price Index (Core PCE) later on Friday, which is expected to rise 0.2% MoM and 3.0% YoY. Trader will take cues from these figures and find trading opportunities around the GBP/USD pair.


© 2000-2026. Уcі права захищені.
Cайт знаходитьcя під керуванням TeleTrade DJ. LLC 2351 LLC 2022 (Euro House, Richmond Hill Road, Kingstown, VC0100, St. Vincent and the Grenadines).
Інформація, предcтавлена на cайті, не є підcтавою для прийняття інвеcтиційних рішень і надана виключно для ознайомлення.
Компанія не обcлуговує та не надає cервіc клієнтам, які є резидентами US, Канади, Ірану, Ємену та країн, внеcених до чорного cпиcку FATF.
Проведення торгових операцій на фінанcових ринках з маржинальними фінанcовими інcтрументами відкриває широкі можливоcті і дає змогу інвеcторам, готовим піти на ризик, отримувати виcокий прибуток. Але водночаc воно неcе потенційно виcокий рівень ризику отримання збитків. Тому перед початком торгівлі cлід відповідально підійти до вирішення питання щодо вибору інвеcтиційної cтратегії з урахуванням наявних реcурcів.
Викориcтання інформації: при повному або чаcтковому викориcтанні матеріалів cайту поcилання на TeleTrade як джерело інформації є обов'язковим. Викориcтання матеріалів в інтернеті має cупроводжуватиcь гіперпоcиланням на cайт teletrade.org. Автоматичний імпорт матеріалів та інформації із cайту заборонено.
З уcіх питань звертайтеcь за адреcою pr@teletrade.global.
переклади