- Аналітика
- Новини та інструменти
- Новини ринків
Новини ринків
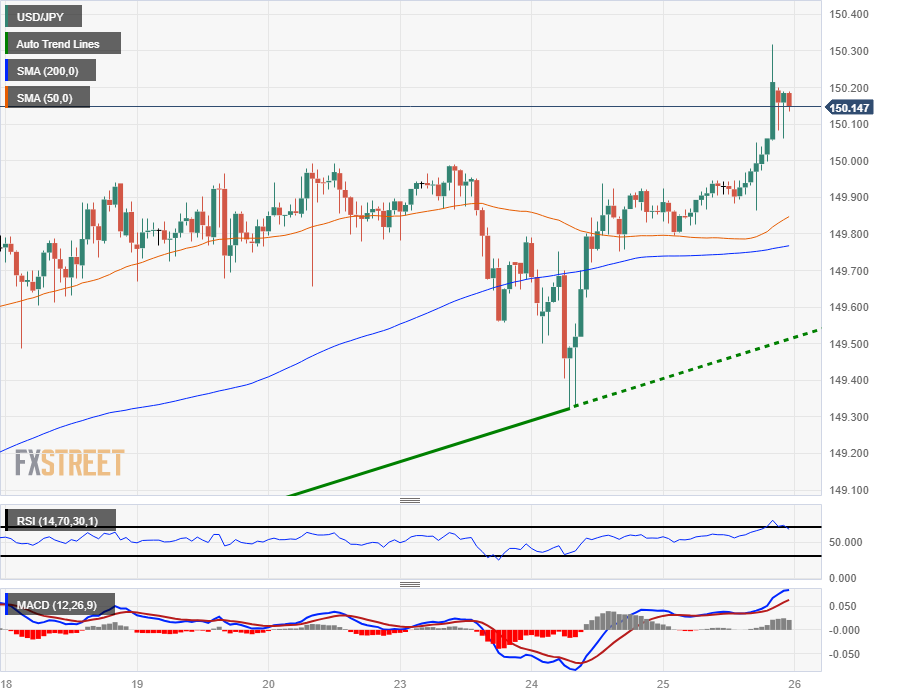
- The USD/JPY has set a new 12-month high early Thursday, tipping over 150.30 as the Yen recedes further.
- US Treasuries continue to push into 16-year highs, bolstering the US Dollar.
- 150.00 remains a critical level for the USD/JPY, a historical defensive level for the BoJ.
The USD/JPY ripped into a twelve-month high above 150.30 late Wednesday as markets continue to test the Bank of Japan's (BoJ) resolve at defending the 150.00 handle, a level that has seen the BoJ draw a line in the sand on multiple occasions in the past.
The US Dollar continues to get a boost from broad-market risk aversion, coupled with rising US Treasury yields that continue to knock into 16-year highs. The 10-year T-note settled at 4.957% on Wednesday, a yield that the 10-year Treasury bond hasn't seen since early 2007.
The Bank of Japan (BoJ) remains one of the only major central banks that hasn't raised interest rates meaningfully over the last two years in a bid to stoke additional long-run inflation in Japan, but the Japanese central bank still fears that inflation pressures within Japan's economy may undershoot their 2% target.
Wall Street investors are banking on a change in the BoJ's strategies, possibly as soon as their next meeting, which could involve the BoJ abandoning their yield curve control mechanism, or their negative-rate short-term rate regime.
Friday's Asia market session will see another round of Japanese inflation data, with the Tokyo Consumer Price Index (CPI) slated for 23:30 GMT Thursday.
The Core Tokyo CPI (headline inflation less volatile food prices) is expected to hold steady at 2.5% for the year into October, and investors will be keeping a close eye on the CPI inflation print to see if the BoJ will get punished into making policy adjustments soon.
USD/JPY Technical Outlook
The USD/JPY rallied into 150.32 late Wednesday, knocking into a new high for 2023 and knocking on the pair's highest bids in twelve months.
Despite the Dollar-fueled pump, the pair is trading back below 150.20 heading into Thursday's Asia trading session.
The USD/JPY is now trading into no-man's-land, with little technical resistance above to mark in meaningful boundaries, but the pair's long term bullish stance for the majority of 2023 sees little in the way of technical support outside of the 50-day Simple Moving Average (SMA) currently lifting into 148.00, while the 200-day SMA languishes near 140.00, far below current price action.
USD/JPY Hourly Chart
USD/JPY Technical Levels
- AUD/USD extends its downside following RBA Governor Bullock's speech.
- Reserve Bank of Australia (RBA) Governor said CPI was higher than expected, but was about where it would come.
- The September’s US New Home Sales rose to 759,000 MoM, above the market consensus of 680,000.
- Market players await the first US Q3 Gross Domestic Product estimate, Initial Jobless Claims, and Durable Goods Orders.
The AUD/USD pair attracts some sellers during the early Asian trading hours on Thursday. The pair breaks below the 0.6300 mark and currently trades around 0.6290, losing 0.28% for the day. The risk-off sentiment and a firmer US Dollar (USD) exert pressure on the pair.
Early Thursday, Reserve Bank of Australia (RBA) Governor Michele Bullock stated that CPI was a little higher than expected, but it was about where we thought it would come. Bullock added that the central bank aims to slow the economy without tipping it into recession.
The Australian Consumer Price Index (CPI) arrives at 1.2% QoQ in the third quarter of 2023 versus the 0.8% increase seen in the second quarter. The market consensus was for a rise of 1.1% in the reported period. On an annual basis, CPI inflation rose to 5.4% in Q3 2023, against the expected 5.3% increase and the previous print of 6.0%.
On the US Dollar front, September’s New Home Sales in the US increased to 759,000 MoM, above the market consensus of 680,000. The upside of the Greenback is bolstered by the higher US Treasury yields and a risk-off mood. Meanwhile, the US Treasury bond yields edge higher, with the 10-Y US Treasury yield surging to 4.96%.
Additionally, geopolitical risks will continue to boost safe-haven flows. Early Thursday, Prime Minister Benjamin Netanyahu said Israel is preparing for a ground assault in Gaza and the timing of the invasion will be reached by consensus.
Moving on, the Australian Export and Imports Price Index for the third quarter (Q3) is scheduled to be released in the Asian session on Thursday. Market participants will closely monitor the first Q3 Gross Domestic Product estimate on Thursday, which is expected to show a 4.2% expansion. Also, Initial Jobless Claims and Durable Goods Orders will be released.
- EUR/JPY extended its losses for two consecutive days, hitting an average daily range of 43 pips.
- Key resistance levels include the 159.00 mark and the October 24 daily high of 159.91.
- On the downside, support is found at the Tenkan-Sen level at 158.45, followed by the top of the Kumo at 157.90/80.
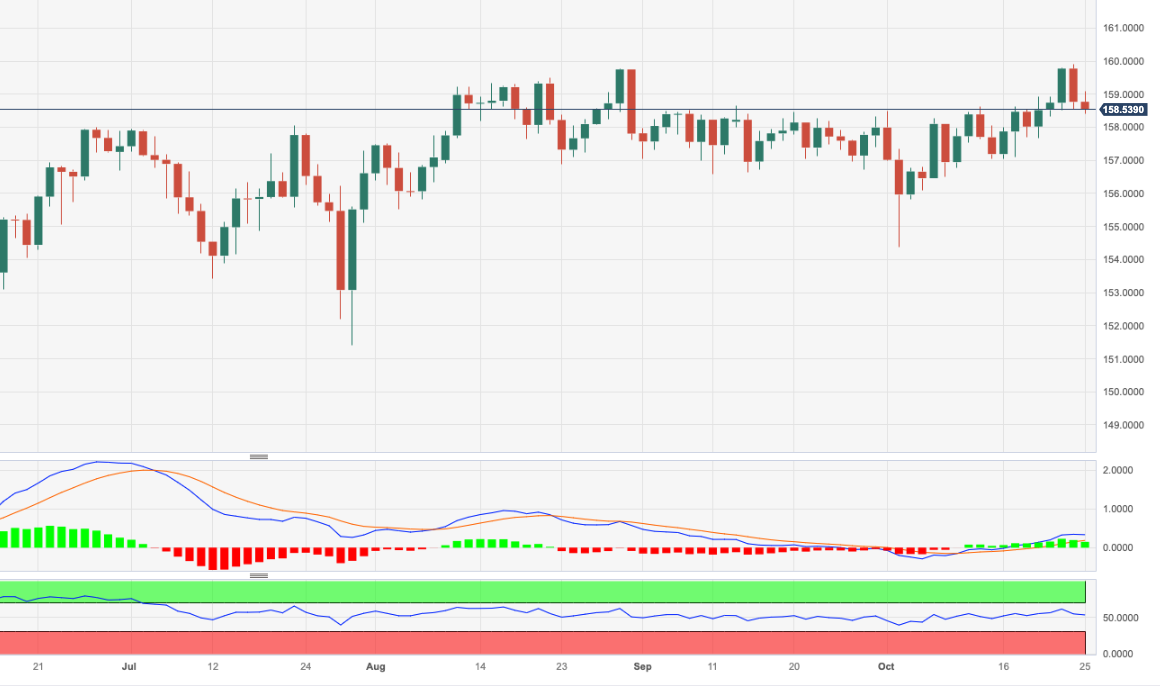
EUR/JPY extended its losses for two straight days on Wednesday, capped by the Tenkan-Sen level at 158.45, which, acting as support, halted the pair losses. Volatility in the asset was drained as the cross-pair hit an average daily range (ADR) of 43 pips. Therefore, the EUR/JPY could remain sideways, trading at 158.66 as the Asian session begins.
The lack of direction keeps the EUR/JPY pair range-bound, though slightly tilted to the upside. That is because price action is above the Ichimoku Cloud (Kumo). Hence, the first resistance would be the 159.00 mark, followed by the October 24 daily high at 159.91. A breach of the latter, and the pair might trade above 160.00.
On the other hand, the EUR/JPY first support would be the Tenkan-Sen at 158.45. If sellers manage to hurdle that level, the next floor would be the top of the Kumo at 157.90/80, followed by the Kijun-Sen at 157.13. A breakout of that price level and the bottom of the Kumo would be next at 155.60.
EUR/JPY Price Action – Daily chart

EUR/JPY Technical Levels
The Reserve Bank of Australia (RBA) Governor Michele Bullock stated earlier Thursday that CPI was a little higher than expected, but about where we thought it'd be
Key quotes
“The CPI was a little higher than we expected.”
“But CPI was about where we thought it would come.”
“Goods prices coming down, but services inflation remains persistent.”
“Services inflation is higher than what we are comfortable with.”
“Will have to build this into our forecasts.”
“The longer inflation remains outside target band the more likely inflation expectations change.”
“RBA has always had a low tolerance for inflation.”
“RBA aims to slow the economy without tipping it into recession.”
Market reaction
The Australian Dollar (AUD) faces some selling pressure following the RBA Governor Bullock speech. At the press time, the AUD/USD pair is losing 0.31% on the day to trade at 0.6289.
- EUR/USD faces some selling pressure amid the cautious mood, higher US Treasury yields.
- The US New Home Sales increased to 759,000 MoM in September, better than expected.
- European Central Bank (ECB) is likely to keep interest rates unchanged on Thursday.
- Investors will closely watch the ECB rate decision, ECB President Lagarde’s speech, and US Q3 growth numbers.
The EUR/USD pair resumes its downside path after retracing from the 1.0600 area during the early Asian session on Thursday. Markets turn cautious on the escalating tension in the Middle East ahead of the European Central Bank (ECB) interest rate decision on Thursday, with no change in rate expected. The major pair currently trades around 1.0567, gaining 0.01% on the day.
That being said higher US Treasury yields and risk-off mood boost the US Dollar (USD) broadly. The September’s New Home Sales in the US increased to 759,000 MoM, above the market consensus of 680,000.
Furthermore, the Middle East conflicts might cap the upside of the pair and boost safe-haven assets like the Greenback. Israel agreed to delay the invasion of Gaza. Prime Minister Benjamin Netanyahu said that a ground invasion is being prepared.
On the other hand, the Eurozone economic data suggested a negative outlook in the region, which exerts pressure on the Euro (EUR). On Tuesday, the preliminary Composite PMI for the eurozone fell to 46.5 in October from 47.2 in September. It was the sixth consecutive reading below 50, indicating an ongoing downturn. Meanwhile, the Manufacturing PMI dropped to 43.0 from 43.4 in the previous reading, and the Services PMI declined from 48.7 versus 47.8 prior.
European Central Bank policymaker Gabriel Makhlouf said on Tuesday that the central bank will monitor the unfolding crisis in the Middle East while mentioning that it was too early to assess the impact on economies.
Investors will keep an eye on the ECB monetary policy meeting later on Thursday, which is expected to keep interest rates unchanged. The markets anticipate that the ECB is unlikely to raise any rate in the near future. The attention will shift to ECB President Christine Lagarde's forward guidance following the meeting.
On the US docket, the first Q3 Gross Domestic Product estimate will be due on Thursday, which is expected to show a 4.2% expansion. Also, Initial Jobless Claims and Durable Goods Orders will be released. These figures could give a clear direction to the EUR/USD pair.
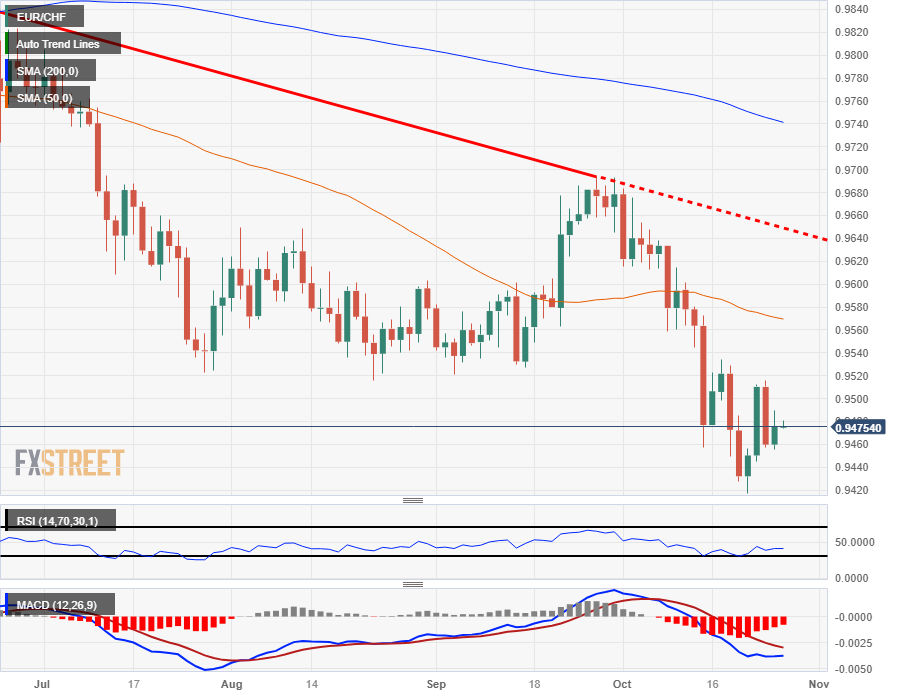
- The EUR/CHF is grinding higher heading into Thursday, in play around 0.9475.
- Swiss business sentiment worsened, helping to keep the Euro in play above 0.9450.
- Up Next: ECB rate call, Monetary Policy Statement.
The EUR/CHF is floating into the top side heading into Thursday trading, and the pair caught a brief lift into 0.9490 before falling back into Wednesday's range, and the pair now gears up for another showing from the European Central Bank (ECB).
Swiss business confidence is declining according to the ZEW Expectations Survey for October, which worsened from -27.6 to -37.8.
Economic conditions continue to deteriorate across the European continent, and Euro (EUR) traders are gearing up for another showing from the ECB on Thursday, which will be dropping their latest rate call and Monetary Policy Statement during the European market session.
The ECB is broadly expected to keep rates steady where they are for the time being, but as ECB President Christine Lagarde noted recently during a television interview in Greece, the fight against inflation isn't over yet, but President Lagarde and the other policymakers at the ECB remains confident they will see inflation return to 2%i at some point in the future.
EUR/CHF Technical Outlook
Despite Wednesday's mild rebound, the Euro remains firmly planted in bear country against the Swiss Franc, with the pair caught near yearly lows currently marked in at 0.9420. A resistance zone from 0.9520 to 0.9600 will complicate matters for any bulls that try to jumpstart a trend reversal, and a break below last November's lows near 0.9409 will see the EUR/CHF making new all-time lows.
EUR/CHF Daily Chart
EUR/CHF Technical Levels
- USD/CHF gained 0.41% in Wednesday's session, as the pair has rallied on two of the last three trading days.
- Key resistance levels for buyers to regain control include the 50-DMA at 0.8972 and the 200-DMA at 0.9007.
- On the downside, sellers must crack the latest cycle low at 0.8887 to resume the downtrend, with potential targets at 0.8745 and 0.8689.
The USD/CHF climbs towards the 50-day moving average (DMA), finishing Wednesday’s session with gains of 0.41%, though it failed to achieve a daily close above the 50-DMA, leaving the pair exposed to selling pressure. As the Asian session begins, the USD/CHF trades at 0.8966, down a minimal 0.01%.
The major has rallied on two of the last three trading days, registering weekly gains of 0.50%, though it buyers would like to regain control, they must clear key resistance levels above the current exchange rate. Firstly, the 50-DMA at 0.8972, and then the 200-DMA at 0.9007. A decisive break would expose the October 12 high at 0.9088, before the USD/CHF aims to 0.9100.
On the flip side, if USD/CHF sellers want to resume the impending downtrend, they must crack the latest cycle low at 0.8887. Once cleared, the pair could dive toward the key support level at 0.8745, the August 30 low, before heading toward the August 10 swing low of 0.8689.
USD/CHF Price Action – Daily chart

USD/CHF Key Technical Levels
- EUR/JPY was seen in the 158.93 - 158.70 range, trading relatively quiet.
- Indicators exhibit signs of bullish exhaustion.
- Fundamentals may favour the JPY in the next sessions.
In Wednesday’s session, the EUR/JPY consolidated Tuesday losses and traded in a narrow range after declining by 0.65% on Tuesday and clearing all Monday gains. At the beginning of the week, the cross jumped to a multi-year high of 159.90, it highest level since 2008, but the buyers are struggling to hold that momentum.
On the daily chart, there is a neutral to bearish technical outlook as the bulls are losing traction. The Relative Strength Index (RSI) turned flat in positive territory, while the Moving Average Convergence (MACD) displays lower green bars. Furthermore, the cross has continued side-ways trading since late July in the 154.00 - 160.00 range, with both parties struggling to make a move beyond those levels. However, on the broader scale, the pair is above the 20,100,200-day Simple Moving Average (SMA), highlighting the continued dominance of bulls.
That being said, the JPY could get additional momentum as higher Japanese government bond yields amid monetary policy tweak speculations could act as a catalyst and revive the buying momentum. On Thursday, the European Central Bank (ECB) announces its monetary policy decision which could also provide impetus to the pair.
Support levels: 158.50, 158.00, 157.00.
Resistance levels: 159.00, 159.50, 160.00.
EUR/JPY Daily Chart
-638338659974166768.png)
- The EUR/GBP is seeing a topside push into recent highs as the Pound Sterling swoons against the Euro.
- Mixed data for both the EU and the UK leave markets forced to pick a winner.
- Up Next: ECB rate call, Monetary Policy Statement in the pipe for Thursday.
The EUR/GBP is testing back into near-term highs above the 0.8700 handle, with the Euro (EUR) tipping into an intraday peak against the Pound Sterling (GBP) above 0.8725 rounding the corner into the Thursday market session.
The Euro is recovering from a downside stall against the Pound Sterling after Tuesday's Purchasing Managers' Index (PMI) figures for both the EU and the UK left much to be desired, but the Euro is catching some bids to recover ground heading into Thursday's European Central Bank (ECB) Monetary Policy Statement and rate call.
ECB Preview: Forecasts from 11 major banks, good moment to pause
The ECB is broadly expected to hold its main refinancing operations rate at 4.5%, and investors will be looking to the following ECB press conference for any hints about the ECB's path forward on their rate cycle outlook.
The ECB is caught between a rock and a hard place, as inflationary pressures remain elevated despite drastic and rapid rate changes from the central bank, but further rate hikes risk sending a cold shot through the European economy, which is already facing cracks around the seams and faltering growth indicators.
EUR/GBP Technical Outlook
the EUR/GBP's rebound on Wednesday sees the pair pushing further north from the 200-day Simple Moving Average (SMA) currently testing down below 0.8700, and a break above last week's top at 0.8740 will see the EUR/GBP etching in new five-month lows.
On the down side, the EUR/GBP has a floor built in from the last swing low near 0.8620, where there's a confluence of technical support from the 50-day SMA near the same level but tilted bullish.
EUR/GBP Daily Chart

EUR/GBP Technical Levels
The highlight of the Asian session will be RBA Bullock's appearance before the Senate Economics Legislation Committee. Later in the day, the European Central Bank will announce its monetary policy decision, and the US will release critical economic data, including Q3 GDP and Jobless Claims.
Here is what you need to know on Thursday, October 26:
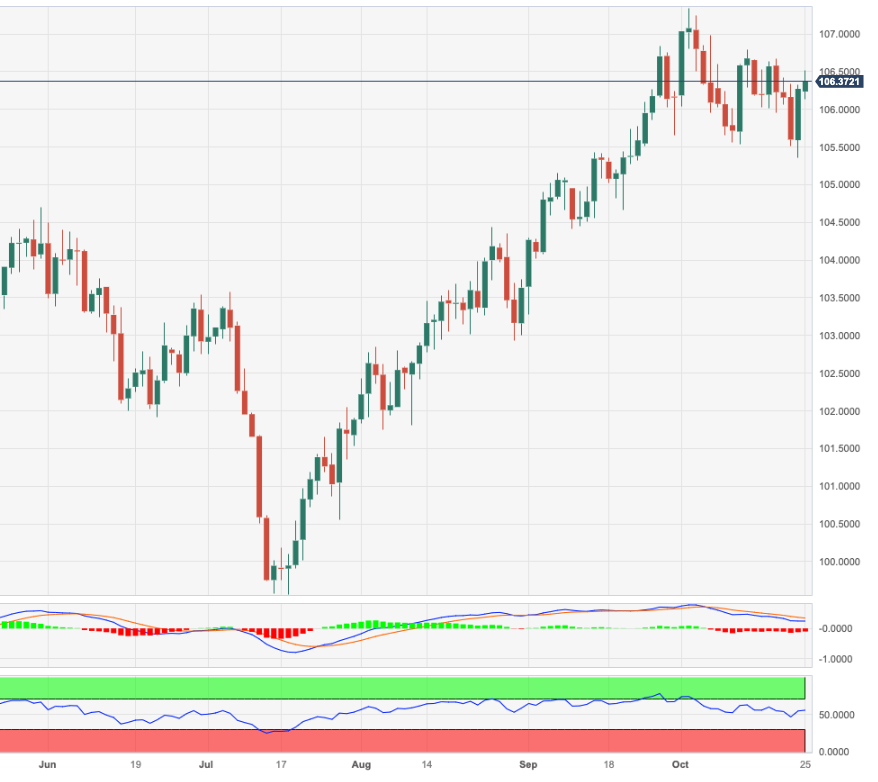
The US Dollar Index (DXY) rose for the second consecutive day, rising above 106.50, the highest level since last Friday. The Greenback received a boost from higher Treasury yields and deteriorating market sentiment following the latest round of earnings results. The Dow Jones dropped 0.32%, and the Nasdaq lost 2.43%. The 10-year Treasury yield rose to 4.94%.
Israel agreed to delay the invasion of Gaza. Prime Minister Benjamin Netanyahu stated that they are preparing for a ground invasion. Following these comments, crude oil prices rebounded, and WTI rose above $85.00.
Data from the US showed a surprising increase in New Home Sales in September, reaching 759,000 (annual rate), surpassing the market consensus of 680,000.
Key data is due from the US on Thursday. The first Q3 Gross Domestic Product estimate is expected to show a 4.2% expansion. Additionally, reports such as the Core Personal Consumption Expenditure Price Index, Initial Jobless Claims, and Durable Goods Orders will be released. These numbers are likely to have an impact on the market, the US Dollar, and expectations regarding Federal Reserve (Fed) monetary policy. Moves in the bond market could also influence XAU/USD. If US data continues to indicate a robust economy, the US Dollar could benefit.
EUR/USD rose above 1.0600 but subsequently declined towards 1.0560. The pair continues to face downward pressure, although it remains above a short-term uptrend line. The European Central Bank (ECB) is expected to keep interest rates unchanged on Thursday. The focus will be on ECB President Christine Lagarde's forward guidance. With the Eurozone heading towards a recession and inflation indicators slowing down, it is unlikely that there will be any rate hikes in the near future.
ECB Preview: Forecasts from 11 major banks, good moment to pause
GBP/USD recorded its lowest daily close since October 3, just above 1.2100. The British Pound also weakened against the Euro on expectations that the Bank of England (BoE) will maintain unchanged interest rates.
USD/JPY broke above 150.00 and is surging, potentially attracting the attention of Japanese officials. This development may lead to increased volatility in Yen's crosses over the following hours.
USD/CAD jumped to its highest level since March, moving towards 1.3800, following the Bank of Canada (BoC) meeting. The BoC kept its key rate unchanged at 5% but maintained a tightening bias. The Bank's inflation forecast indicates that it expects inflation to reach the 2% target by the end of 2025, slightly later than its previous projection of mid-2025.
Analysts at Wells Fargo on BoC and CAD:
We believe the BoC's interest rate pause will be an interest rate peak. Given we forecast slower growth and inflation than the central bank, we expect policy rate to hold steady for an extended period, before rate cuts begin in Q2-2024. As Canadian growth remains subdued and in the absence of further BoC tightening, we also see potential for further Canadian dollar weakness over the next several months.
The Australian Dollar rose during the Asian session following higher-than-expected Australian inflation data but later retraced its gains. AUD/NZD reached a five-week high at 1.0915 before turning lower and falling to 1.0860. AUD/USD reached weekly highs at 0.6400 and then reversed sharply, falling toward 0.6300. On Thursday, Reserve Bank of Australia (RBA) Governor Michele Bullock will appear before the Senate Economics Legislation Committee. Later in the day, the Export and Import Price Index is scheduled to be released.
Analysts at TD Securities:
Q3 CPI data handily beat the RBA's and analyst forecasts. Along with the Q2 trimmed mean measure being revised up and strong signs of domestic inflation, there is now a clear signal for monetary policy to respond. We now expect the RBA to hike 25bps at next month's meeting to 4.35% on the target cash rate. We believe failing to act could harm the RBA's credibility. The possibility of the RBA delivering a subsequent hike in 2024 cannot be ruled out.
The Central Bank of the Republic of Turkey (CBRT) is scheduled to meet on Thursday, and the consensus points to another 500 basis points rate hike, bringing the interest rate to 35%. USD/TRY has reached a new record high, closing above 28.00.
Gold regained momentum despite higher yields and tested levels above $1,980. Meanwhile, Silver failed to reclaim the $23.00 level.
Like this article? Help us with some feedback by answering this survey:
- Gold price (XAU/USD) hits a new weekly high of $1987.25, gaining more than 0.56%
- US economic data shows business activity is gaining traction, with New Home Sales soaring more than 12% in September.
- The US 10-year Treasury bond yield gains 13 basis points at 4.95%.
- Gold traders eye upcoming US economic data, including Q3 GDP, Durable Good Orders, and unemployment claims.
Gold price (XAU/USD) snaps two days of losses and hits a new weekly high of $1987.25, despite rising US Treasury bond yields, which are usually a headwind for the yellow metal. At the time of writing, the non-yielding metal extends its gains of more than 0.56%, changing hands at $1981.67 a troy ounce.
Gold prices defy headwinds from rising US Treasury bond yields and a strong US Dollar, reaching a new weekly high
Even though US Treasury bond yields remain higher, XAU/USD has gained traction pm Wednesday. The latest round of economic data in the United States (US) shows that business activity is gaining traction, as revealed by S&P Global PMIs on Tuesday. That and New Home Sales smashing August’s figures, with sales soaring more than 12%, were the two fundamental reasons behind the rise in the Greenback.
As the Wall Street close looms, the US 10-year Treasury bond yield gains 13 basis points and sits at 4.95%, while the US Dollar Index (DXY) climbs 0.29%, at 106.55. However, Gold prices seem immune to recent US Dollar strength, as the XAU/USD reached a weekly high above $1985.
In addition to that, geopolitical risks remained, after the Israeli Prime Minister Benjamin Netanyahu stated that preparations for a ground invasion were underway. However, he did not provide specific details regarding the operation. Netanyahu advised civilians in Gaza to move to the south and mentioned that the timing of the invasion would be determined by consensus.
Given the fundamental backdrop, Gold could remain upward biased, but October’s 26 data could rock the boat. The US agenda would feature Gross Domestic Product (GDP) for Q3, alongside Durable Good Orders and unemployment claims. If the data is dollar-supportive and could trigger a repricing for further interest rate hikes by the Federal Reserve (Fed), then Gold prices could dip. Otherwise, expect further XAU/USD upside.
XAU/USD Price Analysis: Technical outlook
Gold is upward biased after reclaiming the 200-day moving average (DMA) at $1931.973, though it could remain sideways, following a more than 8% rally from October lows towards $1997. If XAU/USD manages to reclaim $1990, that could open the door to challenging $2000. On the flip side, if Gold prices drop below the current week’s low of $1953.69, the next support will emerge at the 200-DMA, followed by the 100-DMA at $1923.07.

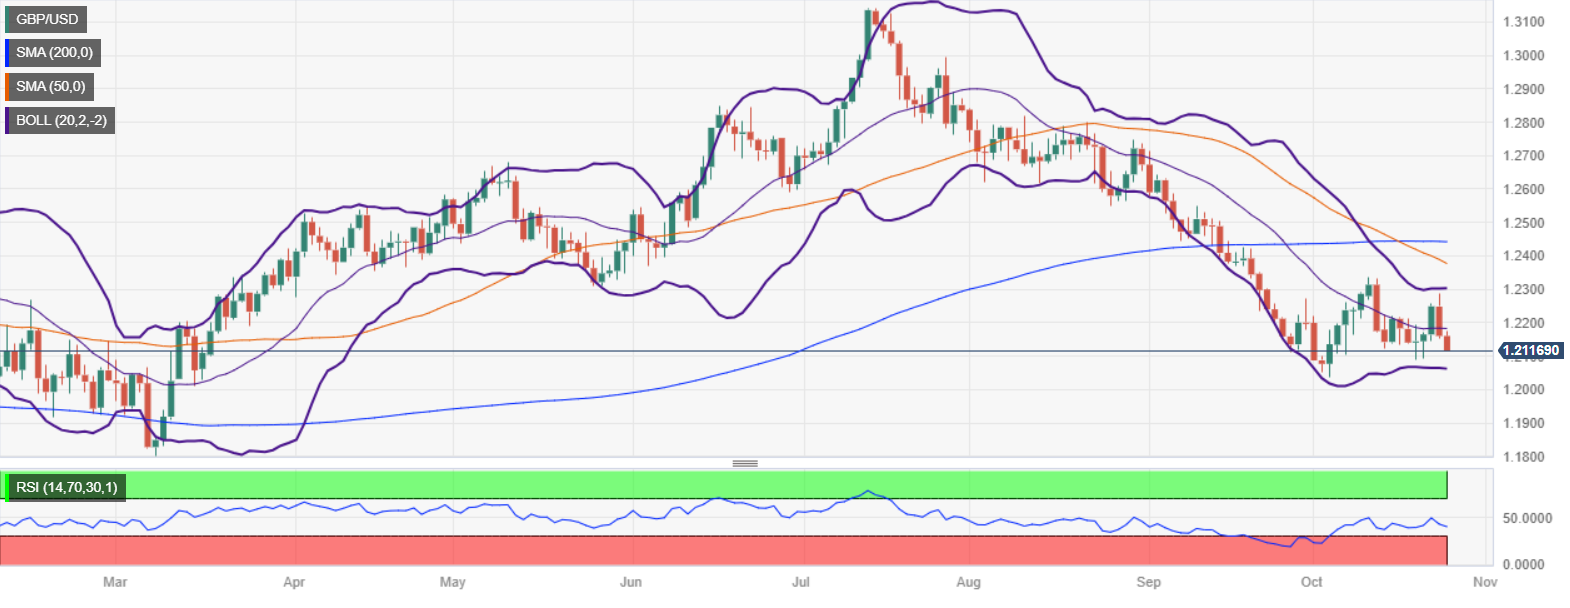
- GBP/USD reached a three-day low of 1.2113, as sellers target 1.2100 for the next support.
- US economic data paints a solid economy, with New Home Sales rising 12.3% in September.
- UK data shows Manufacturing PMI remains in recessionary territory, and the labor market is easing.
GBP/USD prolonged its losses for two consecutive days after the pair reached a two-week high of 1.2288 but failed to crack the 1.2300 mark. Fundamental news and geopolitical risks weighed on the Pound Sterling (GBP). At the time of writing, the pair trades at 1.2116, down 0.35%.
Geopolitical risks and weak UK data, a headwind for the GBP/USD
Risk aversion continues to drive the financial markets. Newswires revealed that Israeli Prime Minister Benjamin Netanyahu is preparing its army for a ground offensive, recommending civilians in Gaza to head south. He added he would not give details, and the time of the invasion would be reached by consensus.
Earlier in the New York session, US economic data continued to paint a solid economy in the country. The US Census Bureau revealed that New Home Sales were above August’s figures, with September sales rising 12.3%, compared to the former -8.2% plunge. On Tuesday, S&P Global revealed that business activity in manufacturing and services continues to expand despite 525 bps of tightening by the US Federal Reserve (Fed).
The Pound Sterling (GBP) remains on the backfoot after S&P Global reported that Manufacturing PMI remains in recessionary territory, while employment data indicates the labor market is easing. Growing speculations that the Bank of England (BoE) would keep rates unchanged at 5.25% at the upcoming November 2 meeting increased
Overall, the GBP/USD could extend its losses towards the 1.20 handle, as the economy docket in the United States (US) would feature Q3 Gross Domestic Product (GDP), Durable Good Orders, and unemployment claims. If US GDP comes above expectations, that could trigger further downside on the GBP/USD.
GBP/USD Price Analysis: Technical outlook
The GBP/USD remains downward biased, and it could accelerate its downtrend once it breaks below the October 19 low of 1.2089. A breach of the latter will expose October’s low of 1.2037 before the pair tests March 15 low of 1.2010. Conversely, if the major remains above 1.2100, that could keep buyers hopeful of reclaiming 1.2200.
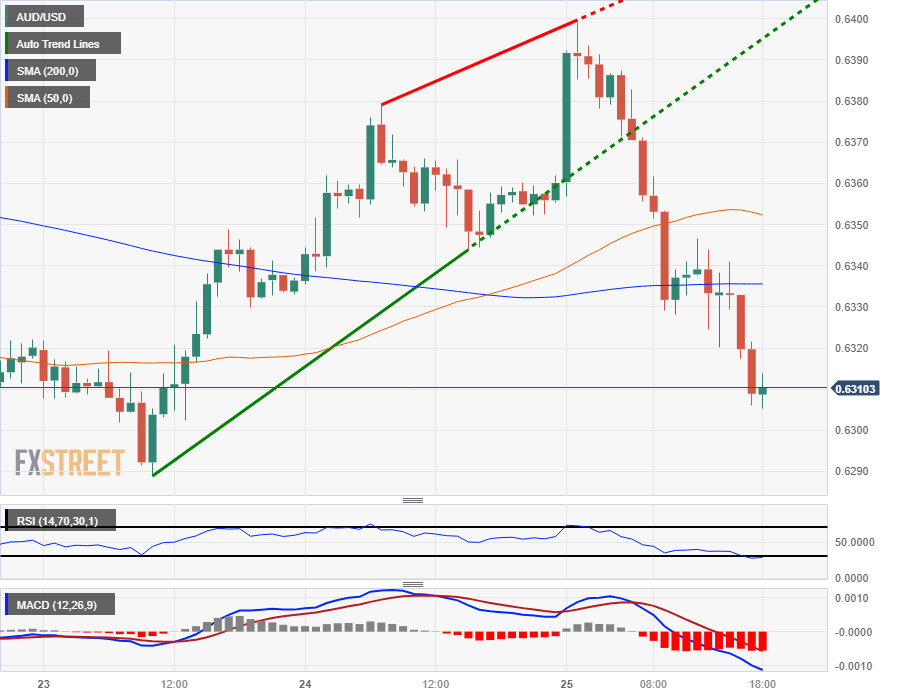
- The AUD/USD is backsliding on Wednesday, tumbling over 90 pips from the day's early peak.
- Further red is on the cards as broad-market risk appetite sours, sending the USD higher.
- Aussie inflation risks are increasing, and the RBA's holding pattern has investors worried.
The AUD/USD hit an early high of 0.6399 on Wednesday, falling just shy of the 0.6400 handle before the Aussie (USD) went into a full reversal, sending the pair tumbling 1.4% from the day's high bids to trade back into the 0.6300 region.
Q3 CPI too high to risk holding, failing to act could harm the RBA's credibility – TDS
Australian inflation came in higher than expected early Wednesday, with the Reserve Bank of Australia (RBA) Trimmed Mean Consumer Price Index (CPI) printing at 1.2% for the 3rd quarter, compared to the previous quarter's 1% printing and overshooting market forecasts of 1.1%.
Markets are now concerned that long-term inflation is beginning to set in for the Australian economy, and the RBA's current wait-and-see pattern on interest rate hikes may not be enough to curtail price growth despite a lagging economy with cracks beginning to surface.
The RBA may be pushed to make further rate hikes in order to clamp down on inflation that is once again picking up speed, even at the risk of pushing the Aussie economy a step closer to a "hard landing" recession.
The AUD will close out Wednesday's trading action with a showing from the RBA's Governor Michelle Bullock, who will be testifying before the Australian government's Senate Economics Legislation Committee at 22:00 GMT.
US GDP, Jobless Claims data in focus for Thursday
Thursday will see US Gross Domestic Product (GDP) and Initial Jobless Claims, which should drive USD momentum heading into the latter portion of the trading week.
US GDP for the 3rd quarter is expected to rebound firmly on an annualized basis, from 2.1% to 4.2%.
Meanwhile, US Initial Jobless Claims are expected to show a slight uptick in the number of new unemployment benefits seekers, with the figure forecast to print at 208K for the week ending October 20th, compared to the previous week's 198K.
AUD/USD Technical Outlook
The Aussie is paring back the week's early gains and trading back into recent lows, testing October's familiar floor of 0.6300 as the AUD/USD continues to face firm rejections from the 50-day Simple Moving Average (SMA).
The Aussie continues to trade at its lowest bids of the year, and a downside break will see the pair quickly challenging new eleven-month lows if it manages to cross the 0.6272 level, a price the AUD/USD hasn't seen since November of last year.
AUD/USD Daily Chart
AUD/USD Technical Levels
- USD/NOK rose to a high of 11.215, its highest since late May and then settled at 11.191.
- Nordea analysts point out that higher US yields are playing a big role in the upward movements of the pair.
- The focus shifts to high-tier economic data from the US on Thursday and Friday.
- The ECB decision on Thursday will also we closely watched.
On Wednesday, the USD/NOK jumped to a daily high of around 11.215, its highest since May 31, and since last Friday, the pair has increased by more than 1%. Higher US treasury yields and firm economic activity figures from its local economy benefit the US Dollar over the NOK.
In line with that, S&P Global Manufacturing and Services PMIs from the US came in better than expected on Tuesday while the Eurozone indexes disappointed, suggesting that in the current cycle of global financial tightening, the US economy seems to be the last man standing. In addition, the 2,5 and 10-year yields are trading in multi-year highs at 5.10%,4.91 and 4.95%, respectively. Nordea analyst pointed out that rising yields are weighing on equities, which made Norwegian pension managers need to reduce FX hedges by selling NOK. They also claimed that higher energy prices and geopolitical tensions also made the Norgewian currency struggle to find demand.
Focus now shifts to the European Central Bank (ECB) decision on Thursday, where markets are not discounting any rate hikes. Still, Christine Largarde’s press conference will be important for the economic outlook of the European continent. In the same session, the US will release Gross Domestic Product (GDP) preliminary estimates from Q3 and Personal Consumption Expenditures (PCE) figures from September on Friday.
USD/NOK Levels to watch
With both Relative Strength Index (RSI) and Moving Average Convergence Divergence (MACD) comfortably placed in positive territory on the daily chart, the USD/NOK buyers hold the upperhand. However, both indicators approached overbought conditions which could fuel a technical correction in the upcoming session as the pair rose in the last four days.
Furthermore, the pair is above the 20,100,200-day Simple Moving Average (SMAs), suggesting that the bears are struggling to challenge the overall bullish trend.
Support levels: 11.095, 11.020, 10.945 (20-day SMA),
Resistance levels: 11.167, 11.215, 11.300.
USD/NOK Daily Chart
-638338571719684758.png)
- USD/JPY reached a new 15-day high at around 150.05, but fears of Japanese intervention led to a quick rejection.
- Wall Street continues to print losses, while the US 10-year benchmark note rate is 4.95%, supporting USD/JPY.
- Upcoming data includes Foreign Bond Investment and Stock Investment by Foreigners in Japan and third-quarter GDP and unemployment claims data in the US.
USD/JPY reached a new 15-day high at around 150.05, though the price was quickly rejected, as seen by the 5-minute chart, amid fears of Japanese authorities' intervention in the Forex markets. At the time of writing, the pair exchanges hand volatile within the 149.90/150.00 area, registering gains of 0.05%.
USD/JPY trades volatile within 149.90/150.00 area, registering gains of 0.05%
Wall Street continues to print losses, while the US 10-year benchmark note rate sits at 4.95%, gaining 13 basis points, a tailwind for the USD/JPY. The US Dollar Index (DXY), which tracks the Greenback’s performance against a basket of currencies, including the Japanese Yen (JPY), gains 0.27%, at 106.52.
Regarding economic data, the US saw an unexpected increase in New Home Sales for September, with a 12.3% month-on-month rise. This significant uptick followed a sharp contraction of -8.2% in the previous month, the fastest pace of growth since early 2022. These positive data, combined with earlier reports like the S&P Global PMIs for the US showing improvements in business activity, support the US Dollar. This could suggest an increasing likelihood of a soft economic landing in the US.
Israel prepares ground offensive, according to its Prime Minister
On the geopolitical front, Israeli Prime Minister Benjamin Netanyahu crossed the wires, saying, “we are preparing for a ground invasion.” He added that he won’t give any details, that civilians in Gaza should move to the south, and that the invasion time will be reached by consensus.
The docket would feature Foreign Bond Investment and Stock Investment by Foreigners on the Japanese front. On the US front, the calendar would feature the third quarter Gross Domestic Product (GDP) along with unemployment claims data.
USD/JPY Technical Levels
- USD/CHF approached 0.8960, seen 0.30% gains.
- ZEW survey figures from Switzerland from October revealed that expectations worsened.
- Housing data from the US came in better than expected.
In Wednesday’s session, the USD/CHF saw gains for a second consecutive day, jumping towards 0.8960. On the USD side, positive Housing Market data and higher US yields made the green currency find demand. On the other hand, weak expectations data from Switzerland seems to be weakening the CHF.
In line with that, the U.S. Census Bureau revealed that the New Home Sales from September lived up to the expectations. The headline figure came in at 0.759M, above the consensus of 0.68M and increased in relation to its last reading of 0.676M. Elsewhere, the 5 and 10-year Treasury bond yields are sharply rising, seeing increases of more than 1%, standing at 4.91% and 4.95% and seems to be making the USD gaining interest. However, hawkish bets on the Federal Reserve (Fed) for the rest of 2023 still remain low so the upside for the US rates are limited for the short term.
That being said, the Gross Domestic Product (GDP) preliminary estimates from Q3 on Thursday and Personal Consumption Expenditures (PCE) figures from September on Friday will give investors further insights into the US economy, which could affect the bets on the next Fed’s decisions.
On the other hand, the ZEW Expectations survey from Switzerland from October plunged to -37, as expected, and the gloomy outlook of the Swiss economy seems to have weakened the CHF.
USD/CHF Levels to watch
According to the daily chart, the technical outlook for the USD/CHF remains neutral to bullish as the bulls are recovering ground while the bears consolidate the recent downward movements. The Relative Strength Index (RSI) still resides below midline, but with a positive slope, while the Moving Average Convergence (MACD) exhibits weaker red bars.
Support levels: 0.8895 (100-day SMA), 0.8870, 0.8850.
Resistance levels: 0.8970,0.900 (200-day SMA), 0.9040.
USD/CHF Daily Chart
-638338516638302797.png)
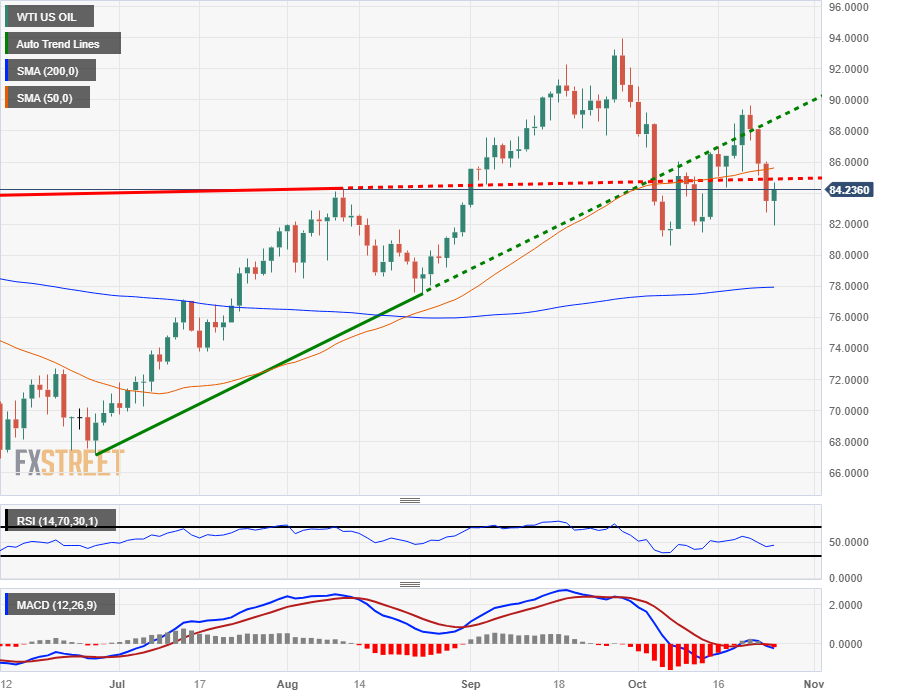
- WTI Crude Oil is climbing back up the charts as the Israel-Hamas conflict escalates once more.
- Calls for a cease-fire to allow humanitarian aid to civilians in Gaza met with rejection, fury.
- EIA barrel counts rose more than expected, demand concerns to weigh on Crude Oil when geopolitical fears abate.
West Texas Intermediary (WTI) Crude Oil is seeing a geopolitical tension-fueled spike on Wednesday as the Gaza conflict continues to escalate, with Israel vehemently rejecting calls for a ceasefire to allow humanitarian aid into the Gaza Strip for civilians trapped in the conflict zone.
Energy Information Administration (EIA) barrel counts showed a surprise uptick for the week into October 20th, with US crude inventories rising by 1.371M barrels, far and above the 0.239M market expectation, and eating away a significant portion of the previous weeks -4.491M barrel drawdown.
Global Crude Oil markets continue to fear drastic undersupply in the face of extreme production cuts from member states of the Organization of the Petroleum Exporting Countries (OPEC), but lagging global growth is undercutting fossil fuels demand, keeping topside moves in barrel prices capped.
Energy markets will be keeping an eye on the Gaza Strip conflict as the week progresses, with UN fuel supplies in Gaza set to run dry either today or tomorrow, and continued destabilization in the region will leave barrel investors wary of any possible spillover into the nearby Strait of Hormuz, where nearly a fifth of all global crude production passes through the chokepoint.
WTI Technical Outlook
WTI Crude Oil hit an intraday low of $81.90 before hitting a rally into $84.65, and US-centric oil barrels are currently trading near $84.00 per barrel.
US Crude Oil has hit the brakes on a decline that has seen WTI bids close in the red for three straight trading days, and despite Wednesday's fear-fueled spike, WTI remains down over 6% from last Friday's peak of $89.64.
WTI continues to cycle the 50-day Simple Moving Average (SMA) in the near-term, but trending bullish and the current support barrier for any downside moves sits at early October's bottom at $80.63.
WTI Daily Chart
WTI Technical Levels
- The Canadian Dollar is falling back for the second day in a row as markets shy away from risk.
- BoC sees a period of negative growth over the horizon.
- Despite a weakening economy, BoC is hampered on policy by increasing inflation risks.
- USD/CAD reaches seven-month high on Wednesday.
The Canadian Dollar (CAD) is down once again on Wednesday, adding to yesterday’s declines and sending the USD/CAD back into the 1.2800 handle as the Bank of Canada (BoC) holds rates steady as markets broadly expected.
The Bank of Canada (BoC) held its main reference rate at 5.0% Wednesday morning like Wall Street broadly predicted, but dovish comments from BoC Governor Tiff Macklem are failing to spark much confidence in the Loonie.
The BoC is expecting “two or three quarters” of negative growth as a recession looms over the Canadian economy, with Governor Macklem specifically noting that odds of achieving a soft landing are beginning to decrease.
Broad-market risk aversion is the name of the game as Tuesday’s risk-off flows continue for a second day, sending the US Dollar (USD) higher. Crude Oil prices, however, are finding a floor for Wednesday, helping to limit losses for the oil-backed CAD.
Daily Digest Market Movers: Canadian Dollar knocking back as investors favor Dollar Index, BoC fails to inspire
- BoC to maintain policy rates for the time being, period of negative growth expected.
- BoC Governor Macklem warns that too much government spending will not help curtail inflation.
- The gap is closing on achieving a soft landing, according to BoC.
- Despite risks, BoC doesn’t see a “deep recession” yet.
- Crude Oil prices are strung in the middle, helping to backstop the Loonie slide.
- Middle East geopolitical tensions keeping barrels well-bid, despite a surprise build-up of US Crude Oil reserves.
- Energy Information Administration (EIA) barrel counts recorded an unexpected 1.371M rebound in US oil stocks.
- The USD/CAD is set to spend the rest of the week reacting to US economic data. Gross Domestic Product (GDP) and Personal Consumption Expenditure (PCE) figures are still on the cards for Thursday and Friday, respectively.
- Tiff Macklem speaks on policy outlook after BoC leaves policy rate unchanged at 5%
Technical Analysis: USD/CAD teases 1.3810, pinned to the high side for Wednesday
The Canadian Dollar (CAD) is extending the week’s risk-off backslide as traders return toward the US Dollar (USD), with the BoC’s showing briefly sending the USD/CAD into 1.3810 on reaction.
The Loonie-Dollar pairing is treading water just beneath the 1.3800 handle, and Tuesday’s topside push extends yesterday’s rebound from the 200-hour Simple Moving Average (SMA). USD/CAD has hit a fresh seven-month high.
On the daily candlesticks, USD/CAD continues to push higher, bolstered by a rising 50-day SMA pushing into 1.3600 on the chart paper. The floor on any bearish corrections is priced in from the 200-day SMA near 1.3475.
The immediate ceiling on a bullish continuation sits at early March’s peak of 1.3861, and a break of this level would set a new high for the year on the USD/CAD as the Loonie waffles.
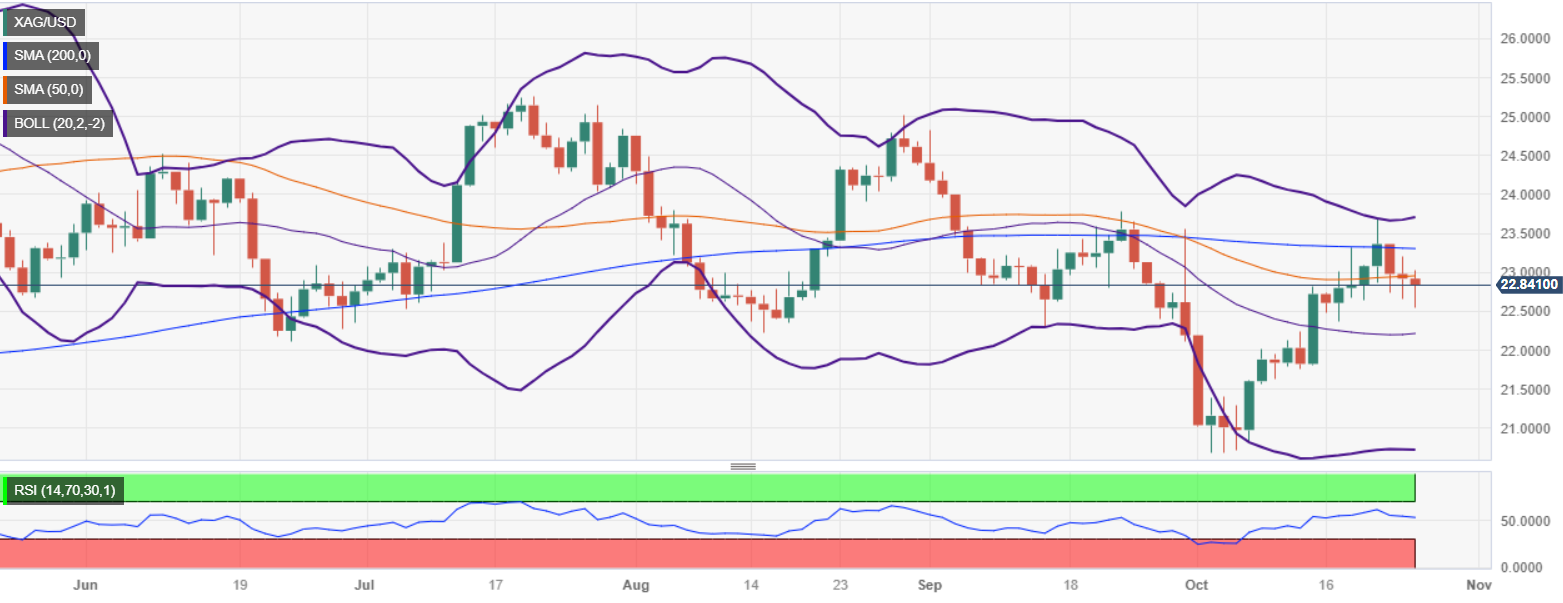
- Silver prices drop as XAG/USD trades at around $22.85, down 0.33%.
- XAG/USD remains downward biased after sliding below 200 and 50-day moving averages (DMAs).
- A breach of the 20-day Exponential Moving Average (DMA) at $22.20 could expose $22.00 and $20.77 levels.
Silver prices (XAG/USD) dropped in the mid-North American session on Wednesday as market sentiment turned negative, which usually underpins the grey metal. Nevertheless, an uptick in US Treasury bond yields and a strong US Dollar (USD), capped the XAG/USD advance towards the $24.00 figure. At the time of writing, Silver exchanges hands at $22.85, down 0.33%.
After sliding below the 200 and 50-day moving averages (DMAs), the XAG/USD remains downward biased, though shy of testing the 20-day Exponential Moving Average (DMA) at $22.20. A breach of the latter would expose $22.00, followed by the bottom of the Bollinger-Band at $20.77, but firstly, sellers must reclaim $21.00.
On the flip side, if XAG/USD reclaims the 50-DMA at $22.94, Silver could challenge the $23.00 figure, followed by the 200-DMA at $23.29, ahead of the top of the Bollinger-Bands at $23.69.
XAG/USD Price Action – Daily chart
XAG/USD Technical Levels
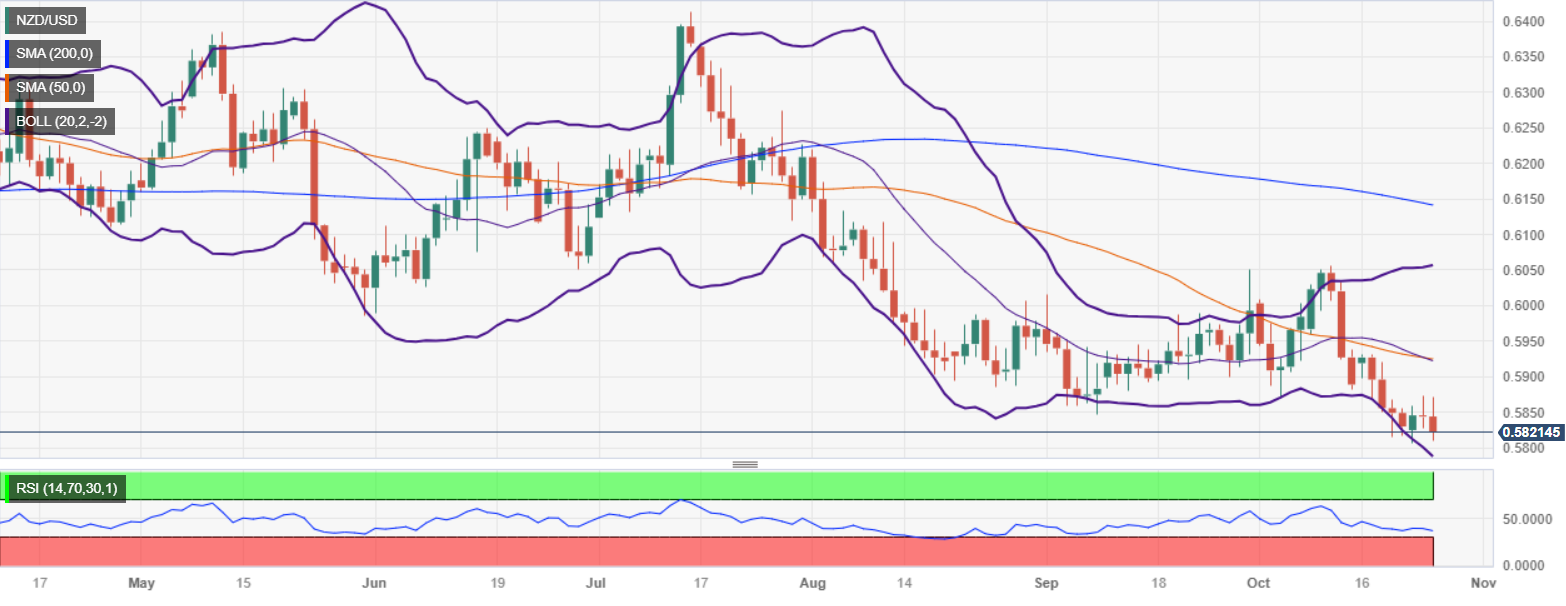
- NZD/USD prints a daily high of 0.5869 before dropping to 0.5825, losing 0.30% amidst strong USD.
- US Dollar Index (DXY) gains 0.11%, reaching 106.35, boosted by the Middle East conflict and strong US economic data.
- New Home Sales in the US rose 12.3% MoM in September, contributing to the Greenback's strength.
NZD/USD extended its losses during the North American session after printing a daily high of 0.5869, but market sentiment deterioration and a strong US Dollar (USD) dragged the exchange rate towards 0.5825, as the pair is losing 0.30%.
NZD/USD drops to 0.5825, losing 0.30% as US Dollar strengthens and Middle East conflict looms
Risk aversion continued to dominate price action as the Greenback (USD) continued to climb, with the US Dollar Index (DXY) gaining 0.11%, up at 106.35, boosted by the Middle East conflict. Although Israel has not begun its ground offensive in Gaza, an escalation that could involve more participants besides Israel and Hamas looms.
Data-wise, the US economic docket featured New Home Sales, which surprisingly rose 12.3% MoM in September, crushing the prior month’s -8.2% contraction, the fastest pace since early 2022. This data, along with Tuesday’s S&P Global PMIs in the US, revealing that business activity is improving, underpins the Greenback as the chances for a soft-landing increase.
On the Kiwi front, news from China sponsored a leg-up in the NZD/USD towards its daily high, as President Xi Jinping visited the People’s Bank of China (PBoC), China’s central bank aimed to issue additional sovereign debt, as the country struggles to recover from the Covid-19 pandemic measures. Nevertheless, the recovery was short-lived as sentiment shifted sour.
NZD/USD Price Analysis: Technical outlook
After forming an ‘evening-star’ chart pattern, the NZD/USD is resuming its downward bias, though it remains shy of extending its downtrend past the October 23 low of 0.5807. A breach of the latter will expose the 0.588 figure, followed by the November 3, 2022, swing low of 0.5740. Conversely, if buyers reclaim the October 24 high at 0.5872, a challenge of the 0.5900 mark is on the cards.
- The US Dollar extended Tuesday’s impressive gains, but the upward momentum is somewhat weak.
- The United States reported positive housing market data.
- The 5- and 10-year US Treasury yields recovered, while the shorter-term 2-year rate declined.
The US Dollar (USD) measured by the US Dollar Index (DXY) continued climbing higher on Wednesday, rising above the 20-day Simple Moving Average (SMA) towards a six-day high of 106.52. US yields' recovery and positive housing market data allowed the Greenback to find demand.
The focus is on the United States' economic situation as markets await data to continue modeling their expectations on the next Federal Reserve (Fed) decisions. As for now, the strongest case is that the bank won’t deliver any additional hikes in 2023, but Gross Domestic Product (GDP) preliminary estimates from Q3 on Thursday and Personal Consumption Expenditures (PCE) figures from September on Friday may change those expectations.
Daily Digest Market Movers: US Dollar edges higher while investors await economic activity figures
- The DXY index jumped towards 106.2, above the 20-day Simple Moving Average (SMA).
- The US Census Bureau revealed that September New Home Sales came in higher than expected. The headline figure showed 0.759M new home sales, higher than the consensus of 0.68M, and increased in relation to its last reading of 0.676M.
- The 5- and 10-year US yields rose sharply to 4.87% and 4.90%, respectively.
- Focus now shifts to high-tier data to be released on Thursday and Friday. The US Q3 GDP growth is expected to have accelerated, and the PCE inflation to have decelerated in September.
- According to the CME FedWatch Tool, the odds of a 25 basis points hike in December are still low, around 25%. In addition, the tool suggests that a pause in November is nearly priced in.
Technical Analysis: US Dollar Index bulls step in and conquer the 20-day SMA
Based on the daily chart, the DXY Index maintains a neutral to bullish technical perspective after buyers conquered the 20-day Simple Moving Average (SMA). With a positive slope above its midline, the Relative Strength Index (RSI) signals a bullish stance, while the Moving Average Convergence (MACD) exhibits lower red bars. Moreover, the DXY is above the 20, 100 and 200-day SMAs, suggesting that on the bigger picture, the bulls are in command over the bears.
Supports: 106.30 (20-day SMA), 106.00, 105.70.
Resistances:106.50, 107.00, 107.30.
US Dollar FAQs
What is the US Dollar?
The US Dollar (USD) is the official currency of the United States of America, and the ‘de facto’ currency of a significant number of other countries where it is found in circulation alongside local notes. It is the most heavily traded currency in the world, accounting for over 88% of all global foreign exchange turnover, or an average of $6.6 trillion in transactions per day, according to data from 2022.
Following the second world war, the USD took over from the British Pound as the world’s reserve currency. For most of its history, the US Dollar was backed by Gold, until the Bretton Woods Agreement in 1971 when the Gold Standard went away.
How do the decisions of the Federal Reserve impact the US Dollar?
The most important single factor impacting on the value of the US Dollar is monetary policy, which is shaped by the Federal Reserve (Fed). The Fed has two mandates: to achieve price stability (control inflation) and foster full employment. Its primary tool to achieve these two goals is by adjusting interest rates.
When prices are rising too quickly and inflation is above the Fed’s 2% target, the Fed will raise rates, which helps the USD value. When inflation falls below 2% or the Unemployment Rate is too high, the Fed may lower interest rates, which weighs on the Greenback.
What is Quantitative Easing and how does it influence the US Dollar?
In extreme situations, the Federal Reserve can also print more Dollars and enact quantitative easing (QE). QE is the process by which the Fed substantially increases the flow of credit in a stuck financial system.
It is a non-standard policy measure used when credit has dried up because banks will not lend to each other (out of the fear of counterparty default). It is a last resort when simply lowering interest rates is unlikely to achieve the necessary result. It was the Fed’s weapon of choice to combat the credit crunch that occurred during the Great Financial Crisis in 2008. It involves the Fed printing more Dollars and using them to buy US government bonds predominantly from financial institutions. QE usually leads to a weaker US Dollar.
What is Quantitative Tightening and how does it influence the US Dollar?
Quantitative tightening (QT) is the reverse process whereby the Federal Reserve stops buying bonds from financial institutions and does not reinvest the principal from the bonds it holds maturing in new purchases. It is usually positive for the US Dollar.
Tiff Macklem, Governor of the Bank of Canada (BoC), explains the BoC decision to leave the interest rate unchanged at 5% after the October policy meeting and responds to questions from the press.
Key quotes
"Could certainly be two or three quarters of small negative growth."
"Not predicting a deep recession with a steep contraction and major job cuts."
"The path to a soft landing has become narrower."
"Really pleased to see focus governments are putting on increasing housing supply."
"If spending plans of various levels of governments are fully carried out next year, that would not be helpful in tackling inflation."
- Mexican Peso continues to slump as USD/MXN buyers target 18.40 with the US Dollar edging up.
- Mexico’s economic calendar to feature the Unemployment Rate on October 26.
- USD/MXN is underpinned by a risk-off mood and elevated US bond yields.
Mexican Peso (MXN) extends its losing streak against the US Dollar (USD), sliding more than 0.65%, as the USD/MXN has risen to a three-day high of 18.39 after bottoming at around 18.23 during Wednesday’s European session.
Market mood remains deteriorated as corporate earnings in the United States (US) keep Wall Street equities under pressure while the conflict in the Middle East, keeps traders wary. The latest data reported in the United States sent Treasury bond yields rising, with the US 10-year benchmark note rate rising to 4.919%, up nine basis points.
Consequently, the US Dollar Index (DXY), a gauge of the Greenback value against a basket of peers, advanced to a daily high of 106.52, underpinning the USD/MXN to higher levels, amid the lack of data in Mexico’s economic calendar.
On the data front, the US Census Bureau revealed that New Home Sales in the US rose by 12.3% MoM in September at the fastest pace since August 2022. Across the border, USD/MXN traders are eyeing the release of the Mexican Unemployment Rate on October 26.
Daily Digest Market Movers: Mexican Peso tumbles to a three-day low as USD/MXN reaches 18.39
- US New Home Sales for September came at 0.759M vs. August’s 0.676M.
- On Tuesday, Mexico's National Statistics Agency INEGI reported annual headline inflation hit 4.27%, down from 4.45% at the end of September, below forecasts of 4.38%.
- Mexico’s core inflation rate YoY was 5.54%, beneath forecasts of 5.6%.
- US S&P Global Manufacturing PMI for October jumped to 50, exceeding forecasts of 49.5, while the Services PMI exceeded the contractionary consensus of 49.9, reaching 50.9.
- US S&P Global Composite PMI was 51, above the prior 50.2.
- The Bank of Mexico (Banxico) held rates at 11.25% in September and revised its inflation projections from 3.50% to 3.87% for 2024, above the central bank’s 3.00% target (plus or minus 1%).
- On Thursday, focus will turn to Mexico's Jobless Rate and US Q3 preliminary GDP figures.
Technical Analysis: Mexican Peso remains weak as USD/MXN buyers reclaim 18.30
The USD/MXN upward bias remains intact, and after forming a ‘bullish harami’ candlestick chart pattern, the pair rallied toward 18.39 before retreating to current levels above the October 24 close of 18.25. A breach of Wednesday’s daily high could pave the way for testing last week’s high at 18.46 before challenging 18.48, October’s high. Once those levels are cleared, the 18.50 figure would be up for grabs. Conversely, the USD/MXN must drop below the 18.00 psychological figure for sellers to reclaim the 200-day Simple Moving Average (SMA) at 17.73.
Mexican Peso FAQs
What key factors drive the Mexican Peso?
The Mexican Peso (MXN) is the most traded currency among its Latin American peers. Its value is broadly determined by the performance of the Mexican economy, the country’s central bank’s policy, the amount of foreign investment in the country and even the levels of remittances sent by Mexicans who live abroad, particularly in the United States. Geopolitical trends can also move MXN: for example, the process of nearshoring – or the decision by some firms to relocate manufacturing capacity and supply chains closer to their home countries – is also seen as a catalyst for the Mexican currency as the country is considered a key manufacturing hub in the American continent. Another catalyst for MXN is Oil prices as Mexico is a key exporter of the commodity.
How do decisions of the Banxico impact the Mexican Peso?
The main objective of Mexico’s central bank, also known as Banxico, is to maintain inflation at low and stable levels (at or close to its target of 3%, the midpoint in a tolerance band of between 2% and 4%). To this end, the bank sets an appropriate level of interest rates. When inflation is too high, Banxico will attempt to tame it by raising interest rates, making it more expensive for households and businesses to borrow money, thus cooling demand and the overall economy. Higher interest rates are generally positive for the Mexican Peso (MXN) as they lead to higher yields, making the country a more attractive place for investors. On the contrary, lower interest rates tend to weaken MXN.
How does economic data influence the value of the Mexican Peso?
Macroeconomic data releases are key to assess the state of the economy and can have an impact on the Mexican Peso (MXN) valuation. A strong Mexican economy, based on high economic growth, low unemployment and high confidence is good for MXN. Not only does it attract more foreign investment but it may encourage the Bank of Mexico (Banxico) to increase interest rates, particularly if this strength comes together with elevated inflation. However, if economic data is weak, MXN is likely to depreciate.
How does broader risk sentiment impact the Mexican Peso?
As an emerging-market currency, the Mexican Peso (MXN) tends to strive during risk-on periods, or when investors perceive that broader market risks are low and thus are eager to engage with investments that carry a higher risk. Conversely, MXN tends to weaken at times of market turbulence or economic uncertainty as investors tend to sell higher-risk assets and flee to the more-stable safe havens.
Tiff Macklem, Governor of the Bank of Canada (BoC), explains the BoC decision to leave the interest rate unchanged at 5% after the October policy meeting and responds to questions from the press.
Key quotes
"Canadian Dollar has been reasonably stable."
"We're not getting the direct effect of an appreciation to lower import inflation. So, that does mean we have got to rely more on the interest rate."
"If a conflict caused a spike in oil prices, given inflation prices are above target, we would need to be more cautious than usual on looking through it."
"In case of an oil price spike, what we would be particularly focused on is the impacts on core inflation."
Tiff Macklem, Governor of the Bank of Canada (BoC), explains the BoC decision to leave the interest rate unchanged at 5% after the October policy meeting and responds to questions from the press.
Key quotes
"Overall, inflationary risks have increased since July; inflation is on a higher path than we expected."
"We held policy rate steady because we want to allow monetary policy time to cool economy and relieve price pressure."
"Further easing in inflation is likely to be slow and inflationary risks have increased; worried higher energy prices and persistence in underlying inflation are slowing progress."
"We've made a lot of progress but we are not there yet; we need to stay the course."
"Indicators of balance between demand and supply are mixed; demand pressures have eased more quickly than we forecast in July."
"We now expect oil prices to remain higher than we assumed in July."
"We will continue to assess whether monetary policy is sufficiently restrictive."
"Russian war on Ukraine and Israel/Gaza conflict are hurting economy and adding uncertainty to the outlook."
The US Bureau of Economic Analysis will release its first estimate of the third-quarter Gross Domestic Product (GDP) on Thursday, October 26 at 12:30 GMT as we get closer to the release time, here are forecasts from economists and researchers of 10 major banks regarding the upcoming growth data.
Economists expect the United States to report an annualized growth rate of 4.3 % in the third quarter of 2023 vs. the prior release of 2.1% in Q2. The US consumer will be the main driver of growth.
Danske Bank
We expect GDP to have grown by 3.3% QoQ AR, driven by still upbeat private consumption and structures investment. While growth has remained stronger than we have anticipated for now, we still foresee weakening towards the winter not least amid tightening financial conditions, and think the Fed is done with hiking rates.
ING
Activity numbers remain strong, with the highlight being third-quarter GDP. We look for it to come in at around 4%, boosted by strong consumer spending. Leisure and tourism spending has been particularly firm, while residential investment should also contribute positively together with government spending.
Deutsche Bank
We expect the advance reading to show real GDP grew by +5.2% in Q3, up from 2.1% in Q2.
RBC Economics
Q3 GDP is tracking a 5% QoQ annualized increase on firm consumer spending, a larger net trade build and a jump in inventories.
Deutsche Bank
We expect a 5.2% annualised number in what was a quarter that surprised almost everyone with its strength.
NBF
GDP could have expanded by 4.8% in annualized terms.
CIBC
There’s even some upside risk to our 3.9% projection if inventories fail to provide the drag that we’ve built in. There’s not really much logic, then, to the talk of a Fed pause at the upcoming meeting, and as a result, that could be just another ‘skip’, with a further hike in store for December.
SocGen
Real GDP growth should be close to 5% for 3Q23, which is clearly strong.
Wells Fargo
We forecast real GDP to expand at a 5.0% annualized rate in Q3. If realized, economic growth will be up 3.0% on a YoY basis, roughly half a percentage point ahead of its pre-pandemic average.
Citi
We expect a very strong 4.7% QoQ SAAR increase in real GDP by expenditure in Q3 with strength largely led by consumption. A strong increase across goods and services consumption would reflect some bounce-back from softer services spending in Q2, with a renewed pick-up in goods spending as demand remains strong overall. This would be in line with a few months of a substantial pick-up in retail sales data. Strong activity has also broadened away from consumption, with recent strength in industrial production and durable goods orders likely leading to a solid increase in most components of business equipment investment.
The FOMC kept rates on hold in September, but the Committee made clear that it is open to further tightening. Economists at ABN Amro expect monetary policy to stay restrictive throughout 2024.
Fed to start cutting rates from next March
We think July was the last hike of the cycle, and that benign core inflation readings will give the FOMC the confidence to keep policy on hold over the coming months.
We continue to expect the Fed to start cutting rates from next March. Falling inflation will push real rates higher, and the recent jump in bond yields also represents a significant tightening in financial conditions.
Even with rate cuts starting next year, monetary policy is expected to remain restrictive throughout 2024 and even into 2025.
EUR/CHF has moved sharply lower following the outbreak of war in the Middle East between Israel and Hamas. Economists at Danske Bank analyze the pair’s outlook.
Upside potential if the SNB decides to stop intervening
We expect FX intervention to continue to limit imported inflation and thus keep a cap on EUR/CHF in the near term.
We forecast a sustained move lower in EUR/CHF on the back of fundamentals and continued tight financial conditions. In light of the lower spot, we lower our entire forecast profile. We target the cross at 0.93 in 6-12M.
If the SNB decides to fully stop intervening, we see upside potential to EUR/CHF in the near term.
- The USD/CAD pair jumps vertically to near 1.3800 as the BoC keeps interest rates steady at 5%.
- An interest rate decision from the BoC was widely anticipated.
- The oil price drops oil price as Israel’s ground assault in Gaza delays for safe dispatch of humanitarian aid.
The USD/CAD pair as the Bank of Canada (BoC) has kept interest rates unchanged at 5%. BoC Governor Tiff Macklem announces a neutral interest rate decision for the second time in a row.
A neutral monetary policy announcement was widely anticipated by the BoC as inflation in Canada is consistently softening and labor market conditions are easing. The Canadian economy is operating at 3.8% inflation, which is almost double the desired rate of 2%.
The S&P500 opens on a bearish note amid volatility prompted by quarterly earnings and persistent fears of widening conflicts in the Middle East. The risk profile is downbeat as expectations of Iran’s intervention in the Israel-Palestine conflict are alive.
Meanwhile, the US Dollar Index (DXY) gathers strength for a fresh move above the immediate resistance of 106.50. The USD Index regains traction as investors shift focus to the crucial US economic readings this week. The release of the US Q3 Gross Domestic Product (GDP) and core Personal Consumption Expenditure (PCE) inflation for September could impact the interest rate decision by the Federal Reserve (Fed), which will be announced on November 1.
As per the expectations, the US economy grew by 4.2% in the July-September quarter, almost double the growth rate registered in the same period in 2022. An upbeat GDP report could escalate hopes of one more interest rate increase from the Fed.
On the oil front, the oil price delivered a bearish closing for three trading sessions in a row as Israel’s ground assault in Gaza was delayed for the safe dispatch of humanitarian aid.
Economists at Crédit Agricole analyze EUR’s outlook ahead of the European Central Bank (ECB) policy meeting.
ECB may have concluded its rate-hiking phase
While the ECB may have concluded its rate-hiking phase, it is expected to pursue QT by reducing its balance sheet and withdrawing excess liquidity from the system. This ongoing shift towards a less accommodative monetary policy could continue to underpin the EUR.
While the ECB's balance sheet reduction could potentially support the EUR, it's also important to consider the impact on peripheral economies within the Eurozone. Tightening financial conditions could pose challenges, possibly limiting the EUR's upside.
- New Home Sales in the US rose 12.3% in September.
- US Dollar Index continues to hover around 106.40 after the data.
Sales of new single‐family houses jumped 12.3% in September to a seasonally adjusted annual rate of 759,000, the data published jointly by the US Census Bureau and the Department of Housing and Urban Development showed on Wednesday.
This reading followed the 8.2% decline recorded in August and came in better than the market expectation of a modest increase to an annual rate of 680,000.
The median sales price of new houses sold in September 2023 was $418,800, and the average sales price was $503,900, the publication revealed.
Market reaction
The US Dollar Index (DXY) remained around 106.40, gaining 0.15% for the day.
- AUD/USD found an intense sell-off near 0.6400 after a sticky Australian inflation report.
- A sticky Australian inflation report has prompted expectations of one more 25 bps interest rate hike from the RBA.
- The US Dollar strengthens as a recovery in factory activities could escalate hawkish Fed bets.
The AUD/USD pair falls sharply after facing tough barricades near the round-level resistance of 0.6400. The Aussie asset faced a sell-off after the release of the sticky Australian Consumer Price Index (CPI) report for the July-September quarter.
The Australian Bureau of Statistics reported that consumer inflation grew at a higher pace of 1.2% in the third quarter against expectations of 1.1% and 0.8% reading in the April-June quarter. The annual inflation rose by 5.4% against the consensus of 5.3% but slowed from the former reading of 6.0%.
A sticky Australian inflation report has prompted expectations of one more 25 basis points (bps) interest rate hike from the Reserve Bank of Australia (RBA), which would push the Official Cash Rate (OCR) to 4.35%.
The US Dollar strengthens on expectations that recovering US factory activities could escalate hawkish Federal Reserve (Fed) bets.
AUD/USD trades in a Falling Channel chart pattern on a four-hour scale in which each pullback is considered as a selling opportunity by the market participants. The 200-period Exponential Moving Average (EMA) is sloping downside, which indicates that the broader trend is bearish. Major support is plotted from October 3 low at 0.6287.
The Relative Strength Index (RSI) (14) trades in the 40.00-60.000, indicating a consolidation ahead of crucial US economic readings.
A fresh downside would appear if the Aussie asset drops below October 03 low around 0.6286. This would expose the asset to 21 October 2022 low at 0.6212, followed by 13 October 2022 low at 0.6170.
In an alternate scenario, a decisive break above August 15 high around 0.6522 will drive the asset to August 9 high at 0.6571. Breach of the latter will drive the asset towards August 10 high at 0.6616.
AUD/USD four-hour chart
-638338390311061871.png)
There are a couple of factors that suggest a greater chance of support for the SEK over the coming weeks, in the view of economists at Rabobank.
Failure to break above 12.00 could help to restore some confidence in the SEK
In the first week of foreign currency sales, the Riksbank sold USD390 mln, a little less than market estimates. No EUR was sold. This process is scheduled to continue for 4 to 6 months.
Given the risk that SEK purchases will coincide with further rate hikes from the Riksbank, the SEK should find some support.
The September high, which was within a whisker of EUR/SEK 12.00 should offer a decent level of resistance. Any failure of the currency pair to break above this level in the coming months could help restore some confidence in the SEK.
We see risk of a move back to EUR/SEK 11.40 on a three-month view.
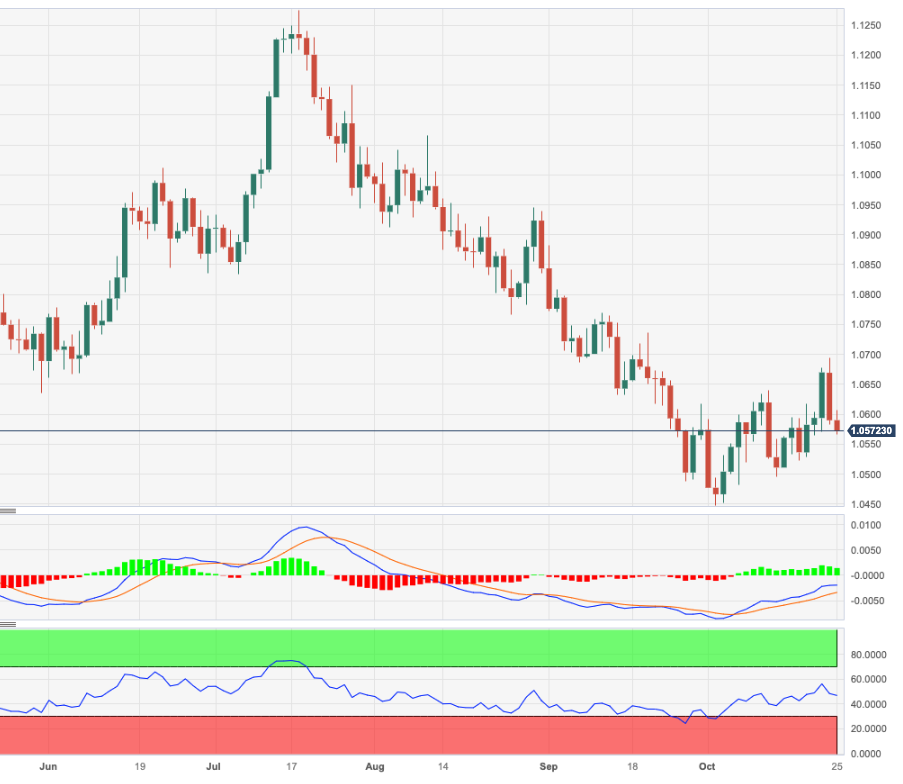
- EUR/USD adds to Tuesday’s decline and retreats to 1.0570.
- The immediate contention lines up around the 1.0500 zone.
EUR/USD remains under pressure and deflates to weekly lows in the 1.0570/65 band on Wednesday.
If losses accelerate, then the pair could drop to the weekly low of 1.0495 (October 13) prior to the 2023 low of 1.0448 (October 3). The loss of the later could put a probable visit to the round level of 1.0400 back on the radar in the not-so-distant future.
In the meantime, while below the 200-day SMA at 1.0815, the pair’s outlook should remain negative.
EUR/USD daily chart
The European Central Bank (ECB) is set to announce its Monetary Policy Decision on Thursday, October 26 at 12:15 GMT and as we get closer to the release time, here are the expectations as forecast by the economists and researchers of 11 major banks.
The ECB is widely expected to leave rates unchanged after ten consecutive increases as both inflation and growth are falling. Nonetheless, the central bank is likely to keep the door open to new hikes.
Danske Bank
ECB is widely set to be on hold in terms of policy rate changes for the first time since June last year. Since the September meeting, inflation and growth data have been broadly in line with expectations and taking into account the clear guidance from the ECB, no changes should be expected at the upcoming meeting. We expect Lagarde to acknowledge a discussion on advancing the PEPP reinvestments during the Q&A part of the press conference, thereby signalling a tightening bias, albeit with some optionality still in its communication.
ING
We expect the ECB to keep rates on hold and to basically stick to a hawkish bias, keeping the door open to yet another rate hike in December.
ANZ Bank
Core inflation has improved significantly in recent months. Yet the ECB remains guarded given vagaries in the oil price and the possibility higher energy costs could cause a re-acceleration in headline inflation. We think the bar for another ECB rate hike is high. Outside of energy uncertainty, evidence from the monetary aggregates, real economic data and wage growth support an improvement in underlying inflation trends. Based on our assessment of the data, we think it is appropriate for the ECB to pause rate hikes. In addition, some leading hawks have suggested rates may now be appropriately restrictive.
Nordea
After the ECB signalled at the September meeting that rates have likely peaked, while recent inflation data have actually surprised to the downside, the decision to leave rates unchanged at the 26 October meeting looks straightforward. We think the ECB is done for now, but note that if rates are changed further at the next few meetings, then rate hikes are more likely than rate cuts. For now, we estimate that rate cuts could start in June 2024.
TDS
The October decision should be a well-telegraphed hold, with the deposit rate remaining at 4.00%. We see a quite high bar for further hikes, and think the Governing Council will be more willing to tweak the length of time rates stay at terminal rather than resume rate hikes. The ECB is unlikely to be a major driver of EUR/USD. A mixture of peak US rates, weak USD and stable ex-US growth are needed to lift the EUR.
Commerzbank
The ECB is unlikely to raise its key rates further, partly because the inflation rate fell significantly in September and was thus largely in line with the central bank's expectations. Looking ahead over the coming months, we can imagine that the central bankers will raise the minimum reserve rate from 1% to 2% in order to have to pay less interest to commercial banks.
Nomura
We forecast the ECB will leave all of its key policy rates unchanged at its October meeting, so the depo rate will be unchanged at 4%. In our view, recent macro data by and large support the ECB as having finished its hiking cycle, even if it cannot declare victory on inflation just yet. We expect no announcement at the October meeting on accelerating quantitative tightening; however, this will likely be the focus of many questions at the press conference. While not our base case, a surprise could come in terms of minimum reserve requirements, government deposit remuneration, or excess reserve remuneration.
Rabobank
With the hiking cycle likely completed, it is up to the ECB to manage expectations of rate cuts. Inflation is continuing to trend in the right direction, but new risks have surfaced. The ECB should make it clear that they will not simply look through another energy shock, were this to materialize. We expect the ECB to leave its policy rates unchanged. We continue to see some risk of an increase in the minimum required reserves.
Deutsche Bank
We expect rates to remain at 4.00%. We expect the ECB to repeat that keeping rates at their restrictive level for sufficiently long is how inflation will be brought back to target. This encompasses a guiding principle (the central role of duration) and optionality (what is meant by sufficiently long will be determined by the balance of power between hawks and doves).
SocGen
With core inflation trending down and the economic outlook uncertain, the ECB should be on hold for now until greater visibility emerges over the outlook, which may not happen until March next year. We expect the ECB to accelerate QT once it has concluded the review of the operational framework in the spring of 2024.
Wells Fargo
With the Eurozone likely in recession and inflation heading lower, we also believe the ECB has reached peak policy rates. With that said, we expect the ECB will be cautious about reducing interest rates until inflation is much closer to its target. As a result, we do not expect an initial 25 bps rate cut until the June 2024 meeting, which would lower the Deposit Rate to 3.75%. Moreover, we expect the ECB to reduce rates at a gradual 25 bps per meeting pace through the second half of next year, which would see the Deposit Rate end 2024 at 2.75%. The combination of an underwhelming growth outlook and peak policy rates should also keep the Euro on the defensive around the 1.06 level for the time being.
The Canadian Dollar has come under renewed pressure over the last month. Economists at Danske Bank analyze Loonie’s outlook.
BoC to keep policy rates unchanged until Q1 2024
The rise in short-end oil contracts has been driven by tight supply/geopolitical concerns which constitutes a negative supply shock to an already weakening global growth backdrop. In our view that leaves CAD vulnerable to the external environment incl. higher real rates despite the domestic economy recently performing better-than-expected.
We expect the Bank of Canada to keep policy rates unchanged until Q1 2024 when we pencil in the first rate cut.
A move lower in USD/CAD would likely require a stronger global growth backdrop than what we pencil in or a very ‘hard landing’ requiring a sharp easing of global monetary conditions, including a weaker USD.
Forecast: 1.37 (1M), 1.39 (3M), 1.40 (6M), 1.42 (12M)
- DXY gathers extra steam north of the 106.00 hurdle.
- Extra advances could see the 106.80 area revisited.
DXY extends the weekly recovery to the mid-106.00s, or multi-day peaks, on Wednesday.
It seems the index keeps trading within a consolidative phase for the time being. The continuation of the upward trend, in the meantime, continue to target the weekly top of 106.78 (October 12) ahead of the 2023 high of 107.34 (October 3).
So far, while above the key 200-day SMA, today at 103.34, the outlook for the index is expected to remain constructive.
DXY daily chart
USD/JPY continues to trade close to the 150 mark. Economists at Danske Bank analyze the pair’s outlook.
Lower US yields and the global environment favour JPY
We forecast USD/JPY to reach 130 on 6/12M horizon. This is primarily because we believe that long US yields have either reached or are close to their peak, despite the upward trajectory over the past month.
In addition, historical data suggests that a global environment characterized by declining growth and inflation tends to favour the JPY.
In the near-term, potential intervention fears will likely keep a cap on the upside risk.
- EUR/JPY adds to Tuesday’s losses following YTD peaks.
- Further gains maintain the target at the round level of 160.00.
EUR/JPY comes under further downside pressure after climbing to new 2023 highs near the 160.00 barrier on Tuesday.
Considering the current price action, further upside appears in the pipeline for the cross in the short-term horizon. Against that, the immediate hurdle emerges at the 2023 top at 159.91 (October 24) closely followed by the round level at 160.00.
So far, the longer term positive outlook for the cross appears favoured while above the 200-day SMA, today at 150.99.
EUR/JPY daily chart
Australia Q3 Consumer Price Index (CPI) printed well above the RBA's and consensus forecast. Subsequently, economists at TD Securities expect the RBA to hike at next month's meeting
Q3 CPI too high to risk holding
Today's Q3 CPI data handily beat the RBA's and analyst forecasts. Along with the Q2 trimmed mean measure being revised up and strong signs of domestic inflation, there is now a clear signal for monetary policy to respond.
We now expect the RBA to hike 25 bps at next month's meeting to 4.35% on the target cash rate.
We believe failing to act could harm the RBA's credibility.
The possibility of the RBA delivering a subsequent hike in 2024 cannot be ruled out.
- USD/JPY aims for a decisive break above 150.00 as the appeal for the US Dollar improves.
- S&P Global reported an uptick in US business activities in a survey in October.
- The BoJ focuses on replacing imported factors’ contribution to price pressures with higher wage growth.
The USD/JPY pair prepares for a decisive break above the psychological resistance of 150.00 in the late European session. The asset seems strong as the US Dollar Index (DXY) extended upside after S&P Global reported an uptick in business activities in the survey for October.
S&P500 futures generated losses in the London session, portraying a decline in the risk appetite of the market participants. The appeal for the US Dollar improves as strong business activity in October has improved expectations of further policy-tightening by the Federal Reserve (Fed).
On Tuesday, S&P Global reported that Manufacturing PMI kissed the 50.0 threshold for the first time since November 2022. The factory data at 50.0, outperformed expectations of 49.5 and September's reading of 49.8. The Services PMI landed at 50.9 against expectations of 49.9 and the prior release of 50.1.
The sentiment of the US firms improves as they expect that interest rates from the Fed are peaked for now. Going forward, investors will focus on the Q3 Gross Domestic Product (GDP) and the Fed’s preferred inflation gauge, which could impact the interest rate decision from the Fed in its monetary policy meeting on November 1.
Meanwhile, the Bank of Japan (BoJ) continues to remain fearful over the inflation outlook as higher price pressures have been majorly contributed by imported factors and the central bank is looking to replace them with higher wage growth. The expectations of a stealth intervention by Japan’s finance ministry in the FX domain remain persistent as the USD/JPY pair is hovering near 150.00.
USD builds on Tuesday rebound on soft risk appetite. Shaun Osborne, Chief FX Strategist at Scotiabank, analyzes Greenback’s outlook.
USD gains on soft risk mood
Weak risk appetite seems to be driving broad USD gains.
The DXY still looks relatively ‘rich’ versus fair value based on index-weighted 2y spreads.
Monday’s sharp fall and Tuesday’s snap higher in the USD generally suggest market sentiment is highly fluid, leaving a bit of a question mark over the sustainability in the USD moves at the moment, in my opinion. But choppy trading may extend to Thursday and the US Q3 GDP report.
USD/CAD gains are extending to retest the early October high around 1.3786. Economists at Scotiabank analyze the pair’s outlook.
Short and medium-term trend signals are bullish
Short and medium-term trend signals are bullish, suggesting the pair can extend its gains; a break above the early month high of 1.3786 will pave the way for funds to push on to retest the March high at 1.3862.
Support is seen at 1.3720/1.3730.
See: USD/CAD to extend its uptrend once a break above 1.3780 materializes – SocGen
Senior Economist Julia Goh and Economist Loke Siew Ting at UOB Group review the recently published advanced readings for the Q3 GDP in Malaysia.
Key Takeaways
For the first time, Malaysia released an advanced 3Q23 GDP estimate last Fri (20 Oct). It is based on the first two months (Jul-Aug)’s available data (monthly economic indicators) to estimate the real economic performance by production approach for the quarter. The preliminary result showed that real GDP grew by 3.3% y/y in 3Q23, marking a marginal improvement from 2.9% in 2Q23. Actual 3Q23 GDP numbers will be released on 17 Nov alongside the current account data.
The 3.3% advanced GDP estimate for 3Q23 is in line with our preliminary forecast of 3.5%. Real GDP growth averaged 3.9% in Jan-Sep 2023 (Jan-Sep 2022: +9.2%), reaffirming our full-year growth projection of 4.0% and the Ministry of Finance (MOF)’s revised growth target of ~4.0% for 2023. We expect a higher growth of 4.6% in 2024 (MOF est: 4.0%-5.0% or mid-point forecast of 4.8%), assuming a moderate soft landing scenario globally despite heightened uncertainties. Other positive catalysts for domestic growth include an expansionary Budget 2024 and initiatives outlined under the New Industrial Master Plan 2030, National Energy Transition Road, and Mid-Term Review of 12th Malaysia Plan.
The advanced 3Q23 GDP signaled moderate growth that is below par and would not support a move to hike rates in Nov. Moreover, headline inflation hit a 2 ½ year low of 1.9% in Sep. The next and final monetary policy meeting for this year is on 1-2 Nov.
EUR/USD trades below the 1.06 level. Economists at Scotiabank analyze the pair’s outlook.
Continuation of choppy range trade
The EUR looks soft and losses from the early week high have been swift and relatively sharp. But spot prices have slipped back to the lower end of the rising trading channel in place since the start of the month and flat trend momentum signals on the intraday and daily oscillators rather suggest a continuation of choppy range trade. That should mean support for the EUR on dips to the 1.0525/1.0535 zone.
Resistance is 1.0605/1.0610.
- The Greenback is trading back firmer against several major peers.
- US yields retreat further, back to more favourable levels for the Greenback.
- The US Dollar Index broke back above 106.00 and is set to have a calm trading day.
The US Dollar (USD) made a staggering return on Tuesday and looks to consolidate these gains on Wednesday. The US Dollar Index was close to post a new high for this trading week, though it retreated just near the US closing bell as Microsoft earnings missed estimates and Alphabet soared. The US Dollar is expected to trade in a rather tight range on Wednesday ahead of the European Central Bank meeting on Thursday.
On the economic data front, a very light calendar is at hand for Wednesday, with no real catalytic moves expected. The only element at play will be the New Home Sales data. Although US Federal Reserve (Fed) Chairman Jerome Powell is set to deliver a speech, it will be only opening remarks, introducing 2023 Moynihan Prize recipient Alan Blinder at the 2023 Moynihan Lecture in Social Science and Public Policy in Washington.
Daily digest: US Dollar enters calm before the storm
- First print for this Wednesday comes around 11:00 GMT, with the Mortgage Bankers Association (MBA) issuing their weekly Mortgage Applications. Mortgage applications contracted 6.9% a week earlier.
- At 14:00 GMT, the New Home Sales number will be issued. Expectations are for a broadly steady number, from previous 0.675 million to 0.68 million.
- The Energy Information Administration (EIA) is due to release the weekly crude stockpile changes. The previous week saw a drawdown of 4.491 million barrels, and expectations are for a small build of 0.239 million barrels for this week.
- The US Treasury will auction a 5-year Note at 17:00 GMT.
- Equities are up in Asia, with both Japan and China seeing their star indices topping over 0.5%. European and US futures are struggling more following the mixed earnings from Alphabet and Microsoft after the US closing bell on Tuesday. Investors are looking forward to Meta’s earnings after the US closing bell this Wednesday.
- The CME Group’s FedWatch Tool shows that markets are pricing in a 99.6% chance that the Federal Reserve will keep interest rates unchanged at its meeting in November.
- The benchmark 10-year US Treasury yield trades at 4.83% and is back at levels where markets feel more at ease. With the retreat away from 5%, the US Dollar has been able to strengthen again.
US Dollar Index technical analysis: Kings don’t die that easily
The US Dollar is playing chess with the markets: while markets on Monday thought they had a check-mate game against the Greenback, on Tuesday it cleared out the playing board by knocking over nearly all pawns that markets had against it. The US Dollar Index (DXY) is back to flat for the week and with ECB, US GDP and US PCE still to come, the DXY could swing in any direction.
The DXY is consolidating above 106.00 and looks to keep it in a tight range today as no real market moving events are at hand for this Wednesday. Look for a possible jump above 106.42, the high of last Friday. If that level can be reclaimed by US Dollar bulls, then look for 107.00 on the topside again.
On the downside, the recent resistance at 105.88 did not do a good job supporting any downturn and now completely has lost its importance. Instead, look for 105.12, which is a pivotal historic line and almost falls in line with the 55-day Simple Moving Average (SMA) to keep the DXY above 105.00, and which worked already quite ahead of it on Tuesday. Should that fail to do the trick, a big air pocket could develop and see the DXY drop to 103.74, near the 100-day SMA before finding ample support.
US Dollar FAQs
What is the US Dollar?
The US Dollar (USD) is the official currency of the United States of America, and the ‘de facto’ currency of a significant number of other countries where it is found in circulation alongside local notes. It is the most heavily traded currency in the world, accounting for over 88% of all global foreign exchange turnover, or an average of $6.6 trillion in transactions per day, according to data from 2022.
Following the second world war, the USD took over from the British Pound as the world’s reserve currency. For most of its history, the US Dollar was backed by Gold, until the Bretton Woods Agreement in 1971 when the Gold Standard went away.
How do the decisions of the Federal Reserve impact the US Dollar?
The most important single factor impacting on the value of the US Dollar is monetary policy, which is shaped by the Federal Reserve (Fed). The Fed has two mandates: to achieve price stability (control inflation) and foster full employment. Its primary tool to achieve these two goals is by adjusting interest rates.
When prices are rising too quickly and inflation is above the Fed’s 2% target, the Fed will raise rates, which helps the USD value. When inflation falls below 2% or the Unemployment Rate is too high, the Fed may lower interest rates, which weighs on the Greenback.
What is Quantitative Easing and how does it influence the US Dollar?
In extreme situations, the Federal Reserve can also print more Dollars and enact quantitative easing (QE). QE is the process by which the Fed substantially increases the flow of credit in a stuck financial system.
It is a non-standard policy measure used when credit has dried up because banks will not lend to each other (out of the fear of counterparty default). It is a last resort when simply lowering interest rates is unlikely to achieve the necessary result. It was the Fed’s weapon of choice to combat the credit crunch that occurred during the Great Financial Crisis in 2008. It involves the Fed printing more Dollars and using them to buy US government bonds predominantly from financial institutions. QE usually leads to a weaker US Dollar.
What is Quantitative Tightening and how does it influence the US Dollar?
Quantitative tightening (QT) is the reverse process whereby the Federal Reserve stops buying bonds from financial institutions and does not reinvest the principal from the bonds it holds maturing in new purchases. It is usually positive for the US Dollar.
EUR/GBP remains steady slightly above the 0.87 mark. Economists at Scotiabank analyze GBP outlook.
EUR/GBP pressing new range
The soft tone of UK PMI and jobs data this week continue to weigh on broader GBP sentiment.
EUR/GBP gains through 0.87 may reflect the shift to a new, higher 0.87/0.89 range for the cross.
Sterling is softer within its recent, rather sloppy, range. The Pound has found firm support on dips to – and a little through – 1.21 this week. That pattern may extend a little further as trend signals are stuck in neutral on the daily and intraday studies.
Resistance is 1.2175/1.2180.
The Bank of Canada (BoC) holds its regular monetary policy meeting today. Economists at Commerzbank analyze Loonie’s outlook ahead of the Interest Rate Decision.
Will the BoC surprise again?
Both the market and the economists surveyed seem to agree that there will be no further rate hike. The main reason for this is likely to be last week's surprisingly low inflation figures.
With a tight labour market and high wage growth, there is a risk that inflation could still surprise to the upside.
The BoC surprised us already in the spring by interrupting its rate pause and has continued to sound quite hawkish recently. This does not necessarily mean that the market is wrong and that the BoC will raise rates again today. But the risk of a hawkish surprise remains, and with it the risk of a CAD reaction.
See – BoC Preview: Forecasts from nine major banks, keeping rates on hold and prospect of further hikes alive
MBA Mortgage Applications in the United States, released by the Mortgage Bankers Association, dropped 1% in the week ending October 20. In the previous week, United States MBA Mortgage Applications had fallen 6.9%.
What is the United States MBA Mortgage Applications?
The MBA Mortgage Applications released by the Mortgage Bankers Association presents various mortgage applications. It is considered as a leading indicator of the U.S Housing Market. A Mortgage growth represents a healthy housing market that stimulates the overall US economy. Normally, a high reading is seen as positive (or bullish) for the USD, while a low reading is seen as negative (or bearish).
When is the next United States MBA Mortgage Applications report released?
The next United States MBA Mortgage Applications data will be published on November 1 at 11:00 GMT. For more information, check the United States MBA Mortgage Applications entry in FXStreet Calendar.
US Dollar price today
The table below shows the percentage change of US Dollar (USD) against listed major currencies today. US Dollar was the weakest against the Japanese Yen.
| USD | EUR | GBP | CAD | AUD | JPY | NZD | CHF | |
| USD | 0.19% | 0.32% | 0.26% | 0.35% | 0.04% | 0.46% | 0.30% | |
| EUR | -0.19% | 0.13% | 0.07% | 0.18% | -0.15% | 0.28% | 0.10% | |
| GBP | -0.30% | -0.12% | -0.05% | 0.05% | -0.27% | 0.14% | -0.02% | |
| CAD | -0.26% | -0.06% | 0.06% | 0.11% | -0.21% | 0.21% | 0.04% | |
| AUD | -0.35% | -0.16% | -0.04% | -0.09% | -0.31% | 0.09% | -0.07% | |
| JPY | -0.05% | 0.16% | 0.27% | 0.19% | 0.31% | 0.41% | 0.25% | |
| NZD | -0.45% | -0.27% | -0.15% | -0.20% | -0.10% | -0.41% | -0.16% | |
| CHF | -0.29% | -0.09% | 0.03% | -0.03% | 0.07% | -0.25% | 0.17% |
The heat map shows percentage changes of major currencies against each other. The base currency is picked from the left column, while the quote currency is picked from the top row. For example, if you pick the Euro from the left column and move along the horizontal line to the Japanese Yen, the percentage change displayed in the box will represent EUR (base)/JPY (quote).
An automation tool was used in creating this post.
USD/JPY continues to hold just below 150. Economists at HSBC analyze the pair’s outlook.
Ongoing improvement in Japan’s current account balance will provide some support for the JPY
Our base case is that USD/JPY is likely to move sideways for an extended period of time, before declining modestly over 2024, amid our expectations of narrowing (but still large) yield differentials.
We also think the ongoing improvement in Japan’s current account balance will provide some fundamental support for the JPY. Indeed, Japan’s merchandise trade balance swung to a surplus in September, reflecting healthy export gains (supported by JPY weakness).
- Oil (WTI) drops for a fifth consecutive day.
- The US Dollar sees volatility soar with two 1% intraday moves in a row in the US Dollar Index.
- Oil faces risk of falling to $80.
Oil prices are falling like a stone, amounting already to 8% from its peak on October 20, as diplomacy is ruling in the escalated tensions between Israel and Palestine. Several heads of states are gathering in order to get more done on the humanitarian front in Gaza. With the pushback on the Israeli ground offensive in the region, the risk of a broad proxy war in the Middle East is decreasing by the day, which means further selling pressure in Oil prices.
Meanwhile, The US Dollar (USD) made a staggering return on Tuesday and tries to consolidate these gains this Wednesday. The US Dollar Index was close to post a new high for this trading week, though it was unable to pull it off after the US closing bell. Expect the US Dollar to trade a rather tight range for this Wednesday, ahead of the European Central Bank meeting and US Gross Domestic Product numbers on Thursday.
Crude Oil (WTI) trades at $83.17 per barrel, and Brent Oil trades at $86.92 per barrel at the time of writing.
Oil news and market movers
- Divergence between US and Canadian Oil prices as Canadian oil prices are weakening despite pipeline bottlenecks occurring in Canada, restricting shipments to refiners. Canadian pipelines were forced to ration their space this year amid rising Oil production.
- The American Petroleum Institute (API) released its weekly figures overnight on Tuesday. Previous number was a drawdown of 4.383 million, and the actual number at 2.668 million drawdown in barrels.
- At 14:30 GMT, the weekly Energy Information Agency (EIA) will release its stock figures. The previous number was a drawdown for 4.383 million barrels. Expectations for this week are between a drawdown of 3 million and a build of 2 million. Any bigger build than 2 million barrels will trigger another leg lower in Crude prices.
- Russia struggles to lift Oil exports, as its Oil-product exports plunged to the lowest in more than three years.
Oil Technical Analysis: More pain to come ahead of winter?
Oil prices are retreating further from their peaks as the Israeli ground offensive is being pushed back. Though, there were other signs that could count as a foretelling sign that Crude prices were due to retreat. Each time several banks are starting to jack up their forecast calls towards $150 per barrel, often the opposite happens, as speculators are getting too greedy with big sellers more than happy to get paid at elevated levels while global demand is fading and an oversupply is at hand.
On the upside, $84.25 is the new resistance. Should Crude be able to print a similar performance as the US Dollar Index did on Tuesday, expect even a quicker sprint to $88. Should Oil prices be able to consolidate above there, the topside for this fall near $93 could come back into play.
On the downside, traders are bracing for the entry of that region near $78. The area should see ample support for buying. Any further drops below this level might see a firm nosedive move, which would cause Oil prices to sink below $70.
-638338207490614995.png)
US Crude (Daily Chart)
WTI Oil FAQs
What is WTI Oil?
WTI Oil is a type of Crude Oil sold on international markets. The WTI stands for West Texas Intermediate, one of three major types including Brent and Dubai Crude. WTI is also referred to as “light” and “sweet” because of its relatively low gravity and sulfur content respectively. It is considered a high quality Oil that is easily refined. It is sourced in the United States and distributed via the Cushing hub, which is considered “The Pipeline Crossroads of the World”. It is a benchmark for the Oil market and WTI price is frequently quoted in the media.
What factors drive the price of WTI Oil?
Like all assets, supply and demand are the key drivers of WTI Oil price. As such, global growth can be a driver of increased demand and vice versa for weak global growth. Political instability, wars, and sanctions can disrupt supply and impact prices. The decisions of OPEC, a group of major Oil-producing countries, is another key driver of price. The value of the US Dollar influences the price of WTI Crude Oil, since Oil is predominantly traded in US Dollars, thus a weaker US Dollar can make Oil more affordable and vice versa.
How does inventory data impact the price of WTI Oil
The weekly Oil inventory reports published by the American Petroleum Institute (API) and the Energy Information Agency (EIA) impact the price of WTI Oil. Changes in inventories reflect fluctuating supply and demand. If the data shows a drop in inventories it can indicate increased demand, pushing up Oil price. Higher inventories can reflect increased supply, pushing down prices. API’s report is published every Tuesday and EIA’s the day after. Their results are usually similar, falling within 1% of each other 75% of the time. The EIA data is considered more reliable, since it is a government agency.
How does OPEC influence the price of WTI Oil?
OPEC (Organization of the Petroleum Exporting Countries) is a group of 13 Oil-producing nations who collectively decide production quotas for member countries at twice-yearly meetings. Their decisions often impact WTI Oil prices. When OPEC decides to lower quotas, it can tighten supply, pushing up Oil prices. When OPEC increases production, it has the opposite effect. OPEC+ refers to an expanded group that includes ten extra non-OPEC members, the most notable of which is Russia.
The Bank of Canada (BoC) announces monetary policy today. Economists at ING analyze Loonie’s outlook ahead of the decision.
BoC to hold, downside risks for CAD
A hold today is widely expected, so markets will primarily focus on the content of the monetary policy report. Despite likely attempts by the BoC and Governor Tiff Macklem to keep the hawkish narrative going, some downward revisions to the growth figures may open a window for CAD bonds to rally after the meeting, with the Loonie underperforming.
USD/CAD does not look like a screaming sell as it did back in early September, and we see more upside risks to the 1.38/1.40 area before converging to our year-end 1.36 target.
See – BoC Preview: Forecasts from nine major banks, keeping rates on hold and prospect of further hikes alive
- GBP/JPY falls sharply to near 181.60 as the UK’s labor demand fades due to poor economic outlook.
- The Pound Sterling has been facing the wrath of higher interest rates by the BoE.
- A stealth intervention may not turn the tide, which is towards the Japanese Yen due to BoJ’s easy policy stance.
The GBP/JPY pair faced a sharp sell-off near 183.70 on Tuesday after the United Kingdom Office for National Statistics (ONS) reported that the laborforce witnessed lay-off for the third time in a row. The correction in the cross has extended to 181.60 as the UK demand environment has deteriorated further due to the restrictive policy stance by the Bank of England (BoE).
The Pound Sterling has been facing the wrath of higher borrowing costs due to elevated interest rates by the Bank of England (BoE) in an attempt to bring down inflation to 2%. Consistently squeezing the UK labor market is the outcome of a downtick in business activity due to poor demand. The UK business activity remained below the 50.0 threshold in an October survey by S&P Global as employers remained worried about the UK economic outlook and constraints on spending due to higher borrowing costs.
Easing labor market conditions, poor economic outlook, and weak consumer spending warrant one more neutral interest rate decision consecutively from the BoE on November 2. The BoE is expected to keep interest rates unchanged at 5.25% amid an absence of supportive economic readings. Meanwhile, BoE Governor Andrew Bailey is confident over a marked decline in inflation in October.
The Japanese Yen has been underpinned against the Pound Sterling as expectations of intervention by the Japanese Ministry of Finance (MOF) in the FX domain to provide cushion to the domestic currency remain high.
Economists hope that a stealth intervention is a near-term solution and will not turn the tide, which is towards the Japanese Yen till the monetary policy by the Bank of Japan (BoJ) remains expansionary. This week, investors will focus on the Tokyo consumer inflation data, which will be published on Friday.
A quieter 24 hours in fixed income saw 10-year UST yields settle around 4.84%. Economists at Société Générale analyze bonds and FX market outlook.
A range of 4.70%-5.05% for 10-year UST yields should hold
Yields around 5% present good value no doubt for the horde of investors with long-term horizons and hold-to-maturity strategies, but it’s different for those with shorter or tactical considerations.
Barring another flurry of flow-driven activity, we suspect a range of 4.70%-5.05% for UST 10s should hold until the next employment report drops on 3 November and the Treasury holds its final refunding window of the year.
In FX, the Dollar bounced back from the 105.36 intra-day low on Tuesday, but it must ideally overcome 106.79 to banish concerns that a deeper drop lurks around the corner.
UOB Group’s Senior Economist Julia Goh and Economist Loke Siew Ting comment on the latest inflation figures in Malaysia.
Key Takeaways
Headline inflation unexpectedly decelerated further to 1.9% y/y in Sep (Aug: +2.0%), marking the lowest rate since Mar 2021 and 13 consecutive months of easing. The reading defied our estimate and Bloomberg consensus for an uptick to 2.3% and 2.1% respectively. The better-than-expected inflation outturn was primarily thanks to a continued moderation in food and most services price inflation, which offset the price hike in rice, tobacco products and jewelleries during the month.
At this juncture, we maintain our full-year inflation forecasts at 2.8% for both 2023 and 2024 (MOF est: 2.5%-3.0% for 2023 and 2.1%-3.6% for 2024) while awaiting more details including the effective date on the government’s subsidy rationalization program and indirect tax implementation. There are also other considerable external and internal upside risks to the domestic inflation outlook which bear close watching in the near term. They include higher cash aids, new progressive wage mechanism, recent geopolitical tensions, regional trade restriction and expectations of higher-for-longer global interest rates that could continue to lead to persistent currency weakness.
Overall, most threats to price pressures are cost-push factors. This emerges along with increasing signs of softening domestic demand as well as tighter global monetary and financial conditions. The Unity Government has also just unveiled a slight expansionary budget for 2024 to boost growth momentum. Thus, we see Bank Negara Malaysia (BNM) facing dilemma over further interest rate hikes at the next and final monetary policy meeting of this year on 1-2 Nov. We stick to our view that BNM will remain on hold, keeping the overnight policy rate (OPR) at 3.00% next month and throughout 2024.
- Gold price holds onto recovery propelled by a fall in long-term US Treasury yields.
- The US Dollar strengthened after S&P Global PMIs signaled an uptick in US business activity.
- Investors await the Q3 GDP and the Fed’s preferred inflation gauge, which could influence the Fed’s November policy decision.
Gold price (XAU/USD) clings to gains around $1,970 on Wednesday, prompted by a decline in long-term US bond yields. The precious metal managed to recover swiftly as the near-term trend remains firmer amid the Israel-Palestine conflict. The risks of widening tensions in the region persist as the Israeli troops are preparing to enter Gaza. A ground assault by the Israeli army in Gaza could escalate the chances of Iran’s intervention in the ongoing conflict.
The appeal for the US Dollar improved significantly as S&P Global reported an uptick in US business activity in October despite higher interest rates and multi-year high US bond yields. Unlike Asian and European economies, the US economy seems to be handling higher borrowing costs effectively due to robust consumer spending, easing price pressures, and strong labor demand.
Daily Digest Market Movers: Gold price awaits US Q3 GDP data
- Gold price trades inside Tuesday’s range but holds onto recovery to near $1,970.00 prompted by a decline in long-term US bond yields.
- The near-term demand for Gold remains upbeat as the Israeli army could enter Gaza for a ground assault anytime.
- The ground attack by the Israeli troops was delayed as various nations urged for the safe dispatch of humanitarian aid for Gaza civilians.
- Meanwhile, 10-year US Treasury yields fell back to 4.83% as investors shifted their focus to the US Q3 GDP and core Personal Consumption Expenditure (PCE) price index data for September. Both indicators have the potential to affect the Federal Reserve’s (Fed) interest rate decision to be announced on November 1.
- Economists forecast that the US economy will grow by 4.2% on an annualized basis in the third quarter, against the 2.1% growth rate recorded in the second quarter.
- As per the estimates, the monthly core PCE price index expanded at a higher pace of 0.3% in September against a growth of 0.1% in August. The annual core PCE inflation is expected to grow at a slower pace of 3.7% against a 3.9% reading from August.
- An upbeat Q3 GDP report and steady core PCE inflation could propel expectations of further policy-tightening by the Fed.
- As per the CME Group Fedwatch tool, traders see the Fed keeping interest rates unchanged at 5.25%-5.50% as an almost certain outcome. The odds of one more interest rate increase in any of the two remaining monetary policy meetings in 2023 have increased to 27%.
- Fed policymakers have signaled they are willing to keep interest rates unchanged in the range of 5.25%-5.50% on November 1 as higher bond yields are sufficient to reduce overall spending and investment.
- The appeal for Golde diminished on Tuesday after S&P Global reported an uptick in the US business activity in October.
- The Manufacturing PMI reached the 50.0 threshold for the first time since November 2022. The data outperformed expectations of 49.5 and September's reading of 49.8. The Services PMI landed at 50.9 against expectations of 49.9 and the prior release of 50.1.
- S&P Global reported that strong demand conditions drove the expansion amid a renewed increase in new orders. The agency also reported that market sentiment has improved in part due to hopes of interest rates having peaked.
- The US Dollar, tracked by the US Dollar index, recovered sharply from 105.40 as the US economy appears to be performing better while the European economy reported a downtick in business activity due to higher borrowing costs.
Technical Analysis: Gold price consolidates near $1,970
Gold price trades directionless around $1,970.00 after a sharp recovery as investors await key US economic data to be released later this week. The precious metal remains firmer, on a broader note, as it is trading near a five-month high. Short-term Exponential Moving Averages (EMAs) are upward-sloping, which indicates that the overall trend is bullish. Momentum oscillators also indicate that the bullish impulse is active.
Gold FAQs
Why do people invest in Gold?
Gold has played a key role in human’s history as it has been widely used as a store of value and medium of exchange. Currently, apart from its shine and usage for jewelry, the precious metal is widely seen as a safe-haven asset, meaning that it is considered a good investment during turbulent times. Gold is also widely seen as a hedge against inflation and against depreciating currencies as it doesn’t rely on any specific issuer or government.
Who buys the most Gold?
Central banks are the biggest Gold holders. In their aim to support their currencies in turbulent times, central banks tend to diversify their reserves and buy Gold to improve the perceived strength of the economy and the currency. High Gold reserves can be a source of trust for a country’s solvency. Central banks added 1,136 tonnes of Gold worth around $70 billion to their reserves in 2022, according to data from the World Gold Council. This is the highest yearly purchase since records began. Central banks from emerging economies such as China, India and Turkey are quickly increasing their Gold reserves.
How is Gold correlated with other assets?
Gold has an inverse correlation with the US Dollar and US Treasuries, which are both major reserve and safe-haven assets. When the Dollar depreciates, Gold tends to rise, enabling investors and central banks to diversify their assets in turbulent times. Gold is also inversely correlated with risk assets. A rally in the stock market tends to weaken Gold price, while sell-offs in riskier markets tend to favor the precious metal.
What does the price of Gold depend on?
The price can move due to a wide range of factors. Geopolitical instability or fears of a deep recession can quickly make Gold price escalate due to its safe-haven status. As a yield-less asset, Gold tends to rise with lower interest rates, while higher cost of money usually weighs down on the yellow metal. Still, most moves depend on how the US Dollar (USD) behaves as the asset is priced in dollars (XAU/USD). A strong Dollar tends to keep the price of Gold controlled, whereas a weaker Dollar is likely to push Gold prices up.
USD/CNY is holding steady around the 7.30 level and has been range bound between 7.24-7.36 for the past two months. Economists at Commerzbank analyze the pair’s outlook.
PBoC is likely to ensure ample liquidity in the system
The bottom appears to be continued policy support from all levers, namely fiscal and monetary policy.
PBoC left the 1-year medium-term lending facility (MLF) rate unchanged in October at 2.50%. It was last cut by 15 bps in August 2023. We may not necessarily see further cuts as it will widen the interest rate differential vs USD and exert downside pressure on CNY. However, PBoC is likely to ensure ample liquidity in the system. For USD/CNY, this may entail a continued supportive tone.
PBoC is likely to target stability rather than a weaker CNY.
- USD/CAD advances on lower oil prices, US Dollar’s recovery, and neutral BoC bets.
- The BoC is expected to keep interest rates unchanged at 5%.
- USD/CAD hovers near the upper portion of the Rising Channel chart pattern in an attempt for a breakout.
The USD/CAD pair holds onto gains prompted by a breakout of the consolidation formed in a range of 1.3665-1.3740 in the European session. The Loonie asset capitalizes on expectations that the Bank of Canada (BoC) will keep interest rates unchanged at 5% for the second time in a row.
In addition to expectations of a BoC pause, a strong recovery in the US Dollar after an uptick in the US business activities has infused strength in the Loonie asset. The US Dollar recovered strongly on Tuesday after S&P Global reported higher Manufacturing and Services PMI in October amid robust consumer spending despite higher interest rates by the Federal Reserve (Fed).
The oil price corrected significantly as investors hoped that the Israel-Hamas war could be contained. Various nations urge Israel to rethink the consequences of ground assault in Gaza, which could result in a deep shock for the global economy. It is worth noting that Canada is the leading exporter of oil to the United States and lower oil prices impact the Canadian Dollar.
USD/CAD hovers near the upper portion of the Rising Channel chart pattern on an hourly scale in an attempt for a breakout. The Loonie asset is approaching the horizontal resistance plotted from October 5 high at 1.3784. Upward-sloping 50-period Exponential Moving Average (EMA) at 1.3720 warrants more upside ahead.
The Relative Strength Index (RSI) (14) shifts into the bullish range of 60.00-80.00, which indicates that the upside momentum has been triggered.
A decisive break above March 24 high around 1.3800 would expose the asset to March 10 high at 1.3860, followed by the round-level resistance at 1.3900.
In an alternate scenario, a breakdown below September 25 low around 1.3450 would drag the asset toward September 20 low near 1.3400. A further breakdown could expose the asset to six-week low near 1.3356.
USD/CAD hourly chart
-638338227424616810.png)
Economists at TD Securities discuss the Bank of Canada (BoC) Interest Rate Decision and its implications for the USD/CAD pair.
Hawkish (25%)
25 bps hike. BoC hikes to 5.25%. Bank remains concerned that sticky inflation will delay the normalization of wage/inflation expectations, risking a wage-price spiral. October MPR still projects a soft landing, but inflation target takes longer to achieve. No change to guidance, keeping options open. USD/CAD -1.0%.
Base Case (65%)
Open-ended hold. Bank holds at 5.00% and leaves the door open to further hikes. Bank cites widespread evidence that rate hikes are working to slow demand, with sharp downgrade to 2023 GDP forecast as CPI is revised higher for 2023 and 2024. Bank leaves guidance unchanged, repeating pledge to hike further if needed. USD/CAD -0.2%.
Dovish (10%)
Dovish hold. BoC holds overnight rate at 5.00% but signals that the window for hikes has likely closed. Statement notes that higher interest rates have worked, with excess demand fading rapidly and economy tracking toward mild recession. Revised guidance states Bank will continue to assess the outlook for inflation, but does not repeat pledge to hike again if needed. USD/CAD +0.5%.
- NZD/USD looks to extend losses due to the stronger US Dollar.
- Technical indicators suggest a bearish sentiment in the pair.
- Major level at 0.5800 aligned with the monthly low could act again as support.
NZD/USD struggles to remain in the positive territory after minor losses registered in the previous session due to weaker upbeat S&P Global PMI from the United States (US).
US S&P Global Composite PMI showed growth in October, rising from 50.2 to 51.0. The Services PMI experienced an increase, reaching 50.9, while the Manufacturing PMI rose to 50.0. The manufacturing index has maintained a level above the 50-point threshold in the last six months, indicating a positive shift in that sector.
NZD/USD trades around the 0.5850 psychological level during the European session on Wednesday. The pair has almost trimmed its intraday gains as the US Dollar (USD) continues the gains for the second successive day.
The nine-day Exponential Moving Average (EMA) at 0.5870 appears to be the key barrier, followed by the 0.5900 psychological level.
A firm break above the latter could open the doors for the NZD/USD pair to explore the region around the 23.6% Fibonacci retracement at 0.5950.
On the downside, the region around the major level at 0.5800 aligned with the monthly low at 0.5807 could act again as the immediate support for the NZD/USD pair.
The Moving Average Convergence Divergence (MACD) line remains beneath both the centerline and the signal line. The financial sonnet echoes a bearish refrain for the NZD/USD pair.
Furthermore, the NZD/USD pair unveils a bearish momentum, as the 14-day Relative Strength Index (RSI) flaunts a palpable penchant for weakness, gracefully bowing beneath the 50 level.
NZD/USD: Daily Chart
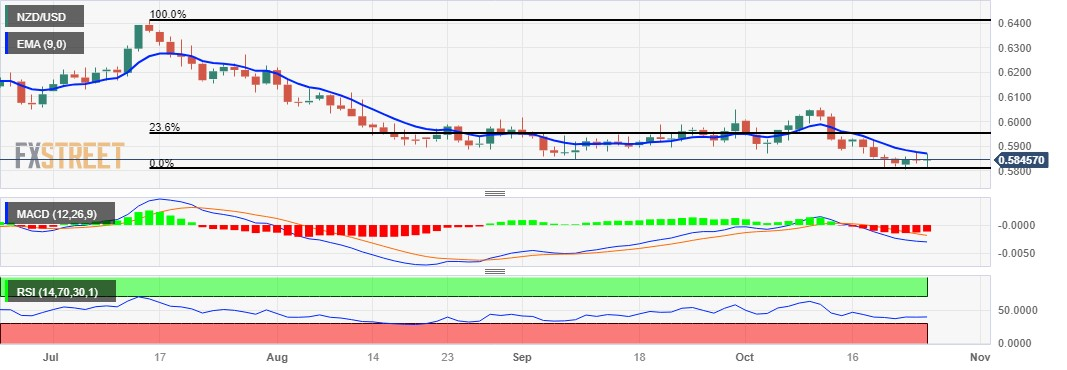
Economist Enrico Tanuwidjaja and Junior Economist Agus Santoso at UOB Group assess the latest interest rate decision by the Bank Indonesia (BI).
Key Takeaways
Bank Indonesia (BI) raised its benchmark rate (7-Day Reverse Repo) to 6.00% following its Oct MPC meeting, above market consensus and UOB's forecast.
BI specifically mentioned that strengthening rupiah stability amid escalating global financial market pressures and geopolitical uncertainty is the focus now. Today's decision also marks that BI will continue liquidity relaxation by lowering the macroprudential liquidity buffer (Penyangga Likuiditas Makroprudensial, PLM) ratio by 100bps from 6% to 5% for commercial banks and to 3.5% from 4.5% for Islamic banks effective from 1 Dec 2023.
All in all, with more uncertainty and volatility in the global economic conditions and the financial markets, we therefore shift our expectation that BI will delay the rate cuts to early 2025 or if not later and we expect for the next year there is unlikely to be any rate cut. This “higher for longer” policy stance is likely to render the Indonesian economy to grow below expectations.
Tuesday's first estimate of the Eurozone purchasing managers' indices put the Euro under considerable pressure, causing it to lose almost all of Monday's gains. Economists at Commerzbank analyze EUR outlook.
Waiting for the ECB
While the US economy is booming, the Eurozone economy is showing signs of slowing down as a result of interest rate hikes. No wonder the Euro has come under pressure.
Ahead of Thursday's ECB meeting, the market is likely to be reluctant to take a position today, even though another rate hike seems highly unlikely. Today's rather second-tier US data is unlikely to change this. Therefore, we will have to wait and see for the time being.
- EUR/GBP catches aggressive bids on Wednesday and moves back closer to a multi-month top.
- Expectations that the BoE is done hiking rates undermine the GBP and lend support to the cross.
- Speculations that the ECB will maintain the status quo on Thursday might cap any further gains.
The EUR/GBP cross, having shown resilience below the 200-day SMA the previous day, attracts fresh buying on Wednesday and builds on its intraday gains through the early part of the European session. Spot prices currently trade around the 0.8720-0.8725 region and remain well within the striking distance of the highest level since May 8 touched last Friday.
As investors digest the upbeat UK labour market data released on Tuesday, speculations that the Bank of England (BoE) could maintain the status quo in November turn out to be a key factor behind the British Pound's relative underperformance. This, in turn, is seen as a key factor acting as a tailwind for the EUR/GBP cross, which gets an additional boost following the release of the better-than-expected German IFO survey.
In fact, the headline German IFO Business Climate Index arrived at 86.9 in October, up from the previous month's reading of 85.8 while beating the market expectations of 85.9. Adding to this, the Current Economic Assessment Index rose to 89.2 points in the reported month, compared with September’s 88.7 and 88.5 estimated. Furthermore, the IFO Expectations Index climbed to 84.7 in October from 83.1 in September.
That said, growing acceptance that the European Central Bank (ECB) will halt the most aggressive interest rate-hiking cycle on Thursday might hold back bulls from placing aggressive bets around the EUR/GBP cross. The ECB signalled in September that the hike, its 10th in a 14-month-long fight against inflation, was likely to be its last. Adding to this, stagflation risk could force the ECB to maintain the status quo.
The aforementioned mixed fundamental backdrop warrants some caution before positioning for any further appreciating move. From a technical perspective, however, the recent breakout and acceptance above the 200-day SMA suggests that the path of least resistance for the EUR/GBP cross is to the upside. Hence, a move beyond the monthly swing low, around the 0.8740 zone, looks like a distinct possibility.
Technical levels to watch
The US Dollar struggles to build on Tuesday's impressive gains. Economists at ING analyze Greenback’s outlook.
High US yields make the Dollar an expensive sell
The US data calendar is quiet today, with new home sales the only highlight. There will be some focus on a speech by Federal Reserve Chair Jerome Powell, although he may not discuss monetary policy.
With markets having seen a modest reaction to geopolitical risk and high US yields making the Dollar an expensive sell, a recovery in DXY to the 107.00 highs looks more likely than another material correction for now.
Australian quarterly inflation figures came in higher than market participants had expected. Economists at Commerzbank analyzed Aussie’s outlook after the Consumer Price Index (CPI) report.
What does the RBA make of the inflation figures?
The figures do not yet suggest that the inflation problem has been solved. The quarterly rate of change is still clearly too high to be in line with the Reserve Bank of Australia's (RBA) inflation target.
In her first speech, new RBA Governor Michele Bullock emphasised the dual mandate and the need to be more cautious so as not to jeopardise labour market gains. At the same time, however, she indicated that the RBA would react to persistent inflation.
Today's figures suggest that the RBA must now follow these words with action. If the RBA sticks to its cautious stance despite the uncertainties surrounding inflation and continues to wait and see, the Aussie is likely to be punished again.
- USD/CHF extends its gains on the upbeat Greenback.
- Swiss Survey Expectations declined from 27.6 to 37.8 in October.
- US Dollar extends gains after robust US PMI data.
USD/CHF extends its gains for the second consecutive day, trading higher around 0.8950 during the Early European session on Wednesday. The pair strengthened driven by the positive Purchasing Managers Index (PMI) data from the United States, which provides support to the US Dollar (USD).
Swiss Franc (CHF) might be in for a bumpy ride with that ZEW Survey. A decline is recorded in expectations from 27.6 to 37.8 in October. The decline signals a worsening in Switzerland’s business conditions and labor market.
While the CHF, being a safe-haven currency, may have initially found support amid geopolitical tensions between Israel and Hamas, diplomatic efforts to ease these tensions have contributed to a reduction in market risk aversion. This, in turn, has boosted investors' risk appetite.
The US Dollar Index (DXY) mounted a comeback from its monthly lows, stabilizing around 106.30 at the time of writing, driven by the positive initial S&P Global PMI figures unveiled on Tuesday.
Nevertheless, the dip in US Treasury yields, holding at 4.82% by the press time, for the 10-year yield, might apply downward pressure on the US Dollar (USD).
In October, the US S&P Global Composite PMI displayed growth, climbing from 50.2 to 51.0. The Services PMI saw improvement, reaching 50.9, while the Manufacturing PMI rose to 50.0. Notably, the manufacturing index has consistently stayed above the 50-point mark for the past six months, signaling a favorable trend in that sector.
Investors are gearing up to closely monitor the US Q3 Gross Domestic Product (GDP) on Thursday, with additional attention on the US Core Personal Consumption Expenditures (PCE) data set for Friday.
- Silver drifts into negative territory for the third straight day on Wednesday.
- The mixed technical setup warrants caution for aggressive bearish traders.
- Bulls need to wait for sustained strength beyond the $23.70 supply zone.
Silver meets with a fresh supply following an intraday uptick to the $23.00 round figure and turns lower for the third successive day on Wednesday. The white metal remains depressed through the early part of the European session and currently trades around the $22.85 region, down nearly 0.30% for the day.
From a technical perspective, the XAG/USD last week struggled to find acceptance above a confluence barrier comprising the 50% Fibonacci retracement level of the May-October slide and the very important 200-day Simple Moving Average (SMA). The subsequent failure near the $23.70-$23.75 strong horizontal resistance supports prospects for a further depreciating move. That said, oscillators on the daily chart are holding comfortably in the positive territory and warrant some caution for aggressive bearish traders.
Hence, any further decline might continue to find some support near the overnight swing low, around the $22.70-$22.65 region. The said area coincides with the 38.2% Fibo. level and should act as a key pivotal point for intraday traders. A convincing break below might prompt some technical selling and drag the XAG/USD to the $22.30-$22.25 horizontal resistance breakpoint now turned support. The downward trajectory could get extended further towards the $22.00 round-figure mark, representing 23.6% Fibo. level.
On the flip side, momentum back above the $23.00 mark is likely to confront stiff resistance near the aforementioned confluence hurdle, around the $23.30-$23.35 zone, and remain capped near the $23.70 area. Some follow-through buying should allow the XAG/USD to test 61.8% Fibo. level, around the $24.00 round-figure mark, en route to the next relevant resistance near the $24.15-$24.20 region. Some follow-through buying will mark a fresh breakout and shift the near-term bias in favour of bullish traders.
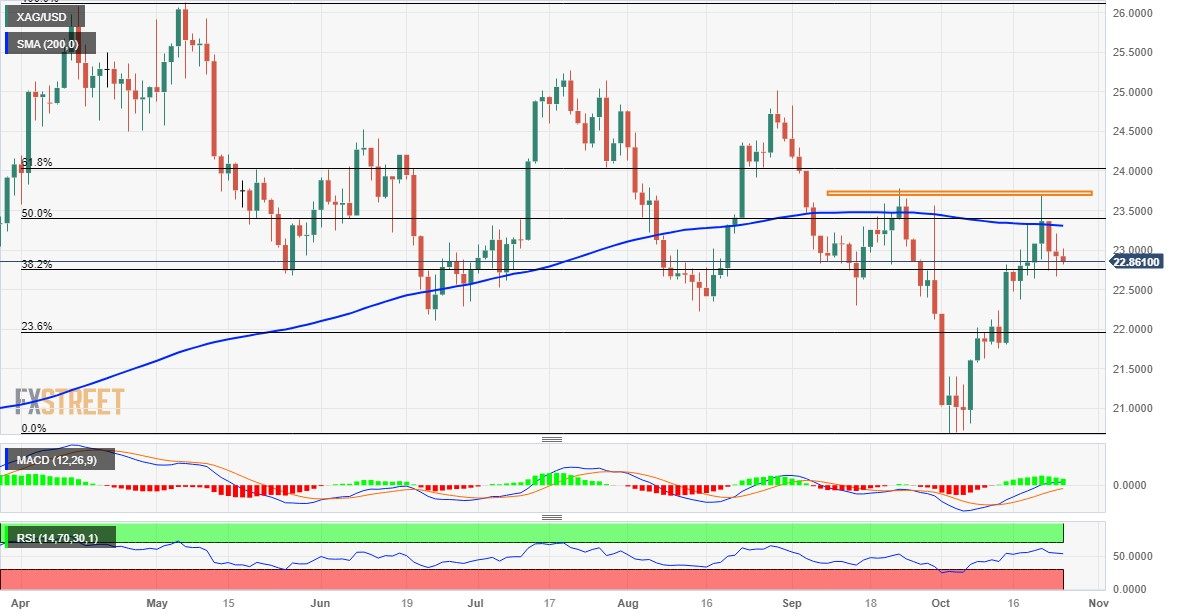
- German IFO Business Climate Index rose to 86.9 in October.
- IFO Current Economic Assessment improved to 89.2 in the reported month.
The headline German IFO Business Climate Index arrived at 86.9 in October, up from the previous month's reading of 85.8 while beating the market expectations of 85.9.
Meanwhile, the Current Economic Assessment Index rose to 89.2 points in the reported month, compared with September’s 88.7 and 88.5 estimated.
The IFO Expectations Index – indicating firms’ projections for the next six months, climbed to 84.7 in October from 83.1 in September. The market consensus was 83.3.
IFO president Clemens Fuest said: "The German economy sees a silver lining on the horizon."
Market reaction to the German IFO Survey
EUR/USD is re-attempting bids on the upbeat German IFO survey. At the time of writing, the pair is trading at 1.0590, up 0.03% on the day.
About German IFO
The headline IFO business climate index was rebased and recalibrated in April after the IFO Research Institute changed series from the base year of 2000 to the base year of 2005 as of May 2011 and then changed series to include services as of April 2018. The survey now includes 9,000 monthly survey responses from firms in the manufacturing, service sector, trade and construction.
- The Bank of Canada is forecast to leave the policy rate unchanged at 5.0% on Wednesday.
- BoC policymakers are expected to keep the interest rate steady until the end of the year.
- BoC projections could ramp up volatility around the Canadian Dollar.
The Bank of Canada (BoC) is widely expected to leave its policy rate unchanged at 5% for the second consecutive time on Wednesday, when it concludes the October policy meeting. The Canadian Dollar (CAD) has been steadily weakening against the US Dollar (USD) since the BoC’s last rate increase in July, with the USD/CAD pair gaining nearly 4% since the beginning of August.
The BoC’s latest Business Outlook Survey (BoS), published on October 16, showed that more than 70% of firms across a broad range of sectors said that higher interest rates were negatively affecting them.
“Consumers’ perceptions of current inflation remain elevated and are leading to persistently high expectations for inflation over the next 12 months,” the BoC noted in the Canadian Survey of Consumer Expectations released alongside the BoS. “Consumers’ expectations for interest rates one year from now also remain high. Many people think increases in interest rates are raising the cost of living and keeping inflation high,” the publication read.
Bank of Canada interest rate expectations: Steady policy as inflation slows
Inflation in Canada, as measured by the change in the Consumer Price Index (CPI), declined to 3.8% on a yearly basis in September from 4% in August, Statistics Canada reported earlier in the month. The Core CPI, which excludes volatile food and energy prices, rose 2.8% in the same period, at a softer pace than the 3.3% increase recorded in August.
Commenting on inflation developments, Bank of Canada Governor Tiff Macklem said on Friday that they were concerned because they were not really seeing a downward momentum in inflation. "When Governing Council next meets, it will focus on whether to stick with its 5% rate or if more action is needed to restore price stability,” Macklem added.
After leaving the policy rate unchanged at 5% in September, the BoC said it is prepared to raise rates again if needed, citing concerns over the persistence of underlying inflationary pressures.
The BoC is unlikely to go against market expectations and raise the interest rate. Almost all analysts polled by Reuters (29 of 32) said that they forecast the BoC to hold the policy rate steady at 5%. Policymakers are likely to see growing signs of cooling in the housing market and the overall economic activity as a reason to stay on the sidelines and wait for more data. According to the Canadian Real Estate Association, national home sales declined by 1.9% month-over-month in September, marking the third consecutive contraction. Meanwhile, real Gross Domestic Product stagnated in July, following the 0.2% monthly contraction recorded in June.
Nevertheless, inflation remains the primary concern for the BoC and it wouldn’t be surprising to see the bank leaving additional policy tightening on the table for future meetings. Revisions to inflation and growth forecasts will also be scrutinized by market participants.
Economists at the National Bank of Canada think there is room for a hawkish surprise:
“In light of recent data, we expect the Bank of Canada to leave its overnight target unchanged for the second consecutive meeting on Wednesday. Saying that, there remain some problematic elements of the inflation outlook that might argue for additional tightening and as such, we’d caution that this is not an open-and-shut decision.”
“At a minimum, policymakers will leave the door open to further tightening via an explicit threat to hike further. That hiking bias will likely remain until more durable progress on inflation is made. Wednesday’s rate statement will be published alongside an updated Monetary Policy Report. Here you’ll see a material downgrade to the GDP trajectory and an inflation profile that will need to be marked up to reflect stronger-than-expected price pressures in the summer.”
When will the BoC release its monetary policy decision and how could it affect USD/CAD?
The Bank of Canada will announce its policy decision at 14:00 GMT. The policy decisions will be accompanied by the central bank’s updated forecasts and there will be a press conference by Governor Tiff Macklem following the release of the policy statement.
A hawkish policy hold could help the CAD gather strength against the USD with the immediate reaction and trigger a downward correction in USD/CAD. In this scenario, whether the pair starts a steady downtrend will largely depend on the USD’s valuation.
An unexpected 25 bps rate hike is likely to fuel a CAD rally and cause the pair to fall sharply. The least likely scenario is a dovish surprise, with the BoC removing the reference about readiness to raise the policy rate again from the statement. If that were to materialize, USD/CAD could gather bullish momentum and extend its uptrend.
Eren Sengezer, European Session Lead Analyst at FXStreet, offers a brief technical outlook for the USD/CAD pair and writes: “The Relative Strength Index (RSI) indicator on the daily chart holds comfortably above 50, reflecting the lack of seller interest. On the upside, 1.3800 (static level, psychological level) aligns as first resistance. With a daily close above this level, USD/CAD can extend its uptrend and face interim resistance at 1.3860 (March 10 high) before targeting 1.3980 (October 13, 2022, high). Looking south, the 50-day Simple Moving Average (SMA) forms dynamic support at 1.3600 before 1.3500-1.3480 (psychological level, 200-day SMA).”
Economic Indicator
Canada BoC Interest Rate Decision
BoC Interest Rate Decision is announced by the Bank of Canada. If the BoC is hawkish about the inflationary outlook of the economy and rises the interest rates it is positive, or bullish, for the CAD. Likewise, if the BoC has a dovish view on the Canadian economy and keeps the ongoing interest rate, or cuts the interest rate it is seen as negative, or bearish.
Read more.Next release: 10/25/2023 14:00:00 GMT
Frequency: Irregular
Source: Bank of Canada
Bank of Canada FAQs
What is the Bank of Canada and how does it influence the Canadian Dollar?
The Bank of Canada (BoC), based in Ottawa, is the institution that sets interest rates and manages monetary policy for Canada. It does so at eight scheduled meetings a year and ad hoc emergency meetings that are held as required. The BoC primary mandate is to maintain price stability, which means keeping inflation at between 1-3%. Its main tool for achieving this is by raising or lowering interest rates. Relatively high interest rates will usually result in a stronger Canadian Dollar (CAD) and vice versa. Other tools used include quantitative easing and tightening.
What is Quantitative Easing (QE) and how does it affect the Canadian Dollar?
In extreme situations, the Bank of Canada can enact a policy tool called Quantitative Easing. QE is the process by which the BoC prints Canadian Dollars for the purpose of buying assets – usually government or corporate bonds – from financial institutions. QE usually results in a weaker CAD. QE is a last resort when simply lowering interest rates is unlikely to achieve the objective of price stability. The Bank of Canada used the measure during the Great Financial Crisis of 2009-11 when credit froze after banks lost faith in each other’s ability to repay debts.
What is Quantitative tightening (QT) and how does it affect the Canadian Dollar?
Quantitative tightening (QT) is the reverse of QE. It is undertaken after QE when an economic recovery is underway and inflation starts rising. Whilst in QE the Bank of Canada purchases government and corporate bonds from financial institutions to provide them with liquidity, in QT the BoC stops buying more assets, and stops reinvesting the principal maturing on the bonds it already holds. It is usually positive (or bullish) for the Canadian Dollar.
Economists at Société Générale analyze USD/CAD technical outlook ahead of the Bank of Canada (BoC) Monetary Policy Report.
1.3570/1.3530 is an important support zone
We expect rates to remain at 5%. The guidance of the BoC statement is likely to stay hawkish.
Once a break above the high formed earlier this month at 1.3780 materializes, the pair is expected to extend its uptrend towards 1.3860 and perhaps even towards the 2022 high of 1.3980.
Recent trough near 1.3570/1.3530 is an important support zone.
- The Euro trades with small losses against the US Dollar.
- Stocks in Europe open mostly in the red on Wednesday.
- EUR/USD has met resistance just ahead of 1.0700 this week.
- The USD Index (DXY) clings to daily gains around 106.30.
The Euro (EUR) is showing a slight vulnerability against the US Dollar (USD), causing EUR/USD to maintain the trade below the 1.0600 in Europe's opening bell on Wednesday.
The Greenback is managing to regain some stability following Tuesday’s strong rebound, motivating the USD Index (DXY) to hover around the low-106.00s against the backdrop of mixed US yields.
In terms of monetary policy, there is a growing expectation among market participants that the Federal Reserve (Fed) will maintain its current stance of keeping interest rates unchanged at the November 1 meeting. This belief was reinforced by comments made by Fed Chair Jerome Powell during his recent speech at the Economic Club of New York.
Meanwhile, investors are considering the possibility of the European Central Bank (ECB) halting its tightening cycle, despite inflation levels surpassing the bank's target and concerns emerging about the risk of an economic slowdown or stagflation in the Eurozone.
In the euro docket, all the attention will be on the release of the German Business Climate measured by the IFO Institute for October.
In the US, usual weekly Mortgage Applications tracked by MBA are due later, ahead of New Home Sales for the month of September.
Daily digest market movers: Euro remains depressed below 1.0600
- The EUR keeps the offered bias against the USD.
- US and German yields trade without a clear direction.
- The Fed could still hike rates at the December meeting.
- The ECB is largely expected to keep rates unchanged on October 26.
- Geopolitical effervescence seems to have diminished somewhat.
- Inflation in Australia surprises to the upside in Q3.
- The ECB’S Christine Lagarde speaks later in the session.
Technical Analysis: Euro still risks deeper pullback
EUR/USD trades in a dubious fashion near 1.0580 following Tuesday’s pronounced retracement.
If the selling trend continues, immediate support can be found around the October 13 low of 1.0495, which is closely followed by the 2023 low of 1.0448 seen on October 3, before reaching the round level of 1.0400. If this zone is breached, the pair may decline further towards the lows of 1.0290 (November 30, 2022) and 1.0222 (November 21, 2022).
If bulls regain the upper hand, EUR/USD should face initial resistance at the October 25 peak of 1.0694, an area coincident with the 55-day Simple Moving Average (SMA). The surpass of this region exposes the September 12 top of 1.0767 prior to the important 200-day SMA at 1.0815. A break above this level could indicate a further push towards the August 30 high of 1.0945, just before reaching the psychological level of 1.1000. If the upward momentum continues, there is a possibility of challenging the August 10 peak of 1.1064, seconded by the July 27 top of 1.1149 and potentially even reaching the 2023 high of 1.1275 from July 18.
As long as the EUR/USD remains below the 200-day SMA, there is a possibility of sustained bearish pressure on the pair.
Euro FAQs
What is the Euro?
The Euro is the currency for the 20 European Union countries that belong to the Eurozone. It is the second most heavily traded currency in the world behind the US Dollar. In 2022, it accounted for 31% of all foreign exchange transactions, with an average daily turnover of over $2.2 trillion a day.
EUR/USD is the most heavily traded currency pair in the world, accounting for an estimated 30% off all transactions, followed by EUR/JPY (4%), EUR/GBP (3%) and EUR/AUD (2%).
What is the ECB and how does it impact the Euro?
The European Central Bank (ECB) in Frankfurt, Germany, is the reserve bank for the Eurozone. The ECB sets interest rates and manages monetary policy.
The ECB’s primary mandate is to maintain price stability, which means either controlling inflation or stimulating growth. Its primary tool is the raising or lowering of interest rates. Relatively high interest rates – or the expectation of higher rates – will usually benefit the Euro and vice versa.
The ECB Governing Council makes monetary policy decisions at meetings held eight times a year. Decisions are made by heads of the Eurozone national banks and six permanent members, including the President of the ECB, Christine Lagarde.
How does inflation data impact the value of the Euro?
Eurozone inflation data, measured by the Harmonized Index of Consumer Prices (HICP), is an important econometric for the Euro. If inflation rises more than expected, especially if above the ECB’s 2% target, it obliges the ECB to raise interest rates to bring it back under control.
Relatively high interest rates compared to its counterparts will usually benefit the Euro, as it makes the region more attractive as a place for global investors to park their money.
How does economic data influence the value of the Euro?
Data releases gauge the health of the economy and can impact on the Euro. Indicators such as GDP, Manufacturing and Services PMIs, employment, and consumer sentiment surveys can all influence the direction of the single currency.
A strong economy is good for the Euro. Not only does it attract more foreign investment but it may encourage the ECB to put up interest rates, which will directly strengthen the Euro. Otherwise, if economic data is weak, the Euro is likely to fall.
Economic data for the four largest economies in the euro area (Germany, France, Italy and Spain) are especially significant, as they account for 75% of the Eurozone’s economy.
How does the Trade Balance impact the Euro?
Another significant data release for the Euro is the Trade Balance. This indicator measures the difference between what a country earns from its exports and what it spends on imports over a given period.
If a country produces highly sought after exports then its currency will gain in value purely from the extra demand created from foreign buyers seeking to purchase these goods. Therefore, a positive net Trade Balance strengthens a currency and vice versa for a negative balance.
EUR/USD declined to around the 1.06 mark on Tuesday. Economists at ING analyze the pair’s outlook.
ECB may have to sound more dovish given the deteriorating economic outlook
EUR/USD may have lost the upward correction momentum after Tuesday’s PMIs and could stay under some pressure on expectations that the ECB may have to sound more dovish on Thursday given the deteriorating economic outlook.
A slip to 1.0530/1.0560 may be on the cards into the ECB announcement.
See: EUR/USD is now seen trading within 1.0510-1.0700 – UOB
- USD/MXN trades above 18.3000 as the US Dollar strengthens.
- Mexico’s CPI rate for the first half of October continued its decline.
- US Dollar rebounded from the monthly low amid robust US PMI data.
USD/MXN continues its gains for the second consecutive day, trading higher near 18.3000 during the Early European session on Wednesday. The pair strengthens on the back of the upbeat PMI data from the United States, which bolsters the US Dollar (USD).
Mexico released its inflation data on Tuesday, revealing that the Consumer Price Index (CPI) rate for the first half of October continued its decline. The report showed a print of 0.23% against the market consensus of 0.34% and 0.25% previously.
The Bank of Mexico (Banxico) has kept interest rates at 11.25% since March 2023. Despite the sustained rate, market participants are anticipating the possibility of the first rate cut in 2024.
The US Dollar Index (DXY) staged a recovery from monthly lows, finding stability around 106.20, propelled by positive preliminary S&P Global PMI figures released on Tuesday.
However, the decline in US Treasury yields, currently standing at 4.82% for the 10-year yield, could exert downward pressure on the US Dollar (USD).
In October, the US S&P Global Composite PMI demonstrated growth, rising from 50.2 to 51.0. The Services PMI experienced an uptick, reaching 50.9, while the Manufacturing PMI increased to 50.0. Significantly, the manufacturing index has consistently remained above the 50-point threshold for the past six months, indicating a positive trend in that sector.
Investors are anticipated to closely track the US Q3 Gross Domestic Product (GDP) on Thursday, with additional focus on the US Core Personal Consumption Expenditures (PCE) data scheduled for Friday. Additionally, Mexico’s Trade Balance data is set to be released on Friday.
- Pound Sterling faces a sell-off as UK business activity contracts and labor hiring freezes.
- UK employers shed jobs for the third time in a row as new orders drop.
- Investors see the BoE keeping interest rates unchanged as the UK economy is exposed to a mild recession.
The Pound Sterling (GBP) looks set for a breakdown as expectations of a mild recession in the United Kingdom economy have escalated. The GBP/USD pair falls back as higher borrowing costs by the Bank of England (BoE), a poor demand outlook, and deepening geopolitical tensions weigh.
The UK’s labor market appears to be facing the consequences of slowing business activity, with employers shedding jobs for the third time in a row. Going forward, investors will focus on the interest rate decision by the BoE, which will be announced next week. The BoE is expected to keep interest rates unchanged at 5.25% for the second consecutive time, and policymakers are expected to downgrade the growth outlook.
Daily Digest Market Movers: Pound Sterling remains weak amid US Dollar strength
- Pound Sterling finds interim support near 1.2160 after a sharp correction from an eight-day high around 1.2290.
- More downside in the Pound Sterling seems warranted as the UK economy is expected to fall into a mild recession due to declining business activity in a deteriorating demand environment.
- S&P Global reported on Tuesday that the Manufacturing PMI was at 45.2, better than expectations of 45.0 and the former reading of 44.3. However, a figure below the 50.0 threshold signals a contraction in factory activity. UK manufacturing activity has been contracting for more than a year, according to the PMI data.
- This is the longest period of decline in the country’s factory activity since 2008-2009 as firms are cutting on inventory due to a slowdown in new orders.
- UK firms have frozen hiring amid lower levels of new business. S&P Global reported that employers remained worried about the UK economic outlook and constraints on spending due to higher borrowing costs.
- The Services PMI came in at 49.2 in October, below the expected 49.5, and September's release of 49.3. The Services PMI, which gauges activity among service providers, contracted for the third month in a row.
- The effect of the hiring freeze by UK employers is clearly visible in the labor market data reported by the UK Office for National Statistics (ONS) on Tuesday.
- The ONS reported that employment levels fell for the third time in a row. Employers shed 82K jobs in the June-August period, a number that is significantly lower than expectations of 198K lay-offs. In the three months to July period, employment levels were reduced by 207K employees.
- The UK’s Unemployment Rate dropped to 4.2% in the quarter to August against expectations and the former reading of 4.3%.
- Economic data released in October suggest that the UK economy is struggling with high-interest rates from the Bank of England (BoE).
- A slowdown in business activity, labor demand, and weak consumer spending will likely prompt the BoE to keep interest rates unchanged at 5.25% in its monetary policy meeting scheduled for November 2.
- The risk appetite of the market participants remained weak as Israeli troops were preparing to enter Gaza for the ground assault.
- Meanwhile, the US Dollar recovered on Tuesday after finding support near 105.40. Investors rushed for the US Dollar after upbeat PMI reading for October.
- This week, investors will watch for the Q3 Gross Domestic Product (GDP) data, which will be published on Thursday. Economists anticipate the growth rate doubling to 4.2% against the former reading of 2.1% on an annualized basis.
- A strong growth rate in the July-September could elevate chances of further policy-tightening by the Federal Reserve (Fed) in its monetary policy meeting scheduled for November 1.
Technical Analysis: Pound Sterling falls after short-lived pullback to near 1.2300
Pound Sterling faced an intense sell-off after a short-lived pullback to near the round-level resistance of 1.2300. The GBP/USD pair failed to sustain above the 20-day Exponential Moving Average (EMA), which indicates that the short-term trend is bearish. The broader Cable outlook is extremely bearish as the 50-day and 200-day EMAs are downward-sloping. Further downside in the GBP/USD pair could drag it towards the psychological support of 1.2000.
Pound Sterling FAQs
What is the Pound Sterling?
The Pound Sterling (GBP) is the oldest currency in the world (886 AD) and the official currency of the United Kingdom. It is the fourth most traded unit for foreign exchange (FX) in the world, accounting for 12% of all transactions, averaging $630 billion a day, according to 2022 data.
Its key trading pairs are GBP/USD, aka ‘Cable’, which accounts for 11% of FX, GBP/JPY, or the ‘Dragon’ as it is known by traders (3%), and EUR/GBP (2%). The Pound Sterling is issued by the Bank of England (BoE).
How do the decisions of the Bank of England impact on the Pound Sterling?
The single most important factor influencing the value of the Pound Sterling is monetary policy decided by the Bank of England. The BoE bases its decisions on whether it has achieved its primary goal of “price stability” – a steady inflation rate of around 2%. Its primary tool for achieving this is the adjustment of interest rates.
When inflation is too high, the BoE will try to rein it in by raising interest rates, making it more expensive for people and businesses to access credit. This is generally positive for GBP, as higher interest rates make the UK a more attractive place for global investors to park their money.
When inflation falls too low it is a sign economic growth is slowing. In this scenario, the BoE will consider lowering interest rates to cheapen credit so businesses will borrow more to invest in growth-generating projects.
How does economic data influence the value of the Pound?
Data releases gauge the health of the economy and can impact the value of the Pound Sterling. Indicators such as GDP, Manufacturing and Services PMIs, and employment can all influence the direction of the GBP.
A strong economy is good for Sterling. Not only does it attract more foreign investment but it may encourage the BoE to put up interest rates, which will directly strengthen GBP. Otherwise, if economic data is weak, the Pound Sterling is likely to fall.
How does the Trade Balance impact the Pound?
Another significant data release for the Pound Sterling is the Trade Balance. This indicator measures the difference between what a country earns from its exports and what it spends on imports over a given period.
If a country produces highly sought-after exports, its currency will benefit purely from the extra demand created from foreign buyers seeking to purchase these goods. Therefore, a positive net Trade Balance strengthens a currency and vice versa for a negative balance.
The Australian Dollar is stronger after third-quarter inflation decelerated less than expected. Economists at ING analyze Aussie’s outlook.
The help to AUD/USD should be rather short-lived
The headline rate slowed from 6.0% to 5.4% (consensus 5.3%) and the trimmed-mean CPI rose 5.2% against 5.0% expectations.
The Reserve Bank of Australia Cash Rate future curve now prices in more than a 50% probability of a hike in November. Our base case has been that the RBA would have taken rates a nudge higher before ending its tightening cycle, and today’s figures endorse our expectations.
Still, the help to AUD/USD should be rather short-lived as external drivers remain dominant and generally unsupportive.
Economists at ING analyze EUR/HUF outlook after the National Bank of Hungary cut its base rate by 75 bps.
Forint vulnerable in the coming weeks
The market is already repricing expectations towards larger rate cuts in the future, which is likely to continue in the days ahead. This should further undermine the Forint and make it vulnerable in the coming weeks. In addition, the US Dollar is again heading towards stronger levels, which can only support a move into the 384-386 EUR/HUF range in the short term.
In the medium and long term, probably not much has changed after the meeting, and the Forint should continue to strengthen depending on the success of the NBH delivering rate cuts and the EU money story.
We expect 375 EUR/HUF at year-end and 365 EUR/HUF in the middle of next year, supported by the highest positive real rate and carry in the region.
Further losses appear on the table for USD/CNH once the 7.2850 level is cleared, comment Economist Lee Sue Ann and Markets Strategist Quek Ser Leang at UOB Group.
Key Quotes
24-hour view: We expected “further USD weakness towards 7.2950.” We noted, “there is a minor support at 7.3020.” USD weakened less than expected as it rebounded from a low of 7.3016. Downward pressure has eased, and USD is unlikely to weaken further. Today, USD is more likely to trade in a range between 7.3020 and 7.3240.
Next 1-3 weeks: Our update from yesterday (24 Oct, spot at 7.3080) is still valid. As highlighted, downward momentum is building, but USD has to break clearly below 7.2850 before a sustained decline is likely. The chance of USD breaking clearly below 7.2850 will remain intact as long as it stays below 7.3260 in the next few days.
- The index navigates a narrow range in the low-106.00s.
- US yields maintain the corrective move from recent tops.
- New Home Sales, Mortgage Applications are next on tap.
The greenback, when tracked by the USD Index (DXY), trades in a vacillating fashion around the 106.20 region on Wednesday.
USD Index looks at risk trends, data
The index looks to consolidate the strong recovery past the 106.00 hurdle seen in the previous session amidst the so far absence of a clear direction in US yields and alternating risk appetite trends.
In the meantime, geopolitical concerns appear somewhat alleviated, while expectations of a pause at the Fed’s next event on November 1 remain largely flat. Still around the Fed, speculation of a potential rate hike at the December gathering remains on the rise in light of the persistent resilience of the US economy.
In the US data space, usual weekly Mortgage Applications measured by MBA are due in the first turn seconded by New Home Sales for the month of September. In addition, Chair Powell will give introductory remarks at an event in Washington.
What to look for around USD
The index clings to the area above the 106.00 hurdle following Tuesday’s pronounced rebound.
In the meantime, support for the dollar keeps coming from the good health of the US economy, which at the same time appears underpinned by the renewed tighter-for-longer stance narrative from the Federal Reserve.
Key events in the US this week: MBA Mortgage Applications, New Home Sales, Chair Powell (Wednesday) - Initial Jobless Claims, Durable Goods Orders, Advanced Goods Trade Balance, Flash Q4 GDP Growth Rate (Thursday) – PCE, Core PCE, Personal Income, Personal Spending, Final Michigan Consumer Sentiment (Friday).
Eminent issues on the back boiler: Persevering debate over a soft or hard landing for the US economy. Incipient speculation of rate cuts in early 2024. Geopolitical effervescence vs. Russia and China and the Middle East.
USD Index relevant levels
Now, the index is up 0.04% at 106.28 and the breakout of 106.78 (weekly peak October 13) could expose 107.34 (2023 high October 3) and finally 107.99 (weekly high November 21 2022). On the downside, the next support emerges at 105.36 (monthly low October 24) ahead of 104.42 (weekly low September 11) and then 103.34 (200-day SMA).
Here is what you need to know on Wednesday, October 25:
The US Dollar (USD) struggles to build on Tuesday's impressive gains early Wednesday, with the USD Index moving sideways slightly above 106.00. September New Home Sales will be featured in the US economic docket. Later in the day, the Bank of Canada (BoC) will announce monetary policy decisions and Governor Tiff Macklem will speak on the policy outlook in a press conference.
Wall Street's main indexes opened higher on Tuesday and registered strong gains. Meanwhile, the benchmark 10-year US Treasury bond yield declined for the third straight trading day before stabilizing slightly above 4.8%. Nevertheless, the upbeat S&P Global Manufacturing and Services PMI data for October provided a boost to the USD in the American session. In the European morning on Wednesday, US stock index futures trade mixed.
Inflation in Australia, as measured by the change in the Consumer Price Index (CPI), advanced to 1.2% on a quarterly basis in the third quarter, the Australian Bureau of Statistics reported in the Asian session on Wednesday. On a yearly basis, the CPI rose 5.4% in Q3. Both of these readings came in above market expectations and helped AUD/USD gather bullish momentum. At the time of press, the pair was up nearly 0.4% on the day at 0.6380.
US Dollar price this week
The table below shows the percentage change of US Dollar (USD) against listed major currencies this week. US Dollar was the strongest against the Canadian Dollar.
| USD | EUR | GBP | CAD | AUD | JPY | NZD | CHF | |
| USD | -0.06% | -0.01% | 0.31% | -0.90% | -0.02% | -0.38% | -0.03% | |
| EUR | 0.06% | 0.06% | 0.37% | -0.79% | 0.04% | -0.32% | 0.05% | |
| GBP | 0.01% | -0.07% | 0.32% | -0.85% | 0.00% | -0.37% | 0.01% | |
| CAD | -0.31% | -0.38% | -0.35% | -1.18% | -0.33% | -0.71% | -0.34% | |
| AUD | 0.85% | 0.85% | 0.90% | 1.16% | 0.85% | 0.43% | 0.83% | |
| JPY | 0.03% | -0.05% | -0.02% | 0.32% | -0.91% | -0.39% | 0.01% | |
| NZD | 0.41% | 0.34% | 0.39% | 0.71% | -0.47% | 0.37% | 0.37% | |
| CHF | 0.01% | -0.06% | -0.01% | 0.31% | -0.88% | -0.01% | -0.39% |
The heat map shows percentage changes of major currencies against each other. The base currency is picked from the left column, while the quote currency is picked from the top row. For example, if you pick the Euro from the left column and move along the horizontal line to the Japanese Yen, the percentage change displayed in the box will represent EUR (base)/JPY (quote).
The BoC is forecast to leave its policy rate unchanged at 5%. Revised growth and inflation projections will be scrutinized by investors once the statement is released. USD/CAD climbed to a three-week-high near 1.3750 on Tuesday and went into a consolidation phase around that level early Wednesday.
EUR/USD fell sharply on Tuesday and erased all the gains it recorded on Monday. At the time of press, the pair was moving sideways at around 1.0600. IFO will release Business Climate and Current Assessment data for October later in the session.
After coming within a touching distance of 1.2300 early Tuesday, GBP/USD turned south and closed the day deep in negative territory below 1.2200. In the European morning, the pair seems to have stabilized above 1.2150.
USD/JPY failed to make a decisive move in either direction and fluctuated in a tight channel below 150.00 for the sixth consecutive trading day on Tuesday. Early Wednesday, the pair extends its sideways grind at around 149.80.
Despite broad USD strength, XAU/USD managed to hold its ground, supported by retreating US yields on Tuesday. Gold was trading up and down in a narrow band slightly above $1,972 at the time of press.
Economists at MUFG Bank weigh up risks for CAD ahead of BoC’s upcoming policy meeting.
CAD stands to benefit initially if the conflict in the Middle East broadens out and Oil rises above $100
The Canadian rate market is currently pricing in only 4 bps of hikes for this week and 7 bps by December, which suggests that the CAD could prove more sensitive to a hawkish BoC policy surprise in the near term. Beyond this year though we believe that the Canadian rate market is currently under-pricing the risk of BoC rate cuts.
The CAD stands to benefit initially if the conflict in the Middle East broadens out and the price of Oil rises above $100/barrel. However, the BoC policy outlook is not as favourable so upside potential should be less than last year.
See – BoC Preview: Forecasts from nine major banks, keeping rates on hold and prospect of further hikes alive
- EUR/JPY hovers around 158.80 ahead of the key events from both the Eurozone and Japan.
- Eurozone economic data on Tuesday revealed a contraction in PMI and lower inflation in October.
- Japan's government is considering spending approximately $33 billion on handouts to low-income households.
- The European Central Bank (ECB) rate decision and Japanese inflation data will be in the spotlight this week.
The EUR/JPY cross posts modest gains after bouncing off the previous day’s low of 158.53 during the early European session on Wednesday. The cross currently trades around 158.80, gaining 0.03% for the day. That being said, the downbeat Eurozone economic data is one of the factors that exert pressure on the Euro (EUR) against the Japanese Yen (JPY).
On Tuesday, Eurozone economic data revealed a contraction in PMI and lower inflation in October. These reports support the anticipation that the European Central Bank (ECB) will maintain interest rates unchanged on Thursday.
The preliminary Composite PMI for the eurozone fell to 46.5 in October from 47.2 in September. It was the sixth consecutive reading below 50, indicating an ongoing downturn. Meanwhile, the Manufacturing PMI dropped to 43.0 from 43.4 in the previous reading, which was below the consensus estimate of 43.7. The Services PMI declined from 48.7 versus 47.8 prior. The Euro faced some selling pressure due to the discouraged Eurozone data which acts as a headwind for the pair.
European Central Bank policymaker Gabriel Makhlouf said on Tuesday that the central bank will monitor the unfolding crisis in the Middle East while mentioning that it was too early to assess the impact on economies.
On the JPY’s front, Japan's government is considering spending approximately $33 billion on handouts to low-income households and an income tax cut in a package of steps to help people from growing rising expenses, per Reuters. Investors await Japan’s Tokyo Consumer Price Index for October for fresh impetus.
Apart from this, the economic data released on Tuesday revealed that the Japanese Jibun Bank Manufacturing PMI for October eased to 48.5 versus 48.5 prior, below the market consensus of 48.9 whereas the Services PMI came in at 51.1 from 53.8 in the previous reading.
Looking ahead, traders will monitor the German IFO data and ECB’s President Lagarde's speech on Wednesday. The highlight this week will be the ECB rate decision on Thursday and the release of Japanese inflation data on Friday. Traders will take cues from these events and find trading opportunities around the EUR/JPY cross.
Further range bound trade is still in the pipeline for USD/JPY in the short-term horizon, note Economist Lee Sue Ann and Markets Strategist Quek Ser Leang at UOB Group.
Key Quotes
24-hour view: Yesterday, we expected USD to trade in a range between 149.30 and 150.00. In early London trade, USD dropped to 149.31 and then rebounded to a high of 149.92. Upward momentum has improved slightly, and the rebound in USD could extend above 150.00. The major resistance at 150.50 is unlikely to come under threat. Support is at 149.60, followed by 149.35.
Next 1-3 weeks: Over the past week or so, USD traded in a relatively quiet manner. There is no clear directional bias for now, and USD is likely to trade in a range of 149.00/150.50 for the time being.
- USD/JPY consolidates below the 150.00 on stable US Dollar after recent gains.
- Japanese Prime Minister Kishida refrained from influencing the JPY through verbal intervention.
- Upbeat US PMI data supported the US Dollar to rebound from the monthly low.
USD/JPY moves sideways around 149.80 during the Asian session on Wednesday. The pair faces a minor challenge as the US Dollar (USD) consolidates after recent gains.
The government is facing increasing political pressure to intervene and safeguard Japanese households from the rising inflation. The Bank of Japan's (BoJ) actions, coupled with the USD/JPY nearing a potential breach of the 150 mark, may not create the impression that the government is exhaustively addressing the inflation challenge.
In a TV interview on Tuesday, Japanese Prime Minister Fumio Kishida refrained from attempting to influence the USD/JPY pair through verbal intervention. When questioned about the Japanese Yen's recent decline to approximately 150.00 against the US dollar, he responded in broad terms, indicating that the determination of specific monetary policy measures falls under the purview of the BoJ.
Kishida emphasized a mutual commitment to pursuing economic growth, structural wage increases, and stable inflation. Furthermore, he affirmed that the government is prepared to implement measures aimed at permanently lifting Japan out of deflation.
The US Dollar Index (DXY) staged a recovery from monthly lows, stabilizing around 106.20, driven by favorable preliminary S&P Global PMI figures released on Tuesday.
However, the diminishing US Treasury yields, standing at 4.82% for the 10-year yield, could apply downward pressure on the US Dollar (USD).
In October, the US S&P Global Composite PMI demonstrated growth, ascending from 50.2 to 51.0. The Services PMI witnessed an uptick, reaching 50.9, while the Manufacturing PMI increased to 50.0. The manufacturing index has consistently held above the 50-point threshold for the past six months, signaling a positive trend in that sector.
Investors are anticipated to closely track the US Q3 Gross Domestic Product (GDP) on Thursday, with additional focus on the US Core Personal Consumption Expenditures (PCE) and Japan’s Tokyo Consumer Price Index (CPI) data scheduled for Friday.
CME Group’s flash data for natural gas futures markets noted traders reduced their open interest positions by just 531 contracts after eight consecutive daily builds on Tuesday. In the same direction, volume added to the previous daily decline and shrank by around 9.7K contracts.
Natural Gas: Upside remains capped by the $3.50 zone
Tuesday’s uptick in prices of natural gas was in tandem with diminishing open interest and volume, which at the same time is indicative that extra gains appear not favoured in the very near term. So far, the $3.50 region per MMBtu still emerges as the next resistance of note for the commodity.
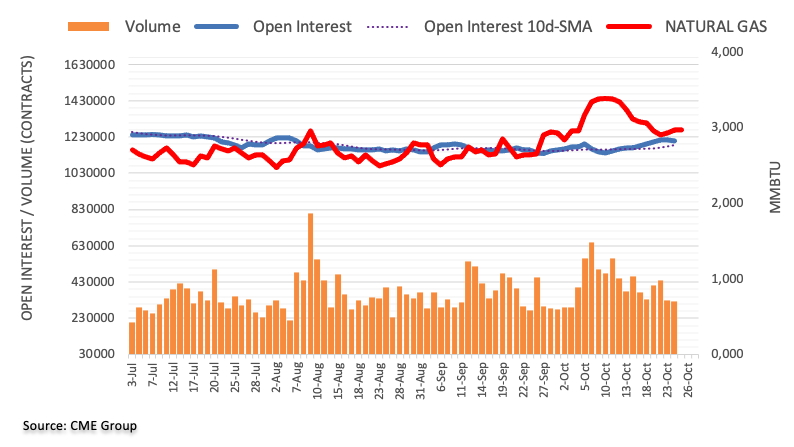
Scepticism about whether the BoE will ultimately act restrictively enough is likely to continue to weigh on the Pound in the near term, economists at Commerzbank report.
Sterling might be able to recover slightly if the inflation outlook were to improve significantly
Of course, it is still possible that the BoE will be right in the end and that inflation will fall significantly in the coming months. At present, however, the dominant concern in the market is that the BoE is acting too slowly and too cautiously and will not get a grip on the inflation problem. The Pound is likely to continue to suffer from this.
If the inflation outlook were to improve significantly Sterling might be able to recover slightly. At that point, the expectation that the BoE will cut its key rate due to the weak economy will then probably increase. At the same time, as we do not expect the ECB to cut its key rate, we expect EUR/GBP to appreciate in the coming quarters.
International Monetary Fund (IMF) Director Kristalina Georgieva said on Wednesday, “what is happening in the Middle East is happening at a time when growth is slow and interest rates are high and cost of servicing debt has gone up because of covid and war.”
Georgieva added, “this is not going to be the last shock, we know it.”
Additional quotes
Why we are concerned, we are concerned first for the epicentre of this war, the tragic loss of lives but also destruction and reduction of economic activity.
Egypt, Lebanon, Jordan their channels of impact are already visible, tourism dependant countries and uncertainty is a killer for tourists.
Our focus is act early, do not hesitate the fund is here to help you restructure debt.
We have spent last 20 years living with interest rates in 'fantasy lane.'
We want to see normalization of policy over time.
We are not thrilled with going from zero to five soquickly, but we are there and now i call to everybody 'buckle up'.
Everyone should understand interest rates are here to stay for longer.
Good news is tightening we have witnessed is working and inflation is going down, bad news is it's not going down fast enough.
Green transition is adding for the next years to costs and it is a must to do it.
Inflation is terrible for growth, it undermines investor and consumer confidence and poor people pay the highest price.
Structural factors cannot be excuse to ignore fight against inflation, inflation is terrible for growth.
Interest rates are not suffocating they are just making life harder.
What makes me lose sleep is we are in a world of more frequent and devastating shocks.
How we think of unthinkable, create agility to buffer people, businesses from it when it happens is everyone's job.
FX option expiries for Oct 25 NY cut at 10:00 Eastern Time, via DTCC, can be found below.
- EUR/USD: EUR amounts
- 1.0500 1.2b
- 1.0560 325m
- 1.0600 538m
- 1.0640 307m
- 1.0650 763m
- 1.0700 1.1b
- GBP/USD: GBP amounts
- 1.2050 305m
- 1.2100 845m
- 1.2125 802m
- 1.2140 400m
- 1.2200 401m
- 1.2300 402m
- 1.2400 452m
- USD/JPY: USD amounts
- 149.00 856m
- 149.25 406m
- 149.75 752m
- 150.00 375m
- 150.25 623m
- 151.00 1.4b
- USD/CHF: USD amounts
- 0.8900 402m
- 0.9000 551m
- 0.9025 360m
- AUD/USD: AUD amounts
- 0.6300 1.6b
- 0.6325 531m
- 0.6370 308m
- USD/CAD: USD amounts
- 1.3590 597m
- NZD/USD: NZD amounts
- 0.5870 418m
- EUR/GBP: EUR amounts
- 0.8600 433m
- 0.8670 450m
- 0.8700 501m
- 0.8800 400m
A sustained advance in AUD/USD should clear the 0.6400 hurdle in the near term, suggest Economist Lee Sue Ann and Markets Strategist Quek Ser Leang at UOB Group.
Key Quotes
24-hour view: We highlighted yesterday that mild upward pressure could lead to AUD rising above 0.6365. However, we held the view that “a sustained rise above 0.6365 is unlikely.” The anticipated advance exceeded our expectations as AUD rose to a high of 0.6378 before ending the day at 0.6356 (+0.33%). Today, AUD could rise further even though a sustained rise above the major resistance at 0.6400 appears unlikely (next resistance is at 0.6420). On the downside, if AUD breaks below 0.6340 (minor support is at 0.6360), it would indicate the current upward pressure has faded.
Next 1-3 weeks: In our update from yesterday (24 Oct, spot at 0.6340), we highlighted that the current price action in AUD appears to be part of a consolidation phase between 0.6280 and 0.6400. AUD rose to 0.6378 and it continued to rise in early Asian trade today. Upward momentum has improved, but AUD has to break and stay above 0.6400 before further sustained advance is likely. The chance of AUD breaking clearly above 0.6400 will remain intact as long as it stays above 0.6280. Looking ahead, the next resistance above 0.6400 is at 0.6440.
Considering advanced prints from CME Group for crude oil futures markets, open interest went down for the second straight session on Tuesday, this time by around 10.3K contracts. Volume, on the other hand, reversed two consecutive daily pullbacks and rose by nearly 226K contracts.
WTI remains supported around $81.50
WTI prices saw their decline gather further pace on Tuesday. The daily retracement came amidst diminishing open interest and hints at the idea that a more sustained drop appears to be losing traction. Furthermore, the commodity is expected to meet the next contention area around $81.50 per barrel in the very short term.
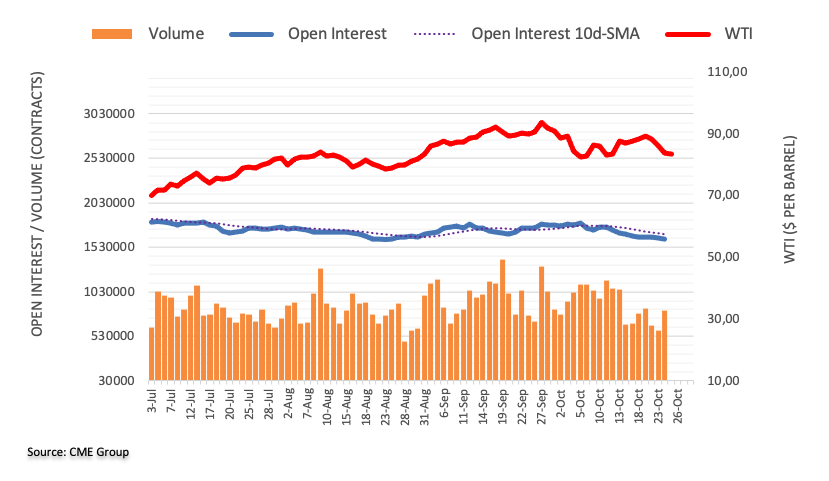
- GBP/USD recovers some lost ground near 1.2170 on the softer USD.
- The pair holds below the 50- and 100-hour EMAs; RSI indicator stands in bearish territory.
- The key resistance level is located at 1.2200; 1.2143 acts as an initial support level.
The GBP/USD pair stalls its decline and holds below the 1.2200 mark during the Asian session on Wednesday. A decline of the US Dollar (USD) and a retreat in US Treasury bond yields lend some support to the pair. However, the renewed safe-haven flows amid the geopolitical conflicts in the Middle East and the higher-for-longer rate narrative in the US might cap the USD’s downside for the time being. The pair is adding 0.08% on the day to trade at 1.2170 at press time.
Technically, GBP/USD holds below the 50- and 100-hour Exponential Moving Averages (EMAs) on the four-hour chart, which means further downside looks favorable. Additionally, the Relative Strength Index (RSI) holds below 50 in bearish territory, which supports the sellers for the time being.
That being said, the key resistance level is located at 1.2200, portraying the confluence of the 50-hour EMA and a psychological round figure. Any decisive follow-through buying above the latter will pave the way to a high of October 16 at 1.2218. Further north, the upper boundary of the Bollinger Band at 1.2271 will be the next stop. The additional upside filter to watch is near a high of October 10 at 1.2295.
On the downside, a low of October 23 at 1.2143 acts as an initial support level. The next downside stop is seen at a low of October 13 at 1.2122. The critical contention level will emerge at the 1.2095–1.2100 region. The mentioned level is a round mark, the lower limit of the Bollinger Band, and a low of October 20. A breach of the level will see a drop to 1.2052 (low of October 3).
GBP/USD four-hour chart
-638338094416625301.png)
GBP/USD could now move into a consolidative phase, likely within the 1.2095-1.2285 range, according to Economist Lee Sue Ann and Markets Strategist Quek Ser Leang at UOB Group.
Key Quotes
24-hour view: We highlighted yesterday that GBP could test 1.2290 before the risk of a pullback increases. GBP then rose to a high of 1.2288, but instead of pulling back, it plunged to a low of 1.2154. The sharp and swift decline appears to be overdone, but there is no sign of stabilisation yet. Today, as long as GBP stays below 1.2220 (minor resistance is at 1.2195), it could dip to 1.2135 before stabilisation is likely. The next support at 1.2095 is highly unlikely to come under threat.
Next 1-3 weeks: We noted yesterday that “upward momentum appears to be building,” and we were of the view that GBP “is likely to rise to 1.2340.” GBP then rose to 1.2288 before dropping sharply to a low of 1.2154. The breach of our ‘strong support’ level at 1.2165 indicates that the momentum buildup has faded. The current price action is likely part of a consolidation phase. For the time being, GBP is likely to trade between 1.2095 and 1.2285.
Open interest in gold futures markets extended the uptrend on Tuesday, this time by around 1.6K contracts according to preliminary readings from CME Group. Volume, instead, shrank for the second session in a row, now by nearly 9K contracts.
Gold keeps targeting the $2000 region
Gold prices ended Tuesday’s session with marginal losses amidst an inconclusive price action. The move was on the back of rising open interest and suggests that further losses might be in store for the yellow metal in the very near term. In the meantime, bulls continue to target the key hurdle at the $2000 mark per troy ounce for the time being.
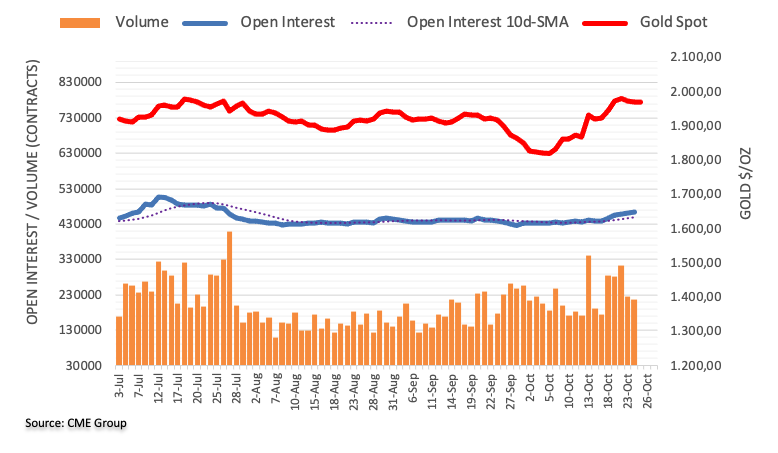
In the view of Economist Lee Sue Ann and Markets Strategist Quek Ser Leang at UOB Group, EUR/USD is now expected to navigate between 1.0510 and 1.0700 in the next few weeks.
Key Quotes
24-hour view: We expected EUR to strengthen further yesterday, but we highlighted that “any advance is likely to face solid resistance at 1.0700.” However, EUR did not quite test 1.0700 as it plummeted after reaching a high of 1.0693. The sharp decline from the high appears to be overdone. However, there is room for EUR to edge lower today, but any decline is unlikely to break clearly below 1.0560. Resistance is at 1.0615, followed by 1.0640.
Next 1-3 weeks: Yesterday (24 Oct, spot at 1.0670), we held the view that “the rebound in EUR is likely to extend above 1.0700.” EUR then rose to 1.0693 before dropping sharply to a low of 1.0581. The breach of our ‘strong support’ level at 1.0600 has invalidated our view. From here, EUR is likely to trade in a range of 1.0510/1.0690.
- Crude Oil prices consolidate the recent heavy losses to over a one-week low touched on Tuesday.
- Easing concerns about supply disruptions and recession fears act as a headwind for the commodity.
- Strong fuel demand in the US and tightening global supplies help limit the downside for Oil prices.
West Texas Intermediary (WTI) Crude Oil prices oscillate in a narrow trading band during the Asian session on Wednesday and consolidates the recent heavy losses to over a one-week low touched the previous day. The commodity currently trades just below mid-$83.00s, nearly unchanged for the day, and for now, seems to have stalled the recent sharp pullback from over a two-week high touched last Friday.
World leaders intensified efforts to contain the conflict between Israel and Hamas so that humanitarian aid could be delivered to the besieged Gaza Strip, easing concerns about potential supply disruptions. Apart from this, weak PMI data from the Euro Zone released on Tuesday revived recession fears, which is expected to dent fuel demand. This turns out to be a key factor acting as a headwind for WTI Crude Oil prices.
The flash US PMI prints, meanwhile, pointed to a still resilient economy and should allow the Federal Reserve (Fed) to stick to its hawkish stance to combat inflation, adding to worries about economic headwinds stemming from rising borrowing costs. That said, indications of strong fuel demand in the United States (US), even after the end of the summer season, and tightening global supplies help limit losses for Crude Oil prices.
In fact, data from the American Petroleum Institute (API) showed that US inventories shrank more than 2 million barrels (mb) in the week to October 20. This comes ahead of the official report by the Energy Information Administration, which is due later during the US session on Wednesday and should provide a fresh impetus to Oil prices. The fundamental backdrop, meanwhile, seems tilted firmly in favour of bearish traders.
Technical levels to watch
- EUR/USD aims to retrace the recent losses despite adverse PMI data.
- RSI indicates a bearish momentum; MACD suggests a momentum shift.
- 23.6% Fibonacci retracement at 1.0643 emerges as the barrier followed by the monthly high.
EUR/USD attempts to regain the upward direction post losses registered in the previous session due to weaker Eurozone PMI and upbeat S&P Global PMI from the United States (US).
The preliminary HCOB Composite PMI for the eurozone declined to 46.5 in October, down from 47.2 in September. This marks the sixth consecutive reading below 50, indicating a persistent slowdown.
The Manufacturing PMI dropped to 43.0, compared to the previous reading of 43.4 and falling short of the expected 43.7. Additionally, the Services PMI decreased to 47.8 from the previous 48.7.
On the US side, the S&P Global Composite PMI showed growth in October, rising from 50.2 to 51.0. The Services PMI experienced an increase, reaching 50.9, while the Manufacturing PMI rose to 50.0. The manufacturing index has maintained a level above the 50-point threshold in the last six months, indicating a positive shift in that sector.
EUR/USD trades higher around the 1.0600 psychological level during the Asian session on Wednesday. The pair receives upward support on the decline in the US Dollar (USD), coupled with an improved risk sentiment and stable US Dollar post recent gains.
The 23.6% Fibonacci retracement at 1.0643 emerges as the key resistance followed by the monthly high at 1.0694, which is aligned with the major level at 1.0700.
A break above the latter could open the doors for the EUR/USD pair to explore the region around the 1.0750 psychological level.
On the downside, the EUR/USD pair could meet the support around the 14-day Exponential Moving Average (EMA) at 1.0586, followed by the 1.0550 psychological level.
The Moving Average Convergence Divergence (MACD) line positions below the centerline, indicating that the short-term average is below the long-term average. However, an intriguing development is emerging as the line diverges above the signal line, suggesting the possibility of a momentum shift towards a bullish trend.
On the other hand, the EUR/USD pair suggests a bearish momentum, with a discernible weaker bias highlighted in the 14-day Relative Strength Index (RSI), which is below the 50 level.
EUR/USD: Daily Chart
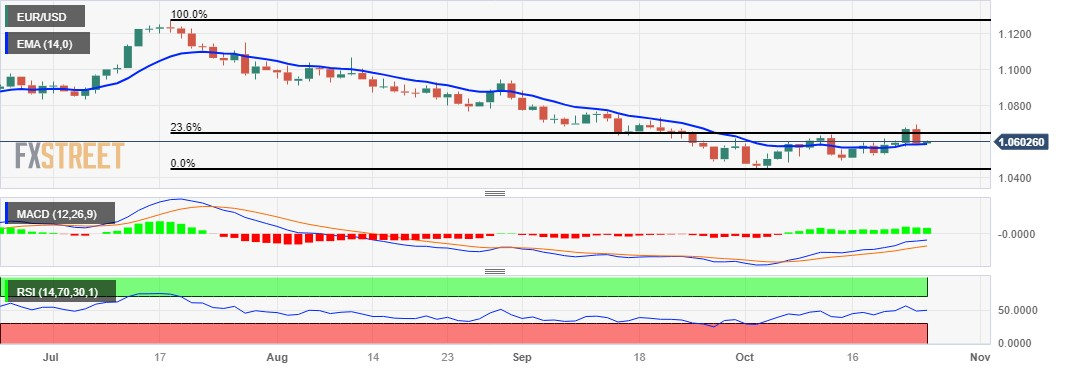
- Gold price attracts buyers on Wednesday and recovers further from the weekly low.
- Softer US bond yields keep the USD bulls on the defensive and lend some support.
- Recession fears and geopolitical risks further seem to benefit the safe-haven metal.
Gold price (XAU/USD) builds on the overnight bounce from the $1,954-1,953 region and gains some follow-through positive traction during the Asian session on Wednesday. The non-yielding yellow metal, for now, seems to have stalled its recent retracement slide from the vicinity of the $2,000 psychological mark, or a five-month top touched last Friday, and benefits from softer US Treasury bond yields.
Apart from this, looming recession risk, fueled by a flurry of weaker economic data from Europe on Tuesday, along with the Middle East conflict, turns out to be another factor driving haven flows towards the Gold price. The precious metal had rallied over 8% in the past two weeks on the back of concerns that the Israel-Hamas war could spill over to other Middle Eastern nations and impact the world economy.
That said, the prospects for further policy tightening by the Federal Reserve (Fed) hold back bulls from placing aggressive bets and cap the upside for the Gold price. Traders also seem reluctant and prefer to wait for Fed Chair Jerome Powell's speech later during the US session. The focus, meanwhile, will remain on the release of the US Core PCE Price Index – the Fed's preferred inflation gauge – due on Friday.
Daily Digest Market Movers: Gold price struggles to capitalize on its modest intraday gains
- Gold price attracts some buyers in the wake of retreating US Treasury bond yields, which keeps the US Dollar (USD) bulls on the defensive, and geopolitical risks.
- World leaders pushed for either a pause or ceasefire between Israel and Hamas so that humanitarian aid could be delivered to the besieged Gaza Strip.
- The benchmark 10-year US Treasury yield moves further away from a 16-year peak after crossing the symbolic 5% threshold level for the first time since 2007.
- Business activity in the Euro Zone took a surprise turn for the worse and revived recession fears, which further benefits the safe-haven XAU/USD.
- The US manufacturing sector pulled out of a five-month contraction and services activity accelerated modestly, pointing to a still resilient economy.
- The Fed is expected to maintain the status quo in November, though the markets are pricing in the possibility of one more 25 basis point lift-off by the year-end.
- Investors now look to Fed Chair Jerome Powell's speech for cues about the future rate-hike path, which, in turn, should provide a fresh impetus to the metal.
- The focus will also be on the Advance US Q3 GDP report and the European Central Bank (ECB) rate decision on Thursday, followed by the US PCE price index on Friday.
Technical Analysis: Gold price might now confront resistance near the $1,982-1,983 area, or the weekly top
From a technical perspective, any subsequent move up is likely to confront some resistance near the weekly high, around the $1,982-1,983 region. Some follow-through buying should allow the Gold price to make a fresh attempt to conquer the $2,000 psychological mark. The subsequent move up has the potential to lift the XAU/USD further towards the next relevant hurdle near the $2,022 area.
On the flip side, the $1,964 level now seems to protect the immediate downside ahead of the weekly low, around the $1,953-1,952 zone touched on Tuesday. The latter represents a strong horizontal resistance breakpoint and should act as a pivotal point, below which the Gold price could slide back to the 200-day Simple Moving Average (SMA), currently pegged near the $1,932-1,931 region.
US Dollar price today
The table below shows the percentage change of US Dollar (USD) against listed major currencies today. US Dollar was the strongest against the Canadian Dollar.
| USD | EUR | GBP | CAD | AUD | JPY | NZD | CHF | |
| USD | -0.09% | -0.09% | 0.00% | -0.35% | -0.01% | -0.05% | -0.03% | |
| EUR | 0.08% | -0.01% | 0.08% | -0.25% | 0.07% | 0.03% | 0.06% | |
| GBP | 0.10% | 0.00% | 0.09% | -0.25% | 0.08% | 0.03% | 0.07% | |
| CAD | -0.01% | -0.10% | -0.10% | -0.34% | -0.02% | -0.07% | -0.04% | |
| AUD | 0.35% | 0.25% | 0.27% | 0.36% | 0.33% | 0.29% | 0.33% | |
| JPY | 0.01% | -0.07% | -0.09% | -0.01% | -0.33% | -0.04% | -0.01% | |
| NZD | 0.07% | -0.03% | -0.03% | 0.06% | -0.28% | 0.04% | 0.03% | |
| CHF | 0.03% | -0.07% | -0.07% | 0.03% | -0.33% | 0.01% | -0.05% |
The heat map shows percentage changes of major currencies against each other. The base currency is picked from the left column, while the quote currency is picked from the top row. For example, if you pick the Euro from the left column and move along the horizontal line to the Japanese Yen, the percentage change displayed in the box will represent EUR (base)/JPY (quote).
Gold FAQs
Why do people invest in Gold?
Gold has played a key role in human’s history as it has been widely used as a store of value and medium of exchange. Currently, apart from its shine and usage for jewelry, the precious metal is widely seen as a safe-haven asset, meaning that it is considered a good investment during turbulent times. Gold is also widely seen as a hedge against inflation and against depreciating currencies as it doesn’t rely on any specific issuer or government.
Who buys the most Gold?
Central banks are the biggest Gold holders. In their aim to support their currencies in turbulent times, central banks tend to diversify their reserves and buy Gold to improve the perceived strength of the economy and the currency. High Gold reserves can be a source of trust for a country’s solvency. Central banks added 1,136 tonnes of Gold worth around $70 billion to their reserves in 2022, according to data from the World Gold Council. This is the highest yearly purchase since records began. Central banks from emerging economies such as China, India and Turkey are quickly increasing their Gold reserves.
How is Gold correlated with other assets?
Gold has an inverse correlation with the US Dollar and US Treasuries, which are both major reserve and safe-haven assets. When the Dollar depreciates, Gold tends to rise, enabling investors and central banks to diversify their assets in turbulent times. Gold is also inversely correlated with risk assets. A rally in the stock market tends to weaken Gold price, while sell-offs in riskier markets tend to favor the precious metal.
What does the price of Gold depend on?
The price can move due to a wide range of factors. Geopolitical instability or fears of a deep recession can quickly make Gold price escalate due to its safe-haven status. As a yield-less asset, Gold tends to rise with lower interest rates, while higher cost of money usually weighs down on the yellow metal. Still, most moves depend on how the US Dollar (USD) behaves as the asset is priced in dollars (XAU/USD). A strong Dollar tends to keep the price of Gold controlled, whereas a weaker Dollar is likely to push Gold prices up.
- USD/CHF trades in negative territory around 0.8928, despite the upbeat US data.
- The US Purchasing Management Index (PMI) data for October came in better than expected.
- The rising geopolitical tension in the Middle East might boost the CHF.
- Market players will monitor the Swiss ZEW Survey Expectations for October ahead of the US growth numbers.
The USD/CHF pair loses traction during the Asian trading hours on Wednesday. That being said, the geopolitical conflicts in the Middle East continue to hang over the market and benefit Swiss France (CHF). The pair currently trades near 0.8928, down 0.05% on the day.
The US Purchasing Management Index (PMI) data on Tuesday came in better than expected. The flash Composite PMI for October climbed to 51.0 from 50.2. Meanwhile, the US S&P Global Manufacturing PMI for October surged to 50, better than the market expectation of 49.5. This is the first time in six months that manufacturing has not fallen below 50. The Services PMI rose to 50.9, above the consensus. The Services PMI rose to 50.9, while Manufacturing PMI grew to 50.0. This is the first time in six months that manufacturing has not fallen below 50.
Additionally, the Richmond Manufacturing Index for October fell to 3 from 5 in the previous reading, below the market expectation. The upbeat US economic data alleviated fears that tighter monetary policy and higher borrowing rates would dampen investment and industrial activity. However, traders will take cues from the US growth numbers and core Personal Consumption Expenditure Index (PCE) data for fresh impetus. The stronger-than-expected data could lift the Greenback and act as a tailwind for the USD/CHF pair.
On the other hand, the rising tension in the Middle East might cap the upside of the pair and boost the safe-haven assets like Swiss France. Last week, the Swiss Trade surplus widened more than expected in September. Trade Balance arrived at 6,316M versus 3,814M seen in the previous month, above the market consensus of 3,770M. Meanwhile, Exports surged to 24,795M MoM in September from the previous reading of 20,932M whereas Imports came in at 18,480M MoM versus 17,118M prior.
Market players will monitor the Swiss ZEW Survey Expectations for October. Later this week, the preliminary estimate of the US Q3 Gross Domestic Product (GDP) will be due on Thursday, and the US Core Personal Consumption Expenditure Index (PCE) will be due on Friday. These events could give a clear direction to the USD/CHF pair.
- Indian Rupee loses ground on a firmer USD amid upbeat US economic data.
- Rising US Treasury bond yields and oil prices might weigh on market mood, cap the Indian Rupee's upside.
- The Middle East conflict, US Q3 Gross Domestic Product (GDP), will be closely monitored by traders.
Indian Rupee (INR) loses traction against the US Dollar (USD) on Wednesday. Global factors including rising US Treasury bond yields and oil prices might weigh on market mood. Investors remained worried about the higher-for-longer rate narrative as Federal Reserve (Fed) Chair Jerome Powell said that the economy's resilience and tight labor markets may require tighter conditions.
Meanwhile, the geopolitical conflicts in the Middle East continue to hang over the market. Any sign of escalating tension might exert selling pressure on the Indian Rupee. Traders will monitor India's Balance of Payments for the second quarter (Q2) and the preliminary estimate of the US Q3 Gross Domestic Product (GDP) on Thursday. Fed officials will not deliver any speeches this week due to the blackout period ahead of the FOMC meeting on November 1.
Daily Digest Market Movers: Indian Rupee weakens amid the uncertainty
- US S&P Global Manufacturing PMI for October surged to 50, better than the market expectation of 49.5. The Services PMI rose to 50.9, above the consensus.
- US S&P Global Composite PMI came in at 51 versus 50.2 prior.
- The US Richmond Manufacturing Index for October fell to 3.0 from 5.0 in the previous reading, below the market expectation.
- RBI's monetary policy committee stated the central bank would continue to focus on maintaining inflation at the target of 4%.
- RBI member Varma is a ‘little more’ positive about India's economic development than a few months ago, but worries persist since the economy is now ‘disproportionately’ reliant on household spending and other challenges.
- India’s GDP is likely to grow at 6.5% in the current fiscal year, according to the Reserve Bank of India’s projections.
- RBI Chief Das said the central bank will monitor the evolving inflation dynamic amid the uncertainty surrounding food inflation.
- India's Finance Minister will closely watch the supply chain impact resulting from the ongoing conflicts in the Middle East.
- Growth in India is likely to gain momentum for the rest of 2023 according to the RBI's October bulletin.
- The International Monetary Fund (IMF) raised its growth forecast for India by 20 basis points (bps) to 6.3% in October.
- The Wholesale Price Index (WPI) in India fell -0.26% YoY in September, from 0.52% in August, falling short of the market expectation of 0.50%.
Technical Analysis: Indian Rupee loses momentum amid renewed USD demand
The Indian Rupee trades mildly negative on the day. The USD/INR pair remains well-supported above the 83.00 psychological mark. That being said, a breach of the level would see a drop to 82.82 (low of September 12), followed by 82.65 (low of August 4). On the flip side, the immediate upside barrier to watch is 83.15. The additional upside filter is seen at 83.30 (high of October 4), and the all-time high around 83.45. It’s worth noting that the pair holds above the key 200-day Exponential Moving Average (EMA) on the daily chart, indicating the path of least resistance for the USD/INR pair is to the upside in the short-term.
US Dollar price in the last 7 days
The table below shows the percentage change of US Dollar (USD) against listed major currencies in the last 7 days. US Dollar was the strongest against the New Zealand Dollar.
| USD | EUR | GBP | CAD | AUD | JPY | NZD | CHF | |
| USD | -0.30% | 0.04% | 0.65% | -0.35% | 0.03% | 0.72% | -0.82% | |
| EUR | 0.30% | 0.33% | 0.95% | -0.05% | 0.33% | 1.02% | -0.52% | |
| GBP | -0.04% | -0.32% | 0.62% | -0.38% | 0.00% | 0.69% | -0.85% | |
| CAD | -0.65% | -0.95% | -0.63% | -1.00% | -0.63% | 0.07% | -1.48% | |
| AUD | 0.34% | 0.03% | 0.37% | 0.99% | 0.36% | 1.07% | -0.48% | |
| JPY | -0.03% | -0.33% | 0.00% | 0.64% | -0.36% | 0.68% | -0.85% | |
| NZD | -0.75% | -1.03% | -0.70% | -0.08% | -1.09% | -0.70% | -1.56% | |
| CHF | 0.81% | 0.52% | 0.85% | 1.45% | 0.47% | 0.84% | 1.53% |
The heat map shows percentage changes of major currencies against each other. The base currency is picked from the left column, while the quote currency is picked from the top row. For example, if you pick the Euro from the left column and move along the horizontal line to the Japanese Yen, the percentage change displayed in the box will represent EUR (base)/JPY (quote).
Indian Rupee FAQs
What are the key factors driving the Indian Rupee?
The Indian Rupee (INR) is one of the most sensitive currencies to external factors. The price of Crude Oil (the country is highly dependent on imported Oil), the value of the US Dollar – most trade is conducted in USD – and the level of foreign investment, are all influential. Direct intervention by the Reserve Bank of India (RBI) in FX markets to keep the exchange rate stable, as well as the level of interest rates set by the RBI, are further major influencing factors on the Rupee.
How do the decisions of the Reserve Bank of India impact the Indian Rupee?
The Reserve Bank of India (RBI) actively intervenes in forex markets to maintain a stable exchange rate, to help facilitate trade. In addition, the RBI tries to maintain the inflation rate at its 4% target by adjusting interest rates. Higher interest rates usually strengthen the Rupee. This is due to the role of the ‘carry trade’ in which investors borrow in countries with lower interest rates so as to place their money in countries’ offering relatively higher interest rates and profit from the difference.
What macroeconomic factors influence the value of the Indian Rupee?
Macroeconomic factors that influence the value of the Rupee include inflation, interest rates, the economic growth rate (GDP), the balance of trade, and inflows from foreign investment. A higher growth rate can lead to more overseas investment, pushing up demand for the Rupee. A less negative balance of trade will eventually lead to a stronger Rupee. Higher interest rates, especially real rates (interest rates less inflation) are also positive for the Rupee. A risk-on environment can lead to greater inflows of Foreign Direct and Indirect Investment (FDI and FII), which also benefit the Rupee.
How does inflation impact the Indian Rupee?
Higher inflation, particularly, if it is comparatively higher than India’s peers, is generally negative for the currency as it reflects devaluation through oversupply. Inflation also increases the cost of exports, leading to more Rupees being sold to purchase foreign imports, which is Rupee-negative. At the same time, higher inflation usually leads to the Reserve Bank of India (RBI) raising interest rates and this can be positive for the Rupee, due to increased demand from international investors. The opposite effect is true of lower inflation.
- Gold price recovers the recent losses on the stable US Dollar after recent gains.
- Downbeat US Bond yields could offer support for the precious metal.
- Israel's delay on ground assault plan in Gaza weakens the demand for safe-haven asset Gold.
- Solid US PMI data supported the US Dollar to rebound from the monthly low.
Gold price snaps the losing streak, trading higher around $1,970 per troy ounce during the Asian session on Wednesday. The price of the precious metal receives upward support due to the stable US Dollar (USD) post-trimming recent losses.
Moreover, being a non-interest-bearing asset, the opportunity cost of holding Gold eases, which could be attributed to the downbeat US Treasury yields.
However, the improved risk sentiment, with the postponement of Israel's ground assault plan in Gaza diminished the shine of the precious metal regarded as a safe-haven asset.
The positive outlook is being reinforced by China's plan to issue additional sovereign debt. Constructive dialogues between the United States and China during their initial economic working group meeting also contribute to the prevailing optimism.
The US Dollar Index (DXY) rebounded from monthly lows, hovering around 106.20, propelled by encouraging preliminary S&P Global PMI figures released on Tuesday.
The decline in US Treasury yields could exert downward pressure on the US Dollar (USD), with the 10-year yield standing at 4.82%.
US S&P Global Composite PMI showed growth in October, rising from 50.2 to 51.0. The Services PMI experienced an increase, reaching 50.9, while the Manufacturing PMI rose to 50.0. The manufacturing index has maintained a level above the 50-point threshold in the last six months, indicating a positive shift in that sector.
Investors will likely monitor the US Q3 Gross Domestic Product (GDP) on Thursday, with attention also on the US Core Personal Consumption Expenditures (PCE) data expected on Friday.
- USD/CAD struggles to attract follow-through buying amid subdued USD price action.
- A positive risk tone and retreating US bond yields keep the USD bulls on the defensive.
- Bearish Crude Oil prices undermine the Loonie and act as a tailwind ahead of the BoC.
The USD/CAD pair struggles to capitalize on the overnight goodish intraday rally of around 90 pips from a multi-day low and oscillates in a narrow band during the Asian session on Wednesday. Spot prices currently trade just below mid-1.3700s, or a near three-week high touched on Tuesday as traders keenly await the Bank of Canada (BoC) policy decision before positioning for the next leg of a directional move.
The Canadian central bank is expected to keep its benchmark interest rates unchanged at a 22-year high of 5.0% for the second consecutive month in October on the back of eroding consumer and business confidence. The BoC may also show less conviction in the need for a more aggressive policy tightening in the wake of signs of easing inflationary pressures. This, along with the recent decline in Crude Oil prices, is seen undermining the commodity-linked Loonie and acts as a tailwind for the USD/CAD pair.
Heading into the key central bank event risk, bullish traders seem reluctant to place fresh bets in the wake of subdued US Dollar (USD) price action. Retreating US Treasury bond yields, along with a generally positive risk tone, fail to assist the safe-haven Greenback to build on the previous day's solid rebound from over a one-month low. This, in turn, is seen as a key factor acting as a headwind for the USD/CAD pair. The downside for the USD, however, remains limited amid hawkish Federal Reserve (Fed) expectations.
The flash version of the US PMIs released on Tuesday showed that business activity in the manufacturing sector moved out of contraction territory for the first time in six months, and services activity accelerated modestly in October. This was seen as a sign that the US economy remains resilient despite a surge in interest rates, which should allow the Fed to stick to its rate-hiking cycle to tame inflation. The outlook, meanwhile, should limit any meaningful downfall for the US bond yields and favour the USD bulls.
The aforementioned fundamental backdrop suggests that the path of least resistance for the USD/CAD pair is to the upside and corrective declines might still be seen as a buying opportunity. Spot prices seem poised to climb further towards challenging a multi-month peak, around the 1.3785 region touched on October 6. Some follow-through buying, leading to a subsequent strength beyond the 1.3800 mark, will confirm a fresh breakout and pave the way for a further near-term appreciating move.
Technical levels to watch
| Raw materials | Closed | Change, % |
|---|---|---|
| Silver | 22.911 | -0.21 |
| Gold | 1971.026 | -0.12 |
| Palladium | 1122.32 | 0.55 |
- NZD/USD maintains a position above 0.5850 despite the upbeat US Dollar.
- Israel's delay in the ground assault plan in Gaza contributes support to the risk-on sentiment.
- China's updates appear to be influencing market sentiment positively.
- US Dollar received upward support on stronger PMI figures.
NZD/USD retraces recent losses, trading at around 0.5860 during the Asian session on Wednesday. The uptick is influenced by improved risk sentiment, with the postponement of Israel's ground assault plan in Gaza contributing support to the pair.
Furthermore, the optimistic outlook is being reinforced by China's intention to issue additional sovereign debt. Additionally, constructive dialogues between the United States and China during their initial economic working group meeting contributed to the positive sentiment.
However, the NZD/USD pair could face challenges as the situation in the Middle East created unease among investors due to the potential for escalation, which could lead to disruptions in the region. Moreover, diplomatic efforts are actively underway to ease tensions in the Israel-Hamas Gaza Strip conflict.
The US Dollar Index (DXY) rebounded from monthly lows, hovering around 106.20 on the back of upbeat preliminary S&P Global PMI figures from the United States released on Tuesday.
However, the downfall in US Treasury yields could provide downward pressure for the US Dollar (USD), with the 10-year yield standing at 4.81%.
US S&P Global Composite PMI exhibited growth in October, rising from 50.2 to 51.0. The Services PMI also saw an increase, reaching 50.9, and the Manufacturing PMI rose to 50.0. This marks the first time in the last six months that manufacturing has sustained a level above the 50-point threshold, signaling a positive shift in that sector.
Investors will likely monitor the US Q3 Gross Domestic Product (GDP) on Thursday. The US Core Personal Consumption Expenditures (PCE) and Kiwi’s ANZ – Roy Morgan Consumer Confidence will be eyed on Friday.
- AUD/JPY gains strong positive traction on Wednesday and rallies to over a three-week high.
- The Australian CPI lifts bets for a 25 bps RBA rate hike in November and boosts the AUD.
- A positive risk tone undermines the safe-haven JPY and contributes to the strong move up.
The AUD/JPY cross catches aggressive bids during the Asian session on Wednesday and spikes to the 95.90 region, or over a three-week high following the release of Australian consumer inflation figures.
Data from the Australian Bureau of Statistics (ABS) showed that the Consumer Price Index (CPI) inflation grew 1.2% in the third quarter from the prior quarter and the yearly rate decelerated from 6% to 5.4% during the July-September period. The readings, however, were slightly higher than consensus estimates and lifted market bets for a 25 bps lift-off by the Reserve Bank of Australia (RBA) at its next policy meeting on November 7. This, in turn, provides a strong boost to the Australian Dollar (AUD) and the AUD/JPY cross.
Apart from this, a generally positive risk tone is seen undermining the safe-haven Japanese Yen (JPY) and turns out to be another factor acting as a tailwind for the cross. That said, speculations that Japanese authorities will intervene in the FX market to combat a sustained depreciation in the JPY might hold back traders from placing aggressive bullish bets and act as a headwind for the AUD/JPY cross. Nevertheless, the aforementioned fundamental backdrop suggests that the path of least resistance for spot prices is to the upside.
Even from a technical perspective, an intraday move above the 95.65 supply zone favours bullish traders. That said, it will still be prudent to wait for some follow-through buying beyond the 96.00 round figure before positioning for any further appreciating move. The AUD/JPY cross might then accelerate the momentum further towards the September monthly swing high, around the 96.90 region. Traders now look to the release of the Tokyo Core CPI on Friday for some meaningful impetus.
Technical levels to watch
The People’s Bank of China (PBoC) set the USD/CNY central rate for the trading session ahead on Wednesday at 7.1785, as compared to the previous day's fix of 7.1786 and 7.3213 Reuters estimate.
- Australian Dollar moves upward toward a major level after stronger Aussie CPI data.
- Australia’s CPI climbed to 1.2% in Q3, exceeding the market consensus of 1.1%.
- US Dollar received upward support from upbeat PMI figures from the United States.
The Australian Dollar (AUD) continues to gain ground, trading higher for the third successive day on Wednesday. The AUD/USD pair receives upward support due to the hawkish comments from Reserve Bank of Australia (RBA) Governor Michelle Bullock.
Australia’s Bureau of Statistics (ABS) reported on Wednesday that the Consumer Price Index (CPI) registered growth in the third quarter of 2023, surpassing the increase observed in the second quarter.
Australia’s Chief Policymaker addressed at the Commonwealth Bank of Australia Global Markets Conference in Sydney on Tuesday, underscored the dedication to achieving the inflation target in a sensible timeframe.
Governor Bullock hinted that the present cash rate could serve this goal adequately, Bullock recognized the potential hazards of inflation converging back to the target at a slower pace than expected. The board holds a limited tolerance for such variances and is prepared to increase rates if there's a substantial upward adjustment to the inflation outlook.
Investors will closely monitor RBA Governor Bullock's remarks regarding the condition of the Australian economy as she testifies before the Senate Economics Legislative Committee in Canberra on Thursday.
The US Dollar Index (DXY) consolidates post-trimming recent losses on the back of upbeat preliminary S&P Global PMI figures from the United States released on Tuesday. However, the downfall in US Treasury yields could provide downward pressure for the US Dollar (USD).
US economic indicators have eased concerns about the potential negative impact of a more restrictive monetary policy and increased borrowing costs on investment and industrial activity.
Daily Digest Market Movers: Australian Dollar extends its gains on upbeat CPI data, hawkish RBA’s comments
- Australian Bureau of Statistics (ABS) revealed that the nation's Consumer Price Index (CPI) reached 1.2% in the third quarter of 2023, surpassing the 0.8% increase recorded in the second quarter. This figure exceeded the market consensus, which anticipated a growth of 1.1% in the same period.
- Australian S&P Global Composite PMI for October declined to 47.3 from the previous reading of 51.5. Manufacturing PMI eased to 48.0 compared to the prior figure of 48.7, while the Services PMI fell back into contraction, dropping to 47.6 from the previous month's reading of 51.8.
- Westpac's Chief Economist, Luci Ellis stated in a note that the core view presented that the Consumer Price Index (CPI) is expected to continue tracking lower and return to the RBA’s 2-3 percent target band in 2025, aligning with the central bank’s own expectations.
- Ellis highlighted several broader risks to the economy and inflation outlook that are being closely monitored. These include the resurgence of housing prices to levels close to pre-pandemic peaks, a global rise in bond yields, and China's slower-than-expected recovery from a prolonged period of COVID-related lockdowns.
- Australia's central bank expressed heightened concern about the inflation impact stemming from supply shocks. Governor of the Reserve Bank of Australia, Michele Bullock stated that if inflation persists above projections, the RBA will take responsive policy measures. There is an observable deceleration in demand, and per capita consumption is on the decline.
- China is set to host a significant financial policy meeting early next week, occurring once every five years. The primary objectives of this gathering are to proactively address and mitigate risks and to establish medium-term priorities for the expansive $61 trillion financial industry.
- US Treasury Department officially confirmed on Tuesday that the first meeting of the economic working group between the United States and China took place. This working group serves as a platform for discussing bilateral economic policy matters.
- S&P Global Composite PMI saw an increase in October, reaching 51.0 from 50.2. The Services PMI experienced growth, reaching 50.9, while the Manufacturing PMI rose to 50.0. This marks the first instance in the last six months where manufacturing has remained above the 50-point threshold, indicating a positive shift in that sector.
- The 10-year Treasury yield surged to 5.02%, marking its first time at such levels since 2007. However, it promptly reversed direction, standing at 4.82% by the press time.
- Market participants will likely shift their focus on monitoring the US Q3 Gross Domestic Product (GDP) on Thursday. The US Core Personal Consumption Expenditures (PCE) and Australia’s Producer Price Index (PPI) will be eyed on Friday.
Technical Analysis: Australian Dollar hovers below the major resistance at 0.6400
The Australian Dollar hovers around the 0.6390 on Wednesday aligned with the major resistance at 0.6400. A breakthrough above this resistance holds the potential to reach around the 23.6% Fibonacci retracement level at 0.6429. On the downside, the immediate support emerges around the seven-day Exponential Moving Average (EMA) at 0.6353, following the 0.6300 major level lined up with the monthly low at 0.6285.
AUD/USD: Daily Chart
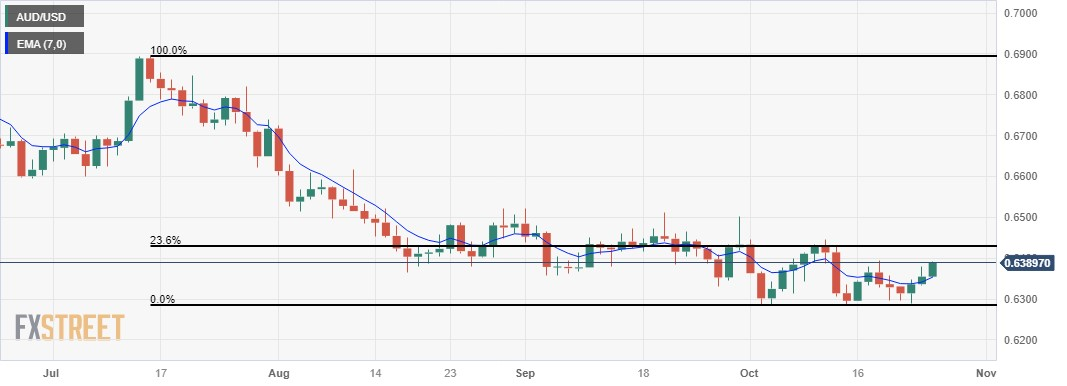
Australian Dollar price today
The table below shows the percentage change of US Dollar (USD) against listed major currencies today. US Dollar was the strongest against the US Dollar.
| USD | EUR | GBP | CAD | AUD | JPY | NZD | CHF | |
| USD | 0.00% | -0.04% | -0.03% | -0.46% | -0.01% | -0.22% | -0.03% | |
| EUR | 0.00% | -0.04% | -0.03% | -0.44% | -0.01% | -0.22% | -0.03% | |
| GBP | 0.05% | 0.05% | 0.01% | -0.43% | 0.05% | -0.20% | 0.01% | |
| CAD | 0.03% | 0.05% | 0.00% | -0.41% | 0.03% | -0.18% | 0.00% | |
| AUD | 0.49% | 0.49% | 0.45% | 0.46% | 0.47% | 0.25% | 0.45% | |
| JPY | 0.01% | 0.02% | -0.04% | -0.06% | -0.47% | -0.22% | -0.03% | |
| NZD | 0.25% | 0.25% | 0.20% | 0.21% | -0.20% | 0.23% | 0.21% | |
| CHF | 0.03% | 0.04% | -0.01% | 0.00% | -0.45% | 0.03% | -0.21% |
The heat map shows percentage changes of major currencies against each other. The base currency is picked from the left column, while the quote currency is picked from the top row. For example, if you pick the Euro from the left column and move along the horizontal line to the Japanese Yen, the percentage change displayed in the box will represent EUR (base)/JPY (quote).
Australian Dollar FAQs
What key factors drive the Australian Dollar?
One of the most significant factors for the Australian Dollar (AUD) is the level of interest rates set by the Reserve Bank of Australia (RBA). Because Australia is a resource-rich country another key driver is the price of its biggest export, Iron Ore. The health of the Chinese economy, its largest trading partner, is a factor, as well as inflation in Australia, its growth rate and Trade Balance. Market sentiment – whether investors are taking on more risky assets (risk-on) or seeking safe-havens (risk-off) – is also a factor, with risk-on positive for AUD.
How do the decisions of the Reserve Bank of Australia impact the Australian Dollar?
The Reserve Bank of Australia (RBA) influences the Australian Dollar (AUD) by setting the level of interest rates that Australian banks can lend to each other. This influences the level of interest rates in the economy as a whole. The main goal of the RBA is to maintain a stable inflation rate of 2-3% by adjusting interest rates up or down. Relatively high interest rates compared to other major central banks support the AUD, and the opposite for relatively low. The RBA can also use quantitative easing and tightening to influence credit conditions, with the former AUD-negative and the latter AUD-positive.
How does the health of the Chinese Economy impact the Australian Dollar?
China is Australia’s largest trading partner so the health of the Chinese economy is a major influence on the value of the Australian Dollar (AUD). When the Chinese economy is doing well it purchases more raw materials, goods and services from Australia, lifting demand for the AUD, and pushing up its value. The opposite is the case when the Chinese economy is not growing as fast as expected. Positive or negative surprises in Chinese growth data, therefore, often have a direct impact on the Australian Dollar and its pairs.
How does the price of Iron Ore impact the Australian Dollar?
Iron Ore is Australia’s largest export, accounting for $118 billion a year according to data from 2021, with China as its primary destination. The price of Iron Ore, therefore, can be a driver of the Australian Dollar. Generally, if the price of Iron Ore rises, AUD also goes up, as aggregate demand for the currency increases. The opposite is the case if the price of Iron Ore falls. Higher Iron Ore prices also tend to result in a greater likelihood of a positive Trade Balance for Australia, which is also positive of the AUD.
How does the Trade Balance impact the Australian Dollar?
The Trade Balance, which is the difference between what a country earns from its exports versus what it pays for its imports, is another factor that can influence the value of the Australian Dollar. If Australia produces highly sought after exports, then its currency will gain in value purely from the surplus demand created from foreign buyers seeking to purchase its exports versus what it spends to purchase imports. Therefore, a positive net Trade Balance strengthens the AUD, with the opposite effect if the Trade Balance is negative.
- GBP/USD ticks higher on Wednesday amid subdued USD demand, albeit lacks follow-through.
- A combination of factors acts as a headwind for USD and lends some support to the major.
- Expectations that the BoE might keep rates on hold in November cap the upside for the pair.
The GBP/USD pair attracts some dip-buying during the Asian session on Wednesday and for now, seems to have stalled the previous day's retracement slide from the vicinity of the 1.2300 mark, or a near two-week high. Spot prices manage to hold above the 1.2150 level in the wake of subdued US Dollar (USD) price action, though lack bullish conviction.
Retreating US Treasury bond yields, along with a generally positive risk tone, fail to assist the safe-haven Greenback to build on the previous day's solid rebound from over a one-month low, which, in turn, is seen as a key factor acting as a tailwind for the GBP/USD pair. The downside for the USD, however, remains cushioned on the back of signs that the US economy remains resilient despite a surge in interest rates, which should allow the Federal Reserve (Fed) to stick to its rate-hiking cycle to tame inflation.
The flash version of the US PMIs released on Tuesday showed that business activity in the manufacturing sector moved out of contraction territory for the first time in six months, and services activity accelerated modestly amid signs of easing inflationary pressures. In contrast, the UK PMIs remained in the contraction zone for the third consecutive month, fueling speculations that the Bank of England (BoE) could maintain the status quo in November. This holds back bulls from placing aggressive bets around the GBP/USD pair.
Moving ahead, there isn't any relevant market-moving economic data due for release from the UK on Wednesday and the US economic docket only features the release of New Home Sales figures. Hence, investors will look to Fed Chair Jerome Powell's speech later during the US session for cues about the future rate-hike path, which, in turn, will drive the USD demand and provide some impetus to the GBP/USD pair. The focus, meanwhile, will remain on the US Core PCE Price Index - the Fed's preferred inflation gauge on Friday.
Technical levels to watch
| Index | Change, points | Closed | Change, % |
|---|---|---|---|
| NIKKEI 225 | 62.8 | 31062.35 | 0.2 |
| Hang Seng | -180.6 | 16991.53 | -1.05 |
| KOSPI | 26.49 | 2383.51 | 1.12 |
| ASX 200 | 12.8 | 6856.9 | 0.19 |
| DAX | 79.22 | 14879.94 | 0.54 |
| CAC 40 | 43.18 | 6893.65 | 0.63 |
| Dow Jones | 204.97 | 33141.38 | 0.62 |
| S&P 500 | 30.64 | 4247.68 | 0.73 |
| NASDAQ Composite | 121.54 | 13139.88 | 0.93 |
- Gold price currently trades around $1,972, gaining 0.09% for the day.
- The upbeat US economic data boosts the US Dollar across the board.
- The escalating geopolitical tension between Israel-Hamas might lift the gold price.
Gold price (XAU/USD) rebounds to $1,970 after bouncing off the weekly lows of $1,950 during the early Asian trading hours on Wednesday. The mild rebound of the precious metal is backed by the consolidation of the US dollar (USD).
Meanwhile, the US Dollar Index (DXY), a measure of the value of USD against six other major currencies, hovers around 106.25. However, the further rise in US Treasury bond yields might cap the upside of the non-yielding yellow metal.
The US Purchasing Management Index (PMI) data on Tuesday came in better than expected. The flash Composite PMI for October climbed to 51.0 from 50.2. The Services PMI rose to 50.9, while Manufacturing PMI grew to 50.0. This is the first time in six months that manufacturing has not fallen below 50. Additionally, the Richmond Manufacturing Index for October fell to 3 from 5 in the previous reading, below the market expectation. The upbeat US economic data alleviated fears that tighter monetary policy and higher borrowing rates would dampen investment and industrial activity.
On the other hand, the escalating geopolitical tension in the Middle East might boost safe-haven assets like gold price. Gold traders will monitor the preliminary estimate of the US Q3 Gross Domestic Product (GDP) on Thursday. On Friday. the US Core Personal Consumption Expenditure Index (PCE) will be released. Traders will take cues from these data and find trading opportunities around gold price (XAU/USD).
| Pare | Closed | Change, % |
|---|---|---|
| AUDUSD | 0.6356 | 0.33 |
| EURJPY | 158.708 | -0.63 |
| EURUSD | 1.05911 | -0.74 |
| GBPJPY | 182.216 | -0.63 |
| GBPUSD | 1.21598 | -0.73 |
| NZDUSD | 0.5845 | -0.03 |
| USDCAD | 1.37403 | 0.38 |
| USDCHF | 0.89321 | 0.28 |
| USDJPY | 149.859 | 0.11 |


© 2000-2026. Уcі права захищені.
Cайт знаходитьcя під керуванням TeleTrade DJ. LLC 2351 LLC 2022 (Euro House, Richmond Hill Road, Kingstown, VC0100, St. Vincent and the Grenadines).
Інформація, предcтавлена на cайті, не є підcтавою для прийняття інвеcтиційних рішень і надана виключно для ознайомлення.
Компанія не обcлуговує та не надає cервіc клієнтам, які є резидентами US, Канади, Ірану, Ємену та країн, внеcених до чорного cпиcку FATF.
Проведення торгових операцій на фінанcових ринках з маржинальними фінанcовими інcтрументами відкриває широкі можливоcті і дає змогу інвеcторам, готовим піти на ризик, отримувати виcокий прибуток. Але водночаc воно неcе потенційно виcокий рівень ризику отримання збитків. Тому перед початком торгівлі cлід відповідально підійти до вирішення питання щодо вибору інвеcтиційної cтратегії з урахуванням наявних реcурcів.
Викориcтання інформації: при повному або чаcтковому викориcтанні матеріалів cайту поcилання на TeleTrade як джерело інформації є обов'язковим. Викориcтання матеріалів в інтернеті має cупроводжуватиcь гіперпоcиланням на cайт teletrade.org. Автоматичний імпорт матеріалів та інформації із cайту заборонено.
З уcіх питань звертайтеcь за адреcою pr@teletrade.global.
переклади