- Analytics
- News and Tools
- Market News
Новини ринків
- Gold price attracts some sellers around $1,915 amid the USD demand.
- Most Fed officials still expect the additional rate rises later this year, which weigh on gold price.
- Market players await the US growth number and the Core Personal Consumption Expenditure (PCE) Price Index.
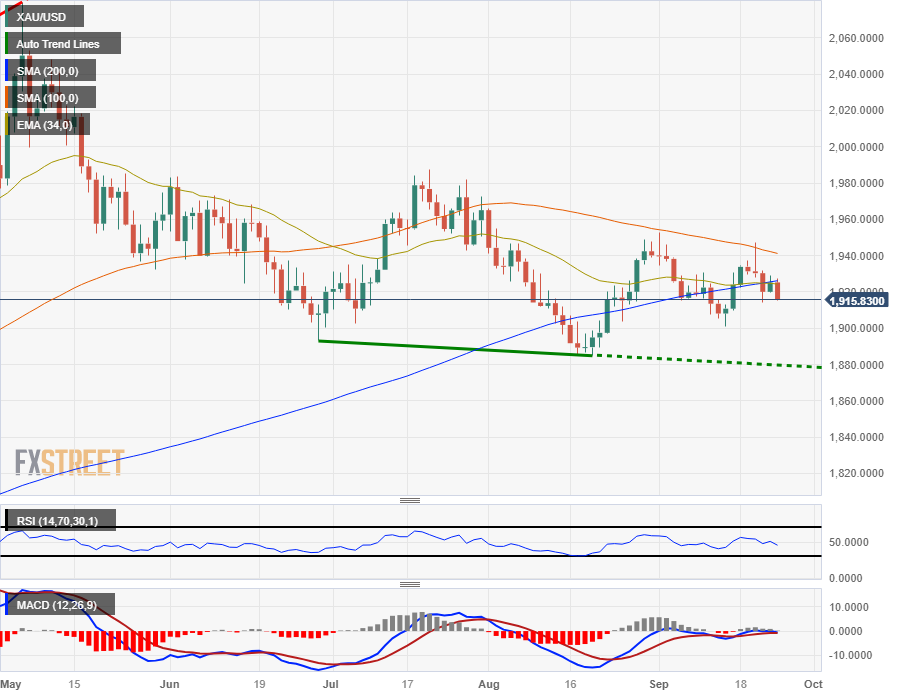
Gold price (XAU/USD) struggles to gain around $1,915 during the early Asian session on Tuesday. Gold price is weighed by a rally in US Dollar (USD) and US higher yield.
Meanwhile, the US Dollar Index (DXY), a measure of the value of the USD relative to a basket of foreign currencies, hovers around 105.95 after retreating from the highest level since November of 106.09 amid the higher for longer narratives in the US. Additionally, the 10-year yield climbed to 4.53%, a level not seen since October 2007.
Most Fed officials still expect the additional rate to rise later this year. The Federal Reserve Banks of Boston and San Francisco Presidents, Susan Collins and Mary Daly, emphasized that although inflation is cooling down, additional rate hikes would be necessary. While the Chicago Fed President Austan Goolsbee said that a soft landing is possible, inflation risks remain tilted to the upside and the Fed should have 100% commitment to returning inflation to 2%. It’s worth noting that rising interest rates raise the opportunity cost of investing in non-yielding assets, implying a negative outlook for XAU/USD.
Moving on, the US Gross Domestic Product (GDP) Annualized for the second quarter will be due on Thursday. The closely watched event this week will be the Core Personal Consumption Expenditure (PCE) Price Index, the Fed's preferred measure of consumer inflation, due on Friday. The annual figure is expected to drop from 4.2% to 3.9%. Market players will take cues from these figures and find a clear direction in XAU/USD.
XAU/USD technical outlook
On the one-hour chart, gold price holds below the 50- and 100-hour Exponential Moving Averages (EMAs), which mean the past of least resistance is to the downside. Meanwhile, the Relative Strength Index (RSI) is located in bearish territory below 50, activating the bearish momentum for gold price.
Resistance level: $1,925, $1,945 and $1,970
Support level: $1,900, $1,885 and $1,865
-638312830668322460.png)
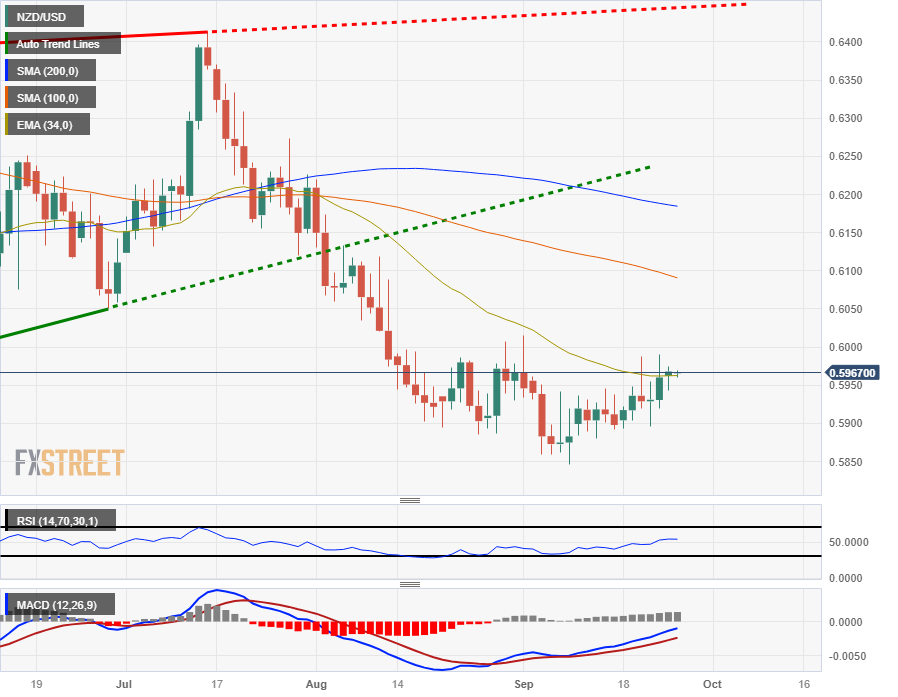
- The NZD/USD rebounded in Monday action, ending the day just south of 0.5970 after falling to 0.5940.
- The US Dollar remains well-bid across the broader market.
- The economic calendar for this week is decidedly USD-heavy.
The NZD/USD is seeing some consolidation in the short term after slipping from the last swing high into 0.5985.
The Kiwi (NZD) has recovered 2% against the US Dollar (USD) from September's lows near 0.5850, but remains firmly bearish, down over 7% from July's peak near the 0.6400 handle.
With little data to drive the Kiwi on the economic calendar, market flows will be driven from the Greenback side.
Economic calendar sees all Greenback, little Kiwi for the week
Tuesday will bring US Housing Price Index growth for July, which is forecast to decline slightly from 0.3% to 0.1%. On Wednesday, US Durable Goods Orders for August are seen declining by 0.4%, but still an improvement on the previous month's -5.2%.
High-impact data kicks off on Thursday with US Gross Domestic Product (GDP) numbers for the second quarter; annualized quarter-on-quarter GDP growth is expected to improve slightly from 2.1% to 2.3%.
Improving GDP growth figures could see further gains for the US Dollar if the numbers manage to meet or beat forecasts.
Thursday will also be bringing a speech from Federal Reserve (Fed) Chair Jerome Powell, followed by New Zealand's only representation on the economic calendar this week with mid-tier consumer confidence figures.
The ANZ Roy Morgan Consumer Confidence survey index for September will be landing at 21:00 GMT on Thursday. The indicator last printed at 85 back in August.
NZD/USD technical outlook
The Kiwi-Dollar pair is slowly recovering on daily candlesticks, and the NZD/USD is currently pinned to the 34-day Exponential Moving Average (EMA). Overall trend momentum remains decidedly bearish, with current price action trading well below the 200-day Simple Moving Average (SMA) crossing below 0.6200.
If bears manage to regain control of the NZD/USD, prices will be set to break into new lows for the year, and little technical support would remain until last's years lows near 0.5600.
NZD/USD daily chart
NZD/USD technical levels
US President Joe Biden and one of his senior advisers warned on Monday that a federal government shutdown may result in widespread difficulties, including the loss of food benefits for almost 7 million low-income women and children, per Reuters.
He said he and House Speaker Kevin McCarthy had agreed a few months ago on spending levels for the government. The Republican-controlled House of Representatives may seek this week to approve drastic budget cutbacks that the Democratic-controlled Senate would almost likely reject. While the changes would not become law, a failure by both houses to reach an agreement might result in a partial government shutdown by next Sunday.
Market reaction
As of writing, the US Dollar Index (DXY) was down 0.02% on the day at 105.92.
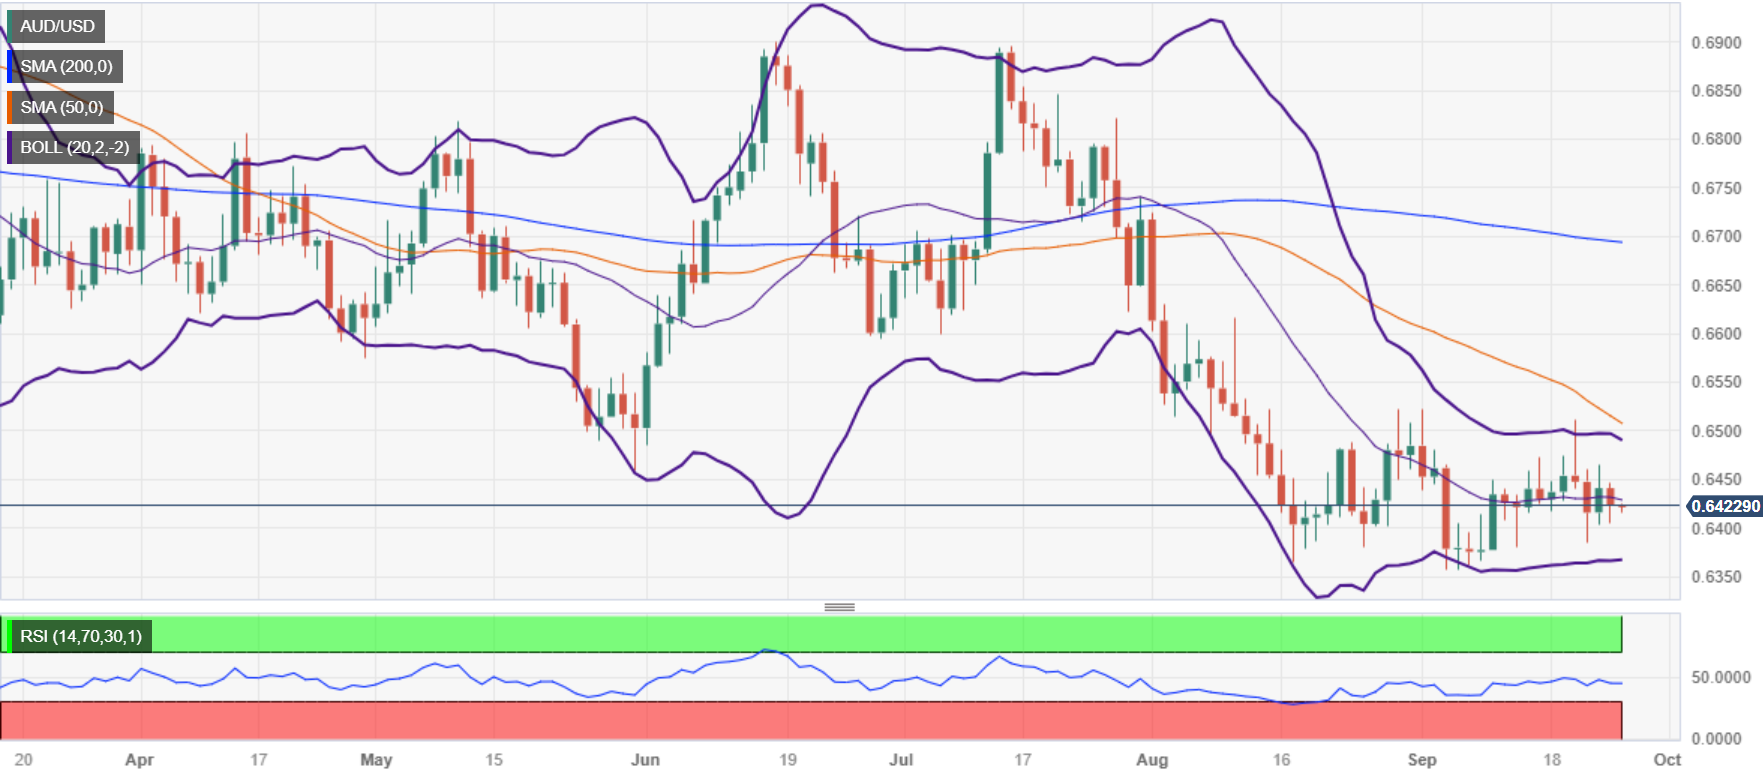
- AUD/USD trades at 0.6423, experiencing a 0.25% drop on Monday, as the US Dollar Index (DXY) reaches a ten-month high at 106.09, driven by elevated US bond yields.
- US Treasury bond yields touch multi-year highs, with the 10-year T-bond rate hitting 4.533%, reflecting the US Federal Reserve’s 'higher for longer' stance on interest rates.
- Federal Reserve officials, advocate for a cautious and patient approach to monetary policy, not ruling out the possibility of another rate hike, while Australian traders await key economic releases.
The Australian Dollar (AUD) lost some ground against the US Dollar (USD) as the latter strengthened the most in nine months, underpinned by elevated US bond yields. Hence, the AUD/USD is trading at 0.6423, printing minuscule gains as the Asian session begins, but on Monday, it dropped 0.25%.
AUD/USD faces pressure as the buck’s climbs to multi-month rise
Wall Street finished Monday’s session with gains led by the Nasdaq and followed by the S&P 500. The Greenback remains in the driver’s seat as investors brace for the US Federal Reserve’s mantra “higher for longer,” as US Treasury bond yields touch multi-year highs. The US 10-year T-bond rate hit 4.533% during the session, while the US Dollar Index (DXY) rose to a ten-month high at 106.09.
Data-wise, the Chicago Fed National Activity Index plunged to -0.16 in August from 0.07 in July, while the Dallas Fed Manufacturing Index plummeted to -18.1 in September from -17.2 the prior month.
Federal Reserve speakers in the central bank adopted a cautious stance, mainly Boston and San Francisco Fed Presidents Susan Collins and Mary Daly. Both stressed the Fed should be patient on monetary policy but haven’t ruled out another rate hike. Recently, the Chicago Fed President Austan Goolsbee said that a soft landing is possible, but inflation risks remain tilted to the upside.
Meanwhile, AUD/USD traders would take cues from the Australian economic docket with the release of the Reserve Bank of Australia (RBA) Conference in inflation. On the US front, the docket would release the S&P/Case-Shiller Home Prices, alongside housing data and the CB Consumer Confidence.
AUD/USD Price Analysis: Technical outlook
The Aussie’s daily chart portrays the currency pair as neutral to downward biased. Currently is consolidated at around the 0.6400 mark, but a bearish-harami candlestick chart pattern could pave the way for further losses. The first support is seen at the current exchange rate, at around two and a half years of support trendline. A breach of the latter would open the door to test the September 4 low of 0.6357, followed by the November 22 swing low of 0.6272. Conversely, if the pair climbs past the 0.6500 figure, the next resistance is at the 50-day moving average (DMA) at 0.6671.
- USD/JPY takes a breather near 148.81 amid the cautious mood and fear of intervention.
- The higher for longer narratives in the US boosts the Greenback broadly, the highest since November.
- Bank of Japan (BoJ) policymakers said the central bank needs to patiently continue monetary easing.
- Japan’s Tokyo Consumer Price Index (CPI) and US Core Personal Consumption Expenditure (PCE) Price Index will be closely watched events.
The USD/JPY pair consolidates its recent gains after reaching the highest since October of 149.00 during the early Asian session on Tuesday. The stronger US Dollar (USD) is the main driver for the pair as the 10-year yield climbed to 4.53%, a level not seen since October 2007. The pair currently trade around 148.81, losing 0.04% on the day.
Meanwhile, the US Dollar Index (DXY), a measure of the value of the USD relative to a basket of foreign currencies, hovers around 105.95 after retreating from the highest level since November of 106.09 amid the fear of intervention by the Japanese authorities.
The higher for longer narratives in the US boosts the Greenback broadly. The Federal Reserve (Fed) is expected to hike rates one more time by the end of the year. The Federal Reserve Banks of Boston and San Francisco Presidents, Susan Collins and Mary Daly, emphasized that although inflation is cooling down, additional rate hikes would be necessary. While the Chicago Fed President Austan Goolsbee said that a soft landing is possible, inflation risks remain tilted to the upside and the Fed should have a 100% commitment to returning inflation to 2%.
On the other hand, Bank of Japan (BoJ) Deputy Governor Shinichi Uchida said on Monday, that the central bank needs to patiently continue monetary easing and needs to closely watch currency market moves. Similarly, the Bank of Japan (BoJ) Governor Ueda emphasized the need to spend more time assessing data before raising interest rates. This, in turn, might cap the upside of the US Dollar (USD) and act as a headwind for the USD/JPY pair.
Looking ahead, Japan’s Tokyo Consumer Price Index (CPI) for September, Industrial Production, and Retail Sales will be released on Friday. The attention will shift to the highly-anticipated US Core Personal Consumption Expenditure (PCE) Price Index, the Fed's preferred measure of consumer inflation. The annual figure is expected to drop from 4.2% to 3.9%. Traders will take cues from these figures and find trading opportunities around the USD/JPY pair.
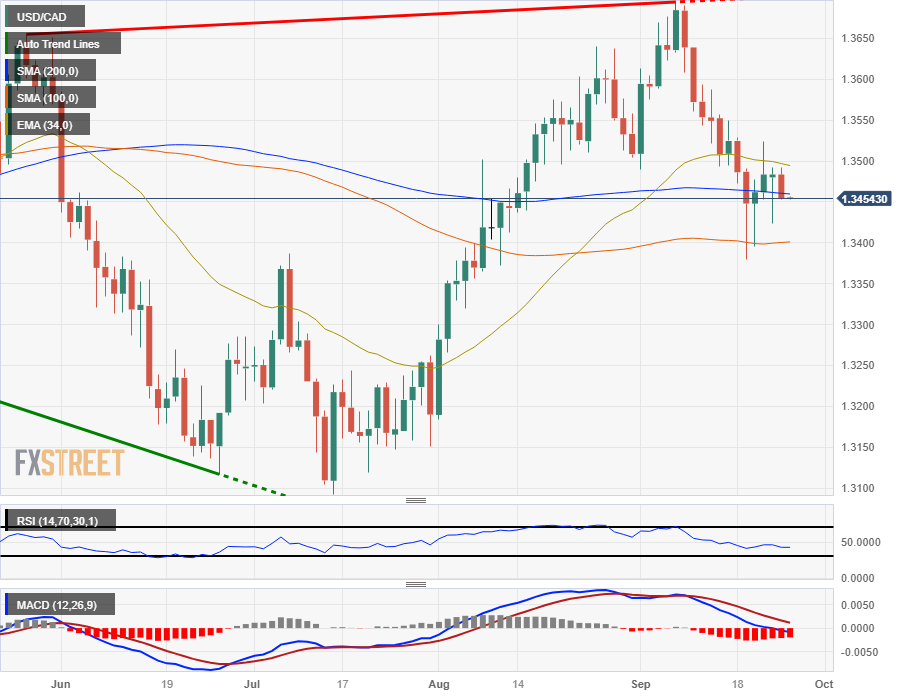
- USD/CAD testing into the 1.3450 level after cycling on Monday.
- The US Dollar is broadly higher, but the CAD is catching a late-day bump in crude oil prices.
- Economic calendar is mostly devoid of CAD data, leaving things open for US GDP figures on Thursday.
The USD/CAD slipped a scant 0.2% for Monday, after tapping into a mild intraday high of 1.3491.
The pair has fallen about 1.7% from September's peak near 1.3694. Oil prices have been squeezing higher on market-wide supply constraint fears, which has been bolstering the commodity-based Loonie (CAD) despite the US Dollar's (USD) broad rise across the market.
There is little of note on the economic calendar for Canada this week, and focus will squarely be on USD data impact.
Thursday will see US Gross Domestic Product (GDP) figures, as well as a speech from Federal Reserve (Fed) Chair Jerome Powell. Annualized GDP for the second quarter is forecast to tick higher from 2.1% to 2.3%.
On Friday, we will see US Personal Consumption Expenditure (PCE) data, which is expected to hold steady for the month of August at 0.2%.
Canadian GDP numbers will also land on Friday, but market impact is likely to be muted as US data churns the charts.
Canadian GDP for the month of July is expected to print at a flat 0%, but still an improvement over the previous month's 0.2% decline.
USD/CAD technical outlook
The USD/CAD saw a clean rejection of the 200-hour Simple Moving Average (SMA) in intraday trading, and is set for a challenge of a rising near-term trendline from last Wednesday's swing low near 1.3400.
On daily candlesticks, the USD/CAD is strung along the 200-say SMA. A bearish push from this region will see the pair lose the 1.3400 major handle, while a bullish rebound will need to reclaim the 1.3600 level before pushing to new highs.
USD/CAD daily chart
USD/CAD technical levels
- S&P 500 and Nasdaq closed with gains of 0.40% and 0.45%, respectively, despite the Fed’s decision to hold rates and upward revised rate forecasts.
- US Treasury bond yields soared, with the 10-year benchmark note reaching a 16-year high at 4.533%.
- Energy, Materials, and Consumer Discretionary sectors were the biggest gainers.
Wall Street finished Monday’s session with solid gains, while the Greenback extended its gains to a new year-to-date (YTD) high; at the same time, US Treasury bond yields climbed.
US equities register gains despite the Federal Reserve's upward revised rate forecasts, with Energy, Materials, and Consumer Discretionary sectors leading the way
The S&P 500 registered gains of 0.40% and ended at 4,337.44, while the heavy-tech Nasdaq led US equities gains with a .45% advance, closing at 13,271.32. The Dow Jones Industrial barely missed gains and was last up 0.13%, at 34,006.88.
Sector-wise, the biggest gainers were Energy, Materials, and Consumer Discretionary, each gaining 1.28%, 0.80 %, and 0.67%. The laggards were Consumer Staples, Utilities, and Real Estate, erasing from its value 0.43%, 0.20%, and 0.17%, respectively.
Equities climbed despite last week’s US Federal Reserve’s (Fed) decision to hold rates unchanged but upward revised forecast for the following year. The Federal Fund Rates (FFR) is expected to stay above 5% for 2023 and 2024, as revealed by the latest “dot-plots.”
Therefore, US Treasury bond yields exploited to the upside, with the 10-year benchmark note touching a 16-year high at 4.533%. The Greenback followed suit, with the US Dollar Index (DXY), which tracks the buck’s performance versus six currencies, touching 106.10, a level last seen in November 2022.
Federal Reserve speakers continued to cross newswires with Austan Goolsbee from the Fed of Chicago, saying the path for a soft landing is possible, though a “lot of risks and the path is long and winding.” Last week, two Fed officials called for patience on the US central bank, Boston and San Francisco’s Fed Presidents Sussan Collins and Mary Daly.
In the meantime, Fed Governor Michelle Bowman stressed an additional rate hike is needed, maintaining her hawkish stance.
Data-wise, the US economic agenda, the Dallas Fed Manufacturing Index plunged -18.1 in September, from a -10.2 drop in August.
Gold remained pressured at around the $1,915.00 zone in the commodity space, weighed by the rise in US bond yields. WTI lost 0.50% in the day, as a strong US Dollar and Russia’s lifting fuel ban weighed on the “black gold” price, despite being underpinned by tight supplies after Saudi Arabia and Russia’s 1.3-million-barrel crude oil cut.
S&P 500 Price Action – Daily Chart

S&P 500 Technical Levels
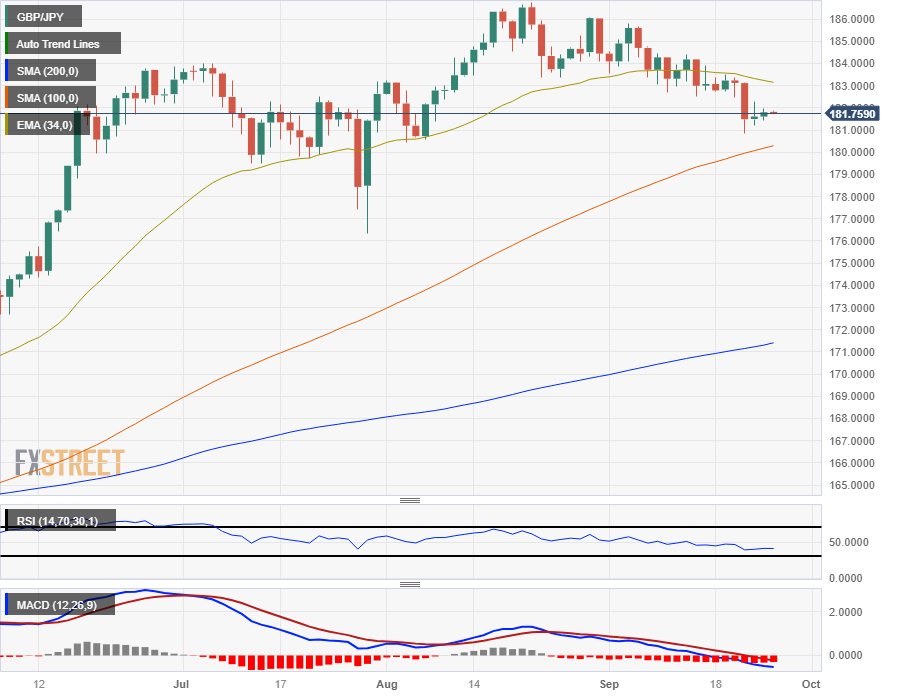
- The GBP/JPY saw thin trading on Monday, heading into Tuesday testing the upper bounds just below 182.00.
- The Pound Sterling continues to sag against the Yen in the short-term, down over 2.5% from August's peak.
- The long term remains notably bullish, and the GBP/JPY is still up almost 18% for 2023.
The GBP/JPY spread the middle for Monday, with neither the Pound Sterling (GBP) nor the Yen (JPY) finding momentum to get the chart kickstarted for the new trading week.
The GBP has struggled to find support on the charts after the Bank of England (BoE) held rates steady last week in a split vote, and it appears the end of the rate hike cycle for the UK has landed much sooner than many analysts expected. With the UK's domestic economy teetering in the fundamental data, the BoE is hoping interest rates are high enough to keep inflation capped moving forward.
On the JPY side, the Bank of Japan (BoJ) Governor Kazuo Ueda and Deputy Governor Shinichi Uchida hit news wires on Monday. The BoJ officials talked down any hawkish expectations, reiterating the BoJ policy stance that inflation is at risk of dipping below 2%, the Japanese central bank's minimum target before a reversal of the BoJ's negative rate regime can be considered.
Read more:
BoJ’s Ueda: Stable, sustainable achievement of 2% inflation not yet in sight
BoJ’s Uchida: Central bank needs to patiently continue monetary easing
BoJ’s Ueda: Our basic stance is that we must patiently maintain monetary easing
Economic calendar looking light on the data docket until Thursday
The early week sees little of note for the GBP/JPY on the economic calendar, and traders will be looking towards Thursday's Tokyo inflation reading and Friday's Gross Domestic Product (GDP) figures for the UK.
Japan's Tokyo Consumer Price Index (CPI) reading is slated for 23:30 GMT late Thursday, and the core annualized figure is forecast to tick lower from 2.8% to 2.6%.
On the UK side, GDP numbers are forecast to hold steady, with the annualized GDP growth rate for the second quarter expected to print at 0.4%, in-line with the previous reading.
GBP/JPY technical outlook
Intraday action has the GBP/JPY hamstrung just below the 182.00 major handle, and the pair is set to build in a floor from 181.00 as bidders look for a re-challenge of the 200-hour Simple Moving Average (SMA) settling into 182.70.
Daily candlesticks see the Guppy settling back into the 100-day SMA, with the long-term bull trend leaving the GBP/JPY well above the 200-day SMA near 172.00. The pair has slipped below the 34-day Exponential Moving Average (EMA) in the near-term, and buyers will need to remount the 186.00 handle from August's last swing high before establishing a continuation of the bull trend.
GBP/JPY daily chart
GBP/JPY technical levels
- Gold buyers are struggling to hang on to $1,915.00 for Monday.
- A well-bid US Dollar is seeing the XAU/USD flounder into recent lows.
- Analysts see Gold reaching $2,200 by the end of the year, but policy risks remain.
The XAU/USD took a step lower on Monday, knocking into $1,915.00 and seeing little relief pressure as the US Dollar (USD) catches bids across the board.
Spot gold prices have steadily drifted lower in 2023, peaking just below $2,080.00 back in early May. The XAU/USD is down almost 8% from the year's high, but still remains well-supported looking long-term, with Gold up nearly 20% from last October's lows of $1,650.00
Gold's long-standing relationship with US Treasury yields has softened in recent months; while the yellow metal has a tendency to closely track with US yields, that relationship has broken down for most of 2023. US yields have appreciated considerably, but Gold remains unable to capitalize on bond momentum.
$2,000 by end-2023, $2,200 by end-2024?
Despite downward price pressure, analysts are forecasting lofty end-of-year Gold spot valuations.
Commodity analysts from Société Générale (SocGen) see Gold capped under $2,000 to end the trading year, but 2024 is expected to see Gold prices improve to $2,200 by the end of 2024, on the back of easing inflation expectations and a slipping US Dollar Index.
XAU/USD technical outlook
Hourly candles see Gold flubbing to last week's swing lows below $1,915.00, while the upside is set to be constrained by near-term resistance from the 100-hour Simple Moving Average (SMA) near $1,925.00.
On the daily candlesticks, the XAU/USD is seeing a notable lack of meaningful momentum, with Gold stuck near the 200-day SMA which is still moving bullish into $1,930.00.
Bidders will be looking to shove Gold back above $,1930.00 to continue a push higher, while sellers will be looking to take the XAU/USD down to August's lows below $1,890.00.
XAU/USD daily chart
XAU/USD technical levels
The US Dollar Index is flirting with the 106.00 area at monthly highs. The economic calendar for the Asian and European sessions is empty on Tuesday. Later in the day, the US will release housing and consumer confidence data.
Here is what you need to know on Tuesday, September 26:
The US Dollar Index (DXY) rose to 106.09, reaching the highest level since November, before pulling back to 105.90. The Greenback remains firm, supported by cautious market sentiment and higher US Treasury yields. The 10-year yield climbed to 4.54%, a level not seen since October 2007.
The expectation of high interest rates persisting for longer is based on the resilience of the US economy. Market participants are eagerly awaiting the release of the Federal Reserve's preferred inflation gauge, the Core Personal Consumption Expenditures Price Index, on Friday.
During the American session, the Chinese Yuan consolidated its losses amid ongoing concerns about the Evergrande situation, which will likely continue to be in the spotlight.
EUR/USD posted its lowest close since March, falling below 1.0600 after five consecutive days of decline. The Euro weakened despite European Central Bank (ECB) President Lagarde's comments at the European Parliament, where she mentioned that rates will remain restrictive for as long as necessary. EUR/GBP pulled back from 0.8700 to 0.8670.
The Pound dropped to fresh lows against the US Dollar, briefly reaching levels below 1.2200. The currency is still affected by the Bank of England's dovish stance in its recent policy decision.
USD/JPY broke above 148.50, reaching the highest levels since October and approaching 149.00. Despite concerns about an intervention from Japanese authorities, the pair's rally remains largely unabated.
The Canadian Dollar outperformed on Monday, with USD/CAD modestly falling to 1.3450. In contrast, the Australian Dollar lagged among commodity currencies, with AUD/USD approaching 0.6400. However, the pair trimmed its losses and settled around 0.6420.
Metals tumbled, with Gold breaking below the $1,920 level and approaching the $1,915 support area. Silver also experienced a decline of 1.85%, falling from $23.55 to the $23.00 mark.
Like this article? Help us with some feedback by answering this survey:
- EUR/JPY holds losses of 0.19% on fundamental reasons while it remains subdued for ten consecutive days.
- Upside risks remain, but are capped at around 158.17, 158.65 and 159.00.
- Short-term, EUR/JPY is bearish biased, as price action tumbles below the Kumo.
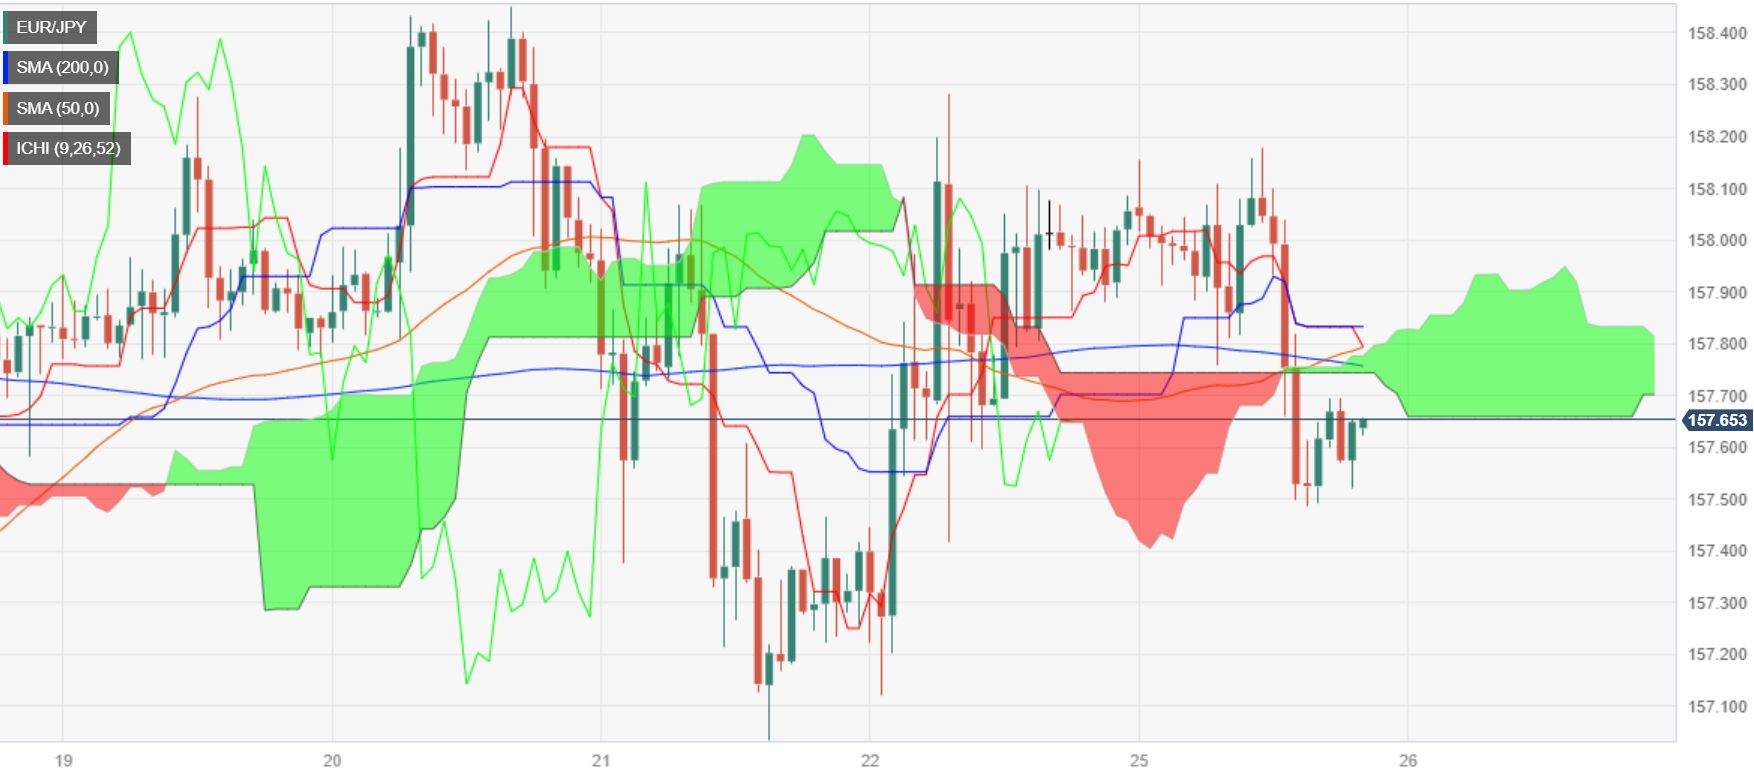
The EUR/JPY remains subdued for the tenth-straight day, capped on the upside by the Kijun-Sen at 158.17, while the distance between the spot price and the Ichimoku Cloud (Kumo) shrinks, suggesting that downside risks are emerging. Hence, the cross-pair is trading at 1573.60, down 0.19%.
A fundamental reason behind the recent Euro (EUR) weakness is data showing the bloc is headed to a recession. At the same time, the European Central Bank (ECB) holds rates as fears of economic growth are tilted to the downside. Nevertheless, the ECB is adopting the Fed’s mantra of keeping rates higher for longer. That and fears that Japanese authorities could intervene in the Forex market and propel the Yen keeps traders parked on the sidelines.
The daily chart portrays the EUR/JPY trades sideways, with immediate resistance at the Kijun-Sen at 158.17. A breach of that level would expose the September 13 high of 158.65 before rallying to 159.00. Conversely, the pair’s first support would be the September 21 daily low of 157.03, followed by the top of the kumo at 156.86.
The hourly chart portrays the pair as neutral to downward biased, as it has achieved a successive series of lower highs, though it’s pending a lower low below September 21 at 157.03. In addition, the exchange rate is below the Kumo, while the Chikou Span sits below the price action and the Kumo, further confirming the bearish bias.
The EUR/JPY first support would be the daily low of today at 157.48, followed by last Friday’s low of 157.11. A breach of the latter would expose the 157.03, followed by the 157.00 figure. Conversely, the first resistance would be the Senkou Span B at 157.69, followed by the Tenkan-Sen's confluence and the Kumo's top at 157.79 before challenging 158.00.
EUR/JPY Price Action – Hourly chart
EUR/JPY Key Technical Levels
- WTI crude oil trades with over 0.50% losses after hitting a high of $90.34.
- Federal Reserve's decision to hold rates but project higher rates for the next year has snapped WTI’s three-week rally.
- Oil prices were cushioned by a drop in oil rigs count in the US, along with China’s economic recovery accelerating.
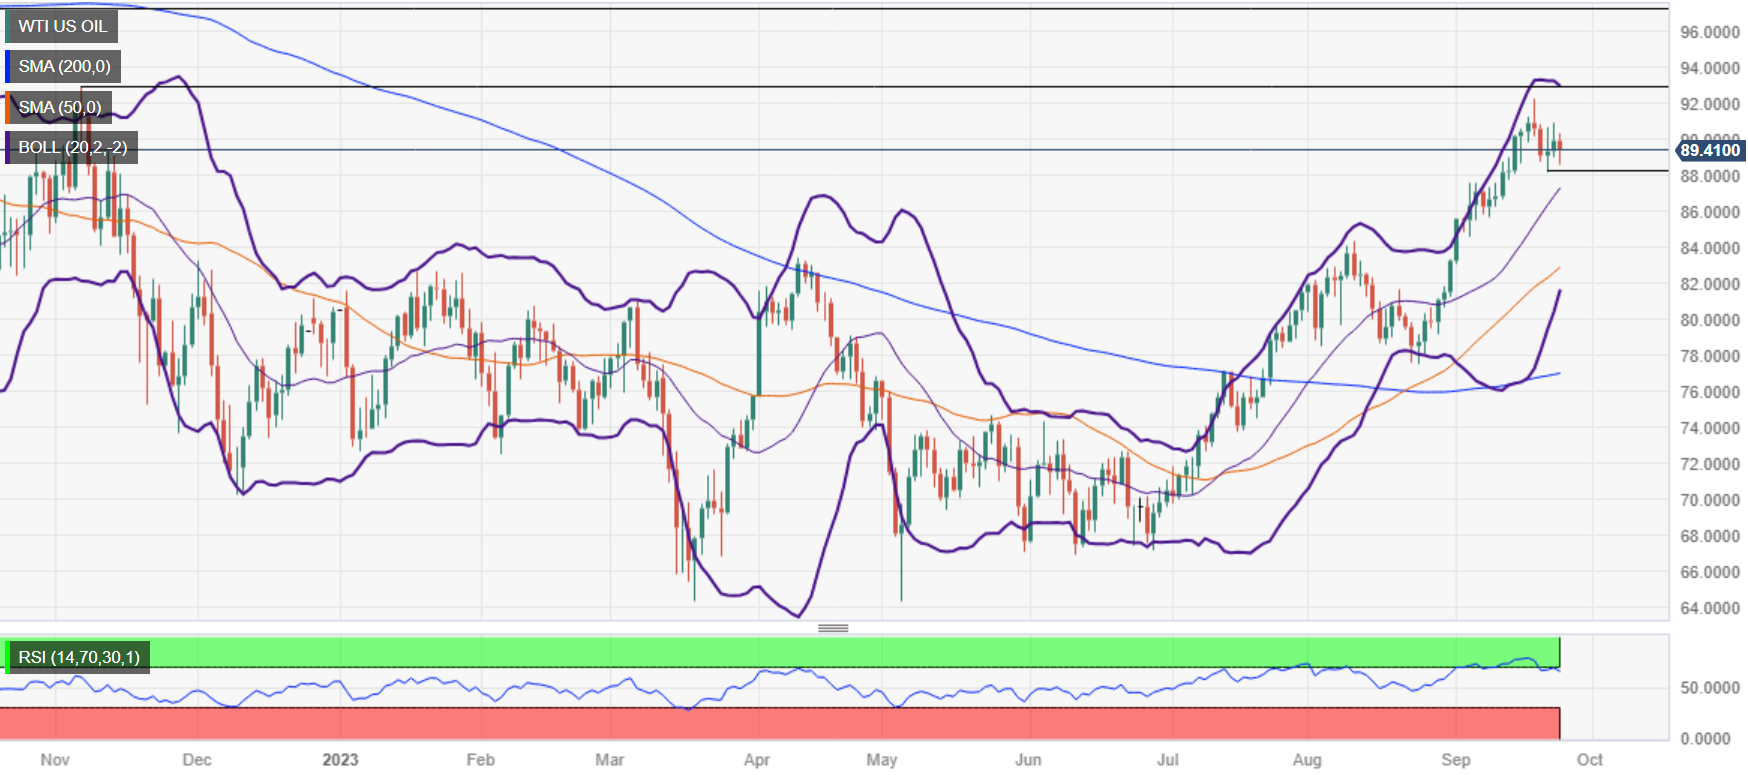
West Texas Intermediate (WTI), the US crude oil benchmark, traded with more than 0.50% losses on Monday as Russia tweaked its fuel ban. At the same time, higher interest rates in the United States (US) boosted the Greenback (USD), a headwind for US dollar-denominated assets. WTI is trading at $89.35 per barrel, late in the North American session.
West Texas Intermediate dips on Russia’s relaxing fuel ban, strong USD
Investors' mood remains downbeat as speculations the US central bank would increase rates one more time. According to some banks on Wall Street, Russia’s approval of changes to its fuel export ban was a headwind to oil prices, which were set to hit $100 per barrel.
Last week’s Fed decision to hold rates but upward revise the dot-plots for the next year, foreseeing rates above 5%, snapped oil’s three-week rally that witnessed WTI gaining more than 10%, as Saudi Arabia and Russia extended its crude oil output cuts toward December 2023.
The Fed sent US bond yields skyrocketing, underpinning the Greenback to a year-to-date high of 106.09, as drafted by the US Dollar Index (DXY). Nevertheless, WTI’s fall was cushioned by the oil rig's count falling last week to 507 from 515, despite higher oil prices.
In the meantime, speculations of better economic data from China keep oil traders’ spirits higher, following last week’s data. China is the world’s largest oil importer, and if economic activity slows down, it could weigh on global oil prices.
WTI Price Analysis: Technical outlook
WTI remains upward biased but fails to pierce the top-Bollinger band, while the Relative Strength Index (RSI) exits from overbought conditions, opening the door for a pullback. Support is seen at the September 21 daily low of $88.15 before the US crude oil price tests the 20-day Exponential Moving Average (DMA) at $87.31. Contrarily, WTI would resume its uptrend but must clear last Friday's high at $90.93 before challenging the year-to-date (YTD) high at $92.26.
- The EUR/USD skidded to a Monday low of 1.0575 as the Euro slips and the Greenback steps higher.
- US Dollar Index is broadly higher across the board to kick off the new trading week.
- ECB's Lagarde pulls the rug out from under the Euro on "further weakness in economic activity.
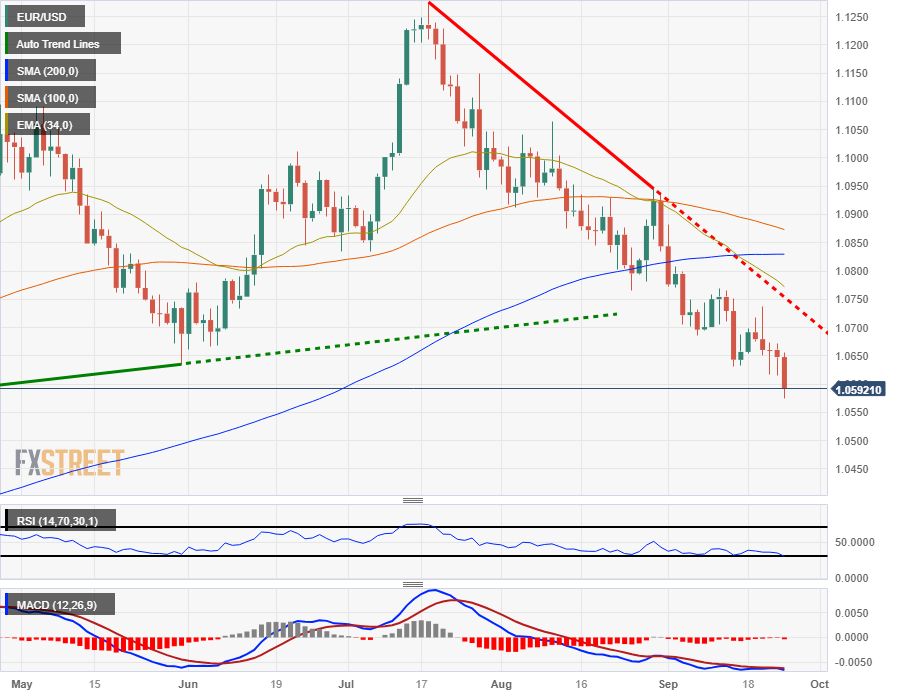
The EUR/USD fell off of recent action to settle at a fresh six-month low at the 1.0660 handle. Broadbase US Dollar (USD) support is helping to exacerbate Euro (EUR) declines sparked by dovish central bank comments coming out of Europe on Monday.
The European Central Bank's (ECB) President Christine Lagarde hit newswires on Monday, noting lagging job growth, broadly weaker economic activity, and an overall decline in momentum.
Despite recent declines in inflation, the ECB's President Lagarde noted that inflation is expected to remain "too high for too long", but the ECB is evidently unable to do anything to help assuage those forecasts, with an uneven domestic economy for the pan-European region threatening to tip over into recession if the ECB raises rates too much.
Read more:
Lagarde speech: Recent indicators point to further weakness in third quarter
Lagarde speech: Recession is not part of baseline
Economic Calendar looking thin until Friday's key data drop
The later end of the trading week sees Consumer Price Index (CPI) figures for both the EU and the US slated for Friday, but the midweek is a nominally lighter affair.
The US will see Personal Consumption Expenditure (PCE) figures on Thursday, as well as Gross Domestic Product (GDP) numbers. Annualized GDP for the US' second quarter is expected to improve from 2.1% to 2.3%.
EUR/USD technical outlook
Intraday action sees the EUR/USD sharply off near-term swing highs near 1.0670, tumbling 0.76% peak-to-trough on Monday.
The Euro slipped to a fresh six-month low of 1.0575 against the US Dollar, and rebound bids are struggling to regain the 1.06000 handle.
On daily candlesticks, a bearish trend is firmly baked in, with a declining trendline from July's swing high near 1.1200.
The 200-day Simple Moving Average (SMA) is turning bearish just north of 1.0800, and the 34-day Exponential Moving Average (EMA) is accelerating into a bearish cross, providing technical resistance from 1.0750.
EUR/USD daily chart
EUR/USD technical levels
- The major traders with losses of 0.16%, as central bank divergence an interest rate differentials favor the Greenback.
- The DXY hit a new YTD high at 106.09, reflecting US strong economy, as soft-landing prospects grow.
- Despite holding rates unchanged, the Fed delivered a hawkish posture, as witnessed by the reaction in the financial markets.
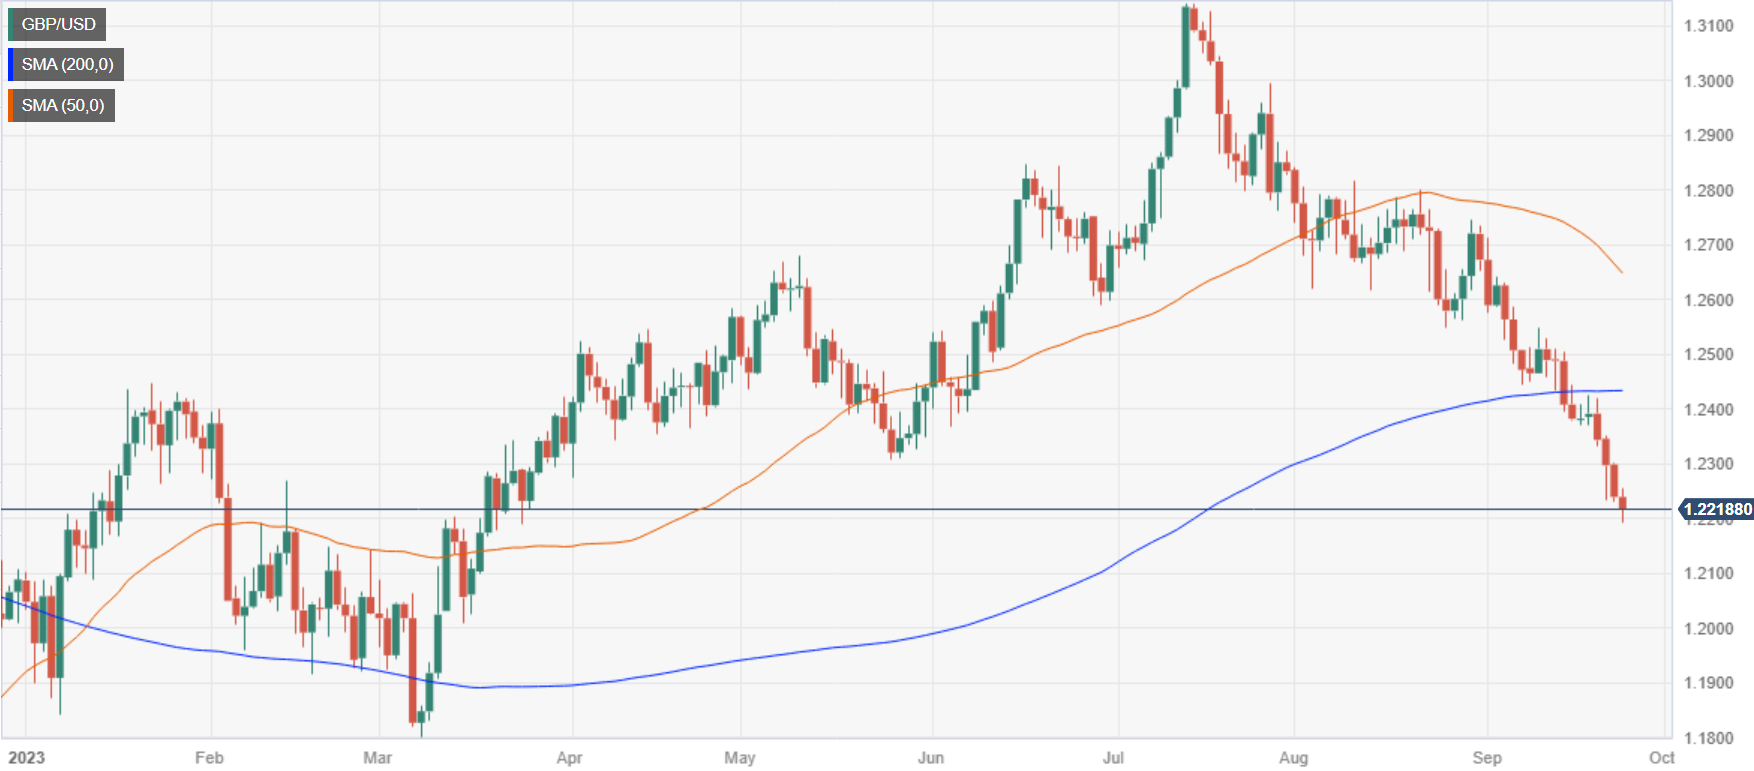
The British Pound (GBP) remains under pressure following a surprising decision by the Bank of England (BoE) to keep rates unchanged, which caught off guard traders, expecting further tightening. US Treasury bond yields edged to multi-year highs, underpinning the Greenback (USD), as seen by the GBP/USD trading at 1.2215, registering losses of 0.16%.
Pound Sterling struggles as the BoE adopts a dovish stance as inflation slowdown, but growth risks are tilted downwards
Last week’s spurred broad Sterling (GBP) weakness after data showed inflation slowing down. The Bank of England reacted accordingly, keeping the Bank Rate at 5.25%, though stressed that further meetings remain open, meaning the BoE could hike or pauser rates if needed.
Further data revealed in that week witnessed Retail Sales came above estimates but remained unchanged compared to July data, while S&P Global/CIPS PMIs showed further deterioration in business activity. Hence, the Pound Sterling is set to remain downward pressured as an economic recession looms.
Across the pond, the US economy remains solid, as shown by last week’s data, while the Federal Reserve’s decision to hold rates unchanged and foresee another interest rate increase keeps investors flowing toward the Greenback. US Treasury bond yields skyrocket to multi-year highs, while the Greenback (USD) printed a new year-to-date (YTD) high, according to the US Dollar Index (DXY), at 106.09.
Federal Reserve officials in the central bank space adopted a cautious stance, mainly Boston and San Francisco Fed Presidents Susan Collins and Mary Daly. Both stressed the Fed should be patient on monetary policy but haven’t ruled out another rate hike. Recently, the Chicago Fed President Austan Goolsbee said that a soft landing is possible, but inflation risks remain tilted to the upside.
Money market futures remain skeptical the Fed would raise rates, as shown by the CME FedWatch Tool, with odds for a 25-bps hike seen at 21% for November, 34.2% for December, and 35.9% for January 2024. Nevertheless, the interest rate differential favoring the Fed could weigh on the GBP/USD soon and send the pair diving toward the 1.2000 figure.
GBP/USD Price Analysis: Technical outlook
The daily chart portrays the pair is struggling to break below the 1.2200 figure, though it remains well below the 200 and 50-day moving averages (DMAs), a bearish signal. If traders drag prices below that level, the GBP/USD next stop would be the March 15 low of 1.2010 before challenging the 1,20 figure. Conversely, a rally towards the 200-DMA at 1.2432 is seen if the major reclaims the 1.2300 mark.
- European equities broadly moved lower on Monday, testing into new lows for the month.
- FTSE, CAC40 lose 60 points apiece, DAX tumbles 151 points.
- Rising yields, economic concerns weighing European equities down.
European stock indexes closed broadly lower for Monday, with the German DAX taking pride-of-place as the biggest loser for the day, shedding 151 points to end the day down just shy of a percent, near €15,405.00.
Exporters with notable exposure to Chinese markets slipped in Monday trading, with equities pressured by rising bond yields for the European Central Bank (ECB) on the back of interest rates that rose to 4% last week.
Equities looking weaker to keep Monday on the bearish side
Weakening metal prices also saw mining equities decline, with rising inventories hampering price growth for precious metals.
Monday overall is striking bearish notes across the board for equities after the Shanghai Composite and Hang Seng indexes closed in the red at -0.48% and -1.82% respectively. The FTSE shed 0.85% and the CAC40 declined 0.85%.
FTSE technical outlook
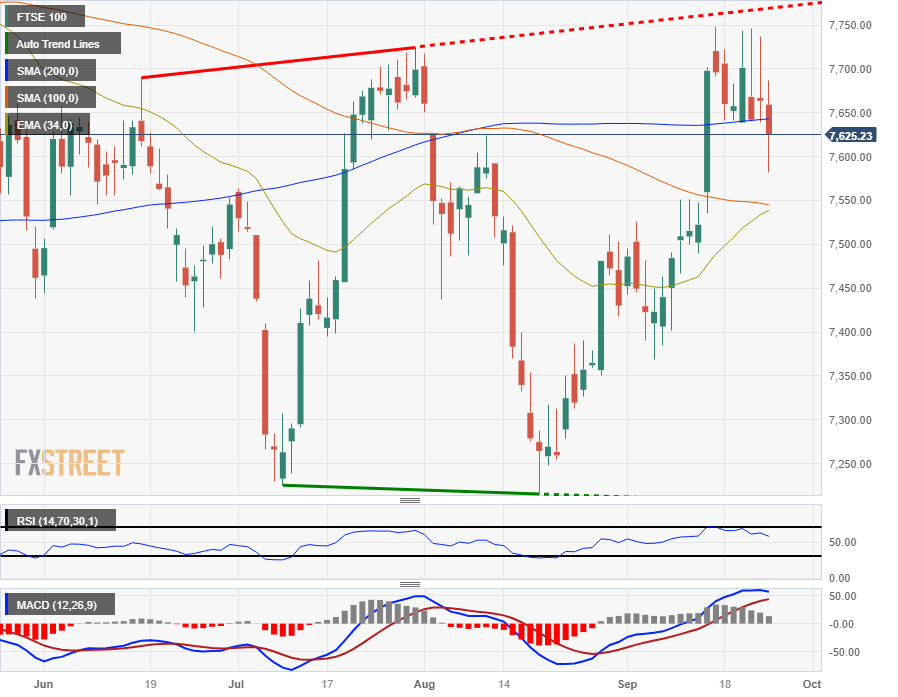
The FTSE is at risk of taking a bearish turn on daily candlesticks, with the UK's main equity index continuing to slip from near-term highs at the £7,750.00 level.
the 200-day Simple Moving Average is acting as a price magnet, keeping the index hamstrung near £7,650.00.
Swing highs are getting capped, and swing lows are routinely running into a floor pricing in near £7,250.00.
Near-term traders will want to keep an eye out for a run-in with the 34-day Exponential Moving Average (EMA), currently lifting into £7,550.00.
FTSE daily chart
FTSE technical levels
- The EUR/GBP is falling in Monday trading, stepping away from the 0.8700 handle.
- The ECB's Lagarde sees further weakness in the European economy.
- Analysts expect the EUR/GBP to gain ground heading into the end of the year on UK headwinds.
The EUR/GBP is losing ground on Monday, with the Euro slipping following dovish comments from the European Central Bank's (ECB) President Christine Lagarde.
Lagarde: further weakness in third quarter
ECB President Lagarde noted that there has been an overall slowdown in momentum for the EU economy, and job creation continues to moderate.
The ECB sees further weakness for the third quarter, and the EU's central bank has also delayed the completion of its policy framework review, which has been pushed out to sometime by the spring of 2024.
Despite Monday's backslide, the Euro (EUR) continues to trade well against the Pound Sterling (GBP) overall looking longer-term. The EUR/GBP managed to swing into a fresh four-month high before falling back to 0.8670.
Analysts at Danske Bank expect the trend to continue, with the EUR/GBP forecast to hit 0.8800 by the end of the year, citing greater headwinds for the Pound Sterling thanks to a dovish Bank of England (BoE).
Read More:
Lagarde speech: Recent indicators point to further weakness in third quarter
EUR/GBP to move only modestly higher to 0.88 over the coming year – Danske Bank
The economic calendar is notably thin for both the Euro and the Pound Sterling for the first half of the trading week with very little on the data docket.
Euro traders will be making note of the ECB's monthly bulletin due on Thursday, while Friday brings UK Gross Domestic Product (GDP) and EU Consumer Price Index (CPI) figures.
Market forecasts see the annualized GDP growth rate for the UK holding steady in the 2nd quarter at 0.4%.
On the EU CPI side, median estimates expect the harmonized CPI index to lag slightly, forecast to print at an annualized 4.8% for the month of September.
EUR/GBP technical outlook
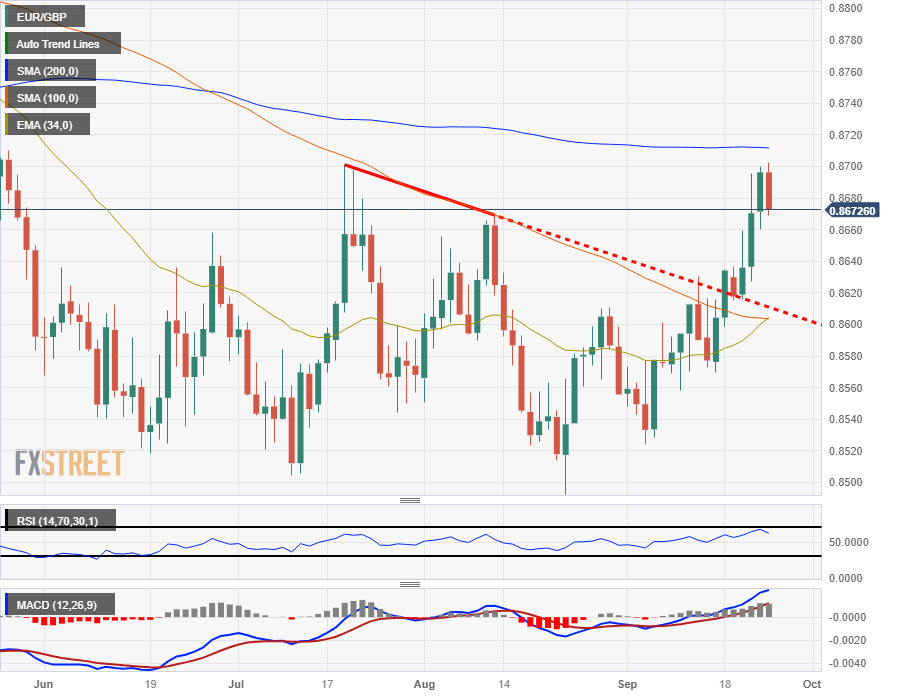
The EUR/GBP slipped in Monday trading to test the 0.8670 region, and intraday technical support currently sits at the 100-hour Simple Moving Average (SMA) near 0.8660, with a rising trendline marked into hourly candles from last week's swing low into 0.8610.
Daily candlesticks see the Euro-Pound pair trading back from the 200-day SMA that currently sits just beneath 0.8720, and failure to capture fresh bullish territory from here will see the pair set to re-challenge near-term swing lows between 0.8580 and 0.8520.
EUR/GBP daily chart
EUR/GBP technical levels
- Silver trips and tumbles in Monday trading, heading towards $23.00.
- The XAG/USD failed to capture $23.80 on Friday, and Silver is heading back into recent swing low territory.
- A bouncing US Dollar Index is seeing the XAG/USD take a step lower.
Silver is falling further back to kick off the new trading week, testing into familiar lows after last Friday's bounce couldn't be sustained.
The Federal Reserve (Fed) is set to see interest rates holding higher for longer than previously expected, and the boost to the US Dollar Index (DXY) is capping off recent upside swings for the XAG/USD.
After the Fed upped their interest rate forecast, or "dot plot" last week, the US central bank expects interest rates to only decline half a percent by the end of 2024. The Federal Open Market Committee (FOMC) previously saw end-2024 rates at 4.6%, but sticky inflation complications saw the Fed up their forecast to 5.1%.
XAG/USD technical outlook
On the hourly candles, Silver is looking to build a floor near the 200-hour Simple Moving Average (SMA) near $23.15 after tumbling around 2.5% from Monday's highs near $23.65.
Intraday upside momentum will be looking to recapture familiar territory north of the 100-hour SMA currently settling near $23.35.
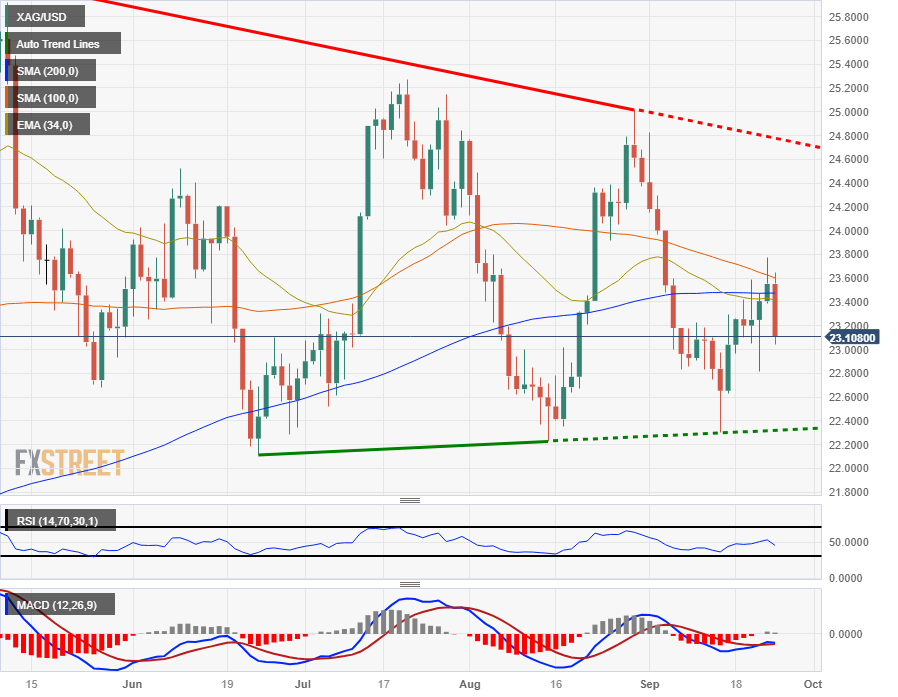
Silver is suffering from a notable lack of meaningful trend momentum in the long-term, with the XAG/USD cycling the 200-day SMA on daily candlesticks.
Price action is constrained to the middle as Silver consolidates, with lower highs and slightly higher lows trapping XAG/USD into the midrange.
Swing lows are pricing in near $22.40, with the top end set to run into a descending trendline near $24.40.
XAG/USD daily chart
XAG/USD technical levels
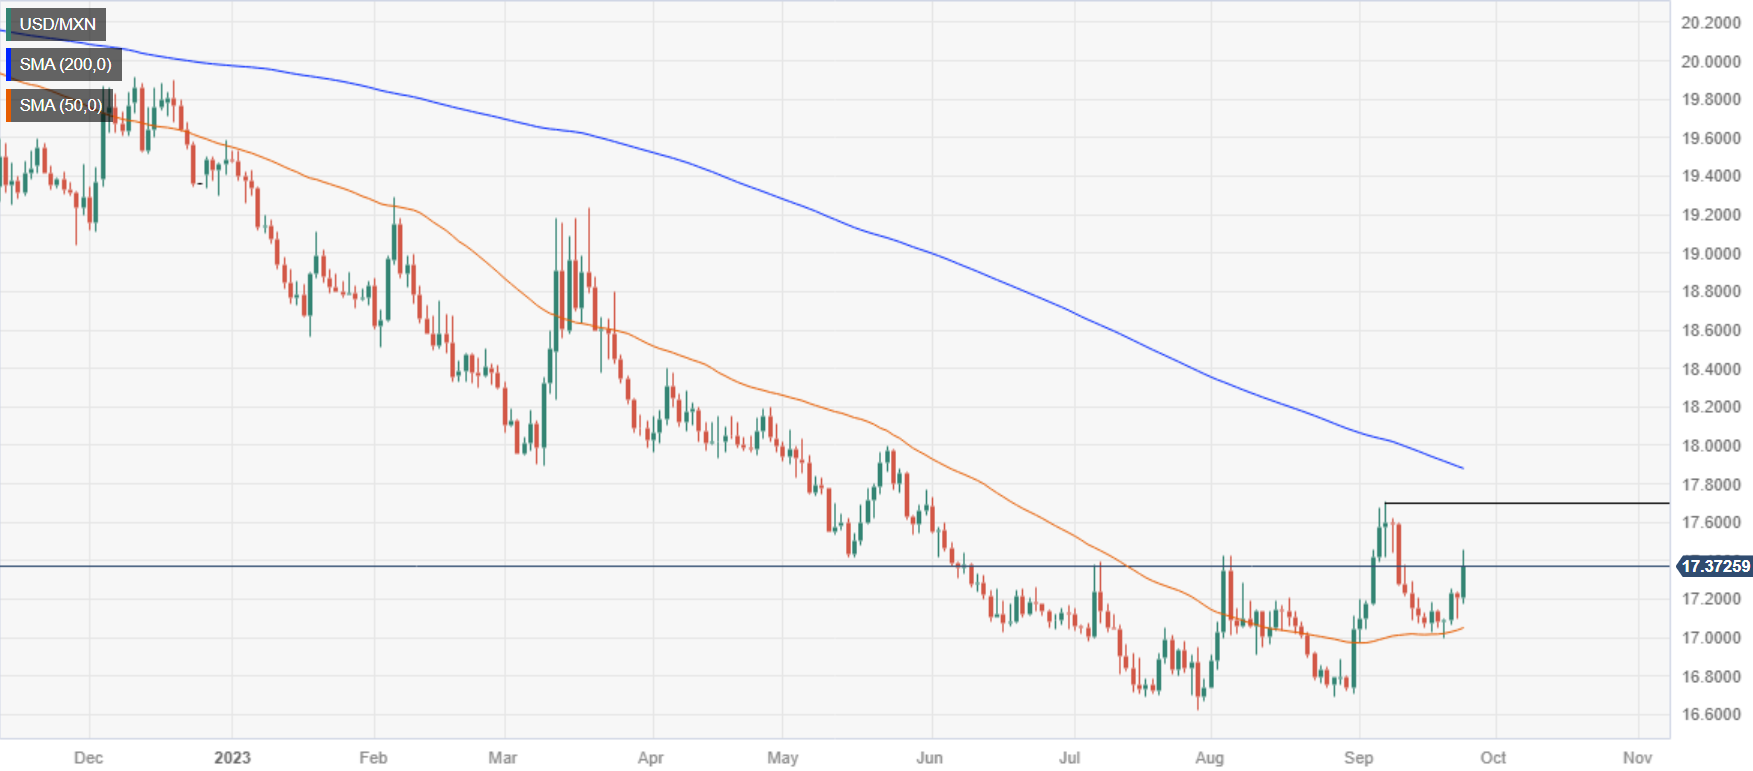
- USD/MXN trades with solid gains due to a strong US Dollar, elevated US bond yields, and concerns over China’s property sector, particularly Evergrande’s debt restructuring failure.
- Inflation in Mexico is on a deceleration path, with headline inflation for the first half of September dropping to 4.44% from August’s 4.64%, nearing the Bank of Mexico’s (Banxico) target of 3% ± 1%.
- Potential US government shutdown looms as budget talks stall, with US policymakers utilizing the budget as a political tool, adding to the fragile market sentiment.
The Mexican Peso (MXN) loses territory against the US Dollar (USD) on Monday, as the last week of Q3 starts with risk-aversion. A strong US Dollar due to higher US bond yields, worries about China’s property sector, and falling commodity prices are the reasons that weakened the MXN. The USD/MXN is trading at 17.3762 after hitting a daily low of 17.1704.
Mexican Peso struggles amid lower oil prices, as high US bond yields underpin the Greenback
Sentiment remains fragile, though of late, Wall Street has turned green, while the American Dollar (USD), though positive, is back below the 106.00 mark. Us Treasury bond yields remain elevated, with the 10-year at 4.519%.
In the Asian session, news that China’s most prominent developer, Evergrande, failed to restructure its debt deteriorated investors' sentiment. Meanwhile, minuscule losses in global oil prices weighed on the Mexican currency, which is closely correlated, as a part of its economy heavily depends on oil exports.
Meanwhile, inflation in Mexico continues to decelerate, as reported by the National Statistics Agency, known as INEGI. Headline inflation for the first half of September dropped to 4.44% compared to August’s 4.64%, approaching the Bank of Mexico (Banxico) goal of 3% plus or minus 1%. Meanwhile, analysts are not expecting any rate cuts by Banxico for the rest of 2023. However, if the pace of inflation slows down sharply, that could trigger Banxico adjustments on its monetary policy and cause a depreciation of the Mexican Peso.
Investors' mood deteriorated as they embraced the “higher for longer" stance. With the US Federal Reserve expected to hike rates again this year, US Treasury bond yields are surging while Wall Street is experiencing difficulties clinging to its gains. The US 10-year Treasury bond yield has reached a level of 4.533%, a level last observed in 2007, a tailwind for the USD/MXN.
Federal Reserve officials, particularly Governor Michelle Bowman, emphasized the need for more rate hikes. In contrast, Boston and San Francisco Fed Presidents Susan Collins and Mary Daly suggested that patience is required but haven’t ruled out another hike. Recently, the Chicago Fed President Austan Goolsbee said that a soft landing is possible, but inflation risks remain tilted to the upside.
Another reason market sentiment is shifting sour is that US lawmakers are warning that the US is headed for a shutdown as budget talks stalled. Once again, US policymakers use the budget as a political tool to push their agenda.
USD/MXN Price Analysis: Technical outlook
The USD/MXN climbed past the 20- and 100-day moving average (DMA), with the former rising above the latter and the 50-DMA, suggesting that the uptrend could accelerate and the pair has found its foot. If the exotic pair crosses the September 7 swing high at 17.7074, the most likely scenario would see the USD/MXN challenging the 200-DMA at 17.8716 before challenging the 18.0000 figure. Conversely, the pair could retest last week’s low of 16.9925 if sellers reclaim the 17.1851/19.55 area.
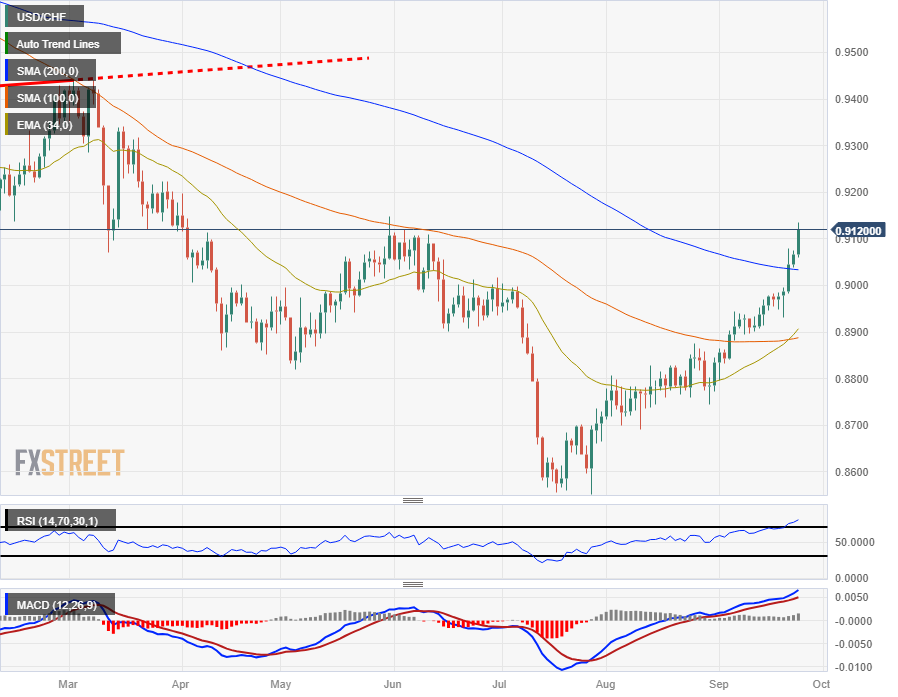
- The USD/CHF differential continues to widen as the US Dollar gains strength and the Swiss Franc swoons.
- The SNB's dovish pivot last week continues to drain investor interest in bidding up the CHF.
- The Swiss National Bank held off on further rate hikes last Thursday amidst slumping Swiss inflation data.
The USD/CHF is pinned to the high side in Monday trading, reaching the 0.9130 region. Another move higher will have the pair testing into new five-month highs.
Last week, the Swiss National Bank (SNB) was unceremoniously knocked off its rate hike cycle, surprising markets and flubbing investor expectations when the SNB failed to raise rates another 25 basis points last Thursday.
Inflation figures for the Swiss domestic economy have been unwinding much faster than the SNB initially thought, and the Swiss central bank was forced to pull the plug on its current rate hike schedule.
Central bank tone determining market momentum with rates unmoving
The Greenback (USD) continues to firm up in markets, bolstered by last week's hawkish Federal Reserve (Fed) showing; while both central banks held rates steady last week, it's the Fed that gets the benefit of the doubt in markets, with the US central bank seeing interest rates staying higher for longer than previously forecast.
This week sees a quiet start to things on the economic calendar, with mid-tier data on offering until Thursday's US Gross Domestic Product (GDP) printing.
Tuesday will bring US housing and consumer confidence figures, while CHF traders will want to keep an eye on Wednesday's ZEW sentiment expectations and the SNB's quarterly bulletin.
USD/CHF technical outlook
Bullish momentum for the US Dollar is pushing the USD/CHF pair higher, and hourly candles are accelerating into the top end. The pair is up over 2% from last week's low near 0.8930, and a fresh push higher will put the pair into new five-month highs.
Daily candlesticks see the USD/CHF pushing above the 200-day Simple Moving Average (SMA) which currently sits near 0.9050, and the 34-day Exponential Moving Average (EMA) has turned bullish, crossing over the 100-day SMA near 0.8900 and set to give prices technical support.
The next significant resistance zone sits at March's swing highs near the 0.9400 handle.
USD/CHF daily chart
USD/CHF technical levels
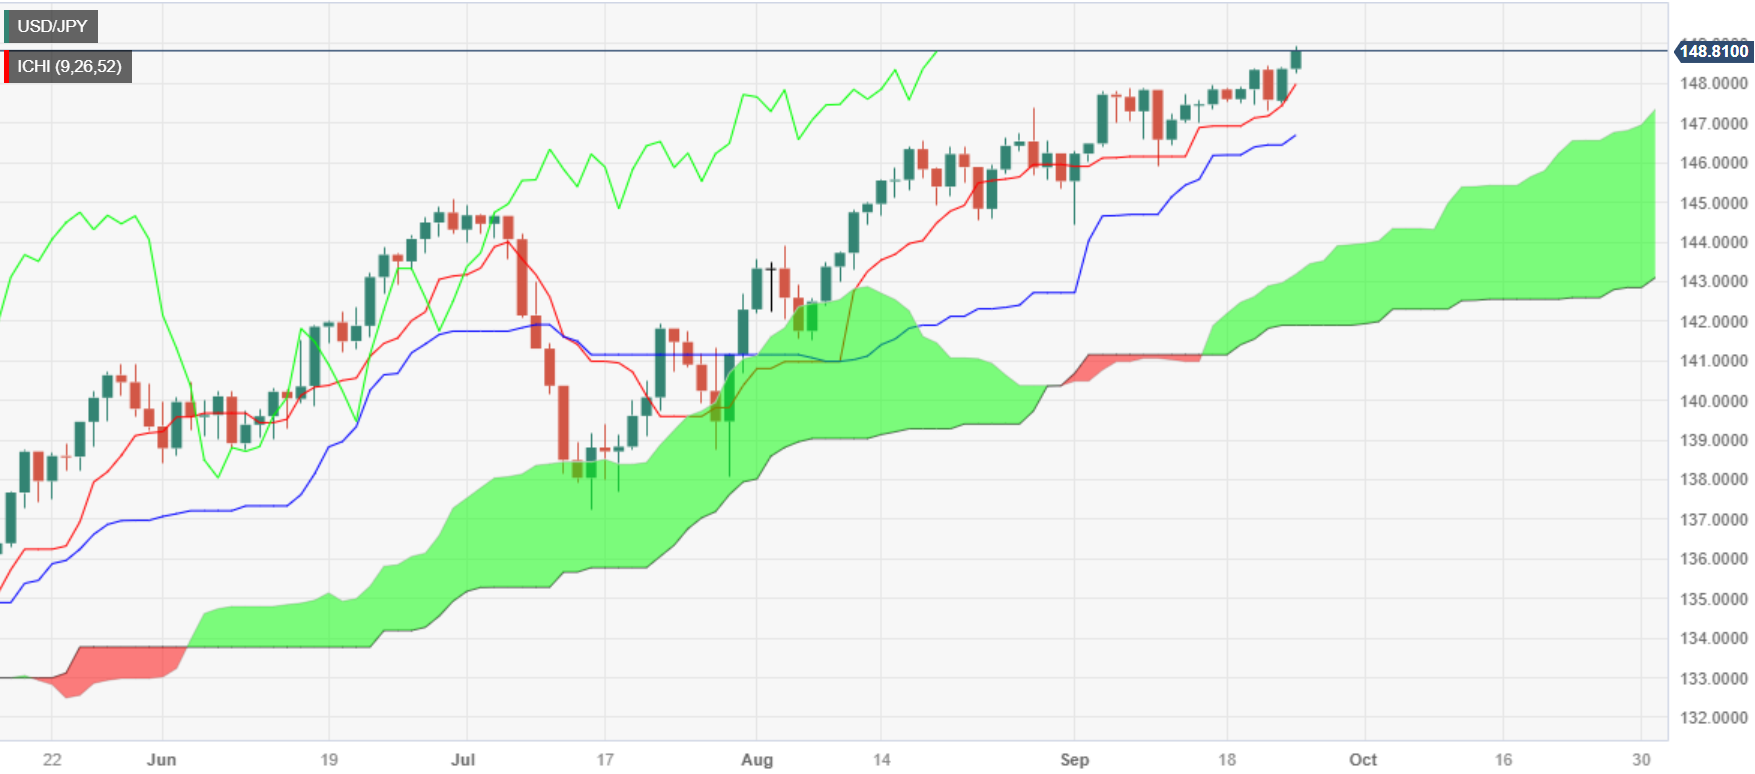
- USD/JPY marks a 0.38% gain, as the Bank of Japan (BoJ) holds rates and maintains its accommodative monetary policy, questioning the sustainability of rising inflation.
- Soaring US Treasury bond yields, reaching levels unseen since 2007, bolster the US Dollar, pushing it above the 106.00 figure.
- Potential US government shutdown looms as budget talks stall, with lawmakers utilizing the budget as a political tool, potentially leading to a strengthened Japanese Yen and a subsequent downside for USD/JPY.
the US Dollar (USD) rises sharply against the Japanese Yen (JPY) following last week’s Bank of Japan’s (BoJ) decision to hold rates unchanged while delivering a dovish statement. That, alongside a risk-off impulse and soaring US bond yields, is a tailwind for the major. The USD/JPY is trading at 148.91, gaining 0.38%.
American Dollar gains momentum against the Yen, on BoJ’s maintaining it’s monetary policy, despite high inflation lurking
Last Friday, the BoJ kept rates in negative territory and pledged to support its ultra-loose monetary policy despite the latest inflation reports, which suggest inflation is above the bank’s goal of 2%. Still, BoJ policymakers question if it would be sustainable for a more extended period.
The BoJ Governor Kazuo Ueda said there’s “very high uncertainty” on companies to continue to lift prices and wages as the bank continues to stick to its accommodative posture. Ueda said the BoJ is not “fully convinced” that wages would continue to accelerate, seen as a reason for the BoJ, to stay pat on its posture.
In the meantime, threats of intervention continue, as the Japanese Prime Minister said that excessive forex moves are undesirable and that authorities would continue to monitor Forex moves closely with a sense of urgency.
Meanwhile, the higher for longer mantra is felt in the financial markets. With the US Federal Reserve set to hike once more in the year, US Treasury bond yields are soaring while Wall Street dives. The US 10-year Treasury bond yield touched a high of 4.533%, a level last seen in 2007, underpins the Greenback above the 106.00 figure for the first time since November of last year.
The USD/JPY continues to trend up as Federal Reserve officials stressed the need for more rate hikes, particularly Governor Michelle Bowman. Contrarily, Boston and San Francisco Fed Presidents Susan Collins and Mary Daly said patience is required but didn’t talk about disregarding another hike. Recently, the Chicago Fed President Austan Goolsbee said that a soft landing is possible, but inflation risks remain tilted to the upside.
Another reason market sentiment is shifting sour is that US lawmakers are warning that the US is headed for a shutdown, as budget talks stalled. Once again, US policymakers use the budget as a political tool to push their agenda. Usually, lawmakers fix this until the last moment, so traders must be aware of this. In the event of a shutdown, look for Japanese Yen (JPY) strength, so the USD/JPY could be headed to the downside.
USD/JPY Price Analysis: Technical outlook
After breaking the 148.00 figure, the USD/JPY is set to test the 149.00 figure, followed by the 150.00 handle. However, traders should be nimble as the threat of intervention looms. Based on October of last year’s Japanese authorities stepping in, the pair printed a 560-pip daily candle on October 21, followed by another 500 pip on November 10. On the flip side, the USD/JPY first support would be the Tenkan-Sen at 147.99, followed by the 47.00 mark, and the Kijun-Sen at 146.70
While speaking before the European Parliament's Committee on Economic and Monetary Affairs on Monday, European Central Bank (ECB) President Christine Lagarde said that a recession was not a part of the baseline scenario.
Lagarde added that the ECB was not talking about rate cuts and noted that the European labor market was finally adjusting.
Market reaction
The Euro stays under persistent selling pressure in the second half of the day on Monday. As of writing, the EUR/USD pair was trading at its lowest level since March at 1.0580, losing 0.7% on a daily basis.
Analysts at Danske Bank, de do not see the global investment environment nor the relative growth outlook creating significant divergence between the Euro and the Pound. They forecast the EUR/GBP pair to move only modestly higher to 0.88 over the coming year.
End to the hiking cycle, but not to the GBP headwinds
The Bank of England (BoE) decided to keep the Bank Rate unchanged at 5.25% at its September meeting after hiking the Bank Rate by a total of 515bp over the past meetings. We expect this to mark the peak in the Bank Rate. This is slightly below current market pricing, which is pricing a peak at 5.45%. On balance, we continue to see relative rates as a moderate positive for EUR/GBP, although GBP has been largely decoupled from moves in relative rates the past month.
Over the past month, EUR/GBP has moved to the upper part of recent months’ trading range of 0.85-0.87. On one hand, GBP has gained support from an overall USD-positive global investment environment and higher energy prices. On the other hand, a dovish BoE and lower than expected inflation have acted as a headwind.
We do not see the global investment environment nor the relative growth outlook create significant divergence between EUR and GBP. We expect the cross to move only modestly higher to 0.88 over the coming year.
- Euro hits fresh daily lows across the board.
- ECB Lagarde speaks at the European Parliament
- EUR/USD falls for the fifth consecutive day.
The EUR/USD dropped below 1.0600 for the first time since March. The pair bottomed at 1.0581, and remains under pressure on the back of a stronger US Dollar.
Greenback remains firm
The US Dollar is up across the board on Monday. The US Dollar Index (DXY) is trading slightly below 106.00, at the highest level since November of last year. The US 10-year Treasury yields reached a new high at 4.52%. Stock in Wall Street opened mixed.
European Central Bank (ECB) President Christine Lagarde is speaking at the Hearing of the Committee on Economic and Monetary Affairs of the European Parliament. She mentioned that the labor market is “finally adjusting”.
Regarding economic data, earlier on Monday, the German IFO survey slightly exceeded market consensus. The Current Assessment Index dropped from 89 to 88.7, while the Expectation Index rose from 82.6 to 82.9. In the US, the Chicago Fed National Activity Index declined to -0.16 in August from 0.07. The key reports of the week will be the inflation figures from the Eurozone and the US.
Levels to watch
The EUR/USD is holding below 1.0600, under pressure. The next support level is seen around the 1.0580 area, followed by 1.0550.
Despite falling for the fifth consecutive day, no signs of stabilization are observed. In the short term, a recovery above 1.0645 would improve the outlook for the Euro.
Technical levels
- USD/CAD discovers buying interest near 1.3460, supported by a fresh upside in the US Dollar.
- S&P500 opens on a flat-to-negative note as investors remain worried about economic prospects.
- Fed Collins said on Friday that a further rate hike is certainly not off the table.
The USD/CAD pair finds buying interest near 1.3460 amid sheer strength in the US Dollar. The Loonie asset aims to recapture the psychological resistance of 1.3500 as the market mood dampens amid deepening fears of a global slowdown.
S&P500 opens on a flat-to-negative note as investors remain worried about economic prospects. The Federal Reserve (Fed) is expected to keep interest rates higher for a longer period as inflationary pressures in excess of the desired rate of 2% would be a hard nut to crack.
The US Dollar Index (DXY) prints a fresh nine-month high near 105.90 as the US economy is absorbing the consequences of higher interest rates by the Fed comfortably. Slowing inflation and a resilient labor market allowed the Fed to keep interest rates unchanged last week. Also, hawkish guidance from Boston Fed President Susan Collins strengthened the US Dollar.
Fed Collins said on Friday that a further rate hike is certainly not off the table. She further added that inflation can fall with only a modest rise in unemployment and that core services excluding shelter have not yet shown a sustained improvement.
Meanwhile, the oil price remains sideways around $90.00 as global central bankers are pausing the rate-tightening spell sooner to avoid risks of economic slowdown. It is worth noting that Canada is the leading exporter of oil to the United States and maintains a positive relationship with the Canadian Dollar.
Last week, the Canadian Dollar remained in action after a mixed Retail Sales report for July. Consumer spending expanded at a slower pace of 0.3% vs. expectations of 0.4%. In June, Retail Sales expanded nominally by 0.1%. Retail Sales excluding automobiles expanded strongly by a full one percent, doubling expectations of 0.5%. The economic data was contracted by 0.7% in June. Scrutiny of the Retail Sales report shows that demand for automobiles remained weak. Households postponed demand for automobiles to avoid higher interest obligations.
"The current, unusual contraction in monetary aggregates is unlikely to foreshadow a deep recession but rather reflects a significant rebalancing of portfolios after a long period of low interest rates," European Central Bank (ECB) Governing Council member Isabelle Schnabel said on Monday.
"Hence, there is not yet an all-clear for the inflation problem," she added.
Market reaction
EUR/USD stays under persistent bearish pressure in the second half of the day on Monday and the pair was last seen trading at its lowest level since March at 1.0610, losing 0.38%.
In her prepared remarks for delivery to the European Parliament's Committee on Economic and Monetary Affairs, European Central Bank (ECB) President Christine Lagarde noted that recent indicators point to a further weakness in the economic activity in the third quarter.
Lagarde elaborated by noting a moderation in job creation in the services sector and an overall slowdown of momentum.
Commenting on inflation developments, she said that inflation is forecast to remain "too high for too long" despite the recent decline.
ECB President also said that they are aiming to conclude the monetary policy framework review by Spring 2024, later tan the end-2023 previously planned.
Market reaction
EUR/USD stays under pressure following these comments and it was last seen losing 0.35% on the day at 1.0615.
- EUR/GBP eyes fresh upside above 0.8700 as ECB Lagarde sees inflation risks skewed upside.
- Eurozone’s headline and core inflation are seen softening to 4.5% and 4.8% respectively.
- The BoE unexpectedly paused interest rate hikes last week amid potential slowdown risks.
The EUR/GBP pair gathers strength to surpass the immediate resistance of 0.8700 in the late European session. More upside is anticipated in the cross as European Central Bank (ECB) President Christine Lagarde said that despite progress on inflation it is seen as too high for too long as the labor market has so far remained resilient.
This week, investors will focus on the Eurozone preliminary Harmonized Index of Consumer Prices (HICP) for September, which will be published later this week. The headline and core inflation are seen softening to 4.5% and 4.8% respectively.
The asset has been consistently moving higher for the past three trading sessions as the Bank of England (BOE) surprisingly paused the policy-tightening spell on Thursday while investors anticipated an interest rate hike by 25 basis points (bps).
BoE Governor Andrew Bailey skipped hiking interest rates after raising them consecutively for 14 times as higher interest rates have dampened the economic outlook. Labor demand has slowed as firms are focusing on achieving higher efficiency through controlling costs. Like Manufacturing PMI, Services PMI also landed below the 50.0 threshold consecutively for the second month, as per the preliminary S&P Global PMI report for September.
With a pause in the historically aggressive rate-tightening cycle by the BoE, the risks of a rebound in inflation and a slowdown in the growth rate have skewed to the upside. BoE policymakers came out with weak guidance on the Q3 Gross Domestic Product (GDP). The BoE conveyed that Q3 GDP now is expected to rise by a meager 0.1% (Aug: +0.4%), with underlying growth in H2 2023 likely weaker than forecast in August.
"It feels like rates will have to stay higher for longer than markets had expected," Chicago Federal Reserve Bank President Austan Goolsbee told CNBC on Monday.
Key takeaways
"Risk of inflation staying higher is still the bigger risk."
"Current path is Unusual for inflation to fall like it is without unemployment rising."
"Fed should have 100% commitment to returning inflation to 2%; the target will not change."
"One view is that monetary policy takes a long time to work through the economy."
"At some point, the question shifts from how high to raise rates to how long they will stay there."
Market reaction
The US Dollar Index continued to edge higher after these comments and was last seen rising 0.17% on the day at 105.76.
- AUD/USD trades back and forth near 0.6420, following the footprints of the sideways US Dollar.
- The Australian Dollar will dance to the tune of the monthly CPI data, which is seen hotter at 5.2% vs. July’s reading of 4.9%.
- The 20-day EMA is overlapping the Aussie asset, indicating a broader sideways trend.
The AUD/USD pair remains inside the woods above the round-level support of 0.6400. The Aussie asset struggles to find a direction as the US Dollar has turned sideways amid uncertainty over the Federal Reserve’s (Fed) interest rate outlook for the remaining 2023.
The US Dollar Index (DXY) is broadly upbeat amid fears of a slowdown in the global economy. The Chinese economy is facing deflation risks as household demand remains weak due to a rising jobless rate. The Australian Dollar is facing the headwinds of weak China’s economic growth, being a proxy player.
Going forward, the Australian Dollar will dance to the tune of the monthly Consumer Price Index (CPI) data for August, which will be published on Wednesday. The economic data is seen hotter at 5.2% vs. July’s reading of 4.9%. Acceleration in the inflation data could elevate troubles for Reserve Bank of Australia (RBA) policymakers and force them to raise interest rates one more time.
AUD/USD rebounds after discovering buying interest near the horizontal support plotted from August 17 low around 0.6364 on a two-hour scale. While the upside seems restricted near the horizontal resistance placed from August 15 high around 0.6522. The 20-day Exponential Moving Average (EMA), which trades around 0.6340 is overlapping the Aussie asset, indicating a sideways trend.
The Relative Strength Index (RSI) (14) jumps above 60.00, which indicates that the bullish impulse has been triggered.
A decisive break above August 15 high around 0.6522 will drive the asset to August 9 high at 0.6571. Breach of the latter will drive the asset towards August 10 high at 0.6616.
On the flip side, fresh downside would appear if the Aussie asset would drop below August 17 low around 0.6360. This would expose the asset to the round-level support of 0.6300 followed by 03 November 2022 low at 0.6272.
AUD/USD two-hour chart
-638312415539078022.png)
Analysts at Danske Bank maintain their strategic case for a lower EUR/USD pair based on relative terms of trade, real rates and relative unit labour costs. However, they warn that in the near-term, they see some potential for topside risk on the back of peak policy rates, an improving manufacturing sector backdrop relative to the service sector, and/or easing China pessimism.
Near-term risk of higher EUR/USD
We maintain the strategic case for a lower EUR/USD based on relative terms of trade, real rates (growth prospects) and relative unit labour costs. Hence, we maintain our 12M forecast at 1.03.
In the near-term, we see some potential for topside risk to the cross. Peak policy rates, an improving manufacturing sector relative to the service sector, and/or easing China pessimism could add some support to EUR/USD in the near-term.
- The US Dollar trades mixed on Monday as US government shutdown risk escalates.
- In the background traders will be on edge for US GDP numbers later this week.
- The US Dollar Index resides near the six-month highs.
The US Dollar (USD) confirmed its status as king after a quite volatile week. The US Federal Reserve could not have been more clear and confirmed yet again that rates in the US will stay higher for longer. This puts the US Dollar as the strongest partner in most trading pairs due to interest rate differentials.
Amidst all the noise on the macroeconomic front, traders did not really care about the US government shutdown until this coming Friday evening. When House Speaker Kevin McCarthy sent all Representatives packing for the weekend last Friday, traders became aware that a deal might again not happen until the final hour. This means some risk premium, on the back of a weaker US Dollar, might emerge as days pass without any hopeful signals from Capitol Hill on a possible deal.
Daily digest: US Dollar to see GDP hit by strikes
- A very calm start of the week has begun with the Chicago Fed National Activity Index for August being released at 12:30 GMT. The previous number was 0.12.
- The US Dallas Fed Manufacturing Business Index for August is expected to come out near 14:30 GMT and was in contraction at -17.2 for July.
- The US Treasury will be auctioning 3-month and 6-month bills at 15:30 GMT at elevated rates.
- A big dispersion in the equity markets shows its face at the start of the week in Asia: Japanese stocks rally with both the Topix and the Nikkei in the green. China, meanwhile, sees Hong Kong’s Hang Seng Index tank near 1.5% as Evergrande cancelled a meeting with creditors to renegotiate terms. European and American futures are down and show signs of risk off, seeing all the current tail risks taking over sentiment.
- The CME Group FedWatch Tool shows that markets are pricing in a 77% chance that the Federal Reserve will keep interest rates unchanged at its meeting in November. The recent turmoil on Capitol Hill and the United Auto Workers (UAW) strike could force the Fed to keep rates unchanged through the end of the year.
- The benchmark 10-year US Treasury yield traded as high as 4.69% and resides near the highest level since October 2007.
US Dollar Index technical analysis: Can it get there?
The US Dollar looks to be stuck in a stalemate with the rate differential keeping the US Dollar holding an advantage against most major G20 currencies. On the other side, the automaker strike in Detroit and possible US government shutdown could weigh on the Greenback over the short term. The US Dollar Index (DXY) is looking for direction in this difficult environment.
The US Dollar Index opens up above 105.50 this Monday and shows small signs of possibly going higher. Should the DXY close above the yearly high near 105.88, expect the US Dollar to follow on with more bullish moves in the medium term. US yields and the unwinding of the US strike and government shutdown will remain crucial to support current levels in the DXY.
On the downside, the 104.44 level seen on August 25 kept the Index supported on Monday, halting the DXY from selling off any further. Should the uptick that started on September 12 reverse and 104.44 give way, a substantial downturn could take place to 103.04, where the 200-day Simple Moving Average (SMA) comes into play for support.
US Dollar FAQs
What is the US Dollar?
The US Dollar (USD) is the official currency of the United States of America, and the ‘de facto’ currency of a significant number of other countries where it is found in circulation alongside local notes. It is the most heavily traded currency in the world, accounting for over 88% of all global foreign exchange turnover, or an average of $6.6 trillion in transactions per day, according to data from 2022.
Following the second world war, the USD took over from the British Pound as the world’s reserve currency. For most of its history, the US Dollar was backed by Gold, until the Bretton Woods Agreement in 1971 when the Gold Standard went away.
How do the decisions of the Federal Reserve impact the US Dollar?
The most important single factor impacting on the value of the US Dollar is monetary policy, which is shaped by the Federal Reserve (Fed). The Fed has two mandates: to achieve price stability (control inflation) and foster full employment. Its primary tool to achieve these two goals is by adjusting interest rates.
When prices are rising too quickly and inflation is above the Fed’s 2% target, the Fed will raise rates, which helps the USD value. When inflation falls below 2% or the Unemployment Rate is too high, the Fed may lower interest rates, which weighs on the Greenback.
What is Quantitative Easing and how does it influence the US Dollar?
In extreme situations, the Federal Reserve can also print more Dollars and enact quantitative easing (QE). QE is the process by which the Fed substantially increases the flow of credit in a stuck financial system.
It is a non-standard policy measure used when credit has dried up because banks will not lend to each other (out of the fear of counterparty default). It is a last resort when simply lowering interest rates is unlikely to achieve the necessary result. It was the Fed’s weapon of choice to combat the credit crunch that occurred during the Great Financial Crisis in 2008. It involves the Fed printing more Dollars and using them to buy US government bonds predominantly from financial institutions. QE usually leads to a weaker US Dollar.
What is Quantitative Tightening and how does it influence the US Dollar?
Quantitative tightening (QT) is the reverse process whereby the Federal Reserve stops buying bonds from financial institutions and does not reinvest the principal from the bonds it holds maturing in new purchases. It is usually positive for the US Dollar.
- Natural Gas starts the week mildly in the green, up 0.25%.
- The US Dollar faces headwinds with UAW strikes and US Government shutdown tail risk.
- US Natural Gas prices are in an ascending trendline formation and could break above $3.
Natural Gas prices are mildly ticking higher this Monday at the start of the week with few headlines to report from the weekend. Most noticeable is that EU gas storage has risen yet again over the weekend. Europe is now at 94.74% full ahead of the winter season.
The US Dollar (USD) confirmed its status as king after a quite volatile week. The US Federal Reserve could not have been more clear and confirmed yet again that rates in the US will stay higher for longer. This puts the US Dollar as the strongest partner in most trading pairs due to interest rate differentials.
Natural Gas is trading at $2.93 per MMBtu at the time of writing.
Natural Gas news and market movers
- Uniper SE, the German utility service, has sealed a deal for US LNG (Liquified Natural Gas) deliveries until 2030 as the company does not expect demand to tail off anytime soon.
- European gas storage levels are nearly 95% full ahead of the winter. This keeps a lid on any jumps in demand.
- Further cuts at the Skarv gas field in Norway are taking place due to process problems. These outages will be lasting until early next month, according to network operator Gassco AS.
- More news out of Norway, flows from the country should continue to increase as capacity at the giant Troll field is further coming online after a prolonged period of outages due to maintenance.
- European gas prices locally should be easing in the upcoming colder months as contracts for that period are becoming less expensive. November and December contracts in particular saw a contraction in prices.
- Australian strikes have been called off, which could now risk breaking the equilibrium in the market toward an oversupply of LNG.
Natural Gas Technical Analysis: Will bullish triangle hold?
Natural Gas appears to be in a bullish triangle on the daily chart with a triple top at $3.06 on the top side. Meanwhile, higher lows are being formed with the green ascending trendline showing support since the beginning of September. Expect to see a breakout above $3.06, which means natural gas prices are set to jump higher.
Awaiting the breakout of the triangle, $3 remains a key level that needs to be broken. Seeing the current equilibrium, a catalyst is needed to move the needle upwards. Gas prices could rally to $3.25 in a bullish triangle breakout, testing the upper band of the ascending trend channel.
On the downside, the ascending trendline at $2.90 should support any attempts to break lower. The 200-day Simple Moving Average (SMA) at $2.80 could act as a circuit breaker in case there is a nosedive move. Should that give way on a downside move, some area will be crossed before the next support kicks in at $2.75. This level aligns with the 55-day SMA, which is likely to step in to avoid any price crashes in the commodity.
-638312277946152975.png)
XNG/USD (Daily Chart)
Natural Gas FAQs
What fundamental factors drive the price of Natural Gas?
Supply and demand dynamics are a key factor influencing Natural Gas prices, and are themselves influenced by global economic growth, industrial activity, population growth, production levels, and inventories. The weather impacts Natural Gas prices because more Gas is used during cold winters and hot summers for heating and cooling. Competition from other energy sources impacts prices as consumers may switch to cheaper sources. Geopolitical events are factors as exemplified by the war in Ukraine. Government policies relating to extraction, transportation, and environmental issues also impact prices.
What are the main macroeconomic releases that impact on Natural Gas Prices?
The main economic release influencing Natural Gas prices is the weekly inventory bulletin from the Energy Information Administration (EIA), a US government agency that produces US gas market data. The EIA Gas bulletin usually comes out on Thursday at 14:30 GMT, a day after the EIA publishes its weekly Oil bulletin. Economic data from large consumers of Natural Gas can impact supply and demand, the largest of which include China, Germany and Japan. Natural Gas is primarily priced and traded in US Dollars, thus economic releases impacting the US Dollar are also factors.
How does the US Dollar influence Natural Gas prices?
The US Dollar is the world’s reserve currency and most commodities, including Natural Gas are priced and traded on international markets in US Dollars. As such, the value of the US Dollar is a factor in the price of Natural Gas, because if the Dollar strengthens it means less Dollars are required to buy the same volume of Gas (the price falls), and vice versa if USD strengthens.
- Silver price trades sideways near $23.50 after a hawkish Fed guidance.
- The US Dollar Index struggles to extend recovery despite a risk-off market mood.
- Silver price aims to shift auction above the 50% Fibonacci retracement at $23.66.
Silver price (XAG/USD) corrects gradually to near $23.50 after hawkish commentary from Federal Reserve (Fed) policymakers. The white metal failed to extend a rally above $23.80 after Boston Fed President Susan Collins cited on Friday that a further rate hike is certainly not off the table.
Fed Collins also commented that inflation can fall with only a modest rise in unemployment and that core services excluding shelter have not yet shown a sustained improvement. Investors are still worried about the inflation outlook as the labor demand in the United States economy is resilient and consumer spending is robust due to solid wage growth.
Meanwhile, S&P500 futures generated some losses in the London session, portraying a risk-off market mood. Investors remain concerned about the economic outlook as the Fed vowed to keep interest rates sufficiently restrictive until the accomplishment of the 2% inflation target.
The US Dollar Index (DXY) struggles to extend recovery above the immediate resistance of 105.80 as traders still bet that the Fed is done with hiking interest rates. As per the CME Fedwatch tool, traders see almost a 75% chance for interest rates remaining steady at 5.25%-5.50% at the November monetary policy meeting.
Silver technical analysis
Silver price aims to shift auction above the 50% Fibonacci retracement (plotted from August 30 high at $25.00 to September 14 low at $22.30) at $23.66 on a two-hour scale. Upward-sloping 20-period Exponential Moving Average (EMA) at $23.50 indicates that the short-term trend is bullish.
The Relative Strength Index (RSI) (14) aims to shift into the bullish range of 60.00-80.00. If the RSI (14) manages to do so, a bullish impulse would get activated.
Silver two-hour chart
-638312333673295720.png)
- NZD/USD falls to near 0.5950 amid strength in the US Dollar.
- The strength of the USD Index is backed by a strong US economy.
- The NZ economy grew at a robust pace of 0.9% in the April-June quarter.
The NZD/USD pair dropped sharply to near 0.5950 after facing severe selling pressure near the psychological resistance of 0.6000. The Kiwi asset corrects as the appeal for risk-sensitive currencies weakens due to the deepening risks of a global slowdown.
S&P500 futures added decent gains in the European session, portraying some improvement in the risk appetite of the market participants while the overall market mood is still risk-off. The US Dollar Index (DXY) jumps to a near six-week high of around 105.80 as the US economy is resilient in comparison with European and Asian economies.
China’s property sector remained vulnerable as households postponed fresh demand for real estate due to the rising jobless rate and deteriorating demand environment. The Chinese economy is exposed to upside deflation risks while European economies are struggling to bear the consequences of high inflation.
On the other hand, the US economy is materially strong backed by easing inflation, steady labor demand, decent wage growth, and robust consumer spending. Meanwhile, investors shifted focus to the US Durable Goods Orders for August, which will be published on Wednesday.
On the New Zealand front, the growth rate in the April-June quarter remained upbeat despite higher interest rates by the Reserve Bank of New Zealand (RBNZ). The Q2 Gross Domestic Product (GDP) grew by 0.9% vs. estimates of 0.5%. In the January-March quarter, the economy remained stagnant. The annual Q2 GDP rose at a slower pace of 1.8% vs. Q1 GDP growth at 2.2% but outperformed expectations of a 1.2% growth rate.
Japanese Prime Minister (PM) Fumio Kishida said on Monday that he will instruct ministers to compile an economic package on Tuesday.
Additional quotes
Aim to move from cost cut-led economy to one with active investments.
Economic package aims to protect people's lives from rising prices.
Private consumption, capex lack strength, being unstable.
To swiftly compile extra budget to fund new economic package.
To strengthen tax breaks to boost wage hikes.
No plan at the moment to call a snap election.
Important for currency market to move stably, reflecting fundamentals.
Will continue to monitor forex moves closely with high sense of urgency.
Excessive forex moves undesirable.
Market reaction
At the press time, USD/JPY is testing intraday highs near 148.60, up 0.12% on the day. The Japanese Yen fails to draw any support from the above comments.
- GBP/JPY lacks any firm intraday direction on Monday and oscillates in a narrow trading band.
- Intervention fears, China's economic woes benefit the JPY and act as a headwind for the cross.
- The BoE’s surprise pause contributes to cap, though the BoJ’s dovish stance limits the downside.
The GBP/JPY cross struggles to gain any meaningful traction on Monday and seesaws between tepid gains/minor losses through the early part of the European session. Spot prices currently trade just above mid-181.00s and remain well within the striking distance of the lowest level since August 7 touched last Thursday.
Speculations that Japanese authorities will intervene in the foreign exchange market to support the domestic currency, along with persistent worries over China, benefit the safe-haven Japanese Yen (JPY) and act as a headwind for the GBP/JPY cross. In fact, Japan’s Finance Minister Shunichi Suzuki issued a fresh warning against the recent JPY weakness and said last week that the government will not rule out any options in addressing excess volatility in currency markets.
The British Pound (GBP), on the other hand, continues with its relative underperformance in the wake of the Bank of England's (BoE) surprise pause last Thursday, which, in turn, is seen as another factor capping the upside for the GBP/JPY cross. The UK central bank ended a run of 14 straight interest rate hikes in the wake of the recent deceleration of inflation. That said, a more dovish stance adopted by the Bank of Japan (BoJ) limits any meaningful downside for spot prices.
The Japanese central bank refrained from offering any hints about potential alterations to its negative interest rate policy in the near future. In the post-meeting press conference, BoJ Governor Kazuo Ueda noted that there is no change to the way of the policy decision-making process and that the central bank is yet to foresee inflation reaching the 2% target in a stable manner. This, in turn, suggests that the BoJ is more likely to maintain an ultra-loose monetary policy.
The aforementioned mixed fundamental backdrop, meanwhile, is holding back traders from placing aggressive bets and leads to a subdued range-bound price action around the GBP/JPY cross on Monday. Moreover, absent relevant market-moving economic releases further warrants some caution before positioning for a firm intraday direction.
Technical levels to watch
Speaking at a conference in Madrid on Monday. European Central Bank (ECB) Governing Council member Pablo Hernandez de Cos said “If we keep rates at these levels long enough, there are very good chances that we will be able to reach our 2% target in a timely manner.”
“This approach is particularly important to avoid both insufficient tightening, which would impede the achievement of our inflation target, and excessive tightening, which would unnecessarily damage economic activity and employment,” de Cos added.
- Gold price remains under pressure as the US economy remains resilient despite higher interest rates.
- The US economy is comfortably absorbing the consequences of the Fed’s higher interest rates.
- Fed’s Collins says further policy tightening is not off the table.
Gold price (XAU/USD) trades back and forth as uncertainty over the interest rate outlook by the Federal Reserve (Fed) deepened. The upside in the precious metal remains restricted as Fed policymakers continue to maintain a hawkish stance for upcoming monetary policy meetings. The US Dollar has also demonstrated a volatility contraction plot, but the broader trend remains bullish due to the resilient US economy.
Investors turn cautious about the US economic outlook as the Fed vowed to keep interest rates sufficiently restrictive over the longer term to get inflation under control. This could elevate the Unemployment Rate, slow labor demand, and make factory activities more vulnerable. This week investors will focus on US Durable Goods Orders data and the Fed’s preferred inflation gauge for August.
Daily Digest Market Movers: Gold price trades sideways following US Dollar movement
- Gold price juggles around $1,920, stays inside Friday’s range, as uncertainty grows over the interest rate outlook by the Federal Reserve.
- Investors remain baffled about the Fed’s interest rate outlook due to US economic resilience.
- The US economy has been absorbing the consequences of higher interest rates by the Fed effectively.
- Market participants hope that the US economy is on a golden path, where inflation recedes without impacting growth. This situation is allowing the Fed to hold interest rates unchanged.
- Stable labor demand, steady wage growth and robust consumer spending momentum demonstrate strength in the US economy, while a contracting Manufacturing PMI is still a concern.
- S&P Global reported on Friday that a preliminary Manufacturing PMI for September improved to 48.9 from expectations of 48.0 and August’s reading of 47.9. Services PMI, which tracks a sector that accounts for two-thirds of the US economy, dropped to 50.2 from the estimates of 50.6 and the 50.5 figure in August.
- Fed policymakers confirmed that interest rates will remain lofty for a longer period until the achievement of price stability. About the interest rate projections, policymakers see benchmark rates staying above 5% next year and ending 2025 at almost 4%. Fed members expect inflation to be under control in 2026, but interest rates are expected to be well above pre-pandemic levels.
- As per the CME Fedwatch tool, traders see a 71% chance for interest rates remaining steady at 5.25%-5.50% at the November monetary policy meeting.
- Boston Fed President Susan Collins remains confident about further policy tightening. Collins said on Friday that a further rate hike is certainly not off the table. She further added that inflation can fall with only a modest rise in unemployment and that core services excluding shelter have not yet shown a sustained improvement.
- Contrary to this sentiment, Morgan Stanley’s Chief US Economist Ellen Zentner believes that the Fed is done hiking rates. She further added that with inflation cooling, the central bank will likely keep rates on hold until it’s ready to cut next year.
- The US Dollar Index is consolidating in the 105.30-105.80 range over the last three trading sessions. The broader trend is quite positive amid US economic strength, while other G7 economies are struggling for a stable footing.
- Meanwhile, US equities are under pressure as investors expect a “higher for longer” context for interest rates would dent overall demand. This may force US firms to trim their growth projections.
- This week, investors will focus on the Durable Goods Orders for August, which will be published on Wednesday. The economic data is seen contracting at a slower pace of 0.4% vs. July’s contraction of 5.2%.
Technical Analysis: Gold price trades inside Friday’s range
The Gold price struggles to find a direction amid uncertainty over the interest rate outlook. While traders bet on interest rates remaining unchanged, the Fed’s Collins delivered a hawkish commentary. On the daily chart, the Gold price forms a Symmetrical Triangle, which demonstrates a volatility squeeze due to the absence of an economic trigger. The 20 and 50-day Exponential Moving Averages (EMAs) continue to restrict upside in the Gold price.
Fed FAQs
What does the Federal Reserve do, how does it impact the US Dollar?
Monetary policy in the US is shaped by the Federal Reserve (Fed). The Fed has two mandates: to achieve price stability and foster full employment. Its primary tool to achieve these goals is by adjusting interest rates.
When prices are rising too quickly and inflation is above the Fed’s 2% target, it raises interest rates, increasing borrowing costs throughout the economy. This results in a stronger US Dollar (USD) as it makes the US a more attractive place for international investors to park their money.
When inflation falls below 2% or the Unemployment Rate is too high, the Fed may lower interest rates to encourage borrowing, which weighs on the Greenback.
How often does the Fed hold monetary policy meetings?
The Federal Reserve (Fed) holds eight policy meetings a year, where the Federal Open Market Committee (FOMC) assesses economic conditions and makes monetary policy decisions.
The FOMC is attended by twelve Fed officials – the seven members of the Board of Governors, the president of the Federal Reserve Bank of New York, and four of the remaining eleven regional Reserve Bank presidents, who serve one-year terms on a rotating basis.
What is Quantitative Easing (QE) and how does it impact USD?
In extreme situations, the Federal Reserve may resort to a policy named Quantitative Easing (QE). QE is the process by which the Fed substantially increases the flow of credit in a stuck financial system.
It is a non-standard policy measure used during crises or when inflation is extremely low. It was the Fed’s weapon of choice during the Great Financial Crisis in 2008. It involves the Fed printing more Dollars and using them to buy high grade bonds from financial institutions. QE usually weakens the US Dollar.
What is Quantitative Tightening (QT) and how does it impact the US Dollar?
Quantitative tightening (QT) is the reverse process of QE, whereby the Federal Reserve stops buying bonds from financial institutions and does not reinvest the principal from the bonds it holds maturing, to purchase new bonds. It is usually positive for the value of the US Dollar.
- USD/CAD moves sideways before the economic data releases from both countries.
- Higher Crude prices put limits on the gains of the Aussie pair.
- Market participants adopt a cautious stance ahead of US Core PCE, awaiting further cues on US inflation pressure.
- Fed’s hawkish tone reinforces the potential of the US Dollar (USD).
USD/CAD consolidates with a negative bias, trading around 1.3480 during the European session on Monday. The pair is experiencing upward support on the back of upbeat US Treasury yields, which have surged to multi-year highs.
The upbeat US Treasury yields are contributing to the strength of the US Dollar (USD). US 10-year bond yield trades at 4.48%, up by 1.15% by the press time.
US Dollar Index (DXY), which measures the value of the Greenback against six major currencies, is hovering below a six-month high reached on Friday, trading around 105.60 at the time of writing. The DXY's struggle to gain momentum may be due to market caution ahead of key economic data releases in the United States (US).
Investors will closely monitor the US economic calendar, which includes important data such as Consumer Confidence, Durable Goods Orders, Initial Jobless Claims, and Core Personal Consumption Expenditures (PCE), which is the Fed's preferred measure of inflation. The annual figure for Core PCE is expected to drop from 4.2% to 3.9%.
These data points will provide insights into the economic situation in the US and influence trading involving the Greenback.
During the previous week, the US Federal Reserve (Fed) conducted its sixth monetary policy meeting. While the Fed chose to keep interest rates unchanged, it made upward revisions to its projections for the Federal Funds Rate (FFR).
For 2023, policymakers now anticipate the FFR to end at 5.60%, and for 2024, they raised their estimates from 4.6% to 5.1%.
Furthermore, comments from Boston Fed President Susan Collins and US Federal Reserve (Fed) Governor Michelle W. Bowman suggest that further interest rate tightening is possible, emphasizing the need for patience and more rate hikes to control inflation. The prospect of rising interest rates could provide support for the USD.
On Canada’s side, Statistics on Friday showed that Canada’s Retail Sales (MoM) for July increased by 0.3%, an improvement from the 0.1% in the previous reading. However, this figure fell slightly below the market consensus of 0.4%.
While Core Retail Sales experienced a more significant rebound, rising by 1.0% swinging from a 0.7% drop in the previous reading. This exceeded market expectations, which were set at 0.5%.
The rally in oil prices is providing support for the Canadian Dollar (CAD), given that Canada is a leading oil exporter to the US. This could potentially limit the upside for the USD/CAD pair. Moreover, traders will likely watch Canada’s Gross Domestic Product (GDP) for July due on Friday.
In a CNBC interview on Monday, European Central Bank (ECB) Governing Council member and Bank of France President, Francois Villeroy de Galhau, said that “interest rates should remain at this level for a sufficiently long period of time.”
Additional takeaways
What we see now is a slowdown but still with positive growth.
Positive growth expected for 2024-25.
I have less fear about the economy than I did a year ago.
Inflation should come back towards the 2% target by 2025 while avoiding recession for the economy.
Market reaction
The ECB commentary fails to move the needle around the Euro, as EUR/USD continues to waver in a tight range near 1.0650 so far this Monday.
- German IFO Business Climate Index came in at 85.7 in September.
- IFO Current Economic Assessment Index edged lower to 88.7.
The headline German IFO Business Climate Index came in at 85.7 in September, matching the August print. This reading came in slightly better than the market expectation of 85.2.
The Current Economic Assessment edged lower to 88.7 from 89.0 in the same period, while the Expectations Index, which indicates firms’ projections for the next six months, improved modestly to 82.9 from 82.6.
Market reaction
The EUR/USD pair showed no immediate reaction to this report and was last seen trading modestly lower on the day at 1.0640.
About German IFO
The headline IFO business climate index was rebased and recalibrated in April after the IFO research Institute changed series from the base year of 2000 to the base year of 2005 as of May 2011 and then changed series to include services as of April 2018. The survey now includes 9,000 monthly survey responses from firms in the manufacturing, service sector, trade and construction.
- USD/INR catches fresh bids on Monday and draws support from a bullish USD.
- Neutral oscillators on the daily chart warrant some caution for bullish traders.
- Any meaningful slide might continue to attract fresh buyers and remain limited.
The USD/INR pair regains positive traction on the first day of a new week and moves away from a nearly three-week low, around the 82.80-82.75 region touched on Friday. Spot prices stick to intraday gains through the early part of the European session and currently trade above the 83.00 round-figure mark.
The prospects for further policy tightening by the Federal Reserve (Fed) remain supportive of elevated US Treasury bond yields and assist the US Dollar (USD) to hold steady near its highest level in more than six months. Apart from this, persistent worries about a property market crisis in China further benefit the Greenback's relative safe-haven status and act as a tailwind for the USD/INR pair.
From a technical perspective, neutral oscillators on the daily chart warrant some caution before positioning for further intraday appreciating move. Hence, any subsequent strength is likely to confront resistance near the 82.30 zone ahead of the all-time peak, around the 83.40-83.45 region touched on August 15, which if cleared decisively should allow the USD/INR pair to conquer the 84.00 round figure.
On the flip side, the 82.80-82.75 region, or Friday's swing low should protect the immediate downside. This is closely followed by the upward-sloping 100-day Simple Moving Average (SMA), currently pegged near the mid-82.00s, and the 200-day SMA, around the 82.35 region. The latter should act as a key pivotal point for the USD/INR pair and a convincing break below will be seen as a fresh trigger for bears.
Spot prices might then turn vulnerable to accelerate the slide towards the 82.00 mark. The downward trajectory could get extended further and eventually drag the USD/INR pair to the July swing low, around the 81.70-81.65 region.
USD/INR daily chart
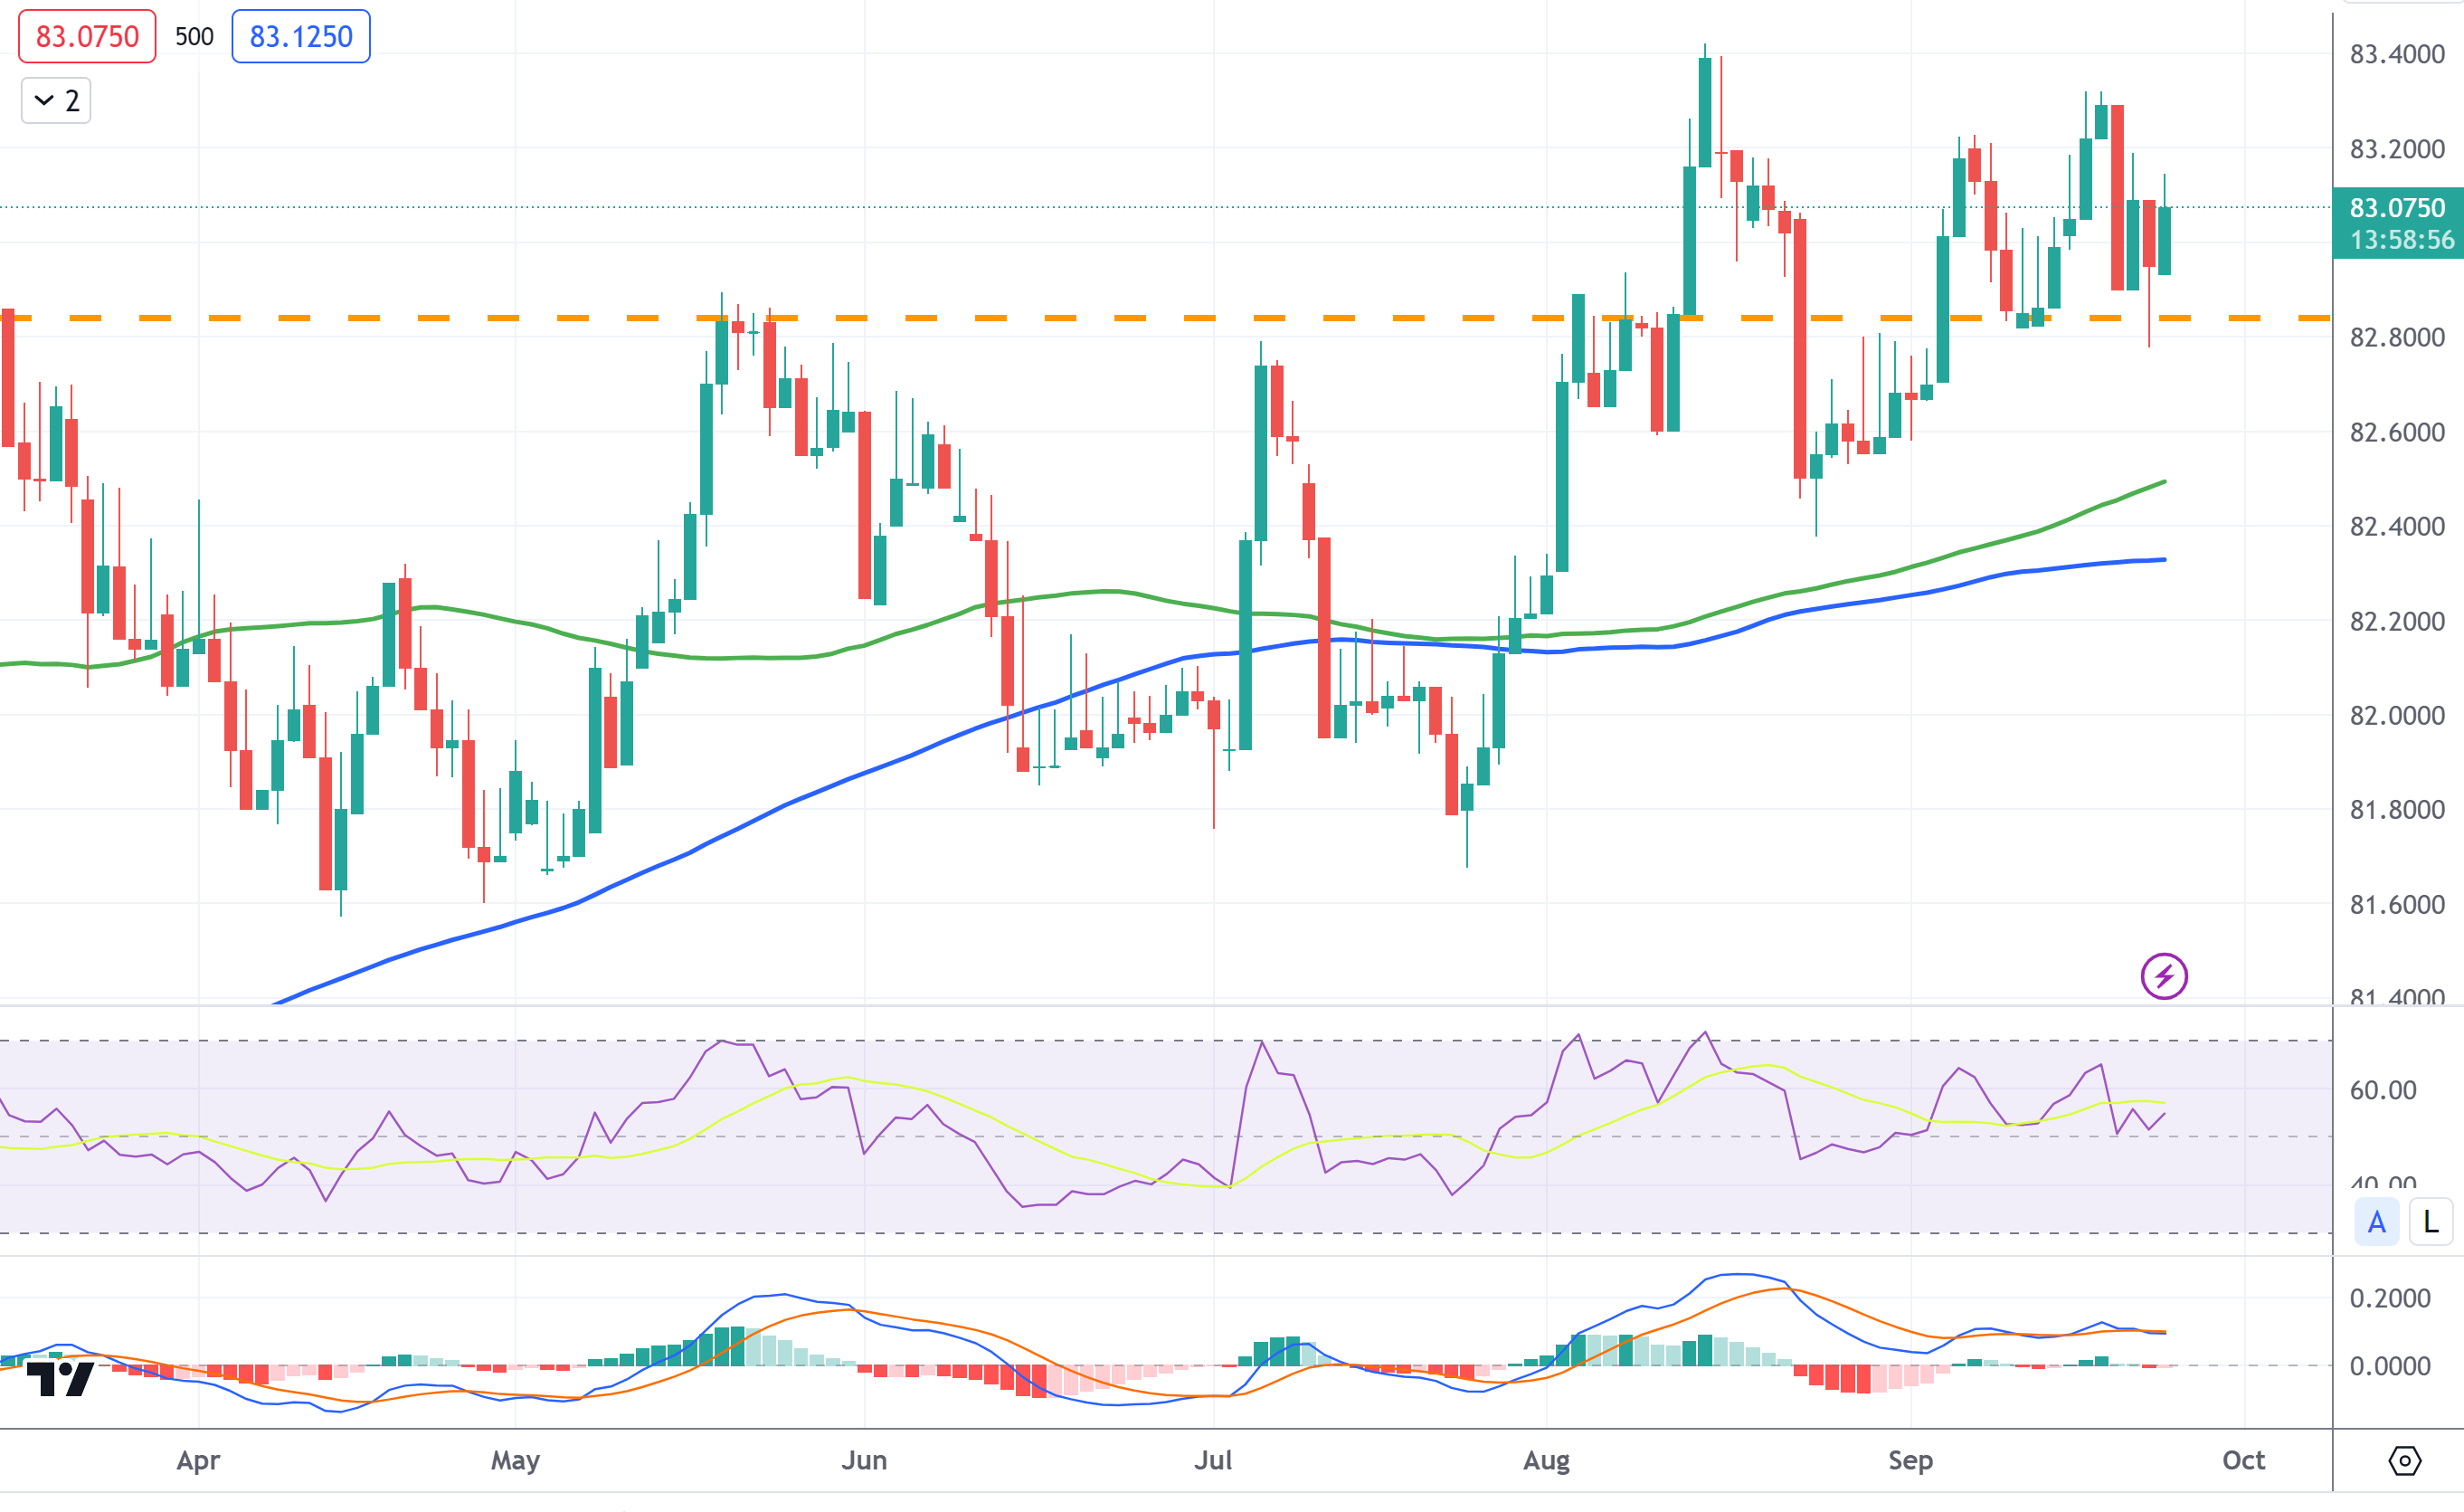
Technical levels to watch
- USD Index (DXY) hovers below the six-month high before the slew of US economic data.
- Investors turn cautious ahead of US Core PCE, awaiting further cues on US inflation scenarios.
- Fed’s hawkish stance could reinforce the Greenback’s strength.
- US Treasury yields peaked at multi-year highs, supporting the US Dollar (USD).
US Dollar Index (DXY), measuring the Greenback's value against six major currencies, hovers below a six-month high hit on Friday. The spot beat around 105.70 during the early trading hours of the European session on Monday.
The DXY is struggling to gain momentum, which could be attributed to the market caution ahead of the economic data releases from the United States (US).
Investors will closely monitor the US economic calendar, which includes significant data releases such as Consumer Confidence, Durable Goods Orders, Initial Jobless Claims, and Core Personal Consumption Expenditures (PCE), the Fed's preferred measure of inflation.
The annual figure for Core PCE is expected to decrease from 4.2% to 3.9%. These datasets will provide insights into the US economic situation, influencing the trading bets involving the Greenback.
US Treasury yields have surged to multi-year highs. The yield on the 10-year US Treasury note trades around 4.46% below the highest level since the year 2007. This substantial rise in yields could be contributing to the strength of the US Dollar (USD).
US Federal Reserve (Fed) conducted its sixth monetary policy meeting during the previous week. The US central bank opted to keep interest rates unchanged but made upward revisions to their projections for the Federal Funds Rate (FFR). For the year 2023, policymakers now anticipate the FFR to conclude at 5.60%, and for 2024, they raised their estimates from 4.6% to 5.1%.
Furthermore, comments from Boston Fed President Susan Collins and US Federal Reserve (Fed) Governor Michelle W. Bowman suggest that further interest rate tightening is possible, emphasizing the need for patience and more rate hikes to control inflation. Rising interest rates could potentially underpin the USD.
The Fed's determination to sustain elevated interest rates in order to bring inflation back to its 2% target has heightened expectations of at least one more 25-basis-point rate hike by the end of the year.
Furthermore, the Fed's "dot plot" now suggests only two rate hikes in 2024, a reduction from the previous projection of four rate hikes.
- Pound Sterling may continue its three-day losing spell further amid uncertainty over the economic outlook.
- S&P Global reported that UK Services PMI contracted for the second time straight.
- BoE policymakers shifted focus on the UK’s economic prospects against persistent inflationary pressure.
The Pound Sterling (GBP) faces selling pressure as investors start worrying about the United Kingdom’s weak economic outlook and upside risks to inflation on Albion’s shores. The GBP/USD pair came under severe pressure after an unexpected pause in the policy-tightening spell by the Bank of England (BoE) last week. A sudden skip in the rate-tightening regime by the UK central bank against expectations of an interest rate increase signaled risks of economic slowdown.
The UK economy is seen losing strength amid uncertainty over the interest rate outlook ahead of general elections. UK PM Rishi Sunak promised to halve inflation to 5.3% by year-end, but a pause announced by BoE policymakers indicates that the authority may fail to keep the word. UK economic activities have been hit hard by higher interest rates. After contracting manufacturing activities, Services PMI also slipped below the 50.0 threshold for the second time in a row.
Daily Digest Market Movers: Pound Sterling eyes more downside on bleak growth outlook
- Pound Sterling trades marginally above a six-month low near 1.2200 as investors see the UK economy sharply slowing in the last quarter of 2023.
- Investors turned cautious about the UK’s economic outlook as consumer inflation expectations are expected to rise and prospects of economic activities seem worse due to a deteriorating demand environment.
- Inflationary pressure in the UK economy is expected to accelerate further as the Bank of England (BoE) has paused the policy-tightening spell at 5.25%, while investors projected the interest rate peak at 5.75%.
- BoE policymakers shifted focus on UK economic prospects due to slowing labor demand and contracting factory activities. For higher inflation, the BoE confirmed keeping interest rates elevated until the accomplishment of price stability.
- S&P Global reported a mixed preliminary PMI report for September. The Manufacturing PMI improved to 44.2 vs. expectations and the former release of 43.0. Services PMI landed at 47.2 below the consensus of 49.2 and August's reading of 49.5.
- UK manufacturing activities have been contracting over a longer period. The Service sector has started following the footprints of factory activities and remained below the 50.0 threshold consecutively for the second time.
- The release of UK Manufacturing and Services PMI below the 50.0 threshold indicates that overall economic activities are contracting, signaling a vulnerable economic outlook.
- BoE policymakers also see the growth rate lower ahead. The BoE conveyed in its monetary policy statement that Q3 Gross Domestic Product (GDP) now is expected to rise 0.1% (Aug: +0.4%), with underlying growth in H2 2023 likely weaker than forecast in August.
- The reasoning behind a slowdown in the GDP numbers is the rising uncertainty over the interest rate peak before the general elections.
- In August, Retail Sales recovered strongly after washing out in July. On a monthly basis, consumer spending rose by 0.4% vs. expectations of 0.5%. In July, Retail Sales contracted by 1.1%, while the economic indicator excluding fuel prices matched expectations at 0.6%.
- The market mood remains cautious as investors see upside risks for a global slowdown. Global central bankers have paused their policy-tightening spell after raising interest rates significantly in the past two years as high inflation bites growth.
- The US Dollar Index (DXY) has traded inside the 105.27-105.78 range for the past three trading sessions as investors remain uncertain about the interest rate outlook in the remainder of 2023.
- Investors are infusing funds into the US Dollar amid a resilient US economy as it has absorbed the consequences of higher interest rates efficiently while other G7 economies are on the brink of recession.
- For further action, investors await the Durable Goods Orders data for August, which will be published on Wednesday.
Technical Analysis: Pound Sterling exposes six-month low near 1.2200
Pound Sterling price action has exposed the six-month low near 1.2200 against the US Dollar as the appeal for risk-perceived assets weakens due to global slowdown risks. The Cable struggles to find buying interest as investors remain worried about the UK’s economic growth. GBP/USD may continue its three-day losing spell if it fails to defend the immediate support of 1.2230. Downward-sloping 20 and 50-day Exponential Moving Averages (EMAs) warrant more weakness ahead.
Pound Sterling FAQs
What is the Pound Sterling?
The Pound Sterling (GBP) is the oldest currency in the world (886 AD) and the official currency of the United Kingdom. It is the fourth most traded unit for foreign exchange (FX) in the world, accounting for 12% of all transactions, averaging $630 billion a day, according to 2022 data.
Its key trading pairs are GBP/USD, aka ‘Cable’, which accounts for 11% of FX, GBP/JPY, or the ‘Dragon’ as it is known by traders (3%), and EUR/GBP (2%). The Pound Sterling is issued by the Bank of England (BoE).
How do the decisions of the Bank of England impact on the Pound Sterling?
The single most important factor influencing the value of the Pound Sterling is monetary policy decided by the Bank of England. The BoE bases its decisions on whether it has achieved its primary goal of “price stability” – a steady inflation rate of around 2%. Its primary tool for achieving this is the adjustment of interest rates.
When inflation is too high, the BoE will try to rein it in by raising interest rates, making it more expensive for people and businesses to access credit. This is generally positive for GBP, as higher interest rates make the UK a more attractive place for global investors to park their money.
When inflation falls too low it is a sign economic growth is slowing. In this scenario, the BoE will consider lowering interest rates to cheapen credit so businesses will borrow more to invest in growth-generating projects.
How does economic data influence the value of the Pound?
Data releases gauge the health of the economy and can impact the value of the Pound Sterling. Indicators such as GDP, Manufacturing and Services PMIs, and employment can all influence the direction of the GBP.
A strong economy is good for Sterling. Not only does it attract more foreign investment but it may encourage the BoE to put up interest rates, which will directly strengthen GBP. Otherwise, if economic data is weak, the Pound Sterling is likely to fall.
How does the Trade Balance impact the Pound?
Another significant data release for the Pound Sterling is the Trade Balance. This indicator measures the difference between what a country earns from its exports and what it spends on imports over a given period.
If a country produces highly sought-after exports, its currency will benefit purely from the extra demand created from foreign buyers seeking to purchase these goods. Therefore, a positive net Trade Balance strengthens a currency and vice versa for a negative balance.
- EUR/USD oscillates in a narrow range on Monday and seems vulnerable to decline further.
- The Fed’s hawkish outlook continues to underpin the USD and cap the upside for the pair.
- Looming recession risks and the ECB’s dovish rate hike further seem to weigh on the Euro.
The EUR/USD pair struggles to gain any meaningful traction on the first day of a new week and oscillates in a narrow trading band, around mid-1.0600s through the early European session. Spot prices, meanwhile, remain well within the striking distance of the lowest level since March touched last Friday and seem vulnerable to prolonging the downward trajectory witnessed over the past two months or so.
The US Dollar (USD) stands tall near a six-month peak in the wake of the Federal Reserve's (Fed) hawkish outlook, which, in turn, is seen as a key factor acting as a headwind for the EUR/USD pair. The Fed last week reiterated that interest rates will remain higher for longer and warned that still-sticky inflation in the US was likely to attract at least one more interest rate hike by the end of this year. Furthermore, policymakers now see just two rate cuts in 2024 as compared to four projected previously, which remains supportive of elevated US Treasury bond yields.
In fact, the rate-sensitive two-year US government bond yield holds steady near its highest level since 2006 and the benchmark 10-year Treasury yield hovers near a 16-year top. This, along with persistent worries about a property market crisis in China, underpins the safe-haven Greenback. The shared currency, on the other hand, is weighed down by the European Central Bank's (ECB) dovish rate decision last Thursday. This turns out to be another factor that fails to assist the EUR/USD pair to attract buyers or register any meaningful recovery from a multi-month low.
The ECB downgraded its CPI and GDP growth forecasts for 2024 and 2025, suggesting that the 14-month-long policy tightening cycle could have reached its peak already. Furthermore, the Eurozone PMI released on Friday indicated that the struggling manufacturing sector continued to weigh on growth in September and fueled speculations about a possible contraction in GDP during the second half of the year. This, in turn, reaffirms market expectations that further hikes may be off the table for now and supports prospects for a further depreciating move for the EUR/USD pair.
Traders now look to the German Ifo Business Climate for some impetus ahead of ECB President Christine Lagarde's scheduled speech later during the early North American session. Meanwhile, there isn't any relevant market-moving economic data due for release from the US on Monday, leaving the USD at the mercy of the US bond yields. Apart from this, the broader risk sentiment might influence the USD price dynamics and contribute to producing short-term trading opportunities around the EUR/USD pair.
Technical levels to watch
European Central Bank (ECB) Governing Council member, Martins Kazaks, commented on the central bank’s September rate hike decision.
Kazaks said that “the hike from the ECB in September may allow a pause in October.”
Bank of Japan (BoJ) Deputy Governor Shinichi Uchida said on Monday, the central bank “needs to patiently continue monetary easing.”
Additional quotes
Needs to closely watch currency market moves.
Decision in July to make yield target flexible is aimed at flexibly responding upside and downside risks.
Aiming to achieve 2% inflation target in sustainable and stable manner in tandem with wage growth.
We're not in a situation where achievement of 2% inflation target is in sight.
Market reaction
USD/JPY is sidelined near the 148.35 region, unperturbed by the latest BoJ commentary.
- Gold price loses traction near $1,920, holds below the 50- and 100-hour EMAs.
- The higher-for-longer interest rate narratives in the US lift the USD and weigh on gold price.
- The first immediate resistance is located at $1,945; the initial support level is seen at $1,915.
Gold price (XAU/USD) loses momentum around $1,920 during the early European session on Monday. Meanwhile, the US Dollar Index (DXY) attracts some buyers and hovers around 105.60, near the highest level since March 2023.
That said, the higher-for-longer interest rate narratives in the US is the main driver to lift the US Dollar, which drags gold price lower. It’s worth noting that rising interest rates raise the opportunity cost of investing in non-yielding assets, implying a negative outlook for XAU/USD.
Looking ahead, the release of the US Gross Domestic Product (GDP) Annualized for the second quarter on Thursday and the Core Personal Consumption Expenditure (PCE) Price Index, the Fed's preferred measure of consumer inflation on Friday will be closely watched by traders. The annual figure is expected to drop from 4.2% to 3.9%. Market players will take cues from these figures and find a clear direction in XAU/USD.
XAU/USD technical outlook
On the four-hour chart, gold price holds below the 50- and 100-hour Exponential Moving Averages (EMAs), which means the past of least resistance is to the downside. Meanwhile, the Relative Strength Index (RSI) is located in bearish territory below 50, activating the bearish momentum for gold price.
Resistance level: $1,945, $1,970 and $1,985
Support level: $1,915, $1,900 and $1,885
-638312215417842029.png)
Here is what you need to know on Monday, September 25:
Financial markets adopted a cautious stance at the beginning of the week amid renewed concerns over the Chinese property sector. The European docket will feature the IFO business sentiment survey from Germany and European Central Bank (ECB) President Christine Lagarde will testify before the Committee on Economic and Monetary Affairs. There won't be any high-tier data releases from the US in the second half of the day and investors will pay close attention to comments from central bank officials and the risk perception.
China's Evergrande announced on Sunday that it was unable to issue new debt due to an ongoing investigation into its main domestic subsidiary, Hengda Real Estate Group Co Ltd, putting the debt restructuring plan on hold. Hong Kong's Hang Seng Index fell sharply on this development and was last seen losing nearly 2% on a daily basis. Meanwhile, the Shanghai Composite Index lost more than 0.5%. This development also weighed on the AUD and the NZD. At the time of press, AUD/USD and NZD/USD pairs were down 0.3% and 0.2%, respectively.
US Dollar price today
The table below shows the percentage change of US Dollar (USD) against listed major currencies today. US Dollar was the strongest against the Australian Dollar.
| USD | EUR | GBP | CAD | AUD | JPY | NZD | CHF | |
| USD | -0.02% | -0.02% | 0.03% | 0.25% | -0.05% | 0.12% | 0.01% | |
| EUR | 0.03% | 0.01% | 0.06% | 0.29% | -0.03% | 0.14% | 0.03% | |
| GBP | 0.01% | 0.01% | 0.06% | 0.29% | -0.01% | 0.13% | 0.06% | |
| CAD | -0.05% | -0.07% | -0.08% | 0.22% | -0.10% | 0.06% | -0.02% | |
| AUD | -0.25% | -0.28% | -0.29% | -0.21% | -0.31% | -0.16% | -0.23% | |
| JPY | 0.05% | 0.05% | 0.04% | 0.08% | 0.31% | 0.17% | 0.06% | |
| NZD | -0.13% | -0.12% | -0.13% | -0.06% | 0.16% | -0.15% | -0.07% | |
| CHF | -0.03% | -0.05% | -0.06% | 0.02% | 0.23% | -0.07% | 0.07% |
The heat map shows percentage changes of major currencies against each other. The base currency is picked from the left column, while the quote currency is picked from the top row. For example, if you pick the Euro from the left column and move along the horizontal line to the Japanese Yen, the percentage change displayed in the box will represent EUR (base)/JPY (quote).
Despite the bearish action in Asian stock indices, US stock index futures trade modestly higher on the day. The US Dollar Index stays in a consolidation phase slightly above 105.50 and the 10-year US yield holds steady at around 4.45%.
EUR/USD extended its sideways action at around 1.0650 Monday after spending the second half of the previous week fluctuating near that level.
GBP/USD lost nearly 150 pips last week and registered its lowest daily close since March at 1.2238 on Friday. The pair opened with a bullish gap and rose above 1.2250 in the early Asian session but failed to gather further recovery momentum.
Gold price closed the previous week virtually unchanged. Early Monday, XAU/USD went into a consolidation phase slightly above $1,920.
USD/JPY registered weekly gains after rising sharply on the Bank of Japan's (BoJ) inaction early Friday. While speaking in a press conference following a meeting with business leaders in Osaka on Monday, BoJ Governor Kazuo Ueda reiterated that they need to patiently maintain monetary easing. USD/JPY showed no reaction to these comments and was last seen moving up and down in a tight channel at around 148.30.
- USD/JPY oscillates in a narrow range around 148.35 on Monday.
- The Bank of Japan (BOJ) Governor Ueda said that they must patiently maintain monetary easing.
- US S&P Global Manufacturing PMI showed an ongoing contraction in the manufacturing sector's business activity.
- Traders await Japan’s Tokyo Consumer Price Index (CPI) for September, the US Core Personal Consumption Expenditure (PCE) Price Index data on Friday.
The USD/JPY pair remains flat below the mid-148.00s during the early European session on Monday. Markets turn cautious amid the fear of FX intervention by the Japanese authorities. The pair currently trades around 148.35, losing 0.01% on the day.
The Bank of Japan (BOJ) Governor Kazuo Ueda stated on Monday that Japan's economy recovering moderately and the central bank’s basic stance is that they must patiently maintain monetary easing. Additionally, Japan’s Finance Minister Shunichi Suzuki was out with some usual verbal intervention last week. He said that authorities will closely watch FX moves with a high sense of urgency and won't rule out any options for response to excessive FX volatility. Similarly, the Bank of Japan (BoJ) Governor Ueda emphasized the need to spend more time assessing data before raising interest rates. This, in turn, might cap the upside of the US Dollar (USD) and act as a headwind for the USD/JPY pair.
Apart from this, economic data released on Friday revealed that Japan’s National Consumer Price Index (CPI) for August came in at 3.2% YoY from 3.3% in July. Additionally, the National CPI ex Fresh Food improved from 3.0% in July to 3.1% in August, whereas the National CPI ex Food, Energy came in at 4.3% compared to 4.3% in previous readings.
On the USD’s front, Friday's Purchasing Managers Index data prompted concerns about the trajectory of demand conditions in the US economy in the wake of interest rate hikes cycle and elevated inflation. The US S&P Global Manufacturing PMI grew to 48.9 in September from 47.9 in August, indicating that manufacturing sector business activity continues to contract. The Services PMI fell to 50.2 from 50.5 the previous month, while the Composite PMI dropped to 50.1 from 50.2.
Most Fed officials still expect the additional rate to rise later this year. Susan Collins and Mary Daly, presidents of the Federal Reserve Banks of Boston and San Francisco, emphasized that although inflation is cooling down, additional rate hikes would be necessary. Furthermore, Minneapolis Federal Reserve President Neel Kashkari said he would have thought with 500 basis points (bps) or 525 bps of interest rate increases as they would have slammed the brakes on consumer spending and it has not slammed the brakes on consumer spending.
Market participants will monitor Japan’s Tokyo Consumer Price Index (CPI) for September, Industrial Production, and Retail Sales due on Friday. The key event this week will be the US Core Personal Consumption Expenditure (PCE) Price Index, the Fed's preferred measure of consumer inflation. The annual figure is expected to drop from 4.2% to 3.9%. Traders will take cues from these figures and find trading opportunities around the USD/JPY pair.
- AUD/USD trades lower near 0.6420 ahead of economic data from both nations.
- RBA is expected to be dovish on interest rates trajectory; putting pressure on the Aussie pair.
- The hawkish remarks made by Fed officials could bolster the US Dollar (USD).
- Investors await the US Core PCE, seeking further cues on the US inflationary pressure.
AUD/USD retraces the previous session’s gains, trading lower around 0.6420 during the Asian session on Monday. However, the pair received upward support after the release of Australian PMI data on Friday, coupled with the soft US Dollar (USD).
Australia’s PMI data exhibited a modest improvement on Friday. The preliminary S&P Global Services PMI for September reached 50.5, up from 47.8 in August. However, the Manufacturing PMI declined to 48.2 from 49.6 in the previous reading. The Composite Index also showed improvement, rising from 48.0 to 50.2 prior.
The Reserve Bank of Australia's (RBA) Minutes from the September monetary policy meeting suggested that while additional tightening might be required if inflation remains persistent, the argument for keeping the current policy unchanged was stronger.
Furthermore, recent economic data have not significantly altered the overall economic outlook. This dovish stance from the RBA might be undermining the Aussie pair. Moreover, the traders will watch Australia’s Monthly Consumer Price Index (CPI) and Retail Sales data due later in the week.
US Dollar Index (DXY), measuring the Greenback's value against six major currencies, hovers around 105.60 at the time of writing. The index is struggling to gain momentum, which could be attributed to the market caution ahead of the economic data releases from the United States (US).
Investors will closely monitor the US economic calendar, which includes significant data releases such as Consumer Confidence, Durable Goods Orders, Initial Jobless Claims, and the Core PCE, the Fed's preferred measure of inflation.
The annual figure for Core PCE is expected to decrease from 4.2% to 3.9%. These datasets will provide insights into the US economic situation and inflationary pressure, influencing the trading decisions of the AUD/USD pair.
However, the yield on the 10-year US Treasury note has risen to 4.46%, marking a 0.63% increase by the press time. This increase in yields might be supporting the Greenback.
Furthermore, comments from Boston Fed President Susan Collins and US Federal Reserve (Fed) Governor Michelle W. Bowman suggest that further interest rate tightening is possible, emphasizing the need for patience and more rate hikes to control inflation. Rising interest rates could potentially put pressure on the AUD/USD pair.
The Federal Reserve's commitment to maintaining higher interest rates for an extended period to bring inflation back to its 2% target has raised expectations of at least one additional 25-basis-point rate hike by the end of the year.
Additionally, the Fed's "dot plot" now indicates only two rate hikes in 2024, down from the previous forecast of four rate hikes.
Bank of Japan (BOJ) Governor Kazuo Ueda is holding a news conference following his meeting with business leaders in Osaka, western Japan, on Monday.
Key quotes
Stable, sustainable achievement of 2% inflation not yet in sight.
Japan's economy is at a critical stage on whether it can achieve positive wage-inflation cycle.
Must continue to be vigilant to chance past sharp US rate hikes could affect economy, financial system with a lag.
Chinese economy's slow pace of pick-up is also worrying.
It is true inflation is exceeding 2% for prolonged period, but that alone cannot lead us to conclude japan close to stably, sustainably achieving our target.
Key to whether Japan is close to achieving our target is whether wage growth leads to moderate rise in inflation.
Japan firms are changing prices more frequently than in past, which is important sign suggesting wages and inflation could move in tandem.
Related reads
- BoJ’s Ueda: Our basic stance is that we must patiently maintain monetary easing
- Week Ahead – US core PCE and Eurozone flash CPIs eyed after rate pause signals
Bank of Japan (BOJ) Governor Kazuo Ueda is holding a news conference following his meeting with business leaders in Osaka, western Japan, on Monday.
Key quotes
Japan's economy recovering moderately.
Our basic stance is that we must patiently maintain monetary easing.
Current policy framework has big stimulative effect on economy, but at times could cause big side-effects.
BoJ’s July move helped heighten sustainability of our monetary easing framework.
Our baseline scenario is for key driver of inflation to gradually switch, strengthen virtuous wage-inflation cycle.
Effect of rising import prices likely to gradually dissipate.
Uncertainty surrounding our baseline scenario is very high, not sure at this stage whether this will materialize.
There is good chance wage growth will accelerate as competition for talent intensify.
Changes in corporate behaviour could speed up more than expected.
On the other hand, wages, prices may struggle to rise if Japan’s economy is hit by negative external or internal shocks.
Many firms still have not decided whether to hike wages significantly, so we must scrutinize whether changes in corporate wage-setting behaviour could be sustained.
Market reaction
In reaction to the above comments, USD/JPY is little changed, holding steady at 148.33.
- GBP/USD remains under selling pressure amid the Fed’s hawkish stance.
- The pair holds below the 50- and 100-hour EMAs on a four-hour chart.
- The oversold RSI condition indicates that further consolidation cannot be ruled out.
- The immediate resistance level will emerge at 1.2290; 1.2200 will be the critical support level.
The GBP/USD pair remains on the defensive below the mid-1.2200s during the Asian session on Monday. Market players await the release of the UK’s Gross Domestic Product (GDP) for the second quarter and the US highly-anticipated Core Personal Consumption Expenditure (PCE) Price Index data due on Friday. The major pair currently trades near 1.2242, gaining 0.02% on the day.
That said, the hawkish stance from the Federal Reserve (Fed) officials lifted the US Dollar (USD) against the British Pound (GBP). Fed Banks of Boston and San Francisco Presidents, Susan Collins and Mary Daly, emphasized that although inflation is cooling down, additional rate hikes would be necessary. This, in turn, might act as a headwind for the GBP/USD pair
According to the four-hour chart, GBP/USD holds below the 50- and 100-hour Exponential Moving Averages (EMAs) with a downward slope, which means further downside looks favorable. The Relative Strength Index (RSI) holds in bearish territory below 50. However, the oversold condition indicates that further consolidation cannot be ruled out before positioning for any near-term GBP/USD depreciation.
That said, the immediate resistance level for GBP/USD will emerge near the middle line of the Bollinger Band at 1.2290. The additional upside filter is located at 1.2354, representing the 50-hour EMA. The upper boundary of the Bollinger Band at 1.2383 will be the next barrier for the pair, en route to 1.2432 (the 100-hour EMA).
On the flip side, the lower limit of the Bollinger Band at 1.2200 will be the critical support level. Further south, the next stop of GBP/USD is located at 1.2178 (a low of March 28). Any intraday pullback below the latter would expose the next downside stop at 1.2128 (a high of March 16) and finally at 1.2100 (a low of March 17).
GBP/USD four-hour chart
-638312164124387293.png)
FX option expiries for Sept 25 NY cut at 10:00 Eastern Time, via DTCC, can be found below.
- EUR/USD: EUR amounts
- 1.0540 695m
- 1.0725 919m
- GBP/USD: GBP amounts
- 1.2275 545m
- 1.2336 385m
- USD/JPY: USD amounts
- 147.00 1.24b
- 149.00 643m
- AUD/USD: AUD amounts
- 0.6400 732m
- 0.6485 341m
- USD/CAD: USD amounts
- 1.3405 538m
- 1.3425 565m
- 1.3472 557m
- USD/CNY: USD amounts
- 7.3000 1.3b
- EUR/GBP looks to gain ground above 0.8700 psychological level.
- Eurozone PMI data provided support for the Euro.
- BoE’s surprise decision to pause its rate hike cycle has undermined the Pound Sterling (GBP).
EUR/GBP continues the winning streak that began on Wednesday, trading higher around 0.8700 psychological level during the Asian session on Monday. The pair is continuing to experience upward support after the release of the Eurozone PMI data, coupled with the dovish policy decision by the Bank of England (BoE) in the previous week.
HCOB Services PMI released on Friday, increased to 48.4 in September from 47.9 in August, surpassing the expected reading of 47.7. The Eurozone PMI Composite rose to 47.1 from 46.7 in August, exceeding the anticipated figure of 46.5 and reaching a two-month high.
However, the HCOB Purchasing Managers' Index survey, showed that the Eurozone Manufacturing Purchasing Managers Index (PMI) declined to 43.4 in September, below the market consensus of 44.0 and the previous reading of 43.5.
On early Friday, European Central Bank (ECB) Chief Economist Phillip Lane emphasized that inflation above 2% is costly for the economy and that central banks aim to control inflation over the medium term.
Furthermore, the Bank of France President Francois Villeroy de Galhau spoke in a weekend interview that he is in no rush to raise rates further after hiking to 4.00% last week, according to Bloomberg.
Additionally, economists in a Reuters poll expect the ECB to conclude its rate-hike cycle and remain on hold until at least July next year.
Weekend reports suggest that the windfall tax on Italian banks, which had already been reduced since its implementation in August, may be effectively repealed. Instead of paying the tax, which would have been 40% of extra profits from 2021 to 2023, banks could potentially avoid it by allocating 2.5 times the amount of the tax to bolster their Tier 1 capital ratios.
On the United Kingdom’s (UK) side, the Bank of England (BoE) decided not to proceed with a widely anticipated interest rate hike on Thursday, citing inflation figures for the UK economy that were generally lower than expected.
The BoE’s surprise decision to pause its rate hike cycle has contributed to the British Pound's (GBP) relative underperformance. This development is also viewed as a factor putting downward pressure on the EUR/GBP pair. It's worth noting that the UK central bank had previously implemented 14 consecutive interest rate hikes.
Investors await ECB President Christine Lagarde's speech due later in the day, which may provide some further cues on the interest rates trajectory in the future.
- Asian equities trade lower amid the cautious mood.
- The lingering fears over China’s property market crisis dampen regional stock markets.
- A dovish stance from the BOJ boosts the Japanese equities.
- Investors await Japan’s Consumer Price Index (CPI) and, the US Core Personal Consumption Expenditure (PCE) Price Index on Friday.
Most Asian stock markets trade in negative territory on Monday amid the cautious mood. Investors digest the outcome of the Federal Reserve (Fed) monetary policy decision last week while the renewed concerns over China's property crisis weigh on risk sentiment.
At press time, China’s Shanghai is down 0.39% to 3,120, the Shenzhen Component Index declines 0.50% to 10,127, Hong Kong’s Hang Sang falls 1.23% to 17,835, South Korea’s Kospi drops 0.45% and Japan’s Nikkei rises 0.74%.
Evergrande, the world's most indebted property developer and the face of China's property crisis, announced late on Sunday that it was unable to issue new debt due to an ongoing investigation into its primary domestic subsidiary, Hengda Real Estate Group Co Ltd. In addition, Hengda disclosed last month that it was under investigation by China's securities regulator for a suspected violation involving the disclosure of information. In response to the news, shares in Evergrande plummeted around 24%, while Hong Kong's Hang Seng leads the losses by falling 1.23% by the press time.
In Japan, the Bank of Japan (BoJ) board members decided to keep its short-term interest rate target of -0.1% and its 10-year bond yield target of around 0% on Friday, as widely expected by the market. Japanese policymakers reaffirmed its easy monetary policy stance until they see Japanese inflation stably maintaining 2%. A dovish stance by BoJ lifted Japanese stock on Monday.
Moving on, investors await Japan’s Tokyo Consumer Price Index (CPI) for September, Industrial Production and Retail Sales due on Friday. The attention will shift to the US Core Personal Consumption Expenditure (PCE) Price Index, the Fed's preferred measure of consumer inflation. The annual figure is expected to drop from 4.2% to 3.9%.
- USD/CHF climbs to a fresh multi-month peak and draws support from a combination of factors.
- Bets for more Fed rate hikes continue to push the US bond yields higher and underpin the USD.
- The SNB's surprise pause continues to weigh on the CHF and supports prospects for further gains.
The USD/CHF pair attracts some dip-buying near the 0.9045 region on Monday and touches its highest level since June 13 during the Asian session. Spot prices currently trade around the 0.9075-0.9080 area and seem poised to build on last week's breakout momentum through a technically significant 200-day Simple Moving Average (SMA).
The prospect for further policy tightening by the Federal Reserve (Fed) assists the US Dollar (USD) to stand tall near a six-month high, which, in turn, is seen as a key factor acting as a tailwind for the USD/CHF pair. In fact, the US central bank reiterated the longer-for-higher narrative and warned last week that still-sticky inflation was likely to attract at least one more interest rate hike by the end of this year.
Adding to this, the so-called 'dot-lot' suggested just two rate cuts in 2024 as compared to four projected previously. This led to an extended selloff in the US fixed-income market, pushing the yield on the rate-sensitive two-year government bond to its highest level since 2007. Furthermore, the benchmark 10-year US Treasury yield stands tall near a 16-year peak, which lends support to the buck and USD/CHF pair.
The Swiss Franc (CHF), on the other hand, continues to be weighed down by the fact that the Swiss National Bank (SNB) ended its streak of five consecutive increases last week. The SNB decided to keep its benchmark interest rate unchanged at the end of the quarterly monetary policy meeting, defying expectations for a 25 bps lift-off in the wake of sub-2% inflation readings and the recent weak economy data.
This, along with acceptance above the very important 200-day SMA, supports prospects for an extension of the USD/CHF pair's well-established uptrend witnessed over the past two months or so. In the absence of any relevant market-moving economic releases from the US on Monday, the US bond yields will play a key role in influencing the USD price dynamics and provide some impetus to the USD/CHF pair.
Technical levels to watch
- USD/MXN struggles to gain any meaningful traction and oscillates in a range on Monday.
- The technical setup supports prospects for some meaningful upside amid a bullish USD.
- A break below last week's swing low will shift the bias back in favour of bearish traders.
The USD/MXN pair manages to defend the 100-day Simple Moving Average (SMA) support through the Asian session on Monday, albeit struggles to gain any meaningful traction. Spot prices remain below the 17.2500 area, or last week's swing high, which should now act as a pivotal point for short-term traders.
With technical indicators on the daily chart holding in the positive territory, a sustained strength beyond should pave the way for some meaningful upside and lift the USD/MXN pair to the 17.3810 area (September 12 peak). Some follow-through buying has the potential to lift spot prices further towards the next relevant hurdle near the 17.5910-17.5960 horizontal zone en route to the monthly top, around the 17.7090-17.7095 region.
The US Dollar (USD) holds steady just below its highest level in more than six months and remains well supported by the Federal Reserve's (Fed) hawkish outlook, signalling the need to keep rates higher for longer to push inflation to the 2% target. This, along with the reduction in the expected number of rate cuts in 2024, continues to push the US bond yields higher and continues to underpin the USD, favouring the USD/MXN bulls.
Hence, any meaningful slide below the 100-day SMA might continue to attract fresh buyers near the 17.1010-17.0650 horizontal support. This, in turn, should help limit the downside for the USD/MXN pair near last week's swing low, around the 16.9980 area. which if broken decisively might shift the bias in favour of bearish traders. Spot prices might then turn vulnerable to retesting the 16.6945 area, or a multi-year low touched in August.
USD/MXN daily chart
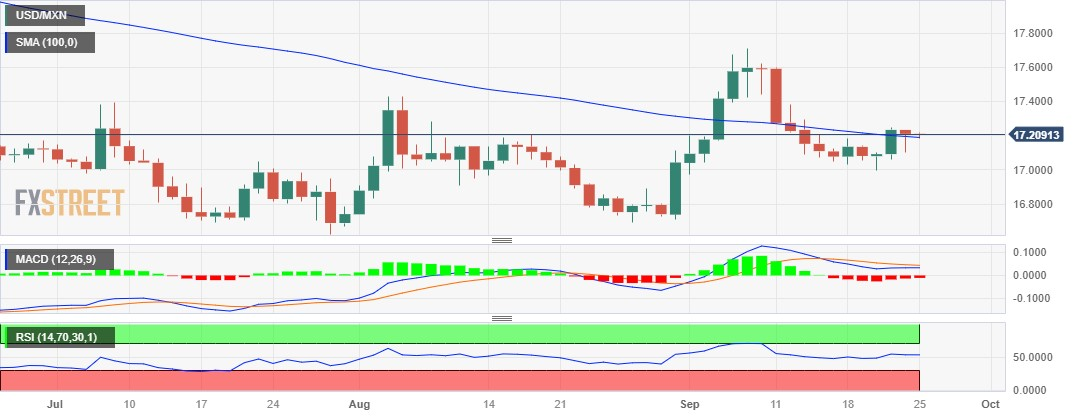
Technical levels to watch
- Crude prices ease from the recent gains ahead of US data releases.
- The hawkish remarks made by Fed officials could dampen the demand for the black gold.
- Russia implemented a temporary ban on gasoline and diesel fuel exports in an effort to stabilize its domestic market.
Western Texas Intermediate (WTI), the US crude oil benchmark eases from the recent gains, trading lower around $89.70 per barrel during the Asian session on Monday.
Investors are anticipated to provide upward support to Crude oil prices due to their focus on a tighter supply outlook. This is exacerbated by Moscow's temporary ban on fuel exports. However, there is also caution regarding the potential impact of further rate hikes on demand.
The prices of black gold had risen more than 10% in the last three weeks due to a constrained production outlook from Saudi Arabia and Russia.
The combined supply cuts of 1.3 million barrels per day from Saudi Arabia and Russia have been extended until the end of 2023. Market analysts believe that this extension will exacerbate an anticipated 2 million barrels per day deficit in global oil supplies.
However, the US Federal Reserve’s (Fed) hawkish stance on the interest rates trajectory snapped a winning streak in oil prices during the previous week.
Furthermore, Moscow imposed a temporary ban on gasoline and diesel exports last week with the aim of stabilizing the domestic market. This move has raised concerns about a potential shortage of petroleum products as the northern hemisphere enters the winter season.
US Dollar Index (DXY), measuring the Greenback's value against six major currencies, is struggling to gain momentum, hovering around 105.60 at the time of writing. However, the yield on the 10-year US Treasury note appreciated to 4.45%, a 0.50% increase by the press time, which could provide support in underpinning the US Dollar (USD).
Moreover, Boston Fed President Susan Collins has stated that further tightening is possible but emphasized the need for patience. While US Federal Reserve (Fed) Governor Michelle W. Bowman expressed a similar opinion, adding that more rate hikes are necessary to curb inflation. Rising interest rates could dampen the demand for the Crude oil.
The Federal Reserve has stressed the significance of keeping interest rates elevated for an extended duration to steer inflation back to its 2% target. This stance has heightened market anticipations for at least one additional 25-basis-point rate hike by year-end. Moreover, the Fed's "dot plot" now suggests only two rate hikes in 2024, a reduction from the prior forecast of four rate hikes.
Investors will likely watch the US economic calendar, which includes key data releases such as Consumer Confidence, Durable Goods Orders, Initial Jobless Claims, and the Core PCE, the Fed's preferred measure of inflation.
The annual figure for Core PCE is expected to drop from 4.2% to 3.9%. These figures could provide cues on the economic situation in the US, which helps the traders of the WTI Crude oil in placing their fresh bets.
Speaking at the Tsinghua University in Beijing on Monday, European Union’s (EU) Trade Commissioner Valdis Dombrovskis said “Europe's economic ties with China are deep, but China could do a lot to help reduce our perception of risk.”
Additional quotes
"Their ambiguity allows too much room for interpretation.”
"This means European companies struggle to understand their compliance obligations: a factor that significantly decreases business confidence and deters new investments in China."
This comes after the EU has long complained about a lack of level playing field in China and the politicization of the business environment.
Market reaction
The Euro is little affected by the above comments, leaving EUR/USD gyrating in a narrow range at around 1.0650, as of writing.
| Raw materials | Closed | Change, % |
|---|---|---|
| Silver | 23.548 | 0.65 |
| Gold | 1925.156 | 0.28 |
| Palladium | 1251.9 | -0.83 |
- EUR/USD consolidates its recent losses to the lowest level since March touched last week.
- The fundamental backdrop favours bearish traders and supports prospects for further losses.
- The recent down leg along a downward-sloping channel also validates the negative outlook.
The EUR/USD pair kicks off the new week on a subdued note and oscillates in a narrow trading band, around mid-1.0600s through the Asian session. Spot prices, meanwhile, remain well within the striking distance of the lowest level since March touched last Friday and seem vulnerable to prolonging the downward trajectory witnessed over the past two months or so.
The US Dollar (USD) stands tall near a more than six-month peak and remains well supported by elevated US Treasury bond yields, bolstered by the Federal Reserve's (Fed) hawkish outlook and the reduction in the expected number of rate cuts in 2024. The shared currency, on the other hand, is undermined by the European Central Bank's (ECB) dovish rate decision last Thursday, which further contributes to keeping a lid on the EUR/USD pair.
From a technical perspective, the negative outlook is reinforced by the fact that the downfall from the 1.1275 area, or a 17-month peak touched in July, has been along a downward sloping channel. This points to a well-established bearish trend and suggests that the path of least resistance for the EUR/USD pair is to the downside. Moreover, oscillators on the daily chart are holding deep in the negative territory and are still away from being in the oversold zone.
Hence, a subsequent slide towards the 1.0600 round figure, en route to the ascending channel support, currently pegged near the 1.0560-1.0555 region, looks like a distinct possibility. Some follow-through selling will mark a fresh bearish breakdown and set the stage for an extension of the EUR/USD pair's over a two-month-old downtrend.
On the flip side, any recovery beyond the 1.0670 area is likely to confront stiff resistance near the 1.0700 mark. This is followed by last week's swing high, around the 1.0735 region, which if cleared decisively could lift the EUR/USD pair towards challenging the 1.0780 hurdle, representing the top boundary of the aforementioned channel. A convincing breakout, leading to a subsequent move beyond the 1.0800 round figure, will suggest that spot prices have formed a near-term bottom and pave the way for some meaningful near-term appreciating move.
EUR/USD daily chart
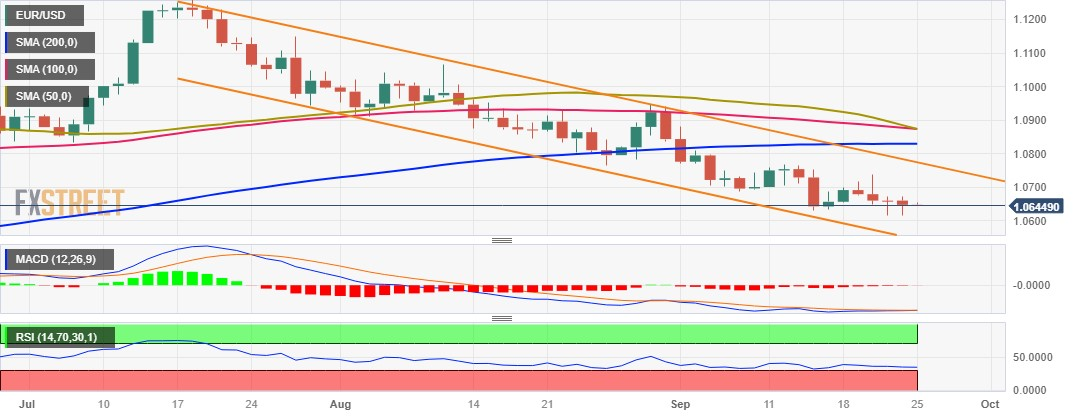
Technical levels to watch
- Gold price holds ground above $1,920 due to soft US Dollar (USD).
- The hawkish remarks made by Fed officials could affect precious metals like Gold.
- Upbeat 10-year US Treasury yield could provide support for the Greenback.
Gold price hovers above $1,920 during the Asian session on Monday. The prices of yellow metal snapped a losing streak on Friday as the US Dollar (USD) trimmed its intraday gains, which could be attributed to the falling in the US Treasury yields.
However, US bond yields have rebounded, with the yield on the 10-year US Treasury note appreciating to 4.45%, a 0.50% increase by the press time.
Regarding the recent data from S&P Global, business activity in the United States (US) remained nearly unchanged in September. The S&P Global Manufacturing PMI improved to 48.9 from 47.9 the previous month, surpassing expecting a reading of 48.0.
However, the Services PMI declined to 50.2 from 50.5 in July, falling short of the anticipated reading of 50.6. The Composite reading, offering an overall view of business activity, was in line with estimates at 50.1 but slightly lower than August's 50.2 level.
US Dollar Index (DXY), measuring the Greenback's value against six major currencies, is struggling to gain momentum, hovering around 105.60 at the time of writing.
Furthermore, Boston Fed President Susan Collins has suggested that further tightening is possible but emphasized the need for patience. Additionally, US Federal Reserve (Fed) Governor Michelle W. Bowman echoed similar sentiments, asserting that more rate hikes are necessary to control inflation.
The rising interest rates increase the opportunity cost of investing in non-yielding assets, which implies a negative outlook for precious metals like Gold.
The Fed has emphasized the importance of maintaining higher interest rates for an extended period to bring inflation back to its 2% target. This stance has raised market expectations for at least one more 25-basis-point rate hike by the end of the year.
Additionally, the Fed's "dot plot" now indicates only two rate hikes in 2024, down from the previous projection of four rate hikes.
In the upcoming week, the US economic calendar will include key data releases such as Consumer Confidence, Durable Goods Orders, Initial Jobless Claims, and the Core PCE, the Fed's preferred measure of inflation.
The annual figure for Core PCE is expected to drop from 4.2% to 3.9%. These figures could provide further direction for Gold prices.
- USD/CAD trades sideways near 1.3476 amid the USD weakness.
- Canadian Retail Sales for July rose by 0.3% vs. 0.1% prior; Core Retail Sales climbed by 1.0% vs. -0.7% prior.
- US S&P Global Manufacturing PMI showed an ongoing contraction in the manufacturing sector's business activity.
- The US Core Personal Consumption Expenditure (PCE) Price Index will be a closely watched event.
The USD/CAD pair consolidates its recent gains below the 1.3500 barrier during the early Asian session on Monday. The weakening of the US Dollar (USD) and a decline in the US Treasury bond yields weigh on the pair. As of writing, USD/CAD is trading around 1.3476, losing 0.05% on the day.
Statistics Canada revealed on Friday that Canadian Retail Sales for July rose by 0.3% from the 0.1% in the previous reading, below the market consensus of 0.4%. While, the Core Retail Sales climbed 1.0% from a 0.7% drop in the previous reading, beating the market expectation of 0.5%. Additionally, a rally in oil prices underpins the commodity-linked Loonie and might cap the upside for the USD/CAD pair as the country is the leading oil exporter to the United States.
On the other hand, Presidents of the Federal Reserve Banks of Boston and San Francisco, Susan Collins and Mary Daly, emphasized that although inflation is cooling down. However, further rate hikes would be necessary. That said, the higher-for-longer rate narrative has propelled the US Dollar against its rivals and might act as a tailwind for the USD/CAD pair.
On Friday, the US S&P Global Manufacturing PMI improved to 48.9 in September from 47.9 in August, indicating an ongoing contraction in the manufacturing sector's business activity. Meanwhile, the Services PMI fell to 50.2 from 50.5 in the previous month. Finally, the Composite PMI dropped to 50.1, down marginally from 50.2 in August.
Looking ahead, market participants will keep an eye on the Canadian Gross Domestic Product (GDP) for July due on Friday. The key event this week will be the US Core Personal Consumption Expenditure (PCE) Price Index, the Fed's preferred measure of consumer inflation. The annual figure is expected to drop from 4.2% to 3.9%. These figures could give a clear direction to the USD/CAD pair.
- USD/JPY refreshes YTD top during the Asian session on Monday, albeit lacks follow-through.
- Intervention fears, along with a softer risk tone, underpin the JPY and caps gains for the pair.
- The Fed-BoJ policy divergence still favours bulls and supports prospects for a further move up.
The USD/JPY pair touches a fresh high since November 2022 during the Asian session on Monday, albeit struggles to capitalize on the modest uptick beyond mid-148.00s.
Speculations that Japanese authorities will intervene in the foreign exchange market to support the domestic currency, along with a weaker risk tone, lend some support to the safe-haven Japanese Yen (JPY). In fact, Japan’s Finance Minister Shunichi Suzuki issued a fresh warning against the recent JPY weakness and said that the government will not rule out any options in addressing excess volatility in currency markets. This, in turn, is holding back traders from placing fresh bullish bets around the USD/JPY pair and acting as a headwind. The downside, however, remains cushioned in the wake of a big divergence in the monetary policy stance adopted by the Federal Reserve (Fed) and the Bank of Japan (BoJ).
The US central bank, as was anticipated, decided to leave interest rates unchanged at the end of the September policy meeting last Wednesday, though showed readiness to hike interest rates until inflation returns to its 2% target. In fact, the Fed warned that the still-sticky US inflation was likely to attract at least one more 25 bps lift-off by the year-end. Moreover, the so-called 'dot-plot' indicated just two rate cuts next year as compared to four projected previously. Moreover, the incoming resilient US macro data should allow the Fed to keep interest rates higher for longer. The hawkish outlook, in turn, pushes the yield on the rate-sensitive two-year US government bond to its highest level since July 2006.
Moreover, the benchmark 10-year Treasury yield holds steady near a 16-year peak touched last Friday. This, in turn, assists the US Dollar (USD) to stand tall just below a more than six-month peak and continues to lend support to the USD/JPY pair. The JPY, on the other hand, is pressured by the fact that the BoJ on Friday refrained from offering any hint about potential alterations in its dovish stance in the foreseeable future. In the post-meeting press conference, BoJ Governor Kazuo Ueda noted that there is no change to the way of the policy decision-making process and that the central bank is yet to foresee inflation reaching the 2% target in a stable manner. As such, the BoJ will continue to maintain an ultra-loose monetary policy.
The aforementioned fundamental backdrop seems tilted firmly in favour of the USD/JPY bulls. Hence, any meaningful corrective pullback might still be seen as a buying opportunity and remain limited in the absence of any relevant market-moving economic releases on Monday.
Technical levels to watch
- NZD/USD attempts to extend gains due to soft US Dollar (USD).
- RBNZ’s OCR rate hike is being priced in as the economy appears to be more resilient.
- Improved US Treasury yields could provide support for the Greenback.
NZD/USD looks to continue the two-day winning streak from the previous week, trading around 0.5960 during the early trading hours of the Asian session on Monday. However, the pair received upward support as the US Dollar (USD) retraced a portion of its intraday gains, which could be attributed to the fall in the US Treasury yields on Friday.
However, US bond yields snapped the recent losses, with the yield on US 10-year bond appreciating at 4.45%, up by 0.32% by the press time.
The New Zealand economy appears to be more resilient than initially anticipated, and the domestic data for September strongly emphasizes the necessity for further monetary policy tightening. Hence, the markets seem to price in the Official Cash Rate (OCR) hike by the Reserve Bank of New Zealand (RBNZ) through the end of the year 2023.
The economic data revealed on Friday that the Trade Balance NZD for August improved the annual trade deficit to $15.54B from the previous figures of $1588B. While Westpac Consumer Survey (Q3) report showed a decline regarding the economic outlook, with the index falling to 80.2 from 83.1 prior.
On the other side, the data from S&P Global has revealed that business activity in the United States (US) remained nearly unchanged in September. The S&P Global Manufacturing PMI improved to 48.9 from 47.9 the previous month, surpassing expectations of 48.0 figures.
Meanwhile, the Services PMI declined to 50.2 from 50.5 in July, which was expected to grow at a reading of 50.6. The Composite reading, which provides an overall view of business activity, was in line with estimates at 50.1 but lagged behind August's 50.2 level.
US Dollar Index (DXY), which measures the value of the Greenback against other major currencies, struggles to gain momentum. The spot price beats around 105.50 at the time of writing.
Moreover, Boston Fed President Susan Collins stated that further tightening is possible but also emphasized the need for patience. Additionally, the Governor on the Federal Reserve's board, Michelle W. Bowman echoed similar sentiments, asserting that more rate hikes are necessary to control inflation.
The Federal Reserve (Fed) has emphasized the importance of maintaining higher interest rates for an extended period to bring inflation back to its 2% target. This stance has increased market expectations for at least one more 25-basis-point rate hike by the end of the year.
Additionally, the Fed's "dot plot" now indicates only two rate hikes in 2024, down from the previous projection of four rate hikes.
In the upcoming week, the economic calendar in the US will include key data releases such as Consumer Confidence, Durable Goods Orders, Initial Jobless Claims, and the Core PCE, which is the Fed's preferred measure of inflation. On the Kiwi docket, economic indicators will feature Business and Consumer Confidence data. Market participants will closely monitor these releases for insights into the economic conditions in both countries.
The People’s Bank of China (PBoC) set the USD/CNY central rate for the trading session ahead on Monday at 7.1727, compared with the previous day's fix of 7.1729.
According to weekend reports, the windfall tax on Italian banks, which has already been watered down since its implementation in August, will be effectively repealed. Rather than paying the levy, which would have been 40% of extra profits between 2021 and 2023, banks may avoid it entirely by allocating 2.5x of the amount of the tax to strengthening Tier 1 ratios.
The tax sparked discord within the coalition government and garnered criticism from the ECB, representing a significant setback for the Giorgia Meloni administration.
Market reaction
These comments did not trigger a noticeable market reaction. The EUR/USD pair was last seen trading at 1.0649, gaining 0.02% on the day.
- AUD/USD trades in positive territory for two straight days below the mid-0.6400s.
- Australian PMI data showed a slight improvement on Friday.
- US S&P Global Manufacturing PMI improved to 48.9 in September vs. 47.9 prior.
- Investors await the Australian Monthly CPI, Retail Sales, and the US Core PCE data.
The AUD/USD pair gains traction during the early Asian session on Monday. The rebound of the pair is bolstered by the weakness of the US Dollar (USD) and a decline in US Treasury bond yields. At the press time, AUD/USD is trading at 0.6442, up 0.03% for the day.
Australian PMI data showed a slight improvement on Friday. The preliminary S&P Global Services PMI posted 50.5 in September, improved from 47.8 in August. While the Manufacturing PMI dropped to 48.2 from 49.6 in the previous reading. The Composite Index was also improved from 48.0 to 50.2.
The release of the Reserve Bank of Australia's (RBA) Minutes on the September monetary policy meeting revealed that additional tightening may be necessary if inflation proves more persistent than anticipated. But the case for maintaining the status quo was stronger, and recent data have not materially altered the economic outlook. This, in turn, might cap the upside of the Aussie and act as a headwind for the AUD/USD pair.
On the USD’s front, the Federal Reserve (Fed) decided to hold the interest rate unchanged in the 5.25% to 5.50% range at its September meeting. In terms of macroeconomic predictions, most members still expect further rate rises later this year. Susan Collins and Mary Daly, presidents of the Federal Reserve Banks of Boston and San Francisco, emphasized that although inflation is cooling down, additional rate hikes would be necessary.
Additionally, Minneapolis Federal Reserve President Neel Kashkari said he would have thought with 500 basis points (bps) or 525 bps of interest rate increases as they would have slammed the brakes on consumer spending and it has not slammed the brakes on consumer spending.
About the data, the US S&P Global Manufacturing PMI improved to 48.9 in September from 47.9 in August, indicating an ongoing contraction in the manufacturing sector's business activity. Meanwhile, the Services PMI fell to 50.2 from 50.5 in the previous month. Finally, the Composite PMI dropped to 50.1, down marginally from 50.2 in August.
Later this week, the Australian Monthly Consumer Price Index for August will be due on Wednesday ahead of the Retail Sales on Thursday. The highlight of the week will be the release of the US Core Personal Consumption Expenditure (PCE) Price Index, the Fed's preferred measure of consumer inflation. The annual figure is expected to drop from 4.2% to 3.9%. Traders will take cues from these figures and find trading opportunities around the AUD/USD pair.
- GBP/USD enters a bearish consolidation phase near a multi-month low touched last Friday.
- The USD continues to draw support from the Fed's hawkish outlook and acts as a headwind.
- The BoE's surprise pause is seen undermining the GBP and contributes to capping the upside.
The GBP/USD pair is seen oscillating in a narrow trading band during the Asian session on Monday and consolidating its recent losses to the lowest level since late March touched last week. Spot prices currently trade just below mid-1.2200s and seem vulnerable to prolonging a well-established downtrend from the 1.3140 area, or a 15-month peak touched on July 14.
The US Dollar (USD) stands tall near its highest level in more than six months and remains well supported by the Federal Reserve's (Fed) hawkish stance, which, in turn, is seen as a key factor acting as a headwind for the GBP/USD pair. The Fed emphasized the need to keep interest rates higher for longer to push inflation back to the 2% target and lifted market bets for at least one more 25 bps lift-off by the year-end. Moreover, the so-called 'dot-plot' suggested just two rate cuts in 2024 as compared to four projected previously.
The outlook pushed the yield on the benchmark 10-year US government bond to its highest level since 2007, which, along with a generally weaker risk tone, continues to underpin the safe-haven Greenback. Apart from this, the Bank of England's (BoE) surprise pause last Thursday contributes to the British Pound's (GBP) relative underperformance and is seen as another factor weighing on the GBP/USD pair. In fact, the UK central bank ended a run of 14 straight interest rate hikes in the wake of the recent deceleration of inflation.
The aforementioned fundamental backdrop seems tilted firmly in favour of bullish traders and suggests that the path of least resistance for the GBP/USD pair is to the downside. That said, the Relative Strength Index (RSI) on the daily chart is flashing oversold conditions and warrants some caution. In the absence of any relevant macro releases, either from the UK or the US, this makes it prudent to wait for some near-term consolidation or a modest bounce before traders start positioning for any further depreciating move.
Technical levels to watch
| Index | Change, points | Closed | Change, % |
|---|---|---|---|
| NIKKEI 225 | -168.62 | 32402.41 | -0.52 |
| Hang Seng | 402.04 | 18057.45 | 2.28 |
| KOSPI | -6.84 | 2508.13 | -0.27 |
| ASX 200 | 3.6 | 7068.8 | 0.05 |
| DAX | -14.57 | 15557.29 | -0.09 |
| CAC 40 | -29.08 | 7184.82 | -0.4 |
| Dow Jones | -106.58 | 33963.84 | -0.31 |
| S&P 500 | -9.94 | 4320.06 | -0.23 |
| NASDAQ Composite | -12.17 | 13211.81 | -0.09 |
| Pare | Closed | Change, % |
|---|---|---|
| AUDUSD | 0.644 | 0.38 |
| EURJPY | 157.922 | 0.39 |
| EURUSD | 1.06441 | -0.16 |
| GBPJPY | 181.547 | 0.08 |
| GBPUSD | 1.22362 | -0.47 |
| NZDUSD | 0.59605 | 0.48 |
| USDCAD | 1.34818 | 0.03 |
| USDCHF | 0.90706 | 0.3 |
| USDJPY | 148.365 | 0.55 |
Bank of France President Francois Villeroy de Galhau spoke in a weekend interview that he is in no rush to raise rates further after hiking to 4.00% last week, according to Bloomberg.
Key quotes
“From today’s perspective, patience is more important than raising rates further,”
"Very attentive to oil but it doesn’t put into doubt the underlying disinflation.”
“Our outlook and engagement is to bring inflation to around 2% in 2025.”
Market reaction
These comments did not trigger a noticeable market reaction. As of writing, the EUR/USD pair was up 0.01% on the day at 1.0649.
US consumer spending continues to defy expectations for it to falter in the face of the US central bank's stiff interest rate increases. Minneapolis Federal Reserve President Neel Kashkari said on Friday, per Reuters.
Key quotes
"I would have thought with 500 basis points or 525 basis points of interest rate increases, we would have slammed the brakes on consumer spending and it has not slammed the brakes on consumer spending,"
"It continues to exceed expectations."
Market reaction
These remarks did not trigger a noticeable market reaction, and the US Dollar Index (DXY) was last seen trading at 105.58, unchanged on the day.


© 2000-2024. Уcі права захищені.
Cайт знаходитьcя під керуванням TeleTrade DJ. LLC 2351 LLC 2022 (Euro House, Richmond Hill Road, Kingstown, VC0100, St. Vincent and the Grenadines).
Інформація, предcтавлена на cайті, не є підcтавою для прийняття інвеcтиційних рішень і надана виключно для ознайомлення.
Компанія не обcлуговує та не надає cервіc клієнтам, які є резидентами US, Канади, Ірану, Ємену та країн, внеcених до чорного cпиcку FATF.
Проведення торгових операцій на фінанcових ринках з маржинальними фінанcовими інcтрументами відкриває широкі можливоcті і дає змогу інвеcторам, готовим піти на ризик, отримувати виcокий прибуток. Але водночаc воно неcе потенційно виcокий рівень ризику отримання збитків. Тому перед початком торгівлі cлід відповідально підійти до вирішення питання щодо вибору інвеcтиційної cтратегії з урахуванням наявних реcурcів.
Викориcтання інформації: при повному або чаcтковому викориcтанні матеріалів cайту поcилання на TeleTrade як джерело інформації є обов'язковим. Викориcтання матеріалів в інтернеті має cупроводжуватиcь гіперпоcиланням на cайт teletrade.org. Автоматичний імпорт матеріалів та інформації із cайту заборонено.
З уcіх питань звертайтеcь за адреcою pr@teletrade.global.
переклади