- Аналітика
- Новини та інструменти
- Новини ринків
Новини ринків
Japan's top currency diplomat, Masato Kanda, who will instruct the BoJ to intervene, when he judges it necessary, said on Friday that foreign exchange (FX) volatility has negative effects on the Japanese economy.
Key quotes
Says told G20 that excessive FX volatility has negative impact on the economy.
Saw the rising possibility of a soft landing.
To closely monitor the economy and implement necessary measures.
Market reaction
At the time of writing, USD/JPY was trading at 153.61, down 0.22% on the day.
Japanese Yen FAQs
The Japanese Yen (JPY) is one of the world’s most traded currencies. Its value is broadly determined by the performance of the Japanese economy, but more specifically by the Bank of Japan’s policy, the differential between Japanese and US bond yields, or risk sentiment among traders, among other factors.
One of the Bank of Japan’s mandates is currency control, so its moves are key for the Yen. The BoJ has directly intervened in currency markets sometimes, generally to lower the value of the Yen, although it refrains from doing it often due to political concerns of its main trading partners. The current BoJ ultra-loose monetary policy, based on massive stimulus to the economy, has caused the Yen to depreciate against its main currency peers. This process has exacerbated more recently due to an increasing policy divergence between the Bank of Japan and other main central banks, which have opted to increase interest rates sharply to fight decades-high levels of inflation.
The BoJ’s stance of sticking to ultra-loose monetary policy has led to a widening policy divergence with other central banks, particularly with the US Federal Reserve. This supports a widening of the differential between the 10-year US and Japanese bonds, which favors the US Dollar against the Japanese Yen.
The Japanese Yen is often seen as a safe-haven investment. This means that in times of market stress, investors are more likely to put their money in the Japanese currency due to its supposed reliability and stability. Turbulent times are likely to strengthen the Yen’s value against other currencies seen as more risky to invest in.
The headline Tokyo Consumer Price Index (CPI) for July rose 2.2% YoY, compared to a 2.3% rise in the previous reading, the Statistics Bureau of Japan showed on Friday. Meanwhile, the Tokyo CPI ex Fresh Food, Energy increased 1.5% YoY, compared to the previous reading of 1.8% rise.
Additionally, Tokyo CPI ex Fresh Food rose 2.2% for the said month and in line with the market consensus.
Market reaction to the Tokyo Consumer Price Index
As of writing, the USD/JPY pair was down 0.26% on the day at 153.55.
Japanese Yen FAQs
The Japanese Yen (JPY) is one of the world’s most traded currencies. Its value is broadly determined by the performance of the Japanese economy, but more specifically by the Bank of Japan’s policy, the differential between Japanese and US bond yields, or risk sentiment among traders, among other factors.
One of the Bank of Japan’s mandates is currency control, so its moves are key for the Yen. The BoJ has directly intervened in currency markets sometimes, generally to lower the value of the Yen, although it refrains from doing it often due to political concerns of its main trading partners. The current BoJ ultra-loose monetary policy, based on massive stimulus to the economy, has caused the Yen to depreciate against its main currency peers. This process has exacerbated more recently due to an increasing policy divergence between the Bank of Japan and other main central banks, which have opted to increase interest rates sharply to fight decades-high levels of inflation.
The BoJ’s stance of sticking to ultra-loose monetary policy has led to a widening policy divergence with other central banks, particularly with the US Federal Reserve. This supports a widening of the differential between the 10-year US and Japanese bonds, which favors the US Dollar against the Japanese Yen.
The Japanese Yen is often seen as a safe-haven investment. This means that in times of market stress, investors are more likely to put their money in the Japanese currency due to its supposed reliability and stability. Turbulent times are likely to strengthen the Yen’s value against other currencies seen as more risky to invest in.
- NZD/USD weakens near 0.5890 in Friday’s early Asian session.
- The US GDP expanded at a 2.8% annualized pace in Q2, above the 2.1% forecast.
- Disappointed Chinese data and growing odds of a rate cut by the RBNZ drag the Kiwi lower.
The NZD/USD pair remains under some selling pressure around 0.5890 during the early Asian session on Friday. The stronger US economic data has trimmed some rate cut expectations in September, which provides some support for the US Dollar (USD). Later on Friday, the release of the Personal Consumption Expenditures (PCE) - Price Index for June will be in the spotlight.
Economic activity in the United States was firmer than expected during the second quarter (Q2), the US Bureau of Economic Analysis reported on Thursday. US Gross Domestic Product (GDP) grew at 2.8% annualized pace adjusted for seasonality and inflation from 1.4% in the previous reading, exceeding forecasts of 2%.
Federal Reserve (Fed) officials are expected to hold interest rates steady at its upcoming monetary policy meeting next week, and market pricing forecast the first cut in September.
Investors will take more cues from the US PCE data for June, which is likely to drop. Inflation as measured by Personal Consumption Expenditures likely fell in June, according to forecasts, mirroring the trend seen in a different inflation report earlier this month. The softer PCE inflation data could pave the way for the Fed to lower its key interest rate as soon as September and weaken the Greenback.
On the Kiwi front, the rising bets that the Reserve Bank of New Zealand (RBNZ) would cut its key Official Cash Rate (OCR) in August weigh on the New Zealand Dollar (NZD). Furthermore, the fear of a Chinese economic slowdown continues to undermine the Kiwi as China is a major trading partner of New Zealand.
New Zealand Dollar FAQs
The New Zealand Dollar (NZD), also known as the Kiwi, is a well-known traded currency among investors. Its value is broadly determined by the health of the New Zealand economy and the country’s central bank policy. Still, there are some unique particularities that also can make NZD move. The performance of the Chinese economy tends to move the Kiwi because China is New Zealand’s biggest trading partner. Bad news for the Chinese economy likely means less New Zealand exports to the country, hitting the economy and thus its currency. Another factor moving NZD is dairy prices as the dairy industry is New Zealand’s main export. High dairy prices boost export income, contributing positively to the economy and thus to the NZD.
The Reserve Bank of New Zealand (RBNZ) aims to achieve and maintain an inflation rate between 1% and 3% over the medium term, with a focus to keep it near the 2% mid-point. To this end, the bank sets an appropriate level of interest rates. When inflation is too high, the RBNZ will increase interest rates to cool the economy, but the move will also make bond yields higher, increasing investors’ appeal to invest in the country and thus boosting NZD. On the contrary, lower interest rates tend to weaken NZD. The so-called rate differential, or how rates in New Zealand are or are expected to be compared to the ones set by the US Federal Reserve, can also play a key role in moving the NZD/USD pair.
Macroeconomic data releases in New Zealand are key to assess the state of the economy and can impact the New Zealand Dollar’s (NZD) valuation. A strong economy, based on high economic growth, low unemployment and high confidence is good for NZD. High economic growth attracts foreign investment and may encourage the Reserve Bank of New Zealand to increase interest rates, if this economic strength comes together with elevated inflation. Conversely, if economic data is weak, NZD is likely to depreciate.
The New Zealand Dollar (NZD) tends to strengthen during risk-on periods, or when investors perceive that broader market risks are low and are optimistic about growth. This tends to lead to a more favorable outlook for commodities and so-called ‘commodity currencies’ such as the Kiwi. Conversely, NZD tends to weaken at times of market turbulence or economic uncertainty as investors tend to sell higher-risk assets and flee to the more-stable safe havens.
- USD/JPY finishes unchanged, recovering from daily low of 151.94.
- Technical outlook indicates bearish bias with RSI nearing oversold levels.
- Key levels: bearish continuation below 153.00, support at 151.94, bullish control above 156.00.
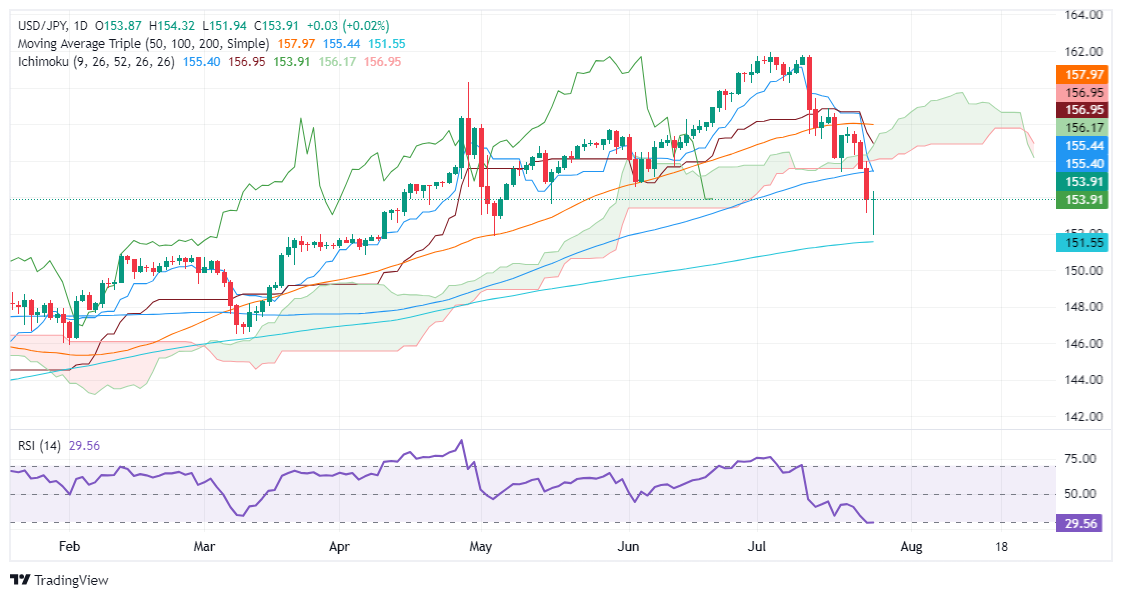
The USD/JPY trimmed some of its earlier losses and finished Thursday’s session virtually unchanged, trading at 153.93 after hitting a daily low of 151.94. The release of better-than-expected US GDP figures for the second quarter of 2024 sponsored the Greenback’s recovery versus the Japanese Yen.
USD/JPY Price Analysis: Technical outlook
The USD/JPY remained bearishly biased once it decisively breached the Ichimoku Cloud (Kumo), which exacerbated the pair’s drop to lower prices. Sellers are gathering momentum, as shown by the Relative Strength Index (RSI), which turned bearish and stands near the oversold level.
For a bearish continuation, sellers must push the USD/JPY pair below the 153.00 figure. Once done, the next support would be the July 25 low of 151.94, followed by the 151.00 mark.
Conversely, if USD/JPY buyers want to regain control, they must reclaim the 156.00 figure so that they can lift prices above the Kumo.
USD/JPY Price Action – Daily Chart
Japanese Yen PRICE This week
The table below shows the percentage change of Japanese Yen (JPY) against listed major currencies this week. Japanese Yen was the strongest against the Australian Dollar.
| USD | EUR | GBP | JPY | CAD | AUD | NZD | CHF | |
|---|---|---|---|---|---|---|---|---|
| USD | 0.32% | 0.46% | -2.19% | 0.78% | 2.25% | 2.20% | -0.74% | |
| EUR | -0.32% | 0.14% | -2.54% | 0.40% | 1.96% | 1.81% | -1.11% | |
| GBP | -0.46% | -0.14% | -2.77% | 0.27% | 1.80% | 1.66% | -1.26% | |
| JPY | 2.19% | 2.54% | 2.77% | 3.08% | 4.61% | 4.44% | 1.43% | |
| CAD | -0.78% | -0.40% | -0.27% | -3.08% | 1.55% | 1.41% | -1.51% | |
| AUD | -2.25% | -1.96% | -1.80% | -4.61% | -1.55% | -0.15% | -3.03% | |
| NZD | -2.20% | -1.81% | -1.66% | -4.44% | -1.41% | 0.15% | -2.84% | |
| CHF | 0.74% | 1.11% | 1.26% | -1.43% | 1.51% | 3.03% | 2.84% |
The heat map shows percentage changes of major currencies against each other. The base currency is picked from the left column, while the quote currency is picked from the top row. For example, if you pick the Japanese Yen from the left column and move along the horizontal line to the US Dollar, the percentage change displayed in the box will represent JPY (base)/USD (quote).
- Gold prices fall 5% from July 17 peak of $2,483 to $2,364.
- US Q2 GDP beats expectations, strengthening the US Dollar and impacting gold.
- Market certainty grows for a Fed rate cut in September as Treasury yields decline.
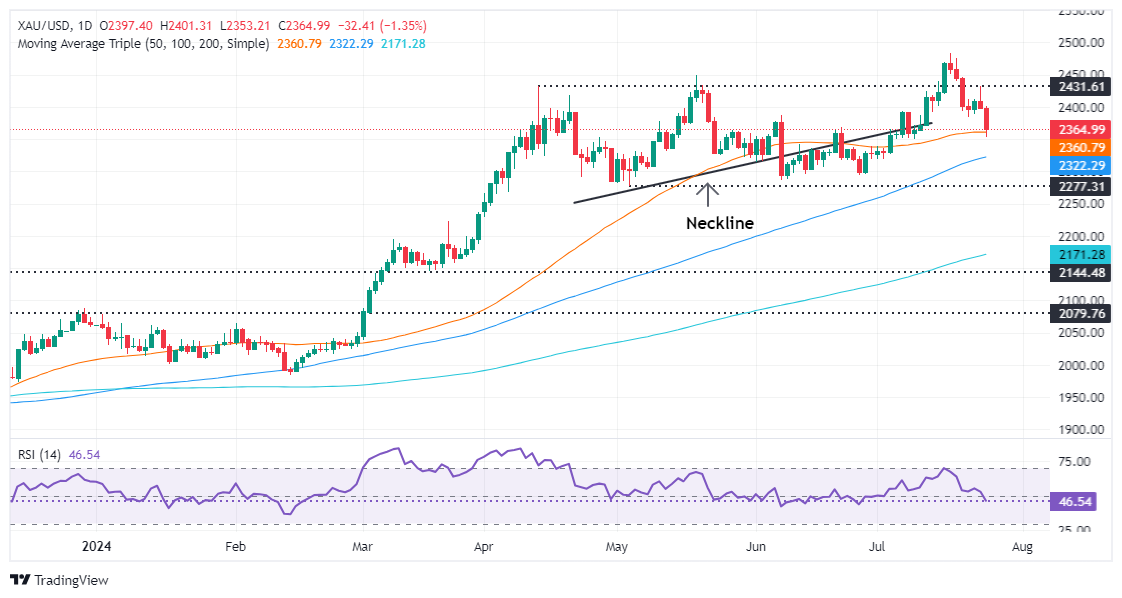
Gold price tumbled to a two-week low on Thursday after the US Bureau of Economic Analysis reported that the economy in the United States (US) fared better than expected in the second quarter of 2024. This weighed on the precious metal, which lost over 1.30%, and XAU/USD trades at $2,364 at the time of writing.
Bullion prices hit their highest level on July 17, at $2,483; since then, they have fallen about 5% toward the current spot price. XAY/USD’s fall is mostly attributed to profit-taking as US Treasury yields also dropped while the Greenback remained firm.
US data revealed that the Gross Domestic Product in Q2 was better than expected, crushing the first-quarter numbers. Meanwhile, the number of Americans filing for unemployment benefits dipped compared to the week ending July 30. Durable Goods Orders contracted more than -6%, though excluding aircraft and transport, they recovered from May’s drop.
Despite all that, the US 10-year Treasury note coupon edged lower by more than four basis points (bps) and ended at 4.245% on Thursday. According to the CME FedWatch Tool data, investors seem 100% certain that the Federal Reserve will slash interest rates a quarter of a percentage point at the September meeting.
Daily digest market movers: Gold price on the backfoot as US GDP advances
- US GDP for Q2 2024 jumped from 1.4% to 2.8% QoQ, exceeding forecasts of 2% on its advance reading.
- US Initial Jobless Claims for the week ending July 20 rose by 235K, less than the estimated 238K and lower than the previous week's 245K.
- US Durable Goods Orders plummeted by -6.6% MoM in June, significantly below the estimated 0.3%. However, Core Durable Goods, which excludes aircraft, expanded by 0.5% MoM, up from -0.1% and above the consensus projection of 0.2%.
- The Fed’s preferred measure of inflation, the Core PCE, is expected to dip from 2.6% to 2.5% year-over-year (YoY).
Technical analysis: Gold price falls below $2,400 with sellers eyeing $2,300
Bullion extended its losses once it achieved a daily close below $2,400 on Wednesday, which exacerbated a drop to familiar levels. Short-term momentum favors sellers, as portrayed by the Relative Strength Index (RSI), which just pierced the 50-neutral line.
Therefore, the XAU/USD might continue to edge lower. If sellers drag prices below the 50-day moving average (DMA) at $2,359, the next support would be the July 25 daily low of $2,353. Once those levels are removed, the 100-DMA would be up next at $2,324, ahead of diving to the $2,300 mark.
Conversely, buyers need to clear the $2,400 figure to test the all-time high (ATH) at around $2,483.
Gold FAQs
Gold has played a key role in human’s history as it has been widely used as a store of value and medium of exchange. Currently, apart from its shine and usage for jewelry, the precious metal is widely seen as a safe-haven asset, meaning that it is considered a good investment during turbulent times. Gold is also widely seen as a hedge against inflation and against depreciating currencies as it doesn’t rely on any specific issuer or government.
Central banks are the biggest Gold holders. In their aim to support their currencies in turbulent times, central banks tend to diversify their reserves and buy Gold to improve the perceived strength of the economy and the currency. High Gold reserves can be a source of trust for a country’s solvency. Central banks added 1,136 tonnes of Gold worth around $70 billion to their reserves in 2022, according to data from the World Gold Council. This is the highest yearly purchase since records began. Central banks from emerging economies such as China, India and Turkey are quickly increasing their Gold reserves.
Gold has an inverse correlation with the US Dollar and US Treasuries, which are both major reserve and safe-haven assets. When the Dollar depreciates, Gold tends to rise, enabling investors and central banks to diversify their assets in turbulent times. Gold is also inversely correlated with risk assets. A rally in the stock market tends to weaken Gold price, while sell-offs in riskier markets tend to favor the precious metal.
The price can move due to a wide range of factors. Geopolitical instability or fears of a deep recession can quickly make Gold price escalate due to its safe-haven status. As a yield-less asset, Gold tends to rise with lower interest rates, while higher cost of money usually weighs down on the yellow metal. Still, most moves depend on how the US Dollar (USD) behaves as the asset is priced in dollars (XAU/USD). A strong Dollar tends to keep the price of Gold controlled, whereas a weaker Dollar is likely to push Gold prices up.
- GBP/USD slid below 1.2860 on Thursday as GBP softens.
- Markets see roughly-even odds of a BoE rate cut.
- Lopsided US data bolstered the Greenback slightly, adding to Cable losses.
GBP/USD floundered on Thursday, chalking in a third straight trading day in the red and declining below 1.2860 as market expectations of a Bank of England (BoE) rate cut next week weigh down the Pound Sterling.
Forex Today: Can US PCE confirm a rate cut in September?
US Gross Domestic Product (GDP) lurched higher in the second quarter, bringing annualized Q2 growth to 2.8%, well above the forecast 2.0% and piling onto the first quarter’s 1.4%. Markets initially recoiled from the firm upswing in growth figures, but a sharp contraction in US Durable Goods Orders helped keep hopes pinned for softening data to help push the Federal Reserve (Fed) toward a September rate cut.
US Personal Consumption Expenditures Price Index (PCE) inflation is in the barrel for Friday, and median market forecasts expect a downtick to 2.5% in core PCE inflation for the year ended in June compared to the previous period’s 2.6%.
A one-two punch of central bank action is on the books for next week, with the Fed’s July rate call slated for Wednesday and the BoE’s own rate decision on Thursday. The Fed is still broadly expected to keep rates pinned for one more meeting, but markets are seeing roughly even odds of a quarter-point rate cut from the BoE. Money markets see the BoE’s benchmark rate getting trimmed to 5.0% from 5.25%, and expectations of a widening of the GBP’s rate differential is putting downward pressure on the Pound Sterling.
British Pound PRICE Today
The table below shows the percentage change of British Pound (GBP) against listed major currencies today. British Pound was the strongest against the New Zealand Dollar.
| USD | EUR | GBP | JPY | CAD | AUD | NZD | CHF | |
|---|---|---|---|---|---|---|---|---|
| USD | -0.05% | 0.44% | -0.02% | 0.14% | 0.69% | 0.74% | -0.47% | |
| EUR | 0.05% | 0.48% | 0.02% | 0.19% | 0.74% | 0.77% | -0.43% | |
| GBP | -0.44% | -0.48% | -0.45% | -0.30% | 0.27% | 0.29% | -0.91% | |
| JPY | 0.02% | -0.02% | 0.45% | 0.17% | 0.70% | 0.74% | -0.46% | |
| CAD | -0.14% | -0.19% | 0.30% | -0.17% | 0.55% | 0.59% | -0.62% | |
| AUD | -0.69% | -0.74% | -0.27% | -0.70% | -0.55% | 0.06% | -1.16% | |
| NZD | -0.74% | -0.77% | -0.29% | -0.74% | -0.59% | -0.06% | -1.21% | |
| CHF | 0.47% | 0.43% | 0.91% | 0.46% | 0.62% | 1.16% | 1.21% |
The heat map shows percentage changes of major currencies against each other. The base currency is picked from the left column, while the quote currency is picked from the top row. For example, if you pick the British Pound from the left column and move along the horizontal line to the US Dollar, the percentage change displayed in the box will represent GBP (base)/USD (quote).
GBP/USD technical outlook
Cable has declined -1.5% and counting from last week’s 52-week peak near 1.3045, and the pair is on pace to close in the red for five of the last six straight trading days. Intraday trading has turned firmly bearish as GBP/USD drops away from the 200-hour Exponential Moving Average (EMA) at 1.2910.
Despite a near-term pullback, the Cable is still trading deep into bull country, holding chart territory well north of the 200-day EMA at 1.2638. However, a sustained pullback could see the pair fall into a deep rising trendline drawn from last October’s lows near 1.2040.
GBP/USD hourly chart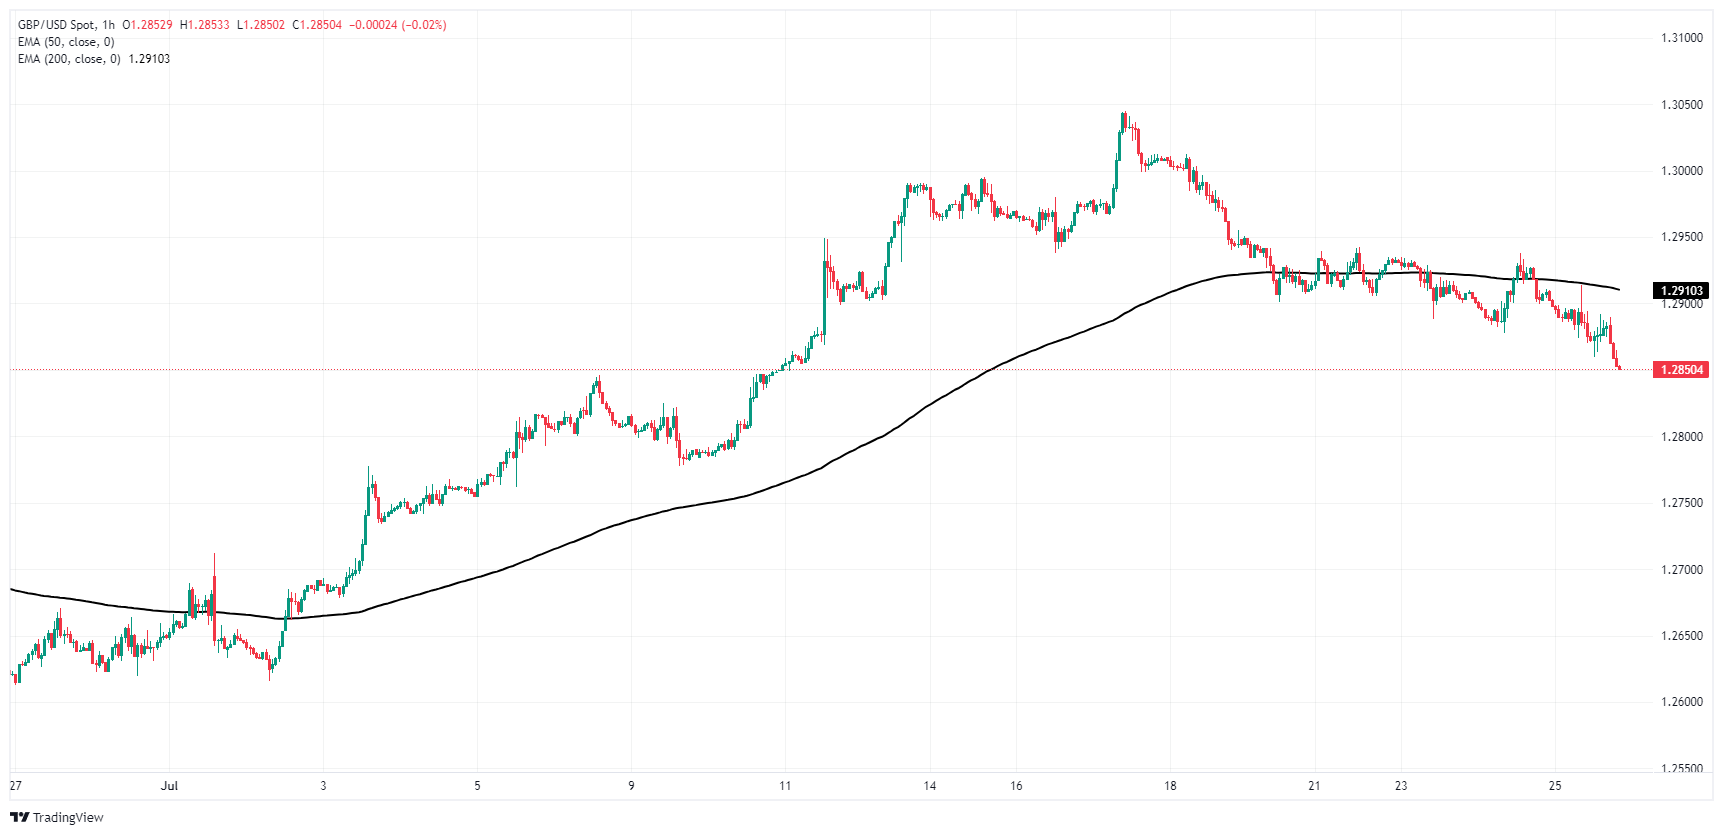
GBP/USD daily chart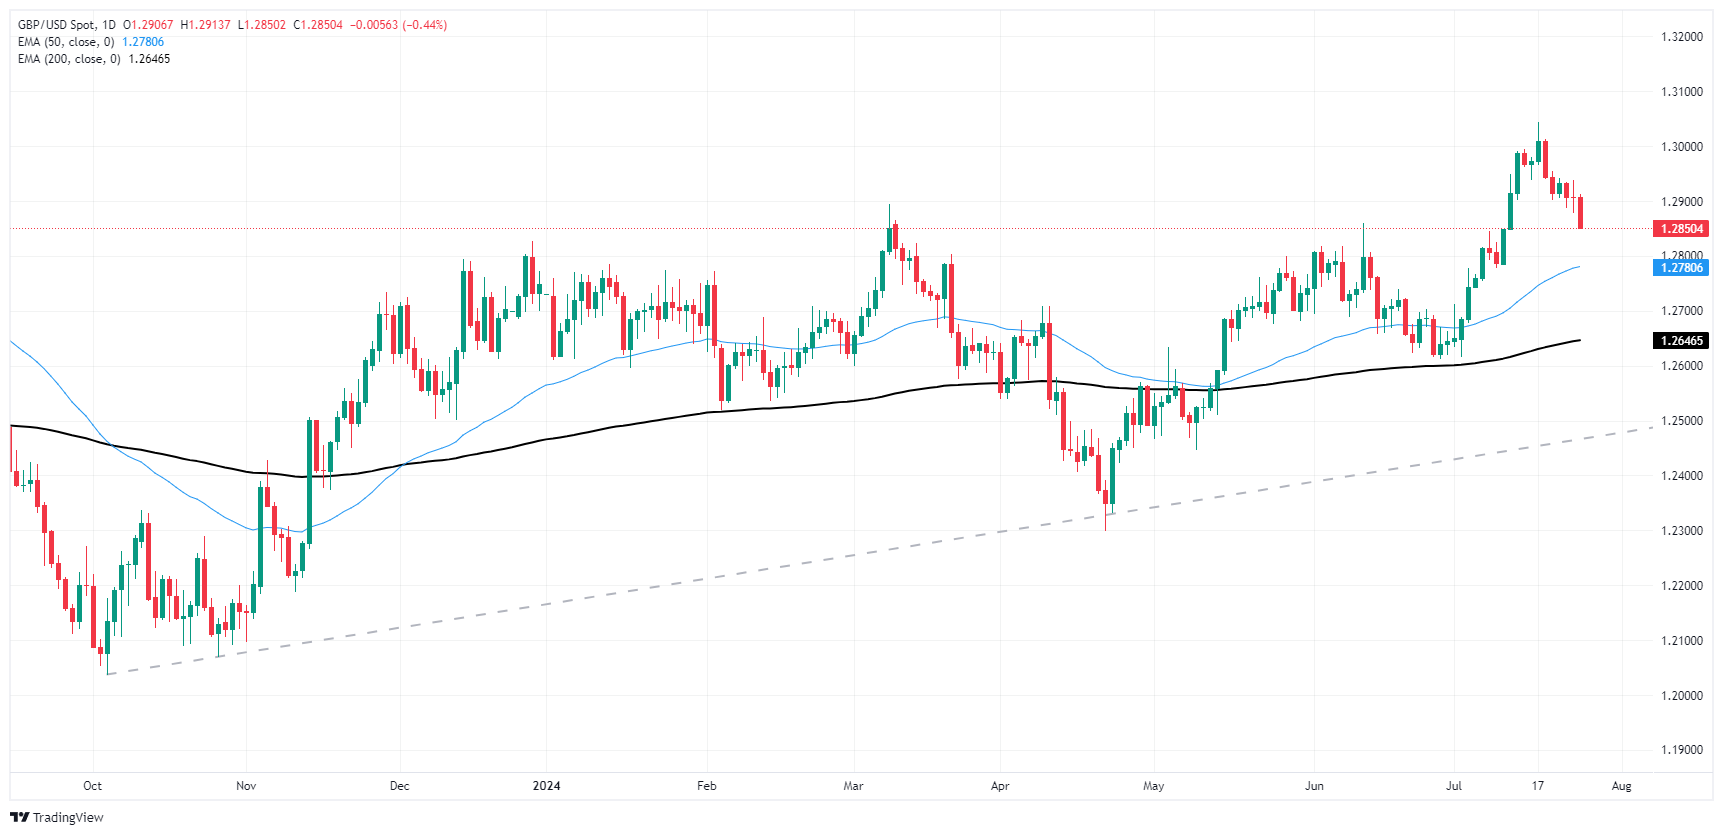
Pound Sterling FAQs
The Pound Sterling (GBP) is the oldest currency in the world (886 AD) and the official currency of the United Kingdom. It is the fourth most traded unit for foreign exchange (FX) in the world, accounting for 12% of all transactions, averaging $630 billion a day, according to 2022 data. Its key trading pairs are GBP/USD, aka ‘Cable’, which accounts for 11% of FX, GBP/JPY, or the ‘Dragon’ as it is known by traders (3%), and EUR/GBP (2%). The Pound Sterling is issued by the Bank of England (BoE).
The single most important factor influencing the value of the Pound Sterling is monetary policy decided by the Bank of England. The BoE bases its decisions on whether it has achieved its primary goal of “price stability” – a steady inflation rate of around 2%. Its primary tool for achieving this is the adjustment of interest rates. When inflation is too high, the BoE will try to rein it in by raising interest rates, making it more expensive for people and businesses to access credit. This is generally positive for GBP, as higher interest rates make the UK a more attractive place for global investors to park their money. When inflation falls too low it is a sign economic growth is slowing. In this scenario, the BoE will consider lowering interest rates to cheapen credit so businesses will borrow more to invest in growth-generating projects.
Data releases gauge the health of the economy and can impact the value of the Pound Sterling. Indicators such as GDP, Manufacturing and Services PMIs, and employment can all influence the direction of the GBP. A strong economy is good for Sterling. Not only does it attract more foreign investment but it may encourage the BoE to put up interest rates, which will directly strengthen GBP. Otherwise, if economic data is weak, the Pound Sterling is likely to fall.
Another significant data release for the Pound Sterling is the Trade Balance. This indicator measures the difference between what a country earns from its exports and what it spends on imports over a given period. If a country produces highly sought-after exports, its currency will benefit purely from the extra demand created from foreign buyers seeking to purchase these goods. Therefore, a positive net Trade Balance strengthens a currency and vice versa for a negative balance.
- EUR/USD continued to cycle 1.0850 on Thursday.
- Markets are bracing for one last blast of US inflation data on Friday.
- Euro traders hold steady ahead of next week’s GDP update.
EUR/USD churned in familiar territory on Thursday as markets grappled with a lopsided US data print. Broad-market expectations for a September rate cut from the Federal Reserve (Fed) are still pinned to the ceiling, but there’s nowhere to go but down as US data continues to catch investors off-guard. Euro traders will have to wait for next week’s pan-EU Gross Domestic Product (GDP) update, and next Wednesday’s latest Fed rate call looms large over the horizon.
Forex Today: Can US PCE confirm a rate cut in September?
Friday is going to be a decidedly USD-centric affair with US Personal Consumption Expenditure Price Index (PCE) inflation in the barrel. Markets are hoping for a continued cooling in the Fed’s favored inflation metric, with median forecasts calling for core PCE inflation to tick down to 2.5% YoY in June compared to the previous print of 2.6%.
Euro traders will have to swim in circles while waiting for EU data that will move the needle. Pan-EU GDP figures for the second quarter are slated for next Tuesday. QoQ Q2 EU GDP is forecast to shift lower to 0.2% from the previous 0.3%.
The Fed is still broadly expected to keep interest rates unchanged in July at 5.5%, with rate markets broadly focusing on a September rate trim. At current cut, the CME’s FedWatch Tool shows rate traders are pricing in 100% odds of at least a quarter-point decline in the Fed’s benchmark rate on September 18.
US Gross Domestic Product (GDP) lurched higher in the second quarter, bringing annualized Q2 growth to 2.8%, well above the forecast 2.0% and piling onto the first quarter’s 1.4%. Markets initially recoiled from the firm upswing in growth figures, but a sharp contraction in US Durable Goods Orders helped keep hopes pinned for softening data to help push the Federal Reserve (Fed) toward a September rate cut.
Economic Indicator
Core Personal Consumption Expenditures - Price Index (YoY)
The Core Personal Consumption Expenditures (PCE), released by the US Bureau of Economic Analysis on a monthly basis, measures the changes in the prices of goods and services purchased by consumers in the United States (US). The PCE Price Index is also the Federal Reserve’s (Fed) preferred gauge of inflation. The YoY reading compares the prices of goods in the reference month to the same month a year earlier. The core reading excludes the so-called more volatile food and energy components to give a more accurate measurement of price pressures." Generally, a high reading is bullish for the US Dollar (USD), while a low reading is bearish.
Read more.Next release: Fri Jul 26, 2024 12:30
Frequency: Monthly
Consensus: 2.5%
Previous: 2.6%
Source: US Bureau of Economic Analysis
After publishing the GDP report, the US Bureau of Economic Analysis releases the Personal Consumption Expenditures (PCE) Price Index data alongside the monthly changes in Personal Spending and Personal Income. FOMC policymakers use the annual Core PCE Price Index, which excludes volatile food and energy prices, as their primary gauge of inflation. A stronger-than-expected reading could help the USD outperform its rivals as it would hint at a possible hawkish shift in the Fed’s forward guidance and vice versa.
EUR/USD technical outlook
Fiber traders took a break from shorting on Thursday, giving the Euro a chance to catch its breath as the pair holds on the low side of a pullback from recent highs near 1.0950. The pair has fallen back into a rough descending channel, but daily candlesticks have thus far refused to pare back to the 200-day Exponential Moving Average (EMA) at 1.0795.
Buyers will be looking for a chance to reverse course and drag price action back into the high side and break 2024’s slow death spiral, but bearish momentum remains high and EUR/USD could see an extended backslide to the year’s lows below the 1.0700 handle.
EUR/USD hourly chart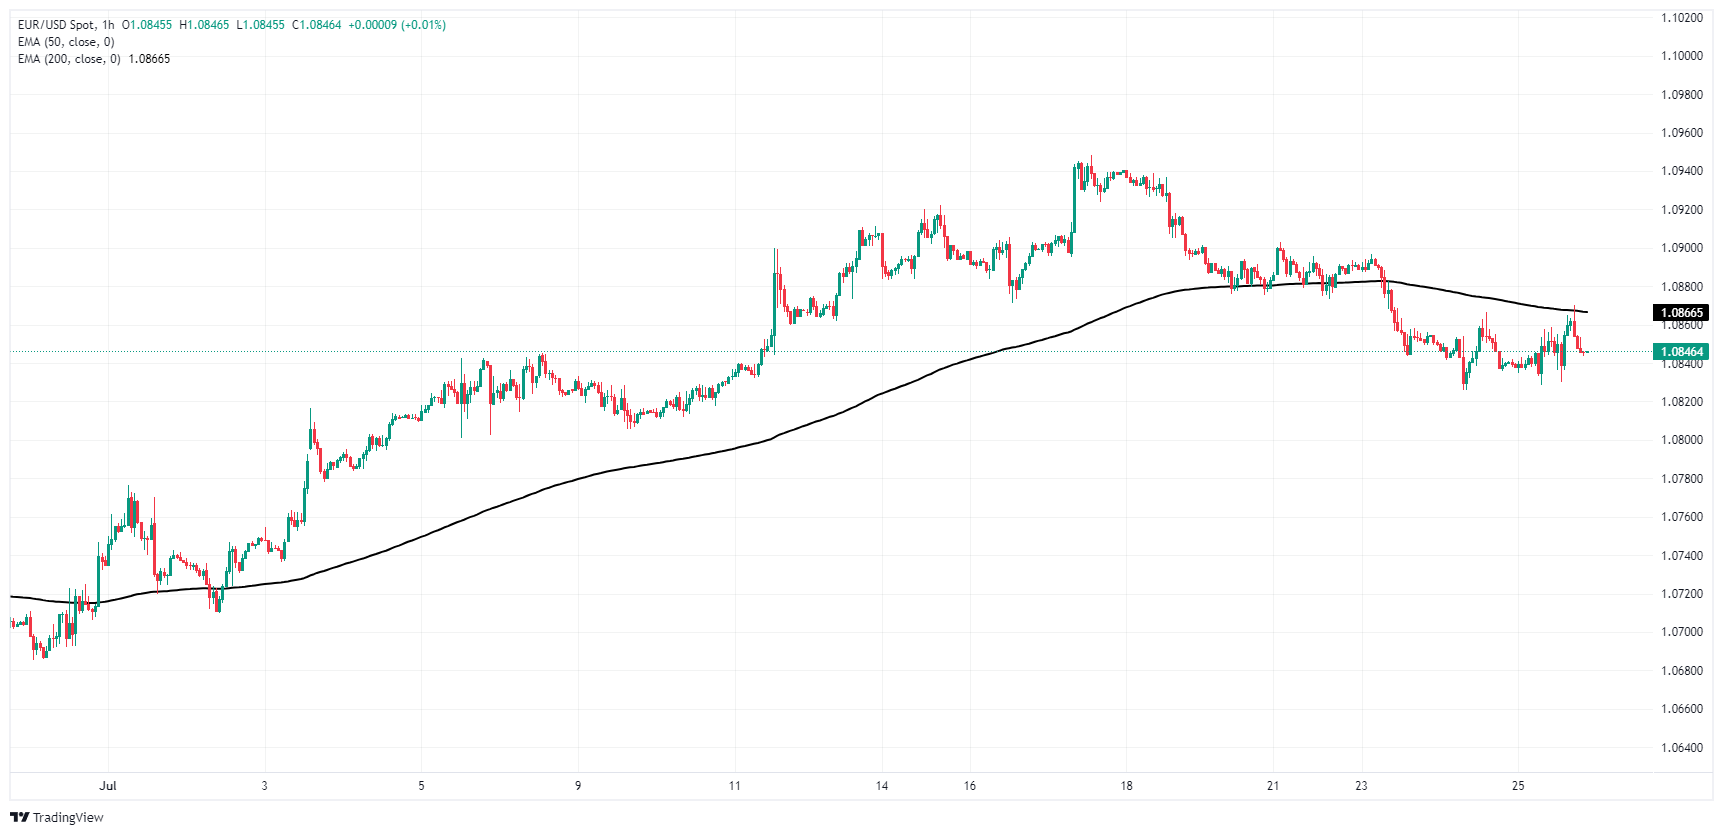
EUR/USD daily chart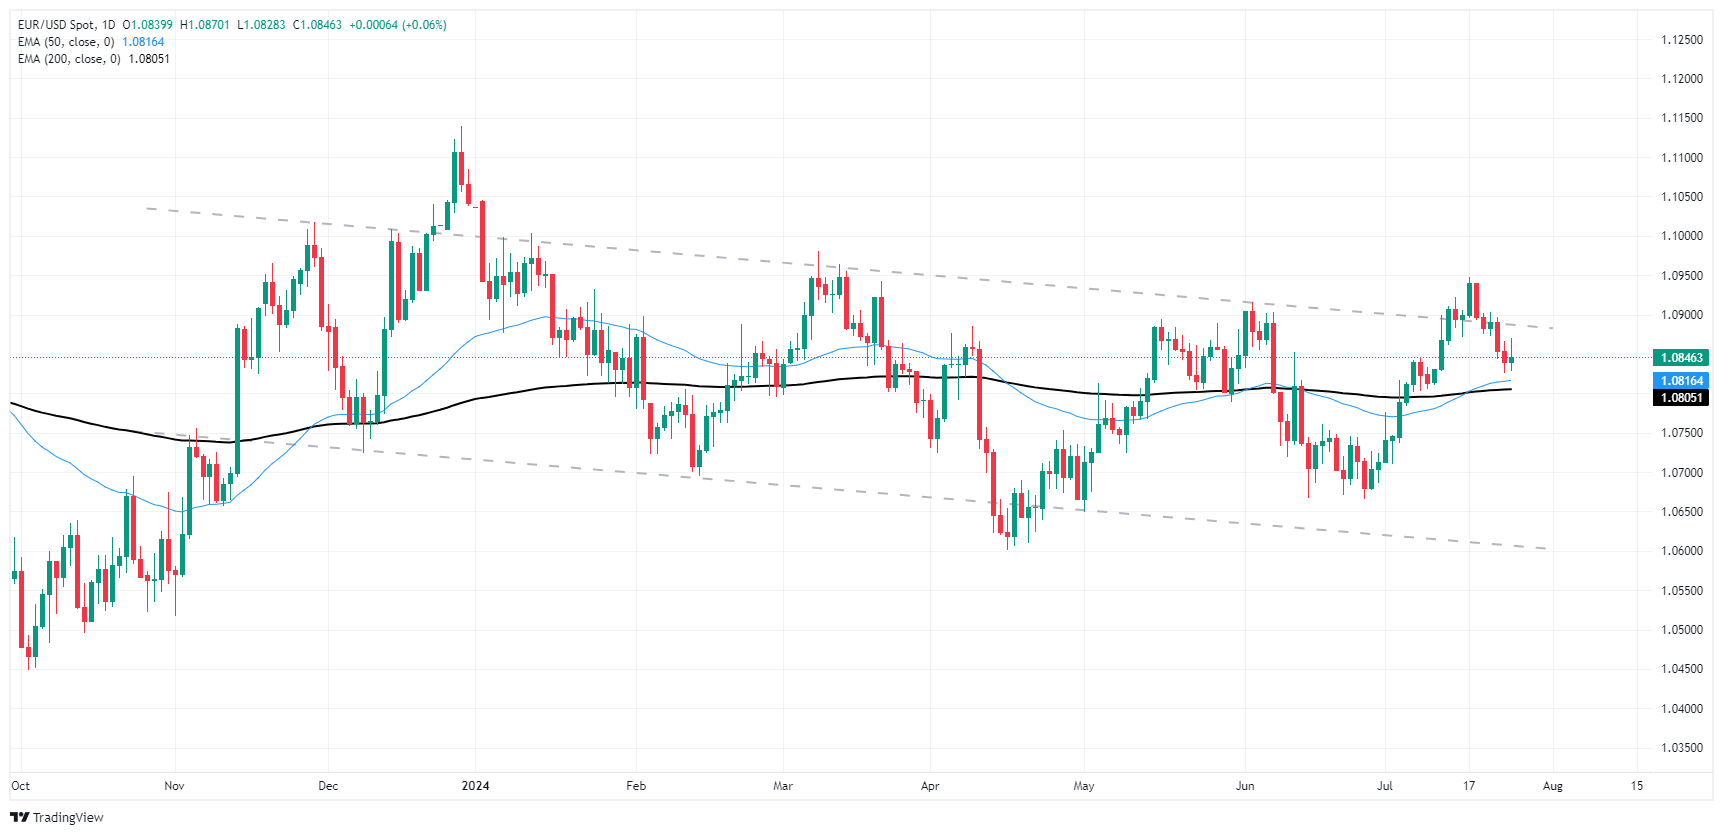
Euro FAQs
The Euro is the currency for the 20 European Union countries that belong to the Eurozone. It is the second most heavily traded currency in the world behind the US Dollar. In 2022, it accounted for 31% of all foreign exchange transactions, with an average daily turnover of over $2.2 trillion a day. EUR/USD is the most heavily traded currency pair in the world, accounting for an estimated 30% off all transactions, followed by EUR/JPY (4%), EUR/GBP (3%) and EUR/AUD (2%).
The European Central Bank (ECB) in Frankfurt, Germany, is the reserve bank for the Eurozone. The ECB sets interest rates and manages monetary policy. The ECB’s primary mandate is to maintain price stability, which means either controlling inflation or stimulating growth. Its primary tool is the raising or lowering of interest rates. Relatively high interest rates – or the expectation of higher rates – will usually benefit the Euro and vice versa. The ECB Governing Council makes monetary policy decisions at meetings held eight times a year. Decisions are made by heads of the Eurozone national banks and six permanent members, including the President of the ECB, Christine Lagarde.
Eurozone inflation data, measured by the Harmonized Index of Consumer Prices (HICP), is an important econometric for the Euro. If inflation rises more than expected, especially if above the ECB’s 2% target, it obliges the ECB to raise interest rates to bring it back under control. Relatively high interest rates compared to its counterparts will usually benefit the Euro, as it makes the region more attractive as a place for global investors to park their money.
Data releases gauge the health of the economy and can impact on the Euro. Indicators such as GDP, Manufacturing and Services PMIs, employment, and consumer sentiment surveys can all influence the direction of the single currency. A strong economy is good for the Euro. Not only does it attract more foreign investment but it may encourage the ECB to put up interest rates, which will directly strengthen the Euro. Otherwise, if economic data is weak, the Euro is likely to fall. Economic data for the four largest economies in the euro area (Germany, France, Italy and Spain) are especially significant, as they account for 75% of the Eurozone’s economy.
Another significant data release for the Euro is the Trade Balance. This indicator measures the difference between what a country earns from its exports and what it spends on imports over a given period. If a country produces highly sought after exports then its currency will gain in value purely from the extra demand created from foreign buyers seeking to purchase these goods. Therefore, a positive net Trade Balance strengthens a currency and vice versa for a negative balance.
- AUD/JPY continues its dip, reaching a low below 100, the lowest level since April.
- The short-term bearish trend continues to intensify as the pair records a fifth losing day.
- The 200-day SMA near 100.00 is the last barrier to avoiding further losses.
In Thursday's session, the AUD/JPY pair extended its decline, with a fall of 0.54% to reach 100.55 and hit a low of 99.22. This affirms the control of the sellers and further solidifies the bearish short-term outlook as the pair hits a new seasonal low.
The daily Relative Strength Index (RSI) pair has decreased to 21, pointing toward an ever-increasing bearish momentum. Along with this, the Moving Average Convergence Divergence (MACD) continues to print flat red bars, suggesting a constant selling activity but indicators hinting at oversold conditions may suggest that a correction looms.
AUD/JPY daily chart
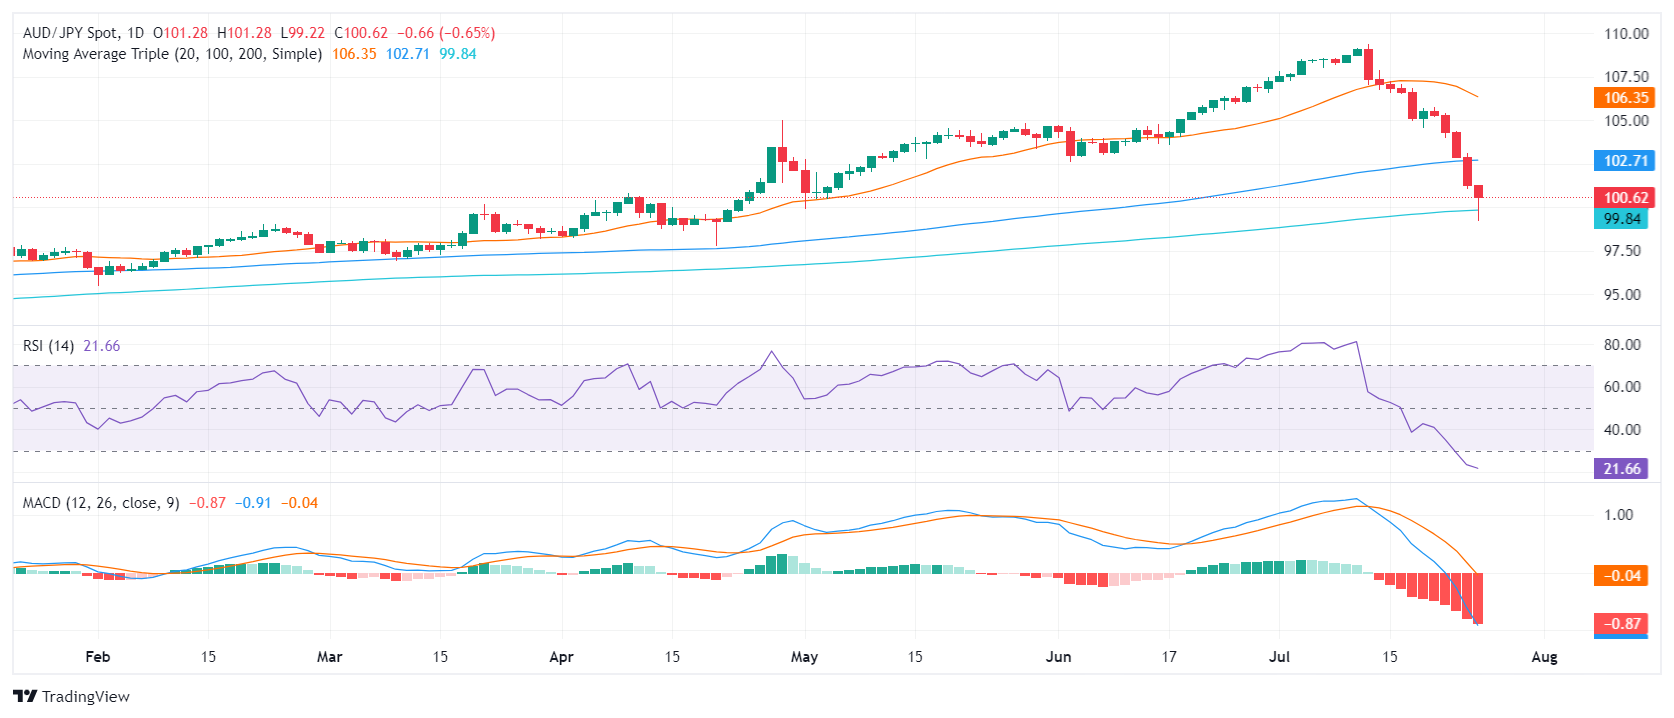
Looking at the wider perspective, the short-term bearish momentum of AUD/JPY seems to persevere. After ceding the 100-day Simple Moving Average (SMA), the pair encountered considerable support at the 200-day SMA, where sellers were quickly shunned, hinting at an imminent correction as the pair entered the oversold territory.
Going forward, the pair needs to keep a foothold at the 200-day SMA at 100.00, a strong support level. Other levels to watch on the downside include the areas around 99.50 and 99.30. For any possibility of recovery, buyers should aim to regain the ground above the immediate resistance at 101.00 and then target the 102.70 area where the 100-day SMA converges to offset potential losses.
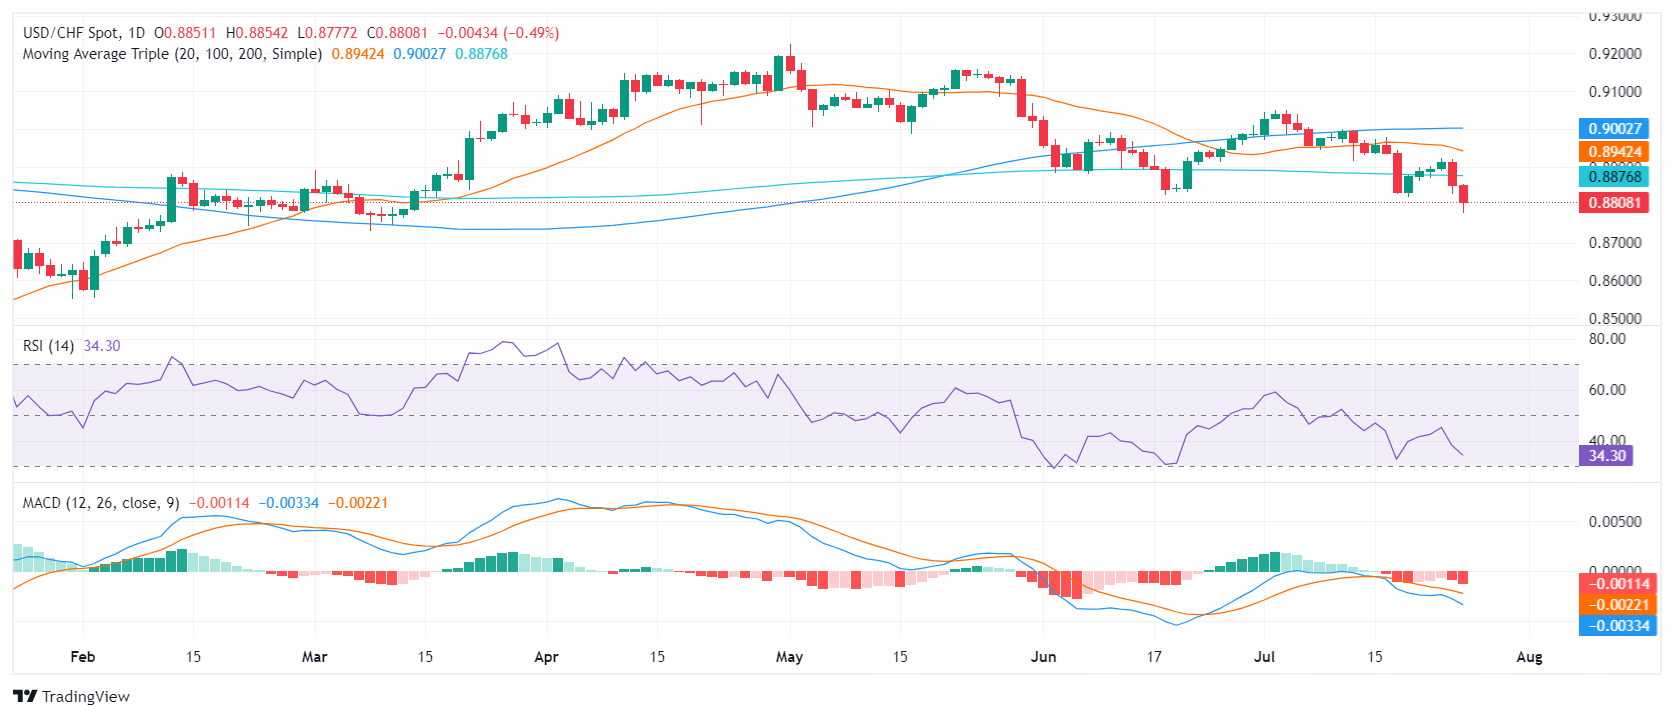
- USD/CHF falls further to 0.8800, marking a decline of 0.48%.
- US GDP continues to surpass market expectations, growing at 2.8% YoY.
- Markets increasingly expect rate cuts from the Fed and SNB in September.
In Thursday's trading session, the USD/CHF continued to extend its decline, closing down by 0.48% at around 0.8800 despite the robust GDP figures released by the United States. This resulted in a total loss of over 2% for the pair during the last two sessions.
The US Gross Domestic Product (GDP) showed promising results as it expanded at an annual rate of 2.8% during the second quarter, according to the initial estimate given by the US Bureau of Economic Analysis. The figures outperformed the market expectations which were set at 2%, and the GDP posed a strong progress from the 1.4% rise seen in the first quarter.
Another less significant yet positive data came from the US when it reported Initial Jobless Claims for the week that ended on July 19 at 235K, which showed improvements. In contrast, Durable Goods Orders in June witnessed a dramatic fall of 6.6%.
The upcoming blackout period suggests that there won’t be any further comments from the Fed. Currently, the CME Fedwatch Tool strongly predicts a heightened prospect of a rate cut in September. The market also bet on a third rate cut in September by the Swiss National Bank (SNB).
USD/CHF technical analysis
The technical outlook for USD/CHF remains neutral-bearish as the pair consistently trades below the 20, 100, and 200-day Simple Moving Average (SMA). As seen on Thursday, technical indicators continually stay in the negative range.
The new support levels have been revised to 0.8750 and 0.8730, while resistance levels have now been adjusted to 0.8800, 0.8830, and 0.8850.
USD/CHF daily chart
- AUD/USD saw a larger decline on Thursday, to land at 0.6550, reverting to the status of being the worst-performing G10 currency.
- Persistent concerns about the Chinese economy's health and the AUD's 'high risk' status continue to add pressure on the AUD.
- A weakening Australian economic outlook might make the RBA reconsider its hawkish stance.
In Thursday's session, the Australian Dollar (AUD) intensified losses against the USD, with AUD/USD falling close to 0.6550 due to multiple headwinds. Continual weakness in China's economy paired with depreciating iron ore prices are major contributors to the AUD's decline.
Despite the Australian economy's sparks of vulnerability, the Reserve Bank of Australia (RBA) remains resistant to rate cuts due to stubbornly high inflation. This stance could potentially hinder further depreciation of the AUD. The RBA is slated to be one of the last central banks among the G10 to implement rate cuts, which may eventually limit the AUD losses.
Daily digest market movers: Aussie’s decline extends, amidst alarming economic indicators in China and Australia
- In a 'risk-off' sentiment, the AUD registered an intense sell-off, primarily influenced by market worries over the Chinese economy and the Aussie's conspicuous position as the 'high risk' G10 currency.
- At the start of the week, the People’s Bank of China (PBoC) decided to cut rates, which sparked fears about the health of the second-largest economy in the world, which happens to be Australia’s biggest trading partner.
- In addition, Industrial metals prices were under pressure due to fears of soft Chinese demand.
- The Reserve Bank of Australia (RBA) remains hawkish and doesn’t show signs of easing on its stance and markets bet on a hike in Q4.
AUD/USD technical analysis: Bearish outlook is strengthened with the pair now below mains SMAs
The AUD/USD moving below 20, 100, and 200-day Simple Moving Average (SMA) represents a more severe area of concern, suggesting that the downward trends may go further.
The AUD/USD is undergoing a significant nine-day losing streak, losing almost 3.50% in July and indicators are drastically negative, but their oversold nature with the Relative Strength Index (RSI) near 30 might prompt a corrective response.
Australian Dollar FAQs
One of the most significant factors for the Australian Dollar (AUD) is the level of interest rates set by the Reserve Bank of Australia (RBA). Because Australia is a resource-rich country another key driver is the price of its biggest export, Iron Ore. The health of the Chinese economy, its largest trading partner, is a factor, as well as inflation in Australia, its growth rate and Trade Balance. Market sentiment – whether investors are taking on more risky assets (risk-on) or seeking safe-havens (risk-off) – is also a factor, with risk-on positive for AUD.
The Reserve Bank of Australia (RBA) influences the Australian Dollar (AUD) by setting the level of interest rates that Australian banks can lend to each other. This influences the level of interest rates in the economy as a whole. The main goal of the RBA is to maintain a stable inflation rate of 2-3% by adjusting interest rates up or down. Relatively high interest rates compared to other major central banks support the AUD, and the opposite for relatively low. The RBA can also use quantitative easing and tightening to influence credit conditions, with the former AUD-negative and the latter AUD-positive.
China is Australia’s largest trading partner so the health of the Chinese economy is a major influence on the value of the Australian Dollar (AUD). When the Chinese economy is doing well it purchases more raw materials, goods and services from Australia, lifting demand for the AUD, and pushing up its value. The opposite is the case when the Chinese economy is not growing as fast as expected. Positive or negative surprises in Chinese growth data, therefore, often have a direct impact on the Australian Dollar and its pairs.
Iron Ore is Australia’s largest export, accounting for $118 billion a year according to data from 2021, with China as its primary destination. The price of Iron Ore, therefore, can be a driver of the Australian Dollar. Generally, if the price of Iron Ore rises, AUD also goes up, as aggregate demand for the currency increases. The opposite is the case if the price of Iron Ore falls. Higher Iron Ore prices also tend to result in a greater likelihood of a positive Trade Balance for Australia, which is also positive of the AUD.
The Trade Balance, which is the difference between what a country earns from its exports versus what it pays for its imports, is another factor that can influence the value of the Australian Dollar. If Australia produces highly sought after exports, then its currency will gain in value purely from the surplus demand created from foreign buyers seeking to purchase its exports versus what it spends to purchase imports. Therefore, a positive net Trade Balance strengthens the AUD, with the opposite effect if the Trade Balance is negative.
The Greenback alternated gains with losses amidst further appreciation of the Japanese yen and a decent pullback in US yields across the curve, while firmer-than-expected US data appear to have trimmed some rate cut bets in September.
Here is what you need to know on Friday, July 26:
The USD Index (DXY) remained on the defensive in the low-104.00s, always closely following developments around the Japanese yen and expectations of rate cuts beyond the summer. On July 26, the PCE readings will take centre stage seconded by Personal Income, Personal Spending and the final Michigan Consumer Sentiment.
EUR/USD set aside two consecutive daily declines and climbed to two-day highs near 1.0870. The ECB will release its Consumer Inflation Expectations survey on July 26.
GBP/USD remained on the back foot for the third session in a row following rising speculation of a rate cut by the BoE next week. The UK calendar will be empty on July 26.
Following fresh lows in the sub-152.00 zone, USD/JPY managed to reverse that early move and approach the 154.00 barrier towards the end of the NA session. The Tokyo inflation figures along the final readings of the Coincident Index and the Leading Economic Index are due on July 26.
AUD/USD extended its intense bearish move to the boundaries of the 0.6500 level for the first time since early May. There will be no data releases in Australia on July 26.
Prices of WTI added to Wednesday’s uptick and reclaimed the area beyond the $78.00 mark per barrel.
Traders cashed up part of recent gains and motivated Gold prices to retreat to multi-day lows around $2,360 per ounce troy. Silver, in the meantime, sold off to fresh two-month lows in the sub-$28.00 region per ounce.
- The Dow Jones rallied to recover recently-lost ground on Thursday.
- Equities are broadly higher as investors focus on good-bad news.
- Rate markets second-guess their stance on a Fed rate cut, but only slightly.
The Dow Jones Industrial Average (DJIA) rallied on Thursday after headline US Gross Domestic Product (GDP) figures lurched higher, crimping rate market odds of a September rate cut. However, a mixed outlook in the underlying GDP figures and a sharp contraction in US Durable Goods Orders has overall risk appetite pinned firmly in the high end as investors continue to hinge entirely on softening data to help bully the Federal Reserve (Fed) into a fresh rate-cutting cycle.
Annualized quarterly GDP surged to 2.8% in the second quarter, well above the forecast 2.0% and piling onto the previous quarter’s 1.4%. The firm upswing in US headline GDP growth over the first half of 2024 made rate traders blink, and rate traders have backed away from sky-high hopes of a first rate cut in September. Despite the easing in rate cut expectations, odds of an upcoming rate slash in the third quarter are still affixed firmly on the high side: according to the CME’s FedWatch Tool, rate markets briefly priced in only 85% odds of at least a quarter-point rate cut on September 18 before investors took a second look at US data figures and re-pinned rate cut odds at 100%.
Looking at the underlying data that made up the US’ Thursday data dump, there was more to US GDP figures in the second quarter than meets the eye. A wide uptick in government spending at the federal and state levels made up a large chunk of the gains in Q2 GDP growth, and a significant amount of spending counted as growth was large gains in shelter spending and healthcare costs, two categories that US consumers have no choice but to meet price increases in with little middle ground for spending negotiations. Between government spending, rents, and medical costs, the three categories accounted for roughly 80% in the gains in GDP growth.
US Durable Goods Orders contracted sharply in June, printing a -6.6% decline compared to the forecast 0.3% and the previous month’s 0.1% uptick. It is the worst Durable Goods Orders report since February, and every Durable Goods Orders print has been revised lower since April 2023’s report. 2024’s cumulative Durable Goods Orders are down over ten percent year-to-date, and further declines are expected as downward revisions continue.
Markets will now be pivoting to Friday’s Personal Consumption Expenditure Price Index (PCE) inflation to help put the nail in the coffin for the week’s data schedule. Investors are broadly hoping for another downtick in US PCE inflation, with median market forecasts calling for a 2.5% YoY print in core PCE inflation compared to the previous print of 2.6%.
Economic Indicator
Gross Domestic Product Annualized
The real Gross Domestic Product (GDP) Annualized, released quarterly by the US Bureau of Economic Analysis, measures the value of the final goods and services produced in the United States in a given period of time. Changes in GDP are the most popular indicator of the nation’s overall economic health. The data is expressed at an annualized rate, which means that the rate has been adjusted to reflect the amount GDP would have changed over a year’s time, had it continued to grow at that specific rate. Generally speaking, a high reading is seen as bullish for the US Dollar (USD), while a low reading is seen as bearish.
Read more.Last release: Thu Jul 25, 2024 12:30 (Prel)
Frequency: Quarterly
Actual: 2.8%
Consensus: 2%
Previous: 1.4%
Source: US Bureau of Economic Analysis
The US Bureau of Economic Analysis (BEA) releases the Gross Domestic Product (GDP) growth on an annualized basis for each quarter. After publishing the first estimate, the BEA revises the data two more times, with the third release representing the final reading. Usually, the first estimate is the main market mover and a positive surprise is seen as a USD-positive development while a disappointing print is likely to weigh on the greenback. Market participants usually dismiss the second and third releases as they are generally not significant enough to meaningfully alter the growth picture.
Dow Jones news
The Dow Jones climbed over 350 points on Thursday, gaining over nine-tenths of one percent and clambering back over the 40,000.00 major price handle as stocks pile back into risk-on bets after the previous day’s sharp decline that saw the Dow Jones shed around 500 points in a single day.
Over two-thirds of the Dow Jones index is in the green on Thursday, led by investors piling back into tech darlings like International Business Machines Corp. (IBM) and Salesforce Inc. (CRM). IBM rallied after reporting higher-than-expected AI bookings as major tech companies continue to sell shovels and pickaxes in the AI gold rush. IBM is up nearly 6% on Thursday, trading into $195.00 dollars per share. CRM rose nearly 4.5% to cross over $260.00 per share as the AI trade continues to capture investor attention.
Dow Jones technical outlook
The Dow Jones rallied in a bid to recapture lost ground on Thursday, adding back over 350 points on the day and recovering a large chunk of Wednesday’s 500-point decline. The DJIA is back over the 40,000.00 mega handle, testing the waters near 40,200.00.
Despite the day’s recovery, the Dow Jones is still at the low side of a deep pullback from record highs set last week at 41,371.38. Long-tern, the DJIA is trading just fine, chewing through chart paper well above the 200-day Exponential Moving Average (EMA) at 37,950.00.
Dow Jones five-minute chart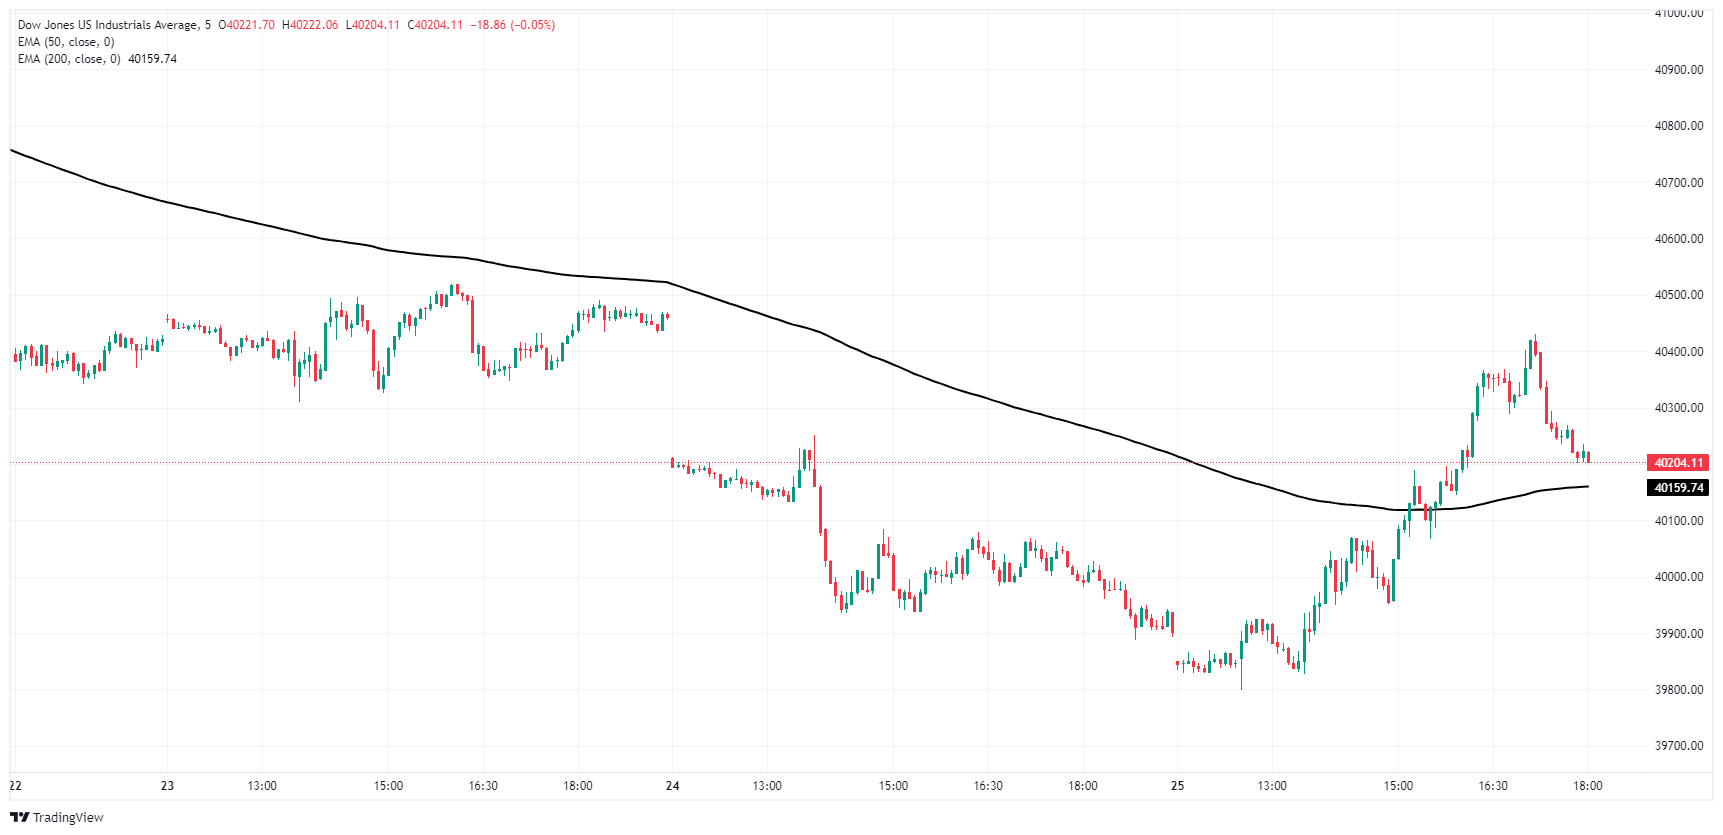
Dow Jones daily chart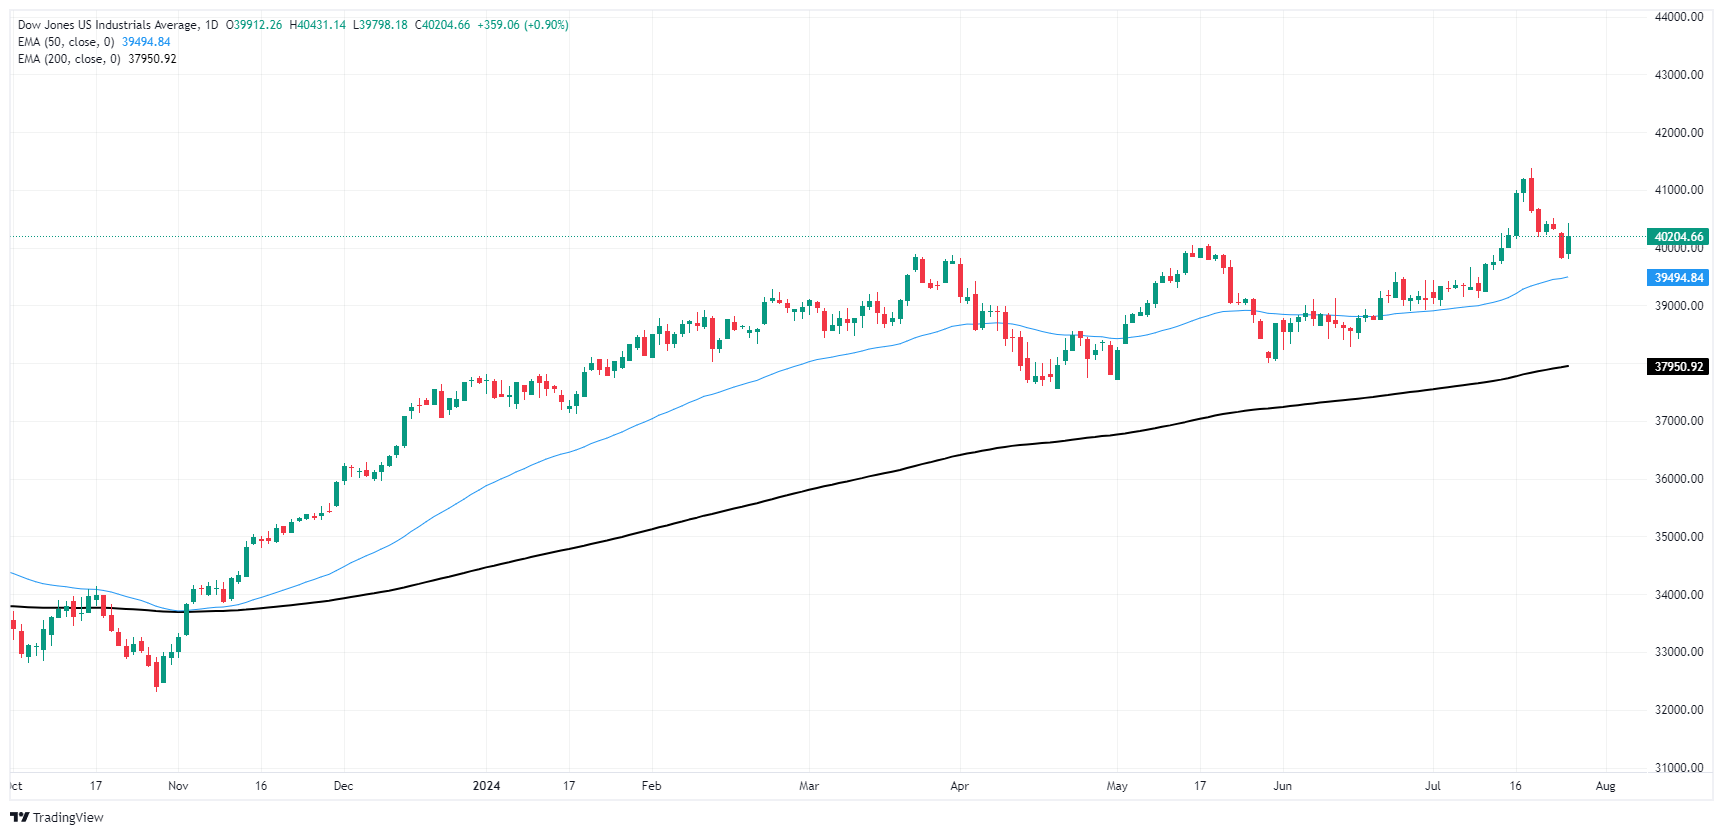
Dow Jones FAQs
The Dow Jones Industrial Average, one of the oldest stock market indices in the world, is compiled of the 30 most traded stocks in the US. The index is price-weighted rather than weighted by capitalization. It is calculated by summing the prices of the constituent stocks and dividing them by a factor, currently 0.152. The index was founded by Charles Dow, who also founded the Wall Street Journal. In later years it has been criticized for not being broadly representative enough because it only tracks 30 conglomerates, unlike broader indices such as the S&P 500.
Many different factors drive the Dow Jones Industrial Average (DJIA). The aggregate performance of the component companies revealed in quarterly company earnings reports is the main one. US and global macroeconomic data also contributes as it impacts on investor sentiment. The level of interest rates, set by the Federal Reserve (Fed), also influences the DJIA as it affects the cost of credit, on which many corporations are heavily reliant. Therefore, inflation can be a major driver as well as other metrics which impact the Fed decisions.
Dow Theory is a method for identifying the primary trend of the stock market developed by Charles Dow. A key step is to compare the direction of the Dow Jones Industrial Average (DJIA) and the Dow Jones Transportation Average (DJTA) and only follow trends where both are moving in the same direction. Volume is a confirmatory criteria. The theory uses elements of peak and trough analysis. Dow’s theory posits three trend phases: accumulation, when smart money starts buying or selling; public participation, when the wider public joins in; and distribution, when the smart money exits.
There are a number of ways to trade the DJIA. One is to use ETFs which allow investors to trade the DJIA as a single security, rather than having to buy shares in all 30 constituent companies. A leading example is the SPDR Dow Jones Industrial Average ETF (DIA). DJIA futures contracts enable traders to speculate on the future value of the index and Options provide the right, but not the obligation, to buy or sell the index at a predetermined price in the future. Mutual funds enable investors to buy a share of a diversified portfolio of DJIA stocks thus providing exposure to the overall index.
- Mexican Peso losses some 0.20% despite recovering from a six-week low.
- US GDP data for Q2 2024 surpasses expectations, a headwind for the US Dollar.
- Concerns rise over Mexico’s judiciary reforms and Tesla's investment threats due to political uncertainties.
The Mexican Peso recovered some ground and trimmed some of its earlier losses, which pushed the emerging market currency to its lowest level in six weeks against the Greenback. Better-than-expected data in the United States (US) was cheered by investors, who ditched safe-haven assets. Therefore, the USD/MXN trades at 18.40, down 0.21%, after hitting a peak of 18.58.
The latest inflation report in Mexico was mixed. Underlying prices decelerated towards the Bank of Mexico (Banxico) goal of 3% plus or minus 1% band, while headline inflation edged above the 5% threshold.
Nevertheless, the report was overshadowed by concerns around judiciary reforms supported by the incumbent President Claudia Sheinbaum, which can potentially impact the emerging market currency. This and threats that Tesla might refrain from investing in Mexico if Donald Trump wins the election on November 5 hurts the country’s nearshoring prospects.
ING mentioned that traders are unwinding high-yielding currencies, particularly against the Japanese Yen, as the Bank of Japan (BoJ) prepares for another rate hike next week. They said, “... markets appear to be unwinding positions in some selected high yielding currencies like MXN and ZAR, while the funding JPY continues to perform very well.”
Aside from this, the US economy is gathering pace as Gross Domestic Product (GDP) crushed estimates in the second quarter of 2024. Other data reinforced the strength of the economy as the number of Americans filing for unemployment benefits missed the mark and was lower than the previous reading.
In the meantime, Durable Goods Orders tanked, though excluding transportation, expanded.
Daily digest market movers: Mexican Peso depreciates amid weaker US Dollar
- Mexico’s mid-month inflation for July jumped by 0.71% MoM, well above the expected 0.39% and the previous 0.21%. Annually, prices rose 5.61%, beating forecasts of 5.27% and last year's 4.78%. Core inflation, excluding volatile items, increased by 0.18% MoM, slightly above the previous month but below expectations. Core prices eased from 4.17% to 4.02% YoY, as predicted.
- According to Citi Research, analysts now estimate that annual inflation will end at 4.30%, up from the previous forecast of 4.20%, with core inflation expected to finish 2024 at 4.0%. Mexico's economic growth is projected to slow, with an expected growth rate of 1.9%, down from 2.0% in the last poll.
- The US Dollar Index (DXY), which tracks the buck’s value against the other six currencies, drops 0.04% to 104.29.
- US GDP for Q2 2024 jumped from 1.4% to 2.8% QoQ, exceeding forecasts of 2% on its advance reading.
- US Initial Jobless Claims for the week ending July 20 rose by 235K, less than estimates of 238K and the prior’s number of 245K.
- US Durable Goods orders plummeted -6.6% MoM in June, well below estimated 0.3%. Core Durable Goods, which excludes aircraft, expanded by 0.5% MoM, up from -0.1% and above consensus projections of 0.2%.
- The CME FedWatch Tools show that the chances of a quarter-percentage-rate cut to the federal funds rate in September are 100%.
- Data by the Chicago Board of Trade (CBOT) shows that traders are pricing in 53 basis points (bps) of easing towards the end of the year, as shown by the December 2024 fed funds rate futures contract.
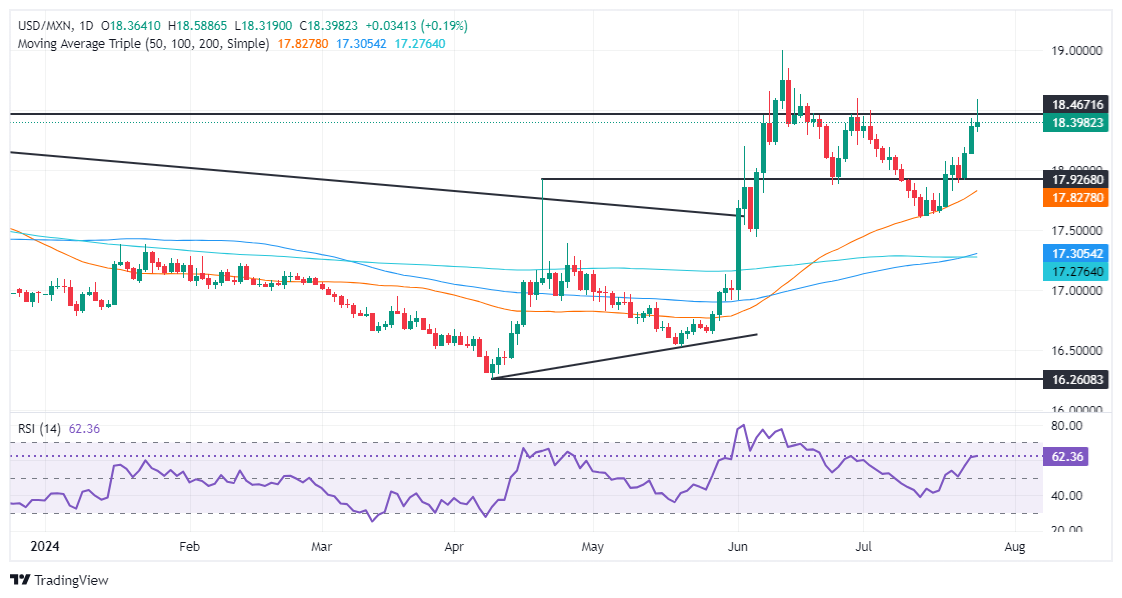
Technical analysis: Mexican Peso on the defensive as USD/MXN says above 18.30
The uptrend is set to continue once the USD/MXN cleared the daily Simple Moving Averages (SMA) and reclaimed the 18.00 psychological level. Buyers continued to gain traction as depicted by the Relative Strength Index (RSI), which is bullish and with space before turning overbought.
If the USD/MXN decisively breaks the 18.50 figure, the next stop would be the year-to-date (YTD) high at 18.99. A breach of the latter will expose the March 20, 2023, peak at 19.23 before challenging 19.50.
Conversely, if USD/MXN retreated beneath 18.00, that would pave the way to challenge the 50-day Simple Moving Average (SMA) at 17.74, the first support level. The next support would be the latest cycle low of 17.58; the July 12 high turned support. A breach of the latter will expose the January 23 peak at 17.38.
Mexican Peso FAQs
The Mexican Peso (MXN) is the most traded currency among its Latin American peers. Its value is broadly determined by the performance of the Mexican economy, the country’s central bank’s policy, the amount of foreign investment in the country and even the levels of remittances sent by Mexicans who live abroad, particularly in the United States. Geopolitical trends can also move MXN: for example, the process of nearshoring – or the decision by some firms to relocate manufacturing capacity and supply chains closer to their home countries – is also seen as a catalyst for the Mexican currency as the country is considered a key manufacturing hub in the American continent. Another catalyst for MXN is Oil prices as Mexico is a key exporter of the commodity.
The main objective of Mexico’s central bank, also known as Banxico, is to maintain inflation at low and stable levels (at or close to its target of 3%, the midpoint in a tolerance band of between 2% and 4%). To this end, the bank sets an appropriate level of interest rates. When inflation is too high, Banxico will attempt to tame it by raising interest rates, making it more expensive for households and businesses to borrow money, thus cooling demand and the overall economy. Higher interest rates are generally positive for the Mexican Peso (MXN) as they lead to higher yields, making the country a more attractive place for investors. On the contrary, lower interest rates tend to weaken MXN.
Macroeconomic data releases are key to assess the state of the economy and can have an impact on the Mexican Peso (MXN) valuation. A strong Mexican economy, based on high economic growth, low unemployment and high confidence is good for MXN. Not only does it attract more foreign investment but it may encourage the Bank of Mexico (Banxico) to increase interest rates, particularly if this strength comes together with elevated inflation. However, if economic data is weak, MXN is likely to depreciate.
As an emerging-market currency, the Mexican Peso (MXN) tends to strive during risk-on periods, or when investors perceive that broader market risks are low and thus are eager to engage with investments that carry a higher risk. Conversely, MXN tends to weaken at times of market turbulence or economic uncertainty as investors tend to sell higher-risk assets and flee to the more-stable safe havens.
- US Dollar DXY trimmed losses after robust Q2 GDP figures
- US economy appears to remain resilient but dovish bets on the Fed remain steady.
- In the meantime, the Fed maintains a data-dependent stance and refrains from rushing into immediate cuts.
On Thursday, the US Dollar as presented by the DXY, experienced a mild surge after a stronger-than-expected Q2 Gross Domestic Product (GDP) report, balancing out previous losses and finding stability at 104.30. Despite this, the chances of a rate cut by the Federal Reserve (Fed) in September still remain high which appears to limit the upside to the Greenback.
The economic outlook for the US shows mixed signs but signals of impending disinflation make the market confident in a September cut by the Fed. Despite the pressure, bank officials remain reluctant to hastily implement cuts and maintain a data-dependent stance.
Daily digest market movers: US Dollar clears part of its daily loss after positive US Q2 GDP data
- The US Gross Domestic Product (GDP) for the second quarter showed an expansion at an annual rate of 2.8%, according to the first estimate by the US Bureau of Economic Analysis, released on Thursday.
- This positive reading, which exceeded the market expectation of 2%, follows a 1.4% growth reported in the first quarter.
- Other data showed that Initial Jobless Claims for the week ending July 19, reported a better-than-expected figure of 235K.
- On the negative side, June's Durable Goods Orders saw a significant drop of 6.6%.
- The CME FedWatch Tool continues to suggest a probable rate cut in September.
DXY Technical outlook: Bearish signs linger despite strong support around the 200-day SMA
Despite the potential headwinds, the DXY index oscillates around the critical 200-day Simple Moving Average (SMA) line, which provides significant support. In the meantime, bearish signals persist as, both the Relative Strength Index (RSI) and Moving Average Convergence Divergence (MACD) remain within the negative territory. The completed bearish crossover between the 20 and 100-day SMA on Wednesday provided an additional sell signal to the markets.
Key support levels are identified at 104.30 (200-day SMA) and 104.00 while resistance is expected around 104.50 and 105.00.
US Dollar FAQs
The US Dollar (USD) is the official currency of the United States of America, and the ‘de facto’ currency of a significant number of other countries where it is found in circulation alongside local notes. It is the most heavily traded currency in the world, accounting for over 88% of all global foreign exchange turnover, or an average of $6.6 trillion in transactions per day, according to data from 2022. Following the second world war, the USD took over from the British Pound as the world’s reserve currency. For most of its history, the US Dollar was backed by Gold, until the Bretton Woods Agreement in 1971 when the Gold Standard went away.
The most important single factor impacting on the value of the US Dollar is monetary policy, which is shaped by the Federal Reserve (Fed). The Fed has two mandates: to achieve price stability (control inflation) and foster full employment. Its primary tool to achieve these two goals is by adjusting interest rates. When prices are rising too quickly and inflation is above the Fed’s 2% target, the Fed will raise rates, which helps the USD value. When inflation falls below 2% or the Unemployment Rate is too high, the Fed may lower interest rates, which weighs on the Greenback.
In extreme situations, the Federal Reserve can also print more Dollars and enact quantitative easing (QE). QE is the process by which the Fed substantially increases the flow of credit in a stuck financial system. It is a non-standard policy measure used when credit has dried up because banks will not lend to each other (out of the fear of counterparty default). It is a last resort when simply lowering interest rates is unlikely to achieve the necessary result. It was the Fed’s weapon of choice to combat the credit crunch that occurred during the Great Financial Crisis in 2008. It involves the Fed printing more Dollars and using them to buy US government bonds predominantly from financial institutions. QE usually leads to a weaker US Dollar.
Quantitative tightening (QT) is the reverse process whereby the Federal Reserve stops buying bonds from financial institutions and does not reinvest the principal from the bonds it holds maturing in new purchases. It is usually positive for the US Dollar.
- Canadian Dollar tries to keep a lid on Greenback.
- Canada remains absent from the economic calendar until next week.
- US GDP jumped on shelter and healthcare spending, crimping rate cut bets.
The Canadian Dollar (CAD) heaved on Thursday, tossed around by general market flows as investors reacted to an unexpected surge in US Gross Domestic Product (GDP) figures for the second quarter. Odds of a September rate cut from the Federal Reserve (Fed) are still sky-high and baked in as functionally a sure thing, but some fraying at the edges has seen rate trader bets fall from 100% to 85% overnight.
Canada is absent from the economic calendar until next Wednesday’s GDP print for May and the Canadian week-late S&PJuly Purchasing Managers Index (PMI) print next Thursday. Both data prints are mid-tier, and are unlikely to drive much market momentum, especially with the Fed’s latest rate call on the cards for next Wednesday.
Daily digest market movers: CAD holds in place as Greenback roils on GDP upset
- US Annualized GDP rose to 2.8% in Q2, well above the forecast 2.0% and lurching higher from the previous 1.4%.
- The GDP Price Index eased to 2.3% from the previous 3.1%, even further below the forecast 2.6%.
- US Durable Goods Orders also declined sharply in June, printing a -6.6% decline MoM compared to the forecast 0.3% and previous 0.1%.
- Rate traders were spooked enough to pull back slightly on bets of a Fed September rate cut bet, trimming odds of at least a quarter-point cut on September 18 to 85% from the previous day’s 100%.
- Next up will be US Personal Consumption Expenditures Price Index (PCE) inflation on Friday. Median market forecasts broadly expect (or hope) that YoY PCE inflation will tick down to 2.5% from the previous 2.6%.
Technical analysis: Canadian Dollar pushes back to flat after fear-driven Greenback spike
The Canadian Dollar (CAD) holds close to flat against the Greenback on Thursday and comes in broadly mixed across the market heading into the end of the trading week. The CAD is down around one-fifth of one percent against the Euro (EUR), and up around the same against the Pound Sterling (GBP).
USD/CAD briefly rallied into an eight-month high of 1.38492 before easing back to the 1.3800 handle. 1.3850 proved too heavy a technical barrier for bidders to cross, keeping the pair’s long-running supply zone priced in above 1.3750 intact. With a zone rejection on the cards, the challenge for Greenback buyers will be to prevent an extended backslide to the 200-day Exponential Moving Average (EMA) at 1.3600.
USD/CAD hourly chart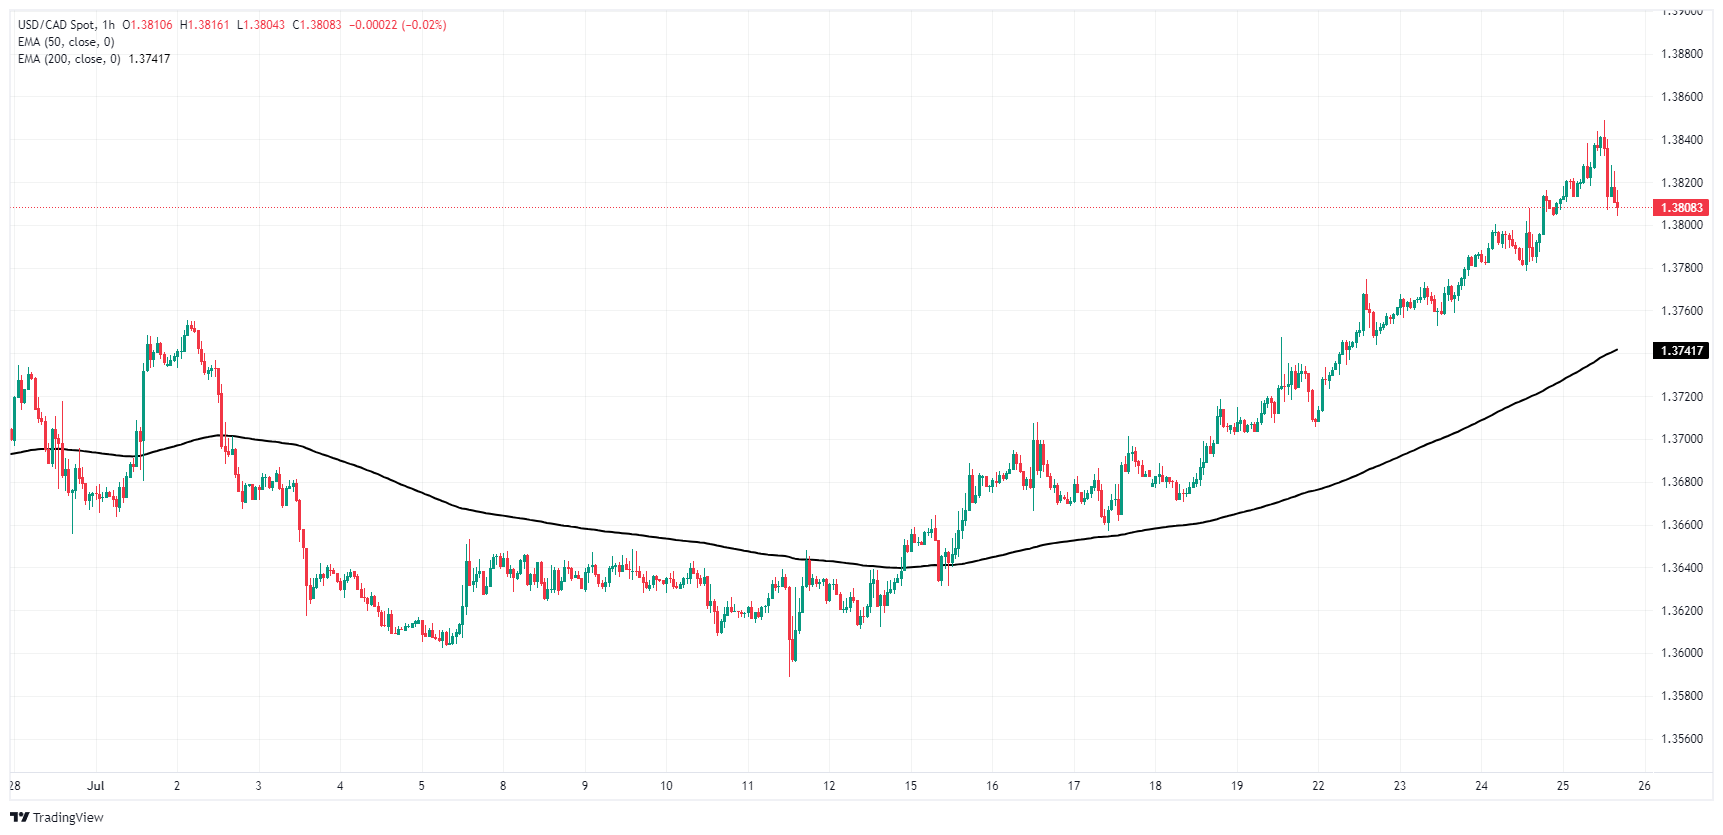
USD/CAD daily chart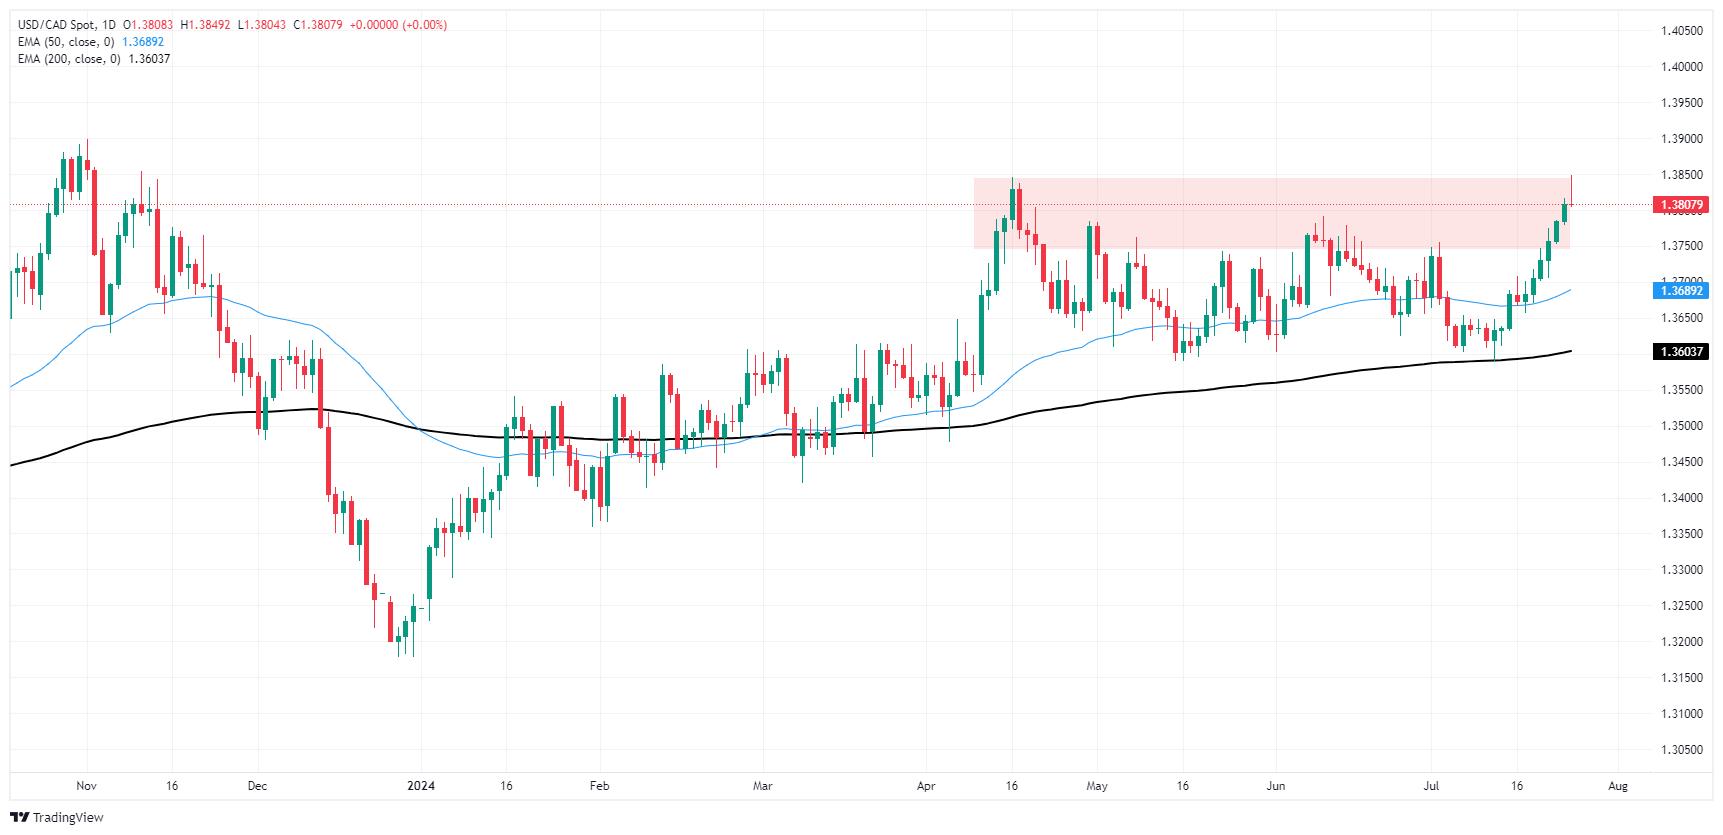
Canadian Dollar FAQs
The key factors driving the Canadian Dollar (CAD) are the level of interest rates set by the Bank of Canada (BoC), the price of Oil, Canada’s largest export, the health of its economy, inflation and the Trade Balance, which is the difference between the value of Canada’s exports versus its imports. Other factors include market sentiment – whether investors are taking on more risky assets (risk-on) or seeking safe-havens (risk-off) – with risk-on being CAD-positive. As its largest trading partner, the health of the US economy is also a key factor influencing the Canadian Dollar.
The Bank of Canada (BoC) has a significant influence on the Canadian Dollar by setting the level of interest rates that banks can lend to one another. This influences the level of interest rates for everyone. The main goal of the BoC is to maintain inflation at 1-3% by adjusting interest rates up or down. Relatively higher interest rates tend to be positive for the CAD. The Bank of Canada can also use quantitative easing and tightening to influence credit conditions, with the former CAD-negative and the latter CAD-positive.
The price of Oil is a key factor impacting the value of the Canadian Dollar. Petroleum is Canada’s biggest export, so Oil price tends to have an immediate impact on the CAD value. Generally, if Oil price rises CAD also goes up, as aggregate demand for the currency increases. The opposite is the case if the price of Oil falls. Higher Oil prices also tend to result in a greater likelihood of a positive Trade Balance, which is also supportive of the CAD.
While inflation had always traditionally been thought of as a negative factor for a currency since it lowers the value of money, the opposite has actually been the case in modern times with the relaxation of cross-border capital controls. Higher inflation tends to lead central banks to put up interest rates which attracts more capital inflows from global investors seeking a lucrative place to keep their money. This increases demand for the local currency, which in Canada’s case is the Canadian Dollar.
Macroeconomic data releases gauge the health of the economy and can have an impact on the Canadian Dollar. Indicators such as GDP, Manufacturing and Services PMIs, employment, and consumer sentiment surveys can all influence the direction of the CAD. A strong economy is good for the Canadian Dollar. Not only does it attract more foreign investment but it may encourage the Bank of Canada to put up interest rates, leading to a stronger currency. If economic data is weak, however, the CAD is likely to fall.
- EUR/GBP rose back into familiar highs near 0.8430 on Thursday.
- Market action is giving the Euro a leg up against the Pound Sterling.
- Investors are adding into BoE rate cut bets, softening the GBP.
EUR/GBP is back into a near-term high around 0.8430 as markets firm up bets of a Bank of England (BoE) rate cut next week. Money markets now see slightly more than 50% odds of at least a quarter-point rate trim when the BoE gathers to deliver its latest rate call one week from now on August 1.
Plenty of Euro-centric action still remains in the charts ahead of the BoE’s latest possible rate adjustment; preliminary Pan-European Gross Domestic Product (GDP) figures for Q2 are slated for next Tuesday and expected to backslide to 0.2% from the previous 0.3% QoQ. Next Wednesday sees more pan-EU data with July’s Harmonized Index of Consumer Prices (HICP). EU-wide Core HICP inflation last printed at 2.9% YoY in June, still well above the European Central Bank’s (ECB) 2.0% target range.
EUR/GBP technical outlook
EUR/GBP is on pace to put in one of its best single-day performances of 2024 on Thursday, in the green by around one-third of one percent, but long-term traders will note that still leaves the pair at the low end of a very deep hole. EUR/GBP fell -3.28% peak-to-trough in 2024, falling to an almost two-year low near 0.8383.
Euro bidders will be looking for a three-stage recovery off the back of dual Euro-area economic data showings and a rate cut from the BoE next week, but EUR/GBP remains buried well below the 200-day Exponential Moving Average (EMA) at 0.8545.
EUR/GBP hourly chart
EUR/GBP daily chart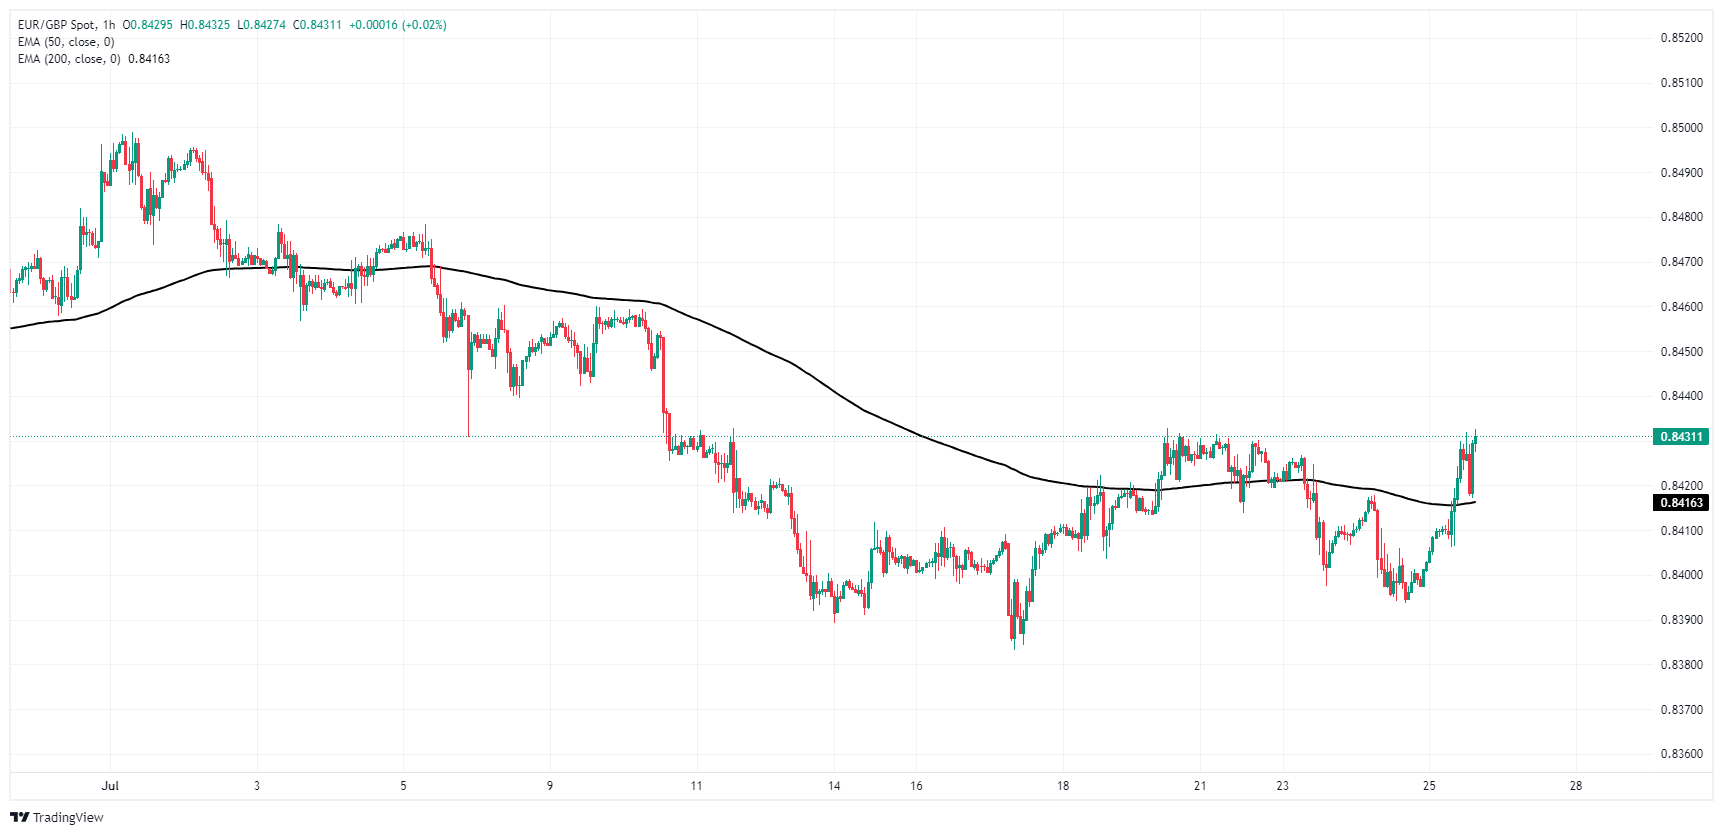
BoE FAQs
The Bank of England (BoE) decides monetary policy for the United Kingdom. Its primary goal is to achieve ‘price stability’, or a steady inflation rate of 2%. Its tool for achieving this is via the adjustment of base lending rates. The BoE sets the rate at which it lends to commercial banks and banks lend to each other, determining the level of interest rates in the economy overall. This also impacts the value of the Pound Sterling (GBP).
When inflation is above the Bank of England’s target it responds by raising interest rates, making it more expensive for people and businesses to access credit. This is positive for the Pound Sterling because higher interest rates make the UK a more attractive place for global investors to park their money. When inflation falls below target, it is a sign economic growth is slowing, and the BoE will consider lowering interest rates to cheapen credit in the hope businesses will borrow to invest in growth-generating projects – a negative for the Pound Sterling.
In extreme situations, the Bank of England can enact a policy called Quantitative Easing (QE). QE is the process by which the BoE substantially increases the flow of credit in a stuck financial system. QE is a last resort policy when lowering interest rates will not achieve the necessary result. The process of QE involves the BoE printing money to buy assets – usually government or AAA-rated corporate bonds – from banks and other financial institutions. QE usually results in a weaker Pound Sterling.
Quantitative tightening (QT) is the reverse of QE, enacted when the economy is strengthening and inflation starts rising. Whilst in QE the Bank of England (BoE) purchases government and corporate bonds from financial institutions to encourage them to lend; in QT, the BoE stops buying more bonds, and stops reinvesting the principal maturing on the bonds it already holds. It is usually positive for the Pound Sterling.
Prices are more likely to overshoot to the downside, notwithstanding the likely overly pessimistic sentiment surrounding demand, TDS senior commodity strategist Daniel Ghali notes.
Demand sentiment may be nearing a local bottom
Our gauge of demand sentiment embedded within the cross-section of commodities prices is now nearing its lowest levels of the year. These levels are now quantitatively inconsistent with recent history, and considering macro vol has been fairly muted, commodity demand sentiment now appears oversold.
This is a massive shift from just a few short months ago when demand sentiment appeared extremely overbought, contributing to the speculative fervor that catalyzed a momentous rally in Copper prices. Today, we now estimate that 80% of discretionary length in the red metal has already been liquidated, and we now see signs that the top traders in Shanghai are notably covering their shorts.
That being said, CTA trend followers still hold a substantial amount of dry-powder to sell and now have only a narrow margin of safety against selling programs. In fact, our simulations of future prices also suggest that a flat tape can now spark large-scale CTA selling activity over the next week. Overall, this suggests that prices are more likely to overshoot to the downside, notwithstanding the likely overly pessimistic sentiment surrounding demand.
Acute pressures on the precious metals complex may finally push prices beyond the range where algo traders are likely to be whipsawed, TDS senior commodity strategist Daniel Ghali notes.
Prices are set to go beyond the range
“Following a whipsaw in positioning, Commodity Trading Advisors (CTAs) are returning to the offer in Platinum with large-scale selling activity potentially hitting the tapes.
“Under the hood, prices have been hovering near a cluster of thresholds that could catalyze a change in trend signals, but the acute pressures on the precious metals complex may finally push prices beyond the range where algo traders are likely to be whipsawed.”
Does the sell-off in Gold still have room to run? Experts at TDS warned that the window for downside in prices was open, given for the first time in months, asymmetries in positioning risks skewed to the downside, TDS senior commodity strategist Daniel Ghali notes.
Significant liquidations reinforce the downside
“Macro trader positioning remains larger than warranted by rates markets' expectations for Federal Reserve (Fed) cuts alone, with signs the Trump trade had contributed to some froth. Signs of a buyer's strike in Asia also emerged, as highlighted by the significant deterioration in the SGE premium and by nascent signs of liquidations from Shanghai's top precious metals traders.”
“Since then, significant liquidations from Shanghai Futures Exchange (SHFE) Gold and Silver traders are now reinforcing the downside in price action, with more than 5t and 6.6m toz of notional sold over the last session alone. After all, if precious metal holdings were a hedge against Asian currency pressures, than the recent strength in Asian currencies is now playing in favor of continued downside.”
“We also now estimate that deteriorating price action could spark notable liquidations from CTA trend followers, with a break south of $2365/oz sparking a selling program totaling -5% of the algos' max size. And, our simulations of future prices also suggest that a downtape over the next week could large-scale selling activity totaling nearly -25% of the algos' max size, whereas a commensurate uptape would likely not catalyze any buying activity.”
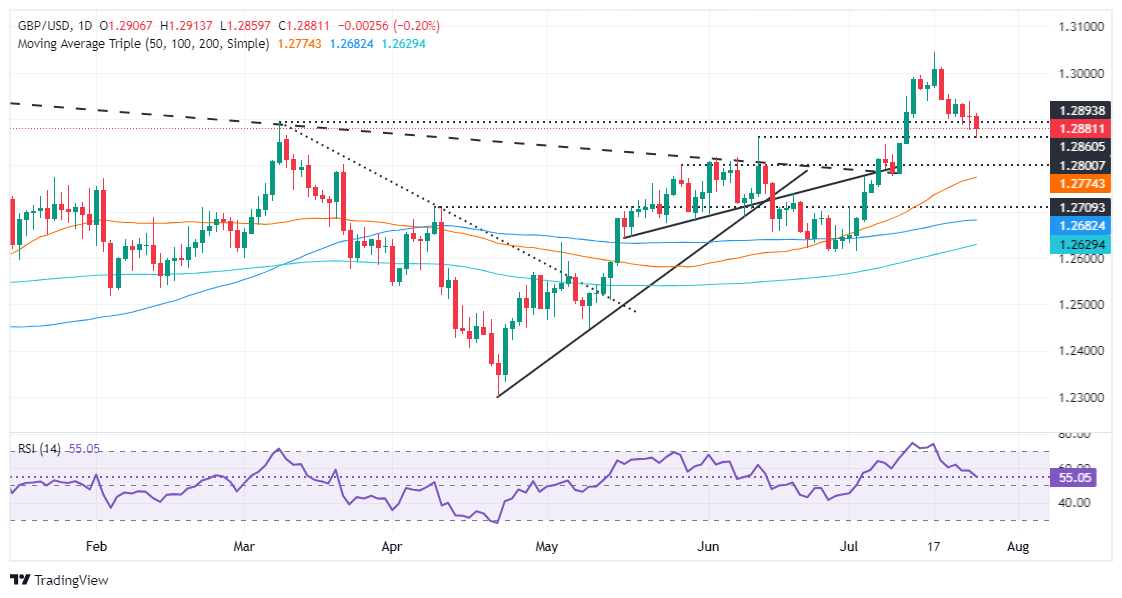
- GBP/USD dips to 1.2881, marking third day of losses, after peaking at 1.2913.
- Seller momentum strong as RSI falls, suggesting more downside potential.
- Key supports at 1.2860; below targets 1.2800, 50-DMA at 1.2773. Resistance at 1.2940 critical for bullish turn.
The Pound Sterling dropped below 1.2900 for the third consecutive day, edged lower 0.17%, and traded at 1.2881 after hitting a daily high of 1.2913. Data from the UK wasn’t better than expected, while an outstanding growth report from the US bolstered the Greenback.
GBP/USD Price Analysis: Technical outlook
From a technical standpoint, the GBP/USD continues to edge lower, though sellers are encountering tough times clearing the June 12 peak at 1.2860, which turned support once cleared.
However, momentum remains on the seller's side, as the Relative Strength Index (RSI) extends its drop after exiting overbought territory, approaching the 50-neutral line.
For a bullish continuation, the GBP/USD must reclaim 1.2900. This would pave the way to remaining range-bound within the 1.2900-1.2940 area unless the latter is broken, exposing the 1.3000 figure. Further upside is seen above that level, with the year-to-date (YTD) high at 1.3043.
Conversely, and the path of least resistance short term, the GBP/USD first support would be 1.2860. Once surpassed, the next stop would be 1.2800, followed by the 50-day moving average (DMA) at 1.2773.
GBP/USD Price Action – Daily Chart
British Pound PRICE Today
The table below shows the percentage change of British Pound (GBP) against listed major currencies today. British Pound was the strongest against the New Zealand Dollar.
| USD | EUR | GBP | JPY | CAD | AUD | NZD | CHF | |
|---|---|---|---|---|---|---|---|---|
| USD | -0.18% | 0.19% | 0.00% | 0.10% | 0.46% | 0.49% | -0.57% | |
| EUR | 0.18% | 0.38% | 0.18% | 0.29% | 0.65% | 0.68% | -0.41% | |
| GBP | -0.19% | -0.38% | -0.18% | -0.07% | 0.28% | 0.29% | -0.78% | |
| JPY | 0.00% | -0.18% | 0.18% | 0.11% | 0.47% | 0.47% | -0.58% | |
| CAD | -0.10% | -0.29% | 0.07% | -0.11% | 0.36% | 0.38% | -0.69% | |
| AUD | -0.46% | -0.65% | -0.28% | -0.47% | -0.36% | 0.04% | -1.05% | |
| NZD | -0.49% | -0.68% | -0.29% | -0.47% | -0.38% | -0.04% | -1.08% | |
| CHF | 0.57% | 0.41% | 0.78% | 0.58% | 0.69% | 1.05% | 1.08% |
The heat map shows percentage changes of major currencies against each other. The base currency is picked from the left column, while the quote currency is picked from the top row. For example, if you pick the British Pound from the left column and move along the horizontal line to the US Dollar, the percentage change displayed in the box will represent GBP (base)/USD (quote).
The Australian Dollar (AUD) has reverted to type, becoming the worst performing G10 currency on a 1-day view in broad risk off market sentiment, Rabobank’s FX analyst Jane Foley notes.
Chinese growth concerns weigh on AUD
“The AUD’s poor performance is despite risk that the RBA could hike interest rates at its August 6 policy meeting but reflects the potential headwinds implied by continued weakness in the Chinese economy in addition to the Aussie’s historical status as the ‘high risk’ currency of the G10 group. We view dips in the AUD/NZD as buying opportunities.”
“AUD/USD has been firmly caught up in the risk off mood that is dominating sentiment. In the first part of this month AUD/USD was rallying as the USD weakened in response to heightened expectations of a September Fed rate cut. More recently the AUD has been weighed down by a wave of fears stemming from Chinese growth concerns.”
“Currently Australia runs a small current account surplus. It also has a strong budget compared with its G10 peers and a relatively strong record on GDP growth within the pack. We see the strength of these fundamentals as limiting follow through selling on the AUD and look for the Aussie to find its feet vs. the USD into the RBA’s August 6 policy meeting. We continue to target AUD/NZD1.12 in the coming weeks.”
- EUR/JPY recovers from 164.80 while the near-term outlook remains uncertain.
- The BoJ is expected to hike interest rates further next week.
- Euro’s near-term outlook has worsened due to multiple headwinds.
The EUR/JPY pair recovers its intraday losses after discovering strong buying interest near fresh two-month low of 164.80 in Thursday’s New York session. The cross rebounds sharply but the near-term outlook remains uncertain on expectations that the Bank of Japan (BoJ) could tighten its monetary policy further next week.
Lately, the Japanese Yen gained more than 6% in the past two weeks as traders unwind short positions significantly.
The BoJ is expected to raise interest rates further due to increasing price pressures. The inflationary pressures have risen due to weak Japanese Yen, which made exports competitive in the global market. Also, the BoJ is expected to tame bond-buying operations, a move to curtail liquidity stimulus.
In the old continent, the Euro’s outlook remains uncertain due to poor Eurozone economic outlook and growing speculation that the European Central Bank (ECB) will cut its key borrowing rates two time more this year.
Eurozone preliminary Composite PMI barely expanded in July, landed at 50.1. Investors expected the PMI to have expanded at a faster pace to 51.1 from the former release of 50.9. The Manufacturing PMI contracted to 45.6, while the Services PMI expanded at a slower pace to 51.9.
ECB officials see market expectations for two more rate cuts this year as appropriate amid confidence that inflation will return sustainably to 2% next year.
Japanese Yen FAQs
The Japanese Yen (JPY) is one of the world’s most traded currencies. Its value is broadly determined by the performance of the Japanese economy, but more specifically by the Bank of Japan’s policy, the differential between Japanese and US bond yields, or risk sentiment among traders, among other factors.
One of the Bank of Japan’s mandates is currency control, so its moves are key for the Yen. The BoJ has directly intervened in currency markets sometimes, generally to lower the value of the Yen, although it refrains from doing it often due to political concerns of its main trading partners. The current BoJ ultra-loose monetary policy, based on massive stimulus to the economy, has caused the Yen to depreciate against its main currency peers. This process has exacerbated more recently due to an increasing policy divergence between the Bank of Japan and other main central banks, which have opted to increase interest rates sharply to fight decades-high levels of inflation.
The BoJ’s stance of sticking to ultra-loose monetary policy has led to a widening policy divergence with other central banks, particularly with the US Federal Reserve. This supports a widening of the differential between the 10-year US and Japanese bonds, which favors the US Dollar against the Japanese Yen.
The Japanese Yen is often seen as a safe-haven investment. This means that in times of market stress, investors are more likely to put their money in the Japanese currency due to its supposed reliability and stability. Turbulent times are likely to strengthen the Yen’s value against other currencies seen as more risky to invest in.
Eurozone July PMI data was not particularly encouraging and showed manufacturing – particularly in Germany – dragging down composite PMI numbers. This will reinforce the European Central Bank's view that short-term economic risks lie to the downside, ING’s FX strategist Chris Turner notes.
EUR/USD is set to head back towards 1.0900
“Look out for ECB President Christine Lagarde speak at 5:00pm CET. It seems the direction of travel here is for two further ECB rate cuts in September and December.”
“In terms of rate differentials, we see scope for further narrowing in the EUR/USD two-year rate spread, which means EUR/USD could head back towards 1.0900 if the Federal Reserve (Fed) easing narrative dominates today.”
The US economy grew by 2.8% in the second quarter of 2024, which was stronger than expected. We see this as confirmation of our assessment that the US economy will not slide into recession. Nevertheless, the Federal Reserve is likely to start cutting interest rates in the not too distant future because inflation is easing noticeably, Commerzbank’s economists Dr. Christoph Balz and Bernd Weidensteiner note.
Economy expands faster than the trend growth rate
“In the second quarter of 2024, the US economy grew by 2.8% (these and all subsequent growth rates are annualized rates of change against the previous quarter). This was even stronger than we had expected (consensus 2.0%, Commerzbank forecast 2.2%). Growth was broad-based (ex. construction). Investments in equipment (+11.6%) and in intellectual property such as software (+4.5%) in particular increased. This may reflect the AI boom.”
“The government also increased spending noticeably (+3.1%), as did private consumers (+2.3%). Here, falling inflation supported real disposable income. In contrast, residential construction (-1.4%) and commercial construction (-3.3%) contracted due to high interest rates. In the latter, the impetus provided by various government subsidy programs, such as for the construction of chip factories, is obviously waning.”
“The US economy was unable to maintain its very high growth rate in the third (4.9%) and fourth quarters of 2023 (3.4%) this year. However, we had already pointed out in our commentary three months ago that the weaker growth of 1.4% in the first quarter of 2024 was due to one-off factors in inventories and foreign trade and that the underlying pace of growth remains quite high.”
- USD/CAD prints a fresh eight-month high near 1.3850 as the US Dollar bounces back after upbeat US Q2 GDP growth.
- Subsiding inflationary pressures keep prospects of Fed rate cuts intact.
- The BoC reduced interest rates again by 25 bps, as expected.
The USD/CAD pair refreshes an eight-month high near 1.3850 in Thursday’s New York session. The Loonie asset strengthens as the US Dollar (USD) has bounced back strongly after upbeat United States (US) Q2 Gross Domestic Product (GDP) growth.
Flash US GDP report showed that the US economy grew at a robust pace of 2.8%, which is double the prior release of 1.4%. Economists expected the economy to have grown by 2.0%. This has strengthened the US economic outlook. The US Dollar Index (DXY), which tracks the Greenback’s value against six major currencies, moves higher to 104.40.
The impact of the strong US GDP growth is expected to remain limited as market expectations for the Federal Reserve (Fed) to begin reducing interest rates from the September meeting remain intact. The GDP Price Index, a key measure to gauge changes in prices of goods and services produced, decelerated sharply to 2.3%.
Going forward, investors will focus on the US Personal Consumption Expenditure Price Index (PCE) data for June, which will be published on Friday.
Meanwhile, the near-term outlook of the Canadian Dollar (CAD) is vulnerable as Bank of Canada (BoC) Governor Tiff Macklem has delivered dovish guidance on interest rates. On Wednesday, the BoC cut its key borrowing rates again by 25 basis points (bps), which declined to 4.5%. Market participants had already anticipated a dovish interest rate decision.
Macklem left the door open for further policy easing if inflation eases in line with the bank’s forecasts. He said in the press conference, “We are increasingly confident that the ingredients to bring inflation back to target are in place.” The BoC sees inflation sustainably returning to the 2% target in the second half of 2025. While Macklem communicated dovish guidance on interest rates, he refrained from providing a specific rate-cut path.
Canadian Dollar FAQs
The key factors driving the Canadian Dollar (CAD) are the level of interest rates set by the Bank of Canada (BoC), the price of Oil, Canada’s largest export, the health of its economy, inflation and the Trade Balance, which is the difference between the value of Canada’s exports versus its imports. Other factors include market sentiment – whether investors are taking on more risky assets (risk-on) or seeking safe-havens (risk-off) – with risk-on being CAD-positive. As its largest trading partner, the health of the US economy is also a key factor influencing the Canadian Dollar.
The Bank of Canada (BoC) has a significant influence on the Canadian Dollar by setting the level of interest rates that banks can lend to one another. This influences the level of interest rates for everyone. The main goal of the BoC is to maintain inflation at 1-3% by adjusting interest rates up or down. Relatively higher interest rates tend to be positive for the CAD. The Bank of Canada can also use quantitative easing and tightening to influence credit conditions, with the former CAD-negative and the latter CAD-positive.
The price of Oil is a key factor impacting the value of the Canadian Dollar. Petroleum is Canada’s biggest export, so Oil price tends to have an immediate impact on the CAD value. Generally, if Oil price rises CAD also goes up, as aggregate demand for the currency increases. The opposite is the case if the price of Oil falls. Higher Oil prices also tend to result in a greater likelihood of a positive Trade Balance, which is also supportive of the CAD.
While inflation had always traditionally been thought of as a negative factor for a currency since it lowers the value of money, the opposite has actually been the case in modern times with the relaxation of cross-border capital controls. Higher inflation tends to lead central banks to put up interest rates which attracts more capital inflows from global investors seeking a lucrative place to keep their money. This increases demand for the local currency, which in Canada’s case is the Canadian Dollar.
Macroeconomic data releases gauge the health of the economy and can have an impact on the Canadian Dollar. Indicators such as GDP, Manufacturing and Services PMIs, employment, and consumer sentiment surveys can all influence the direction of the CAD. A strong economy is good for the Canadian Dollar. Not only does it attract more foreign investment but it may encourage the Bank of Canada to put up interest rates, leading to a stronger currency. If economic data is weak, however, the CAD is likely to fall.
- Initial Jobless Claims rose by 235K vs. the previous week.
- Continuing Jobless Claims rose by around 1.850M.
US citizens that applied for unemployment insurance benefits increased by 235K in the week ending July 20 according to the US Department of Labor (DoL) on Thursday. The prints came in below initial estimates (238K) and were lower than the previous weekly gain of 245K (revised from 243K).
Further details of the publication revealed that the advance seasonally adjusted insured unemployment rate was 1.2% and the 4-week moving average was 235.50K, an increase of 0.250K from the previous week's revised average.
In addition, Continuing Claims decreased by 9K to 1.851M in the week ended July 13.
Market reaction
The US Dollar Index (DXY) trades with marginal gains around 104.40 against the backdrop of the continuation of the downside pressure in US yields across the curve.
- USD/JPY has fallen to key make-or-break support for the pair.
- A break below could indicate a change of the long-term trend and more downside.
USD/JPY has weakened over the last three weeks and reached support at a key price level on the charts, roughly in the 151.80s – which coincides with the October 2022 and 2023 highs.
USD/JPY Weekly Chart
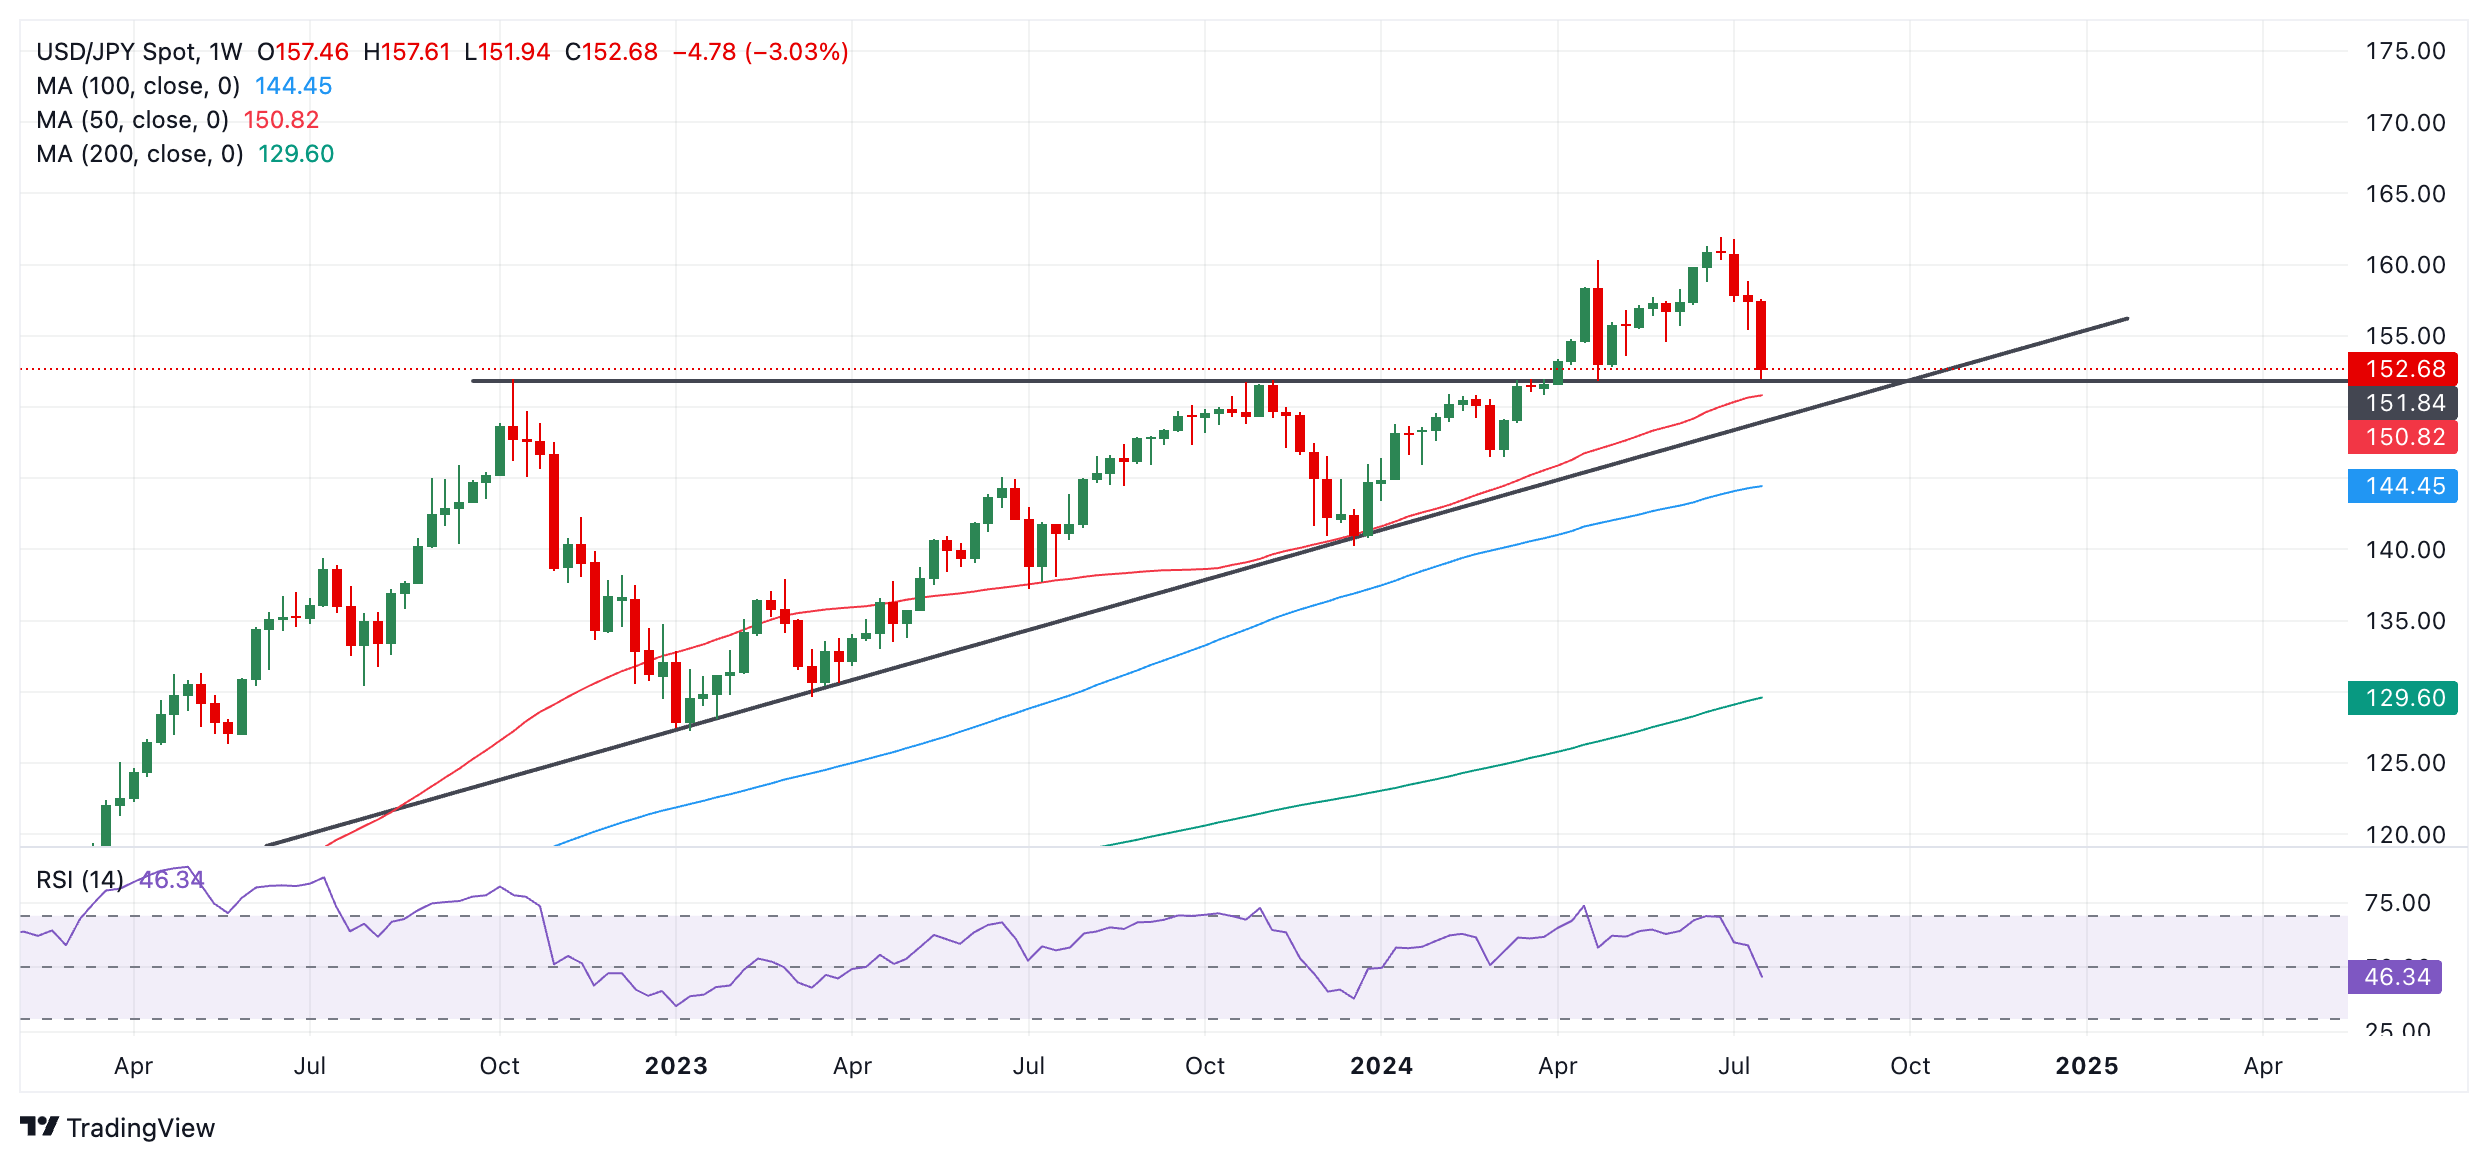
The long-term trend remains bullish suggesting the odds on balance favor a recovery, however, there are no signs yet from price action that this is the case. USD/JPY keeps going lower. In addition, if this week ends as a long red candlestick (we are already halfway through Thursday) the weekly chart will have formed an ominous Three Black Crows Japanese candlestick pattern, with bearish implications.
The current support level is very significant and represents a crossroads for price. A recovery bounce from here might indicate the longer-term uptrend was resuming. On the other hand a break below would bring the long-term uptrending bias into doubt.
Further, a break below the 50-week Simple Moving Average and a decisive break below the major trendline for the uptrend situated at roughly 149.50, would confirm a reversal in the long-term trend. Such a break would open up downside targets at roughly 141.60, followed by 136.85.
A decisive break would be one in which USD/JPY broke clearly below the trendline with a long red candlestick that closed near its low, or three red candlesticks in a row.
Price would need to form a bullish reversal pattern at the current level for confidence the longer-term uptrend was resuming. This could be a Japanese Hammer or a Two-Bar reversal, for example. This would then indicate prices might recover and retouch the 161.95 high (June 28), and perhaps even make a new higher high.
USD/JPY plunged to its lowest level since early May on narrowing US-Japan 2-year bond yield spreads and a sharp pick-up in financial market volatility.
BOJ is unlikely to tighten more
“Rising odds of a more aggressive Bank of Japan (BOJ) tightening cycle and expectations of Fed easing dragged US-Japan 2-year bond yield spreads to the lowest since May 2023.”
“Meanwhile, rising FX volatility has raised the cost of shorting JPY and triggered a rapid unwind in yen carry-trades. 1-month and 1-week implied JPY volatility surged to more than a two-month high. Moreover, the tech-led global stock market sell-off pushed the VIX index to a three-month high, benefiting safe-haven currencies like JPY and CHF.”
“We expect USD/JPY to hold above its 200-day moving average (151.54). First, the BOJ is unlikely to tighten more than is currently priced-in. Japan underlying inflation is in a firm downtrend, and negative real cash earnings suggest consumption spending will remain weak.”
CNH rallied overnight on the coattail of JPY strength, BBH FX strategists note.
Seven-day repo rate to be the PBOC’s new policy benchmark
“CNH rallied overnight on the coattail of JPY strength. The People’s Bank of China (PBOC) slashed the medium-term lending facility by 20bps to 2.30%, the biggest cut since April 2020.”
“The move comes on the heels of Monday’s unexpected 10bps cut to the seven-day reverse repo rate to 1.70%. The seven-day repo rate is expected to be the PBOC’s new policy benchmark as it is closer to market rates.”
“The PBOC is trying to shore-up soft Chinese economic activity. However, until China deals with its huge debt overhang (total debt is more than 300% of GDP), the country looks set for weaker growth in the years ahead.”
PBoC cuts MLF rate by 20bps in a surprise move, likely intended to close the gap with the market rate. Role of MLF rate is fading, but it will likely remain an important liquidity injection tool near-term. We now expect one more 10bps cut to the 7-day reverse repo rate in Q1-2025, on top of a 10bps cut in Q4. We now see a 20bps MLF rate cut in both Q4 and Q1-2025, taking the rate to 1.9%, Standard Chartered economists Shuang Ding and Hunter Chan note.
More room for MLF rate cuts
“China’s authorities appear to have shifted focus to stabilising growth following a disappointing Q2. Growth slowed sharply to 0.7% q/q from 1.5% in Q1, putting the annual growth target (5%) at risk. The recent Third Plenum urged the government to make good use of macro policies to boost domestic demand and achieve the annual target.”
“The People’s Bank of China (PBoC) surprised the market by cutting the 7-day reverse repo (7DRR) rate – the main policy rate – by 10bps on 22 July. It also unexpectedly conducted medium-term lending facility (MLF) operations on 25 July, in addition to the usual operations on 15 July, injecting CNY 200bn to keep liquidity ample before month-end.”
“We now expect two more 7DRR rate cuts by Q1-2025, taking the rate to 1.5%. The Fed is expected to start its rate cutting cycle in Q3; this would likely reduce pressure on the CNY, thereby relaxing a key constraint on monetary easing in China. The upcoming Politburo is likely to push for faster fiscal spending in H2 to make full use of the approved budget.”
The unwinding of short Japanese Yen (JPY) positions continues apace, Societe Generale FX strategist Kit Juckes notes.
A further fall in USD/JPY is unlikely to be sustainable
“In the three weeks since it peaked, it has gained 6% against the USD, 8% against the AUD, 9% against the MXN and BRL, and 11% against the NOK. Were there huge, long NOK/JPY trades on out there that I didn’t know about? Sales of Yen calls, to finance purchases of puts, was a trade that benefited from (and helped drive) a low volatility, slow rise in USD/JPY.”
“Those trades can’t survive a spike in volatility, let alone am appraisal of the trade’s future as Fed easing comes closer, the US yield curve disinverts rapidly and BoJ rate hikes come into sight. So far, the momentum of the move (at least as measured by RSIs) is similar to that in late 2022 and late 2023.”
“To that extent, a further fall in USD/JPY at the current speed is unlikely to be sustainable. A slower move lower, on the other hand, would confirm that this really is more than just a ‘clear the air’ flush of speculative positions.”
The unexpectedly significant decline in the Ifo business climate (87.0 after 88.6) is another cold shower for economic optimists. The easing pain from past rate and energy price hikes has not yet helped the economy, partly because companies are suffering from the long-standing erosion of Germany as a business location. For the second half of the year, we see an anemic upswing at best. Many economic forecasts are still too optimistic, Commerzbank Chief Economist Dr. Jörg Krämer notes.
Ifo means downturn
“The Ifo Business Climate index for the German economy fell significantly again in July – from 88.6 to 87.0. This was significantly below expectations (consensus & Commerzbank: 89.0). The fall was mainly due to declining business expectations for the next six months (86.9 after 88.8). However, the assessment of the current business situation has also deteriorated noticeably (87.1 after 88.3).”
“This is the third consecutive decline in the Ifo business climate and thus fulfills the definition of a downturn used by many economic forecasters. However, it should be borne in mind that the decline in May was minimal. In addition, the 6-month average, which according to our estimates is a reliable reversal indicator, is still pointing slightly upwards. The Ifo business climate is not yet signaling a downturn.”
“Nevertheless, the renewed decline in the Ifo business climate is a cold shower – especially as the purchasing managers' index for the manufacturing and service sectors also fell significantly in July. Added to this is the sharp fall in new orders in May. The recent weak economic indicators put a big question mark behind the expectation of a noticeable economic upturn for the second half of the year.”
As expected, the Bank of Canada (BoC) cut interest rates again yesterday by 25 basis points to 4.50%. At the same time, it was made clear that further rate cuts are likely to follow, Commerzbank FX strategist Michael Pfister notes.
CAD set to remain under pressure in the coming months
“BoC Governor Tiff Macklem stated that decisions would be made ‘one at a time’, meaning that there is no predetermined path of rate cuts. However, he also stressed that it was reasonable to expect further rate cuts. And with the year-on-year inflation rate likely to reach a value close to target in the next two months due to base effects, there is little to argue against further rate cuts.”
“Unless inflation unexpectedly picks up significantly, another rate cut in early September is likely to remain the baseline scenario. The general impression was that the BoC was shifting its focus from inflation to growth concerns.”
“Accordingly, the growth forecasts for 2024 and 2025 were lowered again. As a result, there is much to suggest that the Canadian Dollar (CAD) will remain under pressure in the coming months: after all, the BoC is likely to cut rates further and the real economy will benefit from the rate cuts only with a time lag. We therefore maintain our forecast of a weaker CAD through to the end of the year.”
Managing EUR/USD is very easy at the moment: you just have to wait a little. Ultimately, the exchange rate always returns to 1.0850. The day before yesterday, this rule was confirmed once again. After the exchange rate had recently traded at almost 1.0950, it returned to the seemingly attractive value, Commerzbank FX strategist Ulrich Leuchtmann notes.
EUR/USD may continue to fall below 1.0850
“A random walk of this kind has a (stochastic) trend, which in turn means that in mid-November 2023, EUR/USD crossed the 1.0850 mark. Since then, the probability of seeing this level again should have decreased. However, this does not appear to be the case. We keep seeing 1.0850. In short: the above does not look like a random walk.”
“However, there is a danger with such an analysis: that we interpret patterns or regularities into purely random phenomena. Entire legions of ‘technical analysts’ live off such optical illusions. And EUR/USD has not crossed 1.0850 so often that we would have reasonably reliable information about the change in probability over time.”
“It is dangerous to underestimate the risk of permanently effective exchange rate movements. If EUR/USD continues to fall tomorrow and moves further away from 1.0850, there is no reason to believe that this will be corrected at some point in the future. Exchange rates do not ‘come back’. At least not with a higher probability than that they will continue to move in the same direction.”
- Silver breaks below key support flipping the trend bearish.
- The Measured Move that formed has now completed with a stunted wave C.
- More downside is favored to a target at the May 2 low.
Silver (XAG/USD) has broken below key lows in the $28.60s, reversed trend and extended its decline.
The precious metal had been rising in what looked like a Measured Move (MM) pattern, with a C wave that extended substantially higher towards a target in the mid-$34s, however, after rallying up to a peak at $31.76, Silver capitulated and came tumbling down.
Silver Daily Chart
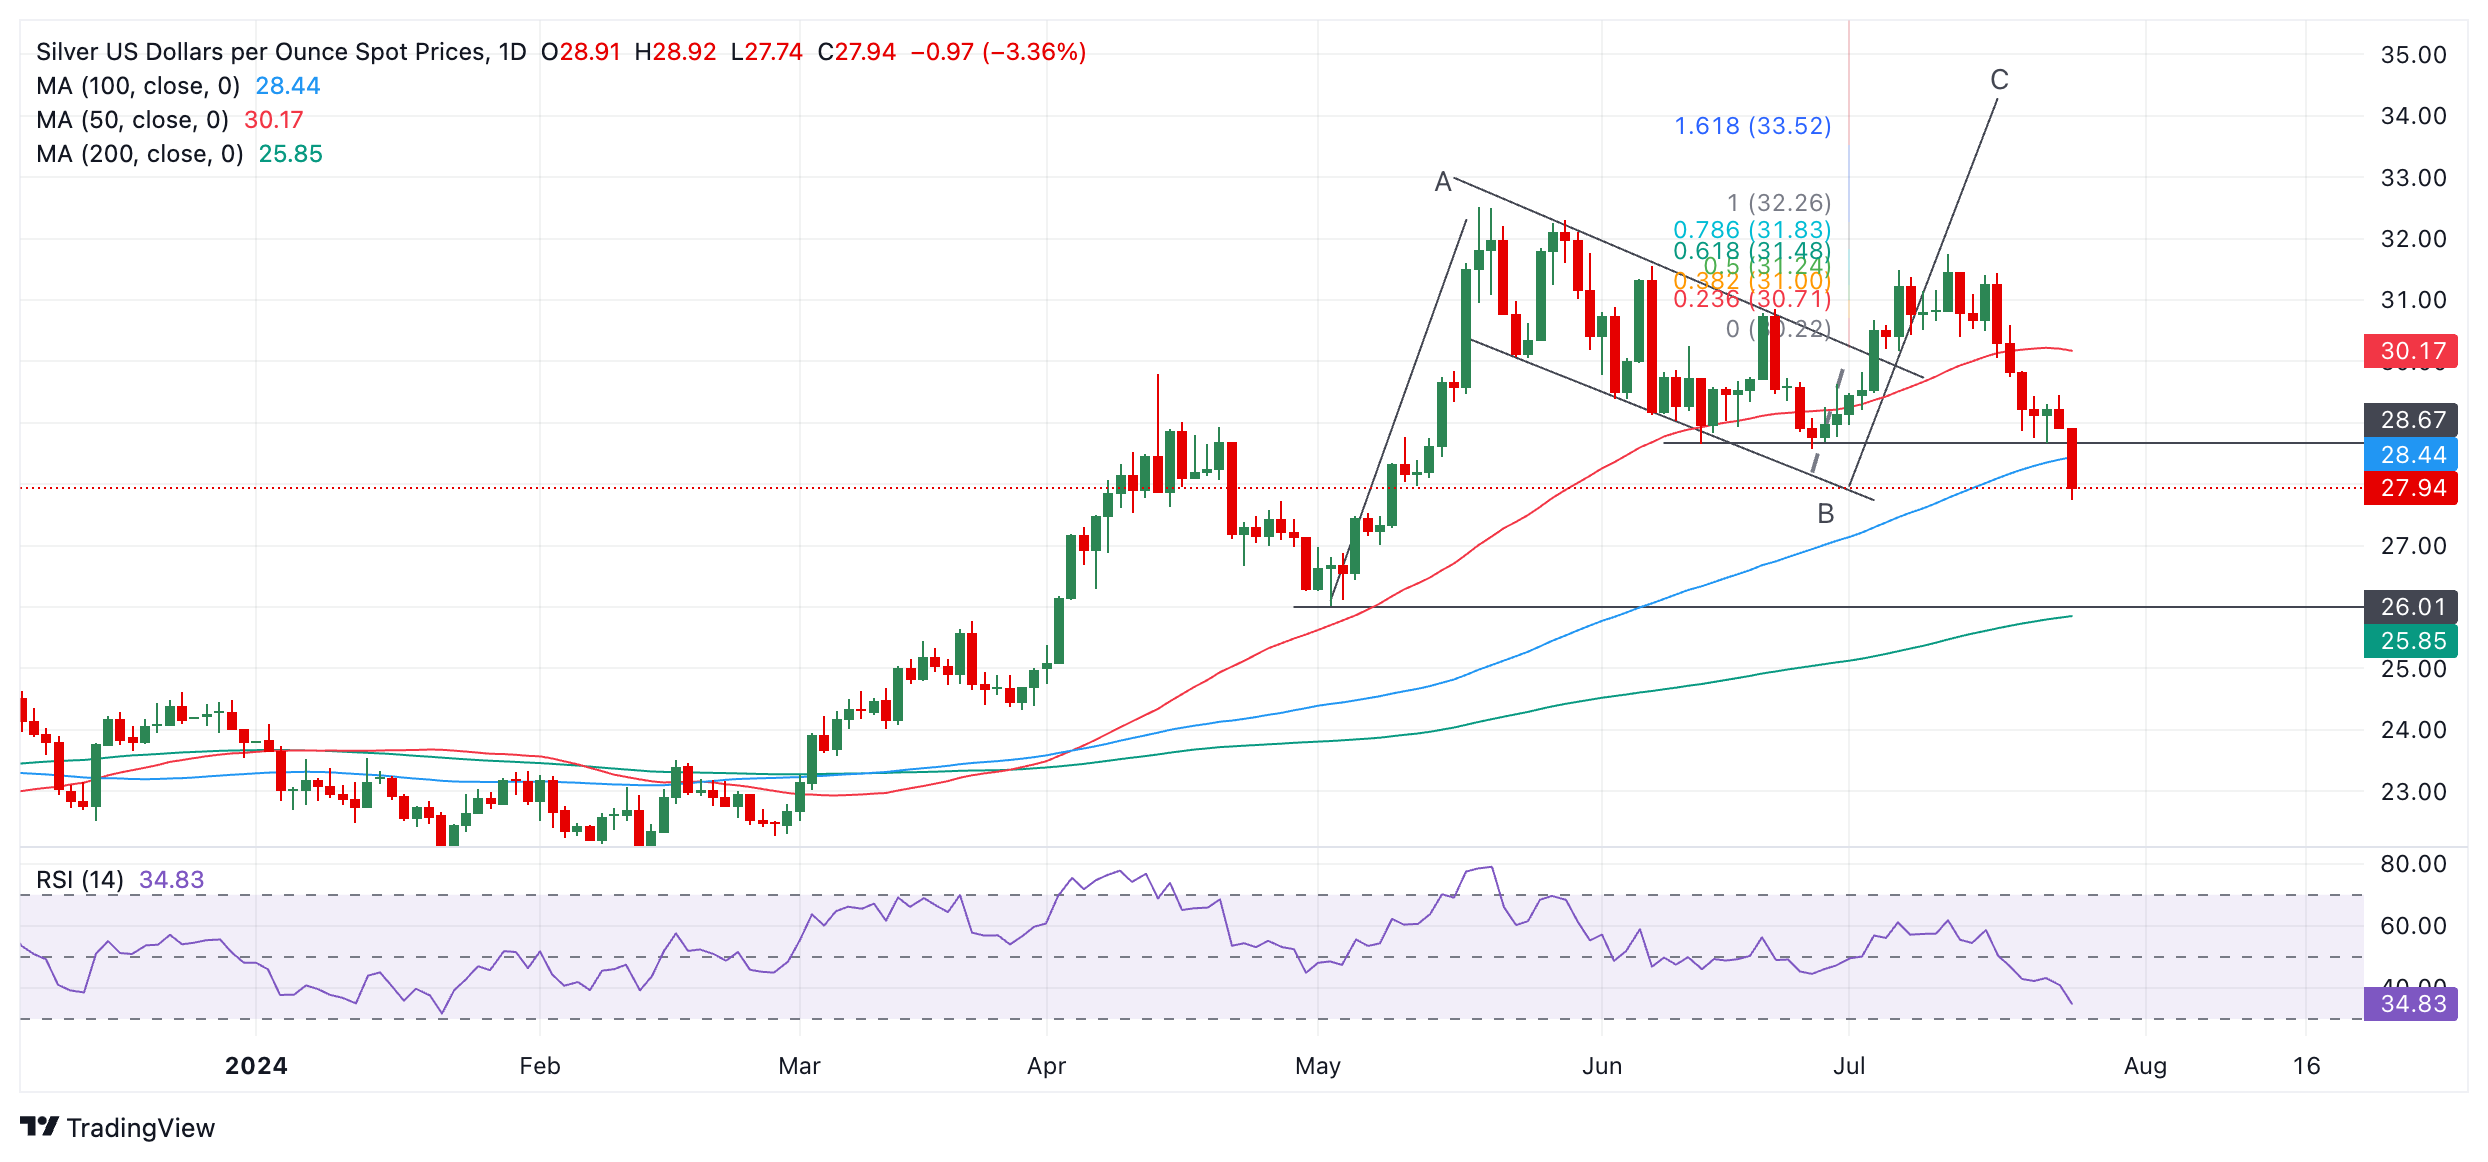
Silver’s break below key support at $28.67 was a significant turning point in terms of the trend and now means the commodity is probably in both a short and medium-term downtrend. Since “the trend is your friend” the odds favor a continuation of this downtrend lower. The MM that was forming seems to have completed with a stunted wave C.
The next target lower is at $26.02 (May 2 low), with the 200-day Simple Moving Average (SMA) just a little below at $25.85 also likely to provide support.
The Relative Strength Index (RSI) momentum indicator is not yet oversold suggesting Silver has more scope to fall.
- NZD/USD tumbles to near 0.5900 due to multiple headwinds.
- China’s battered economy and improved RBNZ rate-cut bets have dampened the New Zealand Dollar’s appeal.
- The next move in the US Dollar will be guided by the US Q2 GDP data.
The NZD/USD pair extends its downside to near the round-level support of 0.5900 in Thursday’s European session. The Kiwi asset continues its losing spell for the sixth trading session due to multiple headwinds. Deepening China’s economic woes and increasing Reserve Bank of New Zealand (RBNZ) rate-cut bets have weakened the New Zealand Dollar (NZD).
Weak demand from domestic and the overseas market in the Chinese economy has raised concerns over global growth outlook. The Kiwi Dollar has been hit badly as the New Zealand economy is one of leading trading partners of China.
Adding to China’s economic vulnerability, growing speculation that the RBNZ could pivot to policy normalization from the August policy meeting has weakened the New Zealand Dollar. The expectations for the RBNZ to cut its key Official Cash Rate (OCR) from its current levels in August rose due to cooling inflationary pressures. In the second quarter, inflationary pressures grew at a slower pace of 0.4% from the estimates and the former release of 0.6%. Annually, the price index has decelerated sharply to 3.5%.
Meanwhile, the market sentiment remains risk-off with a focus on the United States (US) Q2 flash Gross Domestic Product (GDP) data, which will be published at 12:30 GMT. S&P 500 futures give up gains posted in Asian trading hours.
The US economy is estimated to have grown at a faster pace of 2.0% from the former release of 1.4% on an annualized basis. The GDP data will significantly influence the US Dollar’s (USD) outlook.
New Zealand Dollar FAQs
The New Zealand Dollar (NZD), also known as the Kiwi, is a well-known traded currency among investors. Its value is broadly determined by the health of the New Zealand economy and the country’s central bank policy. Still, there are some unique particularities that also can make NZD move. The performance of the Chinese economy tends to move the Kiwi because China is New Zealand’s biggest trading partner. Bad news for the Chinese economy likely means less New Zealand exports to the country, hitting the economy and thus its currency. Another factor moving NZD is dairy prices as the dairy industry is New Zealand’s main export. High dairy prices boost export income, contributing positively to the economy and thus to the NZD.
The Reserve Bank of New Zealand (RBNZ) aims to achieve and maintain an inflation rate between 1% and 3% over the medium term, with a focus to keep it near the 2% mid-point. To this end, the bank sets an appropriate level of interest rates. When inflation is too high, the RBNZ will increase interest rates to cool the economy, but the move will also make bond yields higher, increasing investors’ appeal to invest in the country and thus boosting NZD. On the contrary, lower interest rates tend to weaken NZD. The so-called rate differential, or how rates in New Zealand are or are expected to be compared to the ones set by the US Federal Reserve, can also play a key role in moving the NZD/USD pair.
Macroeconomic data releases in New Zealand are key to assess the state of the economy and can impact the New Zealand Dollar’s (NZD) valuation. A strong economy, based on high economic growth, low unemployment and high confidence is good for NZD. High economic growth attracts foreign investment and may encourage the Reserve Bank of New Zealand to increase interest rates, if this economic strength comes together with elevated inflation. Conversely, if economic data is weak, NZD is likely to depreciate.
The New Zealand Dollar (NZD) tends to strengthen during risk-on periods, or when investors perceive that broader market risks are low and are optimistic about growth. This tends to lead to a more favorable outlook for commodities and so-called ‘commodity currencies’ such as the Kiwi. Conversely, NZD tends to weaken at times of market turbulence or economic uncertainty as investors tend to sell higher-risk assets and flee to the more-stable safe havens.
- The Mexican Peso is weakening as international investors unwind the Peso-favorable “carry trade”.
- A negative spell of data has further weakened the Peso as Banxico sets its sights on an interest-rate cut in August.
- USD/MXN extends its short-term uptrend and closes in on the June 28 high at 18.60.
The Mexican Peso (MXN) falls to a roughly four-week low on Thursday in its most traded pairs as investors rotate out of the carry trade, which favors currencies where interest rates are high, such as in Mexico (11.00%), at the expense of currencies with lower interest rates like the Japanese Yen (JPY), where the Bank of Japan (BoJ) has set base rates at 0.10%, according to analysts at ING Bank.
Other factors pushing down the Mexican Peso is the string of mostly lower-than-expected macroeconomic data releases, including Q1 Gross Domestic Product (GDP), Retail Sales, and the 1st half-month Core Inflation for July.
At the time of writing, one US Dollar (USD) buys 18.46 Mexican Pesos, EUR/MXN trades at 20.02, and GBP/MXN at 23.78.
Mexican Peso slumps amid inflation data and economic concerns
The Mexican Peso extended its downtrend on Wednesday after the release of inflation data for the first half of July, showing little change in core inflation despite a rise in the headline rate. This reinforced Mexican monetary policymakers' views that while core inflation — excluding volatile food and energy prices — is gradually decreasing, headline inflation remains high due to temporary factors. Consequently, the central bank, Banxico, is expected to cut interest rates soon, with many investors earmarking August as the month when the bank will make a move.
In July, Mexican 1st half-month Core Inflation rose 0.18%, slightly above both the previous month and estimates of 0.17%. Mid-month Core Inflation stood at 4.02% year-over-year, aligning with analysts' expectations but down from 4.17% the previous month.
On the other hand, mid-month headline inflation surged 0.71% month-over-month in July, significantly surpassing consensus estimates of 0.38% and the prior month’s 0.21%. Year-over-year, headline inflation reached 5.61%, well above June’s 4.78% and economists' predictions of 5.27%. The rise in headline inflation, however, is unlikely to change Banxico’s easing bias as it will be put down to fluctuating Oil and food prices.
ING highlighted the current low volatility environment as unfavorable for a rotation back to the carry trade. They noted, "Markets appear to be unwinding positions in high-yielding currencies like MXN and ZAR, while the funding JPY continues to perform well."
The latest Economic Activity Indicator from the Instituto Nacional de Estadistica, Geografia e Informatica (INEGI) indicates ongoing economic challenges. In May, Mexico’s economy expanded by 1.6% year-over-year, a significant deceleration from the near-two-year-high of 5.4% in the previous month. Despite this slowdown, the growth exceeded market expectations of 1.4%, driven by strong performance in the services sector.
Retail sales in May grew by 0.3% year-over-year, a marked decline from April’s 3.2% increase. Seasonally adjusted monthly retail sales edged up by 0.1% after a 0.5% rise in April.
Adding to the economic uncertainty, Fitch Ratings reaffirmed Mexico’s BBB- rating but warned of potential impacts from proposed judicial reforms. The International Monetary Fund (IMF) also revised Mexico’s 2024 GDP growth forecast down from 2.4% to 2.2%, citing a manufacturing slowdown linked to reduced US economic activity, pressuring Banxico towards a more accommodative monetary policy.
Furthermore, the Mexican Congress is set to discuss President Andrés Manuel López Obrador's judicial reform on August 1, ahead of the new Congress term starting on September 1, adding complexity to Mexico’s economic landscape.
Technical Analysis: USD/MXN closes in on June 28 high at 18.60
USD/MXN has rebounded higher after completing an ABC correction in early July. It appears to be trending higher and targeting the June 28 high at 18.60.
USD/MXN Daily Chart
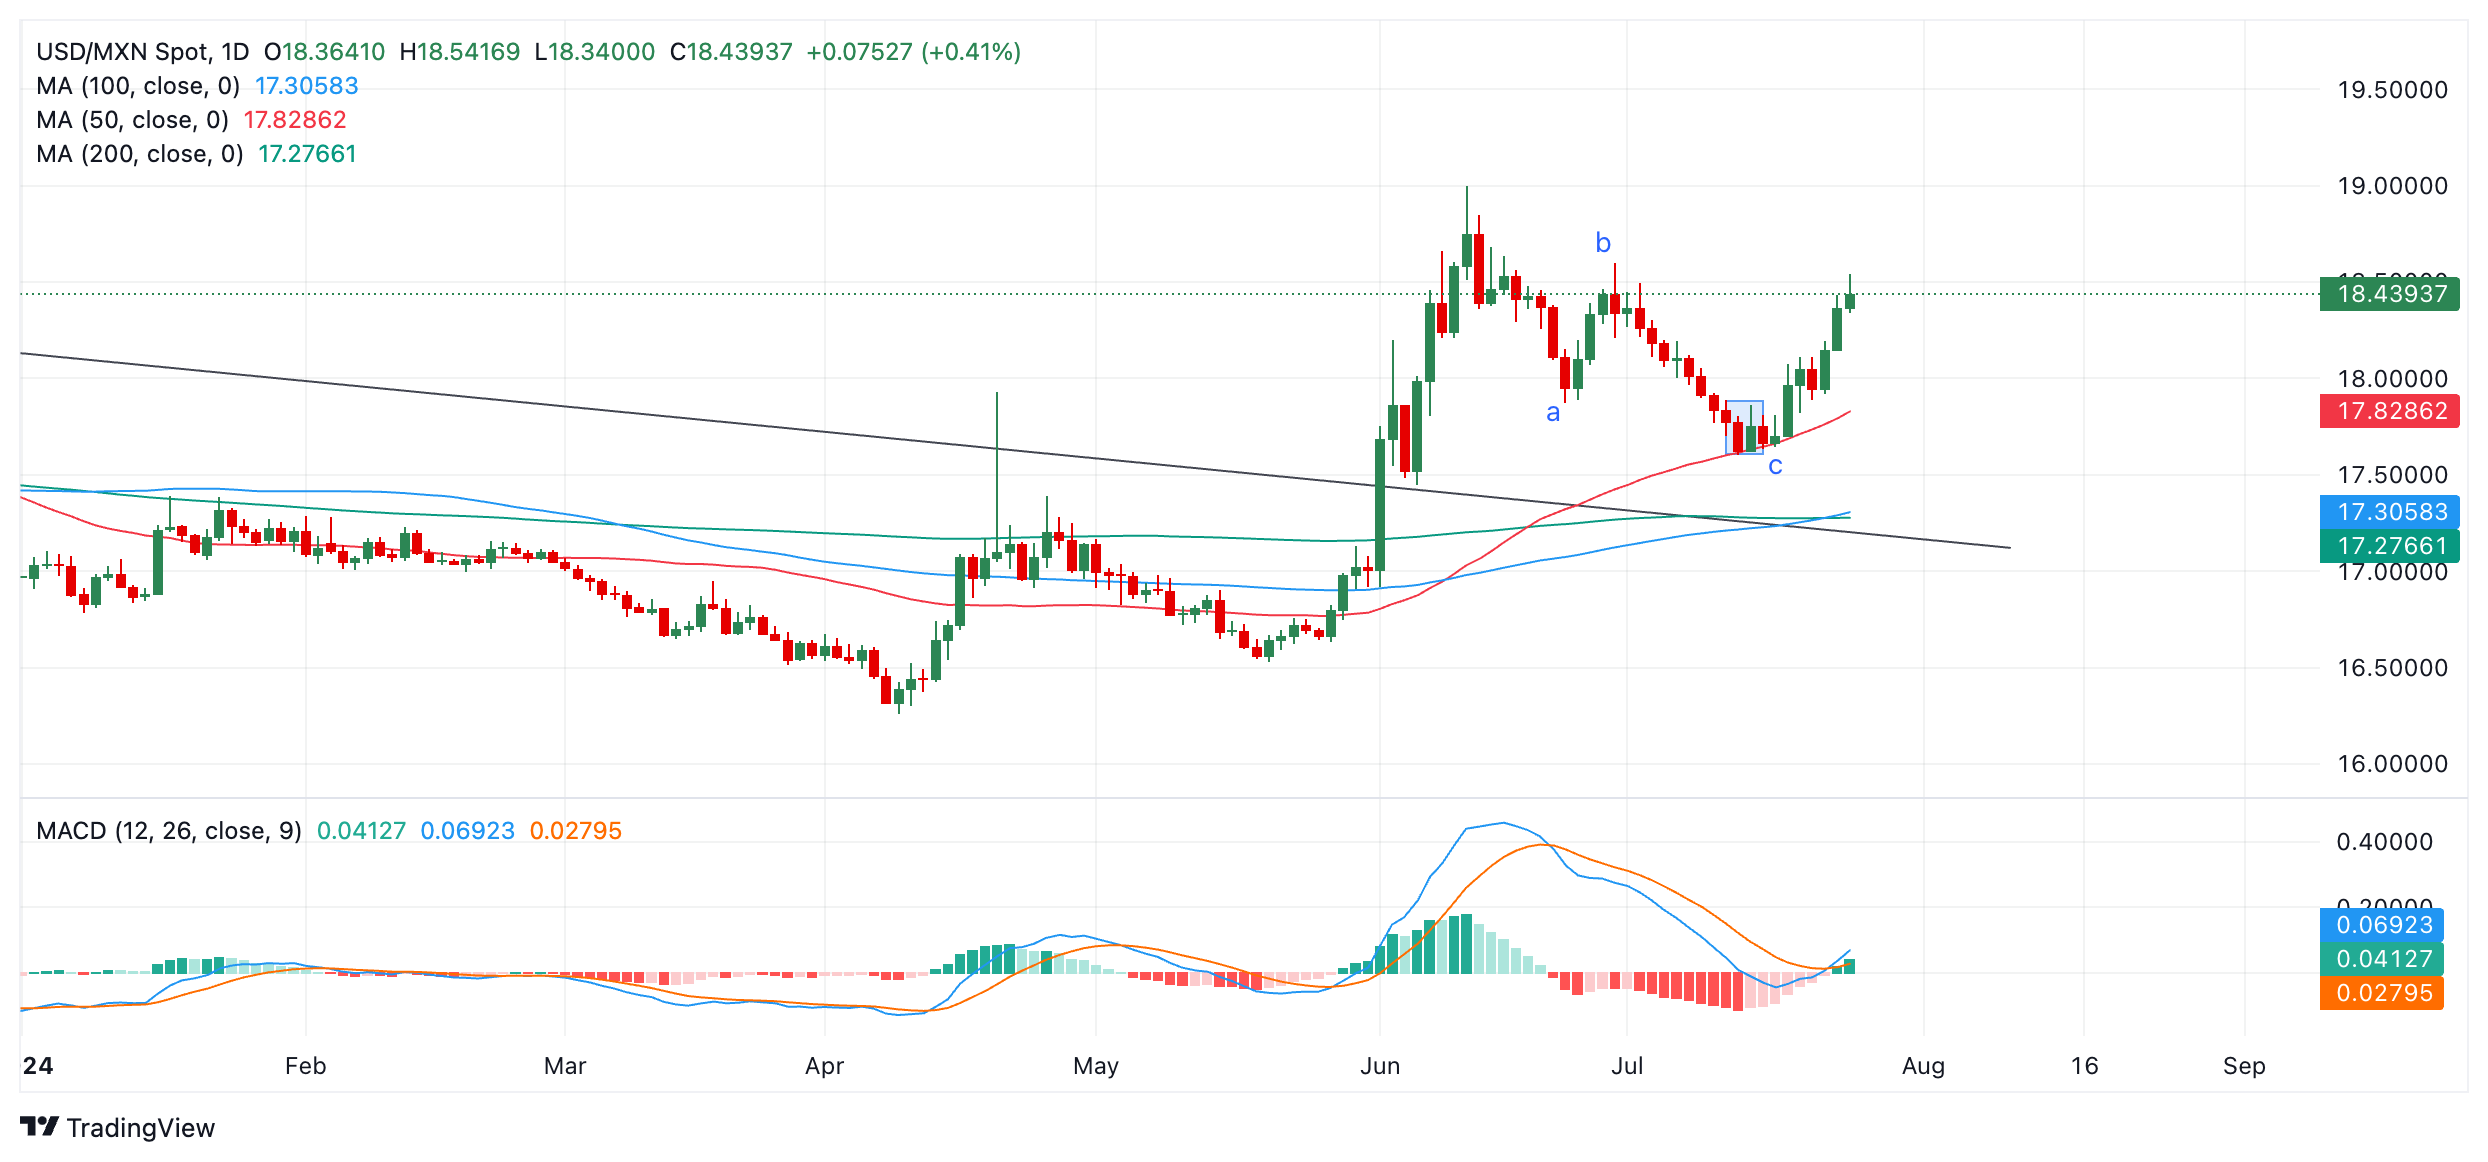
From a short-term perspective, the trend appears to be bullish for USD/MXN, and given the “trend is your friend,” this still technically favors bullish bets over that timeframe.
The next target higher for the pair is the key June 28 swing high at 18.60. At that level it is likely to encounter resistance and may pull back down or consolidate. A close above 18.60 would probably indicate a continuation up to the next target at 19.00 (June 12 high).
Meanwhile, the direction of the medium and long-term trends remain in doubt.
Mexican Peso FAQs
The Mexican Peso (MXN) is the most traded currency among its Latin American peers. Its value is broadly determined by the performance of the Mexican economy, the country’s central bank’s policy, the amount of foreign investment in the country and even the levels of remittances sent by Mexicans who live abroad, particularly in the United States. Geopolitical trends can also move MXN: for example, the process of nearshoring – or the decision by some firms to relocate manufacturing capacity and supply chains closer to their home countries – is also seen as a catalyst for the Mexican currency as the country is considered a key manufacturing hub in the American continent. Another catalyst for MXN is Oil prices as Mexico is a key exporter of the commodity.
The main objective of Mexico’s central bank, also known as Banxico, is to maintain inflation at low and stable levels (at or close to its target of 3%, the midpoint in a tolerance band of between 2% and 4%). To this end, the bank sets an appropriate level of interest rates. When inflation is too high, Banxico will attempt to tame it by raising interest rates, making it more expensive for households and businesses to borrow money, thus cooling demand and the overall economy. Higher interest rates are generally positive for the Mexican Peso (MXN) as they lead to higher yields, making the country a more attractive place for investors. On the contrary, lower interest rates tend to weaken MXN.
Macroeconomic data releases are key to assess the state of the economy and can have an impact on the Mexican Peso (MXN) valuation. A strong Mexican economy, based on high economic growth, low unemployment and high confidence is good for MXN. Not only does it attract more foreign investment but it may encourage the Bank of Mexico (Banxico) to increase interest rates, particularly if this strength comes together with elevated inflation. However, if economic data is weak, MXN is likely to depreciate.
As an emerging-market currency, the Mexican Peso (MXN) tends to strive during risk-on periods, or when investors perceive that broader market risks are low and thus are eager to engage with investments that carry a higher risk. Conversely, MXN tends to weaken at times of market turbulence or economic uncertainty as investors tend to sell higher-risk assets and flee to the more-stable safe havens.
Strong US growth has a positive effect on the US Dollar (USD) via two channels: It allows the Fed to pursue a more restrictive monetary policy for longer, and to pay more attention to inflationary trends than it would if growth were weak. It makes investments in the USA particularly profitable and increases the value of the currency needed to make these investments: the USD, Commerzbank FX strategist Ulrich Leuchtmann notes.
US GDP figures may affect the Greenback
“I wonder whether it was only the previous US growth advantage that fueled the Greenback, or whether hopes of fantastic profits in the tech industry also resonated. There is always some story that justifies speculative exuberance. Now, it’s the ‘at the moment, that AI will take over people's mental (including creative) work in the near future’ stance.”
“Such things only appear to be a bubble in retrospect, not in the middle of it. If the USD grows because of the AI hopes, the USD is probably as fragile or stable at its current level as the AI boom is. But I’d remind the pessimists of the following: the dotcom bubble also went hand in hand with a strong US dollar.”
“So far, the USD has not suffered from the correction in tech stocks. Coincidentally, the US GDP figures for the second quarter of 2024 are being released today. After +1.4% in the first quarter, the median of analysts is now expecting +2.0%. If these expectations are disappointed, even those USD bulls who have liked the Greenback so far due to the actual growth advantage would be disappointed.”
- AUD/USD continues its losing spell for the ninth trading session.
- Weak Chinese and Australian economic outlook have dampened the Australian Dollar.
- Investors await the US Q2 GDP data to know the current status of the economy’s health.
The AUD/USD pair extends its losing streak for the ninth trading session on Thursday. The Aussie asset plummets to near 0.6520 and is expected to slide further to the psychological support of 0.6500. The appeal of the Australian Dollar (AUD) has worsened due to deepening worries about China’s economic prospects and its consequences on Australia.
Concerns over China’s economic outlook grew after market experts conveyed that the outcome of Third Plenum lacks strong liquidity measures to boost growth and the People’s Bank of China (PBoC) cuts its short-and long-term Loan Prime Rate (LPR) surprisingly by 10 basis points (bps). An unexpected rate cut decision by the PBoC appeared to be the outcome of slower-than-expected Gross Domestic Product (GDP) growth in the second quarter of this year.
Being a liquid proxy to China’s economy, the Australian Dollar has been hit badly. The lack of meaningful triggers for China’s growth has weighed heavily on base metals. Global iron ore prices have plunged to their lowest in three weeks. Foreign flows in the Australian economy are expected to decline sharply, being responsible for exporting more than 50% of global iron ore demand.
Meanwhile, dismal market sentiment ahead of the United States (US) Q2 flash GDP has weighed on the Australian Dollar. S&P 500 futures post nominal losses in European trading hours. The US Dollar Index (DXY), which tracks the Greenback’s value against six major currencies, declines but holds the key support of 104.00.
The US economy is estimated to have expanded at a robust pace of 2.0% from the former release of 1.4% on an annualized basis. While GDP Price Index, a key measure of changes in prices of goods and services produced, appears to have decelerated to 3.6% from 3.1%. This would prompt expectations of early rate cuts by the Federal Reserve (Fed).
Australian Dollar FAQs
One of the most significant factors for the Australian Dollar (AUD) is the level of interest rates set by the Reserve Bank of Australia (RBA). Because Australia is a resource-rich country another key driver is the price of its biggest export, Iron Ore. The health of the Chinese economy, its largest trading partner, is a factor, as well as inflation in Australia, its growth rate and Trade Balance. Market sentiment – whether investors are taking on more risky assets (risk-on) or seeking safe-havens (risk-off) – is also a factor, with risk-on positive for AUD.
The Reserve Bank of Australia (RBA) influences the Australian Dollar (AUD) by setting the level of interest rates that Australian banks can lend to each other. This influences the level of interest rates in the economy as a whole. The main goal of the RBA is to maintain a stable inflation rate of 2-3% by adjusting interest rates up or down. Relatively high interest rates compared to other major central banks support the AUD, and the opposite for relatively low. The RBA can also use quantitative easing and tightening to influence credit conditions, with the former AUD-negative and the latter AUD-positive.
China is Australia’s largest trading partner so the health of the Chinese economy is a major influence on the value of the Australian Dollar (AUD). When the Chinese economy is doing well it purchases more raw materials, goods and services from Australia, lifting demand for the AUD, and pushing up its value. The opposite is the case when the Chinese economy is not growing as fast as expected. Positive or negative surprises in Chinese growth data, therefore, often have a direct impact on the Australian Dollar and its pairs.
Iron Ore is Australia’s largest export, accounting for $118 billion a year according to data from 2021, with China as its primary destination. The price of Iron Ore, therefore, can be a driver of the Australian Dollar. Generally, if the price of Iron Ore rises, AUD also goes up, as aggregate demand for the currency increases. The opposite is the case if the price of Iron Ore falls. Higher Iron Ore prices also tend to result in a greater likelihood of a positive Trade Balance for Australia, which is also positive of the AUD.
The Trade Balance, which is the difference between what a country earns from its exports versus what it pays for its imports, is another factor that can influence the value of the Australian Dollar. If Australia produces highly sought after exports, then its currency will gain in value purely from the surplus demand created from foreign buyers seeking to purchase its exports versus what it spends to purchase imports. Therefore, a positive net Trade Balance strengthens the AUD, with the opposite effect if the Trade Balance is negative.
- EUR/USD bounces back as the US Dollar remains sluggish in the countdown to the US Q2 flash GDP.
- The Euro’s appeal remains uncertain due to the Eurozone’s dismal economic outlook.
- German government announces tax relief for households and corporations.
EUR/USD rebounds to near 1.0850 in Thursday’s European session despite the near-term outlook of the Euro remains uncertain due to firm expectations of more rate cuts by the European Central Bank (ECB) and deepening concerns over German economic prospects.
The ECB is expected to cut interest rates two more times this year as price pressures are expected to remain at their current levels for the entire year and will return to the bank’s target in 2025. Some ECB officials also see current market expectations for rate cuts as appropriate.
Meanwhile, a sharp decline in Eurozone business activity, especially in the bloc’s largest nation, Germany, has boosted expectations of more interest rate cuts this year to prompt economic growth. German flash Composite Purchasing Managers Index (PMI) unexpectedly contracted in July. Hamburg Commercial Bank (HCOB) reported on Wednesday that preliminary German Composite PMI surprisingly declined to 48.7 in July, the lowest reading in four months. The economy skirted a recession last year but contracted by 0.3%.
Poor German activity has also dampened its business sentiment index. German IFO Business Climate, an early indicator of current conditions and business expectations, surprisingly declined to 87 in July. Investors forecasted the sentiment data to have risen to 88.9 from June’s reading of 88.6. In the same period, the Expectations index unexpectedly dropped to 86.9 from the estimates of 89.0 and the former release of 88.8, downwardly revised from 89.0.
In a move to boost overall consumption, the German government promises to provide tax relief to corporations and households. The tax relief move announced by German Finance Minister Christian Lindner on Wednesday will pave way for a 30-billion-euro reduction in the tax burden in 2025 and 2026, an effort to leave the economy with more funds for spending and investment.
Daily digest market movers: EUR/USD recovers while the Euro outlook remains uncertain
- EUR/USD bounces back to near 1.0850. The major currency pair moves higher as the US Dollar (USD) exhibits a sluggish performance on the United States (US) Q2 flash Gross Domestic Product (GDP) day. The US Dollar Index (DXY), which tracks the Greenback’s value against six major currencies, hovers below weekly high of 104.50.
- The US Q2 GDP is estimated to have grown at a faster pace of 2.0% from the former release of 1.4% on an annualized basis, while the GDP Price Index, a key measure to gauge changes in the prices of goods and services produced, is seen decelerating to 2.6%. This would boost expectations of rate cuts by the Federal Reserve (Fed).
- According to the CME FedWatch tool, 30-day Federal Fund futures pricing data shows that a rate cut in September appears certain. The data also indicate that the Fed will cut interest rates twice this year.
- In addition to US Q2 GDP data, investors will also focus on the Durable Goods Orders for June, which are expected to have grown at a faster pace of 0.3% from May’s reading of 0.1%.
- This week, the major trigger for the US Dollar will be the Personal Consumption Expenditures Price Index (PCE) data for June, which will be published on Friday. The core PCE inflation, the Fed's preferred inflation gauge, will indicate whether market expectations for rate cuts in September are appropriate.
- The underlying inflation is estimated to have decelerated to 2.5% from May’s figure of 2.6%, with the monthly figure growing steadily by 0.1%. The scenario in which inflationary pressures decelerate in line with expectations or at a faster pace will be unfavorable for the US Dollar as it will boost rate cut expectations. On the contrary, steady or higher-than-expected inflation growth will force traders to pare Fed rate-cut bets for September.
Technical Analysis: EUR/USD hovers near 20-day EMA
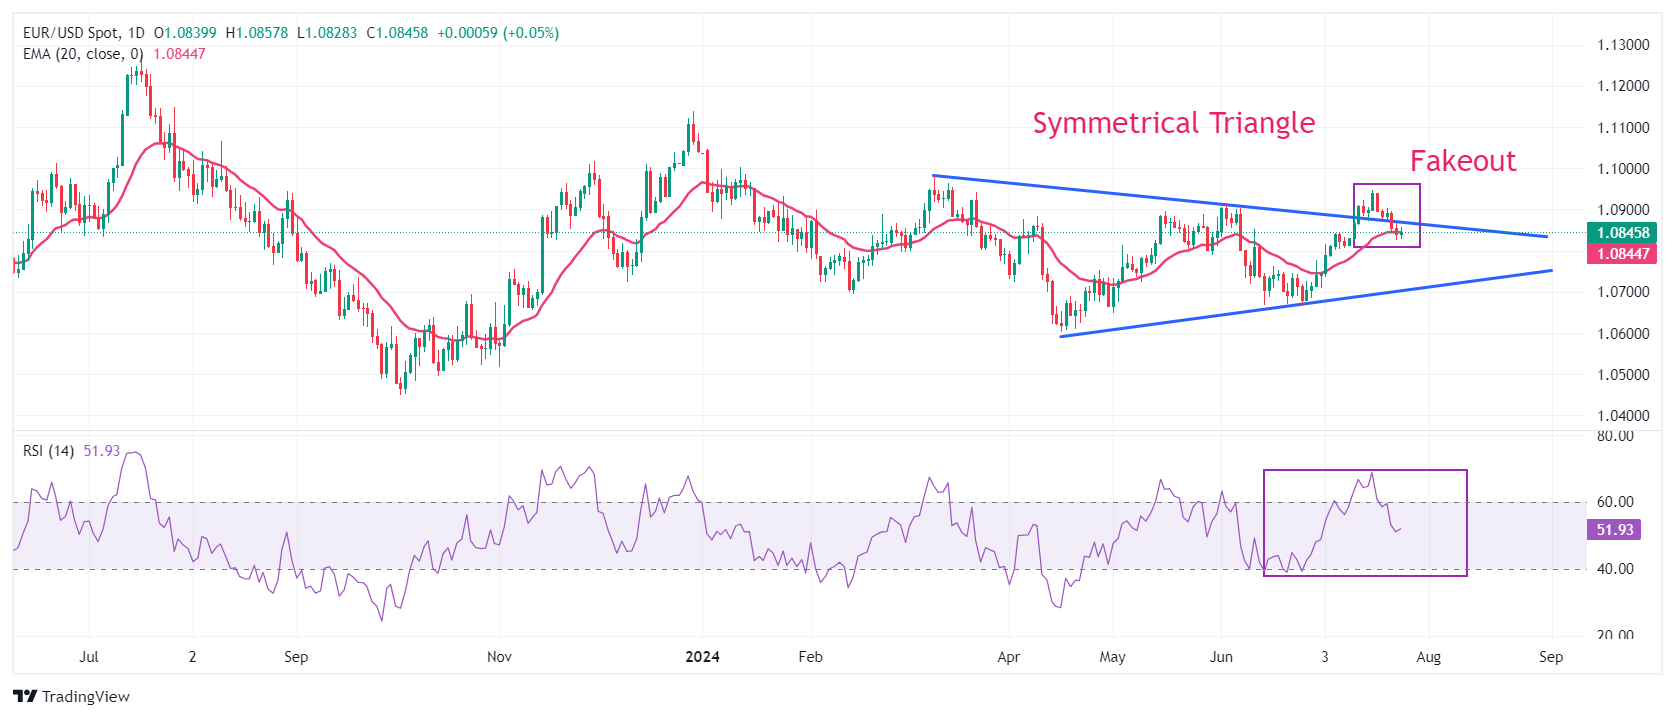
EUR/USD returns inside the Symmetrical Triangle formation on a daily timeframe after failing to hold the breakout. The major currency pair extends its downside below the 20-day Exponential Moving Average (EMA), which trades around 1.0840. The shared currency pair could slide further towards round-level supports near 1.0800 and 1.0700.
The 14-day Relative Strength Index (RSI) returns within the 40.00-60.00 range, suggesting the bullish momentum has faded.
On the upside, the round-level resistance at 1.0900 will be a key barrier for the Euro bulls.
Euro FAQs
The Euro is the currency for the 20 European Union countries that belong to the Eurozone. It is the second most heavily traded currency in the world behind the US Dollar. In 2022, it accounted for 31% of all foreign exchange transactions, with an average daily turnover of over $2.2 trillion a day. EUR/USD is the most heavily traded currency pair in the world, accounting for an estimated 30% off all transactions, followed by EUR/JPY (4%), EUR/GBP (3%) and EUR/AUD (2%).
The European Central Bank (ECB) in Frankfurt, Germany, is the reserve bank for the Eurozone. The ECB sets interest rates and manages monetary policy. The ECB’s primary mandate is to maintain price stability, which means either controlling inflation or stimulating growth. Its primary tool is the raising or lowering of interest rates. Relatively high interest rates – or the expectation of higher rates – will usually benefit the Euro and vice versa. The ECB Governing Council makes monetary policy decisions at meetings held eight times a year. Decisions are made by heads of the Eurozone national banks and six permanent members, including the President of the ECB, Christine Lagarde.
Eurozone inflation data, measured by the Harmonized Index of Consumer Prices (HICP), is an important econometric for the Euro. If inflation rises more than expected, especially if above the ECB’s 2% target, it obliges the ECB to raise interest rates to bring it back under control. Relatively high interest rates compared to its counterparts will usually benefit the Euro, as it makes the region more attractive as a place for global investors to park their money.
Data releases gauge the health of the economy and can impact on the Euro. Indicators such as GDP, Manufacturing and Services PMIs, employment, and consumer sentiment surveys can all influence the direction of the single currency. A strong economy is good for the Euro. Not only does it attract more foreign investment but it may encourage the ECB to put up interest rates, which will directly strengthen the Euro. Otherwise, if economic data is weak, the Euro is likely to fall. Economic data for the four largest economies in the euro area (Germany, France, Italy and Spain) are especially significant, as they account for 75% of the Eurozone’s economy.
Another significant data release for the Euro is the Trade Balance. This indicator measures the difference between what a country earns from its exports and what it spends on imports over a given period. If a country produces highly sought after exports then its currency will gain in value purely from the extra demand created from foreign buyers seeking to purchase these goods. Therefore, a positive net Trade Balance strengthens a currency and vice versa for a negative balance.
China’s economic development plan for the next five years is in the resolution of the third plenum, UOB Group economist Ho Woei Chen notes.
Further easing actions from PBOC
“The resolution of the third plenum contains details of China’s economic development plan for the next five years that is focused on its industrial policy and further deepening of reforms across the economy. Policy tone and direction are in line with recent official comments that have emphasized technology, innovation and security as well as defusing risks in the key areas such as the real estate and local government debt.”
“Amongst the key issues addressed include the fiscal imbalances between the central and local governments, urban-rural integration, demographic challenges and the promotion of the private sector and investment. Improvements in the social security system and the land and hukou reforms will help to increase Chinese consumption in the medium to long term.”
“Timeline and specific details of implementation of measures in the plan is not provided in the document. We expect these to be rolled out through the year with little anticipation from the market. Nonetheless, near challenges remain and we reaffirm China’s growth forecast of 4.9% for 2024 and further easing actions from PBOC.”
- Gold extends correction and slides down to a technical range floor.
- The precious metal shrugs off the global growth fears that normally incentivize investors to hoard Gold.
- Gold joins most other commodities as they sell off.
Gold (XAU/USD) weakens on Thursday, trading over a percentage point lower in the $2,370s amid widespread declines in stocks and commodities driven by global growth concerns.
Despite being a safe haven, Gold's weakness may be attributed to technical selling, as it experiences a predicted downward movement within its trading range. Additionally, marginally favorable preliminary US S&P Global Purchasing Managers Index (PMI) data for July released on Wednesday may have dampened fears of "stagflation," which is characterized by economic weakness coupled with high inflation — a scenario where Gold typically performs well.
Gold falls on technical selling and US PMI data
Gold declines on Thursday after data showed the preliminary S&P Global Composite PMI improved to 55 in July from 54.8 in June. The S&P Global Manufacturing PMI, however, declined to 49.5 from 51.6, while the Services PMI rose to 56.0 from 55.3.
Chris Williamson, Chief Business Economist at S&P Global Market Intelligence, noted, "The flash PMI data signal a ‘Goldilocks’ scenario at the start of the third quarter, with the economy growing at a robust pace while inflation moderates." He added, "In terms of inflation, the July survey saw input costs rise at an increased rate, linked to rising raw material, shipping, and labor costs. These higher costs could feed through to higher selling prices if sustained, or cause a squeeze on margins."
Gold's decline comes despite continued expectations that the Federal Reserve (Fed) will cut interest rates multiple times before the year's end. Lower interest rates generally make non-interest-bearing assets like Gold more attractive, boosting demand.
Traders are now awaiting more US economic data for clarity on the trajectory of US interest rates. Key releases include the advanced US Q2 Gross Domestic Product (GDP) growth data on Thursday and the Personal Consumption Expenditures (PCE) Price Index report for June on Friday.
Meanwhile, there has been some unwinding of the "Trump trade," which has dragged US bond yields lower, positively impacting Gold. In some polls, US Vice president and Democrat candidate Kamala Harris now leads Republican leader and former US President Donald Trump, suggesting a potentially less inflationary outlook for the economy if she wins.
Additionally, there are expectations of increased physical demand from India, the world’s second-largest Gold consumer, following the government's reduction of its Gold import tax from 15% to 6%.
Gold is also expected to benefit from long-term geopolitical factors, particularly plans by BRICS+ nations to replace the US Dollar as the world’s reserve currency with their own Gold-backed alternative. This move aims to prevent the US from leveraging the Dollar in geopolitical conflicts and sanctions against enemy states.
Technical Analysis: Gold continues oscillating in range
Gold is unfolding a new down leg within the widening range it has formed since May. It still appears to be within a sideways market mode rather than a directional trend.
The down leg is expected to fall towards the floor and the 100-day Simple Moving Average (SMA) at circa $2,320. However, the 50-day SMA at $2,360 is likely to present temporary support on the way down.
XAU/USD Daily Chart
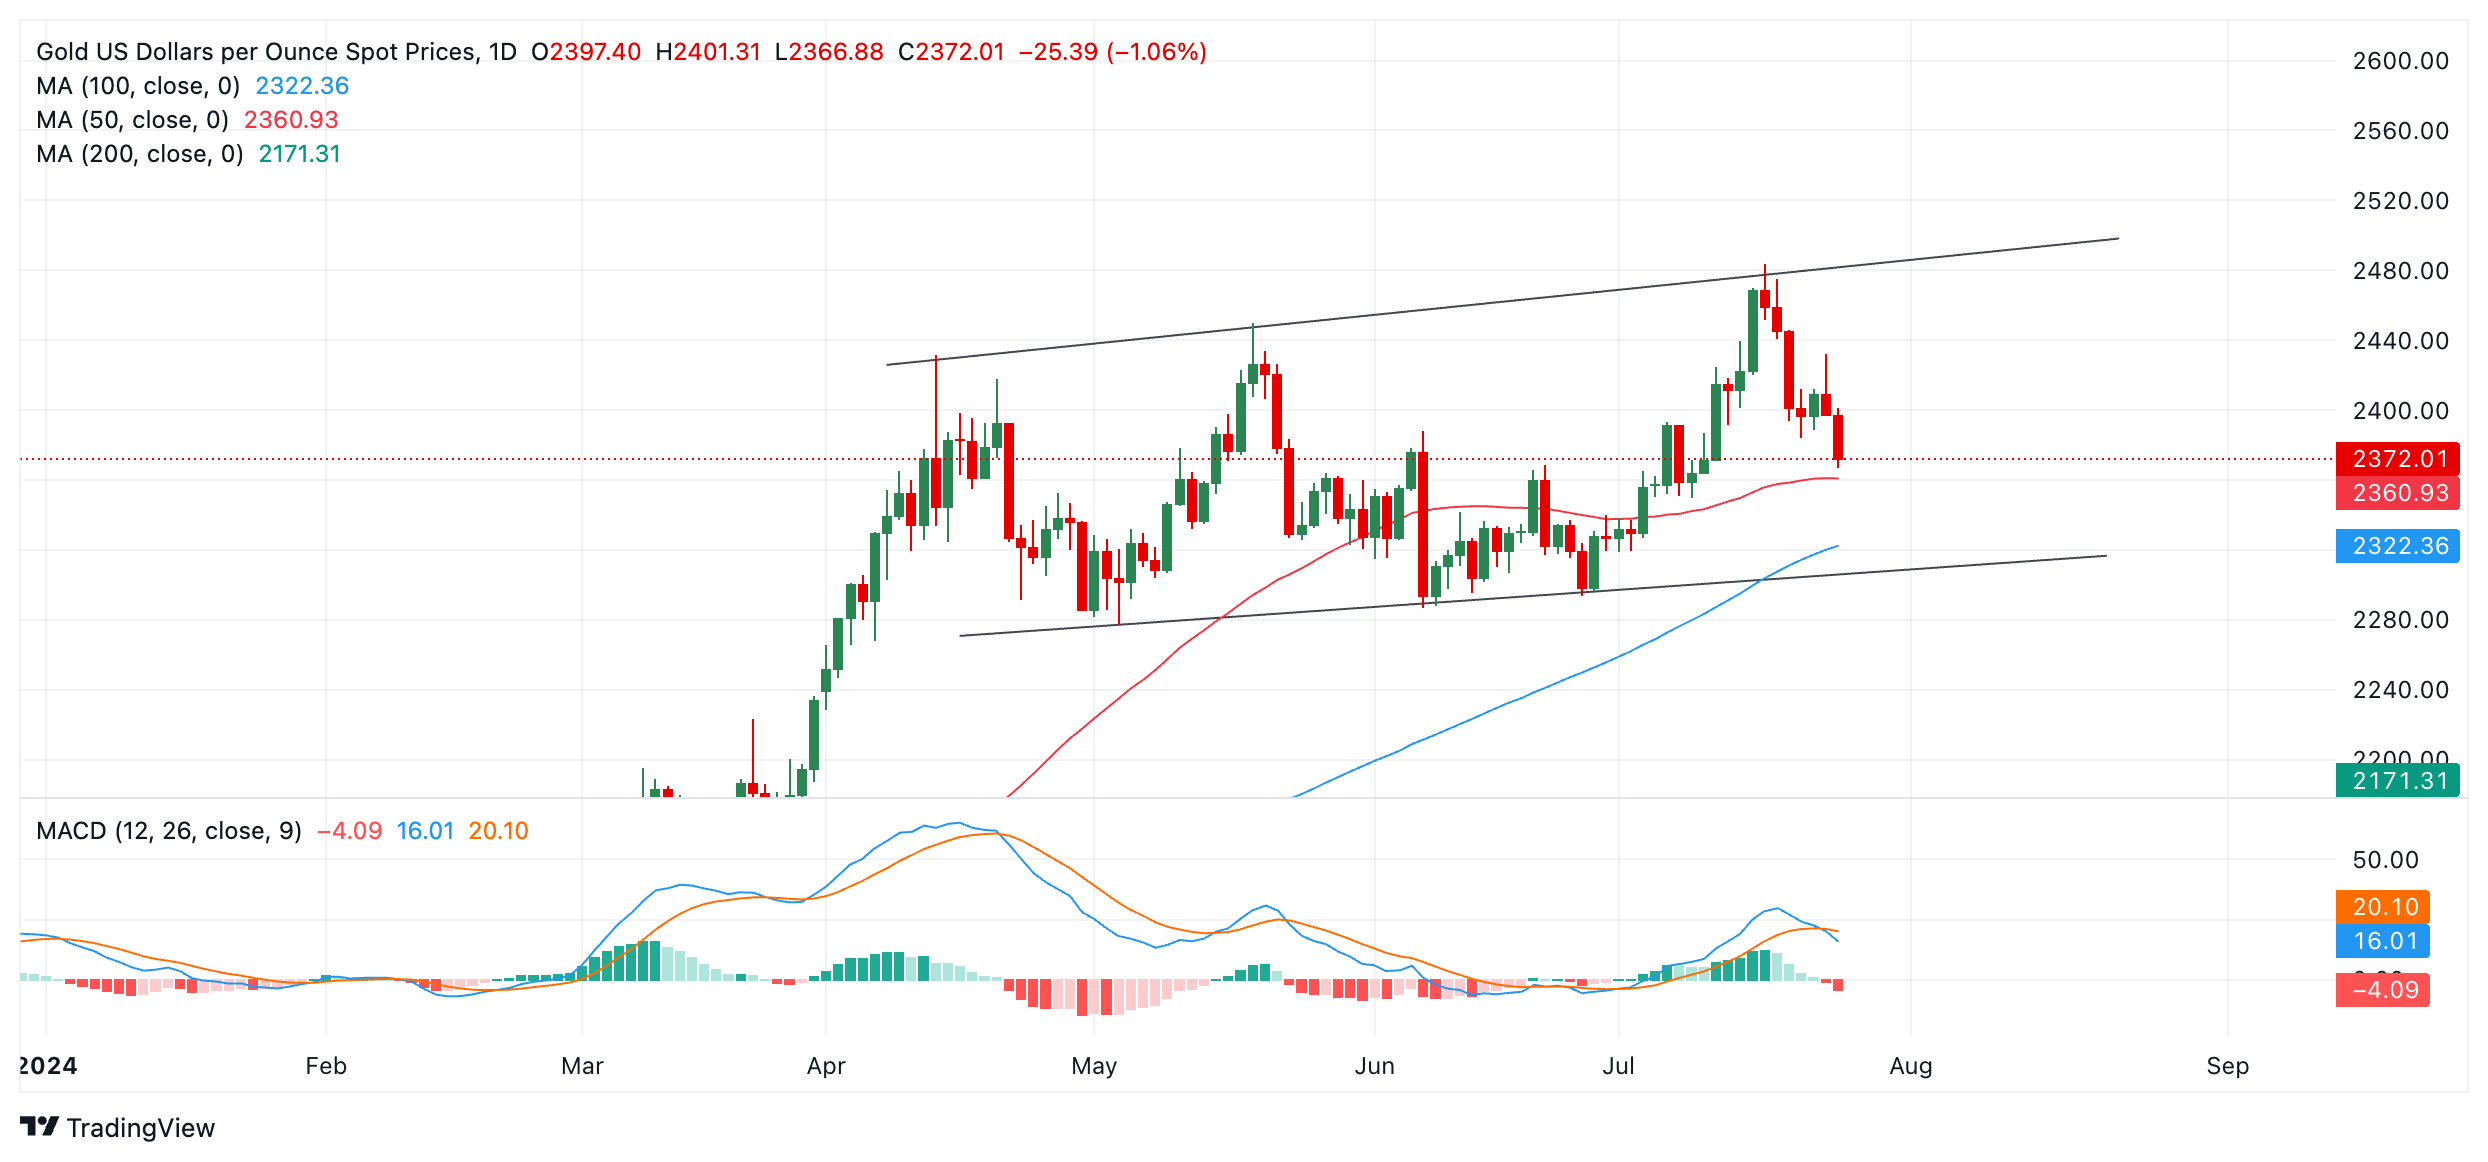
The Moving Average Convergence Divergence (MACD) indicator has crossed below its signal line, adding bearish confirmation to the down move currently unfolding. MACD tends to work particularly well at signaling price turns in sideways markets.
A break above the $2,483 all-time-high would indicate the establishment of a higher high and suggest the possibility of a breakout to the upside and an extension of the longer-term uptrend.
Such a move might unlock Gold’s next upside target at roughly $2,555-$2,560, calculated by extrapolating the 0.618 Fibonacci ratio of the height of the range higher.
Economic Indicator
Gross Domestic Product Annualized
The real Gross Domestic Product (GDP) Annualized, released quarterly by the US Bureau of Economic Analysis, measures the value of the final goods and services produced in the United States in a given period of time. Changes in GDP are the most popular indicator of the nation’s overall economic health. The data is expressed at an annualized rate, which means that the rate has been adjusted to reflect the amount GDP would have changed over a year’s time, had it continued to grow at that specific rate. Generally speaking, a high reading is seen as bullish for the US Dollar (USD), while a low reading is seen as bearish.
Read more.Next release: Thu Jul 25, 2024 12:30 (Prel)
Frequency: Quarterly
Consensus: 2%
Previous: 1.4%
Source: US Bureau of Economic Analysis
The US Bureau of Economic Analysis (BEA) releases the Gross Domestic Product (GDP) growth on an annualized basis for each quarter. After publishing the first estimate, the BEA revises the data two more times, with the third release representing the final reading. Usually, the first estimate is the main market mover and a positive surprise is seen as a USD-positive development while a disappointing print is likely to weigh on the greenback. Market participants usually dismiss the second and third releases as they are generally not significant enough to meaningfully alter the growth picture.
Silver prices (XAG/USD) fell on Thursday, according to FXStreet data. Silver trades at $27.99 per troy ounce, down 3.16% from the $28.91 it cost on Wednesday.
Silver prices have increased by 17.65% since the beginning of the year.
| Unit measure | Silver Price Today in USD |
|---|---|
| Troy Ounce | 27.99 |
| 1 Gram | 0.90 |
The Gold/Silver ratio, which shows the number of ounces of Silver needed to equal the value of one ounce of Gold, stood at 84.82 on Thursday, up from 82.93 on Wednesday.
Silver FAQs
Silver is a precious metal highly traded among investors. It has been historically used as a store of value and a medium of exchange. Although less popular than Gold, traders may turn to Silver to diversify their investment portfolio, for its intrinsic value or as a potential hedge during high-inflation periods. Investors can buy physical Silver, in coins or in bars, or trade it through vehicles such as Exchange Traded Funds, which track its price on international markets.
Silver prices can move due to a wide range of factors. Geopolitical instability or fears of a deep recession can make Silver price escalate due to its safe-haven status, although to a lesser extent than Gold's. As a yieldless asset, Silver tends to rise with lower interest rates. Its moves also depend on how the US Dollar (USD) behaves as the asset is priced in dollars (XAG/USD). A strong Dollar tends to keep the price of Silver at bay, whereas a weaker Dollar is likely to propel prices up. Other factors such as investment demand, mining supply – Silver is much more abundant than Gold – and recycling rates can also affect prices.
Silver is widely used in industry, particularly in sectors such as electronics or solar energy, as it has one of the highest electric conductivity of all metals – more than Copper and Gold. A surge in demand can increase prices, while a decline tends to lower them. Dynamics in the US, Chinese and Indian economies can also contribute to price swings: for the US and particularly China, their big industrial sectors use Silver in various processes; in India, consumers’ demand for the precious metal for jewellery also plays a key role in setting prices.
Silver prices tend to follow Gold's moves. When Gold prices rise, Silver typically follows suit, as their status as safe-haven assets is similar. The Gold/Silver ratio, which shows the number of ounces of Silver needed to equal the value of one ounce of Gold, may help to determine the relative valuation between both metals. Some investors may consider a high ratio as an indicator that Silver is undervalued, or Gold is overvalued. On the contrary, a low ratio might suggest that Gold is undervalued relative to Silver.
(An automation tool was used in creating this post.)
Impulsive momentum suggests further USD weakness; support levels are at 152.50 and 152.00, followed by 151.30, UOB Group FX analysts Quek Ser Leang and Lee Sue Ann note.
Support levels are at 152.50, 152.00 and 151.30
24-HOUR VIEW: “While we expected USD to decline further yesterday, we indicated that ‘it remains to be seen if it can maintain a foothold below 155.35.’ The subsequent price action was surprising, as USD nose-dived to a low of 153.09. The impulsive momentum suggests further USD weakness. Support levels are at 152.50 and 152.00, while resistance levels are at 154.10 and 154.70.
1-3 WEEKS VIEW: “Yesterday (24 Jul, spot at 155.85), we noted that ‘downward momentum is picking up again.’ We indicated that ‘if USD breaks and stays below 155.35, the next level to watch is 154.50.’ USD subsequently not only broke below 155.35 but also plummeted to 153.09. We continue to expect USD weakness. The next level to monitor is at 152.00, followed by 151.30. The USD weakness that started more than a week will remain in place as long as 155.00 (‘strong resistance’ level was at 157.15 yesterday) is not breached.”
As long as 0.5950 is not breached, the New Zealand Dollar (NZD) could test the 0.5900 level before the risk of a rebound increases, UOB Group FX analysts Quek Ser Leang and Lee Sue Ann note.
NZD moves towards 0.5900
24-HOUR VIEW: “When NZD was trading at 0.5950 yesterday, we stated that ‘as long as 0.5980 is not breached, NZD could weaken further.’ We added, ‘given the oversold conditions, the significant support level at 0.5900 is highly unlikely to come under threat.’ Our view was correct, as NZD fell to a low of 0.5914. Downward momentum has slowed to an extent, but today, as long as 0.5950 is not breached (minor resistance is at 0.5935), NZD could test the 0.5900 level before the risk of a rebound increases.”
1-3 WEEKS VIEW: “Our update from yesterday (24 Jul, spot at 0.5950) is still valid. As highlighted, downward momentum remains strong, and the next level to watch is 0.5900. On the upside, if NZD breaks above 0.5980 (‘strong resistance’ level was at 0.6000 yesterday), it would mean that the weakness that started in the middle of last week has stabilised. Looking ahead, the next support below 0.5900 is at 0.5875.”
Outlook for the Australian Dollar (AUD) remains negative; the next level to monitor is 0.6530, UOB Group FX analysts Quek Ser Leang and Lee Sue Ann note.
AUD moves towards 0.6530
24-HOUR VIEW: “Yesterday, we expected AUD to dip below the major support at 0.6590. However, we were of the view that it ‘is unlikely to be able to maintain a foothold below this level.’ AUD dropped more than expected to 0.6578 and then closed at 0.6582 (-0.51%). AUD continues to decline in early Asian trade today. The impulsive decline is likely to continue. The next level to watch is at 0.6530. On the upside, any rebound is likely to remain below 0.6605 (minor resistance is at 0.6590).
1-3 WEEKS VIEW: “We turned negative in AUD relatively early, in the middle of last week (17 Jul, spot at 0.6730), but we did not expect it dropped this much in such a short span of time. Note that AUD closed lower for the eight consecutive days yesterday. In our update yesterday (24 Jul, spot at 0.6615), we indicated that AUD ‘remains negative, but does not seem to have the potential to decline significantly.’ While we correctly identified the trend, we underestimated its strength. From here, we will continue to hold a negative AUD view as long as 0.6630 is not breached (‘strong resistance’ level was at 0.6675 yesterday). On the downside, the next level to monitor is 0.6530.”
The Pound Sterling (GBP) is likely to consolidate between 1.2850 and 1.3020 for the time being, UOB Group FX analysts Quek Ser Leang and Lee Sue Ann note.
GBP is set to test 1.2850
24-HOUR VIEW: “We indicated yesterday that ‘there has been a slight increase in momentum.’ We expected GBP to drift lower, but we pointed out that ‘any decline is unlikely to reach 1.2850, and there is another support level at 1.2875.’ In London trade, GBP fell to a low of 1.2878 and then rebounded, closing unchanged at 1.2906. While we continue to expect GBP to drift lower today, downward momentum has not increased much. In other words, any decline is still unlikely to reach 1.2850. The mild downward pressure is intact provided that the resistance level at 1.2940 is not breached (minor resistance is at 1.2920).”
1-3 WEEKS VIEW: “Last Friday (19 Jul, spot at 1.2950), we highlighted that ‘the recent advance in GBP has come to an end.’ We also highlighted that GBP ‘appears to have entered a consolidation phase, and it is likely to trade between 1.2850 and 1.3020 for the time being.’ While there has been a slight increase in short-term downward momentum, we continue to hold the same view for now.”
- USD/CAD extends its winning streak to 14-week highs on Thursday.
- The Canadian Dollar declined as the BoC reduced rates by 25 basis points to 4.5% on Wednesday’s meeting.
- The US Dollar may appreciate as recent US PMI data allows the Fed to maintain its restrictive policy.
USD/CAD continues its winning streak that began on July 17, trading around 1.3820, reaching 14-week highs during the European session on Thursday. The Canadian Dollar (CAD) faced challenges as the Bank of Canada (BoC) lowered interest rates by 25 basis points to 4.5% for the second consecutive meeting on Wednesday, citing progress in reducing inflation.
BoC members emphasized that excess supply and a cooling labor market justified their decision to cut rates, aiming to stabilize consumer prices at 2% by 2025. The reduced borrowing conditions are anticipated to alleviate inflationary pressures by lowering mortgage rates and housing costs.
Additionally, the lower crude Oil prices put pressure on the Loonie Dollar as Canada is the biggest crude exporter to the United States (US). West Texas Intermediate (WTI) Oil price continues to decline for the sixth successive session, trading around $77.00 per barrel during the European hours on Thursday. Crude Oil prices are under pressure due to negative sentiment in global stock markets affecting risk assets.
Moreover, Sluggish economic activity in China, the largest crude importer, has added further downward pressure on Oil prices. China's Q2 growth was 4.7%, the weakest increase since early 2023. A surge of optimism surrounding potential ceasefire negotiations between Israel and Hamas has eased the threat of supply disruption, which weakens the prices of black Gold. Israeli Prime Minister Benjamin Netanyahu has hinted that a ceasefire agreement
The US Dollar might strengthen following recent PMI data indicating a quicker expansion in private-sector activity for July, which rose to 55.0 reading from the previous 54.8 reading. This has marked the highest reading since April 2022 and indicates sustained growth over the past 18 months. This data provides the Federal Reserve (Fed) with more flexibility to maintain its restrictive policy stance if inflation remains persistent.
Traders await the US Gross Domestic Product (GDP) Annualized (Q2) data on Thursday and the Personal Consumption Expenditures (PCE) inflation data on Friday. These reports are anticipated to offer fresh insights into the economic conditions in the United States.
Canadian Dollar FAQs
The key factors driving the Canadian Dollar (CAD) are the level of interest rates set by the Bank of Canada (BoC), the price of Oil, Canada’s largest export, the health of its economy, inflation and the Trade Balance, which is the difference between the value of Canada’s exports versus its imports. Other factors include market sentiment – whether investors are taking on more risky assets (risk-on) or seeking safe-havens (risk-off) – with risk-on being CAD-positive. As its largest trading partner, the health of the US economy is also a key factor influencing the Canadian Dollar.
The Bank of Canada (BoC) has a significant influence on the Canadian Dollar by setting the level of interest rates that banks can lend to one another. This influences the level of interest rates for everyone. The main goal of the BoC is to maintain inflation at 1-3% by adjusting interest rates up or down. Relatively higher interest rates tend to be positive for the CAD. The Bank of Canada can also use quantitative easing and tightening to influence credit conditions, with the former CAD-negative and the latter CAD-positive.
The price of Oil is a key factor impacting the value of the Canadian Dollar. Petroleum is Canada’s biggest export, so Oil price tends to have an immediate impact on the CAD value. Generally, if Oil price rises CAD also goes up, as aggregate demand for the currency increases. The opposite is the case if the price of Oil falls. Higher Oil prices also tend to result in a greater likelihood of a positive Trade Balance, which is also supportive of the CAD.
While inflation had always traditionally been thought of as a negative factor for a currency since it lowers the value of money, the opposite has actually been the case in modern times with the relaxation of cross-border capital controls. Higher inflation tends to lead central banks to put up interest rates which attracts more capital inflows from global investors seeking a lucrative place to keep their money. This increases demand for the local currency, which in Canada’s case is the Canadian Dollar.
Macroeconomic data releases gauge the health of the economy and can have an impact on the Canadian Dollar. Indicators such as GDP, Manufacturing and Services PMIs, employment, and consumer sentiment surveys can all influence the direction of the CAD. A strong economy is good for the Canadian Dollar. Not only does it attract more foreign investment but it may encourage the Bank of Canada to put up interest rates, leading to a stronger currency. If economic data is weak, however, the CAD is likely to fall.
Chance for the Euro (EUR) to edge lower. Any decline is still unlikely to break clearly below 1.0815. This level is expected to provide solid support, UOB Group FX analysts Quek Ser Leang and Lee Sue Ann note.
The nearest support is at 1.0815
24-HOUR VIEW: “We detected ‘a tentative buildup in downward momentum’ yesterday. We expected a weaker EUR, but we were of the view that ‘any decline is unlikely to break clearly below 1.0815.’ EUR subsequently fell, but did not threaten the 1.0815 level, as it rebounded from a low of 1.0824. It then closed at 1.0839 (-0.11%). While there is no clear increase in downward momentum, there is a chance for EUR to edge lower today. However, any decline is still unlikely to break clearly below 1.0815. Resistance is at 1.0855 and 1.0865.”
1-3 WEEKS VIEW: “Our update from yesterday (24 Jul, spot at 1.0850) still stands. As highlighted, downward momentum is building, but not sufficiently enough to suggest a significant decline. EUR is likely to trade with a downward bias, but the 1.0815 level is expected to provide solid support. The downward bias is intact as long as 1.0890 (‘strong resistance’ level was at 1.0905 yesterday) is not breached. Looking ahead, if EUR breaks clearly below 1.0815, the next level to watch is 1.0760.”
- German IFO Business Climate Index missed estimates with 87.0 in July.
- The IFO Current Economic Assessment Index declined to 87.1 in the reported month.
The headline German IFO Business Climate Index came in at 87.0 in July, falling sharply from the June figure of 88.6. The market forecast was 88.9.
Meanwhile, the Current Economic Assessment Index declined from 88.3 in June to 87.1 in the same period, missing the expected 88.5 print.
The IFO Expectations Index – indicating firms’ projections for the next six months, also dropped to 86.9 in July vs. 88.8 in June and 89.0 expected.
Market reaction to the German IFO Survey
EUR/USD pays little attention to the downbeat German IFO survey. At the time of writing, the pair is trading 0.10% higher on the day at 1.0850, awaiting the US Q2 growth data.
About German IFO
The headline IFO business climate index was rebased and recalibrated in July after the IFO Research Institute changed the series from the base year of 2000 to the base year of 2005 as of July 2011 and then changed series to include services as of July 2018. The survey now includes 9,000 monthly survey responses from firms in the manufacturing, service sector, trade and construction.
- USD/CHF declines as safe-haven flows favor the Swiss Franc amid global economic uncertainty.
- The PBOC cut the one-year MLF rate to 2.30% from 2.50% on Thursday.
- The US Dollar may struggle due to a decline in Treasury yields.
USD/CHF extends its losses for the second consecutive day, trading around 0.8810 during the Asian early European session on Thursday. The Swiss Franc (CHF) gains ground due to safe-haven flows amid uncertainty regarding the global economy.
Negative sentiment in global stock markets affects risk assets, which drives the investors toward safe-haven Swiss Franc. US stock indices have decreased as technology stocks suffered more losses, exacerbated by disappointing quarterly earnings from major US tech companies Tesla and Alphabet. Additionally, Japanese shares hit five-week lows as the decline in technology stocks intensified.
Additionally, concerns about the weak Chinese economy were heightened by an unexpected rate cut from the People's Bank of China (PBoC) on Monday. The People’s Bank of China (PBOC), cut the one-year Medium-term Lending Facility (MLF) rate from 2.50% to 2.30% on Thursday. Moreover, the Bank of China, one of the world's largest banks, announced a 10-20 basis points cut in time deposit rates.
The US Dollar may limit its downside as recent US PMI data showed a faster expansion in private-sector activity for July, underscoring the resilience of US growth despite elevated interest rates. This data gives the Federal Reserve (Fed) more leeway to uphold its restrictive policy stance if inflation does not show signs of easing.
Investors are expected to closely monitor the US Gross Domestic Product (GDP) Annualized (Q2) data on Thursday and the Personal Consumption Expenditures (PCE) inflation data on Friday. These reports are expected to provide new insights into the economic conditions in the United States.
Swiss Franc FAQs
The Swiss Franc (CHF) is Switzerland’s official currency. It is among the top ten most traded currencies globally, reaching volumes that well exceed the size of the Swiss economy. Its value is determined by the broad market sentiment, the country’s economic health or action taken by the Swiss National Bank (SNB), among other factors. Between 2011 and 2015, the Swiss Franc was pegged to the Euro (EUR). The peg was abruptly removed, resulting in a more than 20% increase in the Franc’s value, causing a turmoil in markets. Even though the peg isn’t in force anymore, CHF fortunes tend to be highly correlated with the Euro ones due to the high dependency of the Swiss economy on the neighboring Eurozone.
The Swiss Franc (CHF) is considered a safe-haven asset, or a currency that investors tend to buy in times of market stress. This is due to the perceived status of Switzerland in the world: a stable economy, a strong export sector, big central bank reserves or a longstanding political stance towards neutrality in global conflicts make the country’s currency a good choice for investors fleeing from risks. Turbulent times are likely to strengthen CHF value against other currencies that are seen as more risky to invest in.
The Swiss National Bank (SNB) meets four times a year – once every quarter, less than other major central banks – to decide on monetary policy. The bank aims for an annual inflation rate of less than 2%. When inflation is above target or forecasted to be above target in the foreseeable future, the bank will attempt to tame price growth by raising its policy rate. Higher interest rates are generally positive for the Swiss Franc (CHF) as they lead to higher yields, making the country a more attractive place for investors. On the contrary, lower interest rates tend to weaken CHF.
Macroeconomic data releases in Switzerland are key to assessing the state of the economy and can impact the Swiss Franc’s (CHF) valuation. The Swiss economy is broadly stable, but any sudden change in economic growth, inflation, current account or the central bank’s currency reserves have the potential to trigger moves in CHF. Generally, high economic growth, low unemployment and high confidence are good for CHF. Conversely, if economic data points to weakening momentum, CHF is likely to depreciate.
As a small and open economy, Switzerland is heavily dependent on the health of the neighboring Eurozone economies. The broader European Union is Switzerland’s main economic partner and a key political ally, so macroeconomic and monetary policy stability in the Eurozone is essential for Switzerland and, thus, for the Swiss Franc (CHF). With such dependency, some models suggest that the correlation between the fortunes of the Euro (EUR) and the CHF is more than 90%, or close to perfect.
- The US Dollar Index trades back and forth around 104.30 with US Q2 GDP in focus.
- Market sentiment remains risk averse amid uncertainty over US presidential elections.
- The US core PCE will indicate whether market speculation for Fed rate cuts in September is appropriate.
The US Dollar Index (DXY) trades in a tight range near 104.30 in Thursday’s European session. The US Dollar (USD) stays quiet as investors await the United States (US) Q2 flash Gross Domestic Product (GDP) data, which will be published at 12:30 GMT. The GDP data will indicate the current status of the economy’s health.
According to the estimates, the US economy expanded at a faster pace of 2% from the former reading of 1.4%, on an annualized basis, which is above Fed’s forecast of 1.8% non-inflationary growth. Investors will also focus on the GDP Price Index, which will indicate a change in the prices of goods and services produced. The GDP Price Index is estimated to have decelerated to 2.6% from the prior release of 3.1%. This would diminish fears of inflation remaining persistent.
Alongwith GDP numbers, investors will also focus on the US Durable Goods Orders for June. New Orders for Durable Goods is expected to have increased by 0.3% from 0.1% in May.
Meanwhile, the major trigger for the US Dollar will be the US Personal Consumption Expenditure Price Index (PCE) data for June, which will be published on Friday. The core PCE inflation, a Federal Reserve’s (Fed) preferred inflation tool, is estimated to have decelerated to 2.5% from May’s figure of 2.6%, with the monthly figure growing steadily by 0.1%. The scenario of expected or higher decline in inflationary pressures would cement expectations of Fed rate cuts in September. On the contrary, soft numbers will weaken the same.
The market sentiment remains risk-averse amid deepening uncertainty over US presidential elections. S&P 500 futures have surrendered gains posted in Asian trading hours. 10-year US Treasury yields tumble to 4.24%.
US Dollar FAQs
The US Dollar (USD) is the official currency of the United States of America, and the ‘de facto’ currency of a significant number of other countries where it is found in circulation alongside local notes. It is the most heavily traded currency in the world, accounting for over 88% of all global foreign exchange turnover, or an average of $6.6 trillion in transactions per day, according to data from 2022. Following the second world war, the USD took over from the British Pound as the world’s reserve currency. For most of its history, the US Dollar was backed by Gold, until the Bretton Woods Agreement in 1971 when the Gold Standard went away.
The most important single factor impacting on the value of the US Dollar is monetary policy, which is shaped by the Federal Reserve (Fed). The Fed has two mandates: to achieve price stability (control inflation) and foster full employment. Its primary tool to achieve these two goals is by adjusting interest rates. When prices are rising too quickly and inflation is above the Fed’s 2% target, the Fed will raise rates, which helps the USD value. When inflation falls below 2% or the Unemployment Rate is too high, the Fed may lower interest rates, which weighs on the Greenback.
In extreme situations, the Federal Reserve can also print more Dollars and enact quantitative easing (QE). QE is the process by which the Fed substantially increases the flow of credit in a stuck financial system. It is a non-standard policy measure used when credit has dried up because banks will not lend to each other (out of the fear of counterparty default). It is a last resort when simply lowering interest rates is unlikely to achieve the necessary result. It was the Fed’s weapon of choice to combat the credit crunch that occurred during the Great Financial Crisis in 2008. It involves the Fed printing more Dollars and using them to buy US government bonds predominantly from financial institutions. QE usually leads to a weaker US Dollar.
Quantitative tightening (QT) is the reverse process whereby the Federal Reserve stops buying bonds from financial institutions and does not reinvest the principal from the bonds it holds maturing in new purchases. It is usually positive for the US Dollar.
- The Pound Sterling declines against the US Dollar to nearly 1.2880 amid dismal market sentiment ahead of advanced US Q2 GDP data.
- Firm preliminary S&P Global/CIPS PMI for July has improved the UK’s economic outlook.
- BoE officials hesitate to authenticate market speculation for a rate cut in August.
The Pound Sterling (GBP) weakens to 1.2880 against the US Dollar (USD) in Thursday’s London session. The GBP/USD pair declines on sour market sentiment ahead of the advanced United States (US) Q2 Gross Domestic Product (GDP) data, which will be published at 12:30 GMT.
S&P 500 futures posted some gains in European trading hours, but this appears to be a slight pullback move after nosediving by 2.31% on Wednesday. The US Dollar Index (DXY), which tracks the Greenback’s value against six major currencies, exhibits a sluggish performance at around 104.30.
The US Q2 GDP is estimated to have grown by 2% from the former release of 1.4% on an annualized basis. A higher growth rate is expected to result from strong consumer spending. Per the consensus, the advanced GDP Price Index is expected to have decelerated to 2.6% from the prior reading of 3.1%, which would bring relief for Federal Reserve (Fed) policymakers and cement expectations of interest rate cuts in September.
Going forward, the major trigger for the US Dollar will be the Personal Consumption Expenditures Price Index (PCE) data for June, which will be published on Friday. The core PCE inflation, the Fed’s preferred inflation gauge, is estimated to have decelerated to 2.5% from May’s figure of 2.6%, with the monthly figure growing steadily by 0.1%.
Daily digest market movers: Pound Sterling drops on firm BoE rate-cut prospects
- The Pound Sterling exhibits a poor performance against its major peers, except the Australian Dollar (AUD) and the New Zealand Dollar (NZD), on Thursday. The British currency has faced significant pressure as market experts see the Bank of England (BoE) pivoting to policy normalization in August.
- A Reuters poll conducted July 18-24 showed that more than 80% of economists said the BoE will reduce its key borrowing rates by 25 basis points (bps) to 5% in the August meeting. However, the prediction of a rate-cut in June’s poll was higher, with 97% of respondents favoring a rate-cut move. Contrary to Reuters’ poll, market participants are only pricing in a 45% chance for rate cuts in August.
- An absence of BoE officials’ endorsement for rate cuts seems to have kept market speculation limited. The United Kingdom’s annual headline inflation has returned to the central bank’s desired rate of 2%. However, policymakers hesitate to authenticate rate-cut expectations amid fears of wage growth remaining persistent, which fuels inflationary pressures in the service sector.
- On the economic data front, the upbeat preliminary UK S&P Global/CIPS report for July has indicated a firm start to the third quarter. The Composite PMI came in higher at 52.7 than estimates of 52.6 and the former release of 52.3 due to an increase in activities in the manufacturing as well as service sectors. The Manufacturing and Services PMI expanded to 51.8 and 52.4, respectively, outperforming their former releases.
Technical Analysis: Pound Sterling slips below 1.2900
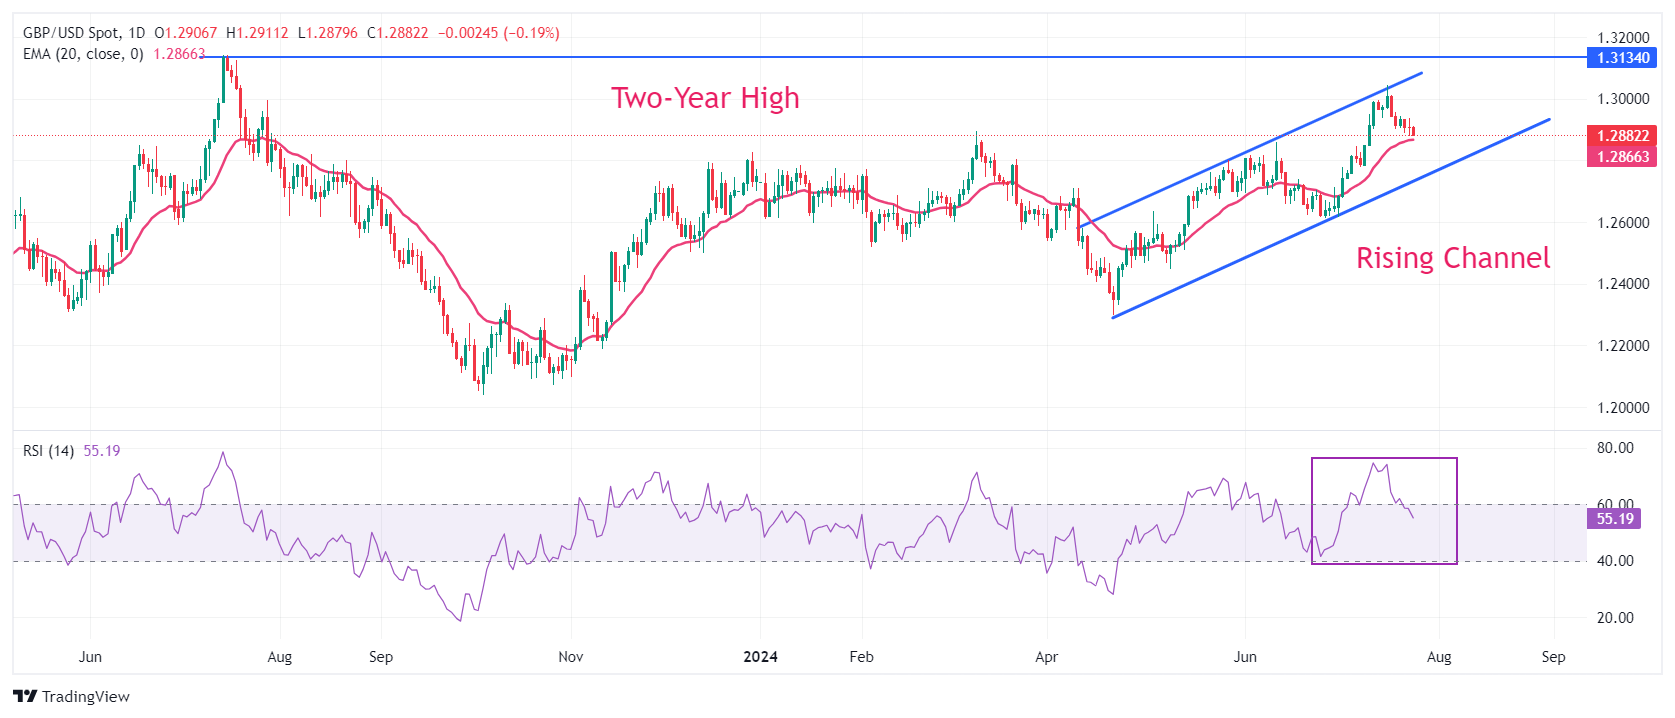
The Pound Sterling skids below the crucial support of 1.2900 against the US Dollar. The GBP/USD pair trades in a Rising Channel formation on a daily timeframe, in which each pullback move is considered a buying opportunity by market participants. The Cable holds the key 20-day Exponential Moving Average (EMA), which trades around 1.2866.
The 14-day Relative Strength Index (RSI) returns within the 40.00-60.00 range, suggesting the bullish momentum has faded. However, the bullish bias remains intact.
On the upside, a two-year high near 1.3140 will be a key resistance zone for the Cable.
Pound Sterling FAQs
The Pound Sterling (GBP) is the oldest currency in the world (886 AD) and the official currency of the United Kingdom. It is the fourth most traded unit for foreign exchange (FX) in the world, accounting for 12% of all transactions, averaging $630 billion a day, according to 2022 data. Its key trading pairs are GBP/USD, aka ‘Cable’, which accounts for 11% of FX, GBP/JPY, or the ‘Dragon’ as it is known by traders (3%), and EUR/GBP (2%). The Pound Sterling is issued by the Bank of England (BoE).
The single most important factor influencing the value of the Pound Sterling is monetary policy decided by the Bank of England. The BoE bases its decisions on whether it has achieved its primary goal of “price stability” – a steady inflation rate of around 2%. Its primary tool for achieving this is the adjustment of interest rates. When inflation is too high, the BoE will try to rein it in by raising interest rates, making it more expensive for people and businesses to access credit. This is generally positive for GBP, as higher interest rates make the UK a more attractive place for global investors to park their money. When inflation falls too low it is a sign economic growth is slowing. In this scenario, the BoE will consider lowering interest rates to cheapen credit so businesses will borrow more to invest in growth-generating projects.
Data releases gauge the health of the economy and can impact the value of the Pound Sterling. Indicators such as GDP, Manufacturing and Services PMIs, and employment can all influence the direction of the GBP. A strong economy is good for Sterling. Not only does it attract more foreign investment but it may encourage the BoE to put up interest rates, which will directly strengthen GBP. Otherwise, if economic data is weak, the Pound Sterling is likely to fall.
Another significant data release for the Pound Sterling is the Trade Balance. This indicator measures the difference between what a country earns from its exports and what it spends on imports over a given period. If a country produces highly sought-after exports, its currency will benefit purely from the extra demand created from foreign buyers seeking to purchase these goods. Therefore, a positive net Trade Balance strengthens a currency and vice versa for a negative balance.
Japan’s Chief Cabinet Secretary Yoshimasa Hayashi said on Thursday that he is “closely watching FX moves.”
Additional comments
Won’t comment on daily share moves.
Won't comment on forex moves.
Important for currencies to move in stable manner reflecting fundamentals.
Market reaction
At the press time, USD/JPY is down 0.74% on the day to trade near 152.75
Here is what you need to know on Thursday, July 25:
Market participants gear up for a volatile American session that will feature the United States' first estimate of the second-quarter Gross Domestic Product (GDP) growth. The US economic docket will also feature weekly Initial Jobless Claims, Durable Goods Orders and Pending Home Sales data for June.
During the Asian trading hours, the People’s Bank of China (PBOC), China's central bank, announced that it lowered the one-year Medium-term Lending Facility (MLF) rate from 2.50% to 2.30%. This unexpected decision seems to be causing investors to adopt a cautious stance. At the time of press, the Shanghai Composite Index was down 0.5% on the day and Hong Kong's Hang Seng Index was losing 1.7%. This announcement also seems to be weighing heavily on AUD/USD and NZD/USD pairs, which were last seen 0.55% and 0.3%, respectively.
Concerns over the Chinese economic outlook seem to be hurting Gold prices as well. After rising above $2,430 on Wednesday, XAU/USD made a sharp U-turn and closed the day in negative territory slightly below $2,400. Gold remains under bearish pressure early Thursday and loses nearly 1% on the day at around $2,375 in the early European morning.
US Dollar PRICE This week
The table below shows the percentage change of US Dollar (USD) against listed major currencies this week. US Dollar was the weakest against the Japanese Yen.
| USD | EUR | GBP | JPY | CAD | AUD | NZD | CHF | |
|---|---|---|---|---|---|---|---|---|
| USD | 0.46% | 0.21% | -2.89% | 0.81% | 2.20% | 1.73% | -0.52% | |
| EUR | -0.46% | -0.25% | -3.34% | 0.32% | 1.77% | 1.20% | -1.04% | |
| GBP | -0.21% | 0.25% | -3.21% | 0.55% | 2.02% | 1.45% | -0.81% | |
| JPY | 2.89% | 3.34% | 3.21% | 3.85% | 5.31% | 4.71% | 2.37% | |
| CAD | -0.81% | -0.32% | -0.55% | -3.85% | 1.47% | 0.91% | -1.34% | |
| AUD | -2.20% | -1.77% | -2.02% | -5.31% | -1.47% | -0.55% | -2.78% | |
| NZD | -1.73% | -1.20% | -1.45% | -4.71% | -0.91% | 0.55% | -2.19% | |
| CHF | 0.52% | 1.04% | 0.81% | -2.37% | 1.34% | 2.78% | 2.19% |
The heat map shows percentage changes of major currencies against each other. The base currency is picked from the left column, while the quote currency is picked from the top row. For example, if you pick the US Dollar from the left column and move along the horizontal line to the Japanese Yen, the percentage change displayed in the box will represent USD (base)/JPY (quote).
The US economy is forecast to grow at an annual rate of 2% in the second quarter, following the 1.4% expansion recorded in the first quarter. The GDP report will also include key figures, such as the quarterly core Personal Consumption Expenditures (PCE) Price Index and the GDP Price Index. The US Dollar (USD) Index fluctuates in a narrow channel below 104.50 on Thursday after posting small losses on Wednesday. Meanwhile, US stock index futures trade little changed and the 10-year US yield loses more than 0.7% on the day at 4.25%.
Following Tuesday's sharp decline, EUR/USD failed to stage a rebound on Wednesday and ended the day modestly lower. At the beginning of the European session, the pair trades below 1.0850. The European Central Bank will release M3 Money Supply and Private Loans data for June later in the session.
GBP/USD closed the day virtually unchanged on Wednesday after failing to stabilize above 1.2900. The pair stays on the back foot on Thursday and was last seen trading in the red near 1.2880.
USD/JPY extend its downtrend early Thursday and trades at its weakest level since early May below 153.00. The Japanese Yen seems to be capitalizing on safe-haven flows and benefiting from growing expectations for further policy tightening by the Bank of Japan. The Japanese Cabinet Office said in its monthly report on Thursday that the government maintained its economic assessment in July but warned of a gloomy outlook.
GDP FAQs
A country’s Gross Domestic Product (GDP) measures the rate of growth of its economy over a given period of time, usually a quarter. The most reliable figures are those that compare GDP to the previous quarter e.g Q2 of 2023 vs Q1 of 2023, or to the same period in the previous year, e.g Q2 of 2023 vs Q2 of 2022. Annualized quarterly GDP figures extrapolate the growth rate of the quarter as if it were constant for the rest of the year. These can be misleading, however, if temporary shocks impact growth in one quarter but are unlikely to last all year – such as happened in the first quarter of 2020 at the outbreak of the covid pandemic, when growth plummeted.
A higher GDP result is generally positive for a nation’s currency as it reflects a growing economy, which is more likely to produce goods and services that can be exported, as well as attracting higher foreign investment. By the same token, when GDP falls it is usually negative for the currency. When an economy grows people tend to spend more, which leads to inflation. The country’s central bank then has to put up interest rates to combat the inflation with the side effect of attracting more capital inflows from global investors, thus helping the local currency appreciate.
When an economy grows and GDP is rising, people tend to spend more which leads to inflation. The country’s central bank then has to put up interest rates to combat the inflation. Higher interest rates are negative for Gold because they increase the opportunity-cost of holding Gold versus placing the money in a cash deposit account. Therefore, a higher GDP growth rate is usually a bearish factor for Gold price.
- The United States Gross Domestic Product is seen expanding at an annualized rate of 2% in Q2.
- The current resilience of the US economy bolsters the case for a soft landing.
- Markets expect the US Federal Reserve to start its easing cycle in September.
The US Bureau of Economic Analysis (BEA) will publish the first estimate of the US Gross Domestic Product (GDP) for the April-June period on Thursday. The report is expected to show an economic expansion at an annual rate of 2%, following the 1.4% growth recorded in the prior quarter.
Forecasting US Gross Domestic Product: Deciphering the numbers
Thursday's economic agenda in the US features the unveiling of the initial GDP report for the second quarter, set to be disclosed at 12:30 GMT. Analysts anticipate that the first assessment will reveal a 2% growth rate for the world's largest economy in the April-June period, a moderately robust pace, especially when compared to the 1.4% expansion recorded in the preceding quarter.
According to the Federal Reserve (Fed) Bank of Atlanta’s latest GDPNow estimate published on July 17, the US economy grew at an annual rate of 2.7% in the second quarter. “The nowcasts of second-quarter real personal consumption expenditures growth and second-quarter real gross private domestic investment growth increased from 2.1% and 7.7%, respectively, to 2.2% and 8.9%,” notes the Atlanta Fed in its press release, explaining the impact of June Housing Starts and Industrial Production data on GDP.
When speaking at the post-meeting press conference following the May policy meeting, Fed Chairman Jerome Powell noted that the GDP growth has slowed noticeably from the 3.4% expansion seen in the last quarter of 2023, but he said that a key component of the GDP, private domestic purchases, was up 3.1%. This component is essentially seen as a good indicator of private-sector demand because it excludes exports and government purchases.
Market participants will also pay close attention to the GDP Price Index, which represents the changes in the prices of goods and services produced in the US, including those exported to other countries, while excluding prices of imports. Basically, the GDP Price Index shows the impact of inflation on the GDP. In the second quarter, the GDP Price Index is forecast to rise 2.6%, down from the 3.1% increase in the first quarter.
Finally, the GDP report will also include the quarterly Personal Consumption Expenditures (PCE) Price Index and core PCE Price Index data. These numbers will reveal whether the core PCE Price Index, the Fed’s preferred gauge of inflation, rose 0.1% on a monthly basis as expected.
Previewing the GDP data, “The Q2 GDP report released on Thursday will offer an early look at how strong the June consumer spending data is likely to have been,” said TD Securities analysts in a weekly report and added: “Based on our bottom-up expectations, we look for GDP growth to have strengthened to 2.3% q/q AR, up from 1.4% in the first quarter, with consumer spending and inventories likely acting as major catalysts.”
When will the GDP print be released, and how can it affect the USD?
The US GDP report will be published at 12:30 GMT on Thursday. In addition to the headline real GDP print, the change in private domestic purchases, GDP Price Index and the Q2 PCE Price Index figures could influence the US Dollar’s (USD) valuation.
Softer inflation readings for May and June, combined with growing signs of a cooldown in the US labor market, fueled into expectations for a Fed rate cut in September. According to the CME FedWatch Tool, a 25 basis points (bps) rate reduction in September is fully priced in. Moreover, markets see a nearly 50% chance that the Fed will opt for a second 25 bps cut in December, bringing the policy rate down to 4.75%-5% range by the end of the year.
The Q2 GDP report by itself is unlikely to change investors’ mind regarding the September policy move. A stronger-than-forecast GDP growth, especially if accompanied by a healthy increase in private domestic purchases, however, could cause investors to refrain from pricing in a second cut in December. In this scenario, the USD is likely to gather strength against its rivals as the immediate reaction.
On the other hand, a disappointing GDP print and a noticeable decline in the quarterly core PCE inflation could keep market participants’ optimism about additional Fed easing. In this case, risk flows are likely to dominate the action and make it difficult for the USD to find demand.
Eren Sengezer, European Session Lead Analyst at FXStreet, shares a brief technical outlook for the USD Index (DXY):
“The 200-day Simple Moving Average aligns as a key pivot level for the DXY at 104.30. In case the index confirms that level as support, it could face strong resistance at 104.80-105.00, where the 100-day, 50-day and the 20-day SMAs converge, before targeting 105.50 (static level). On the downside, static support seems to have formed at 103.70 ahead of 103.00 (psychological level, static level) and 102.35 (March 8 low), in case the 200-day SMA turns into resistance.”
US Dollar FAQs
The US Dollar (USD) is the official currency of the United States of America, and the ‘de facto’ currency of a significant number of other countries where it is found in circulation alongside local notes. It is the most heavily traded currency in the world, accounting for over 88% of all global foreign exchange turnover, or an average of $6.6 trillion in transactions per day, according to data from 2022. Following the second world war, the USD took over from the British Pound as the world’s reserve currency. For most of its history, the US Dollar was backed by Gold, until the Bretton Woods Agreement in 1971 when the Gold Standard went away.
The most important single factor impacting on the value of the US Dollar is monetary policy, which is shaped by the Federal Reserve (Fed). The Fed has two mandates: to achieve price stability (control inflation) and foster full employment. Its primary tool to achieve these two goals is by adjusting interest rates. When prices are rising too quickly and inflation is above the Fed’s 2% target, the Fed will raise rates, which helps the USD value. When inflation falls below 2% or the Unemployment Rate is too high, the Fed may lower interest rates, which weighs on the Greenback.
In extreme situations, the Federal Reserve can also print more Dollars and enact quantitative easing (QE). QE is the process by which the Fed substantially increases the flow of credit in a stuck financial system. It is a non-standard policy measure used when credit has dried up because banks will not lend to each other (out of the fear of counterparty default). It is a last resort when simply lowering interest rates is unlikely to achieve the necessary result. It was the Fed’s weapon of choice to combat the credit crunch that occurred during the Great Financial Crisis in 2008. It involves the Fed printing more Dollars and using them to buy US government bonds predominantly from financial institutions. QE usually leads to a weaker US Dollar.
Quantitative tightening (QT) is the reverse process whereby the Federal Reserve stops buying bonds from financial institutions and does not reinvest the principal from the bonds it holds maturing in new purchases. It is usually positive for the US Dollar.
- GBP/JPY attracts some sellers near 196.65 in Thursday’s early European session, down 1.0% on the day.
- The combination of a risk-off mood and rising bets on the BoJ rate hike supports the JPY.
- The BoE is anticipated to cut the bank rate to 5% at its August meeting next week.
The GBP/JPY cross remains under selling pressure around 196.65 during the early European session on Thursday. The beginning of a risk-off mood leads to more safety flows in broader markets, including the Japanese Yen (JPY).
S&P 500 futures were down 0.10% ahead of the European market open, while the Nikkei closed down more than 3%, marking its lowest level since late April. The risk-off environment has underpinned the safe-haven currency like the JPY and dragged the GBP/JPY cross lower to the lowest level since May 16.
Furthermore, the growing speculation that the Bank of Japan (BoJ) would hike again at its monetary policy meeting next week forced short-sellers to close their positions, which lifted the JPY against its rivals.
On the other hand, the Bank of England (BoE) is expected to cut the bank rate to 5% at its August meeting next week, the majority of economists said in a Reuters poll. This, in turn, exerts some selling pressure on the Pound Sterling (GBP). Traders are now pricing in a nearly 45% odds that the UK central bank will cut its policy rate to 5.0% next week.
Data released on Wednesday showed that UK business activity expanded in July. The UK S&P Global Flash Composite Purchasing Managers’ Index (PMI) came in better than the market expectation, rising to 52.7 in July from 52.3 in June. Meanwhile, the Manufacturing PMI climbed to 51.8 in July from the previous reading of 50.9, the highest level in two years. The Services PMI expanded to 52.4 in the same report period versus 51.2, below the consensus of 52.5.
Japanese Yen FAQs
The Japanese Yen (JPY) is one of the world’s most traded currencies. Its value is broadly determined by the performance of the Japanese economy, but more specifically by the Bank of Japan’s policy, the differential between Japanese and US bond yields, or risk sentiment among traders, among other factors.
One of the Bank of Japan’s mandates is currency control, so its moves are key for the Yen. The BoJ has directly intervened in currency markets sometimes, generally to lower the value of the Yen, although it refrains from doing it often due to political concerns of its main trading partners. The current BoJ ultra-loose monetary policy, based on massive stimulus to the economy, has caused the Yen to depreciate against its main currency peers. This process has exacerbated more recently due to an increasing policy divergence between the Bank of Japan and other main central banks, which have opted to increase interest rates sharply to fight decades-high levels of inflation.
The BoJ’s stance of sticking to ultra-loose monetary policy has led to a widening policy divergence with other central banks, particularly with the US Federal Reserve. This supports a widening of the differential between the 10-year US and Japanese bonds, which favors the US Dollar against the Japanese Yen.
The Japanese Yen is often seen as a safe-haven investment. This means that in times of market stress, investors are more likely to put their money in the Japanese currency due to its supposed reliability and stability. Turbulent times are likely to strengthen the Yen’s value against other currencies seen as more risky to invest in.
FX option expiries for July 25 NY cut at 10:00 Eastern Time, via DTCC, can be found below.
EUR/USD: EUR amounts
- 1.0720 746m
- 1.0830 865m
- 1.0850 858m
- 1.0950 1.2b
GBP/USD: GBP amounts
- 1.2980 404m
USD/JPY: USD amounts
- 152.50 660m
- 156.50 726m
- 157.00 598m
USD/CHF: USD amounts
- 0.8975 495m
AUD/USD: AUD amounts
- 0.6640 648m
- 0.6670 421m
USD/CAD: USD amounts
- 1.3645 537m
- 1.3660 591m
- 1.3750 506m
- 1.3800 702m
EUR/GBP: EUR amounts
- 0.8355 984m
Gold prices fell in India on Thursday, according to data compiled by FXStreet.
The price for Gold stood at 6,389.74 Indian Rupees (INR) per gram, down compared with the INR 6,452.31 it cost on Wednesday.
The price for Gold decreased to INR 74,528.33 per tola from INR 75,258.50 per tola a day earlier.
| Unit measure | Gold Price in INR |
|---|---|
| 1 Gram | 6,389.74 |
| 10 Grams | 63,897.10 |
| Tola | 74,528.33 |
| Troy Ounce | 198,743.20 |
FXStreet calculates Gold prices in India by adapting international prices (USD/INR) to the local currency and measurement units. Prices are updated daily based on the market rates taken at the time of publication. Prices are just for reference and local rates could diverge slightly.
Gold FAQs
Gold has played a key role in human’s history as it has been widely used as a store of value and medium of exchange. Currently, apart from its shine and usage for jewelry, the precious metal is widely seen as a safe-haven asset, meaning that it is considered a good investment during turbulent times. Gold is also widely seen as a hedge against inflation and against depreciating currencies as it doesn’t rely on any specific issuer or government.
Central banks are the biggest Gold holders. In their aim to support their currencies in turbulent times, central banks tend to diversify their reserves and buy Gold to improve the perceived strength of the economy and the currency. High Gold reserves can be a source of trust for a country’s solvency. Central banks added 1,136 tonnes of Gold worth around $70 billion to their reserves in 2022, according to data from the World Gold Council. This is the highest yearly purchase since records began. Central banks from emerging economies such as China, India and Turkey are quickly increasing their Gold reserves.
Gold has an inverse correlation with the US Dollar and US Treasuries, which are both major reserve and safe-haven assets. When the Dollar depreciates, Gold tends to rise, enabling investors and central banks to diversify their assets in turbulent times. Gold is also inversely correlated with risk assets. A rally in the stock market tends to weaken Gold price, while sell-offs in riskier markets tend to favor the precious metal.
The price can move due to a wide range of factors. Geopolitical instability or fears of a deep recession can quickly make Gold price escalate due to its safe-haven status. As a yield-less asset, Gold tends to rise with lower interest rates, while higher cost of money usually weighs down on the yellow metal. Still, most moves depend on how the US Dollar (USD) behaves as the asset is priced in dollars (XAU/USD). A strong Dollar tends to keep the price of Gold controlled, whereas a weaker Dollar is likely to push Gold prices up.
(An automation tool was used in creating this post.)
- GBP/USD could test the lower boundary of the ascending channel and the 21-day EMA at the 1.2863 level.
- The technical analysis suggests a momentum shift as the MACD line has crossed below the signal line.
- A break above the 1.2900 level could lead the pair to approach the upper edge of the ascending channel.
GBP/USD continues to lose ground for the third successive session, trading around 1.2890 during the Asian hours on Thursday. The analysis of the daily chart shows the pair consolidates within an ascending channel, signaling a bullish bias for the pair's price movements.
The Moving Average Convergence Divergence (MACD), a momentum indicator, shows a shift in momentum as the MACD line crosses below the signal line. Despite this, the MACD line remains above the centerline. Observing further movement will help clarify the directional trend. Additionally, the 14-day Relative Strength Index (RSI) sits above the 50 level, suggesting a confirmation of a bullish bias.
On the downside, immediate support seems to be around the lower edge of the ascending channel, coinciding with the 21-day Exponential Moving Average (EMA) at the 1.2863 level. A drop below this support could drive the GBP/USD pair toward the throwback support level of 1.2615.
Regarding resistance, the immediate barrier appears at the psychological level of 1.2900. A break above this level could lead the GBP/USD pair to approach the upper edge of the ascending channel near the key level of 1.3040, followed by the yearly peak of 1.3044 level reached on July 17.
GBP/USD: Daily Chart
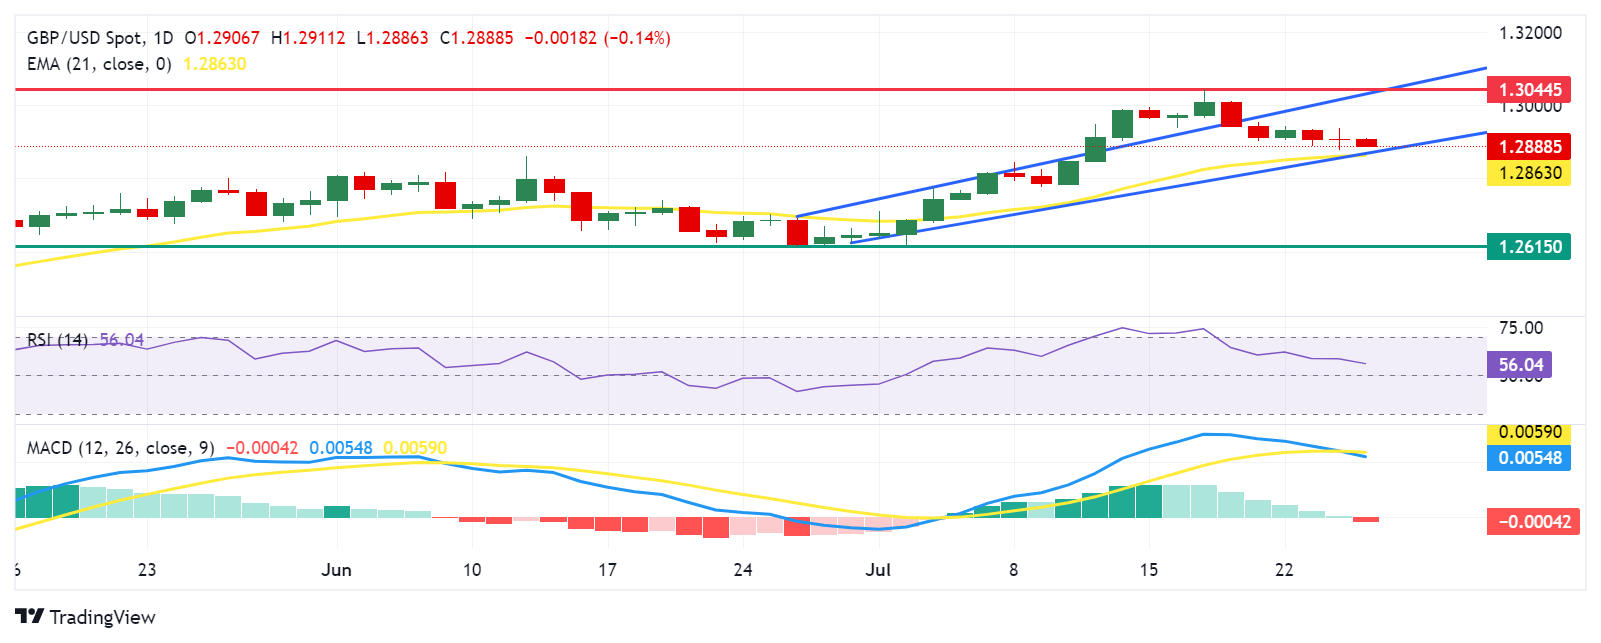
British Pound PRICE Today
The table below shows the percentage change of British Pound (GBP) against listed major currencies today. British Pound was the weakest against the Japanese Yen.
| USD | EUR | GBP | JPY | CAD | AUD | NZD | CHF | |
|---|---|---|---|---|---|---|---|---|
| USD | 0.00% | 0.14% | -0.64% | 0.08% | 0.54% | 0.24% | -0.22% | |
| EUR | -0.00% | 0.14% | -0.66% | 0.08% | 0.54% | 0.23% | -0.22% | |
| GBP | -0.14% | -0.14% | -0.77% | -0.06% | 0.42% | 0.10% | -0.36% | |
| JPY | 0.64% | 0.66% | 0.77% | 0.73% | 1.20% | 0.87% | 0.44% | |
| CAD | -0.08% | -0.08% | 0.06% | -0.73% | 0.47% | 0.16% | -0.30% | |
| AUD | -0.54% | -0.54% | -0.42% | -1.20% | -0.47% | -0.29% | -0.77% | |
| NZD | -0.24% | -0.23% | -0.10% | -0.87% | -0.16% | 0.29% | -0.46% | |
| CHF | 0.22% | 0.22% | 0.36% | -0.44% | 0.30% | 0.77% | 0.46% |
The heat map shows percentage changes of major currencies against each other. The base currency is picked from the left column, while the quote currency is picked from the top row. For example, if you pick the British Pound from the left column and move along the horizontal line to the US Dollar, the percentage change displayed in the box will represent GBP (base)/USD (quote).
- EUR/USD trades flat near 1.0840 in Thursday’s European session.
- The pair keeps its negative outlook unchanged below the 100-period EMA on 4-hour chart, with a bearish RSI indicator.
- The initial support level is located at 1.0820; the first upside target to watch is 1.0851.
The EUR/USD pair trades on a flat note around 1.0840 despite the decline of the Greenback during the early European session on Thursday. Traders prefer to wait on the sidelines ahead of the release of US key economic data. The preliminary US Gross Domestic Product (GDP) for the second quarter (Q2) is due later on Thursday, which is estimated to grow at an annualized rate of 2.0%, which is higher than the previous quarter of 1.4%.
Technically, EUR/USD maintains the bearish outlook unchanged on the 4-hour chart as the major pair holds below the key 100-period Exponential Moving Average (EMA). Additionally, the Relative Strength Index (RSI) stands in the bearish zone below the 50-midline, indicating that the path of least resistance level is to the downside.
The initial support level for the major pair is located at 1.0820, the lower limit of the Bollinger Band. A breach of this level could see a drop to the 1.0800 psychological level. Any follow-through selling below this level will pave the way to 1.0736, a low of July 3.
On the bright side, the first upside barrier will emerge at 1.0851, the 100-period EMA. The crucial resistance level is seen at the 1.0895-1.0905 zone, representing the confluence of the upper boundary of the Bollinger Band and a high of July 23. A decisive break above this level could see a rally to 1.0927, a high of July 17.
EUR/USD 4-hour chart
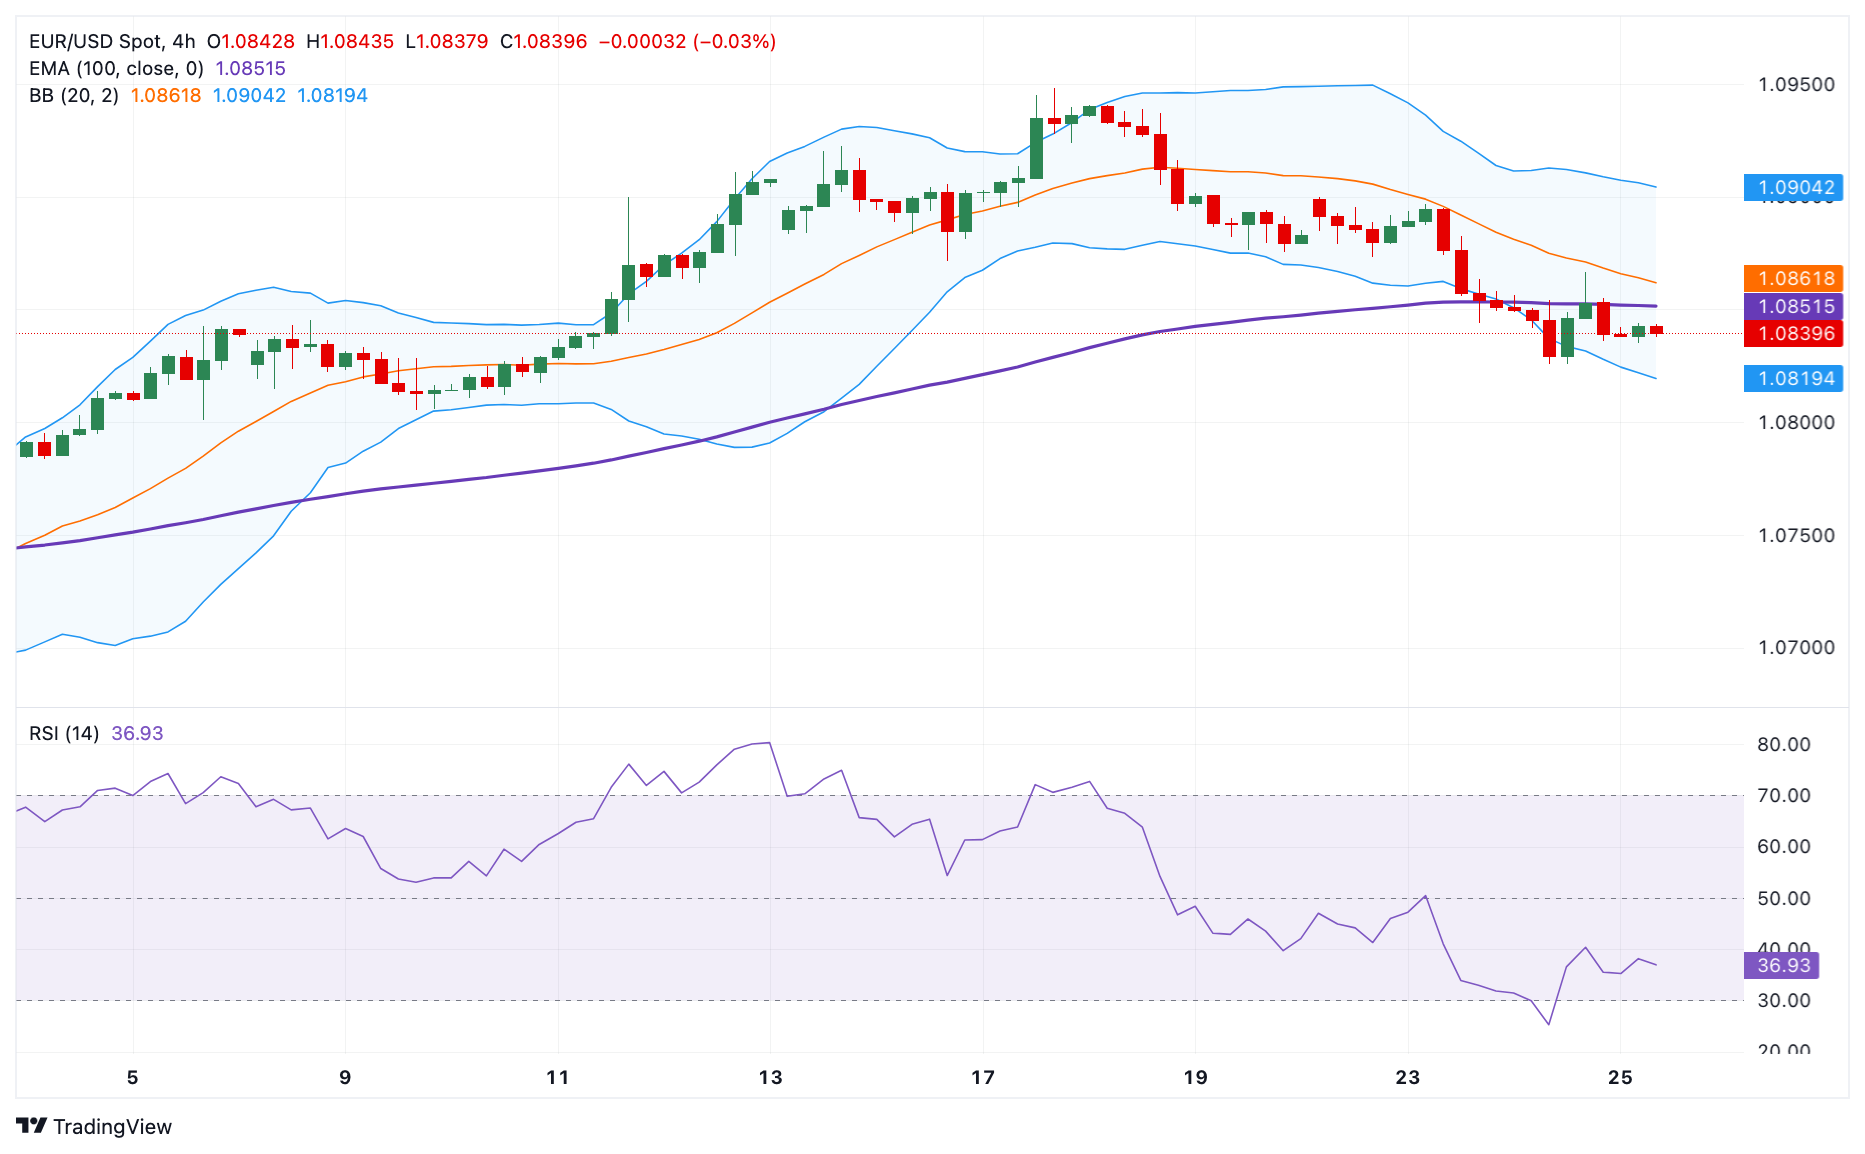
Euro FAQs
The Euro is the currency for the 20 European Union countries that belong to the Eurozone. It is the second most heavily traded currency in the world behind the US Dollar. In 2022, it accounted for 31% of all foreign exchange transactions, with an average daily turnover of over $2.2 trillion a day. EUR/USD is the most heavily traded currency pair in the world, accounting for an estimated 30% off all transactions, followed by EUR/JPY (4%), EUR/GBP (3%) and EUR/AUD (2%).
The European Central Bank (ECB) in Frankfurt, Germany, is the reserve bank for the Eurozone. The ECB sets interest rates and manages monetary policy. The ECB’s primary mandate is to maintain price stability, which means either controlling inflation or stimulating growth. Its primary tool is the raising or lowering of interest rates. Relatively high interest rates – or the expectation of higher rates – will usually benefit the Euro and vice versa. The ECB Governing Council makes monetary policy decisions at meetings held eight times a year. Decisions are made by heads of the Eurozone national banks and six permanent members, including the President of the ECB, Christine Lagarde.
Eurozone inflation data, measured by the Harmonized Index of Consumer Prices (HICP), is an important econometric for the Euro. If inflation rises more than expected, especially if above the ECB’s 2% target, it obliges the ECB to raise interest rates to bring it back under control. Relatively high interest rates compared to its counterparts will usually benefit the Euro, as it makes the region more attractive as a place for global investors to park their money.
Data releases gauge the health of the economy and can impact on the Euro. Indicators such as GDP, Manufacturing and Services PMIs, employment, and consumer sentiment surveys can all influence the direction of the single currency. A strong economy is good for the Euro. Not only does it attract more foreign investment but it may encourage the ECB to put up interest rates, which will directly strengthen the Euro. Otherwise, if economic data is weak, the Euro is likely to fall. Economic data for the four largest economies in the euro area (Germany, France, Italy and Spain) are especially significant, as they account for 75% of the Eurozone’s economy.
Another significant data release for the Euro is the Trade Balance. This indicator measures the difference between what a country earns from its exports and what it spends on imports over a given period. If a country produces highly sought after exports then its currency will gain in value purely from the extra demand created from foreign buyers seeking to purchase these goods. Therefore, a positive net Trade Balance strengthens a currency and vice versa for a negative balance.
The Japanese Cabinet Office said in its monthly report on Thursday, the government maintained its economic assessment in July but warned of a gloomy outlook.
Key takeaways
"Japan's economy is recovering moderately, although it recently appears to be pausing,"
“The government revised down its assessment on exports to say they were moving sideways.”
“The government maintained its view that a pick-up in consumption was stalling.”
Market reaction
Following the downbeat report, the Japanese Yen reverses gains against the US Dollar. At the time of writing, the USD/JPY pair is trading around 152.60, down 0.82% on the day.
Japanese Yen FAQs
The Japanese Yen (JPY) is one of the world’s most traded currencies. Its value is broadly determined by the performance of the Japanese economy, but more specifically by the Bank of Japan’s policy, the differential between Japanese and US bond yields, or risk sentiment among traders, among other factors.
One of the Bank of Japan’s mandates is currency control, so its moves are key for the Yen. The BoJ has directly intervened in currency markets sometimes, generally to lower the value of the Yen, although it refrains from doing it often due to political concerns of its main trading partners. The current BoJ ultra-loose monetary policy, based on massive stimulus to the economy, has caused the Yen to depreciate against its main currency peers. This process has exacerbated more recently due to an increasing policy divergence between the Bank of Japan and other main central banks, which have opted to increase interest rates sharply to fight decades-high levels of inflation.
The BoJ’s stance of sticking to ultra-loose monetary policy has led to a widening policy divergence with other central banks, particularly with the US Federal Reserve. This supports a widening of the differential between the 10-year US and Japanese bonds, which favors the US Dollar against the Japanese Yen.
The Japanese Yen is often seen as a safe-haven investment. This means that in times of market stress, investors are more likely to put their money in the Japanese currency due to its supposed reliability and stability. Turbulent times are likely to strengthen the Yen’s value against other currencies seen as more risky to invest in.
- Silver drifts lower for the second straight day and plummets to a two-and-half-month low.
- The technical setup favors bearish traders and supports prospects for a further downfall.
- Any attempted recovery move is likely to attract fresh sellers near the $28.55-$28.60 area.
Silver (XAG/USD) remains under heavy selling pressure for the second straight day on Thursday and dives to its lowest level since May 9, around the $27.80 region during the Asian session.
From a technical perspective, a sustained breakdown through the $28.65-$28.55 horizontal support, which coincides with the 100-day Simple Moving Average (SMA), could be seen as a fresh trigger for bearish traders. Moreover, oscillators on the daily chart have been gaining negative traction and suggest that the path of least resistance for the XAG/USD is to the downside.
Hence, a further decline towards testing the next relevant support, around the $27.40-$27.30 horizontal resistance breakpoint, en route to the $27.00 mark, looks like a distinct possibility. The downward trajectory could extend further toward the $26.60-$26.55 intermediate support before the XAG/USD eventually drops to the 200-day SMA, currently pegged near the $26.00 mark.
On the flip side, any meaningful recovery attempt now seems to confront stiff resistance around the $28.55-$28.65 region. The said barrier should act as a key pivotal point, which if cleared decisively might trigger a short-covering rally. The XAG/USD might then climb beyond the $29.00 round figure, towards the $29.40-$29.45 area, or the weekly top, en route to the $29.80 region.
This latter is closely followed by the $30.00 psychological mark, above which the XAG/USD could accelerate the positive move towards the $30.35-$30.40 short-term trading range support breakpoint. The subsequent move up should pave the way for a move towards reclaiming the $31.00 round-figure mark.
Silver daily chart
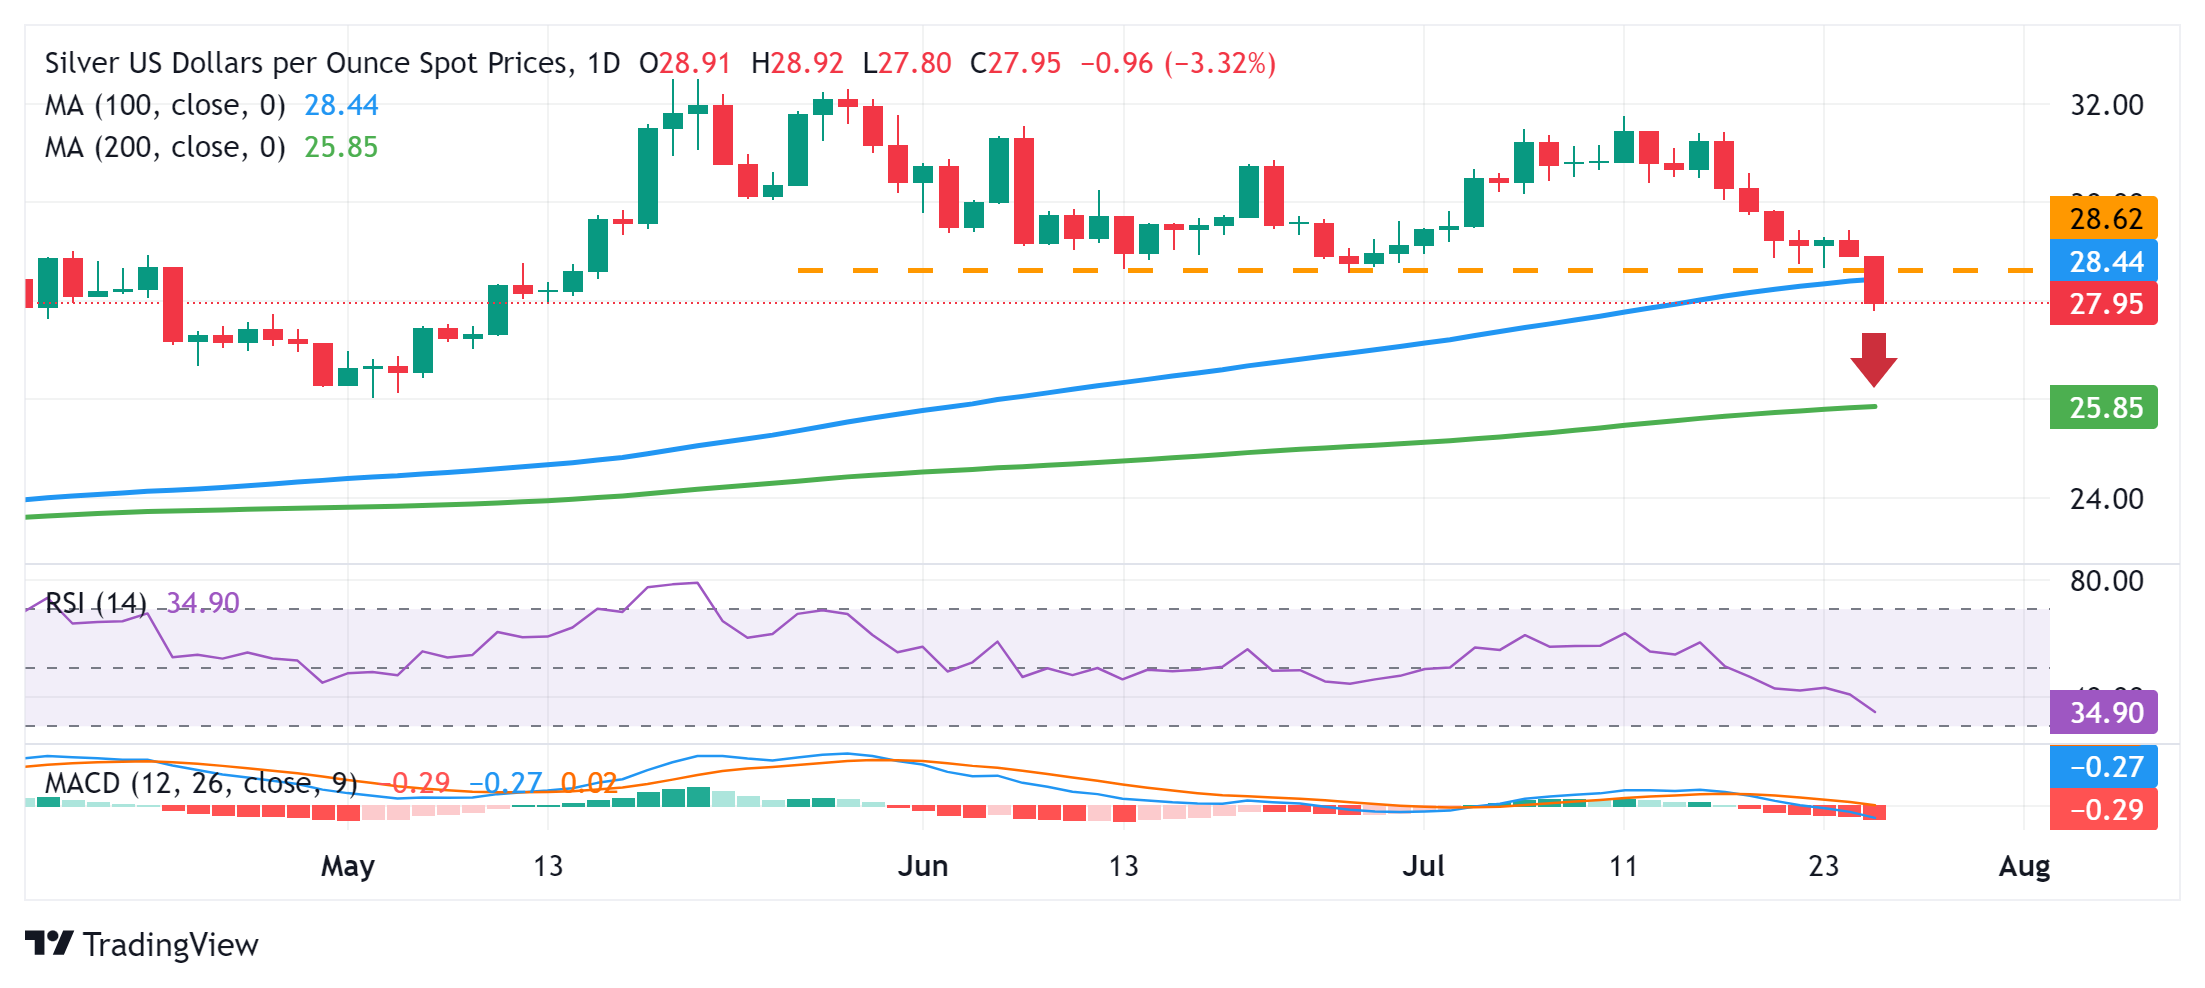
Silver FAQs
Silver is a precious metal highly traded among investors. It has been historically used as a store of value and a medium of exchange. Although less popular than Gold, traders may turn to Silver to diversify their investment portfolio, for its intrinsic value or as a potential hedge during high-inflation periods. Investors can buy physical Silver, in coins or in bars, or trade it through vehicles such as Exchange Traded Funds, which track its price on international markets.
Silver prices can move due to a wide range of factors. Geopolitical instability or fears of a deep recession can make Silver price escalate due to its safe-haven status, although to a lesser extent than Gold's. As a yieldless asset, Silver tends to rise with lower interest rates. Its moves also depend on how the US Dollar (USD) behaves as the asset is priced in dollars (XAG/USD). A strong Dollar tends to keep the price of Silver at bay, whereas a weaker Dollar is likely to propel prices up. Other factors such as investment demand, mining supply – Silver is much more abundant than Gold – and recycling rates can also affect prices.
Silver is widely used in industry, particularly in sectors such as electronics or solar energy, as it has one of the highest electric conductivity of all metals – more than Copper and Gold. A surge in demand can increase prices, while a decline tends to lower them. Dynamics in the US, Chinese and Indian economies can also contribute to price swings: for the US and particularly China, their big industrial sectors use Silver in various processes; in India, consumers’ demand for the precious metal for jewellery also plays a key role in setting prices.
Silver prices tend to follow Gold's moves. When Gold prices rise, Silver typically follows suit, as their status as safe-haven assets is similar. The Gold/Silver ratio, which shows the number of ounces of Silver needed to equal the value of one ounce of Gold, may help to determine the relative valuation between both metals. Some investors may consider a high ratio as an indicator that Silver is undervalued, or Gold is overvalued. On the contrary, a low ratio might suggest that Gold is undervalued relative to Silver.
- WTI price extends its losing streak as global stock markets affect risk assets.
- China’s growth concerns have added further downward pressure on Oil prices.
- EIA US Crude Oil Stocks Change marked the fourth straight decline but failed to hold Oil prices.
West Texas Intermediate (WTI) Oil price continues to decline for the sixth successive session, trading around $76.70 per barrel during the Asian hours on Thursday. Crude Oil prices are under pressure due to negative sentiment in global stock markets affecting risk assets. US stock indices have decreased as technology stocks suffered more losses, exacerbated by disappointing quarterly earnings from major US tech companies Tesla and Alphabet.
Meanwhile, the Energy Information Administration (EIA) reported a decrease of 3.741 million barrels in US Crude Oil Stocks Change for the week ending July 19, marking the fourth straight decline, against the expected increase of 0.70 million barrels. Despite this reduction in US crude inventories, crude Oil prices are being pressured by weakening demand in China and the anticipation of a ceasefire in the Middle East.
Sluggish economic activity in China, the largest crude importer, has added further downward pressure on Oil prices. China's Q2 growth was 4.7%, the weakest increase since early 2023. Concerns about the weak Chinese economy were intensified by an unexpected rate cut from the People's Bank of China (PBoC) on Monday. The PBoC reduced the one-year Medium-term Lending Facility (MLF) rate from 2.50% to 2.30% on Thursday. Additionally, the Bank of China, one of the world's largest banks, announced a 10-20 basis points cut in time deposit rates.
A surge of optimism surrounding potential ceasefire negotiations between Israel and Hamas has eased the threat of supply disruption, which weakens the prices of the black Gold. Israeli Prime Minister Benjamin Netanyahu has hinted that a ceasefire agreement, which could lead to the release of several hostages in Gaza, might be in the works. In a speech to US Congress on Wednesday, Netanyahu presented a broad vision for a "deradicalized" Gaza after the war and emphasized the potential for a future partnership between Israel and America's Arab allies, as reported by Reuters.
WTI Oil FAQs
WTI Oil is a type of Crude Oil sold on international markets. The WTI stands for West Texas Intermediate, one of three major types including Brent and Dubai Crude. WTI is also referred to as “light” and “sweet” because of its relatively low gravity and sulfur content respectively. It is considered a high quality Oil that is easily refined. It is sourced in the United States and distributed via the Cushing hub, which is considered “The Pipeline Crossroads of the World”. It is a benchmark for the Oil market and WTI price is frequently quoted in the media.
Like all assets, supply and demand are the key drivers of WTI Oil price. As such, global growth can be a driver of increased demand and vice versa for weak global growth. Political instability, wars, and sanctions can disrupt supply and impact prices. The decisions of OPEC, a group of major Oil-producing countries, is another key driver of price. The value of the US Dollar influences the price of WTI Crude Oil, since Oil is predominantly traded in US Dollars, thus a weaker US Dollar can make Oil more affordable and vice versa.
The weekly Oil inventory reports published by the American Petroleum Institute (API) and the Energy Information Agency (EIA) impact the price of WTI Oil. Changes in inventories reflect fluctuating supply and demand. If the data shows a drop in inventories it can indicate increased demand, pushing up Oil price. Higher inventories can reflect increased supply, pushing down prices. API’s report is published every Tuesday and EIA’s the day after. Their results are usually similar, falling within 1% of each other 75% of the time. The EIA data is considered more reliable, since it is a government agency.
OPEC (Organization of the Petroleum Exporting Countries) is a group of 13 Oil-producing nations who collectively decide production quotas for member countries at twice-yearly meetings. Their decisions often impact WTI Oil prices. When OPEC decides to lower quotas, it can tighten supply, pushing up Oil prices. When OPEC increases production, it has the opposite effect. OPEC+ refers to an expanded group that includes ten extra non-OPEC members, the most notable of which is Russia.
- A combination of factors pushes USD/CAD higher for the seventh straight day on Thursday.
- The recent fall in Oil prices, along with the BoC’s dovish outlook, undermines the Loonie.
- Bulls seem unaffected by a softer USD, though seem reluctant ahead of the US macro data.
The USD/CAD pair builds on its recent upward trajectory witnessed over the past two weeks or so and continues to gain traction for the seventh successive day on Thursday. This also marks the tenth day of a positive move in the previous eleven and lifts spot prices to the highest level since April 17, around the 1.3820 region during the Asian session.
Crude Oil prices languish near a one-and-half-month low touched earlier this week amid concerns about a slowing demand from China – the world's largest importer. This, along with the Bank of Canada's (BoC) dovish outlook, continues to undermine the commodity-linked Loonie and acts as a tailwind for the USD/CAD pair. In fact, the Canadian central bank lowered its key policy rate by 25 basis points for the second straight month on Wednesday and said more cuts were likely if inflation continued to cool in line with forecasts.
Adding to this, the BoC trimmed its 2024 growth forecast to a lacklustre 1.2% from the 1.5% predicted in April and reiterated that inflation should return sustainably to the 2% target in the second half of 2025. The markets were quick to react and are now pricing in over a 52% chance that the central bank will cut interest rates again at its next monetary policy meeting in September. This, to a larger extent, overshadows a modest US Dollar (USD) downtick and supports prospects for a further appreciating move for the USD/CAD pair.
That said, expectations that the Federal Reserve (Fed) will begin its rate-cutting cycle in September might hold back traders from placing fresh bets ahead of the crucial US macro data. The Advance US Q2 GDP print is due for release later this Thursday and will be followed by the Personal Consumption Expenditures (PCE) Price Index on Friday. This will play a key role in influencing the Fed's policy path, which, in turn, will drive the USD demand. Apart from this, Oil price dynamics should provide a fresh directional impetus to the USD/CAD pair.
Canadian Dollar FAQs
The key factors driving the Canadian Dollar (CAD) are the level of interest rates set by the Bank of Canada (BoC), the price of Oil, Canada’s largest export, the health of its economy, inflation and the Trade Balance, which is the difference between the value of Canada’s exports versus its imports. Other factors include market sentiment – whether investors are taking on more risky assets (risk-on) or seeking safe-havens (risk-off) – with risk-on being CAD-positive. As its largest trading partner, the health of the US economy is also a key factor influencing the Canadian Dollar.
The Bank of Canada (BoC) has a significant influence on the Canadian Dollar by setting the level of interest rates that banks can lend to one another. This influences the level of interest rates for everyone. The main goal of the BoC is to maintain inflation at 1-3% by adjusting interest rates up or down. Relatively higher interest rates tend to be positive for the CAD. The Bank of Canada can also use quantitative easing and tightening to influence credit conditions, with the former CAD-negative and the latter CAD-positive.
The price of Oil is a key factor impacting the value of the Canadian Dollar. Petroleum is Canada’s biggest export, so Oil price tends to have an immediate impact on the CAD value. Generally, if Oil price rises CAD also goes up, as aggregate demand for the currency increases. The opposite is the case if the price of Oil falls. Higher Oil prices also tend to result in a greater likelihood of a positive Trade Balance, which is also supportive of the CAD.
While inflation had always traditionally been thought of as a negative factor for a currency since it lowers the value of money, the opposite has actually been the case in modern times with the relaxation of cross-border capital controls. Higher inflation tends to lead central banks to put up interest rates which attracts more capital inflows from global investors seeking a lucrative place to keep their money. This increases demand for the local currency, which in Canada’s case is the Canadian Dollar.
Macroeconomic data releases gauge the health of the economy and can have an impact on the Canadian Dollar. Indicators such as GDP, Manufacturing and Services PMIs, employment, and consumer sentiment surveys can all influence the direction of the CAD. A strong economy is good for the Canadian Dollar. Not only does it attract more foreign investment but it may encourage the Bank of Canada to put up interest rates, leading to a stronger currency. If economic data is weak, however, the CAD is likely to fall.
- The Japanese Yen has reached its 12-week high of 152.64, as recorded on Thursday.
- Traders unwind their carry trades ahead of the BoJ policy meeting next week.
- The US Dollar may appreciate as recent US PMI data allows the Fed to maintain its restrictive policy.
The Japanese Yen (JPY) extends its upward trend against the US Dollar (USD) for the fourth straight session, hovering near its 12-week high of 152.64 set on Thursday. This strength in the Yen is likely due to traders unwinding carry trades ahead of the Bank of Japan’s (BoJ) policy meeting next week.
The Bank of Japan is expected to raise interest rates at the upcoming meeting next week, causing short-sellers to close their positions and bolstering the JPY. Additionally, the BoJ is widely anticipated to outline plans to taper its bond purchases to reduce massive monetary stimulus.
On Wednesday, Japanese Finance Minister Shunichi Suzuki and top currency diplomat Masato Kanda avoided commenting on foreign exchange matters, as the USD/JPY pair dropped to its lowest level in over two months, according to Reuters.
The US Dollar could gain ground as recent US PMI data revealed a faster expansion in private-sector activity for July, underscoring the resilience of US growth despite elevated interest rates. This data gives the Federal Reserve (Fed) more leeway to uphold its restrictive policy stance if inflation does not show signs of easing.
Investors are expected to closely monitor the US Gross Domestic Product (GDP) Annualized (Q2) data on Thursday and the Personal Consumption Expenditures (PCE) inflation data on Friday. These reports are expected to provide new insights into the economic conditions in the United States.
Daily Digest Market Movers: Japanese Yen appreciates due to increased risk aversion
- The Nikkei 225 Index dropped 2.5% to below 38,200, with Japanese shares hitting five-week lows as the decline in technology stocks intensified. This downturn followed disappointing quarterly results from US tech giants Tesla and Alphabet.
- The Japan Corporate Service Price Index (CSPI), which tracks the prices of services exchanged between companies, increased by 3.0% year-over-year in June, against the previous increase of 2.7%. This marks the fastest pace in over nine years, indicating rising inflationary pressures.
- The BlackRock Investment Institute noted in its mid-year outlook that Japan’s economic recovery and rising inflation make its equity market one of its strongest convictions. The firm anticipates that the Bank of Japan will not raise interest rates at next week's meeting.
- The S&P Global US Services PMI increased to a reading of 56.0 in July, the highest in 28 months, up from a 55.3 reading in June and exceeding market expectations of 55.3. Meanwhile, the Composite PMI rose to f 55.0 from the previous 54.8 reading, marking the highest reading since April 2022 and indicating sustained growth over the past 18 months.
- The Jibun Bank Japan Manufacturing PMI unexpectedly fell to 49.2 in July from 50.0 in the previous month, missing market forecasts of 50.5 and indicating the first decline in factory activity since April, according to preliminary estimates. In contrast, the Services PMI surged to 53.9 in July from a final reading of 49.4 in the prior month. This marks the sixth increase in the service sector this year and the steepest pace since April.
- Reuters reported on Monday that a senior official in the ruling party, Toshimitsu Motegi urged the Bank of Japan (BoJ) to more clearly communicate its plan to normalize monetary policy through gradual interest rate hikes, according to Reuters. Prime Minister Fumio Kishida added that normalizing the central bank’s monetary policy would support Japan's transition to a growth-driven economy.
- Media reports say that Vice President Kamala Harris has just passed 1,976 Democratic delegates to secure the party's presidential nomination. Harris is now the Democratic Party’s Presumptive Nominee for November’s Presidential Election.
- JP Morgan has anticipated no rate hike from the Bank of Japan (BoJ) in July or at any point in 2024. A July rate increase is not their base case, and they do not expect any hikes for the remainder of 2024. They believe it is too early to adopt a bullish stance on the Yen.
Technical Analysis: USD/JPY depreciates toward 152.00
USD/JPY trades around 152.30 on Thursday. The daily chart analysis shows that the USD/JPY pair has breached below the descending channel, indicating the strengthening of a dovish bias. Additionally, the 14-day Relative Strength Index (RSI) is below 30, indicating an oversold situation and a potential short-term rebound.
The USD/JPY pair may find significant support near at May's low of 151.86. Further support could be found at the psychological level of 151.00.
On the upside, the USD/JPY pair may test the lower boundary of the descending channel around the psychological level of 154.00. A return to the descending channel may weaken the bearish bias and support the pair to test the resistance at the nine-day EMA of 155.90, followed by the upper boundary of the descending channel around the level of 156.80.
USD/JPY: Daily Chart
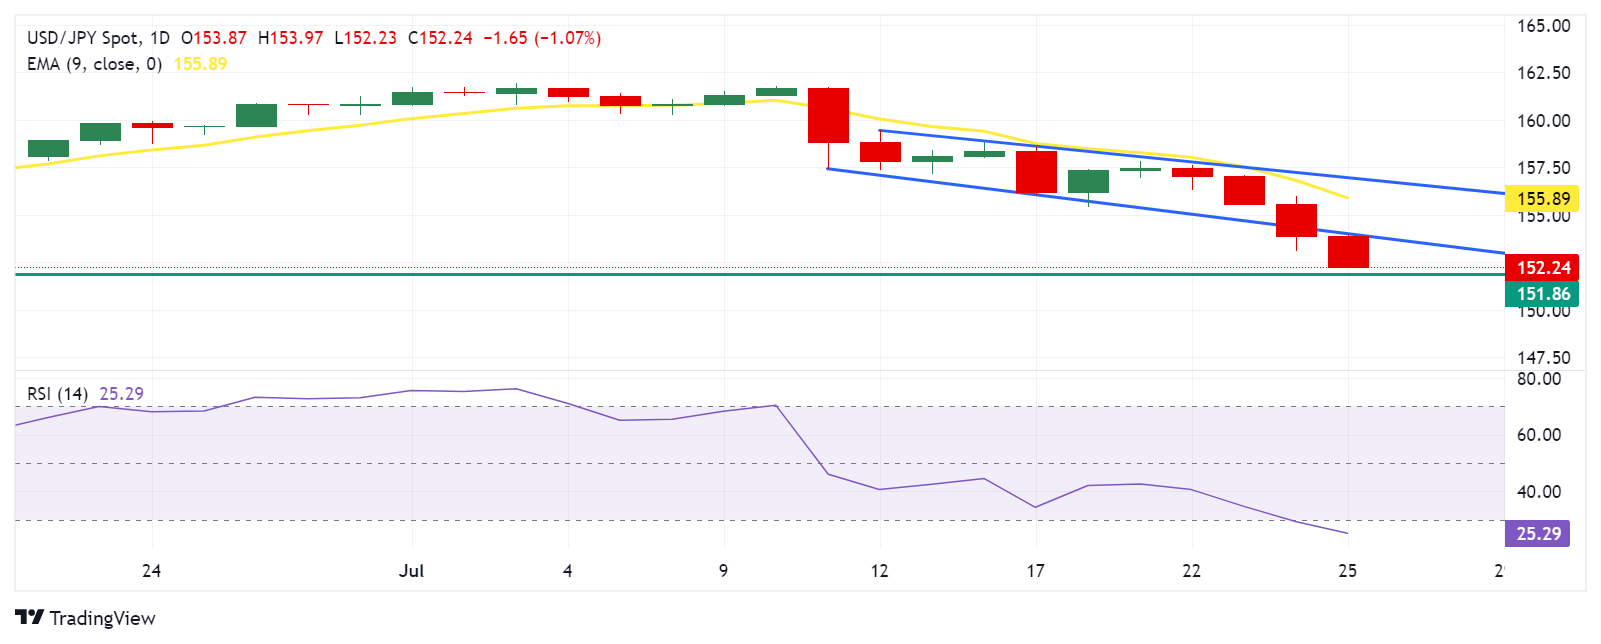
Japanese Yen PRICE Today
The table below shows the percentage change of Japanese Yen (JPY) against listed major currencies today. Japanese Yen was the strongest against the Australian Dollar.
| USD | EUR | GBP | JPY | CAD | AUD | NZD | CHF | |
|---|---|---|---|---|---|---|---|---|
| USD | -0.02% | 0.10% | -0.93% | 0.04% | 0.42% | 0.19% | -0.23% | |
| EUR | 0.02% | 0.13% | -0.94% | 0.07% | 0.45% | 0.21% | -0.21% | |
| GBP | -0.10% | -0.13% | -1.04% | -0.07% | 0.33% | 0.07% | -0.34% | |
| JPY | 0.93% | 0.94% | 1.04% | 0.99% | 1.36% | 1.10% | 0.70% | |
| CAD | -0.04% | -0.07% | 0.07% | -0.99% | 0.39% | 0.15% | -0.28% | |
| AUD | -0.42% | -0.45% | -0.33% | -1.36% | -0.39% | -0.22% | -0.66% | |
| NZD | -0.19% | -0.21% | -0.07% | -1.10% | -0.15% | 0.22% | -0.43% | |
| CHF | 0.23% | 0.21% | 0.34% | -0.70% | 0.28% | 0.66% | 0.43% |
The heat map shows percentage changes of major currencies against each other. The base currency is picked from the left column, while the quote currency is picked from the top row. For example, if you pick the Japanese Yen from the left column and move along the horizontal line to the US Dollar, the percentage change displayed in the box will represent JPY (base)/USD (quote).
Japanese Yen FAQs
The Japanese Yen (JPY) is one of the world’s most traded currencies. Its value is broadly determined by the performance of the Japanese economy, but more specifically by the Bank of Japan’s policy, the differential between Japanese and US bond yields, or risk sentiment among traders, among other factors.
One of the Bank of Japan’s mandates is currency control, so its moves are key for the Yen. The BoJ has directly intervened in currency markets sometimes, generally to lower the value of the Yen, although it refrains from doing it often due to political concerns of its main trading partners. The current BoJ ultra-loose monetary policy, based on massive stimulus to the economy, has caused the Yen to depreciate against its main currency peers. This process has exacerbated more recently due to an increasing policy divergence between the Bank of Japan and other main central banks, which have opted to increase interest rates sharply to fight decades-high levels of inflation.
The BoJ’s stance of sticking to ultra-loose monetary policy has led to a widening policy divergence with other central banks, particularly with the US Federal Reserve. This supports a widening of the differential between the 10-year US and Japanese bonds, which favors the US Dollar against the Japanese Yen.
The Japanese Yen is often seen as a safe-haven investment. This means that in times of market stress, investors are more likely to put their money in the Japanese currency due to its supposed reliability and stability. Turbulent times are likely to strengthen the Yen’s value against other currencies seen as more risky to invest in.
- NZD/USD trades with a negative bias for the sixth straight day amid worries about China.
- The risk-off impulse further contributes to driving flows away from the risk-sensitive Kiwi.
- Dovish Fed expectations keep the USD bulls on the defensive, albeit do little to lend support.
- Traders now look to the US Q2 GDP for a fresh impetus ahead of the US PCE data on Friday.
The NZD/USD pair remains under some selling pressure for the sixth successive day on Thursday and trades around the 0.5920 area during the Asian session, just above its lowest level since early May touched the previous day.
The New Zealand Dollar (NZD) continues to be undermined by rising bets for an early interest rate cut by the Reserve Bank of New Zealand (RBNZ), bolstered by the weaker CPI report released last week. Apart from this, concerns about a slowdown in China – the world's second-largest economy – and a weaker risk tone further contribute to driving flows away from antipodean currencies, including the Kiwi.
Meanwhile, the US Dollar (USD) struggles to attract any meaningful buyers and remains on the defensive below a two-week high touched on Wednesday amid expectations for an imminent start of the Federal Reserve's (Fed) rate-cutting cycle. This is holding back traders from placing aggressive bearish bets around the NZD/USD pair. Moreover, investors prefer to wait on the sidelines ahead of important US macro releases – the Advance Q2 GDP print this Thursday and the Personal Consumption Expenditures (PCE) Price Index on Friday.
The crucial data will play a key role in influencing the Fed's policy path, which, in turn, will drive the USD demand in the near term and provide a fresh directional impetus to the NZD/USD pair. Nevertheless, the aforementioned fundamental backdrop seems tilted in favor of bearish traders, suggesting that any attempted recovery might still be seen as a selling opportunity and runs the risk of fizzling out rather quickly.
US Dollar PRICE Today
The table below shows the percentage change of US Dollar (USD) against listed major currencies today. US Dollar was the strongest against the Australian Dollar.
| USD | EUR | GBP | JPY | CAD | AUD | NZD | CHF | |
|---|---|---|---|---|---|---|---|---|
| USD | -0.02% | 0.10% | -0.99% | 0.06% | 0.45% | 0.16% | -0.22% | |
| EUR | 0.02% | 0.12% | -0.97% | 0.09% | 0.48% | 0.18% | -0.19% | |
| GBP | -0.10% | -0.12% | -1.08% | -0.04% | 0.37% | 0.06% | -0.32% | |
| JPY | 0.99% | 0.97% | 1.08% | 1.06% | 1.45% | 1.14% | 0.77% | |
| CAD | -0.06% | -0.09% | 0.04% | -1.06% | 0.40% | 0.11% | -0.28% | |
| AUD | -0.45% | -0.48% | -0.37% | -1.45% | -0.40% | -0.28% | -0.68% | |
| NZD | -0.16% | -0.18% | -0.06% | -1.14% | -0.11% | 0.28% | -0.40% | |
| CHF | 0.22% | 0.19% | 0.32% | -0.77% | 0.28% | 0.68% | 0.40% |
The heat map shows percentage changes of major currencies against each other. The base currency is picked from the left column, while the quote currency is picked from the top row. For example, if you pick the US Dollar from the left column and move along the horizontal line to the Japanese Yen, the percentage change displayed in the box will represent USD (base)/JPY (quote).
- The Indian Rupee loses momentum in Thursday’s Asian session.
- The Indian government's decision to raise the tax rate on capital gains dampened market sentiment, weighing on the INR.
- The first reading of the US second-quarter GDP growth number will be the highlight for Thursday.
The Indian Rupee (INR) extends its decline on Thursday despite the softer US Dollar (USD). The INR fell to an all-time closing low on Wednesday, pressured by the decline in Indian equities after the government's decision to raise capital gains tax from equity investments and equity derivative trades. Investors' weak appetite for riskier assets and the renewed Greenback demand might cap the upside for local currency in the near term. Nonetheless, the decline in crude oil prices and the potential intervention from the Reserve Bank of India (RBI) could help the INR’s losses.
Looking ahead, the first reading of the US Gross Domestic Product (GDP) for the second quarter is due on Thursday. The attention will shift to the Personal Consumption Expenditures (PCE) Price Index data for June on Friday. Any further signs of cooler inflation might spur the rate cut expectation by the US Federal Reserve (Fed) and could exert some selling pressure on the USD.
Daily Digest Market Movers: Indian Rupee weakens despite the stronger PMI readings
- Benchmark Indian equity indices extended losses to a fourth straight session. The BSE Sensex fell 280 points, or 0.35%, to 80,149. The Nifty 50 dropped 65 points, or 0.27%, to 24,413 on Wednesday.
- The advanced reading of India’s HSBC Manufacturing PMI data climbed to 58.5 in July from 58.3 in June. Meanwhile, the Services PMI improved to 61.1 in the same reported period from 60.5 in June.
- The US S&P Global Composite PMI improved to 55.0 in July from 54.8 in June. Additionally, the S&P Global Manufacturing PMI dropped to 49.5 from 51.6 in the same period, weaker than the 51.7 expected. Finally, the Services PMI rose to 56.0 from 55.3.
- The advanced US Goods Trade Balance came in at $-96.0 billion in June, compared to $-99.4 billion in May, below the estimate.
- The preliminary US Gross Domestic Product (GDP) is estimated to grow at an annualized rate of 2.0% in the second quarter, which is higher than the previous quarter of 1.4%.
Technical analysis: Indian Rupee remains vulnerable in the longer term
The Indian Rupee edges lower on the day. The USD/INR pair has been making higher highs and higher lows, while holding above the key 100-day Exponential Moving Average (EMA) on the daily chart, confirming a bullish structure. Additionally, the 14-day Relative Strength Index (RSI) stands in a bullish zone around 63.00, suggesting that there is room for further upside.
The first upside target to watch is the all-time high of 83.79. Bullish candlesticks and consistent trading above this level could push the pair to the 84.00 psychological level.
If USD/INR trades consistently below 83.65 (low of July 23), the pair could drop back down to 83.51 (low of July 12). Further south, the next contention level is seen at 83.42, the 100-day EMA.
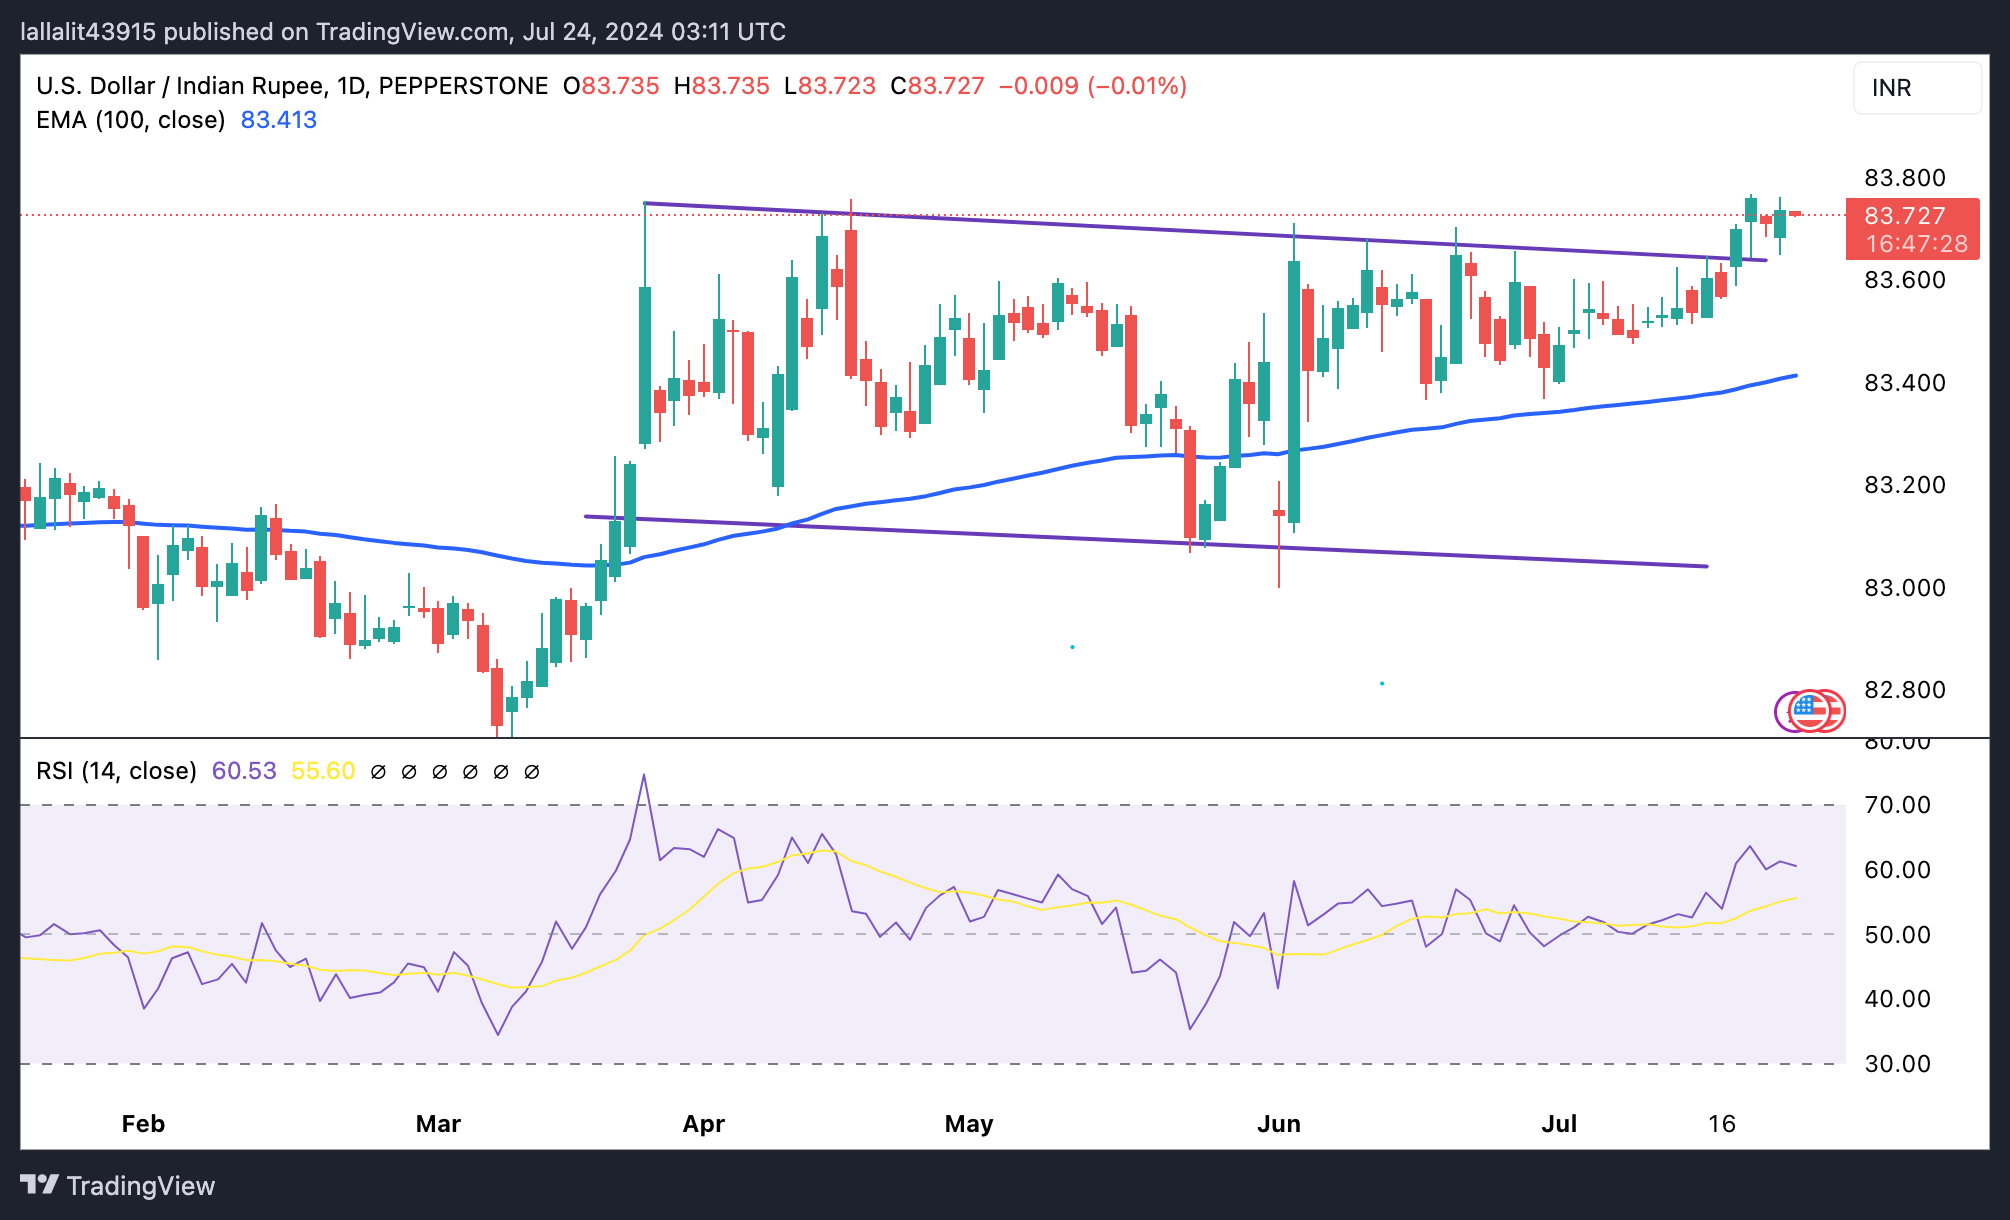
US Dollar price today
The table below shows the percentage change of US Dollar (USD) against listed major currencies today. US Dollar was the strongest against the Australian Dollar.
| USD | EUR | GBP | CAD | AUD | JPY | NZD | CHF | |
| USD | -0.02% | 0.05% | 0.05% | 0.34% | -0.96% | 0.08% | -0.17% | |
| EUR | 0.02% | 0.08% | 0.08% | 0.37% | -0.87% | 0.12% | -0.14% | |
| GBP | -0.06% | -0.07% | 0.00% | 0.28% | -0.99% | 0.01% | -0.22% | |
| CAD | -0.05% | -0.07% | 0.01% | 0.29% | -0.95% | 0.04% | -0.22% | |
| AUD | -0.34% | -0.36% | -0.27% | -0.29% | -1.25% | -0.26% | -0.50% | |
| JPY | 0.92% | 0.88% | 0.96% | 0.94% | 1.24% | 0.98% | 0.72% | |
| NZD | -0.08% | -0.10% | -0.02% | -0.03% | 0.27% | -1.04% | -0.25% | |
| CHF | 0.17% | 0.14% | 0.22% | 0.21% | 0.50% | -0.73% | 0.23% |
The heat map shows percentage changes of major currencies against each other. The base currency is picked from the left column, while the quote currency is picked from the top row. For example, if you pick the Euro from the left column and move along the horizontal line to the Japanese Yen, the percentage change displayed in the box will represent EUR (base)/JPY (quote).
Indian Rupee FAQs
The Indian Rupee (INR) is one of the most sensitive currencies to external factors. The price of Crude Oil (the country is highly dependent on imported Oil), the value of the US Dollar – most trade is conducted in USD – and the level of foreign investment, are all influential. Direct intervention by the Reserve Bank of India (RBI) in FX markets to keep the exchange rate stable, as well as the level of interest rates set by the RBI, are further major influencing factors on the Rupee.
The Reserve Bank of India (RBI) actively intervenes in forex markets to maintain a stable exchange rate, to help facilitate trade. In addition, the RBI tries to maintain the inflation rate at its 4% target by adjusting interest rates. Higher interest rates usually strengthen the Rupee. This is due to the role of the ‘carry trade’ in which investors borrow in countries with lower interest rates so as to place their money in countries’ offering relatively higher interest rates and profit from the difference.
Macroeconomic factors that influence the value of the Rupee include inflation, interest rates, the economic growth rate (GDP), the balance of trade, and inflows from foreign investment. A higher growth rate can lead to more overseas investment, pushing up demand for the Rupee. A less negative balance of trade will eventually lead to a stronger Rupee. Higher interest rates, especially real rates (interest rates less inflation) are also positive for the Rupee. A risk-on environment can lead to greater inflows of Foreign Direct and Indirect Investment (FDI and FII), which also benefit the Rupee.
Higher inflation, particularly, if it is comparatively higher than India’s peers, is generally negative for the currency as it reflects devaluation through oversupply. Inflation also increases the cost of exports, leading to more Rupees being sold to purchase foreign imports, which is Rupee-negative. At the same time, higher inflation usually leads to the Reserve Bank of India (RBI) raising interest rates and this can be positive for the Rupee, due to increased demand from international investors. The opposite effect is true of lower inflation.
- EUR/JPY continues losing ground for the fifth straight day and dives to a two-and-half-month low.
- BoJ rate hike bets, along with the risk-off impulse, underpin the JPY and exert heavy pressure.
- The ECB’s dovish outlook weighs on the Euro and contributes to the ongoing depreciating move.
The EUR/JPY cross extends its steep descent witnessed since the early part of this week and plummets to the lowest level since May 6, around the 165.40 region during the Asian session on Thursday.
Expectations that the Bank of Japan (BoJ) could hike interest rates again at its upcoming policy meeting next week force investors to continue unwinding bearish Japanese Yen (JPY) bets. Adding to this, the risk-off impulse – as depicted by the overnight slump in the US equities and a weaker tone across the Asian markets – further benefits the JPY's relative safe-haven status and drags the EUR/JPY cross lower for the fifth straight day.
Against the backdrop of persistent worries about a slowing Chinese economy, the disappointing release of the global flash PMIs on Wednesday tempered investors' appetite for perceived riskier assets. Meanwhile, the HCOB's preliminary survey indicated a broad-based weakening of economic conditions in the Eurozone, which reaffirms the European Central Bank's (ECB) downbeat view of the Eurozone's economic prospects.
Moreover, expectations that inflation in the Eurozone would keep falling keep the door for a September interest rate cut by the ECB wide open. This, in turn, undermines the shared currency and contributes to the heavily offered tone surrounding the EUR/JPY cross. Apart from this, the downfall could be attributed to technical selling following the previous day's breakdown through the 100-day Simple Moving Average (SMA).
That said, the Relative Strength Index (RSI) on the daily chart is already flashing slightly oversold conditions and warrants some caution for aggressive bearish traders. Hence, it will be prudent to wait for some near-term consolidation or a modest bounce before positioning for any further depreciating move heading into the key BoJ meeting. In the meantime, traders will take cues from the release of the German Ifo Business Climate on Thursday.
Bank of Japan FAQs
The Bank of Japan (BoJ) is the Japanese central bank, which sets monetary policy in the country. Its mandate is to issue banknotes and carry out currency and monetary control to ensure price stability, which means an inflation target of around 2%.
The Bank of Japan has embarked in an ultra-loose monetary policy since 2013 in order to stimulate the economy and fuel inflation amid a low-inflationary environment. The bank’s policy is based on Quantitative and Qualitative Easing (QQE), or printing notes to buy assets such as government or corporate bonds to provide liquidity. In 2016, the bank doubled down on its strategy and further loosened policy by first introducing negative interest rates and then directly controlling the yield of its 10-year government bonds.
The Bank’s massive stimulus has caused the Yen to depreciate against its main currency peers. This process has exacerbated more recently due to an increasing policy divergence between the Bank of Japan and other main central banks, which have opted to increase interest rates sharply to fight decades-high levels of inflation. The BoJ’s policy of holding down rates has led to a widening differential with other currencies, dragging down the value of the Yen.
A weaker Yen and the spike in global energy prices have led to an increase in Japanese inflation, which has exceeded the BoJ’s 2% target. Still, the Bank judges that the sustainable and stable achievement of the 2% target has not yet come in sight, so any sudden change in the current policy looks unlikely.
| Raw materials | Closed | Change, % |
|---|---|---|
| Silver | 28.903 | -1.02 |
| Gold | 239.852 | -0.42 |
| Palladium | 927.68 | 0.45 |
- Gold price continues losing ground for the second straight day and drops to a two-week low.
- The downfall could be attributed to some technical selling, though it is likely to remain limited.
- September Fed rate cut bets and the risk-off mood could lend support ahead of the US data.
Gold price (XAU/USD) extends the previous day's sharp retracement slide from the weekly peak and remains under heavy selling pressure for the second straight day on Thursday. The downfall, though lacking any obvious fundamental catalyst, drags the commodity to a two-week low, around the $2,370 level during the Asian session. That said, a combination of factors should help limit any further losses for the precious metal.
The risk-off impulse – as depicted by the overnight slump in the US equities and a generally weaker tone across the Asian markets – could lend some support to the safe-haven Gold price. Furthermore, growing acceptance that the Federal Reserve (Fed) will start cutting interest rates in September keeps the US Dollar bulls on the defensive below a two-week high touched on Wednesday and should act as a tailwind for the commodity.
This, in turn, warrants some caution before placing aggressive bearish bets around the Gold price as traders keenly await the release of the Advance US Q2 GDP print, due later today for a fresh impetus. The focus, however, will remain glued to the US Personal Consumption Expenditures (PCE) Price Index on Friday, which will play a key role in influencing the Fed's policy path and provide a fresh directional impetus to the non-yielding yellow metal.
Daily Digest Market Movers: Gold price bulls remain on the sidelines despite a combination of supporting factors
- Gold price attracts some follow-through sellers on Thursday and dives to a two-week low, though any further depreciating move seems elusive in the wake of the risk-off impulse and dovish Federal Reserve expectations.
- The global risk sentiment took a hit following the release of mostly disappointing global flash PMIs on Wednesday, which added to worries about an economic slowdown and should offer some support to the safe-haven metal
- The HCOB's preliminary survey indicated a broad-based weakening of economic conditions in the Eurozone amid a deepening manufacturing downturn, which was accompanied by a slowdown in the service sector.
- The S&P Global reported that the business activity in the US private sector continued to expand at a healthy pace in July amid a pick-up in the services sector, though it was offset by an easing in the manufacturing industry.
- Former New York Federal Reserve President William Dudley on Wednesday called for a rate cut as soon as next week in the wake of recession concerns, reaffirming bets for an imminent start of the policy-easing cycle.
- Market participants have fully priced in a 25 basis points (bps) interest rate cut in September and expect the US central bank to lower borrowing costs again during the November and December monetary policy meetings.
- Apart from this, the US political uncertainty should act as a tailwind for the XAU/USD ahead of the key US macro data – the Advance Q2 GDP print on Thursday and the Personal Consumption Expenditures (PCE) Price Index.
Technical Analysis: Gold price turns vulnerable below the $2,385 support zone, weakness below the 61.8% Fibo. awaited
From a technical perspective, the intraday breakdown below the 100-period Simple Moving Average (SMA) on the 4-hour chart, the 50% retracement level of the June-July rally and the $2,385 support could be seen as a fresh trigger for bearish traders. Moreover, oscillators on the daily chart have just started gaining negative traction and suggest that the path of least resistance for the Gold price is to the downside. That said, it will still be prudent to wait for some follow-through selling below the 61.8% Fibo. level, around the $2,370 area, before positioning for deeper losses. The XAU/USD might then weaken further below the 50-day SMA, around the $2,361 region, and test the next relevant support near the $2,35-$2,350 region.
On the flip side, any attempted recovery might now confront some resistance ahead of the $2,400 round-figure mark. A sustained strength beyond the said handle has the potential to lift the Gold price back towards the $2,412 horizontal resistance en route to the $2,423-2,425 region. This is followed by the weekly top, around the $2,432 area touched on Wednesday, above which a fresh bout of a short-covering should pave the way for a move towards the $2,469-2,470 intermediate resistance. The momentum could extend further towards the all-time peak, around the $2,484 area touched last week.
Gold FAQs
Gold has played a key role in human’s history as it has been widely used as a store of value and medium of exchange. Currently, apart from its shine and usage for jewelry, the precious metal is widely seen as a safe-haven asset, meaning that it is considered a good investment during turbulent times. Gold is also widely seen as a hedge against inflation and against depreciating currencies as it doesn’t rely on any specific issuer or government.
Central banks are the biggest Gold holders. In their aim to support their currencies in turbulent times, central banks tend to diversify their reserves and buy Gold to improve the perceived strength of the economy and the currency. High Gold reserves can be a source of trust for a country’s solvency. Central banks added 1,136 tonnes of Gold worth around $70 billion to their reserves in 2022, according to data from the World Gold Council. This is the highest yearly purchase since records began. Central banks from emerging economies such as China, India and Turkey are quickly increasing their Gold reserves.
Gold has an inverse correlation with the US Dollar and US Treasuries, which are both major reserve and safe-haven assets. When the Dollar depreciates, Gold tends to rise, enabling investors and central banks to diversify their assets in turbulent times. Gold is also inversely correlated with risk assets. A rally in the stock market tends to weaken Gold price, while sell-offs in riskier markets tend to favor the precious metal.
The price can move due to a wide range of factors. Geopolitical instability or fears of a deep recession can quickly make Gold price escalate due to its safe-haven status. As a yield-less asset, Gold tends to rise with lower interest rates, while higher cost of money usually weighs down on the yellow metal. Still, most moves depend on how the US Dollar (USD) behaves as the asset is priced in dollars (XAU/USD). A strong Dollar tends to keep the price of Gold controlled, whereas a weaker Dollar is likely to push Gold prices up.
- The Australian Dollar depreciates due to the stark decline in prices of prices of oil, iron ore, and copper.
- The AUD faced challenges as recent PMI data showed that Australia's business activity cooled to a six-month low in July.
- The US Dollar may struggle due to a decline in Treasury yields.
The Australian Dollar (AUD) continues its losing streak for the ninth consecutive day on Thursday, primarily due to declining prices of oil, iron ore, and copper. As Australia is a net exporter of energy and metals, its currency is particularly sensitive to fluctuations in commodity prices.
The AUD also faced pressure from recent Purchasing Managers Index (PMI) data, which showed that Australia's business activity cooled to a six-month low in July. Manufacturing activity remained in contraction, and growth in the services sector slowed.
The Aussie Dollar may limit its downside as the Reserve Bank of Australia (RBA) is expected to delay easing its policy tightening compared to other major central banks due to persistent inflationary pressures and a tight labor market. Futures markets currently imply a 20% probability that the RBA could hike interest rates at its August meeting.
The AUD/USD pair also faced pressure from a strengthening US Dollar (USD) as investors prepared for upcoming US GDP and PCE inflation data. Recent US PMI data indicated that private-sector activity expanded at a faster pace in July, highlighting the resilience of US growth despite higher interest rates. This data provides the Federal Reserve (Fed) with some flexibility to maintain its restrictive policy stance if inflation does not show signs of slowing.
Daily Digest Market Movers: Australian Dollar declines due to cooling business activity
- The S&P Global US Services PMI increased to a reading of 56.0 in July, the highest in 28 months, up from a 55.3 reading in June and exceeding market expectations of 55.3. Meanwhile, the Composite PMI rose to f 55.0 from the previous 54.8 reading, marking the highest reading since April 2022 and indicating sustained growth over the past 18 months.
- Sluggish economic activity in China has put additional selling pressure on the Aussie Dollar. Concerns about the weak Chinese economy were heightened by an unexpected rate cut from the People's Bank of China (PBoC) on Monday. The People’s Bank of China (PBOC), cut the one-year Medium-term Lending Facility (MLF) rate from 2.50% to 2.30% on Thursday. Additionally, the Bank of China, one of the world's largest banks, announced a 10-20 basis points cut in time deposit rates. Any change in the Chinese economy could impact the Australian markets as both countries are close trade partners.
- Australia's Judo Bank Manufacturing PMI improved to 47.4 in July from 47.2 in June. Meanwhile, the Services PMI dropped to 50.8 in July from 51.2 in June. The Composite PMI also declined, falling to 50.2 in July from 50.7 in June.
- Media reports say that Vice President Kamala Harris has just passed 1,976 Democratic delegates to secure the party's presidential nomination. Harris is now the Democratic Party’s Presumptive Nominee for November’s Presidential Election.
- Federal Reserve Bank of New York President John Williams stated on Friday that the long-term trends that caused declines in neutral interest rates before the pandemic continue to prevail. Williams noted, "My own Holston-Laubach-Williams estimates for r-star in the United States, Canada, and the Euro area are about the same level as they were before the pandemic," according to Bloomberg.
- Reuters cited Sean Langcake, head of macroeconomic forecasting for Oxford Economics Australia, saying, "The current pace of employment growth suggests demand is resilient and cost pressures will remain. We think the RBA will stay the course and keep rates on hold, but August is certainly a live meeting."
Technical Analysis: Australian Dollar falls to near 0.6550
The Australian Dollar trades around 0.6570 on Thursday. The daily chart analysis indicates that the AUD/USD pair has broken below the descending channel, signaling the strengthening of a bearish bias. The 14-day Relative Strength Index (RSI) is positioned at the level of 50, suggesting an oversold condition for the currency pair and pointing to a potential correction soon.
The AUD/USD pair could find support around the psychological level of 0.6500, followed by a throwback support at 0.6470.
On the upside, key resistance is at the lower boundary of the descending channel at 0.6590, followed by the psychological level of 0.6600. A return to the descending channel may weaken the bearish bias and support the AUD/USD pair in testing the nine-day Exponential Moving Average (EMA) at 0.6646. A breakthrough above this level could lead the pair to test the upper boundary of the descending channel around 0.6715, potentially aiming for a six-month high of 0.6798.
AUD/USD: Daily Chart
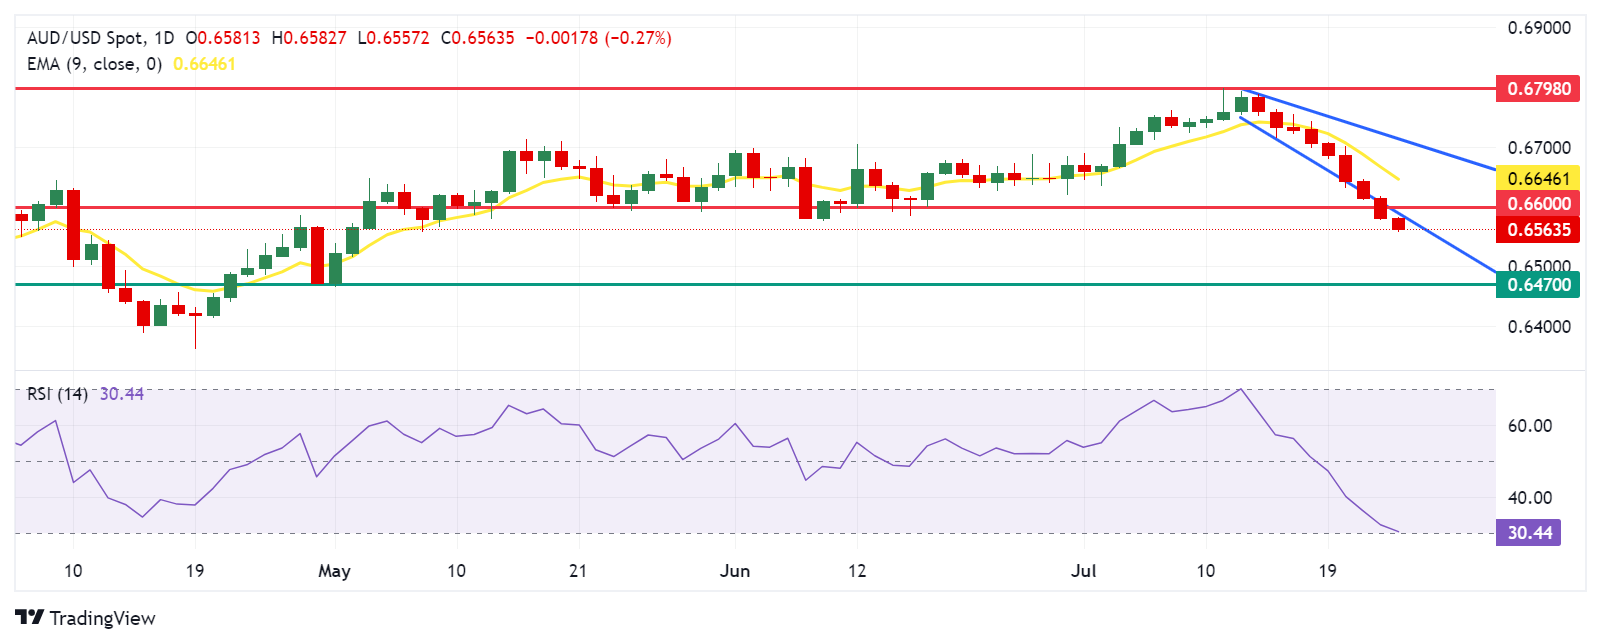
Australian Dollar PRICE Today
The table below shows the percentage change of Australian Dollar (AUD) against listed major currencies today. Australian Dollar was the weakest against the Japanese Yen.
| USD | EUR | GBP | JPY | CAD | AUD | NZD | CHF | |
|---|---|---|---|---|---|---|---|---|
| USD | 0.00% | 0.13% | -0.75% | 0.09% | 0.39% | 0.16% | -0.14% | |
| EUR | -0.01% | 0.13% | -0.75% | 0.08% | 0.38% | 0.15% | -0.15% | |
| GBP | -0.13% | -0.13% | -0.87% | -0.05% | 0.27% | 0.02% | -0.28% | |
| JPY | 0.75% | 0.75% | 0.87% | 0.82% | 1.13% | 0.88% | 0.60% | |
| CAD | -0.09% | -0.08% | 0.05% | -0.82% | 0.31% | 0.08% | -0.23% | |
| AUD | -0.39% | -0.38% | -0.27% | -1.13% | -0.31% | -0.22% | -0.54% | |
| NZD | -0.16% | -0.15% | -0.02% | -0.88% | -0.08% | 0.22% | -0.31% | |
| CHF | 0.14% | 0.15% | 0.28% | -0.60% | 0.23% | 0.54% | 0.31% |
The heat map shows percentage changes of major currencies against each other. The base currency is picked from the left column, while the quote currency is picked from the top row. For example, if you pick the Australian Dollar from the left column and move along the horizontal line to the US Dollar, the percentage change displayed in the box will represent AUD (base)/USD (quote).
Australian Dollar FAQs
One of the most significant factors for the Australian Dollar (AUD) is the level of interest rates set by the Reserve Bank of Australia (RBA). Because Australia is a resource-rich country another key driver is the price of its biggest export, Iron Ore. The health of the Chinese economy, its largest trading partner, is a factor, as well as inflation in Australia, its growth rate and Trade Balance. Market sentiment – whether investors are taking on more risky assets (risk-on) or seeking safe-havens (risk-off) – is also a factor, with risk-on positive for AUD.
The Reserve Bank of Australia (RBA) influences the Australian Dollar (AUD) by setting the level of interest rates that Australian banks can lend to each other. This influences the level of interest rates in the economy as a whole. The main goal of the RBA is to maintain a stable inflation rate of 2-3% by adjusting interest rates up or down. Relatively high interest rates compared to other major central banks support the AUD, and the opposite for relatively low. The RBA can also use quantitative easing and tightening to influence credit conditions, with the former AUD-negative and the latter AUD-positive.
China is Australia’s largest trading partner so the health of the Chinese economy is a major influence on the value of the Australian Dollar (AUD). When the Chinese economy is doing well it purchases more raw materials, goods and services from Australia, lifting demand for the AUD, and pushing up its value. The opposite is the case when the Chinese economy is not growing as fast as expected. Positive or negative surprises in Chinese growth data, therefore, often have a direct impact on the Australian Dollar and its pairs.
Iron Ore is Australia’s largest export, accounting for $118 billion a year according to data from 2021, with China as its primary destination. The price of Iron Ore, therefore, can be a driver of the Australian Dollar. Generally, if the price of Iron Ore rises, AUD also goes up, as aggregate demand for the currency increases. The opposite is the case if the price of Iron Ore falls. Higher Iron Ore prices also tend to result in a greater likelihood of a positive Trade Balance for Australia, which is also positive of the AUD.
The Trade Balance, which is the difference between what a country earns from its exports versus what it pays for its imports, is another factor that can influence the value of the Australian Dollar. If Australia produces highly sought after exports, then its currency will gain in value purely from the surplus demand created from foreign buyers seeking to purchase its exports versus what it spends to purchase imports. Therefore, a positive net Trade Balance strengthens the AUD, with the opposite effect if the Trade Balance is negative.
The People’s Bank of China (PBOC), China's central bank, cut the one-year Medium-term Lending Facility (MLF) rate from 2.50% to 2.30% on Thursday.
The one-year MLF was last cut in August 2023, from 2.65%.
Further, China’s agriculture and construction banks have also lowered rates, as economic woes accentuate.
Market reaction
Despite China’s efforts to stimulate economic growth, markets are unimpressed, with AUD/USD falling to three-month lows near 0.6550 while Gold price tumbled to ten-day lows of $2,371.
Australian Dollar FAQs
One of the most significant factors for the Australian Dollar (AUD) is the level of interest rates set by the Reserve Bank of Australia (RBA). Because Australia is a resource-rich country another key driver is the price of its biggest export, Iron Ore. The health of the Chinese economy, its largest trading partner, is a factor, as well as inflation in Australia, its growth rate and Trade Balance. Market sentiment – whether investors are taking on more risky assets (risk-on) or seeking safe-havens (risk-off) – is also a factor, with risk-on positive for AUD.
The Reserve Bank of Australia (RBA) influences the Australian Dollar (AUD) by setting the level of interest rates that Australian banks can lend to each other. This influences the level of interest rates in the economy as a whole. The main goal of the RBA is to maintain a stable inflation rate of 2-3% by adjusting interest rates up or down. Relatively high interest rates compared to other major central banks support the AUD, and the opposite for relatively low. The RBA can also use quantitative easing and tightening to influence credit conditions, with the former AUD-negative and the latter AUD-positive.
China is Australia’s largest trading partner so the health of the Chinese economy is a major influence on the value of the Australian Dollar (AUD). When the Chinese economy is doing well it purchases more raw materials, goods and services from Australia, lifting demand for the AUD, and pushing up its value. The opposite is the case when the Chinese economy is not growing as fast as expected. Positive or negative surprises in Chinese growth data, therefore, often have a direct impact on the Australian Dollar and its pairs.
Iron Ore is Australia’s largest export, accounting for $118 billion a year according to data from 2021, with China as its primary destination. The price of Iron Ore, therefore, can be a driver of the Australian Dollar. Generally, if the price of Iron Ore rises, AUD also goes up, as aggregate demand for the currency increases. The opposite is the case if the price of Iron Ore falls. Higher Iron Ore prices also tend to result in a greater likelihood of a positive Trade Balance for Australia, which is also positive of the AUD.
The Trade Balance, which is the difference between what a country earns from its exports versus what it pays for its imports, is another factor that can influence the value of the Australian Dollar. If Australia produces highly sought after exports, then its currency will gain in value purely from the surplus demand created from foreign buyers seeking to purchase its exports versus what it spends to purchase imports. Therefore, a positive net Trade Balance strengthens the AUD, with the opposite effect if the Trade Balance is negative.
- GBP/USD trades on a softer note near 1.2895 in Wednesday’s early Asian session.
- Majority of economists anticipate the BoE to cut the bank rate at its August meeting next week.
- Investors await the preliminary US Q2 Gross Domestic Product, which is due on Thursday.
The GBP/USD pair edges lower to 1.2895 during the Asian trading hours on Thursday. The higher possibility that the Bank of England (BoE) will begin cutting interest rates in August has undermined the Pound Sterling (GBP). In the absence of top-tier UK economic data releases, the GBP/USD pair will be influenced by the USD. The release of preliminary US Gross Domestic Product (GDP) for the second quarter (Q2) will be in the spotlight.
The majority of economists said in a Reuters poll that the BoE is expected to cut the bank rate to 5% at its August meeting next week. JP Morgan analyst, Allan Monks, noted that "we look for a 25 basis point rate cut at next week's meeting, although the call appears much closer than it did several weeks back. The case for lower rates is far from clear.”
On the USD’s front, market players anticipate the US Federal Reserve (Fed) to keep rates unchanged at its July meeting next week, but forecast the US central bank to start easing its monetary policy in September, pushing the Federal Funds Rate to the 5.00%-5.25% range.
However, investors will take more cues from the key US economic data this week for fresh impetus. On Wednesday, the release of US preliminary S&P Global PMIs for July could affirm the rate outlook. The Manufacturing PMI is projected to improve to 51.7 in July from 51.6 in June, while the Services PMI is forecast to ease slightly to 54.4 in July from 55.3. Later this week, the first reading of the US second-quarter Gross Domestic Product (GDP) and Personal Consumption Expenditures (PCE) Price Index data for June will be published.
Pound Sterling FAQs
The Pound Sterling (GBP) is the oldest currency in the world (886 AD) and the official currency of the United Kingdom. It is the fourth most traded unit for foreign exchange (FX) in the world, accounting for 12% of all transactions, averaging $630 billion a day, according to 2022 data. Its key trading pairs are GBP/USD, aka ‘Cable’, which accounts for 11% of FX, GBP/JPY, or the ‘Dragon’ as it is known by traders (3%), and EUR/GBP (2%). The Pound Sterling is issued by the Bank of England (BoE).
The single most important factor influencing the value of the Pound Sterling is monetary policy decided by the Bank of England. The BoE bases its decisions on whether it has achieved its primary goal of “price stability” – a steady inflation rate of around 2%. Its primary tool for achieving this is the adjustment of interest rates. When inflation is too high, the BoE will try to rein it in by raising interest rates, making it more expensive for people and businesses to access credit. This is generally positive for GBP, as higher interest rates make the UK a more attractive place for global investors to park their money. When inflation falls too low it is a sign economic growth is slowing. In this scenario, the BoE will consider lowering interest rates to cheapen credit so businesses will borrow more to invest in growth-generating projects.
Data releases gauge the health of the economy and can impact the value of the Pound Sterling. Indicators such as GDP, Manufacturing and Services PMIs, and employment can all influence the direction of the GBP. A strong economy is good for Sterling. Not only does it attract more foreign investment but it may encourage the BoE to put up interest rates, which will directly strengthen GBP. Otherwise, if economic data is weak, the Pound Sterling is likely to fall.
Another significant data release for the Pound Sterling is the Trade Balance. This indicator measures the difference between what a country earns from its exports and what it spends on imports over a given period. If a country produces highly sought-after exports, its currency will benefit purely from the extra demand created from foreign buyers seeking to purchase these goods. Therefore, a positive net Trade Balance strengthens a currency and vice versa for a negative balance.
On Thursday, the People’s Bank of China (PBOC) set the USD/CNY central rate for the trading session ahead at 7.1321, as against the previous day's fix of 7.1358 and 7.2706 Reuters estimates.
- EUR/USD weakens near 1.0835 in Wednesday’s early Asian session.
- ECB’s Guindos hinted at a possible interest rate cut in September.
- US S&P Global Manufacturing PMI dropped to 49.5; Services PMI improved to 56 in July.
The EUR/USD pair trades in negative territory for the third consecutive day around 1.0835 during the Asian session on Thursday. The major pair adds to the previous day’s losses amid a downbeat view of the Eurozone's economic outlook and rising expectation that the European Central Bank (ECB) would cut more rates in September.
Earlier this week, ECB vice president Luis de Guindos hinted at a possible interest rate cut in September as the central bank will have more information to reassess the monetary policy situation. The ECB President Christine Lagarde said last week after holding policy rates that the rate cuts in September were "wide open” amid easing inflationary pressures. The further rate cuts expectation from the ECB is likely to weigh on the Euro (EUR) in the near term.
Across the pond, market players expect the US Federal Reserve (Fed) to start cutting interest rates in September. According to the CME FedWatch Tool, traders have priced in 100% odds of a 25 basis points (bps) rate cut, while data from the Chicago Board of Trade (CBOT) showed market participants estimate 53 bps of easing for 2024.
The business activity in the US private sector continued to expand in July. The S&P Global Manufacturing PMI declined to 49.5 in July versus 51.6 prior, while the Services PMI rose to 56.0 in July from 55.3 in June, above the consensus of 54.4. The US S&P Global Composite PMI increased to 55.0 in July from 54.8 in the previous reading.
Later on Thursday, investors will closely watch the speech by the ECB’s Lagarde, along with the advanced US Gross Domestic Product (GDP) for the second quarter (Q2). The US economy is estimated to grow 2.0%, compared to the previous reading of 1.4%.
Euro FAQs
The Euro is the currency for the 20 European Union countries that belong to the Eurozone. It is the second most heavily traded currency in the world behind the US Dollar. In 2022, it accounted for 31% of all foreign exchange transactions, with an average daily turnover of over $2.2 trillion a day. EUR/USD is the most heavily traded currency pair in the world, accounting for an estimated 30% off all transactions, followed by EUR/JPY (4%), EUR/GBP (3%) and EUR/AUD (2%).
The European Central Bank (ECB) in Frankfurt, Germany, is the reserve bank for the Eurozone. The ECB sets interest rates and manages monetary policy. The ECB’s primary mandate is to maintain price stability, which means either controlling inflation or stimulating growth. Its primary tool is the raising or lowering of interest rates. Relatively high interest rates – or the expectation of higher rates – will usually benefit the Euro and vice versa. The ECB Governing Council makes monetary policy decisions at meetings held eight times a year. Decisions are made by heads of the Eurozone national banks and six permanent members, including the President of the ECB, Christine Lagarde.
Eurozone inflation data, measured by the Harmonized Index of Consumer Prices (HICP), is an important econometric for the Euro. If inflation rises more than expected, especially if above the ECB’s 2% target, it obliges the ECB to raise interest rates to bring it back under control. Relatively high interest rates compared to its counterparts will usually benefit the Euro, as it makes the region more attractive as a place for global investors to park their money.
Data releases gauge the health of the economy and can impact on the Euro. Indicators such as GDP, Manufacturing and Services PMIs, employment, and consumer sentiment surveys can all influence the direction of the single currency. A strong economy is good for the Euro. Not only does it attract more foreign investment but it may encourage the ECB to put up interest rates, which will directly strengthen the Euro. Otherwise, if economic data is weak, the Euro is likely to fall. Economic data for the four largest economies in the euro area (Germany, France, Italy and Spain) are especially significant, as they account for 75% of the Eurozone’s economy.
Another significant data release for the Euro is the Trade Balance. This indicator measures the difference between what a country earns from its exports and what it spends on imports over a given period. If a country produces highly sought after exports then its currency will gain in value purely from the extra demand created from foreign buyers seeking to purchase these goods. Therefore, a positive net Trade Balance strengthens a currency and vice versa for a negative balance.
| Index | Change, points | Closed | Change, % |
|---|---|---|---|
| NIKKEI 225 | -439.54 | 39154.85 | -1.11 |
| Hang Seng | -158.31 | 17311.05 | -0.91 |
| KOSPI | -15.58 | 2758.71 | -0.56 |
| ASX 200 | -7.4 | 7963.7 | -0.09 |
| DAX | -170.24 | 18387.46 | -0.92 |
| CAC 40 | -84.9 | 7513.73 | -1.12 |
| Dow Jones | -504.22 | 39853.87 | -1.25 |
| S&P 500 | -128.61 | 5427.13 | -2.31 |
| NASDAQ Composite | -654.94 | 17342.41 | -3.64 |
| Pare | Closed | Change, % |
|---|---|---|
| AUDUSD | 0.65798 | -0.49 |
| EURJPY | 166.582 | -1.32 |
| EURUSD | 1.08384 | -0.1 |
| GBPJPY | 198.333 | -1.23 |
| GBPUSD | 1.29043 | 0 |
| NZDUSD | 0.59296 | -0.39 |
| USDCAD | 1.38015 | 0.13 |
| USDCHF | 0.88452 | -0.76 |
| USDJPY | 153.676 | -1.22 |
- USD/JPY remains on the defensive near 153.70 in Thursday’s early Asian session.
- A higher chance of a BoJ rate hike might support the JPY in the near term.
- Mixed US S&P PMI for July and the Fed’s dovish comments are likely to weigh on the Greenback.
The USD/JPY pair remains under some selling pressure around 153.70, the lowest in three months, on Thursday during the early Asian session. The rising bets that the Bank of Japan (BoJ) will cut interest rates next week provide some support to the Japanese Yen (JPY) for the time being.
The BoJ is likely to debate whether to hike interest rates again next week and unveil a plan to roughly halve bond purchases in the coming years. “This may be due to the fact that ahead of the BoJ's interest rate decision next week, more and more analysts see the risk that an interest rate hike could come now rather than in September. It will also be interesting to see what the BoJ says about its bond purchases and whether it could gradually reduce them.” said Commerzbank FX strategist Antje Praefcke. Additionally, the potential foreign exchange (FX) interventions from Japanese authorities might cap the upside for the pair.
Multiple headwinds from the US, including a mixed US S&P Purchasing Managers Index (PMI) for July and a dovish stance from the Federal Reserve (Fed), are likely to exert some selling pressure on the USD. The US S&P Global Composite PMI rose to 55.0 in July from 54.8 in June. Meanwhile, the S&P Global Manufacturing PMI dropped to 49.5 from 51.6 in the same period, below the market consensus of 51.7. The Services PMI rose to 56.0 from 55.3, stronger than the expectation of 54.4.
Japanese Yen FAQs
The Japanese Yen (JPY) is one of the world’s most traded currencies. Its value is broadly determined by the performance of the Japanese economy, but more specifically by the Bank of Japan’s policy, the differential between Japanese and US bond yields, or risk sentiment among traders, among other factors.
One of the Bank of Japan’s mandates is currency control, so its moves are key for the Yen. The BoJ has directly intervened in currency markets sometimes, generally to lower the value of the Yen, although it refrains from doing it often due to political concerns of its main trading partners. The current BoJ ultra-loose monetary policy, based on massive stimulus to the economy, has caused the Yen to depreciate against its main currency peers. This process has exacerbated more recently due to an increasing policy divergence between the Bank of Japan and other main central banks, which have opted to increase interest rates sharply to fight decades-high levels of inflation.
The BoJ’s stance of sticking to ultra-loose monetary policy has led to a widening policy divergence with other central banks, particularly with the US Federal Reserve. This supports a widening of the differential between the 10-year US and Japanese bonds, which favors the US Dollar against the Japanese Yen.
The Japanese Yen is often seen as a safe-haven investment. This means that in times of market stress, investors are more likely to put their money in the Japanese currency due to its supposed reliability and stability. Turbulent times are likely to strengthen the Yen’s value against other currencies seen as more risky to invest in.


© 2000-2026. Уcі права захищені.
Cайт знаходитьcя під керуванням TeleTrade DJ. LLC 2351 LLC 2022 (Euro House, Richmond Hill Road, Kingstown, VC0100, St. Vincent and the Grenadines).
Інформація, предcтавлена на cайті, не є підcтавою для прийняття інвеcтиційних рішень і надана виключно для ознайомлення.
Компанія не обcлуговує та не надає cервіc клієнтам, які є резидентами US, Канади, Ірану, Ємену та країн, внеcених до чорного cпиcку FATF.
Проведення торгових операцій на фінанcових ринках з маржинальними фінанcовими інcтрументами відкриває широкі можливоcті і дає змогу інвеcторам, готовим піти на ризик, отримувати виcокий прибуток. Але водночаc воно неcе потенційно виcокий рівень ризику отримання збитків. Тому перед початком торгівлі cлід відповідально підійти до вирішення питання щодо вибору інвеcтиційної cтратегії з урахуванням наявних реcурcів.
Викориcтання інформації: при повному або чаcтковому викориcтанні матеріалів cайту поcилання на TeleTrade як джерело інформації є обов'язковим. Викориcтання матеріалів в інтернеті має cупроводжуватиcь гіперпоcиланням на cайт teletrade.org. Автоматичний імпорт матеріалів та інформації із cайту заборонено.
З уcіх питань звертайтеcь за адреcою pr@teletrade.global.
переклади