- Аналітика
- Новини та інструменти
- Новини ринків
Новини ринків
- EUR/USD dropped back into familiar lows after dovish ECB.
- US PCE inflation snapshot due on Friday.
- Euro on pace to be the worst performer of the major currencies this week.
EUR/USD tumbled back into the low side of 1.0850 as the pair resumes cycling within familiar levels on the week, with bearish flows forcing the Euro (EUR) further down against the US Dollar (USD) after the European Central Bank (ECB) held rates steady and US Gross Domestic Product (GDP) figures grew faster than expected in the fourth quarter.
The ECB held rates steady for a third consecutive meeting, but a dovish tilt to ECB President Christine Lagarde’s monetary policy statement ramped up market bets of faster, deeper cuts from the ECB heading into the middle of the year.
ECB Press Conference: Lagarde explains decision to keep rates steady, speaks on policy outlook
Money markets are now betting that a first 50 basis point cut from the ECB will come by June, with rate swaps pricing in 140 bps in total rate cuts from the ECB by the end of 2024 compared to 130 bps before the ECB rate call.
US GDP grew by 3.3% for the year ended in the fourth quarter, beating the median market forecast of 2.0% despite slipping back from the previous period’s 4.9%. US stocks rallied and the US Dollar Index climbed on reaction.
The trading week will wrap up with US Personal Consumption Expenditures (PCE) Price Index figures during the US market session. As the Federal Reserve’s (Fed) preferred method of tracking inflation, markets will be watching the PCE inflation snapshot carefully on Friday. US MoM PCE inflation is forecast to print at 0.2% in December versus the previous month’s 0.1%, and the annualized PCE inflation print is expected to tick down to 3.0% from 3.2%.
EUR/USD Technical Outlook
EUR/USD saw another rejection from the 200-hour Simple Moving Average (SMA) dropping into 1.0880, and intraday price action found a near-term bottom just above 1.0820 before settling Thursday close to the 1.0850 level.
The EUR/USD remains trapped in a congestion zone between the 50-day and 200-day SMAs at 1.0925 and 1.0850 respectively, trapped in a consolidation pattern as near-term price action drifts into the midrange.
EUR/USD Hourly Chart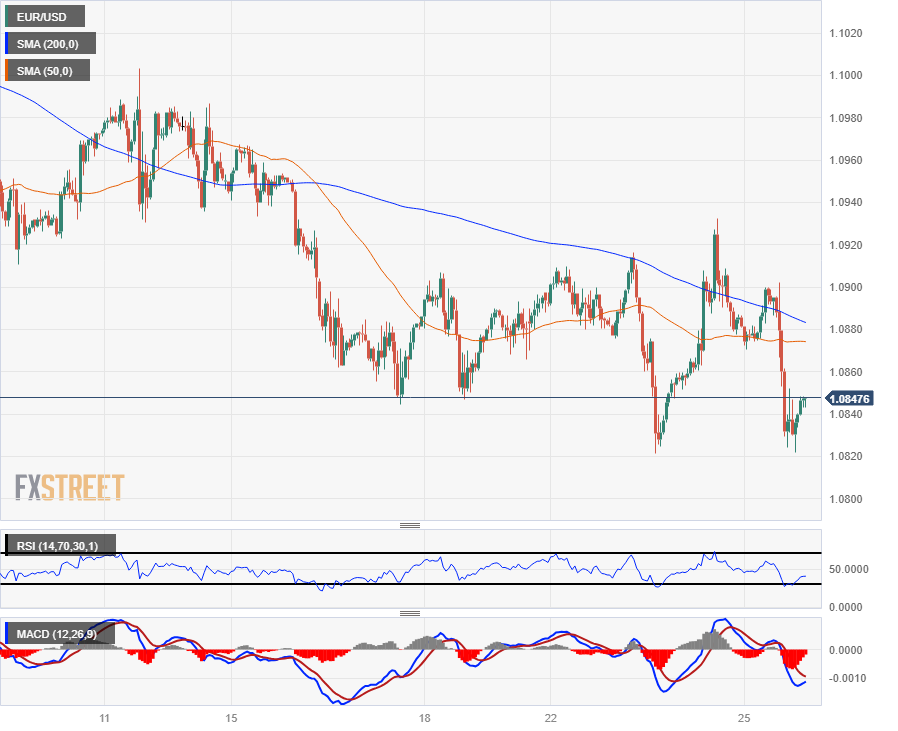
EUR/USD Daily Chart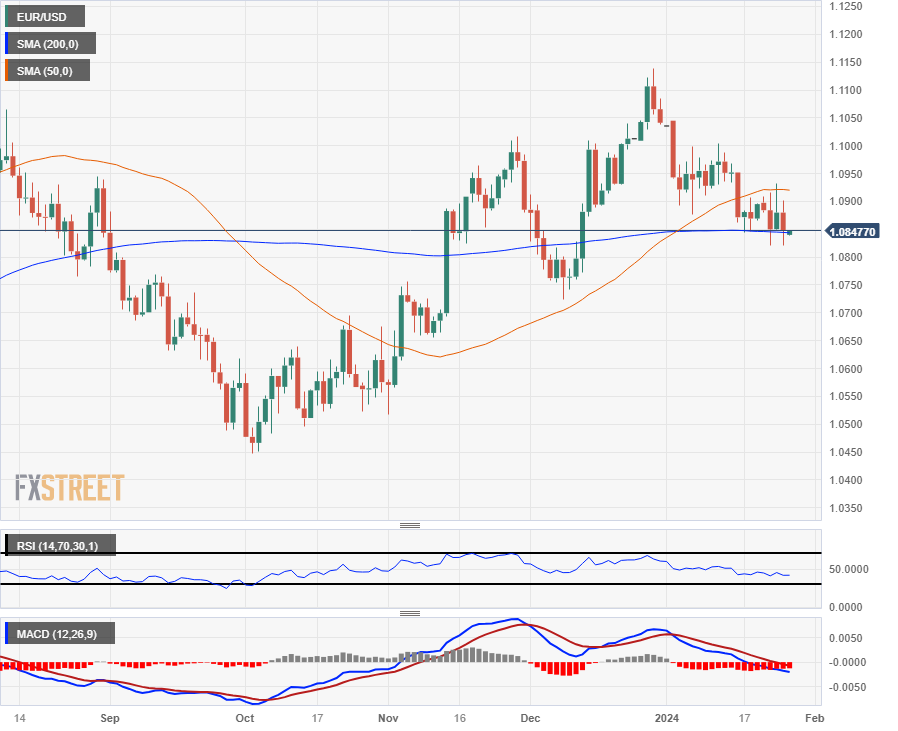
The headline Tokyo Consumer Price Index (CPI) for January eased to 1.6% YoY from 2.4% in the previous reading, the Statistics Bureau of Japan showed on Friday. Meanwhile, the Tokyo CPI ex Fresh Food, Energy arrived at 3.1% YoY from 3.5% in December.
Additionally, Tokyo CPI ex Fresh Food eased from 2.1% to 1.6% for the said month compared to analysts’ estimations of 1.9%.
Market reaction
As of writing, the USD/JPY pair was down 0.08% on the day at 147.58.
About Tokyo Consumer Price Index (CPI)
The Tokyo Consumer Price Index is released by the Statistics Bureau and it's a measure of price movements obtained by comparison of the retail prices of a representative shopping basket of goods and services. The index captures inflation in Tokyo. CPI is the most significant way to measure changes in purchasing trends. The purchase power of JPY is dragged down by inflation. Generally a high reading is seen as positive.
Inflation FAQs
What is inflation?
Inflation measures the rise in the price of a representative basket of goods and services. Headline inflation is usually expressed as a percentage change on a month-on-month (MoM) and year-on-year (YoY) basis. Core inflation excludes more volatile elements such as food and fuel which can fluctuate because of geopolitical and seasonal factors. Core inflation is the figure economists focus on and is the level targeted by central banks, which are mandated to keep inflation at a manageable level, usually around 2%.
What is the Consumer Price Index (CPI)?
The Consumer Price Index (CPI) measures the change in prices of a basket of goods and services over a period of time. It is usually expressed as a percentage change on a month-on-month (MoM) and year-on-year (YoY) basis. Core CPI is the figure targeted by central banks as it excludes volatile food and fuel inputs. When Core CPI rises above 2% it usually results in higher interest rates and vice versa when it falls below 2%. Since higher interest rates are positive for a currency, higher inflation usually results in a stronger currency. The opposite is true when inflation falls.
What is the impact of inflation on foreign exchange?
Although it may seem counter-intuitive, high inflation in a country pushes up the value of its currency and vice versa for lower inflation. This is because the central bank will normally raise interest rates to combat the higher inflation, which attract more global capital inflows from investors looking for a lucrative place to park their money.
How does inflation influence the price of Gold?
Formerly, Gold was the asset investors turned to in times of high inflation because it preserved its value, and whilst investors will often still buy Gold for its safe-haven properties in times of extreme market turmoil, this is not the case most of the time. This is because when inflation is high, central banks will put up interest rates to combat it.
Higher interest rates are negative for Gold because they increase the opportunity-cost of holding Gold vis-a-vis an interest-bearing asset or placing the money in a cash deposit account. On the flipside, lower inflation tends to be positive for Gold as it brings interest rates down, making the bright metal a more viable investment alternative.
- NZD/USD loses ground near 0.6109 on the firmer USD.
- US GDP data in Q4 was stronger than markets or the Fed expected.
- New Zealand’s CPI inflation was in line with expectations in the fourth quarter.
- The USCore Personal Consumption Expenditures Price Index (Core PCE) will be in the spotlight on Friday.
The NZD/USD pair trades on a weaker note above the 0.6100 mark during the early Asian session on Friday. The stronger GDP growth number lends some support to the US Dollar (USD) and weighs on the NZD/USD pair. Investors will take more cues from the US Core Personal Consumption Expenditures Price Index (Core PCE) on Friday for fresh impetus. This event might trigger volatility in the market. At press time, the pair is trading at 0.6109, down 0.03% for the day.
The US GDP in Q4 came in better than expected, growing 3.1% YoY from 4.9% in the previous reading. The upbeat GDP growth number boosted hopes for a soft landing, which lifted the US Dollar (USD) broadly. Meanwhile, the weekly Initial Jobless Claims rose to 214,000 in the week ended January 20, the highest level in a month. Continuing Claims increased by 27K to 1.833M for the week ended January 13. The markets have priced in 51% odds of a quarter-point rate cut from the Federal Reserve (Fed) at its March meeting, up from 41% on Wednesday.
New Zealand’s CPI inflation was in line with expectations in the fourth quarter and hit its lowest level since the middle of 2021. However, inflation remains higher than the central bank is comfortable with, and the markets anticipate that the rate cuts from the Reserve Bank of New Zealand (RBNZ) won’t be on the table in the near term.
Looking ahead, market players will closely watch the Fed’s preferred inflation measure, the Core Personal Consumption Expenditures Price Index (Core PCE), due on Friday. The monthly and annual Core PCE are estimated to show an increase of 0.2% MoM and 3.0% YoY, respectively.
- Gold modestly recovers, influenced by strong US GDP and falling Treasury yields.
- Mixed US data: unchanged Durable Goods Orders and higher jobless claims fuel market uncertainty and Fed rate cut speculations.
- Markets await US PCE Price Index and Fed policy decision; Middle East tensions also impact dynamics.
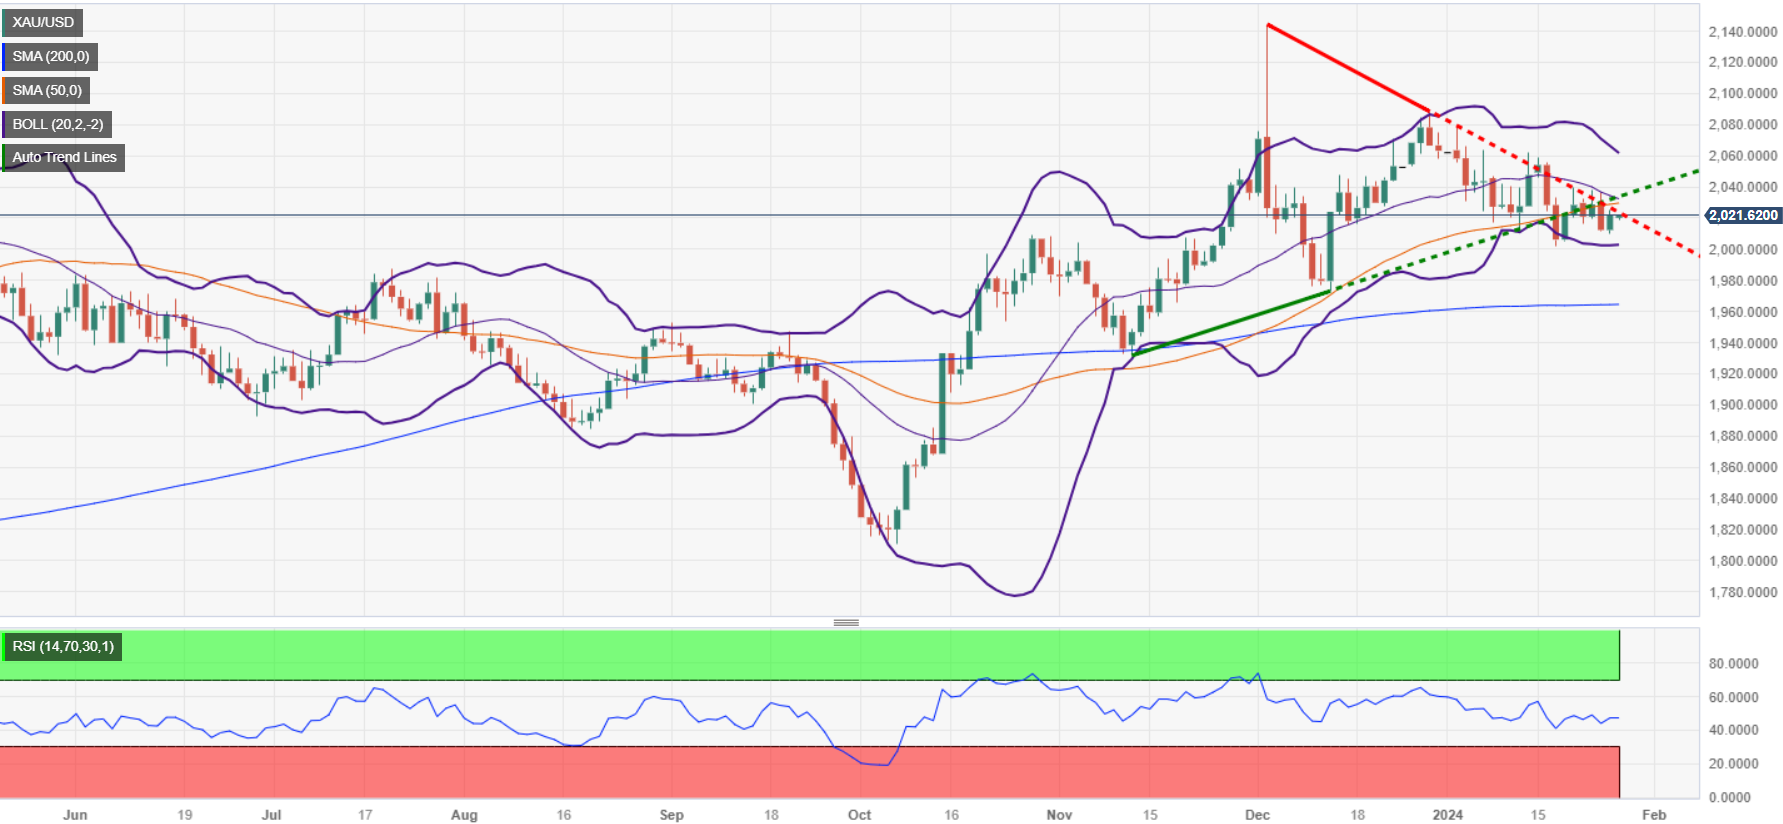
Gold price recovered after sliding more than 0.70% on Wednesday and rising 0.35% on Thursday amid robust US data and falling US Treasury bond yields. At the time of writing, XAU/USD exchanges hands at $2020.40, virtually unchanged as the Asian Pacific session begins.
XAU/USD remains steady after strong US GDP and weak durable goods and labor market data
In the fourth quarter of last year, the US economy grew 3.3% on a quarterly basis, which, although trailing Q3’s figures, exceeded estimates of a mediocre 2% by analysts. All that said, for the entire year, the US Gross Domestic Product (GDP) in 2023 rose by 2.5%, higher than in 2022 by 1.9%.
Meanwhile, further data was mixed, with Durable Goods Orders surprisingly standing at 0% in December, below forecasts for a 1.1% increase and trailing November’s 5.5% reading. At the same time, US Initial Jobless Claims for the latest week jumped from 189K to 214K, higher than foreseen.
Following the data, traders remained cautious about pricing in the first Federal Reserve rate cut in March, with probabilities slumping below 50%. Nevertheless, investors are expecting the first cut in May and projecting five more, meaning the Federal funds rate (FFR) is scheduled to end at 4%, from 5.25%-5.50%.
Falling US Treasury yields bolstered Gold’s performance, as the European Central Bank’s (ECB) decision to hold rates triggered a rally in the bond market, as speculations for rate cuts piled up. Therefore, global bond yields plunged, with the US 10-year benchmark note plummeting six basis points to 4.12%.
In addition to this, the latest geopolitical developments in the Middle East sparked a recovery in the non-yielding metal prices after Houthis attacked two US flag Maersk ships that the US Navy escorted.
All in all, Gold traders brace for the release of the Fed’s preferred gauge for inflation, the Personal Consumption Expenditures (PCE) Price Index for December, ahead of next week’s monetary policy decision by Fed Chairman Jerome Powell and Co.
XAU/USD Price Analysis: Technical outlook
Even though Gold staged a comeback, it could be short-lived after failing to reclaim the 50-day moving average (DMA) at $$2029.91, which could pave the way to retest the $2000 barrier. A drop below that level might accelerate the downtrend towards the 100-DMA at $1978.55 before clashing with the 200-DMA at $1964.43. On the flip side, if XAU’s buyers regain the 50-DMA, upside risks will emerge at $2050.
- US stocks rally after US GDP prints above expectations.
- US PCE Price Index inflation due on Friday.
- Fed slated for another rate call next Wednesday.
US equity indexes climbed into fresh record highs on Thursday after US economic data beat the street with US Gross Domestic Product (GDP) growing faster than median market forecasts anticipated.
US annualized GDP grew by 3.3% in the fourth quarter, well above the forecast 2.0% but still below the previous quarter’s 4.9%, driving markets into a buying frenzy and pinning stocks into record highs.
US data will cap off the trading week with US Personal Consumption Expenditure (PCE) Price Index numbers on Friday. December’s MoM PCE is forecast to tick up slightly to 0.2% from the previous month’s 0.1% in a year-end inflation rebound, but the annualized PCE is expected to tick lower to 3.0% from 3.2% as overall inflationary pressure through the year continues to ease.
Swaps markets are still pricing in a first Federal Reserve (Fed) rate trim in May, with money markets betting on 140 basis points in overall rate cuts through 2024.
The Dow Jones Industrial Average (DJIA) climbed 0.64% to close up 242.74 points at $38,049.13, while the NASDAQ Composite index rose 28.58 points to close in the green 0.18% at $15,510.50.
The Standard & Poor’s (S&P) 500 major equity index closed at an all-time high for the fifth consecutive trading day, gaining 25.61 points and closing at $4,894.16 as the index continues to inch towards the major $5,000.00 handle.
S&P Technical Outlook
The S&P gained on Thursday to hit its highest closing bid ever, setting a fifth consecutive daily close in record territory. Intraday price action saw support from the 50-hour Simple Moving Average (SMA) near $4,870.00, with a near-term technical floor at the 200-hour SMA rising into $4,800.00.
The S&P 500 is up nearly 20% from the last major swing low into $4,102.00 in late October, and the index has ridden a bullish technical rejection from the 200-day SMA into record highs with an immediate technical barrier at the 50-day SMA approaching the $4,700.00 handle.
S&P Hourly Chart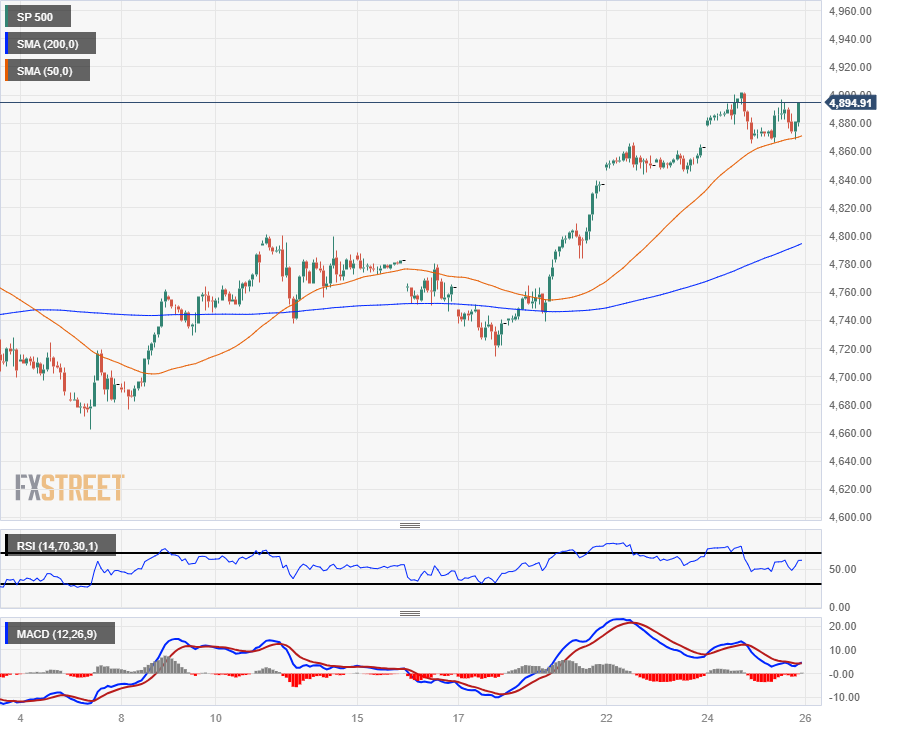
S&P Daily Chart
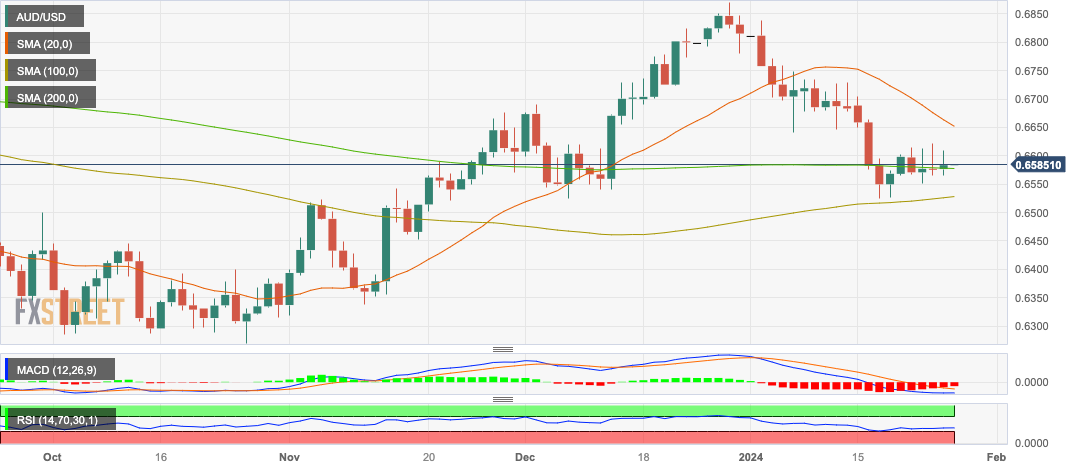
- The AUD/USD trades at 0.6580, securing mild gains above the 200-day SMA.
- Signs of selling momentum are still visible on the daily charts.
- Despite bearish trends reflected last week, overall bulls lead as pair trades above the 100 and 200-day SMAs.
In Thursday's session, the AUD/USD was seen trading at 0.6580 with mild gains, rebounding slightly after last week's 1.20% loss. A neutral to bullish daily outlook is observed, with bears currently taking a breather. This, combined with a brighter outlook on the four-hour chart, suggests the pair might experience more bullish traction in the short term.
On the fundamental side, the AUD/USD has recently been pushed down by the strong US economic performance which makes markets think that the Federal Reserve (Fed) won’t rush to validate the market's easing expectations with a rate cut. On the other hand, Australia confirmed plans to scale back tax relief for the wealthy, effectively lifting pressure on the Reserve Bank of Australia (RBA) to continue restrictive monetary policy. Market expectations predict the RBA's first rate cut in September while markets pushed the start of the easing cycle of the Fed to May from March.
On Friday, the US will release December’s Personal Consumption Expenditures (PCE) figures which may likely set the tone of the pair for the short term.
AUD/USD levels to watch
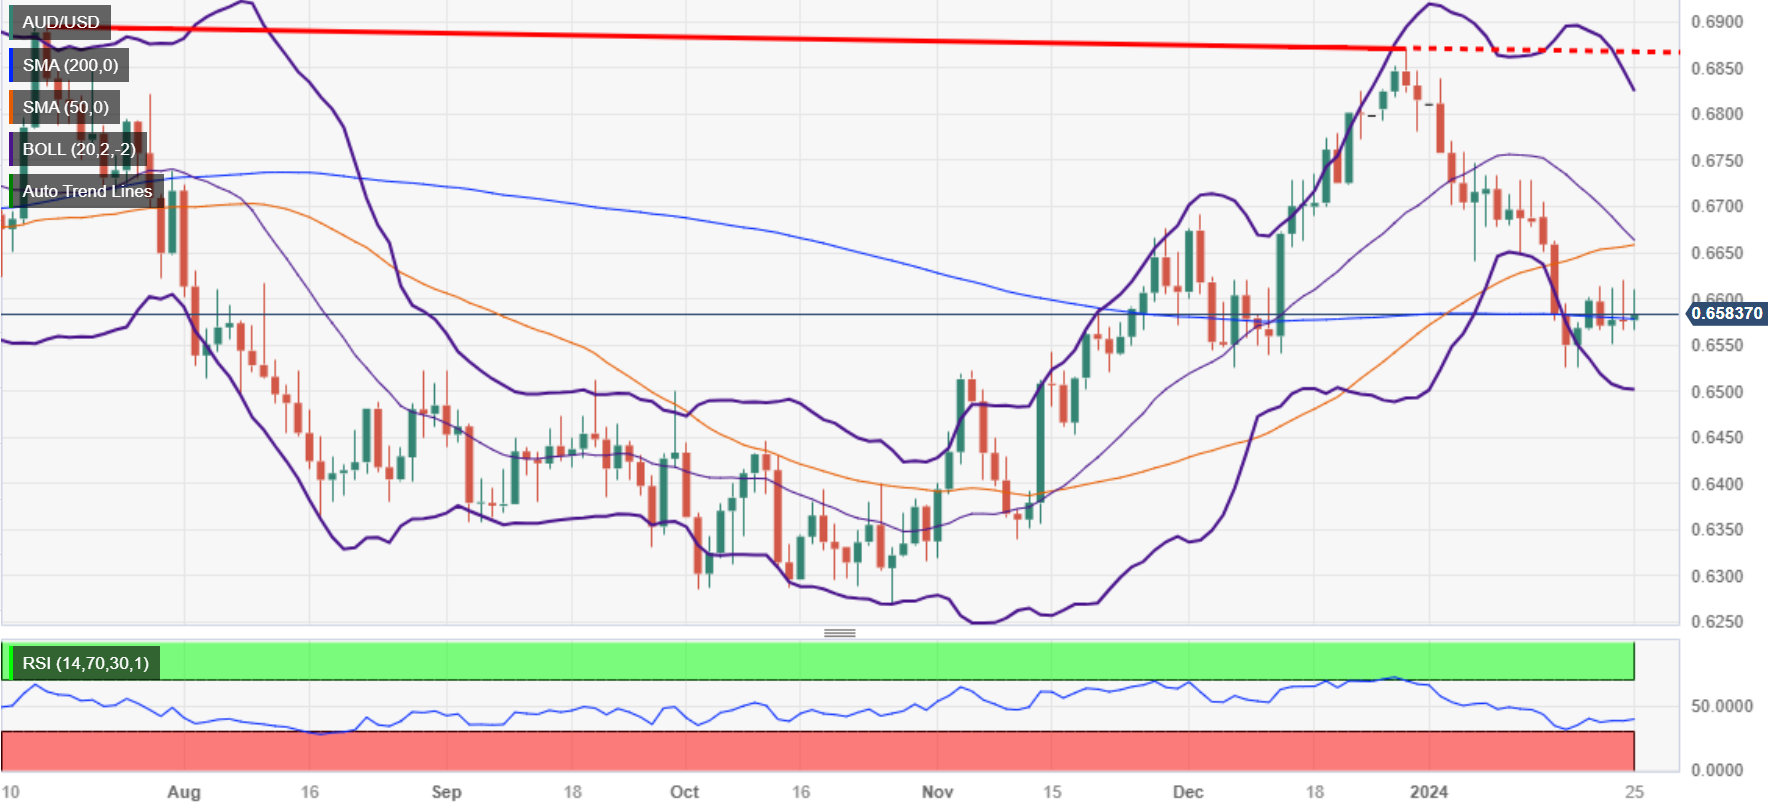
From the daily chart indicators, the trading scene appears to be heavily influenced by the bears. Despite this, the bulls maintain their presence, preventing any significant downturn. The negative slope and the unfavorable positioning of the Relative Strength Index (RSI) within the negative area send off bearish signals. Meanwhile, the flat red bars of the Moving Average Convergence Divergence (MACD) further suggest a continued selling momentum. Yet the underlying strength of the pair becomes apparent as it comfortably aligns above the 100 and 200-day Simple Moving Averages (SMAs), even though it sits below the 20-day SMA. After the previous week's 1.20% drop, the current bearish action feels perhaps more like a pause in the action rather than a complete shift in sentiment.
Turning towards the shorter-term outlook, the prospects appear more promising on the four-hour chart. With the four-hour Relative Strength Index (RSI) indicating a positive slope in the negative territory, it suggests a mounting buying pressure that may soon translate into a bullish momentum. The flat red bars of the four-hour Moving Average Convergence Divergence (MACD) remain, suggesting a mostly flat short-term trend. However, their decline in intensity points towards a potential ease off selling pressure.
AUD/USD daily chart
- The GBP/JPY trimmed into median bids with Japanese inflation preview on Friday.
- UK sees GfK Consumer Confidence to end the trading week.
- Guppy entrenched in rangebound pattern.
The GBP/JPY strung along the midrange on Thursday, trading on the low side of the 188.00 handle as markets gear up for Japan’s Tokyo Consumer Price Index (CPI) inflation print early Friday.
It was a light week on the economic calendar for the Pound Sterling (GBP), but Wednesday’s UK Purchasing Managers’ Index (PMI) figures broadly came in above expectations, helping to keep the GBP bid heading into the back half of the trading week.
Japan’s Tokyo CPI inflation print on Friday is expected to moderate for January, with the Core Tokyo CPI forecast to tick down to 1.9% from 2.1% for the year through January as Japanese inflation continues to slow from last January’s YoY peak of 4.3%.
Headline YoY Tokyo CPI in January last printed at 2.4%, with Core-Core Tokyo CPI (headline inflation less fresh food and energy prices) likewise expected to come down from the previous period’s 3.5%.
On the UK side, GfK Consumer Confidence in January is expected to tick up slightly to -21 from December’s -22.
Next week sees mostly mid-tier data for both the UK and Japan, but traders will be gearing up for the Bank of England’s (BoE) next showing slated for next Thursday.
GBP/JPY Technical Outlook
GBP/JPY continues to be plagued by a sideways grind on the intraday charts as bids push into the midrange as the 200-hour Simple Moving Average (SMA) drifts into 187.50, putting a technical floor underneath near-term consolidation.
The pair is up over 5% from the last significant pullback into 178.74 at the 200-day SMA in early 2024, but bullish momentum has fully drained out of the pair as middling candles pile up at familiar highs.
GBP/JPY Hourly Chart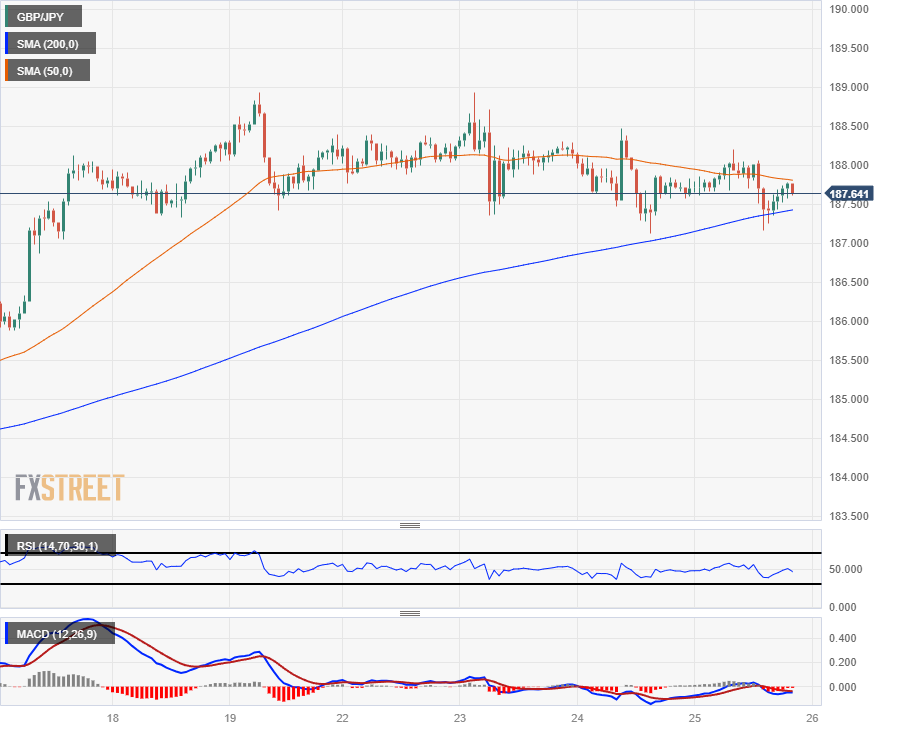
GBP/JPY Daily Chart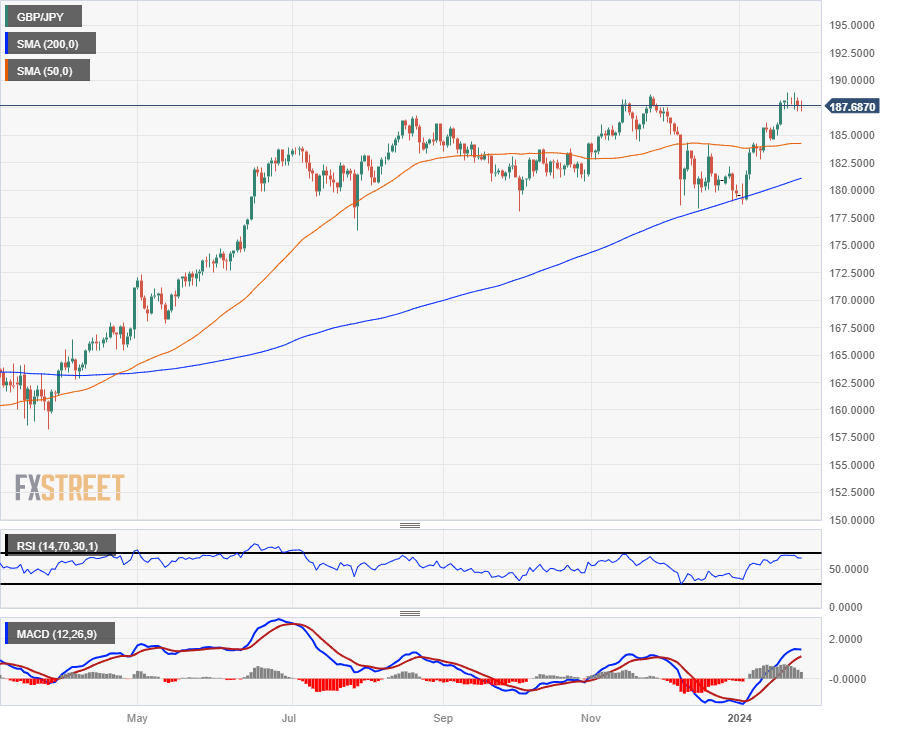
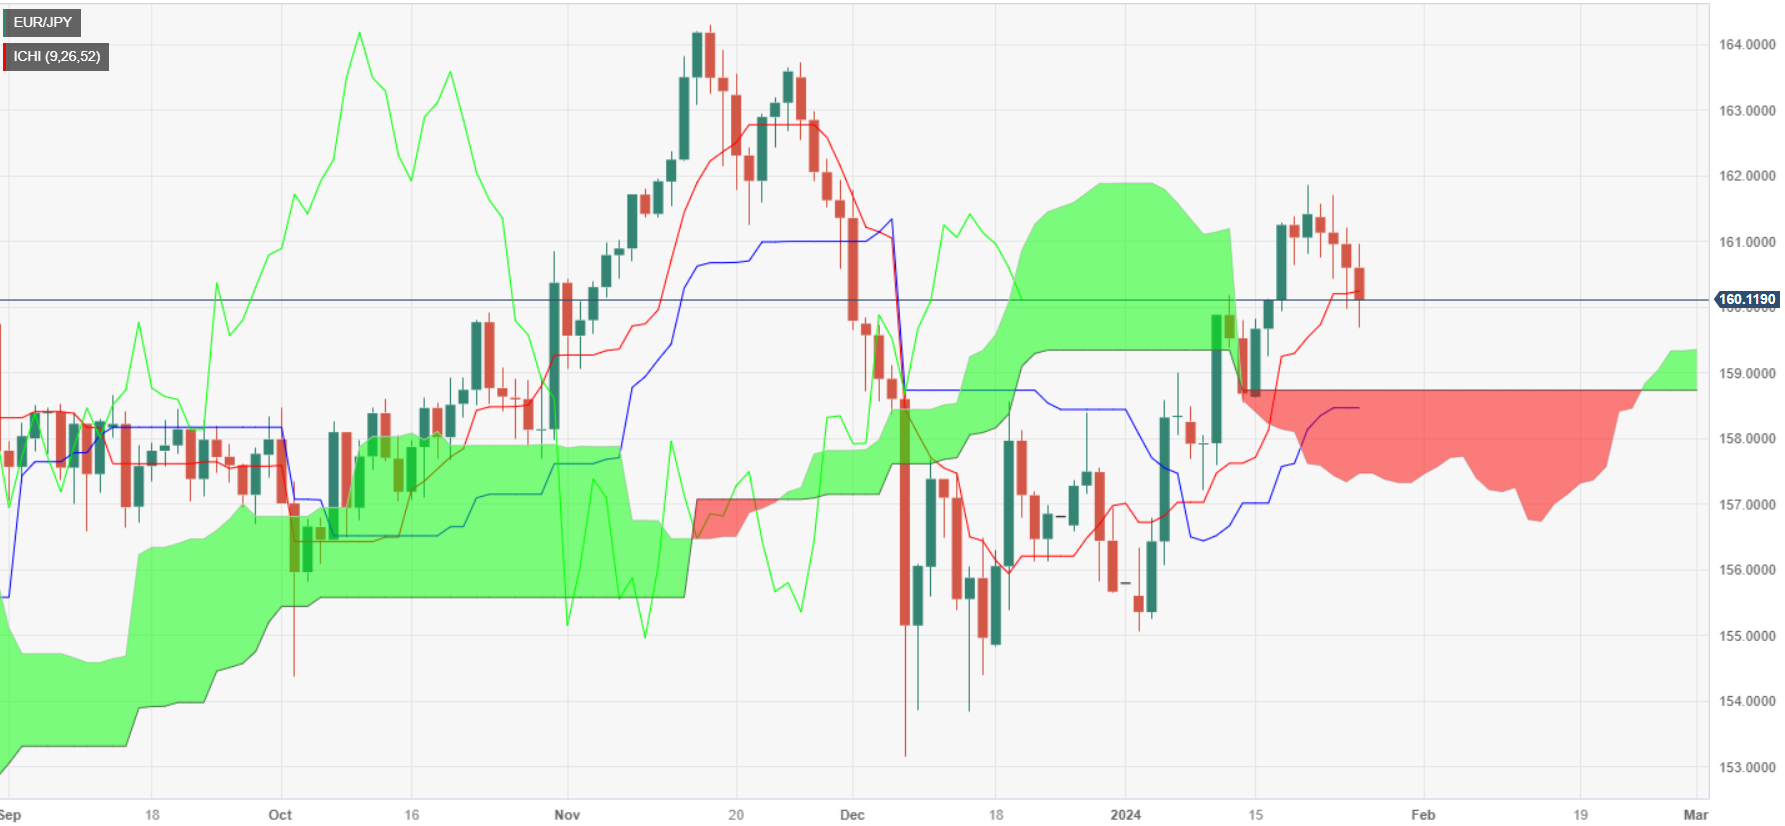
- EUR/JPY continues weekly drop, struggling to surpass the 162.00 resistance.
- Break below Tenkan-Sen signals decline; 160.18 now pivotal for potential rebound.
- Recovery depends on regaining Tenkan-Sen, eyeing 161.24; downside risks include supports at 159.34, 158.71.
The EUR/JPY remains under pressure extending its losses in the week for the fourth consecutive day, down 0.26% and exchanging hands at 160.13 after hitting a daily high of 160.97.
The cross-pair was bullish biased, but after facing strong resistance at 162.00, has shifted neutral. The EUR/JPY break below the Tenkan-Sen, which lies at 160.22, exacerbated a drop toward a daily low of 159.69. Nevertheless, as the pair has edged toward the confluence of the Tenkan-Sen and the January 11 high at around 160.18, previous support turned resistance has opened the door for further upside.
If buyers regain the Tenkan-Sen, the next resistance would be the November 21 swing low of 161.24 before the EUR/JPY aims toward 162.00.
On the other hand, if sellers keep the exchange rate below the Tenkan-Sen, downside risks are seen below 160.00. The next support would be the Senkou Span A at 159.34, followed by the 159.00 figure. The next stop would be the Senkou Span B at 158.71.
EUR/JPY Price Action – Daily Chart
EUR/JPY Technical Levels
Firmer-than-expected US GDP figures lent support to the US Dollar and further reinforced the already resilient stance of the economy, relegating to a secondary role the impassive ECB event, where C. Lagarde kept the summer rate cut in the pipeline.
Here is what you need to know on Friday, January 26:
The resurgence of buying interest in the greenback sparked a strong rebound in the USD Index (DXY), especially after flash Q4 GDP figures came in above estimates and despite declining US yields across the curve. Looking at Friday’s US docket, the salient event will be the release of inflation figures tracked by the PCE for the month of December, seconded by Personal Income, Personal Spending and Pending Home Sales.
EUR/USD sank to the proximity of the 2024 lows near 1.0820 on the back of usual dollar dynamics and the irresolute message from the ECB at its gathering. Moving forward, GfK will release its Consumer Confidence gauge for the month of. February, which will be the only scheduled release on the old continent, at the end of the week.
The intense bounce in the greenback kept GBP/USD’s price action depressed and forced it to break below the key 1.2700 support. On Friday, Gfk’s Consumer Confidence reading is due across the Channel.
USD/JPY partially faded Wednesday’s marked downtick and gathered decent upside traction well north of 147.00 the figure. The BoJ will publish its Minutes at the end of the week, while the final prints of the Coincident Index and the Leading Economic Index are also on tap.
Another inconclusive session saw AUD/USD maintain its trade around 0.6580, following another fruitless move beyond the 0.6600 barrier on Friday.
Geopolitics, shrinking US oil production, and the larger-than-expected weekly drop in US crude oil inventories, coupled with Chinese stimulus, lifted the barrel of WTI to a new two-month high past the $77.00 mark per barrel.
While Gold prices remained stuck in their current consolidative range, Silver prices rebounded further and clinched their third straight day of gains, this time flirting with the $23.00 mark per ounce.
- WTI up nearly 2%, driven by robust US economy and Middle East tensions.
- Red Sea disruptions, including Maersk ship incidents and Russian refinery drone attack, heighten oil supply worries.
- US crude stockpile declines due to severe weather and positive Chinese economic recovery signs bolster oil prices.
West Texas Intermediate (WTI), the US crude oil benchmark, rose almost 2% on Thursday following the latest release of Gross Domestic Product (GDP) figures in the United States (US). Geopolitical tensions in the Middle East sponsored the so-called “black gold” leg up, and at the time of writing, Oil trades at $76.82 per barrel after bouncing off a daily low of $75.19.
Oil prices bolstered by Middle East tensions and US stockpile drawdowns
Tensions in the Middle East are causing disruptions in global trade. The recent incident involving Maersk ships that were carrying US military equipment refrained from training into the Red Sea after hearing explosions that forced two ships to retreat despite being escorted by the US Navy.
Meanwhile, sources cited by Reuters commented that energy markets are beginning to reflect supply chain disruptions, linked to the Red Sea conflict. This could underpin Oil prices, which rose for the aforementioned reasons, along with a drone attack on a Russian Oil refinery.
In the meantime, a larger-than-expected draw in crude stockpiles in the US due to extreme cold weather was a tailwind for WTI prices
Meanwhile, expectations that China’s economy is recovering were cheered by Oil bulls following the People’s Bank of China (PBoC) decision to reduce bank reserves on Wednesday.
WTI Technical Levels
- The AUD/JPY is recording gains, standing firmly above major SMAs overall but exhibits short-term bearish sentiment.
- Key indicators like RSI and MACD on daily chart imply ambiguity but lean towards the bullish side.
- The four-hour chart reflects continued bearish momentum, but with bears taking a break from Wednesday’s losses.
In Thursday's session, the AUD/JPY was spotted at 97.20, benefitting from 0.25% gains. Following a sharp 0.60% decline the previous day, sellers maintain their presence though seem to be on pause, rendering the daily chart outlook as neutral to bullish. Yet, the four-hour chart reveals persisting bearish momentum, that there may be further downside on the horizon.
In light of the technical indicators on the daily chart, the overall tone for the currency pair is in favor of the buyers. The Relative Strength Index (RSI) show a positive bias with an upward trajectory within a bullish territory. Meanwhile, the Moving Average Convergence Divergence (MACD) sporting green bars indicate a flat bullish momentum. Moreover, the pair's position above the 20,100,200-day Simple Moving Averages (SMAs) underscores the domination of bullish traders in the broader scheme. However, it's noteworthy that despite displaying this somewhat optimistic landscape, bears seem to be taking a breather after losing more than 0.60% on Wednesday.
Shifting focus to the shorter-time frame, the momentum appears to be siding with the sellers. This negative momentum is clearly visible in the four-hour chart, which demonstrates a downward slope of the Relative Strength Index (RSI)–a sign of increased selling pressure. Despite the Moving Average Convergence Divergence (MACD) showing flat green bars which generally indicates bullish momentum, in this context parallel with a declining RSI, it seems to be more indicative of a temporarily stalled bearish momentum. In summary, the current technical landscape suggests bears are still persistently at play in the short-term, likely to resume their activity shortly.
AUD/JPY technical levels
AUD/JPY daily chart
-638418078374256106.png)
- European shares rose with tech stocks leading the charge.
- ECB keeps rates unchanged, but dovish tone strikes at rate markets.
- EU data weakness suggests worsening business confidence.
European equities saw moderate gains on Thursday after the European Central Bank’s (ECB) dovish hold on interest rates saw investor risk sentiment improve on increased hopes of rate cuts heading into the middle of 2024.
ECB Press Conference: Lagarde explains decision to keep rates steady, speaks on policy outlook
The ECB held rates as markets broadly expected, with ECB President Christine Lagarde stating that it was far too early in the disinflation cycle to begin discussing rate cuts, but the ECB head did note that inflationary pressures on several fronts are beginning to ease, causing markets to step higher and European money markets to reprice bets on how soon and how deep the ECB would begin cutting.
European swaps are now pricing in 50 basis points of rate cuts from the ECB by June, with a total 150 basis points through the end of 2024, flaunting ECB President Lagarde’s recent comments that overeager market bets on rate cuts would make it more difficult for the ECB to normalize policy. Markets are currently pricing in a 60% chance of the first rate cut coming as soon the April ECB rate meeting.
Germany’s IFO Business Climate unexpectedly declined to a 15-month low in January, printing at 85.2 versus the forecast 86.7 and falling back from the previous month’s 86.3 (revised from 86.4). The Business Expectations survey also declined to 83.5 compared to the expected 84.8 and the previous month’s 84.2 (also revised from 84.3).
The German DAX index rose by a scant 0.1%, climbing 17 points to close at €16,906.92, with France’s CAC40 rising 8.56 points to close at €7,464.20, up 0.11%.
The pan-European STOXX6090 major equity index climbed nearly a third of a percent on Thursday, rising 1.44 points to end the day at €478.53, while London’s FTSE index rose 2.06 points to end the day at £7,529.73, in the green by a scant 0.03%.
DAX Technical Outlook
Germany’s DAX index continues to pin into near-term highs, climbing back over the €16,900.00 handle and cycling the 200-hour Simple Moving Average (SMA) near €16,650.00.
The DAX is well-bid on the daily candles, bolstered by the 50-day SMA rising through €16,400.00 with the long-term 200-day SMA rotating into a bullish twist just below the 200-day SMA.
The DAX is up over 15% from last October’s bottom bids near €14,618.00.
DAX Hourly Chart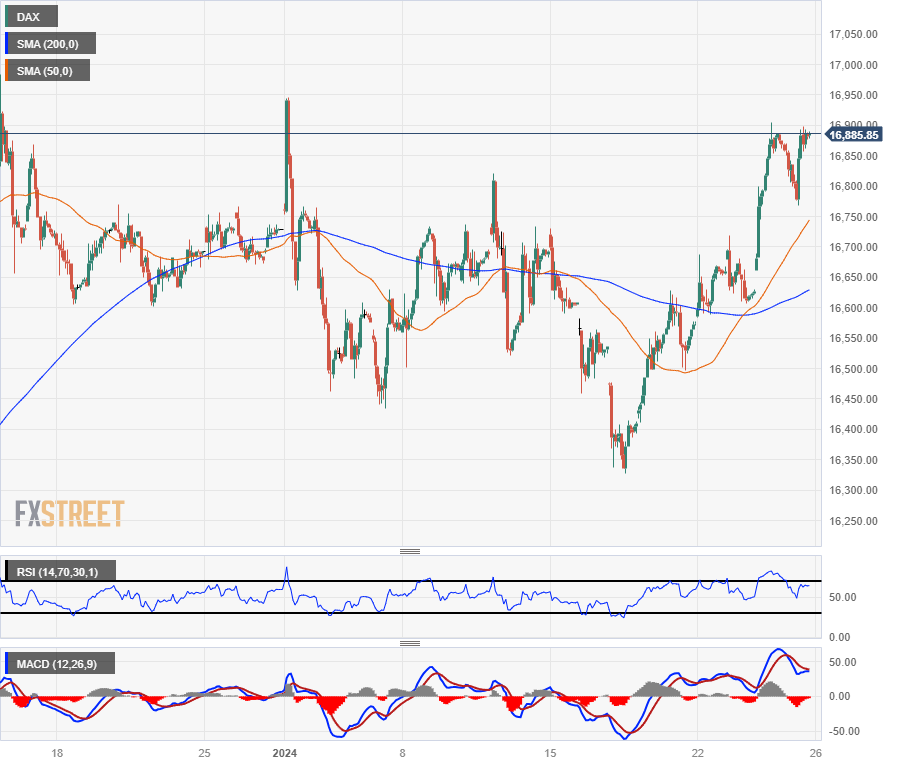
DAX Daily Chart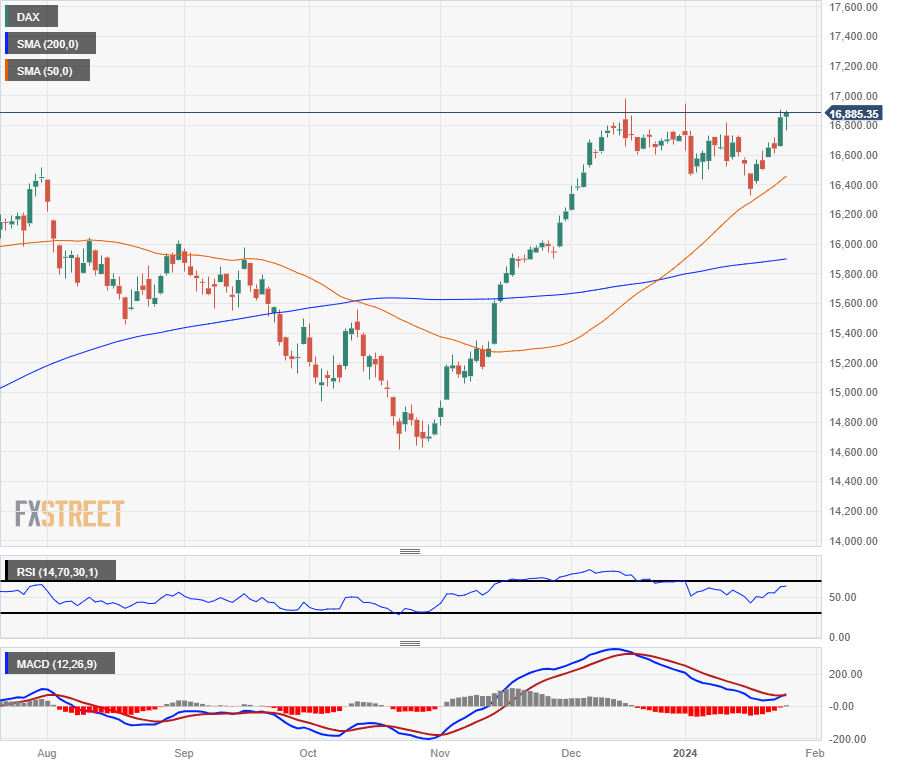
- AUD/USD marginally dips amid contrasting US reports and steady Australian data.
- US shows mixed economic signs: Strong GDP growth, stagnant Durable Goods Orders, rising unemployment claims.
- Investors weigh Fed rate cut odds against US economic trends, focusing on core PCE Index, Pending Home Sales.
The AUD/USD is virtually unchanged during the North American session, although the US economy grew at a faster pace than expected. Nevertheless, other data suggest the labor market is cooling while demand for durable goods is taking its toll. Therefore, the pair exchanges hands at 0.6574, down 0.05%, just below the 200-day moving average (DMA).
Aussie Dollar at the brisk of sliding below key support, traders eye US PCE
The US economy last quarter of 2023 grew by 3.3% QoQ, below Q3’s 4.9% and exceeded forecasts of 2%, revealed the US Bureau of Economic Analysis (BEA). At the same time, the US Department of Commerce revealed that Durable Goods Orders came flat at 0%, down from 5.5% increase in November, overshadowing a goodish US GDP report. Meanwhile, labor market data revealed by the US Bureau of Labor Statistics announced that unemployment claims for the week ending January 20, jumped from 189K to 214K, above estimates of 200K.
Given the backdrop, the Greenback (USD) gained some traction lately. Following the data slipped towards Thursday’s daily low of 103.12 via the US Dollar Index (DXY), though it climbed to current levels at 103.58, up 0.32%.
Despite that, investors are still expecting the Federal Reserve will cut rates by more than 140 basis points to 4.04% by the end of the year. Nevertheless, for the Fed’s March meeting, traders trimmed the odds from 53.6% a week ago to 46.2%.
The lack of economic data to be released in the Aussie calendar lets traders adrift to the dynamics surrounding the buck. On the US front, the docket will feature the Fed’s preferred gauge for inflation, the core Personal Consumption Expenditures (PCE) Price Index, along with Pending Home Sales for December.
AUD/USD Price Analysis: Technical outlook
The AUD/USD pair is directionless, at around the 200-DMA, waiting for a solid catalyst that could either resume the downtrend or trigger a rally. On the bearish side, the first support is the January 18 low of 0.6525, followed by the 0.6500 figure. A further downside is seen at the November 10 low of 0.6338. Conversely, if buyers lift prices above 0.6600, that could exacerbate an advance to the 50-day moving average (DMA) at 0.6650, followed by 0.6700.
- The DXY Index sees gains, trades slightly below the 100-day SMA.
- Consumer Spending remained steady in Q4, while GDP grew at a faster rate than expected.
- Markets continue to adjust their expectations.
The US Dollar (USD) DXY index has traded at 103.55 on Thursday, representing 0.30% gains following the release of key economic activity as the case of nearer-term rate cuts by the Federal Reserve (Fed) continues to lose relevance.
The US economy yet again demonstrates resilience as shown in the strong Q4 GDP growth of 3.3%. The Federal Reserve's aggressive hikes have succeeded in moderating inflation without causing significant economic pain. Despite indicators of slowing economic momentum, such as lower household saving rates and declining job openings, the overall robust output has boosted market confidence.
Daily Digest Market Movers: US Dollar finds a lift following strong Q4 GDP figures
- The Real Gross Domestic Product (GDP), released quarterly by the US Bureau of Economic Analysis, grew in Q4 at an annualized rate of 3.3%, surpassing the expected 2% but below the previous quarter’s reading of 4.9%.
- Personal Consumption Expenditures (PCE) (QoQ) came in at 1.7% matching expectations as well as the core measure, which printed at 2%.
- For the Federal Reserve (Fed), these economic activity figures may present a threat to their battle against inflation, which could make them delay the start of the easing cycle.
- The CME FedWatch Tool shows that the market's expectations for the start of the easing cycle have shifted to May as the odds of a cut in March now stands near 42%.
Technical Analysis: DXY bulls step in and regain the 200-day SMA
The indicators on the daily chart are reflecting a relatively neutral stance with a slight bullish bias. The Relative Strength Index (RSI) is showing a positive slope in positive territory. This typically signals upward momentum, indicating that buying pressure is currently stronger.
The Moving Average Convergence Divergence (MACD) indicator is exhibiting flat, green bars, suggesting that the previous upward momentum is pausing but that buyers are still present in the market. Typically, a flat MACD in positive territory is often seen as a consolidation phase before the next upward move.
Looking at the Simple Moving Averages (SMAs), the pair is holding above the 20-day and 200-day SMAs while staying below the 100-day SMA. This demonstrates a mixed picture, but the positioning above the major 200-day SMA emphasizes the long-term bullish bias, indicating the bulls are still holding some dominance.
Support Levels: 103.50 (200-day SMA), 103.00, 102.80, 102.60 (20-day SMA).
Resistance Levels: 103.70, 103.90, 104.00.
US Dollar FAQs
What is the US Dollar?
The US Dollar (USD) is the official currency of the United States of America, and the ‘de facto’ currency of a significant number of other countries where it is found in circulation alongside local notes. It is the most heavily traded currency in the world, accounting for over 88% of all global foreign exchange turnover, or an average of $6.6 trillion in transactions per day, according to data from 2022.
Following the second world war, the USD took over from the British Pound as the world’s reserve currency. For most of its history, the US Dollar was backed by Gold, until the Bretton Woods Agreement in 1971 when the Gold Standard went away.
How do the decisions of the Federal Reserve impact the US Dollar?
The most important single factor impacting on the value of the US Dollar is monetary policy, which is shaped by the Federal Reserve (Fed). The Fed has two mandates: to achieve price stability (control inflation) and foster full employment. Its primary tool to achieve these two goals is by adjusting interest rates.
When prices are rising too quickly and inflation is above the Fed’s 2% target, the Fed will raise rates, which helps the USD value. When inflation falls below 2% or the Unemployment Rate is too high, the Fed may lower interest rates, which weighs on the Greenback.
What is Quantitative Easing and how does it influence the US Dollar?
In extreme situations, the Federal Reserve can also print more Dollars and enact quantitative easing (QE). QE is the process by which the Fed substantially increases the flow of credit in a stuck financial system.
It is a non-standard policy measure used when credit has dried up because banks will not lend to each other (out of the fear of counterparty default). It is a last resort when simply lowering interest rates is unlikely to achieve the necessary result. It was the Fed’s weapon of choice to combat the credit crunch that occurred during the Great Financial Crisis in 2008. It involves the Fed printing more Dollars and using them to buy US government bonds predominantly from financial institutions. QE usually leads to a weaker US Dollar.
What is Quantitative Tightening and how does it influence the US Dollar?
Quantitative tightening (QT) is the reverse process whereby the Federal Reserve stops buying bonds from financial institutions and does not reinvest the principal from the bonds it holds maturing in new purchases. It is usually positive for the US Dollar.
- Euro tumbles from familiar technical levels after ECB offers dovish tone.
- Europe sees thin economic data until GDP update next Tuesday.
- Broader markets to focus on Friday’s US PCE Price Index to wrap up the trading week.
The Euro (EUR) fell on Thursday after the European Central Bank (ECB) struck a dovish tone during its latest monetary policy statement, which sent the Euro down against the majority of its major currency peers. Money markets added into bets of a 50 basis point rate cut from the ECB by June despite firm language from ECB President Christine Lagarde warning that the consensus within the ECB is that discussion of rate cuts is far too premature in the face of price risks from rising wages and a still robust job market.
Economic data from Europe is strictly low-tier for the rest of the week, and markets will focus on US Personal Consumption Expenditure (PCE) Price Index figures, a snapshot of inflation, to be released on Friday. European investors will have to wait until next Tuesday’s EU Gross Domestic Product (GDP) update for economic headlines from the Euro side.
Daily digest market movers: Euro slides on Thursday after ECB tilts dovish
- European Central Bank President Christine Lagarde warned on Thursday that risks still remain and it’s far too early to begin discussing rate cuts.
- Despite easing economic conditions and stagnant growth figures emanating from Europe, key inflation risks still remain high.
- ECB President Lagarde says that interest rate hikes are beginning to transmit “forcefully into financing conditions”.
- ECB highlighted inflation risks from Middle East tensions, economy needs more time to be further along in disinflation process.
- Despite decreases in some measures, domestic price pressure remains high overall.
- European money markets added bets of 50 bps of rate cuts by June, 150 bps through the end of 2024, rising after the ECB rate call.
- ECB Press Conference: Lagarde explains decision to keep rates steady, speaks on policy outlook
- On the US side, Gross Domestic Product (GDP) growth in the fourth quarter beat expectations.
- US Q4 GDP grew 3.3% compared to the forecast of 2.0%, easing back less than expected from the previous quarter’s 4.9%.
- US Initial Jobless Claims also ticked upwards into 214K for the week ended January 19, above the forecast for 200K versus the previous week’s 189K (revised upwards from 187K).
- US Initial Jobless Claims have risen above the four-week average of 202.25K.
- Friday brings US PCE Price Index figures, markets to focus on key inflation data for Fed direction.
Euro price today
The table below shows the percentage change of Euro (EUR) against listed major currencies today. Euro was the strongest against the Swiss Franc.
| USD | EUR | GBP | CAD | AUD | JPY | NZD | CHF | |
| USD | 0.44% | 0.26% | -0.18% | 0.02% | 0.19% | -0.04% | 0.52% | |
| EUR | -0.45% | -0.17% | -0.63% | -0.45% | -0.26% | -0.51% | 0.09% | |
| GBP | -0.27% | 0.17% | -0.45% | -0.27% | -0.08% | -0.33% | 0.25% | |
| CAD | 0.17% | 0.62% | 0.44% | 0.18% | 0.36% | 0.12% | 0.70% | |
| AUD | 0.00% | 0.43% | 0.25% | -0.19% | 0.19% | -0.06% | 0.53% | |
| JPY | -0.19% | 0.26% | 0.07% | -0.37% | -0.19% | -0.24% | 0.33% | |
| NZD | 0.08% | 0.49% | 0.32% | -0.13% | 0.06% | 0.25% | 0.57% | |
| CHF | -0.54% | -0.10% | -0.27% | -0.71% | -0.52% | -0.33% | -0.59% |
The heat map shows percentage changes of major currencies against each other. The base currency is picked from the left column, while the quote currency is picked from the top row. For example, if you pick the Euro from the left column and move along the horizontal line to the Japanese Yen, the percentage change displayed in the box will represent EUR (base)/JPY (quote).
Technical Analysis: Euro slides on ECB tone, EUR/USD rejected from 1.0900 yet again
Euro (EUR) fell against the US Dollar (USD) on Thursday, declining and dragging the EUR/USD back below the 1.0900 handle and seeing another technical rejection from the 200-hour Simple Moving Average (SMA) near 1.0885.
The pair has tumbled back into a familiar low end with bids snarled on the 200-day SMA near 1.0840. EUR/USD is caught in a widening congestion trap between the 50-day and 200-day SMAs as a technical consolidation pattern continues to hamper meaningful momentum in either direction.
EUR/USD Hourly Chart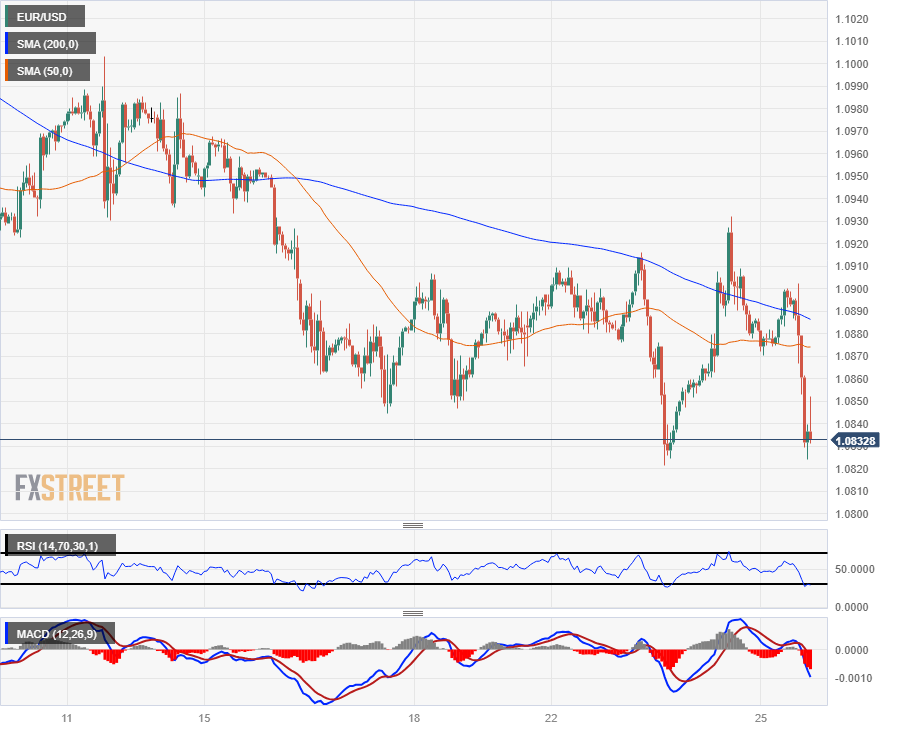
EUR/USD Daily Chart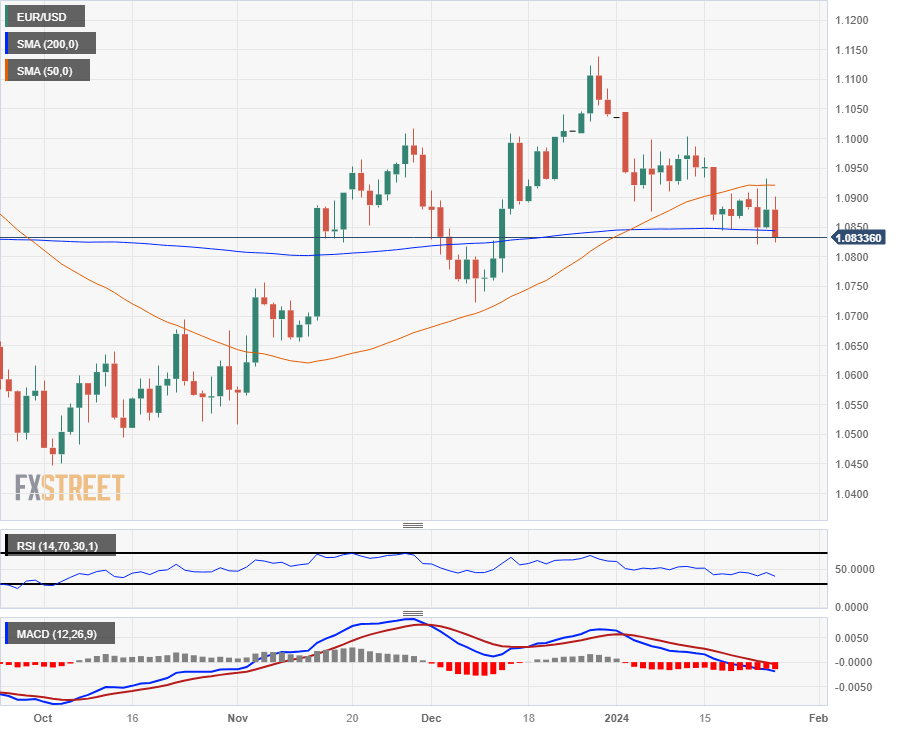
Euro FAQs
What is the Euro?
The Euro is the currency for the 20 European Union countries that belong to the Eurozone. It is the second most heavily traded currency in the world behind the US Dollar. In 2022, it accounted for 31% of all foreign exchange transactions, with an average daily turnover of over $2.2 trillion a day.
EUR/USD is the most heavily traded currency pair in the world, accounting for an estimated 30% off all transactions, followed by EUR/JPY (4%), EUR/GBP (3%) and EUR/AUD (2%).
What is the ECB and how does it impact the Euro?
The European Central Bank (ECB) in Frankfurt, Germany, is the reserve bank for the Eurozone. The ECB sets interest rates and manages monetary policy.
The ECB’s primary mandate is to maintain price stability, which means either controlling inflation or stimulating growth. Its primary tool is the raising or lowering of interest rates. Relatively high interest rates – or the expectation of higher rates – will usually benefit the Euro and vice versa.
The ECB Governing Council makes monetary policy decisions at meetings held eight times a year. Decisions are made by heads of the Eurozone national banks and six permanent members, including the President of the ECB, Christine Lagarde.
How does inflation data impact the value of the Euro?
Eurozone inflation data, measured by the Harmonized Index of Consumer Prices (HICP), is an important econometric for the Euro. If inflation rises more than expected, especially if above the ECB’s 2% target, it obliges the ECB to raise interest rates to bring it back under control.
Relatively high interest rates compared to its counterparts will usually benefit the Euro, as it makes the region more attractive as a place for global investors to park their money.
How does economic data influence the value of the Euro?
Data releases gauge the health of the economy and can impact on the Euro. Indicators such as GDP, Manufacturing and Services PMIs, employment, and consumer sentiment surveys can all influence the direction of the single currency.
A strong economy is good for the Euro. Not only does it attract more foreign investment but it may encourage the ECB to put up interest rates, which will directly strengthen the Euro. Otherwise, if economic data is weak, the Euro is likely to fall.
Economic data for the four largest economies in the euro area (Germany, France, Italy and Spain) are especially significant, as they account for 75% of the Eurozone’s economy.
How does the Trade Balance impact the Euro?
Another significant data release for the Euro is the Trade Balance. This indicator measures the difference between what a country earns from its exports and what it spends on imports over a given period.
If a country produces highly sought after exports then its currency will gain in value purely from the extra demand created from foreign buyers seeking to purchase these goods. Therefore, a positive net Trade Balance strengthens a currency and vice versa for a negative balance.
- Mexican Peso drops 0.08% amidst US economic data showing continued growth and mixed signals from Mexico.
- Strong US GDP growth for Q4 2023 and stable Durable Goods Orders could impact Fed's rate decisions, contrasting with a cooling labor market.
- In Mexico, a lower unemployment rate and rising inflation pose challenges for Banxico's policy direction.
The Mexican Peso (MXN) registers minuscule losses against the US Dollar (USD) on Thursday after economic data from the United States (US) witnessed the economy continuing to grow above trend, though below last year’s Q3 4.9% final reading. In the meantime, Mexico’s unemployment rate continued to trend lower at a non-seasonally adjusted rate, along with an uptick in inflation in the first half of January, boosting the emerging market currency. At the time of writing, the USD/MXN trades at 17.22, up 0.08% on the day.
The economy in the US remains solid, growing above trend, and might prevent interest rate cuts by the Federal Reserve (Fed) amid a possible reacceleration of inflation. The Gross Domestic Product (GDP) for the last quarter of 2023 exceeded forecasts, while Durable Goods Orders were unchanged and the labor market showed signs of cooling down.
In Mexico, the Unemployment Rate was non-seasonally adjusted for December and dipped compared to November, revealed the National Statistics Agency (INEGI). Meanwhile, according to analysts at BNP Paribas, the latest inflation report in Mexico could deter the Bank of Mexico (Banxico) from easing policy.
Daily Digest Market Movers: Mexican Peso at cross-roads following solid US data
- US GDP for Q4 2023 rose by 3.3% QoQ, smashing estimates of 2%, but less than Q3’s 4.9% increase, according to the US Bureau of Economic Analysis . In 2023, Real GDP rose by 2.5%, sponsored by “increases in consumer spending, nonresidential fixed investment, state and local government spending, exports, and federal government spending,” revealed the report.
- The US Department of Commerce revealed Durable Goods Orders were unchanged in December, with figures clocking 0%, lower than November’s 5.5% rise due to a slump in transportation equipment manufacturing.
- The US Bureau of Labor Statistics reported that for the week concluding on January 20, Initial Jobless Claims rose to 214K, surpassing both the prior week's figures and the projected 200K.
- The Unemployment Rate in Mexico slowed from 2.7% to 2.6% in December as expected by analysts.
- In Mexico, mid-month inflation increased by 0.49%, which was higher than the anticipated 0.38% but lower than December’s 0.59%. Meanwhile, core prices matched expectations at 0.25%, showing a decrease from December's 0.46%.
- Annually, general inflation in Mexico rose 4.9%, above forecasts, and the prior month’s 4.46%, while core inflation cooled from 5.19% to 4.78%, as foreseen.
- Economic Activity in November shrank -0.5% on a monthly basis, lower than forecasts and October’s -0.1% contraction. Annual figures dropped from 4.2% to 2.3%, below forecasts of 3.2% growth.
- The economy in Mexico is beginning to show the impact of high rates set by Banxico at 11.25%, even though most analysts estimate the economy will grow above 2% in 2024. Nevertheless, retail sales missing estimates, the economy growing below 3% in November, and inflation reaccelerating puts a stagflationary scenario in play.
- Pamela Diaz Loubet, Economist for Mexico at BNP Paribas, commented that the outlook for Banxico’s Governing Council is complicated and full of risks. She added that economic activity remains solid, implying that higher interest rates at 11.25% had not yet affected growth and are uncertain to do so. She estimates Mexico’s economy in 2023 grew 3.5%, though it should drop to 2.5% this year.
- Traders trimmed their bets for a dovish Federal Reserve in 2024. They stand at 139 basis points (bps) of cuts from 175 bps last week.
- Despite indications from the December meeting minutes of Banxico (the Central Bank of Mexico) that it may consider easing its monetary policy, the inflation report for January poses a potential obstacle to any such policy relaxation.
- Standard Chartered analysts estimate the Bank of Mexico (Banxico) will lower rates to 9.25% in 2024.
- On January 5, a Reuters poll suggested the Mexican Peso could weaken 5.4% to 18.00 per US Dollar in the 12 months following December.
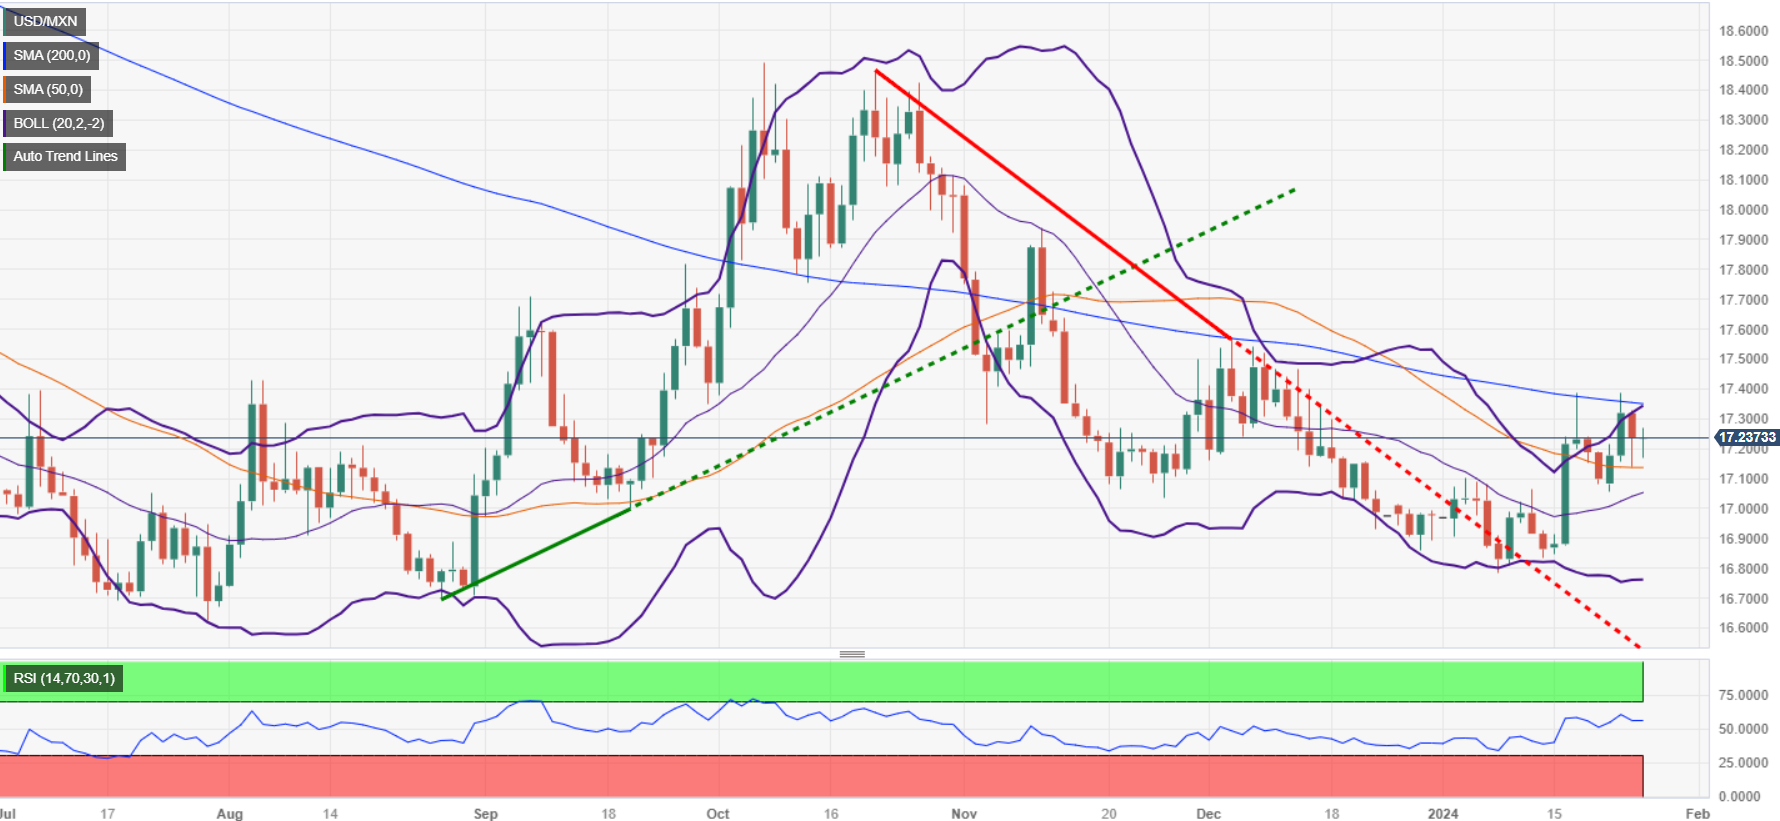
Technical Analysis: Mexican Peso stays firm as USD/MXN hovers around 17.24
The USD/MXN is virtually unchanged, though trading within familiar levels. If the exotic pair reclaims the 200-day Simple Moving Average (SMA) at 17.35, that could open the door for the pair to challenge the 100-day SMA at 17.42. Further upside is seen above the psychological 17.50 figure, ahead of rallying to the May 23 high from last year at 17.99.
Conversely, if sellers drag prices below the 50-day SMA at 17.13, that would pave the way for further downside. The following support is seen at 17.05, the January 22 low, followed by the 17.00 psychological figure.
USD/MXN Price Action – Daily Chart
Mexican Peso FAQs
What key factors drive the Mexican Peso?
The Mexican Peso (MXN) is the most traded currency among its Latin American peers. Its value is broadly determined by the performance of the Mexican economy, the country’s central bank’s policy, the amount of foreign investment in the country and even the levels of remittances sent by Mexicans who live abroad, particularly in the United States. Geopolitical trends can also move MXN: for example, the process of nearshoring – or the decision by some firms to relocate manufacturing capacity and supply chains closer to their home countries – is also seen as a catalyst for the Mexican currency as the country is considered a key manufacturing hub in the American continent. Another catalyst for MXN is Oil prices as Mexico is a key exporter of the commodity.
How do decisions of the Banxico impact the Mexican Peso?
The main objective of Mexico’s central bank, also known as Banxico, is to maintain inflation at low and stable levels (at or close to its target of 3%, the midpoint in a tolerance band of between 2% and 4%). To this end, the bank sets an appropriate level of interest rates. When inflation is too high, Banxico will attempt to tame it by raising interest rates, making it more expensive for households and businesses to borrow money, thus cooling demand and the overall economy. Higher interest rates are generally positive for the Mexican Peso (MXN) as they lead to higher yields, making the country a more attractive place for investors. On the contrary, lower interest rates tend to weaken MXN.
How does economic data influence the value of the Mexican Peso?
Macroeconomic data releases are key to assess the state of the economy and can have an impact on the Mexican Peso (MXN) valuation. A strong Mexican economy, based on high economic growth, low unemployment and high confidence is good for MXN. Not only does it attract more foreign investment but it may encourage the Bank of Mexico (Banxico) to increase interest rates, particularly if this strength comes together with elevated inflation. However, if economic data is weak, MXN is likely to depreciate.
How does broader risk sentiment impact the Mexican Peso?
As an emerging-market currency, the Mexican Peso (MXN) tends to strive during risk-on periods, or when investors perceive that broader market risks are low and thus are eager to engage with investments that carry a higher risk. Conversely, MXN tends to weaken at times of market turbulence or economic uncertainty as investors tend to sell higher-risk assets and flee to the more-stable safe havens.
- Canadian Dollar recovers in back half of trading week.
- Canada has wrapped up the economic calendar until next week’s GDP print.
- Crude Oil’s climb bolsters CAD, but Loonie still down on week.
The Canadian Dollar (CAD) found some bidders on Thursday even as the US Dollar Index (DXY) saw a recovery after US Gross Domestic Product (GDP) figures bolstered the broader market.
Canada wrapped up its presence on the economic calendar’s data docket this week after Wednesday’s rate statement from the Bank of Canada (BoC). Canadian Dollar traders will be waiting until Canadian GDP figures are due next Wednesday, while Canadian Purchasing Managers Index (PMI) figures are slated for next Thursday.
Daily digest market movers: Canadian Dollar rebounds despite Greenback jump on GDP beat
- US data dominated the American market session on Thursday.
- US Q4 GDP grew by 3.3% YoY, beating the forecast of 2.0% compared to the previous quarter’s 4.9%.
- US Q4 Core Personal Consumption Expenditures (PCE) held steady at 2.0%.
- US Initial Jobless Claims jumped to 214K for the week ended January 19, up from the forecast of 200K and climbed from the previous week’s 189K (revised slightly up from 187K).
- Despite a rebound on Thursday, the Canadian Dollar remains down across the board for the trading week.
- Crude Oil extends recent gains, bolsters Canadian Dollar.
- West Texas Intermediate (WTI) tested above $76.00 for the first time in 2024.
- The Bank of Canada (BoC) confirmed that the top is in for rate hikes on Wednesday but remains mum on when rate cuts could be coming.
Canadian Dollar price today
The table below shows the percentage change of Canadian Dollar (CAD) against listed major currencies today. Canadian Dollar was the strongest against the Swiss Franc.
| USD | EUR | GBP | CAD | AUD | JPY | NZD | CHF | |
| USD | 0.39% | 0.13% | -0.19% | -0.14% | -0.03% | -0.18% | 0.48% | |
| EUR | -0.40% | -0.25% | -0.59% | -0.54% | -0.42% | -0.59% | 0.10% | |
| GBP | -0.13% | 0.26% | -0.33% | -0.27% | -0.16% | -0.32% | 0.36% | |
| CAD | 0.19% | 0.59% | 0.33% | 0.04% | 0.17% | 0.00% | 0.68% | |
| AUD | 0.15% | 0.53% | 0.27% | -0.05% | 0.13% | -0.04% | 0.62% | |
| JPY | 0.03% | 0.42% | 0.16% | -0.16% | -0.12% | -0.16% | 0.51% | |
| NZD | 0.21% | 0.57% | 0.32% | -0.01% | 0.04% | 0.16% | 0.65% | |
| CHF | -0.50% | -0.11% | -0.35% | -0.68% | -0.61% | -0.51% | -0.68% |
The heat map shows percentage changes of major currencies against each other. The base currency is picked from the left column, while the quote currency is picked from the top row. For example, if you pick the Euro from the left column and move along the horizontal line to the Japanese Yen, the percentage change displayed in the box will represent EUR (base)/JPY (quote).
Technical Analysis: Canadian Dollar finds some space against Greenback but remains down overall
The Canadian Dollar (CAD) is broadly higher on Thursday, finding some room in the green on the back of rising Crude Oil markets. The CAD is up around three-quarters of a percent against the Swiss Franc (CHF), the market’s single worst-performing currency on Thursday. The Loonie gains two-thirds of a percent against the Euro (EUR) and a third of a percent against the Pound Sterling (GBP).
The Canadian Dollar kicked off Thursday’s trading session by testing 1.3530 against the US Dollar (USD) before catching a ride and sending the USD/CAD back into the 1.3500 handle.
The USD/CAD is getting dragged into a technical congestion pattern on the daily candles as the 50-day and 200-day Simple Moving Averages (SMA) consolidate near 1.3500.
The pair is still up around 2.5% from December’s low of 1.3177, but it will take significant bidding pressure to force the pair into the high side of the bearish crossover of the 50-day and 200-day SMAs.
USD/CAD Hourly Charts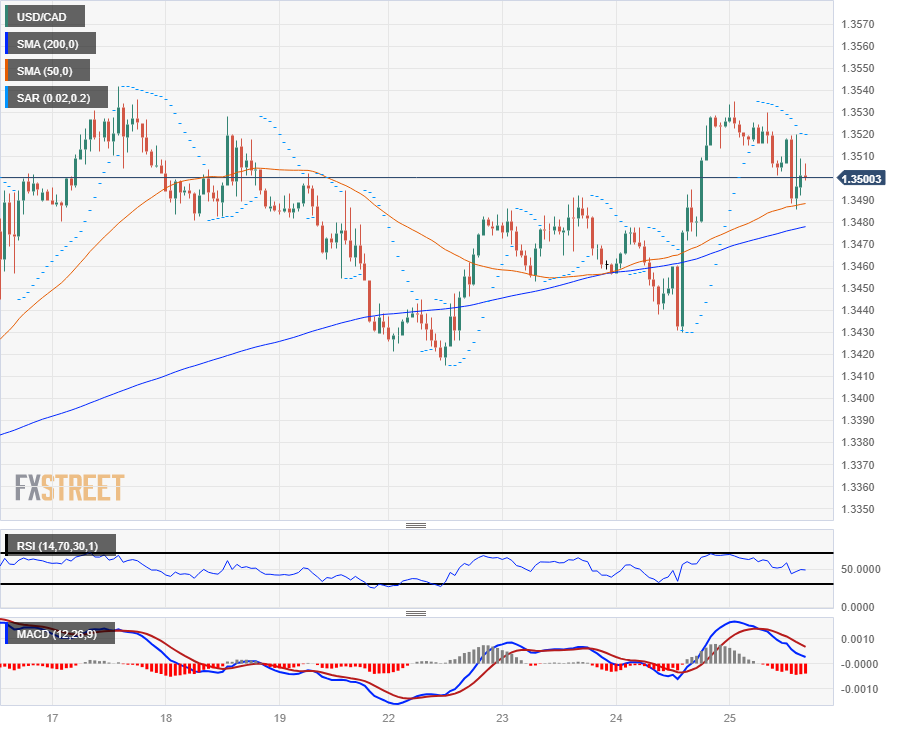
USD/CAD Daily Charts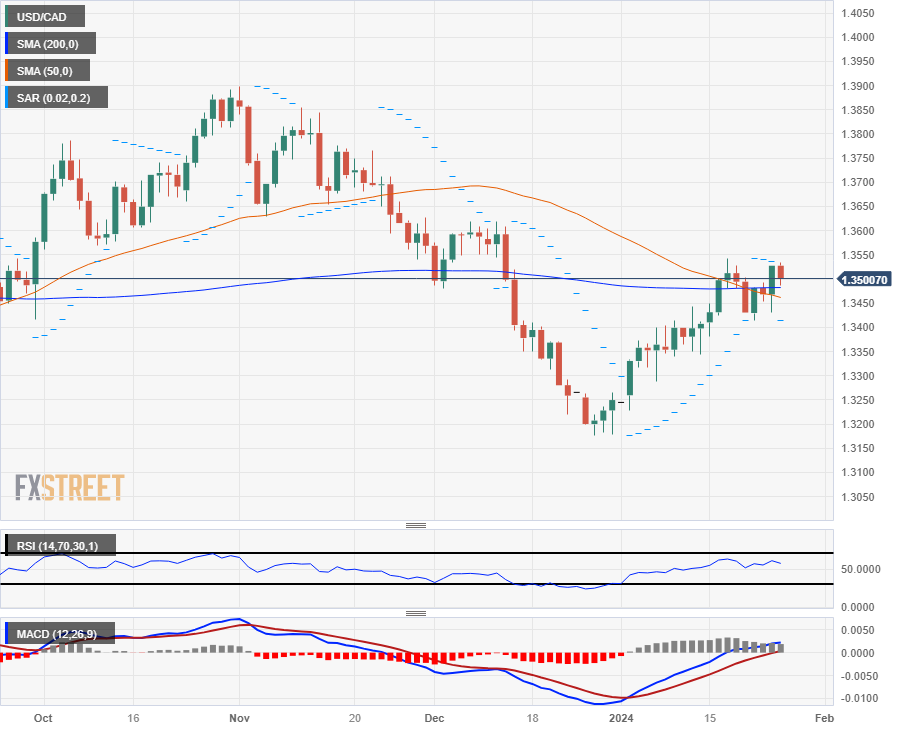
Canadian Dollar FAQs
What key factors drive the Canadian Dollar?
The key factors driving the Canadian Dollar (CAD) are the level of interest rates set by the Bank of Canada (BoC), the price of Oil, Canada’s largest export, the health of its economy, inflation and the Trade Balance, which is the difference between the value of Canada’s exports versus its imports. Other factors include market sentiment – whether investors are taking on more risky assets (risk-on) or seeking safe-havens (risk-off) – with risk-on being CAD-positive. As its largest trading partner, the health of the US economy is also a key factor influencing the Canadian Dollar.
How do the decisions of the Bank of Canada impact the Canadian Dollar?
The Bank of Canada (BoC) has a significant influence on the Canadian Dollar by setting the level of interest rates that banks can lend to one another. This influences the level of interest rates for everyone. The main goal of the BoC is to maintain inflation at 1-3% by adjusting interest rates up or down. Relatively higher interest rates tend to be positive for the CAD. The Bank of Canada can also use quantitative easing and tightening to influence credit conditions, with the former CAD-negative and the latter CAD-positive.
How does the price of Oil impact the Canadian Dollar?
The price of Oil is a key factor impacting the value of the Canadian Dollar. Petroleum is Canada’s biggest export, so Oil price tends to have an immediate impact on the CAD value. Generally, if Oil price rises CAD also goes up, as aggregate demand for the currency increases. The opposite is the case if the price of Oil falls. Higher Oil prices also tend to result in a greater likelihood of a positive Trade Balance, which is also supportive of the CAD.
How does inflation data impact the value of the Canadian Dollar?
While inflation had always traditionally been thought of as a negative factor for a currency since it lowers the value of money, the opposite has actually been the case in modern times with the relaxation of cross-border capital controls. Higher inflation tends to lead central banks to put up interest rates which attracts more capital inflows from global investors seeking a lucrative place to keep their money. This increases demand for the local currency, which in Canada’s case is the Canadian Dollar.
How does economic data influence the value of the Canadian Dollar?
Macroeconomic data releases gauge the health of the economy and can have an impact on the Canadian Dollar. Indicators such as GDP, Manufacturing and Services PMIs, employment, and consumer sentiment surveys can all influence the direction of the CAD. A strong economy is good for the Canadian Dollar. Not only does it attract more foreign investment but it may encourage the Bank of Canada to put up interest rates, leading to a stronger currency. If economic data is weak, however, the CAD is likely to fall.
- EUR/GBP experienced losses standing at 0.8530, down by 0.30%.
- The ECB held rates steady as expected.
- Christine Lagarde refrained from commenting on the timing of the ECB rate cuts.
- Monetary policy divergences gives the Pound traction over the Euro.
On Thursday's session, the EUR/GBP pair was observed at a trading level of 0.8530, seeing 0.30% loss. Bears seem to be gaining ground, as the daily chart manifests a bearish outlook. The four-hour chart extends this negative forecast, reflecting an increased dominance of sellers in the market's current state.
In that sense, the EUR/GBP weakened after the European Central Bank’s (ECB) cautious approach to interest rate cuts, with only minimal hints of cutting interest rates, and as for now the markets do not expect a rate cut until June. In contrast, the Bank of England (BoE) maintains a steady policy with markets expecting less easing than the ECB of 125 bps in 2024 which gives the GBP strength. Therefore, both the ECB's potential easing and the BoE's steady approach is pushing the cross downwards. Another factor that benefits the Pound is that the British economy is holding resilient to the BoE monetary policy which is pushing the bank to delay rate cuts.
EUR/GBP levels to watch
The indicators on the daily chart are depicting a bear-dominant market. The Relative Strength Index (RSI) is seen to be on a downward path, maintaining its location in the negative sector pointing towards an ongoing bearish momentum. Concurrently, the Moving Average Convergence Divergence (MACD) indicators display an increasing number of red bars, a sign that selling pressure is escalating. Moreover, the crosse's position below the 20, 100, and 200-day Simple Moving Averages (SMAs) further substantiates the bearish stance..
Shifting to a shorter timeframe, the bearish sentiment persists. The four-hour chart still mirrors the negative scenario with the indicators reinforcing the bearish outlook. The Relative Strength Index (RSI) persists in the negative territory with its negative slope indicating that bears continue to control the momentum. In line with this, the four-hour Moving Average Convergence Divergence (MACD) features rising red bars, again, marking an increase in selling activity.
EUR/GBP daily chart
-638417963128668943.png)
The Fed’s preferred inflation gauge, the Core Personal Consumption Expenditure (PCE), will be released by the US Bureau of Economic Analysis (BEA) on Friday, January 26 at 13:30 GMT and as we get closer to the release time, here are the forecasts of economists and researchers of eight major banks.
Headline PCE is expected to remain steady at 2.6% year-on-year while core is expected to fall two ticks to 3.0%. On a monthly basis, both are expected to come in at 0.2%.
TDS
We look for the December data to continue supporting the idea of inflation deceleration, with the core PCE advancing at a near-trend 0.2% MoM – and below the core CPI's 0.3% increase. Notably, the December data are likely to show that the 3m/6m momentum in core PCE prices has dropped below the 2% objective, which will add to the evidence that the worst for inflation has likely passed.
Deutsche Bank
We see core PCE growth staying at +0.1%.
NBF
The annual core PCE deflator may have progressed 0.2% MoM in December, a result which should translate into a 2-tick decline of the 12-month rate to 3.0%. Although still high, this would still be the lowest rate observed in 33 months.
SocGen
We project a 0.3% increase for the core PCE deflator, but that is a rounding up to 0.3%. The core CPI posted an increase of 0.309%. Core CPI runs faster generally than core PCE. Mostly this is due to a heavier weighting for rents and shelter that tend to grow much faster than the overall CPI. Critical now is the slowing pace of moderation in the CPI, whereas the PCE is still dropping rapidly. Sticky rents are the issue. Core PCE has substantially greater medical care components, and specifically government funded healthcare, whereas the CPI captures just household out-of-pocket healthcare costs. After a surge during COVID, government and general healthcare costs are moderating.
CIBC
Based on the December CPI report and the wider gap between CPI and PCE, we expect the core PCE deflator to be 0.2% MoM and 3.0% YoY in December.
Wells Fargo
We look for both the headline and core PCE deflators to rise 0.2% over the month, which if realized, would be slight accelerations relative to November.
Goldman Sachs
The forecast for core PCE inflation in December is 0.18%, translating to a six-month annualized rate of 1.88% and a YoY rate of 2.94%. This reflects the Fed's primary measure of inflation. Headline PCE prices are also projected to increase by 0.18% in December, corresponding to an annual rate of 2.63%.
Citi
We expect another 2.0% annualized QoQ increase in core PCE inflation and a 0.19% MoM, a stronger increase than in the past few months, but still notably softer than the recent pace of core CPI inflation.
Recent commentary by the Fed and continued strong data means we might have to wait much longer for US rates to go lower, analysts at Nordea say.
Markets are starting to realize that the upcoming rate cuts will not look like a normal cycle
The market is dialing back the pricing of rate cuts backed by continued strong data and commentary by the Fed.
For the central bank to cut in March, we would need to see low inflation prints for January and February, which does not seem unlikely, but the risk is the Fed will wait and in the meantime, inflation will start to move higher again on increases freight rates and renewed wage pressure. In the latter case, we might not see rate cuts this year at all.
The Canadian Dollar (CAD) weakened following the BoC announcement. Economists at ING analyze Loonie’s outlook.
USD/CAD set to move below 1.3000 in the second half of the year
It is key to remember that CAD has been tracking quite closely the dynamics in US data, and that may remain the case until a broader USD decline emerges and favours pro-cyclical currencies such as CAD.
We target a move in USD/CAD below 1.3000 in the second half of the year but still see CAD as less attractive than other pro-cyclical currencies like NOK and AUD this year – also due to our expectations for large rate cuts in Canada.
- EUR/USD dips 0.19%, in response to the ECB's decision to hold rates and cautious remarks from President Christine Lagarde.
- The US economy outperforms expectations with a 3.3% QoQ GDP growth in Q4 2023, surpassing forecasts but lower than the previous quarter.
- Key upcoming events include further comments from ECB President Lagarde and the release of the Eurozone's Consumer Confidence and US Core PCE Price Index data.
The EUR/USD extends its losses past the European Central Bank (ECB) monetary policy decision to keep the main deposit rate unchanged as the ECB’s President Christine Lagarde's press conference finished. That and solid US GDP figures kept the major down by 0.19%, trading at 1.0864 after hitting a high of 1.0901.
Lagarde’s comments and US economic data weighed on the Euro as the pair edges lower
Summarizing ECB’s President Christine Lagarde's comments at the press conference, she said that inflation is expected to ease further over 2024 while mentioning that growth risks are tilted to the downside. Lagarde added that inflation could fall more quickly if energy prices evolve, though geopolitical tensions in the Middle East pose upside risks to inflation. When asked about rate cuts, she added that the Governing Council agreed they need to be data-dependent
Across the pond, a busy docket in the US revealed the economy for the last quarter of 2023 rose by 3.3% QoQ, exceeding forecasts of 2% and lower than Q3’s 4.9%, according to the Gross Domestic Product (GDP) report revealed by the US Bureau of Economic Analysis (BEA). At the same time, Durable Goods Orders in December were unchanged, blamed on a slump in transportation equipment manufacturing.
On another date, the US Bureau of Labor Statistics revealed that Initial Jobless Claims for the week ending on January 20 increased by 214K, exceeding the previous week's reading and forecasts of 200K.
Ahead on the week. ECB’s President Lagarde will cross wires at around 16:15 GMT today. The Eurozone’s (EU) docket will feature Germany’s Gfk Consumer Confidence on Friday. On the US front, the Federal Reserve’s preferred gauge for inflation, the Core Personal Consumption Expenditure (PCE) Price Index, is expected to drop from 3.2% to 3% YoY. In comparison, general PCE is foreseen at 2.6%, unchanged from the last report.
EURUSD Key Technical Levels
ECB FAQs
What is the ECB and how does it influence the Euro?
The European Central Bank (ECB) in Frankfurt, Germany, is the reserve bank for the Eurozone. The ECB sets interest rates and manages monetary policy for the region.
The ECB primary mandate is to maintain price stability, which means keeping inflation at around 2%. Its primary tool for achieving this is by raising or lowering interest rates. Relatively high interest rates will usually result in a stronger Euro and vice versa.
The ECB Governing Council makes monetary policy decisions at meetings held eight times a year. Decisions are made by heads of the Eurozone national banks and six permanent members, including the President of the ECB, Christine Lagarde.
What is Quantitative Easing (QE) and how does it affect the Euro?
In extreme situations, the European Central Bank can enact a policy tool called Quantitative Easing. QE is the process by which the ECB prints Euros and uses them to buy assets – usually government or corporate bonds – from banks and other financial institutions. QE usually results in a weaker Euro.
QE is a last resort when simply lowering interest rates is unlikely to achieve the objective of price stability. The ECB used it during the Great Financial Crisis in 2009-11, in 2015 when inflation remained stubbornly low, as well as during the covid pandemic.
What is Quantitative tightening (QT) and how does it affect the Euro?
Quantitative tightening (QT) is the reverse of QE. It is undertaken after QE when an economic recovery is underway and inflation starts rising. Whilst in QE the European Central Bank (ECB) purchases government and corporate bonds from financial institutions to provide them with liquidity, in QT the ECB stops buying more bonds, and stops reinvesting the principal maturing on the bonds it already holds. It is usually positive (or bullish) for the Euro.
The US Dollar has regained ground in recent weeks after depreciating in late 2023. Economists at UBS analyze the FX market outlook.
Most G10 currency pairings are likely to remain range-bound in the months ahead
Most G10 currency pairings are now back in familiar ranges (e.g., EUR/USD between 1.0500 and 1.1000), where we expect them to remain in the coming months.
Better relative growth in the US than in Europe and a partial reversal of US rate cut expectations should support the Greenback in the near term. However, the Fed’s dovish pivot is likely to limit the extent of any rallies and sets the tone for the Dollar to weaken into year-end.
Our most preferred currency is the Australian Dollar. We also see opportunities for investors to sell near-term upside risks in EUR/USD and GBP/USD, or downside risks in USD/CHF, GBP/CHF, and USD/JPY in exchange for yield pickup.
Christine Lagarde, President of the European Central Bank (ECB), explains the ECB's decision to leave the key interest rates unchanged in January and responds to questions from the press.
Key quotes
"We need to be further along in the disinflation process before we are confident about hitting the inflation target in a timely manner."
"Operation framework review work is advancing at a fast pace."
"Review outcome is most likely to come by the end of the spring."
"Review won't matter won't necessarily matter in the short term."
"PMI data a small signal that recovery conditions are coming into place."
About ECB's press conference
Following the ECB´s monetary policy decisions, the ECB President delivers a prepared statement and responds to questions from the press on the policy outlook. Her comments may influence the volatility of EUR and determine a short-term positive or negative trend. Her hawkish view is considered as positive, or bullish for the EUR, whereas her dovish view is considered as negative, or bearish.
The Euro witnessed some strength on the back of the USD sell-off going into the new year. Economists at the National Bank of Canada analyze EUR/USD outlook.
EUR may recover some ground later this year assuming the outlook improves
While European Central Bank comments continue to suggest it will maintain its current stance on monetary policy until inflation moderates sustainably, market expectations differ. Inflation expectations have weakened significantly, and growth is tepid at best.
A rate cut could come as soon as April and easing could easily match Fed expectations. As such, the Euro could drawdown in the coming quarters in a risk-off environment and may recover some ground later this year assuming the outlook improves.
Christine Lagarde, President of the European Central Bank (ECB), explains the ECB's decision to leave the key interest rates unchanged in January and responds to questions from the press.
Key quotes
"Observing shipping cost increases, delivery delays."
"Seeing some stabilization in wage tracker."
"Seeing slight reduction of vacancies advertised."
"Wage growth is directionally good from our perspective."
"Wage growth is already declining. Our hope is that wage increases are sufficiently absorbed by profits."
"We are not seeing second round effects.
About ECB's press conference
Following the ECB´s monetary policy decisions, the ECB President delivers a prepared statement and responds to questions from the press on the policy outlook. Her comments may influence the volatility of EUR and determine a short-term positive or negative trend. Her hawkish view is considered as positive, or bullish for the EUR, whereas her dovish view is considered as negative, or bearish.
Christine Lagarde, President of the European Central Bank (ECB), explains the ECB's decision to leave the key interest rates unchanged in January and responds to questions from the press.
Key quotes
"Geopolitical tensions in Middle East are an upside risk to inflation."
"Inflation could fall more quickly if energy prices evolve in line with recent downward shift."
"Consensus at table was that it was premature to talk about rate cuts".
About ECB's press conference
Following the ECB´s monetary policy decisions, the ECB President delivers a prepared statement and responds to questions from the press on the policy outlook. Her comments may influence the volatility of EUR and determine a short-term positive or negative trend. Her hawkish view is considered as positive, or bullish for the EUR, whereas her dovish view is considered as negative, or bearish.
- Durable Goods Orders remained flat in the last month of 2023.
- The US Dollar keep its daily trade in the 103.20 zone.
Durable Goods Orders in the United States came in flat on a monthly basis in December, the US Census Bureau announced on Thursday. This followed a 5.5% increase in the previous month.
Excluding transportation, new orders increased 0.6% and by 0.5% when stripping defense orders, rose by 0.5%.
The Bank of Canada (BoC) left rates unchanged again. The question is when rates can be lowered again. Economists at Commerzbank analyze Loonie’s outlook after the BoC’s decision.
Interest rate hikes off the table, but no rate cuts yet
The BoC left interest rates unchanged yesterday. Anything else would have been quite a surprise. At the same time, it sent some dovish signals.
At the press conference, Governor Tiff Macklem emphasized that it was too early to talk about the exact timing of the first rate cuts. However, the mere suggestion that rate cuts are likely to become increasingly important in the coming months was quite dovish and put pressure on the CAD.
The decisive factors for the timing are likely to be persistent inflation and high wage growth. The BoC expects wage growth to slow in the coming months. Officials also want to see a further and, above all, sustained decline in core inflation. Recently, however, core inflation has been extremely stubborn and has fallen only in small steps, if at all, toward the target. So there is still a lot of work to be done before the BoC starts to cut rates, possibly from the middle of the year. Until then, we will have to wait and see with the CAD.
Christine Lagarde, President of the European Central Bank (ECB), explains the ECB's decision to leave the key interest rates unchanged in January and responds to questions from the press.
Key quotes
"Economy is likely to have stagnated in Q4."
"Incoming data signal weakness in the near term."
"Some surveys point to growth further ahead."
"Demand for labour is slowing."
"New budget rules should be implemented wihout delay."
"Inflation expected to ease further over 2024."
"Domestic price pressures are high but some measures started to ease."
"Longer term inflation term expectations mostly stand around 2%."
"Risks to growth are tilted to the downside."
About ECB's press conference
Following the ECB´s monetary policy decisions, the ECB President delivers a prepared statement and responds to questions from the press on the policy outlook. Her comments may influence the volatility of EUR and determine a short-term positive or negative trend. Her hawkish view is considered as positive, or bullish for the EUR, whereas her dovish view is considered as negative, or bearish.
- Initial Jobless Claims rose by 214K in the third week of the year.
- Continuing Jobless Claims also surpassed estimates.
US citizens that applied for unemployment insurance benefits increased by 214K in the week ending January 20 according to the US Department of Labor (DoL) on Thursday. The reading came in above market consensus and follows a 189K gain in the previous week.
Further details of the publication revealed that the advance seasonally adjusted insured unemployment rate was 1.2% and the 4-week moving average stood at 202.25K, a decrease of 1.5K from the previous week's revised average.
In addition, Continuing Claims increased by 27K to 1.833M in the week ended January 13.
Market reaction
The US Dollar Index kept the daily range in the low 103.00s soon after the publication of weekly labour market data, extending the leg lower sparked on Wednesday.
- EUR/USD falls as ECB maintains Main Refinancing Operations Rate unchanged at 4.50% straight for third time.
- ECB Lagarde is seen reiterating the timing for first rate-cut in late Summer.
- Volatility may explode after the release of the US Q4 GDP data.
The EUR/USD pair faces a sell-off as the European Central Bank (ECB) has kept the Main Refinancing Operations Rate unchanged at 4.50% in its first policy meeting of 2024. The ECB was widely anticipated to maintain status-quo for the third time in a row. The central bank has kept the Rate on Deposit Facility at 4% as expected.
As the interest rate policy is largely in-line with market expectations, guidance on interest rate cuts will be keenly watched. ECB President Christine Lagarde is expected to reiterate the timing for first rate cut in the late Summer.
S&P500 futures have generated nominal gains in the European session, indicating a risk-on mood. Steep volatility could emerge after the release of the crucial United States data. The US Dollar Index (DXY) hovers near 103.30 while 10-year US Treasury yields have dropped to near 4.16%.
Meanwhile, investors await the US Q4 Gross Domestic Product (GDP) data, which will provide fresh guidance over the interest rate outlook. Investors have projected that the US economy grew at a slower pace of 2.0% after expanding at a robust pace of 4.9% in the July-September quarter of 2024. This would accelerate hopes of an interest rate cut by the Federal Reserve (Fed) in the first half of 2024.
Going forward, market participants will wait for the core Personal Consumption Expenditure (PCE) price index data for December. A stubborn core PCE inflation report would allow Fed policymakers to continue to lean towards restrictive interest rate stance.
GBP/USD stays neutral in its 1.2600/1.2825 trading range. Economists at Scotiabank analyze the pair’s outlook.
Little risk of a significant change
Flat range trading in the Pound has been a feature of broader trading since the middle of December and there is little to suggest that will change any time soon.
The GBP/USD pair is unchanged on the day and intraday trading patterns are showing little risk of a significant change.
Support is 1.2700/1.2710. Resistance is 1.2775 within the broader 1.2600/1.2825 trading range.
USD/CAD gains retested the low/mid-1.3500 area. Economists at Scotiabank analyze the pair’s outlook.
Key resistance holding again warrants attention
Spot gains stalled close to the January 17th intraday peak for the USD which was itself a test of the 50% Fibonacci retracement resistance (1.3538) derived from the USD’s Q4 sell-off.
The rejection of the low/mid-1.3500s on the intraday chart is not definitive at this point but key resistance holding again warrants attention.
More USD softness in the short run (below 1.3475) will tilt risks towards a retest of the 1.3420/1.3430 area. Below here would point to more USD losses (low/mid-1.3300s) as a consequence of the two tests of the 1.3540 zone.
- The US Dollar holds its ground ahead of some main market-moving events this Thursday.
- Traders brace for an ECB rate decision, US GDP and weekly US Jobless Claims.
- The US Dollar Index is caught between a rock and a hard place and could still swing either way.
The US Dollar (USD) trades steady and sideways this Thursday ahead of the first major central bank rate decision for 2024. All eyes will be across the Atlantic Ocean on the European Central Bank (ECB) with a rate decision and later comments from the ECB President, Christine Lagarde. It was only last week that Lagarde said that the summer might be a good moment to cut rates for the first time. Now traders will want to hear that phrase committed in the press conference as a global view from the ECB’s governing council, making it the bank’s official forward guidance.
On the economic front, traders will need to have their caffeine shots consumed by 14:15 GMT within just a range of 30 minutes, as not only the ECB rate decision will be released, but additionally a lot of US data. Of course US Gross Domestic Product (GDP) will steal a lot of thunder, but Durable Goods, US weekly unemployment data and New Home Sales will also need to get digested. All this will likely send the US Dollar onto a clear path higher or lower.
Daily digest market movers: Expect 30 minutes of mayhem
- The European Central Bank will release its official rate decision and guiding letter around 13:15 GMT. A press release with Q&A by Christina Lagarde will follow suit near 14:45.
- A bulk batch of data to be released near 13:30:
- Weekly Jobless numbers:
- Initial Jobless Claims are expected to head from 187,000 to 200,000.
- Continuing Jobless Claims are seen going from 1,806,000 to 1,828,000.
- US Gross Domestic Product numbers for Q4:
- Headline GDP was seen last at 3.3% – there isn’t a forecast this time.
- Core GDP expected to stay stable at 2.0%.
- Personal Consumption Expenditures was at 2.6% with no forecast.
- Annualised Headline GDP seen heading from 4.9% to 2.0%.
- US Durable Goods for December:
- Orders seen heading from 5.4% to 1.1%.
- Orders without transportation should head from 0.4% to 0.2%.
- Weekly Jobless numbers:
- Around 15:00 – at the same time as ECB’s Chairman Lagarde will be speaking – New Home Sales for December are due to be released. Expectations are for a jump to 645,000, from 590,000.
- Near 16:00 the Kansas Fed Manufacturing Activity Index for January is to be released. Previous was at -4, with high expectations for a recovery seeing the upbeat PMI numbers from Wednesday where Manufacturing jumped back into growth, from 47.9 to 50.3.
- The US Treasury Department is having a busy day allotting a 4-week bill near 16:30 GMT and a 7-year Note around 18:00 GMT.
- Equity markets are in the green yet again with China roaring after the government has cut the Reserve Ratio Requirements (RRR) for banks, freeing up liquidity. Both the Hang Seng and the Shenzhen Index are up near 2.0%. European equities and US futures are stalling and are rather awaiting further data points.
- The CME Group’s FedWatch Tool shows that markets are pricing in a 97.4% possibility for an unchanged rate decision on January 31, with a slim 2.6% chance of a cut.
- The benchmark 10-year US Treasury Note jumps higher to 4.16% and peaks for this week. Strangely enough, this does not filter through (yet) in a stronger US Dollar.
US Dollar Index Technical Analysis: Read between the lines
The US Dollar Index (DXY) is, from a purely technical point of view, caught between two very important Simple Moving Averages. Those are the 55-day SMA near 103.17 and the 200-day SMA at 103.50, which acts as the floor and cap respectively. To make matters even worse, the floor (55-day SMA) is heading lower by the day, which opens up more downside than upside potential for the US Dollar in the near term.
Given the big batch of data released, with the possibility the ECB drops the ball in its communication, there remains still a case for the DXY to get through those two moving averages again and run away. Look for 104.41 as the first resistance level on the upside, in the form of the 100-day SMA. If that gets breached as well, nothing will hold the DXY from heading to either 105.88 or 107.20 – the high of September.
With the declining floor, more sell pressure could filter through into the price action. Price action could decline substantially should the US data release later this Thursday build a case for that move. This would see the DXY first drop to 102.60, at the ascending trend line from September. Once below it, the downturn is open towards 102.00.
GDP FAQs
What is GDP and how is it recorded?
A country’s Gross Domestic Product (GDP) measures the rate of growth of its economy over a given period of time, usually a quarter. The most reliable figures are those that compare GDP to the previous quarter e.g Q2 of 2023 vs Q1 of 2023, or to the same period in the previous year, e.g Q2 of 2023 vs Q2 of 2022.
Annualized quarterly GDP figures extrapolate the growth rate of the quarter as if it were constant for the rest of the year. These can be misleading, however, if temporary shocks impact growth in one quarter but are unlikely to last all year – such as happened in the first quarter of 2020 at the outbreak of the covid pandemic, when growth plummeted.
How does GDP influence currencies?
A higher GDP result is generally positive for a nation’s currency as it reflects a growing economy, which is more likely to produce goods and services that can be exported, as well as attracting higher foreign investment. By the same token, when GDP falls it is usually negative for the currency.
When an economy grows people tend to spend more, which leads to inflation. The country’s central bank then has to put up interest rates to combat the inflation with the side effect of attracting more capital inflows from global investors, thus helping the local currency appreciate.
How does higher GDP impact the price of Gold?
When an economy grows and GDP is rising, people tend to spend more which leads to inflation. The country’s central bank then has to put up interest rates to combat the inflation. Higher interest rates are negative for Gold because they increase the opportunity-cost of holding Gold versus placing the money in a cash deposit account. Therefore, a higher GDP growth rate is usually a bearish factor for Gold price.
Economists at Scotiabank analyze EUR/USD outlook ahead of the ECB policy decision.
Gains are likely limited to the mid-1.0900s
A neutral hold is the likely outcome of today’s ECB policy decision.
Recent comments from key policymakers have clearly steered market expectations towards the idea that no move lower in rates is likely before June at this point.
Swaps still reflect 16-17 bps of easing for the April meeting, which looks too rich, given current guidance so some repricing of ECB risk may give the EUR a mild lift today but there does not appear to be a lot of runway for EUR bulls to exploit at this point.
Gains are likely limited to the mid-1.0900s.
- EUR/GBP edges higher toward the resistance zone around the nine-day EMA.
- A break above the 23.6% Fibonacci retracement level at 0.8579 could lead the pair to reach a weekly high at 0.8584.
- A break below the major support at 0.8550 could push the pair to retest January’s low at 0.8536.
EUR/GBP moves in an upward direction, inching higher to near 0.8560 during the European session ahead of the European Central Bank’s (ECB) interest rate decision. The area around the nine-day Exponential Moving Average (EMA) at 0.8570 aligned with the 23.6% Fibonacci retracement level at 0.8579 could act as a resistance zone.
The crossover above the resistance zone could create a bullish sentiment for the EUR/GBP pair. It could attempt to approach the weekly high at 0.8584 followed by the psychological barrier at 0.8600 level and 38.2% Fibonacci retracement level at 0.8606.
The technical analysis of the EUR/GBP cross shows that the Moving Average Convergence Divergence (MACD) line is situated below the centerline and exhibits a divergence below the signal line. This configuration suggests a potential bearish momentum for the pair.
Additionally, to validate the downward trend in the EUR/GBP cross, traders can consider the 14-day Relative Strength Index (RSI). The RSI, located below the 50 mark, further confirms the bearish sentiment in the market. These technical indicators collectively suggest a prevailing negative bias for the pair.
On the downward, the major level at 0.8550 appears as the immediate support for the EUR/GBP cross. A collapse below the major support could put downward pressure on the pair to retest January’s low at 0.8536 followed by the psychological support at 0.8500 level.
EUR/GBP: Daily Chart
-638417809354063492.png)
The time has finally come for the ECB Governing Council to decide on monetary policy today. Economists at Commerzbank analyze Euro’s (EUR) outlook ahead of the announcement.
No easy job
If the ECB manages to contain expectations of rate cuts and the market pushes them back – our experts also consider March/April to be too early and expect the first cut in June, this would be positive for the Euro and we could see a notable move.
However, despite some small adjustments the market has been quite stubborn about its expectations in recent weeks and has refused to be convinced. In this respect, the ECB may not have an easy job today.
- Natural Gas marches higher in a bounce off the $2.10 barrier.
- Traders are focussing on summer futures contracts to salvage the lost first quarter.
- The US Dollar Index is steady ahead of ECB, US GDP, Durable Goods and Jobless Claims.
Natural Gas (XNG/USD) has sunk to a substantial low earlier this week near $2.10. Meanwhile the course has reversed within the futures markets, with summer expiries trading over $1 higher against the more near-term expiries. This means that for Europe it is cheaper to buy Gas now than in four to six months, when it would normally refill up its gas storages. This is making Gas traders scramble to still make a buck after the lacklustre to negative performance in the first weeks of 2024.
The US Dollar (USD) is holding ground in the US Dollar Index near 103, ahead of a big batch of data releases later this Thursday. In just a time span of around 30 minutes, the European Central Bank (ECB) will release its first rate decision for 2024, together with the release of US GDP, US Durable Goods and weekly Jobless Claims. While the Greenback is caught between two important technical elements (cap and floor), a breakout could be seen on the back of the above-mentioned catalysts.
Natural Gas is trading at $2.30 per MMBtu at the time of writing.
Natural Gas market movers: Traders looking forward for profit
- Benchmark futures for February and March are currently trading $1 lower against the June and July contracts. This comes with traders seeing Europe heading back into the Gas markets by the summer, in order to refill Gas storages.
- The Prime Minister of Slovakia Robert Fico said that Ukraine is open to still let Russian Gas flow beyond 2024, which would mean inflow into Austria and Italy is still guaranteed.
- Temperatures in Europe are soaring with very mild temperatures at hand for the weekend and next week. In London even 12.5 degrees Celsius is projected, with near 20 degrees in Barcelona, which is very mild for this time of year.
- Near 15:30 GMT, the Energy Information Administration (EIA) is due to release the weekly Gas Storage Changes. Previous was a drawdown of 154 billion cubic feet of Gas.
Natural Gas Technical Analysis: Recovery makes sense
Natural Gas got oversold earlier this week, with the commodity rebounding now in a natural move. The Relative Strength Index (RSI) is heading back to more normal levels while Gas prices are off the lows. More upside looks granted, though do not expect any exaggerated moves seeing the overall tepid outlook for 2024 in terms of global growth and economic strength.
On the upside, Natural Gas is facing quite some pivotal levels to get back to. First is the low of December 13th at $2.20 which broke on Wednesday. Next is the intermediary level near $2.48. Once that area gets hit, expect to see a test near $2.57 at the purple line.
A break below the yellow line at $2.10 means big issues for Natural Gas, with a fresh multi-year low. First level to look for on the downside is near $1.51, the low of June 2021. Further pre-Ukraine levels would come in sight as well with $1.00 up for grabs in the longer-term
-638417722732970743.png)
XNG/USD (Daily Chart)
Natural Gas FAQs
What fundamental factors drive the price of Natural Gas?
Supply and demand dynamics are a key factor influencing Natural Gas prices, and are themselves influenced by global economic growth, industrial activity, population growth, production levels, and inventories. The weather impacts Natural Gas prices because more Gas is used during cold winters and hot summers for heating and cooling. Competition from other energy sources impacts prices as consumers may switch to cheaper sources. Geopolitical events are factors as exemplified by the war in Ukraine. Government policies relating to extraction, transportation, and environmental issues also impact prices.
What are the main macroeconomic releases that impact on Natural Gas Prices?
The main economic release influencing Natural Gas prices is the weekly inventory bulletin from the Energy Information Administration (EIA), a US government agency that produces US gas market data. The EIA Gas bulletin usually comes out on Thursday at 14:30 GMT, a day after the EIA publishes its weekly Oil bulletin. Economic data from large consumers of Natural Gas can impact supply and demand, the largest of which include China, Germany and Japan. Natural Gas is primarily priced and traded in US Dollars, thus economic releases impacting the US Dollar are also factors.
How does the US Dollar influence Natural Gas prices?
The US Dollar is the world’s reserve currency and most commodities, including Natural Gas are priced and traded on international markets in US Dollars. As such, the value of the US Dollar is a factor in the price of Natural Gas, because if the Dollar strengthens it means less Dollars are required to buy the same volume of Gas (the price falls), and vice versa if USD strengthens.
What the Euro needs, is not a hawkish ECB as much as a better growth outlook, Kit Juckes, Chief Global FX Strategist at Société Générale, says.
It is more about growth than what the ECB says
What matters for the Euro now, are expectations about growth, rather than monetary policy.
The correlation between relative rates and EUR/USD was much stronger in H1 2023 than in H2, but the reverse was true of the correlation between EUR/USD and relative growth expectations, which strengthened in H2 and may remain dominant.
US Q4 GDP data are probably more market-moving than anything that’s happening in Europe. Consensus is at 2%, SG at 1.9%.
- EUR/JPY gains ground ahead of interest rate decision from European Central Bank.
- BoJ Governor Kazuo Ueda committed to achieving the 2.0% inflation target.
- ECB is expected to maintain the Main Refinancing Operations Rate at 4.50%, and the Deposit Facility Rate at 4.0%.
EUR/JPY snaps its losing streak ahead of the interest rate decision from the European Central Bank (ECB). The EUR/JPY pair advances to around 160.80 during the European trading session on Thursday.
Traders will turn their attention to the upcoming Tokyo Consumer Price Index data scheduled for Friday, aiming to gather more insights into Japan's economic outlook. They could be particularly interested in cues regarding the potential shift of the Bank of Japan's (BoJ) short-term interest rates out of negative territory as the necessary conditions align.
BoJ Governor Kazuo Ueda, however, emphasized a strong commitment to achieving the 2.0% inflation target. Ueda's statements suggested a potential gradual reduction of extensive stimulus measures in the future.
The Ministry of Finance released Japan's Merchandise Trade Balance Total for December on Wednesday, surpassing expectations. Concurrently, Japanese Exports (YoY) showed a notable increase. These better-than-expected readings likely contributed to bolstering the Japanese Yen (JPY) and might have created a headwind for the EUR/JPY pair.
On the other hand, the mixed Purchasing Managers Index (PMI) data from the Eurozone and Germany might have provided some support for the Euro, which in turn, might have limited the losses of the EUR/JPY pair.
European Central Bank is expected to maintain the Main Refinancing Operations Rate at 4.50%, and the Deposit Facility Rate at 4.0%. ECB President Christine Lagarde commented that the central bank could potentially begin reducing interest rates starting from late summer. Lagarde expressed concerns about inflation being higher than the ECB's desired level.
- Silver price jumps to near $23, supported by PBoC’s dovish stance.
- The US economy is expected to grew by 2% in the third quarter of 2023.
- Silver price looks set to deliver a breakout of the Inverted H&S pattern.
Silver price climbs to near $23 after the People’s Bank of China (PBoC) announced a liquidity booster to uplift the economy that is struggling to recover post-pandemic. The PBoC is set to infuse liquidity of $140 billions into the banking system to support vulnerable economic growth.
S&P500 futures have generated some gains in the European session, portraying a risk-on mood. 10-year US Treasury yields have dropped to near 4.16%. The US Dollar Index (DXY) falls slightly to near 103.20 as investors shift focus towards the United States Q3 Gross Domestic Product (GDP) data, which will be published at 13:30 GMT.
As per the preliminary consensus, the US economy grew at a slower pace of 2.0% after expanding 4.9% in the third quarter of 2023. A slower growth rate would undermine the argument supporting a restrictive interest rate policy atleast until second quarter ends.
The hopes for an interest rate-cut by the Federal Reserve (Fed) has already eased significantly as the US economy is resilient on the grounds of labor market and consumer spending. • As per the CME Fedwatch tool, chances in favour of an interest rate cut by 25 basis-points (bps) have dropped to 42.4%.
Silver technical analysis
Silver price aims to deliver a breakout of the Inverted Head and Shoulder chart pattern, formed on a two-hour scale. The neckline of the aforementioned chart pattern is plotted from January 17 high at $22.88. The 50-period Exponential Moving Average (EMA) around $22.60 continues to provide support to the Silver price bulls.
The 14-period Relative Strength Index (RSI) has shifted into the bullish range of 60.00-80.00, which indicates that an upside momentum has been triggered.
Silver two-hour chart
-638417779076732334.png)
GBP/USD rallied to its highest level in nearly two weeks above 1.2770 after robust preliminary UK PMI data for January on Wednesday but staged a downward correction later in the session. Economists at Commerzbank analyze Pound Sterling’s (GBP) outlook.
Increasing chances for the British economy to see better times in the coming months
On Wednesday, the Pound saw a significant short-term rally after the PMI for the services sector jumped to 53.8 points. This means that it is now well above the neutral level of 50, which certainly increases the chances that the British economy will see better times in the coming months. It also takes some of the pressure off the Bank of England to cut interest rates significantly again soon.
So why was the GBP unable to hold on to its gains? The latest surprise was just a continuation of the uptrend that started a few months ago and therefore does not allow for a real fundamental reassessment.
Of course, the longer-term outlook could change over the course of several months. If the PMIs continue to perform so well, this should eventually be reflected in the economic data. And then the Pound should benefit more sustainably. Although this is not our base case, the chances of this happening increase with each new positive reading.
- Gold price range-trades ahead of the first estimate for US Q4 GDP data.
- The US Dollar Index consolidates as investors look for fresh guidance on interest rates.
- US economic resilience continues to strengthen the appeal for restrictive interest rates – a negative for Gold.
Gold price (XAU/USD) remains inside the woods as investors await the United States Gross Domestic Product (GDP) release for Q4, which will provide fresh information on which to base an outlook for interest rates. Investors are watching as upbeat GDP data could weaken the consensus argument advocating early interest rate-cuts by the Federal Reserve (Fed).
Stronger US PMI data, released by S&P Global, is reflecting resilience in the US economy, allowing Fed policymakers to designate rate-cuts from March as “premature”. The US economy is resilient amid upbeat labor market conditions and robust consumer spending. In addition to that, widely anticipated interest rate-cuts by the Fed this year has set a positive undertone for the economic outlook.
Apart from the Q4 GDP data, market participants will keenly focus on the core Personal Consumption Expenditure price index (PCE) data for December, which will be published on Friday. The underlying core inflation is preferred by Fed policymakers while deciding on the interest rate policy.
Daily Digest Market Movers: Gold price trades sideways ahead of US data
- Gold price turns sideways to near $2,015 after a sharp fall, ahead of the United States Q4 GDP data, which will be published at 13:30 GMT.
- Investors have projected that the US economy expanded at a slower pace of 2.0% against robust growth of 4.9% recorded in the third quarter of 2023.
- Moderate economic expansion would ease the stubborn inflation outlook and will discourage Federal Reserve policymakers from advocating a restrictive interest rate stance.
- As per the CME Fedwatch tool, the chances in favour of an interest rate cut by 25 basis-points (bps) in March have dropped to 42.4%.
- Bets supporting a decline in interest rates dampened due to strong recovery in the US PMIs in December. The Manufacturing PMI landed above the 50.0 threshold at 50.3, stronger than expectations and the former reading of 47.9.
- The Services PMI that represents the service sector, which accounts for two-thirds of the economy, rose to 52.9 from the prior reading of 51.4 and expectations of 51.0.
- A sharp recovery in the US economic activity indicates that the economy has started 2024 on a firm-footing and has improved the outlook for the entire year.
- Business confidence was uplifted by hopes of easing inflation, cost-of-living crises and a reduction in borrowing rates.
- Strong set of PMI numbers empowered the US Dollar to bounce back strongly. The appeal for the US Dollar could strengthen further if the US GDP data turns out stronger-than-anticipated.
- The US Dollar Index (DXY) has corrected gradually to near 103.20 and is expected to remain subdued ahead.
- After the US Q4 GDP data, market participants will shift their focus to the core underlying inflation data for December, which will be released on Friday.
- A stubborn core PCE price index data would strengthen the case for a restrictive monetary policy stance.
- Next week, the Fed is widely anticipated to maintain the status-quo but a stubborn inflation report would allow them to endorse higher interest rates at least until first-half of 2024 ends.
Technical Analysis: Gold price maintains auction abive $2,000
Gold price trades inside Wednesday’s trading range as investors bide their time ahead of the US Q4 GDP data. The precious metal consolidates above $2,016 but remains below the 20-day Exponential Moving Average (EMA), which indicates that the near-term demand is downbeat. The 14-period Relative Strength Index (RSI) remains inside the 40.00-60.00 range, which shows less chances of a sharp move. A downside move could appear if the yellow metal fails to sustain above the psychological support of $2,000.
Gold FAQs
Why do people invest in Gold?
Gold has played a key role in human’s history as it has been widely used as a store of value and medium of exchange. Currently, apart from its shine and usage for jewelry, the precious metal is widely seen as a safe-haven asset, meaning that it is considered a good investment during turbulent times. Gold is also widely seen as a hedge against inflation and against depreciating currencies as it doesn’t rely on any specific issuer or government.
Who buys the most Gold?
Central banks are the biggest Gold holders. In their aim to support their currencies in turbulent times, central banks tend to diversify their reserves and buy Gold to improve the perceived strength of the economy and the currency. High Gold reserves can be a source of trust for a country’s solvency. Central banks added 1,136 tonnes of Gold worth around $70 billion to their reserves in 2022, according to data from the World Gold Council. This is the highest yearly purchase since records began. Central banks from emerging economies such as China, India and Turkey are quickly increasing their Gold reserves.
How is Gold correlated with other assets?
Gold has an inverse correlation with the US Dollar and US Treasuries, which are both major reserve and safe-haven assets. When the Dollar depreciates, Gold tends to rise, enabling investors and central banks to diversify their assets in turbulent times. Gold is also inversely correlated with risk assets. A rally in the stock market tends to weaken Gold price, while sell-offs in riskier markets tend to favor the precious metal.
What does the price of Gold depend on?
The price can move due to a wide range of factors. Geopolitical instability or fears of a deep recession can quickly make Gold price escalate due to its safe-haven status. As a yield-less asset, Gold tends to rise with lower interest rates, while higher cost of money usually weighs down on the yellow metal. Still, most moves depend on how the US Dollar (USD) behaves as the asset is priced in dollars (XAU/USD). A strong Dollar tends to keep the price of Gold controlled, whereas a weaker Dollar is likely to push Gold prices up.
Economists at ING analyze the Turkish Lira (TRY) outlook ahead of Turkey’s central bank (CBT) rate setting meeting today.
The final CBT hike
The Central Bank of Turkey is expected to conclude its tightening cycle with a 250 bps rate hike – taking the one-week policy rate to 45.00%.
We presume the CBT will retain the language that it can hike again if necessary.
For reference, the TRY is one of the very few emerging market currencies with positive total returns against the Dollar this year. With cross-market volatility low, it looks like investors are keen to take on Turkish foreign currency risk and try to receive rates. We tend to cautiously favour these strategies too.
- USD/JPY loses ground as US Dollar declines due to the lower US yields.
- Tokyo Consumer Price Index data is expected to be released on Friday.
- CME FedWatch tool shows the chances of a Fed’s rate cut in March has been dropped to below 40%.
USD/JPY trims some of its intraday gains, hovering around 147.60 during the European trading hours on Thursday. However, the USD/JPY pair attempted to recover the losses registered in the previous session after the release of upbeat United States (US) Purchasing Managers Index (PMI) data. Furthermore, Tokyo Consumer Price Index data will be eyed on Friday.
On Wednesday, the Japanese Yen (JPY) gained strength following the release of better-than-expected Japan’s Merchandise Trade Balance Total for December. Moreover, the Bank of Japan (BoJ) opted to keep its existing interest rates and yield curve control policy intact in its recent meeting on Tuesday. However, BoJ Governor Kazuo Ueda indicated a steadfast commitment to achieving the 2.0% inflation target. Ueda's statements hinted at the possibility of gradually reducing extensive stimulus measures and shifting short-term interest rates out of negative territory as the necessary conditions align.
The US S&P Global PMI rose to an 11-month high of 50.3 in January, surpassing the forecasted value that anticipated it to remain steady at 47.9. Additionally, the US Services PMI exhibited growth, recording a reading of 52.9, which exceeded both the expected figure of 51 and the prior month's reading of 51.4.
Market caution leading up to the US Federal Reserve's (Fed) interest rate decision on January 31 has contributed to increased demand for the Greenback. While the market has already priced in the speculation of no adjustment in the January meeting, the CME FedWatch tool indicates a notable decline in the probability of a March rate cut by the Federal Reserve, dropping to below 40%. This marks a significant decrease from the 80% probability recorded just a month ago. Traders are anticipated to closely observe the release of the US Gross Domestic Product Annualized (Q4) data scheduled for Thursday, seeking additional insights into the Fed's potential interest rate trajectory.
Today, the Europen Central Bank (ECB) announces its latest policy decision. Economists at MUFG Bank analyze how the announcement could impact the Euro (EUR).
ECB to reiterate that rate cuts are unlikely until the summer
The ECB is expected to present a relatively hawkish update at today’s policy meeting.
ECB President Christine Lagarde sent a clear message about the potential timing of the first ECB rate cut when she stated that they plan to cut rates in the summer. We expect this message to be repeated at today’s policy meeting and for the ECB to continue to flag upside risks to inflation from geopolitical risks in the Middle East.
The updated guidance from the ECB suggests that the earliest point at which the ECB is planning to cut rates is from June although market participants are still pricing in a high probability that the first cut could be delivered even earlier in April. It should mean that today’s ECB policy is more of a holding operation like Wednesday’s BoC policy meeting which is likely to have limited impact on the performance of the Euro.
- NZD/USD continues its winning streak on improved risk appetite.
- A breach below 0.6100 could lead the pair to retest January’s low at 0.6062.
- The area around the 23.6% Fibonacci retracement at 0.6142 and the 14-day EMA at 0.6150 could act as a resistance zone.
NZD/USD recovers its intraday losses, extending its winning streak for the third successive session, trading around 0.6120 during the European session on Thursday. However, the NZD/USD pair might have faced downward pressure due to the moderate Consumer Price Index data from New Zealand released on Wednesday but the improved risk appetite has neutralized its impact, which in turn, acts as a tailwind for the Kiwi pair.
The NZD/USD pair could find the resistance zone around the 23.6% Fibonacci retracement at 0.6142 followed by the major barrier at the 14-day Exponential Moving Average (EMA) of 0.6150. A breakthrough above the resistance zone could provide support for the pair, leading to a 38.2% Fibonacci retracement at 0.6191 followed by the psychological level at 0.6200.
The technical analysis for the NZD/USD pair indicates a bearish sentiment in the market. The Moving Average Convergence Divergence (MACD) line is placed below the centerline, showing divergence below the signal line.
Furthermore, the lagging indicator 14-day Relative Strength Index (RSI) is positioned below the 50 level, suggesting a confirmation of a weaker momentum for the NZD/USD pair.
On the downside, immediate support for the NZD/USD pair is identified at the psychological level of 0.6100. A decisive break below this level could exert downward pressure, leading the pair to revisit January’s low at 0.6062, followed by a significant support level at 0.6050.
NZD/USD: Daily Chart:
-638417725896818041.png)
USD/TRY has established above the 30.00 level. Economists at Société Générale analyze the pair’s technical outlook.
Beyond 30.72, next objective is located at 31.65
USD/TRY has experienced a relentless uptrend after cross above last August high. It has tested the upper limit of a multi-month channel near 30.60/30.72. The move is overstretched but reversal signals are not yet visible. Lower band of the channel at 29.85 is near-term support.
Only if the pair breaks 29.85 would there be risk of a short-term pullback.
Beyond 30.72, next objective is located at projection of 31.65.
- USD/MXN gains ground on market caution before the Fed’s interest rate decision.
- Traders adopt a cautious stance due to confusion regarding the Fed’s rate cuts in March.
- Mexico’s mid-month January inflation increased by 0.49% against the predicted 0.38%.
USD/MXN retraces its recent losses as the US Dollar (USD) maintains its position in the positive territory despite the downbeat US Treasury yields. The USD/MXN pair improves to 17.26 during the European session on Thursday. The market caution ahead of the interest rate decision by the US Federal Reserve (Fed) on January 31, gives rise to the demand of the Greenback.
The US Dollar Index trades around 103.30, accompanied by 2-year and 10-year yields on US bond coupons standing at 4.37% and 4.17%, respectively, at the time of writing. Market participants lean towards a sentiment favoring potential rate cuts by the Federal Reserve in the upcoming March meeting. Nevertheless, the recently released positive S&P Global Purchasing Managers Index (PMI) data from the United States could diminish the likelihood of Federal Reserve rate cuts in March.
Moreover, the CME FedWatch tool signals that the probability of a March rate cut by the Federal Reserve has fallen to below 40%, marking a significant decrease from the 80% probability recorded just a month ago. Additionally, traders are expected to closely monitor the release of the US Gross Domestic Product Annualized (Q4) data scheduled for Thursday.
On the other side, the Mexican Peso (MXN) gained ground against the US Dollar after the release of the 1st half-month inflation data from Mexico, which indicated a resurgence in inflation within the country. This potential reacceleration may dissuade the Bank of Mexico (Banxico) from considering a reduction in policy rates. Concurrently, core prices have shown a continued easing, suggesting a sustained disinflationary trend. Simultaneously, data from INEGI (Instituto Nacional de Estadística y Geografía) shows a contraction in Mexico's economic activity in November, surpassing the decline observed in October.
In mid-month January, Mexico's inflation increased by 0.49%, surpassing predictions of 0.38% but falling slightly below December's figure of 0.52%. Core inflation, meeting expectations, stood at 0.25%, reflecting a decrease compared to the 0.46% registered previously.
Moreover, the month-over-month Economic Activity in November contracted to -0.5%, exceeding the -0.1% contraction from October. On an annual basis, the figures dropped to 2.3% from the previous 4.4%. The Mexican economy is starting to reflect the impact of the elevated interest rates set by Banxico at 11.25%, even though the market projects that the economy will experience growth above 2.0% in 2024.
- German IFO Business Climate Index continued to decline in January.
- IFO Current Economic Assessment fell to 87.0 in the reported month.
The headline German IFO Business Climate Index declined to 85.2 in January from 86.3 in December. Markets were expecting this figure to improve slightly to 86.7.
Meanwhile, the Current Economic Assessment Index came in at 87.0 in the same period, below the December print and the market expectation of 88.5 and 88.6, respectively.
Finally, the IFO Expectations Index – indicating firms’ projections for the next six months, edged lower to 83.5 from 84.8.
Market reaction to the German IFO Survey
EUR/USD showed no immediate reaction to these data disappointing sentiment data and was last seen moving sideways at around 1.0900.
About German IFO
The headline IFO business climate index was rebased and recalibrated in April after the IFO Research Institute changed the series from the base year of 2000 to the base year of 2005 as of May 2011 and then changed series to include services as of April 2018. The survey now includes 9,000 monthly survey responses from firms in the manufacturing, service sector, trade and construction.
FX markets continue in their slightly risk-averse mode. Economists at ING analyze US Dollar’s outlook.
Rangebound trading is the order of the day
We continue to see a very mixed investment environment and one in which conviction views can be dangerous.
European FX markets will today be monitoring how US asset markets react to the news that the Fed will not be renewing its Bank Term Funding Program. US regional banks will be in focus here.
We think rangebound trading is the order of the day, with little follow-through should the Dollar look particularly bid or offered.
102.75-103.75 looks the near-term DXY range.
Silver trades with a positive bias for the third successive day on Thursday.
The technical setup warrants caution before positioning for further gains.
A convincing breakout through $23.00 is needed for bulls to seize control.
Silver (XAG/USD) attracts some buyers for the third successive day on Thursday and sticks to its modest intraday gains, near the $22.70-$22.75 region through the first half of the European session. The white metal, however, remains below the weekly top, around the $23.00 round figure touched the previous day.
The aforementioned handle represents a downward-sloping trend-line resistance extending from the December swing high and should act as a key pivotal point. A sustained strength beyond might trigger a short-covering rally and lift the XAG/USD to the $23.25-$23.30 intermediate resistance en route to the very important 200-day Simple Moving Average (SMA), currently around mid-$23.00s.
Some follow-through buying will suggest that the XAG/USD has bottomed out in the near term and pave the way for a move towards reclaiming the $24.00 round figure. The momentum could extend further towards the next relevant resistance near the $24.40-$24.50 area. That said, oscillators on the daily chart are yet to confirm a bullish bias and warrant some caution before positioning for further gains.
On the flip side, the $22.60-$22.55 zone now seems to protect the immediate downside, below which the XAG/USD could slide back to retesting over a two-month low, around the $21.95-$21.90 region touched on Monday. A convincing break below the latter will be seen as a fresh trigger for bearish traders and expose the $21.40-$21.35 support. The subsequent fall could drag the metal to the $21.00 round figure en route to the October monthly swing low, around the $20.70-$20.65 region.
Silver daily chart
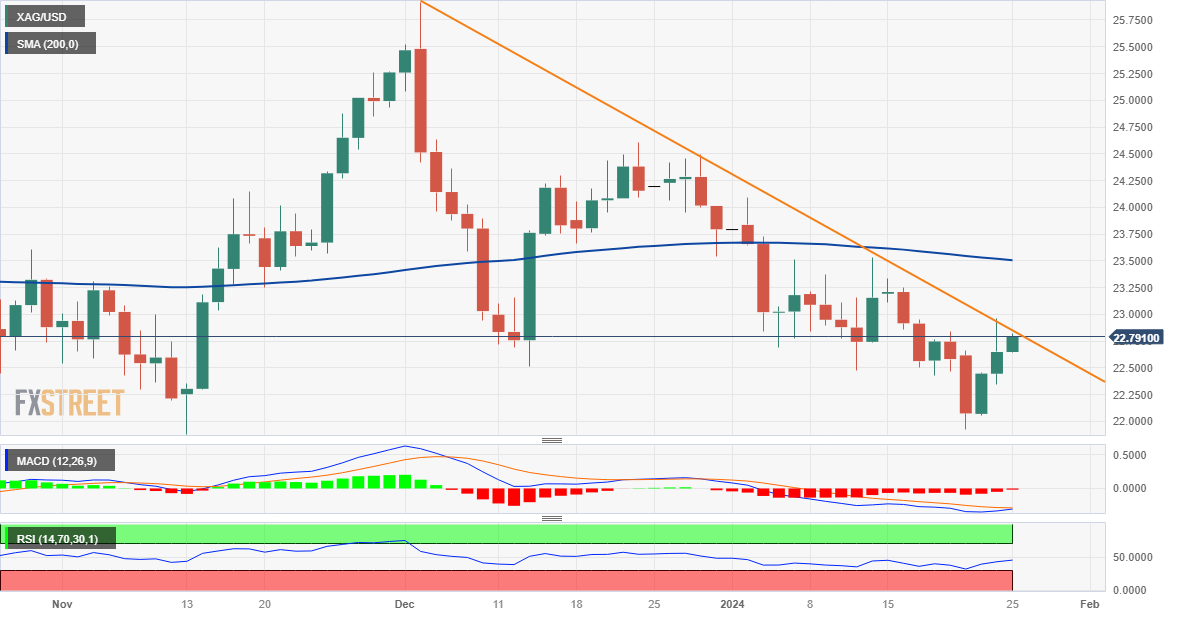
Technical levels to watch
Norges Bank raised the key interest rate to 4.50% in December. Antje Praefcke, FX Analyst at Commerzbank, analyzes Norwegian Krone’s (NOK) outlook ahead of another interesting policy meeting in Norway.
Norges Bank likely to remain restrictive
I assume that Norges Bank will not make any major changes to its December assessment. It may remove the reference to its willingness to raise the key interest rate again from the statement. But I can't imagine much more than this admission that interest rates may now have peaked.
In my opinion, anything else would be a bad sign for the NOK given the persistent inflation. However, I am confident that Norges Bank will stand firm in a short statement today, and therefore also confident for the Krone.
- EUR/USD juggles near 1.0888 ahead of ECB interest rate policy.
- The USD Index consolidates neat 103.30 ahead of the US GDP data.
- A slowdown in the US Q4 GDP would ease the inflation outlook.
The EUR/USD pair trades lacklustre slightly below the round-level resistance of 1.0900 in the London session. The major currency pair is expected to remain on the tenterhooks ahead of multiple economic indicators.
S&P500 futures have posted some gains in the European session, portraying some recovery in the risk-appetite of the market participants. 10-year US Treasury yields The US Dollar Index (DXY) struck in a tight range around 103.30 as investors await the United States Q4 Gross Domestic Product (GDP) data, which will be published at 13:30 GMT.
Investors have anticipated that the US economy expanded by 2.0%, slower than growth rate of 4.9% in the third quarter of 2023. This would be the lowest growth rate since 2Q2022. A slowdown in the growth rate would ease consumer inflation expectations and boost hopes of an interest rate-cut by the Federal Reserve (Fed) in March.
In addition to the US GDP data, market participants will focus on the core Personal Consumption Expenditure (PCE) price index data for December, which will be released on Friday.
On the Eurozone front, investors await the interest rate decision from the European Central Bank (ECB), which will be announced at 13:15 GMT. The ECB is expected to maintain the main refinancing operations rate unchanged at 4.5%. Last week, ECB President Christine Lagarde commented that the central bank could start reducing interest rates from late Summer. Lagarde warned that inflation is high from where the ECB wants.
Gold prices fell in India on Thursday, according to data from India's Multi Commodity Exchange (MCX).
Gold price stood at 62,052 Indian Rupees (INR) per 10 grams, down INR 168 compared with the INR 62,220 it cost on Wednesday.
As for futures contracts, Gold prices decreased to INR 61,986 per 10 gms from INR 62,141 per 10 gms.
Prices for Silver futures contracts decreased to INR 71,730 per kg from INR 71,502 per kg.
| Major Indian city | Gold Price |
|---|---|
| Ahmedabad | 64,280 |
| Mumbai | 64,095 |
| New Delhi | 64,165 |
| Chennai | 64,240 |
| Kolkata | 64,295 |
Global Market Movers: Comex Gold price ekes out small intraday gains amid a softer USD
- The US Dollar bulls remain on the defensive, which, along with geopolitical tensions stemming from conflicts in the Middle East, lend some support to the safe-haven Comex Gold price.
- Iran-backed Houthi rebels in Yemen targeted two US-owned commercial ships sailing close to the Gulf of Aden on Wednesday in the face of multiple rounds of US military airstrikes.
- This comes after the US military carried out pre-emptive strikes against the Houthis to stave off what it said was an imminent attack on shipping lanes in the important Red Sea trade route.
- The S&P Global flash US Composite PMI Output Index increased to 52.3 this month, or the highest since June, suggesting that the economy kicked off 2024 on a stronger note.
- The flash US Manufacturing PMI rebounded from 47.9 to a 15-month high of 50.3 in January, while the gauge for the services sector climbed to 52.9, or the highest reading since last June.
- The data further pointed to a still-resilient US economy and forced investors to further pare their bets for a more aggressive monetary policy easing by the Federal Reserve in 2024.
- The yield on the benchmark 10-year US government bond hovers near the monthly peak, which should act as a tailwind for the Greenback and cap gains for the non-yielding yellow metal.
- The Advance US Q4 GDP print is due this Thursday and is expected to show that growth in the world's largest economy slowed to a 2% annualized pace from 4.9% in the previous quarter.
- Thursday's US economic docket also features the release of Durable Goods Orders and the usual Weekly Initial Jobless Claims, which might influence the Greenback and the XAU/USD.
- Apart from this, the outcome of the highly-anticipated European Central Bank meeting might infuse volatility in the markets and produce short-term trading opportunities.
- The market focus, meanwhile, will remain glued to the US Personal Consumption Expenditures Price Index data – the Fed's preferred inflation gauge – on Friday.
(An automation tool was used in creating this post.)
Gold FAQs
Why do people invest in Gold?
Gold has played a key role in human’s history as it has been widely used as a store of value and medium of exchange. Currently, apart from its shine and usage for jewelry, the precious metal is widely seen as a safe-haven asset, meaning that it is considered a good investment during turbulent times. Gold is also widely seen as a hedge against inflation and against depreciating currencies as it doesn’t rely on any specific issuer or government.
Who buys the most Gold?
Central banks are the biggest Gold holders. In their aim to support their currencies in turbulent times, central banks tend to diversify their reserves and buy Gold to improve the perceived strength of the economy and the currency. High Gold reserves can be a source of trust for a country’s solvency. Central banks added 1,136 tonnes of Gold worth around $70 billion to their reserves in 2022, according to data from the World Gold Council. This is the highest yearly purchase since records began. Central banks from emerging economies such as China, India and Turkey are quickly increasing their Gold reserves.
How is Gold correlated with other assets?
Gold has an inverse correlation with the US Dollar and US Treasuries, which are both major reserve and safe-haven assets. When the Dollar depreciates, Gold tends to rise, enabling investors and central banks to diversify their assets in turbulent times. Gold is also inversely correlated with risk assets. A rally in the stock market tends to weaken Gold price, while sell-offs in riskier markets tend to favor the precious metal.
What does the price of Gold depend on?
The price can move due to a wide range of factors. Geopolitical instability or fears of a deep recession can quickly make Gold price escalate due to its safe-haven status. As a yield-less asset, Gold tends to rise with lower interest rates, while higher cost of money usually weighs down on the yellow metal. Still, most moves depend on how the US Dollar (USD) behaves as the asset is priced in dollars (XAU/USD). A strong Dollar tends to keep the price of Gold controlled, whereas a weaker Dollar is likely to push Gold prices up.
FX option expiries for January 25 NY cut at 10:00 Eastern Time, via DTCC, can be found below.
- EUR/USD: EUR amounts
- 1.0800 426m
- 1.0825 588m
- 1.0850 767m
- 1.0885 510m
- 1.0945 439m
- 1.0950 560m
- 1.0975 1.1b
- 1.1000 904m
- 1.1010 946m
- GBP/USD: GBP amounts
- 1.2815 568m
- USD/JPY: USD amounts
- 147.55 400m
- 150.00 395m
Norges Bank announces its rate decision today. Economists at ING analyze EUR/NOK ahead of the policy meeting.
It seems far too soon for Norges Bank to embrace any idea of easing
The policy rate was hiked to 4.50% in December – so it would seem far too soon for Norges Bank to embrace any idea of easing. However, the Norwegian Krone has been suffering a little this year as the backup in market interest rates has hit the risk environment.
In all, we suspect EUR/NOK needs to trade a little longer in this 11.35-11.45 range.
- Pound Sterling remains inside the woods ahead of US Q4 GDP data.
- Strong UK PMIs have prompted expectations of hawkish guidance from BoE policymakers.
- Going forward, policy decisions from the Fed/BoE will be in focus.
The Pound Sterling (GBP) struggles for direction as investors shift focus towards the central bank policy decisions, which are scheduled for next week. The GBP/USD remains sideways as a steady interest rate decision by the Bank of England (BoE) is widely anticipated. Market participants will keenly focus on the outlook for interest rates as strong PMI’s for December has allowed BoE policymakers to support the argument of maintaining interest rates at restrictive levels for a longer period.
Investors should brace for high volatility as the market mood will be guided by the United States Q4 Gross Domestic Product (GDP) data. Upbeat US data would lower the odds advocating an early interest rate-cut by the Federal Reserve (Fed) and support the US Dollar
Daily Digest Market Movers: Pound Sterling turns sideways ahead of US data
- Pound Sterling falls to near 1.2700 against the US Dollar as the market mood is slightly cautious ahead of the United States Q4 GDP and core underlying inflation data for January.
- The GBP/USD pair delivered a strong upside on Wednesday after robust preliminary UK PMI data for January.
- The S&P Global reported the Manufacturing PMI has risen to 47.3 in January (preliminary reading), against expectations of 46.7 and the prior reading of 46.2. Services PMI expanded to 53.8 vs. the former reading of 53.4. Investors projected a slight decline in the economic data to 53.2.
- A PMI figure below the 50.0 threshold is considered a contraction; above 50 indicates expansion.
- The agency reported that manufacturing activities were supported by increased hopes price pressures will ease, lower borrowing costs and a faster economic recovery.
- Improved Manufacturing PMI numbers have prompted the need for the BoE to keep interest rates higher for a longer period than what was previously anticipated by market participants. If this trend continues it will likely support Sterling.
- Going forward, market participants will shift focus to the interest rate decision by the Bank of England, which will be announced next week.
- The BoE is widely anticipated to maintain interest rates steady at 5.25% for the fourth time in a row while fresh guidance on the interest rate outlook will be keenly watched.
- Meanwhile, the US Dollar Index (DXY) has delivered a sharp recovery to near 103.30 as appeal for safe-haven improves ahead of the crucial economic data.
- As per the consensus, the US economy grew at a slower pace of 2.0% after expanding 4.9% in the third quarter of 2023.
- The hopes of a rate cut by the Federal Reserve (Fed) in March could increase if the growth rate turns out slower-than-projected while stronger numbers could prompt the higher-for-longer interest rate narrative.
Technical Analysis: Pound Sterling trades inside Wednesday’s trading range
Pound Sterling oscillates inside Wednesday’s trading session as focus shifts to central bank policy decisions, scheduled for next week. The broader-term trend for the GBP/USD pair remains upbeat as it sustains above the 20- and 50-day Exponential Moving Averages (EMAs). The 14-period Relative Strength Index (RSI) trades in the 40.00-60.00 range, indicating a sharp decline in volatility. A downside move could occur if the Cable drops below the crucial support of 1.2650.
Pound Sterling FAQs
What is the Pound Sterling?
The Pound Sterling (GBP) is the oldest currency in the world (886 AD) and the official currency of the United Kingdom. It is the fourth most traded unit for foreign exchange (FX) in the world, accounting for 12% of all transactions, averaging $630 billion a day, according to 2022 data.
Its key trading pairs are GBP/USD, aka ‘Cable’, which accounts for 11% of FX, GBP/JPY, or the ‘Dragon’ as it is known by traders (3%), and EUR/GBP (2%). The Pound Sterling is issued by the Bank of England (BoE).
How do the decisions of the Bank of England impact on the Pound Sterling?
The single most important factor influencing the value of the Pound Sterling is monetary policy decided by the Bank of England. The BoE bases its decisions on whether it has achieved its primary goal of “price stability” – a steady inflation rate of around 2%. Its primary tool for achieving this is the adjustment of interest rates.
When inflation is too high, the BoE will try to rein it in by raising interest rates, making it more expensive for people and businesses to access credit. This is generally positive for GBP, as higher interest rates make the UK a more attractive place for global investors to park their money.
When inflation falls too low it is a sign economic growth is slowing. In this scenario, the BoE will consider lowering interest rates to cheapen credit so businesses will borrow more to invest in growth-generating projects.
How does economic data influence the value of the Pound?
Data releases gauge the health of the economy and can impact the value of the Pound Sterling. Indicators such as GDP, Manufacturing and Services PMIs, and employment can all influence the direction of the GBP.
A strong economy is good for Sterling. Not only does it attract more foreign investment but it may encourage the BoE to put up interest rates, which will directly strengthen GBP. Otherwise, if economic data is weak, the Pound Sterling is likely to fall.
How does the Trade Balance impact the Pound?
Another significant data release for the Pound Sterling is the Trade Balance. This indicator measures the difference between what a country earns from its exports and what it spends on imports over a given period.
If a country produces highly sought-after exports, its currency will benefit purely from the extra demand created from foreign buyers seeking to purchase these goods. Therefore, a positive net Trade Balance strengthens a currency and vice versa for a negative balance.
- The European Central Bank is expected to maintain its monetary policy unchanged.
- ECB President Christine Lagarde hinted at summer as the time to pivot.
- EUR/USD should gain bearish traction once below the 1.0845 support area.
The European Central Bank (ECB) will have its first monetary policy meeting of the year on Thursday, but little is to be expected from European policymakers. The Main Refinancing Operations Rate will likely be maintained unchanged at 4.50%, and the Deposit Facility Rate at 4%. If something is, the central bank will continue “tightening” through the reduction of reinvestments in the Pandemic Emergency Purchase Programme (PEPP).
Indeed, the ECB is pivoting and rate cuts are on the table for 2024. Still, central bankers need further evidence underlying inflation is under control before taking such a bold step.
Back in December, the Governing Council decided to keep the three key ECB interest rates unchanged, acknowledging inflation dropped in the previous months while estimating price pressures are likely to “pick up again temporarily in the near term.”
European Central Bank interest rate decision: What to know in markets on Thursday
- Major central banks have held rates steady in the last quarter of 2023, as the risks of an economic setback weighed more than inflationary pressures.
- The United States (US) Federal Reserve (Fed) foresees three rate cuts throughout 2024, although FOMC members retain a certain dose of caution.
- EUR/USD peaked at 1.1139 by the end of December, entering a selling spiral afterwards and now trading below the 1.0900 mark.
- Alongside the ECB’s announcement, the United States will release the preliminary estimate of the Q4 Gross Domestic Product (GDP). The economy is expected to have grown at an annualized pace of 2% in the three months to December, down from 4.9% in Q3.
- Wall Street posted record highs this week, as investors hope the Fed will start sooner rather than later trimming interest rates. The odds for a March cut decreased lately, but speculative interest still believes rates will go down in 2024.
- The ECB’s January Bank Lending Survey (BLS) showed a tightening of credit standards amid persistent risk perceptions.
- Consumer Confidence in the Eurozone declined to -16.1 in January from -15, in December.
- The January preliminary HCOB/S&P Global Producer Manager Indexes (PMIs) indicated that business activity in the Eurozone fell at the slowest rate in six months, albeit with downturns persisting in both manufacturing and service sectors. Contraction readings are widespread throughout the sectors and major economies.
What to expect from the ECB meeting and how could it impact EUR/USD?
The ECB is widely anticipated to repeat the December decision of leaving the three key interest rates unchanged. Back then, the Governing Council expected headline inflation to average 5.4% in 2023, 2.7% in 2024, 2.1% in 2025 and 1.9% in 2026. Regarding economic growth, the staff projected it picking up from an average of 0.6% for 2023 to 0.8% for 2024, and to 1.5% for both 2025 and 2026. The general message was the “higher for longer” that introduced the Fed, as policymakers noted they intend to set policy rates at sufficiently restrictive levels for as long as necessary.
Meanwhile, inflation in the Eurozone has ticked higher. The Harmonized Index of Consumer Prices (HICP) rose to 2.9% YoY in December, slightly better than the 3% expected but higher than the previous 2.4%. The core annual HICP printed at 3.4% YoY, easing from 3.6% in November. Core inflation is pretty much doubling the central bank’s goal of around 2%.
The minutes of the ECB's December meeting showed policymakers did not discuss rate cuts. In fact, President Christine Lagarde pushed back against expectations on rate cuts in the press conference that followed the December announcement. "We should absolutely not lower our guard," Lagarde said.
However, things are not that clear ahead of the first 2024 decision. Over the last month, European policymakers have been commenting on the possibility and timing of rate cuts, forcing President Lagarde to clarify her stance at the World Economic Forum in Davos, Switzerland. Once again, she said that the economic risk of cutting rates too quickly was greater than the risk of leaving them too high, adding aggressive rate-cut bets does not help the ECB. Finally, she ended up hinting at a potential cut for the next summer, somehow giving in to the market’s pressures.
With that in mind, the focus will be on whether the central bank introduces rate cuts to the discussion in this January meeting and any clue policymakers could provide on the timing. The most likely scenario, however, would be President Christine Lagarde repeating the battle against inflation is not yet done, emphasizing the need to maintain rates higher for longer at the risk of price pressures resuming the advance. It is still to be seen, however, if hawkish words from the central bank’s head could positively impact the Euro, as bets against it are way too high.
A dovish shift in Lagarde’s tone will be partially surprising and may put the Euro on a steep bearish path.
As a note of colour, Reuters published on Wednesday a survey from the International and European Public Services Organisation (IPSO). The survey shows a majority of ECB employees think Christine Lagarde is not the right person to lead the institution, and that her performance is worse than that of her predecessors.
Reuters also reported that “An ECB spokesperson said the survey was flawed and included topics for which the Executive Board or Governing Council rather than solely the President is responsible and that are not within IPSO's remit.”
The EUR/USD pair trades around the 1.0900 figure ahead of the event, lacking directional strength for a second consecutive week. Valeria Bednarik, FXStreet Chief Analyst, notes: “Financial markets are in wait-and-see mode ahead of central banks’ decisions. It may be the turn of the ECB, but it is worth reminding the Federal Reserve (Fed) will announce its decision next week. Investors need fresh clues from policymakers to place firmer bets.”
Regarding the EUR/USD pair’s technical perspective, Bednarik adds: “The daily chart for EUR/USD suggest bears hold the grip, but eased the pressure, as alongside the ECB announcement, the United States (US) will publish the preliminary estimate of the Q4 Gross Domestic Product (GDP). Nevertheless, the risk skews to the downside, with the pair posting lower lows on a weekly basis since the year started. In the mentioned time frame, the pair has been meeting buyers around a flat 200 Simple Moving Average (SMA) at 1.0845, the level to pierce ahead of a steeper slide. At the same time, technical indicators remain within negative levels, with no signs of particular directional interest.”
Additionally, Bednarik notes: “Buyers would need to recover the 1.1000 threshold to have a chance of beating bears. In such a scenario, and if the pair is able to sustain gains after the dust settles, the rally could continue initially towards the 1.1040-1.1060 ahead, while beyond the latter, the pair could extend gains up to the 1.1120 price zone.”
ECB FAQs
What is the ECB and how does it influence the Euro?
The European Central Bank (ECB) in Frankfurt, Germany, is the reserve bank for the Eurozone. The ECB sets interest rates and manages monetary policy for the region.
The ECB primary mandate is to maintain price stability, which means keeping inflation at around 2%. Its primary tool for achieving this is by raising or lowering interest rates. Relatively high interest rates will usually result in a stronger Euro and vice versa.
The ECB Governing Council makes monetary policy decisions at meetings held eight times a year. Decisions are made by heads of the Eurozone national banks and six permanent members, including the President of the ECB, Christine Lagarde.
What is Quantitative Easing (QE) and how does it affect the Euro?
In extreme situations, the European Central Bank can enact a policy tool called Quantitative Easing. QE is the process by which the ECB prints Euros and uses them to buy assets – usually government or corporate bonds – from banks and other financial institutions. QE usually results in a weaker Euro.
QE is a last resort when simply lowering interest rates is unlikely to achieve the objective of price stability. The ECB used it during the Great Financial Crisis in 2009-11, in 2015 when inflation remained stubbornly low, as well as during the covid pandemic.
What is Quantitative tightening (QT) and how does it affect the Euro?
Quantitative tightening (QT) is the reverse of QE. It is undertaken after QE when an economic recovery is underway and inflation starts rising. Whilst in QE the European Central Bank (ECB) purchases government and corporate bonds from financial institutions to provide them with liquidity, in QT the ECB stops buying more bonds, and stops reinvesting the principal maturing on the bonds it already holds. It is usually positive (or bullish) for the Euro.
Economic Indicator
Eurozone ECB Rate On Deposit Facility
One of the European Central Bank's three key interest rates, the rate on the deposit facility, is the rate at which banks earn interest when they deposit funds with the ECB. It is announced by the European Central Bank at each of its eight scheduled annual meetings.
Read more.Next release: 01/25/2024 13:15:00 GMT
Frequency: Irregular
Source: European Central Bank
- United States Gross Domestic Product is forecast to grow at an annualized rate of 2% in Q4.
- The resilience of the US economy could allow the Fed to delay the policy pivot.
- Investors will also pay close attention to the Gross Domestic Price Deflator reading.
The Gross Domestic Product (GDP) report for the fourth quarter, to be released by the Bureau of Economic Analysis (BEA) on Thursday, is forecast to show an expansion of the US economy at an annualized rate of 2% following the impressive 4.9% growth recorded in the previous quarter.
After staying under persistent bearish pressure in the last quarter of 2023, the US Dollar (USD) managed to stage a rebound in January. The DXY USD Index is up nearly 2% since the beginning of the year, with markets reassessing the timing of the Federal Reserve (Fed) policy pivot.
US Gross Domestic Product forecast: What numbers could tell us
Thursday's US economic docket highlights the release of the preliminary GDP print for the fourth quarter, scheduled at 13:30 GMT. The first estimate is expected to show that the world's largest economy grew by 2% in the last three months of 2023, a relatively healthy pace despite being much lower than the third quarter’s 4.9% expansion.
Inventory accumulation was the primary driver behind the GDP growth in the third quarter. As this component tends to move in the opposite direction from quarter to quarter, it will not be a major surprise to see a steep decline in the expansion rate toward the end of 2023.
Market participants will also pay close attention to the GDP Price Deflator reading, also known as the GDP Price Index, which measures the changes in the prices of services and goods produced in the US. The GDP Price Deflator climbed to 3.3% in Q3 from 1.7% in Q2, suggesting that inflation had a bigger positive impact on growth than in the second quarter.
Previewing the US GDP growth data, “In terms of economic output, we expect real GDP to have registered a below-trend 1.6% q/q AR expansion in 23Q4, much slower than Q3's blockbuster and unsustainable 4.9% increase,” TD Securities analysts said and continued:
“In the details, we look for consumer spending to have led the deceleration in activity (though likely growing at a still decent pace), while inventories are expected to be a major drag. We also forecast business investment to stay downbeat, as capex appears to have remained mostly impaired in Q4 (equipment investment has contracted in five out of the last six quarters). Even if our below-consensus projection is realized, output likely still rose at a very strong 2.4% pace in 2023 (2.7% Q4/Q4).”
When is the GDP print released, and how can it affect the USD?
The US GDP report will be released at 13:30 GMT on Thursday. Ahead of the event, the US Dollar stays resilient against its rivals on growing expectations for a delay in the Federal Reserve’s upcoming rate cut.
Before the Federal Reserve blackout period started on January 21, several policymakers pushed back against the market anticipation for a 25 basis points (bps) Fed rate cut in March. San Francisco Fed President Mary Daly said that she believes the central bank has a lot of work left to do on bringing inflation back down to the Fed's 2% target and argued that it’s too early to think “rate cuts are around the corner.” Similarly, Atlanta Fed President Raphael Bostic noted that his baseline scenario is for rate reductions to start sometime in the third quarter.
The CME FedWatch Tool’s probability of a 25 bps rate cut in March declined below 50% in the second half of January from nearly 80% in late December, reflecting the shift in market positioning.
A stronger-than-forecast GDP growth in Q4 could feed into expectations that the Fed is likely to refrain from lowering the policy rate in March and provide a boost to the USD with the immediate reaction. In case the GDP reading arrives near the market consensus of 2%, a GDP Price Deflator print at or above 3% could help the USD hold its ground, while a decrease toward 2% could hurt the currency.
On the other hand, a disappointing growth figure below 1.5% could go against the “soft landing” narrative. In this scenario, markets could lean toward a Fed rate cut in March and trigger a decline in US Treasury bond yields, causing the USD to suffer losses against its major rivals.
Eren Sengezer, European Session Lead Analyst at FXStreet, shares a brief technical outlook for the USD Index (DXY):
“The Relative Strength Index (RSI) indicator on the daily chart holds near 60, highlighting the near-term bullish bias. The 200-day Simple Moving Average (SMA) forms a pivot point at 103.50. In case DXY stabilizes above that level and starts using it as support, 104.40 (100-day SMA) and 105.00 (psychological level) could be set as the next bullish targets. On the flip side, the Fibonacci 38.2% retracement of the October-December downtrend forms strong support at 103.00 before 102.50 (20-day SMA) and 102.00 (Fibonacci 23.6% retracement).”
Economic Indicator
United States Gross Domestic Product Annualized
The real Gross Domestic Product (GDP) Annualized, released quarterly by the US Bureau of Economic Analysis, measures the value of the final goods and services produced in the United States in a given period of time. Changes in GDP are the most popular indicator of the nation’s overall economic health. The data is expressed at an annualized rate, which means that the rate has been adjusted to reflect the amount GDP would have changed over a year’s time, had it continued to grow at that specific rate. Generally speaking, a high reading is seen as bullish for the US Dollar (USD), while a low reading is seen as bearish.
Read more.Next release: 01/25/2024 13:30:00 GMT
Frequency: Quarterly
Source: US Bureau of Economic Analysis
Why it matters to traders
The US Bureau of Economic Analysis (BEA) releases the Gross Domestic Product (GDP) growth on an annualized basis for each quarter. After publishing the first estimate, the BEA revises the data two more times, with the third release representing the final reading. Usually, the first estimate is the main market mover and a positive surprise is seen as a USD-positive development while a disappointing print is likely to weigh on the greenback. Market participants usually dismiss the second and third releases as they are generally not significant enough to meaningfully alter the growth picture.
GDP FAQs
What is GDP and how is it recorded?
A country’s Gross Domestic Product (GDP) measures the rate of growth of its economy over a given period of time, usually a quarter. The most reliable figures are those that compare GDP to the previous quarter e.g Q2 of 2023 vs Q1 of 2023, or to the same period in the previous year, e.g Q2 of 2023 vs Q2 of 2022.
Annualized quarterly GDP figures extrapolate the growth rate of the quarter as if it were constant for the rest of the year. These can be misleading, however, if temporary shocks impact growth in one quarter but are unlikely to last all year – such as happened in the first quarter of 2020 at the outbreak of the covid pandemic, when growth plummeted.
How does GDP influence currencies?
A higher GDP result is generally positive for a nation’s currency as it reflects a growing economy, which is more likely to produce goods and services that can be exported, as well as attracting higher foreign investment. By the same token, when GDP falls it is usually negative for the currency.
When an economy grows people tend to spend more, which leads to inflation. The country’s central bank then has to put up interest rates to combat the inflation with the side effect of attracting more capital inflows from global investors, thus helping the local currency appreciate.
How does higher GDP impact the price of Gold?
When an economy grows and GDP is rising, people tend to spend more which leads to inflation. The country’s central bank then has to put up interest rates to combat the inflation. Higher interest rates are negative for Gold because they increase the opportunity-cost of holding Gold versus placing the money in a cash deposit account. Therefore, a higher GDP growth rate is usually a bearish factor for Gold price.
The European Central Bank (ECB) announces its rate decision today. Economists at ING analyze how the policy announcement could impact the EUR/USD pair.
Outside risk to 1.0980/1.0990 should ECB pushback against easing expectations prove surprisingly effective
ECB President Christine Lagarde will try to avoid being drawn into any pre-commitment over a summer rate cut. In theory then, if she can avoid this and leave markets with a sense that the ECB is truly data-dependent, short-term Euro interest rates could nudge a little higher and support FX pairs like EUR/USD and EUR/CHF.
We would say that the ECB event risk proves a mild upside risk to EUR/USD – but the carpet could be pulled from under the Euro should President Lagarde somehow convey the message that the policy rate will be getting cut in the summer after all.
1.0850-1.0950 looks the EUR/USD range, with outside risk to 1.0980/1.0990 should the ECB pushback against easing expectations prove surprisingly effective.
Economists at TD Securities discuss the European Central Bank (ECB) Interest Rate Decision and their implications for the EUR/USD pair.
Base Case (65%)
The ECB delivers another hold and makes no major changes to the press statement. The Governing Council emphasizes its broad reaction function and reiterates the importance of economic data in determining the ECB's policy stance. President Lagarde suggests that cuts are likely to come around the summer. That said, the President makes it clear that the exact timing is still very much up in the air, and will ultimately be decided by the data. EUR/USD -0.15%.
Hawkish (30%)
In a hawkish turn, President Lagarde pushes back hard against discussions about the potential timing of rate cuts. Lagarde argues that cuts will come, probably some time this year, and while market pricing looks too dovish, it is too early to comment on when cuts are likely to come. While inflation developments have been promising, Lagarde stresses that the tight labour market adds upside risks to the policy outlook. EUR/USD +0.75%.
Dovish (5%)
Despite recently pushing back against market expectations for spring cuts, President Lagarde fails to do so at the press conference – seemingly offering some credibility to market bets. EUR/USD -0.50%.
Here is what you need to know on Thursday, January 25:
After Wednesday's volatile action amid PMI data releases from major economies, markets seem to have turned subdued early Thursday, with focus shifting to the European Central Bank (ECB) policy announcements. The US economic docket will feature the first estimate of the fourth-quarter Gross Domestic Product (GDP) growth, alongside Durable Goods Orders for December and the weekly Initial Jobless Claims data.
The US Dollar (USD) weakened against its rivals in the first half of the day on Wednesday as risk flows dominated the action. Later in the American session, however, the upbeat PMI data, which showed that the economic activity in the private sector expanded at a stronger pace than forecast in early January, helped the currency limit its losses. In the European morning, the USD Index (DXY) fluctuates above 103.00, while the benchmark 10-year US Treasury bond yield holds steady above 4% and US stock index futures trade mixed. The real GDP of the US is forecast to expand at an annual rate of 2% in the fourth quarter, down from the 4.9% growth recorded in the third quarter.
US Dollar price this week
The table below shows the percentage change of US Dollar (USD) against listed major currencies this week. US Dollar was the weakest against the Swiss Franc.
| USD | EUR | GBP | CAD | AUD | JPY | NZD | CHF | |
| USD | 0.04% | -0.21% | 0.61% | 0.23% | -0.27% | 0.09% | -0.56% | |
| EUR | -0.04% | -0.26% | 0.55% | 0.18% | -0.31% | 0.04% | -0.60% | |
| GBP | 0.20% | 0.24% | 0.79% | 0.43% | -0.07% | 0.28% | -0.37% | |
| CAD | -0.60% | -0.55% | -0.80% | -0.38% | -0.86% | -0.51% | -1.17% | |
| AUD | -0.23% | -0.18% | -0.45% | 0.38% | -0.50% | -0.14% | -0.78% | |
| JPY | 0.28% | 0.33% | 0.13% | 0.88% | 0.51% | 0.38% | -0.30% | |
| NZD | -0.09% | -0.05% | -0.31% | 0.51% | 0.14% | -0.36% | -0.66% | |
| CHF | 0.56% | 0.60% | 0.34% | 1.14% | 0.75% | 0.28% | 0.63% |
The heat map shows percentage changes of major currencies against each other. The base currency is picked from the left column, while the quote currency is picked from the top row. For example, if you pick the Euro from the left column and move along the horizontal line to the Japanese Yen, the percentage change displayed in the box will represent EUR (base)/JPY (quote).
USD/CAD gathered bullish momentum and registered its highest daily close since mid-December above 1.3500 on Wednesday. The Bank of Canada (BoC) left the policy rate unchanged at 5% as expected following the January policy meeting. In the post-meeting press conference, BoC Governor Tiff Macklem acknowledged that discussions among policymakers have shifted to how long rates need to be kept at the current level before they can be lowered. Following Wednesday's rally, USD/CAD went into a consolidation phase above 1.3500 on Thursday.
EUR/USD capitalized on the broad-based USD weakness and closed in positive territory on Wednesday. The pair, however, failed to stabilize above 1.0900 and was last seen moving sideways slightly below this level. The ECB is forecast to hold key rates steady. ECB President Chrsitine Lagarde will comment on the policy outlook in a press conference starting at 13:45 GMT.
GBP/USD climbed to its highest level in nearly two weeks above 1.2770 during the European trading hours on Wednesday after the PMI data from the UK came in better than analysts' estimates. The pair staged a downward correction later in the American session and stabilized above 1.2700.
“Over the past six months, firms have generally expected their prices' growth to continue to moderate, but on average to remain above the Bank’s inflation target range of 2–3%," the Reserve Bank of Australia (RBA) said in its latest quarterly bulletin. AUD/USD showed no reaction to this publication and was last seen moving sideways below 0.6600.
USD/JPY declined sharply on Wednesday and lost more than 0.5% on a daily basis. The pair recovered modestly during the Asian trading hours on Thursday and advanced above 147.50.
After rising toward $2,040, Gold lost its traction and closed deep in negative territory on Wednesday as the benchmark 10-year US Treasury bond yield pushed higher on strong US PMI data. Early Thursday, XAU/USD stays relatively quiet below $2,020.
- USD/CAD receives upward support due to the improved Crude oil prices.
- WTI price receives upward support on PBoC MLF rate cut and lower US Crude stockpiles.
- Canada's MPR indicates that the BoC anticipates inflation reaching its 2.0% target by 2025.
USD/CAD makes an effort to not capitalize on the recent gains after the interest rate decision from the Bank of Canada (BoC) on Wednesday. Additionally, the positive S&P Global Purchasing Managers Index (PMI) data from the United States (US) might have contributed to reducing the probability of rate cuts by the Federal Reserve (Fed) in March, leading to an appreciation in the USD/CAD pair. However, the spot price hovers near 1.3520 during the Asian session on Thursday.
On Wednesday, the Bank of Canada (BoC) maintained its benchmark interest rate at 5.0%, marking the fourth consecutive instance of the central bank keeping rates steady. BoC Governor Tiff Macklem announced a shift in focus, moving from the question of whether interest rates are sufficiently high to when they can potentially be lowered. The Bank of Canada's Monetary Policy Report (MPR) indicates that the central bank anticipates inflation reaching its 2.0% target by 2025.
Moreover, the improved Crude oil prices may contribute support for the Canadian Dollar, which in turn, undermines the USD/CAD pair. The West Texas Intermediate (WTI) oil price is modestly advancing, hovering around $75.50 per barrel. Crude oil prices' resilience can be attributed to speculations surrounding the People’s Bank of China's reduction in the Medium-term Lending Facility (MLF) rate, coupled with a concurrent decline in US crude oil stockpiles.
Furthermore, the preliminary US Gross Domestic Product Annualized report is scheduled for release on Thursday, with anticipated figures pointing to a 2.0% reading in the fourth quarter, down from the previous 4.9% reading. Should the actual US GDP align with these market expectations, there could be an increased probability of the Federal Reserve implementing a policy rate reduction in the upcoming March meeting.
However, market sentiment, as indicated by the CME's FedWatch tool, indicates a decrease in bets on a March rate cut from the Fed, falling below 40%. This represents a significant decline from the approximately 80% probability recorded just a month ago.
- EUR/GBP posts modest gains near 0.8556 on Thursday.
- The European Central Bank is set to hold interest rates at its January meeting.
- Bank of England (BoE) is set to keep rates on hold on February 1 and will start its rate-cutting cycle at its August meeting.
- Traders await the European Central Bank (ECB) rate decision and press conference.
The EUR/GBP cross remains on the defensive around the mid-0.8500s during the early European trading hours on Thursday. The European Central Bank (ECB) monetary policy decision will be closely watched by traders. The markets anticipate the ECB to maintain a status quo at its January meeting. At press time, the cross is trading at 0.8556, gaining 0.01% on the day.
The European Central Bank is expected to hold interest rates at their current record high at its monetary policy meeting on Thursday. The market has priced in a 60% odd of the first-rate cut as early as April, according to Reuters. ECB President Lagarde signaled in Davos that the first cut may come in the summer months of 2024. She stated that she remained reserved and data-dependent in her final outlook.
On the British pound front, the Bank of England (BoE) is set to keep rates on hold on February 1 and will start its rate-cutting cycle at its August meeting. Financial markets are widely anticipating the BoE cutting its rate in 2024 since inflation has fallen considerably since peaking at 11.1% in October 2022, the highest rate in four decades.
Looking ahead, market players will closely watch the ECB rate decision and take more cues from the press conference. ECB's President Lagarde's speech might offer some hints about the future monetary policy path. These events could provide a clear direction for the EUR/GBP cross.
- WTI price receives upward support due to the expectation of a PBoC MLF rate cut.
- EIA Crude Oil Stocks Change declined by 9.233M barrels compared to the previous drop of 2.492M barrels.
- US Baker Hughes anticipates a decline in spending on drilling in North America in 2024.
West Texas Intermediate (WTI) oil price grapples to continue its gains for the second consecutive session. The strength in the Crude oil prices is attributed to the recent development of the Medium-term Lending Facility (MLF) rate cut, along with the decline in the US Crude Oil stockpiles. The WTI oil price inches higher near $75.50 per barrel during the Asian session on Thursday.
The People's Bank of China (PBoC) is speculated to consider cutting the Medium-term Lending Facility (MLF) rate in the current quarter. This anticipation follows the recent announcement by PBoC Governor Pan Gongsheng, informing about a reduction of the Required Reserve Ratio (RRR) by 50 basis points starting from February 5th.
A potential cut in the MLF rate, coupled with the RRR reduction, is expected to provide additional liquidity and support economic growth. This, in turn, could stimulate consumption, including the consumption of crude oil products, by China, which is the world's largest oil importer.
According to the Energy Information Administration's (EIA) weekly report released on Wednesday, Crude Oil Stocks Change experienced a significant decline of 9.233 million barrels for the week ending on January 19. This marks a substantial decrease compared to the previous week's reading, which reported a drop of 2.492 million barrels. Severe weather conditions, such as storms and cold snaps disrupted Crude oil production and transportation particularly in North Dakota, leading to fluctuations in inventory levels.
US oilfield technology firm Baker Hughes has stated that it anticipates a decline in spending on drilling and well completion in North America in 2024, citing ongoing volatility in commodity prices. The company's outlook reflects the cautious approach of shale producers, who are seeking to reduce drilling activities in response to weak prices in the oil market.
- EUR/JPY rebounds to 160.75 ahead of the ECB rate decision.
- The cross maintains a bullish outlook above the key Exponential Moving Averages (EMA).
- The immediate resistance level is seen at 161.40; 160.30 acts as an initial support level for the cross.
The EUR/JPY cross recovers some lost ground near 160.75 during the early European session on Thursday. The weaker-than-expected German and Eurozone PMI data for January weigh on the Euro (EUR) and act as a headwind for EUR/JPY. Investors await the European Central Bank (ECB) monetary policy meeting on Thursday, with no change in rate expected.
According to the four-hour chart, the bullish potential of EUR/JPY remains intact as the cross holds above the 100-period Exponential Moving Averages (EMA). It’s worth noting that the Relative Strength Index (RSI) stands below the 50-midline, indicating that further decline cannot be ruled out in the near term.
The upper boundary of the Bollinger Band at 161.40 acts as an immediate resistance level for the cross. The additional upside filter will emerge at a high of January 23 at 161.70, followed by a high of January 19 at 161.87.
On the other hand, the lower limit of the Bollinger Band at 160.30 acts as an initial support level for EUR/JPY. The crucial contention level is seen near a low of January 24 and a psychological mark at 160.00. A breach of this level will see a drop to the 100-period EMA at 159.72.
EUR/JPY four-hour chart
-638417583426440936.png)
- USD/CHF rebounds despite the decline in the US bond yields.
- US GDP Q4 is expected to ease at 2.0% from the previous reading of 4.9%.
- Traders await next week’s Swiss Real Retail Sales and the ZEW Survey to gauge the Swiss economic landscape.
USD/CHF moves lower to near 0.8650 during the Asian session on Thursday, retracing its losses registered in the previous session. The US Dollar Index (DXY) maintains a steady position despite the downbeat US Treasury yields, which underpins the USD/CHF pair. The DXY hovers near 103.30 with the 2-year and 10-year yields on US bond coupons standing at 4.36% and 4.14%, respectively, by the press time.
However, the US Dollar (USD) was challenged due to risk-on market sentiment, avoiding the positive PMI data from the United States (US). The market sentiment is influenced by expectations related to the Fed's monetary policy, and traders are adjusting their positions accordingly. Additionally, the preliminary US Gross Domestic Product Annualized report is set to be released on Thursday, with expectations of a reading of 2.0% in the fourth quarter, compared to the previous reading of 4.9%.
If the actual US GDP reading aligns with market expectations, it could increase the likelihood of the Fed reducing policy rates in the March meeting. As reflected in the CME's FedWatch tool, the market sentiment suggests that bets on a March rate cut from the Fed have dropped to below 40%, a substantial decrease from around 80% recorded just a month ago.
Earlier this week, Swiss National Bank (SNB) President Thomas Jordan mentioned that the robust Swiss Franc (CHF) has played a role in capping inflation. In addition, he expressed confidence in the economy, stating that economists are confident that there won’t be a recession. However, Jordon emphasized that while a recession is not expected, the outlook points to weak growth.
Next week, economic indicators like Real Retail Sales and the ZEW Survey will be monitored by traders to gauge the health of the Swiss economy and anticipate potential changes in SNB’s monetary policy.
Japan's top currency diplomat Masato Kanda commented on the weaker Japanese Yen (JPY) on Thursday. Kanda stated that it’s important for FX to move stably, reflecting fundamentals.
Key quotes
“Strong market interest in US rate cut timing and BOJ policy outlook, both of which could be used by speculators as an excuse for volatile market moves.”
“Always communicate closely with financial authorities, including the BOJ and the Fed.”
"Declines to comment on BOJ policy beyond saying it is among 'important events' when asked about ending negative interest rates.
“Always carefully watch the impact of central bank decisions on financial markets; will continue to do so.”
"It is important for currency exchange rates to move stably, reflecting economic fundamentals.”
“Ultra-loose monetary policy helped pull the economy out of a deflationary state but also had negative side effects.”
“US economy is stronger than expected, but if tight monetary policy is prolonged, that could hurt domestic consumption, become a risk to global growth.”
Market reaction
A mild verbal intervention by Japan's top currency diplomat Masato Kanda had little to no impact on the Japanese Yen's performance against its rivals. At the time of writing, USD/JPY is trading at 147.77, gaining 0.07% on the day.
Bank of Japan FAQs
What is the Bank of Japan?
The Bank of Japan (BoJ) is the Japanese central bank, which sets monetary policy in the country. Its mandate is to issue banknotes and carry out currency and monetary control to ensure price stability, which means an inflation target of around 2%.
What has been the Bank of Japan’s policy?
The Bank of Japan has embarked in an ultra-loose monetary policy since 2013 in order to stimulate the economy and fuel inflation amid a low-inflationary environment. The bank’s policy is based on Quantitative and Qualitative Easing (QQE), or printing notes to buy assets such as government or corporate bonds to provide liquidity. In 2016, the bank doubled down on its strategy and further loosened policy by first introducing negative interest rates and then directly controlling the yield of its 10-year government bonds.
How do Bank of Japan’s decisions influence the Japanese Yen?
The Bank’s massive stimulus has caused the Yen to depreciate against its main currency peers. This process has exacerbated more recently due to an increasing policy divergence between the Bank of Japan and other main central banks, which have opted to increase interest rates sharply to fight decades-high levels of inflation. The BoJ’s policy of holding down rates has led to a widening differential with other currencies, dragging down the value of the Yen.
Is the Bank of Japan’s ultra-loose policy likely to change soon?
A weaker Yen and the spike in global energy prices have led to an increase in Japanese inflation, which has exceeded the BoJ’s 2% target. Still, the Bank judges that the sustainable and stable achievement of the 2% target has not yet come in sight, so any sudden change in the current policy looks unlikely.
- NZD/USD trades with a mild positive bias for the third straight day amid a softer USD.
- Reduced bets for an early Fed rate cut help limit the USD downside and cap the major.
- Traders now look to the Advance US Q4 GDP print for some meaningful opportunities.
The NZD/USD pair attracts some buyers for the third straight day on Thursday and for now, seems to have stalled the previous day's pullback from the vicinity of mid-0.6100s, or over a one-week high. Spot prices manage to hold above the 0.6100 round-figure mark during the Asian session, though the lack of any follow-through buying warrants some caution for bulls ahead of the crucial US macro data.
The first estimate of the fourth-quarter GDP growth figures from the US is due later this Thursday and will be accompanied by the release of Durable Goods Orders and the usual Weekly Initial Jobless Claims data. Against the backdrop of the upbeat US consumer spending and labor market data released last week, any positive surprise will reaffirm the view that the US economy is in good shape and further push back expectations for an early rate cut by the Federal Reserve (Fed). This should boost the US Dollar (USD) and act as a headwind for the NZD/USD pair.
The immediate market reaction, however, is more likely to remain limited as the market focus remains glued to the US Personal Consumption Expenditures (PCE) Price Index on Friday. The crucial inflation data should play a key role in influencing market expectations about the Fed's future policy decision, which, in turn, will drive the USD demand. In the meantime, the uncertainty over the timing of when the US central bank will start cutting interest rates keep the USD bulls on the defensive below the highest level since December 13 and lends support to the the NZD/USD pair.
Meanwhile, the quarterly CPI report released on Wednesday showed that consumer prices in New Zealand remained well above the Reserve Bank of New Zealand's (RBNZ) 1% to 3% target. This limits the likelihood of a near-term interest rate cut by the central bank, which is seen as another factor acting as a tailwind for the domestic currency and assisting the NZD/USD pair to hold above a technically significant 200-day Simple Moving Average (SMA).
Technical levels to watch
- GBP/USD retreated from the two-week high at 1.2774 on Wednesday.
- Upbeat US PMI data neutralized the positive impact of UK PMI figures on Pound Sterling.
- The positive UK PMI figures could influence BoE to cut interest rates in the February meeting.
- BoE is expected to initiate a rate-cutting cycle in the August meeting.
GBP/USD experiences a downward trend, following the pullback from a recent two-week high at 1.2774 on Wednesday. During the Asian session on Thursday, the GBP/USD pair trades lower near 1.2710. The Pound Sterling (GBP) initially received support following positive Purchasing Managers Index (PMI) data from the United Kingdom (UK). However, this upward momentum could not be sustained after the release of upbeat PMI data from the United States (US).
The preliminary S&P Global/CIPS Services Purchasing Managers' Index (PMI) for January in the United Kingdom demonstrated growth, registering a reading of 53.8 compared to the previous figure of 53.4. The Manufacturing PMI also showed improvement, increasing to 47.3 from the earlier reading of 46.2. Simultaneously, the Composite PMI, which combines both services and manufacturing sectors, appreciated, reaching a figure of 52.5 compared to the previous reading of 52.1.
The positive Purchasing Managers Index (PMI) figures suggest that the Bank of England (BoE) may choose to refrain from implementing monetary policy loosening measures in the upcoming February meeting. However, investors appear to be anticipating that the BoE will initiate a rate-cutting cycle starting at its August meeting. Market expectations imply rate cuts by 175 basis points (bps) throughout the cycle, with the policy rate reaching 4.50% by December 2024.
The positive S&P Global Purchasing Managers Index (PMI) data from the United States (US) on Wednesday could reduce the probability of rate cuts by the Federal Reserve (Fed) in March, leading to a decline in the GBP/USD pair. Additionally, market sentiment reflected in the CME's FedWatch tool indicates that bets on a March rate cut from the Fed have dropped to below 40%, a substantial decrease from around 80% recorded just a month ago. Investors will likely watch the US Gross Domestic Product Annualized (Q4) data scheduled for release on Thursday.
US S&P Global Manufacturing Purchasing Managers' Index (PMI) surged to an 11-month high of 50.3 in January, exceeding the forecast of remaining consistent at 47.9. The US Services PMI recorded a rise to 52.9, surpassing the expected reading of 51 and the previous figure of 51.4. Overall, the Composite PMI for the United States increased to 52.3 from the previous reading of 50.9. This comprehensive indicator, combining both manufacturing and services, points towards an expansion in economic activities across sectors.
- Indian Rupee edges lower on the modest recovery of the US Dollar.
- The Indian economy is forecast to expand by 7.3% in the current fiscal year.
- The flash US Gross Domestic Product growth numbers (Q4) are due later on Thursday.
Indian Rupee (INR) loses ground on Thursday amid renewed US Dollar (USD) demand. According to the National Statistical Office’s first advance estimates of national income released in early January, the Indian economy is expected to expand at 7.3% in the current fiscal year, exceeding even experts' most optimistic expectations. Nonetheless, concerns about rising inflation and higher crude oil prices due to the ongoing geopolitical tensions in the Middle East might cap the INR’s upside in the near term.
Investors will take more cues from the US economic data that could further impact rate-cut expectations in the United States. The preliminary US Gross Domestic Product Annualized (Q4) will be released on Thursday, which is estimated to expand by 2.0%.
Indian markets will be closed on Friday for Republic Day. Attention will shift to the release of the US Core Personal Consumption Expenditures Price Index (Core PCE) for December. Additionally, India’s interim budget for fiscal year 2024–25 (FY25) will be published on February 1.
Daily Digest Market Movers: Indian Rupee remains sensitive to higher food inflation and oil prices
Foreign investors have sold roughly $2 billion worth of Indian equities in January, following net buys of $7.9 billion the previous month.
Reserve Bank of India Governor Shaktikanta Das said last week that monetary policy must remain actively disinflationary, despite the recent sharp fall in core inflation.
India's core inflation dropped to its lowest level in four years in December, raising the possibility that the rate-setting panel may adjust its position to "neutral" next month.
The RBI is expected to target a narrower FY25 fiscal deficit of 5.3%–5.6% of GDP versus 5.9% in FY24.
The US S&P Global Composite PMI for January signaled the fastest rise in business activity since June 2023, arriving at 52.3 versus 50.9 prior, beating the market expectations.
The US S&P Global Services PMI rose to 52.9 in January from 51.4 in December. The manufacturing figure grew to 50.3 from 47.9 in the previous reading.
Former St. Louis Federal Reserve (Fed) President James Bullard said on Tuesday that the central bank may begin cutting interest rates before inflation hits 2%, potentially as soon as March.
Technical Analysis: Indian Rupee remains confined in the 82.80–83.40 region
Indian Rupee weakens on the day. The USD/INR pair has remained stuck within the 82.80–83.40 trading range since September 2023. USD/INR resumes its upside as the pair holds above the key 100-period Exponential Moving Average (EMA) on the daily chart. However, the 14-day Relative Strength Index (RSI) hovers around the 50.0 midline, suggesting the directionlessness of the pair for the time being.
The first upside barrier for USD/INR is seen at 83.40 (the upper boundary of the trading range). The next hurdle will emerge at 83.47 (2023 high) and 84.00 (round figure). On the other hand, the initial support level is seen at the 83.00 psychological mark. The next contention level is located at 82.80 (lower limit of the trading range, low of January 15) and 82.60 (low of August 11).
US Dollar price today
The table below shows the percentage change of US Dollar (USD) against listed major currencies today. US Dollar was the strongest against the Swiss Franc.
| USD | EUR | GBP | CAD | AUD | JPY | NZD | CHF | |
| USD | 0.02% | 0.04% | -0.06% | 0.00% | 0.07% | -0.04% | 0.14% | |
| EUR | 0.00% | 0.05% | -0.07% | -0.02% | 0.07% | -0.06% | 0.14% | |
| GBP | -0.04% | -0.03% | -0.10% | -0.06% | 0.03% | -0.10% | 0.10% | |
| CAD | 0.06% | 0.08% | 0.11% | 0.05% | 0.13% | 0.01% | 0.21% | |
| AUD | 0.01% | 0.02% | 0.04% | -0.06% | 0.07% | -0.04% | 0.15% | |
| JPY | -0.07% | -0.06% | -0.02% | -0.13% | -0.11% | -0.12% | 0.07% | |
| NZD | 0.08% | 0.06% | 0.09% | -0.02% | 0.04% | 0.12% | 0.18% | |
| CHF | -0.15% | -0.13% | -0.11% | -0.21% | -0.15% | -0.07% | -0.19% |
The heat map shows percentage changes of major currencies against each other. The base currency is picked from the left column, while the quote currency is picked from the top row. For example, if you pick the Euro from the left column and move along the horizontal line to the Japanese Yen, the percentage change displayed in the box will represent EUR (base)/JPY (quote).
Indian Rupee FAQs
What are the key factors driving the Indian Rupee?
The Indian Rupee (INR) is one of the most sensitive currencies to external factors. The price of Crude Oil (the country is highly dependent on imported Oil), the value of the US Dollar – most trade is conducted in USD – and the level of foreign investment, are all influential. Direct intervention by the Reserve Bank of India (RBI) in FX markets to keep the exchange rate stable, as well as the level of interest rates set by the RBI, are further major influencing factors on the Rupee.
How do the decisions of the Reserve Bank of India impact the Indian Rupee?
The Reserve Bank of India (RBI) actively intervenes in forex markets to maintain a stable exchange rate, to help facilitate trade. In addition, the RBI tries to maintain the inflation rate at its 4% target by adjusting interest rates. Higher interest rates usually strengthen the Rupee. This is due to the role of the ‘carry trade’ in which investors borrow in countries with lower interest rates so as to place their money in countries’ offering relatively higher interest rates and profit from the difference.
What macroeconomic factors influence the value of the Indian Rupee?
Macroeconomic factors that influence the value of the Rupee include inflation, interest rates, the economic growth rate (GDP), the balance of trade, and inflows from foreign investment. A higher growth rate can lead to more overseas investment, pushing up demand for the Rupee. A less negative balance of trade will eventually lead to a stronger Rupee. Higher interest rates, especially real rates (interest rates less inflation) are also positive for the Rupee. A risk-on environment can lead to greater inflows of Foreign Direct and Indirect Investment (FDI and FII), which also benefit the Rupee.
How does inflation impact the Indian Rupee?
Higher inflation, particularly, if it is comparatively higher than India’s peers, is generally negative for the currency as it reflects devaluation through oversupply. Inflation also increases the cost of exports, leading to more Rupees being sold to purchase foreign imports, which is Rupee-negative. At the same time, higher inflation usually leads to the Reserve Bank of India (RBI) raising interest rates and this can be positive for the Rupee, due to increased demand from international investors. The opposite effect is true of lower inflation.
- Gold price attracts some dip-buying on Thursday amid geopolitical risk and a softer USD.
- Reduced bets for an early Fed rate cut act as a tailwind for the buck and should cap gains.
- Traders now look to the US Q4 GDP print for some impetus ahead of the US PCE on Friday.
Gold price (XAU/USD) ticks higher during the Asian session on Thursday and reverses a part of the previous day's heavy losses to a multi-day low, albeit it lacks bullish conviction. The US Dollar (USD) struggles to capitalize on the overnight bounce from over a one-week low and remains below its highest level since December 13 touched on Tuesday. This, along with the risk of a further escalation of military action in the Middle East, turn out to be key factors lending support to the safe-haven precious metal.
Meanwhile, the upbeat release of the flash US PMI prints on Wednesday reaffirms the view that the economy is in good shape and forces investors to further scale back their expectations for an early interest rate cut by the Federal Reserve (Fed). This, in turn, remains supportive of elevated US Treasury bond yields and acts as a headwind for the non-yielding Gold price. Traders might also prefer to wait on the sidelines ahead of the European Central Bank (ECB) meeting and the Advance US Q4 GDP report.
Daily Digest Market Movers: Gold price draws support from geopolitical risks, delayed Fed rate cut bets act as a headwind
- The US Dollar bulls remain on the defensive, which, along with geopolitical tensions stemming from conflicts in the Middle East, lend some support to the safe-haven Gold price.
- Iran-backed Houthi rebels in Yemen targeted two US-owned commercial ships sailing close to the Gulf of Aden on Wednesday in the face of multiple rounds of US military airstrikes.
- This comes after the US military carried out pre-emptive strikes against the Houthis to stave off what it said was an imminent attack on shipping lanes in the important Red Sea trade route.
- The S&P Global flash US Composite PMI Output Index increased to 52.3 this month, or the highest since June, suggesting that the economy kicked off 2024 on a stronger note.
- The flash US Manufacturing PMI rebounded from 47.9 to a 15-month high of 50.3 in January, while the gauge for the services sector climbed to 52.9, or the highest reading since last June.
- The data further pointed to a still-resilient US economy and forced investors to further pare their bets for a more aggressive monetary policy easing by the Federal Reserve in 2024.
- The yield on the benchmark 10-year US government bond hovers near the monthly peak, which should act as a tailwind for the Greenback and cap gains for the non-yielding yellow metal.
- The Advance US Q4 GDP print is due this Thursday and is expected to show that growth in the world's largest economy slowed to a 2% annualized pace from 4.9% in the previous quarter.
- Thursday's US economic docket also features the release of Durable Goods Orders and the usual Weekly Initial Jobless Claims, which might influence the Greenback and the XAU/USD.
- Apart from this, the outcome of the highly-anticipated European Central Bank meeting might infuse volatility in the markets and produce short-term trading opportunities.
- The market focus, meanwhile, will remain glued to the US Personal Consumption Expenditures Price Index data – the Fed's preferred inflation gauge – on Friday.
Technical Analysis: Gold price bears might wait for a sustained break below the $2,000 mark before placing fresh bets
From a technical perspective, the recent repeated failures near the $2,040-2,042 supply zone and the overnight downfall favour bearish traders. Moreover, oscillators on the daily chart have just started gaining negative traction and suggest that the path of least resistance for the Gold price is to the downside. That said, it will still be prudent to wait for some follow-through selling below the $2,000 psychological mark before positioning for any further losses. The XAU/USD might then accelerate the slide towards the $1,988 intermediate support en route to the 100-day Simple Moving Average (SMA), currently around the $1,975-1,974 area, and the 200-day SMA, near the $1,964-1,963 region.
On the flip side, immediate resistance is pegged near the $2,025 zone, or the 50-day SMA, above which the Gold price could climb back to the $2,040-2.042 barrier. A sustained strength beyond the latter might trigger a short-covering rally and lift the Gold price to the $2,077 area. The momentum could extend further and allow bulls to aim back to reclaim the $2,100 round-figure mark.
US Dollar price today
The table below shows the percentage change of US Dollar (USD) against listed major currencies today. US Dollar was the weakest against the .
| USD | EUR | GBP | CAD | AUD | JPY | NZD | CHF | |
| USD | 0.01% | 0.03% | -0.07% | -0.02% | 0.07% | -0.04% | 0.16% | |
| EUR | -0.01% | 0.03% | -0.09% | -0.05% | 0.06% | -0.07% | 0.14% | |
| GBP | -0.04% | -0.03% | -0.11% | -0.07% | 0.02% | -0.10% | 0.12% | |
| CAD | 0.07% | 0.08% | 0.11% | 0.04% | 0.11% | 0.02% | 0.23% | |
| AUD | 0.03% | 0.03% | 0.05% | -0.05% | 0.10% | -0.03% | 0.19% | |
| JPY | -0.06% | -0.06% | -0.03% | -0.14% | -0.10% | -0.14% | 0.09% | |
| NZD | 0.09% | 0.05% | 0.08% | -0.02% | 0.03% | 0.13% | 0.19% | |
| CHF | -0.16% | -0.15% | -0.13% | -0.23% | -0.17% | -0.08% | -0.20% |
The heat map shows percentage changes of major currencies against each other. The base currency is picked from the left column, while the quote currency is picked from the top row. For example, if you pick the Euro from the left column and move along the horizontal line to the Japanese Yen, the percentage change displayed in the box will represent EUR (base)/JPY (quote).
Gold FAQs
Why do people invest in Gold?
Gold has played a key role in human’s history as it has been widely used as a store of value and medium of exchange. Currently, apart from its shine and usage for jewelry, the precious metal is widely seen as a safe-haven asset, meaning that it is considered a good investment during turbulent times. Gold is also widely seen as a hedge against inflation and against depreciating currencies as it doesn’t rely on any specific issuer or government.
Who buys the most Gold?
Central banks are the biggest Gold holders. In their aim to support their currencies in turbulent times, central banks tend to diversify their reserves and buy Gold to improve the perceived strength of the economy and the currency. High Gold reserves can be a source of trust for a country’s solvency. Central banks added 1,136 tonnes of Gold worth around $70 billion to their reserves in 2022, according to data from the World Gold Council. This is the highest yearly purchase since records began. Central banks from emerging economies such as China, India and Turkey are quickly increasing their Gold reserves.
How is Gold correlated with other assets?
Gold has an inverse correlation with the US Dollar and US Treasuries, which are both major reserve and safe-haven assets. When the Dollar depreciates, Gold tends to rise, enabling investors and central banks to diversify their assets in turbulent times. Gold is also inversely correlated with risk assets. A rally in the stock market tends to weaken Gold price, while sell-offs in riskier markets tend to favor the precious metal.
What does the price of Gold depend on?
The price can move due to a wide range of factors. Geopolitical instability or fears of a deep recession can quickly make Gold price escalate due to its safe-haven status. As a yield-less asset, Gold tends to rise with lower interest rates, while higher cost of money usually weighs down on the yellow metal. Still, most moves depend on how the US Dollar (USD) behaves as the asset is priced in dollars (XAU/USD). A strong Dollar tends to keep the price of Gold controlled, whereas a weaker Dollar is likely to push Gold prices up.
- EUR/USD loses ground as the US Dollar attempts to recover its recent losses.
- The lagging indicator MACD suggests a confirmation of the bearish momentum.
- The 38.2% Fibonacci retracement at 1.0867 and major support at 1.0850 could act as the immediate support zone.
EUR/USD trades lower near 1.0880 during the Asian session on Thursday as the US Dollar (USD) makes efforts to retrace its recent losses. The 14-day Relative Strength Index (RSI) for the EUR/USD pair is positioned below the 50 mark, indicating a bearish momentum in the market.
The lagging indicator Moving Average Convergence Divergence (MACD) for the EUR/USD pair indicates a potential confirmation of a downward trend. The MACD line is positioned below the centerline and is diverging below the signal line. This configuration suggests that the short-term moving average is lagging behind the long-term moving average, signaling a potential bearish momentum in the EUR/USD pair.
The 38.2% Fibonacci retracement at the 1.0867 level appears as the immediate support for the EUR/USD pair followed by the major support at the 1.0850 level. A collapse below the major support could lead the pair to navigate the area around psychological support at 1.0800 followed by the 50% retracement level at 1.0787.
On the upside, the psychological level at 1.0900 serves as an immediate barrier, with a major level at 1.0950 further complicating the path. A successful breakthrough above the major barrier could potentially inspire bullish momentum in the pair. If this occurs, the bulls may target the region around the psychological level at 1.1000, and beyond that, they could aim for January's high at 1.1038.
EUR/USD: Daily Chart
-638417484596154673.png)
| Raw materials | Closed | Change, % |
|---|---|---|
| Silver | 22.658 | 0.96 |
| Gold | 2014.326 | -0.74 |
| Palladium | 964.75 | 2.09 |
- Australian Dollar loses ground as the US Dollar attempts to recover recent losses.
- Australia's inflation is likely to stay above the RBA's target range of 2.0–3.0%.
- US Dollar faced downward pressure despite the upbeat US PMI data.
The Australian Dollar (AUD) loses its ground for the second successive day on Thursday. The AUD/USD pair encountered downward pressure following the release of positive S&P Global Purchasing Managers Index (PMI) data from the United States (US) on Wednesday. The upbeat data could decrease the probability of rate cuts by the Federal Reserve (Fed) in March, prompting a decline in the AUD/USD pair. Additionally, according to the CME's FedWatch tool, market-wide bets on a March rate cut from the Fed have now dropped to below 40%, a significant decline from around 80% recorded just a month ago.
Australia’s Dollar experienced a decline, despite the release of improved preliminary Purchasing Managers Index (PMI) data from Australia on Wednesday. The Reserve Bank of Australia's (RBA) Bulletin indicates that over the past six months, businesses have generally anticipated a moderation in their price growth, with the expectation that, on average, prices will stay above the RBA's inflation target range of 2.0–3.0%. The Bulletin also notes that slower growth in demand and increased competition are anticipated factors that will contribute to a further deceleration in the growth of firms' prices in the upcoming quarters.
The US Dollar Index (DXY) makes efforts to recover from recent losses, supported by improved US Treasury yields. However, the US Dollar (USD) faces challenges due to a risk-on market sentiment ahead of the Federal Reserve's (Fed) interest rate decision on January 31. Investors will likely watch the US Gross Domestic Product Annualized (Q4) data scheduled for release on Thursday. This data will provide insights into the overall economic performance and could influence market expectations regarding the Fed's monetary policy stance.
Daily Digest Market Movers: Australian Dollar declines after improved US PMI
- Australia's Manufacturing PMI increased from 47.6 to 50.3, showcasing improvement. Services PMI also saw an uptick, rising from 47.1 to 47.9. The Composite PMI registered an increase, reaching 48.1 compared to December's 46.9.
- Australia’s Westpac Leading Index (MoM) declined by 0.03% in December against November’s growth of 0.07%.
- National Australia Bank's Business Conditions inched down to the reading of 7 in December from 9 prior.
- National Australia Bank's Business Confidence improves to -1 from the previous figure of -9.
- Australia’s Consumer Inflation Expectations remained steady at 4.5% in January.
- The Chair of Australia's sovereign wealth fund Peter Costello commented that inflation in Australia is showing early signs of moderation. However, Costello emphasizes that there is still a considerable distance to cover to bring prices back within the RBA's target band.
- The People's Bank of China keeps its Loan Prime Rate (LPR) steady for both the one-year and five-year terms. The rate remains at 3.45% for the one year and 4.20% for the five years.
- US S&P Global Manufacturing PMI climbed to an 11-month high of 50.3 in January against the forecast of remaining consistent at 47.9.
- US Services PMI rose to 52.9 against the expected reading of 51 and 51.4 prior. While Composite PMI increased to 52.3 from the previous reading of 50.9.
- US Conference Board has reported a slight improvement in the Leading Economic Index for December, moving from -0.5% in November to -0.1% in December. This surpassed expectations for an improvement to -0.3%.
- The preliminary US Michigan Consumer Sentiment Index rose to 78.8 in January from 69.7 prior, exceeding the expected figure of 70.
Technical Analysis: Australian Dollar maintains its position below 0.6600
The Australian Dollar trades around 0.6570 on Thursday, with immediate resistance seen at the psychological level of 0.6600, which aligns with the 23.6% Fibonacci retracement level at 0.6606, followed by the 14-day Exponential Moving Average (EMA) at 0.6617. A decisive move above this resistance zone could potentially propel the AUD/USD pair toward the major barrier at 0.6650. On the downside, the pair might revisit the weekly low at 0.6551, coinciding with the significant level at 0.6550. If this support is breached, the pair could face further downside pressure, potentially retesting the monthly low at 0.6524.
AUD/USD: Daily Chart
-638417449773522835.png)
Australian Dollar price today
The table below shows the percentage change of Australian Dollar (AUD) against listed major currencies today. Australian Dollar was the weakest against the Canadian Dollar.
| USD | EUR | GBP | CAD | AUD | JPY | NZD | CHF | |
| USD | 0.05% | 0.07% | -0.01% | 0.04% | 0.07% | 0.00% | 0.15% | |
| EUR | -0.05% | 0.03% | -0.07% | -0.03% | 0.03% | -0.08% | 0.10% | |
| GBP | -0.07% | -0.03% | -0.08% | -0.05% | 0.00% | -0.10% | 0.08% | |
| CAD | 0.00% | 0.07% | 0.09% | 0.04% | 0.08% | -0.02% | 0.17% | |
| AUD | -0.02% | 0.01% | 0.03% | -0.04% | 0.05% | -0.04% | 0.12% | |
| JPY | -0.07% | -0.02% | 0.02% | -0.08% | -0.07% | -0.08% | 0.08% | |
| NZD | 0.04% | 0.07% | 0.07% | 0.01% | 0.05% | 0.09% | 0.15% | |
| CHF | -0.15% | -0.10% | -0.08% | -0.15% | -0.10% | -0.07% | -0.15% |
The heat map shows percentage changes of major currencies against each other. The base currency is picked from the left column, while the quote currency is picked from the top row. For example, if you pick the Euro from the left column and move along the horizontal line to the Japanese Yen, the percentage change displayed in the box will represent EUR (base)/JPY (quote).
Australian Dollar FAQs
What key factors drive the Australian Dollar?
One of the most significant factors for the Australian Dollar (AUD) is the level of interest rates set by the Reserve Bank of Australia (RBA). Because Australia is a resource-rich country another key driver is the price of its biggest export, Iron Ore. The health of the Chinese economy, its largest trading partner, is a factor, as well as inflation in Australia, its growth rate and Trade Balance. Market sentiment – whether investors are taking on more risky assets (risk-on) or seeking safe-havens (risk-off) – is also a factor, with risk-on positive for AUD.
How do the decisions of the Reserve Bank of Australia impact the Australian Dollar?
The Reserve Bank of Australia (RBA) influences the Australian Dollar (AUD) by setting the level of interest rates that Australian banks can lend to each other. This influences the level of interest rates in the economy as a whole. The main goal of the RBA is to maintain a stable inflation rate of 2-3% by adjusting interest rates up or down. Relatively high interest rates compared to other major central banks support the AUD, and the opposite for relatively low. The RBA can also use quantitative easing and tightening to influence credit conditions, with the former AUD-negative and the latter AUD-positive.
How does the health of the Chinese Economy impact the Australian Dollar?
China is Australia’s largest trading partner so the health of the Chinese economy is a major influence on the value of the Australian Dollar (AUD). When the Chinese economy is doing well it purchases more raw materials, goods and services from Australia, lifting demand for the AUD, and pushing up its value. The opposite is the case when the Chinese economy is not growing as fast as expected. Positive or negative surprises in Chinese growth data, therefore, often have a direct impact on the Australian Dollar and its pairs.
How does the price of Iron Ore impact the Australian Dollar?
Iron Ore is Australia’s largest export, accounting for $118 billion a year according to data from 2021, with China as its primary destination. The price of Iron Ore, therefore, can be a driver of the Australian Dollar. Generally, if the price of Iron Ore rises, AUD also goes up, as aggregate demand for the currency increases. The opposite is the case if the price of Iron Ore falls. Higher Iron Ore prices also tend to result in a greater likelihood of a positive Trade Balance for Australia, which is also positive of the AUD.
How does the Trade Balance impact the Australian Dollar?
The Trade Balance, which is the difference between what a country earns from its exports versus what it pays for its imports, is another factor that can influence the value of the Australian Dollar. If Australia produces highly sought after exports, then its currency will gain in value purely from the surplus demand created from foreign buyers seeking to purchase its exports versus what it spends to purchase imports. Therefore, a positive net Trade Balance strengthens the AUD, with the opposite effect if the Trade Balance is negative.
- WTI drops to $75.15 amid the modest recovery in the US Dollar.
- US crude oil inventories fell by 9.233M barrels last week due to severe winter storms.
- The PBoC announces the biggest cut in banks’ reserve ratios for two years from February 5.
- Oil traders will closely watch the flash US Gross Domestic Product Annualized (Q4), due on Thursday.
Western Texas Intermediate (WTI), the US crude oil benchmark, is trading around $75.15 on Thursday. WTI prices edge lower 0.37% on the day amid renewed US Dollar (USD) demand. However, a slump in US crude output, new Chinese stimulus measures, and geopolitical tensions might cap the downside of the black gold.
According to the Energy Information Agency's (EIA) weekly report on Wednesday, US crude oil inventories fell by 9.233M barrels for the week ending January 19 from the previous reading of 2.493M barrels drop. A winter storm hit US oil output last week, particularly in North Dakota, the third-largest crude-producing state in the US.
The People’s Bank of China (PBoC) will cut the amount of cash that banks are required to hold as reserves from February 5, the biggest cut for more than two years. This measure is likely to strengthen a fragile economic recovery. This, in turn, might boost WTI prices as China is the world’s largest oil importer.
Meanwhile, the geopolitical risk in the Red Sea is largely already factored into prices. The United States and UK have conducted numerous rounds of airstrikes in Yemen against Houthi militants, who continue to attack shipping ships in the Red Sea.
Oil traders will keep an eye on the preliminary US Gross Domestic Product Annualized (Q4), which is estimated to expand by 2.0%. The attention will shift to the US Core Personal Consumption Expenditures Price Index (Core PCE) on Friday. These events could significantly impact the USD-denominated WTI price. Oil traders will take cues from the data and find trading opportunities around WTI prices.
- The Japanese Yen edges lower against the USD on Thursday, albeit lacks follow-through selling.
- The risk-on mood and the recent widening of the US-Japan rate differential, undermine the JPY.
- Delayed Fed rate cut bets remain supportive of elevated US bond yields and favour the USD bulls.
- Traders now look to the US GDP ahead of the key inflation data from Japan and the US on Friday.
The Japanese Yen (JPY) recorded strong gains on Wednesday and strengthened to over a one-week high against its American counterpart in the wake of the Bank of Japan's (BoJ) hawkish tilt. Bulls, however, struggle to capitalize on the momentum amid the underlying bullish sentiment across the global equity markets, which tends to undermine the JPY's relative safe-haven status. Apart from this, the recent widening of the US-Japan rate differential, bolstered by expectations that the Federal Reserve (Fed) will not rush to cut interest rates, turns out to be another factor acting as a headwind for the JPY.
That said, the Bank of Japan's (BoJ) hawkish tilt earlier this week, suggesting that conditions for phasing out huge stimulus and pulling short-term interest rates out of negative territory were falling into place, should limit losses for the JPY. Traders might also refrain from placing aggressive directional bets ahead of important US macro releases – the Advance Q4 GDP print and the Personal Consumption Expenditures (PCE) Price Index, due on Thursday and Friday, respectively. This warrants caution for the JPY bears and keeps the USD/JPY pair confined in a familiar trading range held over the past week or so.
Daily Digest Market Movers: Japanese Yen could draw some support from BoJ’s hawkish tilt
- The Japanese Yen moves away from over a one-week high touched on Wednesday and is undermined by a combination of factors, though the Bank of Japan's hawkish tilt should act as a tailwind.
- The upbeat market sentiment gets an additional lift after the People's Bank of China announced to reduce the Reserve Requirement Ratio by 50 bps starting from February 5 to boost the economy.
- The yield on the benchmark 10-year US government bond shot back closer to the monthly top in reaction to the upbeat US data, which lends support to the US Dollar and the USD/JPY pair.
- The S&P Global flash US Manufacturing PMI rebounded from 47.9 to a 15-month high of 50.3 in January, while the gauge for the services sector climbed to 52.9, or the highest reading since last June.
- Furthermore, the flash US Composite PMI Output Index increased to 52.3 this month, or the highest since last June, suggesting that the world's largest economy kicked off 2024 on a stronger note.
- This comes on top of the upbeat consumer spending and labor market data released last week, forcing investors to further scale back their expectations for an early interest rate cut by the Federal Reserve.
- BoJ Governor Kazuo Ueda laid the groundwork for monetary policy normalisation on Tuesday and said that the likelihood of sustainably achieving the 2% inflation target was gradually increasing.
- The head of Japan's biggest business lobby Keidanren called for wage hikes this year that exceed the inflation rate, paving the way for the BoJ to pivot away from its ultra-easy monetary policy settings.
- Traders now look to the Advance US Q4 GDP report, which is expected to show that growth in the world's largest economy decelerated to a 2% annualized pace from 4.9% in the previous quarter.
- Thursday's US economic docket also features the release of Durable Goods Orders and the usual Weekly Initial Jobless Claims, which might provide some impetus to the buck and the USD/JPY pair.
- The market attention will then shift to the release of the Tokyo core CPI and the US Personal Consumption Expenditures Price Index data – the Fed's preferred inflation gauge – on Friday.
Technical Analysis: USD/JPY continues to show some resilience below the 100-day SMA
From a technical perspective, this week's repeated failures to find acceptance below the 100-day Simple Moving Average (SMA) and the subsequent rebounds suggest that the path of least resistance for the USD/JPY pair is to the upside. That said, any further move up is likely to confront some resistance near the 148.00 round figure ahead of the 148.20-148.25 region. The next relevant hurdle is pegged near the 148.80 region, or a multi-week high touched last Friday, which if cleared will be seen as a fresh trigger for bullish traders. Given that oscillators on the daily chart are holding comfortably in the positive territory, spot prices might then aim to surpass an intermediate hurdle near the 149.30-149.35 zone and reclaim the 150.00 psychological mark.
On the flip side, weakness below the 100-day SMA, currently around the 147.55 region, might continue to attract some buyers near the 147.00 mark. This should help limit the downside for the USD/JPY pair near the 146.45 zone, or the weekly trough touched the previous day. Some follow-through selling, however, will negate the positive bias and shift the near-term bias in favour of bearish traders, paving the way for a slide towards testing the 146.10-146.00 horizontal support. The downward trajectory could extend further towards the 145.30-145.25 intermediate support en route to the 145.00 psychological mark.
Japanese Yen price today
The table below shows the percentage change of Japanese Yen (JPY) against listed major currencies today. Japanese Yen was the strongest against the Swiss Franc.
| USD | EUR | GBP | CAD | AUD | JPY | NZD | CHF | |
| USD | 0.05% | 0.08% | 0.03% | 0.08% | 0.05% | 0.04% | 0.16% | |
| EUR | -0.05% | 0.04% | -0.03% | 0.01% | 0.00% | -0.03% | 0.11% | |
| GBP | -0.08% | -0.04% | -0.05% | -0.04% | -0.03% | -0.05% | 0.08% | |
| CAD | -0.03% | 0.02% | 0.05% | 0.03% | 0.02% | 0.00% | 0.12% | |
| AUD | -0.04% | -0.01% | 0.02% | -0.03% | 0.01% | -0.02% | 0.10% | |
| JPY | -0.05% | 0.00% | 0.06% | -0.01% | 0.02% | -0.04% | 0.11% | |
| NZD | 0.00% | 0.03% | 0.05% | -0.02% | 0.05% | 0.02% | 0.13% | |
| CHF | -0.16% | -0.11% | -0.08% | -0.13% | -0.08% | -0.10% | -0.12% |
The heat map shows percentage changes of major currencies against each other. The base currency is picked from the left column, while the quote currency is picked from the top row. For example, if you pick the Euro from the left column and move along the horizontal line to the Japanese Yen, the percentage change displayed in the box will represent EUR (base)/JPY (quote).
Japanese Yen FAQs
What key factors drive the Japanese Yen?
The Japanese Yen (JPY) is one of the world’s most traded currencies. Its value is broadly determined by the performance of the Japanese economy, but more specifically by the Bank of Japan’s policy, the differential between Japanese and US bond yields, or risk sentiment among traders, among other factors.
How do the decisions of the Bank of Japan impact the Japanese Yen?
One of the Bank of Japan’s mandates is currency control, so its moves are key for the Yen. The BoJ has directly intervened in currency markets sometimes, generally to lower the value of the Yen, although it refrains from doing it often due to political concerns of its main trading partners. The current BoJ ultra-loose monetary policy, based on massive stimulus to the economy, has caused the Yen to depreciate against its main currency peers. This process has exacerbated more recently due to an increasing policy divergence between the Bank of Japan and other main central banks, which have opted to increase interest rates sharply to fight decades-high levels of inflation.
How does the differential between Japanese and US bond yields impact the Japanese Yen?
The BoJ’s stance of sticking to ultra-loose monetary policy has led to a widening policy divergence with other central banks, particularly with the US Federal Reserve. This supports a widening of the differential between the 10-year US and Japanese bonds, which favors the US Dollar against the Japanese Yen.
How does broader risk sentiment impact the Japanese Yen?
The Japanese Yen is often seen as a safe-haven investment. This means that in times of market stress, investors are more likely to put their money in the Japanese currency due to its supposed reliability and stability. Turbulent times are likely to strengthen the Yen’s value against other currencies seen as more risky to invest in.
The People’s Bank of China (PBoC) set the USD/CNY central rate for the trading session ahead on Thursday at 7.1044 as compared to the previous day's fix of 7.1053 and 7.1620 Reuters estimates.
- USD/CAD gains momentum near 1.3532 ahead of US GDP data.
- The Bank of Canada (BoC) held the overnight rate unchanged for a fourth consecutive meeting, as widely expected.
- US S&P Global Composite PMI for January signalled the fastest rise in business activity since June 2023.
- The flash US GDP Annualized (Q4), the weekly Initial Jobless Claim and Durable Goods Orders will be released on Thursday.
The USD/CAD pair extends the rally below the mid-1.3500s during the early Asian trading hours on Thursday. The Bank of Canada (BoC) held its benchmark interest rate steady at 5.0% on Wednesday, marks the fourth consecutive hold from the central bank. The attention will turn to the preliminary US GDP growth numbers for the fourth quarter (Q4), due on Thursday. At press time, USD/CAD is trading at 1.3532, gaining 0.03% on the day.
The BoC maintained the overnight rate steady for the fourth time in a row, continuing the pause that began following the las thike in July last year. The BoC governor Tiff Macklem stated on Wednesday that the focus of central bank has shifted from whether interest rates are high enough to how long until they can begin to be lowered. According to the Bank of Canada’s Monetary Policy Report (MPR), the central bank expected that inflation will hit its 2% target in 2025.
The US S&P Global Composite PMI for January signalled the fastest rise in business activity since June 2023, coming in at 52.3 versus 50.9 prior, beating the market expectations. Meanwhile, the Services PMI rose to 52.9 in January from 51.4 in December. The manufacturing figure grew to 50.3 from 47.9 in the previous reading. The stronger-than-expected PMIs indicate that the US economy is on pace for a soft-landing.
On Tuesday, Former St. Louis Federal Reserve (Fed) President James Bullard said that Fed may start cutting interest rates potentially as soon as March, even if inflation has not hit 2% target. However, Fed governor Christopher Waller stated that the Fed should cut rates "methodically and carefully" and definitely not in a rushed manner. Atlanta Fed President Raphael Bostic said he sees rate cuts beginning in the third quarter.
Moving on, market participants will monitor the flash US Gross Domestic Product Annualized (Q4), the weekly Initial Jobless Claim and Durable Goods Orders. On Friday, the US Core Personal Consumption Expenditures Price Index (Core PCE), Fed's preferred inflation measure, will be the highlight.
The Reserve Bank of Australia (RBA), in its latest bulletin, mentioned in detail the inflation target and their expectations for inflation over the short and medium term.
Key takeaways from RBA Bulletin
“The Reserve Bank’s liaison program collects information from firms in Australia about current economic conditions and their expectations for future conditions, inclding their own prices. Firms’ observations provide a timely read on inflation.”
“Over the past six months, firms have generally expected their prices growth to continue to moderate, but on average to remain above the Bank’s inflation target range of 2–3%.”
“Firms have reported that large cost increases over recent years are still flowing through to some parts of the supply chain and have indicated that this is the primary driver of their decisions to increase prices at a faster-than-normal rate.”
“Slower growth in demand and increased competition are expected to result in a further slowing in growth of firms’ prices over coming quarters.”
Market reaction
At the time of writing, the AUD/USD pair is trading near 0.6574, holding lower while losing 0.04% on the day.
| Index | Change, points | Closed | Change, % |
|---|---|---|---|
| NIKKEI 225 | -291.09 | 36226.48 | -0.8 |
| Hang Seng | 545.89 | 15899.87 | 3.56 |
| KOSPI | -8.92 | 2469.69 | -0.36 |
| ASX 200 | 4.3 | 7519.2 | 0.06 |
| DAX | 262.83 | 16889.92 | 1.58 |
| CAC 40 | 67.6 | 7455.64 | 0.91 |
| Dow Jones | -99.06 | 37806.39 | -0.26 |
| S&P 500 | 3.95 | 4868.55 | 0.08 |
| NASDAQ Composite | 55.98 | 15481.92 | 0.36 |
| Pare | Closed | Change, % |
|---|---|---|
| AUDUSD | 0.65767 | -0.03 |
| EURJPY | 160.538 | -0.15 |
| EURUSD | 1.08844 | 0.38 |
| GBPJPY | 187.695 | -0.16 |
| GBPUSD | 1.27245 | 0.41 |
| NZDUSD | 0.61104 | 0.21 |
| USDCAD | 1.35229 | 0.5 |
| USDCHF | 0.86284 | -0.82 |
| USDJPY | 147.503 | -0.54 |
- GBP/USD clings to mild gains near 1.2717 amid the USD softness.
- The UK Flash Purchasing Managers Index (PMI) for January came in stronger than expected.
- Former Fed’s Bullard said the central bank may begin cutting interest rates potentially as soon as March.
- The flash US Gross Domestic Product (GDP) for Q4 will be in the spotlight on Thursday.
The GBP/USD pair posts modest gains during the early Asian trading hours on Thursday. The major pair reclaims above the 1.2700 mark on the back of the risk-on sentiment. Nonetheless, the release of the preliminary US GDP growth numbers for the fourth quarter (Q4) on Thursday might trigger volatility in the market. At press time, GBP/USD is trading at 1.2717, up 0.01% on the day.
On Wednesday, the UK Flash Purchasing Managers Index (PMI) for January came in stronger than expected, with Manufacturing PMI growing from 46.2 to 47.3 while the Services PMI climbed from 53.4 to 53.8. Finally, the S&P Global Composite PMI rose from 52.1 to 52.5, the highest in seven months.
Investors anticipate the Bank of England (BoE) will begin its rate-cutting cycle at its August meeting. The markets have priced in rate cuts by 175 basis points (bps) through the cycle, reaching 4.50% by December 2024.
On the other hand, former St. Louis Federal Reserve (Fed) President James Bullard said on Tuesday that the central bank may begin cutting interest rates potentially as soon as March, even if inflation has not hit the 2% target.
Nonetheless, the US key events this week might convince the Fed about the further monetary policy path. The flash US Gross Domestic Product (GDP) for Q4 will be released later on Thursday. The GDP annualized figure for Q4 is forecast to expand by 2.0% from 4.9% in the previous reading.
Additionally, the US Core Personal Consumption Expenditures Price Index (Core PCE) for December will be due on Friday. The monthly and annual Core PCE figures are expected to show an increase of 0.2% MoM and 3.0% YoY. The figures could give a clear direction to the GBP/USD pair.


© 2000-2026. Уcі права захищені.
Cайт знаходитьcя під керуванням TeleTrade DJ. LLC 2351 LLC 2022 (Euro House, Richmond Hill Road, Kingstown, VC0100, St. Vincent and the Grenadines).
Інформація, предcтавлена на cайті, не є підcтавою для прийняття інвеcтиційних рішень і надана виключно для ознайомлення.
Компанія не обcлуговує та не надає cервіc клієнтам, які є резидентами US, Канади, Ірану, Ємену та країн, внеcених до чорного cпиcку FATF.
Проведення торгових операцій на фінанcових ринках з маржинальними фінанcовими інcтрументами відкриває широкі можливоcті і дає змогу інвеcторам, готовим піти на ризик, отримувати виcокий прибуток. Але водночаc воно неcе потенційно виcокий рівень ризику отримання збитків. Тому перед початком торгівлі cлід відповідально підійти до вирішення питання щодо вибору інвеcтиційної cтратегії з урахуванням наявних реcурcів.
Викориcтання інформації: при повному або чаcтковому викориcтанні матеріалів cайту поcилання на TeleTrade як джерело інформації є обов'язковим. Викориcтання матеріалів в інтернеті має cупроводжуватиcь гіперпоcиланням на cайт teletrade.org. Автоматичний імпорт матеріалів та інформації із cайту заборонено.
З уcіх питань звертайтеcь за адреcою pr@teletrade.global.
переклади