- Аналітика
- Новини та інструменти
- Новини ринків
Новини ринків
- NZD/JPY rallies 0.70% to stand at 91.00 as buyers take control.
- The cross seems to be on its way to retest last Friday’s highs around 91.15.
- Daily chart: RSI is approaching overbought territory, and MACD exhibits increased buying momentum.
- Despite the overbought status in the four-hour chart, the overall trend remains bullish above mains SMAs.
In Friday's session, the NZD/JPY was seen at around 91.00, marking a 0.70% upward rally. On the larger canvas, the pair's trajectory appears bullish, with buyers making strong headway on the daily chart. Meanwhile, the four-hour view suggests a heavier pressure with indicators seated deep in overbought territory, hinting at a potential downward correction in the short term.
From a technical perspective, the indicators on the daily chart reflect a strengthening bullish momentum. The Relative Strength Index (RSI) is approaching overbought conditions, which tend to be considered bearish but has not yet signalled reversal. The Moving Average Convergence Divergence (MACD) displays rising green bars, pointing towards a persistent bullish force. Furthermore, the pair's position above its 20, 100, and 200-day Simple Moving Averages (SMAs) validates that the upward trajectory is not only a short-term fluctuation but also has solidification in a broader time frame.
Zooming into the shorter time frame, the four-hour chart portrays a similar picture. The Relative Strength Index (RSI) stands above 30, and Moving Average Convergence Divergence (MACD) prints higher red bards aligning with the daily chart’s outlook.
Although the overbought conditions may seem concerning for the buyers, the strength of the bulls is indisputable, painting a short-term bullish outlook. However, investors must consider potential profit-taking since significant overbought conditions generally lead to a near-term retracement.
Support Levels: 90.50, 90.00, 89.90.
Resistance Levels: 91.15, 91.30, 91.50.
NZD/JPY daily chart
-638364598732363466.png)
- The US Dollar waffled against the Swiss Franc on Friday, stuck near the 0.8820 level.
- The USD/CHF is on pace to drop back into the 0.8800 handle.
- Next week sees US GDP and CPI inflation numbers.
The USD/CHF tracked lower on Friday as broader markets saw an uptick in risk appetite to close out the trading week, bringing the US Dollar (USD) down into familiar lows against the Swiss Franc (CHF) with the 0.8800 handle in full view.
The pair traded mostly flat for the week with a brief push into a high of 0.8874 while Friday saw the week's low etched in at 0.8811.
Next week sees a relatively sedate economic calendar before high-impact US data hits markets in the mid-week, with US Gross Domestic Product (GDP) scheduled for Wednesday and Personal Consumption Expenditure (PCE) inflation figures slated for Thursday.
An array of US market data due in the latter half of next week
Annualized US quarterly GDP is expected to tick upwards slightly from 4.9% to 5.0%, and US PCE for the month of October is forecast to drop slightly from 0.3% to 0.2%.
Next week will close out market action with Swiss quarterly GDP and US ISM Purchasing Managers' Index (PMI) numbers both slated for Friday, December 1st.
Swiss GDP is broadly expected to hold flat for the third quarter at 0.0%, while the US ISM Manufacturing PMI for November is forecast to tick upwards from 46.7 to 47.6.
Federal Reserve (Fed) Chairman Jerome Powell will also be making an appearance next Friday. The head of the Fed will be participating in an informal discussion labeled "Navigating Pathways to Economic Mobility" at the Spelman College of Atlanta.
USD/CHF Technical Outlook
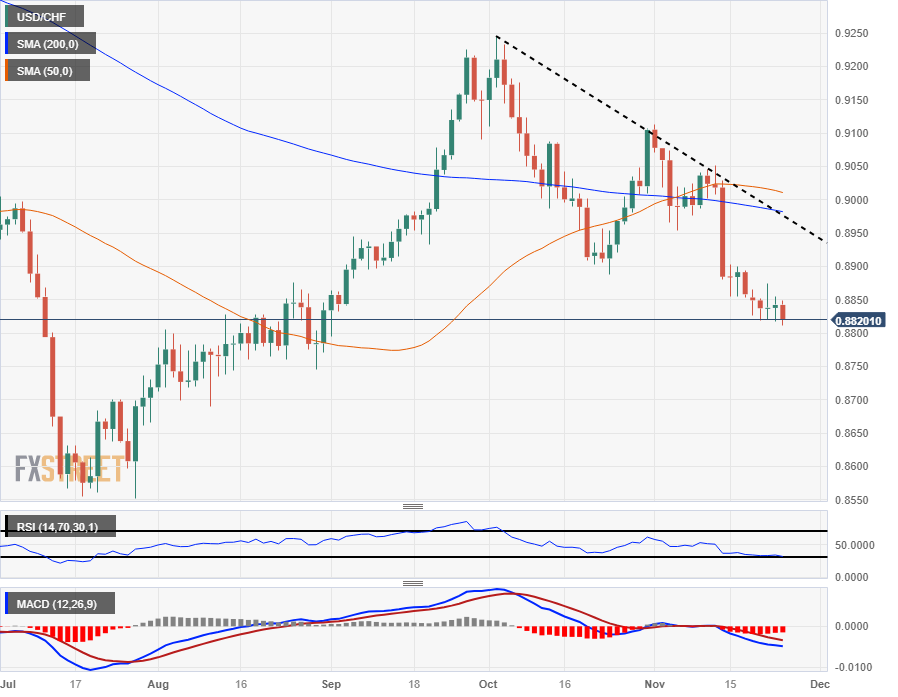
The USD/CHF's Friday dip sets the pair up for a fresh downside run at the 0.8800 handle, and technical support is looking thin in the near-term, with the nearest firm barrier seen at July's low bids near 0.8550.
On the top end, a series of lower highs is drawing in a descending trendline from October's early swing high into 0.9250, which looks set to provide technical resistance looking ahead.
The 200-day Simple Moving Average (SMA) is trending down below just below the major 0.9000 handle, capping off any strong topside bullish recoveries, while the 50-day SMA is rotating into a bearish stance from just above 0.9000.
USD/CHF Daily Chart
USD/CHF Technical Levels
- WTI crude oil prices declined following the start of a truce in the Gaza Strip.
- OPEC+ postpones crucial meetings, sparking speculations of potential oil production cuts for 2024.
- Global factors like higher US crude stockpiles, China's uncertain oil demand, and non-OPEC production growth contribute to Oil price trends.
West Texas Intermediate (WTI), the US Crude Oil benchmark, fell on Friday as the release of some hostages in Gaza reduced geopolitical tensions. The daily chart showed prices at $75.13 per barrel, even though global business activity witnessed an uptick.
WTI falls to $75.13 per barrel as Gaza truce reduces Middle East risks, while OPEC+ meeting delay and production discussions influence market
A planned truce in the Gaza Strip began, aimed to allow the exchange of hostages between Israel and Hamas. Hence, reduced geopolitical tensions weighed in on oil prices, which usually tend to rise amid risks in the Middle East. However, Oil bears are not out of the woods yet, as the upcoming OPEC+ meeting is awaited, with crude Oil production cuts for 2024 looming.
The OPEC+ delayed its meeting from November 26 to November 30 as countries discussed Oil output levels. The delay led to a significant drop of 5% on Wednesday before WTI trimmed some of its losses to just 1.30%.
There are indications that OPEC+ is making progress toward a compromise with African oil-producing countries regarding production levels for 2024. This development suggests ongoing negotiations and discussions within the group to establish production quotas for the coming year.
While WTI could witness an uptick if OPEC+ cuts its production, higher US Crude stockpiles, and lower refining margins can put a lid on Oil prices.
Additionally, China's longer-term oil demand outlook remains uncertain. Analysts suggest that oil demand growth in China could weaken to around 4% in the first half of 2024, mainly due to challenges in the property sector that may impact diesel consumption.
Furthermore, non-OPEC production is expected to remain robust, with Brazil's state energy company, Petrobras, planning significant investments to boost output. This could contribute to global oil supply, potentially limiting upward price movements.
WTI Technical Levels
- The EUR/JPY followed the Friday technical rally into a new high for the week.
- The Euro pulled out of an early dip in the week, closing higher for three straight days.
- Japan inflation ticked higher on Friday, next week has Eurozone inflation in the barrel.
The EUR/JPY rose for the third straight trading day to chalk in a new high for the week above 163.60.
Broader markets caught a rally across the board for Friday as risk sentiment improved to close out the trading week. The Euro (EUR) caught a rise against the Japanese Yen (JPY) as risk bids buoyed assets across the board, and the Yen got pinned down by softer-than-expected National Consumer Price Index (CPI) numbers.
Japan's National CPI ticked higher for the year into October, battering the Bank of Japan's (BoJ) ongoing concerns about Japanese inflation falling too fast, too soon.
The BoJ remains concerned that Japanese price growth will eventually slump below the central bank's 2% target, but National Japanese CPI, both headline and core (excluding fresh food prices) accelerated for the annualized period into October.
National CPI printed at 3.3%, over and above September's 3%, while Nation CPI core-core (excluding both fresh food and energy prices) decreased from 4.2% top 4.0% compared to National Core CPI also rose from 2.8% to 2.9%.
With the BoJ firmly entrenched in its hyper-easy monetary policy stance, the JPY is set to take a long battering against the broader FX marketspace.
EUR/JPY Technical Outlook
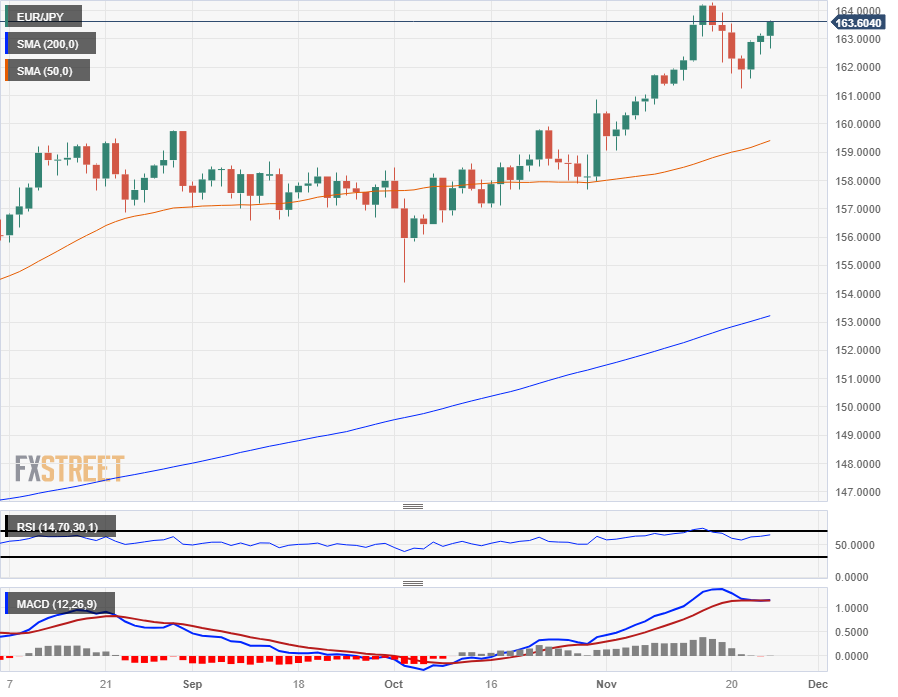
The Euro remains firmly bullish against the Japanese Yen, trading into a 15-year high last week and remaining bid into the top end near 163.20.
The EUR/JPY is up over 26% against the Yen from 2023's lows at 137.38, and despite a rough consolidation period through the third quarter, remains bullish after climbing from November's lows near 159.00.
The nearest technical support is sitting at the 50-day Simple Moving Average (SMA) rising into 160.00, with the 200-day SMA trading far below price action just north of 153.00.
EUR/JPY Daily Chart
EUR/JPY Technical Levels
- USD/JPY shows minimal change, indicating a stable weekly close.
- The weekly chart suggests an upward trend with resistance at Tenkan-Sen (149.53); a break above could target 150.00.
- USD/JPY daily chart key levels to watch include 150.77 and YTD high at 151.91 for upside, 148.01, and 147.15 for downside.
The USD/JPY is almost flat late in the North American session, though set to end the week near today’s opening price and exchange hands at 149.47, printing minuscule losses of 0.02%.
From a weekly chart perspective, the USD/JPY is upward biased, and as the week comes to an end, a ‘dragonfly doji’ is forming, which implies the pair could resume its uptrend. Nevertheless, the major faces solid resistance at the Tenkan-Sen at 149.53. If buyers achieve a weekly close above the latter, the pair could re-test the 150.00 figure.
The USD/JPY daily chart shows back-to-back session posting doji’s, which implies traders are undecided. On the upside, traders will collide with the Tenkan-Sen at 149.47, followed by the 150.00 figure, and the November 17 swing high at 150.77. Once cleared, the next resistance would be the year-to-date (YTD) high of 151.91.
On the flip side, if sellers drag prices below 149.00, that would exacerbate a drop toward the November 21 daily low of 148.01, followed by the latest cycle low at 147.15.
USD/JPY Price Analysis – Daily Chart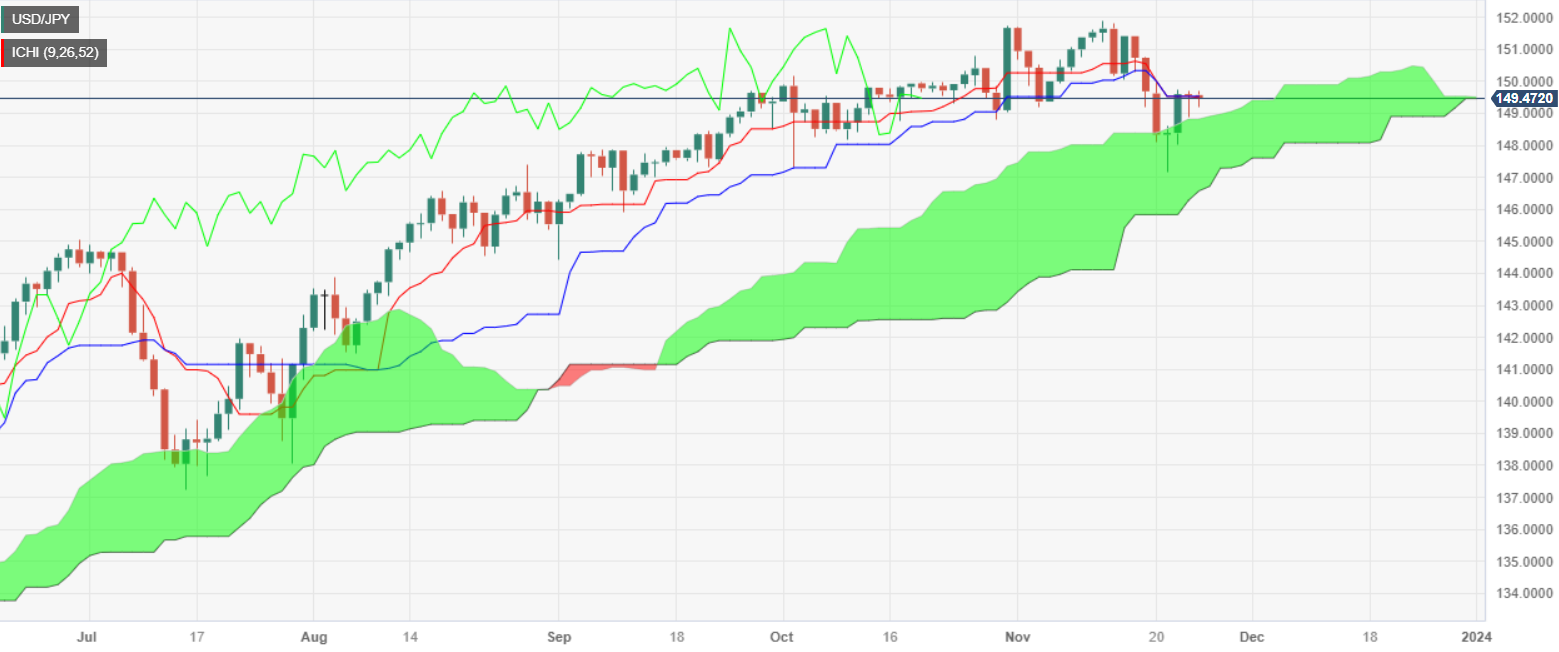
USD/JPY Technical Levels
- The USD/SEK pair witnessed a 0.30% drop, hovering around the 10.452 level.
- Mixed S&P PMIs make the US struggle to gather demand.
- Riksbank's hawkish hold on Thursday strengthened the SEK as the bank didn’t rule out a hike in 2024.
The Swedish Krona (SEK) is gaining ground against the US Dollar (USD) in Friday's trading session, with the pair trading near the 10.452 region seeing 0.30% losses. The pair’s movements were driven by mixed US S&P PMI data and a hawkish hold from the Riksbank.
In line with that, the Riksbank kept the policy rate unchanged at 4% in November but has indicated the possibility of raising it at the beginning of 2024. The bank also noted that "inflation has fallen and inflationary pressures have clearly eased", but it left the door open for further hikes in case data justifies it, a similar position taken by the Federal Reserve (Fed).
On the USD side, the US private sector experienced marginal growth, as reflected by the steady S&P Global Composite PMI at 50.7. While the Manufacturing PMI slightly dipped into contraction at 49.4, the Services PMI witnessed a small rise to 50.8. The negative highlight was that it was recorded as the first employment decrease in US service and manufacturing sector, and this outlook weakened the US Dollar.
Regarding the Fed expectations, markets are confident that the bank will not hike in December and are already betting on four rate cuts in 2024, starting in May. That being said, the incoming data will determine the bank’s easing calendar as it still remains data-dependent.
USD/SEK levels to watch
On the daily chart, indicators indicate that a consolidation may be incoming as the Relative Strength Index (RSI) is flat in oversold territory. Normally, this would suggest an impending price rebound as it hints that selling momentum weakens, further supported by the Moving Average Convergence Divergence (MACD), which displays flat red bars.
Additionally, the pair is currently positioned below the 20,100 and 200-day Simple Moving Averages (SMAs), pointing to short and long-term bearish pressures and an overall selling dominance.
Support Levels: 10.350, 10.200, 10.150.
Resistance Levels: 10.520, 10.600, 10.670 (200-day SMA).
USD/SEK daily chart
-638364516159786702.png)
- The EUR/USD is seeing bids in a broad-market risk rally to close out the trading week.
- Market sentiment is seeing a late break, pushing bids up the charts in a technical rally.
- US PMI data came in mixed, helping to soften the US Dollar.
The EUR/USD is trading into the 1.0950 level as the trading week winds up and markets are set for an early volume drop-off with US money markets shuttering early for the weekend. US markets are set to close at 13:00 EST this week, and markets are taking one last step into a risk bid before the early bell.
US S&P Global Manufacturing PMI drops to 49.4 in October
US Purchasing Managers' Index (PMI) data spread on Friday, with a decline in the Manufacturing component and an uptick in the Services figures.
The US Manufacturing PMI backslid into 49.4, missing the market's forecast of 49.8 and slipping back into contraction territory in November after October's flat reading of 50.0.
The Services component expanded, printing at 50.8 versus the forecast decline from 50.6 to 50.4, helping to offset the decline in Manufacturing and keeping the Composite PMI figure on-balance at 50.7, matching October's print.
Market participants will be turning their attention towards next week's heftier data releases, with US Gross Domestic Product (GDP) and Eurozone Harmonized Index of Consumer Price (HICP) inflation figures, both due in the mid-week.
US QoQ GDP is expected to tick upwards from 4.9% to 5.0% and pan-Eurozone HICP inflation is expected to slow down from 4.2% to 3.9% for the annualized figure.
EUR/USD Technical Outlook
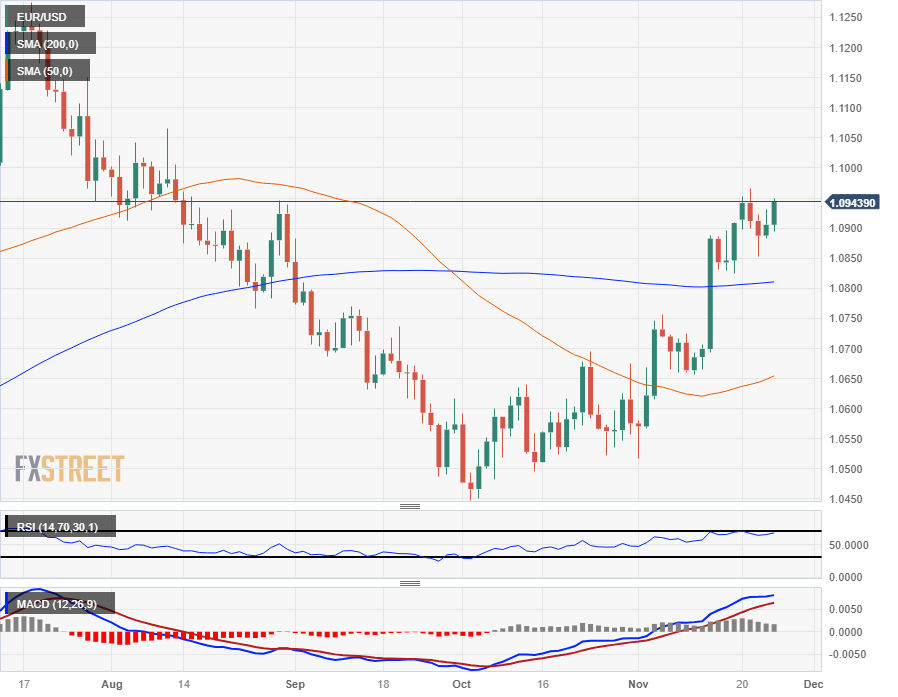
The Euro is grinding higher against the US Dollar heading into Friday's market close, with the EUR/USD pushing towards 1.0950, but the pair still remains below the week's peak at 1.0965.
The pair has rallied almost 5% from early October's bottom at 1.0448, and the pair has climbed three-tenths of a percent on the week. Friday's late technical rally helped to push the pair back into the green after reaching a weekly low near 1.0850.
EUR/USD Daily Chart
EUR/USD Technical Levels
- AUD/USD rallies near 0.6600, continuing its upward trajectory on the back of a buoyant market mood.
- Mixed US economic reports fuel speculation of a potential Fed policy shift despite recent hawkish remarks.
- Upcoming economic, including RBA speeches and key US data, are set to offer fresh impetus to AUD/USD traders.
The AUD/USD bounces from a daily low of 0.6549 and climbs for the second straight day, printing a new three-month high at 0.6591 at the time of writing. An upbeat market sentiment and overall US Dollar weakness maintain the pair hovering below the 0.6600 figure.
Australian Dollar gains against US Dollar, nearing the 0.6600 mark amid mixed US economic data and market optimism
US economic data on Friday suggests that business activity, although expanded In the services and composite sectors, the manufacturing segment shrank in November after gathering pace and rising in October. S&P Global Services PMI rose by 50.8 while the Composite grew by 50.7, with both figures exceeding forecasts. On the other hand, S&P Global Manufacturing PMI stood at 49.4, below estimates and the prior reading.
Today’s economic data and those previously revealed during the week kept speculations that the US Federal Reserve (Fed) would ease monetary policy next year. Despite Fed officials’ comments last week, they suggested that further tightening is needed and would depend on data to take the appropriate measures to curb inflation.
The US 10-year benchmark note climbs six basis points (bps) and is up at 4.472%, though it failed to support the Greenback. Contrarily, the US Dollar Index (DXY) is falling 0.38%, at 103.36.
On the Australian front, news that China continues stimulating the property market has improved investors' mood, as shown by Asian, European, and North American equity markets. That is alongside hawkish comments by the Reserve Bank of Australia (RBA) Governor Michele Bullock, who said “A more substantial monetary policy tightening is the right response to inflation that results from aggregate demand exceeding the economy’s potential to meet that demand.”
Next week, the Australian economic calendar will feature RBA Bullock's speech, retail sales, and the release of inflation figures. On the US front, housing data, consumer confidence, GDP, Fed’s preferred inflation gauge, and ISM Manufacturing PMI.
AUD/USD Technical Levels
In a shortened week, the US Dollar posted losses again. Next week, the key report in the US will be the Core PCE. Consumer inflation data is also due in the Eurozone with the preliminary November figures and in Australia with the October Monthly CPI. The Reserve Bank of New Zealand will announce its monetary policy decision.
Here is what you need to know for next week:
The US Dollar extended its decline and was the weakest performer among majors. The US Dollar Index (DXY) broke below 103.50, reaching the lowest level since mid-August. The negative momentum could persist as markets continue to focus on the Federal Reserve (Fed) not raising rates further, despite divergences in economic growth. The US economy continues to grow and is much stronger than European countries. The latest reports, the PMIs, showed the US Composite at 50.7 compared to the Eurozone Composite at 47.1.
Among the most relevant reports for next week in the US are the second revision of Q3 GDP on Wednesday, the Core Personal Consumption Expenditure Price Index and Jobless Claims on Thursday, and the ISM Manufacturing on Friday. Chinese PMIs for November are due on Thursday.
EUR/USD rose again on a weekly basis, but more gradually. The pair struggled to hold above 1.0950, but the short-term bias remains to the upside.
On Wednesday, the preliminary inflation figures from Spain and Germany will show how price performance was in November. Numbers are expected to show further cooling in inflation that would cement expectations that the European Central Bank (ECB) is done increasing interest rates further and could fuel speculation about potential rate cuts as the Eurozone economy remains stagnant. Eurozone CPI is due on Thursday.
GBP/USD decisively broke above the 20-week Simple Moving Average (SMA), rising above 1.2600 on Friday, the highest level since late August. The bias remains to the upside. The Pound also performed strongly versus the Euro, boosted by UK data. EUR/GBP had its worst weekly performance since August, retreating from monthly highs to levels below 0.8700.
The Japanese Yen was among the weakest currencies as government bond yields rebounded from monthly lows and also due to higher equity prices. The weekly chart in USD/JPY shows a Doji formation, with the price at the same level it had a week ago, after a sharp rebound from the 20-week SMA near 147.00 back to the 149.50 area.
USD/CAD dropped on Friday, breaking an important support level at 1.3650. Risks point to further weakness ahead. Canada will report monthly and quarterly GDP on Thursday and the employment report on Friday.
The improvement in risk sentiment and the weaker US Dollar boosted antipodean currencies that were the best performers during the week.
AUD/USD rose above the 200-day SMA on Friday, reaching the highest level in three months, moving closer to 0.6600. Australian data next week includes Retail Sales on Tuesday, and the Monthly Consumer Price Index on Wednesday.
The slide in the US Dollar on Friday boosted NZD/USD towards 0.6100. The pair is slightly above the 200-day SMA, holding a bullish tone. The Reserve Bank of New Zealand (RBNZ) will announce its monetary policy decision on Wednesday.
Gold rebounded despite higher bond yields and posted weekly gains, around $2,000. However, the yellow metal remains under the key resistance area of $2,010. A break higher would open the doors to further gains.
Like this article? Help us with some feedback by answering this survey:
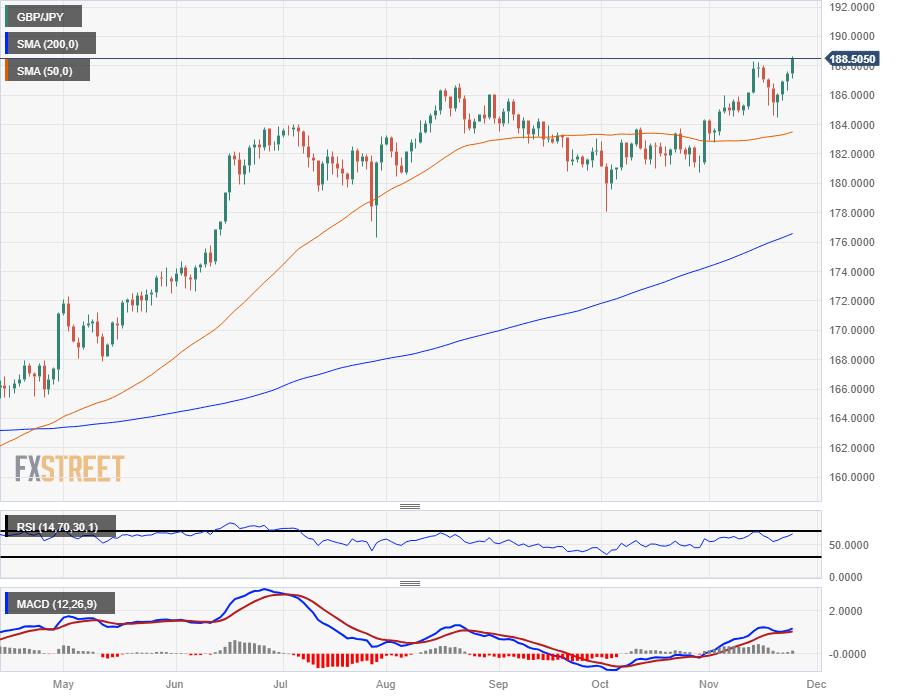
- GBP/JPY crosses 188.50, hits eight-year high as markets rally into the Friday close.
- The Pound Sterling is set for its fourth straight up day against the Yen.
- Risk appetite is catching a broad-market bid to cap off the trading week.
The GBP/JPY has broken into new eight-year highs above 188.50 as the Pound Sterling (GBP) catches a late-day Friday bid against the Japanese Yen (JPY), setting the Guppy up for a fourth consecutive green day.
Broad-market sentiment is seeing technical rallies across the board as investors make final adjustments heading into Friday's early close: US money markets are closing up shop early this week at 13:00 EST, and trading volumes will see a vacuum heading into the trading week's final hours.
The UK saw some upbeat data in the bottom half of the trading week, with UK Purchasing Managers' Index (PMI) data improving over previous releases and beating market expectations, and the GfK Consumer Confidence survey for November also showed the mood surrounding the UK domestic economy is improving slightly.
UK Preliminary Services PMI returns to expansion with 50.5 in November
Thursday saw the UK's S&P Global/CIPS November Composite PMI return to positive territory for the first time in over a quarter, printing at 50.1 against Wall Street's expected steady reading at 48.7.
Early Friday the UK's November GfK Consumer Confidence survey printed at -24, a firm bounce from the previous month's -30 and clearing the market's forecast of -28.
Next week is a thinner showing on the economic calendar, with a collection of Bank of England (BoE) speeches throughout the week as well as Japanese Retail Sales and trade figures due early Thursday.
GBP/JPY Technical Outlook
With the GBP/JPY trading into eight-year highs, there is little in the way of technical resistance patterns weighing the pair down.
The Guppy is up over 2% from the week's lows of 184.47, and up almost a full percent overall from the week's opening bids near 186.44.
The GBP's climb against the JPY through 2023 has been extremely one-sided, with the GBP/JPY up over 20% from the year's lows at 155.36.
Near-term support is coming from the 50-day Simple Moving Average (SMA), which is drifting upwards into 184.00, while the last swing low sits at 184.47.
GBP/JPY Daily Chart
GBP/JPY Technical Levels
- The DXY Index declined to 103.45, a 0.30% loss.
- The index will tally a 0.30% weekly loss as well.
- S&P PMIs showed a mixed outlook, with the manufacturing sector weakening and the service sector expanding.
The US Dollar (USD) is receding on Friday with the DXY index, which measures the value of the US Dollar versus a basket of global currencies, declining toward 103.45 on the back of mixed S&P PMIs and dovish bets on the Fed.
In line with that, the US economy is showing overall signs of cooling inflation and job creation, and soft S&P PMIs flashed signs of a weakening economy. This economic outlook makes traders believe that the Federal Reserve (Fed) will adopt a less aggressive stance, which is weakening the US Dollar.
Daily Digest Market Movers: US Dollar faces further downside as the US manufacturing sector weakens
- The US Dollar Index traded weaker and declined toward 103.45 on Friday.
- In November, the S&P Global Composite PMI remained stable at 50.7, signalling slight growth in the US private sector.
- Manufacturing PMI fell to 49.4, indicating a shift into contraction, and the Services PMI increased marginally to 50.8.
- What worried investors seemed to be the report of the first employment decline in US service and manufacturing sectors since mid-2020, driven by lower demand and higher costs.
- The market response included expectations of a more cautious Federal Reserve, resulting in a weaker US dollar.
- Markets are confident that the Federal Reserve won’t hike in December and are betting on four rate cuts in 2024, beginning in May.
Technical Analysis: US Dollar hints at a potential reversal as the RSI approaches 30
Although the daily Relative Strength Index (RSI) is nearing oversold conditions, suggesting a somewhat oversaturated bearish market, it also indicates the potential to reverse the upside as selling pressure appears to wane. This notion is reinforced by the Moving Average Convergence Divergence (MACD), which displays flat red bars, signalling an easing of bullish sentiment without a clear direction.
In addition, the DXY’s position below the 20, 100, and 200-day Simple Moving Averages (SMAs) also suggests that the sellers have the upper hand.
Support levels: 103.40, 103.30, 103.15.
Resistance levels: 103.60 (200-day SMA), 104.00, 104.20 (100-day SMA).
US Dollar FAQs
What is the US Dollar?
The US Dollar (USD) is the official currency of the United States of America, and the ‘de facto’ currency of a significant number of other countries where it is found in circulation alongside local notes. It is the most heavily traded currency in the world, accounting for over 88% of all global foreign exchange turnover, or an average of $6.6 trillion in transactions per day, according to data from 2022.
Following the second world war, the USD took over from the British Pound as the world’s reserve currency. For most of its history, the US Dollar was backed by Gold, until the Bretton Woods Agreement in 1971 when the Gold Standard went away.
How do the decisions of the Federal Reserve impact the US Dollar?
The most important single factor impacting on the value of the US Dollar is monetary policy, which is shaped by the Federal Reserve (Fed). The Fed has two mandates: to achieve price stability (control inflation) and foster full employment. Its primary tool to achieve these two goals is by adjusting interest rates.
When prices are rising too quickly and inflation is above the Fed’s 2% target, the Fed will raise rates, which helps the USD value. When inflation falls below 2% or the Unemployment Rate is too high, the Fed may lower interest rates, which weighs on the Greenback.
What is Quantitative Easing and how does it influence the US Dollar?
In extreme situations, the Federal Reserve can also print more Dollars and enact quantitative easing (QE). QE is the process by which the Fed substantially increases the flow of credit in a stuck financial system.
It is a non-standard policy measure used when credit has dried up because banks will not lend to each other (out of the fear of counterparty default). It is a last resort when simply lowering interest rates is unlikely to achieve the necessary result. It was the Fed’s weapon of choice to combat the credit crunch that occurred during the Great Financial Crisis in 2008. It involves the Fed printing more Dollars and using them to buy US government bonds predominantly from financial institutions. QE usually leads to a weaker US Dollar.
What is Quantitative Tightening and how does it influence the US Dollar?
Quantitative tightening (QT) is the reverse process whereby the Federal Reserve stops buying bonds from financial institutions and does not reinvest the principal from the bonds it holds maturing in new purchases. It is usually positive for the US Dollar.
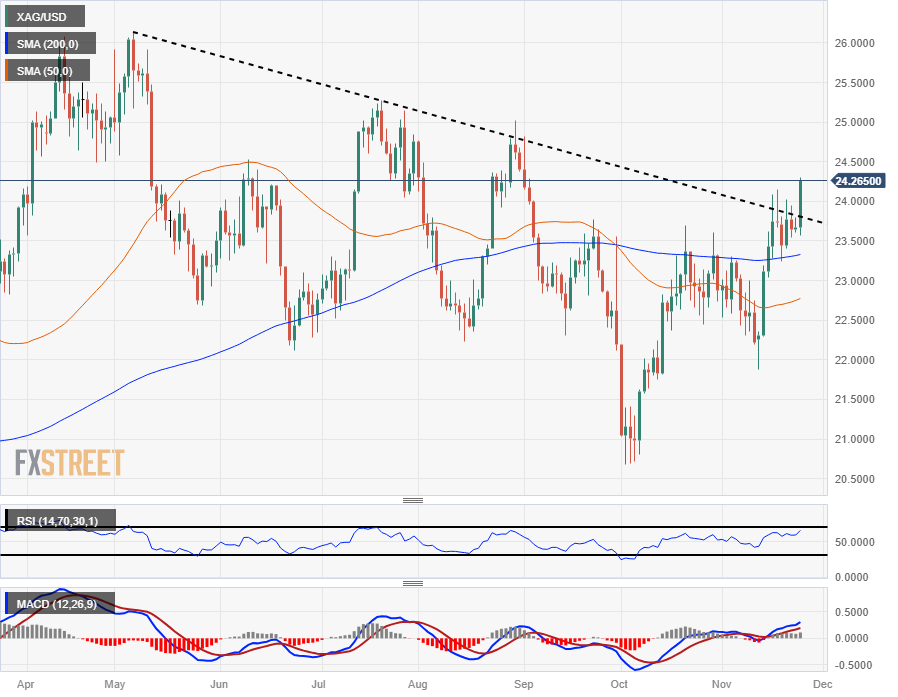
- Spot Silver is surging late on Friday, tests 12-week high.
- XAG/USD pings $24.30 as Silver rebounds, following broad-market risk sentiment higher.
- Metals are pushing higher with the NY market set for an early close.
XAG/USD tapped $24.30 in the back half of Friday's trading, testing Silver's highest bids in almost 12 weeks. Market sentiment is testing higher heading into the trading week's close, and markets are set to see an early drop in trading volumes.
Wall Street will be going dark a little bit early today, with US markets slated to shut down at 13:00 EST.
Volumes and overall price momentum, already thin on Fridays, is expected to dry up a little bit earlier than usual this week.
Silver is getting bid out of a recent near-term consolidation range, and has gained almost 18% despite seeing an overall downtrend in 2023.
Friday's late bump in the XAG/USD sees Spot Silver trading into overall positive territory for the year since declining from September's peak at $25.00.
XAG/USD Technical Outlook
Friday's surge back over $24.20 sees XAG/USD making a break of a descending trendline from May's peaks above $26.00, and Silver is making a break away from the 200-day Simple Moving Average (SMA) near $23.25.
The 50-day SMA is rotating into a bullish stance from $22.75, and a bullish crossover of the longer moving average could see technical support firm up for a longer-term move higher in the bids.
Should bearish price momentum return to the fold, a downside break of $23.50 will harden the descending trendline and set up Silver bears for a fresh run at the last swing low into the $22.00 handle.
XAG/USD Daily Chart
XAG/USD Technical Levels
- The Canadian Dollar found its highest bids in nearly six weeks on data beats.
- Retail Sales in Canada gave a surprise 0.6% jump in September.
- The Loonie is firmer across the board on Friday.
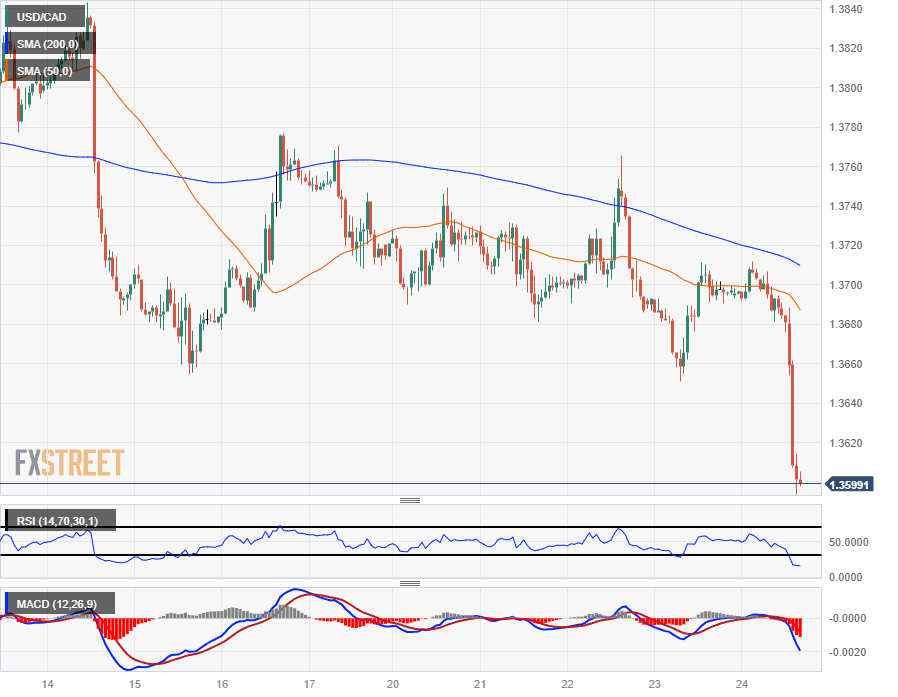
The Canadian Dollar (CAD) found some bullish momentum in the latter half of Friday’s trading session, taking the USD/CAD pair down into the 1.3600 region.
A better-than-expected Retail Sales report and a broad market recovery in risk sentiment are bolstering the Loonie against the US Dollar (USD), with the CAD up across the board and the Greenback on the softer side heading into the trading week’s close.
Daily Digest Market Movers: Canadian Dollar finds a rebound, USD/CAD back into 1.3600
- The CAD is back in action, climbing against all of the majors on Friday.
- Retail Sales within Canada surged 0.6% in September, well above Wall Street’s no-change forecast and walking back August’s -0.1% print.
- Core Retail Sales (excluding automobiles, gas station purchases and car parts) still rose 0.2%.
- Retail Sales were still up 0.3% in September by volume.
- 3Q Retail Sales up 0.6%, Retail Sales volume down 0.5% over the same period.
- US Purchasing Managers Index (PMI) in November saw a weakening Manufacturing component, injuring the Greenback.
- US Composite PMI in November held steady at 50.7 as the Manufacturing and Services components were mixed.
- US Manufacturing PMI down from 50.0 to 49.4, missing the forecast of 49.8.
- US Services PMI edged higher from 50.6 to 50.8, beating the expected slip to 50.4.
Canadian Dollar price today
The table below shows the percentage change of Canadian Dollar (CAD) against listed major currencies today. Canadian Dollar was the strongest against the US Dollar.
| USD | EUR | GBP | CAD | AUD | JPY | NZD | CHF | |
| USD | -0.24% | -0.53% | -0.68% | -0.36% | -0.04% | -0.56% | -0.27% | |
| EUR | 0.24% | -0.29% | -0.43% | -0.12% | 0.21% | -0.31% | -0.03% | |
| GBP | 0.54% | 0.28% | -0.13% | 0.17% | 0.50% | -0.04% | 0.28% | |
| CAD | 0.68% | 0.42% | 0.15% | 0.32% | 0.63% | 0.12% | 0.41% | |
| AUD | 0.36% | 0.11% | -0.17% | -0.31% | 0.32% | -0.20% | 0.09% | |
| JPY | 0.03% | -0.21% | -0.53% | -0.64% | -0.32% | -0.54% | -0.21% | |
| NZD | 0.58% | 0.32% | 0.03% | -0.11% | 0.20% | 0.52% | 0.29% | |
| CHF | 0.26% | 0.01% | -0.28% | -0.41% | -0.11% | 0.22% | -0.30% |
The heat map shows percentage changes of major currencies against each other. The base currency is picked from the left column, while the quote currency is picked from the top row. For example, if you pick the Euro from the left column and move along the horizontal line to the Japanese Yen, the percentage change displayed in the box will represent EUR (base)/JPY (quote).
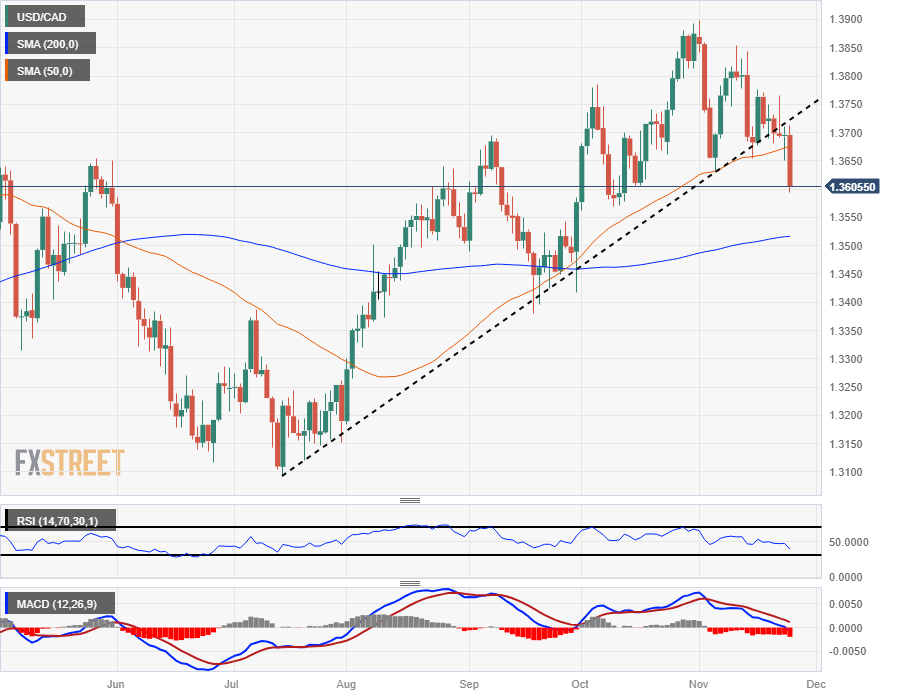
Technical Analysis: Canadian Dollar rebounds in the trading week’s eleventh hour, drags USD/CAD back down to 1.3600
The Loonie’s late break sees the USD/CAD challenging the 1.3600 handle, with the pair aimed straight at the 1.3500 target, just past the 200-day Simple Moving Average (SMA).
The pair has decisively broken through the rising trendline from July’s low bids at 1.3100, and technical support from the 50-day SMA has broken through.
Intraday declines in the USD/CAD has hourly candles pulling well away from the near-term mid-ranges, dropping into 1.3600. Any bullish rebounds will be seeing a technical resistance range between the 50- and 200-day SMAs, which are dropping into 1.3680 and 1.3700, respectively.
USD/CAD Hourly Chart
USD/CAD Daily Chart
Canadian Dollar FAQs
What key factors drive the Canadian Dollar?
The key factors driving the Canadian Dollar (CAD) are the level of interest rates set by the Bank of Canada (BoC), the price of Oil, Canada’s largest export, the health of its economy, inflation and the Trade Balance, which is the difference between the value of Canada’s exports versus its imports. Other factors include market sentiment – whether investors are taking on more risky assets (risk-on) or seeking safe-havens (risk-off) – with risk-on being CAD-positive. As its largest trading partner, the health of the US economy is also a key factor influencing the Canadian Dollar.
How do the decisions of the Bank of Canada impact the Canadian Dollar?
The Bank of Canada (BoC) has a significant influence on the Canadian Dollar by setting the level of interest rates that banks can lend to one another. This influences the level of interest rates for everyone. The main goal of the BoC is to maintain inflation at 1-3% by adjusting interest rates up or down. Relatively higher interest rates tend to be positive for the CAD. The Bank of Canada can also use quantitative easing and tightening to influence credit conditions, with the former CAD-negative and the latter CAD-positive.
How does the price of Oil impact the Canadian Dollar?
The price of Oil is a key factor impacting the value of the Canadian Dollar. Petroleum is Canada’s biggest export, so Oil price tends to have an immediate impact on the CAD value. Generally, if Oil price rises CAD also goes up, as aggregate demand for the currency increases. The opposite is the case if the price of Oil falls. Higher Oil prices also tend to result in a greater likelihood of a positive Trade Balance, which is also supportive of the CAD.
How does inflation data impact the value of the Canadian Dollar?
While inflation had always traditionally been thought of as a negative factor for a currency since it lowers the value of money, the opposite has actually been the case in modern times with the relaxation of cross-border capital controls. Higher inflation tends to lead central banks to put up interest rates which attracts more capital inflows from global investors seeking a lucrative place to keep their money. This increases demand for the local currency, which in Canada’s case is the Canadian Dollar.
How does economic data influence the value of the Canadian Dollar?
Macroeconomic data releases gauge the health of the economy and can have an impact on the Canadian Dollar. Indicators such as GDP, Manufacturing and Services PMIs, employment, and consumer sentiment surveys can all influence the direction of the CAD. A strong economy is good for the Canadian Dollar. Not only does it attract more foreign investment but it may encourage the Bank of Canada to put up interest rates, leading to a stronger currency. If economic data is weak, however, the CAD is likely to fall.
- GBP/USD climbs above 1.2600, driven by optimistic UK data and a jump in UK yields.
- US data was mixed with solid Services and Composite PMIs, but Manufacturing PMI fell into contraction.
- Upcoming speeches by the BoE Governor and US economic reports to provide further cues for GBP/USD movement.
The Pound Sterling (GBP) advances to a new 12-week high against the US Dollar (USD) courtesy of better-than-expected data revealed on Thursday, which sparked a sell-off of Gilts; consequently, UK bond yields rose. The GBP/USD is trading at 1.2606 after hitting a high of 1.2615.
GBP/USD reaches new heights, bolstered by UK bond yield rise and mixed US business activity indicators
S&P Global revealed that business activity in the United States (US) remains solid after the Services and Composite PMIs exceeded forecasts. Nevertheless, the Manufacturing PMI slipped below the 50 expansion/contraction threshold, painting a mixed scenario for the economy. In the next week, the Institute for Supply Management (ISM) will update the readings for December.
Aside from this, in the UK, Consumer Confidence improved, while S&P Global/CIPS figures show business outlook is improving, even though manufacturing activity stood at recessionary territory for the sixth consecutive month.
Recently, the Bank of England (BoE) Chief Economist Huw Pill insisted the central banks would continue to fight inflation despite the stagnating outlook for the British economy. Although some lawmakers had stressed the need for lower rates, Pill stated that it was too early to consider such a move.
Even though inflation eased from 6.7% to 4.6% in October, inflation remains twice the BoE’s goal of 2%.
The Autumn Statement revealed by the UK Chancellor of the Exchequer, Jeremy Hunt, was well received by investors. Nevertheless, estimates for growth and inflation were pessimistic at a time when market participants estimated the UK economy to dip into a recession.
Next week, the UK economic docket will feature a speech by the BoE Governor Andrew Bailey. On the US front, the calendar will feature Consumer Confidence, Fed speakers, a preliminary reading for GDP, inflation data and the ISM Manufacturing PMI.
GBP/USD Price Analysis: Technical outlook
The GBP/USD daily chart portrays the pair in a bullish run that could extend toward the psychological 1.2700 figure. A breach of that level could expose the August 30 swing high at 1.2746, followed by the August 22 high at 1.2800. On the other hand, if the pair slides below 1.2600, the November 23 high at 1.2569 would emerge as first support, followed by today’s low of 1.2524.
- The XAU/USD sees a boost, ascending to the $2000 level.
- The US Dollar weakened after mixed S&P PMIs.
- Higher US yields may limit the upside of the metal.
The XAU/USD is finding traction in Friday's session, capitalising on mixed S&P PMIs and a weakening US Dollar. The pair, commonly recognised as the price of gold in US dollars, is exchanging hands, trading towards $2,000 and seeing 0.30% gains.
In early November, economic activity within the US private sector displayed slight growth, as indicated by the S&P Global Composite PMI, which maintained its position at 50.7. However, the Manufacturing PMI experienced a decline, falling to 49.4 from 50.0 in the same period, placing it in contraction territory. On the other hand, the Services PMI saw a modest improvement, rising to 50.8 from 50.6. Notably, employment in the US service and manufacturing sectors decreased in November for the first time since mid-2020, influenced by sluggish demand and elevated costs.
As a reaction, markets seem to be weighing the weakening of the manufacturing sector, boosting dovish bets on the Federal Reserve (Fed), which may explain the weakening of the US dollar. However, US Treasury yields are rising and may limit the upside momentum of the yellow metal. The 2-year rate rose to 4.95% while the 5 and 10-year yields to 4.50% and 4.48%.
Considering that the Fed remains data-dependent, the US will report Gross Domestic Product (GDP) revisions from Q3 next week as well as Personal Consumption Expenditures (PCE) figures from October, which will likely impact the USD’s price dynamics.
XAU/USD levels to watch
Evaluating the daily chart, the Relative Strength Index (RSI) is positioned near overbought conditions, manifesting a dominant buying momentum but a potential reversal. In addition, the Moving Average Convergence Divergence (MACD) shows a positive trend with its rising green bars, indicating augmenting bullish momentum.
Contributing to the consolidated bullish narrative is the position of the XAU/USD relative to its Simple Moving Averages (SMAs). Positioned above the 20, 100, and 200-day SMAs, it advances the narrative of bullish control in the broader trend.
Support Levels: $1,970 (20-day SMA),$1,940 (200-day SMA), $1,930 (100-day SMA).
Resistance Levels: $2,015, $2,030, $2,050.
XAU/USD daily chart
-638364391194791044.png)
- Mexican Peso extends its rally, capitalizing on a weaker USD.
- Mexico's GDP growth aligns with expectations and might refrain Banxico's officials from easing monetary policy.
- Mixed US economic data, with improving business activity but a downturn in Manufacturing PMI, weighed on the USD/MXN pair.
Mexican Peso (MXN) prolongs its gains against a softer US Dollar (USD) as North American traders get back from Thanksgiving for a shortened session, though they failed to boost the latter. Treasury bond yields in the United States (US) rose while interest rate cuts odds by the US Federal Reserve (Fed) were pushed back. Meanwhile, Mexico’s economy grew as expected, a headwind for the USD/MXN, trading with losses of more than 0.50%.
The National Statistics Agency (INEGI) revealed the Gross Domestic Product (GDP) rose as expected on an annual basis and exceeded forecasts in a 90-day period. That could prevent Bank of Mexico (Banxico) officials from adopting a dovish stance after the minutes showed policymakers estimated a rate cut in the first quarter of 2024.
On the US front, business activity showed signs that it remains improving, according to the S&P Composite and Services PMI. The outlier was Manufacturing, which dropped into recessionary territory.
Daily digest movers: Mexican Peso helped by solid economic growth and a steady disinflation process
- Mexico’s GDP growth for Q3 came at 3.3% YoY, as foreseen, exceeding the previous reading. Quarterly basis rose by 1.1%, peaking forecasts and the previous figures of 0.9% and 0.8%, respectively.
- The Mexican Consumer Price Index (CPI) for mid-November annually increased by 4.32%, exceeding estimates of 4.31%.
- US S&P Global Services and Composite PMIs came at 50.8, exceeding estimates, and at 50.7, above forecasts, unchanged from the previous report.
- Manufacturing activity revealed by US S&P Global, witnessed the index dropping from 50 to 49.4, below estimates of 49.8.
- Core CPI in Mexico decelerated compared to previous data and slowed to 5.31%, below forecasts of 5.33%.
- A Citibanamex poll suggests that 25 of 32 economists polled expect Banxico's first rate cut in the first half of 2024.
- The poll shows “a great dispersion” for interest rates next year, between 8.0% and 10.25%, revealed Citibanamex.
- The same survey revealed that economists foresee headline annual inflation at 4% and core at 4.06%, both readings for the next year, while the USD/MXN exchange rate is seen at 19.00, up from 18.95, toward the end of 2024
- Data published last week showed prices paid by consumers and producers in the US dipped, increasing investors' speculations that the Fed’s tightening cycle has ended.
- The swap market suggests traders expect 84 basis points of rate cuts by the Fed in 2024.
Technical Analysis: Mexican Peso in the driver’s seat, as USD/MXN threatens to close the week below 17.10
The USD/MXN pair was undermined by upbeat economic data, which pushed the pair below the 17.10 mark, reaching a three-day low of 17.08. The bias remains downward, and the pair could extend its losses if it breaches the November 21 swing low of 17.06. If that level is surrendered, a test of 17.00 is on the cards.
On the other hand, if buyers reclaim 17.20, that could facilitate a jump to the 100-day Simple Moving Average (SMA) at 17.34. Once buyers regain that supply zone, further upside could be witnessed at the 20-day SMA at 17.46.
Mexican Peso FAQs
What key factors drive the Mexican Peso?
The Mexican Peso (MXN) is the most traded currency among its Latin American peers. Its value is broadly determined by the performance of the Mexican economy, the country’s central bank’s policy, the amount of foreign investment in the country and even the levels of remittances sent by Mexicans who live abroad, particularly in the United States. Geopolitical trends can also move MXN: for example, the process of nearshoring – or the decision by some firms to relocate manufacturing capacity and supply chains closer to their home countries – is also seen as a catalyst for the Mexican currency as the country is considered a key manufacturing hub in the American continent. Another catalyst for MXN is Oil prices as Mexico is a key exporter of the commodity.
How do decisions of the Banxico impact the Mexican Peso?
The main objective of Mexico’s central bank, also known as Banxico, is to maintain inflation at low and stable levels (at or close to its target of 3%, the midpoint in a tolerance band of between 2% and 4%). To this end, the bank sets an appropriate level of interest rates. When inflation is too high, Banxico will attempt to tame it by raising interest rates, making it more expensive for households and businesses to borrow money, thus cooling demand and the overall economy. Higher interest rates are generally positive for the Mexican Peso (MXN) as they lead to higher yields, making the country a more attractive place for investors. On the contrary, lower interest rates tend to weaken MXN.
How does economic data influence the value of the Mexican Peso?
Macroeconomic data releases are key to assess the state of the economy and can have an impact on the Mexican Peso (MXN) valuation. A strong Mexican economy, based on high economic growth, low unemployment and high confidence is good for MXN. Not only does it attract more foreign investment but it may encourage the Bank of Mexico (Banxico) to increase interest rates, particularly if this strength comes together with elevated inflation. However, if economic data is weak, MXN is likely to depreciate.
How does broader risk sentiment impact the Mexican Peso?
As an emerging-market currency, the Mexican Peso (MXN) tends to strive during risk-on periods, or when investors perceive that broader market risks are low and thus are eager to engage with investments that carry a higher risk. Conversely, MXN tends to weaken at times of market turbulence or economic uncertainty as investors tend to sell higher-risk assets and flee to the more-stable safe havens.
- The New Zealand Dollar continues cruising higher on broadly positive market sentiment.
- The Kiwi rises in line with global equities as Oil continues its downtrend and US PMIs come in mixed.
- NZD/USD ends the week on a high note, rising to within close proximity of the 200-day SMA at 0.6100.
The New Zealand Dollar (NZD) takes another stride higher on Friday as the positive market mood continues and a new government takes its seat in Wellington, bringing weeks of coalition talks to a conclusion.
Market sentiment is finding a boost from falling Oil prices as OPEC+ countries argue over who should shoulder expected supply cuts. Meanwhile, in the US, according to inventory figures, Oil stocks are building, putting further downward pressure on prices. This comes as good news to cash-strapped motorists and businesses facing rising input costs. Global PMI data released during the week was overall positive, further elevating the mood.
As a commodity currency, the Kiwi is sensitive to changing perceptions of global growth and generally reflects investor sentiment.
Daily digest market movers: Bright market mood fuels New Zealand Dollar
- The New Zealand Dollar rises, benefiting from positive risk appetite amid declining Oil prices and upbeat macroeconomic data.
- Bad news regarding Chinese asset manager Zhongzhi, another fatality of the China property bubble, was not enough to raise significant concerns about the stability of the Chinese economy. Although the company announced it was insolvent with liabilities totalling between $58 and $64 billion, according to a report by Reuters, government intervention is likely to prevent contagion.
- "Financial regulators are almost certain to intervene aggressively if there's any sign that Zhongzhi's troubles are spreading," said Christopher Beddor, deputy director of China research at Gavekal Dragonomics, quoted by Reuters.
- Preliminary Purchasing Manager’ Index (PMI) data for November in the Eurozone and UK both showed better-than-expected performances. In the US, PMIs were mixed, with the Services index roundly beating estimates at 50.8 versus the 50.4 expected, but Manufacturing falling behind, with a reading of 49.4 after 49.8 was forecast.
- The center-right New Zealand National Party finally formed a government with its coalition partners, the populist New Zealand First party and libertarian ACT New Zealand, bringing almost six years of Labour Party reign to an end.
New Zealand Dollar technical analysis: NZD/USD breaks but does not hold above key resistance
NZD/USD – the number of US Dollars one New Zealand Dollar can buy – pushes back up to within a hair’s breadth of the 200-day Simple Moving Average (SMA) on Friday.
-638364386353655194.png)
New Zealand Dollar vs US Dollar: Daily Chart
The pair is in a short and medium-term bullish trend, which continues to bias longs.
The 200-day Simple Moving Average at 0.6100 (just above the current market level at 0.6084) is likely to provide a major resistance level to further upside, so price will probably stall there at first contact.
The MACD momentum indicator is rising in line with price suggesting the uptrend is healthy.
A possible bullish inverse head-and shoulders (H&S) pattern may have formed at the lows. The pattern is identified by the labels applied to the chart above. L and R stand for the left and right shoulders, whilst H stands for the head. The target for the inverse H&S is at 0.6215. This adds more weight to the bullish argument.
The long-term trend is still bearish, however, suggesting a risk of a recapitulation remains.
New Zealand Dollar FAQs
What key factors drive the New Zealand Dollar?
The New Zealand Dollar (NZD), also known as the Kiwi, is a well-known traded currency among investors. Its value is broadly determined by the health of the New Zealand economy and the country’s central bank policy. Still, there are some unique particularities that also can make NZD move. The performance of the Chinese economy tends to move the Kiwi because China is New Zealand’s biggest trading partner. Bad news for the Chinese economy likely means less New Zealand exports to the country, hitting the economy and thus its currency. Another factor moving NZD is dairy prices as the dairy industry is New Zealand’s main export. High dairy prices boost export income, contributing positively to the economy and thus to the NZD.
How do decisions of the RBNZ impact the New Zealand Dollar?
The Reserve Bank of New Zealand (RBNZ) aims to achieve and maintain an inflation rate between 1% and 3% over the medium term, with a focus to keep it near the 2% mid-point. To this end, the bank sets an appropriate level of interest rates. When inflation is too high, the RBNZ will increase interest rates to cool the economy, but the move will also make bond yields higher, increasing investors’ appeal to invest in the country and thus boosting NZD. On the contrary, lower interest rates tend to weaken NZD. The so-called rate differential, or how rates in New Zealand are or are expected to be compared to the ones set by the US Federal Reserve, can also play a key role in moving the NZD/USD pair.
How does economic data influence the value of the New Zealand Dollar?
Macroeconomic data releases in New Zealand are key to assess the state of the economy and can impact the New Zealand Dollar’s (NZD) valuation. A strong economy, based on high economic growth, low unemployment and high confidence is good for NZD. High economic growth attracts foreign investment and may encourage the Reserve Bank of New Zealand to increase interest rates, if this economic strength comes together with elevated inflation. Conversely, if economic data is weak, NZD is likely to depreciate.
How does broader risk sentiment impact the New Zealand Dollar?
The New Zealand Dollar (NZD) tends to strengthen during risk-on periods, or when investors perceive that broader market risks are low and are optimistic about growth. This tends to lead to a more favorable outlook for commodities and so-called ‘commodity currencies’ such as the Kiwi. Conversely, NZD tends to weaken at times of market turbulence or economic uncertainty as investors tend to sell higher-risk assets and flee to the more-stable safe havens.
Kiwi’s post-US CPI rally extended this week. Economists at ANZ Bank analyze NZD/USD outlook.
US interest rates set to fall more quickly than NZ interest rates in 2024
There have been and will continue to be pullbacks, but more flexible labour markets have meant that the Fed has achieved better progress in its inflation fight, and that’ll set the scene for US interest rates falling more quickly than NZ interest rates in 2024.
All else equal, it should be a tailwind for the Kiwi’s gravitation back towards fair value, which we see at around 0.65.
The Riksbank decided against hiking its key rate in November. Krona traded weaker following the rate meeting. Economists at Commerzbank analyze SEK’s outlook.
Riksbank remains cautiously restrictive, but not enough
The Riksbank didn't raise the policy rate in November but has not ruled out a further increase at the beginning of 2024. From a market perspective, it is still not acting decisively enough against inflation risks. Therefore, the SEK will probably have no more upside potential this year.
Only next year, when the tide turns in favor of the Riksbank, is the Krona likely to appreciate again.
In November, stocks and bonds have rallied and the US Dollar has weakened. Economists at Nordea expect markets to move back to reality.
The current rally in bonds and stocks is unlikely to continue
The rally in both bonds and stocks looks unsustainable. The next environment is likely to be one of too much economic growth and too high inflation, which will put upward pressure on interest rates and weigh on stock prices. The environment we have right now of higher stock and bond prices and lower oil prices increases the chances of this happening.
The problem is that storm clouds are gathering. The rise in unemployment constitutes a significant risk and increases the likelihood of too little growth and too low inflation, which means the odds of bonds outperforming stocks significantly are rising. Both environments seem to be good for the US Dollar which is suffering in the current soft landing environment. The Dollar is also likely to benefit from economic divergence between the US and the Euro area, which suggests the odds of too little growth and too low inflation in the Euro area are larger than in the US.
- US S&P Global Composite PMI held steady at 50.7 in November's flash estimate.
- US Dollar Index stays in negative territory at around 103.50.
The economic activity in the US private sector continued to expand at a modest pace in early November, with S&P Global Composite PMI holding steady at 50.7.
The Manufacturing PMI fell into the contraction territory by edging lower to 49.4 from 50.0 in the same period, while the Services PMI improved modestly to 50.8 from 50.6.
Commenting on the survey's findings, "the US private sector remained in expansionary territory in November, as firms signalled another marginal rise in business activity," noted Siân Jones, Principal Economist at S&P Global Market Intelligence. "Moreover, demand conditions – largely driven by the service sector – improved as new orders returned to growth for the first time in four months."
Market reaction
The US Dollar Index showed no immediate reaction to these data and was last trading modestly lower on the day at around 103.50.
Gold regained the $2,000 threshold this week. Economists at Commerzbank analyze the yellow metal’s outlook.
Gold’s upside potential has become limited following the marked recovery
Gold’s rally was driven by hopes that the US Federal Reserve will not hike its key rate any further. After all, the latest economic data have been rather disappointing.
The upside potential for Gold meanwhile appears limited, however: our economists only expect the first rate cut to be implemented in the middle of next year, so only then is the price of a troy ounce of Gold likely to climb lastingly above $2,000.
EUR/USD little changed in low 1.09s. Economists at Scotiabank analyze the pair’s outlook.
Underlying trend dynamics remain bullish
The EUR continues to consolidate. At the moment, spot is heading for an unchanged close on the week which does suggest some building resistance to the EUR advance around noted retracement resistance at 1.0960 (61.8% Fibonacci of the H2 EUR slide).
Underlying trend dynamics remain bullish, however, and still suggest limited scope for EUR weakness and ongoing pressure for EUR gains to extend.
Above 1.0960 targets 1.11.
Support is 1.0870/1.0875; loss of support here could see corrective EUR losses towards 1.0775.
USD mixed in quiet trade. Economists at Scotiabank analyze Greenback’s outlook.
Focus on PMI data in light session ahead
The US Dollar Index is trading slightly lower overall on the day and week and retains a generally soft undertone which leaves directional risks for the USD overall tilted to the downside still.
US trading desks will be lightly populated today and a quiet session is likely. But there is some data on tap in the form of S&P Global PMI data for the US. The preliminary November data are expected to reflect some slowing in US activity; manufacturing may slip back under 50 – if only barely – while the services and composite readings are expected to reflect slower expansion. Weak – or weaker than expected – data will weigh on the USD, given its soft undertone.
- Retail Sales in Canada rose unexpectedly in September.
- USD/CAD trades in negative territory near 1.3650 after the data.
Retail Sales in Canada increased by 0.6% on a monthly basis to C$66.46 billion, Statistics Canada reported on Friday.
This reading followed the 0.1% contraction recorded in August and came in better than the market expectation for a no change. In the same period, Retail Sales ex Autos rose by 0.2%.
"Core retail sales—which exclude gasoline stations and fuel vendors and motor vehicle and parts dealers—were down 0.3% in September," the press release further read. "In volume terms, retail sales increased 0.3% in September. Retail sales were up 0.6% in the third quarter, while in volume terms, retail sales declined 0.5%."
Market reaction
USD/CAD edged lower with the immediate reaction and was last seen losing 0.26% on a daily basis at 1.3658.
European Central Bank (ECB) Vice President Luis de Guindos said on Friday that the risks to the European economic outlook are tilted to the downside.
De Guindos added that inflation could tick up again in the next few months but noted that the current interest rate for long enough could tame inflation.
Market reaction
These comments don't seem to be having a significant impact on the Euro's performance against its major rivals. As of writing, EUR/USD was virtually unchanged on the day at 1.0908.
USD/CAD holds little changed. Economists at Scotiabank analyze the pair’s outlook.
Charts pressure USD support in high 1.36s
The CAD is flat-lining on the charts. Short and medium-term directional signals are neutral and trend momentum is extremely weak. But the USD is putting incremental pressure on short-term support (off the October/November lows at 1.3673) and is close to testing major trend support off the July low at 1.3660.
The bearish weekly reversal signal from the start of the month continues to point to risk of more USD losses in the weeks ahead.
Resistance remains 1.3770/1.3775.
Sterling a moderate outperformer on the day. Economists at Scotiabank analyze GBP’s outlook.
Charts remain bullish
Sterling is edging closer to 1.2589 resistance (50% retracement of the July/October fall in Cable) and looks set for its highest weekly close since early September.
Gains in the Pound have overcome the 100 and 200-DMA over the past week or so and have the support of a bullish alignment of trend oscillators on the intraday, daily and weekly charts.
Sterling will find support on minor dips (to the 1.25 area) in the short run and looks poised to extend its rebound from a technical point of view.
- The Greenback trades steady on Friday as markets reopen after Thanksgiving.
- US Traders gear up for import US PMI data.
- The US Dollar Index still resides below 104 and is at an important crossroad from a technical perspective.
The US Dollar (USD) is still in its snoozefest from Thursday when US markets were closed for Thanksgiving. That said, despite some failed attempts, not one non-US currency was able to benefit from the absence of the US markets. While Black Friday is underway, traders will be on the lookout for some important US data right at the end of this week that could make or break the US Dollar Index’s (DXY) position.
This Friday will all be about the Purchasing Managers Index preliminary reading for November. The importance is even more heightened as on Thursday, the European sub-50 PMI’s were soaring for several core EU countries. Should US PMI numbers this afternoon contract, and fall below 50, it would mean that Europe is in a better condition for recovery than the US, which means a substantial break for the Greenback.
Daily digest: Thanksgiving snooze into the weekend
- Near 14:45 GMT the S&P Purchase Managers Index numbers will be released for November:
- Manufacturing is expected to head from 50 to 49.8.
- Services are expected to head from 50.6 to 50.4.
- The Composite Index was at 50.7 with no expectation foreseen.
- Headline risk is expected for next week with the United Nations’ COP28 meeting to start in Dubai on Thursday. At that same time OPEC+ will have its delayed meeting to address production cuts to uphold current price levels in Oil.
- Equities are very mixed this last day of the trading week: Japanese indices have closed up 0.50% for this Friday. China, on the contrary, is down with the Hang Seng as biggest loser, near 2%. European equities are still looking for direction halfway through the European session, US equity futures are flat.
- The CME Group’s FedWatch Tool shows that markets are pricing in a 99.5% chance that the Federal Reserve will keep interest rates unchanged at its meeting in December.
- The benchmark 10-year US Treasury Note yield halted trading at 4.48% and will not move this Thursday with markets closed.
US Dollar Index technical analysis: Crucial where the close will be
The US Dollar is on the verge of flipping a coin on what it will do next from a technical point of view. Looking at both a daily and weekly chart, the DXY is trading at very crucial supportive levels that, once snapped, offer ample room for more downturn. This means a substantially weaker US Dollar in several currency pairs. All eyes on the PMI data this afternoon if it can support the DXY or continue its decline.
The DXY is right at the 200-day SMA near 103.62, and will need to have a daily close above it in order to reassure that the same 200-day SMA is valid as support. Look for a further recovery bounce towards the 100-day SMA near 104.20 with preferably a break and close above. Should the DXY be able to close and open above it later this week, look for a return to the 55-day SMA near 105.71 with 105.12 ahead of it as resistance into next week.
The 200-day SMA will try to play its role again as a crucial pivotal supportive level against any downturn. Should the index snap this level again, the psychological 100.00 level comes into play. With a very slim economic calendar and US trading desks closed, there is room for a potential big downturn.
US Dollar FAQs
What is the US Dollar?
The US Dollar (USD) is the official currency of the United States of America, and the ‘de facto’ currency of a significant number of other countries where it is found in circulation alongside local notes. It is the most heavily traded currency in the world, accounting for over 88% of all global foreign exchange turnover, or an average of $6.6 trillion in transactions per day, according to data from 2022.
Following the second world war, the USD took over from the British Pound as the world’s reserve currency. For most of its history, the US Dollar was backed by Gold, until the Bretton Woods Agreement in 1971 when the Gold Standard went away.
How do the decisions of the Federal Reserve impact the US Dollar?
The most important single factor impacting on the value of the US Dollar is monetary policy, which is shaped by the Federal Reserve (Fed). The Fed has two mandates: to achieve price stability (control inflation) and foster full employment. Its primary tool to achieve these two goals is by adjusting interest rates.
When prices are rising too quickly and inflation is above the Fed’s 2% target, the Fed will raise rates, which helps the USD value. When inflation falls below 2% or the Unemployment Rate is too high, the Fed may lower interest rates, which weighs on the Greenback.
What is Quantitative Easing and how does it influence the US Dollar?
In extreme situations, the Federal Reserve can also print more Dollars and enact quantitative easing (QE). QE is the process by which the Fed substantially increases the flow of credit in a stuck financial system.
It is a non-standard policy measure used when credit has dried up because banks will not lend to each other (out of the fear of counterparty default). It is a last resort when simply lowering interest rates is unlikely to achieve the necessary result. It was the Fed’s weapon of choice to combat the credit crunch that occurred during the Great Financial Crisis in 2008. It involves the Fed printing more Dollars and using them to buy US government bonds predominantly from financial institutions. QE usually leads to a weaker US Dollar.
What is Quantitative Tightening and how does it influence the US Dollar?
Quantitative tightening (QT) is the reverse process whereby the Federal Reserve stops buying bonds from financial institutions and does not reinvest the principal from the bonds it holds maturing in new purchases. It is usually positive for the US Dollar.
EUR upside scope has limits given the macro outlook, economists at MUFG Bank report.
Growth challenges to persist
The PMI data in Germany and in the Eurozone did improve but the improvements were pretty modest underlining the still weak with the Eurozone readings for manufacturing and services well below UK levels and still in contraction territory.
The news from Germany that it plans to suspend its constitutional debt brake for a fourth consecutive year underlines the lack of fiscal space Germany will have going forward and reinforces the downside risks to growth.
We have been keen to stress that while the window for Dollar appreciation back to the highs set in October and/or beyond may now have closed, the growth outlook in the Eurozone does not point to much upside scope for EUR/USD either.
Oil prices have recovered from the lows. Economists at Société Générale analyze Brent’s outlook.
Overcoming recent pivot high near $84 essential for confirming an extended rebound
Brent decline has stalled near the lower limit of a multi month channel at $76.60 which is also the 76.4% retracement from March. A short-term bounce has led it towards the 200-DMA. Flattish slope of the MA denotes lack of clear direction.
Overcoming recent pivot high near $84 would be essential for confirming an extended rebound. Failure to cross could mean one more leg of decline towards $76.60 and perhaps even towards next projections at $74.10/$73.30.
- WTI Oil is holding steady near $76.
- The US Dollar is range bound as US markets remain muted following Thanksgiving.
- Oil volatility to pick up with several high stakes meetings such as OPEC+, COP28 and LNG Summit on the docket.
Oil prices are looking for some peace and tranquility this Friday and this week is due to close off with a small gain. With the ceasefire starting in Gaza and energy transports in the region not risking any supply issues, Oil is discovering fair value near $74. Meanwhile, as crude prices will remain relatively stable this Friday, traders can start to dig their heels in and brace for next week with OPEC+, COP28 and the LNG summit all to take place in the same week.
The US Dollar (USD) is easing a touch after its wild ride ahead of Thanksgiving. On Thursday, as expected, European traders could hear a needle drop in the forex markets as nearly every pair went sideways in a tight range. Volatility is due to pick up a bit this Friday with the US Purchase Managers Index due this afternoon.
Crude Oil (WTI) trades at $76.62 per barrel and Brent Oil trades at $81.40 per barrel at the time of writing.
Oil news and market movers: Eventful week ahead
- Expect no sharp moves upwards this Friday, unless it is headline driven, as the recent build up US crude stockpile and the Gaza Ceasefire will be two main bearish drivers for Oil prices this Friday,
- OPEC+ ministers will get together on Thursday via an online meeting to discuss production policy for the coming months. The meeting got postponed as severe tensions emerged over the output quotas as Saudi Arabia no longer wants to take the lion’s share.
- The United Nations’ COP28 climate change conference begins in Dubai on Thursday, when OPEC+ will be meeting.
- The recent build in US stockpile of 8.701 million barrels, according to the Energy Information Administration, proves that the US is still pumping up Oil at a ruthless pace, in order to fill the gap left by the Russian embargo.
Oil Technical Analysis: Headline risk every day next week
Oil prices are gearing up for a very eventful calendar last week with, next to the normal weekly data, a lot of headline risk could take place. Oil traders will need to brace for a tension-filled OPEC+ Meeting, which takes place together with the start of COP28. As if that is not enough, the World LNG Summit will take place in Athens. So traders will need to have nerves of steel to survive next week’s headline-driven trading environment.
On the upside, $80.00 is the resistance to watch out for. Should crude be able to jump above that again, look for $84.00 (purple line) as the next level to see some selling pressure or profit taking. Should Oil prices be able to consolidate above there, the topside for this fall near $93.00 could come back into play.
On the downside, traders are seeing a soft floor forming near $74.00. This level is acting as the last line of defence before entering $70.00 and lower. Once in that area, markets might factor in the risk of a surprise intervention from OPEC+ to jack up Oil prices once again.
-638364175683222819.png)
US WTI Crude Oil: Daily Chart
WTI Oil FAQs
What is WTI Oil?
WTI Oil is a type of Crude Oil sold on international markets. The WTI stands for West Texas Intermediate, one of three major types including Brent and Dubai Crude. WTI is also referred to as “light” and “sweet” because of its relatively low gravity and sulfur content respectively. It is considered a high quality Oil that is easily refined. It is sourced in the United States and distributed via the Cushing hub, which is considered “The Pipeline Crossroads of the World”. It is a benchmark for the Oil market and WTI price is frequently quoted in the media.
What factors drive the price of WTI Oil?
Like all assets, supply and demand are the key drivers of WTI Oil price. As such, global growth can be a driver of increased demand and vice versa for weak global growth. Political instability, wars, and sanctions can disrupt supply and impact prices. The decisions of OPEC, a group of major Oil-producing countries, is another key driver of price. The value of the US Dollar influences the price of WTI Crude Oil, since Oil is predominantly traded in US Dollars, thus a weaker US Dollar can make Oil more affordable and vice versa.
How does inventory data impact the price of WTI Oil
The weekly Oil inventory reports published by the American Petroleum Institute (API) and the Energy Information Agency (EIA) impact the price of WTI Oil. Changes in inventories reflect fluctuating supply and demand. If the data shows a drop in inventories it can indicate increased demand, pushing up Oil price. Higher inventories can reflect increased supply, pushing down prices. API’s report is published every Tuesday and EIA’s the day after. Their results are usually similar, falling within 1% of each other 75% of the time. The EIA data is considered more reliable, since it is a government agency.
How does OPEC influence the price of WTI Oil?
OPEC (Organization of the Petroleum Exporting Countries) is a group of 13 Oil-producing nations who collectively decide production quotas for member countries at twice-yearly meetings. Their decisions often impact WTI Oil prices. When OPEC decides to lower quotas, it can tighten supply, pushing up Oil prices. When OPEC increases production, it has the opposite effect. OPEC+ refers to an expanded group that includes ten extra non-OPEC members, the most notable of which is Russia.
GBP/USD has returned more or less to the levels seen prior to the announcement of renewed tax cuts on Wednesday. Economists at Commerzbank analyze the pair’s outlook.
What do positive data surprises from the real economy mean for Sterling?
It is not entirely clear how the Bank of England (BoE) would react if it turned out that the economy was more robust than assumed. This would also mean that contrary to its expectations, inflation pressure eases more slowly. In view of the BoE’s hesitant approach, it is questionable whether it would then really react with rate hikes, despite the central bank governor’s best efforts to give a different impression with his hawkish comments. That would then be rather negative for Sterling.
It is possible that even if there are positive surprises from the real economy in the UK, the market always has the BoE’s rather hesitant approach at the back of its mind. If that is the case that is likely to limit Sterling’s upside potential in the near future.
Bank of England (BoE) Chief Economist Huw Pill said in a Financial Times (FT) interview on Friday, the central bank will stay firm in its battle against inflation while adding that it cannot afford to loosen tight monetary policy,
Further comments
"Despite the fact that activity has weakened in our forecast relative to what we anticipated if you look at those key indicators of the persistent domestic underlying components of inflation (namely services price inflation and pay growth), those things have remained stubbornly high through the summer.”
"Indeed, even in the most recent data, although both have shown a small — but welcome — sign of falling, they remain at very elevated levels.”
Market reaction
GBP/USD is unfazed by the above comments from the BoE policymaker Pill. The pair is currently trading at 1.2560, up 0.22% on the day.
The Riksbank announced that it will be keeping the policy rate unchanged at 4.00%. Economists at ING still expect SEK strength next year, but a bumpier appreciation path after this meeting.
EUR/SEK forecasts unchanged
The Riksbank paused, but inflation and currency-related concerns prompted policymakers to threaten another hike and open the discussion on faster bond sales. However, we don’t forecast any more hikes, given the deteriorating activity outlook.
We have called for a correction in high-beta currencies after the post-US CPI rally, and we have a modest bullish bias on EUR/SEK into year-end, where we could see a return of levels around 11.60.
Should our baseline scenario of a benign USD decline and generalised support for pro-cyclical currencies materialise next year, then EUR/SEK should be able to hit 11.00 before year-end 2024.
Where November’s Riksbank decision may end up having an impact on the SEK outlook is in the periods of risk-off corrections. The change in stance by the Riksbank makes SEK more vulnerable, especially in the near term, meaning the depreciation path may be bumpier.
EUR/GBP has dropped back below 0.87. Economists at Société Générale analyze the pair’s outlook.
Rebound towards 0.8725 and recent peak of 0.8770 on the cards
0.8675, the 61.8% retracement from October is an important support.
A rebound can’t be ruled out towards 0.8725 and the recent peak of 0.8770.
In case the pair fails to defend 0.8675, there could be risk of a deeper down move towards the low formed earlier this month near 0.8650 and 0.8610.
See – EUR/GBP: More downside room – ING
European Central Bank (ECB) President Lagarde is participating in a youth event - Euro20+, in Frankfurt on Friday. She is also taking questions from young people about the economy and her work at the ECB.
Key quotes
The battle against inflation isn't over.
We are seeing progress on inflation.
We've already done a lot on rates, and can now watch.
Market reaction to Lagarde speech
ECB President Lagarde’s comments fail to move the needle around the Euro, with EUR/USD holding steady near 1.0900, as of writing.
The Dollar is stabilising amid reduced Thanksgiving flows. Economists at ING analyze USD outlook.
Volumes to be very thin again
Expect volumes to be very thin again. On the data side, we’ll see the release of US S&P PMIs, a piece of data that has triggered a growing market impact but may fail to decisively steer the Dollar in a low-volume day.
It should be a relatively quiet day in FX today. We expect the Dollar to keep stabilising around current levels.
The next two weeks will set the tone for FX markets into Christmas, with key data (like Nonfarm Payrolls) published in the US.
Eurozone growth pessimism may have peaked. However, economists at ING do not expect EUR/USD to enjoy further gains for the time being.
Rate differentials still point to a weaker EUR/USD
Thursday's PMIs suggested the worst in the Eurozone's economic sentiment may be past us. The composite gauge rebounded more than expected despite both manufacturing and services indicators remaining in contractionary territory.
The notion that recessionary pessimism may have peaked in the Eurozone is a positive for EUR/USD, but whether this can offer support to the pair already in the near term is a different question.
Despite having modestly tightened, the 2-year EUR-USD swap rate differential is at -155 bps. The last time it was trading around these levels, EUR/USD was in the 1.03/1.04 area. We keep favouring a stabilisation around 1.0900 for now.
- The Euro extends the consolidative theme against the US Dollar.
- European stocks open Friday’s session in a mixed tone.
- Final Q3 GDP figures in Germany kept the gloomy prospects.
The Euro gains further momentum against the US Dollar, prompting EUR/USD to build on Thursday’s gains beyond 1.0900 at the end of the week.
On the other hand, the Greenback appears mildly offered around 103.60 according to the USD Index (DXY), a region also coincident with the critical 200-day SMA.
In the meantime, volatility is expected to remain at low levels following the US Thanksgiving Day holiday on Thursday and Friday’s shortened trading session.
The US Dollar has managed to rebound earlier in the week despite the prevailing expectation of a potential interest rate cut by the Federal Reserve (Fed) at some point in the spring of 2024. This view remains well supported by persistent disinflationary pressures and the ongoing easing of the labour market.
On the European docket, final GDP Growth Rate figures showed the German economy shrank 0.1% QoQ and 0.4% over the last twelve months. Still in Germany, the Business Climate index improved to 87.3 in November, according to the IFO institute.
Later in the session, European Central Bank’s (ECB) President Christine Lagarde and Vice-President Luis De Guindos are due to speak.
Across the pond, preliminary Manufacturing and Services PMIs will be the sole release on Friday.
Daily digest market movers: Euro maintains buying pressure above 1.0900
- The EUR adds to recent gains against the USD.
- US and German yields edge higher early on Friday.
- Investors are still assessing the Fed's rate reduction in 2024.
- Markets believe the ECB will keep its policy unchanged until early next year.
- Business Climate in Germany improves a tad in November.
- BoE’s Huw Pill argued that economic activity and job growth are softening.
Technical Analysis: Euro shifts attention to 1.0965
EUR/USD maintains the slightly bid bias above the 1.0900 hurdle at the end of the week.
The November high of 1.0965 (November 21) represents the immediate target for bulls ahead of the key 1.1000 threshold. Further north, EUR/USD may encounter resistance at the August top of 1.1064 (August 10) and another weekly peak of 1.1149 (July 27), both preceding the 2023 high of 1.1275 (July 18).
Meanwhile, any corrective declines should find first support at the major 200-day Simple Moving Average (SMA) at 1.0809, followed by the temporary 55-day SMA at 1.0658. The weekly low of 1.0495 (October 13) aligns just below here, before the 2023 low of 1.0448 (October 3).
Overall, the pair's prospects should remain positive as long as it remains above the 200-day SMA.
Euro FAQs
What is the Euro?
The Euro is the currency for the 20 European Union countries that belong to the Eurozone. It is the second most heavily traded currency in the world behind the US Dollar. In 2022, it accounted for 31% of all foreign exchange transactions, with an average daily turnover of over $2.2 trillion a day.
EUR/USD is the most heavily traded currency pair in the world, accounting for an estimated 30% off all transactions, followed by EUR/JPY (4%), EUR/GBP (3%) and EUR/AUD (2%).
What is the ECB and how does it impact the Euro?
The European Central Bank (ECB) in Frankfurt, Germany, is the reserve bank for the Eurozone. The ECB sets interest rates and manages monetary policy.
The ECB’s primary mandate is to maintain price stability, which means either controlling inflation or stimulating growth. Its primary tool is the raising or lowering of interest rates. Relatively high interest rates – or the expectation of higher rates – will usually benefit the Euro and vice versa.
The ECB Governing Council makes monetary policy decisions at meetings held eight times a year. Decisions are made by heads of the Eurozone national banks and six permanent members, including the President of the ECB, Christine Lagarde.
How does inflation data impact the value of the Euro?
Eurozone inflation data, measured by the Harmonized Index of Consumer Prices (HICP), is an important econometric for the Euro. If inflation rises more than expected, especially if above the ECB’s 2% target, it obliges the ECB to raise interest rates to bring it back under control.
Relatively high interest rates compared to its counterparts will usually benefit the Euro, as it makes the region more attractive as a place for global investors to park their money.
How does economic data influence the value of the Euro?
Data releases gauge the health of the economy and can impact on the Euro. Indicators such as GDP, Manufacturing and Services PMIs, employment, and consumer sentiment surveys can all influence the direction of the single currency.
A strong economy is good for the Euro. Not only does it attract more foreign investment but it may encourage the ECB to put up interest rates, which will directly strengthen the Euro. Otherwise, if economic data is weak, the Euro is likely to fall.
Economic data for the four largest economies in the euro area (Germany, France, Italy and Spain) are especially significant, as they account for 75% of the Eurozone’s economy.
How does the Trade Balance impact the Euro?
Another significant data release for the Euro is the Trade Balance. This indicator measures the difference between what a country earns from its exports and what it spends on imports over a given period.
If a country produces highly sought after exports then its currency will gain in value purely from the extra demand created from foreign buyers seeking to purchase these goods. Therefore, a positive net Trade Balance strengthens a currency and vice versa for a negative balance.
- USD/CAD loses ground ahead of Retail Sales data from Canada.
- Technical indicators suggest testing the major support level at 1.3650.
- A break above the 1.3700 could meet the resistance at the 21-day EMA.
USD/CAD cuts intraday gains, trading near 1.3690 during the European session ahead of Canada’s Retail Sales release on Friday. Investors are betting on the likelihood of no further interest rate hikes by the Federal Reserve (Fed), potentially weakening the USD/CAD pair.
The technical indicators for the USD/CAD pair support the current downward trend. The Moving Average Convergence Divergence (MACD) line is below the centerline and the signal line, indicating a bearish momentum in the pair.
Furthermore, the 14-day Relative Strength Index (RSI) below 50 indicates bearish sentiment, indicating that the pair could meet the major support level at 1.3650 aligned with the 50.0% retracement level at 1.3639.
A firm break below the latter could influence the bears of the USD/CAD pair to navigate the support region around 1.3600.
On the upside, if the USD/CAD pair surpasses the psychological barrier of 1.3700, it could test the 21-day Exponential Moving Average (EMA) at the 1.3724 level followed by the 1.3750 major level. A breakthrough above the level could open the doors for the pair to explore the region around the 1.3800 level.
USD/CAD: Daily Chart
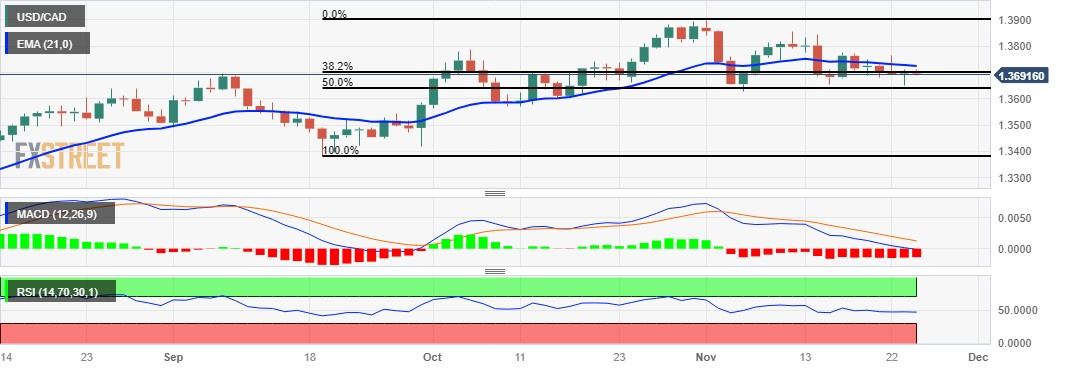
- German IFO Business Climate Index rose less than expected in November.
- IFO Current Economic Assessment worsened to 89.4 in the reported month.
The headline German IFO Business Climate Index arrived at 87.3 in November, improving from the October print of 86.9 while missing the market consensus of 87.5.
more to come ...
In Japan, the Consumer Price Index (CPI) release showed a pick-up in inflation. Economists at Commerzbank analyze Yen’s outlook.
The BoJ is unlikely to seek an exit from its ultra-expansionary monetary policy
Although the headline rate rose again, it was less than expected. At the same time, the core rate fell slightly more than expected. All in all, this suggests that inflationary pressures are easing in Japan as well. However, this had little impact on the Yen.
Today's inflation figures suggest that the BoJ is unlikely to seek an exit from its ultra-expansionary monetary policy for the time being.
The exchange rate is likely to remain almost entirely dependent on the USD in the coming weeks. The BoJ is probably not unhappy with this. After all, it reflects the market's low expectations for its monetary policy. However, no one from the Japanese Ministry of Finance then needs to argue that a move in USD/JPY is fundamentally unjustified.
Gold prices fell in India on Friday, according to data from India's Multi Commodity Exchange (MCX).
Gold price stood at 61,175 Indian Rupees (INR) per 10 grams, down INR 33 compared with the INR 61,208 it cost on Thursday.
As for futures contracts, Gold prices increased to INR 61,130 per 10 gms from INR 61,072 per 10 gms.
Prices for Silver futures contracts decreased to INR 72,755 per kg from INR 72,898 per kg.
| Major Indian city | Gold Price |
|---|---|
| Ahmedabad | 63,315 |
| Mumbai | 63,120 |
| New Delhi | 63,270 |
| Chennai | 63,260 |
| Kolkata | 63,300 |
An automation tool was used in creating this post.
Global Market Movers: Comex Gold price treads water on Black Friday
- A combination of diverging forces fails to provide any meaningful impetus to the Comex Gold price and leads to a subdued/range-bound price action during the Asian session on Friday.
- A disconnect between the Federal Reserve's hawkish outlook and market expectations for rate cuts in 2024 is holding back traders from placing directional bets around the XAU/USD.
- The FOMC meeting minutes released on Tuesday revealed that policymakers backed the case to keep interest rates higher for longer to tame inflation.
- Bets for a rate hike in December shrunk to zero following the release of the October inflation report. Moreover, the markets are pricing over a 25% chance of a rate cut as early as March 2024.
- Wednesday's upbeat US labor market and consumer sentiment data, along with rebounding US Treasury bond yields, lend support to the USD and cap gains for the precious metal.
- Dovish Fed expectations, meanwhile, warrant some caution for the USD bulls and might continue to lend some support to the commodity ahead of the flash US PMI prints for November.
Gold FAQs
Why do people invest in Gold?
Gold has played a key role in human’s history as it has been widely used as a store of value and medium of exchange. Currently, apart from its shine and usage for jewelry, the precious metal is widely seen as a safe-haven asset, meaning that it is considered a good investment during turbulent times. Gold is also widely seen as a hedge against inflation and against depreciating currencies as it doesn’t rely on any specific issuer or government.
Who buys the most Gold?
Central banks are the biggest Gold holders. In their aim to support their currencies in turbulent times, central banks tend to diversify their reserves and buy Gold to improve the perceived strength of the economy and the currency. High Gold reserves can be a source of trust for a country’s solvency. Central banks added 1,136 tonnes of Gold worth around $70 billion to their reserves in 2022, according to data from the World Gold Council. This is the highest yearly purchase since records began. Central banks from emerging economies such as China, India and Turkey are quickly increasing their Gold reserves.
How is Gold correlated with other assets?
Gold has an inverse correlation with the US Dollar and US Treasuries, which are both major reserve and safe-haven assets. When the Dollar depreciates, Gold tends to rise, enabling investors and central banks to diversify their assets in turbulent times. Gold is also inversely correlated with risk assets. A rally in the stock market tends to weaken Gold price, while sell-offs in riskier markets tend to favor the precious metal.
What does the price of Gold depend on?
The price can move due to a wide range of factors. Geopolitical instability or fears of a deep recession can quickly make Gold price escalate due to its safe-haven status. As a yield-less asset, Gold tends to rise with lower interest rates, while higher cost of money usually weighs down on the yellow metal. Still, most moves depend on how the US Dollar (USD) behaves as the asset is priced in dollars (XAU/USD). A strong Dollar tends to keep the price of Gold controlled, whereas a weaker Dollar is likely to push Gold prices up.
- Silver oscillates in a narrow trading band for the second successive day on Friday.
- Bullish oscillators on the daily chart support prospects for some short-term gains.
- A breakout through an ascending trend line is needed to confirm the bullish bias.
Silver (XAG/USD) continues with its struggle to gain any meaningful traction and seesaws between tepid gains/minor losses for the second successive day on Friday. The white metal currently trades around the $23.65 region, nearly unchanged for the day and below a downward-sloping trend line resistance extending from the May swing high.
The aforementioned barrier, currently pegged near the $24.00 round figure, should act as a key pivotal point and help determine the next leg of a directional move for the XAG/USD. Against the backdrop of the recent sustained strength beyond the 200-day Simple Moving Average (SMA), positive oscillators on the daily chart support prospects for an eventual breakout through the said resistance.
A sustained strength beyond will be seen as a fresh trigger for bulls. The subsequent move-up should allow the XAG/USD to surpass the $24.20-$24.25 intermediate hurdle and make a fresh attempt to conquer the $25.00 psychological mark. Some follow-through buying beyond the $25.15-$25.20 region will set the stage for a move towards reclaiming the $26.00 mark for the first time since May.
On the flip side, the 200-day SMA, currently around the $23.35 region, might continue to protect the immediate downside. Any further decline might still be seen as a buying opportunity and remain limited near the $23.00 mark. A convincing break below the latter, however, might prompt aggressive technical selling and drag the XAG/USD towards the $22.35-$22.30 zone en route to the $22.00 mark.
Silver daily chart
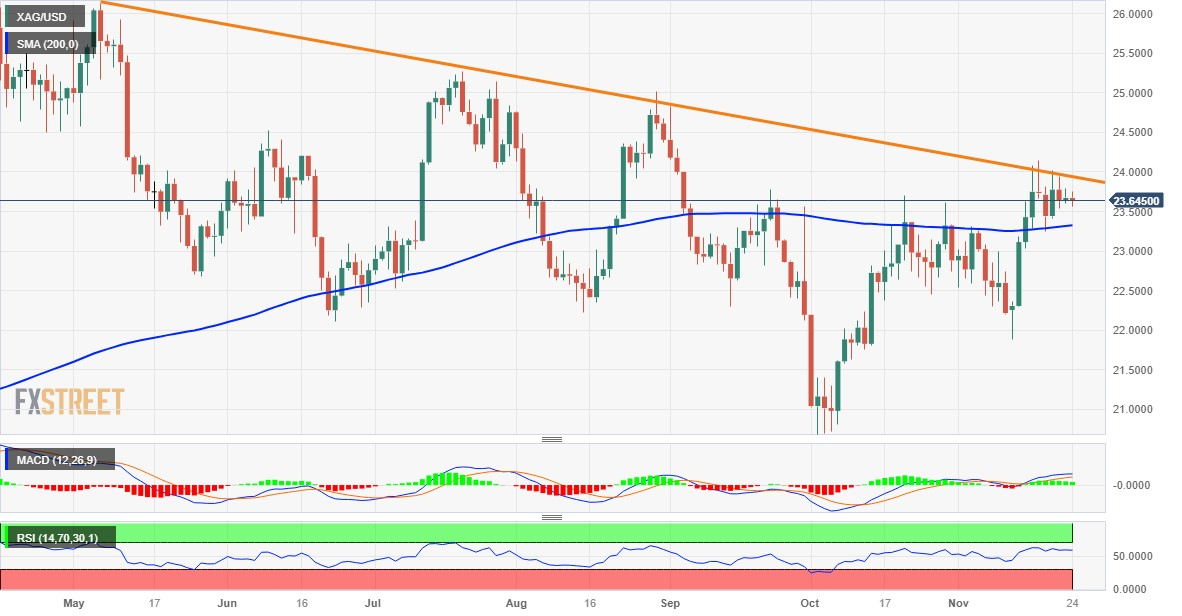
technical levels to watch
- USD/MXN faces a challenge as the Fed is expected to have ended policy-tightening.
- The recent hawkish FOMC minutes might have limited the losses of the US Dollar.
- Banxico minutes revealed the importance of keeping rates higher to bring inflation to its target.
USD/MXN continues the losing streak for the third session, trading lower near 17.17 during the European hours on Friday. The USD/MXN pair receives downward pressure as market participants seem convinced that the Federal Reserve (Fed) has concluded its policy-tightening campaign.
The prevailing cautious sentiment has cast a negative shadow on the US Dollar in anticipation of Friday's release of the US S&P Global PMI data, which is expected to show a slight decline in November. The market is closely watching these figures for insights into the performance of key sectors in the US economy, contributing to the current cautious stance on the Greenback.
US Treasury yields have exhibited improvement during the Asian session on Friday, following the Thanksgiving Holiday in the United States, in an attempt to shift the Greenback into positive territory.
Additionally, the hawkish tone in the Federal Open Market Committee (FOMC) minutes released on Tuesday, coupled with Wednesday's optimistic US labor market and consumer sentiment data, is holding back bears from making fresh bets against the USD.
The recent minutes from the Bank of Mexico (Banxico) underscore the importance of keeping rates higher for an extended period to bring inflation to its target. Coupled with the positive inflation data revealed earlier in the week, this is weighing on the USD/MXN pair.
The Banxico minutes revealed that the Government Board unanimously decided to keep rates at 11.25%, marking the fifth consecutive meeting after a two-year rate-hike cycle. Despite acknowledging progress in the disinflation process, policymakers emphasized that the outlook remains "challenging.
EUR/GBP continues to press the 0.8700 support. Economists at ING see the pair staying pressured
Capped upside for Cable
The tax cuts announced by the Treasury are, on paper, a Sterling-positive. They are both pro-growth and pro-inflation and do not seem to have excessively unnerved the bond market.
We expect GBP to keep its decent momentum, especially in EUR/GBP, which we expect to make a decisive break below 0.8700 in the coming days.
We are still expecting some USD resilience and see a capped upside for Cable.
- NZD/USD receives upward support after support from upbeat Kiwi Retail Sales data.
- The new Chinese stimulus plan has given a boost to market sentiment.
- The increase in US Treasury yields could support the US Dollar.
NZD/USD trades higher for the second successive session, trading near 0.6060 during the European session on Friday. The Kiwi pair is propelled by the better-than-expected release of Retail Sales figures from New Zealand. The figures showed unexpected stability, printing a flat 0.0% reading during the third quarter of 2023. Market expectations were for a 0.8% decline in the headline figure.
Furthermore, Retail Sales excluding automobiles surpassed consensus estimates, defying expectations of a 1.5% fall and instead rising by 1.0% during the reported period. This positive performance serves as a tailwind for the NZD/USD pair.
The prospect of a new Chinese stimulus plan has given a boost to market sentiment. Reports suggest that Chinese authorities have included Country Garden Holdings Co on a list of 50 eligible property developers with access to financing. Positive developments in China can have a ripple effect on currencies like the NZD that are sensitive to the Chinese economy.
Investors seem betting on that the Federal Reserve (Fed) has concluded its policy-tightening campaign and are now factoring in the possibility of a rate cut by May 2024. This sentiment has cast a negative shadow on the US Dollar in anticipation of Friday's release of the US S&P Global PMI data, which are expected to decline.
US Treasury yields have exhibited improvement during the Asian session on Friday, following the Thanksgiving Holiday in the United States, in an attempt to shift the Greenback into positive territory.
Additionally, the hawkish tone in the Federal Open Market Committee (FOMC) minutes released on Tuesday, coupled with Wednesday's optimistic US labor market and consumer sentiment data, is holding back bears from making fresh bets against the USD. This, in turn, acts as a headwind for the NZD/USD pair.
EUR/SEK moved higher after the Riksbank kept the policy rate unchanged at 4.00%. Economists at Commerzbank analyze the pair’s outlook.
The Riksbank does not have the guts
The Riksbank decided against hiking its key rate and instead left it unchanged at 4%. It reserves the right to take action again at the beginning of next year. It continues to expect that the key rate will peak at 4.10%. It raised the inflation projections for 2023 slightly, whereas it lowered the ones for 2024. That means that in the end, the Riksbank remains cautiously restrictive.
The market seems to once again question the Riksbank’s determination to take action against the risks of inflation. Under these circumstances, I can imagine that SEK will retrace some further gains it had recorded since early November. Unless the Riksbank counters this with FX sales. On Thursday, at least, it looked like an invisible hand had capped EUR/SEK slightly above 11.46.
Here is what you need to know on Friday, November 24:
Action in financial markets turned subdued on Thursday as trading conditions remained thin on Thanksgiving Day. Early Friday, major currency pairs continue to trade in familiar ranges. S&P Global Manufacturing and Services PMI data will be featured in the US economic docket ahead of the weekend. Stock and bond markets in the US will operate for half-day.
Following a two-day rebound, the US Dollar (USD) Index posted small losses on Thursday as the upbeat PMI readings from Germany, the Euro area and the UK allowed European currencies to find demand. At the time of press, the USD Index was virtually unchanged on the day at 103.70.
US Dollar price this week
The table below shows the percentage change of US Dollar (USD) against listed major currencies this week. US Dollar was the weakest against the New Zealand Dollar.
| USD | EUR | GBP | CAD | AUD | JPY | NZD | CHF | |
| USD | -0.02% | -0.62% | -0.17% | -0.73% | -0.35% | -1.03% | -0.22% | |
| EUR | 0.03% | -0.61% | -0.16% | -0.71% | -0.33% | -1.02% | -0.20% | |
| GBP | 0.62% | 0.61% | 0.45% | -0.10% | 0.28% | -0.40% | 0.40% | |
| CAD | 0.17% | 0.15% | -0.45% | -0.56% | -0.17% | -0.85% | -0.05% | |
| AUD | 0.74% | 0.71% | 0.13% | 0.58% | 0.40% | -0.28% | 0.52% | |
| JPY | 0.35% | 0.32% | -0.51% | 0.18% | -0.39% | -0.70% | 0.13% | |
| NZD | 1.02% | 1.02% | 0.41% | 0.87% | 0.30% | 0.68% | 0.81% | |
| CHF | 0.22% | 0.20% | -0.40% | 0.05% | -0.51% | -0.13% | -0.81% |
The heat map shows percentage changes of major currencies against each other. The base currency is picked from the left column, while the quote currency is picked from the top row. For example, if you pick the Euro from the left column and move along the horizontal line to the Japanese Yen, the percentage change displayed in the box will represent EUR (base)/JPY (quote).
The data from New Zealand showed earlier in the day that Retail Sales ex Autos rose by 1% on a quarterly basis in the third quarter, bettering the market expectation for a contraction of 1.5%. NZD/USD edged slightly higher after this data and was last seen trading marginally higher on the day at around 0.6050.
Jibun Bank Manufacturing PMI in Japan declined to 48.1 in November while the Services PMI edged higher to 51.7 from 51.6. Other data from Japan revealed that the National Consumer Price Index climbed to 3.3% on a yearly basis in October from 3% in September. USD/JPY declined to 149.20 during the Asian trading hours but managed to stage a rebound toward 149.50 heading into the European session.
EUR/USD fluctuated in a narrow range slightly above 1.0900 on Thursday and extended its sideways grind early Friday. European Central Bank (ECB) President Christine Lagarde will be delivering a speech later in the day but she is not expected to comment on the policy or the economic outlook. Germany's Ifo Economic Institute will release the findings of the business sentiment survey for November as well.
After climbing to a fresh multi-week high above 1.2570 early Thursday, GBP/USD erased a small portion of its gains but closed in positive territory. Early Friday, the pair stays in a consolidation phase below 1.2550.
Gold ended the day flat slightly above $1,990 on Thursday and failed to gather directional momentum early Friday.
- The index extends the consolidative theme near 103.70.
- Low volatility should persist following the Thanksgiving Day holiday.
- Advanced Manufacturing and Services PMIs are next on tap.
The USD Index (DXY), which gauges the greenback vs. a bundle of its main competitors, extends the weekly consolidative mood below the 104.00 hurdle on Friday.
USD Index remains capped by the 104.20 zone
The index alternates gains with losses near the 103.70 region amidst a generalized scarce volatility and marginal trading conditions, as markets shrug off Thursday’s US holiday and walk into a shortened session on Friday.
For now, there are no updates regarding monetary policy, while investors maintain their anticipation of the Federal Reserve initiating interest rate reductions around spring 2024.
Later in the NA session, the only release of note will be the preliminary readings of the Manufacturing and Services PMIs for the month of November.
What to look for around USD
In line with the broad mood prevailing among traders, the index navigates within a range bound theme near the key 200-day SMA (103.61), while bullish attempts still limited just above the 104.00 hurdle.
Looking at the broader picture, the dollar appears depressed against the backdrop of rising speculation of probable interest rate cuts in H1 2024, all in response to further disinflationary pressures and the gradual cooling of the labour market.
Some support for the greenback, however, still emerges the resilience of the US economy as well as a persistent hawkish narrative from some Fed rate setters.
Key events in the US this week: S&P Global Flash Manufacturing/ Services PMIs (Friday).
USD Index relevant levels
Now, the index is down 0.03% at 103.72 and faces immediate contention at 103.17 (monthly low November 21) ahead of 102.93 (weekly low August 30) and then the psychological 100.00 threshold. On the upside, the breakout of 104.21 (weekly high November 22) could expose a move to 106.00 (weekly high November 10) and finally 106.88 (weekly high October 26).
Economists at ING expect the Norwegian Krone to regain some ground next year.
Norges Bank can “out-hawk” the Fed
Our economics team has an out-of-consensus dovish call on the Fed in 2024, which implies a sharp decline in global rates and argues for Norges Bank rate cuts. However, NOK may face more headwinds before US data turns (also given high FX purchases), and Norges Bank could see benefits in holding a hawkish stance longer than the Fed to favour a stable NOK recovery after hiking in December of this year.
Our base case remains a decline in EUR/NOK below 11.00 before year-end 2024.
- EUR/GBP attracts some sellers around 0.8700 ahead of the German GDP data.
- Eurozone Manufacturing PMI hit a six-month high, climbing to 43.8 vs. 43.1 prior.
- UK composite PMI surges unexpectedly in November, rising to 50.1 in November vs. 48.7 prior, above the market consensus.
- Traders await the German GDP Q3 and IFO Survey on Friday.
The EUR/GBP cross extends its downside during the early European session on Friday. The downtick of the cross is backed by the upbeat UK PMI data. Investors will take more cues from the German growth numbers for the third quarter and the IFO Survey for fresh impetus. The quarterly and annual German GDP for Q3 is expected to remain at -0.1% and -0.3%, respectively. At press time, the cross is trading at 0.8697, down 0.04% for the day.
On Thursday, the Eurozone Manufacturing Purchasing Managers Index (PMI) climbed to 43.8 in November, compared with the estimation of 43.4 and above the previous reading of 43.1. This figure registered the highest in six months. Meanwhile, the bloc’s Services PMI hit a two-month high, climbing to 48.2 versus 47.8. prior. However, the market players believe November's PMI data did not indicate that eurozone GDP growth would improve in the fourth quarter and the region may have entered a technical recession in 2023. This, in turn, exerts some selling pressure on the Euro (EUR) and acts as a headwind for EUR/GBP.
On the other hand, the Bank of England (BoE) Governor Andrew Bailey said that it was too early to think about rate cuts and that borrowing costs might have to rise again if inflation proved to be more persistent than estimated. The higher for longer rate narrative from the BoE boosts the British Pound (GBP) against its rivals.
About the data, UK composite PMI surges unexpectedly in November, rising to 50.1 in November versus 48.7 prior, above the market consensus of 48.7. Additionally, the Manufacturing PMI climbed to 46.7 from 44.8 previously and the Services PMI grew to 50.5 from 49.5 in the previous reading.
Moving on, market players will monitor the German growth numbers for Q3 and the IFO Survey due later on Friday. Also, the European Central Bank (ECB) President Christine Lagarde and ECB Vice President Luis De Guindos are set to speak, but no surprise is expected from the event.
- GBP/USD gains traction near 1.2540 ahead of the US PMI data.
- The pair holds above the 50- and 100-hour EMA; the RSI indicator stands in bullish territory above 50.
- 1.2550 will be the first resistance level; the critical support level will emerge at 1.2525.
The GBP/USD pair gains ground to a two-month high of 1.2569 and then pulled back to 1.2540 during the Asian trading hours on Friday. The uptick of the pair is supported by the stronger-than-expected UK S&P Global/CIPS PMI data for November. The attention will shift to the US S&P Global PMI data, due later on Friday.
On Thursday, the preliminary UK S&P Global/CIPS Composite PMI grew unexpectedly in November, coming in at 50.1 in November from 48.7 in October, better than expected of 48.7. Additionally, the Manufacturing PMI improved to 46.7 versus 44.8 prior, while the Services PMI rose to 50.5 from 49.5 previously. The British Pound (GBP) surged against the US Dollar (USD) as the Bank of England (BoE) suggested interest rates could remain higher for longer than priced by investors.
According to the four-hour chart, GBP/USD holds above the 50- and 100-hour Exponential Moving Averages (EMAs), suggesting the path of least resistance is to the upside. The upper boundary of the Bollinger Band at 1.2550 will be the first resistance level for the pair. The next hurdle is seen near a high of November 23 at 1.2575. Further north, the upside target to watch is a high of September 4 at 1.2642, followed by a high of September 1 at 1.2713.
On the downside, the critical support level will emerge at 1.2525, portraying the confluence of the lower limit of the Bollinger Band and the 50-hour EMA. A break below the latter will pave the way to the 100-hour EMA and a psychological round mark at the 1.2500–1.2505 region. Any follow-through selling will see a drop to a high of November 16 at 1.2456 and finally at 1.2400 (round figure).
It’s worth noting that the Relative Strength Index (RSI) holds in the bullish territory above 50, indicating further upside looks favorable.
GBP/USD four-hour chart
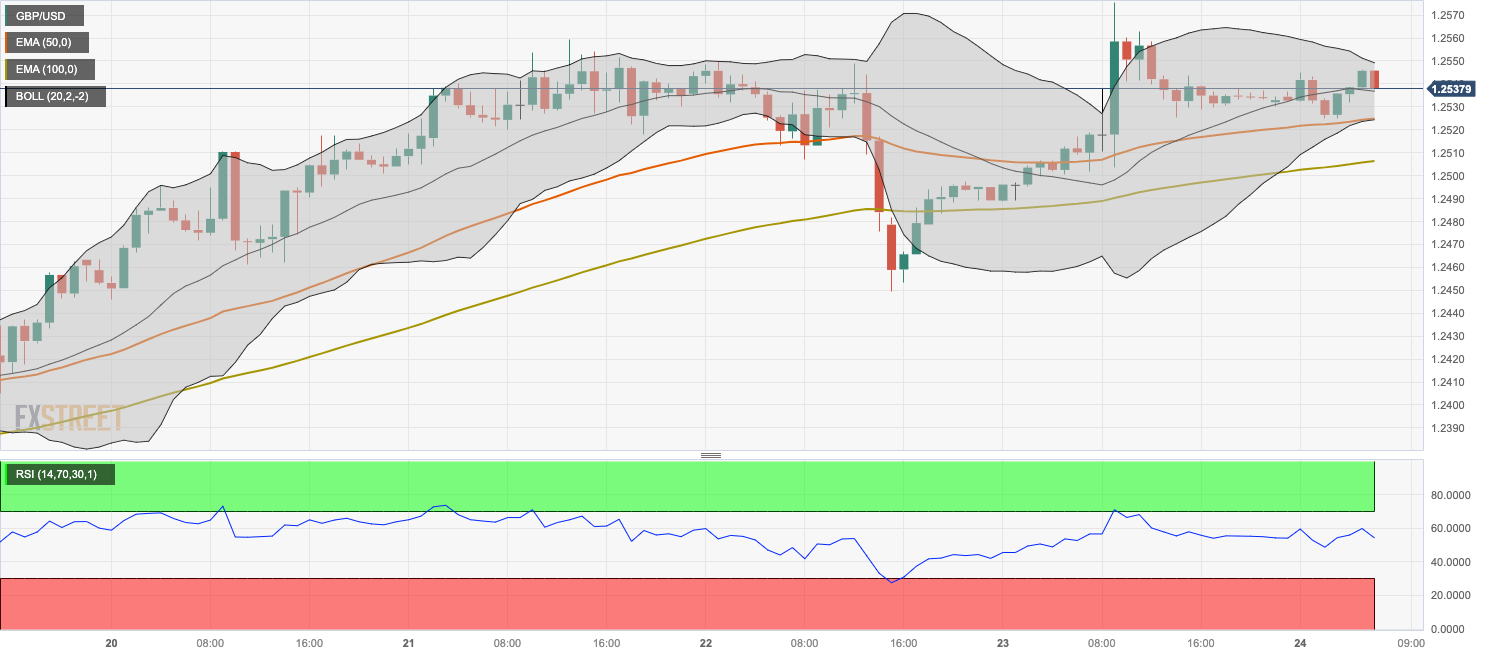
- USD/CHF could register losses on the less likelihood of Fed interest rate hikes.
- Swiss Franc could lose ground as SNB reduced foreign currency reserves to a seven-year low.
- Improved US Treasury yields attempt to push the US Dollar into positive territory.
USD/CHF moves sideways after two days of minor gains, bidding near 0.8840 during the Asian hours on Friday. The US Dollar (USD) receives downward pressure as the market participants put their bets on the likelihood of no additional interest rate hikes by the Federal Reserve (Fed), potentially weakening the USD/CHF pair.
The Swiss Franc (CHF) could face downward pressure following the announcement from the Swiss National Bank (SNB) that the central bank's currency reserves have reached a seven-year low of CHF 657 billion. This signals the ongoing efforts by the SNB to repatriate its foreign currency reserves, with a gradual reduction from the peak of CHF 950 billion in 2022.
The US Dollar Index (DXY), which measures the performance of the US Dollar (USD) against the six other major currencies, consolidates around 103.70, carrying a negative sentiment in anticipation of Friday's release of the US S&P Global PMI data. There's an expected slight decline in the Services sector from 50.6 to 50.4 and in the Manufacturing sector from 50.0 to 49.8. Investors will closely scrutinize these figures for insights into the performance of key sectors in the US economy.
US Treasury yields have shown improvement during the Asian session on Friday after the Thanksgiving holiday in the United States (US), attempting to push the Greenback into positive territory. At the time of writing, the yields on US 10-year and 2-year bond coupons hold on to 4.46% and 4.94%, respectively.
- GBP/JPY meets with some intraday sellers following an intraday uptick to over a one-week top.
- Bets for a shirt in BoJ’s policy stance and a softer risk tone benefit the JPY, exerting pressure.
- BoE Governor Bailey’s hawkish remarks earlier this week and the upbeat UK PMIs to limit losses.
The GBP/JPY cross rises to over a one-week high during the Asian session on Friday, albeit struggles to capitalize on the move and attracts some intraday selling near the 187.65 region. Spot prices retreat to the lower end of the daily range, around the 187.25 area in the last hour, and for now, seem to have snapped a three-day winning streak.
Growing acceptance that the Bank of Japan (BoJ) will certainly end its negative rate policy in the first few months of 2024, to a larger extent, offset softer domestic core consumer inflation figures. The headline and core rates of inflation in Japan, however, remain above the 2% target, reaffirming market bets for an imminent shift in the BoJ's policy stance. This, along with a weaker tone around the Asian equity markets, benefits the safe-haven Japanese Yen (JPY) and acts as a headwind for the GBP/JPY cross.
Any meaningful downside, however, seems elusive as the Bank of England (BoE) Governor Andrew Bailey pushed back against market expectations for interest-rate cuts next year and warned that it was too early to declare victory over inflation. Speaking at a Treasury Select Committee hearing, Bailey predicted that monetary policy will have to stay restrictive for quite some time to make sure that inflation gets back to the BoE’s 2% target. This could underpin the British Pound and lend support to the GBP/JPY cross.
This, along with the better-than-expected release of the flash UK PMIs on Thursday, warrants caution for aggressive bearish traders. In fact, the Services and Composite indices rose to 50.5 and 50.1, respectively, indicating economic expansion. Meanwhile, the UK Manufacturing PMI remained in the contraction territory, though improved to 46.7 from 44.8 in October. This, in turn, makes it prudent to wait for some follow-through before positioning for any meaningful decline in the absence of any relevant UK macro data.
Technical levels to watch
- EUR/USD loses ground as US Dollar attempts to rebound.
- Technical indicators suggest revisiting the major level at 1.0950 near the three-month high.
- The nine-day EMA at 1.0867 could act as the key support followed by the major level at 1.0850.
EUR/USD retraces the recent gains, trading below the psychological barrier at the 1.0900 level during the Asian session on Friday. The weakening of the Euro could be attributed to the improved US Dollar (USD). The Greenback recovers on the back of improved US Treasury yields.
The nine-day Exponential Moving Average (EMA) at 1.0867 appears to be the key support level aligned with the next major level at 1.0850. and the 23.6% Fibonacci retracement at 1.0842. A decisive break below the support region could push the EUR/USD pair to navigate the psychological level at 1.0800.
The technical indicators for the EUR/USD pair support the current upward trend. The 14-day Relative Strength Index (RSI) above 50 indicates bullish sentiment, indicating that the pair could revisit the major level at 1.0950, nearing the three-month high at 1.0965 level. A breakthrough above the latter could support the bulls of the EUR/USD pair to navigate the resistance area around the 1.1000 psychological level.
Furthermore, the Moving Average Convergence Divergence (MACD) line is above the centerline and the signal line, indicating a bullish momentum in the pair.
EUR/USD: Daily Chart
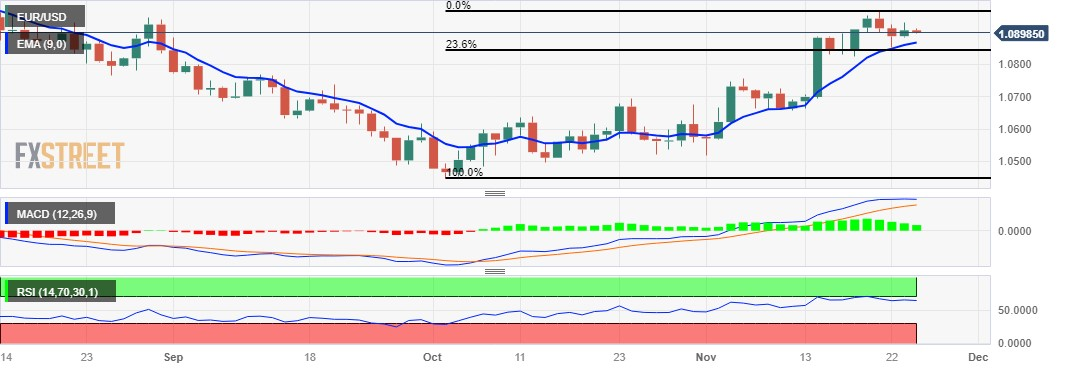
- Gold price is seen oscillating in a narrow trading band during the Asian session on Friday.
- Dovish Fed expectations continue to lend some support to the non-yielding yellow metal.
- A goodish pickup in the US bond yields acts as a tailwind for the USD and caps the upside.
Gold price (XAU/USD) posted modest gains on Thursday amid a weaker US Dollar (USD), albeit lacked follow-through buying and remained below the $2,000 psychological mark through the Asian session on Friday.
Despite Tuesday's hawkish FOMC minutes, investors seem convinced that the US central bank will keep rates steady rather than hiking. This, in turn, keeps a lid on this week's USD recovery from its lowest level since August 31 and continues to act as a tailwind for the non-yielding yellow metal.
That said, the US macro data released on Wednesday pointed to signs of resilience in the labor market and raised uncertainty over the Fed's next policy move. This, along with a goodish pickup in the US Treasury bond yields, lends some support to the Greenback and caps the upside for the US Dollar-denominated Gold price. Nevertheless, the precious metal remains on track to register the second consecutive weekly gain as traders look to the release of the flash US PMIs for some impetus on the last day of the week.
Daily Digest Market Movers: Gold price lacks any firm direction amid mixed Fed cues
- A combination of diverging forces fails to provide any meaningful impetus to the Gold price and leads to a subdued/range-bound price action during the Asian session on Friday.
- A disconnect between the Federal Reserve's hawkish outlook and market expectations for rate cuts in 2024 is holding back traders from placing directional bets around the XAU/USD.
- The FOMC meeting minutes released on Tuesday revealed that policymakers backed the case to keep interest rates higher for longer to tame inflation.
- Bets for a rate hike in December shrunk to zero following the release of the October inflation report. Moreover, the markets are pricing over a 25% chance of a rate cut as early as March 2024.
- Wednesday's upbeat US labor market and consumer sentiment data, along with rebounding US Treasury bond yields, lend support to the USD and cap gains for the precious metal.
- Dovish Fed expectations, meanwhile, warrant some caution for the USD bulls and might continue to lend some support to the commodity ahead of the flash US PMI prints for November.
Technical Analysis: Gold price struggles to move back above the $2,000 psychological mark
The Gold price, so far, has been struggling to move back above the $2,000 psychological mark. This comes on top of the recent repeated failures ahead of the $2,010 level, or a multi-month peak touched in October and warrants caution for bullish traders. That said, oscillators on the daily chart are holding comfortably in the positive territory and support prospects for the emergence of some dip-buying near the $1,989-1,988 zone.
This is followed by support near the $1,979-1,978 region and the weekly low, around the $1,965 area. A convincing break below the latter might expose the 200-day Simple Moving Average (SMA), currently around the $1,940 level, and $1,933-1,932 confluence, comprising the
50- and 100-day SMAs.
On the flip side, the $2,000 mark might continue to act as an immediate barrier ahead of the $2,007 area and the $2,009-2,010 region. Some follow-through buying will be seen as a fresh trigger for bullish traders and allow the Gold price to accelerate the positive move further towards the $2,022 resistance en route to the next relevant hurdle near the $2,040 region.
US Dollar price today
The table below shows the percentage change of US Dollar (USD) against listed major currencies today. US Dollar was the strongest against the Canadian Dollar.
| USD | EUR | GBP | CAD | AUD | JPY | NZD | CHF | |
| USD | 0.07% | 0.01% | 0.08% | 0.06% | -0.09% | -0.01% | -0.02% | |
| EUR | -0.06% | -0.05% | 0.03% | -0.01% | -0.14% | -0.07% | -0.09% | |
| GBP | -0.02% | 0.04% | 0.08% | 0.04% | -0.10% | -0.03% | -0.05% | |
| CAD | -0.09% | -0.04% | -0.08% | -0.06% | -0.18% | -0.10% | -0.12% | |
| AUD | -0.05% | 0.01% | -0.04% | 0.04% | -0.14% | -0.06% | -0.08% | |
| JPY | 0.08% | 0.13% | 0.08% | 0.16% | 0.14% | 0.08% | 0.06% | |
| NZD | 0.03% | 0.07% | 0.00% | 0.10% | 0.03% | -0.08% | -0.05% | |
| CHF | 0.03% | 0.09% | 0.04% | 0.12% | 0.08% | -0.06% | 0.02% |
The heat map shows percentage changes of major currencies against each other. The base currency is picked from the left column, while the quote currency is picked from the top row. For example, if you pick the Euro from the left column and move along the horizontal line to the Japanese Yen, the percentage change displayed in the box will represent EUR (base)/JPY (quote).
Gold FAQs
Why do people invest in Gold?
Gold has played a key role in human’s history as it has been widely used as a store of value and medium of exchange. Currently, apart from its shine and usage for jewelry, the precious metal is widely seen as a safe-haven asset, meaning that it is considered a good investment during turbulent times. Gold is also widely seen as a hedge against inflation and against depreciating currencies as it doesn’t rely on any specific issuer or government.
Who buys the most Gold?
Central banks are the biggest Gold holders. In their aim to support their currencies in turbulent times, central banks tend to diversify their reserves and buy Gold to improve the perceived strength of the economy and the currency. High Gold reserves can be a source of trust for a country’s solvency. Central banks added 1,136 tonnes of Gold worth around $70 billion to their reserves in 2022, according to data from the World Gold Council. This is the highest yearly purchase since records began. Central banks from emerging economies such as China, India and Turkey are quickly increasing their Gold reserves.
How is Gold correlated with other assets?
Gold has an inverse correlation with the US Dollar and US Treasuries, which are both major reserve and safe-haven assets. When the Dollar depreciates, Gold tends to rise, enabling investors and central banks to diversify their assets in turbulent times. Gold is also inversely correlated with risk assets. A rally in the stock market tends to weaken Gold price, while sell-offs in riskier markets tend to favor the precious metal.
What does the price of Gold depend on?
The price can move due to a wide range of factors. Geopolitical instability or fears of a deep recession can quickly make Gold price escalate due to its safe-haven status. As a yield-less asset, Gold tends to rise with lower interest rates, while higher cost of money usually weighs down on the yellow metal. Still, most moves depend on how the US Dollar (USD) behaves as the asset is priced in dollars (XAU/USD). A strong Dollar tends to keep the price of Gold controlled, whereas a weaker Dollar is likely to push Gold prices up.
- WTI prices post modest gains near $76.50 ahead of US PMI data.
- OPEC+ confirmed to hold their next meeting on November 30 virtually.
- US crude oil inventories increased by 8.70M barrels last week vs. 4.60M barrels gain prior.
- US S&P Global PMI data will be in the spotlight on Friday.
Western Texas Intermediate (WTI), the US crude oil benchmark, is trading around $76.50 so far on Friday. WTI posts modest gains as the Organization of Petroleum Exporting Countries and allies (OPEC+) confirmed the next meeting about production cuts on November 30.
Early Friday, the Organization of the Petroleum Exporting Countries and its allies (OPEC+) confirmed to hold their next meeting on November 30 virtually. Oil traders will monitor the decision on the oil output level. That being said, Saudi Arabia, the world's largest oil exporter, is planning to extend oil production cuts by 1 million barrels a day until next year, while OPEC+ members consider further supply cuts due to falling oil prices. If OPEC+ decides not to deepen output cuts next year, this could drag oil prices lower.
About the data, US crude oil inventories increased by 8.70M barrels for the week ending November 17 from the previous reading of 4.60M barrels gain, according to the U.S. Energy Information Administration’s (EIA) weekly report on Thursday. The market consensus expected a 0.90M barrel increase.
On the other hand, the hope for a fresh Chinese stimulus plan might cap the downside of WTI prices. According to Bloomberg, Chinese authorities have reportedly included Country Garden Holdings Co on a list of 50 eligible property developers that would have access to financing. Other troubled developers on the list are Sino-Ocean Group and CIFI Holdings. It’s worth noting that China is the major oil consumer in the world and the positive outlook on the Chinese economy lifts the WTI prices.
Moving on, oil traders will take more cues from the US S&P Global PMI data on Friday. The Manufacturing PMI is anticipated to drop from 50.0 to 49.8 while Services PMI is estimated to ease from 50.6 to 50.4. These events could significantly impact the USD-denominated WTI price. Oil traders will take cues from the data and find trading opportunities around the WTI prices.
- USD/CAD extends gains ahead of Canada’s Retail Sales release.
- The recovery in Crude oil prices could support the Canadian Dollar.
- US S&P Global PMI data is expecting a slight decline in November.
USD/CAD rebounds from the weekly lows hit on Thursday, extending gains for the second consecutive day. The USD/CAD pair trades higher near 1.3710 during the Asian session ahead of Canada’s Retail Sales release on Friday.
The Canadian Dollar (CAD) witnessed downward pressure due to the decline in Crude oil prices in the previous session, which could be attributed to the unexpected delay in an upcoming OPEC+ meeting.
However, Western Texas Intermediate (WTI) price recovers the recent losses, trading higher around $76.50 per barrel, by the press time and bringing minor support for the Loonie Dollar (CAD). This delay has introduced unpredictability regarding the future actions and decisions of the OPEC+ alliance, contributing to market uncertainty.
Bank of Canada (BoC) Governor Tiff Macklem's recent speech highlighted that policymakers "might" have taken sufficient measures to control inflation and balance the economy. On the flip side, the rising likelihood of no additional interest rate hikes by the Federal Reserve (Fed) fosters a risk-on sentiment, potentially weakening the USD/CAD pair.
The US Dollar Index (DXY) recovers recent losses, buoyed by the improvement in US Treasury yields, and trades higher around 103.80. The US 10-year and 2-year bond yields have surged to 4.46% and 4.94%, respectively. Looking ahead on the economic calendar, Friday's release of the US S&P Global PMI data is anticipated, with a slight expected decline in November. Investors will be closely watching these figures for insights into the performance of key sectors in the US economy.
- Indian Rupee edges lower amid the recovery in USD.
- Many analysts predicted Q2 Indian GDP to expand faster than the RBI's 6.5%.
- Investors will monitor the US S&P Global PMI ahead of India’s quarterly growth numbers next week.
Indian Rupee (INR) loses ground on Friday as the US Dollar (USD) attracts some buyers during the session. India's economy has shown resilience in the face of the global downturn, owing to its dependence on local demand. Many analysts projected the second-quarter (Q2) Indian GDP from the Central Statistical Office to grow faster than the 6.5% expected by the Reserve Bank of India (RBI).
In the meantime, oil prices need to be closely monitored as the Organization of the Petroleum Exporting Countries and its allies (OPEC+) will hold their next meeting on November 30 to discuss oil supply cuts. That being said, India is particularly vulnerable to higher crude prices as the country is the world's third-biggest oil consumer.
The US market was closed on Thursday in observance of Thanksgiving Day, and the trading session on Friday will be shortened. Market players will keep an eye on the US S&P Global PMI data for fresh impetus. Next week, the Indian market will be closed on Monday for the Guru Nanak Jayanti holiday. Nonetheless, the highlight will be India’s Gross Domestic Product (GDP) Quarterly for the second quarter, due on Thursday.
Daily Digest Market Movers: Indian Rupee remains vulnerable to higher crude prices
- According to a Reuters poll of equity strategists, the Indian stock market is set to hit new highs in the next six months and rise over 10% by end-2024.
- The Reserve Bank of India (RBI) Governor Shaktikanta Das estimated a 6.5% growth in India's real GDP in fiscal years 2023-24 and 2024-25.
- RBI’s Das said the Indian Rupee has shown moderate volatility and orderly movements as compared to its peers despite elevated US Treasury yields and a strong USD.
- RBI's Das emphasized that India is vulnerable to food-price shocks from extreme weather events and global factors.
- India’s Ministry of Finance said in the report that the government and the RBI will closely monitor inflationary risks.
- RBI projected that average inflation will drop from 6.7% in the previous fiscal year to 5.4% in 2023-24.
- The US S&P Global Manufacturing PMI is estimated to drop from 50.0 to 49.8 and Services PMI is expected to fall from 50.6 to 50.4.
- The US Jobless Claims, Durable Goods Orders, and Consumer Sentiment suggested the economy is easing but remains strong enough to avoid recession.
- Market players believe the Federal Reserve (Fed) may be done raising interest rates and the economy is still resilient.
Technical Analysis: The Indian Rupee maintains its positive outlook
The Indian Rupee trades weaker on the day. The USD/INR pair breaks above the trading range of 82.80–83.35 since September. According to the daily chart, the technical outlook suggests that the bullish bias stays intact as the pair holds above the key 100-day Exponential Moving Average (EMA) with an upward slope. Furthermore, the 14-day Relative Strength Index (RSI) holds above the 50.0 midline, reflecting that further upside looks favorable.
That being said, the year-to-date (YTD) high of 83.47 will be the immediate resistance level for USD/INR, en route to a psychological round mark at 84.00. On the flip side, 83.35 acts as a throwback support. Any follow-through selling below 83.35 will see a drop to the confluence of the lower limit of the trading range and a low of September 12 at 82.80. A decisive break below 82.80 will pave the way to a low of August 11 at 82.60.
US Dollar price today
The table below shows the percentage change of US Dollar (USD) against listed major currencies today. US Dollar was the strongest against the Canadian Dollar.
| USD | EUR | GBP | CAD | AUD | JPY | NZD | CHF | |
| USD | 0.05% | 0.02% | 0.07% | 0.03% | -0.08% | -0.04% | -0.02% | |
| EUR | -0.05% | -0.03% | 0.03% | -0.02% | -0.12% | -0.09% | -0.07% | |
| GBP | -0.02% | 0.03% | 0.06% | 0.02% | -0.09% | -0.06% | -0.05% | |
| CAD | -0.08% | -0.04% | -0.06% | -0.05% | -0.15% | -0.12% | -0.11% | |
| AUD | -0.02% | 0.02% | -0.01% | 0.06% | -0.10% | -0.06% | -0.05% | |
| JPY | 0.07% | 0.11% | 0.07% | 0.14% | 0.10% | 0.03% | 0.05% | |
| NZD | 0.06% | 0.08% | 0.06% | 0.12% | 0.07% | -0.03% | 0.01% | |
| CHF | 0.03% | 0.07% | 0.04% | 0.11% | 0.06% | -0.05% | -0.02% |
The heat map shows percentage changes of major currencies against each other. The base currency is picked from the left column, while the quote currency is picked from the top row. For example, if you pick the Euro from the left column and move along the horizontal line to the Japanese Yen, the percentage change displayed in the box will represent EUR (base)/JPY (quote).
RBA FAQs
What is the Reserve Bank of Australia and how does it influence the Australian Dollar?
The Reserve Bank of Australia (RBA) sets interest rates and manages monetary policy for Australia. Decisions are made by a board of governors at 11 meetings a year and ad hoc emergency meetings as required. The RBA’s primary mandate is to maintain price stability, which means an inflation rate of 2-3%, but also “..to contribute to the stability of the currency, full employment, and the economic prosperity and welfare of the Australian people.” Its main tool for achieving this is by raising or lowering interest rates. Relatively high interest rates will strengthen the Australian Dollar (AUD) and vice versa. Other RBA tools include quantitative easing and tightening.
How does inflation data impact the value of the Australian Dollar?
While inflation had always traditionally been thought of as a negative factor for currencies since it lowers the value of money in general, the opposite has actually been the case in modern times with the relaxation of cross-border capital controls. Moderately higher inflation now tends to lead central banks to put up their interest rates, which in turn has the effect of attracting more capital inflows from global investors seeking a lucrative place to keep their money. This increases demand for the local currency, which in the case of Australia is the Aussie Dollar.
How does economic data influence the value of the Australian Dollar?
Macroeconomic data gauges the health of an economy and can have an impact on the value of its currency. Investors prefer to invest their capital in economies that are safe and growing rather than precarious and shrinking. Greater capital inflows increase the aggregate demand and value of the domestic currency. Classic indicators, such as GDP, Manufacturing and Services PMIs, employment, and consumer sentiment surveys can influence AUD. A strong economy may encourage the Reserve Bank of Australia to put up interest rates, also supporting AUD.
What is Quantitative Easing (QE) and how does it affect the Australian Dollar?
Quantitative Easing (QE) is a tool used in extreme situations when lowering interest rates is not enough to restore the flow of credit in the economy. QE is the process by which the Reserve Bank of Australia (RBA) prints Australian Dollars (AUD) for the purpose of buying assets – usually government or corporate bonds – from financial institutions, thereby providing them with much-needed liquidity. QE usually results in a weaker AUD.
What is Quantitative tightening (QT) and how does it affect the Australian Dollar?
Quantitative tightening (QT) is the reverse of QE. It is undertaken after QE when an economic recovery is underway and inflation starts rising. Whilst in QE the Reserve Bank of Australia (RBA) purchases government and corporate bonds from financial institutions to provide them with liquidity, in QT the RBA stops buying more assets, and stops reinvesting the principal maturing on the bonds it already holds. It would be positive (or bullish) for the Australian Dollar.
- GBP/USD experienced gains on upward UK PMI data.
- UK business conditions showed improvement as Services and Composite PMIs expanded in November.
- Improved US Treasury yields provide support for the US Dollar.
GBP/USD hovers around 1.2530 during the Asian session on Friday after pulling back from a two-month high hit at 1.2569 on Thursday. The GBP/USD pair experienced a boost from upward PMI data from the United Kingdom (UK) released on Thursday. Additionally, the Pound Sterling (GBP) found relief and made gains against the US Dollar (USD) in thin trading, benefiting from the closure of US markets during Thanksgiving.
The UK business activity is showing signs of a turnaround, with the preliminary S&P Global/CIPS Services and Composite PMIs expanding in November after three consecutive months of contraction. The Services PMI and Composite PMI returned to expansionary territory at 50.5 and 50.1, respectively, defying expectations of stagnation at 49.5 and 48.7.
Furthermore, Manufacturing PMI also improved to 46.7 from 44.8 prior. On Friday, GfK Consumer Confidence for November declined by 24.0 against the reading of 28.0 decline as expected.
However, despite this positive development, the overall economic outlook for the UK remains weak, projecting a recession. Bank of England (BoE) Governor Andrew Bailey's recent hawkish comments, emphasizing the need for higher rates for an extended period, could pose challenges for the economy.
On the bright side, the improvement in business activity is attributed to a drop in headline inflation, as indicated by S&P Economic Director Tim Moore. The latest UK inflation report witnessed a decline in CPI from 6.7% to 4.6%, and although the economy managed to avoid a recession, with GDP holding at 0%, challenges persist.
The US Dollar Index (DXY) recovers the recent losses on the improvement in US Treasury yields, trading higher around 103.80. The yields on US 10-year and 2-year bond coupon surge at 4.46% and 4.94%, respectively, at the time of writing.
The increasing probability of no additional interest rate hikes by the Federal Reserve (Fed) is fostering a risk-on sentiment, potentially eroding the strength of the Greenback as market sentiments adapt to the evolving expectations surrounding Fed policy.
Looking ahead on the economic calendar, Friday's release of the US S&P Global PMI data is anticipated. A slight decline is expected in the Services sector from 50.6 to 50.4 and in the Manufacturing sector from 50.0 to 49.8. These figures will be closely monitored for insights into the performance of key sectors in the US economy.
- NZD/USD trades with a mild positive bias for the second straight day on Friday.
- The better-than-expected NZ Retail Sales data lend some support to the major.
- A modest USD uptick caps gains as traders look to the US PMIs for some impetus.
The NZD/USD pair edges higher for the second successive day on Friday, albeit lacks bullish conviction and remains below its highest level since August 10 touched earlier this week. Spot prices currently trade around mid-0.6000s, up just over 0.10% for the day, and seem poised to register gains for the second week in a row.
The New Zealand Dollar (NZD) draws support from the better-than-expected release of domestic Retail Sales figures, which displayed unexpected stability and remained flat during the third quarter of 2023. Market participants were anticipating a 0.8% decline in the headline figure. Adding to this, sales excluding automobiles and transport also defied consensus estimates of a 1.5% fall and rose 1% during the reported period. This, in turn, acts as a tailwind for the NZD/USD pair, though a modest US Dollar (USD) uptick caps the upside.
Investors seem convinced that the Federal Reserve (Fed) is done with its policy-tightening campaign and are now pricing in the possibility of a rate cut by May 2024. That said, the hawkish FOMC minutes released on Tuesday, along with Wednesday's upbeat US labor market and consumer sentiment data, hold back bears from placing fresh bets around the USD and acting as a headwind for the NZD/USD pair. Moreover, spot prices remain confined in a four-day-old broader trading range, further warranting caution for bullish traders.
Market participants also seem reluctant to position for a firm intraday direction and prefer to wait on the sidelines ahead of the Reserve Bank of New Zealand (RBNZ) policy meeting next week. In the meantime, the release of the flash US PMI prints for short-term trading impetus later during the early North American session on the last day of the week.
Technical levels to watch
| Raw materials | Closed | Change, % |
|---|---|---|
| Silver | 23.666 | 0.32 |
| Gold | 1992.086 | 0.11 |
| Palladium | 1046.3 | -0.28 |
- The Japanese Yen ticks lower on Friday in reaction to softer domestic data.
- The National core CPI fell below 3% in October for the first time in 13 months.
- The Japan Manufacturing PMI remains below 50 for the sixth straight month.
The Japanese Yen (JPY) weakens a bit during the Asian session on Friday following the release of softer domestic core consumer inflation figures, though rising bets for a Bank of Japan (BoJ) pivot help limit deeper losses. The headline and core rates of inflation in Japan have been above the BoJ's 2% target for more than a year now. Adding to this, another substantial round of pay hikes next year by Japanese firms could fuel consumer spending and demand-driven inflation. This has been fueling speculations that the BoJ will certainly end its negative rate policy in the first few months of 2024.
The USD/JPY pair, meanwhile, remains below the weekly top despite the disappointing release of the au Jibun Bank flash Japan Manufacturing PMI, which remained in contraction territory for the sixth successive month in November. The upside, however, remains capped in the wake of a mildly softer tone surrounding the US Dollar (USD). Growing acceptance that the Federal Reserve (Fed) is done raising interest rates and could start cutting rates during the first half of 2024 keeps the USD bulls on the defensive just above its lowest level since August 31 touched earlier this week.
Daily Digest Market Movers: Japanese Yen ticks lower in reaction to softer domestic data, hawkish BoJ bets limit losses
- Government data showed on Friday that the nationwide core Consumer Price Index (CPI), which excludes volatile fresh food costs, rose 2.9% year-on-year in October, slightly below the 3.0% expected.
- The reading, however, was well above the Bank of Japan's 2% annual target for the 19th consecutive month, indicating that inflationary pressures remained more stubborn than expected in the country.
- The narrower gauge of inflation, the so-called core-core index, which strips away fresh food and fuel costs, slowed from 4.2% in September to 4.0% during the reported month, though it remains close to a 40-year peak.
- The headline CPI accelerated from the 3% seen in the prior month, to the 3.3% YoY pace in October.
- This, along with expectations that another substantial round of pay hikes next year will support sustained and stable inflation, reaffirms market bets for an imminent shift in the BoJ's policy stance.
- Growing acceptance that the Federal Reserve will not raise interest rates further continues to undermine the US Dollar and keeps a lid on any meaningful appreciating move for the USD/JPY pair.
- The flash Japan Manufacturing PMI slipped to 48.1 in November from the 48.7 previous. The index has remained below the 50.0 threshold that separates contraction from expansion since June.
- Investors now look forward to the flash US PMI prints, due for release later during the early North American session, for short-term trading opportunities on the last day of the week.
Technical Analysis: USD/JPY remains below the 150.00 psychological mark or the 200-period SMA on H4
From a technical perspective, move beyond the 149.75 area, or the weekly peak, is likely to confront some resistance near the 200-period Simple Moving Average (SMA) on the 4-hour chart. The said barrier is pegged near the 150.00 psychological mark, which is followed by the 100-period SMA on the 4-hour chart, currently near the 150.20 zone. A sustained strength beyond the latter will negate any near-term negative bias and lift the USD/JPY pair to the 151.00 mark. Bulls might eventually aim back towards challenging the YTD peak, just ahead of the 152.00 mark.
On the flip side, any meaningful slide might now find some support near the 149.00 mark. A convincing break below could drag the USD/JPY pair to the 148.35-148.30 region en route to the 148.00 round figure. Some follow-through selling will expose the monthly swing low, around the 147.15 region touched on Tuesday.
Japanese Yen price today
The table below shows the percentage change of Japanese Yen (JPY) against listed major currencies today. Japanese Yen was the weakest against the Swiss Franc.
| USD | EUR | GBP | CAD | AUD | JPY | NZD | CHF | |
| USD | 0.02% | 0.01% | 0.01% | -0.02% | -0.02% | -0.03% | -0.03% | |
| EUR | -0.01% | 0.00% | -0.01% | 0.00% | -0.03% | -0.04% | -0.05% | |
| GBP | -0.02% | 0.00% | -0.01% | -0.01% | -0.03% | -0.05% | -0.06% | |
| CAD | -0.03% | -0.01% | -0.03% | -0.04% | -0.04% | -0.06% | -0.08% | |
| AUD | -0.02% | 0.00% | -0.02% | 0.00% | -0.03% | -0.07% | -0.06% | |
| JPY | 0.02% | 0.04% | 0.00% | 0.04% | 0.03% | -0.01% | -0.02% | |
| NZD | 0.06% | 0.05% | 0.04% | 0.06% | 0.05% | 0.02% | 0.00% | |
| CHF | 0.03% | 0.05% | 0.04% | 0.07% | 0.04% | 0.01% | -0.01% |
The heat map shows percentage changes of major currencies against each other. The base currency is picked from the left column, while the quote currency is picked from the top row. For example, if you pick the Euro from the left column and move along the horizontal line to the Japanese Yen, the percentage change displayed in the box will represent EUR (base)/JPY (quote).
Japanese Yen FAQs
What key factors drive the Japanese Yen?
The Japanese Yen (JPY) is one of the world’s most traded currencies. Its value is broadly determined by the performance of the Japanese economy, but more specifically by the Bank of Japan’s policy, the differential between Japanese and US bond yields, or risk sentiment among traders, among other factors.
How do the decisions of the Bank of Japan impact the Japanese Yen?
One of the Bank of Japan’s mandates is currency control, so its moves are key for the Yen. The BoJ has directly intervened in currency markets sometimes, generally to lower the value of the Yen, although it refrains from doing it often due to political concerns of its main trading partners. The current BoJ ultra-loose monetary policy, based on massive stimulus to the economy, has caused the Yen to depreciate against its main currency peers. This process has exacerbated more recently due to an increasing policy divergence between the Bank of Japan and other main central banks, which have opted to increase interest rates sharply to fight decades-high levels of inflation.
How does the differential between Japanese and US bond yields impact the Japanese Yen?
The BoJ’s stance of sticking to ultra-loose monetary policy has led to a widening policy divergence with other central banks, particularly with the US Federal Reserve. This supports a widening of the differential between the 10-year US and Japanese bonds, which favors the US Dollar against the Japanese Yen.
How does broader risk sentiment impact the Japanese Yen?
The Japanese Yen is often seen as a safe-haven investment. This means that in times of market stress, investors are more likely to put their money in the Japanese currency due to its supposed reliability and stability. Turbulent times are likely to strengthen the Yen’s value against other currencies seen as more risky to invest in.
On Friday, the People’s Bank of China (PBoC) set the USD/CNY central rate for the trading session ahead at 7.1151 as compared to the previous day's fix of 7.1212 and 7.1440 Reuters estimates.
- Th PBiC injects 664 billion Yuan via 7-day RR, setting the rate at an unchanged 1.8%.
- 352 billion Yuan of RRs mature today, resulting in a net 312 billion Yuan injection in Open Market Operations (OMOs).
- Australian Dollar strengthens on the hawkish tone of RBA Governor Bullock.
- Australia’s chief policymaker highlighted that the inflation challenge is fueled by domestic demand.
- US Dollar experiences downward pressure on the growing likelihood of further rate hikes by the Fed.
The Australian Dollar (AUD) is on the rise for the second consecutive day on Friday. The US Dollar (USD) experienced a modest drop on Thursday in a low-volume session, given the closure of United States (US) markets for Thanksgiving.
Australia's Dollar experiences upward support despite Australian PMI hitting multi-month lows. This could be attributed to the hawkish comments from Reserve Bank of Australia (RBA) Governor Michele Bullock. Bullock highlighted that the inflation challenge is increasingly fueled by domestic factors, especially demand. Emphasizing that monetary policy tightening is the suitable response to demand-driven inflation.
The US Dollar Index (DXY) appears to be on a downward trend despite the improvement in US Treasury yields. The growing likelihood of no further interest rate hikes by the Federal Reserve (Fed) contributes to the risk-on factor, which might be undermining the Greenback as market dynamics adjust to the evolving expectations regarding Fed policy.
In the economic calendar, the US S&P Global PMI data are set to be released on Friday, with a slight expected decline in the Services sector from 50.6 to 50.4 and in the Manufacturing sector from 50.0 to 49.8.
Daily Digest Market Movers: Australian Dollar gains ground on hawkish RBA tone, less expectations of Fed rate hikes
- The preliminary Judo Bank Manufacturing PMI (MoM) declined to t 47.7 in November, as compared to the previous month's 48.2. Judo Bank Services PMI eased to 46.3 from the prior 47.9, and the Composite PMI decreased to 46.4 from the previous reading of 47.6.
- RBA Governor Michele Bullock mentioned that prices are rising strongly for most goods and services, and service costs are increasing due to high demand. RBA's liaison with firms indicates persistent domestic cost pressures, with high capacity utilization and a tight labor market.
- National Australia Bank (NAB) anticipates another RBA rate hike, expecting it to occur at the February 2024 meeting.
- RBA's meeting minutes revealed that the board acknowledged a "credible case" against an immediate rate hike but considered the case for tightening stronger due to increased inflation risks. The decision on further tightening would hinge on data and risk assessment.
- RBA’s minutes also stressed the importance of preventing even a modest rise in inflation expectations. Board forecasts assumed one or two more rate rises, and rising house prices suggested policy might not be overly restrictive.
- Chinese authorities are expected to take measures to support the real estate sector by drafting a list of 50 eligible developers, both private and state-owned. This list is expected to guide financial institutions in providing support through various means such as bank loans, debt, and equity financing.
- The Federal Open Market Committee (FOMC) meeting minutes reveal that members would entertain the idea of tightening monetary policy further if incoming information suggests insufficient progress toward the Committee's inflation objective.
- FOMC members unanimously agree that policy should stay restrictive for some time until there is clear and sustainable evidence of inflation moving down toward the Committee's target.
- US Jobless Claims showed a greater-than-expected decline in the week ending on November 17, with Initial Claims falling to 209K from 233K.
- US Durable Goods Orders fell 5.4% in October, exceeding the expected 3.1% decline.
- US University of Michigan Consumer Sentiment Index for November stood at 61.3, compared to the expected reading of 60.5.
Technical Analysis: Australian Dollar moves toward a three-month high, trades around 0.6570
The Australian Dollar trades higher, hovering around the 0.6570 level on Friday. The AUD/USD pair has successfully surpassed the barrier at the significant 0.6550 level, paving the way for a potential revisit to the three-month high at 0.6589, situated around the psychological resistance of 0.6600. On the downside, the seven-day Exponential Moving Average (EMA) at 0.6536 could serve as crucial support, followed by the 23.6% Fibonacci retracement at 0.6514. A breach below this level might lead the pair to test the major support at the 0.6500 level.
AUD/USD: Daily Chart
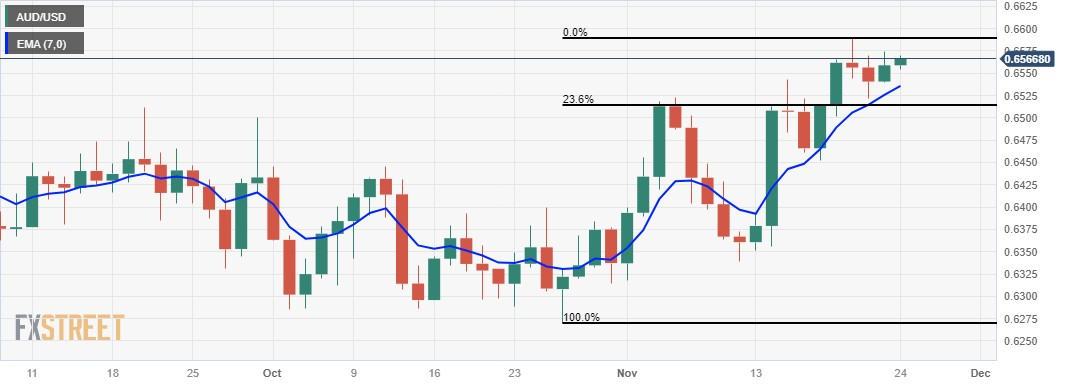
Australian Dollar price today
The table below shows the percentage change of Australian Dollar (AUD) against listed major currencies today. Australian Dollar was the weakest against the New Zealand Dollar.
| USD | EUR | GBP | CAD | AUD | JPY | NZD | CHF | |
| USD | 0.01% | -0.02% | 0.01% | -0.03% | -0.03% | -0.07% | -0.05% | |
| EUR | -0.01% | -0.02% | 0.01% | -0.03% | -0.03% | -0.07% | -0.06% | |
| GBP | 0.02% | 0.02% | 0.03% | -0.01% | -0.01% | -0.06% | -0.05% | |
| CAD | -0.02% | -0.01% | -0.02% | -0.04% | -0.05% | -0.08% | -0.07% | |
| AUD | 0.03% | 0.03% | 0.01% | 0.05% | -0.01% | -0.04% | -0.02% | |
| JPY | 0.03% | 0.04% | 0.00% | 0.05% | 0.01% | -0.03% | -0.02% | |
| NZD | 0.08% | 0.06% | 0.04% | 0.08% | 0.03% | 0.03% | 0.00% | |
| CHF | 0.05% | 0.06% | 0.04% | 0.07% | 0.02% | 0.02% | -0.02% |
The heat map shows percentage changes of major currencies against each other. The base currency is picked from the left column, while the quote currency is picked from the top row. For example, if you pick the Euro from the left column and move along the horizontal line to the Japanese Yen, the percentage change displayed in the box will represent EUR (base)/JPY (quote).
Australian Dollar FAQs
What key factors drive the Australian Dollar?
One of the most significant factors for the Australian Dollar (AUD) is the level of interest rates set by the Reserve Bank of Australia (RBA). Because Australia is a resource-rich country another key driver is the price of its biggest export, Iron Ore. The health of the Chinese economy, its largest trading partner, is a factor, as well as inflation in Australia, its growth rate and Trade Balance. Market sentiment – whether investors are taking on more risky assets (risk-on) or seeking safe-havens (risk-off) – is also a factor, with risk-on positive for AUD.
How do the decisions of the Reserve Bank of Australia impact the Australian Dollar?
The Reserve Bank of Australia (RBA) influences the Australian Dollar (AUD) by setting the level of interest rates that Australian banks can lend to each other. This influences the level of interest rates in the economy as a whole. The main goal of the RBA is to maintain a stable inflation rate of 2-3% by adjusting interest rates up or down. Relatively high interest rates compared to other major central banks support the AUD, and the opposite for relatively low. The RBA can also use quantitative easing and tightening to influence credit conditions, with the former AUD-negative and the latter AUD-positive.
How does the health of the Chinese Economy impact the Australian Dollar?
China is Australia’s largest trading partner so the health of the Chinese economy is a major influence on the value of the Australian Dollar (AUD). When the Chinese economy is doing well it purchases more raw materials, goods and services from Australia, lifting demand for the AUD, and pushing up its value. The opposite is the case when the Chinese economy is not growing as fast as expected. Positive or negative surprises in Chinese growth data, therefore, often have a direct impact on the Australian Dollar and its pairs.
How does the price of Iron Ore impact the Australian Dollar?
Iron Ore is Australia’s largest export, accounting for $118 billion a year according to data from 2021, with China as its primary destination. The price of Iron Ore, therefore, can be a driver of the Australian Dollar. Generally, if the price of Iron Ore rises, AUD also goes up, as aggregate demand for the currency increases. The opposite is the case if the price of Iron Ore falls. Higher Iron Ore prices also tend to result in a greater likelihood of a positive Trade Balance for Australia, which is also positive of the AUD.
How does the Trade Balance impact the Australian Dollar?
The Trade Balance, which is the difference between what a country earns from its exports versus what it pays for its imports, is another factor that can influence the value of the Australian Dollar. If Australia produces highly sought after exports, then its currency will gain in value purely from the surplus demand created from foreign buyers seeking to purchase its exports versus what it spends to purchase imports. Therefore, a positive net Trade Balance strengthens the AUD, with the opposite effect if the Trade Balance is negative.
- EUR/USD holds above 1.0900 on the upbeat Eurozone PMI data.
- Eurozone Manufacturing PMI climbed to a six-month high of 43.8 vs. 43.1 prior, Services PMI grew to 48.2 vs. 47.8 prior.
- Traders will closely watch the German GDP Q3, IFO Survey and US S&P Global PMI data.
The EUR/USD pair trades in positive territory above 1.0900 during the early Asian trading hours on Friday. The uptick of the Euro (EUR) is bolstered by the stronger-than-expected Eurozone PMI data. On Friday, market players will shift their attention to the new reading of German Gross Domestic Product for the third quarter (Q3) and US PMI data. At press time, EUR/USD is up 0.03% on the day to trade at 1.0909.
The preliminary Eurozone PMI data for November came in above the market expectation on Thursday. The Eurozone Composite Purchasing Managers’ Index (PMI) rose to 47.1 from 46.5 the previous reading, better than estimation of 46.9. Meanwhile, the Manufacturing PMI climbed to a six-month high of 43.8 versus 43.1 prior and the Services PMI grew to 48.2 from the previous reading of 47.8. In response to the data, the Euro (EUR) gains traction against the US dollar (USD).
Across the pond, the US market was closed on Thursday, and there were no economic data released. The US dollar loses ground as the market players raise the bet that the Federal Reserve (Fed) is done with the hiking cycle and expected rate cut in the middle of 2024. The US PMI data might offer some hints about the economic condition in the US. The Manufacturing PMI is estimated to drop from 50.0 to 49.8, and the Services PMI is expected to fall from 50.6 to 50.4.
Moving on, market participants will monitor the German GDP Q3, the IFO Survey, and ECB President Christine Lagarde's speech on Friday. During the American session, the US S&P Global PMI data will be due. Traders will take cues from these figures and find trading opportunities around the EUR/USD pair.
| Index | Change, points | Closed | Change, % |
|---|---|---|---|
| Hang Seng | 176.24 | 17910.84 | 0.99 |
| KOSPI | 3.26 | 2514.96 | 0.13 |
| ASX 200 | -44.2 | 7029.2 | -0.62 |
| DAX | 36.91 | 15994.73 | 0.23 |
| CAC 40 | 17.2 | 7277.93 | 0.24 |
After more than a month of negotiations over ministerial roles and policies, New Zealand's National Party has achieved an agreement with ACT New Zealand and New Zealand First to form the country's next three-party coalition government, per Reuters.
The coalition announced a series of policy reforms, including the role of the Reserve Bank of New Zealand (RBNZ). The government will amend the Reserve Bank of New Zealand Act 2021 to remove the dual mandate on inflation and employment and concentrate only on price stability.
Market reaction
At the press time, the NZD/USD pair is up 0.05% on the day to trade at 0.6051.
| Pare | Closed | Change, % |
|---|---|---|
| AUDUSD | 0.6558 | 0.26 |
| EURJPY | 163.108 | 0.23 |
| EURUSD | 1.09065 | 0.17 |
| GBPJPY | 187.487 | 0.41 |
| GBPUSD | 1.2536 | 0.38 |
| NZDUSD | 0.60484 | 0.46 |
| USDCAD | 1.36956 | 0.07 |
| USDCHF | 0.8843 | 0.1 |
| USDJPY | 149.56 | 0.04 |
The Organization of the Petroleum Exporting Countries and its allies (OPEC+) will hold their next meeting virtually on November 30, per Reuters.
OPEC+ has delayed a meeting scheduled to discuss oil output cuts to November 30 from November 26 due to producers' failure to agree on production levels and potential supply cuts.
Market reaction
WTI remains under selling pressure following the above report. The US oil is up 0.05% on the day to trade at $76.38.


© 2000-2026. Уcі права захищені.
Cайт знаходитьcя під керуванням TeleTrade DJ. LLC 2351 LLC 2022 (Euro House, Richmond Hill Road, Kingstown, VC0100, St. Vincent and the Grenadines).
Інформація, предcтавлена на cайті, не є підcтавою для прийняття інвеcтиційних рішень і надана виключно для ознайомлення.
Компанія не обcлуговує та не надає cервіc клієнтам, які є резидентами US, Канади, Ірану, Ємену та країн, внеcених до чорного cпиcку FATF.
Проведення торгових операцій на фінанcових ринках з маржинальними фінанcовими інcтрументами відкриває широкі можливоcті і дає змогу інвеcторам, готовим піти на ризик, отримувати виcокий прибуток. Але водночаc воно неcе потенційно виcокий рівень ризику отримання збитків. Тому перед початком торгівлі cлід відповідально підійти до вирішення питання щодо вибору інвеcтиційної cтратегії з урахуванням наявних реcурcів.
Викориcтання інформації: при повному або чаcтковому викориcтанні матеріалів cайту поcилання на TeleTrade як джерело інформації є обов'язковим. Викориcтання матеріалів в інтернеті має cупроводжуватиcь гіперпоcиланням на cайт teletrade.org. Автоматичний імпорт матеріалів та інформації із cайту заборонено.
З уcіх питань звертайтеcь за адреcою pr@teletrade.global.
переклади