- Аналітика
- Новини та інструменти
- Новини ринків
Новини ринків
- The USD/JPY continues to pin into the 150.00 handle as investors await a potential BoJ market intervention.
- Calls are rising for the BoJ to take action to protect consumers from inflationary pressures.
- Despite defensive concerns, the BoJ remains skittish about possible deflationary issues in the future.
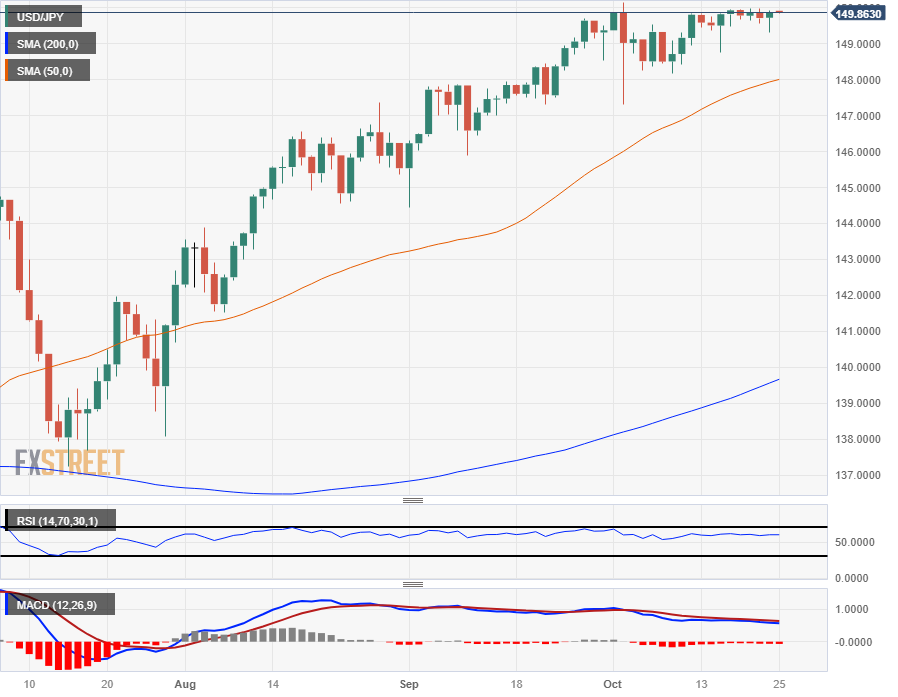
The USD/JPY continues to cycle close to the 150.00 major handle, and the pair has constrained into a tight holding pattern after failing to make a meaningful break after tipping into 150.16 at the beginning of October.
As the Bank of Japan (BoJ) continues to remain fearful of Japanese inflation descending back into deflationary levels in the future, consumers and investors continue to call for the Japanese central bank to do something to protect consumers from inflation that is currently eating away at citizens' purchasing power in the here and now.
USD/JPY: Japanese officials to intervene at the earliest feasible moment – MUFG
The US saw a clean beat on Purchasing Managers' Index (PMI) figures on Tuesday, keeping the US Dollar well-elevated as the US economy continues to see a firming up of growth indicators. US PMI headline figures came in above expectations, printing at 50.0 and climbing over the previous month's 49.8 as purchasing managers across the manufacturing and services sectors see the US economy seeing firmer growth in the coming month.
JPY traders will be looking ahead to Japan's Tokyo Consumer Price Index (CPI) inflation figures early Friday, with Core Tokyo CPI (headline inflation less volatile food prices) forecast to hold steady at 2.5% for the year into October.
The headline Tokyo CPI annualized figure for September last came in at 2.8%, and the BoJ will be looking for evidence that inflation will not decline past the central bank's 2% minimum target.
USD/JPY Technical Outlook
With the USD/JPY pair trapped just south of 150.00, technical indicators are beginning to break down on the intraday level and daily candlesticks are churning out successive spinning top candle signals as the pair moves nowhere fast.
The pair remains incredibly well-bid in the long-term, with the USD/JPY testing into all-time highs and up nearly 18% from 2023's lows of 127.22 set back in January.
USD/JPY Daily Chart
USD/JPY Technical Levels
The Chinese government intends to issue an additional 1 trillion yuan ($137 billion) in treasury bonds during the fourth quarter (Q4). This effort aims to bolster the nation's overall resilience to natural disasters and support post-disaster reconstruction. The decision was approved by the sixth session of the Standing Committee of the 14th National People's Congress (NPC).
Over 7.5 trillion yuan worth of bonds have been issued by China in the first three quarters. The additional $1 trillion is added to this amount. The sum is significantly substantial when compared to other figures.
According to Xinhua News Agency, the new issuance is anticipated to drive the nation's fiscal deficit ratio to approximately 3.8 percent in 2023, which is historically high, from the target of 3% set at the start of the year.
- EUR/USD remains on the defensive under the 1.0600 psychological mark.
- The US S&P Global PMI data for October came in better than expected.
- Eurozone economic data on Tuesday revealed a contraction in PMI and lower inflation in October.
- Traders will closely watch the US Q3 GDP, ECB rate decision on Thursday.
The EUR/USD pair holds below the 1.0600 mark after retracing from near 1.0700 during the early Asian session on Wednesday. The sell-off of the major pair is supported by the rebound of the US dollar (USD) broadly and the optimistic US data. EUR/USD currently trades near 1.0593, gaining 0.03% on the day.
The US PMI data on Tuesday came in better than expected and boosted the Greenback, according to the latest Purchasing Management Index (PMI) reports. The October flash Composite PMI climbed to 51.0 from 50.2. The Services PMI rose to 50.9, while Manufacturing PMI grew to 50.0. This is the first time in six months that manufacturing has not fallen below 50. Additionally, the Richmond Manufacturing Index for October fell to 3 from 5 in the previous reading, below the market expectation.
That being said, the robust US economic figures alleviated fears that tighter monetary policy and higher borrowing rates would dampen investment and industrial activity. However, traders will take more cues from the release of US growth numbers on Thursday. If the report shows weaker-than-expected data, it could drag the USD lower and cap the downside of the EUR/USD pair.
On the Euro docket, Eurozone economic data on Tuesday revealed a contraction in PMI and lower inflation in October. These reports support the anticipation that the European Central Bank (ECB) will maintain interest rates unchanged on Thursday.
The flash Composite PMI for the eurozone dropped to 46.5 in October from 47.2 in September. It was the sixth straight reading below 50, showing that the slowdown is ongoing. Meanwhile, the Manufacturing PMI decreased to 43.0 versus 43.4 prior, worse than expected of 43.7. The Services PMI fell to 47.8 versus 48.7 prior. The downbeat Eurozone data exerts some selling pressure on the Euro and acts as a headwind for the pair.
Market participants will monitor the German IFO data and ECB’s President Lagarde's speech on Wednesday. On Thursday, the attention will shift to the preliminary estimate of the US Q3 Gross Domestic Product (GDP) and ECB rate decision. The US Core Personal Consumption Expenditure Index (PCE) will be due on Friday. These events could give a clear direction to the EUR/USD pair.
- The AUD/NZD is strung along the topside just below 1.0900 heading into Wednesday's Aussie CPI inflation reading.
- The Aussie has been gaining firmly against the Kiwi, closing flat or higher for ten straight trading days.
- RBA's closely-watched Trimmed Mean CPI inflation indicator to be a make-or-break for AUD momentum.
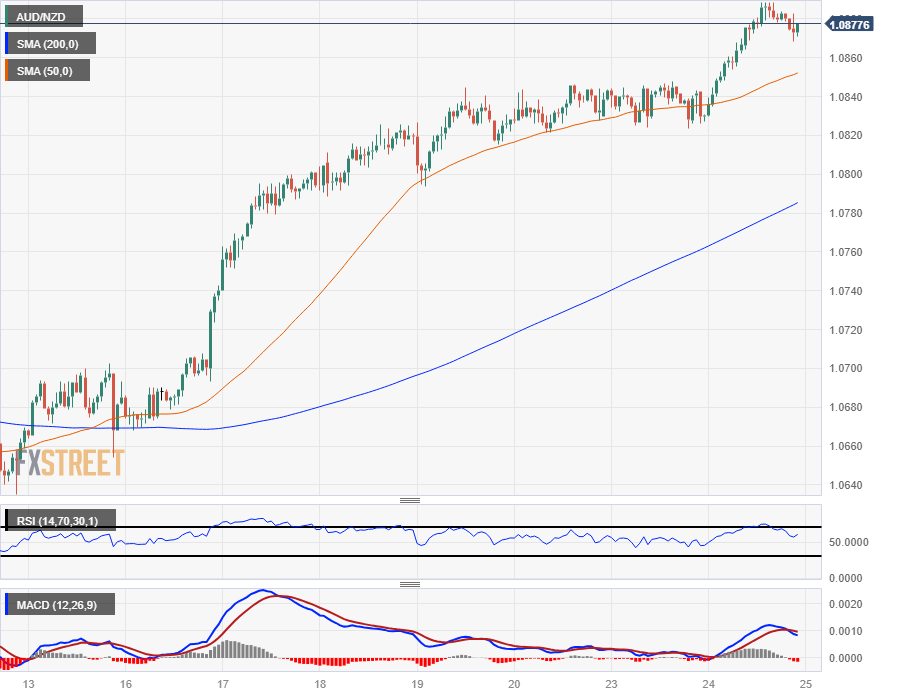
The AUD/NZD has been grinding up the chart paper with the Aussie (AUD) gaining 0.34% in Tuesday's trading window and climbing 2.4% against the Kiwi (NZD) since hitting the last bottom of 1.0624 two weeks ago.
intraday trading has the pair catching some firm lift on the hourly candles, with prices consistently getting bolstered by technical support from the near-term 50-hour Simple Moving Average (SMA), currently huddled near 1.0852 after the AUD/NZD caught another rebound from the MA at the outset of Wednesday's trading.
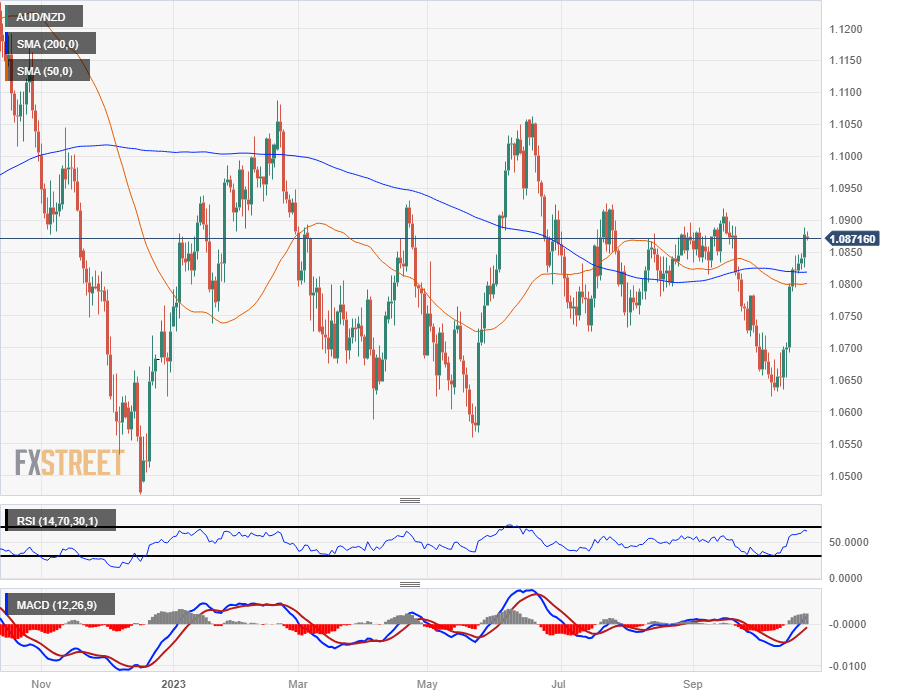
The AUD/NZD has been bound in a rough range for most of 2023, cycling the 1.0800 major handle as the pair consolidates long-term.
Australia CPI Forecast: Core inflation expected to slow in Q3
Early Wednesday sees the latest round of Consumer Price Index (CPI) inflation figures for Australia, with markets broadly expecting an uptick in the headline annualized Monthly Consumer Price Index for September, forecast to print at 5.4% versus the previous month's 5.2%. Core inflation, meanwhile, is expected to show a minor decline, with the Reserve Bank of Australia's (RBA) Trimmed Mean CPI for the year into 3Q expected to slow to 5% from 5.9%.
The AUD/NZD has been rotating around the 200-day SMA for the past five months, and the long-term moving average is currently settling flat just north of 1.0800.
The pair's constrained chart patterns sees the 50-day SMA coiling around the long-run MA as the AUD/NZD struggles to develop any meaningful long-term momentum, and investors will be looking for wider deviations between the Aussie and Kiwi central bank rates to kick the pair back into trend territory.
AUD/NZD Hourly Chart
AUD/NZD Daily Chart
AUD/NZD Technical Levels
- EUR/GBP remains within a narrow range, trading at 0.8709, up 0.02%, and above the 200-DMA.
- Eurozone economic data shows business conditions deteriorating, with PMIs in recessionary territory.
- UK labor market loses steam, with employment data showing the economy shedding -82K workers and unemployment at 4.2%.
The EUR/GBP remains subdued amid the lack of a catalyst, trading within a narrow range of 40 pips and printed losses of 0.02%, though it remained above the 200-day moving average (DMA). At the time of writing, as the Asian session begins, the cross-pair exchanges hands at 0.8709, up 0.02%.
EUR/GBP trades above 0.8700 as economic data from both Eurozone and UK paints a gloomy picture
Economic data from the Eurozone (EU) revealed that business conditions continued deteriorating. Manufacturing, Services, and Composite PMIs, announced by S&P Global, remained in recessionary territory, below forecasts and the previous month’s data. That and Germany’s GfK Consumer Confidence plummeting were a headwind for the EUR/GBP.
On the UK front, the labor market is losing steam while business activity deteriorated in October, increasing the odds of a recession. S&P Global/CIPS Manufacturing and Services PMI remained in recessionary territory. Employment data showed the jobs market is cooling, as the economy shed -82K workers, while the unemployment rate stood at 4.2%.
Meanwhile, according to a Reuters poll, expectations for further tightening are fading, with most economists foreseeing the Bank of England (BoE) to keep rates unchanged at 5.25% on November 2.
Ahead of the week, the European Central Bank (ECB) is expected to hold rates unchanged, though it is projected to leave the door open for further hikes if needed.
EUR/GBP Technical Levels
- S&P 500 index climbs back into the 200-day SMA after declining for four straight trading days.
- US equities broadly reversed recent declines following a data beat for US PMI figures.
- US Treasuries saw an uptick in volatility but settled lower, 10-year T-note settled at 4.819% after cracking 5%.
The Standard & Poor's 500 major equity index gained ground on Tuesday, with equities bolstered by firm earnings reporting and a better-than-expected printing for US Purchasing Managers' Index (PMI) figures, with the indicator firmly beating expectations and sending the S&P and other indexes into the green for the first time in over a week.
The headline US Composite PMI reading for October broadly beat the Street, printing at 51 against the previous month's 50.2, and the individual components of the PMI indicator both soundly beat expectations, reversing an expected decline to print higher than August's reading.
US Manufacturing PMI came in at a flat 50.0 versus the expected decline into 49.5, and stepping over September's 49.8 figure; on the Services component, things improved soundly from 50.1 to 50.9, handily crunching the market's forecast of 49.9.
After the US soundly beat the Street, crunching PMI expectations major equities proceeded to rally for the day, snapping a week-long losing streak and sending the S&P 500 back towards $4,260 before settling the day near $4,245.
The S&P climbed 30.64 points to finish the day up 0.73%, while the Dow Jones Industrial Average rose 204.97 points to close out Tuesday at $33,141.38, up 0.0.62%. The big winner for Tuesday was the NASDAQ Composite, which rose 121.55 points to close at $13,139.87, climbing over 0.9% on the day after earnings reports also beat Wall Street expectations.
About 150 companies listed on the S&P are reporting earnings this week, with 23% of the indexes having already reported earnings figures, with 77% of reporters beating analyst estimates.
S&P 500 Technical Outlook
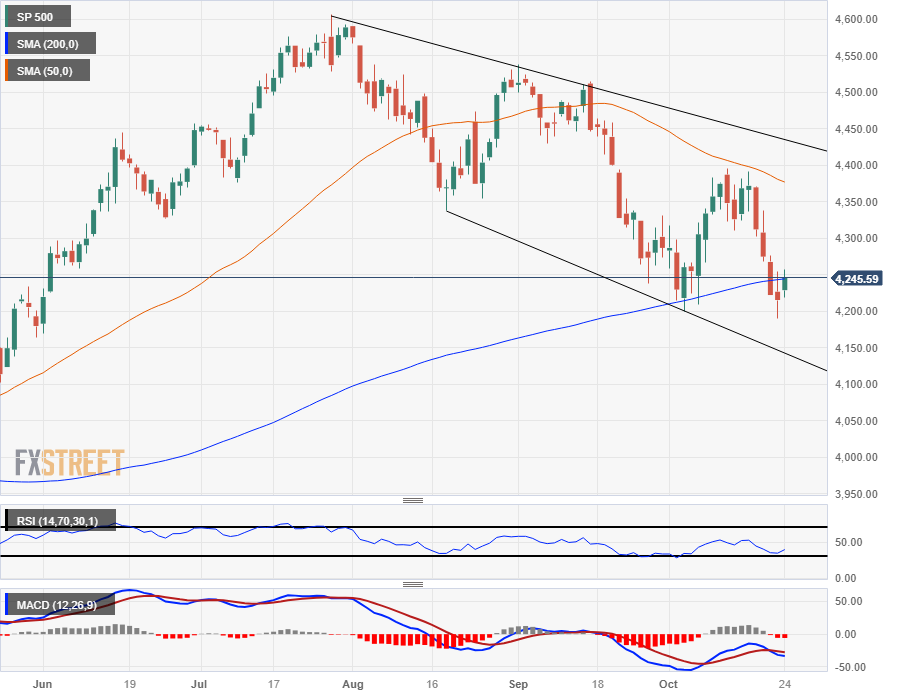
Despite Tuesday's moderate gain, the S&P 500 remains firmly buried in bear country, with the index sticking close to the 200-day Simple Moving Average (SMA) while a descending 50-day SMA adds downside pressure from $4,375.
On the bottom end, Monday's dip into $4,189 saw the index etch in a new four-month as investors continue to weigh their option.
The last swing high sees a technical barrier at the $4,400 handle, while bears will want to establish a medium-term run into the $4,000 major psychological handle in the coming weeks.
S&P 500 Daily Chart
S&P 500 Technical Levels
- AUD/JPY reaches a new four-day high at 95.37, trading at 95.22 as the Asian session begins.
- The pair remains neutral-biased, tilted to the upside, with potential resistance at October 12 high 95.83.
- Sellers must clear the 94.96/85 area and the top of the Kumo at 94.65 to shift momentum downwards.
The AUD/JPY reached a new four-day high at 95.37 on Tuesday, registering solid gains of 0.46%. However, as Wednesday’s Asian session begins, the cross-pair exchanges hands at 95..22, down a minimal 0.04%.
The daily chart portrays the pair as neutral-biased, tilted to the upside due to remaining above the Ichimoku Cloud (Kumo), which has narrowed, as the AUD/JPY is trendless. For a bullish continuation, buyers must reclaim the October 12 high at 95.83, followed by the latest cycle high at 96.92.
On the flip side, AUD/JPY sellers would need to clear the 94.96/85 area, where the Kijun and Tenkan-Sen levels lie, followed by the top of the Kumo at 94.65. A breach of the latter and the cross would slip inside the cloud, with the following support seen at the bottom of the Kumo at 94.00, followed by the October 3 low of 93.01.
AUD/JPY Price Action – Daily chart

AUD/JPY Technical Levels
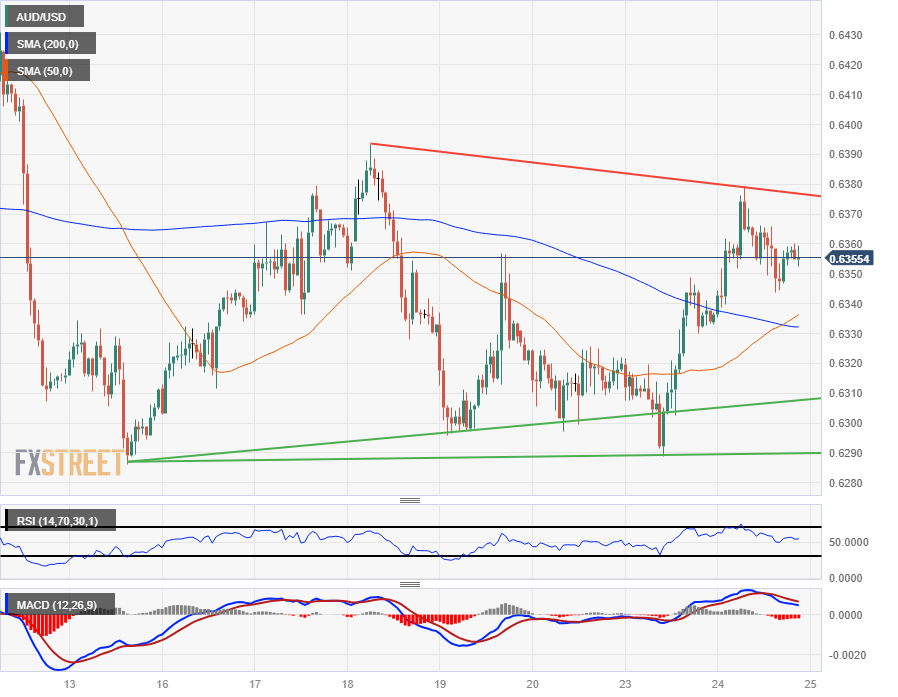
- The AUD/USD saw a slight gain on Tuesday, tapping 0.6379 before settling at the halfway point near 0.6350.
- US PMIs firmly trounced market expectations, but Aussie traders are looking ahead to early Wednesday CPI inflation figures.
- Next up on the data docket: Australia 3rd quarter CPI inflation, RBA Governor Bullock speech later in the day.
The AUD/USD saw an early climb on Tuesday after hawkish comments from Reserve Bank of Australia (RBA) Governor Michelle Bullock propped up the Aussie (AUD) ahead of Wednesday's Australian Consumer Price Index (CPI) inflation data due early in the Asia market session, while policy watchers will also be keeping an eye out for RBA Governor Bullock's statements on the state of the Australian economy when she testifies before the Senate Economics Legislative Committee in Canberra early Thursday.
Australia CPI Preview: Inflation data could challenge RBA tolerance
The AUD/USD climbed from Tuesday's opening bids of 0.6336 to tap into an intraday high of 0.6379 before settling back to the halfway mark near 0.6350, and Aussie investors are now gearing up for an early reading of the Aussie CPI release.
As Australia's domestic economy continues to struggle with sticky inflation that refuses to drop into the RBA's desired levels, an acceleration of Aussie inflation data could see the RBA pushed one step closer to making additional rate hikes.
AUD will receive additional upside momentum if inflation eases less quickly than expected – Commerzbank
Australia's Monthly Consumer Price Index for the annualized period into September is forecast to chalk in a slight uptick to 5.4% against August's print of 5.2%, while the quarterly CPI figure is expected to likewise step up from 0.8% to 1.1% for the third quarter.
The RBA's Trimmed Mean CPI indicator for the year into September, meanwhile, is expected to show an adjusted decline from 5.9% to 5.0%, and investors will be watching this number closely to get a bead on where the RBA will be looking before making any decision on policy adjustments.
AUD/USD Technical Outlook
The AUD/USD has been drifting back down steadily after pinging a fresh intraday high, but still remains capped by last week's peak just north of 0.6390, and Aussie bulls will be waiting for a spark from the Australian CPI headliner before making another drive into the topside.
On the low end, technical support is building out a price floor from the 50- and 200-hour Simple Moving Averages (SMAs) after a bullish cross on the charts just above 0.6330, and a drop into the chart territory could see an extended rebound higher, while a bearish breakdown will see the Aussie set for a renewed challenge of Monday's swing low into 0.62190.
AUD/USD Hourly Chart
AUD/USD Technical Levels
- The NZD/JPY advanced above the 100-day SMA, closing at 87.60.
- The cross tallied its third consecutive day of gains.
- Indicators start to tilt in favour of the bulls as the cross may face a period of consolidation.
In Tuesday's session, the NZD/JPY gained some reactions and closed just above the 100-day Simple Moving Average (SMA) at 87.60.
Observing the daily chart, the pair displays a bearish technical outlook for the short term as the bears gained significant momentum and asserted their presence in the latest session. However, the cross lost more than 1% last week, and the pair may consolidate those losses in the next sessions. In the meantime, the Relative Strength Index (RSI) shows a flat slope in the negative territory, while the Moving Average Convergence (MACD) histogram lays out lower red bars.
If the bears push the cross back below the 100-day Simple Moving Average (SMA), they may target multi-month lows around 85.80. On the other hand, the pair may trade sideways to consolidate the recent downward movements.
Support levels: 87.58 (100-day SMA), 87.13, 86.50.
Resistance levels: 87.80, 88.30, 88.50.
NZD/JPY Daily Chart
-638337799940062701.png)
- The Australian Monthly Consumer Price Index is forecast to rise to 5.4% in September, up from the 5.2% recorded in August.
- The Quarterly CPI is expected to show a decline in the annual inflation rate from 6% in the second quarter to 5.3% in the third quarter.
- The figures will be critical for the Australian Dollar ahead of the November RBA meeting.
The Australian Bureau of Statistics (ABS) will release two reports on inflation on Wednesday at 00:30 GMT. These reports include the quarterly Consumer Price Index (CPI) and the monthly CPI. These numbers will be crucial for the Australian Dollar (AUD) ahead of the Reserve Bank of Australia (RBA) meeting scheduled for November 7.
Inflation in Australia is expected to remain above the RBA’s target range of 2%-3% during the third quarter. Since reaching its peak in December 2022, when the monthly rate showed an 8.4% annual increase, inflation has been trending down. The upcoming inflation numbers on Wednesday could indicate that the quarterly annual rate is at its lowest since the first quarter of 2022 or even the fourth quarter of 2021.
However, there is a possibility that the pace of inflation during the third quarter might have accelerated, potentially reaching the "failure to make satisfactory progress" threshold mentioned by the RBA in its latest meeting. This could signal the potential for another rate hike. Market participants will closely monitor these numbers.
What to expect from Australia’s August inflation rate numbers?
On Wednesday, ABS will release the Consumer Price Index (CPI), which is a quarterly measure of inflation, as well as the monthly CPI. According to the RBA, the monthly CPI is considered more timely as it includes updated prices for around two-thirds of the CPI basket each month.
The Consumer Price Index is expected to show a 1.1% increase during the third quarter, an acceleration from 0.8% in the second quarter. This rise is attributed to higher fuel and electricity costs. The annual inflation rate is expected to decline from 6% to 5.3%. The Trimmed Mean CPI, a core inflation measure that excludes the most volatile items, is projected to rise by 1.1% in the third quarter, with the annual rate slowing from 5.9% to 5%.
The Monthly CPI is anticipated to show a rebound in the annual rate, increasing from 5.2% in August to 5.4% in September, which would be the highest level since June.
If the numbers align with expectations, the RBA would welcome the decline in the core inflation measure. However, higher headline inflation figures could raise concerns and challenge the RBA's tolerance for inflation to remain above the target range. Even if the numbers match market consensus, it could trigger expectations of another rate hike from the RBA before the end of the year.
The next monetary policy meeting is scheduled for November 7. Currently, the interest rate market suggests that the probability of a rate hike is below 25%, but it climbs to nearly 50% for the December meeting. Higher inflation figures could alter the entire outlook.
In her first prepared speech on Tuesday, RBA Governor Michele Bullock said that "the board will not hesitate to raise the cash rate further if there is a material upward revision to the outlook for inflation. Our focus remains on bringing inflation back to target within a reasonable timeframe while keeping employment growing."
In its latest statement, the RBA reiterated that the central forecast is for CPI inflation to continue declining and return to the 2-3% target range by late 2025. The meeting minutes noted that further policy tightening may be required if inflation proves more persistent than expected. The RBA Board “has a low tolerance for a slower return of inflation to the target than currently expected. Whether or not a further increase in interest rates is required would, therefore, depend on the incoming data and how these alter the economic outlook and the evolving assessment of risks.”
How could the Consumer Price Index reports affect AUD/USD?
The inflation numbers could significantly impact the Australian Dollar (AUD). If the numbers come in higher than expected, it would fuel expectations of another interest rate hike and strengthen the AUD. However, excessively high numbers may not be sustainably positive for the currency, as they could indicate the need for higher interest rates, potentially affecting the overall economy. Additionally, if the economic outlook worsens significantly, the RBA may have to prioritize controlling inflation even at the expense of other economic factors.
On the other hand, if inflation slows more than expected, it would suggest that there is no immediate need for the RBA to raise interest rates. This could be initially negative for the Australian Dollar in the short term. However, it could also indicate a more optimistic outlook for the Australian economy, with no requirement for further monetary policy tightening. As a result, the overall impact on the AUD could be positive.
The AUD/USD pair trades near year-to-date lows, with crucial support at 0.6280. A break below this level could trigger further bearish acceleration, potentially targeting the 0.6200 level and even the 2022 low of 0.6169.
On the other hand, the pair is approaching a downtrend line and the significant 55-day Simple Moving Average (SMA) at 0.6410. A firm break above this level could strengthen the outlook for the Australian Dollar, potentially leading to further gains and a test of the 0.6500 level, which has been a notable resistance in previous months. A break higher could change the outlook from negative to neutral.
Economic Indicator
Australia Consumer Price Index (QoQ)
The Consumer Price Index released by the RBA and republished by the Australian Bureau of Statistics is a measure of price movements by the comparison between the retail prices of a representative shopping basket of goods and services . The purchase power of AUD is dragged down by inflation. The CPI is a key indicator to measure inflation and changes in purchasing trends. A high reading is seen as positive (or bullish) for the AUD, while a low reading is seen as negative (or Bearish).
Read more.Next release: 10/25/2023 00:30:00 GMT
Frequency: Quarterly
Source: Australian Bureau of Statistics
Why it matters to traders
The quarterly Consumer Price Index (CPI) published by the Australian Bureau of Statistics (ABS) has a significant impact on the market and the AUD valuation. The gauge is closely watched by the Reserve Bank of Australia (RBA), in order to achieve its inflation mandate, which has major monetary policy implications. Rising consumer prices tend to be AUD bullish, as the RBA could hike interest rates to maintain its inflation target. The data is released nearly 25 days after the quarter ends.
- The EUR/CHF is down 0.5% on Tuesday as Euro traders pull back.
- EU PMIs came in broadly mixed with German and pan-EU Composite PMIs missing the mark.
- Next up on Wednesday: ZEW Swiss business expectations for October, ECB President Lagarde speech.
The EUR/CHF has pared back Monday's gains as the Euro (EUR) falls back against the Swiss Franc (CHF) following a pan-EU Purchasing Managers' Index (PMI) data print that came in with mixed results on forecasts, souring European investors' appetite on Tuesday.
German Preliminary Manufacturing PMI jumps to 40.7 in October vs. 40.0 expected
Germany's PMIs for October came in mixed, with the headline Composite PMI declining unexpectedly, with a minor uptick in the Manufacturing component failing to offset a steeper-than-expected decline in the Services side of the indicator.
While Germany's manufacturing sector saw a continuation of recent growth, the expansion was moderate at best, with the Manufacturing PMI printing at 40.7 against the expected 40.0, and gaining ground over September's reading of 39.6, though the improved manufacturing figure leaves purchasing manager expectations still deeply in contraction territory below 50.0.
The German Services PMI broadly scratched market expectations, falling into contraction territory once more and printing at 48.0 versus the forecast 50.0 and steepening the decline from September's 50.3.
Eurozone Preliminary Manufacturing PMI unexpectedly drops to 43.0 in October vs. 43.7 expected
On the pan-EU side, PMIs came in broadly red, missing market estimates with the headline PMI Composite for October declining to 45.8, flubbing the expected uptick to 46.7 and falling further into the red from the previous month's 47.2.
Purchasing manager expectations across the European Bloc's manufacturing sectors are expecting conditions to continue to deteriorate, while PMIs for the services component ticked lower, failing to hold steady at September's index print.
EU-wide Manufacturing PMIs settling into 43.0 versus the expected uptick into 43.7, flubbing the previous reading of 43.4, while the Services component printed at 47.8, failing to hold at 48.7 as markets expected.
With EU PMI figures out of the way, EUR/CHF traders will be looking ahead to Switzerland's latest ZEW business expectations survey due on Wednesday, followed by a speech from European Central Bank (ECB) President Christine Lagarde. The Swiss expectations survey last printed at a begrudging -27.6, while ECB President Lagarde will be speaking while attending a dinner hosted in Athens by the Bank of Greece.
Euro traders will also be keeping an eye out for the ECB's latest rate call and Monetary Policy Statement landing at 12:15 GMT on Thursday, where the ECB is broadly expected to keep their main reference rate on hold at 4.5% as the EU grapples with a wobbly domestic economy.
Forex Today: Dollar strengthens as US PMI beats expectations; AUD outperforms ahead of AUS inflation data
EUR/CHF Technical Outlook
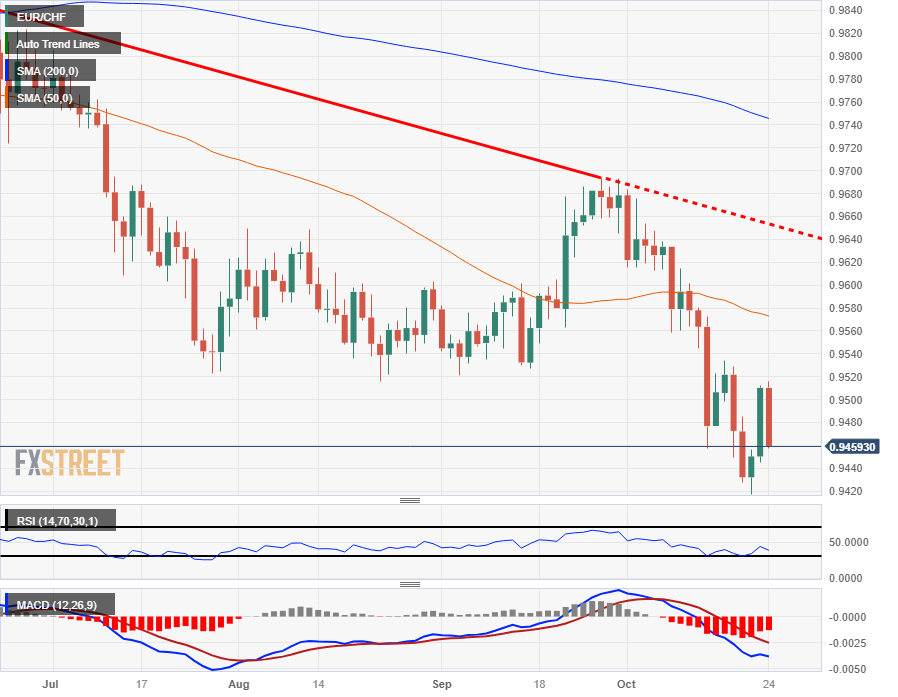
The Euro remains firmly underbid against the CHF after setting a new low of 0.9417 for 2023 last Friday, and the EUR/CHF has done little but decline steadily since the year's early peak at 1.0097.
A bearish continuation of the long-term trend will see the pair set to crack new lows for the year below 0.915, opening up the way to make a run at 2022's bottom bids of 0.9409. A break below this level would represent new all-time lows for the EUR/CHF since the creation of the EU currency bloc.
On the top side, technical barriers are piling up from a resistance zone between 0.9540 and 0.9600, with the last notable swing high near 0.9693.
EUR/CHF Daily Chart
EUR/CHF Technical Levels
During the Asian session, the key data to watch will be Australian inflation figures. Later in the day, Japan will release the Leading Economic Index. Additionally, the German IFO survey results are due. The Bank of Canada will announce its decision on monetary policy.
Here is what you need to know on Wednesday, October 25:
The US Dollar rebounded on Tuesday, supported by positive economic data. The US PMIs exceeded expectations and highlighted the divergence between the US economy and others, indicating that fundamentals still favor the US Dollar.
The US Dollar Index (DXY) rebounded from monthly lows below 105.50 to 106.30. US Treasury yields remained relatively steady, with the 10-year yield below the 5% level and the 2-year yield rising to 5.10%. Key US data, including Q3 GDP and consumer inflation, is scheduled for release on Thursday.
Despite improved risk sentiment, the Greenback strengthened during the American session. The Dow Jones gained 0.62% and the Nasdaq rose by 0.93%.
Eurozone PMIs indicated a significant contraction in Gross Domestic Product in October and lower inflation. These data further reinforce expectations that the European Central Bank (ECB) will keep interest rates unchanged on Thursday.
EUR/USD reversed Monday's gains, falling from near 1.0700 to below 1.0600. The pair managed to hold above the 20-day Simple Moving Average (SMA), but upward momentum evaporated.
Analysts at Commerzbank on Eurozone PMI:
The signs of a recession in the euro area are growing. The Purchasing Managers' Index for the service sector, the most reliable economic barometer for the euro area, fell again in October by 0.9 points to 47.8. It has thus been clearly in recession territory for three months. The index for the manufacturing sector, at 43.0, also gives no hope of a turnaround. Another ECB interest rate hike in the coming months is becoming increasingly unlikely.
The UK PMIs came in mixed, with a moderate recovery in Manufacturing to 45.2. However, the Services and Manufacturing sectors remained in contraction territory. GBP/USD experienced a 130-pip drop from its peak, reaching the 1.2150 area. The pair is now trading within a familiar congestion zone, with short-term technical indicators showing weakness.
USD/JPY rose from 149.30 back toward 150.00, boosted by a stronger US Dollar following positive US data. The Japanese Yen is moving around speculations, trading near intervention levels, with reports suggesting that the Bank of Japan may consider adjusting its Yield Curve Control policy next week. The BoJ did a new round of bond buying.
The Australian Dollar outperformed on Tuesday. AUD/USD closed higher despite Dollar strength, hovering around 0.6350, supported by hawkish comments from Reserve Bank of Australia (RBA) Governor Michele Bullock. Australia will report the Monthly Consumer Price Index and the quarterly CPI on Wednesday.
USD/CAD rebounded from the 20-day SMA and climbed to 1.3754, reaching the highest level in two weeks. The Bank of Canada will announce its monetary policy decision on Wednesday, with the interest rate expected to remain unchanged at 0.5%.
BoC Preview: Forecasts from nine major banks, keeping rates on hold and prospect of further hikes alive
Crude oil prices dropped by more than 2% as Israel delayed its ground invasion in Gaza. The price of WTI crude hit fresh weekly lows near $83.00.
Metals initially hit fresh weekly lows but then trimmed losses. Gold bottomed near $1,950 and rebounded, rising above $1,970. Silver fell to $22.65 and closed at $22.90.
Like this article? Help us with some feedback by answering this survey:
- EUR/JPY retreats from weekly high on gloomy Eurozone economic data.
- Despite losses, EUR/JPY remains upward biased, but intervention risks may cap gains at around 160.00.
- If EUR/JPY drops below Tenkan-Sen at 158.45, it could aim for the top of the Ichimoku cloud at 157.90/158.00.
EUR/JPY retreats from the weekly high hit on Tuesday at around 159.91 after economic data from the Eurozone (EU) painted a gloomy outlook for the whole economy in the bloc. Hence, as a bearish-engulfing candle pattern emerges, the cross-pair drops 0.64% and trades at 158.81, below the 159.00 figure.
Despite registering solid losses, the EUR/JPY remains upward biased, but risks of intervention would likely cap the pair at around 160.00. If that level is cleared, the cross could aim toward August’s 2008 high at 169.47 but, firstly, would need to crack the 165.00 figure on its way to the former.
Conversely, If EUR/JPY drops below the Tenkan-Sen level at 158.45, the pair could aim toward the top of the Ichimoku cloud at 157.90/158.00. Up next, a drop inside the Kumo, and sellers can drag the spot prices towards the Kijun-Sen at 157.13.
EUR/JPY Price Action – Daily chart

EUR/JPY Technical Levels
- Gold price recovers after hitting a weekly low of $1953 following positive US economic data release.
- US Treasury bond yields surge, with the 10-year reaching 4.88%, while US real yields drop to 2.43%.
- Geopolitical risks, upcoming US GDP figures, and inflation data are expected to influence XAU/USD prices.
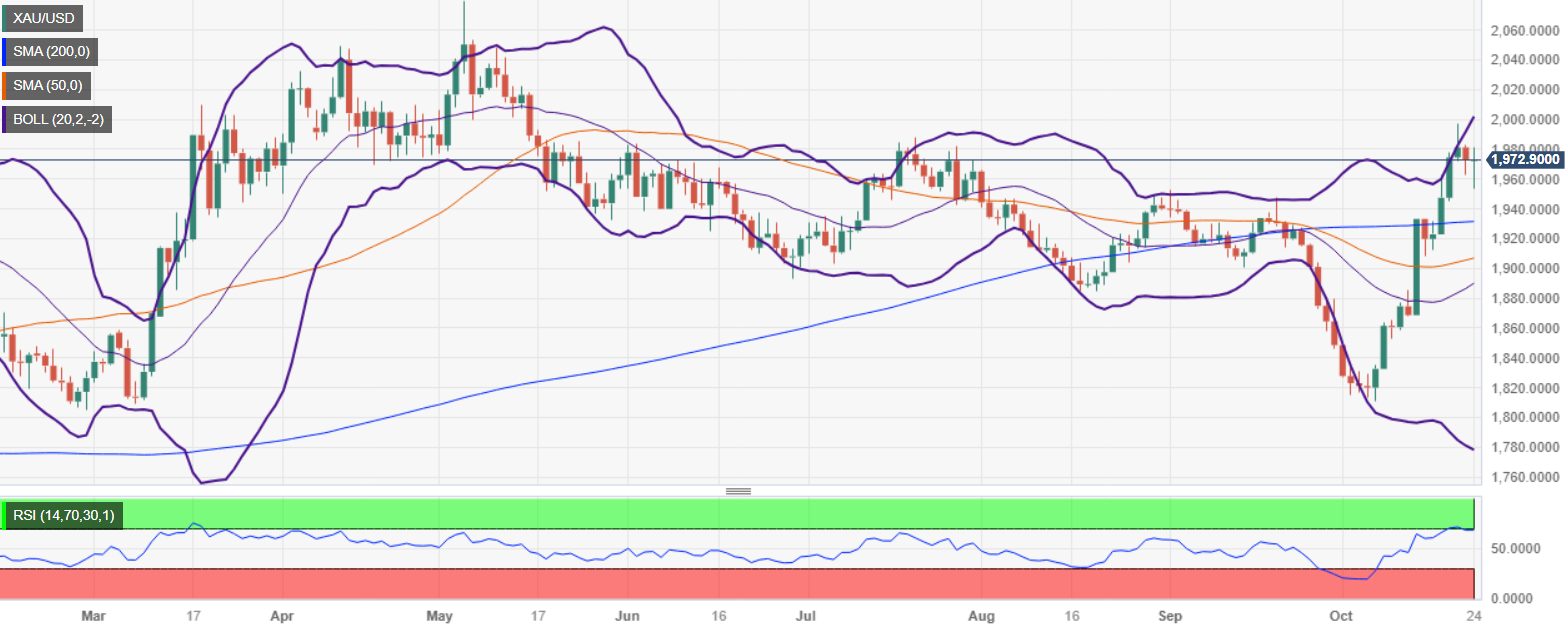
Gold price (XAU/USD) pares some of its earlier losses and climbs back above the $1970 mark after hitting a new weekly low at around $1953 after the release of US economic data. The XAU/USD is trading at around $1974.30 above its opening price by a minuscule 0.09%.
XAU/USD climbs back above $1970, trading at $1974.30, up by 0.09%
US economic data sent US bond yields surging, a headwind for XAU/USD, initially heading toward the day’s low, as business activity in October improved. S&P Global revealed that Manufacturing PMI expanded to 50, surpassing expectations, while the Services PMI reached 50.9, also above forecasts. This resulted in a Composite PMI of 51, indicating overall growth in business activity.
The market reacted, sending US Treasury bond yields rising, with the 10-year reaching a high of 4.88% before retreating five basis points to 4.84%. In the meantime, US real yields, which inversely correlate to Gold prices, dropped 0.33% and sit at 2.43% after reaching a year-to-date (YTD) of 2.61%.
Meanwhile, geopolitical risks would likely continue to underpin XAU/USD prices as the conflict gathers momentum, with Israel intensifying its attacks on Gaza’s strip.
Aside from this, traders' focus shifts toward the release of additional economic data from the United States, with third-quarter Gross Domestic Product (GDP) figures pending to be released on Thursday, along with unemployment claim numbers. On Friday, the Federal Reserve’s (Fed) preferred gauge for inflation is expected to show inflation continues to slow down amid speculation of the end of the Fed’s tightening cycle.
XAU/USD Price Analysis: Technical outlook
Technically speaking, the XAU/USD remains upward biased after testing support earlier in the day, with prices bouncing at a September 1 high of $1953. Following that, Gold jumped toward the current spot price and could soon challenge the $2000 mark. Once that level is cleared, the year-to-date (YTD) high of $2081.82 will be up next. Conversely, if Gold slides below the October 23 low of $1963.29, expect a drop to $1950.l followed by the 200-day moving average (DMA) at $1931.61.
- The NZD/USD retreated from a high of 0.5870 to 0.5840.
- The green currency gained momentum after higher-than-expected S&P Global PMIs.
- US data, including S&P PMIs from October, Q3 GDP and PCE inflation from September figures, will be the next highlights.
On Tuesday, the NZD/USD failed to hold its momentum, which saw the pair rising to 0.5870 and then settling at 0.5840 trading with mild losses. Following the release of strong Manufacturing and Services PMIs the US Dollar gained interest as its economy is holding strong. In addition, US Treasury yields are rising, benefiting the green currency.
The S&P Global revealed that the S&P Global Manufacturing PMI from October came in above the consensus. The headline figure came in at 50, above the consensus of 49.5 and rose from its previous figure of 49.8. Likewise, the Services PMI is at 50.9, above the expected 49.8 and rose from its previous figure of 50.1.
As a reaction, the USD, measured by the DXY index, recovered from a low of around 105.35 and rose above 106.00. Furthermore, the 2,5 and 10-year yields increased to 5.12%,4.84% and 4.87% respectively. That said, the green currency’s upside is limited by markets betting on a less aggressive Federal Reserve (Fed) after Chair Powell’s speech last week. He highlighted that the high bond yields will be considered and that the bank will proceed “carefully”. As for now, according to the CME FedWatch tool, the odds of a 25 bps hike in the December meeting remain low and stand around 25%, while investors have practically priced in a pause in November.
For further guidance, markets await Q3 Gross Domestic Product (GDP) data on Thursday and Personal Consumption Expenditures (PCE) figures from September on Friday. In addition, Jerome Powell will be on the wires on Wednesday. It is worth noticing that last week, the USD faced selling pressure after the Fed Chair's speech, where he pointed out that higher yields will be taken into account in the next decisions and that the bank will proceed "carefully".
NZD/USD Levels to watch
Considering the daily chart, the NZD/USD shows a bearish outlook for the short term.
The Relative Strength Index (RSI), positioned below its midline in negative territory with a southward slope, supports this view along with the negative indication from the Moving Average Convergence Divergence (MACD), which is displaying red bars, pointing towards a strengthening bearish trend. Also, the pair is below the 20,100 and 200-day Simple Moving Averages (SMAs),indicating that on the broader picture, the bears are in command, and that the buyers have some work to do.
Support levels: 0.5820,0.5800,0.5770.
Resistance levels: 0.5890,0.5900,0.5930 (200-day SMA).
NZD/USD Daily Chart
-638337698837635956.png)
- The GBP/USD flubbed a one-week high after UK PMIs missed expectations.
- The Greenback extended its gains after US PMI figures broadly beat forecasts.
- Next up for the US Dollar will be a speech from Fed head Powell tomorrow, Thursday GDP.
The GBP/USD is shedding pips on Tuesday, declining from a one-week high just shy of the 1.2300 handle after UK Purchasing Managers' Index (PMI) figures printed red while US PMI data broadly beat the Street, climbing over market forecasts and chalking in accelerating economic activity in the US economy.
With the US economy continuing to gain ground while the rest of the global economy stagnates or begins to show cracks, market sentiment is prone to downside risk-off shocks as steadily-improving economic indicators for the US decrease chances of the Federal Reserve (Fed) picking up the pace of rate cuts moving forward.
Markets are currently hoping for Fed rate cuts to begin sometime in the back half of 2024, but a lack of weakness in the US economy bodes poorly for interest rate decrease hopes. Investors flocked to the safe-haven US Dollar on reaction to US PMI figures coming in green across the board.
UK Preliminary Services PMI inches lower to 49.2 in October vs. 49.5 expected
The seasonally-adjusted S&P Global/CIPS UK Manufacturing Purchasing Managers’ Index (PMI) gave a slight uptick to 45.2 in October, just barely beating the anticipated value of 45.0 and climbing over September's final reading of 44.3.
At the same time, the Preliminary UK Services Business Activity Index declined to a nine-month low, printing at 49.2 for October, as compared to the final print of 49.3 in September and falling short of the expected figure of 49.5.
US S&P Global Manufacturing PMI edges higher to 50 in October, Services PMI improves to 50.9
In early October, economic activity within the US private sector showed a steady yet moderate expansion. The S&P Global Composite PMI advanced from 50.2 in September to 51.
October also saw the Manufacturing PMI climb from 49.8 to 50, while the Services PMI stepped higher, to 50.9 from 50.1. Both components of the US PMI forward-looking indicator beat expectations set by industry analysts.
With another batch of Greenback-bullish data in the books, GBP/USD traders will be looking ahead to a speech from Fed Chairman Jerome Powell on Wednesday, who will be giving opening remarks at the Moynihan Lecture in Social Science and Public Policy in Washington, DC.
Thursday will also see an advance reading of US Gross Domestic Product (GDP) figures, alongside US Unemployment Claims.
The Preliminary GDP for the US' third quarter of 2023 is expected to increase appreciably from 2.1% to 4.3%, while Initial Jobless Claims for the week into October 20th is expected to print a slight increase of new jobless benefits seekers, from 198K to 208K, a net increase of 10K.
GBP/USD Technical Outlook
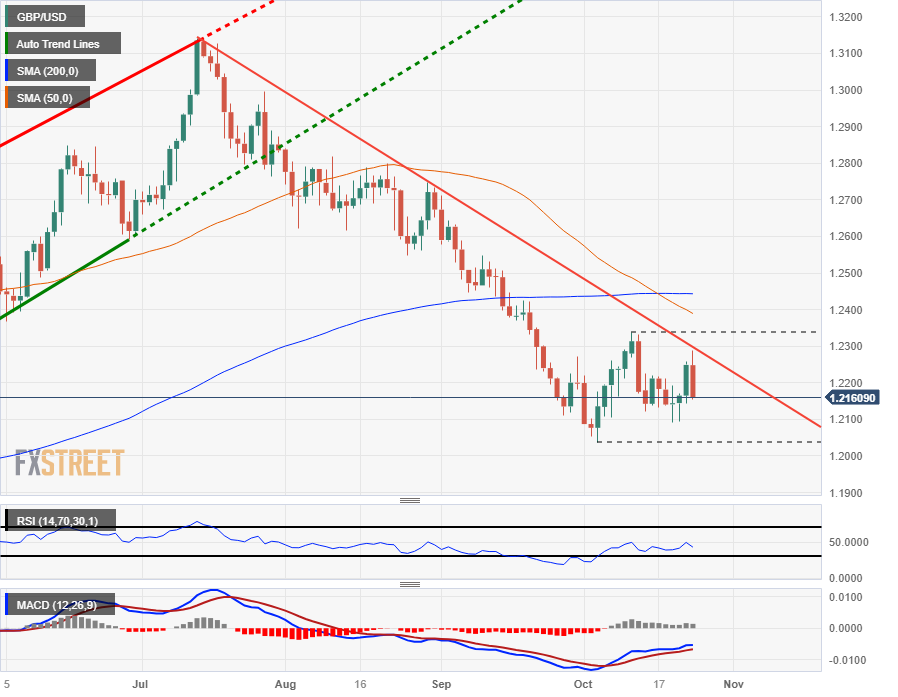
Tuesday's backslide sees the GBP/USD facing a rejection from a bearish trendline from July's peaks near 1.3141 after the pair failed to recapture the 1.2300 handle, and the immediate downside sees a price floor from the last major swing low into 1.2037 in early October.
Topside momentum will face stiff resistance from the downside trendline, as well as the last swing high into 1.2337, and the Sterling-Dollar pair is set for near-term consolidation if market risk appetite recovers, or an extension of bearish declines if US data continues to snub investor hopes for rate-cut inspiring weakness.
GBP/USD Daily Chart
GBP/USD Technical Levels
- The GBP/JPY is seeing a rapid decline back into near-term consolidation after a miss for the UK Composite PMI.
- The Guppy is down 0.9% top-to-bottom on the day so far.
- Tuesday's downside push sees the GBP/JPY trading back into familiar territory.
The GBP/JPY is down around 150 pips from Tuesday's early peak at 183.75, sliding 0.9% on the day as the Pound Sterling (GBP) pares away all of Monday's gains for the early week against the Japanese Yen (JPY).
The GBP has waffled its market stance after a miss for UK Purchasing Manager Index (PMI) figures on Tuesday.
UK Preliminary Services PMI inches lower to 49.2 in October vs. 49.5 expected
The UK's PMI reading on Tuesday exposed the Pound Sterling to the downside after missing expectations in the headline figure, with the Composite PMI printing at 48.6 for October, a minor improvement from September's 48.5 but missing Wall Street's forecast 48.8.
The UK Manufacturing PMI beat expectations slightly, coming in at 45.2 against the expected 45, improving markedly over the previous month's 44.3, but the Services component of the UK PMI reading failed to spark confidence after an unexpected downtick from 49.3 to 49.2, missing the expected increase into 49.5.
With the GBP floundering following the missed forward-looking growth measure, GGBP/JPY traders will be looking ahead to Japan's Tokyo Consumer Price Index (CPI) inflation reading due early in the Asia Friday market session.
The annualized Tokyo CPI last came in at 2.8% for September, and markets are forecasting the Tokyo Core CPI (CPI inflation minus volatile fresh food prices) to hold steady at 2.5%; a miss for the indicator will make it increasingly difficult for the Bank of Japan (BoJ) to look ahead to ending their negative rate regime with inflation broadly expected to decline below the Japanese central bank's lower target band of 2%.
GBP/JPY Technical Outlook
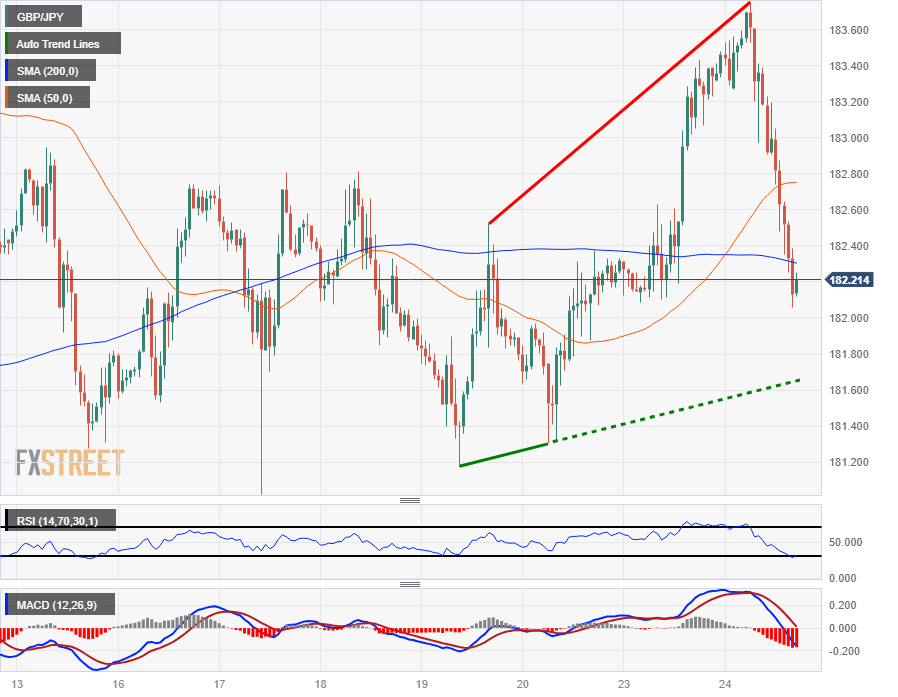
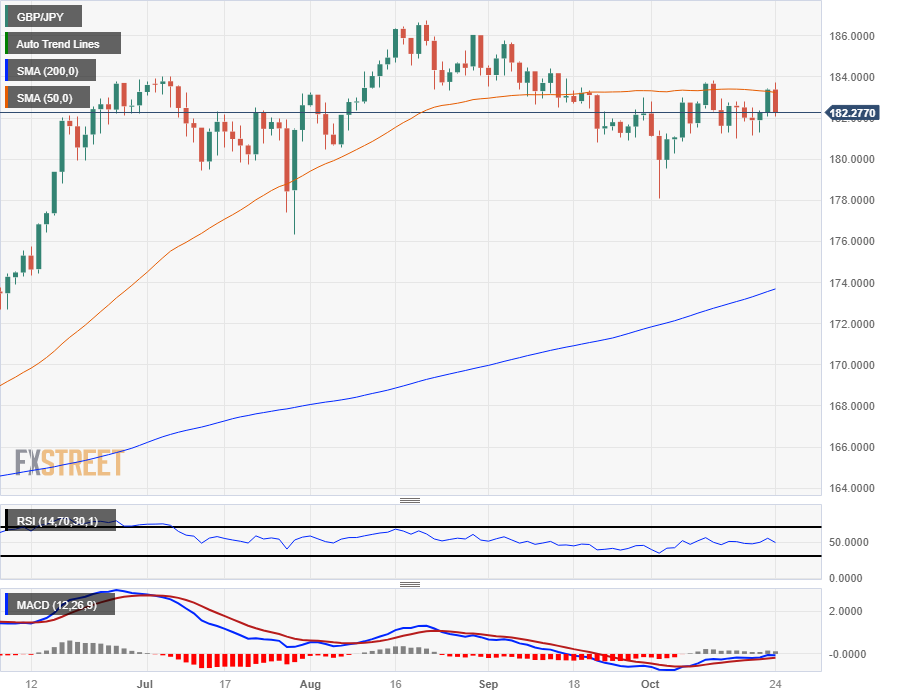
The Pound Sterling has shed 0.9% against the Yen on Tuesday, tumbling from an eight-day high of 183.75 as the GBP/JPY starts to treat the 50-day Simple Moving Average (SMA) as a price ceiling on the charts.
As the daily candlesticks continue to churn, chances for a firm bullish break are evaporating, and the Guppy is looking poised for possible declines back towards the 200-day SMA currently rising into the 174.00 handle.
A topside break will need to reclaim the 186.00 psychological level before gearing up for another run at 2023's highs beyond 186.77 set back in August.
GBP/JPY Hourly Chart
GBP/JPY Daily Chart
GBP/JPY Technical Levels
- Crude Oil markets are extending downside moves, WTI tips below $83.00 on Tuesday.
- Despite the US PMI data beat, broad forecast misses for EU PMIs are souring the outlook on crude demand.
- Geopolitical tensions from the Middle East continue to wane, further pushing down barrel costs.
West Texas Intermediary (WTI) Crude Oil prices are seeing extended declines on Tuesday, continuing Monday's downside push and sending WTI barrels into a new low of $82.76, a fresh one-week low as energies markets rethink their expectations of EU-led fossils demand after a broad miss on Purchasing Manager Index (PMI) figures early Tuesday.
US Manufacturing PMI edges higher to 50 in October, Services PMI improves to 50.9
US PMIs came in well above expectations, sending the US Dollar (USD) higher on Tuesday and adding to downside Crude Oil pressure; the US Composite PMI for October printed a surprise uptick into a flat 51, compared to September's 50.2 printing. Markets were expecting a decline in both the Manufacturing and Services components of the PMI, but US PMIs came in green across the board and investors lurched back into the USD.
The Pan-European PMI, on the other hand, printed broadly in the red, missing Wall Street forecasts and flubbing the latest set of forward-looking growth indicators for the EU.
Eurozone Manufacturing PMI unexpectedly drops to 43.0 in October vs. 43.7 expected
The EU HCOB Manufacturing PMI for October came in at just 43, well below the forecast 43.7 and completely snubbing the expected increase, coming in even worse than September's print of 43.4. The Services component likewise missed forecasts, printing at 47.8 against the expected steady reading of 48.7. The combined PMI Composite headline missed the anticipated 47.4, coming in at 46.5 versus the previous month's 47.2.
The big miss for EU PMI figures, combined with a USD-boosting US PMI beat, is increasing USD-denominated barrel costs and crumbling investor expectations for rising EU-based Crude Oil demand moving forward.
WTI Technical Outlook
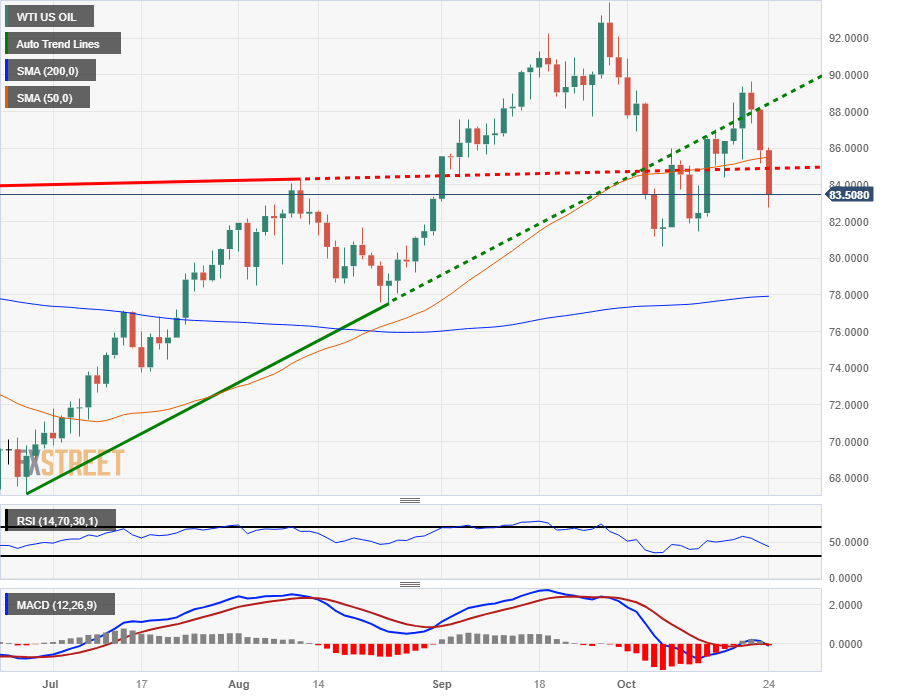
Tuesday's decline for WTI Crude Oil sees US barrel prices tapping a fresh one-week low at $82.76, and the current downside barrier for barrel sellers will be early October's price floor of $80.63, with the 200-day Simple Moving Average (SMA) sitting near $78.00.
WTI has tumbled nearly 7% from Friday's near-term high of $89.64, and Crude Oil bulls will need to recover back to late September's highs for the year near the $94.00 major handle.
WTI Daily Chart
WTI Technical Levels
- XAG/USD trades flat, around $22.90, after peaking at a high around $23.15.
- US Manufacturing and Services PMIs lived up to expectations, while the European figures disappointed.
- Rising US Treasury yields favoured the downward movements. Hawkish bets on the Fed are still low.
In Tuesday’s session, the XAG/USD struggled to gather momentum as the USD traded strong against its rivals after the release of strong S&P Global PMIs. As a reaction, US Treasury yields slightly rose but hawkish bets on the Federal Reserve (Fed) still remain low, which could limit the losses for the grey metal. The US will release additional high-tier figures this week, and Chair Powell will speak on Wednesday.
The S&P Global Manufacturing PMI from October from the US came in at 50, beating the expected 49.5 and rising from its previous figure of 49.8. The Services Index also met expectations, coming in at 50.9, beating the consensus of 49.8 and increasing to expansion territory concerning its last reading of 50.1 and both indexes suggest an optimistic and robust outlook for the US economy.
As a reaction, the USD measured by the DXY index rose from a low of 105.35 towards 106.20, fueled by rising US yields. However, hawkish bets on the Federal Reserve (Fed) remain low, which could limit the upside potential for the green currency. Additional catalysts include key data to be released this week, consisting of Personal Consumption Expenditures figures on Friday, which is expected to have decelerated in September and with the Core PCE Price, the Fed’s preferred gauge of inflation, expected to come in at 3.7% YoY from the previous 3.9%. In addition, Gross Domestic Product (GDP) is expected to have significantly risen in Q3 with an annualised rate growth of 4.2%.
XAG/USD Levels to watch
Observing the daily chart, the outlook is neutral to bullish for the short term as the metal may continue consolidating the recent movements using the convergence of the 100 and 200-day Simple Moving Averages (SMA) as a resistances around $23.30. Meanwhile, the Relative Strength Index (RSI) shows a flat slope above its midline, while the Moving Average Convergence (MACD) lays out lower green bars.
As long as the bulls fail to conquer the $23.30 area, the outlook on the broader outlook will favour the bears.
Support levels: $22.65, $22.50, $22.30.
Resistance levels: $23.30, $23.50, $23.70.
XAG/USD Daily Chart
-638337646844135834.png)
- USD/CHF registers solid gains, bouncing from a weekly low of 0.8878 to trade at 0.8936.
- A breach of the 50-DMA at 0.5965 could test the 200-DMA at 0.9009.
- First support levels are at 0.8900, and the October 23 swing low of 0.8878, with further support at 0.8819 and 0.8800.
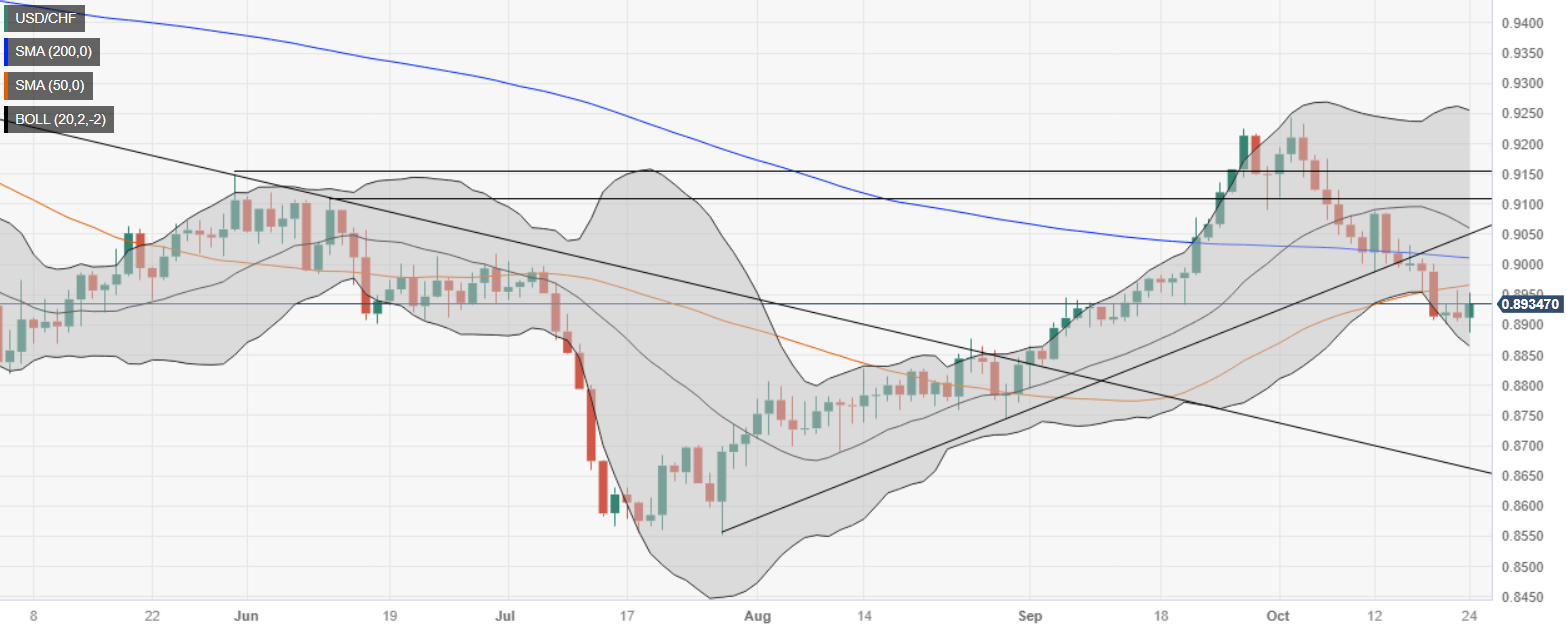
The USD/CHF advances steadily, registering solid gains of 0.33%, after bouncing from a weekly low of 0.8878. Upbeat data from the United States (US) strengthened the Greenback and lifted the major past the 0.8900 figure, currently exchanging hands at 0.8936.
From a daily chart perspective, after dropping below the 50-day moving average (DMA) at 0.5965, the downtrend remains intact unless USD/CHF breaches the latter, which could put into play a test of the 200-DMA at 0.9009. Once cleared, the USD/CHF could aim toward 0.9100.
Conversely, and the path of least resistance, the USD/CHF first support would be 0.8900, followed by the October 23 swing low of 0.8878. IF sellers reclaim those levels, the next stop would be the August 30 swing low of 0.8819, ahead of the 0.8800 mark.
USD/CHF Price Action – Daily chart
USD/CHF Technical Levels
- Canadian Dollar falls back as investors pile into USD once more.
- Crude Oil extends Monday’s losses, evaporating CAD support with it.
- The Bank of Canada is due for its latest rate statement on Wednesday.
The Canadian Dollar (CAD) has slipped back into its lowest bids in almost three weeks against the US Dollar (USD) as broad-market flows reverse direction and pile back into the Greenback following a bumper reading for the US Purchasing Managers’ Index (PMI) that soundly thumped market expectations.
The Bank of Canada (BoC) is set to announce its latest rate call on Wednesday, and Loonie traders will be looking for the Canadian central bank to hold their reference rate at 5% while leaving the way open for more potential hikes to come later on. Market participants expect little change in the BoC’s forward guidance as Canadian policymakers grapple with a domestic economy that is seeing flagging growth indicators but still high inflation on the back of soaring energy prices.
Crude Oil prices are seeing a downside snap on Tuesday, with West Texas Intermediate (WTI) adding to Monday’s decline. The oil-backed Loonie is seeing its supportive base go up in smoke as crude barrels backslide, pushing the CAD into its lowest prices against the USD since October 5.
Daily Digest Market Movers: Canadian Dollar slips as broader market picks up the Greenback
- CAD fumbles to an almost three-week low as investors bid the USD.
- US October PMIs beat the Street, climbing over Wall Street’s forecasts to chalk in gains for the productivity indicator.
- The US Manufacturing PMI printed at a flat 50 versus the expected 49.5 decline from the previous 49.8 reading.
- The US Services PMI gave an impressive reading, coming in at 50.9 and handily vaulting over the forecasted 49.9 against September’s 50.1.
- The dual PMI beats sent the Composite PMI back to 51, its highest reading since July.
- Crude Oil continues to slide, dragging down CAD support with it.
- WTI barrels are down over 7.5% from Friday’s peak.
- BoC Preview: keeping rates on hold and the prospect of further hikes alive
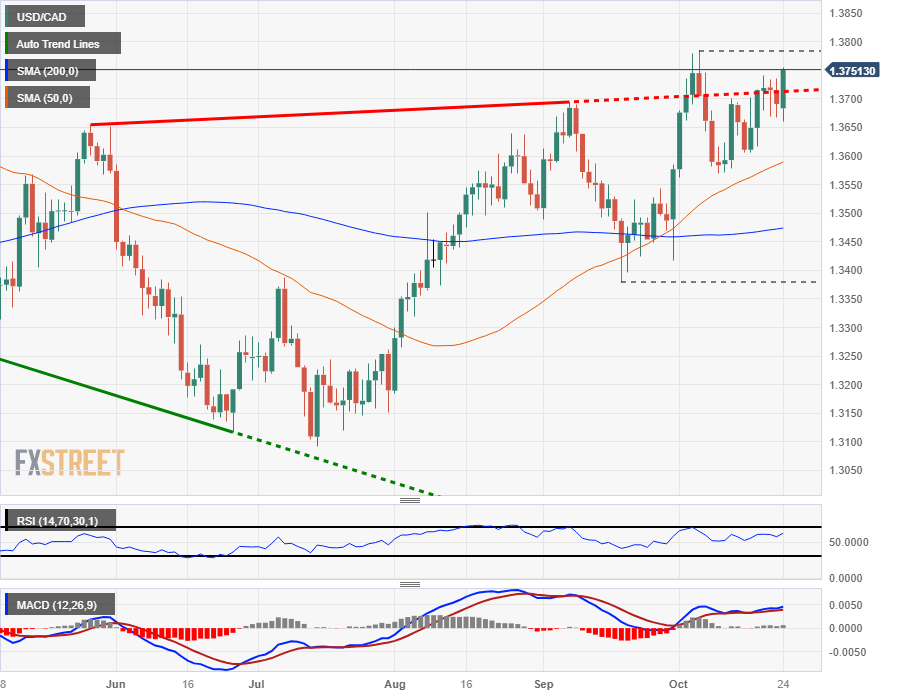
Technical Analysis: Canadian Dollar gives up more ground as investors favor the US Dollar, USD/CAD taps 1.3755
The Canadian Dollar (CAD) is down almost 0.7% against the US Dollar (USD) in Tuesday’s trading session as markets go broadly USD bullish, taking the USD/CAD pair to its highest bids in almost three weeks.
The USD/CAD pinged 1.3755 on Tuesday after reversing direction from an intraday low of 1.3661. The next immediate barrier for USD/CAD bulls will be October’s early high of 1.3785, while the floor for sellers currently sits at the last swing low near 1.3569.
The US Dollar has gained nearly 5% against the Canadian Loonie since July’s low point near 1.3090, and the USD/CAD continues to find technical support from the 50-day Simple Moving Average (SMA) currently lifting into 1.3600.
An extended rally will see the USD/CAD set for a challenge of 2023’s highs at 1.3862, while a full bearish reversal will find the floorboards near the 200-day SMA currently parked just south of 1.3500.
USD/CAD Daily Chart
US Dollar price today
The table below shows the percentage change of US Dollar (USD) against listed major currencies today. US Dollar was the strongest against the Euro.
| USD | EUR | GBP | CAD | AUD | JPY | NZD | CHF | |
| USD | 0.79% | 0.76% | 0.46% | -0.12% | 0.00% | 0.31% | 0.34% | |
| EUR | -0.79% | -0.02% | -0.33% | -0.93% | -0.78% | -0.48% | -0.46% | |
| GBP | -0.77% | 0.03% | -0.30% | -0.91% | -0.76% | -0.45% | -0.44% | |
| CAD | -0.46% | 0.32% | 0.31% | -0.60% | -0.45% | -0.14% | -0.13% | |
| AUD | 0.12% | 0.88% | 0.88% | 0.57% | 0.15% | 0.43% | 0.45% | |
| JPY | -0.01% | 0.78% | 0.75% | 0.47% | -0.18% | 0.29% | 0.32% | |
| NZD | -0.31% | 0.47% | 0.45% | 0.14% | -0.44% | -0.30% | 0.01% | |
| CHF | -0.31% | 0.44% | 0.43% | 0.16% | -0.47% | -0.35% | -0.01% |
The heat map shows percentage changes of major currencies against each other. The base currency is picked from the left column, while the quote currency is picked from the top row. For example, if you pick the Euro from the left column and move along the horizontal line to the Japanese Yen, the percentage change displayed in the box will represent EUR (base)/JPY (quote).
Canadian Dollar FAQs
What key factors drive the Canadian Dollar?
The key factors driving the Canadian Dollar (CAD) are the level of interest rates set by the Bank of Canada (BoC), the price of Oil, Canada’s largest export, the health of its economy, inflation and the Trade Balance, which is the difference between the value of Canada’s exports versus its imports. Other factors include market sentiment – whether investors are taking on more risky assets (risk-on) or seeking safe-havens (risk-off) – with risk-on being CAD-positive. As its largest trading partner, the health of the US economy is also a key factor influencing the Canadian Dollar.
How do the decisions of the Bank of Canada impact the Canadian Dollar?
The Bank of Canada (BoC) has a significant influence on the Canadian Dollar by setting the level of interest rates that banks can lend to one another. This influences the level of interest rates for everyone. The main goal of the BoC is to maintain inflation at 1-3% by adjusting interest rates up or down. Relatively higher interest rates tend to be positive for the CAD. The Bank of Canada can also use quantitative easing and tightening to influence credit conditions, with the former CAD-negative and the latter CAD-positive.
How does the price of Oil impact the Canadian Dollar?
The price of Oil is a key factor impacting the value of the Canadian Dollar. Petroleum is Canada’s biggest export, so Oil price tends to have an immediate impact on the CAD value. Generally, if Oil price rises CAD also goes up, as aggregate demand for the currency increases. The opposite is the case if the price of Oil falls. Higher Oil prices also tend to result in a greater likelihood of a positive Trade Balance, which is also supportive of the CAD.
How does inflation data impact the value of the Canadian Dollar?
While inflation had always traditionally been thought of as a negative factor for a currency since it lowers the value of money, the opposite has actually been the case in modern times with the relaxation of cross-border capital controls. Higher inflation tends to lead central banks to put up interest rates which attracts more capital inflows from global investors seeking a lucrative place to keep their money. This increases demand for the local currency, which in Canada’s case is the Canadian Dollar.
How does economic data influence the value of the Canadian Dollar?
Macroeconomic data releases gauge the health of the economy and can have an impact on the Canadian Dollar. Indicators such as GDP, Manufacturing and Services PMIs, employment, and consumer sentiment surveys can all influence the direction of the CAD. A strong economy is good for the Canadian Dollar. Not only does it attract more foreign investment but it may encourage the Bank of Canada to put up interest rates, leading to a stronger currency. If economic data is weak, however, the CAD is likely to fall.
- EUR/USD reverses course at 50-DMA, sliding below 1.0600 as US Treasury bond yields rise.
- US economy gains momentum with S&P Global Manufacturing PMI at 50 and Services PMI at 50.9.
- Eurozone business conditions continue to deteriorate, with Manufacturing, Services, and Composite PMIs in recessionary territory.
EUR/USD reverses its course at the 50-day moving average (DMA) and slides below the 1.0600 psychological level as Treasury bond yields in the United States (US) rise following business activity data. At the time of writing, the EUR/USD is trading at 1.0591 after hitting a high of 1.0694, down 0.72%.
EUR/USD trades at 1.0591, down 0.72%, as positive US data contrasts with Eurozone's economic struggles
The US economy continues to gather momentum, as revealed by S&P Global, as business activity picked up, according to the latest Purchasing Management Index (PMI) reports. S&P Global Manufacturing PMI expanded by 50, exceeding the forecast of 49.5, while the Services component stood at 50.9, above the projected 49.8. Consequently, the S&P Global Composite PMI was above the prior’s 50.2 figure at 51.
Consequently, US Treasury bond yields advanced to 4.88% as a reaction to the data, underpinning the Greenback as shown by the US Dollar Index (DXY), gaining 0.64%, up at 106.27. Therefore, the EUR/USD extended its losses past the 1.0600 figure.
On the Eurozone (EU) front, the calendar revealed that business conditions continued deteriorating. Manufacturing, Services, and Composite PMIs, revealed by S&P Global, remained at recessionary territory, below forecasts and the previous month’s data. That and Germany’s GfK Consumer Confidence plunging weighed on the Euro (EUR), which fell off the cliff after hitting a daily high shy of 1.0700.
Ahead of the week, the European Central Bank (ECB) is expected to hold rates unchanged, though it is projected to leave the door open for further hikes if needed.
EUR/USD Price Analysis: Technical outlook
The EUR/USD remains downward biased, although upward corrected shy of reclaiming the 1.0700 mark. As the fundamental picture deteriorates in the EU, further downside is expected. First, support is seen at the October 23 low of 1.0571, followed by the previous cycle low of 1.0495, slightly below the 1.0500 mark. Once those two areas are cleared, the next stop would be the year-to-date (YTD) low of 1.0448. On the other hand, if EUR/USD stays above 1.0600, that could open the door to test the October 12 high of 1.0639 before challenging 1.0700.
- Mexican Peso reverses its course, weakens against the US Dollar, losing more than 0.40%
- Mexico’s CPI for October’s first half eases as Banxico has held rates unchanged since March 2023.
- US business activity improves, exiting contractionary territory as per S&P Global PMIs.
Mexican Peso (MXN) gave up some of its Monday’s gains against the US Dollar (USD) after data from the United States (US) boosted the Greenback (USD).Additionally, US Treasury bond yields jumped, even though there is growing consensus amongst investors that the US Federal Reserve (Fed) will keep rates unchanged once again when it meets on November 1. Therefore, the emerging market currency is on the defensive as the USD/MXN is trading at 18.22, up 0.49% on the day.
Mexico reported inflation data before Wall Street opened, with the Consumer Price Index (CPI) rate for the first half of October continuing to ease. That is welcomed news, as the Bank of Mexico (Banxico) has held rates at 11.25% since March 2023, though market players expect the first rate cut in 2024. Aside from this, data from the United States showed that business activity, as revealed by S&P Global PMIs, bounced from the contractionary territory, with most indicators expanding above the contraction/expansion 50 threshold.
Daily Digest Market Movers: Mexican Peso surrenders Monday’s gains, USD/MXN back above 18.20
- Mexico's National Statistics Agency INEGI reported annual headline inflation hit 4.27%, down from 4.45% at the end of September, below forecasts of 4.38%.
- Mexico’s core inflation rate YoY was 5.54%, beneath forecasts of 5.6%.
- US S&P Global Manufacturing PMI for October jumped to 50, exceeding forecasts of 49.5, while the Services PMI exceeded the contractionary consensus of 49.9, reaching 50.9.
- US S&P Global Composite PMI was 51, above the prior 50.2.
- The Overall Index of Economic Activity in Mexico grew by 0.4% in August, exceeding the estimated 0.3%, data showed on Monday.
- Annually based, the Mexican economic activity expanded by 3.7%, smashing forecasts of 3.4%.
- The Bank of Mexico (Banxico) held rates at 11.25% in September and revised its inflation projections from 3.50% to 3.87% for 2024, above the central bank’s 3.00% target (plus or minus 1%).
Technical Analysis: Mexican Peso loses steam as USD/MXN buyers re-enter the market
The USD/MXN is upward biased, and price action of the last couple of days could form a ‘bullish-harami’ candlestick chart pattern on the daily chart, a bullish pattern. The USD/MXN pair's first resistance would be the October 23 high at 18.37 before buyers lift the spot price to last week’s high at 18.46, before challenging 18.48, October’s high. Once those levels are cleared, the 18.50 figure would be up for grabs. On the flip side, the USD/MXN must drop below the 18.00 psychological figure for sellers to reclaim the 200-day Simple Moving Average (SMA) at 17.73.
Mexican Peso FAQs
What key factors drive the Mexican Peso?
The Mexican Peso (MXN) is the most traded currency among its Latin American peers. Its value is broadly determined by the performance of the Mexican economy, the country’s central bank’s policy, the amount of foreign investment in the country and even the levels of remittances sent by Mexicans who live abroad, particularly in the United States. Geopolitical trends can also move MXN: for example, the process of nearshoring – or the decision by some firms to relocate manufacturing capacity and supply chains closer to their home countries – is also seen as a catalyst for the Mexican currency as the country is considered a key manufacturing hub in the American continent. Another catalyst for MXN is Oil prices as Mexico is a key exporter of the commodity.
How do decisions of the Banxico impact the Mexican Peso?
The main objective of Mexico’s central bank, also known as Banxico, is to maintain inflation at low and stable levels (at or close to its target of 3%, the midpoint in a tolerance band of between 2% and 4%). To this end, the bank sets an appropriate level of interest rates. When inflation is too high, Banxico will attempt to tame it by raising interest rates, making it more expensive for households and businesses to borrow money, thus cooling demand and the overall economy. Higher interest rates are generally positive for the Mexican Peso (MXN) as they lead to higher yields, making the country a more attractive place for investors. On the contrary, lower interest rates tend to weaken MXN.
How does economic data influence the value of the Mexican Peso?
Macroeconomic data releases are key to assess the state of the economy and can have an impact on the Mexican Peso (MXN) valuation. A strong Mexican economy, based on high economic growth, low unemployment and high confidence is good for MXN. Not only does it attract more foreign investment but it may encourage the Bank of Mexico (Banxico) to increase interest rates, particularly if this strength comes together with elevated inflation. However, if economic data is weak, MXN is likely to depreciate.
How does broader risk sentiment impact the Mexican Peso?
As an emerging-market currency, the Mexican Peso (MXN) tends to strive during risk-on periods, or when investors perceive that broader market risks are low and thus are eager to engage with investments that carry a higher risk. Conversely, MXN tends to weaken at times of market turbulence or economic uncertainty as investors tend to sell higher-risk assets and flee to the more-stable safe havens.
- The US Dollar cleared Monday’s losses, and the DXY Index jumped above 106.00.
- The S&P Manufacturing and Services PMI rose to expansion territory above 50.00 in October.
- US Treasury yields recover, allowing the USD to find demand.
The US Dollar (USD) measured by the US Dollar Index (DXY) rose toward 106.30 on Tuesday, seeing nearly a 0.50% gain. While Europe’s S&P PMIs came in weak, the American figures beat expectations, and the US economy appears to be holding onto resilience, which is strengthening the green currency. In addition, US Treasury yields recovered, favouring the upward momentum.
Despite the Federal Reserve’s (Fed) contractionary policies, the United States economy seems to be the last man standing. Focus now shifts to Gross Domestic Product (GDP) preliminary estimates from Q3 on Thursday and Personal Consumption Expenditures (PCE) figures from September on Friday for investors to continue modeling their expectations on the next Fed decisions. Only a minority of traders expect the central bank to change current interest rates, but attention will still be paid to Chair Powell’s speech on Wednesday.
Daily Digest Market Movers: US Dollar recovers from multi-month lows thanks to strong economic activity figures
- After falling to a low since late September, around 105.35 earlier in the session, the DXY Index increased toward 106.30.
- The S&P Global Manufacturing PMI from October came in at 50, beating the expected 49.5, accelerating from its prior reading of 49.8.
- The Services PMI also came in higher than expected at 50.9 vs the expected 49.8 and increasing from its prior reading of 50.1.
- In the meantime, US yields are rising, and the 2 and 5-year rates marched toward 5.10%, and 4.81%.
- According to the CME FedWatch Tool, the odds of a 25 bps hike in December are still low, around 25%. In addition, the Tool suggests that a pause in November is near to being priced in. Focus now shifts to the high-tier data released on Thursday and Friday.
- The US Q3 GDP is expected to have accelerated and the PCE inflation to have decelerated in September.
Technical Analysis: US Dollar Index’s bulls need to retake the 20-day SMA to confirm a recovery
Observing the daily chart, the outlook is neutral to bearish for the short term as bulls are gaining momentum but still are yet to reclaim the 20-day Simple Moving Average (SMA) at 106.30. In the meantime, indicators recovered ground, with the Relative Strength Index (RSI) standing with a positive slope in bullish territory, while the Moving Average Convergence (MACD) gives out decreasing red bars.
On the broader picture, the pair is below the 20-day SMA but above the 100 and 200-day SMAs, indicating a favorable position for the bulls in the bigger picture.
Supports: 106.00, 105.70, 105.50.
Resistances:106.33 (20-day SMA),106.50, 107.00.
US Dollar FAQs
What is the US Dollar?
The US Dollar (USD) is the official currency of the United States of America, and the ‘de facto’ currency of a significant number of other countries where it is found in circulation alongside local notes. It is the most heavily traded currency in the world, accounting for over 88% of all global foreign exchange turnover, or an average of $6.6 trillion in transactions per day, according to data from 2022.
Following the second world war, the USD took over from the British Pound as the world’s reserve currency. For most of its history, the US Dollar was backed by Gold, until the Bretton Woods Agreement in 1971 when the Gold Standard went away.
How do the decisions of the Federal Reserve impact the US Dollar?
The most important single factor impacting on the value of the US Dollar is monetary policy, which is shaped by the Federal Reserve (Fed). The Fed has two mandates: to achieve price stability (control inflation) and foster full employment. Its primary tool to achieve these two goals is by adjusting interest rates.
When prices are rising too quickly and inflation is above the Fed’s 2% target, the Fed will raise rates, which helps the USD value. When inflation falls below 2% or the Unemployment Rate is too high, the Fed may lower interest rates, which weighs on the Greenback.
What is Quantitative Easing and how does it influence the US Dollar?
In extreme situations, the Federal Reserve can also print more Dollars and enact quantitative easing (QE). QE is the process by which the Fed substantially increases the flow of credit in a stuck financial system.
It is a non-standard policy measure used when credit has dried up because banks will not lend to each other (out of the fear of counterparty default). It is a last resort when simply lowering interest rates is unlikely to achieve the necessary result. It was the Fed’s weapon of choice to combat the credit crunch that occurred during the Great Financial Crisis in 2008. It involves the Fed printing more Dollars and using them to buy US government bonds predominantly from financial institutions. QE usually leads to a weaker US Dollar.
What is Quantitative Tightening and how does it influence the US Dollar?
Quantitative tightening (QT) is the reverse process whereby the Federal Reserve stops buying bonds from financial institutions and does not reinvest the principal from the bonds it holds maturing in new purchases. It is usually positive for the US Dollar.
Gold price is continuing to profit from the Middle East crisis. Economists at Commerzbank analyze the yellow metal’s outlook.
Gold in demand as safe haven
The news coming out of the Middle East is likely to continue to dictate the direction for Gold, whereas previously dominant factors such as changes in bond yields have taken a back seat.
The normally negative correlation with the US Dollar has also been loose of late because both Gold and the USD are regarded as safe havens.
Australia Consumer Price Index (CPI) report will be decisive for the next Reserve Bank of Australia (RBA) decision and, therefore, for the Aussie, economists at Commerzbank report.
Inflation data will be decisive for the RBA
The Australian inflation data for Q3, due for publication on Wednesday, are likely to be decisive for the RBA when it comes to deciding whether it will hike the key rate again next week (or at the latest in December).
If inflation eases less quickly than expected, rate hike expectations for next week (or December) and thus AUD will receive additional upside momentum. However, the RBA will then have to deliver either with actions or at least with clear words, signalling a rate hike for December. Otherwise, AUD would suffer all the more.
See – Australia CPI Preview: Forecasts from seven major banks, rebound in inflation to continue
- NZD/USD falls back to near 0.5850 amid recovery in the US Dollar.
- S&P Global reported that the US Manufacturing PMI kisses the 50.0 threshold for the first time since November 2022.
- This week, the US Q3 GDP and core PCE price index data will be keenly watched.
NZD/USD faces a sell-off near the 0.5880 resistance as the US Dollar rebounds strongly. The Kiwi asset retreats as investors rush to the US Dollar. The appeal for the US Dollar improves as investors shift focus to the crucial US economic readings this week.
The S&P500 opens on a bullish note as the market mood improves amid a delay in Israel’s ground assault plan in Gaza. However, a stock-specific action is widely expected as the third-quarter earnings season has kicked off. The US Dollar Index (DXY) climbs above 106.00 after the release of the US preliminary S&P Global PMI data for October.
S&P Global reported that the Manufacturing PMI kisses the 50.0 threshold for the first time since November 2022. The factory data at 50.0, outperformed expectations of 49.5 and September's reading of 49.8. The Services PMI landed at 50.9, better than the consensus of 49.9 and the prior release of 50.1.
This week, the Q3 Gross Domestic Product (GDP) and core Personal Consumption Expenditure (PCE) price index data for September will be keenly watched. Economists expect the US economy to have grown by 4.2% on an annualized basis, doubling the growth rate of 2.1% in the former reading.
As per the estimates, annual core PCE decelerated to 3.7% against the former reading of 3.9%. On a monthly basis, the Fed’s preferred inflation gauge expanded at a higher pace of 0.3% vs. 0.1% growth recorded in August.
On the New Zealand Dollar front, investors hope that the Reserve Bank of New Zealand (RBNZ) is done with hiking interest rates as the economic recovery has faltered.
The Bank of Canada (BoC) is set to announce its Interest Rate Decision on Wednesday, October at 14:00 GMT and as we get closer to the release time, here are the expectations as forecast by the economists and researchers of nine major banks regarding the upcoming announcement.
The BoC is expected to keep rates steady at 5% while leaving the door open to further hikes. Wednesday’s rate statement will be published alongside an updated Monetary Policy Report.
ING
Slower-than-expected inflation, a clouded growth outlook and higher bond yields mean the BoC is likely to overlook jobs tightness and keep rates on hold. There is still interest in keeping a higher-for-longer narrative alive, but markets may start to shed some doubts on it.
TDS
We look for the BoC to stay the course and hold the overnight rate at 5.00%. The key issue will be how the Bank attempts to reconcile a significant downgrade to its growth outlook with signs of more persistent inflation, which should preclude any change in tone. We look for the Bank to maintain a hawkish tone, with an emphasis on persistence of inflation/wage pressures and no change to forward guidance.
RBC Economics
Economic data releases since the Bank of Canada opted to forego an interest rate hike in September have been mixed, but we expect that they on net have made a hike unlikely. Near-term inflation projections will very likely be revised higher given the rise in energy prices into the fall. But with signs the economy is cooling, we expect the BoC will likely maintain their call for a more gradual return back to the target inflation rate, somewhere in late 2024 or early 2025.
NBF
We expect the BoC to leave the overnight target rate unchanged. Saying that, there remain some problematic elements of the inflation outlook that might argue for additional tightening and as such, we’d caution that this is not an open-and-shut decision. At a minimum, policymakers should leave the door open to further tightening via an explicit threat to hike further if needed. That hiking bias will likely remain until more durable progress on inflation is made. It is worth noting that Wednesday’s rate statement will be published alongside an updated Monetary Policy Report. Here we’ll see a material downgrade to the GDP trajectory and an inflation profile that will need to be marked up to reflect stronger-than-expected price pressures in the summer. Governor Macklem and Senior Deputy Governor Rogers will also have media availability shortly after the decision where they’ll be able to fine tune their messaging. We’re particularly interested in hearing how they think of policymaking in a stagflationary environment, which we appear to be in the early stages of.
MUFG
We expect the BoC to leave rates on hold while maintaining guidance that they ‘are prepared to increase the policy rate further if needed’.
CIBC
We look for the BoC to keep the overnight rate on hold at 5%. The statement will cite the ample evidence that economic growth has been curtailed by the rate hikes delivered thus far. We don’t share the Bank’s worry that inflation will prove sticky in the face of an evident economic slowdown, as it’s too soon in the move from a tight economy to one with slack to have expected to see a drop in price pressures tied to domestic demand. But we sense that those worries, and references in the statement to the lack of downside momentum in key core inflation metrics, will see the Bank maintain a somewhat hawkish tone, with the statement’s conclusion leaving the door open to further hikes if we don’t see progress towards the 2% target in the months ahead.
Wells Fargo
With inflation more firmly on a downward trajectory and the economy showing signs of deceleration, we feel more comfortable now saying Bank of Canada interest rates have peaked and additional rate hikes are unlikely to be delivered. We also expect this message to be communicated at the central bank's October monetary policy assessment. In our view, policy rates in Canada are on hold until Q2-2024. Once the easing cycle is initiated, we expect BoC policy rates to continue lower over the course of 2024 and into 2025, eventually reaching a terminal rate of 3.00% by Q1-2025.
BMO
Most data points suggest that the BoC has done enough and should be moving firmly to the sidelines. While inflation is still well above target, which will keep the BoC talking hawkishly for now, it is a lagging indicator, and the weak GDP growth outlook points to further disinflation ahead. Assuming growth doesn’t stage a surprising comeback, the BoC should be increasingly comfortable keeping policy rates steady.
Citi
We think the outcome of the October BoC decision is still a very close call, but softer September CPI data this week pushed the balance of risks from a hike to another pause. The retracement of strong core inflation from August could raise enough doubts about whether policy rates definitely need to be higher. However, with rates unchanged at 5.0%, guidance should remain that rates could still rise further, and could possibly even be updated to reflect that the chance of another hike has risen. We would not rule out the possibility of a rate hike in December, especially as there is just one more CPI print released ahead of that decision.
Dollar bullish momentum fades as yields slip. Economists at Société Générale analyze USD outlook.
The Middle East is an obvious tail risk
High real yields have ceased drawing in buyers and technically the bullish pattern has broken down.
If expectations do not change of another Fed rate increase or Oil prices do not shoot back up, the Dollar may struggle to return to winning ways.
The Middle East is an obvious tail risk.
See: It really looks like the Dollar's best days are behind it – Commerzbank
- US S&P Global Composite PMI improved to 51 in October's flash estimate.
- US Dollar Index clings to strong daily gains above 106.00.
The economic activity in the US private sector continued to expand at a modest pace in early October, with S&P Global Composite PMI rising to 51 from 50.2 in September.
The Manufacturing PMI edged higher to 50 from 49.8 in the same period, while the Services PMI rose to 50.9 from 50.1. Both of these readings came in higher than analysts' estimates.
Assessing the survey's findings, “hopes of a soft landing for the US economy will be encouraged by the improved situation seen in October," said Chris Williamson, Chief Business Economist at S&P Global Market Intelligence said.
"Future output expectations have also turned up despite rising geopolitical concerns and domestic political tensions, climbing to the joint-highest for nearly one-and-a-half years," Williamson added.
Market reaction
The US Dollar preserves its strength after this report. As of writing, the US Dollar Index was up 0.55% on the day at 106.17.
- Japanese Yen continues coiling in a right-angled triangle, threatening to breakout.
- Dovish comments from BoJ’s governor Ueda propelled USD/JPY’s last push higher.
- There is a growing chance of intervention from Japanese authorities as key price and yield levels are near.
The Japanese Yen (JPY) makes minor gains against the US Dollar (USD) on Tuesday, with the USD/JPY recovering from a weak start to return to familiar territory just below the key 150 level. The trend is up and biased to extend with the threat of a breakout from a right-angled triangle providing a bullish technical clue.
Comments from Bank of Japan (BoJ) governor Katsuo Ueda fueled USD/JPY’s last bullish impulse. The BoJ governor said on Friday that the bank would be maintaining its current accommodative approach in response to figures showing a slowdown in inflation.
Daily digest market movers: Japanese Yen news and market movers
- The Japanese Yen continues weakening versus USD after comments from BoJ Governor Kazuo Ueda on Friday, in which he reiterated that the BoJ would be “patiently maintaining current easy policy.”
- This came after the release of Japanese inflation data for September revealed a slowdown in price rises.
- The National Consumer Price Index rate fell to 3.0% from 3.2% a year ago. National CPI ex-Fresh Food inflation fell to 2.8% from 3.2% year-on-year (YoY). Whilst still above analysts’ estimates of 2.7%, it was the first time since August 2022 that the index growth had fallen below 3.0%. National CPI ex Food and Energy rate fell to 4.2% from 4.3% YoY.
- The yield on the 10-year Japanese Government Bond (JGB) has risen 0.18% to trade at 0.854% at the time of writing. The YCC threshold lies at 1.0%, which if touched will likely lead to the BoJ implementing further easing to bring it down. This would also probably push the Yen even lower.
- Complicating matters further, the USD/JPY briefly rose above the key 150 threshold on Monday. This is the level where the Japanese Ministry of Finance (MoF) has historically intervened in markets to strengthen the Yen so that imports do not become unaffordably expensive.
- Due to the market’s view that the MoF usually intervenes to defend 150, it could lead to selling pressure as the idea becomes a “self-fulfilling prophecy,” according to analysts at Commerzbank.
- “The market assumption that 150 constitutes the MOF’s line of defense can turn into a self-fulfilling prophecy,” Commerzbank said in its note.
- A decisive break above 150, however, could lead to a strong move substantially higher. The breaking of the level on Monday “constitutes a sign that the exchange rate fundamentally justified from the market’s point of view is much higher than 150,” said Commerzbank.
- The Japanese authorities are in Catch-22 as pressure to maintain the YCC threshold is likely to lead to a weaker Yen, whilst at the same time, maintaining the 150 threshold, will require the opposite – a stronger Yen.
- US Dollar dynamics will also influence the pair, including the release of data in the week ahead. The Fed’s preferred measure of inflation (PCE price index) will carry the most significance when it is published on Thursday, October 27, along with Michigan Consumer Confidence. US Durable Goods Orders and GDP, out on Friday, October 28, may also impact the USD.
Japanese Yen technical analysis: Right-hand triangle in an uptrend
USD/JPY is in an overall uptrend, rising on long-term, intermediate, and short-term bases.
It is expected to continue this trend higher, with the next major target at the 152.00 highs achieved in October 2022.
The pair is completing what appears to be an ascending triangle on the daily chart and a decisive break above the 150.16 highs of October 3 would provide confirmation of a breakout – also with a target in or around the 152s.
-638337518402908852.png)
US Dollar vs Japanese Yen: Daily Chart
In technical terms, a ‘decisive break’ consists of a long green daily candlestick that pierces cleanly above the critical level in question and then closes near to the high of the day. It can also mean three up days in a row that break cleanly above the level, with the final day closing near its high.
Triangles are sometimes the penultimate formations in a trend, suggesting the current uptrend may be nearing its culmination point.
Japanese Yen FAQs
What key factors drive the Japanese Yen?
The Japanese Yen (JPY) is one of the world’s most traded currencies. Its value is broadly determined by the performance of the Japanese economy, but more specifically by the Bank of Japan’s policy, the differential between Japanese and US bond yields, or risk sentiment among traders, among other factors.
How do the decisions of the Bank of Japan impact the Japanese Yen?
One of the Bank of Japan’s mandates is currency control, so its moves are key for the Yen. The BoJ has directly intervened in currency markets sometimes, generally to lower the value of the Yen, although it refrains from doing it often due to political concerns of its main trading partners. The current BoJ ultra-loose monetary policy, based on massive stimulus to the economy, has caused the Yen to depreciate against its main currency peers. This process has exacerbated more recently due to an increasing policy divergence between the Bank of Japan and other main central banks, which have opted to increase interest rates sharply to fight decades-high levels of inflation.
How does the differential between Japanese and US bond yields impact the Japanese Yen?
The BoJ’s stance of sticking to ultra-loose monetary policy has led to a widening policy divergence with other central banks, particularly with the US Federal Reserve. This supports a widening of the differential between the 10-year US and Japanese bonds, which favors the US Dollar against the Japanese Yen.
How does broader risk sentiment impact the Japanese Yen?
The Japanese Yen is often seen as a safe-haven investment. This means that in times of market stress, investors are more likely to put their money in the Japanese currency due to its supposed reliability and stability. Turbulent times are likely to strengthen the Yen’s value against other currencies seen as more risky to invest in.
- AUD/USD advances to near 0.6380 despite a strong recovery in the US Dollar and bond yields.
- The Australian Dollar will remain on tenterhooks amid the release of the Q3 inflation data.
- A breakout of the Descending Triangle chart pattern results in wider ticks and heavy volume.
The AUD/USD pair finds an interim resistance after extending recovery to near 0.6380 in the early New York session. The Aussie asset holds onto recovery despite a sharp recovery in the US Dollar and 10-year US Treasury yields, which demonstrates strength in the Australian Dollar.
A power-pack action is anticipated in the Australian Dollar amid the release of the Q3 inflation data, which will be published on Wednesday. As per the estimates, consumer inflation rose by 1.1% against a 0.8% increase in the April-June quarter. On an annualized basis, the inflation grew at a slower pace of 5.3% against the growth of 6.0% recorded earlier. The monthly Consumer Price Index (CPI) accelerated by 5.4% in September vs. 5.2% reading in August.
The US Dollar Index (DXY) climbs to near 106.00 as investors shift focus to the US Q3 Gross Domestic Product (GDP), which will be published on Thursday. As per the expectations, the US economy grew by 4.2% vs. 2.1% growth rate recorded earlier.
AUD/USD delivers a breakout of the Descending Triangle chart part pattern formed on a two-hour scale. A breakout of the aforementioned chart pattern results in wider ticks and heavy volume. Upward-sloping 20-period Exponential Moving Average (EMA) at 0.6340 warrants more upside ahead.
The Relative Strength Index (RSI) (14) shifts into the bullish range of 60.00-80.00, which indicates that bullish momentum has been triggered.
AUD/USD two-hour chart
-638337515635309320.png)
Australian Consumer Price Index (CPI) figures will be released on Wednesday, October 25 at 00:30 GMT and as we get closer to the release time, here are forecasts from economists and researchers of seven major banks regarding the upcoming inflation data.
September CPI is expected at 5.4% vs. 5.2% in August. If so, it would be the second straight month of acceleration and further above the 2-3% target range. For Q3, CPI is expected at 5.3% YoY vs. the prior release of 6.0%, while Trimmed Mean is expected at 5.0% YoY vs. 5.9% in Q2.
ANZ
We expect headline CPI to print at 1.1% QoQ and trimmed mean inflation at 1.2% QoQ in Q3. This would see the annual measures ease to 5.3% YoY and 5.1% YoY respectively. The monthly CPI indicator is forecast to rise 5.4% YoY in September, up from July’s 4.9% YoY low. This outcome, particularly for trimmed mean, would cause the RBA some discomfort given its ‘low tolerance for a slower return of inflation to target’ than current forecasts.
ING
The good news is that we think there is a chance that the headline inflation rate could manage not to rise again in September. The bad news is that we think it may stay at 5.2% YoY, unchanged after it rose in August.
Westpac
We hold to our forecast for a 1.1% rise in the September quarter CPI which will see the annual pace ease back from 6.0% YoY to 5.3% YoY. For core inflation, our Trimmed Mean estimate is also 1.1% QoQ which will see the annual pace ease to 5.0% YoY from 5.9% YoY. We will also see a moderation in the six-month annualised pace from 4.3% YoY in June to 4.0% YoY in September. The recent peak was 7.4% YoY in December 2022. We forecast a 0.2% rise in the September Monthly CPI Indicator which will see the annual pace hold flat at 5.2% YoY.
TDS
We expect Sep annual CPI to edge higher (5.3%) from a rise in fuel prices and an increase in tobacco tax. Factoring in our Sep f/c and the Jul/Aug prints, CPI trimmed mean probably showed price pressures picking up 1% in Q3 on a QoQ basis, slightly higher than the RBA's forecast of 0.9%. Acceleration in housing, utilities and transport costs are likely the culprits for Q3 inflation.
SocGen
We expect monthly headline inflation to have risen further, from 5.2% in August to 5.3% in September. Australia’s 3Q headline and core CPI readings are expected to have remained strong in QoQ terms, while the yoy rates probably fell notably, thanks only to base effects.
Citi
Headline inflation is set to rise by 0.9% QoQ in Q3, implying a yearly reading of 5.1%, down from 6% the quarter prior. Underlying inflation will likely re-accelerate from 0.9% in Q2 to 1.2% QoQ in Q3, implying a yearly reading of 5.1%. This consists of a 1.3% increase in trimmed mean and a 1.1% increase in the weighted mean measures of the CPI. A variety of subsidies for households, along with falling airfare prices, are more than offset by rising energy costs including electricity and automotive fuel. But underpinning the acceleration in underlying inflation is sticky core-services. This will likely concern the RBA more than energy costs, and now raises a firm prospect of a November hike. We keep the view unchanged for a final hike in December, but will re-adjust, if needed, post CPI.
NAB
We expect the Q3 CPI to show a quarterly print of 1.1% for both headline and underlying inflation, seeing the year-ended rates fall to 5.2% and 5.0% respectively.
USD/CAD holds a narrow range around 1.37. Economists at Scotiabank analyze the pair’s outlook.
No real directional momentum evident
Short-term trading patterns reflect a narrow range trade around the 1.37 point, with no real directional momentum evident on the short-term oscillators.
The broader uptrend in the USD remains intact but there has been no incentive to push funds either way decisively since early in the month.
Resistance is 1.3745/1.3750 and 1.3785/1.3790.
Support is 1.3650 and 1.3570.
See: USD/CAD to shift back toward the lower end of the range near 1.34 – TDS
- EUR/USD abandons the area of monthly highs near 1.0700.
- The 1.0700 zone appears reinforced by the 55-day SMA.
EUR/USD sparked a meaningful corrective decline after hitting monthly highs just below the 1.0700 barrier earlier on Tuesday.
In case bulls regain the upper hand, the pair is expected to dispute the October high at 1.0694 (October 12), which is propped up by the transitory 55-day SMA at 1.0702 and comes ahead of the weekly peak at 1.0736 (September 20).
Meanwhile, further losses remain on the table as long as the pair navigates the area below the key 200-day SMA at 1.0816.
EUR/USD daily chart
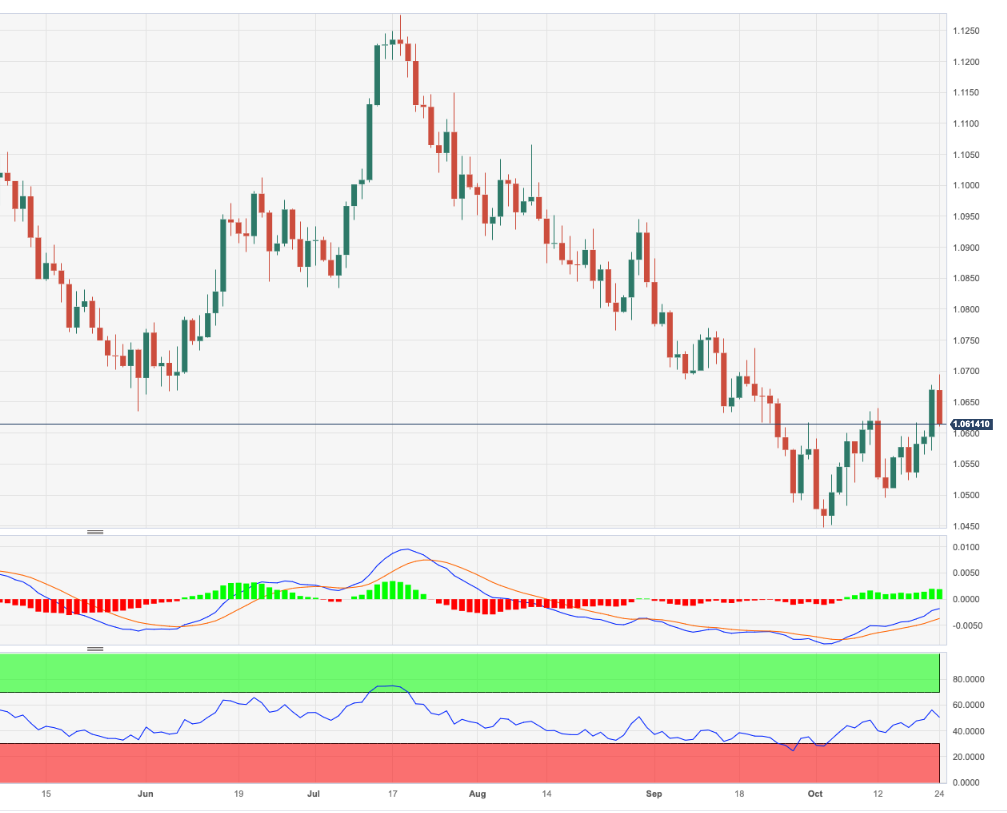
- DXY rebounds sharply and regains the 106.00 zone.
- Further up comes the next up-barrier near 106.80.
DXY regains composure and reclaims the area past the 106.00 hurdle on Tuesday
It seems the index keeps trading within a consolidative phase for the time being. Occasional bullish attempts, in the meantime, continue to target the weekly high of 106.78 (October 12) prior to the 2023 top of 107.34 (October 3).
So far, while above the key 200-day SMA, today at 103.32, the outlook for the index is expected to remain constructive.
DXY daily chart
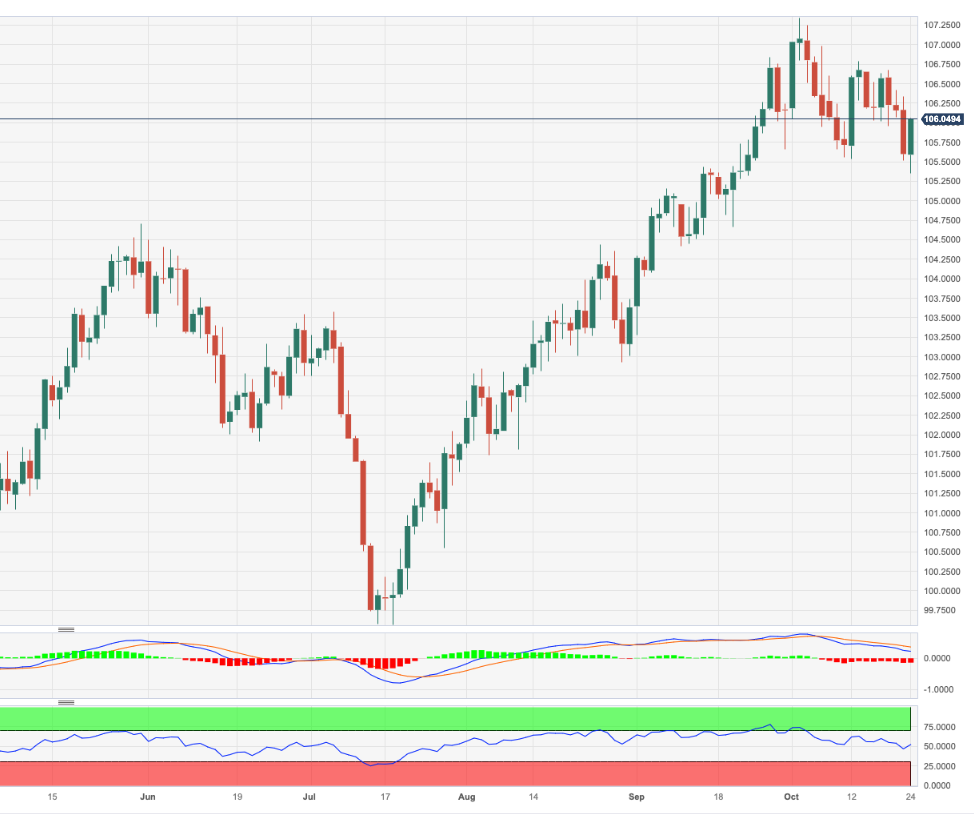
The CFTC market positioning data published on Friday revealed a shift in financial investor sentiment towards Gold, economists at Commerzbank report.
Short positions are likely to have been further reduced
At the end of the latest reporting week on 17 October, financial investors were on balance betting on a rising Gold price again. The data show net long positions amounting to 15,100 contracts, compared to net short positions totalling 26,700 contracts a week earlier. Three quarters of the shift of just shy of 42,000 contracts was due to short covering, which shouldn’t come as any surprise in view of the price performance.
Short covering and the simultaneous build in long positions combined amounted to the equivalent of 130 tons of Gold being purchased via the futures market.
As the Gold price climbed further in the subsequent days, short positions are likely to have been further reduced and long positions further increased in the meantime.
- EUR/JPY comes under pressure following new 2023 highs.
- Extra advance now looks at the round level of 160.00.
EUR/JPY reverses three consecutive daily gains and challenges the 159.00 support after hitting new yearly peaks near the 160.00 barrier earlier in the session.
Considering the current price action, further upside appears in the pipeline for the cross in the short-term horizon. Against that, the immediate hurdle emerges at the 2023 top at 159.91 (October 24) just ahead of the round level at 160.00.
So far, the longer term positive outlook for the cross appears favoured while above the 200-day SMA, today at 150.89.
EUR/JPY daily chart
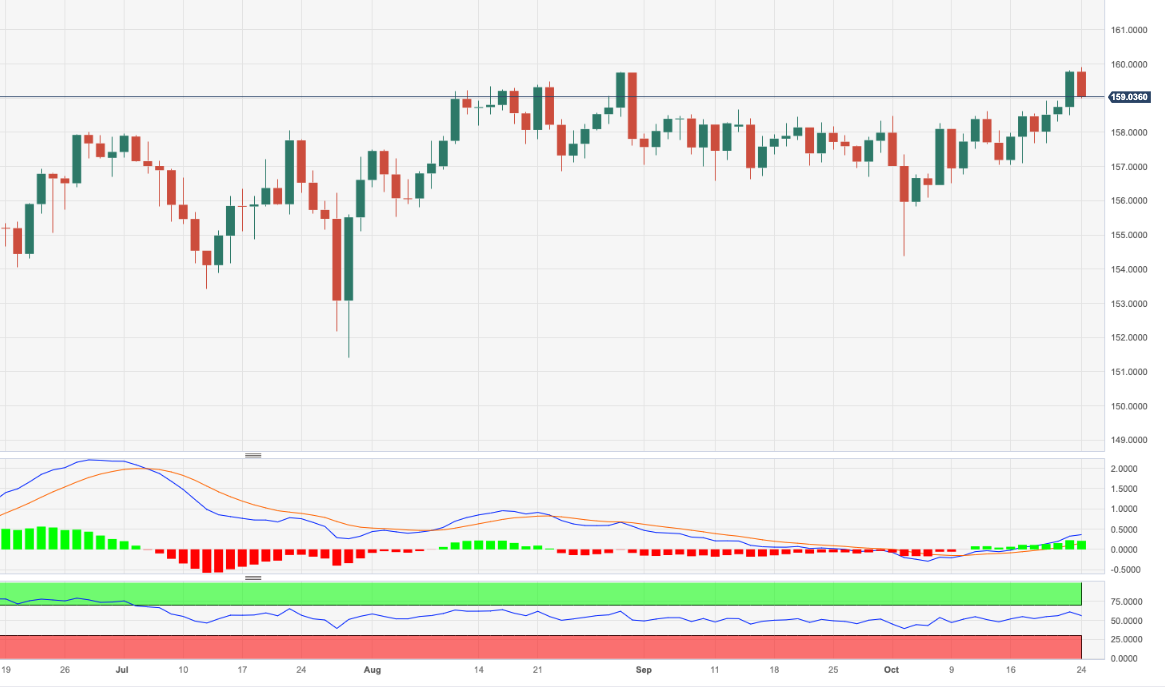
Redbook Index (YoY) in the United States, released by the Redbook Research Inc, rose 5% in the week ending October 20. In the previous week, United States Redbook Index (YoY) had risen 4.6%.
What is the United States Redbook Index (YoY)?
The Johnson Redbook Index, released by Redbook Research Inc., is a sales-weighted of year-over-year same-store sales growth in a sample of large US general merchandise retailers representing about 9.000 stores. By Dollar value, the index represents over 80% of the equivalent "official" retail sales series collected and published by the US Department of Commerce.
When is the next United States Redbook Index (YoY) report released?
The next United States Redbook Index (YoY) data will be published on October 31 at 12:55 GMT. For more information, check the United States Redbook Index (YoY) entry in FXStreet Calendar.
An automation tool was used in creating this post.
US Dollar price today
The table below shows the percentage change of US Dollar (USD) against listed major currencies today. US Dollar was the strongest against the Euro.
| USD | EUR | GBP | CAD | AUD | JPY | NZD | CHF | |
| USD | 0.52% | 0.39% | 0.13% | -0.37% | 0.03% | 0.10% | 0.37% | |
| EUR | -0.52% | -0.10% | -0.37% | -0.87% | -0.48% | -0.40% | -0.13% | |
| GBP | -0.40% | 0.11% | -0.28% | -0.76% | -0.37% | -0.31% | -0.05% | |
| CAD | -0.11% | 0.40% | 0.29% | -0.48% | -0.08% | -0.01% | 0.25% | |
| AUD | 0.36% | 0.84% | 0.75% | 0.48% | 0.39% | 0.45% | 0.72% | |
| JPY | -0.04% | 0.45% | 0.36% | 0.09% | -0.42% | 0.06% | 0.33% | |
| NZD | -0.10% | 0.40% | 0.30% | 0.02% | -0.45% | -0.06% | 0.26% | |
| CHF | -0.36% | 0.18% | 0.04% | -0.23% | -0.71% | -0.34% | -0.26% |
The heat map shows percentage changes of major currencies against each other. The base currency is picked from the left column, while the quote currency is picked from the top row. For example, if you pick the Euro from the left column and move along the horizontal line to the Japanese Yen, the percentage change displayed in the box will represent EUR (base)/JPY (quote).
- USD/CAD recovered to near 1.3700 after the US Dollar rebounded strongly.
- A delay in Israel’s planned ground attack in Gaza has eased the broader risk-off mood.
- The BoC is expected to keep interest rates unchanged at 5%.
The USD/CAD pair recovers from 1.3660 and recaptures the round-level resistance of 1.3700 in the late London session. The Loonie asset finds support as the US Dollar rebounds after discovering buying interest near 105.40.
Investors rush for the US Dollar and long-term bond yields as the focus shifts to the crucial United States economic data, which will be released this week. The US Dollar Index (DXY) has come closer to 106.00. The 10-year US Treasury yields rose sharply to 4.86%.
S&P500 futures generated significant gains in the European session, portraying a sharp revival in the risk appetite of the market participants. A delay in Israel’s planned ground attack in Gaza has eased the broader risk-off mood.
Investors await the speech from Federal Reserve (Fed) Chair Jerome Powell, which is scheduled for Wednesday. Jerome Powell is expected to reiterate the need to keep interest rates higher for a longer period to ensure the achievement of price stability. He is expected to keep hopes of further policy tightening alive if the US economy continues to remain resilient.
In the late New York session, the US S&P Global preliminary PMI for October will be keenly watched. As per the estimates, the Manufacturing PMI dropped to 49.5 against September’s reading of 49.8. The Services PMI is seen declining marginally below the 50.0 threshold to 49.9 versus the former release of 50.1.
On the Canadian Dollar front, the focus will be on the interest rate decision by the Bank of Canada (BoC), which is scheduled for Wednesday. The BoC is expected to keep interest rates unchanged at 5% as the Canadian economy is struggling for a firm footing amid a vulnerable demand outlook.
Onwards and upwards. CHF/JPY has broken the previous high of 159 in 1979. Economists at Société Générale analyze the pair’s outlook.
CHF/JPY technically overbought after overcoming high of 1979
The BoJ meets next week. Governor Ueda last week signalled no change in policy. The cross is technically stretched so a correction could be overdue. However, it is difficult to envisage a sustainable turnaround until the BoJ raises rates, abandons YCC or the SNB sells Swiss Franc. Neither of the three scenarios looks plausible in the near term.
BoJ intervention last year in USD/JPY largely passed CHF/JPY so we should not overplay downside if the central bank decides to sell USD above 150.
New Housing Price Index (MoM) in Canada decreased 0.2% in September, missing the 0.1% rise expected by markets. In August, Canada New Housing Price Index (MoM) had climbed 0.1%.
What is the Canada New Housing Price Index (MoM)?
The New Housing Price Index (NHPI) released by the Statistics Canada is a monthly series that measures changes over time in the contractors' selling prices of new residential houses, where detailed specifications pertaining to each house remain the same between two consecutive periods. The growth rate of the housing market affects the CAD volatility. A high reading is seen as positive (or Bullish) for the CAD, whereas a low reading is seen as negative (or Bearish).
When is the next Canada New Housing Price Index (MoM) report released?
The next Canada New Housing Price Index (MoM) data will be published on November 21 at 13:30 GMT. For more information, check the Canada New Housing Price Index (MoM) entry in FXStreet Calendar.
An automation tool was used in creating this post.
Canadian Dollar price today
The table below shows the percentage change of Canadian Dollar (CAD) against listed major currencies today. Canadian Dollar was the weakest against the Australian Dollar.
| USD | EUR | GBP | CAD | AUD | JPY | NZD | CHF | |
| USD | 0.42% | 0.30% | 0.08% | -0.42% | 0.01% | 0.02% | 0.33% | |
| EUR | -0.42% | -0.12% | -0.35% | -0.85% | -0.40% | -0.41% | -0.10% | |
| GBP | -0.29% | 0.12% | -0.22% | -0.73% | -0.29% | -0.28% | 0.01% | |
| CAD | -0.09% | 0.33% | 0.22% | -0.52% | -0.07% | -0.06% | 0.23% | |
| AUD | 0.42% | 0.82% | 0.72% | 0.50% | 0.43% | 0.46% | 0.75% | |
| JPY | 0.00% | 0.42% | 0.30% | 0.08% | -0.44% | 0.02% | 0.32% | |
| NZD | -0.02% | 0.38% | 0.26% | 0.04% | -0.46% | -0.03% | 0.28% | |
| CHF | -0.32% | 0.11% | -0.03% | -0.24% | -0.74% | -0.30% | -0.31% |
The heat map shows percentage changes of major currencies against each other. The base currency is picked from the left column, while the quote currency is picked from the top row. For example, if you pick the Euro from the left column and move along the horizontal line to the Japanese Yen, the percentage change displayed in the box will represent EUR (base)/JPY (quote).
- Silver price corrects sharply below $23.00 after recovery in the US Dollar and bond yields.
- Investors’ risk appetite improves as Israel’s ground assault in Gaza delays.
- Silver price corrects sharply after facing stiff barricades near the supply zone placed in a range of $23.67-23.80.
Silver price (XAG/USD) extended a sell-off below the crucial support of $23.00 in the last European session. The white metal drops to near $22.80 as the US Dollar and bond yields rebound sharply ahead of crucial US economic readings.
S&P500 futures added stellar gains in the London session, portraying a revival in the risk appetite of the market participants. The appeal for risk-perceived assets improves as investors start digesting the Middle East tensions. The risk-off mood eases amid as Israel’s strategy of ground assault in Gaza delays. The US urged Israel to delay the ground attack as the hostage release operation continues and dispatch humanitarian aid for Gaza civilians.
The US Dollar Index (DXY) recovered strongly after discovering buyers’ interest near 105.40 as investors shifted focus to the Q3 Gross Domestic Product (GDP) data, which will be announced on Thursday. The 10-year US Treasure yields rebounded strongly to near 4.87%.
Economists expect that the US economy grew by 4.2% in the July-September quarter on an annualized basis against the 2.1% growth rate recorded earlier. An upbeat Q3 GDP report would elevate expectations of one more interest rate hike from the Federal Reserve (Fed).
Silver technical analysis
Silver price corrects sharply after facing stiff barricades near the supply zone placed in a range of $23.67-23.80 on a two-hour scale. The white metal drops to near the 100-period Exponential Moving Average (EMA), which trades around $22.80.
The Relative Strength Index (RSI) (14) slips into the 40.00-60.00 range from the bullish range of 60.00-80.00, which indicates that the bullish momentum has faded while the bullish bias is still intact.
Silver two-hour chart
-638337465123630712.png)
Dollar and Treasury bond yields slumped on Monday’s. Economists at Scotiabank analyze Greenback’s outlook.
Today’s data run may add to pressure on the USD in the short run
If yields stop rising, a major incentive for extending USD longs is diminished. The question is, how far might the drop in the USD extend? Fair value for the DXY, based on nominal 2Y yield differentials, sits at 104.33. By this measure at least there is some room for the index to soften still.
Today’s data run may add to pressure on the USD in the short run. While Q3 GDP data Thursday is expected to be firm, October PMIs may look a little soft, adding to concerns that the US economy is slowing a bit more quickly into Q4.
EUR/USD slides from high 1.06 area. Economists at Scotiabank analyze the pair’s outlook.
Bearish reversal signals forming on the 1 and 6-hour charts
Spot’s rejection of the upper 1.06 area looks quite emphatic on the short-term chart, with bearish reversal signals forming on the 1 and 6-hour charts.
The broader pattern of trade still looks quite constructive for the EUR after Monday’s move higher, however, so it will come down to a battle over support in the 1.0625/1.0645 region to determine whether the push higher in the EUR can be sustained and push on to 1.0750/1.0760 of whether it drops back to a 1.05 handle.
The GBP has drifted fractionally lower. Economists at Scotiabank analyze Cable’s outlook.
Near-term risks tilted lower
Sterling peaked just below 1.2290 earlier and, like the EUR, spot losses from the intraday high have been quite significant from a short-term technical point of view.
The 1 and 6-hour charts reflect bearish reversal signals which tilt near-term risks lower.
Cable support may emerge around 1.2200/1.2220, however, where Sterling gains stalled last week. Firmer support may develop nearer 1.2150.
See: EUR/GBP set to continue around the 0.87 area – ING
- The Greenback slides to a one-month-low.
- US yields, which were the main driver for the Greenback rally, are now turning against the US Dollar.
- The US Dollar Index is at risk of having its worst week in over three months.
The US Dollar (USD) is getting gutted by the markets after US yields soared to a new multi decade high. It almost sounds Shakesperian as it was those same yields that have supported the summer rally in the Greenback from July up until mid-October. As yields in the 10-year benchmark breached the psychosocial 5% level, the Greenback got sold across the board and made the US Dollar Index incur its biggest intraday loss since July.
On the economic data front, some further moves might be anticipated with the Purchase Managers Index (PMI) numbers for October due to come out. Markets will get the chance to have a look how the leading indicator behaves and is telling us in terms of outlook for the US economy in the near future. Especially the Services component could be a catalyst as it was previously just above 50, and a break below 50 would mean an economy in contraction with more US Dollar weakness to be factored in.
Daily digest: US Dollar focused on PMI
- Around 12:55 GMT the US Redbook Index is due. The year-over-year previous number was at 4.6% with no expectations pencilled in.
- Around 13:00 the Case Shiller Home Price Index for August is due to print its yearly performance number. Previous was at 0.1%.
- Main event for this Tuesday is at 13:45 GMT with the PMI numbers for the Manufacturing, Services and Composite Index: Manufacturing is expected to head lower into contraction from 49.8 to 49.5. Services are expected to join the contraction regime by heading from 50.1 to 49.9. The Composite was at 50.2, and is expected to head into contraction as well.
- Around 14:00 GMT, the Richmond Fed Manufacturing Index for October is due to come in with the previous number at 5 and expectations for 8.
- The US Treasury will try to auction a 2-year Note in the bond market.
- Equities are in the green, though nothing convincing. In Asia none of the major indices is up over 0.50%. IN Europea very mixed numbers as the European PMI numbers were better, but still in contraction below 50 on all components. US futures are slightly in the green, ahead of Microsoft and Alphabet earnings.
- The CME Group’s FedWatch Tool shows that markets are pricing in a 98.4% chance that the Federal Reserve will keep interest rates unchanged at its meeting in November.
- The benchmark 10-year US Treasury yield trades at 4.81% and briefly broke above 5.05% on Monday, a multi-year high. Although yields have retreated quite quickly, the fact that the pain threshold has been breached, could be a sign on the wall of more pain to come for the bond market.
US Dollar Index technical analysis: King Dollar has fallen
The US Dollar lost its status as King Dollar after US yields, specifically the US 10-year yield, broke above 5%. In financial markets often 5% is seen as the pain threshold where, once above, red lights will start to flash in terms of recession possibilities, shrinking economy and a stand still or contraction growth. With the US PMI numbers later this Tuesday, risk at hand is that the US Dollar Index might add another leg lower to its losses for this week.
In order to recover, the DXY needs to break back above 105.88 and preferably even break above the high of Monday at 106.33. Once that is the case, Dollar bulls are reassured that plenty of Greenback is in play and this correction was just a blip on the hot plate. On the high end 107.20 still remains the level to beat for the year.
On the downside, the recent resistance at 105.88 did not do a good job supporting any downturn and now completely has lost its importance. Instead, look for 105.12 to keep the DXY above 105.00. If that fails to do the trick, 104.33 will be the best level to look for resurgence in US Dollar strength, as it aligns with the 55-day Simple Moving Average (SMA) as a support level.
US Dollar FAQs
What is the US Dollar?
The US Dollar (USD) is the official currency of the United States of America, and the ‘de facto’ currency of a significant number of other countries where it is found in circulation alongside local notes. It is the most heavily traded currency in the world, accounting for over 88% of all global foreign exchange turnover, or an average of $6.6 trillion in transactions per day, according to data from 2022.
Following the second world war, the USD took over from the British Pound as the world’s reserve currency. For most of its history, the US Dollar was backed by Gold, until the Bretton Woods Agreement in 1971 when the Gold Standard went away.
How do the decisions of the Federal Reserve impact the US Dollar?
The most important single factor impacting on the value of the US Dollar is monetary policy, which is shaped by the Federal Reserve (Fed). The Fed has two mandates: to achieve price stability (control inflation) and foster full employment. Its primary tool to achieve these two goals is by adjusting interest rates.
When prices are rising too quickly and inflation is above the Fed’s 2% target, the Fed will raise rates, which helps the USD value. When inflation falls below 2% or the Unemployment Rate is too high, the Fed may lower interest rates, which weighs on the Greenback.
What is Quantitative Easing and how does it influence the US Dollar?
In extreme situations, the Federal Reserve can also print more Dollars and enact quantitative easing (QE). QE is the process by which the Fed substantially increases the flow of credit in a stuck financial system.
It is a non-standard policy measure used when credit has dried up because banks will not lend to each other (out of the fear of counterparty default). It is a last resort when simply lowering interest rates is unlikely to achieve the necessary result. It was the Fed’s weapon of choice to combat the credit crunch that occurred during the Great Financial Crisis in 2008. It involves the Fed printing more Dollars and using them to buy US government bonds predominantly from financial institutions. QE usually leads to a weaker US Dollar.
What is Quantitative Tightening and how does it influence the US Dollar?
Quantitative tightening (QT) is the reverse process whereby the Federal Reserve stops buying bonds from financial institutions and does not reinvest the principal from the bonds it holds maturing in new purchases. It is usually positive for the US Dollar.
EUR/USD accelerated through technical resistance at 1.0635. Economists at Société Générale analyze the pair’s outlook.
ECB overwhelmingly forecast to keep rates on hold
EUR/USD overcomes technical resistance at 1.0635, next level situated at 1.0735.
ECB overwhelmingly forecast to keep rates on hold. Statement likely to repeat that ‘interest rates have reached levels that, maintained for a sufficiently long duration, will make a substantial contribution to the timely return of inflation to the target’.
Discussions to curtail excess liquidity, reduce balance sheet could boost EUR/JPY and EUR/CHF.
UOB Group’s Senior Economist Julia Goh and Economist Loke Siew Ting assess the latest release of trade balance figures in Malaysia.
Key Takeaways
Gross exports deteriorated further for the seventh consecutive month but at a slower pace of 13.7% y/y in Sep (Aug: -18.7%). It marked the longest declining streak since late 2008. However, the reading came in better than our estimate (-18.0%) and Bloomberg consensus (-16.5%). Import contraction almost halved to 11.1% last month (UOB est: -11.5% vs Bloomberg est: -12.1%, Aug: -21.2%). Trade surplus widened to MYR24.5bn (from +MYR17.2bn in Aug).
In 3Q23, both exports and imports maintained a double-digit decline for the second straight quarter at 15.2% y/y and 16.3% y/y respectively (2Q23: -11.1% and -11.5%), leaving a cumulative trade surplus of MYR59.1bn (2Q23: +MYR53.9bn). This is expected to translate into a larger current account surplus of MYR12.0bn (vs +MYR9.1bn in 2Q23). Actual 3Q23 current account data will be released on 17 Nov, together with the 3Q23 GDP numbers.
We maintain our full-year export outlook at -9.0% for 2023 (MOF est: -7.8%, 2022: +24.9%) and +3.5% for 2024 (MOF est: +5.1%) as there is still a lack of catalysts for trade in the near term. The recent Israel-Hamas conflicts occurred since 7 Oct may renew oil crisis and adverse impact on tech sector as market fears that the conflict will grow into larger Middle East war, while the RussiaUkraine war remains unresolved. Increasing expectations of higher-for-longer global interest rate environment and persistent property sector woes in China will likely to hinder a strong rebound in world demand and in turn delaying an upturn in global tech cycle entering 2024. That said, base effects, trade regionalization and price earnings conversion may provide some support to the trade outlook in 2024, amid an expected soft landing in the global economy.
EUR/HUF has hit its lowest levels since early September in recent days. Economists at ING analyze Forint’s outlook ahead of the National Bank of Hungary (NBH) meeting.
Positive on the HUF for today
We expect the central bank to start the second phase of interest rate normalisation with a 50 bps cut in the base rate.
In the event of a 50 bps cut, the market has some room to correct short-term expectations towards smaller cuts further out, which would be positive for HUF. On the other hand, if NBH surprises with a 75 bps rate cut, it should not have much negative impact on HUF given market expectations priced in here.
See – Hungary: Strong cut to put pressure on HUF – Commerzbank
Investors face fresh uncertainties. Heightened geopolitical risks underline the merits of diversification, economists at UBS report.
Oil and Gold assets will also be supported by market fundamentals
Gold closed at a one-month high of $1,981 an ounce on 20 October, and is up around 8.7% over the past two weeks. Brent rose 1.4% last week to $92.16, following a gain in the prior week of 7.5%, reflecting concern that a broader Middle East conflict could disrupt Oil supplies.
In the case of Oil, the risk that the Middle East conflict could interrupt supplies comes at a time when the global market is already tight. Global demand is continuing to rise, while OPEC+ Oil exporters have been disciplined in constraining supplies.
Gold, meanwhile, should benefit from the eventual turn in the Fed’s cycle, which lowers the opportunity cost of holding non-interest-bearing assets like Gold.
The volatility in the liquid US Treasury market spilled over to the US Follar, which weakened significantly during the day on Monday. Antje Praefcke, FX Analyst at Commerzbank, anlayzes Greenback’s outlook.
Rate cut expectations could rise and the USD could depreciate even further
I just think that the question of how long ‘high for longer’ might be valid for interest rates should be a strong driver for the US Dollar.
And that, in turn, would mean that if US economic data, such as today's PMIs, US Q3 GDP, durable goods, or the PCE deflator, show that the US economy is now slowing after the Fed's strong and rapid rate hikes, then rate cut expectations could rise and the USD could depreciate even further.
We have often argued that a lot of positive arguments are already priced into the USD and that it will be less and less able to benefit from a few more pips in the Fed funds rate or from good economic data. Now that doubts about the performance of the US economy seem to be growing, it really looks like the Dollar's best days are behind it.
- Natural Gas prices sold off for two straight weeks and finally found a floor at $3.20
- The US Dollar saw its worst intraday loss in three months on Monday.
- Natural Gas prices appear to have downside potential as demand is still subdued ahead of winter.
Natural Gas prices are starting to recover this week after a steep decline in the past two weeks. Gas prices briefly hit $3.63 and have been plunging since then. Traders were too eager to price in an Israeli ground offensive that would pull other countries into the conflict, likely propelling energy prices. However, with the offensive getting delayed again and demand falling, prices seem to have further room to the downside.
Meanwhile, the US Dollar (USD) seems to have lost its status as King Dollar, posting on Monday its worst intraday performance in three months. With quite a packed calendar on the data front this week, any signal that confirms any downturn in the US economy will likely be translated into another leg lower on the US Dollar Index. A similar pattern should be expected for Natural Gas prices, with only a gradual recovery if it actually happens.
Natural Gas is trading at $3.29 per MMBtu at the time of writing.
Natural Gas news and market movers
- The International Energy Agency (IEA) said that the world demand for Natural Gas is set to be even lower than anticipated by 2040 as renewables are taking up a bigger share of the energy complex.
- In that same report, the IEA lowered for a fourth straight year its projections in Gas consumption, in its latest annual World Energy Outlook.
- European Gas prices drift lower as still mild temperatures are topping any surge in demand.
- On Tuesday, French President Emmanuel Macron is expected to join other world leaders and will visit Israel in order to plead for a humanitarian corridor and delay the ground offensive for another few weeks.
Natural Gas Technical Analysis: What if Israeli ground offensive does not take place?
Natural Gas sees its seasonality being a bit broken this year. Although the winter season normally should see a ramp up in demand, Gas storages in Europe are already filled up ahead of schedule. Demand does not seem to pick up anytime soon, likely leading to a further correction in gas prices before demand comes back.
Still, headlines related to geopolitics could quickly cause severe upswings. There aren’t any significant resistance levels except for $3.65, the peak of January 17. From there, the high of 2023 near $4.3080 comes into play.
On the downside, the trend channel failed to act as support near $3.37. Natural Gas prices could fall to $3.07, with that orange line identified from the double top around mid-August. Should the drop become a broader sell-off, prices could sink to $3, at the 55-day Simple Moving Average.
-638337348704685669.png)
XNG/USD (Daily Chart)
Natural Gas FAQs
What fundamental factors drive the price of Natural Gas?
Supply and demand dynamics are a key factor influencing Natural Gas prices, and are themselves influenced by global economic growth, industrial activity, population growth, production levels, and inventories. The weather impacts Natural Gas prices because more Gas is used during cold winters and hot summers for heating and cooling. Competition from other energy sources impacts prices as consumers may switch to cheaper sources. Geopolitical events are factors as exemplified by the war in Ukraine. Government policies relating to extraction, transportation, and environmental issues also impact prices.
What are the main macroeconomic releases that impact on Natural Gas Prices?
The main economic release influencing Natural Gas prices is the weekly inventory bulletin from the Energy Information Administration (EIA), a US government agency that produces US gas market data. The EIA Gas bulletin usually comes out on Thursday at 14:30 GMT, a day after the EIA publishes its weekly Oil bulletin. Economic data from large consumers of Natural Gas can impact supply and demand, the largest of which include China, Germany and Japan. Natural Gas is primarily priced and traded in US Dollars, thus economic releases impacting the US Dollar are also factors.
How does the US Dollar influence Natural Gas prices?
The US Dollar is the world’s reserve currency and most commodities, including Natural Gas are priced and traded on international markets in US Dollars. As such, the value of the US Dollar is a factor in the price of Natural Gas, because if the Dollar strengthens it means less Dollars are required to buy the same volume of Gas (the price falls), and vice versa if USD strengthens.
- EUR/GBP drops below 0.8700 as the ECB is expected to keep interest rates unchanged at 4.5%.
- The preliminary Eurozone PMI for October remains below the expectations and the former readings.
- The UK laborforce witnessed a drawdown for the third period in a row.
The EUR/GBP pair extends correction below the round-level support of 0.8700 after the release of the weaker-than-expected Eurozone preliminary PMI data for October.
The S&P Global and Hamburg Commercial Bank (HCOB) reported that the Manufacturing PMI dropped to 43.0 against September’s reading of 43.4. Investors anticipated a higher reading at 43.7. The Eurozone factory data has been failing to meet the 50.0 threshold for more than a year.
Eurozone Services PMI at 47.8, dropped sharply from the former reading and expectations of 48.7. The economic activities in the shared continent region have faced consequences of higher borrowing costs by the European Central Bank (ECB). The ECB has raised interest rates to 4.5% to bring down inflation to 2% but is expected to pause the rate-tightening spell in its monetary policy meeting scheduled for Thursday.
Analysts at Commerzbank expect that the ECB is likely to revise its economic outlook further downwards. In its September projections, it still assumed that the Euro area economy would avoid a recession. A further increase in the key interest rate is thus becoming increasingly unlikely.
On the United Kingdom front, the Pound Sterling remained in action after the release of partial labor market data. The UK Office for National Statistics (ONS) delayed reporting of the Unemployment Rate, Employment Change, and Claimant Count Change as responses received by the Labour Force Survey (LFS) were inconsistent in comparison with tax data and surveys of employers.
The Unemployment Rate for the June-August period edged down to 4.2% against expectations and the former release of 4.3%. The UK laborforce witnessed a drawdown for the third period in a row. The UK employers shed 82K jobs in three months to August, which was lower than expectations of 198K lay-offs.
EUR/CHF consolidates above 0.95 after overcoming resistance at 0.9495. Economists at Société Générale analyze the pair’s outlook.
A rebound is almost entirely dependent on geopolitical fears subsiding
Notwithstanding the positive rate differential between the ECB and SNB, EUR/CHF retreated below 0.9450 and on Friday traded within 7 pips of the 0.9410 low of September 2022. The level is an attractive entry point for Euro longs but a rebound is almost entirely dependent on geopolitical fears subsiding.
Discussions by the ECB about earlier PEPP tapering could also give EUR/CHF room to strengthen back above 0.9520 Fibo resistance.
EUR/NOK has risen to 11.80 and USD/NOK is yet again trading above 11. Economists at Nordea analyze Krone’s outlook.
EUR/NOK to hover around 11.50 through year-end and until next summer
For the NOK to do well we probably need the current rates environment to turn around. A goldilocks scenario, where inflation and rates come down while economic activity remains robust, would be the best outcome for the NOK. It will take time, however, before inflationary pressures are reduced sufficiently for central banks to start cutting rates.
As such, the NOK will likely remain weak for some time and remain vulnerable to global developments. There is no guarantee that the global economy will come out on the other end unharmed.
We keep our view for EUR/NOK around 11.50 through year-end and until next summer, but expect large swings around this level.
The Yen was the third worst performing G10 currency on Monday. Economists at MUFG Bank analyze JPY outlook.
Yen weakness, a key factor in driving inflation
Political pressure is mounting on the government to take action to protect Japanese households from the inflation surge. The BoJ’s actions and USD/JPY threatening to break above 150 will not help form an impression that the government is doing all it can to fight inflation. This is an impossible task given the BoJ’s stance is targeted more toward eliminating the risk of deflation.
The political damage from inflation could certainly change the political incentives to intervene in the FX market as well given the focus on Yen weakness being a key factor in driving inflation. That could prove difficult right now given the stability in the USD/JPY market but the poor showing in these elections will certainly encourage intervention at the earliest feasible moment.
Open interest in natural gas futures markets extended the uptrend on Monday, although this time rising by a marginal 231 contracts. On the other hand, volume decreased markedly by nearly 111K contracts after two consecutive daily builds.
Natural Gas looks supported near $2.80
Prices of natural gas started the week with a decent rebound after several sessions of losses. The uptick came on the back of a small increase in open interest, which should open the door to further recovery in the very near term. In the meantime, the $2.80 region per MMBtu continues to offer decent contention.
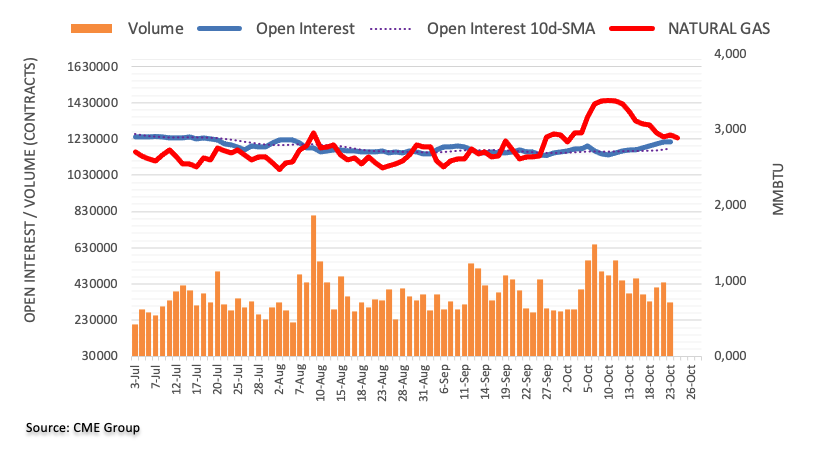
A more sustained decline in USD/CNH needs to break below the 7.2850 region, comment UOB Group’s Economist Lee Sue Ann and Markets Strategist Quek Ser Leang.
Key Quotes
24-hour view: Yesterday, USD fell to a low of 7.3085. USD dropped further in early Asian trade today. The rapid increase in momentum is likely to cause further USD weakness towards 7.2950 (minor support is at 7.3020). In order to maintain the momentum, USD must not break above 7.3200 (minor resistance is at 7.3150).
Next 1-3 weeks: USD fell by 0.23% (7.3111) yesterday. Downward momentum is building, but USD has to break clearly below 7.2850 before a sustained decline is likely. The chance of USD breaking clearly below 7.2850 will remain intact as long as it stays below 7.3260 in the next few days.
- USD/JPY discovers an interim support near 149.50 after recovery in the US Dollar.
- Economists expect that the US economy grew by 4.2% in the third quarter of 2023.
- The BoJ announced that it will conduct an unscheduled bond operation on Wednesday.
The USD/JPY pair discovered interim support near 149.50 after correcting from the crucial resistance of 150.00 in the European session. The asset finds bids after the US Dollar recovered strongly from 105.40 as the focus shifts to a string of United States economic readings, which will be released this week.
S&P500 futures generated significant gains in the London session, portraying a cheerful market mood. The delay in Israel’s ground assault in Gaza has improved the market sentiment while the near-term mood remains risk-off amid persistent risks of widening Middle East conflicts.
The US Dollar recovered on expectations that upbeat Q3 Gross Domestic Product (GDP) data, which will be published on Thursday, would increase hopes of further policy tightening by the Federal Reserve (Fed). As per the expectations, the US economy grew strongly 4.2% against a 2.1% increase recorded earlier. The 10-year US Treasury yields edged down to 4.83% as Fed policymakers continue to deliver neutral guidance on interest rates.
Meanwhile, investors await the speech from Fed Chair Jerome Powell, which is scheduled for Wednesday. Jerome Powell is expected to reiterate the need to keep interest rates unchanged in the 5.25-5.50% range but will keep doors open for further policy tightening as the US economy is resilient on the grounds of labor market and consumer spending.
On the Japanese Yen front, the Bank of Japan (BoJ) announced that it will conduct an unscheduled bond operation on Wednesday in which it will offer to buy JPY300 billion yen ($2.00 billion) in Japanese government bonds (JGBs) having maturities of five to 10 years and 100 billion worth of yen with maturities of 10-25 years.
- USD/MXN extends losses for a third day on the downbeat US Dollar.
- Banxico Deputy Governor Mejia mentioned that the current monetary policy is effective in managing inflation.
- China's plans to issue additional sovereign debt appear to be influencing market sentiment positively.
USD/MXN follows the downward trajectory, trading lower near 18.1250 during the European session on Tuesday. The pair encounters hurdles stemming from a correction in the US Dollar (USD) along with a prevailing risk-on sentiment in the market.
The Mexican Peso (MXN) faced pressure as a result of disappointing retail sales in Mexico. The sharp 0.4% month-on-month decline in August, falling below the expected 0.0%, and the annual growth of 3.2%, which was lower than the forecasted 4.4% and July's 5.1%, are contributing factors.
In the previous week, Deputy Governor Omar Mejia of the Bank of Mexico (Banxico) maintained that the balance of inflation risks hasn't worsened. He highlighted the effectiveness of the current restrictive monetary policy in managing inflation and anticipates it aligning with Banxico's target by the second quarter of 2025.
Investors feel unsettled due to the possibility of an escalation in the Middle East, which could lead to disruptions in the region. Within Israel, there is a demand to reconsider the expected scope of a ground invasion of Gaza in the near future. However, diplomatic efforts are underway to ease tensions in the Israel-Hamas Gaza Strip.
China's announcement of plans to issue slightly over 1 trillion yuan in additional sovereign debt appears to be influencing market sentiment positively. Furthermore, the constructive dialogues between the US and China during their initial economic working group meeting reinforced this optimistic outlook. Consequently, the safe-haven US Dollar is experiencing downward pressure, impacting the USD/MXN pair.
The US Dollar Index (DXY) struggles to halt the losing streak, hovering around 105.70. After peaking at 5.02%, the 10-year Treasury yield swiftly reversed course, dropping to 4.81% in the latest update.
Investors await the US S&P Global PMI on Tuesday, followed by close attention to Q3 Gross Domestic Product (GDP) figures on Thursday. Additionally, Mexico’s Trade Balance data is set to be released on Friday.
The USD softened broadly on Monday. Economists at MUFG Bank analyze Greenback’s outlook.
EUR/USD could see the move to the upside extended further
Ultimately, it will only be a turn in the official data that will prompt a more lasting sustainable turn lower in US yields. Hence, it would be premature to conclude that the US Dollar is now set to weaken on a sustained basis.
Still, positioning does appear to have been quite short and Monday’s bounce in EUR/USD took us to a high not seen since 20th September (intra-day high 1.0737) and positioning given the surprise bounce on Monday could see the move to the upside extended further.
European Central Bank (ECB) policymaker Gabriel Makhlouf said on Tuesday that it is “far too early to tell consequences of the Middle East situation.”
Additional comments
We are watching the developments very closely.
They are bound to have economic implications for us to some extent.
Don't want to jump to conclusions on extent of impact on economies, monetary policy.
Market reaction
EUR/USD is unfazed by the above comments, testing intraday lows near 1.0645. The pair is down 0.21% on the day, as of writing.
The signs of a recession in the Euro area are growing. Therefore, economists at Commerzbank do not expect the ECB to raise rates in the coming months.
Economy in a recession
The Purchasing Managers' Index for the service sector, the most reliable economic barometer for the Euro area, fell again in October by 0.9 points to 47.8. It has thus been clearly in recession territory for three months. The index for the manufacturing sector, at 43.0, also gives no hope of a turnaround.
The ECB is likely to revise its economic outlook further downwards. In its September projections, it still assumed that the Euro area economy would avoid a recession. A further increase in the key interest rate is thus becoming increasingly unlikely.
- Gold price struggles for a direction as investors seek fresh development on Israel-Hamas conflicts and crucial US economic data.
- The US Dollar and bond yields drop as investors await US Q3 GDP and the Fed’s preferred inflation gauge.
- The US Manufacturing PMI is expected to remain below the 50.0 threshold for the 12th time in a row.
Gold price (XAU/USD) trades back and forth in a narrow range as investors seek fresh development over Israel-Palestine tensions. The US urges Israel’s military to delay a ground assault in Gaza, giving preference to hostage release operations and the dispatch of humanitarian aid for civilians. In addition to that, investors await the release of crucial economic indicators, which will shape the Federal Reserve’s (Fed) interest rate outlook.
The Gold price remains underpinned, on a broader note, as Israel continues with airstrikes in Gaza, which has resulted in more than 5K deaths and 15K casualties. Meanwhile, long-term bond yields and the US Dollar edge lower as investors hope that the Fed is done with hiking interest rates. Going forward, investors will focus on the Gross Domestic Product (GDP) data for the July-September quarter and the Fed’s preferred inflation gauge for September.
Daily Digest Market Movers: Gold price trades directionless ahead of S&P Global PMI data
- Gold price trades mixed around $1,980.00 as investors seek fresh development on the Israel-Palestine conflicts and crucial US economic readings this week.
- The broader outlook for the Gold price remains upbeat as Middle East tensions keep the safe-haven bid firmer.
- The precious metal struggles to find a direction amid a delay in the ground assault plan by the Israeli military troops. The market participants anticipate that Israeli troops are preparing as much as possible before the ground attack on Gaza by dismantling Palestinian military positions.
- Meanwhile, the US has been urging Israel to delay a widely anticipated ground assault, thereby allowing more time for the release of hostages and the delivery of humanitarian aid for civilians.
- Long-term bond yields have edged down from multi-year highs of 5.02% as investors turn cautious ahead of a string of US economic indicators.
- 10-year US Treasury yields have dropped to 4.81% as Federal Reserve policymakers continue to endorse no more interest rate hikes as higher yields are consistently impacting financial conditions.
- Fed policymakers conveyed that high bond yields have bought time for the central bank to assess the impact of interest rate hikes made so far.
- For more clarity on the Fed’s interest rate outlook, investors await a speech by Fed chair Jerome Powell, which is scheduled for Wednesday.
- Last week, Jerome Powell kept hopes of further policy tightening alive if the US economy continues to remain resilient. He acknowledged that the labor demand has been upbeat and consumer spending has remained strong despite significant efforts to ease inflation by raising interest rates.
- Over the interest rate outlook, Powell said that further policy-tightening would be largely dependent on economic indicators, evolving outlook, and geopolitical tensions.
- This week, the release of the Q3 GDP, Durable Goods Orders and core Personal Consumption Expenditure (PCE) price index for September will be keenly watched.
- Economists expect that the US economy to have grown by 4.2% on an annualized basis, doubling the growth rate of 2.1% in the former reading.
- Before the US GDP data, investors will focus on the S&P Global preliminary PMI data for October, which will be published at 13:45 GMT. As per the estimates, the Manufacturing PMI dropped to 49.5 against September’s reading of 49.8. The Services PMI is seen declining marginally below the 50.0 threshold to 49.9 versus the former release of 50.1.
- The US factory activities are expected to remain in the contracting phase for the 12th month in a row.
- The US Dollar Index (DXY) drops sharply to near 105.50 as the Fed is expected to keep interest rates unchanged in the 5.25-5.50% range in the November monetary policy meeting.
- As per the CME Fedwatch tool, traders see the Fed keeping interest rates unchanged at 5.25-5.50% almost certain. The odds of one more interest rate increase in any of the two remaining monetary policy meetings in 2023 remain around 24%.
Technical Analysis: Gold price trades mixed around $1,980
Gold price demonstrates a volatility contraction near $1,980.00 ahead of crucial US economic data. The precious metal turns sideways after failing to extend upside above the $2,000 psychological resistance barrier. The 20 and 50-day Exponential Moving Averages (EMAs) have delivered a bullish crossover above the 200-day EMA, which warrants more upside.
Gold FAQs
Why do people invest in Gold?
Gold has played a key role in human’s history as it has been widely used as a store of value and medium of exchange. Currently, apart from its shine and usage for jewelry, the precious metal is widely seen as a safe-haven asset, meaning that it is considered a good investment during turbulent times. Gold is also widely seen as a hedge against inflation and against depreciating currencies as it doesn’t rely on any specific issuer or government.
Who buys the most Gold?
Central banks are the biggest Gold holders. In their aim to support their currencies in turbulent times, central banks tend to diversify their reserves and buy Gold to improve the perceived strength of the economy and the currency. High Gold reserves can be a source of trust for a country’s solvency. Central banks added 1,136 tonnes of Gold worth around $70 billion to their reserves in 2022, according to data from the World Gold Council. This is the highest yearly purchase since records began. Central banks from emerging economies such as China, India and Turkey are quickly increasing their Gold reserves.
How is Gold correlated with other assets?
Gold has an inverse correlation with the US Dollar and US Treasuries, which are both major reserve and safe-haven assets. When the Dollar depreciates, Gold tends to rise, enabling investors and central banks to diversify their assets in turbulent times. Gold is also inversely correlated with risk assets. A rally in the stock market tends to weaken Gold price, while sell-offs in riskier markets tend to favor the precious metal.
What does the price of Gold depend on?
The price can move due to a wide range of factors. Geopolitical instability or fears of a deep recession can quickly make Gold price escalate due to its safe-haven status. As a yield-less asset, Gold tends to rise with lower interest rates, while higher cost of money usually weighs down on the yellow metal. Still, most moves depend on how the US Dollar (USD) behaves as the asset is priced in dollars (XAU/USD). A strong Dollar tends to keep the price of Gold controlled, whereas a weaker Dollar is likely to push Gold prices up.
- UK Manufacturing PMI rose to 45.2 in October, above expectations of 45.0.
- Services PMI in the UK fell to 49.2 in October, a downside surprise.
- GBP/USD is recapturing bids above 1.2250 on mixed UK business PMIs.
The seasonally adjusted S&P Global/CIPS UK Manufacturing Purchasing Managers’ Index (PMI) rose to 45.2 in October versus the 45.0 expected and, 44.3 - September’s final readout.
Meanwhile, the Preliminary UK Services Business Activity Index reached a nine-month low of 49.2 in October, compared with a 49.3 final print for September and the 49.5 expected figure.
Commenting on the flash PMI data, Chris Williamson, Chief Business Economist at S&P Global Market Intelligence said: “The UK economy continued to skirt with recession in October, as the increased cost of living, higher interest rates and falling exports were widely blamed on a third month of falling output.”
“The overall pace of decline remains only modest, signalling a mere 0.1% quarterly rate of GDP decline, but gloom about the outlook has intensified in the uncertain economic climate, boding ill for output in the coming months. A recession, albeit only mild at present, cannot be ruled out,” Williamson added.
FX implications
At the press time, GBP/USD is back on the bids near 1.2260 despite the mixed UK data, adding 0.09% so far.
Economists at Commerzbank analyze Forint’s outlook ahead of the Hungarian National Bank (MNB) Interest Rate Decision.
MNB should act cautiously to avoid creating downside risks for the Forint
A rate cut in line with market expectations is likely to be neutral for the Forint, a continued hawkish tone in the statement might even be slightly positive. If the board decides for unchanged interest rates in a surprise move, I would expect a pronounced upward move in the Forint.
A strong cut on the other hand would put pressure on the HUF, above all if it should then turn out that inflation does not ease as quickly as expected after all. The October data, due for publication the week after next, are likely to be extremely important for the Forint, particularly in that case.
- The Euro appears offered vs. the US Dollar.
- Stocks in Europe remain well on the defensive on Tuesday.
- EUR/USD’s upside bias faltered ahead of the 1.0700 region.
- The USD Index (DXY) rebounds from multi-week lows near 105.40.
- Consumer Confidence in Germany worsens in November.
- Germany, EMU PMIs remain in contraction territory.
- The ECB’s Christine Lagarde will speak later in the session.
- Advanced Manufacturing and Services PMIs are also due in the US.
The Euro (EUR) is now exhibiting a mild fragility against the US Dollar (USD), resulting in EUR/USD retreating to the 1.0650 region after earlier tops in levels just shy of 1.0700 the figure on Tuesday.
Simultaneously, the Greenback is managing to regain some equilibrium and rebound from earlier four-week lows in the 105.40 zone in terms of the USD Index (DXY) against the backdrop of the mixed performance in US yields and further improvement in the sentiment surrounding the risk-linked galaxy.
With regards to monetary policy, participants now foresee the Federal Reserve (Fed) maintaining its present stance of leaving rates unchanged at the November 1 event. This perspective was reinforced by remarks from Fed Chair Jerome Powell during his appearance at the Economic Club of New York last week.
Concurrently, investors are contemplating the potential of the European Central Bank (ECB) discontinuing its tightening cycle. This occurs in spite of inflation levels surpassing the bank's target and developing anxieties regarding the risk of an economic slowdown or stagflation in the euro zone's economy.
In the domestic calendar, Consumer Confidence in Germany tracked by GfK worsened to -28.1 for the month of November. Still in Germany, flash Manufacturing and Services PMI came in at 40.7 and 48.0, respectively, for the current month. In the broader euro area, those gauges came in at 43.0 and 47.8, respectively.
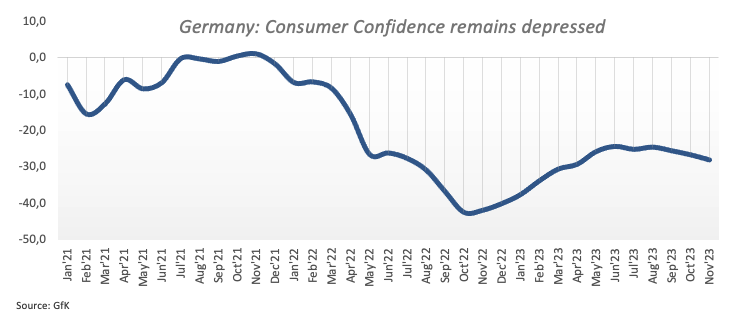
Across the pond, flash Manufacturing and Services PMIs for the current month are also in the pipeline.
Daily digest market movers: Euro surrenders initial gains on poor data
- The EUR gives away the initial advance vs. the USD on Tuesday.
- US and German yields trade mostly with losses early in Europe.
- Markets expect the Fed to extend its impasse in November.
- Investors see the ECB entering a pause in its tightening campaign.
- Geopolitical concerns in the Middle East appear somewhat diminished.
- UK jobs report surprised to the downside.
- RBA’s Bullock suggested inflation could hit the target later than estimated.
Technical Analysis: Euro shifts its attention to 1.0700 and above
EUR/USD runs out of steam near the key round level of 1.0700 on Tuesday.
If the bullish trend continues, EUR/USD may challenge the transitory hurdle at the 55-day SMA at 1.0702 prior to the weekly high of 1.0736 (September 20) and the important 200-day SMA of 1.0816. A break above this level might signal a push to the weekly top of 1.0945 (August 30), just ahead of the psychological mark of 1.1000. Any more gains might re-establish a challenge to the August peak of 1.1064 (August 10) before hitting the weekly high of 1.1149 (July 27) and possibly the 2023 top of 1.1275. (July 18).
If the selling trend resumes, there is immediate support around the weekly low of 1.0495 (October 13), which is just ahead of the 2023 low of 1.0448 (October 3), all before the round level of 1.0400. If this zone is breached, the pair could slip back to weekly lows of 1.0290 (November 30, 2022) and 1.0222 (November 21, 2022).
It is critical to remember that as long as the EUR/USD continues below the 200-day SMA, the possibility of continuous bearish pressure exists.
Euro FAQs
What is the Euro?
The Euro is the currency for the 20 European Union countries that belong to the Eurozone. It is the second most heavily traded currency in the world behind the US Dollar. In 2022, it accounted for 31% of all foreign exchange transactions, with an average daily turnover of over $2.2 trillion a day.
EUR/USD is the most heavily traded currency pair in the world, accounting for an estimated 30% off all transactions, followed by EUR/JPY (4%), EUR/GBP (3%) and EUR/AUD (2%).
What is the ECB and how does it impact the Euro?
The European Central Bank (ECB) in Frankfurt, Germany, is the reserve bank for the Eurozone. The ECB sets interest rates and manages monetary policy.
The ECB’s primary mandate is to maintain price stability, which means either controlling inflation or stimulating growth. Its primary tool is the raising or lowering of interest rates. Relatively high interest rates – or the expectation of higher rates – will usually benefit the Euro and vice versa.
The ECB Governing Council makes monetary policy decisions at meetings held eight times a year. Decisions are made by heads of the Eurozone national banks and six permanent members, including the President of the ECB, Christine Lagarde.
How does inflation data impact the value of the Euro?
Eurozone inflation data, measured by the Harmonized Index of Consumer Prices (HICP), is an important econometric for the Euro. If inflation rises more than expected, especially if above the ECB’s 2% target, it obliges the ECB to raise interest rates to bring it back under control.
Relatively high interest rates compared to its counterparts will usually benefit the Euro, as it makes the region more attractive as a place for global investors to park their money.
How does economic data influence the value of the Euro?
Data releases gauge the health of the economy and can impact on the Euro. Indicators such as GDP, Manufacturing and Services PMIs, employment, and consumer sentiment surveys can all influence the direction of the single currency.
A strong economy is good for the Euro. Not only does it attract more foreign investment but it may encourage the ECB to put up interest rates, which will directly strengthen the Euro. Otherwise, if economic data is weak, the Euro is likely to fall.
Economic data for the four largest economies in the euro area (Germany, France, Italy and Spain) are especially significant, as they account for 75% of the Eurozone’s economy.
How does the Trade Balance impact the Euro?
Another significant data release for the Euro is the Trade Balance. This indicator measures the difference between what a country earns from its exports and what it spends on imports over a given period.
If a country produces highly sought after exports then its currency will gain in value purely from the extra demand created from foreign buyers seeking to purchase these goods. Therefore, a positive net Trade Balance strengthens a currency and vice versa for a negative balance.
- Crude oil moves sideways ahead of US economic data.
- Escalation in Middle-East conflict could drive the prices higher for the oil.
- API Weekly Crude Oil Stock and EIA Crude Oil Stocks Change are set to release their data.
Western Texas Intermediate (WTI) hovers around $85.50 per barrel during the early European session on Tuesday. Crude oil receives upward support due to the fear of the Israel-Hamas war.
Investors are uneasy about the potential escalation of the situation, as it may result in disruptions across the Middle East, potentially disrupting supplies from one of the world's leading production regions. There are growing calls within Israel to reassess the potential scope of a ground invasion of Gaza, which had been anticipated in the near term.
However, diplomatic efforts are underway to ease tensions in the Israel-Hamas Gaza Strip. Additionally, US Crude stockpiles were expected to have risen last week, a preliminary Reuters poll showed on Monday ahead of the API Weekly Crude Oil Stock and EIA Crude Oil Stocks Change.
The revelation of China's intent to authorize just over 1 trillion yuan in additional sovereign debt issuance seems to have had a positive impact on market sentiment. Moreover, constructive discussions between the US and China in their initial economic working group meeting have further bolstered this positive outlook. As a result, the safe-haven US Dollar is facing downward pressure, causing oil prices to appreciate.
The US Dollar Index (DXY) struggles to halt the losing streak, hovering around 105.60. After peaking at 5.02%, the 10-year Treasury yield swiftly reversed course, dropping to 4.81% in the latest update. If US bond yields further decrease, it tends to weaken the US Dollar, making commodities priced in dollars, like crude oil, more attractive.
Market participants gear up for a week filled with economic data. Tuesday will involve a careful examination of the US S&P Global PMI, followed by close attention to Q3 Gross Domestic Product (GDP) figures on Thursday. The week will wrap up with a spotlight on Core Personal Consumption Expenditures (PCE) on Friday.
In its quarterly survey of big banks published on Tuesday, the European Central Bank (ECB) underscored concerns that “demand for loans by firms and households continued to decrease strongly.”
Additional takeaways
“Banks tightened their standards for granting a loan to companies and households in the three months to September, citing more pessimism about the economy but also lower liquidity as a result of the central bank's policy tightening.”
“Similar to recent quarters, the decline in net demand was significantly stronger than banks had expected, driven mainly by higher interest rates as well as lower fixed investment for firms and lower consumer confidence and deteriorating housing market prospects for households.”
Market reaction
At the time of writing, EUR/USD is trading 0.12% lower on the day, testing intraday lows near 1.0650.
Reserve Bank of Australia (RBA) Governor Michele Bullock is speaking at the Commonwealth Bank of Australia Global Markets Conference, in Sydney, on Tuesday.
Key quotes
Focused on bringing inflation to target within reasonable timeframe.
Possible that this can be done with the cash rate at its current level.
But there are risks inflation could return to target more slowly than forecast.
Board has low tolerance for allowing inflation to return to target more slowly than forecast.
Board will not hesitate to raise rates if there is a material upward revision to inflation outlook.
Board is mindful of policy lags and that consumption, inflation have slowed.
Board will get more information before its nov meeting, including updated forecasts.
Board is also seeking to maintain dual mandate of full employment.
A$ relatively stable in trade weighted terms, not a concern for policy.
Market reaction
AUD/USD is clinging to the latest gains on RBA Governor Bullock’s comments, trading 0.54% higher on the day at 0.6370.
- Eurozone Manufacturing PMI fell to 43.0 in October, below estimates of 43.7.
- Bloc’s Services PMI worsened to 47.8 in October vs. 48.7 expectations.
- EUR/USD keeps losses near 1.0660 after German, Eurozone PMI reports.
The Eurozone manufacturing sector contraction worsened alongside the services sector’s in October, the latest figures from the HCOB's latest purchasing managers index survey showed Tuesday.
The Eurozone Manufacturing Purchasing Managers Index (PMI) declined to 43.0 in October, compared with the expectations of 43.7 and below the 43.4 registered in September. The index hit a three-month low.
The bloc’s Services PMI dropped to 47.8 in October from 48.7 in September, touching a 32-month low, arriving way below the 48.7 consensus.
The HCOB Eurozone PMI Composite worsened to 46.5 in October vs. 47.4 estimated and September’s 47.2 print. The index hit a 35-month low.
FX implications
EUR/USD is extending losses to near 1.0650 after disappointing Eurozone PMIs. The spot is down 0.11% on the day, as of writing.
Monday's Dollar correction saw EUR/USD break through resistance at 1.0610/1.0620. Economists at ING analyze the pair’s outlook.
Can the Euro survive today's data?
An obvious target for this correction looks to be something like the 1.0765 area.
Whether we get to 1.0765 depends on US financial markets, Thursday's European Central Bank (ECB) meeting and today's Eurozone data. Here, we see the October flash PMIs for Germany, France and the Eurozone. These are all expected to signal ongoing stagnation or recession.
On balance, we suspect this EUR/USD correction might last a few days and perhaps EUR/USD does not even get below 1.0650 now.
Further range bound trade is likely in USD/JPY for the time being, suggest UOB Group’s Economist Lee Sue Ann and Markets Strategist Quek Ser Leang.
Key Quotes
24-hour view: USD traded in a relatively quiet manner between 149.54 and 149.98 yesterday before closing little changed at 149.70 (-0.09%0. The quiet price action is likely part of a consolidation phase. Today, USD is likely to trade in a range between 149.30 and 150.00.
Next 1-3 weeks: Over the past week or so, USD traded in a relatively quiet manner. There is no clear directional bias for now, and USD is likely to trade in a range of 149.00/150.50 for the time being.
Here is what you need to know on Tuesday, October 24:
Market mood continues to improve early Tuesday following the news of Israel delaying a ground assault to wait for the arrival of additional American forces to the region and Hamas releasing two Israeli hostages. Later in the day, S&P Global will release the Manufacturing and Services PMI surveys for the Euro area, the UK and the US. The US economic docket will also feature S&P/Case-Shiller Home Price Indices and Richmond Fed Manufacturing Index data for October.
Reflecting the positive shift seen in risk sentiment, US stock index futures are up between 0.3% and 0.6% in the early European session. The US Dollar Index lost more than 0.5% on Monday and was last seen consolidating its losses near 105.50. Meanwhile, the benchmark 10-year US Treasury bond yield is down nearly 1% on the day at around 4.8% after falling more than 1% on Monday.
US Dollar price this week
The table below shows the percentage change of US Dollar (USD) against listed major currencies this week. US Dollar was the weakest against the Pound Sterling.
| USD | EUR | GBP | CAD | AUD | JPY | NZD | CHF | |
| USD | -0.70% | -0.84% | -0.20% | -0.78% | -0.31% | -0.61% | -0.22% | |
| EUR | 0.69% | -0.14% | 0.49% | -0.09% | 0.39% | 0.09% | 0.49% | |
| GBP | 0.86% | 0.14% | 0.64% | 0.05% | 0.55% | 0.25% | 0.63% | |
| CAD | 0.20% | -0.48% | -0.65% | -0.57% | -0.09% | -0.40% | 0.00% | |
| AUD | 0.78% | 0.11% | -0.04% | 0.58% | 0.49% | 0.18% | 0.54% | |
| JPY | 0.30% | -0.40% | -0.57% | 0.09% | -0.56% | -0.31% | 0.09% | |
| NZD | 0.63% | -0.09% | -0.25% | 0.40% | -0.19% | 0.31% | 0.37% | |
| CHF | 0.24% | -0.49% | -0.64% | 0.01% | -0.59% | -0.09% | -0.40% |
The heat map shows percentage changes of major currencies against each other. The base currency is picked from the left column, while the quote currency is picked from the top row. For example, if you pick the Euro from the left column and move along the horizontal line to the Japanese Yen, the percentage change displayed in the box will represent EUR (base)/JPY (quote).
EUR/USD registered strong gains on Monday and climbed to a fresh multi-week high near 1.0700 early Tuesday. After the data from Germany showed that the economic activity in the private sector contracted at an accelerating pace in early October, however, the pair erased its daily gains. At the time of press, EUR/USD was trading flat on the day above 1.0650.
ILO Unemployment Rate in the UK edged lower to 4.2% in three months to August, the UK's Office for National Statistics reported on Tuesday. In September, the Claimant Count Change rose by 20.4K, compared to the market expectation of 2.3K. GBP/USD showed no reaction to these figures and was last seen trading in positive territory above 1.2250.
In the Asian trading hours, the data from Australia revealed that the S&P Global Composite PMI declined to 47.3 in October's flash estimate from 51.5 in September. AUD/USD ignored this disappointing data and benefited from risk flows, rising toward 0.6400. In the early Asian session on Wednesday, third-quarter Consumer Price Index (CPI) data from Australia will be watched closely by market participants.
In Japan, Jibun Bank Manufacturing PMI held steady at 48.5 but the Services PMI fell to 51.5 from 53.8. After fluctuating in a narrow channel slightly below 150.00 on Monday, USD/JPY lost its traction and declined below 149.50.
Gold staged a downward correction on Monday but managed to limit its losses amid falling US T-bond yields. Early Tuesday, XAU/USD stabilized above $1,970.
EUR/GBP is still slightly above the 0.87 mark. Economists at ING analyze Sterling’s outlook.
A break above 1.2275 in GBP/USD warns there may be a corrective window to the 1.2450 area
Attention will be paid to the flash October PMI releases today, where any dip in the services index could help wipe out the final 10 bps of tightening still priced into the Bank of England policy cycle.
We prefer EUR/GBP continuing to trade around the 0.8700 area, while a break above 1.2275 in GBP/USD warns there may be a corrective window to the 1.2450 area.
- Germany’s Manufacturing PMI rose to 40.7 in October vs. 40.0 anticipated.
- Services PMI for the German economy dropped to 48.0 in October vs. 50.0 expected.
- EUR/USD eases toward 1.0650 after mixed German PMIs.
Germany’s manufacturing sector is seeing an extended upturn in October while the services sector returns to contraction, the preliminary business activity report from the HCOB survey showed on Friday.
The HCOB Manufacturing PMI in the Eurozone’s economic powerhouse came in at 40.7 this month, as against the 40.0 forecast and September’s 39.6. The index touched its highest level in five months.
Meanwhile, Services PMI tumbled from 50.3 in September to 48.0 in October. The market expected a reading of 50.0 in the reported period. The measure reached a fresh two-month low.
The HCOB Preliminary German Composite Output Index arrived at 45.8 in October vs. 46.7 expected and 46.4 recorded in September. The gauge reached a two-month low.
FX implications
EUR/USD is seeing a fresh selling wave on mixed German data. The pair is trading 0.03% lower at 1.0665, at the time of writing.
Monday's recovery in US bond markets after the US ten-year Treasury yield hit 5.00% has seen the Dollar correct lower. Economists at ING analyze USD outlook.
How far will the Dollar correction run?
Higher US Treasury yields have been a dominant force driving the Dollar higher over recent months. However, unless we start to see some sharply weaker US data coming through, it is hard to see the long end coming a lot lower.
If this Dollar correction is to extend, it may well be via a sharper correction in US equities triggering a re-pricing at the short-end of the US curve – the US two-year yield breaking back below 5.00%, for instance.
105.50/105.55 looks to be key short-term support for DXY, below which there is a risk of a sharp drop to 104.40.
- The index extends the bearish move to the 105.40 region.
- US yields look poised to continue their march south on Tuesday.
- Flash Manufacturing/Services PMIs take centre stage later in the session.
The USD Index (DXY), which measures the greenback vs. a basket of its main competitors, remains under pressure and drops to multi-week lows near 105.40 on turnaround Tuesday.
USD Index weaker on risk-on trade, looks at data
The index loses ground for the fourth session in a row so far on Tuesday, coming under further pressure as geopolitical concerns appear somewhat alleviated, while US yields also lose some momentum.
When it comes to monetary policy, markets continue to expect the Federal Reserve to keep its interest rates unchanged at its November 1 meeting, although uncertainty around a potential rate hike in December remains high for the time being.
In the US docket, advanced Manufacturing and Services PMIs for the month of October will be in the centre of the debate later in the NA session.
What to look for around USD
The index accelerates its decline and breaks the 106.00 support with certain conviction on Tuesday
In the meantime, support for the dollar keeps coming from the good health of the US economy, which at the same time appears underpinned by the renewed tighter-for-longer stance narrative from the Federal Reserve.
Key events in the US this week: Flash Manufacturing/Services PMIs (Tuesday) – MBA Mortgage Applications, New Home Sales, Chair Powell (Wednesday) - Initial Jobless Claims, Durable Goods Orders, Advanced Goods Trade Balance, Flash Q4 GDP Growth Rate (Thursday) – PCE, Core PCE, Personal Income, Personal Spending, Final Michigan Consumer Sentiment (Friday).
Eminent issues on the back boiler: Persevering debate over a soft or hard landing for the US economy. Incipient speculation of rate cuts in early 2024. Geopolitical effervescence vs. Russia and China and the Middle East.
USD Index relevant levels
Now, the index is losing 0.20% at 105.38 and the next support emerges at 105.36 (monthly low October 24) ahead of 104.42 (weekly low September 11) and then 103.32 (200-day SMA). On the other hand, a breakout of 106.78 (weekly peak October 13) could expose 107.34 (2023 high October 3) and finally 107.99 (weekly high November 21 2022).
NZD/USD hit a new cycle low around 0.5808. Economists at ANZ Bank analyze the pair’s outlook.
Worried about an NZD reversal
NZD/USD hit a new low but rebounded as US 10-year bond yields turned around after hitting 5%. There was no catalyst for the turnaround other than talk of short covering as yields hit 5%, which intensified in ‘reef fishy’ market conditions.
It is impossible to gauge accurately what role momentum played on the way up in yields and thus it’s equally impossible to know how long this recent dip will last (which is key for FX given its impact on the Dollar), but we’re cautious, and that leaves us worried about an NZD reversal.
- Pound Sterling advances as the market mood turns cheerful.
- The UK ONS reported that the labor force shed jobs for the third time in a row.
- The BoE is expected to leave interest rates unchanged next week.
The Pound Sterling (GBP) gathers strength to extend upside toward the crucial resistance of 1.2300 amid improved market sentiment and better-than-anticipated employment data. The UK Office for National Statistics (ONS) reported that the labor market shed jobs for the third time in a row in the quarter to August, but the number of jobs lost was lower than expected. Moreover, the Unemployment Rate fell and remained below the expectations, indicating stable labor market conditions.
Labor demand in the UK has slowed significantly due to the deteriorating demand environment amid higher borrowing costs by the Bank of England (BoE), which has been rising interest rates sharply in an attempt to bring down consumer inflation to 2%. Investors shift their focus towards the next BoE’s interest rate decision, which will be announced on November 2. The BoE is expected to keep interest rates steady at 5.25% as weakening signs for the economy mount.
Daily Digest Market Movers: Pound Sterling extends upside on better-than-projected employment data
- Pound Sterling eyes more upside on improved market sentiment in a short-term scenario and better-than-anticipated UK labor market data.
- The UK ONS reported that employers shed 82K jobs in the June-August period, which was significantly lower than expectations of 198K lay-offs. In the three months to July period, employment declined by 207K.
- The labor market squeezed for the third month in a row, which indicates that firms have cut on workforce due to poor demand.
- The Unemployment Rate dropped to 4.2% in the three months to August, against expectations and the former reading of 4.3%.
- In September, the Claimant Count Change rose 20.4K while economists projected a marginal increase of 2.3K. In August, individuals claiming jobless benefits were 0.9K.
- The labor market data was expected last week but the Labour Force Survey (LFS) said that responses were inconsistent in comparison with tax data and surveys of employers.
- Investors should be aware of the fact that the Employment Change and the Unemployment data are experimental adjusted estimates as the usual data collected by the LFS was hampered due to low response rates.
- According to a poll conducted by Reuters, the Bank of England is expected to hold interest rates unchanged at 5.25% on November 2.
- The absence of supportive economic indicators and the confidence of BoE Governor Andrew Bailey that inflation will have a marked fall next month could allow policymakers to leave interest rates unchanged.
- The UK Manufacturing and Services PMI are below the 50.0 threshold, labor demand has slowed and Retail Sales contracted, signaling weak economic activity and likely denting consumer inflation expectations.
- The broader market mood remains downbeat amid Middle East tensions. The Israeli military troops are planning for the ground assault in Gaza to dismantle Hamas. Gaza health authorities reported 5,000 deaths and more than 15,000 civilians wounded.
- The GBP/USD pair recovered strongly on Monday after the US Dollar Index (DXY) faced a sell-off. The USD Index dropped sharply to near 105.50 as long-term US Bond yields edged lower from a multi-year high above 5%.
- The 10-year US Treasury yields drop ahead upcoming key US economic data to be released later this week. Investors keenly await Q3 Gross Domestic Product (GDP), Federal Reserve's (Fed) preferred inflation gauge and Durable Goods Orders data.
- Investors seem worried about deteriorating financial conditions due to higher yields and Middle East tensions as they could trigger a slowdown in the US economy.
Technical Analysis: Pound Sterling approaches 1.2300
Pound Sterling prints a fresh weekly high around 1.2280 amid a risk-on mood. The Cable attracted significant bids after a breakout of the consolidation formed in a range of 1.2100-1.2230. The GBP/USD pair climbs above the 20-day Exponential Moving Average (EMA), which indicates that the short-term trend has turned bullish. While the broader GBP/USD outlook is still bearish due to a death cross signal by the 50-day and 200-day EMAs.
Pound Sterling FAQs
What is the Pound Sterling?
The Pound Sterling (GBP) is the oldest currency in the world (886 AD) and the official currency of the United Kingdom. It is the fourth most traded unit for foreign exchange (FX) in the world, accounting for 12% of all transactions, averaging $630 billion a day, according to 2022 data.
Its key trading pairs are GBP/USD, aka ‘Cable’, which accounts for 11% of FX, GBP/JPY, or the ‘Dragon’ as it is known by traders (3%), and EUR/GBP (2%). The Pound Sterling is issued by the Bank of England (BoE).
How do the decisions of the Bank of England impact on the Pound Sterling?
The single most important factor influencing the value of the Pound Sterling is monetary policy decided by the Bank of England. The BoE bases its decisions on whether it has achieved its primary goal of “price stability” – a steady inflation rate of around 2%. Its primary tool for achieving this is the adjustment of interest rates.
When inflation is too high, the BoE will try to rein it in by raising interest rates, making it more expensive for people and businesses to access credit. This is generally positive for GBP, as higher interest rates make the UK a more attractive place for global investors to park their money.
When inflation falls too low it is a sign economic growth is slowing. In this scenario, the BoE will consider lowering interest rates to cheapen credit so businesses will borrow more to invest in growth-generating projects.
How does economic data influence the value of the Pound?
Data releases gauge the health of the economy and can impact the value of the Pound Sterling. Indicators such as GDP, Manufacturing and Services PMIs, and employment can all influence the direction of the GBP.
A strong economy is good for Sterling. Not only does it attract more foreign investment but it may encourage the BoE to put up interest rates, which will directly strengthen GBP. Otherwise, if economic data is weak, the Pound Sterling is likely to fall.
How does the Trade Balance impact the Pound?
Another significant data release for the Pound Sterling is the Trade Balance. This indicator measures the difference between what a country earns from its exports and what it spends on imports over a given period.
If a country produces highly sought-after exports, its currency will benefit purely from the extra demand created from foreign buyers seeking to purchase these goods. Therefore, a positive net Trade Balance strengthens a currency and vice versa for a negative balance.
Focus back on the Euro. Economists at Commerzbank analyze the single currency outlook.
Euro might suffer a dampener if Eurozone PMIs do not stabilise
The Eurozone PMIs, due for publication today, are likely to further dampen any hopes of an economic recovery. The indicators are likely to confirm the projections of our experts that the Eurozone economy will shrink in the second half of the year. That means that if the indicators do not stabilise and instead might even surprise to the downside, the Euro might suffer a dampener.
What the ECB does this week is not necessarily decisive. The question seems to be how long key rates will remain at current levels before easing again. The market sees a likelihood of that happening as early as the spring. If the PMIs were to confirm this expectation, the Euro might come under downside pressure today. And if the ECB then also sounds cautious on Thursday regarding the future economic outlook, the Euro might suffer even more.
Our experts, on the other hand, do not expect the ECB to cut its key rate in 2024. That is likely to support the Euro if the market then has to adjust its expectations, but that is likely to be some time off yet so the EUR might suffer due to rising rate cut expectations as a result of weaker economic data.
- Gold price recovers the recent losses on improved risk sentiment.
- Escalation in Middle-East conflict could drive the demand for the safe-haven asset Gold.
- Updates from China might contribute to a positive shift in market sentiment.
- Softer US Treasury yields are undermining the US Dollar.
Gold price treads waters near the $1,980 post-intraday gains during the Asian session on Tuesday. The price of the precious metal receives upward support due to the correction in the US Dollar (USD), which could be attributed to the downbeat US Treasury yields.
The US Dollar Index (DXY) continues its four-day losing streak, hovering around 105.50. After peaking at 5.02%, the 10-year Treasury yield swiftly reversed course, dropping to 4.84% in the latest update. If US bond yields continue to decline, the US Dollar would be kept lower, which could provide support for Gold prices to reach the $2,000 mark.
Geopolitical tensions between Israel and Hamas typically drive demand for gold as a safe-haven asset. However, the current risk-on sentiment could pose a challenge to Gold prices following the diplomatic efforts to ease tensions in the Israel-Hamas Gaza Strip, which have reduced market risk aversion. However, there are growing calls within Israel to reassess the potential scope of a ground invasion of Gaza, which had been anticipated in the near term.
The disclosure of China's plan to authorize slightly over 1 trillion yuan in additional sovereign debt issuance potentially improved the market sentiment. Furthermore, positive discussions between the US and China during their first meeting of the economic working group have contributed to an improved market sentiment. This has kept the safe-haven US Dollar under pressure, leading to an appreciation in the price of Gold.
Market watchers gear up for a data-packed week. Tuesday will see scrutiny of the US S&P Global PMI, followed by a close watch on Thursday for Q3 Gross Domestic Product (GDP) figures. The week concludes with a focus on the Core Personal Consumption Expenditures (PCE) on Friday.
In the opinion of UOB Group’s Economist Lee Sue Ann and Markets Strategist Quek Ser Leang, NZD/USD could slip back to the 0.5800 region in the short-term horizon.
Key Quotes
24-hour view: NZD fell to a low of 0.5810 yesterday before rebounding to close higher by 0.5847 (+0.32%). The rebound in oversold conditions (and lacklustre downward momentum) suggests that NZD is unlikely to weaken further. Today, NZD is more likely to trade in a range, probably between 0.5830 and 0.5880.
Next 1-3 weeks: Yesterday, NZD fell to a low of 0.5810, its lowest level since November last year. Despite the decline, downward momentum has not improved much. That said, there is room for NZD to weaken further, even though any decline is expected to face strong support at 0.5800. On the upside, if NZD breaks above 0.5895, it would mean that the weakness in NZD has stabilised.
FX option expiries for Oct 24 NY cut at 10:00 Eastern Time, via DTCC, can be found below.
- EUR/USD: EUR amounts
- 1.0485 625m
- 1.0550 1.7b
- 1.0575 440m
- 1.0600 1.1b
- 1.0610 723m
- 1.0625 754m
- 1.0650 906m
- GBP/USD: GBP amounts
- 1.2255 600m
- 1.2350 377m
- USD/JPY: USD amounts
- 149.00 651m
- 149.50 1.4b
- 149.60 449m
- 150.00 1.8b
- 150.50 563m
- USD/CHF: USD amounts
- 0.8975 474m
- AUD/USD: AUD amounts
- 0.6395 400m
- USD/CAD: USD amounts
- 1.3630 370m
- NZD/USD: NZD amounts
- 0.5850 401m
- EUR/GBP cross hovers around 0.8700 following the UK employment data.
- The UK ILO Unemployment Rate fell to 4.2% (3M) in August vs. 4.3% prior, better than expected.
- The preliminary Eurozone Consumer Confidence arrived at -17.9 in October vs. -17.8 prior.
- Market players await the European Central Bank rate decision on Wednesday, with no change in rates expected.
The EUR/GBP cross remains under pressure around the 0.8700 psychological mark during the early European session on Tuesday. The latest UK employment data showed mixed results. Market players will monitor the economic data releases from both the Eurozone and the UK for fresh impetus ahead of the European Central Bank (ECB) rate decision on Wednesday.
The UK ILO Unemployment Rate fell to 4.2% in the quarter to August, versus 4.3% seen in the previous reading. These figures came in better than the market expectation of 4.3%, according to data published by the Office for National Statistics (ONS) on Tuesday. Additionally, the number of people claiming jobless benefits climbed by 20.4K in September from the previous month’s 0.9K increase and 2.3K expected. Finally, the British Employment Change for August came in at -82K versus -207K recorded in July, above the market consensus of -198K.
There is speculation that the Bank of England (BoE) might maintain interest rates steady at 5.25% in its November meeting due to the weaker-than-expected data. It’s worth noting that the UK Manufacturing PMI remained below the 50.0 threshold while Retail Sales contracted, suggesting sluggish economic activity in the UK economy.
On the Euro front, the preliminary Eurozone Consumer Confidence for October came in at -17.9 from the previous reading of -17.8. These figures arrived better than the market consensus -18.3, data published by the European Commission showed on Monday. Investors will keep an eye on the European Central Bank (ECB) Interest Rate decision on Wednesday, which is expected to remain unchanged at 5%. ECB President Christine Lagarde may stick with the high-for-longer mantra but is likely to push back against rate-cut speculation due to a weakening economy.
Furthermore, the escalating geopolitical tensions in the Middle East push energy prices higher, which exerts some pressure on the Euro (EUR). On Monday, Reuters reported that the European Union is considering extending an emergency gas price cap imposed in February, amid concerns that the Middle East crisis and sabotage of a Baltic pipeline could push prices up again this winter. That being said, the fear of the Eurozone energy crisis acts as a headwind for the EUR/GBP cross.
Market players await the preliminary German and Eurozone HCOB PMI for October, due later in the European session on Tuesday. Also, the UK S&P Global/CIPS PMI data will be released. Traders will take cues from these reports ahead of the ECB monetary policy meeting on Wednesday.
ee
Economists at Rabobank analyze CHF/JPY outlook.
A tweak in BoJ policy at next week’s meeting could alter the dynamic for CHF/JPY
Excitement is whipping up in the market about the possibility of another tweak in the BoJ’s YCC policy at its October 31 meeting. This alters the dynamic for CHF/JPY in the near term.
A steady policy decision by the BoJ next week may be needed to propel CHF/JPY onwards to 170 in the weeks ahead. A tweak to BoJ policy would likely slow the ascent of the currency pair which has been bias higher since 2020.
Considering advanced prints from CME Group for crude oil futures markets, open interest resumed the downtrend on Monday, shrinking by nearly 10K contracts and reversing the previous daily build. Volume followed suit and dropped for the second session in a row, this time by around 61.6K contracts.
WTI: Immediately to the upside comes the $90.00 mark
Prices of WTI extended the corrective knee-jerk on Monday. The downtick was accompanied by declining open interest and volume and removes strength from a potential continuation of the downward bias in the very near term. In the meantime, the weekly peak near the $90.00 mark per barrel continues to cap the upside.
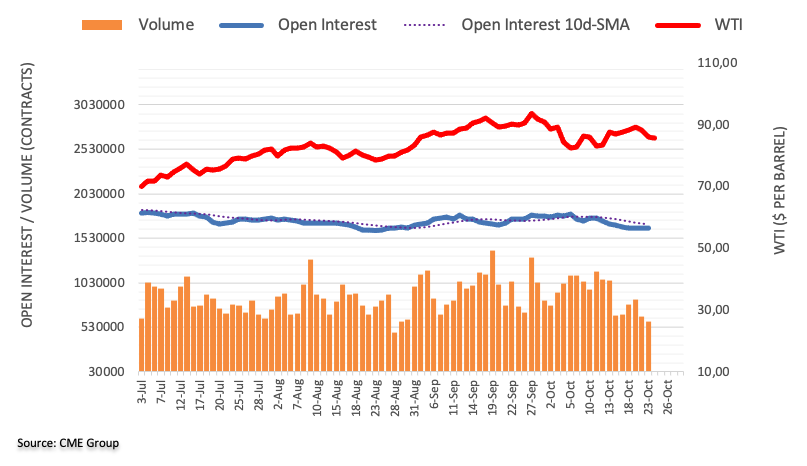
- The UK Unemployment Rate unexpectedly drops to 4.2% in the quarter to August.
- The Claimant Count Change for Britain arrived at 20.4K in September.
- GBP/USD holds firmer toward 1.2300 after the mixed UK jobs data.
The United Kingdom’s (UK) ILO Unemployment Rate dropped slightly to 4.2% in the quarter to August, as against a 4.3% reading reported in the three months to July, according to the official data published by the Office for National Statistics (ONS) on Tuesday. The market consensus was a 4.3% print in the reported period.
Additional details showed that the number of people claiming jobless benefits jumped by 20.4K in September, as against the previous month’s 0.9K increase and 2.3K estimates.
The British Employment Change for August stood at -82K, compared with -207K recorded in July and forecast of -198K.
"Tomorrow we will publish a new series using additional data sources to produce adjusted levels and rates for employment, unemployment and inactivity for the latest two 3-monthly periods," the ONS said in a statement on Monday.
"We will not be publishing the unadjusted June to August LFS (Labour Force Survey) data tomorrow."
The agency delayed the release of employment statistics by a week to improve the quality of the data. However, the wage inflation data was released as planned on October 17.
Wage inflation in the United Kingdom (UK), as measured by the change in the Average Earnings Excluding Bonus, rose 7.8% 3M YoY in August, as against a 7.9% increase registered in July, the partial labor data released by ONS showed last Tuesday. The market expectation was for a 7.8% increase.
GBP/USD reaction to the UK employment report
GBP/USD failed to react to the mixed UK employment data. The pair is trading 0.14% higher on the day at 1.2270, as of writing.
Pound Sterling price today
The table below shows the percentage change of Pound Sterling (GBP) against listed major currencies today. Pound Sterling was the strongest against the US Dollar.
| USD | EUR | GBP | CAD | AUD | JPY | NZD | CHF | |
| USD | -0.12% | -0.17% | -0.09% | -0.35% | -0.08% | -0.09% | 0.00% | |
| EUR | 0.12% | -0.03% | 0.04% | -0.24% | 0.07% | 0.02% | 0.10% | |
| GBP | 0.15% | 0.02% | 0.06% | -0.21% | 0.07% | 0.08% | 0.14% | |
| CAD | 0.09% | 0.00% | -0.05% | -0.25% | 0.01% | -0.01% | 0.07% | |
| AUD | 0.35% | 0.23% | 0.20% | 0.25% | 0.26% | 0.25% | 0.33% | |
| JPY | 0.07% | -0.03% | -0.07% | -0.03% | -0.29% | -0.03% | 0.06% | |
| NZD | 0.09% | -0.03% | -0.05% | 0.00% | -0.25% | 0.01% | 0.08% | |
| CHF | 0.02% | -0.11% | -0.13% | -0.07% | -0.32% | -0.06% | -0.05% |
The heat map shows percentage changes of major currencies against each other. The base currency is picked from the left column, while the quote currency is picked from the top row. For example, if you pick the Euro from the left column and move along the horizontal line to the Japanese Yen, the percentage change displayed in the box will represent EUR (base)/JPY (quote).
Further upside could lift GBP/USD to the 1.2340 zone in the near term, according to UOB Group’s Economist Lee Sue Ann and Markets Strategist Quek Ser Leang.
Key Quotes
24-hour view: GBP rose by 0.69% yesterday (NY close of 1.2249). Upward momentum has increased, albeit not much. Today, GBP could test 1.2290 before the risk of a pullback increases. The mid-October high near 1.2340 is not expected to come into view. Support is at 1.2225, followed by 1.2200.
Next 1-3 weeks: After dipping to a low of 1.2093 last week, GBP rebounded, and yesterday it reached a high of 1.2258. Upward momentum appears to be building, and GBP is likely to rise towards 1.2340 in the next few days. At this stage, the likelihood of GBP breaking clearly above this level is not high. If GBP breaks the ‘strong support’ at 1.2165, it would mean that it is unlikely to rise to 1.2340.
CME Group’s flash data for gold futures markets noted traders increased their open interest positions for the fifth consecutive sessions on Monday, this time by around 3.7K contracts. On the other hand, volume remained choppy and shrank by around 87.2K contracts.
Gold remains capped by $2000 so far
Gold started the week on the defensive amidst rising open interest, which suggests the extra losses could be in store for the commodity in the very near term. In the meantime, occasional bullish attempts in the precious metal appear limited by the key $2000 mark per troy ounce for the time being.
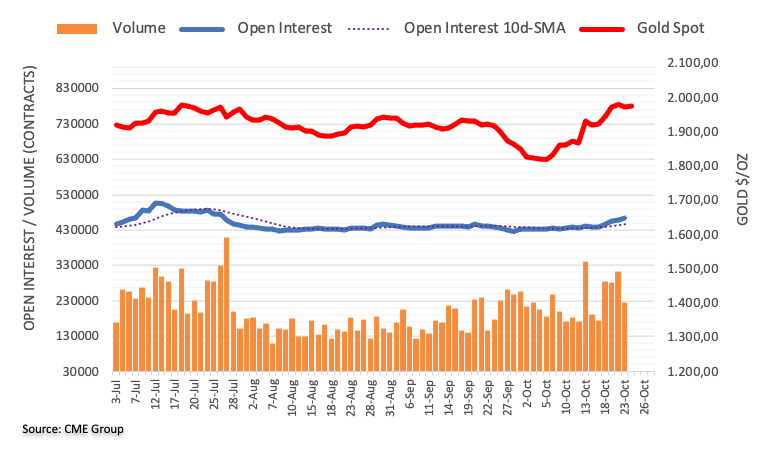
- Asian equities have a mixed performance on Tuesday amid the Middle East geopolitical tensions and the volatile US Treasury bond yields.
- Central Huijin Investment Co plans to increase its local ETF holdings, which boosts Chinese stocks.
- Japanese PMI data showed the ongoing weakness in Asia's second-largest economy.
- Investors will monitor the US S&P Global PMI, due later on Tuesday.
Asian stocks trades mixed on Tuesday amid worries about Israel-Hamas tensions. The US Dollar (USD) drops to one-month lows whereas oil prices recover some lost ground. US Treasury bond was the center of attention in the previous session. The 10-year Treasury yield hit 5.02% for the first time since 2007, but then reversed its course, falling to 4.84%. This, in turn, lends some support to the regional stock markets.
At press time, China’s Shanghai gains 0.38% to 2,950, the Shenzhen Component Index is up 0.24% to 9,448, Hong Kong’s Hang Sang drops 0.66% to 17,059, South Korea’s Kospi is up 0.21%, and Japan’s Nikkei falls 0.24%. India’s markets are closed on Tuesday on account of the Dussehra holidays.
This week's exchange-traded funds (ETF) flows have helped China's stocks regain some ground. That being said, Central Huijin Investment Co, a Chinese sovereign fund, plans to increase its local ETF holdings, which boosts Chinese stocks.
In Japan, Jibun Bank Manufacturing PMI for October eased to 48.5 versus 48.5 prior, worse than the market expectation of 48.9. Meanwhile, the Services PMI came in at 51.1 from the previous reading of 53.8. These figures suggested ongoing weakness in Asia's second-largest economy.
Additionally, the Bank of Japan (BoJ) said on Tuesday that it would execute an unplanned bond operation on Wednesday, proposing to buy JPY300 billion yen in Japanese government bonds (JGBs) with maturities of five to 10 years, as well as JPY100 billion yen in JGBs with maturities of 10–25 years.
In Australia, the preliminary S&P Global Australian Services PMI posted 47.6 in October from 51.8 in September. On the other hand, the Manufacturing PMI eased to 48.0 from 48.7 in the previous reading. Furthermore, the Composite Index came in at 47.3 versus 51.5 prior.
Investors will take cues from the US economic data this week for fresh impetus. On Tuesday, the US S&P Global PMI will be released and might convince the Federal Reserve (Fed) about the next move in monetary policy.
UOB Group’s Economist Lee Sue Ann and Markets Strategist Quek Ser Leang note further upside in EUR/USD is expected to meet a strong resistance around 1.0700.
Key Quotes
24-hour view: EUR soared by 0.71% (NY close of 1.0668) yesterday and closed at its highest level in more than a month. The advance is accompanied by strong upward momentum, and further EUR strength appears likely today. However, any advance is likely to face solid resistance at 1.0700. The major resistance at 1.0740 is unlikely to come under threat. In order to keep the momentum going, EUR must stay above 1.0625 (minor support is at 1.0645).
Next 1-3 weeks: Yesterday, EUR soared by 0.71% (1.0668) and closed at its highest level in about a month. The price action appears to be part of a rebound that is likely to extend above 1.0700. At this stage, it is too early to tell if EUR has enough momentum to reach the major at 1.0740. The risk of a further rebound will remain intact as long as EUR stays above 1.0600 in the next few days.
- EUR/USD continues the winning streak ahead of the Eurozone PMI.
- MACD indicates a shift in momentum towards a bullish trend.
- The major level at 1.0700 emerges as the key resistance following the 38.2% Fibonacci retracement.
EUR/USD continues to move upward for the fourth successive day, trading higher around the 1.0680 level during the Asian session on Tuesday. The pair encounters challenges stemming from the decline in the US Dollar (USD), coupled with an improved risk sentiment amid geopolitical tensions in the Middle East.
Market participants await the preliminary Eurozone October PMI. In Germany, both the German GfK Consumer Confidence Survey and PMI data are also on the agenda. Tuesday will feature a speech by ECB President Christine Lagarde. Looking ahead to Thursday, the ECB has its scheduled monetary policy meeting, and there's no anticipation of a change in interest rates.
The major level at 1.0700 emerges as the key resistance. A break above the latter could open the doors for the EUR/USD pair to explore the region around the 1.0750 psychological level, followed by the 38.2% Fibonacci retracement at 1.0764.
On the downside, the EUR/USD pair could meet the support at 1.0600 lined up with the 14-day Exponential Moving Average (EMA) at 1.0596.
The Moving Average Convergence Divergence (MACD) line lies below the centerline, signaling that the short-term average is beneath the long-term average. However, an interesting development is apparent as the line diverges above the signal line, hinting at a potential shift in momentum towards a bullish trend.
The EUR/USD pair implies a bullish momentum, as emphasized by a stronger bias revealed in the 14-day Relative Strength Index (RSI) holding above the 50 level.
EUR/USD: Daily Chart
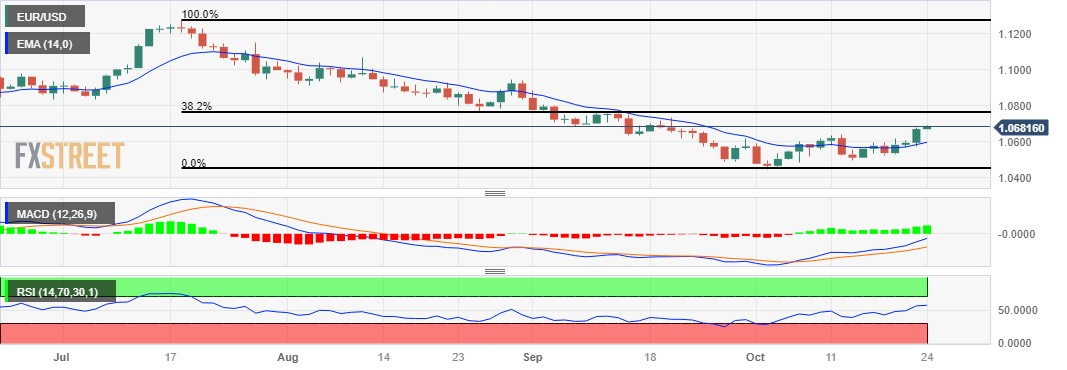
- USD/CHF extends its losses ahead of US economic data.
- Swiss Franc strengthened on geopolitical tensions in Middle-East.
- Dovish stance by the Fed is weighing on the US Dollar.
USD/CHF loses ground for the second successive day, trading lower near 0.8900 during the Asian session on Tuesday. The pair faces challenges due to the downfall in the US Dollar (USD), which could be attributed to the dovish remarks by the US Federal Reserve (Fed) officials.
The Swiss Franc, considered a safe haven, may have found support amidst the geopolitical tensions between Israel and Hamas. However, diplomatic efforts to ease tensions in the Israel-Hamas Gaza Strip have contributed to a reduction in market risk aversion, boosting investors' risk appetite.
Investors will likely watch the ZEW Survey Expectations for October on Wednesday. The sentiment data for September stood at -27.6. If the upcoming data shows a further decline, it would signal a worsening in Switzerland’s business conditions and labor market.
The US Dollar Index (DXY) continues its four-day losing streak, possibly influenced by subdued US Treasury yields. The spot price hovers around 105.50. Despite reaching its highest point since 2007 at 5.02%, the 10-year Treasury yield promptly reversed course, dropping to 4.85% in the latest update.
Atlanta Federal Reserve President Raphael Bostic expressed skepticism about a US central bank rate cut before the middle of next year. Fed Philadelphia President Patrick Harker preferred maintaining existing interest rates, while Fed Cleveland President Loretta Mester suggested that the US central bank is either at or very close to the peak of the rate hike cycle.
Market watchers are gearing up for a data-packed week. Tuesday will see scrutiny of the US S&P Global PMI, followed by a close watch on Thursday for Q3 Gross Domestic Product (GDP) figures. The week concludes with a focus on the Core Personal Consumption Expenditures (PCE) on Friday.
- USD/CAD trades in negative territory for the third consecutive day, around 1.3674.
- The Chicago Fed National Activity Index rose to +0.02 in September vs -0.22 prior.
- Traders await the US S&P Global PMI ahead of the Bank of Canada (BoC) Rate decision on Wednesday.
The USD/CAD pair extends its downside during the Asian session on Tuesday. The downtick of the pair is driven by the correction of the US Dollar (USD) to a one-month low. However, a rise in US Treasury bond yields and the escalating geopolitical tensions in the Middle East might limit the USD’s downside. The pair currently trades near 1.3674, down 0.12% for the day.
The Chicago Fed National Activity Index suggests the US economy is still some distance from a recession. The figure rose to +0.02 in September from the previous reading of -0.22. A zero value for the index indicates the economy is growing in trend.
According to the CME FedWatch Tool, the markets don’t see the probability of a November rate hike, but the odds for January 2024 remain over 30%. The Federal Open Market Committee (FOMC) enters its blackout period. Atlanta Federal Reserve (Fed) President Raphael Bostic said on Friday that he doesn't think that the US central bank will cut the rate before the middle of next year. Fed Philadelphia President Patrick Harker reiterated his preference to keep interest rates unchanged. While Fed Cleveland President Loretta Mester said the US central bank is "at or near the peak of the rate hike cycle.
On the Loonie front, investors await the Bank of Canada (BoC) Interest Rate decision on Wednesday. The market expected the BoC to hold the interest rate unchanged at 5% for the remainder of the year and is expected to cut the rate in the second quarter (Q2) of 2024. Meanwhile, a decline in oil prices might undermine the commodity-linked Loonie as the country is the major oil exporter to the US.
Looking ahead, market participants will keep an eye on the US S&P Global PMI and the Canadian New Housing Price Index for September, which is expected to gain 0.1% in September. On Wednesday, attention will shift to the BoC rate decision and the preliminary estimate of the US Q3 Gross Domestic Product (GDP). The US Core Personal Consumption Expenditure Index (PCE) will be due on Friday.
- Indian Rupee holds positive ground despite the sour market mood.
- Rising oil prices and Middle East geopolitical concerns might trigger risk-off sentiment and limit the Indian Rupee's upside.
- Market players await the US S&P Global PMI data on Tuesday; India’s markets are closed for the Dussehra holidays.
Indian Rupee (INR) trades strongly against the US Dollar (USD) amid a decline in US Treasury bond yields on Tuesday. Moreover, the Reserve Bank of India's (RBI) potential aggressive intervention last week lends some support to the Indian Rupee and acts as a headwind for the USD/INR pair. Nonetheless, the higher crude oil prices and escalating geopolitical tension in the Middle East might contribute to the risk-off mood and cap the upside of the Indian Rupee.
India’s markets are closed on Tuesday on account of the Dussehra holidays. Traders will monitor India's Balance of Payments for the second quarter (Q2) on Thursday. Fed officials will not deliver any speeches this week due to the blackout period ahead of the FOMC meeting next week. In the meantime, traders will take cues from the US S&P Global PMI, the preliminary estimate of the US Q3 Gross Domestic Product (GDP), and the Core Personal Consumption Expenditure Index due later this week.
Daily Digest Market Movers: Indian Rupee soars as the Dollar corrects to one-month lows
- The Chicago Fed National Activity Index rose to +0.02 in September versus -0.22 prior, suggesting the US economy is still some distance from a recession.
- RBI's monetary policy committee stated the central bank would continue to focus on maintaining inflation at the target of 4%.
- MPC member Varma stated that a 1% real interest rate, adjusted for inflation, would consistently achieve India's inflation target.
- Net foreign direct investment (FDI) in India fell to $2.99B in April–August this year from $18.03B last year, reflecting a slowing in global activity and a rise in repatriation.
- RBI Chief Shaktikanta Das said the central bank does intervene in the FX market, but only to prevent excessive volatility in the INR.
- Chief Das stated that RBI will monitor the evolving inflation dynamic amid the uncertainty surrounding food inflation.
- India's Finance Minister will closely monitor the supply chain impact of the ongoing tensions in the Middle East.
- The RBI's October bulletin suggested growth in India is expected to gain momentum for the remainder of the year.
- RBI sold a net total of $3.86B in the spot foreign exchange market in August, as per their monthly bulletin.
- India’s Wholesale Price Index (WPI) arrived at -0.26% YoY in September from 0.52% in August, below the market consensus of 0.50%.
Technical Analysis: Indian Rupee trades firmly above the key support level of 83.00
The Indian Rupee extends its upside against the USD. The USD/INR pair remains well supported above the 83.00 psychological mark despite breaking the low of a prior range. A break below the 83.00 would drag the pair to 82.82 (low of September 12), en route to 82.65 (low of August 4). On the other hand, the immediate upside barrier is the support-turned-resistance at 83.15, followed by a high of October 4 at 83.30, and the all-time high around 83.45. In the meantime, the pair holds above the key 200-day Exponential Moving Average (EMA) on the daily chart, which supports further upside for the USD/INR pair in the short term.
US Dollar price in the last 7 days
The table below shows the percentage change of US Dollar (USD) against listed major currencies in the last 7 days. US Dollar was the weakest against the Euro.
| USD | EUR | GBP | CAD | AUD | JPY | NZD | CHF | |
| USD | -1.21% | -0.44% | 0.42% | -0.29% | 0.00% | 0.69% | -1.13% | |
| EUR | 1.20% | 0.78% | 1.61% | 0.91% | 1.20% | 1.89% | 0.08% | |
| GBP | 0.43% | -0.78% | 0.85% | 0.14% | 0.43% | 1.13% | -0.70% | |
| CAD | -0.43% | -1.65% | -0.87% | -0.72% | -0.43% | 0.27% | -1.57% | |
| AUD | 0.30% | -0.92% | -0.13% | 0.71% | 0.29% | 0.99% | -0.84% | |
| JPY | 0.00% | -1.22% | -0.43% | 0.42% | -0.32% | 0.70% | -1.13% | |
| NZD | -0.70% | -1.93% | -1.14% | -0.29% | -1.01% | -0.71% | -1.86% | |
| CHF | 1.11% | -0.09% | 0.69% | 1.54% | 0.79% | 1.11% | 1.82% |
The heat map shows percentage changes of major currencies against each other. The base currency is picked from the left column, while the quote currency is picked from the top row. For example, if you pick the Euro from the left column and move along the horizontal line to the Japanese Yen, the percentage change displayed in the box will represent EUR (base)/JPY (quote).
Indian Rupee FAQs
What are the key factors driving the Indian Rupee?
The Indian Rupee (INR) is one of the most sensitive currencies to external factors. The price of Crude Oil (the country is highly dependent on imported Oil), the value of the US Dollar – most trade is conducted in USD – and the level of foreign investment, are all influential. Direct intervention by the Reserve Bank of India (RBI) in FX markets to keep the exchange rate stable, as well as the level of interest rates set by the RBI, are further major influencing factors on the Rupee.
How do the decisions of the Reserve Bank of India impact the Indian Rupee?
The Reserve Bank of India (RBI) actively intervenes in forex markets to maintain a stable exchange rate, to help facilitate trade. In addition, the RBI tries to maintain the inflation rate at its 4% target by adjusting interest rates. Higher interest rates usually strengthen the Rupee. This is due to the role of the ‘carry trade’ in which investors borrow in countries with lower interest rates so as to place their money in countries’ offering relatively higher interest rates and profit from the difference.
What macroeconomic factors influence the value of the Indian Rupee?
Macroeconomic factors that influence the value of the Rupee include inflation, interest rates, the economic growth rate (GDP), the balance of trade, and inflows from foreign investment. A higher growth rate can lead to more overseas investment, pushing up demand for the Rupee. A less negative balance of trade will eventually lead to a stronger Rupee. Higher interest rates, especially real rates (interest rates less inflation) are also positive for the Rupee. A risk-on environment can lead to greater inflows of Foreign Direct and Indirect Investment (FDI and FII), which also benefit the Rupee.
How does inflation impact the Indian Rupee?
Higher inflation, particularly, if it is comparatively higher than India’s peers, is generally negative for the currency as it reflects devaluation through oversupply. Inflation also increases the cost of exports, leading to more Rupees being sold to purchase foreign imports, which is Rupee-negative. At the same time, higher inflation usually leads to the Reserve Bank of India (RBI) raising interest rates and this can be positive for the Rupee, due to increased demand from international investors. The opposite effect is true of lower inflation.
- GBP/USD extends its gains for the fourth consecutive day ahead of UK economic figures.
- Improved risk sentiment contributes support to underpinning the Pound Sterling.
- UK employment levels are expected to decline in August.
- US Dollar continues to lose ground on the downbeat US Treasury yields.
GBP/USD continues the winning streak that began on Thursday, trading higher near 1.2270 during the Asian session on Tuesday. The pair receives upward support due to the correction in the US Dollar (USD), coupled with improved risk sentiment.
United Kingdom (UK) gears up for the release of Employment and S&P Global PMI data. Economists anticipate a decline in employment levels for the three months leading to August, signaling that companies are scaling back their workforces in response to a gloomy demand outlook.
The downturn in Retail Sales reflects the financial strain on households, driven by high inflation and increased borrowing costs. The substantial decrease in consumer spending is likely to have a notable impact on consumer inflation expectations. Consequently, there is speculation that the Bank of England (BoE) might lean towards maintaining the current interest rates at 5.25% during November's policy meeting, in response to the weakening spending dynamics.
The GBP/USD pair might have encountered obstacles due to geopolitical tensions between Israel and Hamas. However, the improved risk profile is lending support to the Pound Sterling (GBP). Diplomatic initiatives aimed at easing tensions in the Israel-Hamas Gaza Strip have lessened market risk aversion, buoying investors’ risk appetite.
The US Dollar Index (DXY) prolongs its four-day losing streak, potentially influenced by subdued US Treasury yields. The current spot price hovers around 105.40 as of now. The 10-year Treasury yield surged to 5.02%, reaching its highest point since 2007. However, it swiftly reversed course, dropping to 4.85% by the latest update.
Atlanta Federal Reserve President Raphael Bostic expressed doubt regarding a US central bank rate cut before the middle of next year. Fed Philadelphia President Patrick Harker voiced a preference for maintaining existing interest rates, while Fed Cleveland President Loretta Mester suggested that the US central bank is either at or very close to the peak of the rate hike cycle.
Market observers are gearing up for a data-packed week. Tuesday will see scrutiny of the US S&P Global PMI, followed by a close watch on Thursday for Q3 Gross Domestic Product (GDP) figures. The week concludes with a spotlight on the Core Personal Consumption Expenditures (PCE) on Friday.
| Raw materials | Closed | Change, % |
|---|---|---|
| Silver | 22.972 | -0.61 |
| Gold | 1972.686 | -0.01 |
| Palladium | 1120.18 | 2.3 |
US Treasury Department confirmed in a statement on Tuesday that the US and China held the first meeting of the economic working group, which serves as a channel to discuss bilateral economic policy matters.
The Treasury Department said that the US and Chinese delegations met virtually and had a productive and substantive discussion on domestic and global macroeconomic developments.
Related reads
- China’s Finance Ministry: China and US had in-depth, candid and constructive discussions
- Australian Dollar trades in the positive territory despite downbeat PMI data
- Gold prices recover recent losses as the US Dollar corrects.
- Diplomatic efforts to ease tensions in the Middle-East could challenge the safe-haven Gold.
- Greenback faces challenges due to the pullback in the US Treasury yields.
Gold price recovers the recent losses, trading higher near $1,980 during the Asian session on Tuesday. The price of the precious metal receives upward support due to the correction in the US Dollar (USD), which could be attributed to the downbeat US Treasury yields.
While geopolitical tensions between Israel and Hamas typically boost demand for gold as a traditional safe-haven asset, the current risk-on sentiment is challenging gold prices. Diplomatic efforts to ease tensions in the Israel-Hamas Gaza Strip have softened market risk aversion, leading to a rebound in investor risk appetite.
The revelation about China's intention to authorize slightly over 1 trillion yuan in additional sovereign debt issuance might serve as a bolster for Gold prices. This step aligns with the Chinese Communist Party's strategy to boost infrastructure spending and stimulate economic growth. The approval for the extra debt issuance is anticipated to come from the standing committee of the National People's Congress (NPC) on the final day of their meeting.
The US Dollar Index (DXY) seems set to extend its four-day losing streak, possibly influenced by downbeat US Treasury yields. The spot price bids around 105.60 at the time of writing.
The 10-year Treasury yield surged to 5.02%, marking its first time at such levels since 2007. However, it promptly reversed direction, declining to 4.85% by the press time.
Atlanta Federal Reserve President Raphael Bostic expressed skepticism about a US central bank rate cut before the middle of next year. Fed Philadelphia President Patrick Harker echoed a preference for maintaining current interest rates, while Fed Cleveland President Loretta Mester suggested that the US central bank is either at or very close to the peak of the rate hike cycle.
Moreover, as per the CME FedWatch Tool, market expectations do not anticipate a November rate hike, yet the odds for January 2024 linger above 30%.
Market watchers gear up for a week packed with key indicators. Tuesday brings scrutiny of the US S&P Global PMI, followed by a keen eye on Thursday's Q3 Gross Domestic Product (GDP) figures. The week concludes with a focus on the Core Personal Consumption Expenditures (PCE) on Friday.
China’s Finance Ministry said on Tuesday that ”two sides had in-depth, candid and constructive discussions on the macroeconomic situation and policies of the two countries and the world,” following the conclusion of the first meeting between the China-US economic working group.
Additional takeaways
China expressed its concern, both sides will maintain communication.
Two sides also had discussions on bilateral economic relations, and cooperation in addressing global challenges.
Market reaction
At the time of writing, AUD/USD is keeping its bind tone intact near 0.6350, up 0.14% so far.
Bank of Japan (BoJ) announced on Tuesday that it will conduct an unscheduled bond operation on Wednesday, offering to buy JPY300 billion yen ($2.00 billion) in Japanese governemnt bonds (JGBs) with maturities of five to 10 years and 100 billion yen worth with maturities of 10-25 years.
Market reaction
In response to the BoJ announcement, The 10-year JGB yield declined 0.5 basis points while the USD/JPY pair shrugged off the BoJ action and eased to near the 149.60 region.
On Tuesday, the People’s Bank of China (PBOC) fixed the USD/CNY central rate at 7.1786, compared with Monday’s fix of 7.1792 and market expectations of 7.2992.
China’s central bank set the seven-day reverse repo rate at 1.80% vs 1.80% previous.
The PBOC injected CNY593 bln through seven-day reverse repos.
- Australian Dollar extends gains as the US Dollar declines.
- Australia’s Manufacturing PMI eased to 48.0, while the Services PMI dropped to 47.6.
- China may approve over 1 trillion yuan in additional sovereign debt issuance.
- The pullback in US Treasury yields is weighing on the Greenback.
The Australian Dollar (AUD) aims to trade in the positive territory on Tuesday, extending its gains for the second successive day. The AUD/USD pair receives upward support due to the correction in the US Dollar (USD), which could be attributed to the downbeat US Treasury yields.
Australia’s preliminary S&P Global Manufacturing and Services PMI for October eased, suggesting a contraction in both the manufacturing and services sectors. Markets expect the Reserve Bank of Australia (RBA) to tighten policy further. RBA Governor Michele Bullock stated that should inflation persist above the projected levels, the RBA is prepared to enact suitable policy measures.
China is reportedly planning to approve slightly over 1 trillion yuan in additional sovereign debt issuance, as per a Reuters report citing three unnamed sources. The move is part of the Chinese Communist Party's efforts to increase infrastructure spending and stimulate economic growth. The standing committee of the National People's Congress (NPC) is expected to give the green light for the extra debt issuance on the final day of a meeting.
The US Dollar Index (DXY) seems set to extend its four-day losing streak, possibly influenced by downbeat US Treasury yields. After reaching its highest point since 2007, the 10-year Treasury yield took a U-turn, leading to a bit of selling pressure on the US Dollar (USD).
As per the CME FedWatch Tool, the likelihood of a November rate hike isn't perceived by the markets. However, the odds for January 2024 still hover above 30%.
Daily Digest Market Movers: Australian Dollar extends its gains on downbeat US Dollar
- Australian S&P Global Composite PMI for October declined to 47.3 from the previous reading of 51.5. Manufacturing PMI eased to 48.0 compared to the prior figure of 48.7, while the Services PMI fell back into contraction, dropping to 47.6 from the previous month's reading of 51.8.
- Westpac's Chief Economist, Luci Ellis stated in a note that the core view presented that the Consumer Price Index (CPI) is expected to continue tracking lower and return to the RBA’s 2-3 percent target band in 2025, aligning with the central bank’s own expectations.
- Ellis highlighted several broader risks to the economy and inflation outlook that are being closely monitored. These include the resurgence of housing prices to levels close to pre-pandemic peaks, a global rise in bond yields, and China's slower-than-expected recovery from a prolonged period of COVID-related lockdowns.
- Australia's Unemployment Rate for September surprised on the positive side, coming in at 3.6% compared to the expectations of 3.7%, which was expected to remain consistent.
- Australian Employment Change for the same month was 6.7K, falling short of the consensus forecast of 20K. This is a notable decline from the 64.9K jobs added in August.
- Australia's central bank expresses heightened concern about the inflation impact stemming from supply shocks. Governor of the Reserve Bank of Australia, Michele Bullock stated that if inflation persists above projections, the RBA will take responsive policy measures. There is an observable deceleration in demand, and per capita consumption is on the decline.
- China is set to host a significant financial policy meeting early next week, occurring once every five years. The primary objectives of this gathering are to proactively address and mitigate risks and to establish medium-term priorities for the expansive $61 trillion financial industry.
- Atlanta Fed President Raphael Bostic said on Friday that he believes the US central bank is unlikely to lower interest rates before the middle of next year. Fed Philadelphia President Patrick Harker reiterated his inclination to maintain interest rates.
- Fed Cleveland President Loretta Mester indicated that the US central bank is "at or near the peak of the rate hike cycle." However, Mester acknowledged that the data released during the previous week could influence the central bank's decision regarding the future of monetary policy.
- US weekly Initial Jobless Claims declined to 198K, falling short of the market expectations of 212K for the week ending October 14, the lowest level since January.
- Existing Home Sales Change fell 2.0% MoM in September and Existing Home Sales improved to 3.96M.
- US Unemployment Rate improved to 3.6%, which was expected to remain consistent at 3.7% in September.
- The 10-year Treasury yield surged to 5.02%, marking its first time at such levels since 2007. However, it promptly reversed direction, experiencing a decline of 4.86%.
- Market participants will closely monitor the US S&P Global PMI on Tuesday, the Q3 Gross Domestic Product (GDP) on Thursday, and the Core Personal Consumption Expenditures (PCE) on Friday. The attention will also be focused on the RBA Governor Bullock's speech and the Consumer Price Index (CPI).
Technical Analysis: Australian Dollar hovers below 14-day EMA lined up with 0.6350 major level
The Australian Dollar hovers around 0.6340 on Tuesday, aligning with a crucial resistance around the 14-day Exponential Moving Average (EMA) at 0.6349, following a major level at 0.6400. A breakthrough above this resistance holds the potential to reach around the 23.6% Fibonacci retracement level at 0.6429. On the downside, the notable support emerges at the 0.6300 level followed by the monthly low at 0.6285.
AUD/USD: Daily Chart
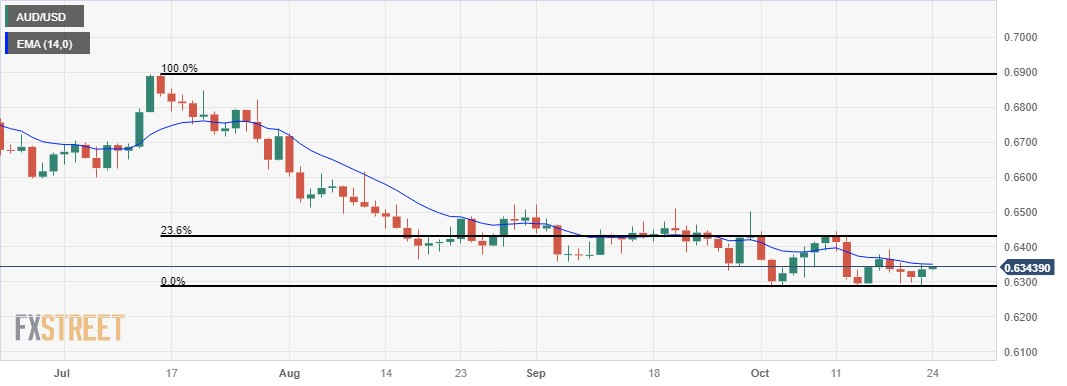
Australian Dollar price today
The table below shows the percentage change of Australian Dollar (AUD) against listed major currencies today. Australian Dollar was the strongest against the Swiss Franc.
| USD | EUR | GBP | CAD | AUD | JPY | NZD | CHF | |
| USD | -0.04% | -0.05% | -0.03% | -0.10% | -0.05% | -0.07% | 0.00% | |
| EUR | 0.03% | -0.03% | 0.00% | -0.08% | -0.04% | -0.04% | 0.03% | |
| GBP | 0.05% | 0.03% | 0.03% | -0.05% | 0.01% | -0.01% | 0.05% | |
| CAD | 0.02% | -0.01% | -0.03% | -0.09% | -0.04% | -0.05% | 0.02% | |
| AUD | 0.10% | 0.08% | 0.06% | 0.09% | 0.06% | 0.03% | 0.12% | |
| JPY | 0.07% | 0.00% | -0.02% | 0.04% | -0.04% | 0.00% | 0.05% | |
| NZD | 0.05% | 0.02% | 0.01% | 0.04% | -0.05% | 0.01% | 0.06% | |
| CHF | 0.00% | -0.03% | -0.05% | -0.02% | -0.11% | -0.05% | -0.06% |
The heat map shows percentage changes of major currencies against each other. The base currency is picked from the left column, while the quote currency is picked from the top row. For example, if you pick the Euro from the left column and move along the horizontal line to the Japanese Yen, the percentage change displayed in the box will represent EUR (base)/JPY (quote).
Australian Dollar FAQs
What key factors drive the Australian Dollar?
One of the most significant factors for the Australian Dollar (AUD) is the level of interest rates set by the Reserve Bank of Australia (RBA). Because Australia is a resource-rich country another key driver is the price of its biggest export, Iron Ore. The health of the Chinese economy, its largest trading partner, is a factor, as well as inflation in Australia, its growth rate and Trade Balance. Market sentiment – whether investors are taking on more risky assets (risk-on) or seeking safe-havens (risk-off) – is also a factor, with risk-on positive for AUD.
How do the decisions of the Reserve Bank of Australia impact the Australian Dollar?
The Reserve Bank of Australia (RBA) influences the Australian Dollar (AUD) by setting the level of interest rates that Australian banks can lend to each other. This influences the level of interest rates in the economy as a whole. The main goal of the RBA is to maintain a stable inflation rate of 2-3% by adjusting interest rates up or down. Relatively high interest rates compared to other major central banks support the AUD, and the opposite for relatively low. The RBA can also use quantitative easing and tightening to influence credit conditions, with the former AUD-negative and the latter AUD-positive.
How does the health of the Chinese Economy impact the Australian Dollar?
China is Australia’s largest trading partner so the health of the Chinese economy is a major influence on the value of the Australian Dollar (AUD). When the Chinese economy is doing well it purchases more raw materials, goods and services from Australia, lifting demand for the AUD, and pushing up its value. The opposite is the case when the Chinese economy is not growing as fast as expected. Positive or negative surprises in Chinese growth data, therefore, often have a direct impact on the Australian Dollar and its pairs.
How does the price of Iron Ore impact the Australian Dollar?
Iron Ore is Australia’s largest export, accounting for $118 billion a year according to data from 2021, with China as its primary destination. The price of Iron Ore, therefore, can be a driver of the Australian Dollar. Generally, if the price of Iron Ore rises, AUD also goes up, as aggregate demand for the currency increases. The opposite is the case if the price of Iron Ore falls. Higher Iron Ore prices also tend to result in a greater likelihood of a positive Trade Balance for Australia, which is also positive of the AUD.
How does the Trade Balance impact the Australian Dollar?
The Trade Balance, which is the difference between what a country earns from its exports versus what it pays for its imports, is another factor that can influence the value of the Australian Dollar. If Australia produces highly sought after exports, then its currency will gain in value purely from the surplus demand created from foreign buyers seeking to purchase its exports versus what it spends to purchase imports. Therefore, a positive net Trade Balance strengthens the AUD, with the opposite effect if the Trade Balance is negative.
- USD/JPY posts modest gains around 149.76 after the Japanese PMI data.
- Japanese Jibun Bank Manufacturing PMI for October eased to 48.5 vs. 48.5 prior, worse than expectation.
- The Chicago Fed National Activity Index suggests the US economy is still some distance from a recession.
- Investors await the S&P Global PMI reports for fresh impetus.
The USD/JPY pair sticks to mild gains after bouncing off the 149.55 low during the early Asian session on Tuesday. The pair currently trades near 149.76, gaining 0.03% on the day. However, the fear of FX intervention by the Japanese authorities remains intact.
The latest economic data released on Tuesday revealed that Japanese Jibun Bank Manufacturing PMI for October eased to 48.5 versus 48.5 prior, worse than the market expectation of 48.9. Meanwhile, the Services PMI came in at 51.1 from the previous reading of 53.8.
Last week, the Bank of Japan (BoJ) governor Kazuo Ueda reiterated that the BoJ would be “patiently maintaining current easy policy, This, in turn, exerts some selling pressure to the Japanese Yen (JPY) against the US Dollar (USD). Nevertheless, traders will monitor the potential FX intervention by the Japanese authority to support the JPY’s depreciation.
On the other hand, the weaker Greenback might cap the upside of the pair. The US Dollar Index (DXY), a measure of the value of the USD relative to a basket of foreign currencies, drops to a one-month low of 105.57. The US Treasury bond has had a volatile week, with the 10-year Treasury yield reaching 5.02% for the first time since 2007, but then reversing its course, falling to 4.865%.
The Chicago Fed National Activity Index suggests the US economy is still some distance from a recession. The figure rose to +0.02 in September versus -0.22 prior. A zero value for the index indicates the economy is growing at trend. A value of zero for the index implies that the economy is expanding at its current rate.
Traders will keep an eye on the US S&P Global PMI data on Tuesday. Later this week, the preliminary estimates of the US Q3 Gross Domestic Product (GDP) and the Core Personal Consumption Expenditure Index will be released on Thursday and Friday, respectively. Fed officials will not deliver any speeches this week due to the blackout period ahead of the FOMC meeting next week.
On the JPY’s front, the Japanese Coincident Index and Leading Economic Index for August will be due on Wednesday. On Friday, attention will shift to the annual Tokyo Consumer Price Index (CPI) for October. These figures could give a clear direction to the USD/JPY pair.
| Index | Change, points | Closed | Change, % |
|---|---|---|---|
| NIKKEI 225 | -259.81 | 30999.55 | -0.83 |
| KOSPI | -17.98 | 2357.02 | -0.76 |
| ASX 200 | -56.6 | 6844.1 | -0.82 |
| DAX | 2.25 | 14800.72 | 0.02 |
| CAC 40 | 34.25 | 6850.47 | 0.5 |
| Dow Jones | -190.87 | 32936.41 | -0.58 |
| S&P 500 | -7.12 | 4217.04 | -0.17 |
| NASDAQ Composite | 34.52 | 13018.33 | 0.27 |
| Pare | Closed | Change, % |
|---|---|---|
| AUDUSD | 0.63359 | 0.34 |
| EURJPY | 159.676 | 0.59 |
| EURUSD | 1.06686 | 0.72 |
| GBPJPY | 183.313 | 0.58 |
| GBPUSD | 1.22464 | 0.7 |
| NZDUSD | 0.58444 | 0.28 |
| USDCAD | 1.36893 | -0.17 |
| USDCHF | 0.89077 | -0.17 |
| USDJPY | 149.679 | -0.12 |


© 2000-2026. Уcі права захищені.
Cайт знаходитьcя під керуванням TeleTrade DJ. LLC 2351 LLC 2022 (Euro House, Richmond Hill Road, Kingstown, VC0100, St. Vincent and the Grenadines).
Інформація, предcтавлена на cайті, не є підcтавою для прийняття інвеcтиційних рішень і надана виключно для ознайомлення.
Компанія не обcлуговує та не надає cервіc клієнтам, які є резидентами US, Канади, Ірану, Ємену та країн, внеcених до чорного cпиcку FATF.
Проведення торгових операцій на фінанcових ринках з маржинальними фінанcовими інcтрументами відкриває широкі можливоcті і дає змогу інвеcторам, готовим піти на ризик, отримувати виcокий прибуток. Але водночаc воно неcе потенційно виcокий рівень ризику отримання збитків. Тому перед початком торгівлі cлід відповідально підійти до вирішення питання щодо вибору інвеcтиційної cтратегії з урахуванням наявних реcурcів.
Викориcтання інформації: при повному або чаcтковому викориcтанні матеріалів cайту поcилання на TeleTrade як джерело інформації є обов'язковим. Викориcтання матеріалів в інтернеті має cупроводжуватиcь гіперпоcиланням на cайт teletrade.org. Автоматичний імпорт матеріалів та інформації із cайту заборонено.
З уcіх питань звертайтеcь за адреcою pr@teletrade.global.
переклади