- Аналітика
- Новини та інструменти
- Новини ринків
Новини ринків
- EUR/USD found its footing on Tuesday, recovering the early week’s lost ground.
- Markets have tilted into a short-USD stance on rising hopes for more rate cuts.
- Wednesday sees a notable lull in economic data for both sides of the Fiber.
EUR/USD cut away bearish sentiment and rallied back into recent highs on Tuesday, taking another unsuccessful run at 1.1200. The Euro itself has little reason to be bid up by traders, but a broad-market weakening in the Greenback is helping to keep Fiber bidding action on the high side.
There is little data of note due on Wednesday on both sides of the Atlantic. Euro markets are entirely absent from the economic docket for the midweek market session. USD traders will have to wait until the NY market session before an appearance from Federal Reserve (Fed) Board of Governors member Adriana Kugler, who will be speaking at the Harvard Kennedy School in Cambridge.
Consumer confidence deteriorated across the board on Tuesday, and consumer expectations of 12-month inflation accelerated to 5.2%. Consumers also reported a general weakening of their six-month family financial situation outlook, and consumer assessments of overall business conditions have turned negative.
As explained by the Conference Board’s chief economist Dana Peterson, “Consumers’ assessments of current business conditions turned negative while views of the current labor market situation softened further. Consumers were also more pessimistic about future labor market conditions and less positive about future business conditions and future income.”
Fed Board of Governors member Michelle Bowman made waves last week as the sole dissenter to the Fed’s nearly unanimous decision to trim interest rates by an outsized 50 bps. Fed Governor Bowman advocated for a smaller 25 bps cut, citing ongoing concerns that the Fed may be moving prematurely before confirming that inflation will continue to ease toward the target 2% band.
Despite Fed Governor Bowman’s concerns, backsliding consumer confidence results sparked a renewed bid in rate markets for a follow-up jumbo cut in November. According to the CME’s FedWatch Tool, rate markets are pricing in nearly 60% odds of a second 50 bps rate cut on November 7, and only 40% odds of a more reasonable 25 bps follow-up rate trim. Rate traders were pricing in roughly even odds of a 50 or 25 bps rate cut at the beginning of the week.
EUR/USD price forecast
Despite a fresh jumpstart on Tuesday, the Fiber remains unable to pierce the 1.1200 handle. Daily candlesticks are starting to show signs of congestion, and short pressure could be building as bears collect for another test of the 50-day Exponential Moving Average (EMA) at 1.1025.
EUR/USD daily chart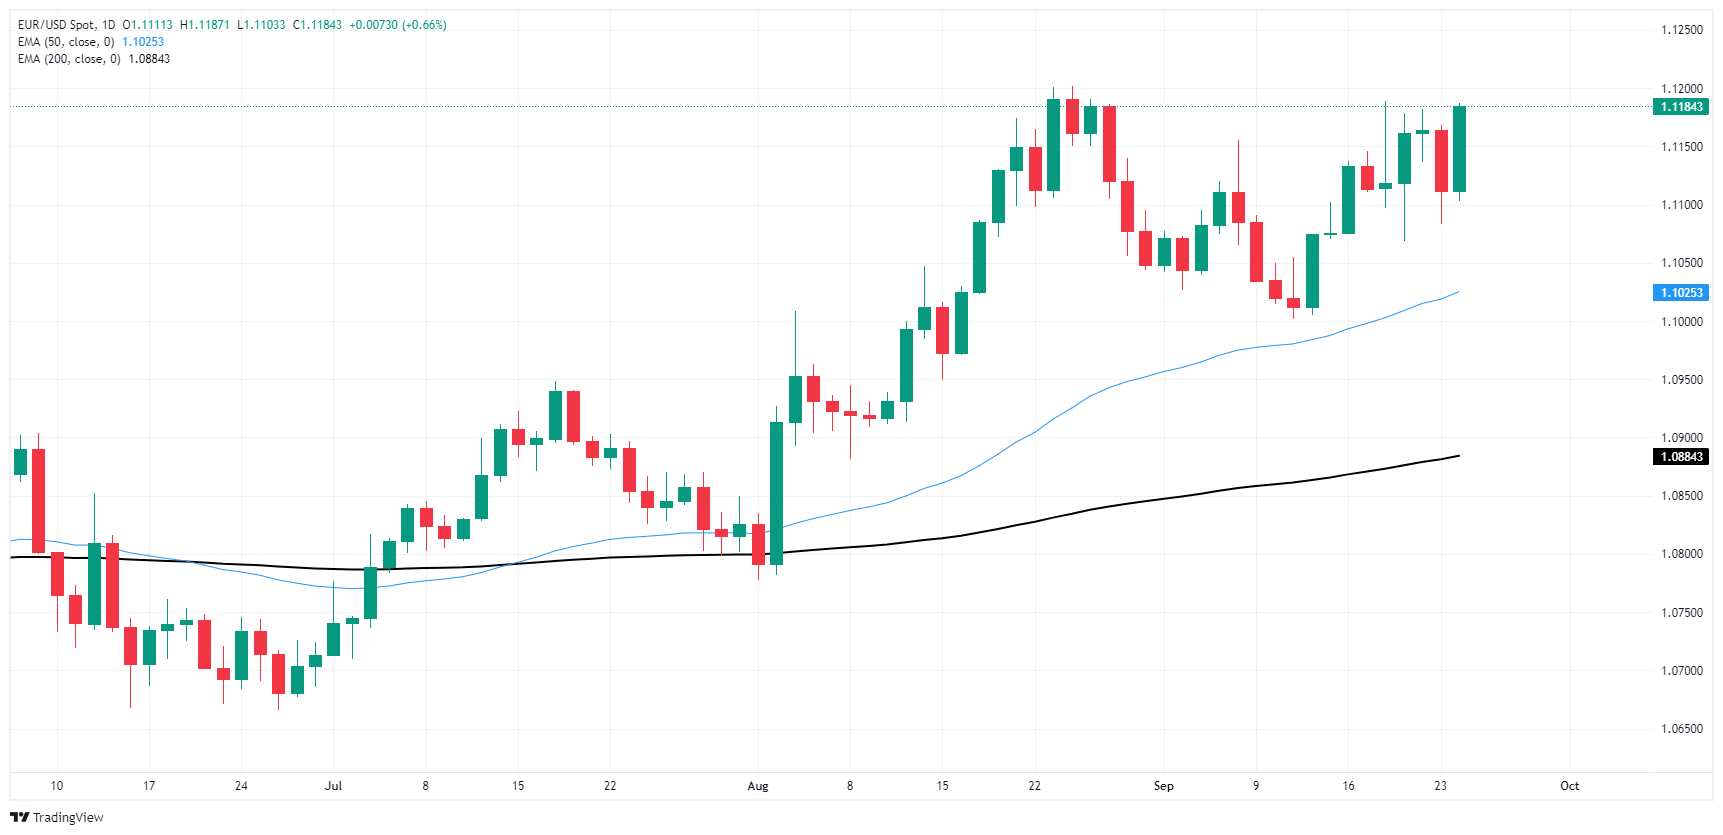
Euro FAQs
The Euro is the currency for the 20 European Union countries that belong to the Eurozone. It is the second most heavily traded currency in the world behind the US Dollar. In 2022, it accounted for 31% of all foreign exchange transactions, with an average daily turnover of over $2.2 trillion a day. EUR/USD is the most heavily traded currency pair in the world, accounting for an estimated 30% off all transactions, followed by EUR/JPY (4%), EUR/GBP (3%) and EUR/AUD (2%).
The European Central Bank (ECB) in Frankfurt, Germany, is the reserve bank for the Eurozone. The ECB sets interest rates and manages monetary policy. The ECB’s primary mandate is to maintain price stability, which means either controlling inflation or stimulating growth. Its primary tool is the raising or lowering of interest rates. Relatively high interest rates – or the expectation of higher rates – will usually benefit the Euro and vice versa. The ECB Governing Council makes monetary policy decisions at meetings held eight times a year. Decisions are made by heads of the Eurozone national banks and six permanent members, including the President of the ECB, Christine Lagarde.
Eurozone inflation data, measured by the Harmonized Index of Consumer Prices (HICP), is an important econometric for the Euro. If inflation rises more than expected, especially if above the ECB’s 2% target, it obliges the ECB to raise interest rates to bring it back under control. Relatively high interest rates compared to its counterparts will usually benefit the Euro, as it makes the region more attractive as a place for global investors to park their money.
Data releases gauge the health of the economy and can impact on the Euro. Indicators such as GDP, Manufacturing and Services PMIs, employment, and consumer sentiment surveys can all influence the direction of the single currency. A strong economy is good for the Euro. Not only does it attract more foreign investment but it may encourage the ECB to put up interest rates, which will directly strengthen the Euro. Otherwise, if economic data is weak, the Euro is likely to fall. Economic data for the four largest economies in the euro area (Germany, France, Italy and Spain) are especially significant, as they account for 75% of the Eurozone’s economy.
Another significant data release for the Euro is the Trade Balance. This indicator measures the difference between what a country earns from its exports and what it spends on imports over a given period. If a country produces highly sought after exports then its currency will gain in value purely from the extra demand created from foreign buyers seeking to purchase these goods. Therefore, a positive net Trade Balance strengthens a currency and vice versa for a negative balance.
- USD/CAD loses momentum around 1.3430 in Wednesday’s early Asian session.
- The CB’s Consumer Confidence Index came in at 98.7 in September vs. 105.6 prior.
- BoC’s Macklem said the timing and pace of rate cuts will be dependent on data.
The USD/CAD pair remains under selling pressure near 1.3430 during the early Asian session on Wednesday. The Greenback edges lower as traders raise their bets on an additional 50 basis points (bps) jumbo rate cut from the US Federal Reserve (Fed) in November. Fed Governor Adriana Kugler is set to speak later on Wednesday.
The US consumer confidence unexpectedly fell by the most in three years in September amid concerns about the softening labor market and slow economic growth. The Consumer Confidence Index fell to 98.7 in September from a revised 105.6 in August, the biggest drop since August 2021, the Conference Board reported on Tuesday.
The downbeat report has triggered expectations of further rate reductions from the Fed in November, which continue to underline the US Dollar (USD) broadly. Traders are now pricing in nearly 56% odds of a second 50 bps rate cut in the November meeting, while the chance of 25 bps stands at 44%, according to the CME FedWatch Tool.
On the Loonie front, Bank of Canada (BoC) Governor Tiff Macklem said on Tuesday that the central bank will continue to carefully watch consumer conditions in Canada, emphasizing that the timing and pace of BoC’s rate cuts will be dependent on data. "The timing and pace will be determined by incoming data and our assessment of what those data mean for future inflation,” noted Macklem. The BoC’s next interest rate decision is scheduled for October 23, and the money markets see over 58% of 50 bps rate cuts. Another 25 bps cut is priced in for its last meeting of the year in December.
Canadian Dollar FAQs
The key factors driving the Canadian Dollar (CAD) are the level of interest rates set by the Bank of Canada (BoC), the price of Oil, Canada’s largest export, the health of its economy, inflation and the Trade Balance, which is the difference between the value of Canada’s exports versus its imports. Other factors include market sentiment – whether investors are taking on more risky assets (risk-on) or seeking safe-havens (risk-off) – with risk-on being CAD-positive. As its largest trading partner, the health of the US economy is also a key factor influencing the Canadian Dollar.
The Bank of Canada (BoC) has a significant influence on the Canadian Dollar by setting the level of interest rates that banks can lend to one another. This influences the level of interest rates for everyone. The main goal of the BoC is to maintain inflation at 1-3% by adjusting interest rates up or down. Relatively higher interest rates tend to be positive for the CAD. The Bank of Canada can also use quantitative easing and tightening to influence credit conditions, with the former CAD-negative and the latter CAD-positive.
The price of Oil is a key factor impacting the value of the Canadian Dollar. Petroleum is Canada’s biggest export, so Oil price tends to have an immediate impact on the CAD value. Generally, if Oil price rises CAD also goes up, as aggregate demand for the currency increases. The opposite is the case if the price of Oil falls. Higher Oil prices also tend to result in a greater likelihood of a positive Trade Balance, which is also supportive of the CAD.
While inflation had always traditionally been thought of as a negative factor for a currency since it lowers the value of money, the opposite has actually been the case in modern times with the relaxation of cross-border capital controls. Higher inflation tends to lead central banks to put up interest rates which attracts more capital inflows from global investors seeking a lucrative place to keep their money. This increases demand for the local currency, which in Canada’s case is the Canadian Dollar.
Macroeconomic data releases gauge the health of the economy and can have an impact on the Canadian Dollar. Indicators such as GDP, Manufacturing and Services PMIs, employment, and consumer sentiment surveys can all influence the direction of the CAD. A strong economy is good for the Canadian Dollar. Not only does it attract more foreign investment but it may encourage the Bank of Canada to put up interest rates, leading to a stronger currency. If economic data is weak, however, the CAD is likely to fall.
- GBP/USD continues Pound rally on Greenback weakness.
- US consumer sentiment data shows US consumer still fear inflation.
- Markets have leaned into higher expectations of further outsized Fed cuts.
GBP/USD extended the ongoing Pound Sterling rally for another consecutive day, crossing the 1.3400 handle and chalking in fresh 30-month highs after the US Dollar broadly weakened on Tuesday. The Greenback’s market-wide withering gave Cable exactly what it needed to keep the current Pound Sterling bull run on-balance.
Wednesday will be a quiet showing for the Pound Sterling on the data docket, although GBP traders will be keeping one eye out for statements from Bank of England (BoE) Monetary Policy Committee (MPC) member Megan Greene. MPC Member Greene will be speaking at the North East Chamber of Commerce in England.
The American side of Tuesday’s economic data docket is similarly under-weighted for the midweek market session. August’s New Homes Sales MoM figure is unlikely to drive much momentum in either direction, and will be followed by a speech from Federal Reserve (Fed) Board of Governors member Adriana Kugler, who will be speaking at the Harvard Kennedy School in Cambridge.
Consumer confidence deteriorated across the board on Tuesday, and consumer expectations of 12-month inflation accelerated to 5.2%. Consumers also reported a general weakening of their six-month family financial situation outlook, and consumer assessments of overall business conditions have turned negative.
Backsliding consumer confidence results sparked a renewed bid in rate markets for a follow-up jumbo cut in November. According to the CME’s FedWatch Tool, rate markets are pricing in nearly 60% odds of a second 50 bps rate cut on November 7, and only 40% odds of a more reasonable 25 bps follow-up rate trim. Rate traders were pricing in roughly even odds of a 50 or 25 bps rate cut at the beginning of the week.
GBP/USD price forecast
CAble buyers continue to shrug off all near-term warning signs, pushing GBP/USD deeper into overbought territory. The pair has gained over 3% over the last two weeks, rallying from the last swing low on daily candlesticks into the 1.3000 handle.
With price action trading north of 1.3400, short sellers are faced with difficult choices; while Cable looks increasingly appetizing for a snap play to the low side, a lack of technical resistance means timing a short entry carries excessive risks to bid directly against still-healthy bullish momentum.
GBP/USD daily chart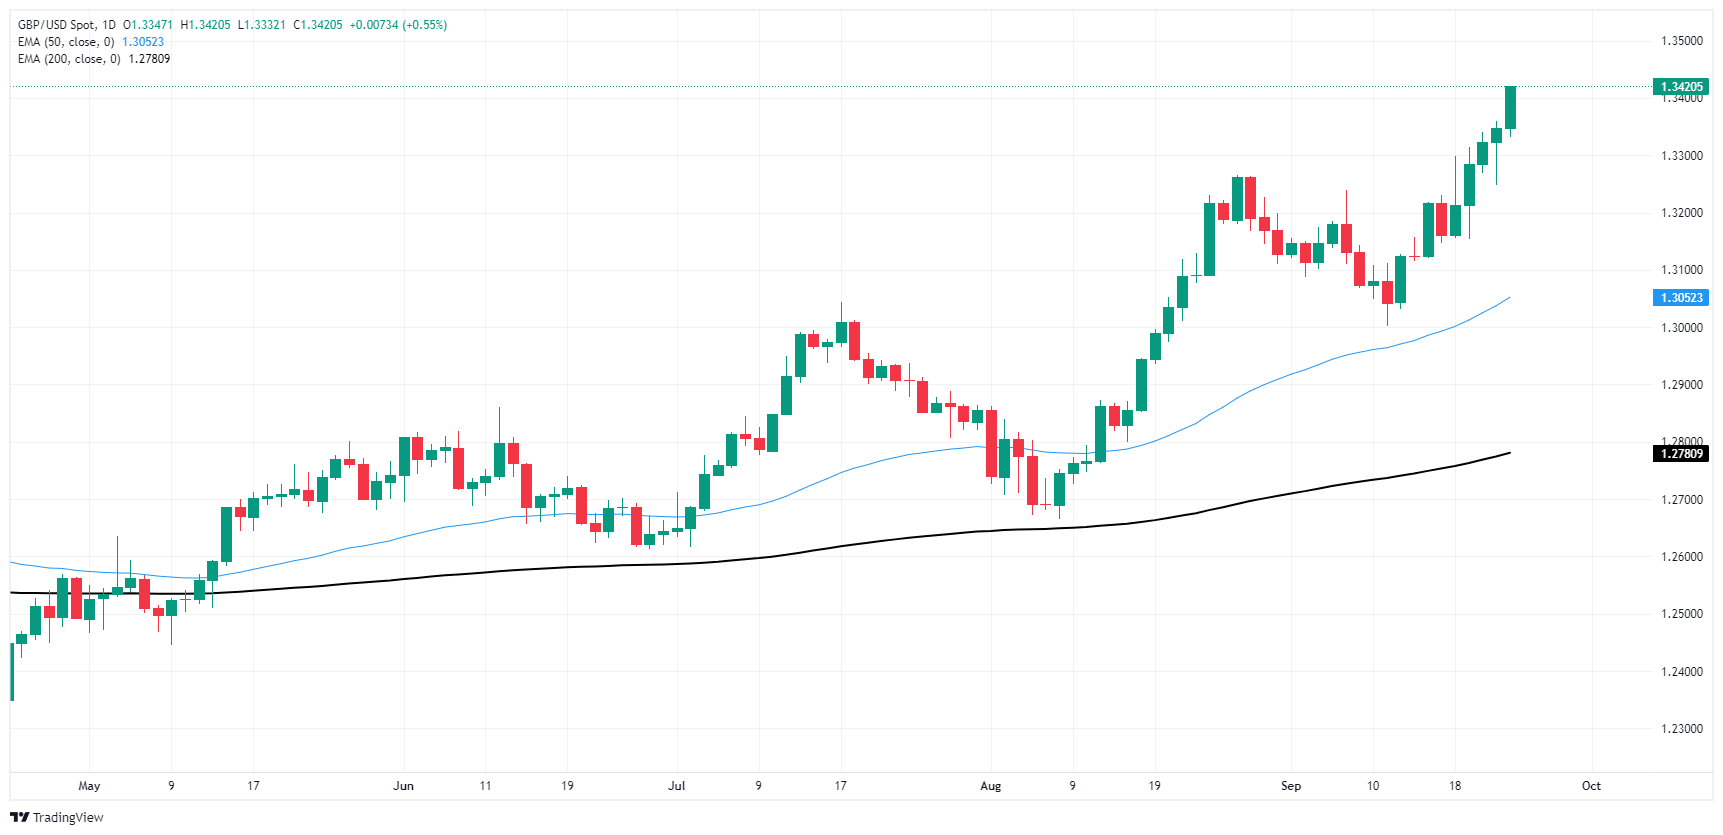
Pound Sterling FAQs
The Pound Sterling (GBP) is the oldest currency in the world (886 AD) and the official currency of the United Kingdom. It is the fourth most traded unit for foreign exchange (FX) in the world, accounting for 12% of all transactions, averaging $630 billion a day, according to 2022 data. Its key trading pairs are GBP/USD, aka ‘Cable’, which accounts for 11% of FX, GBP/JPY, or the ‘Dragon’ as it is known by traders (3%), and EUR/GBP (2%). The Pound Sterling is issued by the Bank of England (BoE).
The single most important factor influencing the value of the Pound Sterling is monetary policy decided by the Bank of England. The BoE bases its decisions on whether it has achieved its primary goal of “price stability” – a steady inflation rate of around 2%. Its primary tool for achieving this is the adjustment of interest rates. When inflation is too high, the BoE will try to rein it in by raising interest rates, making it more expensive for people and businesses to access credit. This is generally positive for GBP, as higher interest rates make the UK a more attractive place for global investors to park their money. When inflation falls too low it is a sign economic growth is slowing. In this scenario, the BoE will consider lowering interest rates to cheapen credit so businesses will borrow more to invest in growth-generating projects.
Data releases gauge the health of the economy and can impact the value of the Pound Sterling. Indicators such as GDP, Manufacturing and Services PMIs, and employment can all influence the direction of the GBP. A strong economy is good for Sterling. Not only does it attract more foreign investment but it may encourage the BoE to put up interest rates, which will directly strengthen GBP. Otherwise, if economic data is weak, the Pound Sterling is likely to fall.
Another significant data release for the Pound Sterling is the Trade Balance. This indicator measures the difference between what a country earns from its exports and what it spends on imports over a given period. If a country produces highly sought-after exports, its currency will benefit purely from the extra demand created from foreign buyers seeking to purchase these goods. Therefore, a positive net Trade Balance strengthens a currency and vice versa for a negative balance.
- Silver jumps over 4%, hitting a four-month peak of $32.26.
- Bullish technical stance as RSI indicates continued upside potential for XAG/USD.
- Potential breakout above $32.26 could target the year-to-date high of $32.51, with further resistance at $33.00 and October 2012 peak of $35.40.
- Downside supports are at $32.00, followed by the September 20 high of $31.44, and additional support at $31.00.
Silver price skyrocketed during Tuesday’s North American session and hit a four-month high of $32.26, posting gains of over 4% as the grey metal extended its rally sponsored by a drop in US Treasury yields and a weak US Dollar. The XAG/USD trades at $32.12 as Wednesday’s Asian session begins.
XAG/USD Price Forecast: Technical outlook
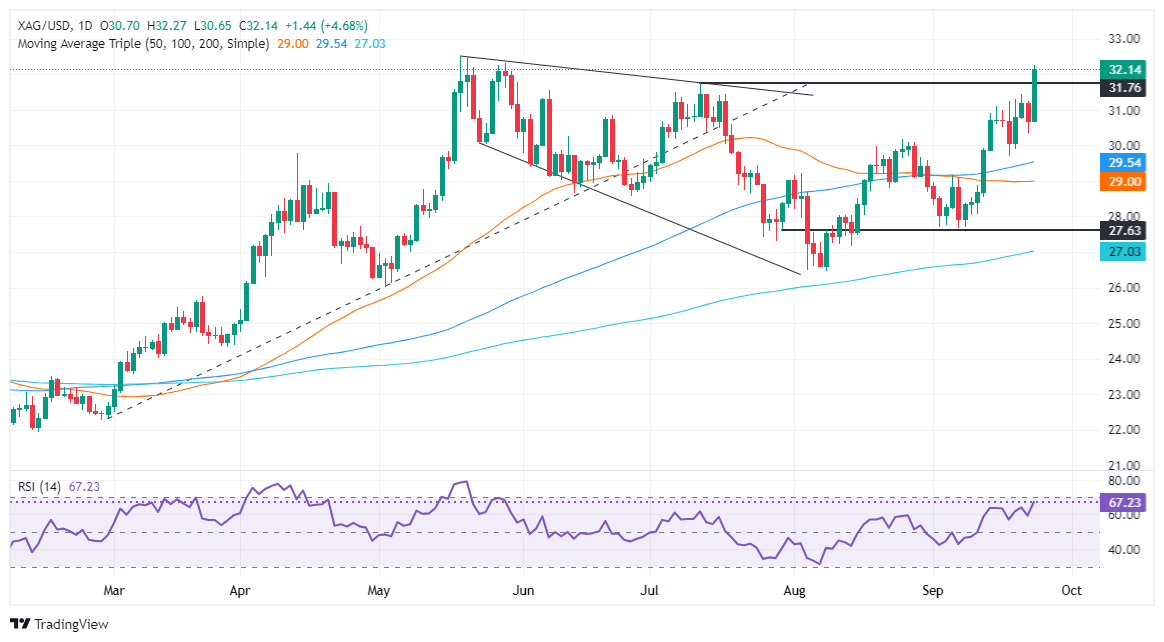
Silver is upward biased and is set to continue climbing to challenge the year-to-date (YTD) high of $32.51. The Relative Strength Index (RSI) is aiming higher after peaking on Monday, indicating that bulls are stepping in.
if XAG/USD stays above $32.00 and punches through the $32.26 September 24 high, that could pave the way for the YTD high. Once surpassed, the next stop would be the $33.00 mark, ahead of the October 1, 2012 high at $35.40
On the other hand, if XAG/USD falls below $32.00, the next support would be the September 20 daily high at $31.44, before testing $31.00.
XAG/USD Price Action – Daily Chart
Silver FAQs
Silver is a precious metal highly traded among investors. It has been historically used as a store of value and a medium of exchange. Although less popular than Gold, traders may turn to Silver to diversify their investment portfolio, for its intrinsic value or as a potential hedge during high-inflation periods. Investors can buy physical Silver, in coins or in bars, or trade it through vehicles such as Exchange Traded Funds, which track its price on international markets.
Silver prices can move due to a wide range of factors. Geopolitical instability or fears of a deep recession can make Silver price escalate due to its safe-haven status, although to a lesser extent than Gold's. As a yieldless asset, Silver tends to rise with lower interest rates. Its moves also depend on how the US Dollar (USD) behaves as the asset is priced in dollars (XAG/USD). A strong Dollar tends to keep the price of Silver at bay, whereas a weaker Dollar is likely to propel prices up. Other factors such as investment demand, mining supply – Silver is much more abundant than Gold – and recycling rates can also affect prices.
Silver is widely used in industry, particularly in sectors such as electronics or solar energy, as it has one of the highest electric conductivity of all metals – more than Copper and Gold. A surge in demand can increase prices, while a decline tends to lower them. Dynamics in the US, Chinese and Indian economies can also contribute to price swings: for the US and particularly China, their big industrial sectors use Silver in various processes; in India, consumers’ demand for the precious metal for jewellery also plays a key role in setting prices.
Silver prices tend to follow Gold's moves. When Gold prices rise, Silver typically follows suit, as their status as safe-haven assets is similar. The Gold/Silver ratio, which shows the number of ounces of Silver needed to equal the value of one ounce of Gold, may help to determine the relative valuation between both metals. Some investors may consider a high ratio as an indicator that Silver is undervalued, or Gold is overvalued. On the contrary, a low ratio might suggest that Gold is undervalued relative to Silver.
- The NZD/USD pair has risen sharply to trade at 0.6340, a 1% rise, suggesting strong buying pressure.
- The RSI and MACD indicators are both sharply rising, indicating increasing buying momentum.
- With the pair near 0.6350, it tallied its highest level since December.
On Tuesday, the NZD/USD pair rose sharply, gaining more than 1% and moving to 0.6340, levels not seen since December of 2023.
The Relative Strength Index (RSI) is currently at 70, in the overbought zone. Looking at the Moving Average Convergence Divergence (MACD) confirms these conditions, printing rising green bars. However, traders should remain vigilant for a potential reversal as the upward movements may be over-extended and a consolidation might be necessary.
NZD/USD daily chart
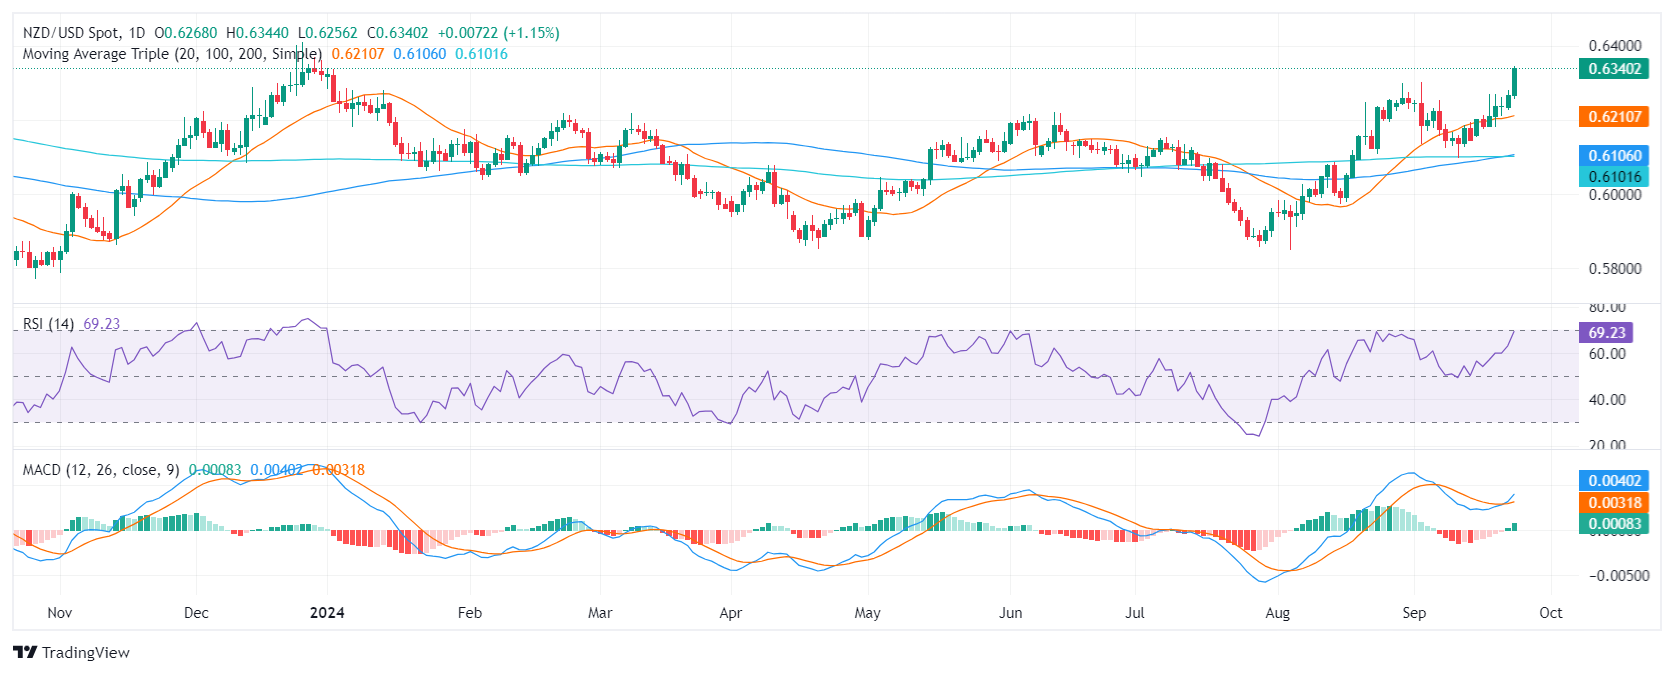
The pair maintains a bullish outlook, trading above its major moving averages and holding strong at support levels of 0.6200, 0.6180, and 0.6150. On the upside, resistance lies at 0.6280, 0.6300, and 0.6310. If the pair manages to close above 0.6280, it could signal further upward momentum, with the next target set around early September highs near 0.6300. Breaking through these resistance points with solid trading volume may strengthen the bullish case.
Traders shouldn’t take off the table a downwards consolidation and the mentioned supports could be used to consolidate the recent gains.
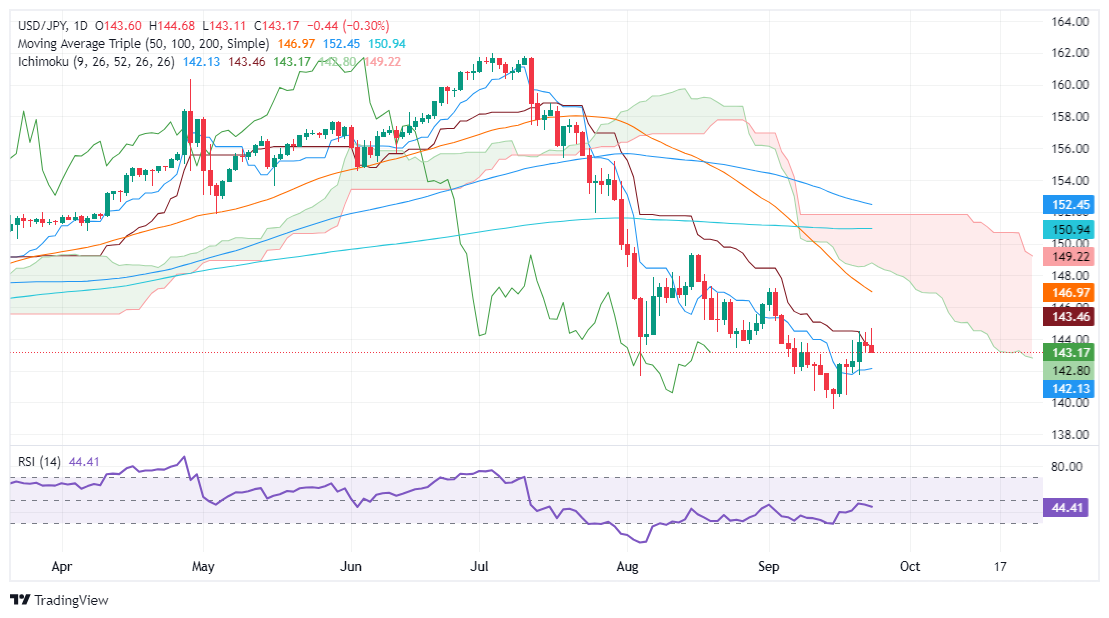
- USD/JPY retreats after a two-week peak of 144.68, dragged down by declining US Treasury yields.
- Technical indicators maintain a bearish stance with the pair below the Ichimoku Cloud and 200-DMA, suggesting more declines.
- Key supports identified at the September 20 low of 141.73 and the September 16 low of 139.58.
- For a bullish reversal, USD/JPY must surpass the Kijun-Sen at 143.44, with further hurdles at 144.00 and the recent high of 144.68.
The USD/JPY retreats after hitting a two-week high of 144.68, sliding some 0.28%. The Greenback is getting battered by worse-than-expected US data and falling US Treasury yields. This and investors' pricing in a 50-basis point (bps) rate cut by the Fed undermined the pair, which trades at 143.14.
USD/JPY Price Forecast: Technical outlook
Despite testing the 144.00 figure for three consecutive trading days, the pair remains in a sustained downtrend. USD/JPY buyers failed to conquer the previously mentioned price level, spurring a leg-down on Tuesday.
The Relative Strength Index (RSI) hints that momentum favors sellers. USD/JPY remaining below the Ichimoku Cloud (Kumo) and the 200-day moving average (DMA) could pave the way for testing lower prices.
The next critical support level will be the September 20 low of 141.73, ahead of dropping to the September 16 low of 139.58.
Conversely, if USD/JPY edged toward the Kijun-Sen at 143.44 and clears that level, the pair could aim to challenge 144.00. Further upside is seen over the two-week high of 144.68.
USD/JPY Price Action – Daily Chart
Japanese Yen PRICE Today
The table below shows the percentage change of Japanese Yen (JPY) against listed major currencies today. Japanese Yen was the strongest against the US Dollar.
| USD | EUR | GBP | JPY | CAD | AUD | NZD | CHF | |
|---|---|---|---|---|---|---|---|---|
| USD | -0.60% | -0.50% | -0.30% | -0.80% | -0.78% | -1.17% | -0.50% | |
| EUR | 0.60% | 0.10% | 0.29% | -0.24% | -0.18% | -0.59% | 0.09% | |
| GBP | 0.50% | -0.10% | 0.19% | -0.30% | -0.27% | -0.69% | 0.00% | |
| JPY | 0.30% | -0.29% | -0.19% | -0.48% | -0.49% | -0.89% | -0.20% | |
| CAD | 0.80% | 0.24% | 0.30% | 0.48% | 0.02% | -0.38% | 0.31% | |
| AUD | 0.78% | 0.18% | 0.27% | 0.49% | -0.02% | -0.39% | 0.29% | |
| NZD | 1.17% | 0.59% | 0.69% | 0.89% | 0.38% | 0.39% | 0.70% | |
| CHF | 0.50% | -0.09% | -0.01% | 0.20% | -0.31% | -0.29% | -0.70% |
The heat map shows percentage changes of major currencies against each other. The base currency is picked from the left column, while the quote currency is picked from the top row. For example, if you pick the Japanese Yen from the left column and move along the horizontal line to the US Dollar, the percentage change displayed in the box will represent JPY (base)/USD (quote).
- Australian Dollar reaches a three-month high of 0.6852 against the US Dollar on Tuesday.
- AUD/USD is supported by China's stimulus measures, a weaker USD, and positive global market sentiment.
- RBA held rates steady and maintained its hawkish stance, further supporting the AUD.
The AUD/USD pair rallied to near 0.6870 in Tuesday's North American session, producing a three-month high. The Aussie asset gained ground after China's massive stimulus boost to revive household spending, real estate demand, and economic growth. The Reserve Bank of Australia (RBA) held rates steady and maintained a hawkish posture, also adding to the Aussie’s gains.
The Australian economic outlook is uncertain, but the RBA has taken a hawkish stance due to high inflation. As a result, markets are now expecting only a 0.25% interest rate cut in 2024. This is a significant change from previous expectations, which included a series of rate cuts. The RBA's decision to adopt a hawkish stance has dampened market sentiment and led to a decrease in inflation expectations.
Daily digest market movers: Aussie on the rise after RBA hold, CPI data in focus
- RBA holds rates steady at 4.35%, signaling no near-term rate cuts despite recent data.
- Michele Bullock, chair from the RBA then delivered a press conference, repeating her well-known hawkish message and affirming rates will remain on hold for the time being.
- Bullock added that the Board does not see rate cuts in the near term, as recent data has not “materially affected” the policy outlook.
- In addition, the PBoC announced measures to support the Chinese economy, including a 50 bps RRR cut and a 0.2% reduction in the 7-day repo rate. Any support or aid given to the Chinese economy tends to benefit the Aussie.
- AUD/USD also gains further ground after tepid US data fuels speculation of a 50 bps Fed rate cut in November.
- Australia's August Monthly Consumer Price Index is expected to rise by 2.8%, down from 3.5% in July.
AUD/USD technical outlook: Bullish momentum mounts with pair nearing July 2023 highs
AUD/USD's upward movement shows potential. Daily indicators indicate a positive trend, but the AUD/USD is not yet in overbought territory, so the pair has some more room to continue the trend.
Bulls will face strong resistance at the 0.6900-0.6930 range. In case of being rejected the pair could fall to the 0.6800-0.6850 zone to consolidate the recent gains.
Australian Dollar FAQs
One of the most significant factors for the Australian Dollar (AUD) is the level of interest rates set by the Reserve Bank of Australia (RBA). Because Australia is a resource-rich country another key driver is the price of its biggest export, Iron Ore. The health of the Chinese economy, its largest trading partner, is a factor, as well as inflation in Australia, its growth rate and Trade Balance. Market sentiment – whether investors are taking on more risky assets (risk-on) or seeking safe-havens (risk-off) – is also a factor, with risk-on positive for AUD.
The Reserve Bank of Australia (RBA) influences the Australian Dollar (AUD) by setting the level of interest rates that Australian banks can lend to each other. This influences the level of interest rates in the economy as a whole. The main goal of the RBA is to maintain a stable inflation rate of 2-3% by adjusting interest rates up or down. Relatively high interest rates compared to other major central banks support the AUD, and the opposite for relatively low. The RBA can also use quantitative easing and tightening to influence credit conditions, with the former AUD-negative and the latter AUD-positive.
China is Australia’s largest trading partner so the health of the Chinese economy is a major influence on the value of the Australian Dollar (AUD). When the Chinese economy is doing well it purchases more raw materials, goods and services from Australia, lifting demand for the AUD, and pushing up its value. The opposite is the case when the Chinese economy is not growing as fast as expected. Positive or negative surprises in Chinese growth data, therefore, often have a direct impact on the Australian Dollar and its pairs.
Iron Ore is Australia’s largest export, accounting for $118 billion a year according to data from 2021, with China as its primary destination. The price of Iron Ore, therefore, can be a driver of the Australian Dollar. Generally, if the price of Iron Ore rises, AUD also goes up, as aggregate demand for the currency increases. The opposite is the case if the price of Iron Ore falls. Higher Iron Ore prices also tend to result in a greater likelihood of a positive Trade Balance for Australia, which is also positive of the AUD.
The Trade Balance, which is the difference between what a country earns from its exports versus what it pays for its imports, is another factor that can influence the value of the Australian Dollar. If Australia produces highly sought after exports, then its currency will gain in value purely from the surplus demand created from foreign buyers seeking to purchase its exports versus what it spends to purchase imports. Therefore, a positive net Trade Balance strengthens the AUD, with the opposite effect if the Trade Balance is negative.
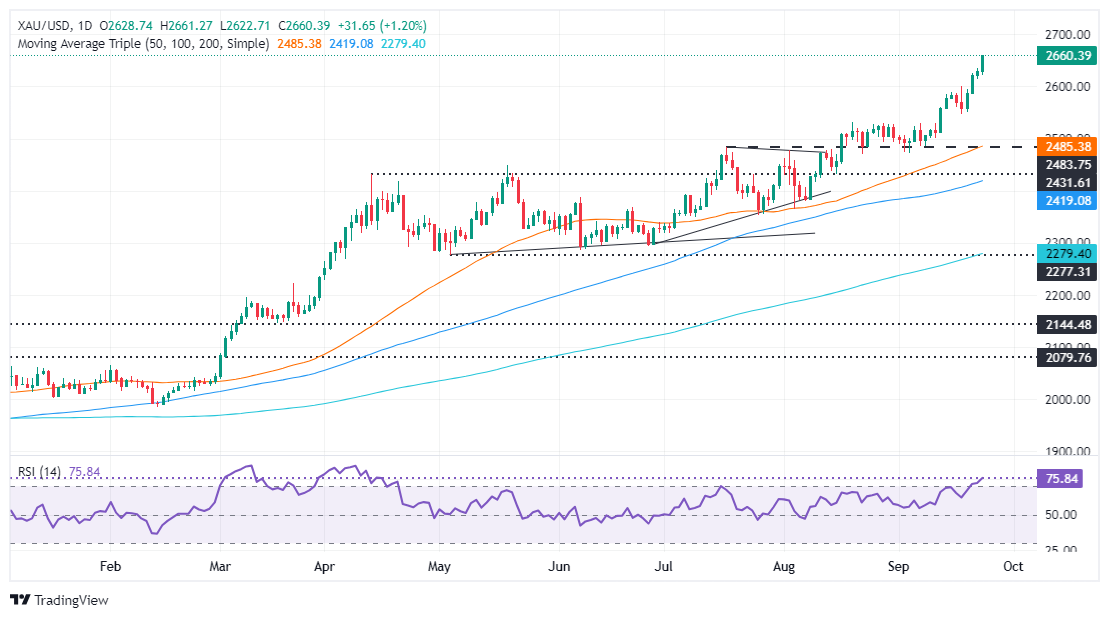
- Gold hits a new ATH of $2,655 amid declining US Consumer Confidence and weakening US Dollar, XAU/USD trades at $2,651.
- Fed Governor Michelle Bowman signals a cautious approach to rate cuts.
- Geopolitical tensions in the Middle East also fuel safe-haven demand for Gold, driving the precious metal to new heights.
Gold prices hit a new all-time high (ATH) during Tuesday's North American session due to a deterioration in Consumer Confidence in the United States (US), according to data provided by the Conference Board. This, along with a dip in US Treasury yields and US Dollar weakness, sponsored a leg-up in the non-yielding metal. The XAU/USD trades at $2,651 after reaching an ATH of $2,655.
The Conference Board revealed that Consumer Confidence declined in September, hitting its lowest level since August 2021, due to growing concerns about the labor market and the overall economic outlook.
After the data, US Treasury bond yields edged lower with the 10-year T-note yielding 3.73%, declining by two basis points. At the same time, the US Dollar Index (DXY), which measures the Greenback’s performance against a basket of six currencies, tumbled to a two-day low of 100.48, down over 0.42%.
Meanwhile, Fed Governor Michelle Bowman, a noted hawk, stated that risks to inflation remain significant, expressing her preference for "a measured pace of cuts" to prevent the risk of reigniting inflation.
Daily digest market movers: Gold price extends rally on soft US data
- The CB Consumer Confidence Index for September fell from 105.6 to 98.7, missing analysts' estimate of 103.8.
- Dana Peterson, chief economist at the Conference Board, said, “The deterioration across the Index’s main components likely reflected consumers' concerns about the labor market and reactions to fewer hours, slower payroll increases, and fewer job openings.”
- Tensions in the Middle East escalated as Hezbollah urged Iran to launch an attack against Israel, according to Axios.
- US data on Monday showed that Business Activity decelerated slightly, but it remains resilient as S&P Global revealed the Services PMI exceeded expectations. On the Contrary, manufacturing activity deteriorated further.
- According to the World Gold Council, global physically-backed Gold ETFs saw modest net inflows of 3 metric tons last week.
- Market participants are certain of at least a 25 bps rate cut by the Fed at November’s meeting, while the odds for a 50 bps cut stand at 56.2%, according to the CME FedWatch Tool.
XAU/USD technical outlook: Gold poised for further gains before retreating
The XAU/USD is upwardly biased, set to print continued record highs, even though the rally seems overextended, with traders eyeing the $2,700 figure. Momentum favors buyers even though the Relative Strength Index (RSI) has turned overbought. Hence, buyers should be wary that a pullback might be on the cards.
If XAU/USD extends its rally, traders could test $2,675, followed by $2,700. Up next would be the $2,750 level, followed by $2,800.
On the flip side, if XAU/USD drops below $2,650, look for a test of the September 18 daily high at $2,600. The following key support levels to test will be the September 18 low of $2,546, followed by the 50-day Simple Moving Average (SMA) at $2,481.
Gold FAQs
Gold has played a key role in human’s history as it has been widely used as a store of value and medium of exchange. Currently, apart from its shine and usage for jewelry, the precious metal is widely seen as a safe-haven asset, meaning that it is considered a good investment during turbulent times. Gold is also widely seen as a hedge against inflation and against depreciating currencies as it doesn’t rely on any specific issuer or government.
Central banks are the biggest Gold holders. In their aim to support their currencies in turbulent times, central banks tend to diversify their reserves and buy Gold to improve the perceived strength of the economy and the currency. High Gold reserves can be a source of trust for a country’s solvency. Central banks added 1,136 tonnes of Gold worth around $70 billion to their reserves in 2022, according to data from the World Gold Council. This is the highest yearly purchase since records began. Central banks from emerging economies such as China, India and Turkey are quickly increasing their Gold reserves.
Gold has an inverse correlation with the US Dollar and US Treasuries, which are both major reserve and safe-haven assets. When the Dollar depreciates, Gold tends to rise, enabling investors and central banks to diversify their assets in turbulent times. Gold is also inversely correlated with risk assets. A rally in the stock market tends to weaken Gold price, while sell-offs in riskier markets tend to favor the precious metal.
The price can move due to a wide range of factors. Geopolitical instability or fears of a deep recession can quickly make Gold price escalate due to its safe-haven status. As a yield-less asset, Gold tends to rise with lower interest rates, while higher cost of money usually weighs down on the yellow metal. Still, most moves depend on how the US Dollar (USD) behaves as the asset is priced in dollars (XAU/USD). A strong Dollar tends to keep the price of Gold controlled, whereas a weaker Dollar is likely to push Gold prices up.
The Greenback shed weight across the board after market participants stepped up bets of an additional 50 bps jumbo rate cut from the Fed in November. Markets have quickly absorbed the Fed’s first rate cut in four years, and are pivoting into hopes for more.
Here is what you need to know on Wednesday, September 25:
The US Dollar Index lost further ground on Tuesday, pushed lower by rising expectations of further double rate cuts from the Federal Reserve (Fed) in November as a follow-up to September’s 50 bps jumbo rate slash. Rate markets are now pricing in 60% odds of a second 50 bps rate cut on November 7, with the remaining 40% expecting a more reasonable 25 bps.
EUR/USD rallied heading into the midweek after kicking off the trading week with a bearish pullback. Still, the pair is getting buoyed by Greenback weakness rather than any particularly bullish Euro flows.
GBP/USD found yet another 30-month high as the Pound Sterling rally continues unabated, but Bank of England (BoE) Monetary Policy Report Hearings due later in the week on Thursday could trip up Cable bulls.
USD/JPY eased back on Tuesday, flubbing a bullish push to try and recapture the 146.00 handle. Bank of Japan (BoJ) Governor Kazuo Ueda reiterated early Tuesday that the BoJ remains in no real rush to raise policy rates, crimping hopes for further hawkish moves from the Japanese central bank.
AUD/USD also found a new 14-month high on Tuesday, rallying despite the Reserve Bank of Australia (RBA) keeping rates pinned on Tuesday. The RBA’s latest rate hold could prove to be poorly timed, depending on how Australia’s Monthly Consumer Price Index (CPI) prints early Wednesday.
Gold continues to grind its way higher as the Greenback falls across the board. XAU/USD is soaring toward $2,700, marking in steady day-on-day record all-time highs. Gold is up just under 30% YTD in 2024.
- The Canadian Dollar gained ground on Tuesday as markets pivot out of Greenback.
- Bank of Canada Governor Macklem reaffirmed BoC’s stance.
- Markets are churning on rising Fed rate cut expectations.
The Canadian Dollar (CAD) gained ground on Tuesday, testing multi-month highs against the softening Greenback. Markets are pivoting into a USD-short stance on rising expectations of future Fed rate cuts, helping to give the CAD a leg up.
Canada remains largely absent from the economic calendar this week, but an appearance from Bank of Canada (BoC) Governor Tiff Macklem helped to provide a springboard for the Canadian Dollar by reminding markets that the BoC is committed to carefully observing deteriorating market conditions and giving a casual head-nod to credit-crunched Canadians.
Daily digest market movers
- The Canadian Dollar rose seven-tenths of one percent against the Greenback on Tuesday, and is testing multi-month highs.
- US consumer confidence slumped into the low side, and US consumers continue to see accelerating inflation looking out over the next 12 months.
- Despite the uptick in consumer inflation expectations, markets have piled into bets of a follow-up 50 bps rate cut from the Federal Reserve (Fed) in November.
- BoC’s Macklem: Bank of Canada is pleased to see inflation at 2%, now we need to stick the landing.
- More Macklem: There is a notable increase in financial stress among borrowers without a mortgage, mainly renters.
Canadian Dollar price forecast
The Greenback’s Tuesday pullback has given the Canadian Dollar a chance to regain ground, sending the USD/CAD pair down into 1.3440. The pair has tested a fresh six-month low, and bidders have been pushed back after a technical rejection from the 200-day Exponential Moving Average (EMA) near the 1.3600 handle.
Canadian Dollar daily chart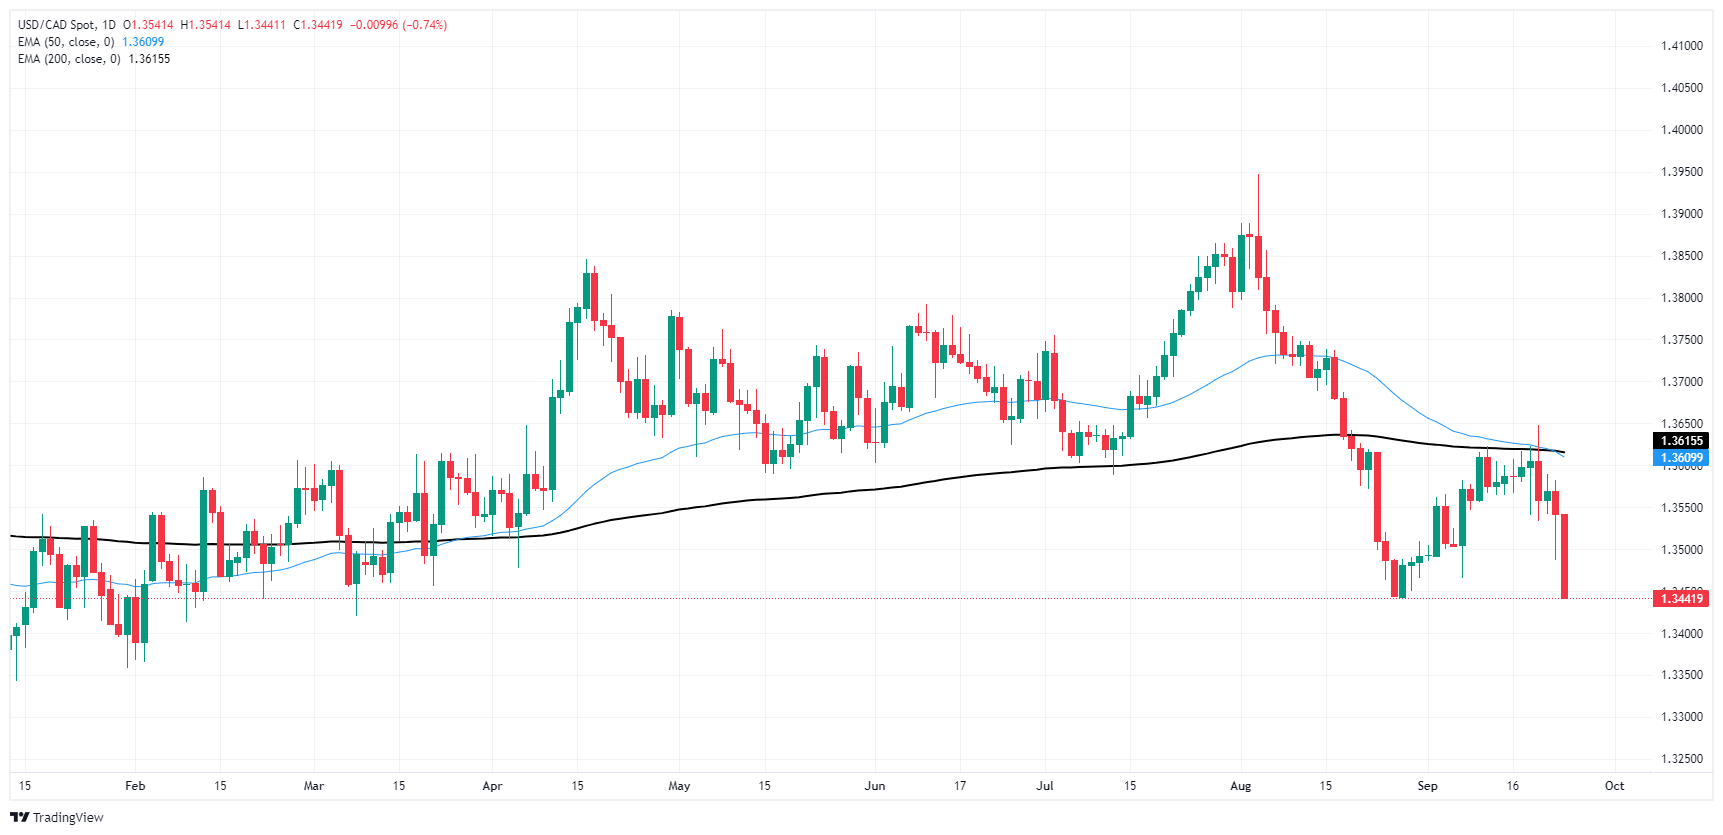
Canadian Dollar FAQs
The key factors driving the Canadian Dollar (CAD) are the level of interest rates set by the Bank of Canada (BoC), the price of Oil, Canada’s largest export, the health of its economy, inflation and the Trade Balance, which is the difference between the value of Canada’s exports versus its imports. Other factors include market sentiment – whether investors are taking on more risky assets (risk-on) or seeking safe-havens (risk-off) – with risk-on being CAD-positive. As its largest trading partner, the health of the US economy is also a key factor influencing the Canadian Dollar.
The Bank of Canada (BoC) has a significant influence on the Canadian Dollar by setting the level of interest rates that banks can lend to one another. This influences the level of interest rates for everyone. The main goal of the BoC is to maintain inflation at 1-3% by adjusting interest rates up or down. Relatively higher interest rates tend to be positive for the CAD. The Bank of Canada can also use quantitative easing and tightening to influence credit conditions, with the former CAD-negative and the latter CAD-positive.
The price of Oil is a key factor impacting the value of the Canadian Dollar. Petroleum is Canada’s biggest export, so Oil price tends to have an immediate impact on the CAD value. Generally, if Oil price rises CAD also goes up, as aggregate demand for the currency increases. The opposite is the case if the price of Oil falls. Higher Oil prices also tend to result in a greater likelihood of a positive Trade Balance, which is also supportive of the CAD.
While inflation had always traditionally been thought of as a negative factor for a currency since it lowers the value of money, the opposite has actually been the case in modern times with the relaxation of cross-border capital controls. Higher inflation tends to lead central banks to put up interest rates which attracts more capital inflows from global investors seeking a lucrative place to keep their money. This increases demand for the local currency, which in Canada’s case is the Canadian Dollar.
Macroeconomic data releases gauge the health of the economy and can have an impact on the Canadian Dollar. Indicators such as GDP, Manufacturing and Services PMIs, employment, and consumer sentiment surveys can all influence the direction of the CAD. A strong economy is good for the Canadian Dollar. Not only does it attract more foreign investment but it may encourage the Bank of Canada to put up interest rates, leading to a stronger currency. If economic data is weak, however, the CAD is likely to fall.
Bank of Canada (BoC) Governor Tiff Macklem noted early Tuesday that the BoC will continue to carefully watch consumer conditions in Canada, reiterating that the BoC's timing and pace of rate cuts will be dependent on data.
Key highlights
With continued progress we've seen on inflation, it is reasonable to expect further cuts in our policy rate.
We will also be looking for continued easing in core inflation, which is still a little above 2%.
Bank of Canada is pleased to see inflation at 2%, now we need to stick the landing.
The timing and pace will be determined by incoming data and our assessment of what those data mean for future inflation.
The bank is scaling down work on retail central bank digital currency, shifting focus to broader payments system research and policy development.
There is a notable increase in financial stress among borrowers without a mortgage, mainly renters.
We will be closely watching consumer spending, as well as business hiring and investment.
I am concerned by the rising share of borrowers without a mortgage who carry a credit card balance of at least 90% of their credit limit.
- DXY gave up some ground and fell to 100.60.
- Conference Board consumer confidence data for September missed expectations.
- Fed speakers are battling the current market’s dovish expectations.
The US Dollar Index (DXY), which measures the value of the USD against a basket of six currencies, posted some losses on Tuesday after the release of the Conference Board’s Consumer Confidence data. In the meantime, Federal Reserve (Fed) officials seem to be trying to push back on the market’s aggressive dovish bets.
The US economy exhibits mixed signals with indications of both a slowdown and ongoing resilience. Economic activity appears to be moderating, but some sectors remain strong. The Fed has indicated that the trajectory of its monetary policy will be guided by the evolving economic data, suggesting that the pace of rate adjustments will depend on the incoming information.
Daily digest market movers: US Dollar declines after CB Consumer Confidence surprise, Fed speakers
- US Consumer Confidence unexpectedly plunged in September, falling below expectations to 98.7.
- Market anticipates excessive Fed easing, pricing in 75 bps of cuts by year-end and 175-200 bps over the next year.
- Some Fed officials, including Neel Kashkari from the Federal Reserve Bank of Minneapolis and Michelle Bowman, are pushing back against dovish market expectations.
- Bowman dissented from the recent 50 bps rate cut, preferring a 25 bps reduction and warning that a larger cut might hinder the inflation fight.
- She highlighted ongoing inflation risks, including supply chain disruptions and fiscal policy, and remains cautious about the strength of the labor market.
- Other Fed officials, like Raphael Bostic from the Federal Reserve Bank of Atlanta and Austan Goolsbee from the Federal Reserve Bank of Chicago, express concerns about the labor market and support faster rate cuts.
- Markets continue to bet strongly on 75 bps of easing this year.
- On the positive side for the USD, divergence in global growth favors the US Dollar, with the eurozone, Australia and China showing signs of weakness.
- US 10-year benchmark rate retreated from September highs, currently trading at 3.75%.
DXY technical outlook: DXY holds bearish momentum, bulls struggle
Technical analysis for the DXY index reveals a bearish trend, supported by the Relative Strength Index (RSI) at around 40 and the Moving Average Convergence Divergence (MACD) printing decreasing green bars. With the index below the 20,100 and 200-day Simple Moving Averages (SMA), the technical outlook remains clearly bearish. A break above the 20-day SMA would improve the outlook somewhat
Support levels exist at 100.50, 100.30 and 100.00, while resistance levels are at 101.00, 101.30 and 101.60.
US Dollar FAQs
The US Dollar (USD) is the official currency of the United States of America, and the ‘de facto’ currency of a significant number of other countries where it is found in circulation alongside local notes. It is the most heavily traded currency in the world, accounting for over 88% of all global foreign exchange turnover, or an average of $6.6 trillion in transactions per day, according to data from 2022. Following the second world war, the USD took over from the British Pound as the world’s reserve currency. For most of its history, the US Dollar was backed by Gold, until the Bretton Woods Agreement in 1971 when the Gold Standard went away.
The most important single factor impacting on the value of the US Dollar is monetary policy, which is shaped by the Federal Reserve (Fed). The Fed has two mandates: to achieve price stability (control inflation) and foster full employment. Its primary tool to achieve these two goals is by adjusting interest rates. When prices are rising too quickly and inflation is above the Fed’s 2% target, the Fed will raise rates, which helps the USD value. When inflation falls below 2% or the Unemployment Rate is too high, the Fed may lower interest rates, which weighs on the Greenback.
In extreme situations, the Federal Reserve can also print more Dollars and enact quantitative easing (QE). QE is the process by which the Fed substantially increases the flow of credit in a stuck financial system. It is a non-standard policy measure used when credit has dried up because banks will not lend to each other (out of the fear of counterparty default). It is a last resort when simply lowering interest rates is unlikely to achieve the necessary result. It was the Fed’s weapon of choice to combat the credit crunch that occurred during the Great Financial Crisis in 2008. It involves the Fed printing more Dollars and using them to buy US government bonds predominantly from financial institutions. QE usually leads to a weaker US Dollar.
Quantitative tightening (QT) is the reverse process whereby the Federal Reserve stops buying bonds from financial institutions and does not reinvest the principal from the bonds it holds maturing in new purchases. It is usually positive for the US Dollar.
- Mexican Peso strengthens after US Consumer Confidence deteriorated.
- Mexico’s inflation fell below estimates in September, with core inflation easing under 5%, boosting expectations for a 25 bps rate cut by Banxico on Thursday.
- Analysts expect Banxico to lower rates from 10.75% to 10.50%, citing falling inflation, weaker economic activity and Fed easing.
The Mexican Peso advanced against the US Dollar during the North American session after the Conference Board (CB) revealed that Consumer Confidence in the United States (US) deteriorated. Meanwhile, Mexican inflation dipped below estimates ahead of Thursday's Bank of Mexico (Banxico) monetary policy meeting. At the time of writing, the USD/MXN trades at 19.36, dropping over 0.28%.
Mexico’s inflation in the first half of September dipped in MoM and YoY figures, according to the Instituto Nacional de Estadistica Geografia e Informatica (INEGI). Core numbers edged lower after being above the 5% threshold and improved compared to the previous reading.
According to Reuters, Banxico is expected to lower interest rates by 25 basis points (bps) on September 26 from 10.75% to 10.50%.
Analysts at Capital Economics quoted by Reuters noted “The fall in inflation, combined with the weakness of economic activity and the fact that the US Fed is now easing monetary policy too, means that Banxico is all but certain to deliver another 25-basis-point cut.”.
Across the border, Consumer Confidence deteriorated in September, hitting its lowest level since August 2021 due to worries about the labor market and the broad economic outlook.
Meanwhile, Fed Governor Michelle Bowman said that risks to inflation are still prominent, adding that she favors “a measured pace of cuts” to avoid reigniting inflation.
Daily digest market movers: Mexican Peso on the front foot as inflation dips
- Mid-month inflation in September came to 0.09% MoM, below estimates of 0.15%. In the 12 months to September, it expanded by 4.66%, below forecasts of 4.73% and the previous reading of 5.16%.
- Underlying inflation for the same period increased slightly from 0.1% to 0.21% MoM, but it was beneath forecasts of 0.23%. Yearly, core prices dropped from 3.98% to 3.95%, lower than the consensus.
- Mexico’s Economic Activity expanded in July, while Retail Sales contracted for the third straight month but improved compared to June’s reading.
- Banxico is expected to lower borrowing costs by 175 bps toward the end of 2025, according to the swaps markets.
- CB Consumer Confidence in September dropped from 105.6 to 98.7, missing the 103.8 estimated by analysts.
- Dana Peterson, chief economist at the Conference Board, said, “The deterioration across the Index’s main components likely reflected consumers concerns about the labor market and reactions to fewer hours, slower payroll increases, fewer job openings.”
- Market participants had fully priced in a 100% chance of a 25 bps rate cut by the Fed. However, the odds for a 50 bps of easing are 56.2%, according to the CME FedWatch Tool date.
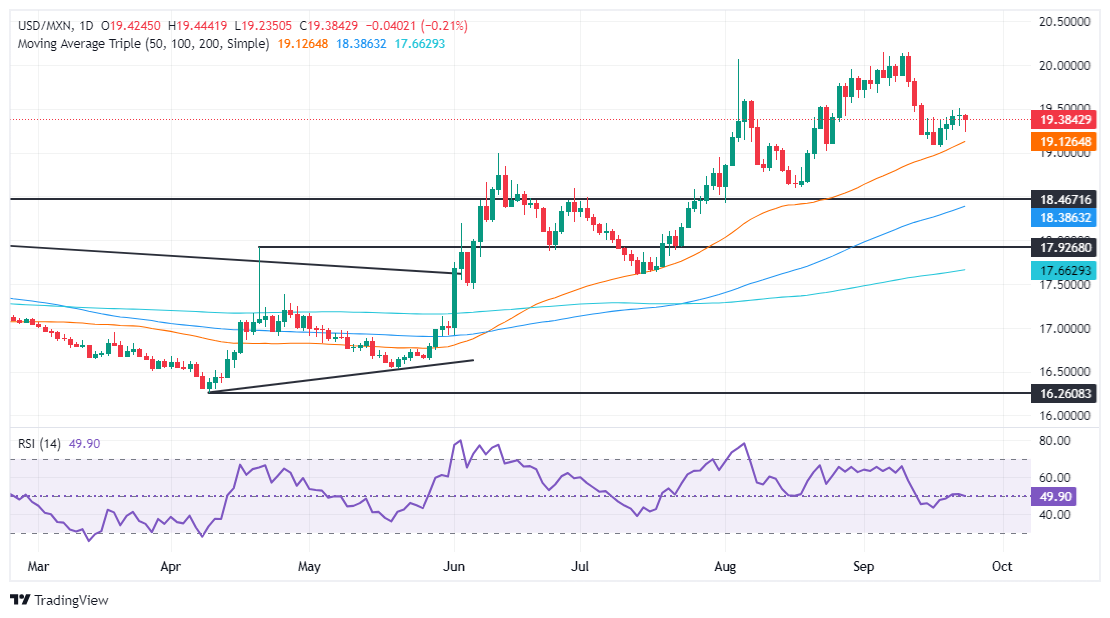
USD/MXN technical analysis: Mexican Peso recovers some ground as USD/MXN falls below 19.40
The USD/MXN remains intact despite consolidating at around the 19.00-19.50 range for the seventh consecutive day. Investors seem to be waiting for Banxico’s decision, though an “ascending wedge” is forming, implying further downside.
The Relative Strength Index (RSI) suggests that sellers gather momentum as the RSI punches below its neutral line. Therefore, the path of least resistance is skewed to the downside.
If USD/MXN tumbles below the September 23 low of 19.29, it will expose the confluence of the 50-day Simple Moving Average (SMA) and the September 18 low near 19.08 to 19.06.
Conversely, if the USD/MXN remains above 19.30, the next resistance will be 19.50, followed by the August 6 high at 19.61. Once cleared, the 20.00 level will follow, followed by the year-to-date (YTD) peak at 20.22.
Mexican Peso FAQs
The Mexican Peso (MXN) is the most traded currency among its Latin American peers. Its value is broadly determined by the performance of the Mexican economy, the country’s central bank’s policy, the amount of foreign investment in the country and even the levels of remittances sent by Mexicans who live abroad, particularly in the United States. Geopolitical trends can also move MXN: for example, the process of nearshoring – or the decision by some firms to relocate manufacturing capacity and supply chains closer to their home countries – is also seen as a catalyst for the Mexican currency as the country is considered a key manufacturing hub in the American continent. Another catalyst for MXN is Oil prices as Mexico is a key exporter of the commodity.
The main objective of Mexico’s central bank, also known as Banxico, is to maintain inflation at low and stable levels (at or close to its target of 3%, the midpoint in a tolerance band of between 2% and 4%). To this end, the bank sets an appropriate level of interest rates. When inflation is too high, Banxico will attempt to tame it by raising interest rates, making it more expensive for households and businesses to borrow money, thus cooling demand and the overall economy. Higher interest rates are generally positive for the Mexican Peso (MXN) as they lead to higher yields, making the country a more attractive place for investors. On the contrary, lower interest rates tend to weaken MXN.
Macroeconomic data releases are key to assess the state of the economy and can have an impact on the Mexican Peso (MXN) valuation. A strong Mexican economy, based on high economic growth, low unemployment and high confidence is good for MXN. Not only does it attract more foreign investment but it may encourage the Bank of Mexico (Banxico) to increase interest rates, particularly if this strength comes together with elevated inflation. However, if economic data is weak, MXN is likely to depreciate.
As an emerging-market currency, the Mexican Peso (MXN) tends to strive during risk-on periods, or when investors perceive that broader market risks are low and thus are eager to engage with investments that carry a higher risk. Conversely, MXN tends to weaken at times of market turbulence or economic uncertainty as investors tend to sell higher-risk assets and flee to the more-stable safe havens.
- The Dow Jones rose into yet another record high, but bidders remain unconfident.
- Consumer confidence surveys show US spenders still fear higher inflation.
- Fedspeak deviations continue, but rate markets price in higher odds of another double cut.
The Dow Jones Industrial Average (DJIA) ground its way into another record bid on Tuesday, but price action remains tepid and intraday momentum is struggling to outpace the 42,000 level. The CB Consumer Confidence Index for September dropped to the bottom end of a familiar two-year range, and Federal Reserve (Fed) Governor Michelle Bowman has leaned into her dissent of the Fed’s recent 50-bps rate cut.
Consumer confidence deteriorated across the board on Tuesday, and consumer expectations of 12-month inflation accelerated to 5.2%. Consumers also reported a general weakening of their six-month family financial situation outlook, and consumer assessments of overall business conditions have turned negative.
As explained by the Conference Board’s chief economist Dana Peterson, “Consumers’ assessments of current business conditions turned negative while views of the current labor market situation softened further. Consumers were also more pessimistic about future labor market conditions and less positive about future business conditions and future income.”
Fed Board of Governors member Michelle Bowman made waves last week as the sole dissenter to the Fed’s nearly unanimous decision to trim interest rates by an outsized 50 bps. Fed Governor Bowman advocated for a smaller 25 bps cut, citing ongoing concerns that the Fed may be moving prematurely before confirming that inflation will continue to ease toward the target 2% band.
While addressing a banking group in Kentucky, Fed Governor Bowman explained that the jumbo rate cut last week “could be interpreted as a premature declaration of victory on our price-stability mandate. Accomplishing our mission of returning to low and stable inflation at our 2 percent goal is necessary to foster a strong labor market and an economy that works for everyone in the longer term.”
Despite Fed Governor Bowman’s concerns, backsliding consumer confidence results sparked a renewed bid in rate markets for a follow-up jumbo cut in November. According to the CME’s FedWatch Tool, rate markets are pricing in nearly 60% odds of a second 50 bps rate cut on November 7, and only 40% odds of a more reasonable 25 bps follow-up rate trim. Rate traders were pricing in roughly even odds of a 50 or 25 bps rate cut at the beginning of the week.
Dow Jones news
Despite an upside tilt to rate cut expectations, a move that would typically see equities lurch into the bid side, the Dow Jones index is roughly on-balance on Tuesday, with around half of the index’s constituent securities trading into the red. Visa (V) is reportedly facing a potential antitrust lawsuit from the US Department of Justice, sending the payment card services company’s stock backsliding -4.5% to $275 per share.
On the high end, Caterpillar (CAT) soared nearly 4% on Tuesday, rising to a new all-time high of $388.44 per share as the construction and mining equipment manufacturer adds to its already-impressive 35% one-year gain in its share price. Despite single-digit declines in Caterpillar’s reported sales, profit margins have been increasing, and the company’s recently announced $20 billion share repurchase authorization is keeping investor confidence pinned to the ceiling.
Dow Jones price forecast
The Dow Jones has pierced into yet another record high on Tuesday as investors continue to bid up the major index, but intraday momentum remains tepid overall and bidders are struggling to hold onto near-term gains. Prices continues to grind back into familiar territory just north of the 42,000 handle.
The DJIA has climbed 5.73% from the last swing low into the 40,000 region, but a lopsided tilt into the bullish side has left price action with little technical footholds, and charts may be primed for a pullback to the 50-day Exponential Moving Average (EMA) near 40,770.
Dow Jones daily chart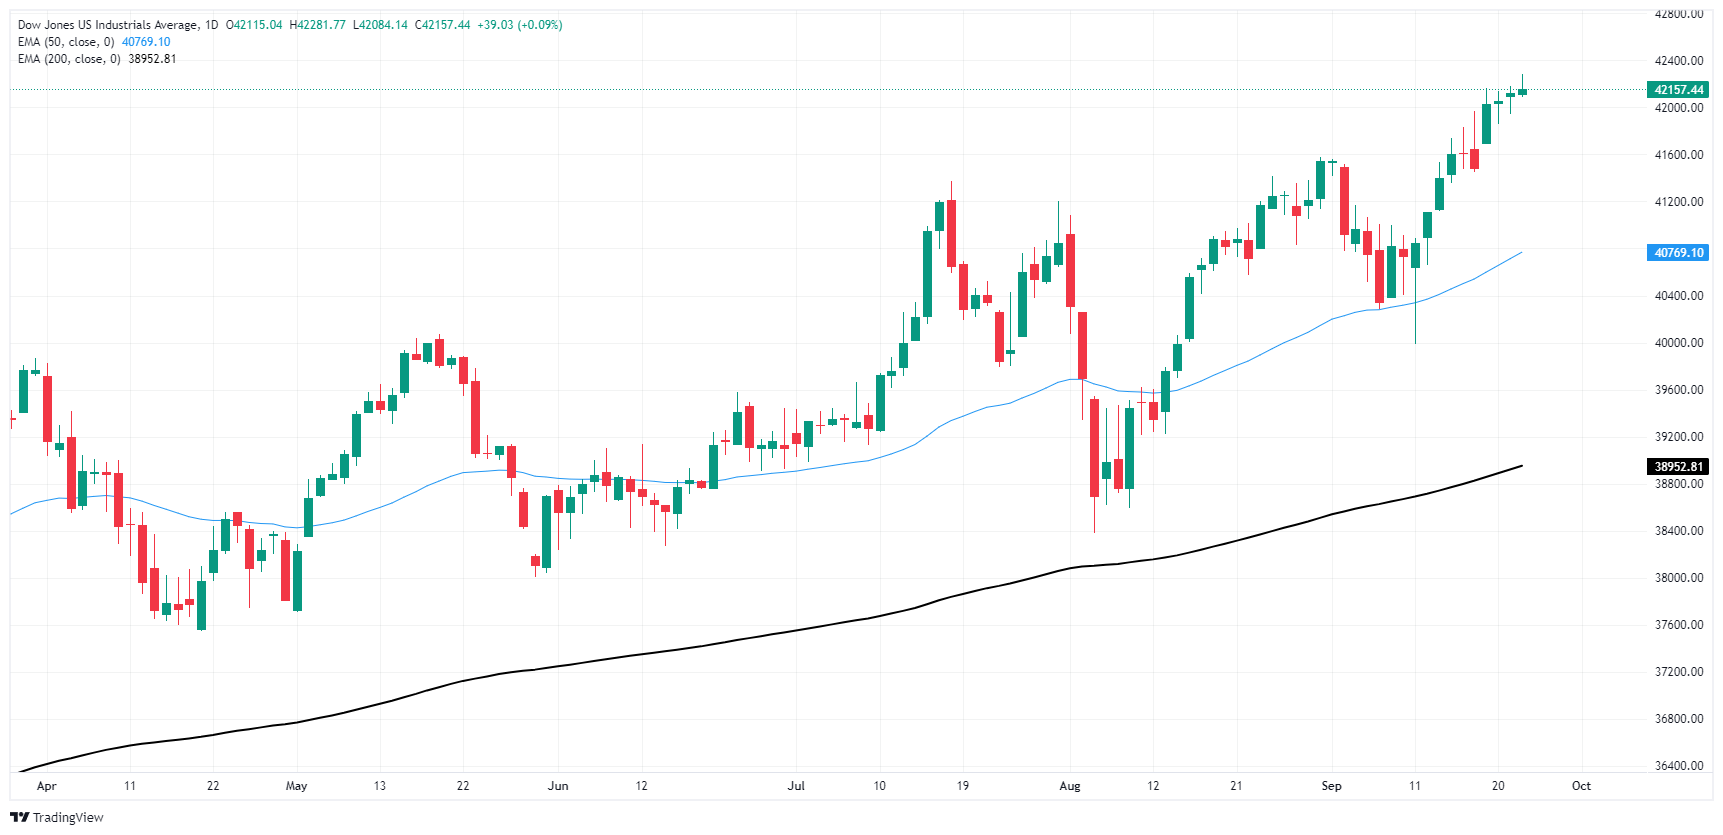
Dow Jones FAQs
The Dow Jones Industrial Average, one of the oldest stock market indices in the world, is compiled of the 30 most traded stocks in the US. The index is price-weighted rather than weighted by capitalization. It is calculated by summing the prices of the constituent stocks and dividing them by a factor, currently 0.152. The index was founded by Charles Dow, who also founded the Wall Street Journal. In later years it has been criticized for not being broadly representative enough because it only tracks 30 conglomerates, unlike broader indices such as the S&P 500.
Many different factors drive the Dow Jones Industrial Average (DJIA). The aggregate performance of the component companies revealed in quarterly company earnings reports is the main one. US and global macroeconomic data also contributes as it impacts on investor sentiment. The level of interest rates, set by the Federal Reserve (Fed), also influences the DJIA as it affects the cost of credit, on which many corporations are heavily reliant. Therefore, inflation can be a major driver as well as other metrics which impact the Fed decisions.
Dow Theory is a method for identifying the primary trend of the stock market developed by Charles Dow. A key step is to compare the direction of the Dow Jones Industrial Average (DJIA) and the Dow Jones Transportation Average (DJTA) and only follow trends where both are moving in the same direction. Volume is a confirmatory criteria. The theory uses elements of peak and trough analysis. Dow’s theory posits three trend phases: accumulation, when smart money starts buying or selling; public participation, when the wider public joins in; and distribution, when the smart money exits.
There are a number of ways to trade the DJIA. One is to use ETFs which allow investors to trade the DJIA as a single security, rather than having to buy shares in all 30 constituent companies. A leading example is the SPDR Dow Jones Industrial Average ETF (DIA). DJIA futures contracts enable traders to speculate on the future value of the index and Options provide the right, but not the obligation, to buy or sell the index at a predetermined price in the future. Mutual funds enable investors to buy a share of a diversified portfolio of DJIA stocks thus providing exposure to the overall index.
- EUR/GBP consolidates Monday’s sharp downward movements.
- The RSI suggests oversold conditions but the MACD signals a stabilizing selling pressure.
- The pair might side-ways trade in the next sessions as bears might take a breather.
EUR/GBP recovered some lost ground on Tuesday, rising mildly to 0.8330, but the overall technical outlook remains bearish as the pair stands at multi-year lows.
A mild oversold condition is currently seen in the pair according to a reading of 27 for the Relative Strength Index (RSI), suggesting that buyers are starting to take control after Monday’s selloff, and the RSI is gradually increasing. The Moving Average Convergence Divergence (MACD) is flat, suggesting that selling is losing steam.
EUR/GBP daily chart
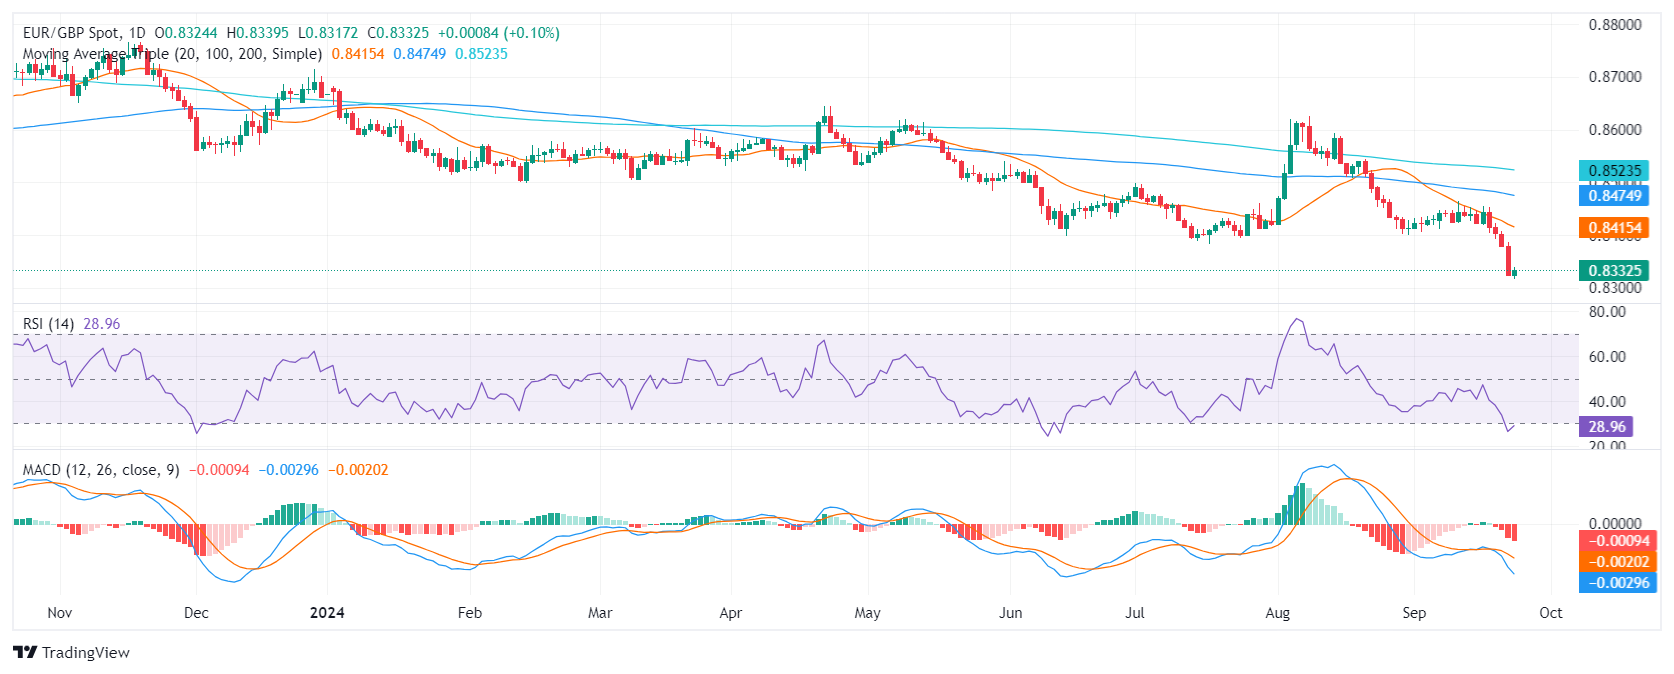
Based on the current technical picture, the EUR/GBP pair is likely to remain in a consolidation phase in the near term. With the pair in lows since 2022, the bears seem to have already done their part and they might step away to consolidate their movements.
Support levels: 0.8315, 0.8330, 0.8340
Resistance levels: 0.8420, 0.8430, 0.8440
In addition to Gold, forecasts revised for the other precious metals, Commerzbank’s commodity analyst Carsten Fritsch notes.
Gold/Silver ratio to remain roughly at its current level
“In line with Gold, we have revised our forecast for the Silver price at the end of the year upwards to $31 per troy ounce (previously $30). The c. We leave the price forecast for 2025 unchanged, with the exception of a small upward revision for the first quarter to $32. For mid-2025, we expect c32 and for the end of 2025, $33.”
“By contrast, we have revised downwards our forecast for Platinum to $1,000 per troy ounce at the end of the year, from $1,100 previously. The record supply deficit expected by the WPIC this year has so far not been able to push up the price of Platinum. In addition, there have recently been considerable outflows from Platinum ETFs. The lower starting level also reduces the forecast trajectory for next year. In mid-2025, we expect Platinum to trade at $1,050, and at $1,150 at the end of 2025 (previously $1,150 and $1,250, respectively).”
“We have confirmed our price forecast for Palladium at $1,050 per troy ounce for the end of the year. This means that the Palladium price will remain roughly at its current level. For next year, we expect a slightly smaller increase to $1,100 by mid-2025 and to $1,150 by the end of 2025 (previously $1,150 and $1,200, respectively). Thus, the downward revision for Palladium is somewhat smaller than for Platinum.”
Oil prices rose by 4% (Brent) and 4.8% (WTI) last week. For Brent, it was the strongest weekly increase since April, for WTI since February. However, this only partially reversed the heavy losses seen at the beginning of September, Commerzbank’s commodity analyst Carsten Fritsch notes.
No reason for a significant widening of the risk premium
“Both Brent and WTI are still trading below the levels seen at the end of August. The latest escalation of the Middle East conflict is driving up prices. Over the weekend, there were heavy clashes between Israel and the Shiite terrorist militia Hezbollah in southern Lebanon. The trigger was the killing of numerous Hezbollah members by targeted explosions of communication devices last week, for which Israel is being blamed.”
“The Middle East conflict has been going on for almost a year now, without any significant supply disruptions on the oil market. The attacks by Houthi rebels in the Red Sea on merchant ships and oil tankers have only led to a realignment of transport routes and to delays in shipments. Oil producers remain not directly involved in the conflict. This applies only indirectly to Iran, which supports the Houthi rebels in Yemen, Hamas and Hezbollah.”
“However, oil supplies from Iran have actually increased further in recent months despite the still-existing US sanctions. It is unlikely that the conflict between Israel and Hizbollah will lead to supply disruptions in the oil market, unless a further escalation results in an Israeli attack on Iran's oil infrastructure or Iran impedes passage through the Strait of Hormuz. We still consider the risk of this to be very low. In our opinion, there is con the oil price and a further price increase.”
- GBP/USD clears the top of an ascending channel and nears the YTD high of 1.3398.
- The Relative Strength Index (RSI) favors buyers, breaking above 70 despite entering overbought territory, signaling potential for further gains.
- Next resistance levels include the March 1, 2022, high at 1.3437 and the psychological 1.3500 mark.
- A pullback could see the pair test support at 1.3350, with further downside targeting 1.3298, 1.3266, and the 1.3200 figure.
The Pound Sterling extended its gains against the US Dollar on Tuesday amid a scarce economic docket in the UK. Across the pond, the US Conference Board Consumer Confidence tumbled on labor market views, sending the Greenback sliding and underpinning other currencies higher. The GBP/USD trades at 1.3388 and advances more than 0.30%.
GBP/USD Price Forecast: Technical outlook
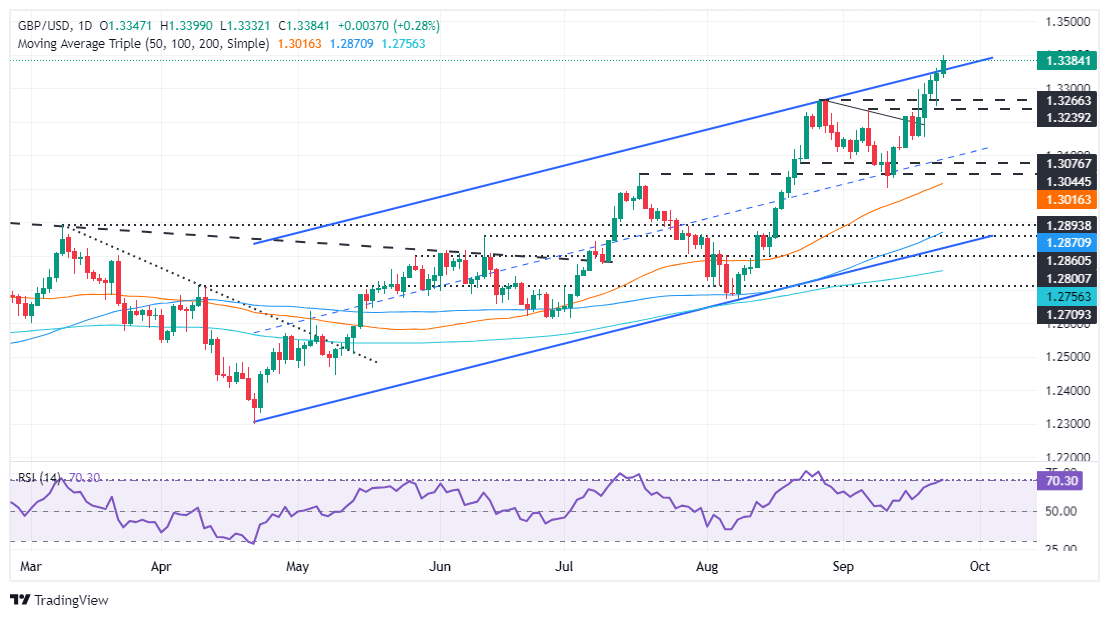
From a technical standpoint, the GBP/USD has cleared the top of an ascending channel, about to challenge the year-to-date (YTD) high of 1.3398, shy of the 1.34 handle. The Relative Strength Index (RSI) favors buyers despite breaking above the 70 marks, seen as overbought territory. However, this could exacerbate a leg-up, before retreating to lower prices.
The next key resistance for GBP/USD will be the March 1, 2022, daily high at 1.3437, followed by the 1.3500 figure. Conversely, if the exchange rate drops below 1.3350, this could pave the way for a pullback. The next support will be the March 23, 2022, daily peak turned support at 1.3298, followed by the August 27 high at 1.3266 and the 1.3200 mark.
GBP/USD Price Action – Daily Chart
Pound Sterling FAQs
The Pound Sterling (GBP) is the oldest currency in the world (886 AD) and the official currency of the United Kingdom. It is the fourth most traded unit for foreign exchange (FX) in the world, accounting for 12% of all transactions, averaging $630 billion a day, according to 2022 data. Its key trading pairs are GBP/USD, aka ‘Cable’, which accounts for 11% of FX, GBP/JPY, or the ‘Dragon’ as it is known by traders (3%), and EUR/GBP (2%). The Pound Sterling is issued by the Bank of England (BoE).
The single most important factor influencing the value of the Pound Sterling is monetary policy decided by the Bank of England. The BoE bases its decisions on whether it has achieved its primary goal of “price stability” – a steady inflation rate of around 2%. Its primary tool for achieving this is the adjustment of interest rates. When inflation is too high, the BoE will try to rein it in by raising interest rates, making it more expensive for people and businesses to access credit. This is generally positive for GBP, as higher interest rates make the UK a more attractive place for global investors to park their money. When inflation falls too low it is a sign economic growth is slowing. In this scenario, the BoE will consider lowering interest rates to cheapen credit so businesses will borrow more to invest in growth-generating projects.
Data releases gauge the health of the economy and can impact the value of the Pound Sterling. Indicators such as GDP, Manufacturing and Services PMIs, and employment can all influence the direction of the GBP. A strong economy is good for Sterling. Not only does it attract more foreign investment but it may encourage the BoE to put up interest rates, which will directly strengthen GBP. Otherwise, if economic data is weak, the Pound Sterling is likely to fall.
Another significant data release for the Pound Sterling is the Trade Balance. This indicator measures the difference between what a country earns from its exports and what it spends on imports over a given period. If a country produces highly sought-after exports, its currency will benefit purely from the extra demand created from foreign buyers seeking to purchase these goods. Therefore, a positive net Trade Balance strengthens a currency and vice versa for a negative balance.
Silver prices have recaptured some ground against Gold this month, likely in relation to its recent underperformance relative to Gold, TDS macro analyst Daniel Ghali notes.
Silver's fundamentals remain on an improving trajectory
“We expect CTA selling activity in Silver markets over the next several sessions to challenge money managers participating in the 'catch-up' trade.”
“Silver prices have recaptured some ground against Gold this month, in line with the improving trends in commodity demand sentiment, supported by a combination of CTA buying activity and macro funds re-engaging in the white metal, likely in relation to its recent underperformance relative to Gold.”
“However, a low bar for a round of large-scale CTA selling activity could add pressure on the 'catch-up' trade in the near-term, with algos likely to sell up to -10% of their net length in Silver, even in an uptape. Under the hood, Silver's fundamentals have remained on an improving trajectory, with only a few speed bumps observed in our grandiose #silversqueeze thesis thus far this year.
- AUD/USD jumps to near 0.6870 as the Australian Dollar strengthens on multiple tailwinds.
- China’s massive stimulus announcement and RBA’s hawkish rate stance strengthen the Aussie Dollar.
- The next move in the US Dollar will be influenced by the US core PCE inflation data.
The AUD/USD pair rallies to near 0.6870 in Tuesday’s North American session. The Aussie asset gains strongly after China’s massive stimulus boost to revive household spending and real estate demand and uplift economic growth.
In a press conference on Tuesday, China’s top regulators outlined a sharp decline in key interest rates and establishment of RMB500 billion swap facility and RMB300 billion re-lending fund by the People’s Bank of China (PBoC). The announcement of the big-bang stimulus has strengthened the Australian Dollar’s (AUD) outlook, being a proxy to China’s economy.
The Australian Dollar was already outperforming on Reserve Bank of Australia’s (RBA) hawkish policy outcome in which the central bank left interest rates unchanged at 4.35% for the eighth time in a row. The RBA kept interest rates steady on upbeat labor market conditions and price pressures remaining persistent.
Meanwhile, the US Dollar (USD) faces selling pressure as investors expect that the Federal Reserve (Fed) could opt for continuing the aggressive policy-easing cycle. The US Dollar Index (DXY), which tracks the Greenback’s value against six major currencies, slumps to near 100.60.
According to a CME FedWatch tool, the likelihood for the Fed to cut interest rates by 50 bps to 4.25%-4.50% in November is close to 52% from 29% a week ago.
This week, investors will keenly focus on the US Personal Consumption Expenditure inflation (PCE) data for August, which will be published on Friday. Economists expect the core PCE price index, which is the Fed’s preferred inflation gauge, to have grown to 2.7% from 2.6% in July.
Australian Dollar FAQs
One of the most significant factors for the Australian Dollar (AUD) is the level of interest rates set by the Reserve Bank of Australia (RBA). Because Australia is a resource-rich country another key driver is the price of its biggest export, Iron Ore. The health of the Chinese economy, its largest trading partner, is a factor, as well as inflation in Australia, its growth rate and Trade Balance. Market sentiment – whether investors are taking on more risky assets (risk-on) or seeking safe-havens (risk-off) – is also a factor, with risk-on positive for AUD.
The Reserve Bank of Australia (RBA) influences the Australian Dollar (AUD) by setting the level of interest rates that Australian banks can lend to each other. This influences the level of interest rates in the economy as a whole. The main goal of the RBA is to maintain a stable inflation rate of 2-3% by adjusting interest rates up or down. Relatively high interest rates compared to other major central banks support the AUD, and the opposite for relatively low. The RBA can also use quantitative easing and tightening to influence credit conditions, with the former AUD-negative and the latter AUD-positive.
China is Australia’s largest trading partner so the health of the Chinese economy is a major influence on the value of the Australian Dollar (AUD). When the Chinese economy is doing well it purchases more raw materials, goods and services from Australia, lifting demand for the AUD, and pushing up its value. The opposite is the case when the Chinese economy is not growing as fast as expected. Positive or negative surprises in Chinese growth data, therefore, often have a direct impact on the Australian Dollar and its pairs.
Iron Ore is Australia’s largest export, accounting for $118 billion a year according to data from 2021, with China as its primary destination. The price of Iron Ore, therefore, can be a driver of the Australian Dollar. Generally, if the price of Iron Ore rises, AUD also goes up, as aggregate demand for the currency increases. The opposite is the case if the price of Iron Ore falls. Higher Iron Ore prices also tend to result in a greater likelihood of a positive Trade Balance for Australia, which is also positive of the AUD.
The Trade Balance, which is the difference between what a country earns from its exports versus what it pays for its imports, is another factor that can influence the value of the Australian Dollar. If Australia produces highly sought after exports, then its currency will gain in value purely from the surplus demand created from foreign buyers seeking to purchase its exports versus what it spends to purchase imports. Therefore, a positive net Trade Balance strengthens the AUD, with the opposite effect if the Trade Balance is negative.
- CB Consumer Confidence edged higher lower to 98.7 in September
- US Dollar Index remains under pressure and approaches further to 100.00.
Consumer sentiment in the United States (US) deteriorated in September, with The Conference Board's (CB) Consumer Confidence Index falling to 98.7 in September after printing at 105.6 in August.
The Present Situation Index fell by 10.3 points to 124.3, while the Expectations Index declined by 4.6 points to 81.7 but remained above 80, indicating recession fears continue to recede.
Market reaction
The US Dollar index remained under pressure following the release, moving one step closer to the critical 100 threshold, now hovering around 100.50.
- GBP/JPY has rallied to a key resistance level – the September 2 high.
- It could face increased resistance and would need to decisively break higher to extend the trend.
GBP/JPY rises for the seventh consecutive day on Tuesday. It is now close to the key September 2 high at 193.49. This is also close to the 50% Fibonacci retracement level of the July decline at 194.03. These levels are likely to present significant resistance to the pair, which may pullback as a result.
GBP/JPY Daily Chart
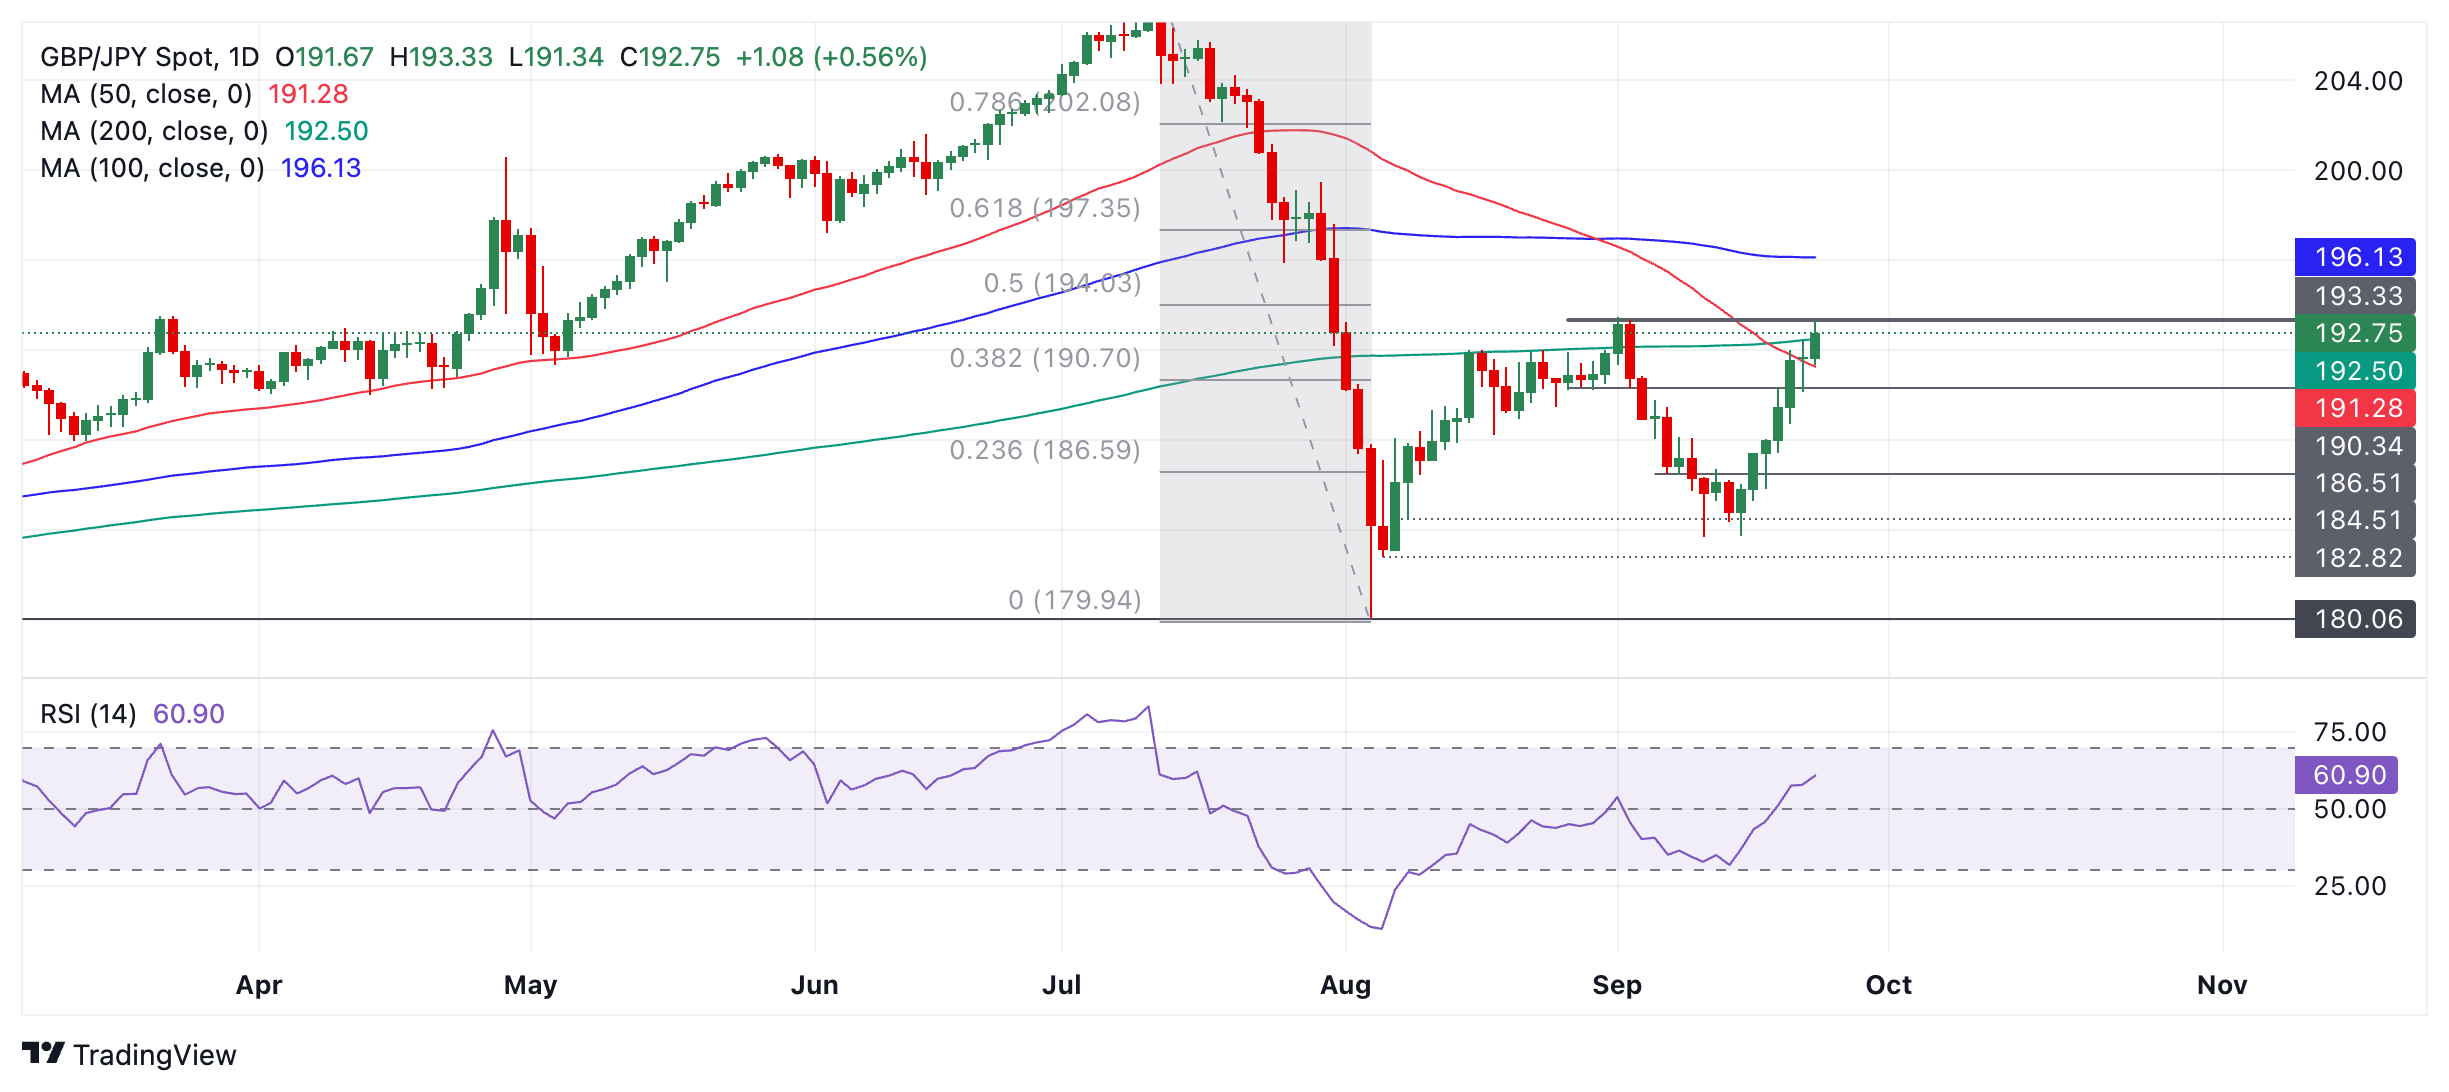
That said, GBP/JPY is in an established short-term uptrend since it pivoted at the September 11 low. Since it is a principle of technical analysis that “the trend is your friend” this uptrend is more likely than not to extend.
There is, therefore, a chance the pair could simply continue higher. If it can decisively break above the resistance line at 193.49 it will confirm an extension of the short-term trend higher.
A decisive break would be one accompanied by a longer-than-average green candle that closed near its high, or three green candles in a row that broke above the level.
The medium-term trend is sideways, signifying no bias in either direction. The long-term trend is up.
PBoC announced outsized RRR and policy rate cuts today. Monetary easing would be less effective without proactive fiscal policy, more bond financing is likely. China rates to fall further on faster rate cuts, USD-CNY may test below 7.0 on improved risk sentiment, Standard Chartered economists note.
Fiscal measures likely to follow
“Governor Pan of the People’s Bank of China (PBoC) announced a 50bps cut to the reserve requirement ratio (RRR) and a 20bps cut to the policy rate, both doubling from the normal size, together with a range of other measures to support the housing market and stock market. Pan also provided forward guidance on a possible RRR cut (25-50bps) in Q4.”
“We expect the PBoC to maintain the easing momentum in the next few quarters amid likely further Fed rate cuts. We now expect a 25bps RRR cut in Q4, in addition to our previous forecast of a 25bps cut in both Q1 and Q3-2025. In addition, we now see a 10bps policy rate cut in Q2-2025, on top of our previous forecast of a 10bps cut in both Q4-2024 and Q1-2025.”
“Under the general public budget, a decline in tax revenues and relatively rigid spending responsibilities may give rise to a financing gap of CNY 0.5-1.0tn this year, according to our estimate. We see a high likelihood of the government increasing bond issuance to fill the gap. Under the government funds budget, we see an opposite risk, i.e., an undershooting of the budget deficit with a slow pace of deployment of government bond proceeds.”
Federal Reserve (Fed) Governor Michelle Bowman speaks about the economic outlook and monetary policy at the Kentucky Bankers Association Annual Convention in Virginia. Her comments come after the Fed announced last week the first 50 basis points (bps) rate cut in four years and hinted at more interest rate cuts coming before year-end.
“In the current economic environment, with no clear signs of material weakening or fragility, in my view, beginning the rate-cutting cycle with a 1/4 percentage point move would have better reinforced the strength in economic conditions while also confidently recognizing progress toward our goals,” Bowman noted.
Key quotes
Though labor market has shown signs of cooling, wage growth, spending and GDP not consistent with a material economic weakening.
Upside risks to inflation are still prominent, including supply chain fragility, fiscal policy, mismatch of housing supply and demand.
Re-calibrating policy is appropriate given progress on inflation, but should not declare victory yet.
Core inflation remains uncomfortably above the 2% target, with upside risks given ongoing growth in spending, wages.
The rise in unemployment is largely due to slowed hiring and improving supply.
Dissent to half-point cut warranted by inflation still above target, a measured pace of cuts is more appropriate.
The estimate of neutral rate is much higher than before the pandemic, policy not as restrictive as it may seem.
Market reaction
Following a rough of dovish comments, Bowman’s words sounded hawkish, although they had no impact on financial markets. The Dollar Index stays unchanged around 100.70 after such words.
- USD/JPY is channeling higher in a short-term uptrend.
- It is likely to extend, although the medium-term bear trend risks pushing it lower again.
USD/JPY has risen up in a channel since bottoming out at the September 16 low.
The rising peaks and troughs, suggest the pair might now be in a short-term uptrend, which favors long holders.
USD/JPY 4-hour Chart
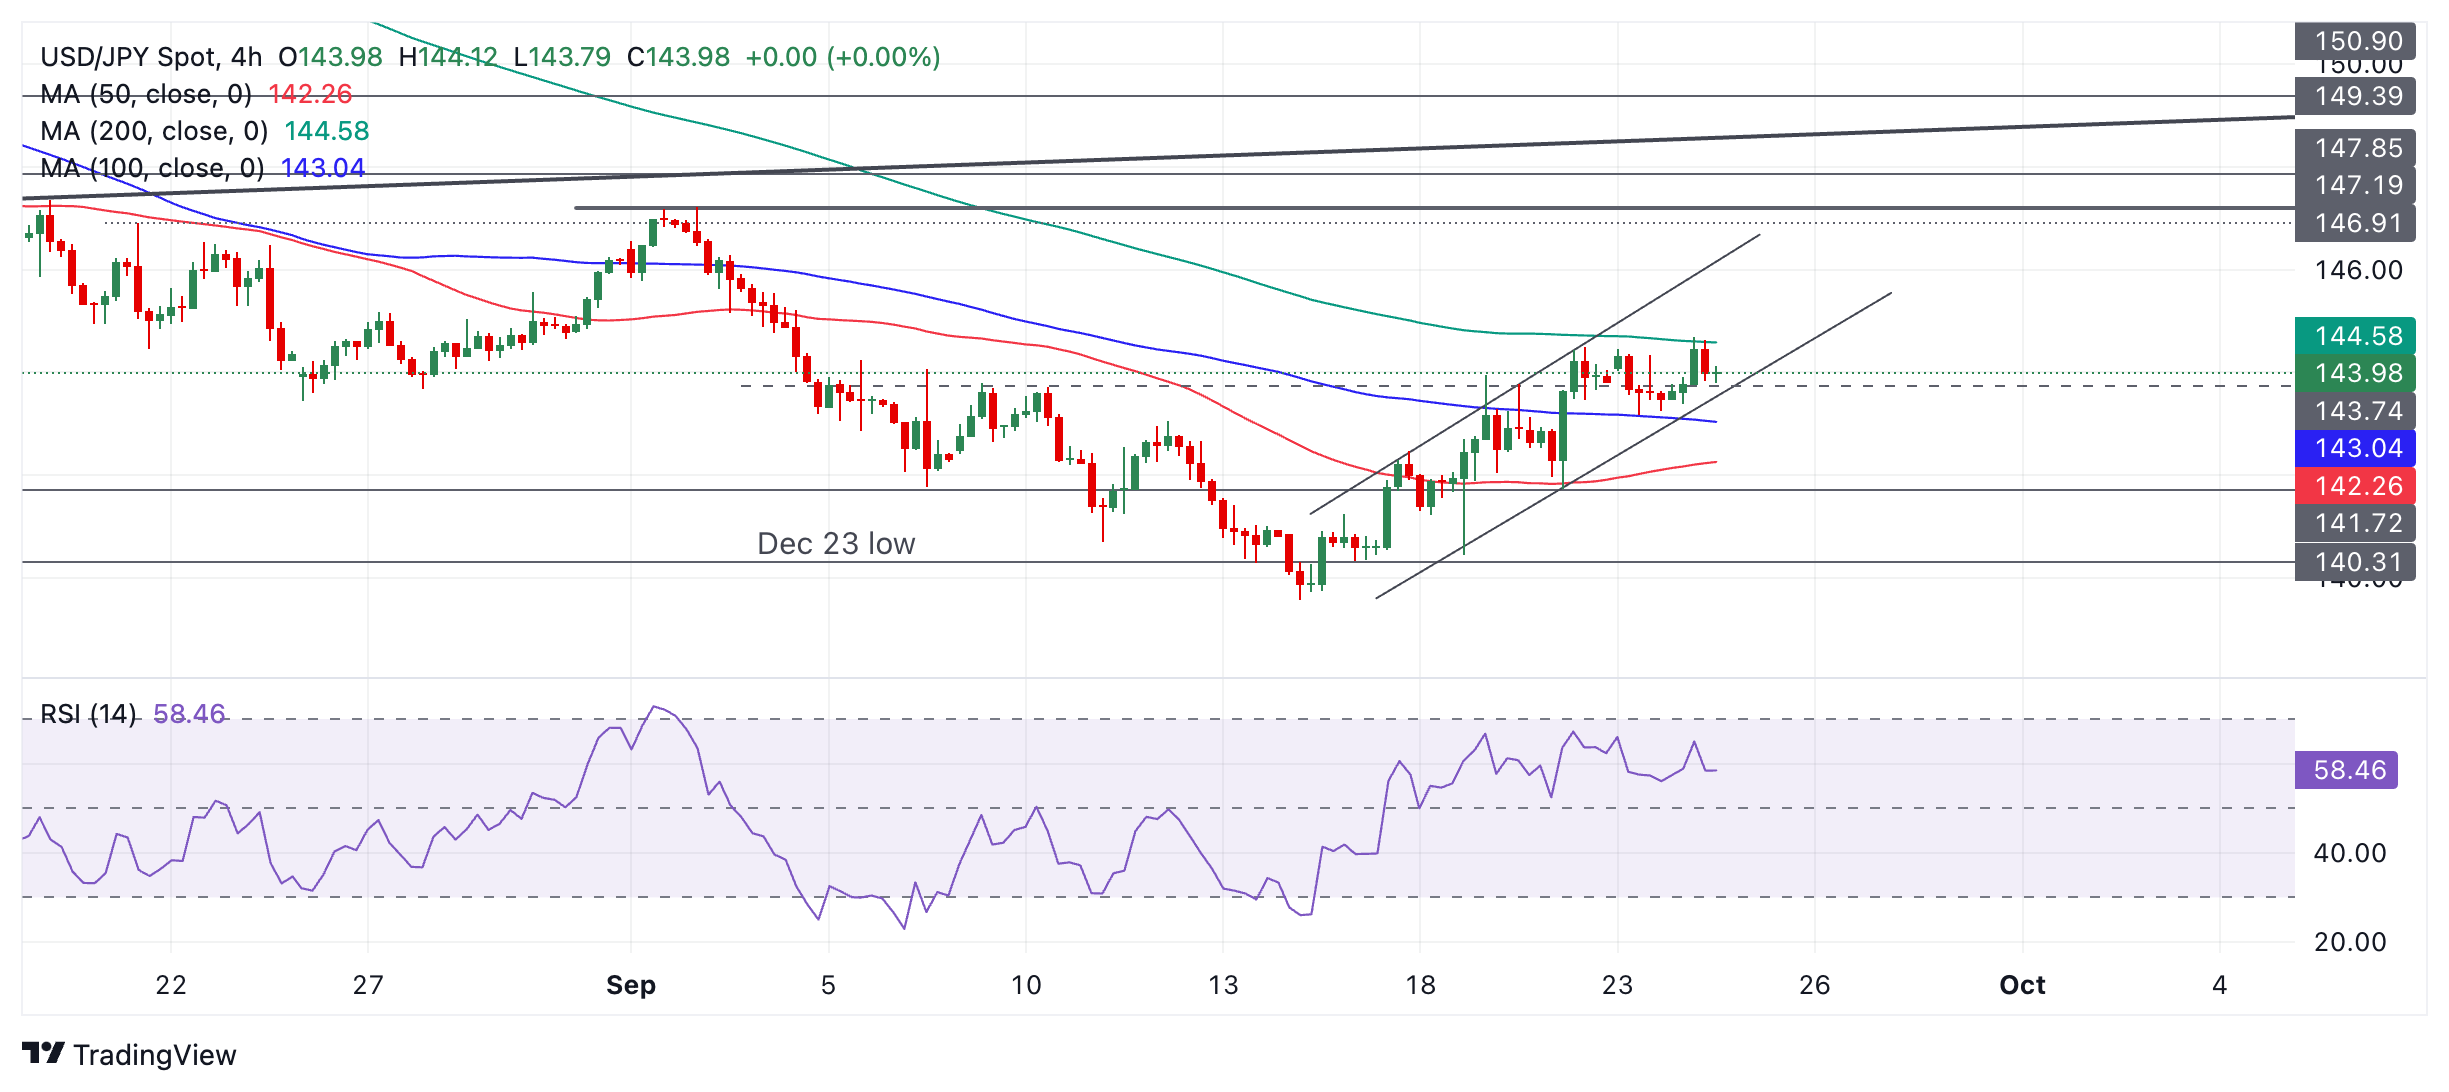
Since “the trend is your friend” the short-term outlook, therefore, is mildly bullish.
A break above 144.68 (September 24 high) would provide confirmation of more upside, to a tentative target at 145.00, then 145.50 and finally in a bullish case 146.00.
A decisive break below the lower channel line, would negate the bullish bias.
The pair is in a medium-term downtrend suggesting a risk of a resumption lower, however, those risks are balanced by its long-term uptrend.
- NZD/USD surges to near 0.6300 as China announces a slew of monetary stimulus.
- The Fed is expected to opt a 50-bps interest rate cut in November.
- Investors await the US core PCE inflation data for August.
The NZD/USD pair rallies to near the key resistance of 0.6300 in Tuesday’s North American session. The Kiwi asset strengthens on the firm New Zealand Dollar (NZD), which is enjoying higher inflows after the announcement of China’s massive stimulus, with the aim to revive the economic prospects, uplifting household spending and real estate demand.
It is worth noting that New Zealand (NZ) is one of the leading trading partners of China, and the announcement of fresh stimulus will prompt Kiwi exports.
Meanwhile, the US Dollar (USD) remains under pressure amid growing discussions that the Federal Reserve (Fed) extend the policy-easing cycle aggressively. The US Dollar Index (DXY), which tracks the Greenback’s value against six major currencies, falls to near 100.75.
Going forward, investors will focus on commentaries from Fed officials and the United States (US) Personal Consumption Expenditure Price Index (PCE) for August, which will be published on Friday. The core PCE inflation is the Fed’s preferred inflation gauge, which is estimated to have grown at a faster pace of 2.7% from 2.6% in July.
NZD/USD extends its winning spell for the fifth trading day on Tuesday. The Kiwi asset approaches the annual high of 0.6400 formed on 26 December 2023. Upward-sloping 20-day Exponential Moving Average (EMA) near 0.6200 suggests that the near-term outlook is upbeat.
The 14-day Relative Strength Index (RSI) strives to sustain above 60.00. A bullish momentum would trigger if the oscillator manages to do so.
Further upside above the Year-To-Date (YTD) high of 0.6330 would drive the asset towards December 26 high of 0.6400, followed by 25 January 2023 low of 0.6450
In an alternate scenario, a downside move would appear if the asset decisively breaks July 17 high near 0.6100. This would push the asset lower to May 3 high at 0.6046 and the psychological support of 0.6000.
NZD/USD daily chart
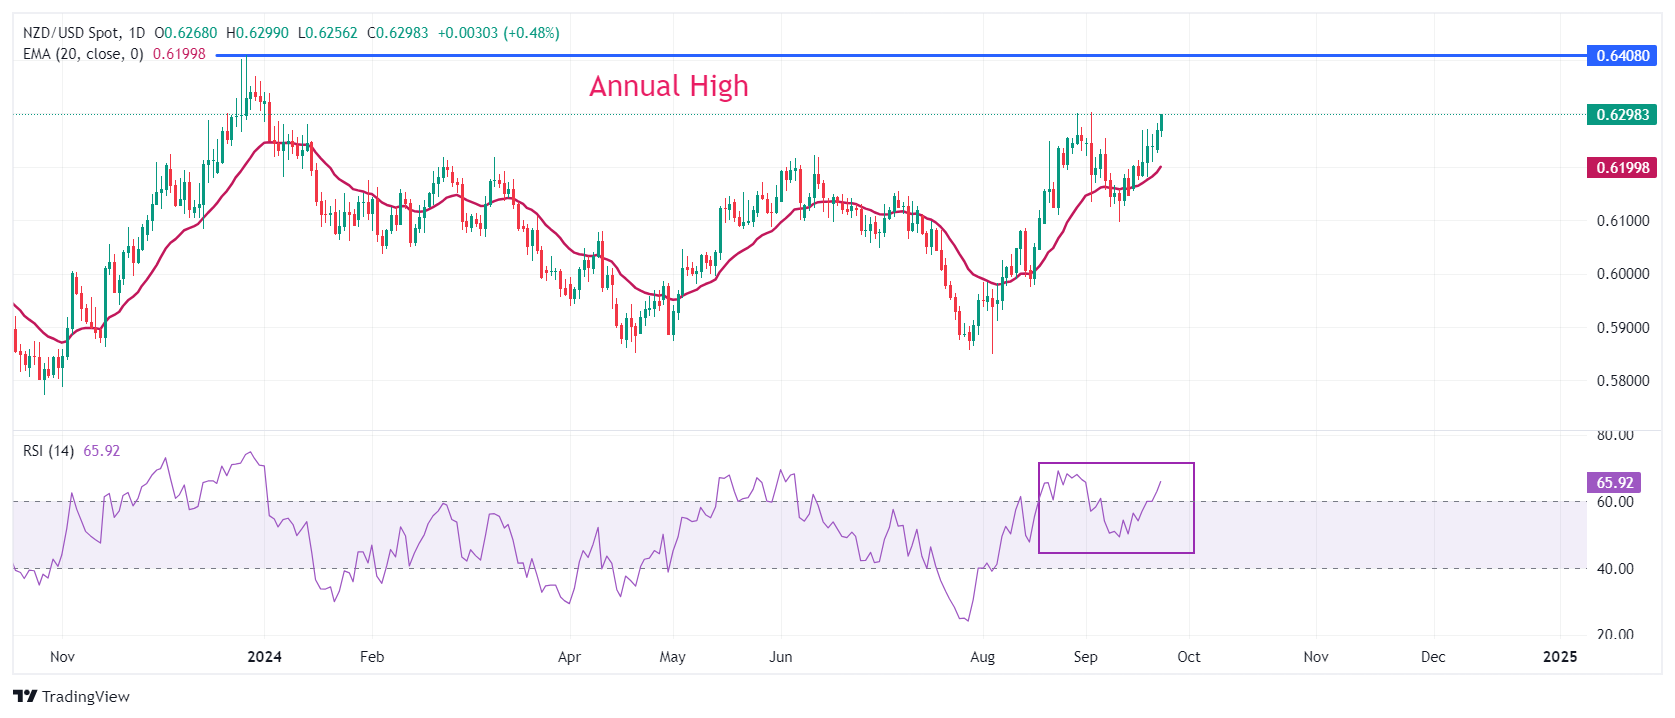
New Zealand Dollar FAQs
The New Zealand Dollar (NZD), also known as the Kiwi, is a well-known traded currency among investors. Its value is broadly determined by the health of the New Zealand economy and the country’s central bank policy. Still, there are some unique particularities that also can make NZD move. The performance of the Chinese economy tends to move the Kiwi because China is New Zealand’s biggest trading partner. Bad news for the Chinese economy likely means less New Zealand exports to the country, hitting the economy and thus its currency. Another factor moving NZD is dairy prices as the dairy industry is New Zealand’s main export. High dairy prices boost export income, contributing positively to the economy and thus to the NZD.
The Reserve Bank of New Zealand (RBNZ) aims to achieve and maintain an inflation rate between 1% and 3% over the medium term, with a focus to keep it near the 2% mid-point. To this end, the bank sets an appropriate level of interest rates. When inflation is too high, the RBNZ will increase interest rates to cool the economy, but the move will also make bond yields higher, increasing investors’ appeal to invest in the country and thus boosting NZD. On the contrary, lower interest rates tend to weaken NZD. The so-called rate differential, or how rates in New Zealand are or are expected to be compared to the ones set by the US Federal Reserve, can also play a key role in moving the NZD/USD pair.
Macroeconomic data releases in New Zealand are key to assess the state of the economy and can impact the New Zealand Dollar’s (NZD) valuation. A strong economy, based on high economic growth, low unemployment and high confidence is good for NZD. High economic growth attracts foreign investment and may encourage the Reserve Bank of New Zealand to increase interest rates, if this economic strength comes together with elevated inflation. Conversely, if economic data is weak, NZD is likely to depreciate.
The New Zealand Dollar (NZD) tends to strengthen during risk-on periods, or when investors perceive that broader market risks are low and are optimistic about growth. This tends to lead to a more favorable outlook for commodities and so-called ‘commodity currencies’ such as the Kiwi. Conversely, NZD tends to weaken at times of market turbulence or economic uncertainty as investors tend to sell higher-risk assets and flee to the more-stable safe havens.
- China’s bumper stimulus package has supported emerging market FX, reviving the carry trade.
- This is weighing on the Yen which is a popular funding currency for the carry trade.
- BoJ commentary and weak Eurozone data weigh on EUR/JPY.
EUR/JPY is trading in the 160.20s, up almost 0.40% on Tuesday, after the announcement of substantial new stimulus measures by China revived the carry trade, which weighed on the Japanese Yen (JPY), the most popular funding currency for this type of trade.
The carry trade is an operation in which traders borrow money in a currency with low interest rates, such as the Yen (around 0.25% APR) and use the money to purchase a currency with a high interest rate such as the Mexican Peso (10.75% APR).
The carry trader profits from the difference in what it costs to service the loan and the interest earned. Because the Yen is so popular as a funding currency, increased carry trading can be a negative factor. China’s stimulus package has revived the carry trade because it had the side-effect of supporting emerging market FX, such as the Mexican Peso (MXN), which makes the trade even more profitable.
EUR/JPY is down from the day’s high of 161.11, however, because of a speech by the Governor of the Bank of Japan (BoJ) Kazuo Ueda which helped strengthen the Yen. The Euro (EUR) also lost some momentum due to more poor data from Europe’s largest economy Germany.
Kazuo Ueda was moderately hawkish (meaning in favor of raising interest rates) in his comments early Tuesday. He said that if inflation continues rising in line with the BoJ’s latest forecasts it would mean that the bank would increase interest rates – a positive for the Yen.
“We will raise interest rate if economy, (and) prices move in line with forecasts shown in our quarterly outlook report,” said Ueda.
A below-expectations result for the IFO German business sentiment index in September, a survey of 7,000 enterprises, further acted as a headwind for EUR/JPY.
Both the IFO Business Climate and Current Assessment indexes fell below both previous readings for August and economists’ forecasts. The IFO Expectations index, meanwhile, matched forecasts but was still lower than the previous month’s reading. The data reinforces the view that the German economy is at risk of falling into a recession.
The Euro lost ground in most of its pairs on Monday after the release of HCOB Purchasing Manager Index (PMI) data showed a stark decline in activity in the Eurozone economy, with the Composite PMI falling from growth to contraction.
In contrast, the Jibun Bank PMI in Japan, whilst showing a mild contraction in Manufacturing showed a slight rise in Services sector activity.
The Gold price continues to rush from record high to record high. The last one so far was reached this morning at $2,640 per troy ounce. This is $110 more than the all-time high recorded just five weeks ago, which held until mid-September, Commerzbank’s commodity analyst Carsten Fritsch notes.
China optimism exaggerated
“Gold benefits from its role as a store of value in times of inflation and uncertainty, and as an interest-free investment in times of falling interest rates. The strength of the Gold price is by no means limited to the US dollar. In numerous other currencies, such as the euro, British pound, Swiss franc, Chinese renminbi and Indian rupee, the Gold price is also at a record level.”
“We are raising our Gold price forecast for the end of the year to $2,600 per troy ounce (previously $2,500). The Gold price could then come under pressure. We can still imagine a further price increase in the short term. However, this is not likely to be permanent.”
“We therefore confirm our price forecast of $2,600 for mid-2025. Since the current Fed projections do not show any interest rate hikes for 2026, we are also raising our price forecast for the end of 2025 to $2,600 per troy ounce (previously $2,550).”
- Crude Oil pops and tests above key level of $72 after China issues chunky financial injection.
- Florida braces for potential Tropical Cyclone Nine.
- The US Dollar Index steadies despite a surge in US yields.
Crude Oil pops higher on Tuesday after the Chinese government launched a 500 billion Yuan (CNY) stimulus plan to reboot its economy. This liquidity injection plan should boost Chinese demand again for Crude Oil. Meanwhile, the geopolitical front is supporting a higher Crude Oil price even with the United Nations (UN) having an emergency assembly later this Tuesday after the intense strikes in Lebanon by Israel over the past few days.
The US Dollar Index (DXY), which tracks the performance of the Greenback against six other currencies, trades sideways even though the uprising in yields, with, for example, the US 10-year Treasury at a fresh September high near 3.79%. The DXY is stuck again in the tight range where it was for most of September and looks unable to move away from it.
At the time of writing, Crude Oil (WTI) trades at $71.94 and Brent Crude at $74.90.
Oil news and market movers: A full house
- Bloomberg reports that European refiners are forced to tap into shale Oil in order to replace the missing barrels from Libya.
- Meanwhile, in the US, Florida braces for Tropical Cyclone Nine, set to hit Florida by Wednesday. Reuters reports that Shell and Chevron have evacuated non-essential personnel from its US Mexican Gulf rigs.
- As usual, the American Petroleum Institute is due to release its weekly Crude stockpile change on Tuesday. No forecast is available for the week of September 20, while the previous release was a build of 1.96 million barrels.
Oil Technical Analysis: It all comes together at once
Crude Oil is not enjoying one but three catalysts, all taking place simultaneously, which are driving Crude Oil prices above the $71.46 (the February 5 low) key level. With the geopolitical, a possible supply outage, and demand resurging from China, a broader rally could be playing out here. It would not come as a surprise that Crude Oil would hit $75 by the end of this week if the three fundamental catalysts remain in focus.
If the positive momentum continues, a return to $75.27 (the January 12 high) could play out with this trifecta of bullish elements. Along the way towards that level, the 55-day Simple Moving Average (SMA) at $74.31 could ease the rally a bit. Once above $75.27, the first resistance to follow is $76.45, with the 100-day SMA in play.
On the downside a reshuffle of supports should take place. First down now is $71.46, which should now act as support instead of resistance. In case that level does not hold, $67.11, a triple bottom in the summer of 2023, should support any downturns. Further down, the next level in line is $64.38, the low from March and May 2023.
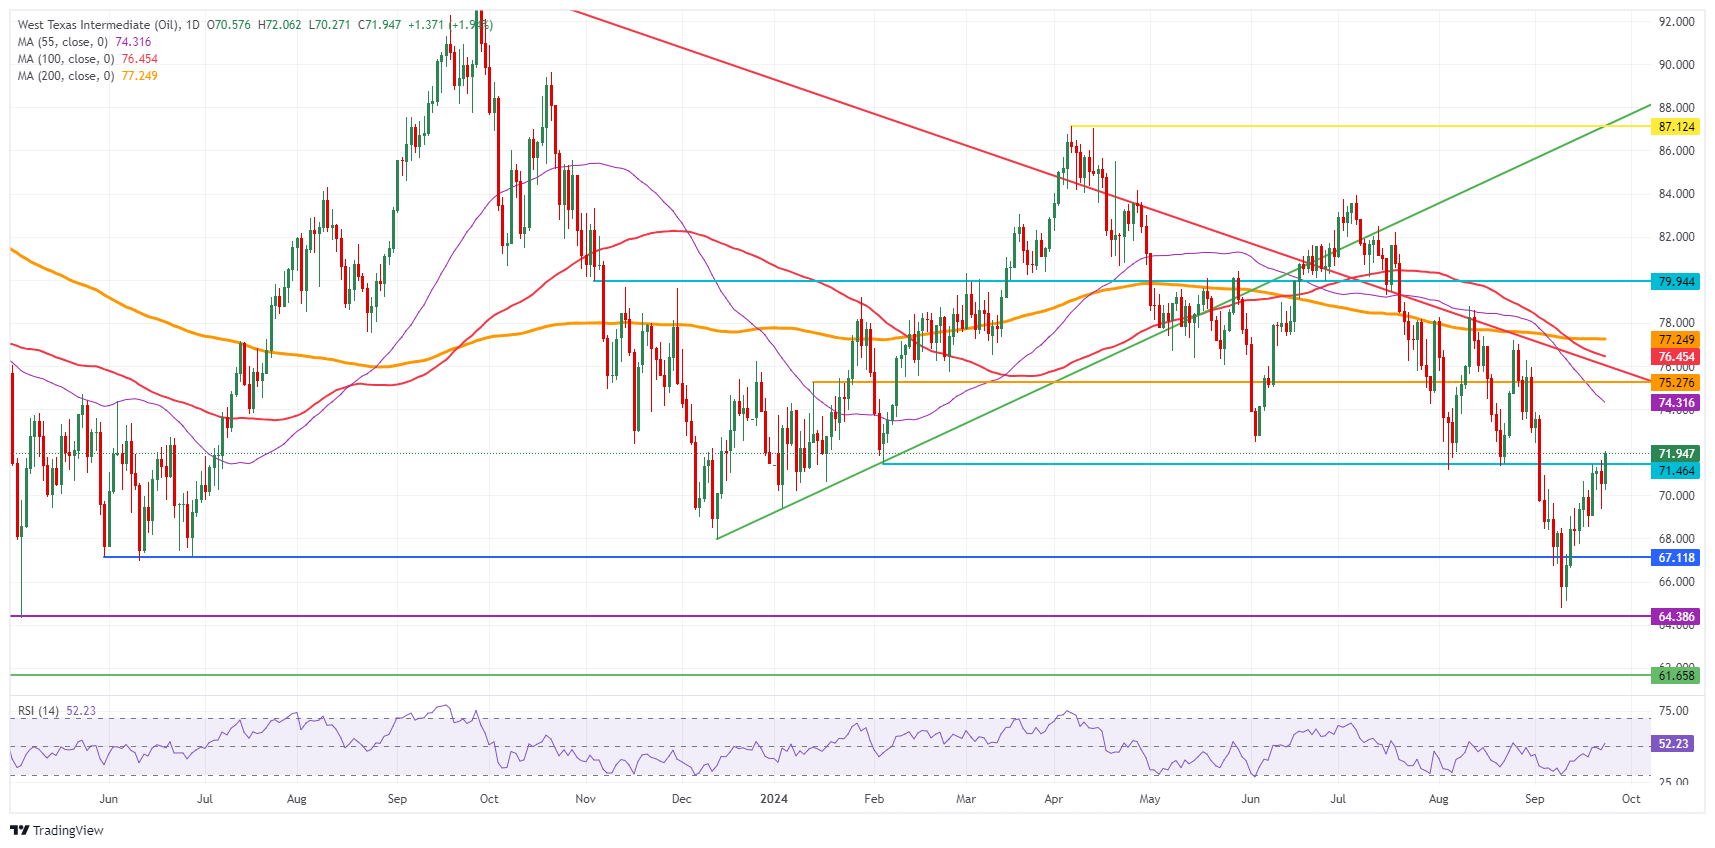
US WTI Crude Oil: Daily Chart
WTI Oil FAQs
WTI Oil is a type of Crude Oil sold on international markets. The WTI stands for West Texas Intermediate, one of three major types including Brent and Dubai Crude. WTI is also referred to as “light” and “sweet” because of its relatively low gravity and sulfur content respectively. It is considered a high quality Oil that is easily refined. It is sourced in the United States and distributed via the Cushing hub, which is considered “The Pipeline Crossroads of the World”. It is a benchmark for the Oil market and WTI price is frequently quoted in the media.
Like all assets, supply and demand are the key drivers of WTI Oil price. As such, global growth can be a driver of increased demand and vice versa for weak global growth. Political instability, wars, and sanctions can disrupt supply and impact prices. The decisions of OPEC, a group of major Oil-producing countries, is another key driver of price. The value of the US Dollar influences the price of WTI Crude Oil, since Oil is predominantly traded in US Dollars, thus a weaker US Dollar can make Oil more affordable and vice versa.
The weekly Oil inventory reports published by the American Petroleum Institute (API) and the Energy Information Agency (EIA) impact the price of WTI Oil. Changes in inventories reflect fluctuating supply and demand. If the data shows a drop in inventories it can indicate increased demand, pushing up Oil price. Higher inventories can reflect increased supply, pushing down prices. API’s report is published every Tuesday and EIA’s the day after. Their results are usually similar, falling within 1% of each other 75% of the time. The EIA data is considered more reliable, since it is a government agency.
OPEC (Organization of the Petroleum Exporting Countries) is a group of 13 Oil-producing nations who collectively decide production quotas for member countries at twice-yearly meetings. Their decisions often impact WTI Oil prices. When OPEC decides to lower quotas, it can tighten supply, pushing up Oil prices. When OPEC increases production, it has the opposite effect. OPEC+ refers to an expanded group that includes ten extra non-OPEC members, the most notable of which is Russia.
The Hungarian MPC paused monetary easing in August as underlying inflation indicators were not improving at all in the preceding months, Commerzbank’s FX Analyst Tatha Ghose notes.
MNB to nudge its base rate lower from the current 6.75%
“The guidance remained that further rate cuts were in the pipeline, but not immediately – stubborn service sector inflation did not allow this. The central bank (MNB) wanted to be cautious and aim for a positive real interest rate at the end of the easing cycle. Against this background, market expectations remained for two more 25bp rate cuts by the end of the year.”
“Circumstances have slightly changed since, and one of these cuts is likely to be made today. In August, Hungarian inflation indicators improved sharply, with both headline and core inflation momentum noticeably decelerating. The increase in tax-adjusted core CPI slowed from a preceding 3-month average rate of circa 0.4% m/m to 0.2% m/m.”
“Given the many dovish signals by major global central banks recently, it is to be expected that MNB would now nudge its base rate lower from the current 6.75%. The forint is currently benefiting from a stronger euro, and is unlikely to be negatively affected by such a rate cut.”
The Bloomberg survey indicates a unanimous expectation among surveyed economists for a 25 bp rate reduction from the Riksbank at tomorrow’s policy meeting. The Reuters survey suggests that the consensus also favours an additional two more 25 bps moves before the end of the year, Rabobank’s Senior FX Strategist Jane Foley notes.
SEK appears cheap
“The combination of stimulus from both monetary and fiscal policy has had a clear impact on confidence levels. Although the Swedish economy has been stagnating for several quarters, consumer confidence has been trending higher from its low in late 2022. This week’s release is expected to show another incremental improvement.”
“It is hoped that this will be reflected in forthcoming retail sales data. In July retail sales rose 0.5% m/m, compared to a drop of -0.8% m/m in June. Other data are also showing signs of improvement. Sweden’s manufacturing PMI release rose to a better than expected 52.7 in August, suggesting that signs of recovery were broadening.”
“Surveys are also showing signs of optimism regarding the outlook for prices in the hard-hit property sector which are stemming from hopes of lower mortgage rates. That said elevated levels of housing supply are likely to dampen the recovery. From a historical basis the SEK appears cheap. Based on Sweden’s improving economic outlook we expect EUR/SEK to tick modestly lower medium-term despite the dovishness of the Riksbank.”
Recently, Bank of Canada (BoC) Governor Tiff Macklem hinted that a larger rate cut of 50 basis points may be appropriate in the coming months. The market has already priced this in quite well, with expectations having corrected significantly in recent weeks, Commerzbank’s FX Analyst Michael Pfister notes.
BoC to accelerate the pace of rate cuts in the coming months
“The market now expects a cut of around 25 basis points at each of the next seven meetings. A move of 50 basis points at each of the next two meetings is even priced in with a probability of around 50%. If that happens, the BoC would have halved the key rate in just under 15 months by the middle of next year.”
“At first glance, this acceleration may seem surprising. After all, the BoC has already cut rates three times by 25 basis points over the last couple of months, putting it in the middle of the G10 pack on policy rates, while other central banks are still hesitating. But there are good reasons for this. Canadian headline inflation has recently fallen back to the middle of the BoC's target range, at 2% year-on-year.”
“In the short term, a more restrictive monetary policy than necessary can have a stabilising effect on the CAD. In the medium term, however, the picture is likely to be different. We are already seeing clear signs of a slowdown in the labour market. And growth is no longer as strong as it once was. There is therefore a strong case for the BoC to accelerate the pace of rate cuts in the coming months – and the CAD is likely to suffer again.”
China’s latest rate cut did little to dent the CNY’s recovery, DBS’ FX strategist Philip Wee notes.
USD/CNY pays more attention to Fed than PBOC
“Monday’s 10 bps reduction in the 14-day reverse repo rate to 1.85% paled compared to last Wednesday’s 50 bps decline in the Fed Fund Rate to 4.75-5.00%. The People’s Bank of China was ensuring ample liquidity ahead of the National Day holidays starting October 1. Conversely, the Fed’s easing sought to avert a further cooling in the US labour market.”
“USD/CNY peaked at 7.2775 on July 24 before declining to the year’s low of 7.0428 last Friday. Despite yesterday’s 0.1% rise to 7.0521, USD/CNY held below last year’s closing level of 7.10, confident that US recession fears have now overshadowed China’s slowdown worries.”
“To break below the psychological level of 7.00 this year, USD/CNY will need the DXY index to depreciate below 100, a scenario we have forecasted through 2025.”
The Reserve Bank of Australia (RBA) left its cash rate unchanged at 4.35% at its monetary policy meeting today, Commerzbank’s FX Analyst Volkmar Baur notes.
Hawkish RBA is supporting the Australian dollar
“This was expected by both the market and all economists surveyed by Bloomberg, given the continued strength of the labor market. The fact that the Australian dollar is slightly higher this morning is likely due to the RBA reiterating that it is not ruling anything out for the future. This means, another rate hike is still on the table, at least in theory.”
“Given the recent weakness in the economy - the PMI for the broader economy fell below 50 yesterday - a further tightening of monetary policy is unlikely. But it also shows that the RBA is still debating whether to cut rates at all, not just when.”
“For now, the hawkish RBA is supporting the Australian dollar. However, I am afraid that this may be too much of a drag on the economy, and this will be reflected in a weaker AUD in the coming months.”
The Euro (EUR) suffered a mild bout of weakness on Monday, as the mostly disappointing purchasing managers' indices were gradually released. For France, for Germany, and finally for the euro area aggregate. For the aggregate, both sub-indices – for manufacturing and for the services sector – were weaker than all analysts surveyed by Bloomberg had expected in advance. For market participants, the scent of recession in the euro zone continues to linger, Commerzbank’s Head of FX and Commodity Research Ulrich Leuchtmann notes.
Significant deterioration of the economic situation to weigh on EUR/USD
“The weakness did not last. Europe's single currency was able to make up for most of the losses quite quickly. Nevertheless, the market's nervousness when it comes to poor euro zone economic data should be a lesson to us. I would like to remind you once again that these reactions to this type of news are so strong because they simultaneously serve two different EUR-negative narratives.”
“The market is already expecting very low inflation in the euro area. If a recession were to occur, the market would have to assume that inflation will be so low that the ECB would have to act quickly to prevent a return to deflation. That would argue for very rapid ECB interest rate cuts. Further euro area economic weakness would again reinforce the impression that the euro area has a sustainable growth problem, unfolding since the immediate recovery from the pandemic is over. But in such an economic area, it is less likely to find many profitable investment opportunities. This reduces the demand for euro and thus weakens the euro on the currency market.”
“Even if not much remained of yesterday's EUR-negative shock in the end, the market reaction reminds us that our expectation of rising EUR/USD rates is also based on the euro area not sliding into a recession. Our economists expect the euro area to see growth rates of around 0.3% over the next few quarters. If the situation were to deteriorate significantly, our EUR/USD forecast would be at risk.”
The People’s Bank of China (PBOC), China Securities Regulatory Commission (CSRC) and National Financial Regulatory Administration (NFRA) announced a slew of stimulus measures in a joint briefing on Tue (24 Sep). The PBOC doubled down on its monetary policy easing by cutting both the interest rates and banks’ reserve requirement ratio (RRR), UOB Group economist Ho Woei Chen notes.
Growth to moderate further to 4.6% in 2025
“China announced a slew of stimulus measures to boost its economy on Tue (24 Sep). The PBOC doubled down on its monetary policy easing by cutting both the 7-day reverse repo rate and banks’ reserve requirement ratio (RRR).”
“China’s latest measures including for the property market were broadly in line with what analysts have called for, though the magnitude of monetary policy easing surpassed expectations. Taking into consideration of the 20bps cut to the 7-day reverse repo rate announced today, we expect the 1Y and 5Y LPR to be lowered to 3.15% and 3.65% respectively by end-2024.”
“The latest set of stimulus measures are likely in response to further deterioration in China’s Aug macroeconomic data but may not be sufficient to reverse the downturn in China’s property market. We keep our GDP growth forecast for China at 4.8% for 2H24 with full-year GDP at 4.9%, after accounting for 1H24 growth of 5.0%. Thereafter, we expect growth to moderate further to 4.6% in 2025.
- USD/CAD has reversed trend and started to decline.
- It is probably forming the wave C of a large ABC or Measured Move pattern.
USD/CAD has rolled over and is beginning to fall in a new down-leg. It is probable in a short-term downtrend now, leaning the odds in favor of more selling. A break below 1.3487 (September 23 low) would probably confirm more downside to targets towards the base of the range (see below).
USD/CAD Daily Chart
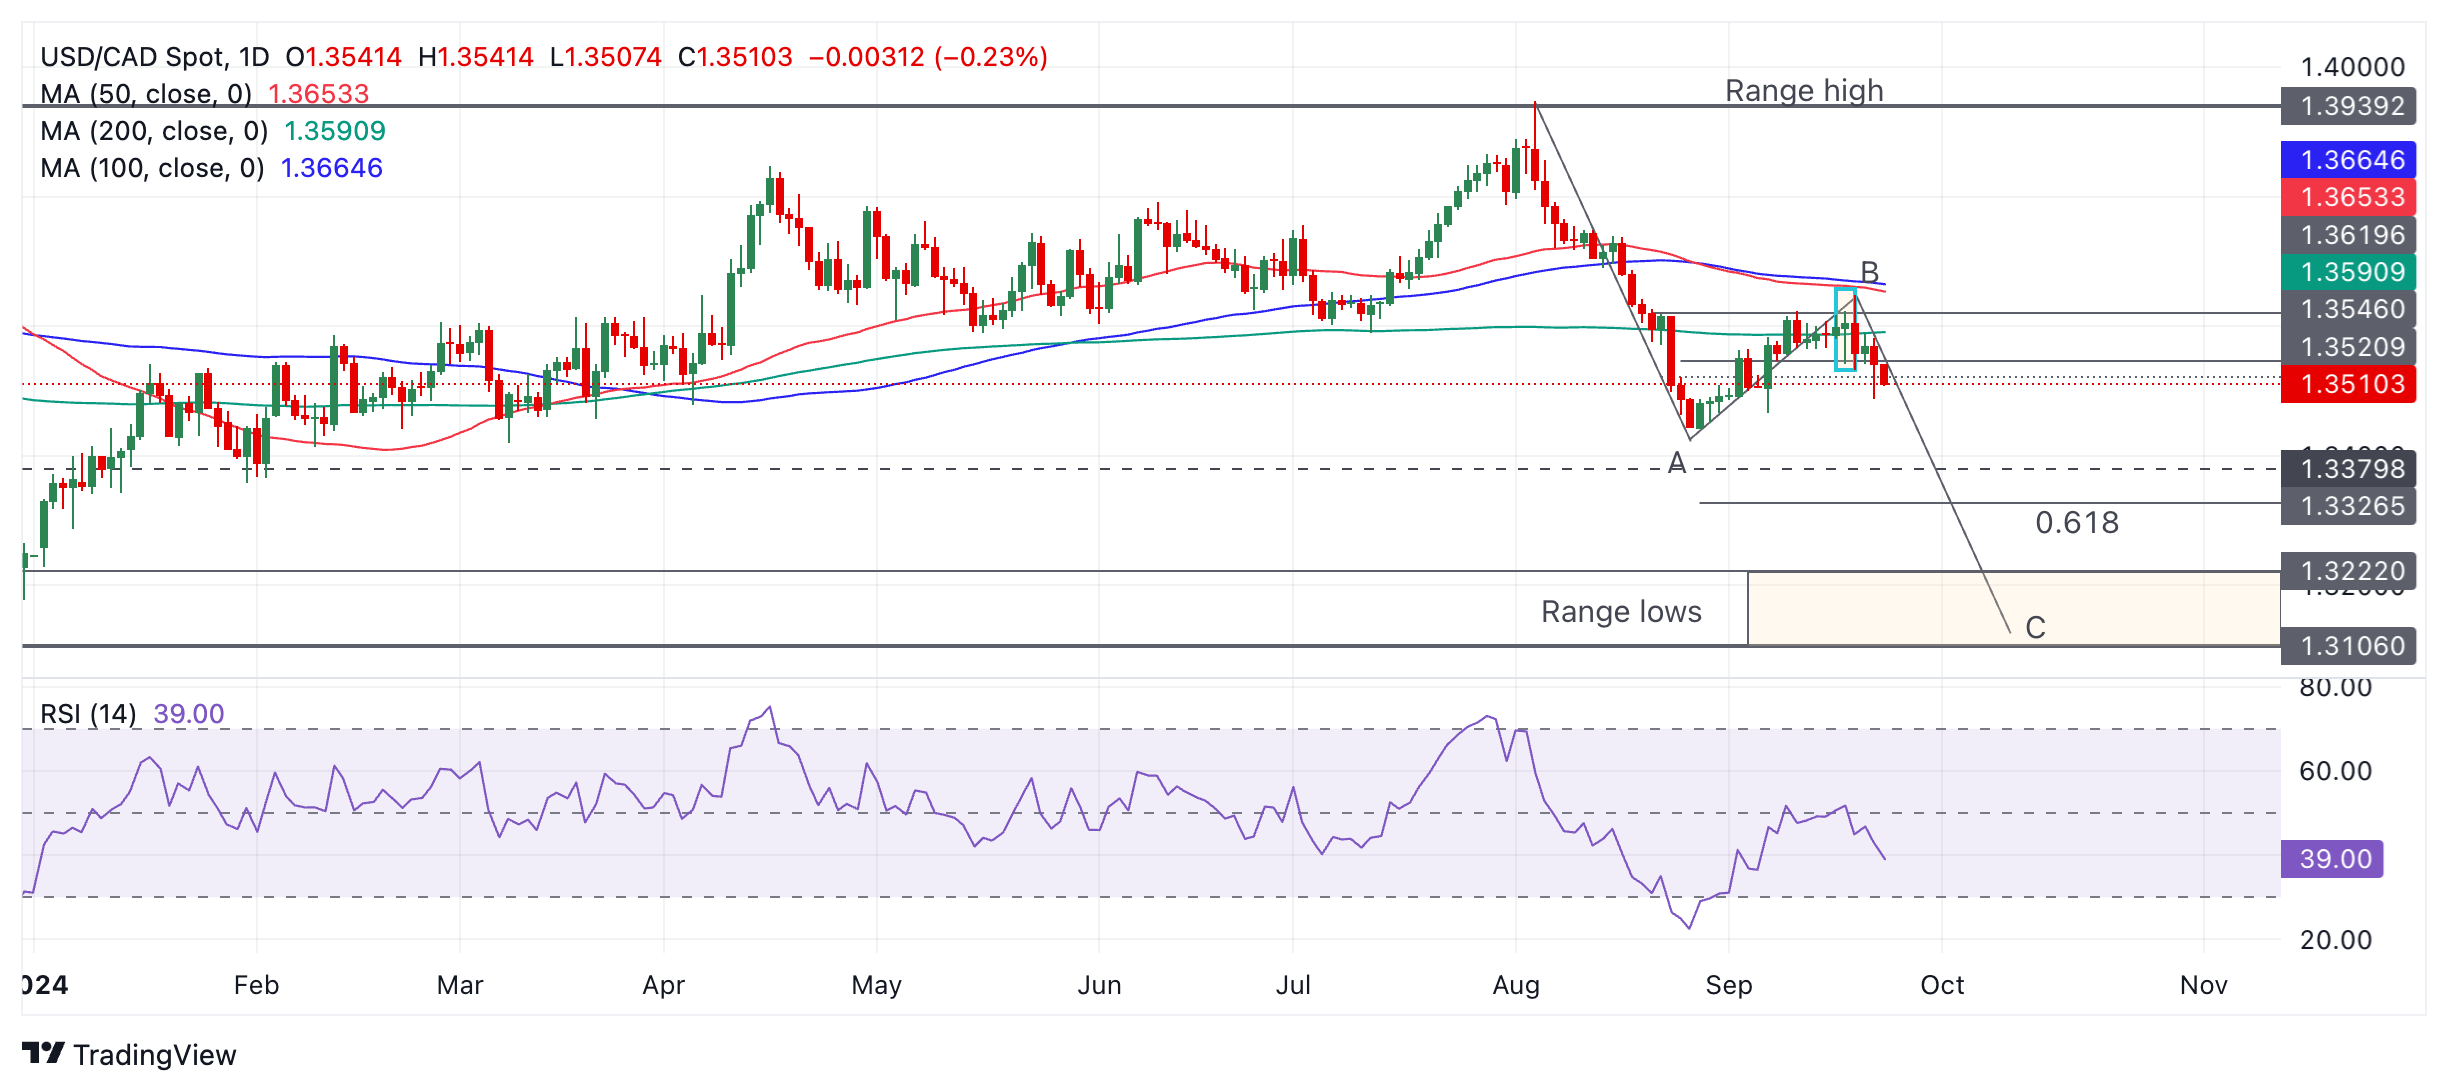
USD/CAD’s move down from the range high, which started on August 5, looks like an ABC pattern, or “Measured Move” (see labels on chart above). Such patterns are like large zig-zags. The wave C usually reaches a similar length to wave A, or at a minimum a Fibonacci 61.8% of A.
As USD/CAD now seems to be forming an ABC pattern, wave C is probably about to unfold and go substantially lower. Such a down leg would probably fall to the zone of the range lows (orange shaded rectangle on chart above). The more conservative 61.8% target, meanwhile, lies at 1.3326.
A break below 1.3466 (September 6 low) more solid bearish confirmation.
- Silver price surges to near $31.00 on Fed dovish bets, China stimulus and Mid East tensions.
- Fed officials remain concerned over the US labor market outlook.
- Silver price holds the downward-sloping trendline breakout
Silver price (XAG/USD) climbs to near $31.00 in Tuesday’s European session. The white metal gains as on firm speculation for the Federal Reserve (Fed) 50 basis points (bps) interest rate cut in November, the announcement of monetary stimulus by China, and escalating Middle East tensions.
According to the CME FedWatch tool, the likelihood of the Fed reducing interest rates by 50 bps to 4.25%-4.50% in November has increased to 51% from 29% a week ago. This has weighed on the US Dollar (USD). The US Dollar Index (DXY), which tracks the Greenback’s value against six major currencies, falls to near 100.80. Historically, lower US Dollar makes the Silver price an inexpensive bet for investors.
Market expectations for Fed large interest rate cuts have strengthened as recent commentaries from policymakers have indicated that they are worried about deteriorating job growth.
Meanwhile, China’s top regulators have announced a slew of stimulus measure to uplift their economy. This would improve the demand for Silver as metal, given that it has applications in various industries, such as electric vehicles and wires and cables, etc.
In the Middle East region, escalating tensions between Israel and Lebanon's Hezbollah has improved Silver’s demand as a safe-haven asset. Mid-East conflicts deepened after Israel’s airstrike in southern Lebanon on Monday.
Silver technical analysis
Silver price strengthens as it holds the breakout of the downward-sloping trendline from May 21 high of $32.50. Upward-sloping 20-day Exponential Moving Average (EMA) near $29.85 suggests that the near-term outlook of the Silver price is bullish.
The 14-day Relative Strength Index (RSI) strives to sustain in the 60.00-80.00. A bullish momentum would trigger if the oscillator manages to do so.
Silver daily chart
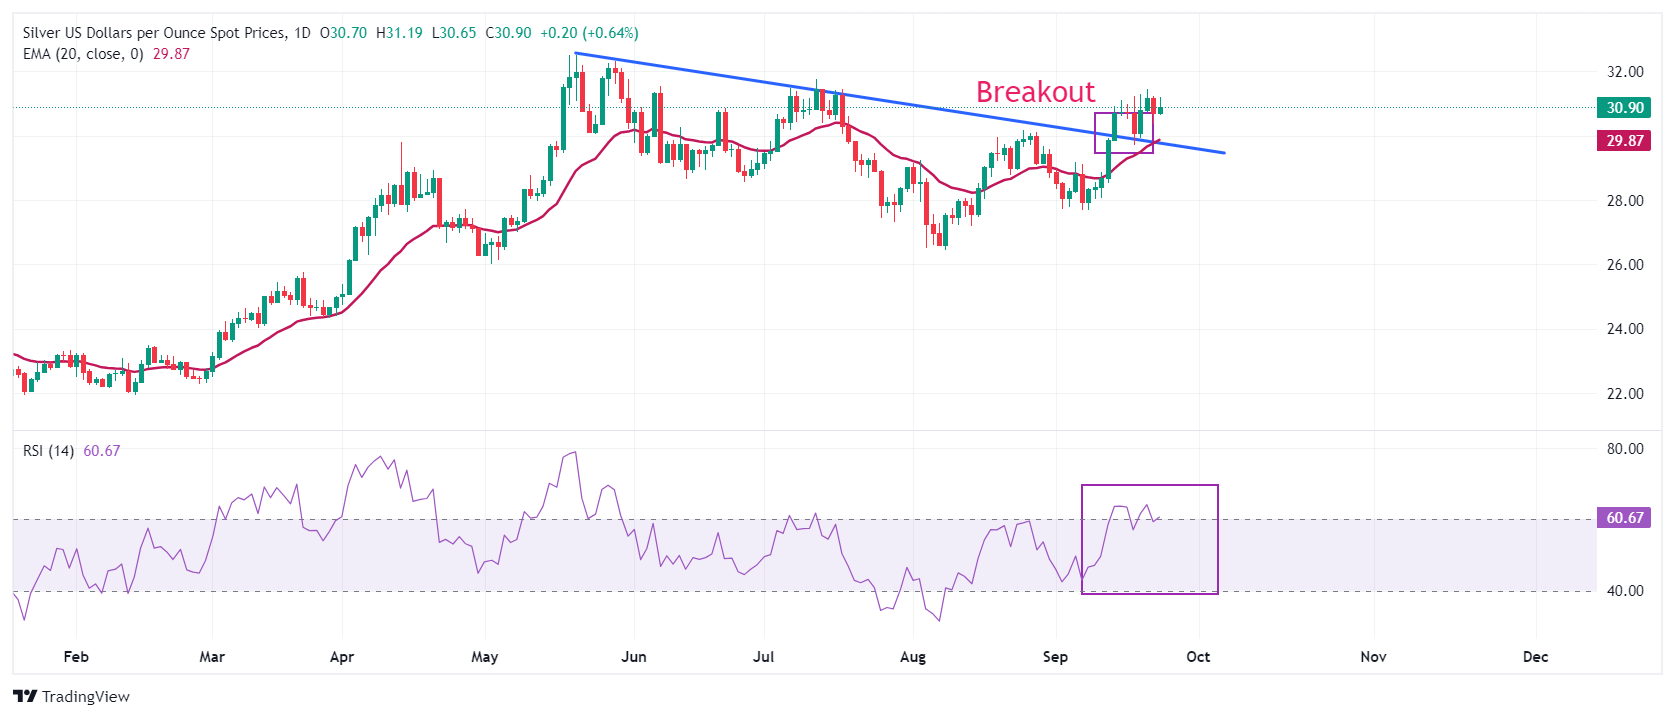
Silver FAQs
Silver is a precious metal highly traded among investors. It has been historically used as a store of value and a medium of exchange. Although less popular than Gold, traders may turn to Silver to diversify their investment portfolio, for its intrinsic value or as a potential hedge during high-inflation periods. Investors can buy physical Silver, in coins or in bars, or trade it through vehicles such as Exchange Traded Funds, which track its price on international markets.
Silver prices can move due to a wide range of factors. Geopolitical instability or fears of a deep recession can make Silver price escalate due to its safe-haven status, although to a lesser extent than Gold's. As a yieldless asset, Silver tends to rise with lower interest rates. Its moves also depend on how the US Dollar (USD) behaves as the asset is priced in dollars (XAG/USD). A strong Dollar tends to keep the price of Silver at bay, whereas a weaker Dollar is likely to propel prices up. Other factors such as investment demand, mining supply – Silver is much more abundant than Gold – and recycling rates can also affect prices.
Silver is widely used in industry, particularly in sectors such as electronics or solar energy, as it has one of the highest electric conductivity of all metals – more than Copper and Gold. A surge in demand can increase prices, while a decline tends to lower them. Dynamics in the US, Chinese and Indian economies can also contribute to price swings: for the US and particularly China, their big industrial sectors use Silver in various processes; in India, consumers’ demand for the precious metal for jewellery also plays a key role in setting prices.
Silver prices tend to follow Gold's moves. When Gold prices rise, Silver typically follows suit, as their status as safe-haven assets is similar. The Gold/Silver ratio, which shows the number of ounces of Silver needed to equal the value of one ounce of Gold, may help to determine the relative valuation between both metals. Some investors may consider a high ratio as an indicator that Silver is undervalued, or Gold is overvalued. On the contrary, a low ratio might suggest that Gold is undervalued relative to Silver.
- The US Dollar trades steadily on Tuesday after Asian equity markets rallied on China’s stimulus plans.
- China wants to restart its economy with a 500 billion Yuan injection.
- The US Dollar Index consolidates in its September range near the yearly lows.
The US Dollar (USD) trades mixed on Tuesday after the Chinese government issued measures to reboot its sluggish economy. The main key elements of the plan are the 500 billion Yuan (CNY) cash injection and the liquidity line with the People’s Bank of China (PBoC) that allows funds and brokers to draw cash for buying stocks. This caused the Chinese Yuan (CNY) to rally nearly 0.50% against the Greenback during the Asian trading session on Tuesday.
On the economic data front, a relatively light calendar ahead with some second-tier data on Tuesday. The Richmond Fed Manufacturing Index for September might be the most market-moving, apart from the Federal Reserve Governor Michelle Bowman, who is expected to comment about the US economic outlook and monetary policy.
Daily digest market movers: Happy with where USD is
- On the geopolitical front, a United Nations emergency meeting is called on Tuesday for Lebanon after intense bombing over the weekend and on Monday by Israel.
- This Tuesday will kick off with Federal Reserve Governor Michelle Bowman, who delivers a speech about the US economic outlook and monetary policy at the Kentucky Bankers Association Annual Convention. Comments are expected to come in around 13:00 GMT.
- At that same time, the Housing Price Index for July is expected to be released. A positive 0.2% is expected after the small 0.1% contraction in June.
- At 14:00 GMT, the Richmond Fed Manufacturing Index for September is set to be released, expected to pick up a touch to -17 from -19 in August.
- At the same time, the Consumer Confidence reading is expected to come in at 104.0, better than the 103.3 previously.
- Equity markets are having a field day, with the Chinese Hang Seng and the Shanghai Shenzhen Index trading up over 4% at the close on Tuesday. European and US equities are following suit with smaller gains.
- The CME Fedwatch Tool shows a 48.5% chance of a 25-basis-point rate cut at the next Fed meeting on November 7, while 51.5% is pricing in another 50-basis-point rate cut.
- The US 10-year benchmark rate trades at 3.79%, flirting with a fresh September high.
US Dollar Index Technical Analysis: Something does not add up
The US Dollar Index (DXY) looks a bit stuck, broken even, and locked in again in that September tight range near the yearly lows. When looking at the yields and the interest rate differentials between the US and other countries, it does not look to add up that the US Dollar is where it is at the moment. Traders are awaiting more data to assess where the US Dollar Index needs to go and commit to a certain trend.
The upper level of the September range remains at 101.90. Further up, the index could go to 103.18, with the 55-day Simple Moving Average (SMA) at 102.51 along the way. The next tranche up is very misty, with the 100-day SMA at 103.66 and the 200-day SMA at 103.77, just ahead of the big 104.00 round level.
On the downside, 100.62 (the low from December 28, 2023) is the first support, and a break could point to more weakness ahead. Should that take place, the low from July 14, 2023, at 99.58, will be the next level to look out for. If that level gives way, early levels from 2023 are coming in near 97.73.
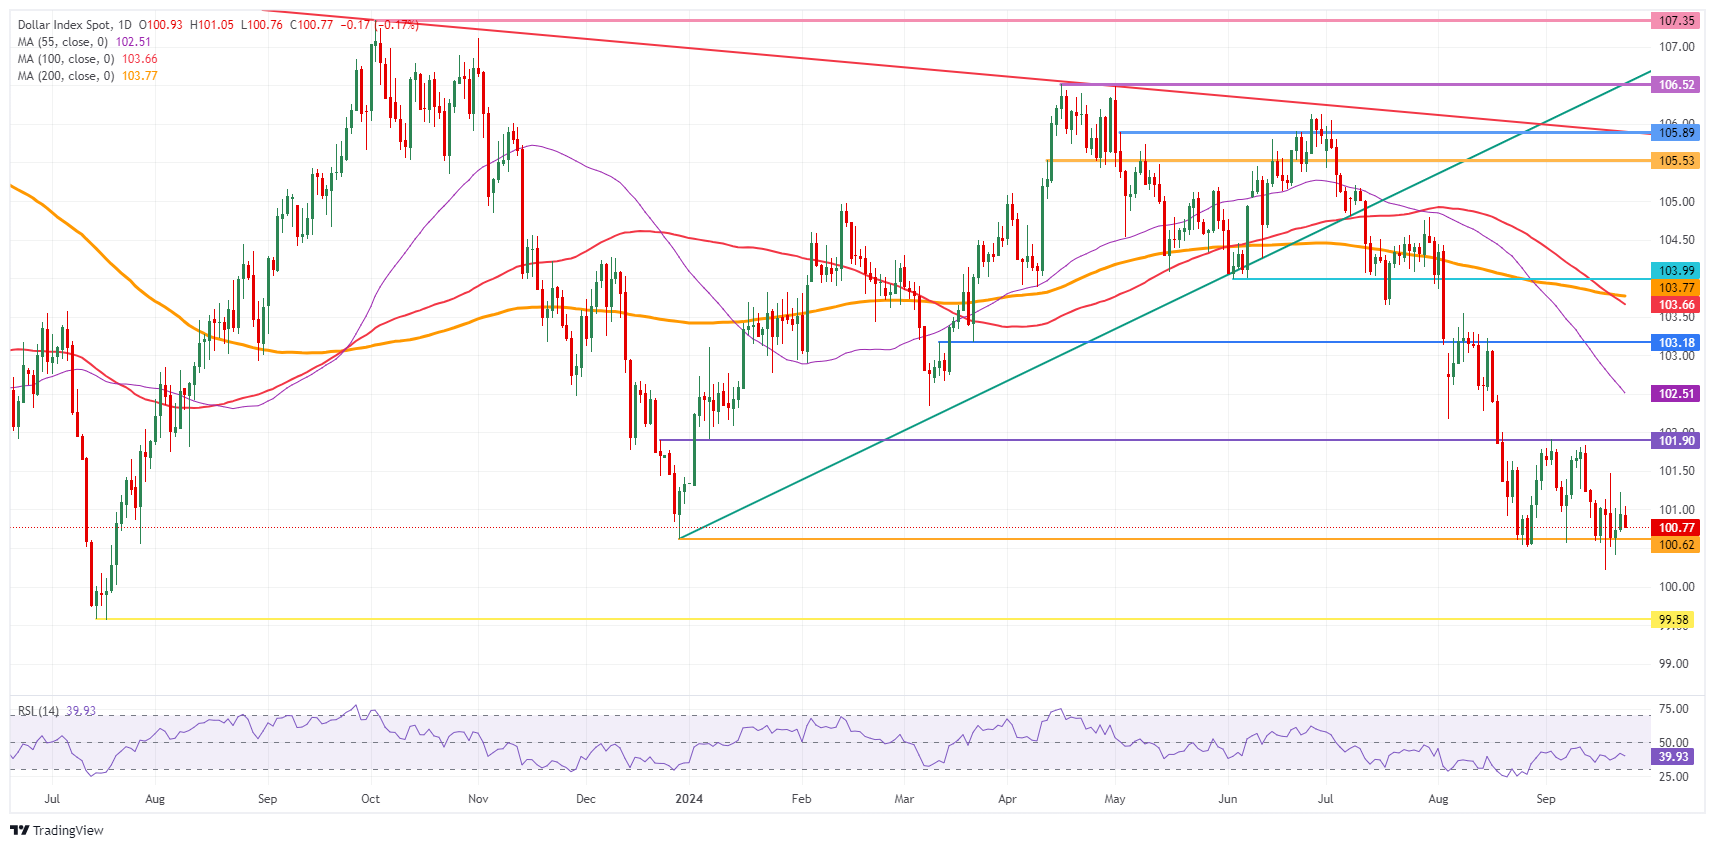
US Dollar Index: Daily Chart
Risk sentiment FAQs
In the world of financial jargon the two widely used terms “risk-on” and “risk off'' refer to the level of risk that investors are willing to stomach during the period referenced. In a “risk-on” market, investors are optimistic about the future and more willing to buy risky assets. In a “risk-off” market investors start to ‘play it safe’ because they are worried about the future, and therefore buy less risky assets that are more certain of bringing a return, even if it is relatively modest.
Typically, during periods of “risk-on”, stock markets will rise, most commodities – except Gold – will also gain in value, since they benefit from a positive growth outlook. The currencies of nations that are heavy commodity exporters strengthen because of increased demand, and Cryptocurrencies rise. In a “risk-off” market, Bonds go up – especially major government Bonds – Gold shines, and safe-haven currencies such as the Japanese Yen, Swiss Franc and US Dollar all benefit.
The Australian Dollar (AUD), the Canadian Dollar (CAD), the New Zealand Dollar (NZD) and minor FX like the Ruble (RUB) and the South African Rand (ZAR), all tend to rise in markets that are “risk-on”. This is because the economies of these currencies are heavily reliant on commodity exports for growth, and commodities tend to rise in price during risk-on periods. This is because investors foresee greater demand for raw materials in the future due to heightened economic activity.
The major currencies that tend to rise during periods of “risk-off” are the US Dollar (USD), the Japanese Yen (JPY) and the Swiss Franc (CHF). The US Dollar, because it is the world’s reserve currency, and because in times of crisis investors buy US government debt, which is seen as safe because the largest economy in the world is unlikely to default. The Yen, from increased demand for Japanese government bonds, because a high proportion are held by domestic investors who are unlikely to dump them – even in a crisis. The Swiss Franc, because strict Swiss banking laws offer investors enhanced capital protection.
The National Bank of Hungary is scheduled to meet today, ING’s FX strategist Frantisek Taborsky notes.
It is too early to go above 400 for EUR/HUF
“We expect a 25bp rate cut to 6.50% in line with market expectations. Even before the Fed's latest decision, we were leaning towards a 25bp cut at the September NBH meeting. Post-Fed, we see a non-negligible chance of a slight dovish shift in forward guidance, with the 6.00-6.25% range cited as a realistic target for the 2024 terminal rate.”
“The NBH will publish its latest set of macroeconomic projections for the main measures (GDP and inflation) alongside the interest rate decision, while the detailed September Inflation Report is due on 26 September. Given the downside surprise in second quarter GDP growth and the weaker-than-expected start to the third quarter, we expect a significant downward revision to the GDP forecast.”
“Almost since the beginning of this year we have been using the 390-400 trading range framework for EUR/HUF, which has worked very well. In recent months the space has probably narrowed to 392-400. While we see a move to the upper bound of the range, we think it is too early to go above 400. One of the reasons is a higher EUR/USD, which will dampen the pressure on HUF, but also a potentially hawkish NBH reversal if HUF comes under pressure.”
Sharp decline has resulted in increase in momentum; USD is likely to continue to weaken, potentially to 7.0100, UOB Group FX analysts Quek Ser Leang and Peter Chia note.
USD/CNH to continue falling towards 7.0100
24-HOUR VIEW: “USD fell sharply two days ago. Yesterday, we indicated that ‘while further USD weakness appears likely today, oversold conditions suggest any further decline could be relatively limited.’ We added, ‘the levels to watch are 7.0380 and 7.0270.’ However, USD did not decline much further, rebounding to 7.0650. The current price action is likely part of a consolidation phase. Today, we expect USD to trade in a 7.0450/7.0680 range.”
1-3 WEEKS VIEW: “We turned negative in USD last Friday (20 Sep, spot at 7.0700), indicating that it ‘is likely to trade with a downward bias towards 7.0500.’ After USD fell to a low of 7.0387, we indicated yesterday (23 Sep, spot at 7.0450) that ‘the sharp decline has resulted in further increase in downward momentum, and USD is likely to continue to weaken, potentially to 7.0100.’ While the subsequent sharp rebound has dented the momentum somewhat, our view remains unchanged for now. However, a breach of 7.0770 (no change in ‘strong resistance’ level) would mean that USD is not weakening further.”
USD/SGD continued to trade in a subdued range near recent low. Pair was last at 1.2885, OCBC FX strategists Frances Cheung and Christopher Wong note.
SGD to continue staying strong
“Daily momentum is flat while RSI rose. Rebound risks not ruled out in the near term. Support here at 1.2870. Resistance at 1.30 (21 DMA), 1.31 levels. S$NEER was last estimated at ~1.88% above our model implied mid, with model implied spot lower bound at 1.2895.”
“Core CPI for Aug re-accelerated. For the first 8 months of the year, core CPI is at 3%. This may suggest that it is premature for MAS to ease policy stance at Oct MPC unless MAS switches from inflation fighting mode to supporting growth.
“SGD strength may continue to stay with us for a little longer, especially if USD softness presses on.”
The US Dollar (USD) is expected to trade between 143.00 and 144.20. In the longer run, sharp advance reinforces view that USD could recover further to 145.50, UOB Group FX analysts Quek Ser Leang and Peter Chia note.
Break above 144.20 to lead to 145.50
24-HOUR VIEW: “Our view for “further USD strength” did not turn out, as it traded between 143.16 and 144.45, closing at 143.60. The price movements appear to be part of a range trading phase. Today, we expect USD to trade between 143.00 and 144.20.”
1-3 WEEKS VIEW: “Our update from yesterday (23 Sep, spot at 144.20) remains valid. As highlighted, the strong advance in USD last week reinforces our view that USD could recover further to 145.50. Our view will be invalidated if USD breaks below 141.90 (no change in ‘strong support’ level).”
- USD/CHF adds nominal gains as the Swiss Franc is weighed down by uncertainty ahead of the SNB’s policy decision.
- The SNB is expected to cut interest rates for the third straight time.
- Growing expectations for Fed large rate cuts in November keep the US Dollar under pressure.
The USD/CHF pair is marginally higher to near 0.8480 in Tuesday’s European session. The Swiss Franc asset edges higher as the Swiss Franc (CHF) weakens amid uncertainty ahead of the Swiss National Bank’s (SNB) interest rate decision, which will be announced on Thursday.
The SNB is widely anticipated to cut interest rates by 25 basis points (bps) to 1%. This would be the third straight quarter-to-a-percentage rate cut as inflation in the Swiss economy has been sustained below the bank’s target of 2% since June 2023. In August, the annual Consumer Price Index (CPI) decelerated further to 1.1%, the lowest from April of this year.
Meanwhile, the Swiss Franc asset gains despite the US Dollar (USD) retreats as growing concerns over the United States (US) job growth have stoked market expectations for second straight Federal Reserve (Fed) 50 bps interest rate cut in the November meeting. The US Dollar Index (DXY), which tracks the Greenback’s value against six major currencies, declines to 100.80.
“The Federal Reserve to cut rates by another 50 basis points in November, a decision that will largely depend on incoming data, especially the next monthly jobs report,” according to strategists from Citi.
Later this week, investors will pay close attention to the US Personal Consumption Expenditure Price Index (PCE) for August, which will be published on Friday. The US core PCE inflation, a Fed’s preferred inflation gauge, is estimated to have accelerated to 2.7% from 2.6% in July.
Economic Indicator
SNB Interest Rate Decision
The Swiss National Bank (SNB) announces its interest rate decision after each of the Bank’s four scheduled annual meetings, one per quarter. Generally, if the SNB is hawkish about the inflation outlook of the economy and raises interest rates, it is bullish for the Swiss Franc (CHF). Likewise, if the SNB has a dovish view on the economy and keeps interest rates unchanged, or cuts them, it is usually bearish for CHF.
Read more.Next release: Thu Sep 26, 2024 07:30
Frequency: Irregular
Consensus: 1%
Previous: 1.25%
Source: Swiss National Bank
The Pound Sterling (GBP) continues to perform well, ING’s FX strategist Chris Turner notes.
Direction of travel continues for GBP/USD to be towards 1.35
“The majority of yesterday's drop in EUR/GBP was down to the miserable eurozone PMI data for September. In addition, the market is looking at some headlines coming out of the Labour Party conference in Liverpool. The focus here has been comments from Chancellor Rachel Reeves hinting at a loosening of fiscal rules which will allow for greater investment.”
“Speculation is growing that there could be a change in the accounting treatment for some of Labour's new institutions – such as the National Wealth and GB Energy – which could potentially unlock an extra £15bn of borrowing. So far the UK sovereign CDS has not widened on this and the concept of these plans seems credible so far.”
“But GBP has enough support at the moment without these potential investment plans. We do not see GBP/USD positioning as particularly stretched and given perhaps a softer dollar environment, the direction of travel continues to be towards 1.35. EUR/GBP has impressed by taking out support at 0.8340/45. Next stop, 0.8300.”
- Gold hits a new record high after China offloads stimulus and cuts interest rates.
- Continued bets that the Fed will make another jumbo cut before year-end also fuel the rally.
- Increased conflict in the Middle East threatens to escalate into all-out war, driving safety flows.
Gold (XAU/USD) breaks above its previous all-time high to reach a new record of $2.640 per troy ounce on Tuesday. Market bets of more aggressive interest rate cuts from the Federal Reserve (Fed) are a major driver. The news of a big stimulus push in China, which includes interest rate cuts, is also a factor. Meanwhile, escalating geopolitical tensions in the Middle East are increasing safe-haven flows into the yellow metal.
Lower interest rates are positive for Gold, as they reduce the opportunity cost of holding the non-interest-paying asset, making it more attractive to investors.
Gold hits new highs as market foresees more cuts coming
Gold peaks as market-based probabilities of the Fed making another double dose 50 basis points (bps), or 0.50%, rate cut remain high. The chances of such a cut at the meeting in November currently stand at 50.2% versus 49.8% for a 25 bps cut, according to the CME FedWatch tool.
On Monday, Fed Bank of Atlanta President Raphael Bostic – a voting member – was relatively neutral in comments about the policy, scoring a 4.0 on FXStreet’s FedTracker, which gauges the tone of Fed officials’ speeches on a dovish-to-hawkish scale from 0 to 10, using a custom AI model.
Non-voting Fed Bank of Atlanta President Austan Goolsbee struck a much more dovish tone, saying inflation had “come way down” and there would be “many more” cuts on their way. His comments scored a 2.0 on FXStreet’s FedTracker.
Fed Bank of Minneapolis President Neel Kashkari (non-voting member) was neutral, scoring a 3.6 on the FedTracker.
On Tuesday, Federal Reserve Governor Michelle Bowman (voter - hawkish) will deliver a speech about the US economic outlook and monetary policy at the Kentucky Bankers Association Annual Convention.
Gold helped by stimulus dump from People’s Bank of China
Gold rallies after the People’s Bank of China (PBoC) announced the largest stimulus package since the Covid pandemic on Tuesday. The PBoC is seeking to combat deflation and support the economy to reach its official yearly growth target of roughly 5.0%.
“The broader-than-expected package offering more funding and interest rate cuts marks the latest attempt by policymakers to restore confidence in the world's second-largest economy after a slew of disappointing data raised concerns of a prolonged structural slowdown,” said Reuters.
The PBoC said it would cut the seven-day reverse repo rate, its new benchmark, by 20 basis points to 1.5%, its medium-term lending facility by 30 bps to 2.30%, and the five and one-year prime rates by 25-30 bps.
PBoC Governor Pan Gongsheng also announced that the central bank will soon cut the amount of cash that banks must hold as reserves - known as reserve requirement ratios (RRR) - by 50 bps. This is likely to free up about 1 trillion yuan ($142 billion) for new lending, according to Reuters.
Pan further added that depending on the market liquidity situation later this year, the RRR may be further lowered by between 25 and 50 bps.
As a country, China constitutes Gold’s largest market.
Middle East tensions rise supporting safe-haven flows
Israel ramped up its bombing of Hezbollah targets in Lebanon overnight, causing over 492 deaths, many of them women and children, according to the BBC.
Hezbollah retaliated by bombing military targets in Northern Israel.
Gold could rise further if the situation escalates into a full-scale conflict. In terms of what such an escalation might look like, BBC International Editor Jeremy Bowan offers an interpretation.
“..some kind of ground operation involving (Israel) sending tanks and troops into Lebanon. And that, I think, then goes into a very escalatory and dangerous situation”, Bowan said.
Technical Analysis: Gold reaches new high of $2,640
Gold breaks to new highs on Tuesday. Given the principle in technical analysis that “the trend is your friend,” the odds favor even more upside for the yellow metal in line with the dominant long, medium, and short-term uptrends.
XAU/USD Daily Chart
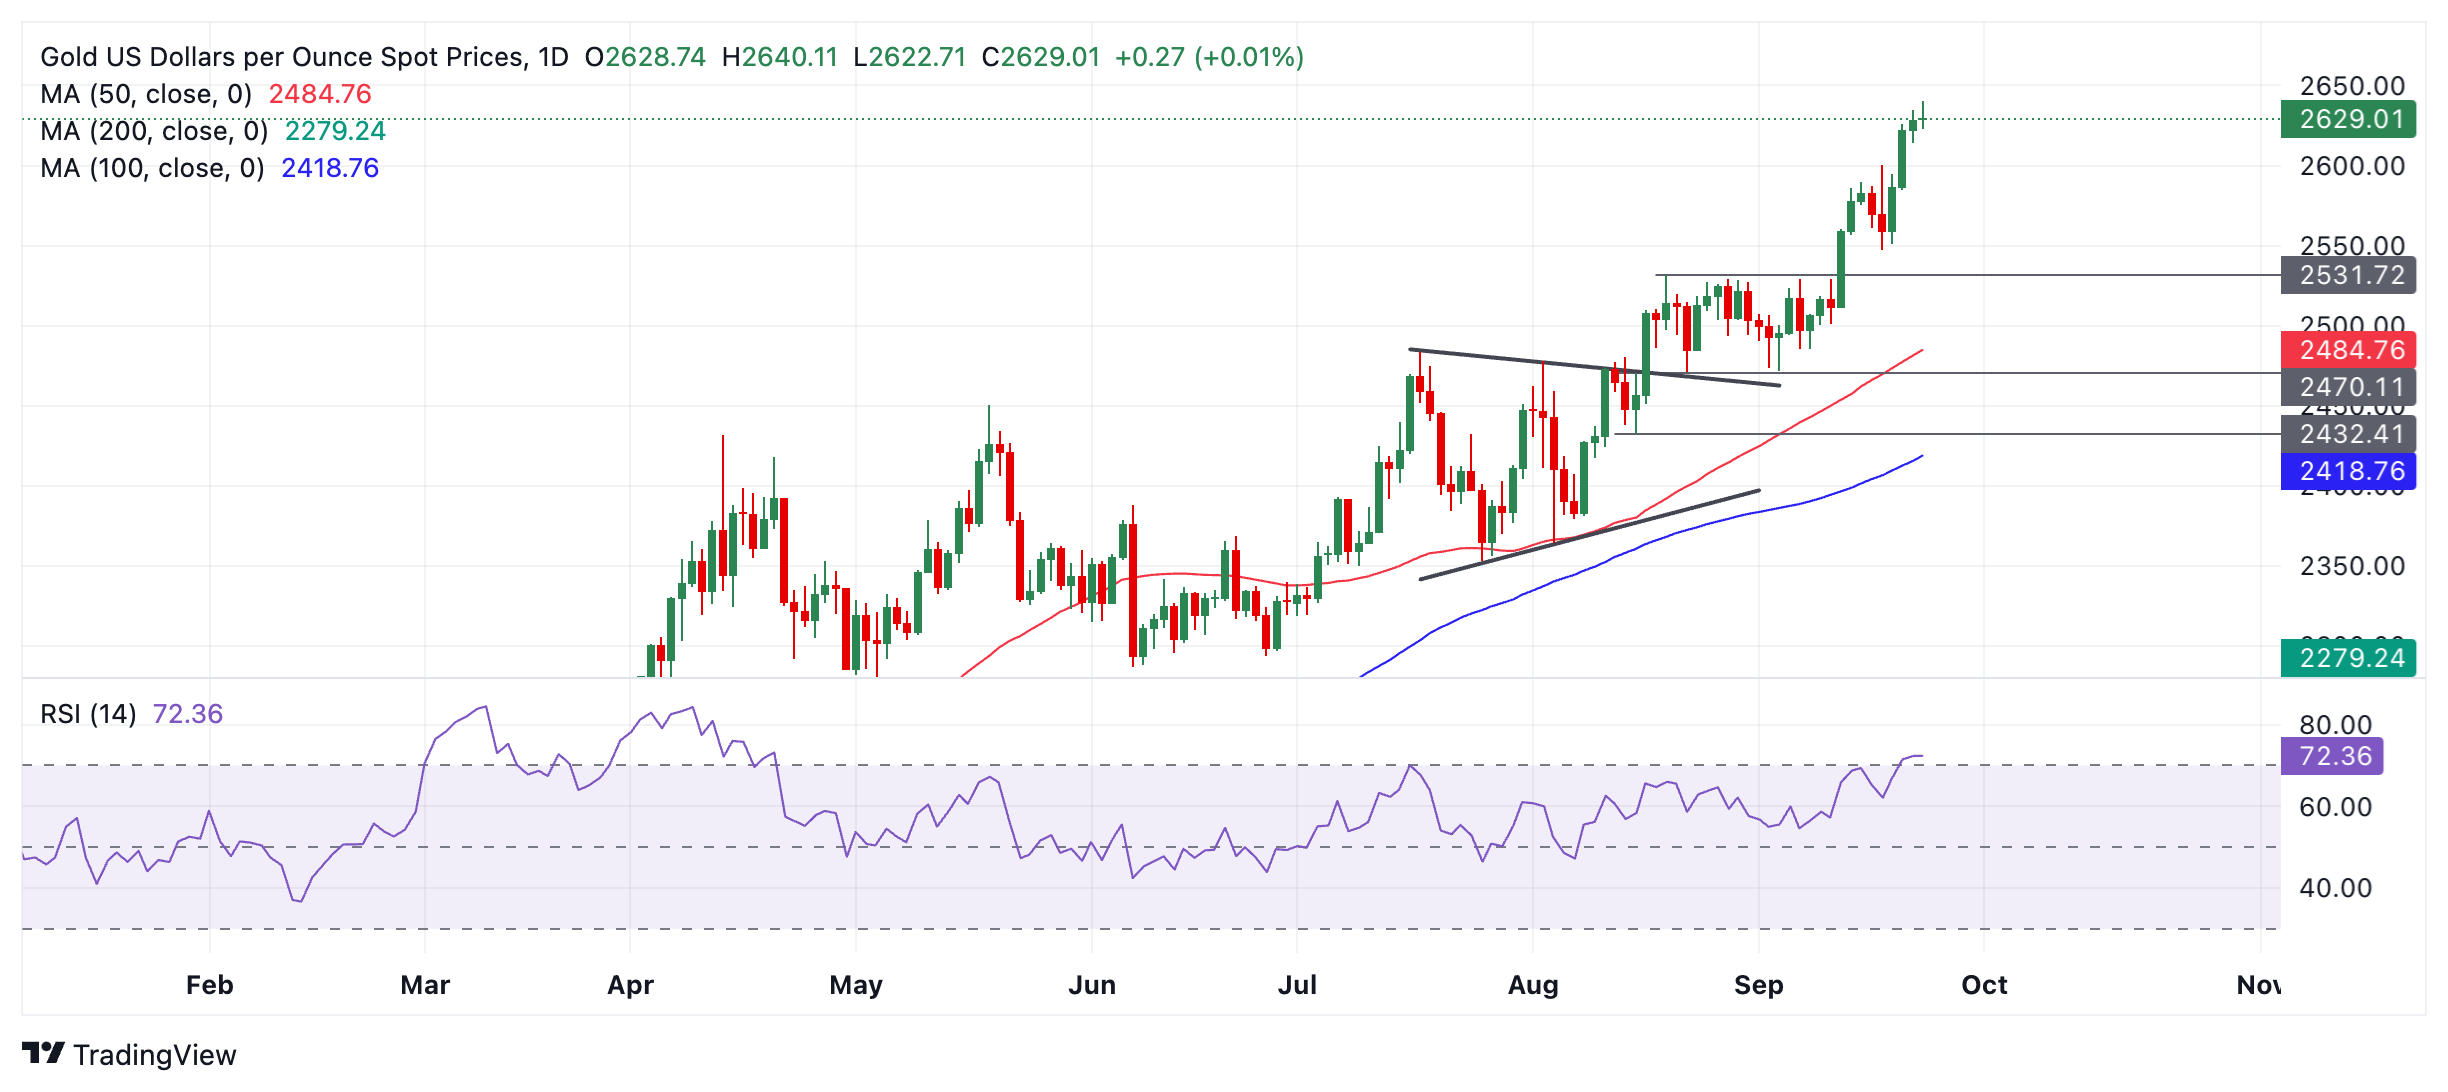
The next targets to the upside are the round numbers: $2,650 first and then $2,700.
Gold entered overbought levels, according to the Relative Strength Index (RSI), on Friday. This advises traders not to add to their long positions. If Gold exits overbought, it will be a sign for them to close long positions and sell shorts, as it would suggest a deeper correction is in the process of unfolding.
If a correction evolves, firm support lies at $2,600 (September 18 high), $2,550 and $2,544 (0.382 Fibonacci retracement of the September rally).
Gold FAQs
Gold has played a key role in human’s history as it has been widely used as a store of value and medium of exchange. Currently, apart from its shine and usage for jewelry, the precious metal is widely seen as a safe-haven asset, meaning that it is considered a good investment during turbulent times. Gold is also widely seen as a hedge against inflation and against depreciating currencies as it doesn’t rely on any specific issuer or government.
Central banks are the biggest Gold holders. In their aim to support their currencies in turbulent times, central banks tend to diversify their reserves and buy Gold to improve the perceived strength of the economy and the currency. High Gold reserves can be a source of trust for a country’s solvency. Central banks added 1,136 tonnes of Gold worth around $70 billion to their reserves in 2022, according to data from the World Gold Council. This is the highest yearly purchase since records began. Central banks from emerging economies such as China, India and Turkey are quickly increasing their Gold reserves.
Gold has an inverse correlation with the US Dollar and US Treasuries, which are both major reserve and safe-haven assets. When the Dollar depreciates, Gold tends to rise, enabling investors and central banks to diversify their assets in turbulent times. Gold is also inversely correlated with risk assets. A rally in the stock market tends to weaken Gold price, while sell-offs in riskier markets tend to favor the precious metal.
The price can move due to a wide range of factors. Geopolitical instability or fears of a deep recession can quickly make Gold price escalate due to its safe-haven status. As a yield-less asset, Gold tends to rise with lower interest rates, while higher cost of money usually weighs down on the yellow metal. Still, most moves depend on how the US Dollar (USD) behaves as the asset is priced in dollars (XAU/USD). A strong Dollar tends to keep the price of Gold controlled, whereas a weaker Dollar is likely to push Gold prices up.
- The Pound Sterling moves higher to near 1.3380 against the US Dollar on expectations of BoE’s shallow policy-easing cycle.
- UK’s overall business activity grew at a slower pace in September, according to a flash estimate.
- Traders raise Fed 50 bps rate cut bets for November.
The Pound Sterling (GBP) gains further against its major peers on Tuesday. The British currency strengthens as investors expect that the Bank of England’s (BoE) policy-easing cycle would be shallower than other central banks from Group of Seven (G-7) nations.
Financial markets expect that the BoE will cut interest rates one more time this year, which will come in any of its two monetary policy meetings remaining this year. High inflation in the United Kingdom’s (UK) service sector seems to be the major reason behind market expectations of BoE’s less-dovish interest rate outlook.
Annual service inflation, which is closely tracked by Bank of England officials, has risen sharply to 5.6% in August from 5.2% in July.
Meanwhile, the comments from BoE Governor Andrew Bailey in his speech during the European trading session on Tuesday indicated that the policy-easing cycle would be gradual.
On the economic front, Flash UK S&P Global/CIPS Purchasing Managers Index (PMI) data for September came in slightly lower but remained above the 50.0 threshold that separates expansion from contraction. The report showed that the overall private business activity fell to 52.9 from 53.8 in August due to a faster-than-expected slowdown in activities in both the manufacturing and service sectors.
Daily digest market movers: Pound Sterling advances toward 1.3400
- The Pound Sterling extends its winning streak for the fifth trading day against the US Dollar (USD) on Tuesday. The GBP/USD pair climbs above 1.3350 as the US Dollar drops amid growing speculation that the Federal Reserve (Fed) could opt for a 50 basis points (bps) interest rate cut for the second time in a row when they meet in November. The US Dollar Index (DXY), which tracks the Greenback’s value against six major currencies, remains under pressure below 101.00.
- The Fed started reducing interest rates from the monetary policy meeting on Wednesday, in which the central bank cut its key borrowing rates by 50 basis points (bps) to a target range of 4.75%-5.00%. The Fed started the policy-easing cycle with a larger-than-usual rate cut as officials focused majorly on preventing job losses, with increased confidence that price pressures will return to the bank’s target of 2%.
- According to the CME FedWatch tool, the likelihood that the Fed will cut interest rates by 50 bps to 4.25%-4.50% in November is close to 51% from 29% a week ago.
- This week, investors will keenly focus on the US Personal Consumption Expenditures Price Index (PCE) data for August, which will be published on Friday. Economists expect the core PCE price index to have grown 2.7% from 2.6% in July.
Technical Analysis: Pound Sterling gains further to 1.3380
The Pound Sterling rises further to 1.3380 against the US Dollar in the European trading hours. The near-term outlook of the GBP/USD pair remains firm as all short-to-long-term Exponential Moving Averages (EMAs) are sloping higher.
Earlier in September, the Cable strengthened after recovering from a corrective move to near the trendline plotted from the December 28, 2023, high of 1.2828, from where it delivered a sharp increase after a breakout on August 21.
The 14-day Relative Strength Index (RSI) shifts above 60.00, suggesting an active bullish momentum.
Looking up, the Cable will face resistance near the psychological level of 1.3500. On the downside, the psychological level of 1.3000 emerges as crucial support.
Pound Sterling FAQs
The Pound Sterling (GBP) is the oldest currency in the world (886 AD) and the official currency of the United Kingdom. It is the fourth most traded unit for foreign exchange (FX) in the world, accounting for 12% of all transactions, averaging $630 billion a day, according to 2022 data. Its key trading pairs are GBP/USD, aka ‘Cable’, which accounts for 11% of FX, GBP/JPY, or the ‘Dragon’ as it is known by traders (3%), and EUR/GBP (2%). The Pound Sterling is issued by the Bank of England (BoE).
The single most important factor influencing the value of the Pound Sterling is monetary policy decided by the Bank of England. The BoE bases its decisions on whether it has achieved its primary goal of “price stability” – a steady inflation rate of around 2%. Its primary tool for achieving this is the adjustment of interest rates. When inflation is too high, the BoE will try to rein it in by raising interest rates, making it more expensive for people and businesses to access credit. This is generally positive for GBP, as higher interest rates make the UK a more attractive place for global investors to park their money. When inflation falls too low it is a sign economic growth is slowing. In this scenario, the BoE will consider lowering interest rates to cheapen credit so businesses will borrow more to invest in growth-generating projects.
Data releases gauge the health of the economy and can impact the value of the Pound Sterling. Indicators such as GDP, Manufacturing and Services PMIs, and employment can all influence the direction of the GBP. A strong economy is good for Sterling. Not only does it attract more foreign investment but it may encourage the BoE to put up interest rates, which will directly strengthen GBP. Otherwise, if economic data is weak, the Pound Sterling is likely to fall.
Another significant data release for the Pound Sterling is the Trade Balance. This indicator measures the difference between what a country earns from its exports and what it spends on imports over a given period. If a country produces highly sought-after exports, its currency will benefit purely from the extra demand created from foreign buyers seeking to purchase these goods. Therefore, a positive net Trade Balance strengthens a currency and vice versa for a negative balance.
Another drop in the eurozone manufacturing PMI yesterday and the composite index dropping into contractionary territory, FX strategist Chris Turner notes.
Best news for EUR/USD coming with US price data
“Yesterday's swathe of PMI data took its toll on the rates markets (two-year EUR swap rates off 7bp) and the Euro.”
“Were it not for the global inflationary environment EUR/USD would look more vulnerable under 1.1100. For the time being, however, we slightly favour this 1.1100-1.1150 range to hold, with the best news for EUR/USD potentially coming with US price data on Friday.”
“As above, we continue to see the possibility of EUR/AUD trading lower and expect that the trend could extend to 1.60. Helping the move is the consistently hawkish Reserve Bank of Australia. The RBA remains definitely on inflation-watch and looks unlikely to cut rates this year.”
Silver prices (XAG/USD) rose on Tuesday, according to FXStreet data. Silver trades at $30.87 per troy ounce, up 0.56% from the $30.70 it cost on Monday.
Silver prices have increased by 29.74% since the beginning of the year.
| Unit measure | Silver Price Today in USD |
|---|---|
| Troy Ounce | 30.87 |
| 1 Gram | 0.99 |
The Gold/Silver ratio, which shows the number of ounces of Silver needed to equal the value of one ounce of Gold, stood at 85.15 on Tuesday, down from 85.63 on Monday.
Silver FAQs
Silver is a precious metal highly traded among investors. It has been historically used as a store of value and a medium of exchange. Although less popular than Gold, traders may turn to Silver to diversify their investment portfolio, for its intrinsic value or as a potential hedge during high-inflation periods. Investors can buy physical Silver, in coins or in bars, or trade it through vehicles such as Exchange Traded Funds, which track its price on international markets.
Silver prices can move due to a wide range of factors. Geopolitical instability or fears of a deep recession can make Silver price escalate due to its safe-haven status, although to a lesser extent than Gold's. As a yieldless asset, Silver tends to rise with lower interest rates. Its moves also depend on how the US Dollar (USD) behaves as the asset is priced in dollars (XAG/USD). A strong Dollar tends to keep the price of Silver at bay, whereas a weaker Dollar is likely to propel prices up. Other factors such as investment demand, mining supply – Silver is much more abundant than Gold – and recycling rates can also affect prices.
Silver is widely used in industry, particularly in sectors such as electronics or solar energy, as it has one of the highest electric conductivity of all metals – more than Copper and Gold. A surge in demand can increase prices, while a decline tends to lower them. Dynamics in the US, Chinese and Indian economies can also contribute to price swings: for the US and particularly China, their big industrial sectors use Silver in various processes; in India, consumers’ demand for the precious metal for jewellery also plays a key role in setting prices.
Silver prices tend to follow Gold's moves. When Gold prices rise, Silver typically follows suit, as their status as safe-haven assets is similar. The Gold/Silver ratio, which shows the number of ounces of Silver needed to equal the value of one ounce of Gold, may help to determine the relative valuation between both metals. Some investors may consider a high ratio as an indicator that Silver is undervalued, or Gold is overvalued. On the contrary, a low ratio might suggest that Gold is undervalued relative to Silver.
(An automation tool was used in creating this post.)
- EUR/GBP breaks its four-day losing streak due to dovish comments from BoE Governor Andrew Bailey.
- BoE’s Bailey believes that inflation outlook is downwards, suggesting the interest rates path will also be downwards, gradually.
- German Business Climate Index declined to 85.4 in September, against August’s 86.6 and expected 86.0 readings.
EUR/GBP breaks its four-day losing streak, trading around 0.8330 during the European hours on Tuesday. This upside of the EUR/GBP cross could be attributed to the dovish comments from the Bank of England (BoE) Governor Andrew Bailey.
BoE Governor Andrew Bailey said, “I'm very encouraged that the path of inflation is downwards therefore I do think the path for interest rates will be downwards, gradually.” Bailey added, “My best guess will be interest rates settle at a 'neutral rate'.”
UK Prime Minister Keir Starmer is expected to warn of a "shared struggle" ahead but will emphasize that there is "light at the end of the tunnel" for the country during his first speech at the Labour Party conference. Starmer will state that "tough" decisions are necessary now to "build a new Britain," per BBC.
On the data front, Germany’s headline IFO Business Climate Index declined to 85.4 in September, down from 86.6 in August, missing market expectations of 86.0. The Current Economic Assessment Index also fell to 84.4, below the forecasted 86.1, compared to 86.4 in the previous month. Meanwhile, the IFO Expectations Index, which reflects firms' outlook for the next six months, dropped to 86.3 in September, in line with expectations, from 86.8 in August.
Monday’s flash HCOB Purchasing Managers Index (PMI) data for September from the Eurozone and Germany has heightened market expectations that the European Central Bank (ECB) may implement a second consecutive interest rate cut at its October meeting.
Interest rates FAQs
Interest rates are charged by financial institutions on loans to borrowers and are paid as interest to savers and depositors. They are influenced by base lending rates, which are set by central banks in response to changes in the economy. Central banks normally have a mandate to ensure price stability, which in most cases means targeting a core inflation rate of around 2%. If inflation falls below target the central bank may cut base lending rates, with a view to stimulating lending and boosting the economy. If inflation rises substantially above 2% it normally results in the central bank raising base lending rates in an attempt to lower inflation.
Higher interest rates generally help strengthen a country’s currency as they make it a more attractive place for global investors to park their money.
Higher interest rates overall weigh on the price of Gold because they increase the opportunity cost of holding Gold instead of investing in an interest-bearing asset or placing cash in the bank. If interest rates are high that usually pushes up the price of the US Dollar (USD), and since Gold is priced in Dollars, this has the effect of lowering the price of Gold.
The Fed funds rate is the overnight rate at which US banks lend to each other. It is the oft-quoted headline rate set by the Federal Reserve at its FOMC meetings. It is set as a range, for example 4.75%-5.00%, though the upper limit (in that case 5.00%) is the quoted figure. Market expectations for future Fed funds rate are tracked by the CME FedWatch tool, which shapes how many financial markets behave in anticipation of future Federal Reserve monetary policy decisions.
- AUD/USD pulls back after touching a fresh YTD peak, albeit the downside remains limited.
- The divergent RBA-Fed policy expectations act as a tailwind amid the upbeat market mood.
- China announces a range of stimulus measures and also underpins the China-proxy Aussie.
The AUD/USD pair struggles to capitalize on its modest intraday gains to the 0.6870 region, or a fresh YTD peak touched earlier this Tuesday and touches a daily low during the first half of the European session. Spot prices, however, rebounded a few pips in the last hour and currently trade around the 0.6835 region, nearly unchanged for the day.
The intraday pullback lacks any obvious fundamental catalyst and could be attributed to some profit-taking, especially after the recent rally of over 250 pips from the monthly low, around the 0.6620 region. Any meaningful corrective fall still seems elusive in the wake of the divergent Reserve Bank of Australia (RBA)-the US Federal Reserve (Fed) policy expectations.
The Australian central bank, as was widely expected, decided to stand pat for the seventh straight meeting and reiterated that policy will need to be restrictive until confidence returns that inflation is moving sustainably towards the target range. Adding to this, RBA Governor Michele Bullock stated that the recent data has not significantly influenced the policy outlook.
Furthermore, China announced a broad range of stimulus measures on Tuesday to support the faltering economy, which, along with renewed US Dollar (USD) selling, should act as a tailwind for the AUD/USD pair. In fact, the People's Bank of China (PBOC) lowered the Reserve Requirement Ratio (RRR) by 50 bps, freeing up about 1 trillion yuan for new lending.
Meanwhile, expectations for more aggressive policy easing by the Federal Reserve (Fed), along with the underlying strong bullish tone across the global equity markets, keep a lid on the recent US Dollar (USD) recovery from the YTD low. This should further contribute to limiting losses for the AUD/USD pair, instead support prospects for further near-term gains.
RBA FAQs
The Reserve Bank of Australia (RBA) sets interest rates and manages monetary policy for Australia. Decisions are made by a board of governors at 11 meetings a year and ad hoc emergency meetings as required. The RBA’s primary mandate is to maintain price stability, which means an inflation rate of 2-3%, but also “..to contribute to the stability of the currency, full employment, and the economic prosperity and welfare of the Australian people.” Its main tool for achieving this is by raising or lowering interest rates. Relatively high interest rates will strengthen the Australian Dollar (AUD) and vice versa. Other RBA tools include quantitative easing and tightening.
While inflation had always traditionally been thought of as a negative factor for currencies since it lowers the value of money in general, the opposite has actually been the case in modern times with the relaxation of cross-border capital controls. Moderately higher inflation now tends to lead central banks to put up their interest rates, which in turn has the effect of attracting more capital inflows from global investors seeking a lucrative place to keep their money. This increases demand for the local currency, which in the case of Australia is the Aussie Dollar.
Macroeconomic data gauges the health of an economy and can have an impact on the value of its currency. Investors prefer to invest their capital in economies that are safe and growing rather than precarious and shrinking. Greater capital inflows increase the aggregate demand and value of the domestic currency. Classic indicators, such as GDP, Manufacturing and Services PMIs, employment, and consumer sentiment surveys can influence AUD. A strong economy may encourage the Reserve Bank of Australia to put up interest rates, also supporting AUD.
Quantitative Easing (QE) is a tool used in extreme situations when lowering interest rates is not enough to restore the flow of credit in the economy. QE is the process by which the Reserve Bank of Australia (RBA) prints Australian Dollars (AUD) for the purpose of buying assets – usually government or corporate bonds – from financial institutions, thereby providing them with much-needed liquidity. QE usually results in a weaker AUD.
Quantitative tightening (QT) is the reverse of QE. It is undertaken after QE when an economic recovery is underway and inflation starts rising. Whilst in QE the Reserve Bank of Australia (RBA) purchases government and corporate bonds from financial institutions to provide them with liquidity, in QT the RBA stops buying more assets, and stops reinvesting the principal maturing on the bonds it already holds. It would be positive (or bullish) for the Australian Dollar.
The Australian Dollar (AUD) is likely to trade sideways, probably in a range of 0.6800/0.6855. In the longer run, there is still room for AUD to rise further, but there may not be enough momentum for it to challenge 0.6870, UOB Group FX analysts Quek Ser Leang and Peter Chia note.
Rangebound between 0.6800 and 0.6855
24-HOUR VIEW: “We expected AUD to trade sideways yesterday. Our expectation was incorrect, as AUD rose to 0.6853, closing at its highest level this year (0.6838, +0.45%). Despite the advance, upward momentum has barely increased, and AUD is unlikely to rise much further. Today, we continue to expect AUD to trade sideways, probably in a range of 0.6800/0.6855.”
1-3 WEEKS VIEW: “We continue to hold the same view as last Friday (20 Sep, spot at 0.6800). As highlighted, while there is still room for AUD to continue to rise, it may not have enough momentum to challenge to significant resistance at 0.6870. On the downside, a breach of 0.6770 (strong support’ level was at 0.6740 yesterday) would mean that the upward pressure that started early last week has eased.”
The top news this European morning is a package of monetary easing measures delivered by Chinese authorities overnight. These measures can be described as a monetary 'bazooka', but there is much work to be done to get Chinese demand back on its feet, ING’s FX strategist Chris Turner notes.
DXY to trade in a tight 100.50-101.00 range
“These measures have delivered decent 3-4% gains in local equity markets and a similar jump in iron ore, seen as a key benchmark for the Chinese property sector. Whilst in theory monetary easing should be negative for a currency, USD/CNH has in fact broken down to a new low. This reflects both Chinese exporters belatedly hedging dollar receivables and re-rating of the China investment thesis and investors being forced to pare back underweight positions in China.”
“Chinese measures add to the reflationary sentiment we were discussing in yesterday's FX Daily. This environment is characterised by steeper yield curves, higher equities and as we pointed out yesterday normally sees the benchmark reflationary FX pair, EUR/AUD, come lower. Indeed, EUR/AUD has dropped 1.3% over the last 24 hours. For the dollar itself, a reflationary environment is mildly negative as investors rotate into more pro-cyclical and EM currencies.”
“Given more manufacturing malaise expected out of Germany today and the euro's large weight in the DXY, this probably means DXY continues to trade in a tight 100.50-101.00 range. However, if a recovery in Chinese domestic demand is the flavour of the day, expect currencies like the South African rand, the Brazilian real and the Australian dollar to do well.”
The Euro (EUR) fell after French services PMI and German manufacturing PMI slumped into contractionary territory. EUR was last at 1.1143, OCBC FX strategists Frances Cheung and Christopher Wong note.
Mild bullish momentum on daily chart
“Slump in PMIs maybe a concern but it remains to be seen if this is a one-off summer lull or whether it represents a more material economic downturn. Further growth/activity data would be key as confirmation of deeper economic slowdown will suggest that ECB easing may need to play catch up and that would warrant a softer EUR (which markets may contemplate playing this theme pre-emptively).”
“Mild bullish momentum on daily chart shows tentative signs of waning while RSI turned lower. Technically, double-top bearish reversal appears to be forming. Risks skewed to the downside. Support at 1.1090 (21 DMA), 1.1060 (23.6% fibo retracement of 2024 low to high) and 1.10 (50 DMA).”
“Resistance at 1.1160, 1.12 (2024 high). Looking at EUR-crosses, we favour tactical short EURGBP on growth and monetary policy divergence between EU/ECB and UK/BOE.”
The Pound Sterling (GBP) could edge higher but is unlikely to reach the major resistance at 1.3400. In the longer run, there has only been a slight increase in momentum, and it remains to be seen if GBP can break above 1.3400, UOB Group FX analysts Quek Ser Leang and Peter Chia note.
To remain bullish above 1.3250
24-HOUR VIEW: “Yesterday, we expected GBP to trade in a range between 1.3270 and 1.3340. We did not anticipate the ensuing volatility as GBP fell sharply, but briefly to 1.3249, snapping back up to reach a high of 1.3360. Despite the strong advance from the low, upward momentum has not increased much. Today, GBP could edge higher, but it is unlikely to reach the major resistance at 1.3400 (there is another resistance at 1.3370). Support is at 1.3325; a breach of 1.3300 would indicate that the current upward pressure has faded.”
1-3 WEEKS VIEW: “We have held a positive GBP view since early last week (see annotations in the chart below). In our latest narrative from last Friday (20 Sep, spot at 1.3280), we highlighted that “while the price action continues to suggest GBP strength, overbought conditions could potentially limit any further advance.” We added, “the next level to watch is 1.3350.” Yesterday (23 Sep, spot at 1.3310), we indicated that “while GBP could rise above 1.3350, the potential of it reaching 1.3400 seems low for now.” GBP subsequently rose to 1.3360. There has only been a slight increase in momentum, and it remains to be seen if GBP can break above the significant resistance at 1.3400. On the downside, should GBP break below 1.3250 (‘strong support’ level previously at 1.3210), it would mean that it is not strengthening further.”
This week is a busy week of Fedspeaks. DXY was last at 100.84, OCBC FX strategists Frances Cheung and Christopher Wong note.
Mild bullish momentum on daily chart
“About 11 separate occasions where multiple Fed officials will air their views, including Powell's pre-recorded speech on Thursday. But last night, for those who spoke, they largely sounded somewhat dovish. For instance, Goolsbee said rates need to be lowered significantly to protect US labour market and the economy and he looks for many more rate cuts over the next year.”
“He also said that current level of interest rates is hundreds of bps above neutral rate. Bostic said large cut supports labor market but pace is not set. Alongside mixed prelim PMI report out of US overnight, the USD still trade mixed while risk-on sentiments remain intact for now (partly supported by China’s stimulus announced this morning).”
“Mild bullish momentum on daily chart intact while RSI rose. Interim double-bottom appears to be forming – this suggests an interim base. USD may drift slightly higher intra-day. Resistance at 101.20 (21 DMA), 101.90. Support at 100.20/50 levels (interim double bottom). This week, we will also watch core PCE (Fri).”
There is room for the Euro (EUR) to test the 1.1080 level; the next support at 1.1050 is unlikely to come under threat. In the longer run, EUR is likely to edge lower, but any decline is expected to face strong support at 1.1050, UOB Group FX analysts Quek Ser Leang and Peter Chia note.
EUR must remain below 1.1175 to remain bearish
24-HOUR VIEW: “Our view of range trading yesterday was incorrect, as EUR tumbled, closing lower by 0.45% (1.1112). The sharp drop appears to be a tad overdone, but barring a breach of 1.1150 (minor resistance is at 1.1135), there is room for EUR to test the 1.1080 level. The next support at 1.1050 is unlikely to come under threat.”
1-3 WEEKS VIEW: “In our most recent narrative from last Friday (20 Sep, spot at 1.1160), we indicated that ‘the likelihood of EUR breaking above the year-todate high of 1.1200 has increased.’ Yesterday, EUR fell and broke below our ‘strong support’ level of 1.1100, reaching a low of 1.1082. Not only has upward momentum faded, but downward momentum is beginning to build. From here, we expect EUR to edge lower, but any decline is expected to face strong support at 1.1050. To maintain the momentum buildup, EUR must remain below 1.1175.”
- The USD/CAD pair could potentially resume its upward movement as a falling wedge pattern suggests a bullish reversal signal.
- A break below the psychological 1.3500 level could lead the pair to test the lower boundary of the falling wedge.
- The immediate barrier appears at the nine-day EMA at 1.3557 level, aligned with the upper boundary of the falling wedge.
USD/CAD extends its losses for the second successive day, trading around 1.3510 during Tuesday’s European hours. Analysis of the daily chart suggests a continuation signal, as the falling wedge pattern is formed during an uptrend, implying that the upward price action would resume.
However, the 14-day Relative Strength Index (RSI) remains below the 50 level, indicating that the bearish trend is still in effect. A further decline toward the 40 mark would suggest an oversold condition for the USD/CAD pair, signaling the potential for an upward correction in the near future.
On the downside, the USD/CAD may navigate the region around the lower boundary of the falling wedge at 1.3470. A break below this level could strengthen the bearish bias and push the pair to test the six-month low of 1.3441 level, recorded on August 28.
Regarding the upside, the immediate barrier appears at the nine-day EMA at 1.3557 level, aligned with the upper boundary of the falling wedge. A breach above the falling wedge would weaken the bearish bias and lead the pair to the USD/CAD pair to test the "throwback support turns into a pullback resistance" level of 1.3590, followed by the psychological level of 1.3600.
USD/CAD: Daily Chart
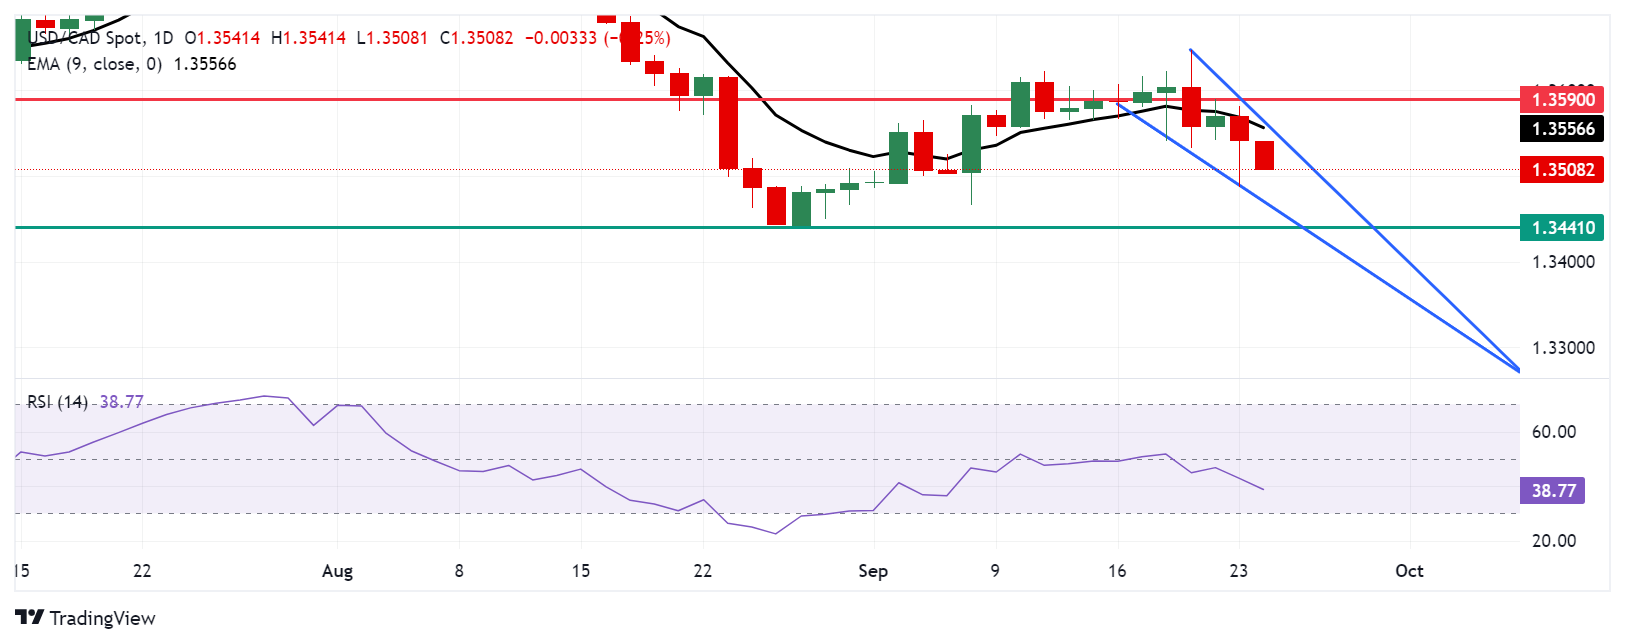
Canadian Dollar PRICE Today
The table below shows the percentage change of Canadian Dollar (CAD) against listed major currencies today. Canadian Dollar was the weakest against the Euro.
| USD | EUR | GBP | JPY | CAD | AUD | NZD | CHF | |
|---|---|---|---|---|---|---|---|---|
| USD | -0.23% | -0.11% | 0.61% | -0.23% | 0.03% | -0.03% | 0.00% | |
| EUR | 0.23% | 0.13% | 0.82% | -0.04% | 0.25% | 0.19% | 0.23% | |
| GBP | 0.11% | -0.13% | 0.71% | -0.13% | 0.14% | 0.06% | 0.11% | |
| JPY | -0.61% | -0.82% | -0.71% | -0.80% | -0.58% | -0.66% | -0.59% | |
| CAD | 0.23% | 0.04% | 0.13% | 0.80% | 0.26% | 0.20% | 0.25% | |
| AUD | -0.03% | -0.25% | -0.14% | 0.58% | -0.26% | -0.06% | -0.02% | |
| NZD | 0.03% | -0.19% | -0.06% | 0.66% | -0.20% | 0.06% | 0.06% | |
| CHF | -0.00% | -0.23% | -0.11% | 0.59% | -0.25% | 0.02% | -0.06% |
The heat map shows percentage changes of major currencies against each other. The base currency is picked from the left column, while the quote currency is picked from the top row. For example, if you pick the Canadian Dollar from the left column and move along the horizontal line to the US Dollar, the percentage change displayed in the box will represent CAD (base)/USD (quote).
- The Mexican Peso trades steadily ahead of key inflation data.
- Banxico will hold its meeting on Thursday; a 25 bps rate cut is expected.
- USD/MXN claws higher from the base of a rising channel, supported by firm momentum.
The Mexican Peso (MXN) fluctuates between tepid gains and losses in its major pairs on Tuesday, ahead of key inflation data later in the day, followed by the Bank of Mexico (Banxico) September policy meeting on Thursday – both factors that could influence the Mexican currency.
Mexican Peso to take cue from inflation data, Banxico meeting
The Mexican Peso has seen moderate weakening against both the US Dollar (USD) and the Pound Sterling (GBP) over the last few days, whilst against the Euro (EUR), it has traded mixed due to the single currency weakening on Monday on growth fears in the Eurozone.
The Instituto Nacional de Estadística Geografía e Informática (INEGI) will release the 1st half-month inflation and core inflation for September on Tuesday at 12:00 GMT.
The previous month’s data showed a 0.03% decline in headline and a 0.1% rise in core inflation. If the new figures are higher, there is a possibility they could influence the Bank of Mexico decision. Higher inflation might increase the probability Banxico will leave interest rates unchanged, whilst lower inflation, that the central bank will cut interest rates.
Banxico currently holds its official interest rate at 10.75%, but this will probably change after Thursday’s meeting. According to a recent Bloomberg survey, 20 out of the 25 economists and bank analysts believe Banxico will go ahead with a 25 basis points (bps) (0.25%) cut. Four analysts expect a 50 bps (0.50%) cut and only one that the central bank will leave interest rates unchanged. The expectation of lower interest rates is generally negative for a currency since it lessens foreign capital inflows.
“We expect Banxico to cut the policy rate 25bp from 10.75% to 10.50% at the September 26th meeting,” says Christian Lawrence, Senior Cross-Asset Strategist at Rabobank, in a recent note. “CPI inflation data released since the last meeting point to progress on a headline basis after the food-induced spike (August at 4.99%), and core inflation has now fallen to the top of the Bank’s +/-1pp tolerance band around its 3% target,” he added.
Whilst some analysts have speculated that Banxico may be dissuaded from cutting rates to support the flagging Peso, which has lost over 10% of its value since June, Rabobank does not think this is the case.
“The recent weakening of MXN will be of some concern for the Bank, given the potential pass-through to inflation. However, moves remain within recent ranges, and much of this can be attributed to the unwind of the carry trade. That said, the perceived rise in sovereign risk premium may support some further structural weakness in MXN, and we would argue that the risk of inflation from the currency has now flipped to the upside,” says Lawrence.
At the August meeting, Banxico decided to cut interest rates by 0.25%, bringing its official rate from 11.00% to 10.75%. The decision, however, was a close call, with only three members voting for the cut versus two who wanted to keep rates unchanged.
“Since that meeting, inflation readings have fallen further,” says Dr. Win Thin, Global Head of Markets Strategy at Brown Brothers Harriman (BBH). “Next Banxico meeting is September 26 and if disinflation continues, another 25 bp cut to 10.50% seems likely. The swaps market is pricing in 175 bp of easing over the next 12 months.”
Technical Analysis: USD/MXN edges higher, backed by bullish momentum
USD/MXN continues edging higher after bouncing off technical support at the base of a long-term rising channel.
The 50-day Simple Moving Average (not shown on the chart below) also bolstered support at the base of the channel.
USD/MXN 4-hour Chart
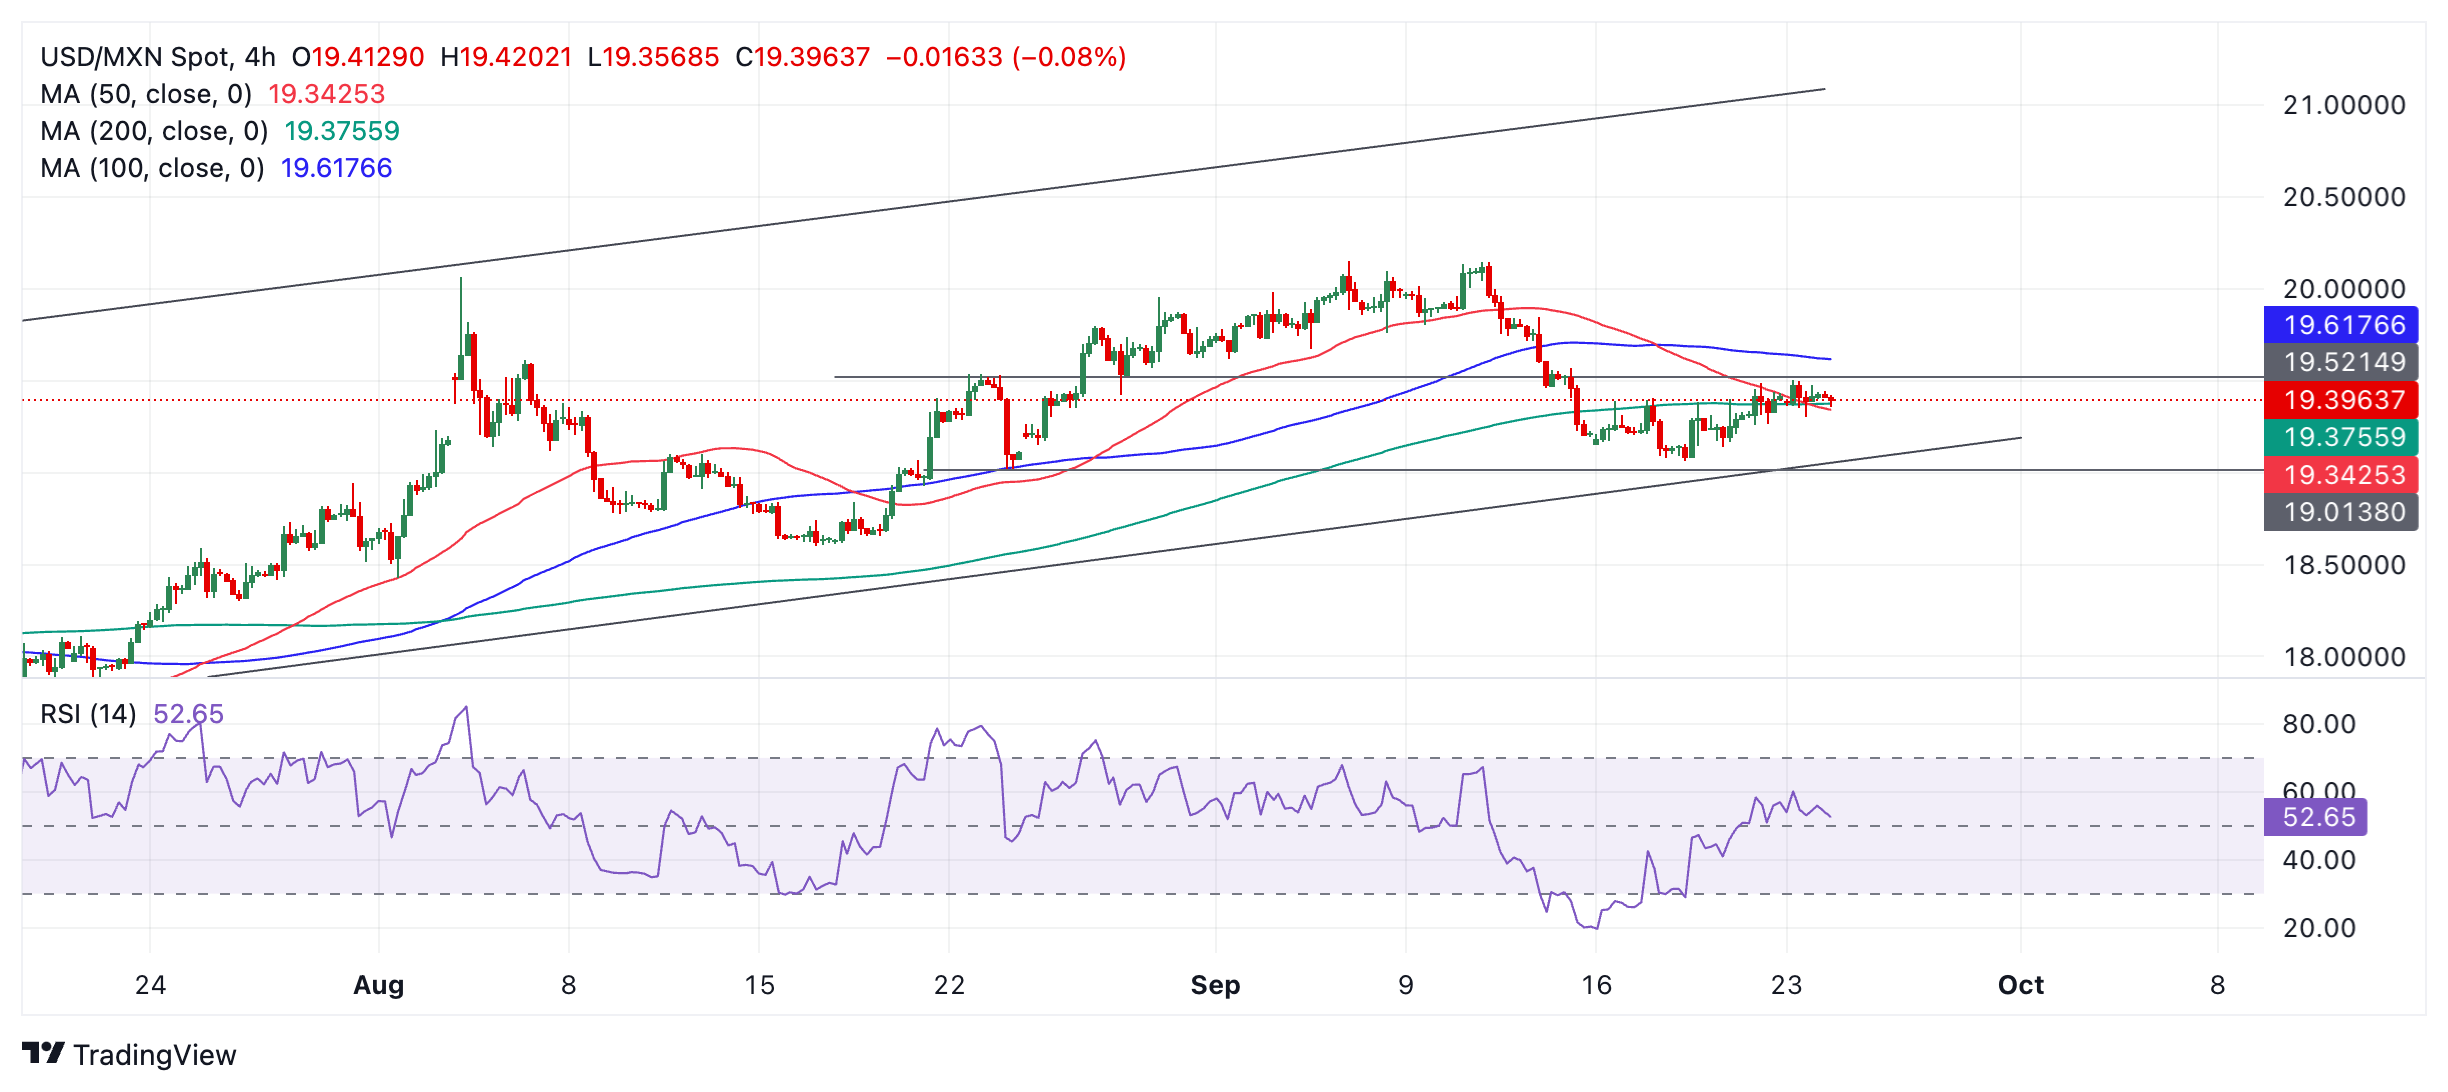
There is a possibility USD/MXN has begun a short-term uptrend within the channel. It is already in a medium and long-term uptrend, so the “current” is flowing north.
The Relative Strength Index (RSI) has risen quite steeply since the market bottom on September 18, and this is a sign of underlying strength in the recovery. RSI has risen more sharply than the price, which is a sign of bullish convergence.
A close above 19.53 (August 23 swing high) on a 4-hour basis would further confirm the pair was in a bullish short-term uptrend, which, given “the trend is your friend,” would be expected to continue higher.
Mexican Peso FAQs
The Mexican Peso (MXN) is the most traded currency among its Latin American peers. Its value is broadly determined by the performance of the Mexican economy, the country’s central bank’s policy, the amount of foreign investment in the country and even the levels of remittances sent by Mexicans who live abroad, particularly in the United States. Geopolitical trends can also move MXN: for example, the process of nearshoring – or the decision by some firms to relocate manufacturing capacity and supply chains closer to their home countries – is also seen as a catalyst for the Mexican currency as the country is considered a key manufacturing hub in the American continent. Another catalyst for MXN is Oil prices as Mexico is a key exporter of the commodity.
The main objective of Mexico’s central bank, also known as Banxico, is to maintain inflation at low and stable levels (at or close to its target of 3%, the midpoint in a tolerance band of between 2% and 4%). To this end, the bank sets an appropriate level of interest rates. When inflation is too high, Banxico will attempt to tame it by raising interest rates, making it more expensive for households and businesses to borrow money, thus cooling demand and the overall economy. Higher interest rates are generally positive for the Mexican Peso (MXN) as they lead to higher yields, making the country a more attractive place for investors. On the contrary, lower interest rates tend to weaken MXN.
Macroeconomic data releases are key to assess the state of the economy and can have an impact on the Mexican Peso (MXN) valuation. A strong Mexican economy, based on high economic growth, low unemployment and high confidence is good for MXN. Not only does it attract more foreign investment but it may encourage the Bank of Mexico (Banxico) to increase interest rates, particularly if this strength comes together with elevated inflation. However, if economic data is weak, MXN is likely to depreciate.
As an emerging-market currency, the Mexican Peso (MXN) tends to strive during risk-on periods, or when investors perceive that broader market risks are low and thus are eager to engage with investments that carry a higher risk. Conversely, MXN tends to weaken at times of market turbulence or economic uncertainty as investors tend to sell higher-risk assets and flee to the more-stable safe havens.
- German IFO Business Climate Index misses estimates with 85.4 in September.
- The IFO Current Economic Assessment Index fell to 84.4 in the reported month.
The headline German IFO Business Climate Index dropped to 85.4 in September from 86.6 in August, missing the market expectations of 86.0.
Meanwhile, the Current Economic Assessment Index fell to 84.4. in the same period from 86.4 recorded in August. The reading came in below the estimated 86.1 print.
The IFO Expectations Index – indicating firms’ projections for the next six months, dropped to 86.3 in September vs. 86.8 in August and 86.3 forecast.
Market reaction to the German IFO Survey
EUR/USD shrug off mostly downbeat German IFO survey. At the time of writing, the pair is trading 0.18% higher on the day at 1.1135, awaiting the Fedspeak and US Consumer Confidence data.
About German IFO
The headline IFO business climate index was rebased and recalibrated in September after the IFO Research Institute changed the series from the base year of 2000 to the base year of 2005 as of September 2011 and then changed series to include services as of September 2018. The survey now includes 9,000 monthly survey responses from firms in the manufacturing, service sector, trade and construction.
- EUR/USD seems vulnerable near 1.1100 on downbeat flash Eurozone PMI data for September.
- Market participants expect the Fed to cut interest rates further by 50 bps in November.
- Investors shift their focus to the US PCE inflation data for August.
EUR/USD struggles to hold the key support of 1.1100 in Tuesday’s European session after a sharp decline move on Monday. The major currency pair remains under pressure as Monday’s flash HCOB Purchasing Managers Index (PMI) data for September has stoked market expectations for the European Central Bank (ECB) to opt for a second straight interest rate cut in the October meeting.
The PMI report showed that the business activity unexpectedly sank into contraction, which was estimated to fall slightly but remained above the 50.0 threshold that separates expansion from contraction.
A decline in the HCOB Composite PMI dominantly came from the manufacturing sector, where contraction in activities accelerated at a faster-than-expected pace. The service sector remained on a growth trajectory but at a slower pace than what economists forecasted.
Weakening Eurozone activity prospects would add to obstacles for ECB policymakers in pursuit of stable market conditions who are already worried about price pressures remaining persistent. Last week, ECB Governing Council Member Isabel Schnabel said that sticky services inflation is keeping headline inflation at an elevated level.
In today’s session, President of Deutsche Bundesbank Joachim Nagel is scheduled to give a speech at 16:00 GMT. Nagel is expected to provide fresh cues on the ECB’s likely interest rate action for the remaining year.
Daily digest market movers: EUR/USD edges lower as US Dollar holds recovery
- EUR/USD stays under pressure as the US Dollar (USD) gains ground after the release of the mixed preliminary United States (US) S&P Global PMI data for September. The US Dollar Index (DXY), which tracks the Greenback’s value against six major currencies, strives to trade confidently above 101.00.
- The US S&P Global Composite PMI came in a little lower at 54.4 from the final reading of 54.6 in August as activities in the manufacturing sector unexpectedly declined further. The US S&P Global Services PMI expanded at a faster-than-expected pace of 55.4 but edged lower from the former reading of 55.7. The agency noted that “Business sentiment, demand, hiring, and investment are being subdued by uncertainty surrounding the Presidential Election, casting a shadow over the outlook for the year ahead at many firms.”
- Going forward, the outlook of the US Dollar could remain uncertain as traders hold bets supporting more big rate cuts from the Federal Reserve (Fed) in the November meeting. Financial market participants expect that the Fed will opt for a 50 basis point (bps) interest rate cut for the second straight time in the November meeting amid growing concerns over deteriorating job growth.
- “The Federal Reserve to cut rates by another 50 basis points in November, a decision that will largely depend on incoming data, especially the next monthly jobs report,” according to strategists from Citi.
- On the economic data front, investors will focus on the Personal Consumption Expenditures Price Index (PCE) for August, which will be published on Friday. Signs of price pressures remaining persistent would weigh on market expectations for a Fed 50 bps interest rate cut. On the contrary, soft figures would prompt the same.
Technical Analysis: EUR/USD trades close to 20-day EMA
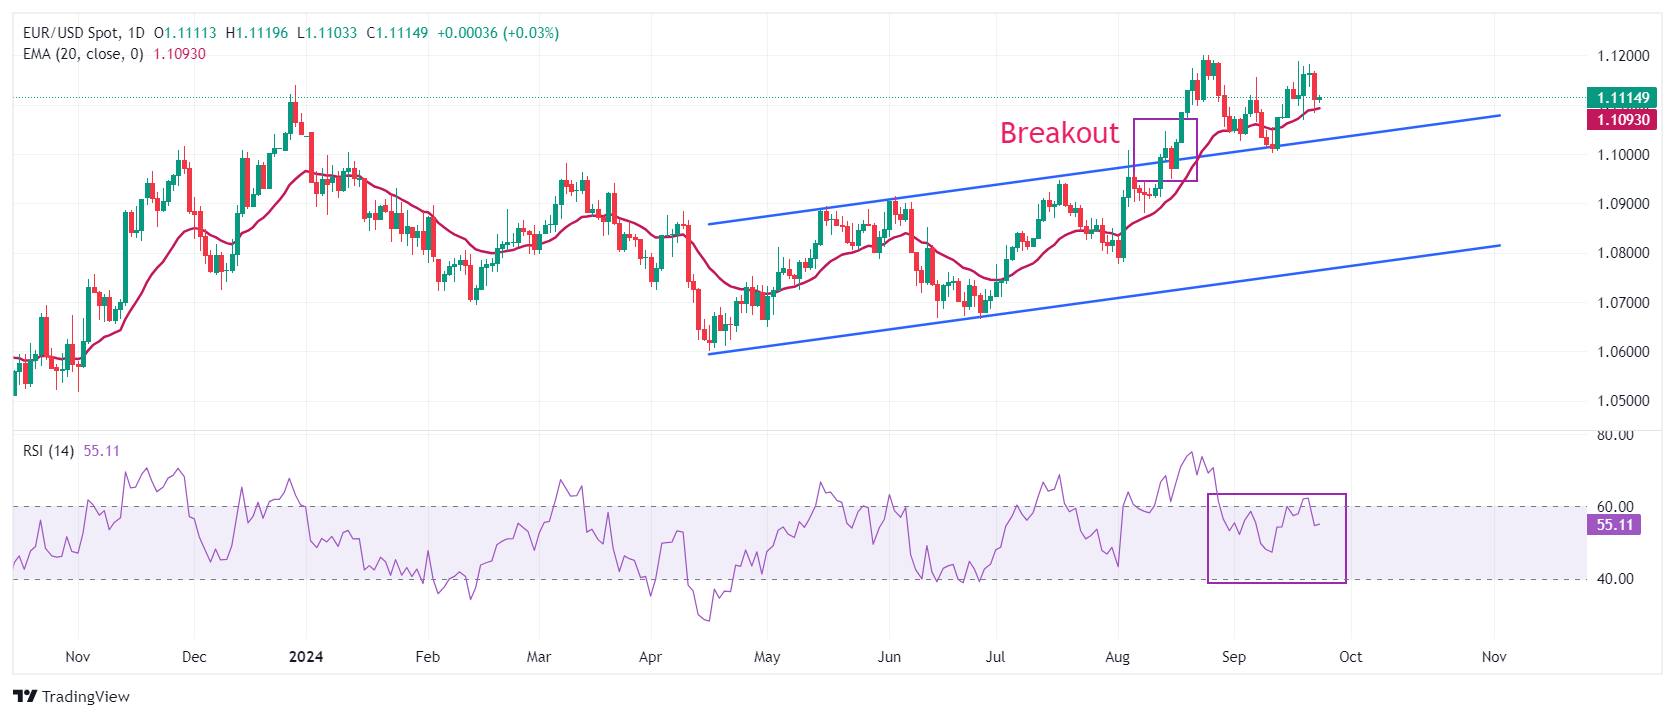
EUR/USD hovers near 1.1100 in European trading hours on Tuesday. The major currency pair finds support near the 20-day Exponential Moving Average (EMA) near 1.1090.
The outlook of the major currency pair would remain firm till it holds the breakout of the Rising Channel chart pattern formed on a daily time frame near the psychological level of 1.1000.
The 14-day Relative Strength Index (RSI) moves lower to 55, suggesting momentum is weakening.
Looking up, the round-level resistance of 1.1200 will act as a major barricade for the Euro bulls. A decisive break above the same would drive the pair toward the July 2023 high of 1.1276. On the downside, the psychological level of 1.1000 and the July 17 high near 1.0950 will be major support zones.
Euro FAQs
The Euro is the currency for the 20 European Union countries that belong to the Eurozone. It is the second most heavily traded currency in the world behind the US Dollar. In 2022, it accounted for 31% of all foreign exchange transactions, with an average daily turnover of over $2.2 trillion a day. EUR/USD is the most heavily traded currency pair in the world, accounting for an estimated 30% off all transactions, followed by EUR/JPY (4%), EUR/GBP (3%) and EUR/AUD (2%).
The European Central Bank (ECB) in Frankfurt, Germany, is the reserve bank for the Eurozone. The ECB sets interest rates and manages monetary policy. The ECB’s primary mandate is to maintain price stability, which means either controlling inflation or stimulating growth. Its primary tool is the raising or lowering of interest rates. Relatively high interest rates – or the expectation of higher rates – will usually benefit the Euro and vice versa. The ECB Governing Council makes monetary policy decisions at meetings held eight times a year. Decisions are made by heads of the Eurozone national banks and six permanent members, including the President of the ECB, Christine Lagarde.
Eurozone inflation data, measured by the Harmonized Index of Consumer Prices (HICP), is an important econometric for the Euro. If inflation rises more than expected, especially if above the ECB’s 2% target, it obliges the ECB to raise interest rates to bring it back under control. Relatively high interest rates compared to its counterparts will usually benefit the Euro, as it makes the region more attractive as a place for global investors to park their money.
Data releases gauge the health of the economy and can impact on the Euro. Indicators such as GDP, Manufacturing and Services PMIs, employment, and consumer sentiment surveys can all influence the direction of the single currency. A strong economy is good for the Euro. Not only does it attract more foreign investment but it may encourage the ECB to put up interest rates, which will directly strengthen the Euro. Otherwise, if economic data is weak, the Euro is likely to fall. Economic data for the four largest economies in the euro area (Germany, France, Italy and Spain) are especially significant, as they account for 75% of the Eurozone’s economy.
Another significant data release for the Euro is the Trade Balance. This indicator measures the difference between what a country earns from its exports and what it spends on imports over a given period. If a country produces highly sought after exports then its currency will gain in value purely from the extra demand created from foreign buyers seeking to purchase these goods. Therefore, a positive net Trade Balance strengthens a currency and vice versa for a negative balance.
Here is what you need to know on Tuesday, September 24:
Risk flows seem to have returned in Tuesday’s trading, as investors cheer China’s stimulus announcement and the overnight dovish US Federal Reserve (Fed) commentary. People’s Bank of China (PBOC) Governor Pan Gongsheng announced plans to roll out a series of measures to boost the economic recovery, including the intention to cut the reserve requirement ratio (RRR) by 50 basis points (bps).
Wall Street indices closed modestly flat, as the dovish Fed bets continued to offer support to stocks, despite the discouraging S&P Manufacturing and Services PMI readings worldwide. The S&P Global US preliminary Manufacturing PMI contracted further to 47.0 in September, compared to 48.5 expected and August’s 47.9. The Services PMI also dipped to 55.4 in September from 55.7 in August.
Fed policymakers Raphael Bostic, Austan Goolsbee and Neel Kashkari spoke on Monday and all three suggested that more rate cuts are on the cards, with Goolsbee seen as the most dovish, as he noted that “many more rate cuts are likely needed over the next year, rates need to come down significantly.” “I am comfortable with the Fed's 50 basis points (bps) rate cut, it shows the Fed is focused on risks to employment, not just inflation,” he added.
Markets currently price in 75 bps in rate cuts by the end of 2024, according to the CME Group’s FedWatch Tool.
Despite the market’s optimism, the US Dollar (USD) looks to build onto overnight recovery gains, as the US Treasury bond yields rebound. Escalating geopolitical tensions between Israel and the Lebanese militant group – Hezbollah appear to keep the safe-haven demand for the USD afloat.
US Dollar PRICE Today
The table below shows the percentage change of US Dollar (USD) against listed major currencies today. US Dollar was the strongest against the Japanese Yen.
| USD | EUR | GBP | JPY | CAD | AUD | NZD | CHF | |
|---|---|---|---|---|---|---|---|---|
| USD | -0.04% | -0.04% | 0.56% | -0.16% | 0.06% | -0.04% | 0.09% | |
| EUR | 0.04% | 0.00% | 0.61% | -0.16% | 0.09% | -0.02% | 0.12% | |
| GBP | 0.04% | -0.01% | 0.60% | -0.13% | 0.11% | -0.03% | 0.13% | |
| JPY | -0.56% | -0.61% | -0.60% | -0.70% | -0.50% | -0.64% | -0.47% | |
| CAD | 0.16% | 0.16% | 0.13% | 0.70% | 0.23% | 0.11% | 0.26% | |
| AUD | -0.06% | -0.09% | -0.11% | 0.50% | -0.23% | -0.11% | 0.03% | |
| NZD | 0.04% | 0.02% | 0.03% | 0.64% | -0.11% | 0.11% | 0.16% | |
| CHF | -0.09% | -0.12% | -0.13% | 0.47% | -0.26% | -0.03% | -0.16% |
The heat map shows percentage changes of major currencies against each other. The base currency is picked from the left column, while the quote currency is picked from the top row. For example, if you pick the US Dollar from the left column and move along the horizontal line to the Japanese Yen, the percentage change displayed in the box will represent USD (base)/JPY (quote).
Bloomberg reported that Israel intensified its airstrikes in southern Lebanon, killing about 500 people while injuring 1000, marking the deadliest attack since the 2006 Israel-Hezbollah war. This follows the weekend’s exchange of missiles by both, Israel and Hezbollah, as the Middle East strife now looks to translate into a wider regional conflict.
With the Reserve Bank of Australia (RBA) policy event out of the way, Fed Governor Michelle Bowman’s speech, US Conference Board (CB) Consumer Confidence data and Middle East geopolitical updates will now be on traders’ radars. Also, of note will be Germany’s IFO survey findings, especially after the downbeat Euro area preliminary business PMI reports, which rekindled recessionary fears.
AUD/USD witnessed good way price moves on the RBA policy announcements, initially jumping to refresh 2024 high at 0.6870 after the central bank held the benchmark interest rate at 4.35% at its September policy meeting. However, the pair turned south following RBA Governor Michele Bullock’s press conference, where she said that the bank did not 'explicitly' discuss rate rise. The Aussie was last seen trading at around 0.6830, as the downside appears limited due to the Chinese stimulus announcement.
USD/JPY regains 144.00 and beyond after dropping as low as 143.38. The US Dollar upswing and a better market mood lift the pair even as Bank of Japan (BoJ) Governor Kazuo Ueda repeated on Tuesday that it is “appropriate to raise rates if trend inflation heightens in line with our forecast.”
USD/CAD looks to test the 1.3500 support area, notwithstanding the broad US Dollar rebound due to the renewed Oil price rally. Oil price found fresh demand amid Middle-East tensions and China policy optimism, with WTI adding over 1% so far to regain $71.
GBP/USD is recovering above 1.3350, having dipped to 1.3330 in an immediate reaction to Bank of England (BoE) Governor Andrew Bailey’s latest remarks. Bailey said that “I'm very encouraged that the path of inflation is downwards therefore I do think the path for interest rates will be downwards, gradually.”
EUR/USD has bounced off the 1.1100 level in the early European session, drawing support from the risk-friendly market environment. Traders await the German IFO survey and European Central Bank (ECB) policymaker Joachim Nagel’s speech for some fresh trading incentives.
Gold consolidates the upside, just below the new lifetime high of $2,640, courtesy of the Chinese stimulus measures and Mideast strife.
Economic Indicator
Fed's Bowman speech
Michelle W. "Miki" Bowman" is an American attorney and a Governor on Federal Reserve's board. She took office as a member of the Board of Governors of the Fed on November 26, 2018, to fill an unexpired term ending January 31, 2020. Bowman is the first person to fill the community bank seat on the Fed’s board, which was created under a 2015 law.
Read more.Next release: Tue Sep 24, 2024 13:00
Frequency: Irregular
Consensus: -
Previous: -
Source: Federal Reserve
“I'm very encouraged that the path of inflation is downwards therefore I do think the path for interest rates will be downwards, gradually,” Bank of England (BoE) Governor Andrew Bailey said on Tuesday.
Bailey added: “My best guess will be interest rates settle at a 'neutral rate'.”
Market reaction
The Pound Sterling came under fresh selling pressure following these comments, currently trading 0.07% lower at 1.3335.
BoE FAQs
The Bank of England (BoE) decides monetary policy for the United Kingdom. Its primary goal is to achieve ‘price stability’, or a steady inflation rate of 2%. Its tool for achieving this is via the adjustment of base lending rates. The BoE sets the rate at which it lends to commercial banks and banks lend to each other, determining the level of interest rates in the economy overall. This also impacts the value of the Pound Sterling (GBP).
When inflation is above the Bank of England’s target it responds by raising interest rates, making it more expensive for people and businesses to access credit. This is positive for the Pound Sterling because higher interest rates make the UK a more attractive place for global investors to park their money. When inflation falls below target, it is a sign economic growth is slowing, and the BoE will consider lowering interest rates to cheapen credit in the hope businesses will borrow to invest in growth-generating projects – a negative for the Pound Sterling.
In extreme situations, the Bank of England can enact a policy called Quantitative Easing (QE). QE is the process by which the BoE substantially increases the flow of credit in a stuck financial system. QE is a last resort policy when lowering interest rates will not achieve the necessary result. The process of QE involves the BoE printing money to buy assets – usually government or AAA-rated corporate bonds – from banks and other financial institutions. QE usually results in a weaker Pound Sterling.
Quantitative tightening (QT) is the reverse of QE, enacted when the economy is strengthening and inflation starts rising. Whilst in QE the Bank of England (BoE) purchases government and corporate bonds from financial institutions to encourage them to lend; in QT, the BoE stops buying more bonds, and stops reinvesting the principal maturing on the bonds it already holds. It is usually positive for the Pound Sterling.
Bank of Japan Governor Kazuo Ueda said during his scheduled appearance on Tuesday, it is “desirable for FX to move stably reflecting fundamentals.”
Additional quotes
Global markets remain somewhat unstable.
Must watch market developments with strong sense of urgency for time being.
In medium- to long-term perspective, BoJ hopes to help household, corporate activity by achieving price stability.
Market reaction
USD/JPY clings to the latest uptick above 144.00 following these comments, adding 0.40% so far.
Japanese Yen PRICE Today
The table below shows the percentage change of Japanese Yen (JPY) against listed major currencies today. Japanese Yen was the weakest against the Canadian Dollar.
| USD | EUR | GBP | JPY | CAD | AUD | NZD | CHF | |
|---|---|---|---|---|---|---|---|---|
| USD | 0.05% | 0.07% | 0.39% | -0.11% | 0.23% | 0.08% | 0.11% | |
| EUR | -0.05% | 0.03% | 0.35% | -0.20% | 0.18% | 0.03% | 0.06% | |
| GBP | -0.07% | -0.03% | 0.33% | -0.19% | 0.17% | -0.00% | 0.03% | |
| JPY | -0.39% | -0.35% | -0.33% | -0.48% | -0.17% | -0.35% | -0.30% | |
| CAD | 0.11% | 0.20% | 0.19% | 0.48% | 0.34% | 0.19% | 0.22% | |
| AUD | -0.23% | -0.18% | -0.17% | 0.17% | -0.34% | -0.15% | -0.13% | |
| NZD | -0.08% | -0.03% | 0.00% | 0.35% | -0.19% | 0.15% | 0.03% | |
| CHF | -0.11% | -0.06% | -0.03% | 0.30% | -0.22% | 0.13% | -0.03% |
The heat map shows percentage changes of major currencies against each other. The base currency is picked from the left column, while the quote currency is picked from the top row. For example, if you pick the Japanese Yen from the left column and move along the horizontal line to the US Dollar, the percentage change displayed in the box will represent JPY (base)/USD (quote).
Reserve Bank of Australia (RBA) Governor Michele Bullock is addressing the press conference, following the announcement of the September monetary policy decision on Tuesday.
Bullock is responding to questions from the media, as part of a new reporting format for the central bank starting this year.
At its September policy meeting, the RBA maintained the benchmark interest rate at 4.35% for the seventh straight meeting.
Key quotes
Recent data has not materially affected policy outlook.
Rates to remain on hold for time being.
Progress on underlying inflation likely remained slow in Q3.
Q2 GDP data suggest slightly softer near term outlook.
Some risk consumption to remain subdued.
Did not explicitly consider rate hike at meeting.
Format of discussion changed at this meeting.
Monthly inflation data are quite volatile.
Expect to see cost of living relief to lower energy prices.
Headline CPI could come withiin 2-3% band.
Not really reflective oif underlying inflation pulse.
Setting rates to domestic circumstances.
Board did discuss whether to change policy messaging.
Message is that board does not see rate cuts in near term.
Prepared to respond in either irection depending on data.
developing story ....
Market reaction
AUD/USD is holding near 2024 highs gains on the above comments, up 0.37% on the day near 0.6865, as of writing.
RBA FAQs
The Reserve Bank of Australia (RBA) sets interest rates and manages monetary policy for Australia. Decisions are made by a board of governors at 11 meetings a year and ad hoc emergency meetings as required. The RBA’s primary mandate is to maintain price stability, which means an inflation rate of 2-3%, but also “..to contribute to the stability of the currency, full employment, and the economic prosperity and welfare of the Australian people.” Its main tool for achieving this is by raising or lowering interest rates. Relatively high interest rates will strengthen the Australian Dollar (AUD) and vice versa. Other RBA tools include quantitative easing and tightening.
While inflation had always traditionally been thought of as a negative factor for currencies since it lowers the value of money in general, the opposite has actually been the case in modern times with the relaxation of cross-border capital controls. Moderately higher inflation now tends to lead central banks to put up their interest rates, which in turn has the effect of attracting more capital inflows from global investors seeking a lucrative place to keep their money. This increases demand for the local currency, which in the case of Australia is the Aussie Dollar.
Macroeconomic data gauges the health of an economy and can have an impact on the value of its currency. Investors prefer to invest their capital in economies that are safe and growing rather than precarious and shrinking. Greater capital inflows increase the aggregate demand and value of the domestic currency. Classic indicators, such as GDP, Manufacturing and Services PMIs, employment, and consumer sentiment surveys can influence AUD. A strong economy may encourage the Reserve Bank of Australia to put up interest rates, also supporting AUD.
Quantitative Easing (QE) is a tool used in extreme situations when lowering interest rates is not enough to restore the flow of credit in the economy. QE is the process by which the Reserve Bank of Australia (RBA) prints Australian Dollars (AUD) for the purpose of buying assets – usually government or corporate bonds – from financial institutions, thereby providing them with much-needed liquidity. QE usually results in a weaker AUD.
Quantitative tightening (QT) is the reverse of QE. It is undertaken after QE when an economic recovery is underway and inflation starts rising. Whilst in QE the Reserve Bank of Australia (RBA) purchases government and corporate bonds from financial institutions to provide them with liquidity, in QT the RBA stops buying more assets, and stops reinvesting the principal maturing on the bonds it already holds. It would be positive (or bullish) for the Australian Dollar.
- NZD/USD gains ground due to risk-on sentiment amid dovish Fedspeak.
- Minneapolis Fed President Kashkari anticipates additional rate cuts in 2024, although expects them to be smaller than previous reductions.
- The New Zealand Dollar found support from a range of stimulus measures implemented by its close trading partner, China.
NZD/USD extends its upside for the second consecutive day, which could be attributed to the improved risk sentiment following the dovish sentiment surrounding the Federal Reserve’s (Fed) policy outlook. The NZD/USD pair trades around its monthly high of 0.6280 level during the Asian session on Tuesday.
The US Dollar (USD) receives downward pressure following the dovish Fedspeak. Minneapolis Fed President Neel Kashkari said on Monday that he believes there should be and will be additional interest rate cuts in 2024. However, Kashkari expects future cuts to be smaller than the one from the September meeting. Additionally, Chicago Fed President Austan Goolsbee noted, “Many more rate cuts are likely needed over the next year, rates need to come down significantly,” per Reuters.
Federal Reserve policymakers anticipate rate cuts amounting to 50 basis points by the end of 2024. Meanwhile, the CME FedWatch Tool indicates a 50% chance of a total 75 basis point reduction by the end of the year, lowering the Fed's rate to a range of 4.0-4.25% by year-end.
Minneapolis Fed President Neel Kashkari said on Monday that he believes there should be and will be additional interest rate cuts in 2024. However, Kashkari expects future cuts to be smaller than the one from the September meeting. Additionally, Chicago Fed President Austan Goolsbee noted, “Many more rate cuts are likely needed over the next year, rates need to come down significantly,” per Reuters.
The New Zealand Dollar (NZD) gained support from a series of stimulus measures introduced by China, New Zealand's largest trading partner. The People's Bank of China (PBoC) provided CNY 74.5 billion in liquidity to the banking system through a 14-day reverse repo, lowering the rate from 1.95% to 1.85%. Additionally, the PBoC injected CNY 160.1 billion via a 7-day reverse repo, maintaining the rate at 1.7%.
The Reserve Bank of New Zealand (RBNZ) remains on track for additional rate cuts this year, with markets fully anticipating another 25 basis points reduction in October. Recent data showed that the economy contracted in the second quarter, highlighting persistent economic weakness in New Zealand.
New Zealand Dollar FAQs
The New Zealand Dollar (NZD), also known as the Kiwi, is a well-known traded currency among investors. Its value is broadly determined by the health of the New Zealand economy and the country’s central bank policy. Still, there are some unique particularities that also can make NZD move. The performance of the Chinese economy tends to move the Kiwi because China is New Zealand’s biggest trading partner. Bad news for the Chinese economy likely means less New Zealand exports to the country, hitting the economy and thus its currency. Another factor moving NZD is dairy prices as the dairy industry is New Zealand’s main export. High dairy prices boost export income, contributing positively to the economy and thus to the NZD.
The Reserve Bank of New Zealand (RBNZ) aims to achieve and maintain an inflation rate between 1% and 3% over the medium term, with a focus to keep it near the 2% mid-point. To this end, the bank sets an appropriate level of interest rates. When inflation is too high, the RBNZ will increase interest rates to cool the economy, but the move will also make bond yields higher, increasing investors’ appeal to invest in the country and thus boosting NZD. On the contrary, lower interest rates tend to weaken NZD. The so-called rate differential, or how rates in New Zealand are or are expected to be compared to the ones set by the US Federal Reserve, can also play a key role in moving the NZD/USD pair.
Macroeconomic data releases in New Zealand are key to assess the state of the economy and can impact the New Zealand Dollar’s (NZD) valuation. A strong economy, based on high economic growth, low unemployment and high confidence is good for NZD. High economic growth attracts foreign investment and may encourage the Reserve Bank of New Zealand to increase interest rates, if this economic strength comes together with elevated inflation. Conversely, if economic data is weak, NZD is likely to depreciate.
The New Zealand Dollar (NZD) tends to strengthen during risk-on periods, or when investors perceive that broader market risks are low and are optimistic about growth. This tends to lead to a more favorable outlook for commodities and so-called ‘commodity currencies’ such as the Kiwi. Conversely, NZD tends to weaken at times of market turbulence or economic uncertainty as investors tend to sell higher-risk assets and flee to the more-stable safe havens.
Bank of Japan Governor Kazuo Ueda said during his scheduled appearance on Tuesday that it is “appropriate to raise rates if trend inflation heightens in line with our forecast.”
Additional comments
Japan's real interest rate remains deeply negative, stimulating economy and working to push up prices.
If trend inflation moves to around 2%, it is desirable to move our policy rate to near levels seen neutral to economy, prices.
We will raise interest rate if economy, prices move in line with forecasts shown in our quarterly outlook report.
Uncertainty surrounding economy, prices are high.
BoJ must conduct monetary policy in timely, appropriate fashion without having a pre-set schedule, taking into account various uncertainties.
We will watch with strong sense of urgency US and overseas economic outlook, still unstable market developments.
One-sided Yen falls have been reversed since August, rise in import prices moderating.
We can afford to spend time scrutinising market moves and overseas developments behind market developments.
It is also clear persistent, accelerating inflation also have negative impact on economy.
Will release findings of comprehensive review by year-end.
Expect elevated corporate profits to lead to increase in capex.
Consumption likely to increase moderately as household income rises.
Developments regarding the US economy remain uncertain including how past Fed rate hikes could affect labor market.
Prices are rising by around 2% for wide range of goods.
Looking closely at service price moves, it is becoming more clear that impact of wage rises is heightening.
Trend inflation likely to gradually heighten toward 2%.
Change in corporate price, wage-setting behaviour likely to become embedded in society, keep inflation on the rise next fiscal year and beyond.
Must scrutinize whether overseas developments could affect japan's corporate profits, behaviour.
Market reaction
USD/JPY is recapturing 144.00 despite the hawkish comments from the BoJ Chief. The pair is up 0.31% on the day, as of writing.
Japanese Yen PRICE Today
The table below shows the percentage change of Japanese Yen (JPY) against listed major currencies today. Japanese Yen was the weakest against the Australian Dollar.
| USD | EUR | GBP | JPY | CAD | AUD | NZD | CHF | |
|---|---|---|---|---|---|---|---|---|
| USD | -0.05% | -0.12% | 0.26% | -0.21% | -0.40% | -0.16% | -0.03% | |
| EUR | 0.05% | -0.07% | 0.32% | -0.20% | -0.36% | -0.13% | 0.01% | |
| GBP | 0.12% | 0.07% | 0.38% | -0.10% | -0.28% | -0.06% | 0.10% | |
| JPY | -0.26% | -0.32% | -0.38% | -0.45% | -0.67% | -0.46% | -0.29% | |
| CAD | 0.21% | 0.20% | 0.10% | 0.45% | -0.19% | 0.04% | 0.19% | |
| AUD | 0.40% | 0.36% | 0.28% | 0.67% | 0.19% | 0.24% | 0.40% | |
| NZD | 0.16% | 0.13% | 0.06% | 0.46% | -0.04% | -0.24% | 0.16% | |
| CHF | 0.03% | -0.01% | -0.10% | 0.29% | -0.19% | -0.40% | -0.16% |
The heat map shows percentage changes of major currencies against each other. The base currency is picked from the left column, while the quote currency is picked from the top row. For example, if you pick the Japanese Yen from the left column and move along the horizontal line to the US Dollar, the percentage change displayed in the box will represent JPY (base)/USD (quote).
- AUD/JPY attracts some follow-through buying on Tuesday and reacts little to the RBA decision.
- The RBA decided to leave its benchmark interest rates unchanged and stick to its hawkish stance.
- Bets for another BoJ rate hike in 2024 limit the JPY losses and might cap the upside for the cross.
The AUD/JPY cross trades with a mild positive bias during the Asian session on Tuesday and climbs to a three-week top, around the 98.75-98.80 region after the Reserve Bank of Australia (RBA) announced its policy decision. Spot prices now look to build on the recent move up beyond the 50-day Simple Moving Average (SMA).
As was widely expected, the Australian central bank decided to stand pat for the seventh straight meeting and hold the Official Cash Rate (OCR) steady at 4.35% at its September policy meeting. In the accompanying policy statement, the RBA stuck to its hawkish stance and reiterated that policy will need to be sufficiently restrictive until confidence returns that inflation is moving sustainably towards the target range. This, along with a surprise move by the People's Bank of China (PBOC) on Monday, to lower its 14-day repo rate by 10 basis points to stimulate the economic recovery, continues to underpin the Australian Dollar (AUD) and lend support to the AUD/JPY cross.
Meanwhile, the underlying bullish sentiment across the global financial markets is seen undermining the safe-haven Japanese Yen (JPY) and turning out to be another factor acting as a tailwind for spot prices. That said, growing acceptance that the Bank of Japan (BoJ) will raise interest rates again by the end of this year, bolstered by last week's data showing that Japan's core inflation rose for the fourth consecutive month, should help limit the JPY losses. Apart from this, persistent geopolitical risk might further contribute to capping gains for the AUD/JPY cross.
Economic Indicator
RBA Interest Rate Decision
The Reserve Bank of Australia (RBA) announces its interest rate decision at the end of its eight scheduled meetings per year. If the RBA is hawkish about the inflationary outlook of the economy and raises interest rates it is usually bullish for the Australian Dollar (AUD). Likewise, if the RBA has a dovish view on the Australian economy and keeps interest rates unchanged, or cuts them, it is seen as bearish for AUD.
Read more.Last release: Tue Sep 24, 2024 04:30
Frequency: Irregular
Actual: 4.35%
Consensus: 4.35%
Previous: 4.35%
Source: Reserve Bank of Australia
Gold prices rose in India on Tuesday, according to data compiled by FXStreet.
The price for Gold stood at 7,080.85 Indian Rupees (INR) per gram, up compared with the INR 7,062.93 it cost on Monday.
The price for Gold increased to INR 82,589.70 per tola from INR 82,380.67 per tola a day earlier.
| Unit measure | Gold Price in INR |
|---|---|
| 1 Gram | 7,080.85 |
| 10 Grams | 70,808.27 |
| Tola | 82,589.70 |
| Troy Ounce | 220,235.20 |
FXStreet calculates Gold prices in India by adapting international prices (USD/INR) to the local currency and measurement units. Prices are updated daily based on the market rates taken at the time of publication. Prices are just for reference and local rates could diverge slightly.
Gold FAQs
Gold has played a key role in human’s history as it has been widely used as a store of value and medium of exchange. Currently, apart from its shine and usage for jewelry, the precious metal is widely seen as a safe-haven asset, meaning that it is considered a good investment during turbulent times. Gold is also widely seen as a hedge against inflation and against depreciating currencies as it doesn’t rely on any specific issuer or government.
Central banks are the biggest Gold holders. In their aim to support their currencies in turbulent times, central banks tend to diversify their reserves and buy Gold to improve the perceived strength of the economy and the currency. High Gold reserves can be a source of trust for a country’s solvency. Central banks added 1,136 tonnes of Gold worth around $70 billion to their reserves in 2022, according to data from the World Gold Council. This is the highest yearly purchase since records began. Central banks from emerging economies such as China, India and Turkey are quickly increasing their Gold reserves.
Gold has an inverse correlation with the US Dollar and US Treasuries, which are both major reserve and safe-haven assets. When the Dollar depreciates, Gold tends to rise, enabling investors and central banks to diversify their assets in turbulent times. Gold is also inversely correlated with risk assets. A rally in the stock market tends to weaken Gold price, while sell-offs in riskier markets tend to favor the precious metal.
The price can move due to a wide range of factors. Geopolitical instability or fears of a deep recession can quickly make Gold price escalate due to its safe-haven status. As a yield-less asset, Gold tends to rise with lower interest rates, while higher cost of money usually weighs down on the yellow metal. Still, most moves depend on how the US Dollar (USD) behaves as the asset is priced in dollars (XAU/USD). A strong Dollar tends to keep the price of Gold controlled, whereas a weaker Dollar is likely to push Gold prices up.
(An automation tool was used in creating this post.)
- Silver attracts dip-buyers on Tuesday and moves back closer to over a two-month top.
- The setup favors bullish traders and supports prospects for a further appreciating move.
- Any downfall towards $30.00 could be seen as a buying opportunity and remain limited.
Silver (XAG/USD) regains positive traction following the previous day's modest downfall and climbs back above the $31.00 mark during the Asian session on Tuesday. The white metal, however, remains below the $31.45 area, or its highest level since July 17 touched last week, though the technical setup seems tilted firmly in favor of bullish traders.
The recent breakout through a short-term descending trend line, along with the fact that oscillators on the daily chart have been gaining positive traction, validates the positive outlook for the XAG/USD. Hence, a subsequent strength beyond the monthly peak, around the $31.45 region, en route to the July swing high, around the $31.75 zone, looks like a distinct possibility.
The XAG/USD might then aim to reclaim the $32.00 mark and extend the momentum further towards challenging a one-decade high, around mid-$32.00s touched in May.
On the flip side, the $30.70-$30.65 area now seems to protect the immediate downside ahead of the overnight swing low, around the $30.35 region. Any further decline towards the $30.00 psychological mark might still be seen as a buying opportunity. This, in turn, should limit the downside near the aforementioned trend-line resistance breakpoint, around the $29.40-$29.35 region.
The said trend line now coincides with the 50-day Simple Moving Average (SMA) and is currently pegged near the $29.00 mark, which should act as a key pivotal point. A convincing break below the latter might shift the bias in favor of bearish traders and pave the way for some meaningful corrective decline for the XAG/USD.
Silver daily chart
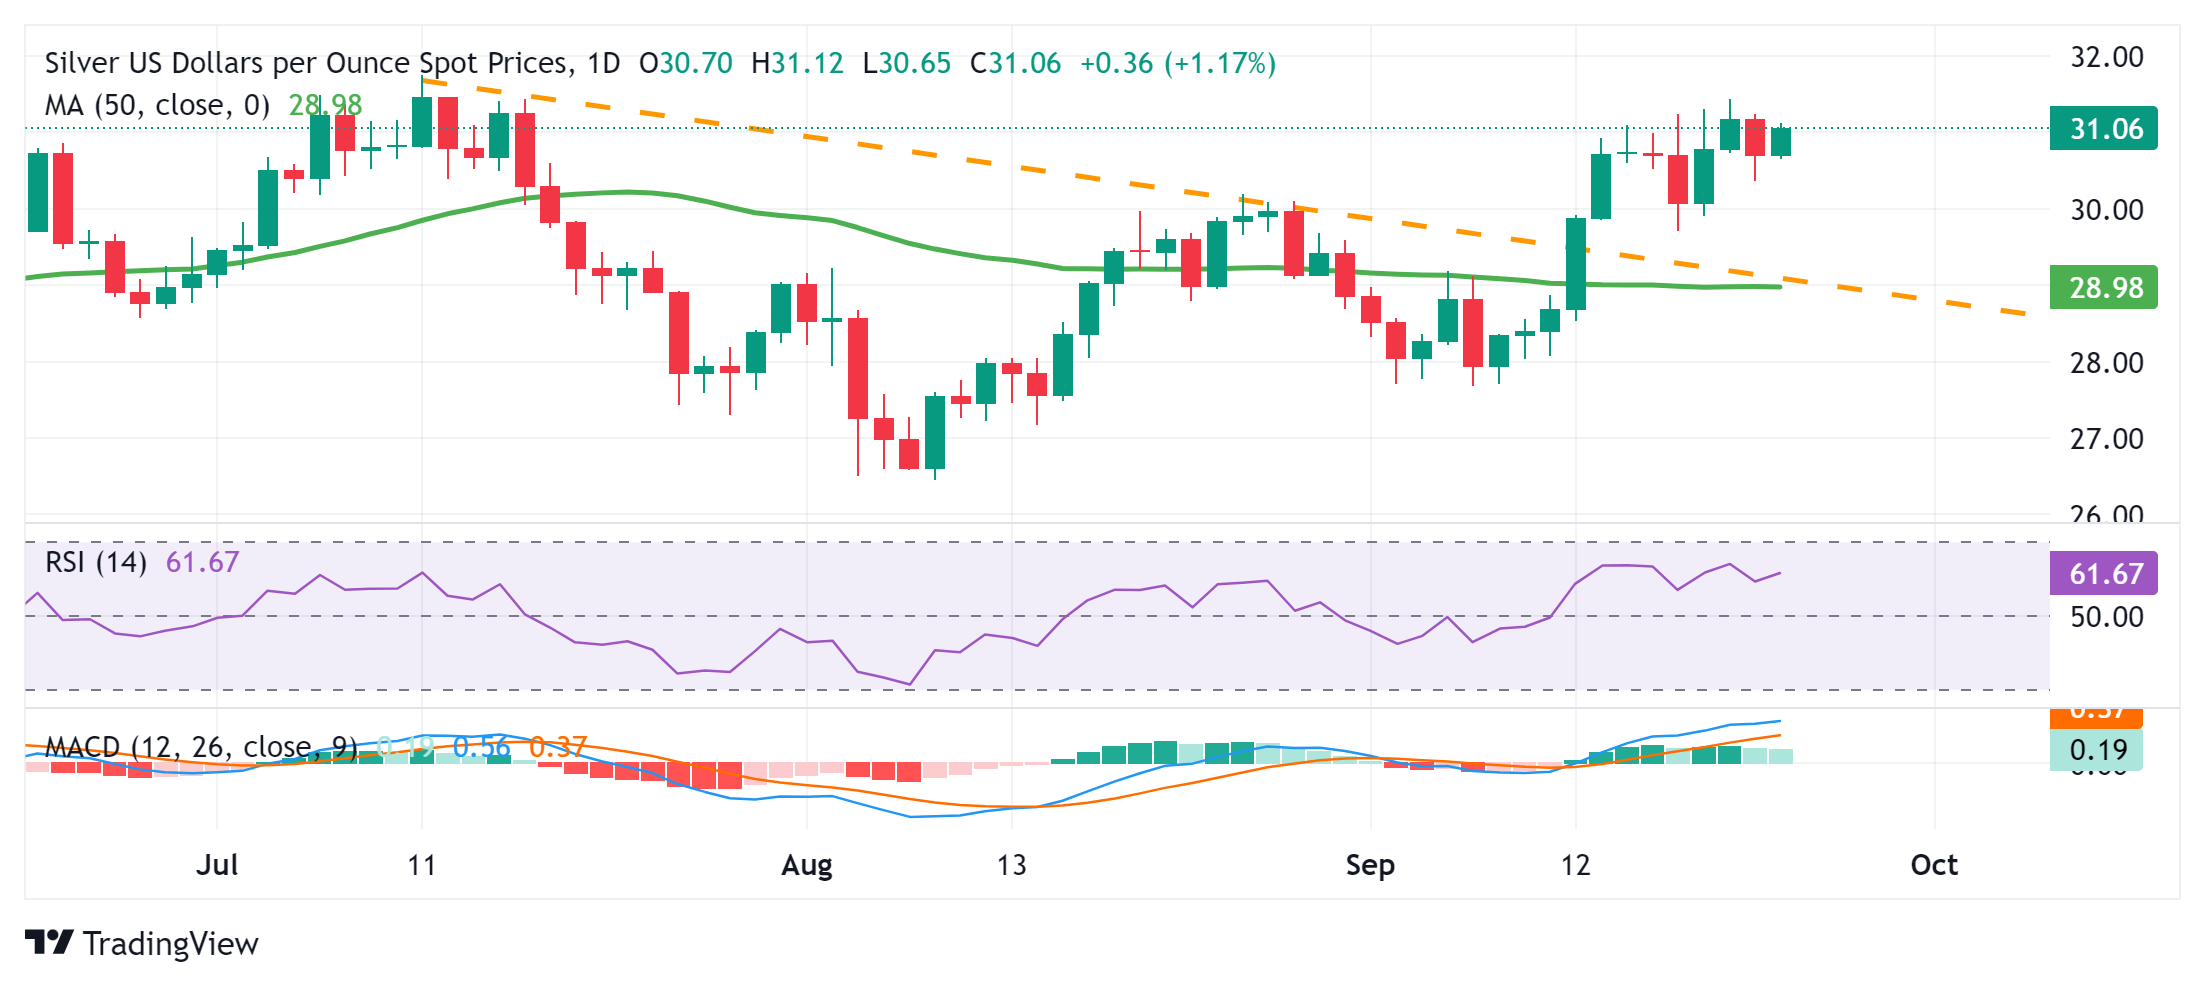
Silver FAQs
Silver is a precious metal highly traded among investors. It has been historically used as a store of value and a medium of exchange. Although less popular than Gold, traders may turn to Silver to diversify their investment portfolio, for its intrinsic value or as a potential hedge during high-inflation periods. Investors can buy physical Silver, in coins or in bars, or trade it through vehicles such as Exchange Traded Funds, which track its price on international markets.
Silver prices can move due to a wide range of factors. Geopolitical instability or fears of a deep recession can make Silver price escalate due to its safe-haven status, although to a lesser extent than Gold's. As a yieldless asset, Silver tends to rise with lower interest rates. Its moves also depend on how the US Dollar (USD) behaves as the asset is priced in dollars (XAG/USD). A strong Dollar tends to keep the price of Silver at bay, whereas a weaker Dollar is likely to propel prices up. Other factors such as investment demand, mining supply – Silver is much more abundant than Gold – and recycling rates can also affect prices.
Silver is widely used in industry, particularly in sectors such as electronics or solar energy, as it has one of the highest electric conductivity of all metals – more than Copper and Gold. A surge in demand can increase prices, while a decline tends to lower them. Dynamics in the US, Chinese and Indian economies can also contribute to price swings: for the US and particularly China, their big industrial sectors use Silver in various processes; in India, consumers’ demand for the precious metal for jewellery also plays a key role in setting prices.
Silver prices tend to follow Gold's moves. When Gold prices rise, Silver typically follows suit, as their status as safe-haven assets is similar. The Gold/Silver ratio, which shows the number of ounces of Silver needed to equal the value of one ounce of Gold, may help to determine the relative valuation between both metals. Some investors may consider a high ratio as an indicator that Silver is undervalued, or Gold is overvalued. On the contrary, a low ratio might suggest that Gold is undervalued relative to Silver.
- GBP/USD marked its 31-month high level of 1.3359, recorded on Monday.
- The US Dollar receives downward pressure due to dovish Fedspeak.
- UK Prime Minister Starmer has voiced concerns that the domestic economy could be heading toward “painful” economic reforms.
GBP/USD extends its winning streak for the fifth consecutive session, trading around 1.3350 during the Asian hours on Tuesday. The pair maintains its position near its 31-month high level of 1.3359, recorded on Monday.
The US Dollar (USD) may depreciate due to increasing expectations for further rate cuts by the US Federal Reserve (Fed) in 2024. According to the CME FedWatch Tool, markets are pricing in a 50% likelihood of a 75 basis point reduction, bringing the Fed's rate to a range of 4.0-4.25% by the end of this year.
Minneapolis Fed President Neel Kashkari said on Monday that he believes there should be and will be additional interest rate cuts in 2024. However, Kashkari expects future cuts to be smaller than the one from the September meeting. Additionally, Chicago Fed President Austan Goolsbee noted, “Many more rate cuts are likely needed over the next year, rates need to come down significantly,” per Reuters.
On the data front, the S&P Global US Composite PMI grew at a slower rate in September, registering 54.4 compared to 54.6 in August. The Manufacturing PMI unexpectedly dropped to 47.0, indicating contraction, while the Services PMI expanded more than anticipated, reaching 55.4, data showed on Monday.
In the United Kingdom (UK), the preliminary UK Manufacturing Purchasing Managers' Index (PMI) fell to 51.5 in September, down from 52.5 in August, missing the market expectation of 52.3. Similarly, the Services PMI declined to 52.8 in September from 53.7 in August, also below the market forecast of 53.5.
Chris Williamson, Chief Business Economist at S&P Global Market Intelligence, stated, “A slight cooling of output growth across manufacturing and services in September should not be viewed as overly concerning.”
UK Prime Minister Keir Starmer has expressed concerns that the domestic economy may be on a collision course with “painful” economic reforms, particularly as UK inflation figures remain significantly stickier than those in other countries.
Pound Sterling FAQs
The Pound Sterling (GBP) is the oldest currency in the world (886 AD) and the official currency of the United Kingdom. It is the fourth most traded unit for foreign exchange (FX) in the world, accounting for 12% of all transactions, averaging $630 billion a day, according to 2022 data. Its key trading pairs are GBP/USD, aka ‘Cable’, which accounts for 11% of FX, GBP/JPY, or the ‘Dragon’ as it is known by traders (3%), and EUR/GBP (2%). The Pound Sterling is issued by the Bank of England (BoE).
The single most important factor influencing the value of the Pound Sterling is monetary policy decided by the Bank of England. The BoE bases its decisions on whether it has achieved its primary goal of “price stability” – a steady inflation rate of around 2%. Its primary tool for achieving this is the adjustment of interest rates. When inflation is too high, the BoE will try to rein it in by raising interest rates, making it more expensive for people and businesses to access credit. This is generally positive for GBP, as higher interest rates make the UK a more attractive place for global investors to park their money. When inflation falls too low it is a sign economic growth is slowing. In this scenario, the BoE will consider lowering interest rates to cheapen credit so businesses will borrow more to invest in growth-generating projects.
Data releases gauge the health of the economy and can impact the value of the Pound Sterling. Indicators such as GDP, Manufacturing and Services PMIs, and employment can all influence the direction of the GBP. A strong economy is good for Sterling. Not only does it attract more foreign investment but it may encourage the BoE to put up interest rates, which will directly strengthen GBP. Otherwise, if economic data is weak, the Pound Sterling is likely to fall.
Another significant data release for the Pound Sterling is the Trade Balance. This indicator measures the difference between what a country earns from its exports and what it spends on imports over a given period. If a country produces highly sought-after exports, its currency will benefit purely from the extra demand created from foreign buyers seeking to purchase these goods. Therefore, a positive net Trade Balance strengthens a currency and vice versa for a negative balance.
- The Japanese Yen may struggle as the BoJ appears to be in no rush to raise interest rates.
- Japan’s Finance Minister Suzuki has expressed his expectation that the BoJ will adopt appropriate monetary policy measures.
- Minneapolis Fed President Neel Kashkari believes there should be and will be additional interest rate cuts in 2024.
The Japanese Yen (JPY) remains steady against the US Dollar (USD) on Tuesday. However, it faces downward pressure amid increasing concerns that the Bank of Japan (BoJ) is not hurrying to raise interest rates. Following the BoJ's policy decision on Friday, Governor Kazuo Ueda noted that although Japan's economy is experiencing moderate recovery, signs of underlying weakness persist.
Japan’s Finance Minister Shunichi Suzuki stated on Tuesday that he is “monitoring the impacts of central banks' monetary policies.” Suzuki expressed his expectation that the Bank of Japan will implement appropriate monetary policy measures while maintaining close coordination with the government.
The USD/JPY pair may weaken due to increasing expectations for further rate cuts by the US Federal Reserve (Fed) in 2024. According to the CME FedWatch Tool, markets are pricing in a 50% likelihood of a 75 basis point reduction, bringing the Fed's rate to a range of 4.0-4.25% by the end of this year.
Daily Digest Market Movers: Japanese Yen remains subdued amid the dovish BoJ
- The Jibun Bank Japan Composite Purchasing Managers Index (PMI) declined to 52.5 in September, down from a final reading of 52.9 in August, which was the highest in 15 months. Despite this decrease, it marks the eighth consecutive month of growth in private sector activity this year, primarily driven by the service sector. The Services PMI increased to 53.9 in September, up from a final 53.7 in the previous month.
- The S&P Global Composite PMI grew at a slower rate in September, registering 54.4 compared to 54.6 in August. The Manufacturing PMI unexpectedly dropped to 47.0, indicating contraction, while the Services PMI expanded more than anticipated, reaching 55.4.
- Minneapolis Fed President Neel Kashkari said on Monday that he believes there should be and will be additional interest rate cuts in 2024. However, Kashkari expects future cuts to be smaller than the one from the September meeting, per Reuters.
- Chicago Fed President Austan Goolsbee noted, “Many more rate cuts are likely needed over the next year, rates need to come down significantly.” Additionally, Atlanta Fed President Raphael Bostic said Monday that the US economy is close to normal rates of inflation and unemployment and the central bank needs monetary policy to "normalize" as well, per Reuters.
- On Monday, Japan's new "top currency diplomat," Atsushi Mimura, stated in an interview with NHK that the Yen carry trades accumulated in the past have likely been mostly unwound. Mimura cautioned that if such trades were to increase again, it could lead to heightened market volatility. "We are always monitoring the markets to ensure that does not happen," he added.
- Japan's Consumer Price Index (CPI) increased to 3.0% year-on-year in August, up from 2.8% previously, marking the highest level since October 2023. Additionally, the Core National CPI, excluding fresh food, reached a six-month high of 2.8%, rising for the fourth consecutive month and in line with market expectations.
- Federal Reserve Chair Jerome Powell commented on the aggressive 50 basis point rate cut, saying, “This decision reflects our increased confidence that, with the right adjustments to our policy approach, we can maintain a strong labor market, achieve moderate economic growth, and bring inflation down to a sustainable 2% level.”
Technical Analysis: USD/JPY holds position above the nine-day EMA near 143.50
USD/JPY trades around 143.70 on Tuesday. Daily chart analysis indicates that the pair is moving within a descending channel, signaling a bearish trend. Furthermore, the 14-day Relative Strength Index (RSI) is just below the 50 level, reinforcing the prevailing bearish sentiment.
On the downside, the USD/JPY pair may test the nine-day EMA at the 143.01 level. A break below this level could lead the pair to explore the 139.58 region, marking its lowest point since June 2023.
Alternatively, immediate resistance is identified at the upper boundary of the descending channel, around the 144.30 level. A breakout above this level could enable the USD/JPY pair to challenge the psychological barrier of 145.00.
USD/JPY: Daily Chart
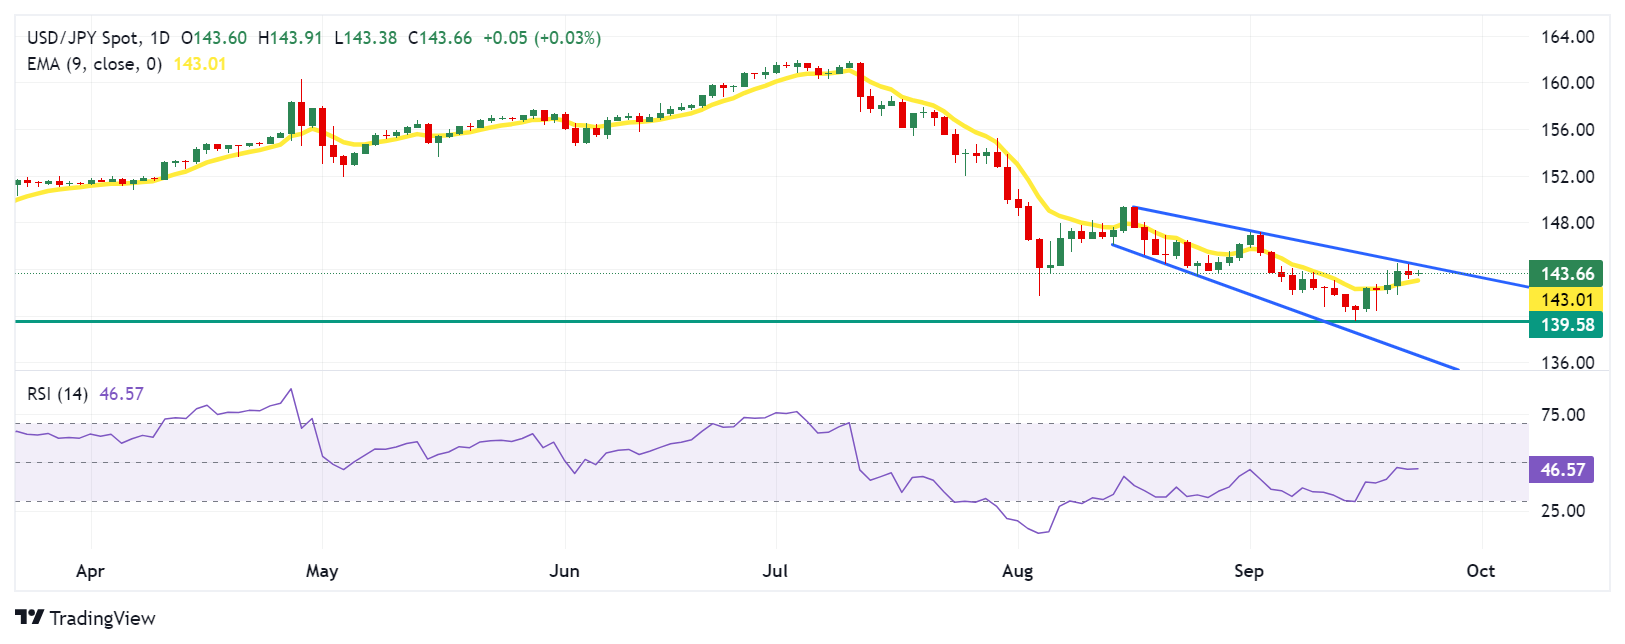
Japanese Yen PRICE Today
The table below shows the percentage change of Japanese Yen (JPY) against listed major currencies today. Japanese Yen was the strongest against the Euro.
| USD | EUR | GBP | JPY | CAD | AUD | NZD | CHF | |
|---|---|---|---|---|---|---|---|---|
| USD | 0.00% | -0.04% | -0.01% | -0.18% | -0.20% | -0.07% | -0.13% | |
| EUR | -0.00% | -0.04% | -0.02% | -0.20% | -0.20% | -0.08% | -0.14% | |
| GBP | 0.04% | 0.04% | 0.04% | -0.14% | -0.15% | -0.05% | -0.08% | |
| JPY | 0.01% | 0.02% | -0.04% | -0.13% | -0.19% | -0.09% | -0.12% | |
| CAD | 0.18% | 0.20% | 0.14% | 0.13% | -0.02% | 0.10% | 0.06% | |
| AUD | 0.20% | 0.20% | 0.15% | 0.19% | 0.02% | 0.12% | 0.05% | |
| NZD | 0.07% | 0.08% | 0.05% | 0.09% | -0.10% | -0.12% | -0.03% | |
| CHF | 0.13% | 0.14% | 0.08% | 0.12% | -0.06% | -0.05% | 0.03% |
The heat map shows percentage changes of major currencies against each other. The base currency is picked from the left column, while the quote currency is picked from the top row. For example, if you pick the Japanese Yen from the left column and move along the horizontal line to the US Dollar, the percentage change displayed in the box will represent JPY (base)/USD (quote).
Japanese Yen FAQs
The Japanese Yen (JPY) is one of the world’s most traded currencies. Its value is broadly determined by the performance of the Japanese economy, but more specifically by the Bank of Japan’s policy, the differential between Japanese and US bond yields, or risk sentiment among traders, among other factors.
One of the Bank of Japan’s mandates is currency control, so its moves are key for the Yen. The BoJ has directly intervened in currency markets sometimes, generally to lower the value of the Yen, although it refrains from doing it often due to political concerns of its main trading partners. The current BoJ ultra-loose monetary policy, based on massive stimulus to the economy, has caused the Yen to depreciate against its main currency peers. This process has exacerbated more recently due to an increasing policy divergence between the Bank of Japan and other main central banks, which have opted to increase interest rates sharply to fight decades-high levels of inflation.
The BoJ’s stance of sticking to ultra-loose monetary policy has led to a widening policy divergence with other central banks, particularly with the US Federal Reserve. This supports a widening of the differential between the 10-year US and Japanese bonds, which favors the US Dollar against the Japanese Yen.
The Japanese Yen is often seen as a safe-haven investment. This means that in times of market stress, investors are more likely to put their money in the Japanese currency due to its supposed reliability and stability. Turbulent times are likely to strengthen the Yen’s value against other currencies seen as more risky to invest in.
- WTI struggles to gain any meaningful traction amid mixed fundamental cues.
- A further escalation of conflicts in the Middle East underpins the commodity.
- Concerns about the slowing global economy act as a tailwind for Oil prices.
West Texas Intermediate (WTI) US crude Oil prices oscillate in a narrow trading band, just above mid-$70.00s during the Asian on Tuesday and remain well within the striking distance of a nearly three-week top touched the previous day.
Israel's airstrikes against Iranian-backed Hezbollah sites in Lebanon killed nearly 500 people on Monday and raises the risk of a broader conflict in the Middle East. This may impact supply in the key Oil producing region, which, along with worries that a tropical storm may impact output in the US, turn out to be key factors acting as a tailwind for the black liquid.
Meanwhile, the US Dollar (USD) struggles to capitalize on its recent bounce from the YTD low touched in the aftermath of the Federal Reserve's (Fed) jumbo interest rate cut last week and bets for more aggressive policy easing going forward. This is seen underpinning demand for USD-denominated commodities and lending some support to Crude Oil prices.
The upside, however, remains capped amid a bleak global economic outlook. The fears resurfaced after the flash PMIs released on Monday showed that business activity in the Eurozone unexpectedly contracted sharply in September. This comes on top of concerns about fuel consumption in China – the world's largest Oil importer – and acts as a headwind for the commodity.
The aforementioned mixed fundamental backdrop warrants some caution before placing aggressive directional bets around Crude Oil prices as traders opt to wait for more cues about the Fed's rate-cut path. Hence, the focus will remain on speeches by influential FOMC members and the release of the US Personal Consumption Expenditures (PCE) Price Index on Friday.
WTI Oil FAQs
WTI Oil is a type of Crude Oil sold on international markets. The WTI stands for West Texas Intermediate, one of three major types including Brent and Dubai Crude. WTI is also referred to as “light” and “sweet” because of its relatively low gravity and sulfur content respectively. It is considered a high quality Oil that is easily refined. It is sourced in the United States and distributed via the Cushing hub, which is considered “The Pipeline Crossroads of the World”. It is a benchmark for the Oil market and WTI price is frequently quoted in the media.
Like all assets, supply and demand are the key drivers of WTI Oil price. As such, global growth can be a driver of increased demand and vice versa for weak global growth. Political instability, wars, and sanctions can disrupt supply and impact prices. The decisions of OPEC, a group of major Oil-producing countries, is another key driver of price. The value of the US Dollar influences the price of WTI Crude Oil, since Oil is predominantly traded in US Dollars, thus a weaker US Dollar can make Oil more affordable and vice versa.
The weekly Oil inventory reports published by the American Petroleum Institute (API) and the Energy Information Agency (EIA) impact the price of WTI Oil. Changes in inventories reflect fluctuating supply and demand. If the data shows a drop in inventories it can indicate increased demand, pushing up Oil price. Higher inventories can reflect increased supply, pushing down prices. API’s report is published every Tuesday and EIA’s the day after. Their results are usually similar, falling within 1% of each other 75% of the time. The EIA data is considered more reliable, since it is a government agency.
OPEC (Organization of the Petroleum Exporting Countries) is a group of 13 Oil-producing nations who collectively decide production quotas for member countries at twice-yearly meetings. Their decisions often impact WTI Oil prices. When OPEC decides to lower quotas, it can tighten supply, pushing up Oil prices. When OPEC increases production, it has the opposite effect. OPEC+ refers to an expanded group that includes ten extra non-OPEC members, the most notable of which is Russia.
- Gold price pauses after the recent strong move up to a fresh all-time peak touched on Monday.
- The fundamental backdrop favors bullish trades and supports prospects for additional gains.
- Traders now look forward to the US PCE Price Index on Friday before placing directional bets.
Gold price (XAU/USD) extends its consolidative price move for the second straight day on Tuesday as bulls turn cautious after the recent rise to a fresh all-time peak touched the previous day amid slightly overbought conditions on the daily chart. The downside remains cushioned in the wake of bets for more aggressive easing by the US Federal Reserve (Fed), which caps the US Dollar (USD) recovery from the YTD peak touched in reaction to a jumbo rate cut last week.
Apart from this, persistent geopolitical risks stemming from the ongoing conflicts in the Middle East, along with the US political uncertainty ahead of the November election and worries about an economic slowdown, should underpin the safe-haven Gold price. That said, the underlying bullish tone across the global equity markets keeps a lid on the safe-haven XAU/USD, ahead of this week's release of the US Personal Consumption Expenditures (PCE) Price Index on Friday.
Daily Digest Market Movers: Gold price remains supported by further Fed rate cut bets, geopolitical risks
- Bets that the Federal Reserve will further lower borrowing costs by 125 basis points in 2024 after last week's jumbo 50 bps rate cut pushed the non-yielding Gold price to a fresh record high on Monday.
- According to the CME Group's FedWatch Tool, investors are now pricing in another oversized rate cut at the November policy meeting, which caps a modest US Dollar recovery from the YTD low.
- Minneapolis Fed President Neel Kashkari noted on Monday that the balance of risks had shifted away from high inflation to a further weakening of the labor market, warranting a lower interest rate.
- Adding to this, Atlanta Fed President Raphael Bostic said that the recent data show convincingly that the US is on a sustainable path to price stability and that risks to the labour market have increased.
- Chicago Fed President Austan Goolsbee said that the labor market deterioration typically happens quickly and that keeping rates high does not make sense when you want things to stay where they are.
- On the data front, a survey compiled by S&P Global showed that business activity in the Eurozone unexpectedly contracted sharply, while business activity in the US was steady in September.
- Additional details of the flash US PMI showed that average prices charged for goods and services rose at the fastest pace in six months, pointing to an acceleration in inflation in the coming months.
- This comes on top of the hypothesis that rate cuts implemented to stimulate the economy occasionally lead to rising prices and could benefit the commodity's status as a hedge against inflation.
- Israeli airstrikes on Monday against what it said are Hezbollah weapons sites in southern and eastern Lebanon killed nearly 500 people, raising the risk of a wider conflict in the Middle East.
- This, along with the US political uncertainty and a bleak global economic outlook, suggests that the path of least resistance for the safe-haven precious metal remains to the upside.
- That said, a surprise rate cut by the People's Bank of China (PBOC) on Monday, along with a stopgap spending bill to fund the US government through December 20, cap gains for the XAU/USD.
- Traders might also opt to move to the sidelines ahead of the release of the US Personal Consumption Expenditures (PCE) Price Index on Friday amid overbought conditions on the daily chart.
Technical Outlook: Gold price needs to consolidate before advancing the recent upward trend
From a technical perspective, the recent breakout and acceptance above the $2,600 mark could be seen as a fresh trigger for bullish traders. That said, the Relatively Strength Index (RSI) on the daily chart is holding above the 70 mark and warrants some caution. Hence, it will be prudent to wait for some near-term consolidation or a modest pullback before positioning for the next leg of a move-up.
Meanwhile, any corrective slide is likely to attract fresh buyers near the $2,600 mark, below which the Gold price could drop to the $2,560 horizontal zone. The next relevant support is pegged near the $2,535-2,530 resistance breakpoint ahead of the $2,500 psychological mark. A convincing break below the latter might shift the near-term bias in favor of bearish trades and pave the way for some meaningful downside.
Gold FAQs
Gold has played a key role in human’s history as it has been widely used as a store of value and medium of exchange. Currently, apart from its shine and usage for jewelry, the precious metal is widely seen as a safe-haven asset, meaning that it is considered a good investment during turbulent times. Gold is also widely seen as a hedge against inflation and against depreciating currencies as it doesn’t rely on any specific issuer or government.
Central banks are the biggest Gold holders. In their aim to support their currencies in turbulent times, central banks tend to diversify their reserves and buy Gold to improve the perceived strength of the economy and the currency. High Gold reserves can be a source of trust for a country’s solvency. Central banks added 1,136 tonnes of Gold worth around $70 billion to their reserves in 2022, according to data from the World Gold Council. This is the highest yearly purchase since records began. Central banks from emerging economies such as China, India and Turkey are quickly increasing their Gold reserves.
Gold has an inverse correlation with the US Dollar and US Treasuries, which are both major reserve and safe-haven assets. When the Dollar depreciates, Gold tends to rise, enabling investors and central banks to diversify their assets in turbulent times. Gold is also inversely correlated with risk assets. A rally in the stock market tends to weaken Gold price, while sell-offs in riskier markets tend to favor the precious metal.
The price can move due to a wide range of factors. Geopolitical instability or fears of a deep recession can quickly make Gold price escalate due to its safe-haven status. As a yield-less asset, Gold tends to rise with lower interest rates, while higher cost of money usually weighs down on the yellow metal. Still, most moves depend on how the US Dollar (USD) behaves as the asset is priced in dollars (XAU/USD). A strong Dollar tends to keep the price of Gold controlled, whereas a weaker Dollar is likely to push Gold prices up.
| Raw materials | Closed | Change, % |
|---|---|---|
| Silver | 30.683 | -1.51 |
| Gold | 262.839 | 0.28 |
| Palladium | 1038.74 | -2.25 |
Japan’s Finance Minister Shunichi Suzuki said on Tuesday that he is “monitoring impacts from central banks' monetary policies.”
Suzuki said that he “expects the Bank of Japan (BoJ) to conduct appropriate monetary policy, while working closely with government.”
Market reaction
USD/JPY remains defensive near 143.70 following these above comments, almost unchanged on the day.
- Indian Rupee holds steady in Monday’s Asian session.
- Robust foreign inflows and lower crude oil prices might support the INR.
- Traders will monitor the US September Consumer Confidence and Fed’s Bowman speech on Tuesday.
The Indian Rupee (INR) consolidated its gains on Monday after reaching its highest level since mid-July in the previous session. The local currency might be bolstered by the Federal Reserve's (Fed) recent rate cut and strong portfolio inflows into Indian markets. Additionally, the decline in crude oil prices could underpin the INR as India is the third-largest oil consumer after the United States (US) and China.
Nonetheless, the US Dollar (USD) demand from local oil companies might help limit the pair’s losses. Investors await the US Consumer Confidence for September for fresh impetus. Also, Fed Governor Michelle Bowman is scheduled to speak later on Tuesday.
Daily Digest Market Movers: Indian Rupee trades flat despite dovish Fed
- The flash HSBC India Manufacturing Purchasing Managers Index (PMI) eased to 56.7 in September from the previous reading of 57.5. The Services PMI declined to 58.9 versus 60.9 prior.
- "The flash Composite PMI in India rose at a slightly slower pace in September, marking the slowest growth observed in 2024," noted Pranjul Bhandari, chief India economist at HSBC.
- Chicago Fed President Austan Goolsbee noted, “Many more rate cuts are likely needed over the next year, rates need to come down significantly.”
- Atlanta Fed President Raphael Bostic stated that cutting the cycle with a large move will help bring interest rates closer to neutral levels as the risks between inflation and employment become more balanced.
- Minneapolis Fed President Neel Kashkari said that he expects to lower interest rates by quarter-point moves at each of the central bank’s two remaining meetings this year, per Bloomberg.
- The flash reading of the US Manufacturing PMI dropped to a 15-month low of 47.0 in September from 47.9 in August, weaker than the estimations of 48.5. Meanwhile, the Services PMI eased to 55.4 in August versus 55.7 prior, above the market consensus of 55.2.
Technical Analysis: USD/INR’s bearish bias prevails in the longer term
The Indian Rupee trades flat on the day. The USD/INR pair keeps the bearish vibe on the daily timeframe as it holds below the key 100-day Exponential Moving Average (EMA). The path of least resistance level is to the downside as the 14-day Relative Strength Index (RSI) stands in the bearish zone near 33.70.
The first upside barrier for USD/INR emerges near the 100-day EMA at 83.68. Any follow-through buying above this level could see a rally to the key resistance level at the 84.00 psychological mark.
On the flip side, the initial support level for the pair is located at 83.30, the low of June 19. The additional downside filter to watch is the 83.00 round mark.
Indian Rupee FAQs
The Indian Rupee (INR) is one of the most sensitive currencies to external factors. The price of Crude Oil (the country is highly dependent on imported Oil), the value of the US Dollar – most trade is conducted in USD – and the level of foreign investment, are all influential. Direct intervention by the Reserve Bank of India (RBI) in FX markets to keep the exchange rate stable, as well as the level of interest rates set by the RBI, are further major influencing factors on the Rupee.
The Reserve Bank of India (RBI) actively intervenes in forex markets to maintain a stable exchange rate, to help facilitate trade. In addition, the RBI tries to maintain the inflation rate at its 4% target by adjusting interest rates. Higher interest rates usually strengthen the Rupee. This is due to the role of the ‘carry trade’ in which investors borrow in countries with lower interest rates so as to place their money in countries’ offering relatively higher interest rates and profit from the difference.
Macroeconomic factors that influence the value of the Rupee include inflation, interest rates, the economic growth rate (GDP), the balance of trade, and inflows from foreign investment. A higher growth rate can lead to more overseas investment, pushing up demand for the Rupee. A less negative balance of trade will eventually lead to a stronger Rupee. Higher interest rates, especially real rates (interest rates less inflation) are also positive for the Rupee. A risk-on environment can lead to greater inflows of Foreign Direct and Indirect Investment (FDI and FII), which also benefit the Rupee.
Higher inflation, particularly, if it is comparatively higher than India’s peers, is generally negative for the currency as it reflects devaluation through oversupply. Inflation also increases the cost of exports, leading to more Rupees being sold to purchase foreign imports, which is Rupee-negative. At the same time, higher inflation usually leads to the Reserve Bank of India (RBI) raising interest rates and this can be positive for the Rupee, due to increased demand from international investors. The opposite effect is true of lower inflation.
- The Australian Dollar remains solid near nine-month high of 0.6839 as RBA is expected to maintain current rates at 4.35%.
- The ANZ-Roy Morgan Australia Consumer Confidence Index increased by 0.8 points this week, reaching 84.9.
- The US Dollar faces challenges as Fed policymakers project additional rate cuts totaling 50 basis points in 2024.
The Australian Dollar (AUD) inches higher against the US Dollar (USD) ahead of the Reserve Bank of Australia’s (RBA) policy decision scheduled for Tuesday. The RBA is expected to maintain the Official Cash Rate (OCR) at 4.35%, citing strong labor market conditions and persistent inflationary pressures. Market projections suggest no rate cut before December, with some analysts predicting the first adjustment could occur as late as February or even in the second quarter of 2025.
The ANZ-Roy Morgan Australia Consumer Confidence Index rose by 0.8 points to 84.9 this week. Despite this increase, Consumer Confidence has now remained below the 85.0 mark for 86 consecutive weeks. On a year-over-year basis, the index is up by 8.5 points from 76.4.
The US Dollar (USD) could face challenges as Federal Reserve (Fed) officials forecast further rate cuts totaling 50 basis points (bps) in 2024, following an aggressive 50 bps cut last week. Supporting this outlook, Minneapolis Fed President Neel Kashkari stated on Monday that he expects and supports additional rate cuts in the coming year, per Reuters.
Daily Digest Market Movers: Australian Dollar maintains position due to hawkish mood surrounding the RBA
- According to the CME FedWatch Tool, markets are pricing in a 50% chance of 75 basis points to be deducted by the Fed to a range of 4.0-4.25% by the end of this year.
- The S&P Global Composite Purchasing Managers Index (PMI) grew at a slower rate in September, registering 54.4 compared to 54.6 in August. The Manufacturing PMI unexpectedly dropped to 47.0, indicating contraction, while the Services PMI expanded more than anticipated, reaching 55.4.
- Chicago Fed President Austan Goolsbee noted, “Many more rate cuts are likely needed over the next year, rates need to come down significantly.” Additionally, Atlanta Fed President Raphael Bostic said Monday that the US economy is close to normal rates of inflation and unemployment and the central bank needs monetary policy to "normalize" as well, per Reuters.
- The People’s Bank of China (PBoC) injected CNY 74.5 billion in liquidity into the banking system via a 14-day reverse repo, with the rate lowered to 1.85% from 1.95%. Additionally, the Chinese central bank also injected CNY 160.1 billion in liquidity via a 7-day reverse repo, with the rate unchanged at 1.7%.
- Australian Treasurer Jim Chalmers is working to establish a new monetary policy board at the Reserve Bank of Australia, but he needs the support of the Greens Party to move forward. The Greens have stated they will only back changes at the RBA if there is a commitment to lowering interest rates.
- Australia’s Judo Bank Composite PMI declined to 49.8 in September from 51.7 in August, indicating a contraction in business activity as slower growth in the services sector was unable to counterbalance a deeper slump in manufacturing output. The Services PMI fell to 50.6 in September from 52.5 previously, while the Manufacturing PMI decreased to 46.7 from 48.5 in August.
- Commonwealth Bank (CBA) has adjusted its expectation for the first Reserve Bank of Australia rate cut of 25 basis points, moving it from November 2024 to December 2024. This shift follows a robust employment rate and a continued "hawkish" outlook from the central bank, according to Yahoo Finance.
- Australian Employment Change came in at 47.5K in August, down from 48.9K (revised from 58.2K) in July, but well above the consensus forecast of 25.0K. The Unemployment Rate remained steady at 4.2% in August, in line with both expectations and the previous month's figure, according to data released by the Australian Bureau of Statistics (ABS).
- Reserve Bank of Australia (RBA) Governor Michele Bullock emphasized that it is premature to consider rate cuts given the persistently high inflation. Additionally, RBA Assistant Governor Sarah Hunter noted that while the labor market remains tight, wage growth seems to have peaked and is expected to slow further.
Technical Analysis: Australian Dollar hovers around a nine-month high near 0.6850
The AUD/USD pair trades near 0.6840 on Tuesday. Technical analysis of the daily chart indicates that the pair is moving upward within the ascending channel pattern, suggesting a bullish bias. Additionally, the 14-day Relative Strength Index (RSI) is positioned above 50, confirming the ongoing bullish trend.
The AUD/USD pair is currently testing the nine-month high of 0.6839, last reached on September 19. A breakout above this level could drive the pair toward the upper boundary of the ascending channel, around the 0.6910 mark.
On the downside, the AUD/USD pair could find support at the lower boundary of the ascending channel, which coincides with the nine-day Exponential Moving Average (EMA) at 0.6788. The next significant support is at the psychological level of 0.6700. A break below this level could push the pair further down toward its six-week low of 0.6622.
AUD/USD: Daily Chart
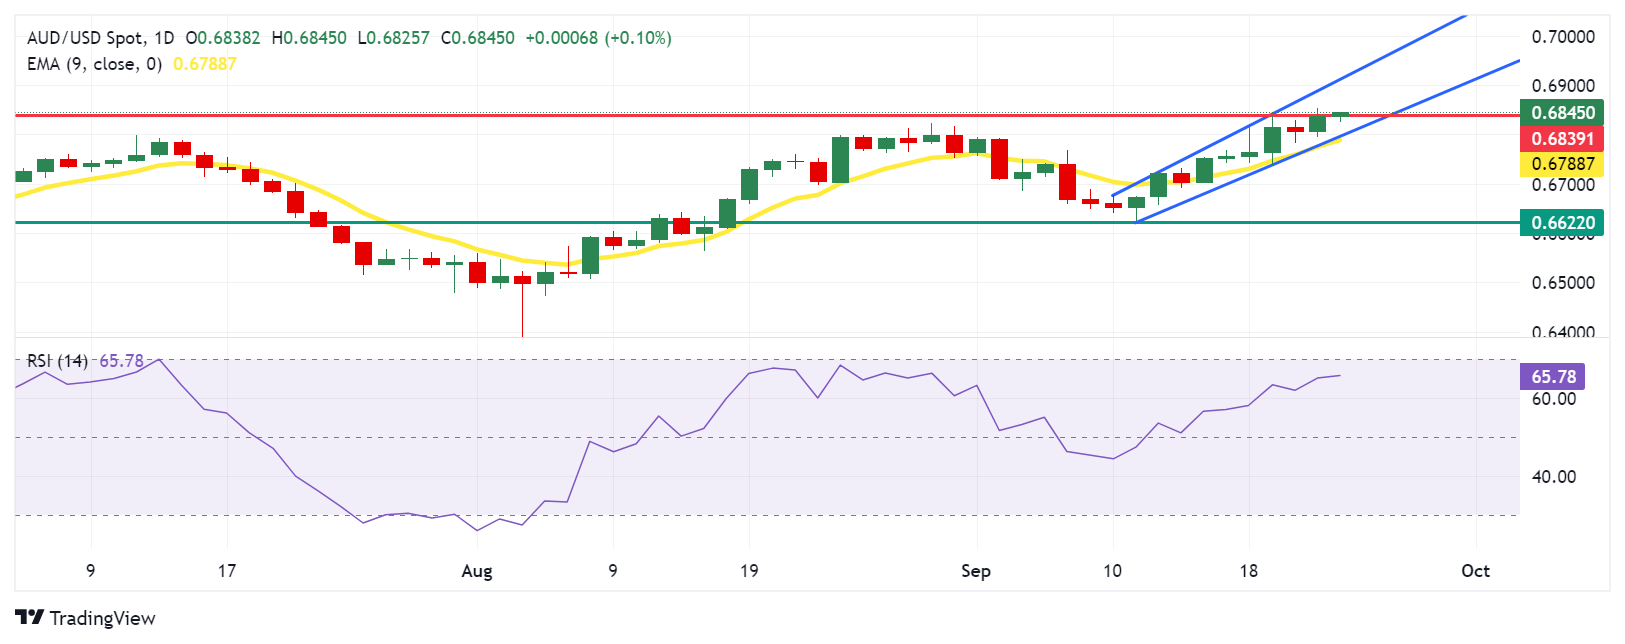
Australian Dollar PRICE Today
The table below shows the percentage change of Australian Dollar (AUD) against listed major currencies today. Australian Dollar was the strongest against the Japanese Yen.
| USD | EUR | GBP | JPY | CAD | AUD | NZD | CHF | |
|---|---|---|---|---|---|---|---|---|
| USD | 0.03% | -0.03% | 0.13% | -0.13% | -0.14% | 0.00% | -0.04% | |
| EUR | -0.03% | -0.06% | 0.08% | -0.20% | -0.18% | -0.05% | -0.08% | |
| GBP | 0.03% | 0.06% | 0.17% | -0.10% | -0.08% | 0.03% | 0.00% | |
| JPY | -0.13% | -0.08% | -0.17% | -0.23% | -0.28% | -0.15% | -0.17% | |
| CAD | 0.13% | 0.20% | 0.10% | 0.23% | -0.01% | 0.13% | 0.10% | |
| AUD | 0.14% | 0.18% | 0.08% | 0.28% | 0.00% | 0.14% | 0.10% | |
| NZD | -0.01% | 0.05% | -0.03% | 0.15% | -0.13% | -0.14% | -0.02% | |
| CHF | 0.04% | 0.08% | -0.00% | 0.17% | -0.10% | -0.10% | 0.02% |
The heat map shows percentage changes of major currencies against each other. The base currency is picked from the left column, while the quote currency is picked from the top row. For example, if you pick the Australian Dollar from the left column and move along the horizontal line to the US Dollar, the percentage change displayed in the box will represent AUD (base)/USD (quote).
Economic Indicator
RBA Interest Rate Decision
The Reserve Bank of Australia (RBA) announces its interest rate decision at the end of its eight scheduled meetings per year. If the RBA is hawkish about the inflationary outlook of the economy and raises interest rates it is usually bullish for the Australian Dollar (AUD). Likewise, if the RBA has a dovish view on the Australian economy and keeps interest rates unchanged, or cuts them, it is seen as bearish for AUD.
Read more.Next release: Tue Sep 24, 2024 04:30
Frequency: Irregular
Consensus: 4.35%
Previous: 4.35%
Source: Reserve Bank of Australia
People’s Bank of China Governor Pan Gongsheng said during a press conference on Tuesday that China will cut the amount of the reserve requirement ratio (RRR) by 50 basis points (bps).
Pan added that the Chinese central bank would cut the 7-day repo rate to 1.5% from 1.7% and down payments for second homes will be cut to 15% from 25%.
Key quotes
Must coordinate monetary and fiscal policies.
Must support the steady recovery of prices in the economy.
By year-end, we might cut the RRR rate further.
After the RRR cut, the financial weighted ratio for large banks will be reduced to 8%.
MLF will be lowered by 0.3%.
LPR will be lowered by 0.2 to 0.25%.
Commenting on falling home prices and valuations, Pan said:
It is expected that the average reduction in the interest rate of existing mortgages will be about 0.5 percentage points.
The policy will reduce household interest payments on mortgages for home owners by an average of 150 billion Yuan.
Will guide commercial banks to improve pricing mechanism for mortgage loans.
Will no longer distinguish between down payment for first, second homes and it will be unified at 15%
Down payments for all homes at 15%.
Market reaction
AUD/USD is defending gains near 0.6850 following these comments, awaiting the Reserve Bank of Australia (RBA) policy decision for fresh impetus.
Australian Dollar FAQs
One of the most significant factors for the Australian Dollar (AUD) is the level of interest rates set by the Reserve Bank of Australia (RBA). Because Australia is a resource-rich country another key driver is the price of its biggest export, Iron Ore. The health of the Chinese economy, its largest trading partner, is a factor, as well as inflation in Australia, its growth rate and Trade Balance. Market sentiment – whether investors are taking on more risky assets (risk-on) or seeking safe-havens (risk-off) – is also a factor, with risk-on positive for AUD.
The Reserve Bank of Australia (RBA) influences the Australian Dollar (AUD) by setting the level of interest rates that Australian banks can lend to each other. This influences the level of interest rates in the economy as a whole. The main goal of the RBA is to maintain a stable inflation rate of 2-3% by adjusting interest rates up or down. Relatively high interest rates compared to other major central banks support the AUD, and the opposite for relatively low. The RBA can also use quantitative easing and tightening to influence credit conditions, with the former AUD-negative and the latter AUD-positive.
China is Australia’s largest trading partner so the health of the Chinese economy is a major influence on the value of the Australian Dollar (AUD). When the Chinese economy is doing well it purchases more raw materials, goods and services from Australia, lifting demand for the AUD, and pushing up its value. The opposite is the case when the Chinese economy is not growing as fast as expected. Positive or negative surprises in Chinese growth data, therefore, often have a direct impact on the Australian Dollar and its pairs.
Iron Ore is Australia’s largest export, accounting for $118 billion a year according to data from 2021, with China as its primary destination. The price of Iron Ore, therefore, can be a driver of the Australian Dollar. Generally, if the price of Iron Ore rises, AUD also goes up, as aggregate demand for the currency increases. The opposite is the case if the price of Iron Ore falls. Higher Iron Ore prices also tend to result in a greater likelihood of a positive Trade Balance for Australia, which is also positive of the AUD.
The Trade Balance, which is the difference between what a country earns from its exports versus what it pays for its imports, is another factor that can influence the value of the Australian Dollar. If Australia produces highly sought after exports, then its currency will gain in value purely from the surplus demand created from foreign buyers seeking to purchase its exports versus what it spends to purchase imports. Therefore, a positive net Trade Balance strengthens the AUD, with the opposite effect if the Trade Balance is negative.
On Tuesday, the People’s Bank of China (PBoC) set the USD/CNY central rate for the trading session ahead at 7.0510, as compared to the previous day's fix of 7.0531 and 7.0495 Reuters estimates.
| Index | Change, points | Closed | Change, % |
|---|---|---|---|
| Hang Seng | -11.46 | 18247.11 | -0.06 |
| KOSPI | 8.64 | 2602.01 | 0.33 |
| ASX 200 | -56.6 | 8152.9 | -0.69 |
| DAX | 126.78 | 18846.79 | 0.68 |
| CAC 40 | 7.82 | 7508.08 | 0.1 |
| Dow Jones | 61.29 | 42124.65 | 0.15 |
| S&P 500 | 16.02 | 5718.57 | 0.28 |
| NASDAQ Composite | 25.95 | 17974.27 | 0.14 |
- USD/JPY loses ground around 143.55 in Tuesday’s early Asian session.
- Fed rate cut maintains bearish mood surrounding USD/JPY.
- BoJ policymakers tempered another hike speculation, which might cap the JPY’s upside; rising geopolitical risks could boost the JPY.
The USD/JPY pair trades with mild losses near 143.55 during the early Asian session on Tuesday. The decline in US Dollar (USD) continues to weigh on the pair. The US September Consumer Confidence is due later in the day and the Federal Reserve (Fed) Governor Michelle Bowman is set to speak.
The Fed rate cut last week had been highly expected, though the decision to cut by 50 basis points (bps) was somewhat of a surprise. Minneapolis Fed President Neel Kashkari said on Monday that he believes there should be and will be additional interest rate cuts in 2024. However, Kashkari expects future cuts to be smaller than the one from the September meeting.
Chicago Fed President Austan Goolsbee noted, “Many more rate cuts are likely needed over the next year, rates need to come down significantly.” Additionally, Atlanta Fed President Raphael Bostic said Monday that the US economy is close to normal rates of inflation and unemployment and the central bank needs monetary policy to "normalize" as well. The Greenback remains under pressure amid the rising expectation that the Fed will cut additional interest rates in the remainder of 2024.
However, the speculation that the Bank of Japan (BoJ) is not in a rush to raise interest rates might cap the upside for Japanese Yen (JPY). The BoJ left interest rates unchanged last week as policymakers need time to assess when it needs to raise borrowing costs further. "The majority of market players had expected the next rate hike to take place in December, but Mr. Ueda's remarks prompted some of them to think that maybe it will be delayed until early next year,” said Tomoichiro Kubota, senior market analyst at Matsui Securities Co.
Meanwhile, the rising geopolitical tensions in the Middle East might boost the safe-haven flows, benefiting the JPY. Bloomberg reported early Tuesday that Israel carried out airstrikes on targets in southern Lebanon, killing almost 500 people in one of the bloodiest days of fighting in nearly two decades and fuelling concerns of all-out conflict.
Japanese Yen FAQs
The Japanese Yen (JPY) is one of the world’s most traded currencies. Its value is broadly determined by the performance of the Japanese economy, but more specifically by the Bank of Japan’s policy, the differential between Japanese and US bond yields, or risk sentiment among traders, among other factors.
One of the Bank of Japan’s mandates is currency control, so its moves are key for the Yen. The BoJ has directly intervened in currency markets sometimes, generally to lower the value of the Yen, although it refrains from doing it often due to political concerns of its main trading partners. The current BoJ ultra-loose monetary policy, based on massive stimulus to the economy, has caused the Yen to depreciate against its main currency peers. This process has exacerbated more recently due to an increasing policy divergence between the Bank of Japan and other main central banks, which have opted to increase interest rates sharply to fight decades-high levels of inflation.
The BoJ’s stance of sticking to ultra-loose monetary policy has led to a widening policy divergence with other central banks, particularly with the US Federal Reserve. This supports a widening of the differential between the 10-year US and Japanese bonds, which favors the US Dollar against the Japanese Yen.
The Japanese Yen is often seen as a safe-haven investment. This means that in times of market stress, investors are more likely to put their money in the Japanese currency due to its supposed reliability and stability. Turbulent times are likely to strengthen the Yen’s value against other currencies seen as more risky to invest in.
| Pare | Closed | Change, % |
|---|---|---|
| AUDUSD | 0.68372 | 0.46 |
| EURJPY | 159.522 | -0.59 |
| EURUSD | 1.11112 | -0.44 |
| GBPJPY | 191.579 | 0.08 |
| GBPUSD | 1.33422 | 0.18 |
| NZDUSD | 0.62672 | 0.51 |
| USDCAD | 1.35344 | -0.22 |
| USDCHF | 0.84717 | -0.33 |
| USDJPY | 143.565 | -0.11 |


© 2000-2026. Уcі права захищені.
Cайт знаходитьcя під керуванням TeleTrade DJ. LLC 2351 LLC 2022 (Euro House, Richmond Hill Road, Kingstown, VC0100, St. Vincent and the Grenadines).
Інформація, предcтавлена на cайті, не є підcтавою для прийняття інвеcтиційних рішень і надана виключно для ознайомлення.
Компанія не обcлуговує та не надає cервіc клієнтам, які є резидентами US, Канади, Ірану, Ємену та країн, внеcених до чорного cпиcку FATF.
Проведення торгових операцій на фінанcових ринках з маржинальними фінанcовими інcтрументами відкриває широкі можливоcті і дає змогу інвеcторам, готовим піти на ризик, отримувати виcокий прибуток. Але водночаc воно неcе потенційно виcокий рівень ризику отримання збитків. Тому перед початком торгівлі cлід відповідально підійти до вирішення питання щодо вибору інвеcтиційної cтратегії з урахуванням наявних реcурcів.
Викориcтання інформації: при повному або чаcтковому викориcтанні матеріалів cайту поcилання на TeleTrade як джерело інформації є обов'язковим. Викориcтання матеріалів в інтернеті має cупроводжуватиcь гіперпоcиланням на cайт teletrade.org. Автоматичний імпорт матеріалів та інформації із cайту заборонено.
З уcіх питань звертайтеcь за адреcою pr@teletrade.global.
переклади