- Аналітика
- Новини та інструменти
- Новини ринків
Новини ринків
- Silver Price stays depressed after reversing from three-week high.
- Overbought RSI, impending bear cross on MACD lures XAG/USD sellers.
- 200-SMA, fears of Fed policy pivot put a floor under the Silver Price.
- XAG/USD rebound remains elusive below five-week-old descending resistance line.
Silver Price (XAG/USD) remains pressured around $24.15 amid the early hours of Friday’s Asian session after reversing from a three-week high the previous day. In doing so, the bright metal portrays the market’s cautious mood ahead of today’s top-tier central bankers’ speeches at the Jackson Hole Symposium, including Federal Reserve (Fed) Chairman Jerome Powell.
That said, the XAG/USD justified the overbought RSI (14) line and a looming bear cross on the MACD while reversing from a multi-day high on Thursday. However, the 38.2% Fibonacci retracement level of the commodity’s late June-July upside, near the $24.00 round figure, prods the sellers amid anxious markets.
Even if the quote breaks the immediate Fibonacci ratio, the 200-SMA level of around $23.80 can act as the final defense of the buyers.
Following that, a quick slump toward the 61.8% Fibonacci retracement surrounding $23.30, also known as the “Golden Ratio”, can’t be ruled out.
Meanwhile, the latest peak of around $24.35 can lure Silver buyers during the fresh recovery.
Even so, the 23.6% Fibonacci retracement and a downward-sloping resistance line from late July, respectively near $24.55 and $24.65, will challenge the XAG/USD bulls before giving them control.
Silver Price: Four-hour chart
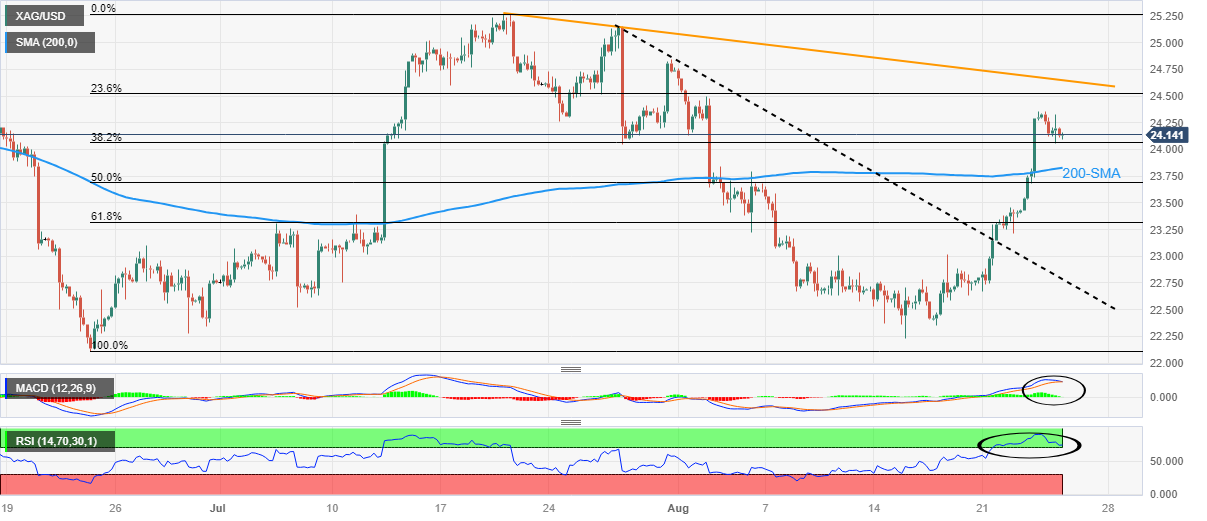
Trend: Further downside expected
Early Friday morning in Asia, the Statistics Bureau of Japan released monthly prints of the Tokyo Consumer Price Index (CPI) for August.
That said, the headline Tokyo CPI eases to 2.9% YoY from 3.2% prior, versus 3.0% market forecasts, whereas the Tokyo CPI ex Fresh Food, Energy remains steady with 4.0% YoY readings.
More importantly, Tokyo CPI ex Fresh Food eased from 3.0% to 2.8% for the said month compared to analysts’ estimations of 2.9%.
USD/JPY bulls ignore mixed Japan inflation
Following the data, USD/JPY marked an immediate pullback from the intraday high to 145.98 but refreshed the intraday high with 146.07 afterward.
Also read: USD/JPY rebounds above 145.00 on Fed hawkish comments and high US yields
About Tokyo CPI
The Tokyo Consumer Price Index is released by the Statistics Bureau and it's a measure of price movements obtained by comparison of the retail prices of a representative shopping basket of goods and services. The index captures inflation in Tokyo. CPI is the most significant way to measure changes in purchasing trends. The purchase power of JPY is dragged down by inflation. Generally a high reading is seen as positive.
- USD/CHF continues to rise, approaching the highest daily close in a month at around 0.8853.
- US economic data showed mixed results.
- Market participants will keep an eye on Fed Chairman Jerome Powell's Speech for fresh impetus.
The USD/CHF pair extends its upside to the highest daily close in a month above the 0.8850 mark during the Asian trading hours on Friday. The pair currently trades near 0.8853, gaining 0.09% on the day. Meanwhile, the US Dollar Index (DXY), a measure of the value of USD against six other major currencies, surges to the 104.00 mark, supported by the higher US Treasury yields. That said, the 10-year US Treasury yield climbs to 4.24%, while the 2-year yield remains stay above 5%.
On Thursday, US Durable Goods Orders MoM declined -5.2% in July, above expectations of -4% but falling short of the previous month's gain of 4.4%. This is the greatest drop since April 2020. Meanwhile, the Chicago Fed National Activity Index increased to 0.12 in July from -0.33 prior, and the Kansas Fed Manufacturing Activity Index rose to 12.0 in August from -20.0 in the previous month.
Philadelphia Federal Reserve (Fed) President Patrick Harker stated at the Jackson Hole Symposium that the central bank has probably done enough with restrictive monetary policy. He also said that he believes the Fed will remain interest rate stable this year, but that next year would depend on the data. While, Boston Fed President Susan Collins said further rate rises are possible and that sending a strong signal regarding the timing of rate cuts is premature.
On the other hand, the Swiss Federal Customs Administration reported earlier this week that Switzerland’s Trade Balance narrowed to 3,129M against the market consensus of 4,300M. Meanwhile, Exports were down 16.7% in July. In the same period, Imports dropped by 12.5%. Nevertheless, growing concerns about China's deteriorating economic conditions should dampen market optimism. This may benefit the traditional safe-haven Swiss Franc and act as a headwind for the USD/CHF pair.
In the absence of economic data released from Switzerland, the USD/CHF pair continues to be at the mercy of USD price dynamics. Market participants will keep an eye on Fed Chairman Jerome Powell's Speech on Friday. The events will be critical for determining a clear movement for the pair.
- USD/CAD edges higher around monthly top after rising the most in three weeks.
- Broadly firmer US Dollar propels Loonie pair even as upbeat US Manufacturing details, China hopes underpin Oil price rebound.
- Central bank talks will be crucial for immediate directions amid doubts about “higher for longer” rates.
- Fed Chair Powell needs to defend hawkish policy moves, rule out rate cuts to keep Greenback on the front foot.
USD/CAD holds onto the bullish bias targeting the key 1.3600 upside hurdle despite the early Asian session inaction on Friday. Also challenging the Loonie pair buyers is the cautious mood ahead of Federal Reserve (Fed) Chairman Jerome Powell’s speech at the Jackson Hole Symposium. That said, the quote rose the most in three weeks the previous day while approaching the highest level since late May marked Wednesday.
While tracing the USD/CAD pair’s latest jump, the broad US Dollar strength gains major attention whereas a recovery in the Oil price, Canada’s main export, challenges the upside momentum towards the multi-day-old descending resistance line surrounding 1.3605.
The US Dollar Index (DXY) remains firmer around the highest level in 11 weeks after refreshing the multi-day peak by rising the most since August 02. On the other hand, WTI crude oil defends the previous day’s rebound to the lowest level in a month while making rounds to $78.50.
It’s worth noting that the mostly firmer US data and hawkish Fed speak, as well as the market’s anxiety ahead of the top-tier central bankers’ speeches underpin the US Dollar’s run-up. On the other hand, Oil price cheers hopes of more stimulus from China and the latest rebound in the US manufacturing gauges.
That said, US Durable Goods Orders for July marked the biggest slump since April 2020 by posting -5.2% MoM figure versus -4.0% expected and 4.4% prior growth (revised). However, the Durable Goods Orders ex Transportation marked a positive surprise with 0.5% figures versus 0.2% market forecasts and previous readings. Further, the Nondefense Capital Goods Orders ex Aircraft also improved to 0.1% while matching the analysts’ estimations compared to -0.4% marked in June.
Additionally, the Chicago Fed National Activity Index for July improved to 0.12 from -0.33 prior whereas the Kansas Fed Manufacturing Activity Index for August was 12.0 versus -20.0 previous readings. On the same line, the weekly figures of the Initial Jobless Claims and Continuing Jobless Claims eased and signaled positive employment conditions.
Talking about the Fed signals, St. Louis Federal Reserve President James Bullard also underpinned the US Dollar’s post-data rebound. “The reacceleration could put upward pressure on inflation and thus makes it impossible for the Fed to start cutting rates anytime soon,” said Fed’s Bullard in an interview with Bloomberg. While Bullard was hawkish, Federal Reserve Bank of Philadelphia President Patrick Harker teased an end of rate hike trajectory whereas Boston Federal Reserve President Susan Collins defended a “higher for longer” bias for rates.
Against this backdrop, Wall Street closed in the red while the benchmark US 10-year Treasury bond yield prints mild weekly losses despite rising to the highest level since 2007 earlier in the week, as well as posting firmer closing the previous day.
Moving on, a light calendar can restrict the USD/CAD moves ahead of the all-important Fed Chair Powell’s speech. That said, the Loonie pair buyers will seek a defense of the hawkish monetary policy to keep the reins.
Technical analysis
A four-month-old descending resistance line around 1.3605 appears a tough nut to crack for the USD/CAD bulls as RSI conditions seem overbought. The pullback moves, however, appear elusive unless they break the 200-DMA support surrounding 1.3460.
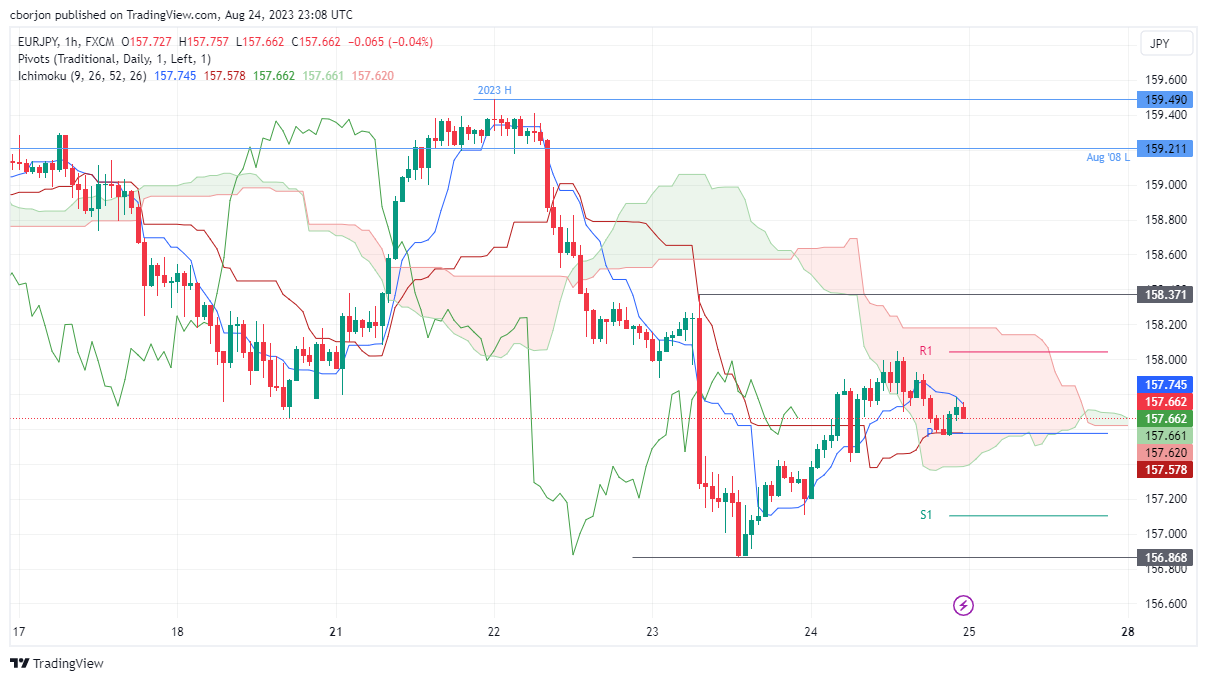
- EUR/JPY trades at 157.71, showing a minimal advance of 0.10% as the Asian session begins.
- The pair struggles to conquer the Tenkan-Sen line at 158.18, indicating a potential shift in momentum.
- Short-term technicals show a neutral bias with a slight tilt to the upside as the pair prints higher highs and higher lows.
As the Asian session begins, the EUR/JPY prints a minimal advance of 0.10% after traders failed to conquer the Tenkan-Sen line at 158.18, as the pair dropped below 158.00. At the time of writing, the cross-currency pair exchanges hands at 157.71, set to finish the week with losses.
EUR/JPY Price Analysis: Technical outlook
From a daily chart perspective, the EUR/JPY is still upward biased, but the recent dip below the Tenkan-Sen could pave the way to test lower prices. Next support emerges at the August 23 swing low of 156.87, followed by the top of the Ichimoku Cloud (Kumo) at 155.65/75. On the flip side, if buyers want to resume the uptrend, the pair must pierce the Tenkan-Sen at 158.18, so the cross could threaten to test the year-to-date (YTD) high at 159.49.
Short term, the EUR/JPY hourly chart portrays the pair as neutral biased, with risks seen slightly tilted to the upside, as the pair achieved two successive series of higher highs and higher lows. Nevertheless, buyers must lift the pair above the August 23 high of 158.37 to reinforce the upside bias.
On its way towards that level, the EUR/JPY must surpass the Tenkan Sen at 157.74, the R1 daily pivot point at 158.04, and the top of the Kumo at around 158.20. Conversely, if the cross drops below the confluence of the Kijun-Sen and the daily pivot point at 157.57, the pair would cre-test the weekly low of 156.86. But first, sellers must reclaim the bottom of the Kumo at 157.40, followed by the 157.00 figure.
EUR/JPY Price Action – Hourly chart
- NZD/USD loses traction near 0.5925 amid the USD demand.
- US Durable Goods Orders for July came in below expectation, while unemployment claims below estimates.
- All eyes are on Fed Chairman Powell’s speech on Friday.
The NZD/USD pair faces some follow-through selling and drops to 0.5925 during the early Asian session on Friday. The US Dollar Index (DXY) falls to its lowest level since early June and rebounds to the 104.00 area, supported by risk aversion and higher US Treasury yields.
At the Jackson Hole Symposium, Federal Reserve Bank of Philadelphia President Patrick Harker stated that the central bank has probably done enough with restrictive monetary policy. He also said that he believes the Fed will remain interest rate stable this year, but that next year would depend on the data. While, Boston Federal Reserve President Susan Collins said further rate rises are possible and that sending a strong signal regarding the timing of rate cuts is premature.
About the data, US Durable Goods Orders MoM for July fell -5.2%, above estimations of -4% and below the 4.4% gain in the previous month. This is the biggest decline since April 2020. Furthermore, the Chicago Fed National Activity Index for July increased to 0.12 from -0.33 prior, while the Kansas Fed Manufacturing Activity Index for August rose to 12.0 from -20.0 previously.
Lastly, the weekly figures provided by the US Department of Labour (DOL) on Thursday indicated that Initial Jobless Claims reached 230K in the week ending August 19. The figure came in below 240k expected and prior. The reading is the lowest in three weeks.
New Zealand’s economic calendar remains empty. Earlier this week, Statistics New Zealand released second-quarter Retail Sales QoQ figures, showing an increase to -1.0 from -1.6% prior and better than expected of -2.6%. The chief economist of the Reserve Bank of New Zealand (RBNZ) said that policymakers would lower the OCR sooner than we have signaled if China experienced a more significant deceleration than the RBNZ anticipates.
Looking ahead, investors will closely watch Friday’s speech from Jerome Powell. The speech could provide insights into economic conditions and hints as to whether inflation is under control or whether additional interest rate hikes are required to combat inflation. The events will be critical for determining a clear movement for the NZD/USD pair.
- GBP/USD remains depressed at the lowest level in two months, licking its wounds after falling the most since late July.
- Four-month-old horizontal support zone, nearly oversold RSI prods Cable sellers.
- Speeches from Fed Chair Powell, BoE Governor Bailey will be crucial for Pound Sterling's directions.
- Hawkish central bank concerns may favor bears but rejections of rate cuts can keep buyers hopeful.
GBP/USD seesaws around the lowest level in two months, after falling the most since late July to refresh the multi-day bottom, as markets await the top-tier central bankers’ speech on early Friday. That said, the Cable pair makes rounds to 1.2600 while poking a four-month-old horizontal support area surrounding 1.2590–2570.
Not only the strong support zone but the nearly oversold conditions of the RSI (14) line also challenge the Pound Sterling sellers ahead of Friday’s speech from Fed Chair Jerome Powell, followed by Saturday’s statements from Bank of England (BoE) Governor Andrew Bailey.
Hence, the GBP/USD price may witness a corrective bounce ahead of the key events.
However, the 100-DMA hurdle of 1.2640 and the bearish MACD signals could challenge the Cable pair’s rebound.
Following that, a one-month-old descending resistance line and the 50-DMA, respectively near 1.2740 and 1.2790, will attract the bids before giving control to the Pound Sterling bulls.
Meanwhile, a daily closing beneath 1.2570 may seek validation from the early June swing high of around 1.2545 before targeting the 200-DMA support of around 1.2400.
GBP/USD: Daily chart
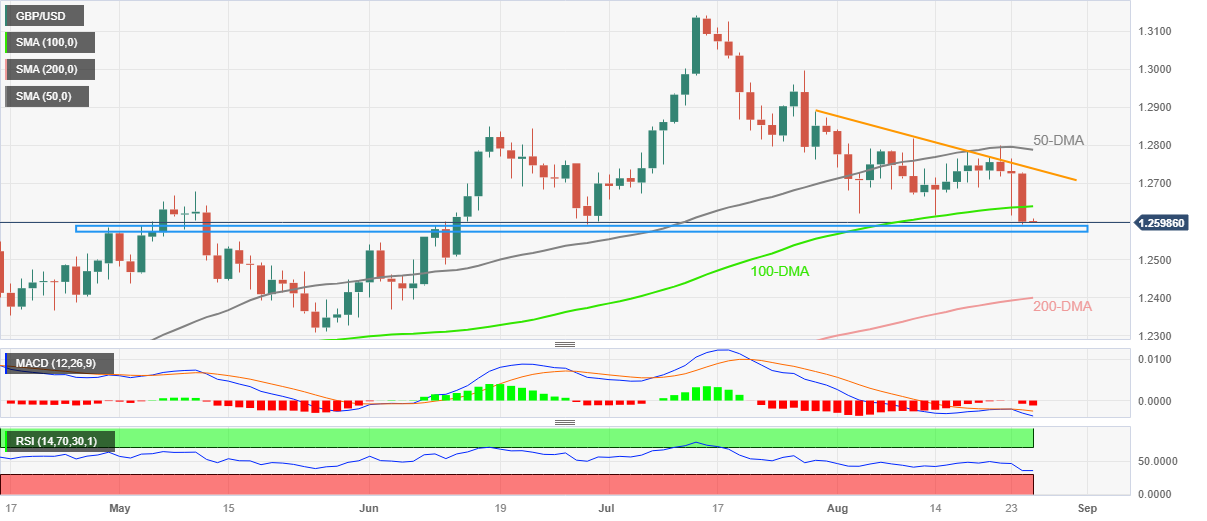
Trend: Limited downside expected
"Underlying inflation in the eurozone remains sticky and monetary policy needs to be more stubborn than price growth," said European Central Bank (ECB) policymaker and Bundesbank Chief Joachim Nagel during an interview with Bloomberg.
The policymaker also said that he didn’t see a recession coming.
ECB’s Nagel is yet to make up his mind about the September policy decision but he considers inflation far too high while a recession is still not on the cards per the Bloomberg interview shared by Reuters.
EUR/USD stays pressured
Although the EUR/USD pair failed to show any quick reaction to the news, it did fade the mid-week rebound from the 10-week low and remains depressed around 1.0800 by the press time of early Friday morning in Asia.
Also read: EUR/USD threatens 200-day SMA amid USD strength
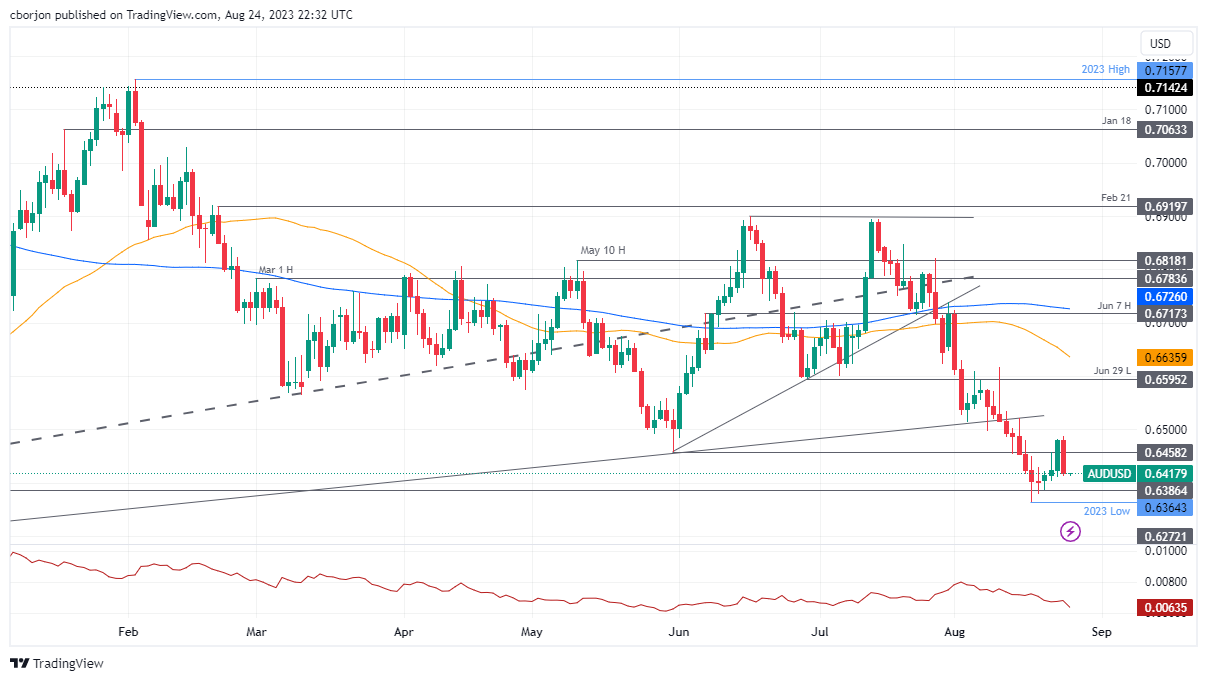
- Hawkish comments from Federal Reserve officials Patrick Harker and Susan Collins weigh on the pair.
- Weak Australian economic data for August and China’s woes add to the bearish sentiment for the Aussie.
- Market participants await Fed Chair Jay Powell’s speech at Jackson Hole on Friday for further direction.
The Australian Dollar (AUD) erased Wednesday’s gains against the American Dollar (USD) on Thursday, as a ‘bearish-engulfing’ candlestick chart pattern emerges, suggesting that further downside is expected. On Thursday, the hawkish commentary by Fed officials, alongside weaker-than-expected economic data from Australia in August, paints a gloomy economic outlook for the Aussie. The AUD/USD changes hands at 0.6412 after retreating from weekly highs of 0.6488, almost flat as the Asian session starts.
The Aussie Dollar loses ground vs. the US Dollar on the Fed’s restrictive stance
Market participants focus shifts to Fed Chair Jay Powell’s speech at Jackson Hole on Friday. A few Federal Reserve policymakers delivered an intro, which struck the markets with hawkish remarks, though both commented that the Federal Fund Rate (FFR) is about to peak. Patrick Harker from the Philadelphia Fed said rates must remain at current “restrictive” levels while acknowledging the US economy will cool off. In the meantime, Boston Fed President Susan Collins said rates are at a “sufficiently restrictive level” but kept the door open for more increases while pushing rate cuts off the table.
The US economic agenda delivered a mixed report on long-lasting goods, with Durable Goods Orders for July plunging, while core figures were above estimates. At the same time, the US Bureau of Labor Statistics (BLS) showed that Initial Jobless Claims for the week ending August 19 were below forecasts at 230K, with estimates of 239K, portraying the tightness of the labor market.
Given the backdrop, the greenback advanced, as seen by the AUD/USD dropping below the 0.6450 psychological level. In the meantime, the US Dollar Index, a measure of the buck’s value versus six currencies, touched a fresh two-month high at 104.027 but ended Thursday’s session at 103.993, gaining 0.61%.
On the Australian front, August’s data has not been good for the Australian economy, while China’s woes weakened the AUD. Given that employment data was weaker, wages came below the prior month, the economy slashing employment, and an unemployment rate ticking towards 4%, the Reserve Bank of Australia (RBA) is expected to keep rates unchanged at the September meeting. The lack of economic data would keep traders focused on Powell’s speech and next week, RBA’s upcoming Governor Michelle Bullock would speak on August 29.
AUD/USD Price Analysis: Technical outlook
The AUD/USD is set to extend its downtrend after pausing during the first three days of the week. Thursday’s reversal opened the door to test the 0.6400 figure. A clear break will expose the November 10 daily low of 0.6386, ahead of challenging the year-to-date (YTD) low of 0.6264. It should be said that an extension past the YTD low would reinforce the downtrend, with sellers eyeing 0.6300. On the contrary, if buyers want to remain hopeful of higher prices, the pair must stay above 0.6400, with the current week’s high of 0.6488 seen as the first resistance, followed by 0.6500.
- Gold Price signals the first weekly gain in five despite firmer US Dollar.
- Overall softer yields, mixed concerns for “higher for longer rates” and China-linked anxiety fuel XAU/USD price.
- Federal Reserve Chairman Jerome Powell’s speech eyed to confirm Fed policy pivot and can propel Gold Price on acceptance.
- A slew of other central bankers’ speeches, mid-tier United States data will be helpful for clear XAU/USD guide.
Gold Price (XAU/USD) seesaws around the weekly top while marking $1,916 as a quote during early Friday’s Asian session, despite fading the bullish bias on late Thursday. Even so, the yellow metal prepares to snap a four-week losing streak as markets await Federal Reserve (Fed) Chairman Jerome Powell’s speech at the Jackson Hole Symposium for further directions, especially amid recently mixed United States data.
Thursday’s US statistics again troubled the traders as the headline numbers came in weak but the details were impressive and justified the Fed’s hawkish bias. However, the mixed Fed talks at Jackson Hole and the likely negative weekly close of the US Treasury bond yields, as well as mixed concerns about China, seem to put a floor under the Gold Price even as the firmer US Dollar prods the XAU/USD bulls.
Gold Price remains sturdy on the week despite firmer US Dollar
Gold Price stays on the front foot, edging higher of late, while bracing for the first positive week in five as risk-on mood joins a pullback in the United States Treasury bond yields. In doing so, the XAU/USD ignores the firmer US Dollar, as well as receding optimism about the US-China ties.
The risk appetite remains firmer, despite recent anxiety, as the US data flashes mixed outcomes and challenges the hawkish bias about major central banks. Adding strength to the upbeat sentiment, as well as a likely increase in the Gold demand, could be China’s readiness for more stimulus to defend the world’s second-biggest economy, as well as one of the top XAU/USD customers, from witnessing a hard landing.
On Thursday, US Durable Goods Orders for July marked the biggest slump since April 2020 by posting -5.2% MoM figure versus -4.0% expected and 4.4% prior growth (revised). However, the Durable Goods Orders ex Transportation marked a positive surprise with 0.5% figures versus 0.2% market forecasts and previous readings. Further, the Nondefense Capital Goods Orders ex Aircraft also improved to 0.1% while matching the analysts’ estimations compared to -0.4% marked in June.
Additionally, the Chicago Fed National Activity Index for July improved to 0.12 from -0.33 prior whereas the Kansas Fed Manufacturing Activity Index for August was 12.0 versus -20.0 previous readings.
It’s worth noting that the weekly figures of the Initial Jobless Claims and Continuing Jobless Claims eased and signaled positive employment conditions.
Not only the upbeat details of the US data but hawkish comments from former St. Louis Federal Reserve President James Bullard also underpinned the US Dollar’s post-data rebound. “The reacceleration could put upward pressure on inflation and thus makes it impossible for the Fed to start cutting rates anytime soon,” said Fed’s Bullard in an interview with Bloomberg.
While Bullard was hawkish, Federal Reserve Bank of Philadelphia President Patrick Harker teased an end of rate hike trajectory whereas Boston Federal Reserve President Susan Collins defended a “higher for longer” bias for rates.
Earlier in the week, downbeat readings of the top-tier economies’ Purchasing Managers Index (PMI) for August renewed concerns about the sooner end of the major central banks’ hawkish monetary policy cycle, which in turn triggered the risk-on mood and favored the Gold Price.
Elsewhere, the upbeat performance of the US technology shares also underpins the market’s optimism and favors the XAU/USD buyers despite a firmer US Dollar.
Alternatively, US-China optimism appears to fade as the Chinese Commerce Ministry said in a statement on Thursday, “China will state its stance on economic and trade matters of concern,” while adding that they will push financial institutions to expand credit to businesses. China’s Commerce Ministry also called on the US to cancel potential arms sales to Taiwan, which in turn flagged fears of geopolitical tension when US Commerce Secretary Gina Raimondo visits Beijing next week.
Amid these plays, the US Dollar Index (DXY) remains firmer around the highest level in 11 weeks while the benchmark US 10-year Treasury bond yield prints mild weekly losses despite rising to the highest level since 2007 earlier in the week, as well as posting firmer closing the previous day.
Additionally, the Wall Street benchmarks closed in the red after an initially positive start as the Fed talks and United States data teased policy hawks.
To sum up, the Gold Price regains the buyer’s attention ahead of the top-tier data/events but the reversal of a five-week-long bearish trend needs strong fundamental support.
Fed Chair Powell’s speech is crucial for XAU/USD
Although XAU/USD bulls brace for a positive week, it all depends upon how well Federal Reserve (Fed) Chairman Jerome Powell manages to defend the hawkish policy amid fresh calls for the end to the “higher for longer” rates. The early signals have been mixed and Analysts at the ANZ said, “We do not think there will be early rate cuts from the Fed as an extended period of strong growth will skew the risk towards higher interest rates. It will be imperative to watch incoming data closely in coming weeks for the likely impact on the future policy path.” The same prods the Gold buyers.
Apart from Fed Chair Powell’s Speech, European Central Bank (ECB) President Christine Lagarde’s statements will also be important as they could indirectly affect the US Dollar and the Gold Price in turn.
Additionally, the mid-tier clues for the US consumer sentiment and inflation conditions will also decorate the calendar and may keep the Gold traders busy.
Overall, an absence of firmer data has already teased the Gold buyers but hawkish central bankers may reverse the XAU/USD jump.
Also read: Gold Price Forecast: XAU/USD losing impetus around $1,920
Gold Price Technical Analysis
Gold Price holds onto the bullish signal, flashed earlier in the week via an upside break of a monthly descending trend line, as traders brace for the week’s top-tier events. Adding strength to the upside is an upward-sloping support line stretched from Monday, as well as a clear break of the 100-SMA.
Furthermore, the bullish signals on the Moving Average Convergence and Divergence (MACD) indicator, as well as the upbeat conditions of the Relative Strength Index (RSI) line, placed at 14, also keep the XAU/USD buyers hopeful.
With this, the Gold Price upside past the immediate hurdle, namely the 38.2% Fibonacci retracement of the July 20 to August 21 fall around $1,925, appears imminent.
However, a convergence of the 200-SMA and the 50% Fibonacci retracement surrounding $1,940 becomes a tough nut to crack for the XAU/USD bulls afterward.
Following that, the 61.8% Fibonacci retracement near $1,948, also known as the “Golden Ratio”, will be the last defense of the bears.
Alternatively, a downside break of the weekly support line, close to $1,910 at the latest, precedes the $1,900 threshold to restrict the immediate downside of the Gold Price.
In a case where the Gold Price remains bearish past $1,900, the resistance-turned-support line stretched from late July, near $1,878 by the press time, will be the final battle to fight for the bulls.
Overall, the Gold price upside appears impulsive but the bulls need fundamental support to retake control.
Gold Price: Four-hour chart
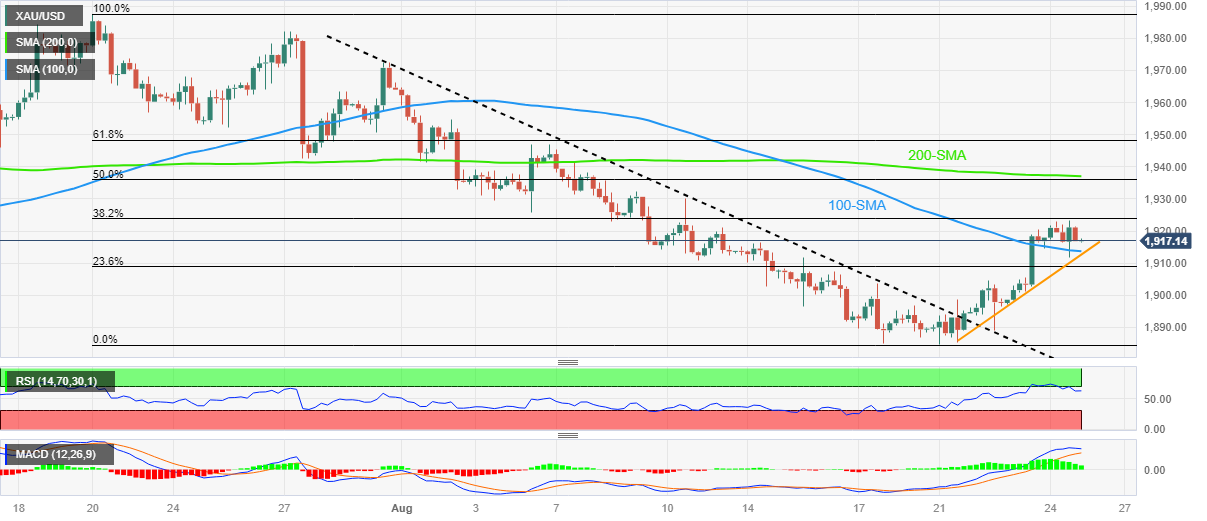
Trend: Further upside expected
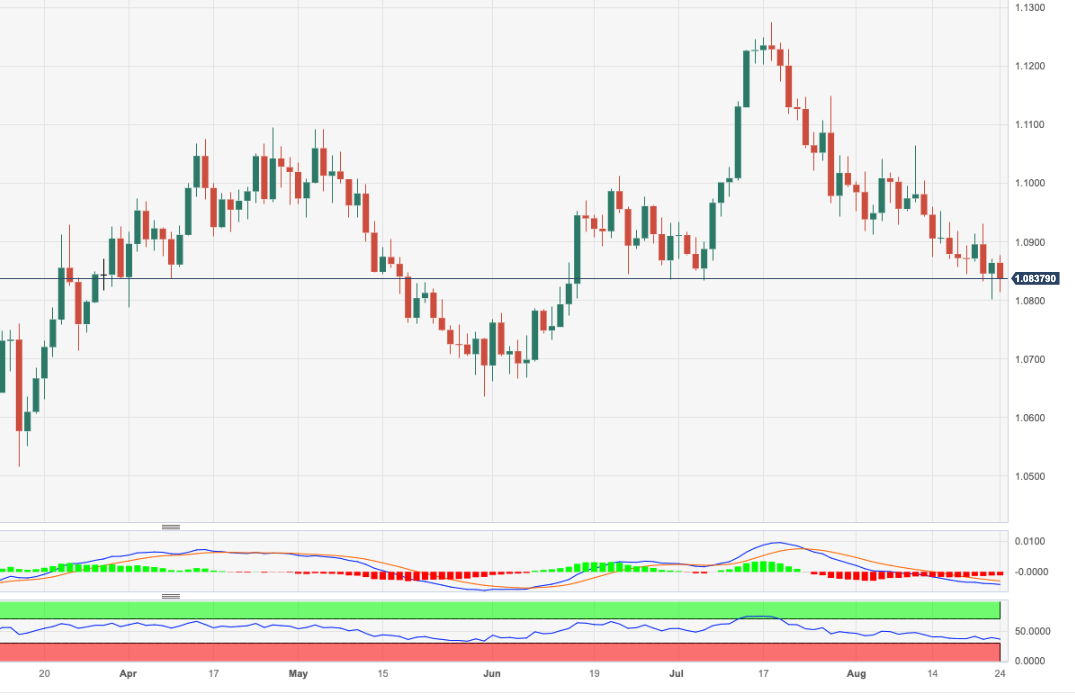
- EUR/USD dived more than 0.50% towards 1.0810, near the 200-day SMA.
- Hawkish remarks by Thomas Barkin and Susan Collins boosted the USD ahead of Powell’s speech on Friday.
- ECB President Christine Lagarde will speak on Saturday.
On Thursday, the EUR/USD lost momentum and traded weak against the USD. Hawkish remarks made by Federal Reserve (Fed) officials gave the Greenback traction, while the European calendar had nothing relevant to offer. All eyes are now on Jerome Powell and Christine Lagarde's speeches on Friday and Saturday, respectively, for fresh impetus.
On the US side, the USD gathered momentum following Susan Collins' remarks indicating the potential for further rate hikes, and the market sentiment shifted, leading investors to anticipate a more aggressive approach by the Federal Reserve (Fed). This sentiment was reinforced by Thomas Barkin's statement that the Fed would keep rates unchanged for the remainder of 2023 and consider rate cuts in 2024. As a result, US yields experienced an uptick and allowed the USD to gain traction against its rivals.
Datawise, the US reported strong Jobless Claims from the second week of August, contributing to the rise of the US yields.
On the other hand, the European calendar had nothing relevant to offer on the data front, and the Euro recovered some ground against its rivals after trading weak on Wednesday. Investors' focus is set on Saturday’s speech by ECB's Christine Lagarde at the Jackson Hole Symposium, where they will look for further clues regarding forward guidance. As for now, World Interest Rates Probabilities (WIRP) suggest that markets continue to discount 25 basis points in September, October and December by the European Central Bank (ECB), which would take rates to 5%.
EUR/USD Levels to watch
From a technical perspective, EUR/USD retains a bearish outlook for the short term, as observed on the daily chart. The Relative Strength Index (RSI) is below its midline, in negative territory, and exhibits a southward slope. The negative signal from the Moving Average Convergence Divergence (MACD), indicated by red bars, reinforces the growing bearish momentum.
Support levels: 1.0800 (200-day SMA), 1.0750, 1.0730.
Resistance levels: 1.0860, 1.0900, 1.0910-1.0930 (bearish convergence between the 20- and 100-day SMAs).
EUR/USD Daily chart
-638285117467972668.png)
- The SPX erased all of Wednesday’s gains, retreating to 4,380.
- Thomas Barkin and Susan Collins sounded hawkish at the start of the Jackson Hole Symposium.
- All eyes are now on Friday’s speech by Jerome Powell.
On Thursday, the US stock market saw losses driven by a stronger USD, boosted amid hawkish remarks by Federal Reserve (Fed) officials at the Jackson Hole Symposium.
Thomas Barkin stated that the Fed will keep rates where they are for the rest of 2023 and push rate cuts to 2024. In addition, Susan Collins commented that “more rate hikes are possible” which made markets place bets on a more aggressive Fed. In line with that, US yield rose, making stocks lose interest. The 2-year rate rose to 5%, while the 5 and 10-year rates increased to 4.44% and 4.23%, respectively.
Eventually, it will come down to the next set of data that the Fed will receive, including an additional jobs report and inflation reading. Powell’s words on Wednesday will also be closely watched for investors to model their expectations.
SPX Levels to watch
The daily chart suggests that the SPX displays a neutral to bearish outlook. The Relative Strength Index (RSI) points south in negative territory, while the Moving Average Convergence Divergence (MACD) prints red bars. However, the index remains above the 100 and 200-day Simple Moving Averages (SMAs), indicating that the bull retains control of the bigger picture.
Support Levels to watch: 4,350, 4,330, 4,310 (100-day SMA).
Resistance Levels to watch: 4,400, 4,460 (20-day SMA), 4,480.
SPX Daily chart
-638285055737391024.png)
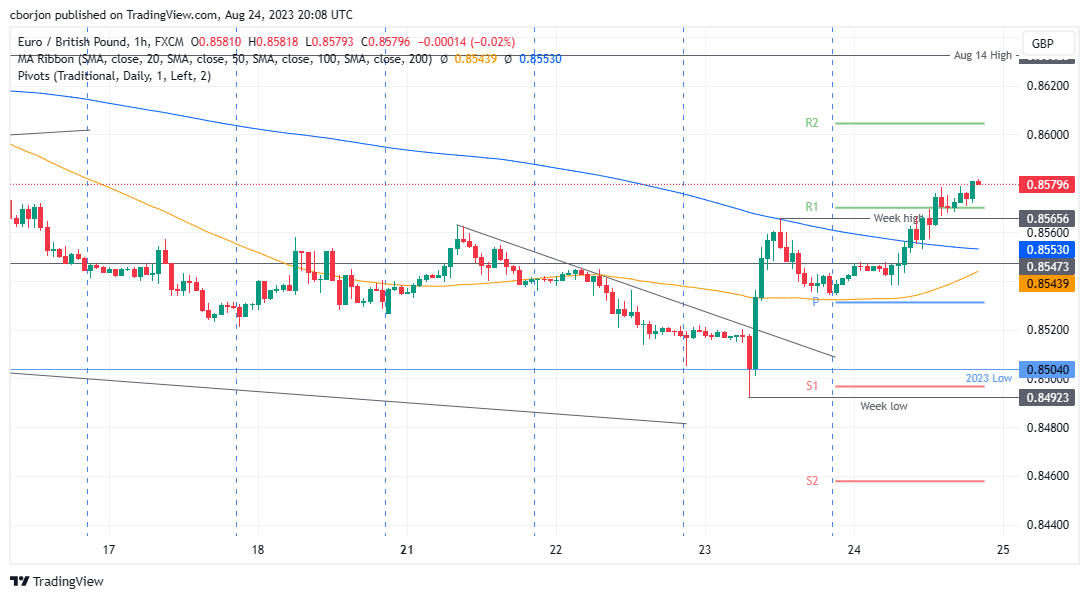
- EUR/GBP prints a new six-day high at around 0.8580, confluence with the 50-day SMA.
- Key resistance levels to watch include the 0.8600 figure, the August 14 high at 0.8632, and the August 11 daily high at 0.8669.
- On the downside, if EUR/GBP drops below the 200-hour MA at 0.8553, it could target the YTD low at 0.8492.
EUR/GBP resumes its uptrend and hits a six-day high, with buyers set to challenge higher prices after weaker economic data from the UK hurt the Pound Sterling (GBP) prospects. At the time of writing, the pair is exchanging hands at 0.8579, gains 0.52%.
EUR/GBP Price Analysis: Technical outlook
From a daily chart perspective, the cross remains neutral to downward biased, but the latest economic data from the UK shifted flows and favored the Euro (EUR). Today’s price action witnessed the EUR/GBP printing a new six-day high at around 0.8580, which confluences with the 50-day Simple Moving Average (SMA). A break above would expose the 0.8600 figure, followed by the month-to-date (MTD) high of 0.8669.
Short term, the pair is set to close the week in an upbeat mode, as the pair would end Thursday’s session at weekly highs. If EUR/GBP decisively breaks 0.8600, key resistance levels emerge at the August 14 high at 0.8632, followed by the August 11 daily high at 0.8669. Next stop would be 0.8700. Conversely, if the cross drops below the 200-hour MA (HMA) at 0.8553, Thursday’s lows would be up for grabs at 0.8534, followed by the YTD low at 0.8492.
EUR/GBP Price Action – Hourly chart
All eyes are on the Kansas City Fed's Jackson Hole Symposium. On Friday, ECB's Lagarde and the Fed's Powell will speak. During the Asian session, the Tokyo Consumer Price Index is due. Later in the day, a new reading of German GDP and the IFO survey will be released, and later the University of Michigan's Consumer Sentiment report.
Here is what you need to know on Friday, August 24:
After a brief correction, the US Dollar Index bounced back and climbed above 104.00, reaching its highest level since early June. Fundamental factors, risk aversion, and higher US Treasury yields continue to support the Greenback.
Market attention is focused on Jackson Hole. First, European Central Bank (ECB) President Christine Lagarde will speak at 11:00 GMT, followed by Federal Reserve (Fed) Chair Jerome Powell at 14:00 GMT. Volatility is expected, and it could lead to sharp moves across financial markets.
Data for the US on Thursday came in mixed but did not weigh down the US Dollar. On Friday, the University of Michigan will release its Consumer Sentiment report.
- US Durable Goods Orders decline 5.2% in July vs. -4% expected
- US: Initial Jobless Claims decline to 230K vs. 240K expected
- US: Chicago Fed National Activity Index rises to 0.12 in July from -0.33
Comments from Federal Reserve officials pointed in different directions, with Fed's Harker mentioning that they have probably "done enough" with policy while Fed's Collins warned that more rate hikes are possible.
The 10-year US Treasury yield rebounded but remained below recent highs, reaching 4.2%, while the 2-year yield climbed back above 5%. The higher yields weighed on the Japanese Yen, which was among the worst performers despite a decline in US stocks. USD/JPY rose from 144.65 to 145.85, awaiting Powell near monthly highs.
EUR/USD dropped back to 1.0800. The pair is trading with a bearish bias, slightly above the 200-day Simple Moving Average (SMA). ECB President Lagarde will speak at Jackson Hole on Friday. As for data, a new reading of German Q2 GDP and the IFO Survey are due.
USD/CHF consolidated above 0.8800 and posted the highest daily close in a month near 0.8850. Switzerland will release employment data for the second quarter on Friday.
GBP/USD resumed its downside after failing to hold above the 20-day SMA at 1.2740, tumbling below 1.2600 to reach fresh monthly lows.
AUD/USD gave up Wednesday's gains and approached the 0.6400 mark. NZD/USD failed to regain 0.6000 and dropped to 0.5920. The Antipodean currencies remain under pressure amid cautious market sentiment.
The Turkish lira was the top performer after a larger-than-expected rate hike from the Turkish central bank. USD/TRY plummeted from 27.00 to 25.60.
Like this article? Help us with some feedback by answering this survey:
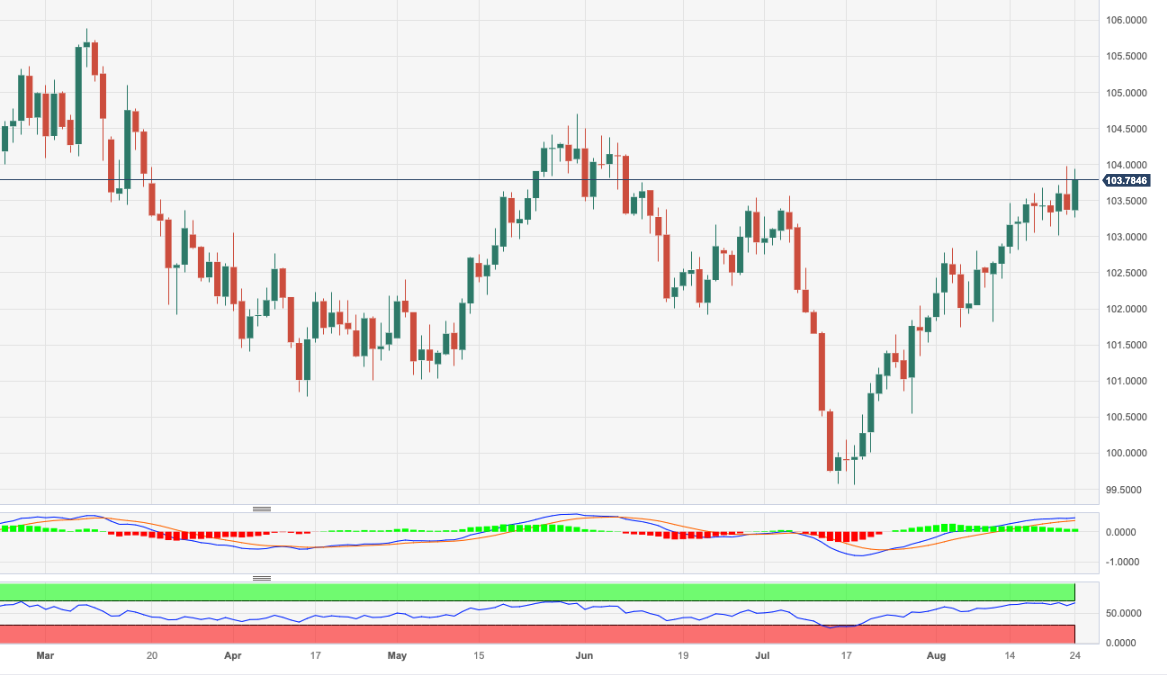
- USD/CHF rose near 0.8840, tallying 0.70% daily gains.
- Thomas Barkin from Richmond’s Fed pointed out that the sooner inflation decelerates, the sooner the cuts.
- Jobless Claims from the US came in higher than expected.
In Thursday’s session, the USD/CHF gained ground near 0.8840 and seems en route to the 100-day Simple Moving Average (SMA) at 0.8890. On the US side, strong Jobless Claims figure and higher US yields traction the USD while the Swiss calendar had nothing relevant to offer.
Ahead of Jerome Powell’s speech on Friday at the Jackson Hole Symposium, the US reported lower-than-expected Jobless Claims from the second week of August. As a reaction, the US Treasury yields are rising, making the USD gain interest. In that sense, lower people filing for unemployment benefits indicates a robust labour market that could give the Federal Reserve (Fed) the green light to remain hawkish.
On the other hand, Thomas Barkin stated that the Fed has already done enough and that the sooner inflation comes down, the sooner the bank will start cutting rates. That said, Chair Powell’s words will be the highlight for investors to continue modelling their expectations towards the Fed’s next moves.
USD/CHF Levels to watch
The technical analysis of the daily chart suggests a neutral to bullish stance for USD/CHF as the bulls are recovering their ground. With an upward trend above its midline, the Relative Strength Index (RSI) points towards a rising bullish sentiment, while the Moving Average Convergence (MACD) histogram presents increasing green bars. On the broader scale, the pair is above the 20-day Simple Moving Average (SMA), but below the 100 and 200-day SMAs, indicating that the bulls aren't done yet and that the outlook is still tilted to the upside for the short term.
Support levels: 0.8800, 0.8760 (20-day SMA), 0.8750.
Resistance levels: 0.8890 (100-day SMA), 0.8900, 0.8950.
USD/CHF Daily chart
-638285024065400194.png)
- US Durable Goods Orders for July show a significant decline of -5.2% MoM, exceeding estimates and marking the biggest drop since April 2020.
- The US labor market remains tight, with unemployment claims below estimates.
- Weak Retail Sales and PMI figures in the UK reignite recession fears, leading to adjustments in Bank of England rate hike expectations.
The Pound Sterling (GBP) drops sharply late in the New York session vs. the US Dollar (USD) and exchanges hands below the 1.2700 figure on Thursday, losing 0.85%. Federal Reserve officials hawkish stance, alongside weak economic data in the United Kingdom (UK), sponsored the GBP/USD fall, which trades at 1.2615 after hitting a high of 1.2728.
Sterling loses ground vs. the US Dollar, as Fed officials eye a longer restrictive stance as UK’s data disappoints
Two Federal Reserve officials crossed news wires as the Jackson Hole event began. Firstly, the Philadelphia Fed President Patrick Harker said the US central bank must keep its current restrictive stance while acknowledging that the economy would suffer a slowdown. After that, Boston Fed President Susan Collins expressed the Fed “may be” at a sufficiently restrictive level but kept the door open for additional hikes. She added that it’s premature to talk about rate cuts.
Data-wise, the US economic docket witnessed a slowdown in long-lasting goods, as the US Commerce Department revealed. Durable Goods Orders in July plunged by --5.2 % MoM, exceeded estimates of -4%, and trailed well below the 4.4% increase a month ago; it was the biggest decline since April 2020.
Digging into the data, excluding transportation, the reading was positive for four straight months, with orders rising 0.5% in July and up from 0.2% in June. Other data, revealed by the US Department of Labor, showed the labor market remains tight, as unemployment claims for the week ending August 19 rose by 230K, below estimates of 240K and 9K below the previous week.
Aside from this, the release of weaker Retail Sales in the UK and Wednesday’s disastrous PMI figures deepening further below the 50 lines, seen as expansion/contraction level, reignited recession fears. Hence, money market futures adjusted Bank of England’s (BoE) rate hike expectations, with most market participants expecting two additional rate hikes, as they see rates peaking at 5.75%.
Given the backdrop, the strength of the US economy can boost the Greenback’s (USD) scenario and keep the GBP/USD exchange rate downward pressured. If BoE officials give any dovish signals, expect the pair to fall towards the 200-day SMA at 1.2394.
GBP/USD Price Analysis: Technical outlook
From a technical perspective, the GBP/USD is neutral to downward biased, with the pair unable to crack the 50-day Simple Moving Average (SMA) at 1.2791, which acted as resistance. However, buyers could remain hopeful the 1.2600 level would hold unless sellers drag the major below and achieve a daily close below the latter. If the GBP/USD drops below 1.2600, the next support would be the 1.2500 mark. Conversely, the pair would remain trading within the 150 pip range of 1.2600-1.2750.

- XAG/USD slightly retreated to $24.15 after rallying more than 3% on Wednesday.
- Jackson Hole Symposium kicked off, where Chair Powell will speak on Friday and Christine Lagarde on Saturday.
- Following strong US Jobless Claims, US yields are rising, limiting the metal’s advance.
The Silver spot price XAU/USD traded with losses on Thursday, mainly driven by a stronger USD and investors taking profits after Wednesday’s rally. The US reported strong labour market data while the annual Jackson Hole Symposium kicked off at Kansas City, where Jerome Powell will deliver a speech on Friday.
The latest Jobless Claims data from the US from the second week of August underscores the labour market's resilience. The number of people filling for unemployment benefits reached 230,000, lower than the consensus estimate and the prior count of 240,000. Concurrently, the Durable Goods report for July revealed a significant softening, droping by 5%, higher than the expctations of a 4.2% decline.
Reacting to the data, the USD trades strongly on rising US yields, often seen as the cost of holding non-yielding metals. The 2-year yield rose to 5%, while the 5- and 10-year rates advanced towards 4.40% and 4.22%. In addition, a stronger USD and limits the XAG/USD advanced as the DXY index jumped to the 103.80 area.
Markets focus now shifts to Jerome Powell’s speech on Friday. As the Federal Reserve (Fed) stated, decisions will remain data-dependent so investors will pay close attention in the Fed’s Chairman stance. As for now, manufacturing and services PMIs from the US showed weakness while inflation decelerated, and the labour market still shows strength. Regarding expectations, markets still bet low odds of 35% of a 25 basis point (bps) in the November meeting, according to the CME FedWatch tool.
XAG/USD Levels to watch
As per the daily chart analysis, the XAG/USD has a bullish technical bias for the short term. The Relative Strength Index (RSI) also exhibits a negative slope above its midline while Moving Average Convergence Divergence (MACD) displays green bars. Furthermore, the pair is above the 20,100,200-day Simple Moving Averages (SMAs9, indicating a favourable position for the bulls in the bigger picture.
Support levels: $24.00 (20-day SMA), $23.70, $23.50
Resistance levels: $24.30, $24.50, $24.80
XAG/USD Daily chart
-638284980522045067.png)
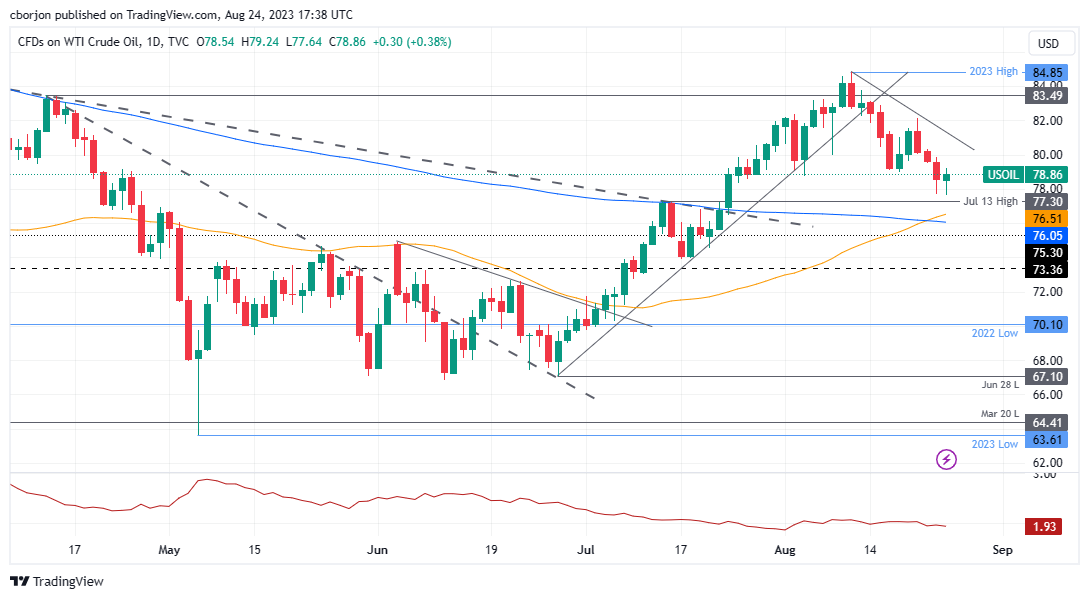
- WTI climbs to $78.80 per barrel, up 0.39%, as hawkish comments from the Fed initially dent but later fail to suppress oil prices.
- Iran announces plans to ramp up crude oil production to 3.4 million bpd by the end of September,
- The US and Venezuela discussed easing sanctions, which would increase global oil production.
Western Texas Intermediate (WTI), the US crude oil benchmark, prints a reversal, climbing to $79.00 per barrel on Thursday, as market participants turned risk-averse on Fed official’s hawkish commentary. Even though it boosted the greenback, oil holds to its earlier gains. WTI is trading at $78.89, up 0.39%.
WTI is up amidst strong US Dollar, Iran’s production plans, and the US easing sanctions on Venezuela
On Wednesday, S&P Global revealed that business activity in the Eurozone (EU), the UK, and the US deteriorated, suggesting dented oil demand for the future. Also, Fed officials led by Patrick Harker and Susan Collins at the Jackson Hole Symposium struck hawkish comments, emphasizing the fight against inflation while holding rates at current levels.
Although WTI dipped as an initial reaction, touching a daily low of $77.59, WTI bounced off those levels despite recent US Dollar strength.
In the meantime, Iran revealed that its crude oil production would reach 3.4 million barrels per day (bpd) by the end of September, as said by its oil minister, despite US sanctions still in place.
Another driver that boosted oil prices was an agreement between US officials and Venezuela to ease sanctions on the latter, allowing more US companies and countries to import their crude oil if the nation moves to free and fair presidential elections.
US crude oil inventories fell in the week to August 18, revealing stockpiles dropped 6.1 million.
Meanwhile, analysts expect Saudi Arabia to extend its 1 million crude oil production cut into October to boost global oil prices.
WTI Price Analysis: Technical outlook
US crude oil found its bottom just below the $78.00 per barrel figure, still at the expense of prices above the latter, as a golden cross in the daily chart portrays a bullish bias. However, as price action has achieved two successive lower lows, oil buyers must lift prices above the current week’s high at $82.13 so WTI can resume its uptrend and challenge the year-to-date (YTD) high of $84.85. Otherwise, further downside is expected below $78.00, with support emerging at $77.30, July 13 high.
- USD/JPY trades at 149.86, up 0.70%, as upbeat earnings from a major US tech company boost market sentiment.
- Hawkish comments from Boston and Philadelphia Fed Presidents suggest a steady rate environment, fueling USD gains.
- Upcoming Tokyo CPI data and Fed Chair Powell’s speech eyed for further direction; DXY advances 0.44% on hawkish Fed remarks.
The US Dollar (USD) recovers some ground against the Japanese Yen (JPY), after posting back-to-back days of losses, as market sentiment turned upbeat on an earnings report of a big tech US company. Nevertheless, US Federal Reserve officials remained hawkish as the waters settled, while economic data from the United States (US) was mixed. At the time of writing, the USD/JPY is trading at 149.86, gaining 0.70%.
USD/JPY gains 0.70% on Fed’s restrictive stance, despite US mixed data
After an absence of one day, Federal Reserve officials are taking the stance as the Jackson Hole Symposium commences. Recently, Boston Fed President Susan Collins commented the Fed “may be” at a place to hold rates steadily to curb inflation towards its 2% target in a “reasonable amount of time.” She said that more rate hikes are possible, and it’s premature to signal the timing of rate cuts.
Earlier, Philadelphia Fed President Patrick Harker stated the Fed must keep its restrictive stance and added the Fed has probably done enough but must hold rates at the current level. He noted that inflation must fall to pave the way for rate cuts while acknowledging an eventual economic slowdown.
Before Wall Street opened, the US Department of Commerce revealed Durable Goods Orders for July plummeted sharply from 4.4% to -5.2% MoM, exceeding estimates. However, excluding transport orders rose 0.5% MoM, above the consensus and June’s 0.2%. In other data, the US Department of Labor revealed the labor market remains tight, as shown by unemployment claims for the week ending August 19, which rose by 230K, below estimates of 240K and 9K below the previous week.
The US Dollar Index (DXY), a gauge of the buck’s value against a basket of currencies, advances 0.44%, up at 103.818, underpinned by US Treasury bond yields climbing on Fed’s Harker words. Hence, the USD/JPY extended its uptrend after bouncing off weekly lows of 144.53, as buyers reclaimed the 145.00 mark.
On the Japanese front, Tokyo’s Consumer Price Index (CPI) will be revealed on August 25 at around 00:30 GMT, with estimates of circa 2.9% on core CPI readings, which could shed some clues for USD/JPY traders.
On the US front, Fed Chair Jerome Powell’s speech will provide forward guidance regarding the last four months of the year as inflation decelerates.
USD/JPY Technical Levels
- The NZD/USD fell near the 0.5920 area, seeing more than 0.90% losses.
- The US reported strong Jobless Claims figures from the second week of August but weak Durable Goods data from July.
- The Jackson Hole Symposium kicked off, eyes on Powell’s speech on Friday.
The NZD/USD faced selling pressure on Thursday, driven by a stronger USD and higher US yields. On the Kiwi’s front, it trades as the worst performer on the session while New Zealand’s economic calendar remains empty.
On the data front, the USD reported that weekly Jobless Claims from the week ending on August 18 came in at 230,000, lower than the expected previous 240,000, pointing out that the labour market is holding firm. In addition, Durable Goods from July came in soft, dropping by 5.2%, higher than the 4% expected.
As a reaction, the 2-year yield reemerged above 5%, accompanied by the 5-year and 10-year rates making strides towards approximately 4.38% and 4.21%, while the US DXY index rose to 103.80.
Markets focus is set on Friday’s speech from Jerome Powell, where investors will look for further clues on forward guidance on the Federal Reserve's (Fed) next moves. Meanwhile, Thomas Barking sent mixed messages on Thursday, stating that the bank has “probably already done enough” and that if inflation comes down sooner, the Fed may cut rates quicker. However, Powell’s remarks probably weigh regarding the market’s expectations on the bank’s next moves and according to the CME FedWatch tool, markets still bet on nearly 35% odds of a 25 basis point (bps) hike in the November meeting.
NZD/USD Levels to watch
Observing the daily chart, the outlook tilts in favour of the bears, but they still have some work to do. The Relative Strength Index (RSI) reveals a bearish bias with a downward slope below its middle point, while the Moving Average Convergence (MACD) lays flat red bars.On the other hand, the pair is below the 20,100 and 200-day Simple Moving Averages (SMAs), indicating a challenging position for the buyers in the bigger picture, as the bears remain in command.
Support levels: 0.5900, 0.5870, 0.5850.
Resistance levels: 0.5950, 0.5980, 0.6000.
NZD/USD Daily chart
-638284906374929608.png)
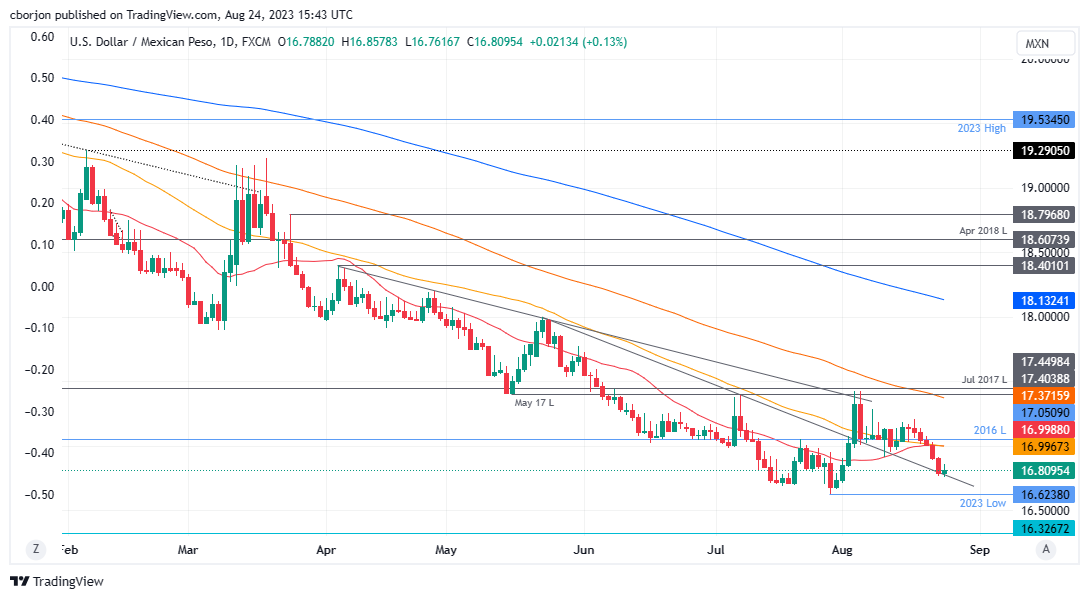
- USD/MXN down 0.12%, trading at 16.7685, as traders await Fed Chair Powell’s speech amid mixed US economic data.
- Philadelphia Fed President Harker suggests holding rates steady, causing US Treasury bond yields to climb and supporting the USD.
- Mexican inflation data above estimates; Banxico minutes reveal focus on high inflation, setting the stage for further USD/MXN downside.
USD/MXN trims some of its earlier losses as a Federal Reserve official rocks the boat. At the same time, mixed economic data from the United States (US) leaves traders focused on the Fed’s Chair Powell speech on Friday. The USD/MXN is trading at 16.7685, down 0.12%.
Philadelphia Fed President Haker advocates for restrictive stance; mixed US data and Mexican inflation in focus
Philadelphia Fed President Patrick Harker began the Fed parade ahead of the weekend. Harker said the Fed must keep its restrictive stance and added the Fed has probably done enough but must hold rates at the current level. He noted that inflation must fall to pave the way for rate cuts while acknowledging an eventual economic slowdown.
Earlier, US Durable Good Orders plunged -5.2, exceeding estimates of -4, weighed by falling Boeing orders. Excluding Transports, orders were steady at 0.5%, as in June, above 0.1% MoM forecasts by analysts. At the same time, the US Department of Labor revealed the labor market remains tight, as shown by unemployment claims for the week ending August 19, which rose by 230K, below estimates of 240K and 9K below the previous week.
The US Dollar Index (DXY), a gauge of the buck’s value against a basket of currencies, advances 0.44%, up at 103.818, underpinned by US Treasury bond yields climbing on Fed’s Harker words.
Across the border, inflation for the first half of August was above estimates monthly, at 0.32% vs. 0.28% foreseen, while annually based, edged to 4.67%, aligned with the consensus. Core inflation edged a tick lower after the Bank of Mexico (Banxico) increased rates toward 11.25%.
Recently, Banxico revealed its latest meeting minutes, which showed that inflation remains high, mentioned by all the members, while emphasizing the need to keep rates at their current level for an extended period. They said that services CPI begins to show a clear turn to the downside.
Given the backdrop, all eyes would turn to Fed Chair Powell’s speech at Jackson Hole. Hence, further USD/MXN downside is expected, as Banxico’s minutes show that its members remain focused on tackling inflation and have not given any dovish signal.
USD/MXN Price Analysis: Technical outlook
The pair remains in a downtrend after standing above the 17.0000 figure, with the USD/MXN set to retest the year-to-date (YTD( low of 16.6238. As of writing, the USD/MXN is testing a previous resistance trendline, turned support, stalling the downtrend. A break below the YTD low would expose the 16.5000 mark, followed by the October 2015 low of 16.3267.
Boston Federal Reserve President Susan Collins told Yahoo Finance on Thursday that the may be at a place where the Fed can hold the policy rate steady, as reported by Reuters.
Key takeaways
"More Fed rate hikes are possible."
"Rise in long term yields are helpful to Fed objectives."
"Hopeful Fed can bring inflation back to 2% in reasonable amount of time."
"Premature to send clear signal about timing of rate cuts."
"Haven't really seen notable slowdown in growth."
"Mindful about how an easing in inflation would affect policy stance."
"Housing is a big challenge for the economy."
Market reaction
The US Dollar Index showed no immediate reaction to these comments and was last seen rising 0.45% on a daily basis at 103.82.
GBP/USD needs to remove key support at 1.2590 to establish a top, analysts at Credit Suisse report.
Break above 1.2819 needed to ease the immediate downside bias
GBP/USD remains under pressure but continues for now at least to hold key support from the 1.2590 late June low. Whilst resistance at 1.2817/19 caps the overall risk will stay seen lower for an eventual break, which if confirmed, would then see a price top established to clear the way for a more concerted decline to test the rising 200-DMA, currently at 1.2392.
Whilst we would expect to see fresh buyers at 1.2392 at first, a break in due course would see support at the 1.2307 May low next, then the 38.2% retracement of the 2022/2023 uptrend at 1.2075.
Above 1.2819 stays seen needed to ease the immediate downside bias and threat of a top, but with a break above the recent ‘outside day’ high at 1.2997 seen needed to reassert the broader uptrend for strength back to the 1.3143 high and eventually 1.3400/14.
In an interview with CNBC on the sidelines of the Jackson Hole Symposium, "right now I think that we've probably done enough and with monetary policy in a restrictive stance" Federal Reserve Bank of Philadelphia President Patrick Harker said.
Key takeaways
"Fed must deal with inflation and is dealing with it."
"Fed will need to keep rates restrictive for a while."
"There clearly is a tightening of credit."
"Unclear how much tighter credit will impact economy."
"Not concerned about rise in market yields."
"Low income consumers are slowing down."
"We are seeing inflation coming down."
"Let the restrictive policy stance play out, should lower inflation."
"Expecting unemployment rate to rise to 4% or just above that."
"Seeing evidence labor market tightness is easing."
"Unclear how China slowdown will impact US economy."
"Next year, Fed will have inflation around 3%, growth slowing to trend."
"At this point I see the Fed holding steady this year, next year is data driven."
"Can't predict when Fed will cut rates."
Market reaction
The US Dollar Index retreated modestly from daily highs after these comments and was last seen rising 0.35% on the day at 103.72.
The USD continues to recover strongly as US Real Yields rise. Analysts at Credit Suisse see scope for further strength in the US Dollar Index (DXY).
Break above 105.88 would warn of a more sustained trend higher
With 10yr US Real yields having completed a large bearish continuation pattern and expected to rise further, this has helped the DXY rally extend for a break above key resistance at its 200-DMA and July high. This is seen to clear the way for further USD strength, with resistance seen next at 104.70 ahead of the 38.2% retracement of the 2022/2023 downtrend and YTD high from March, seen at 105.38 and 105.88 respectively. Our bias would be for 105.88 to cap to define the top of a broader range.
Above 105.88 though would instead worryingly warn of a large base for the USD and a more sustained trend higher.
Below support at 103.01 is now seen needed to ease the immediate upside bias, but with a break below 101.78/101.74 seen needed to reassert a negative tone again for a fall back to 100.55, then the 99.58/99.50 current cycle lows.
Kit Juckes, Chief Global FX Strategist at Société Générale, analyzes the FX picture.
AUD and NZD are vulnerable as yields fall and China struggles
AUD and NZD are vulnerable as yields fall and China struggles, JPY will likely stay in the current range for a while longer (but a stronger Yen still seems inevitable over time) and it may still be too soon for a Wile E Coyote moment in Sterling.
Maybe slowly buying more NOK and SEK will be the best course of action, given superattractive levels and the possibility they’ll be much stronger by this time next year.
Economists at Danske Bank still see the balance of risk skewed towards higher levels on the USD/CAD pair.
A move lower would likely require a stronger global growth backdrop
On the balance of risk, we still think it is skewed to the topside on both US economic outperformance and the USD-support stemming from global risk-off.
A move lower in the USD/CAD pair would likely require a stronger global growth backdrop than what we pencil in.
Forecast: 1.36 (1M), 1.37 (3M), 1.38 (6M), 1.39 (12M)
- EUR/USD resumes the downtrend and re-visits the 1.0810 area.
- Firm contention remains at the 200-day SMA at 1.0800.
EUR/USD quickly forgets Wednesday’s uptick and resumes the downtrend with the immediate target at recent lows near 1.0800 the figure.
This area of recent lows appears so far propped up by the critical 200-day SMA, while the loss of the latter could prompt a potential test of the May low of 1.0635 (May 31) to re-emerge on the horizon.
A drop below the 200-day SMA should keep extra losses in store for the time being.
EUR/USD daily chart
- DXY leaves behind Wednesday’s daily drop and approaches 104.00.
- Once 104.00 is cleared, the index might challenge the 104.70 zone.
DXY manages to regain balance and sets aside Wednesday’s retracement.
The index challenges once again the area of monthly peaks near the 104.00 mark, while a convincing breakout of this zone should open the door to a potential visit to the May top of 104.69 (May 31) ahead of the 2023 peak of 105.88 (March 8).
While above the key 200-day SMA, today at 103.13, the outlook for the index is expected to shift to a more constructive one.
Looking at the broader picture, a convincing breakout of the 200-day SMA should shift the outlook for the index to a more constructive one.
DXY daily chart
- USD/CAD continues to defend the 1.3500 support as the US Dollar recovers swiftly.
- The US Dollar rebounds despite weaker than anticipated Durable Goods Orders data for July.
- Weaker US preliminary PMIs and Durable Goods Orders indicate that the US economy is losing its resilience.
The USD/CAD pair recovered strongly after discovering buying interest near 1.3520 in the early New York session. The Loonie asset strengthens as the US Dollar rebounds swiftly despite downbeat United States Durable Goods Orders data for July.
US Census Bureau reported that Durable Goods Orders data for July contracted at a faster pace of 5.2% while investors anticipated contraction at a 4% pace, swinging from an expansion of 4.4% recorded for June. On Wednesday, S&P Global reported weaker preliminary PMIs for August. This indicates that firms are underutilizing their total capacity due to a bleak demand outlook.
Chris Williamson, Chief Business Economist at S&P Global Market Intelligence, said: “A near-stalling of business activity in August raises doubts over the strength of US economic growth in the third quarter. The survey shows that the service sector-led acceleration of growth in the second quarter has faded, accompanied by a further fall in factory output.”
Meanwhile, the major trigger for the US Dollar will be the Jackson Hole Symposium at which Federal Reserve (Fed) Chair Jerome Powell will guide about interest rates, inflation, and the outlook on the economy.
S&P500 opens on a positive note as investors hope that Jerome Powell will not consider further interest rate hikes as the labor market is losing resilience. The US Dollar Index resumes its upside journey and reaches near 104.00.
The Canadian Dollar comes under pressure due to declining oil prices. Weak preliminary PMIs reported by Western nations dampened the oil demand outlook. It is worth noting that Canada is the leading exporter of oil to the United States and lower oil prices impact the Canadian Dollar.
Gold is still trying to hold the $1,908/$1,892 key support cluster. Economists at Credit Suisse analyze XAU/USD technical outlook.
Weekly close below $1,892 would mark a more important top
We maintain our bias to look for key support and the 38.2% retracement of the 2022/2023 uptrend, 200-DMA and June low at $1,908/$1,892 to hold again, but with a break above the 55-DMA, now at $1,934 seen needed to ease the pressure off this support and above $1,988 to clear the way for a retest of major resistance at the $2,063/$2,075 record highs.
A weekly close below $1,892 though would be seen to mark a more important top to reinforce the longer-term sideways range, and a fall to support next at $1,810/$1,805.
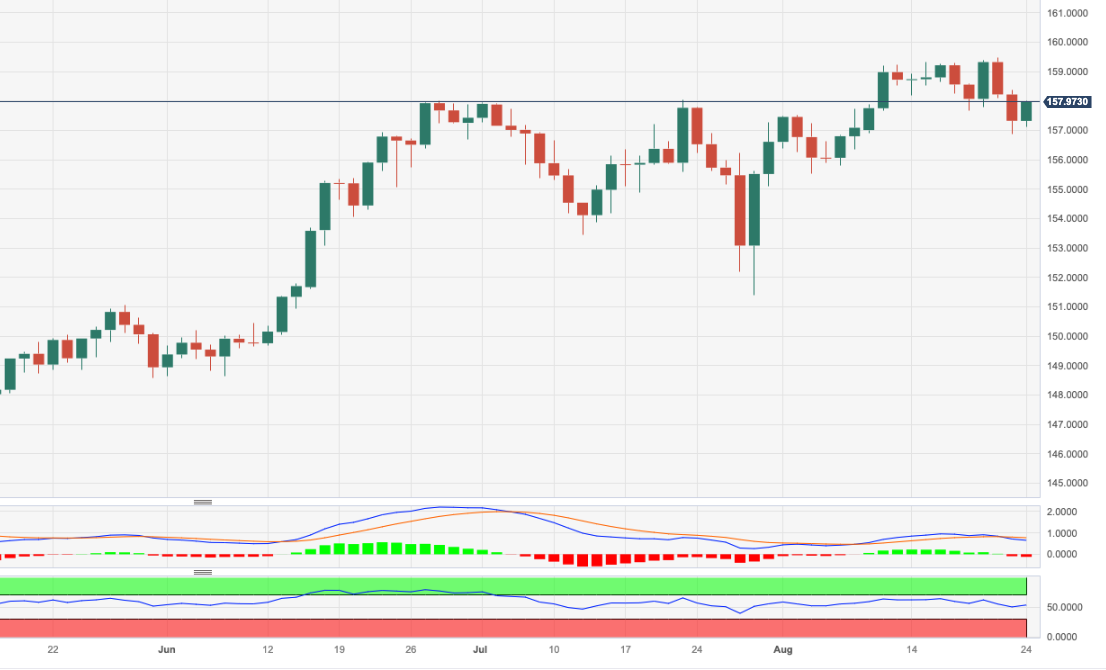
- EUR/JPY reverses part of the recent two-day decline.
- Further recovery keeps targeting the 160.00 region.
EUR/JPY regains upside traction following two consecutive daily pullbacks on Thursday.
If the rebound gathers extra impulse, the cross should challenge recent 2023 peaks near 159.50 ahead of the key round level at 160.00. The surpass of the latter should not see any resistance level of note until the 2008 high at 169.96 (July 23)
So far, the longer term positive outlook for the cross appears favoured while above the 200-day SMA, today at 147.58.
EUR/JPY daily chart
Economists at BBH remain Dollar bulls.
Stronger Dollar should continue to put downward pressure on EM FX
As bad as things may get in the US, the rest of the world looks even worse.
Dollar bears should be asking whether the Euro or Sterling looks that much better than the Dollar. China too is looking quite weak and in that regard, EM will likely remain under pressure.
Not only is China struggling to grow but because of the knock-on effects to EM growth, policymakers there are likely to cut rates sooner rather than later. Hungary, Chile, and Brazil have already cut rates and Poland is up next.
Lower EM rates combined with a hawkish Fed, higher US rates, and a stronger Dollar should continue to put downward pressure on EM FX.
EUR’s rebound from 200-Day Moving Average test fails to develop. Economists at Scotiabank analyze the pair’s technical outlook.
There is solid support for the EUR at 1.08
The EUR’s apparently strong rejection on Wednesday of the 200-DMA test has not translated into additional gains so far today. Underlying trend momentum still leans more USD-bullish here too, which is restraining EUR gains.
On the – technical – face of it though, there is solid support for the EUR at 1.08 (200-DMA at 1.0802 today).
Gains through 1.09 would give the EUR a little more upside momentum.
- Chicago Fed National Activity Index rose to 0.12 in July.
- The US Dollar Index prints daily highs above 103.70 after US economic reports.
The Federal Reserve Bank of Chicago's National Activity Index (CFNAI) rose to +0.12 in July from -0.33 in June (revised from -0.32). The index is back in positive territory after two months.
Key takeaways from the report:
“Production-related indicators contributed +0.18 to the CFNAI in July, up from –0.36 in June. Industrial production increased 1.0 percent in July after decreasing 0.8 percent in the previous month.”
“The contribution of the sales, orders, and inventories category to the CFNAI moved down to –0.05 in July from +0.02 in June.”
“Employment-related indicators contributed –0.02 to the CFNAI in July, down slightly from +0.01 in June.”
Market reaction:
The US dollar weakened after the release of data and also following Durable Goods Orders and Jobless Claims reports. As a result, the DXY (US Dollar Index) gained momentum and broke above 103.80, hitting fresh daily highs.
- AUD/USD drops sharply as US Dollar recovers ahead of Jackson Hole.
- Rising deflation risks in China are impacting the Australian Dollar.
- AUD/USD has remained sideways in a 50-pip range for the past week.
The AUD/USD pair faced selling pressure after failing to recapture the psychological resistance of 0.6500 on Thursday. The Aussie asset has dropped to near 0.6450 as risk-sensitive currencies have come under pressure ahead of the Jackson Hole Symposium.
The US Dollar Index (DXY) rebounds strongly after building a base around 103.30 as investors turn cautious about Federal Reserve (Fed) chair Jerome Powell’s commentary. Investors remain mixed about whether Jerome Powell will emphasize keeping interest rates steady for a longer period or hiking interest rates further.
Meanwhile, the Australian Dollar comes under pressure as market participants expect that the Reserve Bank of Australia (RBA) will keep the interest rate policy unchanged in September. Also, rising deflation risks in China are impacting the Australian Dollar, which is a proxy to China’s economic growth.
AUD/USD has remained sideways in a 50-pip range for the past week. Broadly, the asset is forming a Bearish Flag chart pattern on an hourly scale. The consolidation part of the aforementioned chart pattern signifies inventory distribution from institutional investors to market participants. A breakdown of the same will result in the continuation of the bearish trend.
The Aussie asset fails to sustain above the 200-period Exponential Moving Average (EMA), which indicates that investors use the pullback move for a selling opportunity.
Adding to that, the Relative Strength Index (RSI) (14) slips below 40.00, which indicates that the bearish momentum has been triggered.
Going forward, a breakdown below August 22 low at 0.6403 will expose the asset to August low at 0.6364, followed by the round-level support at 0.6300.
In an alternate scenario, a recovery move above the intraday high at 0.6490 will drive the asset toward August 9 high at 0.6571. A breach of the latter will expose the asset to August 10 high at 0.6616.
AUD/USD hourly chart
-638284772628672604.png)
- Initial Jobless Claims in the US decreased by 10K in the week ending August 19.
- Continuing Jobless Claims decline by 9K, to 1.702 million in the week ending August 12.
- US Dollar Index stays in positive territory above 103.70.
Initial Jobless Claims totaled 230,000 in the week ending August 19, the weekly data published by the US Department of Labor (DOL) showed on Thursday. It is the lowest reading in three weeks. This follows the previous week's print of 240,000 (revised from 239,000) and came in below the market expectation of 240,000.
Further details of the publication revealed “the 4-week moving average was 236,750, an increase of 2,250 from the previous week's revised average.”
Continuing claims decreased by 9K in the week ending August 12 to 1.702 million, below market expectations of 1.708 million. “The 4-week moving average was 1,697,250, an increase of 5,750 from the previous week's revised average”, the DOL further noted in its publication.
Market reaction
Alongside the Jobless Claims, the Durable Goods Orders and the Chicago Fed National Activity Index were released. The US Dollar Index rose modestly reaching fresh daily highs above 103.75.
- Durable Goods Orders in the US fell at a stronger pace than expected in July.
- US Dollar Index stays in positive territory above 103.50.
Durable Goods Orders in the US fell 5.2%, or $15.5 billion, to $285.9 billion in July, the US Census Bureau reported on Thursday. This reading followed the 4.4% increase (revised from +4.7%) recorded in June and came in worse than the market expectation for a decrease of 4%.
"Excluding transportation, new orders increased 0.5%," the press release further read. "Excluding defense, new orders decreased 5.4%. Transportation equipment, also down following four consecutive monthly increases, drove the decrease, $16.4 billion or 14.3% to $98.7 billion."
Market reaction
Despite the disappointing data, the US Dollar preserves its strength on Thursday. As of writing, the US Dollar Index was up 0.4% on the day at 103.77.
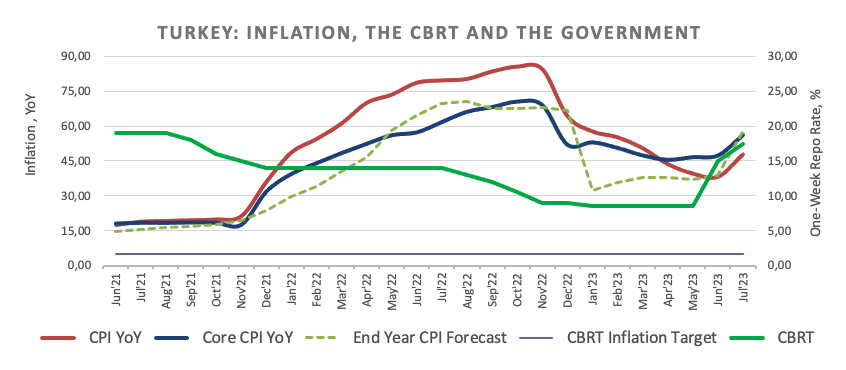
- The Turkish lira regains traction following the CBRT decision.
- USD/TRY retreats to multi-week lows near 26.3000.
- The CBRT hikes its key policy rate by 750 bps to 25.00%.
The Turkish lira gathers extra steam and drags USD/TRY to new five-week lows near 26.30 on Thursday.
USD/TRY lower on CBRT rate hike
USD/TRY reverses a positive streak in place since August 9 in response to the larger-than-expected interest rate hike by the Turkish central bank (CBRT) on Thursday.
Indeed, the CBRT caught everybody off-guard after it raised the One-Week Repo Rate by 750 bps to 25.00% vs. the 20.00% expected by the broad consensus at its event on Thursday.
The bank’s statement said the decision comes to reinforce the monetary tightening process, underpin the disinflationary pressures, and anchor inflation expectations. In addition, the CBRT still believes that disinflation will be achieved at some point next year.
USD/TRY key levels
So far, the pair is retreating 3.13% to 26.3272 and a break below 26.0325 (55-day SMA) would expose 25.8280 (monthly low July 3) and finally 23.2553 (100-day SMA). On the upside, the next hurdle comes at 27.2255 (all-time high August 24).
USD regains some ground in light trade as markets wait for Powell's comments. Economists at Scotiabank analyze Greenback’s outlook.
What does the USD need from Powell’s comments to remain better supported?
The USD is steadying after Wednesday’s reversal off the highs against the majors. The news flow is light, however, and the USD rebound evident so far today may simply reflect markets refusing to overly commit on positioning ahead of Powell’s Jackson Hole comments on Friday.
Markets are barely priced for anything more than 5.50% at the moment, let alone 6%. This perhaps gives us some sense of what the USD needs from Chairman Powell’s comments to remain better supported. Firstly, USD bulls will want to hear that September’s FOMC is ‘live’ (or perhaps get a strong hint that pricing needs to shift more towards a hike) and secondly, that rates are liable to remain restrictive for an extended period. Without some hawkish messaging lifting rates and boosting spreads, the USD may struggle to gain more ground for now.
USD/CAD saw a strong rejection of the 1.36 area on Wednesday. Economists at Scotiabank analyze the pair’s outlook.
Underlying dynamics remain USD-bullish on the trend oscillators
Spot’s reaction to Wedneday’s test of the 1.36 area (effectively a retest of trend support-turned-resistance) looks USD-negative on the face of it, with the intraday chart reflecting a big, bearish ‘shooting star’ candle on the six-hour chart. But the USD is grinding a little higher again so far today and underlying dynamics remain USD-bullish on the trend oscillators.
The USD is overbought but a stronger move lower is needed to signal increased downside risks at this point.
Resistance is 1.3555/1.3565 and 1.3600/1.3610. Support is 1.3495/1.3505.
Senior Economist at UOB Group Alvin Liew reviews the latest release of inflation figures in Singapore.
Key Takeaways
Singapore’s headline CPI inflation eased further to 4.1% y/y (-0.2% m/m NSA) in Jul, from 4.5% y/y (0.5% m/m NSA) in Jun, coming off in line with our expectations (UOB est 4.1% y/y) but slightly missing market expectations (Bloomberg est 4.2%). Core inflation (which exclude private road transport and accommodation) also eased by a similar magnitude, coming in at 3.8% y/y (0.2% m/m) in Jul, from 4.2% y/y in Jun and exactly in line with Bloomberg’s median estimate, but slightly above ours (UOB est: 3.7%). This was the lowest y/y headline inflation print since Jan 2022 (4.0% y/y) and the lowest core inflation since Mar 2022 (3.6% y/y).
Our Inflation Outlook – The moderation in the pace of headline and core inflation remained in line with our projections for the latest month. As such, we remain comfortable for our current forecasts; headline inflation to average 4.7% while core inflation to average 4.0% in 2023. Excluding the 2023 GST impact, we expect headline inflation to average 3.7% and core inflation to average 3.0% in 2023, both still above the “standard” 2% objective.
GBP/USD slips back in range but strong base in low 1.26s remains intact, economists at Scotiabank report.
Short-term price action is GBP-bullish
Short-term price action is GBP-bullish after spot made another strong recovery from the low 1.26 zone where Cable has found support since the start of the month.
A rejection of the range base should tilt risks towards a pushback to the range ceiling (1.2820) at least in the short run.
GBP gains have faded a little so far today but losses should find support on dips to the mid-1.26 zone intraday. Major support remains 1.2620.
- US Dollar price action has rallied 1.20% in EUR/USD over the past two days.
- Traders will be looking for any headlines in the run-up to the Jackson Hole Symposium later this Thursday.
- US Dollar Index strength got sponged over after weak US PMI numbers.
The US Dollar (USD) is back to square one against most peers and trades around the opening price of Monday in plenty of G10 crosses. The whipsaw moves these past few days must have hurt both parties that were trying to take positions before the main event taking place later this Thursday and Friday with the annual Federal Reserve (Fed) Jackson Hole Symposium. The crème-de-la-crème of central bankers from developed countries will be convening to discuss and evaluate what to do next with these elevated rates and inflation not yet being near its projected target.
A big slew of data arrives Thursday with the risk that after the contractionary numbers from the latest US PMI on Wednesday, the Durable Goods data this afternoon could dampen the recent positive tone even more and dent economic confidence in the US. Once at 14:00 GMT, the Jackson Hole Symposium is set to start. Thus be on the lookout for any comment from non-Fed central bankers making statements that could trigger a substantial move in other currencies against the Greenback. Traders will be bracing for an eventful 48 hours to come.
Daily digest: US Dollar will be all over the place
- All eyes on Jackson Hole headlines around 14:00 GMT with several top central bankers of developed countries lined up to make comments and possibly hint at crucial changes in their monetary policy. Expect any fallout not only to be limited to the Greenback, but to other currencies as well.
- Before the Fed Symposium kicks off, at 12:30 GMT a big batch of data gets released.The most important is the preliminary US Durable Goods orders for July. Expectations are: Ex Transportation to head from 0.5% to 0.2%; Ex. Defense previous print was 6%, no projection pencilled in; and the overall Goods Orders index to head from 4.6% to -4%.
- And as if that is not enough, the weekly jobless data will be released as well at 12:30 GMT with initial claims to head higher from 239K to 240K. The continuing claims are expected to head from 1.716M to 1.708M.
- The data set for this Thursday is expected to close off with the Kansas Fed Manufacturing Activity remaining steady from -11 to -10.
- This Thursday the US Treasury is heading to auction a 4-week bill and a 30-year TIPS issuance.
- The BRICS convention invites Saudi Arabia and other countries to join the bloc.
- Equities are up across the board after Nvidia earnings substantially beat expectations after the US closing bell on Wednesday. The Japanese Topix index is up 0.40% at the close, Hong Kong’s Hang Seng index is up nearly 2%. In Europe stock markets are in the green overall near 1%. In the US futures the Nasdaq is leading the charge, up 1.2%.
- The CME Group FedWatch Tool shows that markets are pricing in an 86.5% chance that the Federal Reserve will keep interest rates unchanged at its meeting in September.
- The benchmark 10-year US Treasury bond yield trades at 4.19% after touching a new yearly high on Thursday. The bond market will be very sensitive to any news on Thursday and Friday at the Jackson Hole Symposium. The whole US yield curve could move up or down depending on the speech from Fed Chair Jerome Powell.
US Dollar Index technical analysis: Planting a flag
The US Dollar almost had its hand around that 104-handle in the US Dollar Index (DXY) before taking the contraction in US PMI numbers on the chin. The DXY plunged like a failed jelly cake and closed out Wednesday in the red. Though US Dollar bears should not flaunt their success just yet, DXY bulls are nicely consolidating their positions above the 200-day Simple Moving Average (SMA) before the next attempt to reach 104.
On the upside, as you could have guessed from the above paragraph, 104.00 is the first nearby target. The high of Friday at 103.68 is vital and needs to get a daily close above it in order for the DXY to eke out more monthly gains. Should this US Dollar strength persist for the last part of this year, May’s peak at 104.70 could become the reality again.
On the downside, several floors are likely to prevent a steep decline in the DXY. The first one is the 200-day Simple Moving Average (SMA) at 103.16, which already broke on Monday and Tuesday, though it held on the implosion Wednesday. Passing below the 103.00 figure, some room opens up for a further drop. However, around 102.38 both the 55-day and the 100-day SMAs await to backstop the pairs.
US Dollar FAQs
What is the US Dollar?
The US Dollar (USD) is the official currency of the United States of America, and the ‘de facto’ currency of a significant number of other countries where it is found in circulation alongside local notes. It is the most heavily traded currency in the world, accounting for over 88% of all global foreign exchange turnover, or an average of $6.6 trillion in transactions per day, according to data from 2022.
Following the second world war, the USD took over from the British Pound as the world’s reserve currency. For most of its history, the US Dollar was backed by Gold, until the Bretton Woods Agreement in 1971 when the Gold Standard went away.
How do the decisions of the Federal Reserve impact the US Dollar?
The most important single factor impacting on the value of the US Dollar is monetary policy, which is shaped by the Federal Reserve (Fed). The Fed has two mandates: to achieve price stability (control inflation) and foster full employment. Its primary tool to achieve these two goals is by adjusting interest rates.
When prices are rising too quickly and inflation is above the Fed’s 2% target, the Fed will raise rates, which helps the USD value. When inflation falls below 2% or the Unemployment Rate is too high, the Fed may lower interest rates, which weighs on the Greenback.
What is Quantitative Easing and how does it influence the US Dollar?
In extreme situations, the Federal Reserve can also print more Dollars and enact quantitative easing (QE). QE is the process by which the Fed substantially increases the flow of credit in a stuck financial system.
It is a non-standard policy measure used when credit has dried up because banks will not lend to each other (out of the fear of counterparty default). It is a last resort when simply lowering interest rates is unlikely to achieve the necessary result. It was the Fed’s weapon of choice to combat the credit crunch that occurred during the Great Financial Crisis in 2008. It involves the Fed printing more Dollars and using them to buy US government bonds predominantly from financial institutions. QE usually leads to a weaker US Dollar.
What is Quantitative Tightening and how does it influence the US Dollar?
Quantitative tightening (QT) is the reverse process whereby the Federal Reserve stops buying bonds from financial institutions and does not reinvest the principal from the bonds it holds maturing in new purchases. It is usually positive for the US Dollar.
Insofar as the market is positioned long, in the view of economists at Rabobank, the EUR is looking vulnerable.
The market should be questioning if it remains too long EUR
One of the more shocking elements of Wednesday’s weak European PMI data was the softness in the services indices.
The implication of Wednesday’s data is that the services sector could be losing its buoyancy. If this is borne out by other data releases, there is much less reason to expect further rate rises from the ECB. Under this scenario, the market should be questioning if it remains too long EUR.
- Natural Gas is down this week and flirts with a break below $2.62.
- The US Dollar is in choppy trading as headlines from Jackson Hole, BRICS hit markets.
- Technical support at $x.xx is hanging by a thread.
Natural Gas price is testing the lower end of a technical ascending trend channel on the daily chart which started in late April. Although there are some risk for a substantial uptick in Gas prices, receding risks of a shutdown in Australia’s LNG terminals take away any upward pressures. Adding to that, the recent setback in US Purchasing Manager Index (PMI) numbers – which pointed to a contraction in activity – means less demand ahead from the US.
The US Dollar (USD), in the meantime, is facing one of its most volatile days of the year as plenty of headlines came out of the BRICS meeting. The objective of the meeting is to form a new trade block among non-G10 countries and look into dedollarization. Moreover, the Jackson Hole Symposium starts this Thursday, with Federal Reserve (Fed) Chairman Jerome Powell speaking on Friday. With Powell and other important central bankers ready to signal a message to the markets, a spike in volatility is a given.
At the time of writing, Natural Gas is trading at $2.622 per MMBtu.
Natural Gas news and market movers
- The weekly Natural Gas Storage numbers from the Energy Information Agency (EIA) are due to come out at 14:30 GMT. A small decline is expected, from 35B to 33B.
- Israel approved increasing natural gas exports to Egypt.
- European gas storage levels keep increasing and are at 91.62%, firmly ahead of target.
- European gas futures sink 10% on the back of the Australian workers' possible signing of a wage agreement.
- Australian LNG workers are opening up in favor of the Chevron revamped offer of higher wages and benefits after unions voted in favor of the new offer on the table.
- Tropical Depression Franklin did not cause any structural damage to the Texas bay area and gas production and supply will be quickly back up and running to normal levels.
- The annual Jackson Hole Symposium will be the focal point for the week. In the event, the US Federal Reserve tends to signal a change in its monetary policy going forward.
Natural Gas Technical Analysis: support strong enough?
Natural Gas is dropping like a stone after briefly hitting $2.80 on the topside earlier this week. From a pure technical point of view, the ascending trend channel is still holding and gas prices could still bounce higher. Once the lower trend line gives way, the risk of a sharp decline could be in hand. With Europe far ahead of its gas storage target and no real bottlenecks reported, the slowdown in economic activity across the globe could cause gas prices to fall toward $2.40.
On the upside, $3 is still the level to watch once Natural Gas prices can reclaim $2.8. Should prices recover, look for a close above $2.935, the high of August 15, in order to confirm that demand is picking up again. More upside toward $3 and $3.065 (high of August 9) would be targets or levels to watch.
On the downside, the trend channel is doing its work as the 55-day Simple Moving Average (SMA) at $2.67 has been firmly broken. In case more downside pressure builds, look for $2.54, which aligns with the 100-day SMA and is the last line of defence for Natural Gas prices to tumble.
-638284672378456630.png)
XNG/USD (Daily Chart)
Natural Gas FAQs
What fundamental factors drive the price of Natural Gas?
Supply and demand dynamics are a key factor influencing Natural Gas prices, and are themselves influenced by global economic growth, industrial activity, population growth, production levels, and inventories. The weather impacts Natural Gas prices because more Gas is used during cold winters and hot summers for heating and cooling. Competition from other energy sources impacts prices as consumers may switch to cheaper sources. Geopolitical events are factors as exemplified by the war in Ukraine. Government policies relating to extraction, transportation, and environmental issues also impact prices.
What are the main macroeconomic releases that impact on Natural Gas Prices?
The main economic release influencing Natural Gas prices is the weekly inventory bulletin from the Energy Information Administration (EIA), a US government agency that produces US gas market data. The EIA Gas bulletin usually comes out on Thursday at 14:30 GMT, a day after the EIA publishes its weekly Oil bulletin. Economic data from large consumers of Natural Gas can impact supply and demand, the largest of which include China, Germany and Japan. Natural Gas is primarily priced and traded in US Dollars, thus economic releases impacting the US Dollar are also factors.
How does the US Dollar influence Natural Gas prices?
The US Dollar is the world’s reserve currency and most commodities, including Natural Gas are priced and traded on international markets in US Dollars. As such, the value of the US Dollar is a factor in the price of Natural Gas, because if the Dollar strengthens it means less Dollars are required to buy the same volume of Gas (the price falls), and vice versa if USD strengthens.
Economists at Credit Suisse view the bounce in the S&P 500 Index as temporary.
Resistance at 4,490 capping on a closing basis can keep the immediate risk lower
With weekly MACD momentum having crossed lower though and with 10yr US Real Yields expected to rise further we view this as a temporary and corrective rebound ahead of a retest and then we think break below 4,302.
Below 4,302 would then be seen to open the door to the next meaningful support cluster seen at the 38.2% retracement of the entire 2022/2023 uptrend, key rising 200-DMA and January high at 4,195/4,136. With the uptrend from the March 2020 low seen not far below at 4,102, we would look for a better floor to ideally be found here.
Resistance at 4,490 capping on a closing basis can keep the immediate risk lower. Above can see a retest of the 4,607/4,637 key resistance, which we would look to cap again.
Economists at TD Securities do not expect the USD/KRW pair to establish above its year-to-date highs at 1,345.
China's growing economic troubles will weigh on Korea
China's growing economic troubles will weigh on Korea and add to greater uncertainty over its growth outlook.
USD/KRW closed above its YTD high at 1,345 but didn’t manage to push higher given signs of exhaustion in the USD based on momentum indicators.
We still remain bearish on the USD in the 2H and don't expect USD/KRW to revisit its YTD high again but prefer to take a nimble view given choppy price action amidst the summer season.
The US Dollar Index is trading close to 104. What are the chances of a broader turn lower in the USD from here? Shaun Osborne, Chief FX Strategist at Scotiabank, analyzes Greenback’s outlook.
Macro and policy factors have edged back in the USD’s favour
Macro and policy factors have edged back in the USD’s favour. But some (or a lot) of that is already priced in and longer-run price trends remain generally USD-bearish after the DXY peak and reversal in 2022.
The bear trend has stalled but it has not yet shown clear signs of turning bullish. The US economic outlook is not totally without risk.
DXY gains could perhaps extend a bit more towards 106 from current levels but the USD is already looking ‘rich’ against some currencies and gains would be a stretch in valuation terms without some significant changes in the underlying economic outlook.
- USD/CHF recovers strongly as US Dollar rebounds ahead of Jackson Hole.
- Investors hope that Jerome Powell will not discuss further policy tightening.
- USD index rebounds despite weak PMI figures as other G7 economies have also recorded vulnerable PMI data.
The USD/CHF pair discovers stellar buying interest near a weekly low around 0.8760 and climbs above the round-level resistance of 0.8800 in the European session. The Swiss Franc asset rallies as the US Dollar rebounds ahead of the Jackson Hole Symposium.
S&P500 futures generate stellar gains in London, carry-forwarded buying spree of Wednesday as investors hope that Federal Reserve (Fed) Chair Jerome Powell will not discuss about further policy-tightening. Meanwhile, 10-year US Treasury yields rebounded to near 4.20% after a heavy decline.
The US Dollar Index comes out of the consolidation formed around 103.30 and moves above 103.60. The USD Index witnessed selling pressure on Wednesday after S&P Global reported poor preliminary PMIs for August.
Investors should note that the USD index rebounds despite weak PMI figures as other G7 economies have also recorded vulnerable economic activity data. The scale of weakness in US PMIs is lower than PMI numbers posted by other developed nations, which is expected to keep the US Dollar in the driving seat against other currencies.
Meanwhile, hopes of more interest rates from the Fed have faded but rates are expected to remain elevated for a longer period. Going forward, the US Durable Goods Orders data for July will be keenly watched, which will be published at 12:30 GMT.
The Swiss Franc front comes under pressure as investors remain mixed about the monetary policy from the Swiss National Bank (SNB), which will be announced on September 21. Swiss inflation has come down below 2%, which could allow the SNB to keep interest rates unchanged and assess the impact of already tightened monetary policy.
The "music" in the FX market has faded a bit. But in the view of Ulrich Leuchtmann, Head of FX and Commodity Research at Commerzbank, there is not an exceptionally pronounced summer lull in the FX market.
Summer lull in the FX market?
I have calculated for you the fluctuation intensity of all currency pairs traded in sufficient volume (weighted by their share in foreign exchange trading from the last Triennial Survey). It has never been unusually low this summer. In fact, it has been on the rise since early August. There is no sign of a summer lull.
Just because things were quite volatile last summer, we shouldn't use that as a benchmark. Apart from exceptional events (such as the outbreak of the pandemic), exchange rate volatility tends to be particularly high only when there is a high degree of uncertainty about the path of nominal and real interest rates and when major reassessments are required. That was the case last year. But now that the interest rate cycles are coming to an end, or have come to an end, the ‘music’ in the FX market has faded a bit.
EUR/USD holds ground above 1.0850. However, risks are tilted to the downside, economists at MUFG Bank report.
ECB expected to pause their hiking cycle at the September policy meeting
Unless there is significant upside surprise for core inflation in August, we would expect market participants to remain less confident that the ECB will hike again in September.
The Eurozone rate market is currently pricing in around 14 bps of hikes for September implying that one more hike still judged as more likely than not right now. A decision by the ECB to pause their hiking cycle next month therefore still poses some downside risk for Eurozone yields and the Euro in the month ahead.
French Finance Minister Bruno Le Maire offers her view on the inflation outlook during her appearance this Thursday.
Key takeaways
We will keep lowering taxes for households and businesses.
We will stick to our fiscal policy.
Fight against inflation is an immediate priority.
Inflation has started to slow as we predicted.
Will meet with retailers and industrial food producers next week to address cost of living issues.
We will accelerate process of reducing France's debt, which includes difficult decisions.
State must show good example by reducing public spending.
I confirm we will end gas, electricity price caps.
Market reaction
The Euro is trading on the defensive amid a broad rebound in the US Dollar. EUR/USD is dropping 0.07% on the day to trade at 1.0851, as of writing.
- Gold price recovers sharply, supported by Greenback’s correction as the US economy appears to lose resilience.
- US firms start to operate at lower capacity in line with a deteriorating demand environment.
- Jerome Powell at Jackson Hole might outline the benefits of higher interest rates for a longer period.
Gold price (XAU/USD) recovered confidently as the US Dollar and Treasury yields faced selling pressure after S&P Global reported weak preliminary PMI data for August. Lower factory activity and bleak service sector growth raise concerns over the resilience of the US economy and strengthen hopes of a neutral commentary from Federal Reserve (Fed) Chair Jerome Powell at the Jackson Hole Symposium.
Investors remain worried about the financials of US firms as rising interest rates and higher inflationary pressures force them to scale down their operating capacity in accordance with a deteriorating demand environment. If this situation persists, labor market conditions are likely to deteriorate.
Daily Digest Market Movers: Gold price capitalizes on lower US Yields
- Gold price continues its winning streak on Thursday as the US Dollar remains subdued and Treasury yields edged down ahead of the Jackson Hole Symposium.
- The precious metal strengthens as preliminary US PMI data for August released by S&P Global on Wednesday indicated that the economy is losing its resilience.
- The preliminary Manufacturing PMI came in at 47.0, underperforming expectations of 49.3 and July’s reading of 49.0. The Services PMI decreased to 51.0 against estimates of 52.2 and the former release of 52.3.
- Weak PMI figures signal the hit of tight monetary policy by the Fed on the economy.
- Chris Williamson, Chief Business Economist at S&P Global Market Intelligence, said: “A near-stalling of business activity in August raises doubts over the strength of US economic growth in the third quarter. The survey shows that the service sector-led acceleration of growth in the second quarter has faded, accompanied by a further fall in factory output.”
- The US central bank has raised interest rates aggressively to 5.25%-5.50% in a war against stubborn inflation. Inflation has come significantly lower to 3.2%, but investors are worried about how the Fed will reach the 2% desired rate as price pressures persist.
- Meanwhile, investors will focus on the commentary from Fed Chair Jerome Powell at the Jackson Hole Symposium.
- Jerome Powell is expected to underpin the need to keep interest rates higher for a longer period rather than opting for further tightening of the monetary policy.
- In July’s monetary policy meeting, Powell commented that more hikes were on the cards if economic data remained encouraging.
- Any comment about rate cuts by Powell at Jackson Hole will improve the risk-taking ability of market participants.
- Apart from the interest-rate guidance, the outlook on inflation and the US economy will be keenly watched.
- The US Dollar Index remains rangebound above 103.00 on Thursday after a sell-off move. On the economic data front, Durable Goods Orders for July will be published at 12:30 GMT. Orders are seen contracting by 4.0%, swinging from the 4.6% increase recorded in June.
- The 10-year US Treasury yields extended their correction to 4.19% after the PMI data suggested that the US economy is losing its resilience.
- Contrary to that, St. Louis Fed President James Bullard said the US economy faces risks of stronger growth. This could elevate the need for more interest-rate increases from the central bank to keep up the fight against inflation.
Technical Analysis: Gold price extends four-day winning spell
Gold price extends its four-day winning streak, supported by a correction in the US Dollar and Treasury yields as the PMI data prompted investors to question the resilience of the US economy. The recovery move in the precious metal pushes it above the 200-day Exponential Moving Average (EMA), suggesting that the long-term trend is turning bullish again. The yellow metal also climbs above the 20-day EMA but a closing above the same is highly required to keep the upside momentum.
Fed FAQs
What does the Federal Reserve do, how does it impact the US Dollar?
Monetary policy in the US is shaped by the Federal Reserve (Fed). The Fed has two mandates: to achieve price stability and foster full employment. Its primary tool to achieve these goals is by adjusting interest rates.
When prices are rising too quickly and inflation is above the Fed’s 2% target, it raises interest rates, increasing borrowing costs throughout the economy. This results in a stronger US Dollar (USD) as it makes the US a more attractive place for international investors to park their money.
When inflation falls below 2% or the Unemployment Rate is too high, the Fed may lower interest rates to encourage borrowing, which weighs on the Greenback.
How often does the Fed hold monetary policy meetings?
The Federal Reserve (Fed) holds eight policy meetings a year, where the Federal Open Market Committee (FOMC) assesses economic conditions and makes monetary policy decisions.
The FOMC is attended by twelve Fed officials – the seven members of the Board of Governors, the president of the Federal Reserve Bank of New York, and four of the remaining eleven regional Reserve Bank presidents, who serve one-year terms on a rotating basis.
What is Quantitative Easing (QE) and how does it impact USD?
In extreme situations, the Federal Reserve may resort to a policy named Quantitative Easing (QE). QE is the process by which the Fed substantially increases the flow of credit in a stuck financial system.
It is a non-standard policy measure used during crises or when inflation is extremely low. It was the Fed’s weapon of choice during the Great Financial Crisis in 2008. It involves the Fed printing more Dollars and using them to buy high grade bonds from financial institutions. QE usually weakens the US Dollar.
What is Quantitative Tightening (QT) and how does it impact the US Dollar?
Quantitative tightening (QT) is the reverse process of QE, whereby the Federal Reserve stops buying bonds from financial institutions and does not reinvest the principal from the bonds it holds maturing, to purchase new bonds. It is usually positive for the value of the US Dollar.
On US Commerce Secretary Gina Raimondo's visit to China, the Chinese Commerce Ministry said in a statement on Thursday, “China will state its stance on economic and trade matters of concern.”
“We will push financial institutions to expand credit to businesses,” the Ministry said.
China’s Commerce Ministry also called on the US to cancel potential arms sales to Taiwan.
Market reaction
AUD/USD fails to find any inspiration from the above headlines, currently trading at 0.6450, down 0.39% on the day.
EUR/CHF has experienced a gradual decline after the retest of a multi-year trend line in June. Economists at Société Générale analyze the pair’s outlook.
0.9600 must be overcome to affirm a meaningful up-move
EUR/CHF has drifted towards projections of 0.9515 which could be an interim support. An initial bounce can’t be ruled out however high achieved earlier this week near 0.9600 must be overcome to affirm a meaningful up-move.
Failure to defend 0.9515 can extend the down move towards 0.9455 and perhaps even towards last year’s low at 0.9400.
FX option expiries for Aug 24 NY cut at 10:00 Eastern Time, via DTCC, can be found below.
- EUR/USD: EUR amounts
- 1.0750 830m
- 1.0775 448m
- 1.0800 1b
- 1.0820 1.3b
- 1.0850 1.5b
- 1.0900 2b
- 1.0950 1.2b
- 1.1000 1.4b
- GBP/USD: GBP amounts
- 1.2725 472m
- 1.2800 434m
- 1.2840 352m
- USD/JPY: USD amounts
- 144.00 1.2b
- 144.50 725m
- 145.00 2.4b
- 146.00 2.1b
- 146.50 511m
USD/CHF: USD amounts
- 0.8570 1.2b
- 0.8700 713m
- 0.8950 388m
- AUD/USD: AUD amounts
- 0.6350 440m
- 0.6400 336m
- 0.6550 341m
- USD/CAD: USD amounts
- 1.3465 795m
- EUR/GBP: EUR amounts
- 0.8625 788m
The major foreign exchange rates were more volatile on Wednesday but have since stabilized during the Asian trading session ahead of Jackson Hole. Economists at MUFG Bank analyze USD outlook.
Weak PMI surveys cast doubts on need for further hikes
The US composite PMI declined by 1.6 points to 50.4 in August. While it remains higher than in the Eurozone and the UK, it is more consistent with weaker growth.
We still expect the Fed to leave rates on hold at the September FOMC meeting encouraged by slowing inflation even as the US economy has shown more resilience recently.
The US Dollar should continue to derive more support in near term from more evidence of economic weakness outside of the US in China and Europe, and from the recent yield spread movements in favour of the US.
- GBP/JPY seesaws between tepid gains/minor losses through the early European session.
- Bets for a lower BoE peak rate undermine the GBP and act as a headwind for the cross.
- Recession risks benefit the JPY’s relative safe-haven status and contribute to capping.
The GBP/JPY cross struggles to capitalize on its modest intraday recovery gains on Thursday, though manages to hold in positive territory through the first half of the European session. Spot prices currently trade around mid-184.00s and remain well within the striking distance of a one-and-half-week low touched on Wednesday.
The British Pound (GBP) continues with its relative underperformance in the wake of expectations for a lower Bank of England (BoE) peak rate, which, in turn, acts as a headwind for the GBP/JPY cross. In fact, market participants now seem convinced that the UK central bank will pause its rate-hiking cycle after one more 25 bps lift-off in September. The bets were lifted by the disappointing UK PMI prints on Wednesday, which revived fears about an impending recession in the UK.
Adding to this, worries about a deeper economic downturn continue to lend some support to the safe-haven Japanese Yen (JPY) and further contribute to capping the upside for the GBP/JPY cross. That said, the optimism over US Secretary of Commerce Gina Raimondo's visit to China on August 27-30 might hold back traders from placing aggressive bullish bets around the JPY, amid receding fears of an imminent intervention by authorities, and should help limit the downside for the cross.
In fact, Atsushi Takeuchi, who was head of the Bank of Japan's (BoJ) foreign exchange division in 2010-2012, said this week that Japan will forgo intervening in the market unless the Yen plunges past 150 against the US Dollar (USD). Apart from this, a more dovish stance adopted by the BoJ warrants some caution before placing aggressive bearish bets around the GBP/JPY cross and positioning for an extension of this week's retracement slide from the highest level since November 2015.
There isn't any relevant market-moving economic data due for release from the UK on Thursday, leaving spot prices at the mercy of the broader risk sentiment and safe-haven demand. The focus, however, will be on the Tokyo Core CPI on Friday and the crucial Jackson Hole Symposium, where comments by central banks should infuse significant volatility in the markets and provide some meaningful impetus to the GBP/JPY cross.
Technical levels to watch
EUR/GBP briefly dipped under 0.8500 on the soft eurozone PMI releases only to surge to 0.8565 on the soft UK services PMI release. Economists at ING analyze the pair’s outlook.
Short-term rates remain the key driver
The soft UK data took a large 15 bps out of pricing for the Bank of England (BoE) tightening cycle. We still think that the BoE will not deliver on the 60 bps of tightening still priced by the markets and that EUR/GBP can later this year move back to the 0.87 area.
The only UK data of note today is the August CBI Retail Sales numbers and we suspect EUR/GBP continues to trade a 0.8500-0.8550 range, while Cable is quite steady near 1.2700 too.
- EUR/GBP trades higher on the back of disappointing UK PMI data.
- Soft Eurozone PMI could be capping the gains of the pair.
- Investors await the speech from ECB’s Lagarde, seeking clues about the inflation scenario.
EUR/GBP trades higher around 0.8550 during the early trading hours in the European session on Thursday. The downbeat economic data from the United Kingdom (UK) released on Wednesday, reinforced the pair. As said, the preliminary S&P Global/CIPS Composite PMI (Aug) declined to 47.9 from the previous report of 50.8, weaker than the expectation of 50.3. It is noteworthy, that the index fell below 50 for the first time since January.
On the other hand, soft PMI data from the Eurozone and Germany could be capping the gains of the EUR/GBP pair. This comes amid a cautious market sentiment, as investors might seek further indications concerning the inflation outlook within the Eurozone.
Eurozone’s preliminary HCOB Composite PMI for August reported a decline of 47, against the expectation of 48.5 from the previous 48.6. In the meantime, Germany’s Composite PMI reduced to 44.7, lower than the market consensus of 48.3, which was 48.5 in July.
Investors had already priced in the lower probability of an interest rate hike in the September meeting by the European Central Bank (ECB), given the moderate GDP and inflation figures released the previous week. However, the EUR/GBP strengthened due to the disappointing UK economic data, which reduced the likelihood of the monetary policy tightening by the Bank of England (BoE).
ECB President Christine Lagarde’s speech would be the focal point for Investors on Friday during the Jackson Hole annual symposium, which may provide insights into the financial and economic situations. Market participants will also likely monitor the UK GfK Consumer Confidence and Eurozone’s Gross Domestic Product (GDP) for August, seeking further cues on inflation scenarios in both economies.
Economists Société Générale analyze USD/MXN outlook ahead of Mexican first half-month inflation.
Mid-month CPI data is set to show further deceleration
The mid-month CPI data for Mexico is set to show further deceleration in the headline inflation to 4.61% from 4.78% and in core to 6.24% from 6.52%. The minutes of the recent Banxico meeting will also be in the spotlight for rate guidance.
USD/MXN returned decisively below 17.00 and a retest of late-July lows of 16.62 is not ruled out.
Here is what you need to know on Thursday, August 24:
Risk flows continue to drive the action in financial markets early Thursday and the US Dollar Index consolidates Wednesday's losses near 103.50. July Durable Goods Orders and weekly Initial Jobless Claims data from the US will be looked upon for fresh impetus in the early American session. The annual Jackson Hole Symposium will also get underway later in the day. Although there are no scheduled speeches at the event on Thursday, central bank officials could give interviews on the sidelines.
Disappointing PMI data releases from the EU, the UK and the US caused global bond yields to turn south on Wednesday. The benchmark 10-year US Treasury bond yield declined 3% and weighed on the USD. Meanwhile, Wall Street's main indexes rallied after the opening bell midweek, led by strong gains in technology shares. At the time of press, Nasdaq Futures were up more than 1% on the day, suggesting that the rally in tech shares are likely to continue.
US Dollar price today
The table below shows the percentage change of US Dollar (USD) against listed major currencies today. US Dollar was the weakest against the Swiss Franc.
| USD | EUR | GBP | CAD | AUD | JPY | NZD | CHF | |
| USD | -0.07% | -0.01% | -0.06% | 0.06% | 0.28% | 0.13% | -0.14% | |
| EUR | 0.03% | 0.03% | -0.02% | 0.10% | 0.32% | 0.20% | -0.10% | |
| GBP | 0.01% | -0.06% | -0.04% | 0.05% | 0.29% | 0.19% | -0.15% | |
| CAD | 0.04% | 0.01% | 0.04% | 0.14% | 0.32% | 0.22% | -0.08% | |
| AUD | -0.05% | -0.10% | -0.05% | -0.10% | 0.24% | 0.13% | -0.16% | |
| JPY | -0.27% | -0.33% | -0.30% | -0.33% | -0.20% | -0.12% | -0.43% | |
| NZD | -0.16% | -0.21% | -0.17% | -0.24% | -0.10% | 0.14% | -0.31% | |
| CHF | 0.13% | 0.05% | 0.12% | 0.06% | 0.20% | 0.41% | 0.30% |
The heat map shows percentage changes of major currencies against each other. The base currency is picked from the left column, while the quote currency is picked from the top row. For example, if you pick the Euro from the left column and move along the horizontal line to the Japanese Yen, the percentage change displayed in the box will represent EUR (base)/JPY (quote).
EUR/USD dropped to its weakest level in over two months near 1.0800 in the European session on Wednesday but managed to stage a rebound later in the day amid renewed USD weakness. The pair holds steady slightly above 1.0850 early Thursday.
GBP/USD came under heavy bearish pressure following the dismal PMI reading and fell toward 1.2600 on Wednesday. Similarly to EUR/USD, the pair erased its losses later in the day. In the European morning, GBP/USD fluctuates in a tight channel above 1.2700.
Following Wednesday's sharp decline, USD/JPY gathered recovery momentum and climbed above 145.00 early Thursday.
Gold price benefited from retreating global yields and registered its biggest one-day gain in a month on Wednesday. XAU/USD holds its ground early Monday and trades in positive territory near $1,920.
Bitcoin gained more than 1% on Wednesday, supported by risk flows. BTC/USD, however, finds it difficult to extend its recovery and trades near $26,500 in the European session. Ethereum rose nearly 3% on Wednesday but lost its traction before testing $1,700.
Economist Enrico Tanuwidjaja and Junior Economist Agus Santoso at UOB Group assess the latest Current Account results in Indonesia.
Key Takeaways
Indonesia’s 2Q23 Current Account (CA) position recorded a deficit after seven consecutive quarters of surpluses. The CA recorded a deficit of USD1.9bn (0.5% of GDP), reversing previous quarter’s surplus of USD3bn (0.9% of GDP). Capital and financial account recorded a deficit of USD5bn (1.4% of GDP), easing from previous surplus of USD3.7bn (1.1% of GDP). Overall, Indonesia's 2Q23 Balance of Payments (BOP) recorded a deficit of USD7.4bn compared to 1Q23’s surplus of USD6.5bn.
CA deficit was largely driven by deficit in the services and primary income in line with the pickup in the domestic economy and higher payments of returns on direct investment. The wider services deficit was on the back of larger increase in services imports than exports, aligned with the increasing number of Indonesian tourists visiting abroad. Imports of travel services increased by almost USD1bn in 2Q23, while exports of travel services only increased by less than half.
We expect Indonesia’s CA position to turn from a surplus of 1% of GDP in 2022 into a slight deficit of around -0.3% in this year. The uncertainty of US Fed rate policy coupled with risk-off sentiment amid the global economic slowdown and more moderate financial account performance are key reasons for our forecast of a slight deficit in CA position for 2023.
- NZD/USD comes under heavy selling pressure and is weighed down by resurgent USD demand.
- Reduced bets for more Fed rate hikes might cap the USD and limit any further losses for the pair.
- Traders now look to the US macro data for some impetus ahead of the Jackson Hole Symposium.
The NZD/USD pair meets with a fresh supply on Thursday and reverses a major part of the previous day's positive move to the 0.5985 region, or a one-week high. Spot prices touched a daily low, around mid-0.5900s during the early part of the European session and for now, seem to have stalled this week's recovery from the lowest level since November 2022.
The US Dollar (USD) makes a solid comeback after Wednesday's sharp pullback from a more than two-month high and turns out to be a key factor exerting pressure on the NZD/USD pair. Against the backdrop of the worsening economic conditions in China, a host of manufacturing surveys released on Wednesday painted a grim picture of the health of economies across the globe. This, in turn, fuels worries about a deeper global economic downturn and drives some haven flow towards the USD.
Meanwhile, the flash US PMI prints also showed that business activity in the world's largest economy approached the stagnation point in August and pushed back against expectations for further policy tightening by the Federal Reserve (Fed). This drags the yield on the benchmark 10-year US Treasury note away from a 16-year high. Furthermore, the optimism over signs of easing US-China trade tensions might cap gains for the buck and lend support to antipodean currencies, including the Kiwi.
Traders might also refrain from placing aggressive directional bets and prefer to move to the sidelines ahead of the Jackson Hole Symposium, where comments by Fed Chair Jerome Powell will be scrutinized for cues about the future rate-hike path. This, in turn, will influence the USD and provide a fresh impetus to the NZD/USD pair. In the meantime, traders on Thursday will look to the US economic docket – featuring the Weekly Jobless Claims and Durable Goods Orders – for short-term opportunities.
Technical levels to watch
- Euro gives away part of its recent gains vs. the US Dollar.
- Stocks in Europe open Thursday’s session with decent gains.
- EUR/USD returns to the 1.0850 region ahead of key event.
- The USD Index (DXY) prints decent gains in the mid-103.00s.
- Business Confidence in France weakens to 96 in August.
- Initial Jobless Claims, Durable Goods Orders will be in the limelight.
The Euro (EUR) loses part of Wednesday’s shine vs. the US Dollar (USD) and motivates EUR/USD to give away part of the recent gains and retreat to the 1.0850 region in the wake of the opening bell in Europe on Thursday.
On the other side of the road, the Greenback manages to regain some balance following the marked rejection from Wednesday’s multi-week tops near 104.00 the figure and gyrates around the 103.50 area when tracked by the USD Index (DXY) amidst the still absence of a clear direction in the US money markets.
Moving forward, all the attention is expected to be on the kick-off of the Jackson Hole Symposium, while consensus among investors sees Chief Jerome Powell’s speech on Friday falling in line with his message at the FOMC gathering on July 26.
Regarding monetary policy, there is currently a renewed debate surrounding the Federal Reserve's dedication to maintaining a more stringent approach over an extended period of time. This heightened attention stems from the remarkable resilience of the US economy, despite slight relaxation in the labour market and lower inflation figures observed in recent months.
Meanwhile, within the European Central Bank (ECB), internal divisions among its Council members have emerged regarding the possibility of prolonging tightening measures beyond the summer season. These disagreements are fueling a renewed perception of fragility, which is exerting a detrimental influence on the Euro.
A very light docket in the euro area saw Business Confidence weaken to 96 in August, while the usual Initial Jobless Claims, the Chicago Fed National Activity Index, and Durable Goods Orders for the month of July are all due across the pond.
Daily digest market movers: Euro looks cautious ahead of Jackson Hole
- The EUR weakens a tad vs. USD near the 1.0850 area.
- The cautious tone ahead of key events favour the US Dollar.
- The downside pressure in US yields appears somewhat exhausted.
- Investors’ focus remains on the Jackson Hole event.
- Fed’s tighter-for-longer narrative keeps running in the background.
- Chair Powell’s speech would likely reinforce the battle against inflation.
- The Fed is likely to maintain rates unchanged until Q1 2024.
- Iran, Saudi Arabia and UAE to become new members of BRICS in 2024.
Technical Analysis: Euro looks supported by the 200-day SMA
EUR/USD’s downward bias appears so far propped up by the 1.0800 region, home of recent lows and the critical 200-day SMA.
Further retracements could force EUR/USD to revisit recent lows around 1.0800, an area coincident with the significant 200-day SMA. The loss of this region puts a potential test of the May low of 1.0635 (May 31) back on the radar ahead of the March low of 1.0516 (March 15) and the 2023 low at 1.0481 (January 6).
In case bulls regain the initiative, the pair is expected to meet an interim barrier at the 55-day SMA at 1.0964 prior to the psychological 1.1000 the figure and the August high at 1.1064 (August 10). Once the latter is cleared, spot could challenge the weekly top at 1.1149 (July 27). If the pair surpasses this region, it could alleviate some of the downward pressure and potentially visit the 2023 peak of 1.1275 (July 18). Further up comes the 2022 high at 1.1495 (February 10), which is closely followed by the round level of 1.1500.
Furthermore, the positive outlook for EUR/USD could be threatened is spot breaks below the important 200-day SMA.
Euro FAQs
What is the Euro?
The Euro is the currency for the 20 European Union countries that belong to the Eurozone. It is the second most heavily traded currency in the world behind the US Dollar. In 2022, it accounted for 31% of all foreign exchange transactions, with an average daily turnover of over $2.2 trillion a day.
EUR/USD is the most heavily traded currency pair in the world, accounting for an estimated 30% off all transactions, followed by EUR/JPY (4%), EUR/GBP (3%) and EUR/AUD (2%).
What is the ECB and how does it impact the Euro?
The European Central Bank (ECB) in Frankfurt, Germany, is the reserve bank for the Eurozone. The ECB sets interest rates and manages monetary policy.
The ECB’s primary mandate is to maintain price stability, which means either controlling inflation or stimulating growth. Its primary tool is the raising or lowering of interest rates. Relatively high interest rates – or the expectation of higher rates – will usually benefit the Euro and vice versa.
The ECB Governing Council makes monetary policy decisions at meetings held eight times a year. Decisions are made by heads of the Eurozone national banks and six permanent members, including the President of the ECB, Christine Lagarde.
How does inflation data impact the value of the Euro?
Eurozone inflation data, measured by the Harmonized Index of Consumer Prices (HICP), is an important econometric for the Euro. If inflation rises more than expected, especially if above the ECB’s 2% target, it obliges the ECB to raise interest rates to bring it back under control.
Relatively high interest rates compared to its counterparts will usually benefit the Euro, as it makes the region more attractive as a place for global investors to park their money.
How does economic data influence the value of the Euro?
Data releases gauge the health of the economy and can impact on the Euro. Indicators such as GDP, Manufacturing and Services PMIs, employment, and consumer sentiment surveys can all influence the direction of the single currency.
A strong economy is good for the Euro. Not only does it attract more foreign investment but it may encourage the ECB to put up interest rates, which will directly strengthen the Euro. Otherwise, if economic data is weak, the Euro is likely to fall.
Economic data for the four largest economies in the euro area (Germany, France, Italy and Spain) are especially significant, as they account for 75% of the Eurozone’s economy.
How does the Trade Balance impact the Euro?
Another significant data release for the Euro is the Trade Balance. This indicator measures the difference between what a country earns from its exports and what it spends on imports over a given period.
If a country produces highly sought after exports then its currency will gain in value purely from the extra demand created from foreign buyers seeking to purchase these goods. Therefore, a positive net Trade Balance strengthens a currency and vice versa for a negative balance.
EUR/USD tested the 200-Day Moving Average at 1.0800 on Wednesday. Economists at ING expect the pair to remain under pressure.
Clear near-term range for EUR/USD looks to be 1.0800-1.0930
Markets are quickly losing confidence that the ECB will be able to squeeze in another rate hike before the drop in Eurozone activity closes the door on the tightening cycle. This is certainly frustrating the case for EUR/USD to be making it quickly back above 1.10.
The clear near-term range for EUR/USD looks to be 1.0800-1.0930.
Despite today's slightly better risk environment, we doubt investors will want to chase EUR/USD too much higher and unless there is a sharp spike higher in US initial jobless claims today, EUR/USD may well end up gravitating back towards 1.0800.
- Pound Sterling juggles above 1.2700 after a V-shape recovery inspired by risk-on market mood.
- UK recession fears deepen as BoE warns about rising corporate default risks.
- Investors await the Jackson Hole Symposium for further guidance.
The Pound Sterling (GBP) remains directionless after a confident recovery move as bullish market sentiment neutralizes the impact of vulnerable British PMIs reported by S&P Global on Wednesday. The agency reported that factory activities were at their lowest since the pandemic period as firms underutilized their operating capacity due to a bleak demand outlook.
Fears of a recession in the UK economy deepened on Wednesday as warning from Bank of England (BoE) policymakers about significant upside risks to corporate defaults strengthened after the release of vulnerable PMIs. Deepening recession fears are forcing investors to bet on a lower interest rate peak. A poll from Reuters shows that the BoE could pause the rate-tightening spell after an interest rate hike in September.
Daily Digest Market Movers: Pound Sterling consolidates ahead of Jackson Hole Symposium
- Pound Sterling consolidates above the round-level support of 1.2700 after a V-shape recovery as market sentiment remains bullish.
- The strength in the Pound Sterling shows that investors are ignoring vulnerable UK preliminary PMI figures for August, reported by S&P Global on Wednesday.
- S&P Global reported UK Manufacturing PMI dropped significantly to 42.5 from estimates of 45.0 and July’s reading of 45.3. This has been the lowest factory data figure since the pandemic period and demonstrates the consequences of higher interest rates by the Bank of England.
- Services PMI shifted into the contraction phase below the 50.0 threshold. The economic data landed at 48.7, lower than estimates of 50.8 and July’s release of 51.3.
- On Tuesday, BoE policymakers warned about significant upside risks to corporate defaults amid higher interest rates. The current tightening cycle by the BoE is aggressive as inflation in the UK is the highest among developed nations.
- A survey from the BoE shows that the share of non-financial UK companies experiencing a weak debt-service coverage ratio will rise to 50% by year-end from last year’s reading of 45%.
- Consistently declining factory PMI indicates that UK firms are not operating at full capacity due to a poor economic outlook.
- Declining PMIs have deepened fears of a recession in the UK economy. This has forced traders to bet on a lower interest rate peak.
- According to a Reuters poll, the BoE will raise interest rates one more time on September 21 by 25 basis points (bps) to 5.50%. A minority of economists expect rates to go even higher.
- Significant upside risks to corporate default and vulnerable PMIs are expected to push the UK economy into a recession sooner but BoE policymakers seem helpless and cannot avoid raising interest rates as price pressures are well in excess of the desired rate of 2%.
- The market sentiment turned bullish after the United States' preliminary PMI remained weaker than anticipated, indicating that the economy is losing its resilience.
- The market mood could turn cautious ahead as the Jackson Hole Symposium will start on Thursday. Federal Reserve (Fed) Chair Jerome Powell is expected to provide an outlook on inflation, interest rates, and the economy.
- The US Dollar Index (DXY) turns sideways around 103.30 after a sell-off move ahead of the Jackson Hole event. Apart from that, investors will keenly focus on the Durable Goods Orders data.
- Former St. Louis Fed President James Bullard said on Tuesday that the US economy faces novel risks of stronger growth. This could warrant higher interest rates from the central bank to keep up the fight against inflation.
Technical Analysis: Pound Sterling rebounds after a Triple Bottom formation
Pound Sterling consolidates above 1.2700 after a solid recovery move as investors await the Jackson Hole Symposium for further action. The Cable recovered sharply on Wednesday after forming a Triple Bottom chart pattern around 1.2613. For a confident bullish reversal, the asset has to overstep the round-level resistance of 1.2800. The Cable is consistently failing to close above the 20 and 50-day Exponential Moving Averages (EMAs).
Pound Sterling FAQs
What is the Pound Sterling?
The Pound Sterling (GBP) is the oldest currency in the world (886 AD) and the official currency of the United Kingdom. It is the fourth most traded unit for foreign exchange (FX) in the world, accounting for 12% of all transactions, averaging $630 billion a day, according to 2022 data.
Its key trading pairs are GBP/USD, aka ‘Cable’, which accounts for 11% of FX, GBP/JPY, or the ‘Dragon’ as it is known by traders (3%), and EUR/GBP (2%). The Pound Sterling is issued by the Bank of England (BoE).
How do the decisions of the Bank of England impact on the Pound Sterling?
The single most important factor influencing the value of the Pound Sterling is monetary policy decided by the Bank of England. The BoE bases its decisions on whether it has achieved its primary goal of “price stability” – a steady inflation rate of around 2%. Its primary tool for achieving this is the adjustment of interest rates.
When inflation is too high, the BoE will try to rein it in by raising interest rates, making it more expensive for people and businesses to access credit. This is generally positive for GBP, as higher interest rates make the UK a more attractive place for global investors to park their money.
When inflation falls too low it is a sign economic growth is slowing. In this scenario, the BoE will consider lowering interest rates to cheapen credit so businesses will borrow more to invest in growth-generating projects.
How does economic data influence the value of the Pound?
Data releases gauge the health of the economy and can impact the value of the Pound Sterling. Indicators such as GDP, Manufacturing and Services PMIs, and employment can all influence the direction of the GBP.
A strong economy is good for Sterling. Not only does it attract more foreign investment but it may encourage the BoE to put up interest rates, which will directly strengthen GBP. Otherwise, if economic data is weak, the Pound Sterling is likely to fall.
How does the Trade Balance impact the Pound?
Another significant data release for the Pound Sterling is the Trade Balance. This indicator measures the difference between what a country earns from its exports and what it spends on imports over a given period.
If a country produces highly sought-after exports, its currency will benefit purely from the extra demand created from foreign buyers seeking to purchase these goods. Therefore, a positive net Trade Balance strengthens a currency and vice versa for a negative balance.
It makes sense that the currency market reacted to Wednesday's European and UK PMIs with EUR weakness and even more GBP weakness, but then reacted to the US PMIs with USD weakness. Ulrich Leuchtmann, Head of FX and Commodity Research at Commerzbank, analyzes what are the PMIs telling the forex market.
USD correction is correct, but not enough
Wednesday afternoon the FX market corrected the part of the USD strength that came after the PMI releases on this side of the Atlantic. This is correct, but not enough, I think.
Much of the earlier USD strength had already been fueled by the presumption of US economic exceptionalism. That too has yet to dissipate.
Further upside in USD/CNH now seems to have lost traction, argue Economist Lee Sue Ann and Markets Strategist Quek Ser Leang at UOB Group.
Key Quotes
24-hour view: Yesterday, we expected USD to trade sideways between 7.2800 and 7.3300. USD then traded in a narrower range of 7.2827/7.3075. The underlying tone has softened, and USD is likely to edge lower. However, any decline is unlikely to break clearly below 7.2680. Resistance is at 7.2920, followed by 7.3050.
Next 1-3 weeks: We have held the same view since Monday (21 Aug, spot at 7.3100), wherein USD could consolidate for a few days before breaking above last week’s high of 7.3490. While USD consolidated over the past few days, there are no signs of it breaking above 7.3490. Upward momentum has eased, instead of breaking above 7.3490, USD is more likely to trade in a range of 7.2500/7.3300 for the time being.
- The index looks mildly bid in the mid-103.00s.
- Markets’ attention shifts to the Jackson Hole event.
- Durable Goods Orders, weekly Claims next on tap in the docket.
The greenback, in terms of the USD Index (DXY), regains some balance and revisits the 103.50 region on Thursday.
USD Index focuses on Jackson Hole gathering
The index regains some composure and manages to partially reverse Wednesday’s marked pullback amidst rising expectation ahead of the Jackson Hole Symposium and the speech by Fed’s J. Powell on Friday.
The recovery in the buck also comes amidst the so far lack of traction in US yields across the curve, which seems to have tempered the weekly decline somewhat despite the Fed’s tighter-for-longer stance appears to still prevail among market participants.
Other than the event in Wyoming, usual weekly Initial Claims are due seconded by the Chicago Fed National Activity Index and Durable Goods Orders for the month of July.
What to look for around USD
The index seems to have now moved into a consolidative phase in the upper end of the range and following recent multi-week tops around the 104.00 zone (August 23).
In the meantime, support for the dollar keeps coming from the good health of the US economy, which seems to have reignited the narrative around the tighter-for-longer stance from the Federal Reserve.
Furthermore, the idea that the dollar could face headwinds in response to the data-dependent stance from the Fed against the current backdrop of persistent disinflation and cooling of the labour market appears to be losing traction as of late.
Key events in the US this week: Jackson Hole Symposium, Durable Goods Orders, Chicago Fed National Activity Index, Initial Jobless Claims (Thursday) - Jackson Hole Symposium, Final Michigan Consumer Sentiment, Chief Powell (Friday).
Eminent issues on the back boiler: Persistent debate over a soft or hard landing for the US economy. Incipient speculation of rate cuts in early 2024. Geopolitical effervescence vs. Russia and China.
USD Index relevant levels
Now, the index is up 0.11% at 103.47 and the breakout of 103.98 (monthly high August 23) would open the door to 104.69 (monthly high May 31) and finally 105.88 (2023 high March 8). On the opposite side, immediate support appears at 103.13 (200-day SMA) followed by 102.30 (55-day SMA) and then 101.74 (monthly low August 4).
- Silver meets with some supply and erodes a part of the overnight gains to a three-week peak.
- Extremely overbought RSI on hourly charts prompts traders to lighten some of their bullish bets.
- Any subsequent slide might still be seen as a buying opportunity and is likely to remain limited.
Silver comes under some selling pressure on Thursday and for now, seems to have snapped a five-day winning streak to a three-week high, around the $24.35 region touched the previous day. The white metal extends intraday descent through the early European session and drops to a fresh daily low, around the $24.15 region in the last hour.
From a technical perspective, the extremely overbought Relative Strength Index (RSI) on hourly charts turns out to be a key factor that prompts some long-unwinding around the XAG/USD. That said, oscillators on the daily chart have just started gaining positive traction. Furthermore, the overnight breakout through the $23.75 confluence, comprising the 200-period Simple Moving Average (SMA) on the 4-hour chart and the 50% Fibonacci retracement level of the July-August downfall, favours bulls.
Hence, any subsequent slide below the $24.00 round-figure mark is more likely to attract fresh buyers near the aforementioned confluence breakpoint, now turned support. This should help limit the downside for the XAG/USD near the $23.40 region. This is closely followed by support near the $23.25 area, which if broken could drag the white metal back towards the $23.00 mark. A convincing break below the latter will negate the positive outlook and shift the near-term bias in favour of bearish traders.
On the flip side, bulls might now wait for some follow-through buying beyond the overnight swing high, around the $24.35 area, before placing fresh bets. The XAG/USD might then aim to surpass the $24.55-$24.60 intermediate hurdle and climb further to the $25.00 psychological mark en route to the July monthly swing high, around the $25.25 zone. Some follow-through buying will mark a fresh breakout and pave the way for a further near-term appreciating move toward the $26.00 round figure.
Silver 4-hour chart
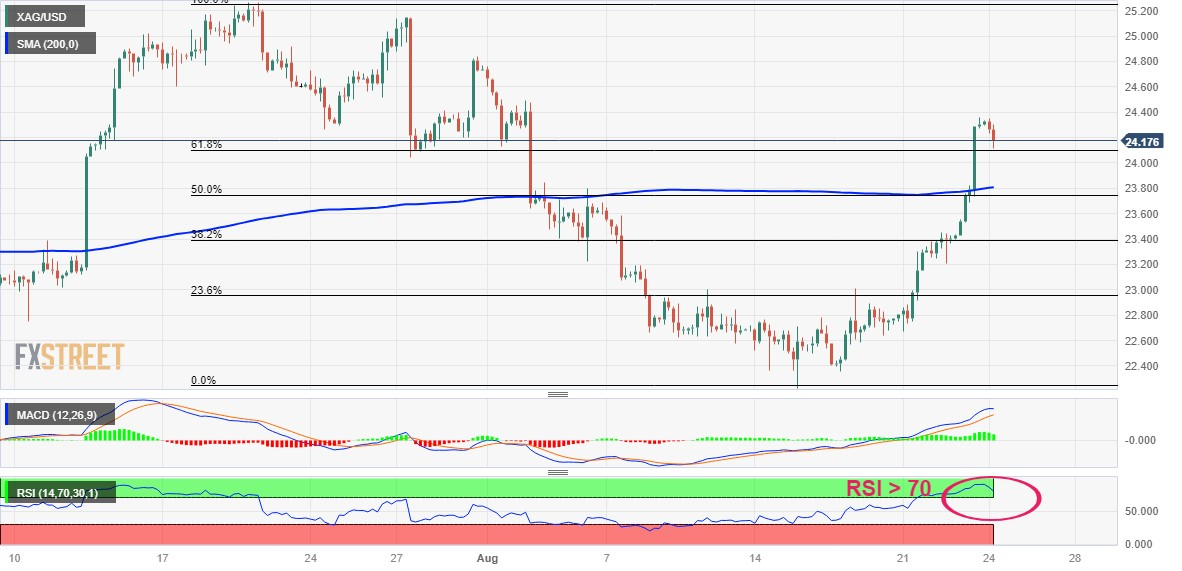
Technical levels to watch
- USD/JPY is experiencing strength due to the positive tone around the Asian equity markets.
- Nine-day EMA acts as the barrier following the 146.00 psychological level.
- Momentum indicators suggest the bullish bias of USD/JPY traders.
USD/JPY trades higher around 145.10 at the time of writing during the Asian session on Thursday, recovering losses from the previous day. The pair is cheering up the positive sentiment around the Asian equity markets. However, the Greenback faced downward pressure due to the downbeat US PMI data released on Wednesday.
The pair could face resistance around the nine-day Exponential Moving Average (EMA) at 145.22, following the 146.00 psychological level. A firm break above that level could support the USD/JPY pair to explore the area around the weekly high at 146.40.
On the downside, the 23.6% Fibonacci retracement at 144.36 appears to be the immediate support, followed by the 21-day EMA at 14.24. A breakout below that level could open the doors for the pair to navigate the area around 38.2% Fibo at 143.00.
The 14-day Relative Strength Index (RSI) remains above 50, which suggests a bullish bias of the USD/JPY traders. In the short term, the outlook remains bullish as long as the Moving Average Convergence Divergence (MACD) line stays above the centerline and the signal line.
USD/JPY: Daily Chart
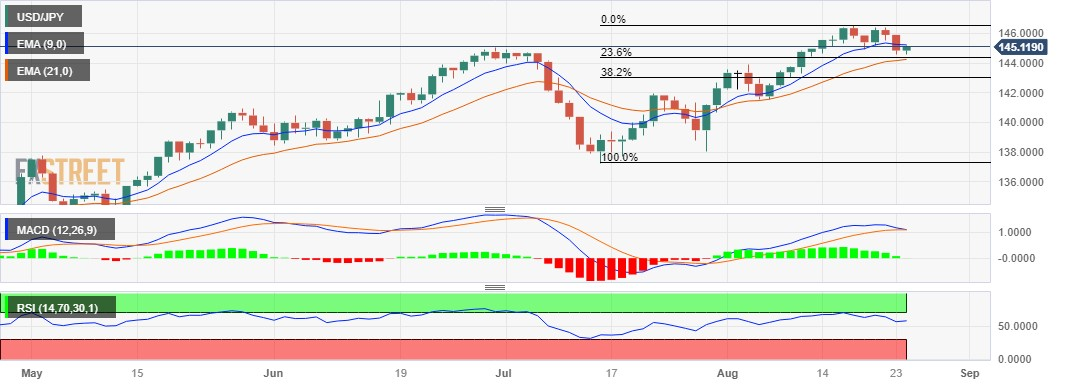
The Central Bank of Turkey (CBT) meets today to set interest rates. Economists at ING analyze the Turkish Lira (TRY) outlook ahead of the meeting.
Will 250 bps of CBT tightening be enough?
So far, it is fair to say that the pace of policy tightening over recent months (900 bps) has disappointed market expectations. And another 250 bps rate hike to 20% in the one-week repo today would still leave real rates deeply in negative territory given inflation is running at close to 50%.
While 35% implied yield through the three-month forwards does make the Lira a high yielder, it does not seem as though the TRY has yet attracted international demand for the popular carry trade.
If the central bank can bring inflation and inflation expectations down, making real rates far less negative, then the Lira could start to find some broader support. Otherwise, gradual depreciation on the back of high inflation looks to be the most likely path.
USD/JPY could now attempt some consolidation within the 143.50-146.20 range in the next few weeks, comment Economist Lee Sue Ann and Markets Strategist Quek Ser Leang at UOB Group.
Key Quotes
24-hour view: We did not expect the sharp drop in USD to a low of 144.53 (we were expecting it to trade sideways). Downward momentum has increased, albeit not much. Today, there is room for USD to weaken further, even though it is unlikely to reach the major support at 143.50. Note that there is another support at 144.10). Resistance is at 145.20, followed by 145.65.
Next 1-3 weeks: After USD rebounded from 144.92, we highlighted on Tuesday (22 Aug, spot at 146.20), “there is hardly any increase in momentum.” We held the view that while USD could rise, “it remains to be seen if there is enough momentum to carry it to the next major resistance at 147.50.” Yesterday, USD fell sharply to a low of 144.53. While our ‘strong support’ level at 144.50 has not been clearly breached, the mild upward momentum has fizzled out. From here, USD is likely to trade in a range, likely between 143.50 and 146.20.
- USD/CAD loses momentum for two days in a row amid the USD weakness.
- The pair holds below the key 100-hour Exponential Moving Average (EMA) on the one-hour chart.
- The first resistance level to watch is 1.3535; the critical support zone is located at the 1.3495-1.3500 region.
The USD/CAD pair trades in negative territory for the second consecutive day. The Greenback declined against its rivals due to the downbeat US PMI data and a decline in US Treasury yields. The pair currently trades near 1.3527, up 0.01% for the day.
That said, Business activity in the United States in August expanded at a slow pace. The preliminary S&P Global Composite PMI decreased to 50.4, down from 52.0 previously and below market expectations of 52.0. This is the largest decrease since November 2022. Meanwhile, US Treasury yields retreated from multi-year highs and declines below 4.20%.
From the technical perspective, USD/CAD holds below the 100-hour Exponential Moving Average (EMA), which means further downside looks favorable for the major pair. Meanwhile, the Relative Strength Index (RSI) stands below 50, activating the bearish momentum for the USD/CAD pair for the time being.
Any follow-through buying above 1.3535 will be exposed to further upside. The mentioned level is a confluence of the middle line of the Bollinger Band and the 100-hour EMA. The next upside stop is located at 1.3575 (high of August 18, the upper boundary of the Bollinger Band), followed by a psychological figure at 1.3600. Further north, the pair will see a rally to 1.3650 (a high of May 31).
On the downside, the critical support zone for USD/CAD is located at the 1.3495-1.3500 region, portraying a psychological round figure and the lower limit of the Bollinger Band. The additional downside filter to watch is 1.3475 (Low of August 16) en route to 1.3445 (Low of August 15) and finally at 1.3410 (Low of August 11).
USD/CAD one-hour chart
-638284574329095003.png)
The Dollar and US yields were knocked off their highs on Wednesday. Economists at ING analyze Greenback’s outlook.
DXY could trade slightly offered in a 103.15 to 103.50 range
Look out for the weekly initial jobless claims data today, where any tick higher to the 250,000 area could slightly weigh on US yields and the Dollar. We would not expect big moves, however, before Federal Reserve Chair Jerome Powell's speech on Friday at the Fed's Jackson Hole symposium.
Given that the risk environment is a little better bid today – with Nvidia's results keeping the tech boom alive – DXY could trade slightly offered in a 103.15 to 103.50 range.
- WTI crude oil prints four-day losing streak while confirming bearish chart formation.
- Sustained trading beneath the key SMAs, bearish MACD signals join Head-and-Shoulders to favor energy bears.
- Six-week-old horizontal support zone can prod WTI bears before directing them toward $71.00 theoretical target.
- Oil buyers remain off the table below $81.40.
WTI crude oil prints mild losses around $78.40 heading into Thursday’s European session. In doing so, the black gold drops for the fourth consecutive day as markets await top-tier US data and central bankers’ speech at the Jackson Hole Symposium.
The energy benchmark’s latest losses could be linked to the downside break of the 200-SMA, as well as confirmation of the Head-and-Shoulders (H&S) bearish chart formation. Adding strength to the downside bias are the bearish MACD signals
It’s worth noting, however, that the market’s cautious mood and the RSI (14) line’s condition below 50.0 suggests limited downside room for the commodity prices, which in turn highlights a 1.5-month-old horizontal support zone surrounding $77.20–$76.80.
In a case where the WTI bears conquer the $76.80 mark and manage to hold the reins afterward, the mid-July swing low of around $73.80 will act as the final defense of the Oil buyers before pushing the quote toward the theoretical targets of the H&S bearish pattern, near $71.00.
Alternatively, the neckline of the H&S formation and the 200-SMA, respectively near $78.90 and $79.20, guard the immediate upside of the WTI crude oil.
Following that, a downward-sloping resistance line from August 10 and the 100-SMA could challenge around $80.70 and $81.00 in that order.
Even if the quote manages to remain firmer past $81.00, the weekly peak surrounding $81.40 can check the buyers before giving them control.
WTI crude oil: Four-hour chart
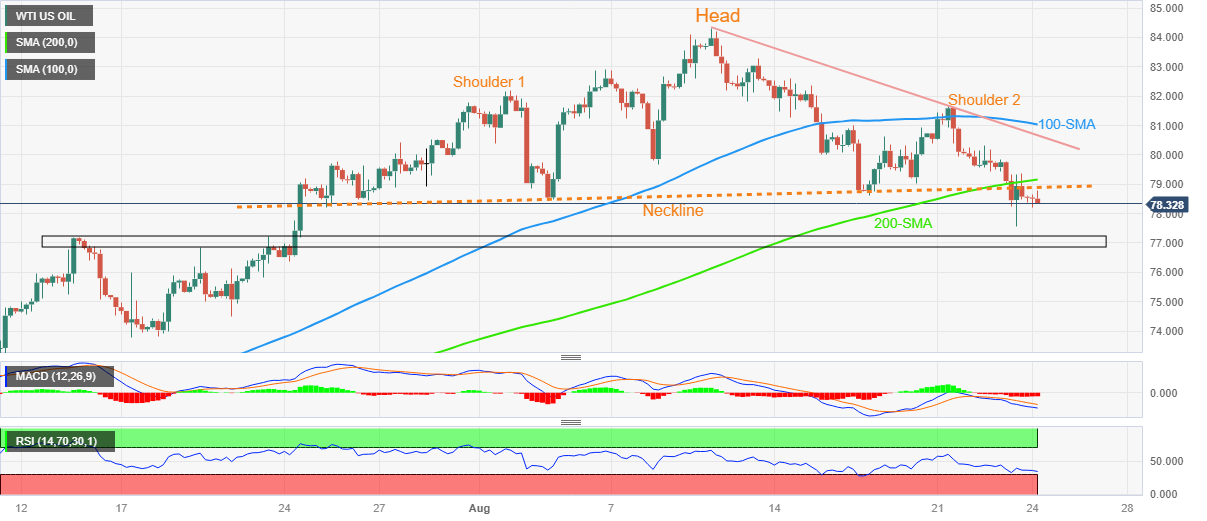
Trend: Further downside expected
In light of advanced prints from CME Group for natural gas futures markets, open interest increased for the first time since August 15, this time by around 2.5K contracts. On the other hand, volume remained choppy and dropped by nearly 7K contracts.
Natural Gas risks further decline below $2.50
Prices of natural gas retreated for the second session in a row and closed just below the key $2.50 mark on Wednesday. The daily decline came along rising open interest and allows for the continuation of the ongoing retracement in the very near term. Furthermore, a sustained drop below $2.50 should pave the way for extra pullbacks to, initially, the June low near $2.15 per MMBtu.
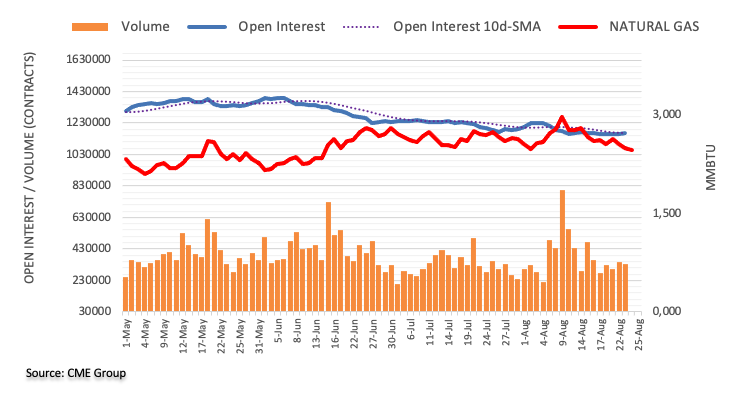
In the opinion of Economist Lee Sue Ann and Markets Strategist Quek Ser Leang at UOB Group, NZD/USD should now trade within the 0.5910-0.6040 range in the short-term horizon.
Key Quotes
24-hour view: We expected NZD to trade in a range of 0.5915/0.5965 yesterday. However, it rose to a high of 0.5984 before closing on a firm note at 0.5980 (+0.55%). The rapid increase in momentum is likely to lead to further NZD strength to 0.6000. The major resistance at 0.6040 is not expected to come under threat today. Support is at 0.5950, followed by 0.5930. The latter level is solid support.
Next 1-3 weeks: Yesterday (23 Aug, spot at 0.5945), we pointed out that “downward momentum has waned further, and the likelihood of further NZD weakness has diminished considerably.” We also pointed out that “only a break of 0.5985 would indicate that the weakness in NZD has stabilised.” In NY trade, NZD rose to a high of 0.5984. While our ‘strong resistance’ level at 0.5985 has not been clearly breached, downward momentum has more or less faded. NZD appears to have moved into a consolidation phase, and it is likely to trade in a range between 0.5910 and 0.6040 for the time being.
EUR/USD’s decline has extended to the 200-Day Moving Average (DMA) at 1.0800. Economists at Credit Suisse analyze the pair’s outlook.
Resistance at 1.0932 capping can now keep the immediate risk lower
Whilst 1.0800 is holding for now as suspected, if our view for the USD is correct this would suggest the risk for a move below 1.0800 in due course is high for a test of what we look to be better support at the 38.2% retracement of the 2022/2023 uptrend and May low at 1.0634/12.
Whilst we would look for an attempt to find a better floor at 1.0634/12, should weakness instead extend this would warn of a more important change of trend lower, with supports then seen next at 1.0516, then the 50% retracement at 1.0407.
Resistance at 1.0932 capping can now keep the immediate risk lower. Above 1.1066 though stays seen needed to see the top negated to reassert a sideways range.
Open interest in crude oil futures markets resumed the downtrend and shrank by around 4.1K contracts on Wednesday according to preliminary readings from CME Group. Volume, instead, went up by around 92.1K contracts after two consecutive daily pullbacks.
WTI remains capped by $85.00
WTI prices extended the weekly corrective decline on Wednesday amidst shrinking open interest. Against that, the likelihood of a sustained drop now looks diminished, while the area of YTD peaks near the $85.00 mark per barrel continues to cap occasional bullish attempts in the commodity.
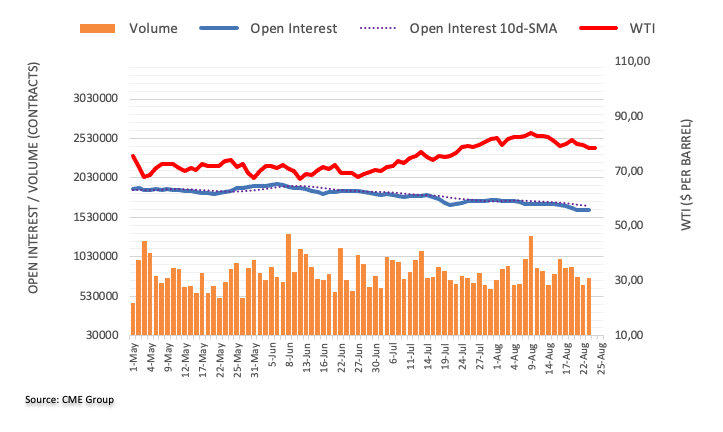
- AUD/JPY trades within a descending trend channel from the middle of June.
- The first resistance level for AUD/JPY emerges at 94.40; the initial support level is seen at 93.70.
- The Relative Strength Index (RSI) holds in bullish territory above 50.
The AUD/JPY cross loses momentum near 94.00 heading into the early European trading hours on Thursday. The cautious mood in the market and the downbeat Australian S&P Global PMI data weigh on the Aussie and act as a headwind for the cross.
The Australian S&P Global Composite PMI fell to 47.1 on Wednesday, from 48.2 in July. In the meantime, the Manufacturing PMI decreased to 49.4 from the 49.6 anticipated and previous, and the Service PMI decreased to 46.7 from 47.9 expected and in the previous month. Apart from the data, the divergence of monetary policy between the Bank of Japan (BoJ) and the Reserve Bank of Australia (RBA) might cap the downside in AUD/JPY as the Japanese central bank keeps ultra-easy monetary policy while allowing long-term rates to move more flexibly.
According to the four-hour chart, AUD/JPY trades within a descending trend channel since the middle of June. That said, the path of least resistance for the AUD/JPY is to the upside as the cross just holds above the 50- and 100-hour Exponential Moving Averages (EMAs).
The first resistance level for AUD/JPY emerges at 94.40, representing the upper boundary of a descending trend channel. The additional upside filter to watch is 94.90 (high of August 15). Any meaningful follow-through buying above the latter will see a rally to 95.40 (high of July 14) and finally at 95.85 (high of July 31).
On the flip side, the cross will meet the initial support level at 93.70, highlighting a confluence of the 50-hour EMA and a low of August 16. The next downside stop appears at 93.50 (low of August 22), followed by a psychological figure at 93.00. A break below the latter will see a drop to 92.60 (the midline of the descending trend channel) en route to 91.80 (the high of May 8) and finally at 91.35 (the lower limit of the descending trend channel).
It’s worth noting that the Relative Strength Index (RSI) holds bullish territory above 50, supporting the buyers for now.
AUD/JPY four-hour chart
-638284558198457554.png)
Economists at Standard Chartered expect the Central Bank of the Republic of Türkiye (CBRT) to raise policy rates further on price and external headwinds.
CBRT to continue with gradual rate hikes
We expect the CBRT to raise the one-week repo rate by 200 bps to 19.5% on 24 August. The CBRT has hiked rates by 900 bps in the last two months and used various policy and prudential measures to underscore its commitment to the ongoing shift towards orthodox policy. This marks a departure from the policy mix prior to Türkiye’s May elections. We expect this approach to continue amid resurgent price pressures, Turkish Lira (TRY) weakness, and rising external and fiscal imbalances.
External balances could deteriorate further near-term, providing little respite for the TRY. We expect a return to monthly C/A deficits for the rest of 2023 amid rising fuel prices, still-robust domestic demand, and a seasonal slowdown in tourism-related FX inflows in Q4. A sustainable improvement in the C/A balance will require a moderation in domestic demand, which should eventually result from the recent policy pivot towards economic stabilisation.
We expect the central bank to proceed cautiously with rate hikes, based on recent monetary policy decisions and CBRT communications. We forecast the weekly repo rate at 24.0% by end-2023. A continuation of recent coordinated monetary, fiscal, and macro-prudential measures to rein in domestic demand and address market distortions could lead to some initial improvements as early as H1-2024.
Economist Lee Sue Ann and Markets Strategist Quek Ser Leang at UOB Group note GBP/USD is now expected to navigate between 1.2580 and 1.2780 in the next few weeks.
Key Quotes
24-hour view: We expected GBP to trade with a downward bias yesterday. However, we held the view that “a sustained decline below 1.2690 is unlikely”. We also held the view that “1.2640 is unlikely to come under threat.” We did not anticipate the volatile price actions as GBP plunged to a low of 1.2615 and then snapped back up to close little changed at 1.2740 (+0.06%). The outlook for GBP is mixed after the sharp swings. Today, GBP could trade sideways in a range of 1.2665/1.2765.
Next 1-3 weeks: Our most recent narrative was from Monday (21 Aug, spot at 1.2740), wherein the price actions in GBP over the past weeks appear to be part of a consolidation phase. We expected GBP to trade sideways between 1.2640 and 1.2830. Yesterday (23 Aug), GBP fell sharply and broke below 1.2640. However, the decline was short-lived, as GBP rebounded strongly from 1.2615. There is no increase in momentum, and we continue to expect GBP to trade sideways, albeit in a lower range of 1.2580/1.2780.
CME Group’s flash data for gold futures markets noted traders added around 5.7K contracts to their open interest positions after two consecutive daily pullbacks on Wednesday. Volume followed suit and went up by around 41.2K contracts
Gold faces interim hurdle around $1930
Gold prices extended its rebound and managed to close above the $1900 mark per troy ounce, surpassing at the same time the key 200-day SMA, on Wednesday. The daily was amidst increasing open interest and volume and is indicative that further gains appears on the cards for the yellow metal in the very near term. That said, bullion faces an interim hurdle at the 55-day SMA at $1933.
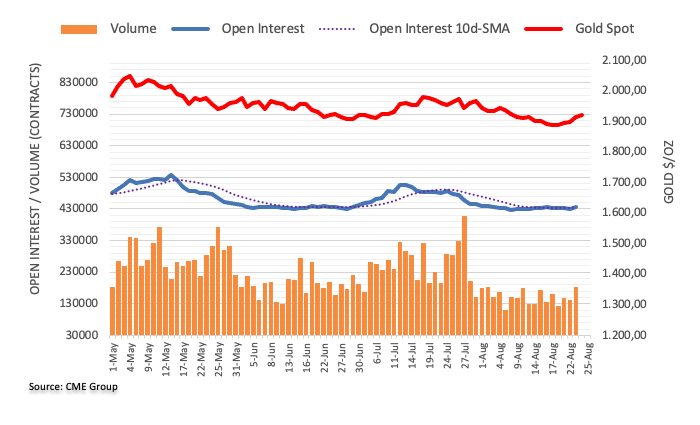
- USD/IDR takes offers to renew weekly low, down for the third consecutive day.
- Downbeat US PMIs, positioning for BI status quo weigh on Indonesia Rupiah.
- Optimism in China, receding fears of higher rates elsewhere add strength to bearish bias.
- Bank Indonesia is expected to keep rates unchanged at 5.75%; Fed Chair Powell’s speech at Jackson Hole is crucial.
USD/IDR prepares for the Bank Indonesia (BI) Interest Rate Decision by refreshing the weekly low near 15,250 early Thursday. In doing so, the Indonesia Rupiah (IDR) pair cheers the downbeat US Dollar and slightly positive mood in the Asia-Pacific zone to print a three-day losing streak.
The US Dollar Index (DXY) remains pressured around 103.30 after reversing from an 11-week high the previous day. That said, the Greenback’s gauge versus the six major currencies reached a multi-day high amid the market’s anxiety ahead of the top-tier data/events. However, downbeat prints of the US PMIs for August, as well as unimpressive housing data, pushed back the hawkish bias about the Federal Reserve and weighed on the DXY afterward.
Not only in the US but softer activity numbers from the major economies also tame fears of the higher rates and allow the traders to pare previous losses amid the upbeat performance of Wall Street and a slump in the US Treasury bond yields.
It’s worth noting that optimism in China, one of Indonesia’s biggest customers, also allows the USD/IDR bears to better prepare for the BI Interest Rate Decision even as no change is expected in the benchmark 5.75% rates.
Amid these plays, S&P500 Futures rose 0.70% to 4,480 by the press time, after rising the most in a month the previous day, whereas stocks in China and Hong Kong are up as well. Also, the US 10-year Treasury bond yields seesaw around 4.20%, pausing a two-day losing streak from the highest level since 2007, following the biggest daily slump in three weeks.
Looking forward, the BI decision is less likely to affect the USD/IDR price unless it offers any major surprises, which are off the table. As a result, today’s US Durable Goods Orders, Chicago Fed National Activity Index, Kansas Fed Manufacturing Activity and weekly Jobless Claims should be watched carefully for intraday directions. Above all, the two-day-long annual Jackson Hole Symposium and Friday’s Fed Chair Jerome Powell’s speech at the key event will be crucial for a clear guide.
Technical analysis
Although the USD/IDR pair’s failure to cross the 15,400 hurdle weighs on the prices, a one-month-old rising support line joins the 21-DMA to restrict immediate downside to around 15,250.
Economist Lee Sue Ann and Markets Strategist Quek Ser Leang at UOB Group suggest EUR/USD could attempt some consolidation ahead of a potential drop below 1.0800.
Key Quotes
24-hour view: We expected EUR to weaken further yesterday. We indicated that “a clear break of the major support at 1.0830 could lead to a drop to 1.0790 before the risk of a rebound increases.” In line with our view, EUR weakened, but it did not reach 1.0790 (low of 1.0800). However, it did rebound to end the day at 1.0859 (+0.14%). Downward pressure has faded, and today, EUR is likely to trade in a range, probably between 1.0830 and 1.0895.
Next 1-3 weeks: Yesterday (23 Aug, spot at 1.0845), we noted that “downward momentum has been ‘boosted’, and a break of 1.0830 is likely.” We highlighted that “the next level to focus on below 1.0830 is a considerable support level near 1.0790.” EUR then broke below 1.0830, fell to a low of 1.0800 before rebounding. Short-term downward momentum has eased somewhat, and EUR could consolidate for 1-2 days before moving towards 1.0790. However, if EUR breaks above 1.0915, it would mean that 1.0790 is out of reach this time around.
- USD/CHF remains pressured at weekly low, extends pullback from 50-DMA, key resistance line.
- Downside break of monthly support line, looming bear cross on MACD also favor Swiss Franc pair sellers.
- One-month-old horizontal support zone appears a tough nut to crack for bears.
- Buyers need successful break of 0.8830 to retake control.
USD/CHF drops to the lowest level in a week while refreshing intraday bottom around 0.8765 heading into Thursday’s European session. In doing so, the Swiss Franc (CHF) pair prints a two-day losing streak by extending the previous day’s reversal from the 50-DMA and a three-month-old descending resistance line.
Not only the failure to cross the key DMA and trend line resistance but a sustained trading beneath the previous support line, which broke on Monday, joins the impending bear cross on the MACD indicator to also keep the USD/CHF sellers hopeful.
With this, the Swiss Franc (CHF) pair sellers approach a one-month-old horizontal support zone surrounding the 0.8700 threshold.
Following that, the 0.8635-30 region will act as the final defense of the USD/CHF buyers before pushing the traders toward the multi-year low marked in July around 0.8552.
Meanwhile, a convergence of the stated DMA and trend line, around 0.8805, restricts the immediate upside of the USD/CHF pair, a break of which could propel the quote towards the previous support line surrounding 0.8825.
However, the quote’s upside past 0.8825 needs validation from the double tops surrounding 0.8830.
Overall, the USD/CHF remains bearish but the room toward the south appears limited.
USD/CHF: Daily chart
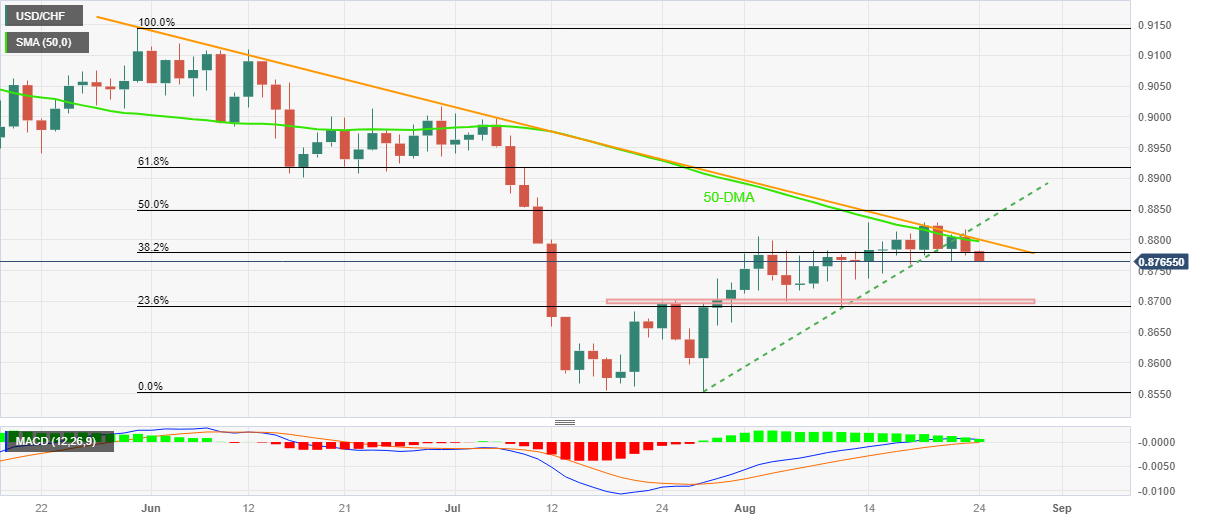
Trend: Limited downside expected
- AUD/USD consolidates its gains near 0.6480 ahead of the US data.
- US Business activity in August expanded at a slow pace
- The Australian S&P Global PMI came in lower than expected.
- Investors await the Jackson Hole Symposium, the Federal Reserve (Fed) Chairman Jerome Powell's Speech.
The AUD/USD pair oscillates in a narrow trading range around 0.6480 heading into the early European session on Thursday. Market participants seem to prefer to wait on the sidelines ahead of the Federal Reserve (Fed) Chairman Jerome Powell's Speech on Friday.
US Business activity in August expanded at a slow pace. That said, the preliminary S&P Global Composite PMI decreased to 50.4, down from 52.0 previously and below market expectations of 52.0. This is the largest decrease since November 2022. S&P Global Manufacturing PMI fell to 47 from 49 in the prior month, while Services PMI dropped to 51 from 52.4 in the previous month. Meanwhile, US annual New Home Sales came in at 714K, exceeding expectations of 705,000 by a significant margin.
In response to the data, the US Dollar weakened against its rivals, which boosted the AUD/USD pair. The US Treasury yields retreated from multi-year highs and hovered around 4.20%. The market discounted a more aggressive Federal Reserve policy for the rest of the year. According to the CME Fed Watch Tool, market pricing in 88% that the Federal Reserve (Fed) will pause the interest rate in the September meeting and would hike more rate in its November meeting. However, Market players will take cues about the interest rates outlook from the Jackson Hole Symposium on Thursday.
Across the pond, the first reading of the Australian S&P Global Composite PMI fell to 47.1 on Wednesday, from 48.2 in July. In the meantime, the Manufacturing PMI decreased to 49.4 from the 49.6 anticipated and previous, and the Service PMI decreased to 46.7 from 47.9 expected and in the previous month.
Furthermore, the People’s Bank of China (PBoC) slashed its Loan Prime Rate (LPR) for one year by a smaller margin than anticipated to 3.45% from 3.55%. This, in turn, exerts some pressure on the Aussie. Investors will keep an eye on the headlines surrounding China’s economic woes as it might impact the Aussie, a proxy for China's economic prospects.
In the quiet day of economic data released from Australia, market players will focus on the US weekly Jobless Claims and Durable Goods Orders due on Thursday. Also, the Jackson Hole Symposium will be a closely watched event ahead of the Federal Reserve (Fed) Chairman Jerome Powell's Speech on Friday. The events will be critical for determining a clear movement for the AUD/USD pair.
- Gold Price renews two-week high as bulls cheer sooner end of hawkish monetary policies.
- Downbeat activity data recalls challenges for “higher for longer” rates, fueling XAU/USD amid upbeat sentiment.
- China-linked optimism adds strength to the Gold Price rebound despite cautious mood ahead of key central bankers’ speeches.
- Jackson Hole Symposium gains additional importance as hawks are challenged by recent PMI.
Gold Price (XAU/USD) rises to the highest levels in two weeks, up for the fifth consecutive day, as bulls cheer receding fears of higher rates ahead of top-tier US data and central bankers’ speech at the annual Jackson Hole Symposium event.
The recent downbeat Purchasing Managers Index (PMI) data for August from the developed economies, including the US, restored the market’s previous concerns about the central bank policy pivot and weighed on the Greenback, which in turn fuelled the Gold Price.
Additionally, expectations that the diplomatic ties between China and the US will improve also allowed the XAU/USD to remain firmer due to Beijing’s status as one of the world’s top Gold customers.
Elsewhere, the US Dollar’s sluggish move and the market’s optimism, backed by the technology stocks, as well as a pullback in the US Treasury bond yields from the multi-year high add strength to the Gold price run-up.
However, a slew of US data remains to be published and can test the XAU/USD bulls. Above all, Fed Chairman Jerome Powell’s defense of the hawkish monetary policy will be crucial to watch for clear directions as the latest US data suggest the nearness to the end of the rate hike cycle, which if confirmed could weigh on the US Dollar and favor the Gold buyers.
Also read: Gold Price Forecast: XAU/USD looks to challenge key $1,932 resistance ahead of Jackson Hole
Gold Price: Key levels to watch
Our Technical Confluence indicator shows that the Gold Price stays well beyond the short-term key resistances, now support, while approaching the key $1,938 resistance confluence comprising Fibonacci 61.8% on one-month and 161.8% on one-week.
Before that, Pivot point one-week R2, near $1,930, may test the XAU/USD buyers.
It’s worth noting that Pivot Point one-week R3 acts as an extra upside filter around $1,942.
That said, the previous weekly high joins the middle band of the Bollinger on the hours chart and Pivot Point one-month S1 to highlight $1,916 as an immediate support.
Following that, the 200-DMA and Pivot Point one-week R1 appears a tough nut to crack for the Gold sellers around $1,910.
Above all, the XAU/USD buyers remain on the table unless witnessing a sustained downside break of the $1,898 support confluence comprising the 5-DMA and Fibonacci 38.2% on one-week.
Here is how it looks on the tool
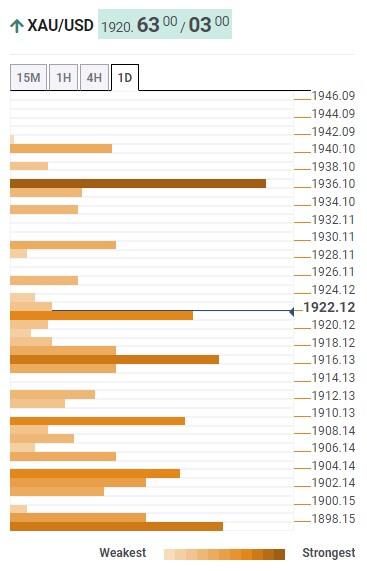
About Technical Confluences Detector
The TCD (Technical Confluences Detector) is a tool to locate and point out those price levels where there is a congestion of indicators, moving averages, Fibonacci levels, Pivot Points, etc. If you are a short-term trader, you will find entry points for counter-trend strategies and hunt a few points at a time. If you are a medium-to-long-term trader, this tool will allow you to know in advance the price levels where a medium-to-long-term trend may stop and rest, where to unwind positions, or where to increase your position size.
- EUR/USD trades higher around 1.0870 on the back of downbeat US PMI data.
- The Euro showed resilience despite weaker Eurozone PMI data.
- Investors await speeches from Fed Chair Powell and ECB President Lagarde.
EUR/USD extends gains for the second consecutive day, trading around 1.0870 at the time of writing during the Asian session on Thursday. The pair has shown resilience despite the downbeat PMI data from the Eurozone and Germany reported on Wednesday, prompting a cautious market sentiment as investors look for additional cues regarding the inflation outlook.
Eurozone’s preliminary HCOB Composite PMI for August reported a decline of 47, against the expectation of 48.5 from the previous 48.6. In the meantime, Germany’s Composite PMI reduced to 44.7, lower than the market consensus of 48.3, which was 48.5 in July.
On the other hand, the United States (US) released softer-than-expected preliminary PMI data on Wednesday. S&P Global Composite PMI in August declined to 50.4 from the prior 52, which was expected to remain consistent. Soft economic data from the US exerted downward pressure on US Treasury yields, reinforcing the correction in the US Dollar (USD).
Investors had anticipated that the European Central Bank (ECB) would maintain interest rates in the upcoming monetary policy meeting, given the moderate GDP and inflation figures released the previous week. However, the EUR/USD is facing upward pressure due to disappointing US economic data, which reduced the likelihood of a September interest rate hike by the US Federal Reserve (Fed).
The US Dollar Index (DXY), which measures the performance of the US Dollar (USD) against the six major currencies, is hovering around 103.40 at the time of writing. Investors await speeches by Fed Chair Jerome Powell and ECB President Christine Lagarde on Friday during the Jackson Hole symposium, which may provide insights into the financial and economic sectors, helping to shape potential strategies in response to the current inflationary outlook.
Market participants will also likely monitor Initial Jobless Claims from the United States (US) and the Eurozone’s Gross Domestic Product (GDP). These datasets could help in providing fresh cues for traders of the EUR/USD pair.
Commenting on the prospects of an Australian-European Union (EU) trade deal, Australia’s Trade Minister Dan Tehan said on Thursday, “I am hopeful of discussions with the EU commissioner for trade in the coming weeks.”
Additional quotes
“EU free trade deal would mean better access to crucial minerals for Europe.”
“I expect a better EU free trade deal offer after negotiations stalled in July.”
Market reaction
Amid improving market mood and trade optimism, AUD/USD is attempting another run toward 0.6500, up 0.05% on the day at 0.6480.
- USD/RUB gains momentum around the 94.00 mark amid the cautious mood in the market.
- Russian President Vladimir Putin warned that inflationary risks were rising in the country.
- The Jackson Hole Symposium, the Federal Reserve (Fed) Chairman Jerome Powell's Speech will be the highlight.
USD/RUB posts modest gains near 94.00 during the Asian session on Thursday. Meanwhile, the US Dollar Index (DXY) consolidates its gains around 103.35 as investors prefer to wait on the sidelines ahead of the Jackson Hole Symposium and Federal Reserve (Fed) Chairman Jerome Powell Speaks this week.
Russian President Vladimir Putin stated on Tuesday that inflationary risks were developing in the country's economy, urging the government and central bank to keep the situation under control.
That said, Russia's budget is under pressure as a result of the Ukraine conflict, and the central bank was compelled to raise interest rates last week to stop the Ruble's decline. It’s worth noting that the Bank of Russia raised the interest rate by 350 basis points (bps) to 12% last week.
Russia has increased its 2023 military spending goal to more than $100 billion, accounting for a third of all state expenditure, as the rising costs of the Ukraine conflict impose a mounting strain on Moscow's finances, according to Reuter.
On the US Dollar front, Federal Reserve Bank (Fed) of Richmond President Thomas Barkin said that monetary policy would need to be tightened if inflation remained elevated. Market players will take cues about the interest rates outlook from the Jackson Hole Symposium on Thursday. Hawkish comments from the central banks' policymakers might boost the Greenback against the Russian Ruble.
Looking ahead, traders will closely watch the Jackson Hole Symposium and the Federal Reserve (Fed) Chairman Jerome Powell's Speech. Traders will take cues from the data and find opportunities around USD/RUB. Also, the headline surrounding Russia’s war in Ukraine remains in focus.
- USD/TRY pushes upside boundaries while refreshing record highs in the last few successive days.
- Wildfire pushes Ankara to close key Strait, pausing hundreds of ships and fueling inflation woes.
- US Dollar struggles for clear directions as softer PMIs flag Fed policy pivot concerns but Powell isn’t known dovish.
- CBRT is expected to lift benchmark Interest Rates by 300 bps to 20.00%, any disappointment can fuel USD/TRY.
USD/TRY stays on the front around 27.20 heading into Thursday’s European session. ignoring the lackluster US Dollar amid fresh challenges to the Turkish inflation conditions. Also allowing the Turkish Lira (TRY) pair to stay on the front foot is the consolidation ahead of today’s Central Bank of the Republic of Türkiye (CBRT) Interest Rate Decision.
Wildfires in areas near Turkey’s Dardanelles Strait intensify fears of more supply crunch and the resulting spike in Turkish inflation as authorities are known to have blocked around 300 ships moving between the Black Sea and the Aegean. It’s worth noting that Inflation is the enemy that previously pushed the CBRT to announce a heavy rate hike to 17.0%.
Furthermore, downbeat prints of Turkish Consumer Confidence for August, to 68.30 from 80.1, also weigh on the Lira prices.
On the contrary, the cautious mood ahead of the US Durable Goods Orders and Fed Chair Jerome Powell’s speech at the Kansas Fed’s annual event called the Jackson Hole Symposium seems to restrict immediate moves of the US Dollar. That said, the US Dollar Index (DXY) reversed from the 11-week high the previous day, seesaws around 103.40 by the press time.
While tracing the US Dollar’s declines the previous day, the receding fears of “higher for longer” rates at the top-tier central banks gain major attention.
It’s worth noting the mostly downbeat Purchasing Managers Index (PMI) for August from the top-tier economies, including the US, restored the market’s previous concerns about the central bank policy pivot and weighed on the Greenback.
The preliminary readings of the US S&P Global Manufacturing PMI dropped to 47.0 for August from 49.0 versus 49.3 market forecasts whereas the Services counterpart also edged lower to 51.0, compared to 52.2 expected and 52.3 marked the previous month. With this, the S&P Global Composite PMI for the US eased to 50.4 for the said month from 52.0 prior and the analysts’ estimations. Further, US New Home Sales change rose to 4.4% MoM for July versus -2.5% previous readings. Not only in the US but the first activity readings from the UK, Australia, Eurozone and Germany were all downbeat and challenged the hawkish central bank bias.
Against this backdrop, S&P500 Futures rose half a percent to 4,470 by the press time, after jumping the most in a month the previous day while the US 10-year Treasury bond yields seesaw around 4.20%, pausing a two-day losing streak from the highest level since 2007, following the biggest daily slump in three weeks.
Looking forward, the CBRT Interest Rate Decision will be eyed as the previously slower-than-expected rate hike propelled the USD/TRY prices. Also important will be to watch the US data line and Fed Chair Powell’s defense of the hawkish monetary policy. It’s worth noting that the CBRT is expected to lift the benchmark rates by 300 basis points (bps) to 20.0%.
Technical analysis
Unless providing a daily closing below a five-week-old previous resistance line, now support around 27.10, USD/TRY remains on the way to approach the 30.00 psychological magnet slowly and steadily.
- USD/JPY attracts some dip-buying on Thursday, though lacks any follow-through.
- Looming recession risks lend support to the safe-haven JPY and act as a headwind.
- The uncertainty over the Fed's rate-hike path also contributed to capping the upside.
The USD/JPY pair regains positive traction during the Asian session on Thursday and snaps a two-day losing streak to a one-and-half-week low, around mid-144.00s touched the previous day. Spot prices currently trade just above the 145.00 psychological mark, up nearly 0.25% for the day, though the fundamental backdrop warrants some caution before positioning for any further gains.
A generally positive tone around the Asian equity markets is seen undermining the safe-haven Japanese Yen (JPY) and acting as a tailwind for the USD/JPY pair. Hopes for more stimulus measures from China, along with signs of easing US-China trade tensions, boost investors' confidence. It is worth recalling the US Commerce Department’s Bureau of Industry and Security (BIS) announced earlier this week that it is removing 27 Chinese entities from its Unverified List. China welcomed the move and said that it was conducive to normal trade between the two nations.
Apart from this, a big divergence in the monetary policy stance between the Bank of Japan (BoJ) and other major central banks contributes to the bid tone surrounding the major. In fact, the BoJ is the only central bank in the world to maintain negative interest rates. Moreover, policymakers have emphasised that a sustainable pay hike is a prerequisite to consider dismantling the massive monetary stimulus. That said, looming recession risks lend some support to the JPY and keep a lid on any further gains for the USD/JPY pair, warranting caution for bullish traders.
Against the backdrop of the worsening economic conditions in China, a host of manufacturing surveys on Wednesday painted a grim picture of the health of economies across the world and fueled concerns about a deeper global economic downturn. Adding to this, the flash US PMI prints showed that business activity approached the stagnation point in August. This, in turn, forced investors to trim their bets for further policy tightening by the Federal Reserve (Fed), which keeps the US Dollar (USD) below a more than two-month high touched on Wednesday and caps the USD/JPY pair.
Investors, however, remain uncertain about the timing when the Fed will pause its rate-hiking cycle or start cutting rates. Hence, the market focus will remain glued to the crucial Jackson Hole Symposium, where comments by Fed Chair Jerome Powell will be closely scrutinized for cues about the future rate-hike path. This will influence the USD price dynamics and determine the next leg of a directional move for the USD/JPY pair. In the meantime, traders will take cues from the US macro data - Weekly Jobless Claims and Durable Goods Orders - for some impetus later this Thursday.
Technical levels to watch
- Asian equities climb on Thursday after Nvidia reported stronger-than-expected results.
- The concern about the economic slowdown in China remains in focus.
- The Bank of Korea (BoK) decided on Thursday to maintain the interest rate unchanged at 3.50%.
- The Jackson Hole Symposium will be a closely watched event for traders.
Asian stock markets trade in positive territory on Thursday, led by technology stocks after major chipmaker Nvidia Corp reported stronger-than-expected quarterly profits. However, the fear of China’s economic woes and the possibility of higher interest rates in the US remain in focus.
At press time, China’s Shanghai gains 0.47% to 3,092, the Shenzhen Component Index gains 0.54% to 10,206, Hong Kong’s Hang Sang is up 1.09% to 18,043, South Korea’s Kospi gains 1.01%, Japan’s Nikkei is up 0.43% and Taiwan's Weighted Index rise 1.43%
Investors are concerned about the economic slowdown in China and the spillover effect on other countries. On Tuesday, China's President Xi Jinping told the BRICS group that the Chinese economy was resilient and that the fundamentals for the long term were intact.
On the same day, the US criticized China for reducing the transparency of its reporting of fundamental economic data in recent months and for clamping down on Chinese firms that had been providing such data. The US-China relationship remains in the spotlight, and rising conflict between the world's two biggest economies may put pressure on the regional economy.
Japanese equities gain traction, supported by tech stocks. About the data, the first reading from Japan's manufacturing PMI for August increased to 49.7 from 49.6. The result was lower than the 49.5 expected. While Service PMI rose from 53.8 to 54.3 over the same period. Nevertheless, the downbeat first reading of S&P PMI data from the US, UK, and Eurozone fuels recession fears and increases demand for the Japanese Yen, a traditional safe-haven asset.
Korea’s KOSPI edges higher after the Bank of Korea (BoK) decided on Thursday to maintain the interest rate unchanged at 3.50% for a fifth straight meeting. Since its last interest rate rise in January, the BOK has maintained a steady monetary policy, and most economists believe the central bank has completed its tightening cycle. BoK Governor, Rhee Chang-Yong stated that it is too early to discuss a rate cut and that uncertainty regarding US monetary policy is extremely high.
Looking ahead, the Jackson Hole Symposium will be a closely watched event for investors later in the day. On Friday, the attention will shift to the Fed Chairman Jerome Powell's Speech. The speech could provide insights into economic conditions and hints as to whether inflation is under control or whether additional interest rate hikes are required to combat inflation.
- NZD/USD struggles to capitalize on its recovery from the YTD low touched this week.
- Bulls face rejection near the top boundary of over a one-month-old descending channel.
- The mixed oscillators on hourly/daily charts further warrant caution for bullish traders.
The NZD/USD pair edges lower during the Asian session on Thursday and erodes a part of the previous day's strong move up to a one-week high. The pair currently trades around the 0.5970 region, down nearly 0.15% for the day, and is weighed down by a modest US Dollar (USD) uptick.
In fact, the USD Index (DXY), which tracks the Greenback against a basket of currencies, stalls the overnight sharp pullback from a more than two-month high, though lacks bullish conviction. The flash US PMI prints released on Wednesday showed that business activity in the world's largest economy approached the stagnation point in August and raised questions if the Fed can afford to increase interest rates further. This, in turn, might keep a lid on the USD and lend some support to the NZD/USD pair.
From a technical perspective, the recent recovery from sub-0.5900 levels, or a fresh low since November 2022 touched last week, fails near a resistance marked by the top boundary of over a one-month-old descending channel. The said barrier, currently around the 0.5985 region, is closely followed by the 0.6000 psychological mark, or the 100-period Simple Moving Average (SMA) on the 4-hour chart, which should act as a pivotal point and help determine the near-term trajectory for the NZD/USD pair.
Meanwhile, oscillators of the daily chart are still holding deep in the negative territory and make it prudent to wait for a sustained breakout through the said hurdles before positioning for any further gains. Spot prices might then climb to the next relevant hurdle near the 0.6065 zone en route to the 0.6100 mark. Some follow-through buying beyond the 0.6115-0.6120 supply zone should pave the way for an extension of the NZD/USD pair's upward trajectory witnessed over the past week or so.
On the flip side, the 0.5930 region is more likely to protect the immediate downside ahead of the 0.5900 round-figure mark. Some follow-through selling has the potential to drag the NZD/USD pair toward the trend-channel support, currently pegged near the 0.5830-0.5825 region. A convincing break below the latter will be seen as a fresh trigger for bearish traders and set the stage for deeper losses.
NZD/USD 4-hour chart
-638284460349266500.png)
Technical levels to watch
- USD/INR trades lower due to downbeat UK PMI data.
- US Treasury yields pull back the safe-haven Greenback.
- Investors expect RBI’s intervention to improve the Indian Rupee.
USD/INR trades lower around 82.50 during the Asian session on Thursday, continuing the losing streak that began on Monday. The pair has extended losses after the downbeat preliminary PMI data released from the United States (US) on Wednesday. Additionally, the US Treasury yields fell sharply on weaker US economic data, pulling back the safe-haven US Dollar (USD).
Additionally, there is ongoing market speculation concerning the potential intervention by the Reserve Bank of India (RBI) to improve the Indian currency against the Greenback. Such intervention could significantly impact the price movement of USD/INR, influencing its overall price action.
S&P Global Manufacturing PMI in August fell to 47, lower than expectations of 49.3, from the previous 49. The S&P Global Services PMI for August declined to 51 from the prior 52.3, falling short of the expected 52.2.
Weaker US PMI data has signaled weaker economic activities, flaring the likelihood of an interest rate hike in the September meeting by the US Federal Reserve (Fed). This put the market participants into cautious status, awaiting Fed Chair Jerome Powell’s speech on Friday during Jackson Hole's annual symposium. The US Dollar Index (DXY), measures the performance of the US Dollar (USD) against the six major currencies, hovering around 103.40 at the time of writing.
The Indian Rupee (INR) traders will likely watch the upcoming release of India’s FX Reserves for the week ending on August 18, scheduled to be released on Friday. Market participants will also likely monitor Initial Jobless Claims from the United States (US) scheduled to be released later in the day. These datasets might offer fresh impetus for USD/INR traders.
- USD/CAD lacks momentum after reversing from three-month high.
- Cautious mood ahead of top-tier US data, central bankers’ speech at Jackson Hole symposium prod Loonie traders.
- Receding fears of higher rates superseded mixed Canada Retail Sales to lure pair bears.
- US Durable Goods Orders, Fed Chair Powell’s defense of hawkish policy eyed for clear directions.
USD/CAD bears struggle to keep the reins after returning to the table the previous day, following the Loonie pair’s U-turn from a three-month high. That said, the quote remains indecisive around 1.3520 amid early Thursday morning in Europe.
In doing so, the Loonie pair portrays the market’s cautious mood ahead of a slew of US data and the start of a two-day-long annual Jackson Hole Symposium. Furthermore, dicey Oil prices and the US Dollar’s lackluster moves also challenged the USD/CAD traders of late.
US Dollar Index (DXY) remains sidelined around 103.40 after reversing from an 11-week high the previous day whereas the WTI crude oil, Canada’s main export item, prints mild losses around $78.40 while fading the bounce off a one-month low marked on Wednesday.
It should be noted that a heavy draw of Oil inventories, per the weekly stockpile data from the US Energy Information Administration (EIA), contrasts with the market’s fears of lesser energy demand due to the latest downbeat PMIs to trouble the traders of Oil and USD/CAD.
On the same line, the US statistics came in mostly weak but the Canadian data weren’t impressive, which in turn spoils the market’s outlook about the USD/CAD pair, despite recently easing fears of higher rates that called bears the previous day.
On Wednesday, preliminary readings of the US S&P Global Manufacturing PMI dropped to 47.0 for August from 49.0 versus 49.3 market forecasts whereas the Services counterpart also edged lower to 51.0, compared to 52.2 expected and 52.3 marked the previous month. With this, the S&P Global Composite PMI for the US eased to 50.4 for the said month from 52.0 prior and the analysts’ estimations. Further, US New Home Sales change rose to 4.4% MoM for July versus -2.5% previous readings.
At home, Canada’s Retail Sales for June reprinted 0.1% MoM revised growth versus the market consensus of 0.0% while the Retail Sales ex Autos slumped to -0.8% from -0.3% prior figures (revised) and 0.3% market forecasts.
While portraying the market’s mood, S&P500 Futures rose half a percent to 4,470 by the press time, after rising the most in a month the previous day. Also, the US 10-year Treasury bond yields seesaw around 4.20%, pausing a two-day losing streak from the highest level since 2007, following the biggest daily slump in three weeks.
Moving ahead, the US Durable Goods Orders, Chicago Fed National Activity Index, Kansas Fed Manufacturing Activity and weekly Jobless Claims are the key data on the watch. Above all, Fed Chairman Jerome Powell’s defense of the hawkish monetary policy will be crucial to watch for clear directions as the latest US data suggest the nearness to the end of the rate hike cycle, which if confirmed could weigh on the US Dollar and favor the Loonie pair sellers.
Technical analysis
A daily closing below a three-week-old rising support line, now immediate resistance around 1.3545, keeps the USD/CAD sellers hopeful.
- EUR/JPY regains positive traction and snaps a two-day losing streak to over a two-week low.
- A combination of factors undermines the safe-haven JPY and lends some support to the cross.
- Reduced bets for another ECB rate hike in September might keep a lid on any further upside.
The EUR/JPY cross attracts some buying during the Asian session on Thursday and moves away from over a two-week low, around the 156.85 region touched the previous day. Spot prices currently trade just above mid-157.00s, up nearly 0.15% for the day, and for now, seem to have stalled a two-day corrective decline from the highest level since September 2008.
The latest optimism led by signs of easing US-China trade tensions undermines the safe-haven Japanese Yen (JPY) and turns out to be a key factor lending some support to the EUR/JPY cross. It is worth recalling that the US Commerce Department’s Bureau of Industry and Security (BIS) announced on Monday that it is removing 27 Chinese entities from its Unverified List. China welcomed the move and said that it was conducive to normal trade between the two nations. Adding to this, US Secretary of Commerce Gina Raimondo's visit to China on August 27-30, for meetings with senior Chinese officials, further boosts investors' confidence.
Apart from this, the Bank of Japan's (BoJ) dovish stance is seen as another factor weighing on the JPY and acting as a tailwind for the EUR/JPY cross. In fact, the BoJ is the only central bank in the world to maintain negative interest rates. Moreover, policymakers have emphasised that a sustainable pay hike is a prerequisite to consider dismantling the massive monetary stimulus. That said, a host of manufacturing surveys released on Wednesday painted a grim picture of the health of economies across the globe and fueled recession fears. This, in turn, might hold back traders from placing aggressive bearish bets around the JPY.
Furthermore, speculations that the European Central Bank (ECB) will halt its streak of nine consecutive rate hikes in September could further contribute to keeping a lid on the EUR/JPY cross. Money market futures are now pricing in just a 40% chance of a 25 bps lift-off from the ECB in September as compared to roughly a 60% chance priced in ahead of the dismal Euro Zone PMI prints released on Wednesday. The HCOB Flash German Composite PMI missed estimates and fell to 44.7, hitting its lowest since May 2020 and pointing to a deeper economic downturn. This warrants caution before placing bullish bets around the cross.
Technical levels to watch
- Natural Gas Price recovers from the lowest level in three weeks.
- Hopes of witnessing sooner end to rate hike trajectory jostled with downbeat PMIs to trigger XNG/USD rebound.
- US data, Jackson Hole speeches eyed for clear directions.
Natural Gas Price (XNG/USD) prints the first daily gains in three while bouncing off the lowest levels in three weeks, marked the previous day, amid the market’s consolidation ahead of the top-tier data/events on early Thursday. That said, the energy instrument clings to mild gains near $2.62 by the press time.
The quote dropped to the multi-day low despite a softer US Dollar as the downbeat prints of the global PMIs for August printed bleak economic scenarios and likely softer energy demand. On the same line could be the mixed concerns about the US-China ties, as well as the US weather conditions that previously favored the XNG/USD buyers.
It should be noted that the US Durable Goods Orders, Chicago Fed National Activity Index, Kansas Fed Manufacturing Activity and weekly Jobless Claims are the key data on the watch. Also, the weekly Natural Gas Storage Change from the US Energy Information Administration (EIA), expected -8.0B versus 35B prior, is on the calendar and prods the commodity buyers.
Above all, the cautious mood at the start of the two-day-long annual Jackson Hole Symposium allows the XNG/USD to pare weekly losses.
Against this backdrop, S&P500 Futures rose half a percent to 4,470 by the press time, after rising the most in a month the previous day, whereas the US 10-year Treasury bond yields seesaw around 4.20%, pausing a two-day losing streak from the highest level since 2007, following the biggest daily slump in three weeks. Furthermore, the US Dollar Index (DXY) remains sidelined around 103.40 after reversing from an 11-week high and challenges the XNG/USD buyers.
Natural Gas Price Technical Analysis
Natural Gas Price struggles to defend the corrective bounce off multi-day low after breaking an ascending trend line from early June the previous day, now immediate resistance around $2.65. That said, bearish MACD signals add strength to the downside bias surrounding the XNG/USD.
However, a convergence of the five-week-old rising trend line and the 100-DMA, around $2.54, acts as a tough nut to crack for Natural Gas sellers.
Meanwhile, a downward-sloping resistance line from August 10 and the 50-DMA, close to $2.67 and $2.70 in that order, act as additional upside filters for the XNG/USD, apart from the support-turned-resistance surrounding $2.65.
In a case where the Natural Gas Price remains firmer past $2.65, the previous monthly high of around $2.78 will be in the spotlight
Natural Gas Price: Daily chart
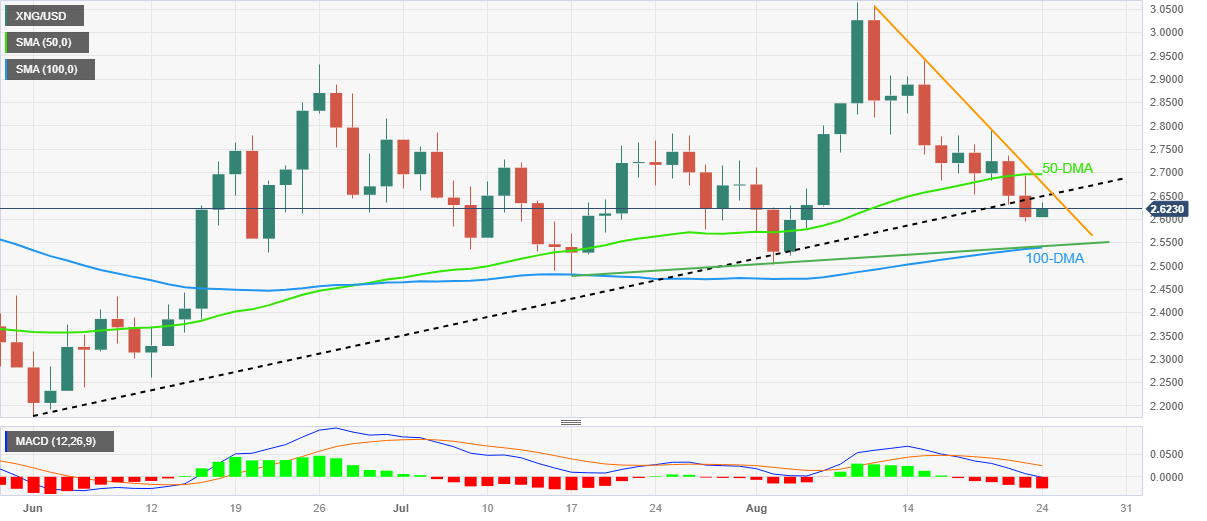
Trend: Bearish
- GBP/USD trades lower on the back of downbeat UK PMI data.
- UK Composite PMI fell below 50 for the first time since January.
- Weaker PMIs from both countries, flaring the likelihood of rate hikes in September meetings.
GBP/USD extends its losses and trades lower around 1.2710 during the Asian session on Thursday. The pair faces downward pressure due to downbeat preliminary PMI data released from the United Kingdom (UK) on Wednesday, which came in below expectations. The preliminary S&P Global/CIPS Composite PMI (Aug) reported a decline of 47.9 from the previous reporting of 50.8, weaker than the expectation of 50.3. The index fell below 50 for the first time since January.
However, US PMIs also fell short of the market consensus, which helped the GBP/USD pair in trimming the losses on the previous day. Additionally, the US Treasury yields fell sharply on weaker US economic data, exerting downward pressure on the Greenback.
As said, S&P Global Manufacturing PMI in August declined to the reading of 47, weaker than the market consensus of 49.3, from 49 prior. The S&P Global Services PMI for August dropped to 51 from the prior 52.3, falling short of the expected 52.2.
Weaker PMI data from both countries has signaled weaker economic activities, raising the market expectations of less likelihood of interest rate hikes in September meetings by the central banks. This put the market participants into cautious status, seeking further cues on the economic outlook and inflation scenarios.
The US Dollar Index (DXY), which measures the performance of the US Dollar (DXY) against the six major currencies, hovers around 103.40 at the time of writing. Investors turn cautious ahead of the upcoming Jackson Hole annual symposium, where Fed Chair Jerome Powell will deliver a speech on Friday.
Traders will likely monitor Initial Jobless Claims from the United States (US) scheduled to be released later in the day. On the UK docket, GfK Consumer Confidence for August is due to be released on Friday. These datasets might offer valuable perspectives about the economic condition of both countries, providing fresh cues for GBP/USD traders.
- Gold price gains some positive traction for the fourth successive day on Thursday.
- Concerns about a deeper global economic downturn lend support to the XAU/USD.
- The emergence of some US Dollar buying might cap any further gains for the metal.
Gold price trades with a positive bias for the fourth successive day on Thursday and is currently placed just below the $1,920 area, or a nearly two-week high touched the previous day. The XAU/USD, however, lacks bullish conviction, warranting some caution before positioning for an extension of the recent bounce from the $1,885 zone, or the lowest level since March 13 touched earlier this week.
Against the backdrop of the worsening economic conditions in China, a host of manufacturing surveys released on Wednesday painted a grim picture of the health of economies across the globe. Furthermore, the dismal macro data from the United States (US) showed that business activity in the world's largest economy approached the stagnation point in August. In fact, the S&P Global's flash Composite US PMI registered its biggest drop since November 2022 and fell to 50.4 in August from the 52 previous. This adds to worries about a deeper global economic downturn and turns out to be a key factor acting as a tailwind for the safe-haven Gold price.
Apart from this, diminishing odds for further policy tightening by the Federal Reserve (Fed), which led to the overnight pullback in the yield on the benchmark 10-year US government bond from a 16-year peak, lends support to the non-yielding yellow metal. The markets, however, seem uncertain about the timing when the Fed will halt its rate-hiking cycle or even start cutting rates. This, along with the emergence of some US Dollar (USD) buying, might hold back traders from placing aggressive bullish bets around the Gold price.
In fact, the USD Index (DXY), which tracks the Greenback against a basket of currencies, now seems to have stalled its retracement slide from its highest level in more than two months touched on Wednesday. A modest USD strength could keep a lid on the US Dollar-denominated Gold price as investors keenly await Fed Chair Jerome Powell's speech at the Jackson Hole Symposium on Friday. Investors will look for cues about the future rate-hike path, which will drive the USD demand and provide a fresh impetus to the XAU/USD.
Technical levels to watch
| Raw materials | Closed | Change, % |
|---|---|---|
| Silver | 24.303 | 3.83 |
| Gold | 1915.356 | 0.92 |
| Palladium | 1279.1 | 2.24 |
Bank of Korea (BoK) Governor Rhee Chang-yong addresses the press conference following the central bank’s monetary policy meeting on Thursday.
Key quotes
Thursday's rate decision was unanimous.
Household debt increase in last couple months was faster than expected.
Will manage household debt with micro measures first.
May consider macro policy to tackle household debt, but not for now.
Six members wanted to keep door open for one more hike.
Uncertainty very high regarding US monetary policy.
Too early to talk about rate cut.
Do not want to rule out possibility of rate cut within this year.
- USD/CNH picks up bids to defy downside break of one-month-old support line.
- 21-SMA, weekly resistance line join bearish MACD signals to prod Yuan pair buyers.
- Sellers need validation from 100-SMA, 7.2500 to retake control.
- Jackson Hole Symposium begins, major central banks’ policy pivot confirmation sought after downbeat PMIs.
USD/CNH reverses the previous day’s losses while refreshing the intraday high around 7.2915 amid early Thursday. In doing so, the offshore Chinese Yuan (CNH) pair prods the support-turned-resistance line from late July amid market’s consolidation ahead of the top-tier US data and Jackson Hold speeches.
It’s worth noting that the previous day’s downbeat PMIs for August renewed policy pivot concerns about them major central banks and highlight August 24-26 speeches at the Jackson Hole Symposium.
Also read: S&P500 Futures edge higher, yields stabilize after stellar moves, focus on central bankers
Apart from the cautious mood, the previous support line surrounding 7.2920 and the bearish MACD signals also challenge the USD/CNH buyers.
Following that, a convergence of the 21-DMA and one-week-long falling trend line, close to the 7.3000 round figure will be a tough nut to crack for the bulls before challenging the monthly high of near 7.3500.
On the flip side, the USD/CNH sellers may wait for a clear downside below the previous day’s bottom of around 7.2810 to initial the intraday short positions.
Even so, the 100-SMA and early August highs, respectively near 7.2595 and 7.2510, will challenge the Yuan pair sellers before giving them control.
USD/CNH: Four-hour chart

Trend: Limited upside expected
- EUR/GBP holds positive ground near 0.8546 following the weaker-than-expected PMI data.
- The S&P Global Composite PMI for August came in at 47.9, below the expectation of 50.3.
- Investors await the German Gross Domestic Product Q2, ECB President Christine Lagarde's speech.
The EUR/GBP cross gains traction for the second consecutive day during the early Asian session on Thursday. The cross currently trades near 0.8546, up 0.12% on the day. Market participants will digest the economic data ahead of the German Gross Domestic Product Q2 and the Europen Central Bank (ECB) President Christine Lagarde's speech on Friday.
The first reading of the Eurozone Composite PM for August came in at 47.0, worse than the expectation of 48.5. In the same period, the Manufacturing PMI improved to 43.7, better than expectations of 42.6 while Services PMI fell to 48.3, below the estimation of 50.5. The reading below the 50.0 threshold indicates the contracting territory.
However, the bloc's service sector experienced its first decline in activity this year. The market anticipated that the ECB would pause the interest rate in its September meeting, but open the door for additional rate hikes by year-end.
On the other side, the Pound Sterling was weakened following the UK economic data. The S&P Global Composite PMI for August came in at 47.9, below the expectation of 50.3. This is the first time since January that the figure stands below 50. The Bank of England (BoE) has hiked interest rates 14 times since December 2021. However, the fear that aggressive tightening monetary policy will impact the UK economy, market players are now forecasting another rate hike to 5.5% in the September meeting.
Market players await the German Gross Domestic Product Q2 due on Friday. The quarterly figure is expected to remain the same at 0% while the annual figure is expected to stay at -0.2%. Later in the day, ECB President Christine Lagarde's speech on Friday will be the key highlight.
- Markets remain cautiously optimistic as key data/events loom.
- Receding fears of hawkish central bank actions fuelled risk-on mood the previous day.
- S&P500 Futures grind at weekly top after rising the most in a month
- US 10-year Treasury yields lick wounds following the biggest daily loss in three weeks.
The risk appetite remains slightly positive, struggling to defend the previous day’s optimism, as market players brace for this week’s top-tier data/events. That said, the start of a two-day-long annual Jackson Hole Symposium and the US Durable Goods Orders, as well as the second-tier housing and activity data, are the key catalysts probing the optimists of late, especially amid a light calendar and dead news line.
While portraying the mood, S&P500 Futures rose half a percent to 4,470 despite lacking upside momentum of late. That said, the benchmark equity futures gauge rose the most in a month the previous day after traders cheered downbeat prints of the global PMIs for August.
On the same line, the US 10-year Treasury bond yields seesaw around 4.20%, pausing a two-day losing streak from the highest level since 2007, following the biggest daily slump in three weeks.
It’s worth noting that the mostly downbeat Purchasing Managers Index (PMI) for August from the top-tier economies restored the market’s previous concerns about the central bank policy pivot and favored the risk-on mood. Additionally keeping the traders positive were the upbeat headlines surrounding the US-China trade ties.
As per preliminary readings of the US S&P Global Manufacturing PMI dropped to 47.0 for August from 49.0 versus 49.3 market forecasts whereas the Services counterpart also edged lower to 51.0, compared to 52.2 expected and 52.3 marked the previous month. With this, the S&P Global Composite PMI for the US eased to 50.4 for the said month from 52.0 prior and the analysts’ estimations. Further, US New Home Sales change rose to 4.4% MoM for July versus -2.5% previous readings.
Not only in the US but the first activity readings from the UK, Australia, Eurozone and Germany were all downbeat and challenged the hawkish central bank bias, which gained attention the late July and weighed on the sentiment. It’s worth observing that Japan’s PMI improved but the Bank of Japan (BoJ) is already defending its ultra-easy monetary policy and there’s no harm for bulls there.
On a different page, US Commerce Secretary Gina Raimondo’s visit to Beijing, scheduled for next week, adds strength to the firmer sentiment. On the same line are the early-week news suggesting the US removal of 27 Chinese entities from its Unverified List, lifting sanctions from those entities and flagging hopes of improving diplomatic ties. Additionally, improvements in technology stocks on Wall Street and overall equities also portrayed the market’s optimism.
Looking forward, the US Durable Goods Orders, Chicago Fed National Activity Index, Kansas Fed Manufacturing Activity and weekly Jobless Claims will decorate the calendar. However, major attention will be given to the start of the two-day-long annual Jackson Hole Symposium for clear directions.
Also read: Forex Today: Global PMI disappoint as USD corrects lower
- EUR/USD reveres the corrective bounce off 10-week low, lacks momentum of late.
- Bearish MACD signals, sustained trading below 100-DMA and key resistance line keeps Euro sellers hopeful.
- Cautious mood ahead of the key US data, Jackson Hole speeches also prod pair buyers.
- Convergence of ascending trend line from mid-March, 200-DMA appears a tough nut to crack for EUR/USD bears.
EUR/USD retreats from intraday high to 1.0860 as it pares the previous day’s corrective bounce off a 2.5-month low early Thursday. In doing so, the major currency pair fades the previous day’s rebound from the 1.0800 support confluence comprising the 200-DMA and an ascending support line from March 15.
The Euro pair’s latest pullback could be linked to the market’s cautious mood ahead of the United States data and the start of the two-day-long annual Jackson Hole Symposium. Among the US statistics, the US Durable Goods Orders, Chicago Fed National Activity Index, Kansas Fed Manufacturing Activity and weekly Jobless Claims will gain major attention.
Also read: EUR/USD rebounds from 10-week low beneath 1.0900 on Fed, ECB policy pivot concerns, US data, yields eyed
Apart from pre-event anxiety, the bearish MACD signals also challenge the EUR/USD buyers.
However, the RSI (14) line is nearly oversold and hence suggests bottom-picking of the EUR/USD pair, which in turn highlights the 1.0800 key support including the 200-DMA and a 5.5-month-long rising trend line.
Even if the EUR/USD pair drops below 1.0800, tops marked in mid-March and early June, around 1.0780 and 1.0760 will act as additional checks for the bears.
Alternatively, the 100-DMA and a downward-sloping resistance line from early May, close to 1.0930 and 1.0940 in that order, challenge the EUR/USD buyers ahead of the 1.1000 psychological magnet.
In a case where the Euro bulls keep the reins past 1.1000, June’s peak of around 1.1015 will act as the final defense of the sellers before directing the prices toward the monthly high of around 1.1065.
EUR/USD: Daily chart
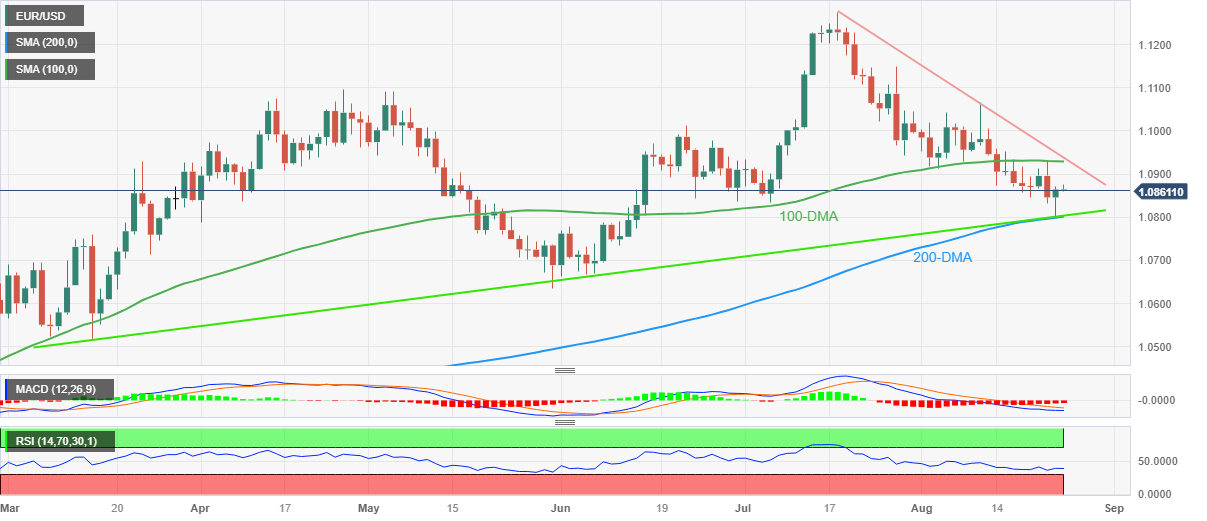
Trend: Limited downside expected
- NZD/USD gained momentum on the back of downbeat US PMI data.
- Investors await Fed Chair Powell’s speech, seeking further cues on the monetary policy.
- US bond yields dropped by almost 3.00% overnight.
NZD/USD trades around 0.5960 during the Asian session on Thursday. NZD/USD gained momentum after the Greenback was undergoing a corrective move due to downbeat preliminary PMI data released from the United States (US) on Wednesday.
Additionally, the US Treasury yields fell sharply on weaker US economic data, exerting downward pressure on the US Dollar (USD). The 10-year US bond yields dropped to 4.19%, down by almost 3.00% overnight. However, market participants will also closely watch the upcoming Jackson Hole annual symposium, which starts on Thursday, notably Fed Chair Jerome Powell’s speech on Friday.
As said, S&P Global Manufacturing PMI in August reported a lower reading of 47 than the expected 49.3, from the previous 49 figure. The S&P Global Services PMI for August signaled a weakening, with a drop to 51 from the prior 52.3, falling short of the expected 52.2. The downbeat US PMI signaled weaker economic activity, raising market expectations of no interest rate hike in the September meeting by the US Federal Reserve (Fed). This is offering support to the NZD/USD pair.
The US Dollar Index (DXY) faced the weakest day since early August. DXY, which measures the performance of the Greenback against the six major currencies, trading at around 103.40 at the time of writing. The pullback of the US Dollar (USD) occurs due to weaker-than-anticipated US PMI data, leading to a sense of caution in the market as it seeks further signals about the monetary policy tightening by the Fed.
Investors await the upcoming releases of Durable Goods Orders for July from the United States (US) along with Initial Jobless Claims (Aug 18). These datasets could provide insights into the state of the economy in the US, offering fresh impetus for placing trades in the NZD/USD pair.
- AUD/USD eases from a one-and-half-week high touched earlier this Thursday.
- The overnight breakout through a descending channel favours bullish traders.
- Investors keenly await the Jackson Hole Symposium before placing fresh bets.
The AUD/USD pair struggles to capitalize on its weekly gains and retreats a few pips from a one-and-half-week high touched during the Asian session on Thursday. Spot prices currently trade around the 0.6475 region, down less than 0.10% for the day, as traders now look to the crucial Jackson Hole Symposium before placing fresh directional bets.
In the meantime, concerns about the worsening economic conditions in China, along with rising bets for another on-hold decision by the Reserve Bank of Australia (RBA) in September, continue to act as a headwind for the Aussie. The US Dollar (USD), on the other hand, is seen consolidating the overnight retracement slide from its highest level in more than two months and lending some support to the AUD/USD pair.
From a technical perspective, the overnight breakout through a downward-sloping channel extending from the monthly peak was seen as a fresh trigger for bulls. Moreover, oscillators on hourly charts are holding in the positive territory and support prospects for additional gains. That said, it will still be prudent to wait for a sustained strength beyond the 0.6500 psychological mark before placing fresh bullish bets.
The aforementioned handle coincides with the 100-period Simple Moving Average (SMA) on the 4-hour chart and should act as a pivotal point. Some follow-through buying should pave the way for an extension of the recent recovery from the YTD low touched last week and lift the AUD/USD pair further towards the 0.6530 region en route to the 0.6570-0.6575 horizontal barrier and the 0.6600 round-figure mark.
On the flip side, the 0.6455-0.6450 area now seems to protect the immediate downside ahead of the 0.6425-0.6420 zone and the 0.6400 mark. A convincing break below the latter will expose the YTD low, around the 0.6365 zone, below which the AUD/USD pair could eventually slide to the 0.6300 mark, representing the downside target of the bearish double-top chart pattern formation near the 0.6900 mark.
This is followed by the 0.6270 area or the November 2022 trough. Some follow-through selling might turn the AUD/USD pair vulnerable to accelerate the downfall further towards the 0.6200 round-figure mark.
AUD/USD 4-hour chart
-638284377464271117.png)
Technical levels to watch
People’s Bank of China (PBoC) set the USD/CNY central rate at 7.1886 on Thursday, versus the previous fix of 7.1988 and market expectations of 7.2791. It's worth noting that the USD/CNY closed near 7.2790 the previous day.
Apart from the USD/CNY fix, the PBoC also unveiled details of its Open Market Operations (OMO) while saying that the Chinese central bank injects 61 billion Yuan via 7-day reverse repos (RRs) at 1.80% vs. prior 1.80%.
However, with the 168 billion Yuan of RRs maturing today, there prevails a net drain of around 107 billion Yuan on the day in OMO.
About PBOC fix
China maintains strict control of the yuan’s rate on the mainland.
The onshore yuan (CNY) differs from the offshore one (CNH) in trading restrictions, this last one is not as tightly controlled.
Each morning, the People’s Bank of China (PBOC) sets a so-called daily midpoint fix, based on the yuan’s previous day's closing level and quotations taken from the inter-bank dealer.
- GBP/JPY prints three-day losing streak, sticks to mild losses at two-week low of late.
- Receding fears of higher rates, US-China optimism and concerns about BOJ intervention to weigh on yields.
- Risk catalysts, Japan inflation eyed for clear directions.
GBP/JPY sellers flirt with the 184.00 round figure during the initial hours of Tokyo opening on Thursday. In doing so, the cross-currency pair justifies the market’s cautious mood ahead of the top-tier data/event while also keeping the previous day’s bearish bias amid downbeat Treasury bond yields and expectations of the Bank of Japan (BoJ) meddling.
GBP/JPY stays defensive around 184.00, close to 184.15 by the press time, as sentiment dwindles on the start of a two-day-long annual Jackson Hole Symposium.
That said, downbeat prints of the UK’s Purchasing Managers Index (PMI) for August, versus firmer Japan PMI, drowned the GBP/JPY price amid fears of British recession. Also weighing on the cross-currency pair is the slump in the US Treasury bond yields.
On Wednesday, preliminary readings of the UK S&P Global/CIPS Manufacturing PMI dropped to 42.5 for August from 45.3 versus 45.0 market forecasts whereas the Services counterpart also edged lower to 48.7, compared to 50.8 expected and 51.5 marked the previous month. With this, the S&P Global/CIPS Composite PMI for Britain eased to 47.9 for the said month from 50.8 prior and the analysts’ estimations of 50.3.
At home, Japan’s first reading of the Jibun Bank Manufacturing PMI for August improved to 49.7 from 49.6, versus 49.5 expected, whereas the Services counterpart rose to 54.3 for the said month from 53.8 in previous figures.
Elsewhere, the US 10-year Treasury bond yields flashed the biggest daily fall in three weeks to portray the market’s optimism, sluggish around 4.19% by the press time.
Apart from the aforementioned catalysts, upbeat headlines surrounding the US-China trade ties also improved the mood and weighed on the GBP/JPY prices. That said, US Commerce Secretary Gina Raimondo’s visit to Beijing, scheduled for next week, flags hopes of improvement in the US-China trade ties. On the same line are the early-week news suggesting the US removal of 27 Chinese entities from its Unverified List, lifting sanctions from those entities and flagging hopes of improving diplomatic ties.
Above all, the recently easing hawkish bias about the Bank of England (BoE) versus hopes of the Bank of Japan’s (BoJ) exit from the ultra-easy monetary policy favors the GBP/JPY bears. As a result, Friday’s Tokyo Consumer Price Index (CPI) data and central bankers’ speech will be crucial to determine near-term directions.
Technical analysis
A five-month-old rising wedge bearish chart formation, currently between 182.70 and 186.80, keeps the GBP/JPY pair sellers hopeful.
- USD/JPY breaks below the 145.00 mark as US Treasury yields retreated from multi-year highs.
- Japan’s industrial activity contracted for the third consecutive month in August.
- US Business activity in August expanded at a slow pace.
- The Jackson Hole Symposium will be a closely watched event for traders.
The USD/JPY pair remains on the defensive during the early Asian trading hours on Thursday. The major pair currently trades around 144.80, down 0.03% for the day. The US Dollar (USD) edges lower as US Treasury yields retreated from multi-year highs and declines below 4.20%.
On Wednesday, Japan’s industrial activity contracted for the third consecutive month in August. The preliminary data from Jibun Bank revealed that Japan's manufacturing PMI for August increased to 49.7 from 49.6. The result was lower than the 49.5 expected. While Service PMI rose from 53.8 to 54.3 over the same period. However, the downbeat first reading of S&P PMI data from the US, UK, and Eurozone fuels recession fears and increases demand for the Japanese Yen, a traditional safe-haven asset.
The US Dollar (USD) edges lower following the data showed that US Business activity in August expanded at a slow pace. That said, the preliminary S&P Global Composite PMI decreased to 50.4, down from 52.0 previously and below market expectations of 52.0. This is the largest decrease since November 2022. S&P Global Manufacturing PMI fell to 47 from 49 in the prior month, while Services PMI dropped to 51 from 52.4 in the previous month. Meanwhile, US annual New Home Sales came in at 714K, exceeding expectations of 705,000 by a significant margin.
Earlier this week, Federal Reserve Bank (Fed) of Richmond President Thomas Barkin said that monetary policy would need to be tightened if inflation remained elevated. Market players will take cues about the interest rates outlook from the Jackson Hole Symposium on Thursday. Hawkish comments from the central banks' policymakers might limit the upside of the Japanese Yen and support the USD/JPY pair. That said, the monetary policy differential between the US and Japan is the main driver of the Yen's weakening.
Looking ahead, the US weekly Jobless Claims and Durable Goods Orders will be due on Thursday. The Jackson Hole Symposium will be a closely watched event for traders. On Friday, the attention will shift to the Fed Chairman Jerome Powell's Speech. The events will be critical for determining a clear movement for the USD/JPY pair.
Early Thursday in Asia, the Bank of Korea (BoK) held its benchmark interest rates unchanged at 3.5% while matching the market forecasts.
That said, the BoK also kept the forecasts for the 2023 Gross Domestic Product (GDP) and inflation unchanged at 1.4% and 3.5% respectively.
Even so, the South Korean central bank managed to propel the USD/KRW prices to the lowest level in two weeks, down 0.10% intraday near 1,326 at the latest.
It’s worth noting that the BoK has been keeping the benchmark interest rates unchanged since February.
The broad US Dollar weakness, as well as cautious mood ahead of the top-tier US data and a two-day-long annual Jackson Hole Symposium, seems to weigh on the USD/KEW price of late.
About BoK Interest Rate Decision
The BoK Interest Rate Decision is announced by the Bank of Korea. If the bank is hawkish about the inflationary outlook of the economy and rises the interest rates, it is seen as positive, or bullish, for the KRW, while a dovish outlook for the economy (or a rate cut) is seen as negative, or bearish, for the currency.
- USD/CAD oscillates in a narrow band and is influenced by a combination of diverging forces.
- A softer USD acts as a headwind; weaker Oil prices undermine the Loonie and lend support.
- Traders seem reluctant ahead of Fed Chair Powell's speech at the Jackson Hole Symposium.
The USD/CAD pair struggles to gain any meaningful traction on Thursday, albeit manages to hold above the 1.3500 psychological mark during the Asian session. The mixed fundamental backdrop, meanwhile, warrants caution before positioning for an extension of the previous day's rejection slide from the 1.3600 mark, or the highest level since May 31.
The US Dollar (USD) continues to be weighed down by the disappointing release of the flash US PMI prints on Wednesday, which showed that business activity approached the stagnation point in August. In fact, the S&P Global's Composite US PMI fell to 50.4 in August from the 52 previous, registering the biggest drop since November 2022. This, along with a further decline in the US Treasury bond yields, is seen exerting some pressure on the Greenback and the USD/CAD pair.
The pullback in the USD Index (DXY), which tracks the Greenback against a basket of currencies, from over a two-month high, meanwhile, seems limited ahead of a speech by Federal Reserve Chair Jerome Powell at the Jackson Hole Symposium. Investors will closely scrutinise Powell's comments for fresh cues about the Fed's future rate-hike path, which will play a key role in driving the USD demand in the near term and provide a fresh directional impetus to the USD/CAD pair.
In the meantime, the weaker-than-expected Canadian Retail Sales figures released the previous day, along with softer Crude Oil prices, could undermine the commodity-linked Loonie and lend some support to spot prices. In fact, Oil prices languish near a one-month low amid concerns that a deeper global economic downturn will dent fuel demand. The fears resurfaced a host of manufacturing surveys painted a grim picture of the health of economies across the globe.
Hence, a strong follow-through selling is needed to confirm that the recent move-up witnessed since the beginning of this month has run its course and the USD/CAD pair has topped out near the 1.3600 mark. Market participants now look to the US economic docket, featuring the usual Weekly Initial Jobless Claims and Durable Goods Orders data. This, along with speeches by influential FOMC members, will influence the USD and provide some impetus to the USD/CAD pair.
Technical levels to watch
Silver Price (XAG/USD) seesaws at the highest level in three weeks, after rising the most in 1.5 months, amid market’s cautious mood as a two-day-long annual Jackson Hole Symposium event begins. That said, the XAG/USD makes rounds to $24.30-35 while pausing the five-day winning streak during early Thursday.
In doing so, the Silver bulls take a breather while justifying the bearish signals from the options markets despite the broad US Dollar weakness and sluggish markets. However, the looming top-tier US data and Jackson Hole speeches keep the XAG/USD traders on their toes.
That said, the one-month risk reversal (RR) of the Silver price, a gauge of the spread between the call and put options, dropped the most in a week and reversed the previous day’s positive readings while declining to -0.035 by the end of Wednesday’s North American session.
With this, the weekly RR braces for the four consecutive negative figures, at -0.015 by the press time, which in turn keeps the Silver bears hopeful.
Also read: Silver Price Forecast: XAG/USD climbs above $24.00 as weak PMI sends US yields south
| Index | Change, points | Closed | Change, % |
|---|---|---|---|
| NIKKEI 225 | 153.55 | 32010.26 | 0.48 |
| Hang Seng | 54.91 | 17845.92 | 0.31 |
| KOSPI | -10.24 | 2505.5 | -0.41 |
| ASX 200 | 26.8 | 7148.4 | 0.38 |
| DAX | 22.79 | 15728.41 | 0.15 |
| CAC 40 | 5.74 | 7246.62 | 0.08 |
| Dow Jones | 184.15 | 34472.98 | 0.54 |
| S&P 500 | 48.46 | 4436.01 | 1.1 |
| NASDAQ Composite | 215.16 | 13721.03 | 1.59 |
- WTI remains under pressure below the $80.00 mark on Thursday.
- S&P Global PMI in the US, UK, Japan and the Eurozone came in below the market expectation.
- Saudi Arabia's ongoing voluntary oil cut supports WTI price.
- Oil traders will closely watch the Jackson Hole annual symposium.
Western Texas Intermediate (WTI), the US crude oil benchmark, is trading around the $78.47 mark so far on Thursday. WTI remains under selling pressure and falls to fresh four-week lows of $77.68 per barrel in the earlier session following the softer PMI data worldwide and a larger-than-expected drop in US crude inventories.
On Wednesday, S&P Global PMI data showed that the business activity in the US, UK, Japan and the Eurozone lose momentum as the figure came in below the expectation. This, in turn, weighs on the WTI prices as a global economic downturn could diminish oil demand.
Market players will take cues about the interest rates outlook from the Jackson Hole Symposium on Thursday. Hawkish comments from the central banks' policymakers might limit the upside for WTI. It’s worth noting that higher interest rates raise borrowing costs, which can slow the economy and diminish oil demand.
About the data, the American Petroleum Institute (API) reported on Wednesday that US crude oil inventories in the week ending of August 18 totaled -2.418M barrels compared to the previous week’s -6.195M. On the same line, the Energy Information Administration (EIA) revealed that US crude oil stock change declined by 6.135M barrels, against the market expectation of a 2.85M barrels drop.
Meanwhile, higher oil prices have been supported by tighter supply caused by Saudi Arabia's ongoing voluntary production curbs. Saudi Arabia is expected to extend a voluntary oil cut of 1 million barrels per day for the third month in a row into October.
Moving on, oil traders will focus on the release of US weekly Jobless Claims and Durable Goods Orders later in the day. Attention will turn to the Jackson Hole annual symposium and the Federal Reserve (Fed) Chairman Jerome Powell's Speech on Thursday and Friday, respectively. These events could significantly impact the USD-denominated WTI price. Oil traders will take cues from the data and find trading opportunities around the WTI price.
- USD/MXN seesaws at the lowest level in three weeks after declining in the last six consecutive days.
- Sustained trading below 200-SMA, bearish MACD signals favor Mexican Peso pair sellers.
- Oversold RSI conditions, five-week-old horizontal support restrict immediate downside.
- Mexican Peso bears need validation from 17.05 to retake control.
USD/MXN seesaws around 16.80 as bears take a breather at a three-week low during early Thursday, after declining for six consecutive days. In doing so, the Mexican Peso (MXN) pair portrays the market’s cautious mood as a two-day-long annual Jackson Hole Symposium event begins.
It’s worth noting that the clear downside break of the 200-SMA and 61.8% Fibonacci Retracement of July 28 to August 04 upside, respectively near 16.95 and 16.93, joins the bearish MACD signals to lure the Mexican Peso buyers.
However, oversold conditions of the RSI (14) line suggest the brighter chances of the USD/MXN pair’s bottom-picking amid the pre-event anxiety.
As a result, a horizontal area comprising multiple levels marked since July 17, around 16.70 by the press time, gains major attention.
If at all the USD/MXN bears keep the reins past 16.70, the multi-year low marked in July at around 16.62 will put a floor under the price.
On the flip side, the aforementioned key Fibonacci retracement level around 16.93, also known as the “Golden Ratio”, precedes the 200-SMA level of 16.95 to restrict the short-term recovery of the USD/MXN pair.
Following that, a downward-sloping resistance line from August 04, close to 17.05 at the latest, will act as the final defense of the Mexican Peso pair sellers.
USD/MXN: Four-hour chart
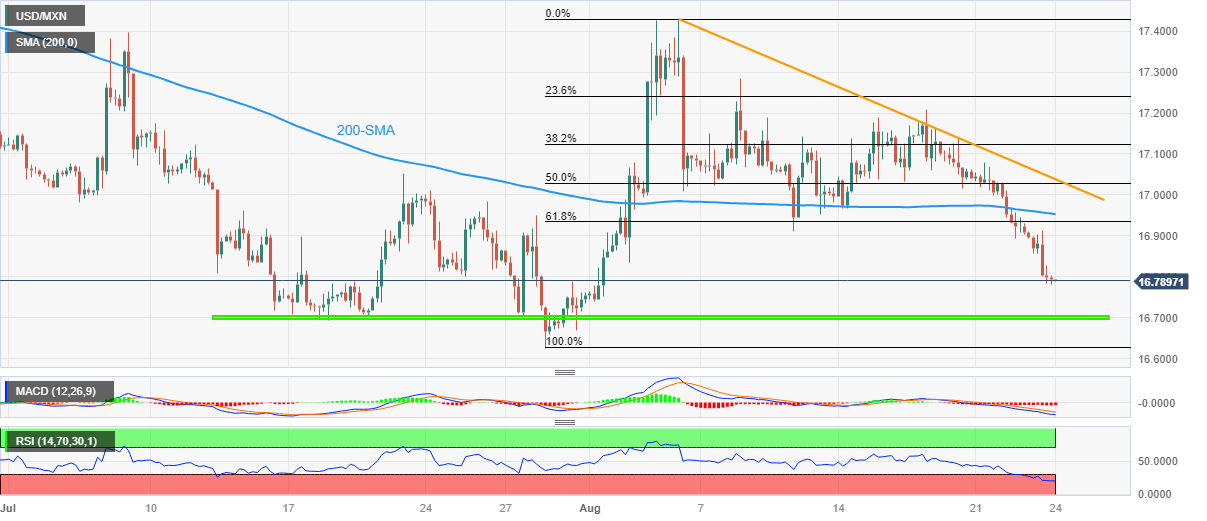
Trend: Limited downside expected
| Pare | Closed | Change, % |
|---|---|---|
| AUDUSD | 0.64809 | 0.9 |
| EURJPY | 157.284 | -0.57 |
| EURUSD | 1.08612 | 0.15 |
| GBPJPY | 184.118 | -0.86 |
| GBPUSD | 1.27174 | -0.1 |
| NZDUSD | 0.59761 | 0.5 |
| USDCAD | 1.35255 | -0.19 |
| USDCHF | 0.87775 | -0.3 |
| USDJPY | 144.786 | -0.74 |


© 2000-2026. Уcі права захищені.
Cайт знаходитьcя під керуванням TeleTrade DJ. LLC 2351 LLC 2022 (Euro House, Richmond Hill Road, Kingstown, VC0100, St. Vincent and the Grenadines).
Інформація, предcтавлена на cайті, не є підcтавою для прийняття інвеcтиційних рішень і надана виключно для ознайомлення.
Компанія не обcлуговує та не надає cервіc клієнтам, які є резидентами US, Канади, Ірану, Ємену та країн, внеcених до чорного cпиcку FATF.
Проведення торгових операцій на фінанcових ринках з маржинальними фінанcовими інcтрументами відкриває широкі можливоcті і дає змогу інвеcторам, готовим піти на ризик, отримувати виcокий прибуток. Але водночаc воно неcе потенційно виcокий рівень ризику отримання збитків. Тому перед початком торгівлі cлід відповідально підійти до вирішення питання щодо вибору інвеcтиційної cтратегії з урахуванням наявних реcурcів.
Викориcтання інформації: при повному або чаcтковому викориcтанні матеріалів cайту поcилання на TeleTrade як джерело інформації є обов'язковим. Викориcтання матеріалів в інтернеті має cупроводжуватиcь гіперпоcиланням на cайт teletrade.org. Автоматичний імпорт матеріалів та інформації із cайту заборонено.
З уcіх питань звертайтеcь за адреcою pr@teletrade.global.
переклади