- Аналітика
- Новини та інструменти
- Новини ринків
Новини ринків
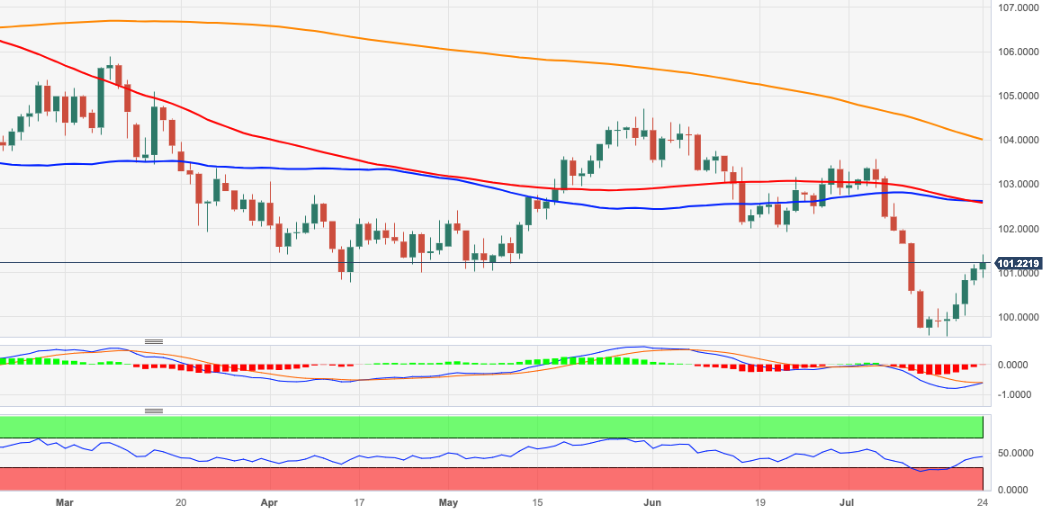
- US Dollar Index bulls pause at the highest levels in fortnight after the five-day winning streak.
- Comparatively better US PMI keeps Fed hawks hopeful despite looming fears of policy pivot.
- Upbeat sentiment adds strength to US Treasury bond yields and propels DXY ahead of second-tier US data.
- US CB Consumer Confidence for July eyed ahead of the all-important Fed Interest Rate Decision.
US Dollar Index (DXY) clings to the highest levels in two weeks, making rounds to 101.45-40 during the initial hours of Tuesday’s Asian session. In doing so, the greenback’s gauge versus the six major currencies seeks fresh to extend the five-day uptrend while waiting for the US CB Consumer Confidence for July and Wednesday’s Federal Open Market Committee (FOMC) monetary policy meeting announcements.
That said, the DXY refreshed a multi-day high the previous day despite marking unimpressive data as the preliminary readings of the US S&P Global PMIs for July were comparatively better than other major economies including the UK, Eurozone, Australia and Japan. Adding strength to the US Dollar’s run-up were upbeat US Treasury bond yields and the market’s preparations for the Fed monetary policy updates.
On Monday, the first readings of the US S&P Global Manufacturing PMI for July improved to 49.0 from 46.3 prior and 46.4 market forecasts while the Services PMI eased to 52.4 versus 54.0 expected and 54.4 previous readings. With this, the Composite PMI edged lower to 52.0 from 53.2 prior and 53.1 market forecasts. That said, Chicago Fed National Activity Index for June slid to -0.32 from -0.28 prior (revised) and 0.03 market forecasts.
Elsewhere, the manufacturing activity data from Eurozone and Germany dropped to the lowest levels since 2020 while the PMIs from the UK, Australia and Japan were also suggesting fears of easy economic activities. The same challenged hawkish bias about the major central banks and weighed on the respective currencies versus the US Dollar. Though, the risk-on mood allowed the Australian Dollar (AUD) to battle against the greenback.
That said, Wall Street closed on the positive side while the US 10-year and two-year Treasury bond yields rose to the highest levels in two weeks, firmer around 3.88% and 4.92% by the press time.
It’s worth observing that the last week’s upbeat prints of the US Retail Sales Group for June superseded the downbeat US housing and activity data to underpin the US Dollar’s rebound from the lowest levels in 15 months. Even so, the previously released US employment and inflation clues have been downbeat and flag fears of the Federal Reserve’s (Fed) policy pivot past July, which in turn prod the greenback bulls of late.
Moving on, the US CB Consumer Confidence for July, expected 112.1 versus 109.70 prior, will entertain the DXY traders ahead of the key Fed decision day.
Also read: Federal Reserve Preview: Powell can play three distinct cards, each with a different US Dollar move
Technical analysis
Successful trading beyond the support-turned-resistance area comprising multiple lows marked since February, around 100.80, allows the US Dollar Index (DXY) bulls to remain hopeful of visiting the previous support line stretched from mid-April, close to 102.45 at the latest.
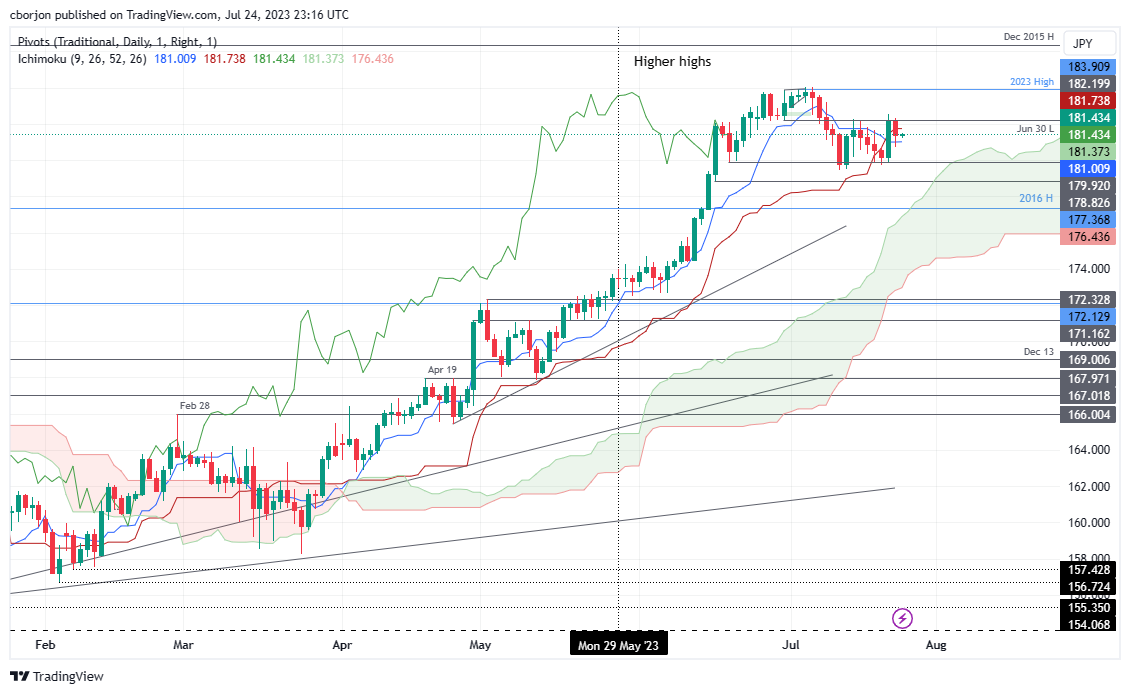
- The daily chart suggests a fading buying pressure and possible sellers' entry, even as the GBP/JPY maintains an upward bias.
- GBP/JPY bearish crossover of the Tenkan-Sen and the Kijun-Sen and the Chikou-Span line crossing below price action point towards potential bearish activity.
- For GBP/JPY to turn bullish, the pair must reclaim the 182.00 level.
On Monday, the GBP/JPY faced barricades at around 182.30s and dropped below the 182.00 psychological level amid a risk-on impulse. Still, economic data from the United Kingdom (UK) weakened the Pound Sterling (GBP), which printed losses against most G8 FX currencies. As the Asian session begins, the GBP/JPY is trading at 181.41, posting minuscule gains of 0.02%.
GBP/JPY Price Analysis: Technical outlook
From a daily chart standpoint, the GBP/JPY is upward biased, though a bearish crossover of the Tenkan-Sen below the Kijun-Sen, suggests that buying pressure is fading, and sellers are stepping in. At the same time, the Chikou-Span line at 181.40, is crossing below the price action, another bearish signal. Yet the GBP/JPY is still trending up, as the Ichimoku Cloud (Kumo) remains below price action.
Nevertheless, the GBP/JPY might be subject to a pullback in the near term. In that scenario, the GBP/JPY first support would be the Tenkan-Sen at 181.00. A breach of the latter will expose the June 20 low of 179.92, followed by the July 20 daily low of 179.73, ahead of the June 12 low of 179.46, ahead of diving towards.
For a bullish resumption, the GBP/JPY must claim 182.00. Once done, the next resistance would emerge at the psychological 183.00 area before the year-to-date (YTD) high of 183.90.
GBP/JPY Price Action – Daily chart
- GBP/USD holds lower grounds at two-week low after declining in the last seven consecutive days.
- Clear downside break of multi-day-old ascending trend line, downbeat oscillators favor Cable sellers.
- Convergence of 50-DMA, support line of bullish channel prods Pound Sterling bears amid light calendar at home.
GBP/USD bears keep the reins for the eighth consecutive day despite making rounds to 1.2810-20 amid early hours of Tuesday’s Asian session. In doing so, the Cable pair prods an upward-sloping support line stretched from early June while staying within a nearly five-month-old bullish channel. Apart from the immediate support line, a light calendar in the UK and a cautious mood ahead of Wednesday’s Federal Reserve (Fed) monetary policy meeting also prods the Pound Sterling traders.
Also read: GBP/USD suffers seven-day slide amid weak UK PMIs, ahead of FOMC's decision
That said, the GBP/USD pair’s reversal from a 15-month high during the mid-July broke an upward-sloping support line from May 08, which in turn joins the bearish MACD signals and steady RSI (14) line to keep the sellers hopeful of breaking the immediate support line near 1.2800.
However, the 50-DMA and bottom line of the aforementioned bullish channel together offers a tough nut to crack for the GBP/USD bears around 1.2670.
Following that, the late June swing low of 1.2590 and the previous monthly bottom surrounding 1.2370 will be in the spotlight.
On the contrary, GBP/USD recovery needs validation from June’s peak of around 1.2850 before challenging the multi-day-old previous support line stretched from early May, close to 1.3030 at the latest.
In a case where the Pound Sterling remains firmer past 1.3030, the odds of witnessing a rally toward crossing the latest multi-month peak of around 1.3145 can’t be ruled out. In doing so, the GBP/USD bulls may aim for the top line of the bullish channel, around 1.3200 by the press time.
GBP/USD: Daily chart
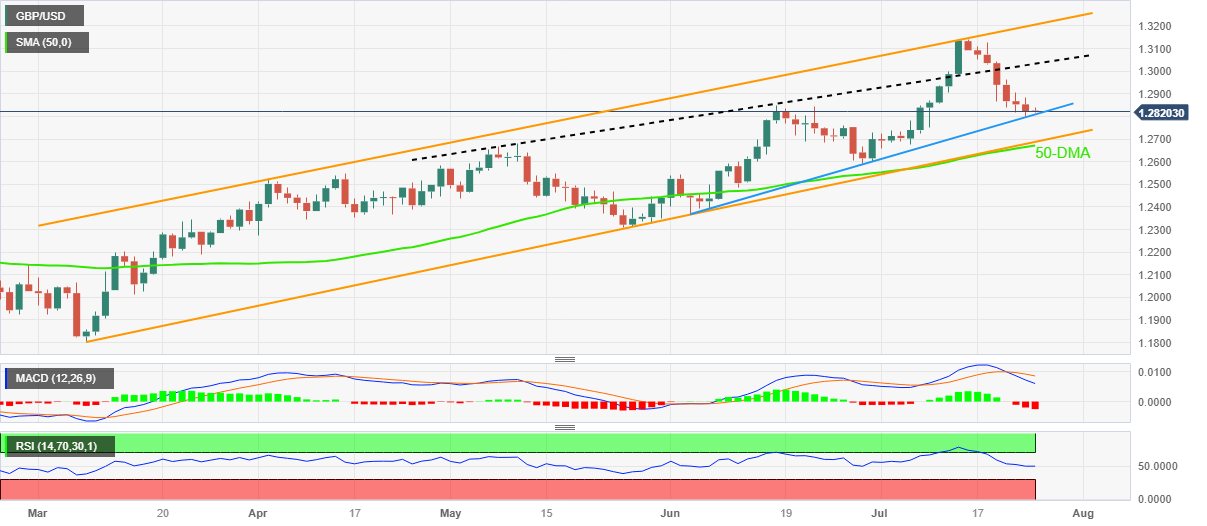
Trend: Limited downside expected
- NZD/USD oscillates in a range just above the 0.6200 area during the early Asian session on Tuesday.
- Market anticipated that the Federal Reserve (Fed) will hike rates by 25 basis points (bps) to 5.25–5.50%.
- Market participants will also focus on US, China developments.
The NZD/USD pair consolidates in a narrow range above the 0.6200 area in the early Asian session. The market seems cautious ahead of the Federal Open Market Committee (FOMC) meeting.
The US S&P Global Composite PMI for July showed weaker-than-expected data. The figure fell to 52 from 53.2, versus 53.1 expected. Meanwhile, the S&P Global Manufacturing PMI improved to 49 from 46.3, and the Services PMI declined to 52.4 from 54.4. The data failed to lift the US Dollar against the Kiwi (NZD), which gained momentum during the day.
The Federal Reserve (Fed) will announce the outcome of its monetary policy meeting on Wednesday. According to the CME Group FedWatch tool, it is widely anticipated that the Fed will increase interest rates by 25 basis points (bps) to 5.25–5.50%.
On Monday, Statistics New Zealand reported that New Zealand's Trade Balance in June decreased to $9M MoM from $52M previously (revised). The annual trade deficit decreased to $15.98B for the same month from $-17.12B previously (revised from $-15.64B). Additionally, Exports for June declined to $6.31B compared to $6.97B (revised) previously, while imports fell to $6.3B from $6.91B prior.
A lack of economic data released from New Zealand later this week has left market participants taking cues from US and China developments. China's top leaders signaled additional support for the real estate sector and a series of measures to stimulate consumption.
Market participants will keep an eye on the FOMC meeting and Fed Chairman Jerome Powell's press conference. Apart from this, traders will take cues from US CB Consumer Confidence, Advance GDP QoQ, and the Fed’s preferred measure of inflation, the core Personal Consumption Expenditure (PCE) Price Index MoM. These events could significantly impact the US Dollar's dynamic and give the NZD/USD pair a clear direction.
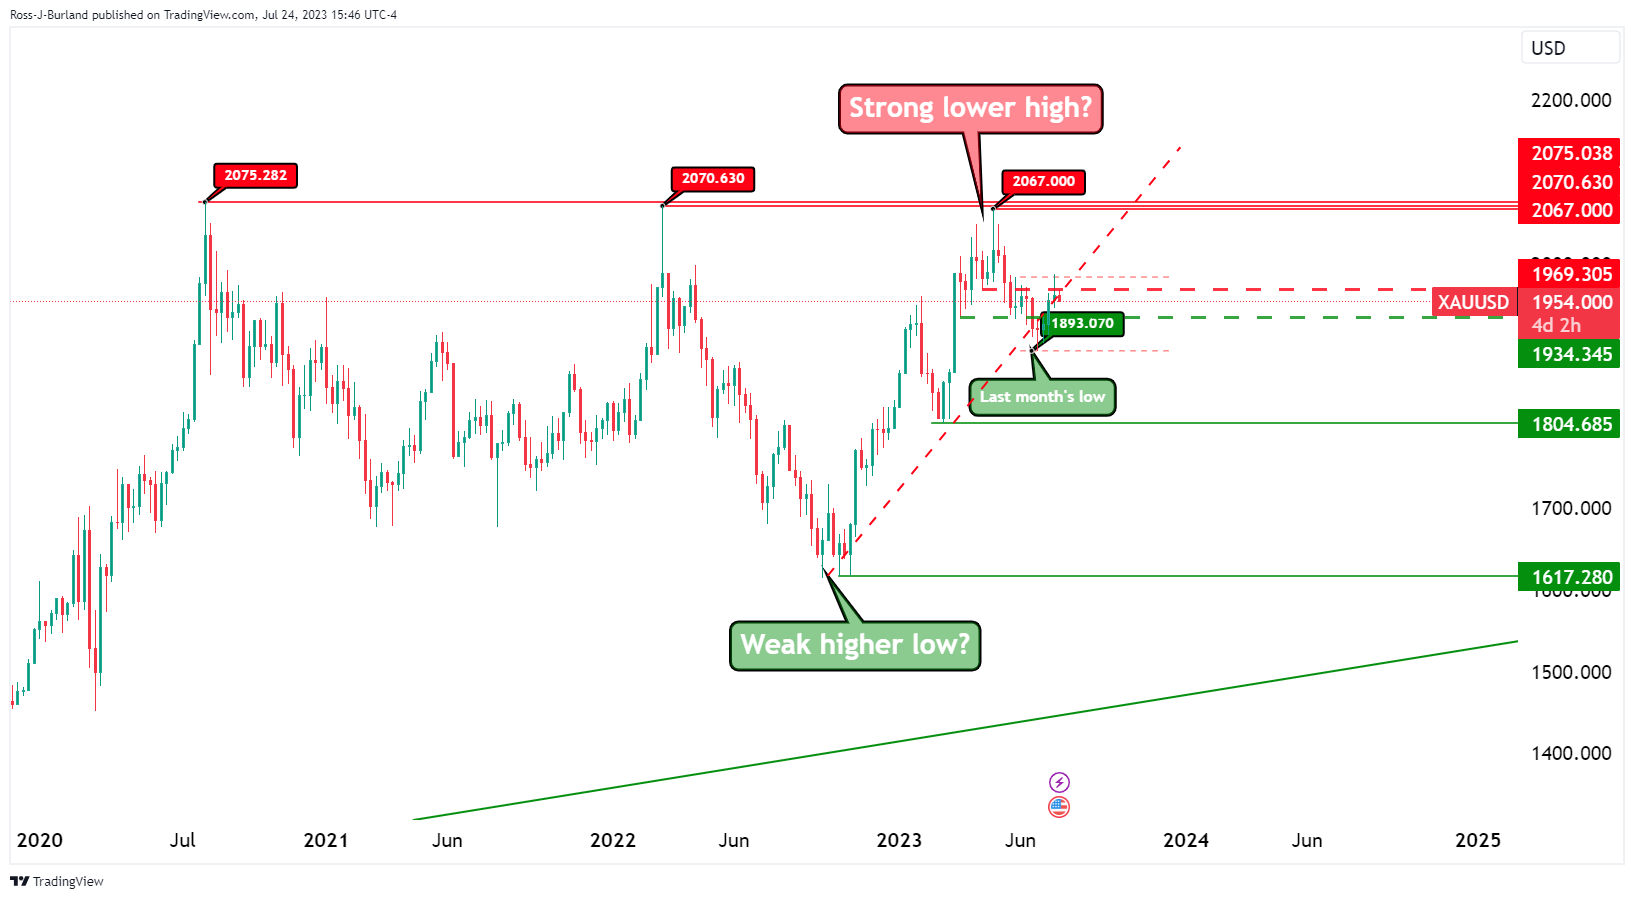
- Gold Price remains on the back foot after four-day downtrend, bears cheer 100-DMA break.
- XAU/USD slides on comparatively better United States data, downbeat statistics from UK, Eurozone also add strength to US Dollar.
- Federal Reserve concerns appear dicey as July rate hike is almost given but policy pivot looms too.
- US Consumer Confidence will entertain intraday Gold traders, Wednesday’s Fed verdict is the key.
Gold Price (XAU/USD) holds lower ground near $1,955, extending reversal from a 10-week-old horizontal resistance after a four-day downtrend amid early trading hours of Tuesday’s Asian session. In doing so, the XAU/USD takes clues from the comparatively upbeat US data while ignoring upbeat sentiment and hopes of witnessing a sooner end to the tightening cycle at the major central banks.
Gold Price stays depressed as United States data favor US Dollar bulls
Gold Price stays on the back foot for the fifth consecutive day despite the latest inaction at the lowest level in a week. In doing so, the XAU/USD cheers comparatively better US PMI data versus the activity numbers from the UK, Eurozone and Australia.
That said, the preliminary readings of the US S&P Global Manufacturing PMI for July improved to 49.0 from 46.3 prior and 46.4 market forecasts while the Services PMI eased to 52.4 versus 54.0 expected and 54.4 previous readings. With this, the Composite PMI edged lower to 52.0 from 53.2 prior and 53.1 market forecasts. That said, Chicago Fed National Activity Index for June slid to -0.32 from -0.28 prior (revised) and 0.03 market forecasts.
During the last week, upbeat prints of the US Retail Sales Group for June superseded the downbeat US housing and activity data to underpin the US Dollar’s rebound from the lowest levels in 15 months. However, the previously released US employment and inflation clues have been downbeat and flag fears of the Federal Reserve’s (Fed) policy pivot past July, which in turn prod the greenback bulls of late.
On the other hand, the first readings of the Eurozone HCOB Manufacturing PMI slumped to the lowest level since May 2020, to 42.7 for July from 43.4 prior and versus 43.5 market forecasts. On the same line, German HCOB Manufacturing PMI also dropped to the 38-month low while Services and Composite PMIs declined below the market expectations and previous readings for July.
Furthermore, the preliminary readings of the UK S&P Global/CIPS Manufacturing PMI for July dropped to the lowest level of 2023 whereas Australia’s preliminary S&P Global Manufacturing PMI for July improved to 49.6 from 48.2 prior but the Services PMI drops below 50.0 level to 48.0 versus 50.3 prior, suggesting a contraction in the activities. Hence, the US PMIs are comparatively upbeat and hence underpin the US Dollar’s run-up for the fifth consecutive day despite posting unimpressive data. That said, the US Dollar Index (DXY) rose for the fifth consecutive day to refresh the highest levels in nearly a fortnight while the Euro dropped across the board, which in turn weighed on the Gold Price.
Mixed headlines about China also weigh on XAU/USD price
While the US data allows the US Dollar to edge higher and weigh on the Gold Price, hopes of witnessing a sooner end to the major central banks’ restrictive monetary policies put a floor under the XAU/USD. Not only the policy pivot chatters but headlines about China also defend the market optimists and prod the Gold bears. That said, the Chinese media conveyed details of the Communist Party's Politburo meeting on Monday that cited new difficulties and challenges for the economy while also showing the policymakers’ readiness for prudent monetary and fiscal policies. Before that, China state planner National Development and Reform Commission (NDRC) issued a notice to promote the high-quality development of private investment. That said, NDRC also pledged encouragement of participation in some projects of transport, water and clean energy, as well as in new infrastructure and modern agriculture.
US CB Consumer Confidence may entertain Gold buyers before Fed decision
While the PMIs join China data to keep the Gold sellers hopeful amid a sluggish start to the likely unimpressive day, mainly due to the light calendar, the XAU/USD bears may keep the reins amid a broadly firmer US Dollar. However, Germany’s IFO Survey details for July and the US CB Consumer Confidence for the said month will entertain the Gold traders for the day. Even so, major attention will be given to Wednesday’s Fed monetary policy meeting and Thursday’s ECB announcements for clear directions.
Also read: Federal Reserve Preview: Powell can play three distinct cards, each with a different US Dollar move
Gold Price Technical Analysis
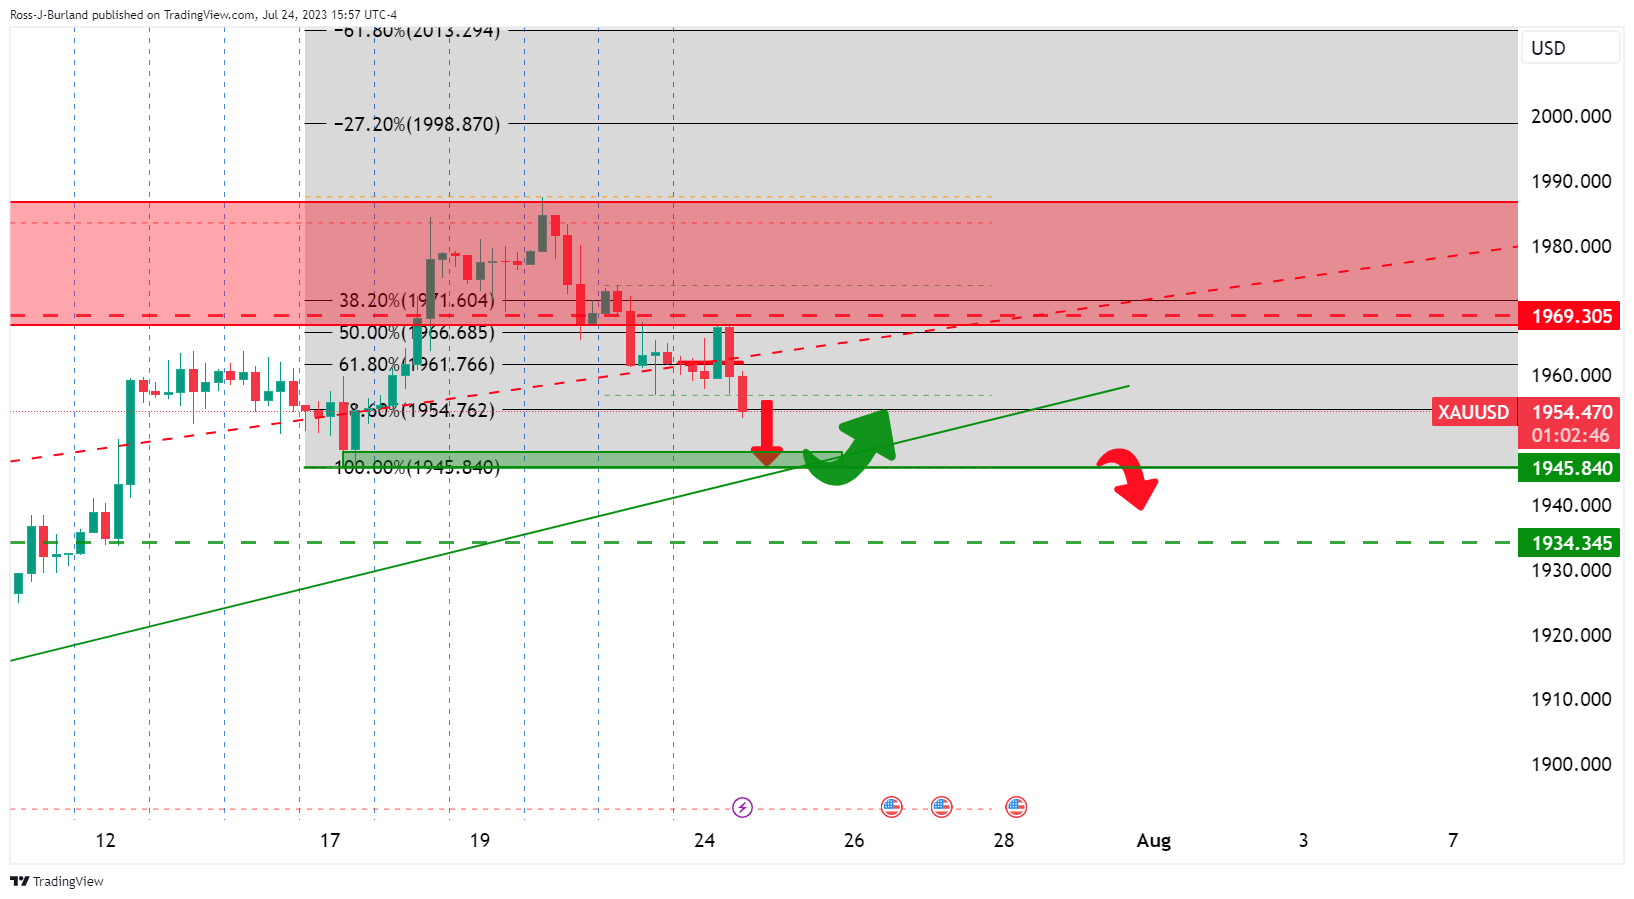
A clear reversal from the 10-week-old horizontal resistance joins the Relative Strength Index (RSI) line’s retreat, placed at 14, to defend the Gold sellers. Adding strength to the downside bias about the XAU/USD is the metal’s latest break of the 100-DMA support, now immediate resistance of around $1,962.
With this, the Gold Price is likely to decline further toward the 50-DMA support of around $1,947. However, a horizontal area comprising multiple levels marked since mid-March, around $1,935-33, will challenge the bears afterward.
In a case where the XAU/USD bears keep the reins past $1,933, a convergence of an upward-sloping trend line from late February and the 61.8% Fibonacci retracement of February-May upside, also known as the golden Fibonacci ratio, of around $1,910 will act as the last defense of the Gold buyers.
On the contrary, a daily closing beyond the 100-DMA of around $1,962 will allow the Gold buyers to challenge the aforementioned horizontal resistance surrounding $1,985.
Following that, the $2,000 psychological magnet and April’s high surrounding $2,050 could lure the XAU/USD bulls.
Overall, the Gold bears are tightening their grips but the conviction remains pending unless the quote stays beyond $1,910.
Gold Price: Daily chart
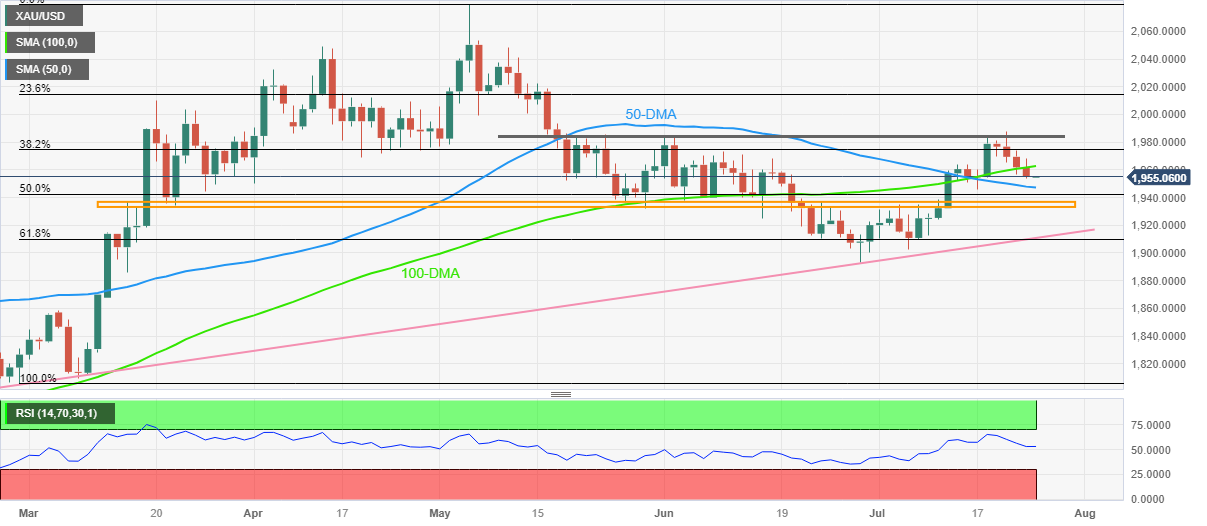
Trend: Further downside expected
- EUR/USD remains sidelined at the lowest level in two weeks after five-day downtrend.
- Eurozone, German PMI for July disappointed Euro bulls as manufacturing gauge slumped to multi-month low.
- Comparatively better US PMI, market’s fears of ECB policy pivot weigh on EUR/USD but upbeat sentiment tests the bears.
- ECB Bank Lending Survey, Germany’s IFO data and US CB Consumer Confidence will entertain traders.
EUR/USD holds lower grounds near 1.1065 after falling in the last five consecutive days to a fresh two-week low, mostly sidelined amid the early hours of Tuesday’s Asian session. That said, the Euro pair dropped the previous day as the monthly PMIs from the Eurozone and Germany bolstered the market’s fears of the economic slowdown in the old continent and tested hawkish bias about the European Central Bank (ECB). Also, comparatively better US data joined upbeat US Treasury bond yields to allow the US Dollar to rise further and exerted additional downside pressure on the major currency pair.
On Monday, the preliminary readings of the Eurozone HCOB Manufacturing PMI slumped to the lowest level since May 2020, to 42.7 for July from 43.4 prior and versus 43.5 market forecasts. That said, the Services PMI also eased to 51.1 for the said month from 52.0 prior and 52.5 expected while the Composite PMI slid to 48.9 from 49.9 previous readings and analysts’ estimations of 49.7. On the same line, German HCOB Manufacturing PMI also dropped to the 38-month low while Services and Composite PMIs declined below the market expectations and previous readings for July.
Talking about the first readings of the US S&P Global PMI for July, the headline Manufacturing PMI improved to 49.0 from 46.3 prior and 46.4 market forecasts while the Services PMI eased to 52.4 versus 54.0 expected and 54.4 previous readings. With this, the Composite PMI edged lower to 52.0 from 53.2 prior and 53.1 market forecasts. However, Chicago Fed National Activity Index for June slid to -0.32 from -0.28 prior (revised) and 0.03 market forecasts.
Considering the data, the US Dollar Index (DXY) rose for the fifth consecutive day to refresh the highest levels in nearly a fortnight while the Euro dropped across the board. With this in mind, Analysts at the ANZ said, “We are of the view that the expected 25bp rate rises from the FOMC and ECB this week will mark the end of the current tightening cycle although central banks are likely to maintain their hawkish guidance given still elevated inflation.”
Moving on, the ECB Bank Lending Survey and Germany’s IFO poll details will entertain EUR/USD traders ahead of the US CB Consumer Confidence. However, major attention will be given to Wednesday’s Fed monetary policy meeting and Thursday’s ECB announcements for clear directions.
Also read: Federal Reserve Preview: Powell can play three distinct cards, each with a different US Dollar move
Technical analysis
A daily closing beneath the previous resistance line from February, now an immediate hurdle around 1.1150, directs EUR/USD towards the previous monthly low of 1.1012.
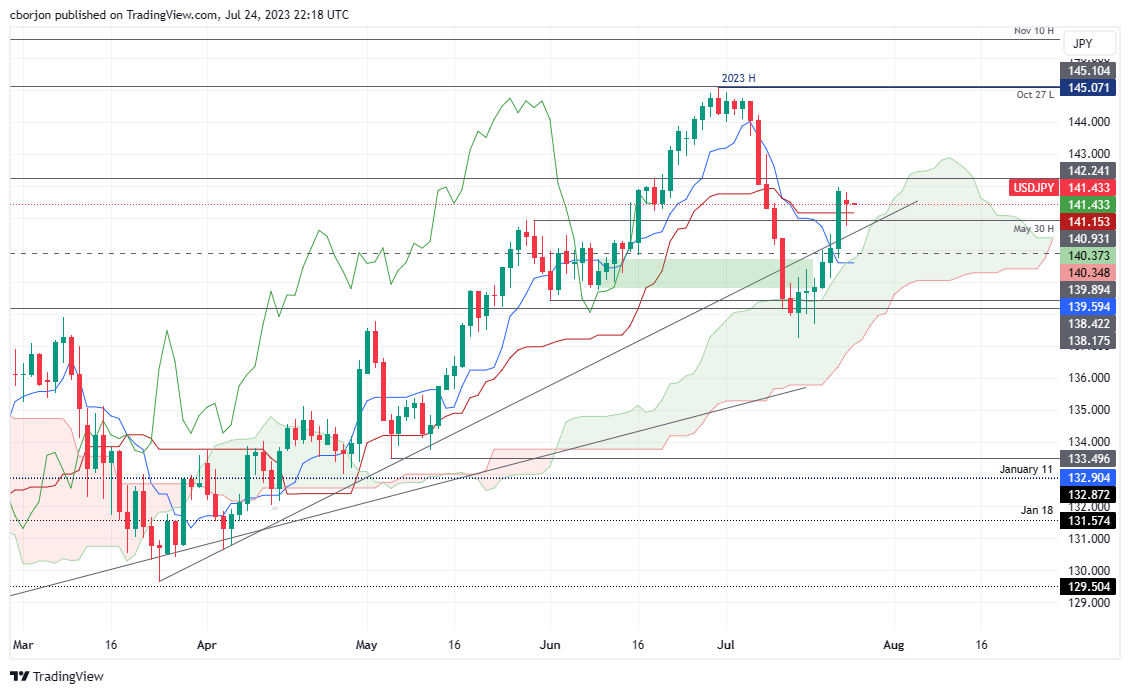
- USD/JPY attempted to shift to a bearish outlook over the last couple of days, with three technical indicators suggesting a potential downside.
- The daily chart shows the pair trading above the Kijun-Sen at 141.43, indicating the potential for further upward movement past 141.95.
- Conversely, if prices remain below 142.00, the first level of support will be the Kijun-Sen at 141.15. If this level is breached, the 141.00 psychological would be exposed.
USD/JPY trades flat as the Asian session begins, exchanging hands at around 141.40s, following a choppy trading session, which formed a dragonfly doji. Hence, during the last couple of days, price action has tried to shift the USD/JPY pair bearish, with three technical indicators paving the way for further downside. At the time of writing, the USD/JPY is trading at 141.42.
USD/JPY Price Analysis: Technical outlook
The daily chart portrays the pair trading above the Kijun-Sen at 141.43, which could pave the way for further upside, but buyers must reclaim the latest two-week high of 141.95. if USD/JPY breaks above 142.00, the next resistance will emerge at the top of the Ichimoku Cloud (Kumo) at around 142.80/95, ahead of challenging 143.00.
On the flip side, and the USD/JPY path of least resistance if prices stay below 142.00, the first support would be the Kijun-Sen at 141.15. A breach of that level will immediately expose the 141.00 psychological level, followed by a 5-month-old support trendline at around 140.50, before the majors test the next floor at the Tenkan-Sen line at 139.59.
USD/JPY Price Action – Daily chart
- AUD/USD grinds higher after bouncing off the lowest levels in nearly two weeks.
- US, Aussie PMIs came in mixed but the former were comparatively stronger and helped US Dollar to remain upbeat.
- Hopes of witnessing sooner end to tightening cycle at major central banks favored sentiment.
- China’s signals for more stimulus also favor Aussie bulls amid light calendar at home.
AUD/USD holds onto the week-start rebound from the lowest levels since July 12 to around 0.6740 amid the early hours of Tuesday’s Asian session. In doing so, the Aussie pair justifies its risk-barometer status, as well as cheers headlines suggesting more stimulus from China, while ignoring the firmer US Dollar and mixed data at home.
On Monday, Australia’s preliminary S&P Global Manufacturing PMI for July improved to 49.6 from 48.2 prior but the Services PMI drops below the 50.0 level to 48.0 versus 50.3 prior, suggesting a contraction in the activities. With this, the S&P Global Composite PMI for July eases to 48.3 from 50.1.
On the other hand, the first readings of the US S&P Global Manufacturing PMI for July improved to 49.0 from 46.3 prior and 46.4 market forecasts while the Services PMI eased to 52.4 versus 54.0 expected and 54.4 previous readings. With this, the Composite PMI edged lower to 52.0 from 53.2 prior and 53.1 market forecasts. That said, Chicago Fed National Activity Index for June slid to -0.32 from -0.28 prior (revised) and 0.03 market forecasts.
Despite the mostly unimpressive data, the bird’s eye view of the global PMI suggests a sooner end of the restrictive monetary policies at the major central bank, including the Federal Reserve (Fed), which in turn allowed the market players to remain optimistic on Monday and fuelled the AUD/USD pair.
Further, the Chinese media conveyed details of the Communist Party's Politburo meeting on Monday that cited new difficulties and challenges for the economy while also showing the policymakers’ readiness for prudent monetary and fiscal policies. Before that, China state planner National Development and Reform Commission (NDRC) issued a notice to promote the high-quality development of private investment. That said, NDRC also pledged encouragement of participation in some projects of transport, water and clean energy, as well as in new infrastructure and modern agriculture.
Apart from China stimulus headlines, hopes of witnessing an upbeat budget surplus also favored the AUD/USD bulls. Australia Treasurer Jim Chalmers said the previous day that he expects that the country’s budget surplus will be set at around AUD20 billion, defending June’s forecast versus May’s AUD4.2 billion (USD2.81 billion) projections.
Amid these plays, Wall Street closed with gains and the US Treasury bond yields joined the US Dollar Index (DXY) to remain firmer.
Moving on, a light calendar at home may allow the AUD/USD to defend the latest gains but challenges to sentiment and cautious mood ahead of Wednesday’s Australian inflation, as well as the Federal Reserve’s monetary policy meeting, may test the pair buyers. That said, US CB Consumer Confidence for July will entertain the traders in the US session.
Technical analysis
Although the 200-DMA restricts the immediate downside of the AUD/USD pair to around 0.6720, a daily closing beyond a one-week-old descending trend line resistance, around 0.6750 at the latest, becomes necessary for the bulls to retake control.
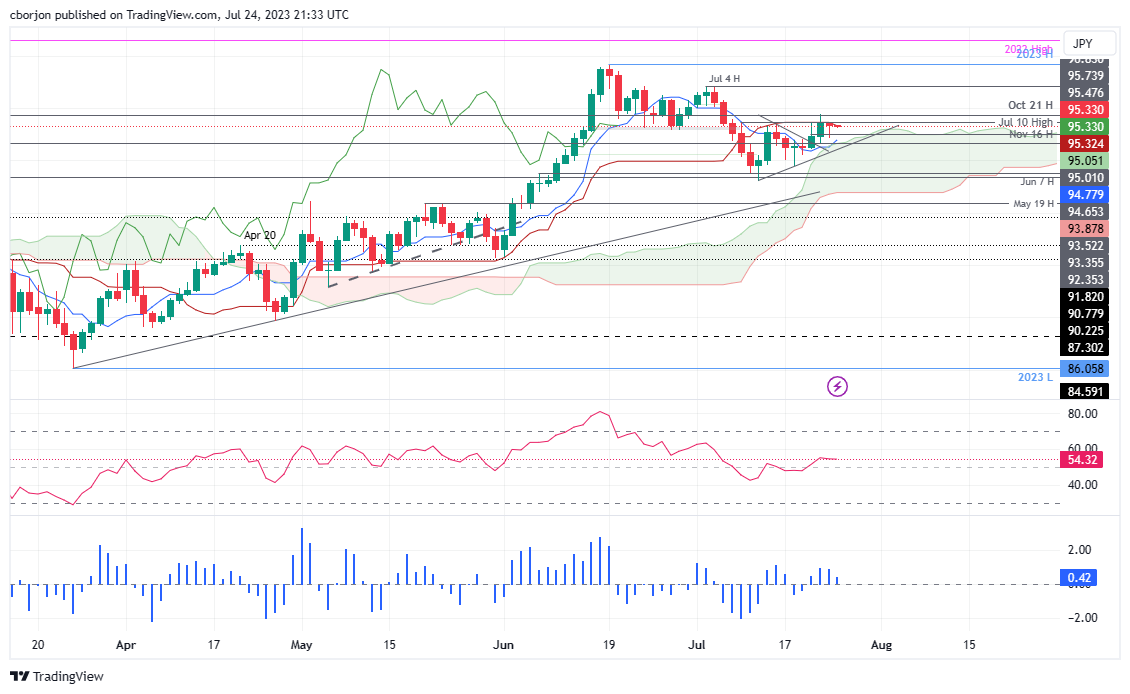
- AUD/JPY trendline suggests a neutral to downward bias as the pair struggles to break the Kijun-Sen line at 95.32.
- Bearish harami formation with a hanging man indicates potential sellers' momentum, heightening the pullback risk.
- Mixed oscillators and bearish technical indicators, including a bearish Chikou Span, hint at potential AUD/JPY losses in the near term.
AUD/JPY registers minuscule losses of 0.07% after touching a daily low of 94.86, but a late risk-on impulse boosted the Australian Dollar (AUD) toward the current exchange rate. The AUD/JPY is trading at 95.30, down 0.05%.
AUD/JPY Price Analysis: Technical outlook
In the near term, the outlook for the AUD/JPY is neutral to downward biased after the pair struggled to break above the Kijun-Sen line at 95.32 for the last couple of days. Aldo, a formation of a bearish harami with a hanging man, suggests sellers are gathering momentum.
That said, the AUD/JPY first support would be the 95.00 figure, followed by the Tenkan-Sen at 94.78. A breach of those levels would expose the top of the Kuo at 94.50/60, followed by the 94.00 figure.
Conversely, if AUD/JPY reclaims the Kijun-Sen, at 95.32, the next resistance would emerge at the October 21 daily high at 95.7, ahead of challenging the 96.00 mark.
Oscillator-wise, the Relative Strength Index (RSI) portrays the pair as bullish; however, the three-day Rate of Change (RoC) shows buying pressure is waning, opening the door for a pullback.
Hence, technical signals suggest the AUD/JPY might be headed downwards, with the Kijun-Sen standing above the Tenkan-Sen, price action below the former, and the Chikou Span turning bearish; the AUD/JPY is headed downwards. That, alongside mixed oscillators, could pave the way for AUD/JPY losses.
AUD/JPY Price Action – Daily chart
- USD/CAD fell towards 1.3170 as the bulls failed to reconquer the 20-day SMA.
- Global supply concerns are boosting Oil prices, favouring the CAD.
- The USD continued to recover following mixed PMIs.
On Monday, the USD/CAD declined towards 1.3170 despite the USD trading strong against most of its rivals. In that sense, the CAD managed to gain traction on the back of rising Oil prices as Canada is a producer. The focus now shifts to Wednesday's Federal Reserve (Fed) decision.
On the data front, S&P Global released mixed data on the US economy. July's Manufacturing PMI came in positive at 49, surpassing the expected 46.4 and the previous 46.3. On the other hand, July's Services PMI reported 52.4, falling short of the higher consensus of 54 but still lower than the previous 54.4. Reacting to the data, the USD DXY traded with gains near the 101.40 area.
Regarding Wednesday’s Fed decision, markets have already priced in a 25 basis point (bps) hike, but the odds of a hike past July fell to near 20%, according to the CME FedWatch tool. In that sense, the Federal Open Market Committee's (FOMC) monetary policy statement and Chair Powell’s words will be closely watched as investors look for clues regarding forward guidance.
In favour of the CAD, the decrease in operating oil rigs contributes to supply-side concerns and drives crude oil prices higher. Additionally, the expectations of economic stimulus in China (the world's biggest Oil importer) support the black gold price, as the Chinese government has expressed its commitment to stimulate domestic demand and support the property sector.
USD/CAD Levels to watch
The daily chart suggests a bearish outlook for the short-term USD/CAD. Bulls were rejected several times by the 20-day Simple Moving Average (SMA), signalling that the buyers struggle to gain momentum. In addition, technical indicators show weakness, with the Relative Strength Index (RSI) below 50.00 and the Moving Average Convergence Divergence (MACD) printing fading green bars.
Resistance Levels: 1.3222 (20-day SMA), 1.3240, 1.3250.
Supports Levels: 1.3150, 1.3120, 1.3110.
USD/CAD Daily chart
-638258297596243933.png)
- NZD/USD bears eye a move to test below the 0.6160s.
- Trendline support is calling with the Bird on the front side of the bearish daily trendline.
The New Zealand Dollar outperformed against G10 currencies after China’s authorities signalled further stimulus, propping up the Bird after weakening in the prior six sessions. At the time of writing, the Bird is trading at 0.6200 and has travelled between 0.6155 and 0.6215.
From a technical standpoint, the Kiwi is under pressure but has come up to test the resistance, both horizontal and dynamic:
NZD/USD daily charts

As illustrated, the pair is on the front side of the bearish trend and sees prospects of a move below the 0.6160s that guards a run towards major trendline support.
Market participants digest the PMIs while awaiting the Fed and the ECB meetings. No relevant data is due during the Asian session. Later in the day, the German IFO survey is due, followed by housing data from the US.
Here is what you need to know on Tuesday, July 4:
US stocks rose despite softer PMIs. The market expects rate hikes from the Federal Reserve (Fed) and the European Central Bank (ECB) this week but hoped that it would mark the end of the tightening cycle. The Dow Jones gained 0.52%, and the Nasdaq rose 0.19%. Microsoft and Alphabet will report earnings on Tuesday. US data due on Tuesday includes the CB Consumer Confidence and the Case-Shiller Home Price Index.
US Treasury yields rose to the highest level in two weeks ahead of the Fed meeting, supporting the US Dollar. The DXY rose for the fourth consecutive day, ending around 103.40, the highest level since July 12.
- US: S&P Manufacturing PMI improves to 49, Services PMI declines to 52.4 in July
EUR/USD resumed its bearish correction and dropped to 1.1060, reaching the lowest level in 12 days. Eurozone PMI data showed that recession risks are intensifying in the region. On Tuesday, the German IFO survey is due. On Thursday, the European Central Bank (ECB) is expected to raise its key interest rates by 25 basis points.
Analysts at Nomura:
July’s PMIs suggested that economic activity is broadly weak across the euro area. The manufacturing PMI fell even deeper into contractionary territory. However, while this is dovish news for the ECB, more hawkish members will probably focus on services sector price data, which suggest inflation may be settling at a permanently higher level.
GBP/USD dropped for the seventh consecutive day and finished slightly above 1.2800 but below the 20-day Simple Moving Average (SMA) for the first time in a month. The UK also reported soft July PMIs, which continue to lower tightening expectations from the Bank of England. Still, a rate hike in August is expected, but the odds of a 50 basis point increase have eased.
USD/JPY finished flat around 141.50 after a recovery during the American session, boosted by higher US Treasury yields. The Bank of Japan on Friday is expected to keep its monetary policy stance unchanged; however, reports suggest that it will raise its inflation forecasts.
AUD/USD rebounded from the 20-day SMA and traded slightly higher around 0.6735. The pair still holds a bearish tone, but it offered signs of stabilization supported by risk appetite and hopes for Chinese stimulus. On Wednesday, Australia will report inflation.
NZD/USD rose after falling for seven consecutive trading days but failed to hold above 0.6200. The Kiwi outperformed; however, the pair still faces bearish pressure and remains below the 20-day SMA.
USD/CAD lost more than 50 pips, falling below 1.3200, favored by higher crude oil prices. Crude oil prices rose more than 2%, with WTI hitting the highest level since mid-April above $79.00.
Gold tumbled amid higher yields, falling toward the $1,950 zone, while Silver lost more than 1%, breaking under $24.50.
Like this article? Help us with some feedback by answering this survey:
- GBP/JPY trades below 182.00 on Monday, seeing more than 0.40% losses.
- UK PMI surveys fueled dovish bets on the BoE amid worries about the British economy's health.
- Japan reported solid PMIs; still, markets bet on a dovish BoJ.
Starting the week, the GBPJPY pair is trading lower near 181.35, though it has maintained relatively stable levels since mid-June. On the one hand, Japan reported solid PMIs in July, while the British ones came in weak sparkling dovish bets on the Bank of England, which decreased local yields, applying selling pressure on the GBP.
The British PMI monthly Composite Reports from July on Manufacturing and Services, released by S&P Global, all came lower than expected and sparked worries about the UK’s economic health. The manufacturing index slid to 45, while the Services and Global Composite fell to 52.4 and 51.5. As a reaction, the Bank of England’s (BoE) tightening expectations have fallen, with the odds of a 50 basis point (bps) decreasing to around 35% according to the World Interest Rate (WIRP) tool. Looking forward, 25 bps hikes are priced in for September and November, but the odds of a final hike in February 2024 slid to 35%.
Due to dovish bets on the BoE, British yields are falling. The 2-year yield fell nearly 1% to 4.88% while the 5 and 10-year rates to 4.31% and 4.22%, respectively, with similar declines of nearly 1%.
On the other hand, the Jibun Bank Services PMI released by Markit Economics remained steady at 52.1, while the Manufacturing Index fell slightly to 49.4. That said, markets are getting mixed signals ahead of Friday's Bank of Japan (BoJ) decision. Governor Kazuo Ueda stated that a dovish interest rate policy should be maintained, while Japan's top currency diplomat, Masato Kanda, stated that inflation surpassing expectations should make the bank consider a policy pivot. Still, the consensus is that the BoJ will steady its dovish stance.
GBP/JPY levels to watch
The daily chart shows strong bearish momentum for the short term. The RSI (Relative Strength Index) is in positive territory, with a sharp negative slope approaching the midline. Meanwhile, the MACD (Moving Average Convergence Divergence) prints soft red bars.
Resistance levels: 182.05 (20-day Simple Moving Average), 183.00, 184.00.
Support levels: 180.00. 179.50, 179.00.
GBP/JPY daily chart
-638258280215254466.png)
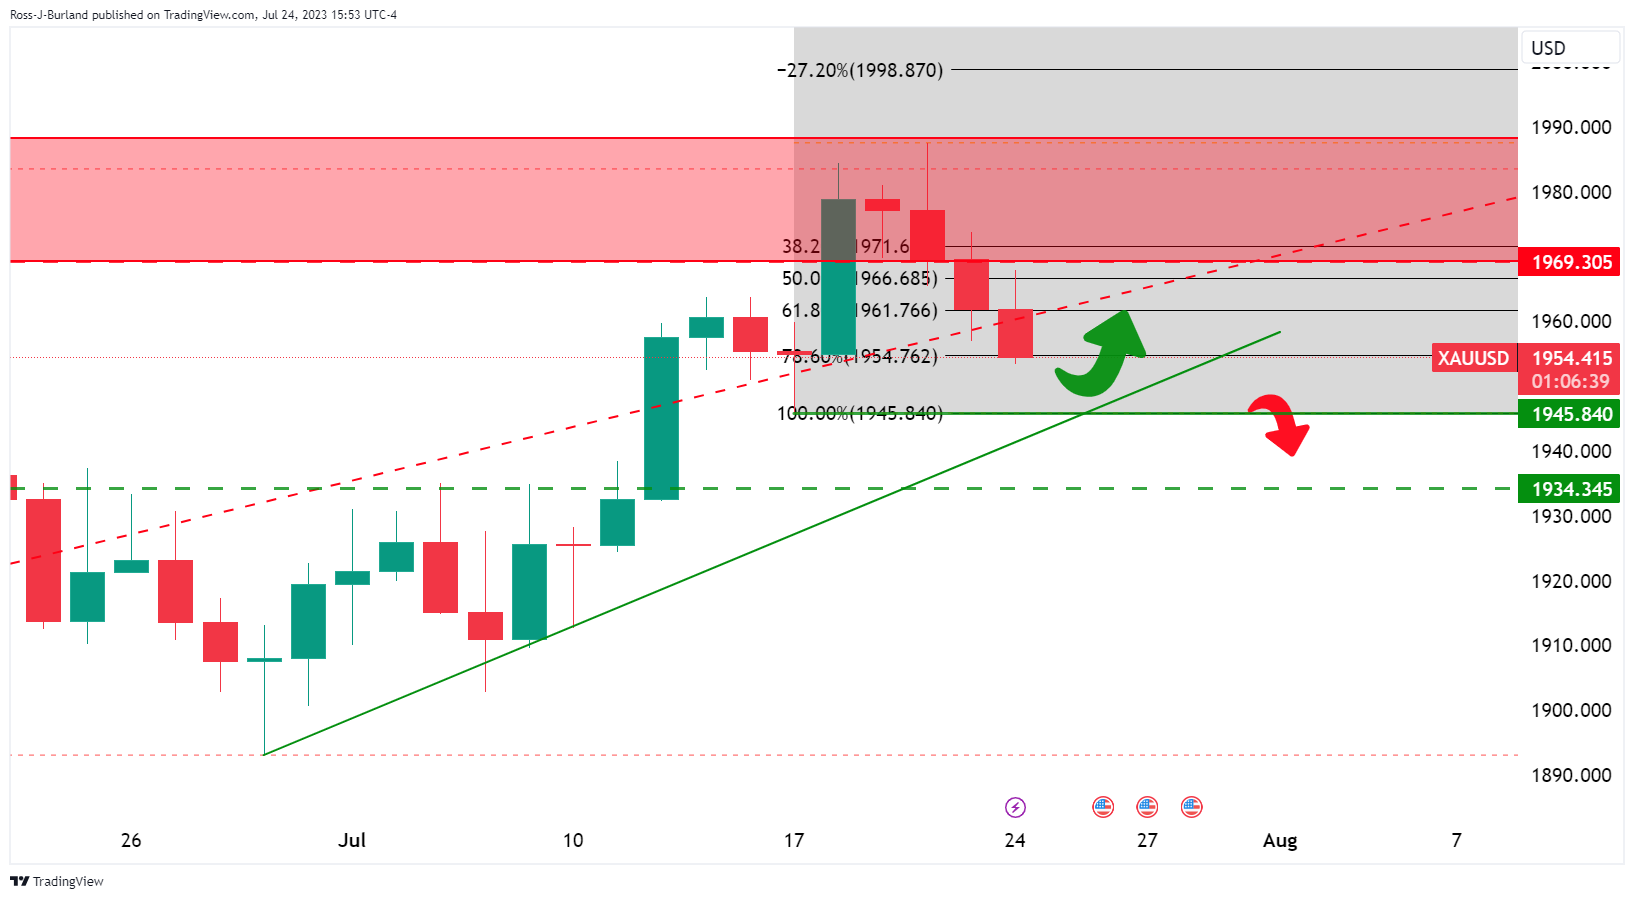
- Gold price is pressured and eyes a key support area.
- Gold price bears will be looking for a break of $1,945.
Gold price was pressured at the start of the week after an initial short squeeze in the open. At the time of writing, Gold price is trading at $1,954 and down by some 0.4% after falling from a high of $1,967.90 to a low of $1,953.47. Attention remains firmly fixed on this week's Federal Open Market Committee meeting and weaker US data suggest the tightening cycle may end this week.
In the data, the US composite flash July PMI eased to 52.0 vs 53.2, service activity fell 2.0pts to 52.4 but manufacturing rose 2.7pts to 49.0. Within the composite index, new orders fell 1.6pts to 51.9.
The services incoming new business index fell 3.0pts to 52.5. Manufacturing new orders rose strongly, gaining 5.8pts to 48.5 but still in contractionary territory. Employment remained above 50.0 signalling ongoing hiring if at a slower pace. Manufacturing employment rose 0.4 to 52.8 but services employment fell 0.4 to 51.0. ''We think the data are consistent with the FOMC pausing rate hikes after raising 25bp this week,'' analysts at ANZ Bank explained. Indeed, the market will be looking to Fed chair Jerome Powell to confirm such a sentiment that when he speaks following the meeting.
Treasury yields rose, bearish for gold since it offers no interest. The US two-year note was last seen paying 4.911%, up 5.2 basis points, while the yield on the 10-year note was up 1.4 basis points to 3.855%. Meanwhile, the US Dollar continues to also benefit from growing divergences. Those divergences are first seen in the economic outlook and this divergence then spreads to monetary policies. The US Dollar looks to be the cleanest shirt in the laundry basket if US data is compared to global data where many economies are tipping into recession.
''Ahead of this week's FOMC meeting, gold bugs have received some support from CTA trend followers near local highs, but prices have failed to rally further,'' analysts at TD Securities explained, adding:
''This may suggest a notable counterparty on the offer that has absorbed the flow, but our gauge of discretionary trader positioning suggests an increase in positioning following the cooling inflation print. This suggests the culprit for recent selling activity following the recent rally may be associated with a physical market participant, this cohort's mean-reverting trading style suggests that gold's inability to rally in the face of CTA buying activity may hold little information about future flows. Still, algos will need prices to break above the $2010/oz mark before a subsequent buying program is catalyzed.''
Gold weekly chart
Gold daily charts
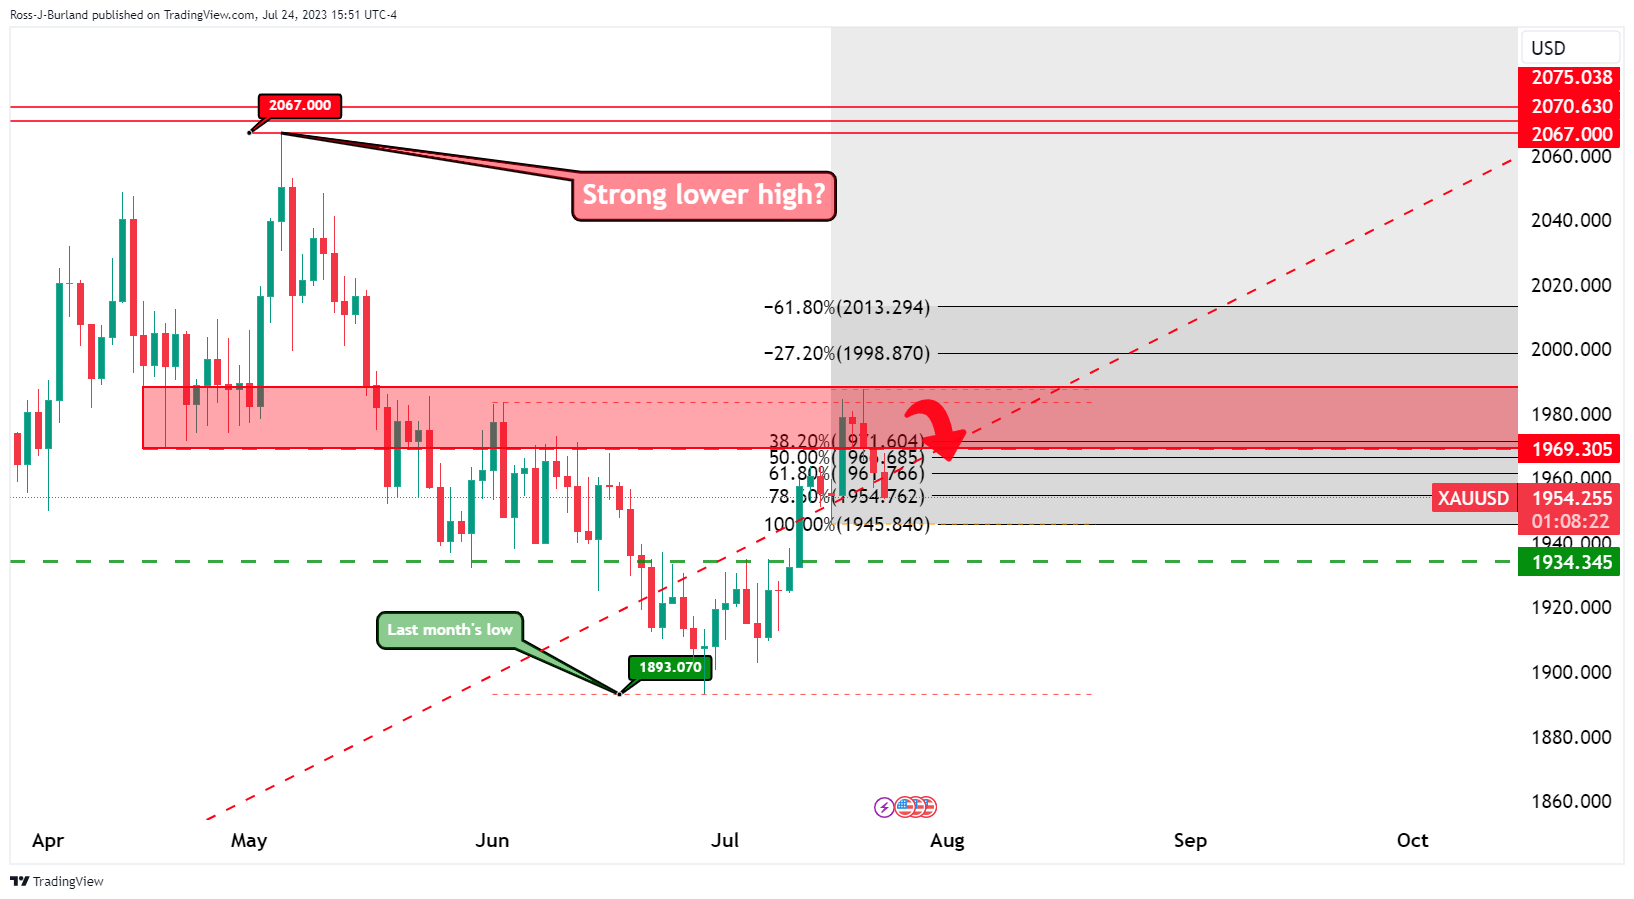
Gold H4 chart
$1,945 is eyed as a key support area and the line in the sand into the FOMC.
- The USD/CHF could shift to a neutral bias if it reclaims the May 4 daily low of 0.8819, which converges with the 61.8% Fibonacci (Fibo) retracement level.
- Resistance beyond this point lies at the confluence of the 50-day EMA and the 78.6% Fibo level at 0.8875/0.8900, followed by the 0.9000 mark.
- USD/CHF's path of least resistance remains downward, with the 23.6% Fibo retracement at 0.8659 marking the level to beat for sellers.
USD/CHF rebounds from last Friday's lows of 0.8640 and climbs on a strong US Dollar (USD) amid a risk-on impulse as Wall Street prints solid gains. The USD/CHF is trading at 0.8683, gains 0.31%, after hitting low of 0.8637.
USD/CHF Price Analysis: Technical outlook
The USD/CHF is yet to turn neutral, even though it recovered some ground during the last three trading days, with the pair gaining 1.50%. Should be said, the USD/CHF could shift its bias to neutral if it reclaims the May 4 daily low of 0.8819, confluence with the 61.8% Fibonacci (Fibo) retracement.
If that ceiling level is broken, the next resistance would emerge at the next confluence of the 50-day EMA and the 78.6% Fibo level at 0.8875/0.8900 area, followed by the 0.9000 mark.
Nevertheless, the USD/CHF path of least resistance is downwards and will resume its downtrend once sellers drag prices below the 23.6% Fibo retracement at 0.8659. On further weakness, the USD/CHF could extend its losses past the 0.8600 figure, followed by the year-to-date (YTD) Low of 0.8554.
From an oscillator standpoint, the Relative Strength Index (RSI), aiming upwards, suggests the USD/CHF upward correction could continue, but as it remains in bearish territory, once turning flat, could pave the way for a reversal. Contrarily, the three-day Rate of Change (RoC) portrays buyers entering the market. That said, mixed signals could refrain USD/CHF traders from opening fresh positions ahead of the FOMC’s meeting.
USD/CHF Price Action – Daily chart
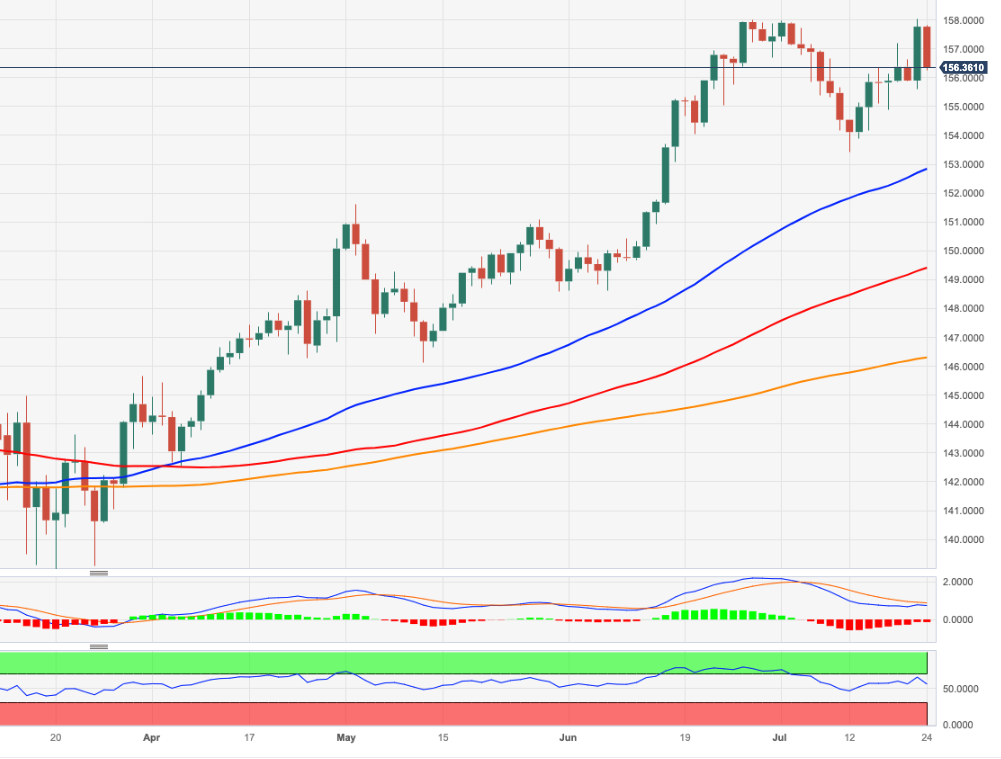
- EUR/JPY pared most of Friday’s gains, falling towards the 156.40 area (20-day SMA).
- European surveys came in lower than expected, while Japan reports solid figures.
During Monday's session, the EUR/JPY pair traded lower following weak Eurozone PMI data, and German yields decreased ahead of Thursday’s European Central Bank (ECB) decision. On the other hand, Japan reported resilience which made the JPY gain traction.
The Services PMI released by the S&P Global and Hamburg Commercial Bank (HCOB) saw weakness in the primary Eurozone’s Manufacturing and Service sector as they all came in below expectations in July. The French and German Services PMI fell to 52 and 47.4, while the Manufacturing Index dropped to 44.5 and 38.8, respectively, failing to meet expectations. That said, the Eurozone’s PMI plunged to 42.7 while the Services index fell to 51.1, also lower than expected.
Ahead of Thursday's meeting, the European Central Bank (ECB) tightening expectations have fallen. A 25 basis point hike is largely priced in this week, but according to the World Interest Rate (WIRP) tool, the odds of similar hikes in September, October and December fell to 55%, 70% and 75%, respectively. As a result, German yields continued to decrease. The 2-year yield fell to 3.18% while the 5 and 10-year rates dropped to 2.51% and 2.36%, respectively, with all three seeing more than 2% decreases on the day, making the EUR struggling to find demand in FXs markets.
On the other hand, Japanese PMIs from July showed that the economy is holding resilient in contrast to the economic downturn seen in the region. The Jibun Bank Services PMI released by Markit Economics remained steady at 52.1, while the Manufacturing Index fell slightly to 49.4. Regarding the Bank of Japan's (BoJ) decision on Friday, markets expect to steady its dovish policy and raise its FY23 core inflation forecast to 2.5%. According to several analysts, the Yield Control Curve (YCC) policy will likely come under scrutiny in October with liftoff to be seen in 2024.
EUR/JPY levels to watch
The daily chart analysis indicates a neutral to a bearish outlook in the short term. The Relative Strength Index (RSI) trades in positive territory, but its steep negative slope suggests weakening bullish strength and a potential bearish reversal. The Moving Average Convergence Divergence (MACD) histogram shows red bars, signalling a downward trend, but their gradual fading suggests diminishing bearish pressure. This may open up possibilities for short-term consolidation or a minor bullish retracement.
Resistance levels: 157.00, 157.50, 158.00.
Support level: 156.40 (20-day SMA), 156.00, 155.50.
EUR/JPY Daily chart
-638258231684304915.png)
- EUR/USD bears are in the market and eye last month's highs.
- A break of support will leave a 61.8% ratio vulnerable on the daily chart.
The Euro is under pressure due to economic data that continues to show the resilience of the US economy in contrast to those that are topping on the edge of a recession, such as the Eurozone. The initial balance for the week is being set ahead of the Federal Reserve on Wednesday and the following analysis leans with a bearish bias.
EUR/USD daily charts
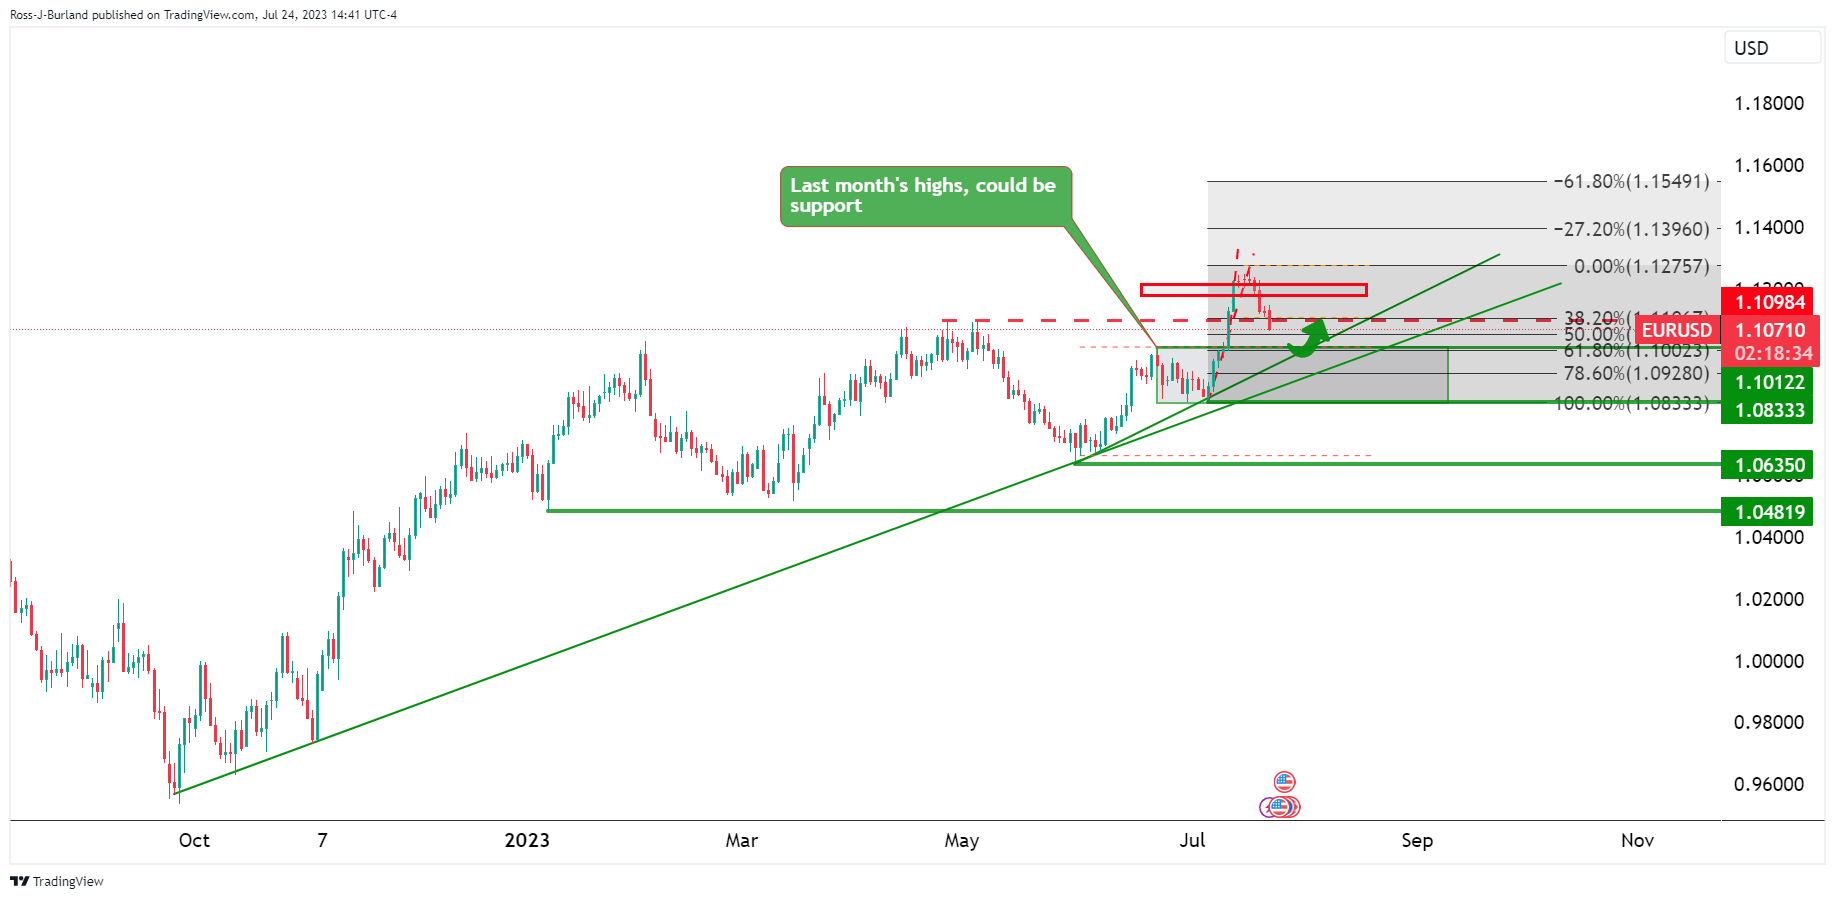
EUR/USD is climbing the trendline support and is now headed back towards it where last month's highs are located in a strong bearish correction. At least a 50% mean reversion is on the cards guarding the 61.8% ratio and conflieuece area.
EUR/USD H4 chart
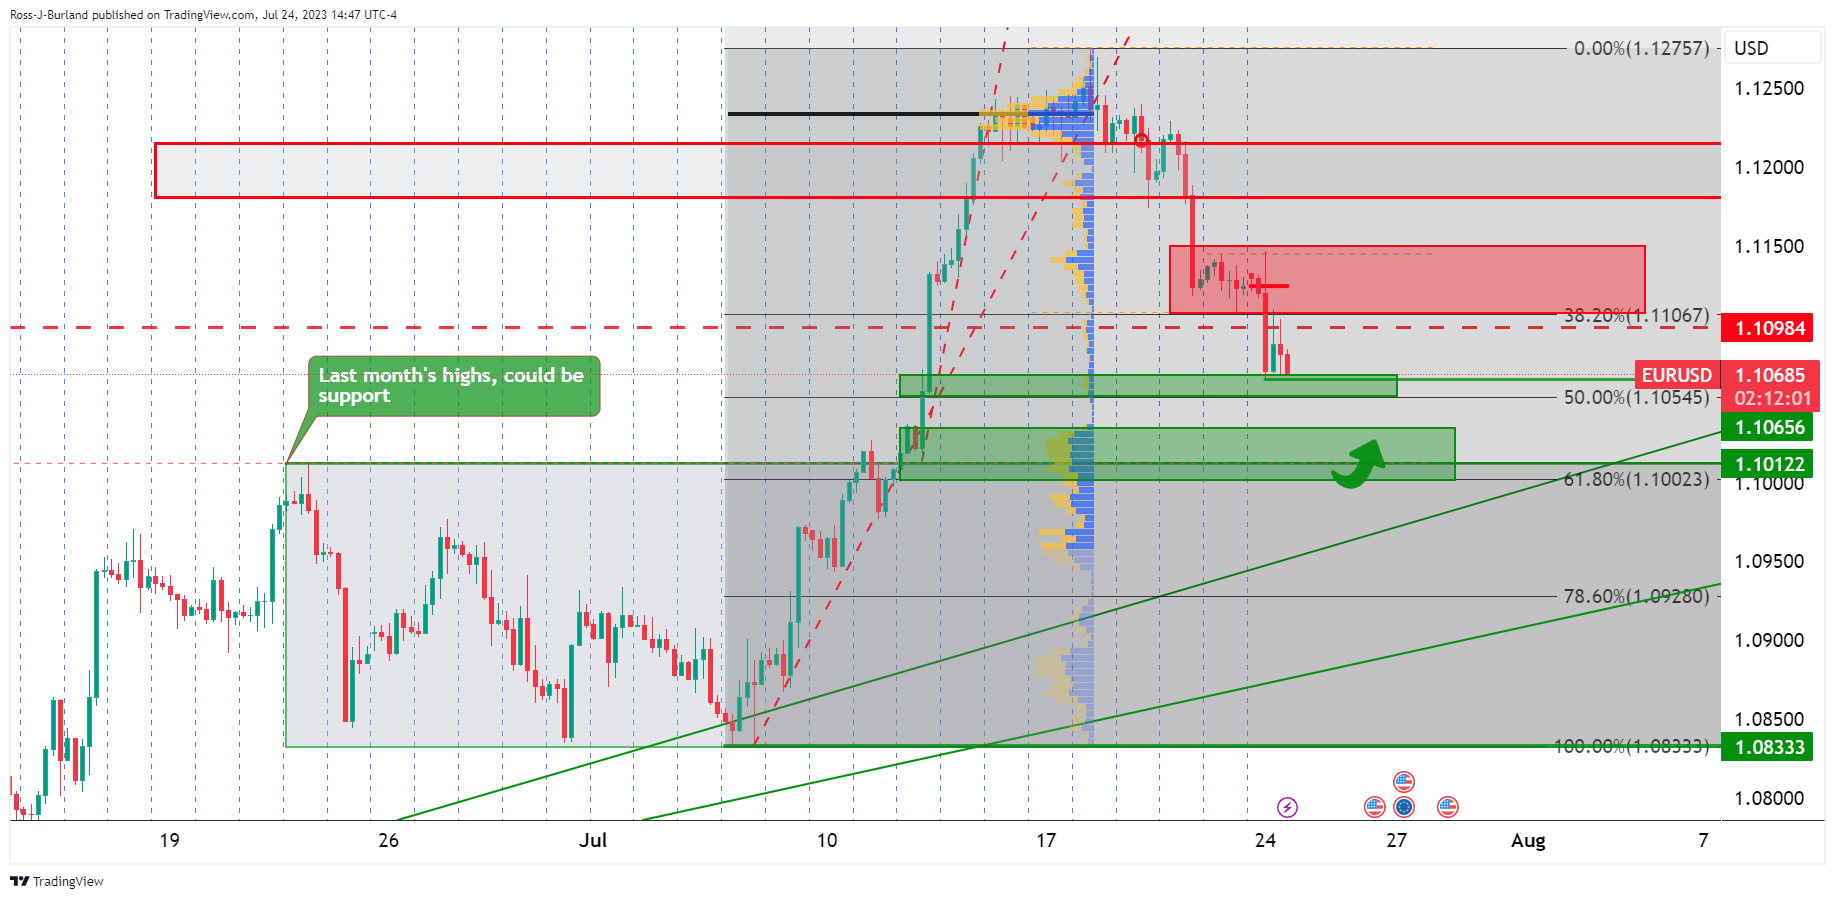
EUR/USD is offered while below Friday's closing price. The price is being supported in a higher volume area but if this were to give, then the prior month's highs will be eyed near a 61.8% Fibonacci level near 1.1000.
- US business activity slowdown and gloomy UK economic outlook push GBP/USD into a seven-day slump.
- UK PMI shows the largest month-on-month drop in 11 months, signaling a potential weakening of post-pandemic spending.
- Market anticipation builds for the Federal Reserve decision and Powell’s press conference, with GBP/USD trajectory hinging on the outcome.
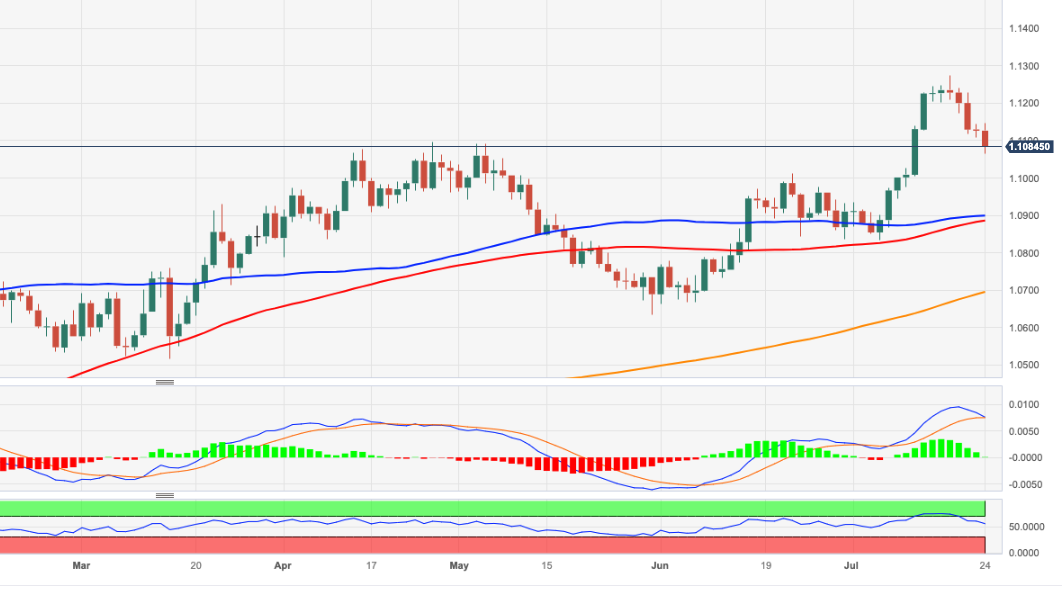
GBP/USD extends its downtrend to seven consecutive days amidst mixed economic data from the United States (US), while further deterioration in the United Kingdom (UK) economy paints a gloomy scenario as the Bank of England (BoE) struggles to curb high inflation. At the time of writing, the GBP/USD is trading at 1.2831 after reaching a high of 1.2883, down 0.16%.
Bank of England's battle with inflation intensifies as UK economy deteriorates
Business activity in the US slowed down, as revealed by S&P Global mixed readings. As shown by the Manufacturing PMI, activity came at 49, above June’s 46.3 as well as estimates, but remained in recessionary territory. Services PMI clung to expansionary territory at 52.4, trailed estimates, and the previous month at 54.4, dragging the composite number to 52 in July, from 53.2 in June, falling to a five-month low.
That weighed on the GBP/USD pair, which began dipping during the European session, with UK PMI showing a preliminary drop to 50.7 from 52.8 in June, the biggest MoM fall in 11 months, as reported by Reuters.
“Rising interest rates and the higher cost of living appear to be taking an increased toll on households, dampening a post-pandemic rebound in spending on leisure activities,” said Chris Williamson, chief business economist at S&P Global, which produces the data.
Late in the week, the Fed would deliver its interest rates decision, with markets estimating a 25 bps increase in the Federal Funds Rates (FFR) to 5.25-5.50%. However, Fed Chair Jerome Powell’s press conference is eyed because the swaps market does not show another Fed hike. Hawkish remarks by Powell could rock the boat, with the GBP/USD extending its losses toward the 1.2700 area, while dovish remarks could lift the pair toward 1.2900 or beyond.
GBP/USD Price Analysis: Technical outlook
The GBP/USD prolongs its downtrend, past below the 61.8% Fibonacci (Fibo) retracement at 1.2851, which could open the door for further losses past the 1.2800 mark. Of note, the GBP/USD slid below the 20-day Exponential Moving Average (EMA) at 1.2862, exacerbating a drop below the 1.2800 figure, but prices recovered from that level toward 1.2830. Nevertheless, If GBP/USD breaks the 1.2800 floors, the next support would emerge at the 78.6% Fibo level at 1.2773 before extending to ward the 50-day EMA at 1.2717. Conversely, if GBP/USD stays afloat at 1.2800, that could open the door to reclaiming the 20-day EMA, followed by 1.2900.
- XAG/USD dropped for a third consecutive day below $24.50. Eyes un bullish cross between the 20 and 100-day SMA.
- German and British yields dropped following weak local PMIs, while Americans rose somewhat.
- Eyes on Fed, ECB and BoJ decisions this week.
At the start of the week, the XAG/USD Silver spot price lost ground as the USD recovery made the grey metal struggle to find demand. The sessions highlight where American and European PMI surveys and focus shifted to the main central bank monetary policy decisions this week.
German and British Manufacturing and Services PMIs came in lower than expected, while the American indexes came in mixed. The Manufacturing PMI from the US rose to 49 vs the 46.4 expected and the previous 46.3, while the Services Index dropped to 52.4, lower than the 54 expected and the last figure of 54.5.
As a reaction, The USD DXY index is trading with gains above 101.00, with American yields seeing little movement. The 2-year yield rose to 4.85%, while the 5 and 10-year rates stand at 4.12% and 3.85%, with mild increases. For Wednesday’s Federal Reserve (Fed) decision, markets expect a 25 basis point announcement but continue to bet on little odds of another hike past July. In that sense, the monetary policy statement followed by Chair Powell’s presser will be closely watched for clues regarding forward guidance.
Regarding Thursday's European Central Bank (ECB) decision, markets expect a 25 bps hike, while on Friday, investors see the Bank of Japan (BoJ) maintaining its dovish stance.
XAG/USD levels to watch
According to the daily chart, the technical outlook for the XAG/USD is bearish for the short term are indicators took a big hit in the previous sessions. However, traders should eye the 20 and 100-day Simple Moving Average (SMA) movements as they are about to perform a bullish cross at the $23.75 area, which could provide vital support to the grey metal.
Support levels: $24.15, $24.00, $23.75.
Resistance levels: $24.50, $25.00, $25.30.
XAG/USD Daily chart
-638258133063413635.png)
- The Mexican Peso gains momentum after Mexico’s mid-month July CPI outperforms estimates, increasing by 4.79% YoY.
- S&P Global data suggests US manufacturing activity rebound, softening the impact of the service sector’s PMI decline.
- Future trajectory of USD/MXN hinges on the upcoming Fed’s policy meeting, with potential hawkish remarks threatening to push it beyond the 17.00 mark.
USD/MXN erased last Friday’s gains amid a data dump from the United States (US) and Mexico, bolstering the emerging market currency as the Mexican Peso (MXN) advances on an inflation report. At the time of writing, the USD/MXN is trading at 16.8277 after reaching a daily high of 17.0091.
Markets anticipate Fed’s decision amid surging US manufacturing activity, mixed economic data
As previously mentioned, the Instituto National de Estadistica, Geografia e Informatica, known as INEGI, revealed that Mexico’s mid-month July Consumer Price Index (CPI) rose by 4.79% YoY, above estimates of 4.7%, but below the prior’s 5.18% reading. Regarding core CPI, data came at 6.76% YoY, above forecasts of 6.73% though it dipped from 6.91%.
Given the fact that the Bank of Mexico, also known as Banxico, decided to keep rates on hold twice after peaking at 11.25%, the data could trigger a shift if core inflation stickiness continues to be an issue keeping inflation from reaching Banxico’s plus/minus 3% target. A source cited by Reuters commented, “The increase in the services component was ‘mainly due to higher airfares and tourist package.’”
In the US, S&P Global revealed that manufacturing activity improved from 46.3 in June to 49 in July, exceeding estimates. That cushioned the fall in services, with its PMI sliding to 52.4 from 54.4 last month. Consequently, the Composite PMI index dropped to 52 in July from 53.2 in June and slowed to a five-month low, reflecting the impact of 500 bps of tightening by the US Federal Reserve (Fed).
On Tuesday, the Fed would begin its two-day monetary policy meeting. Market participants expect the US central bank to deliver a 25 bps rate hike, but as most economists foresee, that would be the last increase; hawkish remarks by the Fed Chair could lift the USD/MXN toward the 17.00 mark and beyond. Otherwise, a dovish stance, and interest rates differentials, favor the MXN as the carry trade prolongs the emerging market currency gains. Hence, further USD/MXN downside is expected.
USD/MXN Price Analysis: Technical outlook
The USD/MXN daily chart favors further downside, as today’s price action, coupled with last Friday, is forming a bearish-engulfing pattern, warranting further downside. Unless the Fed’s decision on Wednesday surprises the markets with a hawkish hike, the USD/MXN could challenge the October 2015 daily low of 16.3267, followed by the 16.00 mark. But firstly, USD/MXN must dive below 16.5000. Conversely, the USD/MXN could threaten the 20-day Exponential Moving Average (EMA) at 16.9567, followed by the 17.0000 figure. A breach of the latter will expose the 50-day EMA at 17.2269.
- WTI started the week with a 2% increase above $78.00 and the 200-day SMA.
- Chinese economic stimulus and global tightening supply underpin Oil prices.
- All eyes are now on the main central bank’s decisions after PMI surveys.
On Monday, the West Texas Intermediate (WTI) pierced through the 200-day Simple Moving Average (SMA) and tallied a third consecutive day of gains. Oil prices seem to be gaining traction on a tight global supply and the hopes of a Chinese economic stimulus to bolster the local economy amid recent weakness.
On the negative side, European countries and the UK reported weak Manufacturing and Services PMIs, while the American Indexes came in mixed. Its worth noticing that a global economic downturn may affect the global Oil demand and push down its price.
As for now, markets expect a 25 basis point increase announcement by the Federal Reserve (Fed) on Wednesday but continue to bet on little odds of another hike past July. On the European side, investors have largely priced in a 25 bps hike by the European Central Bank (ECB) on Thursday, but the odds of hikes in September, October and December fell to 55%, 70% and 75%, respectively. Likewise, markets bet on a less aggressive Bank of England (BoE) as the bets of a 50 bps hike on August 3 have fallen to 35% after being largely priced in.
In that sense, dovish bets may be a tailwind for energy prices as more rate hikes tend to cool down economies and lower demand for commodities like Oil. So, the mentioned banks' policy statements will be closely watched for clues regarding forward guidance.
WTI levels to watch
According to the daily chart, after retaking the 200-day SMA, the technical outlook is bullish for the WTI. In addition, indicators show strong buying momentum, with the Relative Strength Index (RSI) standing in positive territory near overbought levels while the Moving Average Convergence Divergence (MACD) prints rising green bars.
Resistance levels: $79.00,$80.00,$81.00.
Support levels: $76.82 (200-day SMA), $73.50 (100-day SMA), $73.40 (20-day SMA).
WTI Daily chart
-638258112245023007.png)
- Despite the absence of a catalyst, NZD maintains dominance among major currencies fueled by expectations of Chinese economic stimulus.
- While other currencies falter against the strengthening US Dollar, NZD continues its rise, hinting at an unusual market dynamic.
- Investors eagerly await the Federal Reserve decision and Chair Jerome Powell’s statement, which could provide critical direction for NZD/USD.
The New Zealand Dollar (NZD) remains the strongest currency amongst the majors, despite the lack of a catalyst, amid speculations of further stimulus on China’s economy, while traders brace for Wednesday’s release of the US Federal Reserve monetary policy decision. The NZD/USD is exchanging hands at 0.6191 after hitting a daily low of 0.6155.
NZD/USD resilient amid speculations of China stimulus and mixed market mood
Market sentiment is mixed, as Wall Street opens with a positive tone. At the same time, European bourses begin to recover after the worst-than-expected Eurozone (EU) and UK PMI Manufacturing data suggest a global economic slowdown could trigger a shift in central bank tightening intentions.
US S&P Global PMI data showed a decent improvement in Manufacturing activity, advancing from 46.3 to 49, above estimates, while Services PMI dipped to 52.4 from 54.4 in June, below forecasts of 54. Consequently, the Composite PMI index slid to 52 in July from 53.2 in June. The data failed to boost appetite for the US Dollar (USD) against the NZD, which stands positive in the day.
However, the greenback remains trading higher as shown by the US Dollar Index (DXY), which tracks the buck’s performance against a basket of currencies, except for the NZD, which climbs 0.22%, at 101.305, propelled by the short-end of the curve US Treasury bond yields.
On the New Zealand front, an empty agenda left traders adrift to China and US dynamics. Firstly, China’s top leaders signaled that more stimulus is coming, as the country could miss its growth projections of 5% through 2023.
That, alongside Fed’s decision, would give direction on the pairs. A hike of 25 bps is inevitable, and the tone of the statement and Chair Jerome Powell’s press conference is most awaited, as investors would look to hawkish or dovish remarks, so the NZD/USD could gather some direction.
NZD/USD Price Analysis: Technical outlook
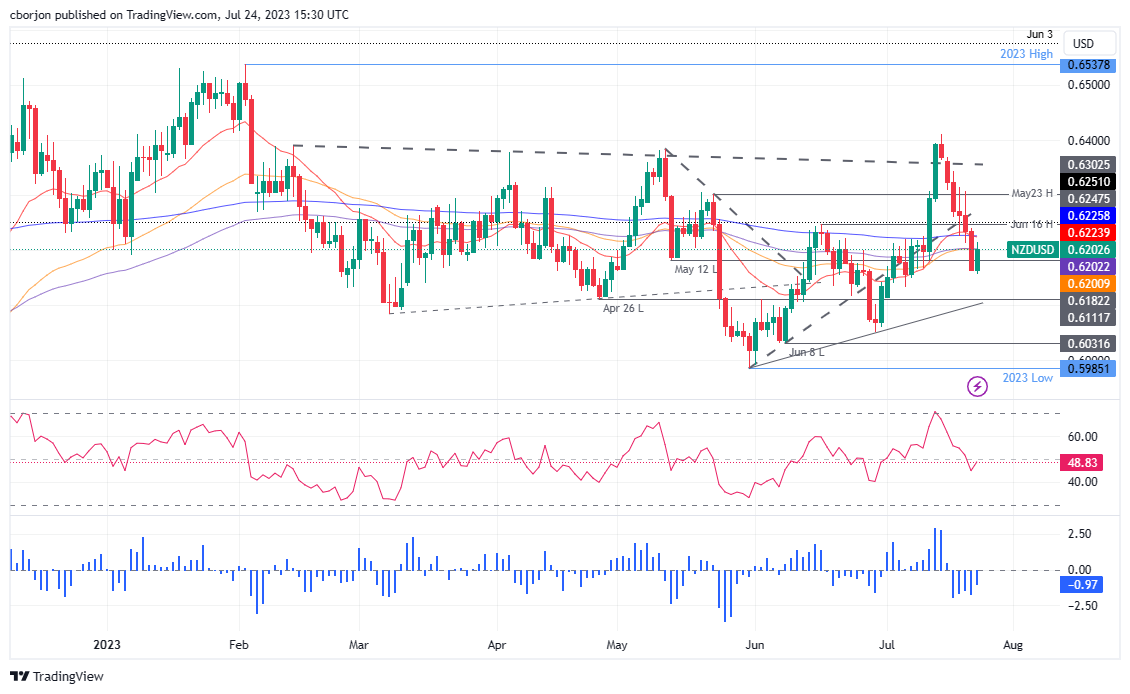
From a technical perspective, the NZD/USD is range-bound, slightly tilted downwards as it trades below the 200-day Exponential Moving Average (EMA), suggesting that further downside is expected. Furthermore, the break below the 100 and 50-day EMAs, at 0.6202, 0.6200, opened the door towards 0.6150, followed by a test of the 0.6100 mark. Conversely, a recovery above 0.6200 could open the door for a U-turn, which the Fed’s decision could trigger. Key resistance levels lie at 0.6200, 0.6220/30m, and then at June 16 daily high at 0.6247. With those levels cleared, the NZD/USD might challenge May’s 23 high at 0.6302.
- Australian Dollar moves marginally lower against the US Dollar on Monday after US Manufacturing PMI data surprises to the upside.
- US Composite PMI is also higher – and in expansionary territory – compared to Aussie correlates.
- Concerns regarding the impact of interest rates on the Australian housing market as well as China’s lackluster growth also weigh on AUD.
The Australian Dollar (AUD) edges lower against the US Dollar (USD) on Monday, after data from ratings agency S&P Global shows Purchasing Managers in key sectors, especially manufacturing, hold a more optimistic outlook in the US than in Australia.
The Aussie is also weighed down by concerns regarding the impact of high interest rates on its rate-sensitive house market and China growth woes, whilst better-than-expected Aussie employment data is a counter-balancing positive.
The AUD/USD pair trades in the 0.67s as the US session gets underway.
Australian Dollar news and market movers
- The Australian Dollar edges lower against the US Dollar on Monday after the release of S&P Global PMIs for both nations shows comparatively better results for the US than Australia, supporting the USD more than the AUD.
- Preliminary S&P Global US Manufacturing PMI data actually came out higher than expected at 49, beating estimates of 46.4 and a previous result of 46.3 in June – though still in contractionary territory (below 50).
- US S&P Global Composite PMI was also higher at 52, and in expansionary territory compared to Australian Composite PMI, which came out at 48.3 for the same period.
- The Australian Dollar is expected to face headwinds as inflation is predicted to fall, reducing pressure on the Reserve Bank of Australia (RBA) to raise interest rates to bring inflation under control.
- Since lower interest rates attract less foreign capital inflows they tend to have a negative impact on currencies.
- Quarterly inflation figures for Australia are out on Wednesday, July 26, and likely to provide invaluable intelligence for Australian Dollar traders attempting to model the future course of interest rates in Australia.
- The Consumer Price Index (CPI) for Australia in the second quarter is estimated to show a 6.2% rise YoY compared to the 7.0% in Q1. On a QoQ basis, it is forecast to show a 1.0% rise versus the 1.4% increase in Q1.
- The RBA’s preferred gauge of inflation, the RBA Trimmed Mean CPI, measured quarterly, is out on Wednesday, July 26, at 01:30 GMT. The data is forecast to show a 6.0% rise in Q2 YoY versus the 6.6% of Q1.QoQ it is estimated to show a 1.1% rise, which is below the 1.2% rise in Q1. CPI could be a key driver for the Aussie in the short term. If CPI is lower than expected, it will weigh on AUD and if higher, it will support AUD.
- Strong Australian labor market data may influence the inflation figures resulting in higher-than-anticipated results. If that is the case, then the AUD may gain after the release of the CPI data.
- The Aussie has weakened on skepticism over China, its largest trading partner’s growth, after the country’s lackluster Q2 GDP readings.
- The Federal Reserve’s (Fed) interest rate decision at 18:00 GMT on Wednesday could also impact the AUD/USD pair by way of influencing the US Dollar.
- The Fed is already expected to raise interest rates by 0.25%, however, the wording of its accompanying statement may impact the US Dollar.
- A more hawkish commentary will come as a surprise as the market is not pricing in further rate hikes from the Fed. As such it would strengthen the US Dollar and weigh on the AUD/USD pair.
- The opposite is true if the Fed indicates it may have reached peak rate or even talks about possibly bringing rates down in 2024.
- There exists a high risk that the RBA will have to cut rates from their current 4.1% level in 2024 because the Australian house market is dominated by variable-rate mortgages so it is more sensitive to changes in interest rates, and homeowners have recently been adversely affected by higher mortgage interest repayments, according to Bloomberg Intelligence, as quoted by Financial Review.
- In comparison, the RBA’s Cash Rate is 4.1%, which is below the Fed’s 5.25% (likely to be 5.50% after Wednesday), thus overall favoring capital flows to the Greenback versus the Aussie.
Australian Dollar Technical Analysis: Underpinned by confluence of support
AUD/USD is in a sideways trend on both the long and medium-term charts. The February 2023 high at 0.7158 is a key hurdle on the weekly chart, which if vaulted, will alter the outlook to one that is more bullishly biased.
Likewise, the 0.6458 low established in June is a key level for bears, which if breached decisively, would give the chart a more bearish overtone.
-638258086834338192.png)
Australian Dollar vs US Dollar: Weekly Chart
A confluence of support made up of all the major daily simple moving averages (50, 100 and 200) exists in the upper 0.66s and early 0.67s. This is expected to provide a rigid cordon of support that will make it difficult for bears to push the exchange rate much lower from its level at the time of writing.
-638258086341841859.png)
Australian Dollar vs US Dollar: Daily Chart
Only a decisive break below the 50 and 100-day Simple Moving Averages (SMA) would confirm a continuation of the recent bear move lower to a speculative target at the June and July lows in the mid-0.64s.
A decisive break lower could consist in a long red daily candlestick, which pierces cleanly below the support levels identified and then closes near to the low of the day, or three red down days in a row that break below the support confluence, with the final day closing near its low and a decent distance below the lowest MA.
There exists the potential for a recovery from the current level, given the underpinning support from the three MAs, however, so far there are no signs of a reversal. Such a sign might come in the form of a candlestick reversal pattern or bullish convergence with the Relative Strength Indicator (RSI) – yet given their absence, it is too early to call a bullish turnaround.
Interest rates FAQs
What are interest rates?
Interest rates are charged by financial institutions on loans to borrowers and are paid as interest to savers and depositors. They are influenced by base lending rates, which are set by central banks in response to changes in the economy. Central banks normally have a mandate to ensure price stability, which in most cases means targeting a core inflation rate of around 2%.
If inflation falls below target the central bank may cut base lending rates, with a view to stimulating lending and boosting the economy. If inflation rises substantially above 2% it normally results in the central bank raising base lending rates in an attempt to lower inflation.
How do interest rates impact currencies?
Higher interest rates generally help strengthen a country’s currency as they make it a more attractive place for global investors to park their money.
How do interest rates influence the price of Gold?
Higher interest rates overall weigh on the price of Gold because they increase the opportunity cost of holding Gold instead of investing in an interest-bearing asset or placing cash in the bank.
If interest rates are high that usually pushes up the price of the US Dollar (USD), and since Gold is priced in Dollars, this has the effect of lowering the price of Gold.
What is the Fed Funds rate?
The Fed funds rate is the overnight rate at which US banks lend to each other. It is the oft-quoted headline rate set by the Federal Reserve at its FOMC meetings. It is set as a range, for example 4.75%-5.00%, though the upper limit (in that case 5.00%) is the quoted figure.
Market expectations for future Fed funds rate are tracked by the CME FedWatch tool, which shapes how many financial markets behave in anticipation of future Federal Reserve monetary policy decisions.
Recent retracement in the US yields and the US Dollar supported Gold prices. Economists at ANZ Bank analyze the yellow metal outlook.
The risk of a US recession could lift Gold investment
Weakening economic data saw US yields and the USD falling sharply, providing much needed support to the Gold market. Slowing inflation in China is increasing the prospect of the Fed pausing its rate raising cycle after its July meeting.
This has built up speculative long positions while failing to curb outflows of exchange-traded funds. The risk of a US recession, evident in the inverted yield curve, could lift Gold investment.
Economists at Commerzbank analyze EUR/USD outlook.
What is needed to see EUR/USD levels of 1.20?
The EUR strength should remind us that there is very little upside scope at current levels.
Anyone mentioning EUR/USD levels of 1.20 has to either assume remarkable general USD weakness or has to have very, very good reasons to expect extreme EUR strength.
See:
- EUR/USD to extend its decline toward 1.0880 on failure to defend 1.1000/1.0970 zone – SocGen
-
EUR/USD: Risks skewed to downside from ECB and Fed policy updates – MUFG
The Bank of Canada's (BoC) latest survey showed that most market participants expect the BoC to hold its policy rate at 5% until the end of 2023, as reported by Reuters.
A median of the participants forecast the BoC to reduce the key interest rate to 3.50% in the fourth quarter of 2024.
Market reaction
The Canadian Dollar is struggling to stay resilient against its rivals on Monday. As of writing, the USD/CAD pair was trading at a daily low of 1.3163, losing 0.45% on a daily basis.
USD/JPY rebounded sharply last week. Economists at OCBC analyze the pair’s outlook ahead of BoJ meeting.
Risk for USD/JPY is asymmetric going into the MPC
Our house view still expects the BoJ to move away from YCC, NIRP regime at some stage this year as inflationary pressures broaden; growth outlook improves and upward pressure on wage growth remains intact.
In the event BoJ surprises on Friday, then we may see USD/JPY turn lower as markets may be caught wrongfooted.
We believe the risk for USD/JPY is asymmetric going into the MPC.
GBP/USD is expected to see a deeper setback yet, but with support from the uptrend from last September at 1.2762 ideally holding, analysts at Credit Suisse report.
Uptrend support at 1.2762 ideally holds, with resistance seen at 1.2905 initially
We look for further weakness yet to test the confirmed uptrend from September last year, today seen at 1.2762. Our bias would then be to look for the market to try and find a floor here for an eventual resumption of its broader uptrend.
Above 1.2905 is needed to ease the immediate downside bias for resistance next at 1.2966 ahead of 1.3050/51. A break above this latter level is seen needed to suggest the broader uptrend has indeed resumed for a move back to the 1.3143 high.
Below 1.2762 would see the uptrend break to warn of a deeper pullback to the 55-DMA and price support at 1.2672/54 but with fresh buyers expected here.
CAD slips into range versus USD. Economists at Scotiabank analyze USD/CAD outlook.
There is clearly firm support for the USD on dips to the low 1.31s
Firmer commodity prices and higher equity markets are CAD-positives that may be somewhat underpriced in the CAD currently.
The week ahead holds plenty of event risk – in the form of central bank meetings in the US, Europe and Japan – and with very little on the domestic data schedule, the CAD is liable to remain something of a range trade as it tracks the overall trend in the USD.
Our week ahead model suggests a potential range of 1.3140-1.3400. The projection may overstate topside risks to some extent (I think the broader range ceiling is perhaps more like 1.3300/50) but there is clearly firm support for the USD on dips to the low 1.31s currently.
EUR/USD is retracing towards upper end of previous range near 1.1000/1.0970. Economists at Société Générale analyze the pair’s technical outlook.
Test of 1.1270 hurdle has led to a wave of pullback
EUR/USD broke out from a multi-month consolidation zone and marched towards the objective of 1.1270 representing the 61.8% retracement from 2021. Test of this hurdle has led to a wave of pullback. The pair is retracting towards the upper part of previous range at 1.1000/1.0970.
Daily MACD is within positive territory and above its trigger denoting lack of steady downward momentum. It would be interesting to see if the pair can defend the zone near 1.1000/1.0970. Failure could result in an extended decline towards the multi-month trend line at 1.0880 and perhaps even towards 200-DMA near 1.0700.
- EUR/USD extends the multi-day pullback to the 1.1065/60 zone.
- Further weakness could see 1.1000 revisited in the near term.
EUR/USD keeps the bearish note unchanged and breaks below the key 1.1100 support to print new 2-week lows on Monday.
Further losses seem in store for the pair in the near term. That said, the continuation of the downward bias could drag the pair to the psychological 1.1000 region in the not-so-distant future.
Looking at the longer run, the positive view remains unchanged while above the 200-day SMA, today at 1.0693.
EUR/USD daily chart
AUD/USD remains in a broad sideways range. Economists at Credit Suisse analyze the pair’s technical outlook.
A close below 0.6694 can see the immediate risk stay lower
We look for an attempt to find a floor at 0.6714/0.6694 and for the risk to turn higher in the range with resistance seen at 0.6750 initially ahead of .6848 and then more importantly, key resistance at 0.6891/0.6901 – the June high, 61.8% retracement of the February/May fall and downtrend from April 2022. Only above this latter area though would suggest we are seeing a more meaningful move higher emerge, with resistance then seen at 0.6922 initially ahead of the 78.6% retracement at 0.7009.
A close below 0.6694 can see the immediate risk stay lower for support next at the potential uptrend from late May, today seen at 0.6636.
- US S&P Global Manufacturing PMI edged higher to 49 in July.
- Service sector's economic activity expanded at a softening pace.
Business activity in the US private sector expanded at a slower pace in early July than in June, with S&P Global Composite PMI declining to 52 from 53.2. This reading came in slightly weaker than the market expectation of 53.1.
S&P Global Manufacturing PMI improved to 49 from 46.3 in the same period and Services PMI fell to 52.4 from 54.4.
Commenting on the survey's findings, "July is seeing an unwelcome combination of slower economic growth, weaker job creation, gloomier business confidence and sticky inflation," said Chris Williamson, Chief Business Economist at S&P Global Market Intelligence.
"The overall rate of output growth, measured across manufacturing and services, is consistent with GDP expanding at an annualized quarterly rate of approximately 1.5% at the start of the third quarter," Williamson added.
Market reaction
This report doesn't seem to be having a significant impact on the US Dollar's performance against its major rivals. As of writing, the US Dollar Index was up 0.1% on the day at 101.18.
Economists at Société Générale analyze USD/JPY outlook ahead of the BoJ meeting.
BoJ forecast to keep YCC settings unchanged
BoJ officials see little urgent need to address the side effects of its YCC programme at this point. Discussions and a final decision will be made on Friday.
It would be an almighty surprise if they tweaked the band and would trigger a seismic retracement in USD/JPY and other JPY crosses considering the shifts last week. The BoJ is likely to defer a decision to September. Hopes are that until then, the Fed will keep rates on hold.
We should prepare for more verbal intervention if the bounce accelerates towards 145 after the Fed decision on Wednesday.
- Silver price has refreshed the day’s low marginally below $24.50 as the focus shifts to Fed’s policy.
- Investors are hoping that the Fed will raise interest rates further by 25 basis points (bps) to 5.25-5.50%.
- Silver price has slipped below the 23.6% Fibonacci retracement at $24.53.
Silver price (XAG/USD) has printed a fresh day’s low at $24.45 in the early New York session. The white metal has sensed immense pressure as bullions have come under pressure ahead of the interest rate decision by the Federal Reserve (Fed), which will be announced on Wednesday.
S&P500 is expected to start the week on a positive note, following positive cues from overnight futures. The US Dollar Index (DXY) has tested the breakout of the consolidation formed around 101.00 after printing a high of 101.41. The 10-year US Treasury yields have dropped to near 3.81%.
Investors are hoping that the Fed will raise interest rates further by 25 basis points (bps) to 5.25-5.50%. Analysts at Goldman Sachs, the Federal Reserve's widely-expected interest rate hike at its upcoming policy meeting next week will be "the last" of the US central bank's long-running tightening cycle.
But before that, preliminary United States S&P Global PMI data for July will be in focus. As per the expectations, Manufacturing PMI is seen marginally expanding to 46.4 vs. the former release of 46.3. Services PMI is seen lower at 54.1 against the former release of 54.4. A figure below 50.00 is considered a contraction in economic activities.
Silver technical analysis
Silver price has slipped below the 23.6% Fibonacci retracement (plotted from June 23 low at $22.11 to July 20 high at $25.27) at $24.53 on a two-hour scale. The 20-period Exponential Moving Average (EMA) at $24.67 is acting as a barricade for the Silver bulls.
Meanwhile, the Relative Strength Index (RSI) (14) has slipped into the bearish range of 20.00-40.00, which indicates that the downside momentum has been triggered.
Silver two-hour chart -638258027892240344.png)
- DXY maintains the bullish development above 101.00.
- Next up-barrier of note emerge around the 102.60 zone.
DXY advances for the fifth consecutive session so far and looks to consolidate the recent breakout of the key 101.00 hurdle.
A more serious bullish attempt in the index should clear the 102.60 zone, where the provisional 55-day and 100-day SMAs coincide. North from here aligns the July high in the mid-103.00s seconded by the key 200-day SMA at 104.00.
Looking at the broader picture, while below the 200-day SMA, the outlook for the index is expected to remain negative.
DXY daily chart
USD/CHF strength ideally gets capped at the falling 13-day exponential average, currently seen at 0.8705, analysts at Credit Suisse report.
A close above 0.8705 would suggest a deeper but still corrective rally can emerge
We look for a test of resistance from the falling 13-day exponential average, now seen placed at 0.8705. Our bias is to look for this to ideally cap on a closing basis and for the risk to turn lower again.
Support is seen at 0.8648/43 initially, beneath which should ease the immediate upside bias for support next at 0.8614 ahead of the lows from last week at 0.8560/55. Beneath here in due course should see a test of price and Fibonacci support at 0.8522/02, which we would look to try and hold at first.
A close above 0.8705 would suggest a deeper but still corrective rally can emerge for a test of 0.8763/0.8780, but with fresh sellers expected to show here.
- EUR/JPY comes under pressure following Friday’s new tops.
- Further gains need to clear the 158.00 region.
EUR/JPY comes under some moderated downside pressure and retreats to the low-156.00s following Friday’s YTD tops just above 158.00 the figure.
In the meantime, the cross keeps the recovery mode well in place and the continuation of the uptrend is expected to challenge the key round level at 160.00 sooner rather than later.
So far, the longer term positive outlook for the cross appears favoured while above the 200-day SMA, today at 146.27.
EUR/JPY daily chart
Economists at Credit Suisse analyze USD/MXN technical outlook.
Scope for a consolidation phase to emerge
The latest move to a new low for USD/MXN has not been confirmed by daily or weekly RSI momentum, and we see scope for a consolidation phase to emerge for a test of resistance at the 55-DMA and July high at 17.2894 and 17.3956 respectively.
With a major top still seen in place though our bias would be for a cap here and for a fresh decline in due course back to the 16.6930 recent low and eventually what we look to be better support at the 15.5813 high of March 2009.
- AUD/USD has sensed selling pressure around 0.6750 as investors have shifted their focus toward the Fed policy.
- As per the consensus, inflation gained at a pace of 1.0% vs. the prior pace of 1.4% on a quarterly basis.
- AUD/USD has sensed selling pressure while attempting to climb above the horizontal resistance plotted around 0.6900
The AUD/USD pair has met stiff resistance near 0.6750 after a less-confident pullback in the late European session. The recovery move in the Aussie asset has faded as investors have turned cautious ahead of the interest rate policy by the Federal Reserve (Fed), which will be announced on July 26.
S&P500 futures have posted significant gains in the London session, portraying ease in the negative market sentiment. The US Dollar Index (DXY) is gathering strength to recapture the intraday high of 101.41 as investors are anticipating that the Fed will hike interest rates on July 26 after skipping in June.
Meanwhile, the Australian Dollar is expected to deliver a power-pack action ahead of the inflation data for the second quarter. As per the consensus, inflation gained at a pace of 1.0% vs. the prior pace of 1.4% on a quarterly basis. Annual Consumer Price Index (CPI) contracted to 6.2% against 7.0% the prior release.
AUD/USD has sensed selling pressure while attempting to climb above the horizontal resistance plotted from June 16 high around 0.6900. The Aussie asset has formed a Double Top chart pattern, which indicates a bearish reversal. The 20-period Exponential Moving Average (EMA) at 0.6758 is acting as a barricade for the Aussie bulls.
The Relative Strength Index (RSI) (14) has slipped below 40.00, which indicates that the downside momentum has been activated.
Going forward, a downside move below the immediate support of 0.6700 would expose the asset toward July 11 low at 0.6650, followed by the round-level support at 0.6600.
On the flip side, a recovery move above July 20 high at 0.6847 would drive the asset toward June 16 high of around 0.6900. Breach of the latter would send the major toward February 16 high at 0.6936.
AUD/USD four-hour chart

USD/BRL is probing 4.75. Economists at Société Générale analyze the pair’s technical outlook.
Failure to reclaim 5.01 could lead to persistent decline
USD/BRL violated the lower limit of the consolidation that took shape last July and March resulting in a steady downtrend. It has recently achieved downside projections of 4.75. This is interim support.
An initial bounce is likely. However, it would be interesting to see if the pair can reclaim the lower band of previous range near 5.01. Failure could lead to persistence in decline.
Break below 4.75 can lead to extension in the phase of downtrend towards next potential objectives at 4.69 and April 2022 lows of 4.61/4.59.
USD/CAD holds range around 1.32 in quiet trade. Economists at Scotiabank analyze the pair’s outlook.
Short-term patterns underscore firm USD resistance around 1.3225
Minor gains for the CAD on the session so far reinforce – at least in the short run – resistance in the low 1.32 zone but extend the recent pattern of flat, sideways range trading around the figure area a little longer.
Short-term patterns underscore firm USD resistance around 1.3225 and the daily and weekly DMI oscillators continue to trend negatively for the USD, which helps account for USD/CAD’s inability to rally significantly. It should also mean that it will shortly have another run at support at 1.3100/20.
- USD/JPY stretches its correction to near 141.00 Japan’s Kanda hopes for a tweak in monetary policy this week.
- US core inflation is softening but at a slower pace due to resilient consumer spending.
- The US Dollar Index has surrendered its entire gains ahead of the preliminary S&P Global PMI data for further guidance.
The USD/JPY has dropped to near the 141.00 support in the London session. The asset is expected to remain in action as the Federal Reserve (Fed) and the Bank of Japan (BoJ) will announce their interest rate decision on July 26 and July 28 respectively.
The major is facing pressure despite investors hoping that Fed-BoJ policy divergence would widen further this week. The Fed is expected to raise interest rates further as inflation in the United States is far from the desired rate of 2%. Inflation in the United States economy softened sharply in June as lower prices of second-hand automobiles offset the impact of a marginal rise in gasoline prices.
Fed officials are consistently reiterating the need for two more interest rate hikes this year as inflation will take time reaching 2% in the face of a tight labor market. US core inflation is softening but at a slower pace due to resilient consumer spending.
Meanwhile, the US Dollar Index (DXY) has surrendered its entire gains after printing an intraday high of 101.40 as investors are awaiting the preliminary S&P Global PMI data for further guidance. According to the estimates, Manufacturing PMI increased marginally to 46.4 vs. the former release of 46.3. Services PMI dropped to 54.1 against the prior release of 54.4.
On the Japanese Yen front, mixed views are coming from top officials. BoJ Governor Kazuo Ueda cited that a dovish interest rate policy should be continued to maintain inflation steadily above 2%. While, Japan's top financial diplomat Masato Kanda suggested the central bank may tweak its approach to monetary stimulus at its next policy meeting, due to "signs of changes" in corporate behavior on wage growth and price rises, Reuters informed.
EUR/USD slides under 1.11. Economists at Scotiabank analyze the pair’s technical outlook.
A close back under support in the upper 1.11s last week is a bit of a disappointment for EUR bulls
A close back under support in the upper 1.11s last week is a bit of a disappointment for EUR bulls and the soft tone in spot has extended another day today with spot losses through the low 1.11s to test the April/May highs (support) at 1.1090.
Risk from here looks to be tilting towards a test of the 1.1050 support zone (retracement and minor high from June).
GBP/USD support holds ahead of 1.28. Economists at Scotiabank analyze the pair’s technical outlook.
GBP losses are slowing near 1.28
Sterling retains a soft undertone but the pattern of trade here does look – potentially – a little more constructive.
GBP losses are slowing near 1.28 and the intraday charts are clearly showing signs of interest in picking up Cable ahead of the figure area today – and late last week.
Minor resistance is 1.2900/10. Gains back through here on the day would be modestly positive at least and help stop the rot of the past week’s steady losses.
- US Dollar stays strong against its major rivals to start the week.
- US Dollar Index clings to modest daily gains above 101.00.
- US Services and Manufacturing PMI surveys could drive USD's valuation later in the day.
The US Dollar started the new week on a bullish note after having outperformed its major rivals in the previous week. The US Dollar Index, which tracks the USD's valuation against a basket of six major currencies, touched its highest level since July 12 near 101.50 in the early European session.
The USD captured capital outflows out of the Euro and Pound Sterling after the Services and Manufacturing PMI data from Germany, the EU and the UK came in weaker than expected for early July.
The US economic docket will feature S&P Global's PMI surveys in the second half of the day. The USD's valuation could be impacted by the PMI readings ahead of the US Federal Reserve's all-important policy announcement on Wednesday.
Daily digest market movers: US Dollar holds ground on Monday
- S&P Global Composite PMI in the US is forecast to edge slightly lower to 53.1 in July's flash estimate. A print above would reflect an expansion in the private sector's business activity.
- 10-year US Treasury bond yield staged a rebound in the second half of last week and closed above 3.8% after having declined toward 3.7% earlier in the week.
- According to the CME Group FedWatch Tool, a 25-basis-point Fed rate hike on Wednesday is fully priced in. The probability of the Fed hiking the policy rate one more time before the end of the year stands at 23%.
- Assessing the USD's short-term outlook, "positioning data suggests investors are running reasonably large short Dollar positions into this week's Fed, ECB and BoJ policy meetings," noted economists at ING. "We do like a weaker USD later this year, but the Dollar's recent corrective rally might endure this week if the Fed hangs onto its tightening bias."
- Wall Street's main indexes ended the previous week on a mixed note. Early Monday, US stock index futures trade modestly higher on the day.
- German HOCB Composite PMI fell to 48.3 in Early July from 50.6 in June. Commenting on the data, “There is an increased probability that the economy will be in recession in the second half of the year," said Dr. Cyrus de la Rubia, Chief Economist at Hamburg Commercial Bank (HCOB).
- HCOB Composite PMI for the Eurozone worsened to 48.9 from 49.9 in the same period, while the UK S&P Global/CIPS Composite PMI fell to 50.7 from 52.8.
Technical analysis: US Dollar Index closes in on dynamic resistance
The US Dollar Index (DXY) started to edge higher after having tested 101.00 (static level) earlier in the day, confirming that level as important near-term support. Meanwhile, the Relative Strength Index (RSI) indicator on the daily chart extended its recovery toward 50, reflecting the lack of seller interest.
On the upside, the 20-day Simple Moving Average (SMA) aligns as dynamic resistance at 101.70 ahead of 102.00 (static level, former support). A daily close below the latter could bring in additional buyers and open the door for an extended uptrend toward 102.50/60 (50-day SMA, 100-day SMA).
In case the DXY returns below 101.00, 100.50 (static level) could be seen as the next support before 100.00 (psychological level, static level).
US Dollar FAQs
What is the US Dollar?
The US Dollar (USD) is the official currency of the United States of America, and the ‘de facto’ currency of a significant number of other countries where it is found in circulation alongside local notes. It is the most heavily traded currency in the world, accounting for over 88% of all global foreign exchange turnover, or an average of $6.6 trillion in transactions per day, according to data from 2022.
Following the second world war, the USD took over from the British Pound as the world’s reserve currency. For most of its history, the US Dollar was backed by Gold, until the Bretton Woods Agreement in 1971 when the Gold Standard went away.
How do the decisions of the Federal Reserve impact the US Dollar?
The most important single factor impacting on the value of the US Dollar is monetary policy, which is shaped by the Federal Reserve (Fed). The Fed has two mandates: to achieve price stability (control inflation) and foster full employment. Its primary tool to achieve these two goals is by adjusting interest rates.
When prices are rising too quickly and inflation is above the Fed’s 2% target, the Fed will raise rates, which helps the USD value. When inflation falls below 2% or the Unemployment Rate is too high, the Fed may lower interest rates, which weighs on the Greenback.
What is Quantitative Easing and how does it influence the US Dollar?
In extreme situations, the Federal Reserve can also print more Dollars and enact quantitative easing (QE). QE is the process by which the Fed substantially increases the flow of credit in a stuck financial system.
It is a non-standard policy measure used when credit has dried up because banks will not lend to each other (out of the fear of counterparty default). It is a last resort when simply lowering interest rates is unlikely to achieve the necessary result. It was the Fed’s weapon of choice to combat the credit crunch that occurred during the Great Financial Crisis in 2008. It involves the Fed printing more Dollars and using them to buy US government bonds predominantly from financial institutions. QE usually leads to a weaker US Dollar.
What is Quantitative Tightening and how does it influence the US Dollar?
Quantitative tightening (QT) is the reverse process whereby the Federal Reserve stops buying bonds from financial institutions and does not reinvest the principal from the bonds it holds maturing in new purchases. It is usually positive for the US Dollar.
USD/IDR faces some consolidation in the short-term horizon according to Markets Strategist Quek Ser Leang at UOB Group.
Key Quotes
Our expectations for USD/IDR to weaken last week was incorrect as it rebounded to a high of 15,032. The rebound lacks momentum and USD/IDR is unlikely to rise much further. This week, USD/IDR is more likely to trade sideways between 14,945 and 15,090.
Economists at Société Générale analyze USD/JPY technical outlook.
Below 137, next potential objectives could be at 135 and 133.80
USD/JPY faced stiff resistance near 145/146.10 resulting in sharp wave of pullback. It dipped towards the graphical zone of 138/137 representing the upper end of previous consolidation zone and the 200-DMA. The slope of the MA is flattish which denotes steady upward momentum is still lacking. This is also highlighted by daily MACD which has dipped within negative territory.
Currently, a bounce is underway however failure to reclaim 143.20, the 76.4% retracement of recent down move can lead to one more down leg.
Below 137, next potential objectives could be at the trend line since January at 135 and 133.80.
EUR/USD is expected to see a deeper but still corrective setback to retracement and price support at 1.1031/03, analysts at Credit Suisse report.
Break below 1.1003 would warn of yet further weakness
EUR/USD extends its pullback after being capped at 1.1275/88. This warns of a deeper but still corrective setback with support seen at 1.1055 next, then the 38.2% retracement of the May/July rally at 1.1031. With further price support seen not far below here at 1.1013/03, we will look for an attempt to find a floor here.
Below 1.1003 though would warn of yet further weakness to support next at 1.0956, potentially the 55-DMA at 1.0900.
Above 1.1148 is needed to reassert an upward bias for strength back to 1.1190 initially and then a retest of 1.1275/88. Although a fresh cap here should be allowed, we maintain our view for an eventual clear break higher in due course with resistance seen next at 1.1313, then 1.1391/96.
The Dollar is stronger against the Euro as we await the big events of the week – the FOMC on Wednesday, ECB on Thursday, and Bank of Japan on Friday, economists at Société Générale report.
Euro market is uncertain about whether there will be another hike in September
The consensus call is for 25 from the Fed and ECB, nothing from the BoJ, and we may have to stare deeply into the comments of central bankers to get any clarity about the odds of further moves. However, the Yen market thinks a YCC change is coming (some sunny day), the Euro market is uncertain about whether there will be another hike in September after Mr. Knot’s intervention (and the PMI data), and the US market is likewise unsure.
As the Eurozone PMI vs US ISM suggests, if US data are ‘OK’ the Euro is likely to drift lower for now.
USD/IDR appears to be consolidating around the 15,000 level. Economists at TD Securities analyze Rupiah outlook ahead of Bank Indonesia meeting.
BI to keep its 7-day reverse repo rate at 5.75%
We expect BI to keep its 7-day reverse repo rate at 5.75%, prolonging the pause since February.
We don't expect any rate cuts in the near term as any premature cut may weigh on IDR, especially after the deterioration in trade balance recently.
We think BI will only dial-up its concern over the currency if it tracks above the 15,200 level.
Markets Strategist Quek Ser Leang at UOB Group sees USD/MYR extending the consolidative phase in the near term.
Key Quotes
After USD/MYR dropped to a low of 4.5120 and rebounded, we highlighted last Monday (17 Jul, spot at 4.5560) that “there is a chance for USD/MYR to drop further to 4.5100. We also highlighted that “The likelihood of USD/MYR breaking clearly below the major support at 4.4880 is not high.” Our view did not materialize as USD/MYR dipped to 4.5200 and then rose to 4.5600. The price actions are likely part of a consolidation phase.
This week, USD/MYR is likely to trade in a range between 4.5230 and 4.6000.
The EUR corrected modestly lower against the USD over the past week. Economists at MUFG Bank analyze EUR/USD outlook ahead of ECB and Fed policy updates.
Higher trading range to hold
We continue to believe that EUR/USD has moved into a new higher trading range between 1.1000 and 1.1500.
On balance, we believe that risks for the pair are skewed to the downside in the week ahead from the ECB and Fed’s policy updates. Assuming that the Fed does not signal that next week’s hike is the last in the cycle and the ECB does not strongly commit to one more hike later this year. However, support at 1.1000 should hold and provide an opportunity to build long positioning in anticipation of a move toward the top of the range in the coming months.
In the opinion of Markets Strategist Quek Ser Leang at UOB Group, USD/THB is now seen trading within the 34.00-35.00 range in the near term.
Key Quotes
We indicated last Monday that USD/THB could consolidate for few days before dropping to 34.42 later on. We did not anticipate the spike in volatility as USD/THB plunged to a low of 33.75 before rebounding quickly. The sharp drop appears to be overdone and we do not expect USD/THB to weaken. This week, USD/THB is more likely to trade in a range, probably between 34.00 and 35.00.
Economists at Société Générale analyze Brent Oil technical outlook.
Crucial support zone aligns at $78/77
Brent defended the low of March near $70 and evolved within a small base. It has given a break above the upper limit and in recent brief pullback, it has successfully held on to that band near $78/77.
A revisit of the 200-DMA can’t be ruled out. $83.65, the 76.4% retracement of last wave of pullback is a potential hurdle. If this is overcome, Brent is expected to embark on an extended rebound towards April high of $87.50.
Low formed last week near $78/77 is crucial support zone.
- USD/CAD has dropped below 1.3200 as oil prices have jumped significantly.
- The USD Index has come out of the woods as the Fed is widely expected to raise interest rates further.
- Momentum in consumer spending in Canada slowed down significantly in May.
The USD/CAD pair has slipped to near the round-level support of 1.3200 in the European session. The Loonie asset struggles to find support despite strength in the US Dollar as investors are expecting a confirm interest rate hike from the Federal Reserve (Fed), which will b announced on July 26.
S&P500 futures have added significant gains in London after a choppy Friday, portraying ease in caution among market participants. It seems that investors are shrugging-off risk ahead of the interest rate decision by the Fed.
The US Dollar Index has faced some pressure after printing a fresh day’s high at 101.40, more upside seems intact as the Federal Reserve (Fed) is expected to restart its rate-hike cycle, which was temporarily paused in June. An interest rate hike of 25 basis points (bps) will push interest rates to 5.25-5.50%. As per the CME Fedwatch tool, this could be a peak of the 17-month-long aggressive interest rate cycle.
Meanwhile, the Canadian Dollar has shown resilience as oil prices are approaching the crucial resistance of $78.00. As global central banks are approaching to interest rate peak, investors hope that the economic outlook would attract upgrades from institutional investors as oil demand will return to normal. It is worth noting that Canada is the leading exporter of oil to the United States and higher oil prices would support the Canadian Dollar.
On the economic front, momentum in consumer spending in Canada slowed down significantly in May. Monthly Retail Sales expanded at a slower pace of 0.2% than expectations of 0.55 and the former release of 1.0%. Retail demand excluding automobiles remained stagnant while investors were expecting an expansion by 0.3%. This would allow the Bank of Canada (BoC) to keep interest rates steady at 5% ahead.
- Pound Sterling tests the previous week’s low as UK’s preliminary S&P Global PMI remained downbeat.
- United Kingdom’s factory activity registers 12th straight contraction as the BoE has raised interest rates aggressively.
- The economic outlook doesn’t look promising as more interest rates by the UK central bank are in the pipeline.
The Pound Sterling (GBP) surrenders its entire gains posted on Friday as the United Kingdom’s preliminary S&P Global PMI data for July came in below expectations. The GBP/USD pair drops as contracting factory activity and a bleak service sector builds pressure on the Pound Sterling. Britain’s economic prospects are facing the wrath of elevated inflation and higher interest rates by the Bank of England (BoE).
Firms in the United Kingdom have postponed their current demand for credit to avoid paying higher interest obligations. The country’s economic outlook doesn’t look promising as the UK central bank is expected to increase interest rates further in August. Going forward, employment conditions are expected to face pressure from weakening economic activity.
Daily Digest Market Movers: Pound Sterling bears in action as July PMI remain downbeat
- Pound Sterling faces selling pressure as the United Kingdom’s preliminary PMI data showed that economic activity remains weaker than expected in July.
- The UK Manufacturing PMI contracted to 45.0, down from the 46.1 expected and the 46.5 registered in June. This signals the 12th straight contraction in the country’s manufacturing sector. A figure below 50.0 is considered a contraction.
- Britain’s preliminary Services PMI dropped to 51.5 from the consensus and the former release of 53.0 and 53.7, respectively.
- Economic activity appears to be facing the wrath of restrictive monetary policy by the Bank of England.
- Investors look mixed about the scale at which the Bank of England will raise interest rates in August.
- Inflation pressures in the United Kingdom look persistent even as the Consumer Price Index (CPI) softened in June as consumer spending remains resilient.
- Monthly Retail Sales expanded at a pace of 0.7% in June, more than the 0.2% increase expected and accelerating from the 0.1% seen in May. On an annual basis, consumer spending contracted 1.0%, softer than the estimates of a 1.5% decline and the prior release of a 2.3% decrease.
- In spite of a decline in inflation, consumer spending picks momentum as lower gasoline prices provide higher disposable income to households.
- Sales at food retailers were weak, possibly because expenditure on dining out was higher due to an extra public holiday to mark King Charles' coronation.
- Resilient momentum in consumer spending has offset the comfort provided by surprisingly softer inflation data.
- Expectations of a big rate hike from the BoE in August have made a comeback as upbeat retail demand could propel inflationary pressures again.
- Soft inflation in June offers relief to BoE policymakers, but the upside risks of elevated core inflation are still solid.
- The US Dollar Index (DXY) delivers a north-side break after an extended consolidation around 101.00 as investors turn cautious ahead of the Federal Reserve’s (Fed) monetary policy meeting.
- An interest rate hike of 25 basis points (bps) is anticipated from the Fed, which will push interest rates to the 5.25%-5.50% range.
- Investors expect interest rates to peak on July 26 and then to remain stable for the rest of the year.
- Investors will keep an eye on the Fed’s interest-rate guidance. A hawkish guidance might trigger a risk-off mood.
- United States consumer spending grew at a marginal pace in June due to declining demand for big-ticket items.
Technical Analysis: Pound Sterling corrects to near 20-day EMA
The Pound Sterling meets stiff resistance below 1.2900 as the market mood has turned cautious. The Cable is expected to test its recent low of 1.2816 recorded on Friday. Earlier, the asset delivered a recovery move after gauging support below the 20-day Exponential Moving Average (EMA). The Cable would find next support near the 50-day EMA around 1.2700 if it continues to decline further. The upside momentum has completely faded, but the long-term trend is still bullish.
Pound Sterling FAQs
What is the Pound Sterling?
The Pound Sterling (GBP) is the oldest currency in the world (886 AD) and the official currency of the United Kingdom. It is the fourth most traded unit for foreign exchange (FX) in the world, accounting for 12% of all transactions, averaging $630 billion a day, according to 2022 data.
Its key trading pairs are GBP/USD, aka ‘Cable’, which accounts for 11% of FX, GBP/JPY, or the ‘Dragon’ as it is known by traders (3%), and EUR/GBP (2%). The Pound Sterling is issued by the Bank of England (BoE).
How do the decisions of the Bank of England impact on the Pound Sterling?
The single most important factor influencing the value of the Pound Sterling is monetary policy decided by the Bank of England. The BoE bases its decisions on whether it has achieved its primary goal of “price stability” – a steady inflation rate of around 2%. Its primary tool for achieving this is the adjustment of interest rates.
When inflation is too high, the BoE will try to rein it in by raising interest rates, making it more expensive for people and businesses to access credit. This is generally positive for GBP, as higher interest rates make the UK a more attractive place for global investors to park their money.
When inflation falls too low it is a sign economic growth is slowing. In this scenario, the BoE will consider lowering interest rates to cheapen credit so businesses will borrow more to invest in growth-generating projects.
How does economic data influence the value of the Pound?
Data releases gauge the health of the economy and can impact the value of the Pound Sterling. Indicators such as GDP, Manufacturing and Services PMIs, and employment can all influence the direction of the GBP.
A strong economy is good for Sterling. Not only does it attract more foreign investment but it may encourage the BoE to put up interest rates, which will directly strengthen GBP. Otherwise, if economic data is weak, the Pound Sterling is likely to fall.
How does the Trade Balance impact the Pound?
Another significant data release for the Pound Sterling is the Trade Balance. This indicator measures the difference between what a country earns from its exports and what it spends on imports over a given period.
If a country produces highly sought-after exports, its currency will benefit purely from the extra demand created from foreign buyers seeking to purchase these goods. Therefore, a positive net Trade Balance strengthens a currency and vice versa for a negative balance.
Short Dollar positioning looks quite heavy. Economists at ING analyze USD outlook ahead of rate decisions in the US, the Eurozone and Japan.
Market running short Dollars into this week’s event risks
Positioning data suggests investors are running reasonably large short Dollar positions into this week's Fed, ECB and BoJ policy meetings.
We do like a weaker USD later this year, but the Dollar's recent corrective rally might endure this week if the Fed hangs onto its tightening bias.
DXY looks like it could grind higher to the 101.50 area.
Following the meeting of China’s Communist Party's Politburo on Monday, Chinese state media released the readout of the meeting.
Key takeaways
China's economy faces new difficulties and challenges.
Will continue to implement prudent monetary policy.
Will continue to implement proactive fiscal policy.
Will implement macro adjustments in a precise and forceful manner.
Keep Yuan exchange rate basically stable.
Domestic demand is insufficient.
Some companies face difficulties in operations.
Will adjust and optimise property policies at appropriate time, promote sound and stable development of property market.
To meet demand of rigid and improving housing needs.
Will effectively prevent risks in local govt debt.
Will form and carry out basket of measures to resolve local govt debt issues.
Will continue to deepen reform and opening up, improve development environment for private firms.
Will promote healthy and sustainable development of platform companies.
Will promote secure development of artificial intelligence.
Will actively expand domestic demand.
Will boost consumption of auto, electronics and household products, promote tourism consumption.
Market reaction
The Chinese proxy, the Australian Dollar, seems to receiving a fresh boost from the above headlines. AUD/USD is trading at daily highs near 0.6750, adding 0.27% on a daily basis, at the press time.
Economists at TD Securities discuss Gold (XAU/USD) outlook ahead of the Fed meeting on Wednesday.
US monetary officials will continue to talk hawkish
With prices falling from the CPI-inspired highs following firmer-than-expected jobless claims data, and rates and the USD again trending higher, it is likely that positioning will tilt to the short end as we approach Fed decision day.
With core CPI still running at a high 4.8 percent and employment staying firm, US monetary officials will continue to talk hawkish after they deliver another 25 bps hike on Wednesday. This is unlikely to be a positive for Gold and we should see it trade near key support levels.
- GBP/USD meets with a fresh supply on Monday and drifts lower through the early European session.
- The disappointing UK PMIs reaffirm bets for a less aggressive BoE and weigh on the British Pound.
- The downside seems limited as the focus remains glued to the crucial BoJ policy decision on Friday.
The GBP/JPY cross kicks off the new week on a weaker note and reverses a part of Friday's positive move to a nearly two-week high, around mid-182.00s. The steady intraday descent remains uninterrupted following the disappointing release of the UK PMI prints and drags spot prices to the 181.20-181.15 area, or a fresh daily low during the early part of the European session.
The British Pound (GBP) weakens across the board after the preliminary report by the S&P Global/CIPS showed that business activity in the UK manufacturing sector contracted for the eleventh straight month in July. Moreover, the gauge for the UK services sector pointed to a further slowdown in growth during the reported month. This comes on the back of last week's softer UK consumer inflation figures and validates market expectations for a less aggressive policy tightening by the Bank of England (BoE), which, in turn, is seen dragging the GBP/JPY cross lower.
Apart from this, concerns about slowing global economic growth, along with the worsening US-China relations and geopolitical risks, benefit the safe-haven Japanese Yen (JPY) and contribute to the intraday slide. The JPY, however, lacks bullish conviction in the wake of growing acceptance that the Bank of Japan (BoJ) will stick to its dovish stance at the end of a two-day meeting on Friday. In fact, a government spokesperson said on Monday that Japan's inflation will likely slow to around 1.5% next year when stripping away the effect of one-off factors.
In contrast, Japan's top currency diplomat Masato Kanda said that the recent inflation and wage rises were overshooting expectations and the data available so far supports prospects for an upgrade in the BoJ's inflation forecasts. Hence, the market focus will remain glued to the latest BoJ monetary policy update, due on Friday. The outlook will play a key role in influencing the JPY and provide a fresh directional impetus to the GBP/JPY cross. This, in turn, warrants some caution for aggressive bearish traders and positioning for deeper losses.
Technical levels to watch
Sterling has been under pressure over the last week. Economists at ING analyze GBP outlook.
EUR/GBP could correct back toward the 0.8600 area
Given the lack of top-tier UK data this week and what could be a slightly hawkish Fed meeting on Wednesday, it may well be that the repricing of the BoE rate cycle and Sterling softness have come far enough for the time being. This could see EUR/GBP correct back toward the 0.8600 area.
GBP/USD could correct to the 1.2670/2700 area this week if the Dollar correction does run a little further on the Fed story.
- UK Manufacturing PMI declines to 45.0 in July, below expectations of 46.1.
- Services PMI in the UK drops to 51.5 in July, misses estimates.
- GBP/USD drops toward 1.2800 on disappointing UK business PMIs.
The seasonally adjusted S&P Global/CIPS UK Manufacturing Purchasing Managers’ Index (PMI) declined to 45.0 in July versus 46.1 expected and, 46.5 - June’s final readout.
Meanwhile, the Preliminary UK Services Business Activity Index hit a six-month low of 51.5c in July, compared with a 53.7 final print for June and 53.0 expected.
FX implications
GBP/USD is losing 0.22% on the day to trade at 1.2822, as of writing. The downbeat UK Manufacturing and Services PMI data is weighing heavily on the Pound Sterling.
- Euro breaks below the 1.1100 support against the US Dollar.
- Stocks in Europe kick off the week on the back foot.
- EUR/USD looks heavily offered below the 1.1100 mark.
- Poor Flash PMIs hurt sentiment around the Euro.
The Euro (EUR) has continued its decline against the US Dollar (USD) for yet another session on Monday, resulting in EUR/USD breaking below the important support level of 1.1100 and reaching fresh lows for the past two weeks.
The drop in the pair's value is driven by the disappointing reports of preliminary Manufacturing and Services PMIs in Germany and the wider eurozone for July. These reports have led to a renewed and strong selling pressure on the European currency.
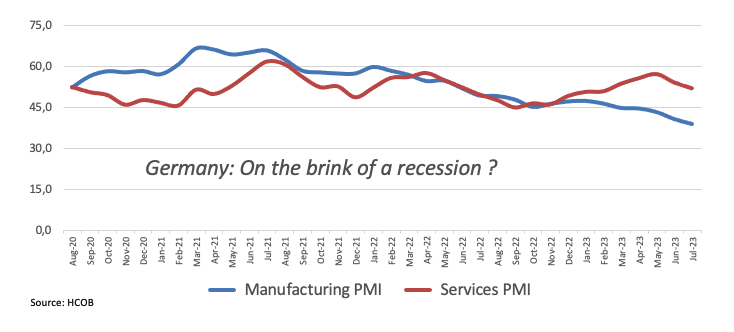
Looking ahead, increased volatility in the currency pair is expected as crucial meetings by both the Federal Reserve and the European Central Bank (ECB) are scheduled later in the week. Both central banks are anticipated to raise interest rates by 0.25%. However, there is a growing divergence in their short-term plans for future tightening.
The Federal Reserve appears to be nearing the end of its hiking cycle, indicating a potential pause or slowdown in future rate increases. On the other hand, some officials from the European Central Bank have recently expressed less-hawkish views on the likelihood of further rate hikes beyond the summer.
In the domestic calendar, flash Manufacturing PMI in Germany came in at 38.8 in July and 42.7 when it comes to the broader Eurozone, while the Services gauge stood at at 52.0 and 51.1, respectively.
It is PMI-day across the pond as well, while the US Chicago Fed National Activity Index will be also published.
Daily digest market movers: Euro keeps the bearish note well in place
- The EUR breaches the 1.1100 support against the USD.
- The USD Index extends the upside momentum above 101.00.
- Market chatter pointing to the end of the Fed’s hiking cycle looks subdued.
- US, German yields start the week with small pullbacks.
- The Fed starts its two-day meeting on Tuesday.
Technical Analysis: Euro risks a deeper drop to 1.1000
EUR/USD remains on the defensive and tests the area of two-week lows in the sub-1.1100 region.
The pair printed a new 2023 high at 1.1275 on July 18. Once this level is cleared, there are no resistance levels of significance until the 2022 peak of 1.1495 recorded on February 10.
On the downside, immediate contention lies at the weekly low of 1.1074 (July 24) ahead of the psychological 1.1000 mark, all seconded by provisional support at the 55-day and 100-day SMAs at 1.0898 and 1.0885, respectively. The loss of this region could open the door to a potential visit to the July 6 low of 1.0833 ahead of the key 200-day SMA at 1.0693 and the May 31 low of 1.0635. South from here emerges the March 15 low of 1.0516 before the 2023 low of 1.0481 on January 6.
The constructive view of EUR/USD appears unchanged as long as the pair trades above the key 200-day SMA.
Euro FAQs
What is the Euro?
The Euro is the currency for the 20 European Union countries that belong to the Eurozone. It is the second most heavily traded currency in the world behind the US Dollar. In 2022, it accounted for 31% of all foreign exchange transactions, with an average daily turnover of over $2.2 trillion a day.
EUR/USD is the most heavily traded currency pair in the world, accounting for an estimated 30% off all transactions, followed by EUR/JPY (4%), EUR/GBP (3%) and EUR/AUD (2%).
What is the ECB and how does it impact the Euro?
The European Central Bank (ECB) in Frankfurt, Germany, is the reserve bank for the Eurozone. The ECB sets interest rates and manages monetary policy.
The ECB’s primary mandate is to maintain price stability, which means either controlling inflation or stimulating growth. Its primary tool is the raising or lowering of interest rates. Relatively high interest rates – or the expectation of higher rates – will usually benefit the Euro and vice versa.
The ECB Governing Council makes monetary policy decisions at meetings held eight times a year. Decisions are made by heads of the Eurozone national banks and six permanent members, including the President of the ECB, Christine Lagarde.
How does inflation data impact the value of the Euro?
Eurozone inflation data, measured by the Harmonized Index of Consumer Prices (HICP), is an important econometric for the Euro. If inflation rises more than expected, especially if above the ECB’s 2% target, it obliges the ECB to raise interest rates to bring it back under control.
Relatively high interest rates compared to its counterparts will usually benefit the Euro, as it makes the region more attractive as a place for global investors to park their money.
How does economic data influence the value of the Euro?
Data releases gauge the health of the economy and can impact on the Euro. Indicators such as GDP, Manufacturing and Services PMIs, employment, and consumer sentiment surveys can all influence the direction of the single currency.
A strong economy is good for the Euro. Not only does it attract more foreign investment but it may encourage the ECB to put up interest rates, which will directly strengthen the Euro. Otherwise, if economic data is weak, the Euro is likely to fall.
Economic data for the four largest economies in the euro area (Germany, France, Italy and Spain) are especially significant, as they account for 75% of the Eurozone’s economy.
How does the Trade Balance impact the Euro?
Another significant data release for the Euro is the Trade Balance. This indicator measures the difference between what a country earns from its exports and what it spends on imports over a given period.
If a country produces highly sought after exports then its currency will gain in value purely from the extra demand created from foreign buyers seeking to purchase these goods. Therefore, a positive net Trade Balance strengthens a currency and vice versa for a negative balance.
- EUR/GBP meets with heavy supply in reaction to the dismal Euro Zone PMI prints for July.
- The weaker data eases pressure on the ECB to hike rates further and weighs on the Euro.
- Diminishing odds for a more aggressive BoE cap gains for the GBP and could limit losses.
The EUR/GBP cross comes under heavy selling pressure during the early European session on Monday and drops to a three-day low, around the 0.8620 region in reaction to the dismal Euro Zone data.
The shared currency takes a hit following the rather disappointing release of Eurozone PMI prints, which, in turn, is seen as a key factor behind the latest leg of a sudden drop for the EUR/GBP cross. In fact, S&P Global's preliminary report pointed to a sharp slowdown in business activity in France and Germany - the Eurozone's two largest economies. Moreover, the composite Euro Zone PMI missed consensus estimates and eases pressure on the European Central Bank (ECB) to hike interest rates after the anticipated 25 bps lift-off later this week.
The EUR/GBP cross, however, manages to hold above the 0.8600 mark, at least for the time being, in the wake of diminishing odds for a more aggressive policy tightening by the Bank of England (BoE), bolstered by last week's softer UK consumer inflation figures. Hence, it will be prudent to wait for strong follow-through selling before confirming that the EUR/GBP pair's recent goodish recovery from the vicinity of the 0.8500 psychological mark, or its lowest level since August 2022 touched earlier this month, has run its course.
Traders might also refrain from placing aggressive bets and wait on the sidelines ahead of the crucial ECB policy meeting on Thursday. In the meantime, the release of the flash version of the UK PMI prints for July might influence the British Pound and provide some impetus to the EUR/GBP cross. Nevertheless, spot prices have now retreated nearly 100 pips from a nearly one-month high touched last week and a convincing break below the 0.8600 round figure should pave the way for a further intraday depreciating move.
Technical levels to watch
The JPY re-weakened over the past week. Economists at MUFG Bank analyze USD/JPY ahead of the BoJ meeting.
JPY risk skewed to a bigger gain than a loss on an unchanged YCC announcement
We admit that our conviction on a change to YCC is lower although we still cannot rule out a move given the inevitable surprise likely involved in shifting away from YCC.
Our current end-Q3 of 136.00 incorporated our view of a YCC change and implies a big drop on a surprise YCC change.
The JPY risk is certainly now skewed to a bigger JPY gain than a JPY loss on an unchanged YCC announcement.
USD/CNH is seen navigating within the 7.1500-7.2500 range in the near term, comment Economist Lee Sue Ann and Markets Strategist Quek Ser Leang at UOB Group.
Key Quotes
24-hour view: We highlighted last Friday that “USD weakness has not stabilized.” We added, “In view of the oversold conditions, USD is unlikely to break the major support at 7.1500.” However, USD did not weaken much as it traded between 7.1645 and 7.1923. The current price actions are likely part of a consolidation phase. Today, we expect USD to trade in a range of 7.1655/7.2000.
Next 1-3 weeks: Our latest narrative was from last Wednesday (19 Jul, spot at 7.1950) still stands. As highlighted, after the recent sharp drop, USD is unlikely to weaken further. For the time being, USD is likely to trade in a range, probably between 7.1500 and 7.2500.
- Eurozone Manufacturing PMI contracts to 42.7 in July, missing estimates of 43.5.
- Bloc’s Services PMI drops to 51.1 in July vs. 51.5 expected.
- EUR/USD extends losses toward 1.1050 after dismal German and Eurozone PMIs.
The Eurozone manufacturing sector pain deepened further in July, the latest data from HCOB's latest purchasing managers index survey showed Monday.
The Eurozone Manufacturing Purchasing Managers Index (PMI) declined to 42.7 in July as against the market expectations of 43.5 and below the 43.4 seen in June. The index hit a 38-month low.
The bloc’s Services PMI eased to 51.1 in July from 52.0 seen in June, reaching a six-month low, arriving below the 51.5 estimates.
The HCOB Eurozone PMI Composite dropped to 48.9 in July vs. 49.7 expected and 49.9 prior. The index recorded the lowest level in eight months.
FX implications
EUR/USD is falling further toward 1.1050 after Eurozone PMIs disappointed markets. The spot is down 0.41% on the day, trading at 1.1075, as of writing.
- The index extends its upside momentum above 101.00.
- Softer-than-expected PMIs hurt the euro on Monday.
- Flash PMIs, Chicago Fed National Activity Index next on tap.
The greenback, in terms of the USD Index (DXY), extends the recovery further north of 101.00 the figure at the beginning of the week.
USD Index looks at data, FOMC
The index trades with gains for the fifth consecutive session so far on Monday and looks to consolidate the recent breakout of the key 101.00 hurdle on the back of further selling pressure in the risk complex.
On the latter, poor advanced PMI prints in the euro area hurt the sentiment among the risky assets and lends extra legs to the greenback at the beginning of the week amidst the continuation of the lack of traction in US yields across all maturities.
Looking at the macro scenario, the Federal Reserve meets later in the week and is expected to hike rates by 25 bps. However, investors’ attention is expected to be on the next steps by the central bank regarding its normalization programme vs, markets’ perception that the July rate raise could be the last one.
Data-wise across the pond, the Chicago Fed National Activity Index is due along with flash Manufacturing and Services PMIs for the month of July.
What to look for around USD
The index extends the optimism north of the 101.00 hurdle amidst further bearishness surrounding the risk-associated universe on Monday.
In the near term, there are no changes to the perception that the Fed would resume its tightening process later in the month despite persistent disinflationary pressures and the still tight labour market.
This view was further bolstered by comments from Fed Chief Powell at the June FOMC event, who referred to the July meeting as "live" and indicated that most of the Committee is prepared to resume the tightening campaign as early as next month.
Key events in the US this week: Chicago Fed National Activity Index, Flash Manufacturing, Services PMI (Monday) – FHFA House Price Index, CB Consumer Confidence (Tuesday) – MBA Mortgage Applications, New Home Sales, Fed Interest Rate Decision (Wednesday) – Durable Goods Orders, Advanced Q2 GDP Growth Rate, Initial Jobless Claims, Flash Goods Trade Balance, Pending Home Sales (Thursday) – PCE, Core PCE, Personal Income, Personal Spending, Final Michigan Consumer Sentiment (Friday).
Eminent issues on the back boiler: Persistent debate over a soft/hard landing of the US economy. Terminal Interest rate near the peak vs. speculation of rate cuts in late 2023/early 2024. Geopolitical effervescence vs. Russia and China. US-China trade conflict.
USD Index relevant levels
Now, the index is up 0.21% at 101.30 and the breakout of 102.61 (55-dat SMA) would open the door to 103.54 (weekly high June 30) and then 104.00 (200-day SMA). On the downside, immediate support emerges at 99.57 (2023 low July 13) followed by 97.68 (weekly low March 30) and 95.17 (monthly low February 10 2022).
- Gold price trades directionless around $1,960.00 as investors await Fed policy for further guidance.
- One more interest- rate hike from the Fed is widely expected to return the United States' stubborn inflation to 2%.
- Diverging views among Fed officials and investors about interest-rate guidance likely to keep the US Dollar Index on edge.
Gold price (XAU/USD) is portraying a non-direction performance on Monday as investors await the interest-rate decision by the Federal Reserve (Fed) for further guidance. The precious metal is expected to continue its lackluster performance as a small interest-rate hike from the Fed is widely expected despite softening inflation and loosening labor market conditions.
There is little doubt among investors that the Fed will increase interest rates to the 5.25-5.50% range as the core Consumer Price Index (CPI) is still stubbornly high partly due to the resilience in consumer spending. A catalyst to which investors are keeping an eye is the interest-rate guidance from the Fed. Fed officials and investors have divergent views about where interest rates will peak for the current year as the former signaled that two more interest-rate hikes are appropriate while market participants are expecting that the upcoming interest-rate increase will be the last one this year.
Daily Digest Market Movers: Gold price remains sideways ahead of Fed policy
- Gold price struggles to maintain an auction above $1,960.00 as investors prepare for a fresh interest-rate hiking cycle by global central banks.
- The Federal Reserve, the European Central Bank (ECB), and the Bank of England (BoE) are set to raise interest rates further to tame stubborn inflation.
- Investors are anticipating 25 basis points (bps) interest-rate hike from the ECB but are mixed about the scale of policy tightening by the BoE.
- Headline inflation in the United States softened in June due to lower gasoline prices while core inflation is still stubborn due to expanding consumer spending, boosting hopes of one more interest-rate hike from the Fed.
- It is widely expected that the Fed will raise interest rates by 25 bps to 5.25-5.50%, according to the CME Group FedWatch tool.
- Fed Chair Jerome Powell skipped its aggressive rate-hike cycle in June to buy some time to assess the impact of interest-rate hikes in the past 17 months.
- As the Fed looks set to raise interest rates further in July, investors’ major focus will be on guidance for the entire year.
- Jerome Powell announced in his testimony that two more interest rate hikes are appropriate by the year-end.
- Contrary to Powell’s commentary, investors are hoping that July’s rate hike would be the last nail in the coffin. Also, Goldman Sachs cited that the Federal Reserve's widely-expected interest- rate hike at its upcoming policy meeting next week will be "the last" of the US central bank's current tightening cycle.
- The Fed is not expected to discuss rate cuts for this year as the foremost priority is to bring down inflation to 2% and its consistent maintenance around desired levels.
- Meanwhile, US S&P preliminary PMI data for July will be keenly watched. Manufacturing PMI is seen improving marginally to 46.4 vs. the former release of 46.3. This would be the second straight in factory activity as the figure would be below 50.0. Services PMI is seen lower at 54.1 against the former release of 54.4.
- US factory activity has remained weak amid aggressive policy-tightening by the Fed and tight credit conditions at commercial banks.
- The upside in the US Dollar Index seems restricted to around 101.00 as an interest-rate hike of 25 bps from the Fed is widely anticipated. Meanwhile, 10-year US Treasury Yields have jumped to 3.85%.
Technical Analysis: Gold price eyes further correction to 20-EMA
Gold price juggles in a narrow range after a three-day correction from the immediate high of $1,984.00. A mean-reversion is expected in the precious metal toward the 20-period Exponential Moving Average (EMA) around $1,950.00. The yellow metal is under pressure due to a decent recovery in the US Dollar Index.
Momentum oscillators show that the upside impulse has faded. However, the north-side bias looks still solid.
Fed FAQs
What does the Federal Reserve do, how does it impact the US Dollar?
Monetary policy in the US is shaped by the Federal Reserve (Fed). The Fed has two mandates: to achieve price stability and foster full employment. Its primary tool to achieve these goals is by adjusting interest rates.
When prices are rising too quickly and inflation is above the Fed’s 2% target, it raises interest rates, increasing borrowing costs throughout the economy. This results in a stronger US Dollar (USD) as it makes the US a more attractive place for international investors to park their money.
When inflation falls below 2% or the Unemployment Rate is too high, the Fed may lower interest rates to encourage borrowing, which weighs on the Greenback.
How often does the Fed hold monetary policy meetings?
The Federal Reserve (Fed) holds eight policy meetings a year, where the Federal Open Market Committee (FOMC) assesses economic conditions and makes monetary policy decisions.
The FOMC is attended by twelve Fed officials – the seven members of the Board of Governors, the president of the Federal Reserve Bank of New York, and four of the remaining eleven regional Reserve Bank presidents, who serve one-year terms on a rotating basis.
What is Quantitative Easing (QE) and how does it impact USD?
In extreme situations, the Federal Reserve may resort to a policy named Quantitative Easing (QE). QE is the process by which the Fed substantially increases the flow of credit in a stuck financial system.
It is a non-standard policy measure used during crises or when inflation is extremely low. It was the Fed’s weapon of choice during the Great Financial Crisis in 2008. It involves the Fed printing more Dollars and using them to buy high grade bonds from financial institutions. QE usually weakens the US Dollar.
What is Quantitative Tightening (QT) and how does it impact the US Dollar?
Quantitative tightening (QT) is the reverse process of QE, whereby the Federal Reserve stops buying bonds from financial institutions and does not reinvest the principal from the bonds it holds maturing, to purchase new bonds. It is usually positive for the value of the US Dollar.
Economists at ING analyze EUR/USD outlook ahead of big central bank meetings.
Some downside risks to EUR/USD this week
Given what could be a mildly hawkish Fed event risk on Wednesday and the prospect of the ECB less than wholeheartedly backing the idea of a follow-up September rate hike, we see some downside risks to EUR/USD this week.
As a result, we think this EUR/USD correction may only extend to the 1.1050 area.
See – EUR/USD: General election in Spain have had limited impact on the Euro – MUFG
- Germany’s Manufacturing PMI arrives at 38.8 in July vs. 41.0 expected.
- Services PMI in Europe’s economic powerhouse drops to 52.0 in July vs. 53.1 expected.
- EUR/USD drops below 1.1100 on disappointing German PMIs.
Germany’s manufacturing downturn extended into July while the services sector slowdown continued, according to the preliminary business activity report from the HCOB survey published on Monday.
The Manufacturing PMI in Eurozone’s economic powerhouse came in at 38.8 this month, compared with 41.0 expected and 40.6 previous figure. The index hit its lowest level in 38 months.
Meanwhile, Services PMI dropped further from 54.1 in June to 52.0 in July. The market consensus was for a 53.1 reading. The PMI reached a fresh five-month low.
The HCOB Preliminary Germany Composite Output Index arrived at 48.3 in July vs. 50.3 estimates and June’s 50.6. The gauge recorded an eight-month low.
FX implications
EUR/USD is extending the drop below 1.1100 on the downbeat German data. The pair is trading 0.30% lower at 1.1085, at the time of writing.
- Silver finds support near mid-$24.00s and reverses an intraday dip to over a one-week low.
- The mixed oscillators on daily/hourly charts warrant caution for aggressive bullish traders.
- A convincing break below the 200-day SMA is needed to negate the near-term positive bias.
Silver rebounds from over a one-week low touched this Monday and trades with a mild positive bias, around the $24.65 region during the early European session. The white metal, for now, seems to have stalled a two-day corrective decline from the $24.25 area, or its highest level since May 11 set last Thursday.
From a technical perspective, the XAG/USD manages to defend the $24.50 strong horizontal resistance breakpoint, now turned support. The said area should now act as a pivotal point, which if broken decisively might prompt some technical selling and drag Silver towards the $24.00 mark. The downward trajectory could get extended further towards the $23.65-$23.60 support en route to the $23.20-$23.15 region.
Some follow-through selling, leading to a subsequent fall below the $23.00 round figure, which nears the very important 200-day Simple Moving Average (SMA), could negate any positive outlook and shift the near-term bias in favour of bearish traders. The XAG/USD might then turn vulnerable to accelerate the fall below the $22.75-$22.70 area, towards challenging the multi-month low, around the $22.15-$22.10 area.
Meanwhile, oscillators on the daily chart are holding comfortably in the positive territory and favour bullish traders. That said, technical indicators on hourly charts are yet to confirm the bullish outlook and warrant caution before positioning for a further intraday appreciating move. Hence, any subsequent move up might attract some sellers near the $25.00 psychological mark and remain capped near last week's swing high, around the $25.25 area.
Some follow-through buying, however, should allow the XAG/USD to surpass the $25.50-$25.55 intermediate hurdle and aim to reclaim the $26.00 round figure. This is closely followed by the YTD peak, around the $26.10-$26.15 area touched in May, which if cleared will set the stage for an extension of the recent upward trajectory witnessed over the past month or so.
Silver daily chart
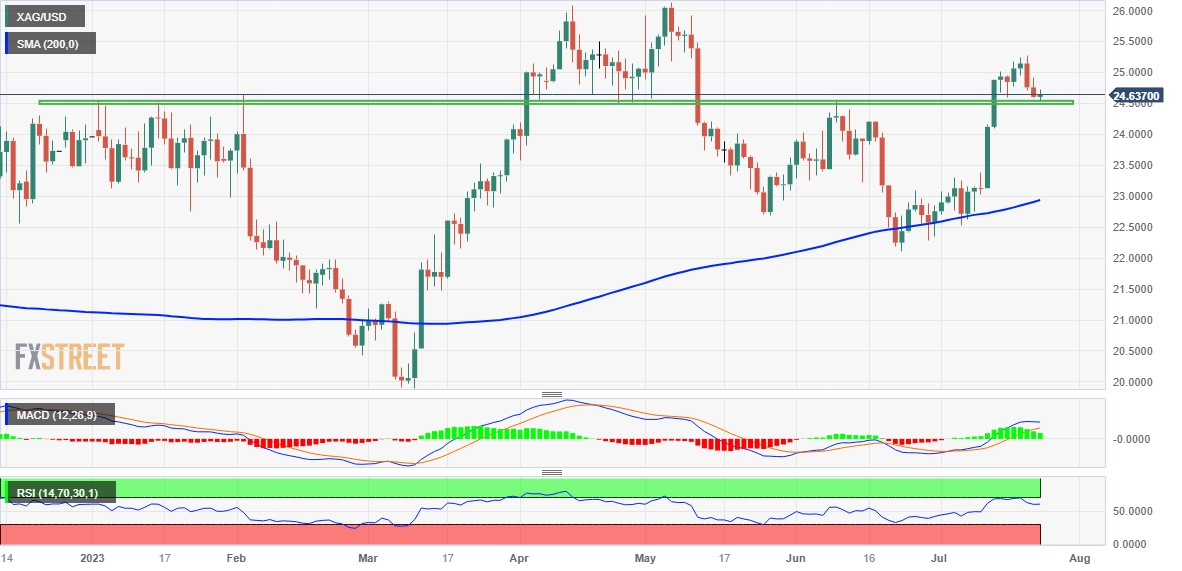
Key levels to watch
Further gains could motivate USD/JPY to revisit the 143.00 region in the next few weeks according to Economist Lee Sue Ann and Markets Strategist Quek Ser Leang at UOB Group.
Key Quotes
24-hour view: While we expected USD to strengthen last Friday, we were of the view that “it is unlikely to threaten the major resistance at 141.00.” Not only did USD break above 141.00, it also jumped to a high of 141.95. While further USD strength is not ruled out, severely overbought conditions suggest the major resistance at 143.00 is likely out of reach today (there is another resistance at 142.50). In order to keep the strong momentum going, USD must stay above 140.95 (minor support is at 141.30).
Next 1-3 weeks: Our most recent narrative was from last Thursday (19 Jul, spot at 139.55) wherein the recent USD weakness had stabilized. We expected USD to trade in a range between 138.00 and 141.00. The strong surge on Friday that sent USD to a high of 141.95 came a surprise. The rapid increase in momentum is likely to lead to USD rising to 143.00. In order to keep the momentum going, USD must stay above 140.00 (‘strong support’ level).
Considering advanced prints from CME Group for natural gas futures markets, open interest went down for the third session in a row on Friday, now by around 19.5K contracts. In the same line, volume reversed the previous daily build and dropped sharply by around 183.2K contracts.
Natural Gas: Next on the upside comes $2.90 ahead of $3.00
Friday’s downtick in prices of natural gas was on the back of diminishing open interest and volume and is indicative that extra pullbacks appear not favoured in the very near term. That said, initial up-barrier emerges at the June’s high near $2.90 (June 28) prior to the March tops past the $3.00 mark per MMBtu (March 23).
EUR/USD has continued to trade at just above the 1.1100 level after correcting modestly lower towards the end of last week. Economists at MUFG analyze the impact of the main event over the weekend, the general election in Spain.
Spain election results have limited impact on Euro performance
The election results have heightened political uncertainty in Spain in the near term after the right and left both failed to secure a clear path to forming a government even though the opposition People’s Party (PP) won the most seats in parliament. With all of the votes counted, the PP had won 136 seats compared to 122 seats for the Socialists. But none of the most probable coalitions will be sufficient for the PP or the Socialists to secure the 176 seats required in parliament for a majority.
The PP is expected to have the first go at forming a government. If neither party is able to secure sufficient support of Congress then another election could be called later this year.
Despite the heightened political uncertainty, the election results are not expected to alter expectations that Spain’s economy to outperform other major Eurozone economies this year.
If no government is formed and new elections are required, previously-agreed fiscal policies will be rolled over and remain highly accommodative.
In the view of Economist Lee Sue Ann and Markets Strategist Quek Ser Leang at UOB Group, AUD/USD risks a potential breakdown of the 0.6700 support in the short-term horizon.
Key Quotes
24-hour view: We highlighted last Friday that AUD “is under mild downward pressure and could dip below 0.6750.” However, we were of the view that “a sustained decline below this level is unlikely.” AUD weakened more than expected as it dropped to 0.6723 before closing on a soft note at 0.6732 (-0.70%). The rapid decline has room to extend. In view of the oversold conditions, a sustained decline below the major support at 0.6700 is unlikely. Resistance is at 0.6755, followed by 0.6775.
Next 1-3 weeks: Our latest narrative was from last Thursday (20 Jul, spot at 0.6775). In the update, we highlighted that “the recent buildup in upward momentum has dissipated” and we expected AUD to trade in a range between 0.6700 and 0.6865. On Friday, AUD fell to a low of 0.6723. Downward momentum is beginning to build and, if AUD breaks below 0.6700, it could continue to weaken to 0.6665. The downward pressure is intact as long as AUD stays below the ‘strong resistance’ level, currently at 0.6800.
FX option expiries for July 24 NY cut at 10:00 Eastern Time, via DTCC, can be found below.
- EUR/USD: EUR amounts
- 1.1000 1b
- 1.1130 634m
- GBP/USD: GBP amounts
- 1.2945 952m
- 1.2975 343m
- USD/JPY: USD amounts
- 140.00 2b
- 140.25 500m
- 141.25 1.1b
- 142.00 680m
- AUD/USD: AUD amounts
- 0.6720 430m
- 0.6780 453m
- 0.6800 1.2b
- NZD/USD: NZD amounts
- 0.6160 1b
- EUR/GBP: EUR amounts
- 0.8475 14b
- 0.8600 950m
Open interest in crude oil futures markets increased by around 13.5K contracts after four consecutive daily advances on Friday according to preliminary readings from CME Group. Volume, instead, shrank for the third straight session, this time by nearly 50K contracts.
WTI still targets July highs above $77.00
WTI prices kept the optimism well in place in the second half of last week. Friday’s gains were on the back of rising open interest and leave the door open to further upside in the very near term. Against that, the immediate target remains at the July peaks past the $77.00 mark per barrel for the time being.

Economists at Commerzbank analyze JPY ahead of the BoJ meeting.
What is the risk that is putting pressure on the Yen even at the current weak levels?
The Yen is affected by two factors if the monetary policy reversal will once again fails to materialize: short-term it suffers because the carry disadvantage is creating pressure; and long-term because there is a risk that inflation will become so ingrained that monetary policy will be unable to control it without considerable fiscal collateral damage.
The risk that is putting pressure on the Yen even at the current weak levels is: as long as the current situation persists it is unclear whether ‘equilibrium’ JPY exchange rates exist any longer or whether there is a risk of never-ending depreciation/inflation spiral.
Further losses appear in store for GBP/USD in the short-term horizon, suggest Economist Lee Sue Ann and Markets Strategist Quek Ser Leang at UOB Group.
Key Quotes
24-hour view: Last Friday, we expected GBP to trade in a range of 1.2835/1.2930. However, GBP traded in a lower range of 1.2817/1.2904 before closing slightly lower at 1.2852 (-0.12%). Despite the lower trading range, there is no clear increase in downward momentum. We continue to expect GBP to trade in a range, probably between 1.2815 and 1.2895.
Next 1-3 weeks: Last Thursday (20 Jul, spot at 1.2935), we highlighted that the decline in GBP had room to extend. However, we indicated that GBP “has to break clearly below 1.2850 before a sustained decline is likely.” After GBP broke below the strong support at 1.2850, we highlighted last Friday (21 Jul, spot at 1.2875) that GBP could drop further. We indicated that there is another solid support at 1.2780. We continue to hold the same view. Overall, only a breach of 1.2960 (‘strong resistance’ level was at 1.3000 last Friday) would indicate that GBP is not weakening further.
- USD/CHF grinds near intraday high, reverses Friday’s U-turn from one-week high.
- CFTC data suggests bearish US Dollar bets jump to record high.
- US statistics flag fears of Fed policy pivot despite lifting greenback from 15-month low in the last week.
- First readings of US S&P Global PMIs for July will direct intraday moves, Fed announcements, US Q2 GDP are crucial.
USD/CHF clings to mild gains around 0.8665 as markets brace for the top-tier data/events during early Monday in Europe. That said, the Swiss Franc (CHF) pair rose for the first time in four weeks, bouncing off the lowest levels since late 2015, as the US Dollar cheered upbeat data to challenge the dovish Fed bias. However, the recently bearish US Dollar bias of the asset managers and anxiety ahead of today’s preliminary readings of the US S&P Global PMIs for July challenge the pair buyers of late.
That said, Bloomberg quotes the US Commodity Futures Trading Commission (CFTC) data for the week ended on July 18 to state that asset managers boosted bearish dollar bets to a record 18% amid speculation slowing US inflation will hasten the end of the Federal Reserve’s 16-month run of policy tightening.
It should be noted that the US Dollar Index (DXY) flirts with the intraday low near 101.00 as it retreats from the highest level in eight days while portraying the market’s cautious mood. With this, the greenback’s gauge versus six major currencies prints the first daily loss in five, after reversing from the lowest levels since April 2022 in the last week.
In the last week, the US housing numbers and regional manufacturing indices were mostly downbeat but an improvement in the Retail Sales Control Group for June defended the Fed hawks, as well as the US Dollar buyers. On the same line were the previously released upbeat prints of the University of Michigan’s (UoM) Consumer Sentiment Index and consumer inflation expectations for July. Though the US Consumer Price Index (CPI) and Producer Price Index (PPI) for June joined the first below-expectations Nonfarm Payrolls (NFP) in 15 months to tease the Federal Reserve’s (Fed) policy pivot past July and challenge the US Dollar bulls.
Hence, the USD/CHF pair traders will not only pay attention to today’s US PMIs but will also closely observe the first readings of the US second-quarter (Q2) 2023 Gross Domestic Product (GDP) and Fed Chair Jerome Powell’s ability to defend the hawks for clear directions. At home, Wednesday’s Swiss ZEW Survey – Expectations and Friday’s KOF Leading Indicator for July can entertain the Swiss Franc pair traders.
Technical analysis
The first daily closing beyond the 10-DMA in two weeks keeps USD/CHF buyers hopeful unless the drops back below the DMA resistance-turned-support of 0.8642.
- USD/CAD remains confined in a narrow trading band around 1.3220.
- USD/CAD holds above the 50- and 100-hour EMAs, which means further upside looks favorable.
- The pair will meet the immediate resistance level of 1.3230; 1.3200 is a critical support level.
The USD/CAD pair oscillates in a narrow trading band near 1.3220 heading into the European session on Monday. In response to Friday's release of Canadian Retail Sales, the Loonie declines against the US Dollar. During the busy week of economic data, market participants remain on the sidelines, awaiting the Federal Reserve's (Fed) interest rate announcement for fresh impetus for the USD/CAD pair.
Meanwhile, the renewed tension between Russia and Ukraine might further tighten oil supplies. This, in turn, might cap the upside in the USD/CAD pair and lift the commodity-linked Loonie.
From the technical perspective, USD/CAD holds above the 50- and 100-hour Exponential Moving Averages (EMA), which means further upside looks favorable.
Therefore, the major pair could meet the immediate resistance level of 1.3230 (High of July 24) en route to 1.3245 (High of July 18). The 1.3290–1.3300 zone appears to be a tough nut to crack for USD/JPY. Any meaningful follow-through buying above the latter will see a rally to the next barrier at 1.3320 (High of June 14).
That said, the Relative Strength Index (RSI) stands above 50, within bullish territory, suggesting that buyers are likely to retain control in the near term.
Looking at the downside, any extended weakness below the 1.3200 mark will challenge the next contention at 1.3185 (the 100-hour EMA). Further south, the pair will see a drop to 1.3150 (Low of July 21).
USD/CAD one-hour chart
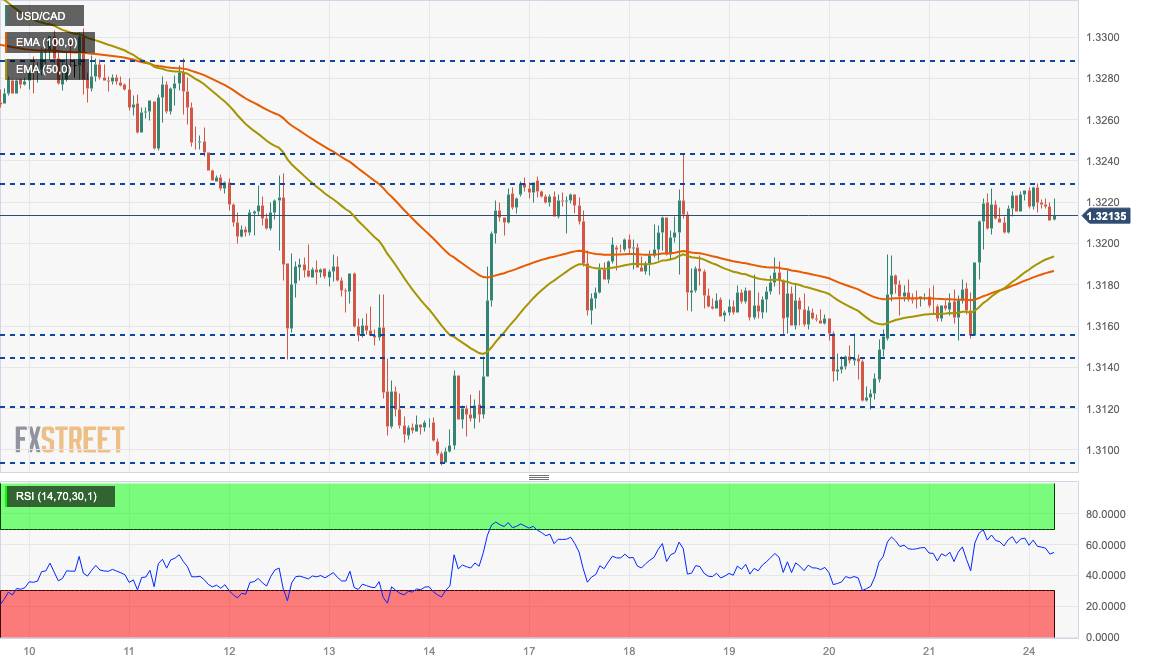
Here is what you need to know on Monday, July 24:
Financial markets stay relatively calm early Monday and major currency pairs trade near the previous week's closing levels. S&P Global will release preliminary Manufacturing and Services PMI surveys for Germany, the Eurozone, the UK and the US later. The Federal Reserve Bank of Chicago's National Activity Index will also be featured in the US economic docket ahead of this week's critical central bank policy meetings.
The US Dollar Index (DXY) snapped a two-week losing streak and gained more than 1% last week, while the benchmark 10-year US Treasury bond yield recovered back above 3.8%. In the European morning, the DXY consolidates its gains near 101.00 and the 10-year yield hold steady at around 3.8%. Following the mixed action seen in Wall Street, US stock index futures trade virtually unchanged on the day in the early European session.
During the Asian trading hours, China state planner National Development and Reform Commission (NDRC) announced that they will "guide and strengthen financing support for private-invested projects." The Shanghai Composite remains on track to end the day with small losses.
The data from Australia showed that the S&P Global Composite PMI declined to 48.3 in July from 50.1 in June, revealing a contraction in the private sector's business activity. AUD/USD edged lower toward 0.6700 following this data before recovering modestly in the European morning.
Jibun Bank Manufacturing PMI in Japan declined to 49.4 in July and the Services PMI stood unchanged at 52.1. In the meantime, "the Bank of Japan (BoJ) is likely to revise inflation projections up," said Japan's top currency diplomat Masato Kanda ahead of Friday's policy announcements. After having gained nearly 300 pips, USD/JPY moves up and down in a tight channel at around 141.50 on Monday.
EUR/USD held steady on Friday and ended the week slightly above 1.1100. The pair moves sideways below 1.1150 ahead of PMI releases. In Spain, the center-right Popular Party won the snap election but fell short of gaining a parliamentary majority.
GBP/USD stays in a consolidation phase above 1.2850 on Monday after having closed every day of the previous week in negative territory.
Despite the downward correction seen in the second half of the previous week, Gold posted small weekly gains. XAU/USD trades in a very narrow range at around $1,960 in the European morning.
Bitcoin failed to end the week above $30,000 despite having climbed above that level on Sunday. BTC/USD was last seen losing nearly 1% on the day at around $29,800. Ethereum rose more than 1% on Sunday but already erased the majority of those gains, returning below $1,900 on Monday.
CME Group’s flash data for gold futures markets noted traders scaled back their open interest positions for the second session in a row on Friday, this time by around 3.5K contracts. Volume followed suit and dropped by around 34.5K contracts.
Gold appears supported around $1945
Gold prices dropped for the third session in a row at the end of last week. The continuation of the weekly decline was on the back of shrinking open interest and volume, which removes strength from further losses in the very near term. In the meantime, there is still decent contention around the weekly at $1945 per troy ounce (July 17).
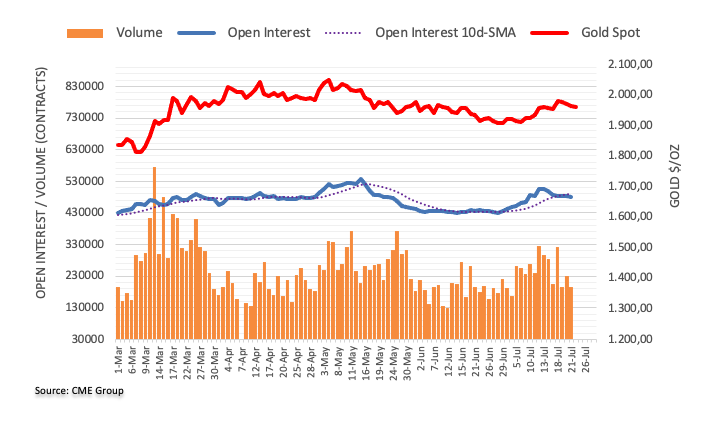
EUR/USD now has a clear bias towards 1.15 over the coming months and quarters, economists at ING report.
US disinflation undermines the Dollar
Strong signs of US disinflation and bullish steepening of the US yield curve should be a EUR/USD positive. Positioning and Rest Of World growth prospects may not trigger the kind of 8% Dollar drop seen last Nov-Dec, but the Dollar should still decline.
One last hike from the Fed, plus two more hikes from the European Central Bank should keep rate differentials supportive of EUR/USD.
EUR/USD – 1M 1.11 3M 1.12 6M 1.15 12M 1.18
- USD/TRY edges higher after snapping two-day losing streak the previous day.
- CBRT’s below-forecast rate increases lure Lira sellers, inflation woes will be crucial to watch in key report.
- US Dollar positions for Fed, bearish bets on greenback jump to record high and flag fears of witnessing positive surprise.
USD/TRY remains sidelined below the 27.00 round figure amid early Monday morning in Europe. In doing so, the Turkish Lira (TRY) pair struggles to defend the previous day’s recovery moves amid a sluggish session ahead of the preliminary reading of the US PMIs for July.
That said, mixed concerns about the Turkish inflation positions and the US Dollar’s ability to defend the previous week’s rebound from a multi-month low prod the USD/TRY pair as traders await top-tier data/events.
It should be noted that the Turkish Lira (TRY) failed to cheer the Central Bank of the Republic of Türkiye’s (CBRT) 2.5% interest rate hike to 17.5%, versus market forecasts of 20.0%. Also likely to have helped the TRY buyers was the news that Saudi Arabia and the UK brace for major business deals with Ankara. However, the TRY remains pressured amid economic fears and concerns surrounding the CBRT’s inability to tame the inflation woes.
On the other hand, the US Dollar Index (DXY) flirts with the intraday low near 101.00 as it retreats from the highest level in eight days while portraying the market’s cautious mood. With this, the greenback’s gauge versus six major currencies prints the first daily loss in five, after reversing from the lowest levels since April 2022 in the last week.
The DXY bounced off the multi-month low the last week as the US housing numbers and regional manufacturing indices were mostly downbeat but an improvement in the Retail Sales Control Group for June defended the Fed hawks. Previously, the upbeat prints of the University of Michigan’s (UoM) Consumer Sentiment Index and consumer inflation expectations for July helped the greenback to challenge the bearish bias. It’s worth noting, however, that the US Consumer Price Index (CPI) and Producer Price Index (PPI) for June joined the first below-expectations Nonfarm Payrolls (NFP) in 15 months to tease the Federal Reserve’s (Fed) policy pivot past July and drowned the US Dollar.
It should be observed, however, that Bloomberg quotes the US Commodity Futures Trading Commission (CFTC) data for the week ended on July 18 to state that Asset managers boosted bearish dollar bets to a record amid speculation slowing US inflation will hasten the end of the Federal Reserve’s 16-month run of policy tightening.
Even so, the US Dollar bulls remain hopeful as the last comments from the Fed policymakers ahead of the silence period were hawkish. Moving on, the preliminary readings of the US S&P Global PMIs for July will direct intraday moves of the USD/TRY pair ahead of the key Federal Reserve (Fed) monetary policy meeting announcements. Also important to watch are the first readings of the US second-quarter (Q2) 2023 Gross Domestic Product (GDP) and Quarterly CBRT Inflation report.
Technical analysis
Although the RSI conditions prod USD/TRY bulls from crossing the 27.00 round figure, a one-month-old rising support line, close to 26.85 by the press time, restricts the short-term downside of the Lira pair.
Economist Lee Sue Ann and Markets Strategist Quek Ser Leang at UOB Group expect EUR/USD to meet solid contention around 1.1010.
Key Quotes
24-hour view: We highlighted last Friday that “the sharp selloff in EUR has room to extend.” We added, “oversold conditions suggest a sustained decline below 1.1090 is unlikely.” However, EUR did not threaten 1.1090 as it dipped to 1.1106 before closing largely unchanged at 1.1123 (0.04%). Downward momentum has waned, and EUR is unlikely to weaken further. Today, EUR is more likely to trade sideways in a range of 1.1105/1.1155.
Next 1-3 weeks: Our update from last Friday (21 Jul, spot at 1.1135) still stands. As highlighted, the recent EUR strength has ended. The current price movements are likely part of a corrective pullback, but any decline is likely to face solid support at 1.1010. The downward pressure will remain intact unless EUR breaks above the ‘strong resistance’ at 1.1200 (level was at 1.1235 last Friday).
- USD/JPY consolidates its recent gains above the 141.50 mark heading into the European session.
- The critical resistance zone is located at 141.95–142.00; 140.85 acts as an immediate support level.
- The Relative Strength Index (RSI) stands above 50, indicating bullish territory.
The USD/JPY pair consolidates its recent gains heading into the European session on Monday. Market players prefer to wait to be sidelined ahead of the Federal Reserve's (Fed) and Bank of Japan's (BoJ) monetary policy decisions. The major pair currently trades near 141.50, down 0.22% on the day.
USD/JPY has edged higher after Reuters reported that the BoJ will likely maintain the easy-money and yield control policies in the July meeting. On the other hand, the Fed will announce its monetary policy decision on Wednesday. The market expected a 25 basis point (bps) rate hike. This, in turn, led to the weakening of the Japanese Yen against its major rivals due to monetary policy divergences between the BoJ and Fed.
According to the one-hour chart, Any meaningful follow-through buying beyond 141.65 could pave the way to the next hurdle at the 141.95–142.00 zone, highlighting a psychological round mark and the upper boundary of the Bollinger Band. The additional upside filter to watch is 142.10 (Low of July 7), followed by the 143.00 area (a psychological round mark, High of July 10). The next barrier to watch is at 143.55 (High of July 10).
On the flip side, a break below 141.35 would expose to 140.85, portraying the 50-hour Exponential Moving Average (EMA) en route to 140.30 (100-hour EMA) and finally 140.00, a confluence of a psychological round figure and a high of July 19.
It’s worth noting that the Relative Strength Index (RSI) stands above 50, indicating further upside cannot be ruled out.
USD/JPY one-hour chart
-638257751105827146.png)
- USD/MXN consolidates around 17.00 ahead of Fed US PMI and Mexico’s inflation data.
- US Manufacturing PMI is expected to contract consecutively.
- The Fed is expected to resume its aggressive rate-hike cycle after a skip in June.
The USD/MXN pair demonstrates topsy-turvy moves near the crucial resistance of 17.00 in the Tokyo session. The asset struggles to gauge a clear direction as investors shift their focus toward the interest rate decision by the Federal Reserve (Fed), which will be announced on Wednesday.
S&P500 futures remains muted, continuing their lackluster performance displayed on Friday. A stock-specific action is witnessed in the US equities as firms have started reporting earnings for the second quarter. The US Dollar Index (DXY) remains choppy in Asia as investors prefer to remain light ahead of Fed’s monetary policy.
It is widely expected that the Fed won’t skip hiking interest rates consecutively and will raise rates by 25 basis points (bps) to 5.25-5.50%. This could be the last nail in the coffin and the Fed will keep elevated interest rates stable this year. According to Goldman Sachs, the Federal Reserve's widely-expected interest rate hike at its upcoming policy meeting next week will be "the last" of the US central bank's long-running tightening cycle.
Before Fed’s policy, investors’ focus will be on preliminary S&P PMI data for July, which will be published today at 13:45 GMT. As per the estimates, Manufacturing PMI is seen improving nominally to 46.4 vs. the former release of 46.3. This could be a consecutive contraction in factory activities as the figure would be below 50.0.
Meanwhile, the Mexican Peso would hog the limelight ahead of semi-annual inflation data, which will release at 12:00 GMT. Earlier, headline inflation delivered a pace of 0.02% while the core Consumer Price Index (CPI) excludes volatile oil and food prices remained at 0.11%.
Later this week, Mexico’s Unemployment data for June will be in focus. The jobless rate is expected to drop to 2.8% against the former release of 2.9%.
- USD/CNH bulls prod 200-SMA during two-day winning streak, clings to mild gains of late.
- Looming bull cross on MACD, sustained trading past short-term support line favors Chinese Yuan sellers.
- Three-week-old descending resistance line adds to the upside filters.
USD/CNH struggles to defend buyers around 7.1980 heading into Monday’s European session, jostling with the 200-SMA of late. In doing so, the offshore Chinese Yuan (CNH) justifies the looming bull cross on the MACD indicator by staying beyond a fortnight-old rising support line.
It’s worth noting that the 38.2% Fibonacci retracement of June 02-30 upside, near 7.2020, will act as an extra upside filter ahead of directing the USD/CNH buyers toward the key resistance line stretched from June 30, close to 7.2270.
In a case where the Chinese Yuan remains weak past 7.2270, the odds of witnessing its slump toward the yearly bottom marked in June surrounding 7.2860 can’t be ruled out.
On the other hand, a convergence of the 50% Fibonacci retracement and an upward-sloping support line from July 14 restricts the immediate downside of the USD/CNH pair near 7.1760.
Following that, the 61.8% Fibonacci retracement, also known as the golden Fibonacci ratio, can challenge the offshore Yuan price near 7.1500.
Should the USD/CNH bears keep the reins past 7.1500, a five-week-old rising support line close to 7.1380 will act as the last defense of the buyers.
Overall, the USD/CNH remains on the bull’s radar even if the 200-SMA challenges the pair’s immediate upside.
USD/CNH: Four-hour chart

Trend: Limited upside expected
- AUD/USD has gauged temporary support near 0.6720 amid a cautious market mood.
- The Fed is expected to resume its rate-hike cycle after a skip in June.
- The RBA could borrow some more time for pausing the policy-tightening cycle if second-quarter inflation softens significantly.
The AUD/USD pair has found temporary support around 0.6720 in the Asian session. The Aussie asset is consistently declining from the past week as the US Dollar Index (DXY) makes a solid comeback amid hopes of one more interest rate hike from the Federal Reserve (Fed).
S&P500 futures are demonstrating a choppy performance amid a cautious market mood ahead of Fed policy. The US Dollar Index is showing a non-directional performance marginally above 101.00, preparing a fair battleground ahead of an interest rate decision by the Fed. But before that, preliminary United Stated S&P PMI data for July will be keenly watched.
As per the expectations, Manufacturing PMI is seen marginally expanding to 46.4 vs. the former release of 46.3. Services PMI is seen lower at 54.1 against the former release of 54.4. A figure below 50.00 is considered a contraction in economic activities.
Meanwhile, a major focus will be on Fed’s monetary policy, which will be announced on Wednesday. Fed chair Jerome Powell is expected to resume its policy tightening spell after a skip in June as core price pressures are still stubborn.
On the Australian Dollar front, S&P reports mix PMI data in early Tokyo. Manufacturing PMI remains higher at 49.6 against the prior release of 48.2. Services PMI landed sharply below 48.0 vs. the former release of 50.3.
Going forward, Australia’s second quarter inflation data will be keenly watched, which will be published on July 26 at 01:30 GMT. As per the consensus, inflation gained at a pace of 1.0% vs. the prior pace of 1.4% on a quarterly basis. Annual Consumer Price Index (CPI) contracted to 6.2% against 7.0% the prior release. Monthly CPI is expected to soften to 5.4%. A decline in CPI could lend some more time to the Reserve Bank of Australia (RBA) for a fresh interest rate hike.
- EUR/GBP takes offers to refresh intraday low, consolidates two-week uptrend.
- Optimism about UK job numbers, PM Rishi Sunak’s efforts to restore voters’ confidence weigh on cross-currency pair.
- UK inflation eased but strong Retail Sales underpin need of further BoE rate hikes.
- Preliminary PMIs for July, ECB’s ability to sound hawkish despite announcing widely anticipated 0.25% rate will be crucial to watch.
EUR/GBP consolidates the latest gains as traders brace for the first readings of the Eurozone and the UK PMIs for July during early Monday. In doing so, the cross-currency pair renews its intraday low near 0.8645 to print the mild losses, after rising in the last two consecutive weeks.
Apart from the pre-data positioning, headlines from Bloomberg also lure the EUR/GBP bears by suggesting more inflation pressure within the UK, via the employment sector. The news covered data from the search engine Adzuna to mention that the UK job vacancies rose for a fifth month, boosting salaries and signaling tightness in the labor market that’s likely to fan inflation.
It’s worth noting that the strong UK Retail Sales growth renewed hawkish bias about the Bank of England (BoE) the previous day event as the softer prints of the UK Consumer Price Index (CPI) earlier poked the Pound buyers.
Additionally, the chatters surrounding UK PM Rishi Sunak’s likely measures to ease the pain of British housing markets and taxpayers, mainly to lure voters ahead of 2024 general elections, also seem to weigh on the EUR/GBP price.
On the other hand, mixed comments from the European Central Bank (ECB) officials and unimpressive data from the bloc, as well as chatters that the ECB won’t be able to offer a major hawkish surprise as the 0.25% rate hike is already priced-in, seem to also weigh on the EUR/GBP price.
Moving on, the preliminary readings of the Eurozone, Germany and the UK PMIs for July will be crucial to determine intraday moves of the EUR/GBP pair ahead of Thursday’s key ECB monetary policy announcements. In that case, the pair traders will keep their eyes on how President Christine Lagarde helps keep the hawks safe ahead of a long wait before September monetary policy meeting, after the current one.
Technical analysis
Repeated failures to cross the 100-day Exponential Moving Average (EMA) surrounding 0.8665 directs the EUR/GBP bears toward the previous resistance line stretched from May 23, close to 0.8615 at the latest.
- Gold price remains pressured and holds above the $1,960 level on Monday.
- The Initial support level is located at $1,940; the immediate resistance level is seen at $1,965.
- The 50-hour EMA is on the verge of crossing below the 100-hour EMA.
Gold price struggles to gain traction during the Asian session on Monday. The XAU/USD currently trades just below the $1,960 level, down 0.11% for the day. Market players await the Federal Open Market Committee (FOMC) meeting and Fed Chairman Jerome Powell's press conference. These events could significantly impact the USD-denominated gold price.
The Federal Reserve (Fed) will announce the outcome of its monetary policy meeting on Wednesday, and market participants expect the Fed to raise interest rates by 25 basis points (bps). The possibility of another Fed rate hike after the July meeting increased to 28% from 15.9% last month, according to the CME FedWatch Tool. That said, the prospects of additional Fed and ECB policy tightening might be another factor capping the upside for the non-yielding gold price.
Looking at the one-hour chart, a break below the lower limit of the Bollinger Band at $1,950 will see a drop towards $1,940 (High of July 12) en route to $1,930 and $1,920 (High of July 3). In case the selling pressure remains, the pair would see the critical contention at $1,900, a psychological round mark.
On the upside, the immediate resistance level is seen at $1,965, representing the upper boundary of the Bollinger Band. A decisive break above the latter would drive gold towards $1,972 (High of July 21), followed by $1,983 (High of July 18). The additional upside filter is $2,000.
It’s worth noting that the 50-hour Exponential Moving Average (EMA) is on the verge of crossing below the 100-hour EMA. If a decisive crossover occurs on the one-hour chart, It would validate a Bear Cross, highlighting that the path of least resistance for gold is to the downside.
Gold price one-hour chart
- NZD/USD struggles to defend the corrective bounce off two-week low.
- Key support line break, sustained trading below 200-SMA favor Kiwi pair sellers to aim for two-month-old rising trend line.
- Oversold RSI provides headwind to immediate declines but bearish MACD signals join technical breakdowns to favour bears.
NZD/USD remains pressured at the lowest level in two weeks around 0.6165 heading into Monday’s European session. In doing so, Kiwi pair sellers justify the oversold RSI while probing bears during a seven-day losing streak.
However, the quote’s sustained trading below the previously important key technical supports keeps the sellers hopeful as market players await the key US PMIs for intraday directions.
That said, a clear downside break of the previous support line from July 06 and the 200-SMA joins the bearish MACD signals to keep the NZD/USD seller hopeful.
Even if the NZD/USD price manages to cross the stated key moving average and the support-turned-resistance, respectively near 0.6200 and 0.6260, a one-week-old horizontal resistance area surrounding 0.6300-6310 will act as the last defense of the bears.
On the contrary, the 61.8% Fibonacci retracement of the May-July upside, near 0.6150, restricts the immediate downside of the NZD/USD pair ahead of a seven-week-old rising support line, close to the 0.6100 round figure at the latest.
Following that, the late June swing low near 0.6050 and the 0.6000 round figure will be in the spotlight.
Overall, the Kiwi bears are likely to keep the reins despite the latest corrective bounce.
NZD/USD: Four-hour chart
Trend: Further downside expected
- Asian stocks kick off the new week on a positive note, with Japanese markets outperforming.
- Fresh concerns over a debt crunch in China's real estate sector underwhelm domestic markets.
- Traders look to the flash PMI prints for some impetus ahead of the key central bank event risks.
Most Asian stock markets rose slightly on Monday, with Japan’s Nikkei 225 turning out to be the best performer and rising nearly 1.5% for the day on the back of strong quarterly earnings by major automotive manufacturers. Broader Japanese shares were also supported by expectations that the Bank of Japan (BoJ) will stick to its ultra-dovish stance at the end of a two-day policy meeting later this week on Friday.
Chinese stocks, meanwhile, lagged their peers as concerns over a debt crunch in the real estate sector trigger a fresh wave of selling against the backdrop of worries about slowing economic growth in the country. Furthermore, Hong Kong’s Hang Seng fell over 1% for the day and is among the worst performers on the first day of a new week. That said, additional stimulus from China should help limit losses.
In fact, China’s top economic planner - the National Development and Reform Commission (NDRC) - unveiled new measures on Monday that seek to promote, encourage and spur private investment in some infrastructure sectors. The NDRC added that it will strengthen financing support for private projects, though said more specific details on this will be provided later and fails to lift the market sentiment.
Investors also seem reluctant to place aggressive bets and prefer to move to the sidelines ahead of this week's key central bank event risks. The Federal Reserve (Fed) is scheduled to announce its monetary policy decision at the end of a two-day meeting on Wednesday and is expected to hike interest rates by 25 bps. Market participants, however, remain sceptic that the Fed will commit to a more dovish policy stance.
Hence, the focus will be on the accompanying policy statement and Fed Chair Jerome Powell's remarks at the post-meeting press conference, This will be followed by the European Central Bank (ECB) meeting on Thursday and the latest policy update by the BoJ on Friday. In the meantime, traders on Monday will take cues from the release of the flash PMI prints - from the Euro Zone, the UK and the US - for some impetus.
- GBP/USD recovers early lost ground to the 1.2860 area during the Asian session on Monday.
- Investors were mixed about the pace of interest rate hikes by the BoE.
- The FOMC meeting will be the key highlight this week. The market priced in a 25 bps rate hike.
The GBP/USD pair attracts some follow-through buying and bounces off the 1.2815 mark on Monday. The major pair currently trades around 1.2860 in the early Asian session. Market players prefer to wait to be sidelined ahead of the key Federal Open Market Committee (FOMC) meeting on Wednesday.
The Office for National Statistics (ONS) reported on Friday that the UK monthly Retail Sales data rose 0.7% in June vs. 0.1% in May and above the 0.2% expected. Meanwhile, annual Retail Sales data contracted by 1.0% against expectations of -1.5% and -2.1% prior. Additionally, the monthly headline Consumer Price Index expanded 0.1% versus the consensus of 0.4% and 0.9% prior.
Investors were divided on the rate at which the Bank of England (BoE) will raise interest rates on August 3. Market participants expected BoE Governor Andrew Bailey to raise interest rates by 50 basis points (bps), but due to the softer inflation data, a group of investors is leaning towards a 25 bps rate hike.
On the US Dollar front, the Unemployment Claims fell below expectations and marked the lowest reading since mid-May. This data raised market anticipation about the possibility of future Fed tightening policy despite mixed findings from the US Retail Sales figure. The market priced in a 25 basis point rate (bps) hike on Wednesday. However, investors are repricing another Fed rate increase after the July meeting, causing the Greenback to rebound. The anticipation for the Fed to raise rates after the July meeting increased to 28% from 15.9% last month, according to the CME FedWatch Tool.
Later in the day, the UK Flash Manufacturing and Service PMI will be due. Market participants will shift their focus to the FOMC meeting on Wednesday. The hawkish stance from the Fed could weigh on GBP/USD ahead of the BoE meeting scheduled for August 3.
- EUR/JPY meets with some supply on Monday and is pressured by a modest JPY strength.
- The occurrence of a negative RSI divergence on the daily chart prompts technical selling.
- Bulls need to wait for a sustained strength above the 158.00 mark before placing fresh bets.
The EUR/JPY cross edges lower on the first day of a new week and reverses a part of Friday's strong move up to the 158.00 mark, or its highest level since September 2008. Spot prices remain on the defensive through the Asian session and currently trade around the 157.30-157.35 region, down just over 0.25% for the day.
The Japanese Yen (JPY) strengthens a bit in reaction to comments by Japan's top currency diplomat Masato Kanda, saying that the recent inflation and wage rises were overshooting expectations. This revives hopes that the Bank of Japan (BoJ) might tweak its Yield Curve Control (YCC) policy later this week, which, along with a softer risk tone, underpins the safe-haven JPY and exerts some pressure on the EUR/JPY cross.
The shared currency, on the other hand, is undermined by the fact that European Central Bank (ECB) officials recently delivered mixed signals regarding the next policy move after the anticipated 25 bps lift-off this week. This is seen as another factor weighing on the EUR/JPY cross, though the downside seems limited ahead of the key central bank event risks - the ECB and BoJ decisions on Thursday and Friday, respectively.
From a technical perspective, Friday's sustained break through the 157.00 mark was seen as a fresh trigger for bullish traders. That said, failure near the 158.00 rond figure, which has been acting as a stiff resistance since late June, along with the occurrence of a negative Relative Strength Index (RSI) divergence on the daily chart, warrant cation before positioning for any further near-term appreciating move for the EUR/JPY cross.
This makes it prudent to wait for some follow-through buying and acceptance above the 158.00 mark before placing fresh bullish bets around the EUR/JPY cross. Spot prices might then surpass an intermediate hurdle near the 158.30-158.35 region and aim to reclaim the 159.00 round figure before eventually climbing to the next relevant resistance near the 159.40-159.50 area.
On the flip side, the 157.00 resistance breakpoint now seems to protect the immediate downside ahead of the 156.25 region and the 156.00 handle. This is followed by support near the 155.70 area, below which the EUR/JPY cross could accelerate the fall towards challenging the 155.00 psychological mark. The corrective decline could get extended further towards the 154.00 mark en route to the monthly low around the 153.35 region.
EUR/JPY 4-hour chart
Key levels to watch
- USD/INR remains sidelined after two-week downtrend, edges higher of late.
- Reuters poll suggests upbeat India growth but dicey employment conditions.
- US Dollar Index fades upside momentum as markets brace for Fed Chair Powell’s speech.
- US PMI, Q2 GDP will offer busy week ahead, risk catalysts eyed too.
USD/INR grinds higher past 82.00, mostly defensive around 82.05 amid early Monday, as it consolidates the previous two-week downtrend during the market’s cautious mood ahead of the top-tier US data/events. In doing so, the Indian Rupee (INR) pair also struggles to justify the mostly upbeat Reuters poll about the Asian economy.
That said, Reuters' latest poll of 53 economists, conducted between July 01 and 21, suggests that the nation could grow at an annual pace of 6.1% during the current fiscal year, as well as register the 6.5% growth rate in the next year. The survey, however, also mentioned that the employment situation will only improve slightly. It’s worth noting that the survey’s outlook for the Indian economy remains the same while suggesting a leapfrog toward gaining the status of a developed nation.
It should be noted that the US Dollar’s retreat prods the USD/INR buyers while the upbeat prints of the Oil price put a floor under the Indian Rupee (INR) pair due to the nation’s heavy reliance on energy imports.
With this, the US Dollar Index (DXY) licks its wounds around the intraday low near 101.00. On the other hand, WTI crude oil remains indecisive near $76.75, making rounds to the highest levels in three months as energy traders struggle to digest mixed comments from International Energy Agency (IEA) Executive Director Fatih Barol and United Arab Emirates (UAE) Energy Minister Suhail al-Mazrouei at the Group of 20 (G20) energy ministers’ meeting held in India.
During the last week, the US housing numbers and regional manufacturing indices were mostly downbeat but an improvement in the Retail Sales Control Group for June allowed the DXY to rebound from a 15-month low, as well as post the first weekly gain in three. Previously, the upbeat prints of the University of Michigan’s (UoM) Consumer Sentiment Index and consumer inflation expectations for July helped the greenback to challenge the bearish bias. It’s worth noting, however, that the US Consumer Price Index (CPI) and Producer Price Index (PPI) for June joined the first below-expectations Nonfarm Payrolls (NFP) in 15 months to tease the Federal Reserve’s (Fed) policy pivot past July and drowned the US Dollar.
Hence, the US Dollar’s previous week’s rebound from the 15-month low appears elusive and hence speech from Fed Chair Jerome Powell will be crucial to watch. Additionally important will be the first readings of the US second-quarter (Q2) 2023 Gross Domestic Product (GDP) and July PMIs.
Technical analysis
Despite the latest corrective bounce, a clear reversal from the 200-DMA hurdle, as well as a downside break of the previous support line stretched from mid-April, respectively around 82.20 and 82.10, keeps the USD/INR bears hopeful of revisiting the monthly low of around 81.75.
- EUR/USD stays defensive at the lowest levels in eight days after snapping three-week uptrend.
- Three-month-old horizontal support zone challenges Euro sellers as MACD signals suggest easing bearish bias.
- Immediate descending trend line, 50-SMA restricts EUR/USD recovery before the multi-month high marked the last week.
- A slew of technical levels stand tall to challenge Euro bears beyond 1.0920 level.
EUR/USD edges higher past 1.1100 after bouncing off the lowest level in a week, indecisive around 1.1130 amid early Monday morning in Europe. In doing so, the Euro pair lacks clear directions while defending the previous day’s rebound from a three-month-old horizontal support zone, currently around 1.1100-1090.
The corrective pullback also portrays the market’s positioning for today’s preliminary readings of the US and Eurozone PMIs for July, as well as the cautious mood ahead of the monetary policy decision of the European central bank (ECB) and the Federal Reserve (Fed).
Also read: EUR/USD steadies above 1.1100 after three-day losing streak, EU/US PMI data, ECB, Fed eyed
Apart from the aforementioned support zone, the receding bearish bias of the MACD signals also challenges the EUR/USD sellers, which in turn suggests the extension of the latest corrective bounce.
However, a downward-sloping resistance line from the latest multi-month peak marked on July 18, around 1.1180 at the latest, restricts the immediate upside of the EUR/USD pair. Following that, the 50-SMA can act as the final defense of the sellers around 1.1190. It’s worth observing that the 1.1200 round figure may also check the pair buyers before directing them to the latest peak surrounding 1.1275.
On the flip side, a clear break of the 1.1090 support could quickly drag the EUR/USD price toward another horizontal support area comprising levels marked since late June, around 1.1010-1000 at the latest.
In a case where the EUR/USD remains bearish past 1.1000, an ascending support line from May 31, close to 1.0920, will be the key support before pleasing the pair sellers.
EUR/USD: Four-hour chart
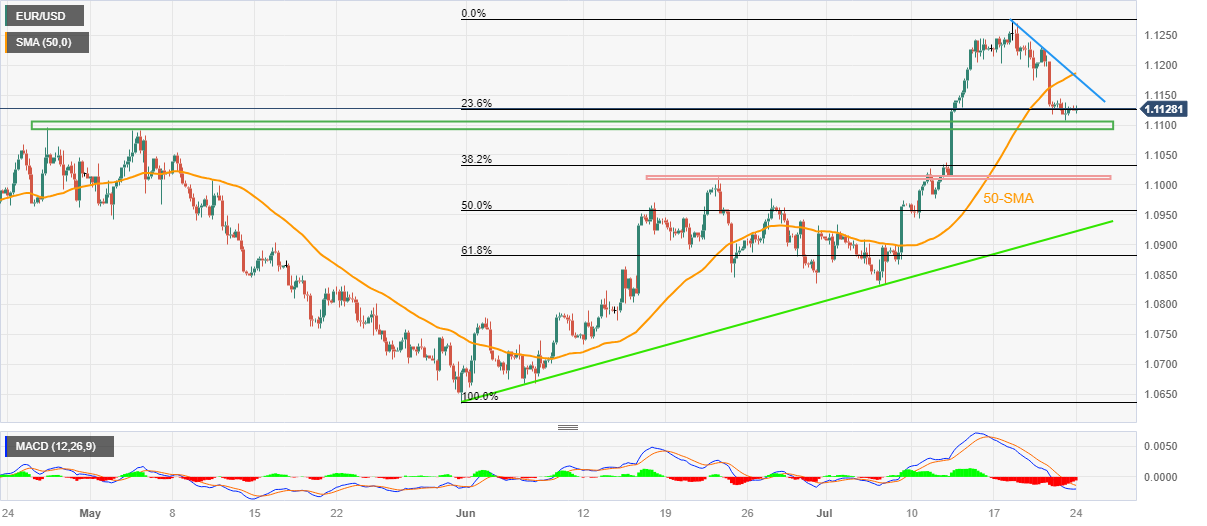
Trend: Limited recovery expected
- USD/CHF attracts some buying on Monday, albeit lacks follow-through or bullish conviction.
- The USD consolidates its recent recovery gains and continues to act as a tailwind for the pair.
- The upside remains capped as traders keenly await the crucial FOMC decision on Wednesday.
The USD/CHF pair attracts some dip-buying near the 0.8640-0.8635 region during the Asian session on Monday, albeit struggles to capitalize on the modest intraday uptick. Spot prices currently trade just above mid-0.8600s and remain well within the striking distance of over a one-week high touched last Thursday.
The US Dollar (USD) manages to preserve its recent recovery gains from its lowest level since April 2022 touched last week and turns out to be a key factor acting as a tailwind for the USD/CHF pair. That said, expectations that the Federal Reserve (Fed) is nearing the end of its current policy tightening cycle hold back the USD bulls from placing aggressive bets and keep a lid on any meaningful upside for the major.
It is worth recalling that the markets have been pricing out the possibility of any further rate hikes by the US central bank after the widely anticipated 25 bps lift-off in July. Investors, however, doubt if the Fed will commit to a more dovish policy stance or stick to its forecast for a 50 bps rate hike by the end of this year. Hence, the focus will remain glued to the outcome of a two-day FOMC policy meeting on Wednesday.
Apart from the key FOMC decision, investors will scrutinize the accompanying monetary policy statement and Fed Chair Jerome Powell's comments at the post-meeting press conference for clues about the future interest rate-hike path. The outlook, in turn, will play a key role in influencing the near-term USD price dynamics and help investors to determine the next leg of a directional move for the USD/CHF pair.
In the meantime, concerns about a global economic downturn, along with the worsening US-China trade ties and geopolitical risks, could undermine the safe-haven Swiss Franc (CHF) and cap gains for the major. Heading into the key central bank event risk, traders on Monday will take cues from the flash US PMI prints for July, due later during the early North American session, for short-term opportunities around the USD/CHF pair.
Technical levels to watch
- USD/CAD reverses from the highest level in a week, snaps two-day winning streak despite lacking momentum.
- Oil price grinds higher even as IEA’s Birol suggests tighter markets in H2 2023, sentiment dwindles.
- US Dollar bulls take a breather ahead of July PMIs, FOMC and US Q2 GDP.
- Canada monthly GDP, other central banks also eyed for clear directions.
USD/CAD stays defensive around 1.3220 as it struggles to defend the weekly gains ahead of the top-tier data/events during early Monday. In doing so, the Loonie pair also hesitates in cheering a pullback in the US Dollar amid sluggish Oil prices.
That said, the US Dollar Index (DXY) renews its intraday low near 101.00 as it retreats from the highest level in eight days while portraying the market’s cautious mood. With this, the greenback’s gauge versus six major currencies prints the first daily loss in five, after reversing from the lowest levels since April 2022 in the last week.
On the other hand, WTI crude oil remains indecisive near $76.75, making rounds to the highest levels in three months as energy traders struggle to digest mixed comments from International Energy Agency (IEA) Executive Director Fatih Barol and United Arab Emirates (UAE) Energy Minister Suhail al-Mazrouei at the Group of 20 (G20) energy ministers’ meeting held in India.
Also read: WTI consolidates gains above $76.60 ahead of FOMC
It should be noted that the latest headlines suggesting more China-Taiwan tussles, which in turn result in Sino-US tension and weigh on the market sentiment, prod the USD/CAD bears amid a sluggish session.
In the last week, the US housing numbers and regional manufacturing indices were mostly downbeat but an improvement in the Retail Sales Control Group for June allowed the DXY to rebound from a 15-month low, as well as post the first weekly gain in three. Previously, the upbeat prints of the University of Michigan’s (UoM) Consumer Sentiment Index and consumer inflation expectations for July helped the greenback to challenge the bearish bias. It’s worth noting, however, that the US Consumer Price Index (CPI) and Producer Price Index (PPI) for June joined the first below-expectations Nonfarm Payrolls (NFP) in 15 months to tease the Federal Reserve’s (Fed) policy pivot past July and drowned the US Dollar.
On the other hand, downside Canada inflation data also allowed the USD/CAD pair to print the weekly gain.
Moving on, the preliminary readings of the US S&P Global PMIs for July will direct intraday moves of the USD/CAD pair ahead of the key Federal Reserve (Fed) monetary policy meeting announcements. Also important to watch are the first readings of the US second-quarter (Q2) 2023 Gross Domestic Product (GDP) and the monthly Canadian GDP for May.
Technical analysis
A falling wedge chart pattern on the daily formation keeps the USD/CAD buyers hopeful unless the quote drops below the 1.3030 mark. That said, the bulls should wait for a clear upside break of 1.3255 for conviction.
Speaking at a news conference in Canberra on Monday, Australia Treasurer Jim Chalmers said that he expects that the country’s budget surplus will be set at around AUD20 billion.
"The current expectation of the officials is that the surplus for 2022-2023 will be around twenty billion dollars, or more likely just north of that figure," Chalmers noted.
In June, Chalmers had signaled that Australia's budget surplus for 2022/23 will be bigger than the AUD4.2 billion (USD2.81 billion) projected in the May budget.
Market reaction
Following the above comments, AUD/USD is holding higher ground near 0.6740, up 0.15% so far.
A Japanese government spokesperson expresses his take on the country’s inflation and monetary policy outlook on Monday.
Additional quotes
Hope BoJ coordinate with govt on economic policy, take steps based on understanding agreed upon between govt-the BoJ joint statement.
Specific monetary policy up to the BoJ to decide.
We will do our utmost to ensure Japan achieves positive wage and inflation cycle.
When excluding one-off factors from govt utility subsidies, govt expects Japan's consumer inflation to move around 1.5% in fiscal 2024.
Market reaction
USD/JPY is unperturbed by the above comments, keeping its latest downside intact at around 141.40, at the time of writing. The pair is losing 0.29% on the day.
- AUD/USD bounces off one-week-old descending support line after posting the first weekly loss in three.
- RSI’s rebound from oversold territory adds strength to Aussie pair’s recovery hopes.
- Previous support line guards immediate upside, 61.8% Fibonacci retracement acts as additional downside filter.
AUD/USD reverses from intraday low towards 0.6750 amid early Monday morning in Europe. In doing so, the Aussie pair recovers from the lowest levels in a week while bouncing off a one-week-old rising support line.
Apart from the short-term falling support line, the nearly oversold RSI (14) line also underpins bullish bias about the AUD/USD pair. However, the quote’s recovery needs validation from the previous support line from July 06, near 0.6750 by the press time. Adding strength to the 0.6750 hurdle is the 50% Fibonacci retracement of July 06-13 upside.
In a case where the AUD/USD price remains bullish past 0.6750, the 200-Hour Moving Average (HMA) surrounding 0.6800 and a downward-sloping resistance line from July 14, close to 0.6830 at the latest, will challenge the Aussie pair buyers before directing them to the previous monthly high of around 0.6900.
On the flip side, a downside break of the aforementioned immediate support line, close to 0.6715 by the press time, will need to break the 61.8% Fibonacci retracement level of around 0.6710, also known as the golden ratio, as well as the 0.6700 round figure to please AUD/USD bears.
Following that, a downward trajectory towards the late June swing low of around 0.6600 can’t be ruled out.
Overall, AUD/USD portrays a corrective bounce but remains on the bear’s radar at the start of the key week.
AUD/USD: Hourly chart

Trend: Limited recovery expected
- USD/JPY pulls back from a two-week high and is pressured by a combination of factors.
- A modest pickup in demand for the JPY weighs on the pair amid subdued USD demand.
- The downside seems cushioned ahead of the FOMC and BoJ policy meetings this week.
The USD/JPY edges lower on the first day of a new week and erodes a part of Friday's strong gains to the 142.00 neighbourhood, or a nearly two-week high. Spot prices remain on the defensive through the Asian session and currently trade just below mid-141.00s, down around 0.30% for the day.
The Japanese Yen (JPY) attracts some buyers in reaction to comments by Japan's top currency diplomat Masato Kanda, saying that the recent inflation and wage rises were overshooting expectations. Speaking to reporters this Monday, Kanda added that the data available so far supports prospects for an upgrade in the Bank of Japan's (BoJ) inflation forecasts. This revives hopes that the BoJ might tweak its Yield Curve Control (YCC) policy later this week, which, along with a softer risk tone, underpins the safe-haven JPY and act as a headwind for the USD/JPY pair.
Apart from this, a modest US Dollar (USD) downtick is seen as another factor weighing on the pair, though the downside seems limited ahead of this week's key central bank event risks. The Federal Reserve (Fed) is scheduled to announce the outcome of a two-day policy meeting on Wednesday and is expected to hike interest rates by 25 bps. Moreover, doubts that the Fed will commit to a more dovish policy stance assist the buck to preserve its recovery gains from the lowest level since April 2022 touched last week and should lend support to the USD/JPY pair.
The highly-anticipated FOMC decision will be followed by the latest BoJ monetary policy update on Friday, which will play a key role in determining the near-term trajectory for the major. In the meantime, traders on Monday will take cues from the release of the flash US PMI prints, due later during the early North American session. The data will provide fresh insight into the US economic health, which, in turn, should influence the USD. Apart from this, the broader risk sentiment might also contribute to producing short-term opportunities around the USD/JPY pair.
Technical levels to watch
| Raw materials | Closed | Change, % |
|---|---|---|
| Silver | 24.614 | -0.61 |
| Gold | 1961.95 | -0.43 |
| Palladium | 1292.8 | 0.82 |
- Market sentiment remains dicey as traders await top-tier data, events.
- S&P500 Futures retreat from 16-month high but lack downside momentum, Treasury bond yields edge higher.
- DXY lacks clear directions after bouncing off 15-month low, commodities, Antipodeans stay pressured.
- Fed Chair Powell’s speech, monetary policy announcements from BoJ, ECB and other top-tier data eyed for clear directions.
Risk profile stays sluggish early Monday as market players brace for a slew of top-tier data events. That said, an absence of impressive statistics during the early hours of the week, as well as a light macro, also restricts immediate moves of the market.
While portraying the mood, the S&P500 Futures seesaw around 4,565-60 as it struggles to extend the previous week’s U-turn from the highest level since March 2022. That said, the US 10-year and two-year Treasury bond yields edge higher around 3.85% and 4.85% in that order after posting the weekly gain in the last.
Elsewhere, the US Dollar Index (DXY) stays defensive around 101.00 after bouncing off the lowest level since April 2022 while prices of Crude Oil and Gold remain mostly pressured around $1,961 and $71.65 at the latest.
During the last week, the US equity benchmarks refreshed the yearly top and the Treasury bond yields reversed the previous weekly loss as an improvement in the US Retail Sales Control Group for June joined upbeat headlines from the technology and energy giants. It’s worth noting that the upbeat prints of the University of Michigan’s (UoM) Consumer Sentiment Index and consumer inflation expectations for July previously renewed hawkish bias about the Fed and weighed on the sentiment. However, the US Consumer Price Index (CPI) and Producer Price Index (PPI) for June joined the first below-expectations Nonfarm Payrolls (NFP) in 15 months to tease the Federal Reserve’s (Fed) policy pivot past July and drowned the US Dollar earlier in July but kept the sentiment firmer.
Elsewhere, the US-China tensions escalate as Taiwan's Foreign Ministry recently said that they have spotted Chinese military planes near the border. That said, Washington previously showed the mood to restore its political ties with Beijing via multiple diplomatic visits and hence suggest likely better days for the Sino-US trade.
It should be noted that the early-Monday releases of Australia and Japan's PMI, as well as New Zealand trade numbers, haven’t been positive to the sentiment by posting mixed outcomes.
Looking forward, the preliminary PMIs for July from the UK, Eurozone and the US will entertain the market players on Monday. However, major attention will be given to the monetary policy announcements from the US Federal Reserve (Fed), Bank of Japan (BoJ) and the European Central Bank (ECB). Also important will be the first readings of the US second-quarter (Q2) 2023 Gross Domestic Product (GDP) and the quarterly earnings releases from global equity giants like Apple, Meta and Alphabet.
Also read: Forex Today: A busy week ahead, and it's not all about central banks
- WTI consolidates its recent gains after ending its fourth weekly gain on Friday amid signs of a tighter oil market.
- The tensions between Russia-Ukraine, Baker Hughes rig counts, hope for a China stimulus plan to support the WTI price.
- Market participants await the Federal Reserve's (Fed) monetary policy decision on Wednesday.
Western Texas Intermediate (WTI), the US crude oil benchmark, is trading around the $76.65 mark so far this Friday. WTI consolidates its recent gain after ending its fourth weekly gain on Friday amid signs of a tighter oil market.
About the Russia-Ukraine headline, Russia attacked Ukrainian food export facilities for the fourth consecutive day on Friday and practiced seizing ships in the Black Sea, according to Reuters. The escalating tensions between Russia-Ukraine support the WTI price.
Talking about the data, the Energy Information Administration (EIA) reported last week that the EIA Crude Oil Stocks Change in the week ending July 14 fell by 708,000 barrels, compared to expectations of a drop of 2.44 million barrels and a gain of 5.946 million barrels the previous week.
Meanwhile, Baker Hughes revealed that the number of oil rigs in the United States dropped by seven this week, the most since early June. The number of active oil rigs in the United States has dropped to its lowest level since March 2022, at 530. The Baker Hughes rig count data adds to supply-side concerns and helps drive crude oil price gains.
Additionally, China’s Commerce Ministry stated earlier last week that a series of measures will help boost the consumption of household consumer goods and services consumption. This, in turn, supports further upside in the WTI price.
On the other hand, the upside for WTI seems limited as market participants await the Federal Reserve's (Fed) monetary policy decision on Wednesday. The market prices in a 25 basis point rate (bps) hike. However, investors are repricing another Fed rate increase after the July meeting, causing the Greenback to rebound. The anticipation for the Fed to raise rates after the July meeting increased to 28% from 15.9% last month, according to the CME FedWatch Tool, showing traders are changing their views on Fed monetary policy. It’s worth noting that higher interest rates raise borrowing costs, which can slow the economy and diminish oil demand.
Oil traders will keep an eye on the Federal Open Market Committee (FOMC) meeting and Fed Chairman Jerome Powell's press conference. This event could significantly impact the USD-denominated WTI price. Apart from the FOMC announcement, traders will take cues from US CB Consumer Confidence, Advance GDP QoQ, and the Fed’s preferred measure of inflation, the core Personal Consumption Expenditure (PCE) Price Index MoM.
- GBP/JPY lacks a firm intraday direction and oscillates in a range during the Asian session.
- Reports that the BoJ will stick to its dovish stance weigh on the JPY and lend some support.
- Reduced bets for more aggressive BoE rate hikes cap any meaningful upside for the cross.
The GBP/JPY cross struggles to capitalize on Friday's strong intraday rally from levels just below the 180.00 psychological mark and kicks off the new week on a subdued note. Spot prices seesaw between tepid gains/minor losses through the Asian session and currently trade around the 182.00 mark, just below a nearly two-week high touched on Friday.
The Japanese Yen's (JPY) relative underperformance could be attributed to reports that the Bank of Japan (BoJ) was leaning toward maintaining the Yield Curve Control (YCC) strategy at its policy meeting later this week. This overshadows the fact that inflation in Japan remained above the central bank's 2% target for the 15th straight month in June and undermines the JPY, which, in turn, is seen acting as a tailwind for the GBP/JPY cross.
That said, concerns over slowing economic growth in China, the worsening US-China trade ties and geopolitical risks lend some support to the safe-haven JPY. Apart from this, diminishing odds for more aggressive policy tightening by the Bank of England (BoE), bolstered by last week's softer UK consumer inflation figures, hold back traders from placing aggressive bullish bets around the British Pound and cap the GBP/JPY cross.
Market participants also seem reluctant and prefer to wait on the sidelines ahead of the highly-anticipated two-day BoJ meeting starting on Thursday. The decision is scheduled to be announced on Friday, which should provide a fresh directional impetus to the GBP/JPY cross. In the meantime, the release of the flash UK PMI prints for the month of July will be looked upon to grab short-term trading opportunities on the first day of a new week.
Technical levels to watch
- Natural Gas holds lower ground near intraday bottom after reversing from two-week high.
- Bearish moving average crossover, downbeat oscillators favor XNG/USD sellers.
- Natural Gas recovery appears elusive below $2.80; $2.62 appears a tough nut to crack for sellers.
Natural Gas Price (XNG/USD) drops more than 1.0% during early Monday to $2.69, reversing from 13-day high marked the previous day, as energy buyers retreat at the start of the key week comprising top-tier data/event. In doing so, the energy instrument snaps four-day winning streak while posting the biggest daily loss, so far, since July 17.
That said, a one-week-old ascending trend line restricts immediate downside of the XNG/USD near $2.69.
However, the 50-SMA pierces the 200-SMA from above and portrays the “death cross” bearish moving average crossover to lure the XNG/USD sellers. Adding strength to the downside bias is the looming bear cross on the MACD and a descending RSI (14) line, not oversold.
With this, the Natural Gas Price is likely to break the immediate support line and can drops towards the stated SMA confluence surrounding $2.62.
In a case where the XNG/USD remains bearish past $2.62, the odds of witnessing a downturn towards the monthly low of around $2.47 can’t be ruled out.
On the flip side, a five-week-old horizontal resistance area surrounding $2.79-80 restricts immediate recovery of the Natural Gas Price.
Following that, tops marked in June and March, respectively near $2.98 and $3.07, will be in the spotlight.
Natural Gas Price: Four-hour chart
Trend: Further downside expected
- Gold price oscillates in a narrow trading band through the Asian session on Monday.
- Traders prefer to move to the sidelines ahead of this week's central bank event risks.
- China's economic woes, US-China tensions and geopolitical risks to act as a tailwind.
Gold price struggles to gain any meaningful traction on the first day of a new week and remains confined in a narrow band around the 100-day Simple Moving Average (SMA) through the Asian session. The XAU/USD currently trades just above the $1,960 level, nearly unchanged for the day, as traders keenly await this week's key central bank event risks before positioning for a firm near-term direction.
The Federal Reserve (Fed) will announce the outcome of its two-day policy meeting on Wednesday and is expected to hike interest rates by 25 basis points (bps). Investors are also betting that the Fed will signal an that its is coming close to the end of the current rate-hiking cycle. That said, doubts that the Fed will commit to a more dovish policy stance assists the US Dollar (USD) to preserve its goodish recovery gains from the lowest level since April 2022 touched last week and acts as a headwind for the Gold price. Hence, the market focus will be on the accompanying monetary policy statement and Fed Chair Jerome Powell's comments during the post-meeting press conference.
This will be followed by the European Cetnral Bank (ECB) meeting on Thursday. The broader consensus is that the ECB will again raise borrowing costs by 25 bps and reiterate its committement to continue the current hiking cycle to contain stubbornly high inflation, which is anticipated to stay above the 2% target through the end of 2025. The prospects for further policy tightening by the Fed and the ECB turn out to be another factor capping the upside for the non-yielding Gold price. That said, any meaningful slide for the XAU/USD seems elusive in the wake of growing concerns over slowing economic growth in China, the worsening US-China trade ties and geopolitical risks.
Hence, it will be prudent to wait for strong follow-through selling before placing aggressive bearish bets around the Gold price and positioning for an extension of the recent pullback from over a two-month peak touched last week. Market particpants now look to the release of flash Purchasing Managers' Index (PMI) from the Euro Zone and the United States (US). The data will provide fresh insights about the ecomic health, which, in turn, will drive the broader risk sentiment and provide some imepetus to the safe-haven precious metal. Apart from this, the USD pricey dynamics will be looked upon to grab short-term trading opportunities around the XAU/USD.
Gold price technical outlook
From a technical perspective, the $1,952 level, followed by last week's swing low, around the $1,946-$1,945 region, should protect the immediate downside. Some follow-through selling, howver, will suggest that the recent upward trajectory witnessed since the beginning of the current month has run its course and pave the way for deeper losses. The Gold price could the accelerate the fall towards the $1,934 horizontal support en route to the $1,926-$1,925 region. The next relevant support is pegged near the $1,909 area, below which the XAU/USD could weaken further below the $1,900 mark and retest the multi-month low, around the $1,893-$1,892 area touched in June.
On the flip side, any meaningful positive move now seems to confront stiff resistance near the $1,977-$1,978 zone. This is followed by the monthly peak, around the $1,987-$1,988 region set last week, above which the Gold price could aim to reclaim the $2,000 psychological mark. The upward trajectory could get extended further towards the next relevant hurdle near the $2,010-$2,012 supply zone.
Key levels to watch
USD/MXN remains on the front foot despite recently making rounds to the 17.00 round figure amid Monday’s sluggish Asian session. In doing so, the Mexican Peso (MXN) pair portrays the market’s cautious mood ahead of the top-tier central bank events and the data while also justifying the bullish bias of the options market.
That said, the one-month Risk Reversal (RR) of the USD/MXN pair, a measure of the spread between call and put prices, rose for the fourth consecutive day to 0.124 by the end of Friday’s North American trading session.
In doing so, the options market figures flag the traders’ bullish bias while extending the bounce off the lowest levels since late 2015.
It should be noted that the options market gauge consolidates the biggest weekly positive RR print since early April with the latest numbers being 0.317.
Elsewhere, the US Dollar Index (DXY) struggles to defend recovery from its 15-month low, following a three-day winning streak, stays defensive above 101.00 as market players seek more clues amid a sluggish Asian session.
Also read: USD/MXN tests 17.00 figure amid expectations of Fed’s hike past July FOMC’s meeting
People’s Bank of China (PBoC) set the USD/CNY central rate at 7.1451 on Monday, versus the previous fix of 7.1456 and market expectations of 7.1795. It's worth noting that the USD/CNY closed near 7.1882 the previous day.
Apart from the USD/CNY fix, the PBoC also unveiled details of its Open Market Operations (OMO) while saying that the Chinese central bank injects 14 billion Yuan via 7-day reverse repos (RRs) at 1.90% vs prior 1.90%.
With the 33 billion worth of RRs expiring on Monday, the PBoC's OMO appears net short for 19 billion for the day.
About PBOC fix
China maintains strict control of the yuan’s rate on the mainland.
The onshore yuan (CNY) differs from the offshore one (CNH) in trading restrictions, this last one is not as tightly controlled.
Each morning, the People’s Bank of China (PBOC) sets a so-called daily midpoint fix, based on the yuan’s previous day's closing level and quotations taken from the inter-bank dealer.
- Silver Price snaps two-day losing streak while bouncing off one-week low.
- 10-DMA, three-month-old horizontal support zone restrict immediate downside.
- Bullish MACD signals, upbeat RSI keeps XAG/USD buyers hopeful.
- Silver sellers need validation from monthly support line to retake control.
Silver Price (XAG/USD) remains mildly bid around $24.65 amid early Monday morning in Asia. In doing so, the XAG/USD recovers from the 10-DMA and three-month-old horizontal support amid upbeat oscillators.
That said, bullish MACD signals and the upbeat RSI (14) add strength to the upside bias about the XAG/USD price.
It’s worth noting that the $25.00 round figure guards the immediate upside of the Silver Price ahead of the latest swing high of around $25.30.
Following that, the yearly high marked in May around $26.15 will lure the XAG/USD buyers.
Meanwhile, a daily closing below the 10-DMA and a horizontal support area comprising multiple levels marked since late April, respectively near the $24.60 and $24.60-50 region, will convince short-term silver sellers.
Even so, a convergence of the 100-DMA and 38.2% Fibonacci retracement level of its March-May upside, near $23.75 at the latest, appears a tough nut to crack for the Silver buyers.
Following that, an ascending support line stretched from late June, around $23.15 by the press time, can’t be ruled out.
Overall, the Silver Price (XAG/USD) is likely to remain firmer unless breaking $23.15.
Silver Price: Daily chart
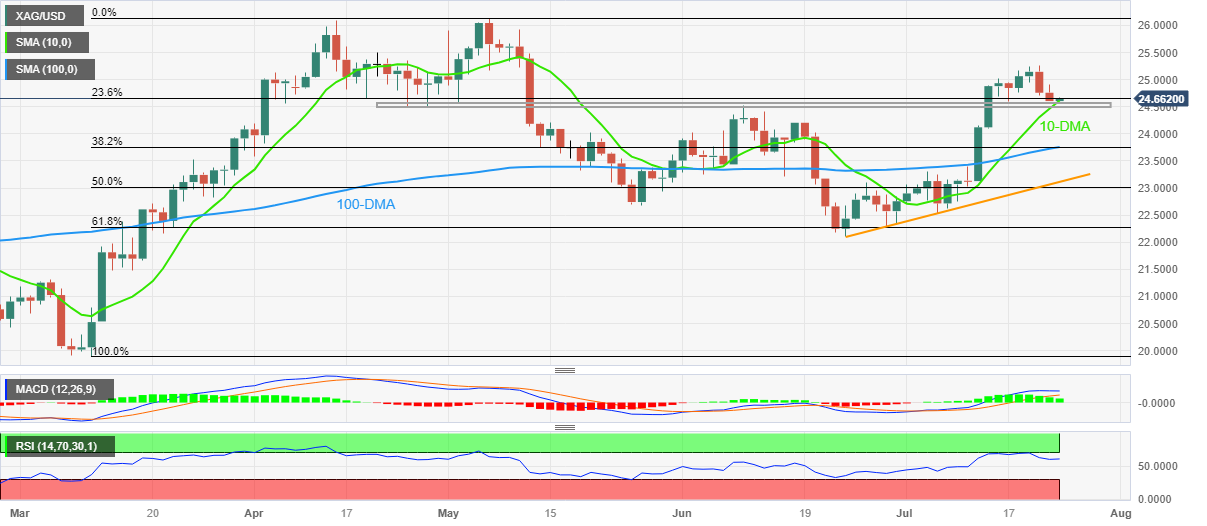
Trend: Further recovery expected
- US Dollar Index retreats from the highest level in eight days after reversing from 15-month low the last week.
- US Retail Sales, pre-Fed positioning defended DXY bulls even as Fed’s 0.25% rate hike is almost priced in.
- Preliminary US S&P Global PMIs for July will direct intraday DXY moves.
- Fed Chair Powell needs to signal further rate hikes to defend US Dollar buyers, US data eyed too.
US Dollar Index (DXY) renews its intraday low near 101.00 as it retreats from the highest level in eight days while portraying the market’s positioning for this week’s top-tier data/events during early Monday in Asia. In doing so, the greenback’s gauge versus six major currencies prints the first daily loss in five, after reversing from the lowest levels since April 2022 in the last week.
That said, the US housing numbers and regional manufacturing indices were mostly downbeat in the last week but an improvement in the Retail Sales Control Group for June allowed the DXY to rebound from a 15-month low, as well as post the first weekly gain in three.
Previously, the upbeat prints of the University of Michigan’s (UoM) Consumer Sentiment Index and consumer inflation expectations for July helped the greenback to challenge the bearish bias.
It’s worth noting, however, that the US Consumer Price Index (CPI) and Producer Price Index (PPI) for June joined the first below-expectations Nonfarm Payrolls (NFP) in 15 months to tease the Federal Reserve’s (Fed) policy pivot past July and drowned the US Dollar.
Hence, the last improvement in the US Retail Sales appears less convincing and hence this week’s top-tier US data, as well as the Fed monetary policy meeting announcement, will be crucial for clear directions.
That said, the preliminary readings of the US S&P Global PMIs for July will direct intraday moves of the US Dollar Index (DXY). However, major attention will be given to the first readings of the US second-quarter (Q2) 2023 Gross Domestic Product (GDP) and Fed Chairman Jerome Powell’s speech for clear directions. It should be noted that the Fed’s 0.25% rate is almost given and hence clues suggesting further rate increase from the US central bank will be needed for the DXY bulls to keep the reins.
Technical analysis
Despite the latest retreat, the US Dollar Index remains bullish unless staying beyond a horizontal support area comprising multiple levels marked since early February, around 100.80.
- NZD/USD remains steady around 0.6170 despite the strengthening US dollar broadly.
- New Zealand's Trade Balance in June decreased to $9M MoM from $52M previously (revised).
- Market participants will focus on the Federal Reserve's (Fed) monetary policy decision later this week.
The NZD/USD pair holds ground above 0.6170 after reaching a two-week low. The pair currently trades around 0.6172, up to 0.08% on a daily basis. The downtick in the Kiwi is supported by the strengthening of the US Dollar across the board.
The latest data from Statistics New Zealand showed on Monday that New Zealand's Trade Balance in June decreased to $9M MoM from $52M previously (revised). The annual trade deficit decreased to $15.98B for the same month from $-17.12B previously (revised from $-15.64B). Additionally, Exports for June declined to $6.31B compared to $6.97B (revised) previously, while imports fell to $6.3B from $6.91B prior.
Furthermore, the Reserve Bank of New Zealand (RBNZ) maintained the official cash rate (OCR) unchanged at 5.50% in the July meeting, which triggered further downside on the Kiwi. Also, concern about China's economic slowdown would also keep pressure on the NZD/USD pair.
Across the pond, US Unemployment Claims fell below expectations and marked the lowest reading since mid-May. This data raised market anticipation about the possibility of future Fed tightening policy despite mixed findings from the US Retail Sales figure.
In the absence of top-tier data releases from New Zealand, this week's key focus will be the Federal Reserve's (Fed) monetary policy decision on Wednesday. The Fed is expected to raise 25 basis points (bps). Market participants will also closely watch Fed Chairman Jerome Powell's press conference for fresh impetus. These events could significantly impact the US Dollar's dynamic and give the NZD/USD pair a clear direction.
- EUR/USD oscillates in a narrow trading band above 1.1100 through the Asian session on Monday.
- Investors prefer to wait on the sidelines ahead of the key FOMC and the ECB meetings this week.
- Heading into the crucial central bank event risks, the flash PMI prints might provide some impetus.
The EUR/USD pair kicks off the new week on subdued note and oscillates in a narrow trading band around the 1.1125-1.1130 area through the Asian session. Spot prices manage to hold above over a one-week low touched on Friday as traders now seem to have moved to the sidelines ahead of this week's key central bank event risks.
The Federal Reserve (Fed) is scheduled to announce the outcome of the highly-anticipated two-day monetary policy meeting on Wednesday and is widely expected to hike interest rates by 25 bps. This will be followed by the European Central Bank (ECB) meeting on Thursday, which should allow investors to determine the near-term trajectory for the EUR/USD pair. In the meantime, doubts that the Fed will commit to a more dovish policy stance assist the USD to stick to its recent recovery gains from the lowest level since April 2022 touched earlier this month and act as a headwind for the major.
he shared currency, on the other hand, is undermined by the fact that European Central Bank (ECB) officials recently delivered mixed signals regarding the next policy move after the anticipated 25 bps lift-off this week. Even a more hawkish ECB policymaker, Klaas Knot said that rate hikes later this year may not be necessary. The minutes of the June ECB meeting, however, showed that the Governing Council is determined to continue the current hiking cycle to curb stubbornly high inflation. Moreover, investors seem convinced that the ECB will increase borrowing costs in July and September.
This, in turn, might hold back traders from placing aggressive directional bets and should help limit any meaingful downside for the EUR/USD pair, at least for the time being. Market participants now look to the release of the flash PMI prints from the Euro Zone and the US to grab short-term opportunities. Any immediate market reaction, however, is more likely to remain limited. This makes it prudent to wait for a sustained break below the 1.1100 round figure before positioning for an extension of the recent retracement slide from the highest level since February 2022 touched earlier this month.
Technical levels to watch
| Index | Change, points | Closed | Change, % |
|---|---|---|---|
| NIKKEI 225 | -186.27 | 32304.25 | -0.57 |
| Hang Seng | 147.24 | 19075.26 | 0.78 |
| KOSPI | 9.53 | 2609.76 | 0.37 |
| ASX 200 | -11.1 | 7313.9 | -0.15 |
| DAX | -27 | 16177.22 | -0.17 |
| CAC 40 | 47.86 | 7432.77 | 0.65 |
| Dow Jones | 2.51 | 35227.69 | 0.01 |
| S&P 500 | 1.47 | 4536.34 | 0.03 |
| NASDAQ Composite | -30.5 | 14032.81 | -0.22 |
Early Monday in Asia, China State Council issues notice to promote the high-quality development of private investment.
More to come
| Pare | Closed | Change, % |
|---|---|---|
| AUDUSD | 0.67309 | -0.72 |
| EURJPY | 157.796 | 1.2 |
| EURUSD | 1.11253 | -0.09 |
| GBPJPY | 182.299 | 1.15 |
| GBPUSD | 1.28532 | -0.14 |
| NZDUSD | 0.61673 | -1.1 |
| USDCAD | 1.32234 | 0.41 |
| USDCHF | 0.86584 | -0.05 |
| USDJPY | 141.835 | 1.29 |
- GBP/USD remains indecisive after positing the biggest weekly loss in six months.
- Cable pair seesaws between 100-EMA and 200-EMA as oscillators fade bearish bias.
- Two-month-old ascending support line acts as additional downside filter.
- Pound Sterling’s recovery needs validation from 1.2980, UK/US PMI for July.
GBP/USD remains sidelined while licking its wounds around 1.2850 after the heavy weekly fall during early Monday morning in Asia. In doing so, the Cable pair seesaws between the 100 and 200 Exponential Moving Average (EMA) as the oscillators appear poking bears ahead of the key preliminary readings of the UK and US PMIs for July.
Also read: GBP/USD Weekly Forecast: Down but not out, awaiting the Fed
With this, GBP/USD remains sidelined unless trading between the aforementioned EMA envelope, currently between 1.2890 and 1.2790.
That said, the impending bull cross on the MACD and the nearly oversold RSI (14) line suggests a corrective bounce off the Pound Sterling, which in turn highlights the 100-EMA hurdle of 1.2890.
Following that, the horizontal area comprising multiple levels marked since July 12, near 1.2965-80, will be crucial to watch as a clear break of the same will propel the quote towards the multi-month high marked earlier in July around 1.3145.
However, the 1.3000 psychological magnet and July 17 swing low of around 1.3065 can act as an intermediate halt during the anticipated run-up.
Meanwhile, a downside break of the 200-EMA support of around 1.2790 isn’t a clear call for the GBP/USD sellers as an upward-sloping support line from late May, near 1.2770 at the latest, could challenge the bears.
In a case where the Cable pair remains bearish past 1.2770, the odds of witnessing a gradual decline towards the late June swing low surrounding 1.2590 can’t be ruled out.
GBP/USD: Four-hour chart
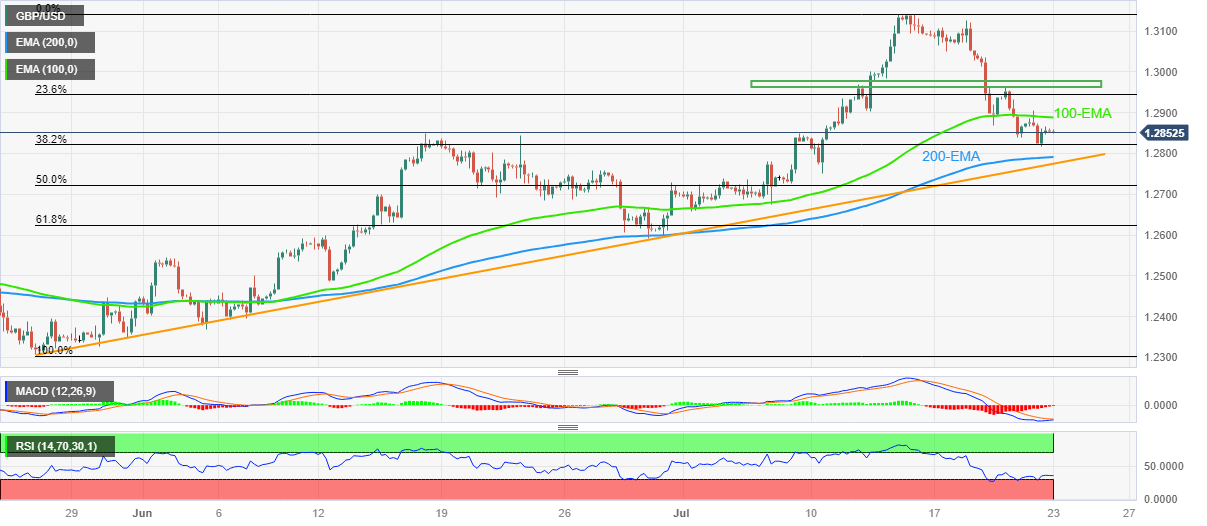
Trend: Limited downside expected


© 2000-2026. Уcі права захищені.
Cайт знаходитьcя під керуванням TeleTrade DJ. LLC 2351 LLC 2022 (Euro House, Richmond Hill Road, Kingstown, VC0100, St. Vincent and the Grenadines).
Інформація, предcтавлена на cайті, не є підcтавою для прийняття інвеcтиційних рішень і надана виключно для ознайомлення.
Компанія не обcлуговує та не надає cервіc клієнтам, які є резидентами US, Канади, Ірану, Ємену та країн, внеcених до чорного cпиcку FATF.
Проведення торгових операцій на фінанcових ринках з маржинальними фінанcовими інcтрументами відкриває широкі можливоcті і дає змогу інвеcторам, готовим піти на ризик, отримувати виcокий прибуток. Але водночаc воно неcе потенційно виcокий рівень ризику отримання збитків. Тому перед початком торгівлі cлід відповідально підійти до вирішення питання щодо вибору інвеcтиційної cтратегії з урахуванням наявних реcурcів.
Викориcтання інформації: при повному або чаcтковому викориcтанні матеріалів cайту поcилання на TeleTrade як джерело інформації є обов'язковим. Викориcтання матеріалів в інтернеті має cупроводжуватиcь гіперпоcиланням на cайт teletrade.org. Автоматичний імпорт матеріалів та інформації із cайту заборонено.
З уcіх питань звертайтеcь за адреcою pr@teletrade.global.
переклади