- Аналітика
- Новини та інструменти
- Новини ринків
Новини ринків
- The daily indicators remain in positive territory but somewhat flattened .
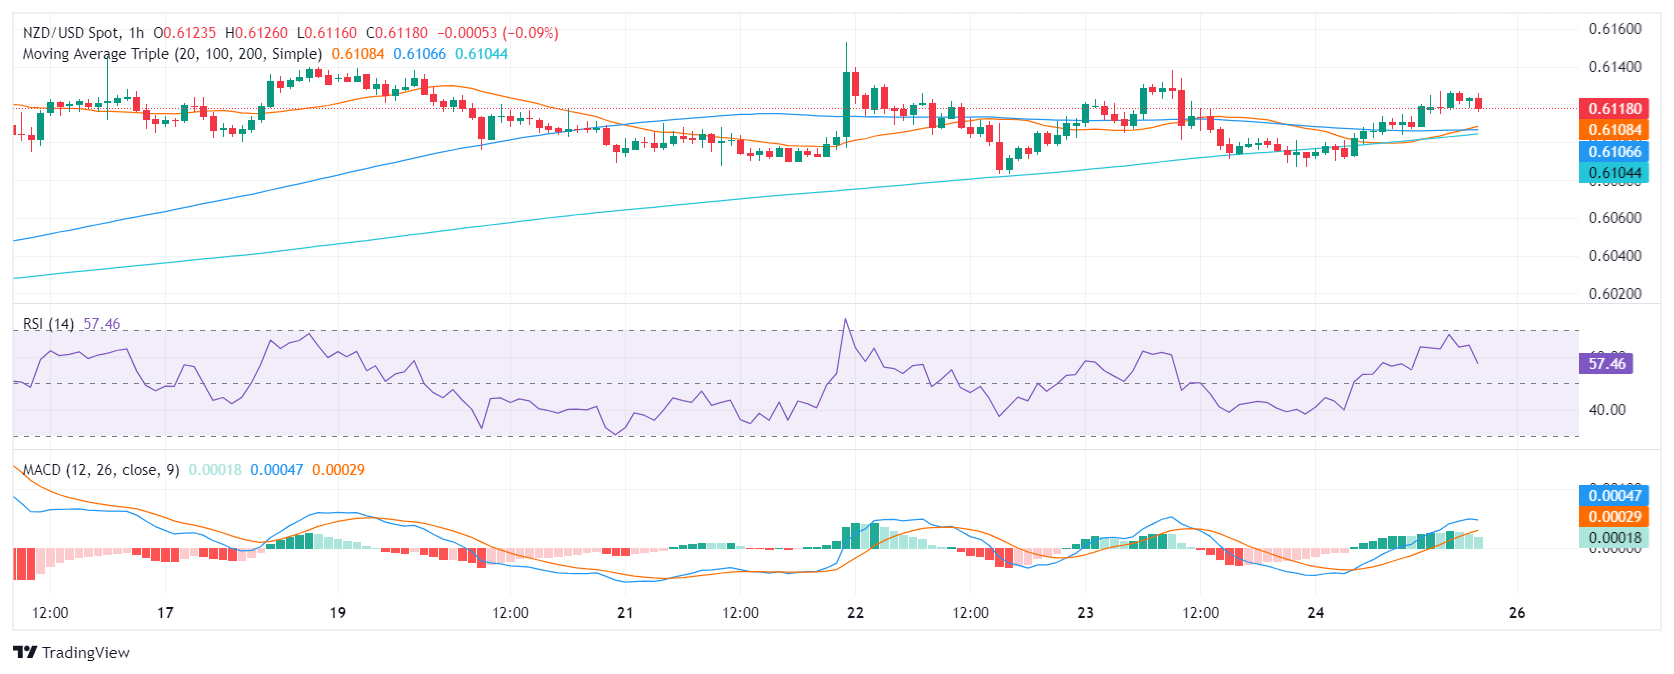
- The hourly charts reveal a temporary dip in the RSI and a MACD flattening, signaling a possible short-term consolidation.
- Pending bullish crossover between the 200 and 100-day SMA at 0.6040 could bolster the bullish momentum in future sessions.
During Friday's session, NZD/USD rose towards the 0.6125 level. The positive trajectory of the pair continues to convey a strong buyer influence in the market. However, echoes of consolidation may suggest a breather following the recent surge which pushed the pair above the 100 and 200-day Simple Moving Averages (SMA).
Examining the daily chart of the NZD/ pair, it is apparent that the Relative Strength Index (RSI) reveals a robust positive trend. After a close approach to overbought conditions at 69, the RSI receded to a still positive level of 63. In line with that, the Moving Average Convergence Divergence (MACD) prints flat green bars which may suggest a flattening momentum.
NZD/USD daily chart
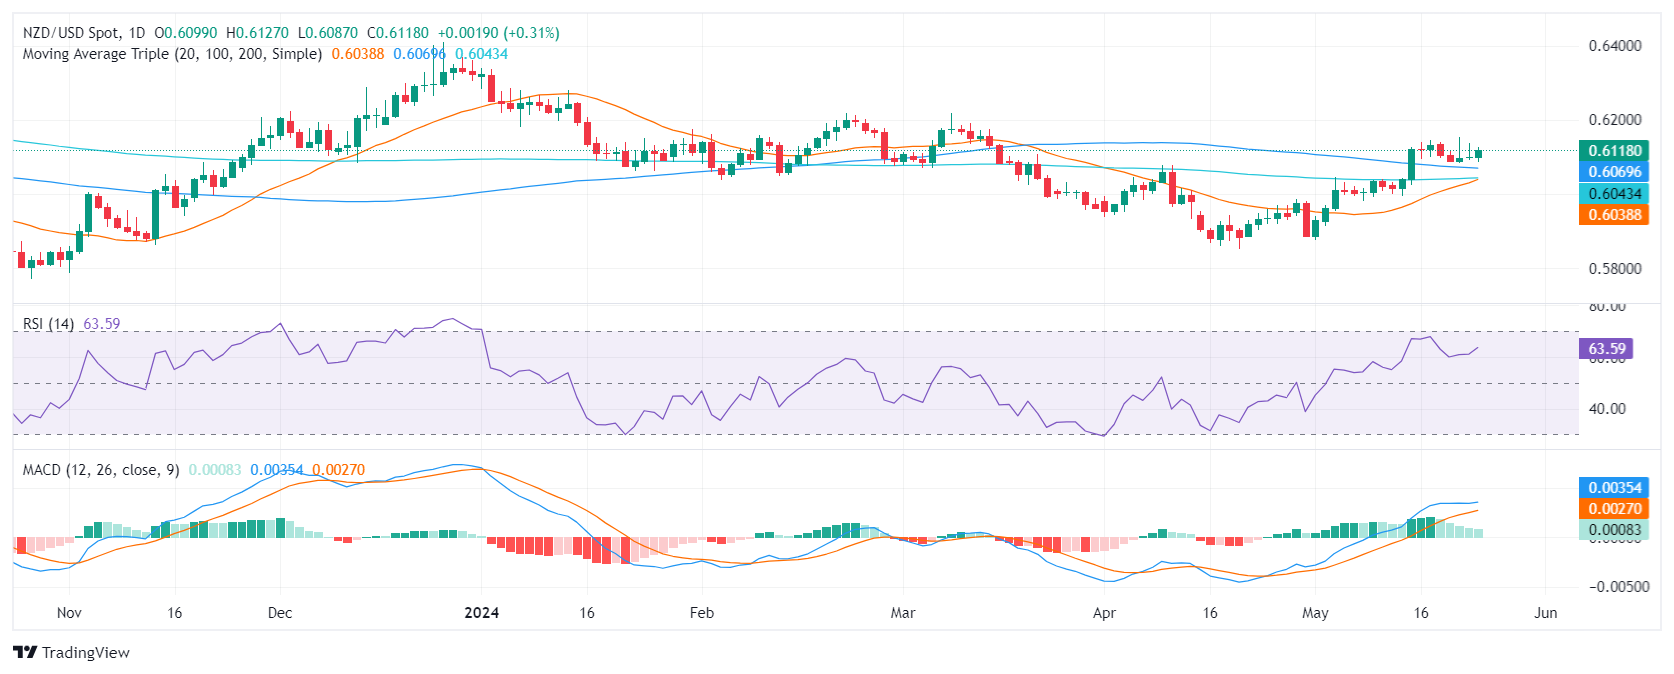
Transitioning to the hourly chart, there is a discernible decreasing trend in the RSI readings, with figures retreating from 64 to 57 throughout Friday’s session. The MACD histogram aligns with this pattern, with flat green bars that signal reduced upward momentum.
NZD/USD hourly chart
From a broader perspective, the position of NZD/USD suggests a strong bullish trend. Trading above the Simple Moving Averages (SMA) of 20, 100, and 200-day, the pair displays upward momentum both on short-term and long-term scales.
Incorporating both the daily and hourly RSI trends, along with MACD and SMA positioning, the conclusion is drawn that the NZD/USD may need some respite after its recent surge. Despite this, the market structure maintains its bullish tone.
- US Dollar broadly eased on Friday, but held close to flat against Yen.
- Japanese National CPI inflation ticked lower in April.
- Risk appetite recovered after US consumer inflation outlook improved.
USD/JPY churned on Friday, wrapping up close to where it started the day, just below the 157.00 handle, as investors looked to recover balance after a tense week.
Broad hopes for a September rate cut from the Federal Reserve (Fed) were knocked back this week after rate markets repriced odds of at least a quarter-point cut in September to less than even. Rate markets were pricing in upwards of 70% odds of a 25-basis-point trim in September at the start of the week.
Forecasting the Coming Week: Fedspeak and PCE remain in the spotlight
Japan’s National Consumer Price Index (CPI) inflation eased to 2.5% YoY in April, but the Bank of Japan (BoJ) remains bitterly determined to hold interest rates at rock-bottom, near-negative levels until they see an expected downturn in inflation hold above 2%. The BoJ currently expects CPI inflation to slump below 2.0% through 2025 and some of 2026.
With the BoJ squarely focused on fears of disinflation, depressed Japanese interest rates continue to erode the Yen. The BoJ and Japan’s Ministry of Finance is widely believed to have directly intervened in global markets in early May, and the BoJ’s financial operations reporting reveal a nine trillion Yen gap between reported operations spending and broker forecasts, adding weight to “Yentervention” speculation.
Despite operations in global markets, the Yen continues to shed weight, and Yen-based pairs are grinding back towards record highs.
USD/JPY technical outlook
USD/JPY cycled the 157.00 handle on Friday, churning chart paper close to near-term highs. USD/JPY has closed in the green for all but three of the last 15 consecutive trading days, recovering from a post-”Yentervention” low near 152.00.
The pair is still trading down from multi-year highs set in late April above 160.00, but USD/JPY continues to drift deeper into bull country above the 200-day Exponential Moving Average (EMA) at 149.13.
USD/JPY hourly chart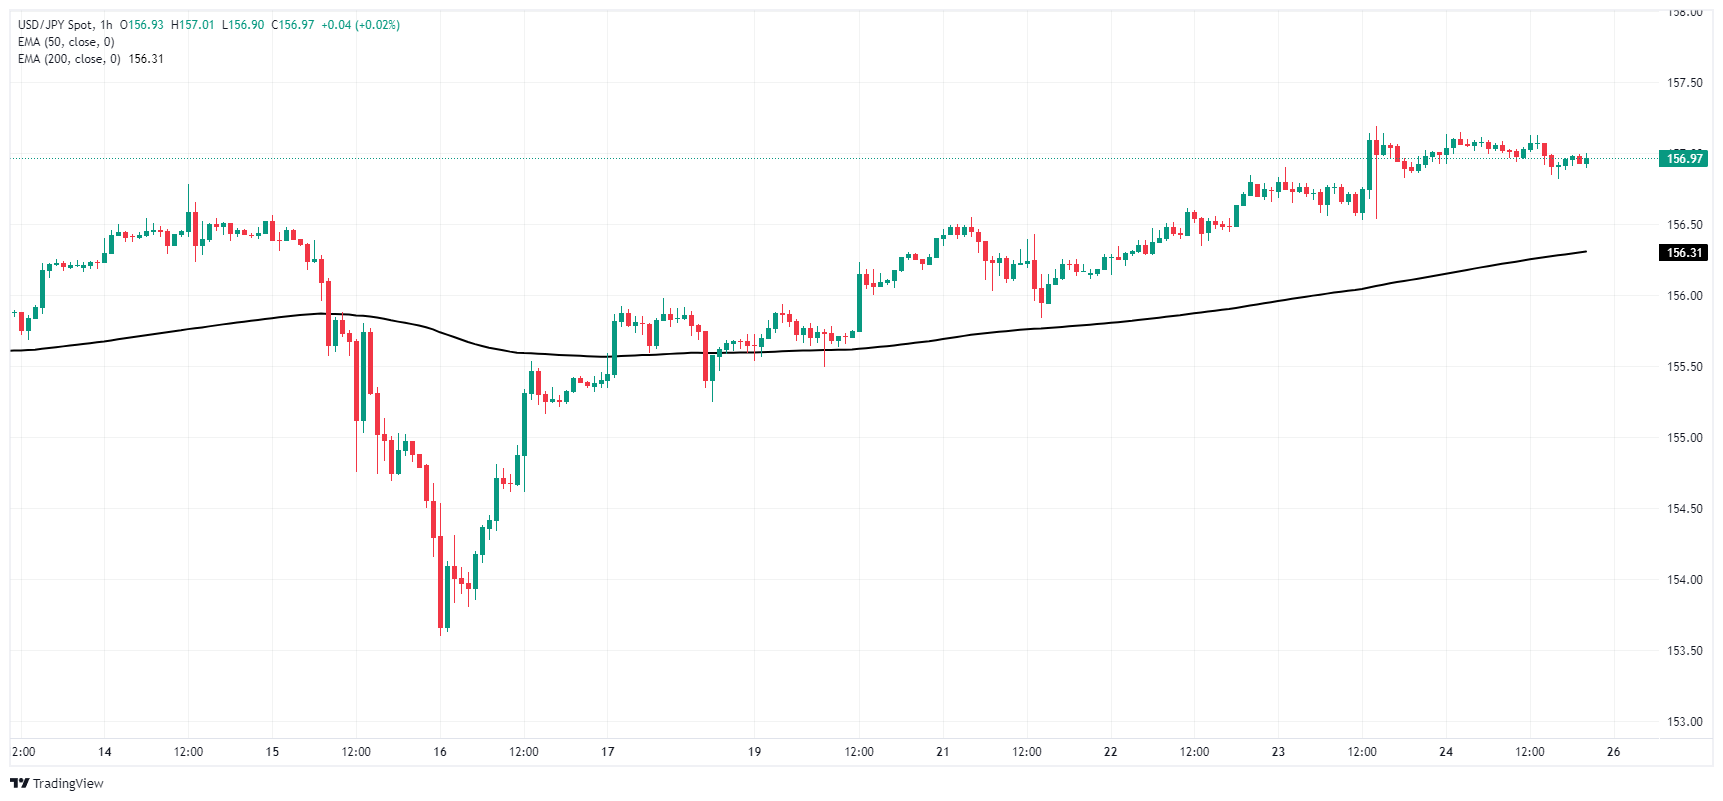
USD/JPY daily chart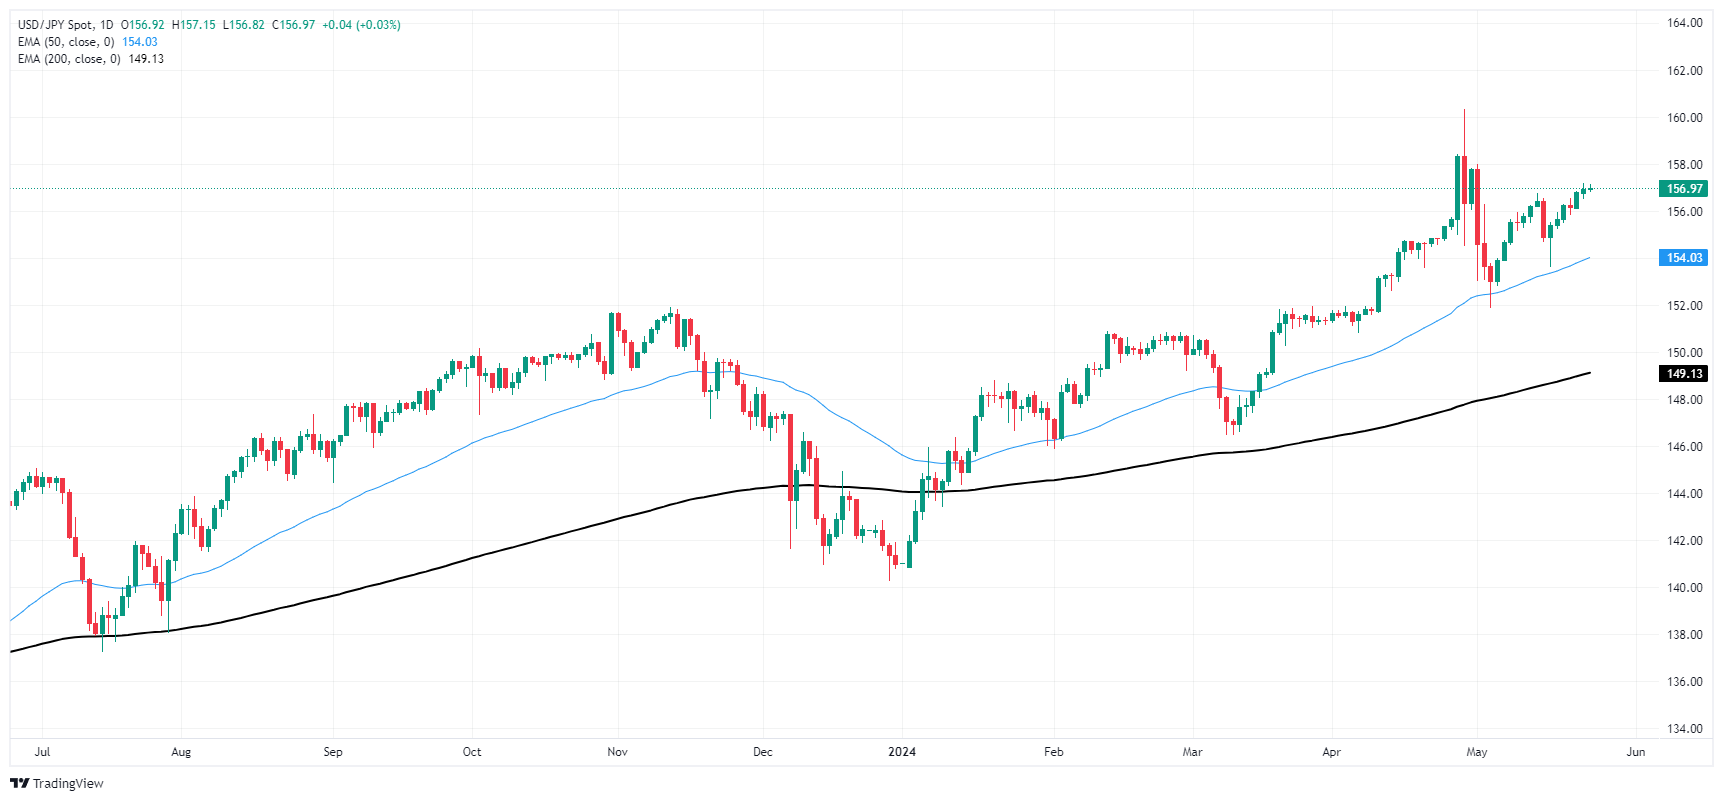
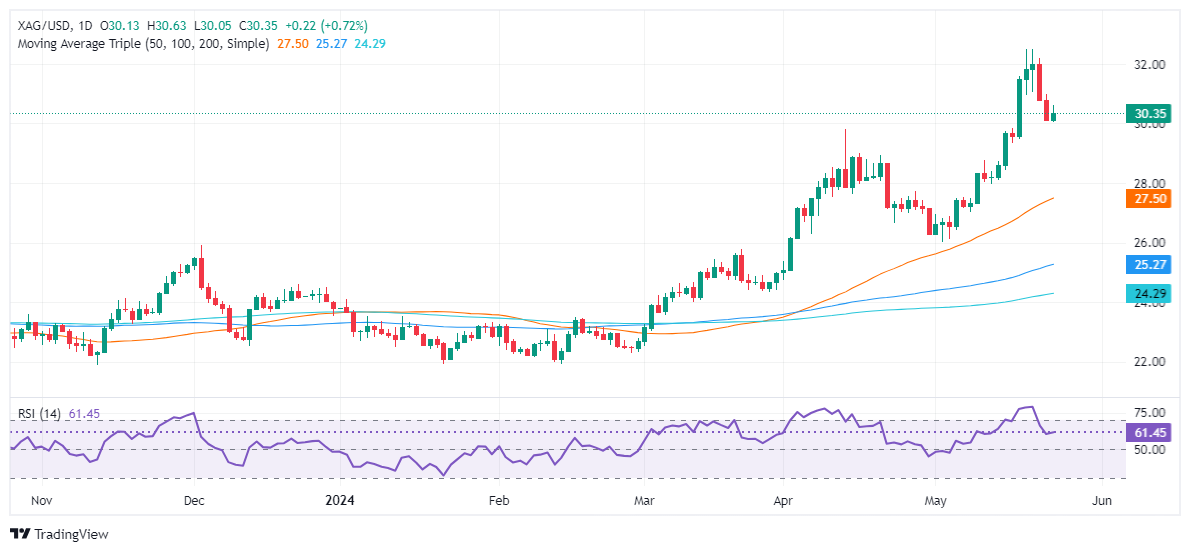
- Silver climbs 0.59%, trading at $30.30, recovering from near-weekly lows of $30.00.
- Softer-than-expected US Durable Goods data and improved consumer sentiment support Silver prices.
- RSI remains bullish, indicating strong buyer momentum despite exiting overbought conditions.
Silver prices trimmed some of Thursday’s losses yet remain near the weekly lows of $30.00; exchange hands at $30.30 are up 0.59% at the time of writing. The grey metal was boosted by softer-than-expected US Durable Goods data, while American consumer sentiment improved.
XAG/USD Price Analysis: Technical outlook
The grey metal is upward biased, and the XAG/USD clinging to gains above $30.00 could pave the way for further upside. After the Relative Strength Index (RSI) exited overbought conditions, it remains bullish and aiming up, hinting that the buyer's momentum remains strong.
With that said, the XAG/USD first resistance would be the May 23 high of $30.97. A breach of the latter will expose the $31.50 figure, followed by $32.00, and the year-to-date (YTD) high reached on May 20 at $32.51.
Conversely, XAG/USD's first support would be the $30.00 psychological level. If further weakness occurs, the next support level would be the April 12 high, now turned support, at $29.79, followed by $29.00. Additional key support levels include the May 18, 2021, high at $28.74 and the June 10, 2021, high at $28.28.
XAG/USD Price Action – Daily Chart
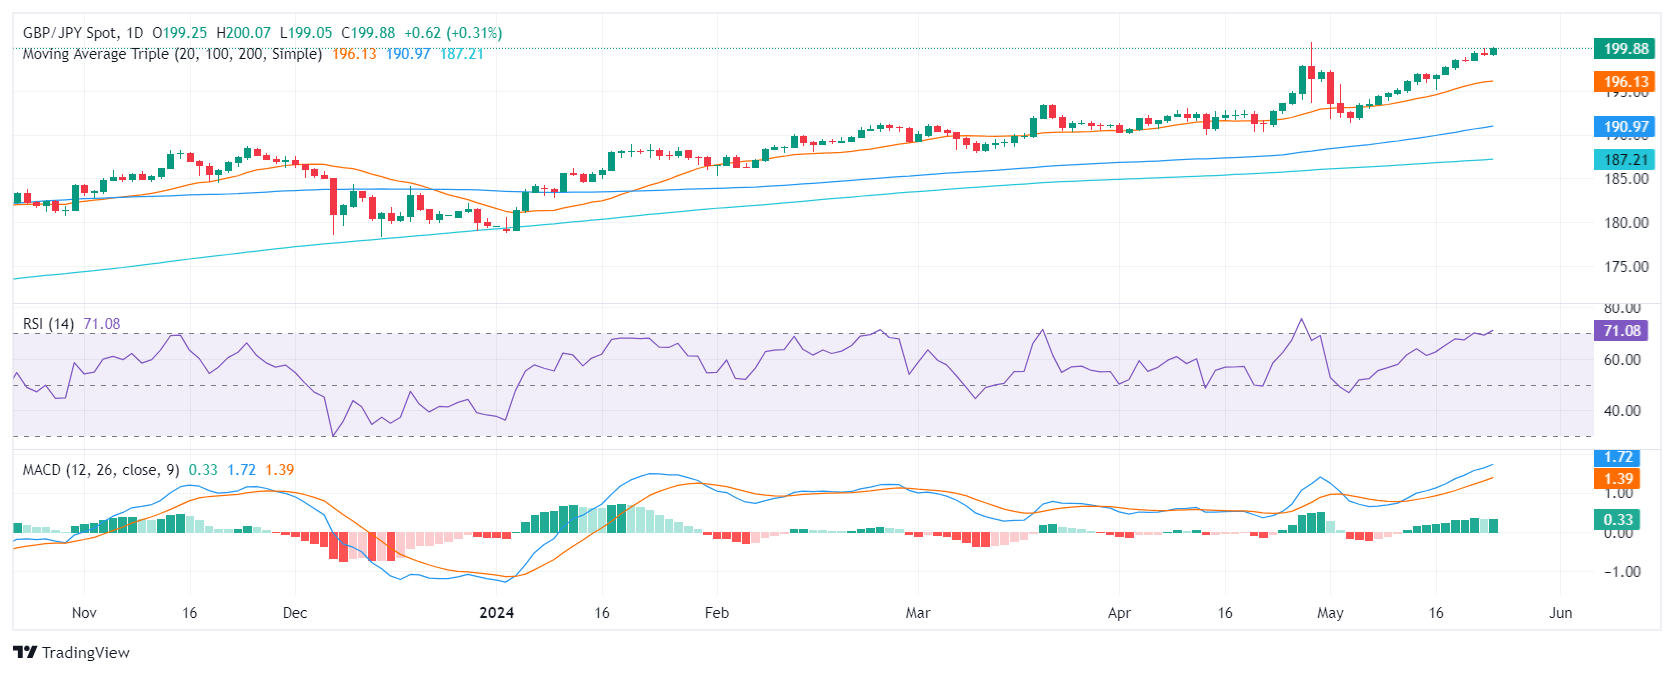
- The pair rose to highs since 2007 at 199.90.
- The daily RSI indicates an overextended buying momentum, suggesting a pending technical correction.
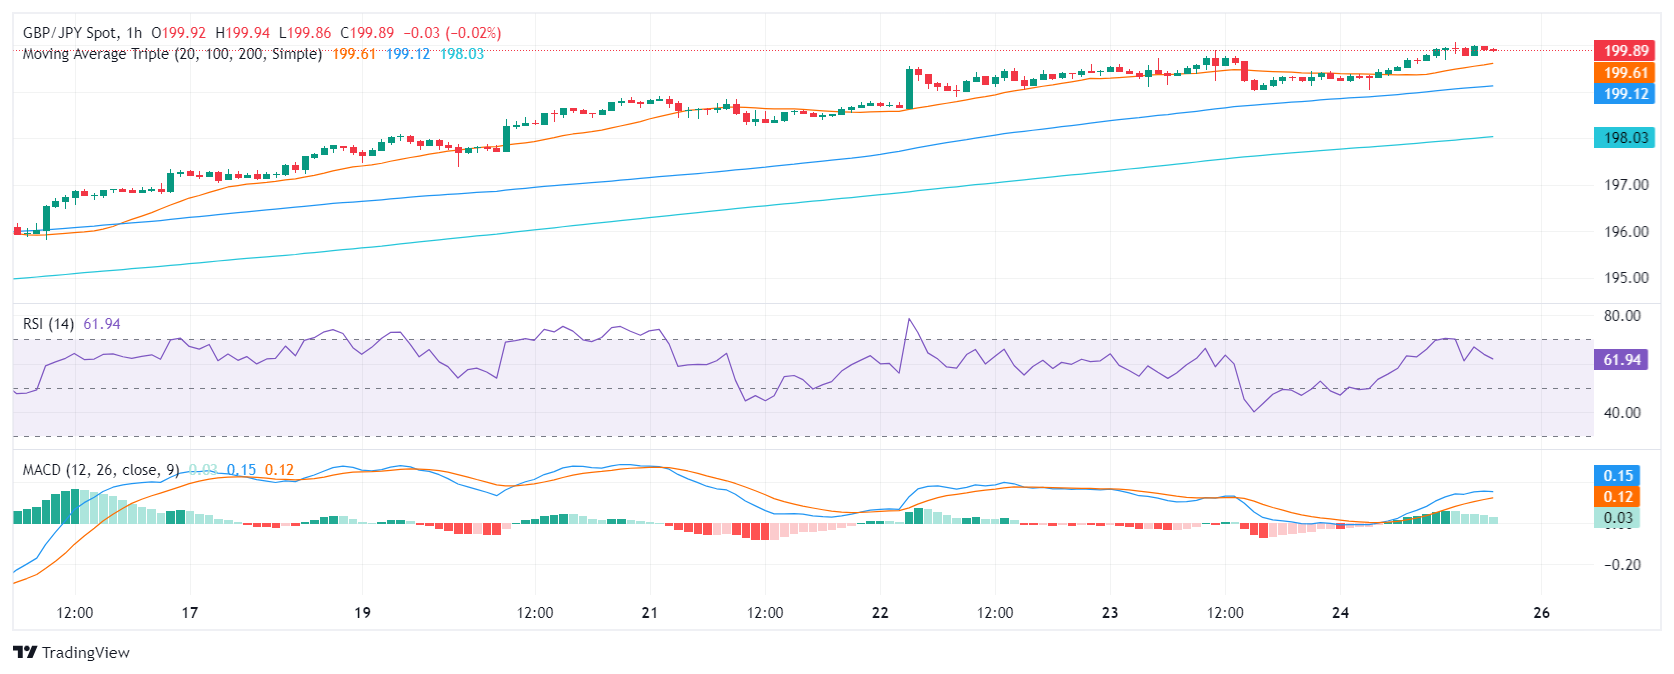
- The hourly indicators have already started to consolidate.
In Friday’s session, the GBP/JPY pair experienced upward momentum, rising by 0.37% and the pair reached multi-year highs, a clear indication of the stronghold buyers have within the market. While a near-term technical correction could potentially occur due to the overbought condition, the overall outlook remains bullish for the cross.
In the daily chart, the Relative Strength Index (RSI) has moved deep into overbought territory. The persistently high values hint at strong buying sentiment, but they also suggest a potential future correction. The Moving Average Convergence Divergence (MACD) reveals flat green bars, indicating positive momentum despite the relatively stable trend which may suggest that the pair might consolidate for the rest of the session.
GBP/JPY daily chart
When examining the hourly chart, the RSI reveals noticeable ebbs and flows, with the latest value standing at 61. Although still positive, this level appears somewhat less intense when compared to the daily chart. The hourly MACD histogram continues to display flat green bars, indicating steady positive momentum which mirrors its daily counterpart.
GBP/JPY hourly chart
From a broader outlook, the GBP/JPY's position relative to its Simple Moving Averages (SMAs) helps to clarify the overall trend. The pair stands above the 20, 100, and 200-day SMAs, reflecting a bullish outlook for both short and long-term scenarios.
- WTI bounced back above $77.50 in broad market sentiment rebound.
- Crude Oil markets are recovering despite ongoing concerns over US oversupply.
- Fed rate cut bets continue to get hammered by sticky inflation fears.
West Texas Intermediate (WTI) US Crude Oil rebounded on Friday, recovering from a fresh 12-week low set early in the day at $76.03. WTI remains down on the week, in the red by -2.38% from Monday’s opening bids.
A recovery in broad market risk appetite is bolstering Crude Oil markets after investor hopes for a rate cut from the Federal Reserve (Fed) in September were knocked further back this week. According to the CME’s FedWatch Tool, rate traders are pricing in slightly-worse-than-even odds of at least a quarter-point rate trim from the Federal Open Market Committee (FOMC) in September, steeply down from 70% odds priced in at the outset of the trading week.
US Durable Goods Orders firmly recovered in April, rising 0.7% MoM compared to the forecast -0.8% decline, while March’s figure was revised down to 0.8% from the initial print of 2.6%. University of Michigan 5-year Consumer Inflation Expectations also eased slightly to 3.0% for the month of May, falling a tick lower from the forecast hold at 3.1%. Easing inflation expectations are helping battered investor sentiment, with commodity traders still licking their wounds after a collapse in September rate cut hopes.
Forecasting the Coming Week: Fedspeak and PCE remain in the spotlight
Talking points from policymakers at the Fed dominated financial headlines this week as Fed officials continue to press down on rate cut hopes, pushing back with cautionary statements that the Fed still needs more evidence that inflation will eventually drop to the Fed’s target of 2% annual price growth.
US Crude Oil production continues to weigh on barrel bulls after US supply counts snubbed forecast declines, showing another buildup in US Crude Oil supply lines. Energy traders were hoping for an extended decline in US supply stocks, but a surprise buildup in barrel counts from both the American Petroleum Institute (API) and the Energy Information Administration (EIA) have left Crude Oil speculators hoping for an as-yet-unseen uptick in demand to eat away at US pumping capacity.
WTI technical outlook
US Crude Oil rebounded from a 12-week low to recapture the $77.50 level ahead of the week’s close. WTI continues to trade on the bearish side of the 200-hour Exponential Moving Average at $78.05, but Friday’s bullish recovery sends US Crude Oil back into familiar technical congestion.
WTI has cycled the 200-day EMA at $79.03 since dipping to a low of $68.00 in late 2023. Despite holding onto gains from 2024’s opening prices, WTI remains down nearly -11% from the year’s peaks near $87.20.
WTI hourly chart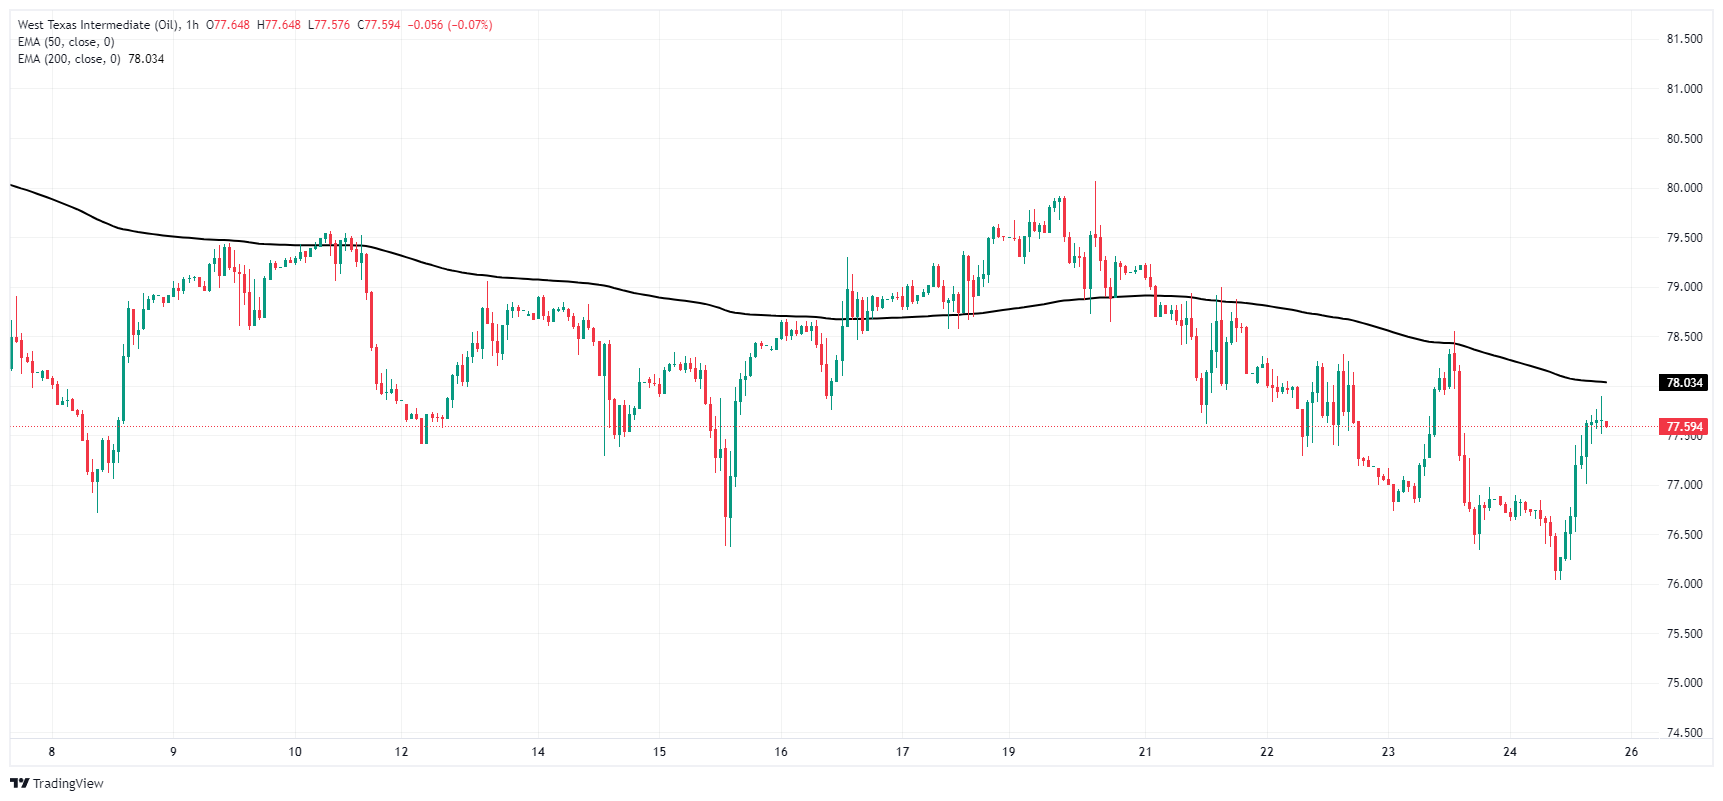
WTI daily chart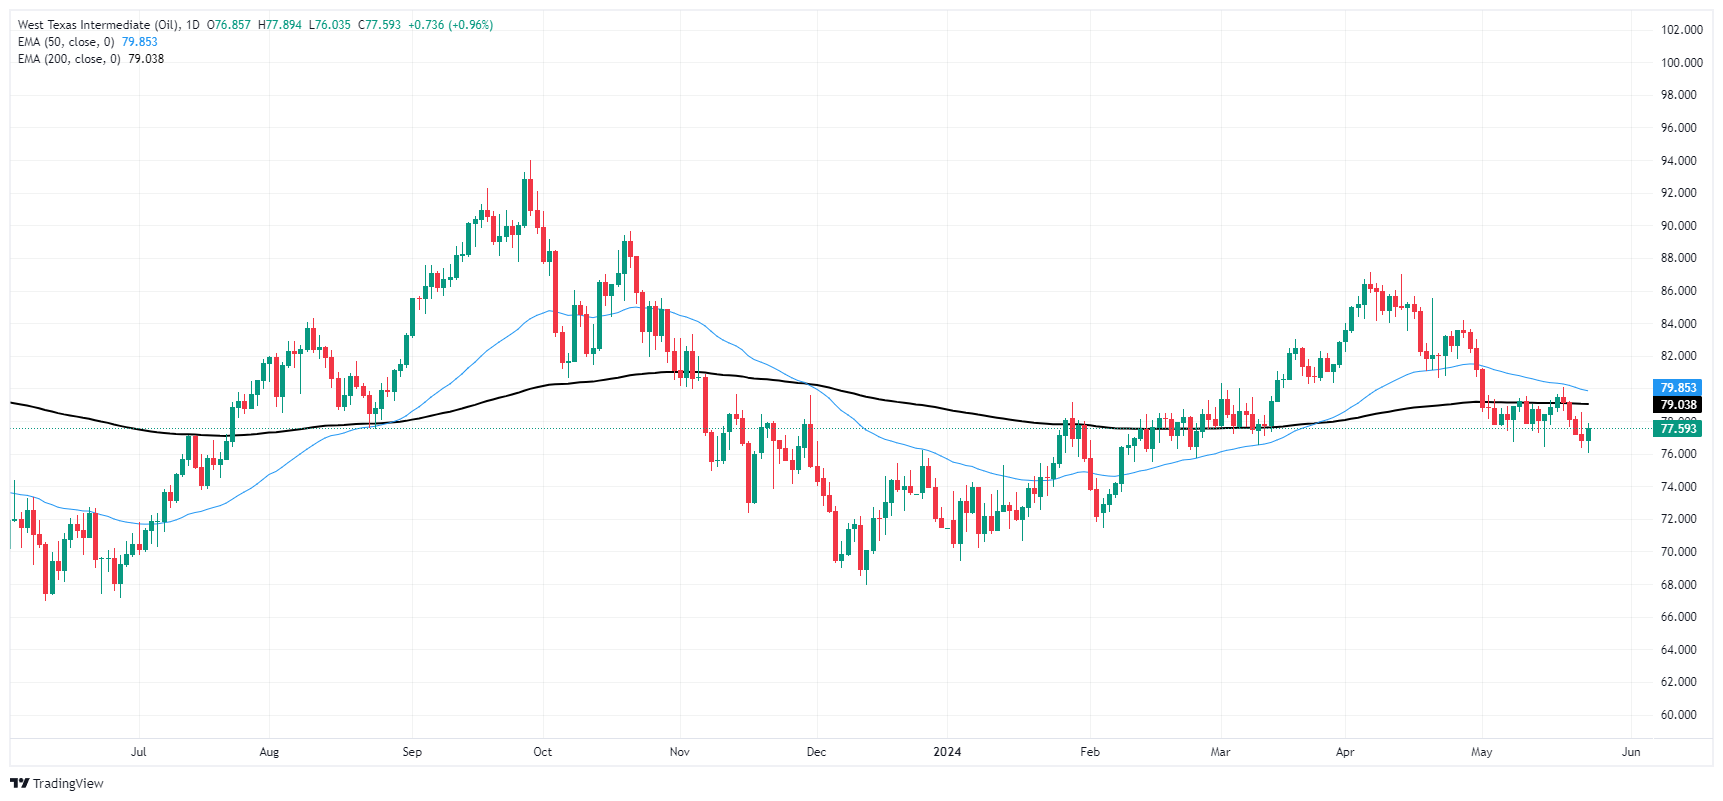
- Gold climbs 0.23% on Friday but is set for weekly drop above 3%.
- US Durable Goods Orders exceed expectations, though March's revised down data softened the impact.
- XAU/USD recovers on mixed US data that weighs on US Dollar.
- Traders now anticipate only 25 basis points of Fed rate cuts in 2024, reducing expectations for easing.
Gold price stabilized on Friday after registering back-to-back days of losses, climbing some 0.23%. Yet it was down more than 3% on the week, the largest weekly loss since December 2023. The US Durable Goods Orders data was better than expected, but a downward revision to the previous month's reading diminished the report’s impact, giving the green light to Gold buyers.
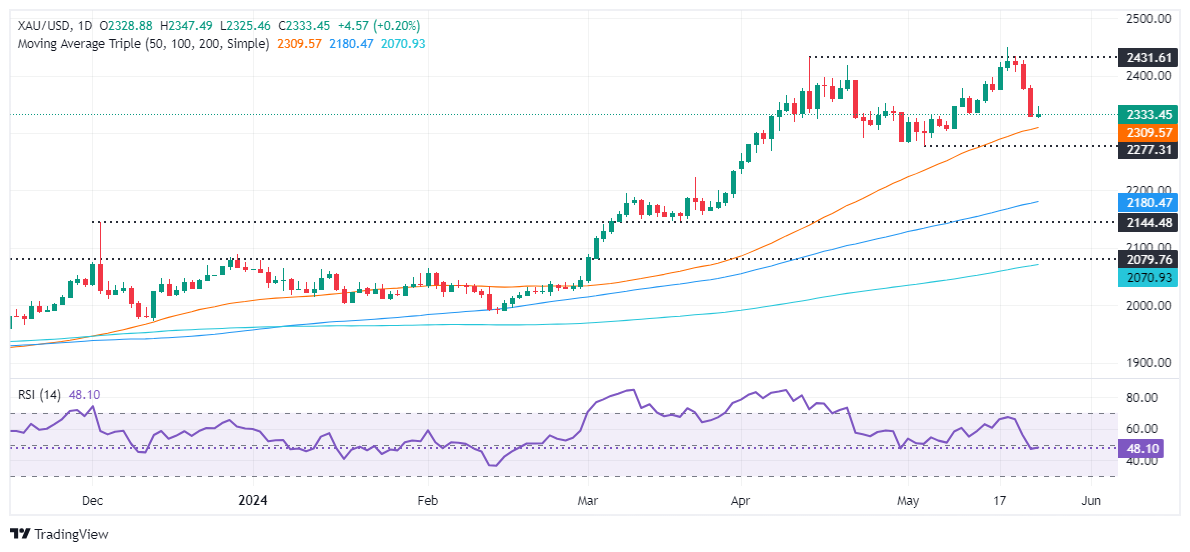
The XAU/USD trades at $2,332 after bouncing off a daily low of $2,325.
Gold traders had stepped in ahead of the weekend. US economic data on Thursday showed that US business activity picked up, decreasing the chances of seeing the Federal Reserve (Fed) cut rates. At the time of writing, fed funds rate futures estimate just 25 basis points of interest rate cuts in 2024.
Friday’s data did little to increase investors' optimism about loosening Fed policy. The US Department of Commerce revealed a goodish Durable Goods Orders report for April, but March’s downward revision weighed on the Greenback. That and the fall in US Treasury yields sponsored Gold’s recovery after hitting a low.
Meanwhile, the University of Michigan's (UoM) recent poll that measures consumer sentiment showed a slight improvement, yet inflation expectations were mixed.
The US 10-year Treasury note is yielding 4.461% and loses one-and-a-half basis points, undermining the Greenback. The US Dollar Index (DXY), which tracks the buck’s performance against a basket of peers, trades at 104.70, down 0.33%.
Daily digest market movers: Gold price climbs as the Greenback gets battered
- Gold prices are boosted by the decline in US Treasury yields, a softer US Dollar, and an improvement in risk appetite as Wall Street recovers some ground.
- April’s US Durable Goods Orders increased by 0.7% MoM, surpassing the estimated -0.8% contraction but lower than the downwardly revised figures of 0.8% for March.
- The University of Michigan Consumer Sentiment Index for May was 69.1, down from April’s 77.2 but above the forecast of 67.5. Inflation expectations for one year rose slightly to 3.3% from 3.2%, while five-year inflation expectations remained unchanged at 3%.
- S&P Global released the final US PMI readings for May. The Manufacturing PMI rose to 50.9, surpassing both estimates and April's figure of 50.0. The Services PMI significantly outperformed forecasts and April's 51.3, increasing to 54.8.
- FOMC Minutes showed that Fed officials remained uncertain about the degree of policy restrictiveness. They added that “it would take longer than previously anticipated to gain greater confidence in inflation moving sustainably to 2%.”
- Gold prices were underpinned by emerging markets' central bank buying, according to an article in The Wall Street Journal. The catalyst that sparked the buying was Western sanctions on Russia after its invasion of Ukraine.
- The World Gold Council revealed that central banks added around 2,200 tons of the golden metal since Q3 2022.
Technical analysis: Gold price clings to gains above $2,330
Gold’s uptrend remains in place despite retreating toward the $2,330 area. Even though the Relative Strength Index (RSI) turned bearish, it is at risk of surpassing the 50-midline, hinting that buyers are moving in.
Therefore, if XAU/USD climbs above $2,350, that would expose the $2,400 mark. Further gains lie overhead as buyers target the year-to-date high of $2,450, followed by the $2,500 mark.
Conversely, if bears remain in charge, they need to push the XAU/USD below the May 8 low of $2,303. Once surpassed, the May 3 cycle low of $2,277 would follow.
Gold FAQs
Gold has played a key role in human’s history as it has been widely used as a store of value and medium of exchange. Currently, apart from its shine and usage for jewelry, the precious metal is widely seen as a safe-haven asset, meaning that it is considered a good investment during turbulent times. Gold is also widely seen as a hedge against inflation and against depreciating currencies as it doesn’t rely on any specific issuer or government.
Central banks are the biggest Gold holders. In their aim to support their currencies in turbulent times, central banks tend to diversify their reserves and buy Gold to improve the perceived strength of the economy and the currency. High Gold reserves can be a source of trust for a country’s solvency. Central banks added 1,136 tonnes of Gold worth around $70 billion to their reserves in 2022, according to data from the World Gold Council. This is the highest yearly purchase since records began. Central banks from emerging economies such as China, India and Turkey are quickly increasing their Gold reserves.
Gold has an inverse correlation with the US Dollar and US Treasuries, which are both major reserve and safe-haven assets. When the Dollar depreciates, Gold tends to rise, enabling investors and central banks to diversify their assets in turbulent times. Gold is also inversely correlated with risk assets. A rally in the stock market tends to weaken Gold price, while sell-offs in riskier markets tend to favor the precious metal.
The price can move due to a wide range of factors. Geopolitical instability or fears of a deep recession can quickly make Gold price escalate due to its safe-haven status. As a yield-less asset, Gold tends to rise with lower interest rates, while higher cost of money usually weighs down on the yellow metal. Still, most moves depend on how the US Dollar (USD) behaves as the asset is priced in dollars (XAU/USD). A strong Dollar tends to keep the price of Gold controlled, whereas a weaker Dollar is likely to push Gold prices up.
- The USD/THB modestly advances in Friday’s session standing near 36.63.
- Fed officials exercising caution against premature policy easing limits further downtick in USD.
- Better-than-expected growth in US Durable Goods Orders for April lends a helping hand to the Greenback.
- The focus will turn to next week’s GDP and PCE data from the US.
The USD/THB pair is trading slightly higher near the 36.63 level, showing mild gains, and bulls are challenging the 20-day SMA at 36.66. The pair remains steady as the cautious stance of the Federal Reserve (Fed), as well as strong economic indicators, justify the call for patience of the officials and hence the delay of the rate cuts.
In the American scenario, the Federal Reserve officials maintain a cautious stance against any premature policy easing, attributing their restraint to the consistent strength of the US economy and persistent inflation. The recently released data for Durable Goods Orders in April also lends support to this stance, with an increase reporting a 0.7% rise which outperformed expectations. This outcome portrays a growing US economy that is additionally backed by firm labor market data reported in Thursday’s lower-than-expected weekly Jobless Claims.
In the meantime, the CME Group’s FedWatch Tool suggests a 53% possibility of a reduction in interest rates by September, down from over 60% earlier this week, echoing rising hawkish bets on the Fed which favors the USD.
USD/THB technical analysis
In the daily analysis, the Relative Strength Index (RSI) shows a gradual shift from negative to positive territory. A rebound from near-oversold conditions on Thursday hints at a potential market recovery, with a slightly positive slope indicating growing buying momentum. Simultaneously, the Moving Average Convergence Divergence (MACD) histogram prints flat red bars, suggesting diminishing selling traction.
USD/THB daily chart
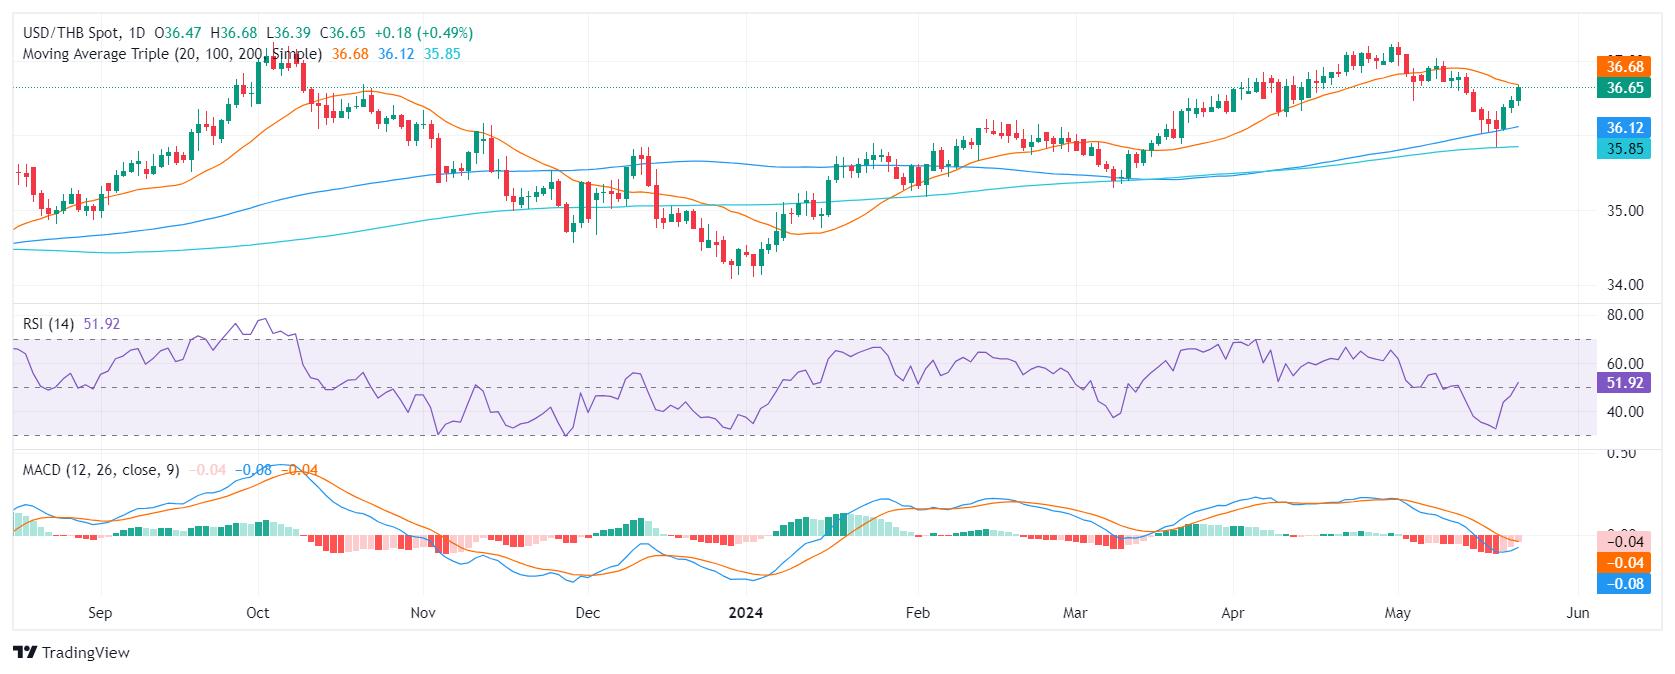
Looking at the broader scope, USD/THB displays considerable resilience, standing firm above its Simple Moving Averages (SMA), and holding above the 100, and 200-day SMA thresholds, it paints a bullish signal for long-term outlooks. If buyers conquer the 20-day SMA, the outlook will also be positive for the short term.
- Dow Jones finds a thin rebound after getting clobbered this week.
- Investors looking for a foothold after a harsh rebalance of rate cut expectations.
- US Durable Goods Orders, UoM Consumer Sentiment recovered on Friday.
The Dow Jones Industrial Average (DJIA) is moderating on Friday, finding thin gains after seeing its second-worst trading day of 2024 on Thursday. The equity index is up around a fifth of a percent heading into the trading week’s close, with investor sentiment broadly recovering.
Read more: US Durable Goods Orders rise 0.7% in April vs. -0.8% expected
US Durable Goods Orders in April rose 0.7% MoM, shrugging off the forecast -0.8% decline, while the previous month’s print was revised to 0.8% from 2.6%. The University of Michigan’s Consumer Sentiment Index for May climbed to 69.1 versus the forecast uptick to 67.5 from the previous 67.4. UoM 5-year Consumer Inflation Expectations also eased to 3.0% from the expected hold at 3.1%, putting further upside pressure on market sentiment as investors look for any sign that inflation figures could ease moving forward.
Forecasting the Coming Week: Fedspeak and PCE remain in the spotlight
Broad-market expectations of Federal Reserve (Fed) rate cuts were knocked back once again this week, and according to the CME’s FedWatch Tool, rate traders are pricing in slightly worse than even odds of at least a quarter-point rate cut from the Fed in September. This is sharply lower than the 70% odds of at least 25 basis points that was priced in at the beginning of the week.
Dow Jones news
A meager Friday recovery leaves the DJIA the worst-performing of the major US equity indexes, with the Dow Jones rising a scant 60 points after Thursday’s steep 600+ point decline. Less than a third of the Dow Jones’ constituent securities are down on Friday, with losses being led by Salesforce Inc. (CRM). CRM is down -2.6% on the day, falling to $271.38 per share. On the high side, Intel Corp. is the Dow Jones’ top gainer, climbing around 2% to $30.68 per share.
Dow Jones technical outlook
The Dow Jones finds thin gains on Friday as the major equity index struggles to recover from recent bearish momentum. The Dow Jones is grappling with the 39,000.00 handle after tumbling from record all-time highs set last week above 40,000.00. An intraday technical floor is priced in at 39,020.00, but the index is steeply off highs, down -2.55% top-to-bottom from last Friday’s record peak.
Downside momentum is running into technical support from the 50-day Exponential Moving Average (EMA) at 38,908.78. Despite near-term losses, the Dow Jones remains firmly bullish, trading deep into bull country and up 3.7% in 2024.
Dow Jones five minute chart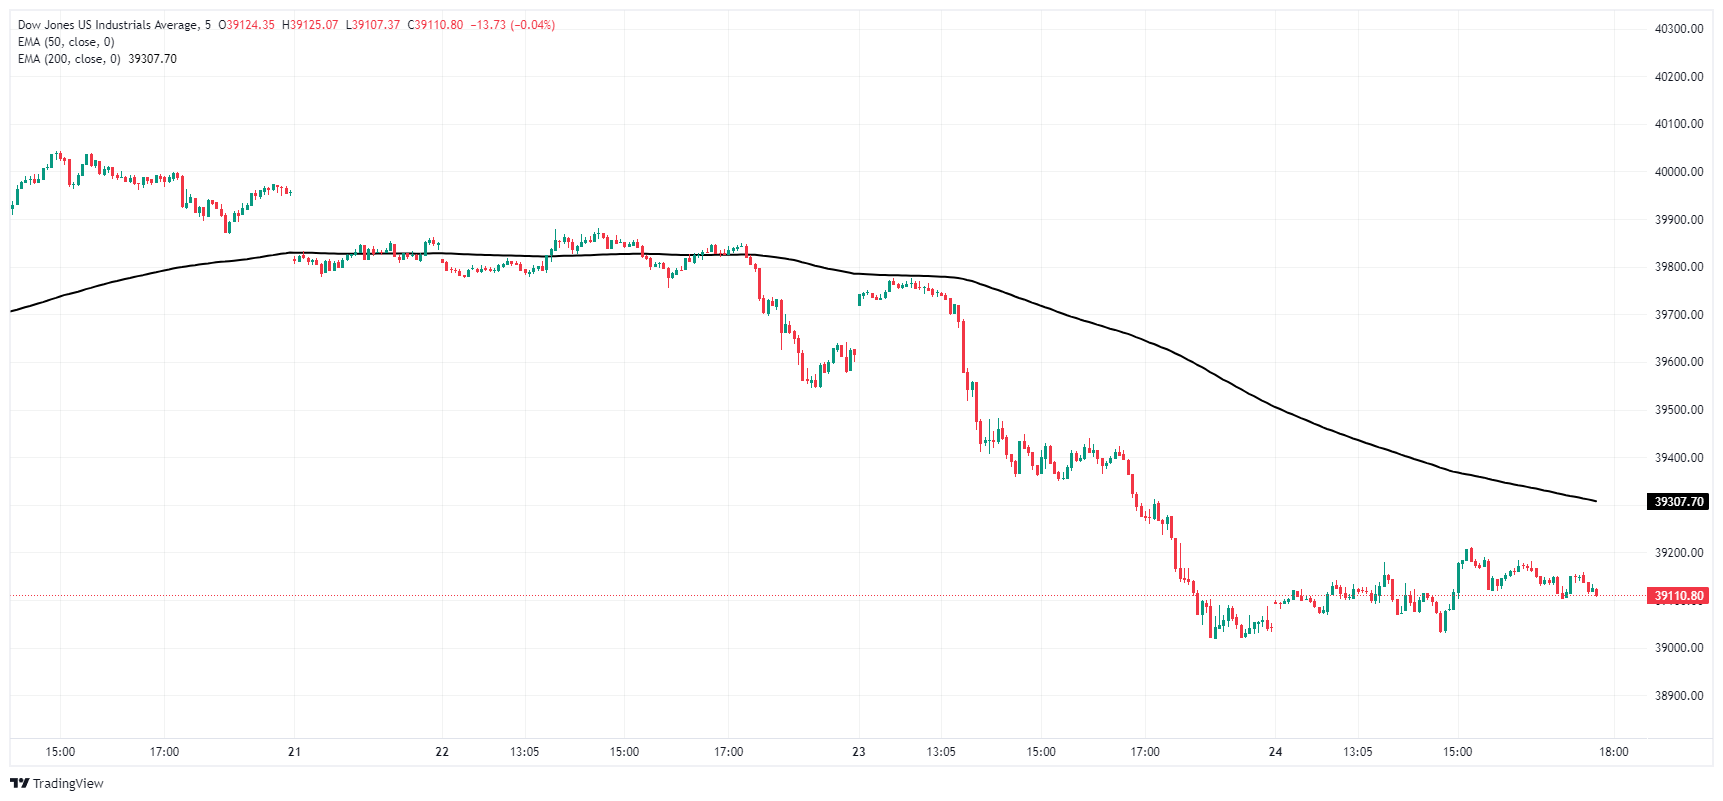
Dow Jones daily chart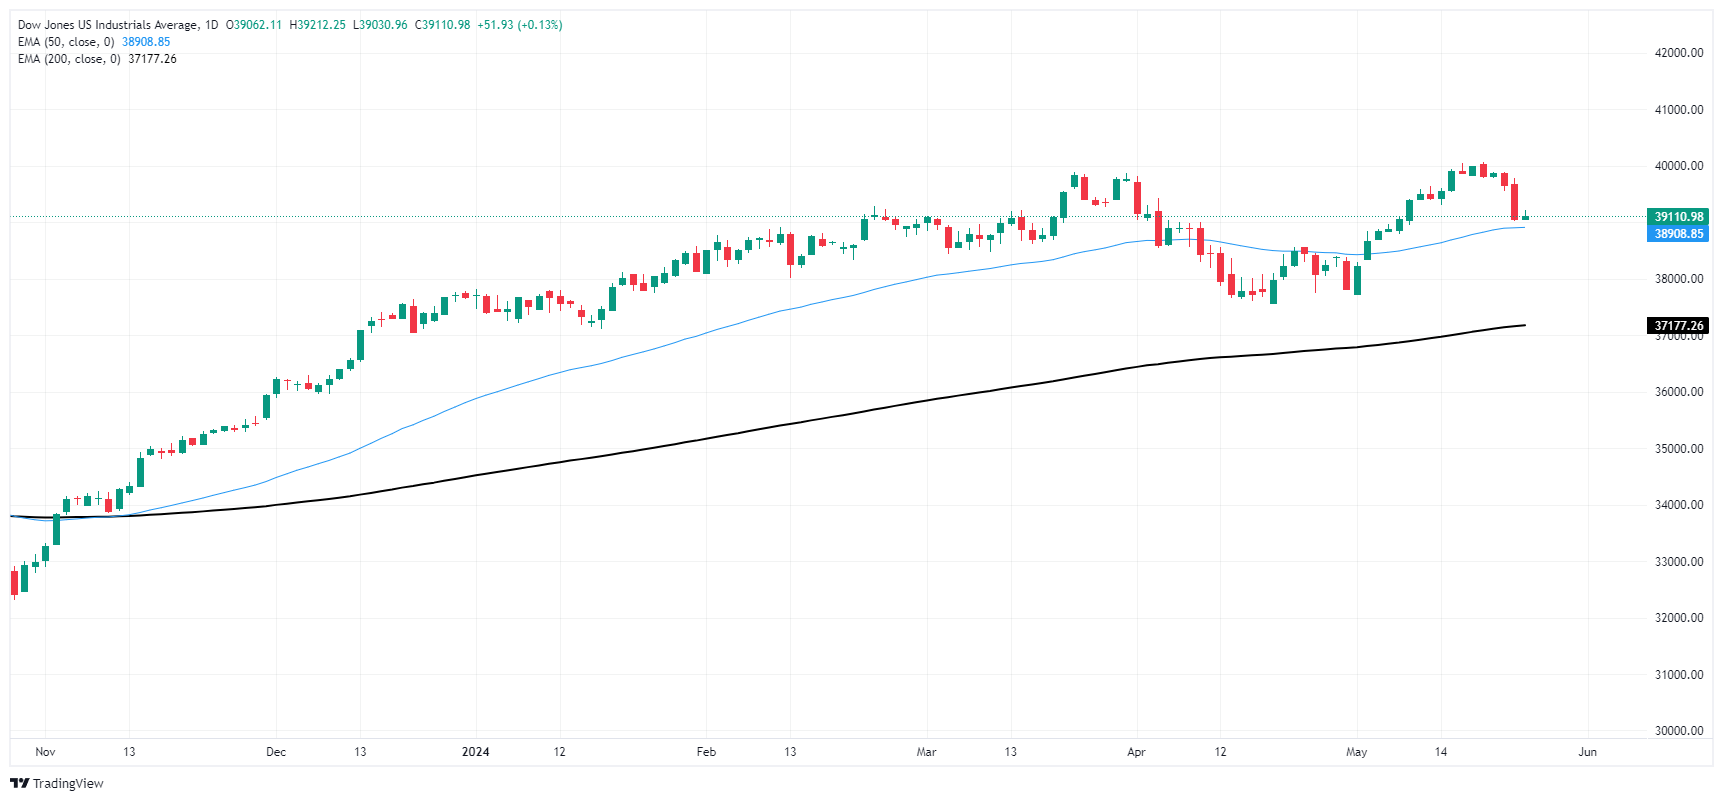
Dow Jones FAQs
The Dow Jones Industrial Average, one of the oldest stock market indices in the world, is compiled of the 30 most traded stocks in the US. The index is price-weighted rather than weighted by capitalization. It is calculated by summing the prices of the constituent stocks and dividing them by a factor, currently 0.152. The index was founded by Charles Dow, who also founded the Wall Street Journal. In later years it has been criticized for not being broadly representative enough because it only tracks 30 conglomerates, unlike broader indices such as the S&P 500.
Many different factors drive the Dow Jones Industrial Average (DJIA). The aggregate performance of the component companies revealed in quarterly company earnings reports is the main one. US and global macroeconomic data also contributes as it impacts on investor sentiment. The level of interest rates, set by the Federal Reserve (Fed), also influences the DJIA as it affects the cost of credit, on which many corporations are heavily reliant. Therefore, inflation can be a major driver as well as other metrics which impact the Fed decisions.
Dow Theory is a method for identifying the primary trend of the stock market developed by Charles Dow. A key step is to compare the direction of the Dow Jones Industrial Average (DJIA) and the Dow Jones Transportation Average (DJTA) and only follow trends where both are moving in the same direction. Volume is a confirmatory criteria. The theory uses elements of peak and trough analysis. Dow’s theory posits three trend phases: accumulation, when smart money starts buying or selling; public participation, when the wider public joins in; and distribution, when the smart money exits.
There are a number of ways to trade the DJIA. One is to use ETFs which allow investors to trade the DJIA as a single security, rather than having to buy shares in all 30 constituent companies. A leading example is the SPDR Dow Jones Industrial Average ETF (DIA). DJIA futures contracts enable traders to speculate on the future value of the index and Options provide the right, but not the obligation, to buy or sell the index at a predetermined price in the future. Mutual funds enable investors to buy a share of a diversified portfolio of DJIA stocks thus providing exposure to the overall index.
- Mexican Peso recovers slightly, breaking three-day losing streak.
- Mexico's wider April trade deficit and slower economic growth are reported by INEGI.
- Banxico minutes show division on rate cuts amid ongoing inflation, emphasizing commitment to price stability.
- US Durable Goods Orders beat expectations, but March's figures are revised down heavily.
The Mexican Peso snapped three days of losses and climbed more than 0.10% against the US Dollar on Friday amid an improvement in risk appetite and softer-than-expected US data that weighed on the Greenback. At the time of writing, the USD/MXN trades at 16.69, down 0.17%.
Mexico’s National Statistics Agency (INEGI) revealed a wider-than-expected trade deficit in April. On Thursday, INEGI announced that the economy grew at a slower pace than foreseen, while inflation for the Mid-month was mixed.
The Bank of Mexico featured its last monetary policy meeting minutes, which revealed the Governing Council is divided over when to resume interest rate cuts amid stubbornly stickier inflation. At the latest meeting, Banxico upwardly revised inflation and mentioned that it remains committed to price stability.
Across the border, the US Department of Commerce revealed that Durable Goods Orders exceeded expectations but revised March’s figures downward from 2.4% to 0.8%. Recently, a survey showed that consumer sentiment shifted to slightly pessimistic, according to a University of Michigan Survey. The same poll revealed that inflation expectations are tilted to the downside.
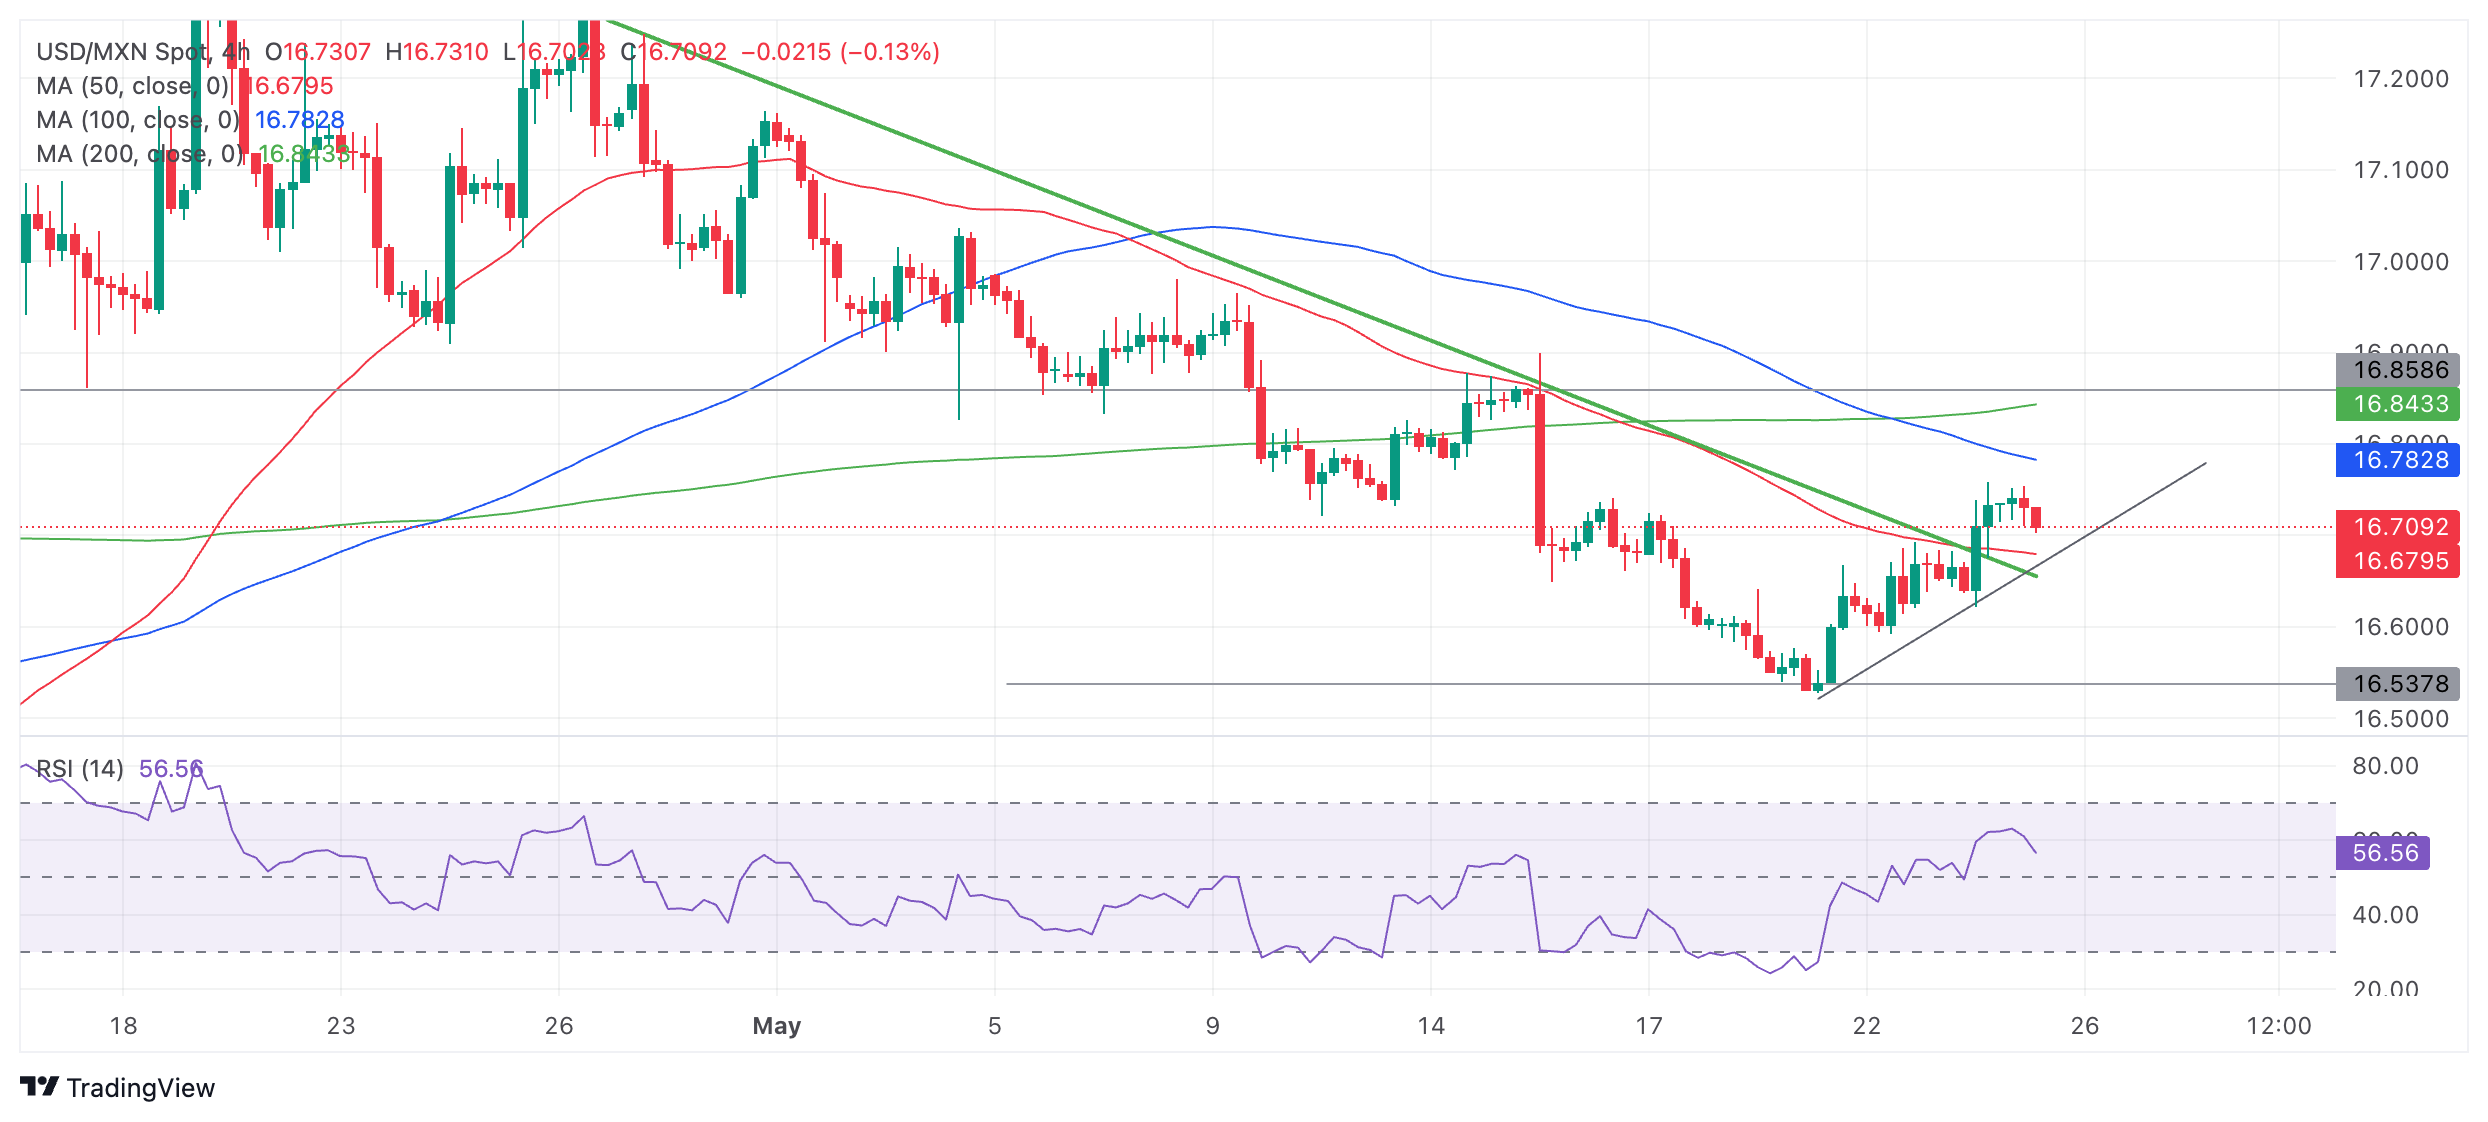
Given the fundamental backdrop, the USD/MXN resumed its downtrend as buyers struggled to breach strong resistance at the 100-day Simple Moving Average (SMA) at 16.76, opening the door for a retracement.
Daily digest market movers: Mexican Peso leans on soft US data to appreciate against USD
- Mexico’s Balance of Trade in April was $-3.746 billion, exceeding forecasts of $-0.8 billion and March’s $2.09 billion surplus.
- Mexico’s economy is slowing as expected as Gross Domestic Product for Q1 2024 grew 1.6% YoY, aligned with estimates but trailing 2023’a last quarter rate of 2.5%.
- Mid-month headline inflation rose from 4.63% to 4.78%, but the core continued to aim lower. Underlying inflation for the same period stood at 4.31% YoY, down from 4.39%.
- May’s Citibanamex poll showed that most economists estimate Banxico will cut rates on June 27 from 11% to 10.75%. The median expects headline inflation at 4.21% and core at 4.07% in 2024.
- April’s US Durable Goods Orders increased by 0.7% MoM, exceeding estimates of -0.8% contraction but lower than the downwardly revised March figures.
- The UoM Consumer Sentiment Index in May was 69.1, below April’s 77.2, but exceeded forecasts of 67.5. Inflation Expectations for one year stood at 3.3%, up from 3.2%. For a five-year period, they were unchanged at 3%.
- Despite that, fed funds rate futures estimated just 26 basis points of easing toward the end of the year after S&P Global revealed that US business activity is gathering steam.
Technical analysis: Mexican Peso counter attacks as USD/MXN tumbles below 16.70
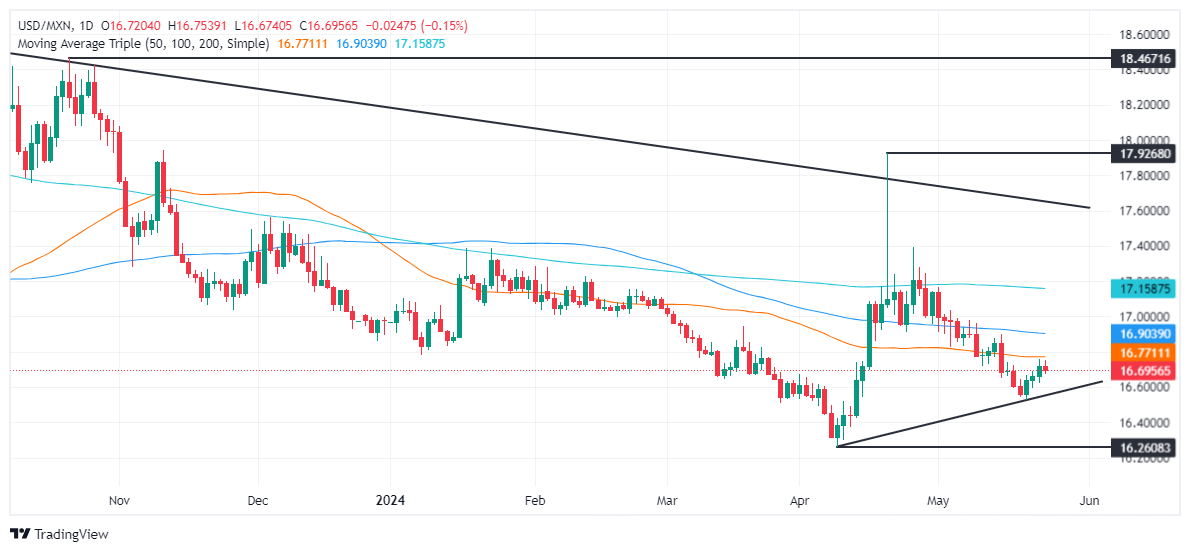
The USD/MXN downtrend extended after buyers were unable to cancel the 100-day SMA at 16.76. The exotic pair retreated afterward, down some 365 pips and back below the psychological 16.70 mark. Momentum is on the sellers’ side as the Relative Strength Index (RSI) aims downward in bearish territory.
Due to seller strength, the path of least resistance is downward. The pair would meet its next support at 16.62, the 2023 low, followed by the May 21 cycle low at 16.52 and the year-to-date low of 16.25.
Conversely, if buyers reclaim 16.70, they must clear the 100-day SMA at 16.76 before extending its gains. In that outcome, key resistance levels emerge like the 50-day SMA at 16.89, the 17.00 psychological figure and the 200-day SMA at 17.15.
Mexican Peso FAQs
The Mexican Peso (MXN) is the most traded currency among its Latin American peers. Its value is broadly determined by the performance of the Mexican economy, the country’s central bank’s policy, the amount of foreign investment in the country and even the levels of remittances sent by Mexicans who live abroad, particularly in the United States. Geopolitical trends can also move MXN: for example, the process of nearshoring – or the decision by some firms to relocate manufacturing capacity and supply chains closer to their home countries – is also seen as a catalyst for the Mexican currency as the country is considered a key manufacturing hub in the American continent. Another catalyst for MXN is Oil prices as Mexico is a key exporter of the commodity.
The main objective of Mexico’s central bank, also known as Banxico, is to maintain inflation at low and stable levels (at or close to its target of 3%, the midpoint in a tolerance band of between 2% and 4%). To this end, the bank sets an appropriate level of interest rates. When inflation is too high, Banxico will attempt to tame it by raising interest rates, making it more expensive for households and businesses to borrow money, thus cooling demand and the overall economy. Higher interest rates are generally positive for the Mexican Peso (MXN) as they lead to higher yields, making the country a more attractive place for investors. On the contrary, lower interest rates tend to weaken MXN.
Macroeconomic data releases are key to assess the state of the economy and can have an impact on the Mexican Peso (MXN) valuation. A strong Mexican economy, based on high economic growth, low unemployment and high confidence is good for MXN. Not only does it attract more foreign investment but it may encourage the Bank of Mexico (Banxico) to increase interest rates, particularly if this strength comes together with elevated inflation. However, if economic data is weak, MXN is likely to depreciate.
As an emerging-market currency, the Mexican Peso (MXN) tends to strive during risk-on periods, or when investors perceive that broader market risks are low and thus are eager to engage with investments that carry a higher risk. Conversely, MXN tends to weaken at times of market turbulence or economic uncertainty as investors tend to sell higher-risk assets and flee to the more-stable safe havens.
- DXY Index is trading at 104.7, showcasing 0.35% losses.
- Durable Good orders from the US came in higher than expected but didn’t trigger movement from Greenback.
- Fed maintains cautious stance on premature easing, hinting at lower chances for swift interest rate cuts which cushions the USD.
The US Dollar Index (DXY) is currently trading at 104.7, experiencing some losses despite positive indications from the economy. This week, the US reported robust domestic economic indicators, such as the rising preliminary May PMIs reported by S&P Global, along with strong Durable Goods Orders and Jobless Claims figures, which suggest a potential continuation of the US Dollar's recovery. Despite these fundamentals, the DXY Index faces resistance at the 20-day Simple Moving Average and feels the effects of selling pressure.
As the US economy displays robust indicators, the Federal Reserve's (Fed) cautious stance on premature easing will limit any downward movement. Next week, April Personal Consumption Expenditures (PCE), the Fed's preferred gauge of inflation, will be released and might change the stance of the central bank’s messaging.
Daily digest market movers: DXY sees red despite signs of economic resilience in the US
- Durable Goods Orders in the US increased by 0.7% in April after March’s figures were revised down steeply to 0.8%. April’s reading exceeded market predictions, which expected a drop of 0.8%.
- Excluding transportation, a 0.4% rise was recorded in new orders. With defense set aside, new orders stayed almost unchanged.
- Fed remains mindful of premature easing with Fed members implying that the policy rate limitation will continue for a prolonged period. Market probabilities for a rate cut in the upcoming meetings are around 50% in September and 85% in November, with a cut priced in by December.
DXY technical analysis: DXY faces strong resistance at 20-day SMA
The DXY's technical outlook paints a mixed picture. The Relative Strength Index (RSI) is sloping downward within negative territory, hinting that selling momentum is underway. This negative slope implies bears gaining an upper hand in the short term. The Moving Average Convergence Divergence (MACD) displays flat red bars, which indicate steady buying pressure, adding more color to the bearish narrative.
Bulls, despite struggling, show their resilience as the DXY is clinging above the 100 and 200-day Simple Moving Averages (SMAs). This position above long-term averages indicates an underlying bullish bias. However, as long as it remains below the 20-day SMA, the short-term outlook will be painted with red.
US Dollar FAQs
The US Dollar (USD) is the official currency of the United States of America, and the ‘de facto’ currency of a significant number of other countries where it is found in circulation alongside local notes. It is the most heavily traded currency in the world, accounting for over 88% of all global foreign exchange turnover, or an average of $6.6 trillion in transactions per day, according to data from 2022. Following the second world war, the USD took over from the British Pound as the world’s reserve currency. For most of its history, the US Dollar was backed by Gold, until the Bretton Woods Agreement in 1971 when the Gold Standard went away.
The most important single factor impacting on the value of the US Dollar is monetary policy, which is shaped by the Federal Reserve (Fed). The Fed has two mandates: to achieve price stability (control inflation) and foster full employment. Its primary tool to achieve these two goals is by adjusting interest rates. When prices are rising too quickly and inflation is above the Fed’s 2% target, the Fed will raise rates, which helps the USD value. When inflation falls below 2% or the Unemployment Rate is too high, the Fed may lower interest rates, which weighs on the Greenback.
In extreme situations, the Federal Reserve can also print more Dollars and enact quantitative easing (QE). QE is the process by which the Fed substantially increases the flow of credit in a stuck financial system. It is a non-standard policy measure used when credit has dried up because banks will not lend to each other (out of the fear of counterparty default). It is a last resort when simply lowering interest rates is unlikely to achieve the necessary result. It was the Fed’s weapon of choice to combat the credit crunch that occurred during the Great Financial Crisis in 2008. It involves the Fed printing more Dollars and using them to buy US government bonds predominantly from financial institutions. QE usually leads to a weaker US Dollar.
Quantitative tightening (QT) is the reverse process whereby the Federal Reserve stops buying bonds from financial institutions and does not reinvest the principal from the bonds it holds maturing in new purchases. It is usually positive for the US Dollar.
- Canadian Dollar recovers lost ground but remains down for the week.
- Canada Retail Sales decline further, limiting CAD recovery.
- Broad market risk appetite recovers after US inflation expectations ease.
The Canadian Dollar (CAD) recovered ground on Friday, sparked by a shift in investor risk appetite. US Durable Goods Orders snubbed an expected decline, and Consumer 5-year Inflation Expectations in May eased slightly.
Canada saw a fresh downturn in Retail Sales in March after median forecasts expected a slight bounce. Despite further signs of economic weakness in Canada, broader market sentiment gained ground and forced the US Dollar (USD) lower after the Michigan Consumer Sentiment Index climbed higher than expected in May.
Daily digest market movers: Market sentiment rebounds, Canadian Dollar shrugs off Canadian data miss
- Canadian Retail Sales slid -0.2% MoM in March, missing the forecasted recovery to 0.0% from the previous month’s -0.1%.Canadian Retail Sales excluding Automobiles tumbled to a nine-month low of -0.6% MoM, entirely missing the forecast of 0.1%, though the previous month’s figure was revised upward slightly to -0.2% from -0.3%.
- US Durable Goods Orders in April rose 0.7%, shrugging off the -0.8% forecast, though the previous month’s print was steeply revised lower to 0.8% from 2.6%.
- The University of Michigan’s Consumer Sentiment Index printed firmly higher at 69.1 compared to the previous month’s 67.4. Median market forecasts had expected a slight uptick to 67.5.
- The UoM 5-year Consumer Inflation Expectations in May eased to 3.0% versus the expected hold at 3.1%.
- Market sentiment is recovering on Friday after a midweek spike in risk aversion sparked by a harsh rebalancing of investor rate cut expectations. The CME’s FedWatch Tool shows that rate markets are pricing in nearly-even odds of a rate cut from the Federal Reserve (Fed) in September, down sharply from 70% at the beginning of the week.
Canadian Dollar PRICE This week
The table below shows the percentage change of Canadian Dollar (CAD) against listed major currencies this week. Canadian Dollar was the strongest against the Australian Dollar.
| USD | EUR | GBP | JPY | CAD | AUD | NZD | CHF | |
|---|---|---|---|---|---|---|---|---|
| USD | 0.18% | -0.31% | 0.85% | 0.36% | 1.03% | 0.27% | 0.58% | |
| EUR | -0.18% | -0.52% | 0.73% | 0.19% | 0.89% | 0.10% | 0.41% | |
| GBP | 0.31% | 0.52% | 1.10% | 0.73% | 1.40% | 0.62% | 0.92% | |
| JPY | -0.85% | -0.73% | -1.10% | -0.49% | 0.19% | -0.55% | -0.26% | |
| CAD | -0.36% | -0.19% | -0.73% | 0.49% | 0.62% | -0.09% | 0.21% | |
| AUD | -1.03% | -0.89% | -1.40% | -0.19% | -0.62% | -0.79% | -0.48% | |
| NZD | -0.27% | -0.10% | -0.62% | 0.55% | 0.09% | 0.79% | 0.30% | |
| CHF | -0.58% | -0.41% | -0.92% | 0.26% | -0.21% | 0.48% | -0.30% |
The heat map shows percentage changes of major currencies against each other. The base currency is picked from the left column, while the quote currency is picked from the top row. For example, if you pick the Canadian Dollar from the left column and move along the horizontal line to the US Dollar, the percentage change displayed in the box will represent CAD (base)/USD (quote).
Technical analysis: Canadian Dollar pulls back from bearish edge but is still broadly lower for the week
The Canadian Dollar (CAD) pared some of the week’s losses on Friday, but still remains firmly lower against most of its major currency peers compared to Monday’s opening bids. The Canadian Dollar extended gains to two-thirds of a percent against the Australian Dollar (AUD) this week, while holding a third of a percent higher against the Japanese Yen through the week.
Despite a firm Friday rebound, the CAD remains down four-tenths of one percent against the Greenback as the US Dollar remains one of the week’s strongest performers. USD/CAD pulled back to 1.3670 during Friday’s US market session, dipping from the week’s highs near 1.3745. However, the pair still remains higher on the week, trading on the high side of a technical bounce from the 1.3600 handle.
Choppy chart conditions hold USD/CAD near the 200-hour Exponential Moving Average (EMA) near 1.3668. Further bearish momentum will find a firm price floor at the 200-day EMA at 1.3553.
USD/CAD hourly chart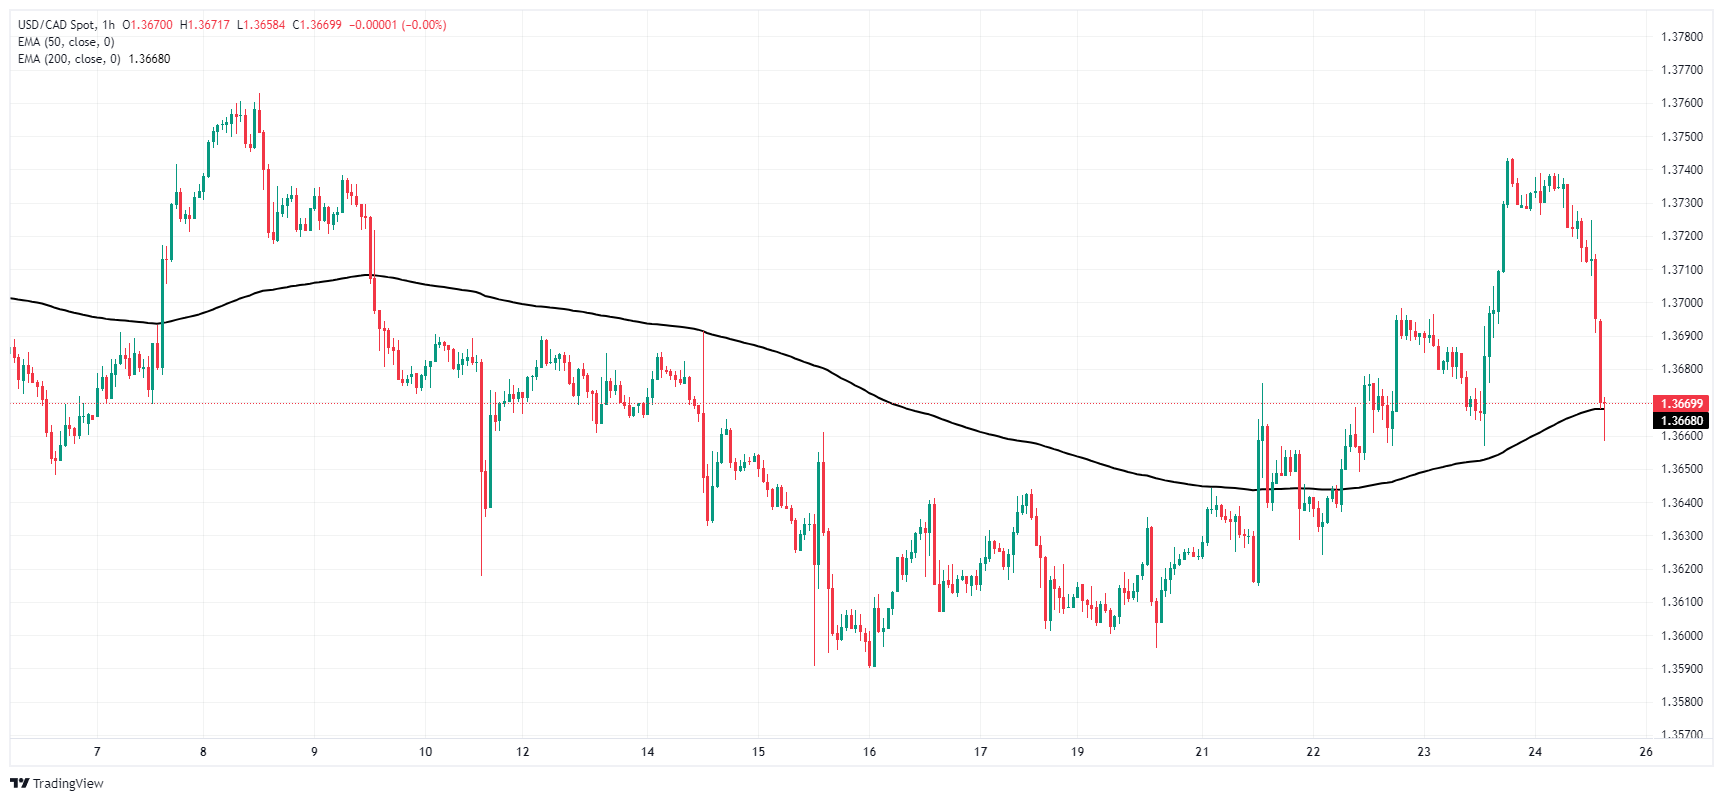
USD/CAD daily chart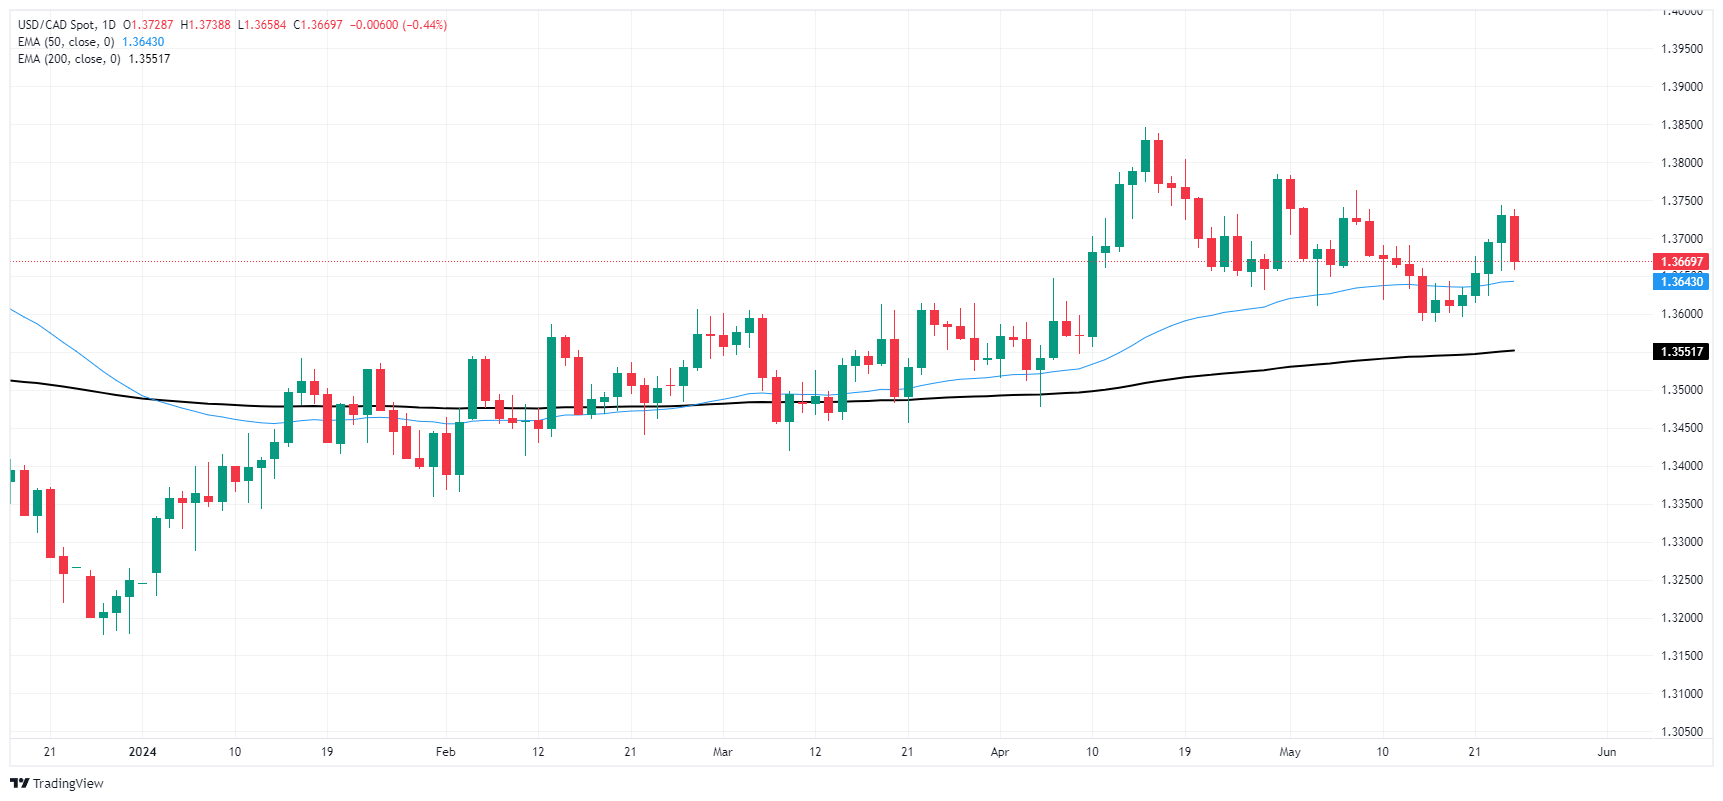
Economic Indicator
Retail Sales (MoM)
The Retail Sales data, released by Statistics Canada on a monthly basis, measures the total value of goods sold by retailers in Canada based on a sampling of retail stores of different types and sizes. Changes in Retail Sales are widely followed as an indicator of consumer spending. Percent changes reflect the rate of changes in such sales, with the MoM reading comparing sales values in the reference month with the previous month. Generally, a high reading is seen as bullish for the Canadian Dollar (CAD), while a low reading is seen as bearish.
Read more.Last release: Fri May 24, 2024 12:30
Frequency: Monthly
Actual: -0.2%
Consensus: 0%
Previous: -0.1%
Source: Statistics Canada
European Central Bank (ECB) Governing Council Member Dr. Joachim Nagel noted on Friday that a wait-and-see period before a follow-up rate trim would likely follow an early rate cut from the ECB.
Key highlights
The wage uptick wasn't a surprise.
The wage uptick is linked to high inflation rates of the past.
Core and headline inflation are both decelerating.
The ECB can probably cut rates in June.
There is no autopilot on rate cuts.
After June, we will probably have to wait on the next move until September.
The improved sentiment in the Greenback came in line with hawkish FOMC Minutes and another set of positive results from US fundamentals, all reinforcing the Fed’s tighter-for-longer narrative ahead of key PCE data and more Fedspeak.
Despite Friday’s pullback, the US Dollar managed to reverse recent weakness and closed the week with decent gains. The FHFA’s House Price Index comes on May 28 seconded by the always-relevant Consumer Confidence gauged by the Conference Board. On May 29, MBA will report on weekly Mortgage Applications ahead of the Fed’s Beige Book. Another revision of the Q1 GDP Growth Rate is due on May 30, followed by the usual weekly Initial Jobless Claims, the advanced Goods Trade Balance and Pending Home Sales. Closing the month, the focus of attention will shift to inflation figures tracked by the PCE along with Personal Income and Spending.
EUR/USD extended its weekly decline and revisited the 1.0800 region, where it met some decent contention for the time being. Germany’s Business Climate tracked by the IFO institute is expected on May 27. Later in the week, Germany will be at the centre of the debate with the releases of the Consumer Confidence measured by GfK and the preliminary Inflation Rate, all due on May 29. The EMU’s final Consumer Confidence, Economic Sentiment, Industrial Sentiment and the Unemployment Rate are all expected on May 30, while German Retail Sales and the advanced Inflation Rate in the Euroland are due on May 31.
GBP/USD maintained its bullish perspective and advanced for the second week in a row, this time managing to break above the 1.2700 hurdle. In the UK calendar, the Nationwide Housing Prices, Mortgage Lending and Mortgage Approvals are all due on May 31.
USD/JPY kept the recovery well in place and regained the area beyond 157.00, around the 61.8% Fibo retracement of the steep decline following the suspected FX intervention by the MoF in late April. The final prints of the Coincident Index and the Leading Economic Index are due on May 27. Japan’s Consumer Confidence is due on May 29 ahead of weekly Foreign Bond Investment on May 30. At the end of the week come the Unemployment Rate, flash Industrial Production, Retail Sales and Housing Starts.
AUD/USD saw its recent strong rebound meet tough resistance just above 0.6700 the figure, coming under downside pressure afterwards. On May 28 comes the preliminary Retail Sales, while the Westpac Leading Index and the RBA’s Monthly CPI Indicator will be released on May 29. Preliminary Building Permits are due on May 30 seconded by Housing Credit on May 31.
Anticipating Economic Perspectives: Voices on the Horizon
- BoJ’s Ueda and Fed’s Williams speak on May 27.
- Fed’s Bowman, Mester, Kashkari, and Cook speak on May 28 along with SNB’s Jordan.
- Fed’s Williams speaks on May 29.
- Fed’s Bostic and Williams speak on May 30 along with SNB’s Jordan, BoE’s Bailey and RBA’s Hunter.
- Fed’s Bostic speaks on June 1.
Central Banks: Upcoming Meetings to Shape Monetary Policies
- The SARB is expected to keep its rate unchanged at 8.25% on May 30.
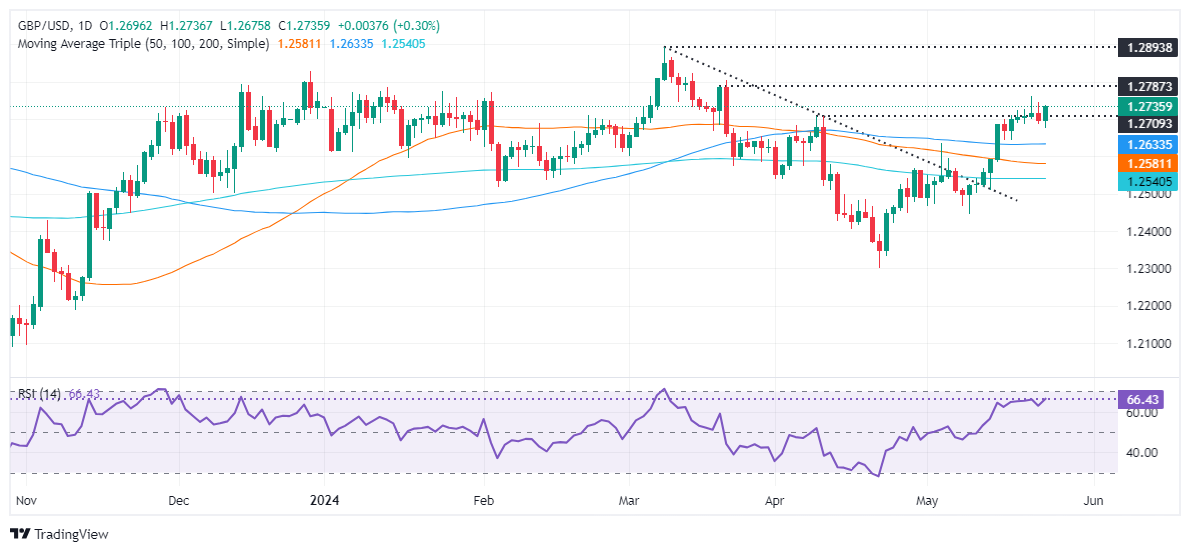
- GBP/USD jumps above 1.2700 on softer US data, yet the pair remains sideways.
- Key resistance emerges at 1.2761, 1.2800, and the YTD high near 1.2900.
- Support is seen at 1.2700, 1.2674, and the confluence of May 3 high and 100-DMA.
The British Pound erases some of its previous losses against the US Dollar and rises some 0.29%, as the GBP/USD aims above 1.2700 after bouncing off a daily low of 1.2674. Data from the United States (US) was cheered by market participants and weighed on the safe-haven peers, like the Greenback.
GBP/USD Price Analysis: Technical outlook
The GBP/USD remains in consolidation, within the 1.2670-1.2760 during the week, unable to decisively breach the range. Still, buyers remain in charge as depicted by the Relative Strength Index (RSI) standing in bullish territory, yet almost flat.
For a bullish continuation, the major should clear 1.2760, which will expose the 1.2800 figure. Further strength would pave the way to test a year-to-date (YTD) high of 1.2893, followed by 1.2900.
Conversely, if bears stepped in, they must clear 1.2700 and the May 23 low of 1.2674. In that event, the Bulls’ next line of defense would be the confluence of the 100-day moving average (DMA) and the May 3 high-turned support at 1.2634 before the GBP/USD tumbles to 1.2600.
GBP/USD Price Action – Daily Chart
British Pound PRICE Today
The table below shows the percentage change of British Pound (GBP) against listed major currencies today. British Pound was the strongest against the Japanese Yen.
| USD | EUR | GBP | JPY | CAD | AUD | NZD | CHF | |
|---|---|---|---|---|---|---|---|---|
| USD | -0.31% | -0.31% | 0.05% | -0.41% | -0.29% | -0.25% | 0.02% | |
| EUR | 0.31% | 0.00% | 0.32% | -0.13% | 0.01% | 0.06% | 0.32% | |
| GBP | 0.31% | -0.00% | 0.32% | -0.12% | 0.03% | 0.05% | 0.31% | |
| JPY | -0.05% | -0.32% | -0.32% | -0.43% | -0.32% | -0.28% | -0.03% | |
| CAD | 0.41% | 0.13% | 0.12% | 0.43% | 0.11% | 0.17% | 0.42% | |
| AUD | 0.29% | -0.01% | -0.03% | 0.32% | -0.11% | 0.03% | 0.30% | |
| NZD | 0.25% | -0.06% | -0.05% | 0.28% | -0.17% | -0.03% | 0.25% | |
| CHF | -0.02% | -0.32% | -0.31% | 0.03% | -0.42% | -0.30% | -0.25% |
The heat map shows percentage changes of major currencies against each other. The base currency is picked from the left column, while the quote currency is picked from the top row. For example, if you pick the British Pound from the left column and move along the horizontal line to the US Dollar, the percentage change displayed in the box will represent GBP (base)/USD (quote).
- EUR/GBP rebounds to 0.8530 as ECB Schnabel doubts over rate cuts in July.
- The Euro has strengthened due to strong preliminary Eurozone PMI data for May.
- Weak UK Retail Sales limit the upside in the Pound Sterling.
The EUR/GBP pair bounces back from the psychological support of 0.8500 and recovers to 0.8530 in Friday’s New York session. The cross finds buying interest as investors remain uncertain about the European Central Bank (ECB) extending the policy-tightening spell to subsequent monetary policy meetings.
The ECB is widely anticipated to start reducing interest rates from the June meeting. Therefore, investors focus on whether the ECB will follow the suit in the July meeting. In Friday’s European session, ECB Governing Council member Isabel Schnabel said that the adaptation of aggressive rate-cut cycle by the central bank could have significant consequences. She agreed that there is a noticeable decline in price pressures but some elements such as domestic and service inflation are still persistent.
Meanwhile, consistently growing Eurozone PMI numbers are also a major factory behind the Euro’s strength. Early HCOB PMI print showed that the Composite PMI data rose at the fasted pace in just over two years after two months of slower growth, suggesting that the economy is on track to post solid Gross Domestic Product (GDP) gain in the second quarter.
On the United Kingdom front, the Pound Sterling struggles to outperform the Euro as weak preliminary PMI for May and poor Retail Sales data for April have raised concerns over the economic outlook. The country’s Office for National Statistics (ONS) reported that monthly Retail Sales declined at a faster pace of 2.3%. Investors forecasted the economic data to have declined by 0.4% from the prior reading of 0.2%. Annual Retail Sales contracted by 2.7% after expanding at a pace of 0.4% in March.
This has boosted expectations for the BoE pivoting to interest-rate cuts in the June meeting. Earlier this week, traders pared bets leaned towards rate-cuts in the June meeting after the inflation data for April softened at a slower pace than what market participants had forecasted.
- NZD/USD trades in a range which could represent part of a Bull Flag continuation pattern.
- Conditional on a break above the range highs the pair could rally up to the targets for the Bull Flag.
- Alternatively a break lower is possible, bringing the uptrend into doubt.
NZD/USD has spent the last week or so forming a range bound consolidation (shaded rectangle on chart) which could represent the flag square of a Bull Flag continuation pattern.
The pair is probably in an uptrend on a short-term basis, favoring more upside in line with the saying “the trend is your friend”, however, a break above the rectangle’s highs at 0.6153 would give more confirmation of an extension higher.
NZD/USD 4-hour Chart
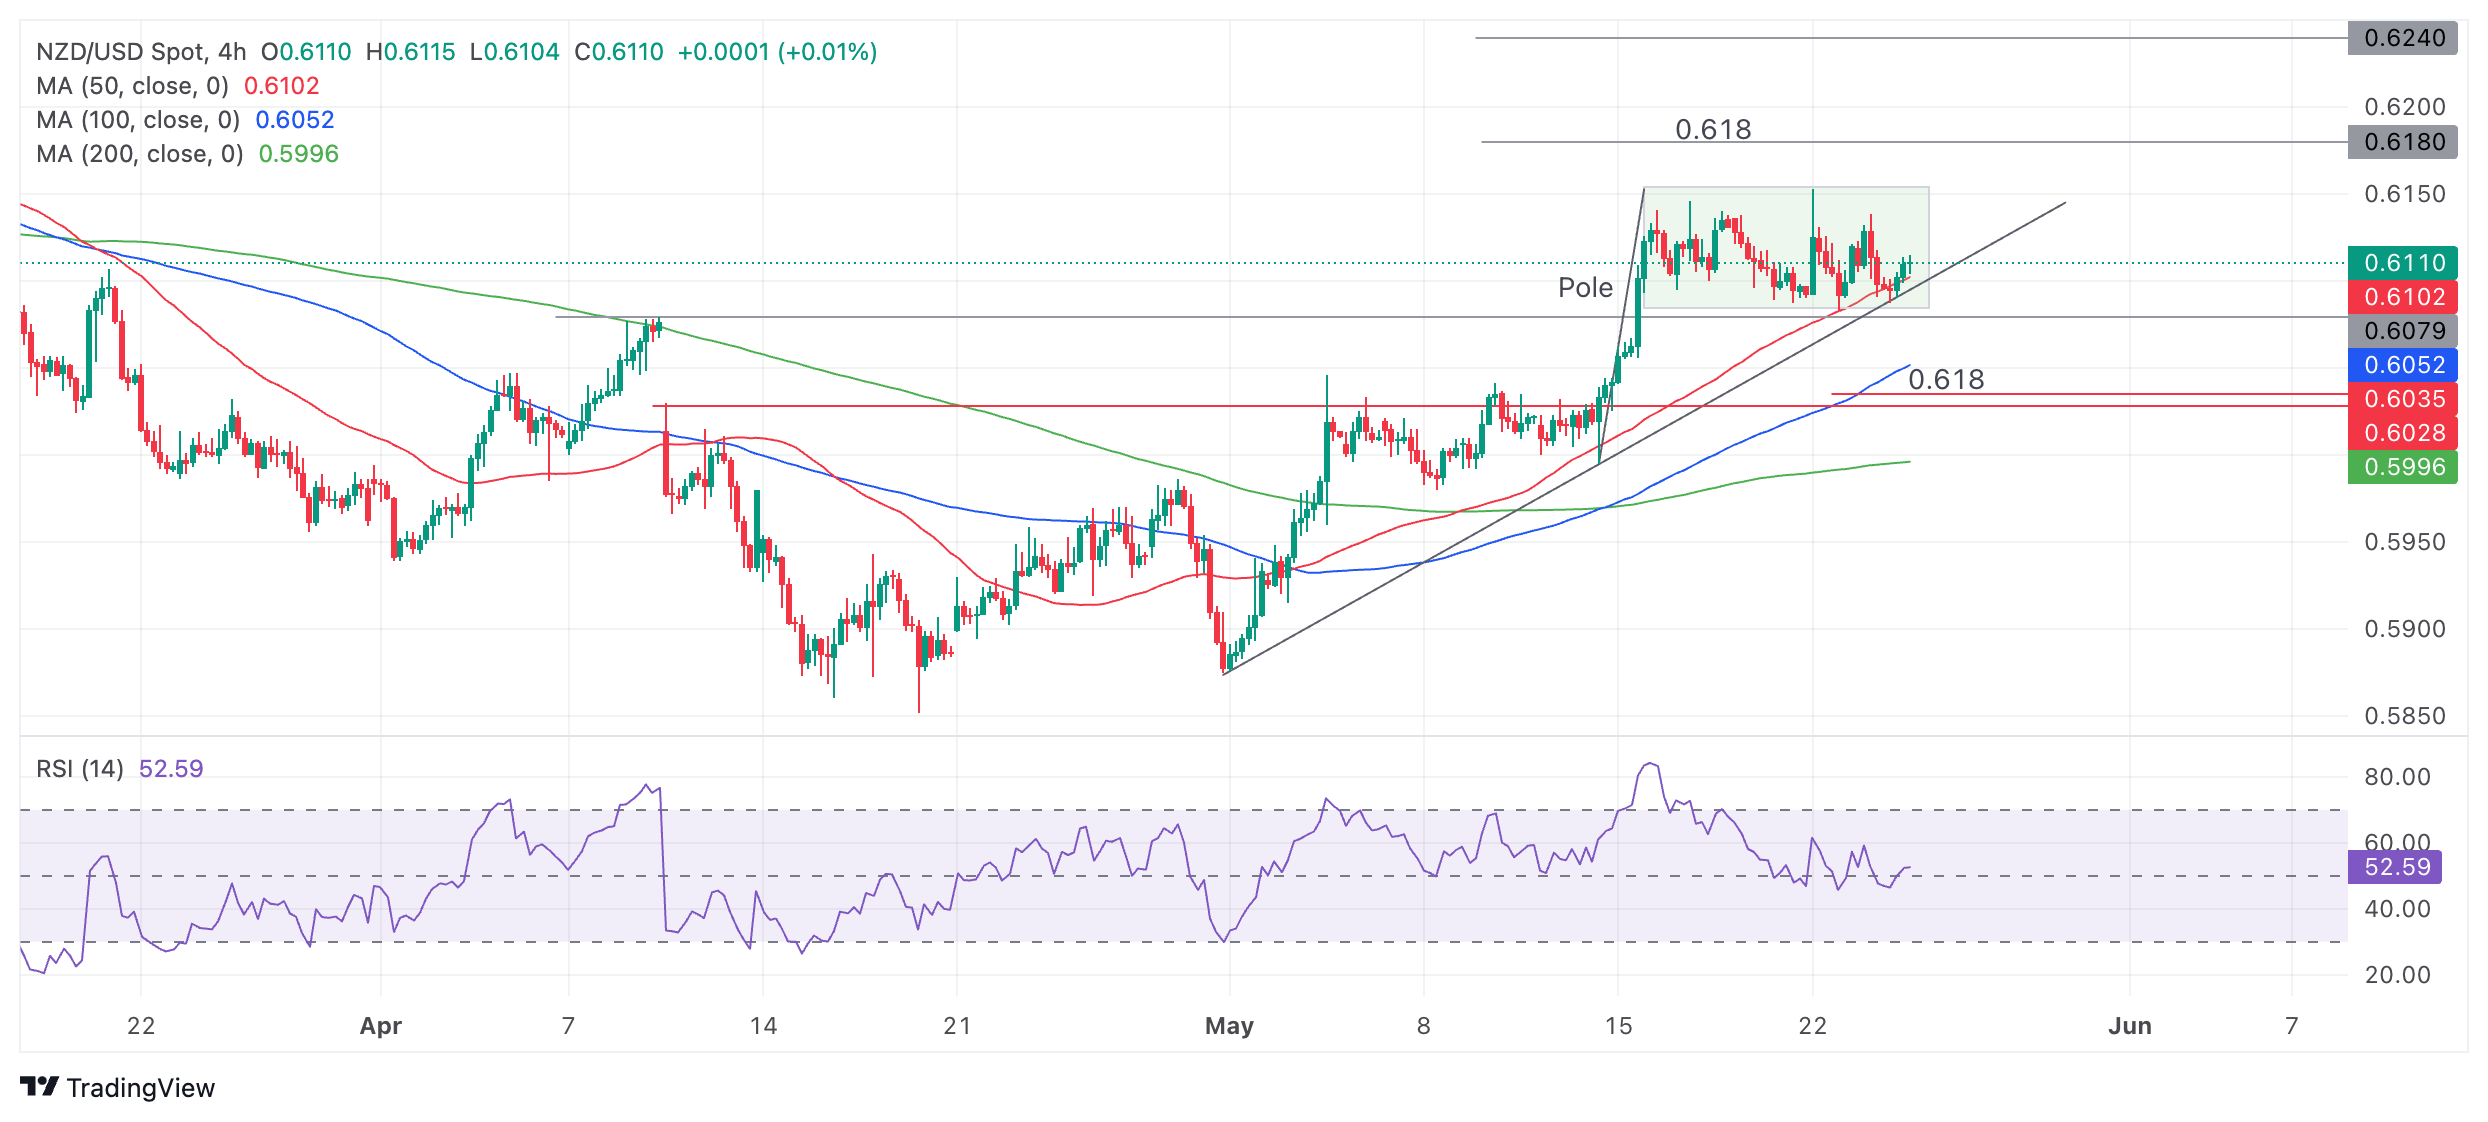
Such a breakout would probably see the price rally up to 0.6180, the first target for the Bull Flag pattern. This is calculated by taking the length of the “pole” and extrapolating it by a 0.618 Fibonacci ratio from the base of the rectangle higher. This is the conservative target for the pattern but a more bullish move could even reach the 0.6240 target at the 100% extension of the pole higher.
A breakdown is also possible, however, and a break on a closing basis below the rectangle’s base would negate the Bull Flag hypothesis and suggest a more bearish tone to the chart. Such a break would also pierce the trendline for the move up during May and likely see NZD/USD decline to a downside target at 0.6035, the 0.618 Fib. ratio of the height of the rectangle extrapolated lower.
- Silver has corrected back to key support near $30.00.
- It will probably steady and resume its uptrend in time.
- A decisive break below the $30.00 level would reverse the trend and usher in more bearishness.
Silver (XAG/USD) corrects back after peaking at the $32.51 high of May 19. It is close to a major support level at $30.00, the top of a four-year consolidation range.
Silver 4-hour Chart
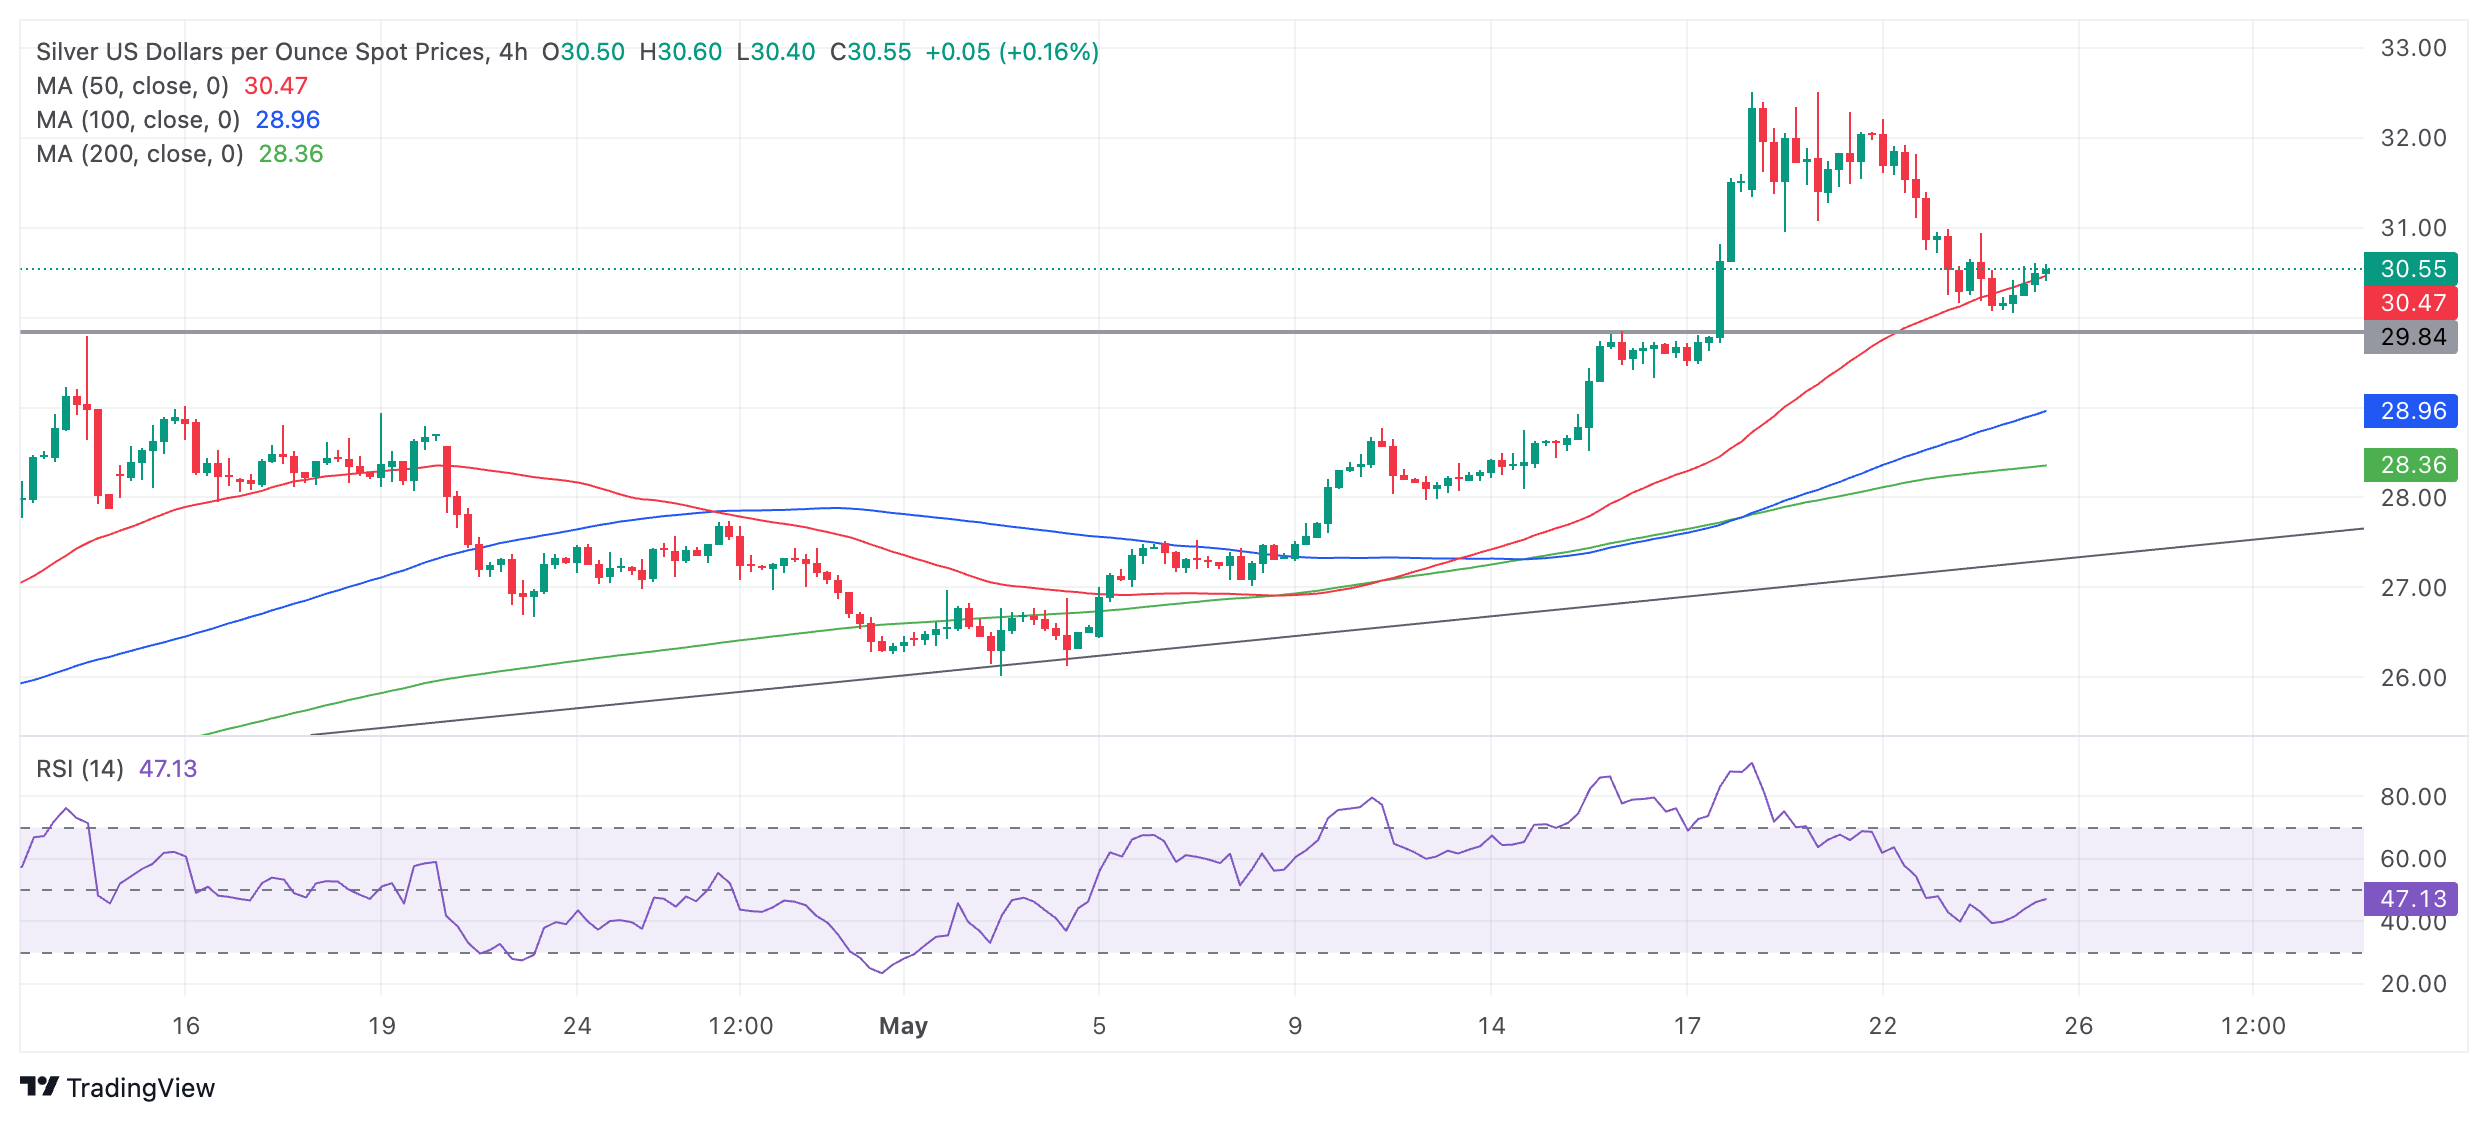
Despite the correction, the short-term trend is still probably bullish, which given the saying “the trend is your friend” favors long positions over shorts.
If Silver pulls back any lower it will probably find support at the $30.00 level of the former range highs. From there it is likely to rebound and resume its uptrend, probably climbing back up to retouch the $32.51 high, then possibly surpassing it. However, there are no signs yet from price action that this is happening.
It would require a decisive break below the $30.00 level to bring into doubt the dominant uptrend.
A decisive break would be one accompanied by a long red candlestick that closed near its lows or three red candlesticks in a row.
- USD/CAD didn’t move as expected despite the release of the Canadian Retail Sales and the US Durable Goods Orders data.
- The Canadian Retail Sales contracted by 0.2% in March on a month-on-month basis.
- US Durable Goods Orders surprisingly rose by 0.8% in April.
The USD/CAD pair remains unchanged above the crucial support of 1.3700 even though Canadian Retail Sales were weaker-than-expected in March and United States Durable Goods Orders for April beats estimates.
Canadian Retail Sales were down by 0.2% while investors forecasted them to have remained stagnant. In February, Retail Sales also contracted by 0.1%. Sales data excluding automobiles surprisingly declined by 0.6% as economists expected them to rise by 0.1%.
Retail Sales data indicate the current status of consumer spending, which accounts for a major part of economic growth. Significant decline in sales at retail stores indicates households are struggling to bear the consequences of higher interest rates by the Bank of Canada (BoE). This would strengthen the speculation that the BoC will start reducing interest rates from the June meeting.
Meanwhile, the market sentiment is upbeat though Federal Reserve (Fed) policymakers continue to maintain a hawkish guidance on interest rates. Considering positive overnight futures, the S&P 500 is expected to open on a positive note. The US Dollar Index (DXY), which tracks the Greenback’s value against six major currencies, falls to 104.77.
The United States (US) Census Bureau has reported that Durable Goods Orders surprisingly rose by 0.7% while investors expected them to decline by 0.8%. The Durable Goods Orders data is a leading indicator of core Consumer Price Index (CPI) and higher demand for durable goods suggest a stubborn inflation outlook.
- Durable Goods Orders in the US rose 0.7% in April.
- US Dollar Index stays in negative territory below 105.00.
Durable Goods Orders in the US increased $1.9 billion, or 0.7%, to $284.1 billion in April, the US Census Bureau reported on Friday. This reading followed the 0.8% growth recorded in March (revised from +2.6%) and came in better than the market expectation for a decrease of 0.8%.
"Excluding transportation, new orders increased 0.4%," the press release read. "Excluding defense, new orders were virtually unchanged. Transportation equipment, also up three consecutive months, led the increase, $1.1 billion, or 1.2%, to $96.2 billion."
Market reaction
These figures don't seem to be having a significant impact on the US Dollar's performance against its rivals. At the time of press, the USD Index was down 0.22% on the day at 104.80.
- AUD/USD has broken out of a rising channel and reached an initial target.
- There is a possibility the short-term trend is now bearish and the pair may go lower.
AUD/USD has broken out of the rising channel and fallen to a preliminary target for the breakout, based on the Fibonacci 0.618 ratio of the height of the channel extrapolated from the breakout point lower.
AUD/USD 4-hour Chart
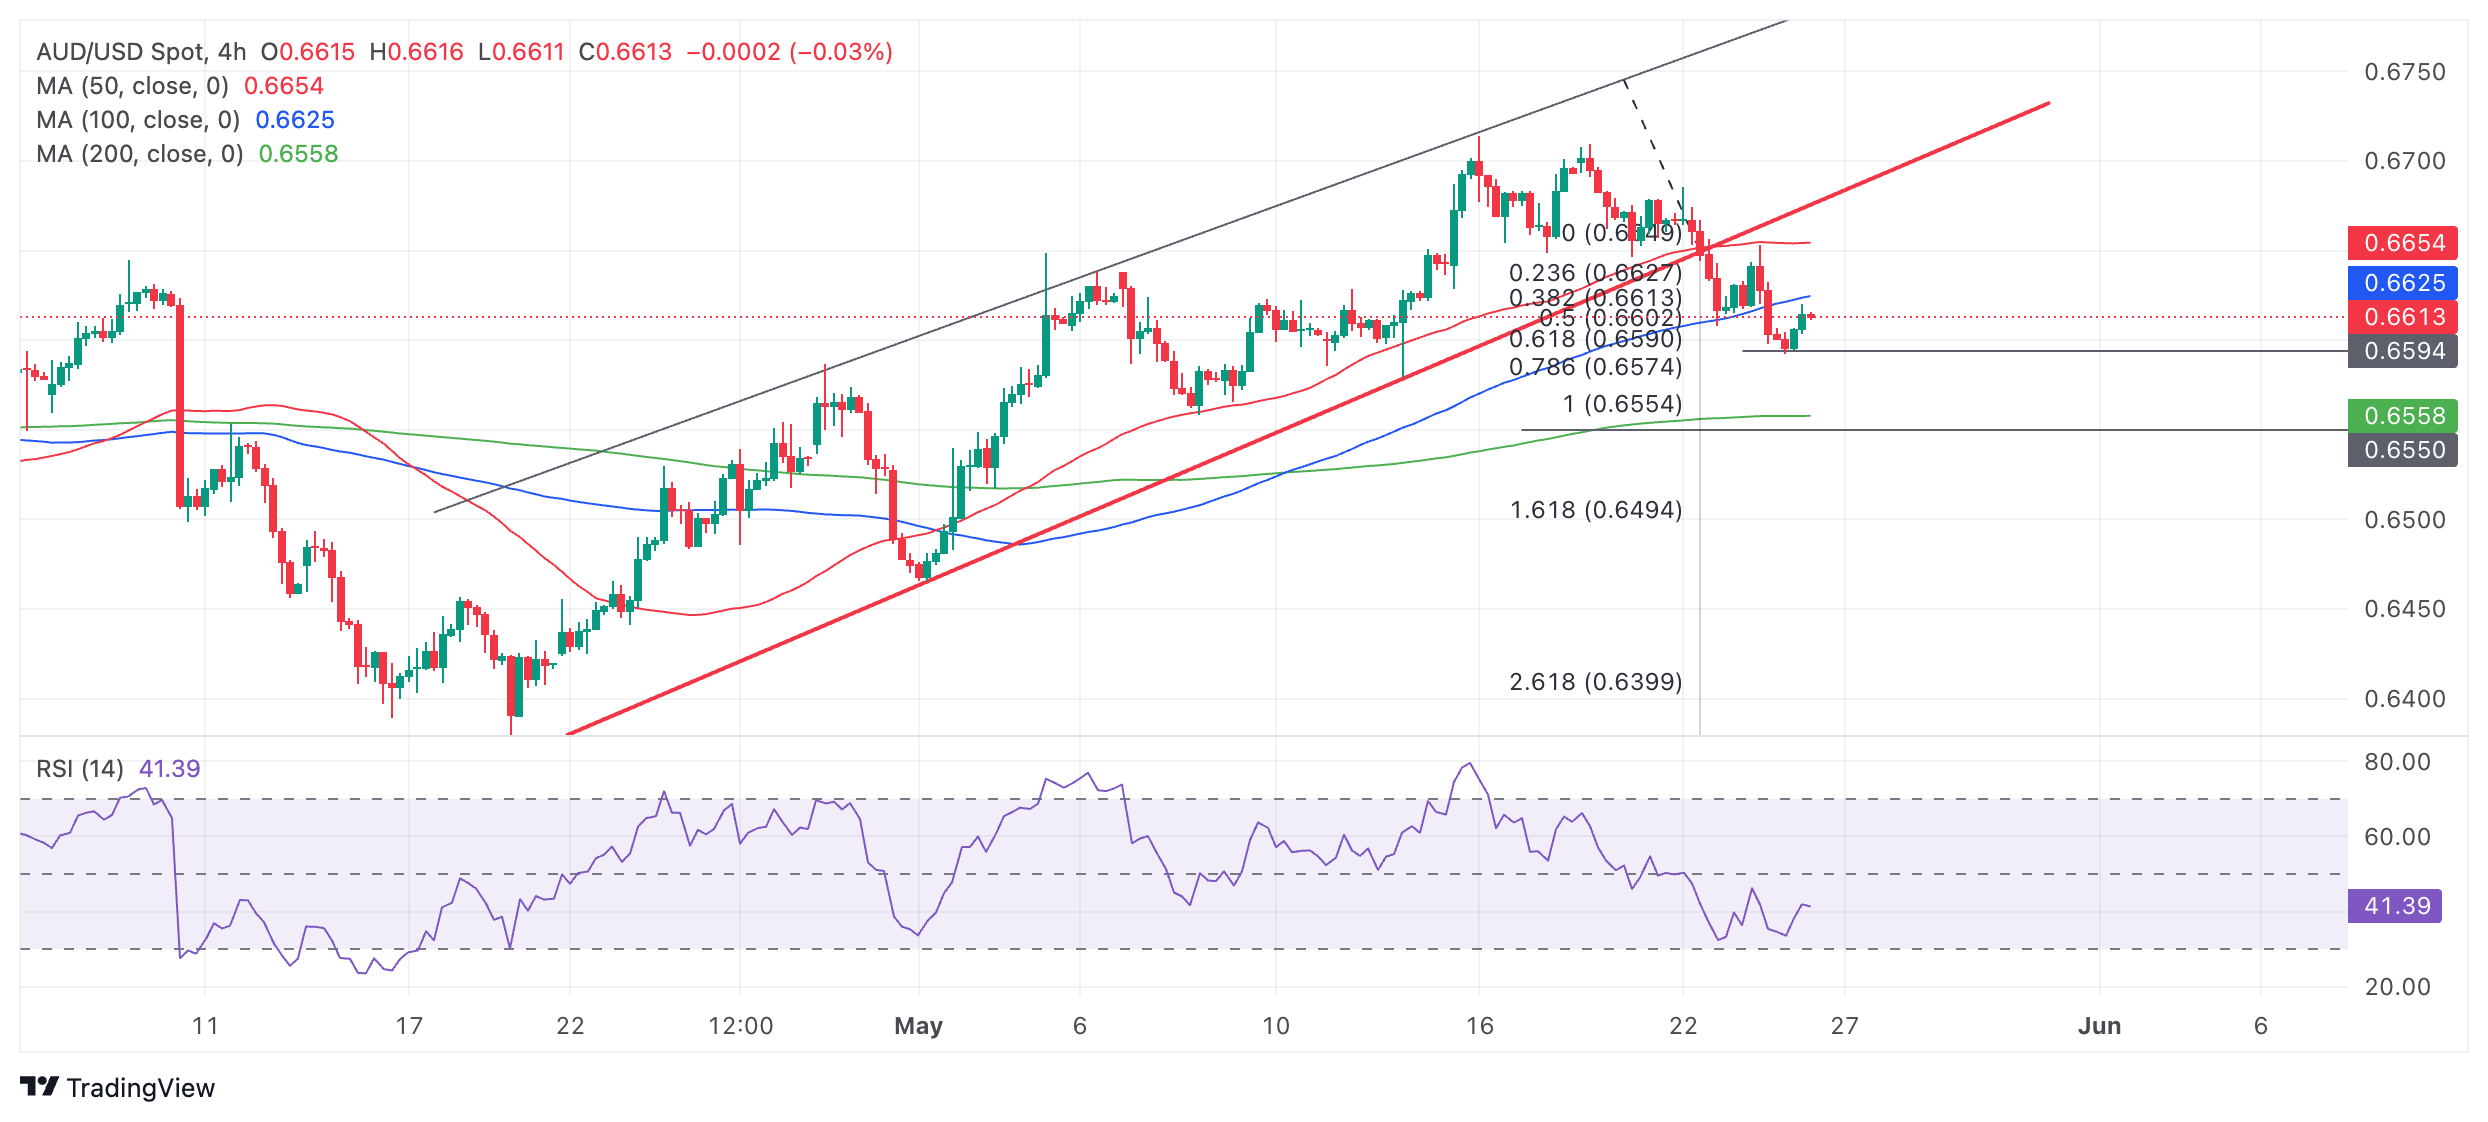
The breakdown from the channel brings the short-term uptrend into doubt. If price now breaks below the 0.6592 day’s low it would help confirm the bearish trend and probably result in a continuation to the next downside target in the 0.6550-8 zone, where the 200 Simple Moving Average (SMA) is situated.
A recovery above the 0.6653 May 23 high, however, would suggest the uptrend was still intact and AUD/USD is likely to go higher.
- The Mexican Peso weakens in most pairs on increased risk aversion.
- The Peso fell against the US Dollar after strong US economic data strengthened the buck on Thursday.
- USD/MXN could be in a new short-term uptrend after breaking above a trendline.
The Mexican Peso (MXN) declines in most pairs on Friday as widespread risk aversion, on the back of geopolitical concerns, disproportionately weigh on the Peso, a risk-on currency.
More specifically, MXN recently weakened against the US Dollar, threatening to reverse the Peso’s short-term trend, after a slew of positive economic data from the US further delayed the time the Federal Reserve (Fed) is expected to lower interest rates, supporting the Greenback.
USD/MXN is trading at 16.70 at the time of writing, EUR/MXN is trading at 18.11 and GBP/MXN at 21.25.
Mexican Peso falls on geopolitical risk and US data
The Mexican Peso loses ground on Friday as the news that China has started a second day of war games around Taiwan ratchets up geopolitical tensions. The news added to reports of a continued escalation in conflicts in Gaza and Ukraine.
US data released on Thursday showed a surprise rise in US preliminary Purchasing Manager Index (PMI) for May – especially in Services sector – and led to a substantial fall in the MXN against the USD.
The US data came after the release of hawkish Fed meeting Minutes from the April 30-May 1 meeting, in which policymakers repeated their mantra that more work needed to be done to bring down inflation and even discussed the possibility of hiking rates.
Bank of Mexico releases meeting Minutes
Mexican data released on Thursday mostly came out in line with estimates, but the Q1 Gross Domestic Product (GDP) showed a surprise upward revision to 0.3% on a quarter-on-quarter basis compared to the 0.2% previous estimate. This temporarily boosted the Mexican Peso in its pairs.
The release of the Bank of Mexico (Banxico) May meeting Minutes showed most policymakers continued to see upside risks to inflation despite data showing core inflation continuing to decline. Persistent inflation in the Services sector was seen as a key stumbling block to inflation falling to Banxico’s 3.0% target.
The Minutes showed the decision to keep interest rates at 11.00% was unanimous.
In its concluding statements, Banxico’s Governing Board said: “challenges and risks prevail, which requires monetary policy to continue being managed prudently.”
Adding, “With this decision, the monetary policy stance remains restrictive and will continue being conducive to the convergence of inflation to the 3% target in the forecast horizon.”
Technical Analysis: USD/MXN breaks above trendline and continues rising
USD/MXN – or the number of Pesos that can be bought with one US Dollar – rises after breaking above the trendline for the April-May decline. This could possible indicate the pair is now in a short-term uptrend, favoring long positions over shorts.
USD/MXN 4-hour Chart
A break above Thursday’s high at 16.76 would confirm a continuation of the young uptrend to a possible target at the previous range lows around 16.85.
Given the medium and long-term trends are bearish, however, there remains a high risk of the short-term trend reversing and the pair continuing lower.
A decisive break below the grey trendline for the up move at roughly 16.68 would bring the short-term uptrend into doubt and possibly signal the resumption of more downside.
Economic Indicator
Gross Domestic Product (QoQ)
The Gross Domestic Product released by INEGI is a measure of the total value of all goods and services produced by Mexico. The GDP is considered as a broad measure of economic activity and health. Generally speaking, a high reading is seen as positive (or bullish) for the Peso, while a negative trend is seen as negative (or bearish).
Read more.
- The US Dollar has thrived this week, flirting with a five-day winning streak.
- Markets favored the US Dollar after jaw-breaking US PMI numbers.
- The US Dollar Index trades above 105.00 and could set sail to the 105.50 area.
The US Dollar (USD) trades broadly stable on Friday and looks set to end the week in the green as the US Dollar Index (DXY) fights to log in a five-day winning streak. The USD seems to have fallen back into the graces of the markets as the rate differential is supporting a stronger Greenback against many of its peers. Both the Federal Reserve Minutes and Fed members throughout the week have been vocal on their concerns about inflation and that the initial rate cut will be happening only when all conditions are met.
The broad US Dollar strength was supported on Thursday by stronger-than-expected Purchasing Managers Indexes (PMIs) for May. The data suggested that US business activity expanded at the fastest pace in just over two years, led by an upturn in the services sector.
On the economic data front, there are two main components that could snap the four-day winning streak for the DXY. First up, the preliminary Durable Goods Orders data for April. Secondly, the University of Michigan Consumer Sentiment and Inflation expectation release for May will deliver the last data point for this week.
Daily digest market movers: Durable Goods already priced in
- Durable Goods Orders for April will be released at 12:30 GMT:
- Orders are set to decline by 0.8% after increasing 2.6% in March.
- Orders without cars and transportation should increase by a marginal 0.1%, down from the 0.2% advance seen a month earlier.
- With a softer print already in the consensus backed in, any uptick above the consensus could see some more US Dollar strength.
- Around 13:35 GMT, Federal Reserve Governor Christopher Waller will deliver a keynote address at the Reykjavik Economic Conference in Iceland.
- To round off this Friday, at 14:00 GMT, the University of Michigan will release its recent findings for May:
- Consumer Sentiment is expected to come in at 67.5, broadly unchanged from its preliminary reading of 67.4.
- The 5-year inflation expectations index is also expected to remain unchanged from the mid-month estimate of 3.1%.
- Equities are in the red this Friday from the Asia-Pacific session to Europe. US futures are flat for the day and looking for direction.
- The CME Fedwatch Tool is pricing 98.7% for no change in the policy rate for June. September futures are seeing more action where it is a neck-a-neck race with 53.2% chances for a cut against 46.2% for unchanged. A marginal 0.6% price in a rate hike.
- The benchmark 10-year US Treasury Note trades around 4.47%, near the high for this week.
US Dollar Index Technical Analysis: Do not think it will be that easy!
The US Dollar Index (DXY) is surging again, nearly erasing all the losses from last week on the back of the disinflationary report. Still, the US Dollar Index is not out of the woods yet. It is still a long way to go to head to 106.00, and several economic data points are starting to retreat from their peak performances.
Traders will need to ask themselves when the US is no longer exceptional in its economic performance against other countries. Is the Greenback then really earning to be back at 106.00 or higher, with the rate differential against its peer as a single main driver? Food for thought for traders over the weekend.
On the upside, the DXY Index has broken two technical elements which were keeping price action in check. The first level was the 55-day Simple Moving Average (SMA) at 104.83 and the second was the red descending trend line crossed at 104.79 on Wednesday. From now further up, the following levels to consider are 105.12 and 105.52.
On the downside, the 100-day SMA around 104.28 is the last man supporting the decline. Once that level snaps, an air pocket is placed between 104.11 and 103.00. Should the US Dollar decline persist, the low of March at 102.35 and the low from December at 100.62 are levels to consider.
US Dollar FAQs
The US Dollar (USD) is the official currency of the United States of America, and the ‘de facto’ currency of a significant number of other countries where it is found in circulation alongside local notes. It is the most heavily traded currency in the world, accounting for over 88% of all global foreign exchange turnover, or an average of $6.6 trillion in transactions per day, according to data from 2022. Following the second world war, the USD took over from the British Pound as the world’s reserve currency. For most of its history, the US Dollar was backed by Gold, until the Bretton Woods Agreement in 1971 when the Gold Standard went away.
The most important single factor impacting on the value of the US Dollar is monetary policy, which is shaped by the Federal Reserve (Fed). The Fed has two mandates: to achieve price stability (control inflation) and foster full employment. Its primary tool to achieve these two goals is by adjusting interest rates. When prices are rising too quickly and inflation is above the Fed’s 2% target, the Fed will raise rates, which helps the USD value. When inflation falls below 2% or the Unemployment Rate is too high, the Fed may lower interest rates, which weighs on the Greenback.
In extreme situations, the Federal Reserve can also print more Dollars and enact quantitative easing (QE). QE is the process by which the Fed substantially increases the flow of credit in a stuck financial system. It is a non-standard policy measure used when credit has dried up because banks will not lend to each other (out of the fear of counterparty default). It is a last resort when simply lowering interest rates is unlikely to achieve the necessary result. It was the Fed’s weapon of choice to combat the credit crunch that occurred during the Great Financial Crisis in 2008. It involves the Fed printing more Dollars and using them to buy US government bonds predominantly from financial institutions. QE usually leads to a weaker US Dollar.
Quantitative tightening (QT) is the reverse process whereby the Federal Reserve stops buying bonds from financial institutions and does not reinvest the principal from the bonds it holds maturing in new purchases. It is usually positive for the US Dollar.
- GBP/JPY advances to 199.50 as soft Japan’s CPI report raised doubts over BoJ extending the rate-tightening cycle.
- Japan’s inflation declines due to weak private spending.
- UK’s weak Retail Sales suggest that inflation will soften further.
The GBP/JPY pair moves higher to 199.50 in Friday’s European session. The cross rebounds after a short-lived corrective move to near 199.00 as Japan’s inflation declined again on April, deepening fears that the Bank of Japan (BoJ) will take more time in raising interest rates further.
Japan’s Consumer Price Index (CPI) report showed that annual National CPI excluding fresh food declined to 2.2% as expected from the prior reading of 2.6%. The core core index, which is BoJ’s preferred inflation gauge that strips off volatile fresh food and energy items decelerated to 2.4% from the prior reading of 2.9%. The CPI report also showed that weak private consumption led to softening of inflationary pressures.
Though inflation remains above BoJ’s desired target of 2%, investors are uncertain about steadiness in price pressures, which could limit the scope of BoJ’s rate-tightening plans.
Meanwhile, the Pound Sterling remains firm despite weak United Kingdom Retail Sales data for April. The UK Office for National Statistics (ONS) reported that monthly Retal Sales declined at a faster pace of 2.3%. Investors forecasted the economic data to have declined by 0.4% from the prior reading of 0.2%, revised to negative from a stagnant performance. Annual Retail Sales contracted by 2.7% after expanding at a pace of 0.4% in March, downwardly revised from 0.8%. Economists expected a decline of 0.2%. The Retail Sales report showed that sales at retail stores contracted due to the rainy season.
Weak UK Retail Sales data indicate that households are struggling to bear the consequences of higher interest rates by the Bank of England (BoE). This would force the BoE to start reducing interest rates earlier than what was previously anticipated.
- Oil sinks further and falls to three-month lows near $76.00.
- Despite geopolitical headlines, oil has kept sinking this week.
- The US Dollar Index trades back above 105.00 after surprisingly positive PMI numbers.
Oil prices extend their decline on Friday and fall to a three-month low to levels not seen since February 26 near $76.00, erasing the previous week's gains and losing more than 4% this week. There were plenty of headlines for Crude prices to jump up on, such as Russia planning to move its borders in the Baltic Sea and fresh missile attacks from Russia into Ukraine, which could affect the supply of crude in the markets. Unfortunately, those headlines were no match for the US Federal Reserve (Fed), which is currently killing off any hopes or prospects of early interest rate cuts, that in turn would boost demand for Crude Oil.
Meanwhile, the US Dollar Index (DXY), which tracks the performance of the US Dollar against a basket of six major currencies, has jumped back above 105.00 after the US preliminary Purchasing Managers Index (PMI) numbers for May revealed that all sectors keep expanding, with Services leading the charge. In the PMI report, the prices component showed an uptick as well, which could filter through into an already hot Consumer Price Index (CPI) release again, and would see the DXY benefit from inflow into the Greenback again.
At the time of writing, Crude Oil (WTI) trades at $76.20 and Brent Crude at $80.55.
Oil news and market movers: OPEC June meeting not in person
- OPEC+ (OPEC members plus other oil-producing countries) has just confirmed to Bloomberg that it will not hold its June 2 meeting in Vienna. Countries will participate in a video conference, which could point to no big decisions or changes to be announced, making it a non-event already in advance.
- In addition to discussing rolling over current production cuts, the production capacity per member will be reviewed ahead of the individual targets for 2025.
- Mexico produced nearly 6.4% less Oil in April than a year before, according to Bloomberg News. The decline means nearly 1.56 million barrels per day less.
- Markets have completely discarded the possibility that the Fed will not cut interest rates before the summer, and chances for a cut thereafter are even diminishing. This kills off the assumption that a boost given by rate cuts to the US economy will not take place, and translates into more sluggish Oil demand for the rest of the year.
Oil Technical Analysis: Stand still despite all moving parts
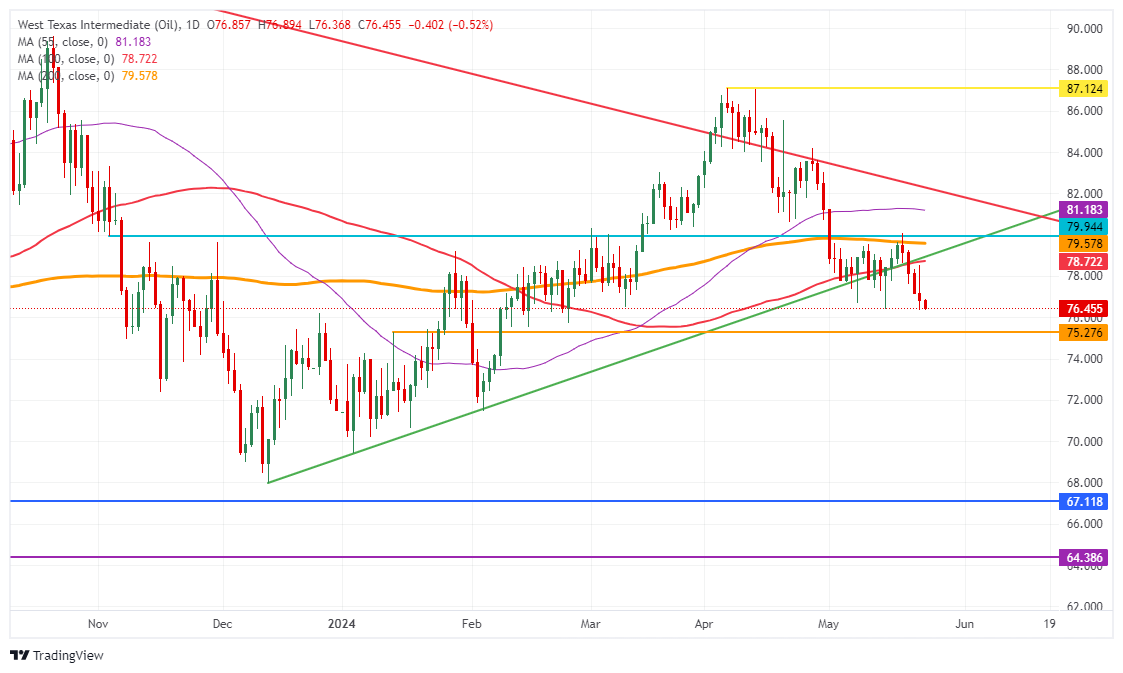
Oil prices are flirting with a three-month low to levels not seen since the end of February. The pivotal line in the sand is $75.27, where Oil prices are currently trading. With the outlook for more sluggish demand in the US and possibly in the rest of the world, the risk could be that more discounts need to be priced in, in order to keep demand balanced. Although a full unwind back to $68 does not look to be in the cards for now, a snoozing OPEC decision, which is not taking up more actions to underpin Oil prices, might see a $72.00 or $70.00 price tested over the summer.
On the upside, a trifecta of Simple Moving Averages (SMA) is forming, with two of them falling in line with pivotal levels to have in mind. First up is the 100-day SMA at $78.72, which falls in line with the ascending green trend line as the first hurdle. Next, just ahead of $80.00 is the 200-day SMA at $79.57, near the pivotal blue line at $79.94. The last one is the 55-day SMA at $81.18, the target level once $80.00 got firmly broken.
On the downside, the pivotal level at $75.27 is the last solid line that could support the decline. If this level is unable to hold, investors could expect an accelerated sell-off towards $72.00 and $70.00, erasing all gains for 2024. Further down, Oil price could test $68, the December 13 low.
US WTI Crude Oil: Daily Chart
WTI Oil FAQs
WTI Oil is a type of Crude Oil sold on international markets. The WTI stands for West Texas Intermediate, one of three major types including Brent and Dubai Crude. WTI is also referred to as “light” and “sweet” because of its relatively low gravity and sulfur content respectively. It is considered a high quality Oil that is easily refined. It is sourced in the United States and distributed via the Cushing hub, which is considered “The Pipeline Crossroads of the World”. It is a benchmark for the Oil market and WTI price is frequently quoted in the media.
Like all assets, supply and demand are the key drivers of WTI Oil price. As such, global growth can be a driver of increased demand and vice versa for weak global growth. Political instability, wars, and sanctions can disrupt supply and impact prices. The decisions of OPEC, a group of major Oil-producing countries, is another key driver of price. The value of the US Dollar influences the price of WTI Crude Oil, since Oil is predominantly traded in US Dollars, thus a weaker US Dollar can make Oil more affordable and vice versa.
The weekly Oil inventory reports published by the American Petroleum Institute (API) and the Energy Information Agency (EIA) impact the price of WTI Oil. Changes in inventories reflect fluctuating supply and demand. If the data shows a drop in inventories it can indicate increased demand, pushing up Oil price. Higher inventories can reflect increased supply, pushing down prices. API’s report is published every Tuesday and EIA’s the day after. Their results are usually similar, falling within 1% of each other 75% of the time. The EIA data is considered more reliable, since it is a government agency.
OPEC (Organization of the Petroleum Exporting Countries) is a group of 13 Oil-producing nations who collectively decide production quotas for member countries at twice-yearly meetings. Their decisions often impact WTI Oil prices. When OPEC decides to lower quotas, it can tighten supply, pushing up Oil prices. When OPEC increases production, it has the opposite effect. OPEC+ refers to an expanded group that includes ten extra non-OPEC members, the most notable of which is Russia.
- EUR/USD finds cushion near 1.0800 amid improvement in the Eurozone’s economic outlook.
- The ECB is set to start reducing interest rates from the June meeting.
- The US Dollar drops even though traders pare back Fed rate-cut bets.
EUR/USD seems well-supported near the round-level support of 1.0800 in Friday’s European session. The strength in the major currency pair is majorly driven by strong Eurozone preliminary Purchasing Managers Index (PMI) data for May. The strong Composite PMI has improved the Eurozone’s economic outlook, but the likelihood of the European Central Bank (ECB) lowering interest rates in the short term remains firm.
S&P Global reported on Thursday that the Composite PMI jumped to 52.3, beating the consensus of 52.0 and the former release of 51.7. The PMI data rose for the third consecutive month even though the ECB is maintaining a restrictive policy framework.
Dr. Cyrus de la Rubia, Chief Economist at Hamburg Commercial Bank (HCOB) – which also publishes the PMI data in collaboration with S&P Global – said: “This time, there is also some good news for the ECB as the rates of inflation for input and output prices in the services sector have softened compared to the month before. This will be supportive of the apparent stance of the ECB to cut rates at the meeting on June 6. However, the better inflation outlook will most probably not be enough for the central bank to announce that further rate cuts will follow suit.”
Daily digest market movers: EUR/USD rebounds as US Dollar recovery stalls
- EUR/USD holds the crucial support of 1.0800 as the US Dollar declines despite upbeat data from the United States and deepening uncertainty about when the Federal Reserve (Fed) will start reducing interest rates. The early PMI print by S&P Global for May showed that the Composite PMI also beat expectations in the US, exceeding the prior reading due to robust growth in both manufacturing and service activities.
- The US preliminary PMI numbers suggested that business activity rose at the fastest pace in just over two years after two months of slower growth, indicating that the economy is on track to post solid Gross Domestic Product (GDP) gain in the second quarter. Strong US PMI data has weakened market speculation that the Fed will start reducing interest rates from the September meeting.
- The CME FedWatch tool shows that the probability for rate cuts from their current levels in September has been reduced to 53% from 64% recorded a week ago. Meanwhile, hawkish guidance on interest rates by Fed policymakers has also weighed on rate-cut bets for September.
- On Thursday, Atlanta Fed Bank President Raphael Bostic said the central bank may need to wait for the rate-cut consideration amid upside risks to inflation despite a slowdown in price pressures in April’s Consumer Price Index (CPI) report, Reuters reported. In a virtual class session with Stanford University business school students, Bostic said prices of a few goods are increasing at a faster pace than what is required to bring inflation down to the 2% target. Bostic added that a strong job market gives him comfort in maintaining a restrictive stance on interest rates.
- In Friday’s session, investors will focus on the US Durable Goods Orders data for April, which will be published at 12:30 GMT. Fresh orders for Durable Goods are estimated to have declined by 0.8% after expanding 2.6% in March.
Technical Analysis: EUR/USD holds 1.0800
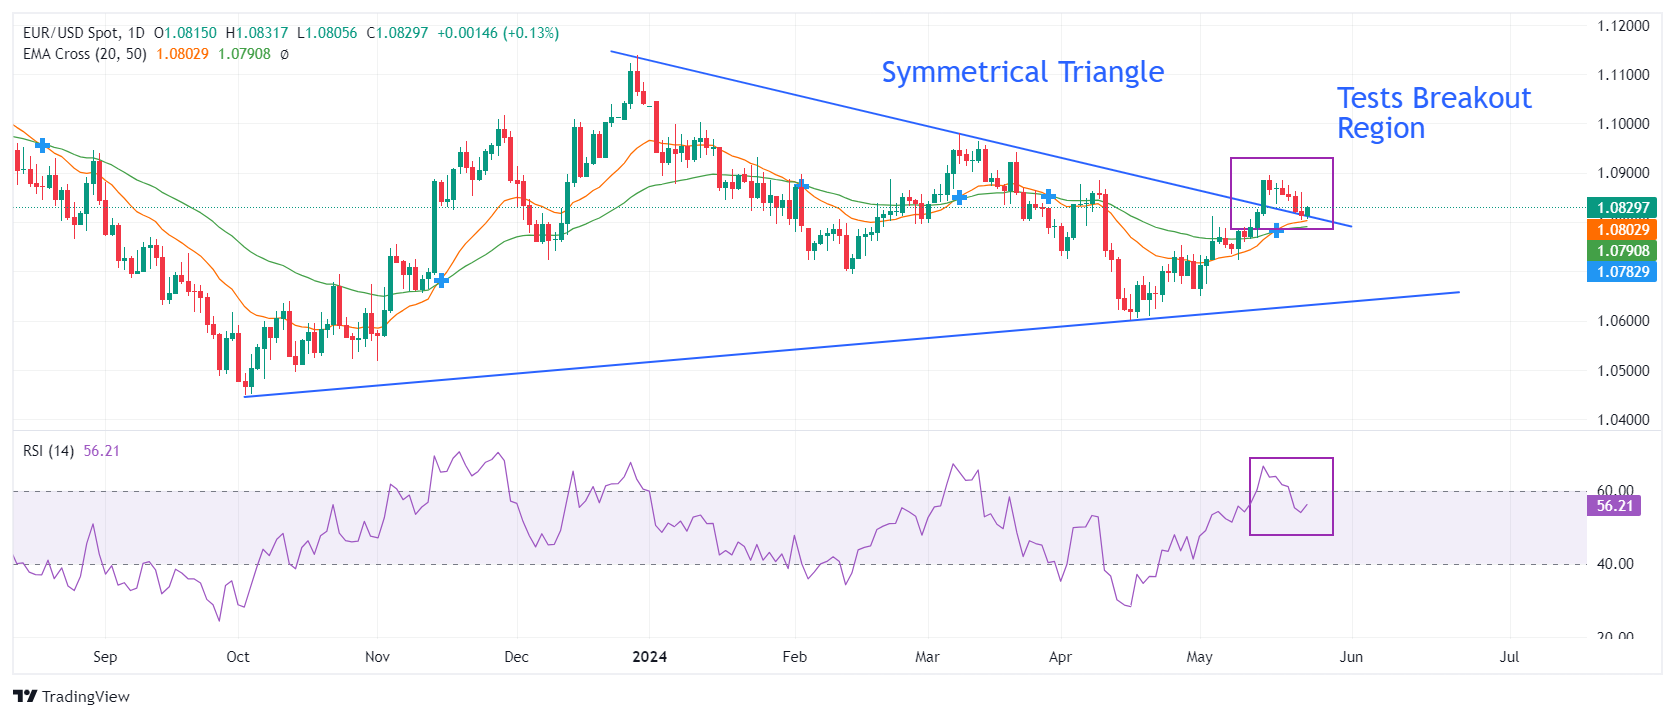
EUR/USD finds buying interest near the breakout region of the Symmetrical Triangle formed on the daily time frame around 1.0800. The near-term outlook of the shared currency pair remains firm as the 20-day and 50-day Exponential Moving Averages (EMAs) have delivered a bullish crossover around 1.0780.
The 14-period Relative Strength Index (RSI) has slipped into the 40.00-60.00, suggesting that the momentum, which was leaned toward the upside has faded for now.
The major currency pair is expected to recapture a two-month high around 1.0900. A decisive break above this level would drive the asset towards March 21 high around 1.0950 and the psychological resistance of 1.1000. However, a downside move below the 200-day EMA at 1.0800 could push it further down.
Euro FAQs
The Euro is the currency for the 20 European Union countries that belong to the Eurozone. It is the second most heavily traded currency in the world behind the US Dollar. In 2022, it accounted for 31% of all foreign exchange transactions, with an average daily turnover of over $2.2 trillion a day. EUR/USD is the most heavily traded currency pair in the world, accounting for an estimated 30% off all transactions, followed by EUR/JPY (4%), EUR/GBP (3%) and EUR/AUD (2%).
The European Central Bank (ECB) in Frankfurt, Germany, is the reserve bank for the Eurozone. The ECB sets interest rates and manages monetary policy. The ECB’s primary mandate is to maintain price stability, which means either controlling inflation or stimulating growth. Its primary tool is the raising or lowering of interest rates. Relatively high interest rates – or the expectation of higher rates – will usually benefit the Euro and vice versa. The ECB Governing Council makes monetary policy decisions at meetings held eight times a year. Decisions are made by heads of the Eurozone national banks and six permanent members, including the President of the ECB, Christine Lagarde.
Eurozone inflation data, measured by the Harmonized Index of Consumer Prices (HICP), is an important econometric for the Euro. If inflation rises more than expected, especially if above the ECB’s 2% target, it obliges the ECB to raise interest rates to bring it back under control. Relatively high interest rates compared to its counterparts will usually benefit the Euro, as it makes the region more attractive as a place for global investors to park their money.
Data releases gauge the health of the economy and can impact on the Euro. Indicators such as GDP, Manufacturing and Services PMIs, employment, and consumer sentiment surveys can all influence the direction of the single currency. A strong economy is good for the Euro. Not only does it attract more foreign investment but it may encourage the ECB to put up interest rates, which will directly strengthen the Euro. Otherwise, if economic data is weak, the Euro is likely to fall. Economic data for the four largest economies in the euro area (Germany, France, Italy and Spain) are especially significant, as they account for 75% of the Eurozone’s economy.
Another significant data release for the Euro is the Trade Balance. This indicator measures the difference between what a country earns from its exports and what it spends on imports over a given period. If a country produces highly sought after exports then its currency will gain in value purely from the extra demand created from foreign buyers seeking to purchase these goods. Therefore, a positive net Trade Balance strengthens a currency and vice versa for a negative balance.
Reuters reported comments delivered by European Central Bank (ECB) policymaker Isabel Schnabel during an interview conducted on May 16.
Key quotes
A June rate cut is likely.
The decision won't be made until the day the Governing Council meets.
If data gives us confidence that price target can be met sustainably, a June rate cut will be likely.
Some elements of inflation are proving persistent, services in particular.
Would caution against moving too quickly on rate cuts.
Market reaction
EUR/USD is holding the rebound near 1.0830, despite the dovish comments. The pair is up 0.17% on the day.
Silver prices (XAG/USD) rose on Friday, according to FXStreet data. Silver trades at $30.58 per troy ounce, up 1.50% from the $30.13 it cost on Thursday.
Silver prices have increased by 20.06% since the beginning of the year.
| Unit measure | Today Price |
|---|---|
| Silver price per troy ounce | $30.58 |
| Silver price per gram | $0.98 |
The Gold/Silver ratio, which shows the number of troy ounces of Silver needed to equal the value of one troy ounce of Gold, stood at 76.59 on Friday, down from 77.30 on Thursday.
Investors might use this ratio to determine the relative valuation of Gold and Silver. Some may consider a high ratio as an indicator that Silver is undervalued – or Gold is overvalued – and might buy Silver or sell Gold accordingly. Conversely, a low ratio might suggest that Gold is undervalued relative to Silver.
(An automation tool was used in creating this post.)
Silver FAQs
Silver is a precious metal highly traded among investors. It has been historically used as a store of value and a medium of exchange. Although less popular than Gold, traders may turn to Silver to diversify their investment portfolio, for its intrinsic value or as a potential hedge during high-inflation periods. Investors can buy physical Silver, in coins or in bars, or trade it through vehicles such as Exchange Traded Funds, which track its price on international markets.
Silver prices can move due to a wide range of factors. Geopolitical instability or fears of a deep recession can make Silver price escalate due to its safe-haven status, although to a lesser extent than Gold's. As a yieldless asset, Silver tends to rise with lower interest rates. Its moves also depend on how the US Dollar (USD) behaves as the asset is priced in dollars (XAG/USD). A strong Dollar tends to keep the price of Silver at bay, whereas a weaker Dollar is likely to propel prices up. Other factors such as investment demand, mining supply – Silver is much more abundant than Gold – and recycling rates can also affect prices.
Silver is widely used in industry, particularly in sectors such as electronics or solar energy, as it has one of the highest electric conductivity of all metals – more than Copper and Gold. A surge in demand can increase prices, while a decline tends to lower them. Dynamics in the US, Chinese and Indian economies can also contribute to price swings: for the US and particularly China, their big industrial sectors use Silver in various processes; in India, consumers’ demand for the precious metal for jewellery also plays a key role in setting prices.
Silver prices tend to follow Gold's moves. When Gold prices rise, Silver typically follows suit, as their status as safe-haven assets is similar. The Gold/Silver ratio, which shows the number of ounces of Silver needed to equal the value of one ounce of Gold, may help to determine the relative valuation between both metals. Some investors may consider a high ratio as an indicator that Silver is undervalued, or Gold is overvalued. On the contrary, a low ratio might suggest that Gold is undervalued relative to Silver.
- USD/CHF gained ground as investors turned toward US Dollar after robust US PMI data.
- Fed’s Raphael Bostic stated that the inflation outlook might not improve as quickly as market expectations.
- Swiss Employment Level (QoQ) came in at 5.484 million in Q1 compared to the previous reading of 5.488 million.
USD/CHF retraces its recent losses that were registered in the previous session, trading around 0.9150 during the European hours on Friday. Traders shifted their focus to the US Dollar (USD) following higher-than-expected Purchasing Managers Index (PMI) data from the United States (US), which dampened risk appetite. The robust data further strengthened the hawkish sentiment surrounding the Federal Reserve (Fed), suggesting the maintenance of higher policy rates for an extended period.
The S&P Global US Composite PMI increased to 54.4 in May, up from 51.3 in April, reaching its highest level since April 2022 and surpassing market expectations of 51.1. The Service PMI surged to 54.8, indicating the most significant output growth in a year, while the Manufacturing PMI rose to 50.9.
Additionally, Federal Reserve Bank of Atlanta President Raphael Bostic stated on Thursday that the inflation outlook might not improve as quickly as market participants are hoping for. According to the CME FedWatch Tool, the probability of the Federal Reserve implementing a 25 basis-point rate cut in September has decreased to 46.6% from 49.4% a day earlier.
In Switzerland, the Employment Level (QoQ) released by the Swiss Statistics indicated that the total number of employed workers stood at 5.484 million in the first quarter, slightly below the previous reading of 5.488 million.
The yield on the 10-year Swiss government bond hovers around 0.76%, suggesting that the Swiss National Bank (SNB) is likely to maintain current interest rates. This could potentially strengthen the CHF and weaken the USD/CHF pair.
Investors have been closely watching for clues on when the Fed will begin cutting interest rates. Meanwhile, the Swiss National Bank unexpectedly lowered interest rates for the first time in nine years in March, reducing the key interest rate by 25 basis points to 1.50%. This move made it the first major central bank to ease its monetary policy.
Gold prices fell in India on Friday, according to data from India's Multi Commodity Exchange (MCX).
Gold price stood at 71,668 Indian Rupees (INR) per 10 grams, down INR 893 compared with the INR 72,561 it cost on Thursday.
As for futures contracts, Gold prices decreased to INR 71,531 per 10 gms from INR 71,577 per 10 gms.
Prices for Silver futures contracts decreased to INR 91,030 per kg from INR 900,437 per kg.
Global Market Movers: Comex Gold price retreats from record highs amid the Fed’s hawkish remarks
- The US Initial Jobless Claims fell by 8K to 215K for the week ending May 18. This figure came in lower than the expectation of 220K and the previous week's reading of 223K.
- The flash US S&P Global Manufacturing PMI rose to 50.9 in May from 50.0 in April. The Services PMI climbed to 54.8 in May from the previous reading of 51.3. Both figures came in better than the estimation.
- The US S&P Global Composite PMI jumped to 54.4 in May from 51.3 in April, beating the market expectation of 51.1, the highest level since April 2022.
- Atlanta Fed President Raphael Bostic said that he still sees upward inflation pressure, adding the Fed may need to be more patient to avoid heating the economy.
- China’s private sector imported 543 tonnes of gold in Q1 2024, and the People’s Bank of China (PBoC) added another 189 tonnes to its reserves during the same period, according to the latest analysis by Gainesville Coins’ Jan Nieuwenhuijs.
- Gold imports to India, the world's second-largest gold consumer, might decline by about a fifth in 2024 as high prices encourage retail customers to exchange old jewelry for new products, per Reuters.
(An automation tool was used in creating this post.)
Gold FAQs
Gold has played a key role in human’s history as it has been widely used as a store of value and medium of exchange. Currently, apart from its shine and usage for jewelry, the precious metal is widely seen as a safe-haven asset, meaning that it is considered a good investment during turbulent times. Gold is also widely seen as a hedge against inflation and against depreciating currencies as it doesn’t rely on any specific issuer or government.
Central banks are the biggest Gold holders. In their aim to support their currencies in turbulent times, central banks tend to diversify their reserves and buy Gold to improve the perceived strength of the economy and the currency. High Gold reserves can be a source of trust for a country’s solvency. Central banks added 1,136 tonnes of Gold worth around $70 billion to their reserves in 2022, according to data from the World Gold Council. This is the highest yearly purchase since records began. Central banks from emerging economies such as China, India and Turkey are quickly increasing their Gold reserves.
Gold has an inverse correlation with the US Dollar and US Treasuries, which are both major reserve and safe-haven assets. When the Dollar depreciates, Gold tends to rise, enabling investors and central banks to diversify their assets in turbulent times. Gold is also inversely correlated with risk assets. A rally in the stock market tends to weaken Gold price, while sell-offs in riskier markets tend to favor the precious metal.
The price can move due to a wide range of factors. Geopolitical instability or fears of a deep recession can quickly make Gold price escalate due to its safe-haven status. As a yield-less asset, Gold tends to rise with lower interest rates, while higher cost of money usually weighs down on the yellow metal. Still, most moves depend on how the US Dollar (USD) behaves as the asset is priced in dollars (XAU/USD). A strong Dollar tends to keep the price of Gold controlled, whereas a weaker Dollar is likely to push Gold prices up.
- USD/CAD halts its winning streak ahead of Canadian Retail Sales and US Consumer Sentiment due on Friday.
- The US Dollar edges lower due to a downward correction in US Treasury yields.
- Lower WTI price puts pressure on the commodity-link Canadian Dollar.
USD/CAD halts its four-day winning streak, trading around 1.3720 during the European session on Friday. However, the US Dollar (USD) advanced against the Canadian Dollar (CAD) during the earlier hours of the Asian market due to the emergence of the risk aversion sentiment. This could be attributed to the higher-than-expected Purchasing Managers Index (PMI) data released on Thursday from the United States (US). The data reinforced the hawkish sentiment surrounding the Federal Reserve (Fed) of maintaining higher policy rates for an extended period.
The S&P Global US Composite PMI rose to 54.4 in May from April's 51.3, marking the highest level since April 2022. The index exceeded market expectations of 51.1. The Service PMI surged to 54.8, indicating the biggest output growth in a year, while the Manufacturing PMI increased to 50.9.
Additionally, the latest Federal Open Market Committee (FOMC) Minutes suggested that Fed policymakers expressed concerns about the lack of progress on inflation, which was more persistent than expected at the start of 2024. Federal Reserve Bank of Atlanta President Raphael Bostic stated on Thursday that the inflation outlook might not improve as quickly as market participants are hoping for.
On the CAD front, declining crude Oil prices are exerting selling pressure on the commodity-linked Canadian Dollar (CAD), as Canada is the largest oil exporter to the United States. West Texas Intermediate (WTI) Oil prices have been falling for the fifth consecutive session, trading around $77.80 per barrel at the time of writing.
Higher-than-expected US PMI data and hawkish comments from Federal Reserve officials suggest a delay in the Fed’s rate cuts. Higher interest rates can negatively impact economic activities in the United States, the world's largest oil consumer, potentially reducing Oil demand.
Additionally, the expectation that the Bank of Canada (BoC) might cut interest rates before the US Federal Reserve could weigh on the Canadian Dollar, supporting the USD/CAD pair.
Investors expect Retail Sales data from Canada on Friday. On the US front, US Durable Goods Orders and the Michigan Consumer Sentiment Index will offer insight into economic conditions in the United States.
- Gold has cushioned its decline as investors seek it out for its safe-haven qualities on Friday.
- Mounting geopolitical risks from multiple hotspots – China, Gaza and Ukraine – are sending investors fleeing for safety.
- Stronger-than-expected US data on Thursday sent Gold into a downward spiral as higher interest rates become normalized.
Gold (XAU/USD) puts in a temporary floor under the recent sell-off on Friday, trading a quarter of a percent higher at around the $2,330s, as a combination of market and geopolitical concerns lead investors to seek solace in its safe-haven qualities.
Gold retrenches on geopolitical concerns
The news that China has started a second day of war games around Taiwan, as well as the decision by Ireland, Norway and Spain to recognise the independent state of Palestine, have ratcheted up geopolitical tensions and impacted markets, helping drive demand for Gold.
Asian stocks are broadly lower on Friday, with the Hang Seng down 1.71%, the Shanghai Composite down 0.90%, and the Nikkie closing 1.36% lower. Investor concerns about high interest rates were a further factor weighing on sentiment.
Gold price weakened after US data
A slew of unexpectedly strong US economic data took its toll on the price of Gold on Thursday.
The higher-than-expected US Purchasing Manager Index (PMI) preliminary data for May, especially in the Services sector – which has been singled out as a major contributor to high inflation – has dialed back bets that the Federal Reserve (Fed) will implement early interest-rate cuts. This is negative for non-yielding Gold as it increases the opportunity cost of holding the precious metal.
India imports fall
The relatively high price of Gold may also be acting as a counterweight to demand in India, according to Reuters, who notes a fall in imports to the country as “high prices encourage retail customers to exchange old jewelry for new products”, reports FXStreet Editor Lallalit Srijandorn.
Technical Analysis: Gold breaks below major trendline
Gold price (XAU/USD) has decisively broken below a major trendline for the uptrend since February, ushering in a new more bearish technical atmosphere.
The steep decline from the all-time highs registered on Monday now suggests Gold is probably in a short-term downtrend, favoring short positions over longs.
XAU/USD 4-hour Chart
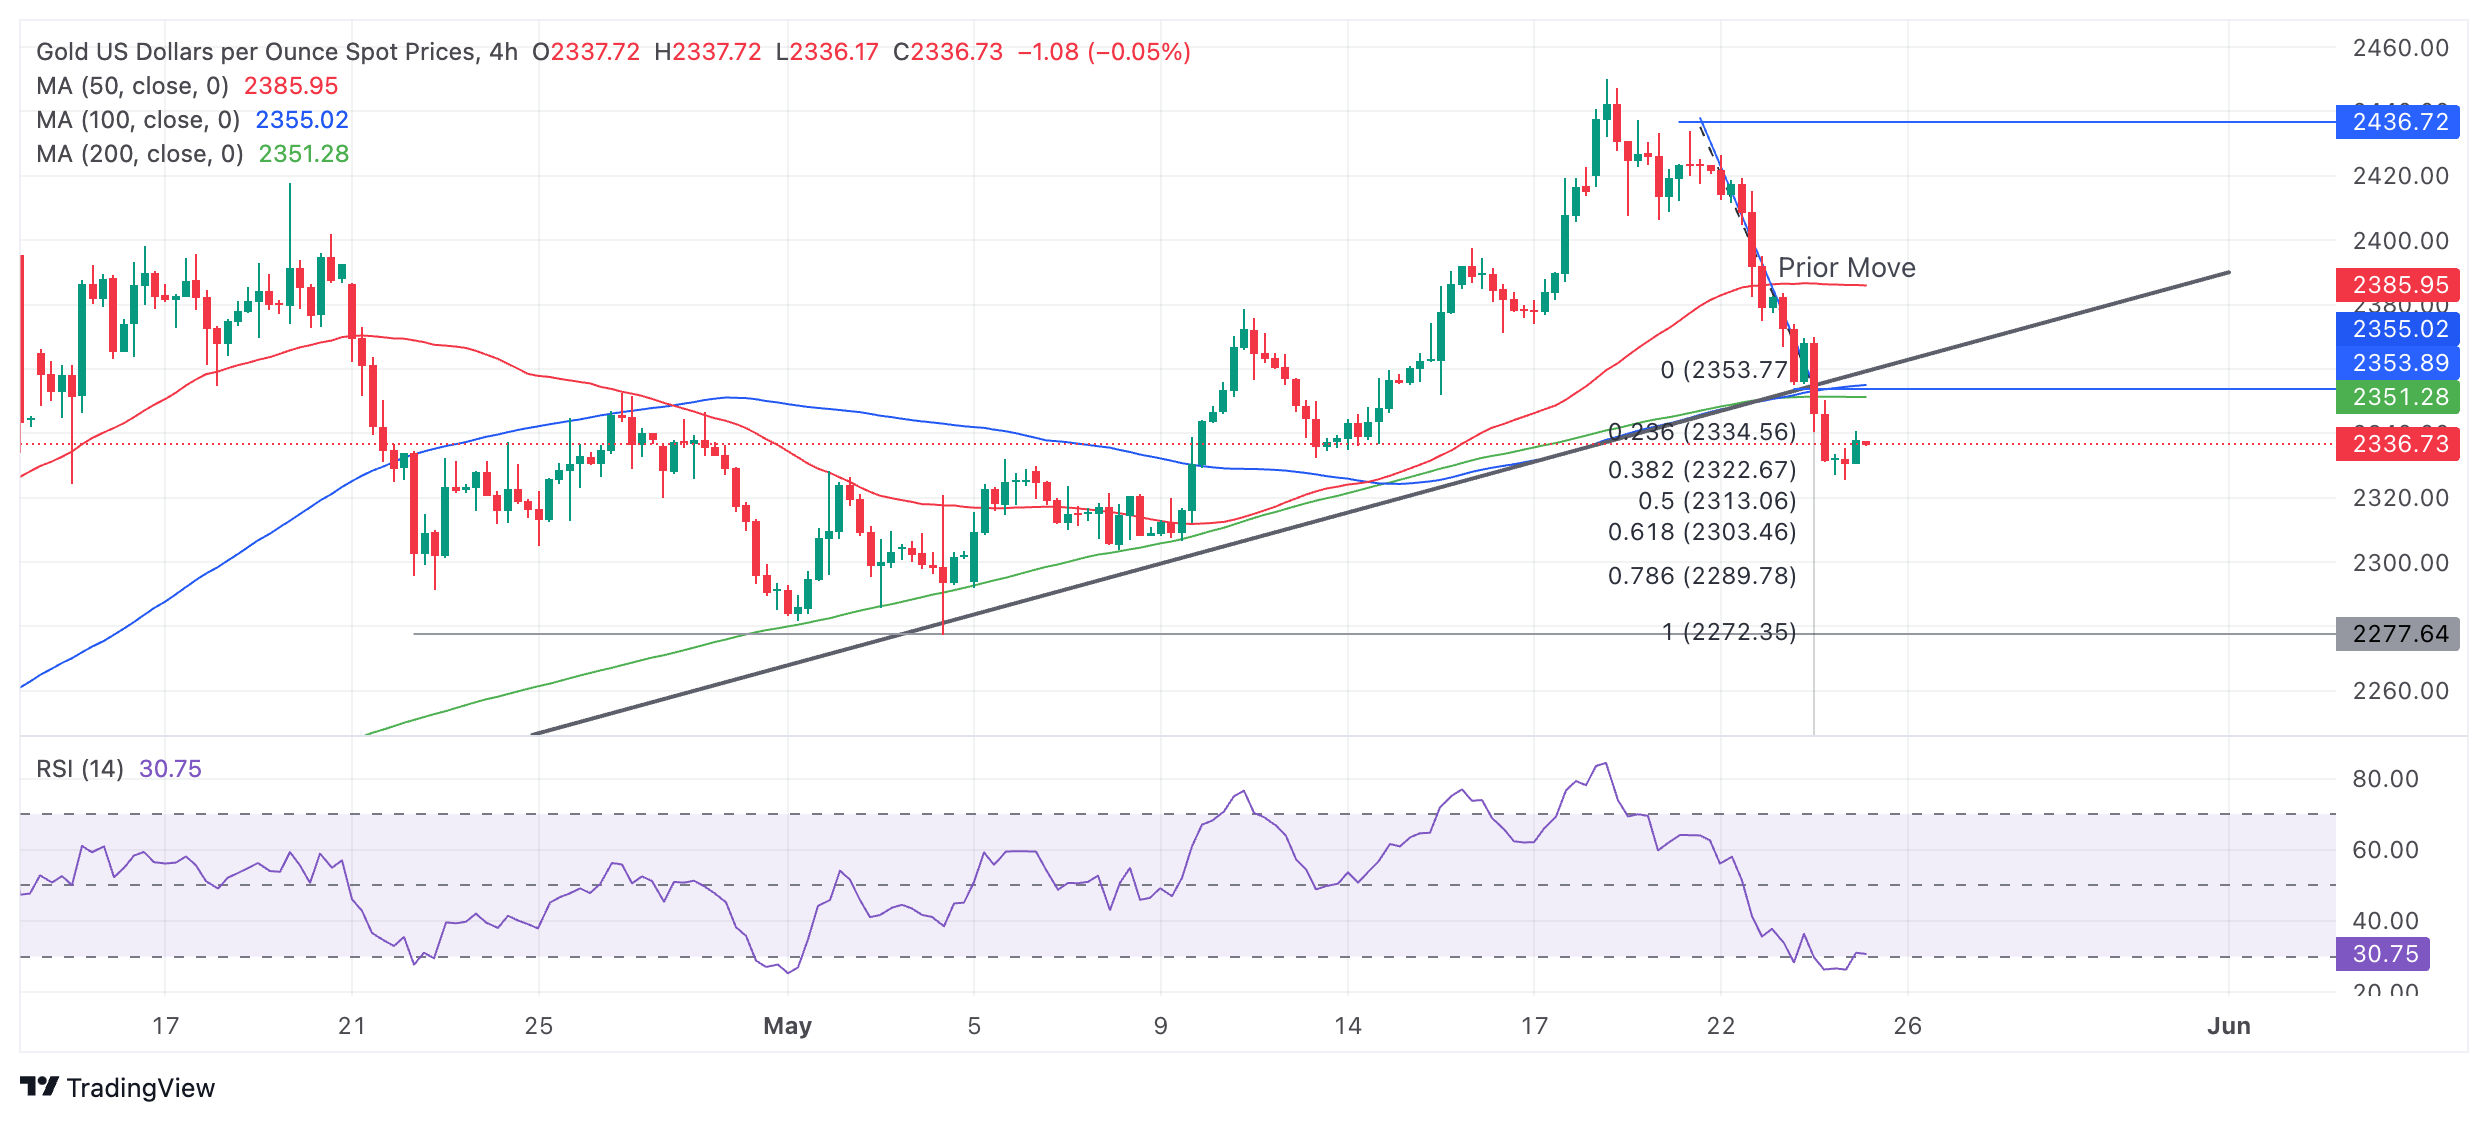
The penetration of the major trendline signals Gold will probably now fall to a conservative target at $2,303 (Fibonacci 0.618 extrapolation of the prior down move from $2,435 to $2,355) or all the way down to $2,272 (100% of the prior down move). The latter level is also the support from the May 3 lower high. A break below the $2,325 lows would provide confirmation of more downside to these targets.
The Relative Strength Index (RSI) became oversold and then reentered neutral territory on the previous bar, suggesting an increased chance of a pull back. It is also possible Gold could correct higher and return to the trendline in a throwback move before rolling over and going lower.
The precious metal’s medium and long-term trends are still bullish, suggesting the risk of a recovery remains high, yet price action does not suggest this is currently the case.
A decisive break back above the trendline at $2,360 would provide evidence of a recovery and reversal of the short-term downtrend.
A decisive break would be one accompanied by a long green bullish candle or three green candles in a row.
- Silver price steadies above $30.00 but is prone to more downside amid multiple headwinds.
- The US Dollar strengthens as Fed supports maintaining interest rates at their current levels for longer.
- Strong US economic outlook has negatively impacted Fed rate-cut prospects for September.
Silver price (XAG/USD) finds temporary support near the psychological support of $30.00 in Friday’s European session after witnessing a sharp sell-off in the past two trading session. The outlook for the Silver price is still uncertain as investors are losing confidence over the Federal Reserve (Fed) returning to policy normalization in the September meeting.
The CME FedWatch tool shows that the probability for rate cuts in September has reduced to 53% from 64% recorded a week ago. Diminished Fed rate-cut bets are the outcome of hawkish Fed’s commentary on interest rates and upbeat United States (US) economic outlook. Fed officials have been communicating the need to maintain interest rates at their current levels for a longer period until they get evidence that inflation will sustainably return to the desired rate of 2%.
The US economic outlook has improved as early S&P Global PMI report for May has shown that both Manufacturing and Services PMI surprisingly beat their prior readings.
Chris Williamson, Chief Business Economist at S&P Global Market Intelligence commented on data, “The US economic upturn has accelerated again after two months of slower growth, with the early PMI data signalling the fastest expansion for just over two years in May. The data put the US economy back on course for another solid GDP gain in the second quarter.”
The US Dollar Index (DXY) exhibits strength near 105.00 due to Fed’s hawkish stance on the interest rate outlook and firm US economic prospects. Going forward, investors will focus on the US Durable Goods Orders data for April, which will be published at 12:30 GMT. Fresh orders for Durable Goods are estimated to have declined by 0.8% after expanding 2.6% in March.
- EUR/GBP gains ground as Office for National Statistics released lower-than-expected UK Retail Sales data on Friday.
- UK Retail Sales (MoM) declined by 2.3% in April, marking the largest decrease in four months.
- The Euro continues to advance since the improved Eurozone Manufacturing PMI released on Thursday.
EUR/GBP extends its gains, trading around 0.8520 during the early European session on Friday. The decline in the Pound Sterling (GBP) supports the EUR/GBP cross, which could be attributed to lower-than-expected Retail Sales data from the United Kingdom (UK).
UK Retail Sales (MoM) declined by 2.3% in April, following a downwardly revised 0.2% fall in March and a worse-than-expected decline of 0.4%. This marks the largest decrease in retail sales in four months. Annually, Retail Sales decreased by 2.7%, swinging from the previous increase of 0.4%.
Core Retail Sales, which exclude auto motor fuel sales, fell by 2.0% MoM, compared to a 0.6% decline in March. On an annual basis, Core Retail Sales decreased by 3.0%, compared to no change in the previous month.
Moreover, the GfK Consumer Confidence came in at the reading of -17 in May, as compared to the previous reading of -19 in April, posting the highest reading since December 2021 and coming in better than forecasts of -18. The data shows that the cost of living crisis and high borrowing costs continued to weigh on consumer sentiment.
On Friday, Reuters reported Joe Staton, client strategy director at GfK, saying “All in all, consumers are clearly sensing that conditions are improving. This good result anticipates further growth in confidence in the months to come.”
On Thursday, the Eurozone Preliminary Manufacturing Purchasing Managers Index (PMI) improved to 47.4 in May from April's 45.7, surpassing the expected reading of 46.2 and reaching a 15-month high. This improvement in the manufacturing sector's downturn supported the Euro.
According to a Bloomberg report on Wednesday, ECB President Christine Lagarde expressed confidence that Eurozone inflation is under control and suggested that an interest rate cut is likely next month. LSEG data indicates that financial markets have priced in a 25 basis-point cut in June.
- The Pound Sterling falls sharply to 1.2670 as UK Retail Sales contracted at a faster pace than expected.
- Weak UK Retail Sales data for April suggests a soft inflation outlook.
- The US Dollar strengthens after upbeat US preliminary PMI report for May.
The Pound Sterling (GBP) extends its downside to 1.2670 against the US Dollar (USD) in Friday’s London session after failing to keep above the round figure of 1.2700. The GBP/USD pair has come under pressure as the United Kingdom (UK) Office for National Statistics (ONS) has reported a sharp decline in the Retail Sales data for April and the US Dollar extended recovery.
The ONS has shown that monthly Retail Sales declined at a faster pace of 2.3%. Investors forecasted the economic data to have declined by 0.4% from the prior reading of -0.2%, revised negative from a stagnant performance. Annual Retail Sales contracted by 2.7% after expanding at a pace of 0.4% in March, downwardly revised from 0.8%. Economists expected a decline by 0.2%.
Retail Sales data indicate the current status of consumer spending, which accounts for a major part of economic growth. A significant decline in sales at retail stores indicates that the consequences of the Bank of England's (BoE) higher interest rates have deeply impacted consumer spending. Retail Sales data is a leading indicator of the inflation outlook, and weak numbers suggest that price pressures will ease further. This could force the BoE to shift to policy normalization earlier than previously expected.
Daily digest market movers: Pound Sterling drops while US Dollar extends upside
- The Pound Sterling faces an intense sell-off due to weak economic data such as Retail Sales and the preliminary S&P Global/CIPS UK Purchasing Managers Index (PMI) data for May, released on Thursday. The agency reported that the Composite PMI dropped at a faster pace to a two-month low at 52.8 from the estimates of 54.0 and the prior reading of 54.1.
- The sharp decline in the Composite PMI was driven by weak Services PMI, which fell to a six-month low at 52.9 from the consensus of 54.7 and the former reading of 55.0. The Manufacturing PMI rose above the 50.0 threshold that separates expansion from contraction and grew strongly to 51.3. Economists forecasted that the factory PMI would have increased to 49.5 from 49.1 in April.
- Weak economic indicators have painted a gloomy picture of the UK economic outlook, which could revamp speculation that the BoE will begin reducing interest rates from the June meeting. Expectations for the BoE to begin lowering interest rates in June were strong earlier this week, but a slower-than-expected decline in the Consumer Price Index (CPI) data for April forced traders to pare rate-cut bets.
- Meanwhile, firm US Dollar has also weighed on the GBP/USD pair. The US Dollar Index (DXY), which tracks the Greenback’s value against six major currencies, jumps to the crucial resistance of 105.00 as uncertainty about when the Federal Reserve (Fed) will start reducing interest rates has deepened.
- The CME FedWatch tool shows that traders see a 53% probability that interest rates will be lower than the current level at the September meeting. The probability has reduced from 64% recorded a week ago due to Fed policymakers maintaining hawkish guidance on the interest rate outlook and surprisingly strong preliminary United States PMI data for May.
Technical Analysis: Pound Sterling holds the 61.8% Fibo retracement support
The Pound Sterling has extended its correction slightly below 1.2700 against the US Dollar from a two-month high near 1.2750 recorded on Wednesday. The near-term outlook of the GBP/USD pair remains firm as it is well-established above the 61.8% Fibonacci retracement (plotted from the March 8 high of 1.2900 to the April 22 low at 1.2300) at 1.2667.
The Cable is expected to remain in the bullish trajectory as all short-to-long-term Exponential Moving Averages (EMAs) are sloping higher, suggesting a strong uptrend.
The 14-period Relative Strength Index (RSI) has shifted into the bullish range of 60.00-80.00, suggesting that the momentum has leaned toward the upside.
Pound Sterling FAQs
The Pound Sterling (GBP) is the oldest currency in the world (886 AD) and the official currency of the United Kingdom. It is the fourth most traded unit for foreign exchange (FX) in the world, accounting for 12% of all transactions, averaging $630 billion a day, according to 2022 data. Its key trading pairs are GBP/USD, aka ‘Cable’, which accounts for 11% of FX, GBP/JPY, or the ‘Dragon’ as it is known by traders (3%), and EUR/GBP (2%). The Pound Sterling is issued by the Bank of England (BoE).
The single most important factor influencing the value of the Pound Sterling is monetary policy decided by the Bank of England. The BoE bases its decisions on whether it has achieved its primary goal of “price stability” – a steady inflation rate of around 2%. Its primary tool for achieving this is the adjustment of interest rates. When inflation is too high, the BoE will try to rein it in by raising interest rates, making it more expensive for people and businesses to access credit. This is generally positive for GBP, as higher interest rates make the UK a more attractive place for global investors to park their money. When inflation falls too low it is a sign economic growth is slowing. In this scenario, the BoE will consider lowering interest rates to cheapen credit so businesses will borrow more to invest in growth-generating projects.
Data releases gauge the health of the economy and can impact the value of the Pound Sterling. Indicators such as GDP, Manufacturing and Services PMIs, and employment can all influence the direction of the GBP. A strong economy is good for Sterling. Not only does it attract more foreign investment but it may encourage the BoE to put up interest rates, which will directly strengthen GBP. Otherwise, if economic data is weak, the Pound Sterling is likely to fall.
Another significant data release for the Pound Sterling is the Trade Balance. This indicator measures the difference between what a country earns from its exports and what it spends on imports over a given period. If a country produces highly sought-after exports, its currency will benefit purely from the extra demand created from foreign buyers seeking to purchase these goods. Therefore, a positive net Trade Balance strengthens a currency and vice versa for a negative balance.
Here is what you need to know on Thursday, May 23:
The US Dollar (USD) capitalized on the upbeat PMI data from the US on Thursday, and the USD Index closed the fourth consecutive day in positive territory. Durable Goods Orders data for April and the revision to the University of Michigan's Consumer Sentiment Survey for May will be featured in the US economic docket ahead of the weekend.
S&P Global Composite PMI climbed to 54.4 in May's flash estimate from 51.3 in April, showing that the business activity continued to expand at an accelerating pace. Manufacturing and Services PMIs improved to 50.9 and 54.8, respectively. Following a downward correction seen in the European trading hours, the USD Index regained its traction and climbed above 105.00 for the first time in 10 days. Early Friday, the index holds steady near Thursday's closing level, while the benchmark 10-year US Treasury bond yield fluctuates below 4.5% after gaining more than 1% on Thursday.
US Dollar PRICE This week
The table below shows the percentage change of US Dollar (USD) against listed major currencies this week. US Dollar was the strongest against the Australian Dollar.
| USD | EUR | GBP | JPY | CAD | AUD | NZD | CHF | |
|---|---|---|---|---|---|---|---|---|
| USD | 0.49% | 0.06% | 0.89% | 0.86% | 1.42% | 0.65% | 0.62% | |
| EUR | -0.49% | -0.46% | 0.46% | 0.37% | 0.93% | 0.14% | 0.14% | |
| GBP | -0.06% | 0.46% | 0.76% | 0.88% | 1.41% | 0.60% | 0.58% | |
| JPY | -0.89% | -0.46% | -0.76% | -0.06% | 0.52% | -0.24% | -0.27% | |
| CAD | -0.86% | -0.37% | -0.88% | 0.06% | 0.50% | -0.22% | -0.24% | |
| AUD | -1.42% | -0.93% | -1.41% | -0.52% | -0.50% | -0.80% | -0.79% | |
| NZD | -0.65% | -0.14% | -0.60% | 0.24% | 0.22% | 0.80% | -0.03% | |
| CHF | -0.62% | -0.14% | -0.58% | 0.27% | 0.24% | 0.79% | 0.03% |
The heat map shows percentage changes of major currencies against each other. The base currency is picked from the left column, while the quote currency is picked from the top row. For example, if you pick the US Dollar from the left column and move along the horizontal line to the Japanese Yen, the percentage change displayed in the box will represent USD (base)/JPY (quote).
During the Asian trading hours, the data from Japan showed that the National Consumer Price Index (CPI) rose 2.5% on a yearly basis in April, following the 2.7% growth recorded in March. In the same period, National CPI ex Fresh Food rose 2.2%, matching the market expectation. USD/JPY showed no reaction to this data and extended its sideways grind at around 157.00.
Reserve Bank of New Zealand (RBNZ) Deputy Governor Hawkesby said on Friday that lowering interest rates was not a part of near-term discussions and noted that there was a lot of uncertainty about tradable inflation going forward. After rising to its highest level in over two months above 0.6150 on the RBNZ's hawkish hold earlier in the week, NZD/USD lost its traction and retreated to the 0.6100 area.
The UK's Office for National Statistics reported that Retail Sales declined 2.3% on a monthly basis in April. This reading followed the 0.2% contraction recorded in March and came in much worse than the market expectation for a decrease of 0.4%. GBP/USD stays under modest bearish pressure after the disappointing data and trades below 1.2700.
EUR/USD registered small losses on Thursday but managed to hold above 1.0800. The pair fluctuates in a tight range at around 1.0820 in the European morning on Friday. Germany's Destatis confirmed earlier in the day that the real Gross Domestic Product expanded 0.2% on a quarterly basis in the first quarter.
After suffering heavy losses on Wednesday, Gold extended its slide on Thursday and fell more than 2% on the day. XAU/USD stages a technical correction early Friday and trades below $2,340.
US Dollar FAQs
The US Dollar (USD) is the official currency of the United States of America, and the ‘de facto’ currency of a significant number of other countries where it is found in circulation alongside local notes. It is the most heavily traded currency in the world, accounting for over 88% of all global foreign exchange turnover, or an average of $6.6 trillion in transactions per day, according to data from 2022. Following the second world war, the USD took over from the British Pound as the world’s reserve currency. For most of its history, the US Dollar was backed by Gold, until the Bretton Woods Agreement in 1971 when the Gold Standard went away.
The most important single factor impacting on the value of the US Dollar is monetary policy, which is shaped by the Federal Reserve (Fed). The Fed has two mandates: to achieve price stability (control inflation) and foster full employment. Its primary tool to achieve these two goals is by adjusting interest rates. When prices are rising too quickly and inflation is above the Fed’s 2% target, the Fed will raise rates, which helps the USD value. When inflation falls below 2% or the Unemployment Rate is too high, the Fed may lower interest rates, which weighs on the Greenback.
In extreme situations, the Federal Reserve can also print more Dollars and enact quantitative easing (QE). QE is the process by which the Fed substantially increases the flow of credit in a stuck financial system. It is a non-standard policy measure used when credit has dried up because banks will not lend to each other (out of the fear of counterparty default). It is a last resort when simply lowering interest rates is unlikely to achieve the necessary result. It was the Fed’s weapon of choice to combat the credit crunch that occurred during the Great Financial Crisis in 2008. It involves the Fed printing more Dollars and using them to buy US government bonds predominantly from financial institutions. QE usually leads to a weaker US Dollar.
Quantitative tightening (QT) is the reverse process whereby the Federal Reserve stops buying bonds from financial institutions and does not reinvest the principal from the bonds it holds maturing in new purchases. It is usually positive for the US Dollar.
FX option expiries for May 24 NY cut at 10:00 Eastern Time, via DTCC, can be found below
- EUR/USD: EUR amounts
- 1.0690 2.5b
- 1.0700 1.6b
- 1.0705 1.1b
- 1.0710 1.2b
- 1.0830 911m
- 1.0850 977m
- 1.0885 963m
- 1.0875 3b
- 1.0890 2.3b
- 1.0900 1.4b
- GBP/USD: GBP amounts
- 1.2700 407m
- USD/JPY: USD amounts
- 154.50 1.1b
- 155.00 1.5b
- 155.50 1.4b
- 156.00 1.4b
- 157.00 3.4b
- USD/CHF: USD amounts
- 0.9115 576m
- 0.9200 1.3b
- AUD/USD: AUD amounts
- 0.6605 545m
- 0.6675 907m
- USD/CAD: USD amounts
- 1.3705 546m
- The UK Retail Sales came in at -2.3% MoM in April, a big miss.
- Core Retail Sales for the UK dropped 2.0% MoM in April.
- GBP/USD extends losses below 1.2700 after dismal UK data.
The UK Retail Sales dropped 2.3% over the month in April vs. -0.4% expected and -0.2% in March, the latest data published by the Office for National Statistics (ONS) showed Friday.
The Core Retail Sales, stripping the auto motor fuel sales, fell 2.0% MoM, compared to a 0.6% decline in March and the market forecast of -0.6%.
The annual Retail Sales in the United Kingdom decreased by 2.7% in April versus March’s 0.4% while the Core Retail Sales declined by 3.0% in the reported month versus 0% previous. Both figures fell short of expectations.
Market reaction to UK Retail Sales report
GBP/USD sees fresh offers on the poor UK data release, down 0.7% on the day to trade near 1.2685, as of writing.
British Pound PRICE Today
The table below shows the percentage change of British Pound (GBP) against listed major currencies today. British Pound was the weakest against the Canadian Dollar.
| USD | EUR | GBP | JPY | CAD | AUD | NZD | CHF | |
|---|---|---|---|---|---|---|---|---|
| USD | 0.03% | 0.03% | 0.11% | 0.03% | 0.08% | 0.07% | 0.10% | |
| EUR | -0.03% | 0.02% | 0.05% | -0.02% | 0.05% | 0.04% | 0.09% | |
| GBP | -0.03% | -0.02% | 0.02% | -0.04% | 0.05% | 0.02% | 0.05% | |
| JPY | -0.11% | -0.05% | -0.02% | -0.06% | -0.03% | -0.03% | -0.01% | |
| CAD | -0.03% | 0.02% | 0.04% | 0.06% | 0.04% | 0.04% | 0.07% | |
| AUD | -0.08% | -0.05% | -0.05% | 0.03% | -0.04% | -0.02% | 0.02% | |
| NZD | -0.07% | -0.04% | -0.02% | 0.03% | -0.04% | 0.02% | 0.03% | |
| CHF | -0.10% | -0.09% | -0.05% | 0.00% | -0.07% | -0.02% | -0.03% |
The heat map shows percentage changes of major currencies against each other. The base currency is picked from the left column, while the quote currency is picked from the top row. For example, if you pick the British Pound from the left column and move along the horizontal line to the US Dollar, the percentage change displayed in the box will represent GBP (base)/USD (quote).
- EUR/USD loses traction near 1.0808 in Friday’s early Asian session.
- The upbeat US PMI data and the Fed’s hawkish comments support the Greenback.
- Traders raise their bets on the ECB rate cuts in June, weighing on the Euro.
The EUR/USD pair extends the decline around 1.0808 during the early European session on Friday. The recovery of the US Dollar (USD) broadly, backed by the stronger US PMI data drags the major pair lower. The German Gross Domestic Product (GDP) for the first quarter (Q1) is due on Friday. The quarterly GDP is projected to grow 0.2% QoQ, while the annual GDP is estimated to contract 0.2% YoY in Q1.
The Greenback edges higher on the upbeat US economic data released on Thursday. The US S&P Global flash May Composite Purchasing Managers Index (PMI) climbed to 54.4 in May from 51.3 in April, the highest since April 2022. Meanwhile, the Manufacturing PMI rose to 50.9 in May from 50.0 in April. The Services PMI climbed to 54.8 in May from the previous reading of 51.3. Both figures came in above the market consensus. Additionally, the weekly Initial Jobless Claims for the week ending May 18 dropped to 215K from 223K in the previous week, lower than the estimation of 220K.
Atlanta Fed President Raphael Bostic said on Thursday that the US central bank may need to wait longer to cut interest rates as he still sees upward inflation pressure. His hawkish remarks boost the US Dollar (USD) against the Euro (EUR).
Across the pond, the growing speculation that the European Central Bank (ECB) will start cutting the interest rate before the Fed exerts some selling pressure on the EUR. The ECB President Christine Lagarde said that she is "really confident" that Eurozone inflation was under control and an interest-rate cut is probable next month. According to LSEG data, financial markets currently priced in a 25 basis point (bps) cut in June.
- The Oil price sets to conclude the week on a bearish note.
- Fed officials believe that the decline in US inflation observed in April won’t be long-lasting.
- OPEC members are scheduled to meet on June 1 to discuss supply policy.
West Texas Intermediate (WTI), futures on NYMEX, look set to close the week on a bearish note. The Oil price has extended its losing spree for the fifth trading session on Friday. The black gold has remained under pressure for the entire week as Federal Reserve (Fed) policymakers maintain a hawkish guidance on interest rates despite an expected decline in the United States Consumer Price Index (CPI) report for April.
Fed officials are uncertain about a resumption in progress in the disinflation process, given the strength in the labor market. Policymakers are clear that rate cuts will be considered only if they get greater confidence that inflation will sustainably return to the desired rate of 2%.
The Federal Open Market Committee (FOMC) minutes for the May meeting indicated that a few policymakers have supported for tightening the monetary policy further to be sure that price stability will be achieved. While Fed Chair Jerome Powell and the majority of other policymakers said that more rate hikes are unlikely.
The Fed's hawkish outlook on interest rates is unfavorable for the Oil price. Higher interest rates reduce the flow of liquidity into the economy, which negatively influences consumer spending and factor activities and eventually impacts overall oil demand.
The next trigger for the Oil price will be the OPEC meeting scheduled for June 1, during which members will discuss the supply policy. In the last meeting on April 13, oil-rich nations made no change in the current voluntary oil output cut, which is 2.2 million barrels per day.
- NZD/USD pares daily losses amid hawkish comments from RBNZ officials on Friday.
- Strong PMI data pushed US yields higher, bolstering the Greenback.
- The improved Kiwi Consumer Confidence could limit the losses of the New Zealand Dollar.
NZD/USD received pressure due to the emergence of the risk aversion sentiment after the higher-than-expected Purchasing Managers Index (PMI) data from the United States (US) was released on Thursday. The data reinforced the hawkish sentiment surrounding the Federal Reserve (Fed) of maintaining higher policy rates for an extended period. The NZD/USD pair trades around 0.6100 during the Asian session on Friday.
The S&P Global US Composite PMI rose to 54.4 in May from April's 51.3, marking the highest level since April 2022. The index exceeded market expectations of 51.1. The Service PMI surged to 54.8, indicating the biggest output growth in a year, while the Manufacturing PMI increased to 50.9.
Additionally, the latest Federal Open Market Committee (FOMC) Minutes suggested that Fed policymakers expressed concerns about the lack of progress on inflation, which was more persistent than expected at the start of 2024.
Investors are expected to closely monitor US Durable Goods Orders on Friday, which assess the worth of orders received by manufacturers for durable goods meant to last for three years or more. Additionally, the Michigan Consumer Sentiment Index will offer insight into consumer attitudes toward financial and income situations in the United States.
In New Zealand, the ANZ – Roy Morgan Consumer Confidence rose to 84.9 in May from April’s 82.1, yet it remains relatively low, staying close to values observed during the pandemic response. While this uptick in data may have offered some support for the New Zealand Dollar (NZD), limiting the downside of the NZD/USD pair.
Deputy Governor Christian Hawkesby of the Reserve Bank of New Zealand (RBNZ) stated on Friday that "cutting interest rates is not part of the near-term discussion." Additionally, RBNZ Assistant Governor Karen Silk expressed concern about near-term inflation risks, noting that the bank has adjusted its modeling after underestimating domestic inflation strength.
In an interview with Bloomberg on Thursday, Governor Adrian Orr played down the likelihood of another interest rate hike, indicating that the bank would only tighten policy further if necessary to contain inflation expectations. Orr also mentioned that the central bank could consider easing before inflation reaches 2%.
- Indian Rupee gains ground despite the firmer USD on Friday.
- India’s flash PMI showed a robust expansion in May, boosting the INR.
- US Durable Goods Order, Michigan Consumer Sentiment Index report, and speech from Fed’s Waller are the highlights on Friday.
Indian Rupee (INR) trades with a mild positive bias on Friday despite the rebound of the US Dollar (USD). The strong growth of India's business sector in May and the sharp exports and job addition rate provide some support to the INR. Additionally, a decline in crude oil prices underpins the local currency, as India is the world's third-biggest oil importer and consumer.
On Friday, investors will focus on the US Durable Goods Orders, the Michigan Consumer Sentiment Index, and the Fed’s Waller speech for fresh impetus. The stronger US economic data and hawkish remarks from Federal Reserve (Fed) officials might lift the Greenback and limit the downside for the pair. Also, the foreign outflows ahead of India's upcoming election outcome might also weigh on the INR.
Daily Digest Market Movers: Indian Rupee remains strong, supported by robust economic data
- India’s flash HSBC Composite PMI came in at 61.7 in May from 61.5 in April, reaching the third strongest reading in nearly 14 years and marking the 34th consecutive month above the 50-level, which separates growth from contraction.
- The Indian Manufacturing PMI dropped to 58.4 in May from 58.8 in April. The services PMI index rose to a four-month high of 61.4 in May from 60.8 in April.
- The preliminary US S&P Composite PMI came in better than market expectations, jumping to 54.4 in May from 51.3 in April, the highest level since April 2022.
- The US Manufacturing PMI rose to 50.9 in May versus 50.0 in April, above the market consensus of 50.0. The Services PMI jumped to 54.8 in May, better than the estimation and previous reading of 51.3.
- The US Initial Jobless Claims for the week ending May 18 declined to 215K from the previous week's reading of 223K, lower than the expectation of 220K.
Technical analysis: USD/INR becomes more vulnerable on the daily timeframe
The Indian Rupee trades stronger on the day. The USD/INR pair has formed the Head and Shoulders pattern since March 21. The bullish picture of the pair seems fragile on the daily chart as the price is hovering around the key 100-day Exponential Moving Average (EMA) and the neckline. If USD/INR crosses below the mentioned level, its downside could resume. Meanwhile, the 14-day Relative Strength Index (RSI) stands in bearish territory near 42.30, suggesting that further consolidation or downside cannot be ruled out.
The confluence of the 100-day EMA and the neckline of 83.20 is the potential support level for USD/INR. A decisive closing price below this level could pave the way to the 83.00 psychological level and a low of January 15 at 82.78.
On the upside, any follow-through buying above the right shoulder of the Head and Shoulders pattern of 83.54 (high of May 13) would end up invalidating the chart pattern and attract some buyers to a high of April 17 at 83.72 en route to 84.00.
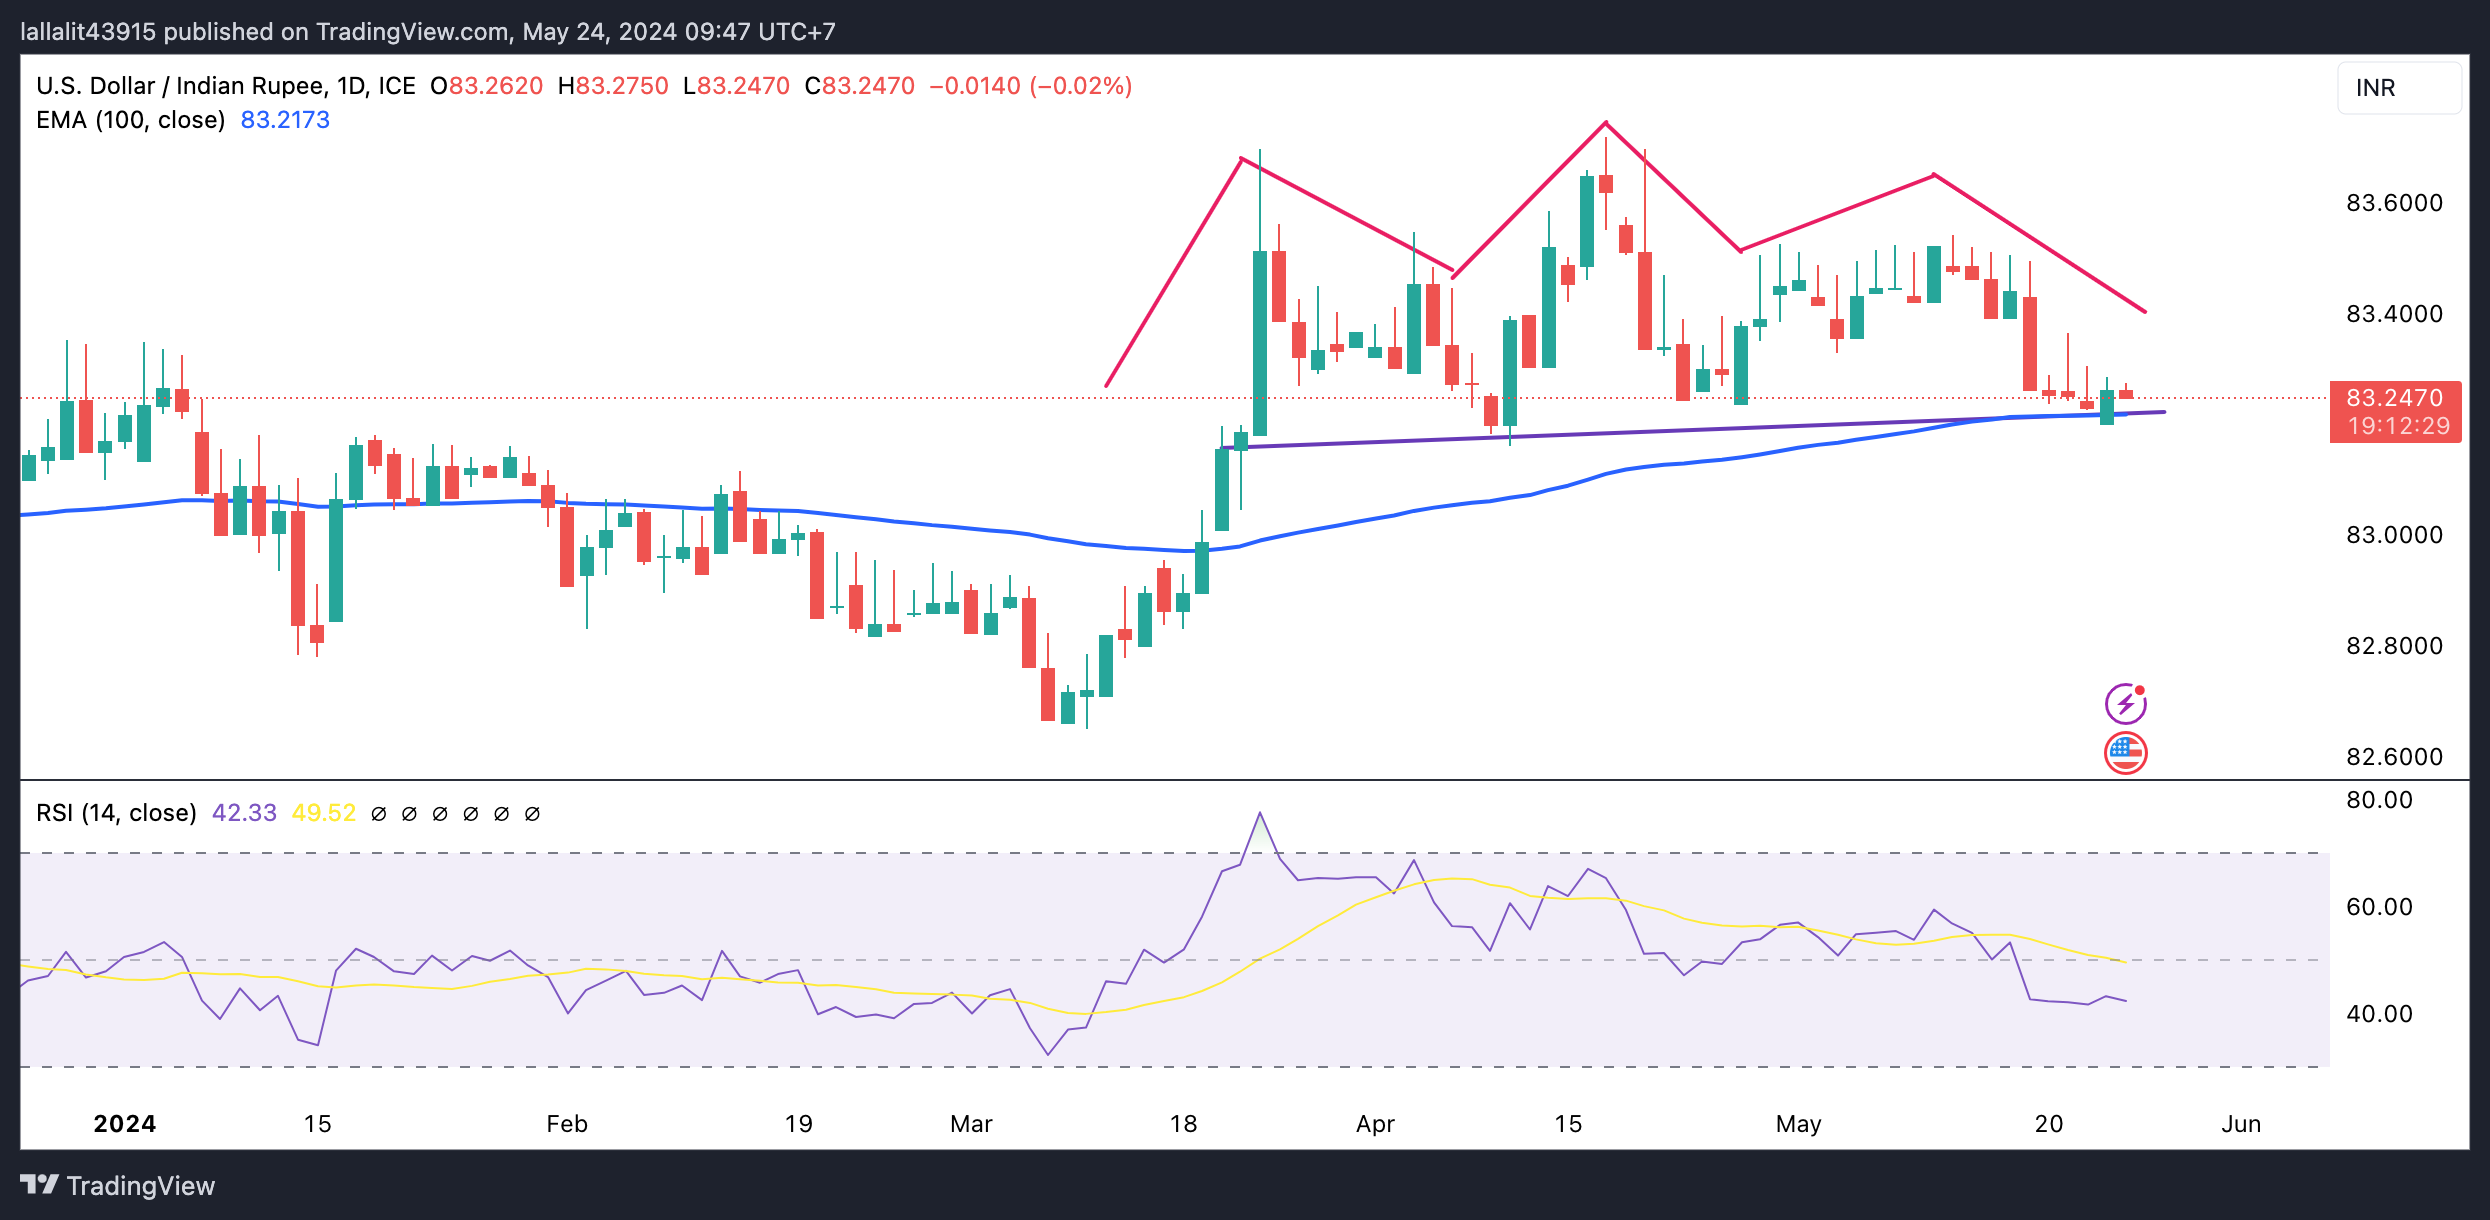
US Dollar price today
The table below shows the percentage change of US Dollar (USD) against listed major currencies today. US Dollar was the weakest against the Pound Sterling.
| USD | EUR | GBP | CAD | AUD | JPY | NZD | CHF | |
| USD | 0.04% | 0.03% | 0.05% | 0.10% | 0.07% | 0.05% | 0.10% | |
| EUR | -0.04% | -0.01% | -0.01% | 0.08% | 0.04% | 0.03% | 0.05% | |
| GBP | -0.03% | 0.01% | 0.02% | 0.09% | 0.07% | 0.05% | 0.07% | |
| CAD | -0.04% | 0.04% | 0.00% | 0.10% | 0.04% | 0.04% | 0.06% | |
| AUD | -0.10% | -0.07% | -0.09% | -0.06% | -0.05% | -0.05% | 0.00% | |
| JPY | -0.09% | -0.05% | -0.06% | -0.06% | 0.02% | 0.01% | 0.02% | |
| NZD | -0.05% | -0.03% | -0.04% | -0.02% | 0.05% | 0.00% | 0.02% | |
| CHF | -0.10% | -0.04% | -0.07% | -0.06% | 0.01% | -0.02% | -0.04% |
The heat map shows percentage changes of major currencies against each other. The base currency is picked from the left column, while the quote currency is picked from the top row. For example, if you pick the Euro from the left column and move along the horizontal line to the Japanese Yen, the percentage change displayed in the box will represent EUR (base)/JPY (quote).
Indian Rupee FAQs
The Indian Rupee (INR) is one of the most sensitive currencies to external factors. The price of Crude Oil (the country is highly dependent on imported Oil), the value of the US Dollar – most trade is conducted in USD – and the level of foreign investment, are all influential. Direct intervention by the Reserve Bank of India (RBI) in FX markets to keep the exchange rate stable, as well as the level of interest rates set by the RBI, are further major influencing factors on the Rupee.
The Reserve Bank of India (RBI) actively intervenes in forex markets to maintain a stable exchange rate, to help facilitate trade. In addition, the RBI tries to maintain the inflation rate at its 4% target by adjusting interest rates. Higher interest rates usually strengthen the Rupee. This is due to the role of the ‘carry trade’ in which investors borrow in countries with lower interest rates so as to place their money in countries’ offering relatively higher interest rates and profit from the difference.
Macroeconomic factors that influence the value of the Rupee include inflation, interest rates, the economic growth rate (GDP), the balance of trade, and inflows from foreign investment. A higher growth rate can lead to more overseas investment, pushing up demand for the Rupee. A less negative balance of trade will eventually lead to a stronger Rupee. Higher interest rates, especially real rates (interest rates less inflation) are also positive for the Rupee. A risk-on environment can lead to greater inflows of Foreign Direct and Indirect Investment (FDI and FII), which also benefit the Rupee.
Higher inflation, particularly, if it is comparatively higher than India’s peers, is generally negative for the currency as it reflects devaluation through oversupply. Inflation also increases the cost of exports, leading to more Rupees being sold to purchase foreign imports, which is Rupee-negative. At the same time, higher inflation usually leads to the Reserve Bank of India (RBI) raising interest rates and this can be positive for the Rupee, due to increased demand from international investors. The opposite effect is true of lower inflation.
- The Japanese Yen lost ground as Japanese CPI fell to 2.5% YoY in April from 2.7% prior.
- The Japanese inflation remains above the 2% target, keeping the BoJ under pressure to tighten policy further.
- The US Dollar gained ground as stronger US PMI data reinforced that the Fed may maintain higher rates for longer.
The Japanese Yen (JPY) continued its decline on Friday after the release of softer National Consumer Price Index (CPI) data by the Statistics Bureau of Japan. The annual inflation rate dropped to 2.5% in April from 2.7% in the previous month, marking the second consecutive month of moderation but still staying above the Bank of Japan’s (BoJ) 2% target. This sustained inflation keeps pressure on the central bank to consider further policy tightening.
The Bank of Japan has emphasized that a virtuous cycle of sustained, stable achievement of its 2% price target along with strong wage growth is essential for normalizing policy. Meanwhile, investors expect that the persistent weakness of the JPY might compel the BOJ to advance its next interest rate hike to mitigate the impact on the cost of living, according to Reuters.
US Dollar (USD) advances on hawkish sentiment surrounding the Federal Reserve (Fed) of maintaining higher policy rates for an extended period. This sentiment is reinforced by the higher-than-expected Purchasing Managers Index (PMI) data from the United States (US) that was released on Thursday.
According to the CME FedWatch Tool, the probability of the Federal Reserve implementing a 25 basis-point rate cut in September has decreased to 46.6% from 49.4% a day earlier.
Daily Digest Market Movers: Japanese Yen extends losses after softer CPI
- Japan’s Core CPI (YoY), which excludes fresh food but includes fuel costs, rose 2.2% in April as expected, slowing for the second straight month, as compared to March’s reading of 2.6%.
- The S&P Global US Composite PMI jumped to 54.4 in May, from 51.3 in April, reaching its highest point since April 2022 and surpassing market expectations of 51.1. The Service PMI climbed to 54.8, reflecting the largest output growth in a year, while the Manufacturing PMI edged up to 50.9.
- The Bank of Japan announced on Thursday that it left the Japanese government bonds (JGB) amounts unchanged compared to the previous operation. Over a month ago, the BoJ trimmed the amount of 5-10 years it bought in a scheduled operation.
- Tensions are escalating following Lai Ching-te's assumption of office as Taiwan's new president. Chinese state media reports indicate that China has deployed numerous fighter jets and conducted simulated strikes in the Taiwan Strait and around groups of Taiwan-controlled islands, per Reuters.
- Japan’s Manufacturing Purchasing Managers Index (PMI), released on Thursday by Jibun Bank and S&P Global, rose to 50.5 in May from April’s 49.6, surpassing market expectations of 49.7. This marks the first growth since May 2023. Meanwhile, the Services PMI fell to 53.6 from the previous 54.3, still indicating the fastest expansion in eight months.
- Japan’s 10-year government bond yield surpassed 1% this week for the first time since May 2013, fueled by traders' increasing bets that the Bank of Japan would tighten policy further in 2024.
Technical Analysis: USD/JPY moves above the psychological level of 157.00
The USD/JPY pair trades around 157.10 on Friday. A rising wedge pattern on the daily chart suggests a potential bearish reversal as the pair approaches the wedge’s tip. Despite this, the 14-day Relative Strength Index (RSI) remains above 50, indicating continued bullish momentum. A decline below this level would signify a shift in momentum.
The USD/JPY pair might retest the upper boundary of the rising wedge at approximately 157.20. If it breaks above this level, the pair could advance toward the recent high of 160.32.
On the downside, the nine-day Exponential Moving Average (EMA) at 156.33 seems to appear as immediate support, followed by the lower threshold of the rising wedge and a psychological level of 156.00. A break below this level could exert downward pressure on the USD/JPY pair, potentially moving it toward the throwback support at 151.86.
USD/JPY: Daily Chart
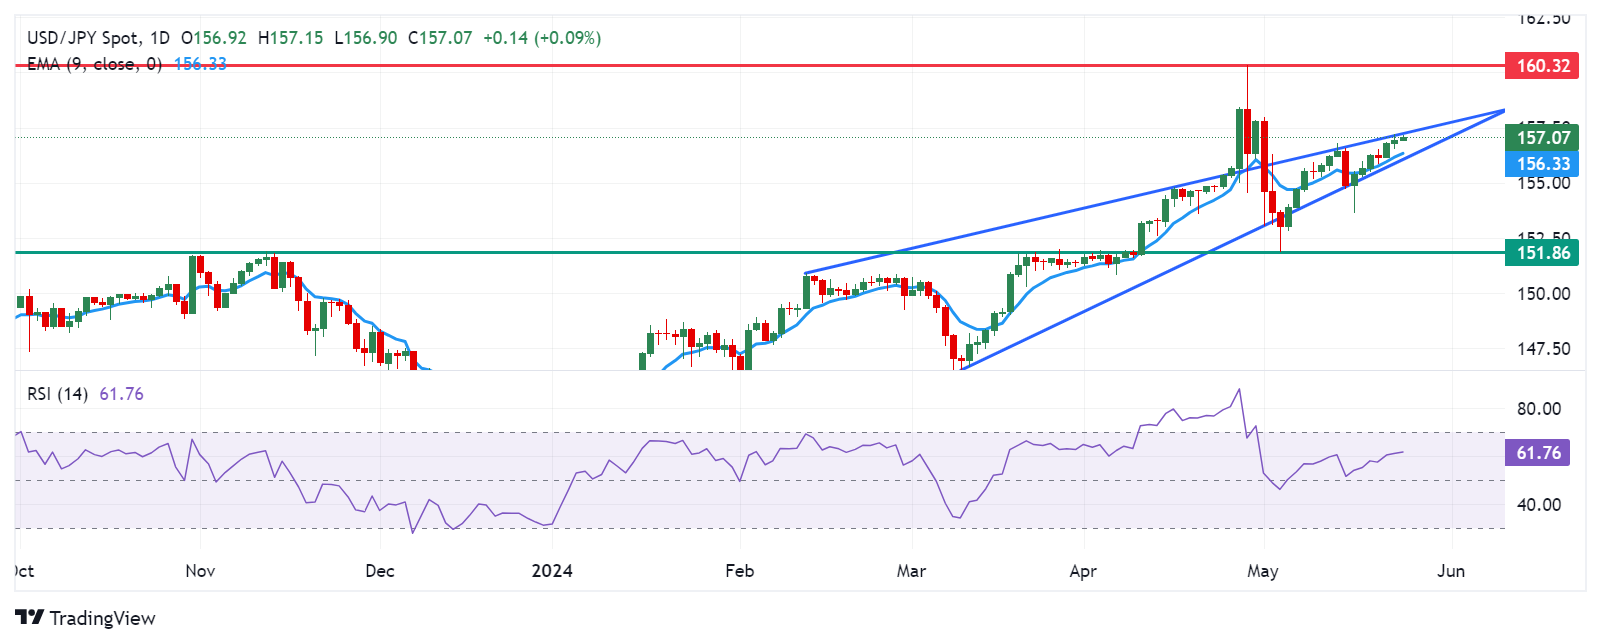
Japanese Yen price today
The table below shows the percentage change of the Japanese Yen (JPY) against listed major currencies today. Japanese Yen was the weakest against the US Dollar.
| USD | EUR | GBP | CAD | AUD | JPY | NZD | CHF | |
| USD | 0.03% | 0.02% | 0.02% | 0.09% | 0.06% | 0.07% | 0.07% | |
| EUR | -0.03% | 0.00% | -0.01% | 0.08% | 0.03% | 0.07% | 0.04% | |
| GBP | -0.02% | 0.00% | -0.01% | 0.08% | 0.04% | 0.06% | 0.04% | |
| CAD | -0.03% | 0.04% | 0.00% | 0.08% | 0.04% | 0.07% | 0.05% | |
| AUD | -0.10% | -0.08% | -0.09% | -0.09% | -0.05% | -0.02% | -0.03% | |
| JPY | -0.07% | -0.04% | -0.04% | -0.05% | 0.01% | 0.06% | 0.01% | |
| NZD | -0.06% | -0.07% | -0.07% | -0.08% | 0.02% | -0.03% | -0.03% | |
| CHF | -0.07% | -0.03% | -0.05% | -0.06% | 0.02% | -0.02% | 0.00% |
The heat map shows percentage changes of major currencies against each other. The base currency is picked from the left column, while the quote currency is picked from the top row. For example, if you pick the Euro from the left column and move along the horizontal line to the Japanese Yen, the percentage change displayed in the box will represent EUR (base)/JPY (quote).
Japanese Yen FAQs
The Japanese Yen (JPY) is one of the world’s most traded currencies. Its value is broadly determined by the performance of the Japanese economy, but more specifically by the Bank of Japan’s policy, the differential between Japanese and US bond yields, or risk sentiment among traders, among other factors.
One of the Bank of Japan’s mandates is currency control, so its moves are key for the Yen. The BoJ has directly intervened in currency markets sometimes, generally to lower the value of the Yen, although it refrains from doing it often due to political concerns of its main trading partners. The current BoJ ultra-loose monetary policy, based on massive stimulus to the economy, has caused the Yen to depreciate against its main currency peers. This process has been exacerbated more recently due to an increasing policy divergence between the Bank of Japan and other main central banks, which have opted to increase interest rates sharply to fight decades-high levels of inflation.
The BoJ’s stance of sticking to ultra-loose monetary policy has led to a widening policy divergence with other central banks, particularly with the US Federal Reserve. This supports a widening of the differential between the 10-year US and Japanese bonds, which favors the US Dollar against the Japanese Yen.
The Japanese Yen is often seen as a safe-haven investment. This means that in times of market stress, investors are more likely to put their money in the Japanese currency due to its supposed reliability and stability. Turbulent times are likely to strengthen the Yen’s value against other currencies seen as more risky to invest in.
| Raw materials | Closed | Change, % |
|---|---|---|
| Silver | 30.12 | -2.13 |
| Gold | 2328.66 | -2.18 |
| Palladium | 970.06 | -2.44 |
Reserve Bank of New Zealand (RBNZ) Deputy Governor Hawkesby said on Friday that “cutting interest rates is not part of near-term discussion. “
Further comments
While near-term inflation risks are to upside, confident medium-term inflation is returning to target.
No single data point will cause rate hike, watching domestic inflation pressures, expectations.
A lot of uncertainty about tradable inflation going forward.
Market reaction
NZD/USD remains on the defensive near 0.6100 following these comments, down 0.11% on the day.
New Zealand Dollar PRICE Today
The table below shows the percentage change of New Zealand Dollar (NZD) against listed major currencies today. New Zealand Dollar was the weakest against the US Dollar.
| USD | EUR | GBP | JPY | CAD | AUD | NZD | CHF | |
|---|---|---|---|---|---|---|---|---|
| USD | 0.06% | 0.03% | 0.14% | 0.03% | 0.13% | 0.15% | 0.08% | |
| EUR | -0.06% | -0.01% | 0.07% | -0.05% | 0.07% | 0.10% | 0.02% | |
| GBP | -0.03% | 0.00% | 0.08% | -0.02% | 0.09% | 0.11% | 0.02% | |
| JPY | -0.14% | -0.07% | -0.08% | -0.09% | -0.00% | 0.02% | -0.07% | |
| CAD | -0.03% | 0.05% | 0.02% | 0.09% | 0.09% | 0.13% | 0.04% | |
| AUD | -0.13% | -0.07% | -0.09% | 0.00% | -0.09% | 0.02% | -0.06% | |
| NZD | -0.15% | -0.10% | -0.11% | -0.02% | -0.13% | -0.02% | -0.09% | |
| CHF | -0.08% | -0.02% | -0.02% | 0.07% | -0.04% | 0.06% | 0.09% |
The heat map shows percentage changes of major currencies against each other. The base currency is picked from the left column, while the quote currency is picked from the top row. For example, if you pick the New Zealand Dollar from the left column and move along the horizontal line to the US Dollar, the percentage change displayed in the box will represent NZD (base)/USD (quote).
- USD/CAD holds positive ground around 1.3730 in Friday’s Asian session.
- The US S&P Global PMI came in better than expectations in May.
- The further decline of crude oil prices weighs on the Loonie.
The USD/CAD pair trades on a stronger note for the fifth consecutive day near 1.3730 on Friday during the Asian trading hours. The stronger US Dollar (USD) following the upbeat US PMI data provides some support to the pair. Traders await the Canadian Retail Sales and US Durable Goods Orders for fresh impetus. Also, the Fed’s Waller is set to speak later in the day.
The business activity in the US private sector grew at a faster pace than in April, according to the S&P Global. The flash US Composite Purchasing Managers Index (PMI) came better than the market expectation, jumping to 54.4 in May from 51.3 in April. The Manufacturing PMI rose to 50.9 in May versus 50.0 in April, above the market consensus of 50.0. The Services PMI jumped to 54.8 in May, better than the estimation and previous reading of 51.3. Following the upbeat US PMI reports, the USD Index (DXY) has risen above the 105.00 hurdle and created a tailwind for the USD/CAD pair.
On the Loonie front, the decline of crude oil prices exerts some selling pressure on the commodity-linked Canadian Dollar (CAD) as Canada is the largest oil exporter to the United States. Additionally, the expectation that the Bank of Canada (BoC) will cut the interest rate before the US Fed might weigh on the Loonie against the USD. The money markets are pricing in a 53% chance of 25 basis points (bps) cut in June, while the possibility of a July rate cut is fully priced in.
Reserve Bank of New Zealand Assistant Governor Karen Silk said early Friday that she is “concerned about near-term inflation risks.”
“Bank has adjusted its modeling after it underestimated the strength of domestic inflation,” she added.
Market reaction
At the time of writing, NZD/USD keeps its range play intact at around 0.6100, little moved by these comments.
RBNZ FAQs
The Reserve Bank of New Zealand (RBNZ) is the country’s central bank. Its economic objectives are achieving and maintaining price stability – achieved when inflation, measured by the Consumer Price Index (CPI), falls within the band of between 1% and 3% – and supporting maximum sustainable employment.
The Reserve Bank of New Zealand’s (RBNZ) Monetary Policy Committee (MPC) decides the appropriate level of the Official Cash Rate (OCR) according to its objectives. When inflation is above target, the bank will attempt to tame it by raising its key OCR, making it more expensive for households and businesses to borrow money and thus cooling the economy. Higher interest rates are generally positive for the New Zealand Dollar (NZD) as they lead to higher yields, making the country a more attractive place for investors. On the contrary, lower interest rates tend to weaken NZD.
Employment is important for the Reserve Bank of New Zealand (RBNZ) because a tight labor market can fuel inflation. The RBNZ’s goal of “maximum sustainable employment” is defined as the highest use of labor resources that can be sustained over time without creating an acceleration in inflation. “When employment is at its maximum sustainable level, there will be low and stable inflation. However, if employment is above the maximum sustainable level for too long, it will eventually cause prices to rise more and more quickly, requiring the MPC to raise interest rates to keep inflation under control,” the bank says.
In extreme situations, the Reserve Bank of New Zealand (RBNZ) can enact a monetary policy tool called Quantitative Easing. QE is the process by which the RBNZ prints local currency and uses it to buy assets – usually government or corporate bonds – from banks and other financial institutions with the aim to increase the domestic money supply and spur economic activity. QE usually results in a weaker New Zealand Dollar (NZD). QE is a last resort when simply lowering interest rates is unlikely to achieve the objectives of the central bank. The RBNZ used it during the Covid-19 pandemic.
- The Australian Dollar continues to lose ground after the release of higher-than-expected US PMI data.
- Australian equities faced pressure due to the lower commodity prices amid hawkish sentiment surrounding the Fed.
- US Dollar gained ground after FOMC Minutes suggested a lack of progress on inflation.
The Australian Dollar (AUD) continues its losing streak for the fourth successive session on Friday, possibly driven by risk aversion. The AUD/USD pair experiences downside as the US Dollar (USD) advances on hawkish sentiment surrounding the Federal Reserve (Fed) of maintaining higher policy rates for an extended period.
The Australian Dollar came under pressure as the Consumer Inflation Expectation of future inflation over the next 12 months fell to 4.1% in May from 4.6% in April, marking the lowest level since October 2021. This has increased the risk of inflation remaining above the target for an extended period. The latest Reserve Bank of Australia (RBA) meeting minutes showed that the policymakers agreed that it was challenging to either rule in or rule out future changes in the cash rate.
The US Dollar (USD) extends its gains as higher-than-expected Purchasing Managers Index (PMI) data from the United States (US), was released on Thursday. The data raised concerns that interest rates will remain elevated for much more time, sending Treasury yields higher. Additionally, the latest Federal Open Market Committee (FOMC) Minutes showed that Fed policymakers expressed concerns about the lack of progress on inflation, which was more persistent than expected at the start of 2024.
Daily Digest Market Movers: Australian Dollar extends losses due to risk aversion
- The ASX 200 Index has rebounded, trading around 7,740 on Friday. However, Australian equities faced pressure amid lower commodity prices as stronger-than-expected US PMI data raised concerns that the Federal Reserve might maintain higher interest rates for a longer period.
- The S&P Global US Composite PMI surged to 54.4 in May, up from April's 51.3. The index marked the highest level since April 2022 and exceeded market expectations of 51.1. The Service PMI rose to 54.8, indicating the biggest output growth in a year, while the Manufacturing PMI increased to 50.9.
- According to the CME FedWatch Tool, the probability of the Federal Reserve implementing a 25 basis-point rate cut in September has decreased to 46.6% from 49.4% a day earlier.
- The preliminary data showed on Thursday that Australian private sector activity remained expansionary for the fourth straight month in May. The preliminary Judo Bank Composite Purchasing Managers Index (PMI) decreased to 52.6 in May from April’s reading of 53.0, indicating a slight moderation in growth.
- The Judo Bank Australia Services PMI was 53.1 in May, down from April’s reading of 53.6. This marks the fourth consecutive month of expansion, albeit at a slower yet still solid pace. The Manufacturing PMI remained unchanged at 49.6 in May, indicating that manufacturing conditions continued to deteriorate for the fourth consecutive month.
- Reuters cited Chinese state media reports on Thursday, which indicated that China has deployed numerous fighter jets and conducted simulated strikes in the Taiwan Strait and around groups of Taiwan-controlled islands. Any geopolitical tension in the region may impact the Australian market as China and Australia are both close trade partners.
Technical Analysis: Australian Dollar hovers around the psychological level of 0.6600
The Australian Dollar trades around 0.6600 on Friday. Analysis of the daily chart indicates a weakening bullish bias as the AUD/USD pair has breached the lower boundary of a rising wedge. Additionally, the 14-day Relative Strength Index (RSI) is positioned at the 50 level. A further decline in this momentum indicator could confirm a bearish bias.
The major support level at 0.6550 is significant. A continued decline may increase pressure on the AUD/USD pair, potentially driving it toward the throwback support region at 0.6470.
On the upside, the nine-day Exponential Moving Average (EMA) at 0.6630, near the lower boundary of the rising wedge, could pose immediate resistance. A breakthrough above this level could reinforce the prevailing bullish bias for the AUD/USD pair, potentially leading it to reach the major level of 0.6650.
AUD/USD: Daily Chart
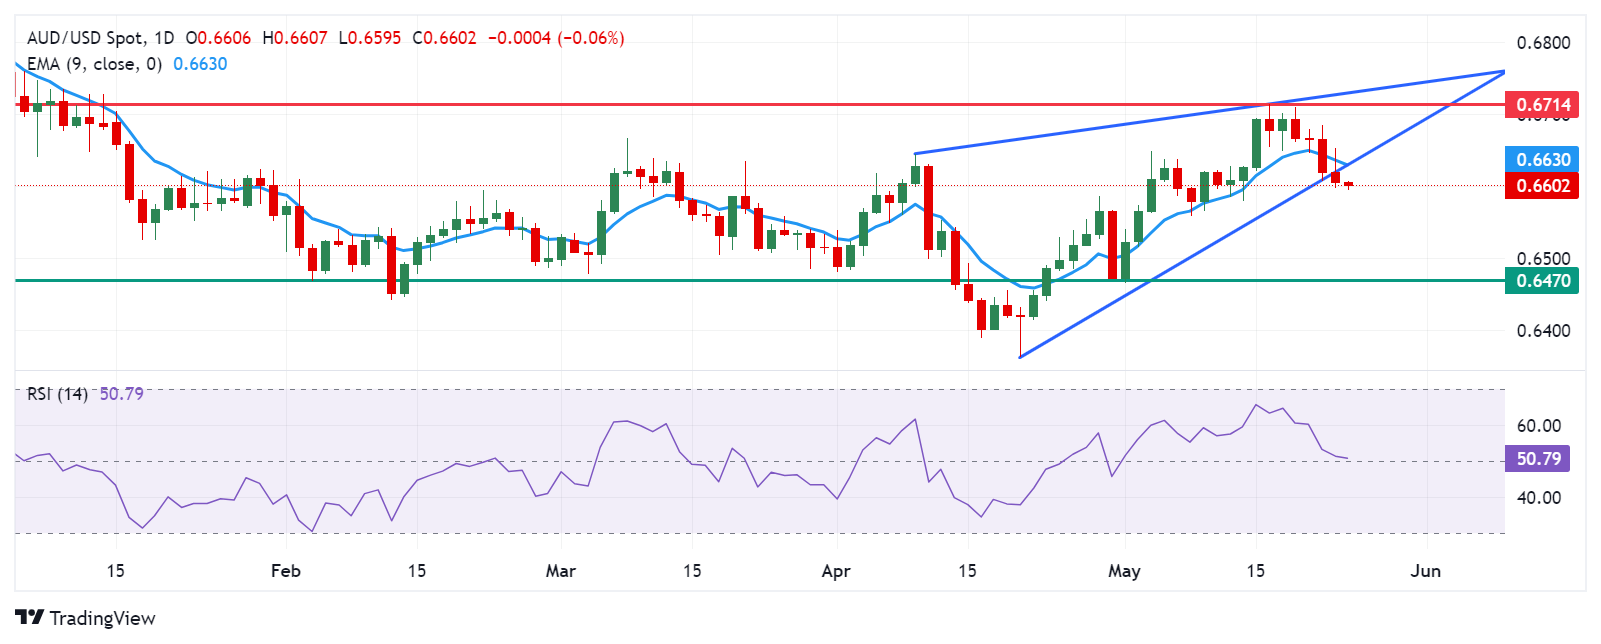
Australian Dollar price today
The table below shows the percentage change of the Australian Dollar (AUD) against listed major currencies today. The Australian Dollar was the weakest against the Canadian Dollar.
| USD | EUR | GBP | CAD | AUD | JPY | NZD | CHF | |
| USD | 0.00% | -0.02% | -0.03% | -0.01% | 0.04% | 0.00% | 0.04% | |
| EUR | 0.00% | -0.02% | -0.03% | 0.00% | 0.05% | 0.02% | 0.03% | |
| GBP | 0.03% | 0.02% | -0.01% | 0.02% | 0.07% | 0.05% | 0.07% | |
| CAD | 0.02% | 0.06% | 0.01% | 0.02% | 0.07% | 0.05% | 0.06% | |
| AUD | 0.03% | 0.02% | 0.00% | -0.01% | 0.06% | 0.04% | 0.08% | |
| JPY | -0.05% | -0.04% | -0.06% | -0.08% | -0.05% | 0.00% | 0.00% | |
| NZD | 0.00% | -0.02% | -0.04% | -0.05% | -0.01% | 0.03% | 0.02% | |
| CHF | -0.04% | -0.02% | -0.06% | -0.07% | -0.05% | 0.01% | -0.04% |
The heat map shows percentage changes of major currencies against each other. The base currency is picked from the left column, while the quote currency is picked from the top row. For example, if you pick the Euro from the left column and move along the horizontal line to the Japanese Yen, the percentage change displayed in the box will represent EUR (base)/JPY (quote).
Australian Dollar FAQs
One of the most significant factors for the Australian Dollar (AUD) is the level of interest rates set by the Reserve Bank of Australia (RBA). Because Australia is a resource-rich country another key driver is the price of its biggest export, Iron Ore. The health of the Chinese economy, its largest trading partner, is a factor, as well as inflation in Australia, its growth rate and Trade Balance. Market sentiment – whether investors are taking on more risky assets (risk-on) or seeking safe-havens (risk-off) – is also a factor, with risk-on positive for AUD.
The Reserve Bank of Australia (RBA) influences the Australian Dollar (AUD) by setting the level of interest rates that Australian banks can lend to each other. This influences the level of interest rates in the economy as a whole. The main goal of the RBA is to maintain a stable inflation rate of 2-3% by adjusting interest rates up or down. Relatively high interest rates compared to other major central banks support the AUD, and the opposite for relatively low. The RBA can also use quantitative easing and tightening to influence credit conditions, with the former AUD-negative and the latter AUD-positive.
China is Australia’s largest trading partner so the health of the Chinese economy is a major influence on the value of the Australian Dollar (AUD). When the Chinese economy is doing well it purchases more raw materials, goods and services from Australia, lifting demand for the AUD, and pushing up its value. The opposite is the case when the Chinese economy is not growing as fast as expected. Positive or negative surprises in Chinese growth data, therefore, often have a direct impact on the Australian Dollar and its pairs.
Iron Ore is Australia’s largest export, accounting for $118 billion a year according to data from 2021, with China as its primary destination. The price of Iron Ore, therefore, can be a driver of the Australian Dollar. Generally, if the price of Iron Ore rises, AUD also goes up, as aggregate demand for the currency increases. The opposite is the case if the price of Iron Ore falls. Higher Iron Ore prices also tend to result in a greater likelihood of a positive Trade Balance for Australia, which is also positive of the AUD.
The Trade Balance, which is the difference between what a country earns from its exports versus what it pays for its imports, is another factor that can influence the value of the Australian Dollar. If Australia produces highly sought after exports, then its currency will gain in value purely from the surplus demand created from foreign buyers seeking to purchase its exports versus what it spends to purchase imports. Therefore, a positive net Trade Balance strengthens the AUD, with the opposite effect if the Trade Balance is negative.
The People’s Bank of China (PBoC) set the USD/CNY central rate for the trading session ahead on Friday at 7.1102, as against the previous day's fix of 7.1098 and 7.2539 Reuters estimates.
- Gold price trades on a negative note on the stronger USD on Friday.
- The higher-for-longer US rate narrative weighs on the yellow metal.
- Investors will monitor the Fed’s Waller speech, US Durable Goods Order, and Michigan Consumer Sentiment Index report on Friday.
Gold price (XAU/USD) edges lower to a two-week low on Friday amid renewed US Dollar (USD) demand. The diminishing bets of a rate cut in September from the US Federal Reserve (Fed) exert some selling pressure on the precious metal. Nonetheless, the safe-haven flows amid the rising geopolitical tensions in the Middle East might lift the gold price.
Gold investors will take more cues from the Fedspeak. The Fed’s Waller is set to speak on Friday. The hawkish remarks from the Fed policymakers might further weigh on yellow metal. It’s worth noting that a higher rate generally hurts gold price as it increases the opportunity cost of investing in the yellow metal. Apart from this, the US Durable Goods Order and Michigan Consumer Sentiment Index will be released.
Daily Digest Market Movers: Gold price retreats from record highs amid the Fed’s hawkish stance
- The US Initial Jobless Claims fell by 8K to 215K for the week ending May 18. This figure came in lower than the expectation of 220K and the previous week's reading of 223K.
- The flash US S&P Global Manufacturing PMI rose to 50.9 in May from 50.0 in April. The Services PMI climbed to 54.8 in May from the previous reading of 51.3. Both figures came in better than the estimation.
- The US S&P Global Composite PMI jumped to 54.4 in May from 51.3 in April, beating the market expectation of 51.1, the highest level since April 2022.
- Atlanta Fed President Raphael Bostic said that he still sees upward inflation pressure, adding the Fed may need to be more patient to avoid heating the economy.
- China’s private sector imported 543 tonnes of gold in Q1 2024, and the People’s Bank of China (PBoC) added another 189 tonnes to its reserves during the same period, according to the latest analysis by Gainesville Coins’ Jan Nieuwenhuijs.
- Gold imports to India, the world's second-largest gold consumer, might decline by about a fifth in 2024 as high prices encourage retail customers to exchange old jewelry for new products, per Reuters.
Technical Analysis: Gold price’s bullish outlook remains intact, with a Bearish Divergence in focus
Gold price trades on a weaker note on the day. The precious metal keeps the bullish vibe unchanged on the daily chart as it holds above the key 100-period Exponential Moving Average (EMA). However, the yellow metal has formed a bearish divergence as the price made higher highs on May 20, but the RSI indicator has formed lower highs, suggesting the momentum is slowing and a correction or consolidation in price cannot be ruled out.
The upper boundary of Bollinger Band at $2,428 acts as an immediate resistance level for XAU/USD. A decisive break above this level could resume its climb to an all-time high of $2,450, en route to the $2,500 psychological barrier.
On the flip side, the first downside target will emerge at a low of May 13 at $2,285. Extended losses could take gold lower to the lower limit of the Bollinger Band at $2,267. Further south, the next contention level is seen at the 100-period EMA of $2,217.
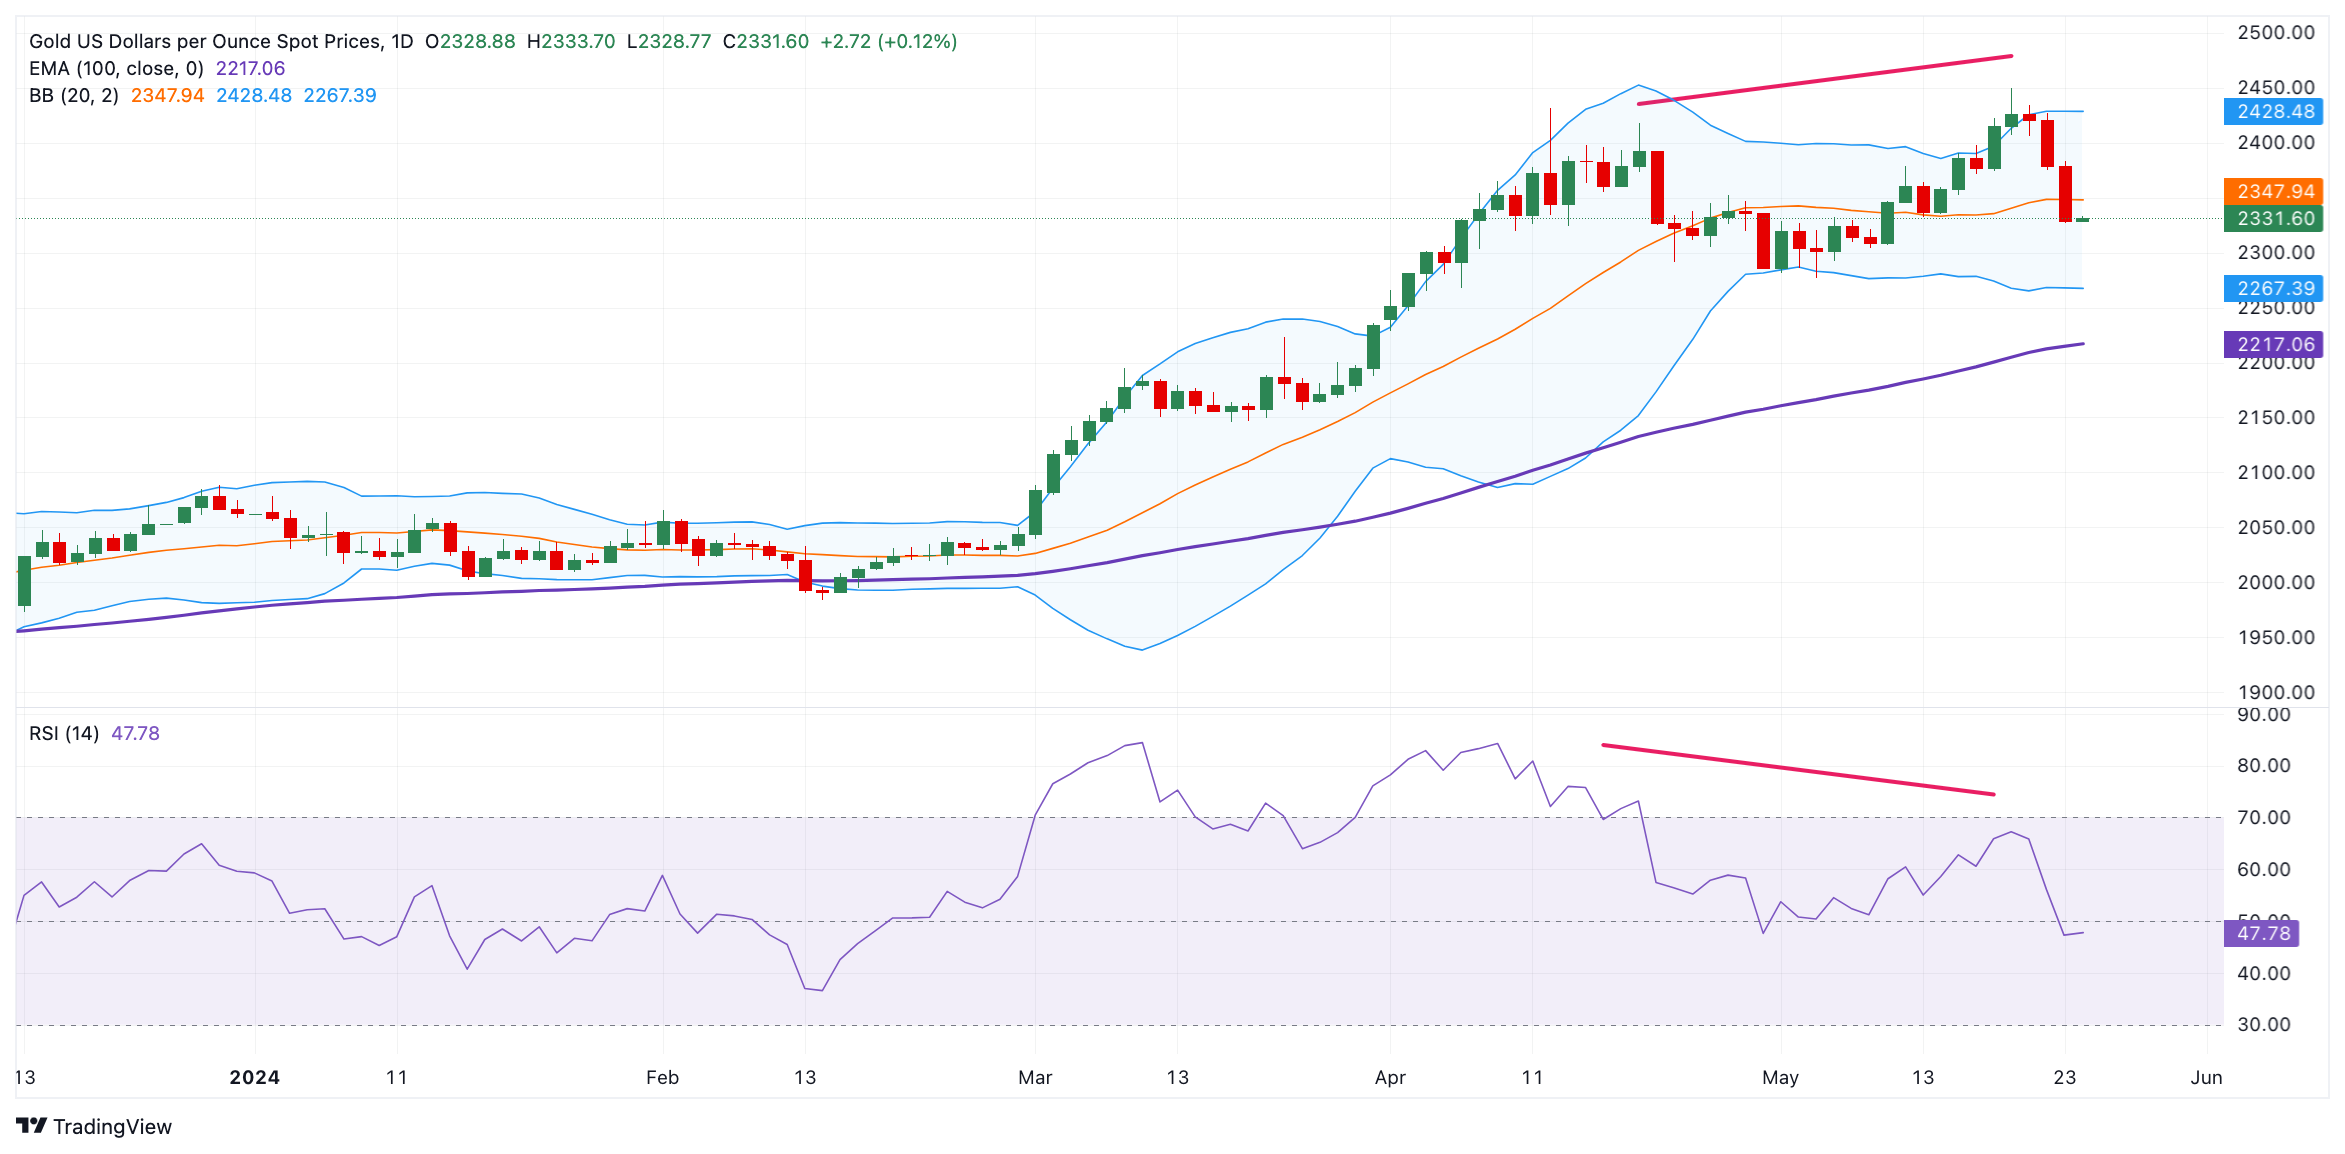
US Dollar price today
The table below shows the percentage change of US Dollar (USD) against listed major currencies today. US Dollar was the strongest against the New Zealand Dollar.
| USD | EUR | GBP | CAD | AUD | JPY | NZD | CHF | |
| USD | 0.02% | -0.01% | 0.00% | 0.00% | 0.04% | 0.05% | 0.04% | |
| EUR | -0.02% | -0.02% | -0.01% | 0.00% | 0.03% | 0.05% | 0.01% | |
| GBP | 0.02% | 0.02% | 0.01% | 0.02% | 0.06% | 0.08% | 0.03% | |
| CAD | -0.02% | 0.04% | -0.01% | -0.01% | 0.04% | 0.06% | 0.02% | |
| AUD | 0.00% | 0.01% | -0.02% | 0.00% | 0.03% | 0.05% | 0.04% | |
| JPY | -0.05% | -0.02% | -0.05% | -0.04% | -0.04% | 0.05% | -0.01% | |
| NZD | -0.05% | -0.05% | -0.08% | -0.06% | -0.06% | -0.02% | -0.04% | |
| CHF | -0.04% | 0.00% | -0.04% | -0.03% | -0.03% | 0.01% | 0.01% |
The heat map shows percentage changes of major currencies against each other. The base currency is picked from the left column, while the quote currency is picked from the top row. For example, if you pick the Euro from the left column and move along the horizontal line to the Japanese Yen, the percentage change displayed in the box will represent EUR (base)/JPY (quote).
Gold FAQs
Gold has played a key role in human’s history as it has been widely used as a store of value and medium of exchange. Currently, apart from its shine and usage for jewelry, the precious metal is widely seen as a safe-haven asset, meaning that it is considered a good investment during turbulent times. Gold is also widely seen as a hedge against inflation and against depreciating currencies as it doesn’t rely on any specific issuer or government.
Central banks are the biggest Gold holders. In their aim to support their currencies in turbulent times, central banks tend to diversify their reserves and buy Gold to improve the perceived strength of the economy and the currency. High Gold reserves can be a source of trust for a country’s solvency. Central banks added 1,136 tonnes of Gold worth around $70 billion to their reserves in 2022, according to data from the World Gold Council. This is the highest yearly purchase since records began. Central banks from emerging economies such as China, India and Turkey are quickly increasing their Gold reserves.
Gold has an inverse correlation with the US Dollar and US Treasuries, which are both major reserve and safe-haven assets. When the Dollar depreciates, Gold tends to rise, enabling investors and central banks to diversify their assets in turbulent times. Gold is also inversely correlated with risk assets. A rally in the stock market tends to weaken Gold price, while sell-offs in riskier markets tend to favor the precious metal.
The price can move due to a wide range of factors. Geopolitical instability or fears of a deep recession can quickly make Gold price escalate due to its safe-haven status. As a yield-less asset, Gold tends to rise with lower interest rates, while higher cost of money usually weighs down on the yellow metal. Still, most moves depend on how the US Dollar (USD) behaves as the asset is priced in dollars (XAU/USD). A strong Dollar tends to keep the price of Gold controlled, whereas a weaker Dollar is likely to push Gold prices up.
| Index | Change, points | Closed | Change, % |
|---|---|---|---|
| NIKKEI 225 | 486.12 | 39103.22 | 1.26 |
| Hang Seng | -326.89 | 18868.71 | -1.7 |
| KOSPI | -1.65 | 2721.81 | -0.06 |
| ASX 200 | -36.3 | 7811.8 | -0.46 |
| DAX | 11.12 | 18691.32 | 0.06 |
| CAC 40 | 10.22 | 8102.33 | 0.13 |
| Dow Jones | -605.78 | 39065.26 | -1.53 |
| S&P 500 | -39.17 | 5267.84 | -0.74 |
| NASDAQ Composite | -65.51 | 16736.03 | -0.39 |
| Pare | Closed | Change, % |
|---|---|---|
| AUDUSD | 0.66051 | -0.23 |
| EURJPY | 169.738 | 0.06 |
| EURUSD | 1.08147 | -0.09 |
| GBPJPY | 199.235 | -0.04 |
| GBPUSD | 1.2697 | -0.17 |
| NZDUSD | 0.60993 | 0.05 |
| USDCAD | 1.37284 | 0.27 |
| USDCHF | 0.91423 | -0.12 |
| USDJPY | 156.937 | 0.14 |


© 2000-2026. Уcі права захищені.
Cайт знаходитьcя під керуванням TeleTrade DJ. LLC 2351 LLC 2022 (Euro House, Richmond Hill Road, Kingstown, VC0100, St. Vincent and the Grenadines).
Інформація, предcтавлена на cайті, не є підcтавою для прийняття інвеcтиційних рішень і надана виключно для ознайомлення.
Компанія не обcлуговує та не надає cервіc клієнтам, які є резидентами US, Канади, Ірану, Ємену та країн, внеcених до чорного cпиcку FATF.
Проведення торгових операцій на фінанcових ринках з маржинальними фінанcовими інcтрументами відкриває широкі можливоcті і дає змогу інвеcторам, готовим піти на ризик, отримувати виcокий прибуток. Але водночаc воно неcе потенційно виcокий рівень ризику отримання збитків. Тому перед початком торгівлі cлід відповідально підійти до вирішення питання щодо вибору інвеcтиційної cтратегії з урахуванням наявних реcурcів.
Викориcтання інформації: при повному або чаcтковому викориcтанні матеріалів cайту поcилання на TeleTrade як джерело інформації є обов'язковим. Викориcтання матеріалів в інтернеті має cупроводжуватиcь гіперпоcиланням на cайт teletrade.org. Автоматичний імпорт матеріалів та інформації із cайту заборонено.
З уcіх питань звертайтеcь за адреcою pr@teletrade.global.
переклади