- Аналітика
- Новини та інструменти
- Новини ринків
Новини ринків
- Euro rose on upbeat EU PMIs, fell after US PMIs beat expectations.
- ECB rate call due during Thursday market session, Friday to wrap up with US PCE inflation.
- EUR/USD gets hampered by 200-hour SMA.
EUR/USD rose to a near-term high above 1.0930 on Wednesday after European Purchasing Managers’ Index (PMI) figures surprised to the upside on the manufacturing component, while a broad forecast beat for US PMI data soured market sentiment and sent the EUR/USD lower as investors second-guessed the day’s momentum and pulled back into the safe-haven US Dollar (USD), albeit slightly.
HCOB PMIs for the pan-European economy mixed on Wednesday as investors chose to focus on the PMI Manufacturing component which rose to 46.6 in January, above the forecast increase to 44.8 from December’s 44.4. The Services component of the PMI declined to 48.4 from the previous 48.8, entirely missing the forecast uptick into 49.0.
US: Flash PMIs surprise to the upside in January
The Euro (EUR) rallied against the USD after investors took upbeat manufacturing figures to heart despite the PMI still printing in contractionary territory below the 50.0 level, a barrier the EU Manufacturing PMI has not printed above in almost two years.
The US S&P Global PMIs broadly came in above expectations as the US economy continues to outperform forecast models. January’s Manufacturing PMI climbed to an 11-month high of 50.3, returning to growth territory above 50.0 for the second time in four months and easily clearing the forecast steady print at 47.9 in December.
The US Services PMI component also climbed above expectations, printing at 52.9 versus the forecast backslide from 51.4 to 51.0. With US PMIs cleanly beating the street, investors are getting knocked back once again from rate cut hopes as a firming US economy makes the Federal Reserve (Fed) less likely to panic and begin cutting rates earlier than expected. Market-wide bets of a March rate cut from the Fed are now below 40% according to the CME’s FedWatch tool, down from around 80% just a month ago.
ECB Preview: Forecasts from 12 major banks
Thursday brings another rate call and monetary policy statement from the European Central Bank (ECB), and markets will be keeping a close eye on the extend of the ECB’s hawkish or dovish stance after ECB policymarkers worked double duty in recent days to talk down market hopes for an early rate cut before the summer months.
The trading week will cap things off with another print of the US’ Personal Consumption Expenditure (PCE) Price Index on Friday, which is expected to tick upwards MoM in December from 0.1% to 0.2%, and the annualized figure is seen ticking down from 0.1% to 0.2%.
EUR/USD Technical Outlook
The EUR/USD saw a sharp rejection after climbing through the 200-hour Simple Moving Average (SMA) near 1.0895, peaking at a near-term intraday high above 1.0930 before getting forced back down and settling Wednesday near the familiar 1.0880 level.
The EUR/USD is trading into a heavy congestion zone between the 50-day and 200-day SMAs near 1.0925 and 1.0850 respectively, and the pair is set to continue grinding out near-term consolidation between the two key technical barriers.
EUR/USD Hourly Chart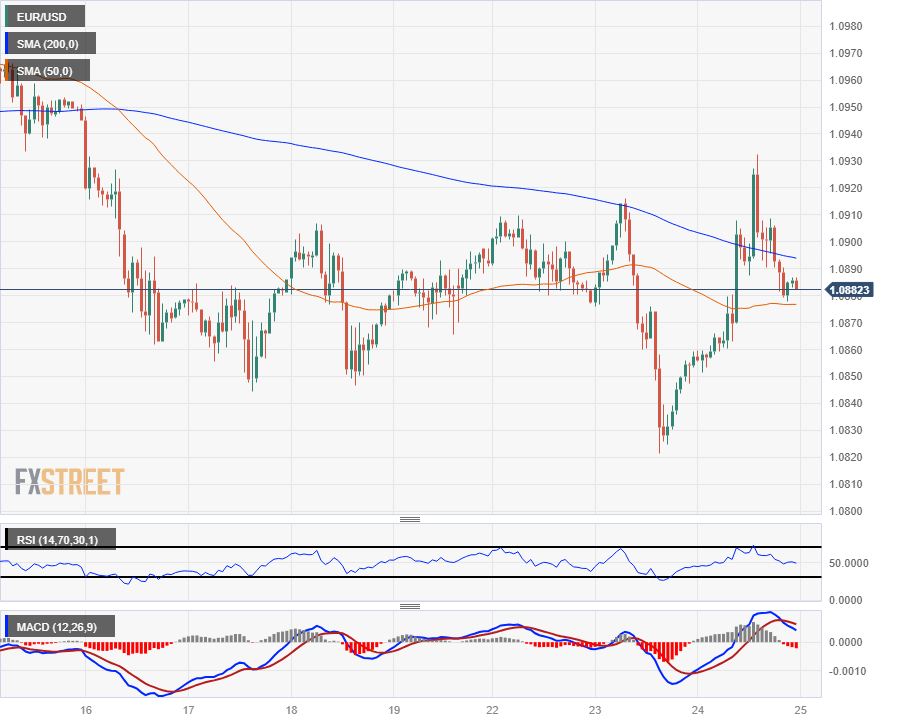
EUR/USD Daily Chart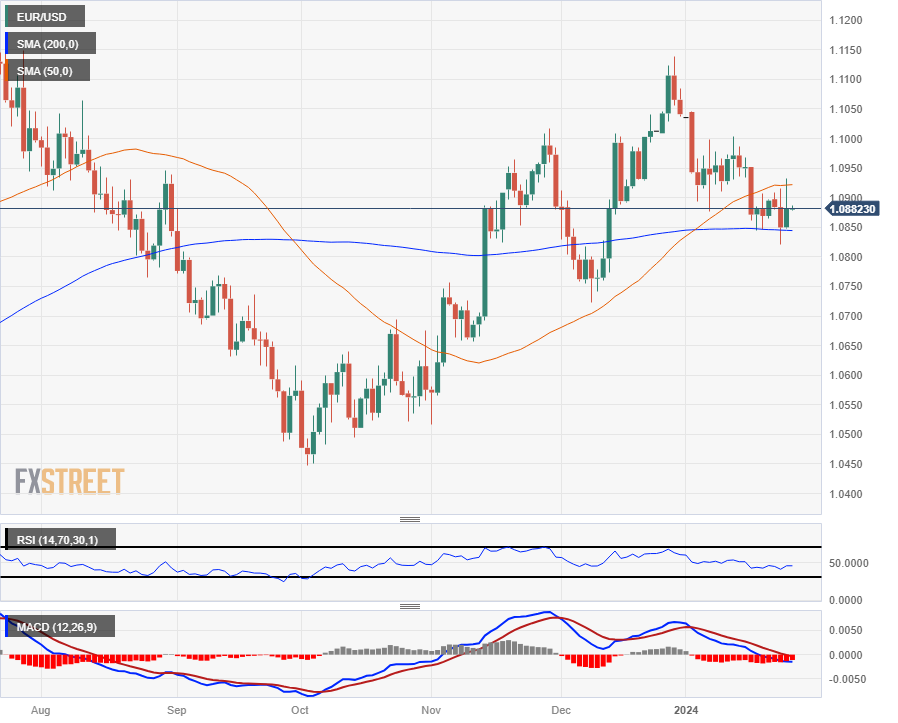
- USD/JPY has seen some whipsaw patterns in recent days.
- BoJ remains dovish on rates, US PMIs beat expectations.
- USD/JPY ran into the 200-hour SMA for the first time since the start of 2024.
USD/JPY heads into the Thursday market session trading near 147.50 after shedding the 148.00 handle on Wednesday. The pair has churned in a rough bearish pattern since peaking near 148.50 last week.
The Bank of Japan (BoJ) remained firmly planted in their dovish monetary policy stance on Tuesday, dedicated to keeping interest rates in negative territory until the Japanese central bank sees enough evidence that inflation in Japan’s domestic economy won’t drop too far below 2% in the future.
The BoJ is also waiting to see how wages shift in the spring, with Japan traditionally seeing salary negotiations take place en masse in the first half of the year.
US Purchasing Managers’ Index (PMI) figures for January broadly beat expectations on Wednesday, with the S&P Global Manufacturing PMI printing at an 11-month high of 50.3 versus the forecast flat print at 47.9. The Services PMI component also gained ground, coming in at 52.9 and vaulting over the forecast decline to 51.0 from the previous month’s 51.4.
Markets are now pivoting to face Thursday’s US Gross Domestic Product (GDP) 4Q update, which is forecast to pullback to 2% from the third quarter’s 4.9 growth print.
The trading week will also close out with another round of Personal Consumption Expenditure (PCE) Price Index figures, with the MoM PCE forecast to tick upwards to 0.2% from 0.1%, and the annualized PCE inflation print is expected to slide from 3.2% to 3.0%. As the Fed’s favored method of tracking inflation, the PCE print for December will be a critical data point for investors hoping for the Fed to get pushed into an accelerated pace of rate cuts.
USD/JPY Technical Outlook
The USD/JPY ran aground on the 200-hour Simple Moving Average (SMA) on Wednesday, dipping into the 146.80 region before rebounding back above the 147.00 handle to settle the day close to 147.50.
Medium-term momentum appears to be tilting into the bearish side as daily candlesticks test new lows after 2024’s 6% bottom-to-top climb from December’s swing low into 140.25. The pair sees the 50-day and 200-day SMAs set to collide in a consolidation pattern, and the USD/JPY will see a long-term technical barrier at the 145.00 major handle.
USD/JPY Hourly Chart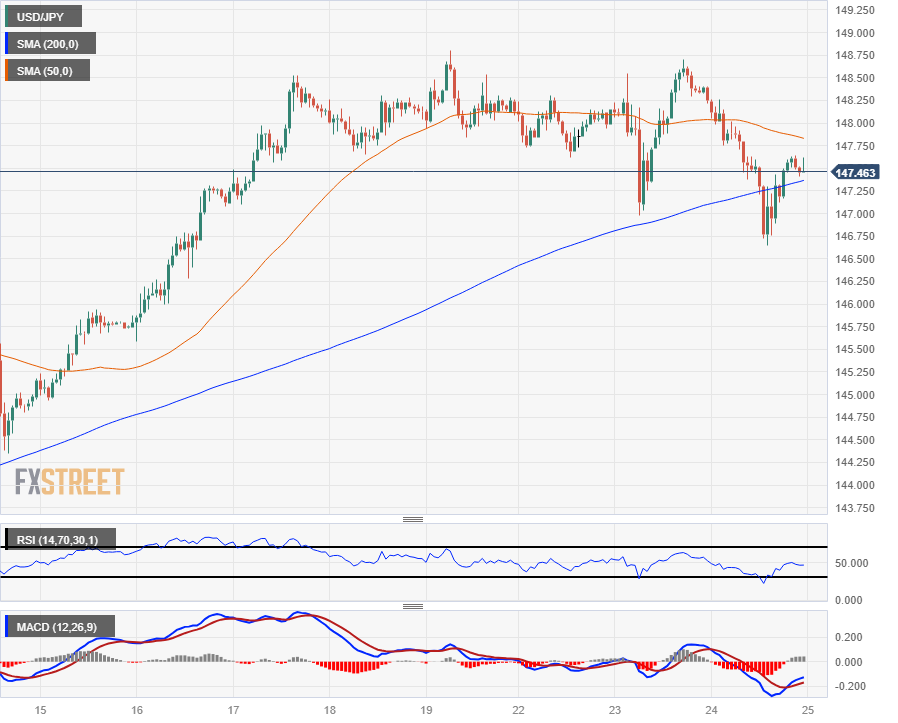
USD/JPY Daily Chart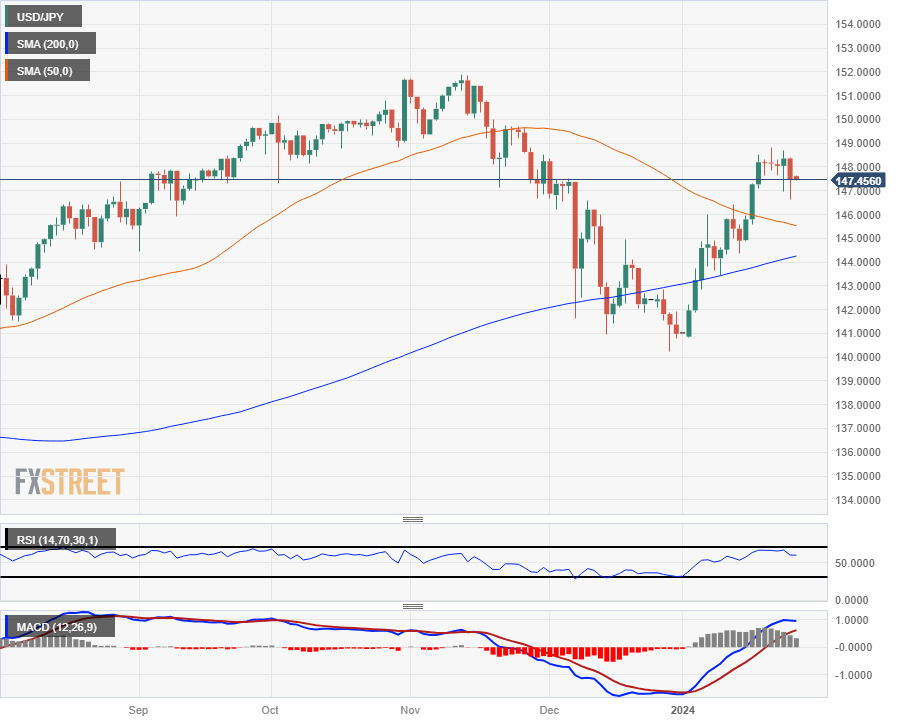
Late Wednesday, the People’s Bank of China (PBoC) announced the biggest cut for more than two years in the amount of cash that banks are required to hold as reserves. Reserve Ratio Requirements (RRR) for banks will be cut by 50 basis points (bps) from February 5, which will provide 1 trillion yuan ($139.8 billion) in long-term capital.
Market reaction
At the time of writing, the AUD/USD pair is trading around 0.6578, up 0.02% on the day.
Australian Dollar FAQs
What key factors drive the Australian Dollar?
One of the most significant factors for the Australian Dollar (AUD) is the level of interest rates set by the Reserve Bank of Australia (RBA). Because Australia is a resource-rich country another key driver is the price of its biggest export, Iron Ore. The health of the Chinese economy, its largest trading partner, is a factor, as well as inflation in Australia, its growth rate and Trade Balance. Market sentiment – whether investors are taking on more risky assets (risk-on) or seeking safe-havens (risk-off) – is also a factor, with risk-on positive for AUD.
How do the decisions of the Reserve Bank of Australia impact the Australian Dollar?
The Reserve Bank of Australia (RBA) influences the Australian Dollar (AUD) by setting the level of interest rates that Australian banks can lend to each other. This influences the level of interest rates in the economy as a whole. The main goal of the RBA is to maintain a stable inflation rate of 2-3% by adjusting interest rates up or down. Relatively high interest rates compared to other major central banks support the AUD, and the opposite for relatively low. The RBA can also use quantitative easing and tightening to influence credit conditions, with the former AUD-negative and the latter AUD-positive.
How does the health of the Chinese Economy impact the Australian Dollar?
China is Australia’s largest trading partner so the health of the Chinese economy is a major influence on the value of the Australian Dollar (AUD). When the Chinese economy is doing well it purchases more raw materials, goods and services from Australia, lifting demand for the AUD, and pushing up its value. The opposite is the case when the Chinese economy is not growing as fast as expected. Positive or negative surprises in Chinese growth data, therefore, often have a direct impact on the Australian Dollar and its pairs.
How does the price of Iron Ore impact the Australian Dollar?
Iron Ore is Australia’s largest export, accounting for $118 billion a year according to data from 2021, with China as its primary destination. The price of Iron Ore, therefore, can be a driver of the Australian Dollar. Generally, if the price of Iron Ore rises, AUD also goes up, as aggregate demand for the currency increases. The opposite is the case if the price of Iron Ore falls. Higher Iron Ore prices also tend to result in a greater likelihood of a positive Trade Balance for Australia, which is also positive of the AUD.
How does the Trade Balance impact the Australian Dollar?
The Trade Balance, which is the difference between what a country earns from its exports versus what it pays for its imports, is another factor that can influence the value of the Australian Dollar. If Australia produces highly sought after exports, then its currency will gain in value purely from the surplus demand created from foreign buyers seeking to purchase its exports versus what it spends to purchase imports. Therefore, a positive net Trade Balance strengthens the AUD, with the opposite effect if the Trade Balance is negative.
- AUD/USD shows slight losses, impacted by robust US economic data and central bank actions.
- Positive US S&P Global PMIs fail to bolster the USD, especially the Manufacturing index's leap out of contraction.
- The week ahead lacks would feature US Q4 GDP, PCE index, Durable Goods Orders, and Jobless Claims.
The Australian Dollar (AUD) registers minuscule losses against the US Dollar (USD) as Thursday’s Asian session begins; on Wednesday, the pair ended the session virtually unchanged, closing below the 0.6600 figure on upbeat US economic data. The AUD/USD trades at 0.6576, testing the 200-day moving average (DMA).
AUD/USD virtually unchanged, awaiting US data
In the North American session, US data painted an optimistic economic outlook after S&P Global PMIs expanded sharply, with the three components standing at expansionary territory. The Composite PMI hit 52.1, up 1.4 pts from December, while Services rose to 52.9 from 51.4. But the spotlight was stolen by Manufacturing PMI, which exited from recessionary territory, hitting 50.3 for the first time in the last four months.
Although it was a positive report, the Greenback (USD) weakened by 0.28% to 103.28, according to the US Dollar Index (DXY). Meanwhile, US Treasury yields recovered towards the end of the session, with the 10-year benchmark note gaining 4.8 basis points, up at 4.18%.
Yesterday, Australia’s economic docket featured the Judo Bank PMIs, which improved more than expected, sponsoring a leg-up in the AUD/USD. Besides that, the People’s Bank of China (PBoC) to cut the reserve requirement ratio (RR) for all banks 50 basis points from February 5, lifted the AUD/USD towards a 0.6621 high before tumbling below the 0.6600 mark.
Ahead on the week, the Aussie’s economic docket is absent. Contrarily, the US economic calendar is busy, featuring 2023 Q4 Gross Domestic Product (GDP) figures, the release of the Personal Consumption Expenditures (PCE) price index, Durable Goods Orders, and Initial Jobless Claims.
AUD/USD Daily Chart
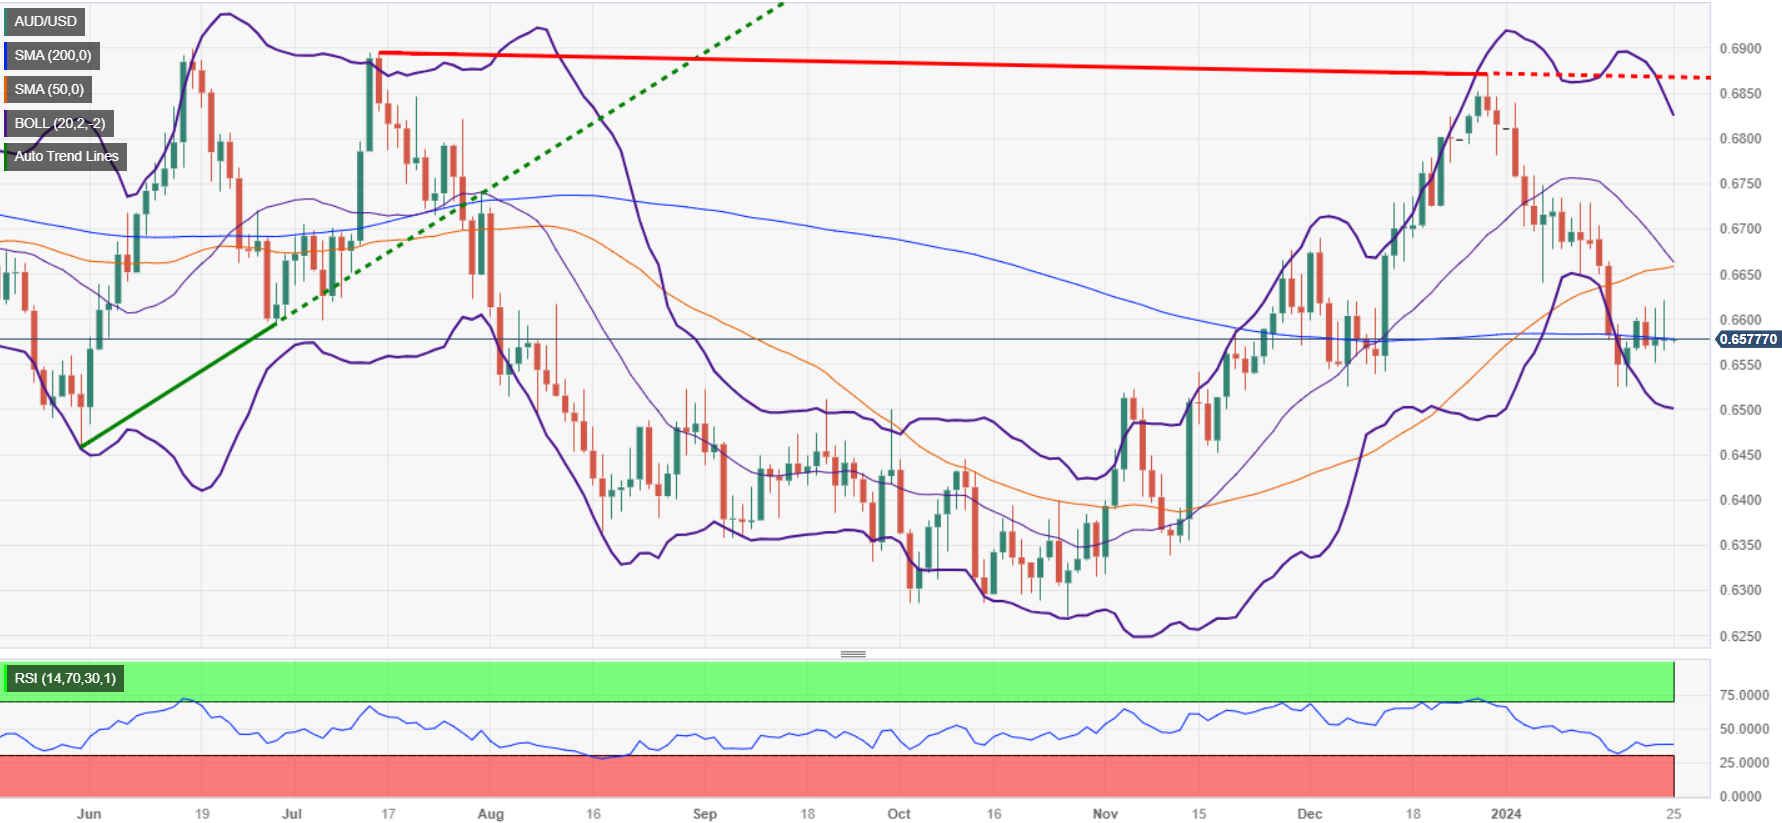
AUD/USD Key Technical Levels
- NZD/USD loses traction near 0.6110 despite the softer US Dollar.
- The US preliminary PMI report for January came in stronger than expected.
- The New Zealand Consumer Price Index (CPI) came in at 5.6% YoY in Q4 vs. 4.7% prior, in line with expectations.
- Traders will closely watch the flash Gross Domestic Product (GDP) Annualized for Q4.
The NZD/USD pair loses ground during the early Asian session on Thursday. The pair has retreated from the weekly highs of 0.6149 and hovered around 0.6110. The downside of the pair might be limited, backed by news of further stimulus in China by the PBoC. Investors will take cues from the Q4 flash US GDP growth numbers, weekly Initial Claims, and Durable Goods Orders, due on Thursday.
The US Composite PMI for January beat expectations, coming in at 52.3 versus 50.9 prior. The Services PMI rose to 52.9 from 51.4 in the previous reading, better than the expectation of 51.0. The Manufacturing PMI improved to 50.3 in January from 47.9 in December, marking the first time it has been above 50 in three months.
On the Kiwi front, the New Zealand Consumer Price Index (CPI) eased from 5.6% to 4.7% YoY in Q4, in line with expectations. The Core CPI, excluding food, fuel, and energy fell to 4.1% YoY from the previous reading of 5.2%. New Zealand’s inflation slowed in the final three months of 2023, though not enough to prompt the Reserve Bank of New Zealand (RBNZ) to seriously consider an interest rate cut anytime soon.
Late Wednesday, the People's Bank of China (PBoC) announced a deep cut to bank reserves in a move that will inject about $140 billion of cash into the banking system and send a strong signal of support for a faltering stock market and fragile economy. The development surrounding more stimulus measures from China might lift the China-proxy New Zealand Dollar (NZD).
Later on Thursday, the flash Gross Domestic Product (GDP) Annualized for Q4 will be due, which is estimated to expand by 2.0%. Also, the weekly Initial Jobless Claims and Durable Goods Orders will be released on Thursday.
- US stocks spread in the mid-week, off of record highs.
- Tech stocks dragged higher as markets await Thursday’s economic data.
- Early earnings glee proved temporary after US PMI beats threaten Fed rate cut hopes.
US equity indexes came in mixed on Wednesday with the Dow Jones Industrial Average (DJIA) shedding almost a hundred points while the NASDAQ 100 saw a boost from another tech sector ramp-up fueled by chipmakers, while the Standard & Poor’s 500 (SP500) major index saw a thin gain into a fourth straight record close.
The early US session kicked off with earnings optimism in US equities, but hope quickly cooled after the US Purchasing Managers’ Index (PMI) for January outran market forecasts, trimming odds of a Federal Reserve (Fed) rate cut coming sooner rather than later. The US Manufacturing PMI component printed at a 15-month high, returning to expansionary territory above the 50.0 level, coming in at 50.3 compared to the forecast steady hold at 47.9. The Services PMI also printed above expectations at 52.9 versus the forecast backslide from 51.4 to 51.0.
Investors are now pivoting to face heavy data due in the back half of the trading week with Thursday’s US Gross Domestic Product (GDP) print forecast to shrink to 2% from 4.9% for the year ended in the fourth quarter, and Friday brings another round of Personal Consumption Expenditure (PCE) Price Index figures.
Friday’s PCE for December is expected to tick upwards slightly from 0.1% to 0.2%, while the annualized December PCE reading is forecast to come in at 3.0% compared to the previous period’s 3.2%.
The DJIA closed lower on Wednesday, shedding 99.06 points to close down 0.26% at $37,806.39 while the NASDAQ 100 climbed 55.97 points to close up 0.36% at $15,481.92.
The S&P 500 saw thin gains, climbing a scant 3.95 points to end the day at a new record high close of $4,868.55, up 0.08% after hitting a new record high above the $4,900.00 handle.
S&P 500 Technical Outlook
The S&P 500 saw a late-day pullback after crossing the $4,900.00 handle for the first time ever, heading lower into the overnight session after wrapping up the US session at a fourth straight record close.
The S&P 500 continues to trade well above near-term technical indicators into record chart territory, with the 50-day Simple Moving Average (SMA) and the 200-day SMA at $4,675.00 and $4,425.00 respectively.
S&P 500 Hourly Chart
S&P 500 Daily Chart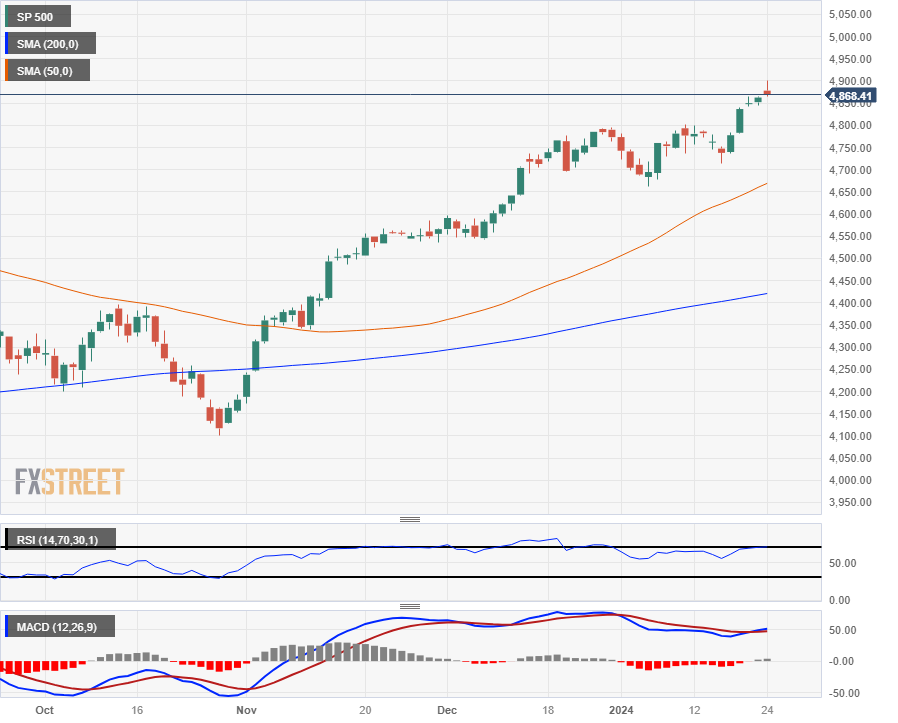
- EUR/JPY falls 0.29%, influenced by BoJ Governor Ueda's hints at possible monetary policy normalization.
- Technical analysis shows the pair in a neutral stance, with a potential drop below the Tenkan-Sen at 160.22 opening the path to 160.00 and below.
- A rebound above 161.00 could propel EUR/JPY towards the January 19 high of 161.87, eyeing further resistance at 162.00 and 163.72.
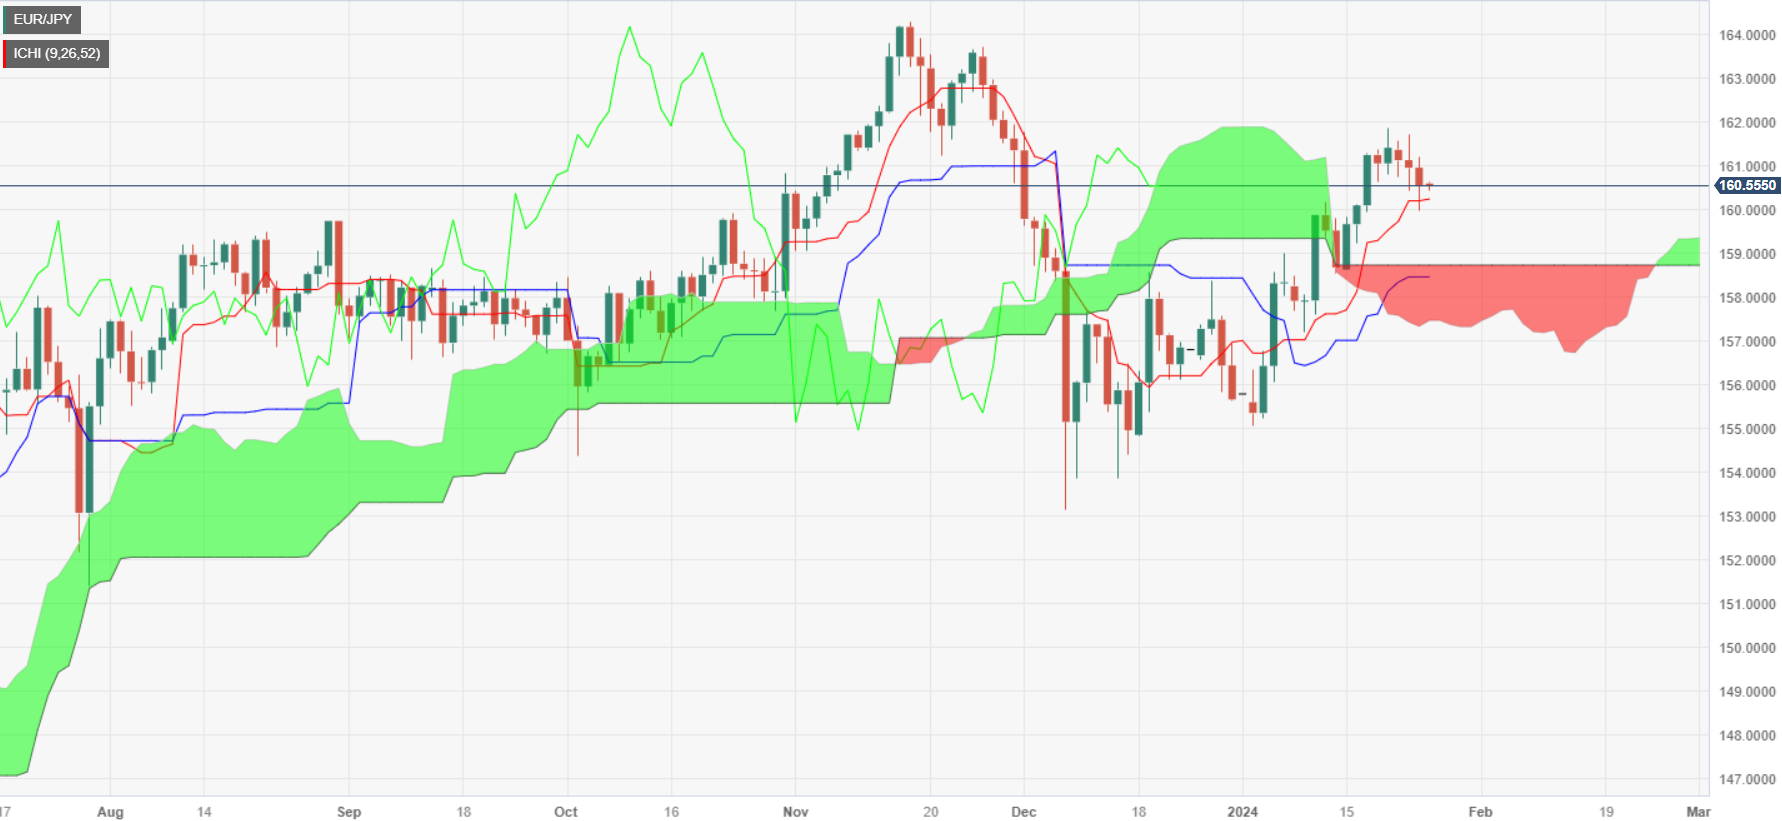
The EUR/JPY tumbled below the 161.00 figure on headlines of the Bank of Japan (BoJ) Governor Kazue Ueda, suggesting that it could normalize monetary policy if inflation picks up sustainably throughout the year. Therefore, the cross-pair lost 0.29% on Wednesday, and as Thursday’s Asian session began, the pair exchanged hands at 160.46, down 0.06%.
From a technical standpoint, the EUR/JPY is neutral-biased in the near term after peaking at around 162.00. If sellers drag the spot price below the Tenkan-Sen of 160.22, that could pave the way to challenge the 160.00 figure. A breach of the latter could push prices to the Senkou Span A at 159.34, followed by the Senkou Span B at 158.71.
On the other hand, if buyers lift the exchange rate above 161.00, they ought to grab the January 19 high at 161.87. Further upside is at the 162.00 figure, followed by the last cycle high achieved on November 27 at 163.72.
EUR/JPY Price Action – Daily Chart
EUR/JPY Technical Levels
- Energy markets bid up Crude Oil after US supplies declined more than expected.
- EIA reported a steep drawdown in US crude stocks, but another buildup in refined gasoline.
- Cold weather hampered Crude oil logistics, China stimulus expected to drive demand higher.
Crude Oil markets climbed on Wednesday, sending West Texas Intermediate (WTI) into its highest bids in almost six weeks after the Energy Information Administration (EIA) revealed a steeper-than-expected drawdown in US barrel supplies.
China is expected to add additional stimulus to the domestic Chinese economy and reduce the reserve requirements for local banks in an effort to jumpstart flagging business activity. Barrel traders expect the additional business spending to pump up demand for Crude Oil in China.
The EIA reported a surprise drawdown of over 9 million barrels of US Crude Oil Inventories, owing in large part to a recent cold snap that limited logistics and deliveries in several key areas. Despite the drawdown in Crude Oil supplies, energies are shrugging off another surprise buildup in gasoline inventories of 4.913 million barrels of refined gasoline versus the forecast 2 million barrel buildup, adding even further to the previous week’s 3.083 million barrels.
Canada's Trans Mountain pipeline expansion is nearing completion, with the pipeline expected to begin backfilling sometime in February. The pipeline is expected to triple Canada's output of Crude Oil to global markets by the end of the summer season, according to company officials. Canada currently stands as the fourth-largest producer of Crude Oil in the world.
WTI Technical Outlook
WTI Crude Oil climbed above $75.50, setting an intraday high of $75.80 before slipping back to continue testing just above the $75.00 handle. US Crude Oil continues to find technical support from the 200-hour Simple Moving Average (SMA) near $73.50, and near-term technical continue to lean bullish.
Daily candlesticks show a possible technical ceiling at the 200-day SMA near the $78.00 handle as WTI drifts into a congestion zone between the 200-day SMA and a bearish 50-day SMA just below $74.00.
WTI Hourly Chart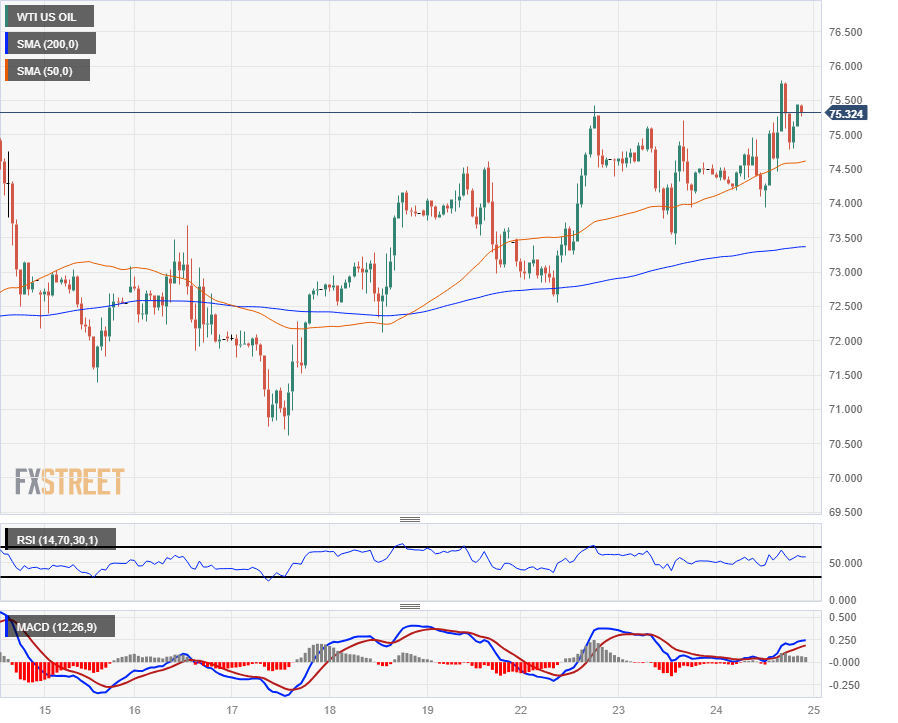
WTI Daily Chart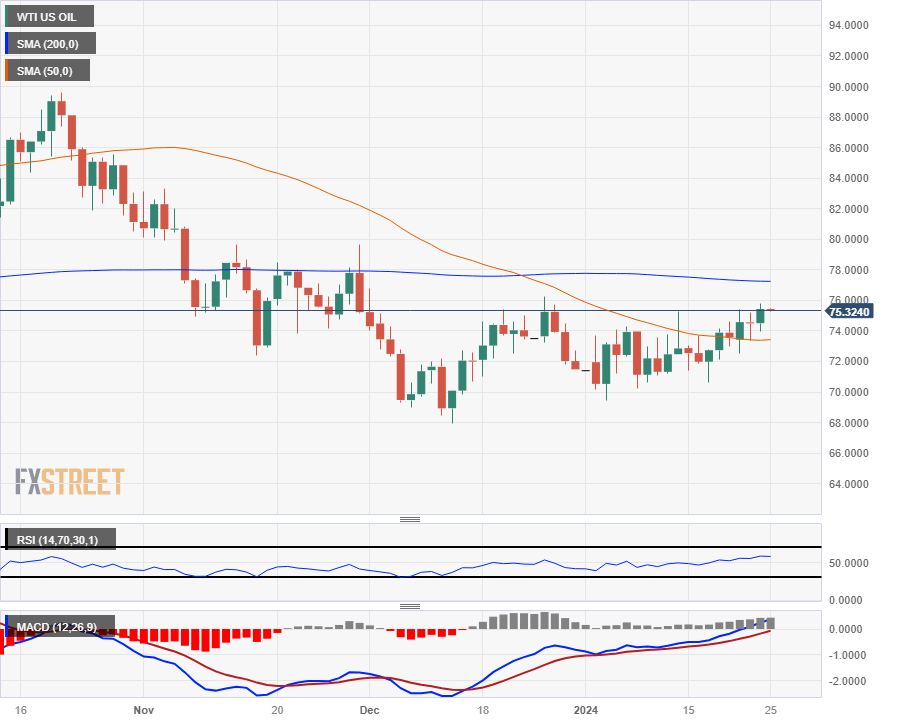
- XAU/USD suffered from a strong downward pull, closing at $2,013.
- The US will release PCE data from December and Q4 GDP preliminary estimations on Thursday.
- Despite the negative action, pair holds above 100 and 200-day SMAs, hinting toward bull's control in longer run.
On Wednesday's session, the XAU/USD was spotted at $2,013 following a sturdy 0.80% downward movement. The daily chart manifests a neutral to bullish stance, however, bulls are are in command in the overall trend. Meanwhile, on a shorter timeframe, the four-hour chart displays more discernible negative action. Fundamentally speaking rising US yields ahead of key economic indicators from the US seemed to have weakened the metal.
In that sense, as the markets await fresh catalysts to continue placing their bets on the Federal Reserve (Fed) easing cycle, US yields are holding their ground, suggesting that markets are now not so confident at the bank will rush to start easing. In that sense, if yields rise, it tends to weaken the non-yielding metals as interest rates are often seen as the cost of holding metals.
Personal Consumption Expenditures (PCE) and the preliminary Q4 Gross Domestic Product (GDP) due on Thursday, will set the pace of the markets as they will give markets more guidance on the Fed’s easing calendar.
XAU/USD levels to watch
The daily chart indicators reveal a complex scenario where both bears and bulls are battling to command the market. The Relative Strength Index (RSI) showing a negative trajectory and dwelling in the bearish sector indicates a certain selling momentum. Simultaneously, the red bars of the Moving Average Convergence Divergence (MACD) are rising, suggesting increased bearish momentum. However, the pair remains above both the 100 and 200-day Simple Moving Averages (SMAs), pointing to an enduring overall bullish stronghold, despite a failing grip on the 20-day SMA.
Taking a shorter-term look at the four-hour chart, the scenario appears more tilted towards a bearish outlook. The Relative Strength Index (RSI) points down in the negative sphere reflecting the mounting selling pressure. The escalating red bars on the Moving Average Convergence Divergence (MACD) confirm the growing bearish momentum. This tendency indicates that the bears are fortifying their position in the near term, leading to the bulls struggling to regain footing.
XAU/USD daily chart
-638417303962691849.png)
- GBP/JPY falls 0.26% after BoJ retains accommodative policy, hinting at future changes.
- Struggling to hold above 188.00; support at 187.00 and Tenkan-Sen 186.70.
- Rebound over 188.00 may lead to 188.92 year-to-date high, targeting 189.00, eyeing key 190.00 level.
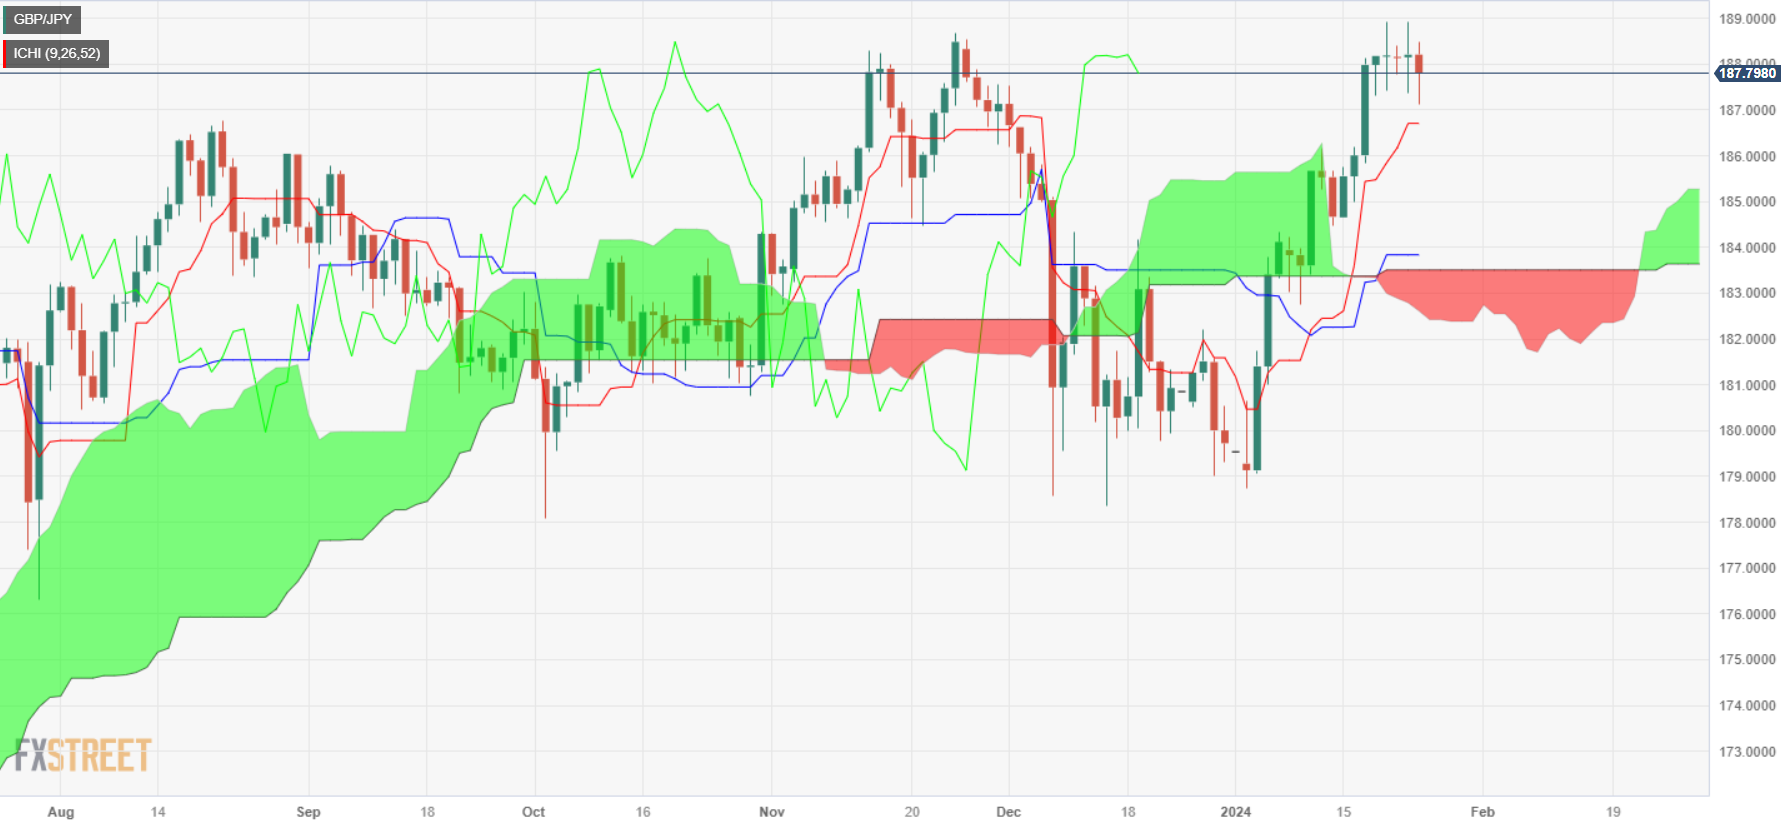
The GBP/JPY dropped by 0.26% late in the North American session after the Bank of Japan’s (BoJ) decision to maintain monetary policy loose. However, words from BoJ Governor Kazue Ueda had opened the door to normalize policy if inflation keeps heading up. At the time of writing, the cross exchanged hands at 187.64 after hitting a high of 188.47.
The daily chart portrays the pair peaked at around the 188.00 figure, and since sellers took over buyers, they dragged the GBP/JPY exchange rate to the 187.00 handle. Nevertheless, they must clear the psychological 187.00 barrier ahead of hurdling the Tenkan-Sen at 186.70. A breach of those two levels will expose the Senkou Span A at 185.26, followed by the 185.00 mark.
On the other hand, if GBP/JPY regains 188.00, that could pave the way to test the current year-to-date (YTD) high of 188.92, ahead of 189.00 and 190.00.
GBP/JPY Price Action – Daily Chart
GBP/JPY Technical Levels
The re-emergence of the appetite for the risk complex weighed on the Dollar and lifted EUR/USD past 1.0900. The prevailing bullish sentiment was also supported by news of further stimulus in China by the PBoC as well as auspicious prints from preliminary PMIs in Europe and the US.
Here is what you need to know on Thursday, January 25:
The risk-on trade forced the USD Index (DXY) to test the region below the key 103.00 support, although higher yields sparked a bounce in the index afterwards. Moving forward, the Q4 flash GDP Growth Rate will be in the spotlight on Thursday, along with the usual weekly Initial Claims and Durable Goods Orders.
In Europe, EUR/USD surpassed the 1.0900 hurdle and reached fresh multi-day highs, although the move fizzled out towards the end of the NA session. On Thursday, the ECB takes centre stage and is expected to leave its rates unchanged. President Lagarde is also seen reinforcing the case of a rate cut in the summer.
GBP/USD maintained the erratic performance and faded Tuesday’s retracement, managing to reclaim the area beyond 1.2700 the figure on the back of the risk-on sentiment.
USD/JPY bounced off multi-session lows near 146.60, regaining the 147.00 barrier and above amidst higher US and Japanese yields. Next on tap in the domestic docket is the weekly Foreign Bond Investment.
AUD/USD continued to navigate without a clear direction and retreated to the 0.6580 zone after climbing to weekly highs around 0.6620 during early trading. The AUD found support in the PBoC stimulus, higher copper prices, and the bearish tone in the greenback.
USD/CAD advanced to four-day peaks north of the 1.3500 barrier as investors assessed the BoC’s decision to keep rates unchanged for the fourth meeting in a row. Governor Macklem suggested that any discussion on rate cuts is premature.
A larger-than-expected drop in US crude oil supplies and Chinese stimulus helped the barrel of WTI reach a new four-week top near the $76.00 mark.
Gold prices slipped back to the $2010 region on the back of a rising appetite for risk-linked assets, while Silver saw its price edge higher and flirt with the $23.00 mark per ounce, or six-day highs.
- Euro area indexes broadly higher in the mid-week.
- German DAX pings €16,900 level in tech rally.
- European manufacturing sees signs of life, but still in contraction territory.
European equity indexes broadly climbed on Wednesday after a surprise upside in the Manufacturing component of the pan-European and German Purchasing Managers’ Indexes (PMI), with stocks getting a further boost from a global rally in tech-based stocks.
A slate of better-than-expected earnings concentrated in the tech sector helped to lift European equities on Wednesday, with markets rallying across the board after Manufacturing PMIs for both the euro area and Germany beat expectations, with investors shrugging off a broad-base miss in the Services PMI component.
Eurozone HCOB Composite PMI improves to 47.9 in January vs. 48 expected
The pan-European HCOB Manufacturing PMI for January came in at 46.6, still in contraction territory but above the forecast increase from 44.4 to 44.8, and Germany’s Manufacturing PMI fared equally well, driving to an eleven-month high of 45.4 versus the forecast uptick from 43.3 to 43.7.
The European Services PMI backslid to 48.4 from 48.8, missing the forecast increase to 49.0, but the slight shift in the services sector was brushed off by EU investors piling back into stock bids after weeks of waffling index prices.
Thursday brings another rate call and monetary policy statement from the European Central Bank (ECB), and European markets will have to grapple with how dovish or hawkish ECB President Christine Lagarde strikes at the ECB’s first scheduled meeting after ECB policymakers hammered down on market rate cut hopes last week. ECB President Lagarde and several central policy planners have made several speaking appearances in recent weeks to try to quell market hopes of fast and furious rate cuts, and the ECB has loudly telegraphed their current stance that there will be no moves on rates until the summer months at the earliest.
ECB Preview: Forecasts from 12 major banks
Germany’s DAX equity index climbed 1.58% on Wednesday to close 262.83 points higher at €16,889.92, hitting an intraday peak above the €16,900.00 handle, the index’s highest prices since a sharp rally at the start of 2024.
The pan-European STOXX600 major index climbed 1.18%, gaining 5.56 points and ending the day at €477.09, and the French CAC40 rose 0.91% to end Wednesday trading at €7,455.64, a 67.6 point gain.
London’s FTSE 100 also gains over half a percent on Wednesday, adding a modest 41.94 points to close at £7,527.67.
DAX Technical Outlook
The DAX index’s rise on Wednesday dragged the major equity board into the €16,900 handle for the first time since the DAX’s early 2024 spike. A near-term pullback will see the index support from a bullish crossover of the 50-hour and 200-hour Simple Moving Averages (SMA).
The DAX has risen 3.3% from 2024’s low bids of €16,322.87 set last week, and is riding technical support from the 50-day SMA near €16,400.00.
DAX Hourly Chart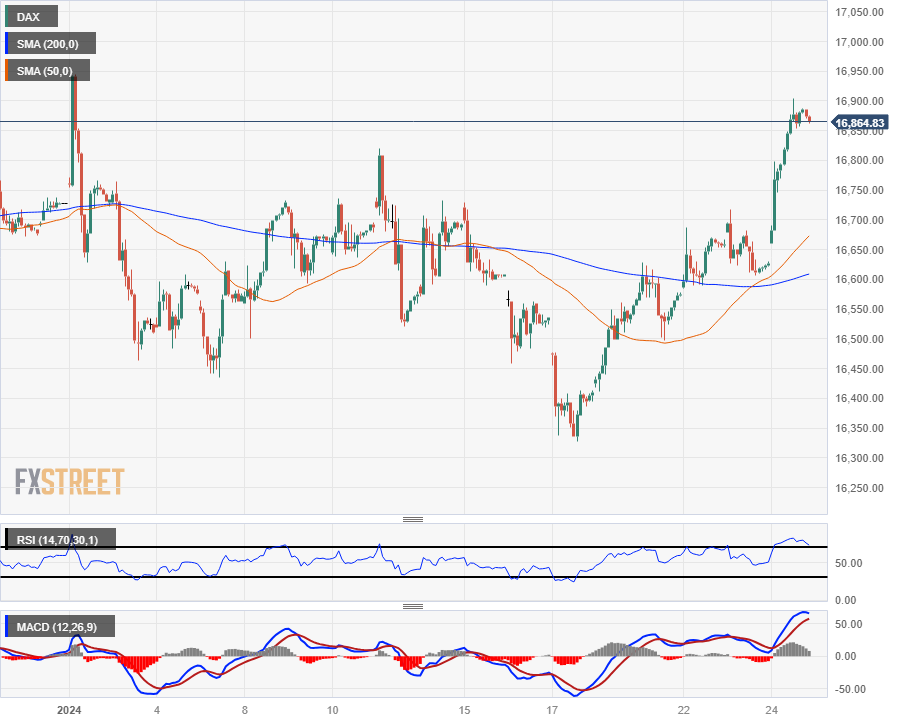
DAX Daily Chart
- AUD/JPY trades at 97.12 with 0.40% losses.
- Daily chart indicators reveal sellers hold the momentum, in the immediate short term.
- Australian S&P PMIs were weak in January while the Japanese indexes were positive.
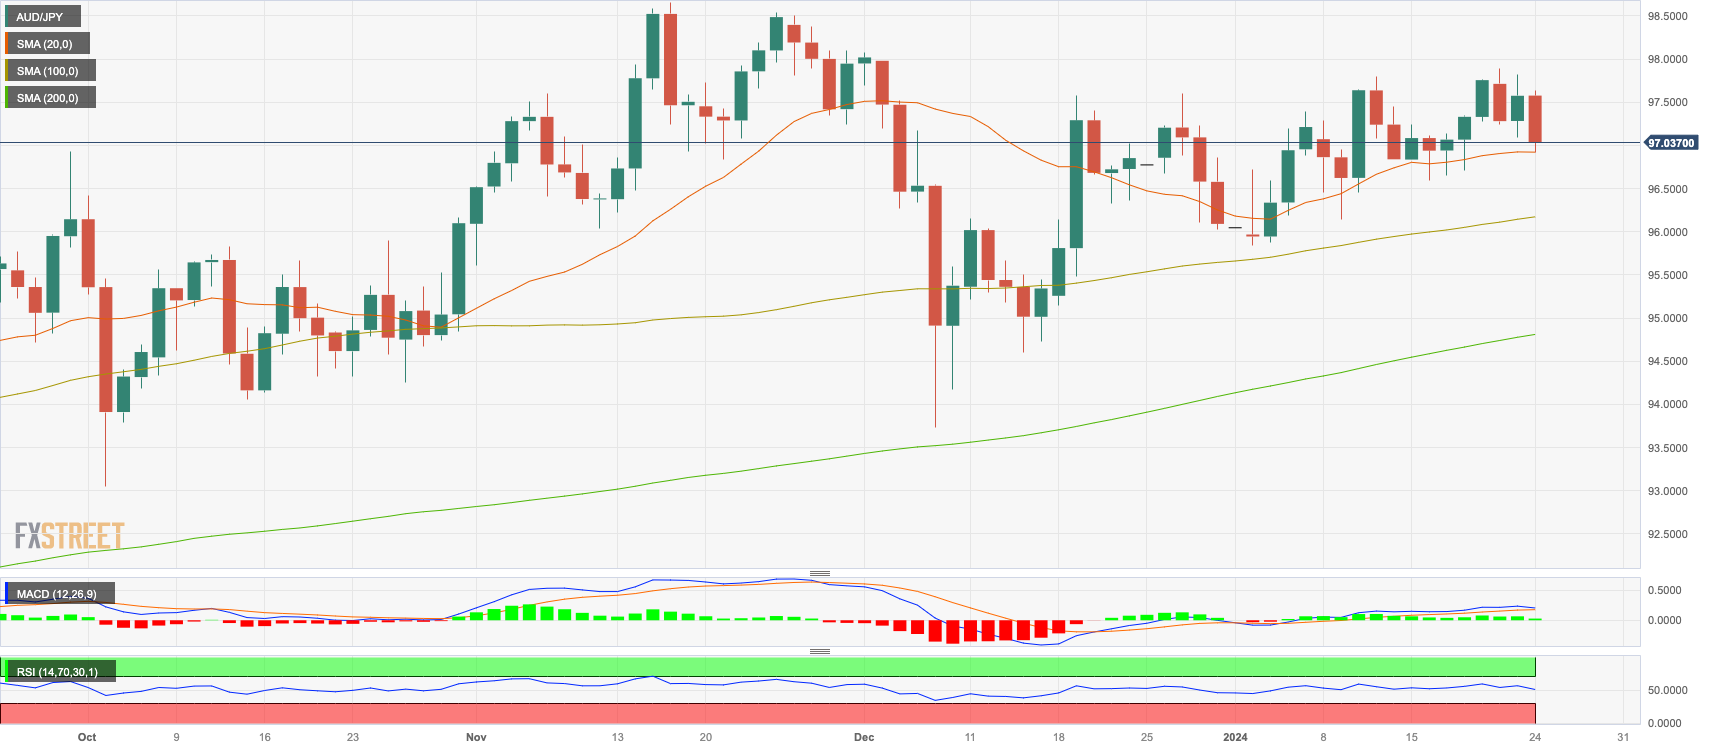
On Wednesday's session, the AUD/JPY finds itself trading near the 97.12 mark, registering a 0.45% decline. The currency pair's daily chart portrays a neutral to bearish outlook, with bears slowly gaining control. Meanwhile, signs of a negative stance are more pronounced as we glance at the four-hour chart. In that sense, the sellers recently gained ground on the back of the Bank of Japan’s hints on a potential pivot and positive economic figures from Japan.
In that sense, the Australian economy, as indicated by the preliminary S&P January PMIs, seems to be on a sluggish note, as the composite PMI has been below 50 for four consecutive months. On the other hand, the Japanese economy appears to be resilient with firm January PMIs across both manufacturing and services, in addition to robust December trade data. Moreover, the JPY seems to be finding demand as the expectations for the BoJ have shifted towards a potential rate increase around mid-year, as on Tuesday’s decision, Governor Ueda hinted that inflation seems to be aligning with the bank’s goal.
AUD/JPY daily chart
The indicators on the daily chart are currently portraying a diverse scenario. With the Relative Strength Index (RSI) in positive territory yet on a downward slope, there is an indication of weakening bullish momentum. Furthermore, diminishing green bars in the Moving Average Convergence Divergence (MACD) histogram reinforce this interpretation. However, the positioning above the essential Simple Moving Averages (SMAs) of 20, 100, and 200-day averages, acknowledge the dominant control of buyers over the extended trend.
A negative outlook is more pronounced on the four-hour charts. Here, the declining slope of the RSI reveals a strong bearish undercurrent, already in negative territory aligning with the falling green bars of the MACD.
AUD/JPY daily chart
- GBP/USD advances 0.46%, buoyed by robust UK PMI figures and stagnant US Treasury yields, supporting Sterling's upward movement.
- UK's Manufacturing and Services PMIs outperform expectations, driving the Composite PMI to a 7-month high, signaling sustained economic growth.
- Despite a rise in US business activity and Treasury yields, the Dollar's strength wanes.
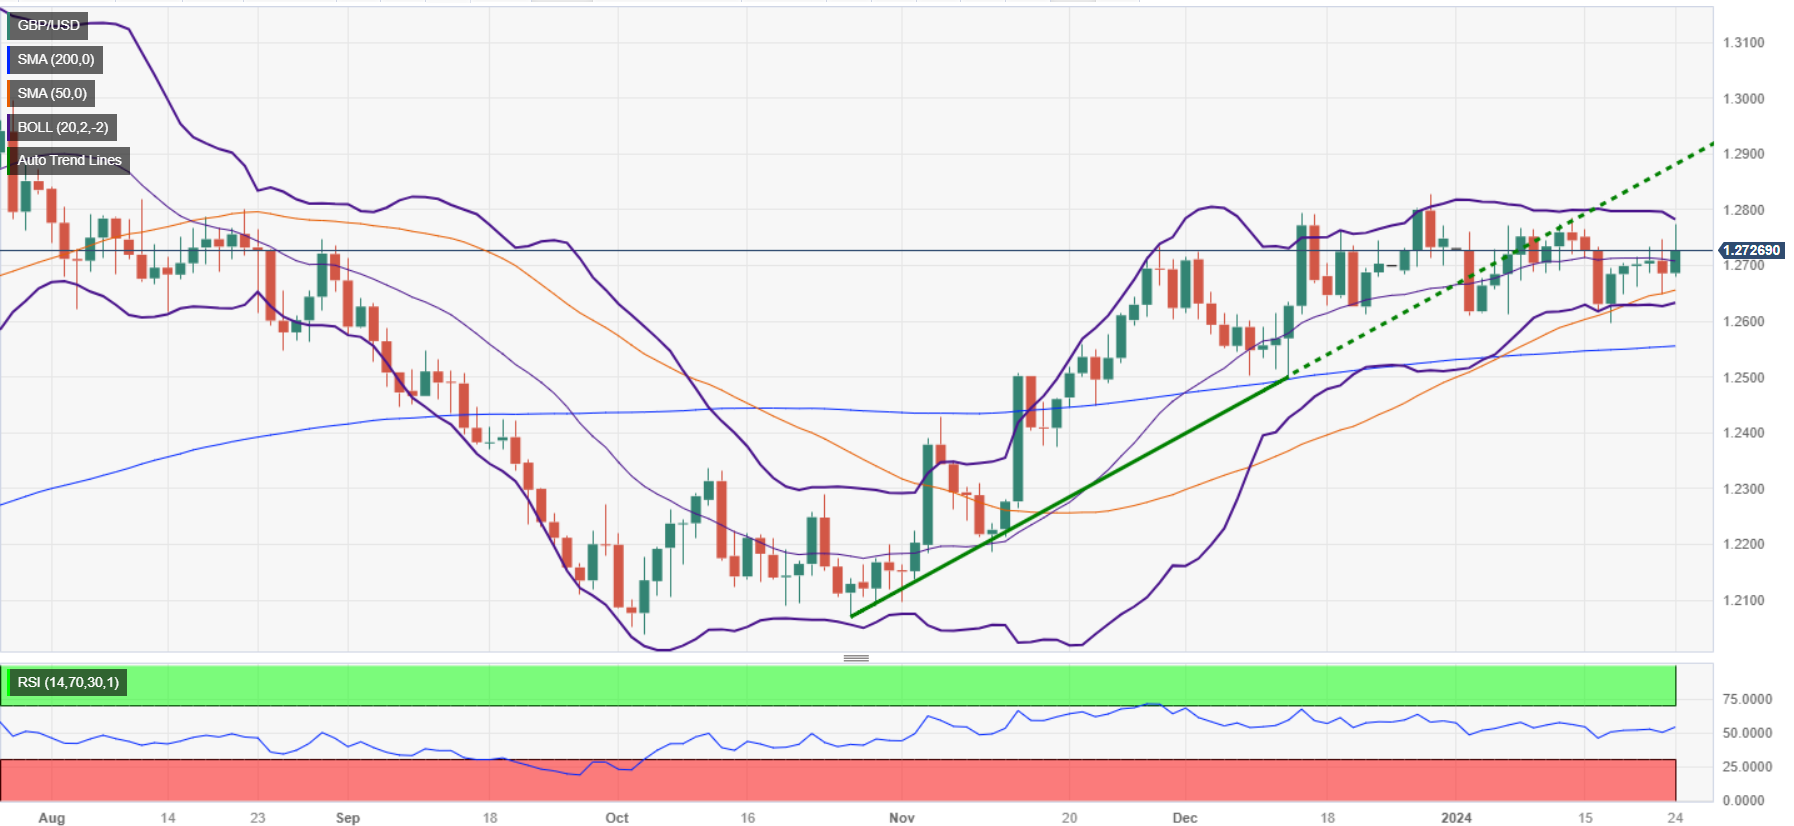
The GBP/USD climbed during the mid-North American session on Wednesday after economic data suggested the UK’s economy remains solid after a release of strong PMI figures. That and soft US Dollar, which are the reasons supporting Sterling’s advance. At the time of writing, the major trades at 1.2726 gaining 0.36%.
Sterling gains as UK economic activity surges, eyes on upcoming US data
UK Flash PMIs for January revealed by S&P Global showed that economic activity gathered steam, with Manufacturing PMI rising from 46.2 to 47.3 while the Services index jumped from 53.4 to 53.8. Consequently, the S&P Global Composite PMI rose from 52.1 to 52.5 hitting a 7-month high. Comments by Chris Williamson, Chief Economist of S&P Global, said that business activity “accelerated for a third straight month.”
Across the pond, the Greenback gained some traction and dragged the GBP/USD from its daily high of 1.2774 to current exchange rates, as the economy gains momentum, revealed the latest S&P Global PMIs. January figures. The manufacturing index exited from recessionary territory, clocking 50.3 above forecasts and last month’s 47.9 reading, while the services sector advanced from 51.4 to 52.9. Therefore, the Composite PMI ascended from 50.9 to 52.3.
In the meantime, traders seem convinced the US Federal Reserve (Fed) would cut rates by more than 150 basis points, as shown by the Chicago Board of Trade (CBOT) data. Nevertheless, US data from the last two weeks depicts the US economy remains robust and might dissuade Fed officials from relaxing monetary conditions.
In the meantime, US Treasury bond yields are rising sharply in the belly and long end of the yield curve. The 10-year benchmark note rate is up four basis points at 4.17%. Despite that, the US Dollar remains on the defensive, according to the DXY – US Dollar Index–, down 0.33% at 103.19.
Ahead of the week, the UK economic calendar is light, though the US docket would feature GDP and the Fed’s preferred gauge for inflation, the Personal Consumption Expenditures (PCE).
GBP/USD Price Analysis: Technical outlook
From a technical standpoint, the GBP(SD remains upward biased but must reclaim the next cycle high hit on January 12 at 1.2785 before challenging the 1.2800 mark. Further gains are seen above December’s 28 swing high of 1.2821, followed by last July’s 27 high at 1.2995. On the flip side, if sellers keep the spot price below 1.2750, that could pave the way for a drop to first support at 1.2700. Up next would be the confluence of the 50-day moving average (DMA) and January’s 23 low of 1.2644/49m ahead of the 200-DMA at 1.2551.
- US Dollar trades lower despite strong S&P PMIs
- The DXY Index took a downturn toward 103.05, below the 200-day SMA.
- US January S&P PMIs came in better than expected.
- All eyes are on Thursday’s PCE figures from December.
The US Dollar (USD), as expressed by the DXY Index, faced downward pressure falling towards 103.05. However, the USD’s losses may be capped by the report of strong economic activity figures, which may push investors to delay their rate cut expectations. Personal Consumption Expenditures (PCE) figures on Thursday will dictate the pace of the short term.
The US economy is maintaining its robustness as traders await key data and central bank meetings later this week. Despite a lack of major data or any Fed speakers, the market pushed back its easing expectations to roughly 125 bps over 2024, down from nearly 175 bps earlier this month, which has helped the Greenback recover.
Daily Digest Market Movers: US Dollar loses traction as markets digest S&P PMIs
- The S&P Global Composite PMI released by S&P Global has posted 52.3 for January, surpassing the previous figure of 50.9.
- The Manufacturing PMI stood at 50.3 for January, reported by S&P Global, surpassing the previous and consensus figure of 47.9, indicating a solid growth in manufacturing activities.
- The Services PMI significantly beat the previous figure of 51.4 and consensus of 51 to settle at 52.9, highlighting a robust expansion in the services sector.
- For the Federal Reserve (Fed) these figures may present a threat to their battle against inflation, which could make them delay the start of the easing cycle.
- Projections from the CME FedWatch Tool show that the market's expectations for the start of the easing cycle have shifted to May as the odds of a cut in March now stands near 42%.
- Those odds may change after the US releases December’s Personal Consumption Expenditures (PCE) figures, the Fed’s preferred gauge of inflation, on Thursday.
Technical Analysis: DXY bulls struggle to hold ground as bears takes center stage
The indicators on the daily chart are reflecting moving dynamics. A downturn can be seen in the Relative Strength Index (RSI), Despite being in positive territory, the negative slope indicates that the buying momentum has been losing strength.
The Moving Average Convergence Divergence (MACD) also aligns with this outlook. The decreasing green bars on the MACD histogram highlight the weakening of bullish momentum.
Looking at the Simple Moving Averages (SMAs), the index is straddling a key transitional area. Its ability to remain above the 20-day SMA suggests that the buyers still dominate the short term. That being said, the index is below the 100 and 200-day SMAs, a clear indication that the longer-term trend still favors the bears.
Support Levels: 103.00, 102.80, 102.60 (20-day SMA).
Resistance Levels: 103.50 (200-day SMA),103.70, 103.90.
US Dollar FAQs
What is the US Dollar?
The US Dollar (USD) is the official currency of the United States of America, and the ‘de facto’ currency of a significant number of other countries where it is found in circulation alongside local notes. It is the most heavily traded currency in the world, accounting for over 88% of all global foreign exchange turnover, or an average of $6.6 trillion in transactions per day, according to data from 2022.
Following the second world war, the USD took over from the British Pound as the world’s reserve currency. For most of its history, the US Dollar was backed by Gold, until the Bretton Woods Agreement in 1971 when the Gold Standard went away.
How do the decisions of the Federal Reserve impact the US Dollar?
The most important single factor impacting on the value of the US Dollar is monetary policy, which is shaped by the Federal Reserve (Fed). The Fed has two mandates: to achieve price stability (control inflation) and foster full employment. Its primary tool to achieve these two goals is by adjusting interest rates.
When prices are rising too quickly and inflation is above the Fed’s 2% target, the Fed will raise rates, which helps the USD value. When inflation falls below 2% or the Unemployment Rate is too high, the Fed may lower interest rates, which weighs on the Greenback.
What is Quantitative Easing and how does it influence the US Dollar?
In extreme situations, the Federal Reserve can also print more Dollars and enact quantitative easing (QE). QE is the process by which the Fed substantially increases the flow of credit in a stuck financial system.
It is a non-standard policy measure used when credit has dried up because banks will not lend to each other (out of the fear of counterparty default). It is a last resort when simply lowering interest rates is unlikely to achieve the necessary result. It was the Fed’s weapon of choice to combat the credit crunch that occurred during the Great Financial Crisis in 2008. It involves the Fed printing more Dollars and using them to buy US government bonds predominantly from financial institutions. QE usually leads to a weaker US Dollar.
What is Quantitative Tightening and how does it influence the US Dollar?
Quantitative tightening (QT) is the reverse process whereby the Federal Reserve stops buying bonds from financial institutions and does not reinvest the principal from the bonds it holds maturing in new purchases. It is usually positive for the US Dollar.
- EUR/USD knocks back after a firm rally as safe-haven bids step up.
- US PMI beats take center stage as rate cut hopes wither further.
- A beat for the EU Manufacturing PMI helped kick off a EUR/USD climb.
The EUR/USD drove back into the high side near 1.0930 on Wednesday after markets shrugged off a miss for pan-European Purchasing Managers Index (PMI) figures before a follow-up beat in US PMIs sent risk appetite skidding back into the safe havens. The pair gained over a full percent bottom-to-top climbing from the previous day’s low of 1.0821 before getting pushed back into a familiar technical level near 1.0900.
European PMIs broadly printed in the sub-50.0 region, suggesting the broader euro area economy remains in contraction territory, and nearly all missed market expectations with the exception of a single bright spot in the manufacturing sector. Meanwhile, US PMIs broadly beat the Street, with a climb to multi-month highs in both manufactured goods and the service sector.
Daily digest market movers: EUR/USD rally gets cut short after US PMIs tarnish rate outlook once more
- European PMIs broadly missed expectations, but a beat in the Manufacturing PMI helped bolster the mood as investors search for a Euro win.
- The pan-European Manufacturing PMI printed at 46.6 in January, above the forecasted 44.8 and climbing even higher above the previous month’s 44.4.
- The Europe-wide PMI Services component fell to 48.4, missing the forecast of 49.0 and slipping back further from December’s 48.8.
- European Manufacturing PMIs climbed to a ten-month high, extending a recovery from multi-year lows and bolstering the Euro (EUR).
- US PMIs broadly beat market expectations to print healthy gains in business activity, crumpling rate cut hopes even further and sending traders back into the US Dollar in the mid-week market session.
- January’s US Manufacturing PMI climbed to a 15-month high of 50.3, returning to expansion territory above 50.0 and easily beating the market forecast of a steady print at December’s 47.9.
- The US Services PMI for January also jumped forecasts to print at 52.9 versus the forecasted decline from 51.4 to 51.0.
- EUR-based pairs will be turning to face Thursday’s European Central Bank (ECB) rate call.
- Markets are broadly looking for rate cuts from the ECB to begin sometime around the midpoint of 2024.
- ECB Preview: Forecasts from 12 major banks
Euro price today
The table below shows the percentage change of Euro (EUR) against listed major currencies today. Euro was the strongest against the Canadian Dollar.
| USD | EUR | GBP | CAD | AUD | JPY | NZD | CHF | |
| USD | -0.37% | -0.46% | 0.17% | -0.27% | -0.67% | -0.39% | -0.78% | |
| EUR | 0.37% | -0.09% | 0.53% | 0.06% | -0.29% | -0.03% | -0.42% | |
| GBP | 0.46% | 0.09% | 0.62% | 0.16% | -0.21% | 0.06% | -0.31% | |
| CAD | -0.17% | -0.51% | -0.62% | -0.47% | -0.84% | -0.57% | -0.95% | |
| AUD | 0.29% | -0.07% | -0.17% | 0.45% | -0.33% | -0.12% | -0.50% | |
| JPY | 0.65% | 0.28% | 0.21% | 0.79% | 0.38% | 0.25% | -0.13% | |
| NZD | 0.41% | 0.00% | -0.07% | 0.54% | 0.10% | -0.26% | -0.41% | |
| CHF | 0.78% | 0.41% | 0.32% | 0.94% | 0.50% | 0.12% | 0.39% |
The heat map shows percentage changes of major currencies against each other. The base currency is picked from the left column, while the quote currency is picked from the top row. For example, if you pick the Euro from the left column and move along the horizontal line to the Japanese Yen, the percentage change displayed in the box will represent EUR (base)/JPY (quote).
Technical Outlook: EUR/USD continues to splash around in tight congestion zone
EUR/USD finds itself getting dumped back into the 1.0900 handle near the 200-hour Simple Moving Average (SMA) on Wednesday as the pair struggles to find real momentum, keeping the pair pinned to near-term technical levels amidst a broader push into mid-term consolidation. A widening consolidation range is highlighting the increased volatility in the EUR/USD despite keeping the pair close to long-term support near 1.0850.
Daily candlesticks have the EUR/USD stuck in the middle of a consolidation pattern between the 50-day and 200-day SMAs at 1.0920 and 1.0850, respectively. The Euro-Dollar pair is set to drift until a meaningful push develops in either direction.
EUR/USD Hourly Chart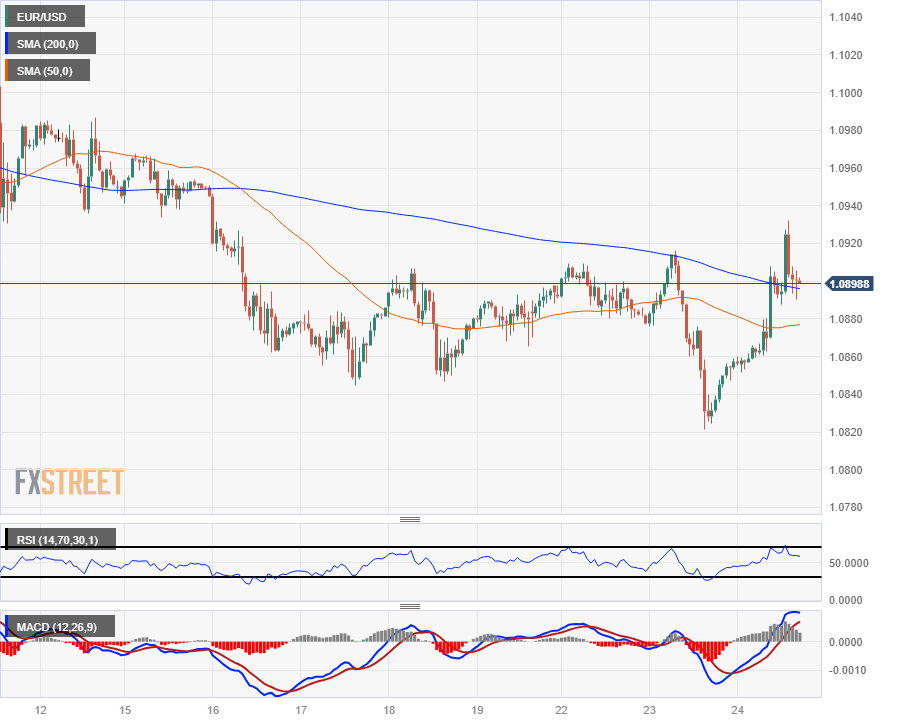
EUR/USD Daily Chart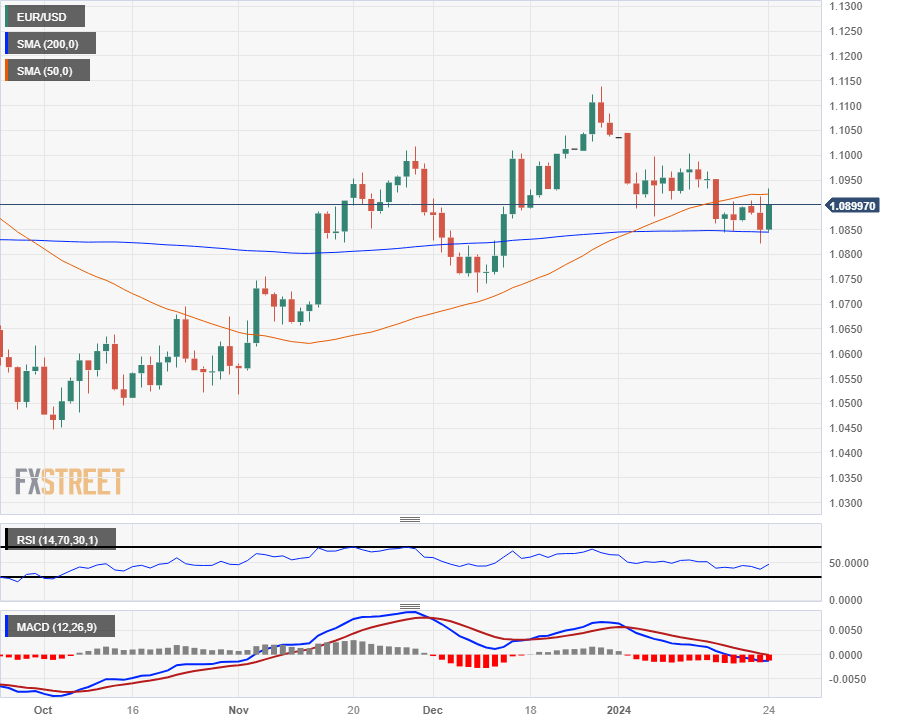
Euro FAQs
What is the Euro?
The Euro is the currency for the 20 European Union countries that belong to the Eurozone. It is the second most heavily traded currency in the world behind the US Dollar. In 2022, it accounted for 31% of all foreign exchange transactions, with an average daily turnover of over $2.2 trillion a day.
EUR/USD is the most heavily traded currency pair in the world, accounting for an estimated 30% off all transactions, followed by EUR/JPY (4%), EUR/GBP (3%) and EUR/AUD (2%).
What is the ECB and how does it impact the Euro?
The European Central Bank (ECB) in Frankfurt, Germany, is the reserve bank for the Eurozone. The ECB sets interest rates and manages monetary policy.
The ECB’s primary mandate is to maintain price stability, which means either controlling inflation or stimulating growth. Its primary tool is the raising or lowering of interest rates. Relatively high interest rates – or the expectation of higher rates – will usually benefit the Euro and vice versa.
The ECB Governing Council makes monetary policy decisions at meetings held eight times a year. Decisions are made by heads of the Eurozone national banks and six permanent members, including the President of the ECB, Christine Lagarde.
How does inflation data impact the value of the Euro?
Eurozone inflation data, measured by the Harmonized Index of Consumer Prices (HICP), is an important econometric for the Euro. If inflation rises more than expected, especially if above the ECB’s 2% target, it obliges the ECB to raise interest rates to bring it back under control.
Relatively high interest rates compared to its counterparts will usually benefit the Euro, as it makes the region more attractive as a place for global investors to park their money.
How does economic data influence the value of the Euro?
Data releases gauge the health of the economy and can impact on the Euro. Indicators such as GDP, Manufacturing and Services PMIs, employment, and consumer sentiment surveys can all influence the direction of the single currency.
A strong economy is good for the Euro. Not only does it attract more foreign investment but it may encourage the ECB to put up interest rates, which will directly strengthen the Euro. Otherwise, if economic data is weak, the Euro is likely to fall.
Economic data for the four largest economies in the euro area (Germany, France, Italy and Spain) are especially significant, as they account for 75% of the Eurozone’s economy.
How does the Trade Balance impact the Euro?
Another significant data release for the Euro is the Trade Balance. This indicator measures the difference between what a country earns from its exports and what it spends on imports over a given period.
If a country produces highly sought after exports then its currency will gain in value purely from the extra demand created from foreign buyers seeking to purchase these goods. Therefore, a positive net Trade Balance strengthens a currency and vice versa for a negative balance.
- Mexican Peso up, USD/MXN down nearly 1% as unexpected high inflation in Mexico may hinder Banxico’s easing policy plans.
- INEGI reveals mixed Mexican economy: Rising inflation, shrinking monthly activity, yet core prices stabilizing.
- US business activity strengthens, marked by a surge in the manufacturing index and easing inflation pressure, could underpin USD/MXN.
The Mexican Peso regains its momentum on Wednesday, rising against the US Dollar after economic data from Mexico suggests inflation is reaccelerating. This could deter the Bank of Mexico (Banxico) from easing policy rates. That along with a drop in US Treasury yields weighing on the Greenback keeps the USD/MXN trading with losses of almost 1%, at 17.14, testing a key support level ahead of the 17.00 figure.
The National Statistics Agency (INEGI) in Mexico revealed that inflation in the first 15 days of January was above forecasts and exceeded December’s print. Meanwhile, core prices continued to ease, signaling a continuation of the disinflation process. At the same time INEGI revealed that Mexico’s economy shrank in November, more than in October on a monthly reading, while expanding below forecasts on an annual basis.
Across the border, S&P Global announced that business activity picked up sharply in the US The manufacturing index surprisingly returned to expansionary territory and kept inflation in check as prices cooled down.
Daily Digest Market Movers: Mexican Peso strengthens as inflation exceeds forecasts
- Mexico’s mid-month inflation rose by 0.49%, exceeding forecasts of 0.38% but below December’s 0.59%, while underlying prices stood as expected at 0.25%, an improvement compared to the 0.46% print last December.
- Annually based, general inflation rose 4.9%, above forecasts and the prior’s month 4.46%, while core inflation cooled from 5.19% to 4.78%, as foreseen.
- Economic Activity in November shrank -0.5%, lower than forecasts and October’s -0.1% contraction, on a monthly basis. Annual figures dropped from 4.2% to 2.3%, below forecasts of 3.2% growth.
- The economy in Mexico is beginning to show the impact of high rates set by Banxico at 11.25%, even though most analysts estimate the economy will grow above 2% in 2024. Nevertheless, retail sales missing estimates, the economy growing below 3% in November, and inflation reaccelerating puts a stagflationary scenario in play.
- US S&P Global Composite PMI for January came in at 52.3, up from 50.9 in December, while the Manufacturing Index improved from 47.9 to 50.3. The Services Index advanced to 52.9 from 51.4.
- On the US front, last week’s economic data paints a soft-landing outlook. Even though housing data has remained mixed, improving American household sentiment , lower inflation expectations and business activity gathering steam could underpin the USD/MXN in the near term.
- Traders trimmed their bets for a dovish Federal Reserve in 2024. They stand at 139 basis points (bps) of cuts from 175 bps last week.
- Despite indications from the December meeting minutes of Banxico (the Central Bank of Mexico) that it may consider easing its monetary policy, the inflation report for January poses a potential obstacle to any such policy relaxation.
- Standard Chartered analysts estimate the Bank of Mexico (Banxico) will lower rates to 9.25% in 2024.
- On January 5, a Reuters poll suggested the Mexican Peso could weaken 5.4% to 18.00 per US Dollar in the 12 months following December.
Technical Analysis: Mexican Peso climbs to two-day high as USD/MXN drops toward100-day moving average
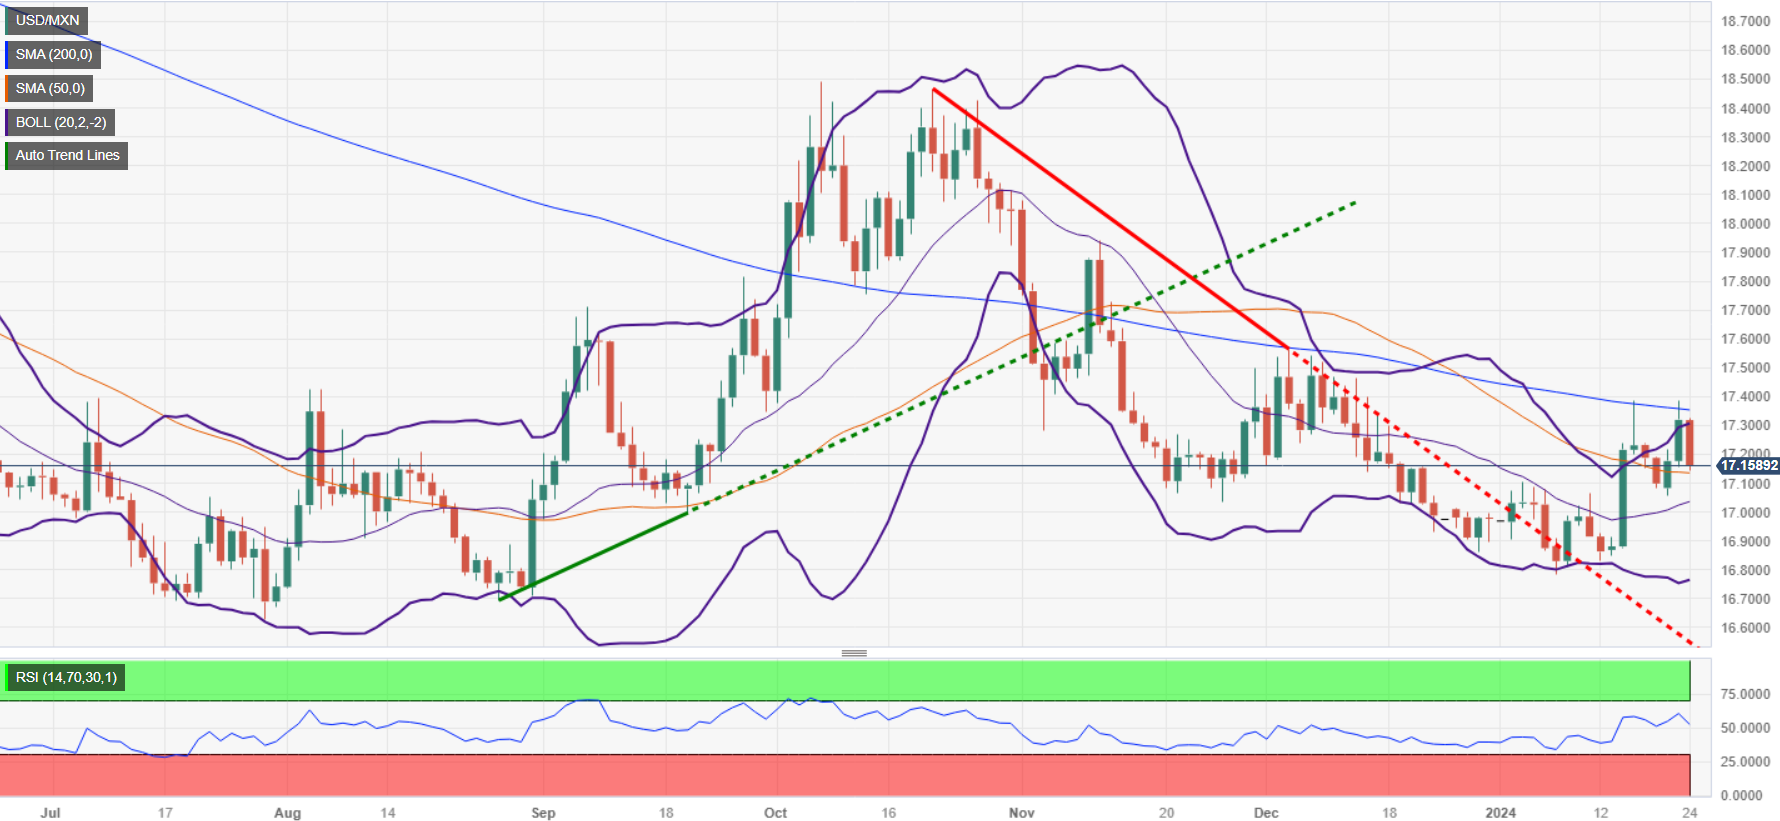
The USD/MXN erased Tuesday’s gains on Mexico’s economic data releases. Therefore, the exotic pair failed to breach the 200-day Simple Moving Average (SMA) at 17.36, extending its losses toward the 50-day SMA at 17.14. Next support is seen at 17.05, the January 22 low, followed by the 17.00 psychological figure.
On the other hand, if buyers lift the exchange rate past the 17.20 area, that could pave the way to retest the 200-DMA, followed by the 100-day SMA at 17.42. A breach of the latter will expose the psychological 17.50 mark, ahead of rallying to the May 23 high from last year at 17.99.
USD/MXN Price Action – Daily Chart
Mexican Peso FAQs
What key factors drive the Mexican Peso?
The Mexican Peso (MXN) is the most traded currency among its Latin American peers. Its value is broadly determined by the performance of the Mexican economy, the country’s central bank’s policy, the amount of foreign investment in the country and even the levels of remittances sent by Mexicans who live abroad, particularly in the United States. Geopolitical trends can also move MXN: for example, the process of nearshoring – or the decision by some firms to relocate manufacturing capacity and supply chains closer to their home countries – is also seen as a catalyst for the Mexican currency as the country is considered a key manufacturing hub in the American continent. Another catalyst for MXN is Oil prices as Mexico is a key exporter of the commodity.
How do decisions of the Banxico impact the Mexican Peso?
The main objective of Mexico’s central bank, also known as Banxico, is to maintain inflation at low and stable levels (at or close to its target of 3%, the midpoint in a tolerance band of between 2% and 4%). To this end, the bank sets an appropriate level of interest rates. When inflation is too high, Banxico will attempt to tame it by raising interest rates, making it more expensive for households and businesses to borrow money, thus cooling demand and the overall economy. Higher interest rates are generally positive for the Mexican Peso (MXN) as they lead to higher yields, making the country a more attractive place for investors. On the contrary, lower interest rates tend to weaken MXN.
How does economic data influence the value of the Mexican Peso?
Macroeconomic data releases are key to assess the state of the economy and can have an impact on the Mexican Peso (MXN) valuation. A strong Mexican economy, based on high economic growth, low unemployment and high confidence is good for MXN. Not only does it attract more foreign investment but it may encourage the Bank of Mexico (Banxico) to increase interest rates, particularly if this strength comes together with elevated inflation. However, if economic data is weak, MXN is likely to depreciate.
How does broader risk sentiment impact the Mexican Peso?
As an emerging-market currency, the Mexican Peso (MXN) tends to strive during risk-on periods, or when investors perceive that broader market risks are low and thus are eager to engage with investments that carry a higher risk. Conversely, MXN tends to weaken at times of market turbulence or economic uncertainty as investors tend to sell higher-risk assets and flee to the more-stable safe havens.
- Canadian Dollar extended declines after US PMIs cast a long shadow.
- Bank of Canada remains dovish on inflation outlook.
- Canadian money markets are trimming their BoC rate cut bets.
The Canadian Dollar (CAD) fell on Wednesday, pushed lower across the FX market as the Loonie struggles under the weight of a dovish Bank of Canada (BoC) that is still extremely cautious on rate cuts with Canadian inflation not expected to return to the BoC’s 2% target until 2025.
Canada saw money markets trim bets of a BoC rate cut in April down to 40%, tumbling from 65% before the BoC’s monetary policy statement on Wednesday morning. The Bank of Canada followed up their latest policy statement with a press conference, where BoC Governor Tiff Macklem highlighted the BOC’s determination to see inflation come down before adding rate cut discussions to the table.
Daily digest market movers: Canadian Dollar grinds lower on soft BoC, US PMI beat
- Bank of Canada reiterates that monetary policy structure is currently working, but there is still a long way to go on inflation.
- BoC Governor Tiff Macklem states that internal discussions should remain squarely focused on how long to keep rates at 5%, rather than focusing on delivering rate cuts as soon as possible.
- Canadian money markets are pulling away from BoC rate cut bets, odds of an April rate cut down to 40% from 65% prior to BoC statement.
- BoC hopes that Canadian growth will slowly pick up its pace through the second half of 2024 with inflation falling below 2% in early 2025.
- BoC continues to focus on rising rents and shelter costs alongside high wage growth as problematic areas.
- Tiff Macklem comments on policy outlook
- Wednesday’s US Purchasing Managers’ Index (PMI) drove investors into safe havens after US figures cleanly beat the market, putting downside pressure on broad-market rate cut hopes.
- The US’ S&P Global Manufacturing PMI hit a 15-month high of 50.3 versus the expected hold at 47.9 in January as the US economy continues to outpace forecasts put forth by markets hoping for an economic backslide to spark a rate cut cycle.
- The US’ S&P Global Services PMI component also hit a seven-month high of 52.9 versus the forecasted decline from 51.4 to 51.0.
Canadian Dollar price today
The table below shows the percentage change of Canadian Dollar (CAD) against listed major currencies today. Canadian Dollar was the weakest against the Swiss Franc.
| USD | EUR | GBP | CAD | AUD | JPY | NZD | CHF | |
| USD | -0.44% | -0.46% | 0.16% | -0.29% | -0.67% | -0.41% | -0.74% | |
| EUR | 0.44% | -0.02% | 0.59% | 0.14% | -0.24% | 0.03% | -0.31% | |
| GBP | 0.45% | 0.01% | 0.60% | 0.13% | -0.22% | 0.03% | -0.30% | |
| CAD | -0.17% | -0.57% | -0.62% | -0.48% | -0.83% | -0.58% | -0.91% | |
| AUD | 0.29% | -0.13% | -0.16% | 0.44% | -0.33% | -0.14% | -0.45% | |
| JPY | 0.66% | 0.23% | 0.22% | 0.80% | 0.37% | 0.25% | -0.07% | |
| NZD | 0.43% | -0.05% | -0.07% | 0.54% | 0.11% | -0.26% | -0.36% | |
| CHF | 0.74% | 0.30% | 0.28% | 0.89% | 0.44% | 0.08% | 0.33% |
The heat map shows percentage changes of major currencies against each other. The base currency is picked from the left column, while the quote currency is picked from the top row. For example, if you pick the Euro from the left column and move along the horizontal line to the Japanese Yen, the percentage change displayed in the box will represent EUR (base)/JPY (quote).
Technical Outlook: Canadian Dollar struggles under the weight of entrenched BoC
The Canadian Dollar (CAD) is on pace to be the poorest performer of the majors on Wednesday. The CAD is in the red across the board, down close to a full percent against the Japanese Yen (JPY) and the Swiss Franc (CHF). The Loonie saw its most moderate losses against the US Dollar (USD) but still shed around a fifth of a percent against the Greenback for the day.
The USD/CAD rallied back into the 1.3490 neighborhood after an early plunge to 1.3430 on Wednesday. The pair is seeing some technical friction from the 200-hour Simple Moving Average (SMA), but near-term momentum remains tilted toward the bullish side with the early week’s swing low pricing in a technical floor at 1.3420.
Continued bullish momentum will send the USD/CAD through a technical congestion zone as the 50-day and 200-day SMAs consolidate near the 1.3500 handle. The pair is on pace to close in the green for a fourth straight week as the USD/CAD grinds back up from December’s bottom bids near 1.3200.
USD/CAD Hourly Chart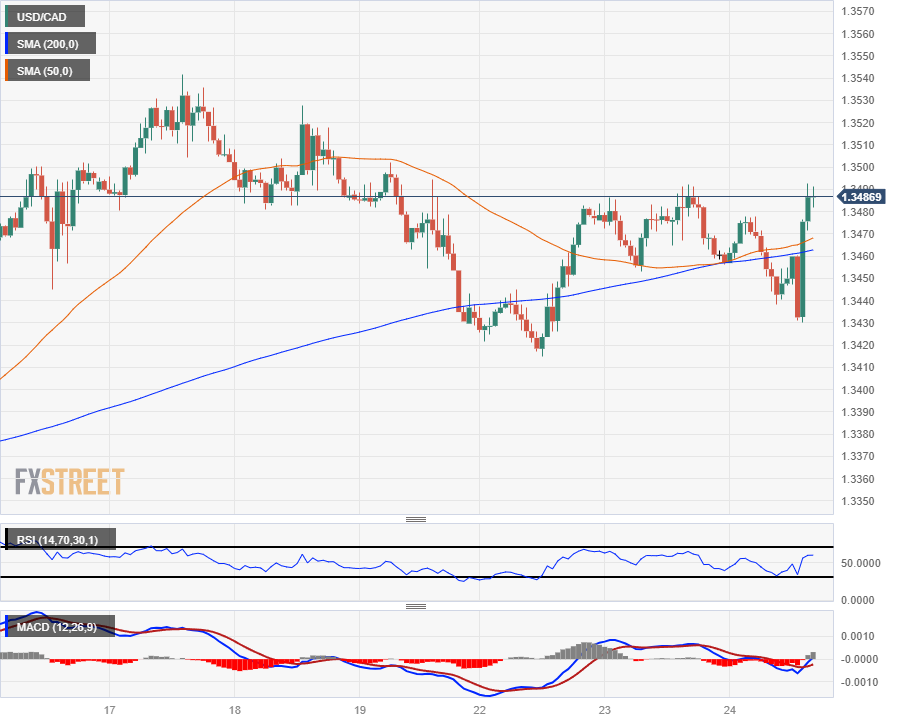
USD/CAD Daily Chart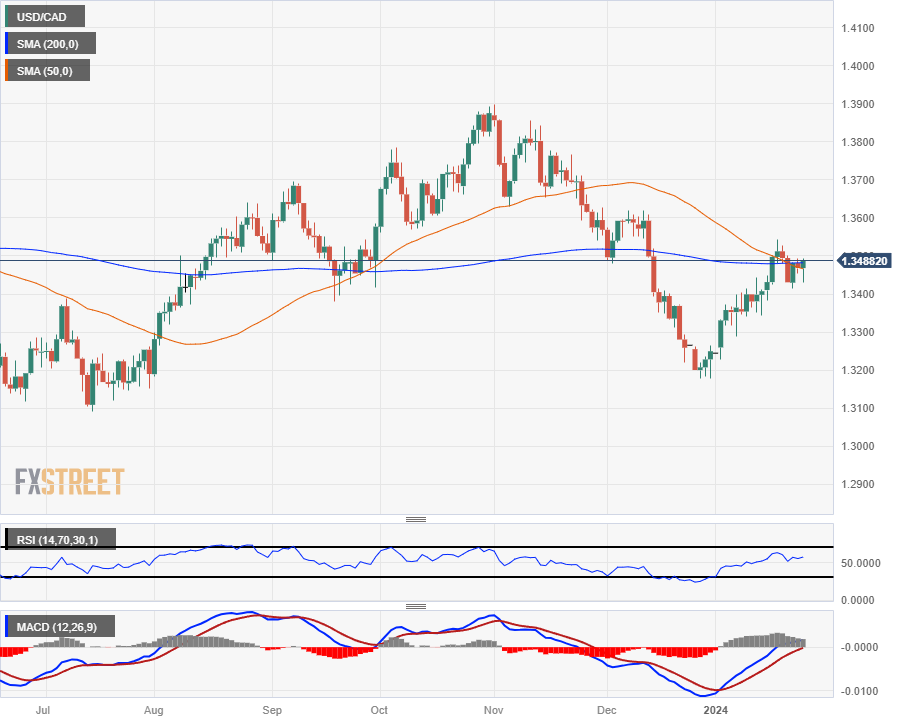
Canadian Dollar FAQs
What key factors drive the Canadian Dollar?
The key factors driving the Canadian Dollar (CAD) are the level of interest rates set by the Bank of Canada (BoC), the price of Oil, Canada’s largest export, the health of its economy, inflation and the Trade Balance, which is the difference between the value of Canada’s exports versus its imports. Other factors include market sentiment – whether investors are taking on more risky assets (risk-on) or seeking safe-havens (risk-off) – with risk-on being CAD-positive. As its largest trading partner, the health of the US economy is also a key factor influencing the Canadian Dollar.
How do the decisions of the Bank of Canada impact the Canadian Dollar?
The Bank of Canada (BoC) has a significant influence on the Canadian Dollar by setting the level of interest rates that banks can lend to one another. This influences the level of interest rates for everyone. The main goal of the BoC is to maintain inflation at 1-3% by adjusting interest rates up or down. Relatively higher interest rates tend to be positive for the CAD. The Bank of Canada can also use quantitative easing and tightening to influence credit conditions, with the former CAD-negative and the latter CAD-positive.
How does the price of Oil impact the Canadian Dollar?
The price of Oil is a key factor impacting the value of the Canadian Dollar. Petroleum is Canada’s biggest export, so Oil price tends to have an immediate impact on the CAD value. Generally, if Oil price rises CAD also goes up, as aggregate demand for the currency increases. The opposite is the case if the price of Oil falls. Higher Oil prices also tend to result in a greater likelihood of a positive Trade Balance, which is also supportive of the CAD.
How does inflation data impact the value of the Canadian Dollar?
While inflation had always traditionally been thought of as a negative factor for a currency since it lowers the value of money, the opposite has actually been the case in modern times with the relaxation of cross-border capital controls. Higher inflation tends to lead central banks to put up interest rates which attracts more capital inflows from global investors seeking a lucrative place to keep their money. This increases demand for the local currency, which in Canada’s case is the Canadian Dollar.
How does economic data influence the value of the Canadian Dollar?
Macroeconomic data releases gauge the health of the economy and can have an impact on the Canadian Dollar. Indicators such as GDP, Manufacturing and Services PMIs, employment, and consumer sentiment surveys can all influence the direction of the CAD. A strong economy is good for the Canadian Dollar. Not only does it attract more foreign investment but it may encourage the Bank of Canada to put up interest rates, leading to a stronger currency. If economic data is weak, however, the CAD is likely to fall.
Tiff Macklem, Governor of the Bank of Canada (BoC), and Senior Deputy Governor Carolyn Rogers explain the BoC decision to leave the interest rate unchanged at 5% after the January policy meeting and respond to questions from the press.
Key quotes
"Inflation is still somewhat broad-based and that's why we're concerned about the persistence of underlying inflation
"It's important that we don't give Canadians a false sense of precision as regards the timing of a rate cut."
"If governments were to add more spending on top of what they've already planned for this year, it certainly could start getting in the way of trying to bring inflation down to 2% target."
"We didn't spend a lot of time talking about hikes this time."
- The EUR/GBP stands at 0.8549 with mild losses after hitting fresh multi-month lows of 0.8535.
- Daily and four-hour chart indicators show that the bears are in command.
- Eurozone’s PMIs came in mixed, the UK indexes show resilience.
In Wednesday's session, the EUR/GBP pair was trading at 0.8549, reflecting a mild losses but recovered after hitting a low of 0.8535 earlier in the session, it lowest level since September. Ahead of Thursday’s European Central Bank (ECB) decision, markets digest European S&P PMIs from January to continue placing their bets on the easing cycle calendar.
In that sense, the Eurozone economies are recording mixed performances, with preliminary PMIs for January showcasing lower-than-predicted figures in services but better-than-expected in manufacturing. The UK economy, on the other hand, is showing resilience with stronger-than-expected preliminary January PMIs in both manufacturing and services sectors.
Regarding the European Central Bank (ECB), the markets anticipate the bank to hold steady at 4.0% on Thursday and start its easing cycle on Q2, with a total of 150 bps of rate cuts in 2024. The Bank of England (BOE) on the other hand anticipated to limit its rate cuts due to an improved UK growth outlook and persistently high underlying inflation and investors are betting on less easing than the ECB of 125 bps throughout 2024, which seems to be favouring the Pound over the Euro in the short term.
EUR/GBP levels to watch
From a daily chart perspective, the situation is tilted towards the sellers. The Relative Strength Index (RSI) is in the negative territory and is currently experiencing a downward slope, highlighting a bearish pressure. Simultaneously, the Moving Average Convergence Divergence (MACD) shows rising red bars, further reinforcing the dominant selling momentum. Additionally, the position of the cross below its 20, 100, and 200-day Simple Moving Averages (SMAs) is a strong testament to the selling forces controlling the broader outlook.
On the other hand, the shorter-term outlook gleaned from the four-hour chart presents a somewhat more balanced view. The indicators are seen to be somewhat flat but tilting slightly to the downside. The four-hour Relative Strength Index (RSI) shows a negative slope below the 50 mark while the Moving Average Convergence Divergence (MACD) on this time frame shows flat red bars, suggesting flat but steady bearish pressure.
EUR/GBP daily chart
-638417089719491270.png)
The US Bureau of Economic Analysis will release its first estimate of the fourth quarter (Q4) of 2023 Gross Domestic Product (GDP) on Thursday, January 25 at 13:30 GMT as we get closer to the release time, here are forecasts from economists and researchers of 10 major banks regarding the upcoming growth data.
Economists expect the United States to report an annualized growth rate of 2% vs. the prior release of 4.9% in Q3.
ING
We expect fourth quarter GDP growth to come in at around 2.5% – and with the unemployment rate ending 2023 at just 3.7% and inflation still well above target in YoY terms, there seems to be little pressure to start cutting rates imminently.
Deutsche Bank
We expect real GDP growth to print at an annualised +2.3% in Q4, down from +4.9% in Q3.
TDS
We expect real GDP to have registered a below-trend 1.6% QoQ AR expansion in 23Q4, much slower than Q3's blockbuster and unsustainable 4.9% increase.
RBC Economics
We are currently tracking 2% annualized increase in US GDP in Q4 2023, supported by a robust gain in consumer spending. Residential investment likely continued to grow on higher housing starts, albeit at a slower rate than in the prior quarter.
NBF
Domestic demand likely remained vigorous during the quarter, supported by strong household consumption and, to a lesser extent, government spending. All in all, GDP could have expanded 2.0% in annualized terms.
SocGen
GDP is likely to have been more resilient than had been expected after the surge in Q3, and we estimate a 1.9% growth rate, roughly in line with potential growth.
CIBC
Our forecast calls for 2.5% QoQ SAAR, above the current consensus number of 2.0% but in line with the Atlanta Fed Nowcast (2.4%). Once again, most of the strength in GDP will come from the sizzling consumption prints we’ve seen. But other components of domestic demand should also be solid in the quarter. However, with consumers continuing to pull goods off the shelves quickly and imports weak, downside risks to inventory accumulation are fairly high. Markets are overly optimistic on how much the Fed will ease and the GDP print will likely be an opportunity to recalibrate. The source data indicate another strong outturn for domestic demand and that will likely be enough for some pullback in market pricing despite potential volatility from inventories and net exports that could push down the headline number.
Wells Fargo
Although we no longer forecast a recession on the horizon, we suspect that the pace of real GDP growth will moderate in the coming quarters. To that effect, we estimate that real GDP grew at an annualized pace of 1.7% in Q4, a downshift from 4.9% in Q3.
Goldman Sachs
We estimate a 2.1% annualized growth in GDP for Q4 2023. This growth is attributed to strong consumer spending (+2.9%) and government expenditure (+3.5%). However, a decline in the housing sector (-6.3%) and a 0.7 percentage point negative contribution from inventories are expected to impact overall growth.
Citi
We expect a 2.0% QoQ SAAR increase in real GDP by expenditure in Q4 with the largest support to growth again coming from consumption with we expect consumption to rise a still-strong 2.6% in Q4. Other elements of GDP in Q4 should only contribute modestly to growth.
The Bank of Canada stayed the course and held the overnight rate at 5.00%. The statement delivered a mostly hawkish tone. USD/CAD edged higher also propelled by the better-than-expected US PMIs. Economists at TD Securities analyze Loonie’s outlook.
BoC still concerned about risks to outlook for core inflation
BoC's statement came in on the slightly hawkish side with concerns about the strength and persistence of core inflation. However, Governor Macklem's prepared remarks for the presser seemed more balanced where he stated that while rate hikes cannot be completely ruled out, the discussion is now more about how long to keep policy rates where they are (and hence laying the groundwork for future cuts).
USD/CAD moved higher as US PMIs surprised to the upside and given the relatively more balanced tone of the presser. Markets had recently priced out BoC cuts and might have been expecting the central banks to push back on any talk of easing given the recent strength in wages and inflation.
We continue to expect CAD to underperform peers like the JPY, EUR, and AUD. This is based on Canada's exposure to a slowing US, upcoming mortgage resets, weaker growth profile and less support from oil prices.
Tiff Macklem, Governor of the Bank of Canada (BoC), explains the BoC decision to leave the interest rate unchanged at 5% after the January policy meeting and responds to questions from the press.
Key quotes
"Focus was very much on holding rates steady."
"It's premature to discuss a rate cut."
"We need to see more progress before we discuss a possible rate cut."
"As regards the future of quantitative tightening, we'll take it one decision at a time."
"Certainly not there yet when it comes to ending QT."
"We're not forecasting a deep recession, we don't think we need one to get inflation back to target."
Tiff Macklem, Governor of the Bank of Canada (BoC), explains the BoC decision to leave the interest rate unchanged at 5% after the January policy meeting and responds to questions from the press.
Key quotes
"BoC is now starting to look at how long rates need to stay at current levels rather than whether policy rate is restrictive enough."
"This doesn't mean we have ruled out further policy rate increases; if new developments push inflation higher, we may still need to raise rates."
"We need to give higher rates time to do their work."
"If economy evolves broadly in line with our latest projections, expect future discussions will be about how long we maintain rate at 5%."
"Push and pull on inflation means further declines are likely to be gradual and uneven, path back to 2% target will be slow and risks remain."
"There was clear consensus at Governing Council to maintain policy rate at 5%."
"Global growth has slowed but not as much as we thought it would."
The European Central Bank (ECB) is set to announce its Monetary Policy Decision on Thursday, January 25 at 13:15 GMT and as we get closer to the release time, here are the expectations as forecast by the economists and researchers of 12 major banks.
The ECB is expected to remain flat on interest rates, leaving the deposit rate at 4% and holding its main reference rate at 4.5%. Traders will be dissecting ECB’s President Christine Lagarde’s comments on forward guidance.
Danske Bank
This ECB meeting is set to see few, if any, new policy signals, given the limited new information that has been released since the December meeting. We expect President Lagarde to confirm that the next policy rate change is most likely a cut, which may happen in summer. We expect Lagarde to repeat the three key criteria for setting the policy rates, which should point to the new staff projections in March as key.
Nordea
Recent comments from the ECB Governing Council members have clearly suggested that rates are unlikely to be lowered in the near term. The ECB is in a data-dependent mode, so weak data could yet shift such expectations. After the December attempts failed and given the recent repricing towards less aggressive rate cut expectations, the ECB is unlikely to push strongly against current market expectations. We continue to expect the first 25 bps rate cut in June, followed by quarterly 25 bps decreases in rates, though risks are tilted towards both earlier and steeper cuts.
Rabobank
The ECB needs more confidence about the inflation outlook before easing policy. We are not unsympathetic to the view that the ECB may start cutting in June, but we maintain a slight preference for September. Wage dynamics need to improve visibly before we can fully subscribe to an earlier cut. Moreover, attacks on ships in the Red Sea inject new uncertainty into the outlook. We expect no changes to the policy stance at the January meeting.
SocGen
As usual, the January meeting is unlikely to deliver any policy changes or major policy messages, involving instead a reflection on the year ahead. In light of our slightly weaker inflation forecasts, we have moved our first rate cut to September, but there is high uncertainty as regards the data, implying that no cuts this year are also possible.
TDS
This should be another straightforward decision – we and the unanimous consensus expect another hold. The Governing Council will likely keep its language largely unchanged.
Commerzbank
The ECB is likely to be keen to significantly dampen euphoric market expectations about rapid interest rate cuts, even though the members of the ECB Governing Council recently commented on possible interest rate cuts in 2024 at the Economic Forum in Davos. Communication is likely to focus on the development of wages and profit margins as well as geopolitical risks.
ING
We expect the ECB to stay on hold and give very little indication about the timing of any upcoming rate cut. We don’t expect this meeting to be a turning point for Eurozone rates or for the Euro.
Deutsche Bank
We expect the ECB to stay cautious on the inflation front and continue pushing back against a rate cut in Q1. We continue seeing the first rate cut in April (50 bps back to back in April-June and 150 bps in total in 2024) amid weak growth and inflation ahead.
ABN Amro
The ECB is expected the keep policy unchanged. A whole range of ECB officials have been setting out their views on monetary policy over the last few days. The overall message is that it is too early to declare victory in their fight against inflation and hence to start cutting policy rates. Yet they judge that data is moving in the right direction and rate cuts are likely to come in the summer. Our base scenario is that the ECB will cut interest rates by 25 bps in June.
BMO
No changes to policy are expected. The last gathering was just a little over a month ago, and there were a couple of quiet weeks nestled in there given the holidays and all. So if not January, then when? There had been some rumblings about the March 7 meeting being ‘live’ but they were silenced pretty quickly, given the emphasis on the first quarter wage negotiations, and their eventual impact on business pricing and consumer spending. April 11 is unlikely as there won’t be any updated staff forecasts to lean on. That brings us to June 11 (also our call). Also, the ECB will start the process of normalizing its balance sheet on July 1, which coincides nicely with the first cut. How many more cuts to follow will depend on the data but 75 bps for the year should be a minimum.
Wells Fargo
The ECB is widely expected to hold its Deposit Rate at 4.00%, but there will be significant interest in its assessment of the economy and potential hints into the timing of monetary easing. While we ultimately think weak Eurozone growth and softening inflation could prompt a rate cut as early as April, we think it's unlikely this week's policy announcement will endorse such a path. Instead, for the time being, we would not be surprised to see the ECB repeat that it "considers that the key ECB interest rates are at levels that, maintained for a sufficiently long duration, will make a substantial contribution" to returning inflation toward target.
Citi
The January meeting should sound hawkish, but probably won’t offer much new, likely leaving it to the 31 January Fed gathering for a more decisive near-term steer with the HICP flash for January due the following day on 1 February. So far, the largely consistent hawkish message from the ECB has underwhelmed in its market impact. The desire to avoid a premature loosening in financial conditions began in December with the message that the HICP projections (of which end-2025 is most important) were conditioned on a market rate path with a cut-off of 23 November, clearly implying they would be higher on a mark-to-market basis (with HICPX only just ‘sliding’ to 2.1% in 4Q25).
- EUR/USD gains momentum, , fueled by falling US Treasury yields and significant options expiry, despite mixed business activity in the EU.
- EU business activity remains in contraction, with the HCOB Composite PMI slightly improving but still in recessionary territory, reflecting challenges in demand and rising prices.
- US business activity surprisingly expanded, portraying a solid economy, a headwind for EUR/USD.
The EUR/USD resumed its uptrend on Wednesday amid the lack of a catalyst. Even though business activity improved in the Eurozone (EU), it is not the main reason behind the major’s advance. Falling US Treasury yields and a large option expiring on Thursday at 10:00 AM ET of 2.1 billion Euros linked to the major at around 1.0900 sponsored an uptick toward a daily high of 1.0932. At the time of writing, the EUR/USD trades at 1.0900, up 0.43%.
Divergence in business activity between the US and the EU, favors EUR/USD’s downside
Data-wise, business activity in the EU remained in contractionary territory as the HCOB Composite PMI, which encompasses the Services and Manufacturing PMIs, rose by 47.9 in January from December’s 47.6. However, it remained in recessionary territory for the eighth straight month. The report revealed that demand is falling, while prices rose courtesy of tensions in the Red Sea.
Across the pond, at around 14:45 GMT, S&P Global revealed that business activity in the US economy is picking up while prices abated. The US Flash Composite PMI rose to 52.3 its highest since June 2023, while the Services PMI expanded by 52.9 from 51.4. Meanwhile, manufacturing activity was the largest contributor to the composite index, which rebounded from 47.9 to 50.4, crushing estimates of 47.9.
S&P Global Chief Business Economist Chris Williamson said, “With the survey indicating that supply delays have intensified while labor markets remain tight, cost pressures will need to be monitored closely in the coming months, but for now, the survey sends a clear and welcome message of resilient economic growth and sharply waning inflation.”
The latest US Flash PMI report and last week’s data suggest the US economy remains solid and could deter the Federal Reserve (Fed) from easing policy, as the risks for inflation remain tilted to the upside. Next in the US economic docket are the Gross Domestic Product (GDP) report release, the Core Personal Consumption Expenditures (PCE) Price Index, Durable Goods Orders, and the unemployment claims.
On the Eurozone, the European Central Bank (ECB) monetary policy decision is awaited, followed by ECB’s President Christine Lagarde's press conference.
EUR/USD Price Analysis: Technical outlook
The EUR/USD dipped and formed a ‘bearish engulfing’ chart pattern, which is being invalidated by a leg-up that has breached the 50-day moving average at 1.0922 and tests the 61.8% Fibonacci retracement at 1.0931. A daily close above those two levels would expose the January 16 high at 1.0951, followed by the January 11 cycle high at 1.0999.
On the other hand, if prices tumble toward the 1.0900 figure, dropping beneath that, bears would regain control and could drag the pair below the 200-DMA at 1.0844, followed by a January 23 low of 1.0821 ahead of the 1.0800 figure.
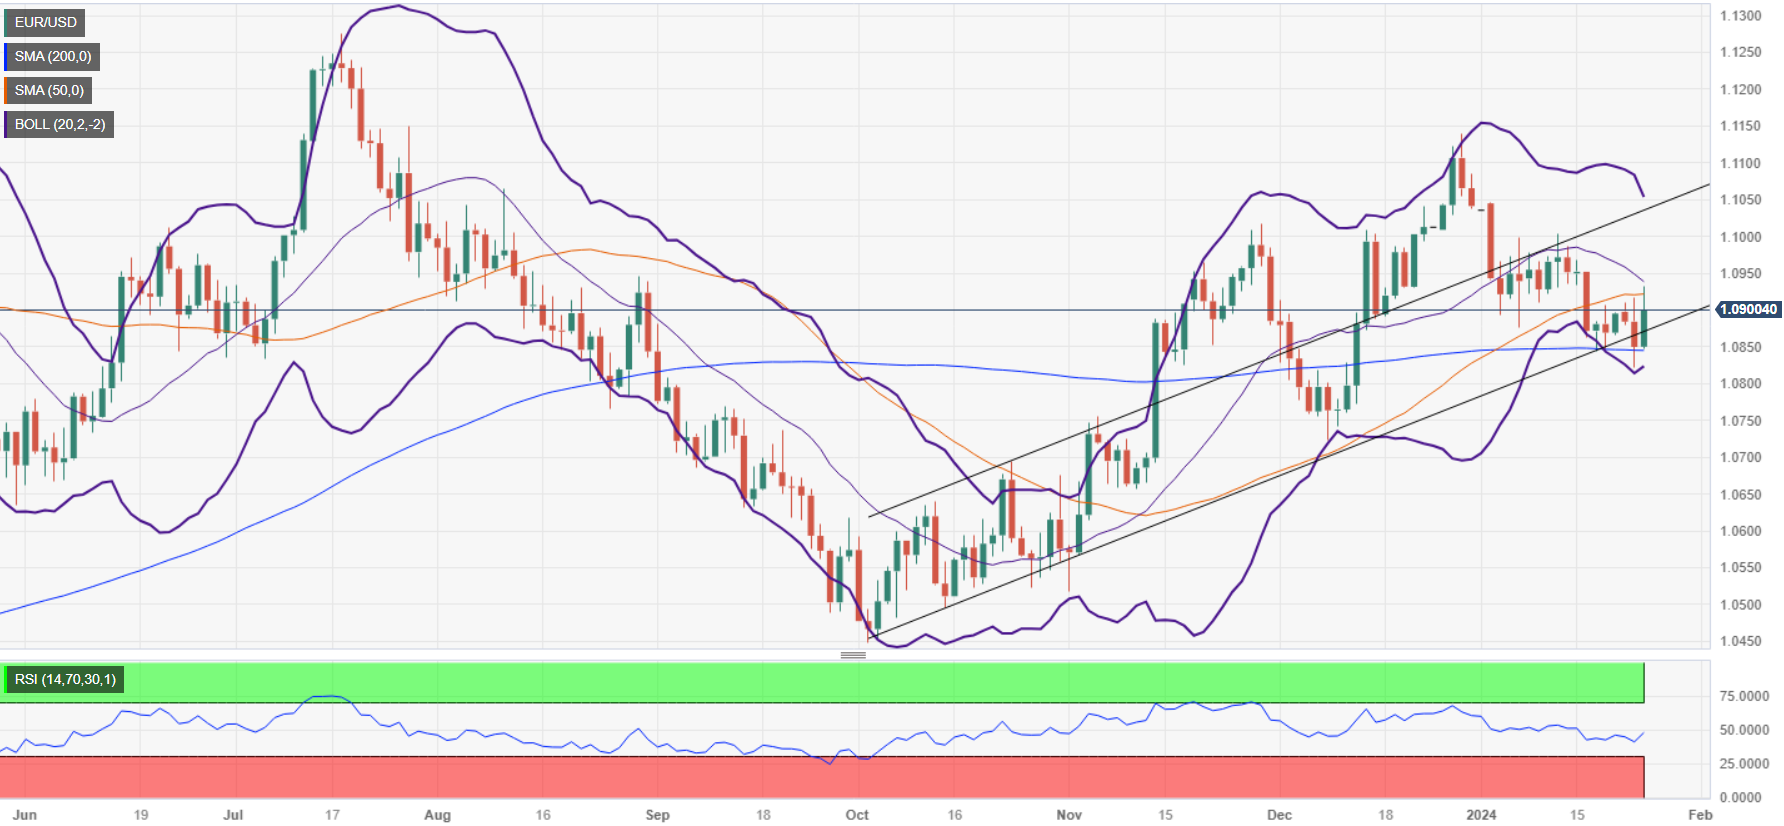
USD/MXN is now in the 17.20 area. Economists at ING analyze Mexican Peso’s outlook.
MXN underperformance may be indicating markets are pricing in a larger chance of Donald Trump winning the presidency
One dynamic to keep an eye on is the impact on markets of US Republican Primaries. The underperformance of the Mexican Peso since the start of the week may be indicating markets are pricing in a larger chance of Donald Trump winning the presidency after Ron DeSantis endorsed him.
Trump won the New Hampshire primary on Tuesday, securing 55% of votes and casting serious doubt on the future of Nikki Haley’s campaign. It all seems rather premature, but Banxico is also on the brink of a rate cutting cycle which can compound to keeping the Peso soft. This should not translate into a one-way direction for the MXN though, we still expect to see high demand in the dips, not least due to the preserved carry attractiveness and our view of a US Dollar decline.
According to Markit, the advanced S&P Global Manufacturing PMI improved to 50.3 for the month of January, up from December’s 47.9.
In addition, the S&P Global Services PMI climbed to 52.9 (from 51.4) and the S&P Global Composite PMI rose to 52.3 (from 50.9).
USD/CAD has pushed higher to start the year. Economists at the National Bank of Canada analyze Loonie’s outlook
Rate cuts by the BoC are likely to arrive before the Fed
The Canadian Dollar (CAD) has been under pressure from a combination of a stronger USD, a slowing economy and rising expectations for an easing in monetary policy. Oil prices have also failed to significantly rise despite renewed geopolitical pressure on the global stage.
Looking ahead, rate cuts by the Bank of Canada are likely to arrive before the Fed and exacerbate the yield differential with the US. Combined with a risk-off appreciation of the USD, we expect USD/CAD could reach 1.4500 by the midpoint of this year only to recover slightly by year-end.
Economists at Rabobank discuss when the BoJ may exit its negative interest rate policy and its implication for the USD/JPY pair.
There is room for disappointment in the pace of policy moves
We retain the forecast that April could bring a rate hike from the BoJ. However, this will be very dependent on strong data on wages from the spring ‘Shunto’ talks and on evidence of changing behaviour in firms with respect to wages and pricing.
Our forecast that USD/JPY could end the year at 135.00 assumes that the BoJ will hike rates this year. However, there is room for disappointment on the pace of policy moves and we see potential for USD/JPY to trade back at 148.00 on a one-month view.
The US Dollar is trading generally lower again after failing to build on Tuesday’s gains against the majors. Economists at Scotiabank analyze Greenback’s outlook.
DXY weakness below 102.90 may spell a bit more softness in the big Dollar in the short run
The moves in the USD over the past week or so have been rather limited but they may be significant – particularly the USD’s failure to capitalize on the DXY’s push through the 103.50 area on Tuesday.
Short-termism may be a factor for investors who are unwilling to stick with positioning for too long amid an uncertain backdrop. But the window for improvement in the USD may be closing a little.
Seasonally, Q1 is usually USD-positive but typically, the best of that comes in January history shows us.
DXY weakness below 102.90 may spell a bit more softness in the big Dollar in the short run at least.
The Canadian Dollar (CAD) has not enjoyed the best start to the year, weakening by around 2.2% against the US Dollar (USD). Economists at Société Générale analyze USD/CAD technical outlook.
USD/CAD remains delicately poised around the 200-DMA
USD/CAD has experienced a steady bounce after forming interim low near 1.3200/1.3180 last month. It has marched towards 1.3540, the 50% retracement from November.
The pair is evolving within crisscross moves around the 200-DMA which is having flattish slope; this denotes lack of clear direction.
A break above 1.3540 would be essential to confirm extension in rebound. Inability to overcome this hurdle can lead to a brief pullback; last week low of 1.3380/1.3350 is first layer of support near term.
GBP/USD has surged to the upper 1.2700s. Economists at Scotiabank analyze the pair’s outlook.
Daily support is firming up in the 1.2650/1.2675 zone
Sterling continues to draw support on dips. Intraday gains took the Pound back to the upper 1.2700s, more than a cent up from Tuesday’s low.
The broader 1.2600/1.2825 range remains intact, and gains show signs of stalling on the intraday chart. But bear trend momentum is weakening on the daily study and turning bullish on the intraday DMI while daily support is firming up in the 1.2650/1.2675 zone.
Another test of 1.28+ levels would not surprise.
EUR/USD retests the 1.0900 mark. Economists at Scotiabank analyze the pair’s outlook.
Trend strength signals are still leaning EUR-bearish
EUR/USD traded very weakly on Tuesday but failed to crack the 200-DMA support (1.0845) decisively.
Today’s rebound in the EUR is testing pivotal short-term resistance at 1.0910. Gains through the 1.0900 area have been difficult to sustain since the middle of the month and trend strength signals are still leaning EUR-bearish. But the EUR’s rebound from Tuesday’s losses has been impressive and a push through 1.0925 resistance should see the rebound develop a little more momentum.
USD/CAD drops marginally. Economists at Scotiabank analyze the pair’s outlook.
Resistance at 1.3480/1.3500 is firming up
Short-term price action is leaning USD-negative on the intraday chart following Tuesday’s slide back in funds from the upper 1.3400 area. Softness through 1.3450/1.3460 may extend to retest the low 1.3400 area again later today.
On the daily chart, the USD’s failure to hold gains through the upper 1.3400s is starting to look a little more significant, with spot losses compromising trend support of the late December low.
Resistance at 1.3480/1.3500 is firming up.
- The US Dollar is back flirting with a break lower.
- Traders are going into risk-on mode with German and EU PMI numbers improving.
- The US Dollar Index faces pressure on the 103-handle again.
The US Dollar (USD) slides lower against most major peers on Wednesday as markets send it lower. The initial moves came with German and European Purchasing Manager Indexes (PMIs), which in nearly all sectors showed improvement (though remaining in contraction territory). A further contraction in US PMI numbers later this afternoon could mean a meltdown for the Greenback.
On the economic front, as already mentioned in the above paragraph, US PMI numbers are set to be released this afternoon. The Manufacturing number will be especially significant (it is expected to remain unchanged at 47.9). Seeing the current market move already, a further sell-off of the Greenback could be at hand and see the DXY slide lower.
Daily digest market movers: US PMI on docket
- German Purchase Manager Index numbers pumped up the Euro against the US Dollar. German Manufacturing went to 45.4, coming from 43.3.
- French Manufacturing PMI was an upbeat surprise as well, heading form 44.4 to 46.6.
- The US Mortgate Applicatoins from the Mortgage Bankers Association has already been released and came in at 3.7%, from 10.4% last week.
- Near 14:45 GMT S&P Global is due to release the Purchase Manager Index for major sectors in the US:
- Manufacturing for January is expected to remain unchanged at 47.9.
- Services are expected to head to 51.0 from 51.4.
- Composite number was at 50.9 with no expectation pencilled in.
- The US Treasury will place a 5-year Note in the market near 18:00.
- Equity markets are in the green after the positive evolution in the German and EU PMI numbers. All European indices are up over 1%. In the US Netflix released better-than-expected subscription numbers, which sent the Nasdaq soaring ahead of the US opening bell.
- The CME Group’s FedWatch Tool shows that markets are pricing in a 97.4% possibility for an unchanged rate decision on January 31, with a slim 2.6% chance of a cut.
- The benchmark 10-year US Treasury Note sinks lower and flirts with a break below 4% as risk on is back in the markets.
US Dollar Index Technical Analysis: PMI ahead
The US Dollar Index (DXY) is down after Europe reported two upbeat numbers in the Manufacturing PMI print. Though the two European numbers are still in contraction, this does not mean the EU is out of the woods yet, or is outperforming the US. This afternoon’s US PMI numbers could either eke out more losses for the Greenback if the numbers disappoint, or send the Greenback back to its earlier level in Asian trading if they surprise to the upside.
There are some economic data points that could still build a case for the DXY to get through those two moving averages again and run away. Look for 104.44 as the first resistance level on the upside, in the form of the 100-day SMA. If that gets scattered as well, nothing will hold the DXY from heading to either 105.88 or 107.20 – the high of September.
A bull trap looks to be underway, where US Dollar bulls were caught buying into the Greenback when it broke above both the 55-day and the 200-day SMA in last week's trading. Price action could decline substantially and force US Dollar bulls to sell their positions at a loss. This would see the DXY first drop to 102.60, at the ascending trend line from September. Once below it, the downturn is open towards 102.00.
US Dollar FAQs
What is the US Dollar?
The US Dollar (USD) is the official currency of the United States of America, and the ‘de facto’ currency of a significant number of other countries where it is found in circulation alongside local notes. It is the most heavily traded currency in the world, accounting for over 88% of all global foreign exchange turnover, or an average of $6.6 trillion in transactions per day, according to data from 2022.
Following the second world war, the USD took over from the British Pound as the world’s reserve currency. For most of its history, the US Dollar was backed by Gold, until the Bretton Woods Agreement in 1971 when the Gold Standard went away.
How do the decisions of the Federal Reserve impact the US Dollar?
The most important single factor impacting on the value of the US Dollar is monetary policy, which is shaped by the Federal Reserve (Fed). The Fed has two mandates: to achieve price stability (control inflation) and foster full employment. Its primary tool to achieve these two goals is by adjusting interest rates.
When prices are rising too quickly and inflation is above the Fed’s 2% target, the Fed will raise rates, which helps the USD value. When inflation falls below 2% or the Unemployment Rate is too high, the Fed may lower interest rates, which weighs on the Greenback.
What is Quantitative Easing and how does it influence the US Dollar?
In extreme situations, the Federal Reserve can also print more Dollars and enact quantitative easing (QE). QE is the process by which the Fed substantially increases the flow of credit in a stuck financial system.
It is a non-standard policy measure used when credit has dried up because banks will not lend to each other (out of the fear of counterparty default). It is a last resort when simply lowering interest rates is unlikely to achieve the necessary result. It was the Fed’s weapon of choice to combat the credit crunch that occurred during the Great Financial Crisis in 2008. It involves the Fed printing more Dollars and using them to buy US government bonds predominantly from financial institutions. QE usually leads to a weaker US Dollar.
What is Quantitative Tightening and how does it influence the US Dollar?
Quantitative tightening (QT) is the reverse process whereby the Federal Reserve stops buying bonds from financial institutions and does not reinvest the principal from the bonds it holds maturing in new purchases. It is usually positive for the US Dollar.
- USD/CAD trims its intraday gains and extends its losses for the second session.
- BoC is expected to maintain its policy rate at 5.0% for the fourth consecutive time.
- Traders await the US PMI data to gain insights into business activities in the United States.
USD/CAD failed to capitalize on its intraday gains ahead of Canada’s interest rate decision scheduled to be released on Wednesday. The USD/CAD pair extends its losing streak for the second session, trading lower to near 1.3450 during the European session. However, the decline in Crude oil prices could put pressure on the Canadian Dollar (CAD), which in turn, limits the losses of the USD/CAD pair.
The Canadian Dollar (CAD) receives upward support as it is widely expected that the Bank of Canada (BoC) will deter from any policy rate cuts during its first meeting of the year. This would mark the fourth consecutive time that the BoC maintains the current interest rate at 5.0%. The anticipation for a steady policy is supported, especially after the release of Canada's inflation figures in December, which revealed an unexpected increase of 3.4% in consumer prices over the last twelve months. Additionally, the BoC's Trimmed-CPI and Median-CPI have remained firm, further contributing to the expectation of a status quo in the central bank's policy rate.
The US Dollar Index (DXY) moves lower to near the 103.10 level with the 2-year and 10-year yields on US bond coupons standing at 4.32% and 4.10%, respectively, by the press time. The US Dollar faces challenges due to the downward movement in the bond market and improved risk appetite, which could be attributed to the renewed confidence in the market sentiment towards the Federal Reserve’s rate cuts in March.
Looking forward, market participants will likely observe the release of the preliminary S&P Global Purchasing Managers Index (PMI) data from the United States (US) scheduled for Wednesday. This data is significant for providing insights into business activities in the manufacturing and servicing sector within the United States.
The Bank of Canada (BoC) will hold its first policy meeting of 2024 today. Economists at MUFG Bank analyze USD/CAD outlook ahead of the announcement.
Core inflation pick-up argues against earlier BoC cuts
Core inflation picked up at the end of last year which should make the BoC reluctant to discuss rate cuts as at today’s policy meeting. If that proves to be the case it could disappoint market expectations for earlier BoC cuts and encourage a stronger Canadian Dollar.
However, we expect any upside for the CAD to be only modest. Any gains for the Loonie could be tempered if there are discussions by the BoC about scaling back quantitative tightening.
- WTI Oil staples near $75 with current events not enough to send Crude higher.
- OPEC cuts are not sufficient and are just a drop on a hot plate.
- The US Dollar Index fails again to hold ground above important technical indicators.
Oil prices are going nowhere, despite the small uptick near $75, proving that the current Oil production cuts from OPEC+ are simply not enough. Especially when Russia, who would take the biggest share of supply cuts, is not respecting them and continues to pump up even more Crude in order to fund its war in Ukraine.
Meanwhile, the US Dollar Index (DXY) is having another downbeat day ahead of the European Central Bank (ECB) meeting on Thursday. Markets are sending the US Dollar lower again with a risk-on tone present in the markets. Halfway through the European trading session, all European indices are up over 1%.
Crude Oil (WTI) trades at $74.48 per barrel, and Brent Oil trades at $79.22 per barrel at the time of writing.
Oil news and market movers: What will it take?
- Since the November OPEC decision to issue production cuts for further and longer, Crude prices have been unable to substantially move higher and stay there for longer.
- Energy traders are signalling a lost year for 2024 with less profit as Red Sea issues are jacking up the costs to transport the black fuel across the globe.
- The overnight American Petroleum Institute (API) print on Tuesday was a substantial drawdown of 6.674 million barrels and against a previous build of 0.483 million barrels. Expectations were a smaller drawdown of just 3 million barrels.
- Later this Wednesday, near 15:30 GMT, the weekly stock pile print will be released from the Energy Information Administration (EIA). Previously it experienced a drawdown of 2.492 million barrels with another drawdown of 2.15 million barrels expected.
Oil Technical Analysis: OPEC unable to shore up prices
Oil prices are not having the hoped-for return OPEC, and especially Saudi Arabia, had projected. Oil prices, though near $75, are not going substantially higher. A failed result thus of an even bigger failed meeting back in November, with, in the meanwhile, two African members having left OPEC – leaving the organisation unable to turn the tide in order to keep prices profitable, even in a slowing down economy.
On the upside, $74 continues to act as a line in the sand after a failed break above it on Friday. Although quite far off, $80 comes into the picture should tensions build further. Once $80 is broken, $84 is next on the topside.
Below $74, the $67 level could still come into play as the next support to trade at, as it aligns with a triple bottom from June. Should that triple bottom break, a new low could be close at $64.35 – the low of May and March 2023 – as the last line of defence. Although still quite far off, $57.45 is worth mentioning as the next level to keep an eye on if prices fall sharply.
-638416913339529496.png)
US WTI Crude Oil: Daily Chart
WTI Oil FAQs
What is WTI Oil?
WTI Oil is a type of Crude Oil sold on international markets. The WTI stands for West Texas Intermediate, one of three major types including Brent and Dubai Crude. WTI is also referred to as “light” and “sweet” because of its relatively low gravity and sulfur content respectively. It is considered a high quality Oil that is easily refined. It is sourced in the United States and distributed via the Cushing hub, which is considered “The Pipeline Crossroads of the World”. It is a benchmark for the Oil market and WTI price is frequently quoted in the media.
What factors drive the price of WTI Oil?
Like all assets, supply and demand are the key drivers of WTI Oil price. As such, global growth can be a driver of increased demand and vice versa for weak global growth. Political instability, wars, and sanctions can disrupt supply and impact prices. The decisions of OPEC, a group of major Oil-producing countries, is another key driver of price. The value of the US Dollar influences the price of WTI Crude Oil, since Oil is predominantly traded in US Dollars, thus a weaker US Dollar can make Oil more affordable and vice versa.
How does inventory data impact the price of WTI Oil
The weekly Oil inventory reports published by the American Petroleum Institute (API) and the Energy Information Agency (EIA) impact the price of WTI Oil. Changes in inventories reflect fluctuating supply and demand. If the data shows a drop in inventories it can indicate increased demand, pushing up Oil price. Higher inventories can reflect increased supply, pushing down prices. API’s report is published every Tuesday and EIA’s the day after. Their results are usually similar, falling within 1% of each other 75% of the time. The EIA data is considered more reliable, since it is a government agency.
How does OPEC influence the price of WTI Oil?
OPEC (Organization of the Petroleum Exporting Countries) is a group of 13 Oil-producing nations who collectively decide production quotas for member countries at twice-yearly meetings. Their decisions often impact WTI Oil prices. When OPEC decides to lower quotas, it can tighten supply, pushing up Oil prices. When OPEC increases production, it has the opposite effect. OPEC+ refers to an expanded group that includes ten extra non-OPEC members, the most notable of which is Russia.
- USD/JPY loses ground on speculation of Fed interest rate cuts in March.
- The better-than-expected Japan’s data might have supported the JPY.
- US Dollar faces challenges due to the downbeat US yields and improved risk appetite.
The USD/JPY pair experiences a downward trend as market confidence is restored, driven by expectations that the Federal Reserve will start implementing interest rate cuts in March. Currently, the probability of this scenario is priced at around 50:50, indicating uncertainty among market participants. The USD/JPY pair trades lower near 147.50 during the European session on Wednesday.
The Bank of Japan (BoJ) decided to maintain its current interest rates and yield curve control policy during its recent meeting on Tuesday. However, BoJ Governor Kazuo Ueda signaled a strong commitment to achieving the 2.0% inflation target. Ueda's remarks suggested that the conditions necessary for gradually phasing out extensive stimulus measures and moving short-term interest rates out of negative territory were aligning.
Additionally, the better-than-expected Japan’s Merchandise Trade Balance Total for December was released by the Ministry of Finance on Wednesday. The report printed the figure of ¥62.1B against the expected ¥-122.1B and the previous figure of ¥-780.4B. While Japanese Exports (YoY) rose to 9.8% from the previous decline of 0.2%. These improved readings might have provided support to underpinning the Japanese Yen (JPY), which in turn, acts as a headwind for the USD/JPY pair.
On the other side, the US Dollar faces challenges due to the downward movement in the bond market and improved risk appetite. The US Dollar Index (DXY) edges lower to near the 103.10 level with the 2-year and 10-year yields on US bond coupons standing at 4.32% and 4.10%, respectively, by the press time. Looking forward, market participants are expected to keenly observe the release of the S&P Global Purchasing Managers Index (PMI) data from the United States (US) scheduled for Wednesday.
USD/JPY is pegged back below 148.00 on higher JGB yields. Economists at Société Générale analyze the pair’s outlook.
Market speculating of March/April exit from negative rates
JGB yields stay higher across the curve, diverging from softer yields in the US and Europe. The increase by 5 bps in 2y yields to 0.72% reflects greater speculation that the central bank could adjust policy in March or April. Our economists are having second thoughts about a policy change this soon and think the bank will not be confident of achieving its 2% price target sustainably and stably. This year's base pay rise is likely to be insufficient to achieve the 2% target.
Moreover, there is a growing feeling that the rate of increase in service prices has already peaked. Our economists therefore do not expect the BoJ to abolish YCC and negative rates in April, the first meeting of the new fiscal year. This keeps the onus on the US economy and the Fed for downside in USD/JPY to gain traction.
An economic crisis in China would cut the German Gross Domestic Product (GDP) growth by 0.7% in the first year and by almost 1% in the second year, Germany's Bundesbank said in its monthly report on Wednesday, per Reuters.
Bundesbank noted that an abrupt decoupling from China would not be realistic or desirable, adding that even an orderly withdrawal would bring considerable losses.
Market reaction
EUR/USD largely ignored these comments and was last seen trading near 1.0900, where it was up 0.45% on a daily basis.
The Bank of Canada (BoC) announces monetary policy today. Economists at ING analyze USD/CAD outlook ahead of the decision.
CAD can find some moderate support
The focus is on whether the Bank is ready to deliver a Fed-like dovish pivot. We think it may be too early for a radical shift in the policy message.
While the hawkish bias should be softened and the discussion on rate cuts opened, we think the BoC will fall short of the dovish stance expressed by the Federal Reserve in December.
Expect the policy message to include concerns about the path of inflation and readiness to keep policy restrictive for longer if necessary.
Markets are pricing in around 110 bps of easing by the BoC in the next 12 months: we suspect today’s meeting will fail to endorse those expectations, and CAD can find some moderate support. Still, we expect USD/CAD to find good demand below the 1.3400 mark.
USD/JPY rose to a high on Tuesday at 148.70 after hitting a low of 146.99 in the initial aftermath of the BoJ policy update. Economists at MUFG Bank analyze the pair’s outlook.
The Yen which has fallen back closer to last year’s lows
The 10-year JGB yield hit a year-to-date high overnight at 0.75% and now stands almost 20 bps higher than the low from earlier in the month. If Japanese yields continue to adjust higher ahead of the BoJ’s next policy meeting in March, the developments should offer more support to the Yen which has fallen back closer to last year’s lows. However, the move higher in Japanese yields is currently being offset by the recent hawkish repricing of the US yield curve which is dampening the bullish impact on the yen from the BoJ’s policy update.
For USD/JPY to come back under renewed downward pressure in near term, market participants would have to become more confident again that the Fed could begin to cut rates in March which is currently priced at around a 50:50 probability.
- GBP/USD advances as UK PMI data beats the market expectations in January.
- UK Services and Manufacturing PMI improved to 53.8 and 47.3, respectively in January.
- US bond yields decline on expectation of Fed’s rate cuts in May, undermines the US Dollar.
GBP/USD rises to near 1.2760 during the European session on Wednesday. The positive Purchasing Managers Index (PMI) data from the United Kingdom (UK) contribute to a rise in the Pound Sterling (GBP) against the US Dollar (USD). The preliminary S&P Global/CIPS Services PMI for January demonstrated growth, reaching 53.8 compared to the previous figure of 53.4. Additionally, the Manufacturing PMI increased to 47.3 from the earlier reading of 46.2. Concurrently, the Composite PMI showed appreciation, reporting a figure of 52.5 as compared to the previous reading of 52.1.
These upbeat Purchasing Managers Index (PMI) figures indicate that the Bank of England (BoE) may refrain from implementing monetary policy loosening measures in the upcoming February meeting. However, market participants are expected to remain cautious and await additional economic indicators to provide momentum leading up to the May meeting. There is speculation that the Bank of England might consider initiating rate cuts as early as May, with the possibility of three more cuts throughout 2024.
The US Dollar faces a challenge due to the downward movement in the bond market, driven by market expectations that the Federal Reserve (Fed) might commence rate cuts in May. There is full pricing in of a 25 basis point (bps) cut in interest rates for May, reflecting the anticipation of a more accommodative monetary policy.
However, the market is pricing in the possibility of no adjustment by the Fed in the upcoming February meeting. This suggests a cautious stance among market participants as they await further signals from the central bank. Looking forward, market participants are expected to keenly observe the release of the S&P Global Purchasing Managers Index (PMI) data from the United States (US) scheduled for Wednesday.
The Dollar strengthened across the board on Tuesday with no clear catalyst. Economists at ING analyze the spurious USD rally.
Dollar rebound to rebound sustainably once short-term Treasury yields take another leap higher
We admit the Dollar jump was quite surprising, and without a clear catalyst, and therefore see room for the USD correction initiated overnight to extend today.
We suspect that in an environment that keeps pricing large Fed cuts, USD rallies aren’t very sustainable.
We’ll be awaiting the next leap higher in short-term USD rates to endorse a Dollar rebound.
- EUR/USD snaps its recent losses after the improved Manufacturing PMI data.
- Eurozone Manufacturing PMI improved to 46.6 from the previous reading of 44.4.
- German Manufacturing PMI reached 45.4 in January from 43.3 prior.
- US Dollar declines as US yields face a challenge on expectations of the Fed to initiate rate cuts from May.
EUR/USD gains ground after the mixed Purchasing Managers Index (PMI) data for the Eurozone and Germany. The EUR/USD pair edges higher to near 1.0880 during the European session on Wednesday. Additionally, the subdued US Treasury yields are contributing to downward pressure for the US Dollar (USD), which in turn, underpins the EUR/USD pair.
In January, the preliminary Eurozone HCOB Services Purchasing Managers' Index (PMI) decreased to 48.4, falling short of the anticipated reading of 49.0. The Manufacturing PMI showed improvement, improving to 46.6 from the previous reading of 44.4. In Germany, the Services PMI declined to 47.6, below the market consensus of 49.5. While the Manufacturing PMI in Germany improved, reaching 45.4 compared to the prior reading of 43.3.
These figures indicate a mixed picture for economic activities in the Eurozone, with the services sector experiencing a decline while manufacturing shows signs of improvement ahead of the European Central Bank’s (ECB) monetary policy statement on Thursday.
The US Dollar Index (DXY) experiences a decline, nearing the 103.20 level, as the 2-year and 10-year yields on US bond coupons stand at 4.31% and 4.09%, respectively, at the time of writing. This movement in the bond market could be suggestive of market expectations that the Federal Reserve (Fed) may initiate rate cuts, with full pricing in of a 25 basis point (bps) cut in interest rates for May.
Adding to this, former St. Louis Fed President James Bullard has put forth a perspective suggesting the possibility of the Fed implementing interest rate cuts even before inflation reaches the 2.0% threshold. Bullard speculates that these cuts could potentially occur as early as March, introducing an alternative timeline for potential monetary policy adjustments.
Looking ahead, the S&P Global Purchasing Managers Index (PMI) data from the United States (US) scheduled for release on Wednesday will be closely observed. This data is significant for providing insights into business activities within the United States and could further influence market sentiments regarding the monetary actions of the Federal Reserve.
The Bank of Canada (BoC) holds its first meeting of the year today. Economists at Commerzbank analyze Loonie’s outlook ahead of the policy announcement.
Will the BoC continue to wait and see?
The actual interest rate decision is unlikely to be particularly exciting at this stage. Instead, the BoC is likely to leave rates unchanged. This should not really surprise the market, even though a small residual probability of a first rate cut is currently priced in.
If the BoC's statement and Governor Tiff Macklem's subsequent meeting with reporters can reassure the market of its continued cautious approach, the CAD should benefit slightly given current market expectations.
However, there is of course a risk that the BoC will not fight market expectations very vigorously. Simply because it knows that it is likely to cut rates in the coming months. Dovish comments are likely to put pressure on the CAD. Although this is not my base case, the probability of this happening is much higher than zero given the advanced state of the interest rate cycle. Anyone who needs to manage CAD risks should keep this in mind.
- S&P Global/CIPS PMIs for January came in above expectations.
- GBP/USD climbed above 1.2750 on upbeat PMI figures.
Economic activity in the UK's private sector continued to expand at an accelerating pace in January, with S&P Global/CIPS Composite PMI rising to 52.5 in January's flash estimate from 52.1 in December. This print came in above the market consensus of 52.2.
S&P Global/CIPS Manufacturing PMI edged higher to 47.3 from 46.2 in the same period, while the Services PMI advanced to 53.8 from 53.4.
Commenting on the report, "the surprising strength of growth in January, which has exceeded forecasts, may deter the Bank of England from cutting interest rates as soon as many are expecting, especially as supply disruptions in the Red Sea are reigniting inflation in the manufacturing sector," said Chris Williamson, Chief Business Economist at S&P Global Market Intelligence Supply.
"Supply delays have spiked higher as shipping is re-routed around the Cape of Good Hope, the longer journey times lifting factory costs at a time of still-elevated price pressures in the service sector. Inflation is therefore indicated to remain stubbornly higher in the 3-4% range in the near future," Williamson added.
Market reaction
GBP/USD gathered bullish momentum on the upbeat PMI readings and was last seen rising 0.6% on the day at 1.2760.
New Zealand's Consumer Price Index (CPI) eased further in the fourth quarter of 2023. NZD/USD broke back above 0.6100 on the release. Economists at ING analyze the pair’s outlook.
Non-tradeable inflation offers RBNZ a hawkish "loophole"
New Zealand’s inflation matched estimates at 0.5% quarter-on-quarter and 4.7% YoY in the 4Q print. However, non-tradeable CPI did come in hotter than expected at 1.1% QoQ, which has led to a move higher in short-term NZD rates.
The stronger non-tradeable CPI may offer an excuse for the RBNZ to stick to some hawkish narrative on 28 February, although they will need to admit that general inflation pressures have declined and the economy underperformed, making any promise of higher-for-longer a harder sell to markets.
The next key release in New Zealand is the 4Q jobs report on 6 February. Until then, expect volatile Chinese sentiment and USD dynamics to drive NZD performance.
Even in the case of an RBNZ dovish shift, we like the chances of a higher NZD/USD beyond the short term as the Kiwi benefits from a broader USD decline and Fed rate cuts. Our year-end target is 0.6400.
- USD/MXN snaps a two-day winning streak ahead of US PMI data
- The decline in the US bond yields undermines the US Dollar.
- Banxico’s former Governor Agustin Carstens suggested being cautious before making policy decisions.
USD/MXN moves in a downward direction after registering gains in the previous two sessions. The USD/MXN pair trades lower near 17.23 during the European session on Wednesday. The US Dollar (USD) experiences a decline, attributed to a decrease in US bond yields, which may be influenced by expectations of the Federal Reserve (Fed) initiating rate cuts starting in May. The market is fully pricing in a 25 basis point (bps) cut in interest rates for May.
Additionally, former St. Louis Fed President James Bullard presented his perspective, proposing the possibility of the Federal Reserve (Fed) implementing interest rate cuts even before inflation reaches the 2.0% threshold. Bullard speculates that these cuts could potentially take place as early as March.
Agustin Carstens, the former Governor of the Bank of Mexico (Banxico) emphasized the importance of not lowering interest rates prematurely. He stated "Recent developments allow policymakers to look at the future with cautious optimism." Carstens' comments suggest a measured approach to monetary policy decisions in response to current economic conditions.
The performance of the Mexican Peso (MXN) could be significantly influenced by factors associated with the United States (US), according to TD Securities. The interconnection between the Mexican Peso and US-related factors underscores the importance of monitoring developments in the US economy for insights into the trajectory of the MXN.
Looking forward, the Bank of Mexico (Banxico) is scheduled to release the first half-month inflation data for January on Wednesday. This data release is anticipated to provide valuable information about inflation trends in Mexico, which can impact Banxico's decisions regarding interest rates and monetary policy in the upcoming meetings.
- HCOB Composite PMI for the Euro area improved slightly in early January.
- EUR/USD continues to fluctuate below 1.0900 after PMI data.
The economic activity in the Euro area's private sector continued to contract in early January, albeit at a slower pace than in December. HCOB Composite PMI edged higher to 47.9 in January's flash estimate from 47.6 in December. This reading, however, fell short of the market expectation of 48.0.
In the same period, HCOB Services PMI declined to 48.4 from 48.8, while the Manufacturing PMI improved to 46.6 from 44.4.
Commenting on the PMI survey's findings, “the commencement of the year brings positive tidings for the Eurozone as manufacturing experiences a widespread easing of the downward trajectory witnessed in the past year," said Dr. Cyrus de la Rubia, Chief Economist at Hamburg Commercial Bank. "This positive shift is evident across key indicators such as output, employment, and new orders. Notably, the export sector plays a pivotal role in driving the improvement of the latter, showing better conditions compared to the end of the preceding year."
Market reaction
EUR/USD clings to modest daily gains above 1.0850 following this report.
- Canadian central bank is widely expected to keep its interest rate at 5.0%.
- Bank of Canada officials could emphasize the stickiness of inflation.
- Canadian Dollar has been on the defensive so far this year.
- Investors’ attention should also remain on the BoC Monetary Policy Report.
It is widely anticipated that the Bank of Canada (BoC) will maintain its policy rate at 5.0% for the fourth consecutive time at its event on Wednesday, January 24. The Canadian Dollar (CAD) has been depreciating markedly since the beginning of the new year against its southern neighbour, the US Dollar (USD). So far this week, USD/CAD managed to regain some ground lost in the latter half of the last week, revisiting the 1.3480 zone, where the critical 200-day SMA also sits.
It will be the first meeting of the year and those who expect the central bank to drop its guard could be greatly disappointed, particularly since the release of Canada's inflation figures in December, which saw consumer prices unexpectedly rise 3.4% over the last twelve months and the BoC’s Trimmed-CPI and Median-CPI maintain its firm stance.
Bank of Canada interest rate expectations: Rate hikes still on the table?
While the central bank could revise lower its GDP forecasts, it should certainly keep its cautious stance well in place, therefore the likelihood of further rate hikes are expected to remain an option in case the disinflationary pressures continue to show signs of exhaustion.
According to BoC Governor Tiff Macklem, in the latest recap of discussions, the Governing Council emphasized the significance of restating their readiness to increase the rate if necessary. He added that fortunately, longer-term inflation expectations have remained securely anchored, although short-term expectations have escalated in tandem with inflation. Macklem also mentioned that by the conclusion of 2024, the bank should be approaching the 2% inflation target.
When will the BoC release its monetary policy decision and how could it affect USD/CAD?
The Bank of Canada is set to disclose its policy decision at 15:00 GMT on January 24, followed by the publication of the bank’s Monetary Policy Report (MPR).
The anticipated impact on the Canadian currency is expected to be limited if any at all. A hawkish hold could prompt a near-term knee-jerk drop in USD/CAD, although its duration and extension are unlikely to be convincing. Of note is that much of the so-far yearly uptrend in spot is attributed to the dynamics of the USD. The pair, in the meantime, continues to navigate around the 200-day SMA near 1.3480, and a sustained breakout of this zone should lend fresh wings to the pair and refocus its target to the December peaks around 1.3620.
On the flip side, there seems to be no strong catalysts in the very near term to allow for the Canadian Dollar to embark on a sustainable appreciation, which could eventually drag the pair to its initial contention zone at the December lows near 1.3180.
Bank of Canada FAQs
What is the Bank of Canada and how does it influence the Canadian Dollar?
The Bank of Canada (BoC), based in Ottawa, is the institution that sets interest rates and manages monetary policy for Canada. It does so at eight scheduled meetings a year and ad hoc emergency meetings that are held as required. The BoC primary mandate is to maintain price stability, which means keeping inflation at between 1-3%. Its main tool for achieving this is by raising or lowering interest rates. Relatively high interest rates will usually result in a stronger Canadian Dollar (CAD) and vice versa. Other tools used include quantitative easing and tightening.
What is Quantitative Easing (QE) and how does it affect the Canadian Dollar?
In extreme situations, the Bank of Canada can enact a policy tool called Quantitative Easing. QE is the process by which the BoC prints Canadian Dollars for the purpose of buying assets – usually government or corporate bonds – from financial institutions. QE usually results in a weaker CAD. QE is a last resort when simply lowering interest rates is unlikely to achieve the objective of price stability. The Bank of Canada used the measure during the Great Financial Crisis of 2009-11 when credit froze after banks lost faith in each other’s ability to repay debts.
What is Quantitative tightening (QT) and how does it affect the Canadian Dollar?
Quantitative tightening (QT) is the reverse of QE. It is undertaken after QE when an economic recovery is underway and inflation starts rising. Whilst in QE the Bank of Canada purchases government and corporate bonds from financial institutions to provide them with liquidity, in QT the BoC stops buying more assets, and stops reinvesting the principal maturing on the bonds it already holds. It is usually positive (or bullish) for the Canadian Dollar.
Economic Indicator
Canada BoC Monetary Policy Statement
At each of the Bank of Canada (BoC) eight meetings, the Governing Council releases a post-meeting statement explaining its policy decision. The statement may influence the volatility of the Canadian Dollar (CAD) and determine a short-term positive or negative trend. A hawkish view is considered bullish for CAD, whereas a dovish view is considered bearish.
Read more.Next release: 01/24/2024 14:45:00 GMT
Frequency: Irregular
Source: Bank of Canada
Economists at TD Securities discuss the Bank of Canada (BoC) Interest Rate Decision and its implications for the USD/CAD pair.
Base Case: Mildly Hawkish (70%)
The BoC leaves overnight rate at 5.00% and notes concern about persistent price pressures despite more evidence of waning demand. Modest downgrades to GDP/CPI in Jan MPR, with latter driven by energy prices, as unchanged forward guidance keeps the (empty) threat of rate hikes on the table going forward. USD/CAD -0.10%.
Dovish: (25%)
Bank leaves overnight rate at 5.00% but lays some early groundwork for rate cuts with dovish tweaks to forward guidance by dropping the reference to further hikes. Statement also cites concern around underlying prices/wage pressures despite weaker growth backdrop, while revised guidance introduces some caveats to the timeline for cuts. USD/CAD +0.30%.
Extremely Dovish (5%)
The BoC leaves overnight rate at 5.00% but throws caution to the wind by dropping threat of hikes and leaving guidance open-ended. Statement notes that headwinds to activity have increased and that inflation pressures have subsided outside of shelter component. MPR revises GDP/CPI growth lower over 2023/24, projects flat print on Q4 GDP. USD/CAD +0.70%.
- Silver attracts some buyers for the second straight day and climbs back closer to the weekly top.
- The technical setup warrants caution before positioning for any meaningful appreciating move.
- A descending trend-line hurdle extending from the December swing high might cap further gains.
Silver (XAG/USD) gains positive traction for the second straight day on Wednesday and recovers further from its lowest level since November 13, around the $21.95-$21.90 area touched earlier this week. The white metal builds on the intraday move-up through the first half of the European session and climbs to the top end of its weekly range, around the $22.60-$22.65 region in the last hour.
From a technical perspective, any subsequent strength beyond the $22.75 zone is more likely to confront stiff resistance near the $23.00 round-figure mark. The said handle now coincides with a downward sloping trend-line extending from the December swing high, which if cleared decisively might trigger a short-covering rally. The XAG/USD might then accelerate the momentum beyond an intermediate hurdle near the $23.25-$23.30 area and aim to retest the very important 200-day Simple Moving Average (SMA), currently around mid-$23.00s.
The latter should act as a key pivotal point and a sustained strength beyond will suggest that the XAG/USD has formed a near-term bottom and pave the way for a further near-term appreciating move. The white metal could then reclaim the $24.00 mark and extend the positive move further towards the next relevant hurdle near the $24.40-$24.50 region. That said, negative oscillators on the daily chart warrant some caution for aggressive bulls.
On the flip side, the daily swing low, around the $22.35 zone, now seems to protect the immediate downside ahead of over a two-month low, around the $21.95-$21.90 region touched on Monday. Some follow-through selling will be seen as a fresh trigger for bearish traders and drag the XAG/USD to the $21.40-$21.35 support. The downward trajectory could extend further towards the $21.00 round figure en route to the October monthly swing low, around the $20.70-$20.65 region.
Silver daily chart
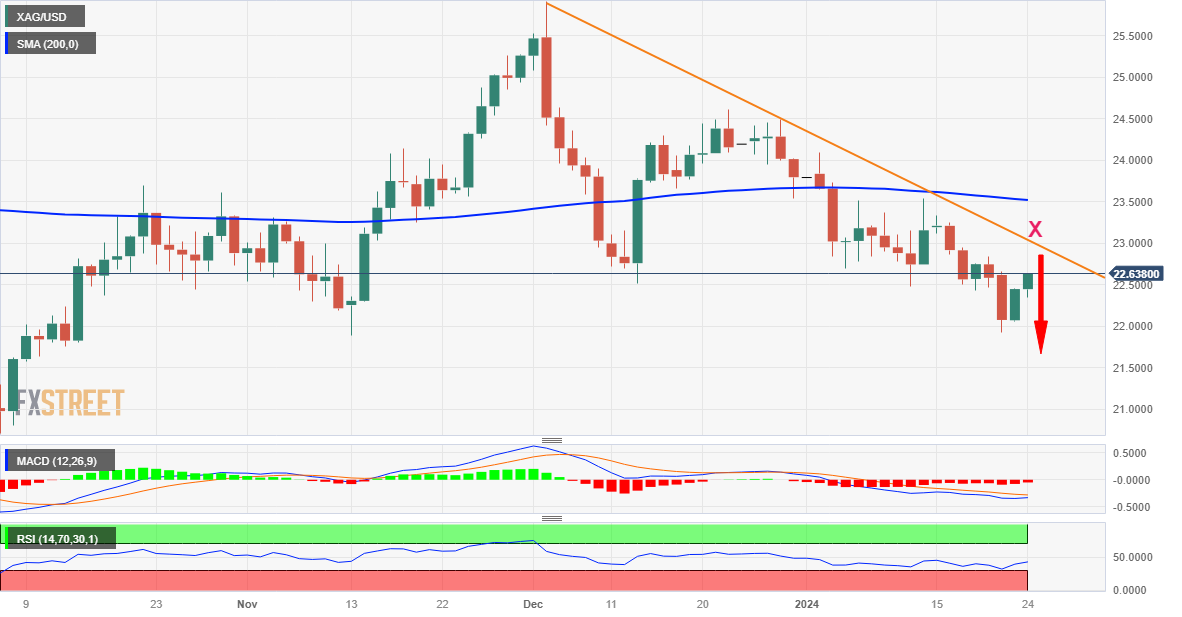
Technical levels to watch
- HCOB Manufacturing PMI in Germany improved modestly in early January.
- HCOB Services PMI declined further in the contraction territory below 50.
Business activity in Germany's private sector continued to contract at an accelerating pace in early January, with HCOB Composite PMI declining to 47.1 from 47.4 in December. This reading came in below the market expectation of 47.8.
HCOB Manufacturing PMI improved to 45.4 from 43.3 in the same period, while HCOB Services PMI dropped to 47.6 from 49.3.
Commenting on the flash PMI data, "Germany has faced a sluggish start to the new year. Services activity has not only declined for the fourth consecutive month but has also accelerated in its downturn. Manufacturing, remaining in recessionary territory for the 19th straight month, has displayed a somewhat softened downturn, as reflected in the steadily rising PMI index since August of last year," said Dr. Cyrus de la Rubia, Chief Economist at Hamburg Commercial Bank, and continued:
"Recognizing the inherent uncertainty at this early stage, our GDP Nowcast, which considers the PMI data, suggests a continuation of the recession into the current quarter, however."
Market reaction
EUR/USD showed no immediate reaction to the PMI data and was last seen rising 0.15% on the day at 1.0870.
- NZD/USD gains ground as US Dollar loses ground on lower US bond yields.
- Kiwi CPI YoY came above the RBNZ’s target 1-3% target range at 4.7% in Q4.
- Market expects no adjustment in the Fed’s monetary policy in February’s meeting.
NZD/USD capitalizes on its intraday gains as the US Dollar (USD) declines after recording profits in the previous two sessions. The NZD/USD pair trades around the 0.6110 during the early European hours on Wednesday. Furthermore, the Consumer Price Index (CPI) data for the New Zealand Dollar (Kiwi), released on Wednesday, showed a year-over-year figure of 4.7% in the fourth quarter, aligning with expectations. However, this marked a decrease from the previous reading of 5.6%.
Despite the decline, consumer inflation remains above the Reserve Bank of New Zealand's (RBNZ) target range of 1.0% to 3.0%. The elevated level of consumer inflation, above the RBNZ's target range, reduces the likelihood of an immediate interest rate cut by the RBNZ. This, in turn, could provide some support to the NZD/USD pair as the central bank may exercise caution in implementing a rate cut given the persistently higher inflationary pressures.
The US Dollar Index (DXY) is seeing a decline, approaching the 103.40 level, while the 2-year and 10-year yields on US bond coupons are reported at 4.32% and 4.10%, respectively, at the time of writing. This suggests a movement in the bond market that may be influencing the performance of the US Dollar. Furthermore, S&P Global Purchasing Managers Index (PMI) data from the United States (US) will be eyed on Wednesday.
In terms of market sentiment, there is a prevailing notion of reduced probability for a rate cut by the Federal Reserve (Fed) in March. However, former St. Louis Fed President James Bullard holds a divergent view, suggesting that the Fed might implement interest rate cuts even before inflation reaches 2.0%. Bullard speculates that these cuts could occur as early as March.
Today, we have the first estimates of the purchasing managers' indices from the Eurozone, the UK and the US on the agenda. Economists at Commerzbank analyze the relevance of today's PMIs for the respective currency.
The UK and US indices are likely to remain in expansionary territory above the 50 mark
Our economists expect only a slight rebound for the Eurozone (but still in recessionary territory), while the UK and US indices are likely to remain in expansionary territory above the 50 mark. In practice, however, the numbers are unlikely to change much from December.
Unless the figures come as a clear surprise (which has happened several times in recent months), this would not really be worth mentioning. Nevertheless, some interesting conclusions can be drawn. A single surprise may not make much difference in the medium term. However, if the numbers settle in one area (whether in recession or expansion), then the chances of a recession or clear upswing naturally increase. And depending on the outcome, this is good or bad for the currency in the medium term.
Each additional number in recessionary or expansionary territory increases the probability of a recession or solid economic growth, but the probability does not rise to 1. Therefore, while it should be positive for the Pound and the USD in the medium term if today's numbers are solid again, ultimately it is the full spectrum of economic data that counts. And in the short term, whether the numbers surprise to the upside or the downside is more important today anyway.
Gold prices fell in India on Wednesday, according to data from India's Multi Commodity Exchange (MCX).
Gold price stood at 62,220 Indian Rupees (INR) per 10 grams, down INR 104 compared with the INR 62,324 it cost on Tuesday.
As for futures contracts, Gold prices increased to INR 62,141 per 10 gms from INR 62,124 per 10 gms.
Prices for Silver futures contracts decreased to INR 71,502 per kg from INR 71,090 per kg.
| Major Indian city | Gold Price |
|---|---|
| Ahmedabad | 64,425 |
| Mumbai | 64,225 |
| New Delhi | 64,240 |
| Chennai | 64,370 |
| Kolkata | 64,340 |
Global Market Movers: Gold Comex price draws support from a combination of factors
Retreating US Treasury bond yields keep the US Dollar (USD) bulls on the defensive and turn out to be a key factor lending some support to the Comex Gold price amid geopolitical tensions in the Middle East.
US military forces struck 3 facilities used by Iranian-affiliated militant groups in western Iraq in direct response to a series of escalatory attacks, raising the risk of a further escalation of tensions in the Middle East.
The incoming US macro data suggested that the economy is in good shape and gives the Federal Reserve more headroom to keep interest rates higher for longer, which should cap the non-yielding bullion.
The current market pricing indicates a greater chance of the first interest rate cut by the Fed in May, which was initially expected in March, and less aggressive policy easing than is now anticipated by investors.
The lack of strong follow-through buying warrants caution for bulls ahead of this week's key macro releases – the flash global PMIs, the Advance US Q4 GDP print and the US Core PCE Price Index.
The crucial US inflation data will influence expectations about the Fed's future policy actions, which, in turn, will drive the USD demand and determine the near-term trajectory for the XAU/USD.
(An automation tool was used in creating this post.)
Gold FAQs
Why do people invest in Gold?
Gold has played a key role in human’s history as it has been widely used as a store of value and medium of exchange. Currently, apart from its shine and usage for jewelry, the precious metal is widely seen as a safe-haven asset, meaning that it is considered a good investment during turbulent times. Gold is also widely seen as a hedge against inflation and against depreciating currencies as it doesn’t rely on any specific issuer or government.
Who buys the most Gold?
Central banks are the biggest Gold holders. In their aim to support their currencies in turbulent times, central banks tend to diversify their reserves and buy Gold to improve the perceived strength of the economy and the currency. High Gold reserves can be a source of trust for a country’s solvency. Central banks added 1,136 tonnes of Gold worth around $70 billion to their reserves in 2022, according to data from the World Gold Council. This is the highest yearly purchase since records began. Central banks from emerging economies such as China, India and Turkey are quickly increasing their Gold reserves.
How is Gold correlated with other assets?
Gold has an inverse correlation with the US Dollar and US Treasuries, which are both major reserve and safe-haven assets. When the Dollar depreciates, Gold tends to rise, enabling investors and central banks to diversify their assets in turbulent times. Gold is also inversely correlated with risk assets. A rally in the stock market tends to weaken Gold price, while sell-offs in riskier markets tend to favor the precious metal.
What does the price of Gold depend on?
The price can move due to a wide range of factors. Geopolitical instability or fears of a deep recession can quickly make Gold price escalate due to its safe-haven status. As a yield-less asset, Gold tends to rise with lower interest rates, while higher cost of money usually weighs down on the yellow metal. Still, most moves depend on how the US Dollar (USD) behaves as the asset is priced in dollars (XAU/USD). A strong Dollar tends to keep the price of Gold controlled, whereas a weaker Dollar is likely to push Gold prices up.
FX option expiries for January 24 NY cut at 10:00 Eastern Time, via DTCC, can be found below.
- EUR/USD: EUR amounts
- 1.0865 446m
- 1.0900 2.2b
- 1.0950 487m
- USD/JPY: USD amounts
- 147.50 555m
- 149.00 554m
- 150.00 600m
- AUD/USD: AUD amounts
- 0.6565 1.4b
- 0.6575 1.8b
- 0.6580 1.2b
- 0.6615 572m
- 0.6620 792m
- 0.6625 485m
- 0.6630 651m
- NZD/USD: NZD amounts
- 0.6500 517m
EUR/USD touched its weakest level in over a month near 1.0820 on Tuesday. Economists at ING analyze the pair’s outlook.
A new PMI test
We believe the Dollar rallied a bit too far on Tuesday, and there is some room for EUR/USD to tick back above 1.0900 into Thursday’s European Central Bank announcement.
At the same time, much of today’s price action in the pair will depend on PMIs. French and German figures are published ahead of the Eurozone-wide numbers. Expectations are modestly optimistic, with the Eurozone composite PMIs seen rising from 47.6 to 48.0, led by marginal gains in both services and manufacturing.
PMIs are often assessed in comparison with other countries. In the case of the Eurozone, against the US and the UK. The consensus for UK PMIs is for a flat 52.1 (composite) reading. Barring a material surprise in the Eurozone print, the lingering divergence between contractionary (EZ) and expansionary (UK) PMIs will keep EUR/GBP pressured today.
The Bank of Canada makes its first policy announcement of 2024 on Wednesday, January 24 at 14:45 and as we get closer to the release time, here are the expectations as forecast by the economists and researchers of seven major banks regarding the upcoming Interest Rate Decision. We will also get a Monetary Policy Report, which means fresh forecasts.
The BoC is widely expected to leave the overnight rate at 5.00%. Investors will keep a close eye on the press conference to follow.
ING
Canadian core inflation came in hotter than expected in December and rules out the BoC shifting meaningfully in a dovish direction at the January policy meeting. However, higher interest rates are biting. The latest BoC Business Outlook Survey reported softening demand and ‘less favourable business conditions’ in the fourth quarter with high interest rates having ‘negatively impacted a majority of firms’, leading to most firms not planning to add new staff. As such, inflation looks set to soften further in coming months and so we favour rate cuts from the second quarter onwards, most likely starting in April.
TDS
We look for the BoC to stick to the script as it holds the overnight rate at 5.00% and maintains its current guidance. Renewed momentum across core inflation and wage growth has reduced the scope for any pivot in the Bank's messaging, and we look for the statement to lean hawkish with an emphasis on the persistence of price pressures despite mild downward revisions to MPR forecasts. This can support the CAD, especially vs G10 peers where central banks are more dovish like the CHF.
RBC Economics
The BoC is widely expected to hold the overnight rate steady at 5% in the first policy decision of 2024 – extending a pause that started following the last hike in July. We expect the BoC to push back against the idea that a shift to interest rate cuts is coming soon. There is some potential that the central bank could hint at an earlier-than-expected end to quantitative tightening policy but would likely take pains to communicate the primary objective of that change would be to ensure adequate liquidity in funding markets rather than flagging a shift to easier monetary policy and imminent rate cuts. The BoC will be cautious about declaring victory over inflation too soon. We expect the first decrease in the overnight rate to come around the middle of this year, and that to be followed by 75 bps more later in the year to lower the overnight rate to 4% by the end of 2024.
NBF
The BoC is widely expected to leave its policy rate unchanged at 5% for the fourth consecutive meeting. More intriguing than the headline decision on rates will be guidance offered by Governing Council. With the Bank’s preferred measures of core inflation accelerating in recent months, we don’t expect policymakers to materially water down their hiking bias. It’s more likely than not that the statement reiterates ‘Governing Council remains prepared to raise the policy rate further, if needed’.
CIBC
Not much has changed over the past few months. Growth in Canada remains weak and inflation, as judged by the Bank’s preferred core measures, has shown some but not enough progress. We expect that to be the main message of the press conference will be to draw a line in the sand that we need to see further progress on the inflation before discussing rate cuts. There will likely be another token reference to the possibility of further monetary restraint, but that should be balanced by an acknowledgement of flexibility to get back to target and the outsized role of shelter costs. What we would like to see is the Bank putting greater weight on a broader set of inflation measures (cough …*CPIX*…cough) as a guidepost to monetary policy.
BMO
No change is expected in the overnight rate for the fourth consecutive meeting. There have also been some rumblings about potential changes to quantitative tightening (QT), but we aren’t expecting any shifts on that front just yet either (though there’s an outside chance of a tweak). There’s no denying there’s been progress on bringing inflation lower; however, it’s also clear that there’s still plenty of work to do to get back to 2%. Rate cuts are very likely in 2024, but the Bank of Canada is going to remain as patient as possible for inflation and inflation expectations to retreat further. Following three years of well-above-target inflation, the last thing policymakers want to do is ease policy too early and allow inflation to re-accelerate.
Wells Fargo
We expect the BoC to hold its policy rate at 5.00%. However, the accompanying statement may lean hawkish in tone. We expect the BoC to repeat that it is still concerned about risks to the inflation outlook and remains prepared to raise the policy rate further if needed. Wage growth and services inflation will likely remain areas of focus for BoC policymakers. The BoC will also offer updated economic projections at this meeting. Forecasts for a more gradual return of CPI inflation toward the 2% target (currently seen happening by the end of 2025) would also likely be viewed as a hawkish signal.
People's Bank of China Governor Pan Gongsheng said on Wednesday that China's monetary policy is based on domestic conditions and added that they will improve the credit structure, while stepping up support for private and small firms, per Reuters.
Pan added that they will use various policy tools to keep liquidity reasonably ample and reiterated that they will steadily promote Yuan internationalization.
Market reaction
These comments don't seem to be having a significant impact on the risk mood. At the time of press, US stock index futures were up between 0.1% and 0.5%.
Here is what you need to know on Wednesday, January 24:
Following Tuesday's choppy action, financial markets remain relatively quiet early Wednesday. S&P Global will release the Manufacturing and Services PMI reports for Germany, the Euro area, the UK and the US later in the day. In the American trading hours, the Bank of Canada (BoC) will announce monetary policy decisions.
The US Dollar came under bearish pressure early Tuesday, with the USD Index (DXY) falling below 103.00 for the first time in a week in the European session. The negative shift seen in risk mood, as reflected by the bearish opening in Wall Street, helped DXY gain traction in the second half of the day. A late rally in technology stocks, however, limited the USD's gains. Early Wednesday, the benchmark 10-year US Treasury bond yield continues to move sideways above 4% and US stock index futures trade modestly higher on the day.
US Dollar price this week
The table below shows the percentage change of US Dollar (USD) against listed major currencies this week. US Dollar was the strongest against the Australian Dollar.
| USD | EUR | GBP | CAD | AUD | JPY | NZD | CHF | |
| USD | 0.22% | -0.06% | 0.19% | 0.27% | -0.26% | 0.18% | 0.07% | |
| EUR | -0.23% | -0.31% | -0.04% | 0.04% | -0.49% | -0.05% | -0.15% | |
| GBP | 0.05% | 0.30% | 0.24% | 0.35% | -0.19% | 0.25% | 0.15% | |
| CAD | -0.19% | 0.04% | -0.26% | 0.07% | -0.45% | 0.00% | -0.09% | |
| AUD | -0.25% | -0.01% | -0.33% | -0.05% | -0.51% | -0.07% | -0.12% | |
| JPY | 0.26% | 0.49% | 0.24% | 0.37% | 0.51% | 0.46% | 0.33% | |
| NZD | -0.17% | 0.07% | -0.25% | 0.01% | 0.08% | -0.44% | -0.08% | |
| CHF | -0.09% | 0.14% | -0.17% | 0.09% | 0.12% | -0.30% | 0.06% |
The heat map shows percentage changes of major currencies against each other. The base currency is picked from the left column, while the quote currency is picked from the top row. For example, if you pick the Euro from the left column and move along the horizontal line to the Japanese Yen, the percentage change displayed in the box will represent EUR (base)/JPY (quote).
The BoC is widely expected to leave its policy rate unchanged at 5% following the January policy meeting. Governor Tiff Macklem will comment on the policy outlook and respond to questions at a press conference starting at 15:30 GMT. Following Monday's upsurge, USD/CAD encountered resistance at around 1.3500 and closed in negative territory on Tuesday. The pair holds steady at around 1.3450 in the European morning.
EUR/USD climbed above 1.0900 in the European session on Tuesday but reversed its direction in the second half of the day and touched its weakest level in over a month near 1.0820. The pair staged a technical correction during the Asian trading hours and was last seen fluctuating in a tight channel above 1.0850.
After coming within a touching distance of 1.2750, GBP/USD turned south and registered marginal losses on Tuesday. Early Wednesday, the pair holds above 1.2700.
The data from Australia showed that the Judo Bank Composite PMI improved to 48.1 in January from 46.9 in December. AUD/USD ignored this data and was last seen moving sideways below 0.6600.
The Consumer Price Index in New Zealand rose 4.7% on a yearly basis in the fourth quarter, following the 5.6% increase recorded in the previous quarter. This reading matched the market expectation and failed to trigger a noticeable reaction. At the time of press, NZD/USD was virtually unchanged on the day near 0.6100.
Following a sharp decline seen in the early European session on Tuesday, USD/JPY turned north and erased its daily gains. The pair struggled to preserve its bullish momentum and retreated below 148.00 early Wednesday.
For the fourth consecutive trading day, Gold failed to make a decisive move in either direction on Tuesday. In the European morning, XAU/USD continues to move up and down in a narrow band above $2,020.
- EUR/USD trades in positive territory near 1.0862, adding 0.12% on the day.
- The bearish outlook of the pair remains intact below the key EMA; RSI holds below the 50 midline.
- 1.0895 acts as an immediate resistance level for EUR/USD; the initial support level is seen at 1.0840.
The EUR/USD pair trades on a stronger note during the early European session on Wednesday. The major pair has flirted with the weekly lows of 1.0821 and rebounded to 1.0862. However, the potential upside seems limited as investors turn cautious ahead of the European Central Bank's (ECB) interest rate decision on Thursday.
Ahead of the ECB key event, the preliminary Eurozone Purchasing Managers Index (PMI) will be due. The Composite PMI is expected to improve from 47.6 to 48.0 in January. The Manufacturing PMI is estimated to rise to 44.8, and the Services PMI is projected to grow to 49.0.
According to the four-hour chart, EUR/USD keeps the bearish vibe unchanged below the 50- and 100-period Exponential Moving Averages (EMA) with a downward slope. Furthermore, the Relative Strength Index (RSI) stands in bearish territory below the 50 midlines, suggesting that further decline looks favorable.
The 50-period EMA at 1.0895 acts as an immediate resistance level for the major pair. The crucial upside barrier will emerge at 1.0915, portraying the confluence of the upper boundary of the Bollinger Band and the 100-period EMA. The next hurdle is located near a high of January 15 at 1.0967, and finally at the 1.1000 psychological round figure.
On the other hand, the initial support level is seen near the lower limit of the Bollinger Band at 1.0840. The additional downside filter to watch is a low of January 23 at 1.0820. Further south, the next downside stop is located near a low of December 13 at 1.0773.
EUR/USD four-hour chart
-638416745350626093.png)
- USD/CAD gains ground ahead of the BoC monetary policy decision on Wednesday.
- Technical analysis suggests a bullish trend towards a weekly high at 1.3491 and a psychological level at 1.3500.
- The 23.6% Fibonacci retracement at 1.3454 and the 1.3450 major level could act as the immediate support zone.
USD/CAD attempts to recover its recent losses ahead of the Bank of Canada (BoC) interest rate decision on Wednesday, improving higher to near 1.3470 during the Asian trading hours on Wednesday.
The technical analysis of the Moving Average Convergence Divergence (MACD) for the USD/CAD pair suggests a potential bullish sentiment in the market. This interpretation is derived from the positioning of the MACD line above the centerline and the presence of divergence above the signal line.
USD/CAD pair could find the immediate barrier at the weekly high at 1.3491 followed by the psychological resistance level at 1.3500. The pair could surpass the resistance level as indicated by the lagging indicator 14-day Relative Strength Index (RSI). The RSI is positioned above 50, suggesting the confirmation of stronger momentum for the USD/CAD pair.
On the downside, the region around the 23.6% Fibonacci retracement at 1.3454 level aligned with the major level at 1.3450 could act as the immediate support zone. A collapse below the support zone could put pressure on the USD/CAD pair to break below the 21-day Exponential Moving Average (EMA) at 1.3427 followed by the 38.2% Fibonacci retracement level at 1.3401.
USD/CAD: Daily Chart
-638416736456938808.png)
Former St. Louis Federal Reserve (Fed) President James Bullard said on Tuesday that the central bank may begin cutting interest rates before inflation hits 2%, potentially as soon as March.
Key quotes
“Inflation on a 12-month core basis, you could get to 2% by the third quarter of this year.”
"They don't want to get into the second half of 2024, and inflation’s already at 2%, and you still haven't moved the policy, right? That would be too late.”
“If inflation is somewhere between 2% and 2.5% and you still haven't moved the policy rate, then you might have to move very aggressively, with 50 basis points at a meeting or something, and that would be a difficult thing.”
Market reaction
The US Dollar Index (DXY) is trading lower by 0.10% on the day to trade at 103.45, as of writing.
Fed FAQs
What does the Federal Reserve do, how does it impact the US Dollar?
Monetary policy in the US is shaped by the Federal Reserve (Fed). The Fed has two mandates: to achieve price stability and foster full employment. Its primary tool to achieve these goals is by adjusting interest rates.
When prices are rising too quickly and inflation is above the Fed’s 2% target, it raises interest rates, increasing borrowing costs throughout the economy. This results in a stronger US Dollar (USD) as it makes the US a more attractive place for international investors to park their money.
When inflation falls below 2% or the Unemployment Rate is too high, the Fed may lower interest rates to encourage borrowing, which weighs on the Greenback.
How often does the Fed hold monetary policy meetings?
The Federal Reserve (Fed) holds eight policy meetings a year, where the Federal Open Market Committee (FOMC) assesses economic conditions and makes monetary policy decisions.
The FOMC is attended by twelve Fed officials – the seven members of the Board of Governors, the president of the Federal Reserve Bank of New York, and four of the remaining eleven regional Reserve Bank presidents, who serve one-year terms on a rotating basis.
What is Quantitative Easing (QE) and how does it impact USD?
In extreme situations, the Federal Reserve may resort to a policy named Quantitative Easing (QE). QE is the process by which the Fed substantially increases the flow of credit in a stuck financial system.
It is a non-standard policy measure used during crises or when inflation is extremely low. It was the Fed’s weapon of choice during the Great Financial Crisis in 2008. It involves the Fed printing more Dollars and using them to buy high grade bonds from financial institutions. QE usually weakens the US Dollar.
What is Quantitative Tightening (QT) and how does it impact the US Dollar?
Quantitative tightening (QT) is the reverse process of QE, whereby the Federal Reserve stops buying bonds from financial institutions and does not reinvest the principal from the bonds it holds maturing, to purchase new bonds. It is usually positive for the value of the US Dollar.
- USD/CHF strives to snap its winning streak as US Treasury yields decline.
- Markets bets on Fed rate cuts in March have slowed down.
- Fed’s Bullard has anticipated the central bank to initiate policy rate cuts as early as March.
- SNB President Thomas Jordan noted that the robust CHF has played a role in capping inflation.
USD/CHF makes an effort to halt its winning streak that began on January 11. The USD/CHF pair trades lower near 0.8690 during the Asian session on Wednesday. This could be attributed to a minor decline in the US Dollar due to the downbeat US Treasury yields.
The US Dollar Index (DXY) edges lower to near 103.40 with the 2-year and 10-year yields on US bond coupons standing at 4.32% and 4.11%, by the press time. Market sentiment suggests a decreased likelihood of a rate cut by the Federal Reserve (Fed) in March. However, former St. Louis Fed President James Bullard has expressed a contrasting view, anticipating the Fed to initiate interest rate cuts even before inflation reaches 2.0%, with the possibility of cuts as early as March.
Moreover, there is full pricing in of a 25 basis point (bps) cut in May, and the chances of a 50 bps cut stand at 50%. Traders are likely eagerly awaiting the release of the S&P Global Purchasing Managers Index (PMI) data from the United States on Wednesday.
Swiss National Bank (SNB) President Thomas Jordan addressed the strong Swiss Franc (CHF) during an event in the Swiss town of Brig on Tuesday. He noted that the robust Swiss Franc has played a role in capping inflation. Additionally, Jordan expressed confidence in the economy, stating, "Economists are confident that there won’t be a recession, and we are also confident, otherwise we would forecast one." He emphasized that while a recession is not expected, the outlook points to weak growth.
In the context of economic indicators, the Federal Statistical Office of Switzerland reported last week that the decline in Producer and Import Prices decelerated in December compared to the fall observed in November. Looking ahead, traders are eagerly anticipating the release of Real Retail Sales and the ZEW Survey – Expectations in the coming week. These releases are expected to provide further insights into the trajectory of the Swiss National Bank's interest rates.
EUR/JPY loses traction around 160.61 ahead of the German and Eurozone PMI data.
The cross keeps the bullish vibe above the key EMA; RSI indicator stands below the 50 midline.
The first upside barrier is seen at 161.56; the key support level will emerge at 160.40.
The EUR/JPY cross extends its downside during the Asian trading hours on Wednesday. Investors await the German and Eurozone HCOB Purchasing Managers Index (PMI) reports on Wednesday for fresh impetus. The attention will shift to the European Central Bank (ECB) on Thursday, which is anticipated to maintain its benchmark policy. The cross currently trades near 160.61, losing 0.21% on the day.
Technically, EUR/JPY maintains a bullish outlook as the cross holds above the 50- and 100-period Exponential Moving Averages (EMA) on the 4-hour chart. However, the Relative Strength Index (RSI) stands below the 50-midline, suggesting the sellers look to retain control in the near term.
The first upside barrier for EUR/JPY will emerge at the upper boundary of the Bollinger Band at 161.56. A decisive break above the latter will expose a weekly high on January 23 at 161.70. The next hurdle is seen at a high of January 19 at 161.87.
On the flip side, the key contention level for the cross is located near the confluence of the 50-period EMA and a weekly on January 23 at 160.40. Further south, the additional downside filter to watch is the 160.00 psychological round mark. A breach of this level will see a drop to the 100-hour EMA at 159.60, followed by a low of January 12 at 158.54.
EUR/JPY four-hour chart

- Gold price comes under some renewed selling amid reduced bets for an early Fed rate cut.
- Geopolitical risks and the uncertain global economic outlook to limit losses for the XAU/USD.
- Traders might also refrain from placing aggressive directional bets ahead of key US data.
Gold price (XAU/USD) meets with a fresh supply during the Asian session on Wednesday and erodes a part of the overnight modest gains back closer to the $2,040-2,042 supply zone. The precious metal, however, remains confined in a multi-day-old trading range as traders seek clarity over the timing of when the Federal Reserve (Fed) will start cutting interest rates. Hence, the focus will remain glued to this week's important US macro releases – starting with the flash PMIs later today, followed by the Advance Q4 GDP on Thursday and the Personal Consumption Expenditures (PCE) Price Index on Friday.
In the meantime, investors have been scaling back their expectations for an early interest rate cut by the Fed in the wake of a resilient US economy. Furthermore, several Fed officials last week emphasized the need for more inflation data before any judgment on interest rates could be made. This, in turn, assists the US Dollar (USD) to stand tall near its highest level since December 13 touched on Tuesday and is seen as a key factor weighing on the Gold price. That said, geopolitical tensions, along with worries about slowing economic growth in China, could lend support to the safe-haven XAU/USD.
Daily Digest Market Movers: Gold price is pressured by rising bets for a delayed Fed rate cut
- The incoming US macro data suggested that the economy is in good shape and gives the Federal Reserve more headroom to keep interest rates higher for longer, which, in turn, acts as a headwind for the Gold price.
- The current market pricing indicates a greater chance of the first interest rate cut by the Fed in May, which was initially expected in March, and less aggressive policy easing than is now anticipated by investors.
- The US Dollar (USD) consolidates near a multi-week top and exerts some pressure on the non-yielding metal, though geopolitical risk and the uncertain global economic outlook should help limit deeper losses.
- US military forces struck 3 facilities used by Iranian-affiliated militant groups in western Iraq in direct response to a series of escalatory attacks, raising the risk of a further escalation of tensions in the Middle East.
- Traders also seem reluctant to place aggressive directional bets and prefer to wait on the sidelines ahead of this week's key US macro releases – the flash PMIs, the Advance Q4 GDP print and the Core PCE Price Index.
- The crucial data will play a key role in influencing market expectations about the Fed's future policy actions, which, in turn, will drive the USD demand and determine the near-term trajectory for the XAU/USD.
Technical Analysis: Gold price oscillates in a multi-day-old trading range; bearish potential intact
From a technical perspective, the $2,022-2,020 region might offer some support to the Gold price ahead of the weekly trough, around the $2,017-2,016 zone touched on Monday. This is followed by over a one-month low, around the $2,000 psychological mark set last week, which if broken decisively will be seen as a fresh trigger for bearish traders. The XAU/USD might then turn vulnerable to accelerate the fall towards the $1,988 intermediate support before eventually dropping to the 100-day Simple Moving Average (SMA), currently around the $1,972 area, en route to and the 200-day SMA, near the $1,964-1,963 region.
On the flip side, any meaningful strength beyond the $2,029-2,030 immediate hurdle might continue to confront stiff resistance near the $2,040-2,042 supply zone. Some follow-through buying, however, might negate the near-term bearish outlook and trigger a short-covering rally. The Gold price might then climb to the $2,077 area before aiming to reclaim the $2,100 round-figure mark.
US Dollar price today
The table below shows the percentage change of US Dollar (USD) against listed major currencies today. US Dollar was the strongest against the Australian Dollar.
| USD | EUR | GBP | CAD | AUD | JPY | NZD | CHF | |
| USD | -0.02% | -0.06% | 0.11% | 0.19% | -0.25% | 0.09% | -0.01% | |
| EUR | 0.02% | -0.04% | 0.13% | 0.18% | -0.22% | 0.10% | 0.01% | |
| GBP | 0.07% | 0.04% | 0.17% | 0.23% | -0.18% | 0.14% | 0.05% | |
| CAD | -0.12% | -0.10% | -0.17% | 0.06% | -0.36% | -0.03% | -0.12% | |
| AUD | -0.18% | -0.18% | -0.23% | -0.07% | -0.38% | -0.11% | -0.19% | |
| JPY | 0.24% | 0.22% | 0.19% | 0.34% | 0.44% | 0.31% | 0.23% | |
| NZD | -0.07% | -0.11% | -0.15% | 0.02% | 0.10% | -0.31% | -0.10% | |
| CHF | -0.01% | -0.03% | -0.07% | 0.13% | 0.22% | -0.23% | 0.08% |
The heat map shows percentage changes of major currencies against each other. The base currency is picked from the left column, while the quote currency is picked from the top row. For example, if you pick the Euro from the left column and move along the horizontal line to the Japanese Yen, the percentage change displayed in the box will represent EUR (base)/JPY (quote).
Gold FAQs
Why do people invest in Gold?
Gold has played a key role in human’s history as it has been widely used as a store of value and medium of exchange. Currently, apart from its shine and usage for jewelry, the precious metal is widely seen as a safe-haven asset, meaning that it is considered a good investment during turbulent times. Gold is also widely seen as a hedge against inflation and against depreciating currencies as it doesn’t rely on any specific issuer or government.
Who buys the most Gold?
Central banks are the biggest Gold holders. In their aim to support their currencies in turbulent times, central banks tend to diversify their reserves and buy Gold to improve the perceived strength of the economy and the currency. High Gold reserves can be a source of trust for a country’s solvency. Central banks added 1,136 tonnes of Gold worth around $70 billion to their reserves in 2022, according to data from the World Gold Council. This is the highest yearly purchase since records began. Central banks from emerging economies such as China, India and Turkey are quickly increasing their Gold reserves.
How is Gold correlated with other assets?
Gold has an inverse correlation with the US Dollar and US Treasuries, which are both major reserve and safe-haven assets. When the Dollar depreciates, Gold tends to rise, enabling investors and central banks to diversify their assets in turbulent times. Gold is also inversely correlated with risk assets. A rally in the stock market tends to weaken Gold price, while sell-offs in riskier markets tend to favor the precious metal.
What does the price of Gold depend on?
The price can move due to a wide range of factors. Geopolitical instability or fears of a deep recession can quickly make Gold price escalate due to its safe-haven status. As a yield-less asset, Gold tends to rise with lower interest rates, while higher cost of money usually weighs down on the yellow metal. Still, most moves depend on how the US Dollar (USD) behaves as the asset is priced in dollars (XAU/USD). A strong Dollar tends to keep the price of Gold controlled, whereas a weaker Dollar is likely to push Gold prices up.
- GBP/USD maintains its position below the psychological barrier of 1.2700.
- A break above the 1.2750 major level could lead the pair to revisit the monthly high at 1.2785.
- The pair could find a support zone around the 1.2650 major level and the 23.6% Fibonacci retracement at 1.2648.
- Technical analysis suggests a lack of a strong directional bias in the pair.
GBP/USD recovers its recent gains, trading higher near 1.2690 during the Asian session on Wednesday. The psychological level at 1.2700 appears as the immediate resistance followed by the weekly high of 1.2747 aligned with the major barrier at 1.2750. A breakthrough above the major barrier could influence the GBP/USD pair to revisit the monthly high at 1.2785 followed by the psychological level at 1.2800.
On the downside, the GBP/USD pair could find support at the major level 1.2650 aligned with the 23.6% Fibonacci retracement at 1.2648. A break below the latter could lead the pair to test the 50-day Exponential Moving Average (EMA) at 1.2632 before the psychological support at 1.2600 level. If the pair moves below the psychological support, it could approach the 38.2% Fibonacci retracement at 1.2532.
In addition, the Moving Average Convergence Divergence (MACD), a lagging indicator, provides further nuanced information. The fact that the MACD line is above the centerline is considered a bullish signal, suggesting the potential for upward momentum. However, caution is warranted as the MACD line is below the signal line. This could indicate a degree of hesitation or uncertainty among investors, and it suggests that the bullish momentum may not be confirmed.
The technical analysis of the GBP/USD pair shows insights from key indicators. The 14-day Relative Strength Index (RSI) positioned at a value of 50 signifies a neutral point, indicating a balance between buying and selling pressure. This suggests a lack of a strong directional bias in the market at this moment. Given these mixed signals, traders may exercise caution and wait for additional confirmation before making aggressive bets on the GBP/USD pair.
GBP/USD: Daily Chart
-638416662986664413.png)
- Indian Rupee attracts some sellers on the firmer USD, higher US yield.
- The Indian economy is poised to touch $5 trillion next financial year, said the Union Petroleum Minister.
- US S&P Global Purchasing Managers' Index (PMI) report will be released later on Wednesday.
Indian Rupee (INR) weakens on Wednesday amid further strength in the US Dollar (USD) and higher US yields. The robust US economic data prompted the expectation that the Federal Reserve (Fed) is unlikely to cut rates as aggressively as the market expects. Investors have priced in a 49% chance of a March rate cut from an 80% just a week ago, according to the CME FedWatch Tool.
Nonetheless, the positive economic outlook in India provides some support for the Indian Rupee. Union Petroleum Minister Hardeep Puri said that the Indian economy is poised to touch $5 trillion next financial year and capitalize to double to $10 trillion by the end of this decade. Puri further stated that the Indian economy is booming and expected to be the fastest-growing major economy and would be a $5 trillion economy by 2024–25.
Market players await the US S&P Global Purchasing Managers' Index (PMI) report on Wednesday for fresh impetus. Later this week, the US Q4 Gross Domestic Product Annualized and the December Core Personal Consumption Expenditures Price Index (Core PCE) will be in the spotlight. These two key US events may provide a guide to the outlook for interest rates in the United States. Indian markets will be closed on Friday for Republic Day.
Daily Digest Market Movers: Indian Rupee remains resilient amid global challenges and uncertainties
- India has replaced Hong Kong as the fourth-largest stock market in the world, with a market capitalization of $4.3 trillion.
- The Indian GDP is expected to grow 7.3% in the current financial year 2023–24, remaining the fastest-growing major economy, according to the National Statistics Office.
- The US Richmond Fed Manufacturing Index came in at -15 in January versus -11 prior, below the market consensus of -7. This figure marked its third consecutive negative reading.
- The market now expects 125 basis points (bps) of rate cuts from the Federal Reserve (Fed) in 2024, down from around 175 bps earlier this month.
- Fed governor Christopher Waller stated that the Fed should cut rates "methodically and carefully" and definitely not in a “rushed" manner.
- Atlanta Fed President Raphael Bostic said he sees rate cuts beginning in the third quarter, whereas San Francisco Fed President Mary Daly suggested policymakers must be patient about rate cuts.
- The preliminary US S&P Global Services PMI for January is forecast to ease from 51.4 to 51.0, while the Manufacturing PMI is projected to remain steady at 47.9.
Technical Analysis: Indian Rupee sticks to the 82.80–83.40 range
Indian Rupee trades on a softer note on the day. The USD/INR pair remains confined within a familiar trading band of 82.80–83.40 since September 2023. USD/INR holds above the key 100-period Exponential Moving Average (EMA) on the daily chart. Additionally, the 14-day Relative Strength Index (RSI) bounces back above the 50.0 midline, supporting the buyers for the time being.
The key resistance level for USD/INR will emerge at the upper boundary of the trading range at 83.40. The next hurdle is located at 83.47 (2023 high) and 84.00 (round figure). On the downside, the first support level is seen at the 83.00 psychological mark. A break below 83.00 will see the next contention level at 82.80 (the lower limit of the trading range and a low of January 15) and 82.60 (low of August 11).
US Dollar price today
The table below shows the percentage change of US Dollar (USD) against listed major currencies today. US Dollar was the strongest against the Australian Dollar.
| USD | EUR | GBP | CAD | AUD | JPY | NZD | CHF | |
| USD | -0.01% | -0.02% | 0.11% | 0.23% | -0.13% | 0.18% | 0.00% | |
| EUR | 0.01% | -0.01% | 0.11% | 0.20% | -0.12% | 0.17% | 0.02% | |
| GBP | 0.02% | 0.00% | 0.12% | 0.21% | -0.12% | 0.18% | 0.01% | |
| CAD | -0.11% | -0.08% | -0.12% | 0.09% | -0.24% | 0.06% | -0.11% | |
| AUD | -0.22% | -0.21% | -0.21% | -0.10% | -0.33% | -0.07% | -0.23% | |
| JPY | 0.13% | 0.12% | 0.13% | 0.22% | 0.36% | 0.29% | 0.13% | |
| NZD | -0.16% | -0.19% | -0.20% | -0.07% | 0.04% | -0.29% | -0.19% | |
| CHF | -0.01% | -0.02% | -0.03% | 0.10% | 0.25% | -0.14% | 0.18% |
The heat map shows percentage changes of major currencies against each other. The base currency is picked from the left column, while the quote currency is picked from the top row. For example, if you pick the Euro from the left column and move along the horizontal line to the Japanese Yen, the percentage change displayed in the box will represent EUR (base)/JPY (quote).
Indian Rupee FAQs
What are the key factors driving the Indian Rupee?
The Indian Rupee (INR) is one of the most sensitive currencies to external factors. The price of Crude Oil (the country is highly dependent on imported Oil), the value of the US Dollar – most trade is conducted in USD – and the level of foreign investment, are all influential. Direct intervention by the Reserve Bank of India (RBI) in FX markets to keep the exchange rate stable, as well as the level of interest rates set by the RBI, are further major influencing factors on the Rupee.
How do the decisions of the Reserve Bank of India impact the Indian Rupee?
The Reserve Bank of India (RBI) actively intervenes in forex markets to maintain a stable exchange rate, to help facilitate trade. In addition, the RBI tries to maintain the inflation rate at its 4% target by adjusting interest rates. Higher interest rates usually strengthen the Rupee. This is due to the role of the ‘carry trade’ in which investors borrow in countries with lower interest rates so as to place their money in countries’ offering relatively higher interest rates and profit from the difference.
What macroeconomic factors influence the value of the Indian Rupee?
Macroeconomic factors that influence the value of the Rupee include inflation, interest rates, the economic growth rate (GDP), the balance of trade, and inflows from foreign investment. A higher growth rate can lead to more overseas investment, pushing up demand for the Rupee. A less negative balance of trade will eventually lead to a stronger Rupee. Higher interest rates, especially real rates (interest rates less inflation) are also positive for the Rupee. A risk-on environment can lead to greater inflows of Foreign Direct and Indirect Investment (FDI and FII), which also benefit the Rupee.
How does inflation impact the Indian Rupee?
Higher inflation, particularly, if it is comparatively higher than India’s peers, is generally negative for the currency as it reflects devaluation through oversupply. Inflation also increases the cost of exports, leading to more Rupees being sold to purchase foreign imports, which is Rupee-negative. At the same time, higher inflation usually leads to the Reserve Bank of India (RBI) raising interest rates and this can be positive for the Rupee, due to increased demand from international investors. The opposite effect is true of lower inflation.
- NZD/USD ticks higher following the release of domestic inflation figures, albeit lacks follow-through.
- Hawkish Fed expectations continue to act as a tailwind for the USD and cap the upside for the pair.
- Traders also seem reluctant amid global economic woes and ahead of important US macro releases.
The NZD/USD pair struggles to capitalize on its modest gains registered during the Asian session on Wednesday and remains well within the striking distance of a near two-month low, around the 0.6065-0.6060 area touched the previous day. Spot prices currently trade just below the 0.6100 mark, nearly unchanged for the day, though a combination of factors could help limit deeper losses.
Statistics New Zealand reported that domestic consumer inflation decelerated from the 5.6% YoY rate to 4.7% in the final three months of 2023, though remained well above the Reserve Bank of New Zealand's (RBNZ) 1% to 3% target. This, in turn, limits the likelihood of a near-term interest rate cut by the central bank, which, along with subdued US Dollar (USD) price action, could lend some support to the NZD/USD pair.
The downside for the USD, however, seems limited amid expectations that the Federal Reserve (Fed) will not rush to cut rates in the wake of a still-resilient US economy. This, along with the risk of a further escalation of geopolitical tensions in the Middle East and the uncertain global economic outlook, might continue to act as a tailwind for the safe-haven Greenback and cap any meaningful gains for the risk-sensitive Kiwi.
Traders might also refrain from placing aggressive directional bets and prefer to wait for important US macro releases – the Advance Q4 GDP print and the Core PCE Price Index – scheduled during the latter part of the week. In the meantime, the flash US PMIs, along with the US bond yields and the broader risk sentiment, provide some impetus to the NZD/USD pair later during the early North American session on Wednesday.
Nevertheless, the aforementioned fundamental backdrop makes it prudent to wait for strong follow-through buying before confirming that the NZD/USD pair has formed a near-term bottom and positioning for any further appreciating move. On the flip side, a break below the 0.6065-0.6060 area will be seen as a fresh trigger for bearish trades and set the stage for an extension of a near one-month-old descending trend.
Technical levels to watch
- EUR/USD attempts to gain ground ahead of PMI data from the Eurozone and Germany.
- The downbeat EU Consumer Confidence weighed on the Euro.
- The risk-averse sentiment is driving the US Dollar in an upward direction.
- Fed is expected to not adjust its monetary policy at the February's decision.
EUR/USD strives to retrace its recent losses, trading slightly higher near 1.0850 during the Asian session on Wednesday. However, the Euro (EUR) encountered downward pressure following the preliminary Consumer Confidence released by the European Commission on Tuesday, indicating a decrease in consumer trust regarding economic activity. The index declined to -16.1 against the expected reading of -14.3 in January and the previous reading of -15.0.
Market participants will observe the HCOB Purchasing Managers Index (PMI) data from the Eurozone and Germany on Wednesday. Thursday marks another rate call and the release of a monetary policy statement from the European Central Bank (ECB). The ECB has generally predicted a stable interest rate environment until the summer months unless there are significant shifts in the underlying economic indicators.
The US Dollar Index (DXY) maintains its stability following a recent increase, driven by ongoing buying interest in the US Dollar amid risk aversion sentiment. This behavior is likely linked to heightened geopolitical tensions in the Middle East. However, the decline in short-term US Treasury yield could undermine the US Dollar, which in turn, acts as a tailwind for the EUR/USD pair. The 2-year US yield trades lower at 4.33%, down by 87%, by the press time.
Market sentiment indicated a decreased probability of a rate cut by the Federal Reserve in March. Nevertheless, there is complete pricing in of a 25 basis point (bps) cut, and the likelihood of a more significant 50 bps cut stands at 50% in May. Traders are likely awaiting the release of the S&P Global Purchasing Managers Index (PMI) data from the United States on Wednesday.
| Raw materials | Closed | Change, % |
|---|---|---|
| Silver | 22.434 | 1.66 |
| Gold | 2029.096 | 0.37 |
| Palladium | 948.3 | 1.92 |
- The Japanese Yen benefits from the BoJ’s hawkish tilt on Tuesday, though lacks follow-through.
- Geopolitical tensions and the uncertain global economic outlook underpin the safe-haven JPY.
- Reduced bets for an early rate cut by the Fed lend support to the USD and the USD/JPY pair.
The Japanese Yen (JPY) ticks higher following the previous day's good two-way price swings, albeit lacks bullish conviction and remains confined in a familiar range during the Asian session on Wednesday. The Bank of Japan (BoJ) Governor Kazuo Ueda's comments during the post-meeting press conference suggested that conditions for phasing out huge stimulus and pulling short-term interest rates out of negative territory were falling into place. Apart from this, a larger-than-expected rise in Japan's exports and geopolitical tensions offer some support to the safe-haven JPY.
Meanwhile, the BoJ lowered its forecast for core consumer prices for fiscal 2024, tempering hopes for the need to immediately begin tightening the ultra-loose policy. This, in turn, might hold back the JPY bulls from placing aggressive bets, which, along with the underlying bullish sentiment surrounding the US Dollar (USD), should help limit the downside for the USD/JPY pair. Traders might also prefer to wait on the sidelines ahead of the top-tier US macro data, the Advance Q4 GDP print and the Core PCE Price Index, scheduled for release on Thursday and Friday, respectively.
Daily Digest Market Movers: Japanese Yen draws support from the fact that BoJ opened the door to end negative rates
- The Bank of Japan said on Tuesday that the likelihood of sustainably achieving the 2% inflation target was gradually increasing, laying the groundwork for monetary policy normalisation.
- The head of Japan's biggest business lobby Keidanren called for wage hikes this year that exceed the inflation rate, paving the way for the BoJ to pivot away from its ultra-easy policy.
- The global economic outlook, especially in China and Europe, remains uncertain, which, along with geopolitical tensions, is seen lending some support to the safe-haven Japanese Yen.
- Data released this Wednesday showed that Japan's exports rose 9.8% from a year earlier, with exports to China rising for the first time in 13 months and exports to the US hitting a record higher.
- The au Jibun Bank flash Japan Manufacturing PMI improved slightly to 48.0 in January from December's reading of 47.9, though remained in contraction territory for the eighth straight month.
- Meanwhile, the au Jibun Bank flash Services PMI rose from 51.5 to 52.7 in January, while the Composite PMI advanced to 51.1 during the reported month from 50.0 in December.
- US military forces struck 3 facilities used by Iranian-affiliated militant groups in western Iraq in direct response to a series of escalatory attacks against US forces in the Middle East.
- The US Dollar holds steady near a six-week peak touched on Tuesday amid expectations that the Federal Reserve will be in no hurry to cut rates in the wake of a resilient US economy.
- Traders now look to the release of flash PMI prints from the Eurozone and the US, which will provide a fresh insight into the global economic health and drive demand for the JPY.
- The focus, however, will remain on the Advance US Q4 GDP print and the US Core PCE Price Index – the Fed's preferred inflation gauge – due on Thursday and Friday, respectively.
Technical Analysis: USD/JPY awaits a breakout through the recent trading range before the next leg of a directional move
From a technical perspective, the USD/JPY pair's inability to build on the overnight bounce from sub-147.00 levels warrants some caution for bullish traders. Hence, it will be prudent to wait for some follow-through buying beyond the 148.80 region, or a multi-week top touched last Friday, before positioning for an extension of the recent move-up witnessed since the beginning of this month. Given that oscillators on the daily chart are holding comfortably in the positive territory and are still far from being in the overbought zone, spot prices might then aim to surpass an intermediate hurdle near the 149.30-149.35 zone and reclaim the 150.00 psychological mark for the first time since November 17.
On the flip side, the 100-day Simple Moving Average (SMA), currently around the 147.55 region, now seems to protect the immediate downside ahead of the 147.00 mark, or the overnight swing low. The next relevant support is pegged near the 146.60-146.55 area, below which the USD/JPY pair could weaken further towards the 146.10-146.00 horizontal support. The latter should act as a key pivotal point, which if broken decisively will negate any near-term positive outlook and shift the bias in favour of bearish traders.
Japanese Yen price today
The table below shows the percentage change of Japanese Yen (JPY) against listed major currencies today. Japanese Yen was the strongest against the Australian Dollar.
| USD | EUR | GBP | CAD | AUD | JPY | NZD | CHF | |
| USD | -0.02% | -0.03% | 0.04% | 0.08% | -0.09% | -0.05% | -0.02% | |
| EUR | 0.02% | -0.01% | 0.05% | 0.07% | -0.07% | -0.05% | -0.01% | |
| GBP | 0.03% | 0.01% | 0.06% | 0.08% | -0.07% | -0.04% | 0.00% | |
| CAD | -0.04% | -0.01% | -0.06% | 0.03% | -0.13% | -0.09% | -0.06% | |
| AUD | -0.07% | -0.08% | -0.10% | -0.04% | -0.12% | -0.14% | -0.10% | |
| JPY | 0.08% | 0.07% | 0.08% | 0.11% | 0.18% | 0.02% | 0.06% | |
| NZD | 0.06% | 0.02% | 0.01% | 0.08% | 0.13% | -0.03% | 0.01% | |
| CHF | 0.02% | 0.00% | -0.01% | 0.06% | 0.10% | -0.07% | -0.03% |
The heat map shows percentage changes of major currencies against each other. The base currency is picked from the left column, while the quote currency is picked from the top row. For example, if you pick the Euro from the left column and move along the horizontal line to the Japanese Yen, the percentage change displayed in the box will represent EUR (base)/JPY (quote).
Japanese Yen FAQs
What key factors drive the Japanese Yen?
The Japanese Yen (JPY) is one of the world’s most traded currencies. Its value is broadly determined by the performance of the Japanese economy, but more specifically by the Bank of Japan’s policy, the differential between Japanese and US bond yields, or risk sentiment among traders, among other factors.
How do the decisions of the Bank of Japan impact the Japanese Yen?
One of the Bank of Japan’s mandates is currency control, so its moves are key for the Yen. The BoJ has directly intervened in currency markets sometimes, generally to lower the value of the Yen, although it refrains from doing it often due to political concerns of its main trading partners. The current BoJ ultra-loose monetary policy, based on massive stimulus to the economy, has caused the Yen to depreciate against its main currency peers. This process has exacerbated more recently due to an increasing policy divergence between the Bank of Japan and other main central banks, which have opted to increase interest rates sharply to fight decades-high levels of inflation.
How does the differential between Japanese and US bond yields impact the Japanese Yen?
The BoJ’s stance of sticking to ultra-loose monetary policy has led to a widening policy divergence with other central banks, particularly with the US Federal Reserve. This supports a widening of the differential between the 10-year US and Japanese bonds, which favors the US Dollar against the Japanese Yen.
How does broader risk sentiment impact the Japanese Yen?
The Japanese Yen is often seen as a safe-haven investment. This means that in times of market stress, investors are more likely to put their money in the Japanese currency due to its supposed reliability and stability. Turbulent times are likely to strengthen the Yen’s value against other currencies seen as more risky to invest in.
- Australian Dollar consolidates after the release of improved PMI figures.
- Australian Manufacturing and Services PMI increased to 50.3 and 47.9, respectively.
- The upbeat Australian share market provides support for the AUD.
- US Dollar demand persists on risk aversion sentiment as escalated geopolitical tension.
- US forces carried out strikes on Iran-backed Kataib Hezbollah militia group in Iraq.
The Australian Dollar (AUD) attempts to move on an upward trajectory on Wednesday on the back of the improved preliminary Purchasing Managers Index (PMI) from Australia, released on a monthly basis by Judo Bank and S&P Global on Wednesday. However, the US Dollar (USD) maintains stability, holding its positive position from the previous session, despite a decrease in the 2-year United States (US) bond yield.
Australia's PMI data revealed a positive shift in business activity in January across all sectors. The Manufacturing PMI increased from 47.6 to 50.3, showcasing improvement. Services PMI also saw an uptick, rising from 47.1 to 47.9. The Composite PMI registered an increase, reaching 48.1 compared to December's 46.9. Furthermore, Australian shares continued their upward trajectory, setting a third consecutive record high. The surge was attributed to increased performance in Miners and energy stocks, serving as a favorable factor for the AUD/USD pair.
The US Dollar Index (DXY) remains stable after its recent upswing, as buying interest in the US Dollar persists due to risk aversion sentiment. This trend is likely associated with the escalated geopolitical tensions in the Middle East. The US Secretary of Defense issued a statement confirming that "US military forces carried out essential and proportional strikes on three facilities utilized by the Iranian-backed Kataib Hezbollah militia group and other Iran-affiliated groups in Iraq." These actions were a direct response to a sequence of escalating attacks.
Traders are likely anticipating the release of the S&P Global Purchasing Managers Index data from the United States on Wednesday. This data is expected to provide crucial insights into business activities within the nation, influencing market sentiments about the Federal Reserve’s (Fed) interest rate trajectory.
Money market futures have reduced the likelihood of a rate cut by the Fed in March. However, by May, there is full pricing in of a 25 basis point (bps) cut, and the probability of a more substantial 50 bps cut stands at 50%.
Daily Digest Market Movers: Australian Dollar improves on positive PMI data
- Australia’s Westpac Leading Index (MoM) declined by 0.03% in December against November’s growth of 0.07%.
- National Australia Bank's Business Conditions inched down to the reading of 7 in December from 9 prior.
- National Australia Bank's Business Confidence improves to -1 from the previous figure of -9.
- Australia’s Consumer Inflation Expectations remained steady at 4.5% in January.
- The Chair of Australia's sovereign wealth fund Peter Costello commented that inflation in Australia is showing early signs of moderation. However, Costello emphasizes that there is still a considerable distance to cover to bring prices back within the RBA's target band.
- The People's Bank of China keeps its Loan Prime Rate (LPR) steady for both the one-year and five-year terms. The rate remains at 3.45% for the one year and 4.20% for the five years.
- US Conference Board has reported a slight improvement in the Leading Economic Index for December, moving from -0.5% in November to -0.1% in December. This surpassed expectations for an improvement to -0.3%.
- The preliminary US Michigan Consumer Sentiment Index rose to 78.8 in January from 69.7 prior, exceeding the expected figure of 70.
Technical Analysis: Australian Dollar hovers below the psychological level at 0.6600
The Australian Dollar trades around 0.6580 on Wednesday, with immediate resistance noted at the psychological level of 0.6600 aligned with the nine-day Exponential Moving Average (EMA) at 0.6603 before the 23.6% Fibonacci retracement level at 0.6606. A firm breakthrough above the resistance zone could help the pair approach the major barrier at 0.6650 followed by the 38.2% Fibonacci retracement at 0.6657. On the downside, the AUD/USD pair could revisit the weekly low at 0.6551 aligned with the major level at 0.6550. A break below the latter could push the pair to retest the monthly low at 0.6524.
AUD/USD: Daily Chart
-638416565598216473.png)
Australian Dollar price today
The table below shows the percentage change of Australian Dollar (AUD) against listed major currencies today. Australian Dollar was the strongest against the Canadian Dollar.
| USD | EUR | GBP | CAD | AUD | JPY | NZD | CHF | |
| USD | -0.02% | -0.04% | 0.02% | 0.07% | -0.10% | -0.02% | -0.03% | |
| EUR | 0.01% | -0.03% | 0.03% | 0.04% | -0.08% | -0.03% | -0.01% | |
| GBP | 0.05% | 0.03% | 0.05% | 0.08% | -0.06% | -0.05% | 0.01% | |
| CAD | -0.02% | 0.00% | -0.05% | 0.03% | -0.11% | -0.09% | -0.04% | |
| AUD | -0.04% | -0.04% | -0.08% | -0.03% | -0.12% | -0.12% | -0.07% | |
| JPY | 0.08% | 0.07% | 0.06% | 0.09% | 0.17% | 0.01% | 0.07% | |
| NZD | 0.10% | 0.06% | 0.03% | 0.09% | 0.14% | 0.01% | 0.05% | |
| CHF | 0.03% | 0.01% | -0.02% | 0.04% | 0.09% | -0.07% | -0.05% |
The heat map shows percentage changes of major currencies against each other. The base currency is picked from the left column, while the quote currency is picked from the top row. For example, if you pick the Euro from the left column and move along the horizontal line to the Japanese Yen, the percentage change displayed in the box will represent EUR (base)/JPY (quote).
Australian Dollar FAQs
What key factors drive the Australian Dollar?
One of the most significant factors for the Australian Dollar (AUD) is the level of interest rates set by the Reserve Bank of Australia (RBA). Because Australia is a resource-rich country another key driver is the price of its biggest export, Iron Ore. The health of the Chinese economy, its largest trading partner, is a factor, as well as inflation in Australia, its growth rate and Trade Balance. Market sentiment – whether investors are taking on more risky assets (risk-on) or seeking safe-havens (risk-off) – is also a factor, with risk-on positive for AUD.
How do the decisions of the Reserve Bank of Australia impact the Australian Dollar?
The Reserve Bank of Australia (RBA) influences the Australian Dollar (AUD) by setting the level of interest rates that Australian banks can lend to each other. This influences the level of interest rates in the economy as a whole. The main goal of the RBA is to maintain a stable inflation rate of 2-3% by adjusting interest rates up or down. Relatively high interest rates compared to other major central banks support the AUD, and the opposite for relatively low. The RBA can also use quantitative easing and tightening to influence credit conditions, with the former AUD-negative and the latter AUD-positive.
How does the health of the Chinese Economy impact the Australian Dollar?
China is Australia’s largest trading partner so the health of the Chinese economy is a major influence on the value of the Australian Dollar (AUD). When the Chinese economy is doing well it purchases more raw materials, goods and services from Australia, lifting demand for the AUD, and pushing up its value. The opposite is the case when the Chinese economy is not growing as fast as expected. Positive or negative surprises in Chinese growth data, therefore, often have a direct impact on the Australian Dollar and its pairs.
How does the price of Iron Ore impact the Australian Dollar?
Iron Ore is Australia’s largest export, accounting for $118 billion a year according to data from 2021, with China as its primary destination. The price of Iron Ore, therefore, can be a driver of the Australian Dollar. Generally, if the price of Iron Ore rises, AUD also goes up, as aggregate demand for the currency increases. The opposite is the case if the price of Iron Ore falls. Higher Iron Ore prices also tend to result in a greater likelihood of a positive Trade Balance for Australia, which is also positive of the AUD.
How does the Trade Balance impact the Australian Dollar?
The Trade Balance, which is the difference between what a country earns from its exports versus what it pays for its imports, is another factor that can influence the value of the Australian Dollar. If Australia produces highly sought after exports, then its currency will gain in value purely from the surplus demand created from foreign buyers seeking to purchase its exports versus what it spends to purchase imports. Therefore, a positive net Trade Balance strengthens the AUD, with the opposite effect if the Trade Balance is negative.
- WTI edges lower to $74.30 amid the rising oil supply.
- US crude oil inventories fell by 6.674M barrels for the week ending January 19 vs. 0.483M barrels gains previously.
- The rising geopolitical tensions in the Red Sea are a primary driver behind lower demand for oil.
Western Texas Intermediate (WTI), the US crude oil benchmark, is trading around $74.30 on Wednesday. WTI prices drift lower on the day as traders focus on increasing oil output in the US and rising supply in Libya and Norway.
According to the American Petroleum Institute weekly report on Wednesday, US crude oil inventories fell by 6.674M barrels for the week ending January 19 from the previous reading of 0.483M barrels.
Elsewhere, Norway’s crude production rose to 1.85M barrels per day (bpd) in December from 1.81M bpd the previous month, while Libya’s production was at 300,000 bpd. That being said, rising production might exert some pressure on WTI prices.
Apart from this, the sluggish economic recovery in China weighs on WTI prices, as China is the world’s largest oil importer. The weaker-than-expected GDP growth number for the fourth quarter of 2023 dampened oil demand.
On the other hand, the geopolitical tensions in the Red Sea might cap the downside of WTI prices. The Pentagon said on Monday that the US and British forces carried out a new round of strikes in Yemen, targeting a Houthi underground storage site as well as missile and surveillance capabilities used by the Iran-aligned group against Red Sea shipping.
Oil traders will monitor US S&P Global Purchasing Managers Index (PMI) data on Wednesday. The US GDP data for Q4 will be released on Thursday and the Core Personal Consumption Expenditures Price Index (Core PCE) will be due on Friday. These events could significantly impact the USD-denominated WTI price. Oil traders will take cues from the data and find trading opportunities around WTI prices.
On Wednesday, the People’s Bank of China (PBoC) set the USD/CNY central rate for the trading session ahead at 7.1053 as compared to the previous day's fix of 7.1117 and 7.1825 Reuters estimates.
- USD/CAD edges lower to 1.3463 amid the modest decline of US Dollar.
- Bank of Canada is expected to hold interest rate steady at its January meeting.
- Federal Reserve (Fed) is unlikely to cut rates as aggressively as the market expects.
- Traders will focus on the BoC monetary policy decision and US PMI report on Wednesday.
The USD/CAD pair loses ground above the mid-1.3400s during the early Asian trading hours on Wednesday. Market participants will closely monitor the Bank of Canada (BoC) interest rate decision on Wednesday, which no change in policy expected. At press time, USD/CAD currently trading around 1.3463, down 0.04% on the day.
The BoC is anticipated to maintain its key overnight rate unchanged at a 22-year high of 5% on Wednesday as stubborn inflation has markets delaying the timeline for the first rate cut. Traders will take more cues from BoC Governor Tiff Macklem's comments on the rate trajectory. Meanwhile, the higher oil prices due to concerns over global energy supplies might lift the commodity-linked Loonie and acts as a headwind for the USD/CAD pair
On the other hand, the US economy is robust, and the Federal Reserve (Fed) is unlikely to cut rates as aggressively as the market expects. The market now expects 125 basis points of easing in 2024, down from around 175 basis points earlier this month. The key US events this week, including the Q4 US Gross Domestic Product Annualized and the December Core Personal Consumption Expenditures Price Index (Core PCE) will offer some hints about the path of Fed policy. If the data remain strong, there is room for Fed funds future pricing to converge towards the FOMC’s projections for only three cuts this year. This, in turn, might lift the Greenback.
The BoC monetary policy decision will be in the spotlight on Wednesday. Also, the US S&P Global Purchasing Managers Index (PMI) report will be due later in the day. On Thursday, the US GDP growth numbers Annualized for Q4 will be released. The Core Personal Consumption Expenditures Price Index (Core PCE) will be published on Friday. These figures could give a clear direction to the USD/CAD pair.
| Index | Change, points | Closed | Change, % |
|---|---|---|---|
| NIKKEI 225 | -29.38 | 36517.57 | -0.08 |
| Hang Seng | 392.8 | 15353.98 | 2.63 |
| KOSPI | 14.26 | 2478.61 | 0.58 |
| ASX 200 | 38.3 | 7514.9 | 0.51 |
| DAX | -56.27 | 16627.09 | -0.34 |
| CAC 40 | -25.21 | 7388.04 | -0.34 |
| Dow Jones | -96.36 | 37905.45 | -0.25 |
| S&P 500 | 14.17 | 4864.6 | 0.29 |
| NASDAQ Composite | 65.65 | 15425.94 | 0.43 |
| Pare | Closed | Change, % |
|---|---|---|
| AUDUSD | 0.6579 | 0.15 |
| EURJPY | 161.02 | 0.06 |
| EURUSD | 1.08531 | -0.26 |
| GBPJPY | 188.241 | 0.06 |
| GBPUSD | 1.26874 | -0.13 |
| NZDUSD | 0.61007 | 0.43 |
| USDCAD | 1.34588 | -0.11 |
| USDCHF | 0.87027 | 0.18 |
| USDJPY | 148.37 | 0.19 |


© 2000-2026. Уcі права захищені.
Cайт знаходитьcя під керуванням TeleTrade DJ. LLC 2351 LLC 2022 (Euro House, Richmond Hill Road, Kingstown, VC0100, St. Vincent and the Grenadines).
Інформація, предcтавлена на cайті, не є підcтавою для прийняття інвеcтиційних рішень і надана виключно для ознайомлення.
Компанія не обcлуговує та не надає cервіc клієнтам, які є резидентами US, Канади, Ірану, Ємену та країн, внеcених до чорного cпиcку FATF.
Проведення торгових операцій на фінанcових ринках з маржинальними фінанcовими інcтрументами відкриває широкі можливоcті і дає змогу інвеcторам, готовим піти на ризик, отримувати виcокий прибуток. Але водночаc воно неcе потенційно виcокий рівень ризику отримання збитків. Тому перед початком торгівлі cлід відповідально підійти до вирішення питання щодо вибору інвеcтиційної cтратегії з урахуванням наявних реcурcів.
Викориcтання інформації: при повному або чаcтковому викориcтанні матеріалів cайту поcилання на TeleTrade як джерело інформації є обов'язковим. Викориcтання матеріалів в інтернеті має cупроводжуватиcь гіперпоcиланням на cайт teletrade.org. Автоматичний імпорт матеріалів та інформації із cайту заборонено.
З уcіх питань звертайтеcь за адреcою pr@teletrade.global.
переклади