- Аналітика
- Новини та інструменти
- Новини ринків
Новини ринків
- AUD/USD remains confined in a narrow trading range of 0.6550–0.6570 on Friday.
- The Australian Judo Bank PMI report indicated an economic slowdown in Australian economic activity in November.
- All eyes are on the US S&P Global PMI data on Friday.
The AUD/USD pair consolidates its gains between 0.6550 and 0.6570 during the early Asian session on Friday. Market activity was subdued, with US markets closed for the Thanksgiving holiday on Thursday. On Friday, the US S&P Global PMI will be in the spotlight. AUD/USD currently trades near 0.6560, gaining 0.02% on the day.
On Thursday, the preliminary Australian Judo Bank Manufacturing PMI for November arrived at 47.7 from 48.2 the previous month, the lowest reading in 42 months. Additionally, the Judo Bank Services PMI dropped to 46.3 from the previous reading of 47.9. The Composite PMI fell to a 27-month low of 46.4 in November from 47.6 previously. The report indicated the economic slowdown in Australian economic activity in November.
Nonetheless, the hope for a fresh Chinese stimulus plan boosted market sentiment on Friday. That being said, Chinese authorities have reportedly included Country Garden Holdings Co on a list of 50 eligible property developers that would have access to financing. Other troubled developers on the list are Sino-Ocean Group and CIFI Holdings. This, in turn, lifts the China-proxy Australian Dollar (AUD) and acts as a tailwind for the AUD/USD pair.
On the other hand, there was no economic data released from the US on Thursday due to the Thanksgiving holiday. Investors will keep an eye on the US S&P Global PMI data, due later in the American session on Friday. The Manufacturing and Services PMI are estimated to ease to 49.8 and 50.4, respectively. These figures could give a clear direction to the AUD/USD pair.
- GBP/USD briefly saw a ten-week high after UK PMIs beat the street.
- Markets are notably constrained with US markets dark for the Thanksgiving holiday.
- Next up will be Friday's US PMI flash reading.
The GBP/USD is trading tightly near 1.2540 after seeing a brief tip into a ten-week high on a surprise upside beat in UK Purchasing Managers' Index (PMI) figures early Thursday.
The pair spent the back half of the trading day trading into the middle with money markets seeing a severe decline in overall liquidity and volume with US market shuttered for the day for the US Thanksgiving holiday.
US market participants will be returning to the fold in reduced hours tomorrow to close out the trading week.
UK Preliminary Services PMI returns to expansion with 50.5 in November
The Pound Sterling (GBP) caught a bid into its highest bids against the US Dollar (USD) after a better-than-expected PMI print, with both the Services and Composite components returning to expansionary territory, at 50.5 and 50.1 respectively.
The Services PMI was expected to hold steady at 49.5, and the Composite was likewise seen flat at 48.7.
The trading week will close out with US PMI figures in the back half of the trading day. Investors will be looking for only a minor downtick in the US figures.
The US Manufacturing PMI for November is forecast to decline from October’s flat 50.0 into contraction territory at 49.8, while the Services component is expected to tick lower from 50.6 to 50.4.
GBP/USD Technical Outlook
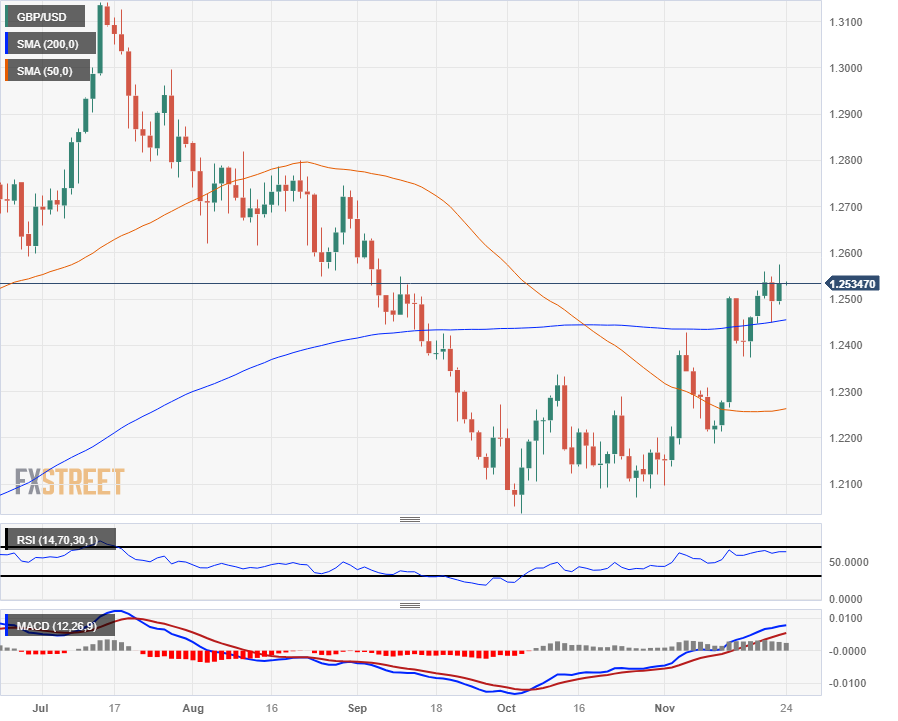
With the GBP/USD briefly testing its highest bids since early September, the pair has set a new near-term technical ceiling at 1.2575, although daily candlesticks show the pair has been struggling to develop meaningful momentum above the 200-day Simple Moving Average (SMA).
The pair has struggled to move too far in either direction after piercing the long-term moving average last week.
The 50-day SMA is rotating into a bullish lean from just below 1.2300, and a technical floor is priced in from the last swing low into the 1.2200 handle.
GBP/USD Daily Chart
- Silver price stays firm, despite subdued trading conditions.
- Key resistance levels in focus for XAG/USD, with $24.00 as immediate hurdle, followed by June high at $24.52.
- Downside risks include potential drop below the 200-DMA at $23.32 as a critical support to watch.
Silver price advanced on Thursday by 0.91%, amid low volume conditions, and as the Asian Pacific session begins, trades at around $23.82, unchanged in the early Friday session, as Japan and the US markets, reopen after being on holiday.
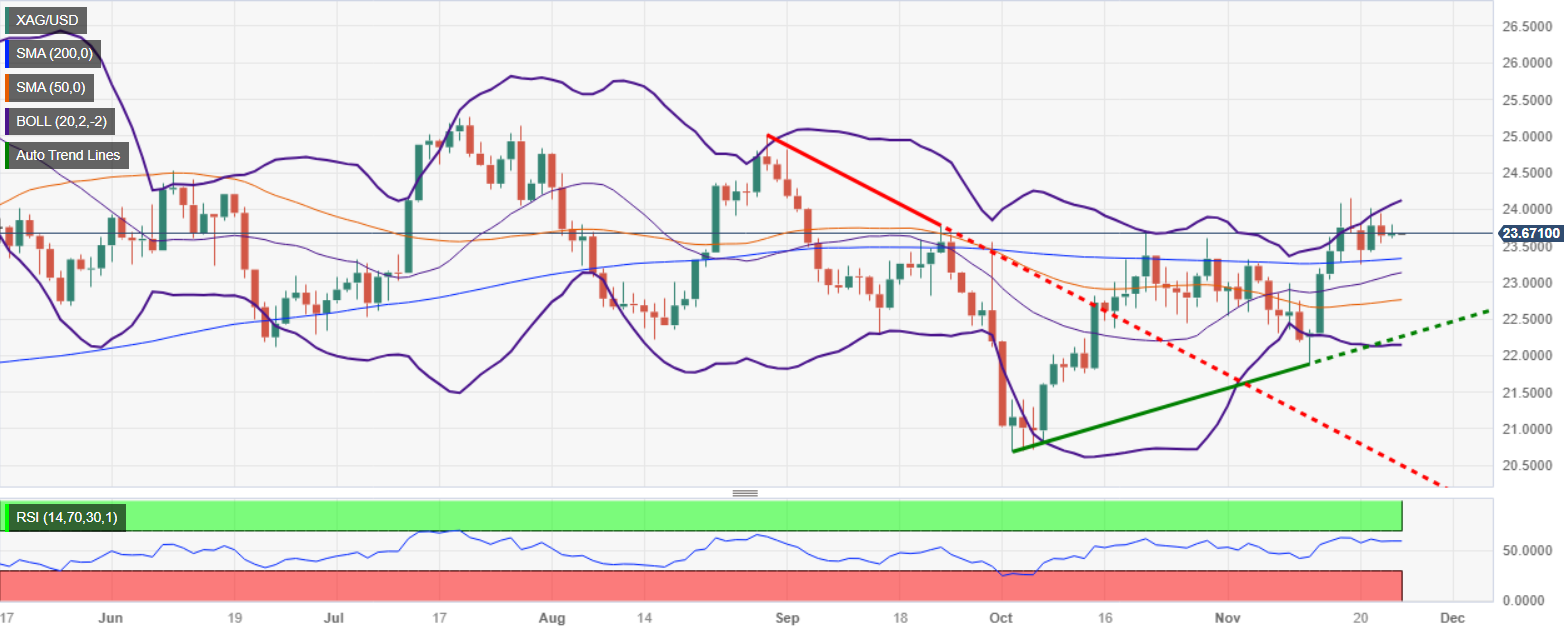
Silver daily chart portrays the grey metal as neutral to upward biased but remains near the weekly highs, which could pave the way for a test of the $24.00 figure. Once cleared, the next resistance would be the Jun 9 high at $24.52 before XAG/USD climbs to $25.00. Once surpassed, that would cement the uptrend, and expose the year-to-date (YTD) high at $26.12.
Conversely, if XAG/USD falls below the November 23 low of $23.60, that could pave the way for testing the 200-day moving average (DMA) at $23.32. If sellers drag prices below that demand zone, the XAG/USD would shift neutral bearish, and expose the 20-DMA at $23.13, followed by the 50-DMA at $22.75.
XAG/USD Price Analysis – Daily Chart
XAG/USD Technical Levels
- Gold price holds positive ground near $1,992 in early Friday.
- The hope for China's stimulus plan to alleviate the property crisis boosted market sentiment.
- Investors await the US S&P Global PMI data, due later in the American session.
Gold price (XAU/USD) pares losses as the US dollar (USD) resumes its decline during the early Asian session on Friday. There will be no economic data release from the US on Friday, and Wall Street will be closed. The gold price currently trades around $1,992, unchanged for the day.
Meanwhile, the US Dollar Index (DXY), an index of the value of the USD measured against a basket of six world currencies, declined marginally to 103.75. The US Treasury yields consolidate their losses, with the 10-year yields standing at 4.41%. This, in turn, benefits the yellow metal as US yields are the opportunity cost of holding non-yielding metals.
China's efforts to alleviate the property crisis boosted market sentiment on Friday. According to Bloomberg, Chinese authorities have reportedly included Country Garden Holdings Co on a list of 50 eligible property developers that would have access to financing. Other troubled developers on the list are Sino-Ocean Group and CIFI Holdings.
Looking ahead, gold traders will monitor the US S&P Global PMI data on Friday. The Manufacturing PMI is expected to decline from 50 to 49.8 while Services PMI is estimated to ease from 50.6 to 50.4. Trades will take cues from these figures and find a trading opportunity around the gold price.
Gold price (XAU/USD) technical outlook:
The technical outlook suggests that the bullish bias stays intact as the yellow metal holds above the key 100-hour Exponential Moving Averages (EMA) on the daily chart. Furthermore, the Relative Strength Index (RSI) stands in bullish territory above 50, which supports the buyers for the time being.
Resistance level: $2,000, $2030, and $2,045
Support level: $1,970, $1,950 and $1,935
- USD/JPY trades in a narrow range after recovering from a weekly low of 147.15.
- Mixed global stock performance and Japanese data to provide fresh impetus to the USD/JPY pair.
- Key levels in focus: support at Kijun-Sen (149.51) and potential rally towards the 150.00 threshold depending on CPI outcomes.
The USD/JPY began the Asian session almost unchanged, exchanging hands at around 149.55 after the pair reached a weekly low of 147.15 on Tuesday, but buyers stepping in lifted the pair toward the current exchange rates.
USD/JPY traders await the release of inflation data in Japan
On Thursday, European and Asian stocks closed mixed, while US markets remained closed due to the Thanksgiving holiday. That kept the USD/JPY pair trading within a 70-pip range, though the resumption of activities in Japan and the United States (US) would boost liquidity ahead of the weekend.
USD/JPY buyers remain hopeful the pair would extend its rally after Japan revealed a negative Gross Domestic Product (GDP) reading in the third quarter. Nevertheless, soft inflation figures released in the United States, spurred speculations the US Federal Reserve (Fed) ended its tightening cycle. Consequently, US bond yields plunged, a headwind for the pair.
Ahead of the week, the Japanese docket will feature inflation data. The Consumer Price Index (CPI) expanded by 3% YoY in September. Core CPI is estimated to jump by 3%, above the previous month’s 2.8% increase. If inflation numbers exceed the prior month’s figures, that could boost the Yen and tumble the USD/JPY below the first support seen at the Kijun-Sen at 149.51. On the other hand, a further upside is expected, with buyers eyeing the 150.00 mark.
USD/JPY Price Analysis: Technical outlook
From a technical perspective, the USD/JPY remains neutral to upward biased, on the upside capped by the confluence of the Tenkan and Kijun-Sen at around 149.47/53. A breach of the latter will expose the 150.00 figure, followed by the November 13 high at 151.91. On the flip side, if USD/JPY drops inside the Ichimoku Cloud, the first support would be the November 22 low at 148.01, followed by the weekly low at 147.15. Once cleared, the 147.00 figure would be up for grabs.
- NZ Retail Sales flat at 0%, but beat market expectations of -0.8%.
- QoQ NZ Retail Sales last printed at -1% in the second quarter.
New Zealand's third-quarter Retail Sales beat expectations early Friday, printing at 0% QoQ and showing a 1% rebound in consumption spending after excluding automobiles and transport. Markets were anticipating a 0.8% decline in the headline figure compared to the second quarter's -1% print.
Retail Sales less automotive purchases rebounded 1%, reversing course on the market forecast of -1.5% and chewing through a portion of last quarter's print of -1.6%, which was revised upwards from -1.8%.
According to Stats NZ, the consumables categories saw the highest increases in overall sales volumes, with clothing, footwear, and personal accessories climbing 4% over the quarter, with hardware and building supplies up 2.9% and grocery items climbing an additional 1%.
Vehicles, transportation, and fuel spending were the biggest drags on Retail Sales by volume, with fuel retailing and motor vehicles & parts both declining 3.4% apiece.
(via Stats NZ) Sales values up in September
Eleven of the 15 industries had higher seasonally adjusted sales values in the September 2023 quarter compared with the June 2023 quarter. With price effects included, the largest industry movements were:
- fuel retailing – up 7.0 percent (NZD $167 million)
- motor vehicle and parts retailing – down 2.9 percent (NZD $124 million)
- supermarket and grocery stores – up 1.7 percent (NZD $109 million)
- food and beverage services – up 1.9 percent (NZD $72 million)
- hardware, building, and garden supplies – up 2.6 percent (NZD $72 million).
Market reaction
The Kiwi only saw a limited reaction in early Friday market action, and the NZD/USD pair continues to trade near 0.6050 following the Retail Sales data release.
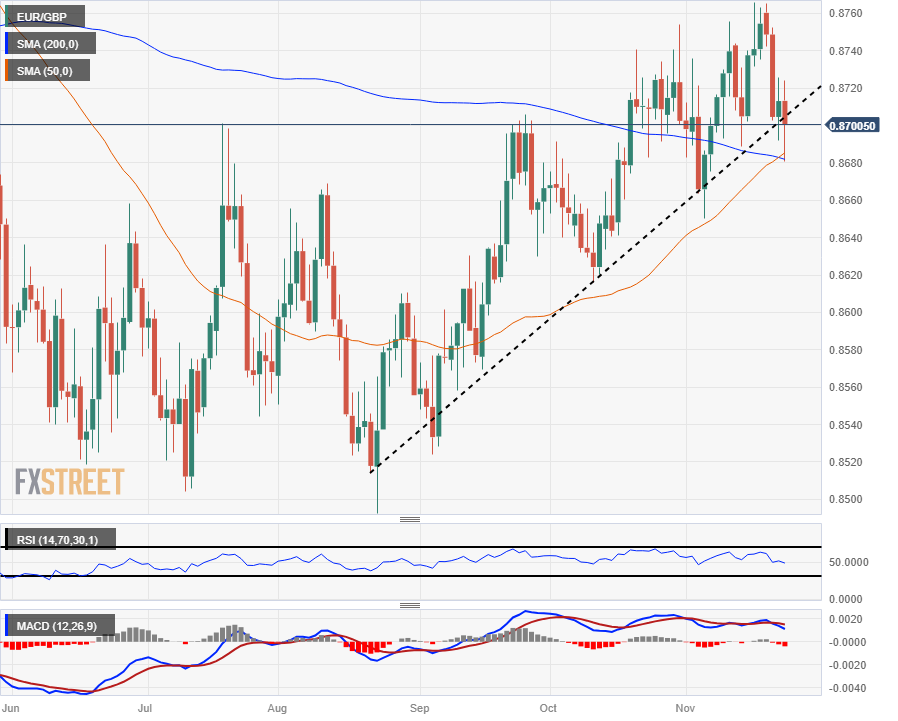
- EUR/GBP gravitates around 0.8700, seeing losses of 0.15%.
- The daily chart signals a bearish bias, while the four-hour chart indicators imply a temporary selling momentum pause.
On Thursday's session, the EUR/GBP was found to be declining towards 0.8700, seeing 0.15% losses. On the daily chart, sellers are firmly in charge, with the bears steadily gaining ground. However, according to the four-hour chart, selling momentum appears to have slowed down, suggesting that the bulls may step in time.
The downward trend of the Relative Strength Index (RSI) in negative territory raises a red flag, suggesting a strengthening bearish momentum as well as the rising red bars of the Moving Average Convergence Divergence (MACD). Simultaneously, the pair is trading in a limbo state between the Simple Moving Averages (SMAs). It resides under the 20-day SMA, indicating bearish pressure in the short run, while lofting above the 100 and 200-day SMAs, pointing to a bullish bias on a broader scope. This split profile insinuates that although bears have gained ground, the bulls remain dominant in the overall trend.
Zooming in, the four-hour chart’s RSI is flatlining in negative territory, hinting at the exhaustion of selling pressure. Furthermore, the MACD accentuates this impression by displaying flat red bars, indicating limited bearish momentum.
Support Levels: 0.8680 (200-day SMA), 0.8650, 0.8600.
Resistance Levels: 0.8715 (20-day SMA), 0.8750, 0.8800.
EUR/GBP daily chart
-638363736403967395.png)
- The Kiwi has earned the dubious title of Thursday’s largest market mover.
- The NZD/JPY cleared almost half a percent in otherwise flat trading.
- Price action still capped underneath last week’s eight-year peak of 91.20.
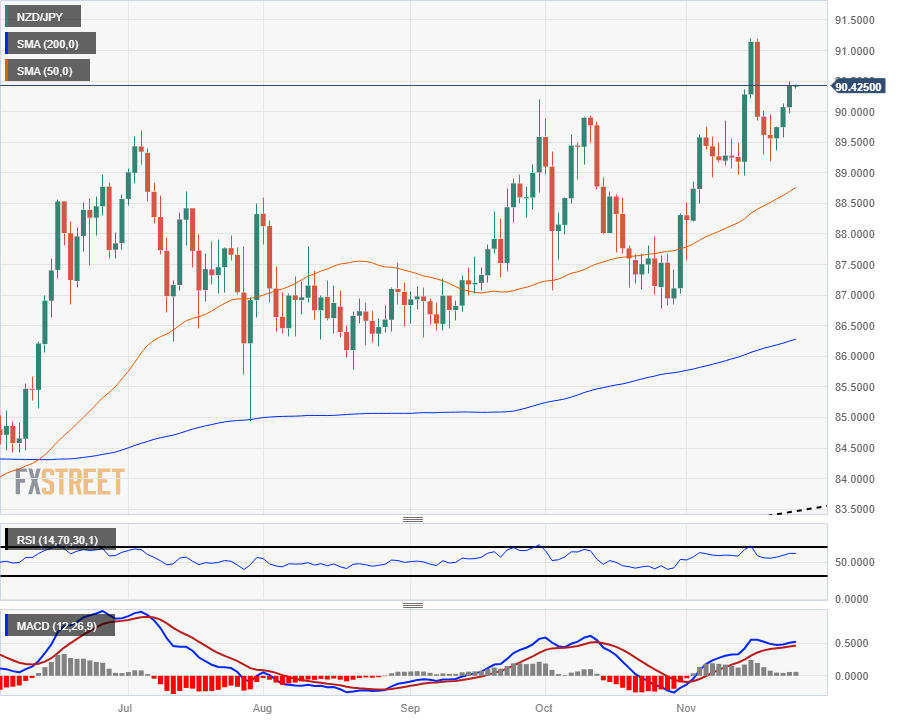
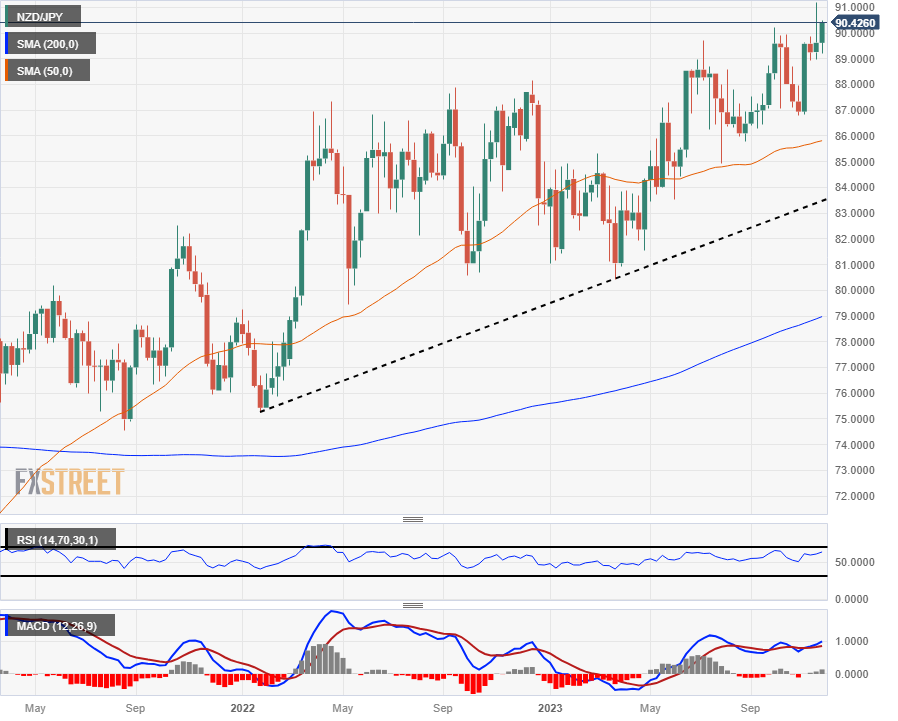
The NZD/JPY rolled up almost half a percent on Thursday as the Kiwi (NZD) sees a continuation of its climb up and over the Japanese Yen (JPY). The pair has closed in the green for three consecutive trading days and has pared back half of its losses after tumbling last week from an eight-year high of 91.20.
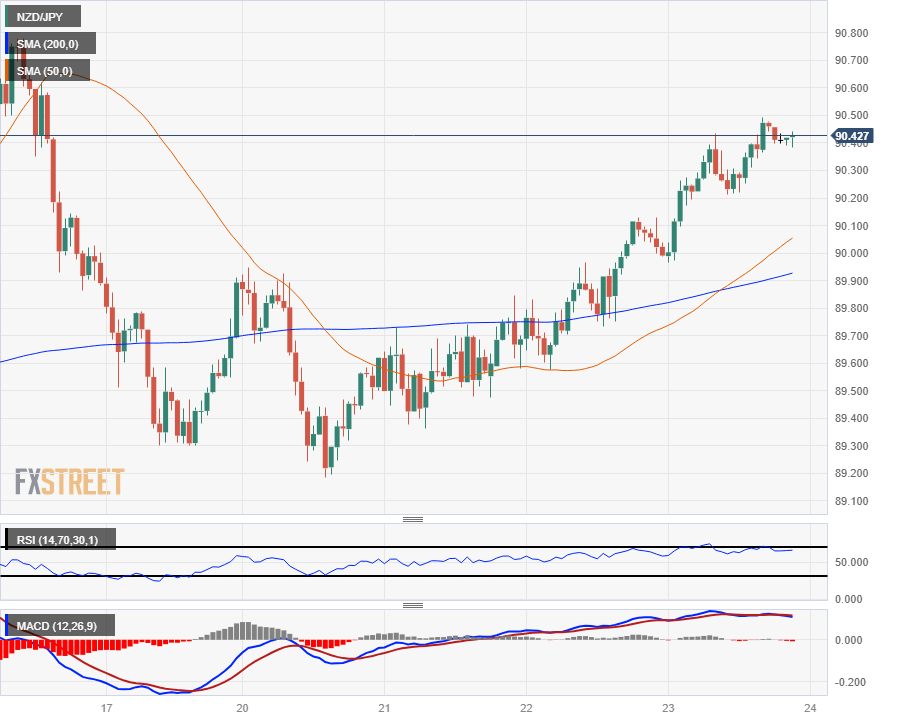
Hourly candles see the NZD/JPY trading bullish after catching a technical reversal from constrained 50- and 200-hour Simple Moving Averages (SMA) giving way to a bullish crossover.
The pair is now catching technical support from the 200-hour SMA lifting above 89.90 while the 50-hour SMA provides near-term support above the major 90.00 handle.
Weekly candlesticks tell an incredibly bullishly overbought story, with the NZD/JPY trading into eight-year highs as the Kiwi attempts to take a run at 92.00, a level the pair hasn’t seen since April of 2015.
New Zealand Dollar price today
The table below shows the percentage change of New Zealand Dollar (NZD) against listed major currencies today. New Zealand Dollar was the strongest against the Japanese Yen.
| USD | EUR | GBP | CAD | AUD | JPY | NZD | CHF | |
| USD | -0.16% | -0.37% | 0.04% | -0.24% | 0.05% | -0.44% | 0.03% | |
| EUR | 0.17% | -0.20% | 0.20% | -0.09% | 0.21% | -0.27% | 0.20% | |
| GBP | 0.35% | 0.19% | 0.39% | 0.11% | 0.41% | -0.08% | 0.39% | |
| CAD | -0.04% | -0.20% | -0.40% | -0.28% | 0.02% | -0.47% | -0.01% | |
| AUD | 0.26% | 0.07% | -0.13% | 0.27% | 0.29% | -0.20% | 0.26% | |
| JPY | -0.05% | -0.23% | -0.41% | -0.01% | -0.29% | -0.49% | -0.03% | |
| NZD | 0.43% | 0.27% | 0.08% | 0.46% | 0.20% | 0.49% | 0.47% | |
| CHF | -0.03% | -0.20% | -0.39% | 0.01% | -0.28% | 0.02% | -0.47% |
The heat map shows percentage changes of major currencies against each other. The base currency is picked from the left column, while the quote currency is picked from the top row. For example, if you pick the Euro from the left column and move along the horizontal line to the Japanese Yen, the percentage change displayed in the box will represent EUR (base)/JPY (quote).
NZD/JPY Hourly Chart
NZD/JPY Daily Chart
NZD/JPY Weekly Chart
During the Asian session, New Zealand Q3 Retail Sales and Japan CPI and PMI data are due. Later in the day, the German Q3 GDP and the IFO Survey. Canada will release Retail Sales data. Additionally, the US PMI and Canada Retail Sales will also be published.
Here is what you need to know on Friday, November 24:
The US Dollar dropped modestly on Thursday in a low-volume session, with US markets closed due to Thanksgiving. The holiday shopping season starts in the US with Black Friday.
The US Dollar Index (DXY) held below 104.00 and settled around 103.75. Wall Street futures are in positive territory after European markets posted gains.
No official data is due from the US on Friday, and it will be a shortened session on Wall Street. The US S&P Global PMI is due, with a slight deterioration expected in the Services sector from 50.6 to 50.4 and in the Manufacturing sector from 50 to 49.8.
The Euro received a modest boost from Eurozone PMI data that surpassed expectations. The European Central Bank's account of the latest meeting offered no new information. EUR/USD is consolidating around 1.0900, moving without a clear direction, although the main trend is up. On Friday, a new reading of German Q3 GDP is due, along with the IFO Survey. ECB President Christine Lagarde will speak at an event in Frankfurt, but it is not expected that she will share views on monetary policy.
Analysts at Commerzbank on EZ PMI:
Today's data is therefore likely to fuel speculation about an ECB rate cut. However, we continue to believe that such a move is unlikely in the near future given the still high underlying inflationary pressures.
The Pound outperformed on Thursday, boosted by UK PMI data. GBP/USD hit a two-month high and then pulled back modestly to 1.2530. EUR/GBP posted its lowest close in three weeks, slightly below 0.8700.
USD/JPY rebounded during the American session back to the 149.60 area, confirming the recent recovery. Japan will report the Consumer Price Index for October. Also due is the Jibun PMI.
Japan CPI Preview: Forecasts from four major banks, inflation likely picked up
NZD/USD held above 0.6000 but remained limited by 0.6050. New Zealand will report Q3 Retail Sales.
USD/CAD hit weekly lows near 1.3650 but then rebounded back to the 1.3700 area, holding above the 55-day Simple Moving Average. Canada will report September Retail Sales on Friday.
AUD/USD rose despite Australian PMI hitting multi-month lows. The pair is hovering around 0.6550 amid subdued price action.
Like this article? Help us with some feedback by answering this survey:
- EUR/JPY sees a 0.19% rise, maintaining a position below the YTD high of 164.30 amid US and Japan holidays.
- For further bullish momentum, EUR/JPY needs to breach 164.00; downside risks include a potential drop towards 161.25 support.
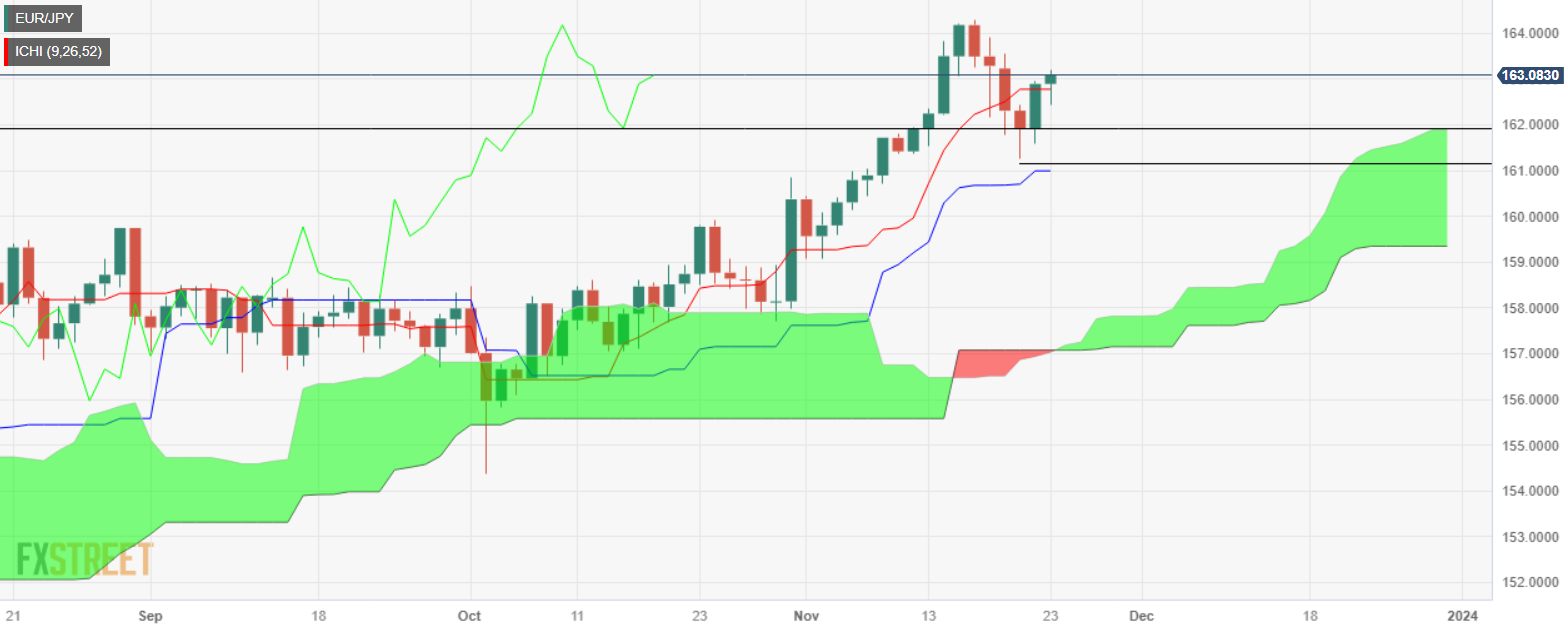
The EUR/JPY rose a decent 0.19% yet remains well below the latest cycle and a year-to-date (YTD) high at 164.30 on Thursday. At the time of writing, the pair exchanges hands at 163.09 amid thin liquidity conditions due to holidays in the US and Japan.
From a technical perspective, the EUR/JPY daily chart portrays the pair as neutral to upward biased, with price action remaining above the Ichimoku Cloud (Kumo) and above the Tenkan-Sen level at 162.77. Although the bias is bullish, the Tenkan and Kijun-Sen lines turned flat, suggesting consolidation lies ahead.
For a bullish continuation, the EUR/JPY needs to remain above 163.00 and test the 164.00 figure, ahead of threatening the year-to-date (YTD) high at 164.30. On the other hand, if the cross drops below the Tenkan-Sen at 162.77, that would exacerbate a drop to the Senkou Span A at 161.88. The next demand zone would be 161.25, the November 21 daily and last cycle low.
EUR/JPY Price Analysis – Daily Chart
EUR/JPY Technical Levels
- The Aussie is trading on the firm side against the US Dollar on Thursday, grabbing 0.6560.
- Declining Australian PMIs are hampering upside momentum as technical indicators weigh.
- US markets dark for the Thanksgiving holiday, due back on Friday with US PMIs.
The AUD/USD is seeing a slight lift on Thursday, with the Aussie (AUD) up three-tenths of a percent against the US Dollar (USD) which is seeing some backpedaling with US markets out for the day as the US celebrates Thanskgiving.
US money markets are due back to close out the trading week with a limited trading schedule on Friday, and Greenback traders will be keeping a close eye on the US’ Purchasing Managers’ Index (PMI) figures due in the latter half of the day.
Australia's Judo Bank Composite PMI for November declines to 46.4 vs. October's 47.6
Early Thursday saw Australia’s latest Judo Bank PMI figures broadly miss the mark in November, with the headline composite figure hitting a 27-month low as Australia’s economy continues to wobble with declining demand and still-high inflation depressing consumers’ confidence both in the broader economy and their capacity to consume.
Australia’s Services PMI slid to 46.3 in November compared to October’s print of 47.9, while the Manufacturing component hit an eye-watering 42-month low at 47.7, slipping even further back from the previous month’s 48.2.
Friday will see a contracted return of US money markets to close out the trading week, and investors are betting on a slight decline in US PMI numbers.
The US Manufacturing PMI for November is forecast to decline from October’s flat 50.0 into contraction territory at 49.8, while the Services component is expected to tick lower from 50.6 to 50.4.
Australian Dollar price today
The table below shows the percentage change of Australian Dollar (AUD) against listed major currencies today. Australian Dollar was the strongest against the Japanese Yen.
| USD | EUR | GBP | CAD | AUD | JPY | NZD | CHF | |
| USD | -0.15% | -0.36% | 0.03% | -0.26% | 0.06% | -0.42% | -0.04% | |
| EUR | 0.17% | -0.21% | 0.16% | -0.11% | 0.22% | -0.25% | 0.14% | |
| GBP | 0.34% | 0.20% | 0.38% | 0.09% | 0.41% | -0.06% | 0.32% | |
| CAD | -0.03% | -0.18% | -0.38% | -0.29% | 0.03% | -0.44% | -0.06% | |
| AUD | 0.27% | 0.11% | -0.09% | 0.29% | 0.32% | -0.15% | 0.22% | |
| JPY | -0.07% | -0.21% | -0.41% | -0.03% | -0.33% | -0.47% | -0.10% | |
| NZD | 0.41% | 0.26% | 0.05% | 0.41% | 0.14% | 0.47% | 0.37% | |
| CHF | 0.04% | -0.11% | -0.32% | 0.07% | -0.23% | 0.09% | -0.37% |
The heat map shows percentage changes of major currencies against each other. The base currency is picked from the left column, while the quote currency is picked from the top row. For example, if you pick the Euro from the left column and move along the horizontal line to the Japanese Yen, the percentage change displayed in the box will represent EUR (base)/JPY (quote).
AUD/USD Technical Outlook
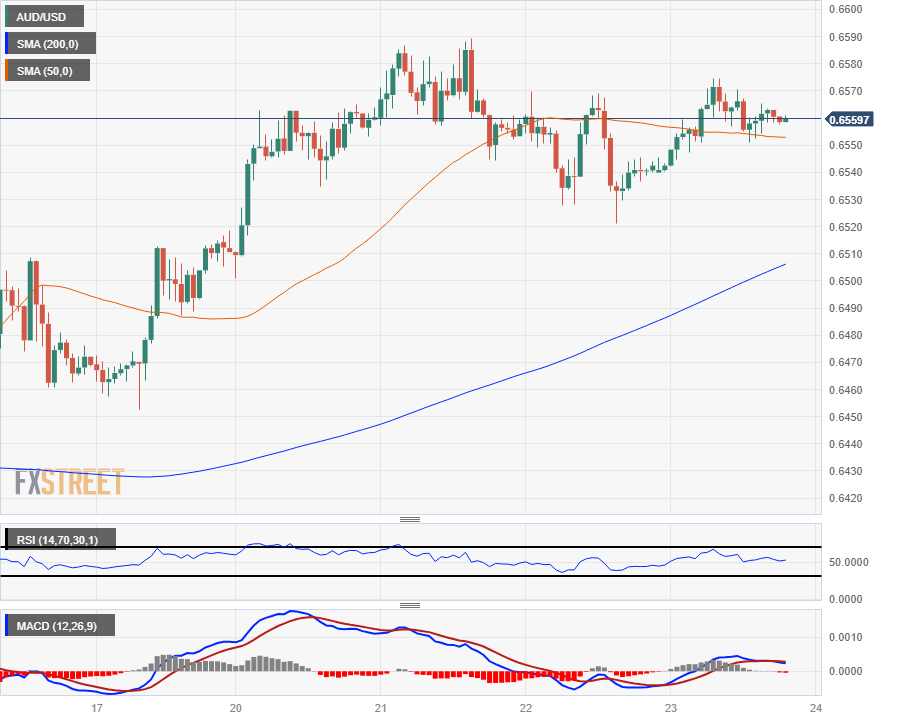
The AUD/USD has seen constraining chart play at the 50-hour Simple Moving Average (SMA) for the midweek trading window after tapping a high of 0.6590. Wednesday saw an intraday low near 0.6520, but the pair remains up on the week despite back-and-forth churn in the hourly candlesticks.
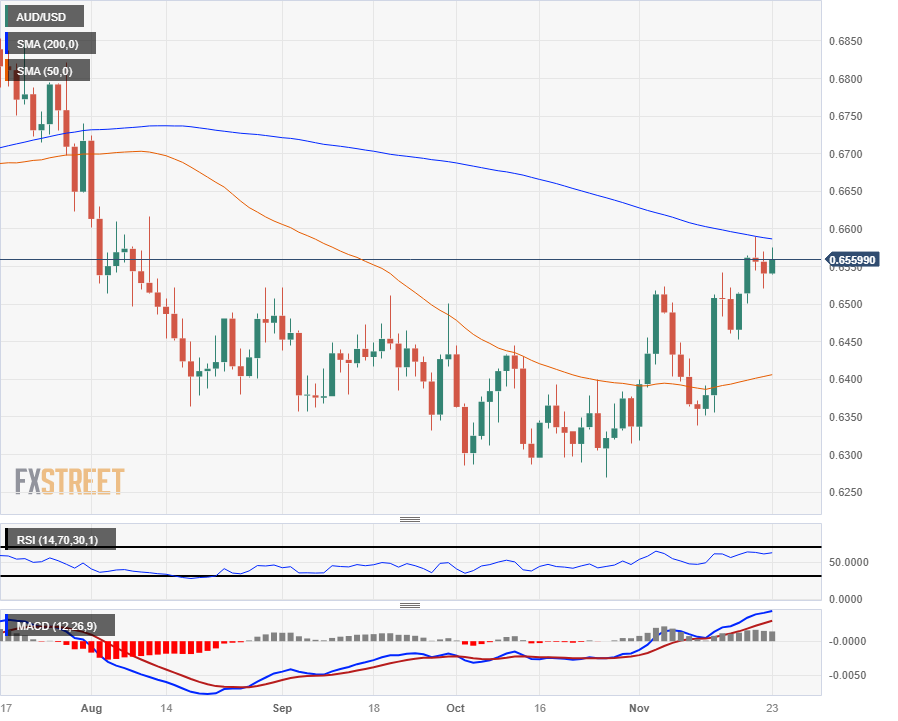
The AUD/USD is seeing some consolidation on the daily candlesticks as the pair grapples with etching in new highs, and the pair is currently lidded by the 200-day SMA just below the 0.6600 handle.
The Aussie is still up over 4.6% against the Greenback from October’s low of 0.6270, and AUD/USD bids could see some sideways grind with the pair caught in the dead zone between the 200-day SMA and the 50-day SMA, at 0.6586 and 0.6406 respectively.
AUD/USD Hourly Chart
AUD/USD Daily Chart
- The USD/CHF is hovering around the 0.8835 level, reflecting slight losses on the day.
- The pair continues consolidating, with indicators suggesting stagnation near oversold levels.
- No relevant reports were released on Thursday, and US markets were closed as the country celebrated Thanksgiving.
On Thursday, the USD/CHF pair experienced minor losses, nudging lower to trade around the 0.8835 mark. The marginal downtrend primarily stemmed from a relatively muted session, with the American traders on the sidelines celebrating Thanksgiving.
All eyes are on Friday when the S&P will release November's preliminary PMIs, which could impact the USD price dynamics and provide a clearer picture of the US economy. As the Federal Reserve (Fed) maintains a hawkish stance and could implement further tightening measures, positive figures may strengthen the USD via hawkish bets on the Fed.
A no-hike is already priced in for December, and markets are betting on rate cuts by mid-2024. However, it will come down to the incoming data, and before the last 2023 meeting, the Fed will get an additional Consumer Price Index (CPI) and Nonfarm Payrolls reports from November.
USD/CHF levels to watch
The indicators on the daily chart reflect that the pair may continue consolidating losses in the short term. The Relative Strength Index (RSI) nearing oversold conditions suggests that the selling momentum has been strong recently, indicating a potential short-term oversold bounce. However, the flat red bars of the Moving Average Convergence Divergence (MACD) give a nod towards a stagnant bearish sentiment. The pair is below the 20-day Simple Moving Averages (SMA), indicating that bears have gained some ground in the short term, reinforced by the bear's breather stance visible in the price chart.
On the broader scale, the pair is below the 20,100 and 200-day Simple Moving Averages (SMA), favouring the case of a bearish bias for the short-term.
Support Levels: 0.8820, 0.8800, 0.8780.
Resistance Levels: 0.8860, 0.8890 (100-day SMA), 0.8900.
USD/CHF daily chart
-638363654066019482.png)
- The Euro is pushing slightly higher against the US Dollar on Thursday.
- A dovish ECB and shuttered US holiday markets are capping momentum.
- The EUR is up about 0.15% against the USD for Thursday following mixed releases.
The EUR/USD is drifting into the high side on Thursday, tapping an early high for the day of 1.0930 and the pair is now waffling into the 1.0900 handle as thin trading volumes drain market momentum.
US markets are dark for the Thanksgiving holiday with banks and market participants alike taking the day off before returning to close out the week on Friday with a limited schedule.
Eurozone Preliminary Manufacturing PMI improves to 43.8 in November vs. 43.4 expected
The Euro (EUR) caught a bid in early Thursday trading after pan-European Purchasing Managers’ Index (PMI) came in broadly above-expectations, but the European Central Bank’s (ECB) latest Monetary Policy Meeting Accounts (a more informal reading of the ECB’s internal policy dialogue) reveals the ECB remains uneasy about the inflationary and economic outlook for the Eurozone.
ECB Accounts: Uncertainty surrounding the economic outlook had increased
Eurozone PMIs beat the street across the board, printing above expectations, but bulls were ultimately limited as European PMIs continue to print in sub-50.0 territory. Overall purchasing manager sentiment is slowly improving from recent lows, but meaningful activity expansion remains elusive for the Eurozone’s broader economy.
The Eurozone’s HCOB Manufacturing PMI ticked up to 43.8 against the forecast 43.8 compared to October’s 43.1. The Services PMI component saw only a minor improvement, from October’s 47.8 to 48.2, while markets were anticipating a print of 48.1.
The Eurozone HCOB Composite PMI printed at 47.1 for November, a step higher than the forecast 46.9 and clawing back some ground from October’s 46.5.
Inflation continues to cool in the Eurozone, but the ECB remains concerned about stubborn price growth that is receding much slower than ECB policymakers would like. Economic uncertainty continues to plague the Eurozone, and the ECB noted that downside risks have increased since their last major check-in in September.
With prices still running on the hot side, the ECB currently doesn’t expect inflation to return to the central bank’s 2% target until sometime in 2025, and investors will have to grapple with not seeing interest rate cuts for some time to come.
Euro price today
The table below shows the percentage change of Euro (EUR) against listed major currencies today. Euro was the strongest against the Japanese Yen.
| USD | EUR | GBP | CAD | AUD | JPY | NZD | CHF | |
| USD | -0.16% | -0.38% | 0.02% | -0.26% | 0.07% | -0.42% | -0.06% | |
| EUR | 0.16% | -0.22% | 0.17% | -0.10% | 0.22% | -0.25% | 0.11% | |
| GBP | 0.37% | 0.22% | 0.38% | 0.12% | 0.45% | -0.04% | 0.32% | |
| CAD | -0.02% | -0.19% | -0.39% | -0.27% | 0.06% | -0.43% | -0.08% | |
| AUD | 0.27% | 0.08% | -0.12% | 0.27% | 0.33% | -0.16% | 0.21% | |
| JPY | -0.07% | -0.23% | -0.45% | -0.05% | -0.35% | -0.49% | -0.13% | |
| NZD | 0.41% | 0.26% | 0.04% | 0.40% | 0.15% | 0.48% | 0.36% | |
| CHF | 0.06% | -0.10% | -0.31% | 0.08% | -0.20% | 0.13% | -0.35% |
The heat map shows percentage changes of major currencies against each other. The base currency is picked from the left column, while the quote currency is picked from the top row. For example, if you pick the Euro from the left column and move along the horizontal line to the Japanese Yen, the percentage change displayed in the box will represent EUR (base)/JPY (quote).
EUR/USD Technical Outlook
The Euro’s travels across the charts this week have been marred with back-and-forth action, and Thursday sees the EUR/USD getting hung up on the 50-hour Simple Moving Average (SMA) as the pair grapples with thin holiday trading.
Daily candlesticks have the pair trading just north of the 200-day SMA at the 1.0800 handle, but technical resistance is forming at the 1.0950 level as bulls struggle to make a clean break of the week’s highs.
EUR/USD Hourly Chart
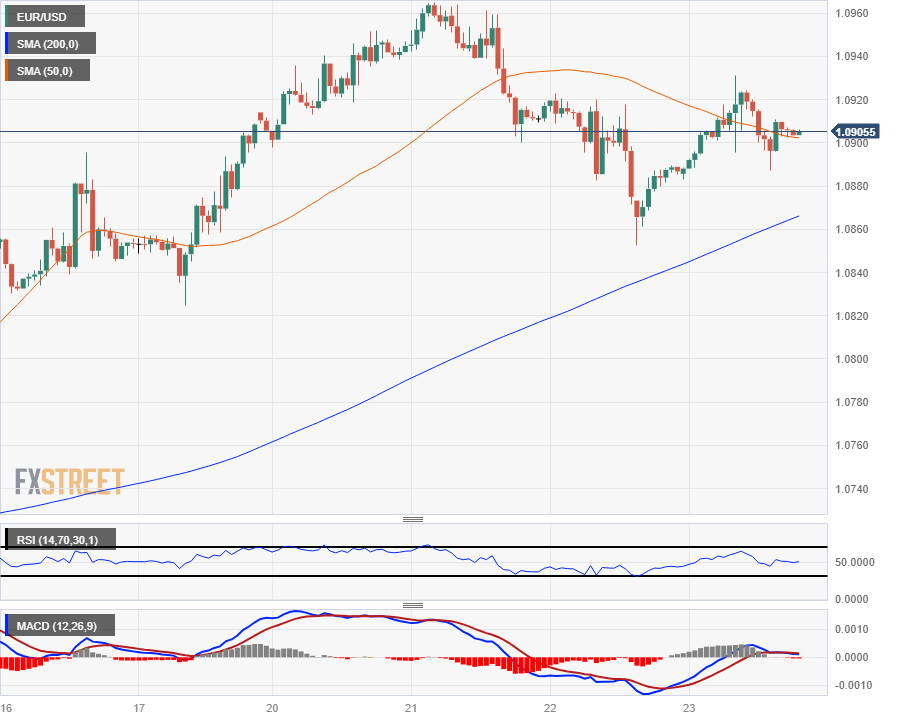
EUR/USD Daily Chart
- GBP/JPY climbs for the third consecutive day, supported by strong UK economic indicators and subdued trading activity.
- GBP/JPY's recovery from a three-week low, propels the pair above 187.00 with potential target at 188.00.
- Downside risks remain, with immediate support at Tenkan-Sen (186.37); a drop below 187.00 could lead to further declines.
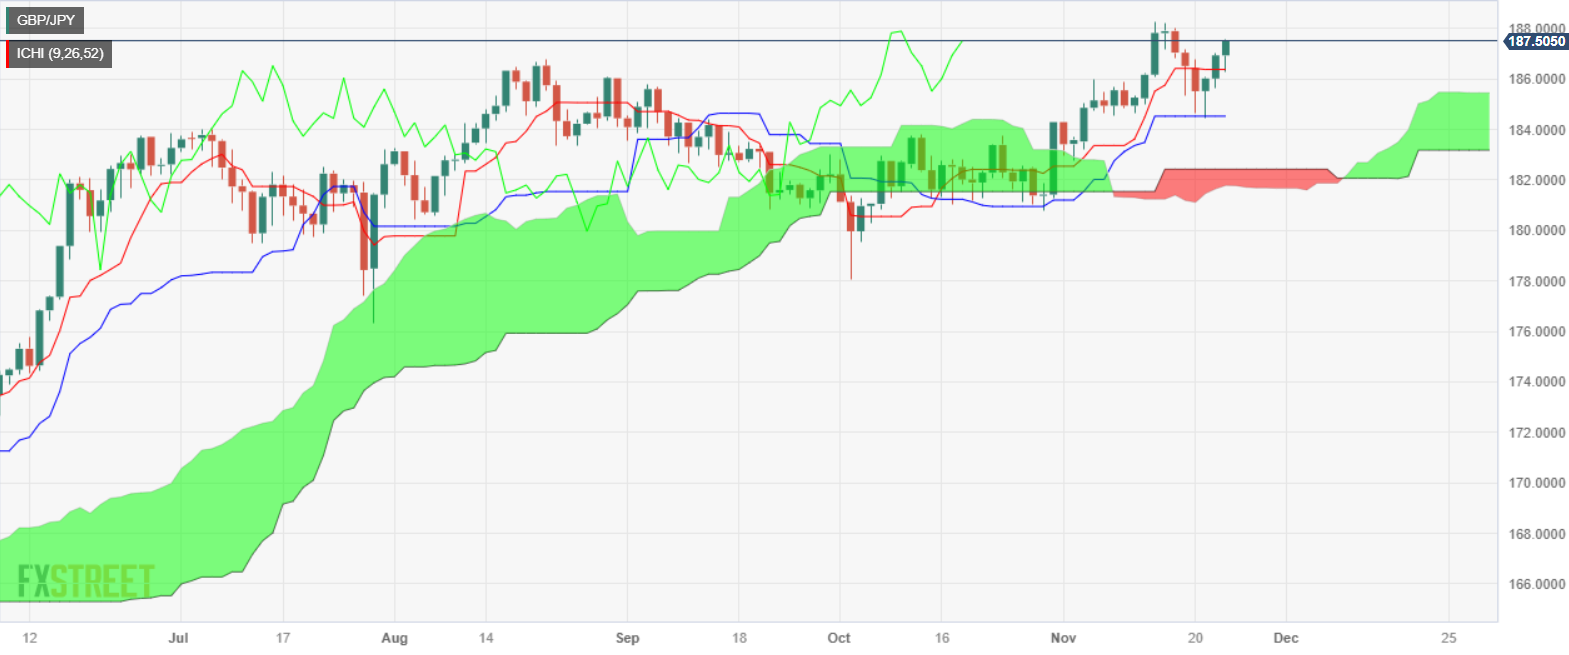
The Pound Sterling (GBP) continued to rally for the third straight day against the Japanese yen (JPY) on Thursday, courtesy of goodish economic data from the UK. That, alongside thin liquidity conditions due to Japan and the US being on holiday, keeps GBP buyers in charge. At the time of writing the GBP/JPY is trading at 187.50.
European equities portrayed an upbeat market mood. S&P Global revealed that business activity in the UK picked up, after printing three months of contraction. Nevertheless, the Manufacturing PMI index shrunk for the sixth consecutive month, though it approaches the 50 expansion/contraction threshold.
From a technical standpoint, the GBP/JPY recovered after diving to a three-week low at 184.46, as shown by the daily chart. Buyers stepped in as the price bounced at the Kijun-Sen at 184.52 and broke on its way north the Tenkan-Sen at 186.37. For a bullish continuation, the pair must reclaim the 188.00 figure, followed by the year-to-date (YTD) high at 188.28. to cement the uptrend toward the 190.00 mark.
On the other hand, if GBP/JPY drops below 187.00, the first support would be the Tenkan-Sen at 186.37, before sliding toward the 186.00 figure. Downside risks remain below that level, with next support at the Senkou Span A at 185.44.
GBP/JPY Price Analysis – Daily Chart
GBP/JPY Technical Levels
- Gold price edges up 0.14%, as US markets close for Thanksgiving, creating thin trading conditions.
- XAU/USD finds support from declining US Treasury yields, maintaining its position in the $1990-$2000 range.
- Upcoming S&P Global PMIs could provide further direction for Gold traders in a market assessing the Fed's tightening stance.
Gold price advanced moderately on Thursday due to thin liquidity conditions spurred by US markets remaining closed during Thanksgiving. At the time of writing, the XAU/USD is trading at $1992, gaining 0.14%, after hitting a daily low of $1989.56.
XAU/USD benefits from softer US Treasury yields and USD weakness, trading near the $2000 mark
European equities closed in the green, portraying a positive mood. A drop in US Treasury bond yields keeps XAU/USD underpinned after the US 10-year Treasury bond yield has fallen more than 6.20%, or 29 basis points, since the beginning of November.
XAU/USD broke above the $2000 mark on November 21; since then, the yellow metal has remained trading within the $1990-$2000 range.
The latest meeting minutes by the US Federal Reserve (Fed) failed to weigh on the bright metal, even though policymakers kept the door open for further tightening. Meanwhile, money market futures had priced in 85 basis points (bps) of rate cuts for the next year, the reason behind the sudden US Dollar (USD) weakness.
Since the Fed’s latest meeting on November 1, the Greenback has lost 2.76%, as the US Dollar Index (DXY) dropped from 106.67 to 103.78. However, in the last three days, buyers have entered the market and lifted the DXY above the 200-day moving average (DMA), which could pave the way to testing the 104.00 mark.
Ahead of the weekend, Gold traders would get some cues on the US economic docket, which would feature S&P Global PMIs, which are expected to post worse readings than the prior release.
XAU/USD Price Analysis: Technical outlook
Gold’s upward bias remains intact, though it’s subject to a pullback. Buyers' failure to keep prices above $2000 exacerbated a drop toward the week's low of $1965.57, below the 20-day moving average (DMA), but buyers lifted XAU/USD toward the current spot price. A breach of $2000, could put into play a test of the $2010 area, seen as next resistance, ahead of the April 23 high at $2048. On the other hand, if XAU/USD stays below $2000, the next support is seen at the 20-DMA at $1976.29.
- Crude Oil barrels are consolidating as energies markets weigh OPEC angst.
- Disagreement over quotas led to a delay in a scheduled OPEC meeting.
- Mismatched production quota desires within OPEC is crimping energy risk sentiment.
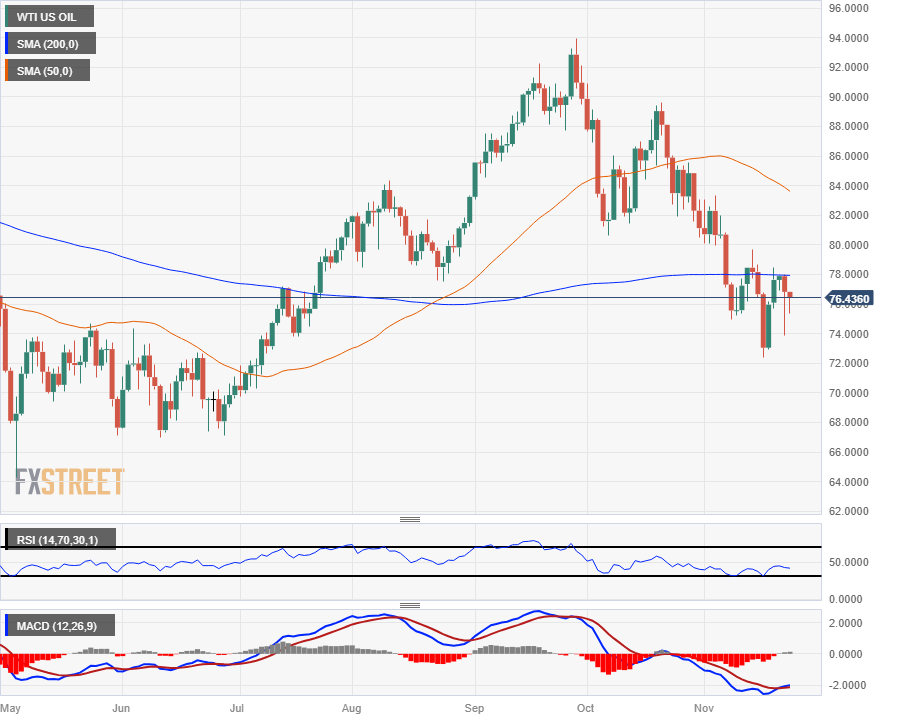
West Texas Intermediate (WTI) Crude Oil barrels are continuing to grind into the low side on Thursday, struggling to develop momentum as barrel traders chew on the Organization of the Petroleum Exporting Countries (OPEC) row that sees proponents for further production cuts coming to loggerheads with smaller Crude Oil producers looking to increase their production in order to defend their energy exporting sectors.
The United Arab Emirates (UAE) has been chasing higher OPEC production quotas for years as the country seeks to ramp up its Crude Oil production and exporting facilities which are sitting with plenty of unutilized capacity.
OPEC disagreement on quotas causes meeting delay, Crude Oil traders get nervous
Saudi Arabia, one of the largest players on the OPEC board, has been aggressively pursuing production cuts across the oil cartel’s member states in order to bolster Crude Oil prices. The UAE was provided additional quota capacity in OPEC meetings last year to the detriment of several smaller OPEC states, mostly in Africa, who saw their production caps tightened even further in order to grant the UAE additional production capacity.
Those oil-producing nations are now dissatisfied with their current oil pumping and selling limits, and are seeking increases in their respective quotas.
Saudi Arabia is allegedly expressing discontent with OPEC member states seeking additional production capacity as the Kingdom of Saudi Arabia seeks to cut global oil production even further in an attempt to offset Crude Oil price declines from increasing production from non-OPEC members.
The OPEC’s upcoming meeting slated for November 30th where the oil cartel will discuss current production quotas was delayed by four days, and energy investors are seeing a drag on sentiment ahead of the delayed meeting.
Crude Oil Technical Outlook
WTI barrel bids are seeing a technical ceiling forming at the 200-day Simple Moving Average (SMA), with prices capped under the moving average as Crude Oil forms a consolidation pattern in the $78 to $74 region, a bid neighborhood barrels haven’t seen since a bullish upshot last July.
WTI peaked near $94 per barrel in late September, and is down nearly 23% peak-to-trough, with Thursday’s bids still down nearly 19% from September’s $93.98 peak despite a recovery from last week’s drop into $72.38, its lowest bids in 18 weeks.
WTI Daily Chart
- The DXY Index declined to 103.70, seeing mild losses.
- US markets will remain closed on Thursday as the country celebrates Thanksgiving.
- The focus shifts to Friday’s S&P Global PMIs.
On Thursday, the US Dollar measured by the DXY index saw little downward movements. The markets are closed due to the Thanksgiving celebration, and the focus shifts to the S&P preliminary PMIs for November.
The United States economy showed that inflation and job creation cooled down in October, which was welcomed by Federal Reserve (Fed) officials. However, the Federal Open Market Committee (FOMC) Minutes from the November meeting and several officials warning that one month of positive data might not be enough to call it a victory means that the incoming data will determine the USD’s trajectory.
Daily Digest Market Movers: US Dollar loses further ground as investors bet on a dovish Fed despite warnings
- The US Dollar Index trades weak around 103.70.
- Despite warnings by the Fed, markets still bet on a less aggressive stance after the report of soft inflation figures from October.
- The US Bureau of Labor Statistics reported that October's Core Consumer Price Index (CPI) missed the consensus. It came in at 4% YoY vs the expected 4.1% and decelerated from its previous figure of 4.1%.
- The headline figure came in at 3.2%YoY, below the consensus of 3.3% and in relation to its last reading of 3.7%.
- In addition, the Core Producer Price Index (PPI) from October fell short of expectations. It came in at 2.4% YoY vs the expected 2.7% and declined from its previous reading of 2.7%.
- The Federal Open Market Committee's November Minutes revealed that officials were concerned about inflation and needed to see more evidence to be convinced that inflation is coming down.
- Markets are confident that the Federal Reserve won’t hike in December and are betting on rate cuts sooner than expected in May 2024. A sizable minority is even betting on a rate cut in March.
Technical Analysis: US Dollar sellers gain ground, eyes on bearish crossover
The indicators on the daily chart reflect a predominance of bearish momentum while revealing some remaining bullish potential. The Relative Strength Index (RSI) nearing oversold conditions may suggest exhausted selling pressure, with a potential turnaround in favour of buyers while the Moving Average Convergence Divergence (MACD) shows flat red bars.
Furthermore, the index position below the 20-day and 100-day Simple Moving Averages (SMAs) suggests that the selling momentum prevails in the short term, but the index above the 200-day SMA implies that the longer-term bullish trend could still influence it. However, a looming bearish crossover between the 20-day SMA and the 100-day SMA underscores the possibility of augmented selling momentum.
Support levels: 103.60 (200-day SMA), 103.30, 103.15.
Resistance levels: 104.00, 104.20 (100-day SMA),104.50.
US Dollar FAQs
What is the US Dollar?
The US Dollar (USD) is the official currency of the United States of America, and the ‘de facto’ currency of a significant number of other countries where it is found in circulation alongside local notes. It is the most heavily traded currency in the world, accounting for over 88% of all global foreign exchange turnover, or an average of $6.6 trillion in transactions per day, according to data from 2022.
Following the second world war, the USD took over from the British Pound as the world’s reserve currency. For most of its history, the US Dollar was backed by Gold, until the Bretton Woods Agreement in 1971 when the Gold Standard went away.
How do the decisions of the Federal Reserve impact the US Dollar?
The most important single factor impacting on the value of the US Dollar is monetary policy, which is shaped by the Federal Reserve (Fed). The Fed has two mandates: to achieve price stability (control inflation) and foster full employment. Its primary tool to achieve these two goals is by adjusting interest rates.
When prices are rising too quickly and inflation is above the Fed’s 2% target, the Fed will raise rates, which helps the USD value. When inflation falls below 2% or the Unemployment Rate is too high, the Fed may lower interest rates, which weighs on the Greenback.
What is Quantitative Easing and how does it influence the US Dollar?
In extreme situations, the Federal Reserve can also print more Dollars and enact quantitative easing (QE). QE is the process by which the Fed substantially increases the flow of credit in a stuck financial system.
It is a non-standard policy measure used when credit has dried up because banks will not lend to each other (out of the fear of counterparty default). It is a last resort when simply lowering interest rates is unlikely to achieve the necessary result. It was the Fed’s weapon of choice to combat the credit crunch that occurred during the Great Financial Crisis in 2008. It involves the Fed printing more Dollars and using them to buy US government bonds predominantly from financial institutions. QE usually leads to a weaker US Dollar.
What is Quantitative Tightening and how does it influence the US Dollar?
Quantitative tightening (QT) is the reverse process whereby the Federal Reserve stops buying bonds from financial institutions and does not reinvest the principal from the bonds it holds maturing in new purchases. It is usually positive for the US Dollar.
- The EUR/GBP is struggling to stick to the middle near 0.8700.
- The Euro got knocked back following an ECB Accounts that focused on risks and stubborn inflation.
- EU & UK PMIs beat market forecasts across the board, but most still remain in sub-50.0 contraction territory.
The EUR/GBP is grasping at the 0.8700 handle after the Euro (EUR) got knocked lower against the Pound Sterling (GBP) following a dovish showing from the European Central Bank (ECB) which moderated bullish market sentiment following a resounding thumping of Purchasing Managers' Index (PMI) figures for both the Eurozone and the UK.
Eurozone and UK PMIs broadly beat the street, printing above median market forecasts across the entire slew of component data.
Despite the market beat, topside momentum remains limited; the majority of PMI prints still remain steeply in bearish/contraction territory, and recoveries in figures are mostly forecasters struggling to nail down accurate figures: the Eurozone Flash Manufacturing PMI has under or overshot forecasts for the last ten straight months.
Eurozone Preliminary Manufacturing PMI improves to 43.8 in November vs. 43.4 expected
The Eurozone's HCOB Composite PMI for November printed at 47.1, improving over the previous month's 46.5 and beating the forecast 46.9.
UK Preliminary Services PMI returns to expansion with 50.5 in November
The shining bright spot from the European session's data docket was the UK's PMI print, with both the Services and Composite components returning to expansionary territory, at 50.5 and 50.1 respectively.
The Services PMI was expected to hold steady at 49.5, and the Composite was likewise seen flat at 48.7.
ECB Accounts: Uncertainty surrounding the economic outlook had increased
The Euro got dragged down against the Sterling after the ECB's latest Monetary Policy Meeting Accounts, which showed the Eurozone's central bank is growing increasingly unsure about the economic outlook, but is standing pat for the time being.
EUR/GBP Technical Outlook
The EUR/GBP's Thursday bounce sees the pair catching support from the 50-day Simple Moving Average (SMA), which is currently set to confirm a bullish crossover of the long-term 200-day SMA near 0.8680.
The EUR/GBP is also seeing some chart grind as bids come into contact with a rising trendline from late August's swing low into the 0.8500 handle.
The Euro has been struggling to develop topside momentum against the Pound Sterling ever since first piercing the 200-day SMA in mid-October, and the EUR/GBP pair has been grinding just north of the moving average ever since.
The nearest target for bidders will be the last swing high at 0.8760.
EUR/GBP Daily Chart
- GBP/USD sustains rise above 1.2500, in a market quieted by US Thanksgiving holiday.
- UK's economic recovery signals boost GBP, with Services and Composite PMIs expanding and Manufacturing PMI outperforming expectations.
- The UK's long-term economic outlook remains cautious, with potential BoE rate hikes looming.
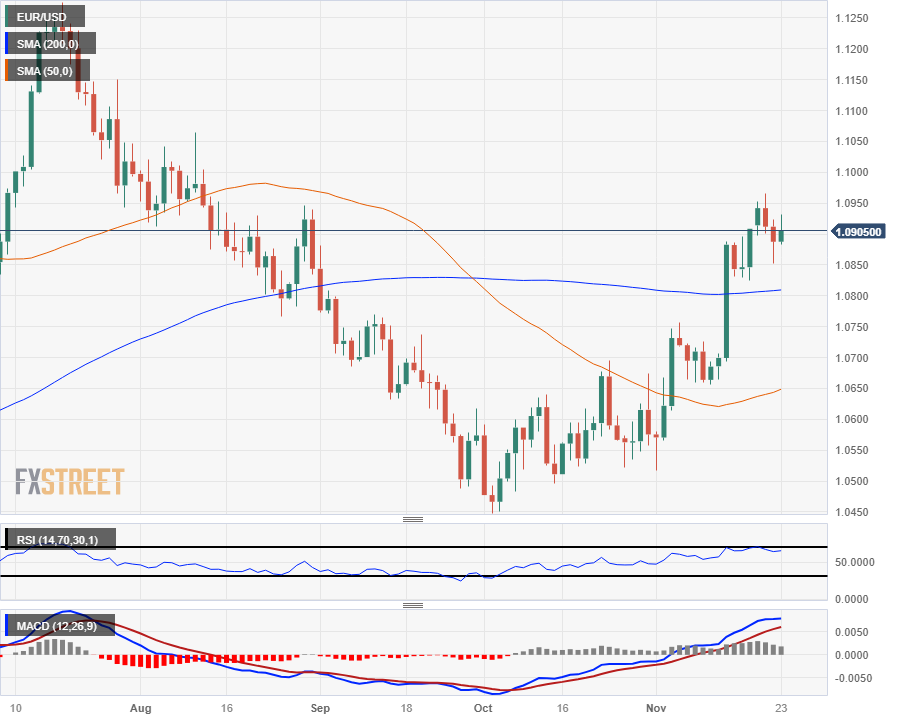
The Pound Sterling (GBP) gets some relief and advances against the US Dollar (USD) in thin trading due to US markets being closed during Thanksgiving. Nevertheless, the GBP/USD has risen to a ten-week high and trades above the 1.2500 figure for the fourth consecutive day.
Pound Sterling gains against the Dollar, supported by improved business activity and inflation drop in the UK
GBP/USD’s advance is courtesy of positive economic data in the UK. Business activity in the UK recovered some ground, as S&P Global revealed that Services and the Composite PMIs expanded after staying at contractionary territory after three months of contraction. Although the Manufacturing PMI remained below the 50 thresholds of contraction/expansion, it grew from 44.8 to 46.7, exceeding forecasts of 45.
According to S&P Economic Director Tim Moore, the drop in headline inflation was the main driver of supporting business activity. The latest UK inflation report witnessed the CPI plunging from 6.7% to 4.6%, while the economy dodged a recession, with GDP standing at 0%.
Nevertheless, the economic outlook for the UK remains weak, as data projects a recession. Recent hawkish comments by the Bank of England (BoE) Governor Andrew Bailey emphasized that rates must be higher for longer, which could weigh on the economy.
GBP/USD Price Analysis: Technical outlook
The GBP/USD daily chart portrays the pair as remaining in an uptrend during the week, though after hitting a new weekly high of 1.2569, it gave back some gains and retraced below the 1.2550 mark. For a bullish continuation, buyers need to lift the exchange rates above the November 22 daily open at 1.2537 so they can remain hopeful of testing the 1.2600 mark. Failure to do it, the GBP/USD could dive to 1.2500, which, once surrendered, would expose the 200-day moving average (DMA) at 1.2451.
- The Canadian Dollar is catching a breather as the Loonie market goes flat.
- Friday’s Canada Retail Sales to be overshadowed by US PMIs.
- Thursday set to be a quiet session with the US out for Thanksgiving.
The Canadian Dollar (CAD) is holding steady on Thursday, with the USD/CAD trading closely with the day’s opening bids. Friday will see US equity markets return to the fold for a reduced trading day before shutting down again for the weekend.
Friday will also see the latest round of Retail Sales from Canada, but the release is likely to be overshadowed by the US Purchasing Managers’ Index (PMI) release.
Daily Digest Market Movers: Canadian Dollar sees little movement, constrained by slightly softer Crude Oil
- The CAD is grinding into the middle as US holiday trading volumes deflate market momentum.
- The Loonie initially kicked higher on the day but quickly fell back to Thursday’s opening bids.
- Crude Oil is seeing some downside play, limiting CAD support.
- In a speech on Wednesday, Bank of Canada (BoC) Governor Tiff Macklem highlighted that BoC policymakers “might” have done enough to tame inflation, balance economy.
- Friday’s CAD Retail Sales to have limited impact as traders focus on US PMIs.
- Median market forecasts are expecting flat results or slight declines in both data sets.
- CAD Retail Sales in September expected to print 0.0%, previous -0.1%.
- Retail Sales Excluding Vehicles is expected to reveal a -0.2% decline in consumption spending.
- US November PMIs are forecast to decline in both the Services and Manufacturing components.
- Services are forecast to tick lower from 50.6 to 50.4, while Manufacturing is expected to fall into contractionary territory at 49.8 versus October’s 50.0.
Canadian Dollar price this week
The table below shows the percentage change of Canadian Dollar (CAD) against listed major currencies this week. Canadian Dollar was the strongest against the US Dollar.
| USD | EUR | GBP | CAD | AUD | JPY | NZD | CHF | |
| USD | 0.00% | -0.65% | -0.17% | -0.76% | -0.25% | -0.86% | -0.28% | |
| EUR | 0.00% | -0.67% | -0.17% | -0.76% | -0.25% | -0.86% | -0.26% | |
| GBP | 0.65% | 0.66% | 0.51% | -0.09% | 0.42% | -0.19% | 0.38% | |
| CAD | 0.17% | 0.17% | -0.49% | -0.57% | -0.07% | -0.69% | -0.10% | |
| AUD | 0.74% | 0.75% | 0.10% | 0.58% | 0.51% | -0.10% | 0.49% | |
| JPY | 0.24% | 0.24% | -0.66% | 0.07% | -0.52% | -0.62% | -0.04% | |
| NZD | 0.87% | 0.86% | 0.21% | 0.69% | 0.10% | 0.61% | 0.58% | |
| CHF | 0.28% | 0.28% | -0.37% | 0.11% | -0.47% | 0.03% | -0.58% |
The heat map shows percentage changes of major currencies against each other. The base currency is picked from the left column, while the quote currency is picked from the top row. For example, if you pick the Euro from the left column and move along the horizontal line to the Japanese Yen, the percentage change displayed in the box will represent EUR (base)/JPY (quote).
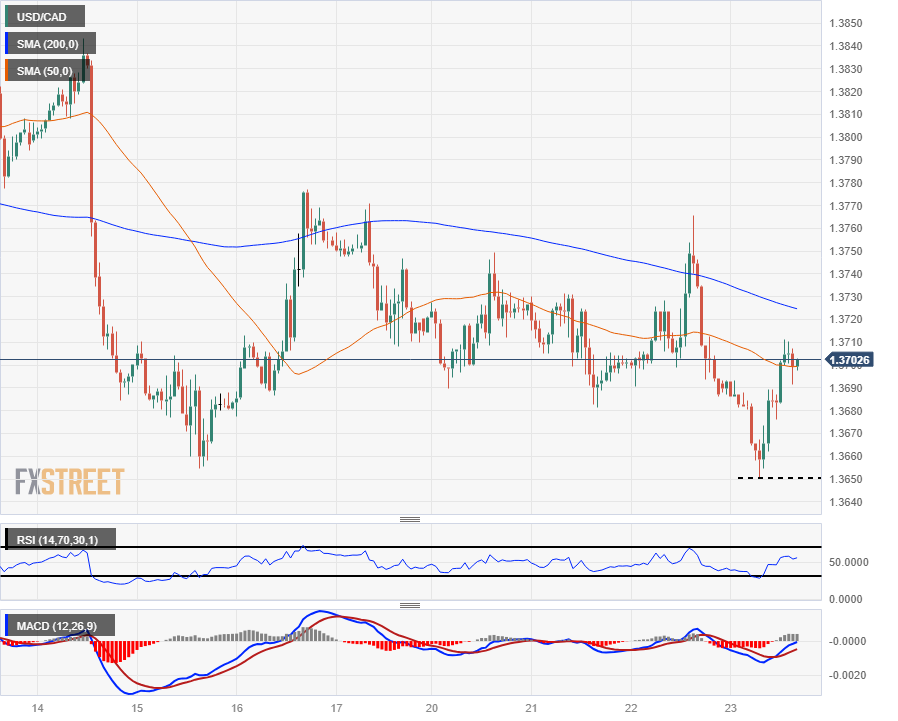
Technical Analysis: Canadian Dollar gets hung out to dry in holiday trading, USD/CAD goes flat near 1.3700
The Canadian Dollar (CAD) is losing all momentum on Thursday, trading closely with the day’s opening bids of 1.3700 against the US Dollar (USD). The USD/CAD briefly fell into a new low for the week as the Loonie found some bidding (or the Greenback just lost some steam), but a slight softening in Crude Oil bids is pulling the CAD back into the day’s starting gate.
The USD/CAD briefly dipped into 1.3650 before getting pushed back into near-term median bids at the 50-hour Simple Moving Average (SMA). Intraday action continues to see constraint from the 200-hour SMA declining into 1.3720.
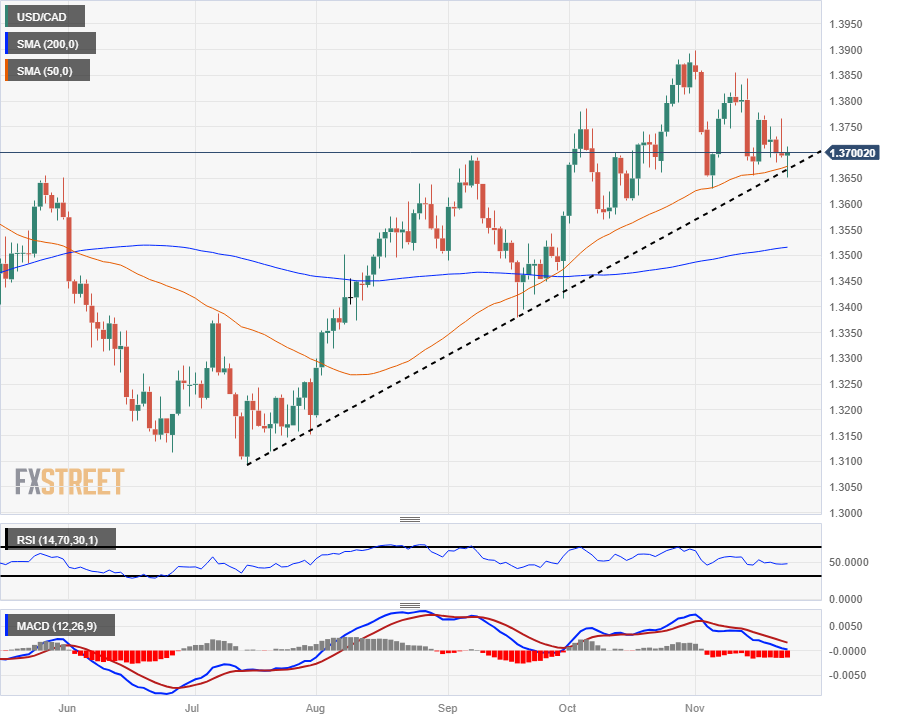
On the daily candlesticks, Thursday’s bounce back into 1.3700 makes more sense following a rebound from the 50-day SMA, and technicals are lining up for a slow grind with technical support from the 50 and 200-day SMAs at 1.3670 and 1.3512, respectively.
Technical indicators are leaning into the midrange as momentum leaks out of the USD/CAD chart in the medium term. The Relative Strength Index (RSI) is drifting around the 50.0 middle level, while the Moving Average Convergence Divergence (MACD) has multiple levels of moving averages constraining it into the zero threshold, indicating an overall lack of strength in either direction.
USD/CAD Hourly Chart
 USD/CAD Daily Chart
Canadian Dollar FAQs
What key factors drive the Canadian Dollar?
The key factors driving the Canadian Dollar (CAD) are the level of interest rates set by the Bank of Canada (BoC), the price of Oil, Canada’s largest export, the health of its economy, inflation and the Trade Balance, which is the difference between the value of Canada’s exports versus its imports. Other factors include market sentiment – whether investors are taking on more risky assets (risk-on) or seeking safe-havens (risk-off) – with risk-on being CAD-positive. As its largest trading partner, the health of the US economy is also a key factor influencing the Canadian Dollar.
How do the decisions of the Bank of Canada impact the Canadian Dollar?
The Bank of Canada (BoC) has a significant influence on the Canadian Dollar by setting the level of interest rates that banks can lend to one another. This influences the level of interest rates for everyone. The main goal of the BoC is to maintain inflation at 1-3% by adjusting interest rates up or down. Relatively higher interest rates tend to be positive for the CAD. The Bank of Canada can also use quantitative easing and tightening to influence credit conditions, with the former CAD-negative and the latter CAD-positive.
How does the price of Oil impact the Canadian Dollar?
The price of Oil is a key factor impacting the value of the Canadian Dollar. Petroleum is Canada’s biggest export, so Oil price tends to have an immediate impact on the CAD value. Generally, if Oil price rises CAD also goes up, as aggregate demand for the currency increases. The opposite is the case if the price of Oil falls. Higher Oil prices also tend to result in a greater likelihood of a positive Trade Balance, which is also supportive of the CAD.
How does inflation data impact the value of the Canadian Dollar?
While inflation had always traditionally been thought of as a negative factor for a currency since it lowers the value of money, the opposite has actually been the case in modern times with the relaxation of cross-border capital controls. Higher inflation tends to lead central banks to put up interest rates which attracts more capital inflows from global investors seeking a lucrative place to keep their money. This increases demand for the local currency, which in Canada’s case is the Canadian Dollar.
How does economic data influence the value of the Canadian Dollar?
Macroeconomic data releases gauge the health of the economy and can have an impact on the Canadian Dollar. Indicators such as GDP, Manufacturing and Services PMIs, employment, and consumer sentiment surveys can all influence the direction of the CAD. A strong economy is good for the Canadian Dollar. Not only does it attract more foreign investment but it may encourage the Bank of Canada to put up interest rates, leading to a stronger currency. If economic data is weak, however, the CAD is likely to fall.
- The USD/JPY trades at 149.60 after reaching a daily low of 148.90 .
- Hawkish bets on BoJ is benefiting the JPY as investors anticipate a tighter monetary policy.
- US Traders will be on the sidelines celebrating Thanksgiving.
- Eyes on Japanese inflation data.
The USD/JPY, in Thursday's session, is experiencing mild losses at the 149.60 mark after reaching a low of around 148.90. What drove the pair downwards appears to be the hawkish bets on the Bank of Japan (BoJ). On Friday, Japan will report inflation figures from October.
As the primary catalyst for the JPY is speculations surrounding a shift in the Bank of Japan's policy stance, Japan's National Consumer Price Index (CPI) figures will be closely watched. The headline figure is expected to accelerate 3% YoY from the previous 2.8% YoY, while the Core figure is also forecasted to accelerate above the BoJ’s 2% target.
On the other hand, as the US traders celebrate Thanksgiving, no big moves are expected for the pair on Thursday. On Friday's session, the US will report November’s preliminary S&P PMIs, which will likely impact the USD as it will give a clearer outlook of the US economy. Investors should remember that the Federal Reserve (Fed) remains hawkish and doesn’t rule out further tightening in case data justifies it, so hot figures may strengthen the USD.
USD/JPY levels to watch
On the daily chart, the Relative Strength Index (RSI) is currently flat, residing in the negative territory, which suggests a struggle among the market participants and reflects potential selling momentum. Meanwhile, the Moving Average Convergence Divergence (MACD) presenting flat red bars indicates waning buying momentum, a possible inclination towards a bearish market sentiment. In addition, the pair is trading below the 20-SMA (Simple Moving Averages), which supports this view.
That being said, the USD/JPY maintains a position above the critical 100 and 200-SMAs, hinting the broader trend still favours the bullish side. In short, despite the recently gained ground by the bears, the buying momentum appears dominant in the larger context.
Resistance Levels: 150.00, 105.20 (20-day SMA), 151.00.
Support Levels: 149.00, 148.00, 147.00.
USD/JPY daily chart
-638363540677269679.png)
- The New Zealand Dollar makes small gains in quiet holiday trading on Thursday.
- The Kiwi rises in line with global equities as Oil continues its downtrend and PMIs come in broadly positive.
- NZD/USD continues to recover. The medium-term outlook looks increasingly bullish.
The New Zealand Dollar (NZD) trades higher on Thursday, supported by a mildly positive market mood. The broad lift in sentiment is reflected by rises in most global equity indices. The Hang Seng and Nikkei 225 both inched higher during the Asian session, whilst in Europe the Euro STOXX 50 and FTSE 100 are also higher. In the US, markets remain closed for Thanksgiving.
The positive risk sentiment is probably due to the continued decline in Oil prices after OPEC+ delayed its decision on whether to continue cutting quotas. This will translate into lower input costs for companies and lower prices at fuel pumps for consumers. Other analysts posited an uptick in purchasing manager indices as a factor.
As a commodity currency, the Kiwi is sensitive to changing perceptions of global growth and generally reflects investor sentiment.
Daily digest market movers: New Zealand Dollar higher with risk appetite
- The New Zealand Dollar rises, benefiting from continued appetite for risk amid tumbling Oil prices and strong purchasing manager data.
- Asian stocks seem to have absorbed the bad news regarding Chinese asset manager Zhongzhi, another fatality of the China property bubble. The company announced it was insolvent with liabilities totalling between $58 and $64 billion in a letter to investors, according to a report by Reuters on Thursday.
- Contagion is unlikely according to experts: "Financial regulators are almost certain to intervene aggressively if there's any sign that Zhongzhi's troubles are spreading," said Christopher Beddor, deputy director of China research at Gavekal Dragonomics, quoted by Reuters.
- Recent preliminary Purchasing Manager’ Index data for November in the Eurozone and UK both showed better-than-expected performances, also enhancing the economic outlook.
- The center-right New Zealand National Party has agreed to a deal to form a government with coalition partners. It means the country will end almost six years of reign for the left.
- Markets continue pricing in the possibility of Fed rate cuts by December 2024, which has led to a decline in US Treasury bond yields. Yields are closely correlated with the USD, resulting in overall upside bias for NZD/USD.
New Zealand Dollar technical analysis: NZD/USD breaks but does not hold above key resistance
NZD/USD – the number of US Dollars one New Zealand Dollar can buy – has retreated back below the key October high at 0.6055 after temporarily breaking above it on Tuesday.
-638363535405215846.png)
New Zealand Dollar vs US Dollar: Daily Chart
Nevertheless, the pair remains in a short-term bullish trend, continuing to bias longs. Since the break above the October highs, it could also now be argued it is in a medium-term bullish trend.
Tuesday’s breakout, however, failed to hold and so it cannot be classed as decisive. This suggests caution in adopting an overly bullish outlook in the medium term. A re-break above the October high would give fresh impetus to the uptrend. A higher high above Tuesday’s 0.6086 high would provide confirmation.
The 200-day Simple Moving Average at 0.6100 is likely to provide a major resistance level to further upside, so price will probably stall there at first contact.
A possible bullish inverse head-and shoulders (H&S) pattern may have formed at the lows. The pattern is identified by the labels applied to the chart above. L and R stand for the left and right shoulders, whilst H stands for the head. The target for the inverse H&S is at 0.6215. This adds more weight to the bullish argument.
The long-term trend is still bearish, suggesting a risk of downside remains.
New Zealand Dollar FAQs
What key factors drive the New Zealand Dollar?
The New Zealand Dollar (NZD), also known as the Kiwi, is a well-known traded currency among investors. Its value is broadly determined by the health of the New Zealand economy and the country’s central bank policy. Still, there are some unique particularities that also can make NZD move. The performance of the Chinese economy tends to move the Kiwi because China is New Zealand’s biggest trading partner. Bad news for the Chinese economy likely means less New Zealand exports to the country, hitting the economy and thus its currency. Another factor moving NZD is dairy prices as the dairy industry is New Zealand’s main export. High dairy prices boost export income, contributing positively to the economy and thus to the NZD.
How do decisions of the RBNZ impact the New Zealand Dollar?
The Reserve Bank of New Zealand (RBNZ) aims to achieve and maintain an inflation rate between 1% and 3% over the medium term, with a focus to keep it near the 2% mid-point. To this end, the bank sets an appropriate level of interest rates. When inflation is too high, the RBNZ will increase interest rates to cool the economy, but the move will also make bond yields higher, increasing investors’ appeal to invest in the country and thus boosting NZD. On the contrary, lower interest rates tend to weaken NZD. The so-called rate differential, or how rates in New Zealand are or are expected to be compared to the ones set by the US Federal Reserve, can also play a key role in moving the NZD/USD pair.
How does economic data influence the value of the New Zealand Dollar?
Macroeconomic data releases in New Zealand are key to assess the state of the economy and can impact the New Zealand Dollar’s (NZD) valuation. A strong economy, based on high economic growth, low unemployment and high confidence is good for NZD. High economic growth attracts foreign investment and may encourage the Reserve Bank of New Zealand to increase interest rates, if this economic strength comes together with elevated inflation. Conversely, if economic data is weak, NZD is likely to depreciate.
How does broader risk sentiment impact the New Zealand Dollar?
The New Zealand Dollar (NZD) tends to strengthen during risk-on periods, or when investors perceive that broader market risks are low and are optimistic about growth. This tends to lead to a more favorable outlook for commodities and so-called ‘commodity currencies’ such as the Kiwi. Conversely, NZD tends to weaken at times of market turbulence or economic uncertainty as investors tend to sell higher-risk assets and flee to the more-stable safe havens.
The Swiss Franc (CHF) has proven to be the strongest G10 currency in the world this year. Economists at ING analyze EUR/CHF outlook.
2025 is when EUR/CHF will turn higher
We think the SNB may tolerate EUR/CHF down near 0.95 during 2024 while it is still concerned with 2%+ inflation.
Into 2025, however, Swiss CPI should be dropping below 2% and the SNB will be more open to listening to Swiss exporters that the Swiss Franc is too strong. 2025 is our preliminary estimate for when EUR/CHF turns higher.
- Mexican Peso halts two-day losing streak against USD, with USD/MXN trading down on the day.
- Mexico's inflation data was mixed ahead of the release of Banxico's last meeting minutes.
- USD/MXN to remain trading range-bound amid low volume due to the Thanksgiving holiday in the US.
Mexican Peso (MXN) snaps two days of losses against the US Dollar (USD), though it remains sideways amid thin liquidity trading as markets remain closed in observance of the Thanksgiving holiday in the United States (US). Economic data from Mexico shows the disinflation process found a bump, despite comments from the Bank of Mexico (Banxico) officials, suggesting they could ease monetary policy in 2024. The USD/MXN trades with losses of 0.12% on the day, though it remains near the weekly highs.
The economic docket in Mexico witnessed an uptick in headline mid-November inflation in monthly and annually based figures, while the core, which excludes volatile items, was below estimates and the prior’s reading. The rise in inflation could be attributed to the government's end of the power summer subsidies in some cities. Ahead of the week, the calendar will feature the release of Banxico’s last meeting minutes, which is expected to shed some light on the status of the economy.
Daily digest movers: Mexican Peso virtually unchanged due to the US holiday
- The Mexican Consumer Price Index (CPI) for mid-November annually increased by 4.32%, exceeding estimates of 4.31%.
- Core CPI in Mexico decelerated compared to previous data and slowed to 5.31%, below forecasts of 5.33%.
- INEGI estimates the economy shrank 0.1% MoM in October, though annually based, it expanded by 2.9%, according to the agency Timely Indicator of Economic Activity (IOAE).
- A Citibanamex poll suggests that 25 of 32 economists polled expect Banxico's first rate cut in the first half of 2024.
- The poll shows “a great dispersion” for interest rates next year, between 8.0% and 10.25%, revealed Citibanamex.
- The same survey revealed that economists foresee headline annual inflation at 4% and core at 4.06%, both readings for the next year, while the USD/MXN exchange rate is seen at 19.00, up from 18.95, toward the end of 2024
- Data published last week showed prices paid by consumers and producers in the US dipped, increasing investors' speculations that the Fed’s tightening cycle has ended.
- The swap market suggests traders expect 100 basis points of rate cuts by the Fed in 2024.
- Banxico revised its inflation projections from 3.50% to 3.87% for 2024, which remains above the central bank’s 3.00% target (plus or minus 1%).
Technical Analysis: Mexican Peso stays firm, though USD/MXN trades range-bound on thin liquidity conditions
The USD/MXN remains bearishly biased, as the pair remains trading well below the downward slope of the 100, 20, 200, and 50-day Simple Moving Averages (SMAs). Even though it formed a ‘tweezers bottom’ chart pattern, price action was capped below the November 21 high of 17.26, which so far weighed on the pair, which dipped to a two-day low of 17.14.
For a bearish continuation, the exotic pair must get toward the 17.00 figure, so sellers could threaten to drag prices toward the year-to-date (YTD) low of 16.62. On the other hand, if buyers reclaim the current week’s high of 17.26, that could open the door to testing the 100-day SMA.
Mexican Peso FAQs
What key factors drive the Mexican Peso?
The Mexican Peso (MXN) is the most traded currency among its Latin American peers. Its value is broadly determined by the performance of the Mexican economy, the country’s central bank’s policy, the amount of foreign investment in the country and even the levels of remittances sent by Mexicans who live abroad, particularly in the United States. Geopolitical trends can also move MXN: for example, the process of nearshoring – or the decision by some firms to relocate manufacturing capacity and supply chains closer to their home countries – is also seen as a catalyst for the Mexican currency as the country is considered a key manufacturing hub in the American continent. Another catalyst for MXN is Oil prices as Mexico is a key exporter of the commodity.
How do decisions of the Banxico impact the Mexican Peso?
The main objective of Mexico’s central bank, also known as Banxico, is to maintain inflation at low and stable levels (at or close to its target of 3%, the midpoint in a tolerance band of between 2% and 4%). To this end, the bank sets an appropriate level of interest rates. When inflation is too high, Banxico will attempt to tame it by raising interest rates, making it more expensive for households and businesses to borrow money, thus cooling demand and the overall economy. Higher interest rates are generally positive for the Mexican Peso (MXN) as they lead to higher yields, making the country a more attractive place for investors. On the contrary, lower interest rates tend to weaken MXN.
How does economic data influence the value of the Mexican Peso?
Macroeconomic data releases are key to assess the state of the economy and can have an impact on the Mexican Peso (MXN) valuation. A strong Mexican economy, based on high economic growth, low unemployment and high confidence is good for MXN. Not only does it attract more foreign investment but it may encourage the Bank of Mexico (Banxico) to increase interest rates, particularly if this strength comes together with elevated inflation. However, if economic data is weak, MXN is likely to depreciate.
How does broader risk sentiment impact the Mexican Peso?
As an emerging-market currency, the Mexican Peso (MXN) tends to strive during risk-on periods, or when investors perceive that broader market risks are low and thus are eager to engage with investments that carry a higher risk. Conversely, MXN tends to weaken at times of market turbulence or economic uncertainty as investors tend to sell higher-risk assets and flee to the more-stable safe havens.
There are increasing signs of recession in the Euro area. However, an ECB rate cut is unlikely in the near future, economists at Commerzbank report.
Euro area PMIs remain in recession territory
The PMI for the services sector, the most reliable economic barometer for the Euro area, improved slightly to 48.2 but remained firmly in recession in November. Despite an increase of 0.7 points to 43.8, the manufacturing index also offers little hope of a turnaround in the industrial sector.
We do not expect the Euro area economy to emerge from recession until the spring, and then to pick up significantly.
The strong upswing that usually follows a recession is unlikely to materialize as the ECB will probably remain on the brakes. It will have to revise its economic outlook further downwards. In its September projections, it still expected the Euro area economy to avoid recession. However, with inflation remaining high, the ECB is unlikely to start cutting rates until late 2024.
Japan will release October Consumer Price Index (CPI) data on November, Thursday 23 at 23:30 and as we get closer to the release time, here are the forecasts by the economists and researchers of four major banks regarding the upcoming Japanese inflation print.
Headline CPI is expected at 3.4% year-on-year vs. 3.0% in September, while core (ex-fresh food) is expected at 3.0% YoY vs. the prior release of 2.8%. If so, headline would move further above the inflation target.
Standard Chartered
We expect headline CPI inflation to have picked up to 3.4% YoY from 3.0% in the previous month. Core CPI inflation also likely rose to 2.9% from 2.8%, reversing from a downward trend in the prior three months. We expect core CPI inflation excluding fresh food to have stayed below 3%, but core-core excluding fresh food and energy to have stayed above 4%, indicating that Japan’s inflation remains sticky. A reduction in utility subsidies likely pushed up inflation. Also, strong tourism may have affected CPI. October Tokyo CPI rose more than market expectations – headline CPI inflation rose to 3.3% from 2.8%; national CPI will likely follow this trend.
ING
We expect headline inflation to reaccelerate to 3.3% YoY in October (vs 3.0% in September). Prices of fresh food and energy will be the main drivers, but prices of other services are also expected to rise, reflecting the accumulated input price upward pressure. Core inflation (excluding fresh food and energy) will likely stay above the 4.0% level, which is likely to shift the BoJ’s policy stance more towards the neutral from the ultra-easing bias.
Citi
We expect nationwide core CPI (excluding only fresh food) to increase 3.0% YoY in October, picking up from a 2.8% YoY rise in September. Meanwhile, CPI excluding fresh food and energy likely increased 4.1% YoY in October, down from a 4.2% YoY advance in September and core CPI inflation excluding special factors (i.e., energy, mobile phone charges and hotel charges) likely increased 3.58% YoY in October, slowing from a 3.94% YoY climb in September. As October Tokyo CPI data confirmed, YoY inflation probably moderated, especially for goods, as businesses raised prices rapidly a year ago. We expect overall CPI to accelerate from +3.0% YoY in September to +3.5% YoY in October, driven by the halving of subsidies for electricity and gas charges as well as spikes in fresh vegetable prices.
Wells Fargo
While Japanese inflation has slowed in recent months, the consensus forecast is for that trend to be interrupted with the October CPI. Headline inflation is expected to quicken to 3.4% YoY (from 3.0% in September), while the CPI excluding fresh food is also seen quickening modestly to 3.0% in October (from 2.8% in September). On the one hand, the continued persistence of inflation above BoJ’s 2% inflation target should be supportive of the view of an eventual policy rate increase during the first half of next year. However, to the extent that ongoing inflation restrains consumer purchasing power, that would provide a partially offsetting argument. Overall however, we expect persistent elevated inflation, accompanied by firmer wage growth and steady economic growth, will see the BoJ raise its policy rate 10 bps to 0.00% at its April monetary policy meeting next year.
Technical analysis is a method of evaluating financial assets using mathematical calculations based on prices, trading volumes or open interest in futures and options. Does technical analysis matter? Economists at JP Morgan analyze the technical aspects of market forecasting.
Technical indicators have been reliable signals for short-term market performance
The issue with technical analysis is that while it can be very effective at predicting daily performance, it is less helpful when looking out into the more distant future. For that, fundamentals are much more effective: for example, S&P 500 forward valuations alone have historically explained almost a third of subsequent five-year annualized returns.
As a result, professional day traders may benefit more from technical analysis, whereas long-term investors will see more fruitful results by relying on fundamentals. In other words, technical analysis matters, but its limitations are important to recognize.
The price of Brent Crude Oil fell briefly below $80 per barrel in mid-November, its lowest level in four months. Strategists at Commerzbank analyze Oil’s outlook.
Oil price with upside potential
We expect the price of Brent Oil to rise to $85 per barrel in the first half of 2024.
The Oil market is likely to tighten again over the course of next year, which suggests a further price increase to $90 by the end of 2024.
See – Oil: Saudi Arabia will extend its production cuts into 2024 if they want prices to remain above $80 – ANZ
Economists at Commerzbank analyze the long-term growth advantage of the US Dollar and its implications for the EUR/USD pair.
US growth advantage: an argument in favor of the Dollar
With EUR/USD at current levels, the Dollar is already quite expensive. The US growth advantage is not news after all but has been observed for some time. Nonetheless: if it became clear that the significant growth advantage of the US is permanent and not just the result of a temporary period of European weakness, an even more pronounced undervaluation of the EUR would be justified. That is not yet the case.
If my colleagues, the US economists, are correct and the US will slide into recession next year, a massive EUR undervaluation would seem unjustified. That, by the way, is one of the arguments for our EUR-bullish medium-term view.
However: once the US recession is over, our US economists expect the US growth advantage to come to the fore again. That too confirms our view that the EUR recovery we expect to see medium-term will not last forever.
The accounts of the European Central Bank's (ECB) October policy meeting revealed on Thursday that members “highlighted that the uncertainty surrounding the economic outlook had increased compared with at the time of the September”.
According to the document members agreed that most indicators of underlying inflation appeared to have passed their peak and continued to decline, but they warned that domestic inflation was stubbornly high and longer-run inflation projections still seemed to be above ECB’s target.
Key takeaways:
Members highlighted that the uncertainty surrounding the economic outlook had increased compared with at the time of the September Governing Council meeting, also affecting the assessment of the appropriate monetary policy stance.
it was maintained that, given the current outlook, it could be expected that the Governing Council would be able to bring inflation back to its 2% target by 2025. Although it was generally assumed that the “last mile” in bringing inflation back to target was the most difficult, it was argued that the Governing Council should be careful that its efforts to tame inflation did not eventually lead to an undershooting of the target.
Members agreed that the Governing Council should continue to stress its determination to set policy rates, through its future decisions, at sufficiently restrictive levels for as long as necessary to bring inflation back to target in a timely manner.
Even if interest rates were left unchanged at the current meeting, the view was held that the Governing Council should be ready, on the basis of an ongoing assessment, for further interest rate hikes if necessary, even if this was not part of the current baseline scenario.
Market reaction
The Euro declined modestly following the release of the accounts. The EUR/USD dropped towards 1.0900, and the EUR/GBP remained under 0.8700.
- The Greenback is unable to hold on to gains ahead of this week’s close.
- US Traders are absent this Thursday as Thanksgiving and Black Friday will keep US trading desks closed.
- The US Dollar Index breaks below 104 again and is facing a loss for this Thursday and for this week’s performance overall.
The US Dollar (USD) is not on US trader’s minds for once as they are off this Thursday enjoying Thanksgiving. Although the Greenback held good cards on Wednesday to erase this week's losses, it saw a near complete reversal in the last trading hour before going into the US bank holiday. With no US trading, Asian and European markets are sending the US Dollar Index (DXY) lower and a weekly loss looks nearly inevitable.
Today sees a very light calendar with no US data to be published. From the European front the Purchase Managers Index (PMI) numbers were already issued ahead of the US PMI numbers for Friday. Although the European numbers are still in contraction, below 50, they are soaring against the previous from October. Should Friday’s US PMI numbers decline, the shift in dynamics between European and US PMI’s could see the Greenback declining further.
Daily digest: Thanksgiving quietness
- European purchasing manager indices numbers are showing an uptick from earlier lower levels in October, with an uptick in November in the preliminary readings.
- The ceasefire deal in Gaza has been delayed by a day, and should take place on Friday.
- A car explosion on the border between Canada and the US was deemed an accident with no terrorist motive at hand.
- The Chinese support and funding issued on Wednesday, made the Chinese property sector jump nearly 7%.
- ECB member Joachim Nagel said in early morning comments that the European Central Bank (ECB) is unsure if it has actually reached its peak rates. Rates must stay higher for longer as inflation might resurge quickly in the coming months.
- Equities are mildly in the green on this US holiday. The Chinese Hang Seng is worth mentioning, up 1% near its closing bell. European equities are looking for direction while US equity futures are marginally higher in their half-day-trading regime due to the US holiday.
- The CME Group’s FedWatch Tool shows that markets are pricing in a 97.8% chance that the Federal Reserve will keep interest rates unchanged at its meeting in December. A juicy sidenote is that now 2.2% even thinks a hike might be at hand.
- The benchmark 10-year US Treasury Note yield halted trading at 4.40% and will not move this Thursday with markets closed.
US Dollar Index technical analysis: Imbalance and no counterweight
The US Dollar is trading weaker and has erased all its gains from Wednesday. The losses are big enough to tip the US Dollar Index (DXY) into the red this week. With this Thursday’s uptick in European PMI numbers and the US trading desks closed, a window of opportunity could open for another substantial weakening of the US Dollar this Thursday.
The DXY is right at the 200-day SMA near 103.62, and will need to have a daily close above it in order to reassure that the same 200-day SMA is valid as support. Look for a further recovery bounce towards the 100-day SMA near 104.20 with preferably a break and close above. Should the DXY be able to close and open above it later this week, look for a return to the 55-day SMA near 105.71 with 105.12 ahead of it as resistance into next week.
The 200-day SMA will try to play its role again as a crucial pivotal supportive level against any downturn. Should the index snap this level again, the psychological 100.00 level comes into play. With a very slim economic calendar and US trading desks closed, there is room for a potential big downturn.
US Dollar FAQs
What is the US Dollar?
The US Dollar (USD) is the official currency of the United States of America, and the ‘de facto’ currency of a significant number of other countries where it is found in circulation alongside local notes. It is the most heavily traded currency in the world, accounting for over 88% of all global foreign exchange turnover, or an average of $6.6 trillion in transactions per day, according to data from 2022.
Following the second world war, the USD took over from the British Pound as the world’s reserve currency. For most of its history, the US Dollar was backed by Gold, until the Bretton Woods Agreement in 1971 when the Gold Standard went away.
How do the decisions of the Federal Reserve impact the US Dollar?
The most important single factor impacting on the value of the US Dollar is monetary policy, which is shaped by the Federal Reserve (Fed). The Fed has two mandates: to achieve price stability (control inflation) and foster full employment. Its primary tool to achieve these two goals is by adjusting interest rates.
When prices are rising too quickly and inflation is above the Fed’s 2% target, the Fed will raise rates, which helps the USD value. When inflation falls below 2% or the Unemployment Rate is too high, the Fed may lower interest rates, which weighs on the Greenback.
What is Quantitative Easing and how does it influence the US Dollar?
In extreme situations, the Federal Reserve can also print more Dollars and enact quantitative easing (QE). QE is the process by which the Fed substantially increases the flow of credit in a stuck financial system.
It is a non-standard policy measure used when credit has dried up because banks will not lend to each other (out of the fear of counterparty default). It is a last resort when simply lowering interest rates is unlikely to achieve the necessary result. It was the Fed’s weapon of choice to combat the credit crunch that occurred during the Great Financial Crisis in 2008. It involves the Fed printing more Dollars and using them to buy US government bonds predominantly from financial institutions. QE usually leads to a weaker US Dollar.
What is Quantitative Tightening and how does it influence the US Dollar?
Quantitative tightening (QT) is the reverse process whereby the Federal Reserve stops buying bonds from financial institutions and does not reinvest the principal from the bonds it holds maturing in new purchases. It is usually positive for the US Dollar.
Has 2023 been the golden year for carry trades? Economists at Commerzbank analyze the performance of the carry strategy.
2023 was rather disappointing from the carry traders’ point of view
2023 was rather disappointing from the carry traders’ point of view. The development of exchange rates did not provide any performance. High-yielding currencies did not appreciate against low-yielding currencies. The performance resulted exclusively from the rate advantage.
I don’t know any carry traders who would rely on this strategy merely because of the rate advantage. Expected exchange rate gains are always the most important argument. That means that carry trades did not work as expected in 2023.
However, I agree with the competition that 2024 will probably not provide a good carry trade performance. If central banks on the whole will cut interest rates again, principally those central banks will be the most aggressive who were in the biggest rush on the way up too. That means currencies with the highest interest rate levels are going to suffer the most.
- USD/TRY retreats to the 28.5000 region on Thursday.
- The CBRT hiked rates more than initially expected.
- Further tightening still appears on the horizon.
The Turkish currency gathers renewed steam and drags USD/TRY to fresh weekly lows near the 28.5000 zone on Thursday.
USD/TRY retreats to multi-day lows on CBRT
USD/TRY reversed four consecutive daily advances and briefly revisited the 28.5000 region after the Turkish central bank (CBRT) caught market participants off guard by raising its One-Week Repo Rate by 500 bps to 40.00% at its event on Thursday.
The move by the CBRT came as a surprise after market consensus was expecting a 250 bps rate hike. According to the statement, the Committee has determined that the current monetary tightening level is close to the necessary level for disinflation, and the pace of tightening will slow down, completing the tightening cycle quickly while maintaining price stability.
So far this year, the Turkish lira has depreciated nearly 55% vs. the greenback, having advanced in only six months since January 2021.
USD/TRY significant levels
So far, USD/TRY is losing 0.16% to 28.7611 and faces the next support at 27.8265 (55-day SMA) seconded by 25.2143 (monthly low August 25) and finally 23.9286 (200-day SMA). On the flip side, immediate resistance comes at 28.8736 (2023 high November 23) followed by 29.0000 (round level) and 30.0000 (round level).
(This story was corrected on November 23 at 12:09 GMT to say that the pair was USD/TRY instead of USD/JPY)
Gold prices are up. Economists at MUFG Bank analyze the yellow metal’s outlook.
Bullion has had a swathe of bullish factors working in its favour
Gold’s back testing above $2,000 and could see some follow-through buying if the level breaks decisively.
Bullish factors working in favour range from safe haven demand to lower US rates and a downdraft in the US Dollar.
Going forward, a so-called golden cross beckons, with Gold’s 50-DMA on track to top its 200-DMA in the coming weeks (last time the pattern came around was in mid-January).
- Natural Gas prices fall further as a ceasefire breakthrough in Gaza looks imminent.
- The US Dollar trades in the red again for this week, erasing Wednesday’s gains.
- Natural Gas prices could decline to $2.70 in a worst case scenario.
Natural Gas (XNG/USD) is sinking this week as a ceasefire deal in Gaza means less risk of any supply issues in the Middle East for Crude Oil and Natural Gas. Although the ceasefire got delayed for one day to Friday, markets are still hopeful that the agreement could be the start of a longer-term easing of tensions in the region. Meanwhile, frost is kicking in on the European continent, though Gas storages remain filled up at historically high levels.
Meanwhile, the US Dollar (USD) lost the brief resurgence seen on Wednesday. Throughout the day the Greenback was in good form to turn this week around in its favor. However, the Greenback let loose of its intraday gains near the US closing bell. With the US market closed for Thanksgiving, expect little counterweight in the US trading session, which means that the US Dollar could weaken a touch further.
Natural Gas is trading at $3.02 per MMBtu at the time of writing.
Natural Gas market movers: split drivers
- Malaysian energy group Petronas had to delay several LNG shipments to its customers for December. The cause for the delay comes from production issues at its export facility in Malaysia.
- Recent reports show that flows from Norway to Europe and the UK are above the five-day average, according to Gassco. Overall LNG inflow for Western Europe is in line with the 30-day average.
- Although temperatures in several parts of Europe are starting to head near 0° Celsius, European Gas storages remain at elevated, near-full, levels.
- Several cargo traders are reporting that demand for LNG storage on the water is soaring substantially as European underground storage sites are full.
Natural Gas Technical Analysis: Demand is not there
Natural Gas is playing a dangerous game of chicken on the charts as price action is below the pivotal level at $3.06, which falls in line with the double top from August 8 and 9. Pressure is on the 100-day Simple Moving Average (SMA), which could give way to let prices drop to $2.72 before finding the 200-day SMA as a support.
Although a ceasefire deal comes into play in Gaza, the possibility of an escalation of violence into a proxy war can’t be ruled out. In this scenario, Natural Gas would likely edge up, with $3.20 as the level to watch. Just above, the 55-day SMA at $3.23 could throw a brief spanner in the works. Once bulls have dealt with a break above the 55-day SMA, look for $3.50 as another resistance barrier in the short-term.
The current pivotal level, marked in an orange line near $3.07, is being turned into a cap and should put more pressure on the downside. The 100-day SMA already snapped on Wednesday, though it was able to salvage the situation with a bounce. Once that 100-day SMA breaks at $3, expect pressure to build on the lower-end of that longer-term trend channel, lined up near $2.95. Once broken, it becomes an open road to $2.72 before meeting the 200-day SMA as last support.
-638363318132743128.png)
XNG/USD (Daily Chart)
Natural Gas FAQs
What fundamental factors drive the price of Natural Gas?
Supply and demand dynamics are a key factor influencing Natural Gas prices, and are themselves influenced by global economic growth, industrial activity, population growth, production levels, and inventories. The weather impacts Natural Gas prices because more Gas is used during cold winters and hot summers for heating and cooling. Competition from other energy sources impacts prices as consumers may switch to cheaper sources. Geopolitical events are factors as exemplified by the war in Ukraine. Government policies relating to extraction, transportation, and environmental issues also impact prices.
What are the main macroeconomic releases that impact on Natural Gas Prices?
The main economic release influencing Natural Gas prices is the weekly inventory bulletin from the Energy Information Administration (EIA), a US government agency that produces US gas market data. The EIA Gas bulletin usually comes out on Thursday at 14:30 GMT, a day after the EIA publishes its weekly Oil bulletin. Economic data from large consumers of Natural Gas can impact supply and demand, the largest of which include China, Germany and Japan. Natural Gas is primarily priced and traded in US Dollars, thus economic releases impacting the US Dollar are also factors.
How does the US Dollar influence Natural Gas prices?
The US Dollar is the world’s reserve currency and most commodities, including Natural Gas are priced and traded on international markets in US Dollars. As such, the value of the US Dollar is a factor in the price of Natural Gas, because if the Dollar strengthens it means less Dollars are required to buy the same volume of Gas (the price falls), and vice versa if USD strengthens.
The Riksbank kept interest rates on hold at 4.0%, sparking a bounce in EUR/SEK. Economists at Société Générale analyze the pair’s outlook.
Riksbank prepared to raise the policy rate further if inflation prospects deteriorate
Riksbank keeps repo rate on hold at 4.0%, prepared to raise rates further if inflation prospects deteriorate, considering faster pace of bond sales in January. Repo path unchanged at 4.1% in 2024, 4.0% in 2025. New forecast 3.6% in 2026.
EUR/SEK uptrend stalled near 11.95/12.00 and it recently gave up the 200-DMA. It is near the lower limit of its range since July at 11.40. An initial bounce is taking shape however it would be interesting to see if the pair can reclaim the MA near 11.54. This break would be essential to affirm an extended rebound.
In case EUR/SEK establishes below 11.40, there could be risk of persistent down move. Next potential supports are located at projections of 11.31 and 11.19/11.16.
USD/ZAR skipped back above the 200-DMA at 18.63. Economists at Société Générale analyze the pair’s outlook.
18.50 is first support
USD/ZAR recently tested the ascending trend line drawn since April 2022 near 18.10 resulting in a sharp rebound. It has moved beyond 200-DMA and recent pivot high.
Daily MACD is in negative territory, but it has crossed above its trigger line denoting receding downward momentum.
A retest of graphical levels near 19.27/19.30 representing highs of August/September is likely.
18.50, the 50% retracement of recent bounce is first support.
In the view of UOB Group’s Economist Lee Sue Ann and Markets Strategist Quek Ser Leang, NZD/USD is likely to trade within the 0.5950-0.6085 range in the near term.
Key Quotes
24-hour view: We highlighted yesterday that “upward momentum is showing signs of slowing, and this, combined with overbought conditions suggests NZD is likely to trade sideways today, probably in a range of 0.6025/0.6075.” Instead of trading in a range, NZD fell to a low of 0.5998 before rebounding. The brief drop to 0.5998 lacks momentum, and NZD is unlikely to weaken much further. Today, NZD is more likely to trade in a range of 0.5995/0.6055.
Next 1-3 weeks: Yesterday (22 Nov, spot at 0.6050), we indicated “while the NZD strength that started one week ago is intact, overbought short-term conditions could lead to a couple of days of consolidation first.” We added, “if NZD breaks below 0.6000, it would mean that 0.6100 is out of reach. In NY trade, NZD broke slightly below 0.6000 (low of 0.5998). The breach of the ‘strong support’ at 0.6000 indicates that the recent buildup in upward momentum has eased. From here, NZD is likely to trade in a range, probably between 0.5950 and 0.6085.
EUR/SEK spiked higher after Riksbank’s decision to leave rates unchanged. Economists at Danske Bank analyze Krona’s outlook.
“Hawkish hold”
Expectations were split. However, this ‘hawkish hold’ is arguably a better outcome for the real economy and the housing market than a hike and as such it should limit the negative impact on the SEK – it might even give some support (growth channel).
As the decision is bang in line with our call, we keep our 1M 11.40 target for EUR/SEK.
EUR/GBP rebounded modestly on Wednesday after the UK’s Autumn Statement. Economists at ING analyze Sterling’s outlook.
There was some “buy the rumour, sell the fact” effect
Chancellor Jeremy Hunt announced some widely expected cuts to personal and business taxes. The implications for Sterling should – in general – be positive as the tax cuts suggest a better growth outlook and potentially stickier inflation.
However, it felt like the move in GBP already happened into the announcement, and there was some ‘buy the rumour, sell the fact’ effect causing a softening of the Sterling momentum.
- UK Manufacturing PMI rose to 46.7 in November, above expectations of 45.0.
- Services PMI in the UK jumped to 50.5 in November, a big beat.
- GBP/USD rallied hard on strong UK business PMIs but quickly pared back gains.
The seasonally adjusted S&P Global/CIPS UK Manufacturing Purchasing Managers’ Index (PMI) rose to 46.7 in November versus the 45.0 expected and, 44.8 - October’s final print.
Meanwhile, the Preliminary UK Services Business Activity Index jumped to a four-month high of 50.5 in November, as against a 49.5 final print for October and the 49.5 market consensus.
Commenting on the flash PMI data, Tim Moore, Economics Director at S&P Global Market Intelligence said: “The UK economy found its feet again in November as the service sector arrested a three-month sequence of decline and manufacturers began to report less severe cutbacks to production schedules.”
“Relief at the pause in interest rate hikes and a clear slowdown in headline measures of inflation are helping to support business activity, although the latest survey data merely suggests broadly flat UK GDP in the final quarter of 2023,” Moore added.
FX implications
At the press time, GBP/USD is paring back gains to trade near 1.2540, having spiked to 1.2573 in a knee-jerk reaction to the upbeat UK data. The pair is up 0.42% on the day.
- USD/CAD weakens due to the likelihood of no more rate hikes by the Fed.
- Downbeat Crude oil prices could limit the advances of the Canadian Dollar.
- WTI prices declined as the OPEC+ meeting delay introduced uncertainty over the magnitude of additional supply cuts.
- UoM Consumer Sentiment poll revised annual inflation expectations from 4.4% to 4.5%.
USD/CAD continues to lose ground for the third consecutive session, bidding lower near 1.3680 during the Asian hours on Thursday. The USD/CAD pair encounters a hurdle as market participants are adjusting to the likelihood of no additional rate hikes by the Fed. which erodes the safe-haven allure of the US Dollar (USD).
However, the Canadian Dollar (CAD) faced a setback against the Greenback, driven by the drop in Crude oil prices. The decline in Western Texas Intermediate (WTI) prices persisted, prompted by an unexpected delay in an upcoming OPEC+ meeting. This delay introduces uncertainty regarding the potential magnitude of additional supply cuts by the producer group.
US Dollar Index (DXY) steps back after notching gains for two consecutive days, hovering around 103.70 as of now. However, the Greenback might have gained some support following an upward revision in inflation expectations among American households. This shift triggered a rise in Treasury bond yields in the United States (US), potentially offering support to the buck.
The University of Michigan Consumer Sentiment poll disclosed that inflation expectations for a one-year period increased to 4.5% from the previous report's 4.4%, while it stood at 3.2% for a five-year period. Additionally, US Durable Goods Orders in October declined by 5.4%, falling short of the market consensus of 3.1%. Meanwhile, US Jobless Claims reported a larger-than-anticipated drop for the week ending on November 17, decreasing to 209K from the previous 233K.
Looking ahead, investor focus is likely to shift to Friday's Retail Sales figures from Canada. US markets will be closed on Thursday for Thanksgiving Day. US is slated to unveil the preliminary S&P Global Manufacturing and Services PMI for November on Friday, both with expectations leaning towards a decline.
The Dollar rose for a second consecutive session on Wednesday. Economists at ING analyze USD outlook.
No turkey for Dollar bears
Today, FX flows will be subdued due to the Thanksgiving holiday. Equity and bond markets are closed, and there are no data releases in the US.
Part of the rebound in the Dollar observed over the past two sessions (especially on Tuesday) may well be related to some profit-taking on risk-on trades and more defensive positioning ahead of Thanksgiving.
We think DXY can find some stabilisation around 104.00 into the weekend amid thinner trading volumes and a lack of market-moving data releases in the US.
Gold prices fell in India on Thursday, according to data from India's Multi Commodity Exchange (MCX).
Gold price stood at 61,208 Indian Rupees (INR) per 10 grams, down INR 100 compared with the INR 61,308 it cost on Wednesday.
As for futures contracts, Gold prices increased to INR 61,084 per 10 gms from INR 61,024 per 10 gms.
Prices for Silver futures contracts decreased to INR 74,590 per kg from INR 72,826 per kg.
| Major Indian city | Gold Price |
|---|---|
| Ahmedabad | 63,360 |
| Mumbai | 63,190 |
| New Delhi | 63,350 |
| Chennai | 63,320 |
| Kolkata | 63,370 |
An automation tool was used in creating this post.
Global Market Movers: Comex Gold price rebounds on Thanksgiving Day
- The emergence of fresh selling around the US Dollar assists the Comex Gold price to regain positive traction during the Asian session on Thursday.
- The hawkish FOMC minutes-inspired USD recovery falters in the wake of expectations that the Federal Reserve (Fed) will not hike rates further.
- Policymakers reiterated the stance to keep rates higher for longer and remain committed to tightening policy further if progress in controlling inflation falters.
- The current market pricing, however, indicates a greater than 50% chance that the US central bank will start cutting interest rates by May 2024.
- Dovish Fed expectations, meanwhile, overshadow the better-than-expected US labor market and consumer sentiment data released on Wednesday.
- The number of Americans filing new claims for unemployment benefits fell more than expected last week, to 209K, or the lowest level in more than a month.
- The University of Michigan's survey of consumer sentiment showed that US consumers' inflation expectations rose for a second straight month in November.
- Other US data showed orders for long-lasting US manufactured goods fell more than expected in October, pointing to slowing economic demand.
- Lighter trading volumes on the back of the US Thanksgiving holiday and repeated failures ahead of the $2,010 level warrant caution for bullish traders.
Gold FAQs
Why do people invest in Gold?
Gold has played a key role in human’s history as it has been widely used as a store of value and medium of exchange. Currently, apart from its shine and usage for jewelry, the precious metal is widely seen as a safe-haven asset, meaning that it is considered a good investment during turbulent times. Gold is also widely seen as a hedge against inflation and against depreciating currencies as it doesn’t rely on any specific issuer or government.
Who buys the most Gold?
Central banks are the biggest Gold holders. In their aim to support their currencies in turbulent times, central banks tend to diversify their reserves and buy Gold to improve the perceived strength of the economy and the currency. High Gold reserves can be a source of trust for a country’s solvency. Central banks added 1,136 tonnes of Gold worth around $70 billion to their reserves in 2022, according to data from the World Gold Council. This is the highest yearly purchase since records began. Central banks from emerging economies such as China, India and Turkey are quickly increasing their Gold reserves.
How is Gold correlated with other assets?
Gold has an inverse correlation with the US Dollar and US Treasuries, which are both major reserve and safe-haven assets. When the Dollar depreciates, Gold tends to rise, enabling investors and central banks to diversify their assets in turbulent times. Gold is also inversely correlated with risk assets. A rally in the stock market tends to weaken Gold price, while sell-offs in riskier markets tend to favor the precious metal.
What does the price of Gold depend on?
The price can move due to a wide range of factors. Geopolitical instability or fears of a deep recession can quickly make Gold price escalate due to its safe-haven status. As a yield-less asset, Gold tends to rise with lower interest rates, while higher cost of money usually weighs down on the yellow metal. Still, most moves depend on how the US Dollar (USD) behaves as the asset is priced in dollars (XAU/USD). A strong Dollar tends to keep the price of Gold controlled, whereas a weaker Dollar is likely to push Gold prices up.
The Turkish Lira has depreciated substantially since the start of the year. Economists at Commerzbank analyze TRY’s outlook.
External disinflation may not help Türkiye
The FX market is ever watchful of Erdogan pulling the plug or beginning to demand rate cuts as soon as some improvement has been achieved. Either outcome would be disastrous.
External disinflation may be helping other Eastern European countries at present, but it may not help Türkiye.
Under such circumstances, the risks associated with Turkish monetary policy and the Lira remain elevated despite the appearances.
- Eurozone Manufacturing PMI rose to 43.8 in November, beating estimates of 43.4.
- Bloc’s Services PMI improved to 48.2 in November vs. 48.1 expectations.
- EUR/USD keeps gains near 1.0920 after German, Eurozone PMI reports.
The Eurozone manufacturing sector slowed its pace of contraction alongside the services sector in November, the latest figures from the HCOB's latest purchasing managers index survey showed Thursday.
The Eurozone Manufacturing Purchasing Managers Index (PMI) climbed to 43.8 in November, compared with the expectations of 43.4 and above the 43.1 booked in October. The index hit a six-month top.
The bloc’s Services PMI rose to 48.2 0 in November from 47.8 in October, hitting a two-month high, outpacing the 48.1 consensus.
The HCOB Eurozone PMI Composite improved to 47.1 in November vs. 46.9 estimated and October’s 46.5 figure. The index jumped to a two-month high.
FX implications
EUR/USD is consolidating gains near 1.0920 after upbeat Eurozone PMIs. The spot is up 0.25% on the day, as of writing.
Further side-lined trading remains on the table for GBP/USD in the next few weeks, according to UOB Group’s Economist Lee Sue Ann and Markets Strategist Quek Ser Leang.
Key Quotes
24-hour view: On Tuesday, GBP rose to a high of 1.2558. Yesterday (Wednesday), we indicated that “despite the advance, upward momentum still has not shown much improvement.” We held the view that “there is scope for GBP to continue to edge higher, even though 1.2580 is still likely out of reach for now.” However, GBP did not edge higher, but fell to 1.2450. Upward pressure has faded, and today, GBP is likely to trade sideways, probably in a range of 1.2440/1.2530.
Next 1-3 weeks: Our latest narrative was from two days ago (21 Nov, spot at 1.2505), wherein we indicated that “despite the mild increase in momentum, there is still a chance for GBP to rise to 1.2580. Yesterday, GBP fell and broke below our ‘strong support’ level of 1.2460 (low has been 1.2450). The breach of the ‘strong support’ indicates that the GBP strength that started in the middle of last week has ended. GBP appears to have moved into a range-trading phase and is likely to trade between 1.2360 and 1.2560 for the time being.
- NZD/USD gains ground as the market prices out the possibility of any rate hike by the Fed.
- Technical indicators suggest a bullish sentiment to revisit the three-month high aligned with the 0.6100 psychological level.
- A decisive break below 0.6050 could lead the pair to navigate the 23.6% Fibonacci retracement.
NZD/USD surges as markets factor out the likelihood of additional interest rate hikes by the Fed. The NZD/USD pair trades higher around 0.6060 during the European session on Thursday.
The market participants seem to price out the chance of any further rate hike by the Fed. This development initiates a new downward trend in US Treasury bond yields. Coupled with a steady performance in the equity markets, this undermines the safe-haven appeal of the US Dollar (USD).
The 14-day Relative Strength Index (RSI) is above the 50 level, indicating a bullish sentiment for the NZD/USD pair. This could encourage bulls of the pair to revisit the three-month high at 0.6086 followed by the 0.6100 psychological level.
Moreover, the Moving Average Convergence Divergence (MACD) line, situated above the centerline and diverging above the signal line, is a confirmation of bullish momentum in the market.
On the downside, a break below the major support level of 0.6050 could push the pair to fall to the 23.6% Fibonacci retracement at 0.6010, which may serve as a crucial support level lined up with the nine-day Exponential Moving Average (EMA) at 0.6007.
A decisive break below the nine-day EMA could potentially pave the way for the NZD/USD pair to test the 38.2% Fibonacci retracement at 0.5964, aligning with the psychological support region at 0.5950 level.
NZD/USD: Daily Chart
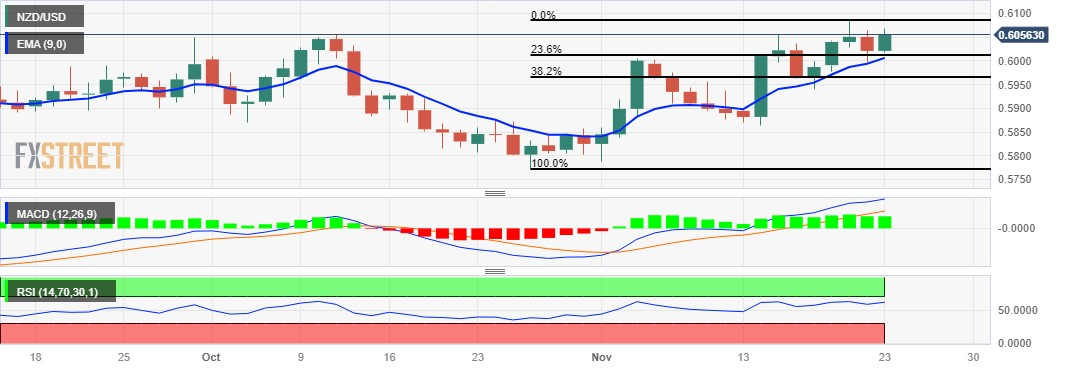
- EUR/USD gains strong positive traction and draws support from a combination of factors.
- Fed rate cut bets drag the US bond yields lower and prompt fresh selling around the USD.
- The German PMIs ease fears of a deeper economic downturn and lift the shared currency.
The EUR/USD pair attracts some buying on Thursday and stalls this week’s retracement slide from the 1.0965 region, or its highest level since August 11. The buying interest picks up pace following the release of the flash German PMI prints and lifts spot prices to a fresh daily peak, around the 1.0930 region during the early part of the European session.
The preliminary business activity report from the HCOB survey showed that the downturn in Germany’s manufacturing and services sectors eased a bit in November. This, in turn, raises hopes that the recession in the Eurozone's largest economy could be shallower than anticipated, which, in turn, boosts the shared currency. Apart from this, the emergence of fresh US Dollar (USD) selling, led by dovish Federal Reserve (Fed) expectations, turns out to be another factor pushing the EUR/USD pair higher.
The USD Index (DXY), which tracks the Greenback against a basket of currencies, struggles to capitalize on its recent recovery from the lowest level since August 31 touched on Tuesday in the wake of bets that the Fed is done raising interest rates. Instead, the current market pricing indicates a greater than 50% chance that the Fed will cut rates by May 2024. This is reinforced by a fresh leg down in the US Treasury bond yields, which exerts downward pressure on the buck and benefits the EUR/USD pair.
The aforementioned fundamental backdrop, along with the European Central Bank (ECB) President Christine Lagarde's hawkish remarks earlier this week, supports prospects for a further near-term appreciating move for spot prices. Speaking at an event in Berlin, Lagarde said that it was too early to declare victory over inflation and that bets based on short-term data flow are premature. This forces investors to scale back their expectations that the ECB's next move is set to be a rate cut.
It will now be interesting to see if the EUR/USD pair can capitalize on the positive momentum or if bulls refrain from placing fresh bets in the wake of relatively thin trading volumes on the back of the US Thanksgiving holiday on Thursday. Nevertheless, spot prices, for now, seem to have snapped a two-day losing streak and remain at the mercy of the USD price dynamics.
Technical levels to watch
- The Euro leaves behind the recent weakness against the US Dollar.
- European stocks open Thursday’s session with decent gains.
- There will be no activity in the US due to the Thanksgiving Day holiday.
The Euro regains some upside traction against the US Dollar, encouraging EUR/USD to fade part of the recent two-day retracement and reclaim the area beyond 1.0900 the figure on Thursday.
On the flip side, the Greenback surrenders part of the recent robust bounce to the area north of the 104.00 hurdle (Wednesday) and recedes to the 103.60 region when gauged by the USD Index (DXY).
The inactivity in the US markets is expected to also magnify movements in the FX universe against the backdrop of dwindled volatility and marginal trading conditions.
The dollar's recent bounce, in the meantime, comes despite unchanged anticipation of a probable interest rate cut by the Federal Reserve (Fed) at some point in the spring of 2024, a view that is being supported by persevering disinflationary pressures data as well as further easing of the labour market .
On the domestic calendar, flash Manufacturing and Services PMIs in Germany surprised to the upside at 42.3 and 48.7, respectively, for the month of November. Later in the session, European Central Bank (ECB) will release its Accounts of the latest meeting.
Daily digest market movers: Euro reclaims the 1.0900 barrier and beyond
- The EUR regains buying interest against the USD on Thursday.
- German yields rebound after two sessions of losses.
- Investors continue to adjust to rate cuts by the Fed in H1 2024.
- Markets perceive the ECB could enter an impasse until early next year.
- China plans to boost its real estate sector with further stimulus.
Technical Analysis: Euro retargets the monthly highs
EUR/USD picks up fresh upside traction and retakes the 1.0900 hurdle and above on Thursday.
The November high of 1.0965 (November 21) is now the immediate target for bulls ahead of the key 1.1000 threshold. Further north, EUR/USD may come into contact with the August top of 1.1064 (August 10) and another weekly peak of 1.1149 (July 27), all preceding the 2023 high of 1.1275 (July 18).
Bearish rallies, on the other hand, should find first support at the major 200-day SMA at 1.0808, followed by the temporary 55-day SMA at 1.0654. The weekly low of 1.0495 (October 13) aligns south of here, before the 2023 low of 1.0448 (October 3).
Overall, the pair's prospects should remain positive as long as it remains above the 200-day SMA.
Interest rates FAQs
What are interest rates?
Interest rates are charged by financial institutions on loans to borrowers and are paid as interest to savers and depositors. They are influenced by base lending rates, which are set by central banks in response to changes in the economy. Central banks normally have a mandate to ensure price stability, which in most cases means targeting a core inflation rate of around 2%.
If inflation falls below target the central bank may cut base lending rates, with a view to stimulating lending and boosting the economy. If inflation rises substantially above 2% it normally results in the central bank raising base lending rates in an attempt to lower inflation.
How do interest rates impact currencies?
Higher interest rates generally help strengthen a country’s currency as they make it a more attractive place for global investors to park their money.
How do interest rates influence the price of Gold?
Higher interest rates overall weigh on the price of Gold because they increase the opportunity cost of holding Gold instead of investing in an interest-bearing asset or placing cash in the bank.
If interest rates are high that usually pushes up the price of the US Dollar (USD), and since Gold is priced in Dollars, this has the effect of lowering the price of Gold.
What is the Fed Funds rate?
The Fed funds rate is the overnight rate at which US banks lend to each other. It is the oft-quoted headline rate set by the Federal Reserve at its FOMC meetings. It is set as a range, for example 4.75%-5.00%, though the upper limit (in that case 5.00%) is the quoted figure.
Market expectations for future Fed funds rate are tracked by the CME FedWatch tool, which shapes how many financial markets behave in anticipation of future Federal Reserve monetary policy decisions.
Economists at ING expect some stabilisation in EUR/USD after strong jobless claims fuelled the Dollar rebound.
PMI test for positioning
Today’s PMI surveys will be a new opportunity for markets to gauge whether Eurozone growth sentiment has indeed bottomed out.
From an FX perspective, the reaction to the November PMIs will tell us how much position-squaring effects are still playing a role in EUR/USD. Should a surprise in either direction be followed by an exacerbated move in EUR/USD despite thinner trading on Thanksgiving, then we would conclude positioning imbalances persist. We think, however, that some flattening around 1.0900 is more likely.
- Germany’s Manufacturing PMI rose to 42.3 in November vs. 41.2 forecast.
- Services PMI for the German economy improved to 48.7 in November vs. 48.5 expected.
- EUR/USD jumps toward 1.0950 after upbeat German PMIs.
Germany’s manufacturing sector's upbeat momentum extended in November while the services sector downturn eased, the preliminary business activity report from the HCOB survey showed on Thursday.
The HCOB Manufacturing PMI in the Eurozone’s economic powerhouse jumped to 42.3 this month, as against the 41.2 forecast and October’s 40.8. The index hit the highest level in six months.
Meanwhile, Services PMI improved from 48.2 in October to 48.7 in November. The market expected a reading of 48.5 in the reported period. The measure reached a fresh two-month high.
The HCOB Preliminary German Composite Output Index arrived at 47.1 in November vs. 46.5 expected and 45.9 registered in October. The gauge reached a four-month high.
FX implications
EUR/USD came under fresh buying pressure on encouraging German data. The pair is trading 0.32% higher on the day at 1.0920, at the time of writing.
UOB Group’s Economist Lee Sue Ann and Markets Strategist Quek Ser Leang suggest EUR/USD could have now moved into a consolidative phase.
Key Quotes
24-hour view: While we expected EUR to edge lower yesterday, we were of the view that “any decline is likely part of a 1.0885/1.0955 range.” However, EUR dropped to 1.0850 in NY trade before rebounding quickly. Despite the rebound, the bias appears to be on the downside. Today, EUR could retest the 1.0850 level before the risk of a more sustained rebound increases. The major support at 1.0780 is not expected to come under threat. Resistance is at 1.0910, followed by 1.0930.
Next 1-3 weeks: EUR broke below our ‘strong support’ level of 1.0860 in NY trade and reached a low of 1.0850. The breach of the ‘strong support’ level indicates that the EUR strength that started last Wednesday has ended. From here, EUR is likely to trade in a range, probably between 1.0780 and 1.0965.
Here is what you need to know on Thursday, November 23:
The US Dollar (USD) struggles to find demand early Thursday after outperforming its major rivals for two consecutive days. HCOB Manufacturing and Services PMIs from Germany and the Euro area will be featured in the European economic docket alongside the S&P Global PMIs for the UK. The European Central Bank will release the accounts of the October policy meeting as well. Stock and bond markets in the US will be closed in observance of the Thanksgiving Day holiday, possibly causing trading volumes to thin out in the second half of the day.
The data from the US revealed on Wednesday that the number of first-time application for unemployment benefits declined to 209,000 in the week ending November 17 from 233,000 in the previous week. The benchmark 10-year US Treasury bond yield edged higher following this data and the USD Index closed the second straight day in positive territory. In the meantime, Wall Street's main indexes registered modest gains, limiting the USD's upside later in the American session.
US Dollar price this week
The table below shows the percentage change of US Dollar (USD) against listed major currencies this week. US Dollar was the weakest against the New Zealand Dollar.
| USD | EUR | GBP | CAD | AUD | JPY | NZD | CHF | |
| USD | -0.08% | -0.52% | -0.41% | -0.87% | -0.49% | -1.02% | -0.37% | |
| EUR | 0.08% | -0.45% | -0.34% | -0.78% | -0.42% | -0.95% | -0.28% | |
| GBP | 0.51% | 0.44% | 0.11% | -0.34% | 0.04% | -0.49% | 0.15% | |
| CAD | 0.41% | 0.33% | -0.14% | -0.47% | -0.08% | -0.62% | 0.05% | |
| AUD | 0.84% | 0.79% | 0.33% | 0.43% | 0.36% | -0.17% | 0.48% | |
| JPY | 0.50% | 0.42% | -0.27% | 0.08% | -0.37% | -0.52% | 0.12% | |
| NZD | 1.01% | 0.95% | 0.51% | 0.62% | 0.18% | 0.53% | 0.67% | |
| CHF | 0.34% | 0.28% | -0.15% | -0.05% | -0.51% | -0.14% | -0.67% |
The heat map shows percentage changes of major currencies against each other. The base currency is picked from the left column, while the quote currency is picked from the top row. For example, if you pick the Euro from the left column and move along the horizontal line to the Japanese Yen, the percentage change displayed in the box will represent EUR (base)/JPY (quote).
The business activity in Australia's private sector continued to contract at an accelerating pace in early November, with the Judo Bank Composite PMI declining to 46.4 from 47.6 in October. AUD/USD ignored the uninspiring PMI data and gained traction in the Asian session. At the time of press, the pair was up 0.4% on the day at 0.6570.
EUR/USD posted marginal losses on Wednesday but managed to climb back above 1.0900 early Thursday. Bundesbank President Joachim Nagel said that interest rates must stay high to bring inflation back to the target.
GBP/USD snapped a three-day winning streak on Wednesday but didn't have a difficult time stabilizing above 1.2500.
USD/JPY registered strong gains on Wednesday and advanced beyond 149.00 before going into a consolidation phase in the Asian session on Thursday. Early Friday, National Consumer Price Index and Jibun Bank PMI data from Japan will be watched closely by market participants.
Gold failed to hold above $2,000 on Wednesday and retreated below level while US T-bond yields edged higher in the American trading hours. In the European morning, XAU/USD clings to small gains but remains below $2,000.
Economists at ING analyze SEK’s outlook ahead of today's monetary policy decision from the Riksbank.
A very close call
We are slightly leaning in favour of a rate hike today, even though we admit it is a very close call.
A hold may be accompanied by an acceleration in quantitative tightening.
The FX impact won’t just depend on the outcome, since there is a tangible risk of a split board, which could limit the upside potential for SEK in the event of a hike.
- The index abandons the area of recent peaks above 104.00.
- Expectations of interest rate cuts by the Fed remain in place.
- US markets celebrate Thanksgiving Day on Thursday.
The greenback, in terms of the USD Index (DXY), now faces some selling pressure following Wednesday’s tops past 104.00 the figure.
USD Index meets some initial resistance around 104.20
Some selling bias kicks in around the greenback and forces the index to give away part of Wednesday’s uptick to the 104.20 zone, an area also coincident with the provisional 100-day SMA.
There is no news on the monetary policy front, where investors continue to see the Federal Reserve starting to reduce its interest rates at some point in the spring of 2024.
In addition, US markets will be closed due to the Thanksgiving Day holiday and this is expected to weigh on usual volatility and affect trading conditions.
What to look for around USD
So far, the rebound in the index seems to have met an initial obstacle around the 104.20 region.
Looking at the broader picture, the dollar appears depressed against the backdrop of rising speculation of probable interest rate cuts in H1 2024, all in response to further disinflationary pressures and the gradual cooling of the labour market.
Some support for the greenback, however, still emerges the resilience of the US economy as well as a persistent hawkish narrative from some Fed rate setters.
Key events in the US this week: S&P Global Flash Manufacturing/ Services PMIs (Friday).
USD Index relevant levels
Now, the index is down 0.25% at 103.61 and faces immediate contention at 103.17 (monthly low November 21) ahead of 102.93 (weekly low August 30) and then the psychological 100.00 threshold. On the upside, the breakout of 104.21 (weekly high November 22) could expose a move to 106.00 (weekly high November 10) and finally 106.88 (weekly high October 26).
- USD/MXN moves sideways following the upward revision of US inflation expectations.
- UoM Consumer Sentiment poll revised inflation expectations for one year to 4.5% from 4.4%.
- Mexico Retail Sales decelerated from 3.2% to 2.3% annual growth in September.
USD/MXN extends its losses on the second successive session, bidding lower around 17.18 during the early European hours on Thursday. The Mexican Peso (MXN) experienced volatility following the upward revision of inflation expectations by American households. This development led to a surge in Treasury bond yields in the United States (US), which might have provided support for the US Dollar (USD).
The University of Michigan Consumer Sentiment poll revealed that inflation expectations, rose for one year to 4.5% from 4.4% in the previous report, while it stood at 3.2% for a five-year period. Moreover, However, US Durable Goods Orders in October declined by 5.4% against the market consensus of 3.1%. US Jobless Claims reported a larger-than-anticipated decline for the week ending on November 17, with reducing to 209K from 233K prior.
Looking at the flip side, Mexico experienced a 2.3% year-on-year growth in Retail Sales for September. This marked a deceleration from the 3.2% growth observed in August and fell short of the anticipated 3.6% expansion. The numbers are starting to reflect the influence of the elevated interest rates imposed by the Bank of Mexico (Banxico), which currently stands at 11.25%.
Furthermore, the initial projections reported by Reuters indicate a 2.9% year-on-year growth for Mexico's economy in October. Looking ahead, Thursday's forecast predicts a rise in the first half-month inflation for November, although there's an expectation of a slight dip in core inflation. Furthermore, Friday will unveil the annual rate of Gross Domestic Product, with an anticipated contraction in the third quarter.
US markets will be taking a break on Thursday for Thanksgiving Day on Thursday. Come Friday, the US is scheduled to unveil the S&P Global Manufacturing and Services PMI figures for November, expecting a potential decrease in both indices.
On Wednesday, UK Chancellor Jeremy Hunt presented the Autumn Statement. Economists at Commerzbank analyze GBP outlook following the Tories’ tax plans.
Lower taxes and public spending are possibly going to be welcomed by Tory voters
Lower taxes and public spending are possibly going to be welcomed by Tory voters due to the effects on the individual, but I find it difficult to believe that FX traders and/or a large share of the electorate will believe in the Laffer curve. In that case, the tax plans are not going to be interpreted as a GBP-positive factor.
Don’t get me wrong: I certainly do not want to say that this interpretation might not turn out to be correct. Such an assessment would exceed my competence. But for the current development of GBP exchange rates, it does not matter. What matters is how the tax plans are seen today. I can only guess that. There is no watertight way to prove my view. However, the readers who disagree will at least draw the conclusion that it is this kind of sentiment that currently drives GBP developments.
European Central Bank (ECB) policymaker and Bundesbank Chief Joachim Nagel said on Thursday, “it is too early to talk about rate cuts. “
Additional comments
Rates must stay high to bring inflation back to target.
Still cannot be sure if we have reached a peak in rates.
The goal is in sight in terms of inflation, but not yet reached.
Inflation could still tick up in the coming months.
Does not see a hard landing for Eurozone economy.
Market reaction
At the time of writing, EUR/USD is trading 0.22% higher on the day at 1.0910.
Economists at Commerzbank forecast of a moderate appreciation of the Norwegian Krone.
Norges Bank remains hawkish
Increased risk aversion in the market is weighing on the Krone, but rising Oil prices are supporting it. In this respect, the current geopolitical situation is relatively neutral for the NOK, but it is likely to trade volatile in the short term.
Norges Bank does not see first interest rate cuts until the end of 2024. At the same time, from a market's perspective, the ECB will no longer act decisively enough against stubbornly high inflation next year with a view to the peripheral countries, so that a risk premium on the euro is justified. This suggests that the NOK will continue to appreciate against the Euro in 2024.
- EUR/JPY remains capped below 163.00 ahead of the Eurozone PMI data.
- The cross maintains a positive outlook above the 100-hour EMA; RSI indicator is located in the bullish territory above 50.
- The key resistance level is located at the 163.00–163.10 zone; 162.10 acts as an initial support level for EUR/JPY.
The EUR/JPY cross loses momentum after facing a rejection from 163.00 during the early European session on Thursday. As of writing, the cross is trading near 162.60, down 0.20% on the day. Investors await the preliminary Eurozone PMI data for fresh impetus. The downbeat reading could fuel the fear of a recession in the Eurozone and exert some selling pressure on the Euro (EUR) against the Japanese Yen (JPY).
Technically, EUR/JPY maintains a positive outlook on the four-hour chart as the cross holds above the key 100-hour Exponential Moving Averages (EMAs). Furthermore, the Relative Strength Index (RSI) is located in the bullish territory above 50, indicating that further upside looks favorable.
That being said, the key resistance level is located in the 163.00–163.10 area. The mentioned level is the confluence of the upper boundary of the Bollinger Band and a psychological round figure. The next upside barrier is seen at a high of November 19 at 163.55. A break above the latter will see the rally to the year-to-date (YTD) high of 164.30.
On the other hand, a low of November 22 at 162.10 acts as an initial support level for EUR/JPY. The additional downside filter to watch is the 100-hour EMA at 161.74. A breach of the latter will see a drop to the lower limit of the Bollinger Band at 161.33, followed by a low of November 7 at 160.43, and finally the round figure at 160.00.
EUR/JPY four-hour chart
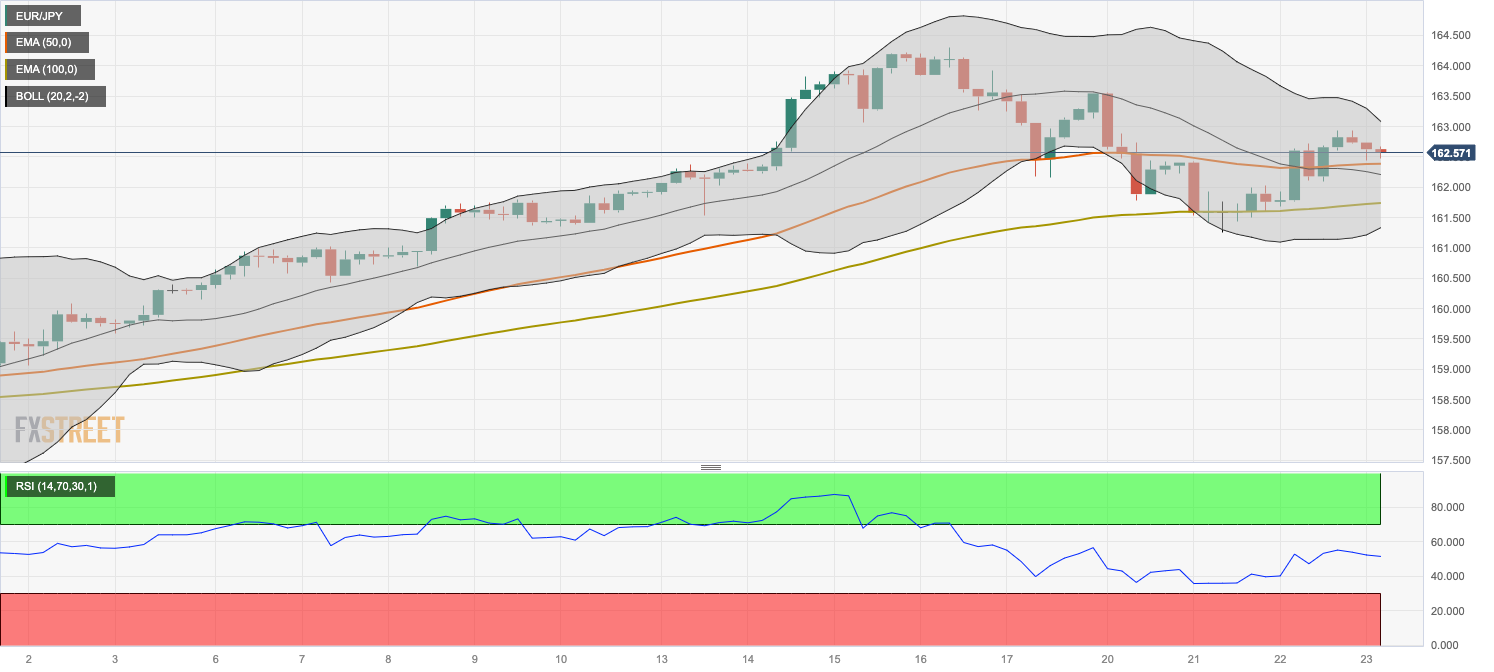
- EUR/GBP holds positive ground around 0.8720 ahead of Eurozone, UK key data.
- ECB President Christine Lagarde said the discussion about rate cuts is premature.
- BoE Governor Andrew Bailey stated that the Middle East conflict could add to the risk that inflation could go back up.
- Traders will closely monitor the Eurozone and UK PMI data on Thursday.
The EUR/GBP cross trades in positive territory for the second consecutive day during the early European session on Thursday. At press time, the cross is trading around 0.8718, gaining 0.17% for the day. Market participants await the Eurozone HCOB PMI data and UK Global S&P PMI data on Thursday. These figures could trigger the volatility of the cross.
Inflation in the Eurozone has declined more than estimated in recent months, raising market expectations that the ECB will cut the rate soon. However, ECB President Christine Lagarde said on Tuesday that the central bank has time to assess how inflation develops after a record streak of rate hikes, but victory has not yet been achieved and the discussion about rate cuts is premature.
Additionally, many ECB policymakers, including Bundesbank President Joachim Nagel and ECB Vice President Luis de Guindos, agreed that the ECB is data-dependent while mentioning that economic data would decide if more tightening is appropriate and that it's premature to discuss rate cuts.
On the British Pound (GBP) front, the Bank of England (BoE) Governor Andrew Bailey underlined that the central bank's policy on interest rates did not need to be changed. Bailey further stated that inflation was on course to get back to the central bank's 2% target, but the conflict in the Middle East had added to the risk that inflation could go back up.
Later on Thursday, market players will keep an eye on the Eurozone and German HCOB PMI data. The Eurozone Manufacturing PMI for November is expected to grow to 43.4 while the Services PMI is estimated to climb to 48.1. Furthermore, the UK S&P Global/CIPS PMI will be released. The Manufacturing and Service figures are estimated to rise to 45.0 and 49.5, respectively. These reports could give a clear direction to the EUR/GBP cross.
- GBP/USD moves above the 1.2500 level while recovering recent losses.
- The pair's bulls could explore the 1.2550 major barrier as technical indicators suggest strong momentum.
- Seven-day EMA appears as a key support aligned with the 1.2450 major level near to the weekly low.
GBP/USD retraces recent losses registered in the previous session, trading higher around 1.2500 psychological level during the Asian session on Thursday.
The technical indicators for the GBP/USD pair are signaling a bullish outlook. The 14-day Relative Strength Index (RSI) above the 50 level indicates upward support, suggesting a bullish momentum in favor of the pair.
Additionally, the Moving Average Convergence Divergence (MACD) line, positioned above the centerline and exhibiting divergence above the signal line, implies a strong momentum in the GBP/USD pair.
The GBP/USD could face a challenge around the region at a major level of 1.2550, nearing a two-month high at 1.2559 level. A firm breakthrough above the latter could inspire the bulls of the pair to test the 1.2600 psychological level.
The US Dollar (USD) could improve as investors seem to perceive persistent inflation in the United States (US) following US economic data, which could put pressure on the GBP/USD pair. The seven-day Exponential Moving Average (EMA) at 1.2469 could act as a key support aligned with the 1.2450 major level and the weekly low at 1.2446.
A decisive break below the support region could push the GBP/USD pair to navigate the next support area around the 23.6% Fibonacci retracement at 1.2436 followed by the 1.2400 psychological level.
GBP/USD: Daily Chart
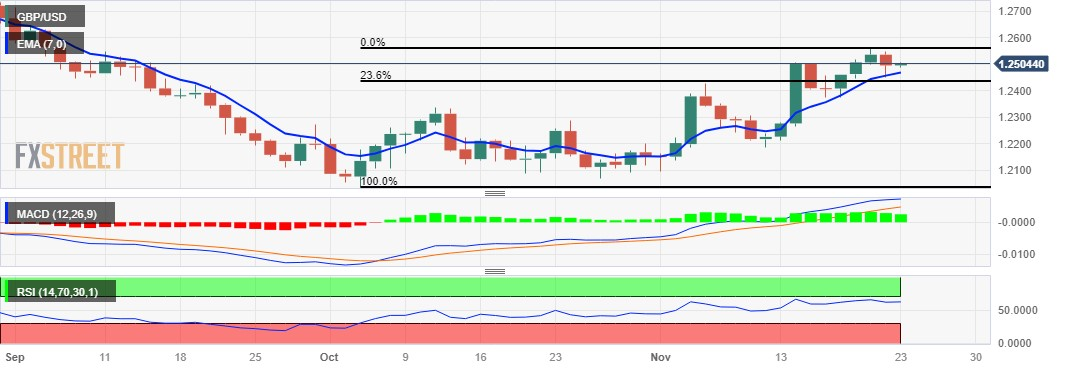
- EUR/USD climbs above the 1.0900 mark on Thursday ahead of the Eurozone PMI data.
- The bullish outlook of EUR/USD remains intact as the major pair holds above the 50- and 100-hour EMA.
- The first resistance level is seen at 1.0965; 1.0870 acts as an initial support level for the pair.
The EUR/USD pair snaps its two-day losing streak and surges above 1.0900 during the Asian session on Thursday. Traders will closely monitor the Eurozone preliminary PMI data and the minutes of the ECB on Thursday. The markets remain subdued due to the Thanksgiving day holiday in the US on Thursday. The major pair currently trades around 1.0905, up 0.16% on the day.
From a technical perspective, the bullish potential of EUR/USD remains intact as the major pair holds above the 50- and 100-hour Exponential Moving Averages (EMA) on the four-hour chart. Additionally, the Relative Strength Index (RSI) stands in bullish territory above 50, which supports the buyers for the time being.
The first upside barrier for EUR/USD is seen at 1.0965, representing the confluence of the upper boundary of the Bollinger Band and a high of November 21. The key resistance level will emerge near a psychological round figure and a high of August 11 at 1.1000. A decisive break above the latter will see the rally to a high of August 4 at 1.1042, en route to a high of July 27 at 1.1149.
On the flip side, the lower limit of the Bollinger Band at 1.0870 acts as an initial support level for the major pair. The additional downside filter to watch is near the 50-hour EMA and a low of November 22 at the 1.0850-1.0860 zone. Further south, the next contention level is located at the 100-hour EMA at 1.0790. A breach of the latter will see a drop to a high of November 9 at 1.0725.
EUR/USD four-hour chart
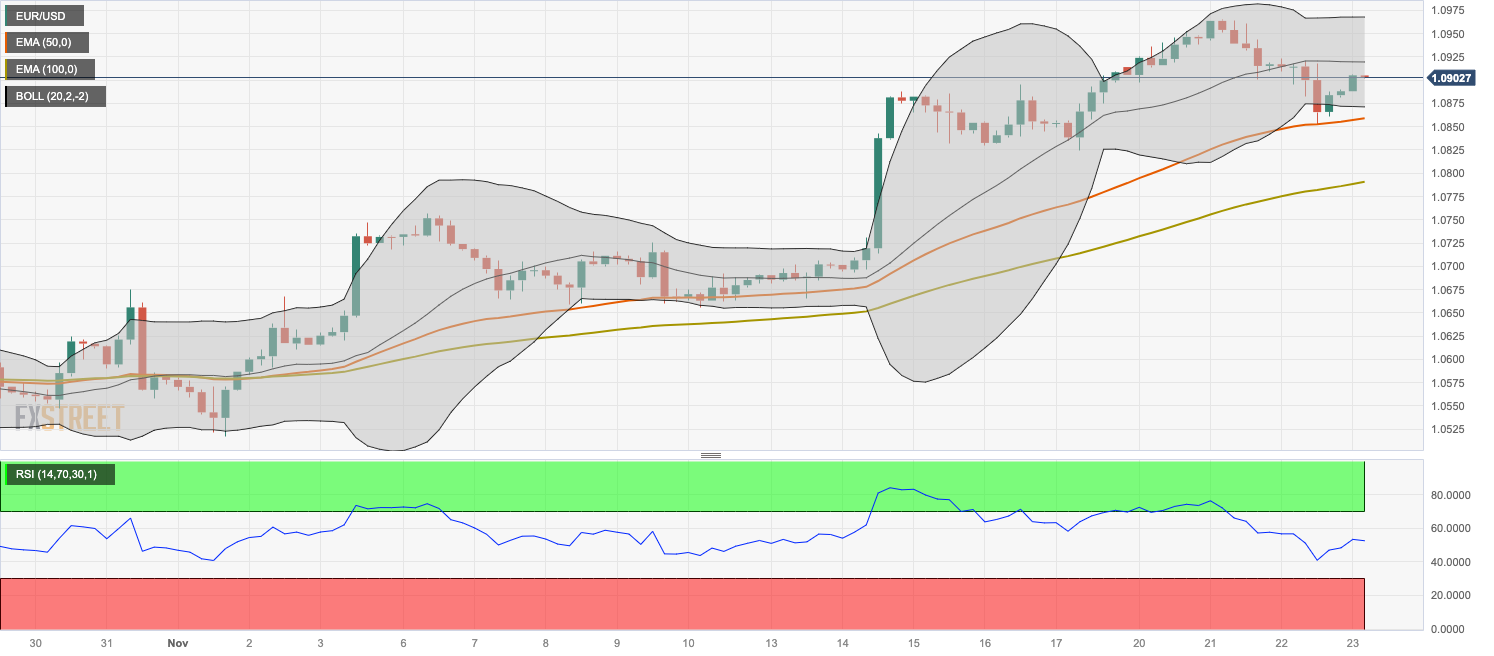
- USD/CHF retraces recent gains as SNB repatriates the Swiss Franc.
- SNB's currency reserves reduced to a seven-year low of CHF 657 billion as of October.
- Traders are cautious as recent US data raised the likelihood of further tightening by the Fed.
USD/CHF moves on a downward trajectory as the Swiss Franc (CHF) maintains its strength, driven by ongoing CHF repatriation by the Swiss National Bank (SNB). The USD/CHF pair retraces recent gains, trading lower around 0.8830 during the Asian session on Thursday.
The Swiss Franc receives upward support as the SNB has been gradually reducing its foreign currency reserves, which peaked at CHF 950 billion in 2022. The SNB's balance sheet of currency reserves has now reached a seven-year low of CHF 657 billion as of October.
However, the US dollar (USD) attempted to halt its slide against the CHF in the previous session after three days of declines. Traders seem to adopt a cautious stance in response to potential further tightening by the Federal Reserve (Fed) following the recent data from the United States (US), turning the market sentiment toward persistent inflation in the country, along with a slowing economy.
University of Michigan Consumer Sentiment Index for November posted a reading of 61.3, surpassing the projected 60.5 figure. However, US Durable Goods Orders in October fell by 5.4% against the anticipated 3.1%.US Jobless Claims data indicated a larger-than-anticipated decline for the week ending on November 17, dropping to 209K from 233K prior.
The Employment Level for Q3 will be released by the Swiss Statistics on Friday, which will show the total number of employed workers. The focus will shift toward the US preliminary S&P Global Manufacturing and Services PMI for November to gain further cues on the economic situation in the United States.
- Gold price catches fresh bids on Thursday and reverses a part of the overnight decline.
- Bets that the Fed is done raising rates prompt fresh USD selling and remain supportive.
- A move beyond the $2,010 resistance is needed to support prospects for further gains.
Gold price (XAU/USD) attracts some dip-buying during the Asian session on Thursday and reverses a part of the previous day's retracement slide from the vicinity of the monthly peak. A two-day-old US Dollar (USD) recovery move from its lowest level since August 31 touched on Tuesday falters near the 100-day Simple Moving Average (SMA) amid firming expectations that interest rates in the US have peaked. This is reinforced by a fresh leg down in the US Treasury bond yields, which undermines the Greenback and acts as a tailwind for the non-yielding yellow metal.
The precious metal, however, remains below the $2,000 psychological mark. This, along with the recent repeated failures ahead of the $2,010 horizontal barrier, warrants some caution before placing fresh bullish bets around the Gold price amid a relatively light trading session ahead in the wake of the US Thanksgiving holiday. Nevertheless, dovish Federal Reserve (Fed) expectations might continue to act as a tailwind for the XAU/USD, suggesting that any meaningful corrective decline might still be seen as a buying opportunity and is more likely to remain limited.
Daily Digest Market Movers: Gold price regains positive traction and draws support from renewed USD weakness
- The emergence of fresh selling around the US Dollar assists the Gold price to regain positive traction during the Asian session on Thursday.
- The hawkish FOMC minutes-inspired USD recovery falters in the wake of expectations that the Federal Reserve (Fed) will not hike rates further.
- Policymakers reiterated the stance to keep rates higher for longer and remain committed to tightening policy further if progress in controlling inflation falters.
- The current market pricing, however, indicates a greater than 50% chance that the US central bank will start cutting interest rates by May 2024.
- Dovish Fed expectations, meanwhile, overshadow the better-than-expected US labor market and consumer sentiment data released on Wednesday.
- The number of Americans filing new claims for unemployment benefits fell more than expected last week, to 209K, or the lowest level in more than a month.
- The University of Michigan's survey of consumer sentiment showed that US consumers' inflation expectations rose for a second straight month in November.
- Other US data showed orders for long-lasting US manufactured goods fell more than expected in October, pointing to slowing economic demand.
- Lighter trading volumes on the back of the US Thanksgiving holiday and repeated failures ahead of the $2,010 level warrant caution for bullish traders.
Technical Analysis: Gold price needs to make it through the $2,010 strong barrier for bulls to regain near-term control
From current levels, any subsequent move beyond the $2,000 mark might continue to confront stiff resistance near the $2,007 area. Some follow-through buying, leading to a subsequent breakout through the $2,009-2,010 barrier, or a multi-month peak touched in October, will be seen as a fresh trigger for bullish traders. The Gold price might then accelerate the positive move further towards the $2,022 intermediate resistance en route to the next relevant hurdle near the $2,040 region.
On the flip side, the $1,989-1,988 zone is likely to protect the immediate downside ahead of the $1,979-1,978 region and the weekly low, around the $1,965 area. Failure to defend the said support levels might prompt aggressive technical selling and drag the Gold price back towards the 200-day Simple Moving Average (SMA), currently around the $1,940 level. This is closely followed by the 50- and 100-day SMA confluence, around the $1,933-1,932 region, which if broken decisively might shift the near-term bias in favour of bearish traders.
US Dollar price today
The table below shows the percentage change of US Dollar (USD) against listed major currencies today. US Dollar was the weakest against the New Zealand Dollar.
| USD | EUR | GBP | CAD | AUD | JPY | NZD | CHF | |
| USD | -0.16% | -0.12% | -0.06% | -0.16% | -0.23% | -0.48% | -0.17% | |
| EUR | 0.14% | 0.03% | 0.08% | -0.02% | -0.09% | -0.33% | -0.02% | |
| GBP | 0.11% | -0.04% | 0.04% | -0.05% | -0.11% | -0.36% | -0.05% | |
| CAD | 0.05% | -0.10% | -0.06% | -0.11% | -0.17% | -0.42% | -0.12% | |
| AUD | 0.18% | 0.01% | 0.05% | 0.11% | -0.06% | -0.31% | 0.00% | |
| JPY | 0.23% | 0.07% | 0.11% | 0.17% | 0.05% | -0.23% | 0.06% | |
| NZD | 0.47% | 0.32% | 0.36% | 0.39% | 0.31% | 0.24% | 0.30% | |
| CHF | 0.17% | 0.02% | 0.05% | 0.10% | 0.00% | -0.06% | -0.30% |
The heat map shows percentage changes of major currencies against each other. The base currency is picked from the left column, while the quote currency is picked from the top row. For example, if you pick the Euro from the left column and move along the horizontal line to the Japanese Yen, the percentage change displayed in the box will represent EUR (base)/JPY (quote).
Gold FAQs
Why do people invest in Gold?
Gold has played a key role in human’s history as it has been widely used as a store of value and medium of exchange. Currently, apart from its shine and usage for jewelry, the precious metal is widely seen as a safe-haven asset, meaning that it is considered a good investment during turbulent times. Gold is also widely seen as a hedge against inflation and against depreciating currencies as it doesn’t rely on any specific issuer or government.
Who buys the most Gold?
Central banks are the biggest Gold holders. In their aim to support their currencies in turbulent times, central banks tend to diversify their reserves and buy Gold to improve the perceived strength of the economy and the currency. High Gold reserves can be a source of trust for a country’s solvency. Central banks added 1,136 tonnes of Gold worth around $70 billion to their reserves in 2022, according to data from the World Gold Council. This is the highest yearly purchase since records began. Central banks from emerging economies such as China, India and Turkey are quickly increasing their Gold reserves.
How is Gold correlated with other assets?
Gold has an inverse correlation with the US Dollar and US Treasuries, which are both major reserve and safe-haven assets. When the Dollar depreciates, Gold tends to rise, enabling investors and central banks to diversify their assets in turbulent times. Gold is also inversely correlated with risk assets. A rally in the stock market tends to weaken Gold price, while sell-offs in riskier markets tend to favor the precious metal.
What does the price of Gold depend on?
The price can move due to a wide range of factors. Geopolitical instability or fears of a deep recession can quickly make Gold price escalate due to its safe-haven status. As a yield-less asset, Gold tends to rise with lower interest rates, while higher cost of money usually weighs down on the yellow metal. Still, most moves depend on how the US Dollar (USD) behaves as the asset is priced in dollars (XAU/USD). A strong Dollar tends to keep the price of Gold controlled, whereas a weaker Dollar is likely to push Gold prices up.
- WTI prices lose ground near $76.20 amid concern about global crude oil supplies.
- OPEC+ unexpectedly delayed a meeting on production cuts from November 25–26 to November 30.
- US S&P Global PMI data on Friday will be in the spotlight.
Western Texas Intermediate (WTI), the US crude oil benchmark, is trading around $77.20 so far on Thursday. WTI prices extended their downside as the Organization of Petroleum Exporting Countries and allies (OPEC+) unexpectedly delayed a meeting on production cuts.
Early Thursday, the OPEC Secretariat stated that the OPEC+ meeting on Sunday could be delayed from November 25–26 to November 30, which would drag oil prices lower and raise concerns about global crude oil supplies.
Saudi Arabia, the world's largest oil exporter, is planning to extend oil production cuts by 1 million barrels a day through next year, while OPEC+ members consider additional cuts in response to declining prices. However, the forthcoming meeting was confronted with a difficult market environment, caused by rising tensions over the Israel-Hamas conflict and a slower-than-expected Chinese demand recovery.
Meanwhile, the recovery of the US Dollar (USD) might cap the upside of the oil prices as it makes dollar-denominated oil more expensive to buy the same amount of oil.
The US market is closed for the Thanksgiving Day holiday on Thursday. The attention will shift to the US S&P Global PMI data, due on Friday. The Manufacturing PMI figure is expected to grow to 49.8 while the Services PMI is estimated to rise to 50.4. These events could significantly impact the USD-denominated WTI price. Oil traders will take cues from the data and find trading opportunities around WTI prices.
- USD/CAD seems biased to move downward despite the weakening in Crude oil prices.
- WTI prices lose ground on an unexpected delay in an upcoming OPEC+ meeting.
- US economic data turn investors to perceive persistent inflation in the country.
USD/CAD seems to extend its losses for the third consecutive session, trading slightly lower near 1.3680 during the Asian hours on Thursday. However, the Canadian Dollar (CAD) dragged down on Wednesday due to the decline in Crude oil prices. Additionally, the improved US Dollar (USD) contributed to underpinning the USD/CAD pair as the economic data from the United States (US) turned investors to perceive persistent inflation in the country, coupled with a decelerating economy.
Western Texas Intermediate (WTI) extends losses, trading lower near $76.10 per barrel, by the press time. Crude oil prices are facing downward pressure due to an unexpected delay in an upcoming OPEC+ meeting, causing uncertainty about the extent of further supply cuts by the producer group.
The US Dollar Index (DXY) retraces its gains after two consecutive days, trading lower around 103.70. However, the stable US Treasury yields might have helped the Greenback hold its ground, with the 10-year US bond yield closing at 4.40%. The index extended the gains after the release of moderate US economic data but lost momentum amidst higher equity prices.
US Durable Goods Orders in October fell by 5.4% against the anticipated 3.1%. However, the University of Michigan Consumer Sentiment Index for November posted a reading of 61.3, surpassing the projected 60.5 figure. Additionally, US Jobless Claims data indicated a larger-than-anticipated decline for the week ending on November 17, with Initial Claims dropping to 209K from 233K prior.
Investors are likely to turn their attention to Friday's Retail Sales figures from Canada. Note that US markets will be closed on Thursday for Thanksgiving Day. On Friday, the US is set to release the preliminary S&P Global Manufacturing and Services PMI for November, both with expectations pointing towards a decline.
- Indian Rupee trades flat despite the weaker USD, lower oil prices.
- RBI’s Das said the Indian Rupee has witnessed “low volatility” and orderly movements as compared to its peers.
- Das estimates India's real GDP to grow by 6.5% in fiscal years 2023-24 and 2024-25.
Indian Rupee trades around a flatline on Thursday despite the softer US Dollar (USD) and the decline in oil prices. On Wednesday, the Reserve Bank of India (RBI) Governor Shaktikanta Das said the Indian Rupee has shown moderate volatility and orderly movements as compared to its peers despite elevated US treasury yields and a strong USD. Nonetheless, RBI will continue to closely monitor external financial factors that have potentially impacted the value of INR and the nation’s balance of payments.
Furthermore, RBI Governor Das expressed optimism about India’s economy as the country has demonstrated resilience despite a global slowdown and largely due to its reliance on domestic demand. Das estimates India's real GDP to grow by 6.5% in fiscal years 2023-24 and 2024-25 due to its robust growth rate, ranking the country among the fastest-growing large economies in the world.
Markets remain subdued on Thursday as traders prepare for the Thanksgiving Day holiday in the US. On Friday, the attention will shift to the US S&P Global PMI data. Meanwhile, the foreign fund's outflows and higher oil prices might cap the INR’s upside in the near term.
Daily Digest Market Movers: Indian Rupee remains sensitive to the higher US Treasury yield, stronger USD
- Reserve Bank of India (RBI) Governor Shaktikanta Das forecasted India's real GDP to grow by 6.5% in fiscal years 2023-24 and 2024-25.
- RBI’s Das said its monetary policy will pursue disinflation to progressively align inflation to the target while supporting growth.
- RBI’s Das further stated India is vulnerable to food-price shocks from extreme weather events and global factors despite a recent moderation in prices.
- India’s Ministry of Finance said in the report that the government and the RBI remain on high alert over inflationary risks.
- Indian central bank, which maintained the interest rate over the last four meetings, anticipates that average inflation will decline to 5.4% in 2023-24 from 6.7% in the last fiscal year.
- RBI raised its gold holdings by nine tonnes during the September 2023 quarter, bringing the total to 337 tonnes amassed by central banks worldwide.
- The US weekly Jobless Claims unexpectedly fell to 209K, the biggest fall since June. Continuing Claims dropped to 1.840M versus 1.862M prior.
- The University of Michigan Consumer Sentiment Index climbed to 61.3 in November from an initial reading of 60.4, better than the market expectation of 60.5.
- The UoM 1-year inflation expectations rose to 4.5% from the preliminary 4.4%. The 5–year inflation expectations were steady at 3.2%.
- The FOMC minutes showed all participants agreed to “proceed carefully” and policy decisions at every meeting would continue to be based on the totality of incoming information and economic outlook as well as the balance of risks.
Technical Analysis: The Indian Rupee keeps a positive outlook intact
The Indian Rupee trades flat on the day. The USD/INR pair has traded within the 82.80–83.35 range since September. The technical outlook suggests that the path of least resistance is to the upside as the pair holds above the key 100-day Exponential Moving Average (EMA) on the daily chart. Additionally, the 14-day Relative Strength Index (RSI) holds above the 50.0 midline, suggesting that further upside looks favorable.
The first resistance level for USD/INR will emerge at 83.35 (the upper boundary of the trading range). If the buyers reclaim the latter, further upside is seen at the year-to-date (YTD) high of 83.47. The next hurdle to watch is a psychological round figure at 84.00.
On the downside, the contention level is located at 82.80. The mentioned level is the confluence of the lower limit of the trading range and a low of September 12. A decisive break below 82.80 will pave the way to a low of August 11 at 82.60. The additional downside filter to watch is a low of August 24 at 82.37.
US Dollar price today
The table below shows the percentage change of US Dollar (USD) against listed major currencies today. US Dollar was the weakest against the New Zealand Dollar.
| USD | EUR | GBP | CAD | AUD | JPY | NZD | CHF | |
| USD | -0.15% | -0.12% | -0.05% | -0.17% | -0.19% | -0.50% | -0.17% | |
| EUR | 0.16% | 0.04% | 0.10% | -0.01% | -0.04% | -0.34% | -0.01% | |
| GBP | 0.11% | -0.04% | 0.05% | -0.06% | -0.07% | -0.39% | -0.05% | |
| CAD | 0.06% | -0.09% | -0.05% | -0.11% | -0.12% | -0.44% | -0.11% | |
| AUD | 0.19% | 0.03% | 0.07% | 0.13% | -0.01% | -0.32% | 0.01% | |
| JPY | 0.19% | 0.03% | 0.07% | 0.13% | -0.02% | -0.32% | 0.02% | |
| NZD | 0.49% | 0.34% | 0.38% | 0.41% | 0.32% | 0.31% | 0.33% | |
| CHF | 0.17% | 0.01% | 0.06% | 0.11% | -0.01% | -0.02% | -0.33% |
The heat map shows percentage changes of major currencies against each other. The base currency is picked from the left column, while the quote currency is picked from the top row. For example, if you pick the Euro from the left column and move along the horizontal line to the Japanese Yen, the percentage change displayed in the box will represent EUR (base)/JPY (quote).
Indian Rupee FAQs
What are the key factors driving the Indian Rupee?
The Indian Rupee (INR) is one of the most sensitive currencies to external factors. The price of Crude Oil (the country is highly dependent on imported Oil), the value of the US Dollar – most trade is conducted in USD – and the level of foreign investment, are all influential. Direct intervention by the Reserve Bank of India (RBI) in FX markets to keep the exchange rate stable, as well as the level of interest rates set by the RBI, are further major influencing factors on the Rupee.
How do the decisions of the Reserve Bank of India impact the Indian Rupee?
The Reserve Bank of India (RBI) actively intervenes in forex markets to maintain a stable exchange rate, to help facilitate trade. In addition, the RBI tries to maintain the inflation rate at its 4% target by adjusting interest rates. Higher interest rates usually strengthen the Rupee. This is due to the role of the ‘carry trade’ in which investors borrow in countries with lower interest rates so as to place their money in countries’ offering relatively higher interest rates and profit from the difference.
What macroeconomic factors influence the value of the Indian Rupee?
Macroeconomic factors that influence the value of the Rupee include inflation, interest rates, the economic growth rate (GDP), the balance of trade, and inflows from foreign investment. A higher growth rate can lead to more overseas investment, pushing up demand for the Rupee. A less negative balance of trade will eventually lead to a stronger Rupee. Higher interest rates, especially real rates (interest rates less inflation) are also positive for the Rupee. A risk-on environment can lead to greater inflows of Foreign Direct and Indirect Investment (FDI and FII), which also benefit the Rupee.
How does inflation impact the Indian Rupee?
Higher inflation, particularly, if it is comparatively higher than India’s peers, is generally negative for the currency as it reflects devaluation through oversupply. Inflation also increases the cost of exports, leading to more Rupees being sold to purchase foreign imports, which is Rupee-negative. At the same time, higher inflation usually leads to the Reserve Bank of India (RBI) raising interest rates and this can be positive for the Rupee, due to increased demand from international investors. The opposite effect is true of lower inflation.
- NZD/USD catches fresh bids on Thursday amid the emergence of fresh selling around the USD.
- Dovish Fed expectations trigger a fresh leg down in the US bond yields and undermine the buck.
- Relatively thin liquidity on the back of the US holiday might hold bulls from placing fresh bets.
The NZD/USD pair builds on the overnight bounce from levels just below the 0.6000 psychological mark and gains strong positive traction during the Asian session on Thursday. The momentum lifts spot prices back closer to mid-0.6000s in the last hour and is sponsored by the emergence of fresh US Dollar (USD) selling.
The USD Index (DXY), which tracks the Greenback against a basket of currencies, faced rejection near the 100-day Simple Moving Average (SMA) and for now, seems to have stalled a two-day-old recovery trend from its lowest level since August 31. The better-than-expected US labor market data released and a rise in consumer inflation expectations did provide a goodish lift to the Greenback on Wednesday, though dovish Federal Reserve (Fed) expectations keep a lid on any further gains.
In fact, the markets have fully priced out the possibility of any further interest rate hikes by the Fed and see a better than 50% chance of a rate cut by May 2024. This triggers a fresh leg down in the US Treasury bond yields, which, along with a stable performance around the equity markets, undermines the safe-haven buck and benefits the risk-sensitive Kiwi. That said, thin liquidity on the back of the US Thanksgiving holiday might hold bulls from placing fresh bets around the NZD/USD pair.
Even from a technical perspective, this week’s failure ahead of the 200-day Simple Moving Average (SMA) further warrants caution before positioning for an extension of the appreciating move. In the absence of any relevant market-moving economic data, the USD price dynamics will continue to play a key role in influencing the NZD/USD pair. The focus will then shift to Friday's release of the quarterly New Zealand retail sales figures, followed by the flash US PMI prints later during the US session.
Technical levels to watch
- GBP/USD gains ground as US Dollar retreats after two-day gains.
- US Jobless Claims declined to 209K from 233K prior; the UoM Consumer Sentiment Index reached 61.3 instead of the projected 60.5.
- UK Chancellor of the Exchequer, Jeremy Hunt outlined plans to reduce debt, cut taxes, and incentivize work.
GBP/USD strives to bounce back after its three-day winning streak paused in the previous session, trading marginally higher around 1.2500 during the Asian session on Thursday. The pair faced challenges in the previous session, influenced by the strengthened US Dollar (USD) following economic data releases from the United States (US). Investors seem to perceive persistent inflation in the US, coupled with a decelerating economy.
The US Dollar Index (DXY) retreats after hitting gains for two successive days, bidding lower around 103.70 at the time of writing. The Greenback continued its correction after releasing moderate US economic data but was losing momentum amid higher equity prices.
US Jobless Claims data on Wednesday indicated a larger-than-anticipated decline for the week ending on November 17, with Initial Claims dropping to 209K from 233K prior. Additionally, Durable Goods Orders in October experienced a greater decline than expected, falling by 5.4% compared to the anticipated 3.1%. However, the University of Michigan Consumer Sentiment Index for November surpassed expectations, reaching 61.3 instead of the projected 60.5.
Jeremy Hunt, the UK Chancellor of the Exchequer, unveiled the Autumn Statement, outlining plans to reduce debt, cut taxes, and incentivize work. He highlighted the collaboration with the Bank of England (BoE) to achieve the 2.0% inflation target by 2025, as projected by the Office for Budget Responsibility (OBR). Despite anticipating a positive impact on inflation and GDP, Hunt acknowledged a revised growth forecast, with GDP expected to grow by only 0.7%, down from the previous OBR projection of 1.8% in March.
The preliminary S&P Global/CIPS Purchasing Managers Index (PMI) data for November in the United Kingdom is set to be released on Thursday. Additionally, US markets will be closed on Thursday for Thanksgiving Day. On Friday, the US will release the preliminary S&P Global Manufacturing and Services PMI for November, with expectations of a decline.
- Japanese Yen recovers some of its losses against the USD registered over the past two days.
- Speculations of a hawkish shift in the BoJ’s policy stance benefit the JPY and exert pressure.
- Bets that the Fed is done raising rates cap the recent USD recovery and contribute to the slide.
The Japanese Yen (JPY) gave back some of its recent strong gains against the US Dollar (USD) and continued with its weakening trend for the second successive day on Wednesday. Against the backdrop of Tuesday's hawkish FOMC minutes, the better-than-expected US labor market data and a rise in consumer inflation expectations assisted the USD to move away from its lowest level since August 31. This, in turn, allowed the USD/JPY pair to build on its solid recovery from the 147.15 area, or over a two-month low touched on Tuesday.
Spot prices, however, struggle to capitalize on the move and meet with a fresh supply during the Asian session on Thursday. Bets that the Federal Reserve (Fed) will not hike interest rates any further and instead will start cutting rates during the first half of 2024 could keep a lid on any further gains for the USD. This, along with expectations of a possible hawkish shift in the Bank of Japan's (BoJ) policy stance, forces the USD/JPY pair to snap a two-day winning streak and reverse a part of the overnight strong gains.
Daily Digest Market Movers: Japanese Yen stalls a two-day-old weakening trend against the US Dollar ahead of the US Thanksgiving holiday
- The Japanese Yen weakened to 149.75 against the US Dollar on Wednesday, albeit recovered some of its losses registered over the past two days on Thursday.
- Speculations that the Bank of Japan (BoJ) will almost certainly end its negative rate policy in the first few months of 2024 dragged the USD/JPY lower on Thursday.
- Minutes from the Federal Reserve's last meeting indicated the central bank was likely to maintain a restrictive stance on interest rates for some time.
- The US Initial Jobless Claims dropped by 24,000 to a seasonally adjusted 209,000 for the week ended November 18, the lowest level in more than a month.
- The upbeat data suggested that the US labor market remains resilient despite economic uncertainties and is not cooling as quickly as the Fed might have been expecting.
- The University of Michigan's survey showed that the Consumer Sentiment Index marked a fourth straight month of declines and came in at 61.3 for November.
- Inflation expectations, however, jumped to 4.5% in November, up from the 4.2% previous, rising for the second straight month and reaching to its highest reading since April 2023.
- Durable Goods Orders experienced a significant decline in October and dropped more than anticipated, by 5.4%, reversing the previous month's gain of 4.6%.
- Market participants have essentially priced out any further interest rate hikes by the Fed and now see a better than 50% chance of a rate cut by May 2024.
- Traders also opt to lighten their positions during the Asian session as trading activity is likely to remain limited on the back of the US Thanksgiving holiday.
Technical Analysis: USD/JPY needs to defend the 149.00 mark to support prospects for any further appreciating move
From a technical perspective, the USD/JPY pair has now dropped below the 23.6% Fibonacci retracement level of the latest leg up from the 147.15 area. A subsequent slide below the 149.00 mark will set the stage for a slide towards the 38.2% Fibo. level, around the 148.75 region. This is followed by support near mid-148.00s, or the 50% Fibo. level, and 61.8% Fibo. level, around the 148.15 region. A convincing break below the latter will suggest that the corrective bounce has run its course and expose the monthly swing low, around the 147.15 region touched on Tuesday, with some intermediate support near the 148.00 round figure.
On the flip side, the overnight swing high, around the 149.75 region, now seems to act as an immediate hurdle ahead of the 150.00 confluence, comprising the 200-period Simple Moving Average (SMA) on the 4-hour chart and the 61.8% Fibo. level. This is followed by the 100-period SMA on the 4-hour chart, currently near the 150.35 zone, which if cleared decisively will negate any near-term negative bias. The USD/JPY pair might then aim to reclaim the 151.00 mark before climbing further towards challenging the YTD peak, just ahead of the 152.00 mark.
US Dollar price today
The table below shows the percentage change of US Dollar (USD) against listed major currencies today. US Dollar was the weakest against the New Zealand Dollar.
| USD | EUR | GBP | CAD | AUD | JPY | NZD | CHF | |
| USD | -0.10% | -0.08% | -0.04% | -0.20% | -0.25% | -0.38% | -0.13% | |
| EUR | 0.09% | 0.01% | 0.05% | -0.12% | -0.16% | -0.29% | -0.03% | |
| GBP | 0.07% | -0.02% | 0.02% | -0.14% | -0.17% | -0.31% | -0.05% | |
| CAD | 0.05% | -0.04% | -0.02% | -0.15% | -0.20% | -0.33% | -0.08% | |
| AUD | 0.22% | 0.11% | 0.14% | 0.18% | -0.04% | -0.17% | 0.08% | |
| JPY | 0.25% | 0.15% | 0.16% | 0.22% | 0.01% | -0.13% | 0.10% | |
| NZD | 0.38% | 0.28% | 0.30% | 0.30% | 0.17% | 0.13% | 0.25% | |
| CHF | 0.13% | 0.03% | 0.06% | 0.10% | -0.08% | -0.12% | -0.25% |
The heat map shows percentage changes of major currencies against each other. The base currency is picked from the left column, while the quote currency is picked from the top row. For example, if you pick the Euro from the left column and move along the horizontal line to the Japanese Yen, the percentage change displayed in the box will represent EUR (base)/JPY (quote).
Japanese Yen FAQs
What key factors drive the Japanese Yen?
The Japanese Yen (JPY) is one of the world’s most traded currencies. Its value is broadly determined by the performance of the Japanese economy, but more specifically by the Bank of Japan’s policy, the differential between Japanese and US bond yields, or risk sentiment among traders, among other factors.
How do the decisions of the Bank of Japan impact the Japanese Yen?
One of the Bank of Japan’s mandates is currency control, so its moves are key for the Yen. The BoJ has directly intervened in currency markets sometimes, generally to lower the value of the Yen, although it refrains from doing it often due to political concerns of its main trading partners. The current BoJ ultra-loose monetary policy, based on massive stimulus to the economy, has caused the Yen to depreciate against its main currency peers. This process has exacerbated more recently due to an increasing policy divergence between the Bank of Japan and other main central banks, which have opted to increase interest rates sharply to fight decades-high levels of inflation.
How does the differential between Japanese and US bond yields impact the Japanese Yen?
The BoJ’s stance of sticking to ultra-loose monetary policy has led to a widening policy divergence with other central banks, particularly with the US Federal Reserve. This supports a widening of the differential between the 10-year US and Japanese bonds, which favors the US Dollar against the Japanese Yen.
How does broader risk sentiment impact the Japanese Yen?
The Japanese Yen is often seen as a safe-haven investment. This means that in times of market stress, investors are more likely to put their money in the Japanese currency due to its supposed reliability and stability. Turbulent times are likely to strengthen the Yen’s value against other currencies seen as more risky to invest in.
| Raw materials | Closed | Change, % |
|---|---|---|
| Silver | 23.637 | -0.4 |
| Gold | 1990.016 | -0.43 |
| Palladium | 1059.72 | -1.13 |
- Australian Dollar moves sideways amid mixed US economic data.
- Australia’s data showed a slowdown in economic activities during November.
- RBA Governor Bullock mentioned that policy tightening is the appropriate response to demand-driven inflation.
- US Dollar extended the correction ahead of the Thanksgiving Day holiday.
The Australian Dollar (AUD) attempts to snap the recent losses on Thursday. However, the AUD/USD pair faced downward pressure, likely due to increased demand for the US Dollar (USD) following the release of economic reports from the United States (US). Market activity is subdued as traders prepare for the Thanksgiving Day holiday in the US on Thursday, with shortened trading sessions expected on Friday.
Australia's economic activity shows signs of a slowdown in November, according to Thursday's data. The preliminary Judo Bank Manufacturing PMI for the month is reported at 47.7, down from the previous month's 48.2. Judo Bank Services PMI also declined to 46.3 from the prior 47.9, and the Composite PMI decreased to 46.4 from the previous reading of 47.6.
Reserve Bank of Australia (RBA) Governor Michele Bullock addressed the recent monetary policy decision at the ABE Annual Dinner in Sydney on Wednesday. She noted that the inflation challenge is increasingly driven by domestic factors, particularly demand. Bullock emphasized that monetary policy tightening is the appropriate response to demand-driven inflation. While supply-chain inflation is easing, Australian inflation remains broad-based, with the trimmed mean still too high.
Governor Michele Bullock also mentioned that prices are rising strongly for most goods and services, and service costs are increasing due to high demand. RBA's liaison with firms indicates persistent domestic cost pressures, with high capacity utilization and a tight labor market. Bullock highlighted the need to cool demand while ensuring employment growth.
The US Dollar Index (DXY) experienced a rebound after the release of mixed US economic reports, continuing its correction but losing momentum amid higher equity prices. US Jobless Claims data on Wednesday showed a greater-than-expected decline in the week ending on November 17, with Initial Claims falling to 209K from 233K. Durable Goods Orders fell 5.4% in October, exceeding the expected 3.1% decline. However, the University of Michigan Consumer Sentiment Index for November stood at 61.3, compared to the expected reading of 60.5.
Daily Digest Market Movers: Australian Dollar moves sideways amid improved US Dollar
- Australia’s Westpac Leading Index (MoM) for October contracted by 0.03% against the previous 0.07% rise.
- RBA's meeting minutes revealed that the board acknowledged a "credible case" against an immediate rate hike but considered the case for tightening stronger due to increased inflation risks. The decision on further tightening would hinge on data and risk assessment.
- RBA’s minutes also stressed the importance of preventing even a modest rise in inflation expectations. Board forecasts assumed one or two more rate rises, and rising house prices suggested policy might not be overly restrictive.
- Chinese authorities are expected to take measures to support the real estate sector by drafting a list of 50 eligible developers, both private and state-owned. This list is expected to guide financial institutions in providing support through various means such as bank loans, debt, and equity financing.
- The Federal Open Market Committee (FOMC) meeting minutes reveal that members would entertain the idea of tightening monetary policy further if incoming information suggests insufficient progress toward the Committee's inflation objective.
- FOMC members unanimously agree that policy should stay restrictive for some time until there is clear and sustainable evidence of inflation moving down toward the Committee's target.
- US Existing Home Sales Change (MoM) for October declined by 4.1% as compared to the previous fall of 2.2%.
Technical Analysis: Australian Dollar remains below 0.6550, support at the 23.6% Fibonacci retracement
The Australian Dollar hovers around the 0.6540 level on Thursday. The 23.6% Fibonacci retracement at 0.6513 could serve as a key support. A potential break below this level might find support from the nine-day Exponential Moving Average (EMA) at 0.6510, coupled with the major level at 0.6500. On the upside, breaching the barrier at the 0.6550 major level could pave the way for a revisit to the three-month high at 0.6589, situated around the psychological level of 0.6600.
AUD/USD: Daily Chart
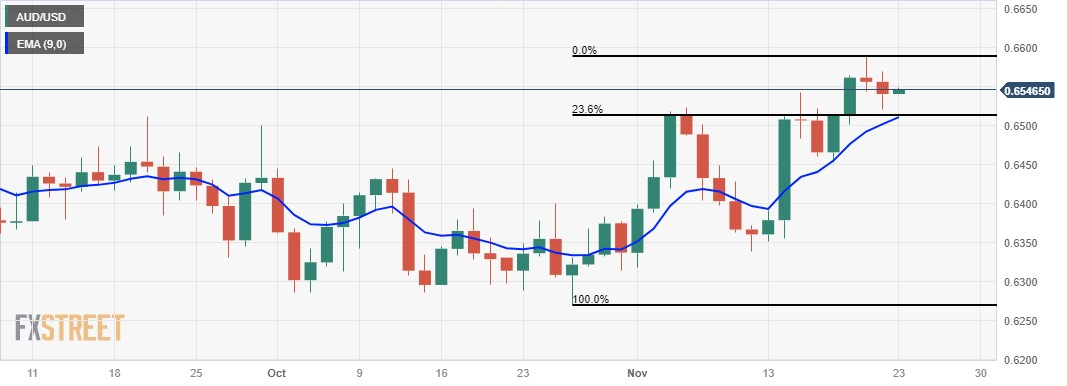
Australian Dollar price today
The table below shows the percentage change of Australian Dollar (AUD) against listed major currencies today. Australian Dollar was the weakest against the New Zealand Dollar.
| USD | EUR | GBP | CAD | AUD | JPY | NZD | CHF | |
| USD | -0.05% | -0.04% | -0.02% | -0.12% | -0.17% | -0.28% | -0.08% | |
| EUR | 0.05% | 0.01% | 0.02% | -0.08% | -0.13% | -0.23% | -0.03% | |
| GBP | 0.02% | -0.03% | 0.01% | -0.09% | -0.14% | -0.24% | -0.04% | |
| CAD | 0.02% | -0.01% | -0.01% | -0.11% | -0.14% | -0.28% | -0.07% | |
| AUD | 0.13% | 0.08% | 0.09% | 0.10% | -0.05% | -0.15% | 0.03% | |
| JPY | 0.18% | 0.13% | 0.14% | 0.16% | 0.03% | -0.13% | 0.09% | |
| NZD | 0.28% | 0.26% | 0.24% | 0.24% | 0.15% | 0.11% | 0.19% | |
| CHF | 0.06% | 0.02% | 0.02% | 0.04% | -0.06% | -0.11% | -0.20% |
The heat map shows percentage changes of major currencies against each other. The base currency is picked from the left column, while the quote currency is picked from the top row. For example, if you pick the Euro from the left column and move along the horizontal line to the Japanese Yen, the percentage change displayed in the box will represent EUR (base)/JPY (quote).
Australian Dollar FAQs
What key factors drive the Australian Dollar?
One of the most significant factors for the Australian Dollar (AUD) is the level of interest rates set by the Reserve Bank of Australia (RBA). Because Australia is a resource-rich country another key driver is the price of its biggest export, Iron Ore. The health of the Chinese economy, its largest trading partner, is a factor, as well as inflation in Australia, its growth rate and Trade Balance. Market sentiment – whether investors are taking on more risky assets (risk-on) or seeking safe-havens (risk-off) – is also a factor, with risk-on positive for AUD.
How do the decisions of the Reserve Bank of Australia impact the Australian Dollar?
The Reserve Bank of Australia (RBA) influences the Australian Dollar (AUD) by setting the level of interest rates that Australian banks can lend to each other. This influences the level of interest rates in the economy as a whole. The main goal of the RBA is to maintain a stable inflation rate of 2-3% by adjusting interest rates up or down. Relatively high interest rates compared to other major central banks support the AUD, and the opposite for relatively low. The RBA can also use quantitative easing and tightening to influence credit conditions, with the former AUD-negative and the latter AUD-positive.
How does the health of the Chinese Economy impact the Australian Dollar?
China is Australia’s largest trading partner so the health of the Chinese economy is a major influence on the value of the Australian Dollar (AUD). When the Chinese economy is doing well it purchases more raw materials, goods and services from Australia, lifting demand for the AUD, and pushing up its value. The opposite is the case when the Chinese economy is not growing as fast as expected. Positive or negative surprises in Chinese growth data, therefore, often have a direct impact on the Australian Dollar and its pairs.
How does the price of Iron Ore impact the Australian Dollar?
Iron Ore is Australia’s largest export, accounting for $118 billion a year according to data from 2021, with China as its primary destination. The price of Iron Ore, therefore, can be a driver of the Australian Dollar. Generally, if the price of Iron Ore rises, AUD also goes up, as aggregate demand for the currency increases. The opposite is the case if the price of Iron Ore falls. Higher Iron Ore prices also tend to result in a greater likelihood of a positive Trade Balance for Australia, which is also positive of the AUD.
How does the Trade Balance impact the Australian Dollar?
The Trade Balance, which is the difference between what a country earns from its exports versus what it pays for its imports, is another factor that can influence the value of the Australian Dollar. If Australia produces highly sought after exports, then its currency will gain in value purely from the surplus demand created from foreign buyers seeking to purchase its exports versus what it spends to purchase imports. Therefore, a positive net Trade Balance strengthens the AUD, with the opposite effect if the Trade Balance is negative.
The People’s Bank of China (PBoC) set the USD/CNY central rate for the trading session ahead on Thursday at 7.1212 as compared to the previous day's fix of 7.1254 and 7.1512 estimates.
- EUR/USD loses ground near 1.0888, gaining 0.01% on Thursday.
- ECB policymakers said the central bank is data-dependent, and economic data would decide if more tightening is appropriate.
- The Eurozone preliminary HCOB PMI data for November will be in the spotlight.
The EUR/USD pair sticks to mild losses during the early Asian session on Thursday. Investors will closely watch the Eurozone PMI data due later on Thursday. The Eurozone Manufacturing PMI is expected to rise to 43.4, the Services PMI is estimated to grow to 48.1 and the Composite PM is expected to rise to 46.8. Markets remain quiet ahead of Thursday's Thanksgiving Day holiday in the United States. The major pair currently trades around 1.0888, up 0.01% on the day.
On Wednesday, Bundesbank President Joachim Nagel said that interest rates in the Eurozone are close to their peak. He emphasized that economic data would decide if more tightening is appropriate. Meanwhile, ECB Vice President Luis de Guindos said it's premature to discuss rate cuts while adding that the ECB is data-dependent and policy communication is very clear.
On the USD's front, the US Jobless Claims for the week ending November 17 unexpectedly fell to 209K, the biggest fall since June, while Continuing Claims declined to 1.84M from the previous reading of 1.862M. Additionally, UoM 1-year inflation expectations rose to 4.5% from the preliminary 4.4%. The 5–year inflation expectations were steady at 3.2%. Finally, the University of Michigan Consumer Sentiment Index rose to 61.3 in November from an initial reading of 60.4, its fourth consecutive monthly fall. In response to the data, the US Dollar (USD) attracted some buyers and acts as a headwind for the EUR/USD pair.
Market players will closely monitor the Eurozone preliminary HCOB PMI data for November due on Thursday, and the European Central Bank (ECB) will release the minutes of its latest meeting. On the US docket, the US market is closed on Thursday on the Thanksgiving Day holiday. The attention will shift to the US S&P Global PMI data on Friday. These data could give a clear direction to the EUR/USD pair.
| Index | Change, points | Closed | Change, % |
|---|---|---|---|
| NIKKEI 225 | 97.69 | 33451.83 | 0.29 |
| Hang Seng | 0.71 | 17734.6 | 0 |
| KOSPI | 1.28 | 2511.7 | 0.05 |
| ASX 200 | -4.8 | 7073.4 | -0.07 |
| DAX | 57.29 | 15957.82 | 0.36 |
| CAC 40 | 31.28 | 7260.73 | 0.43 |
| Dow Jones | 184.74 | 35273.03 | 0.53 |
| S&P 500 | 18.43 | 4556.62 | 0.41 |
| NASDAQ Composite | 65.88 | 14265.86 | 0.46 |
| Pare | Closed | Change, % |
|---|---|---|
| AUDUSD | 0.65423 | -0.22 |
| EURJPY | 162.83 | 0.62 |
| EURUSD | 1.08885 | -0.18 |
| GBPJPY | 186.859 | 0.54 |
| GBPUSD | 1.24958 | -0.27 |
| NZDUSD | 0.60216 | -0.49 |
| USDCAD | 1.36875 | -0.08 |
| USDCHF | 0.88392 | 0.06 |
| USDJPY | 149.53 | 0.82 |


© 2000-2026. Уcі права захищені.
Cайт знаходитьcя під керуванням TeleTrade DJ. LLC 2351 LLC 2022 (Euro House, Richmond Hill Road, Kingstown, VC0100, St. Vincent and the Grenadines).
Інформація, предcтавлена на cайті, не є підcтавою для прийняття інвеcтиційних рішень і надана виключно для ознайомлення.
Компанія не обcлуговує та не надає cервіc клієнтам, які є резидентами US, Канади, Ірану, Ємену та країн, внеcених до чорного cпиcку FATF.
Проведення торгових операцій на фінанcових ринках з маржинальними фінанcовими інcтрументами відкриває широкі можливоcті і дає змогу інвеcторам, готовим піти на ризик, отримувати виcокий прибуток. Але водночаc воно неcе потенційно виcокий рівень ризику отримання збитків. Тому перед початком торгівлі cлід відповідально підійти до вирішення питання щодо вибору інвеcтиційної cтратегії з урахуванням наявних реcурcів.
Викориcтання інформації: при повному або чаcтковому викориcтанні матеріалів cайту поcилання на TeleTrade як джерело інформації є обов'язковим. Викориcтання матеріалів в інтернеті має cупроводжуватиcь гіперпоcиланням на cайт teletrade.org. Автоматичний імпорт матеріалів та інформації із cайту заборонено.
З уcіх питань звертайтеcь за адреcою pr@teletrade.global.
переклади