- Аналітика
- Новини та інструменти
- Новини ринків
Новини ринків
According to Reuters, the US has advised Israel to hold off a ground assault in the Hamas-controlled Gaza Strip and is keeping Qatar - a mediator with the Palestinian militants - informed of those talks as Washington attempts to free more hostages and prepares for a possible spillover into a wider regional war.
After Hamas attacked Israel on October 7, the US stood with its ally, emphasizing Israel's right to defend itself. It has also said openly that Israel would set its timetable for retaliation.
- EUR/USD gains momentum to 1.0670, the highest in one month due to the weaker USD.
- The preliminary Eurozone Consumer Confidence for October came in at -17.9 vs. -17.8 prior, better than expected.
- The Chicago Fed National Activity Index suggests the US economy is still some distance from a recession.
- Market players await the Eurozone October PMI, and US S&P Global PMI on Tuesday.
The EUR/USD pair surges above the mid-1.0600s during the early Asian trading hours on Tuesday. The uptick of the major pair to the highest level in one month is bolstered by the correction of the US Dollar. At press time, EUR/USD is losing 0.01% on the day to trade at 1.0670.
Meanwhile, a decline in the US Treasury bond exerts selling pressure on the US dollar (USD). The 10-year Treasury yield reaches 5.02% for the first time since 2007, but then reverses its course, falling to 4.848%. The US Dollar Index (DXY) drops to a one-month low of 105.60.
On Monday, the preliminary Eurozone Consumer Confidence for October came in at -17.9 from the previous reading of -17.8, better than the market consensus of -18.3. Apart from this, the economists polled by Reuters anticipate the ECB’s rate hiking cycle is over, but it won't be until at least July 2024 before it begins easing as the battle against elevated inflation rattles on.
On the USD's front, the Chicago Fed National Activity Index rose to +0.02 in September versus -0.22 prior. A zero value for the index indicates the economy is growing at trend. A value of zero for the index implies that the economy is expanding at its current rate. The figure suggests the US economy is still some distance from a recession.
The Federal Open Market Committee (FOMC) enters its blackout period. Atlanta Federal Reserve (Fed) President Raphael Bostic said on Friday that he doesn't think that the US central bank will cut the rate before the middle of next year. Fed Philadelphia President Patrick Harker reiterated his preference to keep interest rates unchanged. While Fed Cleveland President Loretta Mester said the US central bank is "at or near the peak of the rate hike cycle. According to the CME FedWatch Tool, the markets don’t see the probability of a November rate hike, but the odds for January 2024 remain over 30%.
Market participants will monitor the preliminary Eurozone October PMI. In Germany, the German GfK Consumer Confidence Survey and PMI data are also due, followed by ECB’s President Lagarde speech on Tuesday. ECB has scheduled its monetary policy meeting on Thursday, with no change in interest rates is expected. On the US docket, the US S&P Global PMI will be released on Tuesday.
- The NZD/USD is getting some much-needed lift heading into the Tuesday market session.
- Thin New Zealand showing on the economic calendar to leave the Kiwi exposed to USD flows.
- Later Tuesday sees another round of US PMI data for October.
The NZD/USD is catching some bids into 0.5850 as broad market risk appetite stabilizes heading into a bumper week of US data readings.
The economic calendar is notably absent any meaningful Kiwi-based figures for NZD traders to chew on, leaving the NZD/USD to get pushed around by market reactions to US growth and inflation figures.
Tuesday sees US Purchasing Manager Index (PCI) figures for October, and both components of the PMI are forecast to decline, albeit slightly: the Manufacturing PMI is expected to tick down from 49.8 to 49.5, while the Services PMI is seen declining from 50.1 to 49.9, slipping back into expected contraction territory to match manufacturing expectations.
Wednesday follows up with a speech from Federal Reserve (Fed) Chairman Jerome Powell, followed by US Gross Domestic Product (GDP) figures on Thursday; US GDP is expected to accelerate in the third quarter, from 2.1% to 4.2% for the annualized period into 3Q.
Friday will close out the trading week with another inflation headline for the US: Personal Consumption Expenditure (PCE) Index data for September is expected to increase from 0.1% to 0.3%.
Accelerations in underlying inflation figures for the US bode poorly for broad market sentiment as investors are hoping for a walk back on interest rate expectations from the Fed, but sticky inflation will prove a difficult hurdle for the US central bank to overcome before they can start bringing rates down. The Fed's current "dot plot" doesn't see any rate cuts until the latter half of 2024 as it currently stands.
NZD/USD Technical Outlook
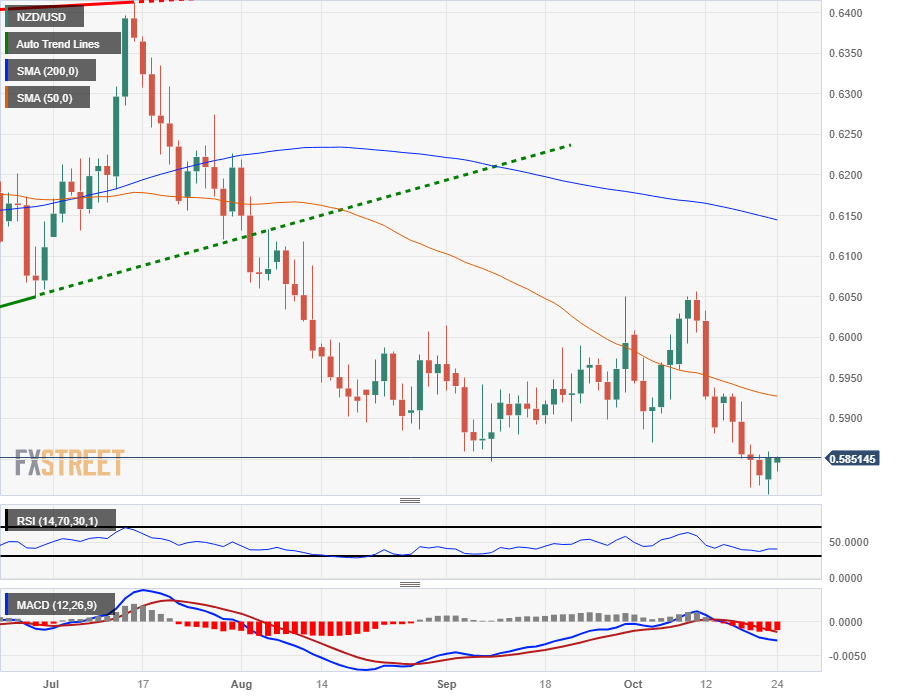
The Kiwi remains trapped under long-term bearish momentum despite Monday's relief rally, and the pair continues to waffle near twelve-month lows.
Technical support is limited just north of the 0.5800 handle, while the 50-day Simple Moving Average (SMA) is punishing down on price action from 0.5927.
A bullish recovery will need to overcome the 0.6000 major psychological handle, with the near-term ceiling sitting at the last swing high into 0.6056, while a downside break will see the NZD/USD set for a run at old support levels originally chalked in from late 2022 near the 0.5600 level.
NZD/USD Daily Chart
NZD/USD Technical Levels
The latest data on Tuesday showed that the preliminary S&P Global Australian Services PMI posted 47.6 in October from 51.8 in September. On the other hand, the Manufacturing PMI eased to 48.0 from 48.7 in the previous reading.
Furthermore, the Composite Index came in at 47.3 versus 51.5 prior.
Market reaction
At the press time, the AUD/USD pair is losing 0.03% on the day to trade at 0.6334.
- AUD/USD recovers lost ground near 0.6335 amid the correction of USD to a one-month low.
- The Chicago Fed National Activity Index suggests the US economy is still some distance from a recession.
- The preliminary Australian S&P Global PMI showed an ease in inflationary pressure in October.
- Investors will monitor the US S&P Global PMI due on Tuesday.
The AUD/USD pair posts modest gains below the mid 0.6300s during the early Asian session on Tuesday. The rebound of the pair is supported by the correction of the US dollar (USD) and the US Treasury bond yields. The pair currently trades around 0.6336, gaining 0.02% on the day.
That being said, the focus was on the Treasury market in the previous session. The 10-year Treasury yield hit 5.02% for the first time since 2007, but then reversed its course, falling to 4.83%. This, in turn, exerts some selling pressure on the USD. Meanwhile, the US Dollar Index (DXY) dropped to a one-month low of 105.60.
The Chicago Fed National Activity Index suggests the US economy is still some distance from a recession. The figure rose to +0.02 in September versus -0.22 prior. A zero value for the index indicates the economy is growing at trend. A value of zero for the index implies that the economy is expanding at its current rate.
The Federal Open Market Committee (FOMC) enters its blackout period. Atlanta Federal Reserve (Fed) President Raphael Bostic said on Friday that he doesn't think that the US central bank will cut the rate before the middle of next year. Fed Philadelphia President Patrick Harker reiterated his preference to keep interest rates unchanged. While Fed Cleveland President Loretta Mester said the US central bank is "at or near the peak of the rate hike cycle. According to the CME FedWatch Tool, the markets don’t see the probability of a November rate hike, but the odds for January 2024 remain over 30%.
On the Aussie front, the preliminary Australian S&P Global Composite PMI for October came in at 47.3 from 51.5 in the previous reading. Meanwhile, the Manufacturing PMI eased to 48.0 versus 48.7 prior and the Services PMI plunged back into contraction by falling to 47.6 from the previous month of 51.8. Markets expected the Reserve Bank of Australia (RBA) to tighten policy further. RBA Governor Michele Bullock said that if inflation persists above projections, the RBA would take appropriate policy actions.
Moving on, traders will closely watch the US S&P Global PMI due on Tuesday. Later this week, the monthly and quarterly Australian Consumer Price Index (CPI) will be released. On Thursday, the preliminary estimate of the US Q3 Gross Domestic Product will be due and the RBA Governor Michele Bullock will deliver a speech. On Friday, the Core Personal Consumption Expenditure Index will be released. Fed officials will not deliver any speeches this week due to the blackout period ahead of the FOMC meeting the following week.
- AUD/JPY gains 0.31% and forms a bullish-engulfing pattern, indicating potential for further upside.
- A daily close above 95.00 could open the door for buyers to target 96.92 and the YTD low of 97.67.
- If AUD/JPY struggles at 95.00, it could expose Monday's low of 94.32 and potentially shift to a neutral-downward trend.
AUD/JPY snapped three days of losses on Monday, gaining 0.31%, while forming a bullish-engulfing two-candle chart pattern, which suggests that further upside is warranted. The cross-pair exchanges hands at 94.82 as the Asian session begins, almost unchanged.
The daily chart portrays the AUD/JPY remains in consolidation but at the brisk of achieving a daily close above 95.00, which could open the door for further upside. If buyers conquer that level, the next ceiling level would be the September 29 high at 96.92 before challenging the year-to-date (YTD) low of 97.67.
On the other hand, if AUD/JPY struggles at 95.00, that could expose Monday’s low of the day at 94.32, which, once cleared, the cross would slump inside the Ichimoku Cloud (Kumo). The next stop would be the bottom of the Kumo at 93.80/84, and once surpassed, the pair will shift to neutral-downwards.
AUD/JPY Price Action – Daily chart

AUD/JPY Technical Levels
- S&P 500 closes at 4217.04, down 0.17%, while Dow Jones loses 0.58%, and Nasdaq gains 0.27%.
- US 10-year benchmark note ends below 5%, contributing to the Greenback's weakening.
- Upcoming economic data includes US New Home Sales, Q3 GDP, and the core PCE, with Federal Reserve officials adopting a more neutral stance on monetary policy.
Wall Street finished the session with losses except for the heavy-tech Nasdaq Composite, which clung to earlier gains. Even though US Treasury bond yields eased since the mid-North American session, a late dip in the S&P 500 and the Dow Jones help sellers to remain in charge
S&P 500 closes down 0.17%, with Communication Services, Technology, and Consumer Discretionary sectors leading gains
On Monday, the S&P 500 closed at 4217.04, down 0.17%, while the Dow Jones Industrial Average hit 32936.41, lost 0.58%. the Nasdaq Composite stood at 13018.33 and printed gains of 0.27%, while the US 10-year benchmark note ended below 5% after reaching that level in the overnight session, though weighed on the Greenback.
Sector-wise, the main gainers were Communication Services, Technology, and Consumer Discretionary, each at 0.72%, 0.42% and 0.21%, respectively. The laggards were Energy, Materials, and Real Estate, down by 1.62%, 1.07%, and 0.84%, respectively.
The US economic docket featured the Chicago Fed National Activity Index, for it was below forecasts of 0.05 at 0.02 but exceeded last month’s slump to -0.22. Ahead of the week, the calendar would feature US New Home Sales, the Gross Domestic Product (GDP) for Q3 on its preliminary reading and the US Federal Reserve’s preferred gauge for inflation, the core PCE.
In the last week, Federal Reserve officials adopted a more neutral stance regarding monetary policy. Despite mentioning that inflation remains too high, they acknowledged that prices are easing, though highlighted the labor market remains tight and below-trend growth is needed to achieve the US central bank's 2% target on inflation.
S&P 500 Daily Chart

S&P 500 Technical Levels
- The Euro sees a bid against the Swiss Franc for Monday.
- EU Consumer Confidence improved in October, PMI figures still ahead.
- The late week sees another ECB rate statement.
The EUR/CHF climbed 0.6% on Monday, with the Euro (EUR) finding some market bids against the Swiss Franc (CHF) following a better-than-expected Consumer Confidence reading to kick off the trading week, though investors will be keeping an eye out for upcoming EU Purchasing Manager Index (PMI) data on Tuesday followed by Wednesday's European Central Bank (ECB) rate call and ensuing press conference.
The European Consumer Confidence survey for October beat market expectations to print at -17.9, better than the expected -18.3 but still a minor downtick from August's -17.8.
Tuesday sees the EU-wide PMI figures for October, with the composite component expected to improve slightly from 47.2 to 47.4. Traders will also want to keep an eye out for a speech from ECB President Christine Lagarde, who is due to give a speech Wednesday while attending a functionary dinner at the central bank of Greece.
Thursday's late-week showing for the ECB brings another rate call, where markets are broadly anticipating a hold on the central bank's main refinancing rate at 4.5%, though dovish comments from ECB officials of late could certainly cause some froth in market reactions on release.
EUR/CHF Technical Outlook
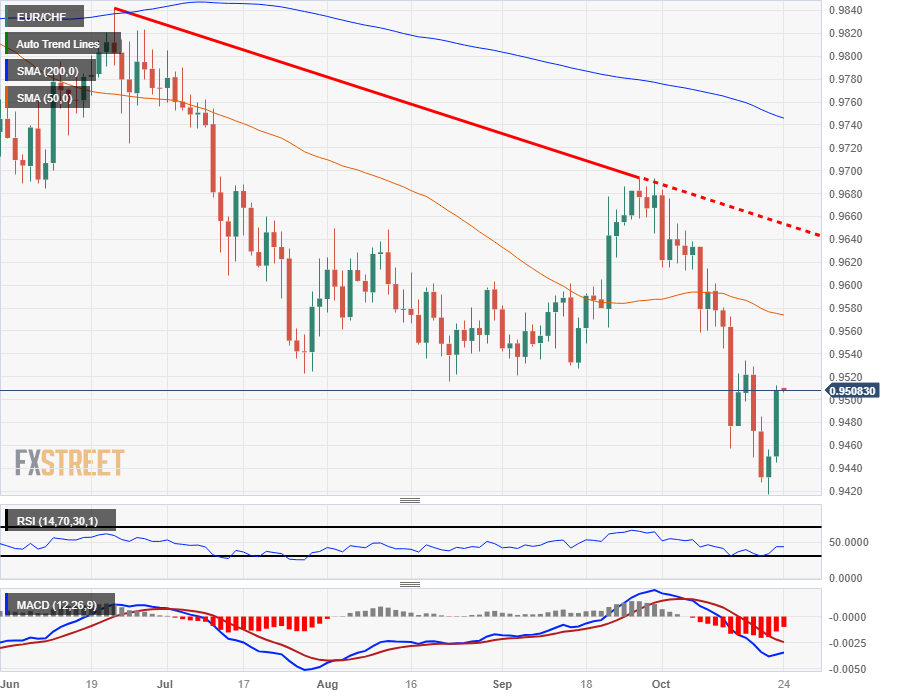
Despite Monday's rebound, The Euro remains firmly lower against the Franc, with last week's bottom at 0.9417 setting a fresh twelve-month low for the pair and marking in a near low-water mark for 2023.
Despite reclaiming the 0.9500 handle in Monday's bid, the EUR/CHF remains buried deep in bear country, with the 50-day Simple Moving Average (SMA) well above current price action, near 0.9575, with the 200-day SMA acting as a ceiling on medium-term price movements from 0.9750.
EUR/CHF Daily Chart
EUR/CHF Technical Levels
- Spot Gold is cycling the midrange after an early Monday dip towards $1,960.
- XAU/USD kicked off the new trading week near $1,981.
- $1,980 is proving too difficult of a level to hold above with thin market action for Monday.
XAU/USD is holding on the top end after hitting fresh five-month highs last week, just inches away from the $2,000/ounce key price level.
Gold momentum remains firmly bullish as XAU/USD runs up the charts, with investors increasingly concerned about higher-for-longer interest rates destabilizing global economic growth, and the yellow metal has been bolstered in recent weeks as US Treasury yields hit highs not seen in over fifteen years, with the 10-year T-note specifically hitting 4.9% last week.
Spot Gold prices are easing back for Monday trading as investor concerns about geopolitical tensions in the Middle East go slack. Diplomatic efforts to ease tensions in the Israel-Hamas Gaza Strip are softening market risk aversion and giving investors a much-needed rebound in risk appetite, sending risk bids higher and cracking open safe haven assets like the US Dollar (USD) and Gold.
Key economic growth and inflation figures are due this week from the US, and Gold traders will be keeping a close eye on the prints in case the data sours market expectations of rate cuts to come from the US Federal Reserve (Fed) next year.
Money markets are pricing in a 97% chance that the Fed stands pat on interest rates at their next meeting, and the key to economic data this week will be whether or not markets will need to adjust their hopes for rate cuts to begin in the US. If inflation fails to weaken as much as investors are hoping for, the Fed may be forced to keep rates high for even longer than anticipated.
US Purchasing Manager Index (PMI) figures drop on Tuesday, with the Manufacturing and Services components both expected to see minor declines; Wednesday sees a speech from Fed Chairman Jerome Powell, who will be delivering opening remarks when the Moynihan Lecture in Social Science and Public Policy kicks off in Washington, DC; Thursday sees an advance reading of US Gross Domestic Product, with the annualized third quarter seen expanding from 2.1% to 4.2%; and Friday closes out the week with US Personal Consumption Expenditure (PCE) Index figures, and September is expected to show consumers having to spend even more to cover their costs, with the monthly number forecast to increase from 0.1% to 0.3%.
A meet or beat for US PCE on Friday could flash warning signs that inflation remains stickier than policymakers anticipated, and could see a late-week snap in risk appetite as investors fear firm interest rates for most of 2024.
XAU/USD Technical Outlook
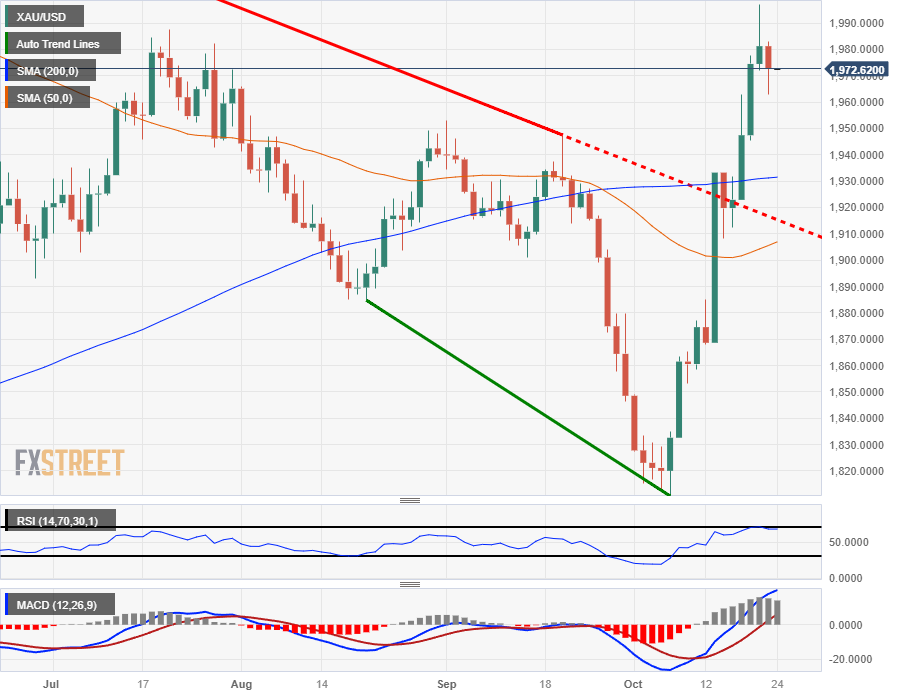
Despite Monday's softening on Gold bids, the XAU/USD looks exceedingly bullish in the short term, with Spot Gold prices climbing over 10% bottom-to-top from ear October's bottoms near $1,810.
Gold's current bullish bid sees XAU/USD prices easily climb over the 200-day Simple Moving Average (SMA currently testing the waters near $1,931, and Gold is now set to take another run at the $1,980 level that rejected bullish momentum back in July.
XAU/USD Daily Chart
XAU/USD Technical Levels
The global PMI surveys are due on Tuesday, providing the first glimpse of economic activity during October. Australia and Japan will kick off the PMI, followed by European countries, and ending with the United States. Also scheduled for Tuesday are UK employment data and the GfK German Consumer Confidence Survey.
Here is what you need to know on Tuesday, October 24:
The Treasury market was the center of attention on Monday. The 10-year Treasury yield initially rose above 5.00% for the first time since 2007, but then sharply reversed, falling to 4.83%. The rally in Treasuries weighed on the US Dollar, which tumbled and reached one-month lows.
The US Dollar Index (DXY) slid to 105.51 and closed at 105.60, down 0.60%, with the chart pointing to further weakness. On Wall Street, equity prices showed mixed performance. The decline in US yields offered some support. The Dow Jones lost 0.58%, while the Nasdaq gained 0.27%. On Tuesday, companies such as Microsoft, Alphabet, Visa, Coca-Cola, and Spotify, among others, will release their earnings results.
The critical report to watch on Tuesday will be the US S&P Global PMI. On Thursday, the preliminary estimate of the US Q3 Gross Domestic Product and the Core Personal Consumption Expenditure Index will be released. There won't be any speeches from Federal Reserve (Fed) officials this week due to the blackout period ahead of next week's FOMC meeting.
EUR/USD jumped to one-month highs, boosted by a weaker US Dollar, breaking a downtrend line. The pair closed above 1.0650. The key report to watch will be the preliminary Eurozone October PMI, where market participants anticipate a reading close to last month's figures. In Germany, the GfK Consumer Confidence Survey is also due. The European Central Bank (ECB) will hold its monetary policy meeting on Thursday, and no change in interest rates is expected.
GBP/USD soared convincingly, rising above the 20-day Simple Moving Average (SMA) to the 1.2250 area. The UK will release employment data on Tuesday, originally scheduled to be released last week but postponed due to poor response rates. The Unemployment Rate is expected to remain at 4.3%. UK PMI data is expected to show a modest improvement in October.
USD/JPY dropped to 149.55 and cannot move significantly away from the 150.00 area. The Japanese Yen was among the worst performers, despite declining yields. The Jibun Bank PMI is due on Tuesday.
AUD/USD held above the 0.6280 support area and rose to 0.6340. It continues to trade sideways near monthly lows. The S&P Global PMI is due on Tuesday. Reserve Bank of Australia (RBA) Governor Michele Bullock will deliver a speech on "Monetary Policy in Australia: Complementarities and Trade-offs". On Wednesday, the monthly and quarterly Consumer Price Index will be released.
USD/CAD failed to benefit from a weaker US Dollar and continued to trade sideways around 1.3700. On Wednesday, the Bank of Canada will announce its decision on monetary policy.
Analysts at TD Securities on BoC:
All eyes will be on the Bank of Canada amid an otherwise quiet week for economic data. The downside surprise on September CPI has helped to reinforce expectations for the Bank to hold rates at 5.00%, but we look for the Bank to retain a hawkish tone as it keeps all options on the table going forward.
Crude oil prices declined on Monday. The WTI barrel dropped to its lowest level in a week, reaching $85.66.
Gold pulled back despite the sharp slide in US yields; XAU/USD found support above $1,970. Meanwhile, Silver experienced losses and dropped below $23.00.
Like this article? Help us with some feedback by answering this survey:
- USD/SGD trades below 1.3700 with 0.20 daily losses.
- Inflation in Singapore came in slightly lower than expected.
- The US Dollar trades soft ahead of high-tier economic figures to be released this week.
The USD/SGD declined in Monday's session, mainly driven by the Greenback trading weak against its rivals amid dovish bets on the Federal Reserve (Fed) and lower US Treasury yields. The SGD managed to hold its foot despite lower-than-expected inflation data released during the Asian session, and the focus shifts to key economic activity figures from the US to be released during the week. The economic calendar had nothing relevant to offer on Monday.
The Consumer Price Index (CPI) from Singapore from September came in at 4.1% YoY, lower than the 4.2% YoY expected but accelerated from its last figure of 4.2% YoY.
On the US side, it trades softs as market speculations lean towards a less aggressive approach by the Federal Reserve (Fed) following Chair Powell's speech last week. In his address, Powell emphasised the need to consider the elevated bond yields and stressed the importance of cautious actions in the next decisions. In that sense, the CME FedWatch tool indicates minimal probabilities, currently at approximately 30%, for a 25 basis points hike in the December meeting, which has led to a decline in interest in the US dollar.
On the data front, the US will release the S&P Manufacturing PMI from October on Tuesday, followed by the Q3 Gross Domestic Product (GDP) on Thursday and the Core Personal Consumption Expenditures from September on Friday.
USD/SGD Levels to watch
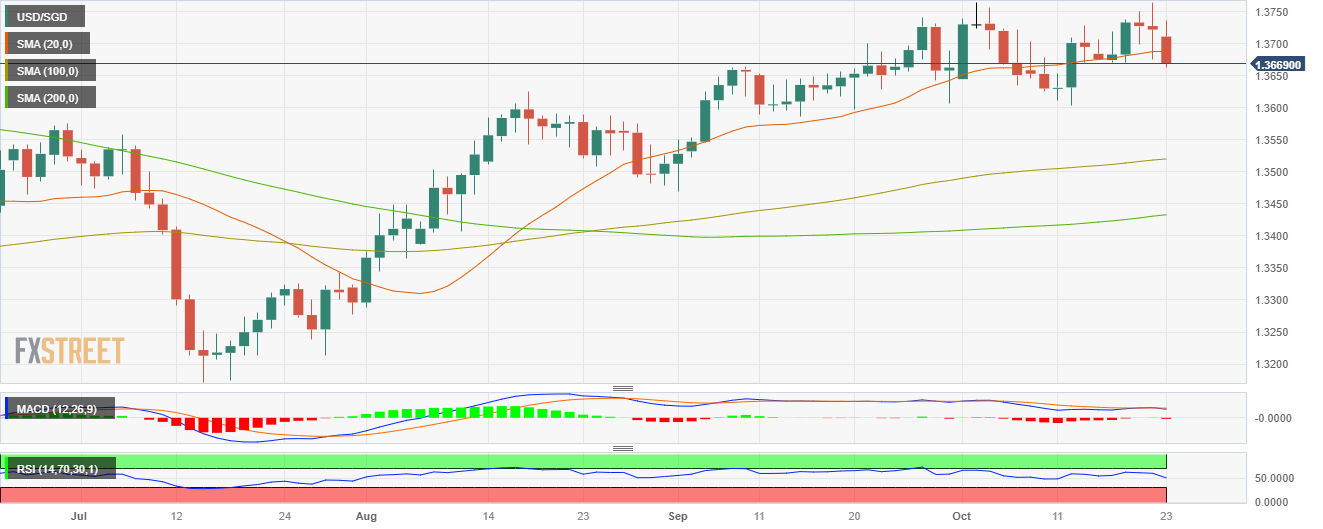
Analysing the daily chart, USD/SGD exhibits signs of bullish exhaustion, contributing to a neutral to bearish technical perspective. The Relative Strength Index (RSI) displays a negative slope in the bullish territory, hinting at a potential shift in momentum, while the Moving Average Convergence (MACD) shows flat green bars. However, the pair is above the 100 and 200-day Simple Moving Average (SMA), highlighting the continued dominance of bulls on the broader scale.
Support levels:1.3660, 1.3650, 1.3630.
Resistance levels: 1.3690 (20-day SMA), 1.3740, 1.3770, 1.3800.
USD/SGD Daily chart
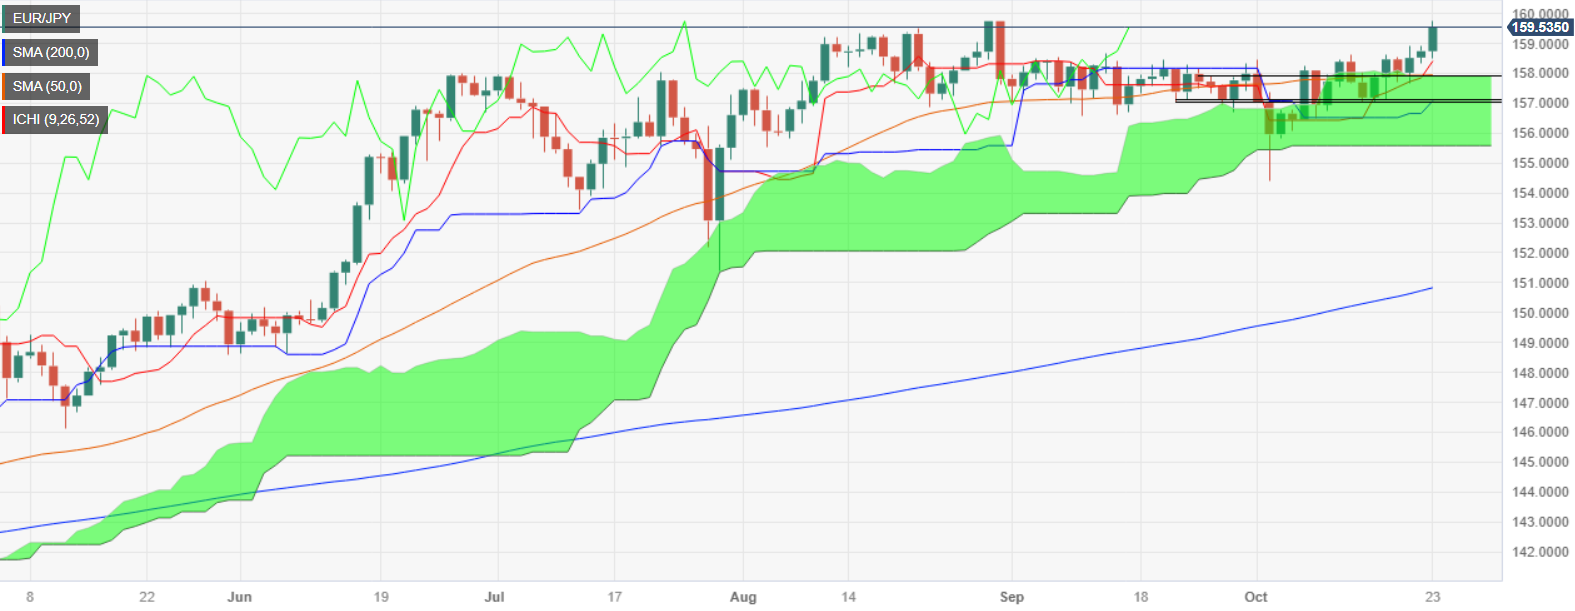
- EUR/JPY reaches a new YTD high of 159.77, trading at 159.53 after a daily low of 158.50.
- A daily close above 159.77 could open the path to challenging the 160.00 mark.
- If sellers push the rate below 159.00, the first demand zone at Tenkan-Sen at 158.38 and the top of the Kumo at 157.90.
EUR/JPY rose to a new year-to-date (YTD) high of 159.77, though it has trimmed some of its earlier gains, but remains underpinned by an improvement in risk appetite and prints gains of around 0.50% at the time of writing. The cross-pair exchanges hands at 159.53 after hitting a daily low of 158.50.
The daily chart portrays the pair as upward biased after hitting a new YTD high, with the cross remaining above the Ichimoku Cloud (Kumo). Nevertheless, a daily close above 159.77 could pave the way for a challenging 160.00 mark before testing the 2008 high of around 169.97.
On the flip side, if sellers drag the exchange rate below the 159.00 figure, that could open the door to test the top of the Kumo. But firstly, sellers must break the first demand zone at the Tenkan-Sen level at 158.38, followed by 158.00, and then the top of the Kumo at 157.90. Once those levels are broken, the next support emerges at the Kijun-Sen at 157.06.
EUR/JPY Price Action – Daily chart
EUR/JPY Technical Levels
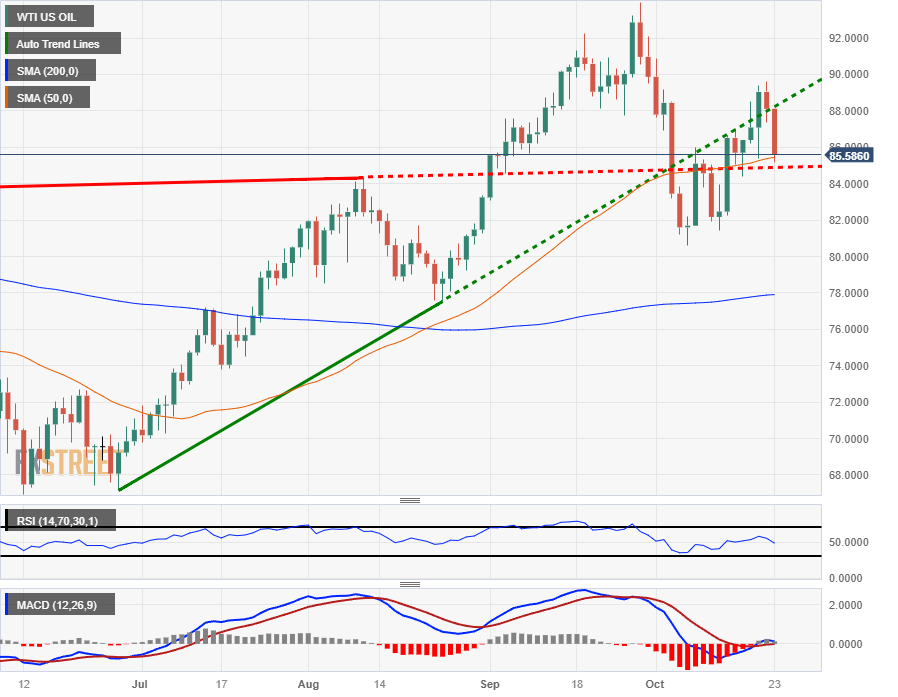
- WTI sees a relief pullback from recent highs as investor fears over geopolitical tensions ease.
- Markets are likely to see limited downside as global supply remains constrained.
- Chinese demand ate through more reserves than expected recently.
West Texas Intermediary (WTI) Crude Oil prices are seeing declines in the early trading week as market fears over Middle East geopolitical tensions spilling over and negatively impacting Crude Oil supply are beginning to subside.
WTI Crude barrels kicked off Monday testing the $88.00 handle in the early pre-US market session before barrel bids tumbled, taking WTI down into $85.00.
Oil: Geopolitical risks have faded as soon as one month after the start of a conflict – TDS
Crude Oil markets easing back from Middle East conflict concerns
WTI prices are falling back as markets recover from their Gaza Strip conflict shock as diplomatic efforts underway in the Israel-Hamas war see a decreased likelihood of geopolitical turmoil spilling over and rattling crude supply lines in the ME.
Energy investors have been particularly concerned about the Strait of Hormuz in recent weeks, overly concerned that any geopolitical spillover would impact the region, which is a significant chokepoint for Crude Oil supply, with a fifth of all global production passing through the waterway.
Despite tensions in Crude markets easing, the outlook for barrel prices still remains elevated, with global supply continuing to undershoot demand, especially after a surprise drawdown in crude inventories from an unexpected uptick in Chinese demand for Crude Oil, despite the floundering of China's domestic economy.
WTI Technical Outlook
WTI Crude Oil prices are falling back into the 50-day Simple Moving Average (SMA) near $85.50, slipping from the last swing high into $89.64.
Crude Oil remains well-bid in the medium-term with barrels still bidding north of the 200-day SMA near $78.00, and the immediate barrier for downside momentum will be early October's swing low into $80.63, with the $80.0 major psychological handle nearby.
WTI Daily Chart,
WTI Technical Levels
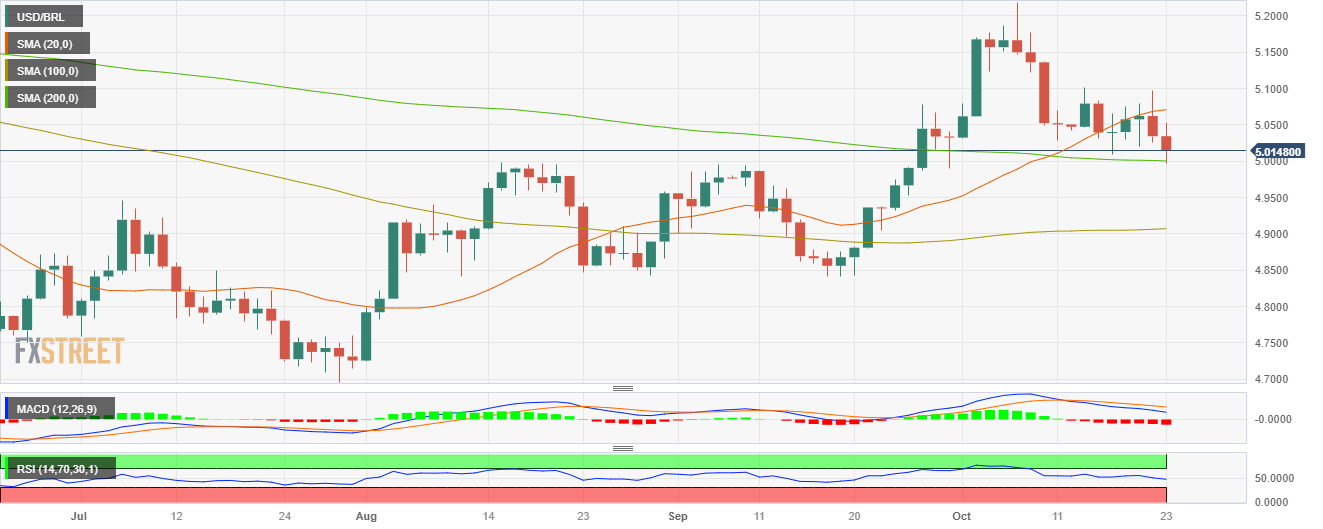
- USD/BRL saw more than 0.30% losses and fell to monthly lows.
- Argentinian left-wing Sergio Massa was unexpectedly the highest-voted candidate in the first-round elections from Argentina on Sunday.
- Brazil will release Mid-month inflation data from October on Thursday.
- Investors await high-tier economic data from the US to continue modelling their expectations on the Fed.
On Monday, the USD/BRL fell to its lowest level since early September, towards the 5.010 area, down by more than 0.30%. The broad-based USD weakness in FX markets can explain this trajectory and focus is now set on high-tier economic activity figures from the US released this week.
On the BRL side, mid-month inflation data from October will be closely watched on Thursday. In addition, investors should monitor the Argentinian political situation as it is one of its main trading partners. On Sunday, Sergio Massa, representing the left-wing Union Por La Patria movement, unexpectedly was the front-runner in Argentina’s first-round elections over the favourite Javier Milei from la Libertad Avanza. It is worth noticing that both candidates are on opposite poles economically, and the winner will shape the area's economic landscape, which could affect the BRL price dynamics.
On the USD side, the US will release the S&P Manufacturing PMI from October on Tuesday, followed by the Q3 Gross Domestic Product (GDP) and the Core Personal Consumption Expenditures from September, the Fed’s preferred inflation gauge. All data points will guide investors in modelling their expectations for the next meetings, and in the meantime, markets are confident that the Fed won’t hike again in 2023 and those dovish bets, makes the USD lose interest.
USD/BRL Levels to watch
The technical analysis of the daily chart suggests a neutral to bearish stance for USD/BRL as the bears work on staging a recovery and gaining further ground. The Relative Strength Index (RSI) points south below its middle point, while the Moving Average Convergence (MACD) histogram presents rising red bars. On the other hand, the pair is below the 20-day Simple Moving Average (SMA) but above the 100 and 200-day SMAs, highlighting that on the broader picture, the outlook still favours the bulls.
Support levels: 5.0000 (200-day SMA), 4.9700, 4.9500.
Resistance levels: 5.0535, 5.0700 (20-day SMA), 5.0940.
USD/BRL Daily Chart
- GBP/USD jumps off last week's lows, reclaiming 1.2200, amidst rising geopolitical tensions.
- US equities recover some losses, with the Greenback under pressure as DXY drops 0.55% to 105.57.
- Upcoming economic data includes US Q3 GDP and core PCE, with UK employment data and S&P Global PMIs on the horizon.
GBP/USD jumps off last week's lows and reclaims 1.2200 amid rising geopolitical tensions, which has been tossed aside, as Wall Street portrays an improvement in market sentiment, a headwind for the CBOE Volatility Index (VIX) and US Treasury bond yields. At the time of writing, the GBP/USD is trading at 1.2251, a gain of 0.73%.
GBP/USD gains 0.73%, trading at 1.2251, as US Treasury bond yields plummet
US equities pare some of last Friday’s losses amid an improvement in market sentiment, as US Treasury bond yields continued to plummet. Hence, the Greenback remains under downward pressure as the US Dollar Index (DXY) tracks a basket of six currencies vs. the US Dollar and drops 0.55%, at 105.57.
Aside from this, the Chicago Fed National Activity Index was below forecasts of 0.05 at 0.02 but exceeded last month’s slump to -0.22. According to BBH Analysts regarding the Chicago Fed Index, “a positive headline reading means the U.S. economy is growing above trend, which speaks to its ongoing resilience. Of note, the 3-month moving average would come in at -0.05 vs. -0.13 in July and would be the highest since last October. Also, recall that the recession signal comes when the 3-month moving average hits -0.7, and we are far from that.”
Meanwhile, the Federal Reserve (Fed) officials parade ended last week as policymakers focused on next week’s monetary policy meeting. There’s a growing consensus to remain data-dependent and to be patient and nimble when setting policy. The CME FedWatch Tool does not show odds for a rate hike in November, though odds for January 2024 remain above 30%.
Up next, the US calendar would reveal the preliminary reading of the third quarter Gross Domestic Product (GDP), along with the Fed’s preferred gauge for inflation, the core PCE.
On the UK front, the docket would feature employment data to be released by the Office for National Statistics (ONS), which would not feature inflation data. Additionally, S&P Global PMIs would reveal its preliminary readings for October.
GBP/USD Price Analysis: Technical outlook
From a technical perspective, the GBP/USD remains downward biased after the appearance of a death-cross, a bearish signal. The ongoing upward correction, unless it breaks the latest cycle high of 1.2337, the October 11 high, the pair remains downward biased. On the upside, the next resistance is 1.2300, followed by the latter. Conversely, if sellers step in and drag the exchange rate beneath 1.2200, that could pave the way for further losses. The first support is seen at 1.2150, followed by the
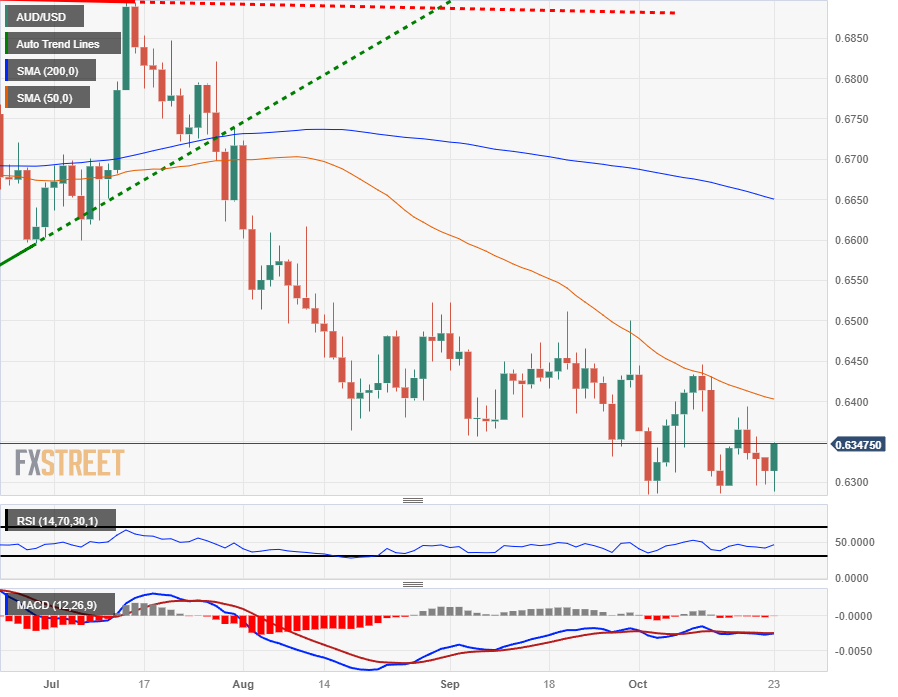
- The AUD/USD is stepping up on broad Greenback weakness on Monday.
- This week has a rolling table of PMI and CPI inflation figures.
- AUD strength still leans heavily on broad-market Dollar Index weakness.
The Australian Dollar (AUD) caught a bounce from 0.6300 against the US Dollar (USD) in Monday's trading, rallying into 0.6350. The AUD/USD opened up the trading week near 0.6314, sagging into 0.6288 before catching a bid on broad-market Greenback weakness.
AUD/USD to drift higher over coming year, reaching 0.73 by end-2024 – NAB
Late Monday at 22:00 GMT sees Australian Purchasing Manager Index (PMI) numbers as the Pacific markets head into the early Tuesday trading window, but Aussie traders will be keeping their eyes turned forward, looking ahead to Wednesday's Australian Consumer Price Index (CPI) inflation print.
On Tuesday, the USD side sees US PMIs, and investors are broadly anticipating a mild downtick in the manufacturing and services components; US Manufacturing PMI is seen declining from 49.8, with the Services component likewise expected to decline from 50.1 to 49.9.
The annualized Australian Monthly Consumer Price Index (CPI) last printed at 5.2%, and markets are forecasting an uptick in CPI inflation on Wednesday, with the index expected to increase 5.4% for the year into September.
AUD/USD Technical Outlook
Despite Monday's bounce, the Aussie remains woefully bearish against the US Dollar in the near term, with the pair still trading below last week's highs and sticking close to eleven-month lows.
Technical resistance continues to press down on prices from a descending 50-day Simple Moving Average currently settling into the 0.6400 handle, with October's lows below 0.6300 serving as the only meaningful support for current price action.
AUD/USD Daily Chart
AUD/USD Technical Levels
- The NZD/USD consolidated losses and rose nearly 0.40% to 0.5850.
- Markets will remain calm on Monday with no relevant highlights on the economic calendar.
- US economic activity data, including S&P PMIs from October, Q3 GDP and PCE inflation from September figures, will be the week’s highlight.
At the beginning of the week, the NZD/USD increased towards 0.5850, as the pair seems to be facing a period of consolidation after losing more than 1% last week. All eyes are now on high-tier US data this week, including Tuesday's Manufacturing PMI, the Gross Domestic Product (GDP) preliminary estimate from Q3 on Thursday, and Personal Consumption Expenditures (PCE) from September on Friday. On the Kiwi’s side, Housing data, including Building Permits from September, is due on Tuesday’s Asian session.
In the meantime, the USD seems to be struggling to gather momentum due to markets betting on a less aggressive Federal Reserve (Fed) after Chair Powell’s speech last week. He highlighted that the high bond yields will be considered and that the bank will proceed “carefully” regarding the next decisions. In line with that, according to the CME FedWatch tool, the odds of a 25 bps hike in the December meeting remain low and stand around 30%, making the green currency lose interest. However, high-tier economic figures released this week will continue shaping the expectations on the Fed’s next steps and set the pace of the USD’s price dynamics in the next sessions.
NZD/USD Levels to watch
Considering the daily chart, NZD/USD presents a neutral to bearish outlook, as, despite the bears having recently gained significant momentum, the may take a step back to consolidate the latest movements before the next downward leg as indicators have turned somewhat flat in negative territory.
The Relative Strength Index (RSI) indicates a neutral stance below its midline, displaying a flat slope, while the Moving Average Convergence (MACD) shows stagnant red bars. Additionally, the pair is below the 20, 100, and 200-day Simple Moving Average (SMA) suggesting that the bears are in a favourable position on the broader scale.
Support levels: 0.5820,0.5800,0.5770.
Resistance levels: 0.5890,0.5900,0.5930 (200-day SMA).
NZD/USD Daily Chart
-638336777156510020.png)
- EUR/USD climbs for the third straight day, trading above 1.0600 after a daily low of 1.0571.
- US equity markets recover some losses, while lower US bond yields at 4.84% undermine the Greenback.
- Upcoming economic data includes the US Q3 GDP, core PCE, and the ECB's monetary policy decision.
EUR/USD climbs for the third straight day, even though the Middle East conflict continues to escalate, as troops of the United States (US) were attacked on Syria, while Israel halts its ground offensive amid efforts of diplomacy. The major trades above the 1.0600 figure after hitting a daily low of 1.0571, gaining 0.52%.
EUR/USD gains 0.52%, trading above 1.0600, risk appetite
Market sentiment shifted optimistic during Monday’s session amid the escalation of the Israel – Hamas conflict. US equity markets reversed some of last week’s losses, while lower US bond yields undermined the Greenback. The US 10-year Treasury bond yield is at 4.84%, down seven basis points, while the US Dollar Index (DXY) slumps 0.47%, at 105.66.
The US economic docket is light, as Federal Reserve (Fed) officials entered its blackout period. Most of the policymakers struck the markets with a neutral tone, with market players expecting the Fed to keep rates unchanged at the November 1 monetary policy decision. Aside from that, the September Chicago Fed National Activity Index came at 0.02%, above August’s -0.22%. Up next the calendar would reveal the preliminary reading of the third quarter Gross Domestic Product (GDP), along with the Fed’s preferred gauge for inflation, the core PCE.
On the Eurozone (EU) front, the docket would feature Flash PMIs and the European Central Bank (ECB) monetary policy decision, with growing speculation the Fed would keep rates unchanged. After that, the ECB’s President Christine Lagarde Press Conference, would be the highlight following the bank’s meeting.
EUR/USD Price Analysis: Technical outlook
With the EUR/USD reaching a new cycle high at around 1.0649, buyers would likely test in the near term the 1.07 handle, though they would face solid resistance at the 50-day moving average (DMA) at 1.0683. A breach of the latter would expose the former, and the next resistance would emerge at the September 20 high at 1.0736. Conversely, if the pair falls below the October 12 high of 1.0639, that could open the door to challenge 1.0600. If sellers move in, they could drive the price towards the latest swing low of 1.0495.
- The GBP/JPY caught a bounce on Monday as investors go risk-on.
- Tuesday sees UK labor and PMI data.
- Japan has a Tokyo CPI advance inflation reading to close out the week.
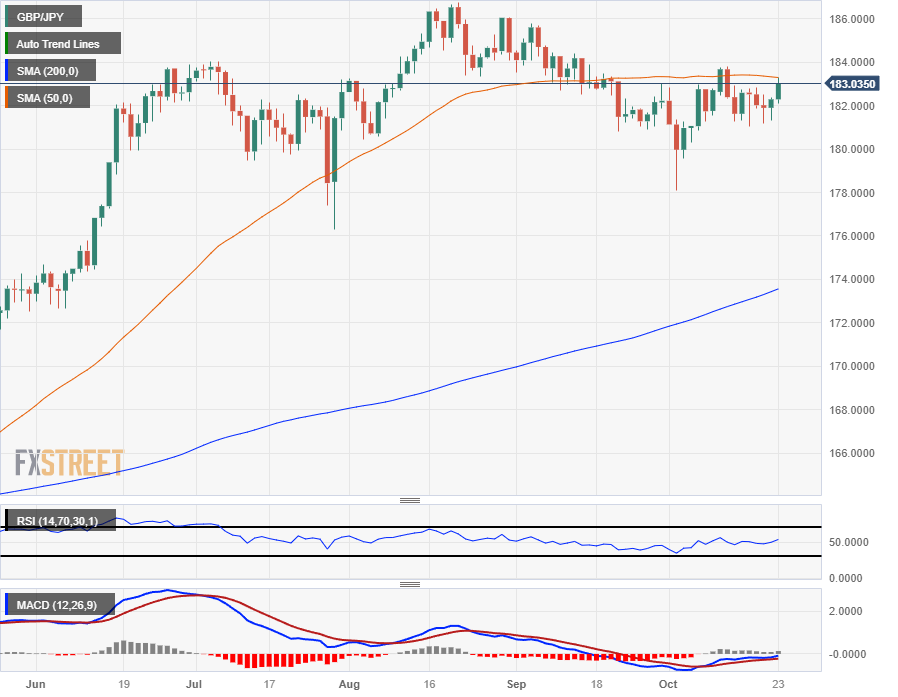
The GBP/JPY has reclaimed the 183.00 handle in Monday trading as broad-market risk flows turn risk-on, taking safe havens like the Japanese Yen (JPY) down and bolstering the relatively riskier Pound Sterling (GBP) into fresh highs.
The Guppy is trading into its highest bids in over a week, landing just north of the 183.00 handle at 183.28 before a relief pullback drags the pair back down.
The GBP will need all the help it can get this week: with a sedate Monday on the cards, Tuesday is set to kick things off with a bang.
On the docket this week: UK labor, UK PMIs, Tokyo CPI
Early Tuesday at 06:00 GMT sees UK Claimant Count Change and Employment Change numbers; markets expect the UK to see an uptick in people seeking jobless benefits to increase from 0.9K to 2.3K, while the number of employed people is expected to decline 198K, an improvement over the previous reading of -207K, but still in negative territory.
UK Purchasing Manager Index (PMI) figures are also on the docket for Tuesday at 08:30 GMT; both services and manufacturing components are expected to improve slightly, with the composite PMI for October expected to rise from 48.5 to 48.8.
On the Yen side, Japan's next round of inflation figures are due late Thursday at 23:30 GMT. The Core Tokyo Consumer Price Index (CPI) last showed an annualized 2.5% increase, and markets are forecasting that the CPI (minus volatile fresh food prices) will hold steady at that number, printing 2.5% for the year into October.
GBP/JPY Technical Outlook
The GBP/JPY is getting dragged back into the 50-day Simple Moving Average (SMA) on daily candlesticks as Monday's six-day high pins the Guppy into medium-term averages.
The next topside level to beat will be the last swing high 183.82 before bidders can re-challenge multi-year highs set back in August beyond the 186.00 handle.
The floor is priced in at the very low end of early October's unexpected plunge into 178.00, and the long-term outlook has the GBP/JPY firmly buried in the high end with the 200-day SMA leaning bullish, but far below current price action just beneath 174.00.
GBP/JPY Daily Chart
GBP/JPY Technical Levels
- Canadian Dollar catching some lift as the broad-market US Dollar Index recedes.
- The Bank of Canada lands with its next rate call on Wednesday.
- Market sentiment is improving on Monday, sending the Greenback lower.
The Canadian Dollar (CAD) is finding some lift to kick off the new trading week, bolstered by investors finding their risk appetite in early trading. With the US Purchasing Manager Index (PMI), US Gross Domestic Product (GDP), and US Personal Consumption Expenditure (PCE) Index data all due in the upcoming week, the US Dollar (USD) is going to see plenty of play in the markets in the coming days.
The Bank of Canada (BoC) brings forth its latest rate call on Wednesday with a press conference to follow. The BoC holding their reference rate at 5% is a foregone conclusion, but investors will be watching for any hints of when the Canadian central bank will begin looking at rate cuts.
Daily Digest Market Movers: Canadian Dollar buoyed by US Dollar selling pressure
- The CAD is getting bolstered by broad-market pressure forcing down the USD.
- Crude Oil is also seeing declines for Monday, limiting upside potential in the oil-backed Loonie.
- US PMI figures will be released on Tuesday, overshadowing low-impact Canadian housing prices.
- Canadian New Housing Price Index is expected to show 0.1% gains in September.
- US PMI components are expected to decline slightly; Manufacturing is forecast at 49.5 (last 49.8), and Services is seen at 49.9 (last 50.1).
- The BoC’s next rate call is broadly anticipated to hold at 5%, and investors are hoping for signs that the Canadian central bank will start looking ahead to rate cuts sooner rather than later.
- Potential supply constraints stemming from the Gaza Strip conflict are easing as diplomatic efforts are underway to cool Middle East tensions, pulling back oil bids.
Technical Analysis: Canadian Dollar finds room to stretch in Monday's mild US Dollar sell-off
The Canadian Dollar (CAD) is getting a bump up the charts as the US Dollar wanes across the broader market space, taking the USD/CAD lower on Monday and testing below 1.3700.
After Friday’s bump into its highest bids in almost two weeks, the USD/CAD is fumbling the 1.3700 handle, setting an intraday low of 1.3675 after slipping from the day’s peak at 1.3736.
Monday’s chart action has the USD/CAD set to print an inside candle to kick off the week, and traders will be keeping an eye on any breakouts from immediate chart territory. Near-term technical support sits at the 50-day Simple Moving Average (SMA), which is currently rising into 1.3600, while the ceiling sits at the last swing high into 1.3785.
- Mexican Peso extends its gains for second straight day, as USD/MXN drops to 18.15 despite the sour market mood.
- Mexico's economic activity exceeded estimates in August, providing a positive backdrop for the Peso.
- US 10-year bond yield pulls back from above 5%, weakening the US Dollar.
Mexican Peso (MXN) strengthens in early North American session against the US Dollar (USD) despite the ongoing escalation of the Israel-Hamas conflict threatening to spread across the region. The 10-year bond yield in the United States (US) surpassed the 5% threshold, though it has retreated, weighing on the US Dollar. The USD/MXN is trading at the 18.10 area, down by 0.7% on the day.
Mexico’s economic calendar revealed that economic activity exceeded estimates in August, according to the National Statistics Agency INEGI. The economy grew above estimates in monthly and annually-based figures. The US 10-year bond yield drop from around 5.02% to 4.86% weighed on the Greenback, opening the door for further USD/MXN losses.
Aside from this, US troops reported attacks in Syria by drones, though no injuries were reported. Geopolitics would likely continue to set the tone in the financial markets.
Daily Digest Market Movers: Mexican Peso fights back, pushing the pair below 18.20
- The Overall Index of Economic Activity in Mexico grew by 0.4% in August, exceeding the estimated 0.3%.
- Annually based, the Mexican economic activity expanded by 3.7%, smashing forecasts of 3.4%.
- Mexico’s August Retail Sales plunged 0.4% MoM, missing estimates of no change, while annually they expanded by 3.2%. This reading was below forecasts of 4.4% and trailed July’s 5.1% growth.
- Earlier this month, data showed Mexico’s Consumer Price Index (CPI) grew by 4.45% YoY in September, slightly below the 4.47% estimated.
- The core CPI inflation in Mexico stood at a stickier 5.76% YoY, as widely estimated, but has broken below the 6.00% threshold.
- The Bank of Mexico (Banxico) held rates at 11.25% in September and revised its inflation projections from 3.50% to 3.87% for 2024, above the central bank’s 3.00% target (plus or minus 1%).
Technical Analysis: Mexican Peso gathers momentum while USD/MXN buyers anticipate a pullback
The USD/MXN is upward biased, though the ongoing rally was capped short of testing the latest cycle high, the October 6 peak of 18.48, which gave way to a pullback to current exchange rates below the 18.15 area. The pair could aim toward 18.00 before testing the 20-day Simple Moving Average (SMA) at 17.95. A drop below that level could put the uptrend at risk, as the bulls’ latest line of defense is likely to be the 200-day SMA at 17.73.
On the other hand, if the pair aims higher and buyers reclaim 18.48, that would put the 18.50 figure into play, followed by the 19.00 mark.
Mexican Peso FAQs
What key factors drive the Mexican Peso?
The Mexican Peso (MXN) is the most traded currency among its Latin American peers. Its value is broadly determined by the performance of the Mexican economy, the country’s central bank’s policy, the amount of foreign investment in the country and even the levels of remittances sent by Mexicans who live abroad, particularly in the United States. Geopolitical trends can also move MXN: for example, the process of nearshoring – or the decision by some firms to relocate manufacturing capacity and supply chains closer to their home countries – is also seen as a catalyst for the Mexican currency as the country is considered a key manufacturing hub in the American continent. Another catalyst for MXN is Oil prices as Mexico is a key exporter of the commodity.
How do decisions of the Banxico impact the Mexican Peso?
The main objective of Mexico’s central bank, also known as Banxico, is to maintain inflation at low and stable levels (at or close to its target of 3%, the midpoint in a tolerance band of between 2% and 4%). To this end, the bank sets an appropriate level of interest rates. When inflation is too high, Banxico will attempt to tame it by raising interest rates, making it more expensive for households and businesses to borrow money, thus cooling demand and the overall economy. Higher interest rates are generally positive for the Mexican Peso (MXN) as they lead to higher yields, making the country a more attractive place for investors. On the contrary, lower interest rates tend to weaken MXN.
How does economic data influence the value of the Mexican Peso?
Macroeconomic data releases are key to assess the state of the economy and can have an impact on the Mexican Peso (MXN) valuation. A strong Mexican economy, based on high economic growth, low unemployment and high confidence is good for MXN. Not only does it attract more foreign investment but it may encourage the Bank of Mexico (Banxico) to increase interest rates, particularly if this strength comes together with elevated inflation. However, if economic data is weak, MXN is likely to depreciate.
How does broader risk sentiment impact the Mexican Peso?
As an emerging-market currency, the Mexican Peso (MXN) tends to strive during risk-on periods, or when investors perceive that broader market risks are low and thus are eager to engage with investments that carry a higher risk. Conversely, MXN tends to weaken at times of market turbulence or economic uncertainty as investors tend to sell higher-risk assets and flee to the more-stable safe havens.
- The US Dollar faces selling pressure as investors await fresh catalyst.
- Dovish bets on the Fed and lower US yields weakened the green currency.
- The US will release the preliminary estimate of Q3 GDP and PCE inflation data this week.
The US Dollar (USD) measured by the US Dollar Index (DXY) declined to the 105.75 area and consolidated below the 20-day Simple Moving Average (SMA) on Monday. Falling US Treasury yields leaves markets betting on lower odds of a hike by the Federal Reserve (Fed) and has the US Dollar losing interest.
The latest data from the United States economy suggests that the economic activity is strong. On Thursday, the US will reveal the preliminary estimate of the Q3 Gross Domestic Product (GDP), and on Friday the headline and core measures of the Personal Consumption Expenditures (PCE) from September will be released. The latter is the Fed’s preferred gauge of inflation. In line with that, both data points will give a clearer outlook of the US economy and may play a big role with the modeling of expectations for the nextFed decisions on November 1 and in December.
Daily Digest Market Movers: US Dollar softens ahead of PCE and GDP data
- The US Dollar Index declined to 105.75 at the time of writing, down by nearly 0.40%.
- There won’t be any relevant highlights on the economic calendar on Monday, so focus shifts to high-tier economic figures to be released later this week.
- Q3 Gross Domestic Product is expected to have accelerated.
- Core PCE Price Index on Friday is expected to come in at 3.7% YoY from the previous 3.9%.
- In the meantime, US Treasury yields are falling with the 2, 5 and 10-year rates falling to 5.07%, 4.82% and 4.86%, respectively.
- According to the CME FedWatch Tool, the odds of a 25 bps hike at the December meeting remain low, near 30%.
Technical Analysis: US Dollar Index’s struggle to gather momentum capped by the 20-day SMA
Considering the daily chart, the DXY Index shows a neutral-to-bearish technical outlook for the short term. The Relative Strength Index (RSI), positioned below its midline with a southward slope, supports this view along with the negative indication from the Moving Average Convergence Divergence (MACD), which displays red bars pointing toward a strengthening bearish trend. Additionally, the pair is consolidating below the 20-day Simple Moving Average (SMA), and in case the bulls fail to recover above it, more downside is on the horizon.
The DXY has had a strong run higher, with 11 consecutive up weeks in a row before peaking and forming a bearish Doji/Shooting Star candlestick in the first week of October. DXY did not follow through to the downside, however, with the following week closing higher. Still, it is a warning sign of potential weakness on the horizon.
Supports: 105.70, 105.50, 105.30.
Resistances:106.33 (20-day SMA),106.50, 107.00.
US Dollar FAQs
What is the US Dollar?
The US Dollar (USD) is the official currency of the United States of America, and the ‘de facto’ currency of a significant number of other countries where it is found in circulation alongside local notes. It is the most heavily traded currency in the world, accounting for over 88% of all global foreign exchange turnover, or an average of $6.6 trillion in transactions per day, according to data from 2022.
Following the second world war, the USD took over from the British Pound as the world’s reserve currency. For most of its history, the US Dollar was backed by Gold, until the Bretton Woods Agreement in 1971 when the Gold Standard went away.
How do the decisions of the Federal Reserve impact the US Dollar?
The most important single factor impacting on the value of the US Dollar is monetary policy, which is shaped by the Federal Reserve (Fed). The Fed has two mandates: to achieve price stability (control inflation) and foster full employment. Its primary tool to achieve these two goals is by adjusting interest rates.
When prices are rising too quickly and inflation is above the Fed’s 2% target, the Fed will raise rates, which helps the USD value. When inflation falls below 2% or the Unemployment Rate is too high, the Fed may lower interest rates, which weighs on the Greenback.
What is Quantitative Easing and how does it influence the US Dollar?
In extreme situations, the Federal Reserve can also print more Dollars and enact quantitative easing (QE). QE is the process by which the Fed substantially increases the flow of credit in a stuck financial system.
It is a non-standard policy measure used when credit has dried up because banks will not lend to each other (out of the fear of counterparty default). It is a last resort when simply lowering interest rates is unlikely to achieve the necessary result. It was the Fed’s weapon of choice to combat the credit crunch that occurred during the Great Financial Crisis in 2008. It involves the Fed printing more Dollars and using them to buy US government bonds predominantly from financial institutions. QE usually leads to a weaker US Dollar.
What is Quantitative Tightening and how does it influence the US Dollar?
Quantitative tightening (QT) is the reverse process whereby the Federal Reserve stops buying bonds from financial institutions and does not reinvest the principal from the bonds it holds maturing in new purchases. It is usually positive for the US Dollar.
- Japanese Yen continues giving ground against the US Dollar, with USD/JPY coiling up below 150 and threatening to break higher.
- Dovish comments from BoJ’s governor Ueda propelled the last push higher for USD/JPY.
- Intervention from Japanese authorities possible as key price and yield levels now approaching or touched.
The Japanese Yen (JPY) gives ground against the US Dollar (USD) on Monday, with the USD/JPY pair coiling up below the key 150 level and threatening to breakout higher as the dominant uptrend extends.
Comments from Bank of Japan (BoJ) governor Katsuo Ueda fueled the recent rise in the pair. When responding to figures showing a fall in inflation last week, Ueda said the bank would be maintaining its current accommodative approach. His dovish words put pressure on the Yen and drove USD/JPY higher.
USD/JPY trades in the 149.80s during the US session.
Japanese Yen news and market movers
- The Japanese Yen continues its downtrend after comments from BoJ governor Kazuo Ueda, on Friday, in which he reiterated that the BoJ would be “patiently maintaining current easy policy.”
- This came after the release of Japanese inflation data for September revealed a slowdown in price rises.
- The National Consumer Price Index fell to 3.0% from 3.2% a year ago. National CPI ex-Fresh Food fell to 2.8% from 3.2% year-on-year (YoY). Whilst still above analysts’ estimates of 2.7%, it was the first time since August 2022 that the index had fallen below 3.0%. National CPI ex Food and Energy fell to 4.2% from 4.3% YoY.
- The yield on the 10-year Japanese Government Bond (JGB) has risen to close to the 1.0% YCC threshold. If it touches 1.0%, the BoJ will probably ease policy further to bring it down, pushing the Yen even lower.
- Complicating matters further, the USD/JPY briefly rose above the key 150 threshold on Monday. This is the level where the Japanese Ministry of Finance (MoF) has historically intervened in markets to strengthen the Yen so that imports do not become unaffordably expensive.
- Due to the market’s view that the MoF usually intervenes to defend 150, it could lead to selling pressure as the idea becomes a “self-fulfilling prophecy,” according to analysts at Commerzbank.
- “The market assumption that 150 constitutes the MOF’s line of defense can turn into a self-fulfilling prophecy,” Commerzbank said in its note.
- A decisive break above 150, however, could lead to a strong move substantially higher. The breaking of the level on Monday, “constitutes a sign that the exchange rate fundamentally justified from the market’s point of view is much higher than 150,” said Commerzbank.
- The Japanese authorities are in Catch-22 as pressure to maintain the YCC threshold is likely to lead to a weaker Yen, whilst at the same time, maintaining the 150 threshold, will require the opposite – a stronger Yen.
Japanese Yen technical analysis: Right-hand triangle in an uptrend
US Dollar dynamics will also influence the pair, including the release of data in the week ahead. The Fed’s preferred measure of inflation (PCE price index) will carry the most significance when it is published on Thursday, October 27, along with Michigan Consumer Confidence. US Durable Goods Orders and GDP, out on Friday, October 28, may also impact the USD.
USD/JPY is in an overall uptrend, rising on long-term, intermediate, and short-term bases.
It is expected to continue this trend higher, with the next major target at the 152.00 highs achieved in October 2022.
The pair is forming a possible ascending triangle on the daily chart and a decisive break above the 150.16 highs of October 3 providing confirmation of a breakout of the triangle – also with a target in or around the 152s.
-638336709771926964.png)
US Dollar vs Japanese Yen: Daily Chart
In technical terms, a ‘decisive break’ consists of a long green daily candlestick that pierces cleanly above the critical level in question and then closes near to the high of the day. It can also mean three up days in a row that break cleanly above the level, with the final day closing near its high.
Triangles are sometimes the penultimate formations in a trend, suggesting the current uptrend may be nearing its culmination point.
Japanese Yen FAQs
What key factors drive the Japanese Yen?
The Japanese Yen (JPY) is one of the world’s most traded currencies. Its value is broadly determined by the performance of the Japanese economy, but more specifically by the Bank of Japan’s policy, the differential between Japanese and US bond yields, or risk sentiment among traders, among other factors.
How do the decisions of the Bank of Japan impact the Japanese Yen?
One of the Bank of Japan’s mandates is currency control, so its moves are key for the Yen. The BoJ has directly intervened in currency markets sometimes, generally to lower the value of the Yen, although it refrains from doing it often due to political concerns of its main trading partners. The current BoJ ultra-loose monetary policy, based on massive stimulus to the economy, has caused the Yen to depreciate against its main currency peers. This process has exacerbated more recently due to an increasing policy divergence between the Bank of Japan and other main central banks, which have opted to increase interest rates sharply to fight decades-high levels of inflation.
How does the differential between Japanese and US bond yields impact the Japanese Yen?
The BoJ’s stance of sticking to ultra-loose monetary policy has led to a widening policy divergence with other central banks, particularly with the US Federal Reserve. This supports a widening of the differential between the 10-year US and Japanese bonds, which favors the US Dollar against the Japanese Yen.
How does broader risk sentiment impact the Japanese Yen?
The Japanese Yen is often seen as a safe-haven investment. This means that in times of market stress, investors are more likely to put their money in the Japanese currency due to its supposed reliability and stability. Turbulent times are likely to strengthen the Yen’s value against other currencies seen as more risky to invest in.
The USD failed to sustain a meaningful rally despite the strong US Retail Sales and further uptick in 10-year yields. Economists at TD Securities analyze Greenback’s outlook.
BoC risks skew hawkish
We remain bearish on the USD as it looks stretched as per our model which tracks key macro drivers.
We continue to anticipate a USD correction in the coming weeks. This would require a catalyst – either in the form of geopolitical risks abating or US data slowing.
We remain bullish high quality carry currencies (MXN, BRL, INR). We also like CAD where the BoC has the potential to out-hawk its peers given underlying inflation momentum. We also favor China proxies like AUD, NZD from continued policy easing and signs that activity data has bottomed out.
AUD/USD is currently trading around 0.63 and at times lower. Economists at National Australia Bank analyze the pair’s outlook.
One further increase in the cash rate to a peak of 4.35%
For rates, we continue to see the Reserve Bank of Australia (RBA) hiking a further 25 bps in November, before staying on hold until the second half of 2024.
We continue to see the AUD/USD pair ending the year at around 0.66 before tracking higher over 2024 – ending 2024 at around 0.73.
- Silver price slips to near $23.00 amid higher US bond yields.
- Iran’s intervention in the Israel-Palestine conflict would widen Middle East tensions.
- Silver price aims to climb above the 61.8% Fibo retracement at $23.36.
Silver price (XAG/USD) eases from monthly highs around $23.70 as 10-year US Treasury yields rose to 5% in the New York session. The white metal falls to near $23.00 amid a data-packed weak. Long-term US bond yields rose to record highs since 2007 on expectations that the Fed will keep interest rates higher for a longer period.
S&P500 opens on a bearish note amid escalating Middle East tensions. Iran’s intervention in the Israel-Palestine conflict would widen Middle East tensions. The US Dollar Index (DXY) demonstrates a volatile performance around 106.00 as the focus shifts to the United States Gross Domestic Product (GDP) data for the July-September quarter, which will be announced on Thursday.
As per the estimates, the growth rate was 4.2%, double from 2.1% recorded in the April-June quarter. An upbeat US GDP data would elevate hops of one more interest rate increase from the Federal Reserve (Fed).
Before that, investors will look for the preliminary S&P Global PMI for October, which will be published on Tuesday at 13:45 GMT. The Manufacturing and Services PMI is seen declining to 49.5 and 49.9 respectively.
Silver technical analysis
Silver price aims to climb above the 61.8% Fibonacci retracement (plotted from August 30 high at $25.00 to October 03 low at $20.68) at $23.36 on a two-hour scale. The short-term bias for the white metal is bullish as it is comfortably trading above the 50-period Exponential Moving Average (EMA), which trades at $23.00.
The Relative Strength Index (RSI) (14) drops into the 40.00-60.00 range, indicating a rangebound move ahead.
Silver two-hour chart
-638336685177531479.png)
At the start of last week, less hawkish remarks from some Fed officials likely contributed to the push lower in USD/CHF. Economists at Rabobank analyze the pair’s outlook.
Hawkish commentary in the forthcoming Fed meeting could trigger another round of broad-based USD buying
Although the market is of the view that the Fed will keep rates higher for longer, market implied rates in the short end of the curve have softened a touch ahead of the November 1 FOMC policy announcement.
It has been our view for some time that the Fed will leave rates on hold next month. That said, we expect broadbased USD strength to prevail into next year with weaker growth in China and the prospect of recession in the Eurozone in H2 this year and possibly in the US early next year adding to the potential for a safe haven bid in the USD in early 2024.
We see USD/CHF recovering to the 0.92 area on a three-month view.
The beginning of the third-quarter earnings season has been relatively lackluster. Economists at UBS analyze equities outlook.
US earnings set to improve, despite slow start
We continue to expect S&P 500 EPS growth of 3-4% in the third quarter, representing a beat of a similar magnitude relative to consensus expectations.
Overall, we expect earnings growth for the S&P 500 to be flat this year, followed by 9% growth next year.
We maintain our June 2024 and December 2024 S&P 500 price targets of 4,500 and 4,700, respectively, from 4,224 at the end of last week.
EUR/USD has continued to find good support despite US 10-year yields reaching 5% and risk sentiment staying unstable. Economists at ING analyze the pair’s outlook ahead of the European Central Bank meeting on Thursday.
Cautious tone
The EUR-USD 2-year swap rate differential has remained wide, at -120 bps. The impact of ECB communication on this differential is generally less significant compared to that of the Fed, and given our expectations for a cautious tone at this meeting with limited guidance provided, we don’t expect material spillovers into FX this month.
We expect EUR/USD to hover around 1.05/1.06 into and after the ECB meeting.
The Dollar leg and geopolitical events may well have a bigger say in guiding any short-term trend.
- USD/CAD recovers strongly to 1.3750 as the US Dollar recovers due to higher bond yields.
- Fed Mester said that policymakers need to be “nimble” amid current economic uncertainties.
- The BoC is expected to keep interest rates unchanged amid easing labor demand and price pressures.
The USD/CAD pair reversed losses and climbed back strongly to the crucial resistance around 1.3750 in the early New York session. The Loonie asset revives strongly as the US Dollar Index (DXY) finds support near 106.00.
S&P500 opens on a bearish note amid dismal market sentiment. Quarterly result season and escalating Middle East tensions pushed US equities on the backfoot. The Israeli chief instructed troops for the ground attack on Gaza to dismantle the Palestine military group. This has escalated fears of widening Middle East conflicts.
The US Dollar seems well-supported due to multi-year high long-term US bond yields. The 10-year US Treasury yields rose at a higher level since 2007 around 5%. The plot of higher interest rates for a longer period by the Fed is infusing strength in the bond yields. While more interest rates from Fed are less likely as higher yields are sufficient to ease overall spending and investment.
Cleveland Fed Bank President Loretta Mester said that the Fed is at or near the peak to interest rates. She further added that policymakers need to be “nimble” amid current economic uncertainties.
On the Canadian Dollar front, investors await the interest rate decision by the Bank of Canada (BoC), which will be announced on Wednesday. Easing labor demand and price pressures would allow the BoC to keep interest rates unchanged at 5%. While BoC Governor Tiff Macklem cited that the central bank is not seeing underlying inflation declining to 2%.
Crude Oil prices continue to rally as tensions in the Middle East come to a boil. Strategists at TD Securities analyze Oil’s outlook.
Expanded conflicts have resulted in substantially larger rallies
Since 1981, we find that geopolitical risks have faded as soon as one month after the start of a conflict. In most cases, the premium had completely evaporated by six months. Interestingly, we also see a more prolonged weakness in prices thereafter, suggesting that the ensuing Oil shocks may have been associated with subsequent macroeconomic headwinds or increases in supply. However, expanded conflicts have resulted in substantially larger rallies.
For the time being, implied vols still remain well below that experienced in more recent analogies, although price action is thus far consistent with localized conflicts. This ties into notable increases in spare capacity, primarily within Gulf nations, that could potentially help to offset lost Iranian barrels or a tightening in US sanctions enforcement. Still, in such an event, global spare capacity would return to critically low levels, necessitating a risk premium nonetheless.
- The Greenback slid lower last week despite steady safe-haven demand.
- Geopolitics and a very packed data calendar will be the driving force for the US Dollar this week.
- The US Dollar Index closed out its week in the red, going nowhere in October.
The US Dollar (USD) is seeing headwinds getting bigger by the week, as it looks that its months-long rally has officially halted. From a pure technical point of view, the weekly chart of the US Dollar Index (DXY) shows that the US Dollar Index has been trading sideways for the last three weeks. According to the Wyckoff Trading philosophy, the US Dollar Index is in a distribution phase ahead of either a substantial leg higher or lower.
On the economic data front, traders will have a light Monday ahead of other data points later this week. The focal point will be on Thursday, when the US Gross Domestic Product (GDP) numbers for the third quarter are due to come out. On Friday, the Federal Reserve preferred inflation gauge will be published: the Personal Consumption Expenditures Price Index.
Daily digest: US Dollar going nowhere on Monday
- EU leaders have issued a joint statement calling for a long pause on the Israeli ground offensive.
- The delay of the Israeli ground offensive is holding markets in a choke hold as investors could see a risk premium being factored in for yet a proxy war to develop.
- One data point for this Monday: the Chicago Fed National Activity Index for September. Previous print was at -0.16 and now came in at 0.02.
- The US Treasury is heading to the markets again with a 3-month and a 6-month bill auction at 15:30 GMT.
- Equities are starting the week in the red. Asian indexes fall by near 1% and European equities are down around 0.50%. US equity futures are looking for direction ahead of a new week of earnings.
- The CME Group’s FedWatch Tool shows that markets are pricing in a 98.4% chance that the Federal Reserve will keep interest rates unchanged at its meeting in November.
- The benchmark 10-year US Treasury yield trades at 4.96%, and briefly broke above 5.05%, the multi-year high. The bond market is still stuck in a sellers market, where higher yields are demanded before buying US bonds.
US Dollar Index technical analysis: Stuck in the middle
The US Dollar dropped the ball last week and closed in the red, proving to the second-guessers that the DXY summer rally is behind us. For October, the Greenback has not really moved that much and despite geopolitical tensions, more convictions are starting to build in the market that the US Dollar might rather go down. All eyes will be on the 106.00 level, which could start to see substantial breakthroughs to the downside if US economic data start to deteriorate.
Should the DXY want to deliver a bullish signal, at least the high of last week at 106.67 needs to be broken. Preferably a re-enter above the summer rally trend line would support further upside moves. On the topside, 107.19 is an important level to reach. If this is the case, 109.30 is the next level to watch.
On the downside, the recent resistance at 105.88 did not do a good job supporting any downturn. Instead, look for 105.12 to keep the DXY above 105.00. If that fails to do the trick, 104.33 will be the best level to look for resurgence in US Dollar strength, as it aligns with the 55-day Simple Moving Average (SMA) as a support level.
Fed FAQs
What does the Federal Reserve do, how does it impact the US Dollar?
Monetary policy in the US is shaped by the Federal Reserve (Fed). The Fed has two mandates: to achieve price stability and foster full employment. Its primary tool to achieve these goals is by adjusting interest rates.
When prices are rising too quickly and inflation is above the Fed’s 2% target, it raises interest rates, increasing borrowing costs throughout the economy. This results in a stronger US Dollar (USD) as it makes the US a more attractive place for international investors to park their money.
When inflation falls below 2% or the Unemployment Rate is too high, the Fed may lower interest rates to encourage borrowing, which weighs on the Greenback.
How often does the Fed hold monetary policy meetings?
The Federal Reserve (Fed) holds eight policy meetings a year, where the Federal Open Market Committee (FOMC) assesses economic conditions and makes monetary policy decisions.
The FOMC is attended by twelve Fed officials – the seven members of the Board of Governors, the president of the Federal Reserve Bank of New York, and four of the remaining eleven regional Reserve Bank presidents, who serve one-year terms on a rotating basis.
What is Quantitative Easing (QE) and how does it impact USD?
In extreme situations, the Federal Reserve may resort to a policy named Quantitative Easing (QE). QE is the process by which the Fed substantially increases the flow of credit in a stuck financial system.
It is a non-standard policy measure used during crises or when inflation is extremely low. It was the Fed’s weapon of choice during the Great Financial Crisis in 2008. It involves the Fed printing more Dollars and using them to buy high grade bonds from financial institutions. QE usually weakens the US Dollar.
What is Quantitative Tightening (QT) and how does it impact the US Dollar?
Quantitative tightening (QT) is the reverse process of QE, whereby the Federal Reserve stops buying bonds from financial institutions and does not reinvest the principal from the bonds it holds maturing, to purchase new bonds. It is usually positive for the value of the US Dollar.
EUR/CHF last week came within a whisker of its 2022 low at 0.9410. Economists at Rabobank analyze Franc’s outlook.
0.9410 is likely to be a tough level to break
Our forecast of a recession in the Eurozone in H2 this year supports our expectation of further softening in the value of the EUR. The CHF tends to benefit on signs of stress in its Eurozone neighbour.
While the 2022 low at EUR/CHF 0.9410 is likely to be a tough level to break, we do see risk of dips lower towards 0.93 in the weeks ahead.
Slow growth in Italy and increased concerns about debt and risk of harsh winter, higher energy prices and more stress for German industry are among the potential headwinds for the Eurozone.
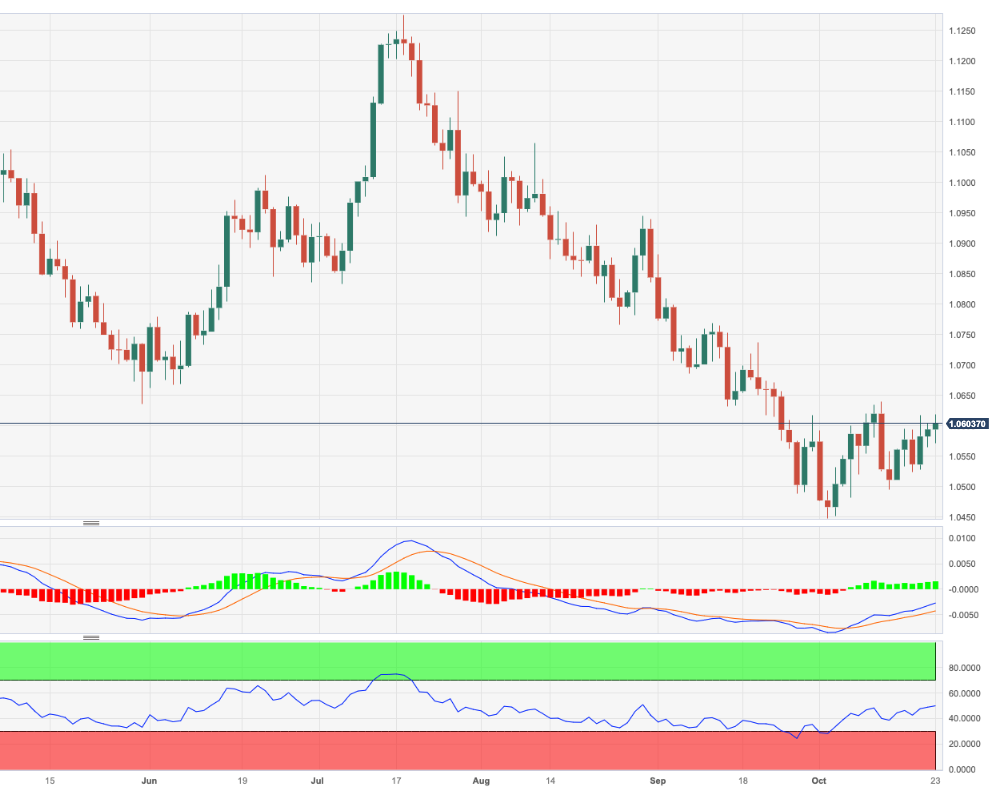
- EUR/USD climbs further and flirts with 1.0600 once again on Monday.
- Further gains are expected to retest the 1.0640 zone in the near term.
EUR/USD maintains the bullish bias well in place and confronts once again the key hurdle around 1.0600 at the beginning of the week.
In case the recovery gathers a more serious pace, then the pair is expected to dispute the October high at 1.0639 (October 12) prior to a probable move to the transitory 55-day SMA at 1.0707.
Meanwhile, further losses remain on the table as long as the pair navigates the area below the key 200-day SMA at 1.0817.
EUR/USD daily chart
The USD remains firm but gains versus the core majors are relatively minor. Shaun Osborne, Chief FX Strategist at Scotiabank, analyzes Greenback’s outlook.
USD is correlating less strongly with yields and spreads than it did in August and September
While the USD is firm overall it closed lower on the week through Friday in DXY terms and late week price action in the index was technically soft despite the weak risk environment. Price action today echoes that trend to an extent and the USD generally is correlating less strongly with yields and spreads than it did in August and September.
The USD remains heavily overbought on the longer-term (weekly) chart and price action in the early part of the month suggests the DXY has peaked. These two technical factors suggest building negative risks for the USD from my own point of view.
- USD/CHF fails to hold gains as the US Dollar remains subdued ahead of multiple US data.
- The market mood remains downbeat due to escalating Middle East tensions.
- Fed Logan said that higher bond yields and recent economic data have bought some time for the central bank.
The USD/CHF pair surrenders gains after facing barricades near 0.8950 in the European session. The Swiss Franc asset faced selling pressure as the US Dollar turned subdued in a data-packed week. The US Dollar Index (DXY) trades marginally above the crucial support of 106.00.
S&P500 futures added some losses in the London session, portraying a dismal market sentiment due to escalating Middle East tensions. The 10-year US Treasury yields climb to 5% on expectations of sustained higher interest rates from the Federal Reserve (Fed) for a longer period.
Fed policymakers are endorsing unchanged interest rates in the 5.25-5.50% range as higher long-term bond yields are sufficient to ease overall spending and investment. Dallas Fed Bank President Lorie Logan said last week that higher bond yields and recent economic data have bought some time for the central bank to keep interest rates unchanged.
This week, investors will focus on the preliminary S&P Global PMI data for October, Durable Goods Orders, and the core Personal Consumption Expenditure (PCE) price index data for September. The show-stopper event would be the Q3 Gross Domestic Product (GDP) data, which will be announced on Thursday. As per the consensus, the growth rate was 4.2% vs. 2.1% growth in the April-June quarter on an annualized basis.
On the Swiss Franc front, investors await the ZEW Survey Expectations for October. In September, the sentiment data landed at -27.6. A further decline in the data would indicate that business conditions, the labor market, and other elements have worsened further.
- DXY adds to the ongoing downtrend on Monday.
- Gains appear so far limited around the 106.80 zone.
DXY extends the negative price action and challenges once again the key 106.00 neighbourhood at the beginning of the week.
It seems the index keeps trading within a consolidative phase for the time being. Occasional bullish attempts, in the meantime, continue to target the weekly high of 106.78 (October 12) prior to the 2023 top of 107.34 (October 3).
So far, while above the key 200-day SMA, today at 103.31, the outlook for the index is expected to remain constructive.
DXY daily chart
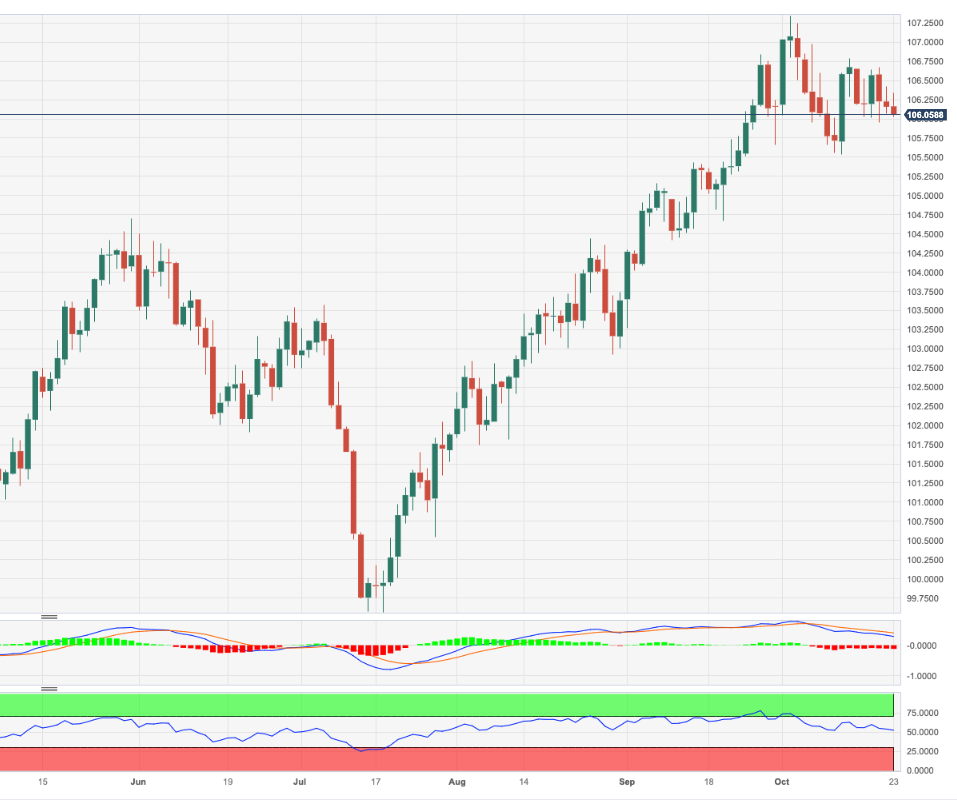
GBP/USD trades back to the mid-1.21 area. Economists at Scotiabank analyze the pair’s outlook.
Choppy range trading may continue in the short run
Cable slippage to the 1.21 area or just below found good support last week but gains to the upper 1.21 area are attracting firm selling pressure as well.
Sterling may continue to find support on weakness to the 1.20 area in the short run but gains may be hard to come by for now.
Weak trend signals suggest choppy range trading may continue in the short run.
- EUR/JPY adds to the recent uptrend around 159.00.
- Further gains now look at the yearly highs near 159.80.
EUR/JPY adds to the ongoing rebound and surpasses the 159.00 hurdle, printing at the same time new multi-week tops.
Considering the current price action, further upside appears in the pipeline for the cross in the short-term horizon. Against that, the immediate hurdle emerges at the 2023 top at 159.76 (August 30) just ahead of the round level at 160.00.
So far, the longer term positive outlook for the cross appears favoured while above the 200-day SMA, today at 150.79.
EUR/JPY daily chart
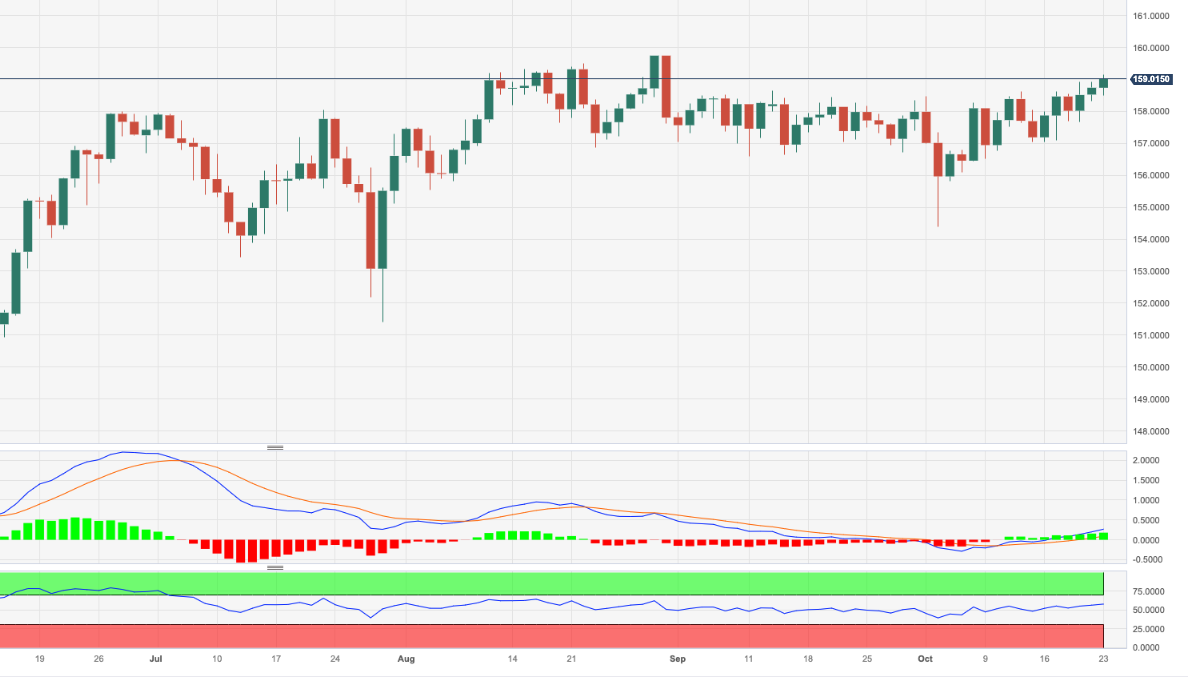
- The Greenback slid lower last week despite steady safe-haven demand.
- Geopolitics and a very packed data calendar will be the driving force for the US Dollar this week. .
- The US Dollar Index closed out its week in the red, going nowhere in October.
The US Dollar (USD) is facing headwinds as it looks that its months-long rally has officially halted. From a pure technical point of view, the weekly chart of the US Dollar Index (DXY) shows that the US Dollar Index has been trading sideways for the last three weeks. According to the Wyckoff Trading philosophy, the US Dollar Index is in a distribution phase ahead of either a substantial leg higher or lower.
On the economic data front, traders will have a light Monday ahead of other data points later this week. The focal point will be on Thursday, when the US Gross Domestic Product (GDP) numbers for the third quarter are due to come out. On Friday, the Federal Reserve preferred inflation gauge will be published: the Personal Consumption Expenditures Price Index.
Daily digest: US Dollar between a rock and a hard place
- The delay of the Israeli ground offensive is holding markets in a choke hold as investors could see a risk premium being factored in for yet a proxy war to develop.
- One data point for this Monday at 12:30 GMT is the Chicago Fed National Activity Index for September. Previous print was at -0.16.
- The US Treasury is heading to the markets again with a 3-month and a 6-month bill auction at 15:30 GMT.
- Equities are starting the week in the red. Asian indexes fall by near 1% and European equities are down around 0.50%. US equity futures are looking for direction ahead of a new week of earnings.
- The CME Group’s FedWatch Tool shows that markets are pricing in a 98.4% chance that the Federal Reserve will keep interest rates unchanged at its meeting in November.
- The benchmark 10-year US Treasury yield trades at 4.98%, just a sigh away from 4.99%, the multi-year high. The bond market is still stuck in a sellers market, where higher yields are demanded before buying US bonds.
US Dollar Index technical analysis: Going nowhere
The US Dollar dropped the ball last week and closed in the red, proving to the second-guessers that the DXY summer rally is behind us. For October, the Greenback has not really moved that much and despite geopolitical tensions, more convictions are starting to build in the market that the US Dollar might rather go down. All eyes will be on the 106.00 level, which could start to see substantial breakthroughs to the downside if US economic data start to deteriorate.
Should the DXY want to deliver a bullish signal, at least the high of last week at 106.67 needs to be broken. Preferably a re-enter above the summer rally trend line would support further upside moves. On the topside, 107.19 is an important level to reach. If this is the case, 109.30 is the next level to watch.
On the downside, the recent resistance at 105.88 did not do a good job supporting any downturn. Instead, look for 105.12 to keep the DXY above 105.00. If that fails to do the trick, 104.33 will be the best level to look for resurgence in US Dollar strength, as it aligns with the 55-day Simple Moving Average (SMA) as a support level.
US Dollar FAQs
What is the US Dollar?
The US Dollar (USD) is the official currency of the United States of America, and the ‘de facto’ currency of a significant number of other countries where it is found in circulation alongside local notes. It is the most heavily traded currency in the world, accounting for over 88% of all global foreign exchange turnover, or an average of $6.6 trillion in transactions per day, according to data from 2022.
Following the second world war, the USD took over from the British Pound as the world’s reserve currency. For most of its history, the US Dollar was backed by Gold, until the Bretton Woods Agreement in 1971 when the Gold Standard went away.
How do the decisions of the Federal Reserve impact the US Dollar?
The most important single factor impacting on the value of the US Dollar is monetary policy, which is shaped by the Federal Reserve (Fed). The Fed has two mandates: to achieve price stability (control inflation) and foster full employment. Its primary tool to achieve these two goals is by adjusting interest rates.
When prices are rising too quickly and inflation is above the Fed’s 2% target, the Fed will raise rates, which helps the USD value. When inflation falls below 2% or the Unemployment Rate is too high, the Fed may lower interest rates, which weighs on the Greenback.
What is Quantitative Easing and how does it influence the US Dollar?
In extreme situations, the Federal Reserve can also print more Dollars and enact quantitative easing (QE). QE is the process by which the Fed substantially increases the flow of credit in a stuck financial system.
It is a non-standard policy measure used when credit has dried up because banks will not lend to each other (out of the fear of counterparty default). It is a last resort when simply lowering interest rates is unlikely to achieve the necessary result. It was the Fed’s weapon of choice to combat the credit crunch that occurred during the Great Financial Crisis in 2008. It involves the Fed printing more Dollars and using them to buy US government bonds predominantly from financial institutions. QE usually leads to a weaker US Dollar.
What is Quantitative Tightening and how does it influence the US Dollar?
Quantitative tightening (QT) is the reverse process whereby the Federal Reserve stops buying bonds from financial institutions and does not reinvest the principal from the bonds it holds maturing in new purchases. It is usually positive for the US Dollar.
EUR/USD holds near 1.06. Economists at Scotiabank analyze the pair’s outlook.
Minor new highs above 1.0640 should trigger a push on to the mid/upper 1.07s
Positioning may be fueling support for the EUR to some extent but a further shift in relative economic surprises should give the EUR some more obvious fundamental support.
The EUR is still struggling to extend gains through the low 1.06 area which could/should point to a bit more strength ahead. But the broader look of the charts is leaning EUR-bullish – steady gains from the early part of the month are holding and a firm (technically bullish) close to the week again last Friday which follows the bull ‘hammer’ pattern at the start of the month.
Minor new highs (above 1.0640) should see the EUR push on to the mid/upper 1.07s.
The CAD remains soft near recent range lows. Economists at Scotiabank analyze USD/CAD outlook.
1.3785 should remain strong resistance in the week ahead
The CAD’s technical picture has a negative undertone still.
The USD trend higher retains bullish momentum on the daily and weekly studies. The USD continues to encounter selling pressure above 1.37, however, and USD gains remain shy of the early October high at (and the strong, bearish rejection of) 1.3785. This area should remain strong resistance in the week ahead.
Support is 1.3640, with the USD liable to leak a bit lower to key, short-term support at 1.3570 below there.
EUR/USD has shown considerable resilience of late despite the move in rate spreads clearly favouring the US. Energy risks and BTP volatility are downside risks for EUR, economists at MUFG Bank report.
Could ECB threaten recent EUR resilience?
Even prior to the Hamas attack, Germany was already suffering from the still elevated natural gas price relative to prepandemic levels. A further rise from here would likely put renewed downward pressure on EUR/USD. Record levels of crude oil production in the US underline the favourable terms of trade shift for the Dollar.
The primary FX downside risk for EUR would be the ECB acknowledging that it discussed its PEPP policy guidance for 2024. That would likely fuel a widening of the BTP/Bund spread and would be made worse if there was explicit criticism of Italy and any hint that the ECB’s TPI is not a tool to be used to protect governments from adopting inappropriate fiscal policies.
- EUR/GBP finds buyers’ interest near 0.8700 amid hawkish BoE bets fade.
- The UK labor force is seen squeezing for the second time in a row.
- Eurozone preliminary Consumer Confidence is seen declining to -18.3 against the former reading of -17.8.
The EUR/GBP pair discovers buying interest rates after correcting to near the round-level support of 0.8700 in the European session. The cross recovers swiftly as investors hope that the Bank of England (BoE) will keep interest rates unchanged at 5.25% for the second time in a row.
The UK factory data remained weak in September as firms cut heavily on laborforce and inventory due to a weak demand outlook. In the same period, consumer spending contracted by almost 1% as higher borrowing costs squeezed households’ pockets. The absence of strength in the UK economic data would allow the BoE to deliver an unchanged interest rate decision in the monetary policy meeting on November 2. Meanwhile, BoE Governor Andrew Bailey remains confident that inflation will come down in October.
Going forward, UK Employment data will be keenly watched, which will be published on Tuesday at 06:00 GMT. According to the consensus, UK employers shed 198K jobs in the quarter to August. In the same period to July, the UK laborforce was squeezed by 207K. A slowdown in the labor demand would also allow BoE policymakers to remain neutral on the interest rates.
The Unemployment Rate in the quarter to August is seen unchanged at 4.3%. The Claimant Count Change in September is seen rising by 2.3K against an increase of 0.7K in August.
On the Eurozone front, investors await the preliminary Consumer Confidence data for October, which will be published at 14:00 GMT. The economic data is seen declining to -18.3 against the former reading of -17.8. This indicates a decline in the confidence of consumers in the growth prospects of the economy.
- Oil (WTI) trades near $87.50 and drops lower as markets see tensions ease in the Middle East.
- The US Dollar closed in the red last week and is facing more selling pressure this Monday.
- Oil could sink lower if the Israeli ground offensive could be completely cancelled due to international pressure.
Oil prices are sinking lower as several world leaders have scrambled to make an appearance in Tel Aviv to demand a more humane and humanitarian approach for the retaliation against Hamas. Little by little humanitarian help is being allowed on the field in Gaza, though several request have been issued by state departments from foreign countries, calling their citizens to evacuate the area in light of a possible massive ground offensive. As the days pass and the ground offensive is being delayed, markets are pricing out the risk premium as the probability of the offensive actually happening, will diminish.
Meanwhile, The US Dollar (USD) is facing headwinds as it looks that its months-long rally has officially halted. Traders are bracing for two big data points later this week, with on Thursday the US Gross Domestic Product (GDP) numbers and on Friday the Fed’s preferred inflation gauge with the Personal Consumption Expenditures Index (PCE). A contraction or pullback in the numbers could mean another leg lower in the Greenback’s performance.
Crude Oil (WTI) trades at $87.86 per barrel, and Brent Oil trades at $91.20 per barrel at the time of writing.
Oil news and market movers
- Indian Oil refineries have processed 4.1% more crude in September than last year. Oil refiners in India processed 20.3 million tons of crude in September.
- Last week, Crude Oil prices rose for a second week in a row as markets continue to keep an eye on any supply disruptions in a spillover effect on the back of the Israeli ground invasion.
- Macquarie strategists have issued a report mentioning that there is a short-term upward risk in oil price, though in the medium-term oil prices are expected to head lower.
- China is tapping into its Crude Oil stockpiles as it looks to boost its refining production, recent data revealed.
Oil Technical Analysis: Gaza weak spot
Oil prices have had a second week of solid gains in their performance, though the rally starts to stall now. With again a delay in the possible ground invasion by Israel into Gaza, markets are starting to second guess if it will ever happen. This means a very big risk premium needs to be priced out, which could mean more downside risk in the balance for Crude prices.
On the upside, the resistance level near $88 is the first level on the bulls’ radar. From there, the next level will be this year’s high at $94. Should a substantial squeeze unfold, look for $97.11, the high of August 2022.
On the downside, traders are bracing for the entry of that region near $78. The area should see ample support for buying. Any further drops below this level might see a firm nosedive move, which would cause Oil prices to sink below $70.
-638336506712649128.png)
US Crude (Daily Chart)
WTI Oil FAQs
What is WTI Oil?
WTI Oil is a type of Crude Oil sold on international markets. The WTI stands for West Texas Intermediate, one of three major types including Brent and Dubai Crude. WTI is also referred to as “light” and “sweet” because of its relatively low gravity and sulfur content respectively. It is considered a high quality Oil that is easily refined. It is sourced in the United States and distributed via the Cushing hub, which is considered “The Pipeline Crossroads of the World”. It is a benchmark for the Oil market and WTI price is frequently quoted in the media.
What factors drive the price of WTI Oil?
Like all assets, supply and demand are the key drivers of WTI Oil price. As such, global growth can be a driver of increased demand and vice versa for weak global growth. Political instability, wars, and sanctions can disrupt supply and impact prices. The decisions of OPEC, a group of major Oil-producing countries, is another key driver of price. The value of the US Dollar influences the price of WTI Crude Oil, since Oil is predominantly traded in US Dollars, thus a weaker US Dollar can make Oil more affordable and vice versa.
How does inventory data impact the price of WTI Oil
The weekly Oil inventory reports published by the American Petroleum Institute (API) and the Energy Information Agency (EIA) impact the price of WTI Oil. Changes in inventories reflect fluctuating supply and demand. If the data shows a drop in inventories it can indicate increased demand, pushing up Oil price. Higher inventories can reflect increased supply, pushing down prices. API’s report is published every Tuesday and EIA’s the day after. Their results are usually similar, falling within 1% of each other 75% of the time. The EIA data is considered more reliable, since it is a government agency.
How does OPEC influence the price of WTI Oil?
OPEC (Organization of the Petroleum Exporting Countries) is a group of 13 Oil-producing nations who collectively decide production quotas for member countries at twice-yearly meetings. Their decisions often impact WTI Oil prices. When OPEC decides to lower quotas, it can tighten supply, pushing up Oil prices. When OPEC increases production, it has the opposite effect. OPEC+ refers to an expanded group that includes ten extra non-OPEC members, the most notable of which is Russia.
US data this week should offer nothing to Dollar bears, economists at ING report.
Positioning is probably the biggest headwind to the Dollar
US GDP should come in at over 4% and the Fed's preferred measure of inflation should still be running hot.
DXY should continue to consolidate in a narrow 106.00-106.50 range, but we can imagine that protective stops are building on long DXY positions in the 105.55/105.75 area.
Perhaps the most likely scenario for a lower Dollar is one where equities fall so hard that the short-end of the US curve is re-priced lower and crowded long Dollar positions get scaled back.
- USD/JPY juggles around 150.00 while Japan’s intervention fears remain intact.
- US annualized GDP data is seen higher at 4.1% despite higher interest rates by the Fed.
- Japan’s stealth intervention won’t be able to provide longer stability to the Japanese Yen.
The USD/JPY pair consolidates in a narrow range near the crucial resistance of 150.00. The upside in the asset seems upbeat as investors hope that the Federal Reserve (Fed) will keep the interest rate policy tight for a long period if not discuss raising interest rates further.
S&P500 futures generated losses in the European session, indicating a risk-off mood amid Middle East tensions. US equities were heavily sold on Friday amid geopolitical tensions and tech earnings report. The 10-year US Treasury yields rose to 5% ahead of crucial economic data.
The US Dollar Index (DXY) consolidates above 106.00 as investors shift focus to the US Q3 Gross Domestic Product (GDP) data, which will be published on Thursday. The annualized GDP data is seen higher at 4.1% despite higher interest rates by the Fed.
On the Fed’s interest rate outlook, Fed Chair Jerome Powell endorsed a stable interest rate policy amid higher long-term US Treasury yields. Jerome Powell commented that higher yields are impacting current financial conditions. Philadelphia Fed Bank President Patrick Harker, in an interview on Friday, favored holding interest rates as the economy is softening than thought.
On the Japanese Yen front, investors watch out for intervention by the Japanese authority in the FX domain to provide support to the weakening Yen. Investors hope that the stealth intervention won’t be able to provide longer stability to the Japanese Yen as the tide is against the currency due to the maintenance of the expansionary policy stance by the Bank of Japan (BoJ).
The resilience of EUR/USD was one of the main stories in G10 FX last week. Economists at Société Générale analyze the pair’s outlook.
It is too soon to conclude that EUR/USD has bottomed
No matter how strong US GDP prints on Thursday, it should not affect expectations for a Fed pause in November after we heard from Chair Powell last week. However, a number close to 5% could make investors more nervous about a hike in December.
The widening in 10y UST/Bund spreads and the resilience of EUR/USD was one of the main stories in G10 FX last week, but we believe it is too soon to conclude that the pair has bottomed.
The premium in options has continued to rise for EUR puts/USD calls, and it is entirely possible that large option structures contained the pair between 1.0550 and 1.06. A retracement to 1.05 could follow if bond differentials take the upper hand again and the 10-year bond spread stays above 200 bps following the US GDP release and the ECB meeting.
Economists at MUFG Bank analyze the Beige Book released last week and its implications for yields and the US Dollar.
The Fed seems more mindful of impending slowdown
Our natural language sentiment indicator of the wording in the latest Beige book to describe the US economy shows that on balance there was a greater share of negative words overall. It was the most negative sentiment score since May. It stands in contrast to the trend for most of this year of improving sentiment scores. The deterioration in the overall sentiment score was driven mainly by more negative descriptions of the economy, the consumer, housing and financial conditions.
We certainly will need to wait to see some evidence in the official data, which may take time, but our text sentiment analysis of the Beige Book, the comments from Harker on Friday and Powell’s more cautious tone on the restrictiveness of the monetary stance make us more confident that the flow of macro data should start to turn more in favour of some correction lower in yields that would mark a turn for the Dollar too.
- Gold price discovered support near $1,970.00 as demand for safe-haven assets remains intact.
- Investors shift focus to the US Q3 GDP data that will provide an undertone for the Fed’s interest rate outlook.
- Fed policymakers are consistently supporting keeping interest rates unchanged.
Gold price (XAU/USD) recovered after a corrective move from the psychological resistance that was inspired by rising long-term US Treasury yields. The precious metal aims to recapture a five-week high as Israel-Palestine tensions keep the fears of widening Middle East conflict persistent. The 10-year US Treasury yields jumped to a multi-year high of 5% amid expectations of firmer US economic data, which will be published this week.
Investors will keenly watch for the growth rate in the July-September quarter, which will set the undertone for interest rates by the year-end. An upbeat growth rate would demonstrate strong labor market conditions, robust consumer spending, and a recovery in economic activities despite tight monetary policy by the Federal Reserve (Fed).
Daily Digest Market Movers: Gold price rebounds as Middle East tensions remain firm
- Gold price finds intermediate support after correcting to near $1,965.00 as escalating Middle East tensions keep the safe-haven demand firmer.
- Rising tensions between Israel and Palestine have escalated fears of a wider conflict in the Middle East.
- The potential ground invasion plan of the Israeli army would strengthen after humanitarian aid to Gaza civilians and the safe release of hostages.
- Fears of Iran's intervention in the Israel-Palestine conflicts remain firm amid expectations of sanctions on Palestine and Iran to squeeze revenue for funding the Hamas military.
- The precious metal witnessed selling pressure after registering a fresh five-month high near the psychological resistance of $2,000.00 as investors shifted focus to the economic data, which will be released this week.
- Rising long-term US Treasury yields built some pressure on the Gold price as investors saw strong numbers from the Q3 Gross Domestic Product (GDP), preliminary S&P Global PMIs for October and core Personal Consumption Expenditure (PCE) price index data for September.
- The Manufacturing PMI for October is seen remaining below the 50.0 threshold for the 12th time in a row. Also, the Services PMI is seen marginally below 50.0, demonstrating the impact of higher interest rates by the Federal Reserve.
- This week, the major focus will be on the July-September GDP data, which will be published on Thursday. As per the estimates, economists see the annualized growth rate at 4.1% against the former reading of 2.1%. An upbeat GDP data would keep hopes of one more interest rate increase in the remaining year of 2023 alive.
- As per the CME Fed watch tool, traders see the Fed keeping interest rates unchanged at 5.25-5.50% almost certain. The odds of one more interest rate increase in any of the two remaining monetary policy meetings in 2023 remain around 24%.
- The US Dollar trades in a narrow range above the immediate support of 106.00 as investors see GDP data for fresh guidance on interest rates.
- Last week, the commentary from Fed policymakers kept the US Dollar on the tenterhooks. Cleveland Fed Bank President Loretta Mester said that the Fed is at or near the peak of interest rates. She further added that policymakers need to be “nimble” amid current economic uncertainties.
- Atlantic Fed Bank President Raphael Bostic, in an interview with CNBC, said that a slowdown is coming due to higher interest rates but the economy won’t see a recession. Bostic remains confident that the central bank will get inflation under control. He forecasted that the Fed would cut interest rates in late 2024.
Technical Analysis: Gold price finds support below $1,970
Gold price recovers after a corrective move to near $1,970.00 and is expected to recapture the five-month high near $2,000.00. The precious metal recorded significant gains for two weeks. A bull cross, represented by the 20 and 50-day Exponential Moving Averages (EMAs), warrants more upside ahead. Momentum oscillators shift into the bullish range, indicating that the upside momentum has been activated.
Gold FAQs
Why do people invest in Gold?
Gold has played a key role in human’s history as it has been widely used as a store of value and medium of exchange. Currently, apart from its shine and usage for jewelry, the precious metal is widely seen as a safe-haven asset, meaning that it is considered a good investment during turbulent times. Gold is also widely seen as a hedge against inflation and against depreciating currencies as it doesn’t rely on any specific issuer or government.
Who buys the most Gold?
Central banks are the biggest Gold holders. In their aim to support their currencies in turbulent times, central banks tend to diversify their reserves and buy Gold to improve the perceived strength of the economy and the currency. High Gold reserves can be a source of trust for a country’s solvency. Central banks added 1,136 tonnes of Gold worth around $70 billion to their reserves in 2022, according to data from the World Gold Council. This is the highest yearly purchase since records began. Central banks from emerging economies such as China, India and Turkey are quickly increasing their Gold reserves.
How is Gold correlated with other assets?
Gold has an inverse correlation with the US Dollar and US Treasuries, which are both major reserve and safe-haven assets. When the Dollar depreciates, Gold tends to rise, enabling investors and central banks to diversify their assets in turbulent times. Gold is also inversely correlated with risk assets. A rally in the stock market tends to weaken Gold price, while sell-offs in riskier markets tend to favor the precious metal.
What does the price of Gold depend on?
The price can move due to a wide range of factors. Geopolitical instability or fears of a deep recession can quickly make Gold price escalate due to its safe-haven status. As a yield-less asset, Gold tends to rise with lower interest rates, while higher cost of money usually weighs down on the yellow metal. Still, most moves depend on how the US Dollar (USD) behaves as the asset is priced in dollars (XAU/USD). A strong Dollar tends to keep the price of Gold controlled, whereas a weaker Dollar is likely to push Gold prices up.
Considering advanced prints from CME Group for natural gas futures markets, open interest extended its multi-day uptrend and increased by almost 10K contracts on Friday. In the same direction, volume rose for the second session in a row, now by around 28.1K contracts.
Natural Gas: Initial Contention emerges around $2.80
Natural Gas prices extended their downtrend on Friday, almost fully fading the rally seen in the first couple of weeks of October. The daily pullback came on the back of rising open interest and volume, which allows for the continuation of the bearish move for the time being. That said, there is an immediate contention zone around $2.80 region per MMBtu.
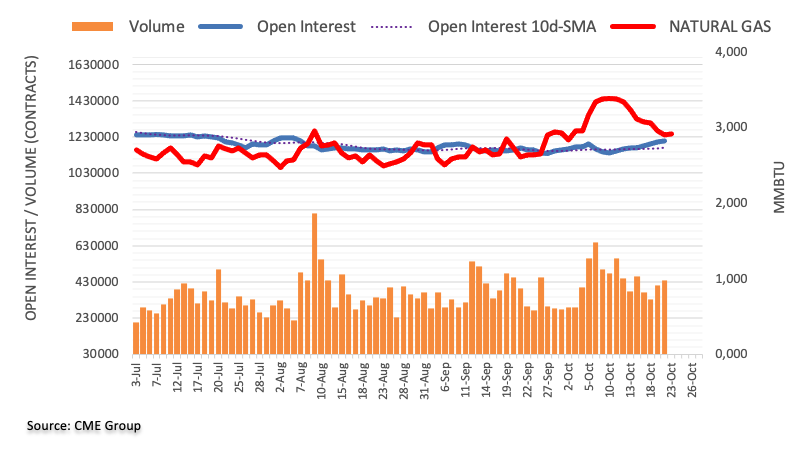
- USD/CAD treads waters above 1.3700 post-trimming intraday losses.
- BoC is expected to maintain interest rates at 5.0% in Wednesday’s meeting.
- Upbeat US Treasury yields contribute support to underpinning the Greenback.
USD/CAD retraces intraday losses, trading around 1.3710 during the European session on Monday. The pair gains ground as the US Dollar treads waters to halt the recent losses, driven by higher US Treasury yields. Additionally, increased risk aversion, stemming from the Israel-Hamas military situation, contributes to the USD/CAD pair's gains.
However, the bearish trend in Crude oil prices, which weighs on the commodity-linked Loonie, advances further losses in the USD/CAD pair.
Western Texas Intermediate (WTI) oil price drops for the second successive day, trading lower around $87.40 per barrel during the European session on Monday.
Investors await the Bank of Canada (BoC) Interest Rate Decision on Wednesday, with expectations that the interest rate will be maintained at 5.0%. The market is expecting the BoC to keep the interest rate unchanged for the rest of the year. Furthermore, there are anticipations of a rate cut in the second quarter of 2024.
Mixed remarks from US Federal Reserve (Fed) officials on the trajectory of interest rates may contribute to pressure on the USD/CAD pair. Atlanta Fed President Raphael Bostic indicated that the Federal Reserve is unlikely to lower interest rates before the middle of next year, and Fed Philadelphia President Patrick Harker expressed a preference for maintaining unchanged interest rates.
Moreover, Federal Reserve (Fed) Chairman Jerome Powell clarified in the previous week that the central bank is not planning an immediate rate hike, emphasizing the potential for further tightening of monetary policy in response to signs of growth.
The US Dollar Index (DXY) trims intraday gains, trading lower around 106.10, the index had earlier received upward support from positive momentum in US Treasury yields. The 10-year US Treasury yield stands at 4.99%, up by 1.65% at the time of writing.
Investors are likely to keep a close eye on the US S&P Global PMI on Tuesday and the Q3 Gross Domestic Product (GDP) on Thursday for potential market-moving insights into the US economic landscape.
To what extent does the fiscal situation restrict central banks? And what does that mean for the FX market? Economists at Commerzbank analyze the fiscal situation in the US and compare it to that in Europe.
25 or 50 bps make very little difference
Will the Fed gather from higher US yields that this has created sufficient restrictive effect? So that the rate path does not have to be raised even if inflation developments are disappointing? That would lead to a deterioration in the relation of interest rate and inflation levels and weaken the USD.
Will the ECB consider the rise in yields, in particular the disproportionate rise in yields in those Eurozone countries with high debt levels to constitute an argument against higher yields?
To re-establish the confidence of the FX market in the ECB which has been weakened over the years, the central bank would have to act in a particularly restrictive manner under Lagarde’s leadership. It was unwilling to do that most recently.
Of course, from a material point of view, 25 or 50 bps make very little difference; but in this case, they demonstrate that the ECB does not want to believe that it is affected by a credibility deficit which is becoming increasingly relevant again in times of growing doubts about fiscal stability.
The US Dollar remains broadly stable in the foreign exchange market at the start of the week. Economists at MUFG Bank analyze Greenback’s outlook.
US yields remain elevated, providing USD support
The 10-year yield remains close to the 5.00% level and hence risk appetite will likely remain fragile given the challenge for risk assets on a further move higher in US yields.
Q3 GDP from the US will be released this week and the rate of growth is expected to accelerate from the 2.1% QoQ SAAR in Q2 to 4.1% in Q3. With a notable slowdown in GDP growth expected in Q4, a figure closer to 5.0% would likely be needed to prompt a notable move higher for yields and the Dollar.
- NZD/USD faces a challenge due to the stronger US Dollar.
- Fed Chair Powell mentioned that there is no plan for an immediate rate hike.
- Upbeat US Treasury yields contribute support for the Greenback.
NZD/USD continues to move on the downward trajectory that began on October 17, trading lower around 0.5820 during the European session on Monday. The pair gains ground as the US Dollar rebounds, driven by higher US Treasury yields. Additionally, increased risk aversion, stemming from the Israel-Hamas military situation, contributes to the NZD/USD pair's gains.
The mixed remarks from US Federal Reserve (Fed) officials regarding the interest rates trajectory could limit the losses of the NZD/USD pair. Atlanta Fed President Raphael Bostic suggested that the Federal Reserve is unlikely to lower interest rates before the middle of next year, and Fed Philadelphia President Patrick Harker expressed a preference for maintaining unchanged interest rates.
Furthermore, Federal Reserve (Fed) Chairman Jerome Powell clarified in the previous week that the central bank is not planning an immediate rate hike, emphasizing the potential for further tightening of monetary policy in response to signs of growth.
The US Dollar Index (DXY) trims intraday gains, trading lower around 106.10 at the time of writing. However, the Greenback received upward support due to the positive momentum in US Treasury yields, with the 10-year US Treasury yield standing at 4.97%, up by 1.22% by the press time.
On Friday, the New Zealand Trade Balance figures revealed a close resemblance to the previous month's data. In September, the headline Trade Balance recorded a deficit of $2.329 billion, slightly surpassing August's deficit of $2.273 billion.
In the previous week, the headline Consumer Price Index (CPI) for the third quarter showed an increase of 1.8%, below the expected 2.0%. The yearly rate decelerated from 6.0% to 5.6%, falling short of consensus estimates of 5.9%. This data has prompted investors to adjust their expectations for a November interest rate hike by the Reserve Bank of New Zealand (RBNZ), leading to downward pressure on the NZD/USD pair.
China Plans Twice-a-Decade Financial Policy Conference Next Week. Meeting to discuss risk prevention including Local Government Financing Vehicles (LGFVs). China plans to convene a key financial policy gathering which takes place once every five years early next week to prevent risks and set medium-term priorities for the $61 trillion industry, according to people familiar with the matter.
Investors are likely to monitor the US S&P Global PMI on Tuesday and the Q3 Gross Domestic Product (GDP) on Thursday. On the Kiwi docket, Consumer Confidence will be eyed on Friday.
Sterling has been stabilising after a soft week. Economists at ING analyze GBP outlook.
The UK calendar this week looks slightly Sterling negative
The UK calendar this week looks slightly Sterling negative in that Tuesday's release of the services PMI might disappoint and we also might see some slight softening in the delayed jobs data.
However, EUR/GBP has been unable to hold a break over the 0.8700 area and we think it is a little too early for that break, especially since the Eurozone data could be soft this week too.
- The Euro clings to daily gains against the US Dollar.
- Stocks in Europe open in a mixed tone on Monday.
- EUR/USD’s upside remains limited around the 1.0600 zone.
- The USD Index (DXY) extends its range bound theme in the low 106.00s.
- Eurozone flash Consumer Confidence is due in the domestic docket.
- The Chicago Fed National Activity Index comes next in the US calendar.
The Euro (EUR) is showing a slight strength against the US Dollar (USD), causing EUR/USD to keep the trade around the 1.0600 region at the beginning of the week.
The Greenback is managing to regain some stability, advancing modestly towards the low-106.00s when tracked by the USD Index (DXY). This price action comes in tandem with a tepid bounce in US yields across different maturities and a knee-jerk reaction in market sentiment towards riskier assets.
In terms of monetary policy, market participants expect the Federal Reserve (Fed) to maintain its current stance of keeping interest rates unchanged at the November 1 meeting. This view was reinforced by comments from Fed Chair Jerome Powell at his appearance at the Economic Club of New York last Thursday.
At the same time, investors are contemplating the possibility of the European Central Bank (ECB) discontinuing certain policy measures. This comes despite inflation levels surpassing the bank's target and growing concerns about the risk of a slowdown or stagflation in the Eurozone's economy.
In the euro docket, the European Commission (EC) will publish its advanced gauge of the Consumer Confidence for the euro area for October.
In the US data space, the only release will be the Chicago Fed National Activity Index for September.
Daily digest market movers: Euro flattens as it looks to risk trends, geopolitics
- The EUR gathers some traction against the USD on Monday.
- US and German yields look slightly bid early in the European session.
- Investors see the Fed keeping its interest rate unchanged in November.
- Market expectations suggest that the ECB will also keep rates unchanged.
- ECB is likely to encounter a stalemate in its interest rate hiking cycle.
- Geopolitical concerns in the Middle East remain in the centre stage.
Technical Analysis: Euro outlook remains negative below 200-day SMA
The EUR/USD keeps the consolidative mood well in place below the 1.0600 region at the beginning of the week.
If the bullish trend continues, EUR/USD may test the October 12 high of 1.0639, before moving on to the September 20 top of 1.0736 and the critical 200-day Simple Moving Average (SMA) of 1.0816. A break above this level might indicate a push to the August 30 peak of 1.0945, ahead of the psychological threshold of 1.1000. Any more advances might reintroduce a challenge of the August 10 high of 1.1064 before reaching the July 27 top of 1.1149 and potentially the 2023 peak of 1.1275 seen on July 18.
If the selling tendency returns, there is an immediate support at the low of 1.0495 from October 13 prior to the 2023 low of 1.0448 seen on October 3, all before the round level of 1.0400. If this zone is violated, the weekly lows of 1.0290 (November 30, 2022) and 1.0222 (November 21, 2022) may be retested.
It is crucial to recall that the risk of sustained negative pressure persists as long as the EUR/USD remains below the 200-day SMA.
(This story was corrected on October 23 at 08:20 GMT to say that the 1.0222 level was reached on November 21, 2022, not November 30, 2022.)
Euro FAQs
What is the Euro?
The Euro is the currency for the 20 European Union countries that belong to the Eurozone. It is the second most heavily traded currency in the world behind the US Dollar. In 2022, it accounted for 31% of all foreign exchange transactions, with an average daily turnover of over $2.2 trillion a day.
EUR/USD is the most heavily traded currency pair in the world, accounting for an estimated 30% off all transactions, followed by EUR/JPY (4%), EUR/GBP (3%) and EUR/AUD (2%).
What is the ECB and how does it impact the Euro?
The European Central Bank (ECB) in Frankfurt, Germany, is the reserve bank for the Eurozone. The ECB sets interest rates and manages monetary policy.
The ECB’s primary mandate is to maintain price stability, which means either controlling inflation or stimulating growth. Its primary tool is the raising or lowering of interest rates. Relatively high interest rates – or the expectation of higher rates – will usually benefit the Euro and vice versa.
The ECB Governing Council makes monetary policy decisions at meetings held eight times a year. Decisions are made by heads of the Eurozone national banks and six permanent members, including the President of the ECB, Christine Lagarde.
How does inflation data impact the value of the Euro?
Eurozone inflation data, measured by the Harmonized Index of Consumer Prices (HICP), is an important econometric for the Euro. If inflation rises more than expected, especially if above the ECB’s 2% target, it obliges the ECB to raise interest rates to bring it back under control.
Relatively high interest rates compared to its counterparts will usually benefit the Euro, as it makes the region more attractive as a place for global investors to park their money.
How does economic data influence the value of the Euro?
Data releases gauge the health of the economy and can impact on the Euro. Indicators such as GDP, Manufacturing and Services PMIs, employment, and consumer sentiment surveys can all influence the direction of the single currency.
A strong economy is good for the Euro. Not only does it attract more foreign investment but it may encourage the ECB to put up interest rates, which will directly strengthen the Euro. Otherwise, if economic data is weak, the Euro is likely to fall.
Economic data for the four largest economies in the euro area (Germany, France, Italy and Spain) are especially significant, as they account for 75% of the Eurozone’s economy.
How does the Trade Balance impact the Euro?
Another significant data release for the Euro is the Trade Balance. This indicator measures the difference between what a country earns from its exports and what it spends on imports over a given period.
If a country produces highly sought after exports then its currency will gain in value purely from the extra demand created from foreign buyers seeking to purchase these goods. Therefore, a positive net Trade Balance strengthens a currency and vice versa for a negative balance.
- Pound Sterling juggles around 1.2150 as investors shift focus to the UK employment data.
- Economists see a decrease in employment in the quarter to August due to a poor demand outlook.
- The BoE is anticipated to keep interest rates unchanged at its November monetary policy meeting.
The Pound Sterling (GBP) struggles to find a direction as investors await for UK Employment data, which will be published on Tuesday. The GBP/USD pair outlook remains vulnerable as economists expect employment levels to decrease again in the three months to August, in a sign that firms are cutting back on their workforces due to a dismal demand outlook.
Higher interest rates by the Bank of England (BoE) and stubborn price pressures have squeezed households’ real income significantly, weighing on demand. Deepening Israel-Palestine tensions add to uncertainty and have the potential to cause higher energy prices, adding to inflation pressures. In this context, investors see the BoE keeping interest rates unchanged for the second straight time in November.
Daily Digest Market Movers: Pound Sterling awaits employment data
- Pound Sterling has been consolidating for more than a week as the interest rates are seen unchanged by the Bank of England monetary policy meeting, which is scheduled for next week.
- The majority of UK economic data released in October indicates that the BoE will not raise interest rates further, keeping them at 5.25% for a second straight meeting. The UK Manufacturing PMI continued to remain below the 50.0 threshold and Retail Sales contracted, signaling weak economic activity and likely denting consumer inflation expectations.
- Consumer spending has remained weak in September as both high inflation and borrowing rates have squeezed households’ pockets.
- UK inflation topped expectations marginally in September but BoE Governor Andrew Bailey, in an interview with Belfast Telegraph, remained confident over a marked fall in inflation next month.
- Bailey said that a sharp decline in wage growth should bring down inflation to 2%.
- The GBP/USD pair trades back and forth around 1.2150 but an action move is expected after the release of labor market data, which will be published on Tuesday at 06:00 GMT.
- This month, the UK Office for National Statistics (ONS) postponed part of the employment data release as the agency said it failed to get responses from some private players.
- As per the estimates, the UK employers shed 198K jobs in the three months to August. In the quarter to July, the labor force saw a drawdown of 207K. The Unemployment Rate is expected to remain unchanged at 4.3%. Claimant Count Change is seen rising by 2.3K in September against a 0.9K increase in jobless claims in August.
- UK employers cut back on their workforce and inventory due to a poor demand outlook. Last month, UK firms said that higher borrowing costs and persisting price pressures have dented households’ demand.
- Last week, ratings agency Moody's revised UK's outlook to "stable" from "negative", saying policy predictability has been restored after heightened volatility last year around the so-called "mini-budget" crisis under former Prime Minister Liz Truss, Reuters reported.
- The market mood remains downbeat as Israel-Palestine tensions have increased due to the Gaza hospital blast, with more than one thousand casualties.
- The US Dollar trades directionless in a narrow range above 106.00 as investors shift focus to the Q3 Gross Domestic Product (GDP) data scheduled for Thursday.
- Meanwhile, neutral guidance on interest rates from Federal Reserve (Fed) Chair Jerome Powell and his colleagues has restricted upside in the US Dollar.
- Cleveland Fed Bank President Loretta Mester said on Friday that the policymakers need to be “nimble” amid current economic uncertainties.
Technical Analysis: Pound Sterling trades directionless around 1.2150
Pound Sterling remains inside Friday’s trading range as investors await the UK employment data to have a more complete set of economic data for shaping the BoE’s monetary policy action in November. The 20-day Exponential Moving Average (EMA) at around 1.2200 continues to act as a barricade for the Pound Sterling bulls. The broader GBP/USD outlook remains vulnerable amid a death cross signal by the 50-day and 200-day EMAs.
Pound Sterling FAQs
What is the Pound Sterling?
The Pound Sterling (GBP) is the oldest currency in the world (886 AD) and the official currency of the United Kingdom. It is the fourth most traded unit for foreign exchange (FX) in the world, accounting for 12% of all transactions, averaging $630 billion a day, according to 2022 data.
Its key trading pairs are GBP/USD, aka ‘Cable’, which accounts for 11% of FX, GBP/JPY, or the ‘Dragon’ as it is known by traders (3%), and EUR/GBP (2%). The Pound Sterling is issued by the Bank of England (BoE).
How do the decisions of the Bank of England impact on the Pound Sterling?
The single most important factor influencing the value of the Pound Sterling is monetary policy decided by the Bank of England. The BoE bases its decisions on whether it has achieved its primary goal of “price stability” – a steady inflation rate of around 2%. Its primary tool for achieving this is the adjustment of interest rates.
When inflation is too high, the BoE will try to rein it in by raising interest rates, making it more expensive for people and businesses to access credit. This is generally positive for GBP, as higher interest rates make the UK a more attractive place for global investors to park their money.
When inflation falls too low it is a sign economic growth is slowing. In this scenario, the BoE will consider lowering interest rates to cheapen credit so businesses will borrow more to invest in growth-generating projects.
How does economic data influence the value of the Pound?
Data releases gauge the health of the economy and can impact the value of the Pound Sterling. Indicators such as GDP, Manufacturing and Services PMIs, and employment can all influence the direction of the GBP.
A strong economy is good for Sterling. Not only does it attract more foreign investment but it may encourage the BoE to put up interest rates, which will directly strengthen GBP. Otherwise, if economic data is weak, the Pound Sterling is likely to fall.
How does the Trade Balance impact the Pound?
Another significant data release for the Pound Sterling is the Trade Balance. This indicator measures the difference between what a country earns from its exports and what it spends on imports over a given period.
If a country produces highly sought-after exports, its currency will benefit purely from the extra demand created from foreign buyers seeking to purchase these goods. Therefore, a positive net Trade Balance strengthens a currency and vice versa for a negative balance.
EUR/USD ended last week higher, just below the 1.06 mark. Economists at ING analyze the pair’s outlook.
Positioning is the main factor why EUR/USD is not going any lower
Somewhat surprisingly, Friday's release of euro futures contracts in Chicago saw speculators actually increasing net long positions. Overall, we suspect positioning is the main factor why EUR/USD is not going any lower now.
Despite a negative macro backdrop, it looks worth placing tight protective stops above 1.0620/1.0640 against an unexpected correction higher.
CME Group’s flash data for crude oil futures markets noted traders added around 4.3K contracts to their open interest positions at the end of last week, reversing a multi-day negative trend. Volume, instead, left behind three consecutive daily retracements and went up by around 182.3K contracts.
WTI: Next on the downside comes $81.50
WTI prices retreated from the area of weekly peaks on Friday, closing the session with humble losses. The downtick was on the back of increasing open interest, which hints at the potential continuation of the decline in the very near term. That said, further selling pressure should meet the next support around the monthly lows near $81.50 (October 6).
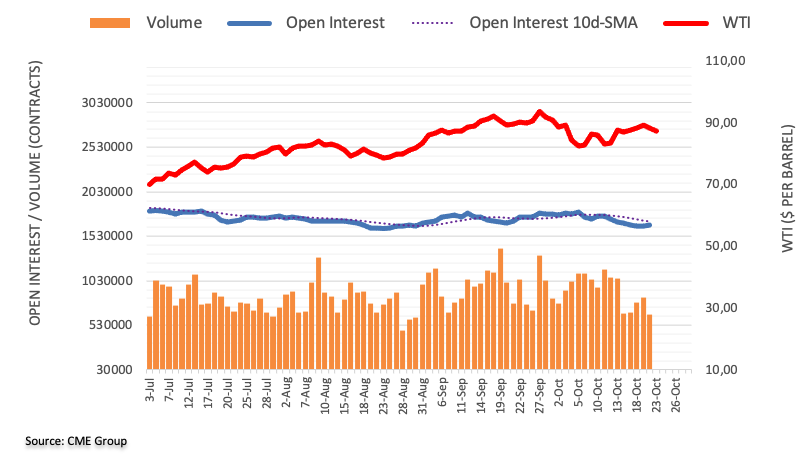
Gold climbed amid the rising geopolitical crises. Strategists at TD Securities analyze the yellow metal’s outlook.
XAU/USD needs more instability to continue its race higher
With the yellow metal trading at $1,980, there would need to be more instability such as a broadening of the conflict to the broader Middle East for the rally to continue.
It is likely that Gold may trend lower, given high rates for longer and a firm USD.
See – Gold Price Forecast: XAU/USD could chalk up some additional gains if Middle East conflict widens – Commerzbank
Open interest in gold futures markets rose for the fourth session in a row on Friday, now by around 5.2K contracts according to preliminary readings from CME Group. Volume followed suit and went up by more than 30K contracts, reversing the previous daily pullback.
Gold still looks to $2000 and above
Friday’s continuation of the uptrend in gold prices was on the back of rising open interest and volume and leaves intact the prospects for further gains in the very near term. Against that, the next target of note for the commodity remains at the critical $2000 mark per troy ounce.
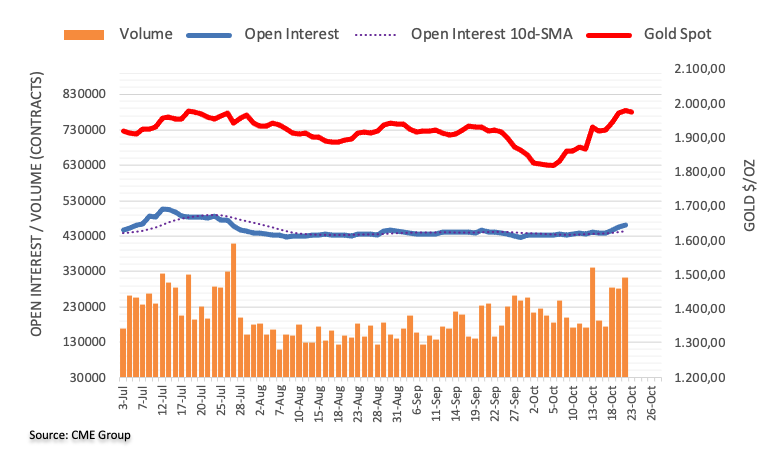
- USD/MXN faced a challenge due to risk-off sentiment.
- Israel-Hamas war could weigh on the Mexican Peso.
- Mexico's Retail Sales declined to 0.4% (MoM) in August, while the annual data grew at 3.2%.
- Greenback receives upward support on improved US Treasury yields.
USD/MXN aims to recover recent losses, trading around 18.2500 during the Asian session on Monday. The pair gained ground due to increased risk aversion stemming from the Israel-Hamas military situation.
The mixed remarks from US Federal Reserve (Fed) officials regarding the interest rates trajectory could put pressure on the USD/MXN pair. Atlanta Fed President Raphael Bostic suggested that the Federal Reserve is unlikely to lower interest rates before the middle of next year, and Fed Philadelphia President Patrick Harker expressed a preference for maintaining unchanged interest rates.
Furthermore, Federal Reserve (Fed) Chairman Jerome Powell clarified in the previous week that the central bank is not planning an immediate rate hike, emphasizing the potential for further tightening of monetary policy in response to signs of growth.
The US Dollar Index (DXY) trades higher around 106.30 at the time of writing. This upward movement is supported by the positive momentum in US Treasury yields, the 10-year US Treasury yield standing at 4.96%, up by 0.96% by the press time.
In the week ending October 14, US weekly Initial Jobless Claims dropped to 198K, coming in below market expectations of 212K. This marks the lowest level since January, indicating a positive trend in the job market.
However, Existing Home Sales Change showed a decline of 2.0% month-on-month in September, while Existing Home Sales improved to 3.96M units.
The US Unemployment Rate improved to 3.6% in September, surpassing the expected consistency at 3.7%. These data points provide insights into the current state of the US labor market and housing sector.
Moreover, downbeat retail sales in Mexico could contribute to undermining the Mexican Peso (MXN). Mexico's Retail Sales experienced a sharp decline of 0.4% month-on-month in August, falling short of the anticipated 0%. The annual growth of 3.2%, was below the of 4.4% forecasted and lagged behind the 5.1% recorded in July.
During the previous week, Deputy Governor Omar Mejia of the Bank of Mexico (Banxico) reiterated that the balance of inflation risks has not deteriorated. Mejia emphasized that the current restrictive monetary policy is effectively managing inflation, and he anticipates it to align with Banxico's target by the second quarter of 2025.
Investors are likely to monitor the US S&P Global PMI on Tuesday and the Q3 Gross Domestic Product (GDP) on Thursday. Additionally, Mexico’s Trade Balance data is set to be released on Friday. These key indicators have the potential to significantly impact market sentiment and provide valuable insights into the broader economic landscapes of both the United States and Mexico.
It seems to be the case that, shortly after the start of FX trading in Asia, USD/JPY briefly traded above the important level of 150. Economists at Commerzbank analyze the pair’s outlook.
Market assumption that 150 constitutes the MOF’s line of defense can turn into a self-fulfilling prophecy
The extremely small distance of the exchange rate to 150 constitutes a sign that the exchange rate fundamentally justified from the market’s point of view is much higher than 150.
If the MOF were to not intervene after a serious breach of 150, we would have to expect a very, very significant jump of the JPY exchange rates. That is not likely to be what the MOF wants. As a result, it will have no choice but to take action when a serious breach of 150 arises. The market assumption that 150 constitutes the MOF’s line of defense can turn into a self-fulfilling prophecy.
Here is what you need to know on Monday, October 23:
Financial markets remain relatively calm to on Monday as investors stay on the sidelines ahead of this week’s key macroeconomic data releases. Later in the session, Germany’s Bundesbank will publish its monthly report and the European Commission will release the preliminary Consumer Confidence data for October. The Federal Reserve Bank of Chicago’s National Activity Index will be featured in the US docket in the American session.
US Dollar price today
The table below shows the percentage change of US Dollar (USD) against listed major currencies today. US Dollar was the strongest against the Australian Dollar.
| USD | EUR | GBP | CAD | AUD | JPY | NZD | CHF | |
| USD | 0.04% | 0.02% | 0.07% | 0.09% | 0.02% | -0.01% | 0.02% | |
| EUR | -0.04% | -0.03% | 0.02% | 0.09% | -0.03% | -0.06% | -0.04% | |
| GBP | 0.00% | 0.02% | 0.05% | 0.09% | 0.01% | -0.03% | 0.02% | |
| CAD | -0.06% | -0.03% | -0.07% | 0.03% | -0.04% | -0.07% | -0.05% | |
| AUD | -0.14% | -0.07% | -0.04% | -0.06% | -0.09% | -0.09% | -0.10% | |
| JPY | -0.02% | 0.01% | -0.02% | 0.04% | 0.01% | -0.03% | 0.00% | |
| NZD | 0.01% | 0.05% | 0.07% | 0.07% | 0.09% | 0.04% | 0.04% | |
| CHF | -0.01% | 0.03% | -0.01% | 0.06% | 0.06% | 0.01% | -0.06% |
The heat map shows percentage changes of major currencies against each other. The base currency is picked from the left column, while the quote currency is picked from the top row. For example, if you pick the Euro from the left column and move along the horizontal line to the Japanese Yen, the percentage change displayed in the box will represent EUR (base)/JPY (quote).
The benchmark 10-year US Treasury bond yield stays below 5% after touching its highest level since November 2007 last week and US stock index futures trade modestly higher in the early European session. Following Jim Jordan’s third failed vote on Friday, 9 Republican lawmakers announced their candidacies for speaker. Republicans will reportedly meet on Monday to discuss the candidates and have an internal vote Tuesday morning.
Meanwhile, Israel’s military said that it will ramp up aerial bombardment of Gaza and called for civilians to evacuate to northern parts of the region. The US government is reportedly trying to convince Israel to delay a ground operation to allow more time for hostage negotiations and to get more humanitarian aid into the area.
EUR/USD closed the previous in positive territory but failed to stabilize above 1.0600. At the time of press, the pair was seen moving sideways in a tight channel slightly above 1.0550.
After falling below 1.2100 on Friday, GBP/USD staged a rebound ahead of the weekend. The pair seems to have stabilized above 1.2150 to start the new week. On Tuesday, the UK's Office for National Statistics will release the August jobs data.
Japan's Nikkei newspaper reported on Sunday that the Bank of Japan officials were considering to adjust the yield curve control strategy amid heightened uncertainty surrounding the global economic outlook with escalating geopolitical tensions in the Middle East. Japan's Nikkei 225 Index came under heavy bearish pressure and fell nearly 1% on Monday. In the meantime, USD/JPY continues to trade dangerously close to 150.00.
Gold continued to benefit from safe-haven demand and extended its weekly rally on Friday. XAU/USD came within a touching distance of $2,000 and set a new multi-month high ahead of the weekend. The pair staged a downward correction early Monday and was last seen trading in negative territory below $1,980.
- USD/CHF holds positive ground around the mid-0.8900s on Monday.
- The rising geopolitical tension in the Middle East might boost safe-haven flows.
- Many Fed officials signaled that rates would be held steady at its November meeting.
The USD/CHF pair hovers around 0.8935 during the early European session on Monday. The renewed US Dollar (USD) demand lends some support to the pair. However, geopolitical tensions continue to hang over the market and might cap the Greenback’s upside.
Fears that the Israel-Hamas confrontation would escalate into a larger Middle East battle grew on Sunday, with Washington warning of a significant risk to US interests in the region. Furthermore, Chinese state media stated early Monday that the situation in Gaza is "very serious," with the possibility of a large-scale ground conflict rising and the outlook "worrisome" as armed conflicts along neighboring borders spread. That being said, the rising geopolitical tension in the Middle East might boost safe-haven assets like Swiss France and act as a headwind for the USD/CHF pair.
Last week, the Swiss Trade surplus widened more than expected in September. Trade Balance arrived at 6,316M versus 3,814M seen in the previous month, above the market consensus of 3,770M. Meanwhile, Exports surged to 24,795M MoM in September from the previous reading of 20,932M whereas Imports came in at 18,480M MoM versus 17,118M prior.
Across the pond, Atlanta Fed President Raphael Bostic said on Friday that he doesn't think that the US central bank will cut the rate before the middle of next year. Fed Philadelphia President Patrick Harker reiterated his preference to keep interest rates unchanged. While Fed Cleveland President Loretta Mester said the US central bank is "at or near the peak of the rate hike cycle. However, the data released this week might convince the central bank about the future monetary policy path. The stronger-than-expected data might lift the Greenback and limit the downside of the USD/CHF pair.
About the data, September’s US budget deficit was $170 billion, according to the Treasury Department on Friday. The overall 2023 budget deficit was $1.695 trillion, 23% larger than the previous year and exceeding all pre-COVID deficits.
Looking ahead, market participants will focus on the US S&P Global PMI data on Tuesday. Additionally, the first reading of Q3 US Gross Domestic Product (GDP) growth will be released on Thursday, and the Core Personal Consumption Expenditures (PCE) will be due on Friday. On the Swiss front, the Swiss ZEW Survey for October will be released on Wednesday. These figures could give a clear direction to the USD/CHF pair.
For the time being, the weight of the Renminbi as a reserve currency and as an international trade currency is very low. Can the RMB become a reserve and invoicing currency for large-scale trade, competing with the Dollar? Economists at Natixis analyze the mandatory features of an international reserve currency.
If the RMB does not become a reserve currency, it will be difficult for it to become a trade currency
The Renminbi is not convertible, is not backed by a large and liquid government bond market, and is not issued by a country (China) that has an external deficit and debt: the Renminbi therefore has none of the features of an international reserve currency, whereas the Dollar has all these features.
This will also limit the role of the RMB as an invoicing currency for trade: countries exporting to China in Renminbi would not be able to keep the money they earn from this trade, and the only possible use of this income would be to buy Chinese products.
FX option expiries for Oct 23 NY cut at 10:00 Eastern Time, via DTCC, can be found below.
- EUR/USD: EUR amounts
- 1.0450 400m
- 1.0525 384m
- 1.0540 538m
- 1.0550 971m
- 1.0600 1.1b
- 1.0625 2.5b
- 1.0670 838m
- 1.0675 405m
- USD/JPY: USD amounts
- 148.75 1.7b
- 149.00 1.8b
- 149.20 1.5b
- 149.30 630m
- 149.50 1.7b
- 150.00 1.7b
- 150.25 1.1b
- 150.35 452m
- 150.50 659m
- USD/CHF: USD amounts
- 0.8900 520m
- 0.8950 500m
- 0.9050 892m
- AUD/USD: AUD amounts
- 0.6300 410m
- USD/CAD: USD amounts
- 1.3600 880m
- NZD/USD: NZD amounts
- 0.5825 735m
- 0.5900 482m
- EUR/USD remains capped under the 1.0600 barrier ahead of the key events.
- A key resistance level is located at the 1.0600-1.0610 region; the initial support level is seen at 1.0566.
- The Relative Strength Index (RSI) is in the 40-60 zone, suggesting a lack of direction.
The EUR/USD pair snaps a two-day winning streak during the early European session on Monday. Market players await the European Central Bank (ECB) Interest Rate Decision on Thursday, with no rate change expected. The markets anticipate ECB’s rate hiking cycle is over, but it won't be until at least July 2024 before it begins easing as the battle against elevated inflation rattles on. At the press time, the major pair is losing 0.15% on the day to trade at 1.0577.
From the technical perspective, the EUR/USD pair sticks to the range-bound theme on the four-hour chart. The major pair holds above the 50- and 100-hour Exponential Moving Averages (EMAs) but the long-term average is above the short-term average indicating further upside looks favorable.
The 1.0600-1.0610 region acts as a key resistance level for the major pair. The mentioned level represents the confluence of the upper boundary of Bollinger Band, a psychological round mark, and a high of October 20. A decisive break above the latter will see a rally to the next barrier at 1.0635 (high of October 11). The additional upside filter to watch is 1.0671 (high of September 22), followed by 1.0735 (high of September 20).
On the downside, the initial support level for EUR/USD is seen near the 50-hour EMA at 1.0566. The critical contention will emerge at 1.0525, portraying a low of October 18 and a lower limit of the Bollinger Band. Further south, a round figure at 1.0500 will be the next downside stop. A breach of the latter will see a drop to 1.0450 (low of October 4).
That being said, the Relative Strength Index (RSI) is located in the 40-60 zone, suggesting a non-directional movement in the pair.
EUR/USD four-hour chart
-638336361669654818.png)
- The index regains the smile in the low-106.00s.
- Investors expect the Fed to keep rates on hold in November.
- Inflation tracked by the PCE takes centre stage this week.
The greenback, in terms of the USD Index (DXY), manages to regain balance and revisits the106.30 zone at the beginning of the week.
USD Index focuses on risk trends, geopolitics
The index maintains the side-lined theme for yet another session on Monday, always in the low-106.00s and amidst alternating risk appetite trends for the time being.
In the meantime, market participants continue to look at the geopolitical front in the Middle East for some near-term direction. When it comes to the monetary policy expectations, investors see the Federal Reserve keeping its interest rates unchanged at the upcoming November 1 meeting, while the door for a potential rate hike in December remains open.
In the US data space, the Chicago Fed National Activity Index will be the sole data release later in the session.
What to look for around USD
The index maintains the multi-session range bound theme unchanged in the low-106.00s for the time being.
In the meantime, support for the dollar keeps coming from the good health of the US economy, which at the same time appears underpinned by the renewed tighter-for-longer stance narrative from the Federal Reserve.
Key events in the US this week: Chicago Fed National Activity Index (Monday) – Flash Manufacturing/Services PMIs (Tuesday) – MBA Mortgage Applications, New Home Sales, Chair Powell (Wednesday) - Initial Jobless Claims, Durable Goods Orders, Advanced Goods Trade Balance, Flash Q4 GDP Growth Rate (Thursday) – PCE, Core PCE, Personal Income, Personal Spending, Final Michigan Consumer Sentiment (Friday).
Eminent issues on the back boiler: Persevering debate over a soft or hard landing for the US economy. Incipient speculation of rate cuts in early 2024. Geopolitical effervescence vs. Russia and China and the Middle East.
USD Index relevant levels
Now, the index is up 0.13% at 106.30 and a breakout of 106.78 (weekly peak October 13) could expose 107.34 (2023 high October 3) and finally 107.99 (weekly high November 21 2022). On the other hand, the next support emerges at 105.53 (monthly low October 12) ahead of 104.42 (weekly low September 11) and then 103.31 (200-day SMA).
- Crude oil prices weaken despite geopolitical tension in the Middle-East.
- Israel hit missiles at Damascus and Aleppo international airports in Syria.
- Chinese crude oil output edged up 0.3% (YoY) to 16.87 million tonnes.
Western Texas Intermediate (WTI) oil price extends losses for the second session, trading lower around $86.70 per barrel during the Asian session on Monday. However, Crude oil prices received upward support due to the concerns that the Israel-Gaza conflict may escalate across the Middle East, potentially disrupting supplies from one of the world's leading production regions.
Concerns among investors are rising due to the potential spillover of geopolitical tensions in the Gaza Strip, which poses a threat to the stability of the region near the Strait of Hormuz. This strategic waterway is a crucial chokepoint for global oil supply, with about a fifth of the world's oil passing through its waters.
Moreover, the situation in the region remains tense as Israel targeted missiles at Damascus and Aleppo international airports in Syria on Sunday. The strikes resulted in both airports being rendered out of service. However, there is currently no indication of a ground war in Gaza.
China's crude oil output has seen a 1.9% year-on-year increase in the first three quarters of 2023, reaching 156.72 million tonnes, according to data from the National Bureau of Statistics (NBS). In the most recent month, crude oil output edged up 0.3% (YoY) to 16.87 million tonnes.
Additionally, China's crude oil imports surged, with the country importing 424.27 million tonnes in the first nine months of 2023, reflecting a significant increase of 14.6% compared to the same period in 2022. These figures indicate ongoing dynamics in China's energy landscape and its role in the global oil market.
The US Dollar Index (DXY) trades higher around 106.30 at the time of writing, recovering the recent losses. The US Dollar receives upward support due to the positive momentum in US Treasury yields, with the 10-year US Treasury yield standing at 4.98%, up by 1.30% by the press time.
The Greenback seems to be finding potential support from robust US economic data released in the previous week. The recent job data reflects a strong economy, with Weekly Initial Jobless Claims reaching their lowest level since January, indicating a resilient job market. However, the housing market presents challenges as existing home sales have fallen to their lowest point since 2010.
Despite the positive economic data, mixed remarks from US Federal Reserve (Fed) officials regarding the interest rates trajectory could weigh on the US Dollar. Atlanta Fed President Raphael Bostic indicated that the Federal Reserve is unlikely to lower interest rates before the middle of next year, and Fed Philadelphia President Patrick Harker reiterated a preference for maintaining unchanged interest rates.
Additionally, Federal Reserve (Fed) Chairman Jerome Powell clarified in the previous week that the central bank is not planning an immediate rate hike, emphasizing the potential for further tightening of monetary policy in response to signs of growth.
Investors are likely to monitor the US S&P Global PMI on Tuesday and the Q3 Gross Domestic Product (GDP) on Thursday. These key indicators hold the potential to significantly impact market sentiment and provide valuable insights into the broader economic landscape of the United States.
- Gold prices snap the winning streak amid US Dollar rebound.
- Escalation of the Israel-Hamas conflict could limit the downfall in the prices of Gold.
- Greenback receives upward support on improved US Treasury yields.
- Dovish remarks by Fed officials weakened the buck.
Gold price halts the winning streak that began on October 17, trading lower around $1,970 per troy ounce during the Asian session on Monday. While geopolitical tensions between Israel and Hamas typically contribute to a higher demand for gold as a traditional safe-haven asset, the current risk-on sentiment is posing a challenge to the price of gold.
The US Dollar Index (DXY) rebounds, trading higher around 106.30 at the time of writing. The US Dollar receives upward support due to the positive momentum in US Treasury yields, with the 10-year US Treasury yield standing at 4.98%, up by 1.30% by the press time.
The Greenback is also potentially supported by robust US economic data released during the previous week. The recent job data paints a picture of a robust economy. Weekly Initial Jobless Claims have reached their lowest level since January, indicating a solid and resilient job market. However, a contrasting trend is seen in existing home sales, which have fallen to their lowest point since 2010, signaling challenges in the housing market.
Atlanta Fed President Raphael Bostic, on Friday, expressed that the Federal Reserve is unlikely to lower interest rates before the middle of next year. Fed Philadelphia President Patrick Harker reiterated his preference for maintaining unchanged interest rates.
Furthermore, Fed Cleveland President Loretta Mester stated that the Fed is "at or near the peak of the rate hike cycle." However, Mester also acknowledged that the data released in the previous week could influence the central bank's decision regarding the future of monetary policy.
Federal Reserve (Fed) Chairman Jerome Powell, in the previous week, made it clear that the central bank is not planning an immediate rate hike. Powell emphasized the potential for further tightening of monetary policy in response to additional signs of growth.
Investors will likely keep a close eye on the US S&P Global PMI on Tuesday, followed by the Q3 Gross Domestic Product (GDP) on Thursday. These key indicators have the potential to significantly impact market sentiment and provide insights into the broader economic landscape of the United States.
- USD/CAD remains flat around 1.3715 in the Asian session on Monday.
- Bank of Canada (BoC) is likely to hold the rate unchanged for the remainder of the year.
- Federal Reserve (Fed) officials expressed a desire to hold rates unless inflation rises.
- Investors will closely monitor the Bank of Canada (BoC) Interest Rate Decision on Wednesday.
The USD/CAD pair trades sideways around 1.3715 during the early Asian session on Monday. Investors await the Bank of Canada (BoC) Interest Rate Decision on Wednesday, which is expected to hold the rate at 5.0%. Meanwhile, A rise in US Treasury bond yields and the escalating geopolitical tensions in the Middle East might boost the US Dollar (USD) and weigh on the pair.
The market anticipates the Bank of Canada (BoC) to maintain the interest rate for the remainder of the year and is expected to cut the rate in the second quarter of 2024. Meanwhile, a decline in oil prices undermines the commodity-linked Loonie as the country is the leading oil exporter to the US.
Last week, the Canadian headline Consumer Price Index (CPI) decelerated to 3.8% YoY in September from 4% in the previous month, meeting the market expectation. The BoC CPI, which excludes volatile food and energy prices, surged 2.8% in September versus 3.3% prior. The figures showed an easing in inflationary pressure in the Canadian economy.
On the other hand, the Federal Open Market Committee (FOMC) enters its blackout period. Atlanta Federal Reserve (Fed) President Raphael Bostic said on Friday that he doesn't think that the US central bank will cut the rate before the middle of next year. Fed Philadelphia President Patrick Harker reiterated his preference to keep interest rates unchanged. While Fed Cleveland President Loretta Mester said the US central bank is "at or near the peak of the rate hike cycle.
Traders will monitor the US S&P Global PMI on Tuesday. The attention will shift to the BoC monetary policy decision on Wednesday, with no change in rate expected. Additionally, the first reading of Q3 US Gross Domestic Product (GDP) growth will be released on Thursday and the Core Personal Consumption Expenditures (PCE) will be due on Friday. Traders will take cues from the data and find trading opportunities around the USD/CAD pair.
- NZD/USD loses ground around 0.5821 amid the escalating geopolitical tensions in the Middle East.
- Fed Chair Jerome Powell and other officials expressed a desire to hold rates unless inflation rises.
- the New Zealand Trade Balance (NZD) came in at $-15.33B YoY in September versus $-15.52B prior.
The NZD/USD pair trades in negative territory for the fifth consecutive day during the Asian trading hours on Monday. The escalating geopolitical tensions in the Middle East exert some selling pressure on riskier assets like the New Zealand Dollar (NZD). The pair currently trades around 0.5821, losing 0.15% on the day.
As the FOMC enters its blackout period, Atlanta Federal Reserve (Fed) President Raphael Bostic said on Friday that he doesn't think that the US central bank will cut the rate before the middle of next year. Fed Philadelphia President Patrick Harker reiterated his preference to keep interest rates unchanged. While Fed Cleveland President Loretta Mester said the US central bank is "at or near the peak of the rate hike cycle. The expectation that the Fed will hold rates high for longer might lift the USD against the Kiwi and act as a headwind for the pair.
On the Kiwi front, the New Zealand markets closed for Labor Day. On Friday, the nation’s Trade Balance (NZD) came in at $-15.33B YoY in September versus $-15.52B prior. Exports eased to $4.87B during the said month versus $4.97B prior whereas Imports dropped to $7.20B compared to $7.24B in previous readings, Statistics New Zealand reported.
In the absence of economic data released from New Zealand’s docket this week, the NZD/USD pair remains at the mercy of USD price dynamics. Traders will focus on the US S&P Global PMI on Tuesday, the first reading of Q3 Gross Domestic Product (GDP) growth on Thursday, and the Core Personal Consumption Expenditures (PCE) on Friday. These figures could give a clear direction to the NZD/USD pair.
- USD/JPY extends the gains for a second trading session on the upbeat US Dollar.
- Japan’s ruling LDP won the lower house seat but faced defeat in the House of Councilors poll in by-elections.
- Greenback strengthens on the back of higher US Treasury yields.
USD/JPY trades higher near 149.90 during the Asian session on Monday. The pair receives upward support following the comments from Bank of Japan (BoJ) Governor Kazuo Ueda on Friday.
BoJ Governor Kazuo Ueda reiterated that the central bank remains steadfast in its commitment to achieve a 2% inflation target in a stable and sustainable manner. This objective is complemented by a focus on wage growth, and Ueda emphasized that the current accommodative policy will be maintained with patience.
In terms of political developments in Japan, there were two by-elections on Sunday for a lower house seat and an upper house seat. The ruling Liberal Democratic Party (LDP) secured victory in the lower house (House of Representatives) seat but faced defeat in the House of Councilors poll, which was claimed by an opposition-backed independent candidate.
However, approval ratings for Japanese Prime Minister Kishida's Cabinet have plummeted to their lowest levels since he assumed power in October 2021. Speculation had been circulating that Kishida might dissolve the lower house and call a general election by the end of the year if the LDP won both seats.
Furthermore, traders are concerned about the potential for Japan to intervene to counter a prolonged depreciation in the JPY, which could limit the advance of the USD/JPY pair.
US Dollar Index (DXY) snaps the recent losses, possibly supported by robust economic data from the United States (US). The spot price bids higher around 106.30 at the time of writing.
Additionally, the upbeat US Treasury yields provide support in underpinning the US Dollar (USD), with the 10-year US Treasury yield standing at 4.98%, up by 1.30%, by the press time.
Federal Reserve (Fed) Chairman Jerome Powell mentioned during the previous week that the central bank has no plans to raise rates. Powell also emphasized that further tightening of monetary policy is possible on further signs of growth.
Atlanta Fed President Raphael Bostic said on Friday that the Federal Reserve is unlikely to lower interest rates before the middle of next year. Fed Philadelphia President Patrick Harker reiterated his inclination to maintain unchanged interest rates.
Moreover, Fed Cleveland President Loretta Mester stated that the Fed is "at or near the peak of the rate hike cycle." However, Mester also acknowledged that the data released during the previous week could impact the central bank's decision regarding the future of monetary policy.
Investors will closely monitor the US S&P Global PMI on Tuesday, followed by the Q3 Gross Domestic Product (GDP) on Thursday. Japan’s Consumer Price Index will be eyed on Friday.
- Indian Rupee trades firmly, supported by the potential aggressive intervention by the Reserve Bank of India (RBI).
- A rise in US Treasury yields and higher crude oil prices might cap the upside of the Indian Rupee.
- Investors will focus on the RBI Forex swap maturity, US economic data.
Indian Rupee (INR) posts modest gains on Monday. The strengthening of the Indian Rupee is bolstered by the potential aggressive intervention by the Reserve Bank of India (RBI) last week. However, the anticipation that the Federal Reserve (Fed) will hold rates ‘higher for longer’ lifts the US Treasury yields near multi-year highs. However, a rise in oil prices might cap the upside of the Indian Rupee.
Traders will keep an eye on a $5 billion RBI swap transaction, which is set to mature on Monday. The maturity of the USD/INR swaps will wipe out $5 billion from the system while injecting about 400 billion Rupees. Furthermore, the release of the US S&P Global PMI, the first reading of Q3 Gross Domestic Product (GDP), and the Core Personal Consumption Expenditures (PCE) data this week will be closely watched by traders.
Daily Digest Market Movers: Indian Rupee gains traction with the bullish economic outlook
- Fed Chair Jerome Powell and other officials expressed a desire to hold rates unless inflation rises.
- September's US budget deficit was $170 billion. The overall 2023 budget deficit was $1.695 trillion, 23% larger than the previous year and exceeding all pre-COVID deficits.
- RBI Chief Shaktikanta Das said the central bank does intervene in the forex market, but only to prevent excessive volatility of the Indian Rupee.
- Chief Das stated that RBI will monitor the evolving inflation dynamic amid the uncertainty on food inflation.
- India's Finance Minister will focus on the impact of ongoing tensions in the Middle East on the supply chain.
- The Indian government is concerned with the settlement currency, the yuan, as Indian refiners have used the yuan to pay for some oil from Russian sellers.
- The RBI's October bulletin suggested growth is expected to gain momentum through the rest of the year.
- The RBI sold a net $3.86 billion in the spot foreign exchange market in August.
- India’s Wholesale Price Index (WPI) for September came in at -0.26% YoY from 0.52% in the previous reading, missing the market estimation of 0.50%.
Technical Analysis: Indian Rupee holds above the key support level around the 83.00 mark
The Indian Rupee kicks off the week in a positive mood against the US Dollar (USD). The USD/INR pair trades within a narrow range of 83.15-83.30 and the key contention level is seen at the 83.00 psychological round mark. A breach below the latter could see a drop to 82.82 (low of September 12), followed by 82.65 (low of August 4). On the upside, the first resistance level for USD/INR is located near a high of October 4 at 83.30, en route to the all-time high around 83.45, followed by a psychological figure at 84.00. In the meantime, the pair holds above the 100- and 200-day Exponential Moving Averages (EMA) on the daily chart, which hints that further upside looks favorable.
US Dollar price in the last 7 days
The table below shows the percentage change of US Dollar (USD) against listed major currencies in the last 7 days. US Dollar was the weakest against the Swiss Franc.
| USD | EUR | GBP | CAD | AUD | JPY | NZD | CHF | |
| USD | -0.52% | 0.00% | 0.52% | -0.04% | 0.23% | 1.41% | -0.92% | |
| EUR | 0.52% | 0.52% | 1.04% | 0.48% | 0.74% | 1.92% | -0.41% | |
| GBP | 0.00% | -0.52% | 0.53% | -0.04% | 0.23% | 1.41% | -0.92% | |
| CAD | -0.53% | -1.05% | -0.51% | -0.56% | -0.30% | 0.89% | -1.45% | |
| AUD | 0.04% | -0.49% | 0.03% | 0.57% | 0.26% | 1.45% | -0.90% | |
| JPY | -0.22% | -0.72% | -0.22% | 0.29% | -0.25% | 1.20% | -1.12% | |
| NZD | -1.44% | -1.96% | -1.43% | -0.90% | -1.48% | -1.19% | -2.40% | |
| CHF | 0.91% | 0.41% | 0.92% | 1.43% | 0.90% | 1.15% | 2.31% |
The heat map shows percentage changes of major currencies against each other. The base currency is picked from the left column, while the quote currency is picked from the top row. For example, if you pick the Euro from the left column and move along the horizontal line to the Japanese Yen, the percentage change displayed in the box will represent EUR (base)/JPY (quote).
Indian Rupee FAQs
What are the key factors driving the Indian Rupee?
The Indian Rupee (INR) is one of the most sensitive currencies to external factors. The price of Crude Oil (the country is highly dependent on imported Oil), the value of the US Dollar – most trade is conducted in USD – and the level of foreign investment, are all influential. Direct intervention by the Reserve Bank of India (RBI) in FX markets to keep the exchange rate stable, as well as the level of interest rates set by the RBI, are further major influencing factors on the Rupee.
How do the decisions of the Reserve Bank of India impact the Indian Rupee?
The Reserve Bank of India (RBI) actively intervenes in forex markets to maintain a stable exchange rate, to help facilitate trade. In addition, the RBI tries to maintain the inflation rate at its 4% target by adjusting interest rates. Higher interest rates usually strengthen the Rupee. This is due to the role of the ‘carry trade’ in which investors borrow in countries with lower interest rates so as to place their money in countries’ offering relatively higher interest rates and profit from the difference.
What macroeconomic factors influence the value of the Indian Rupee?
Macroeconomic factors that influence the value of the Rupee include inflation, interest rates, the economic growth rate (GDP), the balance of trade, and inflows from foreign investment. A higher growth rate can lead to more overseas investment, pushing up demand for the Rupee. A less negative balance of trade will eventually lead to a stronger Rupee. Higher interest rates, especially real rates (interest rates less inflation) are also positive for the Rupee. A risk-on environment can lead to greater inflows of Foreign Direct and Indirect Investment (FDI and FII), which also benefit the Rupee.
How does inflation impact the Indian Rupee?
Higher inflation, particularly, if it is comparatively higher than India’s peers, is generally negative for the currency as it reflects devaluation through oversupply. Inflation also increases the cost of exports, leading to more Rupees being sold to purchase foreign imports, which is Rupee-negative. At the same time, higher inflation usually leads to the Reserve Bank of India (RBI) raising interest rates and this can be positive for the Rupee, due to increased demand from international investors. The opposite effect is true of lower inflation.
| Raw materials | Closed | Change, % |
|---|---|---|
| Silver | 23.353 | 1.53 |
| Gold | 1980.326 | 0.37 |
| Palladium | 1100.56 | -0.68 |
- GBP/USD struggles to extend gains as US Dollar rebounds.
- UK Retail Sales dipped to 0.9% against the expected 0.1% decline.
- Upbeat US Treasury yields provide support to underpin the Greenback.
GBP/USD struggles to continue the winning streak. trading around 1.2160 during the Asian session on Monday. However, the currency pair encountered a hurdle following the release of downbeat United Kingdom (UK) Retail Sales data for September on Friday. The Pound Sterling (GBP) managed to recover its losses against the weaker US Dollar (USD).
Monthly Retail Sales revealed a 0.9% decline, in contrast to the expected 0.1% decrease, following a modest 0.4% rise in August. On an annual basis, sales contracted by 1.0%, defying market predictions of a stagnant performance.
This dip in Retail Sales is indicative of the financial strain on households due to high inflation and increased borrowing costs. The significant drop in consumer spending is likely to have a notable impact on consumer inflation expectations. As a consequence of weakening spending, there's speculation that the Bank of England (BoE) might lean towards maintaining the current interest rates at 5.25% in November’s policy meeting.
US Dollar Index (DXY) attempts to recoup recent losses, possibly bolstered by robust economic data from the United States (US). Additionally, the upbeat US Treasury yields provide support in underpinning the US Dollar (USD), with the 10-year US Treasury yield standing at 4.96%, up by 0.92%, by the press time.
Federal Reserve (Fed) Chairman Jerome Powell, on Thursday, suggested that the central bank has no immediate plans to raise rates, providing support for the GBP/USD pair. Powell also mentioned that additional tightening of monetary policy might be necessary if there are further signs of growth or the labor market stops improving.
Atlanta Fed President Raphael Bostic shared his belief on Friday that the US central bank is unlikely to lower interest rates before the middle of next year. Fed Philadelphia President Patrick Harker reiterated his inclination to maintain unchanged interest rates.
Moreover, Fed Cleveland President Loretta Mester indicated that the US central bank is "at or near the peak of the rate hike cycle." However, Mester acknowledged that the data released during the previous week could influence the central bank's decision regarding the future of monetary policy.
Market participants will closely monitor the US S&P Global PMI on Tuesday, followed by the Q3 Gross Domestic Product (GDP) on Thursday, and the Core Personal Consumption Expenditures (PCE) on Friday. On the UK docket, Claimant Count Change, Employment Change, and S&P Global/CIPS PMI will also be eyed.
On Monday, the People’s Bank of China (PBOC) fixed the USD/CNY central rate at 7.1792, compared with Friday’s fix of 7.1793 and market expectations of 7.3109.
- Australian Dollar struggles as the US Dollar recovers recent losses.
- Australia’s central bank is expected to implement more interest rate hikes.
- Upbeat US Treasury yields contribute support for the Greenback.
The Australian Dollar (AUD) continues the losing streak for the fourth successive day on Monday. The AUD/USD pair faces challenges due to a rebound in US Dollar (USD) amid upbeat US Treasury yields.
Australia’s central bank is anticipated to implement more stringent monetary policies. Reserve Bank of Australia (RBA) Governor Michele Bullock has stated that should inflation persist above the projected levels, the RBA is prepared to enact suitable policy measures.
Australia's employment scenario is experiencing interesting shifts. In September, the Employment Change took an unexpectedly sharp decline, adding a surprising twist to the equation. On a positive note, the Unemployment Rate made a favorable move by dropping more than anticipated, deviating from the expected trend.
The US Dollar Index (DXY) bounces back to recover recent losses, potentially supported by strong economic data from the United States (US). However, the US Dollar (USD) encountered hurdles as US Treasury yields experienced a pullback on Friday.
Federal Reserve (Fed) Chairman Jerome Powell indicated on Thursday that the central bank is not planning to raise rates in the short term providing support for the pair. Powell added that additional tightening of monetary policy could be in order if there are further signs of growth or the labor market ceases to improve.
Daily Digest Market Movers: Australian Dollar looks to continue the losing streak on upbeat US Dollar
- Australia's Unemployment Rate for September surprised on the positive side, coming in at 3.6%. This outperformed expectations of 3.7% and matched the previous figure of 3.7%.
- Australian Employment Change for the same month was 6.7K, falling short of the consensus forecast of 20K. This is a notable decline from the 64.9K jobs added in August.
- Australia's central bank expresses heightened concern about the inflation impact stemming from supply shocks. Governor of the Reserve Bank of Australia, Michele Bullock stated that if inflation persists above projections, the RBA will take responsive policy measures. There is an observable deceleration in demand, and per capita consumption is on the decline.
- Atlanta Fed President Raphael Bostic expressed on Friday that he believes the US central bank is unlikely to lower interest rates before the middle of next year. Fed Philadelphia President Patrick Harker reiterated his inclination to maintain unchanged interest rates.
- Fed Cleveland President Loretta Mester indicated that the US central bank is "at or near the peak of the rate hike cycle." However, Mester acknowledged that the data released during the previous week could influence the central bank's decision regarding the future of monetary policy.
- US weekly Initial Jobless Claims declined to 198K, falling short of the market expectations of 212K for the week ending October 14, the lowest level since January.
- Existing Home Sales Change fell 2.0% MoM in September and Existing Home Sales improved to 3.96M.
- US Unemployment Rate improved to 3.6%, which was expected to remain consistent at 3.7% in September.
- Market fluctuations persist in the US bond market, as the 10-year Treasury yield stabilizes around 4.94%. Meanwhile, the 2-year yield has dipped to 5.09%.
- Market participants will closely monitor the US S&P Global PMI on Tuesday, the Q3 Gross Domestic Product (GDP) on Thursday, and the Core Personal Consumption Expenditures (PCE) on Friday. The attention will also be focused on the Australian S&P Global PMI and Consumer Price Index (CPI), along with RBA Governor Bullock's speech.
Technical Analysis: Australian Dollar maintains position above 0.6300 major level
The Australian Dollar trades lower around 0.6310 on Monday, aligning with notable support at the 0.6300 level. The further support level is indicated by the monthly low at 0.6285. Looking upward, a crucial resistance is identified around the 14-day Exponential Moving Average (EMA) at 0.6347, following a major level at 0.6400. A breakthrough above this level holds the potential to reach around the 23.6% Fibonacci retracement level at 0.6429.
AUD/USD: Daily Chart
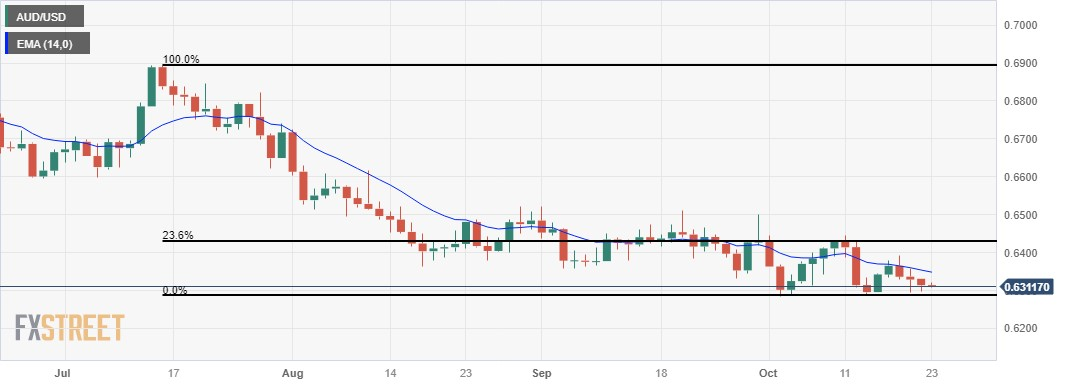
Australian Dollar price today
The table below shows the percentage change of Australian Dollar (AUD) against listed major currencies today. Australian Dollar was the weakest against the US Dollar.
| USD | EUR | GBP | CAD | AUD | JPY | NZD | CHF | |
| USD | 0.05% | 0.04% | 0.05% | 0.12% | -0.02% | 0.06% | 0.07% | |
| EUR | -0.05% | -0.01% | -0.01% | 0.07% | -0.07% | 0.01% | 0.03% | |
| GBP | -0.03% | 0.00% | 0.01% | 0.12% | -0.05% | 0.02% | 0.06% | |
| CAD | -0.04% | 0.01% | -0.01% | 0.12% | -0.05% | 0.01% | 0.04% | |
| AUD | -0.13% | -0.05% | -0.06% | -0.08% | -0.12% | -0.07% | -0.04% | |
| JPY | 0.02% | 0.05% | 0.02% | 0.05% | 0.10% | 0.05% | 0.10% | |
| NZD | -0.05% | 0.00% | -0.01% | -0.01% | 0.07% | -0.06% | 0.03% | |
| CHF | -0.08% | -0.03% | -0.04% | -0.04% | 0.04% | -0.10% | -0.03% |
The heat map shows percentage changes of major currencies against each other. The base currency is picked from the left column, while the quote currency is picked from the top row. For example, if you pick the Euro from the left column and move along the horizontal line to the Japanese Yen, the percentage change displayed in the box will represent EUR (base)/JPY (quote).
Australian Dollar FAQs
What key factors drive the Australian Dollar?
One of the most significant factors for the Australian Dollar (AUD) is the level of interest rates set by the Reserve Bank of Australia (RBA). Because Australia is a resource-rich country another key driver is the price of its biggest export, Iron Ore. The health of the Chinese economy, its largest trading partner, is a factor, as well as inflation in Australia, its growth rate and Trade Balance. Market sentiment – whether investors are taking on more risky assets (risk-on) or seeking safe-havens (risk-off) – is also a factor, with risk-on positive for AUD.
How do the decisions of the Reserve Bank of Australia impact the Australian Dollar?
The Reserve Bank of Australia (RBA) influences the Australian Dollar (AUD) by setting the level of interest rates that Australian banks can lend to each other. This influences the level of interest rates in the economy as a whole. The main goal of the RBA is to maintain a stable inflation rate of 2-3% by adjusting interest rates up or down. Relatively high interest rates compared to other major central banks support the AUD, and the opposite for relatively low. The RBA can also use quantitative easing and tightening to influence credit conditions, with the former AUD-negative and the latter AUD-positive.
How does the health of the Chinese Economy impact the Australian Dollar?
China is Australia’s largest trading partner so the health of the Chinese economy is a major influence on the value of the Australian Dollar (AUD). When the Chinese economy is doing well it purchases more raw materials, goods and services from Australia, lifting demand for the AUD, and pushing up its value. The opposite is the case when the Chinese economy is not growing as fast as expected. Positive or negative surprises in Chinese growth data, therefore, often have a direct impact on the Australian Dollar and its pairs.
How does the price of Iron Ore impact the Australian Dollar?
Iron Ore is Australia’s largest export, accounting for $118 billion a year according to data from 2021, with China as its primary destination. The price of Iron Ore, therefore, can be a driver of the Australian Dollar. Generally, if the price of Iron Ore rises, AUD also goes up, as aggregate demand for the currency increases. The opposite is the case if the price of Iron Ore falls. Higher Iron Ore prices also tend to result in a greater likelihood of a positive Trade Balance for Australia, which is also positive of the AUD.
How does the Trade Balance impact the Australian Dollar?
The Trade Balance, which is the difference between what a country earns from its exports versus what it pays for its imports, is another factor that can influence the value of the Australian Dollar. If Australia produces highly sought after exports, then its currency will gain in value purely from the surplus demand created from foreign buyers seeking to purchase its exports versus what it spends to purchase imports. Therefore, a positive net Trade Balance strengthens the AUD, with the opposite effect if the Trade Balance is negative.
According to Chinese state media, the situation in Gaza is "very serious," with the possibility of a large-scale ground conflict rising and the outlook "worrisome" as armed conflicts along neighboring borders spread, citing the country's Middle East special envoy.
The envoy Zhai Jun said China has supplied and would continue to offer emergency humanitarian assistance to Palestinians via the UN and bilateral channels in order to help alleviate the humanitarian crisis.
Market reaction
Following the above headline, the US dollar Index (DXY) is up 0.06% on the day at 106.22
- EUR/USD loses ground around 1.0586 in the busy week of economic data.
- Federal Reserve (Fed) Chair Jerome Powell and many Fed officials signaled that rates would be held steady at its November meeting.
- Market players await the European Central Bank (ECB) meeting on Thursday, with the Deposit Rate likely to remain at 4.00%.
The EUR/USD pair turns red during the early Asian session on Monday after retracing from the 1.0600 psychological round mark. Market players await the Eurozone and US data ahead of the European Central Bank (ECB) meeting on Thursday, with no rate change expected. The major pair currently trades around 1.0586, losing 0.07% on the day.
According to the economists polled by Reuters, the ECB’s rate hiking cycle is over, but it won't be until at least July 2024 before it begins easing as the battle against elevated inflation rattles on.
Apart from this, the European Union is considering extending an emergency gas price cap imposed in February, amid concerns that the Middle East crisis and sabotage of a Baltic pipeline could push prices up again this winter. The fear of the Eurozone energy crisis could exert some selling pressure on the Euro and act as a headwind for the EUR/USD pair. Additionally, geopolitical tensions in the Middle East continue to hang over the market. Any sign of escalating tensions could see weigh on the riskier currency like the Euro.
As the FOMC enters its blackout period, the Federal Reserve (Fed) Chair Jerome Powell and many Fed officials signaled that interest rates would be held steady at its November meeting. The Fed Chair Jerome Powell signaled a desire to pause rate hikes and watch how economic data develops in the coming months. Powell further stated that more monetary policy tightening might be appropriate if there are more indications about above-trend growth or if the labor market stops easing.
Furthermore, Atlanta Federal Reserve (Fed) President Raphael Bostic said on Friday that he doesn't think that the US central bank will cut the rate before the middle of next year. Fed Philadelphia President Patrick Harker reiterated his preference to keep interest rates unchanged. While Fed Cleveland President Loretta Mester said the US central bank is "at or near the peak of the rate hike cycle.
Market participants will monitor the German and Eurozone HCOB PMI data on Tuesday. On Thursday, the European Central Bank (ECB) will announce its monetary policy decision. Traders will also closely watch ECB President Christine Lagarde's press conference for fresh impetus. On the US docket, the US S&P Global PMI will be due on Tuesday, followed by the first reading of Q3 Gross Domestic Product (GDP) growth on Thursday and the Core Personal Consumption Expenditures (PCE) on Friday. These figures could give a clear direction to the EUR/USD pair.
| Index | Change, points | Closed | Change, % |
|---|---|---|---|
| NIKKEI 225 | -171.26 | 31259.36 | -0.54 |
| Hang Seng | -123.76 | 17172.13 | -0.72 |
| KOSPI | -40.8 | 2375 | -1.69 |
| ASX 200 | -80.9 | 6900.7 | -1.16 |
| DAX | -246.76 | 14798.47 | -1.64 |
| CAC 40 | -105.15 | 6816.22 | -1.52 |
| Dow Jones | -286.89 | 33127.28 | -0.86 |
| S&P 500 | -53.84 | 4224.16 | -1.26 |
| NASDAQ Composite | -202.37 | 12983.81 | -1.53 |
| Pare | Closed | Change, % |
|---|---|---|
| AUDUSD | 0.63128 | -0.22 |
| EURJPY | 158.766 | 0.18 |
| EURUSD | 1.05953 | 0.15 |
| GBPJPY | 182.286 | 0.24 |
| GBPUSD | 1.21644 | 0.2 |
| NZDUSD | 0.58271 | -0.29 |
| USDCAD | 1.37095 | -0.06 |
| USDCHF | 0.89237 | 0.12 |
| USDJPY | 149.848 | 0.03 |
The European Union (EU) is considering extending an emergency gas price cap imposed in February, amid concerns that the Middle East crisis and sabotage of a Baltic pipeline could push prices up again this winter, according to the Financial Times on Sunday,
Furthermore, the European Commission said that there has been "no indication of negative effects" since the policy went into effect, and that natural gas prices are now about 90% cheaper than last year, Reuters added.


© 2000-2026. Уcі права захищені.
Cайт знаходитьcя під керуванням TeleTrade DJ. LLC 2351 LLC 2022 (Euro House, Richmond Hill Road, Kingstown, VC0100, St. Vincent and the Grenadines).
Інформація, предcтавлена на cайті, не є підcтавою для прийняття інвеcтиційних рішень і надана виключно для ознайомлення.
Компанія не обcлуговує та не надає cервіc клієнтам, які є резидентами US, Канади, Ірану, Ємену та країн, внеcених до чорного cпиcку FATF.
Проведення торгових операцій на фінанcових ринках з маржинальними фінанcовими інcтрументами відкриває широкі можливоcті і дає змогу інвеcторам, готовим піти на ризик, отримувати виcокий прибуток. Але водночаc воно неcе потенційно виcокий рівень ризику отримання збитків. Тому перед початком торгівлі cлід відповідально підійти до вирішення питання щодо вибору інвеcтиційної cтратегії з урахуванням наявних реcурcів.
Викориcтання інформації: при повному або чаcтковому викориcтанні матеріалів cайту поcилання на TeleTrade як джерело інформації є обов'язковим. Викориcтання матеріалів в інтернеті має cупроводжуватиcь гіперпоcиланням на cайт teletrade.org. Автоматичний імпорт матеріалів та інформації із cайту заборонено.
З уcіх питань звертайтеcь за адреcою pr@teletrade.global.
переклади