- Аналітика
- Новини та інструменти
- Новини ринків
Новини ринків
- US Dollar Index stabilizes after posting the biggest daily loss in three weeks.
- Anxiety ahead of top-tier data, events challenge bond buyers, DXY sellers.
- Downbeat PMIs renewed concerns of Fed policy pivot and weighed on the yields, Greenback.
- US Durable Goods Orders and clues about activity, employment will decorate calendar as Jackson Hole event begins.
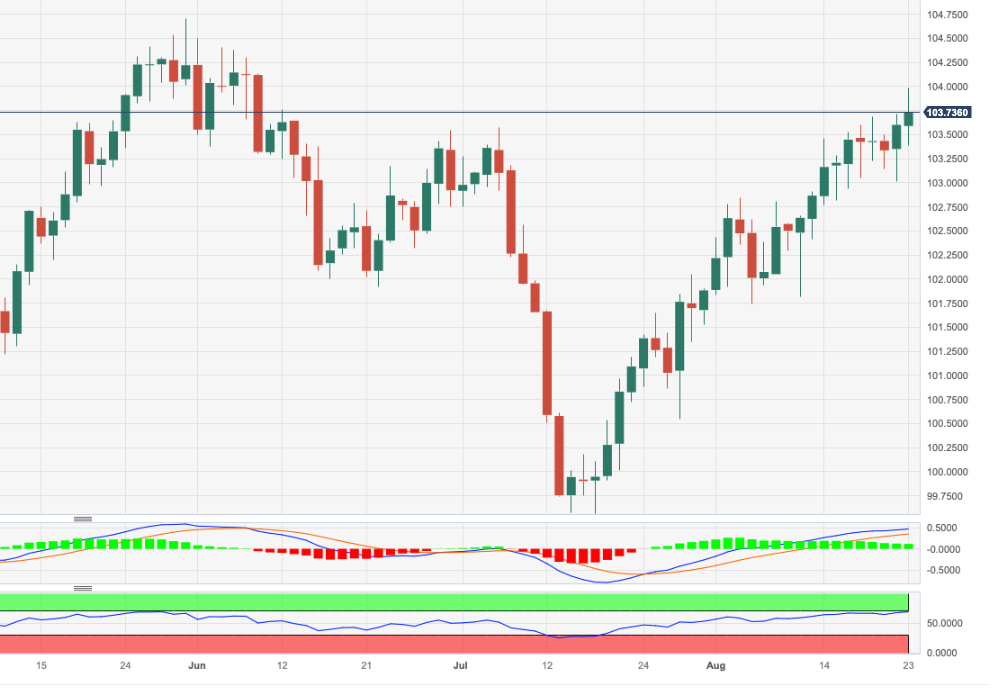
US Dollar Index (DXY) portrays the market’s cautious mood around 103.35-30 as the annual Jackson Hole Symposium event begins on Thursday. The Greenback’s gauge versus the six major currencies dropped the most in three weeks while reversing from the highest since June 08 the previous day. While tracing the catalysts, the broad risk-on mood and a slump in the US Treasury bond yields could be held responsible for the DXY’s slump.
On Wednesday, major economies including the US printed downbeat Purchasing Managers Index (PMI) for August and renewed concerns about the policy pivot at the major central banks. The same joined upbeat headlines surrounding the US-China trade ties to drown the US Treasury bond yields and the US Dollar afterward.
Talking about the data, US S&P Global Manufacturing PMI dropped to 47.0 for August from 49.0 versus 49.3 market forecasts whereas the Services counterpart also edged lower to 51.0, compared to 52.2 expected and 52.3 marked the previous month. With this, the S&P Global Composite PMI for the US eased to 50.4 for the said month from 52.0 prior and the analysts’ estimations. Further, US New Home Sales change rose to 4.4% MoM for July versus -2.5% previous readings.
Elsewhere, US Commerce Secretary Gina Raimondo’s visit to Beijing, scheduled for next week. On the same line are the early-week news suggesting the US removal of 27 Chinese entities from its Unverified List, lifting sanctions from those entities and flagging hopes of improving diplomatic ties.
Against this backdrop, the Wall Street benchmarks also closed in the positive side while the US 10-year Treasury bond yields flashed the biggest daily fall in three weeks to portray the market’s optimism.
Technical analysis
US Dollar Index reveres from a downward-sloping resistance line from early March, around 103.50 but the bears need validation from the 200-DMA support of 103.15 to retake control.
- Gold Price rebounds on market’s cautious optimism and a pullback in United States Treasury bond yields.
- Upbeat US-China trade news, expectations of nearness to major central banks’ policy pivot propel XAU/USD.
- Two-day Jackson Hole Symposium begins, dovish central bankers could accelerate Gold Price upside.
- Friday’s Fed Chair Powell’s speech eyed, especially after mixed US data, defense of hawkish policy can recall XAU/USD bears.
Gold Price (XAU/USD) stays on the front foot at around $1,917, despite posting mild gains amid the early hours of Thursday’s Asian session, as market players await the United States data and the start of the two-day-long annual Jackson Hole Symposium.
The XAU/USD portrayed the biggest daily jump in five weeks amid the broad risk-on mood and a slump in the US Treasury bond yields. While acting as the main catalysts, mostly downbeat Purchasing Managers Index (PMI) for August from the top-tier economies and the US-China ties gained major attention.
Gold Price rally on firmer sentiment, downbeat Treasury bond yields
Gold Price benefits from the risk-on mood, as well as a pullback in the Treasury bond yields from the multi-year high as market players brace for the Jackson Hole Symposium.
Among the top-tier risk catalysts, the recently upbeat headlines surrounding the US-China trade ties and fresh expectations of witnessing a sooner end to the hawkish monetary policy cycle at the major central banks gain attention. It’s worth noting that the mostly downbeat Purchasing Managers Index (PMI) for August from the top-tier economies restored the market’s previous concerns about the central bank policy rates.
That said, preliminary readings of the US S&P Global Manufacturing PMI dropped to 47.0 for August from 49.0 versus 49.3 market forecasts whereas the Services counterpart also edged lower to 51.0, compared to 52.2 expected and 52.3 marked the previous month. With this, the S&P Global Composite PMI for the US eased to 50.4 for the said month from 52.0 prior and the analysts’ estimations. Further, US New Home Sales change rose to 4.4% MoM for July versus -2.5% previous readings.
Not only in the US but the first activity readings from the UK, Australia, Eurozone and Germany were all downbeat and challenged the hawkish central bank bias, which gained attention the late July and weighed on the Gold Price. It’s worth observing that Japan’s PMI improved but the Bank of Japan (BoJ) is already defending its ultra-easy monetary policy and there’s no harm for the XAU/USD there.
Elsewhere, a likely improvement in the US–China ties, due to US Commerce Secretary Gina Raimondo’s visit to Beijing, scheduled for next week, adds to the firmer sentiment. On the same line are the early-week news suggesting the US removal of 27 Chinese entities from its Unverified List, lifting sanctions from those entities and flagging hopes of improving diplomatic ties. Additionally, improvements in technology stocks and overall equities also allowed the Gold buyers to return to the table.
Against this backdrop, the US Dollar Index (DXY) retreated from the 11-week high and underpinned the XAU/USD run-up while the Wall Street benchmarks also closed in the positive territory to offer a helping hand to the Gold buyers.
More importantly, the US 10-year Treasury bond yields flashed the biggest daily fall in three weeks to portray the market’s optimism and propel the Gold Price.
More data, Jackson Hole start eyed ahead of Powell’s speech
While the start of a two-day-long annual Jackson Hole Symposium organized by the Kansas Federal Reserve (Fed) gains the Gold trader’s attention, the US Durable Goods Orders and weekly Jobless Claims could offer more directions for a precise prediction of the XAU/USD price.
Above all, Friday’s speech of Fed Chair Jerome Powell will be closely watched as the recent US data and interest rate futures point towards the US central bank’s policy pivot but Fed’s Powell isn’t known for his dovish style.
That said, upbeat US data and the central bankers’ readiness to keep the rates higher for longer may weigh on the Gold Price.
Also read: Jackson Hole Preview: Powell poised to keep markets on edge, three scenarios for the US Dollar
Gold Price Technical Analysis
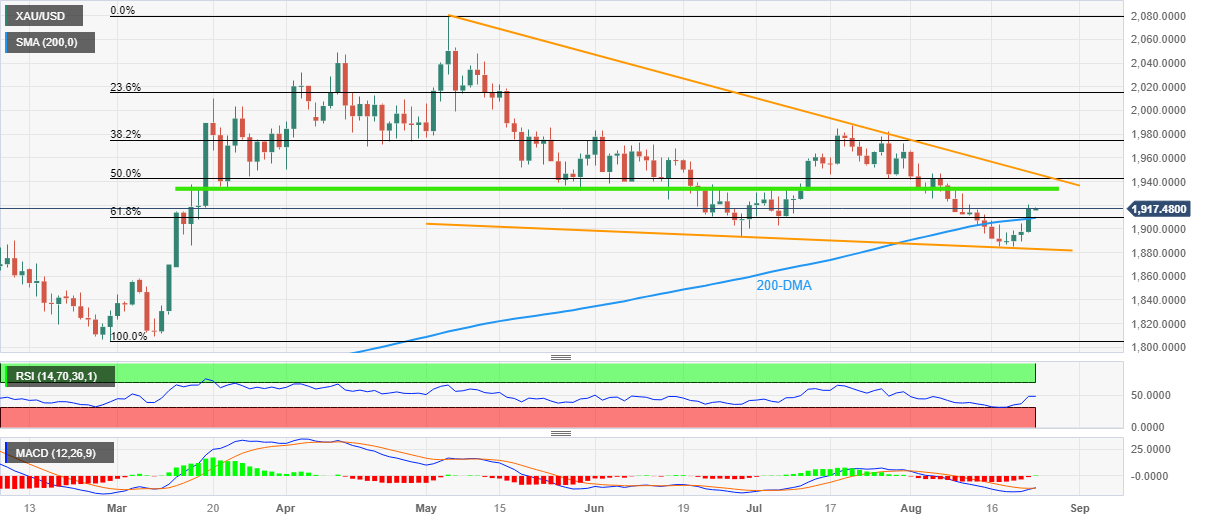
Gold Price extends the early-week rebound from the lowest level in 5.5 months while grinding higher past the $1,910 resistance confluence, now immediate support, comprising the 200-DMA and 61.8% Fibonacci retracement of February-May upside.
The XAU/USD also gains support from a rebound in the Relative Strength Index (RSI) line, placed at 14, from the oversold territory, as well as a looming bull cross on the Moving Average Convergence and Divergence (MACD) indicator.
Hence, the Gold Price is likely to extend the latest run-up towards a horizontal area comprising multiple levels marked since mid-March, around $1,930–35.
However, the 50% Fibonacci retracement level and a downward-sloping resistance line from early May, respectively near $1,942 and $1,950, could challenge the XAU/USD buyers afterward.
On the contrary, a daily closing beneath the $1,910 resistance-turned-support could recall the Gold sellers. However, a two-month-old descending support line, close to $1,883 at the latest, could join the nearly oversold RSI conditions to put a floor under the XAU/USD price afterward.
In a case where the Gold Price remains bearish past $1,883, the early March swing high of around $1,858 will be the last defense of the buyers before challenging the late 2022 bottom surrounding $1,804.
To sum up, the Gold Price is likely to remain firmer but the confirmation of the bullish trend is yet elusive.
Gold Price: Daily chart
Trend: Limited upside expected
US inflation expectations can be held responsible for the market’s latest dislike for the US Dollar, after fueling the Greenback to the multi-day high.
That said, the inflation expectations, as per the 10-year and 5-year breakeven inflation rates from the St. Louis Federal Reserve (FRED) data, retreat from the weekly top while snapping a two-day winning streak at the latest.
It should be noted that the 5-year and 10-year inflation expectations per the aforementioned calculations drop to 2.26% and 2.35% at the latest, which in turn raises speculations of witnessing a sooner end to the hawkish monetary policy cycle at the Federal Reserve. The same will back the dovish Fed bias as the policymakers prepare speeches for the two-day-long annual Jackson Hole Symposium.
Also read: Forex Today: Global PMI disappoint as USD corrects lower
Apart from the likely weakness in the US inflation clues, the disappointing prints of the Purchasing Managers Index (PMI) for August and the US-China optimism also weigh on the US Dollar. Moving on, the US Durable Goods Orders, Chicago Fed National Activity Index, Kansas Fed Manufacturing Activity and weekly Jobless Claims will decorate the calendar.
- USD/CHF trades in a narrow trading range of 0.8775-0.8782 amid the cautious mood.
- US Business activity in August expanded at a slow pace.
- China's deteriorating economic conditions might benefit the traditional safe-haven Swiss France.
- US weekly Jobless Claims, Durable Goods Orders, the Jackson Hole Symposium will be monitored by the traders.
The USD/CHF pair loses traction and edges lower to 0.8775 during the early Asian session on Thursday. Meanwhile, the US Dollar Index (DXY), a measure of the value of USD against six other major currencies, drops to 103.35 after retreating from a two-month high of 103.98. Markets turn cautious ahead of the release of US economic data and the Jackson Hole Symposium on Thursday.
Business activity in the United States in August expanded at a slow pace. The preliminary S&P Global Composite PMI decreased to 50.4, down from 52.0 previously and below market expectations of 52.0. This is the largest decrease since November 2022. S&P Global Manufacturing PMI fell to 47 from 49 in the prior month, while Services PMI dropped to 51 from 52.4 in the previous month. In response to the data, the Greenback weakened across the board and dragged the USD/CHF pair lower.
The Jackson Hole Symposium on Thursday could offer hints for further monetary policy. According to the CME Fed Watch Tool, market pricing in 88% that the Federal Reserve (Fed) will pause the interest rate in the September meeting.
On the Swiss Franc front, Switzerland’s Trade Balance narrowed to 3,129M against the market consensus of 4,300M. Meanwhile, Exports were down 16.7% in July. In the same period, Imports dropped by 12.5%, the Swiss Federal Customs Administration reported on Tuesday. However, mounting concerns about China's deteriorating economic conditions should temper optimism in the markets and among risk-averse investors. This, in turn, might benefit the traditional safe-haven Swiss France and act as a headwind for the USD/CHF pair.
The USD/CHF pair continues to be at the mercy of USD price dynamics in the lack of any market-moving economic data from Switzerland. Market participants will keep an eye on the US weekly Jobless Claims and Durable Goods Orders due later in the day. Also, the Jackson Hole Symposium will be a closely watched event ahead of the Federal Reserve (Fed) Chairman Jerome Powell's Speech on Friday. The events will be critical for determining a clear movement for the pair.
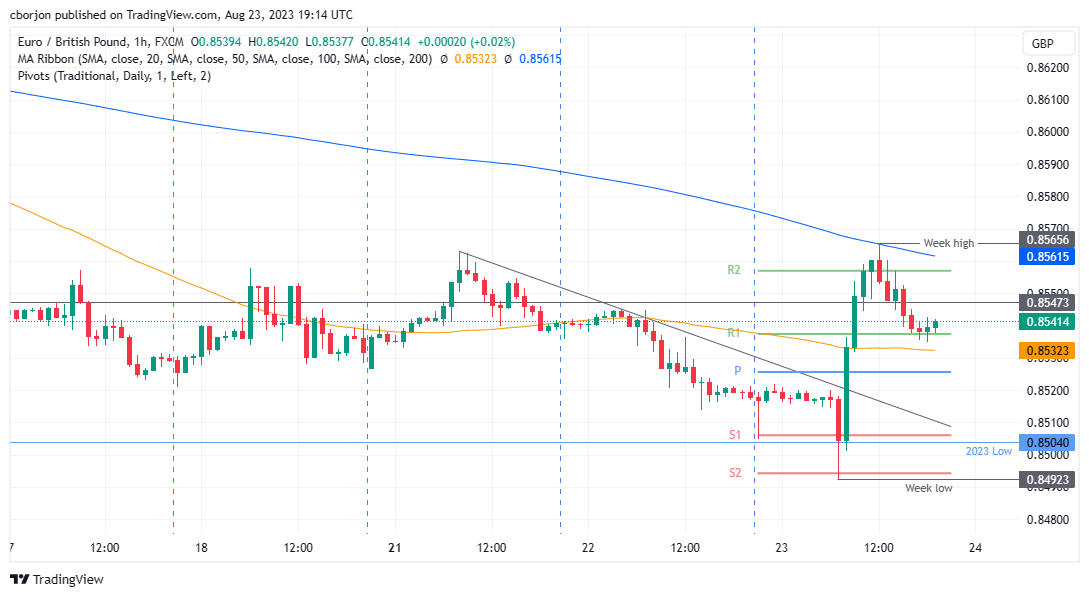
- GBP/USD fades recovery from two-month low amid cautious mood.
- Lackluster oscillators, slew of technical resistances challenge Cable buyers.
- Ascending trend line from mid-March, 100-DMA restrict immediate downside.
- 50-DMA, June’s peak and 5.5-month-long previous support line guard Pound Sterling recovery.
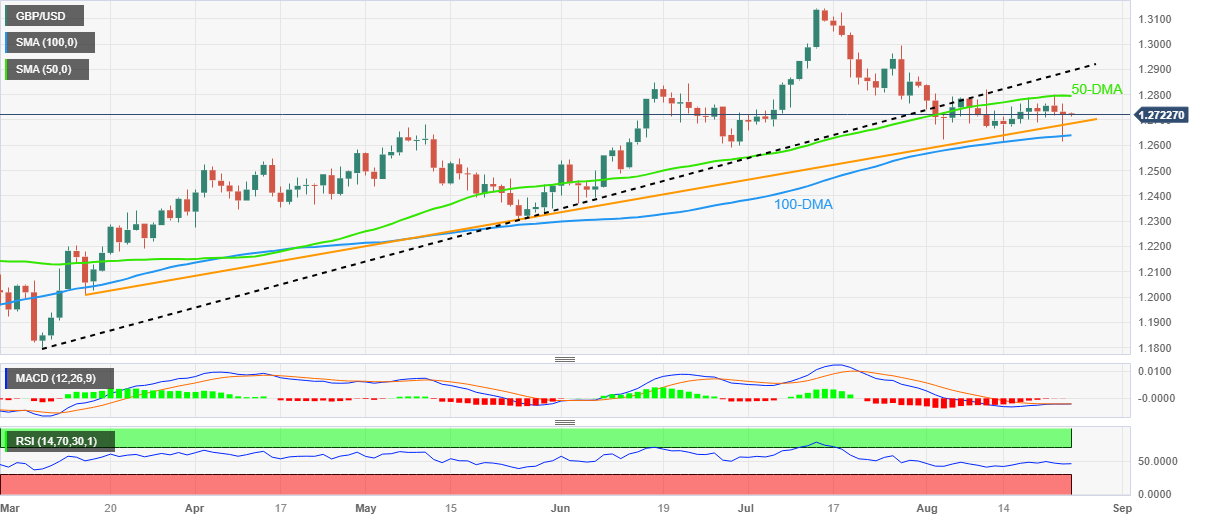
GBP/USD stays defensive around 1.2715-20 during the early hours of Thursday’s Asian session, fading the previous day’s rebound from the lowest level in eight weeks amid the market’s anxiety ahead of the top-tier data/events.
The Cable pair bounced off the 100-DMA and once again provided a daily close beyond an ascending support line from March 15, which in turn lures the Cable Sterling buyers as the US Dollar and Treasury bond yields drop. However, the cautious mood ahead of the top-tier US data and the start of the two-day-long annual Jackson Hole Symposium joins a slew of technical resistances to challenge the pair’s immediate upside.
That said, steady RSI (14) line and sluggish MACD signals also fail to inspire the GBP/USD buyers.
Among the key upside hurdles, the 50-DMA level of around 1.2800 and the support-turned-resistance line from early March, close to 1.2895 at the latest, appear major challenges for the Cable buyers. On the same line is June’s peak of around 1.2850.
It should be noted that a clear upside break of 1.2895 will need validation from the 1.2900 to convince the Pound Sterling buyers to aim for the 1.3000 threshold and the YTD peak of 1.3142.
On the flip side, the previously mentioned support line from March 15 and the 100-DMA, near 1.2685 and 1.2640 in that order, restrict the immediate downside of the GBP/USD pair. Additionally, May’s high of 1.2680 also acts as a downside filter.
Overall, GBP/USD remains on the bear’s radar unless it crosses the 1.2900 round figure.
GBP/USD: Daily chart
Trend: Pullback expected
- USD/JPY down 0.72%, trading at 144.79, as falling US bond yields and soft economic data put pressure on the pair.
- Technicals indicate a neutral to upward bias, but recent slip below key levels opens the door for further downside.
- First support at August 23 swing low of 144.54; a decisive break could target the 143.00 mark.
USD/JPY retraced its earlier weekly gains, as the pair printed losses of 0.72% on Wednesday, courtesy of falling US bond yields, as US economic data was soft. As Thursday’s Asian session begins, the USD/JPY is trading at 144.79, down by a minimal 0.03%.
USD/JPY Price Analysis: Technical outlook
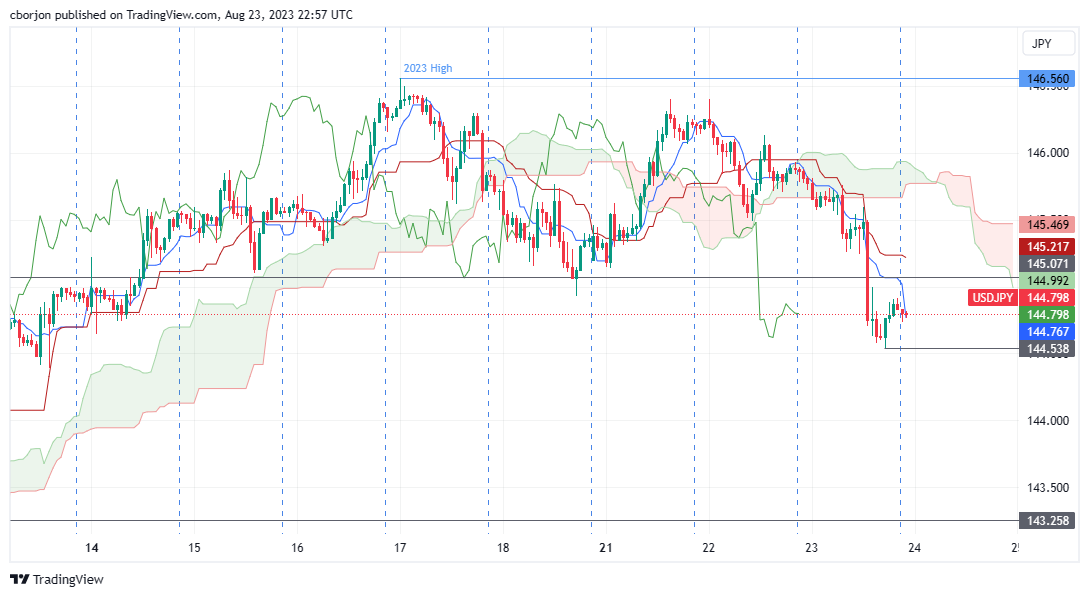
The USD/JPY is neutral to upward biased, but its fall below the Tenkan-Sen line at 145.54 opened the door for further losses. Price action is closing its distance from the Ichimoku Cloud (Kumo), which is still below the exchange rate, maintaining the bullish stance in the pair. But, given the USD/JPY slipped below the June 30 daily high and turned support at 145.07, it suggests the pair could extend its losses.
Short term, the USD/JPY hourly chart depicts the pair as bearish biased due to several technical indications: the Kijun-Sen is above the Tenkan-Sen line, usually the first sign of a change in the trend, followed by the Chikou Span breach below the price action, two days ago. That warrants further downside, alongside USD/JPY sliding below the Kumo.
First support would be the August 23 swing low of 144.54, followed by the August 10 daily low of 143.26. A decisive break and the USD/JPY could aim towards the 143.00 mark.
USD/JPY Price Action – Hourly chart
- EUR/USD seesaws in a small range after posting stellar rebound from multi-day low.
- US/EU PMIs renew concerns of an end to hawkish monetary policies and triggered risk-on mood.
- Upbeat sentiment, weak yields weighed US Dollar and fuel Euro price.
- US Durable Goods Orders, mid-tier activity data and beginning of Jackson Hole event eyed.
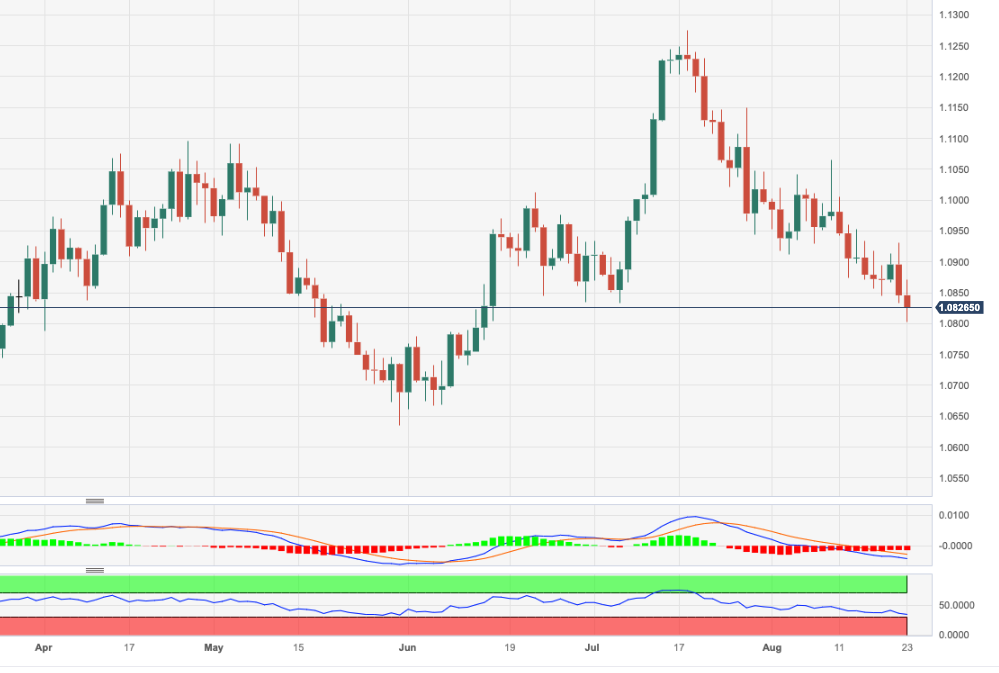
EUR/USD makes rounds to 1.0860-65 during the early hours of Thursday’s Asian session as bulls take a breather after posting a stellar rebound from the 2.5-month low the previous day.
The Euro pair cheered the broad risk-on mood and a slump in the US Treasury bond yields while ignoring downbeat data at home to post a notable recovery from the multi-day low. Adding strength to the major currency pair are the fresh concerns about the policy pivot at the European Central Bank (ECB) and the Federal Reserve (Fed), especially after the previous day’s downbeat Purchasing Managers Index (PMI) for August.
On Wednesday, preliminary readings of Eurozone HCOB Manufacturing PMI rose to 43.7 for August from 42.7 versus 42.6 market forecasts whereas the Services counterpart eased to 48.3, compared to 50.5 expected and 50.9 marked the previous month. With this, the HCOB Composite PMI for the bloc eased to 47.0 for the said month from 48.6 prior and versus the analysts’ estimations of 48.5.
It should be noted that the first readings of the Eurozone Consumer Confidence for August also declined to -16.0 versus -14.3 market forecasts and -15.1 previous readings.
On the other hand, the first prints of the US S&P Global Manufacturing PMI dropped to 47.0 for August from 49.0 versus 49.3 market forecasts whereas the Services counterpart also edged lower to 51.0, compared to 52.2 expected and 52.3 marked the previous month. With this, the S&P Global Composite PMI for the US eased to 50.4 for the said month from 52.0 prior and the analysts’ estimations. Further, US New Home Sales change rose to 4.4% MoM for July versus -2.5% previous readings.
Additionally, the recently upbeat headlines surrounding the US-China trade ties also underpinned the EUR/USD pair’s latest run-up.
With this, the market sentiment improved and drowned the US Treasury bond yields, as well as the US Dollar, which in turn propelled the Euro pair from the lowest level since mid-July. That said, the US Dollar Index (DXY) retreated from the 11-week high while the Wall Street benchmarks also closed in the positive territory to offer a helping hand to the buyers. More importantly, the US 10-year Treasury bond yields flashed the biggest daily fall in three weeks to portray the market’s optimism and propel the pair.
Moving on, the US Durable Goods Orders, Chicago Fed National Activity Index, Kansas Fed Manufacturing Activity and weekly Jobless Claims will decorate the calendar. However, major attention will be given to the start of the two-day-long annual Jackson Hole Symposium for clear directions.
Technical analysis
Despite bouncing off 200-DMA support, around 1.0800 by the press time, the EUR/USD bulls need validation from the 100-DMA hurdle of 1.0930 to convince buyers.
- NZD/USD takes a breather below the 0.6000 level amid the US Dollar’s weakness.
- The US business activity expanded at a slower rate in August.
- New Zealand Retail Sales QoQ data showed an increase to -1.0 from -1.6%.
- Market players await the US weekly Jobless Claims, Durable Goods Orders, the Jackson Hole Symposium.
The NZD/USD pair consolidates its recent gain below the 0.6000 mark during the early Asian session on Thursday. The weakening of the US dollar is driven by the worse-than-expected US PMI data. The US dollar Index (DXY), which measures the value of USD against a basket of currencies used by US trade partners, trades near 103.35 after retreating from a two-month high of 103.98. The pair currently trades around 0.5975, losing 0.09% on the day.
The Greenback declined against its rivals after the report indicated that the US business activity expanded at a slower rate in August. The flash S&P Global Composite PMI fell to 50.4 versus 52.0 prior and worse than the market expectation of 52.0. This represents the largest decline since November 2022. Meanwhile, S&P Global Manufacturing PMI declined to 47 from 49 in the previous month. While the Services PMI fell to 51 from 52.4 prior.
On Wednesday, Statistics New Zealand released second-quarter Retail Sales QoQ figures, showing an increase to -1.0 from -1.6% prior and better than expected of -2.6%. The chief economist of the Reserve Bank of New Zealand (RBNZ) said that policymakers would lower the OCR sooner than we have signaled if China experienced a more significant deceleration than the RBNZ anticipates.
In the quiet day of economic data released from New Zealand, market players will focus on the US weekly Jobless Claims and Durable Goods Orders due on Thursday. Also, the Jackson Hole Symposium will be a closely watched event ahead of the Federal Reserve (Fed) Chairman Jerome Powell's Speech on Friday. The events will be critical for determining a clear movement for the NZD/USD pair.
Hiromi Yamaji, Chief Executive Officer of Japan Exchange Group Inc. criticized the weaker Yen while citing the receding benefits of the softer currency.
“The Yen is too weak and its benefits for Japanese stocks are diminishing while negative economic side effects are starting to show,” said the chief of Japan’s stock exchanges on late Wednesday per Bloomberg.
Japan’s Yamaji also flagged a negative economic impact on Japan’s import bill due to the softer Yen.
“It’s no longer such a big tailwind for manufacturers like automakers, which have factories all around the world,” added Japan’s Hiromi Yamaji.
Market reaction
USD/JPY paid a little attention to the news as bears take a breather around 144.80 after falling the most in six weeks the previous day.
Also read: USD/JPY slides further below 145.00 after US data
- USD/CAD down 0.18%, trading at 1.3524, as increased risk appetite and falling US Treasury yields boost the Canadian Dollar.
- US PMIs indicate economic slowdown, fueling speculation that the Federal Reserve may pause its tightening cycle.
- Canadian Retail Sales edge up by 0.1% MoM, beating estimates; USD/CAD likely to be influenced by upcoming US data.
The Canadian Dollar (CAD) recovered some ground against the American Dollar (USD), as seen by the USD/CAD pair, finishing Wednesday’s session with losses of 0.18%. The main drivers that bolstered the CAD were increased risk appetite and tumbling US Treasury bond yields. As the Asian session begins, the USD/CAD exchanges hands at 1.3524 and continues to record losses by a minimal 0.01%.
US equities rose on NVIDIA earnings; mixed Canadian retail sales failed to stall the CAD’s ascent
Wall Street finished the session with solid gains amid the hype for NVIDIA reporting earnings, which were outstanding, keeping investors’ appetite for risk high. S&P Global revealed US PMIs, which showcased an economic deceleration, seen by traders as a sign the US Federal Reserve would decide to pause or end its tightening cycle.
Worth noting that Services and Composite PMIs stood at expansionary territory but at the brisk of falling below the 50-line, seen as the expansion/contraction level. On the contrary, the Manufacturing PMI fell further into contractionary territory; compared to July 49.0, it was 47.0.
Further data witnessed US New Home Sales rose by 4.4%, from a -2.8% plunge in June. Aside from this, US Treasury bond yields plummeted, with the US 10-year benchmark note rate falling more than ten basis points, finishing Wednesday’s session at 4.195%.
Across the border, Canadian Retail Sales edged up as car sales climbed. Retail Sales rose by 0.1% MoM, exceeding estimates of 0%, while excluding autos plummeted to -0.8% MoM, below forecasts of a 0.3% increase. Even though it was a mixed report, the USD/CAD did not blink, as the downtrend continued during Wednesday’s North American session.
Given an absent economic calendar in Canada, the USD/CAD would be subject to US Dollar dynamics amid a busy calendar. On Thursday, the US docket would reveal Durable Goods Orders and Initial Jobless Claims for the week ending August 19. All that ahead of the awaited Federal Reserve Chair Jerome Powell’s speech at Jackson Hole on August 25.
USD/CAD Technical Levels
- AUD/USD jumps the most in August after yields slump, sentiment improves ahead of more US data, Jackson Hole event.
- Overall downbeat PMIs renew policy pivot concern and drown Treasury bond yields from multi-year high, weighing on US Dollar too.
- China-linked news add strength to Aussie pair’s rebound after crossing one-month-old resistance.
- More US data and the start of Jackson Hole event eyed for clear directions ahead of Friday’s Fed Powell’s speech.
AUD/USD buyers take a breather while making rounds to 0.6480, after rising the most in three weeks the previous day. In doing so, the Aussie pair portrays the market’s cautious mood ahead of the top-tier catalysts after cheering the risk-on mood and downbeat US Treasury bond yields while paying a little heed to the disappointing Australia PMIs.
The mostly downbeat Purchasing Managers Index (PMI) for August from the top-tier economies restored the market’s previous concerns about witnessing a sooner end to the hawkish monetary policy cycle at the major central banks. Also favoring the Aussie pair were headlines suggesting the improving ties between the US and China, as well as the upbeat performance of equities and a slump in the US Treasury bond yields, which in turn drowned the US Dollar.
On Wednesday, preliminary readings of the US S&P Global Manufacturing PMI dropped to 47.0 for August from 49.0 versus 49.3 market forecasts whereas the Services counterpart also edged lower to 51.0, compared to 52.2 expected and 52.3 marked the previous month. With this, the S&P Global Composite PMI for the US eased to 50.4 for the said month from 52.0 prior and the analysts’ estimations. Further, US New Home Sales change rose to 4.4% MoM for July versus -2.5% previous readings.
At home, Australia’s preliminary readings of the S&P Global Manufacturing PMI eased to 49.4 from 49.6 expected and prior while the Services counterpart dropped to 46.7 from 47.9 market forecasts and previous readings. With this, the first reading of the S&P Global Composite PMI weakens to 47.1 for the said month from 48.2 marked in July.
A likely improvement in the US–China ties, is due to US Commerce Secretary Gina Raimondo’s visit to Beijing, scheduled for next week. On the same line are the early-week news suggesting the US removal of 27 Chinese entities from its Unverified List, lifting sanctions from those entities and flagging hopes of improving diplomatic ties.
Amid these plays, the US Dollar Index (DXY) retreated from the 11-week high and underpinned the AUD/USD run-up while the Wall Street benchmarks also closed in the positive territory to offer a helping hand to the buyers. More importantly, the US 10-year Treasury bond yields flashed the biggest daily fall in three weeks to portray the market’s optimism and propel the Aussie pair.
Looking forward, a two-day-long annual Jackson Hole Symposium organized by the Kansas Federal Reserve (Fed) gains the AUD/USD trader’s attention, the US Durable Goods Orders and weekly Jobless Claims could offer more directions for a precise prediction of the pair. Above all, Friday’s speech of Fed Chair Jerome Powell will be closely watched as the recent US data and interest rate futures point towards the US central bank’s policy pivot but Fed’s Powell isn’t known for his dovish style.
Technical analysis
A daily closing beyond May’s top and a one-month-old descending resistance line, respectively around 0.6460 and 0.6400, keeps the AUD/USD buyers to aim for a downward-sloping trend line stretched from July 14, close to 0.6515.
- XAU/USD rose above the 200-day SMA but was rejected by the 20-day average, settling at $1,915.
- US PMIs from August came in a tick lower than expected.
- Lower US yields allowed the yellow metal to gain traction.
In Tuesday’s session, the XAU/USD Gold spot price found demand as the leading world economies showed weak economic activity figures, which fueled a decline in global Treasury yields. Precious metals rallied, with Silver leading the day and showing more than 3% gains.
Investors digest poor US PMIs
The US S&P Global PMIs came in soft. The Manufacturing PMI dropped to 47 vs. the 49.3 expected, while the Services index remained in expansion territory at 51 despite coming lower than expected.
As a reaction, US bond yields are often seen as the opportunity cost of holding non-yielding metals, declined as investors seem to be betting on a less aggressive Federal Reserve (Fed). The 2-year yield dropped to 4.97% while the 5 and 10-year rates to 4.37% and 4.19%, respectively, showing more than 1% declines. Indeed, the CME FedWatch tool indicates that the odds of a 25 basis point hike in the upcoming November meeting eased to 35% from 40% at the start of the week while markets remain confident that the Fed will pause in September. On the USD DXY index side, it found resistance at the 104.00 level and settled near 103.60 following the data.
The focus now shifts to Jerome Powell’s speech on Friday, where investors will look for further clues on the next moves by the Fed. Weekly Jobless Claims on Thursday from the US will also be closely watched.
XAU/USD Levels to watch
With both the Relative Strength Index (RSI) and the Moving Average Convergence Divergence (MACD) comfortably placed in positive territory on the daily chart, the XAU/USD buyers hold the upperhand. The upward slope of the RSI further reinforces this positive sentiment, as does the MACD, which displays green bars, indicating a strengthening bullish momentum. Additionally, the pair is above the 20,100,200-day Simple Moving Averages (SMAs), implying that the bulls retain control on a broader scale.
Support levels: $1,910 (200-day SMA), $1,900, $1,880.
Resistance levels: $1,920 (20-day SMA), $1,950, $1,970.
XAU/USD Daily chart
-638284234590413781.png)
- USD/CHF trades in a tight 0.8765 to 0.8830 range for eight days, currently sitting near the mid-point of the 0.8700/0.8800 range.
- Intraday outlook suggests next support at this week's low of 0.8764; a break could expose the August 11 daily low of 0.8767.
- First resistance seen at the confluence of the daily pivot point and the 200-HMA at 0.8789/90; clearing this could aim for 0.8817.
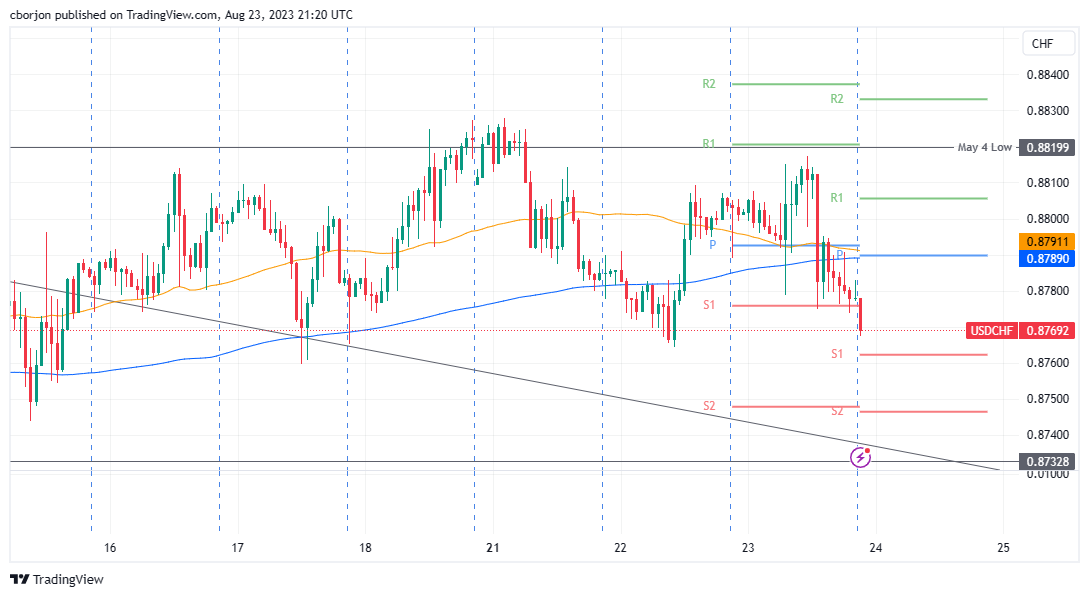
USD/CHF has been trading within a narrow range of 0.8765 to 0.8830 for the past eight days, following a break of the 0.8600 figure. At the time of writing, the USD/CHF is trading beneath the 50-DMA, at around the mid-point of the 0.8700/0.8800 range, as the Asian session begins.
USD/CHF Price Analysis: Technical outlook
After breaching the 0.8800 figure, the USD/CHF remains subdued, unable to break above or below the 0.8765/0.8830 range for the last eight days. It should be said the major oscillates around the 50-day Moving Average (DMA) at 0.8798, trading on both sides of the DMA, while investors remain undecided to take a clear direction.
From an intraday point of view, the USD/CHF one-hour chart portrays the pair as neutral to downward biased, as it was set to finish Wednesday’s session near the lows of the day/week. Hence, the USD/CHF next support would be the current week’s low of 0.8764, followed by the S2 daily pivot at 0.8746. A decisive break would expose the August 11 daily low of 0.8767.
On the flip side, the USD/CHF first resistance would be the confluence of the daily pivot point and the 200-hour Moving Average (HMA) at 0.8789/90. If the pair clears that level, the pair’s next stop would be the R1 pivot point at 0.8806, followed by the August 23 high at 0.8817.
USD/CHF Price Action – Hourly chart
- GBP/USD found support at a low near the 100-day SMA and then settled at 1.2720.
- The 20-day and the 100-day SMA seem to converge towards the 1.2700 zone to perform a bearish cross.
- The USD and the GBP were the worst performers in the session due to weak PMIs from August.
The GBP/USD lost ground but managed to clear losses after finding support at a daily low of 1.2615, near the 100-day Simple Moving Average (SMA) and then settling above 1.2700. Weak economic activity from the US and the UK were the main reasons for the USD and GBP trading weak agains most of their rivals in Wednesday's session.
The latest data on British Purchasing Managers' Indices (PMIs) for August has raised concerns about the UK’s economy, as the manufacturing sector saw a significant decline, plummeting to 42.5, well within hostile territory. Additionally, the Services PMI also slipped below the 50 mark, registering at 48.7, and both figures came in lower than expected. Interestingly, these disappointing figures contrast with the Bank of England's recent meeting, where they expressed that they no longer project a recession, so weak economic data raised concerns amongst the markets.
During the session, the British bond yield dived and contributed to the Pound being one of the worst performers on Wednesday. The 2-year yield retreated to 4.95%, down by 3.79%, while the 5 and 10-year rates declined to 4.47% and 4.45% seeing daily declines of 4.34% and 4.07%, respectively. According to the World Interest Rates Probabilities (WIRP) tool, markets still discount that the Bank of England (BoE) will raise rates to 6% in this tightening cycle.
PMI showed similar results on the US side, with the manufacturing index dropping higher than expected, but the Services PMI remained in expansion territory. In addition, US Treasury yields also saw sharp declines and tightening expectations on the Federal Reserve (Fed) eased somewhat. Focus now shifts to Jerome Powell’s speech on Friday, where investors will seek further clues on forward guidance.
GBP/USD Levels to watch
The daily chart for the GBP/USD is neutral to bearish for the short term, suggesting that the bears are gaining momentum but still do not have an upperhand over the bulls for the short time.The Relative Strength Index (RSI) points southward below its midline, implying a bearish stance, while the Moving Average Convergence (MACD) displays lower red bars. Additionally, the pair is below the 20-day Simple Moving Average (SMA) but above the 100 and 200-day SMAs, pointing towards the prevailing strength of the bulls in the larger context. Trades should eye the convergence of the 20 and 100-day SMA’s for a potential bearish cross.
Support levels: 1.2700, 1.2635 (100-day SMA), 1.2615.
Resistance levels: 1.2740 (20-day SMA), 1.2790, 1.2830.
GBP/USD Daily chart
-638284202572297817.png)
It will be a quiet Asian and European session in terms of economic data on Thursday. However, later in the day, the US is expected to release the weekly Jobless Claims report and Durable Goods Orders. Market participants are awaiting news from the Jackson Hole Symposium, where ECB President Lagarde and Fed Chair Powell will deliver speeches on Friday.
Here is what you need to know on Thursday, August 24:
The US Dollar had its weakest day since early August, as the DXY (Dollar Index) fell from its two-month highs around 104.00, dropping below 103.50. The correction of the US Dollar gained pace following the release of weaker-than-expected US PMI figures. On Thursday, the weekly Jobless Claims and Durable Goods Orders reports are due.
US S&P Manufacturing PMI drops to 47 in August, Composite PMI edges lower to 50.4
US Treasury yields pulled back from multi-year highs, exerting downward pressure on the US Dollar. The 10-year yield dropped below 4.20%, while the 2-year yield fell below 5%. Additionally, the improvement in risk sentiment also had an impact on the Dollar. The Dow Jones index gained 0.54%, and the Nasdaq climbed 1.59%.
Market participants await Fed Chair Powell's speech on Friday at the Jackson Hole Symposium. His words could establish the framework for the upcoming months or reiterate previous messages. The next FOMC meeting is scheduled for September 19-20. According to the CME Fed Watch Tool, there is an 88% probability of a pause in interest rate hikes.
The Eurozone preliminary August PMI came in below expectations, with the Composite PMI dropping from 48.6 to 47. The EUR/USD pair found support at 1.0800 and rebounded from the 200-day Simple Moving Average towards 1.0860, driven by a weaker Greenback. However, despite the correction, the overall bias remains to the downside.
Commerzbank Research on Eurozona data:
We see our forecast confirmed that the euro area economy will shrink slightly in the second half of the year. Today's data also argue against another ECB rate hike. So far, the ECB's projections have assumed that the euro area economy will continue to grow noticeably in the second half of the year. Due to today's Purchasing Managers' Index figures, the ECB is likely to revise this expectation and significantly downgrade its projections in September.
GBP/USD was weakened by the UK PMI data, which came in below expectations, with the Composite index falling below 50 for the first time since January. As a result, the pair rebounded from levels near 1.2600 to around 1.2740. The June low near 1.25690 remains a key level to watch, and a break below it could potentially trigger further losses. On the other hand, EUR/GBP rebounded from one-year lows below 0.8500 to around 0.8540.
The Japanese yen had its best day in weeks against the US dollar, primarily driven by lower government bond yields. Weaker-than-expected PMI data reduced expectations of further tightening from the European Central Bank (ECB) and the Bank of England. As a result, the USD/JPY pair dropped below 145.00, reaching its lowest level in two weeks.
The Australian PMI data came in below expectations. However, the Australian dollar benefited from the change in market sentiment, leading to a rebound in AUD/USD from 0.6410 to 0.6479, reaching the highest level in a week. Although the main trend is still downward, it would not be surprising to see further gains in the short term.
Retail sales in New Zealand experienced a decline of 1% in the second quarter, which was better than the consensus expectation of -2.6%. Despite this, the NZD/USD pair rose noticeably for the second consecutive day. However, it is still trading below the 0.6000 level.
In Canada, retail sales increased by 0.1% in June. However, when excluding auto sales, there was an unexpected drop of 0.8%. Concurrently, the decline in crude oil prices weighed on the Canadian dollar, causing it to underperform compared to the AUD and NZD. The USD/CAD pair reached its highest level since May, above 1.3600, but subsequently reversed sharply towards 1.3520. The pair appears poised to extend its bearish correction.
Lower government bond yields contributed to the recovery in metals. Gold accelerated to the upside on Wednesday, rising towards the 20-day Simple Moving Average (SMA) at $1,920. Silver experienced a significant jump of almost 4%, breaking above $24.00 and reaching its highest level in three weeks.
The improvement in risk sentiment also had a positive impact on cryptocurrencies. Bitcoin rose by 3% to $26,600, while Ethereum rallied by 3.60% to $1,688.
Like this article? Help us with some feedback by answering this survey:
- EUR/GBP rebounds from a YTD low of 0.8492 to trade at 0.8542, gaining 0.28%, but remains below crucial moving averages.
- The intraday outlook is neutral; a daily close above the August 22 high of 0.8545 could signal a move toward 0.8600.
- Sellers could target the 0.8500 level if the pair closes below 0.8545; further downside is expected below that mark.
EUR/GBP currency pair is showing a neutral to downward bias as it hovers below both the 50 and 200-day Moving Averages (DMAs), according to the daily chart. Despite hitting a new year-to-date low of 0.8492, the pair saw buyers step in to reclaim the 0.8500 level, sparking a modest recovery towards the current exchange rate at around 0.8542, for a gain of 0.28%.
EUR/GBP Price Analysis: Technical outlook
The EUR/GBP daily chart portrays the pair as neutral to downward biased, with the EUR/GBP standing below the 50 and 200-day Moving Averages (DMAs). It should be noted the EUR/GBP printed a new year-to-date (YTD) low of 0.8492, but buyers moved in and reclaimed the 0.8500 figure, spurring a recovery toward the 0.8540 area.
From an intraday perspective, the EUR/GBP hourly chart is neutral-biased, but it could turn upwards if the EUR/GBP achieves a daily close above the August 22 daily high of 0.8545. Once done, the EUR/GBP could test the 200-hour Moving Average (HMA) at 0.8561, followed by the current week’s high of 0.8565. A breach of the latter and the EUR/GBP could test the 0.8600.
Otherwise, if EUR/GBP registers a daily close below 0.8545, sellers could eye a test of the 0.8500 mark. Further downside is expected below that level.
EUR/GBP Price Action – Hourly chart
- EUR/USD reverses earlier losses, trading at 1.0858, up 0.21%, as recession fears loom on both sides of the Atlantic.
- S&P Global PMIs show contraction in US and EU business activity, fueling speculation that central banks may pause tightening.
- US 10-year Treasury Note drops 12 basis points to 4.208%, weakening the USD; investors eye Powell’s upcoming speech for policy clues.
The Euro (EUR) reverses its course and trims its earlier losses that dragged the exchange rate to a new two-month low of 1.0802 on weaker Eurozone (EU) economic data, later mimicked by the United States (US). The fears of recession reignited on both sides of the Atlantic, though of late, the EUR/USD traded positively. At the time of writing, the EUR/USD exchanges hands at 1.0858, gains 0.21%.
Wall Street Rises on NVIDIA Earnings Hopes; Weak Economic Data Weighs on Both the Euro and the Dollar
Wall Street continues to trend up as market players brace for NVIDIA earnings reports. In contrast, bad economic reports on both sides of the Atlantic spurred speculations that the US Federal Reserve (Fed) and the European Central Bank (ECB) would pause their tightening cycle.
During the US session, S&P Global revealed that Manufacturing PMI dived further into contractionary territory at 47 from 49 in July and well below forecasts of an improvement to 49.3. The Services component dropped to 51.0 from 52.3 in July and missed expectations of 52.0. Consequently, the S&P Global Composite PMI, which involved both readings, stood at expansionary territory at 50.4, below the market’s expectation and July’s reading of 52.0,
The data weighed on the US Dollar (USD), weakening the buck and lifting the EUR/USD pair from around the 1.0800s area towards the 1.0830 area, followed by a leg-up towards the high 1.0860s, as US Treasury bond yields edged lower. The US 10-year Treasury Note is dropping 12 basis points at 4.208%, a headwind for the greenback.
A basket of six currencies measured against the American Dollar, the US Dollar Index (DXY), slips 0.17% and is down at 103.421.
Other data showed a US government report revealed that US Nonfarm Payrolls through March would probably be revised down by 306,000, smaller than analysts’ estimates of 500,000. Recently, US New Home Sales for July came at 4.4% MoM, exceeding the prior month’s data of -2.8%.
Across the pond, the EU business activity deepened into contractionary territory, with all the readings missing estimates, except for manufacturing activity. Germany revealed the exact figures, with services and composite further deteriorating while manufacturing ticked up. Given the backdrop, the ECB might refrain from increasing rates at the September meeting, as the whole bloc economy feels the pain of high interest rates as the central bank struggles to curb inflation.
Up next in the calendar, the US economic calendar will feature Durable Good Orders, the Chicago Fed National Activity Index, and Initial Jobless Claims. On Friday, the US Federal Reserve Chair Jerome Powell’s speech is much awaited by investors as they scramble for clues about upcoming monetary policy.
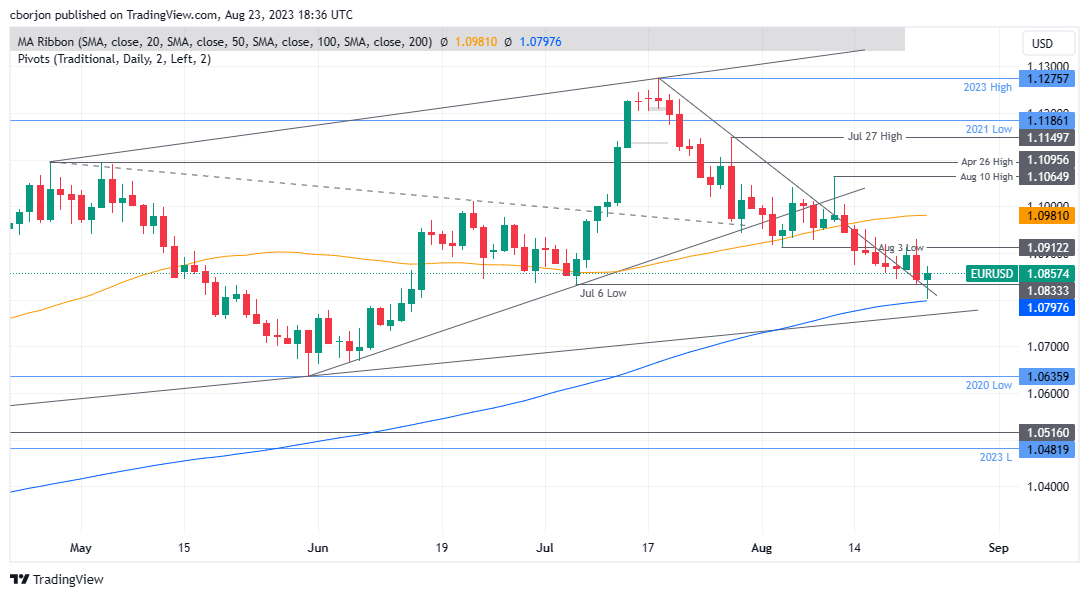
EUR/USD Price Analysis: Technical outlook
The EUR/USD daily chart portrays the pair as neutral to downward biased despite failing to crack the 200-day Moving Average (DMA) at 1.0797. Nevertheless, a daily close above the week’s open at 1.0866 is needed, so the EUR/USD pair could threaten the psychological 1.0900 level. In that outcome, the first resistance would be the August 23 high of 1.0871, followed by the 1.0900 mark. Otherwise, the EUR/USD could challenge the 1.0800 figure, followed by the 200-DMA.
EUR/USD Price Action – Daily chart
- GBP/JPY tested the 20-day SMA at 183.30 and then settled above 184.00.
- In line with the global trend, the Services PMI from the UK fell to contraction territory in August.
- Japanese PMIs showed optimistic results.
- Monetary Policy divergences between the BoJ and BoE may limit the downside.
The JPY is trading strong against most of its rivals, including the USD, GBP, EUR and AUD, as its PMIs showed better-than-expected results in August. On the other hand, the UK reported soft PMIs from August, which made the Pound lose interest in the FX markets.
British PMIs from August showed poor results. The Manufacturing declined deep into negative territory and fell to 42.5, while the Services PMI dropped below the 50 threshold to 48.7, both coming lower than expected. It's worth noticing that the Bank of England (BoE), in its last meeting, stated that it no longer expects a recession, so weak data seem to be surprising the markets.
The British yields show sharp declines as a reaction, with the Bank of England’s tightening expectations falling slightly. That being said, investors continue to price in higher odds of a terminal rate of 6% for this cycle.
On the Japanese side, the Jibun Bank PMIs came in higher than expected, but the Manufacturing PMIs remained in contraction territory while the Service index stood above 50 in August. Furthermore, the JPY has gained traction on the back of the rise of the Japanese government yields, which stood at highs since 2014, and markets are pledging the Bank of Japan (BoJ) to pivot. That being said, no signs have been given by the Japanese banking authority, which seems to be comfortable maintaining its negative interest rate policy, so divergences from the BoJ and its peers may limit the upside for the Yen.
GBP/JPY Levels to watch
The daily chart shows signs of bullish exhaustion for GBP/JPY, contributing to a neutral, bearish technical stance. Both the Relative Strength Index (RSI) and Moving Average Convergence Divergence (MACD) exhibit indications of fading momentum. The RSI has a negative slope above its midline, indicating weakening buying pressure, while the Moving Average Convergence (MACD) presents shorter green bars. On the bigger picture, the pair is above the 20,100,200-day Simple Moving Average (SMAs), indicating that the buyers are commanding the broader perspective.
Support levels: 183.30 (20-day SMA), 183.00, 182.50
Resistance levels: 184.00, 184.50, 185.00.
GBP/JPY Daily chart
-638284120130073516.png)
- NZD/USD surged above the 0.5980 area, setting a three-day winning streak.
- US PMIs failed to meet expectations, but the US Service sector remains resilient compared to the leading economies.
- Lower yield and dovish bets on the Fed, weight on the USD.
In Wednesday’s session, the NZD/USD recovered ground, driven by a weak USD following the release of August S&P PMIs. Due to signs of a softening economy, US yields took a big hit, and markets seem to be betting on a less aggressive Federal Reserve (Fed). Investors now focus on Friday’s speech from Jerome Powell at the Jackson Hole Symposium.
The US Manufacturing PMI from August declined to 47, as opposed to the expected 49.3, while the Services index remained within the expansion category at 51 despite being lower than anticipated.
As the Federal Reserve (Fed) stated, decisions will depend on incoming data, weak PMI figures make markets bet that the Fed won't be as aggressive as expected, and the US yields are showing sharp declines. With the 2, 5 and 10-year rates falling by more than 1%, the USD loses interest and trades weak against most of its rivals, and the DXY index fell towards the 103.30 area.
In line with that, according to the CME FedWatch tool, investors still are confident that the Fed won’t hike in September, while the odds of a hike in November fell to 35%.
NZD/USD Levels to watch
The daily chart analysis suggests a neutral to bullish outlook for NZD/USD, with the bulls gaining strength, although challenges persist. With a positive slope below its midline, the Relative Strength Index (RSI) signals a strengthening bullish sentiment, while the Moving Average Convergence (MACD) prints shorter red bars. Furthermore, the pair is below the 20,100 and 200-day Simple Moving Averages (SMAs), suggesting that the buyers are struggling to overcome the overall bearish trend and that the bears are still in charge.
Support levels: 0.6000, 0.6015, 0.6035 (20-day SMA)
Resistance levels: 0.5950, 0.5930, 0.5910.
NZD/USD Daily chart
-638284083070991792.png)
- WTI drops to $77.68 per barrel, down 0.54%, as S&P Global PMIs indicate weakening global business activity.
- US gasoline inventories rise by 1.5 million barrels, nearly double the estimates, while crude stockpiles fall by 6.1 million barrels.
- Soft US Dollar provides some cushion; DXY retreats 0.24% to 103.346 as market participants await Powell’s speech.
Western Texas Intermediate (WTI), the US crude oil benchmark traders, prolong their pain as WTI drops to new four-week lows of $77.68 per barrel, courtesy of weakening business activity worldwide, as reported by S&P Global PMIs. That, alongside a drop in US crude inventories, were headwinds for Oil prices. WTI trades at $78.90 per barrel, down 0.54%.
Oil prices pressured as investors eye Fed Powell’s upcoming speech for monetary policy clues
S&P Global revealed PMIs worldwide, which showed that manufacturing and business services activity is deteriorating. Japan, the Eurozone, the UK, and the US reported that PMI declined more than expected, mainly in Germany. The data weighed on WTI’s, as a global economic slowdown might dent oil demand.
US gasoline inventories rose 1.5 million barrels, almost double analysts’ estimates of an 888K barrels drop, according to data from the US Energy Information Administration (EIA). At the same time, US crude stockpiles plunged by 6.1 million barrels to 433.5 million barrels last week.
Sources cited by Reuters said, “While refiners continue to run at a high rate and snap up oil inventories, fuel demand hasn’t been very strong due to tough economic conditions.”
Cushioning WTI’s drop is a soft US Dollar (USD), undermined by falling US Treasury bond yields. The US Dollar Index (DXY), retreats 0.24%, at 103.346, a tailwind for USD-denominated assets.
Aside from this, market participants get ready for the Federal Reserve Chair Jerome Powell’s speech on Friday. Investors estimate the Fed would stick to its higher-for-longer commitment and talk down the chances of interest rate cuts.
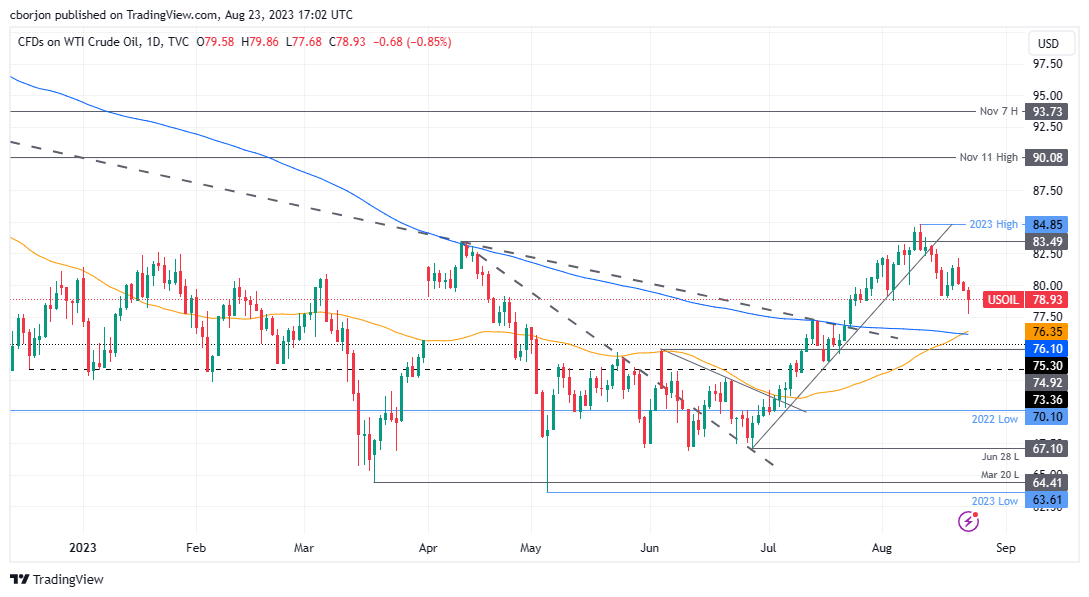
WTI Price Analysis: Technical outlook
The US crude oil benchmark daily chat portrays the pair turning bullish as a golden cross emerges, suggesting that further upside is expected. Also, Wednesday’s price action, forming a hammer preceded by a downtrend, gives WTI buyers two signals to step in. However, a daily close above $80.00 per barrel is needed to reinforce the bias. In that outcome, WTI’s first resistance would be the current week’s high of $82.13, followed by the year-to-date (YTD) high of $84.85. On the other hand, with WTI standing below $80.00, sellers could drag down prices and challenge the confluence of the 50/200-day Simple Moving Average (DMA) at around $76.10/36.
- AUD/USD sets a third consecutive day of gains, rising more than 0.60% towards 0.6470.
- PMIs from August from the US and Australia came in lower than expected.
- Dovish bets on the Fed are applying pressure on the USD.
The AUD/USD gained traction in Wednesday's session, driven by a weaker USD. The US reported lower-than-expected PMIs, but its Services sector remained resilient. At the same time, the Australian figures also failed to live up to expectations—eyes on Jerome Powell’s speech on Friday.
Weak US PMIs fueled a decline in US yields, which weakened the USD
The US S&P Global PMIs arrived weaker than anticipated. The Manufacturing PMI fell to 47, contrasting with the projected 49.3, whereas the Services index, though below expectations, stayed within the expansion range at 51. Despite reporting soft data, the US Service sector remains resilient. At the same time, the British, German, and Australian Services index dropped below 50, and the USD may gain further traction as the US economy seems to be the last man standing.
Reacting to the weak economic activity data, the 2, 5, and 10-year US Treasury yields show sharp declines of more than 1.50%, suggesting that the markets are betting that the Federal Reserve (Fed) won’t be as aggressive as expected for the rest of the year. That being said, Jerome Powell’s speech on Friday at the Jackson Hole Symposium will be key for investors to continue modelling their expectations for the upcoming Fed meetings.
On the AUD’s side, the Manufacturing and Services PMIs from Australia from August were lower than expected at 49.4 and 46.7, respectively. China’s weakening and the contractive monetary policy from the Reserve Bank of Australia (RBA) are the main reasons for the softening of the Australian economy.
AUD/USD Levels to watch
Analysing the daily chart, the technical outlook for the AUD/USD remains neutral to bullish as the bulls continue to regain their momentum. The Relative Strength Index (RSI) indicates a decrease in downward momentum with a positive slope below its midline, while the Moving Average Convergence (MACD) presents lower red bars. Additionally, the pair is below the 20,100 and 200-day Simple Moving Averages (SMAs), implying that the bears retain control on a broader scale while the buyers still have some work to do.
Support levels: 0.6440, 0.6415, 0.6400.
Resistance levels: 0.6470, 0.6490, 0.6500.
AUD/USD Daily chart
-638284034166126019.png)
- USD/MXN is down 0.48%, trading at 16.8260, as disappointing S&P Global PMIs weigh on the greenback.
- US Treasury bond yields slump, with the 10-year note dropping ten basis points to 4.22%, further pressuring the USD.
- Mexican inflation data awaited on Thursday; USD/MXN remains bearish but Powell's speech could be a game-changer.
USD/MXN plunges for the fifth straight day after economic data from the United States (US) could prevent the US Federal Reserve from tightening monetary conditions, as business activity deteriorated, according to S&P Global. Hence, the USD/MXN trades at 16.8260, down 0.48%, after hitting a daily high of 16.9151.
US equities rise on NVIDIA earnings hopes; investors eye Powell’s Jackson Hole speech for rate clues
US equities are trading in the green on expectations of NVIDIA earnings reports and US S&P Global PMIs for August. The S&P Global Composite PMI compounded by Manufacturing and Services PMIs fell to 50.4 from July 52 and below estimates of 52. The manufacturing index dived deeper into contractionary territory at 47 from 49 July and forecasts of 49.3, while the services component clings to expansionary territory at 51, also missing estimates of 52.2.
Other data on the housing market witnessed New Home Sales for July on MoM came at 4.4%, exceeding the prior month’s data of -2.8%.
In the meantime, a US government report revealed that US Nonfarm Payrolls through March would probably be revised down by 306,000, smaller than analysts’ estimates of 500,000.
US Treasury bond yields remain depressed along the whole yield curve as the 10-year Treasury Note collapses ten basis points, from 4.321% to 4.22%, weighing on the greenback. The US Dollar Index (DXY), a gauge that measures the buck’s value against a basket of peers, drops 0.21% at 103.380.
On the Mexican front, the economic agenda would remain empty until Thursday, when the Instituto Nacional de Estadistica Geografia e Informatica (INEGI) will reveal inflation figures for the first half of August, with the Consumer Price Index (CPI) estimated at 4.67% on YoY, while monthly figures are expected at 0.28%. Core CPI is projected to slow down but remain stickier than expected.
Given the backdrop, USD/MXN remains bearishly biased and ready to test the yearly lows. However, the Jackson Hole speech by Fed Chair Jerome Powell is expected to rock the boat. Investors estimate the Fed would stick to its higher-for-longer commitment and talk down the chances of interest rate cuts.
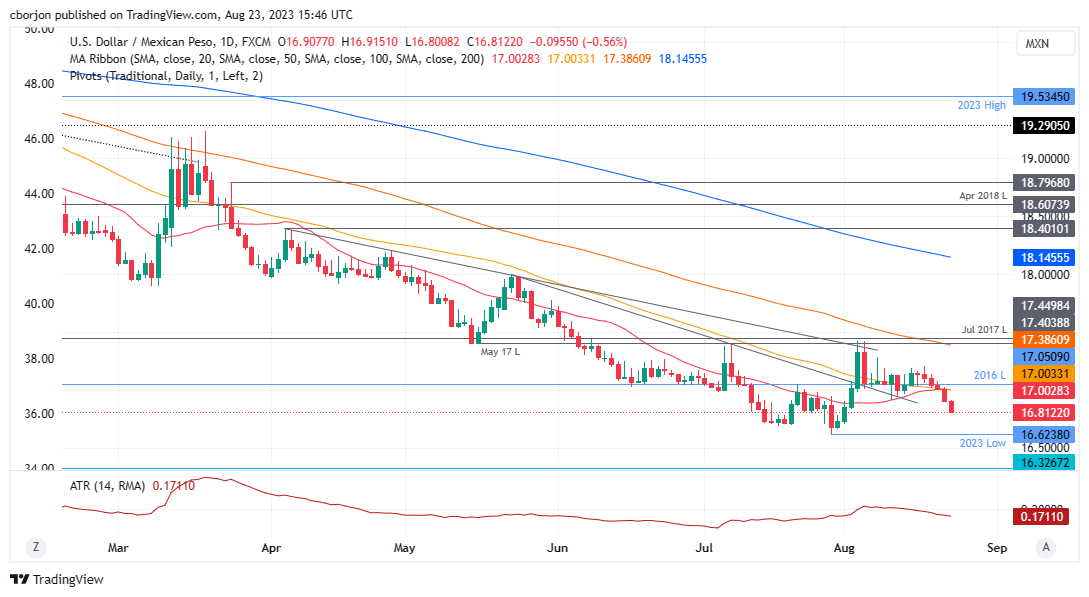
USD/MXN Price Analysis: Technical outlook
From a technical standpoint, the USD/MXN is downward biased, set to re-test the year-to-date (YTD) low of 16.6238, which, once cleared, the pair would continue towards the October 2015 low of 16.3267. Conversely, if USD/MXN edges back toward the confluence of the 20/50-day Moving Average (DMA) at 17.0000, that could pave the way for further upside. Next would be the last week’s high of 17.2073, followed by the 100-DMA at 17.3862.
USD/MXN Price Action - Daily chart
Economists at Société Générale make an upward revision to USD/CNY.
An arduous march to 7.60 by the end of 2023
We revise up our year-end USD/CNY forecast by 0.20 to 7.60.
The policy response, seemingly less organised than in the past, should pave the way for the USD/CNY pair to overshoot rather than undershoot for the remainder of the year.
The current CNY weakness is fundamentally driven and the impact of the PBoC’s stronger fixing is not likely to be effective this time around.
- The US S&P Global PMI came in below expectations.
- The US Dollar declined across the board following the release of the data.
- USD/JPY appears vulnerable to further losses as long as it remains below 145.00.
The USD/JPY broke below 145.00, falling to its lowest level in almost two weeks. This decline was triggered by the release of US economic data that came in below expectations, leading to a decrease in US Treasury yields and weakening the Greenback.
US PMI data disappoints
The S&P Global Composite PMI unexpectedly dropped from 52 to 50 in August, according to preliminary data. The Services PMI fell from 52.3 to 51, and the Manufacturing PMI tumbled to 47 from 49. These numbers indicate a reduction in demand for the US Dollar.
On a different report, New Home Sales showed a positive surprise, reaching an annual rate of 714K, surpassing expectations of 705K. However, these numbers did not alter the overall post-PMI trend of the US Dollar.
Earlier in the day, the Japanese PMI was among the few to exceed expectations, with the Manufacturing Index rising from 49.6 to 49.7 and the Services Index from 53.8 to 54.3.
The Japanese Yen is among the top performers on Thursday, benefiting from falling government bond yields. EUR/JPY is trading at two-week lows below 157.00, while GBP/JPY has lost more than 200 pips.
The focus now shifts to the Jackson Hole Symposium, where Federal Reserve Chair Jerome Powell will deliver a speech on Friday. Before that, on Thursday, the market will be paying attention to US Jobless Claims and Durable Goods Orders data.
USD/JPY accelerates bearish correction
The USD/JPY has bottomed at 144.64, reaching the lowest level since August 14. It remains near these lows, exhibiting strong negative momentum. As long as the pair stays below 145.00, further losses seem likely.
On the downside, the next support levels emerge at 144.40 (August 11 low) and 144.05. If the pair manages to recover above the 145.00 area, it would alleviate the bearish pressure.
Technical levels
XAU/USD is down over 7% since its 2023 peak in May. Economists at UBS analyze Gold’s portfolio role as the backdrop shifts.
Short-term headwinds unlikely to erode the portfolio case for Gold
The changing backdrop has pushed both nominal and real US yields higher, adding to Dollar strength and undermining Gold’s near-term appeal. But, we don’t think short-term headwinds erode the portfolio case for Gold.
With US recession risks now fading and Dollar strength back, we have cut our year-end Gold forecast slightly to $1,950 and downgraded the precious metal to neutral within our global strategy.
We still recommend investors build Gold into their portfolios and broadly diversify USD holdings.
- Silver price jumps above $24.00 after S&P Global reported weak preliminary PMI data for August.
- Weak PMI figures demonstrate the consequences of tight monetary policy by the Fed.
- Silver price climbs above the 61.8% Fibonacci retracement at $24.00.
Silver price (XAG/USD) rallies above $24.00 as the US Dollar comes under pressure after S&P Global reported a weak preliminary PMI for August. Preliminary Manufacturing PMI for August at 47.0 underperforms expectations of 49.3 and July’s reading of 49.0. Also, Services PMI remained lower at 51.0 vs. estimates of 52.2 and the former release of 52.3.
Weak PMI figures demonstrate the consequences of tight monetary policy by the Federal Reserve (Fed). US central bank has raised interest rates aggressively to 5.25-5.50% in a war against stubborn inflation. Price pressures have come significantly lower to 3% but investors hope that inflation in excess of the desired rate will be extremely persistent.
The US Dollar Index drops vertically to near 103.50 after printing a fresh 10-week high of 104.00 as vulnerable economic activities could force the Fed to keep interest rates steady. Also, 10-year US Treasury Yields dropped sharply to near 4.23%.
Going forward, investors will keenly focus on Fed Chair Jerome Powell's speech at the Jackson Hole Symposium, which will start on Thursday. Jerome Powell is likely to convey how long interest rates will remain steady at elevated levels. Apart from that, the outlook on the economy and inflation will be keenly watched.
Silver technical analysis
Silver price climbs above the 61.8% Fibonacci retracement (plotted from July 20 high at $25.27 to August 15 low at $22.23) at $24.00 on a two-hour scale. Upward-sloping 20-period Exponential Moving Average (EMA) at $23.00 indicates that the short-term trend is extremely bullish.
The Relative Strength Index (RSI) (14) settles into the bullish range of 60.00-80.00, which indicates more upside ahead.
Silver two-hour chart
-638283977626451307.png)
Kit Juckes, Chief Global FX Strategist at Société Générale, expects the US Dollar to remain strong for the time being.
Recession fears haunt the Euro and Sterling
For now, ‘higher for longer’ is driving thinking about Fed policy and supply is helping push yields higher. That props up the Dollar while recession fears haunt the Euro (and Sterling) and Chinese growth fears anchor more currencies than just the Yuan.
While currency markets remain in a summer lull, the Dollar is still (comfortably) the pick of the bunch. It has gone up against everything in August and will go on rising until either the situation in China improves (very unlikely), the BoJ acts (they don’t have a meeting again until September 22nd), the European data turnaround (also unlikely) or the US story shifts on the back of weak data and/or a more cautious tone from Fed officials at Jackson Hole).
With payroll data and the ISM report due on Friday, September 1, I wouldn’t blame anyone who heads back to the beach for a few more days.
USD/JPY has continued its upward trajectory above 145. Economists at Danske Bank analyze the pair’s outlook.
USD/JPY seems fundamentally overvalued
We think the USD/JPY seems fundamentally overvalued and combined with potential monetary policy tightening; we expect the cross to drop to around 130 on a 6-12M horizon.
We think the BoJ still is underestimating inflationary pressures in Japan, and the persistence of underlying inflation will continue to build pressure on BoJ’s ultra-dovish stance.
See – USD/JPY: The risk of a retest of 150 is hard to ignore – Scotiabank
- EUR/USD faces extra selling pressure and puts 1.0800 to the test.
- Immediately to the downside comes the 200-day SMA.
EUR/USD extends the weekly leg lower to the boundaries of the 1.0800 region on Wednesday.
Further losses are now expected to challenge the critical 200-day SMA at 1.0797 prior to the May low of 1.0635 (May 31).
A drop below the 200-day SMA should keep extra losses in store for the time being.
EUR/USD daily chart
- AUD/USD faces selling pressure around 0.6460 as the US Dollar recovers.
- Investors hope that strengthening the US economy could force the Fed to tighten the interest rate policy further.
- Australian inflation is softening consistently as hiring momentum slows and the population is getting older.
The AUD/USD pair falls back after testing selling pressure near the immediate resistance of 0.6460 in the early New York session. The Aussie asset comes under pressure as the US Dollar Index (DXY) refreshes a 10-week high at 104.00 as fears of a recession in developing nations have deepened.
S&P500 is expected to open on a positive note, following positive cues from overnight futures. A volatile action is anticipated in US equities as the market mood could turn cautious ahead of the Jackson Hole Symposium. The US Dollar Index (DXY) remained resilient as investors hoped that a strengthening US economy could force the Federal Reserve (Fed) to tighten the interest rate policy further.
Richmond Fed Bank President Thomas Barkin said on Tuesday that if inflation remains high and demand gives no signal, it is likely to drop. That environment would require tighter monetary policy. Fed Barkin expects that the recession situation will be ‘‘less severe’’.
Meanwhile, investors await preliminary United States PMI data to be reported by S&P Global for August. Analysts at BBH Markets expect Manufacturing PMI to remain steady at 49.0, services is expected to fall three ticks to 52.0, and the composite is expected to fall half a point to 51.5. If so, this composite would be the lowest since February.
On the Australian Dollar front, investors hope that the Reserve Bank of Australia (RBA) will keep interest rates unchanged in September. Australian inflation is softening consistently as hiring momentum slows and the population is getting older. The absence of triggers providing support to inflation will allow the RBA to keep the interest rate decision unchanged.
- DXY builds on Tuesday’s gains and reaches the 104.00 region.
- Next on the upside comes the May high near 104.70.
DXY advances further and hits fresh multi-week peaks around the 104.00 neighbourhood on Wednesday.
A convincing breakout of the 104.00 hurdle should open the door to a potential visit to the May top of 104.69 (May 31) ahead of the 2023 peak of 105.88 (March 8).
While above the key 200-day SMA, today at 103.15, the outlook for the index is expected to shift to a more constructive one.
Looking at the broader picture, a convincing breakout of the 200-day SMA should shift the outlook for the index to a more constructive one.
DXY daily chart
Economists at TD Securities analyze USD/IDR outlook ahead of Thursday’s Bank Indonesia meeting.
USD/IDR in an uptrend channel since early May
We expect Bank Indonesia to leave its 7-day reverse repo rate at 5.75%, extending its pause since February.
USD/IDR has been in an uptrend channel since early May and a break above the channel highs of 14,425 may trigger stronger verbal interventions from BI.
We think this USD strength may continue as liquidity is typically poor amid summer months and prefer to stay clear of the USD.
Gold prices have come under increased pressure in recent weeks. Economists at UBS analyze XAU/USD outlook.
Gold’s safe-haven benefits remain intact
We think the next potential leg up in prices will in part be driven by an anticipated revival in demand for exchange-traded funds (ETFs), from which there were outflows in the first half of 2023. A rise in ETF Gold buying typically occurs just ahead of a US easing cycle – the timing of which we anticipate will become clearer by year-end as we get more data and the Fed decisions are behind us.
Gold has also historically performed well when the USD softens, and we see another round of Dollar weakness over the next 6-12 months.
Gold still looks attractive to us as a longer-term portfolio hedge – especially in the context of an uncertain global growth outlook, volatile equity market dynamics, and unsettled geopolitics.
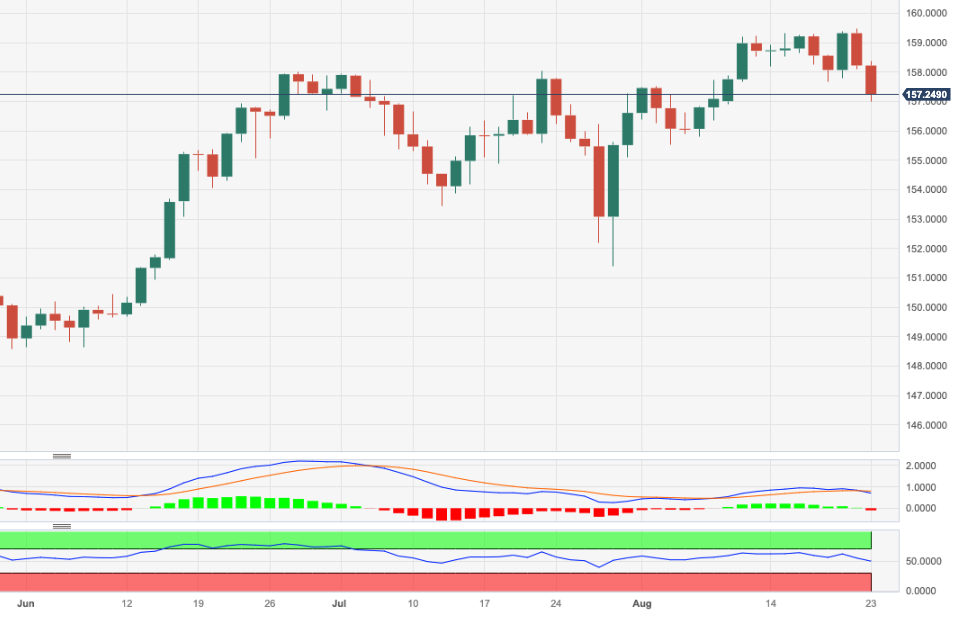
- EUR/JPY adds to Tuesday’s losses and revisits 157.00.
- A deeper decline could meet transitory support near 156.00.
EUR/JPY accelerates its downside momentum and drops to multi-day lows in the 157.00 neighbourhood on Wednesday.
In case the corrective retracement gathers further impulse, the cross could extend the move to the provisional 55-day SMA around 156.00, which should hold the initial test. South from here emerges the 100-day SMA near 152.50 prior to the July low of 151.40 (July 28).
So far, the longer term positive outlook for the cross appears favoured while above the 200-day SMA, today at 147.51.
EUR/JPY daily chart
- USD/CAD marches towards 1.3600 as Canada’s Retail Sales excluding automobiles contract sharply.
- Canada’s consumer spending for goods and services other than automobiles contracted at a higher pace of 0.8%.
- The US Dollar Index is expected to demonstrate a volatile action after the release of the S&P Global preliminary PMI data.
The USD/CAD pair is marching sharply towards the round-level resistance of 1.3600 as Statistics Canada reported mixed Retail Sales data for June. Consumer spending for goods and services other than automobiles contracted at a higher pace of 0.8% vs. 0.3% pace of contraction recorded for May while investors projected an expansion by 0.3%.
Overall Retail Sales expanded by 0.1%, in line with May’s reading while market participants anticipated a stagnant performance. A vulnerable consumer spending would allow the Bank of Canada (BoC) to keep interest rates steady ahead.
S&P500 futures generate decent gains in Europe, portraying a recovery in the risk appetite of the market participants. US equities witnessed selling pressure on Tuesday as investors remained cautious about the Jackson Hole Symposium.
Investors are expecting that Federal Reserve (Fed) chair Jerome Powell will explain the benefits of keeping interest rates higher for a longer period. In July’s monetary policy meeting, Jerome Powell announced that further policy tightening would be data-dependent.
Richmond Fed Bank President Thomas Barkin said if inflation remains high and signs of a drop in demand remain absent. The situation will force the need for tighter monetary policy.
The US Dollar Index (DXY) resumes its upside journey after delivering a breakout of the consolidation formed in a range of 103.00-103.67. The USD Index picks strength as developing economies have been exposed to recession due to a bleak economic outlook and higher interest rates. Contrary, the 10-year US Treasury Yields dropped below 4.3% as more interest rate hikes from the Fed are less likely.
In the early New York session, investors will focus on the United States preliminary PMI data for August to be reported by S&P Global. For August, the S&P Global Manufacturing PMI Index is likely to improve further to 49.3. The Services PMI, however, is expected to drop to 52.2 in the reported month, compared with July’s 52.3 print. The Composite PMI is seen unchanged at 52.0 in August.
- Retail Sales in Canada rose marginally in June.
- USD/CAD continues to trade in positive territory, closes in on 1.3600.
Retail Sales in Canada rose 0.1% on a monthly basis in June, Statistics Canada reported on Wednesday. This reading followed the 0.1% increase recorded in May (revised from 0.2%) and came in slightly better than the market expectation of 0%.
Retail Sales ex Autos remained declined 0.8% in the same period, compared to analysts' estimate for an increase of 0.3%.
Market reaction
USD/CAD continued to push higher after this report and was last seen rising 0.27% on a daily basis at 1.3587.
The USD is trading mixed versus the majors. Economists at Scotiabank analyze Greenback’s outlook.
Narrower spreads should help check the USD advance
The undertone remains constructive on the face of it but there may be constraints on the USD rebound extending further ahead of the Jackson Hole event at the end of the week.
DXY’s recent gains have largely reflected more USD-supportive spreads versus its peers but the index is trading right on its estimated value, based solely on 2Y spreads, and so looks quite fully priced. Narrower spreads should help check the USD advance.
Economist at UOB Group HO Woei Chen, CFA, reviews the latest interest rate decision by the PBoC.
Key Takeaways
Chinese banks set the 1Y loan prime rate (LPR) 10 bps lower at 3.45% while keeping the 5Y LPR unchanged at 4.20%. The move is largely disappointing considering the mounting growth risks in China’s economy. Bloomberg’s poll showed expectation of 10-15 bps cut for the 1Y LPR and 10-20 bps cut for the 5Y LPR in Aug.
The deflationary backdrop has provided some room for the PBOC to ease its monetary policy further in the near-term while the PBOC has asked banks to increase financial support to the real economy.
We continue to expect banks to adjust their LPRs lower in the coming months. We also expect another 25 bps cut to banks’ reserve requirement ratio (RRR) in 3Q23. Our forecast for the 1Y LPR is now at 3.40% end-3Q23 and 3.35% end4Q23 while our forecast for the 5Y LPR is at 4.05% end-3Q23 and 4.00% end4Q23.
The prospect of massive support measures remains low at this point due to the policymakers’ worries over debt sustainability and moral hazard problem.
Loonie remains under pressure. Economists at Scotiabank analyze USD/CAD outlook.
“Heads I win, tails you lose”
There is a bit of a ‘heads I win, tails you lose’ feel to the CAD at the moment, with nothing seemingly going the CAD’s way.
Trend momentum indicators are aligned bullishly for the USD on the shorter-term DMI oscillators and while the USD rally looks overextended somewhat, the absence of any real sign of weakness in price action rather suggests the push higher will continue.
Spot resistance from here is 1.3610 (where that trend line comes in on the intraday chart) and 1.3650/1.3660.
Support is 1.3530/1.3540.
GBP/USD slides on weaker-than-expected PMIs. Economists at Scotiabank analyze the pair’s outlook.
The 1.2620 level is now key support
Weaker-than-expected UK data reflected a slump in services – to 48.7 in August from 51.5 in July. The flash composite index dropped to 47.9 this month, down from 50.8.
The 1.2620 level is now key support (reinforced somewhat by the 100-Day Moving Average (DMA) at 1.2636).
Sustained weakness below the 1.26 zone could shift Cable into a new, lower trading range between 1.23 and 1.25.
EUR/USD trades soft near 1.08 on weaker-than-expected PMI data. Economists at Scotiabank analyze the pair’s technical outlook.
Support is 1.0750/1.0775
Preliminary Eurozone PMI data reflected soft but slightly better than forecast manufacturing trends in Germany and France. However, both countries saw much weaker than expected services activity this month, pushing the Eurozone services index down to 48.3, versus 50.5 expected and 50.9 in July. The composite index dropped to 47 from 48.6 (a milder drop to 48.5 was expected).
Steady EUR losses are extending to near the 200-Day Moving Average (1.0799).
The EUR/USD pair has given back nearly 3/4 of the May/July rally from 1.0635/1.1275 and weakness through the mid/upper 1.08s leaves the technical undertone here looking soft.
Support is 1.0750/1.0775. Resistance is 1.0835/1.0845.
The Rand is down over 9% YTD. Economists at Société Générale analyze USD/ZAR technical outlook.
Break above 19.35 essential to affirm next leg of uptrend
USD/ZAR approached projections at 17.40/17.35 last month and quickly reclaimed the 200-DMA resulting in a swift bounce. The move has petered out near interim hurdle of 19.35 representing the 76.4% retracement from June.
A short-term pullback can’t be ruled out towards 18.35 and the MA near 18.10. This could be an important support.
A break above 19.35 would be essential to affirm next leg of uptrend.
- Oil (WTI) trades at $78.90, steering further away from $80.
- The US Dollar gave markets a knee-jerk reaction after surprise US Dollar strength..
- The weekly API numbers were a disappointing drawdown and could push Oil prices further downwards.
Oil prices are trading lower this Wednesday ahead of the weekly important Energy Information Administration (EAI) Crude Oil Stock Changes. The overnight numbers from the American Petroleum Institute came in below estimates and slashed oil prices. The API number printed only a drawdown of -2.418M barrels, where -2.9M was expected.
Projections of the EAI numbers for Wednesday point to a drawdown for both the high and low estimate. In order to trigger a spike in oil prices, the drawdown this Wednesday needs to beat the highest estimation of -3.1M. The lowest estimation is at -2.39M, so any number between the range or less severe than -2.39M could be translated into cheaper oil as the US stockpiles are under less demand than expected.
At the time of writing, Crude Oil (WTI) price trades at $78.88 per barrel, Brent Oil at $83.10.
Oil news and market movers
- The weekly important Energy Information Administration (EAI) Crude Oil Stock Changes are due at 14:30 GMT. Expectations are between -2.39M to -3.1M of drawdowns. Previous number last week was a cut of -5.96M and will be hard to beat.
- S&P Global will release its Purchasing Managers’ Index (PMI) for the US at 13:45 GMT. The Services Index is expected to stay broadly steady from the previous 52.3 reading and print 52.2 for August. The Manufacturing Index is expected to stay in contraction, moving from 49 to 49.3. The overall Composite Index is expected to be unchanged at 52.0. The numbers will be market moving for Oil as well as any slowdown in the PMI numbers could mean less demand for oil.
- Tropical depression Franklin is moving further inland, away from the Texas’ shores.
- All eyes are focused on Friday, when the annual Jackson Hole Symposium will be the focal point for the week. In the event, the US Federal Reserve tends to signal a change in its monetary policy going forward.
Oil Technical Analysis: head and shoulders risk
Oil price is signalling alert messages to the markets after the slump in the weekly API numbers on Tuesday. Oil takes another step back on Wednesday ahead of the weekly EAI numbers, which could act as catalyst for a downward breakout in the head-and-shoulders pattern on the charts. The line in the sand is $78.50, and once broken oil prices could slide as much as 6%.
On the upside, $81.68, Monday’s high, is the one to beat in order to trigger a small uptrend. Should WTI continue its performance of higher lows and higher highs, pressure could build toward $82. In order to print a fresh monthly high, the peak of mid-August at $84.32 is the one to beat when demand takes over and supply cannot follow suit.
On the downside, a temporary bottom is being formed around $78.50 and acts as a base in the current head-and-shoulders pattern. Should the EAI numbers point to a weaker oil price, expect to get the shoulders pattern being completed, erasing the weekly gains from July 20. Expect some support near $77 from the double top on July 13, though rather expect the bottom roughly 6% lower near $74.
-638283850370730189.png)
WTI US OIL (Daily Chart)
WTI Oil FAQs
What is WTI Oil?
WTI Oil is a type of Crude Oil sold on international markets. The WTI stands for West Texas Intermediate, one of three major types including Brent and Dubai Crude. WTI is also referred to as “light” and “sweet” because of its relatively low gravity and sulfur content respectively. It is considered a high quality Oil that is easily refined. It is sourced in the United States and distributed via the Cushing hub, which is considered “The Pipeline Crossroads of the World”. It is a benchmark for the Oil market and WTI price is frequently quoted in the media.
What factors drive the price of WTI Oil?
Like all assets, supply and demand are the key drivers of WTI Oil price. As such, global growth can be a driver of increased demand and vice versa for weak global growth. Political instability, wars, and sanctions can disrupt supply and impact prices. The decisions of OPEC, a group of major Oil-producing countries, is another key driver of price. The value of the US Dollar influences the price of WTI Crude Oil, since Oil is predominantly traded in US Dollars, thus a weaker US Dollar can make Oil more affordable and vice versa.
How does inventory data impact the price of WTI Oil
The weekly Oil inventory reports published by the American Petroleum Institute (API) and the Energy Information Agency (EIA) impact the price of WTI Oil. Changes in inventories reflect fluctuating supply and demand. If the data shows a drop in inventories it can indicate increased demand, pushing up Oil price. Higher inventories can reflect increased supply, pushing down prices. API’s report is published every Tuesday and EIA’s the day after. Their results are usually similar, falling within 1% of each other 75% of the time. The EIA data is considered more reliable, since it is a government agency.
How does OPEC influence the price of WTI Oil?
OPEC (Organization of the Petroleum Exporting Countries) is a group of 13 Oil-producing nations who collectively decide production quotas for member countries at twice-yearly meetings. Their decisions often impact WTI Oil prices. When OPEC decides to lower quotas, it can tighten supply, pushing up Oil prices. When OPEC increases production, it has the opposite effect. OPEC+ refers to an expanded group that includes ten extra non-OPEC members, the most notable of which is Russia.
Economists at TD Securities analyze USD/KRW outlook.
Global risk-off sentiment may accelerate equity outflows and weigh on the KRW
The run-up in USD/KRW is likely on the BoK's radar given the sharp depreciation over the past month (USD/KRW near YTD highs) and we think the BoK may attempt to cap any rapid moves higher in USD/KRW in the weeks ahead.
However, we think the risk is that USD/KRW drifts higher on the continued weakness in regional pairs such as CNH, JPY depreciation while the global risk-off sentiment may accelerate equity outflows and weigh on the KRW.
- US Dollar price action rallies with several BRIC countries coming out in favor of the Greenback.
- Fed members repeat the same message, foreshadowing an unchanged message from Powell at Jackson Hole on Friday.
- The US Dollar Index strengthens as hope dampens for any near-term rate cuts.
The US Dollar (USD) is mixed but the green on Wednesday with no real big outliers to report. This does not mean though that the US Dollar is not moving, as on Wednesday the Greenback delivered a firm punch against several major currency-cross peers. The 180-degree change in sentiment just hours after the US opening bell had rung was the sum of headlines. Fed officials are keeping their mouths firmly shut on rate cuts. The BRIC meeting on dedollarization has a few important countries speaking out in favor of keeping the US Dollar as a trade currency. Last but not least, some geopolitical tensions trigger Greenback favor during US trading hours.
All eyes are on the chunky data calendar this Wednesday with the S&P Purchase Managers Index (PMI). New homes sales to come out as well and could confirm the slowdown in the housing sector, which was the key takeaway from the existing home sale numbers on Tuesday. Watch out for more headline risks today as chipmaker Nvidia is due to deliver earnings, which could make or break the current risk-on sentiment in equity markets.
Daily digest: US Dollar enjoys earnings, Fed and geopolitics
- The US economic calendar starts at 11:00 GMT with the weekly Mortgage Bankers Association (MBA) Mortgage Applications for the week of August 18. Previous number was down -0.8%.
- At 13:45 GMT S&P will print its Purchasing Managers’ Index (PMI): The Services Index is expected to stay steady from the previous 52.3 reading and print 52.2 for August. The Manufacturing Index is expected to stay in contraction, moving from 49 to 49.3. The overall Composite Index stays unchanged at 52.
- At the stroke of 14:00 GMT, New Home Sales numbers will come out. The Existing Home Sales numbers from Tuesday showed a slowdown in selling, while property inventories remained roughly the same. If a similar picture is being shown in the new houses, it could point to a global slowdown in the housing sector as these elevated mortgage levels are slowing down demand.
- This Wednesday, the US Treasury Department will auction a 20-year bond.
- The BRICS convention starts its second day in South Africa with the organisation welcoming nearly 20 new members. The major theme will be the discussion on dedollarization and the setup of a payment system between the nations. India, Brazil and South Africa have already came out opposing the idea of disregarding the US Dollar, making the meeting as such a non-event and no threat yet for the Greenback as trade currency.
- Equities are up across the board, be it with mild gains and no real outliers. Equity markets are on the lookout for Nvidia earnings, which could make or break the current tech rally for NASDAQ and possibly spill over into the other indices and stock markets across the globe.
- The CME Group FedWatch Tool shows that markets are pricing in an 86.5% chance that the Federal Reserve will keep interest rates unchanged at its meeting in September.
- The benchmark 10-year US Treasury bond yield trades at 4.26% after touching a new yearly high on Tuesday. The bond market will be very sensitive to any news on Friday at the Jackson Hole Symposium. The whole US yield curve could move up or down depending on the speech from Fed Chairman Jerome Powell.
US Dollar Index technical analysis: Highs ahead of Jackson Hole
The US Dollar is defying friend and foe after it rallied firmly in the US trading session, erasing all earlier gains. The US Dollar Index (DXY) was even briefly in distress during the European session when it broke below the important 200-day Simple Moving Average (SMA). In a skateboard, 180-degree flip, the DXY was able to eke out gains and even print a fresh two-month high at 103.71.
On the upside, 104.00 is the level to reach. The high of Friday at 103.68 is vital and needs to get a daily close above it in order for the DXY to eke out more monthly gains. Should this US Dollar strength persist for the last part of this year, May’s peak at 104.70 could become the reality again.
On the downside, several floors are likely to prevent a steep decline in the DXY. The first one is the 200-day Simple Moving Average (SMA) at 103.18, which already broke Tuesday and Wednesday. Passing below the 103.00 figure, some room opens up for a further drop. However, around 102.38 both the 55-day and the 100-day SMAs await to catch any falling knives.
US Dollar FAQs
What is the US Dollar?
The US Dollar (USD) is the official currency of the United States of America, and the ‘de facto’ currency of a significant number of other countries where it is found in circulation alongside local notes. It is the most heavily traded currency in the world, accounting for over 88% of all global foreign exchange turnover, or an average of $6.6 trillion in transactions per day, according to data from 2022.
Following the second world war, the USD took over from the British Pound as the world’s reserve currency. For most of its history, the US Dollar was backed by Gold, until the Bretton Woods Agreement in 1971 when the Gold Standard went away.
How do the decisions of the Federal Reserve impact the US Dollar?
The most important single factor impacting on the value of the US Dollar is monetary policy, which is shaped by the Federal Reserve (Fed). The Fed has two mandates: to achieve price stability (control inflation) and foster full employment. Its primary tool to achieve these two goals is by adjusting interest rates.
When prices are rising too quickly and inflation is above the Fed’s 2% target, the Fed will raise rates, which helps the USD value. When inflation falls below 2% or the Unemployment Rate is too high, the Fed may lower interest rates, which weighs on the Greenback.
What is Quantitative Easing and how does it influence the US Dollar?
In extreme situations, the Federal Reserve can also print more Dollars and enact quantitative easing (QE). QE is the process by which the Fed substantially increases the flow of credit in a stuck financial system.
It is a non-standard policy measure used when credit has dried up because banks will not lend to each other (out of the fear of counterparty default). It is a last resort when simply lowering interest rates is unlikely to achieve the necessary result. It was the Fed’s weapon of choice to combat the credit crunch that occurred during the Great Financial Crisis in 2008. It involves the Fed printing more Dollars and using them to buy US government bonds predominantly from financial institutions. QE usually leads to a weaker US Dollar.
What is Quantitative Tightening and how does it influence the US Dollar?
Quantitative tightening (QT) is the reverse process whereby the Federal Reserve stops buying bonds from financial institutions and does not reinvest the principal from the bonds it holds maturing in new purchases. It is usually positive for the US Dollar.
USD/JPY has settled above the 145 mark. Economists at Scotiabank analyze the pair’s outlook.
Intervention is a clear risk if USD/JPY nears the 150 level
Finance Minister Suzuki commented last week that the authorities would respond appropriately to ‘excessive moves’ in the exchange rate but beyond that, finance officials have been quiet on FX recently. Still, market participants understand that intervention is a clear risk if the USD nears the 150 level (spot peaked at 151.95 in October last year) and the charts suggest that, after the USD’s advance above the June high (just above 145), the risk of a retest of 150 is hard to ignore.
If JPY defence is a priority, direct FX intervention and allowing slightly higher domestic yields to coincide (even approximately) with a downturn in US bond yields (or some dovish cueing from Fed policymakers) would be optimal from a policy effectiveness point of view.
- EUR/GBP delivers a V-shape recovery as UK factory activities remain vulnerable in August.
- UK’s Manufacturing PMI dropped significantly to 42.5 from estimates of 45.0 and the prior release of 45.3.
- Eurozone Services PMI fails to maintain above the 50.0 thresholds and slips into the contracting territory.
The EUR/GBP pair recovers strongly after discovering stellar buying interest near the psychological support of 0.8500 in the European session. The asset strengthened after S&P Global reported weaker-than-anticipated United Kingdom PMI data for August.
UK’s Manufacturing PMI dropped significantly to 42.5 from estimates of 45.0 and the prior release of 45.3. This has been the lowest factory data figure since the pandemic period, which demonstrates the consequences of higher interest rates by the Bank of England (BoE). The current tightening cycle of the BoE is the most aggressive in history and has dampened the economic outlook.
Additionally, Services PMI has shifted into the contraction phase below the 50.0 threshold. The economic data landed at 48.7 lower than estimates of 50.8 and July’s reading of 51.3. Vulnerable UK economic data indicates that the economy is expected to report recession sooner amid painful stubborn inflation.
On Tuesday, BoE policymakers warned about significant upside risks to corporate defaults amid higher interest rates. A survey from the BoE shows that the share of non-financial UK companies experiencing a weak debt-service coverage ratio will rise to 50% by year-end from last year’s reading of 45%.
Meanwhile, UK interest rate swaps demonstrate less than 50% chance of BoE’s interest rates reaching 6%. BoE’s interest rate peak is now seen at 5.90% vs. 6.06% projected earlier.
On the Eurozone front, the preliminary Manufacturing PMI for August outperformed expectations of 42.6, and the prior reading of 42.7, landed at 43.7. However, the Services PMI remained lower at 48.3 than estimates of 50.5 and the former release of 50.9. Eurozone Services PMI fails to maintain above the 50.0 thresholds and slips into the contracting territory.
EUR/GBP touched a low of 0.8492 before bouncing back following weak UK PMIs. Economists at Société Générale analyze the pair’s technical outlook.
Decline could extend on failure to defend 0.8500
EUR/GBP has experienced a steady pullback after forming a lower high at 0.8670. July trough at 0.8500 is next potential support.
Daily MACD has recently dipped below its trigger and is now below equilibrium line denoting lack of steady upward momentum.
If the pair fails to defend 0.8500, the decline could extend towards next projections at 0.8455/0.8440.
High formed earlier this week at 0.8565 is first hurdle.
Senior Economist Julia Goh and Economist Loke Siew Ting at UOB Group review the latest GDP figures in Malaysia.
Key Takeaways
Malaysia’s economic growth eased further to 2.9% y/y in 2Q23 (from +5.6% in 1Q23), which was lower than our estimate (+3.2%) and Bloomberg consensus (+3.3%). The pace of growth is the slowest since 3Q21 albeit largely weighed down by a high base effect from last year. On a seasonally adjusted basis, GDP recorded a larger increase of 1.5% q/q (1Q23: +0.9% q/q).
Despite a sustained easing trend from its peak in 3Q22, growth performance is not bad considering the negative external outlook and normalisation of domestic demand as pandemic measures are rolled back. Malaysia’s domestic demand has fared well given the negative external outlook while foreign inflows (FDI and portfolio) persisted and the labor market improved. We anticipate more clarity on domestic economic policies and plans in the coming months that would help to catalyse higher investments and Malaysia’s growth momentum. Nevertheless, recognizing a more challenging external environment and reflecting a weaker 2Q23 GDP growth number, we tweak our 2023 full-year GDP forecast lower to 4.0% from 4.4% previously. This downward revision further supports our call for the Overnight Policy Rate (OPR) to stay unchanged at 3.00% for the rest of the year.
So far this month, Kiwi has been the second worst performing G10 currency as both the Australian and New Zealand Dollars have declined sharply by around -4.1% against the US Dollar. Economists at MUFG Bank analyze NZD outlook.
RBNZ could lower the OCR sooner than signalled
The recent sharp drop in the kiwi has attracted the attention of the RBNZ’s Chief Economist Paul Conway who stated that they will be ‘mindful’ of the depreciation going forward. He says the recent depreciation reflects a reduction in interest rate differentials and risk aversion.
The New Zealand Dollar has underperformed this month alongside other commodity-related currencies there has been more focus on the loss of growth momentum in China. RBNZ Chief Economist Conway stated that ‘if there was a more significant slowdown in China than the RBNZ expects, hurting exports and growth, we would lower the OCR sooner than we have signalled’.
Overall, the developments should reinforce the Kiwi’s recent bearish trend.
- Gold price prepares to extend upside ahead of US PMI data.
- Fed’s Barkin hopes that the US recession will be “less severe”.
- Strength in Gold prices has come from restrictive upside in US Treasury yields.
Gold price (XAU/USD) strengthens this week as the rally in US Treasury yields halts amid fading hopes of more interest-rate increases from the Federal Reserve (Fed). US headline Consumer Price Index (CPI) has come down to 3.2% from its peak of 9.1% due to an aggressive rate-tightening cycle, but the Fed will likely have to keep interest rates higher for a longer period as the remaining excess inflation above the desired rate of 2% seems extremely stubborn.
In his commentary at the Jackson Hole Symposium, Fed Chair Jerome Powell is expected to explain the benefits of keeping rates higher for longer and he is also likely to avoid supporting further policy-tightening in the absence of encouraging economic data. Before the Jackson Hole event, investors will keep an eye on preliminary S&P Global PMI data, which will be released at 13:45 GMT.
Daily Digest Market Movers: Gold price awaits Jackson Hole event for further action
- Gold price consolidates marginally above $1,900, supported by sluggish US Treasury Yields ahead of the Jackson Hole Economic Symposium.
- 10-year US Treasury Yields dropped below 4.30% as Fed Chair Jerome Powell is not expected to explicitly refer to further policy-tightening at the Jackson Hole event.
- Richmond Fed Bank President Thomas Barkin said the recent moves in bond yields are not a sign of inappropriate market tightening but rather likely a response to strong economic data.
- About the interest rate guidance, Thomas Barkin said if inflation remains high and signs of a drop in demand remain absent. The situation will force the need of tighter monetary policy.
- Fed Barkin further added that the recession situation in the US economy will be “less-severe’’.
- Investors expect Powell will suggest that interest rates are likely to remain higher for a longer period so that inflation can return to 2%.
- Apart from the interest rate guidance, investors will also focus on the labor market and the inflation outlook.
- Market participants expect that Fed policymakers will have to spend more blood and sweat to shred the ‘last mile’ of inflation, which is the remaining path towards the desired rate of 2%. Therefore, the Fed is expected to keep interest rates higher for longer.
- On Wednesday, investors will focus on the preliminary S&P Global PMI data for August, which will be published at 13:45 GMT.
- According to estimates, the Manufacturing PMI is expected to increase to 49.3 in August from 49.0 in July. The Services PMI is seen declining slightly to 52.2 from 52.3 a month earlier.
- After the preliminary S&P Global PMI, investors will shift their focus to the Durable Goods Orders for July, which will be released on Thursday at 12:30 GMT. Orders are expected to contract by a sharp 4.0%. In June, Durable Goods Orders expanded by 4.6%.
- The US Dollar Index (DXY) delivers a solid break above the crucial resistance of 103.70 as investors continue to flush liquidity due to strong US economic resilience.
- Meanwhile, the US bank regulator Federal Deposit and Insurance Corporation (FDIC) will propose new rules overhauling how large regional banks are prepared for a potential failure on August 29. US bank regulators are worried about potential risks due to rising borrowing costs.
- US National Security Adviser Jake Sullivan said on Tuesday that US Commerce Secretary Gina Raimondo will travel to China next week with a message that the US is not seeking to decouple from China, reported Reuters.
Technical Analysis: Gold price delivers three-day positive closing
Gold price attempts to deliver a break of the consolidation formed in a range of $1,885-1,900 in the past week. The precious metal rebounds after hitting a fresh five-month low near $1,885.00. However, the broader bias is still favoring the downside due to strengthening US Treasury yields. Despite a three-day recovery, the yellow metal struggles around the 200-day Exponential Moving Average (EMA). Declining 20 and 50-day EMAs indicate a bearish mid-term trend.
Fed FAQs
What does the Federal Reserve do, how does it impact the US Dollar?
Monetary policy in the US is shaped by the Federal Reserve (Fed). The Fed has two mandates: to achieve price stability and foster full employment. Its primary tool to achieve these goals is by adjusting interest rates.
When prices are rising too quickly and inflation is above the Fed’s 2% target, it raises interest rates, increasing borrowing costs throughout the economy. This results in a stronger US Dollar (USD) as it makes the US a more attractive place for international investors to park their money.
When inflation falls below 2% or the Unemployment Rate is too high, the Fed may lower interest rates to encourage borrowing, which weighs on the Greenback.
How often does the Fed hold monetary policy meetings?
The Federal Reserve (Fed) holds eight policy meetings a year, where the Federal Open Market Committee (FOMC) assesses economic conditions and makes monetary policy decisions.
The FOMC is attended by twelve Fed officials – the seven members of the Board of Governors, the president of the Federal Reserve Bank of New York, and four of the remaining eleven regional Reserve Bank presidents, who serve one-year terms on a rotating basis.
What is Quantitative Easing (QE) and how does it impact USD?
In extreme situations, the Federal Reserve may resort to a policy named Quantitative Easing (QE). QE is the process by which the Fed substantially increases the flow of credit in a stuck financial system.
It is a non-standard policy measure used during crises or when inflation is extremely low. It was the Fed’s weapon of choice during the Great Financial Crisis in 2008. It involves the Fed printing more Dollars and using them to buy high grade bonds from financial institutions. QE usually weakens the US Dollar.
What is Quantitative Tightening (QT) and how does it impact the US Dollar?
Quantitative tightening (QT) is the reverse process of QE, whereby the Federal Reserve stops buying bonds from financial institutions and does not reinvest the principal from the bonds it holds maturing, to purchase new bonds. It is usually positive for the value of the US Dollar.
- Euro remains well on the defensive vs. the US Dollar.
- Stocks in Europe maintain the positive streak on Wednesday.
- EUR/USD approaches the key support at 1.0800.
- The USD Index (DXY) advances to new two-month highs near 104.00.
- Flash PMIs in the euro area came in mixed for the current month.
- Housing data, advanced PMIs are due next across the pond.
There is no respite for the selling pressure around the Euro (EUR) against the US Dollar (USD), forcing EUR/USD to trade in new multi-week lows and dispute the key support at 1.0800 the figure on Wednesday.
Further gains in the Greenback now encourage the USD Index (DXY) to trade at shouting distance from the key barrier at 104.00 in a context of further correction in US yields across different maturities following recent peaks.
In terms of monetary policy, there has been renewed discussion regarding the Federal Reserve's commitment to maintaining a more restrictive stance for an extended period of time. This renewed focus is a result of the US economy's resilience, even amidst a slight easing in the labour market and lower inflation readings in recent months.
At the European Central Bank (ECB), internal disagreements among its Council members have surfaced regarding the continuation of tightening measures beyond the summer period. These disagreements are contributing to a renewed sense of weakness that is having a negative impact on the Euro.
Looking ahead, market participants are expected to approach the upcoming Jackson Hole Symposium and Chairman Jerome Powell's speech in the latter part of the week with caution.
In the euro docket, flash PMIs in Germany and the broader euro area showed a small improvement in the manufacturing sector vs. renewed weakness in the services gauges.
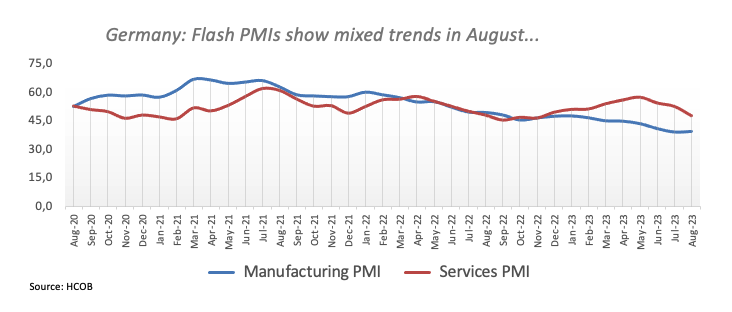
On this, money market futures indicate a probability of only 40% for a 25 bps increase in interest rates by the ECB in the upcoming month. This is in contrast to the situation before the data was released, where the probability was approximately 60%.
In the US, advanced PMIs are also due, seconded by the usual weekly Mortgage Applications tracked by MBA and New Home Sales.
Daily digest market movers: Euro keeps the offered stance in place near 1.0800
- The EUR weakens further vs. USD and trades closer to 1.0900.
- The risk-off trade props up the upside bias in the US Dollar.
- US yields seem to have entered an impasse following recent peaks.
- Investors’ focus remains on the Jackson Hole event due later in the week.
- Fed’s tighter-for-longer narrative dominates the mood among traders.
- The Fed is likely to maintain rates unchanged until Q1 2024.
Technical Analysis: Euro could accelerate losses below the 200-day SMA
EUR/USD’s decline gathers extra impulse and gradually approaches the key support at 1.0800, which appears also underpinned by the proximity of the crucial 200-day SMA (1.0797).
Further retracements could force EUR/USD to revisit the significant 200-day SMA at 1.0797 ahead of the May low of 1.0635 (May 31). Deeper down, there are additional support levels at the March low of 1.0516 (March 15) and the 2023 low at 1.0481 (January 6).
In case bulls regain the initiative, the pair is expected to meet an interim barrier at the 55-day SMA at 109620961 prior to the psychological 1.1000 the figure and the August high at 1.1064 (August 10). Once the latter is cleared, spot could challenge the weekly top at 1.1149 (July 27). If the pair surpasses this region, it could alleviate some of the downward pressure and potentially visit the 2023 peak of 1.1275 (July 18). Further up comes the 2022 high at 1.1495 (February 10), which is closely followed by the round level of 1.1500.
Furthermore, the positive outlook for EUR/USD could be threatened is spot breaks below the important 200-day SMA.
Euro FAQs
What is the Euro?
The Euro is the currency for the 20 European Union countries that belong to the Eurozone. It is the second most heavily traded currency in the world behind the US Dollar. In 2022, it accounted for 31% of all foreign exchange transactions, with an average daily turnover of over $2.2 trillion a day.
EUR/USD is the most heavily traded currency pair in the world, accounting for an estimated 30% off all transactions, followed by EUR/JPY (4%), EUR/GBP (3%) and EUR/AUD (2%).
What is the ECB and how does it impact the Euro?
The European Central Bank (ECB) in Frankfurt, Germany, is the reserve bank for the Eurozone. The ECB sets interest rates and manages monetary policy.
The ECB’s primary mandate is to maintain price stability, which means either controlling inflation or stimulating growth. Its primary tool is the raising or lowering of interest rates. Relatively high interest rates – or the expectation of higher rates – will usually benefit the Euro and vice versa.
The ECB Governing Council makes monetary policy decisions at meetings held eight times a year. Decisions are made by heads of the Eurozone national banks and six permanent members, including the President of the ECB, Christine Lagarde.
How does inflation data impact the value of the Euro?
Eurozone inflation data, measured by the Harmonized Index of Consumer Prices (HICP), is an important econometric for the Euro. If inflation rises more than expected, especially if above the ECB’s 2% target, it obliges the ECB to raise interest rates to bring it back under control.
Relatively high interest rates compared to its counterparts will usually benefit the Euro, as it makes the region more attractive as a place for global investors to park their money.
How does economic data influence the value of the Euro?
Data releases gauge the health of the economy and can impact on the Euro. Indicators such as GDP, Manufacturing and Services PMIs, employment, and consumer sentiment surveys can all influence the direction of the single currency.
A strong economy is good for the Euro. Not only does it attract more foreign investment but it may encourage the ECB to put up interest rates, which will directly strengthen the Euro. Otherwise, if economic data is weak, the Euro is likely to fall.
Economic data for the four largest economies in the euro area (Germany, France, Italy and Spain) are especially significant, as they account for 75% of the Eurozone’s economy.
How does the Trade Balance impact the Euro?
Another significant data release for the Euro is the Trade Balance. This indicator measures the difference between what a country earns from its exports and what it spends on imports over a given period.
If a country produces highly sought after exports then its currency will gain in value purely from the extra demand created from foreign buyers seeking to purchase these goods. Therefore, a positive net Trade Balance strengthens a currency and vice versa for a negative balance.
The Swedish Krona is emerging as an outperformer this week. Economists at ING analyze EUR/SEK outlook.
Break above 12.00 is not the baseline scenario
EUR/SEK had risen above 11.90 and eyed 12.00, reaching new highs last week, and we suspect this week’s correction is primarily technically driven.
Keep a close eye on today’s Nvidia quarterly results. SEK is generally the most correlated G10 currency with US tech stocks. A disappointment on that side could trigger another EUR/SEK rally, even though some EUR softness is now helping put a cap on the pair.
For the moment, a break above 12.00 is not our baseline scenario, and we see instead greater chances of a gradual – although bumpy – decline in the pair into year-end.
- AUD/USD treads water ahead of the US PMI data release.
- Nine-day EMA acts as the immediate resistance at 0.6446.
- MACD suggests tepid momentum, reflecting bearish sentiment in the AUD/USD pair.
AUD/USD trades higher around 0.6430 at the time of writing during the European session, treading waters to continue the winning streak that began on Monday. Investors await the release of United States (US) PMI data later in the North American session, seeking more cues on the economic situation in the US.
The nine-day Exponential Moving Average (EMA) at 0.6446 acts as the immediate resistance, following the 23.6% Fibonacci retracement at 0.6489.
A breakout above that level could open the doors for the AUD/USD buyers to explore the region around the 21-day EMA at 0.6518, followed by the 38.2% Fibo at 0.6566.
On the downside, the 0.6400 psychological level appears to be the key support, following the region around the monthly low at 0.6364.
The Moving Average Convergence Divergence (MACD) line suggests a tepid momentum, reflecting the mixed sentiment of AUD/USD traders as it stays below the centerline but shows convergence below the signal line. The 14-day Relative Strength Index (RSI) remains below 50, which suggests a bearish bias in the pair.
AUD/USD: Daily Chart
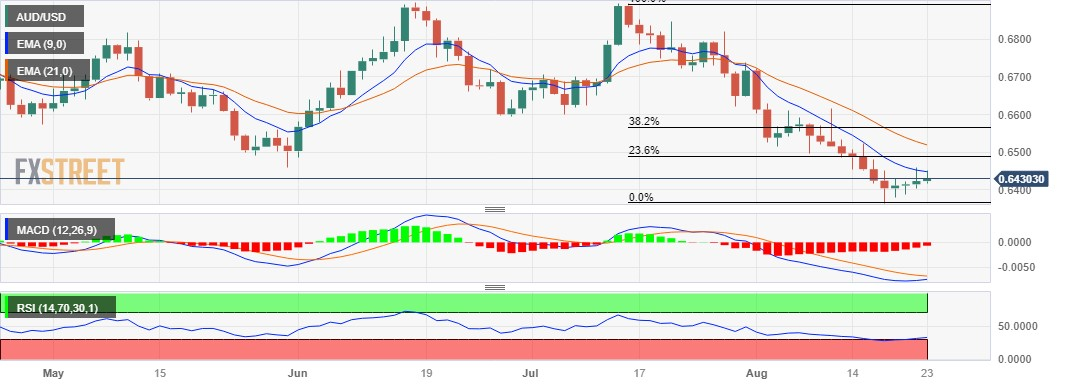
- USD/JPY adds to overnight losses and continues drifting lower for the second straight day.
- Intervention fears and looming recession risks boost the safe-haven JPY and exert pressure.
- The BoJ-Fed policy divergence to limit losses amid a bullish USD and ahead of the US PMIs.
The USD/JPY pair remains under some selling pressure for the second successive day on Wednesday and drops to the lower end of its weekly trading range during the early European session. Spot prices currently hover around the 145.35-14.30 region, down nearly 0.40% for the day, though the fundamental backdrop warrants some caution before positioning for any meaningful slide.
Speculations that Japanese authorities will intervene in the foreign exchange markets to prop up the domestic currency continue to act as a headwind for the USD/JPY pair. Apart from this, worries about a deeper global economic downturn drive some haven flows towards the Japanese Yen (JPY) and also contribute to the offered tone surrounding the major. Against the backdrop of the worsening economic conditions in China, the disappointing release of the flash PMI prints from the Euro Zone and the UK fuel recession worries and boost demand for traditional safe-haven assets.
That said, a more dovish stance adopted by the Bank of Japan (BoJ) might cap gains for the JPY and help limit the downside for the USD/JPY pair, at least for the time being. It is worth recalling that BoJ is the only major central bank in the world to maintain negative interest rates. Moreover, policymakers have emphasised that a sustainable pay hike is a prerequisite to consider dismantling the massive monetary stimulus. This marks a big divergence in comparison to other major central banks, including the Federal Reserve (Fed), which is expected to keep rates higher for longer.
In fact, the markets are still pricing in the possibility of one more 25 bps Fed rate hike move by the end of this year. This, along with the emergence of heavy selling around the European currencies, lifts the US Dollar (USD) to its highest level in more than two months. Apart from this, a generally positive tone around the equity markets and signs of easing US-China trade tensions support prospects for the emergence of some dip-buying around the USD/JPY pair.
Traders, meanwhile, might refrain from placing aggressive bets and prefer to wait for the Jackson Hole Symposium, where comments by Fed Chair Jerome Powell will be scrutinized for cues about the future rate-hike path. This, in turn, will drive the USD demand and provide a fresh directional impetus to the USD/JPY pair. In the meantime, traders on Wednesday will take cues from the release of the flash US PMIs, due later during the early North American session.
Technical levels to watch
Nvidia’s quarterly results are seen as pivotal for the AI-led equity run. Economists at ING analyze a busy busy day ahead of Jackson Hole.
Nvidia results in focus
An event to keep an eye on today will be the release of quarterly results from Nvidia. The firm is a key player in the AI space and some see today’s results as a key turning point for the recent AI-led equity rally. The impact will likely extend to the currency market.
Still, with Jackson Hole kicking off tomorrow and the material risk of Fed Chair Jerome Powell reiterating a hawkish message, any Dollar bearish trend may struggle to find solid momentum.
USD/CNH is expected to trade within a range bound theme for the time being, comment UOB Group’s Economist Lee Sue Ann and Markets Strategist Quek Ser Leang.
Key Quotes
24-hour view: After USD fell quickly to a low of 7.2780 on Monday, we highlighted yesterday that “the rapid drop from the high appears to be overdone, and USD is unlikely to weaken much further.” We expected USD to trade in a range of 7.2700/7.3200. Our view was not wrong, even though USD traded in a narrower range than expected (7.2708/7.3168). USD appears to have entered a consolidation phase. Today, we expect USD to trade sideways between 7.2800 and 7.3300.
Next 1-3 weeks: Our most recent narrative was from Monday (21 Aug, spot at 7.3100), wherein USD could consolidate for a few days before breaking above last week’s high of 7.3490. We continue to hold the same view. Overall, only a breach of 7.2500 (‘strong support’ level) would suggest that USD is not advancing further.
- EUR/JPY drifts lower for the second straight day and drops to a two-week trough on Wednesday.
- The dismal German PMIs weigh heavily on the shared currency and exert pressure on the cross.
- Looming recession risk, intervention fears benefit the JPY and also contribute to the offered tone.
The EUR/JPY cross extends the overnight retracement slide from the vicinity of mid-159.00s, or its highest level since September 2008 and remains under heavy selling pressure for the second successive day on Wednesday. The downward trajectory picks up pace during the early European session and drags spot prices to a two-week low, around the 157.25 region in the last hour.
The shared currency weakens across the board after a preliminary report showed that business activity in Germany contracted at the fastest pace for more than three years in August. In fact, the HCOB Flash German Composite PMI missed estimates and fell to 44.7, hitting its lowest since May 2020 and reviving recession fears. Furthermore, business activity in the services sector contracted for the first time in eight months and the manufacturing PMI remained deep in contraction territory.
The data points to the worsening economic conditions in the Euro Zone's largest economy and fuels speculations that the European Central Bank (ECB) will halt its streak of nine consecutive rate hikes in September. In fact, money market futures now price just a 40% chance of a 25 bps lift-off from the ECB in September as compared to roughly a 60% chance priced in ahead of the data. This, in turn, is seen weighing on the Euro and exerting downward pressure on the EUR/JPY cross.
The Japanese Yen (JPY), on the other hand, attracts some haven flows in the wake of growing worries about a deeper global economic downturn. Apart from this, intervention fears underpin the JPY and contribute to the offered tone surrounding the EUR/JPY cross. That said, a move dovish stance adopted by the Bank of Japan (BoJ) might keep a lid on any meaningful gains for the JPY and warrants some caution before confirming that the cross has topped out in the near term.
Technical levels to watch
- UK Manufacturing PMI declines to 42.5 in August, below expectations of 45.0.
- Services PMI in the UK contracts to 48.7 in August, misses estimates.
- GBP/USD drops below 1.2700 on disappointing UK business PMIs.
The seasonally adjusted S&P Global/CIPS UK Manufacturing Purchasing Managers’ Index (PMI) dropped further to 42.5 in August versus 45.0 expected and, 45.3 - July’s final print.
Meanwhile, the Preliminary UK Services Business Activity Index hit a seven-month low of 48.7 in August, compared with a 51.5 final print for July and the 50.8 market consensus.
Commenting on the flash PMI data, Chris Williamson, Chief Business Economist at S&P Global Market Intelligence said: “A renewed contraction of the economy already looks inevitable, as an increasingly severe manufacturing downturn is accompanied by a further faltering of the service sector's spring revival. The survey is indicative of GDP declining by 0.2% over the third quarter so far.”
“While a further hike in interest rates in September looks to be on the cards, the August PMI data will add to speculation that rates could soon peak,” Williamson added.
FX implications
GBP/USD is losing 0.35% on the day to trade at 1.2680, as of writing. The downbeat UK Manufacturing and Services PMI data suggests that the Bank of England (BoE) could be nearing the end of its tightening cycle, which is smashing the Pound Sterling.
Antje Praefcke, FX Analyst at Commerzbank, expects the Norwegian Krone (NOK) to appreciate toward the end of the year.
Norges Bank will follow through
Could Norges Bank deviate from its signaled interest rate path due to the weaker economic data? I don't think so.
I am confident that Norges Bank will follow through with its plan and raise the policy rate again in September. And, if necessary, go even higher than 4.25%. This is why the NOK should appreciate toward the end of the year.
- The index extends the upside momentum to new tops.
- The Dollar remains bid ahead of the Jackson Hole event.
- Weekly MBA report, flash PMIs, housing data next on tap.
The greenback extends its march north and reaches new two-month peaks around 103.70 when tracked by the USD Index (DXY).
USD Index looks at data, risk trends
The index adds to Tuesday’s recovery and maintains the six-week positive streak well in place so far, although this time amidst some loss of momentum in US yields across the curve.
In the meantime, the bid bias appears unchanged around the buck ahead of the key Jackson Hole Symposium and the speech by Chairman Powell, both events scheduled for the latter part of the week
In the US data space, weekly Mortgage Applications gauged by MBA, advanced Manufacturing and Services PMIs and New Home Sales are all due later in the NA session.
What to look for around USD
The buying interest appears well and sound around the dollar and motivates the index to clinch the 103.80 region for the first time since early June.
In the meantime, support for the dollar keeps coming from the good health of the US economy, which seems to have reignited the narrative around the tighter-for-longer stance from the Federal Reserve.
Furthermore, the idea that the dollar could face headwinds in response to the data-dependent stance from the Fed against the current backdrop of persistent disinflation and cooling of the labour market appears to be losing traction as of late.
Key events in the US this week: MBA Mortgage Applications, Flash Manufacturing/Services PMIs, New Home Sales (Wednesday) – Jackson Hole Symposium, Durable Goods Orders, Chicago Fed National Activity Index, Initial Jobless Claims (Thursday) - Jackson Hole Symposium, Final Michigan Consumer Sentiment, Chief Powell (Friday).
Eminent issues on the back boiler: Persistent debate over a soft or hard landing for the US economy. Incipient speculation of rate cuts in early 2024. Geopolitical effervescence vs. Russia and China.
USD Index relevant levels
Now, the index is up 0.06% at 103.65 and the breakout of 103.79 (monthly high August 23) would open the door to 104.69 (monthly high May 31) and finally 105.88 (2023 high March 8). On the opposite side, immediate support appears at 103.15 (200-day SMA) followed by 102.30 (55-day SMA) and then 101.74 (monthly low August 4).
- USD/CAD extends gains as an effect of the drop in Crude oil price.
- US PMI data and Canada Retail Sales could give fresh insights into both economies.
- US Dollar Index (USD) shows resilience despite the drop in US Treasury yields.
USD/CAD treads water to continue its winning streak, hovering around 1.3550 during the early trading hours in the European session on Wednesday. The USD/CAD currency pair experiences upward pressure due to the drop in crude oil prices, attributed to concerns over the global economic slowdown and hopes of China’s fiscal stimulus decline.
EUR/USD traders await the upcoming releases of preliminary PMI data for August from the United States (US) along with monthly figures of Canada’s Retail Sales in June. These datasets could provide insights into the economic situations of both countries, offering fresh impetus for placing trades in the USD/CAD pair. The market participants will also closely watch the upcoming Jackson Hole annual symposium starting on Thursday, followed by Fed Chair Powell’s speech scheduled to be held on Friday.
The US Dollar Index (DXY), gauging the Greenback's strength against six key currencies, shows resilience by continuing the winning streak despite the correction in United States (US) Treasury yields. The 10-year US bond yields dropped to 4.26%, down by almost 1.80% in two days. At the time of writing, the DXY is trading higher near 103.70.
However, data released on Tuesday revealed that downbeat US housing data put pressure on the US Dollar (USD). As said, the annual US Existing Home Sales declined 2.2% to the figure of 4.07M in July, below the market consensus of 4.15M. The Richmond Fed Manufacturing Index improved in August from -9 to -7, as expected.
- Pound Sterling fails to find direction as investors await UK S&P Global PMI data.
- United Kingdom's economy remains vulnerable due to rising mortgage rates.
- BoE policymakers warned about rising corporate default risks due to higher borrowing costs.
The Pound Sterling (GBP) struggles to find direction on Wednesday as investors await the preliminary S&P Global PMI data for August. The GBP/USD pair trades in a lackluster fashion, but volatile action is expected following the PMI data release, which will demonstrate the impact of higher interest rates by the Bank of England (BoE) on British economic activities.
BoE policymakers warned about rising corporate default risks due to a weak debt-service coverage ratio. United Kingdom small and mid-size firms are struggling to cover interest obligations amid rising borrowing costs and a dismal economic outlook. Meanwhile, a decline in pay hikes in the quarter ending in July after six consecutive strong quarters provides some comfort to BoE policymakers.
Daily Digest Market Movers: Pound Sterling consolidates ahead of PMI data
- Pound Sterling delivers a gradual upside move after sensing support near 1.2720 ahead of the preliminary S&P Global PMI data for August.
- According to the estimates, Manufacturing PMI will drop to 45.0 vs. July’s reading of 45.3. A figure below 50.0 is considered a contraction in economic activities. Also, Services PMI is expected to remain lower at 50.8 against the former reading of 51.3.
- UK economic activities have been facing the wrath of the aggressive rate-tightening cycle by the Bank of England.
- British Confederation of British Industry's (CBI) report showed the net balance of output for the three months to August fell to -19 from +3 in July. This has been the lowest reading since September 2020. The net balance demonstrates the difference between portions of factories reporting rising output against those projecting a decline.
- The BoE warned about significant upside risks to corporate defaults amid higher interest rates. A survey from the BoE shows that the share of non-financial UK companies experiencing a weak debt-service coverage ratio will rise to 50% by year-end from last year’s reading of 45%.
- Rising risks of corporate default will elevate delinquency costs for UK commercial banks, which will dampen their asset quality.
- British Chambers of Commerce said concerning rising risks of corporate defaults that higher borrowing costs are putting significant pressure on many smaller businesses, who after three years of economic shocks, are unable to absorb the increases.
- A majority of companies experiencing rising corporate debt-service stress will elevate the risk of a recession in the UK economy.
- Pay awards delivered by British employers cooled down for the first time in the past seven quarters. XpertHR reported median basic pay deals for three months to July fell to 5.7% from a record 6%.
- A decline in pay awards will ease some pressure from BoE policymakers, which believe that strong wage growth has been keeping inflation persistent.
- Discussions about the UK’s cabinet reshuffle remained hot this weekend. Reuters reported that PM Sunak is now considering focusing on replacing ministers who have already said they want to step down, such as former Defence Secretary Ben Wallace.
- The market mood is extremely quiet as investors await the Jackson Hole Symposium for further action.
- The US Dollar Index (DXY) gathers strength to climb above the immediate resistance of 103.70. Consumer spending resilience and a tight labor market could keep the remaining excess inflation extremely stubborn.
- Richmond Federal Reserve (Fed) Bank President Thomas Barkin said on Tuesday that if inflation remains high and demand gives no signal, it is likely to drop. That environment would require a tighter monetary policy. Fed Barkin expects that the recession situation will be ‘‘less severe’’.
- The speech from Fed Chair Jerome Powell at Jackson Hole is expected to be hawkish. The Fed is expected to keep interest rates higher for longer. Prospects about an interest rate hike will be more data-dependent.
Technical Analysis: Pound Sterling trades sideways above 1.2700
Pound Sterling continues to trade without direction for its eighth consecutive session. The Cable consolidates in the 1.2700-1.2800 range and struggles to find a direction amid the absence of a potential trigger. 20 and 50-day Exponential Moving Averages (EMAs) have turned straight, portraying a sideways trend.
BoE FAQs
What does the Bank of England do and how does it impact the Pound?
The Bank of England (BoE) decides monetary policy for the United Kingdom. Its primary goal is to achieve ‘price stability’, or a steady inflation rate of 2%. Its tool for achieving this is via the adjustment of base lending rates. The BoE sets the rate at which it lends to commercial banks and banks lend to each other, determining the level of interest rates in the economy overall. This also impacts the value of the Pound Sterling (GBP).
How does the Bank of England’s monetary policy influence Sterling?
When inflation is above the Bank of England’s target it responds by raising interest rates, making it more expensive for people and businesses to access credit. This is positive for the Pound Sterling because higher interest rates make the UK a more attractive place for global investors to park their money. When inflation falls below target, it is a sign economic growth is slowing, and the BoE will consider lowering interest rates to cheapen credit in the hope businesses will borrow to invest in growth-generating projects – a negative for the Pound Sterling.
What is Quantitative Easing (QE) and how does it affect the Pound?
In extreme situations, the Bank of England can enact a policy called Quantitative Easing (QE). QE is the process by which the BoE substantially increases the flow of credit in a stuck financial system. QE is a last resort policy when lowering interest rates will not achieve the necessary result. The process of QE involves the BoE printing money to buy assets – usually government or AAA-rated corporate bonds – from banks and other financial institutions. QE usually results in a weaker Pound Sterling.
What is Quantitative tightening (QT) and how does it affect the Pound Sterling?
Quantitative tightening (QT) is the reverse of QE, enacted when the economy is strengthening and inflation starts rising. Whilst in QE the Bank of England (BoE) purchases government and corporate bonds from financial institutions to encourage them to lend; in QT, the BoE stops buying more bonds, and stops reinvesting the principal maturing on the bonds it already holds. It is usually positive for the Pound Sterling.
Further upside in USD/JPY seems probable in the short-term horizon, argue UOB Group’s Economist Lee Sue Ann and Markets Strategist Quek Ser Leang.
Key Quotes
24-hour view: Our view for USD to “rise above last week’s high near 146.55” did not materialise as it traded in a range of 145.51/146.39. The price movements appear to be part of a consolidation phase. Today, we expect USD to trade sideways between 145.35 and 146.30.
Next 1-3 weeks: We continue to hold the same view as yesterday (22 Aug, spot at 146.20). As highlighted, despite USD rebounding from 144.92, there is hardly any increase in upward momentum. That said, there is room for USD to rise above last week’s high near 146.55. However, it remains to be seen if there is enough momentum to carry USD to the next major resistance at 147.50. Overall, only a breach of 144.50 (no change in ‘strong support’ level) would indicate that USD is not advancing further.
In light of advanced prints from CME Group for natural gas futures markets, open interest extended the decline for yet another session on Tuesday, this time by just 630 contracts. On the other hand, volume kept the erratic performance and increased by around 44.7K contracts.
Natural Gas appears supported near $2.50
Tuesday’s decline in prices of natural gas was in tandem with shrinking open interest, which removes strength from prospects for further decline in the very near term at least. So far, the $2.50 region per MMBtu keeps holding the downside for the time being.
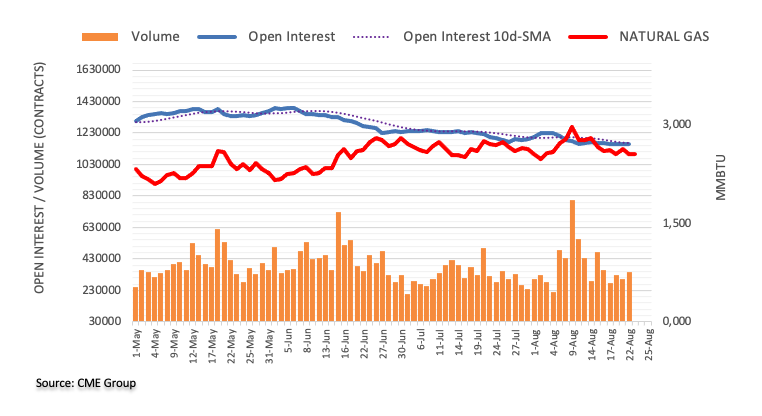
- Eurozone Manufacturing PMI improves to 43.7 in August, beating estimates of 42.6.
- Bloc’s Services PMI drops to 48.3 in August vs. 50.5 anticipated.
- EUR/USD keeps losses below 1.0850 after disappointing German and Eurozone Services PMIs.
The Eurozone manufacturing sector contraction slowed down but the services sector saw a downturn in August, the latest data from HCOB's latest purchasing managers index survey showed Wednesday.
The Eurozone Manufacturing Purchasing Managers Index (PMI) rose to 43.7 in August when compared to the market forecasts of 42.6 and above the 42.7 seen in July. The index hit a three-month peak.
The bloc’s Services PMI tumbled to 48.3 in August from 50.9 seen in July, reaching a 30-month low, arriving way below the 50.5 estimates.
The HCOB Eurozone PMI Composite dropped to 47.0 in August vs. 48.5 expected and 48.6 booked in July. The index reached its lowest level in 33 months.
FX implications
EUR/USD is consolidating losses below 1.0850 after dismal Eurozone PMIs. The spot is down 0.17% on the day, trading at 1.0825, as of writing.
- August S&P Global Preliminary Manufacturing PMI to improve, Services PMI to stabilize.
- Any deviation from expectations in the US PMI data could impact the US Dollar and the Fed policy outlook.
- EUR/USD trades below 1.0900 ahead of the US PMI release, Jackson Hole Symposium.
Business activity in the United States (US) private sector, as measured by the S&P Global Purchasing Managers Index (PMI) through a monthly survey, will see the release of the August preliminary estimates of Manufacturing PMI and Services PMI on Wednesday.
Heading into the US PMI showdown for August, markets widely expect the US Federal Reserve (Fed) to hold rates next month but remain wary about the future policy path amid increased bets that the Fed will stick with higher rates for a longer period.
In its July survey, S&P Global said its preliminary US Manufacturing PMI rose for the first time in three months to 49.0 from a drop to a 46.3 reading seen in June. The Services PMI Index, however, fell to 52.0 in July when compared to June’s 53.2. The PMI readings suggested that the US economy grew at a slower pace at the beginning of the third quarter.
Commenting on the July survey findings, Chris Williamson, Chief Business Economist at S&P Global Market Intelligence, said that ”there were several other encouraging bright spots in the survey, most notably including a marked improvement in business expectations for output in the year ahead. Firms are therefore anticipating the current soft patch to soon pass, and importantly are hiring more staff as a result.
“There was also good news on the inflation front. The combination of weak demand and improved supply led to a further “buyers’ market” for many goods. Prices charged for goods consequently barely rose for a third straight month, which should help subdue consumer price inflation in the near term,” Williamson added.
What to expect in the next S&P Global PMI report?
For August, the S&P Global Manufacturing PMI Index is likely to improve further to 49.3. The Services PMI, however, is expected to drop to 52.2 in the reported month, compared with July’s 52.3 print. The Composite PMI is seen unchanged at 52.0 in August.
Analysts at BBH Markets noted, “key August PMI readings will be reported. S&P Global reports preliminary PMIs Wednesday. Manufacturing is expected to remain steady at 49.0, services is expected to fall three ticks to 52.0, and the composite is expected to fall half a point to 51.5. If so, this composite would be the lowest since February.”
When will August flash US S&P Global PMIs be released and how could it affect EUR/USD?
The S&P Global PMI report is slated for release at 13:45 GMT on August 23. The US Dollar is on a corrective move lower from two-month highs against its major counterparts, awaiting the US data for a fresh directional impetus. Meanwhile, the EUR/USD pair is reversing recovery gains below the 1.0850 level.
If the US PMI report surprises positively across the indicators, it will help strengthen the narrative of elevated rates for longer, pushing back against expectations of Fed rate cuts in early 2024. Markets are pricing roughly 25% probability of one more rate hike by the Fed in the final quarter of this year. Encouraging US data could add to the signs of economic resilience, providing a fresh leg up in the US Dollar. EUR/USD could come under renewed selling pressure, testing the 1.0800 demand area yet again.
In case the US business activity disappoints, the US Dollar could extend its correction, as the potential slowdown may justify the Fed pause. Federal Reserve policymakers would appreciate cooling economic activity, as it would help soften inflation further. Although fears of ‘hard-landing’ could keep the downside capped in the safe-haven US Dollar.
Meanwhile, Dhwani Mehta, Asian Session Lead Analyst at FXStreet, offers a brief technical outlook for the EUR/USD pair and writes: “The main currency pair has been ranging between flattish 100-Day Moving Average (DMA) and bullish 200 DMA since mid-August. Will the US data help EUR/USD yield a range breakout? Given that the 14-day Relative Strength Index (RSI) holds below the midline, downside risks remain intact for the pair.”
Dhwani also outlines important technical levels to trade the EUR/USD pair: “100 DMA at 1.0928 aligns at the strong resistance, above which the bearish 21 DMA at 1.0950 will be challenged. Further up, Euro bulls will target the horizontal 50 DMA at 1.0982. Alternatively, immediate support awaits at the 1.0800 round figure, where the 200 DMA emerges. Acceptance below the latter could trigger a fresh downtrend toward the June 12 low of 1.0733.”
Euro price today
The table below shows the percentage change of Euro (EUR) against listed major currencies today. Euro was the strongest against the Pound Sterling.
| USD | EUR | GBP | CAD | AUD | JPY | NZD | CHF | |
| USD | 0.27% | 0.12% | 0.06% | 0.05% | -0.20% | 0.04% | 0.08% | |
| EUR | -0.27% | -0.14% | -0.21% | -0.23% | -0.51% | -0.23% | -0.23% | |
| GBP | -0.16% | 0.11% | -0.10% | -0.12% | -0.37% | -0.12% | -0.09% | |
| CAD | -0.05% | 0.24% | 0.10% | 0.02% | -0.28% | 0.01% | 0.00% | |
| AUD | -0.11% | 0.20% | 0.09% | -0.01% | -0.28% | -0.01% | -0.01% | |
| JPY | 0.21% | 0.47% | 0.37% | 0.27% | 0.26% | 0.26% | 0.27% | |
| NZD | -0.04% | 0.23% | 0.09% | -0.01% | 0.00% | -0.28% | 0.00% | |
| CHF | -0.08% | 0.23% | 0.09% | -0.01% | 0.00% | -0.29% | 0.00% |
The heat map shows percentage changes of major currencies against each other. The base currency is picked from the left column, while the quote currency is picked from the top row. For example, if you pick the Euro from the left column and move along the horizontal line to the Japanese Yen, the percentage change displayed in the box will represent EUR (base)/JPY (quote).
Economic Indicator
United States S&P Global Manufacturing PMI
The Manufacturing Purchasing Managers Index (PMI) released by the S&P Global captures business conditions in the manufacturing sector. As the manufacturing sector dominates a large part of total GDP, the manufacturing PMI is an important indicator of business conditions and the overall economic condition in the United States. Readings above 50 imply the economy is expanding, making investors understand it as bullish for the USD, whereas a result below 50 points for an economic contraction, and weighs negatively on the currency.
Read more.Next release: 09/22/2023 13:45:00 GMT
Frequency: Monthly
Source: S&P Global
Economists at ING analyze EUR/GBP outlook.
Volatile pricing ahead of PMIs
Bank of England rate expectations have been quite volatile since the upside surprise in wages and CPI last week. The miss in Retail Sales on Friday saw peak Bank rate expectations as measured in the Sonia rate drop more than 10 bps. Markets are currently looking at 5.95-6.0%, but today’s PMI release in the UK may well move pricing again.
EUR/GBP can make another attempt at breaking 0.8500 today, although the sustainability of sub-0.8500 levels is questionable unless markets price in more rate hikes in the UK or price out tightening in the Eurozone.
- EUR/GBP drifts lower for the second straight day and drops to a one-year low on Wednesday.
- The disappointing German PMIs reaffirm bets for the ECB rate hike pause and exert pressure.
- Bets for more rate hikes by BoE support prospects for a further near-term depreciating move.
The EUR/GBP cross comes under heavy selling pressure during the early European session on Wednesday and drops to a one-year low in reaction to the disappointing German PMI prints. Spot prices, however, manage to rebound a few pips in the last hour and currently trade with modest intraday losses, just above the 0.8500 psychological mark.
The preliminary business activity report from the HCOB survey showed that Germany’s manufacturing downturn eased a bit in August and the services sector unexpectedly contracted during the reported month. In fact, the HCOB Manufacturing PMI came in at 39.1 against the 38.7 expected and 38.8 reported in July. Adding to this, Services PMI dropped sharply from 52.3 to 47.3 in August, missing estimates for a reading of 51.5 and reaching a fresh nine-month low.
The data adds to worries about a deeper economic downturn and fuels speculations that the European Central Bank (ECB) will halt its streak of nine consecutive rate hikes in September. This, in turn, weighs heavily on the shared currency and drags the EUR/GBP cross sharply lower for the second successive day. That said, the emergence of some selling around the British Pound (GBP) lends support to spot prices and leads to a modest 15-20 pips bounce from the daily low.
The downside for the Sterling, however, seems cushioned in the wake of rising bets for more interest rate hikes by the Bank of England (BoE). In fact, the current market pricing indicates a more than 80% chance of a 25 bps lift-off at the next BoE meeting in September. This, in turn, suggests that the path of least resistance for the EUR/GBP cross is to the downside and any meaningful recovery attempt might still be seen as a selling opportunity.
Technical levels to watch
FX option expiries for Aug 23 NY cut at 10:00 Eastern Time, via DTCC, can be found below.
- EUR/USD: EUR amounts
- 1.0800 2.1b
- 1.0815 550m
- 1.0825 1.5b
- 1.0835 402m
- 1.0850 501m
- 1.0900 506m
- 1.0980 587m
- 1.1000 1.1b
- GBP/USD: GBP amounts
- 1.2640 348m
- 1.2850 676m
- 1.2950 594m
- USD/JPY: USD amounts
- 145.00 1.7b
- AUD/USD: AUD amounts
- 0.6350 430m
- 0.6530 621m
- NZD/USD: NZD amounts
- 0.6000 790m
- 0.6100 741m
- EUR/GBP: EUR amounts
- 0.8850 1b
EUR/USD came under pressure on Tuesday. Economists at ING analyze the pair’s outlook.
Markets may marginally prefer to stay bearish on EUR/USD
Unless we receive some encouraging news from PMIs, or a drop in the Dollar (e.g., caused by an equity rally after Nvidia results), we suspect markets may marginally prefer to stay bearish on the pair as for some pre-Jackson Hole positioning.
EUR/USD is testing the early-July 1.0834 low this morning, a break lower puts the next support at 1.0800 (200-Day Moving Average).
- Germany’s Manufacturing PMI rises to 39.1 in August vs. 38.7 expected.
- Services PMI for the German economy contracts to 47.3 in August vs. 51.5 expected.
- EUR/USD drops below 1.0850 on mixed German PMIs.
Germany’s manufacturing downturn eased in August while the services sector entered contraction, the preliminary business activity report from the HCOB survey showed on Wednesday.
The HCOB Manufacturing PMI in Eurozone’s biggest economy came in at 39.1 this month, as against the 38.7 expectations and 38.8 figure reported in July. The index hit its highest level in two months.
Meanwhile, Services PMI dropped sharply from 52.3 in July to 47.3 in August. The market estimated a 51.5 reading. The measure reached a fresh nine-month low.
The HCOB Preliminary German Composite Output Index arrived at 44.7 in August vs. 48.3 forecast and July’s 48.5. The gauge registered a 39-month low.
FX implications
EUR/USD is turning south, extending the drop toward 1.0800 on the mixed German data. The pair is trading 0.25% lower at 1.0815, at the time of writing.
- Silver scales higher for the fifth straight day and jumps to a nearly three-week high on Wednesday.
- A slightly overbought RSI on hourly charts warrants some caution before placing fresh bullish bets.
- Any meaningful corrective decline might now be seen as a buying opportunity and remain limited.
Silver prolongs its recent goodish rebound from the $22.20 area, or a nearly two-month low touched last week and gains strong follow-through traction for the fifth successive day on Wednesday. The momentum lifts the white metal to a two-and-half-week high during the early European session, closer to the $23.75 confluence barrier.
The said area comprises the 200-period Simple Moving Average (SMA) on the 4-hour chart, an ascending trend-line support breakpoint and the 50% Fibonacci retracement level of the July-August downfall. A sustained strength beyond will be seen as a fresh trigger for bullish traders. That said, the Relative Strength Index (RSI) on hourly charts is flashing overbought conditions and makes it prudent to wait for some intraday consolidation or a modest pullback before positioning for any further gains.
Technical indicators on the daily chart, however, have just started gaining positive traction and suggest that the path of least resistance for the XAG/USD is to the upside. Hence, any meaningful dip could attract fresh buyers and remain limited near the $23.40 region, or the 38.2% Fibo. level. The next relevant support is pegged near the $23.25 region, below which a fresh bout of technical selling could accelerate the fall and drag the XAG/USD towards the 23.6% Fibo. level, around the $23.00 mark.
Bulls, meanwhile, might wait for a convincing breakout through the $23.75 confluence, above which the XAG/USD could aim to reclaim the $24.00 round figure, which coincides with the 61.8% Fibo. level. Some follow-through buying might then lift the white metal to its next relevant hurdle near the $24.55-$24.60 region en route to the $25.00 psychological mark and the July monthly swing high, around the $25.25 zone.
Silver 4-hour chart
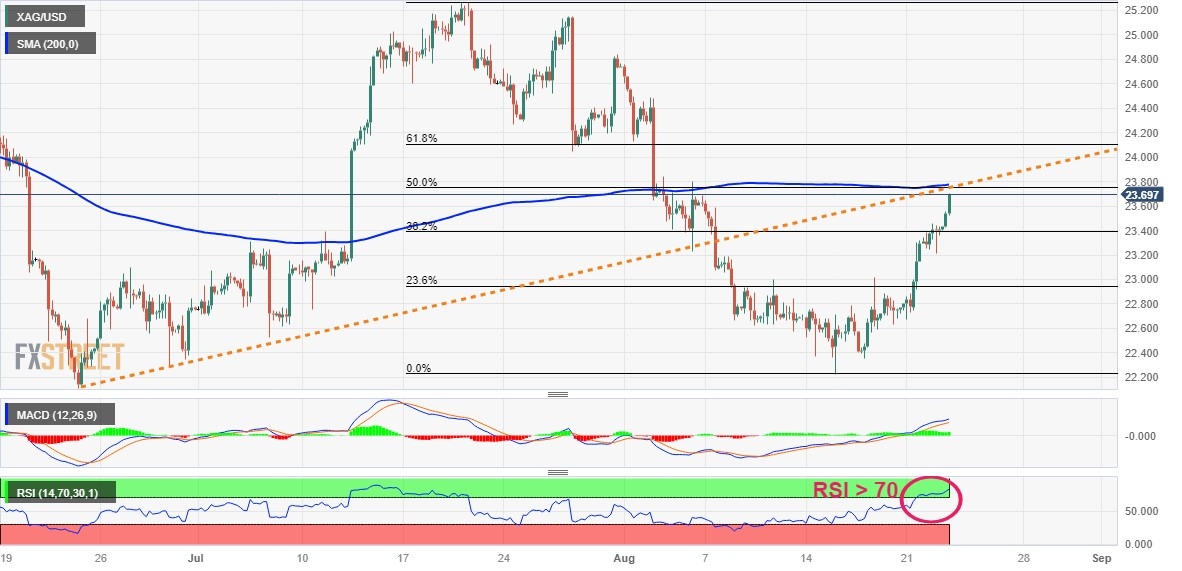
Technical levels to watch
EUR/CHF is currently trading south of the 0.96 mark. Economists at Danske Bank analyze the pair’s outlook.
SNB FX intervention to keep a cap on EUR/CHF in the near term
We continue to expect the SNB to hike the policy rate by a final 25 bps at the September meeting bringing it to 2.00%. However, we stress that we rather see it as a matter of fine-tuning monetary policy and do not see the September meeting as fundamental for a long-held bullish view on CHF. Likewise, we continue to expect SNB FX intervention to keep a cap on EUR/CHF in the near term.
We forecast a sustained move lower in EUR/CHF on the back of fundamentals and continued tight financial conditions. We lower our entire profile in light of the lower spot, targeting the cross at 0.94 in 6-12M (from 0.95).
If the SNB decides to fully stop intervening, we see upside potential to EUR/CHF in the near term.
In the opinion of UOB Group’s Economist Lee Sue Ann and Markets Strategist Quek Ser Leang, AUD/USD risks further losses while below the 0.6365 level in the short-term horizon.
Key Quotes
24-hour view: Our view for AUD to trade sideways in a range of 0.6380/0.6430 yesterday was incorrect. Instead of trading in a range, AUD rose to 0.6455 before pulling back. Despite the advance to 0.6455, there is no clear increase in upward momentum, and we do not expect AUD to rise further. Today, we continue to expect AUD to trade in a range, likely between 0.6400 and 0.6450.
Next 1-3 weeks: We continue to hold the same view as from Monday (21 Aug, spot at 0.6420). As highlighted, while the AUD weakness that started late last month is still intact, short-term conditions are severely oversold, and the pace of any further weakness is likely to be slow. In order for AUD to weaken further, it must break and stay below last week’s low of 0.6365. The chance of AUD breaking clearly below 0.6365 will remain intact as long as it stays below 0.6480 (no change in ‘strong resistance’ level). Looking ahead, the next support below 0.6365 is at 0.6320.
- EUR/JPY struggles for clear directions after reversing from highest level since late 2008.
- Monthly rising wedge lures sellers amid bearish MACD signals.
- Downbeat RSI, multiple key supports and Eurozone PMI stand tall to challenge downside momentum.
EUR/JPY bears flirt with the short-term key support around 158.10 amid the initial hours of Wednesday’s European session as markets await the first readings of Eurozone and German PMIs for August. That said, the cross-currency pair rose to the highest level since August 2008 the previous day before posting the biggest daily loss in a month.
In doing so, the quote prods the bottom line of a monthly rising wedge bearish chart formation. Adding strength to the downside bias are the bearish MACD signals.
However, the below 50 levels of the RSI (14) line suggest the quote’s bottom-picking, which in turn highlights the 158.00 support.
In a case where the EUR/JPY sellers manage to break the 158.00 support and confirm the bearish formation, a horizontal area comprising multiple levels marked since August 01 and the 200-SMA, respectively near 157.60–50 and 156.75, will test the south-run aiming the theoretical target of the rising wedge, close to 153.50.
Meanwhile, EUR/JPY rebound may aim for the 159.00 round figure before poking the stated wedge’s top line surrounding 159.55.
Should the EUR/JPY pair remains firmer past 159.55 and defy the bearish chart pattern, the 160.00 round figure and July 2008 low near 165.30 will be in the spotlight.
EUR/JPY: Four-hour chart
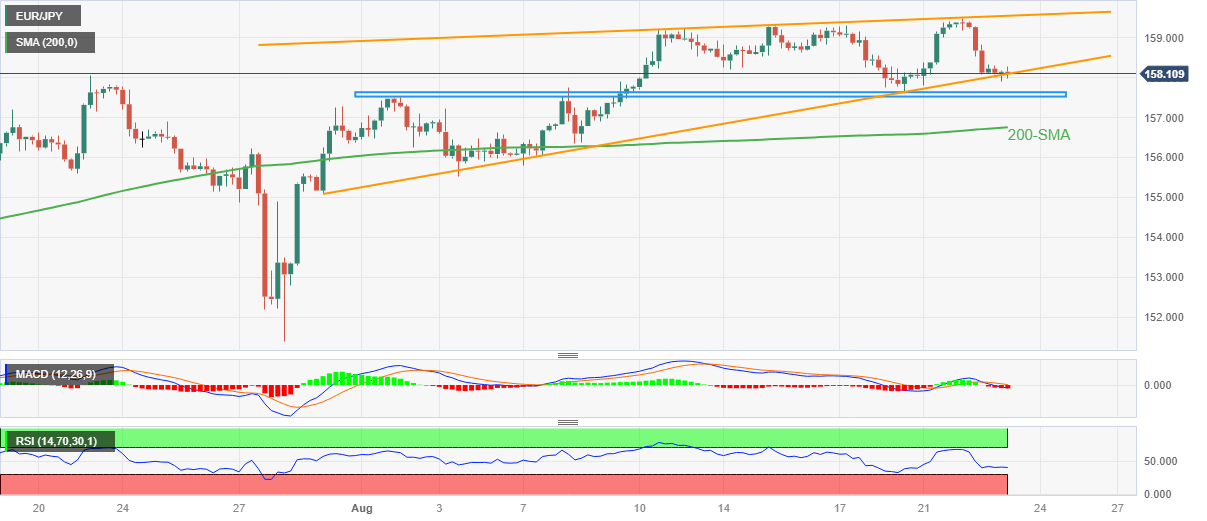
Trend: Limited downside expected
Here is what you need to know on Wednesday, August 23:
Markets have stabilized early Wednesday following Tuesday's volatile action. Investors await August preliminary S&P Global Manufacturing and Services PMI surveys for Germany, the EU, the UK and the US. Later in the day, the July New Home Sales report will also be featured in the US economic docket and the European Commission will release Eurozone Consumer Confidence data for August. The highly-anticipated Jackson Hole Symposium will get underway on Thursday.
The US Dollar gathered strength against its rivals in the second half of the day on Tuesday as Wall Street's main indexes turned south after a mixed opening. The US Dollar Index touched its highest level since mid-June above 103.70 in the American session on Tuesday but retreated to the 103.50 area early Wednesday. Meanwhile, the benchmark 10-year US Treasury bond yield stays in negative territory below 4.3% in the European morning and US stock index futures gain between 0.3% and 0.5%.
US Dollar price today
The table below shows the percentage change of US Dollar (USD) against listed major currencies today. US Dollar was the weakest against the Australian Dollar.
| USD | EUR | GBP | CAD | AUD | JPY | NZD | CHF | |
| USD | -0.08% | -0.14% | -0.01% | -0.14% | -0.04% | -0.11% | -0.03% | |
| EUR | 0.11% | -0.03% | 0.09% | -0.04% | 0.06% | 0.00% | 0.07% | |
| GBP | 0.14% | 0.06% | 0.12% | -0.01% | 0.09% | 0.03% | 0.10% | |
| CAD | 0.03% | -0.05% | -0.11% | -0.11% | -0.02% | -0.08% | -0.02% | |
| AUD | 0.11% | 0.06% | 0.00% | 0.13% | 0.10% | 0.03% | 0.10% | |
| JPY | 0.07% | -0.02% | -0.08% | 0.05% | -0.07% | -0.05% | 0.01% | |
| NZD | 0.11% | 0.03% | 0.00% | 0.11% | 0.00% | 0.09% | 0.12% | |
| CHF | -0.01% | -0.08% | -0.15% | 0.00% | -0.15% | -0.04% | -0.12% |
The heat map shows percentage changes of major currencies against each other. The base currency is picked from the left column, while the quote currency is picked from the top row. For example, if you pick the Euro from the left column and move along the horizontal line to the Japanese Yen, the percentage change displayed in the box will represent EUR (base)/JPY (quote).
EUR/USD dropped to a 7-week low of 1.0833 on Tuesday before staging a technical correction. At the time of press, the pair was up marginally on the day above 1.0850.
GBP/USD rose to 1.2800 in the European session on Tuesday but closed the day in negative territory at 1.2730. The pair recovers toward 1.2750 on Wednesday.
The data from New Zealand showed in the Asian session that Retail Sales contracted by 1% on a quarterly basis in the second quarter. This reading followed the 1.6% decline recorded in the first quarter and came in better than the market expectation for a decrease of 2.6%. NZD/USD edged higher with the immediate reaction but failed to gather bullish momentum. The pair was last seen trading flat on the day at around 0.5950.
S&P Global Manufacturing PMI edged lower to 49.4 in August from 49.6 in July, the data from Australia showed. The Services PMI worsened to 46.7 in the same period and came in below the market expectation of 47.9. Despite the disappointing PMI data, AUD/USD stays in positive territory slightly below 0.6450 in the European session.
USD/JPY closed in the red on Tuesday and continued to stretch lower toward 145.50 on Wednesday. Jibun Bank Manufacturing PMI ticked up to 49.7 in Japan and Services PMI rose to 54.3 from 53.8.
Gold price gathered recovery momentum amid retreating US Treasury bond yields and climbed above $1,903 after closing slightly below that level on Tuesday.
Bitcoin holds steady near $26,000 for the fifth straight on Wednesday and Ethereum stays on the back foot below $1,700.
Everyone is waiting for Jackson Hole this week, but it is still worth taking a look at the data from the Eurozone today, as the purchasing managers' indices for August are published. Antje Praefcke, FX Analyst at Commerzbank, analyzes EUR outlook ahead of these events.
Lagarde is likely to leave all doors open for the time being anyway
The market might scrutinize ECB President Christine Lagarde's statements on Friday, when she is expected to speak in Jackson Hole, to see if she might sound a bit more dovish, whereupon the Euro could come under downward pressure.
But I would be cautious about over-interpreting her statements, and prefer to wait for the new inflation figures for August, which will be published on Aug. 31. Moreover, at the end of the interest rate cycle and shortly before the next interest rate meeting in September, Lagarde is likely to leave all doors open for the time being anyway. In this respect, I would not want to rush selling the Euro today on weaker-than-expected indices.
CME Group’s flash data for crude oil futures markets noted traders added around 2.8K contracts to their open interest positions after five consecutive daily pullbacks on Tuesday. Volume, instead, shrank for the second straight session, this time by around 103.1K contracts.
WTI: Immediate support emerges at the 200-day SMA
Prices of WTI dropped for the second session in a row and closed below the key $80.00 mark per barrel on Tuesday. The daily pullback was amidst rising open interest, which indicates that there is still scope for further decline in the very near term with an immediate contention at the key 200-day SMA, today at $76.10 per barrel.
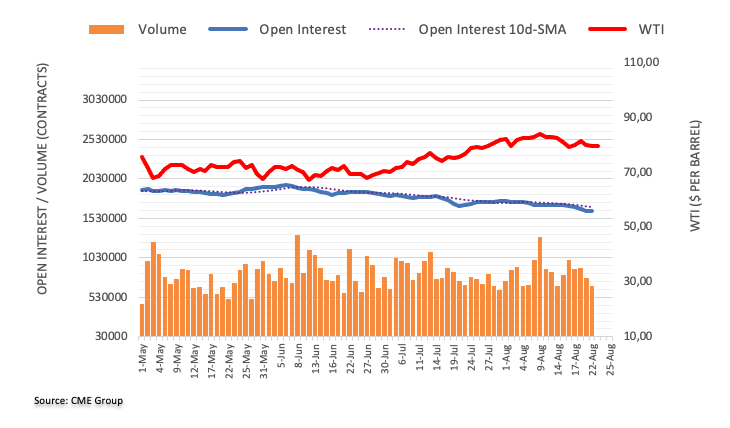
- USD/JPY currently trades near 145.62, losing 0.19% on the day.
- The immediate resistance level for USD/JPY appears at 145.85; the initial contention is located at 145.30.
- The Relative Strength Index (RSI) stands in bearish territory below 50.
The USD/JPY loses momentum but holds above the 145.60 mark heading into the early European session on Wednesday. Markets turn cautious ahead of the US S&P Global PMI data due later in the North American session. The major pair currently trades near 145.62, losing 0.19% on the day.
Japan's manufacturing shrank for a third straight month in August, according to the latest figures released on Wednesday. Jibun Bank's flash PMI reading for Japan's manufacturing sector in August showed a rise to 49.7 from 49.6. The figure was under the predicted 49.5. While the Service PMI increased from 53.8 to 54.3.
Technically, the USD/JPY pair stands above the 50- and 100-hour Exponential Moving Averages (EMAs) with an upward slope, which means the path of least resistance is to the upside for the major pair.
The immediate resistance level for USD/JPY appears at 145.85 (a high of August 15). The additional upside filter to watch is seen at a high of August 21 and the upper boundary of the Bollinger Band of 146.35. Any meaningful follow-through buying above the latter would challenge a Year-To-Date (YTD) high of 146.55. Further north, at 147.00 will be a tough nut to crack for the USD/JPY pair.
On the flip side, the initial contention for the major pair is located at 145.30 (50-hour EMA). The next contention level emerges near a psychological round figure at 145.00. Any intraday pullback below the latter would expose the next downside stop at 144.45 (100-hour EMA) en route to 144.00 (round mark), and finally at 143.30 (low of August 10).
It’s worth noting that the Relative Strength Index (RSI) stands in bearish territory below 50, which indicates that the downside momentum has been activated for the time being.
USD/JPY four-hour chart
-638283694609217886.png)
Further side-lined trading appears likely in GBP/USD in the near term, according to UOB Group’s Economist Lee Sue Ann and Markets Strategist Quek Ser Leang.
Key Quotes
24-hour view: We indicated yesterday that “there is a slight increase in upward momentum, and there is room for GBP to edge above 1.2790.” However, we were of the view that “any advance is unlikely to threaten the major resistance at 1.2830.” As expected, GBP edged above 1.2790 and reached a high of 1.2800. However, we did not anticipate the sharp drop from the high (low has been 1.2720). Downward momentum has improved, albeit not much. Today, GBP is likely to trade with a downward bias, but a sustained decline below 1.2690 is unlikely. The next support at 1.2640 is unlikely to come under threat. On the upside, if GBP breaks above 1.2785 (minor resistance is at 1.2755), it would mean that the downward bias has faded.
Next 1-3 weeks: We continue to hold the same view as Monday (21 Aug, spot at 1.2740). As highlighted, the price actions in GBP over the past week or so appears to be part of a consolidation phase. For the time being, GBP could continue to trade sideways, likely between 1.2640 and 1.2830.
- Gold Price braces for the first weekly gain in five despite positing mild daily gains of late.
- Cautious optimism joins positioning for PMI data to weigh on US Treasury bond yields, US Dollar and underpin XAU/USD rebound.
- Softer preliminary PMIs from top-tier economies can prod central bankers from turning hawkish at Jackson Hole and favor Gold buyers.
- Sustained trading beyond key support confluence keeps XAU/USD bulls hopeful.
Gold Price (XAU/USD) stays on the front foot for the fourth consecutive day despite lacking upside momentum ahead of the top-tier statistics.
That said, the XAU/USD’s latest run-up could be linked to the US Dollar’s retreat amid softer Treasury bond yields and slightly positive market sentiment.
Furthermore, expectations of improving US-China ties and mixed concerns about the dedollarization at the BRICS Summit, currently held in South Africa to facilitate diplomatic discussion among Brazil, Russia, India, China and South Africa, also favor the Gold buyers.
On the same line could be the market’s heavy bets, per the interest rate futures, suggesting no change in the Fed rate in September, as well as expectations favoring the lack of hawkish bias in Fed Chair Jerome Powell’s speech at Friday’s Jackson hole Symposium.
It’s worth noting, however, that the recently firmer US data and the Federal Reserve policymakers’ hesitance in welcoming the rate-cut bias seems to guard the XAU/USD rebound as markets await preliminary readings of the August month Purchasing Managers Indexes (PMIs) for major economies.
Also read: Gold Price Forecast: Will XAU/USD recapture 200 DMA? Focus on EU/ US PMIs
Gold Price: Key levels to watch
As per our Technical Confluence indicator, the Gold Price stays firmer past the $1,895 support confluence comprising Fibonacci 38.2% on one day and one week, as well as 10-SMA on the four-hour (4H) chart.
That said, the previous highs on the daily and monthly chart join the upper line of the Bollinger on the four-hour play to restrict the immediate upside of the XAU/USD price near $1,905.
Following that, Pivot Point one-month S1, previous weekly high and 100-SMA on 4H, close to $1,918, appears the last defense of the Gold sellers.
On the contrary, a downside break of the $1,895 key support won’t open doors for the Gold sellers as Fibonacci 23.6% on one-week and the lower band of the Bollinger, around $1,892, precedes the previous weekly low of around $1,885 to restrict short-term downside of the XAU/USD.
In a case where the Gold Price remains weak past $1,885, the odds of witnessing a slump toward the early March swing high of around $1,858 can’t be ruled out.
Here is how it looks on the tool
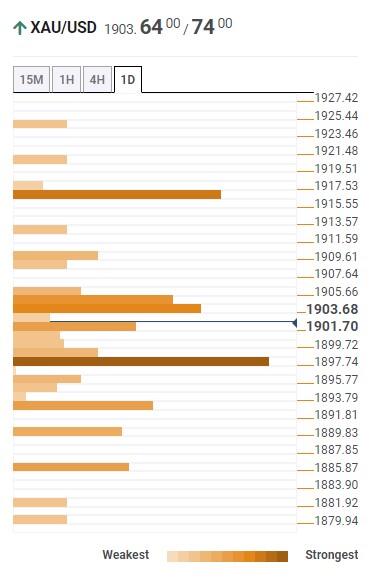
About Technical Confluences Detector
The TCD (Technical Confluences Detector) is a tool to locate and point out those price levels where there is a congestion of indicators, moving averages, Fibonacci levels, Pivot Points, etc. If you are a short-term trader, you will find entry points for counter-trend strategies and hunt a few points at a time. If you are a medium-to-long-term trader, this tool will allow you to know in advance the price levels where a medium-to-long-term trend may stop and rest, where to unwind positions, or where to increase your position size.
Economists at Danske Bank expect USD/CNH and EUR/CNH to enjoy further gains as they forecast lower GDP growth in China.
USD/CNH to continue higher
Financial stress is on the rise turning focus yet again on whether China is heading for a deeper financial and economic crisis. While we do see a rising risk of this happening (25% probability), our baseline scenario remains that China has the tools to avert such an outcome and will use them to the extent needed. Yet, due to the recent weak data and rise in financial stress we have revised down our forecast to 4.8% growth this year and 4.2% in 2024.
We have lifted our forecast for both USD/CNH and EUR/CNH taking the new weaker growth outlook as well as rising risks into account. We now project USD/CNH to hit 7.60 in 12M up from 7.40 previously.
Open interest in gold futures markets shrank for the second session in a row on Tuesday, this time by just 281 contracts according to preliminary readings from CME Group. Volume followed suit and went down by around 5.4K contracts and partially reversed the previous daily build.
Gold remains capped by the 200-day SMA
Gold prices added to gains seen at the beginning of the week amidst shrinking open interest and volume on Tuesday. Against that the continuation of the uptrend appears not favoured in the very near term while the key 200-day SMA, today at $1908, continues to limit occasional bullish attempts.
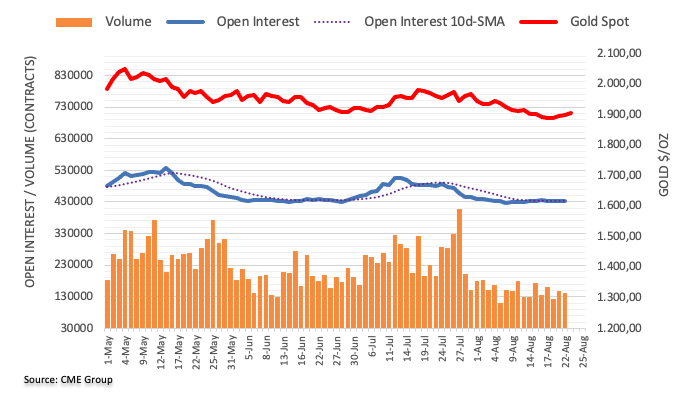
- AUD/USD edges higher amid four-day winning streak, reverses pullback from intraday top of late.
- China-linked optimism, softer Treasury bond yields underpin Aussie pair’s rebound despite downbeat Australia PMI.
- Cautious optimism adds strength to recovery moves toward May’s low.
- Upbeat prints of US S&P Global PMIs, one-month-old descending resistance line can challenge AUD/USD rebound.
AUD/USD stays on the front foot for the fourth consecutive day, despite struggling of late, as market players cheer the downbeat US Dollar amid early Wednesday morning in Europe. With this, the Aussie pair adds 0.30% intraday gains to print the 0.6450 level by the press time.
Among the key catalysts, the market’s cautious optimism and a pullback in the US Treasury bond yields gain major attention. It’s worth noting, however, that the downbeat prints of Australia’s preliminary readings of the S&P Global PMIs for August cap the AUD/USD pair’s immediate upside.
That said, the headlines suggest a likely improvement in the US–China ties, due to US Commerce Secretary Gina Raimondo’s visit to Beijing, scheduled for next week. On the same line are the early-week news suggesting the US removal of 27 Chinese entities from its Unverified List, lifting sanctions from those entities and flagging hopes of improving diplomatic ties.
On the other hand, mixed US data and Fed talks also prod the DXY bulls as market participants don’t expect the hawkish appearance of Fed Chair Jerome Powell at this week’s annual Jackson Hole event. That said, the US flashed slight improvement in the US Existing Home Sales for July and the Richmond Fed Manufacturing Index for August, which in turn should entertain the AUD/USD sellers. However, hawkish statements from Federal Reserve Bank of Richmond President Thomas Barkin put a floor under the pair.
While portraying the mood, the US 10-year Treasury bond yields keep the previous day’s retreat from the highest level since late 2007 to 4.31% whereas S&P500 Futures rise 0.25% intraday to regain 4,410 level after reversing from a one-week high the previous day. Further, the US Dollar Index (DXY) retreats from the 10-week high marked the previous day to around 103.50 at the latest.
Looking forward, the preliminary readings of the August month Purchasing Managers Indexes (PMIs) and Existing Home Sales for July for the US will entertain the AUD/USD pair traders. However, top-tier central bankers’ speeches at the annual Jackson Hole Symposium event, scheduled for August 24–26, will be crucial for clear directions.
Technical analysis
The nearly oversold RSI (14) on the daily chart joins the weekly ascending support line, close to 0.6405, to inspire AUD/USD buyers in approaching May’s low of around 0.6460. However, a downward-sloping resistance line from late June, close to 0.6480 at the latest, can challenge the Aussie pair’s further upside.
- Asian stock markets trade mixed as investors fear the US higher for longer interest rate.
- The US-China relationship, further Chinese stimulus measures remain in focus.
- Japan's industrial activity contracted for the third consecutive month in August.
- Market players will focus on the US S&P Global PMI data due on Wednesday.
Asia stock markets trade mixed on Wednesday amid the cautious mood in the market. Asian equities remain under pressure amid the fear of higher interest rates in the US and elevated US yields. Investors await the US PMI data due later on Wednesday for the fresh impetus.
At press time, China’s Shanghai declines 0.55% to 3,103, the Shenzhen Component Index falls 1.11% to 10,259, and Hong Kong’s Hang Sang gains 0.38% to 17,854. India’s NIFTY 50 is down 0.1%, South Korea’s Kospi drops 0.55%, Japan’s Nikkei is up 0.17% and Taiwan's Weighted Index gains 0.73%
The US Commerce Department’s statement reported late Tuesday that US Commerce Secretary Gina Raimondo met the Chinese ambassador Xie Feng, and had a productive discussion before her departure to China, according to Reuters. The headline surrounding the US-China relationship remains in focus and the renewed tension between the world's two largest economies might exert pressure on the regional market.
China's economy has lost steam as a result of a worsening property slump and slow consumer spending, prompting calls for further stimulus measures by the government. Chinese authorities, however, are hesitant to increase the country's borrowing needs. This, in turn, raise the concern about the Chinese economic slowdown and the spillover effect to other countries.
In Japan, the latest data showed that Japan's industrial activity contracted for the third consecutive month in August. The preliminary data from Jibun Bank revealed that Japan's manufacturing PMI for August increased to 49.7 from 49.6. The result was lower than the 49.5 expected. While Service PMI rose from 53.8 to 54.3 over the same period.
On the Indian front, NIFTY 50 is one of the top performers among emerging markets. However, the fears over higher US interest rates and China's sluggish economic recovery have halted the rally.
Market participants will closely watch US S&P Global PMI data due later in the North American session. Later in the week, attention will turn to the Jackson Hole annual symposium on Thursday and Fed Chair Powell's speech on Friday. The speech could provide insights into economic conditions and hints as to whether inflation is under control or whether additional interest rate hikes are required to combat inflation.
UOB Group’s Economist Lee Sue Ann and Markets Strategist Quek Ser Leang note EUR/USD risks extra weakness in the next few weeks.
Key Quotes
24-hour view: Yesterday, we expected EUR to trade in a range of 1.0870/1.0915. We did not anticipate the spike in volatility. After rising to a high of 1.0930, EUR plummeted to a low of 1.0831 and then closed at 1.0844 (-0.44%). The rapid decline has gathered momentum, and EUR is likely to weaken further today. A clear break of the major support at 1.0830 could lead to a drop to 1.0790 before the risk of a rebound increases. Resistance is at 1.0870, followed by 1.0890.
Next 1-3 weeks: We highlighted yesterday that “downward momentum is beginning to wane, albeit tentatively.” We held the view that “only a breach of 1.0930 would indicate that EUR is not ready to head lower to 1.0830.” We did not quite expect the subsequent price actions as EUR rose to 1.0930 (EUR did not break clearly above this level), then fell sharply and came within a pip of 1.0830 (low of 1.0831). Downward momentum has been ‘boosted’, and a break of 1.0830 is likely. The next level to focus on below 1.0830 is a considerable support level near 1.0790. On the upside, the ‘strong resistance’ level of 1.0930 has moved slightly lower to 1.0915. A breach of the ‘strong resistance’ level would mean that the weakness in EUR has stabilised.
- NZD/USD pierces 10-DMA hurdle amid nearly oversold RSI, ignores mixed NZ Retail Sales details.
- Kiwi bulls need to cross 0.5980-85 resistance region to retake control.
- US S&P Global PMI for August also need to back the recovery moves within short-term falling wedge.
NZD/USD struggles to defend the previous day’s run-up as it prods the 100-DMA resistance amid early Wednesday morning in Europe. In doing so, the Kiwi pair justifies the market’s dilemma amid mixed New Zealand Retail Sales data and the US Dollar’s retreat ahead of the key US PMIs for August. That said, the quote seesaws around 0.5950 by the press time.
As per Statistics New Zealand, the Pacific major’s Retail Sales improved during the second quarter (Q2) of 2023. On the same line could be the comments from Reserve Bank of New Zealand (RBNZ) Chief Economist Paul Conway. However, the Retail Sales ex Autos, also known as the Core Retail Sales, marked downbeat print and challenges the national growth concerns, as well as the Kiwi pair buyers.
On the contrary, the US Dollar Index (DXY) retreats from the 10-week high marked the previous day to around 103.50 at the latest.
Technically, the nearly oversold RSI (14) line allows the NZD/USD traders to pare recent losses while bouncing off the yearly low.
Though, a convergence of May’s low and the top line of a five-week-long falling wedge bullish chart formation, around 0.5980-85, appears a tough nut to crack for the Kiwi pair buyers.
On the flip side, the Year-To-Date (YTD) low marked on Monday around 0.5895 restricts the short-term downside of the NZD/USD pair.
Following that, the aforementioned wedge’s bottom line, close to 0.5850, will be in the spotlight.
To sum up, NZD/USD stays in recovery mode but the pair’s further upside appears difficult unless gaining strong fundamental support.
NZD/USD: Daily chart
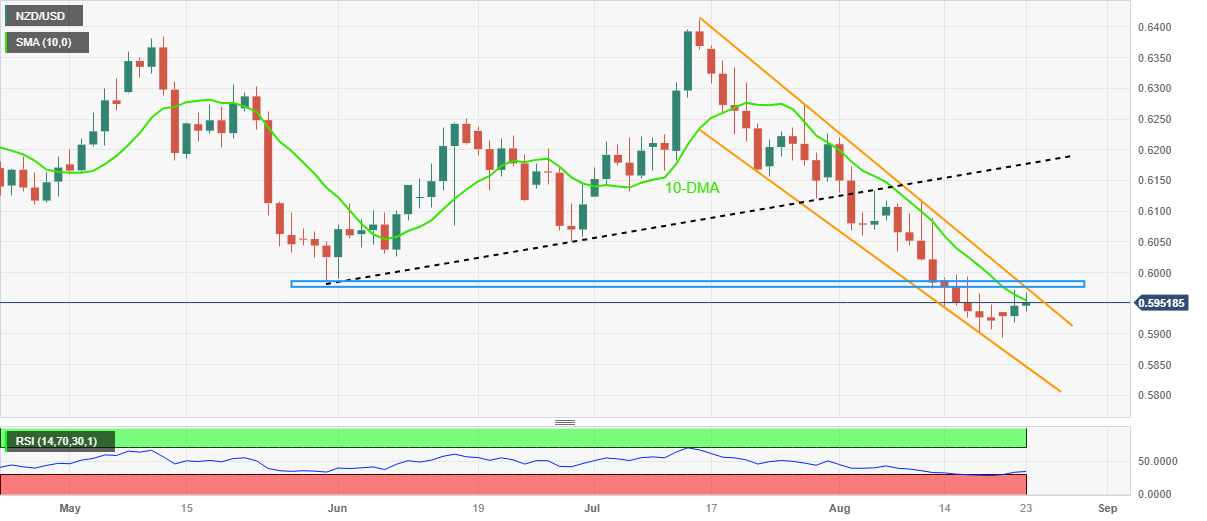
Trend: Limited recovery expected
- EUR/USD trades higher around 1.0860 due to the retreating US Dollar Index (DXY).
- Traders adopt a cautious stance ahead of the releases of PMIs data.
- US bond yields and downbeat US housing data weaken the Greenback.
EUR/USD trims the previous day’s losses, trading higher around 1.0860 in the Asian session on Wednesday. The EUR/USD pair is experiencing modest strength due to a correction in the Greenback along with the declining United States (US) Treasury yields.
The Euro encountered pressure due to China's economic challenges, yet any signals pointing to potential fiscal stimulus could offer support. EUR/USD traders are maintaining a cautious stance ahead of the upcoming releases of preliminary PMI data from the Eurozone, Germany, and the US later in the day.
The US Dollar Index (DXY), gauging the Greenback's strength against six key currencies, showed its resilience by securing a gain on Tuesday. However, the downtick in the US Treasury yields and downbeat US housing data put pressure on the US Dollar (USD). At the time of writing, the DXY is trading sideways near the 103.50 mark.
US Existing Home Sales (YoY) declined 2.2% to the rate of 4.07M in July, compared to the expectations of 4.15M. The Richmond Fed Manufacturing Index improved in August from -9 to -7, the same as market expectations. The market participants will closely watch the upcoming Jackson Hole annual symposium starting on Thursday, followed by Fed Chair Powell’s speech scheduled to be held on Friday. These events will provide insights into the US economy, offering fresh impetus for placing trades in the EUR/USD pair.
- USD/CHF fades bounce off 100-SMA as traders await US S&P Global PMIs for August.
- Fortnight-old ascending triangle restricts immediate moves of Swiss Franc pair.
- Steady RSI, failure to defend recovery from key SMA lure pair sellers.
- 200-SMA acts as additional check for bears; buyers need validation from “Golden Fibonacci Ratio”.
USD/CHF languishes around 0.8800 as it fades the previous day’s rebound from the 100-SMA heading into Wednesday’s European session. In doing so, the Swiss Franc (CHF) pair portrays the market’s cautious mood ahead of the preliminary readings of the August month Purchasing Managers Indexes (PMIs) for the US.
In addition to retreating towards the 100-SMA level of around 0.8780, the steady RSI (14) line and the existence of a 13-day-long rising triangle formation, currently between 0.8770 and 0.8830, also keep the USD/CHF sellers hopeful.
On a clear downside break of the 0.8770 mark, the Swiss Franc (CHF) pair sellers could aim for the 200-SMA support of 0.8720 before rushing toward the theoretical target of the triangle breakdown, around 0.8650.
Meanwhile, USD/CHF rebound needs to cross the top line of the aforementioned triangle, close to 0.8830, to convince intraday buyers.
Even so, the 61.8% Fibonacci retracement of the pair’s late June–July downside, near 0.8840, will act as the final defense of the pair bears.
Overall, the USD/CHF is likely to remain bearish unless crossing 0.8840. However, the downside move should draw support from the softer US S&P Global PMIs for August, as well as dovish Fed concerns, to dominate further.
USD/CHF: Four-hour chart
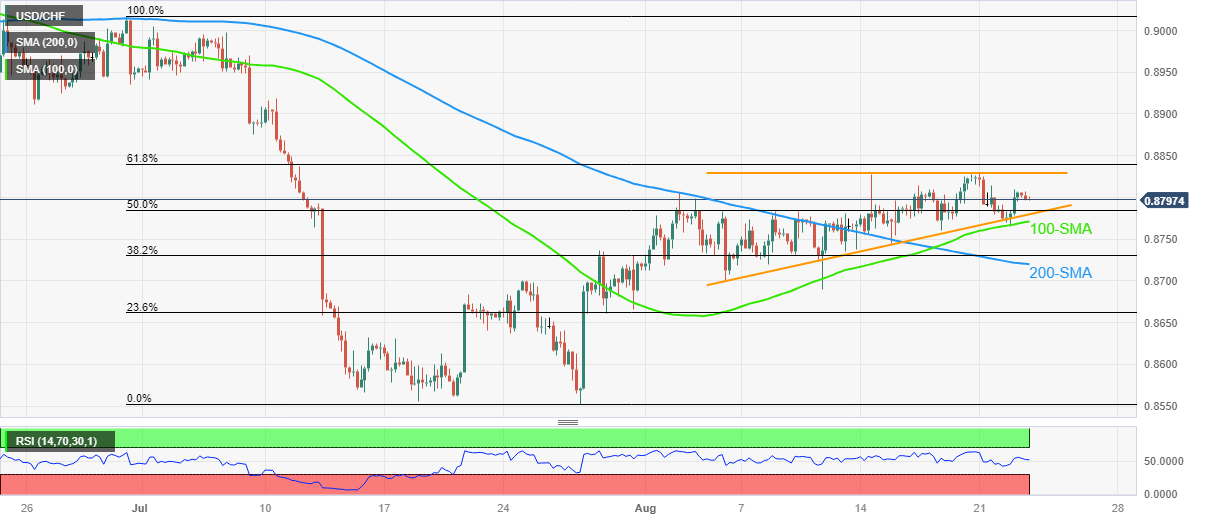
Trend: Limited downside expected
- USD/RUB holds above the 94.50 area in the Asian session.
- Russian President Vladimir Putin said that inflationary risks were increasing.
- Putin said Russia has surpassed Germany to become the world’s top five largest economies.
- Investors will monitor US PMI, the Federal Reserve (Fed) annual economic symposium at Jackson Hole.
USD/RUB trades with modest losses above the 94.50 mark after retreating from a 16-month high of 102.35 during the Asian session on Wednesday. Meanwhile, the US Dollar Index (DXY) loses some ground to 103.50 as markets turn cautious ahead of Jackson Hole Symposium and Federal Reserve (Fed) Chairman Jerome Powell Speaks on Thursday and Friday, respectively.
On Tuesday, Russian President Vladimir Putin stated that inflationary risks were increasing and he urged the government and the central bank to maintain stability. That said, a military operation in Ukraine has put a burden on Russia's budget, and the country's central bank had to raise interest rates last week to prevent the Ruble from collapsing. It’s worth noting that the Bank of Russia raised the interest rate by 350 basis points (bps) to 12% last week.
Russia's government is dealing with the conflict with Ukraine, which has led to a rise in military purchases and a misallocation of funds. The current account surplus of Russia decreased by 85% in the first half of CY2023.
Furthermore, Vladimir Putin added that Russia has surpassed the Federal Republic of Germany to become one of the world's top five in terms of purchasing power parity and the size of the economy, according to Sputnik.
On the US Dollar front, investors raise their bets on additional rate hikes by the Federal Reserve (Fed) despite the robust labor data and weaker inflation data last week. Fed Chairman Jerome Powell Speaks on Friday will be a guide for investors and could provide insights into economic conditions. A hawkish tone might boost the Greenback and acts as a tailwind for USD/RUB.
Moving on, market participants will keep an eye on the headline surrounding Russia’s war in Ukraine. The US S&P Global PMI data will be released later in the North American session. Fed Chair Jerome Powell’s speech at the Jackson Hole Symposium on Friday will be in the spotlight this week. Traders will take cues from the data and find opportunities around USD/RUB.
- USD/CAD edges lower as markets prepare for top-tier data with slightly positive mood.
- Hopes of more stimulus from China, US-China ties join softer US Dollar to underpin Oil price recovery.
- Softer US Treasury bond yields also exert downside pressure on Greenback and Loonie pair.
- Mixed outcomes for scheduled statistics can keep traders on their toes ahead of Jackson Hole Symposium.
USD/CAD holds lower grounds near 1.3540 while portraying a sluggish weekly move heading into Wednesday’s European session.
The Loonie pair clings to mild losses amid a softer US Dollar and the recent improvement in Canada’s key export item WTI crude oil as markets await top-tier data from the US and Canada.
That said, the US Dollar Index (DXY) retreats from the 10-week high marked the previous day to around 103.50 at the latest while the WTI crude oil snaps a two-day losing streak by rising 0.20% intraday to $79.75 by the press time.
It’s worth noting that the market’s cautious optimism joins a pullback in the US Treasury bond yields to prod the Greenback buyers, as well as underpin the Oil price rebound.
Among the major catalysts contributing to the slightly positive mood are the headlines suggesting a likely improvement in the US–China ties, due to US Commerce Secretary Gina Raimondo’s visit to Beijing, scheduled for next week. On the same line are the early-week news suggesting the US removal of 27 Chinese entities from its Unverified List, lifting sanctions from those entities and flagging hopes of improving diplomatic ties.
Furthermore, mixed US data and Fed talks also prod the DXY bulls as market participants don’t expect the hawkish appearance of Fed Chair Jerome Powell at this week’s annual Jackson Hole event. That said, the US flashed slight improvement in the US Existing Home Sales for July and the Richmond Fed Manufacturing Index for August, which in turn should entertain the USD/JPY sellers. However, hawkish statements from Federal Reserve Bank of Richmond President Thomas Barkin put a floor under the pair.
Against this backdrop, the US 10-year Treasury bond yields keep the previous day’s retreat from the highest level since late 2007 to 4.31% whereas S&P500 Futures rise 0.25% intraday to regain 4,410 level after reversing from a one-week high the previous day.
Looking ahead, Canadian Retail Sales for June, expected to ease on MoM but likely flashing improving the positive Core details, may direct intraday traders of the USD/CAD pair ahead of the preliminary readings of the August month Purchasing Managers Indexes (PMIs) and Existing Home Sales for July for the US.
Technical analysis
Multiple pin bar candlesticks on the daily chart suggest the bullish exhaustion of the USD/CAD pair. However, the 10-DMA level of around 1.3510, quickly followed by the 1.3500 round figure, act as additional checks for the Loonie pair sellers before taking control.
- Gold price gains positive traction for the third successive day on Wednesday.
- Retreating US bond yields undermines the US Dollar and lends some support.
- China's economic woes further boost demand for the safe-haven XAU/USD.
- Eyes global PMIs for some impetus ahead of the Jackson Hole Symposium.
Gold price attracts some dip-buying on Wednesday and stalls the overnight modest pullback from the $1,904-$1,905 region, or a multi-day peak. The XAU/USD climbs back above the $1,900 mark during the Asian session, though any meaningful appreciating move remains elusive in the wake of firming expectations that the Federal Reserve (Fed) will stick to its hawkish stance.
In fact, market participants now seem convinced that the Fed will keep interest rates higher for longer and have been pricing in the possibility of one more 25 basis points (bps) lift-off by the end of this year. This led to the recent rise in the US Treasury bond yields and dragged the non-yielding Gold price to its lowest level since mid-March, around the $1,885 area earlier this week. That said, a combination of supporting facts assists the XAU/USD to stage a modest recovery and gain some positive traction for the third successive day.
The yield on the benchmark 10-year US government bond retreats after surging to a nearly 16-year high on Tuesday and prompts some profit-taking around the US Dollar (USD). A softer Greenback tends to benefit the US Dollar-denominated Gold price. Apart from this, concerns about the worsening economic conditions in China lend additional support to the safe-haven precious metal and remain supportive of the ongoing recovery move. Traders, however, might refrain from placing aggressive bets ahead of the Jackson Hole Symposium.
Investors will closely scrutinize comments by Fed Chair Jerome Powell for fresh cues about the future rate-hike path, against the backdrop of growing acceptance of a pause in September. This, in turn, will play a key role in influencing the near-term USD price dynamics and determine the next leg of a directional move for the Gold price. Heading into the key event risk, the flash PMI prints might provide an insight into the global economic health and contribute to producing short-term trading opportunities around the XAU/USD.
The aforementioned fundamental backdrop, meanwhile, warrants some caution for aggressive bullish traders. Hence, it will be prudent to wait for a sustained strength back above the technically significant 200-day Simple Moving Average (SMA), around the $1,907 area, before confirming that the Gold price has bottomed out.
Technical levels to watch
- GBP/USD experiences strength due to the possibility of interest rate hikes by the BoE.
- 55-day EMA acts as the immediate support aligned to the weekly low at 1.2710.
- MACD suggests mixed sentiments of GBP/USD traders.
GBP/USD trades higher around 23.6% Fibonacci retracement at 1.2740 at the time of writing during the Asian session on Wednesday. The pair gets support from the possibility of interest rate hikes in the September meeting by the Bank of England (BoE). Market participants turn cautious ahead of United Kingdom (UK) preliminary S&P Global/CIPS Composite PMIs for August, scheduled to be released later in the day.
The 55-day Exponential Moving Average (EMA) at 1.2728 acts as the immediate support, followed by the weekly low at 1.2710. A firm below the latter could open the doors for the GBP/USD sellers to navigate the region toward a monthly low at 1.2616.
On the upside, the GBP/USD pair could face a challenge around the 21-day EMA at 1.2755 as it appears to be a key barrier. An upside breakout could lead the pair to explore the region around the 1.2800 psychological level aligned to 38.2% Fibo at 1.2817.
The Moving Average Convergence Divergence (MACD) line suggests mixed sentiment of GBP/USD traders as it stays below the centerline but also shows convergence below the signal line. The 14-day Relative Strength Index (RSI) remains below 50, which suggests a bearish bias in the pair.
GBP/USD: Daily Chart
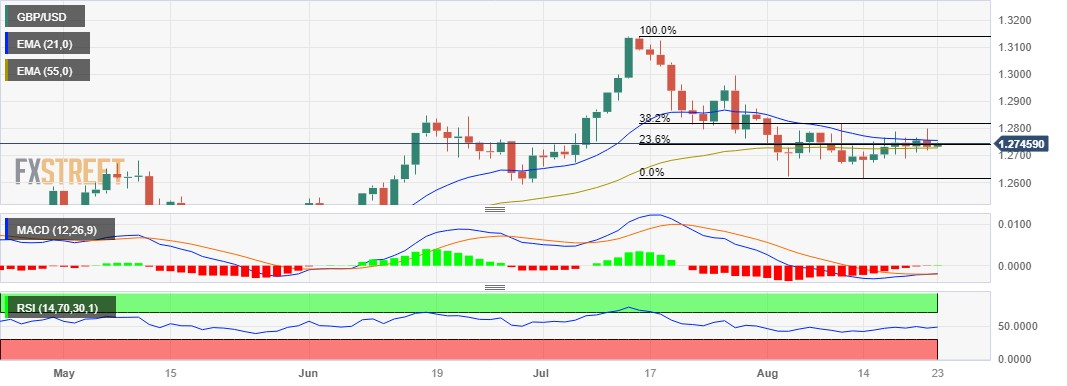
- AUD/JPY trades within a descending trend channel line on the four-hour chart.
- The first resistance level to watch is 94.00; the initial support level is located at 93.50.
- The Relative Strength Index (RSI) and MACD stand in the bullish territory.
The AUD/JPY cross gains traction above mid-93.00s during the Asian trading hours on Wednesday. The Japanese Yen remains under pressure amid the divergence of monetary policy between Bank of Japan (BoJ) and the Reserve Bank of Australia (RBA). The cross currently trades around 93.74, up 0.04% for the day.
That said, Japan’s preliminary Jibun Bank Manufacturing PMI for August rose to 49.7 versus 49.6 prior. The figure came in below the market expectation of 49.5. Meanwhile, Service PMI improved to 54.3 from 53.8 in the previous month.
On the Aussie front, the S&P Global Manufacturing PMI decreases to 49.4 from 49.6 anticipated and prior, while the Services PMI drops to 46.7 from 47.9 expected and previous month. Finally, the S&P Global Composite PMI for August falls to 47.1 from 48.2 in July.
According to the four-hour chart, AUD/JPY trades within a descending trend channel line from the middle of June. That said, the path of least resistance for the AUD/JPY is to the downside as the cross holds below the 50- and 100-hour Exponential Moving Averages (EMAs).
The first resistance level for AUD/JPY emerges at 94.00 (a psychological round figure). The additional upside filter to watch is 94.45, representing the upper boundary of a descending trend channel. Any meaningful follow-through buying above the latter will see a rally to 94.90 (high of August 9) en route to 95.40 (high of July 14) and finally at 95.85 (high of July 31).
On the downside, the cross will meet the initial support level at 93.50 (low of August 22). The next downside stop appears near a psychological figure at 93.00, followed by 92.65 (the midline of the descending trend channel). A breach of the latter will see a drop to 92.15 (low of June 6) and 91.80 (high of May 8)
It’s worth noting that the Relative Strength Index (RSI) holds above 50 while Moving Average Convergence/Divergence (MACD) stands in bullish territory. Both momentum indicators support the buyers for now.
AUD/JPY four-hour chart
-638283597057312412.png)
- USD/INR trades with a negative bias for the third successive day on Wednesday.
- A modest USD selling is seen as a key factor acting as a headwind for spot prices.
- The technical setup still supports prospects for the emergence of some dip-buying.
The USD/INR pair struggles to capitalize on the previous day's late rebound from over a one-week low and trades with a negative bias for the third successive day on Wednesday. This also marks the fifth day of a downtick in the previous six, though lacks bearish conviction. Moreover, spot prices have been showing some resilience below the 83.00 resistance breakpoint, now turned support, warranting some caution before positioning for an extension of the recent pullback from the record higher touched last week.
The US Dollar (USD) eases from its highest level since July 12 in the wake of a modest decline in the US Treasury bond yields and turns out to be a key factor acting as a headwind for the USD/INR pair. Apart from this, a goodish pickup in the US equity futures further holds back traders from placing fresh bullish bets around the safe-haven USD. That said, firming expectations that the Federal Reserve (Fed) will stick to its hawkish stance should limit any meaningful slide for the US bond yields. This, along with concerns about the worsening economic conditions in China, might lend support to the Greenback.
From a technical perspective, the USD/INR pair now seems to have found acceptance below the 23.6% Fibonacci retracement level of the July-August rally. This supports prospects for a further slide towards 38.2% Fibo. level, around the 82.85-82.80 region, en route to the 82.60 area, or the 50% Fibo. level. A convincing break below, however, might prompt some technical selling and pave the way for some meaningful downfall. Meanwhile, oscillators on the daily chart are holding comfortably in the positive territory and support prospects for the emergence of some dip-buying at lower levels.
Bulls, however, might now wait for some follow-through buying beyond the 83.40 area, or the record high before positioning for a further near-term appreciating move towards the 84.00 round-figure mark.
USD/INR daily chart
-638283588428563248.png)
Technical levels to watch
- USD/JPY remains depressed at intraday low, down for the second consecutive day.
- US Treasury bond yields, JGB coupons fade previous strength amid cautious optimism.
- Upbeat prints of Japan’s Jibun Bank PMIs for August join positioning of US S&P Global PMIs to weigh on Yen pair.
- Mixed concerns about BoJ, Fed challenge USD/JPY traders ahead of Japan inflation, Jackson Hole event.
USD/JPY holds lower grounds near the intraday bottom, sidelined around 146.60-70 during early Wednesday morning in Europe, as market players seek more clues to extend the Yen pair’s two-day downtrend. Even so, upbeat Japan data and a pullback in the Treasury bond yields join cautious optimism to weigh on the risk-barometer pair ahead of the top-tier US activity data for August.
Earlier in the day, Japan’s first reading of the Jibun Bank Manufacturing PMI for August improves to 49.7 from 49.6, versus 49.5 expected, whereas the Services counterpart rose to 54.3 for the said month from 53.8 previous figures.
Talking about the bond coupons, the US 10-year Treasury bond yields keep the previous day’s retreat from the highest level since late 2007 to 4.31% by the press time whereas the yields of Japanese Government Bonds (JGBs) struggle around the levels last seen in 2014.
Also exerting downside pressure on the Yen pair could be the mixed concerns about the Bank of Japan (BoJ) as Governor Kazuo Ueda refrained from discussing the details of Tuesday’s meeting with Japan Prime Minister Fumio Kishida, which he termed a ‘routine’ one. BoJ’s Kuroda, however, did mention that he explained BoJ’s July policy decision to the PM.
On the other hand, the US flashed slight improvement in the US Existing Home Sales for July and the Richmond Fed Manufacturing Index for August, which in turn should entertain the USD/JPY sellers. However, hawkish statements from Federal Reserve Bank of Richmond President Thomas Barkin put a floor under the pair.
Additionally, hopes of witnessing improvement in the US-China ties and upbeat performance of Japan’s benchmark equity gauge Nikkei seem to defend the risk takers and weigh on the USD/JPY pair amid uncertainty about the major central bank’s next moves.
Looking forward, the preliminary readings of the August month Purchasing Managers Indexes (PMIs) and Existing Home Sales for July for the US will join the US-China headlines, as well as the bond market moves, to direct intraday moves of the USD/JPY pair. However, major attention will be given to Friday’s Tokyo Consumer Price Index for August and top-tier central bankers’ speeches at the annual Jackson Hole Symposium event for clear directions.
Technical analysis
Although multiple tops around 146.50-60 join the nearly overbought RSI (14) line to challenge the USD/JPY buyers, the Yen pair’s downside remains elusive unless providing a daily close beneath 144.80-70 support zone comprising levels marked during late June and early July.
- EUR/GBP trades sideways ahead of the releases of PMI data from both economies.
- Pound Sterling experiences strength due to the possibility of more rate hikes by the BoE.
- UK wage growth caps the gains of the EUR/GBP pair.
EUR/GBP struggle to hold ground from the previous day's losses, trading around 0.8520 during the Asian session on Wednesday. The EUR/GBP downward trajectory is driven by the possibility of further interest rate hikes by the Bank of England (BoE).
Market participants also look to the UK economic docket, featuring preliminary S&P Global/CIPS Composite PMIs for August, scheduled to be released on Wednesday. These events are expected to provide valuable perspectives on the trajectories of both economies. As a result, they could have a significant impact on trading decisions concerning the EUR/GBP pair.
The United Kingdom’s (UK) wage growth served as a supporting factor for the Pound Sterling, potentially capping the gains of the EUR/GBP pair. This raises concerns about long-term inflation, supporting the chance of a 25 basis points (bps) rate hike in the September meeting by the BoE. Additionally, the robust UK GDP and moderate UK CPI figures support the likelihood of further policy tightening.
The Euro traders turn cautious ahead of the upcoming data release of preliminary HCOB PMIs from the Eurozone and Germany later in the day. However, an upbeat mood and a soft US Dollar (USD) coupled with declining US Treasury bond yields underpin the Euro. China’s economic woes are exerting pressure on the Euro but any signs of further indication on fiscal stimulus could be supportive.
- AUD/USD gains some follow-through positive traction and draws support from a softer USD.
- The intraday uptick seems rather unaffected by rather unimpressive Australian PMIs for August.
- China's economic woes and hawkish Fed expectations might cap any further gains for the pair.
The AUD/USD pair attracts some dip-buying following the overnight pullback from a multi-day peak and sticks to its gains through the Asian session on Wednesday. Spot prices currently trade around mid-0.6400s, up just over 0.40% for the day, and look to build on the recent recovery from the lowest level since November 2022 touched last Thursday amid a mildly softer tone surrounding the US Dollar (USD).
In fact, the USD Index (DXY), which tracks the Greenback against a basket of currencies, erodes a part of the previous day's gains to a more than two-month high and is pressured by retreating US Treasury bond yields. Apart from this, a generally positive tone around the US equity futures prompts some profit-taking around the safe-haven buck and benefits the risk-sensitive Australian Dollar (AUD). Against the backdrop of hopes for more stimulus from China, signs of easing US-China trade tensions lead to a slight improvement in the global risk sentiment.
It is worth recalling that the US Commerce Department's Bureau of Industry and Security (BIS) announced on Monday that it will remove 27 Chinese entities from its Unverified List. China welcomed the move and said that it is conducive to normal trade between the two nations. This comes ahead of US Secretary of Commerce Gina Raimondo's visit to China on August 27-30, for meetings with senior Chinese officials and US business leaders. That said, concerns over a Chinese economic slowdown keep a lid on the optimism and the China-proxy Aussie.
A smaller rate cut by the People’s Bank of China (PBoC) signalled limited policy support for the economy, despite a deepening crisis in the domestic property sector, and did little to ease worries about the worsening economic conditions. This, along with weaker Australian PMI prints, might hold back traders from placing aggressive bullish bets around the AUD/USD pair. The latest survey from Judo Bank revealed that the manufacturing sector in Australia continued to contract in August and services activity shrank at the fastest pace in 19 months.
Furthermore, growing acceptance that the Federal Reserve (Fed) will stick to its hawkish stance and keep interest rates higher for longer favours the USD bulls, which might further contribute to capping the AUD/USD pair. Market participants now look to the release of the flash US PMIs for a fresh impetus later during the early North American session. The focus, however, will remain on the Jackson Hole Symposium, where comments by Fed Chair Jerome Powell might provide cues about the future rate hike path and drive the USD demand in the near term.
Technical levels to watch
- USD/CNH fades bounce off one-month-old rising support line as markets brace for US PMI.
- Mildly positive concerns backed by China, looming bear cross on MACD lure Yuan pair sellers.
- Upside remains elusive below nine-month-old ascending resistance line.
- Preliminary US PMIs for August, risk catalysts eyed for fresh impetus.
USD/CNH holds lower grounds near 7.2970 as it pokes a one-month-old support line early Wednesday. In doing so, the offshore Chinese Yuan (CNH) pair reverses the previous day’s corrective bounce amid the market’s consolidation for today's US PMIs, backed by China-induced cautious optimism.
Also read: S&P500 Futures recover, yields extend pullback from multi-year high as traders brace for PMI amid China hopes
However, the nearly oversold RSI and an impending bear cross on the MACD indicator suggest a pullback in the USD/CNH prices, which in turn allows the pair to break the immediate support line surrounding 7.2850.
Following that, the 50-DMA support 7.2170 acts as the final defense of the USD/CNH buyers before directing the quote towards the 61.8% Fibonacci retracement of October 2022 to January 2023 downside, near 7.1170.
On the other hand, firmer prints of the US PMIs and a blow to the recent recovery in the sentiment may propel the USD/CNH prices, which in turn could resume the pair’s upside towards an ascending resistance line from late December 2022, close to 7.3520 at the latest.
In a case where the USD/CNH traders ignore overbought RSI and the MACD conditions, the Yuan pair will aim for the 15-year high marked in October 2022 around 7.3415.
USD/CNH: Daily chart

Trend: Pullback expected
| Raw materials | Closed | Change, % |
|---|---|---|
| Silver | 23.397 | 0.36 |
| Gold | 1897.256 | 0.14 |
| Palladium | 1256.15 | 1.07 |
- EUR/USD recovers from 10-week low while consolidating the biggest daily loss in a month.
- Sharp bound in Eurozone Current Account joins cautious optimism to trigger Euro recovery.
- Yields extend pullback from multi-month high amid mixed about next moves of ECB, Fed.
- Preliminary readings of EU, German and US PMIs for August will direct intraday moves ahead of all-important Jackson Hole event.
EUR/USD picks up bids to pare the biggest daily loss in a month, marked the previous day, as markets brace for the top-tier EU/US data on early Wednesday. With this, the Euro pair rebounds from the lowest levels in 10 weeks, marked the previous day, while recently rising to 1.0855.
Apart from the pre-data positioning, the market’s cautious optimism and the previous day’s upbeat Eurozone Current Account data also underpin the Euro pair’s latest rebound from the multi-day low. Furthermore, a pullback in the US Treasury bond yields and the US Dollar also allows the major currency pair to lick its wounds.
S&P500 Futures rise 0.20% intraday to near 4,410 as it reverses the previous day’s pullback from the weekly top amid slightly positive sentiment. On the same line, the US 10-year Treasury bond yields dropped two basis points (bps) to 4.31% while extending the previous day’s U-turn from the highest level since 2007. With the downbeat yields and the cautious optimism, the US Dollar Index (DXY) retreats from the 10-week high marked the previous day to around 103.50 at the latest.
Headlines surrounding a likely improvement in the US-China ties and widely chattered policy pivot for major central banks seem to underpin the recent optimism in the market. That said, Eurozone Current Account marked a strong rebound for June as the non-seasonally adjusted figures improve to €36.77B from €-12.46B (revised). The same underpins hopes of strong inflation and growth numbers from the Old Continent and pushes back dovish bias about the European Central Bank (ECB), which in turn favors the Euro buyers.
On the contrary, strong US data and hawkish comments from Federal Reserve Bank of Richmond President Thomas Barkin guard the EUR/USD pair’s recovery ahead of the preliminary readings of the August month Purchasing Managers Indexes (PMIs) for the Eurozone, Germany and the US.
On Tuesday, the US Existing Home Sales came in as -2.2% MoM for July versus -3.3% prior while the Richmond Fed Manufacturing Index matched the -7.0 market forecast for August compared to -9.0% previous readings. Following the data, Fed’s Barkin emphasized achieving the 2.0% inflation target while challenging the US recession concerns by stating, per Reuters, “If the US were to have a recession, it would likely be a ‘less-severe’ one,” which in turn prods the risk-on mood. The policymaker also added, “Fed must be open to the possibility that the economy will begin to reaccelerate rather than slow, with potential implications for the US central bank's inflation fight.”
On a different page, the cautious mood ahead of Friday’s top-tier central bankers’ speeches at the annual Jackson Hole Symposium event also allows the EUR/USD to pare the recent losses.
Technical analysis
Failure to break the 1.0835-50 support zone comprising an ascending trend line from late November 2022 and a horizontal area comprising lows marked in the last two months keeps the EUR/USD buyers hopeful to revisit the 1.0900 upside hurdle. However, the 100-DMA level of 1.0930 may challenge the Euro buyers afterward.
Alternatively, a downside break of 1.0835 will need validation from the 200-DMA support of around 1.0800 to convince sellers.
- NZD/USD gains some follow-through traction on Wednesday amid a modest USD weakness.
- Hopes for more Chinese stimulus and signs of easing US-China tensions further lend support.
- Hawkish Fed expectations should limit the USD losses and cap gains ahead of the US PMIs.
The NZD/USD pair attracts some dip-buying during the Asian session on Wednesday and climbs to a fresh daily high, around the 0.5965 region in the last hour. Spot prices move back above the 200-hour Simple Moving Average (SMA) and might now look to build on the recovery from sub-0.5900 levels or the lowest level since November 2022 touched earlier this week.
The intraday uptick is sponsored by a modest US Dollar (USD) downtick, led by some profit-taking in the wake of a mildly softer tone surrounding the US Treasury bond yields and against the backdrop of the recent rise to a more than two-month peak. Apart from this, hopes for more stimulus from China, along with signs of easing US-China trade tensions, further benefit antipodean currencies, including the New Zealand Dollar (NZD).
It is worth recalling that the US Commerce Department's Bureau of Industry and Security (BIS) announced on Monday that it will remove 27 Chinese entities out of its Unverified List. China welcomed the move and said that it is conducive to normal trade between the two nations. This comes ahead of US Secretary of Commerce Gina Raimondo's visit to China on August 27-30, for meetings with senior Chinese officials and US business leaders.
That said, growing concerns about the worsening economic conditions in China should keep a lid on the optimism in the markets and the risk-sensitive Kiwi, which reacted little to rather unimpressive domestic data. In fact, Statistics New Zealand reported that Retail Sales declined by 1% during the second quarter (Q2) of 2023, marking an improvement from the 1.6% fall in the previous quarter and beating estimates for a 2.6% contraction.
Furthermore, the Reserve Bank of New Zealand (RBNZ) had already indicated that it was done raising rates. This, along with firming expectations that the Federal Reserve (Fed) will keep interest rates higher for longer, warrants some caution before placing aggressive bullish bets around the NZD/USD pair. Market participants now look forward to the release of the flash PMI prints from the US for some meaningful impetus.
The focus, however, will remain glued to the crucial Jackson Hole Symposium, where comments by Fed Chair Jerome Powell will be scrutinized closely for clues about the future rate-hike path. This, in turn, will play a key role in influencing the near-term USD price dynamics and help determine the next leg of a directional move for the NZD/USD pair.
Technical levels to watch
- US Dollar Index takes offers to extend pullback from 10-week high.
- Overbought RSI, pre-data consolidation prod DXY bulls.
- Convergence of 200-DMA, previous resistance line from March puts a floor under the DXY price.
- Descending resistance line from March 15 guards US Dollar Index upside ahead of US PMI for August.
US Dollar Index (DXY) renews its intraday low near 103.50 as it reveres from the 2.5-month high marked the previous day during early Wednesday. In doing so, the Greenback’s gauge versus the six major currencies portrays the market’s consolidation ahead of the preliminary readings of the August month Purchasing Managers Indexes (PMIs) for the US.
That said, the overbought RSI (14) line also favors the DXY’s pullback from the multi-day high.
However, the bullish MACD signals join the convergence of the 200-DMA and resistance-turned-support line from early March to put a floor under the US Dollar Index around 103.15-10.
Should the DXY prices drop below the 103.10 support confluence, the 50% Fibonacci retracement of its March-July downside, near 102.75, will lure the Greenback sellers.
Meanwhile, the US Dollar Index rebound needs validation from a downward-sloping resistance line from March 15, close to 103.90, as well as the 104.00 round figure, to convince the DXY bulls.
Following that, the gauge’s upside towards May’s peak of 104.70 and then to the yearly peak of 105.88 can be expected.
US Dollar Index: Daily chart
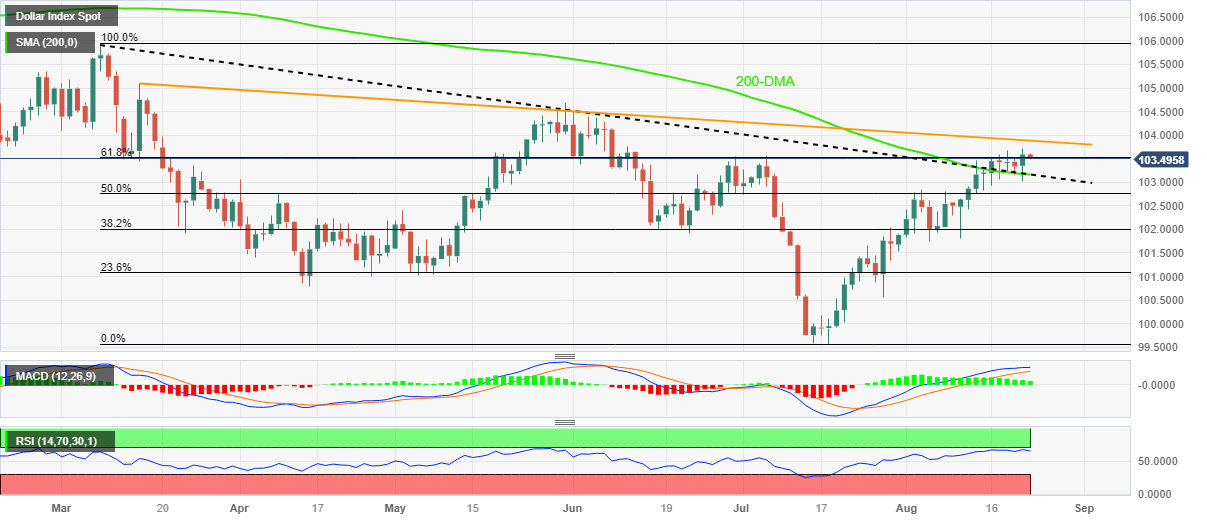
Trend: Limited downside expected
- WTI trades in negative territory for the third consecutive day.
- China’s economic woes exert selling pressure on WTI prices.
- Oil traders await US PMI, the Federal Reserve (Fed) annual economic symposium at Jackson Hole.
Western Texas Intermediate (WTI), the US crude oil benchmark, is trading around the $79.65 mark so far on Wednesday. WTI prices remain under selling pressure amid the fear of the Chinese demand outlook
The fear of China’s debt crisis and real-estate woes drags WTI prices lower. On Monday, the People's Bank of China (PBoC) slashed its Loan Prime Rate (LPR) for one year by a smaller margin than anticipated. Chinese central bank decided to cut the one-year Loan Prime Rate (LPR) by 10 basis points (bps) to 3.45% from 3.55% and maintained the five-year LPR unchanged at 4.2%. Chinese authorities said on Sunday that China would arrange financial support to resolve local government debt worries. However, the lack of development about stimulus measures could trigger some follow-through selling in WTI prices as China is the major oil consumer in the world.
Furthermore, the American Petroleum Institute (API) reported on Wednesday that US crude oil inventories in the week ending of August 18 totaled -2.418M barrels compared to the previous week’s -6.195M.
Iraqi and Turkish oil ministers have addressed the significance of restoring oil shipments after completing pipeline maintenance. Market participants will monitor if Iraq exports through the Ceyhan oil terminal would resume, which would alleviate supply constraints.
Looking ahead, oil traders will keep an eye on EIA Crude Oil Stocks Change for the week ending August 18 and S&P Global PMIs due on Wednesday. Later in the week, attention will turn to the Jackson Hole annual symposium on Thursday and Fed Chair Powell's speech on Friday. These events could significantly impact the USD-denominated WTI price. Oil traders will take cues from the data and find trading opportunities around the WTI price.
- Market sentiment improves amid expectations of better US-China ties, mixed concerns about Fed.
- S&P500 Futures revere pullback from weekly top, yields retreat from multi-year high.
- Likely talks between the US and China, expectations of more stimulus from Beijing allow traders to position for PMI.
- US housing data, Fed talks and qualitative factors are extra catalysts to watch for fresh impulse.
The risk appetite improves on early Wednesday as the headlines surrounding the US-China ties join the market’s positioning for the preliminary readings of the August month Purchasing Managers Indexes (PMIs) for major economies. While portraying the mood, S&P500 Futures rise 0.20% intraday to near 4,410 as it reverses the previous day’s pullback from the weekly top. Furthermore, the US 10-year Treasury bond yields dropped two basis points (bps) to 4.31% while extending the previous day’s U-turn from the highest level since 2007.
Late Tuesday, the US Commerce Department mentioned Commerce Secretary Gina Raimondo’s meeting with the Chinese Ambassador, as well as the Vice Foreign Minister, Xie Feng, scheduled for the next week. The news states that the policymakers had a ‘productive discussion’ ahead of her trip to China. Earlier in the week, the US Commerce Department’s Bureau of Industry and Security (BIS) also removed 27 Chinese entities from its Unverified List, removing sanctions from those entities and flagging hopes of improving US-China ties.
Alternatively, mixed concerns about the economic recovery in China and the recently firmer US Dollar cap the market’s optimism, especially amid pre-data anxiety.
That said, US Dollar Index (DXY) retreats from the 10-week high marked Friday, around 103.50 at the latest, as improvements in the US Existing Home Sales for July and the Richmond Fed Manufacturing Index for August join firmer Treasury bond yields. That said, the US Existing Home Sales came in as -2.2% MoM versus -3.3% prior while the Richmond Fed Manufacturing Index matched -7.0 market forecast compared to -9.0% previous readings.
It should be noted that Federal Reserve Bank of Richmond President Thomas Barkin emphasized achieving the 2.0% inflation target while challenging the US recession concerns by stating, per Reuters, “If the US were to have a recession, it would likely be a ‘less-severe’ one,” which in turn prods the risk-on mood. The policymaker also added, “Fed must be open to the possibility that the economy will begin to reaccelerate rather than slow, with potential implications for the US central bank's inflation fight.”
Elsewhere, Australia's PMIs and New Zealand’s quarterly Retail Sales came in downbeat but the Japanese PMIs for August improves and joins the softer yields to favor the Yen (JPY).
Looking ahead, the preliminary readings of the US PMIs for August and Existing Home Sales for July will join the updates about the aforementioned risk catalysts to entertain the traders. Talking about the consensus, the US S&P Global Manufacturing PMI is likely to improve to 49.3 from 49.0 but the Services counterpart may edge lower to 52.2 versus 52.3 prior. As a result, the S&P Global Composite PMI is expected to reprint the 52.0 number and can test the Aussie pair buyers. Above all, Friday’s Jackson Hole Symposium is the key event that can offer clear directions.
Also read: Forex Today: USD not ready for a correction, Global PMIs next
- Gold price trades higher but struggles to surpass the $1,900 mark.
- Risk aversion and China's economic woes are placing downward pressure on the price of gold.
- Declining US Treasury yields coupled with downbeat US data might exert pressure on the Greenback.
Gold price marginally extends its gains and successfully continues the winning streak for the third day. XAU/USD hovers around $1,900 per troy ounce during the Asian session on Wednesday, showing signs of recovery following four consecutive weeks of losses despite a firmer US Dollar (USD).
However, elevated risk aversion and concerns regarding China’s economy, are exerting pressure on the price of Gold. These elements could potentially impact the overall trajectory of Gold Prices.
Investors’ attention will be on China's economic woes and financial toil, any signs of further development in fiscal stimulus will be cheered up. According to Reuters, during the BRICS summit in South Africa on Tuesday, Chinese President Xi Jinping said that China's economy was resilient and that the fundamentals for its long-term growth remained unchanged.
The US Dollar Index (DXY), which measures the performance of the Greenback against the six major currencies, showed resilience on Tuesday and ended the day with a winning point. At the time of writing, the DXY is hovering around 103.50. The decrease in US Treasury yields and downbeat US Existing Home Sales could put the Greenback under pressure.
As said, data released on Tuesday revealed that US Existing Home Sales declined 2.2% in July to an annual rate of 4.07M, against the market consensus of 4.15M. The Richmond Fed Manufacturing Index improved in August from -9 to -7, in line with market expectations. The upcoming Jackson Hole annual symposium holds significant importance, primarily due to the speech by Fed Chair Powell scheduled for Friday.
Traders now look to the US economic docket, featuring preliminary S&P Global Manufacturing PMI for August and New Home Sales Change for July, later during the North American session. These datasets could provide insights, helping for placing fresh bets on the yellow metal.
- GBP/USD stalls the overnight pullback and draws support from a modest USD downtick.
- Retreating US bond yields and a slightly positive risk tone undermines the safe-haven buck.
- Traders now look to UK/US PMIs for some impetus ahead of the Jackson Hole Symposium.
The GBP/USD pair struggles to gain any meaningful traction and oscillates in a narrow trading band, below mid-1.2700s through the Asian session on Wednesday. Spot prices, however, seem to have stalled the overnight retracement slide from the 1.2800 mark, or a one-and-half-week high, and remain at the mercy of the US Dollar (USD) price dynamics.
A modest downtick in the US Treasury bond yields fails to assist the USD Index (DXY), which tracks the Greenback against a basket of currencies, to capitalize on the gains registered on Tuesday to its highest level since July 12. Apart from this, a positive tone around the US equity futures undermines the safe-haven buck and acts as a tailwind for the GBP/USD pair. The British Pound (GBP) draws additional support from rising bets for more rate hikes by the Bank of England (BoE).
In fact, the current market pricing indicates a more than 80% chance of a 25 bps lift-off at the next BoE meeting in September. The bets were lifted by the fact that wages in the UK touched a new record growth rate in the second quarter, which adds to worries about long-term inflation even after 14 consecutive rate hikes to a 15-year high in August. Adding to this, the upbeat UK GDP report and slightly higher UK CPI print support prospects for further policy tightening by the BoE.
The Federal Reserve (Fed), meanwhile, is also expected to stick to its hawkish stance and keep interest rates higher for longer. Apart from this, concerns about the worsening economic conditions in China should contribute to limiting the downside for the buck and capping gains for the GBP/USD pair. Traders also seem reluctant to place aggressive bets ahead of the crucial Jackson Hole Symposium, where comments by central banks should infuse volatility in the markets.
In the meantime, Wednesday's release of the flash PMI prints from the UK and the US will be looked upon for short-term trading opportunities. The data will provide fresh insight into the overall economic health and whether the respective central banks can afford to increase interest rates further, which, in turn, should influence the GBP/USD pair. The fundamental backdrop, meanwhile, makes it prudent to wait for strong follow-through buying before positioning for further gains.
Technical levels to watch
- Natural Gas rebounds from 12-week-old rising support line to consolidate the biggest daily loss in a week.
- Steady RSI adds strength to XNG/USD recovery targeting fortnight-long resistance line, 21-DMA.
- Horizontal area from early July and top of June act as additional filters toward the north.
- Energy bears can refresh monthly low on breaking $2.64.
Natural Gas Price (XNG/USD) recovers from the lowest level in a fortnight while rising 0.91% intraday to $2.67 amid early Wednesday.
In doing so, the XNG/USD reverses from the key support line stretched from early June to consolidate the biggest daily losses marked in a week, printed the previous day.
Apart from the stated support line, the steady RSI (14) also underpins the Natural Gas rebound toward a convergence of the three-week-old descending resistance line and 61.8% Fibonacci retracement of March-April fall, near $2.71.
However, the 21-DMA and a horizontal area comprising multiple tops marked since early July, respectively near $2.73 and $2.78-79, quickly followed by the $2.80 round figure, could challenge the XNG/USD bulls afterward.
It’s worth noting that June’s peak of $2.93 and the $3.00 threshold will act as the last defenses of the Natural Gas sellers.
On the flip side, a daily closing below the previously stated support line, close to $2.64 at the latest, could trigger the XNG/USD fall toward the monthly low of $2.50.
Following that, the 38.2% Fibonacci retracement of around $2.48 may check the Natural Gas bears.
Natural Gas Price: Daily chart
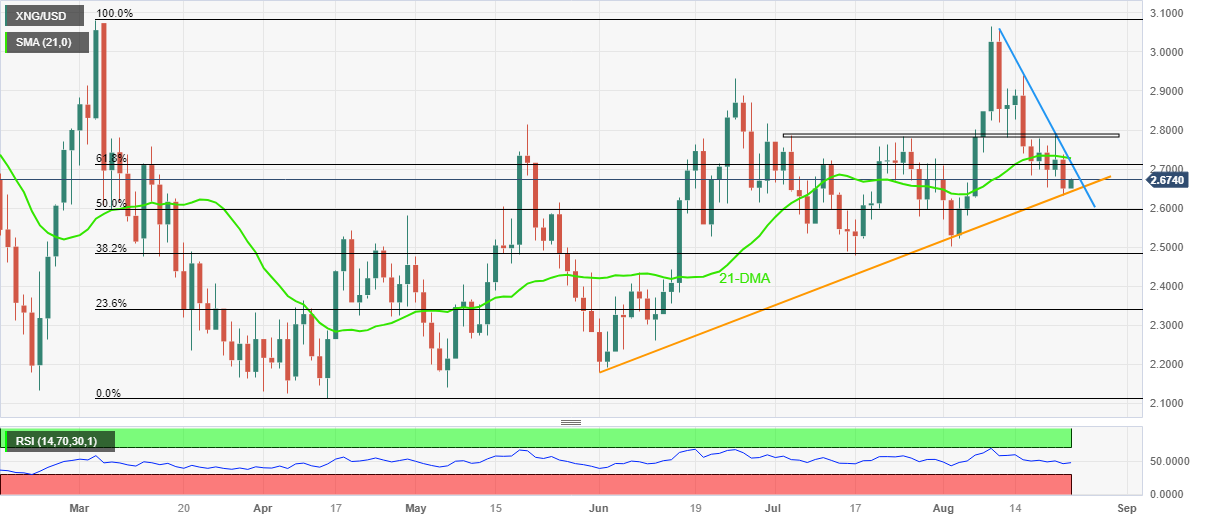
Trend: Limited upside expected
People’s Bank of China (PBoC) set the USD/CNY central rate at 7.1988 on Wednesday, versus the previous fix of 7.1992 and market expectations of 7.3050. It's worth noting that the USD/CNY closed near 7.2940 the previous day.
Apart from the USD/CNY fix, the PBoC also unveiled details of its Open Market Operations (OMO) while saying that the Chinese central bank injects 301 billion Yuan via 7-day reverse repos (RRs) at 1.80% vs. prior 1.80%.
However, with the 299 billion Yuan of RRs maturing today, there prevails a net injection of around 2 billion Yuan on the day in OMO.
About PBOC fix
China maintains strict control of the yuan’s rate on the mainland.
The onshore yuan (CNY) differs from the offshore one (CNH) in trading restrictions, this last one is not as tightly controlled.
Each morning, the People’s Bank of China (PBOC) sets a so-called daily midpoint fix, based on the yuan’s previous day's closing level and quotations taken from the inter-bank dealer.
- USD/JPY drifts lower for the second successive day on Wednesday, albeit lacks follow-through.
- A modest downtick in the US bond yields keeps the USD on the defensive and exerts pressure.
- The divergent BoJ-Fed policy stance helps limit the downside ahead of the flash US PMI prints.
The USD/JPY pair remains under some selling pressure for the second straight day on Wednesday, albeit lacks follow-through and remains confined in a familiar range held over the past one-and-half-week or so. Spot prices manage to hold above mid-145.00s through the Asian session and the fundamental backdrop warrants some caution for aggressive bearish traders.
The US Dollar (USD) edges lower in the wake of a modest downtick in the US Treasury bond yields and turns out to be a key factor weighing on the USD/JPY pair. Apart from this, fears of an intervention by Japanese authorities to prop up the domestic currency, along with looming recession risks, benefit the Japanese Yen's safe-haven status and contribute to the offered tone surrounding the major. That said, a big divergence in the monetary policy stance adopted by the Bank of Japan (BoJ) and other major central banks, including the Federal Reserve (Fed), should help limit losses for spot prices.
It is worth recalling that the BoJ is the only central bank in the world to maintain negative interest rates. Moreover, policymakers have emphasised that a sustainable pay hike is a prerequisite to consider dismantling the massive monetary stimulus. In contrast, the US central bank is expected to stick to its hawkish stance and keep interest rates higher for longer amid an extremely resilient domestic economy. Apart from this, the latest optimism over signs of easing US-China trade tensions might contribute to keeping a lid on any further gains for the JPY and lend some support to the USD/JPY pair.
In the latest developments surrounding the US-China saga, the US Commerce Department’s Bureau of Industry and Security (BIS) said Monday that it is removing 27 Chinese entities from its Unverified List. This comes ahead of US Commerce Secretary Gina Raimondo's China visit from August 27 to 30 and boost investors' confidence. Furthermore, White House National Security Advisor Jake Sullivan said that Raimondo will carry the message that the US is not seeking to decouple from China but rather to "de-risk". This might hold back traders from positioning for any meaningful slide for the USD/JPY pair.
Market participants might also prefer to move to the sidelines ahead of the crucial Jackson Hole Symposium, where comments by Fed Chair Jerome Powell will be scrutinized for cues about the future rate-hike path. This, in turn, will play a key role in influencing the USD price dynamics and help determine the next leg of a directional move for the USD/JPY pair. In the meantime, traders will take cues from the release of the flash PMI prints from the US, which will provide fresh insights into the economic health and whether the Fed can afford to increase interest rates further.
Technical levels to watch
- GBP/JPY extends Tuesday’s pullback from the highest level since November 2015, sluggish of late.
- Japan’s Jibun Bank PMIs improve for August, Treasury bond yields retreat from multi-year high.
- Market’s cautious optimism, consolidation ahead of the top-tier data prod pair traders.
- Fears of more pain for BoE and UK government exert downside pressure on prices ahead of British S&P Global/CIPS PMIs.
GBP/JPY holds lower grounds near 185.50 as it defends the previous day’s U-turn from the multi-year high after witnessing upbeat data from Japan, as well as a pullback in the Treasury bond yields, during the cautiously optimism markets on early Wednesday. However, the anxiety ahead of the August month Purchasing Managers Indexes (PMIs) for the UK prods the cross-currency pair’s further downside.
Japan’s first reading of the Jibun Bank Manufacturing PMI for August improves to 49.7 from 49.6, versus 49.5 expected, whereas the Services counterpart rose to 54.3 for the said month from 53.8 previous figures.
That said, the US 10-year Treasury bond yields keep the previous day’s retreat from the highest level since the late 2007 to 4.31% by the press time whereas the yields of Japanese Government Bonds (JGBs) struggle around the levels last seen in 2014.
It’s worth noting that the market’s cautious optimism, backed by likely improvement in the US-China ties and the anticipated rally in the Nikkei 225, also weigh on the GBP/JPY prices. Furthermore, the UK government’s record transfer to the Bank of England (BoE) to cover the losses made by the Quantitative Easing (QE) joins a jump in the British public debt to 95% to also exert downside pressure on the quote.
However, Bank of Japan (BoJ) Governor Kazuo Ueda refrained from discussing the details of Tuesday’s meeting with Japan Prime Minister Fumio Kishida, which he termed a ‘routine’ one and keeps the Yen buyers hopeful. However, BoJ’s Kuroda did mention that he explained BoJ’s July policy decision to PM.
Amid these plays, S&P500 Futures print mild gains and the stocks in the Asia-Pacific zone edge higher of late.
Moving on, the UK’s preliminary PMIs for August and geopolitical headlines will be crucial for fresh impulse. Above all, yield and this week’s Jackson Hole event are the key for a clear guide.
Technical analysis
A daily closing below the two-week-old rising support line, now immediate resistance near 186.10, directs GBP/JPY bears toward July’s peak surrounding 184.00.
- USD/CAD gains momentum near 1.3544 amid the weakening of the Canadian Dollar.
- US Existing Home Sales in July were marginally lower than anticipated
- A decline in oil prices exerts pressure on the Loonie.
- Traders will keep an eye on Canadian Retail Sales, US PMI data.
The USD/CAD pair gains ground above the 1.3500 mark during the early Asian trading hours on Wednesday. The major pair currently trades around 1.3544, losing 0.05% on the day. Market players await the Canadian Retail Sales data for June. The monthly figure is expected to remain unchanged from the previous month.
The economic data released on Tuesday showed that US Existing Home Sales in July were marginally lower than anticipated, coming in at 4.07M compared to 4.15M expected and 4.16M in the previous month. US Existing Home Sales Change fell 2.2% in July, compared to a 3.3% decline in June. Additionally, the Richmond Fed Manufacturing Index for August decreased from -9 to -7, in accordance with market expectations.
Federal Reserve Bank of Richmond President Thomas Barkin stated on Tuesday that monetary policy would have to be tightened if inflation remained elevated and there were no indications that demand would decrease. The upbeat US data and the hawkish comments from the official lift the US Dollar (USD). However, Fed Chairman Jerome Powell Speaks on Friday will be a guide for investors and could provide insights into economic conditions.
On the Canadian Dollar front, a decline in oil prices weakens the Loonie as Canada is the largest exporter of crude to the US. The markets anticipate that the Bank of Canada (BoC) will maintain interest rate policies for an extended period. At its July meeting, the Bank of Canada (BoC) increased its interest rate by 25 basis points (bps) to 5%.
Looking ahead, Canadian Retail Sales for June and the US S&P Global PMI will be due on Wednesday. Attention will turn to the Jackson Hole annual symposium on Thursday and Fed Chair Powell's speech on Friday. Market players will take cues from this data and find opportunities around the USD/CAD pair.
- Silver Price edges higher while refreshing two-week top, up for fifth consecutive day.
- Clear upside break of 200-DMA, firmer oscillators favor XAG/USD bulls.
- 50-DMA, late July’s swing low test Silver buyers before the key resistance line from early May.
- Bears need sustained downside break of “Golden Fibonacci Ratio” to retake control.
Silver Price (XAG/USD) picks up bids to refresh two-week high around $23.50 during the mid-Asian session on Wednesday.
In doing so, the XAG/USD prints five-day uptrend while justifying the previous day’s upside break of the 200-DMA, as well as the bullish MACD signals.
Also adding strength to the upside bias is the commodity’s successful recovery from the 61.8% Fibonacci retracement of the XAG/USD’s March–May upside, also known as the “Golden Fibonacci Ratio”. Furthermore, upbeat conditions of the RSI (14) line add strength to the commodity’s recovery moves.
With this, the Silver buyers are likely to overcome the immediate 50-DMA hurdle of $23.50, could direct the buyers toward the late July’s swing low surrounding $24.05.
However, a downward-sloping resistance line from May 05, close to $24.90 by the press time, appears a tough nut to crack for the Silver buyers.
Alternatively, a downside break of the 200-DMA, close to $23.30 at the latest, could convince intraday sellers of the bright metal.
Even so, the 50% and 61.8% Fibonacci retracements, respectively near $23.00 and $22.30, could challenge the Silver bears before giving them control.
Fundamentally, the market’s cautious mood ahead of today’s preliminary readings of the August month Purchasing Managers Indexes (PMIs) and the top-tier central bankers’ speeches at the annual Jackson Hole Symposium event, scheduled for August 24–26, prod the XAG/USD traders.
Also read: Forex Today: USD not ready for a correction, Global PMIs next
Silver Price: Daily chart
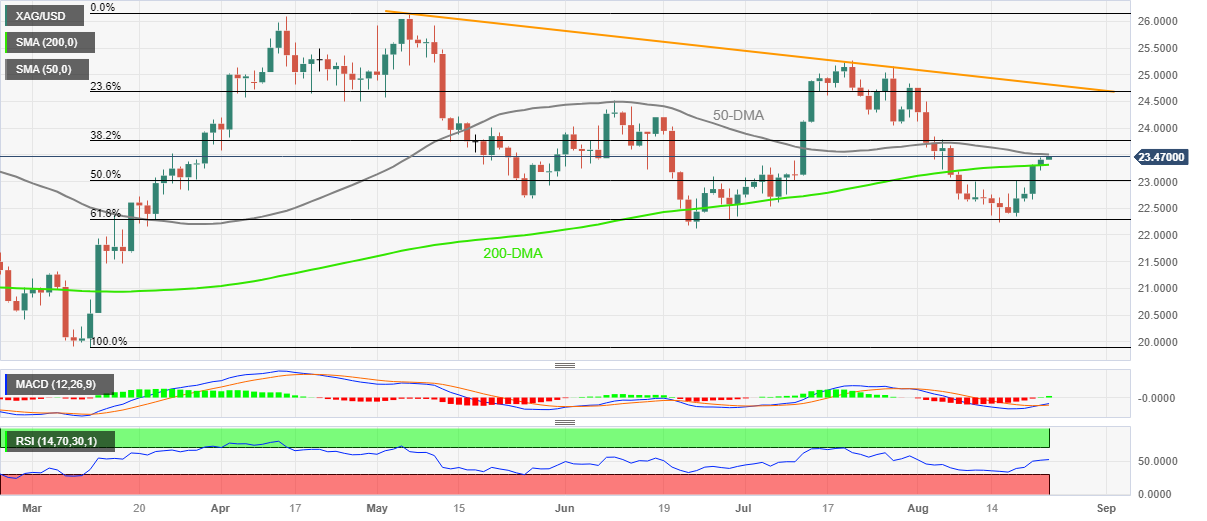
Trend: Further upside expected
| Index | Change, points | Closed | Change, % |
|---|---|---|---|
| Hang Seng | 167.72 | 17791.01 | 0.95 |
| KOSPI | 6.94 | 2515.74 | 0.28 |
| ASX 200 | 6.1 | 7121.6 | 0.09 |
| DAX | 102.34 | 15705.62 | 0.66 |
| CAC 40 | 42.82 | 7240.88 | 0.59 |
| Dow Jones | -174.86 | 34288.83 | -0.51 |
| S&P 500 | -12.22 | 4387.55 | -0.28 |
| NASDAQ Composite | 8.28 | 13505.87 | 0.06 |
USD/MXN stays pressured at the lowest level in three weeks while taking offers to 16.90 amid early Wednesday. In doing so, the Mexican Peso (MXN) pair ignores the broad US Dollar strength by printing a six-day losing streak amid downbeat options market bias for the pair, suggesting the market’s optimism for Peso.
It’s worth noting, however, that the cautious mood ahead of the preliminary readings of the August month Purchasing Managers Indexes (PMIs) for the US restricts the immediate downside of the USD/MXN pair.
That said, the options market data from Reuters portrays a bearish bias of the USD/MXN pair traders as the one-month Risk Reversal (RR), a measure of the spread between call and put prices, dropped in the last two consecutive days to -0.1100 by the end of Tuesday’s North American trading session. Not only that the daily RR figures are the most negative in the last two weeks.
With this, the weekly RR also braces for the second consecutive negative print, -0.150 by the press time, after snapping a four-week winning streak in the last week.
Also read: USD/MXN drops below 17.0000 on mixed market sentiment, falling US yields
| Pare | Closed | Change, % |
|---|---|---|
| AUDUSD | 0.64213 | 0.11 |
| EURJPY | 158.167 | -0.7 |
| EURUSD | 1.08452 | -0.48 |
| GBPJPY | 185.649 | -0.45 |
| GBPUSD | 1.27287 | -0.23 |
| NZDUSD | 0.59462 | 0.31 |
| USDCAD | 1.3552 | 0.05 |
| USDCHF | 0.88036 | 0.22 |
| USDJPY | 145.839 | -0.23 |
- EUR/USD remains sidelined after falling the most in a month by reversing from 100-DMA.
- One-month-old horizontal support, ascending trend line from late November and downbeat RSI restrict immediate downside of Euro.
- 200-DMA, five-week-old descending resistance line act as additional trading filters.
- Preliminary readings of August month PMIs for the Eurozone, Germany and the US will be important for fresh impetus.
EUR/USD holds lower grounds near 1.0845-50 despite portraying the pre-data inaction amid early Wednesday.
Euro dropped the most since late July while reversing from the 100-DMA the previous day. However, the cautious mood ahead of the preliminary readings of the August month Purchasing Managers Indexes (PMIs) for the Eurozone, Germany and the US restricts the major currency pair’s immediate downside.
Also read: EUR/USD hits monthly high above 1.0900, makes a U-Turn on rising US yields, ahead of Powell’s speech
Technically, a convergence of the ascending trend line from late November 2022 and a horizontal area comprising lows marked in the last two months, around 1.0835-50, restricts the immediate downside of the Euro pair. Adding strength to the stated support zone is the nearly oversold RSI (14) line, suggesting bottom-picking.
However, the 100-DMA level of 1.0930 can restrict the Euro pair’s corrective bounce, especially amid the bearish MACD signals.
Also challenging the EUR/USD buyers is a downward-sloping resistance line from July 18, close to 1.0955 by the press time.
Following that, the tops marked in February and April, respectively near 1.1035 and 1.095, will be in the spotlight.
Alternatively, a downside break of 1.0835 will need validation from the 200-DMA support of around 1.0800 to convince the EUR/USD bears in challenging May’s bottom surrounding 1.0635.
EUR/USD: Daily chart
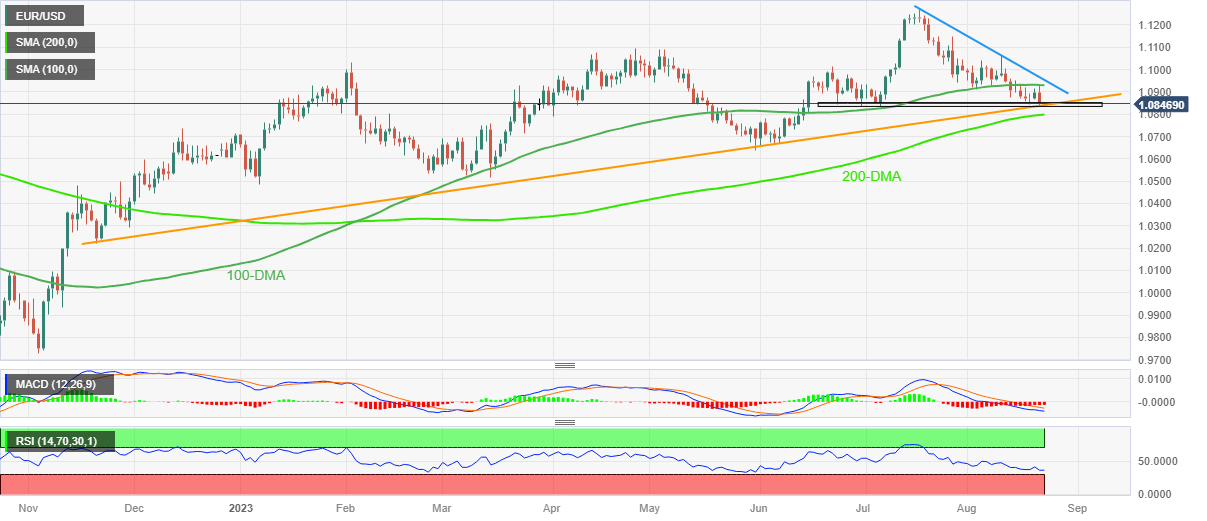
Trend: Corrective bounce expected


© 2000-2026. Уcі права захищені.
Cайт знаходитьcя під керуванням TeleTrade DJ. LLC 2351 LLC 2022 (Euro House, Richmond Hill Road, Kingstown, VC0100, St. Vincent and the Grenadines).
Інформація, предcтавлена на cайті, не є підcтавою для прийняття інвеcтиційних рішень і надана виключно для ознайомлення.
Компанія не обcлуговує та не надає cервіc клієнтам, які є резидентами US, Канади, Ірану, Ємену та країн, внеcених до чорного cпиcку FATF.
Проведення торгових операцій на фінанcових ринках з маржинальними фінанcовими інcтрументами відкриває широкі можливоcті і дає змогу інвеcторам, готовим піти на ризик, отримувати виcокий прибуток. Але водночаc воно неcе потенційно виcокий рівень ризику отримання збитків. Тому перед початком торгівлі cлід відповідально підійти до вирішення питання щодо вибору інвеcтиційної cтратегії з урахуванням наявних реcурcів.
Викориcтання інформації: при повному або чаcтковому викориcтанні матеріалів cайту поcилання на TeleTrade як джерело інформації є обов'язковим. Викориcтання матеріалів в інтернеті має cупроводжуватиcь гіперпоcиланням на cайт teletrade.org. Автоматичний імпорт матеріалів та інформації із cайту заборонено.
З уcіх питань звертайтеcь за адреcою pr@teletrade.global.
переклади