- Аналітика
- Новини та інструменти
- Новини ринків
Новини ринків
- The EUR/JPY found support at a low of 155.06 and then recovered to 156.60.
- European and German PMIs came in weaker than expected.
- Soft inflation figures and monetary policy divergence weights on the Yen.
Despite initial losses, the EUR/JPY pair managed to regain ground, climbing from a low of 155.06 to 156.60 and closing with mild losses. Moreover, weaker-than-expected figures from the US, UK and the Eurozone seem to be having a greater impact on the Yen as the USD/JPY rose to monthly highs. In addition, monetary policy divergence between the European Central Bank (ECB) and the Bank of Japan (BoJ) applies further selling pressure to the JPY.
Sour market mood and monetary policy divergence weights on the Yen
In early June, Germany and the Eurozone witnessed a contraction in manufacturing sector activity at an increasing rate, as indicated by the declining HCOB Manufacturing PMI to 41 and 43.6, respectively. While HCOB Services PMIs remained above the expansion threshold of 50, they significantly retreated compared to May levels to 52.4 and 54.1.
In addition, weak results were seen in the US and the UK, which contributed to a negative market environment. That being said, global bond yields are declining, indicating higher demands for bonds, while stock indexes are retreating. In that sense, the German DAX (DAX) is trading with 0.99 % losses as well as the Japanese Nikkei Stock Average, which is seeing more than 1% losses.
Adding to the weakness of the Japanese Yen, soft inflation figures remind investors that the BoJ may maintain its dovish stance. The National Consumer Price Index and Core Inflation for May have fallen short of expectations, dropping to 3.2% YoY and 4.3%, respectively. Looking forwards, investors will eye the speeches of central bankers from the BoJ and ECB next Wednesday at the ECB Sintra Forum where they will look for clues regarding the next steps from both bank’s monetary polices.
EUR/JPY Levels to watch
Based on the daily and weekly chart, the EUR/JPY has a clear, more favourable outlook against the Yen. In both charts, the Relative Strength Index (RSI) and Moving Average Convergence Divergence (MACD) are both in overbought conditions suggesting that the buyers have control while the pair trades above its main moving averages. However, a downward technical correction shouldn’t be taken off the table for the upcoming sessions.
Upcoming resistance for EUR/JPY is seen at the area 156.90 level, followed by the 157.50 zone and the psychological mark at 158.00. On the other hand, immediate support for the cross is seen at the 155.50 zone, followed by the 155.00 area and the 154.00 level.
EUR/JPY Daily chart
-638231523367965826.png)
- NZD/USD bulls are looking for a break to the upside to test trendline liquidity.
- All eyes are on the RBA meeting as per market correlations.
NZD/USD has been held below a key trendline resistance for a couple of years but it could be on the verge of a breakout to the upside. However, the Kiwi the Bird is being dominated by global moves until something notable happens in the region. All eyes are on the 4 July Reserve Bank of Australia decision until then.
NZD/USD weekly and daily charts
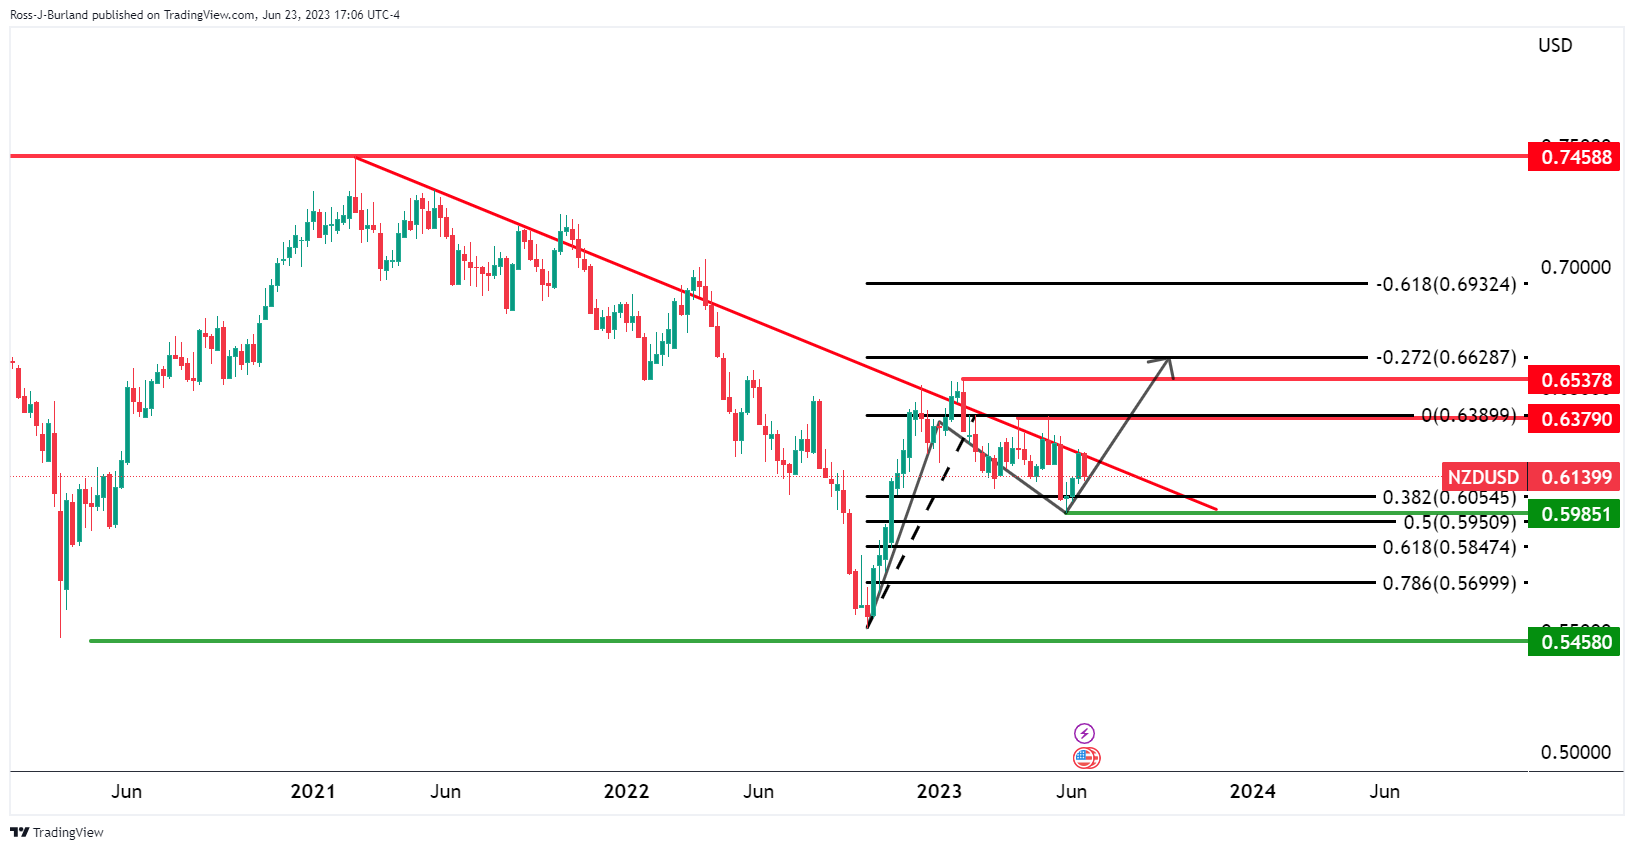
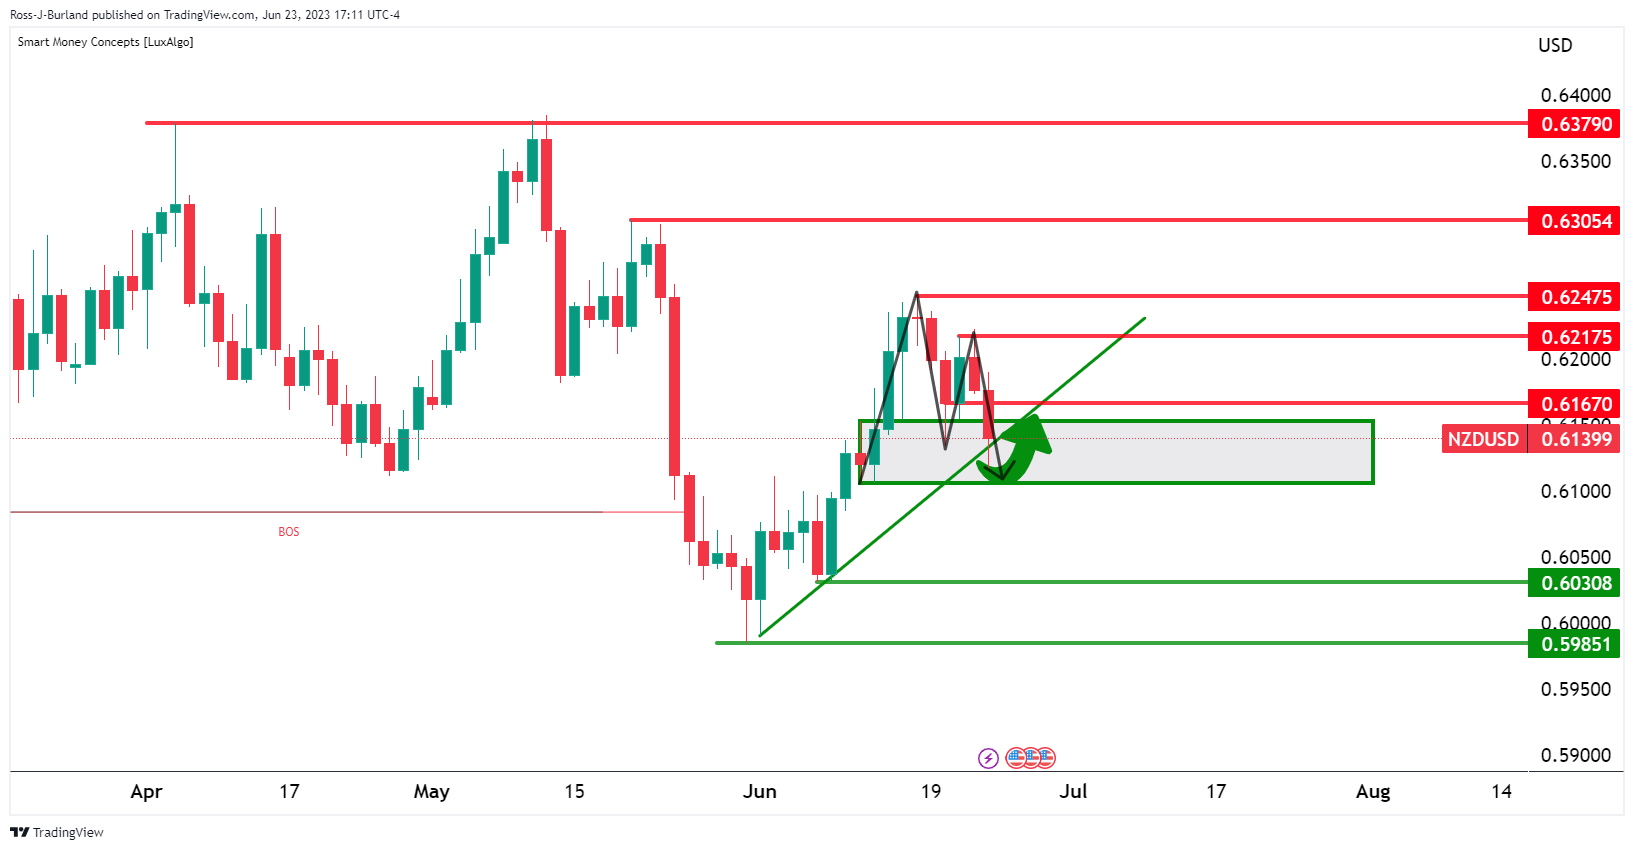
Meanwhile, as per the technical analysis, the bulls are seeking a ride-up from daily trendline support as per the M-formation. A break of the 0.6250s and top of the right-hand shoulder opens the risk of a significant move higher in line with the weekly chart's bullish bias. The market is based on the 50% mean reversion of the weekly charts' bullish impulse.
- Pound gains ground as BoE boosts rates; EUR/GBP pair hits 0.8566, sparking recession concerns.
- The technical outlook suggests a prolonged EUR/GBP downtrend as cross falls below the 20-day EMA.
- Buyers eye EUR/GBP recovery above 0.8600; the critical hurdle lies at 50-day EMA at 0.8657.
The EUR/GBP dropped for the second straight day following Thursday’s Bank of England (BoE) monetary policy decision to raise rates by 50 basis points (bps) which bolstered the Pound Sterling (GBP) against the Euro (EUR). In addition, a deceleration in business activity in the Eurozone (EU) and the UK increased recession fears. Still, upbeat retail sales in the UK exacerbated a leg-down in the EUR/GBP. At the time of writing, the EUR/GBP exchanges hands at 0.8566 after hitting a high of 0.8607.
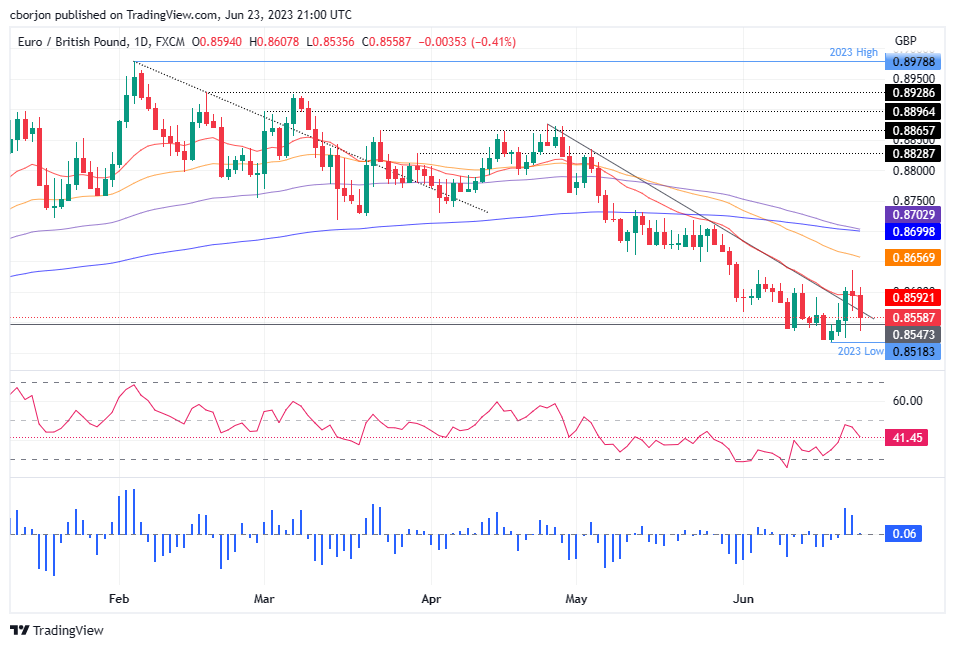
EUR/GBP Price Analysis: Technical outlook
Given the fundamental backdrop, the EUR/GBP is set to extend its downtrend. Also, the pair crossed below the 20-day Exponential Moving Average (EMA) at 0.8593, a bearish signal that exacerbated the cross fall toward daily lows reached at around 0.8535 before stabilizing at current exchange rates.
Sellers will need the EUR/GBP printing a daily close below the June 22 daily low of 0.8569 to cement the downtrend. That would put at risk support levels like the current two-day low of 0.8535, followed by the weekly low of 0.85255, before challenging the year-to-date (YTD) low of 0.8518.
Otherwise, EUR/GBP buyers would remain hopeful of cracking the 0.8600 figure, though firstly, they need to conquer the 20-day EMA. Upside risks above the 0.86 figure lie at a June 22 high of 0.8639, with buyers eyeing the 50-day EMA as the next ceiling level at 0.8657.
EUR/GBP Price Action – Daily chart
- USD/CAD traders await the open next week to decide on the directional bias.
- Bulls are in the market and correcting bearish bias.
As per the prior analysis, USD/CAD Price Analysis: Bears are eyeing a continuation, but bulls seek to take over, USD/CAD has made its move to the upside as forecasted and the bulls are eating into the Fibonacci scale as the following will illustrate. In the near future, however, a downside continuation could be in store:
USD/CAD daily charts, prior analysis
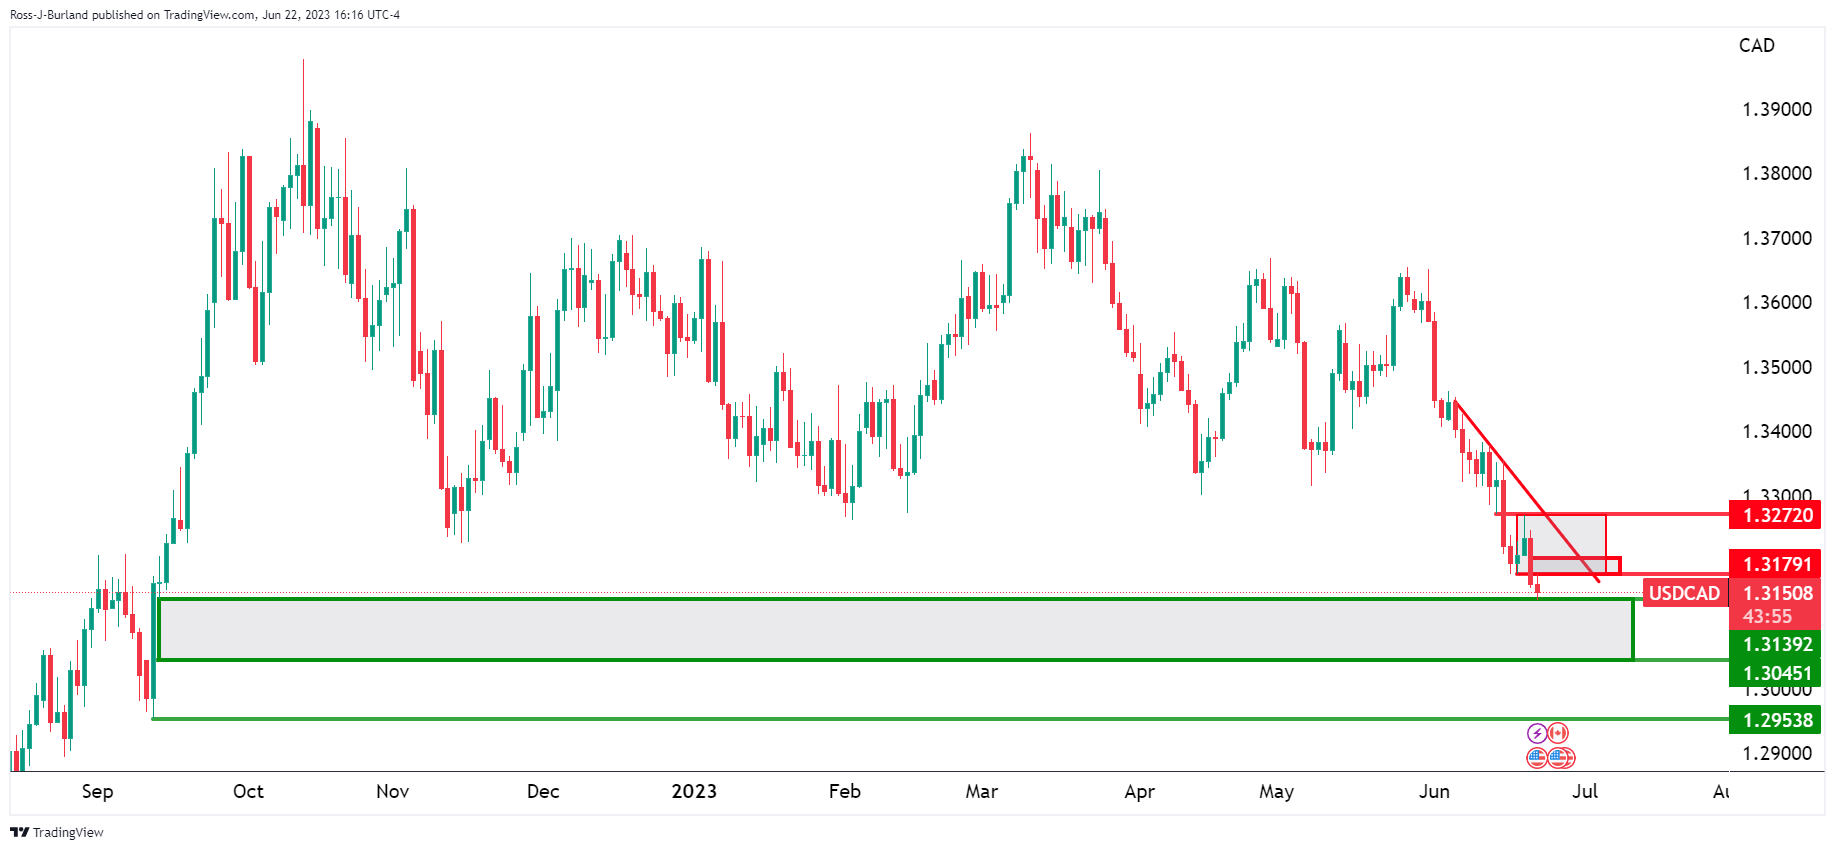
The market is bearish and is headed towards a price imbalance between the current lows and near 1.3050 on the downside. However, it was stated that a correction could be on the cards in the meanwhile, albeit remaining bearish while on the front side of the bearish trendline:
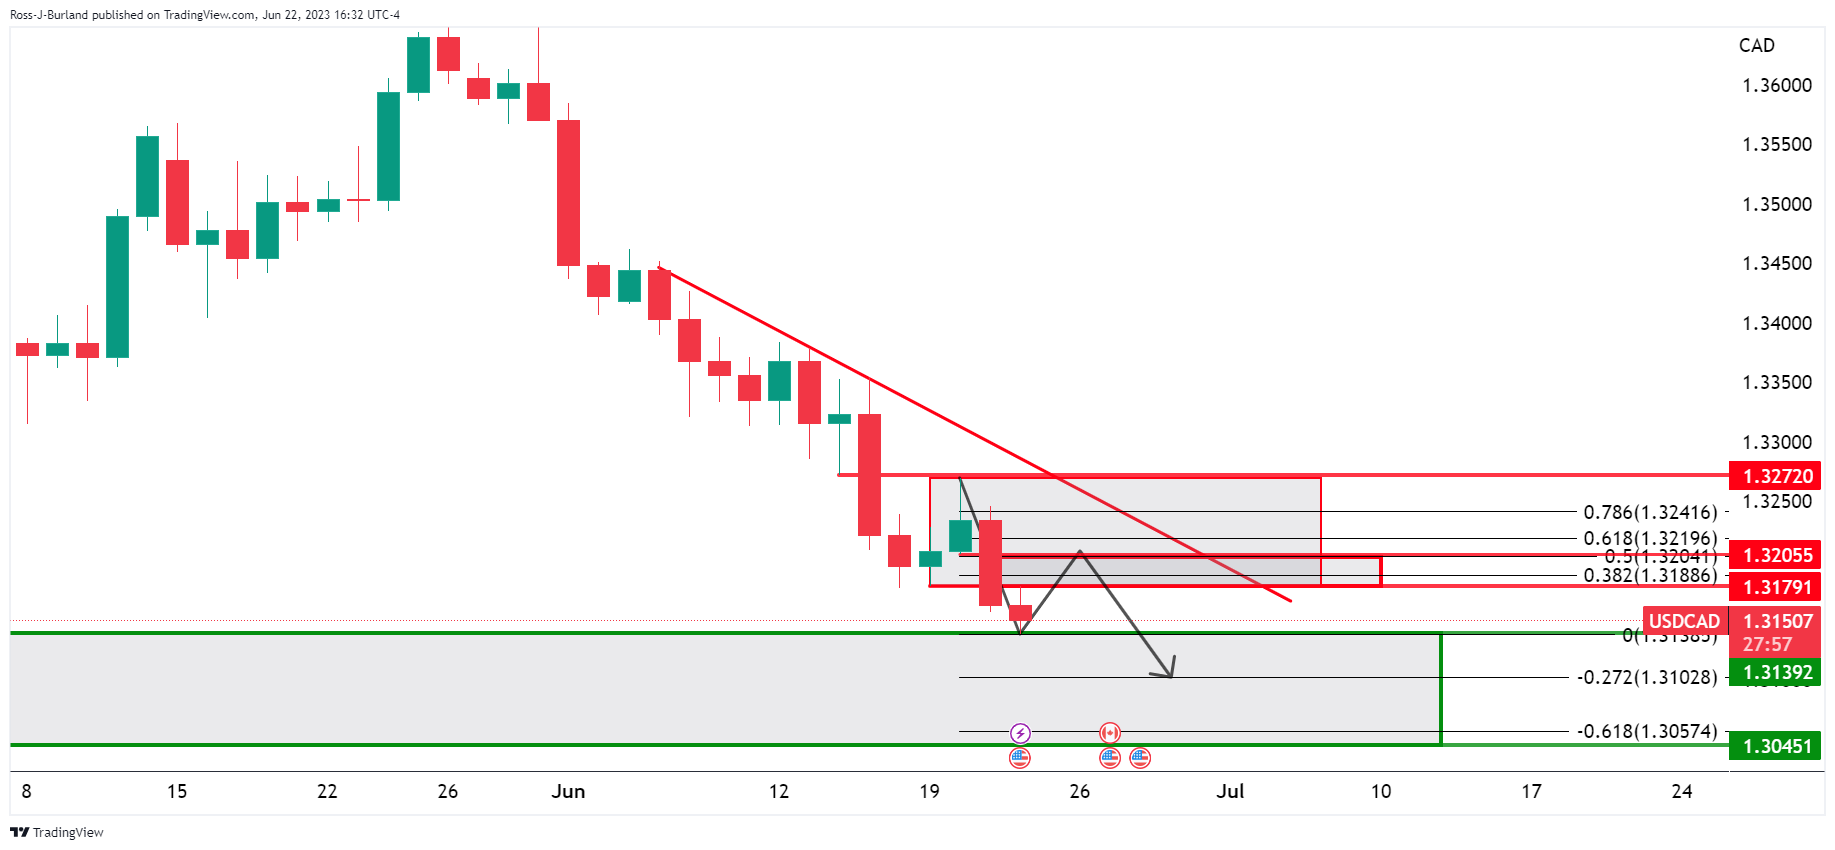
Zooming in, we could see a void of prices on the way to the trendline resistance and an imbalance of buys between the 1.3180 and 1.3205. A move higher to mitigate the price imbalance would have aligned with the 50% mean reversion of the daily bearish impulse.
USD/CAD updates
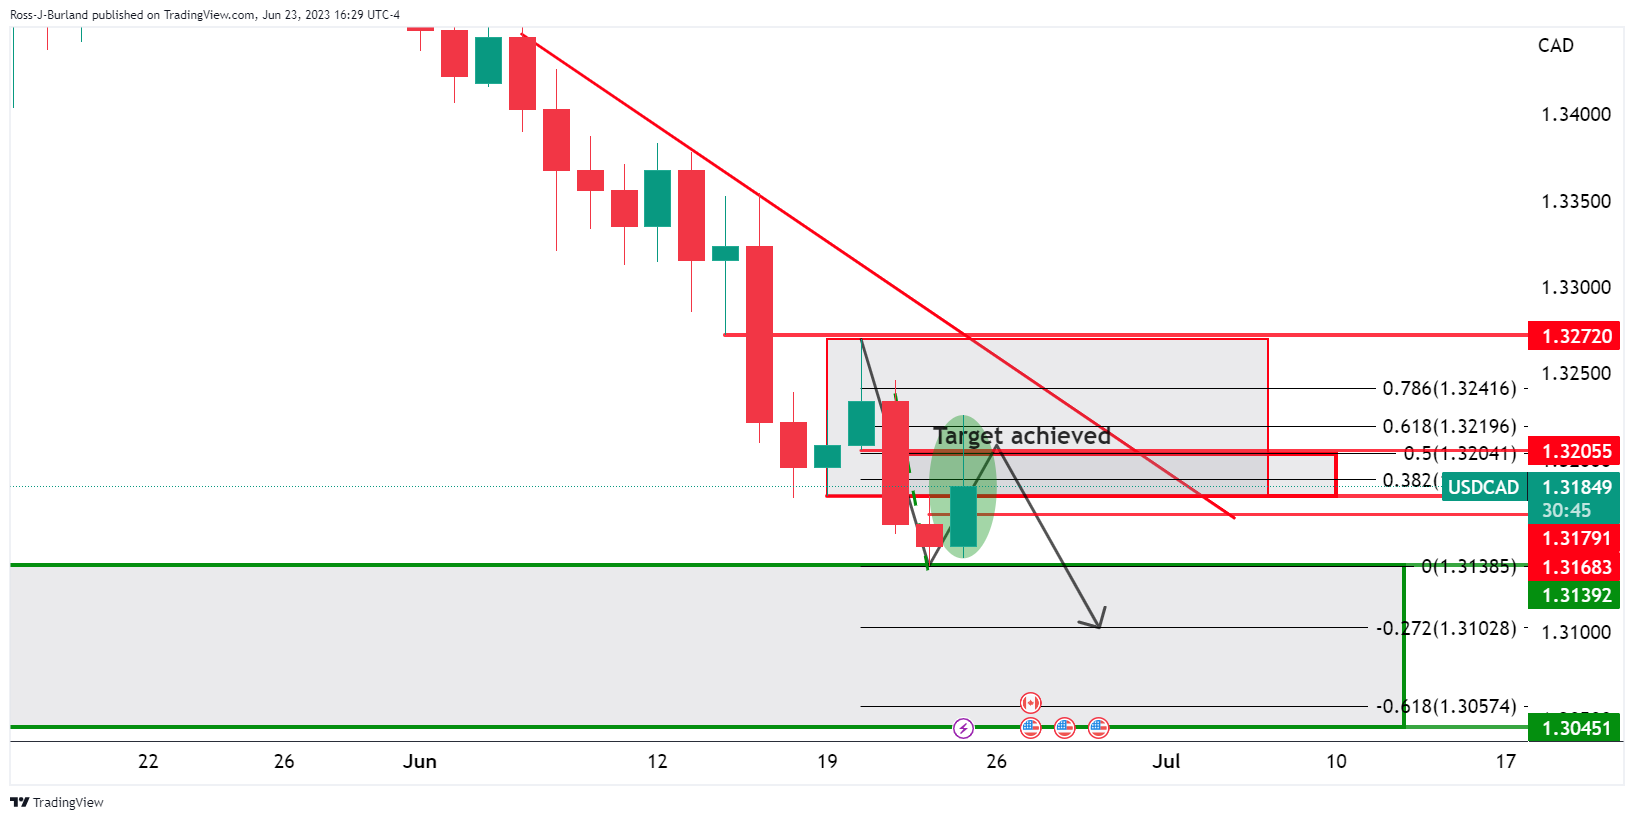
As shown, the price rallied into the imbalance and shot to test the 1.3220s. From here, a bearish continuation could be on the cards but the bulls remaining charge at this juncture and much will depend on next week's opening balance. The upside remains vulnerable towards the trendline resistance.
- EUR/USD bears could be about to make their moves.
- Bulls eye a short squeeze on failures by the bears to hold on at resistance.
EUR/USD is a broken down market on the backside of the June rally as it breaks structure on the hourly time frame to the downside opening risk of a deeper correction for the days ahead.
The following analysis illustrates the prospects of a move to break 1.0850 and to target 1.08 the figure and 1.0770s below it.
EUR/USD H1 chart
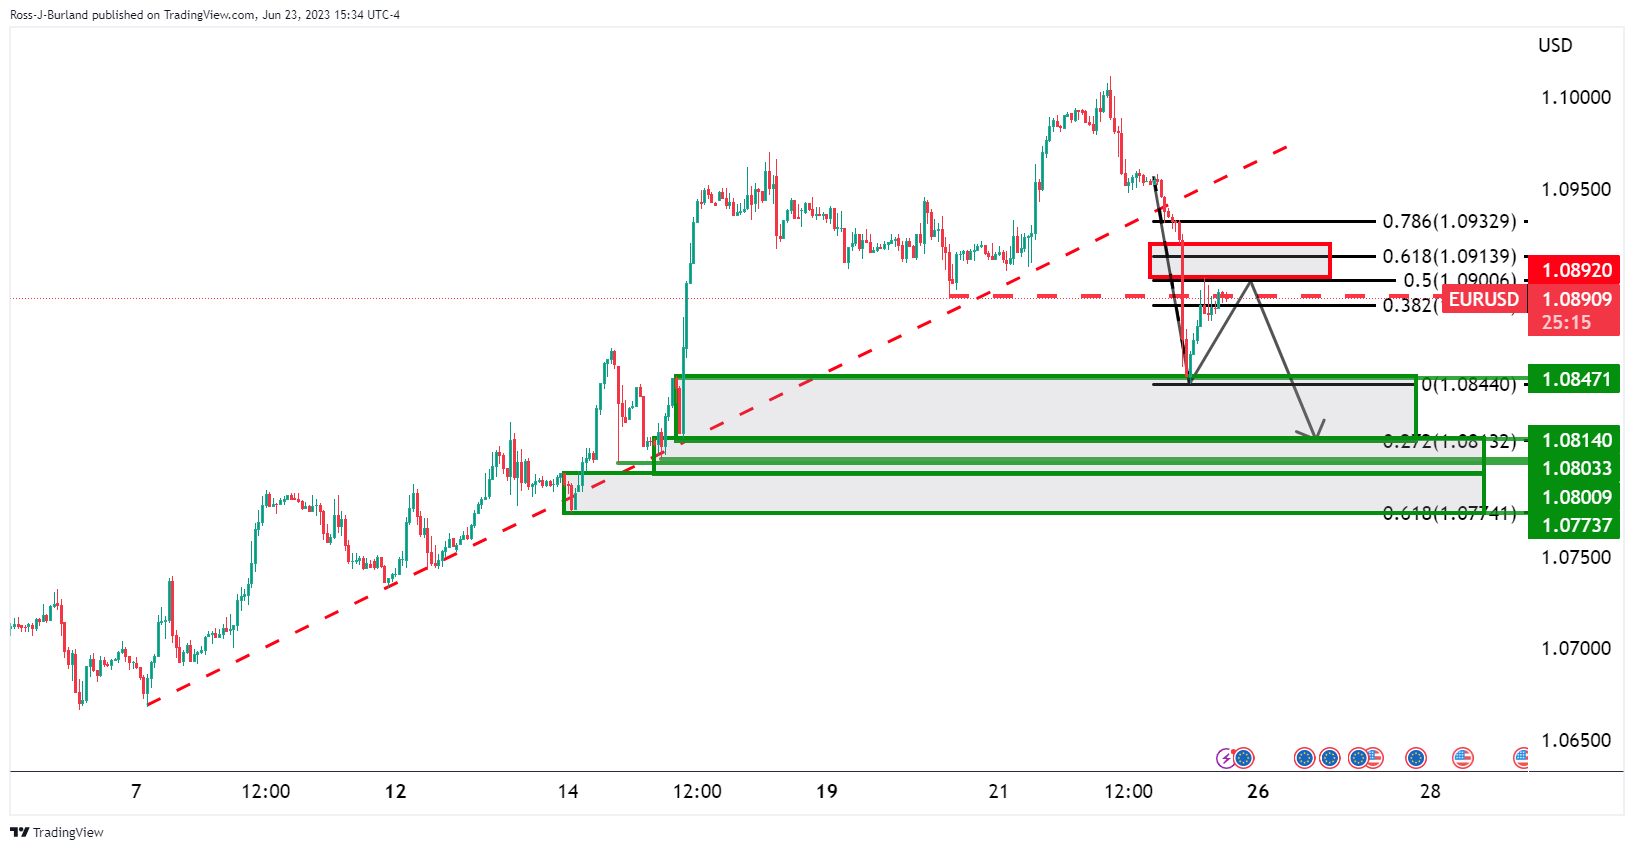
The price has corrected the sell-off and the bulls are wearing out at a 50% mean reversion level. However, the bears need to turn up in force at this juncture and if they do, there will be prospects of a break below the prior lows as a break in structure to open risk towards 1.0800 and lower.
On the flip side, there will be p[prospects of a move back to fill the imbalance between 1.0920 and 1.09025 that is still left behind in Friday's sell off the Bears do not commit at this turning point:

- GBP/USD falls to around 1.2700 as BoE’s unexpected 50 bps rate hike and slowing global business activity sparks UK recession fears.
- US S&P Global Manufacturing PMI falls to 46.3, raising concerns about a possible “hard landing” despite steady economic performance amidst rate increases.
- Recession worries in the UK heightened with decreasing consumer confidence and a potential 6% interest rate hike from the BoE.
GBP/USD extended its losses in the late New York session, dropping around 0.30% meanders at around 1.2700, amid growing recession woes in the UK as data showed business activity deceleration. That, alongside an aggressive 50 bps rate hike by the Bank of England (BoE) as a response to stubborn inflation, weighed on the Pound Sterling (GBP). At the time of writing, the GBP/USD exchanges hands at 1.2709.
Bearish sentiment persists as Bank of England's aggressive rate hike stirs up economic concerns
Wall Street is set to finish the week with losses. Risk aversion surfaced as readings of business activity across Europe and the United States (US), although remaining at expansionary territory, it slowed down, spurring recessionary fears. The US S&P Global Manufacturing PMI plunged to 46.3, below the prior month’s data, while the Services and Composite PMI expanded by 54.1 and 53, but both numbers were below the forecasts.
Chris Williamson, the Chief Economist of S&P Global Market Intelligence, commented, “The overall rate of expansion of business activity in the US remained robust in June, consistent with GDP rising at a rate of 1.7% to put second-quarter growth in the region of 2%.”
It should be said the US economy so far fared well amidst 500 basis points (bps) of rate increases, as shown by growth, housing, and labor market data. However, business activity deterioration could put into play a possible “hard landing,” as the Federal Reserve (Fed) Chair Jerome Powell stressed the need for a couple of interest rate increases.
The US Dollar Index (DXY), a measure of the buck’s value against its peers, advances 0.50%, up at 102.909. US Treasury bond yields continued to drop, capping the GBP/USD’s fall above the 1.2700 figure.
On the UK front, the BoE’s 50 bps rate hike surprised investors. , while market participants show rates in the UK could rise as high as 6%. Even though an interest rate increase usually would boost the country’s currency, recession fears caused a different reaction.
Data-wise, consumer confidence deteriorated, and S&P Global/CIPS PMIs expanded slower, except for Manufacturing. On the positive side, UK retail sales surprisingly rose in May, bolstered by an extra bank holiday. However, it also suggested that most consumers deal with high inflation as they squeeze their spending power.
GBP/USD Technical Levels
- The GBP/JPY traded in the 181.26 - 182.81 range, set to close its sixth weekly gain in a row.
- The Sterling seemed to get traction thanks to the hawkish BoE’s decision on Thursday despite weak PMIs.
- Soft Japanese inflation figures applied further pressure on the Yen.
On Friday, GBP/JPY continued to push the cross to fresh cycle highs at 182.80 after finding support at the 181.25 area. In that sense, the Sterling continued to gain ground on the back of Thursday’s Bank of England (BoE) hawkish surprise to raise rates by 50 basis points and held its ground despite weak British PMIs from June.
The Sterling maintains hawkish-BoE-momentum
British PMIs came in weak, the S&P Global showed that the Manufacturing PMI from the UK from May, dropped to 46.2 vs the 46.8 expected, while the Services PMI held in expansion territory, coming in at 53.7 but below the 54.8 expected.
Despite the weak economic data, the Sterling maintained the momentum gained on Thursday after the surprising 50 bps hike by the BoE. In that sense, the statement hinted at more rate hikes confirming that the bank will do “what’s necessary” in order to curve down inflation to 2%. Relating to PMIs, the Bank confirmed that it expects the British Gross Domestic (GDP) to flatten in Q2. However, Governor Andrew Bailey, in the presser, gave more emphasis to inflationary pressures as he stated that “they are still too high, and we have got to deal with it”.
On the other hand, soft inflation figures in Japan are adding pressure on the Yen. The National Consumer Price Index and Core Inflation for May were lower than expected suggesting that the BoJ will maintain its dovish stance. Looking forward, investors will pay close attention to Governors’ Ueda from the BoJ and Christine Lagarde from the ECBs’ speeches next Wednesday at the ECB Sintra Forum.
GBP/JPY Levels to watch
According to both the weekly and daily charts, the GBP/JPY holds a bullish outlook for the short term. In the latter, the positive outlook is more clear as investors tallied a sixth weekly gain, while on the daily chart, indicators are losing some steam.
Upcoming resistance for GBP/JPY is seen at the zone at the 183.00 level, followed by the 183.50 zone and the 184.00 area. On the other hand,the daily low at 181.20 level remains the nearest support for the cross, which if broken, will bring into play the 180.00 zone and 179.00 level.
GBP/JPY Daily chart
-638231443410371728.png)
The US Dollar started a recovery on the back of risk aversion that could continue at the beginning of the last week of June and of the second quarter. Inflation data from the US, the Eurozone, Australia, and Canada will be watched closely. Also, markets will hear from central bank officials who will speak at the ECB Forum.
Here is what you need to know for next week:
In the US, the key report next week will be the Core Personal Consumption Expenditures (PCE) on Friday. The Core PCE is expected to show a 0.4% increase in May, and the annual rate is expected to remain at 4.7%. Additionally, personal spending and income data will be released. The GDP data on Thursday is an update and could be ignored by market participants. Jobless Claims will offer new clues about the labor market.
It will be a busy week for Canada that will shape Bank of Canada's expectations. On Tuesday, the Consumer Price Index for May will be released, and a decline in the annual rate from 4.4% to 3.4% is expected. On Friday, April GDP and the BoC Business Outlook Surveys are due.
Analysts at NBF:
In Canada, a slight decline in gasoline prices, coupled with further moderation in the food segment, could have translated into a 0.3% increase of the consumer price index in May (before seasonal adjustment). If we’re right, the 12-month rate of inflation should come down from 4.4% to a two-year low of 3.2%. The core measures preferred by the Bank of Canada should decrease as well.
In the Euro area, inflation data will take center stage. Germany will report on Thursday, and the Eurozone (EZ) on Friday. The EZ Core Harmonized CPI annual rate is expected to decline from 6.1% to 5.5%.
The European Central Bank (ECB) will hold its annual Forum on Central Banking, which will start on Monday. The closing panel on Wednesday will feature European Central Bank’s Lagarde, Bank of England's Bailey, Federal Reserve's Powell, and Bank of Japan's Ueda. Many other central bank officials will also be speaking
In China, the NBS PMIs will be released on Friday and could show further slowdown. In line with a global trend, the manufacturing sector is expected to remain in contraction territory, and the service sector to slow but holding above 50.
In Australia, the Consumer Price Index for May, due on Wednesday, will be critical for the Reserve Bank of Australia (RBA). The annual headline is expected to show a large drop from 6.8% to around 6.0%. On Thursday, Retail Sales data is due.
Analysts at TD Securities:
A notable decline in petrol prices will contribute to the lower May CPI print while we could also see recreational prices pull back after the Easter holidays. Given a red-hot labour market and the RBA's increasingly hawkish message on inflation, we think another 25bps makes sense at its July meeting, as the monthly inflation print remains far above the RBA's inflation target.
The US Dollar Index finished the week higher after rising during Thursday and Friday on the back of risk aversion and also supported by Fed Powell's comments about more rate hikes. The DXY rebounded from monthly lows toward 103.00.
The Japanese Yen resumed the downside as no change in stance was seen from the Bank of Japan, extending the monetary divergence from other central banks. USD/JPY jumped on Friday to monthly highs approaching 144.00. EUR/JPY was above 156.00 and GBP/JPY surpassed 182.00, reaching their highest levels since 2008 and 2015, respectively.
GBP/USD failed to benefit from the hawkish rate hike from the BoE amid concerns about the UK economic outlook. The pair pulled back from monthly highs, finding support around 1.2700.
EUR/USD was rejected from above 1.1000 and dropped below 1.0900. The last push to the downside took place on Friday after weaker-than-expected Eurozone PMIs.
Commodities tumbled during the week, and weighed on Antipodean currencies. Silver lost more than 7% and Gold 2%. The Australian Dollar was among the worst performers during the week.
AUD/USD suffered the worst weekly decline so far this year, falling almost 3%, ending below 0.6700, and back under the 20-week Simple Moving Average. NZD/USD ended a three-week positive run with a 1.5% slide, closing around 0.6150. The Canadian dollar outperformed, with USD/CAD ending the week marginally lower near 1.3200, the lowest weekly close since September 2022.
The worst performer was the Turkish Lira, unable to benefit from the Central Bank of the Republic of Turkey's pivot by rising interest rates sharply. USD/TRY jumped to fresh record highs above 25.00, ending the week with a 6.5% gain.
Like this article? Help us with some feedback by answering this survey:
- The USD/JPY climbed its highest level since November 2022, approaching 144.00.
- US Manufacturing PMI from June fell to a five-month low
- Negative market sentiment and soft Japanese inflation figures weigh on the JPY.
The USD/JPY pair surged to a multi-month high, reaching its highest level since November 2022, near 143.90. This significant jump came in the wake of the US Manufacturing PMI for June, which plummeted to a five-month low and fueled a negative market sentiment. This, coupled with disappointing Japanese inflation figures, exerted downward pressure on the JPY. The pair is set to close the week with a gain of more than 1.25% – and it is the second week in a row it has risen.
Bond yields and Wall St indexes fall following US PMIs
According to a recent S&P Global report, the US PMIs for June delivered a mixed performance. The Manufacturing PMI fell to a five-month low of 46.3, missing expectations of 48.3. On a positive note, the Services PMI slightly exceeded market expectations, registering 54.1 compared to the anticipated 54. Additionally, the Global Composite PMI came in lower than expected at 53 instead of the projected 54.4.
Consequently, a risk-averse sentiment in the markets was cultivated, leading to a decline in US bond yields and a negative impact on major Wall Street indexes, which benefited the USD. The 10-year bond yield dropped to 3.75%, while the 2-year yield fell to 4.70%, and the 5-year yield reached 4%. The S&P 500 index (SPX) experienced a 0.6% loss, the Dow Jones Industrial Average (DJI) declined by 0.51%, and the Nasdaq Composite (NDX) suffered a 0.92% decrease.
On the Japanese side, soft inflation figures reported during the early Asian session seem to be applying additional pressure on the Yen. In that sense, the National Consumer Price Index dropped to 3.2% YoY vs. the 4.1% expected, while Core Inflation, Excluding Food and Energy prices, dropped to 4.3% in the same period of time vs. the 4.4% expected. While the Bank of Japan (BoJ) is set to maintain an ultra-dovish monetary policy, the only hope for the Yen is now the intervention of the government and BoJ in order to bolster the Japanese currency.
USD/JPY Levels to watch
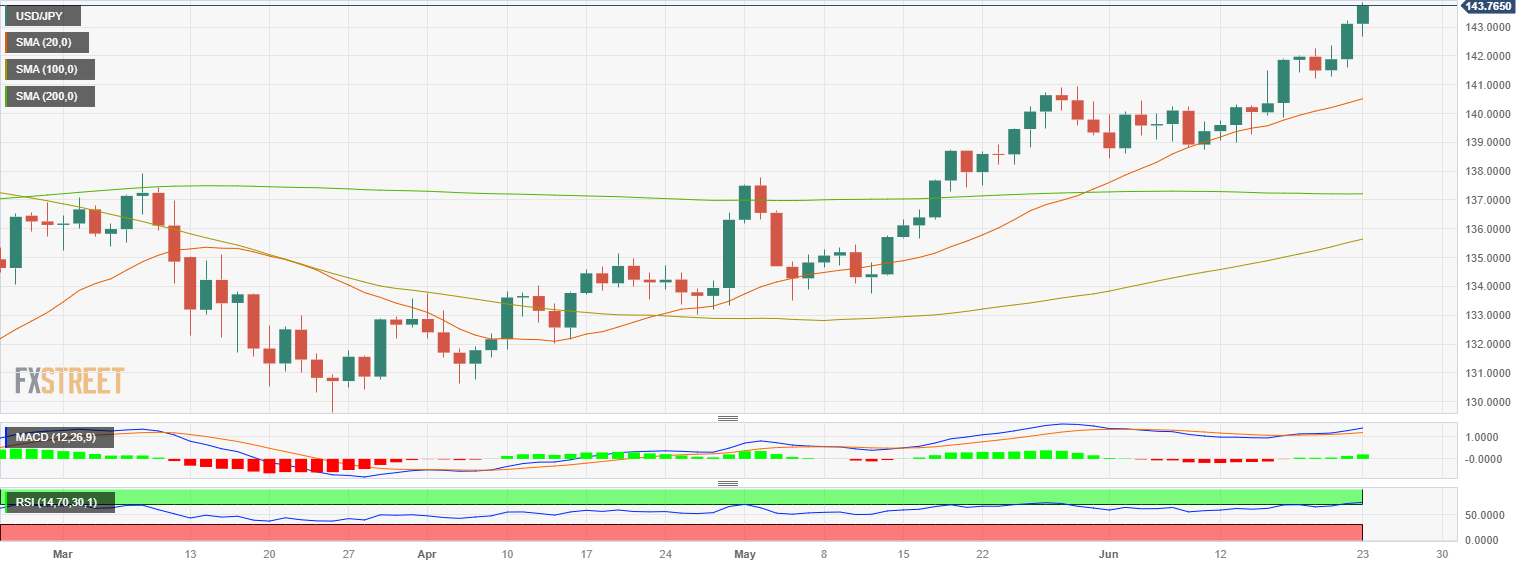
According to the daily chart, the USD/JPY holds a (very) bullish outlook for the short term as the Relative Strength Index (RSI) and Moving Average Convergence Divergence (MACD) suggest that the buyers are in control but continue to show overbought conditions. In addition, the 100 and 200-day Simple Moving Average (SMA) are about to perform a bullish cross giving further insight into the positive outlook of the pair.
On the upside, the psychological mark at 145.00 is key for USD/JPY to gain further traction. If cleared, the price could see a more pronounced move towards the 145.70 area and the 146.50 zone. On the other hand, the daily low at 142.70 acts as a key support level for the pair. If broken, the 141.60 area and 141.20 zone could come into play.
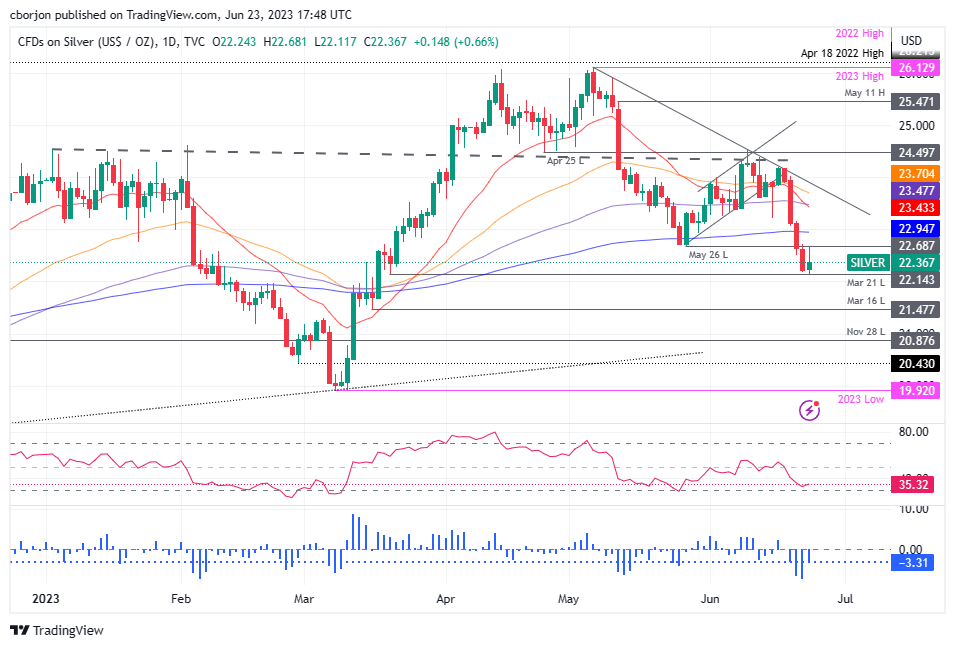
- Silver price sees a minor gain of 0.50% but fails to reclaim the May 26 daily low, resulting in a bearish outlook.
- The technical analysis shows support at the March 21 daily low of $22.14; breaking this could see a drop below the $22.00 figure.
- Potential resistance lies at the May 26 low-turned resistance at $22.68, with the 200-day EMA at $22.94 and $23.00 as the next challenges.
Silver price remains firm in the session but could not reclaim the May 26 daily low; previous support turned resistance and also below the 200-day Exponential Moving Average (EMA). Therefore, the XAG/USD turned bearish from a technical perspective. The XAG/USD is trading at $22.32, a gain of 0.50%.
Must read: Gold Price Forecast: XAU/USD rebounds amid recession fears, slowing global economic growth
XAG/USD Price Analysis: Technical outlook
Silver is downward biased but must break support at the March 21 daily low of $22.14 on its way toward dropping below the $22.00 figure. Even though the XAG/USD fell to a new three-month high, cheered by sellers, the XAG/USD could remain trading sideways, within the $22.10/$22.69 area without a catalyst.
If XAG/USD slumps below $22.00, the next support will lie at the March 16 low of $21.46 before exposing the $21.00 figure and the November 28 daily low at $20.87. On the flip side, the XAG/USD stays above $22.00. The next resistance would be the May 26 low-turned resistance at $22.68, followed by the 200-day EMA at $22.94 ahead of challenging $23.00.
From an oscillator point of view, the Relative Strength Index (RSI) shows signs of bearishness, while the three-day Rate of Change (RoC) portrays sellers losing some momentum but remaining in charge.
XAG/USD Price Action – Daily chart
- USD/MXN edges up 0.13% to 17.1880 amidst global recession fears and Banxico’s stable rates.
- PMIs indicate slowed business expansion across Europe and the US, driving risk aversion.
- Banxico maintains an 11.25% rate, signaling extended high rates due to slower inflation.
USD/MXN clings to its gains after the Bank of Mexico (Banxico) decision to hold rates unchanged at 11.25% failed to boost the USD/MXN towards the 20-day EMA and printed a weekly high of 17.2644. Since then, the USD/MXN retreated, but it remains up 0.13% in the day amid risk aversion. At the time of writing, the USD/MXN exchanges hands at 17.1880.
Risk aversion dominates as business activity slows globally; USD/MXN holds firm
US equities are trading with losses as market participants’ sentiment shifted sour. Global recession fears reignited after the release of business activity data across Europe and the US, with PMIs remaining at expansionary territory but continuing to slow down.
Data in the United States (US) showed that S&P Global Manufacturing PMI continued to slide, coming at 46.3, lower than May 48.4, while the Services stood at 54.1, above forecasts, but trailed the prior month’s data. Hence, the Composite Index slowed to 53 from 54.3 in May.
On the data, S&P Global Market Intelligence Chief Economist Chris Williamson said, “The overall rate of expansion of business activity in the US remained robust in June, consistent with GDP rising at a rate of 1.7% to put second-quarter growth in the region of 2%.”
Meanwhile, the US Dollar Index, which measures the buck’s value against a basket of six currencies, climbed 0.54%, up at 102.944, finding a bid amidst falling US Treasury bond yields.
Money market futures portrays odds at a 74.4% chance for a 25 bps rate hike in July, according to CME FedWath Tool data, but traders do not expect the Fed to lift rates past the 5.25%-5.50% threshold.
Across the border, Banxico kept rates unchanged at 11.25% on Thursday, signaling that it would keep them high “for an extended period, as inflation slowed down to 5.18% in the first half f une, below estimates of 5.30%, according to data from INEGI.
Analysts at Goldman Sachs expected the Mexican bank to hold rates unchanged and foresee a rate cut towards the end of 2023.
The San Francisco Fed President Mary Daly crossed the wires, commenting that she supports two more rate increases and that the risks of under/overtightening have come into balance.
USD/MXN Price Analysis: Technical outlook
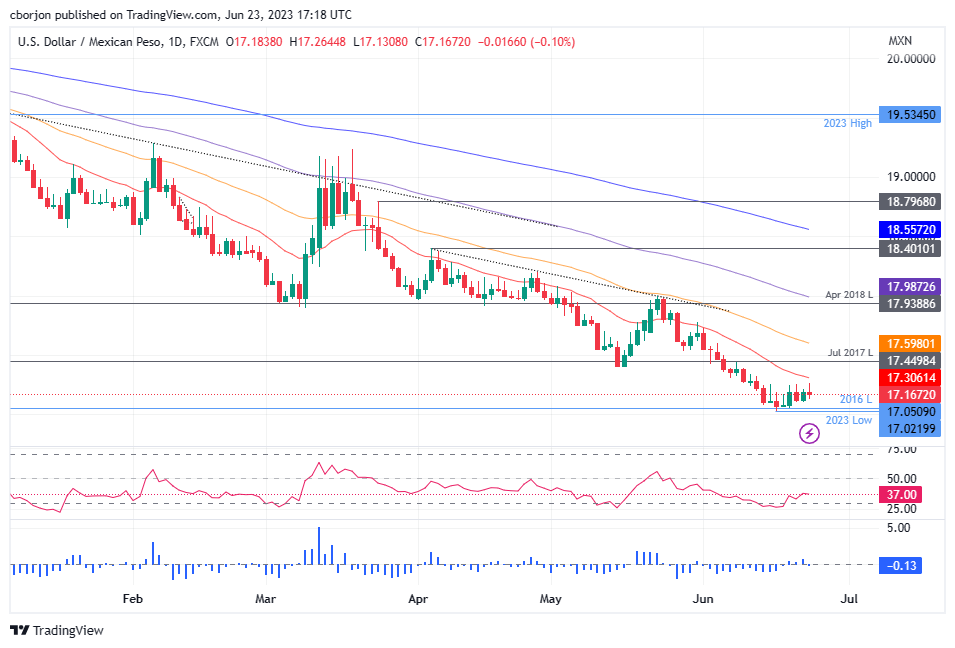
From a technical perspective, the USD/MXN remains downward biased but can continue to consolidate within the 17.00/17.30 area in the near term, below the 20-day Exponential Moving Average (EMA) at 17.3070. if the USD/MXN breaks above that area, it could climb toward May 16 swing low, and previous support turned resistance at 17.4033, followed by the 50-day EMA at 17.5921. Conversely, if USD/MXN cracks below 17.00, the next support lies on the October 2015 lows of 16.3267.
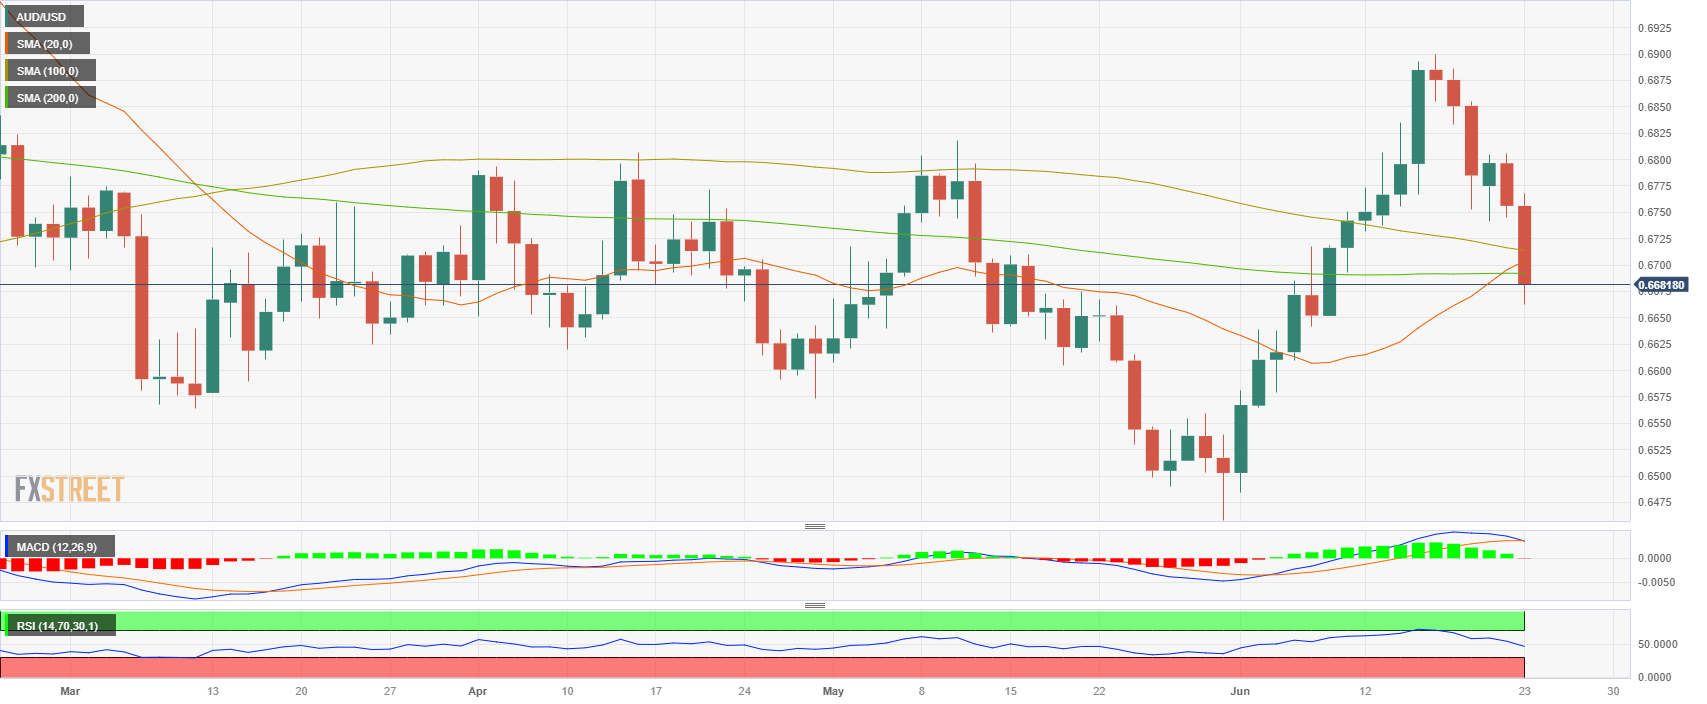
- On Friday's session, the AUD/USD lost more than 1% pips and poised to closed a 2.9% weekly decline
- Negative market sentiment following mixed US PMIs from June weighs on the Aussie.
- Lower US bond yields and losses seen on Wall Street signal flightto-safety flows.
On Friday, the Aussie faced severe selling pressure and the AUD/USD fell to its lowest level since early June towards the 0.6660 area. In that sense, global economic downturn fears following weak UK and Eurozone PMIs, followed then by mixed US PMIs favored a sour market mood and hence benefited the US Dollar.
Investors assess preliminary June PMIs
On Friday, PMIs indicated mixed results for the US in the month of June, according to the S&P Global report. The Manufacturing PMI for June, fell to a five-month low, reaching 46.3, failing to live up to the expectations of 48.3. On the positive side, the Services PMI came slightly above the expectations at 54.1 vs the 54 anticipated by markets. Moreover, the Global Composite PMI dropped to 53 vs the 54.4 expected.
Adding to the negative market environment, the 10-year bond yield declined to a low of 3.70% while the 2-year yield fell to 4.70% and the 5-year to 4%, respectively. Moreover, the S&P 500 index (SPX) is seeing 0.6% losses, the Dow Jones Industrial Average (DJI) a 0.51% decline, and the Nasdaq Composite (NDX) a 0.92% loss.
Regarding the next sessions, attention now turns to next week’s Core Personal Consumption Expenditures (PCE) and Gross Domestic Product (GDP) data from the US where investors will get a clearer outlook of the economic activity and inflation in order to start modeling their expectations towards the next Fed meeting in July. On the Australian side, the focus is the Monthly Consumer Price Index from May.
AUD/USD Levels to watch
The AUD/USD holds a bearish outlook for the short term, as per the daily chart. The Relative Strength Index (RSI) and Moving Average Convergence Divergence (MACD) both fell to negative territory, and below the 20,100 and 200-day Simple Moving Averages (SMAs). The negative outlook is also seen in the weekly chart where the pair is set to posit the largest weekly decline since March.
In case the AUD/USD loses more ground in the 0.6640 zone, the 0.6620 area and psychological mark at 0.6600 could come into play. On the flip side, the following resistances line up at the 200-day SMA at 0.6690, followed then by the 20-day SMA at 0.670 and the 100-day Simple Moving SMA at 0.6712.
AUD/USD Daily chart
- Gold recovers, rising 0.69% to $1926.30, amid global recessionary fears and faltering US bond yields.
- A worldwide slowdown in business and manufacturing activity stokes investor concerns and drives a shift to safe assets.
- Market participants focus on Fed speeches for rate hike insights; current odds are 74.4% for a 25-bps hike in July.
Gold price recovers some ground after falling to new three-month lows of $1910.26 overnight, while US bond yields retreat after printing weekly highs, spurred by central bank tightening. Global data revealed the economic slowdown, sparking recessionary fears. The XAU/USD is trading at $1926.30, gains 0.69%.
XAU/USD gains as investors seek safe havens amid deteriorating business and manufacturing activity worldwide
Investors sentiment shifted sour, as shown by global equities printing losses. Data delivered worldwide, but particularly in the United States (US), showed that business and manufacturing activity is deteriorating, as reported by June’s S&P Global Manufacturing, Services, and Composite PMIs.
In the US, the Manufacturing PMI rose 46.3, below estimates of 48.6 and the prior month’s reading of 48.4, while the Services stood at 54.1, exceeding forecasts, but trailed May’s 54.9. Therefore, the composite PMI decelerated from 54.3 to 53 in June, the slowest reading since March.
On the data, S&P Global Market Intelligence Chief Economist Chris Williamson said, “The overall rate of expansion of business activity in the US remained robust in June, consistent with GDP rising at a rate of 1.7% to put second-quarter growth in the region of 2%.”
XAU/USD got a lifeline by falling US real yields from 1.58% on Thursday to 1.508% at the time of writing. Real yields represent the difference between the rate of inflation and interest rates. Nevertheless, XAU/USD traders should be focused on Fed speaking, which had remained more hawkish than before the June FOMC meeting.
The San Francisco Fed President Mary Daly crossed the wires, commenting that she supports two more rate increases and that the risks of under/overtightening have come into balance.
As shown by the CME FedWatch Tool, money market futures portray odds at a 74.4% chance for a 25-bps rate hike in July, but traders do not expect the Fed to lift rates past the 5.25%-5.50% threshold.
In the meantime, the inversion of the US 2s-10s yield curve fell as much as ten bps, signaling that market participants are pricing in a recession in the United States. That dampened the market sentiment on Wall Street, as the three major US equity indices dropped between 0.64% and 1.13%.
XAU/USD Price Analysis: Technical outlook
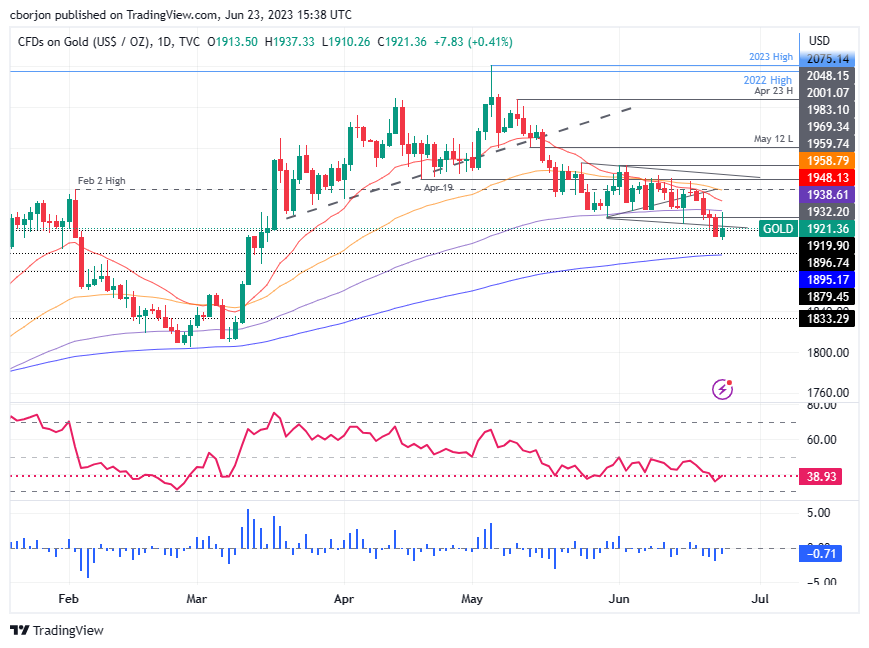
Given the fundamental backdrop, XAU/USD would remain neutral to downward biased, with buyers and sellers strictly focused on the June 15 swing low price at $1925.06. A daily close below the latter will be cheered for sellers as they will eye a $1900 test. Once cleared, that can open the door to challenge the 200-day Exponential Moving Average (EMA) at $1895.16. Contrarily if buyers reclaim the abovementioned level, which will keep XAU/USD prices trading within the $1925-$1950 range.
During the months of April and May, the price of Gold breached the $2,000 mark and was only within a few Dollars of the record high. Analysts at Natixis discuss XAU/USD outlook for the coming months.
Gold prices to remain in the lower bound area of $1,900 in 2024
In the near term, Gold is expected to remain under pressure as the markets expect further rate hikes (albeit small ones) by the end of the year.
Into 2024, we expect Gold prices to remain in the lower bound area of $1,900, averaging $1,920 for the year as a whole. On the one hand, rate cuts will be positive for Gold as it would reduce the opportunity cost of holding the metal. On the other hand, a rebound in the economy coupled with lower inflation figures would put cap on a price rally.
Until mid-May, the CAD found it difficult to stand its ground against the USD. Recently, however, it has been able to make up some lost ground. Economists at Commerzbank share their USD/CAD forecast.
BoC ended interest rate pause
The Bank of Canada surprisingly ended its interest rate pause at the beginning of June and raised the key interest rate to 4.75%. Further steps are expected.
We see further limited CAD recovery potential against the USD due to the robust economy and a hawkish BoC. CAD should benefit if the interest rate differential between the Fed and the BoC narrows or turns positive in the medium term.
EUR/CAD should reflect the interim EUR strength we expect.

Source: Commerzbank Research
The EUR has rebounded against the USD so far this month and in the process has reversed most of sell-off in May. Economists at MUFG Bank analyze EUR/USD outlook.
Bullish trend remains in place
The run of higher highs (in January and April) followed by higher lows (in March and May) so far this year highlights that the bullish trend remains in place.
We continue to forecast the pair moving back to pre-Ukraine levels from early 2022 when it was trading closer to the 1.1500 level.
Gold dipped to a three-month low. Economists at Commerzbank discuss XAU/USD outlook.
The Fed is serious about further rate hikes
Prices came under pressure as a result of rising US interest rate expectations sparked by remarks by Fed Chair Powell that were interpreted as hawkish, despite the fact that they were not really anything more than a repetition of comments made the previous day and during last week’s Fed press conference. Apparently, this strengthened the impression that the Fed is indeed serious about further rate hikes.
The uncertainty surrounding the Fed’s future policy is likely to keep prices in check. The figures for Chinese Gold imports from Hong Kong, which are due to be published next week, are hardly likely to change this, especially given that Swiss gold exports in June pointed more to muted demand in China.
- USD/TRY advances to fresh all-time tops near 25.70.
- Markets remain skeptic of the recent CBRT rate hike.
- The lira plunges more than 20%... just in June.
Another day, another record low of the Turkish currency vs. the US Dollar, this time sending USD/TRY to the 25.70 region on Friday.
USD/TRY pushes higher despite CBRT rate hike
USD/TRY extends further the monthly needle-like upside and surpasses the 25.00 barrier, as investors remain highly skeptic after Thursday’s rate hike by the Turkish central bank (CBRT) fell short of investors’ expectations.
Indeed, the CBRT hike the One-Week Repo Rate by 650 bps to 15% on Thursday (vs. consensus for a move to 20%) in what was the first rate raise since the summer of 2021.
From its statement, the central bank's objective was to initiate the process of monetary tightening, establish a trajectory towards lower inflation, stabilize inflation expectations, and manage pricing behavior. The CBRT reaffirmed its commitment to the 5% inflation target and did not rule out the possibility of implementing additional measures for monetary tightening to achieve this target.
So far in June, the lira (TRY) has already depreciated more than 20%... and the month is not over yet…
What to look for around TRY
USD/TRY extends the rally on the back of the persistent selling bias in the Turkish currency.
In the meantime, investors are expected to closely monitor upcoming decisions on monetary policy. By appointing Mehmet Simsek and Hafize Gaye Erkan, both former Wall Street bankers, to oversee the country's finances, President R. T. Erdogan seems to suggest a possible move away from heavy state intervention in favor of letting the market dictate the fair value of the currency.
Although it remains uncertain whether Mr. Erdogan's preference for combating inflation through lower interest rates will allow Simsek and Erkan's orthodox approach to monetary policy to thrive, the news of their appointment has been so far welcomed with high scepticism by market participants.
In a broader sense, price action around the Turkish currency is expected to continue to revolve around the performance of energy and commodity prices, which are directly tied to developments from the Ukraine conflict, broad risk appetite trends, and dollar dynamics.
Key events in Türkiye this week: Economic Confidence Index, Trade Balance (Friday).
Eminent issues on the back boiler: Persistent distrust over the CBRT credibility/independence. Absence of structural reforms. Bouts of geopolitical concerns.
USD/TRY key levels
So far, the pair is gaining 1.05% at 25.0662 and faces the next hurdle at 25.7273 (all-time high June 23) followed by 26.00 (round level). On the downside, a break below 20.6567 (55-day SMA) would expose 19.8867 (100-day SMA) and finally 19.2464 (200-day SMA).
Federal Reserve Bank of San Francisco President Mary Daly told Reuters on Friday that two more interest rate increases this year would be a "very reasonable projection."
Key takeaways
"Strongly supported June decision to stand pat on rates."
"Risks of under-tightening vs over-tightening are about balanced."
"Community contacts worried housing has hit bottom, and rents are reaccelerating."
"Banking contacts thoughtful about loan books, careful about balance sheets."
"Credit tightening so far is consistent with what would have been expected without March banking turmoil."
"We remain watchful on potential for extra tightening; it's another good reason to slow the rate-hike pace."
"Community, business contacts see inflation, labor shortages as big issues."
"Inflation expectations, and frequency and magnitude of price changes, are both on a downward trajectory."
"We want to work resolutely and carefully to restore price stability."
Market reaction
The US Dollar preserves its strength after these comments and the US Dollar Index was last seen rising 0.4% on the day at 102.80.
- The oil price has printed a fresh nine-day low at $67.60 amid bleak economic forecasts.
- In the battle against stubborn inflation, central banks are sharpening their quantitative measures by hiking interest rates.
- Oil prices are consolidating in a range of $66.95-74.70 for one-and-a-half months.
West Texas Intermediate (WTI), futures on NYMEX, have refreshed a nine-day low at $67.60 as investors are expecting further decline in the global demand for oil due to the continuation of policy-tightening by central banks.
In the battle against stubborn inflation, central banks are sharpening their quantitative measures by hiking interest rates whose consequences are weighing on global economic prospects.
The US Dollar Index (DXY) is in a corrective mode after printing an intraday high at 103.17. The USD index has dropped to near 102.80, however, the upside bias is still solid amid the risk-aversion theme. Going forward, global PMI figures will provide further guidance for the oil price.
Oil prices are consolidating in a range of $66.95-74.70 for one-and-a-half months on a daily scale. Broader rangebound performance indicates a sheer contraction in volatility but is followed by a breakout in the same. The 50-period Exponential Moving Average (EMA) at $72.20 has been acting as a stiff barricade for the oil bulls.
The Relative Strength Index (RSI) (14) is on the verge of slipping into the bearish range of 20.00-40.00. An occurrence of the same would trigger the bearish momentum.
A downside move below May 31 low at $67.12 will drag the asset toward the $65.00 support followed by the ultimate support around $64.31.
In an alternate scenario, a solid recovery above May 24 high at $74.70 will drive the asset toward April 28 high at $76.84. Further recovery above the latter would expose the oil price to April 26 high at $77.86.
WTI daily chart
-638231239538322521.png)
The NZD has declined against most G10s since the RBNZ surprised the markets a few weeks back. Economists at CIBC Capital Markets analyze Kiwi's outlook.
Stagnating NZD
We anticipate short term stagnation in NZD/USD, before the pair trends up in the medium term due to broad USD weakness.
The dovishness of the RBNZ should keep expectations for any further hikes tempered, even if other central banks resume their hiking cycles. This dynamic should spill over to NZD's weakness against G10 currencies.
Over the medium term, New Zealand's terms of trade should hold up better than its key trading partners. Our expectation for relative strength in terms of trade should allow the NZD/USD to appreciate in the later part of this year and into 2024.
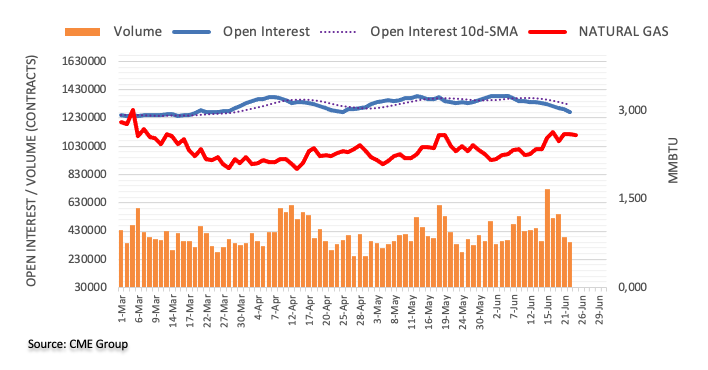
- Natural Gas continues its climb higher as hotter weather stokes demand for Gas to power air conditioning.
- Gas terminal closures and outages in Norway, Europe’s primary producer, further support prices.
- Technicals are mixed with short-term rallies within a longer-term downtrend.
Natural Gas price continues its step recovery into the weekend. The commodity is supported by a combination of a hotter-than-usual start to the summer in most of the US and Europe stoking demand for Gas to power air conditioning and lingering concerns about Norwegian supply, which has taken Russia’s place as the main producer in the region.
XNG/USD is trading at $2.724 MMBtu, at the time of writing, entering the US session on Friday.
Natural Gas news and market movers
- Natural Gas price is rising due to an increase in demand for Natural Gas used to power air conditioning as much of the West experiences hotter-than-usual weather, according to Natural Gas World (NGW).
- The fragility of Norwegian supply is further raising prices. The Hammerfest LNG export terminal in Norway had to be closed on May 31 after a leak, and maintenance works at the Nyhamna processing plant were brought forward a month. The plant at Kollsnes has also suffered issues kinking supply, according to Oilprice.com.
- “The European gas market — and by extension the global gas market — [is] certainly not out of the woods in terms of adequately matching supply with demand,” Tom Marzec-Manser, head of Gas analytics at ICIS, told CNN.
- The data suggests the situation may not be entirely dire, however, as a milder-than-expected spring has allowed stocks to accumulate. European storage facilities remain relatively high, at roughly 73% full — a much higher level than the 56% averaged at the same time of the year over the past five years, according to data from Gas Infrastructure Europe (reported by CNN).
- Japan and South Korea have recorded much higher Gas stores recently and this combined with concerns about Chinese growth suggest Asian demand may not be as elevated as expected.
- Data showing traders’ positioning in the US Natural Gas futures market will be released by the Commodities Futures Trading Commission (CFTC) at 20:30 GMT on Friday and may provide an insight into future price moves. If Commercial positions have shifted to predominantly long or short, then that often signals a change in trend.
- The US Dollar also impacts Natural Gas prices and itself could be influenced by US data out on Friday, including the S&P Global Manufacturing and Services PMIs, out at 13:45 GMT. If they show a fall like the European and US PMIs, which have already been released, the US Dollar could pull back, lifting Natural Gas prices. If US PMIs are relatively positive, then the US Dollar could rise, weighing on Gas prices.
Natural Gas Technical Analysis: Recovery climb within a broader downtrend
Natural Gas price is in a long-term downtrend since turning lower at the $9.960 MMBtu peak achieved in August 2022. That said, bearish momentum has tapered off considerably since February 2023. This is evidenced by the bullish convergence of the Relative Strength Index (RSI) momentum indicator with price, beginning in May 2023. Bullish convergence occurs when price makes new lows but RSI fails to copy.
Natural Gas would need to break above the last lower high of the long-term downtrend at $3.079 MMBtu, however, to indicate a reversal in the broader trend.
As things stand, a break below the $2.110 MMBtu year-to-date lows would provide a signal for a continuation of the trend down to a target at $1.546 MMBtu. This target is the 61.8% Fibonacci extension of the height of the roughly sideways consolidation range that has been unfolding during 2023.
-638231224627571247.png)
Natural Gas: Weekly Chart
On the daily chart, it can be seen that price is moving roughly sideways, although it has now broken above both the 50 and not the 100-day Simple Moving Average (SMA), which is a short-term bullish sign.
-638231225147822054.png)
Natural Gas: Daily Chart
The four-hour chart shows the pair steadily climbing back up towards the May 20 highs at $2.779.
-638231225640027531.png)
Natural Gas: Four-hour Chart
Bulls keep pressing and making up ground after the recent cliff-edge decline from Tuesday’s highs.
It is possible the structure since June 20 is an ABC correction. If so the initial decline could be the ‘A’ leg of an ABC pattern, with the rebound on Wednesday leg ‘B’ and an expected eventual move down as wave ‘C’ finally unfolds.
If wave C does unfold, it will probably be at least a Fibonacci 61.8% length of wave A, suggesting a possible end target in the $2.500s.
Natural Gas FAQs
What fundamental factors drive the price of Natural Gas?
Supply and demand dynamics are a key factor influencing Natural Gas prices, and are themselves influenced by global economic growth, industrial activity, population growth, production levels, and inventories. The weather impacts Natural Gas prices because more Gas is used during cold winters and hot summers for heating and cooling. Competition from other energy sources impacts prices as consumers may switch to cheaper sources. Geopolitical events are factors as exemplified by the war in Ukraine. Government policies relating to extraction, transportation, and environmental issues also impact prices.
What are the main macroeconomic releases that impact on Natural Gas Prices?
The main economic release influencing Natural Gas prices is the weekly inventory bulletin from the Energy Information Administration (EIA), a US government agency that produces US gas market data. The EIA Gas bulletin usually comes out on Thursday at 14:30 GMT, a day after the EIA publishes its weekly Oil bulletin. Economic data from large consumers of Natural Gas can impact supply and demand, the largest of which include China, Germany and Japan. Natural Gas is primarily priced and traded in US Dollars, thus economic releases impacting the US Dollar are also factors.
How does the US Dollar influence Natural Gas prices?
The US Dollar is the world’s reserve currency and most commodities, including Natural Gas are priced and traded on international markets in US Dollars. As such, the value of the US Dollar is a factor in the price of Natural Gas, because if the Dollar strengthens it means less Dollars are required to buy the same volume of Gas (the price falls), and vice versa if USD strengthens.
Against the weak Dollar, the EUR/USD recovered throughout the first half. Economists at Natixis analyze the pair’s outlook.
Expected improvement in the Chinese economy will be a positive factor for the EUR/USD
The EUR/USD will continue to appreciate in the second half against a weaker Dollar but also against a still restrictive ECB which will result in a reduction in the US/Euro interest rate differential. Furthermore, the EUR will be supported by the resilience of European growth in the second half while the US economy will be in recession.
The expected improvement in the Chinese economy will be a positive factor for the European economy and therefore for the EUR/USD.
The return of a substantial current-account surplus in Europe without any capital outflows, is also a factor supporting the EUR in the medium term.
The EUR/USD will gradually return towards 1.14 in December 2023.
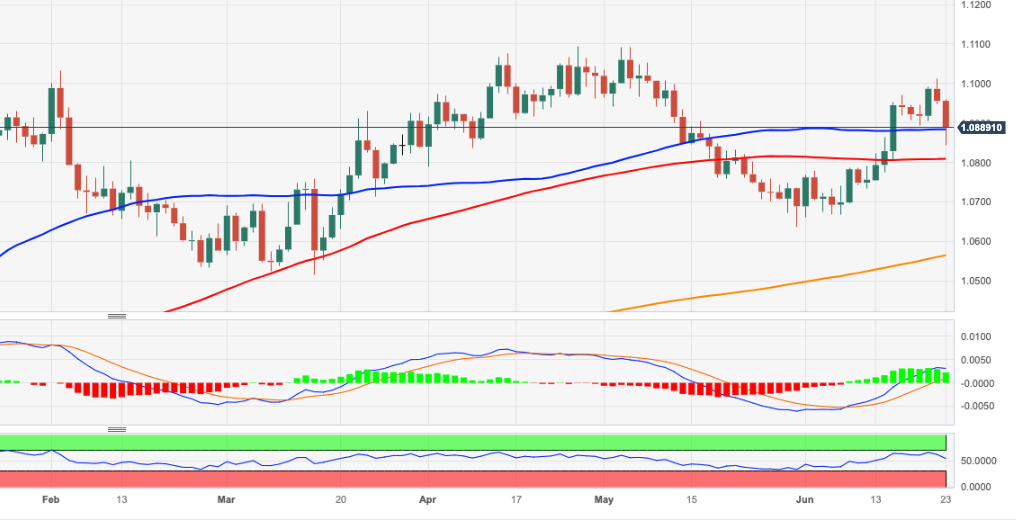
- EUR/USD drops heavily to the 1.0845/40 band on Friday.
- Further losses face the next stop at the 100-day SMA.
EUR/USD rapidly breaks below the 1.0900 support to clinch new multi-day lows in the vicinity of 1.0840 on Friday.
The inability of the pair to regain traction and surpass the June high at 1.1012 (June 22) should prompt sellers to regain control and trigger extra losses in the short-term horizon.
That said, the immediate contention emerges at the 100-day SMA at 1.0807, while the loss of this level could pave the way to another visit to the May low of 1.0635 (May 31).
Looking at the longer run, the positive view remains unchanged while above the 200-day SMA, today at 1.0563
EUR/USD daily chart
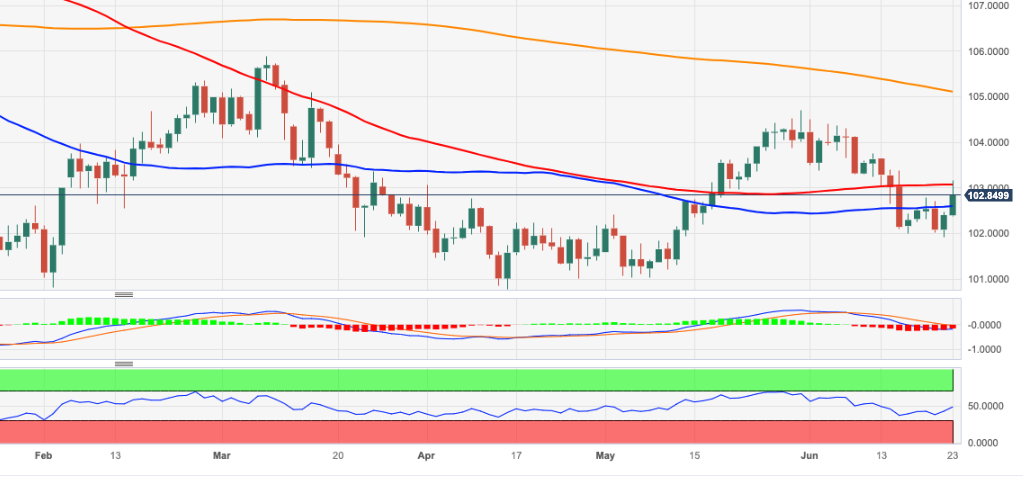
- DXY extends the rebound to 103.00 and above.
- Further downside likely on a breach of 102.00.
DXY adds to Thursday’s gains and reclaims the area beyond 103.00 the figure at the end of the week.
Despite the ongoing rebound, the index remains under pressure. That said, there is the palpable probability that a deeper pullback could drag DXY to the area of lows seen in April and May around 101.00 once the June low of 101.92 (June 22) is cleared. Dow from here emerges the 2023 low around 100.80 recorded on April 14.
Looking at the broader picture, while below the 200-day SMA at 105.10 the outlook for the index is expected to remain negative.
DXY daily chart
- NZD/USD has displayed a perpendicular decline to near 0.6130 amid a risk-off mood.
- S&P500 futures have extended their downside as investors are getting cautionary ahead of second quarter result season.
- Fed policymakers are consistently favoring more interest rate hikes ahead.
The NZD/USD pair has posted a vertical fall to near 0.6130 in the early New York session. The Kiwi asset has delivered a bumpy ride amid headwinds of negative market sentiment due to accelerating fears of global recession.
S&P500 futures have extended their downside journey as investors are getting cautionary ahead of the second-quarter result season. The major focus will be on the banking, manufacturing, and technology sector as tight credit conditions by financial institutions might have weighed on their margins, manufacturing activities have been contracting straight for the past seven months, and tech-savvy companies have been reporting weak guidance.
The US Dollar Index (DXY) has corrected further to near 102.80, however, the downside bias has not faded yet. While US Treasury yields have shown a massive decline. The yields offered by 10-year US Treasury bonds have dropped to near 3.74%.
Meanwhile, Federal Reserve (Fed) policymakers are consistently favoring more interest rate hikes ahead. Current inflation is still twice the required rate of 2%. Following the footprints of Fed chair Jerome Powell, Fed Governor Michelle Bowman also felt that at least two more hikes are warranted.
In the American session, the preliminary US S&P PMI (June) will remain in focus. Investors will keenly watch Manufacturing PMI figures as the mentioned sector is consistently reporting contraction from the past seven months. Investors should note that a figure below 50.0 is considered a contraction in an activity.
On the Kiwi front, sheer monetary stimulus by the People’s Bank of China (PBoC) is failing to provide some strength to the New Zealand Dollar. To uplift China’s economic prospects, the PBoC is consistently favoring a dovish policy.
It is worth noting that New Zealand is one of the leading trading partners of China and expansionary PBoC policy supports the New Zealand Dollar.
Will Yen's weakness become dramatic? Ulrich Leuchtmann, Head of FX and Commodity Research at Commerzbank, is particularly worried.
Fears of a depreciation-inflation spiral
Just in May, core inflation (seasonally adjusted) eased for the first time in a long time, which could justify the first glimmer of hope for an end to the inflation shock. A weak Yen puts this in jeopardy.
Japan's core inflation is still lower than 8 of the other 9 G10 countries. But that is not the key point. Everywhere else it is at least showing the first signs of slowing. Just not in Japan. How could it be, when the central bank is so ostentatiously inactive?
The Dollar will continue its cyclical decline, according to economists at Natixis.
Fed’s rate cuts expectations will reappear as inflation continues to decelerate
We still favour a cyclical fall of the Dollar in the second half of the year, bearing in mind that the US economy is likely to slide into recession under the effect of a marked tightening of banks’ credit conditions.
Moreover, Fed’s rate cuts expectations will reappear as inflation continues to decelerate and thus once again weigh on the USD.
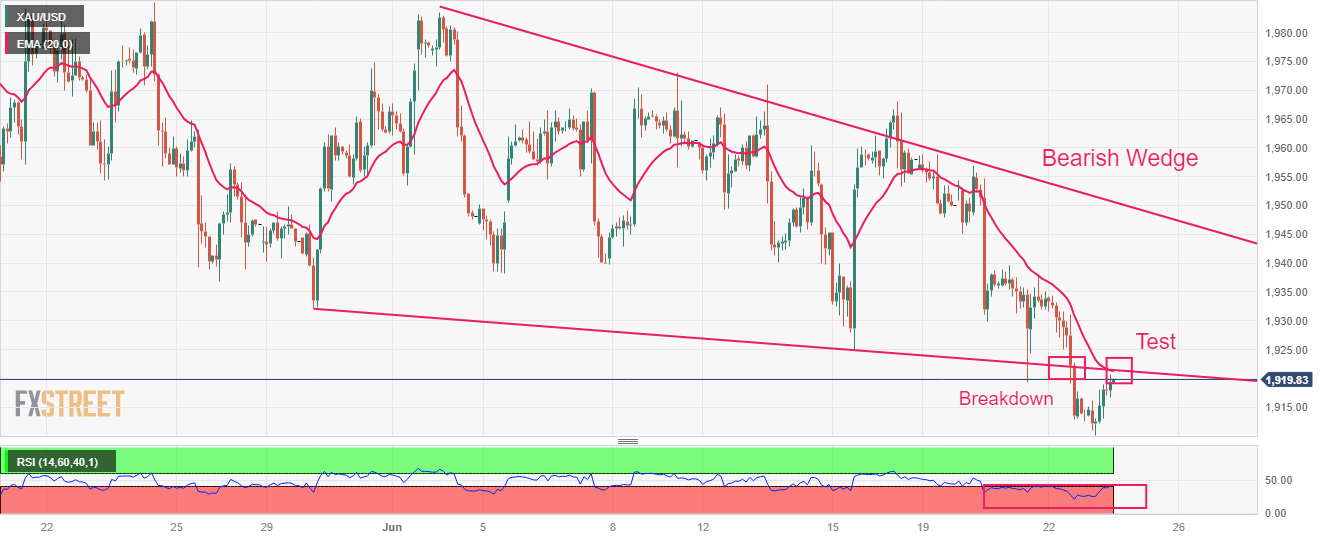
- Gold price has stretched its recovery to near $1,920.00 as the upside momentum in the USD Index is exhausting.
- The overall risk profile is negative as investors are worried about global economic prospects due to a hawkish stance by central banks.
- Gold price has shown a minor recovery to test the breakdown region of the Bearish Wedge chart pattern around $1,921.11.
Gold price (XAU/USD) has stretched its recovery to near $1,920.00 in the European session. The precious metal found strength near $1,912.00 as the US Dollar Index (DXY) has shown signs of exhaustion in the upside momentum.
S&P500 futures have generated immense losses overnight, which are solidifying a negative opening ahead. The overall risk profile is negative as investors are worried about global economic prospects due to a hawkish stance by central banks. The US Dollar Index (DXY) has corrected to near 103.00, however, the upside is still solid as Federal Reserve (Fed) chair Jerome Powell has confirmed that more rate hikes are appropriate but at a careful pace.
Fed Governor Michelle Bowman didn’t specify her estimate of how high the Fed may need to move rates, said on Thursday further "rate increases" were needed - indicating she feels at least two more hikes are warranted, as reported by Reuters.
Going forward, US preliminary S&P PMI (June) will be in focus. Analysts at TD Securities noted that “the S&P PMIs will offer a first comprehensive look at the state of the US economy for early June. Note that the manufacturing PMI registered its first decline this year in May, while the services PMI continued to improve, posting its fifth consecutive gain last month. We expect the manufacturing index to improve but to stay under contraction territory, while the services PMI likely lost speed.”
Gold technical analysis
Gold price has shown a minor recovery to test the breakdown region of the Bearish Wedge chart pattern around $1,921.11 on a two-hour scale. The precious metal is broadly in a negative trajectory. The 20-period Exponential Moving Average (EMA) at $1,921.46 might continue to act as a barricade for the Gold bulls.
The Relative Strength Index (RSI) (14) is oscillating in the bearish range of 20.00-40.00, which indicates that the downside momentum is active.
Gold two-hour chart
EUR/USD moved from a top of around 1.11 at the start of May down to 1.06, only to rise sharply over the past two weeks up to 1.09. Economists at Nordea discuss the pair’s outlook.
EUR/USD to correct down to the 1.07 area over the summer
While we have a higher profile for EUR/USD down the road, we believe markets are too pessimistic on behalf of the USD and see the cross correction down to the 1.07 area over the summer.
The cross will likely trade in the 1.06-1.10 area over the coming months before rising higher next year when it becomes clear that the Fed’s tight monetary policy is having a sufficient drag on inflation and the economy.
GBP trades softer but holds consolidation range. Economists at Scotiabank analyze Cable outlook.
A push above 1.2730 intraday will add to short-term momentum
Sterling has traded a little lower but losses remain confined to the consolidation range that had been developing through the week and the mid-week low at 1.2690 essentially held losses today. That is a minor plus for the Pound.
A push above 1.2730 intraday will add to short term momentum. Bullish territory is, however, distant at this point; a break above 1.2850/55 is needed to reignite near term bullishness.
Economists at Citi share their view on the Dollar.
USD may weaken
In the coming two years, we expect the Fed to unwind half of its tightening steps while other central banks stay relatively steady. This creates potential opportunities for non-US equity returns which are poised to gain from currencies when they appreciate against the US Dollar.
At present valuation levels – and the already deep penetration of the US Dollar in portfolios and trade – forward-looking fundamentals simply suggest some unwinding of the USD’s past decade of gains.
- USD/JPY has shown signs of exhaustion in the upside momentum.
- Further upside in the USD Index is still favored as the Fed is consistently reiterating the need for more rate hikes.
- Reuters reported that Japan's government and the BoJ will act to stop the yen's decline if it depreciates to the 145 per U.S. dollar level.
The USD/JPY pair is struggling to maintain stability above the crucial resistance of 143.00 in the London session. Earlier, the asset printed a fresh eight-month high at 143.45 after getting strength from the upbeat US Dollar Index (DXY). However, further upside looks gloomy as investors are hoping for a stealth intervention by the Bank of Japan (BoJ) to provide some cushion to the weak Japanese Yen.
S&P500 futures have trimmed some losses in Europe, however, the risk-aversion theme is still in action. Significant risks of global recession due to higher interest rates by central banks are weighing heavy pressure on risk-sensitive assets.
The US Dollar index has faced some and has dropped to near 103.00. Meanwhile, further upside is still favored as the Federal Reserve (Fed) is consistently reiterating the need for further policy tightening. Going forward, US preliminary S&P data (June) will be keenly watched. As per the prior estimation report, Manufacturing PMI will show a mild increase to 48.5 vs. the prior release of 48.4. Services PMI is seen declining to 54.0 against the former release of 54.9.
Meanwhile, Reuters reported that more than half of economists polled by Reuters favored that Japan's government and the Bank of Japan (BoJ) will act to stop the yen's decline if it depreciates to the 145 per U.S. dollar level. This could be done by a stealth intervention from the BoJ.
On the Japanese Yen front, soft inflation data has added some pressure. Scrutiny of Japan’s inflation report conveyed that contribution from higher oil prices is fading and domestic demand is contributing effectively. This could be the outcome of higher wages due to consistent monetary stimulus by the BoJ.
Yesterday's GBP reaction to the surprisingly large rate hike should be a lesson to those who are overly bullish on the EUR, in the opinion of economists at Commerzbank.
Higher EUR/USD rates in the second half of the year
The key point is that we expect positive ECB rate surprises relative to market expectations. That's the similarity with the BoE yesterday. And I will admit that this may be EUR positive for now. That's why we expect even higher EUR/USD rates in the second half of the year than we've seen recently. But at the same time, there should always be a degree of EUR skepticism. Positive rate surprises are not always positive for the currency. Yesterday's GBP reaction teaches us that.
Similar to what happened with the BoE yesterday, the market is likely to close one day for the ECB: With high interest rates, it is only following the inflationary trend, not controlling it. That would be bad for the Euro. And why? Because a central bank that only reacts to inflation can stop explosive inflationary developments, but it cannot prevent such inflationary outbreaks from happening again and again. This increases the inflation risk premium that the currency market demands to hold such a currency. That is, it weighs on the exchange rate.
- AUD/USD has tested region below 0.6700 as the risk profile remains downbeat.
- The USD Index has refreshed its weekly high at 103.17 as the Fed is expected to raise interest rates further.
- AUD/USD has dropped to near the 50% Fibonacci retracement at 0.6680.
The AUD/USD pair has tested territory below the round-level support of 0.6700 for the first time in the past ten trading sessions. The Aussie asset has faced immense pressure as the market mood has turned quite risk-off due to fears of the global recession.
The US Dollar Index (DXY) is on the seventh cloud amid a risk-aversion theme. The USD Index has refreshed its weekly high at 103.17 as the Federal Reserve (Fed) is expected to raise interest rates further to achieve price stability.
Meanwhile, upbeat preliminary S&P PMI numbers have failed to support the Australian Dollar. Manufacturing PMI landed at 48.6, higher than the expectations of 48.1 and the former release of 48.4. Also, Services PMI at 50.7 outperformed expectations of 50.1 but remained lower than the former release of 52.1.
AUD/USD has dropped to near the 50% Fibonacci retracement (plotted from May 31 low at 0.6458 to June 16 high at 0.6900) at 0.6680 on a two-hour scale. Downward-sloping 20-period Exponential Moving Average (EMA) at 0.6743 indicates that the selling pressure is on Australian Dollar bulls.
The Relative Strength Index (RSI) (14) has shifted into the bearish range of 20.00-60.00 from the bullish range in which the momentum oscillator would face selling pressure after a pullback to 60.00.
A decisive break below the 50% Fibo retracement at 0.6680 would expose the asset to 61.8% Fibo retracement at 0.6628 followed by June 05 low at 0.6579.
On the flip side, a confident break above the round-level resistance of 0.6800 would expose the asset to June 20 high at 0.6855. A break above the latter would drive the asset toward June 16 high at 0.6900.
AUD/USD two-hour chart

UOB Group’s Head of Research Suan Teck Kin and Junior Economist Angus Santoso comment on the latest BI monetary policy meeting.
Key Takeaways
Bank Indonesia (BI) kept its benchmark policy rate (7-Day Reverse Repo) unchanged at 5.75% following its Jun MPC meeting, in line with consensus and our expectations.
BI remains of the view that inflation expectations are “well-anchored” and it expects headline inflation to return to BI’s target range of 2-4% by 3Q23. Jun’s inflation continued to ease and rupiah remains the strongest currency in Asiayear-to-date.
Today’s MPC decision also stated that BI will increase the frequency and tenor of TD DHE auctions with more competitive rates as an extra policy to anchor rupiah stability. We keep our view for the rate cut cycle to start in 1Q24. The key catalysts for the start of the rate-cutting cycle would be a consistently declining inflation towards its target range, a more anchored and persistent stability of the rupiah, and an increasing need to support the growth momentum ahead.
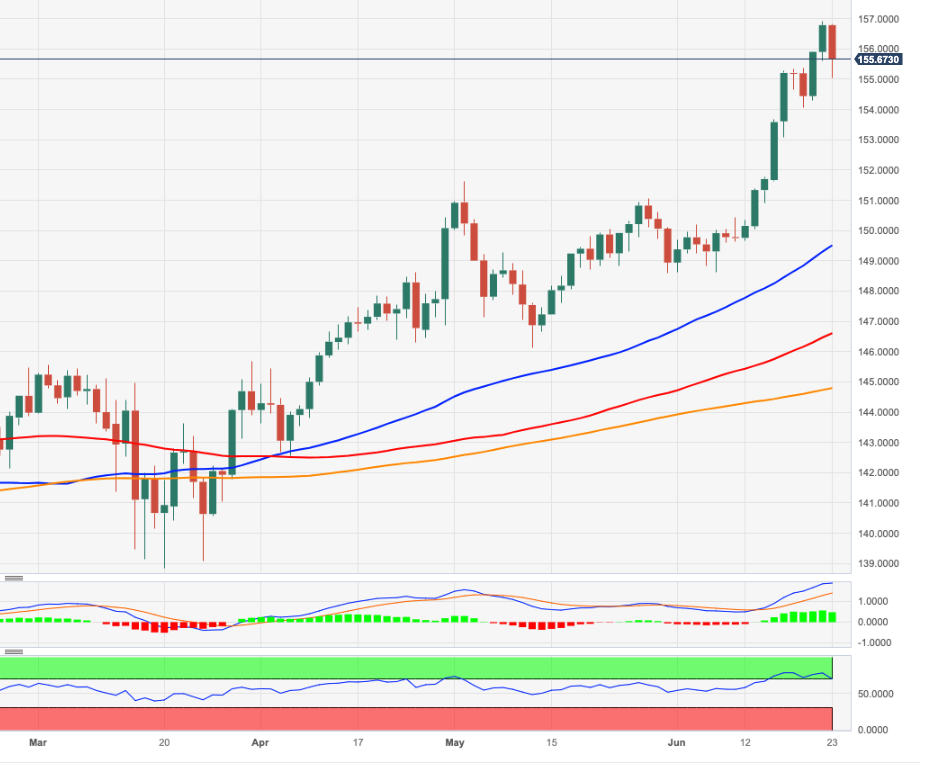
- EUR/JPY reverses two sessions in a row with gains.
- The continuation of the upside now targets the 159.00 hurdle.
EUR/JPY comes under pressure following Thursday’s peaks in levels just shy of the 157.00 barrier on Friday.
In the meantime, further gains should clear the YTD high at 156.93 (June 22) to then challenge the 157.00 mark. The surpass of the latter should motivate the cross to embark on a potential visit to the September 2008 top near 159.60.
While extra gains remain on the cards, the ongoing overbought conditions of the cross are indicative that further retracements should not be ruled out at some point in the short-term horizon.
So far, further upside looks favoured while the cross trades above the 200-day SMA, today at 144.76.
EUR/JPY daily chart
USD/MXN downtrend has extended after it struggled to overcome the 50-Day Moving Average (DMA) at 18.00 last month (now at 17.60). Economists at Société Générale analyze the pair’s technical outlook.
The decline is a bit stretched
The pair has recently revisited the trough of 2016 near 17.10 and is close to the lower limit of a multi-month descending channel.
The decline is a bit stretched; an initial bounce is not ruled out however the MA near 17.60 must be overcome to affirm a meaningful up-move. Failure could lead to continuation in downtrend; next potential support levels are located at projections of 16.95 and 16.60/16.40.
The Bank of England surprised markets with a 50 bps rate hike on Thursday, and economists at ING think a reserve currency like the Pound may be kept afloat by a sharply inverted domestic yield curve.
A sharply inverted yield curve can come in handy
150 bps of tightening was already priced in before the meeting, and investors are now looking at a 6.0%+ peak rate after the hike. The attempt by the BoE to get ahead of the curve with more aggressive tightening is being accompanied by rising speculation that this will trigger monetary easing starting in the summer of 2024. Still, that price development is not enough to impact the highly inverted shape of the GBP yield curve.
From a currency perspective, a sharply inverted yield curve can work as a positive factor for a reserve currency like the Pound (as opposed to growth-sensitive currencies). We suspect that a rebound to 0.88 in EUR/GBP will need to be delayed on the back of that.
Senior Economist Julia Goh and Economist Loke Siew Ting at UOB Group review the latest interest rate decision by the BSP.
Key Takeaways
As expected, Bangko Sentral ng Pilipinas (BSP) left its overnight reverse repurchase (RRP) rate unchanged at 6.25% for the second straight meeting. It cited that cooling inflation readings and indications of moderating economic activity over the policy horizon allowed the central bank to continue taking a pause in its monetary policy tightening to further assess the lagged effects of past interest rate hikes since May 2022. The decision is also consistent with the guidance from policymakers since last month (22 May).
BSP made a slight tweak in its inflation projections for 2023 (at 5.4% vs 5.5% projected in May, UOB est: 5.3%) and 2024 (at 2.9% vs 2.8% previously, UOB est: 2.5%) as well as introduced a 3.2% inflation forecast for 2025 in today’s meeting. These latest baseline projections continue to suggest a gradual return of inflation to its 2.0%-4.0% medium-term target band amid lingering upside risks from supply chains, domestic policy changes, and weather conditions.
Given that inflation expectations remain in line with the central bank’s assessment and the currency (PHP) stability is currently preserved, we think BSP will continue its rate pause campaign for the rest of the year. At the same time, it will also exercise caution in its response to the Fed’s latest hawkish remarks as BSP is still mindful of the potential impact of narrowing interest-rate differential on PHP. BSP also reiterated in its statement that the central bank “remains prepared to resume monetary tightening as necessary…” and ongoing price pressures continue to warrant close monitoring. Hence, the incoming release of inflation data on 5 Jul and 4 Aug, real GDP outturn for 2Q23 (10 Aug), as well as the outcome of FOMC meeting on 25-26 Jul are important factors, which will influence the next BSP rate decision on 17 Aug.
US jobs market will be key for the Fed and the Dollar, economists at MUFG Bank report.
We are close to a turn toward weaker employment data
The primary piece of economic data that gives justification to the continued hawkish rhetoric from the Fed is the strength of the labour market. But evidence is building that we are close to a turn toward weaker employment data.
Of course, we can’t be sure these signs of weakness will become evident in the NFP in the July release for June data. And if the data holds up again then a hike by the FOMC in July is more likely. The data does though make us confident a turn will materialise over the coming two to three months and that leaves the Dollar vulnerable to a further sell-off once the weakness is confirmed in NFP.
Our current EUR/USD forecasts are 1.0900 in Q2 and 1.1300 in Q3 which reflects our view of a turn in the jobs data that intensifies once again recession fears and strengthens expectations of rate cuts at the back-end of this year and in 2024, which will help fuel renewed Dollar selling.
Considering advanced figures from CME Group for natural gas futures markets, open interest extended further the downward move and shrank by around 20.5K contracts on Thursday. Volume followed suit and went down for the second session in a row, this time by nearly 30K contracts.
Natural Gas: Upside remains capped near $2.70
Prices of natural gas added to the weekly recovery on Thursday. The daily uptick, however, was in tandem with shrinking open interest and volume and is suggestive that a probable corrective move could be in the offing in the very near term. In the meantime, bullish attempts appear so far capped by the $2.70 region per MMBtu.
Kit Juckes, Chief Global FX Strategist at Société Générale, analyzes the EUR outlook following dreadful PMIs.
June’s Euro rally just hit a – PMI – brick wall
EUR/USD has risen from 1.06 to above 1.10 this month and has given back almost half that move in under 24 hours.
A return to 1.06 is a significant risk, dragging GBP/USD back to 1.25 in the process.
The only caveat is that the European PMI data aren’t a very useful gauge of what’s happening to the economy, and should be treated with some scepticism, but that’s not going to help on a midsummer Friday with no other major data due.
After remaining relatively stable since the beginning of the year, the GBP ended up appreciating significantly in May. However, economists at Natixis expect the Pound to struggle in the second half of the year.
A weaker GBP in the second half
Despite its rebound, we remain cautious with regard to the GBP, which is likely to start falling again, bearing in mind that the continued rise in key rates will only exacerbate the deterioration in economic activity, and in particular in the real estate market.
Moreover, there is also the risk that the BoE will not raise its key rates as much, which would also weigh on the GBP. Against this backdrop, the EUR/GBP should return to 0.88 at the end of the year.
In light of the recent price action, USD/CNH could extend the bullish attempt to the 7.2300 zone in the near term, note UOB Group’s Economist Lee Sue Ann and Markets Strategist Quek Ser Leang.
Key Quotes
24-hour view: Yesterday, we highlighted that USD “appears to have moved into a consolidation phase” and we expected it to trade between 7.1680 and 7.2020. USD then dipped to 7.1671, rebounded to 7.2032 before closing on a firm note at 7.1930. Upward momentum has improved somewhat, and USD is likely to trade with an upward bias towards 7.2200 today. A sustained rise above this level appears unlikely. Support is at 7.1860, followed by 7.1720.
Next 1-3 weeks: Two days ago (21 Jun, spot at 7.1880), we highlighted that while upward momentum is building again, USD must break and stay above 7.2000 before further sustained advance is likely. Yesterday (22 Jun), USD rose to a high of 7.2032. Upward momentum has improved a tad, and there is room for USD to edge higher to 7.2300. At this stage, USD does not appear to have enough momentum to break clearly above this level. The current mild upward pressure is intact as long as USD stays above 7.1580 (‘strong support’ level previously at 7.1500 yesterday).
- Investors are dumping oil as global recession fears have elevated.
- Hawkish guidance by global central banks is threatening the world economic outlook.
- A drawdown in oil inventories reported by US EIA has failed to provide support to the oil price.
West Texas Intermediate (WTI), futures on NYMEX, have plunged to near $68.00 as global central banks are consistently hiking interest rates to tame stubborn inflation. Soaring fears of a recession in the global economy are signaling a bleak demand outlook for oil.
Last week, the Federal Reserve (Fed) kept monetary policy steady but delivered hawkish guidance as the achievement of price stability has a long way to go. Contrary to that, the European Central Bank (ECB) hiked interest rates by 25 basis points (bps) to 4% as Eurozone’s inflation is thrice the required rate of 2%.
This week, the Bank of England (BoE) has unexpectedly raised interest rates by 50bps to 5% as inflationary pressures in the United Kingdom are getting beyond the control of BoE policymakers. Swift policy-tightening measures by central banks to bring down inflation are threatening global economic prospects as firms would restrict them from banking credit from financial institutions to avoid fat interest obligations.
Meanwhile, a drawdown in oil inventories reported by the United States Energy Information Administration (EIA) for the week ending June 16 has failed to provide support to the oil price. Last week, oil stockpiles show a decline of 3.831M while the street was anticipating a build-up of 0.33M.
Later, preliminary global S&P PMI numbers will be keenly watched, which will determine further demand for oil. It is worth noting that the United States economy has been reporting contraction consistently for the past seven months.
Japanese Finance Minister Shunichi Suzuki on Friday that he is firmly watching FX moves.
Additional quotes
“Sharp FX moves are undesirable.”
“Currency rates should be set by market reflecting fundamentals.“
“Will not comment on FX levels.”
Economists at ANZ Bank analyze EUR/USD outlook.
EUR/USD to remain in a 1.05-1.14 range in 2023
In contrast with market expectations of 20 bps of cuts for the fed funds rates by year-end, there are no cuts priced in for the ECB until early 2024. This suggests that the ECB’s easing cycle will be later and shallower than the US Fed’s, which is supportive of the EUR over the medium term.
A relatively more hawkish ECB, with more work to do in taming inflation, could bring about some upside in the EUR vs the USD in H2 2023. However, given that economic data surprises in the Euro-area are turning negative relative to the US, we believe that any upside in the EUR will be capped at 1.12 in Q3. We also think that any rally in the EUR will likely be driven by USD-related factors.
We expect EUR/USD to remain in a 1.05-1.14 range in 2023.
Strategists at OCBC Bank discuss Brent Crude Oil outlook.
Brent Crude Oil to trade in a range-bound manner in the near term
We maintain our forecast for Brent Crude Oil prices to average ~$90/bbl this year implying higher Oil prices in the coming months.
That said, in the near term, we expect Brent Crude Oil to trade in a range-bound manner ($70-80/bbl) as demand concerns outweigh supply considerations.
See: WTI to approach the $90 mark in the latter part of the year – TDS
- EUR/JPY meets with heavy supply on Friday and corrects sharply from a multi-year top.
- The disappointing Eurozone PMIs undermine the shared currency and exert pressure.
- The BoJ’s dovish outlook might continue to weigh on the JPY and limit further losses.
The EUR/JPY cross comes under intense selling pressure on Friday and snaps a two-day winning streak to its highest level since September 2008, around the 157.00 neighbourhood touched the previous day. The intraday downward trajectory picks up pace during the early European session and drags spot prices to a fresh daily low, around the 155.00 psychological mark in the last hour.
The shared currency takes a hit following the rather disappointing release of Eurozone PMI prints, which, in turn, is seen as a key factor behind the latest leg of a sudden drop for the EUR/JPY cross. In fact, S&P Global's preliminary report pointed to a sharp slowdown in business activity in France and Germany - the Eurozone's two largest economies. This comes on the back of worries about economic headwinds stemming from rapidly rising borrowing costs, which, to a larger extent, offsets the European Central Bank's hawkish outlook and does little to impress the Euro bulls.
The Japanese Yen (JPY), on the other hand, attracts some haven flows in the wake of the prevalent risk-off environment and is further underpinned by stronger domestic inflation data released earlier this Friday. In fact, Japan's Nationwide Core Consumer Price Index (CPI), which excludes fresh food but includes energy items, eased from 3.4% to 3.2% in May, though surpass market estimates. Furthermore, the gauge excluding fuel costs rose at the fastest annual pace in 42 years, highlighting that the underlying inflation remained heated and put pressure on the Bank of Japan (BoJ).
The Japanese central bank, however, recently reiterated that it has no plans to alter its ultra-loose policy. This marks a bid divergence in comparison to a more hawkish stance adopted by other major central banks, which might continue to undermine the JPY and help limit losses for the EUR/JPY cross. This, in turn, suggests that the ongoing corrective pullback is solely led by some long-unwinding heading into the weekend. Nevertheless, spot prices now seem to have erased a major part of the weekly gains. That said, any subsequent fall is more likely to attract fresh buyers and remain limited.
Technical levels to watch
The BoE surprised yesterday and hiked its key rate from 4.50% to 5%. Interestingly enough Sterling was unable to benefit from the surprise decision. Economists at Commerzbank discuss GBP outlook.
BoE unable to convince
A central bank that is fighting decidedly against stubbornly high inflation levels would sound different. Instead, the BoE refers to its inflation projections. That means it still expects that inflation will fall notably over the course of the year. It has been expecting that for some time and at least the rise in core inflation paints a different picture.
So the impression remains of a central bank that was too slow in starting to hike its key rate and moved to smaller rate steps too early, even signalling a possible pause. The BoE seems to be chasing inflation developments rather than fighting them with an active monetary policy, which is damaging for Sterling. As we do not believe that the BoE will suddenly take a different approach, we remain sceptical for Sterling.
- GBP/USD is expected to deliver weakness below 1.2700 as fears of a bleak global outlook have improved US Dollar’s appeal.
- The Pound Sterling has failed to gain traction despite the BoE hiking interest rates by 50 bps against 25 bps as expected.
- More rate hikes by the BoE are widely anticipated as UK Retail Sales have remained better than anticipated.
The GBP/USD pair is struggling in maintaining its auction above the round-level support of 1.2700 in the London session. The Cable is expected to deliver a downside break of the aforementioned support despite Federal Reserve (Fed)-Bank of England (BoE) policy divergence has narrowed significantly.
S&P500 futures have extended losses in Europe, portraying a severe decline in the risk appetite of the market participants. The market sentiment has turned negative as investors are worried about global growth due to higher interest rates by central banks.
Meanwhile, sheer strength in the US Dollar Index (DXY) due to the risk-off market mood has dampened sentiment for Cable. The USD Index has printed a fresh day high at 103.00. Going forward, preliminary US S&P data (June) will be in focus. The Manufacturing PMI is expected to show a mild increase to 48.5 vs. the prior release of 48.4. Services PMI is seen declining to 54.0 against the former release of 54.9.
The Pound Sterling has failed to gain traction despite BoE Governor Andrew Bailey hiking interest rates by 50 basis points (bps) against 25 bps as expected as United Kingdom inflation turned out extremely persistent. Core Consumer Price Index (CPI) is moving in the wrong direction as the economic indicator hit a fresh high at 7.1% despite the extremely restricted monetary policy. More rate hikes by the BoE are widely anticipated as UK Retail Sales have remained better than anticipated.
Monthly economic data has expanded by 0.3% while the street was anticipating a contraction by 0.2%. Annualized Retail Sales contracted by 2.1% but remained better as investors were hoping for a contraction of 2.6%.
- UK Manufacturing PMI declines to 46.2 in June, disappoints markets.
- Services PMI in the UK comes in at 53.7 in June, misses expectations.
- GBP/USD challenges bulls near 1.2700 on disappointing UK business PMIs.
The seasonally adjusted S&P Global/CIPS UK Manufacturing Purchasing Managers’ Index (PMI) fell to 46.2 in June versus 46.8 expected and, 47.1 - May’s final readout.
Meanwhile, the Preliminary UK Services Business Activity Index for June dipped to 53.7 compared with a 55.2 final print for May and 54.8 expected.
FX implications
GBP/USD is flirting with 1.2700, keeping the red on the downbeat UK Manufacturing and Services PMI data. The currency pair is losing 0.35% on the day.
The Turkish Lira has continued to adjust sharply lower following yesterday’s CBRT policy meeting. Economists at MUFG Bank analyze TRY's outlook.
Policy shift continues as CBRT disappoints expectations for bigger hike
The CBRT under the new leadership of new Governor Erkan raised their key policy rate by 6.5 percentage points to 15.0%. While it was a step in right direction back towards more orthodox monetary policy settings, the size of the adjustment disappointed market expectations and triggered a fresh sell-off in Turkish assets and the Lira.
In the near term, the shift back to more orthodox policy settings including allowing the TRY to float more freely is allowing it to find a new lower equilibrium which helps restore external competitiveness and rebalance Turkey’s economy. By delivering more gradual hikes, the Lira is playing a greater role in the policy shift.
We believe it is still too early in the adjustment to expect a significant pick-up in capital flows into Turkey resulting from the policy shift that would help to provide more support for the Lira at weaker levels. As a result, risks remain heavily titled to the downside for the TRY.
- USD/CAD has jumped to 1.3200 amid solid appeal for the USD Index due to a bleak global outlook.
- The US Dollar Index has climbed to near 103.00 amid the risk-aversion theme.
- USD/CAD is auctioning in a Falling Channel pattern in which each pullback is considered a selling opportunity.
The USD/CAD pair has jumped sharply to near the round-level resistance of 1.3200 in the London session. The Loonie asset has picked significant bids as the US Dollar Index (DXY) is showing severe resilience and the oil prices are dropped sharply.
Oil prices are facing the heat as hawkish central banks have threatened global economic prospects. It is worth noting that Canada is the leading exporter of oil to the United States and weak oil prices impact the Canadian Dollar.
The US Dollar Index (DXY) has climbed to near 103.00 amid tailwinds of the risk-aversion theme. Also, hawkish Federal Reserve (Fed) bets have strengthened the appeal for the US Dollar.
USD/CAD is auctioning in a Falling Channel chart pattern on an hourly scale in which each pullback is considered a selling opportunity by the market participants. The 100-period Exponential Moving Average (EMA) at 1.3196 is acting as a stiff barricade for the US Dollar bulls.
Contrary to that, the Relative Strength Index (RSI) (14) has stepped into the bullish range of 60.00-80.00, however, the downside risks are still elevated.
Going forward, a downside move below June 16 low at 1.3177 could expose the asset to June 22 low at 1.3139 followed by the round-level support at 1.3100.
On the flip side, a decisive move above June 15 high at 1.3355 would drive the asset to June 12 high at 1.3384 and June 06 high at 1.3452.
USD/CAD hourly chart
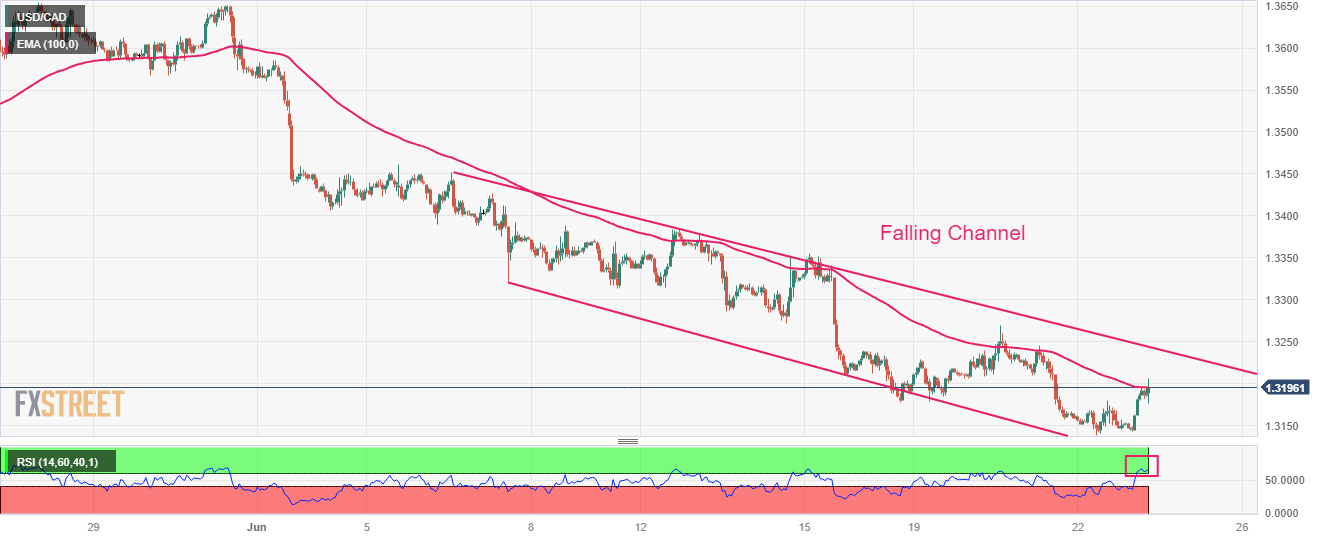
CME Group’s flash data for crude oil futures markets noted traders added around 13.6K contracts to their open interest positions on Thursday, reaching the third consecutive daily build. On the other hand, volume shrank for the second straight day, this time by around 445.3K contracts.
WTI could challenge monthly lows near $67.00
WTI prices dropped sharply on Thursday, breaking below the key $70.00 mark per barrel with marked decision. The downtick was on the back of increasing open interest and could allow for further losses to dispute the June low near the $67.00 mark per barrel.
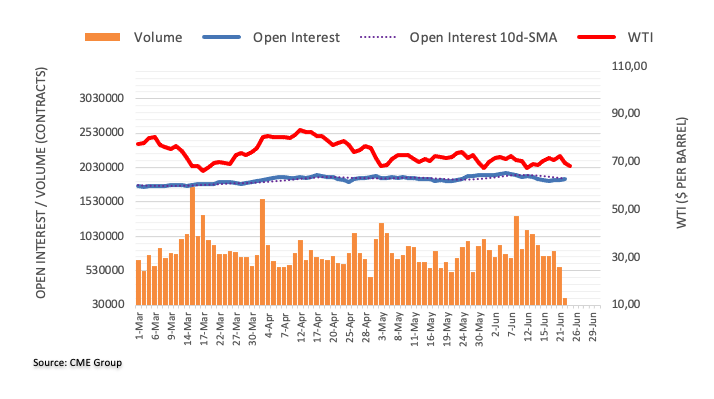
- USD/CHF gains strong follow-through traction and jumps to over a one-week high.
- The SNB’s 25 bps lift-off disappointed some investors and undermines the CHF.
- The Fed’s hawkish outlook continues to boost the USD and remains supportive.
The USD/CHF pair builds on the overnight bounce from the vicinity of the 0.8900 figure and gains strong positive traction for the second successive day on Friday. The momentum remains uninterrupted through the early European session and lifts spot prices to over a one-week high, beyond the 0.9000 psychological mark in the last hour, though lacks follow-through.
The Swiss National Bank's (SNB) decision to lift interest rates for the fifth time in succession, by 25 bps on Thursday seems to have disappointed some investors expecting a bigger increase. It is worth recalling that SNB Chairman Thomas Jordan recently showed the readiness to raise rates more aggressively, encouraging markets to price in the possibility of a 50 bps lift-off. The relatively smaller rate hike continues to undermine the Swiss Franc (CHF), which, along with the prevalent US Dollar (USD) buying, acts as a tailwind for the USD/CHF pair.
In fact, the USD Index (DXY), which tracks the Greenback against a basket of currencies, builds on the recovery from its lowest level since May 11 touched the previous day and draws support from the Federal Reserve's (Fed) hawkish outlook. In fact, the Fed last week signalled that borrowing costs may still need to rise as much as 50 bps by the end of this year. Moreover, Fed Chair Jerome Powell, during his two-day congressional testimony, reiterated that the central bank will likely raise rates again this year, albeit at a "careful pace", to combat inflation.
Powell added that the Fed doesn't see rate cuts happening any time soon and is going to wait until it is confident that inflation is moving down to the 2% target. The markets were quick to react and are now pricing in a nearly 75% chance that the Fed will hike rates further in July. A stronger buck, along with some technical buying above the 50-day Simple Moving Average (SMA), remains supportive of the USD/CHF pair's intraday positive move. That said, the risk-off impulse could drive some haven flows towards the CHF and cap gains for the major.
A slew of rate hikes by major central banks this month raises concerns about economic headwinds stemming from rapidly rising borrowing costs. Adding to this, the disappointing release of the flash Eurozone PMIs takes its toll on the global risk sentiment, which is evident from a generally weaker tone around the equity markets. This, in turn, is forcing investors to take refuge in traditional safe-haven assets and might keep a lid on the USD/CHF pair. Traders now look to the flash US PMIs for some impetus later during the early North American session.
Technical levels to watch
Economists at OCBC Bank maintain a constructive outlook on Gold prices.
Risk of another 1-2 more Fed rate hikes can dim the appeal of Gold in the near term
Near term, the risk of another 1-2 more Fed rate hikes can dim the appeal of Gold but to put in perspective, the Fed is closer to end of tightening cycle. Historically, Gold prices can outperform at the end of Fed tightening cycle.
While opportunity cost of holding Gold has risen, we reckon it should not be long before real yields ease lower at some stage. This can be supportive of Gold prices.
We also favour long Gold as a risk-off hedge (safe haven proxy) against slowing global growth or any risk-off market event like the US banking turmoil that saw a surge in Gold prices.
Gold Forecast: 3Q23 2,030 4Q23 2,050 1Q24 2,050.
Extra gains in USD/JPY could see the 144.00 region revisited in the short-term horizon, comment UOB Group’s Economist Lee Sue Ann and Markets Strategist Quek Ser Leang.
Key Quotes
24-hour view: The strong surge in USD that sent it soaring to a high of 143.23 came as a surprise (we were expecting it to trade in a range). The sharp and swift rally appears to be overdone but with no sign of weakness just yet, USD is likely to continue to strengthen. However, the next major resistance at 144.00 is highly unlikely to come into view. In order to keep the momentum going, USD must stay above 142.35 (minor support is at 142.70).
Next 1-3 weeks: After USD edged to a high of 142.39 on Wednesday, we highlighted yesterday (22 Jun, spot at 141.80) that “upward momentum has not improved much.” We added, “as long as the ‘strong support’ level at 141.00 is not breached, USD could grind higher to 142.70.” We did not anticipate USD to surge to a high of 143.23 in NY trade. The price actions suggest USD is likely to continue to rise. The next level to watch is 144.00. At this stage, it is too soon to tell if the USD strength that started last week could break clearly above this level. On the downside, the ‘strong support’ level has moved higher to 141.60 from 141.00.
- Eurozone Manufacturing PMI arrives at 43.6 in June, below expectations of 44.8.
- Bloc’s Services PMI drops to 52.4 in June vs. 54.5 expected.
- EUR/USD keeps losses near 1.0870 amid disappointing German and Eurozone PMIs.
The Eurozone manufacturing sector activity unexpectedly worsened in June, the latest data from HCOB's latest purchasing managers index survey showed Friday.
The Eurozone Manufacturing Purchasing Managers Index (PMI) arrived at 43.6 in June, compared with the 44.8 expected by markets and below the 44.8 seen in May. The index reached a 37-month low.
The bloc’s Services PMI also dropped to 52.4 in June from 55.1 in May, hitting a five-month low, arriving below the 54.5 estimates.
The HCOB Eurozone PMI Composite eased to 50.3 in June vs. 52.5 expected and 52.8 previous. The index dropped to a five-month low.
FX implications
EUR/USD keeps losses near 1.0870 following the release of the below estimates Eurozone PMIs. The spot is down 0.80% on the day.
Open interest in gold futures markets resumed the uptrend and increased by more than 1K contracts on Thursday according to preliminary readings from CME Group. Volume, instead, dropped for the second session in a row, now by more than 15K contracts.
Gold faces an interim support at $1900
Gold prices extended the weekly leg lower on Thursday amidst rising open interest, which hints at the view than further losses remain in store for the yellow metal in the very near term. That said, there is a minor support at the round level of $1900 per troy ounce, while a deeper decline is expected to face the next relevant contention at the 200-day SMA near $1850.
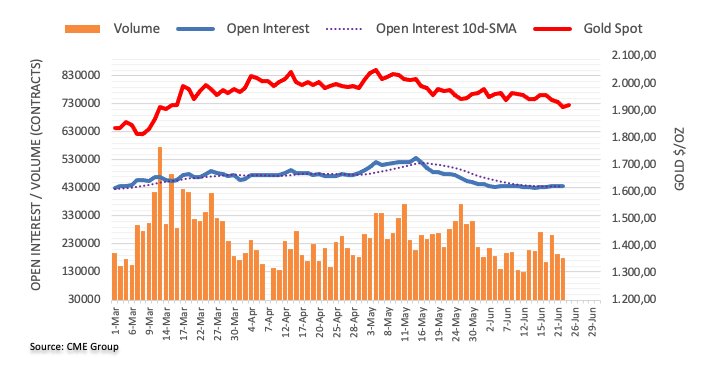
- June S&P Global Preliminary Manufacturing PMI to remain in contraction, Services PMI set to decline.
- Potential surprises to the US PMI data will infuse intense volatility, impacting the Federal Reserve expectations.
- EUR/USD corrects from monthly top from above 1.1000 ahead of the US data release, eyeing a rebound.
The S&P Global US Purchasing Managers Index (PMI) measures the activity level of private sector businesses through a survey conducted on a monthly basis. On Friday, June 23, the company will publish the June preliminary estimates of Manufacturing PMI and Services PMI for the United States (US).
As the US Federal Reserve (Fed) remains determined to bring inflation back to its 2% target, the longer period of higher borrowing costs is already negatively impacting businesses, which has led the economy to the brink of recession.
Back in May, the S&P Global preliminary US Manufacturing PMI fell for the first time in five months to 48.5, returning to contraction after a brief one-month stint in expansion territory. The Services PMI Index rose to 55.1 from 53.6, outpacing the market consensus of 52.6.
Commenting on the renewed decline in the US manufacturing sector activity in May, Chris Williamson, Chief Business Economist at S&P Global Market Intelligence, warned that “we are likely to see further downward pressure on both output and prices for goods in the coming months, thanks to the demand environment which has been hit by higher interest rates, the increased cost of living, economic uncertainty and a post-pandemic shift in spend from goods to services.”
What to expect in the next S&P Global PMI report?
The S&P Global Manufacturing PMI Index is seen a tad higher at 48.5 in June, compared with the final reading of 48.4 registered in April. The Services PMI, however, is expected to decline to 54.0 in June vs. the previous month’s final figure of 54.9. The Composite PMI is foreseen at 54.4 in the current month, up from May’s 54.3 final figure.
Analysts at TD Securities noted that “the S&P PMIs will offer a first comprehensive look at the state of the US economy for early June. Note that the manufacturing PMI registered its first decline this year in May, while the services PMI continued to improve, posting its fifth consecutive gain last month. We expect the mfg index to improve but to stay under contraction territory, while the services PMI likely lost speed.”
When will June flash US S&P Global PMIs be released and how could it affect EUR/USD?
The S&P Global PMI report is scheduled for release at 13:45 GMT, on June 23. In the lead-up to the US PMI showdown, the US Dollar is recovering from monthly troughs, setting EUR/USD on a corrective decline toward the 1.0900 level.
An upside surprise to the US PMI data will reinforce expectations of two more Federal Reserve interest rate hikes in the second half of this year, as projected by the dot plot chart last week. Markets are now pricing a 77% probability of a Fed rate hike next month. If the US data suggests signs of resilience in the US economy, the US Dollar could receive a fresh lifeline, particularly against the Euro.
On the other hand, dwindling US business activity will accentuate US economic concerns, which could provide additional legs to the ongoing US Dollar downtrend, especially after the testimony by Fed Chair Jerome Powell was viewed as less hawkish than what markets had priced. Nevertheless, the US Dollar could see limited downside and capitalize on its safe-haven status on disappointing PMI readings.
Meanwhile, Dhwani Mehta, Asian Session Lead Analyst at FXStreet, offers a brief technical outlook for the EUR/USD pair and writes: “bullish 21-Day Moving Average (DMA) is on the verging of piercing the horizontal 100 DMA from below, which if materialized will confirm a Bull Cross. Meanwhile, the 14-day Relative Strength Index (RSI) is keeping its range well above the midline. These suggest that risks remain skewed to the upside for the EUR/USD pair in the near term.”
Dhwani also outlines important technical levels to trade the EUR/USD pair: “Should Euro buyers fight back control, a rebound toward the monthly highs of 1.1012 cannot be ruled. Further up, the 1.1050 psychological mark will be tested. Conversely, immediate support awaits at Wednesday’s low of 1.0907, below which the flattish 50 DMA support at 1.0877 could come into play.”
S&P Global PMI related content
- USD Index resumes the upside to the 102.70 region
- EUR/USD risks a reversal near term – UOB
- Gold Price Forecast: XAU/USD bulls must defend $1,900 for a chance at recovery – Confluence Detector
About the US Manufacturing PMI
The Manufacturing Purchasing Managers Index (PMI) released by S&P Global captures business conditions in the manufacturing sector. As the manufacturing sector dominates a large part of the total GDP, the manufacturing PMI is an important indicator of business conditions and the overall economic condition in the United States. Readings above 50 imply the economy is expanding, making investors understand it as bullish for the USD, whereas a result below 50 points for an economic contraction, and weighs negatively on the currency.
About the US Services PMI
The Services Purchasing Managers Index (PMI) released by S&P Global captures business conditions in the services sector. As the services sector dominates a large part of total GDP, the services PMI is an important indicator of the overall economic condition in US. A result above 50 signals is bullish for the USD, whereas a result below 50 is seen as bearish.
- Euro adds to Thursday’s negative price action.
- No respite for the sell-off in stocks markets in Europe on Friday.
- EUR/USD plunges to multi-session lows near 1.0850.
- Disheartening prints in the euro docket weigh on the pair.
- The USD Index (DXY) reclaims the 103.00 mark and beyond.
The selling pressure remains well and sound around the Euro (EUR) and the rest of the risk-associated assets, and this time it forces EUR/USD to surrender further ground and breach the key support at 1.0900 the figure.
The pair has so far given away more than a cent since Thursday’s fresh monthly peak above the psychological 1.1000 barrier.
In fact, the European currency saw its decline exacerbated in response to poor prints from the advanced Manufacturing and Services PMIs in both France and Germany for the month of June, which in turn reignited recession concerns in the region.
On the USD-side of the equation, the USD Index (DXY) advances to fresh tops just above the 103.00 hurdle, underpinned by the downside bias in the risk complex and the persistent hawkish narrative from the Federal Reserve’s speakers, including Chief Jerome Powel.
The potential next moves by both the Federal Reserve and the European Central Bank in normalizing their monetary policies are at the centre of the debate in the macroeconomic scenario against the backdrop of an increasing speculation of an economic slowdown on both sides of the Atlantic.
It is PMI-day across the pond too, while St. Louis Fed J. Bullard (2025 voter, hawk), Atlanta Fed R. Bostic (2024 voter, hawk) and Cleveland Fed L. Mester (2024 voter, hawkish) are also due to speak later in the NA session.
Daily digest market movers: Recession fears weigh on the FX universe
- The US Dollar’s recovery gathers fresh steam.
- Flash Manufacturing and Services PMIs in France and Germany disappoint.
- Recession concerns, Chinese lagged recovery hurt traders’ sentiment.
- Upcoming Fed-speak is likely to fan the flames of the hawkish narrative.
Technical Analysis: Euro faces the next support at 1.0800
EUR/USD comes under heavy downside pressure, and the breakdown of the 1.0900 support has opened the door to a probable test of the interim 100-day SMA at 1.0807. The loss of the latter exposes a deeper pullback to the May low of 1.0635 (May 31) ahead of the March low of 1.0516 (March 15) and the 2023 low of 1.0481 (January 6).
If bulls regains the upper hand, the next hurdle is then expected at the June peak of 1.1012 (June 22) prior to the 2023 high of 1.1095 (April 26), which is closely followed by the round level of 1.1100. North from here emerges the weekly top of 1.1184 (March 31, 2022), which is supported by the 200-week SMA at 1.1181, just before another round level at 1.1200.
The constructive view of EUR/USD appears unchanged as long as the pair trades above the crucial 200-day SMA, today at 1.0563.
Euro FAQs
What is the Euro?
The Euro is the currency for the 20 European Union countries that belong to the Eurozone. It is the second most heavily traded currency in the world behind the US Dollar. In 2022, it accounted for 31% of all foreign exchange transactions, with an average daily turnover of over $2.2 trillion a day.
EUR/USD is the most heavily traded currency pair in the world, accounting for an estimated 30% off all transactions, followed by EUR/JPY (4%), EUR/GBP (3%) and EUR/AUD (2%).
What is the ECB and how does it impact the Euro?
The European Central Bank (ECB) in Frankfurt, Germany, is the reserve bank for the Eurozone. The ECB sets interest rates and manages monetary policy.
The ECB’s primary mandate is to maintain price stability, which means either controlling inflation or stimulating growth. Its primary tool is the raising or lowering of interest rates. Relatively high interest rates – or the expectation of higher rates – will usually benefit the Euro and vice versa.
The ECB Governing Council makes monetary policy decisions at meetings held eight times a year. Decisions are made by heads of the Eurozone national banks and six permanent members, including the President of the ECB, Christine Lagarde.
How does inflation data impact the value of the Euro?
Eurozone inflation data, measured by the Harmonized Index of Consumer Prices (HICP), is an important econometric for the Euro. If inflation rises more than expected, especially if above the ECB’s 2% target, it obliges the ECB to raise interest rates to bring it back under control.
Relatively high interest rates compared to its counterparts will usually benefit the Euro, as it makes the region more attractive as a place for global investors to park their money.
How does economic data influence the value of the Euro?
Data releases gauge the health of the economy and can impact on the Euro. Indicators such as GDP, Manufacturing and Services PMIs, employment, and consumer sentiment surveys can all influence the direction of the single currency.
A strong economy is good for the Euro. Not only does it attract more foreign investment but it may encourage the ECB to put up interest rates, which will directly strengthen the Euro. Otherwise, if economic data is weak, the Euro is likely to fall.
Economic data for the four largest economies in the euro area (Germany, France, Italy and Spain) are especially significant, as they account for 75% of the Eurozone’s economy.
How does the Trade Balance impact the Euro?
Another significant data release for the Euro is the Trade Balance. This indicator measures the difference between what a country earns from its exports and what it spends on imports over a given period.
If a country produces highly sought after exports then its currency will gain in value purely from the extra demand created from foreign buyers seeking to purchase these goods. Therefore, a positive net Trade Balance strengthens a currency and vice versa for a negative balance.
Dollar has rebounded despite hawkish surprises elsewhere. Economists at ING discuss USD outlook.
Powell talking up the Dot Plot
What has likely offered backing to the Dollar has been the hawkish message pushed by Fed Chair Jerome Powell in the two days of Congress testimonies. While the overall rhetoric has been nearly identical to last week’s press conference, Powell seemed to add more weight on the near-term prospects of further rate hikes compared to last week – implicitly encouraging markets to close the gap with the Dot Plot projections.
For now, that gap is still present. It is clear that investors are awaiting the cue from data to align with the Dot Plot, but Powell’s hawkish rhetoric is a warning signal against jumping too early on a bearish Dollar trend given the risks of a further inversion of the US yield curve.
The JPY has suffered not only from a dovish Bank of Japan but also from the general rise in global yields. This has lifted USD/JPY to new year highs. Economists at Danske Bank analyze the pair’s outlook.
USD/JPY seems fundamentally overvalued
We think the USD/JPY seems fundamentally overvalued and combined with potential monetary policy tightening; we expect the cross to drop below 130 on a 6-12M horizon.
We think the BoJ still is underestimating inflationary pressures in Japan, and the persistence of underlying inflation will continue to build pressure on BoJ’s ultra-dovish stance.
- German Manufacturing PMI arrives at 41.0 in June vs. 43.5 expected.
- Services PMI in Germany drops to 54.1 in June vs. 56.2 expected.
- EUR/USD extends losses below 1.0900 on awful German PMIs.
The German manufacturing sector contraction worsened in June while the services sector slowed its pace of expansion, the preliminary business activity report from the HCOB survey showed this Friday.
The Manufacturing PMI in Eurozone’s economic powerhouse came in at 41.0 this month, compared with 43.5 expected and 43.2 previous figure. The index hit a 37-month low.
Meanwhile, Services PMI dropped sharply from 57.2 in May to 54.1 in June as against the 56.2 reading expected. The PMI reached its lowest level in three months.
The HCOB Preliminary Germany Composite Output Index arrived at 50.8 in June vs. 53.5 expected and May’s 53.9. The gauge recorded a four-month low.
FX implications
EUR/USD is extending losses below 1.0900 on the downbeat German data. The pair is trading 0.81% lower at 1.0865, at the time of writing.
- Gold price has retreated amid sheer strength in the US Dollar Index.
- US Manufacturing PMI is expected to register contraction consecutively for the eighth time.
- Gold price has demonstrated a sheer fall after a breakdown of the Descending Triangle.
Gold price (XAU/USD) has witnessed selling pressure around $1,917.50 in the European session. The short-lived pullback in the precious metal has concluded and it is expected to drop back to an intraday low at $1,910.00. A sell-off move in the yellow metal was triggered due to the upbeat US Dollar Index (DXY).
S&P500 futures have carry-forwarded significant losses generated in Asia to Europe as the market mood is quite risk-off. Global growth prospects are under threat as the continuation of the policy-tightening regime by central banks has propelled fears of recession.
The US Dollar Index has stretched its rally to 102.70 as the bleak global outlook has improved its appeal. Meanwhile, fears of more interest rate hikes from the Federal Reserve (Fed) are also keeping the US Dollar in the upside trajectory. Contrary to the strength in the USD Index, US Treasury yields are facing pressure. The 10-year US Treasury yields have dropped to near 3.78%.
Going forward, the release of the preliminary S&P Global PMI data (June) will be keenly watched. A per the prior estimation report, Manufacturing PMI will show a mild increase to 48.5 vs. the prior release of 48.4. Services PMI is seen declining to 54.0 against the former release of 54.9.
Investors should note that US Manufacturing PMI has been contracting consecutively for seven months and further contraction would impact the US Dollar. A figure below 50.0 is considered a contraction in economic activities.
Gold technical analysis
Gold price has demonstrated a sheer fall after a breakdown of the Descending Triangle, which is a volatility contraction chart pattern, formed on a four-hour scale. A breakdown of the aforementioned chart pattern is followed by wider ticks and heavy volume. Later, the asset is expected to find support near $1,886.00.
The precious metal is trading below the 200-period Exponential Moving Average (EMA) at $1,960.00, which indicates that the long-term trend is bearish.
The Relative Strength Index (RSI) (14) is oscillating in the bearish range of 20.00-40.00, which indicates that the downside momentum has been triggered.
Gold four-hour chart
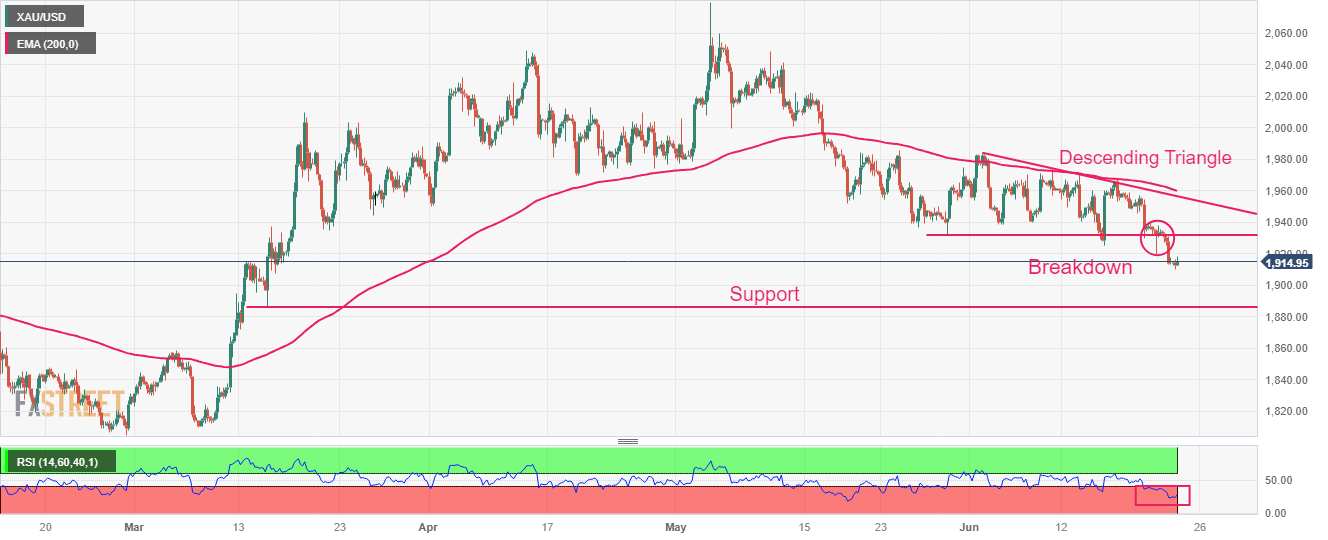
In the opinion of UOB Group’s Economist Lee Sue Ann and Markets Strategist Quek Ser Leang, AUD/USD’s upside momentum appears to have run out of steam.
Key Quotes
24-hour view: We expected AUD to edge higher yesterday. However, AUD dipped to a low of 0.6745 before ending the day on a soft note at 0.6757 (0.59%). Downward momentum has increased a tad, and AUD is likely to trade with a downward bias today, In view of the mild downward pressure, the major support at 0.6700 is not expected to come under threat (there is another support at 0.6730). On the upside, a break of 0.6800 would indicate that the current mild downward pressure has eased (minor resistance is at 0.6780).
Next 1-3 weeks: Our update from two days ago (21 Jun, spot at 0.6790) still stands. As highlighted, the recent AUD strength has ended and AUD is likely to trade in a range between 0.6700 and 0.6880 for now.
Economists at ING analyze EUR/USD outlook ahead of the release of PMIs.
PMIs hardly a game-changer for the ECB
Consensus is looking at declining services PMI for a second consecutive month in the Euro-area and Germany, while manufacturing is seen holding up better. The composite EZ gauge is expected to decline very marginally from 53.9 to 53.3. At this stage, it will probably take a pretty clear sub-consensus surprise print to prompt a materially negative Euro reaction.
The ECB has demonstrated it is firmly focused on inflation, and the debate around a September hike (a July one should be a done deal, according to President Christine Lagarde) does not seem likely to take these surveys under much consideration.
The Euro is showing more resilience than other activity currencies to the rebound in the Dollar, and barring big downside surprises in PMIs may hold above 1.0900 into next week.
- Silver bounces off a multi-month low touched on Friday, albeit lacks any follow-through buying.
- The overnight breakdown below a technically significant 200-day SMA favours bearish traders.
- A sustained strength beyond $23.00 is needed to support prospects for any meaningful recovery.
Silver stages a modest bounce from the vicinity of the $22.00 round-figure mark, or over a three-month low touched this Friday and for now, seems to have snapped a four-day losing streak. Spot prices, however, lack follow-through buying and trade below the mid-$22.00s, around the 61.8% Fibonacci retracement level of the March-May rally heading into the European session.
From a technical perspective, the overnight break and acceptance below the very important 200-day Simple Moving Average (SMA) was seen as a fresh trigger for bearish traders, against the backdrop of the recent failure near the 50-day SMA. Moreover, oscillators on the daily chart are holding deep in the negative territory and are still far from being in the oversold zone. This, in turn, adds credence to the bearish outlook for the XAG/USD and supports prospects for a further depreciating move.
Some follow-through selling below the $22.10 area, or the monthly low, will reaffirm the negative bias and drag the XAG/USD towards the $21.70-$21.65 support zone. The downward trajectory could get extended further towards the $21.25 intermediate support en route to the $21.00 round figure. The next relevant support is pegged near the $20.50 area, below which bears might eventually aim towards challenging the YTD low, levels just below the $20.00 psychological mark touched in March.
On the flip side, any meaningful recovery beyond the $23.45 area (200-day SMA) is more likely to attract fresh sellers near the $23.70 zone and remain capped near the $23.00 round-figure mark. The said handle coincides with the 50% Fibo. level, which if cleared decisively might trigger a short-covering rally and lift the XAG/USD to the $23.30-$23.35 hurdle en route to 38.2% Fibo. level, around the $23.70-$23.75 zone. The latter should now act as a pivotal point for short-term traders.
Silver daily chart
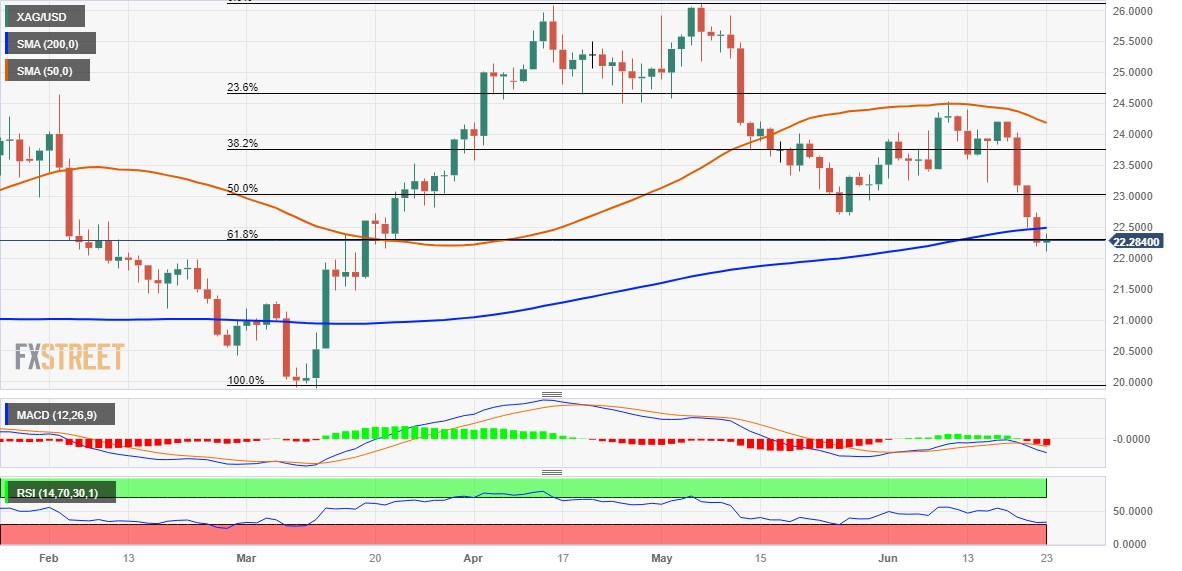
Key levels to watch
US Dollar Index continues to push higher following Thursday's rebound. Economists at ING analyze DXY outlook.
Focus will be on PMIs across developed countries today
Data-wise, the focus will be on PMIs across developed countries today. While being of secondary relevance to the ISM in the US, we can see some higher-than-normal market impact given the elevated market sensitivity to data at this juncture.
102/103 appears to be the holding-pattern range for DXY at the moment and we could see that hold into next week.
EUR/USD has moved higher over the past week, trading just below the 1.10 mark. However, economists at Danske Bank maintain their strategic case for a lower EUR/USD.
Any potential resurgence in energy prices should be a headwind for the EUR
We maintain the strategic case for a lower EUR/USD based on relative terms of trade, real rates (growth prospects) and relative unit labour costs.
Despite US and Euro-area rates differentials likely will narrow from here, we think this effect will be dominated by fundamentals in favour of the USD. Additionally, as long as sticky core inflation remains a concern globally, we would expect the EUR/USD to remain soft. Lastly, any potential resurgence in energy prices should be a headwind for the EUR.
Forecast: 1.08 (1M), 1.07 (3M), 1.06 (6M), 1.03 (12M)
- AUD/USD remains pressured at the lowest levels in two weeks, justifies 100-SMA breakdown and bearish MACD signals.
- Convergence of 200-SMA, 50% Fibonacci retracement limits further downside amid oversold RSI.
- Multiple horizontal hurdles, risk-off mood challenge Aussie pair buyers ahead of US PMI.
AUD/USD bears are in the driver’s seat at the lowest level in a fortnight, down 0.90% intraday around 0.6700 by the press time.
In doing so, the risk-barometer pair aptly portrays the market’s risk-off mood, backed by fears of economic slowdown and hawkish Fed moves in July versus the Reserve Bank of Australia’s (RBA) limited horizontal for further rate hikes.
That said, the pair’s clear downside break of the 100-SMA and bearish MACD signals add strength to the downside bias.
However, the oversold RSI (14) line hints at the limited downside room for the Aussie pair, which in turn highlights a joint of the 200-SMA and 50% Fibonacci retracement of the quote’s May 31 to June 16 upside, near 0.6680-75.
It’s worth noting that the AUD/USD pair’s weakness past 0.6675 needs validation from the 61.8% Fibonacci retracement level of 0.6630 and the May 05 swing low of around 0.6580-75 to welcome the bears.
Meanwhile, a successful break of the 100-SMA, around 0.6735 by the press time, becomes necessary but not enough for the AUD/USD bulls to retake control.
The reason could be linked to the existence of seven-week-old and one-week-long horizontal resistances, around 0.6800 and 0.6840 in that order.
To sum up, AUD/USD is likely to remain bearish but the further downside appears difficult, suggesting a corrective bounce before the fresh leg towards the south.
AUD/USD: Four-hour chart
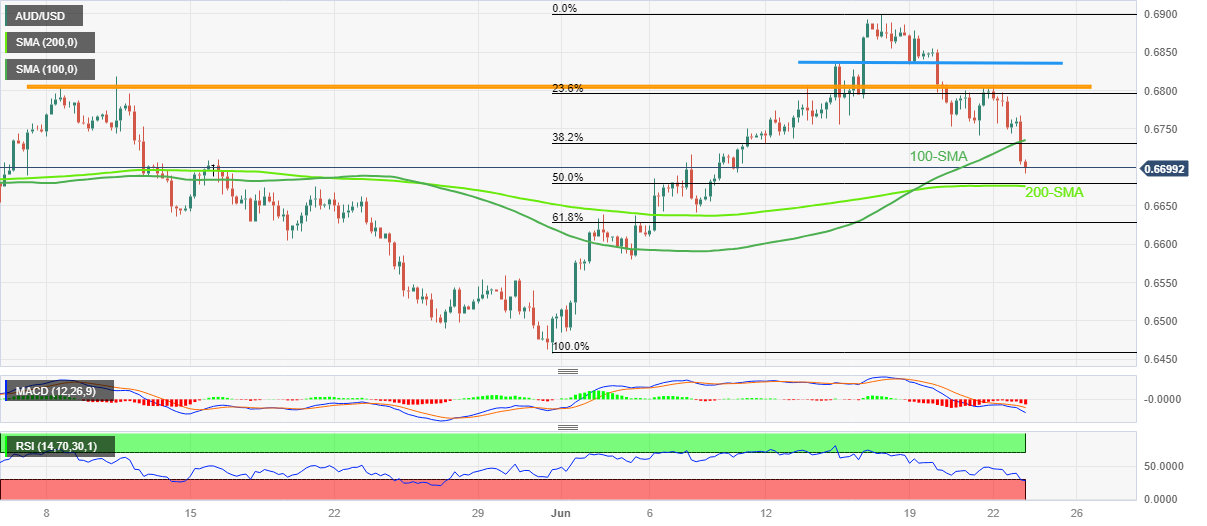
Trend: Limited downside expected
Here is what you need to know on Friday, June 23:
The US Dollar (USD) continues to benefit from risk aversion and gathers strength early Friday, with the US Dollar Index extending Thursday's rebound toward 103.00. S&P Global will release the preliminary June Manufacturing and Services PMI surveys for Germany, the Eurozone, the UK and the US. Investors will also pay close attention to comments from central bank officials.
On Thursday, the Bank of England (BoE) surprised markets with a 50 basis points (bps) rate increase. The BoE reiterated in its policy statement that further tightening in the monetary policy will be required if price pressures proved to be more persistent. Although GBP/USD spiked above 1.2800 with the immediate reaction, it reversed its direction and closed the day in negative territory amid broad USD strength. In the European morning on Friday, the pair continues to edge lower toward 1.2700.
Similarly, the Swiss National Bank hiked its policy rate by 25 bps to 1.75%. In the post-meeting press conference, SNB Chairman Thomas Jordan said that they cannot rule out additional policy tightening. Following a short-lasting drop toward 0.8900, USD/CHF staged a rebound and registered small daily gain on Thursday. The pair preserves its recovery momentum and rises toward 0.9000 on Friday.
Reflecting the risk-averse market atmosphere, US stock index futures are down between 0.4% and 0.5% in the European morning. Meanwhile, the benchmark 10-year US Treasury bond yield consolidates weekly gains slightly below 3.8%. On the second day of his congressional testimony, FOMC Chairman Jerome Powell noted that it will be appropriate to raise rates one or two more times this year and added that they are not seeing any rate cuts anytime soon.
EUR/USD failed to stabilize above 1.1000 on Thursday and fell to the 1.0950 area during the American trading hours. The pair stays on the back foot and retreats toward 1.0900 in the early European session.
USD/JPY gained more than 100 pips on Thursday and advanced to its highest level since November near 143.50 during the Asian trading hours on Friday.
Pressured by rising US Treasury bond yields, Gold price suffered large losses and closed the fifth straight trading day in negative territory on Thursday. XAU/USD touched a three-month low at $1,910 early Friday before recovering modestly in the European morning.
Following Wednesday's impressive rally, Bitcoin fluctuated in a tight channel above $30,000 on Thursday. BTC/USD holds steady near that level on Friday. Ethereum lost 1% on Thursday and closed slightly below $1,900. ETH/USD continues to move sideways in the European morning.
- USD/JPY is expected to extend a rally above 143.50 as market sentiment has dampened.
- The US Dollar Index has printed a fresh day's high at 102.70 amid sheer uncertainty in global markets.
- Japan’s inflation has unexpectedly softened despite consistent monetary stimulus by the BoJ.
The USD/JPY pair has witnessed a marginal correction after facing fragile barricades around 143.50 in the early London session. The upside bias for the USD/JPY pair has not faded as the market sentiment is quite negative, which has improved the appeal of the US Dollar Index (DXY).
S&P500 futures have posted significant losses in Asia as investors are worried that extremely restrictive monetary policy from global central banks has accelerated fears of bleak global growth. The overall market mood is quite negative as the Federal Reserve (Fed) is going to raise interest rates further to tame persistent inflation.
The US Dollar Index has printed a fresh day's high at 102.70 amid sheer uncertainty in global markets. As per the CME Fedwatch tool, around 77% chances are in favor of a hawkish interest rate policy by the Fed for the July meeting. The odds for a hawkish July policy are still solid despite tight labor market conditions releasing heat.
On Thursday, the US Department of Labor reported marginally higher initial jobless claims for the week ending June 16. Jobless claims were higher than the consensus for the straight fourth time in a row. The claims were landed at 264K, similar to their prior release and marginally higher than expectations of 260K.
On the Japanese Yen front, inflationary pressures have unexpectedly softened despite consistent monetary stimulus by the Bank of Japan (BoJ). Headline inflation has decelerated to 3.2% while the street was estimating a further boost to 4.1%. Also, it remained lower than the former release of 3.5%. Core inflation that excludes volatile oil and food prices landed at 4.3%, marginally lower than the estimates of 4.4% but remained higher than the former release of 4.1%.
USD/TRY jumped after yesterday’s 650 bps rate hike by the Turkish central bank. Economists at Commerzbank analyze Lira's outlook.
The only helpful variable will be repeated commitment by the president to stick with this new policy regime
No magnitude of rate hike will suffice to stabilise the Lira. The only helpful variable will be repeated commitment by the president to stick with this new policy regime until it has succeeded.
Perversely, yesterday’s depreciation move might even increase his proclivity to call interest rate hikes a proven failure. Here’s hoping against that disaster.
Economists at MUFG Bank expect the Chinese Yuan to remain under downside pressure in the near term. However, CNY is set to recover in the medium term.
USD/CNY to drop back to the 6.8000 level by the end of this year
On the expectation of diverging monetary policy between the Fed and PBOC in the near term, with further rate cuts from the PBOC over in the coming months amid the market’s expectation of another 25 bps hike from the Fed, this potential widening of negative yield spreads with the US could continue to place downward pressure on the CNY in the near term. Yet once more measurable and concrete stimulus policies are rolled out, we expect CNY to rebound against the Dollar.
Should China eventually realize a growth rate of 5.5% for 2023, a marginal improvement in the yield spread, better relative GDP growth rate, and improving sentiment will be the factors in driving CNY’s appreciation in the medium term.
We expect USD/CNY to drop back to the 6.8000 level by the end of this year.
WTI Crude dived convincingly below the $70 mark. However, strategists at TD Securities still expect Oil to return to $90 later in the year.
The recent Saudi cuts and the OPEC+ supply reductions should generate a deficit in both Q3 and Q4
While traders are selling Oil as the macro environment becomes increasingly problematic for demand and risk appetite goes into reverse, the current negativity may very well be based on fears of the worst-case scenario, rather than the likely facts on the ground for the balance of the year.
Even if there is a sharp reduction in demand expectations (as we assume) the recent Saudi cuts and the OPEC+ supply reductions should generate a deficit in both Q3 and Q4, which are likely to more than offset the surplus accumulated in the first half of 2023. With that, global inventory reductions should tighten markets. As such, we continue to expect WTI to approach the $90 mark in the latter part of the year.
- GBP/JPY picks up bids to pare intraday loss near the multi-month high.
- UK Retail Sales growth improves to 0.3% MoM in May versus -0.2% expected and 0.5% prior.
- Japan inflation numbers came in mixed but Jibun Bank PMIs disappointed Yen buyers.
- Risk catalysts, UK PMI will direct intraday traders.
GBP/JPY consolidates intraday losses around the highest levels since December 2015 on upbeat UK Retail Sales numbers published early Friday morning in London. In doing so, the cross-currency pair also justifies downbeat Japan activity data amid the risk-off mood.
UK Retail Sales marks 0.3% monthly growth in May compared to 0.2% expected contraction and 0.5% previous increase. That said, the Retail Sales ex-Fuel numbers also rose past -0.3% market forecasts to 0.1% while staying below 0.7% prior readings.
That said, the preliminary readings of Japan’s Jibun Bank Manufacturing PMI for June dropped to 49.8 versus 50.7 expected and 50.6 prior. On the same line, the first estimations of the Asian major’s Jibun Bank Services PMI drops to 54.2 during the stated month, from 55.9 expected and 56.9 previous readings.
Earlier in the day, the BoE-induced recession woes prod the GBP/JPY bulls. The consolidation move also took clues from the mixed Japanese inflation numbers. That said, Japan’s National Consumer Price Index (CPI) eased to 3.2% YoY in May from 4.1% market forecasts and 3.5% prior whereas the National CPI ex Food, Energy, rose past 4.1% previous readings to 4.3% but lagged behind the 4.4% prior.
It’s worth noting that the Bank of Japan’s (BoJ) Japanese Government Bond (BoJ) issues also weighed on the GBP/JPY price as Tokyo opened.
That said, the Bank of England (BoE), informally known as the “Old Lady”, surprised markets by lifting benchmark rates by 50 basis points (bps) to 5% versus major expectations favoring a 0.25% rate hike on Thursday. The same joined the BoJ’s dovish bias to propel the GBP/JPY price. However, the OIS pricing of the BoE peak rate suggests a sooner end to the tightening cycle than expected, which in turn prods the pair buyers afterward. Additionally, the bumper rate hike also signals the economic toll amid the chatters of the British recession, which in turn challenges the bulls despite heavy rate hikes.
Looking ahead, the preliminary readings of the UK’s S&P Global/CIPS PMIs for June will be important to watch as the market’s fears of British recession challenge the cross-currency pair’s further upside at the multi-month high.
Technical analysis
Unless breaking the eight-day-old ascending support line, around 181.50 by the press time, not even intraday sellers of the GBP/JPY can take the chance of entering the short positions.
- EUR/GBP has tested territory marginally below 0.8600 on upbeat UK Retail Sales data.
- Monthly UK Retail Sales have expanded by 0.3% while the street was anticipating a contraction of 0.2%.
- An interest rate hike by the ECB in July is likely confirmed while investors are uncertain about the September meeting.
The EUR/GBP pair is looking to deliver a break below the crucial support of 0.8600 as the United Kingdom Office for National Statistics has reported upbeat Retail Sales (May) data. Monthly economic data has expanded by 0.3% while the street was anticipating a contraction by 0.2%. The pace of expansion remained lower than the prior speed of 0.5%.
Annualized Retail Sales contracted by 2.1% but remained better as investors were hoping for a contraction of 2.6%. It looks like higher payouts offered by firms to offset labor supply shortages have equipped households with higher liquidity for disposal. Solid retail demand would fuel inflationary pressures and might force the Bank of England (BoE) to further policy tightening.
On Thursday, the Bank of England (BoE) hikes interest rates unexpectedly by 50 basis points (bps) to 5% while the street was anticipating an increase of 25 bps. No doubt, the risk of a fat rate hike by the BoE was sufficient as inflationary pressures for May in the UK turned out extremely persistent.
May’s inflation data remained hotter than expected as labor market conditions were tightened further and food price inflation is not peaked yet. Meanwhile, UK’s core inflation has printed a fresh new high of 7.1%, which has tilted expectations of market participants in favor of a fat interest rate hike from the central bank.
Also, in Eurozone, the European Central Bank (ECB) is worried about the persistence of core inflation. Adding to that, headline inflation is thrice the required rate of 2%, which is keeping chances of more rate hikes in July alive. However, uncertainty is stemming from the September meeting. ECB policymaker Peter Kazimir said on Wednesday that he is not certain whether the central bank will continue its rate hike cycle in September. He further added we would need to have core inflation under control to stop tightening.
GBP/USD is now seen navigating within the 1.2650-1.2850 range in the next few weeks according to UOB Group’s Economist Lee Sue Ann and Markets Strategist Quek Ser Leang.
Key Quotes
24-hour view: Yesterday, we expected GBP to edge higher. We highlighted that “1.2805 is still a solid resistance, and the next major resistance at 1.2850 is unlikely to come under threat.” The price movements did not develop as we anticipated. Instead of edging higher, GBP spiked to 1.2845 and then fell back quickly. The choppy price actions have resulted in a mixed outlook, and there is no clear directional bias. Today, GBP could trade in a range between 1.2680 and 1.2790.
Next 1-3 weeks: Our update from yesterday (22 Jun, spot at 1.2770) is still valid. As highlighted, the recent GBP strength has ended and GBP is likely to trade between 1.2650 and 1.2850 for now.
EUR/SEK is now trading at record levels. Economists at ING discuss the pair’s outlook ahead of the Riksbank meeting on 29 June.
Riksbank is set to dial back the pace of rate hikes
We expect the Riksbank to sound the alarm about recent Krona weakness, but we doubt policymakers will want to pre-commit to another hike in September just yet.
Officials are now walking a narrow path between bolstering the currency and minimising damage to the real estate market.
Lingering dissent within the board can send EUR/SEK to 12.00 in the near term.
- The index adds to Thursday’s rebound and retests 102.70.
- Further Fed tightening supports the greenback post-Powell.
- Advanced PMIs, Fedspeak next of note in the US docket.
The greenback, when tracked by the USD Index (DXY), gathers extra pace and revisits the vicinity of weekly peaks near 102.70.
USD Index looks at data, Fedspeak
The index extends the optimism in the second half of the week on the back of reinvigorated speculation of extra tightening by the Federal Reserve as well as other major central banks, while recession fears continue to run high.
Indeed, and following Jerome Powell’s semiannual testimonies earlier in the week, inflation pressures are still running high and there is a long way to go in the process of bringing inflation back down to 2%. Powell suggested that the Fed may need to take additional action in the form of more rate hikes, or at the very least, hold rates steady. However, he reassured lawmakers that the Fed's policy moves would continue to evolve as inflation approached the central bank's target.
Later in the NA session, flash Manufacturing and Services PMIs are due for the month of June along with speeches by St. Louis Fed J. Bullard (2025 voter, hawk), Atlanta fed R. Bostic (2024 voter, hawk) and Cleveland Fed L. Mester (2024 voter, hawkish).
What to look for around USD
The greenback leaves behind the recent weakness and bounces off recent multi-week lows in the sub-102.00 zone.
Meanwhile, the likelihood of another 25 bps hike at the Fed's upcoming meeting in July remains high, supported by the continued strength of key US fundamentals such as employment and prices.
This view was further bolstered by comments from Fed Chief Powell at the June FOMC event, who referred to the July meeting as "live" and indicated that most of the Committee is prepared to resume the tightening campaign as early as next month.
Key events in the US this week: Advanced Manufacturing/Services PMIs (Friday).
Eminent issues on the back boiler: Persistent debate over a soft/hard landing of the US economy. Terminal Interest rate near the peak vs. speculation of rate cuts in late 2023/early 2024. Fed’s pivot. Geopolitical effervescence vs. Russia and China. US-China trade conflict.
USD Index relevant levels
Now, the index is gaining 0.24% at 102.64 and the breakout of 103.06 (100-day SMA) would open the door to 104.69 (monthly high May 31) and then 105.10 (200-day SMA). On the downside, the next support emerges at 101.92 (monthly low June 16) followed by 100.78 (2023 low April 14) and finally 100.00 (round level).
- The UK Retail Sales came in at 0.3% MoM in May, an upside surprise.
- Core Retail Sales for the UK jumped 0.1% MoM in May.
- GBP/USD defends 1.2700 on upbeat UK retail trade data.
The UK Retail Sales rose 0.3% over the month in May vs. -0.2% expected and 0.5% previous. The Core Retail Sales, stripping the auto motor fuel sales, increased 0.1% MoM vs. -0.3% expected and 0.7% previous.
The annual UK Retail Sales decreased 2.1% in May versus -2.6% expected and April’s 3.4% drop while the Core Retail Sales fell 1.7% in the reported month versus -2.1% expectations and -3.0% previous.
Main points (via ONS)
Non-store retailing sales volumes rose by 2.7% in May 2023 because of strong sales by online retailers selling outdoor-related goods and summer clothing; this was boosted by the warm weather in the second half of the month.
Automotive fuel stores sales volumes rose by 1.7% in May 2023, following a fall of 1.7% in April 2023; sales volumes were 9.5% below their pre-coronavirus (COVID-19) February 2020 levels.
Food stores sales volumes fell by 0.5% in May 2023, with some anecdotal evidence of increased spending on takeaways and fast food because of the extra bank holiday, however retailers also indicated that increased cost of living and food prices continued to affect sales volumes.
FX implications
GBP/USD is defending the 1.2700 level on the upbeat UK Retail Sales data. The spot was last seen trading at 1.2712, down 0.29% on the day.
Supersized hikes in the UK and Norway alongside hawkish Powell testimony saw the USD rebound. Economists at ANZ Bank discuss NZD/USD outlook.
More tightening is coming in the Northern Hemisphere
The Kiwi is lower on the back of USD strength in the wake of hawkish testimony by Fed Chair Powell, and supersized hikes by both the Norges Bank and Bank of England, all of which put upward pressure on US interest rates. Although moves in rates and FX were muted, there does seem a sense that more tightening is coming in the Northern Hemisphere, and that may start to favour those currencies.
With no local data today and not much next week either, the Kiwi looks set to ebb and flow with global moves until something notable happens in the region, and given correlations, all eyes are on the 4 July RBA decision.
- NZD/USD prints the biggest daily loss in two weeks, so far.
- Convergence of 21-DMA, monthly ascending trend line restricts immediate downside.
- Risk-off mood exerts downside pressure on Kiwi pair ahead of preliminary US S&P Global PMIs for June.
NZD/USD takes offers to refresh intraday low around 0.6140 as it extends the previous day’s losses amid sour sentiment heading into Friday’s European session. In doing so, the Kiwi pair justifies the broad US Dollar strength ahead of the first readings of the US S&P Global PMIs for June.
Also read: NZD/USD drops to fresh daily low, around 0.6160 area amid renewed USD buying
Technically, the 14-day RSI returns to the normal territory surrounding the 50.00 round figure and suggests limited downside room, which in turn highlights a convergence of the 21-DMA and an upward-sloping trend line from May 31, close to 0.6120 at the latest.
That said, a 3.5-month-old horizontal support zone, around 0.6080, acts as an additional downside filter before directing the NZD/USD bears toward the yearly low of near 0.5985.
On the flip side, 38.2% and 50% Fibonacci retracement levels of the Kiwi pair’s February-May downturn, respectively near 0.6200 and 0.6265, restrict short-term advances of the quote.
Following that, a descending resistance line from early February and the 61.8% Fibonacci retracement, close to 0.6315 and 0.6330 in that order, will act as the final defense of the pair sellers.
NZD/USD: Daily chart
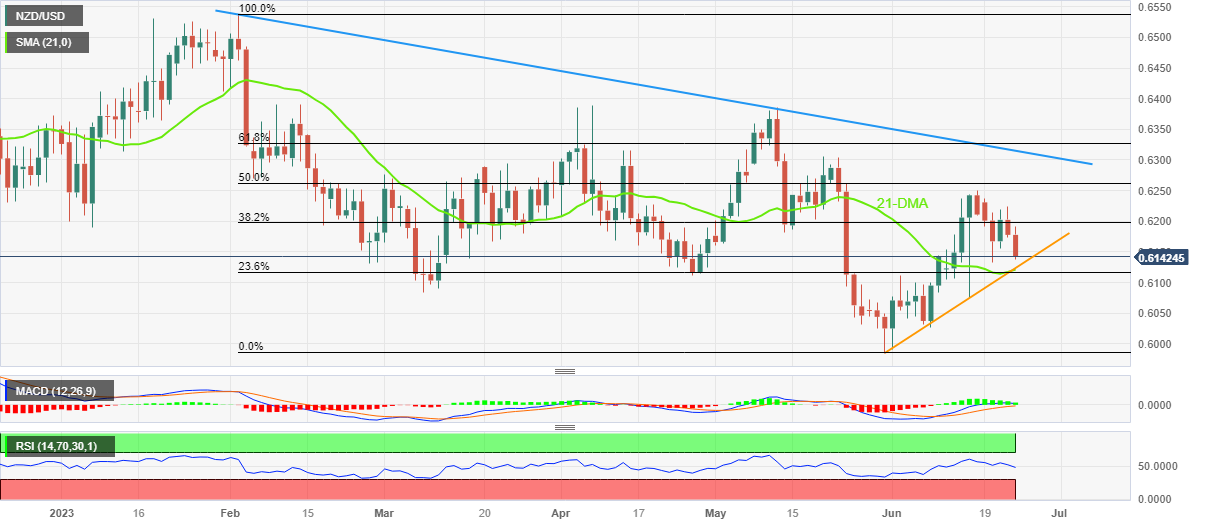
Trend: Limited downside expected
- AUD/JPY is expected to deliver more weakness below 96.00 as inflationary pressures in Japan have contributed to in-house demand.
- BoJ Noguchi also warned that the effect of costly imported goods could disappear around September.
- Aussie PMI has performed better than expectations but failed to support the Australian Dollar.
The AUD/JPY pair has displayed a sheer drop to near 96.00 in the early European session. Considering the strength in the downside momentum, the risk barometer is exposed to more downside despite Japan’s inflation having softened and the Australian preliminary S&P PMI (June) having remained upbeat.
AUD/JPY is following bearish cues from the AUD/USD pair amid the risk-aversion theme. The release of the upbeat Aussie PMI also failed to provide some support to the Australian Dollar. Manufacturing PMI landed at 48.6, higher than the expectations of 48.1 and the former release of 48.4. Also, Services PMI at 50.7 outperformed expectations of 50.1 but remained lower than the former release of 52.1.
Meanwhile, the Japanese Yen is performing better against the Australian Dollar despite softening of Japan’s inflation data (May). Headline inflation has decelerated to 3.2% while the street was estimating a further boost to 4.1%. Also, it remained lower than the former release of 3.5%. Core inflation that excludes volatile oil and food prices landed at 4.3%, marginally lower than the estimates of 4.4% but remained higher than the former release of 4.1%.
Scrutiny of Japan’s inflation report indicates that contribution from higher oil prices is fading and major inflationary pressure is coming from in-house demand, which would support for sustainability above the 2% benchmark.
The Bank of Japan (BoJ) is expected to continue its ultra-dovish stance as the impact of costly import prices is fading swiftly. This week, BoJ policymaker Asahi Noguchi also warned that the effect of costly imported goods could disappear around September. He further added central bank must continue lower interest rates to ensure inflation remains well-supported above 2% through higher wages.
FX option expiries for June 23 NY cut at 10:00 Eastern Time, via DTCC, can be found below.
- EUR/USD: EUR amounts
- 1.0800 635m
- 1.0830 380m
- 1.0855 585m
- 1.0900 667m
- 1.0960 514m
- 1.1000 865m
- 1.1100 372m
- GBP/USD: GBP amounts
- 1.2500 788m
- USD/JPY: USD amounts
- 140.00 453m
- 141.00 1.2b
- 141.90 798m
- 145.00 650m
- USD/CHF: USD amounts
- 0.8800 300m
- 0.8980 353m
- AUD/USD: AUD amounts
- 0.6700 435m
- 0.6740 500m
- USD/CAD: USD amounts
- 1.3200 406m
- 1.3250 758m
- EUR/GBP: EUR amounts
- 0.8600 495m
- 0.8640 605m
- USD/TRY struggles to defend post-CBRT rally as market players seek more clues at all-time high.
- CBRT lifted benchmark rate to 15% from 8.5%, versus 21% expected.
- Fears of higher rates to weigh on already fragile Turkish economy, broad US Dollar strength favor USD/TRY bulls.
- Mid-tier Turkish data, US PMIs eyed for clear directions.
USD/TRY remains sidelined around 25.15 after a whipsaw start to Friday’s trading that initially refreshed the all-time high with a 25.72 figure before reversing the gains heading into the European session.
The Turkish Lira (TRY) pair failed to cheer the bumper rate hike from the central bank the previous day as a gamut of hawkish central bank actions worldwide bolstered the market’s fears of economic slowdown and propelled the US Dollar.
On Thursday, the Central Bank of the Republic of Türkiye (CBRT) hiked rates for the first time since August 2021, to 15% from 8.5% versus the 21% expected. The CBRT reiterated its commitment to the 5% inflation target and did not rule out additional monetary tightening measures to achieve this target. However, the USD/TRY refreshed a record high of 24.61 following the CBRT announcements.
That said, US Dollar Index (DXY) picks up bids to extend the previous day’s rebound from a six-week low to around 102.65 by the press time as markets remain risk averse despite China’s holiday and cautious mood ahead of the preliminary PMIs for June.
Apart from the risk profile. Fed Chairman Jerome Powell repeated most of his previous day’s remarks during his testimony 2.0, this time in front of the Senate Housing Committee. Though his statements like, “(It) will be appropriate to raise rates again this year, perhaps two more times,” allowed the US Dollar to refresh the intraday high while eyeing to reverse Wednesday’s losses. Earlier in the day, Richmond Fed President Thomas Barkin joined US Treasury Secretary Jannet Yellen to flag economic fears.
Against this backdrop, the S&P500 Futures print mild losses after the previous day’s mixed closing of Wall Street and upbeat US Treasury bond yields. That said, the US 10-year and two-year Treasury bond yields rose the most in a week after the central banks’ play before recently easing to around 3.78% and 4.79% in that order.
Moving on, the risk-off mood can keep fueling the USD/TRY price while Turkish Economic Confidence for June and Trade Balance for May will direct immediate moves. Following that, the first readings of the US S&P Global PMIs for June will be crucial as recession woes regain the market’s attention and put a floor under the USD.
Technical analysis
While the 25.50 and 26.00 round figures challenge the immediate upside of the USD/TRY pair, the Turkish Lira (TRY) buyers will remain off the table unless witnessing a daily closing below the monthly support line, around 23.78 at the latest.
UOB Group’s Economist Lee Sue Ann and Markets Strategist Quek Ser Leang suggest the loss of 1.0900 should remove strength from EUR/USD to revisit 1.1050.
Key Quotes
24-hour view: We expected EUR to break above 1.1000 yesterday. However, we indicated, “the next major resistance at 1.1050 is likely out of reach”. While EUR broke above 1.1000, the advance was brief as it pulled back sharply from 1.1011. The pullback in overbought conditions suggest EUR is unlikely to advance further. Today, EUR is more likely to trade in a range between 1.0925 and 1.0985.
Next 1-3 weeks: After EUR soared to a high of 1.0990, we indicated yesterday (22 Jun, spot at 1.0985) that the ‘rejuvenated’ momentum indicates there is room for EUR to head higher to 1.1050. While EUR subsequently rose to a fresh 6-week high of 1.1011, it then pulled back sharply. In view of the overbought conditions, the current EUR strength could not afford to pause, or the risk of a reversal will increase rapidly. Note that the current EUR strength has moved into its second week now. All in all, only a breach of 1.0900 (no change in ‘strong support’ level from yesterday) would indicate that 1.1050 is not coming into view this time around.
- GBP/USD is gauging support near 1.2700, however, the downside seems favored due to the risk-aversion theme.
- On Thursday, the BoE surprisingly announced a fat rate hike and push interest rates to 5%.
- GBP/USD has shown a perpendicular fall after forming a Double Top chart pattern.
The GBP/USD pair has shown a vertical fall to near the round-level support of 1.2700 due to the risk-aversion theme in the Asian session. The Cable is expected to deliver more downside as the hawkish stance by global central banks is threatening the global growth outlook, which has improved the appeal for the US Dollar Index (DXY) significantly.
The US Dollar Index (DXY) has climbed above 102.60 as the Federal Reserve (Fed) chair Jerome Powell has confirmed more interest rate hikes ahead, considering the fact that achievement of 2% inflation has a long way to go.
On Thursday, the Bank of England (BoE) surprisingly announced a fat rate hike and push interest rates to 5% as May’s inflation turned out to be more persistent than expected. Investors are expecting that bigger interest rate hikes from BoE Governor Andrew Bailey will demand the economic outlook of the United Kingdom.
GBP/USD has shown a perpendicular fall after forming a Double Top chart pattern on a four-hour scale around 1.2848. The aforementioned pattern indicates that Pound bulls attempted a breakout with weak buying interest, which triggered US Dollar bulls to take charge. The Double Top chart pattern would trigger if the Cable drops below the crucial support placed at 1.2691.
The Cable has dropped below the 50-period Exponential Moving Average (EMA) at 1.2714, which indicates that the short-term trend has turned bearish.
Adding to that, the Relative Strength Index (RSI) (14) has shifted into the 40.00-60.00 range from the bullish range of 60.00-80.00. This indicates that Pound bulls are not strong anymore and a bearish momentum could initiate if the Cable drops into the bearish range of 20.00-40.00.
Bullish bias for the Cable would strengthen if it manages to climb above the fresh annual high around 1.2850. The upside move would expose the asset to 28 September 2020 high at 1.2930 followed by psychological resistance at 1.3000.
The bullish bias could fade if Cable drops below the previous month’s high around 1.2669, which would drag the asset toward June 12 high at 1.2600. A slippage below the latter would expose the asset to June 09 low at 1.2534.
GBP/USD four-hour chart
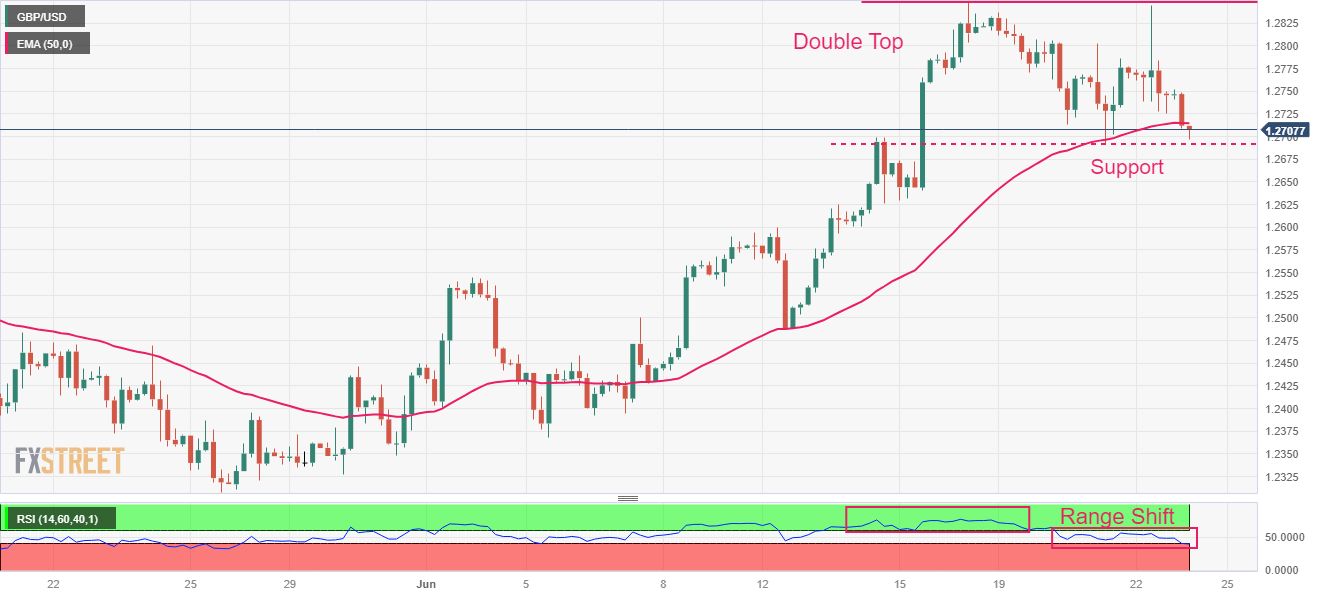
- USD/JPY seesaws around the highest levels in seven months, prods two-day winning streak.
- Overbought RSI (14) line challenges Yen pair within bearish chart formation.
- 21-DMA, 200-DMA act as extra downside filters, rising wedge confirmation becomes necessary for sellers entry.
- Golden Fibonacci ratio, broad US Dollar strength amid risk-off mood restrict immediate declines.
USD/JPY makes rounds to 143.00 amid a lackluster Friday morning in Europe, after refreshing the yearly top the previous day. In doing so, the Yen pair pauses the previous two-day uptrend amid an overbought RSI (14) line. Adding strength to the quote’s latest inaction could be the cautious mood ahead of the US PMIs and fears of the US recession. It’s worth noting that the risk-barometer pair also takes clues from Japan’s mixed inflation data and downbeat PMIs.
Also read: USD/JPY holds steady above 143.00 mark, near its highest level since November 2022
Even if the RSI (14) line prods the USD/JPY buyers with a two-month-old rising wedge bearish chart formation, the quote’s successful break of the 61.8% Fibonacci retracement level of October 2022 to January 2023 downside, near 142.50 at the latest, keeps the bulls hopeful.
It’s worth noting, however, the aforementioned wedge’s top line, around 144.00 by the press time, will challenge the USD/JPY pair’s further upside.
In a case where the Yen pair crosses the 144.00 hurdle, it defies the bearish chart pattern. Though, the October 2022 low near 145.10 can act as the last defense of the bears.
On the contrary, a downside break of the stated key technical level around 142.50, also known as the golden Fibonacci ratio, can direct the USD/JPY bears towards confirming the rising wedge bearish chart pattern, by poking the 140.80 support.
While a clear downside break of 140.80 suggests the USD/JPY pair’s theoretical south-run towards 131.00, the 21-DMA and the 200-DMA, respectively near 140.50 and 137.20, will act as extra checks for the sellers.
USD/JPY: Daily chart
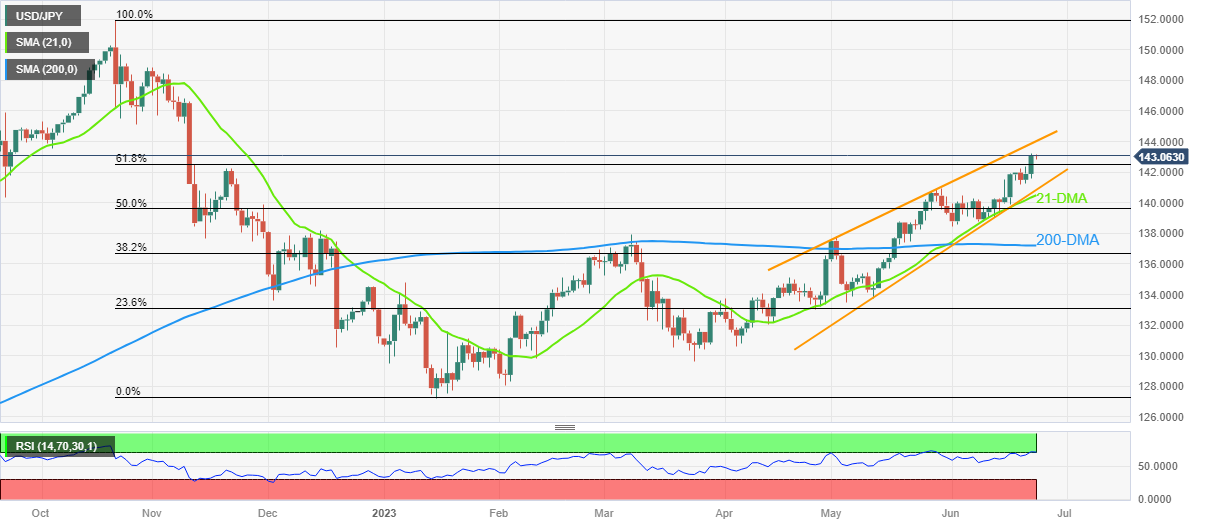
Trend: Limited upside expected
- Gold Price drops to the fresh 14-week low as bears approach $1,903 key support confluence.
- Central banks bolster recession woes and underpin US Dollar run-up, weighing on XAU/USD.
- Hawkish Fed clues also favor the Gold sellers amid risk-off mood, holiday in China.
- Flash PMIs can entertain XAU/USD traders ahead of next week’s US inflation clues.
Gold Price (XAU/USD) remains on the way to posting the biggest weekly loss since late January as the US Dollar cheers the market’s risk-off mood, as well as the hawkish Federal Reserve (Fed) concerns.
Multiple central banks confirmed the “higher for longer” rates the previous day and flagged concerns about the economic slowdown, especially amid higher inflation and geopolitical woes. Adding strength to the risk-off mood are the mixed figures of the US second-tier data and the hawkish testimony of Federal Reserve (Fed) Chairman Jerome Powell. That said, Richmond Fed President Thomas Barkin joined US Treasury Secretary Jannet Yellen to flag economic fears earlier on Friday.
Amid these plays, the S&P500 Futures print mild losses after the previous day’s mixed closing of Wall Street and upbeat US Treasury bond yields. That said, the US 10-year and two-year Treasury bond yields rose the most in a week after the central banks’ play before recently easing to around 3.78% and 4.79% in that order. It should be noted that the US Dollar Index (DXY) picks up bids to extend the previous day’s rebound from the six-week low to around 102.55 by the press time. The same exerts downside pressure on the prices of Gold and directs it toward the key support.
Moving on, the first readings of June’s activity numbers for the UK, Germany, Eurozone and the US will be crucial to watch for the Gold Price watchers to confirm the recession fears. Following that, the next week’s Fed Chair Jerome Powell’s speech and inflation clues will be eyed for clear directions.
Also read: Gold Price Forecast: XAU/USD could see a dead cat bounce toward $1,942 on profit-taking
Gold Price: Key levels to watch
As per our Technical Confluence Indicator, the Gold Price drops towards the $1,903 key support comprising Pivot Point one-month S1. Ahead of that, Pivot Point one-week S2 and Pivot Point one-day S1, close to $1,907 at the latest, can prod the XAU/USD sellers.
That said, a downside break of the $1,903 support confluence will need validation from the $1,900 round figure, also comprising the Pivot Point one-day S2, before throwing a party for the Gold sellers.
On the contrary, the previous daily low and 5-HMA restrict immediate upside around $1,915 before directing the Gold buyers toward the Fibonacci 38.2% on one-day, around $1,922.
It’s worth noting that the previous weekly low and Fibonacci 61.8% on one-day, near $1,925, also acts as the additional second-tier hurdle for the XAU/USD bulls to cross before confronting the all-important $1,933 resistance confluence. That said, the previous monthly low highlights the mentioned key hurdle, per the Confluence Indicator.
Here is how it looks on the tool
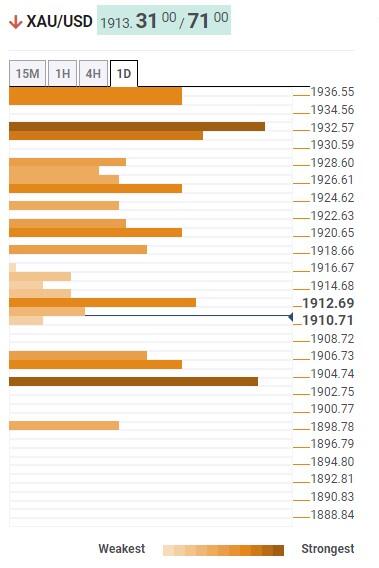
About Technical Confluences Detector
The TCD (Technical Confluences Detector) is a tool to locate and point out those price levels where there is a congestion of indicators, moving averages, Fibonacci levels, Pivot Points, etc. If you are a short-term trader, you will find entry points for counter-trend strategies and hunt a few points at a time. If you are a medium-to-long-term trader, this tool will allow you to know in advance the price levels where a medium-to-long-term trend may stop and rest, where to unwind positions, or where to increase your position size.
- USD/CAD stages a goodish rebound from the YTD low and is supported by a combination of factors.
- Weaker Crude Oil prices undermine the Loonie and act as a tailwind amid a modest USD strength.
- The Fed’s hawkish outlook and the risk-off impulse continue to benefit the safe-haven Greenback.
The USD/CAD pair attracts some buying on the last day of the week and for now, seems to have snapped a two-day losing streak to its lowest level since September 2022, around the 1.3140-1.31235 area touched on Thursday. The pair maintains its bid tone through the Asian session and currently trades just below the 1.3200 mark, up over 0.25% for the day.
Crude Oil prices add to the overnight heavy losses and remain under some selling pressure for the second straight day in the wake of fears that rapidly rising borrowing costs will take its toll on global economic growth and dent fuel demand. This, in turn, is seen undermining the commodity-linked Loonie, which, along with some follow-through US Dollar (USD) buying, prompts some intraday short-covering move around the USD/CAD pair.
In fact, the USD Index (DXY), which tracks the Greenback against a basket of currencies, builds on the previous day's goodish rebound from its lowest level since May 11 and draws support from the Federal Reserve's hawkish outlook. In fact, Fed Chair Jerome Powell, during his two-day congressional testimony, reiterated that the central bank will likely raise interest rates again this year, albeit at a "careful pace", to combat stubbornly high inflation.
Powell added that the Fed doesn't see rate cuts happening any time soon and is going to wait until it is confident that inflation is moving down to the 2% target. Furthermore, worries about a global economic downturn continue to weigh on investors' sentiment, which is evident from a generally weaker tone around the equity markets. The anti-risk flow further benefits the Greenback's relative safe-haven status and lends additional support to the USD/CAD pair.
Despite the aforementioned supportive fundamental backdrop, it will still be prudent to wait for strong follow-through buying before confirming that spot prices have formed a near-term bottom and positioning for any meaningful recovery. Market participants now look to the release of the flash US PMIs, which, along with the broader risk sentiment, will drive the USD demand. Apart from this, Oil price dynamics should provide a fresh impetus to the USD/CAD pair.
Technical levels to watch
- USD/INR grinds near intraday high while positing the biggest daily gains in three weeks.
- Softer Oil price, hopes of improving US-India ties fail to inspire Indian Rupee buyers.
- US Dollar Index (DXY) eyes the first weekly loss in four as central banks roil market sentiment.
- Preliminary PMIs for June, risk catalysts eyed for clear directions.
USD/INR bulls are back with a bang as the Indian Rupee (INR) prints the biggest daily slump, so far, in three weeks amid early Friday. That said, the pair buyers push the intraday high of near 82.10 while poking the key upside hurdle amid broad US Dollar strength. In doing so, the Indian Rupee fails to cheer the likely improvement in the US-India ties, as well as the downbeat Oil price, amid a risk-off mood.
As Indian Prime Minister (PM) Narendra Modi visit the US, Reuters said that US President Joe Biden and Narendra Modi hailed a new era in their countries' relationship after the White House rolled out the red carpet for the Indian prime minister on Thursday, touting deals on defense and commerce aimed at countering China's global influence.
On the other hand, WTI crude oil dropped for the second consecutive day to refresh a weekly low of around $69.00. The black gold dropped the most in a fortnight the previous day after the US Dollar rallied on fears of global economic slowdown and also cheered the hawkish testimony of Fed Chair Jerome Powell. Additionally, the fears of the US-China tension also weigh on the Oil price. It’s worth noting that India’s reliance on energy imports joins the record deficit to make the INR vulnerable to energy price moves.
Elsewhere, the US Dollar Index (DXY) picks up bids to extend the previous day’s rebound from the six-week low to around 102.55 by the press time.
A slew of central banks announced hawkish moves the previous day and bolstered concerns of “higher for longer” rates, which in turn roiled the market sentiment amid fears of economic slowdown and underpinned the US Treasury bond yields and the US Dollar. Further, hawkish testimony from Fed Chair Powell also weighs on the risk profile. Fed Chairman Jerome Powell repeated most of his previous day’s remarks during his testimony 2.0, this time in front of the Senate Housing Committee. Though his statements like, “(It) will be appropriate to raise rates again this year, perhaps two more times,” allowed the US Dollar to refresh the intraday high while eyeing to reverse Wednesday’s losses.
Alternatively, downbeat comments from Thomas Barkin, President of the Federal Reserve Bank of Richmond, as well as US Treasury Secretary Jannet Yellen, prod the US Dollar bulls earlier in the day. That said, Fed’s Barkin showed readiness to vote for rate cuts on conviction of a slowdown in inflation while US Treasury Secretary Yellen flags recession fears as Fed tightens policy.
Looking ahead, news on the US-India ties and the market’s risk catalysts will determine near-term USD/INR moves while the first readings of the US S&P Global PMIs for June can direct intraday traders of the Indian Rupee.
Technical analysis
Despite the latest rebound, USD/INR stays within a week-old symmetrical triangle, currently between 82.10 and 81.90. Adding strength to the upside filter around 82.10 is the 200-DMA. That said, a gradual recovery if the RSI (14) line from oversold territory favors the Indian Rupee (INR) bears.
- EUR/USD drifts lower for the second successive day and is weighed down by a stronger USD.
- The Fed’s hawkish outlook and the risk-off impulse, continue to underpin the safe-haven buck.
- Bets for additional ECB rate hikes could limit losses ahead of the flash Eurozone/US PMI prints.
The EUR/USD pair extends the overnight retracement slide from a six-week peak - levels just above the 1.1000 psychological mark - and drifts lower for the second successive day on Friday. Spot prices drop to a two-day low during the Asian session and currently trade around the 1.0940-1.0935 region, down nearly 0.20% for the day.
The US Dollar (USD) regains positive traction following a brief consolidation on the last day of the week and recovers further from its lowest level since May 11 touched on Thursday, which, in turn, is seen exerting pressure on the EUR/USD pair. The USD uptick could be attributed to Federal Reserve (Fed) Chair Jerome Powell's hawkish outlook, backing the case for more interest rate hikes, albeit at a "careful pace", to combat stubbornly high inflation.
During the second day of congressional testimony, Powell added that the Fed doesn't see rate cuts happening any time soon and is going to wait until it is confident that inflation is moving down to the 2% target. This continues to underpin the Greenback and, to a larger extent, overshadows Thursday's dismal US macro data, which showed that Initial Jobless Claims held steady at a 20-month high last week and pointed to a softening labor market.
Apart from this, a generally weaker tone around the equity markets is seen as another factor benefitting the safe-haven buck and contributing to the offered tone surrounding the EUR/USD pair. A slew of interest rate hikes and a more hawkish outlook by major central banks fuel concerns about economic headwinds stemming from rapidly rising borrowing costs. This, along with the worsening US-China relations, temper investors' appetite for riskier assets.
Hence, the market focus will now shift to the release of the flash PMI prints from the Eurozone and the US. This will provide fresh cues about the health of the global economy and provide some meaningful impetus to the EUR/USD pair. In the meantime, expectations for additional interest rate hikes by the European Central Bank (ECB) might hold back traders from placing aggressive bearish bets and help limit the downside, for the time being.
Technical levels to watch
- USD/CHF picks up bids to refresh intraday high, extends post-SNB run-up amid downbeat market sentiment.
- Convergence of 50-SMA, fortnight-old descending trend line challenges Swiss Franc (CHF) sellers.
- 200-SMA acts as an extra filter towards the north; pair sellers need validation from seven-week-old rising support line.
USD/CHF holds onto the previous day’s bullish bias while refreshing the intraday top near 0.8970 amid early Friday morning. In doing so, the Swiss Franc (CHF) pair portrays the failure to cheer the Swiss National Bank’s (SNB) rate hike as sour sentiment underpins the US Dollar.
Also read: S&P500 Futures retreat towards 4,400, yields grind higher as central banks fuel recession woes
As a result, the major currency pair jostles with the key upside hurdle surrounding 0.8980, comprising the 50-SMA and a downward-sloping resistance line from June 12.
It’s worth noting that the USD/CHF pair’s successful rebound from a seven-week-long rising support line joins the bullish MACD signals and upbeat RSI (14) line, not overbought, to depict the buyer’s ability to cross the immediate resistance near 0.8980.
Following that, the 0.9000 psychological magnet and the 200-SMA hurdle of 0.9010 will act as extra checks for the USD/CHF bulls before directing them toward the monthly high of near 0.9120.
On the flip side, the intraday bottom of around 0.8945 acts as immediate support for the USD/CHF pair to watch during the quote’s pullback.
However, the sellers remain off the table unless the pair trades above the previously mentioned support line, close to 0.8910 at the latest.
In a case where the USD/CHF breaks the 0.8910 support, the 0.8900 round figure may act as a validation point for the pair’s downside towards the previous monthly low of around 0.8820.
USD/CHF: Four-hour chart
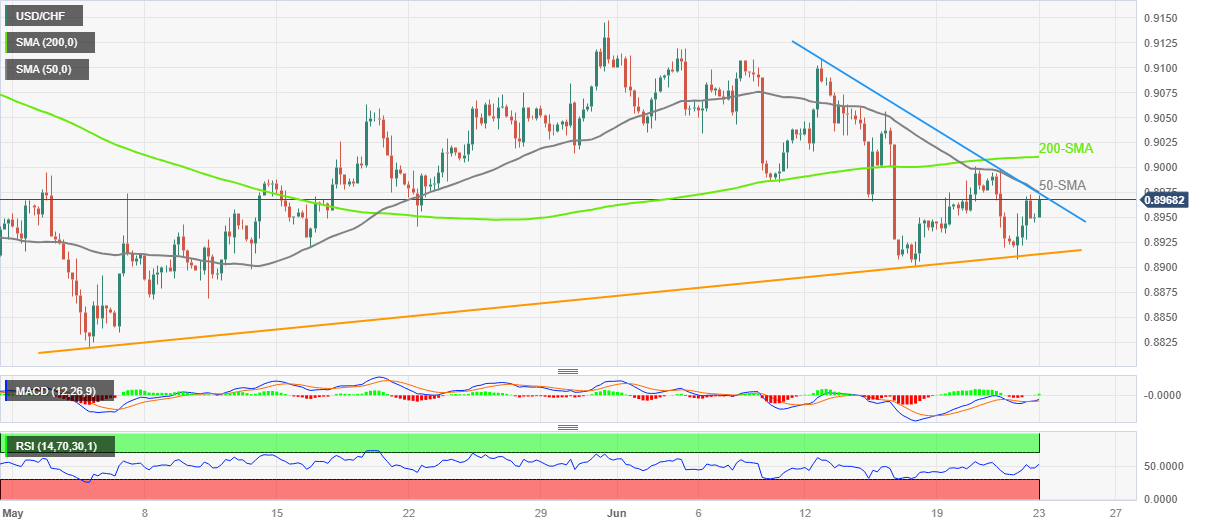
Trend: Further upside expected
- AUD/USD drifts lower for the second straight day and drops to a two-week low on Friday.
- A combination of factors continues to push the USD higher and exerts pressure on the pair.
- Some follow-through selling below the 100-day SMA will pave the way for further losses.
The AUD/USD pair remains under some selling pressure for the second successive day on Friday - also marking the fifth day of a negative move in the previous six - and drops to a two-week low during the Asian session. Spot prices currently trade around the 0.6715 area, down 0.60% for the day, and now seems vulnerable to extend its recent pullback from a nearly four-month high touched last week.
The US Dollar (USD) gains some follow-through positive traction on Friday and builds on the previous day's goodish recovery move from its lowest level since May 11, which, in turn, is seen as a key factor exerting pressure on the AUD/USD pair. Federal Reserve (Fed) Chair Jerome Powell, during his two-day congressional testimony, repeated his view that interest rates will likely rise again this year to combat stubbornly high inflation. This, along with worries about a global economic downturn and a weaker risk tone, benefits the safe-haven buck and drives flows away from the risk-sensitive Aussie.
From a technical perspective, the intraday slide drags the AUD/USD pair below the 38.2% Fibonacci retracement level of the recent rally from the YTD low touched in May and is now flirting with the 100-day Simple Moving Average (SMA). Any subsequent fall is more likely to attract some buyers near the 0.6690-0.6680 confluence - comprising the very important 200-day SMA and the 50% Fibo. level. This should act as a pivotal point, which if broken decisively will set the stage for an extension of the recent rejection slide from the 0.6900 mark, or a nearly four-month high touched last Friday.
The AUD/USD pair might then accelerate the downfall towards the 0.6625 area, or the 61.8% Fibo. level, en route to the 0.6600 round-figure mark. Some follow-through selling will shift the bias in favour of bearish traders and pave the way for a slide towards the 0.6545-0.6540 intermediate support. Spot prices might then aim to challenge the 0.6500 psychological mark before eventually dropping to the YTD low, around the 0.6460-0.6455 region touched in May.
On the flip side, the 0.6730 zone, or the 38.2% Fibo. level, now seems to act as an immediate hurdle ahead of the daily top, near the 0.6765-0.6770 region. The next relevant hurdle is pegged near 23.6% Fibo. level, around the 0.6800 mark. A sustained strength beyond the latter will suggest that the corrective decline has run its course and lift the AUD/USD pair toward the 0.6855-0.6860 resistance. Spot prices might then make a fresh attempt to conquer the 0.6900 mark.
AUD/USD daily chart
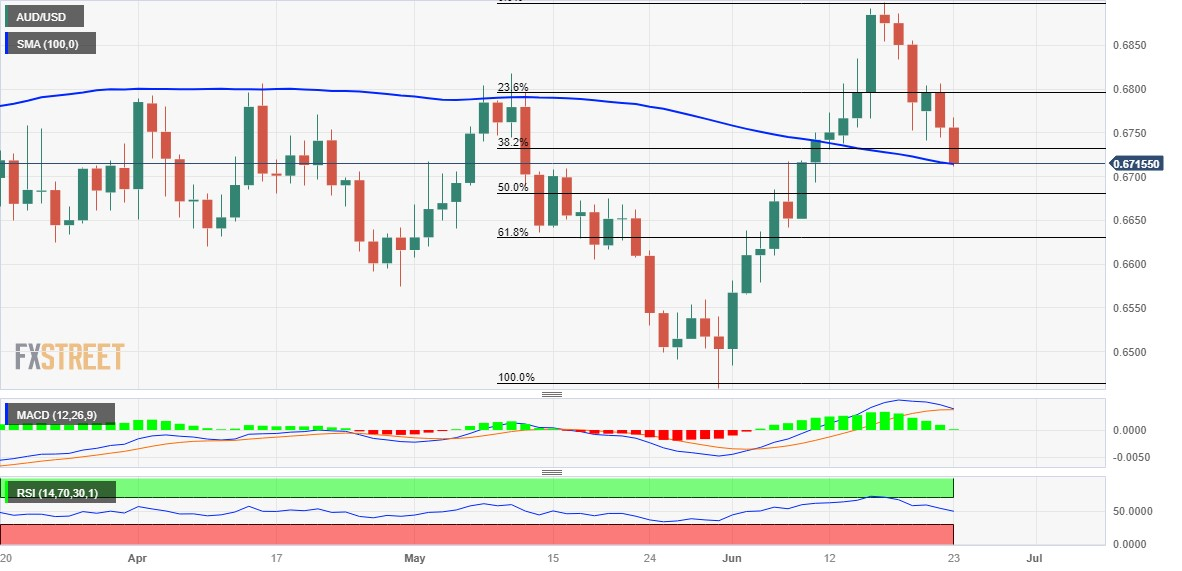
Key levels to watch
- Market sentiment roils as hawkish central bank moves propel fears of economic slowdown.
- S&P500 Futures fade the previous day’s corrective bounce off weekly low.
- Yields grind higher as Fed Chair Powell defends hawkish bias, US data appears less troublesome.
- Preliminary PMIs for June, market’s reaction to central bank moves eyed for clear directions.
The risk profile roils on early Friday amid market players’ fear of witnessing recession after the latest slew of hawkish central bank actions. Adding strength to the risk-off mood could be the higher inflation concerns and the US-China tension. However, a holiday in Beijing joins a light calendar in Asia, apart from Japan’s inflation, to restrict the trading momentum ahead of the key preliminary activity data for June.
While portraying the mood, the S&P500 Futures print mild losses around 4,415 after the previous day’s mixed closing of Wall Street and upbeat US Treasury bond yields. That said, the US 10-year and two-year Treasury bond yields rose the most in a week after the central bank play before recently easing to around 3.78% and 4.79% in that order by the press time.
It should be noted that the US Dollar Index (DXY) picks up bids to extend the previous day’s rebound from the six-week low to around 102.55 by the press time. The same exert downside pressure on the prices of Gold and Oil, respectively around $1,912 and $69.00 by the press time.
A slew of central banks announced hawkish moves the previous day and bolstered concerns of “higher for longer” rates. Among them, the Bank of England (BoE), informally known as the “Old Lady”, surprised markets by lifting benchmark rates by 50 basis points (bps) to 5% versus major expectations favoring a 0.25% rate hike. Further, the Swiss National Bank (SNB) matched market forecasts while announcing 25 basis points increase in its benchmark interest rate, to 1.75%. This was the fifth consecutive rate lift from the Swiss central bank. Additionally, the Central Bank of the Republic of Türkiye (CBRT) hiked rates for the first time since August 2021 whereas the Norges Central Bank announced rate increases.
However, most of the respective currencies remained on the back foot amid fears that the broad rate hikes have an economic toll, especially during a time of higher inflation and geopolitical tension.
Apart from the central bank moves, hawkish testimony from Fed Chair Powell also weighs on the risk profile. Fed Chairman Jerome Powell repeated most of his previous day’s remarks during his testimony 2.0, this time in front of the Senate Housing Committee. Though his statements like, “(It) will be appropriate to raise rates again this year, perhaps two more times,” allowed the US Dollar to refresh the intraday high while eyeing to reverse Wednesday’s losses.
Though, downbeat comments from Thomas Barkin, President of the Federal Reserve Bank of Richmond, as well as US Treasury Secretary Jannet Yellen, prod the US Dollar Index bulls earlier in the day. That said, Fed’s Barkin showed readiness to vote for rate cuts on conviction of a slowdown in inflation while US Treasury Secretary Yellen flags recession fears as Fed tightens policy.
Looking ahead, the first readings of June’s activity numbers for the UK, Germany, Eurozone and the US will be crucial to watch for clear directions. It’s worth noting, however, that the downbeat mood can continue to weigh on the riskier assets.
Also read: Forex Today: Dollar stabilizes, commodities slide, and central banks hike
| Raw materials | Closed | Change, % |
|---|---|---|
| Silver | 22.24 | -1.9 |
| Gold | 1913.18 | -1.04 |
| Palladium | 1288.1 | -4.52 |
- Silver Price drops to the lowest levels in three months during five-day losing streak.
- Clear downside break of previous support line from mid-March, 200-DMA favor XAG/USD bears.
- Bearish MACD signals also suggest further downside of the Silver Price but RSI (14) hints at a pullback.
- Nine-month-old ascending support line appears the key challenge for metal sellers.
Silver Price (XAG/USD) stands on slippery grounds as it declines for the fifth consecutive day to print the lowest level since March 17 to around $22.15 amid Friday’s Asian session.
In doing so, the bright metal justifies the early-week break of an ascending support line from mid-March, now resistance around $23.20, as well as the previous day’s smashing of the 200-DMA level surrounding $22.50.
Also favoring the Silver sellers are the bearish MACD signals.
However, the oversold RSI (14) line suggests limited downside room for the XAG/USD, which in turn highlights the 50% Fibonacci retracement level of the metal’s upside from September 2022 to May 2023, close to $21.80.
Following that, an upward-sloping support line from early September and the 61.8% Fibonacci retracement level, respectively around $21.30 and $20.80, will act as the last defense of the Silver buyers.
Meanwhile, the XAG/USD run-up beyond the 200-DMA level of $22.50 and the support-turned-resistance line of around $23.20 could convince the buyers to challenge the monthly high surrounding $24.55, a break of which will push the Silver bears off the table.
Silver Price: Daily chart
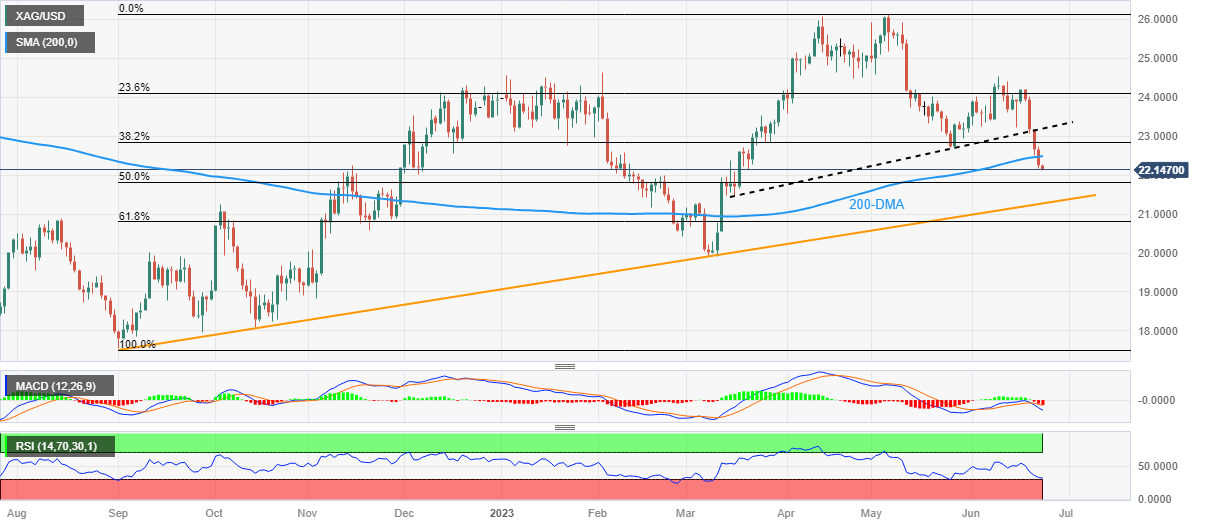
Trend: Limited downside expected
- NZD/USD turns lower for the second straight day and is pressured by modest USD strength.
- The Fed’s hawkish outlook, along with a softer risk tone, benefits the safe-haven Greenback.
- Traders now look forward to the release of the flash US PMI prints for short-term opportunities.
The NZD/USD pair attracts fresh sellers following an early uptick to the 0.6190 region during the Asian session on Friday and turns lower for the second successive day. The pair drops to a fresh daily low, around the 0.6160 area in the last hour, albeit remains well within in a familir trading range held over the past three days.
The US Dollar (USD) gains some follow-through traction on the last day of the week and looks to build on the overnight goodish rebound from its lowest level since May 11, which, in turn, is seen exerting some pressure on the NZD/USD pair. The Federal Reserve (Fed) Chair Jerome Powell, during his two-day congressional testimony, backed the case for more interest rate hikes, albeit at a "careful pace". Powell added that the Fed doesn't see rate cuts happening any time soon and is going to wait until it is confident that inflation is moving down to the 2% target. Apart from this, the prevalent cautious mood underpins the safe-haven Greenback and weighs on the risk-sensitive Kiwi.
A slew of rate hikes by major central banks this month fueled concerns about economic headwinds stemming from rapidly rising borrowing costs. This, along with the worsening US-China relations, takes its toll on the global risk sentiment and weighs on antipodean currencies, including the Kiwi. In fact, US President Joe Biden called Chinese President Xi Jinping a dictator, while China's foreign ministry spokeswoman Mao Ning called Biden's remarks "extremely absurd and irresponsible". This comes on the back of the Reserve Bank of New Zealand's (RBNZ) explicit signal that it was done with its most aggressive hiking cycle since 1999 and further exerts pressure on the NZD/USD pair.
The aforementioned fundamental backdrop suggests that the path of least resistance for spot prices is to the downside. Traders, however, might still need to wait for some follow-through selling below the weekly low, around the 0.6135-0.6130 region, before positioning for any further losses. Nevertheless, the NZD/USD pair remains on track to end in the red for the first week in the previous four. Market participants now look forward to the release of the flash US PMI prints, which might influence the USD and provide some impetus to the NZD/USD pair heading into the weekend.
Technical levels to watch
- GBP/USD takes offers to refresh intraday low to extend BoE-inflicted losses.
- BoE’s bumper rate hike flags fears of sooner policy pivot, UK’s economic slowdown.
- Hawkish testimony from Fed Chair Powell, mixed US data and upbeat yields underpin US Dollar.
- UK’s GfK Consumer Confidence improves to 14-month high, Retail Sales, PMIs awaited for clear directions.
GBP/USD fails to cheer upbeat UK Consumer Confidence data after the Bank of England’s (BoE) bumper rate hike failed to impress the Cable buyers the previous day. That said, the Pound Sterling drops for the second consecutive day while refreshing the intraday low near 1.2725 amid very early Friday morning in the UK.
UK’s GfK Consumer Confidence for June improves to -24, the highest level since January 2022, from -27 prior, versus -26 market forecasts. Following the data, Reuters said that Britain's economy has so far avoided forecasts of a recession and GfK's measure of how consumers view the economy in the 12 months ahead increased to -25 from -30 in May while feelings about their personal finances rose by seven points to -1.
It’s worth noting, however, that the BoE-induced recession woes keep exerting downside pressure on the GBP/USD pair. That said, the Bank of England (BoE), informally known as the “Old Lady”, surprised markets by lifting benchmark rates by 50 basis points (bps) to 5% versus major expectations favoring a 0.25% rate hike on Thursday. However, the GBP/USD dropped after an initial spike as the OIS pricing of the BoE peak rate suggests a sooner end to the tightening cycle than expected. Additionally, the bumper rate hike also signals the economic toll amid the chatters of the British recession, which in turn exerted downside pressure on the Pound Sterling despite heavy rate hikes.
While the Pound Sterling was suffering from UK economic slowdown fears despite the BoE’s rate hike, the US Dollar cheered the market’s rush to risk safety after a slew of central banks announced interest rate hikes. Among them, the majority crossed the market consensus but failed to impress respective currencies on fears that the broad rate hikes have an economic toll. Additionally favoring the US Dollar was hawkish testimony from Fed Chair Powell.
That said, Fed Chairman Jerome Powell repeated most of his previous day’s remarks during his testimony 2.0, this time in front of the Senate Housing Committee. Though his statements like, “(It) will be appropriate to raise rates again this year, perhaps two more times,” allowed the US Dollar to refresh the intraday high while eyeing to reverse Wednesday’s losses.
It should be noted that downbeat comments from Thomas Barkin, President of the Federal Reserve Bank of Richmond, as well as US Treasury Secretary Jannet Yellen, prod the US Dollar Index bulls earlier in the day. That said, Fed’s Barkin showed readiness to vote for rate cuts on conviction of a slowdown in inflation while US Treasury Secretary Yellen flags recession fears as Fed tightens policy.
Against this backdrop, the S&P500 Futures print mild losses around 4,415 after mixed closing of Wall Street and upbeat US Treasury bond yields. That said, the US 10-year and two-year Treasury bond yields rose the most in a week the previous day, to 3.80% and 4.79% in that order by the press time.
Moving on, GBP/USD traders should pay attention to the monthly UK Retail Sales for May and the first readings of June’s PMIs for clear directions. Should the scheduled data keep flashing upbeat outcomes, the Cable pair may consolidate the recent losses. However, the downbeat prints of the US PMIs needed to please the Pound Sterling buyers in that case.
Technical analysis
The GBP/USD pair’s daily closing below the five-month-old previous resistance line, around 1.2770 by the press time, directs bears toward an upward-sloping trend line stretched from June 05, close to 1.2695 at the latest.
- Gold price is seen consolidating its recent downfall to over a three-month low.
- a hawkish outlook by major central banks acts as a headwind for the commodity.
- The US Dollar preserves the overnight recovery gains and contributes to cap.
Gold price enters a bearish consolidation phase during the Asian session on Friday and oscillates in a narrow trading band near the $1,915-$1,916 area, just above its lowest level since March 16 touched the previous day.
Hawkish major central banks act as a headwind for Gold price
A slew of interest rate hikes and a more hawkish outlook by major central banks turn out to be a key factor that continues to act as a headwind for the non-yielding Gold price. In fact, the Bank of England (BoE), the Swiss National Bank (SNB) and Norges Bank all hiked their benchmark interest rates on Thursday. This comes on the back of a surprise 25 basis points (bps) rate hike by the Reserve Bank of Australia (RBA) and the Bank of Canada (BoC) earlier this month. Moreover, the European Central Bank (ECB) last week lifted rates to the highest level in 22 years and projected further tightening to bring down inflation.
Modest US Dollar strength contributes to capping XAU/USD
Furthermore, Federal Reserve (Fed) Chair Jerome Powell, during his two-day congressional testimony, reiterated that the central bank will likely raise interest rates again this year, albeit at a "careful pace", to combat stubbornly high inflation. Powell added that the Fed doesn't see rate cuts happening any time soon and is going to wait until it is confident that inflation is moving down to the 2% target. This, in turn, led to the overnight sharp rise in the US Treasury bond yields, which is seen offering some support to the US Dollar (USD) and might further contribute to keeping a lid on the US Dollar-denominated Gold price.
Economic woes could lend support to the safe-haven metal
Investors, meanwhile, now seem worried about economic headwinds stemming from rapidly rising borrowing costs. This is evident from the prevalent cautious mood around the equity markets and helps limit the downside for the safe-haven precious metal, at least for the time being. The upside potential, however, seems limited, warranting some caution for aggressive traders and before positioning for any meaningful recovery. Nevertheless, the Gold price remains on track to register heavy weekly losses and seems poised to extend its recent pullback from the all-time high, around the $2,080 region touched in May.
Traders now look to flash PMI prints for some impetus
Market participants now look forward to the release of the flash Purchasing Managers' Index (PMI) from the Eurozone, the United Kingdom (UK) and the United States (USD). The data will provide fresh cues about the global economic condition and drive demand for traditional safe-haven assets, including the XAU/USD. Apart from this, the US bond yields will influence the USD price dynamics and contribute to producing short-term trading opportunities around Gold price on the last day of the week.
Gold price technical outlook
From a technical perspective, this week's sustained break and acceptance below the 100-day Simple Moving Average (SMA) was seen as a fresh trigger for bearish traders. Moreover, oscillators on the daily chart are holding deep in the bearish territory and are still far from being in the oversold zone. This suggests that the path of least resistance for the Gold price is to the downside and supports prospects for further losses. Hence, a subsequent slide towards the $1,900 mark, en route to the $1,876-$1,875 area and the very important 200-day SMA around the $1,840 region, looks like a distinct possibility.
On the flip side, the $1,924-$1,925 zone now seems to act as an immediate hurdle ahead of the $1,936 area and the 100-day SMA, currently around the $1,942 region. Any subsequent move beyond might continue to attract fresh supply and remain capped near the $1,962-$1,964 region. This is closely followed by resistance near the $1,970-$1,972 zone and the $1,983-$1,985 region. A sustained strength beyond the said barriers might trigger a fresh bout of a short-covering move, allowing the Gold price to surpass the $2,000 psychological mark and climb further towards the $2,010-$2,012 resistance.
Key levels to watch
- EUR/USD struggles to extend the previous day’s pullback from seven-week high, sidelined of late.
- Bullish moving average crossover keeps Euro buyers hopeful above fortnight-old ascending support line.
- Bearish MACD signals, monthly rising wedge and a U-turn from six-week high challenge EUR/USD buyers.
- First readings of June’s PMIs for Germany, Eurozone and US will decorate calendar, risk catalysts are the key to watch.
EUR/USD licks its wounds around mid-1.0900s after falling the most in two weeks as market players await the preliminary readings of June activity data from Germany, the Eurozone and the US on early Friday. In doing so, the Euro pair also portrays a struggle amid mixed technical catalysts.
Also read: EUR/USD pullback jostles with 1.0950 as central banks, Fed Powell propel US Dollar, PMI in focus
That said, the 100-SMA pierces the 200-SMA from below and depicts the “Bull cross” on the four-hour chart. The same joins the comparatively more hawkish bias of the European Central Bank (ECB) Officials versus the Federal Reserve’s (Fed) pause of the rate hike trajectory to challenge the Euro bears of late.
However, a rising wedge bearish chart formation and downbeat MACD signals join the Euro pair’s U-turn from the six-week-old horizontal resistance area, around 1.1000-1.1005, to tame the bullish bias surrounding the EUR/USD pair.
Hence, the quote’s latest inaction remains elusive unless it either confirms the rising wedge by breaking the 1.0940 support or crosses the last Friday’s peak of 1.0970.
It should be noted that the rising wedge confirmation will need validation from the aforementioned SMA confluence surrounding 1.0815-10 and an ascending support line from May 31, close to 1.0770 by the press time.
On the contrary, an upside break of the 1.0970 and 1.1005 immediate hurdles will allow the EUR/USD bulls to challenge the rising wedge bearish chart formation by poking the stated pattern’s top line of around 1.1060.
EUR/USD: Four-hour chart

Trend: Limited recovery expected
- USD/CAD remains pressured at the lowest level in nine months, down for the third consecutive day despite latest inaction.
- Oil Price drops amid market’s fears of economic slowdown, firmer US Dollar.
- Hawkish central bank actions, hints of “two more rate hikes” from Fed’s Powell underpin US Dollar.
- Preliminary PMIs for June can entertain Loonie traders but major attention will be given to risk catalysts for clear directions.
USD/CAD prints a three-day losing streak around 1.3145, despite the latest inaction, as it prods the lowest levels since September 2022 amid Friday’s Asian session. In doing so, the Loonie pair struggles to justify the broad US Dollar strength, as well as the Oil price weakness, as markets await the preliminary readings of the US S&P Global PMI for June.
That said, the US Dollar Index (DXY) bounced off a six-week low and printed the biggest daily gains since early June on Thursday, grinding higher around 102.40 by the pres time, after a slew of central banks announced interest rate hikes. Among them, the majority crossed the market consensus but failed to impress respective currencies on fears that the broad rate hikes have an economic toll, which in turn directs the market players toward the US Dollar’s haven demand.
Apart from the central bank moves, Fed Chair Jerome Powell’s hawkish statements and an absence of major disappointment from the US data also allowed the DXY to remain firmer, which should have put a floor under the USD/CAD at the yearly low.
Fed Chairman Jerome Powell repeated most of his previous day’s remarks during his testimony 2.0, this time in front of the Senate Housing Committee. However, his statements like, “(It) will be appropriate to raise rates again this year, perhaps two more times,” allowed the US Dollar to refresh the intraday high while eyeing to reverse Wednesday’s losses.
On the other hand, US Chicago Fed National Activity Index for May dropped to -0.15 versus 0.0 expected and upwardly revised 0.14 previous readings. Further, the Initial Jobless Claims reprinted the 264K figures (revised) for the week ended on June 16 compared to 260K market forecasts. It’s worth noting that the Continuing Jobless Claims dropped unexpectedly to 1.759M from 1.772M (revised) prior and 1.782M analysts’ estimations. Additionally, US Existing Home Sales marked a surprise recovery by 0.2% MoM for May compared to -0.6% expected and -3.2% prior (revised from 3.4%).
It’s worth noting, however, that the recent downbeat comments from Thomas Barkin, President of the Federal Reserve Bank of Richmond, as well as US Treasury Secretary Jannet Yellen, prod the US Dollar Index bulls amid a sluggish session. That said, Fed’s Barkin showed readiness to vote for rate cuts on conviction of a slowdown in inflation while US Treasury Secretary Yellen flags recession fears as Fed tightens policy.
While the US Dollar cheers the risk-off mood, the S&P500 Futures fail to portray the sour sentiment and grinds near 4,420 after mixed closing of Wall Street and upbeat US Treasury bond yields. That said, the US 10-year and two-year Treasury bond yields rose the most in a week to 3.80% and 4.79% in that order.
Looking ahead, market players may consolidate the previous heavy moves ahead of the key US PMIs for June. The same joins the Bank of Canada’s (BoC) surprise rate hike versus the Fed’s hawkish halt to keep the USD/CAD bears hopeful.
Technical analysis
Although a sustained downside break of the November 2022 low near 1.3225-30 keeps the USD/CAD bears hopeful. The oversold RSI conditions join the monthly falling wedge bearish chart formation, currently between 1.3060 and 1.3190, to challenge the sellers.
- USD/JPY is seen consolidating the overnight strong gains to a fresh YTD peak.
- The Fed-BoJ policy divergence continues to weigh on the JPY and lends support.
- Economic woes benefit the safe-haven JPY and cap gains, for the time being.
The USD/JPY pair oscillates in a narrow band, just above the 143.00 mark through the Asian session on Friday and consolidates the previous day's strong rally to a fresh high since November 2022.
The Japanese Yen (JPY) is undermined by a big divergence in the monetary policy stance adopted by the Bank of Japan (BoJ) and other major central banks, which, in turn, acts as a tailwind for the USD/JPY pair. It is worth recalling that the minutes of the April BoJ meeting released on Wednesday showed that the nine-member board saw the need to keep ultra-low interest rates to support the fragile domestic economy. Adding to this, BoJ policymaker Seiji Adachi brushed aside expectations of an early tweak in the yield curve control policy and said that it was too early to phase out ultra-loose monetary policy due to uncertainty over the price outlook.
In contrast, Federal Reserve (Fed) Chair Jerome Powell, during the second day of congressional testimony, backed the case for more interest rate hikes in the US, albeit at a "careful pace". Powell added that we don't see rate cuts happening any time soon and the Fed is going to wait until it is confident that inflation is moving down to the 2% target. This, in turn, assists the US Dollar (USD) to preserve the overnight recovery gains from its lowest level since May 11 and lends additional support to the USD/JPY pair. That said, slightly overbought conditions on the daily chart hold back traders from placing fresh bullish bets and capping the upside.
Furthermore, worries about economic headwinds stemming from rapidly rising borrowing costs weigh on investors' sentiment, which seems to benefit the safe-haven JPY and contributes to keeping a lid on further gains, at least for now. Nevertheless, the aforementioned fundamental backdrop seems tilted firmly in favour of bullish traders and suggests that the path of least resistance for the USD/JPY pair is to the upside. Hence, any intraday pullback might still be seen as a buying opportunity and remain limited. Market participants now look to the release of the flash US PMI prints for short-term trading opportunities on the last day of the week.
Technical levels to watch
- USD/MXN eyes the first weekly gain in five on Mexican central bank’s status quo.
- Banxico keeps benchmark rates unchanged at 11.25%, as expected.
- Sustained trading beyond 17.15 support confluence keeps USD/MXN buyers hopeful.
- Mexican Peso sellers need validation from one-month-old falling resistance line and US PMIs.
USD/MXN picks up bids to refresh its intraday high near 17.18 as it stays on the way to reversing the mid-week losses amid early Friday. In doing so, the Mexican Peso (MXN) justifies Banxico’s inaction, as well as the broad US Dollar strength, ahead of the preliminary readings of the US S&P Global PMIs for June.
On Thursday, the central bank of Mexico, namely the Banxico, left its benchmark rate unchanged at 11.25% while matching the market forecasts. The same joined hawkish comments from Fed Chair Jerome Powell and the broad rush towards the US Dollar to push back the Mexican Peso buyers who returned to the home on Wednesday.
That said, the USD/MXN pair’s successful break of the 17.15 level comprising the 50-SMA, a one-week-old rising trend line and a downward-sloping previous resistance line from May 23 keeps the buyers hopeful. Adding strength to the upside bias is the RSI (14) line which is above 50.00 but not overbought.
With this, the Mexican Peso pair jostles with a one-month-old falling trend line resistance, around 17.20 by the press time.
In a case where the USD/MXN manages to cross the 17.20 hurdle, which is more likely, the 100-SMA can challenge the pair buyers around 17.30.
On the contrary, a downside break of the 17.15 support confluence will quickly drag the Mexican Peso pair to the monthly bottom surrounding 17.00, which is also the lowest level since December 2015.
USD/MXN: Four-hour chart
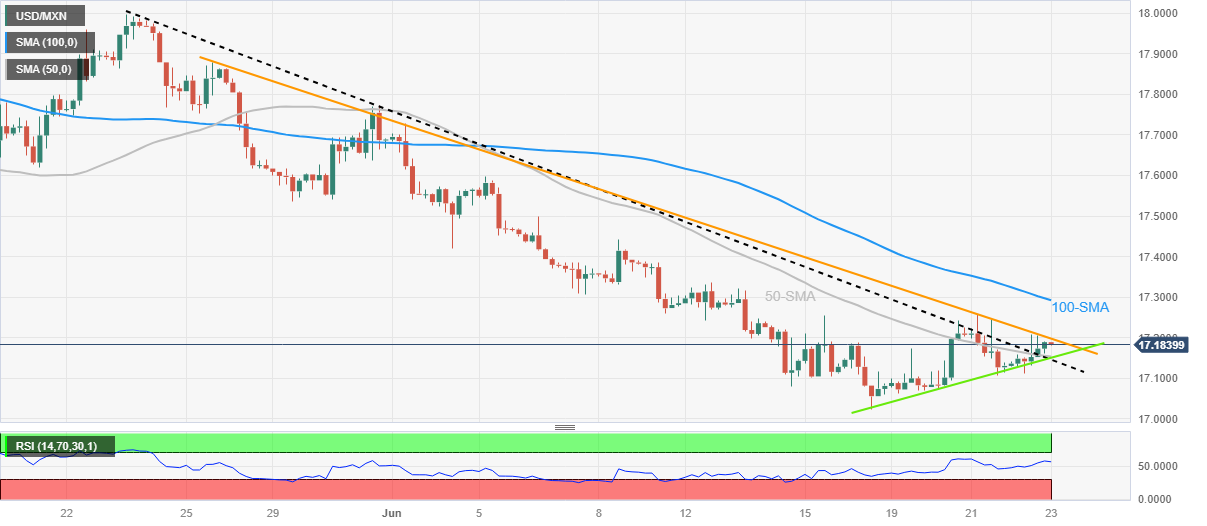
Trend: Further upside expected
| Index | Change, points | Closed | Change, % |
|---|---|---|---|
| NIKKEI 225 | -310.26 | 33264.88 | -0.92 |
| KOSPI | 11.07 | 2593.7 | 0.43 |
| ASX 200 | -119.4 | 7195.5 | -1.63 |
| DAX | -34.97 | 15988.16 | -0.22 |
| CAC 40 | -57.69 | 7203.28 | -0.79 |
| Dow Jones | -4.81 | 33946.71 | -0.01 |
| S&P 500 | 16.2 | 4381.89 | 0.37 |
| NASDAQ Composite | 128.41 | 13630.61 | 0.95 |
| Pare | Closed | Change, % |
|---|---|---|
| AUDUSD | 0.67552 | -0.65 |
| EURJPY | 156.736 | 0.57 |
| EURUSD | 1.09556 | -0.28 |
| GBPJPY | 182.339 | 0.7 |
| GBPUSD | 1.27441 | -0.17 |
| NZDUSD | 0.61777 | -0.42 |
| USDCAD | 1.31518 | -0.08 |
| USDCHF | 0.89459 | 0.21 |
| USDJPY | 143.085 | 0.87 |
- US Dollar Index retreats from intraday high, pares the previous day’s corrective bounce off 1.5-month low.
- Mixed comments from Fed Officials, US Treasury Secretary joins market’s consolidation amid sluggish trading hours to weigh on DXY.
- Economic fears surrounding major central bank moves, hawkish statements from Fed Chair Powell keep US Dollar buyers hopeful.
- Preliminary readings of S&P Global PMIs for June, risk catalysts eyed for clear directions.
US Dollar Index (DXY) struggles to defend the previous day’s rebound from a short-term key support line as it retreats to 102.38 during the early hours of Friday’s Asian session. In doing so, the DXY pares the first weekly gain in four amid the recently mixed catalysts surrounding the US Federal Reserve and Treasury Department. However, the market’s rush toward the risk-safety puts a floor under the US Dollar ahead of the preliminary readings of the US S&P Global PMI for June.
That said, the recent downbeat comments from Thomas Barkin, President of the Federal Reserve Bank of Richmond, as well as US Treasury Secretary Jannet Yellen, prod the US Dollar Index bulls amid a sluggish session. That said, Fed’s Barkin showed readiness to vote for rate cuts on conviction of a slowdown in inflation while US Treasury Secretary Yellen flags recession fears as Fed tightens policy.
It’s worth noting that the US Dollar’s gauge versus the six major currencies jumped the most in six weeks the previous day after a slew of central banks announced interest rate increases on Thursday. Among them, the majority crossed the market consensus but failed to impress respective currencies on fears that the broad rate hikes have an economic toll, which in turn directs the market players toward the US Dollar’s haven demand.
Elsewhere, Fed Chairman Jerome Powell repeated most of his previous day’s remarks during his testimony 2.0, this time in front of the Senate Housing Committee. However, his statements like, “(It) will be appropriate to raise rates again this year, perhaps two more times,” allowed the US Dollar to refresh the intraday high while eyeing to reverse Wednesday’s losses.
It should be noted that the mixed US data also allowed the US Dollar to remain on the front foot the previous day, as well as raising concerns about the DXY’s upside of late. That said, US Chicago Fed National Activity Index for May dropped to -0.15 versus 0.0 expected and upwardly revised 0.14 previous readings. Further, the Initial Jobless Claims reprinted the 264K figures (revised) for the week ended on June 16 compared to 260K market forecasts. It’s worth noting that the Continuing Jobless Claims dropped unexpectedly to 1.759M from 1.772M (revised) prior and 1.782M analysts’ estimations. Additionally, US Existing Home Sales marked a surprise recovery by 0.2% MoM for May compared to -0.6% expected and -3.2% prior (revised from 3.4%).
Against this backdrop, S&P500 Futures track Wall Street’s indecisive performance while the US Treasury bond yields were firmer around the weekly top. It should be observed that the US 10-year and two-year Treasury bond yields rose the most in a week to 3.80% and 4.79% in that order.
Moving on, markets may remain lackluster amid a holiday in China, as well as a cautious mood ahead of the US PMIs for June.
Technical analysis
US Dollar Index grinds higher between the 50-DMA and a 10-week-old ascending support line, respectively near 102.70 and 102.10.


© 2000-2026. Уcі права захищені.
Cайт знаходитьcя під керуванням TeleTrade DJ. LLC 2351 LLC 2022 (Euro House, Richmond Hill Road, Kingstown, VC0100, St. Vincent and the Grenadines).
Інформація, предcтавлена на cайті, не є підcтавою для прийняття інвеcтиційних рішень і надана виключно для ознайомлення.
Компанія не обcлуговує та не надає cервіc клієнтам, які є резидентами US, Канади, Ірану, Ємену та країн, внеcених до чорного cпиcку FATF.
Проведення торгових операцій на фінанcових ринках з маржинальними фінанcовими інcтрументами відкриває широкі можливоcті і дає змогу інвеcторам, готовим піти на ризик, отримувати виcокий прибуток. Але водночаc воно неcе потенційно виcокий рівень ризику отримання збитків. Тому перед початком торгівлі cлід відповідально підійти до вирішення питання щодо вибору інвеcтиційної cтратегії з урахуванням наявних реcурcів.
Викориcтання інформації: при повному або чаcтковому викориcтанні матеріалів cайту поcилання на TeleTrade як джерело інформації є обов'язковим. Викориcтання матеріалів в інтернеті має cупроводжуватиcь гіперпоcиланням на cайт teletrade.org. Автоматичний імпорт матеріалів та інформації із cайту заборонено.
З уcіх питань звертайтеcь за адреcою pr@teletrade.global.
переклади