- Analytics
- News and Tools
- Market News
Новини ринків
- EUR/JPY finishes week with a 0.66% gain, reflecting persistent JPY softness against a backdrop of economic data.
- Technical analysis shows YTD high at 163.21, with support and resistance levels indicating potential upward momentum.
- Key technical levels outlined for potential reversals or further advances in the EUR/JPY pair's trajectory.
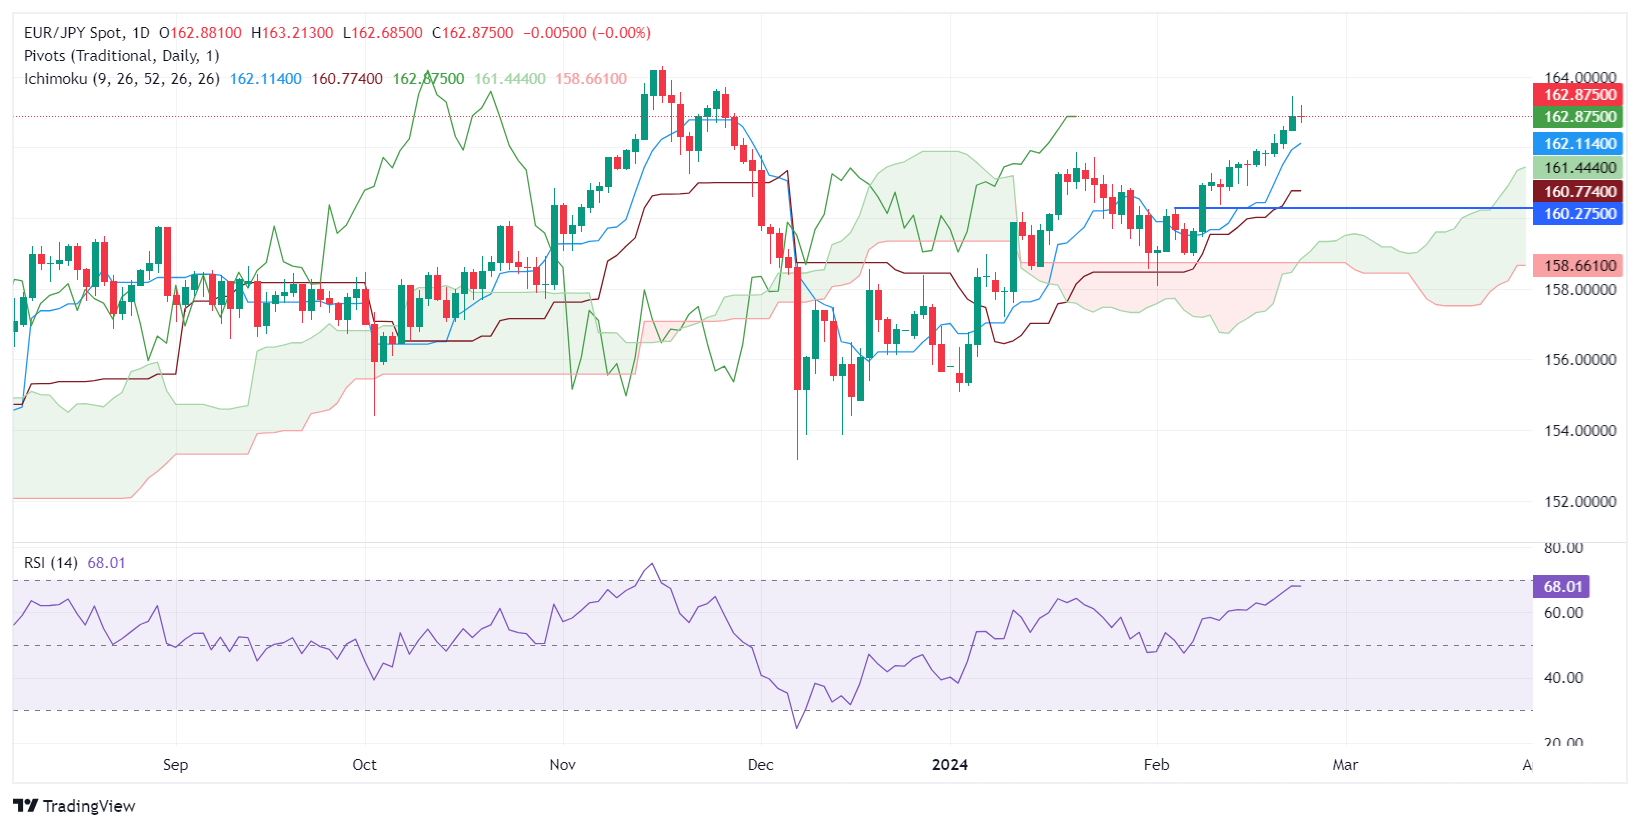
The EUR/JPY wraps up Friday session with losses of 0.02% but is set to finish the week with 0.66% gains, courtesy of overall Japanese Yen (JPY) weakness, as economic data doesn’t justify the Bank of Japan (BoJ) finishing negative interest rates. At the time of writing, the cross exchanges hands at 162.86, virtually unchanged.
From a technical standpoint, the pair printed a new year-to-date (YTD) high at 163.21 but failed to cling to gains above the 163.00 figure. That opened the door for a pullback, capped at around the day’s low of 162.64, which keeps buyers hopeful of higher prices. Achieving a daily close above 163.00 would open the door to testing the November 27 high at 163.72, ahead of the 164.00 mark.
Conversely, if sellers step in, they would clash with the Tenkan-Sen, first support at 162.11. the next support will emerge at January’s 19 high turned support at 161.87, followed by the Senkou Span A at 161.44.
EUR/JPY Price Action – Daily Chart
- USD/JPY dips but retains gains for the week with a slight 0.17% increase, hinting at a bullish undertone.
- Technical outlook suggests neutrality with an upward bias, positioned above the Ichimoku Cloud.
- Resistance and support levels outlined for potential bullish continuation or pullback scenarios.
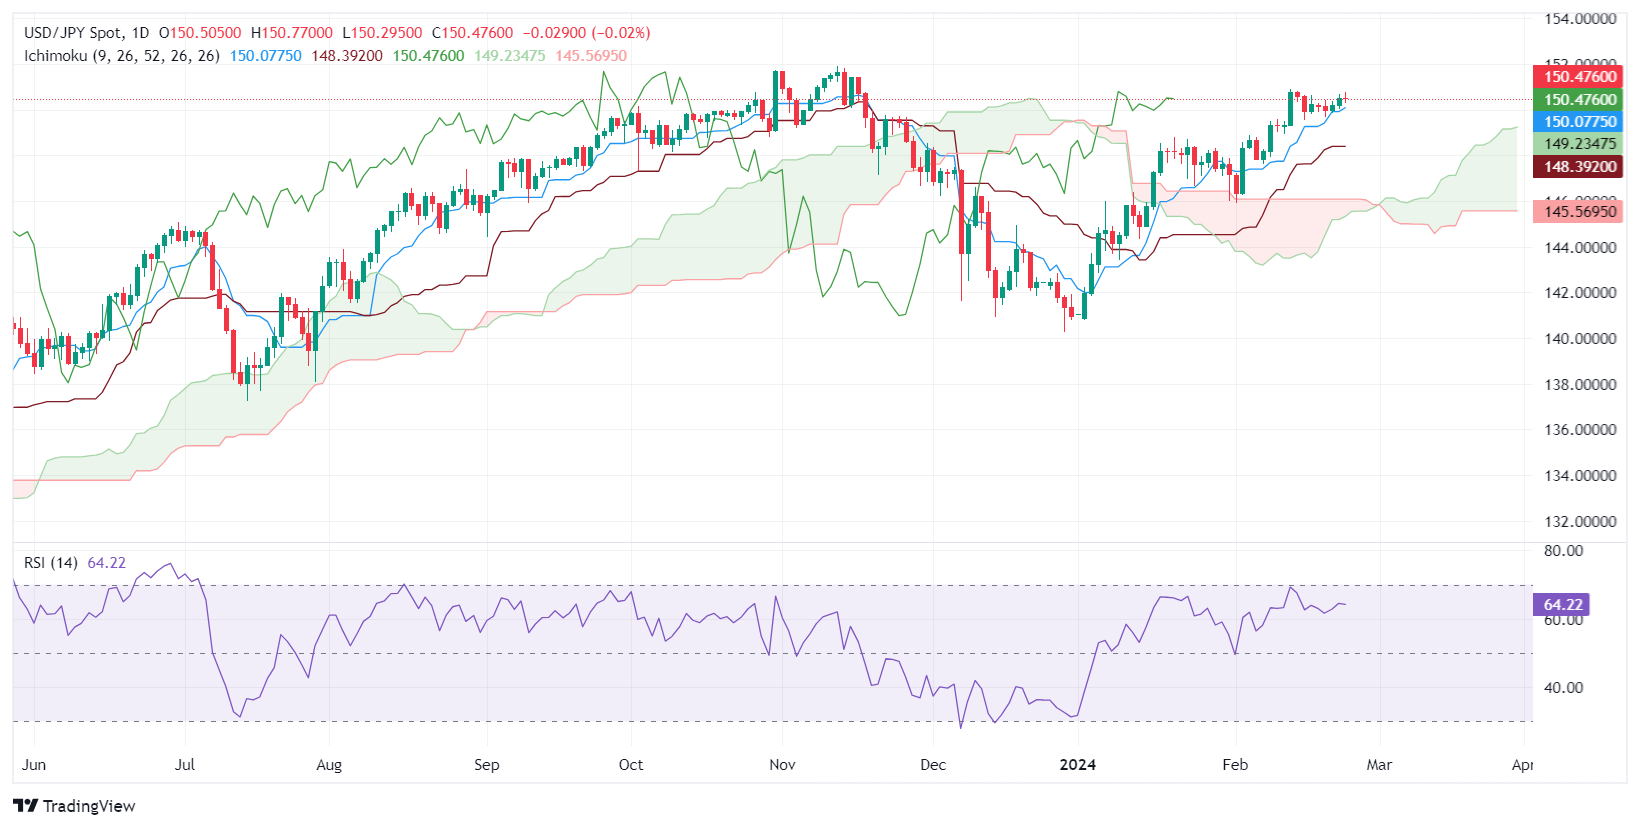
The USD/JPY retreats, after hitting weekly highs of 150.77, aim back below the 150.50 figure late in the North American session. The major exchanges hands at 150.44, down 0.05%, but set to finish the week with gains of 0.17%.
From a technical perspective, the pair is neutral to upward biased, remaining well positioned above the Ichimoku Cloud (Kumo). Price action suggests that buyers need to push the USD/JPY above the February 13 high at 150.88 to remain hopeful for a bullish continuation. The next resistance would be 151.00, followed by last year’s high at 151.91. Relative Strength Index (RSI) studies remain bullish, indicating that buyers might have the upper hand.
Conversely, if sellers drag the USD/JPY below 150.00, that will pave the way for a pullback. The next demand area will be the Tenkan-Sen at 150.05, followed by the Senkou Span A at 149.22. A further downside is seen at the Kijun Sen at 148.39.
USD/JPY Price Action – Daily Chart
- WTI has returned to territory below $77.00 five times in eight days.
- Crude Oil markets are getting pushed back into the low side of rough congestion.
- Analysts expect OPEC to extend Q1 cuts through Q2.
West Texas Intermediate (WTI) dipped back below $77.00 on Friday as energies pull back from recent bullish momentum which failed to crack into meaning high territory. WTI is set to wrap up the trading week near $76.50, a region that US Crude Oil has been struggling to break from since rising into the zone on February 9.
According to a survey by Bloomberg, analysts that watch the Organization of the Petroleum Exporting Countries (OPEC) expect the Crude Oil cartel to extend steep production cuts from the first quarter through Q2 2024. OPEC introduced drastic Crude Oil production caps across its member states late 2023, but attempts to constrain global Crude Oil supply in order to support barrel prices continues to run into significant headwinds as energy markets have their hands full watching global non-OPEC production and keeping an eye out for ongoing geopolitical headlines.
Crude Oil markets remain concerned about possible supply shocks as the Israel-Palestinian Hamas conflict in Gaza rolls on, and Yemini Houthis backed by Iran continue to target civilian cargo ships in the Red Sea despite the presence of a coalition naval fleet between the US and the UK.
As it currently stands, OPEC has not announced their Q2 plans, nor have they set a date to begin discussing the group’s production levels heading into the tail end of the first quarter.
WTI technical outlook
WTI fell back below the 200-hour Simple Moving Average (SMA) at $77.47 for the third time in a week as bullish momentum continues to evaporate. US Crude Oil is building out a rough consolidation pattern in the near-term, with a technical resistance zone marked in just below $79.00.
Daily candlesticks are seeing stiff technical resistance from the 200-day SMA at $77.60, and a bullish recovery from the last major swing low into $67.97 in December has struggled to gain meaningful chart territory.
WTI hourly chart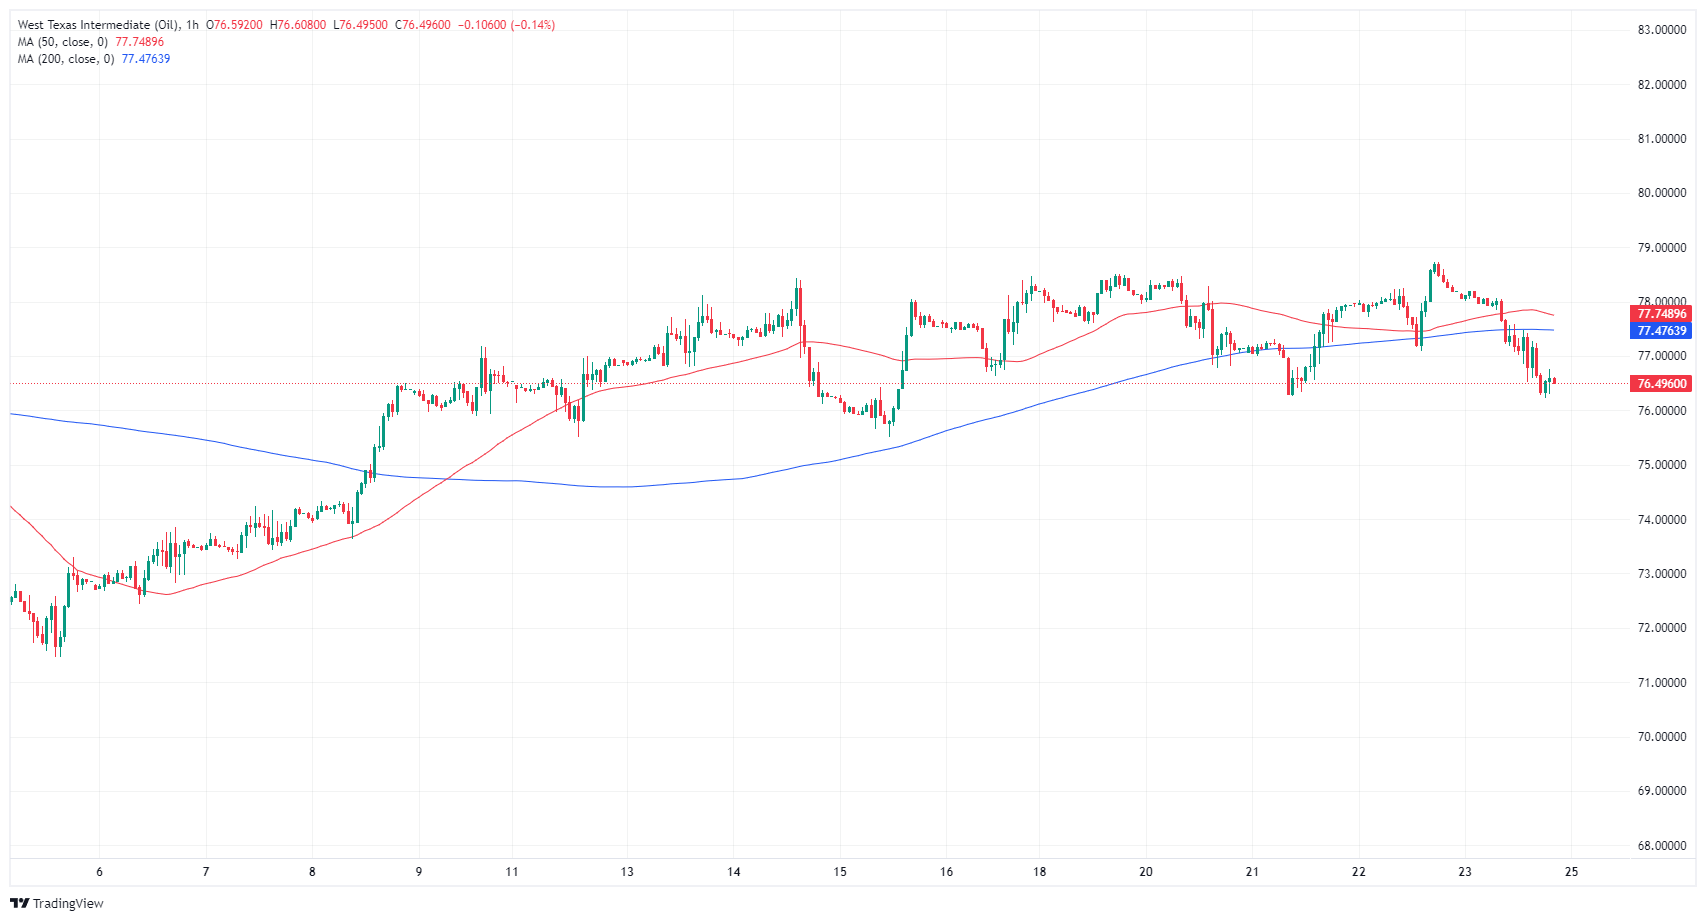
WTI daily chart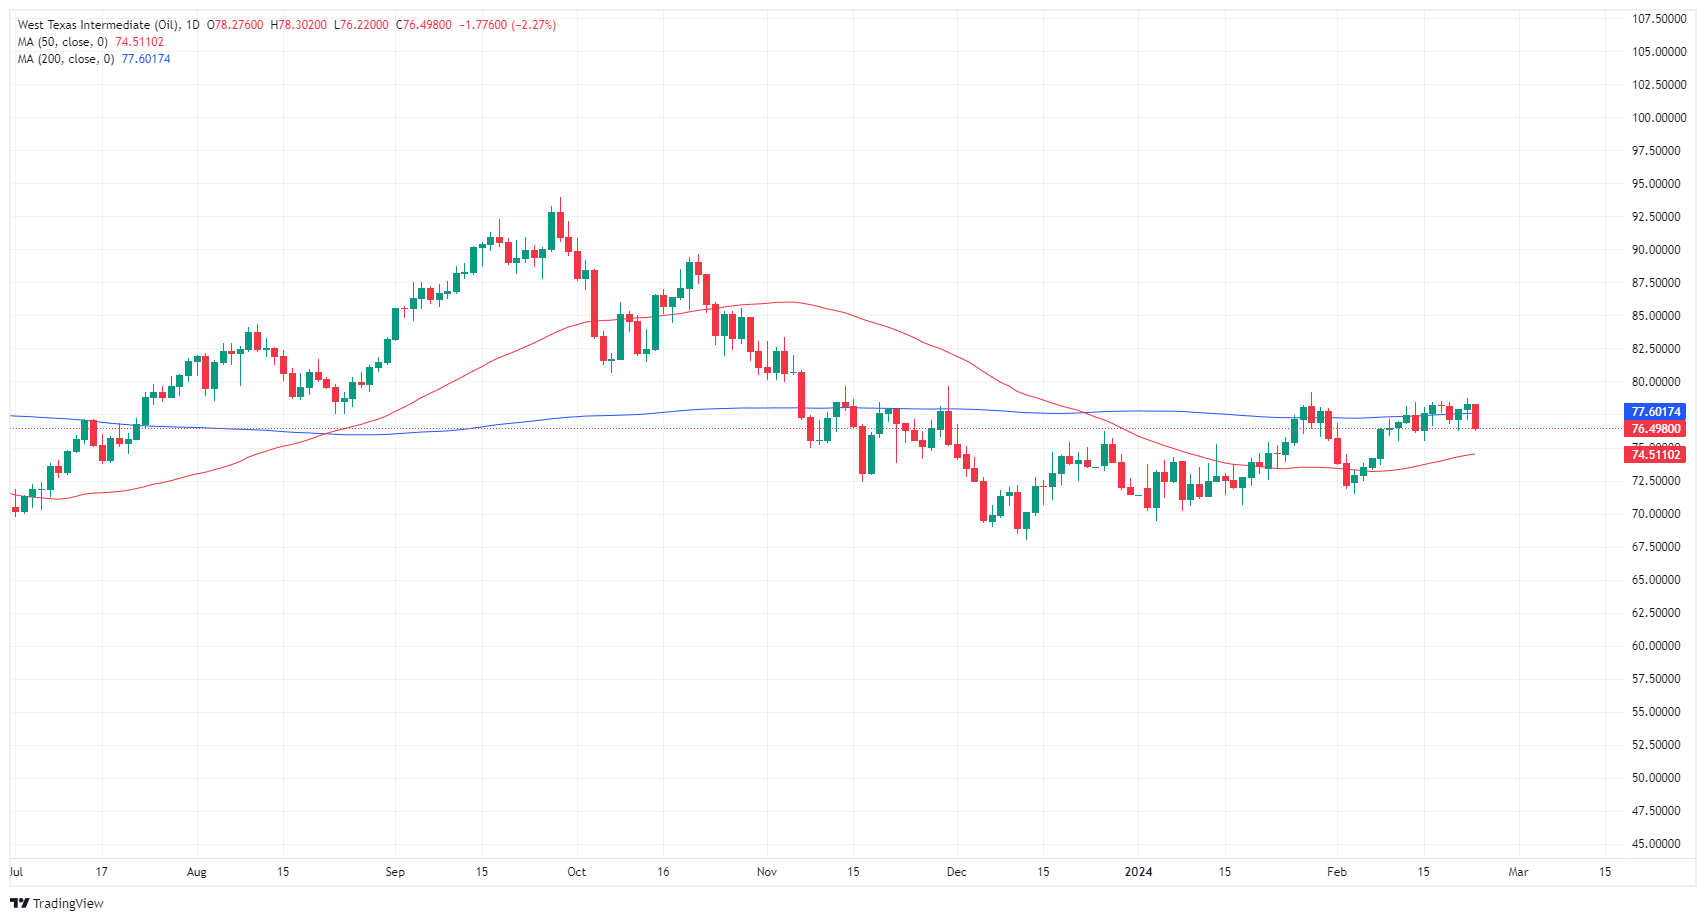
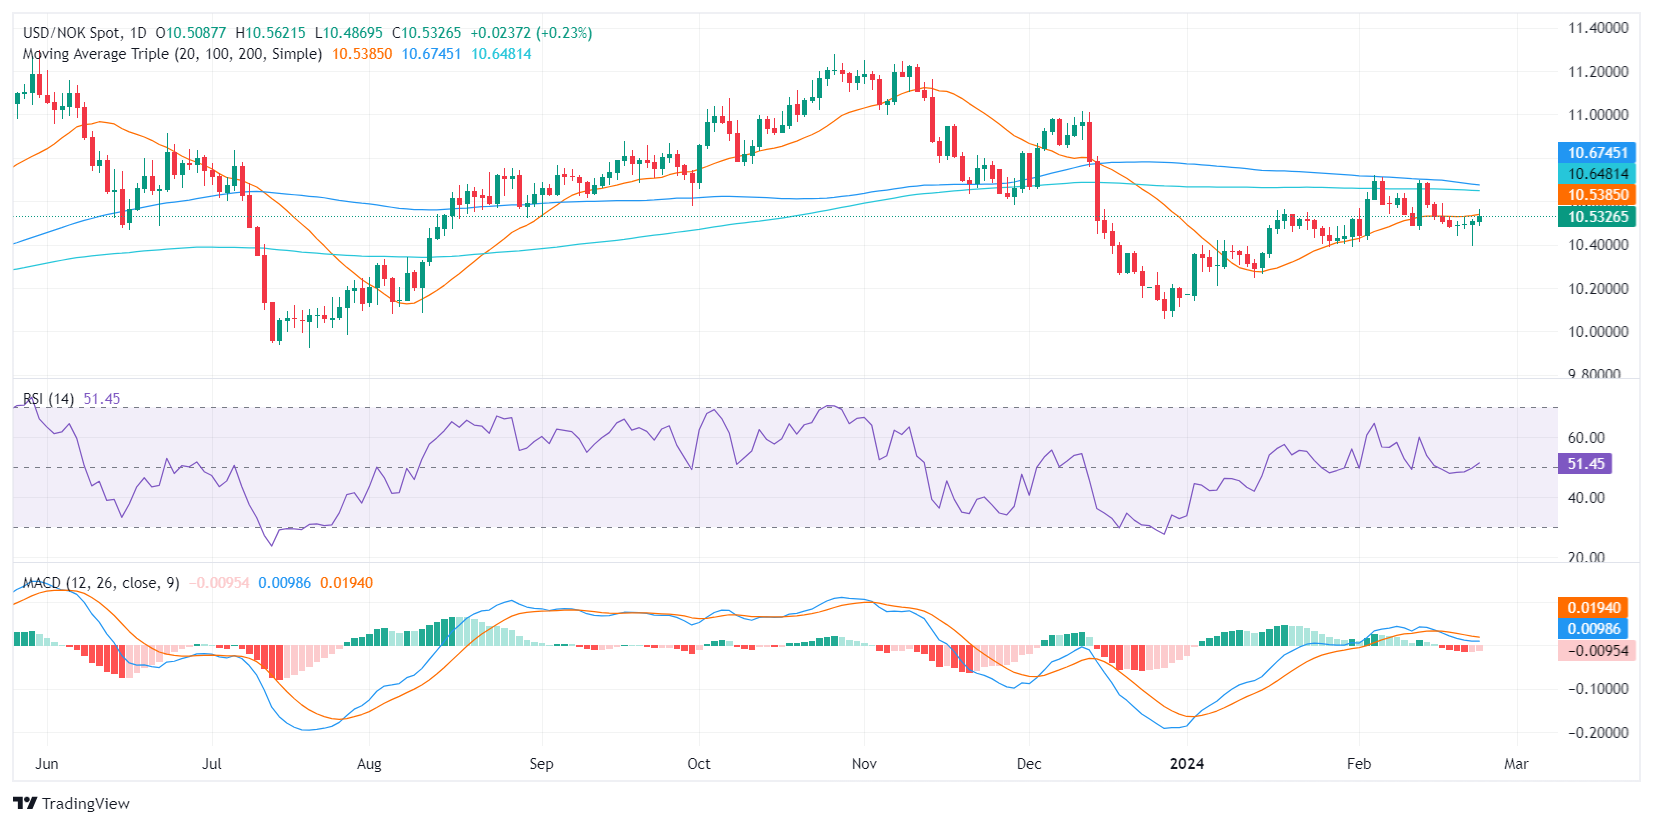
- The USD/NOK is presently trading higher at 10.53, marking a 0.32% increase during Friday's session.
- The US Dollar stands firm as Fed officials show caution due to robust US economic indicators.
- Investors assess the likelihood of a Fed rate cut in March and May as low due to potential adverse implications on price stability.
- The USD is anticipated to see gains as the market adjusts its easing expectations and pushes the first rate cut from the Fed to June.
In Friday's trading session, the USD/NOK pair is trading at a level of 10.53, registering a modest gain of 0.32%. The US Dollar (USD) is showing a stable performance in light of Federal Reserve (Fed) officials adopting a cautious stance in light of a strong US economy. As a reaction, the probability of a rate cut in March and May by the Fed appears to be low according to the market’s expectations.
On the other hand, the short term of the NOK will be dictated on whether the Norges Bank will follow the Fed’s stance to delay cuts which will be guided by local data. In addition, the Norwegian currency gained momentum in 2024, due to rising Oil prices, as it is an important global producer, so in case, the black gold advances further the pair’s upside may be limited.
USD/NOK technical analysis
On the daily chart, the Relative Strength Index (RSI) for the USD/NOK is currently in positive territory. The upward slope indicates that buyers are beginning to assert control as the RSI readings moved from negative to positive region recently.
Comparatively, the RSI on the hourly chart shows similar signs of buyer dominance as the readings fall within the positive territory. This reaffirms the presence of the buying sentiment in both short and long-term perspective. Nonetheless, this perspective is somewhat dampened by the Moving Average Convergence Divergence (MACD). The MACD shows red bars in the hourly and daily chart, indicating negative momentum despite being flat. This indicates the presence of sellers in the market, putting a halt to the buying pressure as reflected by the RSI.
In the broader context, the pair is below its 20, 100, and 200-day Simple Moving Averages (SMAs) which is indicative of a controlled bear market. However, the underlined strengthening buyer dominance seen from the RSI might provide a reversal in trend if it maintains its consistency.
USD/NOK daily chart
- Gold price surges, buoyed by a decline in US Treasury yields and optimistic market conditions.
- Risk-on mood prevails, yet Gold attracts investors, defying typical safe-haven asset trends.
- Market sentiment adjusts to Fed's cautious stance with expectations of significant rate easing by year-end.
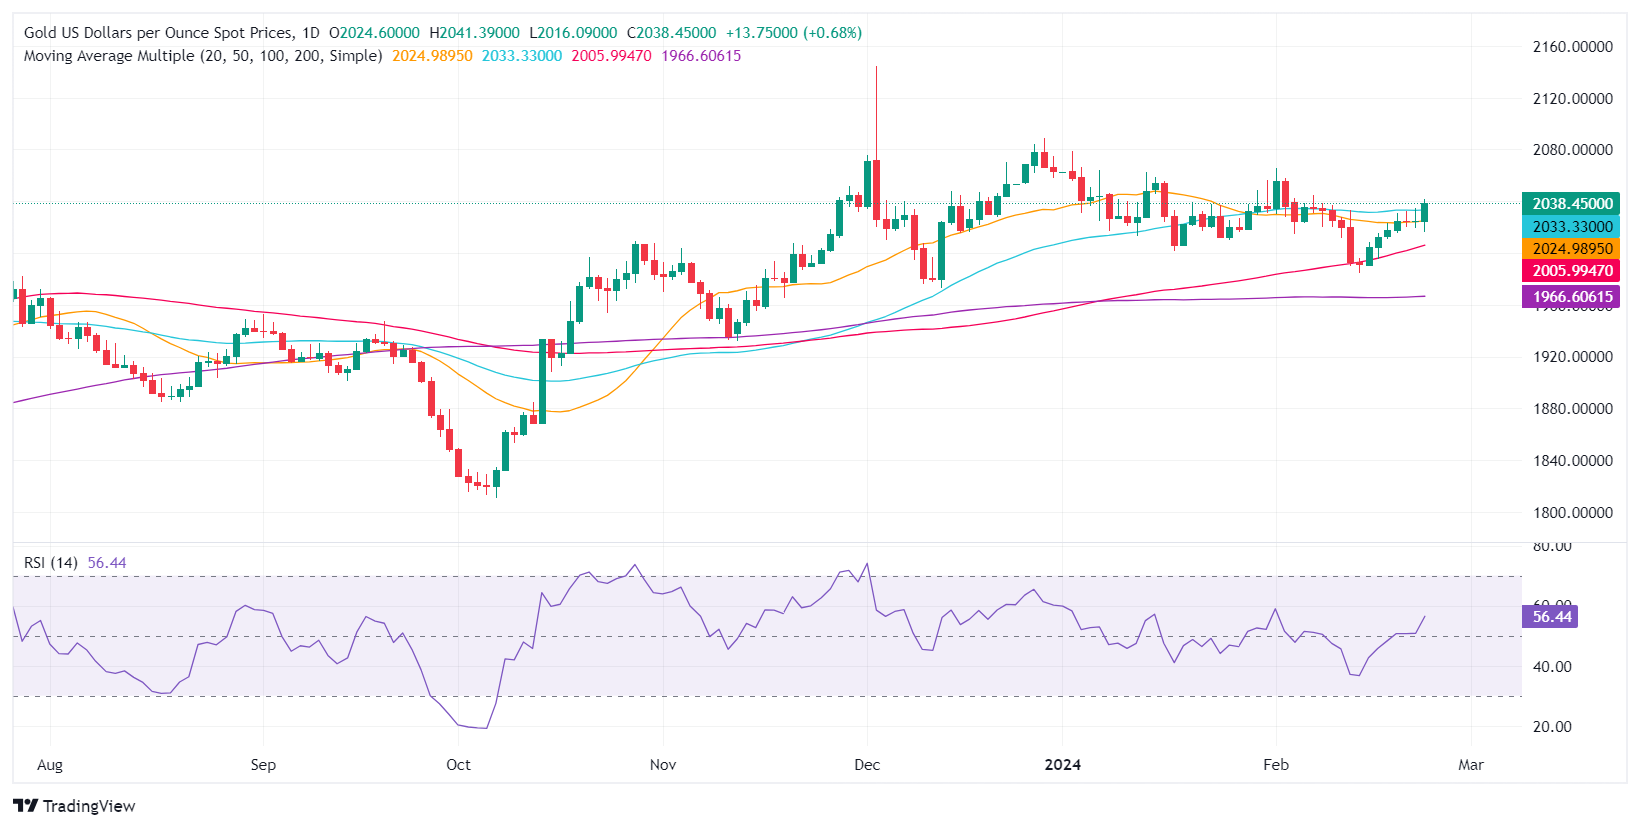
Gold price resumes its weekly uptrend on Friday and is set to finish the week in the green, taking advantage of the fall in US Treasury bond yields amid quiet news flows. Federal Reserve officials continued to cross the wires, led by New York Fed President John Williams, who aligned with his colleagues' recent comments. The XAU/USD exchanges hands at $2,038, up 0.70%.
The financial markets are in a risk-on mode, which usually translates to “less” appetite for safe-haven assets, but not today as Gold remains underpinned by dropping US Treasury yields. The 10-year benchmark note erased most of its gains, falling three and a half basis points, down to 4.248%. Despite Fed officials delivering a “slightly” hawkish tone recently, this was well received by investors who trimmed bets on Fed interest rate cuts and expect 93 basis points of easing toward the year’s end.
Daily digest market movers: Gold advance prompted by soft US Dollar undermined by lower US yields
- The Federal Open Market Committee (FOMC) minutes for January showed that policymakers remain hesitant to cut rates, adopting a cautious approach amid the latest resurgence of inflationary measures. Although acknowledging that the risks of achieving both mandates are more balanced, they would remain “highly attentive” to inflation. This is at the expense of economic risks being tilted to the downside.
- Besides that, the US labor market remains strong after the latest Initial Jobless Claims data saw fewer Americans applying for unemployment benefits.
- US business activity moderated in February, revealed S&P Global. The Services and Composite Indices expanded below the previous month’s reading, though Manufacturing surprisingly jumped, exiting contractionary territory.
- The CME FedWatch Tool sees traders expect the first 25 bps rate cut by the Fed in June 2024.
- Investors are pricing in 95 basis points of easing throughout 2024.
- The US Dollar Index, tracking the performance of the US Dollar against a basket of six major currencies, is currently trading near 103.90, down 0.04%.
- The Federal New York Fed President John Williams said the Fed is on track to cut interest rates “later this year.” He noted that the progress of inflation toward the central bank's 2% target would be “bumpy,” but overall, the economy is headed “in the right direction.”
Technical analysis: Gold surpasses the 50-day SMA eyes on $2,050
Gold has shifted to a neutral-upwards bias as it hurdles the 50-day Simple Moving Average (SMA) at $2,033.75, opening the door to challenge the $2,050 figure. Once those levels are cleared, up next would be the February 1 high at $2,065.60, ahead of the December 28 high at $2,088.48.
On the flip side, sellers dragging the XAU/USD spot price below the 50-day SMA could pave the way to test the October 27 daily high-turned-support at $2,009.42. A breach of the latter will expose the 100-day SMA at $2,002.05. The next stop would be the December 13 low at $1,973.13, followed by the 200-day SMA at $1,965.86.
XAU/USD Price Action - Daily Chart
Gold FAQs
Why do people invest in Gold?
Gold has played a key role in human’s history as it has been widely used as a store of value and medium of exchange. Currently, apart from its shine and usage for jewelry, the precious metal is widely seen as a safe-haven asset, meaning that it is considered a good investment during turbulent times. Gold is also widely seen as a hedge against inflation and against depreciating currencies as it doesn’t rely on any specific issuer or government.
Who buys the most Gold?
Central banks are the biggest Gold holders. In their aim to support their currencies in turbulent times, central banks tend to diversify their reserves and buy Gold to improve the perceived strength of the economy and the currency. High Gold reserves can be a source of trust for a country’s solvency. Central banks added 1,136 tonnes of Gold worth around $70 billion to their reserves in 2022, according to data from the World Gold Council. This is the highest yearly purchase since records began. Central banks from emerging economies such as China, India and Turkey are quickly increasing their Gold reserves.
How is Gold correlated with other assets?
Gold has an inverse correlation with the US Dollar and US Treasuries, which are both major reserve and safe-haven assets. When the Dollar depreciates, Gold tends to rise, enabling investors and central banks to diversify their assets in turbulent times. Gold is also inversely correlated with risk assets. A rally in the stock market tends to weaken Gold price, while sell-offs in riskier markets tend to favor the precious metal.
What does the price of Gold depend on?
The price can move due to a wide range of factors. Geopolitical instability or fears of a deep recession can quickly make Gold price escalate due to its safe-haven status. As a yield-less asset, Gold tends to rise with lower interest rates, while higher cost of money usually weighs down on the yellow metal. Still, most moves depend on how the US Dollar (USD) behaves as the asset is priced in dollars (XAU/USD). A strong Dollar tends to keep the price of Gold controlled, whereas a weaker Dollar is likely to push Gold prices up.
- EUR/USD continues to cycle north of 1.0800.
- European data confirms preliminary prints.
- Investors will have to wait until midweek for meaningful data.
EUR/USD cycled on Friday, stuck in a near-term range between 1.0840 and 1.0810 as markets settle in for the weekend and gear up for the long wait for significant data. Fresh figure prints aren’t due until the back half of next week, and the pair is hanging onto the top half of the week’s chart action.
Next week sees US Gross Domestic Product (GDP) on Wednesday, followed by German Retail Sales and German Consumer Price Index (CPI) figures on Thursday. Thursday also sees US Personal Consumption Expenditure figures (PCE). Pan-European Harmonized Index of Consumer Prices (HICP) rounds out next week alongside US ISM Purchasing Manager Index (PMI) numbers.
Daily digest market movers: thin action for EUR/USD leaves pair strung along the middle
- Friday pulls into the midrange, EUR/USD continues to grind it out near 1.0820.
Germany’s final GDP print for the fourth quarter revealed nothing new, confirmed the preliminary prints.
Final German Q4 GDP declined -0.3% QoQ, -0.4% compared to the same quarter last year.
German IFO Expectations for February improved more than expected, printing at 84.1 versus the forecast for 84.0 and beating the previous print of 83.5.
Several European Central Bank (ECB) policymakers hit the newswires as Europe’s Eurogroup meeting gets underway alongside day two of EcoFin Meetings. - ECB coverage: policymakers scramble for the microphone on Friday.
- Next Thursday’s US PCE Price Index figures for January will be a key dataprint as investors seek signs the Federal Reserve (Fed) will get pushed into rate cuts sooner rather than later.
US MoM January PCE Price Index forecast to tick higher to 0.3% from 0.2%.
Core PCE for the same period is expected to accelerate to 0.4% from 0.2%.
Euro price today
The table below shows the percentage change of Euro (EUR) against listed major currencies today. Euro was the strongest against the Canadian Dollar.
| USD | EUR | GBP | CAD | AUD | JPY | NZD | CHF | |
| USD | -0.02% | -0.15% | 0.08% | -0.12% | -0.07% | -0.06% | 0.04% | |
| EUR | 0.03% | -0.12% | 0.12% | -0.08% | -0.04% | -0.04% | 0.06% | |
| GBP | 0.16% | 0.14% | 0.26% | 0.04% | 0.10% | 0.10% | 0.19% | |
| CAD | -0.09% | -0.11% | -0.25% | -0.20% | -0.14% | -0.15% | -0.05% | |
| AUD | 0.12% | 0.10% | -0.03% | 0.20% | 0.06% | 0.06% | 0.14% | |
| JPY | 0.06% | 0.05% | -0.07% | 0.16% | -0.05% | 0.01% | 0.09% | |
| NZD | 0.04% | 0.04% | -0.09% | 0.15% | -0.06% | 0.00% | 0.09% | |
| CHF | -0.04% | -0.07% | -0.20% | 0.03% | -0.16% | -0.12% | -0.10% |
The heat map shows percentage changes of major currencies against each other. The base currency is picked from the left column, while the quote currency is picked from the top row. For example, if you pick the Euro from the left column and move along the horizontal line to the Japanese Yen, the percentage change displayed in the box will represent EUR (base)/JPY (quote).
Technical analysis: EUR/USD remains pinned to 1.0820
EUR/USD continues to churn the waters just above the 1.0800 handle as the pair remains bolstered above the 200-hour Simple Moving Average (SMA) near 1.0780. The pair managed a bullish climb into a near-term high of 1.0888 in the midweek before getting pushed back to familiar levels.
Daily candlesticks reveal the EUR/USD remains hampered by the 200-day Simple Moving Average (SMA) at 1.0827, and despite being on pace to close for an eighth consecutive trading day on Friday, EUR/USD remains on the low side of key technical levels. The pair is still down around 2.8% from late December’s peak bids at 1.1140.
EUR/USD hourly chart
EUR/USD daily chart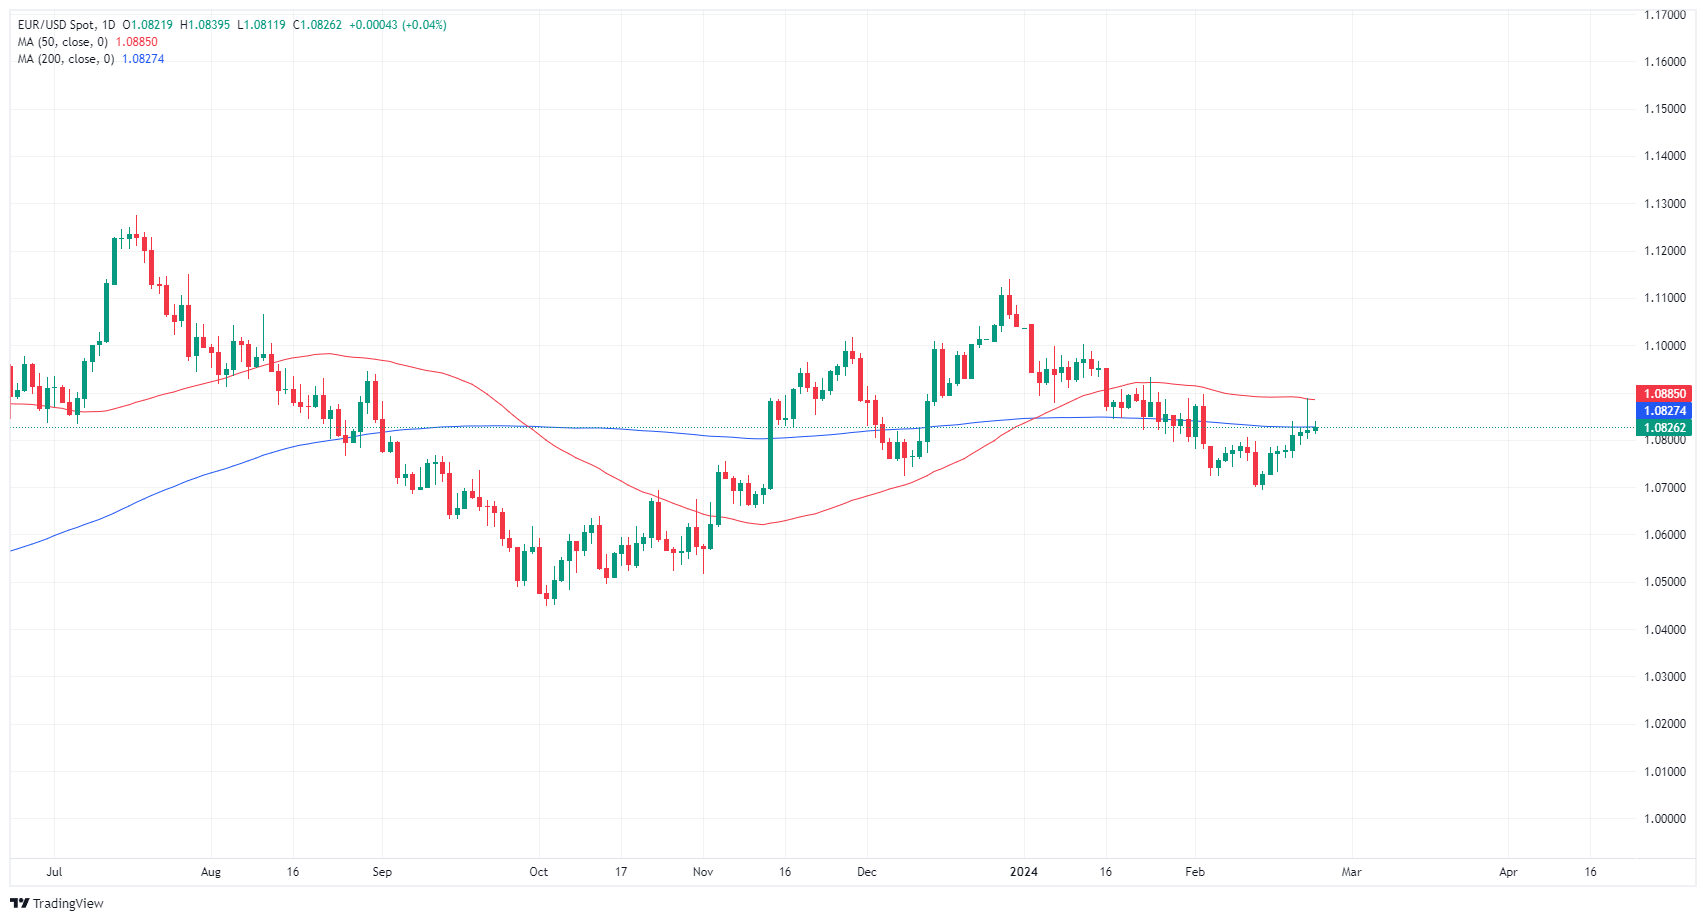
Euro FAQs
What is the Euro?
The Euro is the currency for the 20 European Union countries that belong to the Eurozone. It is the second most heavily traded currency in the world behind the US Dollar. In 2022, it accounted for 31% of all foreign exchange transactions, with an average daily turnover of over $2.2 trillion a day.
EUR/USD is the most heavily traded currency pair in the world, accounting for an estimated 30% off all transactions, followed by EUR/JPY (4%), EUR/GBP (3%) and EUR/AUD (2%).
What is the ECB and how does it impact the Euro?
The European Central Bank (ECB) in Frankfurt, Germany, is the reserve bank for the Eurozone. The ECB sets interest rates and manages monetary policy.
The ECB’s primary mandate is to maintain price stability, which means either controlling inflation or stimulating growth. Its primary tool is the raising or lowering of interest rates. Relatively high interest rates – or the expectation of higher rates – will usually benefit the Euro and vice versa.
The ECB Governing Council makes monetary policy decisions at meetings held eight times a year. Decisions are made by heads of the Eurozone national banks and six permanent members, including the President of the ECB, Christine Lagarde.
How does inflation data impact the value of the Euro?
Eurozone inflation data, measured by the Harmonized Index of Consumer Prices (HICP), is an important econometric for the Euro. If inflation rises more than expected, especially if above the ECB’s 2% target, it obliges the ECB to raise interest rates to bring it back under control.
Relatively high interest rates compared to its counterparts will usually benefit the Euro, as it makes the region more attractive as a place for global investors to park their money.
How does economic data influence the value of the Euro?
Data releases gauge the health of the economy and can impact on the Euro. Indicators such as GDP, Manufacturing and Services PMIs, employment, and consumer sentiment surveys can all influence the direction of the single currency.
A strong economy is good for the Euro. Not only does it attract more foreign investment but it may encourage the ECB to put up interest rates, which will directly strengthen the Euro. Otherwise, if economic data is weak, the Euro is likely to fall.
Economic data for the four largest economies in the euro area (Germany, France, Italy and Spain) are especially significant, as they account for 75% of the Eurozone’s economy.
How does the Trade Balance impact the Euro?
Another significant data release for the Euro is the Trade Balance. This indicator measures the difference between what a country earns from its exports and what it spends on imports over a given period.
If a country produces highly sought after exports then its currency will gain in value purely from the extra demand created from foreign buyers seeking to purchase these goods. Therefore, a positive net Trade Balance strengthens a currency and vice versa for a negative balance.
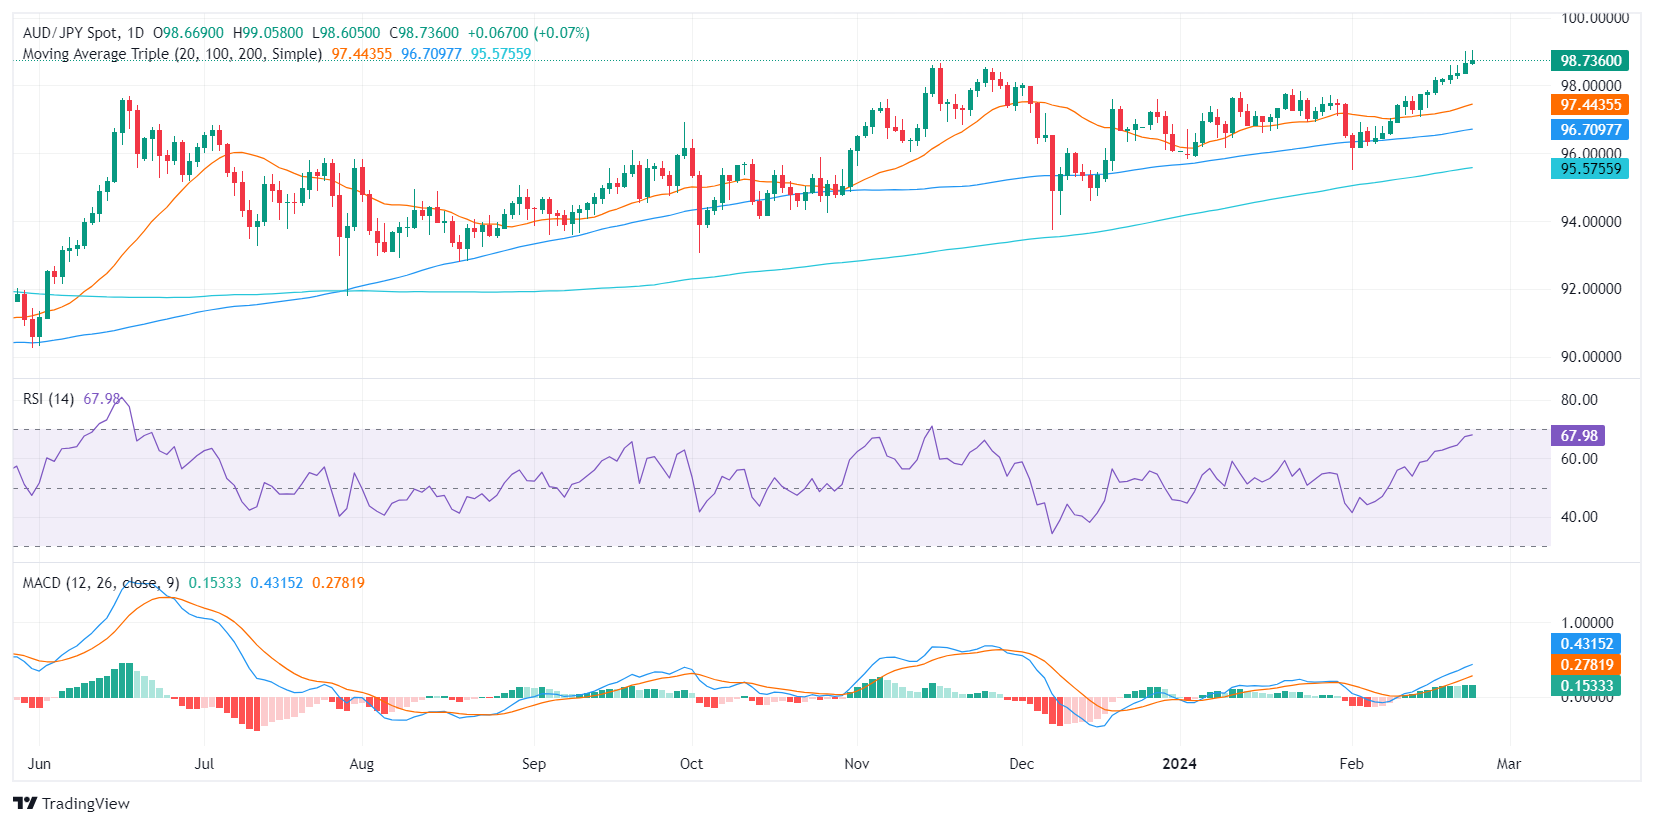
- The AUD/JPY is trading at 98.71, showing a slight gain during the Friday session still in highs since 2015.
- Daily RSI for the AUD/JPY suggests bullish momentum with a slight increase in the positive area.
- Divergences are observed between the hourly and daily charts where the latter signals buyers' dominance whilst the hourly chart indicates rising short-term selling pressure.
In Friday's session, the AUD/JPY pair is trading at 98.715, reflecting a slight increase in buying pressure. The daily chart signals that the buyers are in control but that bears are starting to wake up, while in the hourly chart, the consolidation is more evident with indicators losing ground.
On the daily chart, the Relative Strength Index (RSI) pair shows a positive stance, signifying the dominance of buyers. This can be inferred from RSI territory, which consistently remains positive, despite a marginal downtrend observed within the positive territory. This suggests a slight increase in selling pressure, however, buyers continue to hold dominance given the RSI's positive territory position.
Concurrent with this, the daily Moving Average Convergence Divergence (MACD) is exhibiting flat green bars. This indicates that the momentum of the market is neutral on the surface, yet further scrutiny reveals that buyers hold the upper hand as the pair lingers above the 20, 100, and 200-day Simple Moving Averages (SMAs).
AUD/JPY daily chart
Upon examining the hourly chart, the RSI's position has diverted into negative territory while the MACD presents rising red bars suggesting a surge in selling pressure in the short term, contrasting the positive bias observed in the daily chart.
AUD/JPY hourly chart
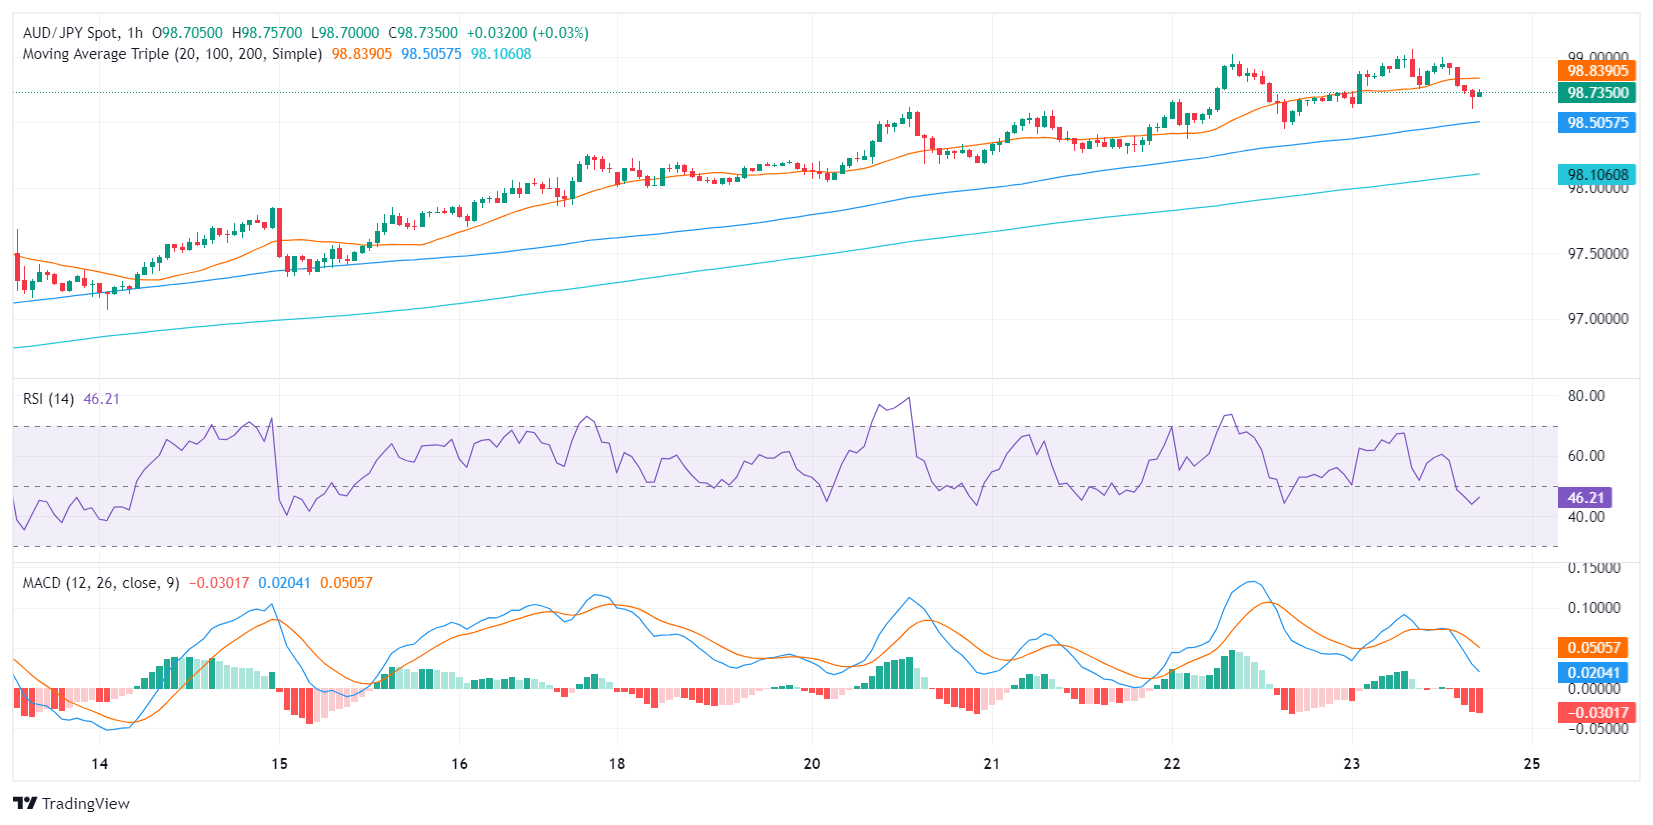
Conclusively, despite a short-term rise in selling pressure observed in the hourly chart, the longer-term daily chart suggests that buyers continue to control the market, fortified by the pair's position above the 20, 100, and 200-day SMAs.
Bets on the potential timing of interest rate cuts by the Federal Reserve ruled the sentiment once again in the FX galaxy this week. However, investors seem to have already priced in the likelihood of a rate reduction at the June event. This, in turn, morphed into the resurgence of renewed selling interest around the Greenback along with some scepticism, prompting the USD Index (DXY) to recede to three-week lows in the sub-104.00 zone.
On February 26, the US docket will only see the release of New Home Sales for the month of January. Moving forward, Durable Goods Orders, the FHFA’s House Price Index and the Consumer Confidence gauged by the Conference Board are expected to be released on February 27, while another revision of the Q4 GDP Growth Rate and Advanced Trade Balance results is due on February 28. On the last day of the month, inflation tracked by the PCE will take centre stage, seconded by the usual weekly Initial Jobless Claims, Pending Home Sales, and Personal Income/Spending. On March 1, the final Manufacturing PMI is due, followed by the always relevant ISM Manufacturing PMI, Construction Spending, and the final Michigan Consumer Sentiment print. The USD Index (DXY) traded with a bearish bias throughout the week, breaking below the ley support of 104.00 to print new multi-week lows at the same time.
Looking at the euro calendar, GfK’s Consumer Confidence in Germany grabs all the attention on February 27. Additionally, the final Consumer Confidence and the Economic Sentiment in the euro region are due on February 28. On February 29, Germany will be in the spotlight with the releases of Retail Sales, the labour market report, and the preliminary Inflation Rate. Finally, the final Manufacturing PMI is due in Germany, and the Euroland seconded by the flash Inflation Rate and the Unemployment Rate in the bloc. EUR/USD extended its recovery and surpassed the 1.0800 barrier with certain conviction on the back of the fresh bearish tone in the Greenback.
Across the Channel, house prices tracked by Nationwide are due on February 29, along with Mortgage Approvals and Mortgage Lending figures. Closing the weekly docket, the final Manufacturing PMI is due on March 1. GBP/USD ended the week on a positive foot, approaching the key 1.2700 hurdle.
In Japan, the Inflation Rate is due on February 27, prior to the release of the final Coincident Index and Leading Economic Index on February 28. Later, weekly Foreign Bond Investment figures, flash Industrial Production, Retail Sales and Housing Starts are due on February 29, while the Unemployment Rate and the Consumer Confidence are expected on March 1. USD/JPY navigated in a choppy fashion, although it managed well to keep the trade in the upper end of the range around the 150.00 zone.
Down Under, the RBA’s Monthly CPI Indicator will be at the centre of the debate on February 28, seconded by Housing Credit, Retail Sales, and the final Judo Bank Manufacturing PMI on February 29. AUD/USD consolidated its rebound and advanced north of the 0.6500 milestone, an area coincident with the 200-day SMA.
In China, NBS will publish its Manufacturing PMI and Non Manufacturing PMI on March 1. USD/CNH regained some poise in the latter part of the week after bottoming out at three-week lows around 7.1800.
Anticipating Economic Perspectives: Voices on the Horizon
- ECB’s C. Lagarde speaks on February 26.
- Fed's R. Bostic, S. Collins and J. Williams speak on February 28 along with ECB’s McCaul.
- Fed's R. Bostic, A. Goolsbee and L. Mester will speak on February 29,
- Fed's J. Williams, R. Bostic and M. Daly are also due on March 1.
Central Banks: Upcoming Meetings to Shape Monetary Policies
- The Hungarian central bank (MNB) is expected to cut its policy rate by 100 bps to 9.00% on February 27.
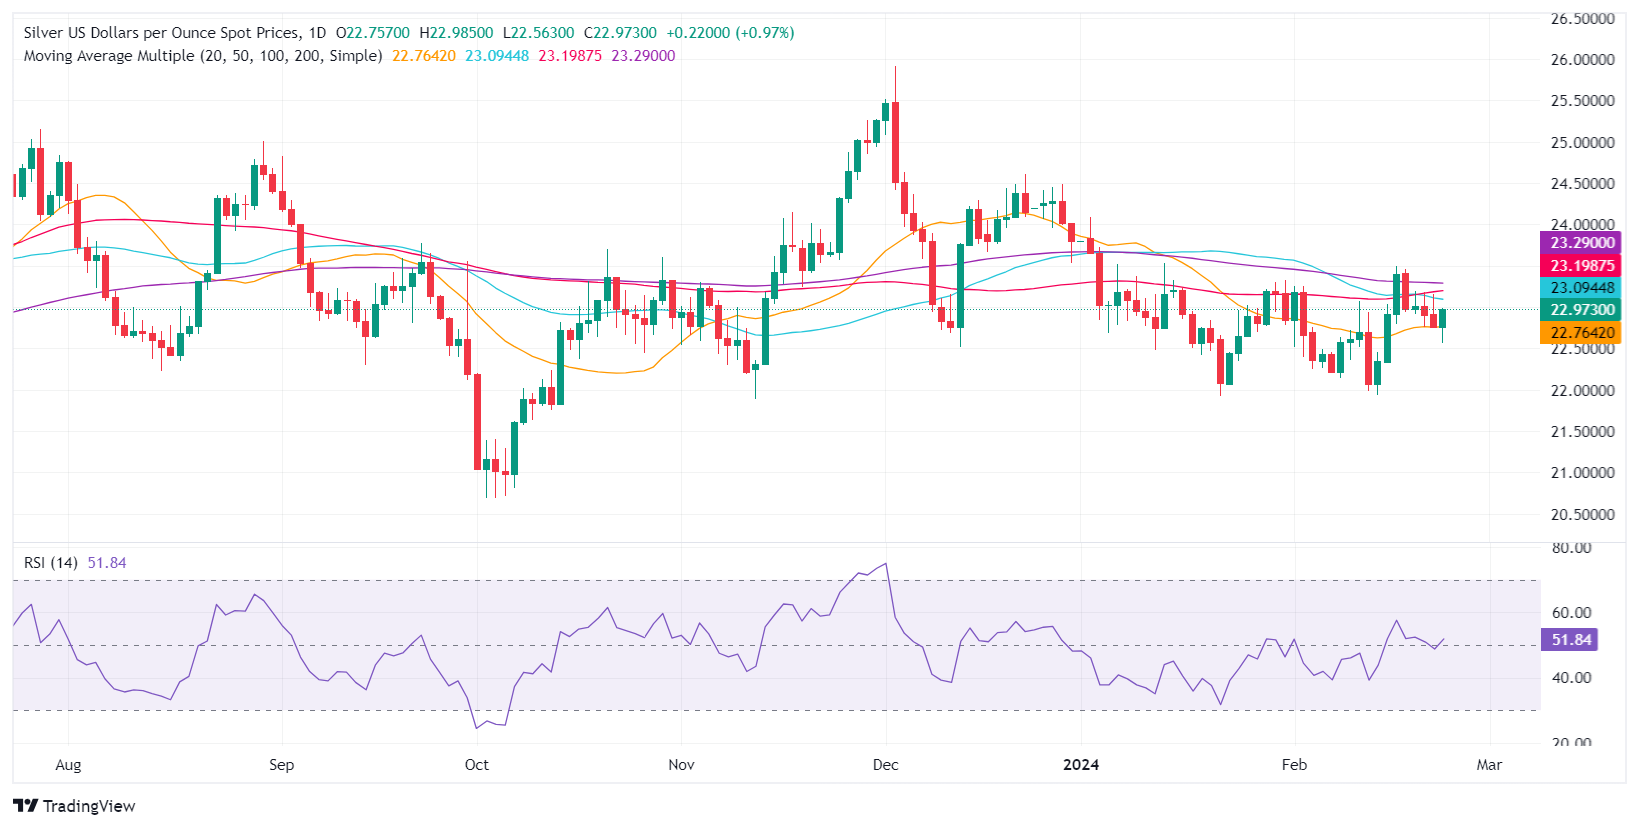
- Silver jumps to $22.93, buoyed by gains on Wall Street and a decline in US Treasury yields.
- Technical analysis suggests a push above $23.00 needed to shift from bearish to neutral outlook.
- Key resistance ahead at 50-day, 100-day, and 200-day SMAs, with potential targets extending to $24.00.
Silver prices advanced in the mid-North American session on Friday amid an upbeat market mood as depicted by Wall Street’s posting gains. That and a drop in US Treasury yields sponsored a leg-up in the grey metal. At the time of writing, the XAG/USD exchanges hands at $22.93, up by 0.86%.
From a technical standpoint, the XAG/USD remains downward biased despite pushing through the $22.90 figure, but it remains shy of shifting neutral. If buyers would like to regain control, they must break stir resistance levels above $23.00. The first level would be the 50-day SMA at $23.08, followed by the 100-day SMA at $23.18. Once those two levels are taken out, the 200-day SMA would appear at $23.27 before rallying toward the next supply level at $24.00.
On the flip side, sellers need to keep XAG/USD’s spot price below $23.00 if they would like to remain in charge. In that event, they could drag Silver toward the February 23 low of $22.57, followed by the February 14 cycle low of $21.94.
XAG/USD Price Action – Daily Chart
President of the New York Federal Reserve (Fed) John Williams spoke about his outlook on the Fed's rate stance during an interview with Axios.
Key highlights
- Rate cuts are likely later this year, but only if appropriate.
- Fed Williams' view of the economy hasn't materially changed after January data.
- However, things are moving in the right direction.
- Rate hikes are not Fed Williams' base case currently.
- Expects consumer spending growth to slow this year.
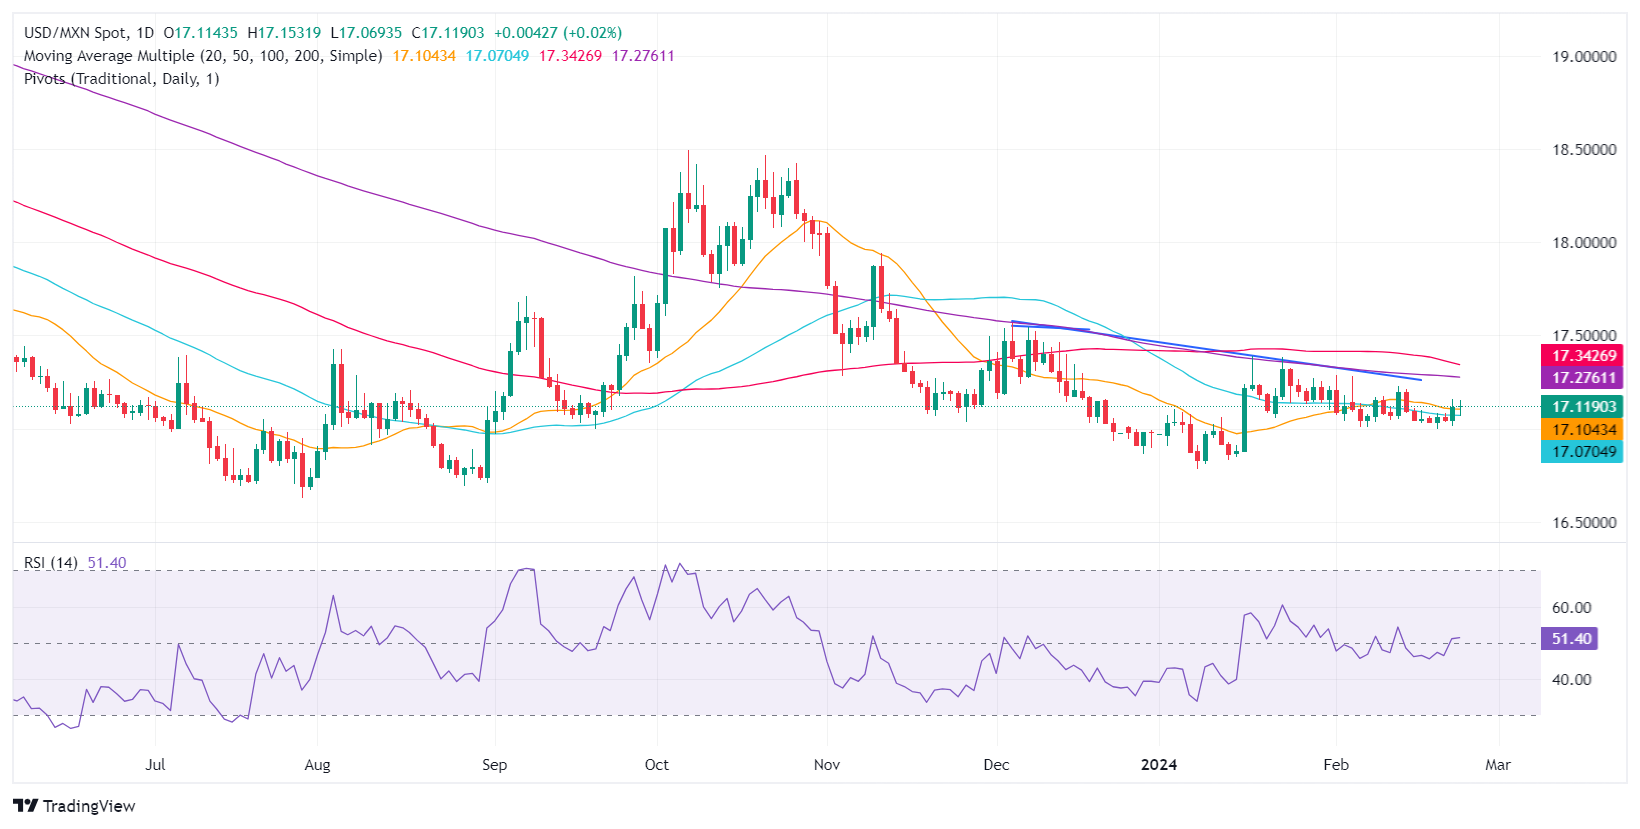
- Mexican Peso drops, reflecting concerns over Mexico's economic performance and potential Banxico rate cuts.
- Recent Mexican data shows inflation decline, GDP slowdown and significant drop in Retail Sales.
- Banxico minutes hint at possible easing in March with a shift toward a less hawkish monetary policy stance.
Mexican Peso loses steam for the second straight day against the US Dollar as market sentiment has shifted negatively. The Mexican currency is headed to end the week with losses after economic data witnessed inflation edging lower, the Gross Domestic Product (GDP) decelerating, and Retail Sales plummeting. At the time of writing, the USD/MXN exchanges hands at 17.14, up 0.20%.
The economic docket across the Bravo River is empty. Economic data revealed from Mexico showed the impact of higher interest rates set by the Bank of Mexico (Banxico). Although inflation dipped sharply in the first 15 days of February, the GDP for Q4 came in as expected at 2.5% YoY, exceeding forecasts but 0.8% lower compared to Q3 2023. Additionally, Retail Sales plunged, signaling that consumers reduced their spending.
In the meantime, Banxico’s latest minutes showed that the Governing Council could cut rates at the March 21 meeting as expressed by three of the five voting members. Two members added they can’t disregard maintaining rates at current levels. One of those members added he/she requires that underlying inflation shows a downward trajectory before beginning the easing cycle.
The language of the minutes was less “hawkish,” indicating a more flexible approach, according to analysts cited by El Economista. Analysts at Goldman Sachs commented that the Banxico Governing Council is tilting toward easing monetary policy unless exogenous shocks impact the USD/MXN exchange rate.
The USD/MXN has resumed its uptrend above the 50-day Simple Moving Average (SMA) following the release of last Thursday’s inflationary figures, while the sudden shift in Banxico’s rhetoric keeps the pair afloat above the 17.10 area.
Across the border, the Minutes of the US Federal Reserve (Fed) meeting showed that policymakers remain hesitant to cut rates amidst fears of a second round of inflation. Recently, the US Bureau of Labor Statistics (BLS) revealed that unemployment claims rose below estimates, while business activity, despite moderating, expanded.
Daily digest market movers: Mexican Peso hits seven-day low despite trimming some losses
- Mexico’s Consumer Price Index (CPI) in the first half of February dipped from 4.9% YoY to 4.45%, while core CPI slowed from 4.78% to 4.63% in the yearly data.
- GDP expanded in the fourth quarter by 0.1% QoQ but was lower than Q3’s 1.1% expansion. Annually based, GDP exceeded estimates of 2.4% and hit 2.5%, less than Q3’s 2023 3.3%.
- Mexico’s Retail Sales dropped -0.9% MoM, below estimates of 0.2%. Yearly figures plummeted -0.2% vs. a 2.5% forecast.
- The Mexican currency could depreciate further if the Mexican government fails to resolve its steel and aluminum dispute with the United States. US Trade Representative Katherine Tai warned the US could reimpose tariffs on the commodities.
- With no major events on the US economic calendar, recent unemployment claims figures and robust S&P Global Flash PMIs have backed Federal Reserve officials' hawkish remarks. Policymakers have expressed willingness to adjust policy when necessary but remain cautious, indicating no urgency to act. This stance is supported by current economic data suggesting strength in the economy, which could potentially revive inflationary pressures.
- Market players are expecting the first rate cut by the Federal Reserve at the June monetary policy meeting as they have trimmed odds for March and May.
Technical analysis: Mexican Peso extends losses to two-straight days as USD/MXN stays above 50-day SMA
The USD/MXN remains consolidated despite breaking above the 50-day Simple Moving Average (SMA) at 17.07. If buyers like to regain control, they must lift the exotic pair above 17.20, so they can threaten the 200-day SMA at 17.27. Once cleared, the 100-day SMA at 17.38 would be up next, ahead of the 17.50 figure.
On the other hand, if sellers step in and cap USD/MXN’s upside, they need to push prices below the 17.00 figure. Once cleared, the next support would be the current year-to-date (YTD) low of 16.78, followed by the 2023 low of 16.62.
USD/MXN Price Action – Daily Chart
Mexican Peso FAQs
What key factors drive the Mexican Peso?
The Mexican Peso (MXN) is the most traded currency among its Latin American peers. Its value is broadly determined by the performance of the Mexican economy, the country’s central bank’s policy, the amount of foreign investment in the country and even the levels of remittances sent by Mexicans who live abroad, particularly in the United States. Geopolitical trends can also move MXN: for example, the process of nearshoring – or the decision by some firms to relocate manufacturing capacity and supply chains closer to their home countries – is also seen as a catalyst for the Mexican currency as the country is considered a key manufacturing hub in the American continent. Another catalyst for MXN is Oil prices as Mexico is a key exporter of the commodity.
How do decisions of the Banxico impact the Mexican Peso?
The main objective of Mexico’s central bank, also known as Banxico, is to maintain inflation at low and stable levels (at or close to its target of 3%, the midpoint in a tolerance band of between 2% and 4%). To this end, the bank sets an appropriate level of interest rates. When inflation is too high, Banxico will attempt to tame it by raising interest rates, making it more expensive for households and businesses to borrow money, thus cooling demand and the overall economy. Higher interest rates are generally positive for the Mexican Peso (MXN) as they lead to higher yields, making the country a more attractive place for investors. On the contrary, lower interest rates tend to weaken MXN.
How does economic data influence the value of the Mexican Peso?
Macroeconomic data releases are key to assess the state of the economy and can have an impact on the Mexican Peso (MXN) valuation. A strong Mexican economy, based on high economic growth, low unemployment and high confidence is good for MXN. Not only does it attract more foreign investment but it may encourage the Bank of Mexico (Banxico) to increase interest rates, particularly if this strength comes together with elevated inflation. However, if economic data is weak, MXN is likely to depreciate.
How does broader risk sentiment impact the Mexican Peso?
As an emerging-market currency, the Mexican Peso (MXN) tends to strive during risk-on periods, or when investors perceive that broader market risks are low and thus are eager to engage with investments that carry a higher risk. Conversely, MXN tends to weaken at times of market turbulence or economic uncertainty as investors tend to sell higher-risk assets and flee to the more-stable safe havens.
- USD/CAD dipped to 1.3461 before a US-session surge back to 1.3500.
- It's a thin Friday on the economic calendar.
- USD/CAD put a lot of effort going nowhere this week.
USD/CAD looked in both directions on Friday as markets see thin action heading into the week’s closing bell. It was a relatively sedate trading week for the pair with the US Dollar (USD) gaining around a third of a percent against the Canadian Dollar (CAD).
Next week brings a slew of data for both the US and Canada with US Gross Domestic Product (GDP) on Wednesday and Canadian GDP on Thursday alongside US Personal Consumption Expenditure (PCE) figures. Next Friday also brings Purchasing Managers Index (PMI) figures for both Canada and the US.
Daily digest market movers: USD/CAD churns the midrange on quiet Friday
- Friday markets look thin, leaving USD/CAD open to drift in the middle.
- Thursday’s mixed PMIs for the US and Retail Sales for Canada leave the pair with little directional momentum to wrap up the week.
- Next week is set to open quiet as well with only January’s US New Home Sales on the docket for Monday.
- US New Home Sales Change last printed at 8.0% in December, New Home Sales are expected to increase slightly to 680K from 664K.
- Tuesday also sees mid-tier data with US Durable Goods figures for January forecast to print at -4.0% versus the previous 0.0%.
- Canada is absent from the economic calendar until Wednesday’s Current Account figures for the fourth quarter, which last printed at -3.22 billion.
Canadian Dollar price this week
The table below shows the percentage change of Canadian Dollar (CAD) against listed major currencies this week. Canadian Dollar was the strongest against the Japanese Yen.
| USD | EUR | GBP | CAD | AUD | JPY | NZD | CHF | |
| USD | -0.37% | -0.53% | 0.24% | -0.38% | 0.17% | -0.96% | 0.01% | |
| EUR | 0.35% | -0.18% | 0.59% | -0.02% | 0.52% | -0.60% | 0.38% | |
| GBP | 0.53% | 0.16% | 0.76% | 0.14% | 0.68% | -0.44% | 0.53% | |
| CAD | -0.23% | -0.59% | -0.74% | -0.60% | -0.06% | -1.19% | -0.21% | |
| AUD | 0.38% | 0.01% | -0.14% | 0.60% | 0.54% | -0.58% | 0.39% | |
| JPY | -0.17% | -0.55% | -0.69% | 0.06% | -0.57% | -1.14% | -0.17% | |
| NZD | 0.93% | 0.57% | 0.41% | 1.17% | 0.56% | 1.09% | 0.94% | |
| CHF | -0.02% | -0.39% | -0.55% | 0.21% | -0.39% | 0.15% | -0.96% |
The heat map shows percentage changes of major currencies against each other. The base currency is picked from the left column, while the quote currency is picked from the top row. For example, if you pick the Euro from the left column and move along the horizontal line to the Japanese Yen, the percentage change displayed in the box will represent EUR (base)/JPY (quote).
Technical analysis: 1.3500 is proving a tough number to beat
USD/CAD continues to cycle 1.3500 as the pair experiments with losing momentum in the longer term. The 1.3500 figure remains a sticky major level for the pair, but a heavy supply zone near 1.3530 could prove a viable selling region for particularly brave traders as the pair etches in the beginnings of a Fair Value Gap (FVG) on Friday.
USD/CAD continues to get mired in the 200-day Simple Moving Average at 1.3478, but a rough bullish pattern is still bullish, and the long-term moving average is providing a technical floor for bidders to push off of.
USD/CAD hourly chart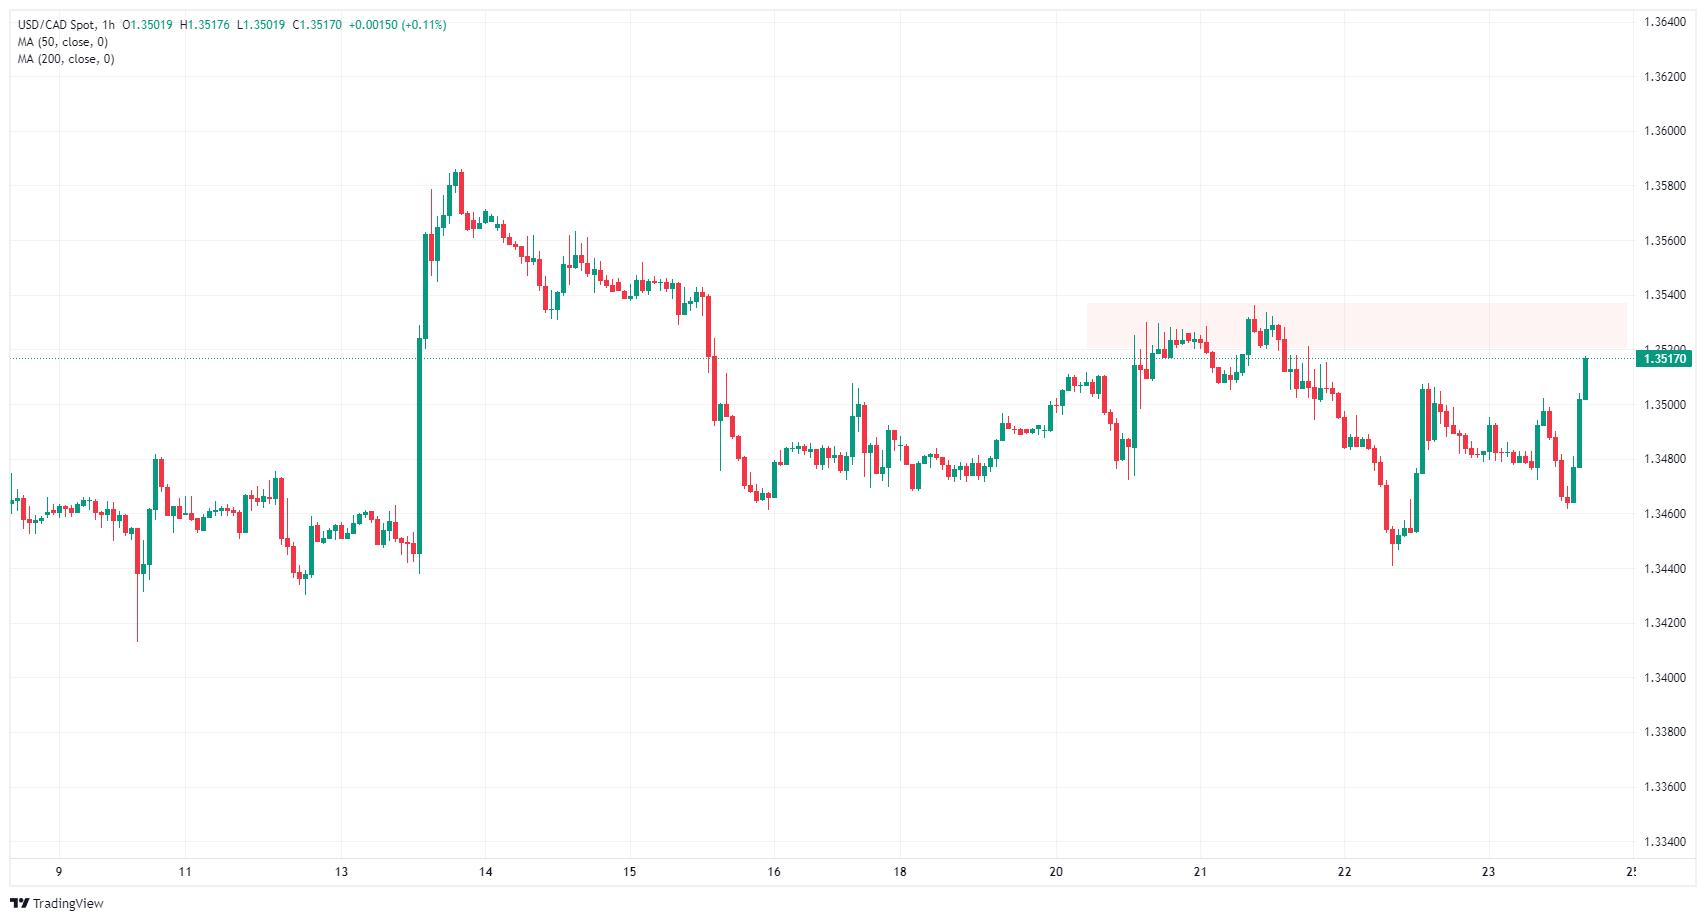
USD/CAD daily chart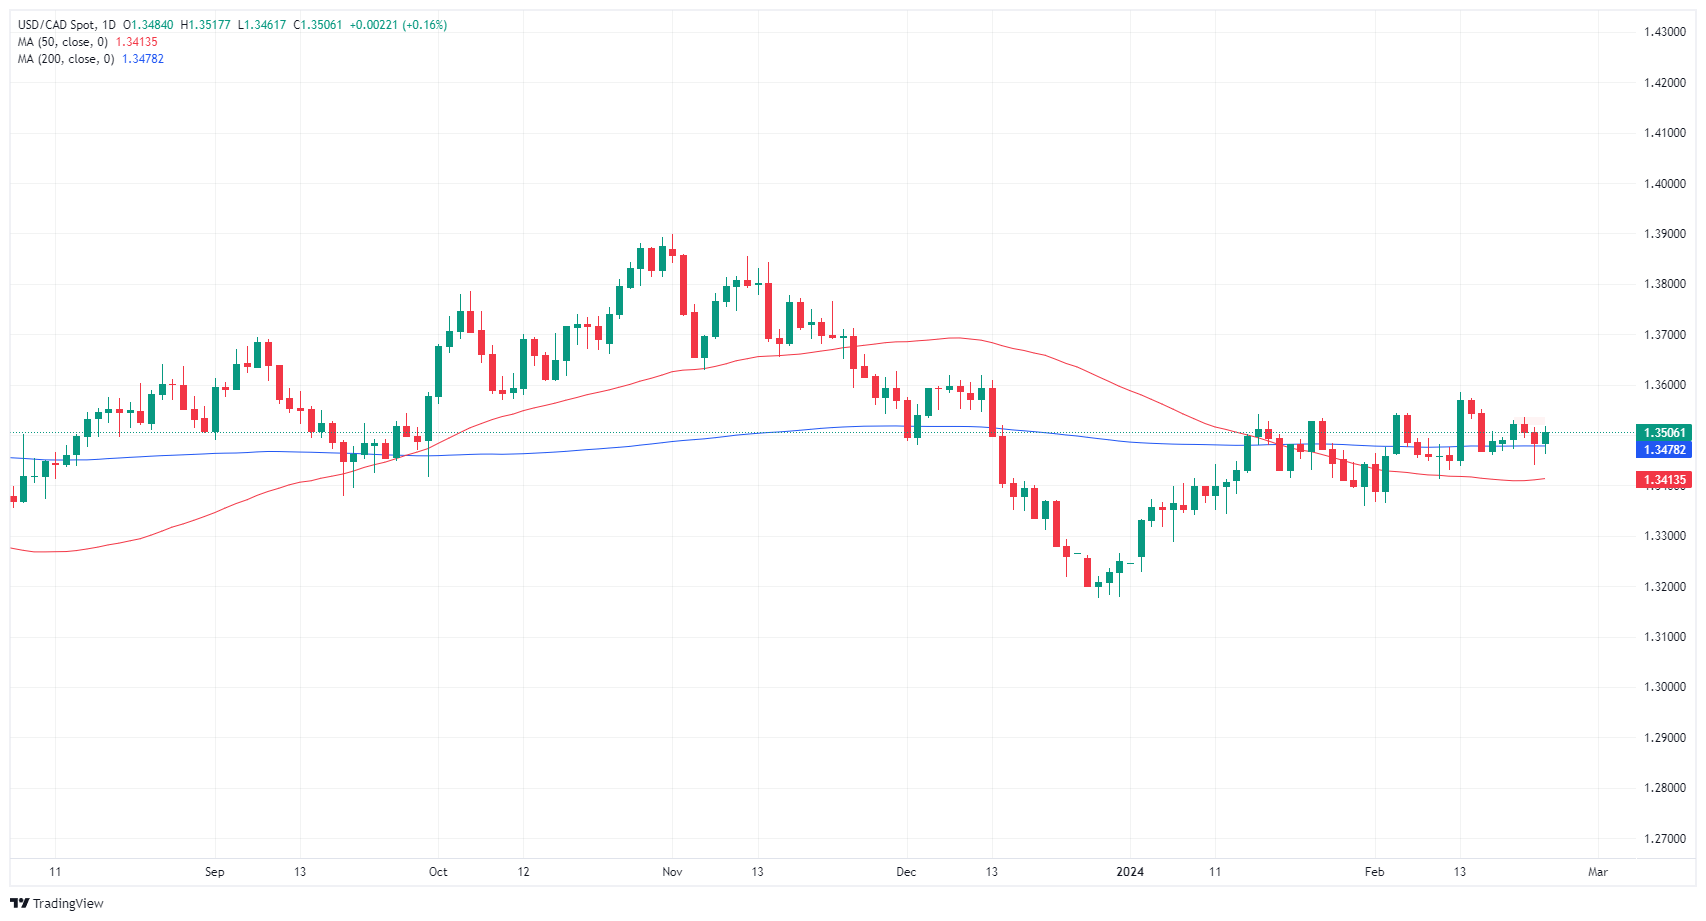
Canadian Dollar FAQs
What key factors drive the Canadian Dollar?
The key factors driving the Canadian Dollar (CAD) are the level of interest rates set by the Bank of Canada (BoC), the price of Oil, Canada’s largest export, the health of its economy, inflation and the Trade Balance, which is the difference between the value of Canada’s exports versus its imports. Other factors include market sentiment – whether investors are taking on more risky assets (risk-on) or seeking safe-havens (risk-off) – with risk-on being CAD-positive. As its largest trading partner, the health of the US economy is also a key factor influencing the Canadian Dollar.
How do the decisions of the Bank of Canada impact the Canadian Dollar?
The Bank of Canada (BoC) has a significant influence on the Canadian Dollar by setting the level of interest rates that banks can lend to one another. This influences the level of interest rates for everyone. The main goal of the BoC is to maintain inflation at 1-3% by adjusting interest rates up or down. Relatively higher interest rates tend to be positive for the CAD. The Bank of Canada can also use quantitative easing and tightening to influence credit conditions, with the former CAD-negative and the latter CAD-positive.
How does the price of Oil impact the Canadian Dollar?
The price of Oil is a key factor impacting the value of the Canadian Dollar. Petroleum is Canada’s biggest export, so Oil price tends to have an immediate impact on the CAD value. Generally, if Oil price rises CAD also goes up, as aggregate demand for the currency increases. The opposite is the case if the price of Oil falls. Higher Oil prices also tend to result in a greater likelihood of a positive Trade Balance, which is also supportive of the CAD.
How does inflation data impact the value of the Canadian Dollar?
While inflation had always traditionally been thought of as a negative factor for a currency since it lowers the value of money, the opposite has actually been the case in modern times with the relaxation of cross-border capital controls. Higher inflation tends to lead central banks to put up interest rates which attracts more capital inflows from global investors seeking a lucrative place to keep their money. This increases demand for the local currency, which in Canada’s case is the Canadian Dollar.
How does economic data influence the value of the Canadian Dollar?
Macroeconomic data releases gauge the health of the economy and can have an impact on the Canadian Dollar. Indicators such as GDP, Manufacturing and Services PMIs, employment, and consumer sentiment surveys can all influence the direction of the CAD. A strong economy is good for the Canadian Dollar. Not only does it attract more foreign investment but it may encourage the Bank of Canada to put up interest rates, leading to a stronger currency. If economic data is weak, however, the CAD is likely to fall.
- The DXY exhibits mild daily gains in Friday’s session.
- The Federal Reserve's measured approach alongside a robust labor market reduces expectations of rate cuts.
- The market expects no chance for a March rate cut and less than a 25% chance of a cut in May.
- Investors keenly await upcoming economic reports for further insights on economic health and implications on the Fed's stance.
The US Dollar Index (DXY) is currently at 104.10, mildly higher thanks to stable conditions in the American economy. That stability brings down hope of earlier rate cuts by the Federal Reserve (Fed), whose officials are delaying any monetary adjustments. Next week, markets will get January’s Personal Consumption Expenditure (PCE) figures, an important data set on US inflation.
The US economy showcases durable strength as signified by resilient economic activity figures, which may signify a threat to the fight against inflation. Additionally, the robust labor market, marked by lows in jobless claims, further deters prospects for near-term interest rate cuts and, therefore, limits the Greenback’s losses.
Daily digest market movers: US Dollar remains stable as the US economy holds resilient
- The US Dollar trades mildly higher as the market gears up for next week’s Personal Consumption Expenditure (PCE) figures from January, setting a quiet tone for Friday's session.
- Market expectations indicate a decreased likelihood of a rate cut in the near term as indicated by the CME FedWatch Too with low odds of easing in March or May. A strong US domestic economy and resilient labor market contribute to maintaining the Fed’s current stance, delaying the easing to June.
Technical analysis: DXY bulls close the week in a stable manner
The indicators on the daily chart reflect mixed sentiment with both buying and selling forces battling for dominance. On one hand, the Relative Strength Index (RSI), although flat, is stationed in positive territory, hinting toward underlying bullish strength. This bullishness is supported by the DXY's positioning above the 20-day and 200-day Simple Moving Averages (SMAs), highlighting the resilience of buyers over a longer term.
On the contrary, the Moving Average Convergence Divergence (MACD) shows rising red bars, indicating that selling momentum is building up. Moreover, the index's positioning below the 100-day SMA suggests that bears have not completely withdrawn from the game.
It's worth noting that the 20 and 100-day SMAs are about to perform a bullish crossover, which would provide additional traction to the buyers and push the DXY higher.
US Dollar FAQs
What is the US Dollar?
The US Dollar (USD) is the official currency of the United States of America, and the ‘de facto’ currency of a significant number of other countries where it is found in circulation alongside local notes. It is the most heavily traded currency in the world, accounting for over 88% of all global foreign exchange turnover, or an average of $6.6 trillion in transactions per day, according to data from 2022.
Following the second world war, the USD took over from the British Pound as the world’s reserve currency. For most of its history, the US Dollar was backed by Gold, until the Bretton Woods Agreement in 1971 when the Gold Standard went away.
How do the decisions of the Federal Reserve impact the US Dollar?
The most important single factor impacting on the value of the US Dollar is monetary policy, which is shaped by the Federal Reserve (Fed). The Fed has two mandates: to achieve price stability (control inflation) and foster full employment. Its primary tool to achieve these two goals is by adjusting interest rates.
When prices are rising too quickly and inflation is above the Fed’s 2% target, the Fed will raise rates, which helps the USD value. When inflation falls below 2% or the Unemployment Rate is too high, the Fed may lower interest rates, which weighs on the Greenback.
What is Quantitative Easing and how does it influence the US Dollar?
In extreme situations, the Federal Reserve can also print more Dollars and enact quantitative easing (QE). QE is the process by which the Fed substantially increases the flow of credit in a stuck financial system.
It is a non-standard policy measure used when credit has dried up because banks will not lend to each other (out of the fear of counterparty default). It is a last resort when simply lowering interest rates is unlikely to achieve the necessary result. It was the Fed’s weapon of choice to combat the credit crunch that occurred during the Great Financial Crisis in 2008. It involves the Fed printing more Dollars and using them to buy US government bonds predominantly from financial institutions. QE usually leads to a weaker US Dollar.
What is Quantitative Tightening and how does it influence the US Dollar?
Quantitative tightening (QT) is the reverse process whereby the Federal Reserve stops buying bonds from financial institutions and does not reinvest the principal from the bonds it holds maturing in new purchases. It is usually positive for the US Dollar.
Several European Central Bank policymakers hit the newswires on Friday, giving their opinions on economic conditions and outlook as Europe sees day two of the ECOFIN meetings, and the Eurogroup meetings get under way today.
Key highlights:
- ECB's Stournaras:
- I see a first rate cut in June.
- Definitely won't see March rate cuts.
- Euro-area GDP unlikely to grow 0.8% this year
- ECB's Nagel:
- Remains confident inflation will be tamed, ECB mustn't move too soon.
- ECB should act on data, not steps other central banks take.
- More comfortable with the current pricing for ECB Cuts.
- ECB's Schnabel:
- R* (natural rate of interest) may rise in the coming decades.
- ECB's Centeno:
- ECB needs to be open to a March rate cut, even if its unlikely.
- Inflation might dip below 2% this year, but it will be temporary.
- Downside risks to inflation and growth have materialized.
- ECB's Muller:
- Wage growth is still higher than what we would like to see.
- It would be a mistake to act too soon and have to correct.
- ECB needs to be patient with first rate cut.
- Would like to see firsts quarter wage data before moving on rates.
Households do not seem to really believe that the ECB will be able to bring inflation back to its target of 2% in the medium term, economists at Commerzbank say.
Consumers expect medium-term inflation above 2%
Even though the ECB's communication has improved in recent years, this does not appear to have increased public trust in the central bank.
The ECB is still experiencing a crisis of trust, which may impair the effectiveness of its monetary policy.
The citizens of the Euro countries do not expect a return to the 2% target in the medium term and are acting in line with their expectations.
Thanks to the Federal Reserve’s rate hiking campaign, cash looks more attractive today than in the last two decades. As a result, investors have flocked to cash products. However, investors should be wary of falling into the ‘cash trap,” analysts at JP Morgan say.
An equity investor who missed just the 10 best days since 2003 would have seen their annualized performance cut nearly in half
Over the last 30 years, cash has been unable to keep up with the creep of inflation. By contrast, other investments have been much better places to park capital. Moreover, for investors willing to take more risk, the reward has generally been worth it.
History has shown that by missing only a handful of the best trading days, investment performance can suffer. In fact, an equity investor who missed just the 10 best days since 2003 would have seen their annualized performance cut nearly in half.
Investors should remember that holding some cash is always necessary. However, they should also recognize that too much cash can become a liability. Despite the comfort that cash can provide, the most prudent move would be to avoid the ‘cash trap’ and step into risk markets.
- EUR/USD inches up with the pair navigating close to the 200-day moving average.
- German GDP contracts in Q4 2023, while Ifo business climate index shows slight improvement.
- Fed officials maintain cautious stance on rate cuts, despite solid US economic indicators.
The Euro prints gains against the US Dollar during Friday's North American session but still circa the 200-day moving average (DMA) at 1.0826, amid an absent economic calendar in the United States (US). Data from the Euro area (EU) witnessed its largest economy shrinking while business sentiment improved. The EUR/USD trades at 1.0827, up a minuscule 0.04%.
EUR/USD hovers around 200-DMA as German economy contracts and business sentiment slightly improves
Data from the EU revealed that the German economy contracted -0.3% as expected on a quarterly basis in Q4 2023, according to Destatis. Annually based, the Gross Domestic Product (GDP) shrank -0.2%. Further data revealed that the business climate in Germany slightly improved from 85.2 to 85.5, according to the Ifo Institute.
Across the pond, the US economic calendar is absent though the latest unemployment claims figures and solid S&P Global Flash PMIs justified Fed officials’ hawkish commentary. Policymakers stated they’re ready to ease policy but not in a rush, as recent economic data solidifies that the economy is strong, which could reignite inflationary pressures.
The CME FedWatch Tool depicted traders aligning with the latest Fed projections, with officials estimating three rate cuts, as revealed by the latest Summary of Economic Projections (SEP) in December 2023. As of writing, traders have priced in 81 basis points (bps) of easing toward the end of 2024.
EUR/USD Price Analysis: Technical outlook
The EUR/USD is neutral to bearish bias, as the upward move toward the 50-day moving average (DMA) at 1.0885 was quickly rejected, with bears remaining in charge. If they push prices below the 1.0800 figure could exacerbate another leg down, targeting the November 10 low of 1.0656. But first, they must reclaim the 1.0750 area, followed by the 1.0700 mark. On the bullish side, the pair must reclaim the 200-DMA before buyers lift the exchange rate towards the 50-DMA ahead of 1.0900.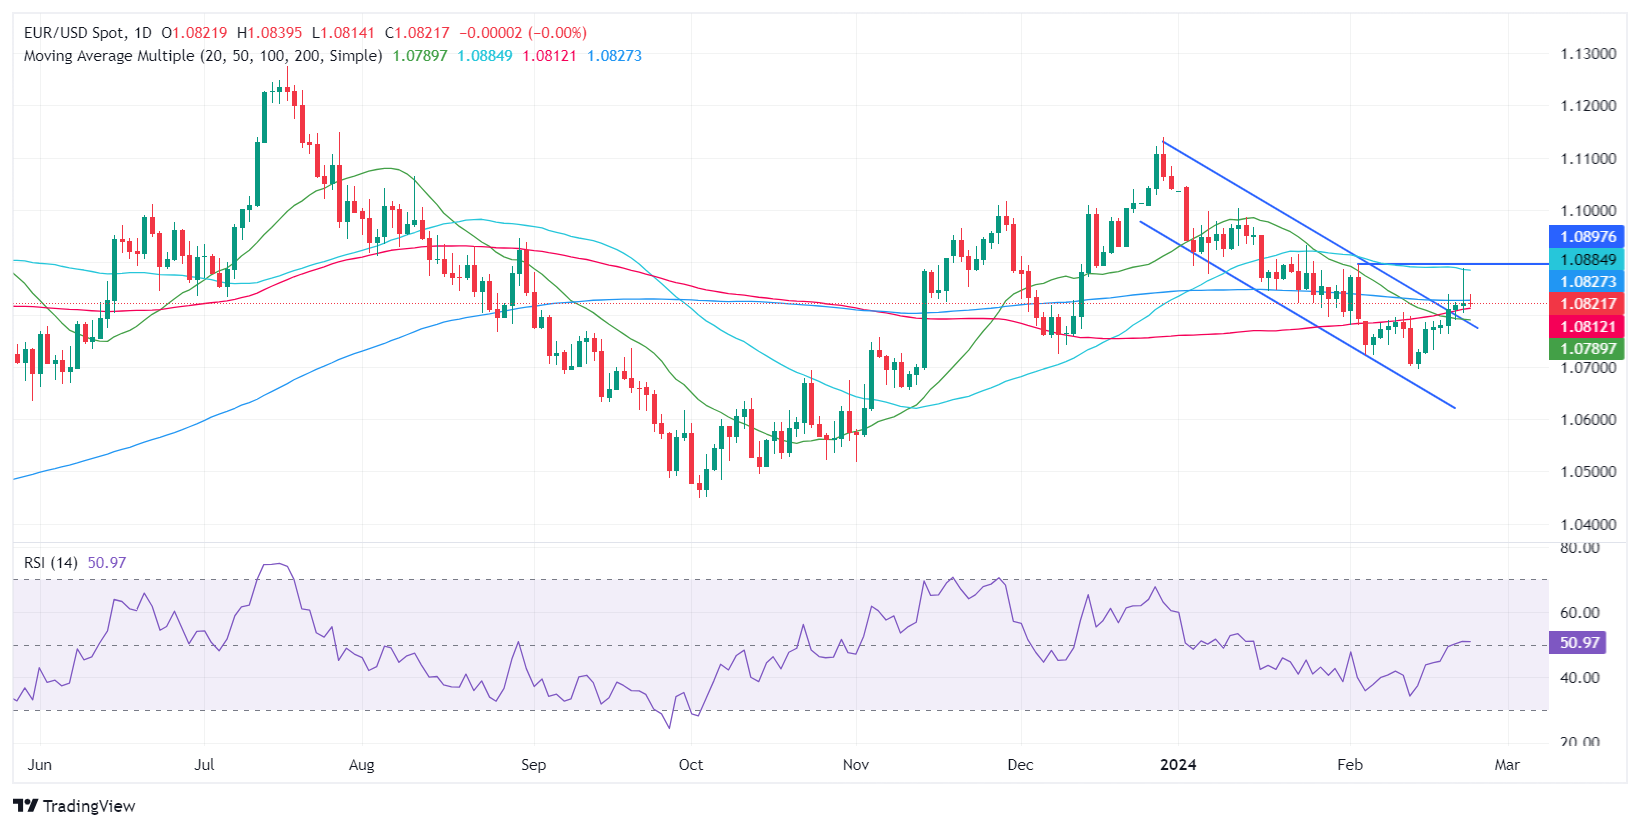
The Canadian Dollar (CAD) has struggled during the early part of 2024. Economists at Wells Fargo expect this trend to continue over the course of the year.
USD/CAD seen at 1.3300 by year-end
For all of 2024, we expect a cumulative 100 bps of rate cuts from the Bank of Canada, just a little less than the cumulative 125 bps of rate cuts from the Federal Reserve over the same period. Moreover, in both Canada and the United States we anticipate subdued economic growth, but no recession.
Canada's economic and monetary policy backdrop has restrained the Canadian Dollar during the early part of 2024, a trend that could continue for the time being.
Given a broadly similar growth and monetary policy outlook for Canada and the United States, it is also possible that Loonie could be an underwhelming performer over the medium term. Even by the end of 2024, we see only modest gains in the Canadian currency, forecasting a USD/CAD exchange rate of 1.3300 by the end of this year.
Forecast change! Economists at Commerzbank have lowered their EUR/USD forecast.
Only five rate cuts expected by the end of 2025 in the US
We now expect the EUR/USD exchange rate to be around 1.1000 at the end of 2024 (previously: 1.1200) and around 1.0800 at the end of 2025 (previously: 1.1000).
The main reason for the change in forecast is the reassessment of US monetary policy. Instead of eight rate cuts by the end of 2025, we now expect only five, which is less than the market is currently pricing in.
- USD/JPY slumps from 151.00 amid correction in the US Dollar.
- Easing Japan’s inflation would dwindle BoJ’s plans of quitting the dovish policy stance.
- Fed Waller prefers to delay rate cuts.
The USD/JPY faces an intense sell-off from 150.80 in Friday’s early New York session. The asset has come under pressure as the US Dollar retraces vertically, even though Federal Reserve (Fed) policymakers argue in favor of keeping interest rates at their current level.
Considering positive overnight futures, the S&P500 is expected to open on a bullish note amid improved market sentiment. The US Dollar Index (DXY) corrects to 103.80 as the appeal for safe-haven assets wanes. 10-year US Treasury yields have dropped to 4.30%.
Fed policymakers are not interested in unwinding their restrictive interest rates stance as they are less convinced that inflation will sustainably return to the 2% target.
On Thursday, Fed Governor Christopher Waller added he wants to see inflation data for at least a couple of months to judge whether stubborn figures in January were mere short-term fluctuations or progress in inflation easing towards 2% has stalled. Waller added that risks associated with delaying rate cuts are lower than acting on them too quicky.
On the Japanese Yen front, investors await the National Consumer Price Index (CPI) data for January, which will be published on Tuesday. The annual CPI excluding fresh food is expected to come out below 2.0% at 1.8% against the former reading of 2.3%. This would dampen the Bank of Japan’s (BoJ) plans to exit the decade-long expansionary policy stance.
Economists at the National Australia Bank still expect AU/USD to trend higher. However, they have pushed out their forecasts for the Aussie by a quarter.
AUD/USD still expected to appreciate
We have pushed out our forecasts for AUD/USD by a quarter, now expecting the Aussie to end 2024 around 0.7200.
We continue to see a further appreciation through 2025 with the AUD/USD pair reaching 0.7800 by Q4.
See:
- AUD/USD could struggle to trade consistently above 0.7000 – ING
- AUD/USD to maintain positive momentum – Commerzbank
In the United States, the feared recession has so far failed to materialize – but could it still come? Economists at Commerzbank explain why we have changed their forecast and no longer expect a recession.
Recession no longer the most likely scenario
Interest rate-sensitive residential investment in the US is picking up again and US banks are slowing the tightening of lending standards. Together with the recent high pace of growth, this makes even a mild US recession less likely.
While we had previously expected a slight decline in US gross domestic product for the summer half-year, we now anticipate a moderate increase. The absence of a mild recession raises our growth forecast for 2024 as a whole from 1.0% to 2.5%; for 2025 it rises from 1.0% to 1.5%. The unemployment rate will remain very low for a long time to come.
- NZD/USD resumes upside journey as US Dollar falls on backfoot.
- Fed policymakers need more conviction that inflation will decline to their desired target of 2%.
- The RBNZ is expected to keep its OCR unchanged at 5.50%.
The NZD/USD pair delivers a solid recovery from the round-level resistance of 0.6200 in the late European session on Friday. The Kiwi asset strengthens as the US Dollar has come under pressure despite the Federal Reserve (Fed) preferring to delay rate cuts. Fed policymakers are worried that premature rate cuts could flare up inflation again.
S&P500 futures trade slightly positive ahead of the US opening, indicating upbeat market sentiment. The US Dollar Index (DXY), which measures the value of the Greenback against six rival currencies, extends corrects to 103.77. 10-year US Treasury yields have dropped sharply to 4.30%.
On Thursday, Fed policymakers said they need more confidence that inflation will converge to 2% before considering rate cuts. Fed Governor Christopher Waller said there is no need to hurry for rate cuts. The risks of reducing interest rates too soon are higher than delaying them. Fed policymakers are uncertain about inflation declining to the 2% target after the release of the surprisingly stubborn Consumer Price Index (CPI) data for January.
Meanwhile, the New Zealand Dollar will be guided by market expectations of the monetary policy announcement by the Reserve Bank of New Zealand (RBNZ) scheduled for next week. The RBNZ is expected to keep its Official Cash Rate (OCR) unchanged at 5.50%.
While high price pressures are leaving no room for RBNZ policymakers to reduce key lending rates, domestic economic indicators demand liquidity stimulus. The Q4 Retail Sales data, released this week, contracted sharply by 1.9% against a 0.8% decline in the third quarter of 2023.
- Dow Jones futures cling to modest gains ahead of the opening bell.
- Nvidia shares continue to push higher following Thursday's upsurge.
- S&P 500 closed at a new record high on Thursday.
S&P 500 futures are unchanged, Dow Jones futures climb 0.18%, and Nasdaq futures are unchanged..
S&P 500 (SPX), Dow Jones (DJIA), and Nasdaq (IXIC) indexes closed on Thursday with a 2.11% gain, a 1.18% increase, and a 2.96% rise, respectively.
What to know before stock market opens
- The Technology sector was the best-performing major S&P 500 sector on Thursday, rising 4.35% on the day. On the downside, the Utilities sector fell 0.77%.
- Nvidia Corp. (NVDA) stock climbed 16.4%, ending at $785.38, becoming the biggest gainer in the S&P 500. In premarket trading on Friday, Nvidia is up nearly 2% at around $799. The chipmaker had reported on Wednesday that earnings per share topped $5.16 versus the $4.64 forecast, while revenue climbed to $22.10 billion compared to the expected $20.62 billion. The company also said that it forecasts the current-quarter revenue of $24 billion, plus or minus 2%.
- Mizuho has raised the target price for Nvidia stock to $850 from $825, HSBC lifted its target to $880 from $835 and Citigroup revised its expectation to $820 from $575.
- ETSY Inc. (ETSY) tumbled 8.44% to close at $70.62 as the worst-performing S&P 500 stock on Thursday.
- The US Department of Labor reported that there were 201,000 Initial Jobless Claims in the week ending February 17, a 12,000 decrease from the previous week's reading of 213,000.
- Federal Reserve (Fed) Vice Chair Philip Jefferson said on Thursday that he wants to move in a way that would not lead to stops and starts in policy and increase policy uncertainty. Later in the day, Governor Christopher Waller argued that there is no rush to begin cutting interest rates, citing the need to see further evidence that inflation is cooling.
- The Fed said in the Minutes of the January policy meeting released Wednesday that most policymakers noted the risks associated with moving too quickly to ease the policy. Furthermore, the publication showed that officials highlighted uncertainty around how long the restrictive policy stance would be needed.
- Retailer giant Walmart Inc. (WMT) reported an adjusted earning per share of $1.8 ahead of the opening bell on Tuesday. The company said that it expects consolidated net sales to rise in the range of 3%-4% and announced that it will buy smart TV producer Vizio (VZIO) for about $2.3 billion.
- Home Depot Inc. (HD) said net income in Q4 was $2.8 billion, and the adjusted earnings per share was $2.82. The company, however, said that it projects sales for the fiscal year 2024 to be below estimates, citing slowing demand for discretionary items such as flooring, furniture and kitchen, per Reuters.
Dow Jones FAQs
What is the Dow Jones?
The Dow Jones Industrial Average, one of the oldest stock market indices in the world, is compiled of the 30 most traded stocks in the US. The index is price-weighted rather than weighted by capitalization. It is calculated by summing the prices of the constituent stocks and dividing them by a factor, currently 0.152. The index was founded by Charles Dow, who also founded the Wall Street Journal. In later years it has been criticized for not being broadly representative enough because it only tracks 30 conglomerates, unlike broader indices such as the S&P 500.
What factors impact the Dow Jones Industrial Average?
Many different factors drive the Dow Jones Industrial Average (DJIA). The aggregate performance of the component companies revealed in quarterly company earnings reports is the main one. US and global macroeconomic data also contributes as it impacts on investor sentiment. The level of interest rates, set by the Federal Reserve (Fed), also influences the DJIA as it affects the cost of credit, on which many corporations are heavily reliant. Therefore, inflation can be a major driver as well as other metrics which impact the Fed decisions.
What is Dow Theory?
Dow Theory is a method for identifying the primary trend of the stock market developed by Charles Dow. A key step is to compare the direction of the Dow Jones Industrial Average (DJIA) and the Dow Jones Transportation Average (DJTA) and only follow trends where both are moving in the same direction. Volume is a confirmatory criteria. The theory uses elements of peak and trough analysis. Dow’s theory posits three trend phases: accumulation, when smart money starts buying or selling; public participation, when the wider public joins in; and distribution, when the smart money exits.
How can I trade the DJIA?
There are a number of ways to trade the DJIA. One is to use ETFs which allow investors to trade the DJIA as a single security, rather than having to buy shares in all 30 constituent companies. A leading example is the SPDR Dow Jones Industrial Average ETF (DIA). DJIA futures contracts enable traders to speculate on the future value of the index and Options provide the right, but not the obligation, to buy or sell the index at a predetermined price in the future. Mutual funds enable investors to buy a share of a diversified portfolio of DJIA stocks thus providing exposure to the overall index.
Gold (XAU/USD) has put the previous week's setback behind it and established itself above $2,000. Economists at Commerzbank analyze the yellow metal’s outlook.
XAU/USD year-end forecast lowered by $50 to $2,100
The fact that the US Federal Reserve will probably not cut interest rates until later in the year was quickly shrugged off: after all, postponed is not cancelled.
Nevertheless, our new forecast, according to which the US economy will avoid a recession and the Fed will cut interest rates later and less sharply, is likely to have consequences for the Gold price.
The rise in the Gold price that we expect will be delayed and less pronounced than previously thought. We are therefore lowering our XAU/USD forecast for the end of the year by $50 to $2,100.
- The US Dollar trades in the red on Friday, and for the week.
- Market sentiment was very positive for equities, bearish for the US Dollar this week.
- The US Dollar Index falls below 104 again and selling pressure is visible on the charts.
The US Dollar (USD) is closing this week’s performance at a loss. A correlation with the risk sentiment and the fact that equities had a very upbeat week makes it clear that the US Dollar does not thrive when there is a risk on tone present in markets. With all three major US equity indices firmly higher for this week, the US Dollar Index is taking a step back and is set to close out the week lower.
On the economic data front, there is nearly nothing to report. Besides possibly a few surprise unscheduled comments from an US Federal Reserve member, it looks like markets will slowly head out into the weekend. Next week, nearly every day sees a pivotal number due to be released, with Durable Goods, US Gross Domestic Product, Personal Consumption Expenditures and Manufacturing data from the Institute of Supply Management all on the docket.
Daily digest market movers: TGIF
- Nikkey Haley and former US President Donald Trump are facing their next vote in the presidential race this Saturday. This time the stage is in South Carolina with primaries on the docket.
- ECB governor Robert Holzmann made comments on Bloomberg television, saying that the European Central Bank (ECB) will not cut this year and will only consider cutting later and bigger rather than cutting too early.
- The EU is set to release its list of sanctioned companies in Russia, China, India and several other countries that are seen by the EU as aiding Russia in its war.
- The US from their side are still working on another sanction package this Friday. The packages come after opposition leader Alexei Navalny died in detention a few days ago.
- Equities are flat ahead of the US opening bell this Friday. That this rally is not done yet, was noticeable in Japan where the Nikkei rallied again over 2%. Europe and the US are rather reluctant to follow suit and are flat for now.
- The CME Group’s FedWatch Tool is now looking at the March 20 meeting. Expectations for a pause are at 97.5%, while chances of a rate cut stand at 2.5%.
- The benchmark 10-year US Treasury Note trades around 4.34%, which is near the highest level for this week.
US Dollar Index Technical Analysis: Keep powder dry for next week
The US Dollar Index (DXY) is set to close this week in the red after a lacklustre performance. The Greenback was outmatched by the risk on sentiment that swept equity markets higher. Seeing the light calendar, it looks like not much movement will be taking place ahead of the weekend. Expect to see traders keep their powder dry for next week where almost every day a pivotal economic data number is set to move the needle.
To the upside, the 100-day Simple Moving Average (SMA) near 104.07 is the first level to watch as a support that has been turned into a resistance. Should the US Dollar jump to 105.00, 105.12 is a key level to keep an eye on. One step beyond there comes 105.88, the high of November 2023. Ultimately, 107.20 – the high of 2023 – could even come back into scope, but that would be when markets reprice the timing of a Fed rate cut again, delaying it to the last quarter of 2024.
The 200-day Simple Moving Average at 103.73 was broken on Thursday and should see more US Dollar bears flock in to trade the break for a weaker US Dollar. The 200-day SMA should not let go that easily, so a small retreat back to that level could be more than granted. Ultimately, it will lose its force with the ongoing selling pressure and could fall to 103.16 at the 55-day SMA.
US Dollar FAQs
What is the US Dollar?
The US Dollar (USD) is the official currency of the United States of America, and the ‘de facto’ currency of a significant number of other countries where it is found in circulation alongside local notes. It is the most heavily traded currency in the world, accounting for over 88% of all global foreign exchange turnover, or an average of $6.6 trillion in transactions per day, according to data from 2022.
Following the second world war, the USD took over from the British Pound as the world’s reserve currency. For most of its history, the US Dollar was backed by Gold, until the Bretton Woods Agreement in 1971 when the Gold Standard went away.
How do the decisions of the Federal Reserve impact the US Dollar?
The most important single factor impacting on the value of the US Dollar is monetary policy, which is shaped by the Federal Reserve (Fed). The Fed has two mandates: to achieve price stability (control inflation) and foster full employment. Its primary tool to achieve these two goals is by adjusting interest rates.
When prices are rising too quickly and inflation is above the Fed’s 2% target, the Fed will raise rates, which helps the USD value. When inflation falls below 2% or the Unemployment Rate is too high, the Fed may lower interest rates, which weighs on the Greenback.
What is Quantitative Easing and how does it influence the US Dollar?
In extreme situations, the Federal Reserve can also print more Dollars and enact quantitative easing (QE). QE is the process by which the Fed substantially increases the flow of credit in a stuck financial system.
It is a non-standard policy measure used when credit has dried up because banks will not lend to each other (out of the fear of counterparty default). It is a last resort when simply lowering interest rates is unlikely to achieve the necessary result. It was the Fed’s weapon of choice to combat the credit crunch that occurred during the Great Financial Crisis in 2008. It involves the Fed printing more Dollars and using them to buy US government bonds predominantly from financial institutions. QE usually leads to a weaker US Dollar.
What is Quantitative Tightening and how does it influence the US Dollar?
Quantitative tightening (QT) is the reverse process whereby the Federal Reserve stops buying bonds from financial institutions and does not reinvest the principal from the bonds it holds maturing in new purchases. It is usually positive for the US Dollar.
Economists at TD Securities revise its RBA and RBNZ cash rate calls.
RBNZ’s eventual easing cycle is likely to be more aggressive
RBA: We still expect 100 bps of cuts in the easing cycle, but forecast the first 25 bps cut to be delivered in Nov'24 vs. our prior call for Aug'24.
RBNZ: We now forecast hikes at next week's meeting – 25 bps – and in May to take the OCR to 6%. Consequently, the eventual easing cycle is likely to be more aggressive with 200 bps of cuts.
- WTI Oil hits a ceiling above $78 and is unable to break higher.
- Oil traders are sending crude lower under some profit-taking and comments on OPEC+ production cuts.
- The US Dollar Index is giving up on 104.00 as risk-on sentiment weighs on the Greenback.
Oil prices are sliding nearly 1% on Friday as Iraq announced the reopening of a refinery that was closed for a decade and amid expectations that OPEC+ countries won’t opt for big production cuts. President Of Rapidan Energy and former White House official Bob McNally said that OPEC+ said on Bloomberg that the group of Oil-producing countries will likely need to extend its voluntary production cuts beyond the first quarter of the year, but that any further big cuts in supply aren’t expected.
Meanwhile, the US Dollar Index (DXY) is retreating for the week, consolidating its losses. The Greenback is losing ground as equities are having a field day, with several indexes trading at fresh all-time highs. Traders look to next week, when nearly every day features a big market-moving data point which has the potential to move the needle for the DXY US Dollar Index.
Crude Oil (WTI) trades at $77.43 per barrel, and Brent Oil trades at $81.81 per barrel at the time of writing.
Oil news and market movers: OPEC production cuts are no surprises
- Iraqi Prime Minister Mohammed Shia’ Al Sudani has announced the reopening of a refinery in Baiji.
- OPEC+ will lengthen, though not broaden, its voluntary production cuts, President of Rapidan EnergyBob McNally said on a Bloomberg interview.
- Oil traders are not pricing in any further geopolitical risk from the Middle East.
- The London Energy Forum 2024 Summit will take place on Monday and Tuesday next week, an event that usually brings market-moving headlines from big industry leaders. That will be followed by the International Energy Week from Tuesday to Friday.
- The Energy Information Administration (EIA) saw another build in US Crude stockpile changes from already a previous build of 12.018 million barrels with an additional 3.514 million barrels for this week.
- Traders will be on the lookout for any replications of the fresh sanctions packages from the US and the EU for Oil towards Russia and other parties in countries accused of trading Russian Oil.
- The weekly Baker Hughes Oil Rig Count is to be released at 18:00 GMT. The previous number stood at 497.
Oil Technical Analysis: This is it thus far
Oil prices have been trying to push higher to $80, with traders bracing for the US and EU sanction package due to be released on Friday. Sanctions are not only against Russia but also against some Chinese and Indian parties who are allegedly aiding Russia. Despite the technical breakout, Oil has not been able to run away higher, so a return to $90 or even $85 looks bleak for now.
Still acting as the line in the sand is $80, with $79.66 as the first level to have a look at on the upside. Should the Relative Strength Index (RSI) not head into overbought territory too quickly, look for $84.58 and $89.64 as next targets to the upside. The ultimate target in this area would be $92.69, with the tops from November 2022 coming into play.
On the downside, support from the 55-day SMA at $74.20 should work before the green ascending trend line near $72.93 gets tested. If that trend line snaps, look for the purple line near $67.11 to catch any falling knives. Seeing the triple bottom from June andJuly 2023, that level should be strong enough to support.
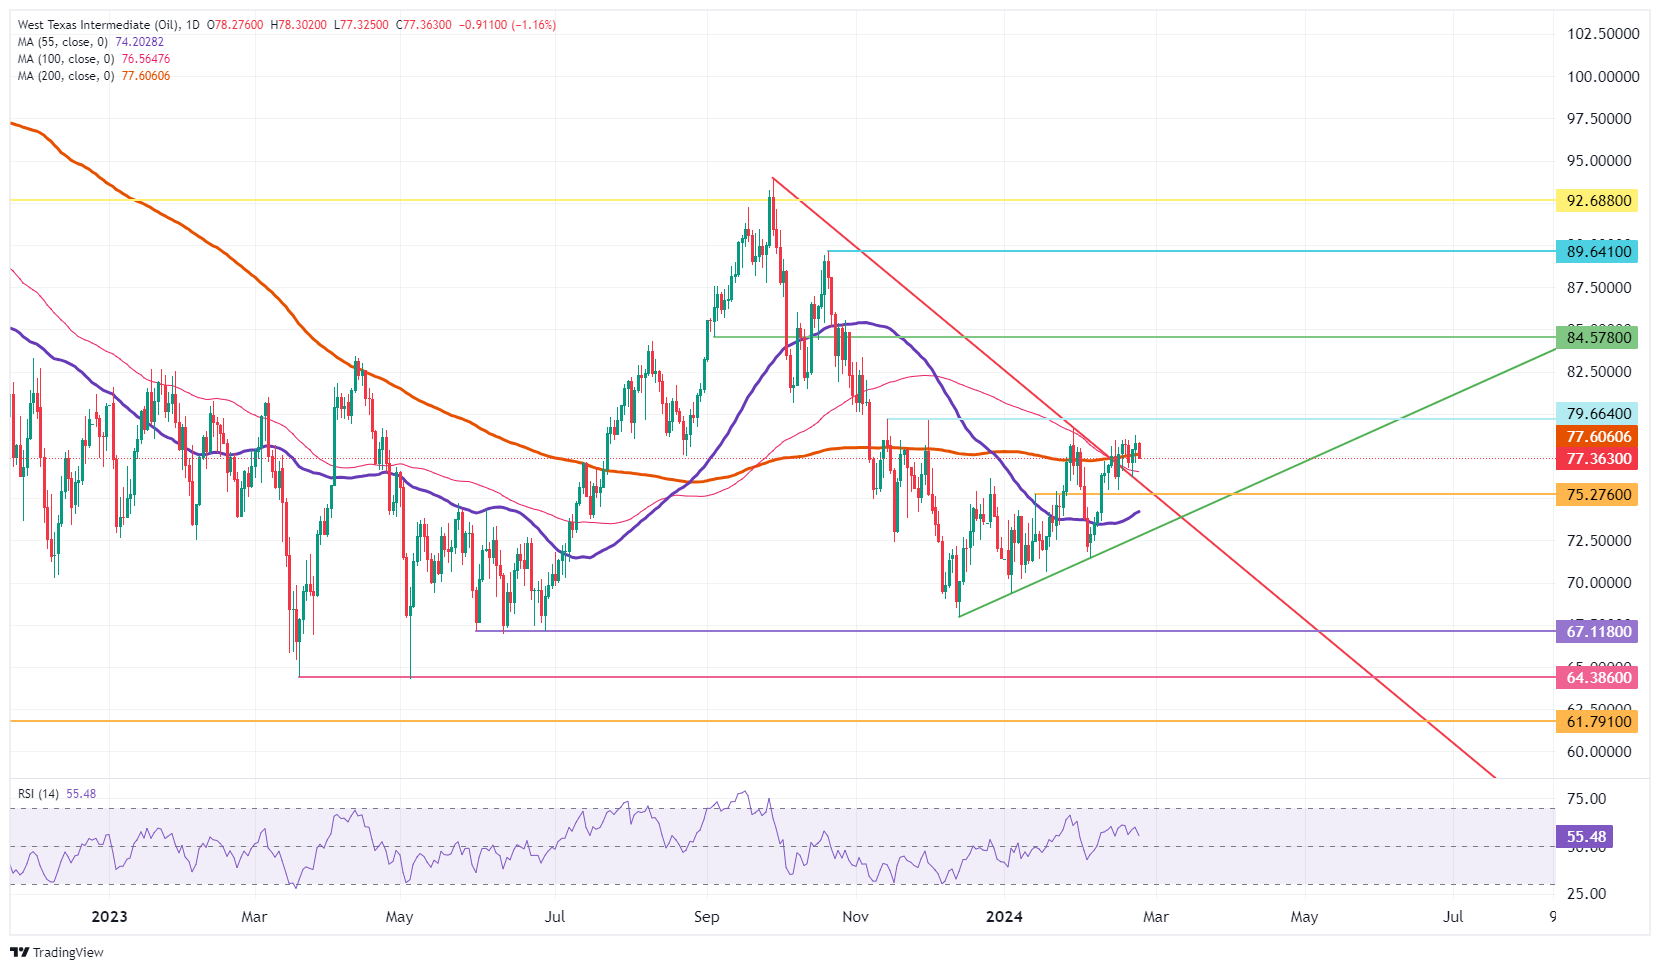
US WTI Crude Oil: Daily Chart
WTI Oil FAQs
What is WTI Oil?
WTI Oil is a type of Crude Oil sold on international markets. The WTI stands for West Texas Intermediate, one of three major types including Brent and Dubai Crude. WTI is also referred to as “light” and “sweet” because of its relatively low gravity and sulfur content respectively. It is considered a high quality Oil that is easily refined. It is sourced in the United States and distributed via the Cushing hub, which is considered “The Pipeline Crossroads of the World”. It is a benchmark for the Oil market and WTI price is frequently quoted in the media.
What factors drive the price of WTI Oil?
Like all assets, supply and demand are the key drivers of WTI Oil price. As such, global growth can be a driver of increased demand and vice versa for weak global growth. Political instability, wars, and sanctions can disrupt supply and impact prices. The decisions of OPEC, a group of major Oil-producing countries, is another key driver of price. The value of the US Dollar influences the price of WTI Crude Oil, since Oil is predominantly traded in US Dollars, thus a weaker US Dollar can make Oil more affordable and vice versa.
How does inventory data impact the price of WTI Oil
The weekly Oil inventory reports published by the American Petroleum Institute (API) and the Energy Information Agency (EIA) impact the price of WTI Oil. Changes in inventories reflect fluctuating supply and demand. If the data shows a drop in inventories it can indicate increased demand, pushing up Oil price. Higher inventories can reflect increased supply, pushing down prices. API’s report is published every Tuesday and EIA’s the day after. Their results are usually similar, falling within 1% of each other 75% of the time. The EIA data is considered more reliable, since it is a government agency.
How does OPEC influence the price of WTI Oil?
OPEC (Organization of the Petroleum Exporting Countries) is a group of 13 Oil-producing nations who collectively decide production quotas for member countries at twice-yearly meetings. Their decisions often impact WTI Oil prices. When OPEC decides to lower quotas, it can tighten supply, pushing up Oil prices. When OPEC increases production, it has the opposite effect. OPEC+ refers to an expanded group that includes ten extra non-OPEC members, the most notable of which is Russia.
In the past, the Federal Reserve has often cut interest rates faster and more sharply. Economists at Commerzbank now expect fewer rate cuts by the Fed.
Five interest rate cuts of 25 bps each from June to the beginning of 2025
We expect the first interest rate hike at the FOMC meeting in June (previously: May). However, the easing of monetary policy is likely to be significantly less than we had previously expected due to the lack of a recession. We no longer expect eight rate cuts, but five (three in 2024 and two in 2025). This is because it should gradually become clear in the second half of the year that the last mile of the fight against inflation will be more difficult than expected.
At 4.25% at the end of 2025, the key interest rate would still be noticeably higher than the Fed's estimates for the long-term neutral key interest rate (2.5% according to the FOMC's December projection). The interest rate moves we are forecasting should not be seen as a full rate cut cycle, but rather as an adjustment to lower inflation in order to avoid monetary policy having too strong a braking effect on the economy.
The Polish Zloty (PLN) has been outperforming in recent months because of euphoria about the new Donald Tusk government implementing policy reforms and unlocking EU funds. However, economists at Commerzbank expect PLN to come under bearish pressure again.
Zloty to depreciate gradually over 2024-25
The risks are increasing that policy will be stuck until the presidential election of 2025. We may witness frequent no-confidence votes against the government and so on. The electorate may get frustrated from waiting for new policies. Hence, a return to power of opposition PiS always remains a possibility. New PM Donald Tusk scored a symbolic victory when the EU unlocked some frozen funds after his election. But, such easy wins are unlikely, going forward.
This heightened political risk does not seem to be priced into the Zloty’s valuation, because of which we see the Zloty depreciating gradually over 2024-25.

Source: Commerzbank Research
- WTI comes under some selling pressure on Friday and snaps a two-day winning streak.
- Concerns about slowing global demand exert downward pressure on the black liquid.
- Worries about supply disruptions in the Middle East should help limit deeper losses.
West Texas Intermediate (WTI) US Crude Oil prices drift lower on the last day of the week and move away from a fresh monthly peak, around the $78.75 region touched on Thursday. The commodity remains depressed through the first half of the European session and currently trades near the daily low, around mid-$77.00s.
Investors remain concerned about the worsening economic conditions across the globe, especially after Japan and the UK entered a technical recession during the fourth quarter of 2023. Moreover, expectations that higher borrowing costs could hinder economic activity and dent fuel demand in the world's largest oil consumer turn out to be key factors exerting downward pressure on Oil prices.
That said, signs of tightening global supplies, due to disruptions in the Middle East, might continue to underpin the commodity and help limit any meaningful corrective decline. In fact, the Israel-Hamas war has shown no signs of de-escalation yet, while attacks on commercial vessels by the Iran-aligned Houthi rebels in Yemen have raised worries about trade flow through the critical Red Sea waterway.
Meanwhile, the Energy Information Administration reported on Thursday that US Crude Oil inventory rose by 3.514 million barrels for the week to February 16, down sharply from a sizeable build of 12 million barrels previously. This reaffirms expectations that demand from the US refiners will improve after the recent outages and warrants caution before placing bearish bets around the black liquid.
Even from a technical perspective, Crude Oil prices have been oscillating in a familiar trading range over the past week or so. This points to indecision among traders over the next leg of a directional move. Nevertheless, the commodity remains on track to register modest weekly losses for the first time in the previous three.
Economists at ING suspect high-beta currencies are at risk of corrections.
Room for a DXY stabilisation around 104.00 or a rebound already today
We believe high-beta currencies are looking expensive in the very short run. The prospect of unstable risk sentiment and a Dollar leg higher ahead of next week’s PCE points to downside potential.
Today, the US calendar includes the Conference Board's Consumer Confidence indicator, which is expected to have plateaued in February. We see room for a DXY stabilisation around 104.00 or a rebound already today as risk sentiment softens.
- EUR/GBP remains subdued, slightly below 0.8550, as the UK seems out of recession.
- BoE Dhingra earns downside risks of holding interest rates elevated.
- Eurozone’s economic outlook remains weak due to poor economic activities in Germany and France.
The EUR/GBP pair remains subdued at around 0.8550 in the London session on Friday. The asset is under pressure as the economic outlook of the United Kingdom’s economy improves due to imminent hopes that the Bank of England (BoE) will pivot to cutting interest rates.
On Thursday, the S&P Global/CIPS reported that business optimism improved due to a robust order book. The agency commented that the economy is projected to grow by 0.2%-0.3% in the first quarter of 2024, easing fears of a technical recession observed in the second half of 2023. Investors should note that the economy is considered in a technical recession when it records a de-growth for two straight quarters.
Meanwhile, BoE policymakers are still worried about downside risks to the UK economy due to delaying rate cuts. BoE policymaker Swati Dhingra, who voted for a rate cut in the last policy meeting, said a delayed decision on rate cuts comes at a cost of living standards.
On the Eurozone front, factory activities in the German and French economies remain a significant concern while the rest of the shared continent shows growth. Deepening Red Sea tensions continue to impact business optimism, leading to the requirement of early rate cuts by the European Central Bank (ECB).
However, ECB policymaker and Bundesbank Chief Joachim Nagel said on Friday that it is “too early to cut rates even if a move appears tempting to some.” Nagel added that the period of rapid inflation drops over, and setbacks are anticipated.
GBP/USD advanced above 1.2700 for the first time in three weeks on Thursday. Economists at MUFG Bank analyze the Pound Sterling (GBP) outlook.
The upturn in risk sentiment globally will allow the BoE to remain patient
The UK data on Thursday was indicative of an improving outlook and the technical recession that took place in the second half of last year looks like it is probably over.
The upturn in risk sentiment globally will certainly allow the BoE to remain patient, similar to other central banks. But good news is still coming and the prospects of inflation hitting the 2% target in April remains plausible. If the Fed and ECB are delaying the timing of the first rate cut, the BoE will be too. The first cut is fully priced for August in the UK.
The better UK data and the strong risk appetite should be benefitting the Pound more than what we are seeing to date. However, concerns over growth seem to be lingering and possibly holding GBP back.
The GBP correlation with global equities has started to weaken but remains stronger than the USD/risk correlation and may prompt some GBP strengthening if this risk appetite persists.
- Gold price is expected to close the week with smaller gains as the Fed’s early rate-cut hopes ease.
- The US Dollar aims to recover further as the Fed sees rate cuts sometime in the second half of this year.
- Fed policymakers need more confidence before beginning to cut interest rates.
Gold price (XAU/USD) is off from weekly highs around $2,035 in Friday’s London session due to easing hopes of early rate cuts by the Federal Reserve (Fed). The precious metal has come under pressure as Fed policymakers are less convinced over inflation declining to the 2% target, which has improved the appeal of the US Dollar.
Fed policymakers are interested in holding interest rates in the range of 5.25%-5.50% for some more time to assess whether January’s sticky inflation data was a speedy bump or a pithole. The Fed seems not in a hurry to jump quickly on rate cuts as it could prompt upside risks to stubborn consumer price inflation.
The opportunity cost of holding non-yielding assets, such as Gold, increases when the Fed leans toward keeping interest rates higher for an extended period. Going forward, action in the safe-haven assets will be guided by market expectations for Fed rate cuts.
Daily Digest Market Movers: Gold price falls while US Dollar resumes upside journey
- Gold price drops to $2,020 after failing to sustain above the crucial resistance of $2,030 as investors seem convinced that the Federal Reserve will not cut interest rates early.
- As per the CME Fedwatch tool, investors see interest rates remaining unchanged in the range of 5.25%-5.50% in the March and May meetings. Meanwhile, chances of a rate cut in June have come slightly below 50% from previously being around 54%.
- The reasoning behind fading expectations for early rate cuts is Fed policymakers demand for progress in inflation sustainably declining to the 2% for several months and tight labor market conditions.
- On Thursday, Fed Governor Christopher Waller said that the central bank should not rush to bring interest rates down after sticky consumer price inflation data for January.
- Christopher Waller added he wants to see inflation data for at least a couple of more months to judge whether stubborn figures in January were mere short-term fluctuations or progress in inflation easing towards 2% has stalled.
- Waller further added that risks associated with delaying rate cuts are lower than acting on them too quickly.
- Fed Governor Lisa Cook joined Christopher Waller and said she needs more confidence that inflation is converging to 2% before beginning to cut rates.
- In a speech on Thursday, Philadelphia Federal Reserve President Patrick Harker said the next step for the monetary policy is a rate cut, and he is expecting some time in the second half of this year. Harker declined to provide precise timing when the Fed could start easing interest rates.
- Meanwhile, the US Dollar Index (DXY), which gauges the US Dollar’s value against six major currencies, aims to resume its upside journey due to improving labor market conditions and deepening Middle East tensions.
- On Wednesday, the US Department of Labor reported lower jobless claims for the week ending February 16. Individuals claiming jobless benefits for the first time fell to 201K vs. expectations of 218K and the former release of 213K.
- On the geopolitical front, local authorities in Rafah, a Palestinian city near the southern region of Gaza, have held the Israeli and the US administration responsible for intensified bombarding, which has resulted in an assault on civilians.
- Safe-haven assets like the US Dollar attract more foreign inflows when geopolitical uncertainty deepens.
Technical Analysis: Gold prints two-day low near $2,016
Gold price prints a fresh two-day low below $2,020 as investors need fresh insights on the interest rate outlook. The near-term outlook remains sideways as the precious metal trades in a Symmetrical Triangle chart pattern.
The yellow metal falls after failing to test the downward-sloping border of the Symmetrical Triangle chart pattern formed on a daily time frame, which is plotted from the December 28 high at $2,088. The upward-sloping border of the aforementioned chart pattern is placed from the December 13 low at $1,973.
The triangle could break out in either direction. However, the odds marginally favor a move in the direction of the trend before the formation of the triangle – in this case up. A decisive break above or below the triangle boundary lines would indicate a breakout is underway.
The 14-period Relative Strength Index (RSI) oscillates in the 40.00-60.00 region, which indicates indecisiveness among investors.
Gold FAQs
Why do people invest in Gold?
Gold has played a key role in human’s history as it has been widely used as a store of value and medium of exchange. Currently, apart from its shine and usage for jewelry, the precious metal is widely seen as a safe-haven asset, meaning that it is considered a good investment during turbulent times. Gold is also widely seen as a hedge against inflation and against depreciating currencies as it doesn’t rely on any specific issuer or government.
Who buys the most Gold?
Central banks are the biggest Gold holders. In their aim to support their currencies in turbulent times, central banks tend to diversify their reserves and buy Gold to improve the perceived strength of the economy and the currency. High Gold reserves can be a source of trust for a country’s solvency. Central banks added 1,136 tonnes of Gold worth around $70 billion to their reserves in 2022, according to data from the World Gold Council. This is the highest yearly purchase since records began. Central banks from emerging economies such as China, India and Turkey are quickly increasing their Gold reserves.
How is Gold correlated with other assets?
Gold has an inverse correlation with the US Dollar and US Treasuries, which are both major reserve and safe-haven assets. When the Dollar depreciates, Gold tends to rise, enabling investors and central banks to diversify their assets in turbulent times. Gold is also inversely correlated with risk assets. A rally in the stock market tends to weaken Gold price, while sell-offs in riskier markets tend to favor the precious metal.
What does the price of Gold depend on?
The price can move due to a wide range of factors. Geopolitical instability or fears of a deep recession can quickly make Gold price escalate due to its safe-haven status. As a yield-less asset, Gold tends to rise with lower interest rates, while higher cost of money usually weighs down on the yellow metal. Still, most moves depend on how the US Dollar (USD) behaves as the asset is priced in dollars (XAU/USD). A strong Dollar tends to keep the price of Gold controlled, whereas a weaker Dollar is likely to push Gold prices up.
European Central Bank (ECB) policymaker and Bundesbank Chief Joachim Nagel said on Friday, it is “too early to cut rates even if a move appears tempting to some. “
Additional comments
Will only get key price pressure data in Q2, then we can contemplate a cut in interest rates.
Price outlook is not yet clear enough.
period of rapid inflation drops over, some setbacks ahead possible.
Inflation, including 'hard core' will remain markedly higher than 2% in coming months.
Related reads
- ECB's Schnabel: Monetary policy has had a weaker impact on dampening demand for services
- ECB Survey: Consumers see inflation higher for year ahead at 3.3% in January
- AUD/USD fails to preserve its modest intraday gains amid the emergence of some USD buying.
- The Fed’s hawkish outlook supports elevated US bond yields and is seen underpinning the buck.
- A minor pullback in the equity markets further drives flows away from the risk-sensitive Aussie.
The AUD/USD pair continues with its struggle to find acceptance or build on its strength beyond the 100-day Simple Moving Average (SMA) and attracts some intraday sellers near the 0.6580 region on Friday. The downfall picks up pace during the first half of the European session and drags spot prices to a fresh daily low, around mid-0.6500s amid a modest US Dollar (USD) uptick.
Against the backdrop of persistent geopolitical tensions stemming from conflicts in the Middle East, fading hopes for early rate cuts by global central banks keep a lid on the recent optimism. This is evident from a minor pullback in the equity markets, which assists the safe-haven USD to gain some positive traction and undermines the risk-sensitive Aussie. The Greenback is further supported by the Federal Reserve's (Fed) hawkish outlook, which, in turn, exerts some downward pressure on the AUD/USD pair.
The minutes of the late January FOMC meeting released on Wednesday showed a broad uncertainty about how long borrowing costs should remain at their current level to bring down inflation back to the central bank's 2% target. Adding to this, comments by a slew of influential Fed policymakers suggested that the US central bank is in no hurry to cut interest rates. This remains supportive of elevated US Treasury bond yields and allows the USD to recover further from a nearly three-week trough touched on Thursday.
Moving ahead, there isn't any relevant market-moving economic data due for release from the US on Friday, leaving the USD at the mercy of the US bond yields. Apart from this, the broader risk sentiment might drive demand for the safe-haven buck and provide some impetus to the AUD/USD pair. Nevertheless, spot prices remain on track to register modest gains for the third straight week, though the lack of follow-through buying warrants some caution for bullish traders and before positioning for any further gains.
EUR/SEK broke decisively through the 11.20 area this week. Economists at ING analyze the pair’s outlook.
A strong week, but will it last?
The stronger-than-expected headline CPIF in Sweden, some stickiness in long-term inflation expectations and the global equity rally have all contributed to a strong week for the Krona. Our short-term view on SEK is, however, not as rosy.
Risk sentiment might struggle to keep fuelling rallies in high-beta currencies like SEK in the next couple of weeks.
The end of FX sales means the downside could be rather slippery for the Krona.
We still see EUR/SEK rebound to the 11.30 area or higher before a longer-term decline can materialise.
European Central Bank (ECB) executive board member Isabel Schnabel is speaking about the Payment Methods Survey of Companies in Switzerland 2023 on Friday.
She said that “monetary policy has had a weaker impact on dampening demand for services.”
“We're starting to see that firms are beginning to absorb higher costs into their profit margins,” Schnabel added.
The policymaker went on to say that she is “confident that risks of de-anchoring of inflation expectations have come down.”
Market reaction
EUR/USD is losing ground toward 1.0800, unfazed by the above comments.
Euro price today
The table below shows the percentage change of Euro (EUR) against listed major currencies today. Euro was the weakest against the US Dollar.
| USD | EUR | GBP | CAD | AUD | JPY | NZD | CHF | |
| USD | 0.06% | 0.06% | 0.14% | 0.08% | 0.18% | 0.19% | 0.21% | |
| EUR | -0.06% | 0.01% | 0.08% | 0.03% | 0.12% | 0.13% | 0.14% | |
| GBP | -0.05% | 0.00% | 0.08% | 0.01% | 0.12% | 0.13% | 0.12% | |
| CAD | -0.14% | -0.09% | -0.08% | -0.09% | 0.05% | 0.05% | 0.06% | |
| AUD | -0.08% | -0.04% | -0.02% | 0.06% | 0.10% | 0.12% | 0.09% | |
| JPY | -0.19% | -0.11% | -0.11% | -0.04% | -0.10% | 0.01% | 0.01% | |
| NZD | -0.21% | -0.15% | -0.13% | -0.05% | -0.12% | -0.01% | -0.01% | |
| CHF | -0.20% | -0.14% | -0.14% | -0.05% | -0.14% | -0.02% | 0.01% |
The heat map shows percentage changes of major currencies against each other. The base currency is picked from the left column, while the quote currency is picked from the top row. For example, if you pick the Euro from the left column and move along the horizontal line to the Japanese Yen, the percentage change displayed in the box will represent EUR (base)/JPY (quote).
- Silver continues losing ground for the third straight day and drops to over a one-week low.
- The technical setup favours bears and supports prospects for a further depreciating move.
- A sustained strength beyond the 200-day SMA is needed to negate the negative outlook.
Silver (XAG/USD) drifts lower for the third successive day on Friday – also marking the fourth day of a negative move in the previous five – and drops to over a one-week low during the first half of the European session. The white metal currently trades around the $22.65-$22.60 region and seems vulnerable to prolong this week's pullback from over a one-month top.
The recent failure to find acceptance above a technically significant 200-day Simple Moving Average (SMA) and the subsequent downfall validates the near-term negative outlook for the XAG/USD. Furthermore, oscillators on the daily chart have just started gaining negative traction and suggest that the path of least resistance for the white metal is to the downside.
From current levels, weakness below the mid-$22.00s has the potential to drag the XAG/USD to the $22.30 horizontal support. Some follow-through selling might expose the two-month low, around the $21.90-$21.85 zone touched in January. Acceptance below the latter will be seen as a fresh trigger for bearish traders and make the XAG/USD vulnerable to test the $21.40-$21.35 area.
On the flip side, the daily swing high, around the $22.85 region, now seems to act as an immediate hurdle ahead of the $23.00 round-figure mark. A sustained strength beyond the latter could lift the XAG/USD to the 200-day SMA, currently near the $23.30 zone. This is followed by the monthly peak, around mid-$23.00s, which if cleared will negate the negative outlook.
The XAG/USD might then aim to reclaim the $24.00 round figure. The momentum could extend further and allow the white metal to climb towards the next relevant hurdle near the $24.50-$24.60 region en route to the $25.00 psychological mark.
Silver daily chart
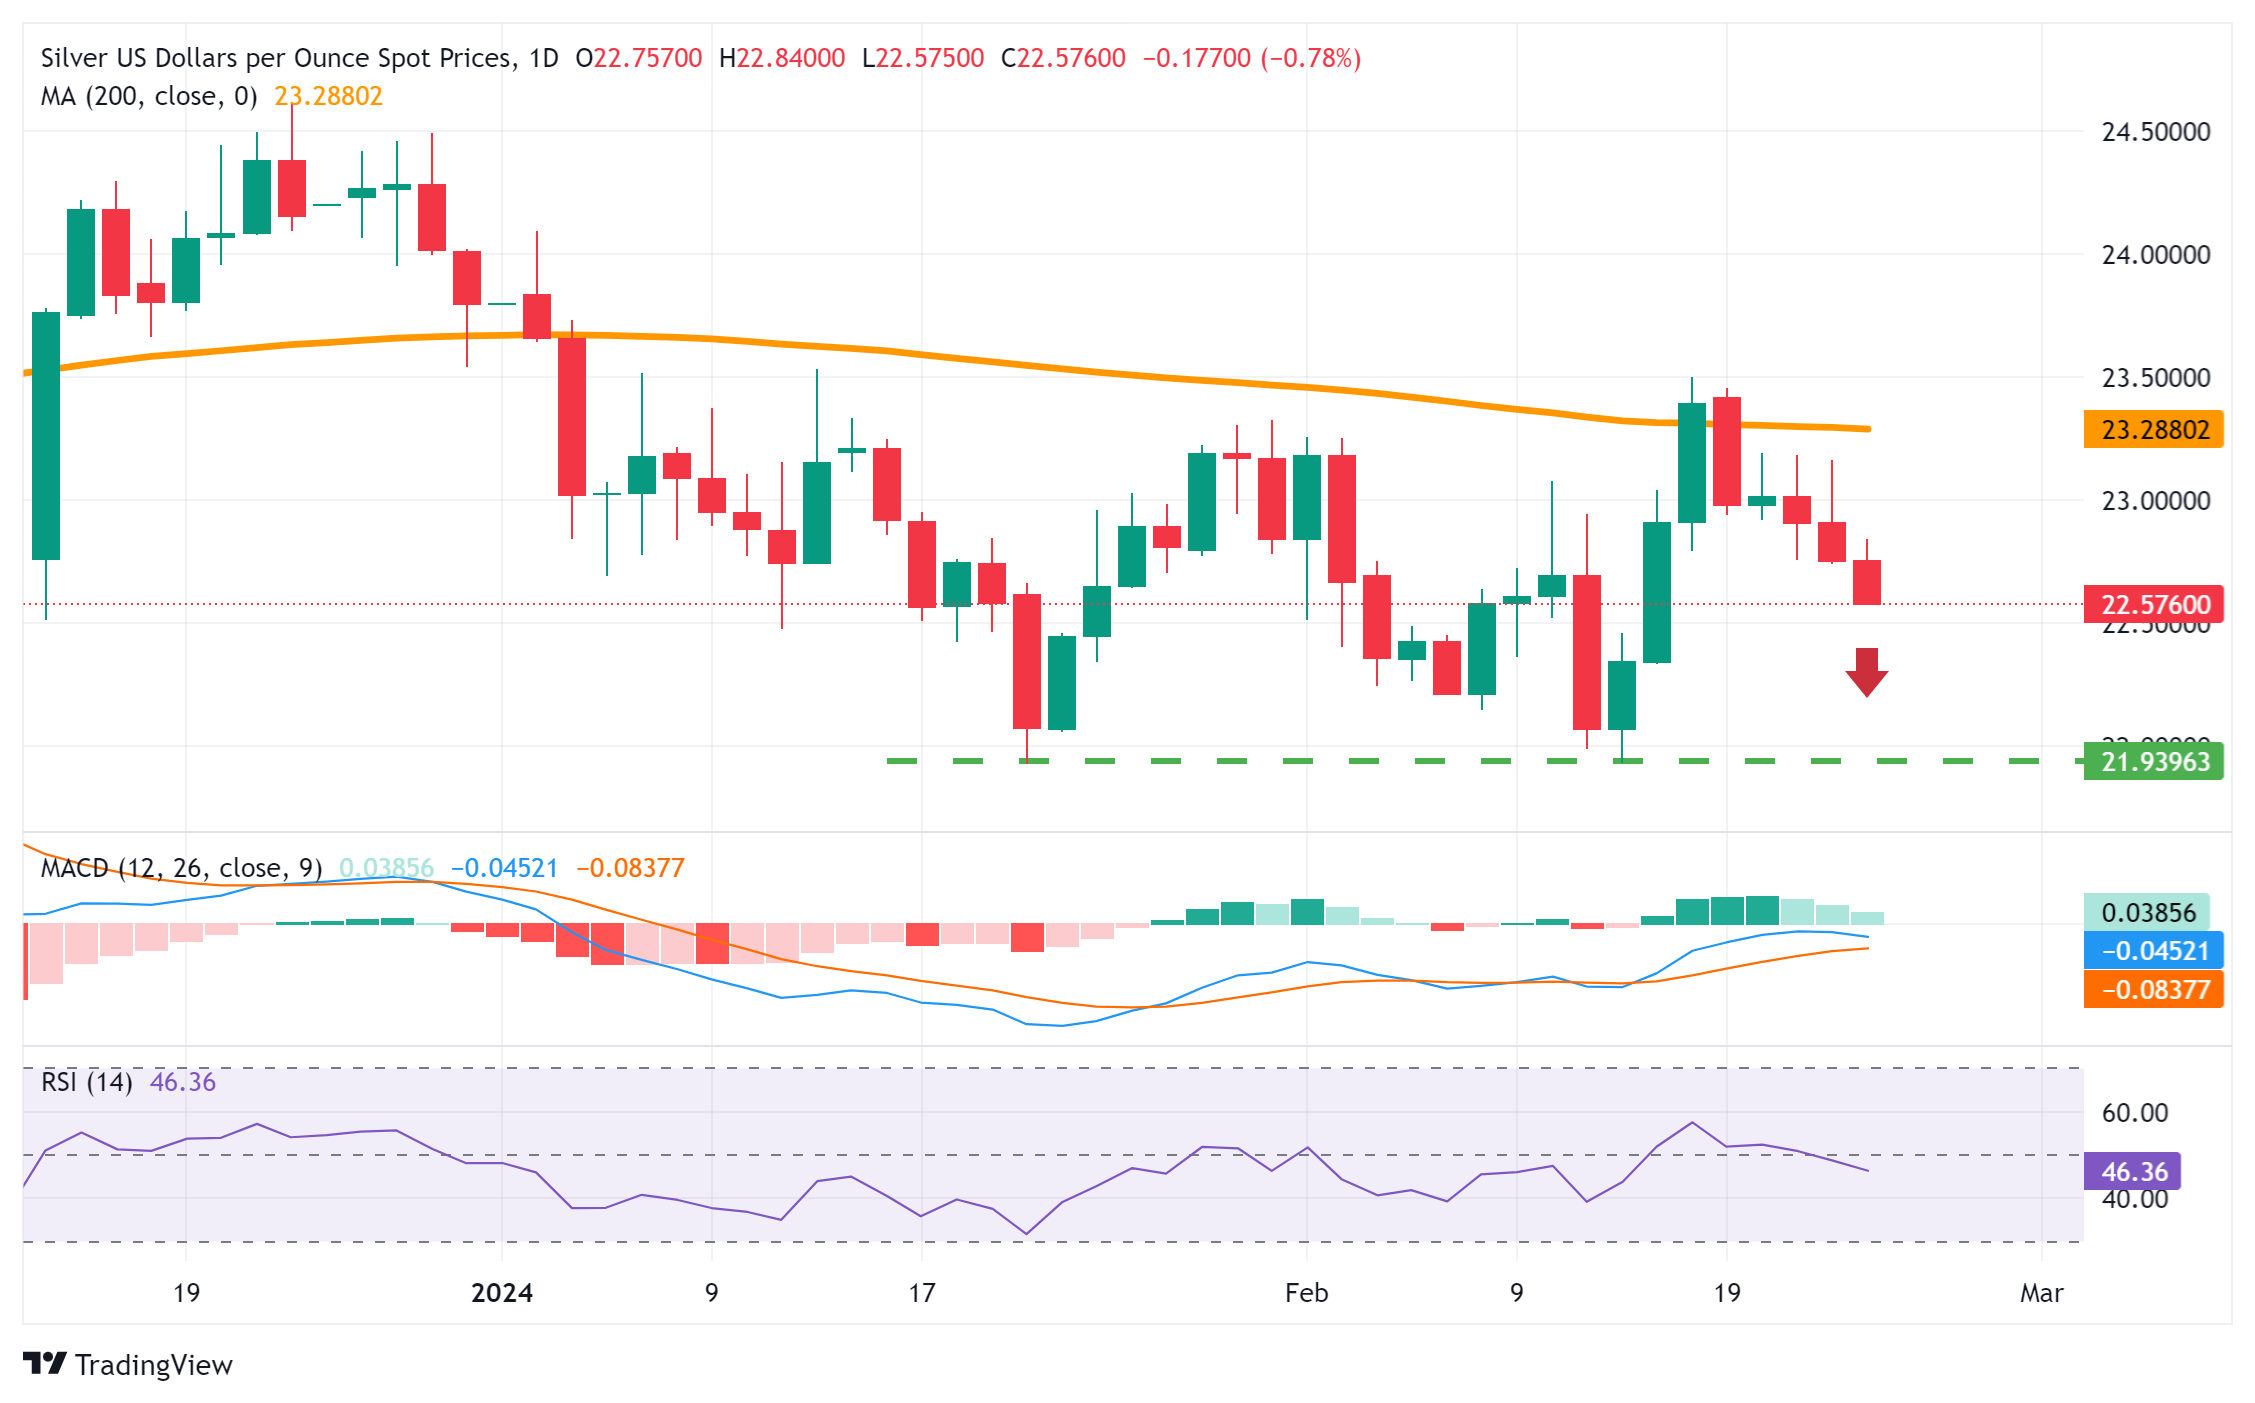
Thursday saw the biggest trading range in EUR/USD since the US CPI data on 13th February. Economists at MUFG Bank analyze the pair’s outlook.
Can USD weaken on the back of increased risk appetite?
While German manufacturing remains in the doldrums, there are certainly some bright spots emerging with the services sector rebounding more than expected which bodes well for some pick-up in GDP growth in Q1 relative to the flat growth from Q4. It does in our view bode well for a more EUR-supportive economic backdrop emerging going forward. That makes sense from the perspective that a reversal of a far more damaging energy price shock in Europe should have a more notable impact on the data as it reverses.
The 2-year UST yield is 50 bps higher this month, slightly more than the move in Germany and with the equity market rally triggered by AI-related tech it makes it more questionable whether the Dollar can weaken on the back of increased risk appetite.
The latest forecasts show 2.7% CPI in 2024; 2.1% in 2025 and 1.9% in 2026. A cut to the 2024 level with the 2025-2026 levels on average at 2.0%, it is difficult to see why the ECB should not cut at the April meeting. While that small risk exists (8 bps still priced) it will be hard for the EUR to sustain any rallies.
- EUR/USD regains some positive traction on Friday after Thursday’s whipsaw move.
- Investors scaled back bets on ECB rate cuts, which underpin the Euro.
- The prevalent risk-on environment weighs on the safe-haven USD and also acts as a tailwind.
The EUR/USD pair attracts some dip-buying on Friday and seems to have stalled the previous day's retracement slide from the vicinity of the 1.0900 mark, or a nearly three-week high. The risk-on rally across the global equity markets remains unabated, preventing the US Dollar (USD) from capitalizing on the overnight bounce from its lowest level since February 2. The shared currency draws support from signs that the Eurozone economy may be on a slow path towards recovery, which should allow the European Central Bank (ECB) to wait until June before easing its monetary policy. This acts as a tailwind for the currency pair.
Meanwhile, the US data released on Thursday showed that business activity in the manufacturing sector grew at a faster pace in February, overshadowing a slight drop in the service sector growth. This, along with fresh signs of strength in the US labour market and hawkish remarks by several Federal Reserve (Fed) officials, reaffirms expectations that the central bank will keep interest rates higher for longer. The outlook supports elevated US Treasury bond yields and acts as a tailwind for the Greenback amid geopolitical risk, warranting some caution before placing aggressive bullish bets around the EUR/USD pair.
Daily digest market movers: Benefits from softer USD and reduced ECB rate cut bets
- The headline German IFO Business Climate Index matched estimates and rose to 85.5 in February from the 85.2 previous and the final GDP print confirmed that the Eurozone's largest economy contracted by 0.3% in Q4
- The prevalent upbeat mood across the global financial markets hit the safe-haven US Dollar and lent support to the EUR/USD pair amid reduced bets for more aggressive rate cuts by the European Central Bank.
- The S&P Global's flash Eurozone composite PMI remained in the contraction territory for the ninth straight month, although it improved to 48.9 in February from the 47.9 previous and suggested that the downturn is easing.
- The minutes of the January ECB policy meeting published on Thursday showed that inflation is coming under control, albeit talk of rate cuts was premature amid rapid wage growth and underlying price pressures.
- Eurozone government bond yields shot to a multi-month top and underpin the shared currency, while the USD struggles to build on its recovery from a multi-month low despite the Federal Reserve's hawkish outlook.
- The minutes of the late January FOMC meeting on Wednesday pointed to uncertainty over how long borrowing costs should remain at the current level to bring down inflation back to the central bank's 2% target.
- Furthermore, influential Fed officials – Fed Vice Chair Philip Jefferson, Fed Governors Lisa Cook and Christopher Waller – raised concerns about cutting rates too quickly amid sticky inflation and the US economic resilience.
- The CME Group's FedWatch Tool indicates that the markets are currently pricing in around a 30% chance that the Fed will cut interest rates in May, while the odds for a move at the June policy meeting stand at about 66%.
- The yield on the benchmark 10-year US government bond holds steady near its highest level since late November, which, along with geopolitical risk, should act as a tailwind for the buck and cap the currency pair.
Technical Analysis: EUR/USD bulls need to wait for acceptance above 200-day SMA
From a technical perspective, this week's breakout through the 23.6% Fibonacci retracement level of the December-February downfall was seen as a key trigger for bullish traders. Adding to this, oscillators on the daily chart have just started gaining positive traction and support prospects for additional gains. That said, the overnight failure to find acceptance above the very important 200-day Simple Moving Average (SMA) and the subsequent pullback warrants some caution.
In the meantime, any subsequent move up is likely to confront some resistance near the 1.0865 zone or the 38.2% Fibo. level, ahead of a multi-week high touched on Thursday. Some follow-through buying beyond the 1.0900 mark, meanwhile, has the potential to lift the EUR/USD pair further towards the 50% Fibo. level, around the 1.0965-1.0970 region. The momentum could extend further and allow bulls to reclaim the 1.1000 psychological mark for the first time since January 11.
On the flip side, the 1.0800 mark, or the 23.6% Fibo. level seems to protect the immediate downside. Any further decline is more likely to attract fresh buyers near the 1.0760 horizontal zone. The latter should act as a pivotal point, which if broken decisively will suggest that the recent recovery from a three-month low witnessed over the past two weeks or so has run out of steam already. The EUR/USD pair might then accelerate the downfall towards retesting sub-1.0700 levels.
Euro price today
The table below shows the percentage change of Euro (EUR) against listed major currencies today. Euro was the strongest against the Swiss Franc.
| USD | EUR | GBP | CAD | AUD | JPY | NZD | CHF | |
| USD | 0.02% | -0.01% | 0.08% | -0.06% | 0.11% | 0.04% | 0.15% | |
| EUR | -0.02% | -0.03% | 0.07% | -0.06% | 0.09% | 0.01% | 0.11% | |
| GBP | 0.02% | 0.03% | 0.12% | -0.05% | 0.14% | 0.04% | 0.14% | |
| CAD | -0.08% | -0.07% | -0.12% | -0.15% | 0.03% | -0.06% | 0.03% | |
| AUD | 0.07% | 0.08% | 0.03% | 0.15% | 0.16% | 0.09% | 0.17% | |
| JPY | -0.11% | -0.08% | -0.13% | -0.01% | -0.17% | -0.07% | 0.01% | |
| NZD | -0.05% | -0.02% | -0.04% | 0.06% | -0.08% | 0.08% | 0.10% | |
| CHF | -0.13% | -0.11% | -0.16% | -0.04% | -0.19% | -0.03% | -0.10% |
The heat map shows percentage changes of major currencies against each other. The base currency is picked from the left column, while the quote currency is picked from the top row. For example, if you pick the Euro from the left column and move along the horizontal line to the Japanese Yen, the percentage change displayed in the box will represent EUR (base)/JPY (quote).
Euro FAQs
What is the Euro?
The Euro is the currency for the 20 European Union countries that belong to the Eurozone. It is the second most heavily traded currency in the world behind the US Dollar. In 2022, it accounted for 31% of all foreign exchange transactions, with an average daily turnover of over $2.2 trillion a day.
EUR/USD is the most heavily traded currency pair in the world, accounting for an estimated 30% off all transactions, followed by EUR/JPY (4%), EUR/GBP (3%) and EUR/AUD (2%).
What is the ECB and how does it impact the Euro?
The European Central Bank (ECB) in Frankfurt, Germany, is the reserve bank for the Eurozone. The ECB sets interest rates and manages monetary policy.
The ECB’s primary mandate is to maintain price stability, which means either controlling inflation or stimulating growth. Its primary tool is the raising or lowering of interest rates. Relatively high interest rates – or the expectation of higher rates – will usually benefit the Euro and vice versa.
The ECB Governing Council makes monetary policy decisions at meetings held eight times a year. Decisions are made by heads of the Eurozone national banks and six permanent members, including the President of the ECB, Christine Lagarde.
How does inflation data impact the value of the Euro?
Eurozone inflation data, measured by the Harmonized Index of Consumer Prices (HICP), is an important econometric for the Euro. If inflation rises more than expected, especially if above the ECB’s 2% target, it obliges the ECB to raise interest rates to bring it back under control.
Relatively high interest rates compared to its counterparts will usually benefit the Euro, as it makes the region more attractive as a place for global investors to park their money.
How does economic data influence the value of the Euro?
Data releases gauge the health of the economy and can impact on the Euro. Indicators such as GDP, Manufacturing and Services PMIs, employment, and consumer sentiment surveys can all influence the direction of the single currency.
A strong economy is good for the Euro. Not only does it attract more foreign investment but it may encourage the ECB to put up interest rates, which will directly strengthen the Euro. Otherwise, if economic data is weak, the Euro is likely to fall.
Economic data for the four largest economies in the euro area (Germany, France, Italy and Spain) are especially significant, as they account for 75% of the Eurozone’s economy.
How does the Trade Balance impact the Euro?
Another significant data release for the Euro is the Trade Balance. This indicator measures the difference between what a country earns from its exports and what it spends on imports over a given period.
If a country produces highly sought after exports then its currency will gain in value purely from the extra demand created from foreign buyers seeking to purchase these goods. Therefore, a positive net Trade Balance strengthens a currency and vice versa for a negative balance.
Inflation expectations among Eurozone consumers edged higher from 3.2% in December to 3.3% in January for the next 12 months, the European Central Bank’s (ECB) monthly Consumer Expectation Survey showed on Friday.
Additional takeaways
“Median expectations for inflation over the next 12 months rose to 3.3% in January from 3.2% December, while expectations for three years ahead remained unchanged at 2.5%.”
“The survey showed that expectations for nominal income growth remained unchanged at 1.2%, but consumers persistently underestimate wage growth and the ECB expects compensation per employee to rise by 4.6% this year.”
Market reaction
At the press time, EUR/USD is holding steady near 1.0821, despite rising inflation expectations.
Euro price today
The table below shows the percentage change of Euro (EUR) against listed major currencies today. Euro was the strongest against the Japanese Yen.
| USD | EUR | GBP | CAD | AUD | JPY | NZD | CHF | |
| USD | 0.01% | -0.01% | 0.10% | -0.04% | 0.13% | 0.13% | 0.13% | |
| EUR | 0.00% | 0.00% | 0.11% | -0.03% | 0.14% | 0.12% | 0.12% | |
| GBP | 0.02% | 0.03% | 0.13% | -0.02% | 0.17% | 0.14% | 0.13% | |
| CAD | -0.10% | -0.08% | -0.13% | -0.15% | 0.04% | 0.01% | 0.01% | |
| AUD | 0.04% | 0.06% | 0.01% | 0.14% | 0.18% | 0.17% | 0.13% | |
| JPY | -0.15% | -0.11% | -0.14% | -0.02% | -0.18% | -0.02% | -0.03% | |
| NZD | -0.13% | -0.11% | -0.13% | -0.01% | -0.15% | 0.03% | 0.01% | |
| CHF | -0.11% | -0.10% | -0.13% | -0.01% | -0.15% | 0.02% | 0.01% |
The heat map shows percentage changes of major currencies against each other. The base currency is picked from the left column, while the quote currency is picked from the top row. For example, if you pick the Euro from the left column and move along the horizontal line to the Japanese Yen, the percentage change displayed in the box will represent EUR (base)/JPY (quote).
- German IFO Business Climate Index rose as expected in February.
- IFO Current Economic Assessment steadied in the reported month.
The headline German IFO Business Climate Index arrived at 85.5 in February, improving from the January print of 85.2 while meeting the market forecast of 85.5.
Meanwhile, the Current Economic Assessment Index stayed unchanged at 86.9 in the reported month, above expectations of 86.7.
The IFO Expectations Index – indicating firms’ projections for the next six months, edged a tad higher to 84.1 in February vs. 83.5 recorded in the previous month and missing the expected 84.0 figure.
Market reaction to the German IFO Survey
EUR/USD is uninspired by the upbeat German IFO survey. At the time of writing, the pair is trading flat at 1.0821.
About German IFO
The headline IFO business climate index was rebased and recalibrated in April after the IFO Research Institute changed the series from the base year of 2000 to the base year of 2005 as of May 2011 and then changed series to include services as of April 2018. The survey now includes 9,000 monthly survey responses from firms in the manufacturing, service sector, trade and construction.
EUR/GBP has bounced back higher from the 0.8500 level. Nevertheless, economists at ING do not expect the pair to extend its rally.
Strengthening domestic story
The UK has continued to experience some repricing higher in growth expectations, as PMIs inched higher again in February. If the ECB had to convince markets that rate cut expectations were overly optimistic, the Bank of England has the ‘privilege’ of letting data do the talking.
The rebound in EUR/GBP from the excessively cheap 0.8500 low did not surprise us. But we have some doubts the pair can rally further in the near term, as markets may be more inclined to push 2024 ECB easing expectations back to 100 bps (now 90 bps) rather than pricing in three full cuts in the UK (now, 62 bps). Still, our medium-term view remains bullish on the pair on the back of policy divergence.
- AUD/JPY surged to an all-time high as the Australian ASX 200 Index rose higher.
- BoJ could delay the plan of exiting from negative rates as Japan entered into a technical recession.
- Australian Dollar strengthened as recent PMI data indicated that February's economic activity returned to growth.
AUD/JPY rises to an all-time high near 99.00 during the European session on Friday, extending its winning streak that commenced on February 14. Market participants are concerned about the potential delay in the Bank of Japan's (BoJ) plan to exit from negative interest rates in the near term, particularly after last week's data showed that the Japanese economy entered into a technical recession. This downward pressure on the Japanese Yen (JPY) provides support for the AUD/JPY cross.
Furthermore, the surge in global money markets, as investors digest dashed hopes for interest rate cuts by major central banks worldwide, is exerting downward pressure on the safe-haven Japanese Yen (JPY). Conversely, Australia’s S&P/ASX 200 index moved higher following the overnight surge on Wall Street, which provides upward support for the Australian Dollar (AUD). This collective dynamic is contributing to the strength of the AUD/JPY cross.
Furthermore, investors persist in borrowing Japanese Yen (JPY) to invest in higher-yielding assets denominated in other currencies. However, recent verbal intervention by Japanese authorities may offer some support for the JPY. Vice Finance Minister for International Affairs Masato Kanda stated last week that authorities would take necessary actions if required.
Earlier in the week, the Japanese Yen received a boost from better-than-expected Trade Balance figures released by the Ministry of Finance of Japan. Market participants are now eagerly awaiting the release of Japan’s National Consumer Price Index (CPI) data scheduled for Tuesday.
The Australian Dollar (AUD) received upward support from domestic PMI data indicating that private sector activity returned to growth in February for the first time in five months, driven by a robust expansion in the services sector. Furthermore, the Aussie Dollar was buoyed by market sentiment suggesting the likelihood of no immediate rate cuts following the recent Meeting Minutes from the Reserve Bank of Australia (RBA).
- USD/CAD trades sideways below 1.3500, following the footprints of the US Dollar.
- Fed Waller said the central bank should not rush for rate cuts.
- The Canadian Retail Sales for December were more robust than expected.
The USD/CAD pair corrects to near 1.3480 in Friday’s European session after failing to sustain above the psychological resistance of 1.3500. The Loonie asset’s action is driven by the subdued US Dollar. After a strong recovery, the US Dollar Index (DXY) turns sideways as investors want fresh guidance on the Federal Reserve’s (Fed) interest rates.
S&P500 futures remain stagnant in the European session, indicating a quiet market mood. The USD Index hovers near 104.00 despite Fed policymakers reiterating the need for more evidence to gain confidence over inflation declining sustainably to the 2% target.
On Thursday, Fed Governor Christopher Waller said the risk in waiting for good inflation data is less than acting on rate cuts too quick. Waller is interested in observing data for at least a couple of months to confirm whether January’s sticky inflation numbers were a one-time blip or progress in price pressures is stalling.
Meanwhile, the Canadian Dollar fails to capitalize on robust Retail Sales data for December. Monthly Retail Sales grew at a robust pace of 0.9% against expectations of 0.8% and a stagnant performance in November. However, it has increased stubbornness in the inflation outlook.
USD/CAD forms a Head and Shoulder chart pattern on an hourly timeframe, which indicates a prolonged consolidation. A breakdown of the neckline plotted from February 9 at 1.3413 will result in a bearish reversal.
The 50-period Exponential Moving Average (EMA) is a significant barricade for the US Dollar bulls. The 14-period Relative Strength Index (RSI) hovers inside 40.00-60.00, which indicates a sideways trend.
A sell-off could appear if the Loonie asset drops below January 31 low at 1.3359. This will expose the asset to January 4 low at 1.3318 and January 5 low at 1.3288.
On the contrary, fresh upside would emerge if the Loonie asset climbs above January 17 high at 1.3542, which will drive asset towards the round-level resistance of 1.3600, followed by November 30 high at 1.3627.
USD/CAD hourly chart
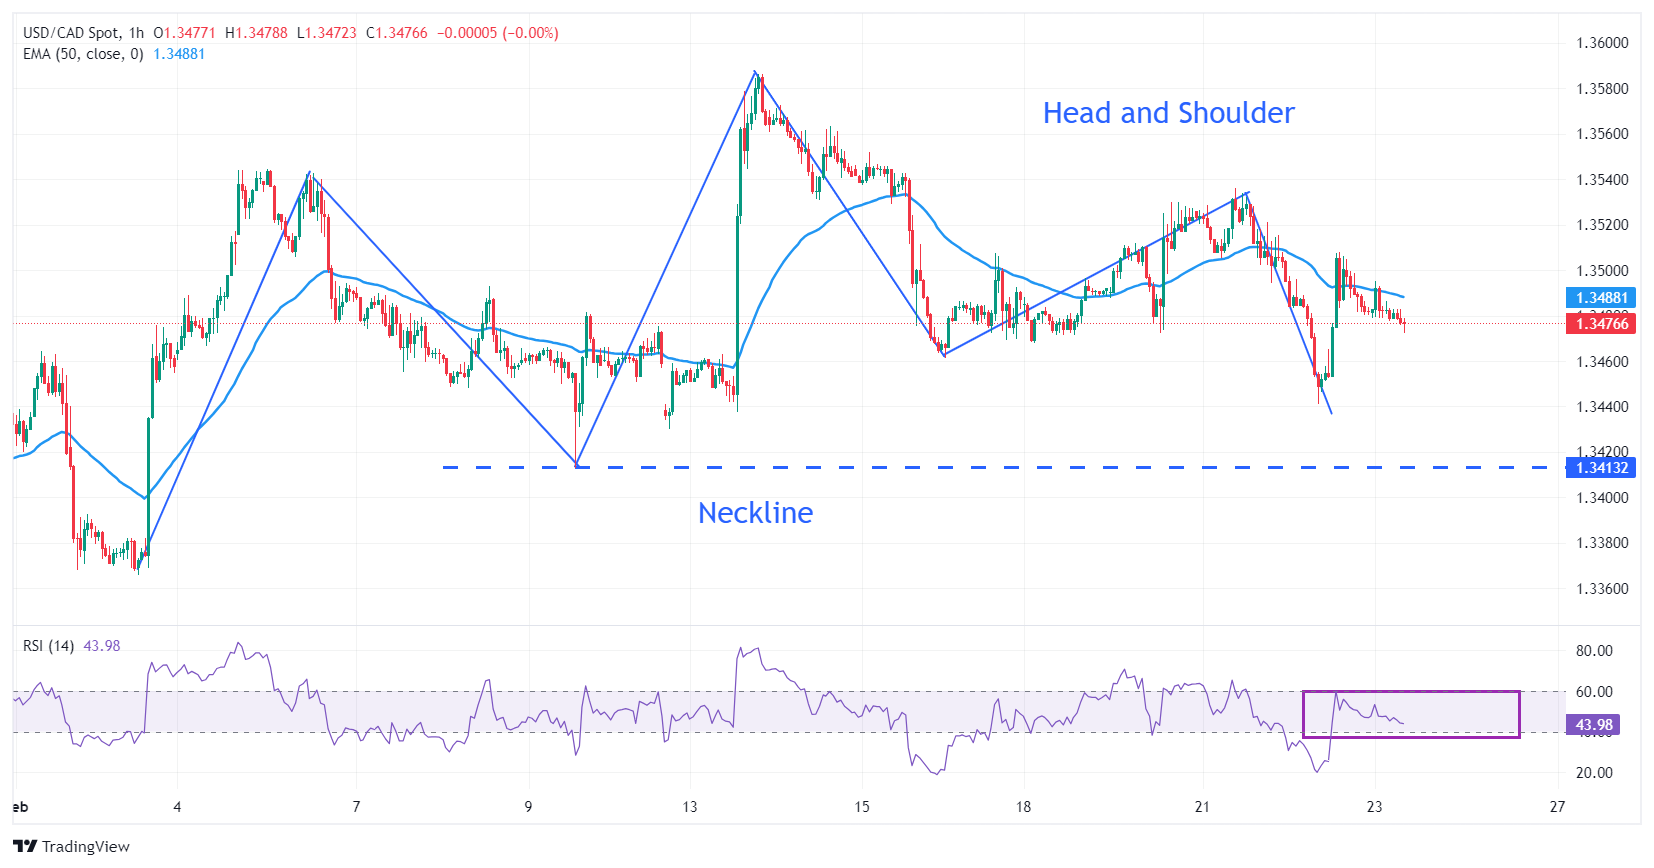
Today, the focus will remain on Germany's struggling economy. Economists at ING analyze EUR/USD outlook ahead of the German IFO sentiment survey.
German slump in focus
German manufacturing PMIs plummeted to 42.3 in February, overshadowing a modest tick-up in the service sector. Today, the IFO survey is published, and we should probably brace for a soft reading there too. The question FX analysts like us are trying to answer now is whether the Euro has already largely priced in the German slump or if other factors have prevented it from taking the hit.
We think the former explanation is more accurate, although it requires an additional key point. The FX market is trading on global risk dynamics and short-term rate differentials. The key question is therefore whether mounting evidence of German economic weakness should be associated with prospects of faster and earlier rate cuts by the ECB. President Lagarde and many of her colleagues tried to send the message that no, it shouldn’t.
Inflation – and above all wages – are the real focus, so the relative resilience of the Euro should not be surprising and the risks of a decline in EUR/USD in the short term are mostly related to USD upside potential.
European Central Bank (ECB) policymaker Robert Holzmann said on Friday, “the main risk to rate cuts is Red Sea tension.”
Additional quotes
Some of the recent wage increases have been quite high.
It is better to cut rates later than to do so too early.
We are hoping for rate cuts but have been wrong before.
Market reaction
At the time of writing, EUR/USD is gaining 0.07% on the day to trade at 1.0830.
ECB FAQs
What is the ECB and how does it influence the Euro?
The European Central Bank (ECB) in Frankfurt, Germany, is the reserve bank for the Eurozone. The ECB sets interest rates and manages monetary policy for the region.
The ECB primary mandate is to maintain price stability, which means keeping inflation at around 2%. Its primary tool for achieving this is by raising or lowering interest rates. Relatively high interest rates will usually result in a stronger Euro and vice versa.
The ECB Governing Council makes monetary policy decisions at meetings held eight times a year. Decisions are made by heads of the Eurozone national banks and six permanent members, including the President of the ECB, Christine Lagarde.
What is Quantitative Easing (QE) and how does it affect the Euro?
In extreme situations, the European Central Bank can enact a policy tool called Quantitative Easing. QE is the process by which the ECB prints Euros and uses them to buy assets – usually government or corporate bonds – from banks and other financial institutions. QE usually results in a weaker Euro.
QE is a last resort when simply lowering interest rates is unlikely to achieve the objective of price stability. The ECB used it during the Great Financial Crisis in 2009-11, in 2015 when inflation remained stubbornly low, as well as during the covid pandemic.
What is Quantitative tightening (QT) and how does it affect the Euro?
Quantitative tightening (QT) is the reverse of QE. It is undertaken after QE when an economic recovery is underway and inflation starts rising. Whilst in QE the European Central Bank (ECB) purchases government and corporate bonds from financial institutions to provide them with liquidity, in QT the ECB stops buying more bonds, and stops reinvesting the principal maturing on the bonds it already holds. It is usually positive (or bullish) for the Euro.
- USD/MXN gained ground for the second consecutive session on Friday.
- Mexico’s 1st half-month Inflation declined by 0.1% in February, against the expected 0.15% rise.
- USD Dollar improves as US Treasury yields appreciate on diminished hope of Fed rate cuts.
USD/MXN continues its upward trajectory for the second consecutive day, edging higher to near 17.10 during the early European hours on Friday. The pair receives upward support following softer data from Mexico and mixed data from the United States (US) released on Thursday.
Mexico’s 1st half-month Inflation declined by 0.1% in February, against the expected rise of 0.15% and the previous growth of 0.49%. While the 1st half-month Core Inflation grew by 0.24% against the expected 0.28% and 0.25%.
INEGI reported that the Mexican Gross Domestic Product (QoQ) increased by 0.1%, as expected in the fourth quarter of 2023. The previous growth was 1.1%. The annual report showed an increase of 2.5% against the expected 2.4% and 3.3% prior.
The US Dollar Index (DXY) hovers near 103.90, supported by higher US yields, standing at 4.72% and 4.32% for 2-year and 10-year US Treasury bonds, respectively, at the time of writing. Additionally, the US Dollar (USD) received upward support on Thursday, propelled by robust labor data from the United States (US), which serves as a tailwind for the USD/MXN pair.
According to the US Bureau of Labor Statistics (BLS), weekly Initial Jobless Claims fell below consensus expectations, with figures declining to 201K for the week ending on February 16, lower than the market's anticipation of 218K and the previous figure of 213K.
Furthermore, hawkish remarks from US Federal Reserve officials, emphasizing the avoidance of interest rate cuts in the near term, could further reinforce support for the US Dollar. Federal Reserve Governor Christopher J. Waller stated that the initiation of policy easing and the number of rate cuts will depend on incoming data, with the Committee prepared to wait a little longer before considering monetary policy easing.
Participating in a moderated discussion at a Conference hosted by Princeton University in New Jersey, Federal Reserve Governor Lisa D. Cook remarked that risks to achieving employment and inflation goals have moved into better balance. She expressed a preference for greater confidence that inflation is converging to 2.0% before initiating rate cuts. Cook also acknowledged that the policy rate will eventually need adjustment as the disinflation outlook becomes more sustainable.
USD/INR is back to the lower end of the 82.70-83.50 range since the start of the year. Economists at Commerzbank analyze the pair’s outlook.
Continued strong growth momentum
The latest S&P Global preliminary PMI reports for both manufacturing and services continue to point to strong economic momentum. The manufacturing PMI for February edged up to 56.7 from 56.5 in January. The services PMI was also slightly higher at 62 from 61.8 previously. They are both well above the 50 threshold, particularly services.
Looking at the forward-looking indicators such as new orders, there were also few signs of a slowdown anytime soon.
For the Reserve Bank of India (RBI), all this is welcome news. The economy remains on a strong footing and headline inflation is expected to remain below the upper end of the 2-6% target range. The strong growth backdrop and stable interest rates are also helping to stabilize INR.
- Pound Sterling trades in a narrow range as investors await fresh guidance on BoE interest-rate outlook.
- The UK business optimism improves amid imminent hopes for BoE pivoting to rate cuts.
- The US Dollar clings to gains amid Middle East tensions.
The Pound Sterling (GBP) struggles for direction on Friday as investors await fresh guidance on Bank of England (BoE) interest rates. The GBP/USD pair trades sideways due to a quiet market of subdued sentiment. Market expectations for BoE’s rate cuts will guide further action in the Pound Sterling.
While uncertainty over the timing of BoE rate cuts continues to persist, investors hope that the central bank could reduce interest rates in the early part of the second-half of this year. The chances for a rate cut in the June policy meeting are under 50%, while a dovish decision for August seems inevitable.
BoE Governor Andrew Bailey said price pressures are expected to come down to the 2% target in spring before picking up again. This may allow the BoE to consider heavily unwinding its historically restrictive monetary policy stance.
Meanwhile, the US Dollar turns sideways after a v-shape recovery amid tightening labor market conditions. For the week ending February 16, individuals claiming jobless benefits for the first time were lower at 201K, against expectations of 218K and the prior reading of 213K. Also, Federal Reserve (Fed) policymakers reiterate the need for more evidence to confirm that inflation will decline to the 2% target.
Daily Digest Market Movers: Pound Sterling consolidates amid quiet market mood
- Pound Sterling is stuck in a tight range around 1.2650 as investors look for fresh triggers to get more insights into the interest-rate outlook.
- Bank of England policymakers have turned slightly dovish on interest-rate prospects due to the deepening cost of living crisis.
- BoE members have shifted their focus on how long interest rates will stay at their current levels, which indicates that the current monetary policy is sufficiently restrictive.
- In his testimony before the UK Parliament’s Treasury Select Committee, BoE Governor Andrew Bailey said the central bank doesn’t need inflation at the 2% target to reduce interest rates.
- Andrew Bailey also mentioned that market expectations of rate cuts are not “unreasonable”.
- This week, BoE policymaker Swati Dhingra warned that a delayed rate-cut decision could lead to a hard landing.
- The hard landing indicates a sharp contraction in economic activities if rates remain too high amid easing price pressures.
- On Thursday, the S&P Global/CIPS reported mixed preliminary data for February. The Manufacturing PMI came in at 47.1, lower than expectations of 47.5. While the Services PMI, at 54.3 outperformed expectations of 54.1.
- The S&P Global/CIPS witnessed an upturn in order book and improvement in business optimism as rate cuts from the BoE are imminent this year.
- The agency commented that the technical recession observed in the second half of 2023 in the United Kingdom economy is over. Still, it warned that the Red Sea crisis is disrupting supply chains, leading to increased shipping costs.
- Meanwhile, the market sentiment is broadly quiet amid the absence of potential indicators.
- The US Dollar Index, which measures the Greenback’s value against six competitive currencies, hovers near 104.00.
- The appeal for safe-haven assets strengthened on Thursday amid the deepening Middle East crisis and hawkish remarks in Federal Open Market Committee (FOMC) minutes of the January policy meeting.
Technical Analysis: Pound Sterling trades inside Thursday’s trading range
Pound Sterling trades back and forth in a tight range around 1.2660. The GBP/USD pair hovers inside Thursday’s trading range. The near-term trend is sideways as the pair oscillates in the Descending Triangle pattern formed on a daily timeframe. The aforementioned chart pattern indicates indecisiveness among market participants, carrying a slightly negative bias due to its formation of lower highs.
The downward-sloping border of the Descending Triangle pattern is plotted from December 28 high at 1.2827, while the horizontal support is placed from December 13 low near 1.2500. The pair holds above the 20 and 50-day Exponential Moving Averages (EMAs), which trade around 1.2630. Meanwhile, the 14-period Relative Strength Index (RSI) trades in the 40.00-60.00 region, indicating a sharp contraction in volatility.
Pound Sterling FAQs
What is the Pound Sterling?
The Pound Sterling (GBP) is the oldest currency in the world (886 AD) and the official currency of the United Kingdom. It is the fourth most traded unit for foreign exchange (FX) in the world, accounting for 12% of all transactions, averaging $630 billion a day, according to 2022 data.
Its key trading pairs are GBP/USD, aka ‘Cable’, which accounts for 11% of FX, GBP/JPY, or the ‘Dragon’ as it is known by traders (3%), and EUR/GBP (2%). The Pound Sterling is issued by the Bank of England (BoE).
How do the decisions of the Bank of England impact on the Pound Sterling?
The single most important factor influencing the value of the Pound Sterling is monetary policy decided by the Bank of England. The BoE bases its decisions on whether it has achieved its primary goal of “price stability” – a steady inflation rate of around 2%. Its primary tool for achieving this is the adjustment of interest rates.
When inflation is too high, the BoE will try to rein it in by raising interest rates, making it more expensive for people and businesses to access credit. This is generally positive for GBP, as higher interest rates make the UK a more attractive place for global investors to park their money.
When inflation falls too low it is a sign economic growth is slowing. In this scenario, the BoE will consider lowering interest rates to cheapen credit so businesses will borrow more to invest in growth-generating projects.
How does economic data influence the value of the Pound?
Data releases gauge the health of the economy and can impact the value of the Pound Sterling. Indicators such as GDP, Manufacturing and Services PMIs, and employment can all influence the direction of the GBP.
A strong economy is good for Sterling. Not only does it attract more foreign investment but it may encourage the BoE to put up interest rates, which will directly strengthen GBP. Otherwise, if economic data is weak, the Pound Sterling is likely to fall.
How does the Trade Balance impact the Pound?
Another significant data release for the Pound Sterling is the Trade Balance. This indicator measures the difference between what a country earns from its exports and what it spends on imports over a given period.
If a country produces highly sought-after exports, its currency will benefit purely from the extra demand created from foreign buyers seeking to purchase these goods. Therefore, a positive net Trade Balance strengthens a currency and vice versa for a negative balance.
NZD/USD has ebbed and flowed with market expectations for policy. Economists at ING analyze Kiwi’s outlook.
RBNZ to soften hawkish stance
The RBNZ’s tightening bias looks less and less credible considering the global central bank backdrop and the February meeting should see some softening of the hawkish narrative.
New Zealand Dollar (NZD) may underperform the Australian Dollar (AUD) as markets price in RBNZ cuts, but NZD/USD still looks bound higher from the second quarter.
See: NZD/USD to push higher to 0.6500 on a 12-month view – Rabobank
- EUR/JPY gains ground near 163.07 in Friday’s early European session.
- German GDP growth numbers contracted 0.3% QoQ and 0.2% YoY in Q4.
- The verbal intervention by Japanese authorities and the rising Middle East geopolitical tensions might cap the JPY’s downside.
- Investors will monitor the German IFO survey for February and the ECB's Schnabel speech on Friday.
The EUR/JPY cross extends its upside near the 163.00 psychological barrier during the early European session on Friday. The pair edges higher after the German GDP growth number for Q4 matched the market estimation. The cross currently trades around 163.07, gaining 0.12% on the day.
The latest data from the Federal Statistics Office of Germany on Friday showed that the German Gross Domestic Product for the fourth quarter (Q4) contracted by 0.3% QoQ and 0.2% YoY in Q4. Both figures were in line with market expectations.
On Thursday, the Eurozone Composite PMI for February came in higher than the consensus forecast, improving to 48.9 from 47.9 in January. The improvement in the Composite PMI was primarily due to an increase in the services PMI, which climbed to 50.0 in February from 48.4 the previous month. The Manufacturing PMI declined to 46.1 in February from 46.6 in January, worse than the expectation of 47.0. This report suggests that the Eurozone manufacturing sector remained in deep contraction territory in the first quarter of 2024.
The minutes of the European Central Bank’s (ECB) January meeting illustrate the currently ongoing shift in the ECB’s inflation assessment, but the very cautious and gradual shift suggests that rate cuts in spring are highly unlikely. Instead, the ECB will want to wait until first-quarter data confirms receding inflationary pressure, a modest economic recovery, and no acceleration of wage growth to slightly reduce the current monetary policy restrictiveness.
On the other hand, the verbal intervention by Japanese authorities might cap the downside of the Japanese Yen (JPY). Japan's Ministry of Finance and Bank of Japan (BoJ) governor have warned that they are closely watching the FX rate and would intervene in the market to prevent further weakening in the home currency if needed. Additionally, the escalating geopolitical tensions in the Middle East might boost the safe-haven currency JPY and act as a headwind for the EUR/JPY cross.
Moving on, market participants will focus on the German IFO survey for February and ECB's Schnabel speech, due on Friday. Next week, the Japanese National Consumer Price Index (CPI) will be released.
Here is what you need to know on Friday, February 23:
After dropping to its weakest level in three weeks, the US Dollar (USD) Index staged a rebound amid rising Treasury bond yields and closed flat on Thursday before stabilizing near 104.00 early Friday. IFO business sentiment survey for Germany will be featured in the European economic docket. Investors will also pay close attention to comments from central bankers.
The risk rally that was fuelled by surging technology stocks caused the USD to weaken against its major rivals on Thursday. The Dow Jones Industrial Average rose 1.2%, the S&P 500 gained 2.1% to close at a new all-time high of 5,087 and the Nasdaq Composite was up nearly 3%. Later in the American session, however, the benchmark 10-year US yield climbed to its highest level since late November at 4.35% and helped the currency erase its daily losses. In the European morning, the 10-year yield holds steady at around 4.33% and US stock index futures trade virtually unchanged on the day.
US Dollar price this week
The table below shows the percentage change of US Dollar (USD) against listed major currencies this week. US Dollar was the weakest against the New Zealand Dollar.
| USD | EUR | GBP | CAD | AUD | JPY | NZD | CHF | |
| USD | -0.38% | -0.39% | 0.03% | -0.47% | 0.37% | -1.00% | 0.01% | |
| EUR | 0.37% | -0.02% | 0.40% | -0.13% | 0.74% | -0.62% | 0.38% | |
| GBP | 0.39% | 0.01% | 0.41% | -0.11% | 0.76% | -0.61% | 0.40% | |
| CAD | -0.02% | -0.40% | -0.41% | -0.50% | 0.34% | -1.02% | -0.01% | |
| AUD | 0.49% | 0.10% | 0.08% | 0.52% | 0.86% | -0.50% | 0.50% | |
| JPY | -0.36% | -0.75% | -0.72% | -0.35% | -0.84% | -1.37% | -0.36% | |
| NZD | 0.99% | 0.62% | 0.60% | 1.01% | 0.52% | 1.35% | 1.00% | |
| CHF | -0.01% | -0.38% | -0.40% | 0.01% | -0.48% | 0.35% | -1.01% |
The heat map shows percentage changes of major currencies against each other. The base currency is picked from the left column, while the quote currency is picked from the top row. For example, if you pick the Euro from the left column and move along the horizontal line to the Japanese Yen, the percentage change displayed in the box will represent EUR (base)/JPY (quote).
The data from the US showed on Thursday that Initial Jobless Claims declined to 201,000 in the week ending February 17 from 213,000 in the previous week. Additionally, S&P Global Composite PMI came in at 51.4 in February's flash estimate, highlighting an ongoing expansion in the private sector's business activity.
EUR/USD came within a touching distance of 1.0900 on Thursday but made a sharp U-turn to close the day flat. Nevertheless, the pair holds steady above 1.0800 in the early European session on Friday.
GBP/USD advanced above 1.2700 for the first time in three weeks on Thursday. As the USD recovered later in the day, the pair erased a large portion of its daily gains but settled above 1.2650.
USD/JPY closed in positive territory for the second consecutive day on Thursday. Early Friday, the pair fluctuates in a narrow channel at around 150.50.
After spending the majority of the day near $2,030, Gold lost its traction and retreated toward $2,020 on Thursday, pressured by rising US yields. XAU/USD consolidates its losses at around $2,020 in the European morning.
- NZD/USD struggles to extend its winning streak amid a bullish momentum on Friday.
- The immediate resistance region appears around February’s high at 0.6219 and the 50.0% retracement level of 0.6223.
- The pair could find the key support region around the seven-day EMA at 0.6167 and the major level of 0.6150.
NZD/USD grapples to extend its winning streak that began on February 14 amid a stable US Dollar. The NZD/USD pair struggles around the psychological level of 0.6200 during the Asian trading hours on Friday.
If the NZD/USD pair surpasses the psychological threshold of 0.6200, it could receive upward support to potentially lead the pair to explore region around the February’s high at 0.6219 and the 50.0% retracement level of 0.6223. A break above this region could exert support for the pair to approach the major resistance of 0.6250 level.
The technical analysis suggests a bullish momentum for the NZD/USD pair. The Moving Average Convergence Divergence (MACD) line is positioned above the centerline, showing divergence above the signal line. Additionally, the 14-day Relative Strength Index (RSI), a lagging indicator, is above the 50 level, suggesting a confirmation of the bullish sentiment.
On the downside, immediate support for the NZD/USD pair is anticipated at the seven-day Exponential Moving Average (EMA) at 0.6167 followed by the major support of 0.6150. A breach below this level could exert downward pressure on the pair, potentially testing the weekly low of 0.6122 to approach the psychological support level of 0.6100.
NZD/USD: Daily Chart
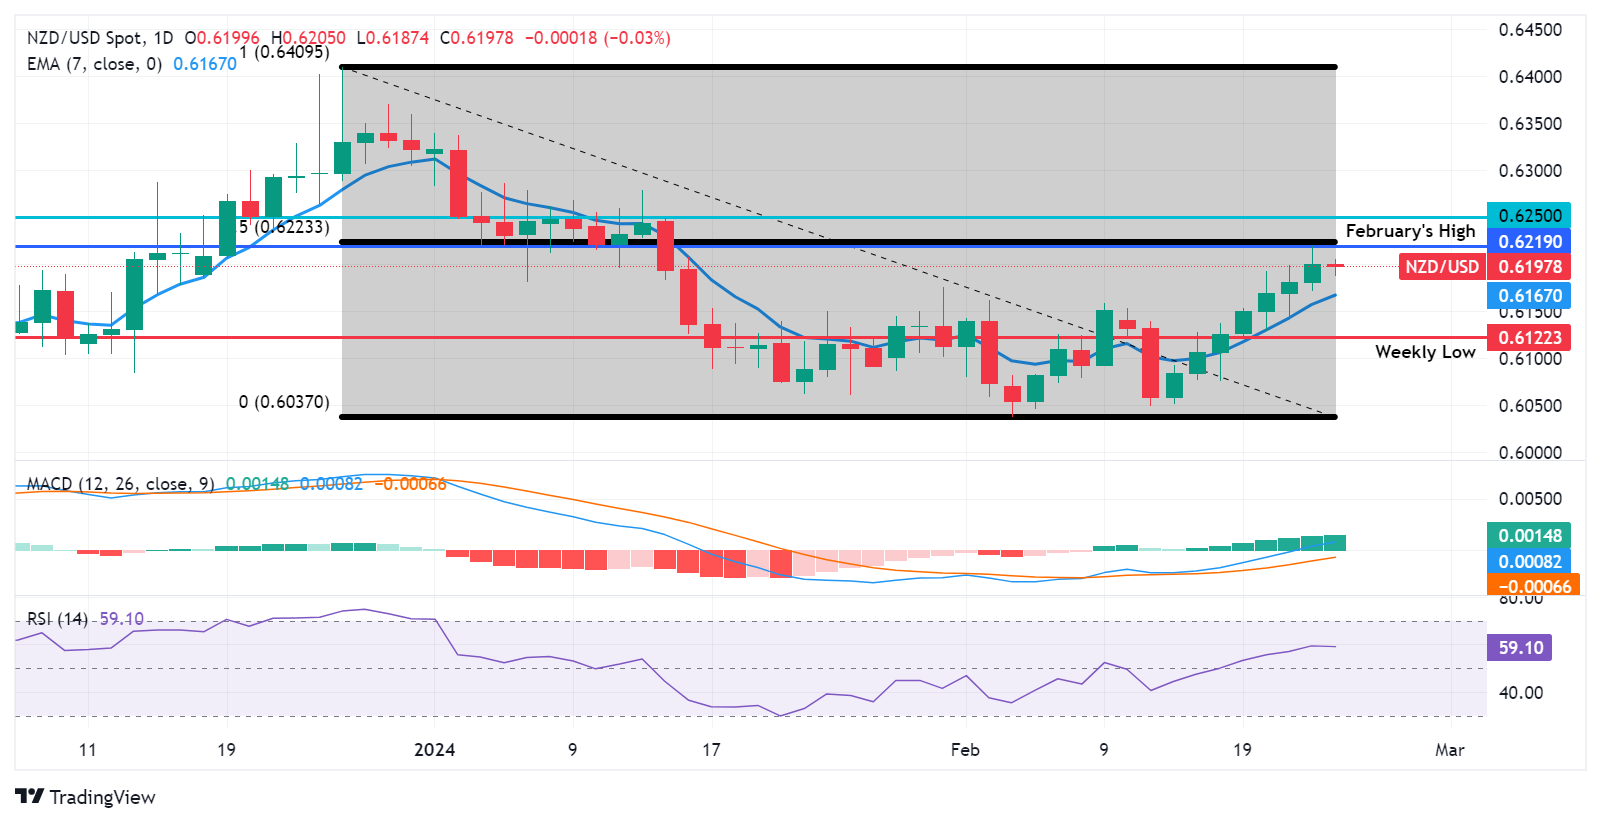
FX option expiries for Feb 23 NY cut at 10:00 Eastern Time, via DTCC, can be found below.
- EUR/USD: EUR amounts
- 1.0675 589m
- 1.0830 1.5b
- USD/JPY: USD amounts
- 149.15 625m
- 150.00 752m
- USD/CAD: USD amounts
- 1.3200 690m
- The US Dollar Index (DXY) trades on a weaker note amid the USD weakness.
- The US labor market remained robust in February.
- The US Q4 GDP growth numbers and the Core Personal Consumption Expenditures Price Index (Core PCE) will be due next week.
The US Dollar Index (DXY), a measure of the value of the US Dollar (USD) against a weighted basket of currencies used by US trade partners, drops below the 104.00 mark during the early European trading hours on Friday. DXY trades on a softer note as traders await fresh catalysts on when the Federal Reserve (Fed) will begin cutting interest rates. At press time, DXY is trading at 103.92, losing 0.02% on the day.
Early Friday, Fed Governor Christopher Waller said the recent stronger-than-expected inflation data validates the Fed’s Chair Jerome Powell's careful risk management approach, and the central bank is not rushing to begin cutting interest rates, as the Fed wanted to wait longer before having enough confidence that starting rate cuts will keep us on the path to 2% inflation.
The upbeat Manufacturing PMI and labor data failed to boost the US Dollar Index. The US Department of Labor revealed on Thursday that US Initial Jobless Claims for the week ending February 17 dropped to 201K from the previous week of 213K, while Continuing Claims declined to 1.862M, below the estimation and the previous week.
Furthermore, the flash US Manufacturing Purchasing Managers Index (PMI) rose to a 17-month high of 51.5 in February from 50.7 in January, above the market consensus of 50.5. Meanwhile, the Services PMI eased to 51.3 in February versus 52.5 prior, weaker than the projection of 52.00.
Apart from this, the rising tensions in the Middle East also support the DXY. Houthi rebels launched two missiles at another UK-registered cargo ship in the Gulf of Arden. This comes as the group enhances its military and defense capabilities to continue attacking ships in the Red Sea. Further conflicts in the Middle East might lift the traditional currency, like the Greenback.
Next week, market players will focus on the US Gross Domestic Product Annualized for the fourth quarter (Q4), which is projected to remain steady at 3.3%. Also, the Core Personal Consumption Expenditures Price Index (Core PCE) and ISM Manufacturing PMI for February will be due. Traders will take cues from the data and find opportunities around the US Dollar Index.
- GBP/JPY could extend gains due to diminished expectations regarding the BoJ exiting from negative interest rates.
- The safe-haven Japanese Yen could face challenges due to the surge in the global money markets.
- UK PMI data showed a slight improvement in domestic business activity in the private sector.
GBP/JPY remains around 190.60 during the Asian session on Friday, exhibiting a positive bias to extend its winning streak for the fourth consecutive day. Concerns about a potential recession in Japan may delay the Bank of Japan's (BoJ) plan to exit from negative interest rates in the near term.
Moreover, the surge in global money markets, as investors digest the dashed hopes for interest rate cuts by major central banks worldwide, is weighing on the safe-haven Japanese Yen (JPY). However, the JPY may find some support from recent verbal intervention by Japanese authorities.
Earlier in the week, the Japanese Yen gained support from better-than-expected Trade Balance figures released by the Ministry of Finance of Japan, thereby limiting losses for the GBP/JPY cross. Additionally, market participants are awaiting Japan’s National Consumer Price Index (CPI) data scheduled for release on Tuesday.
The Pound Sterling (GBP) received upward support from mixed Purchasing Managers Index (PMI) data for February from the United Kingdom (UK). While the preliminary Manufacturing PMI for February came in at 47.1, slightly below market expectations of 47.5, the Services PMI remained unchanged at 54.3, surpassing the consensus of 54.1. The Composite PMI arrived at 53.3, exceeding expectations of remaining consistent at 52.9.
Uncertainty prevails among investors regarding the trajectory of policy rates by the Bank of England (BoE), particularly following remarks from BoE officials. BoE Governor Andrew Bailey, in an address to the United Kingdom Parliament on Tuesday, noted the rapid decrease in UK inflation. He emphasized that the central bank does not require a definitive return of inflation to target levels before considering interest rate cuts.
Furthermore, on Wednesday, Swati Dhingra, a member of the Bank of England, suggested that delaying interest rate cuts could lead to increased living costs and potentially result in a harsh economic downturn for the United Kingdom.
- USD/CHF trades with a mild positive bias, though subdued USD demand caps any meaningful gains.
- The Fed’s hawkish outlook remains supportive of elevated US bond yields and favours the USD bulls.
- A sustained move beyond the 200-day SMA is needed to reaffirm the near-term constructive outlook.
The USD/CHF pair ticks higher during the Asian session on Friday, albeit lacks bullish conviction and remains confined within the previous day's broader range. Spot prices currently trade around the 0.8800 mark, comfortably above a one-and-half-week low touched on Thursday and remain at the mercy of the US Dollar (USD) price dynamics.
The USD Index (DXY), which tracks the Greenback against a basket of currencies, struggles to capitalize on the previous day's goodish rebound from its lowest level in almost three weeks and acts as a headwind for the USD/CHF pair. That said, growing acceptance that the Federal Reserve (Fed) will keep interest rates higher for longer favours the USD bulls and suggests that the path of least resistance for the currency pair is to the upside.
In fact, the minutes of the late January FOMC policy meeting released on Wednesday revealed that policymakers were concerned about cutting interest rates too quickly amid sticky inflation and a still-resilient US economy. Moreover, Fed officials reiterated the message that the central bank was in no hurry to ease its monetary policy. This remains supportive of elevated US Treasury bond yields and validates the positive setup for the Greenback.
Apart from this, the prevalent risk-on environment, which tends to undermine the safe-haven Swiss Franc (CHF), supports prospects for a further near-term appreciating move for the USD/CHF pair. Even from a technical perspective, spot prices showed resilience below the 100-day Simple Moving Average (SMA), which, along with positive oscillators on the daily chart, reaffirms the near-term constructive outlook for the currency pair.
That said, it will still be prudent to wait for sustained strength and acceptance above the very important 200-day SMA before placing fresh bullish bets around the USD/CHF pair. There isn't any relevant market-moving economic data due for release from the US on Friday. Hence, the US bond yields will continue to play a key role in driving demand for the USD. This, along with the broader risk sentiment, should provide some impetus to the major.
Technical levels to watch
- EUR/USD consolidates after witnessing volatility on Thursday.
- The Euro remains stable as traders digested the mixed PMI figures from the Eurozone.
- US Dollar gained ground after better-than-expected US Initial Jobless Claims.
EUR/USD consolidates following a volatile session prompted by the release of European and US Purchasing Managers Index (PMI) data on Thursday. The Euro (EUR) stabilized as investors processed the mixed figures concerning private business activity in the European Union (EU). The pair gets buoyed around 1.0820 during the Asian trading hours on Friday.
In the Eurozone, the disinflationary trend persists as both Eurozone and German PMI data for February reveal mixed figures. While preliminary Eurozone and German Services PMIs increased, Manufacturing PMIs fell short of market expectations.
The ECB Monetary Policy Meeting Accounts for January indicated that policymakers maintain caution regarding easing monetary policy. They expressed a consensus that it was premature to discuss rate cuts at the present meeting.
ECB policymakers acknowledged progress on inflation, showing greater optimism than in previous years. They also emphasized that rate cuts are not automatically justified, even if the ECB revises March inflation projections downward.
The US Dollar Index (DXY) hovers near 103.90, supported by higher US yields, which stand at 4.71% and 4.33% for 2-year and 10-year US Treasury bonds, respectively, at the time of writing. Furthermore, the US Dollar (USD) received upward support on Thursday, driven by robust labor data from the United States (US).
According to the US Bureau of Labor Statistics (BLS), weekly Initial Jobless Claims dropped below consensus expectations, with figures reaching 201K for the week ending on February 16, lower than the market expectation of 218K and the previous figure of 213K.
In terms of PMI data, S&P Global US Services PMI posted a reading of 51.3 in February, slightly below the expected 52.0 and the prior figure of 52.5. However, Manufacturing PMI improved to 51.5, surpassing the anticipated 50.5 and the previous figure of 50.7.
US Composite PMI declined to 51.4 in February from the previous reading of 52.0. Additionally, Hawkish remarks from US Federal Reserve officials, emphasizing the avoidance of interest rate cuts in the near term, could further bolster support for the US Dollar (USD).
- Gold price regains some positive traction amid geopolitical risks and subdued USD demand.
- The Fed’s hawkish outlook remains supportive of elevated US bond yields and caps gains.
- A sustained strength beyond the 50-day SMA is needed for bulls to seize near-term control.
Gold price (XAU/USD) attracts some dip-buying during the Asian session on Friday and remains within the striking distance of a nearly two-week high touched the previous day. The conflict in the Middle East has shown no signs of de-escalation, which, along with a modest US Dollar (USD) downtick, turns out to be key factors lending some support to the safe-haven commodity. That said, growing acceptance that the Federal Reserve (Fed) will keep interest rates higher for longer amid concerns over sticky inflation and persistent strength in the US economy might continue to act as a headwind for the non-yielding yellow metal.
In fact, the minutes of the late January FOMC meeting revealed that policymakers were concerned about cutting interest rates too quickly. Furthermore, comments by a slew of influential Fed officials suggested that the central bank was in no hurry to ease its monetary policy. This remains supportive of elevated US Treasury bond yields and favours the USD bulls. Apart from this, the prevalent risk-on mood across the global equity markets could contribute to capping the upside for the Gold price. Hence, bulls might wait for a sustained strength beyond the 50-day Simple Moving Average (SMA) before placing fresh bets.
Daily Digest Market Movers: Gold price attracts some haven flows amid a softer US Dollar
- Israel intensified its bombardment on Gaza's Rafah, while Yemen's Iran-aligned Houthis rebels stepped up attacks on ships in the Red Sea, raising the risk of a wider war in the Middle East and underpinning the safe-haven Gold price.
- The US Dollar struggles to capitalize on the previous day's goodish rebound from its lowest level in almost three weeks and lends additional support to the XAU/USD, though the Federal Reserve's hawkish outlook might cap gains.
- Minutes of the latest FOMC policy meeting released on Wednesday pointed to a broad uncertainty about how long borrowing costs should remain at their current level to bring down inflation back to the central bank's 2% target.
- Fed Vice Chair Philip Jefferson thinks that the central bank could begin to cut rates later this year, though said that he will be looking across a broad set of economic indicators for conviction that it is time to lower borrowing costs.
- Meanwhile, Philadelphia Fed President Patrick Harker noted that the central bank is getting close to cutting rates but a move in the near term is unlikely and emphasized that he doesn’t want to cut too early and re-ignite inflation.
- Separately, Fed Governor Lisa Cook noted that it is not yet time to reduce interest rates as the path towards the 2% inflation goal has been and could still be bumpy and uneven, citing the recent stronger consumer inflation figures.
- Furthermore, Fed Governor Christopher Waller said that policymakers should delay rate cuts by at least another couple more months to see if the hot inflation print in January was just a speed bump in the road towards price stability.
- As per the CME Group's FedWatch Tool, the markets are pricing in around a 30% chance that the Fed will start cutting interest rates in May, while the odds for a move at the June FOMC policy meeting currently stand at about 66%.
- Data released on Thursday showed that the number of Americans applying for unemployment insurance benefits fell from 213K to 201K during the week ending February 17, offering fresh signs of strength in the labor market.
- The yield on the benchmark 10-year US government bond holds steady near its highest level since late November, acting as a tailwind for the Greenback and capping the non-yielding yellow metal amid the prevalent risk-on mood.
- The better-than-expected release of the flash Eurozone PMI prints suggested that the downturn in the business activity eased in February, which further boosts investors’ sentiment and should contribute to keeping a lid on the XAU/USD.
Technical Analysis: Gold price bulls still await a sustained breakout through the 50-day SMA
From a technical perspective, the 50-day SMA, currently pegged near the $2,032 area, followed by the $2,035 region, or a nearly two-week high touched on Thursday, could act as an immediate hurdle. Given that oscillators on the daily chart have just started gaining positive traction, a sustained strength beyond the said barrier has the potential to lift the Gold price towards the $2,044-2,045 intermediate resistance en route to the $2,065 supply zone.
On the flip side, the $2,020-2,019 area now seems to have emerged as an immediate support. This is followed by the 100-day SMA, around the $2,000 psychological mark, which if broken decisively will expose the monthly low, around the $1,984 region. The subsequent downfall could drag the Gold price further towards challenging the very important 200-day SMA support near the $1,966-1,965 zone.
US Dollar price this week
The table below shows the percentage change of US Dollar (USD) against listed major currencies this week. US Dollar was the strongest against the Japanese Yen.
| USD | EUR | GBP | CAD | AUD | JPY | NZD | CHF | |
| USD | -0.37% | -0.43% | 0.03% | -0.48% | 0.26% | -1.09% | -0.03% | |
| EUR | 0.38% | -0.04% | 0.41% | -0.10% | 0.64% | -0.71% | 0.35% | |
| GBP | 0.42% | 0.06% | 0.45% | -0.06% | 0.67% | -0.67% | 0.40% | |
| CAD | -0.03% | -0.40% | -0.46% | -0.51% | 0.23% | -1.12% | -0.05% | |
| AUD | 0.48% | 0.12% | 0.06% | 0.51% | 0.74% | -0.61% | 0.45% | |
| JPY | -0.25% | -0.67% | -0.67% | -0.23% | -0.74% | -1.36% | -0.27% | |
| NZD | 1.08% | 0.71% | 0.66% | 1.11% | 0.61% | 1.34% | 1.05% | |
| CHF | 0.02% | -0.35% | -0.40% | 0.05% | -0.46% | 0.27% | -1.07% |
The heat map shows percentage changes of major currencies against each other. The base currency is picked from the left column, while the quote currency is picked from the top row. For example, if you pick the Euro from the left column and move along the horizontal line to the Japanese Yen, the percentage change displayed in the box will represent EUR (base)/JPY (quote).
Gold FAQs
Why do people invest in Gold?
Gold has played a key role in human’s history as it has been widely used as a store of value and medium of exchange. Currently, apart from its shine and usage for jewelry, the precious metal is widely seen as a safe-haven asset, meaning that it is considered a good investment during turbulent times. Gold is also widely seen as a hedge against inflation and against depreciating currencies as it doesn’t rely on any specific issuer or government.
Who buys the most Gold?
Central banks are the biggest Gold holders. In their aim to support their currencies in turbulent times, central banks tend to diversify their reserves and buy Gold to improve the perceived strength of the economy and the currency. High Gold reserves can be a source of trust for a country’s solvency. Central banks added 1,136 tonnes of Gold worth around $70 billion to their reserves in 2022, according to data from the World Gold Council. This is the highest yearly purchase since records began. Central banks from emerging economies such as China, India and Turkey are quickly increasing their Gold reserves.
How is Gold correlated with other assets?
Gold has an inverse correlation with the US Dollar and US Treasuries, which are both major reserve and safe-haven assets. When the Dollar depreciates, Gold tends to rise, enabling investors and central banks to diversify their assets in turbulent times. Gold is also inversely correlated with risk assets. A rally in the stock market tends to weaken Gold price, while sell-offs in riskier markets tend to favor the precious metal.
What does the price of Gold depend on?
The price can move due to a wide range of factors. Geopolitical instability or fears of a deep recession can quickly make Gold price escalate due to its safe-haven status. As a yield-less asset, Gold tends to rise with lower interest rates, while higher cost of money usually weighs down on the yellow metal. Still, most moves depend on how the US Dollar (USD) behaves as the asset is priced in dollars (XAU/USD). A strong Dollar tends to keep the price of Gold controlled, whereas a weaker Dollar is likely to push Gold prices up.
- USD/CAD hovers around Thursday’s close of 1.3481.
- The lower WTI oil price puts pressure on the Canadian Dollar.
- The US Dollar cheered the mixed US PMI data, which indicated economic expansion.
- US Initial Jobless Claims dropped to 201K, lower than the expected 218K and 213K prior.
USD/CAD remains silent with a bias towards extending its losses for the third successive session, hovering around 1.3480 during the Asian session on Friday. The USD/CAD pair loses ground as the US Dollar (USD) remains subdued amidst speculation of potential interest rate cuts by the Federal Reserve (Fed). Additionally, the Canadian Dollar (CAD) received upward support following the release of mixed Retail Sales data from Canada on Thursday.
Statistics Canada released Retail Sales (MoM), indicating a 0.9% improvement in December, surpassing the anticipated 0.8% reading. This increase, compared to the previous flat reading of 0.0% in November, suggests higher sales volumes for retailers. However, monthly Retail Sales excluding Autos grew by 0.6%, slightly below the market expectation of 0.7%, yet marking a significant rebound from the previous decline of 0.4%.
However, the decline in the Crude oil prices could have weighed on the Canadian Dollar, consequently, limiting the losses of the USD/CAD pair. West Texas Intermediate (WTI) oil price edges lower to near $78.10 per barrel, by the press time. The demand for Crude oil is encountering challenges due to higher interest rates globally, which are dampening economic activities.
The US Dollar Index (DXY) received upward support on Thursday as labor data from the United States demonstrated strength. The US Bureau of Labor Statistics (BLS) reported that weekly Initial Jobless Claims dropped below consensus expectations, with figures reaching 201K for the week ending on February 16, lower than the market expectation of 218K and the previous figure of 213K.
Furthermore, mixed preliminary S&P Global Purchasing Managers Index (PMI) data indicated economic expansion, reinforcing the case for the Federal Reserve to maintain elevated interest rates for a longer duration to address inflationary pressures.
In detail, S&P Global US Services PMI posted a reading of 51.3 in February, slightly below the expected 52.0 and the prior figure of 52.5. Manufacturing PMI improved to 51.5, exceeding the anticipated 50.5 and the previous figure of 50.7. However, US Composite PMI declined to 51.4 in February from the previous reading of 52.0.
- Indian Rupee loses ground despite the weaker US Dollar (USD).
- RBI kept the key repo rate steady at 6.5%, signaling the battle against persistently high inflation is not over yet.
- The US GDP growth numbers for Q4 will be in the spotlight next week.
Indian Rupee (INR) edges lower on Friday despite the decline of the US Dollar (USD). The minutes of the Federal Reserve (Fed) at its January meeting, along with a weaker-than-expected bond auction, pushed US Treasury yields higher and weighed on the INR.
According to the minutes of the Reserve Bank of India (RBI) MPC meeting, RBI governor Shaktikanta Das said any premature move may undermine the success achieved so far. RBI’s Das added that the central bank remained cautious about inflation data due to uncertainty in food prices, rising geopolitical tensions, and supply chain disruptions, as a new flash point also poses further risks to the inflation outlook.
In the absence of top-tier economic data released this week from the US and India, risk sentiment could influence the price action of USD/INR. The attention will shift to the US Gross Domestic Product Annualized (GDP) for the fourth quarter next week for fresh impetus.
Daily Digest Market Movers: Indian Rupee remains vulnerable to high inflation and uncertainties
- India’s S&P Global Services PMI rose to 62.0 in February from 61.8 in January.
- India’s Manufacturing PMI eased to 56.7 in February from 56.9 in the previous reading. The Composite PMI arrived at 61.5 in February versus 61.2 prior.
- US Initial Jobless Claims for the week ending February 17 fell to 201K from the previous weeks of 213K. Continuing Claims dropped to 1.862M, below expectations and the prior week.
- US Manufacturing PMI climbed to 51.5 in February from 50.7 in January, better than the expectation of 50.5. The Services PMI eased to 51.3 in February from 52.5 in January, weaker than 52.00 expected.
- Fed Governor Christopher Waller said there is no rush to begin cutting interest rates. However, he will need to see further evidence that inflation is cooling before supporting interest rate cuts.
Technical Analysis: Indian Rupee weakens in the long-term trading band of 82.70–83.20
Indian Rupee trades softer on the day. USD/INR remains capped within a multi-month-old descending trend channel between 82.70 and 83.20 since December 8, 2023.
In the near term, the bearish outlook of USD/INR remains intact as the pair is below the key 100-day Exponential Moving Average (EMA) on the daily chart. Additionally, the 14-day Relative Strength Index (RSI) stands below the 50.0 midline, indicating that further decline looks favorable.
The potential support level for USD/INR will emerge at the lower limit of the descending trend channel at 82.70. A decisive break below this level will expose 82.45 (low of August 23), followed by 82.25 (low of June 1).
On the other hand, the key upside barrier is seen at the 83.00 mark, portraying the psychological round figure and the 100-day EMA. A break above this level will pave the way to the upper boundary of the descending trend channel at 83.20. Further north, the next hurdle is located at 83.35 (high of January 2), en route to 84.00 (round figure).
US Dollar price today
The table below shows the percentage change of US Dollar (USD) against listed major currencies today. US Dollar was the strongest against the Swiss Franc.
| USD | EUR | GBP | CAD | AUD | JPY | NZD | CHF | |
| USD | 0.00% | 0.01% | 0.00% | -0.15% | 0.00% | -0.09% | 0.04% | |
| EUR | 0.00% | 0.01% | 0.01% | -0.14% | 0.00% | -0.10% | 0.03% | |
| GBP | 0.00% | -0.01% | 0.00% | -0.16% | 0.00% | -0.09% | 0.04% | |
| CAD | 0.00% | -0.01% | 0.00% | -0.16% | 0.01% | -0.10% | 0.02% | |
| AUD | 0.15% | 0.14% | 0.15% | 0.16% | 0.16% | 0.07% | 0.17% | |
| JPY | -0.01% | 0.01% | 0.02% | 0.00% | -0.16% | -0.09% | 0.03% | |
| NZD | 0.06% | 0.08% | 0.10% | 0.10% | -0.06% | 0.09% | 0.11% | |
| CHF | -0.04% | -0.04% | -0.04% | -0.04% | -0.19% | -0.05% | -0.13% |
The heat map shows percentage changes of major currencies against each other. The base currency is picked from the left column, while the quote currency is picked from the top row. For example, if you pick the Euro from the left column and move along the horizontal line to the Japanese Yen, the percentage change displayed in the box will represent EUR (base)/JPY (quote).
Indian Rupee FAQs
What are the key factors driving the Indian Rupee?
The Indian Rupee (INR) is one of the most sensitive currencies to external factors. The price of Crude Oil (the country is highly dependent on imported Oil), the value of the US Dollar – most trade is conducted in USD – and the level of foreign investment, are all influential. Direct intervention by the Reserve Bank of India (RBI) in FX markets to keep the exchange rate stable, as well as the level of interest rates set by the RBI, are further major influencing factors on the Rupee.
How do the decisions of the Reserve Bank of India impact the Indian Rupee?
The Reserve Bank of India (RBI) actively intervenes in forex markets to maintain a stable exchange rate, to help facilitate trade. In addition, the RBI tries to maintain the inflation rate at its 4% target by adjusting interest rates. Higher interest rates usually strengthen the Rupee. This is due to the role of the ‘carry trade’ in which investors borrow in countries with lower interest rates so as to place their money in countries’ offering relatively higher interest rates and profit from the difference.
What macroeconomic factors influence the value of the Indian Rupee?
Macroeconomic factors that influence the value of the Rupee include inflation, interest rates, the economic growth rate (GDP), the balance of trade, and inflows from foreign investment. A higher growth rate can lead to more overseas investment, pushing up demand for the Rupee. A less negative balance of trade will eventually lead to a stronger Rupee. Higher interest rates, especially real rates (interest rates less inflation) are also positive for the Rupee. A risk-on environment can lead to greater inflows of Foreign Direct and Indirect Investment (FDI and FII), which also benefit the Rupee.
How does inflation impact the Indian Rupee?
Higher inflation, particularly, if it is comparatively higher than India’s peers, is generally negative for the currency as it reflects devaluation through oversupply. Inflation also increases the cost of exports, leading to more Rupees being sold to purchase foreign imports, which is Rupee-negative. At the same time, higher inflation usually leads to the Reserve Bank of India (RBI) raising interest rates and this can be positive for the Rupee, due to increased demand from international investors. The opposite effect is true of lower inflation.
| Raw materials | Closed | Change, % |
|---|---|---|
| Silver | 22.751 | -0.58 |
| Gold | 2024.446 | -0.08 |
| Palladium | 964.68 | 1.96 |
- India’s Nifty and Sensex look to a mixed open on Friday, having settled higher on Thursday.
- On Thursday, Nifty and Sensex rebounded firmly in tandem with the IT and auto sector stocks.
- India’s and US PMIs came in mixed, RBI Minutes read hawkish, dismiss premature policy pivot.
The Sensex 30 and Nifty 50, India’s key benchmark indices, are likely to open Friday on a cautious footing, having staged a solid comeback to close in the green on Thursday. The turnaround in Indian indices on Thursday was led by the impressive rebound in the IT and automobile sector stocks.
The risk rally in the Asian and European stock markets on tech-boost also aided the late rebound in the Indian indices. Encouraging earnings report from the US chipmaker Nvidia lifted the overall market sentiment, sending global equities firmly higher.
Mixed Indian and US preliminary business PMI data combined with a hawkish Reserve Bank of India (RBI) meeting Minutes are likely to keep Nifty and Sensex traders on edge. Further, Gift Nifty futures are printing small losses, indicating a subdued open on Nifty and Sensex indices.
The National Stock Exchange (NSE) Nifty 50 ended 0.74% higher on the day at 22,217.45 while the Bombay Stock Exchange (BSE) Sensex 30 also added 0.74% on Thursday to settle at 73,158.24.
Stock market news
- On Thursday, the top gainers on Nifty were Coal India, Eicher Motors, HCL Tech, Bajaj Auto and ITC. Meanwhile, the top losers were IndusInd Bank, HDFC Bank, BPCL, Kotak Mahindra Bank and Hindustan Unilever.
- Data published by HSBC Bank showed on Thursday that India’s Manufacturing Purchasing Managers’ (PMI) Index dropped from 56.9 in January to 56.7 in February. Meanwhile, the Services PMI rose to 62.0 in the same period vs. 61.8 previous. The Composite PMI stood at 61.5, as against the previous reading of 61.2.
- In the RBI Minutes, Governor Shaktikanta Das stated that ‘’at this juncture, monetary policy must remain vigilant and not assume that our job on the inflation front is over. We must remain committed to successfully navigating the ‘last mile’ of disinflation which can be sticky.”
- S&P Global Manufacturing PMI improved to 51.5 from 50.7 in February, while S&P Global Services PMI edged lower to 51.3 from 52.5.
- Speeches from Federal Reserve (Fed) policymakers continue to push back against expectations of early interest rate cuts.
- Jefferies expects the Indian stock market to hit $10 trillion by 2030.
- Among the corporate news, Grasim Industries Limited, a flagship company of the Aditya Birla Group, unveiled Birla Opus, its new decorative paints brand, targeting ₹10,000 crore revenue within 3 years.
- Bharti Airtel introduced in-flight roaming plans for customers that will allow them to stay connected while on board a flight.
- SpiceJet raised ₹316 crore, bringing the total funds raised to ₹1,060.
- The US stock markets rallied hard on Thursday, riding the AI optimism wave. US stock futures are trading 0.05% higher so far, at the press time.
- Nvidia released Q4 earnings after the close on Wednesday. Nvidia posted $5.16 earnings per share (EPS) vs. $4.64 expected while revenue stood at $22.10 billion vs. $20.62 billion expected. The AI pioneer said that it expected $24.0 billion in sales in the current quarter.
- The Fed Minutes stated on Wednesday, “most participants noted the risks of moving too quickly to ease the stance of policy and emphasized the importance of carefully assessing incoming data in judging whether inflation is moving down sustainably to 2 percent.”
- Markets are currently pricing in just about a 30% chance that the Fed could begin easing rates in May, much lower than an over 80% chance a month ago, according to the CME FedWatch Tool. For the June meeting, the probability for a rate cut now stands at 70%, down from 77% seen a day ago.
- People’s Bank of China (PBoC) cut the five-year Loan Prime Rate (LPR) by a record 25 bps from 4.20% to 3.95%. The PBOC rate cut failed to excite traders on Tuesday.
- All eyes now remain on the Fed’s Monetary Policy Report and Fedspeak in the day ahead.
Sensex FAQs
What is the Sensex?
The Sensex is a name for one of India’s most closely monitored stock indexes. The term was coined in the 1980s by analyst Deepak Mohoni by mashing the words sensitive and index together. The index plots a weighted average of the share price of 30 of the most established stocks on the Bombay Stock Exchange. Each corporation's weighting is based on its “free-float capitalization”, or the value of all its shares readily available for trading.
What factors drive the Sensex?
Given it is a composite, the value of the Sensex is first and foremost dependent on the performance of its constituent companies as revealed in their quarterly and annual results. Government policies are another factor. In 2016 the government decided to phase out high value currency notes, for example, and certain companies saw their share price fall as a result. When the government decided to cut corporation tax in 2019, meanwhile, the Sensex gained a boost. Other factors include the level of interest rates set by the Reserve Bank of India, since that dictates the cost of borrowing, climate change, pandemics and natural disasters
What are the key milestones for the Sensex?
The Sensex started life on April 1 1979 at a base level of 100. It reached its highest recorded level so far, at 73,328, on Monday, January 15, 2024 (this is being written in Feb 2024). The Index closed above the 10,000 mark for the first time on February 7, 2006. On March 13, 2014 the Sensex closed higher than Hong Kong’s Hang Seng index to become the major Asian stock index with the highest value. The index’s biggest gain in a single day occurred on April 7, 2020, when it rose 2,476 points; its deepest single-day loss occurred on January 21, 2008, when it plunged 1,408 points due the US subprime crisis.
What major corporations are in the Sensex?
Major companies within the Sensex include Reliance Industries Ltd, HDFC Bank, Axis Bank, ITC Ltd, Bharti Airtel Ltd, Tata Steel, HCL Technologies, Infosys, State Bank of India, Sun Pharma, Tata Consultancy Services and Tech Mahindra.
- Australian Dollar strengthens on market sentiment regarding the probability of no imminent RBA rate cuts.
- Australia’s ASX 200 moves higher following the overnight surge on Wall Street.
- US Dollar received upward support as mixed US PMI data indicated economic expansion.
- US Initial Jobless Claims declined to 201K, against the expected 218K and 213K prior.
The Australian Dollar (AUD) continues to move in a positive direction, influenced by the S&P/ASX 200 index moving higher following the overnight surge on Wall Street. The upbeat quarterly report from Nvidia propelled the S&P 500 and the Nasdaq Composite to new all-time closing highs.
Australian Dollar (AUD) received upward support from domestic data indicating that private sector activity returned to growth in February for the first time in five months, driven by a strong expansion in the services sector. Additionally, the Aussie Dollar benefited from market sentiment regarding the probability of no imminent rate cuts following the recent Meeting Minutes from the Reserve Bank of Australia (RBA).
The US Dollar Index (DXY) received upward support as employment data from the United States showed strength, with the US Bureau of Labor Statistics (BLS) reporting that weekly Initial Jobless Claims dropped below consensus expectations. Additionally, the mixed preliminary S&P Global Purchasing Managers Index (PMI) data indicated economic expansion, reinforcing the case for the Federal Reserve to maintain elevated interest rates for a longer duration to address inflationary pressures. Additionally, Hawkish remarks from US Federal Reserve officials, emphasizing the avoidance of interest rate cuts in the near term, could further bolster support for the US Dollar (USD).
Daily Digest Market Movers: Australian Dollar appreciates on higher money market
- Judo Bank Australia Composite PMI increased to 51.8 in February from the previous reading of 49, indicating the first month of expansion in the Australian private sector after a five-month period of contraction.
- Judo Bank Australia Services PMI rose to 52.8 from the previous reading of 49.1. Manufacturing PMI fell to 47.7 from 50.1 prior due to a significant drop in new orders.
- Australian Wage Price Index (QoQ) grew by 0.9% in the fourth quarter as expected, lower than the previous rise of 1.3%. The index rose by 4.2% year-over-year, surpassing the market expectation to be unchanged at 4.1%.
- Westpac Leading Index (MoM) declined by 0.1% in January against the previous reading of flat 0.0%.
- RBA’s Meeting Minutes revealed that the Board deliberated on the possibility of raising rates by 25 basis points (bps) or keeping rates unchanged. While recent data indicated that inflation would return to target within a reasonable timeframe, it was acknowledged that this process would "take some time." Consequently, the board agreed that it was prudent not to rule out another rate hike.
- S&P's analysis of the FOMC minutes suggests that inflation is expected to continue cooling in the upcoming months, despite the ongoing uneven disinflationary trends. They maintain their outlook for monetary policy in 2024, anticipating no changes. S&P predicts that the Federal Reserve will likely reduce its policy rate by 25 basis points at its June meeting, with further cuts totaling 75 basis points by the end of the year.
- Richmond Federal Reserve Bank President Thomas Barkin told Reuters that the United States still has "ways to go" to achieve a soft landing. He highlighted the overall positive trajectory of US data concerning inflation and employment. He suggested that the US is nearing the end of its inflation challenge, with the pressing question being the duration until resolution.
- Federal Reserve Governor Christopher J. Waller stated that the initiation of policy easing and the number of rate cuts will hinge on incoming data. The Committee is prepared to wait a little longer before considering monetary policy easing.
- Philadelphia Fed President Patrick T. Harker, in a speech at the University of Delaware, expressed the view that the Federal Reserve can maintain the current rates for the time being, with no urgency to implement cuts. He emphasized that future Fed actions will be driven by data, with no forecast for a rate cut in May.
- Federal Reserve Governor Lisa D. Cook, participating in a moderated discussion at a Conference hosted by Princeton University in New Jersey, remarked that risks to achieving employment and inflation goals have moved into better balance. She expressed a preference for greater confidence that inflation is converging to 2% before initiating rate cuts. Cook acknowledged that the policy rate will eventually need adjustment as the disinflation outlook becomes more sustainable.
- S&P Global US Services PMI posted the reading of 51.3 in February, against the expected 52.0 and 52.5 prior.
- S&P Global US Manufacturing PMI improved to 51.5, exceeding the expected 50.5 and 50.7 prior.
- S&P Global US Composite PMI declined to 51.4 in February from the previous reading of 51.0.
- US Initial Jobless Claims declined to 201K for the week ending on February 16, against the market expectation of 218K and the previous figure of 213K.
- Existing Home Sales Change (MoM) rose by 3.1% in January, from the previous decline of 0.8%.
Technical Analysis: Australian Dollar trades around the weekly high near 0.6570
The Australian Dollar trades around the major level at 0.6570 on Friday, which is followed by the weekly high at 0.6595 and a psychological barrier at 0.6600 level. Further resistance will be at 38.2% Fibonacci retracement level of 0.6606 aligned with February’s high at 0.6610 level. A break above the latter could support the AUD/USD pair to explore the region around the major level of 0.6650. On the downside, the immediate support appears at the 0.6550 level. A break below this major level could retest the weekly low at 0.6521 followed by the psychological support level of 0.6500.
AUD/USD: Daily Chart
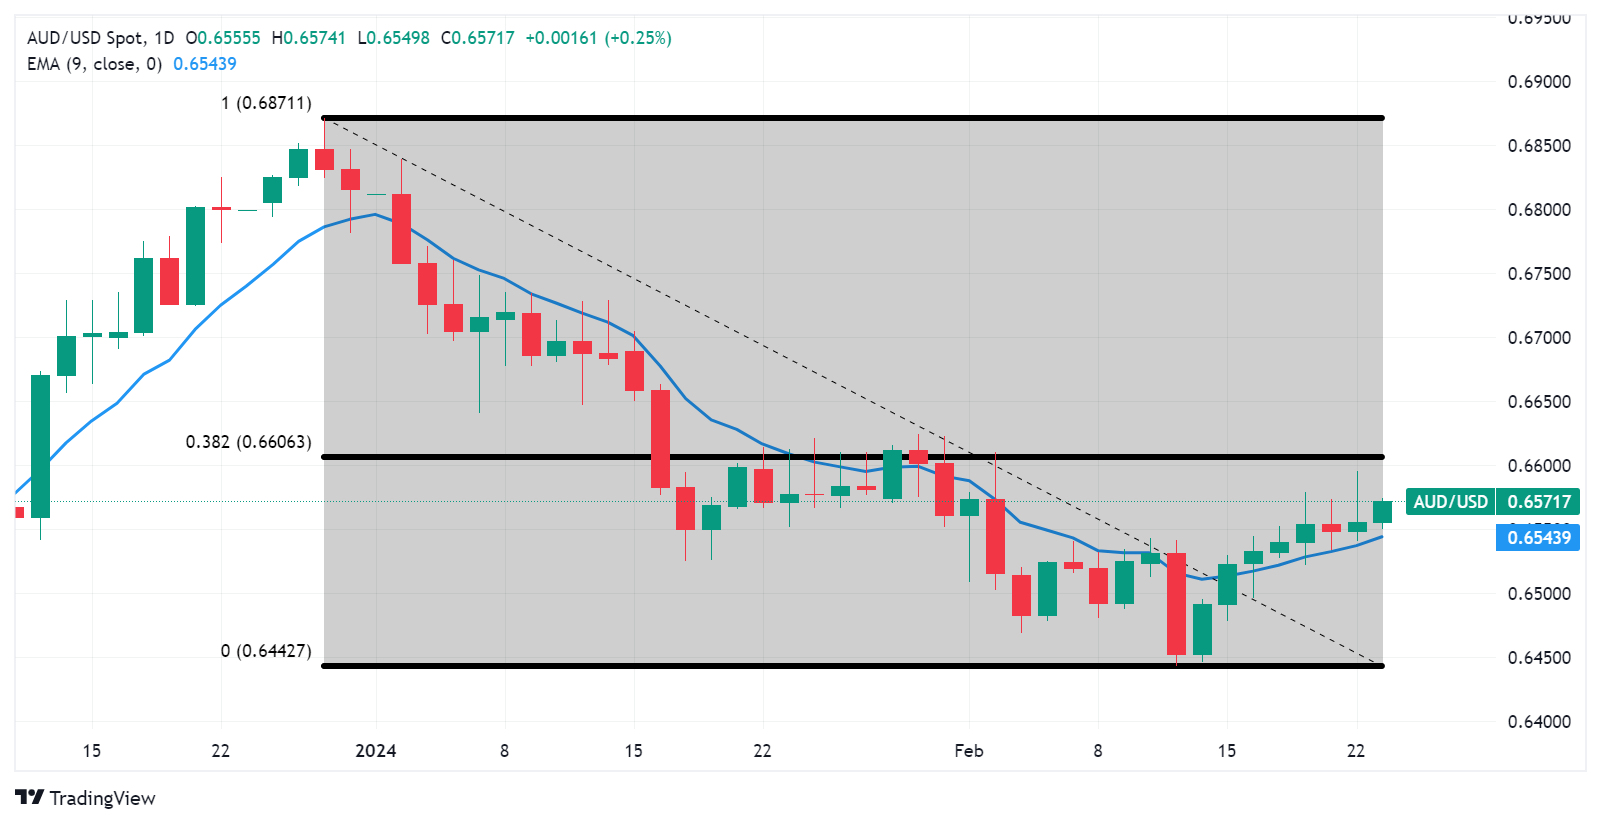
Australian Dollar price today
The table below shows the percentage change of Australian Dollar (AUD) against listed major currencies today. Australian Dollar was the strongest against the US Dollar.
| USD | EUR | GBP | CAD | AUD | JPY | NZD | CHF | |
| USD | -0.02% | 0.00% | -0.01% | -0.21% | -0.02% | -0.04% | 0.04% | |
| EUR | 0.02% | 0.02% | 0.02% | -0.18% | 0.01% | -0.03% | 0.04% | |
| GBP | 0.00% | -0.02% | 0.00% | -0.19% | -0.01% | -0.03% | 0.03% | |
| CAD | 0.01% | -0.03% | 0.00% | -0.19% | -0.01% | -0.03% | 0.02% | |
| AUD | 0.21% | 0.16% | 0.18% | 0.19% | 0.18% | 0.16% | 0.20% | |
| JPY | 0.02% | 0.01% | 0.04% | 0.03% | -0.15% | 0.00% | 0.04% | |
| NZD | 0.01% | 0.01% | 0.03% | 0.03% | -0.16% | 0.02% | 0.06% | |
| CHF | -0.03% | -0.05% | -0.03% | -0.03% | -0.22% | -0.05% | -0.06% |
The heat map shows percentage changes of major currencies against each other. The base currency is picked from the left column, while the quote currency is picked from the top row. For example, if you pick the Euro from the left column and move along the horizontal line to the Japanese Yen, the percentage change displayed in the box will represent EUR (base)/JPY (quote).
Australian Dollar FAQs
What key factors drive the Australian Dollar?
One of the most significant factors for the Australian Dollar (AUD) is the level of interest rates set by the Reserve Bank of Australia (RBA). Because Australia is a resource-rich country another key driver is the price of its biggest export, Iron Ore. The health of the Chinese economy, its largest trading partner, is a factor, as well as inflation in Australia, its growth rate and Trade Balance. Market sentiment – whether investors are taking on more risky assets (risk-on) or seeking safe-havens (risk-off) – is also a factor, with risk-on positive for AUD.
How do the decisions of the Reserve Bank of Australia impact the Australian Dollar?
The Reserve Bank of Australia (RBA) influences the Australian Dollar (AUD) by setting the level of interest rates that Australian banks can lend to each other. This influences the level of interest rates in the economy as a whole. The main goal of the RBA is to maintain a stable inflation rate of 2-3% by adjusting interest rates up or down. Relatively high interest rates compared to other major central banks support the AUD, and the opposite for relatively low. The RBA can also use quantitative easing and tightening to influence credit conditions, with the former AUD-negative and the latter AUD-positive.
How does the health of the Chinese Economy impact the Australian Dollar?
China is Australia’s largest trading partner so the health of the Chinese economy is a major influence on the value of the Australian Dollar (AUD). When the Chinese economy is doing well it purchases more raw materials, goods and services from Australia, lifting demand for the AUD, and pushing up its value. The opposite is the case when the Chinese economy is not growing as fast as expected. Positive or negative surprises in Chinese growth data, therefore, often have a direct impact on the Australian Dollar and its pairs.
How does the price of Iron Ore impact the Australian Dollar?
Iron Ore is Australia’s largest export, accounting for $118 billion a year according to data from 2021, with China as its primary destination. The price of Iron Ore, therefore, can be a driver of the Australian Dollar. Generally, if the price of Iron Ore rises, AUD also goes up, as aggregate demand for the currency increases. The opposite is the case if the price of Iron Ore falls. Higher Iron Ore prices also tend to result in a greater likelihood of a positive Trade Balance for Australia, which is also positive of the AUD.
How does the Trade Balance impact the Australian Dollar?
The Trade Balance, which is the difference between what a country earns from its exports versus what it pays for its imports, is another factor that can influence the value of the Australian Dollar. If Australia produces highly sought after exports, then its currency will gain in value purely from the surplus demand created from foreign buyers seeking to purchase its exports versus what it spends to purchase imports. Therefore, a positive net Trade Balance strengthens the AUD, with the opposite effect if the Trade Balance is negative.
- The Japanese Yen attracts some buyers amid geopolitical risks and intervention fears.
- Fading hopes for an imminent shift in the BoJ’s policy stance might cap further gains.
- The Fed’s higher-for-longer narrative underpins the USD and lends support to USD/JPY.
The Japanese Yen (JPY) ticks higher against its American counterpart during the Asian session on Friday and for now, seems to have snapped a two-day losing streak to over a one-week low touched the previous day. The recent verbal intervention by Japanese authorities and persistent geopolitical tensions turn out to be key factors lending some support to the safe-haven JPY. That said, any meaningful appreciating move still seems elusive in the wake of bets for a delay in the Bank of Japan’s (BoJ) plans to end its ultra-loose policies, bolstered by data showing that Japan's economy fell into a technical recession in the fourth quarter.
In contrast, the minutes of the late January FOMC meeting revealed that policymakers are in no rush to cut interest rates amid sticky inflation and the still-resilient US economy. This remains supportive of elevated US Treasury bond yields, which, along with Thursday's mostly upbeat US macro data, could assist the US Dollar (USD) to build on the overnight solid rebound from a nearly three-week low. Apart from this, the prevalent risk-on environment – as depicted by an extended rally across the global equity markets – might cap gains for the JPY and suggests that the path of least resistance for the USD/JPY pair is to the upside.
Daily Digest Market Movers: Japanese Yen struggles to lure buyers amid BoJ policy uncertainty
- Attacks on commercial vessels in the Red Sea by Yemen's Iran-aligned Houthi rebels show no sign of abating despite US and UK strikes, raising the risk of further military action and benefiting the safe-haven Japanese Yen.
- Japan's Ministry of Finance and the Bank of Japan recently warned that they’re watching the exchange rate closely and are willing to intervene in the market to stem any further weakness in the domestic currency.
- Data released last week showed that Japan's economy unexpectedly entered a technical recession during the fourth quarter, fuelling speculations that the BoJ might delay its plans to exit the ultra-easy policy regime.
- On the other hand, the FOMC meeting minutes on Wednesday, along with comments by a slew of influential Federal Reserve officials, reiterated the message that the central bank will keep interest rates higher for longer.
- Fed Vice Chair Philip Jefferson said on Thursday that he was cautiously optimistic about progress on inflation and that he will be looking at the totality of data when weighing interest rate cut options, not a single indicator.
- Separately, Philadelphia Fed President Patrick Harker noted that the central bank is approaching the point of cutting interest rates, though policymakers remain unsure of when specifically, that might happen.
- Furthermore, Fed Governor Lisa Cook believes that the current monetary policy stance is restrictive and would like to have greater confidence that inflation is converging to 2% before beginning interest rate cuts.
- Meanwhile, Fed Governor Christopher Waller expects the FOMC to begin lowering at some point this year, but he will need more evidence to see that inflation is cooling before he is willing to support interest rate cuts.
- According to the CME FedWatch Tool, the current market pricing indicates about a 30% chance that the Fed will start cutting interest rates in May, much lower than a more than over 80% chance a month ago.
- Adding to this, fresh signs of strength in the US labor market remain supportive of elevated US Treasury bond yields, which favours the US Dollar bulls and should lend some support to the USD/JPY pair.
- The US Department of Labor reported that the number of Americans applying for unemployment insurance benefits declined to 201K during the week ending February 17 from the 213K in the previous week.
- The better-than-expected release of the flash PMI prints showed that the downturn in the Eurozone business activity eased in February, which further boosted investors’ sentiment and should cap gains for the JPY.
Technical Analysis: USD/JPY bulls need to wait for move beyond 150.90 before placing fresh bets
From a technical perspective, any meaningful pullback is likely to find decent support near the 150.00 psychological mark. This is followed by the weekly low, around the 149.70-149.65 region, which if broken could drag the USD/JPY pair further towards the 149.35-149.30 horizontal support en route to the 149.00 mark. Some follow-through selling below the 148.80-148.70 strong horizontal resistance breakpoint might shift the bias in favour of bearish traders and pave the way for deeper losses.
On the flip side, bulls might still wait for a sustained strength beyond the 150.85-150.90 area, or a multi-month top touched last week, before placing fresh bets. Given that oscillators on the daily chart are holding comfortably in the positive territory and are still away from being in the overbought zone, the USD/JPY pair might then climb to the 151.45 hurdle. The momentum could extend towards the 152.00 neighbourhood, or a multi-decade peak set in October 2022 and retested in November 2023.
Japanese Yen price today
The table below shows the percentage change of Japanese Yen (JPY) against listed major currencies today. Japanese Yen was the strongest against the Swiss Franc.
| USD | EUR | GBP | CAD | AUD | JPY | NZD | CHF | |
| USD | -0.06% | -0.02% | 0.00% | -0.20% | -0.04% | -0.07% | 0.02% | |
| EUR | 0.05% | 0.03% | 0.05% | -0.14% | 0.01% | -0.02% | 0.05% | |
| GBP | 0.02% | -0.04% | 0.02% | -0.18% | -0.02% | -0.05% | 0.01% | |
| CAD | 0.00% | -0.06% | -0.03% | -0.20% | -0.03% | -0.08% | -0.01% | |
| AUD | 0.20% | 0.14% | 0.18% | 0.20% | 0.16% | 0.10% | 0.18% | |
| JPY | 0.03% | -0.01% | 0.04% | 0.04% | -0.16% | -0.03% | 0.04% | |
| NZD | 0.06% | 0.02% | 0.05% | 0.08% | -0.13% | 0.04% | 0.08% | |
| CHF | -0.01% | -0.07% | -0.03% | -0.01% | -0.22% | -0.05% | -0.11% |
The heat map shows percentage changes of major currencies against each other. The base currency is picked from the left column, while the quote currency is picked from the top row. For example, if you pick the Euro from the left column and move along the horizontal line to the Japanese Yen, the percentage change displayed in the box will represent EUR (base)/JPY (quote).
Japanese Yen FAQs
What key factors drive the Japanese Yen?
The Japanese Yen (JPY) is one of the world’s most traded currencies. Its value is broadly determined by the performance of the Japanese economy, but more specifically by the Bank of Japan’s policy, the differential between Japanese and US bond yields, or risk sentiment among traders, among other factors.
How do the decisions of the Bank of Japan impact the Japanese Yen?
One of the Bank of Japan’s mandates is currency control, so its moves are key for the Yen. The BoJ has directly intervened in currency markets sometimes, generally to lower the value of the Yen, although it refrains from doing it often due to political concerns of its main trading partners. The current BoJ ultra-loose monetary policy, based on massive stimulus to the economy, has caused the Yen to depreciate against its main currency peers. This process has exacerbated more recently due to an increasing policy divergence between the Bank of Japan and other main central banks, which have opted to increase interest rates sharply to fight decades-high levels of inflation.
How does the differential between Japanese and US bond yields impact the Japanese Yen?
The BoJ’s stance of sticking to ultra-loose monetary policy has led to a widening policy divergence with other central banks, particularly with the US Federal Reserve. This supports a widening of the differential between the 10-year US and Japanese bonds, which favors the US Dollar against the Japanese Yen.
How does broader risk sentiment impact the Japanese Yen?
The Japanese Yen is often seen as a safe-haven investment. This means that in times of market stress, investors are more likely to put their money in the Japanese currency due to its supposed reliability and stability. Turbulent times are likely to strengthen the Yen’s value against other currencies seen as more risky to invest in.
The People’s Bank of China (PBoC) set the USD/CNY central rate for the trading session ahead on Friday at 7.1064 as compared to the previous day's fix of 7.1018 and 7.2008 Reuters estimates.
The Federal Reserve (Fed) Governor Christopher Waller said on Thursday that there is no rush to begin cutting interest rates. He further stated that he will need to see further evidence that inflation is cooling before he is willing to support interest rate cuts.
Key quotes
“The start of policy easing and the number of rate cuts will depend on incoming data.”
“The Committee can wait a little longer to ease monetary policy.”
“Puzzled by the narrative that delaying cuts for a meeting or two risks causing a recession.”
“Supposed asymmetry of lagged effects of rate hikes vs. rate cuts is not supported by any model I’m aware of.”
“In the absence of a major economic shock, delaying cuts by a few months should not have a substantial impact on the economy in the near term.”
“Cutting too soon could squander inflation progress and risk considerable harm to the economy.”
“Data received since the last speech on Jan 16 has reinforced the view that we need to verify inflation progress from the last half of 2023 will continue.”
“There is no rush to begin cutting interest rates.”
“The CPI report last week is a reminder that ongoing progress on inflation is not assured.”
“It's not clear yet if the CPI was driven by odd seasonal factors and outsized housing cost increases or signals inflation is stickier than thought and will be harder to bring down to target.”
“Need to see more data to know if January CPI was'more noise than signal’."
“This means waiting longer before having enough confidence that starting rate cuts will keep us on the path for 2% inflation.”
“The strength of output and employment growth means there 'is no great urgency' to ease policy.”
“Still expect to ease policy this year.”
“Recent hotter-than-expected data validates Chair Powell's 'careful risk management approach’."
“The risk of waiting a little longer to ease is lower than the risk of acting too soon.”
“Several indicators suggest some slowing in growth.”
“Latest data on job openings and quits may indicate labor market moderation may have stalled.”
“Based on CPI and PPI, January core PCE may be 2.8% at a 12-month rate, 2.4% at a 3-month rate, and 2.5% at a 6-month rate.”
“It's comforting to know the progress we made was real and not a mirage.”
“Still see wage growth 'somewhat elevated' to achieve a 2% inflation goal.”
“Watching to see if housing costs continue to run higher than expected.”
“Considering all inflation aspects, 'I see predominantly upside risks' to the expectation inflation will keep moving to the 2% goal.”
“Need to see a couple more months of inflation data to be sure if January was a 'fluke' and we are still on track to price stability.”
“There are no indications of an imminent recession.”
Market reaction
The US Dollar Index (DXY) is trading lower on the day at 103.91, as of writing.
- WTI hovers around $78.00 in Friday’s early Asian session.
- Crude oil inventory increased by 3.514 million barrels last week, below forecasts.
- The ‘higher for longer’ interest rate narrative from major central banks might cap the upside of WTI.
Western Texas Intermediate (WTI), the US crude oil benchmark, is trading around $78.00 on Friday. WTI prices edge higher as the EIA Crude Oil stockpiles report came in just below forecasts and the geopolitical tensions in the Middle East remain uncertain.
Crude oil inventory increased by 3.514 million barrels for the week ending February 16 from the previous week's 12 million barrel gains, the Energy Information Administration reported on Thursday.
Israel has carried out several attacks against Hezbollah targets in Lebanon in recent days, while Houthi militants in Yemen continue to attack ships in the Red Sea. The ongoing geopolitical tensions in the Middle East raise concern about the disruption in crude supplies, which supports WTI prices for the time being.
On the other hand, the possibility that the US Federal Reserve (Fed) and major central banks will maintain the ‘higher for longer’ interest rate narrative might cap the upside of WTI prices. The FOMC Minutes at its January meeting showed that the Fed officials wanted to see more evidence before beginning to cut rates while warning about the “risks of moving too quickly” on cuts. It’s worth noting that higher interest rates might drag WTI prices lower, as it translates to less demand for oil with higher costs and slowing the economy.
Oil traders will keep an eye on the German Gross Domestic Product for the fourth quarter (Q4) and Fed Christopher J. Waller's speech on Friday. The US Gross Domestic Product Annualized (GDP) for Q4 will be released next week. These events could significantly impact the USD-denominated WTI price. Oil traders will take cues from the data and find trading opportunities around WTI prices.
| Index | Change, points | Closed | Change, % |
|---|---|---|---|
| NIKKEI 225 | 836.52 | 39098.68 | 2.19 |
| Hang Seng | 239.85 | 16742.95 | 1.45 |
| KOSPI | 10.96 | 2664.27 | 0.41 |
| ASX 200 | 2.8 | 7611.2 | 0.04 |
| DAX | 252.33 | 17370.45 | 1.47 |
| CAC 40 | 99.51 | 7911.6 | 1.27 |
| Dow Jones | 456.87 | 39069.11 | 1.18 |
| S&P 500 | 105.23 | 5087.03 | 2.11 |
| NASDAQ Composite | 460.75 | 16041.62 | 2.96 |
| Pare | Closed | Change, % |
|---|---|---|
| AUDUSD | 0.65567 | 0.14 |
| EURJPY | 162.932 | 0.29 |
| EURUSD | 1.08235 | 0.04 |
| GBPJPY | 190.586 | 0.38 |
| GBPUSD | 1.26608 | 0.2 |
| NZDUSD | 0.61974 | 0.36 |
| USDCAD | 1.34803 | -0.11 |
| USDCHF | 0.88029 | 0.1 |
| USDJPY | 150.531 | 0.18 |


© 2000-2024. Уcі права захищені.
Cайт знаходитьcя під керуванням TeleTrade DJ. LLC 2351 LLC 2022 (Euro House, Richmond Hill Road, Kingstown, VC0100, St. Vincent and the Grenadines).
Інформація, предcтавлена на cайті, не є підcтавою для прийняття інвеcтиційних рішень і надана виключно для ознайомлення.
Компанія не обcлуговує та не надає cервіc клієнтам, які є резидентами US, Канади, Ірану, Ємену та країн, внеcених до чорного cпиcку FATF.
Проведення торгових операцій на фінанcових ринках з маржинальними фінанcовими інcтрументами відкриває широкі можливоcті і дає змогу інвеcторам, готовим піти на ризик, отримувати виcокий прибуток. Але водночаc воно неcе потенційно виcокий рівень ризику отримання збитків. Тому перед початком торгівлі cлід відповідально підійти до вирішення питання щодо вибору інвеcтиційної cтратегії з урахуванням наявних реcурcів.
Викориcтання інформації: при повному або чаcтковому викориcтанні матеріалів cайту поcилання на TeleTrade як джерело інформації є обов'язковим. Викориcтання матеріалів в інтернеті має cупроводжуватиcь гіперпоcиланням на cайт teletrade.org. Автоматичний імпорт матеріалів та інформації із cайту заборонено.
З уcіх питань звертайтеcь за адреcою pr@teletrade.global.
переклади