- Аналітика
- Новини та інструменти
- Новини ринків
Новини ринків
- GBP/USD recovers some lost ground around 1.2693 on Wednesday.
- The January Richmond Fed Manufacturing Index came in at -15 vs. -7 consensus and -11 prior.
- The markets expect the Bank of England (BoE) to start cutting rates as early as May.
- Traders await the UK and US PMI reports on Wednesday.
The GBP/USD pair recovers its recent losses during the early Asian trading hours on Wednesday. The major pair has flirted with four-day lows near around 1.2650 and rebounded to nearly the 1.2700 mark. Investors await the release of January’s UK advanced Manufacturing and Services PMI for fresh impetus. GBP/USD currently trades near 1.2693, up 0.06% for the day.
According to the Richmond Fed Manufacturing Survey, the composite manufacturing index for January fell to -15 from -11 in December, worse than the market expectation of -7. Among its three component indices, shipments increased from -17 to -15, new orders dropped from -14 to -16, and employment fell significantly from -1 to -15.
The Federal Reserve (Fed) governor, Christopher Waller, stated that the Fed should cut rates "methodically and carefully" and not “rushed." Additionally, Atlanta Fed President Raphael Bostic said he sees rate cuts beginning in the third quarter, while San Francisco Fed President Mary Daly suggested policymakers must be patient about rate cuts. The less aggressive rate-cut stance from the Fed provides some support to the US Dollar (USD) and acts as a headwind for the GBP/USD pair.
On the other hand, investors place a bet that the Bank of England (BoE) will start cutting rates as early as May, with three more cuts over 2024 taking it to 4.25% from 5.25% now. However, there’s no change in monetary policy expected in its February meeting. Market players will take more cues from the data release on Wednesday. The preliminary UK S&P Global Services PMI is estimated to ease from 51.4 in December to 51.0 in January, while the Manufacturing PMI is projected to remain steady at 47.9.
The UK S&P Global/CIPS Purchasing Managers Index (PMI) and US S&P Global PMI reports will be released on Wednesday. The attention will shift to the US Gross Domestic Product (GDP) for Q4 on Thursday and the Core Personal Consumption Expenditures Price Index (Core PCE) on Friday. These figures might convince central bank policymakers about the further path of monetary policy.
- EUR/USD finds itself close to the 200-day SMA as investors brace for PMI figures.
- Wednesday sees preliminary PMI January data for both the EU and the US.
- Markets expect a European uptick but flattening US services.
EUR/USD drifts into a key midrange figure early Wednesday as European and US Purchasing Managers’ Index (PMI) figures loom over the market for the mid-week trading session.
Markets are broadly expecting pan-European HCOB Composite PMI figures to rebound in January from 47.6 to 48.0, which would represent an eighth straight month of sub-50.0 combined PMI activity for the European continent.
On the US side, market forecasts are looking for the S&P Global Manufacturing PMI component to hold steady at 47.9 while the Services PMI component is expected to tick down from 51.4 to 51.0.
After PMIs are done landing on markets, Thursday brings another rate call and monetary policy statement from the European Central Bank (ECB), which has broadly forecast a lack of movement on interest rates until the summer months barring any drastic changes to underlying economic figures. Still, investors will be keeping a close eye on the ECB’s policy statement for any clues about how deep into dovish or hawkish territory ECB President Christine Lagarde and her cohort of central bank policymakers are leaning following Wednesday’s PMI activity expectation figures.
Thursday also sees an update to US Gross Domestic Product (USD) on an annualized basis, with YoY GDP forecast to trim back to 2.0% from 4.9% for the year ended in December.
EUR/USD Technical Outlook
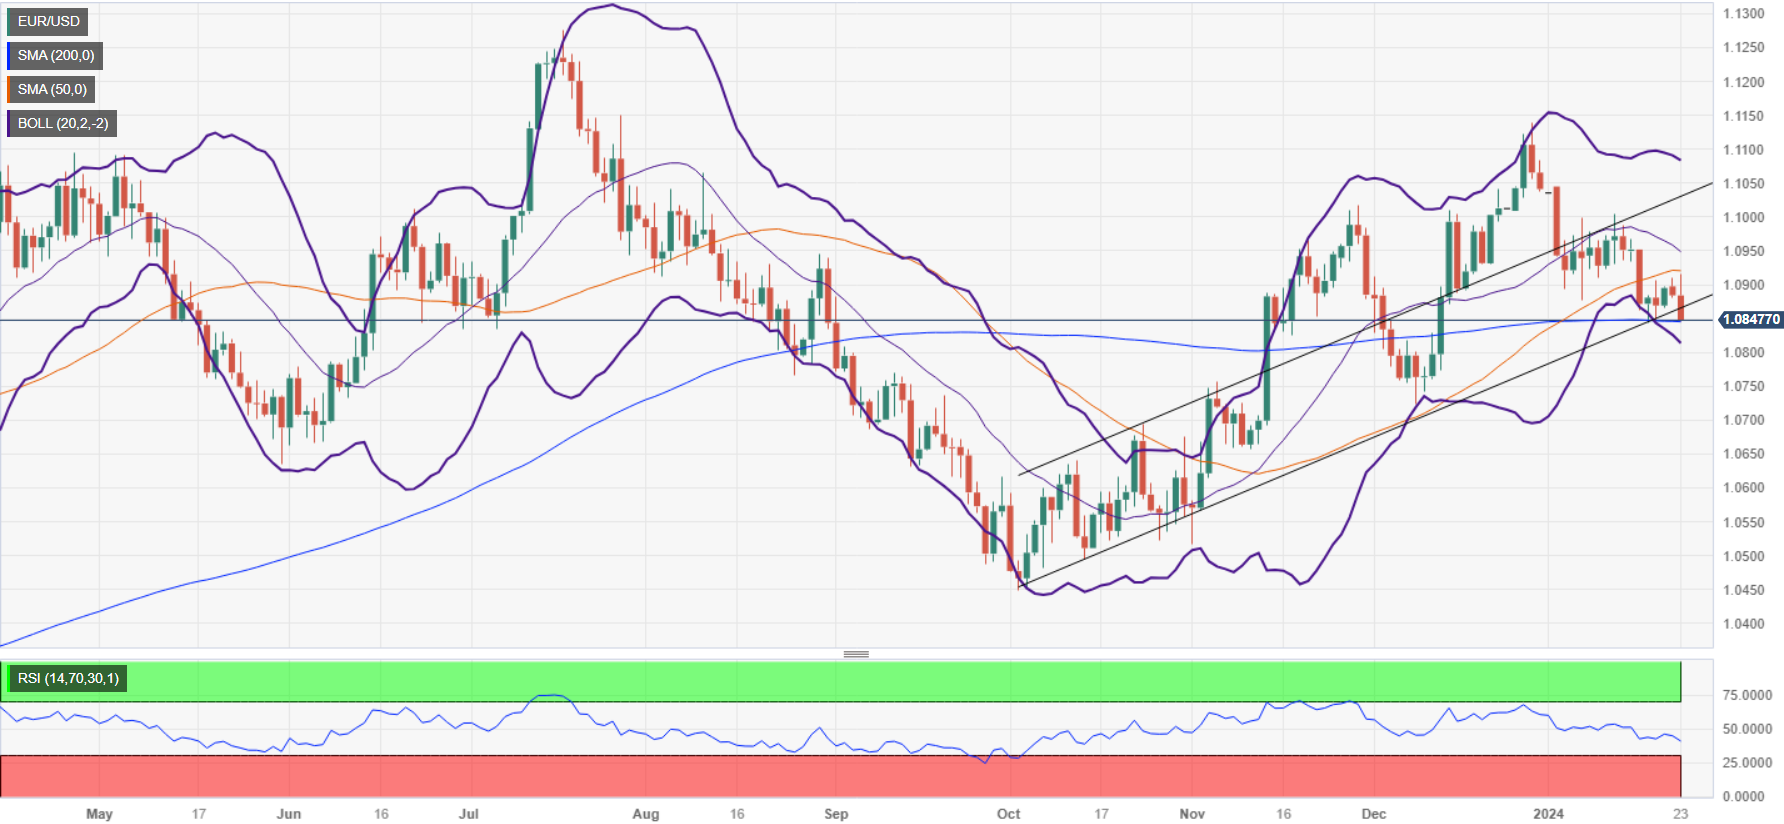
The EUR/USD saw a quick plunge into touch range of 1.0820 following a harsh rejection from the 200-hour Simple Moving Average (SMA) just above 1.0910, sending the major pair back below the 1.0900 handle for the third time in a week.
Daily candlesticks show the EUR/USD coiling tightly into the midrange as broad-market momentum tilts into the middle, and the pair is adrift on market tides in a congestion zone between the 50-day and 200-day SMAs near 1.0925 and 1.0850 respectively.
EUR/USD Hourly Chart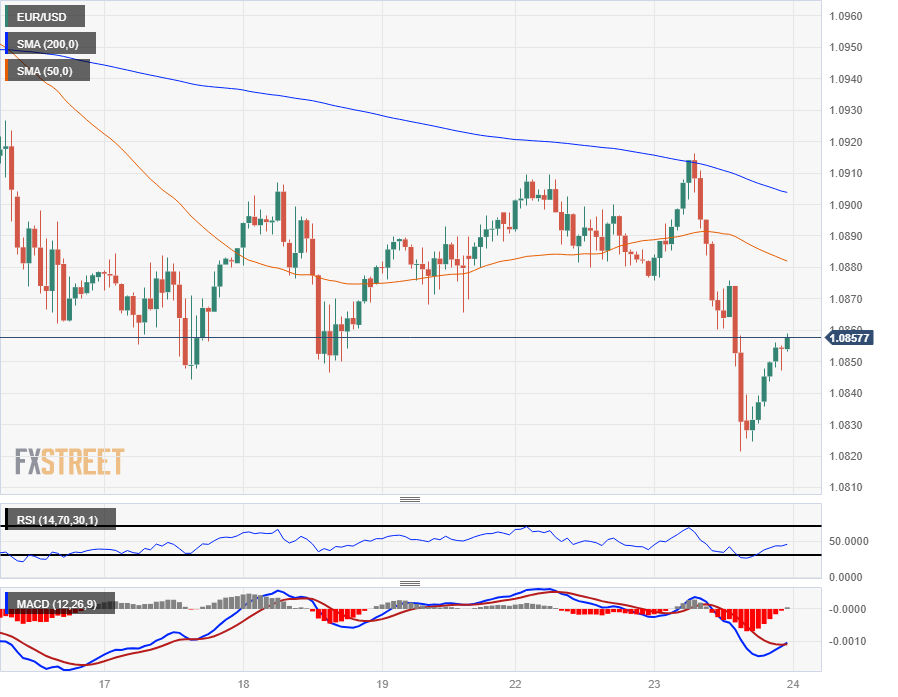
EUR/USD Daily Chart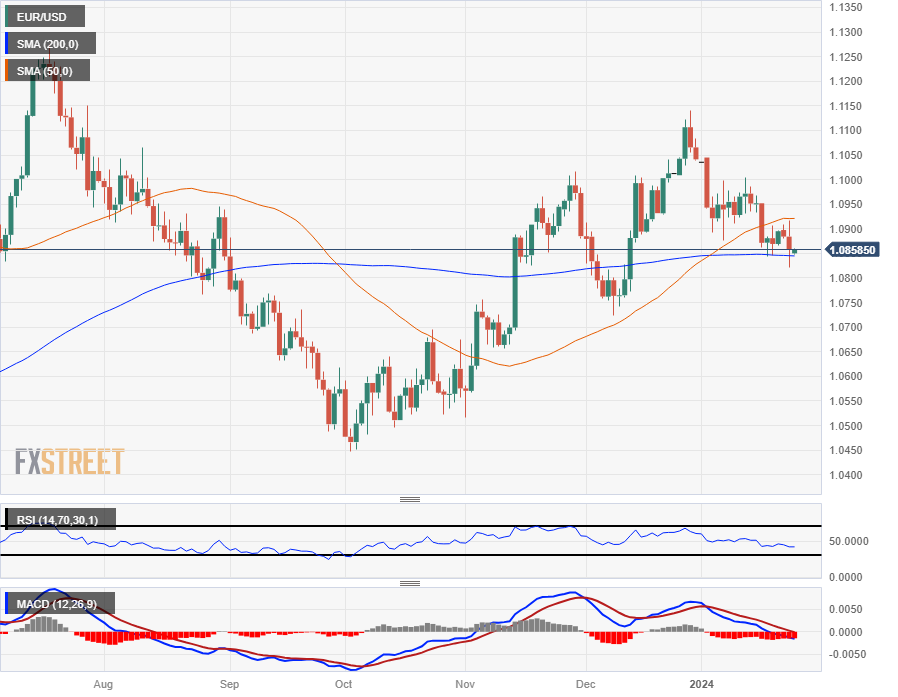
- USD/JPY tipped into familiar highs near 148.70.
- Broad-market risk flows sent investors into the US Dollar.
- BoJ remains steadfast in its inaction on negative rates.
The USD/JPY hit a familiar hit bid at 148.70 as markets picked up the US Dollar (USD) through Tuesday, keeping the Japanese Yen (JPY) broadly lower on the day.
The Bank of Japan (BoJ) kept its policy rate locked in negative territory at -0.1% until the Japanese central bank sees more signs that inflation will avoid cooling off more than anticipated in the future. The BoJ is grappling with an opposite problem that is plaguing most global central banks; Japan’s long-standing struggle to stoke meaningful inflation within the domestic Japanese economy has the BoJ petrified that any upside moves in interest rates without already-rising wages and inflation pressures will cause structural deflation to set in.
Japan sees the next round of Tokyo Consumer Price Index (CPI) inflation figures on Thursday, where markets and the BoJ will both be keeping a close eye for any signs that price pressures will stop declining much below the BoJ’s desired 2% level. January’s Tokyo CPI for the year ended in January is forecast to tick down from 2.1% to 1.9%.
Friday also brings US Personal Consumption Expenditure (PCE) inflation figures, the Federal Reserve’s (Fed) favored methods of tracking US inflation. December’s Core US PCE Price Index is forecast to rise slightly from 0.1% to 0.2%, and the YoY Core figure is expected to ease to 3.0% from 3.2%.
USD/JPY Technical Outlook
USD/JPY continues to run ahead of the 200-hour Simple Moving Average (SMA) rising into the 147.00 handle, and the pair is up over 5% from 2024’s opening bids as Greenback bidding pressure keeps the pair close to medium-term high bids.
Daily candlesticks have the USD/JPY testing back into the high end after a failed bearish break of the 200-day SMA between 142.00 and 143.00, with the pair set for a bullish run into 2023’s late peak just shy of the 152.00 handle.
USD/JPY Hourly Chart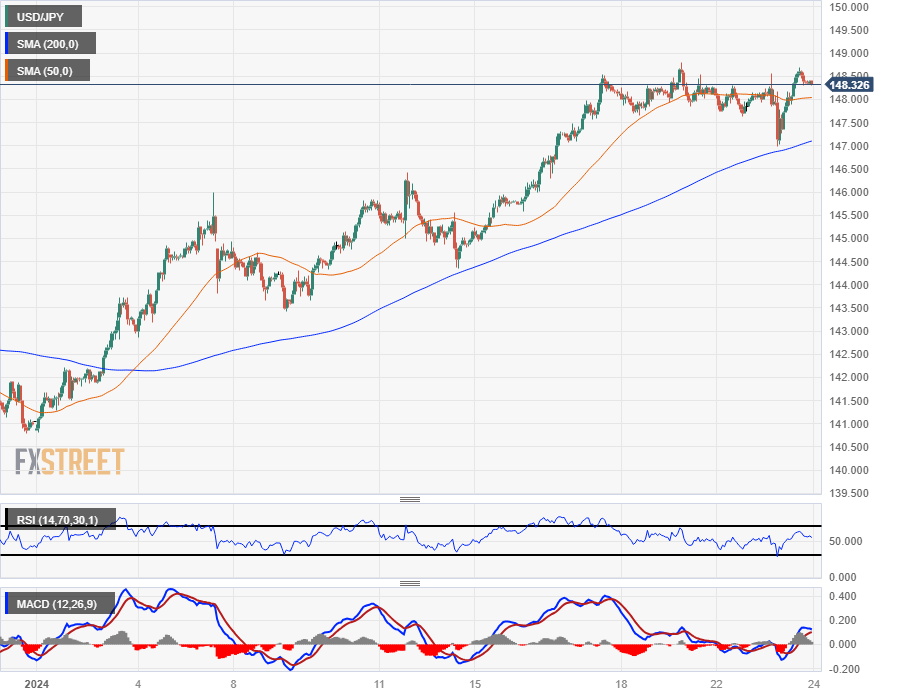
USD/JPY Daily Chart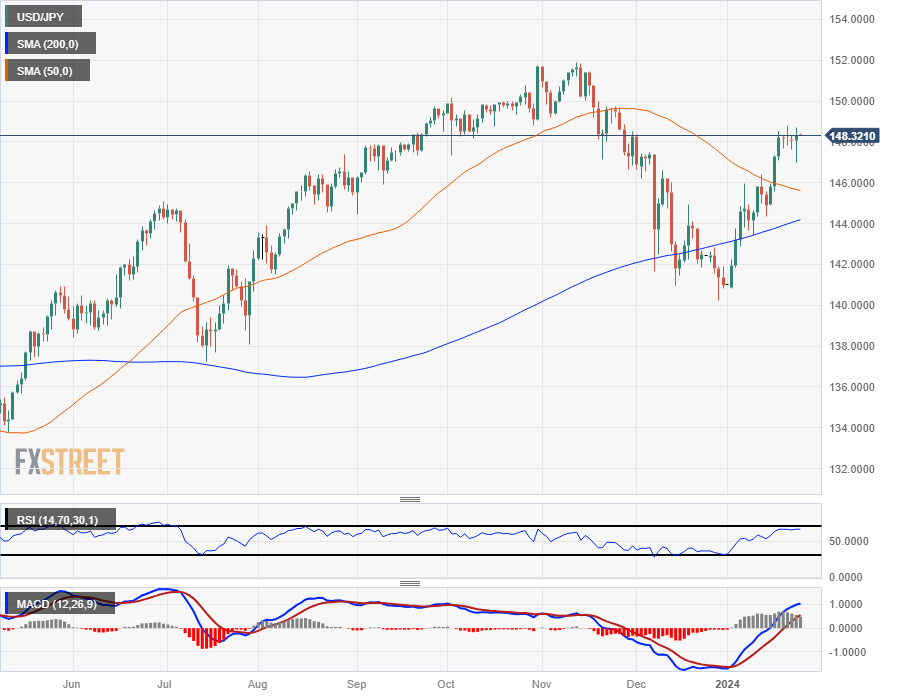
- NZD/USD holds positive ground above 0.6100 despite the firmer USD.
- The US Richmond Fed Manufacturing Index remained sluggish in January.
- New Zealand's Consumer Price Index (CPI) for Q4 arrived at 0.5% QoQ vs. 1.8% prior, in line with market expectations.
The NZD/USD pair hovers around the 0.6100 mark during the early Asian session on Wednesday. The New Zealand Dollar (NZD) initially edged higher overnight before dropping back as the US Dollar strengthened. Meanwhile, the US Dollar Index (DXY) has reached new yearly highs above 103.00 as the markets turn cautious ahead of key US economic data. At press time, NZD/USD is trading at 0.6100, gaining 0.20% on the day.
On Tuesday, the US Richmond Fed Manufacturing Index was weaker than expected in January, coming in at -15 from -11, marking its third consecutive negative reading. This reading was below the market consensus of -7.
The Federal Reserve’s (Fed) official stressed that the central bank should cut rates "methodically and carefully.” The markets expect the Fed to cut rates slower and less aggressively than previously anticipated. According to the CME FedWatch Tool, the odds of a March rate cut fell to 44.3% from an 81% chance last week.
On the Kiwi front, Statistics New Zealand showed that New Zealand's Consumer Price Index (CPI) arrived at 0.5% QoQ in the fourth quarter of 2023 from the previous quarter's 1.8%, in line with market expectations. On an annual basis, the CPI inflation figure came in at 4.7% YoY, compared to the previous reading of 5.6%. In response to the data, the NZD gains traction above the 0.6100 psychological mark.
Market players will keep an eye on the US preliminary S&P Global PMI report, due on Wednesday. Later this week, the US Gross Domestic Product Annualized (Q4) and Core Personal Consumption Expenditures Price Index (Core PCE) for December will be in the spotlight.
- AUD/USD registers a 0.14% gain in the Asian session, stabilizing at the 200-DMA.
- Business activity slightly recovered in Australia but remains shy of expanding.
- High US Treasury yields capped the AUD/USD rise on Tuesday’s session.
- Traders eye key US GDP data and the core PCE index on the horizon.
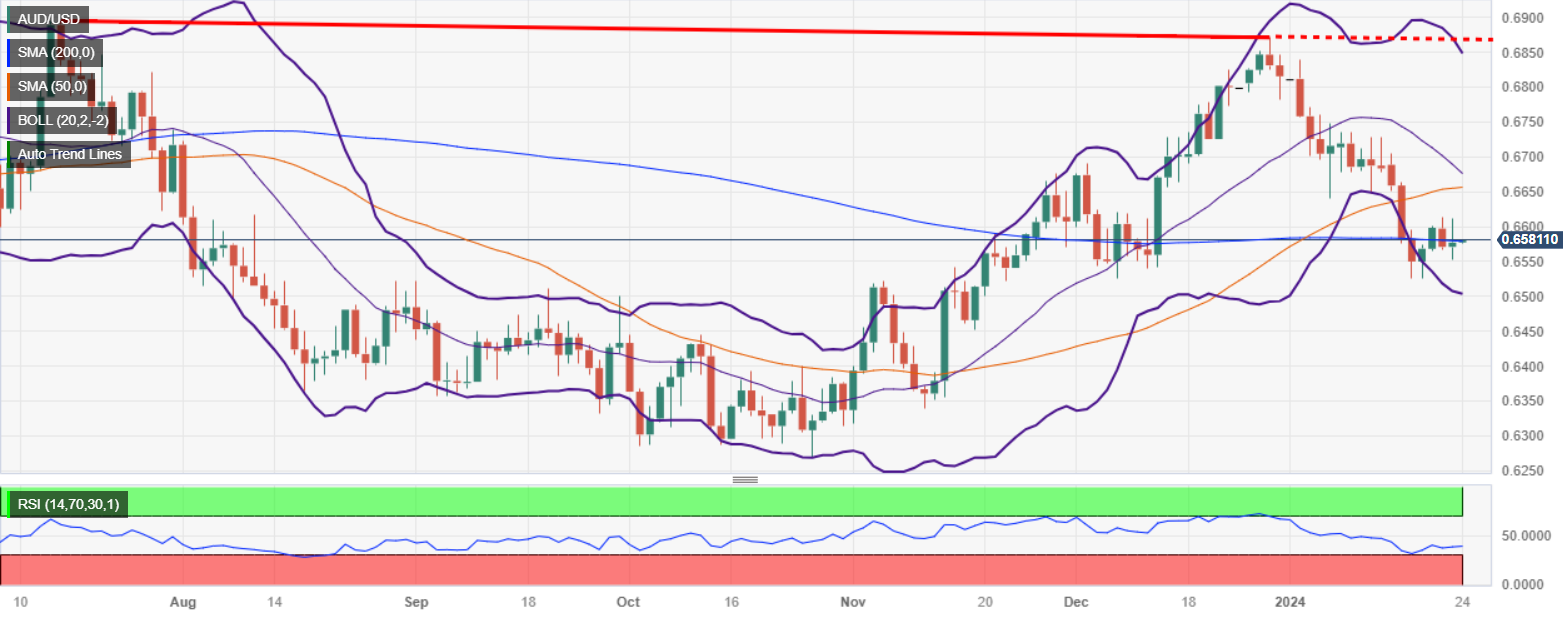
The AUD/USD opened the Asian session virtually unchanged, but on Tuesday registered decent gains of 0.14%, bracing at around the 200-day moving average (DMA) at 0.6578. The lack of catalyst keeps the pair within familiar levels, capped by the 50 and 100-DMAs, each above and below the current exchange rate. At the time of writing, the AUD/USD trades at 0.6579.
AUD/USD looms around the 200-DMA as Aussie’s business activity remains sluggish
Sentiment remains mixed as Wall Street’s closed mixed, with the Nasdaq and S&P 500 closing in the green, while the Dow Jones lost 0.25%. US Treasury bond yields in the belly and the long-end of the curve rose and boosted the Greenback (USD), capping the AUD/USD gains above the 200-DMA.
On the data front in the United States, the Philadelphia Fed Non-Manufacturing Index dropped to -3.7 from a revised 2.1 in December, while the Richmond Fed Manufacturing Index fell in January. The reading came at -15, below forecasts and the prior month’s -11 contraction.
In the meantime, money market futures trimmed the Fed’s odds for a rate cut in March, though in May, a fully 25 basis point (bps) cut is priced in, and the chances for a 50 bps lie at 50%.
The NAB Business conditions worsened to 7 in December on the Aussie front.
Recently, Australia’s Judo Bank Manufacturing PMI improved from 47.6 to 50.3, while the Services stood at recessionary levels despite improving from 47.1 to 47.9. The Composite Index rose by 48.1 from 46.9. Warren Hogan, Chief Economic Advisor at Judo Bank, said: “The Judo Bank Flash PMI for January provides a first look at the economy in the new year. Encouragingly, we have seen a modest improvement in business conditions in January, with a stabilization in service sector activity and a pick-up in manufacturing output.”
On the US front, the economic docket will feature S&P Global Flash PMIs, ahead of Thursday GDP and the Fed’s favorite inflation gauge, the core PCE.
AUD/USD Price Analysis: Technical outlook
Despite clinging to the 200-DMA, the AUD/USD could remain sideways, capped on the upside by the 0.6600 figure. A breach of the latter will expose the 50-DMA at 0.6649 before testing 0.6700. On the flip side, a drop below 200-DMA at 0.6577 and the 100-DMA at 0.6522, would open the door to test the 0.6500 mark. The further downside lies at the major support level at 0.6338, the latest cycle low on November 10.
- Australia's January Judo Bank Services PMI increases to 47.9 versus 47.1 previous.
- Manufacturing PMI Component hits 11-month high of 50.3.
Australia's Judo Bank Purchasing Managers' Index (PMI) showed a welcome rebound in the PMI Manufacturing component, hitting an 11-month high of 50.3 and helping to drag the Composite PMI Output Index to a four-month high of 48.1 versus December's print of 46.9.
Despite a continued overall decline in Australia's private sector activity in January, the pace of contraction has declined, and an easing of business contractions coincides with an improvement in business confidence at the start of 2024.
According to Judo Bank's Chief Economic Advisor Warren Hogan:
“The Judo Bank Flash PMI for January provides a first look at the economy in the new year. Encouragingly, we have seen a modest improvement in business conditions in January, with a stabilisation in service sector activity and a pick-up in manufacturing output.
Business confidence has also improved, measured by the future output index, which rose to the highest level in five months in January. Excluding the spike in August last year, it is the highest reading in a year."
Market Reaction
The AUD/USD is trading tightly near the 0.6580 level as Pacific and Oceania markets gear up for the Wednesday market session.
About the Australian Judo Bank PMI
The Manufacturing Purchasing Managers Index (PMI), released on a monthly basis by Judo Bank and S&P Global, is a leading indicator gauging business activity in Australia’s manufacturing sector. The data is derived from surveys of senior executives at private-sector companies. Survey responses reflect the change, if any, in the current month compared to the previous month and can anticipate changing trends in official data series such as Gross Domestic Product (GDP), industrial production, employment and inflation. The index varies between 0 and 100, with levels of 50.0 signaling no change over the previous month. A reading above 50 indicates that the manufacturing economy is generally expanding, a bullish sign for the Australian Dollar (AUD). Meanwhile, a reading below 50 signals that activity among goods producers is generally declining, which is seen as bearish for AUD.
- NZ CPI inflation hits its coolest price growth in three years at 0.5% QoQ.
- Annualized CPI inflation cools to 4.7%, improved but still well above the RBNZ's 2% target.
New Zealand's Consumer Price Index (CPI) eased further in the fourth quarter of 2023, coming in at 0.5% QoQ in-line with forecasts and cooling off further from the previous quarter's 1.8%.
Annualized CPI inflation in New Zealand also matched expectations, coming in at 4.7% compared to the previous period's 5.6%.
StatsNZ noted that some minor adjustments had to be made to correct previous errors in several statistics, but noted that the overall direction and magnitude of the data release was unchanged as a result of the corrections.
According to StatsNZ, rises in Housing and household utilities (up 1.1%) were driven primarily by rising household energy (up 1.9%), but were offset by declines in the Food category (down 1.2%), fueled by a steep decline in the price of fruit and vegetables (down 6.4%).
New Zealand QoQ CPI inflation has cooled to its lowest price growth in three years, reaching a peak of 2.2% in October of both 2021 and 2022.
Market Reaction
The Kiwi (NZD) saw a quick jump against the US Dollar (USD) to drag the NZD/USD briefly back into the 0.6100 handle in early Wednesday trading action, but thin markets are set to fade the move in short order.
Why NZ CPI inflation matters to traders
With the Reserve Bank of New Zealand's (RBNZ) inflation target being around the midpoint of 2%, Statistics New Zealand’s quarterly Consumer Price Index (CPI) publication is of high significance. The trend in consumer prices tends to influence RBNZ’s interest rates decision, which in turn, heavily impacts the NZD valuation. Acceleration in inflation could lead to faster tightening of the rates by the RBNZ and vice-versa. Actual figures beating forecasts render NZD bullish.
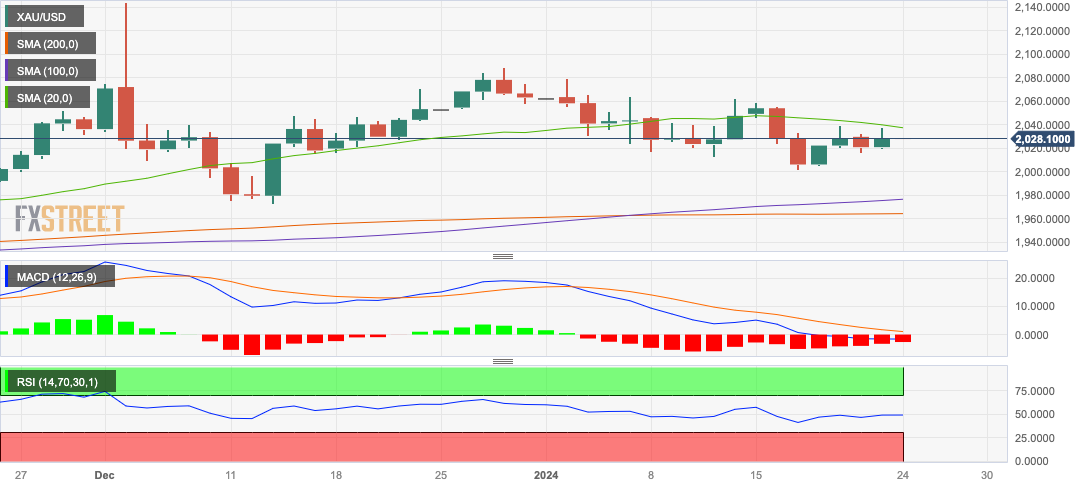
- The XAU/USD trades at $2,030 seeing gains of 0.43%.
- Key indicators on the daily chart signal that the bears are catching their breath after last week's strong movements.
- The four-hour chart outlook suggests potential upward bias, with a positive RSI incline and MACD's green bars.
On Tuesday's session, the Gold spot price XAU/USD was spotted trading at $2,030, reflecting a 0.43% gain, as the bears are taking a breather after last week's notable 2% loss. The daily chart presents a neutral-to-bearish sentiment with the bears while, the four-hour indicators are slightly tilted to the upside, suggesting an imminent potential shift in momentum.
Fundamentally speaking, strong US economic data and hawkish sentiments from the Federal Reserve (Fed) have led to significant selling of metals, causing doubts about an impending Fed rate-cutting cycle. In that sense, as markets start to adjust their bets on the Fed, the upside potential for the metal is capped, as it is causing US yields, often seen as the cost of holding non-yielding metals to rise.
XAU/USD technical levels
The Relative Strength Index (RSI) on the daily chart is flat on the negative side. The Moving Average Convergence Divergence (MACD) displays an equivalently flat activity with negative red bars evidencing bearish sentiment. Despite this, the metal continues to cling just below the 20-day Simple Moving Average (SMA), while managing to remain above the 100 and 200-day SMAs. The maintaining of a position above the longer-term SMAs underscores a ruling bullish perspective in a broader sense, even amidst the bearish undertones polarizing the immediate scenario, particularly after a 2% loss last week.
Zooming into the four-hour timeframe, the momentum subtly changes. The same indicators remain flat, albeit with a small bias towards a buying sentiment. As per the Relative Strength Index (RSI), it shows positive slope taking place within the positive domain. Concurrently, the Moving Average Convergence Divergence (MACD) reflects a stationary display of red bars.
XAU/USD daily chart
- Mixed US Treasury yields: 10-year note rises to 4.136%, short-term yields dip slightly.
- Investor indifference to Richmond Fed data; eyes on upcoming ECB, Fed decisions impacting rate cut views.
- Fewer expected Fed rate cuts in 2024; focus on US GDP, Jobless Claims, Core PCE index this week.
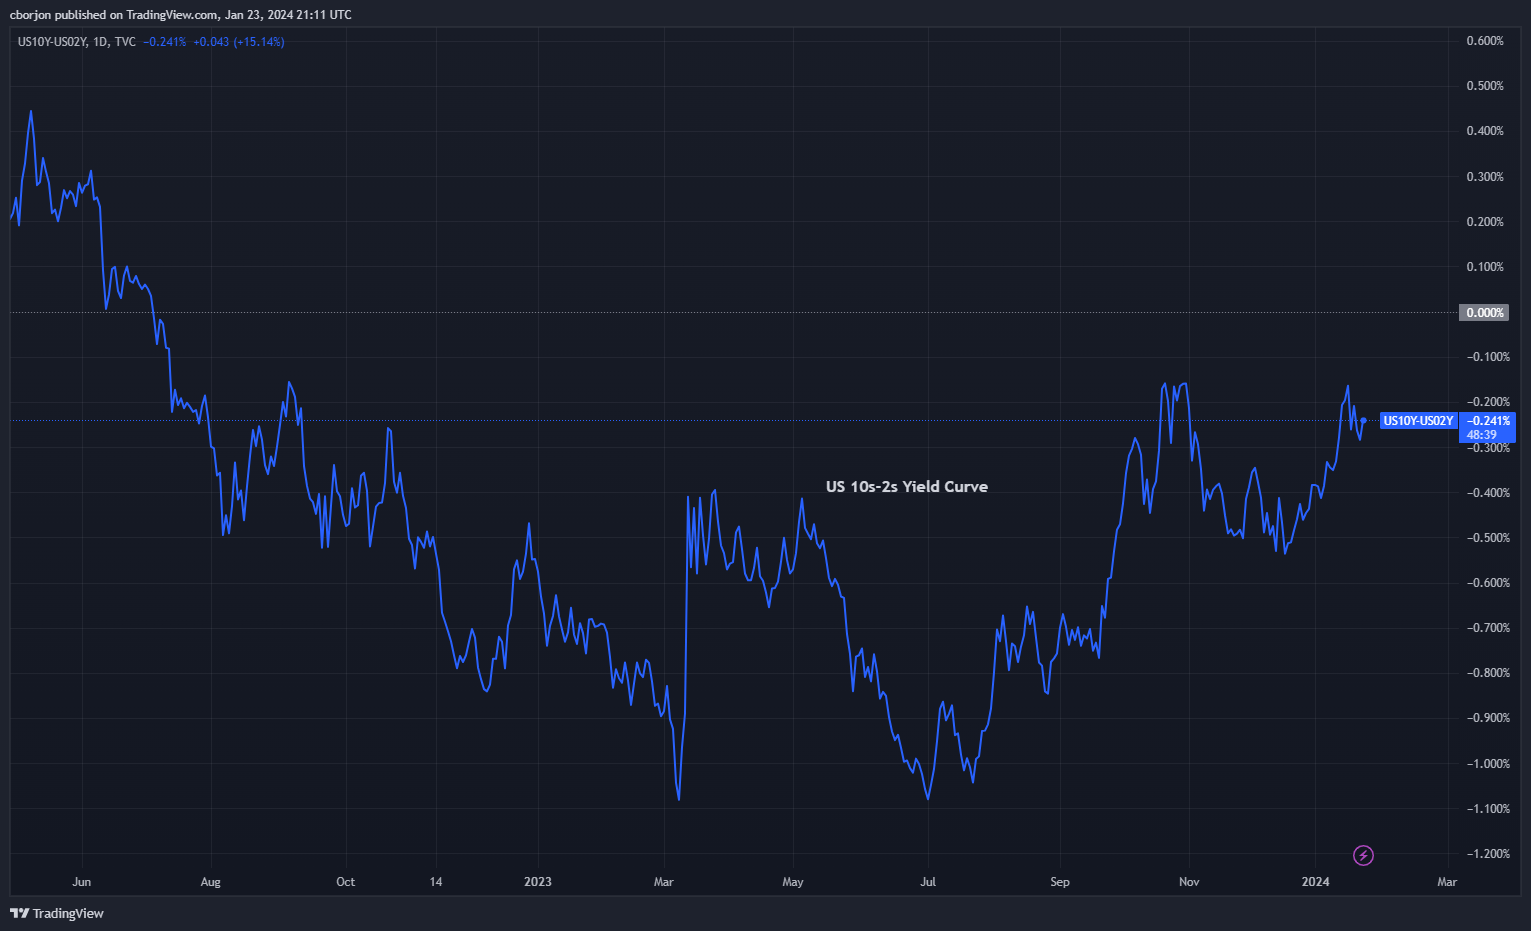
US yields advanced on Tuesday, mainly the belly and the long-end of the yield curve, while the three-month bills and the 2-year note were down one basis point, each at 5.21% and 4.383%. At the same time, the US 10-year benchmark note rate is at 4.136%, up almost three basis points, while the 20 and 30-year bond coupons witnessed a rise of four and four and a half basis points, at 4.48% and 4.37%, respectively.
Investors eye central bank’s decisions amid evolving Economic Indicators
In the US, economic data featured the Richmond Fed Composite and Manufacturing Index experienced a decline, moving from -11 to -15 in January. Conversely, the Services Index saw an improvement, rising from 0 to 4.
Although the data was mainly ignored by investors, they had priced out Federal Reserve’s March 2024 rate cut, pushing it back to ward May. Traders should be aware that the European Central Bank (ECB) will review its monetary policy decision on Thursday, ahead of next week’s Federal Reserve decision.
If the ECB remains on keeping rates higher for longer, that could sponson a leg-up in US Treasury yields. Otherwise, a subtle change of tone on major central banks' monetary policy statements could trigger volatility in the markets.
A week ago, investors anticipated the Federal Reserve to implement rate cuts totaling 175 basis points in 2024. However, as of writing, they modified their expectations to 141 basis points of monetary easing, effectively reducing their forecast by one rate cut.
Ahead of the week, the US economic docket will feature the US Gross Domestic Product (GDP) for last year’s Q4, along with Initial Jobless Claims and the Fed’s preferred gauge for inflation, the Core Personal Consumption Expenditure (PCE) price index.
US 10s-2s Spread Chart
- Middle East tensions, Red Sea risks continue to prop up Crude Oil.
- Growing supply keeps barrel bids weighed down.
- Investors are caught in the middle between supply chain fears and actual supply.
Crude Oil markets roiled once again on Tuesday, sending West Texas Intermediate (WTI) US Crude Oil prices for a lap around familiar price levels between $75.00 and $73.50.
Crude Oil investors continue to fear a shattering of regional and global supply lines as Houthis remain dedicated to attacking civilian cargo ships bound for the Suez Canal through the Red Sea and the Israel-Hamas conflict continues to risk dragging the Middle East into a protracted conflict that could hamper global Crude Oil trade, if not outright production.
US production of Crude Oil tipped into record highs in the tail-end of 2023, and according to the Energy Information Administration (EIA) on Tuesday, Texas’ Crude Oil output is getting aided by an overall increase in the density of its Crude Oil, meaning Texas is pumping oil out of the ground with a higher specific gravity than normal, meaning it can be converted into more light sweet crude than lighter-gravity oils from other pumping locations.
The US-UK naval coalition has launched a total of eight strikes against critical Houthi rebel locations and weapon emplacements throughout Yemen, but the continued military operations have yet to translate into economic stability as civilian cargo ships continue to avoid the Red Sea, keeping nervous Crude Oil markets on edge.
Despite geopolitical tensions keeping oil barrel prices on the high side, energy markets are having a hard time ignoring that global Crude Oil production threatens to swamp out global demand. The US is on pace to hit new production records in both 2024 and 2025 according to forward-looking estimates by the EIA, and the impending completion of the Canadian Trans Mountain pipeline will only push the numbers of available refined products even higher in the future.
WTI Technical Outlook
WTI Crude Oil tested into new highs for 2024 this week near $75.50, and hourly candles are on the high side of the 200-hour Simple Moving Average (SMA) as near-term action tilts into bullish territory on the charts.
Daily candles show Crude Oil stuck on the low side of the 200-day SMA just below the $78.00 handle, and a slight bullish lean to prices see barrel bids getting snagged in a congestion zone between the 50-day and 200-day SMAs as Crude Oil prices drifts into a consolidation pattern, up nearly 10% from December’s swing low into $67.97.
WTI Hourly Chart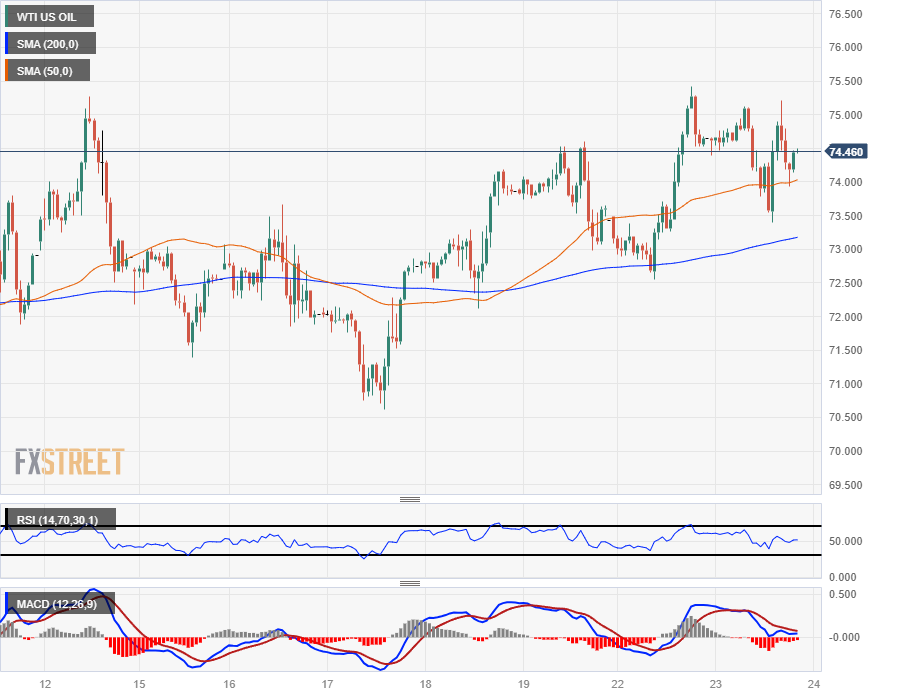
WTI Daily Chart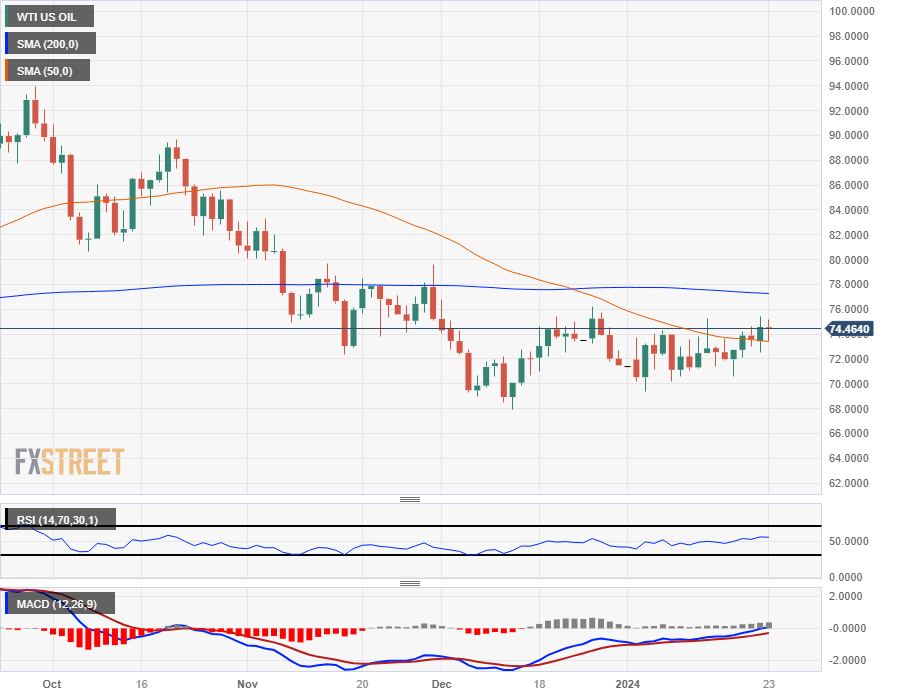
- EUR/JPY near 161.00, down 0.13% as Euro faces pressure before ECB decision in mixed markets.
- Despite Ichimoku Cloud break, bulls struggle at 161.24 resistance; eyes on 162.00, then 163.00 if surpassed.
- Below 161.00, EUR/JPY risk extends; next supports at Tenkan-Sen (160.21), 160.00, 159.25, 158.71.
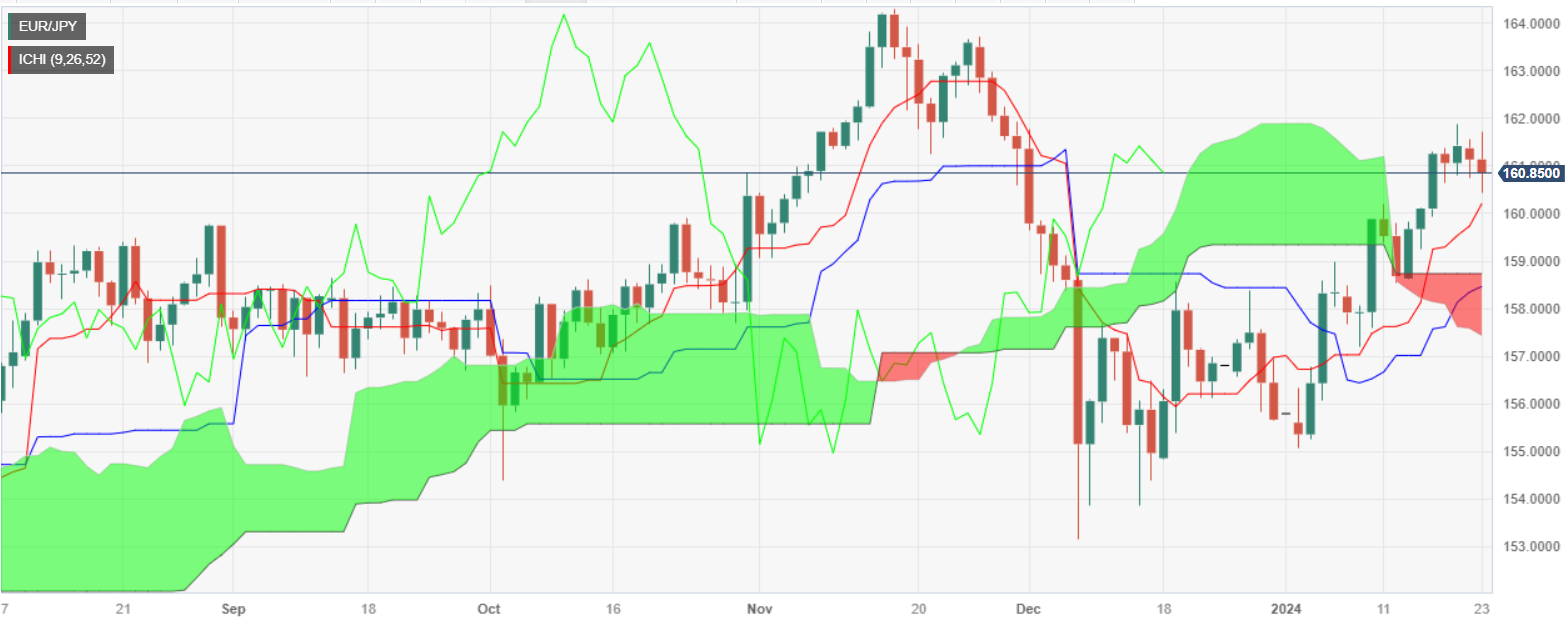
The EUR/JPY seesaws at around the 161.00 figure in the mid-North American session, though it’s trading below its opening price by 0.13% and, at the time of writing, exchanges hands at 160.95.
Market mood is mixed, with two out of three US equity indices in the green, with the Dow Jones being the outlier, down by 0.32%. Nevertheless, the Euro’s weakness keeps the shared currency pressured ahead of Thursday's European Central Bank (ECB) monetary policy decision
The EUR/JPY is consolidating at around the current week's highs after buyers lifted the pair above the Ichimoku Cloud (Kumo), usually a sign that bulls are gathering momentum. Nevertheless, they had failed to edge above the November 21 swing low turned resistance at 161.24, so they could challenge the 162.00 figure. Once those two levels are cleared, the next stop would be the 163.00 figure, followed by the November 27 high at 163.72.
On the other hand, a daily close below 161.00 would open the door for further losses. The first support would be the Tenkan-Sen at 160.21, followed by the 160.00 figure. A breach of the latter, and the pair will extend its losses to the Senkou Span A at 159.25, followed by the Senkou Span B at 158.71.
EUR/JPY Price Action – Daily Chart
EUR/JPY Technical Levels
The strong presence of the risk-off sentiment lent extra legs to the US Dollar and prompted a marked correction in the risk-linked galaxy on Tuesday, as market participants quickly digested the BoJ event and got ready for the publication of advanced PMIs on Thursday as well as the BoC interest rate decision.
Here is what you need to know on Wednesday, January 24:
Further strength in the greenback in combination with higher yields across the curve and the intense risk aversion pushed the USD Index (DXY) to new yearly highs well north of 103.00. Next on tap in the US docket will be the preliminary Manufacturing and Services PMIs for the month of January.
It continued to rain around EUR/USD, which this time extended its downward bias to the 1.0820 region, or six-week lows. Moving forward, flash Manufacturing and Services PMIs in Germany and the Euroland will grab all the looks on Wednesday.
The selling pressure saw GBP/USD flirt with four-day lows near around 1.2650 on the back of the robust recovery in the greenback. Across the Channel, all the attention is expected to be on the release of January’s advanced Manufacturing and Services PMIs.
USD/JPY rapidly reversed a sudden pullback to the 147.00 zone and managed to return to levels well past the 148.00 hurdle as markets seem to have ignored a hawkish (ish) tilt from BoJ’s Ueda. On Wednesday, December Balance of Trade figures takes centre stage in the Japanese calendar.
AUD/USD navigated a volatile session, ending around Monday’s closing levels despite the firmer tone of the greenback and the mixed bias in the commodity complex. In Oz, Westpac will release its Leading Index for the month of December.
An inconclusive session left USD/CAD hovering around the 1.3470 region ahead of the key BoC interest rate decision on Wednesday. Consensus expects the central bank to keep the steady hand for the fourth meeting in a row.
Prices of WTI maintained its gradual yearly upside, although Tuesday saw the commodity recede slightly from Monday’s tops north of the $75.00 mark per barrel.
Despite extra gains in the greenback and increasing US yields, both Gold and its cousin Silver edged higher on Tuesday.
- The NZD/JPY pair holds strong at 90.15, making gains of 0.30%.
- The BoJ left its policy rate unchanged, just as expected.
- Despite the mixed short-term outlook, bulls retain control, with the pair trending above the key SMAs.
- Indicators on the four-hour chart signal a slight tilt towards selling momentum, with RSI and MACD in negative territory.
On Tuesday's session, the NZD/JPY pair made gains to 90.15 due to a 0.30% increase. Although the daily chart outlook remains neutral to bearish, bullish forces appear to maintain a strong stance. However, the pair's situation on the four-hour outlook tilts slightly towards the downside.
On the fundamental side, Governor Ueda from the Bank of Japan (BoJ) gave signs on when the bank will leave negative interest rates stating that the likelihood of achieving 2% inflation target is gradually rising. This reaffirms that the BoJ will eventually exit the ultra-loose monetary policy, which may provide some support to the Yen.
On the technical side, from a daily chart perspective, the indicators are presenting a mixed picture. The relative strength index (RSI) is trending upwards but remains in the bearish zone, suggesting a lack of strong buying momentum. This is further supported by the flat red bars display in the Moving Average Convergence Divergence (MACD), which indicates the presence of selling traction. However, the position of the cross above the 20, 100, and 200-day simple moving averages (SMAs) tells a different narrative, demonstrating that bulls retain robust long-term control.
Turning to the shorter-time frame, the RSI on the four-hour chart is also navigating in the bear territory with a negative incline, suggesting a possible continuation of the selling pressure in the near term. The MACD paints a similar picture with flat red bars, highlighting a pause in bullish activity. Considering these factors, the immediate momentum on the four-hour chart is slightly tipped in favour of the bears. Nonetheless, with the bulls demonstrating resilience, traders should keep a close eye for any potential shift in momentum that may hint towards a reversal of the short-term bearish trend as bulls are presenting a battle.
NZD/JPY technical levels
NZD/JPY daily chart
-638416346186941809.png)
- European stocks decline as risk rebound sees limited dip-buying.
- ECB due Thursday, Europe PMIS on Wednesday.
- Euro area PMIs expected to show slight growth.
European equity indexes initially climb on Tuesday, hitting near-term highs before revising direction once again and testing into the low side of recent activity.
European stocks weren’t able to follow US equities higher, lacking the same drive from AI tech stocks that saw the American equity sector climb into new highs once again on Monday.
This week sees another showing from the European Central Bank (ECB) who is expected to remain flat on interest rates for the time being despite broad-market hopes and expectations of faster, sooner rate cuts.
ECB policymakers have worked double time in the past week trying to talk down market hopes for rate cuts to begin soon, with some particularly determined investors hoping for rate cuts to start as early as March. ECB officials have pushed firmly back on overeager markets, setting a more reasonable hopeful deadline for the summer months.
European Consumer Confidence declined in January from -15.0 to -16.1 versus the forecast -14.3, and the ECB’s Bank Lending Survey kicked off the day’s overall losses after it was revealed that bank lending to both consumers and businesses have continued to decline through the third quarter, and further declines in credit facility access are expected though 2024’s first quarter.
Germany’s DAX and France’s CAC 40 both ended Tuesday down a little over a third of a percent with the DAX down 56.27 points and ending the day at €16,627.09 while the CAC 40 shed 25.21 points to close down at €7,388.04, losing 0.34% on the day.
The pan-European STOXX600 equity index shed 1.33 points to close down 0.28% at €471.53, and London’s FTSO held mostly flat on the day, closing down a scant 0.3% and down 1.98 points to £7,485.73.
DAX Technical Outlook
The DAX German equity index fell back after an early climb on Tuesday, touching an intraday peak above €16,700 before falling back once more. The major equity index is falling into a congestion zone between the 50-hour and 200-hour Simple Moving Average (SMA) near €16,600.00.
The DAX continues to mostly recover, climbing 1.7% from last week's lows near €16,328.00 but downside momentum is getting hard to ignore as the equity index sees frequent drops amidst steady moves higher.
Near-term prices see support from the 50-day SMA at €16,400.00, and a bearish extension would need to cross over the $15,800 barrier before extending into a meaningful downside trend.
DAX Hourly Chart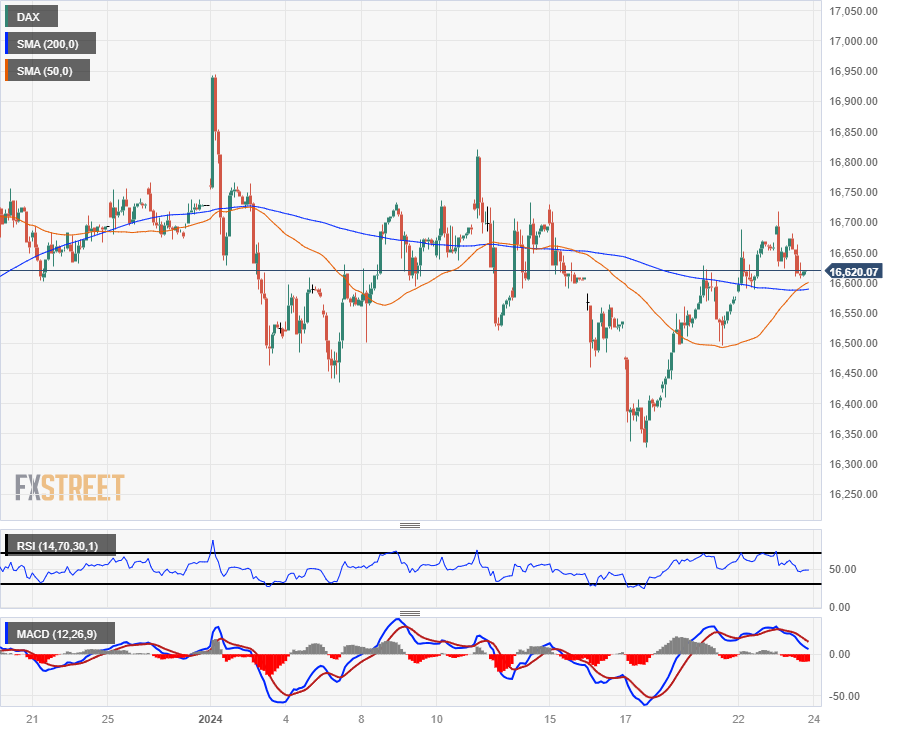
DAX Daily Chart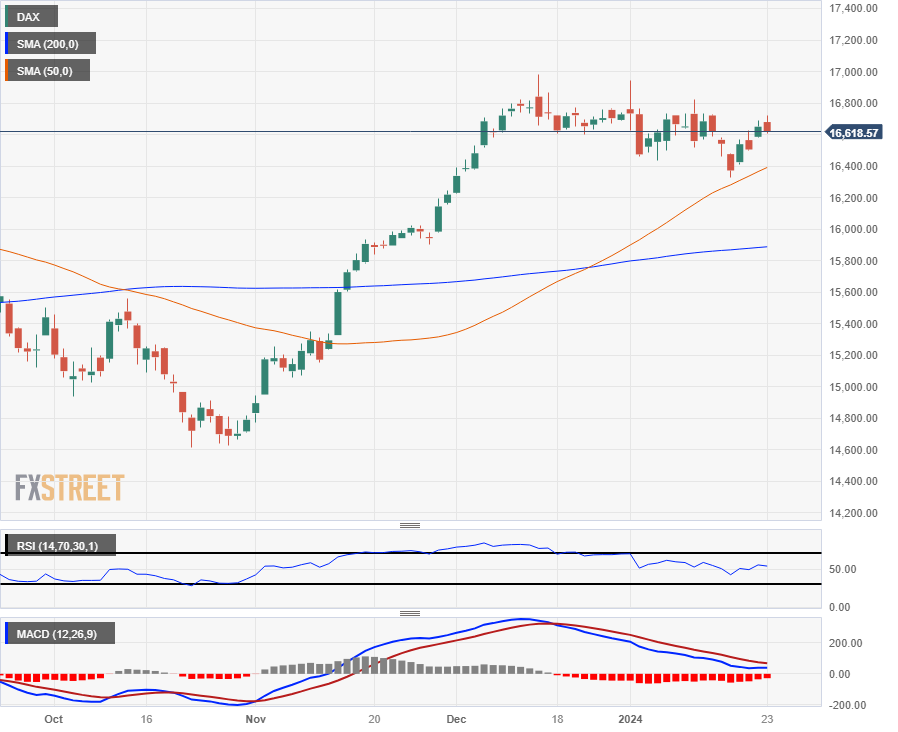
- GBP/USD falls over 0.40% to 1.2657, with a strong USD and high Treasury yields overshadowing Pound amid stock volatility.
- UK deficit reduction spurs tax cut speculation; BoE may hold rates in February, possible cuts from May.
- Traders eye S&P Global Flash PMIs in UK, US; US Q4 GDP, Core PCE price index as key upcoming events.
The GBP/USD slumped more than 0.40% in the mid-North American session amid a strong US Dollar (USD) and high US Treasury bond yields underpinning the Greenback to the detriment of the Pound Sterling (GBP). At the time of writing, the major exchanges hands at 1.2657 after hitting a daily high of 1.2747.
Cable faces pressures as markets eye US GDP figures ahead
US stocks are trading mixed as companies reveal last year’s fourth-quarter results. On the data front, the Richmond Fed Composite and Manufacturing Index deteriorated further from -11 to -15 in January, while the Services edged up from 0 to 4.
During the European session, the Office for National Statistics (ONS) in the UK revealed the budget deficit was narrower than the figures of last year, printed a £-7.77 billion in December, lower than last year’s £-13.71 billion. That could open the door for a cut in taxes, as expressed by Chancellor Hunt and UK Prime Minister Rishu Sunak in the spring budget to be presented on March 6.
Moving to central banks, the Bank of England (BoE) isn’t expected to move the needle in February according to a Reuters poll. Nevertheless, investors see Governor Bailey and Co. slashing rates as early as May, with three additional cuts, which would drag the Bank Rate from 5.25% to 4.25%.
In the US, the Federal Reserve is expected to ease policy in June, via a Reuters poll. TD Securities analysts noted, “We still expect the Committee to maintain a cautious stance in the near term even amid an increasingly improving profile for consumer prices, as the Fed would like to ascertain that the recent progress in inflation is sustainable.” The poll suggests that most analysts estimate the Federal Funds Rate (FFR) would be adjusted from 5.25%-5.50% to 4.25%-4.50%.
Ahead on the week, the UK economic docket will feature S&P Global Flash PMIs on Wednesday, as in the US as well. On Thursday, the US calendar will unveil the preliminary reading for last year’s Q4 GDP figures and the Fed’s preferred inflation gauge, the Core Personal Consumption Expenditure (PCE) price index.
GBP/USD Technical Levels
- The DXY Index showcases gains, jumping back above the 200-day SMA near 103.70.
- No relevant reports were released on Tuesday, focus is set on PCE and GDP data due later this week.
- Rising yields and markets delaying dovish bets on the Fed provide a boost to the Greenback.
The US Dollar (USD) index has been experiencing an uptrend, with the index currently trading up to the 103.70 level. This comes in anticipation surrounding upcoming key inflation data and the impact of rising yield as markets reduced their dovish bets on the Federal Reserve (Fed).
The US economy is maintaining its robustness as traders await key data and central bank meetings later this week. Despite a lack of major data or any Fed speakers, the market pushed back its easing expectations to roughly 125 bps over 2024, down from nearly 175 bps earlier this month, which has helped the Greenback recover.
Daily Digest Market Movers: US Dollar gains momentum as rising yields drive uptrend amid lacking high-tier reports
- On Thursday, the US will release December Personal Consumption Expenditures (PCE) data, which is expected to show that inflation has stagnated. Gross Domestic Product (GDP) figures from Q4 are also due that day and markets expect the economic activity to have cooled off.
- US bond yields are on the rise, with the 2-year yield at 4.40%, the 5-year yield at 4.06%, and the 10-year yield at 4.15%. All three rates are approaching their highest level in January as investors adjust their expectations on the next Fed decision.
- Projections from the CME FedWatch Tool show that the market's expectations for the start of the easing cycle have shifted to May.
Technical Analysis: DXY index recovers the 200-day SMA as bulls find a lift
The indicators on the daily chart reflect a mix of bullish and bearish sentiments. The Relative Strength Index (RSI) is in positive territory, indicating sustained buying pressure in the market that is underscored by the appreciating slope of the RSI plot.
Simultaneously, the Moving Average Convergence Divergence (MACD) paints a contrasting picture. The MACD histogram displays flat green bars, sporting a lack of bullish conviction. This stagnation of MACD hints at a balance in buying and selling pressures for the moment.
As for the Simple Moving Averages (SMAs), the DXY is trading above the 20-day SMA, indicating that the bulls maintain control in the immediate term. Nevertheless, the bearish undercurrent is evident with the index trading below the 100-day SMA. Yet the medium to long-term optimism remains as the index has recovered the crucial 200-day SMA.
Support levels: 103.50 (200-day SMA), 103.30, 103.00.
Resistance levels: 103.80, 104.00, 104.10.
US Dollar FAQs
What is the US Dollar?
The US Dollar (USD) is the official currency of the United States of America, and the ‘de facto’ currency of a significant number of other countries where it is found in circulation alongside local notes. It is the most heavily traded currency in the world, accounting for over 88% of all global foreign exchange turnover, or an average of $6.6 trillion in transactions per day, according to data from 2022.
Following the second world war, the USD took over from the British Pound as the world’s reserve currency. For most of its history, the US Dollar was backed by Gold, until the Bretton Woods Agreement in 1971 when the Gold Standard went away.
How do the decisions of the Federal Reserve impact the US Dollar?
The most important single factor impacting on the value of the US Dollar is monetary policy, which is shaped by the Federal Reserve (Fed). The Fed has two mandates: to achieve price stability (control inflation) and foster full employment. Its primary tool to achieve these two goals is by adjusting interest rates.
When prices are rising too quickly and inflation is above the Fed’s 2% target, the Fed will raise rates, which helps the USD value. When inflation falls below 2% or the Unemployment Rate is too high, the Fed may lower interest rates, which weighs on the Greenback.
What is Quantitative Easing and how does it influence the US Dollar?
In extreme situations, the Federal Reserve can also print more Dollars and enact quantitative easing (QE). QE is the process by which the Fed substantially increases the flow of credit in a stuck financial system.
It is a non-standard policy measure used when credit has dried up because banks will not lend to each other (out of the fear of counterparty default). It is a last resort when simply lowering interest rates is unlikely to achieve the necessary result. It was the Fed’s weapon of choice to combat the credit crunch that occurred during the Great Financial Crisis in 2008. It involves the Fed printing more Dollars and using them to buy US government bonds predominantly from financial institutions. QE usually leads to a weaker US Dollar.
What is Quantitative Tightening and how does it influence the US Dollar?
Quantitative tightening (QT) is the reverse process whereby the Federal Reserve stops buying bonds from financial institutions and does not reinvest the principal from the bonds it holds maturing in new purchases. It is usually positive for the US Dollar.
- EUR/USD declines into five-week lows as safe haven flows pick up the Greenback.
- PMI figures from both the EU and the US due on Wednesday.
- ECB rate call to take center stage on Thursday, US PCE inflation on Friday.
The EUR/USD tumbled into fresh lows for 2024, hitting its lowest bids in nearly six weeks after the Euro extended broad-market declines on the back of souring consumer sentiment and declining bank lending activity confirmed by the latest Bank Lending Survey from the European Central Bank (ECB).
Europe saw extended declines in the Euro (EUR) after the ECB confirmed that business and lending activity in the euro area continued to decline. High interest rates exacerbated overall declines in bank lending activity across the continent, and European banks further tightened lending conditions through the fourth quarter of 2023.
Daily digest market movers: EUR/USD backslides as bad data releases pile up
- The European Consumer Sentiment Index declined to -16.1 in January versus the forecast rebound from December’s -15.0 to .14.3.
- The US Richmond Fed Manufacturing Index also declined to its lowest level in nearly four years in January, printing at -15 compared to December’s -11 and missing the market’s forecast recovery to -7.
- The ECB’s latest Bank Lending Survey showed bank lending activity declined further in the fourth quarter, with high interest rates and souring consumer sentiment specifically highlighted as key triggers.
- The ECB noted that European banks have broadly tightened lending conditions, squeezing credit access that has already seen slumping demand.
- Overall loan demand from both businesses and households is expected to decline further in 2024’s first quarter.
- Lending activity declines slowed in the fourth quarter, but continue to slowdown, exacerbating declines in economic activity.
- Wednesday brings Purchasing Managers’ Index (PMI) figures for both the euro area and the US.
- Markets are hoping the pan-European HCOB Composite PMI sees a slim gain from 47.6 to 48.0.
- The euro area’s Composite PMI has been in sub-50.0 contraction territory since July.
- US Services PMI is expected to decline slightly from 51.4 to 51.0.
- ECB descends on markets with its latest rate call on Thursday.
- Market expectations of steep and dep rate cuts from the ECB have been pushed back by central bank officials constantly warning that market hopes for rate cuts have run too far ahead of what policymakers can deliver.
Euro price today
The table below shows the percentage change of Euro (EUR) against listed major currencies today. Euro was the weakest against the US Dollar.
| USD | EUR | GBP | CAD | AUD | JPY | NZD | CHF | |
| USD | 0.39% | 0.40% | 0.06% | 0.16% | 0.28% | 0.12% | 0.24% | |
| EUR | -0.40% | 0.01% | -0.34% | -0.23% | -0.12% | -0.27% | -0.15% | |
| GBP | -0.40% | -0.01% | -0.35% | -0.21% | -0.14% | -0.27% | -0.17% | |
| CAD | -0.08% | 0.32% | 0.33% | 0.09% | 0.19% | 0.04% | 0.16% | |
| AUD | -0.21% | 0.19% | 0.19% | -0.16% | 0.06% | -0.06% | 0.04% | |
| JPY | -0.28% | 0.11% | 0.12% | -0.21% | -0.07% | -0.13% | -0.03% | |
| NZD | -0.11% | 0.29% | 0.27% | -0.08% | 0.06% | 0.17% | 0.10% | |
| CHF | -0.26% | 0.14% | 0.16% | -0.19% | -0.04% | 0.03% | -0.11% |
The heat map shows percentage changes of major currencies against each other. The base currency is picked from the left column, while the quote currency is picked from the top row. For example, if you pick the Euro from the left column and move along the horizontal line to the Japanese Yen, the percentage change displayed in the box will represent EUR (base)/JPY (quote).
Technical Analysis: EUR/USD gets knocked back sharply from 1.0900 once again
The EUR/USD fell below the 1.0900 handle on Tuesday for the third time in less than a week after the pair saw a sharp rejection from the 200-hour Simple Moving Average (SMA) near 1.0915, shedding over eight-tenths of a percent top-to-bottom.
Tuesday’s decline sees the EUR/USD pair taking a bear run into the 200-day SMA after falling away from the 50-day SMA near 1.0920. EUR/USD intraday volatility sees the pair in rough consolidation trading between the 50-day and 200-day SMAs, and an extended decline will see the pair making a run at the last swing low near 1.0750.
EUR/USD Hourly Chart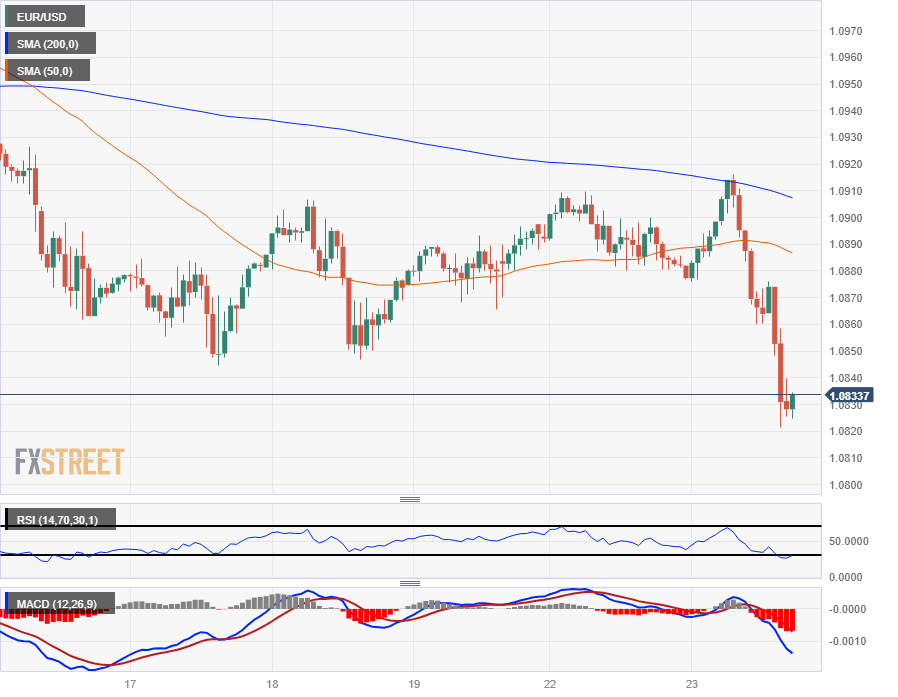
EUR/USD Daily Chart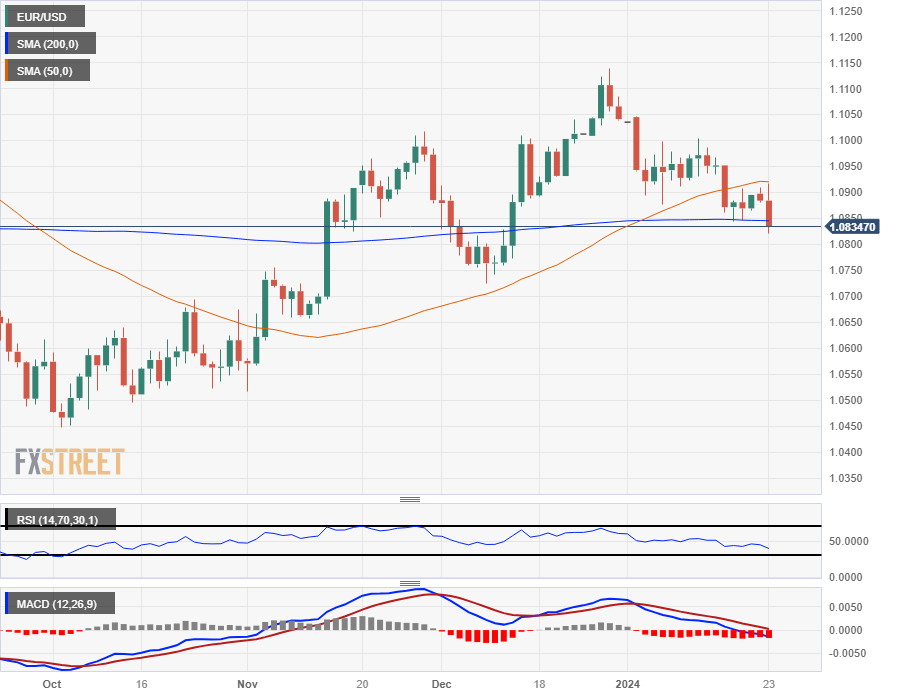
Euro FAQs
What is the Euro?
The Euro is the currency for the 20 European Union countries that belong to the Eurozone. It is the second most heavily traded currency in the world behind the US Dollar. In 2022, it accounted for 31% of all foreign exchange transactions, with an average daily turnover of over $2.2 trillion a day.
EUR/USD is the most heavily traded currency pair in the world, accounting for an estimated 30% off all transactions, followed by EUR/JPY (4%), EUR/GBP (3%) and EUR/AUD (2%).
What is the ECB and how does it impact the Euro?
The European Central Bank (ECB) in Frankfurt, Germany, is the reserve bank for the Eurozone. The ECB sets interest rates and manages monetary policy.
The ECB’s primary mandate is to maintain price stability, which means either controlling inflation or stimulating growth. Its primary tool is the raising or lowering of interest rates. Relatively high interest rates – or the expectation of higher rates – will usually benefit the Euro and vice versa.
The ECB Governing Council makes monetary policy decisions at meetings held eight times a year. Decisions are made by heads of the Eurozone national banks and six permanent members, including the President of the ECB, Christine Lagarde.
How does inflation data impact the value of the Euro?
Eurozone inflation data, measured by the Harmonized Index of Consumer Prices (HICP), is an important econometric for the Euro. If inflation rises more than expected, especially if above the ECB’s 2% target, it obliges the ECB to raise interest rates to bring it back under control.
Relatively high interest rates compared to its counterparts will usually benefit the Euro, as it makes the region more attractive as a place for global investors to park their money.
How does economic data influence the value of the Euro?
Data releases gauge the health of the economy and can impact on the Euro. Indicators such as GDP, Manufacturing and Services PMIs, employment, and consumer sentiment surveys can all influence the direction of the single currency.
A strong economy is good for the Euro. Not only does it attract more foreign investment but it may encourage the ECB to put up interest rates, which will directly strengthen the Euro. Otherwise, if economic data is weak, the Euro is likely to fall.
Economic data for the four largest economies in the euro area (Germany, France, Italy and Spain) are especially significant, as they account for 75% of the Eurozone’s economy.
How does the Trade Balance impact the Euro?
Another significant data release for the Euro is the Trade Balance. This indicator measures the difference between what a country earns from its exports and what it spends on imports over a given period.
If a country produces highly sought after exports then its currency will gain in value purely from the extra demand created from foreign buyers seeking to purchase these goods. Therefore, a positive net Trade Balance strengthens a currency and vice versa for a negative balance.
- Mexican Peso plummets as the USD/MXN tests key resistance level, which could shift the pair bullish.
- Risk appetite is mixed, though elevated US Treasury yields underpin the US Dollar.
- Upcoming economic data from Mexico, including the Economic Activity report and mid-month inflation figures, are closely watched by traders
The Mexican Peso (MXN) plunges sharply against the US Dollar (USD) on Tuesday on risk aversion in the FX space. This benefits safe-haven currencies to the detriment of the emerging market currency. That, along with a jump in Treasury yields in the United States, underpins the USD/MXN, which trades at 17.34, up by almost 1%.
Wall Street is trading mixed, weighed down by the sudden rise in US Treasury bond yields. The increase in yields is led by the belly and the long end of the yield curve, rising between four and seven basis points. The US Dollar Index (DXY), which tracks the buck’s performance against a basket of six other currencies, gains 0.37%, up at 103.74. The Greenback has been bolstered by traders pushing back their expectations of Federal Reserve (Fed) rate cutting from March until May, according to the CME FedWatch Tool data.
Across the border, Mexico’s economic docket will feature the release of the Economic Activity report, along with January’s mid-month inflation data.
Daily Digest Market Movers: Mexican Peso weakens the most since January 16, ahead of crucial data
- The former Bank of Mexico (Banxico) Governor and current General Manager of the Bank of International Settlements, Agustin Carstens, said that the central bank must not lower interest rates prematurely, adding that, “Recent developments allow us (central bankers) to look at the future with cautious optimism.” Carstens said that even though there’s progress on the disinflation process, “inflation is still above central bank targets in most countries and needs to fall further.”
- Agustin Carstens's posture and that of former Banxico Deputy Governor Everardo Elizondo suggest that policy should remain restrictive, which could deter the Mexican central bank from cutting rates, which currently sit at 11.25%, as traders await mid-January’s inflation report.
- Mid-month inflation in Mexico is expected to edge toward 4.78%, while the core is expected to dip further below the 5% threshold.
- The recent economic figures from Mexico indicate a deceleration in the economy, evidenced by Retail Sales falling short of expectations and being lower than those of October. Concurrently, projections for economic growth stand at 2.6%, which is under the anticipated 3%.
- On the US front, last week’s economic data paints a soft-landing outlook. Even though housing data was mixed, American household sentiment improvement, and lower inflation expectations underpinned the USD/MXN.
- Atlanta GDPNow model suggests last year’s Q4 likely expanded by 2.4%, spurred by strong retail sales, firm industrial production, a tight labor market and consumer sentiment improvement.
- Traders trimmed their bets for a dovish Federal Reserve in 2024. They stand at 139 basis points (bps) of cuts from 175 bps last week.
- Mexico witnessed a jump in headline inflation, but core data suggests the Bank of Mexico (Banxico) has done a good job, curbing elevated prices after hiking rates toward 11.25%.
- Despite indications from the December meeting minutes of Banxico (the Central Bank of Mexico) that it may consider easing its monetary policy, the inflation report for January poses a potential obstacle to any such policy relaxation.
- Standard Chartered analysts estimate the Bank of Mexico (Banxico) will lower rates to 9.25% in 2024.
- On January 5, a Reuters poll suggested the Mexican Peso could weaken 5.4% to 18.00 per US Dollar in the 12 months following December.
Technical Analysis: Mexican Peso falls to four-day low as USD/MXN meanders around 200-day SMA
The USD/MXN daily chart depicts buyers gathering momentum as they dragged the exchange rate to the brisk of breaching the 200-day Simple Moving Average (SMA) at 17.36. Once cleared, this could open the door to test the 100-day SMA at 17.42. Further upside is seen at the psychological 17.50 barrier, ahead of aiming toward the May 23 high at 17.99.
Failure to decisively break the 200-day SMA could open the door for a leg up, with first support at the 50-day SMA at 17.14, followed by the 17.05 swing low reached on January 22, ahead of the 17.00 figure.
USD/MXN Price Action – Daily Chart

Mexican Peso FAQs
What key factors drive the Mexican Peso?
The Mexican Peso (MXN) is the most traded currency among its Latin American peers. Its value is broadly determined by the performance of the Mexican economy, the country’s central bank’s policy, the amount of foreign investment in the country and even the levels of remittances sent by Mexicans who live abroad, particularly in the United States. Geopolitical trends can also move MXN: for example, the process of nearshoring – or the decision by some firms to relocate manufacturing capacity and supply chains closer to their home countries – is also seen as a catalyst for the Mexican currency as the country is considered a key manufacturing hub in the American continent. Another catalyst for MXN is Oil prices as Mexico is a key exporter of the commodity.
How do decisions of the Banxico impact the Mexican Peso?
The main objective of Mexico’s central bank, also known as Banxico, is to maintain inflation at low and stable levels (at or close to its target of 3%, the midpoint in a tolerance band of between 2% and 4%). To this end, the bank sets an appropriate level of interest rates. When inflation is too high, Banxico will attempt to tame it by raising interest rates, making it more expensive for households and businesses to borrow money, thus cooling demand and the overall economy. Higher interest rates are generally positive for the Mexican Peso (MXN) as they lead to higher yields, making the country a more attractive place for investors. On the contrary, lower interest rates tend to weaken MXN.
How does economic data influence the value of the Mexican Peso?
Macroeconomic data releases are key to assess the state of the economy and can have an impact on the Mexican Peso (MXN) valuation. A strong Mexican economy, based on high economic growth, low unemployment and high confidence is good for MXN. Not only does it attract more foreign investment but it may encourage the Bank of Mexico (Banxico) to increase interest rates, particularly if this strength comes together with elevated inflation. However, if economic data is weak, MXN is likely to depreciate.
How does broader risk sentiment impact the Mexican Peso?
As an emerging-market currency, the Mexican Peso (MXN) tends to strive during risk-on periods, or when investors perceive that broader market risks are low and thus are eager to engage with investments that carry a higher risk. Conversely, MXN tends to weaken at times of market turbulence or economic uncertainty as investors tend to sell higher-risk assets and flee to the more-stable safe havens.
- Canadian Dollar flows follow the broader market.
- Bank of Canada rate call looms on Wednesday.
- Crude Oil on the high side bolsters Canadian Dollar.
The Canadian Dollar (CAD) is mostly steady on Tuesday as broad-market sentiment dictates the flow of CAD pairs as Loonie traders buckle down ahead of the Bank of Canada’s (BoC) latest rate call and subsequent press conference. Crude Oil markets are tipped into the high end heading into the mid-week, keeping the Canadian Dollar propped up and preventing pre-BoC pullbacks in the near term.
Canada saw new home prices flatten in December and decline on an annualized basis, but Canada’s housing bubble remains one of the worst in the G20 of developed economies with housing affordability at its worst in over four decades. Runaway home prices are expected to crimp economic growth and tilt the Canadian domestic economy into a recession in the first half of 2024.
Daily Digest Market Movers: Canadian Dollar traders pull to the middle ahead of BoC
- BoC rate call and monetary policy statement due on Wednesday, Canadian Dollar traders benched ahead of central bank statement release.
- CAD gains in Loonie pairs result from headline-driven weaknesses in peer currencies.
- Canada’s New House Price Index flatlined at 0.0% in December compared to the previous month’s -0.2%.
- New home prices in Canada eased 0.9% for the year ended December, in-line with the previous figure.
- Despite a near-term loosening of Canadian housing price growth, Canada sees one of the worst housing affordability ratios in the G20.
- Bank of Montreal (BMO) Chief Economist Doug Porter noted that Canada has entered a recession shortly after the last three runaway spikes in housing unaffordability.
- Crude Oil markets are on the high end on Tuesday, bolstering the Canadian Dollar with West Texas Intermediate (WTI) US Crude Oil holding between $75.00 and $73.00 per barrel.
Canadian Dollar price today
The table below shows the percentage change of Canadian Dollar (CAD) against listed major currencies today. Canadian Dollar was the strongest against the Euro.
| USD | EUR | GBP | CAD | AUD | JPY | NZD | CHF | |
| USD | 0.36% | 0.25% | 0.00% | 0.02% | 0.16% | -0.04% | 0.20% | |
| EUR | -0.36% | -0.11% | -0.36% | -0.34% | -0.20% | -0.40% | -0.16% | |
| GBP | -0.25% | 0.11% | -0.26% | -0.24% | -0.10% | -0.30% | -0.06% | |
| CAD | 0.00% | 0.37% | 0.27% | 0.04% | 0.16% | -0.03% | 0.21% | |
| AUD | -0.02% | 0.34% | 0.23% | -0.03% | 0.14% | -0.06% | 0.18% | |
| JPY | -0.15% | 0.19% | 0.08% | -0.17% | -0.13% | -0.19% | 0.03% | |
| NZD | 0.02% | 0.38% | 0.29% | 0.03% | 0.05% | 0.18% | 0.23% | |
| CHF | -0.22% | 0.16% | 0.05% | -0.21% | -0.19% | -0.04% | -0.25% |
The heat map shows percentage changes of major currencies against each other. The base currency is picked from the left column, while the quote currency is picked from the top row. For example, if you pick the Euro from the left column and move along the horizontal line to the Japanese Yen, the percentage change displayed in the box will represent EUR (base)/JPY (quote).
Technical Analysis: CAD sees gains as counterpart currencies shed weight
The Canadian Dollar (CAD) is getting propped up against the broader currency market on Tuesday as the Loonie’s major currency peers waffle heading into the middle of the week. The Canadian Dollar is on the high side against the Euro (EUR) by four-tenths of a percent, while gaining over a quarter of a percent against the Pound Sterling (GBP) and the Swiss Franc (CHF) as the European bloc currencies wither on market sentiment.
The US Dollar (USD) is holding mostly flat against the Canadian Dollar on Tuesday with the USD/CAD rotating sideways on the day. The pair hit an intraday low of 1.3453 before rebounding back within range of Tuesday’s opening bids of 1.3478.
The Dollar-Loonie pair caught a bounce from the 200-hour Simple Moving Average (SMA) on Monday near 1.3415, and the pair is holding on the high side ahead of headline drivers in the mid-week market session on Wednesday.
The USD/CAD continues to get mired in technical congestion between the 50-day and 200-day SMAs, with price action consolidating near the 1.3450 to 1.3500 region. The pair is currently trading up 2.3% from December’s swing low into 1.3177.
USD/CAD Hourly Chart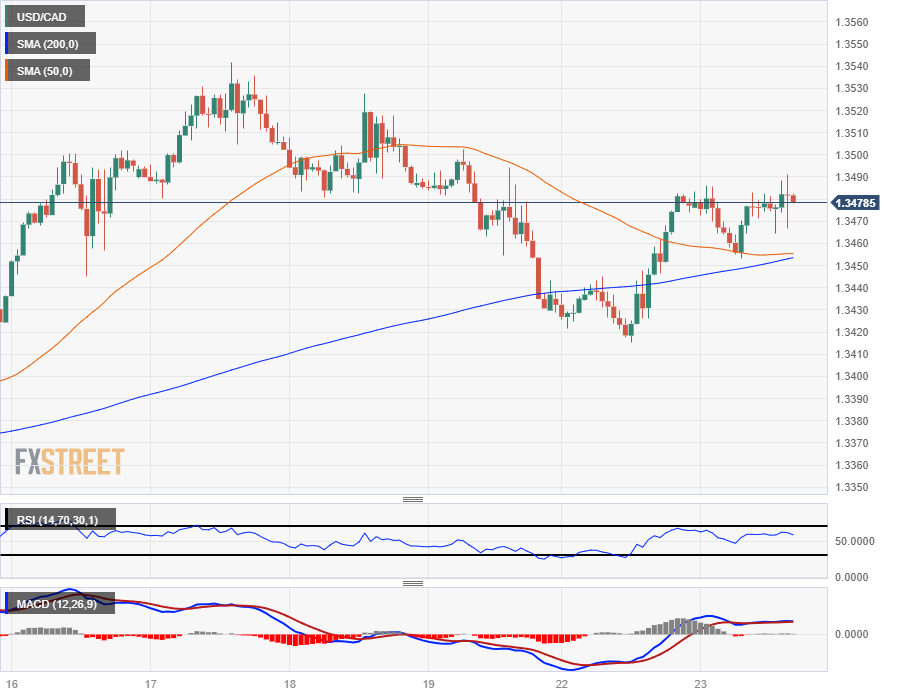
USD/CAD Daily Chart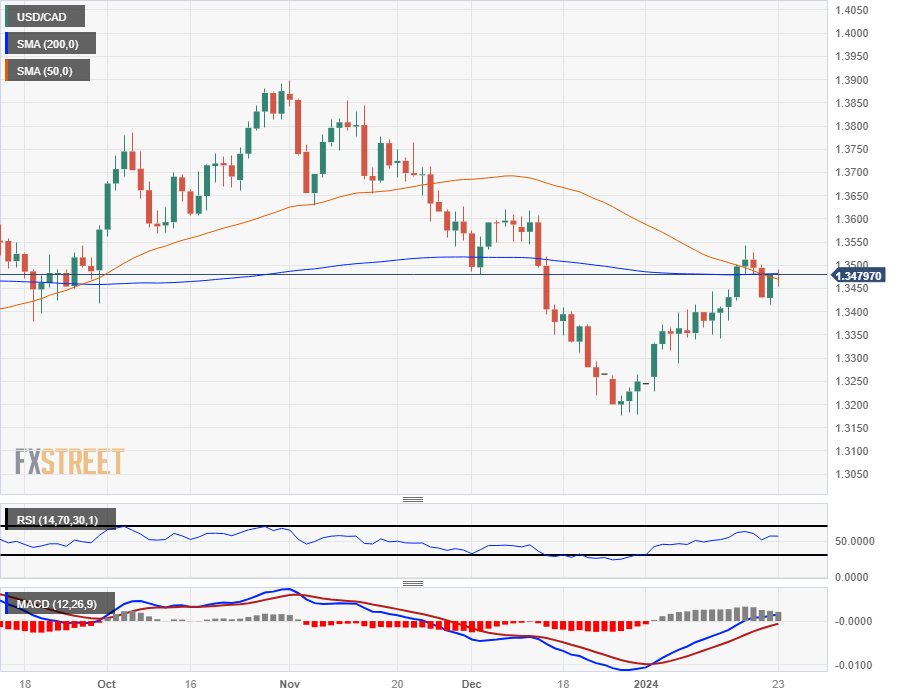
Canadian Dollar FAQs
What key factors drive the Canadian Dollar?
The key factors driving the Canadian Dollar (CAD) are the level of interest rates set by the Bank of Canada (BoC), the price of Oil, Canada’s largest export, the health of its economy, inflation and the Trade Balance, which is the difference between the value of Canada’s exports versus its imports. Other factors include market sentiment – whether investors are taking on more risky assets (risk-on) or seeking safe-havens (risk-off) – with risk-on being CAD-positive. As its largest trading partner, the health of the US economy is also a key factor influencing the Canadian Dollar.
How do the decisions of the Bank of Canada impact the Canadian Dollar?
The Bank of Canada (BoC) has a significant influence on the Canadian Dollar by setting the level of interest rates that banks can lend to one another. This influences the level of interest rates for everyone. The main goal of the BoC is to maintain inflation at 1-3% by adjusting interest rates up or down. Relatively higher interest rates tend to be positive for the CAD. The Bank of Canada can also use quantitative easing and tightening to influence credit conditions, with the former CAD-negative and the latter CAD-positive.
How does the price of Oil impact the Canadian Dollar?
The price of Oil is a key factor impacting the value of the Canadian Dollar. Petroleum is Canada’s biggest export, so Oil price tends to have an immediate impact on the CAD value. Generally, if Oil price rises CAD also goes up, as aggregate demand for the currency increases. The opposite is the case if the price of Oil falls. Higher Oil prices also tend to result in a greater likelihood of a positive Trade Balance, which is also supportive of the CAD.
How does inflation data impact the value of the Canadian Dollar?
While inflation had always traditionally been thought of as a negative factor for a currency since it lowers the value of money, the opposite has actually been the case in modern times with the relaxation of cross-border capital controls. Higher inflation tends to lead central banks to put up interest rates which attracts more capital inflows from global investors seeking a lucrative place to keep their money. This increases demand for the local currency, which in Canada’s case is the Canadian Dollar.
How does economic data influence the value of the Canadian Dollar?
Macroeconomic data releases gauge the health of the economy and can have an impact on the Canadian Dollar. Indicators such as GDP, Manufacturing and Services PMIs, employment, and consumer sentiment surveys can all influence the direction of the CAD. A strong economy is good for the Canadian Dollar. Not only does it attract more foreign investment but it may encourage the Bank of Canada to put up interest rates, leading to a stronger currency. If economic data is weak, however, the CAD is likely to fall.
- The EUR/GBP slightly recovered to 0.8555 after hitting a low of 0.8545.
- The ECB meets this Thursday with no policy change expected.
- The Pound maintains superiority over the Euro due to anticipations of less easing by the BoE in 2024.
In Tuesday's trading session, the EUR/GBP stabilised at 0.8555 after hitting its lowest level since September lows around 0.8545. Weak Consumer Confidence data from the European Commission, weakened the Euro, while the Pound has a slight advantage as markets bet on less easing of the Bank of England (BoE) in 2024.
As for now, the United Kingdom and the Eurozone economies continue to navigate uncertainties with both regions noticing demands for loans and credit dropping in Q4. The British economy is holding somewhat resilient with inflation remaining stubbornly high which is making markets expect less easing by the Bank of England in 2024.
The ECB (European Central Bank) meets on Thursday and President Lagarde might resist market bets on policy easing and maintain a cautious. As for now, investors are forecasting 150 bps of rate cuts in 2024 but the policy statement and Lagarde's tone might affect those odds. Regarding the BoE, its next meeting is due on March 6 and markets are seeing less easing than the ECB, of 125 bps in 2024 which seems to be giving a slight advantage to the Pound over the Euro.
EUR/GBP levels to watch
The indicators on the daily chart reflect the overall bearish sentiment. The Relative Strength Index (RSI) bolsters this viewpoint, as its position is in negative territory with a negative slope, indicating a sustained seller's market.
The Moving Average Convergence Divergence (MACD) histogram tells a similar story as it prints rising red bars.
The Simple Moving Averages (SMAs) align with these previous indicators. It unveils the pair's standing below the 20, 100, and 200-day SMAs, signaling the prevalent strength of the bears in a broader context. It mirrors the uphill struggle that buyers may confront in the short-term scheme.
EUR/GBP daily chart
-638416232254498636.png)
A strong start to the year for the US Dollar is set to continue, probably supported by both risk aversion and somewhat higher yields, analysts at HSBC say.
JPY and CAD are likely to consolidate in the weeks ahead
As the gap between market pricing and central bank guidance remains wide, we expect this USD strength to continue over the near term, notably against the EUR and GBP, in addition to the risk-on currencies, like the AUD and NZD.
Geopolitical risks will also carry scope to add further momentum to recent market moves. Beyond these global headwinds, the EUR and GBP also face domestic economic challenges, for which a ‘high for longer’ rate outlook seems unlikely to offer sustained support for these currencies.
However, not every currency is set to weaken against the USD over the near term. For example, the JPY has been the worst-performing G10 currency year-to-date, but we look for a near-term consolidation, followed by a medium-term modest recovery. We think that any hint from the Bank of Japan (BoJ) about approaching an end to its ultra-loose monetary policy could provide disproportionate support for the JPY after recent weakness.
The CAD may stabilise against the USD, as its weakness so far in 2024 looks overdone, relative to rate differentials and risk appetite.
New Zealand’s Consumer Price Index (CPI) report for the fourth quarter (Q4) will be released on Tuesday, January 23 at 21:45 GMT and as we get closer to the release time, here are the forecasts by the economists and researchers of four major banks regarding the upcoming NZ inflation data.
Headline CPI is expected to rise by 0.5% quarter-on-quarter vs. 1.8% in Q3, while the year-on-year rate is expected at 4.7% vs. the prior release of 5.6%. If so, it would be the lowest since Q2 2021. The RBNZ’s Q4 CPI projection is higher at 0.8% QoQ and 5.0% YoY.
ANZ
We expect annual CPI inflation to decelerate sharply to 4.7% YoY in Q4, below the RBNZ’s November MPS forecast of 5.0% YoY. However, the expected downward surprise versus RBNZ’s November forecast is driven entirely by the tradables component, which we expect to fall from 4.7% to 3.4% YoY. We expect non-tradable inflation of 5.7% YoY, in line with the RBNZ’s November forecast. Given the RBNZ’s focus on this component, it’s surprises here that will matter for the OCR outlook, particularly in context of the RBNZ’s impatience as expressed in the November Monetary Policy Statement. We see the risks as balanced around 5.7%. We expect the suite of core inflation measures to move materially lower. This is absolutely what the RBNZ needs to see, but we are cognisant that these measures are also influenced by weaker tradable inflation, whereas the RBNZ’s primary focus is domestic inflation risks.
Westpac
Inflation is set to again fall short of the RBNZ’s forecasts. We expect consumer prices to have risen by 0.5% in the December quarter, leaving them up 4.7% over the past 12 months. In contrast, the RBNZ’s last published forecasts assumed a 0.8% rise over the quarter (+5.0% for the year to December). Our lower inflation forecast reflects softness in the prices for volatile items like international airfares and food over the past quarter, as signalled by Stats NZ’s expanded suite of monthly price indicators. The bigger question is what’s happening to the underlying trend in prices. We expect most core inflation measures – including measures of domestic price pressures – will moderate, but remain at levels well above the RBNZ’s target range.
TDS
We expect Q4 CPI inflation to print on consensus at 0.5% QoQ (RBNZ: 0.8%), decelerating sharply from the 1.8% QoQ in Q3. This lifts the annual headline to 4.7% YoY, also much lower than 5.6% YoY last quarter. Food prices are likely to be a big drag this quarter, down 1.1% QoQ while petrol prices continue to be on the retreat. However, rent prices appear more sticky and could be a concern to the RBNZ, especially after it flagged that strong population growth poses upside risk to inflation. If CPI inflation does print below RBNZ's forecast, the RBNZ may scale back its hawkish rhetoric at the Feb meeting given the disappointing economic data (e.g., GDP, labour market) in Q4.
ING
We recently updated our estimates for the fourth quarter CPI in New Zealand, and expect a 0.4% QoQ print which translates into 4.6% YoY. Consensus is centred at 4.7%, signalling that expectations are for a marked undershot compared to the latest RBNZ fourth quarter CPI projections at 5.0%.
USD/MXN reversed after briefly testing the 200-Day Moving Average (DMA). Economists at Société Générale analyze the pair’s outlook.
17.42/17.55 likely to cap upside
USD/MXN has resumed its decline after testing the trend line drawn since 2021 at 18.48 (now near 18.10). Recent attempt of rebound has faltered near 200-DMA (17.42/17.55).
Daily MACD has started posting positive divergence however signals of bounce are not yet visible in price action; the Moving Average near 17.42/17.55 must be overcome to denote a meaningful up move.
Holding below the Moving Average, the pair could head lower towards last year’s low of 16.60 and projections of 16.40/16.10.
- EUR/USD drops 0.12% in North American trade, to 1.0855 after rallying to 1.0915, swayed by Fed policy outlook.
- Positive Wall Street sentiment vs. Eurozone confidence drop and ECB's tighter credit affect EUR/USD.
- Upcoming ECB policy decision, US GDP estimate set to shape EUR/USD amidst inflationary pressures.
The EUR/USD dropped some 0.12% in early trading during the North American session amid an upbeat market mood. At the same time, traders adjusted their speculations on rate cuts by the US Federal Reserve (Fed). The pair traded at 1.0855 after hitting a daily high of 1.0915 in the European session.
EUR/USD traders are awaiting the ECB’s Lagarde and Co. decision on Thursday
Wall Street’s sentiment reflects optimism amongst investors, who seem confident that the US economy will avoid a recession. In the meantime, odds that the Fed would cut rates in March plunged from 63.1% a week ago to 38.6%, following last week’s Fed officials declaring that it’s too soon to ease policy.
Aside from this, the European Central Bank (ECB) Bank Lending Survey revealed that credit has tightened while demand for loans diminished, taking a hit from higher interest rates set by the ECB. According to the ECB's survey, banks expect a slight increase in demand for loans to companies and mortgages.
Data-wise, the Eurozone (EU) Consumer Confidence dropped from 15.0 in December to -16.0 in January, revealing the EU’s commission, missing estimates for a rise to -14.3. Further catalysts are expected to rock the boat as the ECB would announce its monetary policy decision on Thursday. Across the pond, the US economic docket will announce the 2023 Q4 Gross Domestic Product (GDP) preliminary estimate, along with the Fed’s preferred gauge for inflation, the Personal Consumption Expenditures (PCE).
EUR/USD Price Analysis: Technical outlook
Even though the EUR/USD is resuming its downtrend, sellers would face stirring support at the 200-day moving average (DMA) at 1.0844. Once cleared, further downside is seen at the 1.0800 figure, followed by the 100-DMA at 1.0771. On the other hand, if buyers lift the major to the 1.0900 handle, expect a challenge of the 50-DMA at 1.0920, before buyers could extend the recovery towards he January 16 high at 1.0951.
The risk-reward is tilted back towards fading the recent US Dollar strength, analysts at TD Securities say.
Last stop on the USD award tour
We think we're getting close to good levels to start selling the USD again.
Although US data remains strong, the Fed can use the trends in core PCE to justify the start of rate cuts. The Fed wants to engineer a soft landing, which allows it to emphasize disinflation over growth now. Fed text and comments analysis remains dovish too.
After the recent correction higher in the USD, it does not look as cheap or oversold. It now looks more balanced versus not just macro drivers but also our positioning indicators. This means that the USD's move higher should now start to see greater resistance and risk-reward tilts towards fading the USD strength.
EUR/USD continues to track shorter-dated yields. Kit Juckes, Chief Global FX Strategist at Société Générale, analyzes the pair’s outlook.
The ECB will ease more slowly than the Fed and
EUR/USD has been tracking 2-year yield differentials in this rate-dominated market. We expect that spread to narrow from 170 bps now to under 100 bps in the second half of the year. If we took the correlation between EUR/USD and the yield differential at face value, that would have the Euro peaking close to 1.2000 but that seems unlikely to us; relative growth trends are likely to be an anchor.
However, we remain confident enough that a) the ECB will ease more slowly than the Fed and b) rate differentials will matter as much as perceived growth differentials, that EUR/USD will continue its slow-motion recovery and make a new lower cyclical high at some point this year (but well before the US election).
EUR/GBP offered below 0.8600. Economists at Rabobank analyze Pound Sterling’s outlook.
High debt levels will limit the scope for spending
Relatively slow growth and high debt in the UK are not a good combination for a new government. The lessons learnt from the Truss debacle have highlighted that the markets have no tolerance for unfunded spending commitments and stressed the importance of budgetary prudence. This should narrow scope for spending giveaways after the election and potentially reduce the likelihood that GBP is undermined by political upheaval.
We continue to expect the GBP to reclaim a little ground vs. the EUR this year and retain our forecast of EUR/GBP 0.8400 by year-end.
US Dollar Index (DXY) advances towards 103.50. Economists at Scotiabank analyze Greenback’s outlook.
The softer risk backdrop for markets may be extending the USD some support on the day
The softer risk backdrop for markets may be extending the USD some support on the day – and suggest limited scope for gains in the currencies overall.
Another quiet session for FX may be in store, with little in terms of data or event risk. DXY gains through 103.50 should provide the USD with a little more lift broadly from a technical point of view, however, and revive the January rally after the recent consolidation.
USD/CAD edged off highs on Monday. Economists at Scotiabank analyze the pair’s outlook.
Whether there is a springboard for renewed upside momentum to develop remains to be seen
Spot gains from the intraday low Monday – equating to (failed) a test of the 40-DMA (1.3417 today) – are strong enough on the chart to suggest that the USD’s recent drift lower has stopped. But whether there is a springboard here for renewed upside momentum to develop remains to be seen.
Intraday gains through 1.3480 minor resistance should see the USD pick up a little more support to retest the low/mid-1.3500s.
GBP/USD trades softer in range. Economists at Scotiabank analyze the pair’s outlook.
Price signals are bearish
Spot losses on the session so far look relatively mild and the GBP remains well within recent trading ranges. But price signals are bearish.
Intraday trading has developed a bearish ‘evening star’ pattern over the past 24 hours and the GBP is trading through minor trends support last week’s low at 1.2600.
Daily trading is shaping up negatively, albeit with a long way to go throughout the session still. Another test of strong GBP support around 1.2600 may be developing.
- The US Dollar is flat to a touch softer in the aftermath of the BoJ meeting.
- Traders try to keep powder dry towards main events on Thursday and Friday.
- The US Dollar Index sees pressure building on 103 to break lower.
The US Dollar (USD) is flat again, though it keeps flirting with a break below the important 103-level in the US Dollar Index (DXY). Markets are having difficulties with the Bank of Japan (BoJ) rate decision this Tuesday. BoJ governor Kazuo Ueda has tested markets’ patience by not hiking, and postponing the long awaited exit out of negative rates. Markets are not reacting very well to the nerve game the BoJ is playing, with US yields jumping higher and equities flat to mildly negative.
On the economic front, some very light data lies ahead of Thursday and Friday. In the run-up to the US Gross Domestic Product (GDP) and rate decision from the European Central Bank (ECB) along with comments from ECB’s head Christine Lagarde on Thursday, traders are looking for some clues in the Redbook index and Richmond Fed Manufacturing Index for January. Certainly that last one might initiate some moves in the Greenback, seeing the recent poor performance of several Manufacturing Index numbers over the past few weeks.
Daily digest market movers: BoJ hits nerves
- The Bank of Japan (BoJ) has kept its interest rates unchanged. Governor Kazuo Ueda said that easing will still take place even when negative interest rates end. There was no commitment on the timing of when the actual hike would happen. Markets are not reacting well on being left in the dark on the timing of the first rate hike.
- Holders of Belarusian EU bonds have sent a notice of default to Minsk, according to RBC.
- Around 13:55 GMT the Redbook Index is due to be released. Previous was at 5%.
- Near 15:00 the Richmond Fed Manufacturing Index for January is due to be released. Previous number was at -11 with -7 expected. Expect some market movements on the back of this number as several Manufacturing Indices have fallen into contraction and might be the first signal of a possible recession or downturn for the US economy.
- Around 16:30 the US Treasury will allocate a 52-week bill.
- A 2-year Note will be placed in the markets by the US Treasury near 18:00.
- Equity markets are not digesting the BoJ rate decision. Equities are looking for direction with most indices in the red by 0.50%. Only outlier is the Chinese Hang Seng, up over 2.6% after the Chinese government is set to issue further supportive measures for the Chinese stock markets.
- The CME Group’s FedWatch Tool shows that markets are pricing in a 97.4% possibility for an unchanged rate decision, with a slim 2.6% chance of a cut.
- The benchmark 10-year US Treasury Note jumps back up to 4.13% after its decline on Monday to sub 4.10%.
US Dollar Index Technical Analysis: Week kicks off
The US Dollar Index (DXY) is not giving up that easily on its opportunity to possibly pop back up above the important resistance at the 200-day SImple Moving Average (SMA) near 103.48. Despite downside pressure with lower highs and lower lows, the DXY for now is not selling off as one would expect in these kinds of conditions. Expect the main rehearsal to come on Thursday with the ECB rate decision, ahead of the US Federal Reserve meeting next week.
There are some economic data points that could still build a case for the DXY to get through those two moving averages again and run away. Look for 104.44 as the first resistance level on the upside, in the form of the 100-day SMA. If that gets scattered as well, nothing will hold the DXY from heading to either 105.88 or 107.20, the high of September.
A bull trap looks to be underway, where US Dollar bulls were caught buying into the Greenback when it broke above both the 55-day and the 200-day SMA in last week's trading. Price action could decline substantially and force US Dollar bulls to sell their positions at a loss. This would see the DXY first drop to 102.60, at the ascending trend line from September. Once below it, the downturn is open towards 102.00.
Bank of Japan FAQs
What is the Bank of Japan?
The Bank of Japan (BoJ) is the Japanese central bank, which sets monetary policy in the country. Its mandate is to issue banknotes and carry out currency and monetary control to ensure price stability, which means an inflation target of around 2%.
What has been the Bank of Japan’s policy?
The Bank of Japan has embarked in an ultra-loose monetary policy since 2013 in order to stimulate the economy and fuel inflation amid a low-inflationary environment. The bank’s policy is based on Quantitative and Qualitative Easing (QQE), or printing notes to buy assets such as government or corporate bonds to provide liquidity. In 2016, the bank doubled down on its strategy and further loosened policy by first introducing negative interest rates and then directly controlling the yield of its 10-year government bonds.
How do Bank of Japan’s decisions influence the Japanese Yen?
The Bank’s massive stimulus has caused the Yen to depreciate against its main currency peers. This process has exacerbated more recently due to an increasing policy divergence between the Bank of Japan and other main central banks, which have opted to increase interest rates sharply to fight decades-high levels of inflation. The BoJ’s policy of holding down rates has led to a widening differential with other currencies, dragging down the value of the Yen.
Is the Bank of Japan’s ultra-loose policy likely to change soon?
A weaker Yen and the spike in global energy prices have led to an increase in Japanese inflation, which has exceeded the BoJ’s 2% target. Still, the Bank judges that the sustainable and stable achievement of the 2% target has not yet come in sight, so any sudden change in the current policy looks unlikely.
EUR/USD nears 1.0845/1.0850 support. Economists at Scotiabank analyze the pair’s technical outlook.
Intraday and daily price signals look bearish
Hefty intraday losses leave the EUR looking soft and prone to more weakness.
Intraday and daily price signals (at least for now) look bearish and leave spot dangling precariously just above the recent low around 1.0850 (200-DMA at 1.0846 today).
Spot appears to have reacted adversely to another failed test of regaining 1.09+ on the day – strong resistance at 1.0910/1.0920.
Weakness below 1.0845/1.0850 should see EUR losses develop towards 1.0700/1.0800.
New Zealand’s Consumer Price Index (CPI) data for the fourth quarter will be released on Tuesday, January 23 at 21:45 GMT. Economists at Commerzbank analyze Kiwi’s outlook ahead of the inflation report.
New Zealand's inflation problem has not been solved yet
I doubt that New Zealand's inflation problem has been solved. The RBNZ is likely to take a similar view – unless today's figures surprise much more to the downside. After all, it has been one of the most hawkish G10 central banks in recent months. The most obvious argument for this is the fact that it has raised interest rates to the highest level (alongside the US).
As a result, the RBNZ is unlikely to deviate from its approach at its meeting at the end of February, despite falling inflation, and will continue to send out hawkish signals. This should support the Kiwi for the foreseeable future.
- Natural Gas hits a floor near $2.13 and risks more downside.
- Traders see short-term demand not picking up with the EU as the biggest laggard.
- The US Dollar Index remains steady above 103 ahead of ECB, US GDP and US PCE data.
Natural Gas (XNG/USD) hits rock bottom again this Tuesday after a steep decline on Monday. Gas prices are hitting the floor again near $2.10 before another steep decline occurs. Despite being technically oversold, more of a downturn could be at hand with Gas exporters unable to ramp prices up while the demand-supply balance is still tilted into oversupply.
Meanwhile, the US Dollar (USD) is hanging by a thread ahead of some main catalytic events that certainly will move the needle for the US Dollar. Although the US Dollar Index (DXY) is holding above 103, selling pressure is building with lower highs and lower lows on a daily chart. WIth the European Central Bank rate decision, US Gross Domestic Product on Thursday and US Personal Consumption Expenditures on Friday, the DXY is set to enter serious volatility later this week.
Natural Gas is trading at $2.13 per MMBtu at the time of writing.
Natural Gas market movers: European demand puts Russia in tight spot
- Sluggish economic demand and mild temperatures are putting Europe’s reserves in good condition to withstand further demand.
- Chinese economic uncertainties are seeing Chinese demand not really hitting elevated levels.
- Russian LNG exporters are trying to jack up prices. Bloomberg reports that Sakhalin Energy in the Far East is trying to renegotiate contracts with Asian partners at a higher price.
- Near 15:00 GMT the Richmond Fed Manufacturing Index for January is due to be released. Previous number was at -11 with -7 expected. A further contraction could mean less demand for LNG for the US markets with economic activity slowing down.
Natural Gas Technical Analysis: Oversold though not yet to buy
Natural Gas has hit rock bottom and is signalling it is oversold on the Relative Strength Index on a daily chart. Though this does not yet mean traders will buy blindly into the commodity. With economic outlooks for especially Europe being very much depressed, it does not look to be the right time just yet to start buying, as demand does not look like it will pick up first.
On the upside, Natural Gas is facing quite some pivotal levels to get back to. First is the low of December 13th at $2.20 which already acts as a first line in the sand. Next is the intermediary level near $2.48. Once that area gets hit, expect to see a test near $2.57 at the purple line.
A break below the yellow line at $2.10 means big issues for Natural Gas, with a fresh multi-year low. First level to look for on the downside is near $1.51, the low of June 2021. Further pre-Ukraine levels would come in sight as well with $1 up for grabs in the longer-term
-638416045195239454.png)
XNG/USD (Daily Chart)
Natural Gas FAQs
What fundamental factors drive the price of Natural Gas?
Supply and demand dynamics are a key factor influencing Natural Gas prices, and are themselves influenced by global economic growth, industrial activity, population growth, production levels, and inventories. The weather impacts Natural Gas prices because more Gas is used during cold winters and hot summers for heating and cooling. Competition from other energy sources impacts prices as consumers may switch to cheaper sources. Geopolitical events are factors as exemplified by the war in Ukraine. Government policies relating to extraction, transportation, and environmental issues also impact prices.
What are the main macroeconomic releases that impact on Natural Gas Prices?
The main economic release influencing Natural Gas prices is the weekly inventory bulletin from the Energy Information Administration (EIA), a US government agency that produces US gas market data. The EIA Gas bulletin usually comes out on Thursday at 14:30 GMT, a day after the EIA publishes its weekly Oil bulletin. Economic data from large consumers of Natural Gas can impact supply and demand, the largest of which include China, Germany and Japan. Natural Gas is primarily priced and traded in US Dollars, thus economic releases impacting the US Dollar are also factors.
How does the US Dollar influence Natural Gas prices?
The US Dollar is the world’s reserve currency and most commodities, including Natural Gas are priced and traded on international markets in US Dollars. As such, the value of the US Dollar is a factor in the price of Natural Gas, because if the Dollar strengthens it means less Dollars are required to buy the same volume of Gas (the price falls), and vice versa if USD strengthens.
The Bank of Japan (BoJ) left all policy settings on hold as expected. Kit Juckes, Chief Global FX Strategist at Société Générale, analyzes USD/JPY outlook.
The BoJ tiptoes toward a policy shift
The Bank of Japan came and did nothing but sound hopeful enough about the outlook for wages and inflation, and negative enough about the side effects of negative rates and yield curve control, to suggest a policy change will be forthcoming after the end of Q1, and by the middle of the year.
The market has read the story of the boy who cried wolf often enough to be a little sceptical but the Yen is helped by a quieter US bond market and by talk of a Chinese plan for equity market support, totalling under 1% GDP, financed by using state-owned companies’ foreign currency holdings. In other words, de facto FX reserves are being repatriated.
We’ll stick to a (fingers firmly crossed) view that USD/JPY has peaked and that we will see a return to levels below 140 in Q2.
EUR/USD held on to recent gains in subdued trade as markets await key event/data risks this week – the preliminary estimates of the January Purchasing Manager Indexes (PMIs) on Wednesday and the European Central Bank (ECB) meeting on Thursday. Economists at OCBC Bank analyze the pair’s outlook.
A more forceful pushback from the ECB can further dampen market expectations for aggressive rate cut
For the upcoming ECB meeting, we will be keeping an eye on how President Christine Lagarde may pull together the somewhat divided Governing Council to agree more on summer timeline concerning a cut. A more forceful pushback from the ECB can further dampen market expectations for aggressive rate cut and this can provide some support for EUR.
But before that, prelim PMIs (Wed) would also be of interest. Improvement in the print can give EUR another boost.
USD/JPY retreats below 147.50 as the Bank of Japan continues its loose monetary policy. Economists at Société Générale analyze the pair’s outlook.
USD/JPY gains overdone relative to 2y UST/JGB spread
The BoJ predictably left all policy settings on hold this morning and Governor Ueda stayed vague on the likelihood of possible adjustments in policy at upcoming meetings, referring to upcoming wage negotiations and pointing to the Nikkei for optimism about the economy. How far or how close the economy is to reaching the 2% inflation target sustainably remains a mystery and keeps markets guessing whether and how soon the central bank will lift interest from negative territory in the new fiscal year (April?).
USD/JPY is expensive based and should realign lower to adjust with 2y and 10y bond spreads. But it takes two to tango beyond the short term. If incoming US economic data keeps deviating to the upsides and the Fed isn't going to budge on interest rates until in 2Q, then USD/JPY will struggle to get meaningful traction to the downside in the near-term.
The Dollar is softer and pro-cyclical currencies are following the Yuan higher after news that China is preparing a CNY 2tn rescue package for the stock market. Economists at ING analyze FX market outlook.
It does seem premature to call for an outperformance of China-linked currencies
Risk sentiment was boosted overnight as the Chinese government is reportedly considering a large CNY 2tn package to support the struggling stock markets. It does appear a temporary solution, though. Ultimately, stronger conviction on a Chinese economic rebound is likely necessary to drive a sustainable recovery in Chinese-linked stocks.
Doubts about the impact of Beijing rescue package’s effects beyond the short-term automatically extend to the FX impact. It does seem premature to call for an outperformance of China-linked currencies (like AUD and NZD) and softening in the Dollar on the back of today’s headlines.
DXY may stabilise slightly below 103.00 once the China-led risk rally has settled.
The Japanese Yen (JPY) is experiencing a rebound following the Bank of Japan (BoJ) policy announcement. Economists at ING analyze USD/JPY outlook.
The BoJ revised inflation expectations lower
There were no changes to the Yield Curve Control, and forward guidance remained unchanged. Inflation projections were revised lower from 2.8% to 2.4% for the fiscal year starting in April. The revision was mostly a consequence of declining oil prices, and the inflation path continues to show an overshoot of the target for some time.
Money markets currently price in a 10 bps rate hike in June. Extra help from a declining USD might push USD/JPY a bit lower (below 147.00) today, but we suspect that markets may favour defensive USD positions as the Fed meeting approaches.
New Zealand’s Fourth quarter inflation figures will be released on Tuesday, January 23 at 21:45 GMT. Economists at ING analyze NZD/USD outlook ahead of the Consumer Price Index (CPI) report.
New Zealand CPI to be soft
We expect a 0.4% QoQ print which translates into 4.6% YoY. Consensus is centred at 4.7%, signalling that expectations are for a marked undershot compared to the latest RBNZ fourth quarter CPI projections at 5.0%.
Markets are already pricing in 95-100 bps of easing by the end of the year in New Zealand, meaning that NZD is probably more likely to be affected by stronger data and hawkish RBNZ surprises than by a data-miss/dovish surprise combination. For this reason, we think that NZD/USD will not get hit hard as the RBNZ pivots to a more dovish stance and still favour the pair to trade higher from the second quarter on the back of a weaker USD and improved risk environment.
Today, the rebound in China’s sentiment can help absorb the impact of softer inflation for NZD.
- USD/MXN gains ground on improved US Treasury yields.
- Mexican Peso could perform on factors associated with the United States.
- Fed members’ remarks indicated a more hawkish interest rate trajectory.
USD/MXN extends its gains and trades around 17.22 during the European trading hours on Tuesday. The US Dollar Index (DXY) trades lower near 103.10, while the 2-year and 10-year yields on US bond coupons trade at 4.40% and 4.12%, respectively, by the press time.
According to TD Securities analysis, the performance of the Mexican Peso (MXN) is notably influenced by factors associated with the United States (US). The market sentiment reflects the expectation that the Federal Reserve (Fed) will cut interest rates more than any other major central bank in 2024. However, the recent hawkish remarks, from Fed members indicate a shift in the Fed's stance towards a more hawkish trajectory for interest rates, providing support for the Greenback.
If the US Federal Reserve (Fed) adopts an aggressive cutting cycle in 2024, it could prompt markets to factor in more rate cuts by the Bank of Mexico (Banxico), potentially resulting in underperformance of the Mexican Peso. Market sentiment suggests that the upcoming 2024 elections in both Mexico and the US could exert additional pressure on the performance of the Mexican Peso.
The recent data on Mexico's Retail Sales indicates a slowdown in the growth of consumer spending. Looking ahead, the Banxico is set to release the 1st half-month Inflation data for January on Wednesday. Market expectations anticipate a reading of 0.38%, declining from the previous reading of 0.58%, with core inflation expected to report a figure of 0.28% against the previous reading of 0.46%. These indicators will be closely monitored for their potential impact on monetary policy and the performance of the Mexican Peso, which in turn, influences the USD/MXN pair.
On the US docket, the release of the Richmond Fed Manufacturing Index for January, scheduled for later in the North American session, will provide additional insights into the current state of the US economy.
Gold prices rose in India on Tuesday, according to data from India's Multi Commodity Exchange (MCX).
Gold price stood at 62,324 Indian Rupees (INR) per 10 grams, up INR 181 compared with the INR 62,143 it cost on Monday.
As for futures contracts, Gold prices increased to INR 62,124 per 10 gms from INR 62,010 per 10 gms.
Prices for Silver futures contracts decreased to INR 71,090 per kg from INR 71,638 per kg.
| Major Indian city | Gold Price |
|---|---|
| Ahmedabad | 64,435 |
| Mumbai | 64,245 |
| New Delhi | 64,320 |
| Chennai | 64,430 |
| Kolkata | 64,445 |
Global Market Movers: Comex Gold price benefits from geopolitical tensions and a softer US Dollar
- The risk of a further escalation of conflicts in the Middle East, along with China's economic woes, assists the safe-haven Comex Gold price to regain some positive traction on Tuesday.
- The US and UK have conducted a fresh series of joint air strikes against the Iran-backed Houthis in Yemen, who have been targeting commercial vessels passing through the Red Sea.
- Pakistan and Iran have decided to resolve their issues with diplomacy, while the Israel-Hamas conflict is threatening to erupt into a large-scale war and impact the global economy.
- Investors continue to scale back their expectations for a more aggressive policy easing by the Federal Reserve in the wake of signs that the economy is still in good shape.
- The current market pricing indicates a 40% chance of a March rate cut, down from as much as 80% a week ago, and five 25 bps rate reductions for 2024 as compared to six two weeks ago.
- The yield on the benchmark 10-year US government bond holds just below the highest level since December touched last week and should acts as a tailwind for the US Dollar, capping the XAU/USD.
- The Bank of Japan, as was widely expected, decided to maintain the status quo and leave its ultra-loose monetary policy settings unchanged at the end of the January meeting this Tuesday.
- Traders now look to the European Central Bank (ECB) meeting, which, along with the global PMIs, the Advance US Q4 GDP and the US Core PCE Price Index, for a fresh directional impetus.
(An automation tool was used in creating this post.)
Gold FAQs
Why do people invest in Gold?
Gold has played a key role in human’s history as it has been widely used as a store of value and medium of exchange. Currently, apart from its shine and usage for jewelry, the precious metal is widely seen as a safe-haven asset, meaning that it is considered a good investment during turbulent times. Gold is also widely seen as a hedge against inflation and against depreciating currencies as it doesn’t rely on any specific issuer or government.
Who buys the most Gold?
Central banks are the biggest Gold holders. In their aim to support their currencies in turbulent times, central banks tend to diversify their reserves and buy Gold to improve the perceived strength of the economy and the currency. High Gold reserves can be a source of trust for a country’s solvency. Central banks added 1,136 tonnes of Gold worth around $70 billion to their reserves in 2022, according to data from the World Gold Council. This is the highest yearly purchase since records began. Central banks from emerging economies such as China, India and Turkey are quickly increasing their Gold reserves.
How is Gold correlated with other assets?
Gold has an inverse correlation with the US Dollar and US Treasuries, which are both major reserve and safe-haven assets. When the Dollar depreciates, Gold tends to rise, enabling investors and central banks to diversify their assets in turbulent times. Gold is also inversely correlated with risk assets. A rally in the stock market tends to weaken Gold price, while sell-offs in riskier markets tend to favor the precious metal.
What does the price of Gold depend on?
The price can move due to a wide range of factors. Geopolitical instability or fears of a deep recession can quickly make Gold price escalate due to its safe-haven status. As a yield-less asset, Gold tends to rise with lower interest rates, while higher cost of money usually weighs down on the yellow metal. Still, most moves depend on how the US Dollar (USD) behaves as the asset is priced in dollars (XAU/USD). A strong Dollar tends to keep the price of Gold controlled, whereas a weaker Dollar is likely to push Gold prices up.
- Silver stages a goodish recovery from over a two-month low touched on Monday.
- The setup favours bears and supports prospects for the emergence of fresh selling.
- A sustained strength beyond the $23.00 mark is needed to negate the negative bias.
Silver (XAG/USD) attracts some buyers on Tuesday and for now, seems to have snapped a two-day losing streak to sub-$22.00 levels, or its lowest level since November 13 touched the previous day. The white metal sticks to its intraday gains through the first half of the European session and currently trades around the $22.30-$22.35 region, up over 1% for the day.
From a technical perspective, the recent repeated failures near the 200-day Simple Moving Average (SMA) resistance, which coincided with a downward sloping trend-line extending from the December swing high, favours bearish traders. Moreover, oscillators on the daily chart are holding deep in the negative territory and are still far from being in the oversold zone. This, in turn, suggests that the path of least resistance for the XAG/USD is to the downside.
Hence, any subsequent move up might still be seen as a selling opportunity and runs the risk of fizzling out rather quickly near the $22.70-$22.75 region. This is followed by the $23.00 round-figure mark, which should now act as a pivotal point. A sustained strength beyond the latter might trigger a short-covering rally and lift the XAG/USD beyond the $23.20-$23.25 intermediate hurdle, towards retesting the 200-day SMA barrier, currently pegged near mid-$23.00s.
Some follow-through buying will suggest that the white metal has formed a near-term bottom and shift the bias in favour of bullish traders. The subsequent move up might then allow the XAG/USD to reclaim the $24.00 round figure and climb further towards the next relevant resistance around the $24.40-$24.50 region.
On the flip side, bearish traders need to wait for acceptance below the $22.00 mark. The XAG/USD might then turn vulnerable to test the $21.40-$21.35 intermediate support before eventually dropping to the $21.00 round figure. The downward trajectory could extend further towards challenging the October monthly swing low, around the $20.70-$20.65 region.
Silver daily chart
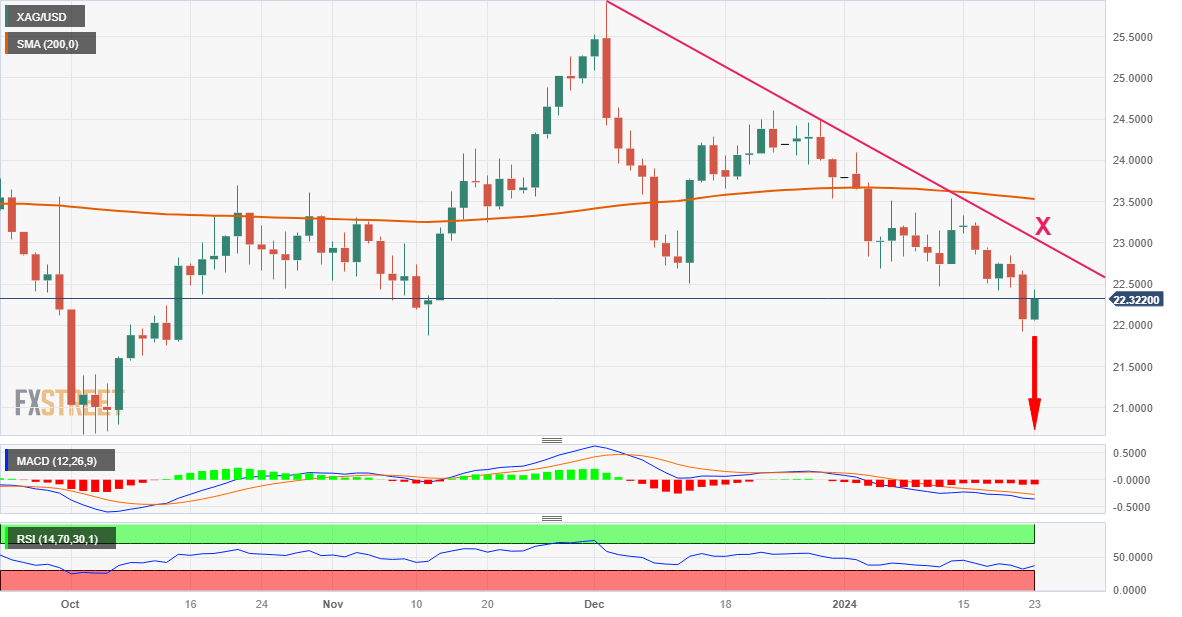
Technical levels to watch
FX option expiries for January 23 NY cut at 10:00 Eastern Time, via DTCC, can be found below.
- EUR/USD: EUR amounts
- 1.0920 445m
- 1.0975 596m
- USD/JPY: USD amounts
- 146.75 450m
- 150.00 559m
- AUD/USD: AUD amounts
- 0.6650 452m
- 0.6700 511m
The Japanese Yen (JPY) has strengthened after today’s BoJ policy meeting resulting in USD/JPY falling back towards the 147.00 level. Economists at MUFG Bank analyze Yen’s outlook.
BoJ policy update supports outlook for rate hike in April
The comments from today’s policy meeting support our view that the BoJ will exit negative rates at the April policy meeting rather than waiting until June. It was backed up by Governor Ueda indicating ‘we can make some judgements on wages at smaller companies by looking at other economic data and from hearings with companies’.
While we expect the BoJ’s exit from negative rates to encourage a stronger Yen alongside rate cuts from other major central banks such as the Fed, recent price action has highlighted that it is still likely premature to expect the JPY to strengthen on a more sustained basis at the current juncture.
- NZD/USD retraces its recent losses on weaker US Dollar.
- The downbeat US bond yields weaken the Greenback.
- Kiwi Business NZ PSI came in at 48.8 in December 51.2 prior.
NZD/USD recovers its recent losses and trades around 0.6100 during the early European session on Tuesday. The NZD/USD pair receives upward support as the US Dollar (USD) declines on downbeat United States (US) Treasury yields.
The US Dollar Index (DXY) inches lower to near 103.10 with the 2-year and 10-year yields on US bond coupons standing at 4.39% and 4.11%, respectively, at the time of writing. The market sentiment reflects the expectation that the Federal Reserve (Fed) will cut interest rates more than any other major central bank in 2024. However, recent hawkish remarks from Fed members indicate a shift in the Fed's stance towards a more hawkish trajectory for interest rates.
Investors seek refuge in the safe-haven US Dollar due to the geopolitical uncertainty and potential disruption to maritime trade routes in the Red Sea region. Iran-backed Houthi rebels intensify their attacks on maritime ships. In addition, US officials have confirmed a new round of military action, including air strikes, against Houthi terrorist targets in Yemen.
The latest data from Business NZ, released on Tuesday, indicates that New Zealand's Business NZ Performance of Services Index (PSI) for December was recorded at 48.8, down from 51.2 in November. Furthermore, concerns about China's growth momentum persist, driven by factors such as a property crisis, and sluggish consumer and business confidence. These concerns are contributing to downward pressure on the New Zealand Dollar (NZD), which in turn, undermines the NZD/USD pair.
The release of the Richmond Fed Manufacturing Index for January, scheduled for later in the North American session, will offer additional insights into the current state of the US economy. On Wednesday, attention will turn to New Zealand's Consumer Price Index (CPI) data for the fourth quarter.
EUR/USD is stuck at 1.0900. Economists at ING analyze the pair’s outlook.
ECB meeting not a game changer for the Euro
The Eurozone consumer confidence and the ECB lending survey are in focus today as markets await Wednesday’s PMIs and the European Central Bank's decision on Thursday.
The direction of travel today for the pair will mostly be a consequence of whether Western stock indices will be able to keep the positive mood shown by Asian equities and FX.
We still deem a sustainable rally to levels above 1.1000 as unlikely and do not see the ECB meeting as a game changer for the Euro.
Gold (XAU/USD) made a swift turnaround in 2023, gaining more than 15%. Economists at UBS analyze the yellow metal’s outlook for 2024.
Upside for Gold prices over the course of the year
We see upside for Gold prices over the course of the year and like the yellow metal as a hedge within portfolios.
With Fed rate cuts likely to begin in the second quarter, we expect to see exchange-traded fund demand for Gold turning positive.
Our December 2024 price target is $2,250, and we recommend adding fresh longs on dips below $2,000.
Here is what you need to know on Tuesday, January 23:
The US Dollar (USD) struggles to find demand early Tuesday, with the USD Index sliding below 103.00 during the European trading hours. The European Commission will release the preliminary Consumer Confidence Index for January later in the day. The US economic docket will feature the Richmond Fed Manufacturing Index for January and the 2-year US Treasury note auction will take place later in the American session.
Following the January policy meeting, the Bank of Japan (BoJ) left policy settings unchanged as expected. The interest rate and the 10-year Japanese government bond yield target are maintained at -10bps and 0%, respectively. The BoJ also held the yield curve control (YCC) strategy steady by allowing 10-year government bond yields to move up to around 1.0%.
Breaking: Bank of Japan maintains policy settings and forward guidance unchanged.
In the post-meeting press conference, BoJ Governor Kazuo Ueda reiterated that they won't hesitate to take additional easing measures if necessary. Ueda noted that the economy was progressing in line with the BoJ forecasts and acknowledged that they will mull if negative rates should be kept once they have the price goal in sight. USD/JPY came under bearish pressure and was last seen trading slightly above 147.00, losing more than 0.5% on a daily basis.
Japanese Yen price today
The table below shows the percentage change of Japanese Yen (JPY) against listed major currencies today. Japanese Yen was the strongest against the US Dollar.
| USD | EUR | GBP | CAD | AUD | JPY | NZD | CHF | |
| USD | -0.34% | -0.31% | -0.18% | -0.53% | -0.62% | -0.63% | -0.43% | |
| EUR | 0.34% | 0.02% | 0.15% | -0.20% | -0.28% | -0.29% | -0.09% | |
| GBP | 0.31% | -0.02% | 0.12% | -0.22% | -0.32% | -0.33% | -0.12% | |
| CAD | 0.18% | -0.14% | -0.13% | -0.33% | -0.44% | -0.45% | -0.24% | |
| AUD | 0.52% | 0.19% | 0.21% | 0.33% | -0.10% | -0.10% | 0.11% | |
| JPY | 0.60% | 0.29% | 0.32% | 0.46% | 0.11% | 0.00% | 0.20% | |
| NZD | 0.61% | 0.28% | 0.31% | 0.44% | 0.09% | 0.00% | 0.19% | |
| CHF | 0.41% | 0.08% | 0.10% | 0.23% | -0.11% | -0.20% | -0.21% |
The heat map shows percentage changes of major currencies against each other. The base currency is picked from the left column, while the quote currency is picked from the top row. For example, if you pick the Euro from the left column and move along the horizontal line to the Japanese Yen, the percentage change displayed in the box will represent EUR (base)/JPY (quote).
NZD/USD gathered bullish momentum and climbed above 0.6100 on Tuesday. In the early trading hours of the Asian session on Tuesday, Statistics New Zealand will release the Consumer Price Index for the fourth quarter.
EUR/USD registered small daily losses on Monday but regained its traction early Tuesday. At the time of press, the pair was trading in positive territory above 1.0900.
Following Monday's indecisive action, GBP/USD turned north and advanced toward 1.2750 in the European morning on Tuesday. The data from the UK revealed that Public Sector Net Borrowing was £6.8 billion in December, compared to £12.7 billion in November.
Gold fluctuated in a tight channel slightly above $2,020 on Monday and closed the day marginally lower. XAU/USD gathered bullish momentum and climbed back above $2,030.
- AUD/JPY loses traction to 97.30 following the BoJ’s Ueda comments.
- The cross keeps the bullish vibe above the key EMA.
- The immediate resistance level will emerge at 97.76; the initial support level for AUD/JPY is seen at 97.24.
The AUD/JPY cross loses its recovery momentum during the early European session on Tuesday. The Japanese Yen (JPY) attracts some buyers following the Bank of Japan (BoJ) Governor Kazuo Ueda's speech. AUD/JPY currently trades near 97.30, up 0.01% on the day.
After the BoJ decided to maintain the policy settings and forward guidance unchanged at the January policy meeting, BoJ Governor Kazuo Ueda stated that the likelihood of achieving the 2% inflation target is rising gradually. He further added that the central bank must continue to monitor financial and foreign exchange market moves and their impact on prices and the economy.
Technically, the bullish outlook of AUD/JPY remains intact as the cross holds above the 50- and 100-period Exponential Moving Averages (EMA) with an upward slope on the four-hour chart. The upward momentum is supported by the Relative Strength Index (RSI) which stands above the 50-midline, indicating further upside looks favorable.
The immediate resistance level will emerge near a high of January 19 at 97.76. Any follow-through buying above the latter will see a rally to the upper boundary of the Bollinger Band at 97.90. Further north, the next hurdle is seen at a high of November 28 at 98.38, followed by a high of November 24 at 98.50.
On the flip side, the initial support level for AUD/JPY is seen at the 50-period EMA at 97.24. The key contention level for the cross is located in the 97.00–97.05 region, representing the confluence of the 100-period EMA and the limit of the Bollinger Band. The additional downside filter to watch is a low of January 18 at 96.83, en route to a low of January 16 at 96.60.
AUD/JPY four-hour chart
-638415902868757781.png)
Following the Bank of Japan's decision to leave the policy settings and forward guidance unchanged at the January policy meeting, BoJ Governor Kazuo Ueda said that the Japan's economy is expected to gradually pick up ahead, per Reuters.
Ueda added that the likelihood of achieving the 2% inflation target is rising gradually, while saying that they must continue to carefully watch financial and foreign exchange market moves and the impact on prices and the economy.
He further reiterated that they won't hesitate to take additional easing measures if necessary and noted that they will be closely watching the outcome of spring wage negotiations.
Market reaction
USD/JPY stays under modest bearish pressure following these comments and the pair was last seen losing 0.2% on the day at 147.83.
- EUR/JPY trades on a stronger note near 161.50 after BoJ rate decision.
- The BoJ held the interest rate and 10-year JGB yield target steady, allowing the 10-year JGB to move up to around 1.0%.
- The European Central Bank (ECB) will announce an interest rate decision on Thursday, with no changes in policy expected.
- Investors await the German, Eurozone HCOB PMI reports ahead of the ECB rate decision.
The EUR/JPY cross gathers strength during the early European session on Tuesday. The Bank of Japan (BoJ) expectedly retained its ultra-loose monetary policy at its January meeting while cutting its core inflation forecast for the next fiscal year. At press time, EUR/JPY is trading at 161.50, up 0.23% on the day.
According to a policy statement on Tuesday, the BoJ decided unanimously to keep interest rates at -0.1% and maintain its yield curve control policy that keeps the upper limit for 10-year Japanese government bond yield at 1.0% as a reference. Furthermore, BOJ board members lowered their median growth forecast for core consumer prices to 2.4% for fiscal 2024 starting this April, compared with 2.8% they estimated in October, according to its BoJ quarterly report.
Traders will keep an eye on BoJ Governor Kazuo Ueda's speech during the press conference. Ueda may provide some insights about when and how the 'normalization' process and the transition away from negative interest rates will occur this year. The markets anticipate the Japanese central bank to exit its negative rates regime at its April meeting at the earliest.
On the Euro front, the European Central Bank (ECB) is likely to maintain its benchmark policy on Thursday as ECB President Lagarde signaled in Davos that the first cut may come in the summer months of 2024. The markets expect the first ECB policy rate cut in April, with a total reduction of 135 basis points (bps) by the end of 2024.
The Japanese Trade Balance, and HCOB Purchasing Managers Index (PMI) from France, Germany, and the Eurozone, are due on Wednesday. Market participants will closely monitor the ECB monetary policy meeting and press conference on Thursday. These events could give a clear direction and trading opportunities around the EUR/JPY cross.
- GBP/USD moves in an upward direction as BoE is expected to maintain its current restrictive policy stance.
- Economists in a Reuters poll anticipated the BoE to maintain the policy rate at 5.25% in February’s meeting.
- The escalated geopolitical situation improves the risk aversion sentiment and increases the demand for US Dollar.
GBP/USD moves on an upward trajectory for the second successive session on Tuesday, inching higher to near 1.2740 during the Asian trading hours. The Bank of England (BoE) is expected to maintain its current restrictive policy stance in the upcoming meeting. This sentiment is supported by a Reuters poll in which economists anticipate the Bank of England to keep the policy rate unchanged at 5.25% during the February meeting. The expectations of a status quo in monetary policy contribute to the positive performance of the Pound Sterling (GBP), which in turn, underpins the GBP/USD pair.
The lackluster Retail Sales data for December from the United Kingdom (UK) on Friday likely contributed to the downward pressure on the British Pound (GBP). The substantial decline in UK Retail Sales signals deep economic challenges, coupled with heightened price pressures. The gloomy UK economy raises concerns about the potential for a technical recession. In this challenging economic context, policymakers at the Bank of England face a dilemma in determining the appropriate course of action.
Investors will be closely monitoring the preliminary UK S&P Global PMI data for January, set to be released on Wednesday. This data will provide further insights into the current state of economic activity in the UK and could influence market sentiment and the performance of the GBP/USD pair.
The US Dollar Index (DXY) declines to around 103.10. However, the demand for the US Dollar could be influenced by risk aversion sentiment, likely stemming from the heightened geopolitical situation in the Middle East. This has led investors to seek safety in the safe-haven USD, which in turn, undermines the GBP/USD pair. The release of the Richmond Fed Manufacturing Index for January later in the North American session will provide further insights into the state of the US economy. Traders will closely analyze this data for potential impacts on the US Dollar and broader economic trends.
- USD/CHF pulls back as the US Dollar faces the challenge of lower US Treasury yields.
- US Dollar might have cheered the hawkish remarks from the Fed’s officials.
- The risk aversion sentiment contributed support to underpinning the Greenback.
- Swiss Franc experienced selling pressure on SNB Jordan’s concern over inflation.
USD/CHF snaps its winning streak that began on January 11, edging lower to near 0.8670 during the Asian session on Tuesday. The US Dollar (USD) faces the challenge of lower US Treasury yields. The 2-year and 10-year yields on US bond coupons stand at 4.38% and 4.09%, respectively, at the time of writing.
However, the Greenback received upward support following hawkish comments from US Federal Reserve (Fed) members. San Francisco Fed President Mary Daly expressed the view that the central bank still has significant work to do in achieving the goal of bringing inflation back down to the 2.0% target. Additionally, Atlanta Fed President Raphael Bostic emphasized his openness to adjusting his outlook on the timing of rate cuts, highlighting the Fed's commitment to a data-dependent approach. These statements have contributed to a boost in support for the US Dollar.
The US Dollar Index (DXY) inches lower to near 103.20. The demand for the US Dollar is being driven by risk aversion sentiment, which is likely associated with the heightened geopolitical situation in the Middle East. Moreover, the US Conference Board Leading Economic Index improved to -0.1% in December from -0.5%, surpassing expectations for an improvement to -0.3%. Looking ahead, the Richmond Fed Manufacturing Index for January will be released later in the North American session, providing further insights into the state of the US economy.
The Swiss Franc (CHF) experienced selling pressure after Swiss National Bank (SNB) Chairman Thomas Jordan voiced concerns about the potential impact of the CHF's strength on the SNB's ability to keep inflation above zero in the Swiss domestic economy. Recent economic indicators have shown a slight increase in Swiss consumer prices in December and an improvement in consumer demand in November. These factors may influence the SNB's decision-making in the upcoming meeting.
However, Swiss Producer and Import Prices (YoY) declined in December following the November decline. These more moderate figures could potentially dissuade the Swiss National Bank from adjusting its monetary policy. In the last policy update from the SNB in December, they expressed a commitment to adjusting monetary policy if needed to maintain inflation within the range consistent with price stability over the medium term.
- Gold price regains positive traction on Tuesday, though the upside potential seems limited.
- Geopolitical risks and China’s economic woes lend some support to the safe-haven XAU/USD.
- Reduced bets for an early rate cut by the Fed should cap any meaningful appreciating move.
Gold price (XAU/USD) attracts some dip-buying during the Asian session on Tuesday and recovers a major part of the overnight modest losses. Geopolitical tensions in the Middle East, along with concerns over China's weak economic recovery, lend some support to the safe-haven precious metal. The upside, however, remains capped as investors continue to roll back expectations for a more aggressive policy easing by the Federal Reserve (Fed), which could undermine the non-yielding yellow metal. Apart from this, the risk-on environment might further contribute to capping any meaningful appreciating move for the bullion ahead of this week's key central bank event risks, especially the European Central Bank (ECB) monetary policy meeting on Thursday.
Traders this week will also confront the release of global flash PMIs on Wednesday, which will be followed by the Advance US Q4 GDP print and the US Core PCE Price Index on Thursday and Friday, respectively. This, in turn, should provide a fresh directional impetus to the Gold price. In the meantime, a shift in expectations in the wake of the recent hawkish comments by several Fed officials, noting that it was too early to consider interest rate cuts, suggests that the path of least resistance for the XAU/USD is to the downside. Hence, any subsequent move up might still be seen as a selling opportunity and runs the risk of fizzling out rather quickly.
Daily Digest Market Movers: Gold price attracts some safe-haven flows; hawkish Fed expectations to cap gains
- The risk of a further escalation of conflicts in the Middle East, along with China's economic woes, assists the safe-haven Gold price to regain some positive traction on Tuesday.
- The US launched its seventh round of strikes on a Houthi anti-ship missile as the drone strikes by Iran-backed Houthi rebels on commercial vessels continue in the Red Sea.
- Pakistan and Iran have decided to resolve their issues with diplomacy, while the Israel-Hamas conflict is threatening to erupt into a large-scale war and impact the global economy.
- Investors continue to scale back their expectations for a more aggressive policy easing by the Federal Reserve in the wake of signs that the economy is still in good shape.
- The current market pricing indicates a 40% chance of a March rate cut, down from as much as 80% a week ago, and five 25 bps rate reductions for 2024 as compared to six two weeks ago.
- The yield on the benchmark 10-year US government bond holds just below the highest level since December touched last week and acts as a tailwind for the US Dollar, capping the XAU/USD.
- The Bank of Japan, as was widely expected, decided to maintain the status quo and leave its ultra-loose monetary policy settings unchanged at the end of the January meeting this Tuesday.
- Traders now look to the European Central Bank (ECB) meeting, which, along with the global PMIs, the Advance US Q4 GDP and the US Core PCE Price Index, for a fresh impetus.
Technical Analysis: Gold price might struggle to make it through the $2,040-2,042 pivotal resistance
From a technical perspective, any subsequent move up beyond the $2,030 area is likely to confront stiff resistance near the $2,040-2,042 supply zone. The latter should act as a key pivotal point, which if cleared decisively could trigger a short-covering rally. The Gold price might then climb to the $2,077 area before aiming to reclaim the $2,100 round-figure mark.
On the flip side, the overnight swing low, around the $2,017-2,016 region, now seems to protect the immediate downside ahead of the $2,000 psychological mark, or over a one-month low touched last week. A sustained break below the latter could make the Gold price vulnerable to accelerate the fall towards the $1,988 intermediate support. The downward trajectory could extend further towards the 100-day Simple Moving Average (SMA), currently around the $1,972 area and the 200-day SMA, near the $1,964-1,963 zone.
US Dollar price today
The table below shows the percentage change of US Dollar (USD) against listed major currencies today. US Dollar was the strongest against the Japanese Yen.
| USD | EUR | GBP | CAD | AUD | JPY | NZD | CHF | |
| USD | -0.19% | -0.16% | -0.11% | -0.36% | -0.07% | -0.34% | -0.27% | |
| EUR | 0.17% | 0.00% | 0.05% | -0.20% | 0.09% | -0.17% | -0.11% | |
| GBP | 0.16% | -0.01% | 0.05% | -0.20% | 0.03% | -0.17% | -0.11% | |
| CAD | 0.11% | -0.05% | -0.05% | -0.24% | 0.03% | -0.23% | -0.16% | |
| AUD | 0.35% | 0.17% | 0.19% | 0.23% | 0.28% | 0.02% | 0.09% | |
| JPY | 0.10% | -0.07% | -0.06% | 0.00% | -0.22% | -0.20% | -0.16% | |
| NZD | 0.33% | 0.16% | 0.17% | 0.22% | -0.03% | 0.20% | 0.05% | |
| CHF | 0.26% | 0.10% | 0.11% | 0.16% | -0.08% | 0.15% | -0.06% |
The heat map shows percentage changes of major currencies against each other. The base currency is picked from the left column, while the quote currency is picked from the top row. For example, if you pick the Euro from the left column and move along the horizontal line to the Japanese Yen, the percentage change displayed in the box will represent EUR (base)/JPY (quote).
Gold FAQs
Why do people invest in Gold?
Gold has played a key role in human’s history as it has been widely used as a store of value and medium of exchange. Currently, apart from its shine and usage for jewelry, the precious metal is widely seen as a safe-haven asset, meaning that it is considered a good investment during turbulent times. Gold is also widely seen as a hedge against inflation and against depreciating currencies as it doesn’t rely on any specific issuer or government.
Who buys the most Gold?
Central banks are the biggest Gold holders. In their aim to support their currencies in turbulent times, central banks tend to diversify their reserves and buy Gold to improve the perceived strength of the economy and the currency. High Gold reserves can be a source of trust for a country’s solvency. Central banks added 1,136 tonnes of Gold worth around $70 billion to their reserves in 2022, according to data from the World Gold Council. This is the highest yearly purchase since records began. Central banks from emerging economies such as China, India and Turkey are quickly increasing their Gold reserves.
How is Gold correlated with other assets?
Gold has an inverse correlation with the US Dollar and US Treasuries, which are both major reserve and safe-haven assets. When the Dollar depreciates, Gold tends to rise, enabling investors and central banks to diversify their assets in turbulent times. Gold is also inversely correlated with risk assets. A rally in the stock market tends to weaken Gold price, while sell-offs in riskier markets tend to favor the precious metal.
What does the price of Gold depend on?
The price can move due to a wide range of factors. Geopolitical instability or fears of a deep recession can quickly make Gold price escalate due to its safe-haven status. As a yield-less asset, Gold tends to rise with lower interest rates, while higher cost of money usually weighs down on the yellow metal. Still, most moves depend on how the US Dollar (USD) behaves as the asset is priced in dollars (XAU/USD). A strong Dollar tends to keep the price of Gold controlled, whereas a weaker Dollar is likely to push Gold prices up.
- Indian Rupee loses ground despite the modest decline of the US dollar Index.
- RBI’s Das said cutting the key policy rate would be premature until the 4% inflation target is achieved on a sustained basis.
- The US Purchasing Managers' Index (PMI) report will be due on Wednesday.
Indian Rupee (INR) trades on a softer note on Tuesday. The Reserve Bank of India (RBI) Governor Shaktikanta Das stated last week that cutting the key policy rate would be premature until the 4% inflation target is achieved on a durable basis. RBI’s Das said Indian Consumer Price Index (CPI) inflation has decreased from a peak of 7.8% during the Ukraine-Russia conflict to within the RBI's target range of 2–6%. However, new geopolitical flashpoints are emerging, and climate change and weather-related events are also affecting food prices.
Investors will focus on the US Purchasing Managers' Index (PMI) report on Wednesday. The preliminary US S&P Global Services PMI for January is expected to ease from 51.4 to 51.0, while the Manufacturing PMI is estimated to remain steady at 47.9. The attention will shift to the Q4 US Gross Domestic Product Annualized on Thursday and the December Core Personal Consumption Expenditures Price Index (Core PCE) on Friday. Indian markets will be closed on Friday for Republic Day.
Daily Digest Market Movers: Indian Rupee remains sensitive to inflation and global factors
- According to the Reserve Bank of India (RBI), India's foreign currency reserves climbed by USD 1.634 billion to USD 618.937 billion in the week ending January 12.
- India’s Foreign Direct Investment (FDI) has surged in the last few years, increasing from $36 billion in 2014 to $70.9 billion in 2023.
- The markets have priced in 42% odds for a rate cut at the March meeting, a slide from 70% just a week ago, according to the CME FedWatch Tool.
- San Francisco Fed President Mary Daly said the central bank has a lot of work left to do on bringing inflation back down to the 2% target, and it’s premature to think interest-rate cuts are around the corner.
- The monthly and annual Core Personal Consumption Expenditures Price Index (Core PCE), the Fed's favorite inflation gauge, are projected to show an increase of 0.2% MoM and 3% YoY, respectively.
Technical Analysis: Indian Rupee remains range-bound between 82.80 and 83.40
Indian Rupee trades weaker on the day. The USD/INR pair remains stuck within a multi-month trading range of 82.80–83.40. USD/INR holds above the key 100-period Exponential Moving Average (EMA) on the daily chart. However, the bullish outlook of USD/INR looks vulnerable as the 14-day Relative Strength Index (RSI) stands below the 50.0 midline, indicating that additional decline cannot be ruled out.
The upper boundary of the trading range at 83.40 acts as a critical resistance level for USD/INR. The additional upside filter to watch is a 2023 high of 83.47, and finally the 84.00 round figure. On the other hand, an initial support level is seen at the 83.00 psychological mark. Any follow-through selling below 83.00 will expose 82.80 (the lower limit of the trading range and a low of January 15) and 82.60 (low of August 11).
US Dollar price today
The table below shows the percentage change of US Dollar (USD) against listed major currencies today. US Dollar was the strongest against the Canadian Dollar.
| USD | EUR | GBP | CAD | AUD | JPY | NZD | CHF | |
| USD | -0.15% | -0.16% | -0.11% | -0.37% | -0.13% | -0.35% | -0.25% | |
| EUR | 0.15% | -0.01% | 0.03% | -0.22% | 0.02% | -0.19% | -0.11% | |
| GBP | 0.16% | 0.01% | 0.04% | -0.22% | 0.02% | -0.19% | -0.10% | |
| CAD | 0.11% | -0.03% | -0.05% | -0.25% | -0.02% | -0.24% | -0.14% | |
| AUD | 0.37% | 0.22% | 0.21% | 0.25% | 0.25% | 0.03% | 0.12% | |
| JPY | 0.14% | -0.05% | -0.06% | 0.02% | -0.26% | -0.21% | -0.13% | |
| NZD | 0.34% | 0.20% | 0.19% | 0.24% | -0.03% | 0.21% | 0.09% | |
| CHF | 0.25% | 0.11% | 0.09% | 0.14% | -0.12% | 0.12% | -0.09% |
The heat map shows percentage changes of major currencies against each other. The base currency is picked from the left column, while the quote currency is picked from the top row. For example, if you pick the Euro from the left column and move along the horizontal line to the Japanese Yen, the percentage change displayed in the box will represent EUR (base)/JPY (quote).
Indian Rupee FAQs
What are the key factors driving the Indian Rupee?
The Indian Rupee (INR) is one of the most sensitive currencies to external factors. The price of Crude Oil (the country is highly dependent on imported Oil), the value of the US Dollar – most trade is conducted in USD – and the level of foreign investment, are all influential. Direct intervention by the Reserve Bank of India (RBI) in FX markets to keep the exchange rate stable, as well as the level of interest rates set by the RBI, are further major influencing factors on the Rupee.
How do the decisions of the Reserve Bank of India impact the Indian Rupee?
The Reserve Bank of India (RBI) actively intervenes in forex markets to maintain a stable exchange rate, to help facilitate trade. In addition, the RBI tries to maintain the inflation rate at its 4% target by adjusting interest rates. Higher interest rates usually strengthen the Rupee. This is due to the role of the ‘carry trade’ in which investors borrow in countries with lower interest rates so as to place their money in countries’ offering relatively higher interest rates and profit from the difference.
What macroeconomic factors influence the value of the Indian Rupee?
Macroeconomic factors that influence the value of the Rupee include inflation, interest rates, the economic growth rate (GDP), the balance of trade, and inflows from foreign investment. A higher growth rate can lead to more overseas investment, pushing up demand for the Rupee. A less negative balance of trade will eventually lead to a stronger Rupee. Higher interest rates, especially real rates (interest rates less inflation) are also positive for the Rupee. A risk-on environment can lead to greater inflows of Foreign Direct and Indirect Investment (FDI and FII), which also benefit the Rupee.
How does inflation impact the Indian Rupee?
Higher inflation, particularly, if it is comparatively higher than India’s peers, is generally negative for the currency as it reflects devaluation through oversupply. Inflation also increases the cost of exports, leading to more Rupees being sold to purchase foreign imports, which is Rupee-negative. At the same time, higher inflation usually leads to the Reserve Bank of India (RBI) raising interest rates and this can be positive for the Rupee, due to increased demand from international investors. The opposite effect is true of lower inflation.
- EUR/USD hovers below the psychological resistance at 1.0900.
- A break above the 14-day EMA at 1.0916 could lead the pair to reach the major barrier at 1.0950.
- Technical indicators suggest a bearish sentiment towards the key support at 1.0850.
EUR/USD edges higher to near 1.0890 during the Asian session on Tuesday. The EUR/USD pair consolidates due to the uncertainty over the uncertainty over the timing of a potential interest rate cut by the European Central Bank (ECB). However, the ECB is expected to maintain its current Main Refinancing Operations Rate of 4.5% in its upcoming policy meeting on Thursday.
The EUR/USD pair could find immediate resistance at the psychological level at 1.0900. A breakthrough above the barrier could support the pair to surpass the 23.6% Fibonacci retracement at 1.0914 aligned with the 14-day Exponential Moving Average (EMA) at 1.0916. If the pair gains further movement, it could explore the area around the major level at 1.0950.
The 14-day Relative Strength Index (RSI), a momentum oscillator gauging the speed and direction of price movements, is positioned below the 50 mark. This positioning indicates a leaning towards bearish sentiment in the market for the EUR/USD pair.
Furthermore, the trend-following momentum indicator, the Moving Average Convergence Divergence (MACD), reinforces the confirmation of a bearish trend. The MACD line is positioned below the centerline, signaling a bearish stance. Additionally, there is a divergence below the signal line, adding further weight to the indications of a downward trend in the EUR/USD pair.
The EUR/USD pair could meet the key support at the 1.0850 level in conjunction with the monthly low at 1.0844. A break below the latter could push the pair to navigate the area around the psychological support at 1.0800.
EUR/USD: Daily Chart
-638415796364913156.png)
- USD/CAD faces a challenge due to the improved Crude oil prices.
- WTI price gains ground on concerns over global supply disruptions.
- BoC is expected to maintain its current policy rate of 5.0% in Wednesday's meeting.
- The escalated geopolitical situation has prompted investors to move towards the safe-haven US Dollar.
USD/CAD attempts to retrace its recent gains on the back of the improved Crude oil prices. The USD/CAD pair trades near 1.3480 during the Asian session on Tuesday. The Canadian Dollar (CAD) experienced losses against the US Dollar (USD) in the previous session, which could be attributed to the risk aversion sentiment over the escalated geopolitical situation in the Middle East.
West Texas Intermediate (WTI) price has continued its upward momentum for the second consecutive session, reaching around $74.70 per barrel, by the press time. The surge in Crude oil prices is primarily attributed to concerns over global energy supplies. These concerns have been heightened by a drone strike on Russia's Novatek by Ukraine, contributing to geopolitical tensions. Furthermore, disruptions in Crude oil production from the United States (US) due to extreme cold weather have added to the upward pressure on oil prices.
Traders will likely observe the December’s New Housing Price Index from Canada on Tuesday. On Wednesday, the Bank of Canada (BoC) is expected to release its Interest Rate Decision. Markets expect that the BoC will not adjust its current 5.0% policy rate.
The US Dollar Index (DXY) maintains stability following recent gains. The demand for the US Dollar is being driven by risk aversion sentiment, which is likely associated with the heightened geopolitical situation in the Middle East. Military actions, including new air strikes in Yemen by the United States (US) and the United Kingdom (UK) targeting Iran-led Houthi terrorists, have prompted investors to seek safety in the safe-haven US Dollar, which in turn, providing support to underpinning the USD/CAD pair.
The US Conference Board has reported a modest improvement in the Leading Economic Index for December. The index moved from -0.5% in November to -0.1% in December, surpassing expectations for an improvement to -0.3%. Looking ahead, Tuesday is anticipated to bring the release of the Richmond Fed Manufacturing Index for January, providing further insights into the state of the US economy.
- WTI price moves higher on concerns over global supply disruptions.
- Ukraine conducted a drone attack on a Russian fuel terminal Novatek.
- US-led coalition continues air strikes against Iran-backed Houthi terrorist targets in Yemen.
- Libya’s Sharara oilfield resumed operations to bring back the supply of 270,000 bpd.
West Texas Intermediate (WTI) price extends its gains for the second successive session, improving to near $74.70 per barrel during the Asian session on Tuesday. The rise in Crude oil prices is attributed to concerns over global energy supplies, sparked by a drone strike on Russia's Novatek by Ukraine. Additionally, disruptions in Crude production from the United States (US) due to extreme cold weather have contributed to the upward pressure on oil prices.
Reports from both the BBC and the Wall Street Journal indicate that Ukraine conducted a drone attack on a Russian fuel terminal using explosives. Furthermore, North Dakota's pipeline authority has stated that over 20% of the state's oil output remained shut in on Monday due to severe cold weather. These developments highlight the multifaceted factors influencing oil markets, which can contribute to fluctuations in Crude oil prices.
The situation in the Red Sea is becoming increasingly precarious as Iran-backed Houthi rebels continue to escalate attacks on maritime ships. This poses a significant risk to oil supply disruptions, especially in the context of mounting instability that could potentially spill over into the Middle East countries. Moreover, US officials have confirmed a fresh round of military action, including air strikes, against Iran-backed Houthi terrorist targets in Yemen. This further adds to the geopolitical tensions in the region, contributing to the overall volatility in energy markets.
Meanwhile, in Libya, the state-run National Oil Corporation has reported that the Sharara oilfield resumed operations on Sunday. This development brings back the supply of 270,000 barrels per day (bpd), contributing to 1 million bpd for the OPEC country.
In 2023, Russia emerged as the largest crude oil exporter to China, surpassing Saudi Arabia, despite Western sanctions to restrict Russian oil trade. According to Chinese customs data, Russia sold approximately 2.14 million barrels per day (bpd) of crude oil to China during the mentioned period.
Market participants will likely watch the upcoming Crude Oil Stock data closely, with the American Petroleum Institute (API) set to release its report for the week ending on January 19 on Tuesday. This will be followed by the Crude Oil Stocks Change data from the US Energy Information Administration (EIA) scheduled for Wednesday.
| Raw materials | Closed | Change, % |
|---|---|---|
| Silver | 22.078 | -2.24 |
| Gold | 2021.196 | -0.36 |
| Palladium | 937.68 | -0.51 |
- EUR/USD trades with a mild negative bias on Tuesday, though the downside seems limited.
- Reduced bets for a March Fed rate cut underpin the USD and act as a headwind for the pair.
- The uncertainty over the timing of a rate cut by the ECB holds traders from placing fresh bets.
The EUR/USD pair struggles to gain any meaningful traction during the Asian session on Tuesday and oscillates in a narrow trading band below the 1.0900 round-figure mark. Traders seem reluctant to place aggressive directional bets and prefer to wait on the sidelines amid the uncertainty over the timing of a potential interest rate cut by the European Central Bank (ECB).
The first ECB policy rate cut is projected to take place in April and the markets have been pricing in a total reduction of 135 basis points (bps) by the end of 2024. That said, ECB President Christine Lagarde signalled last week that borrowing costs will likely start coming down only in the summer and if the incoming economic data supports such a move. Hence, the market focus will remain glued to the ECB monetary policy meeting on Thursday, which will play a key role in influencing the shared currency and provide some meaningful impetus to the EUR/USD pair.
In the meantime, diminishing odds for an early interest rate cut by the Federal Reserve (Fed) continue to act as a tailwind for the US Dollar (USD) and act as a headwind for the EUR/USD pair. In fact, investors have been scaling back their expectations for a more aggressive policy easing in 2024 in the wake of a still-resilient US economy and the recent hawkish remarks by a slew of Fed policymakers. This remains supportive of elevated US Treasury bond yields, which, along with a further escalation of geopolitical tensions in the Middle East, underpin the safe-haven buck.
The USD bulls, however, seem reluctant to place aggressive bets in the wake of the prevalent risk-on environment. This, along with the mixed fundamental backdrop, should help limit the downside for the EUR/USD pair ahead of this week's key central bank event risk and important macro data. The flash PMI prints from the Eurozone and the US are due for release on Wednesday. This will be followed by the Advance US Q4 GDP report on Thursday and the US Core PCE Price Index, or the Fed's preferred inflation gauge on Friday, which should infuse volatility in the markets.
Technical levels to watch
- Australian Dollar gains ground on improved National Australia Bank's Business Confidence.
- Australian share market rise has the potential to provide support for the AUD.
- National Australia Bank's Business Confidence improved to -1 in December from -9 prior.
- US Dollar experiences a positive bias on risk aversion due to the heightened geopolitical situation.
The Australian Dollar (AUD) edges higher on Tuesday after registering losses in the previous session. The improved National Australia Bank's Business Confidence might have contributed to underpinning the Aussie Dollar. Moreover, the Australian Dollar might find support from the improved performance of Australia's share market. However, the US Dollar (USD) managed to strengthen despite lower US Treasury yields, leading to some pressure on the AUD/USD pair.
Australia’s currency encounters headwinds due to speculation surrounding possible early interest rate cuts by the Reserve Bank of Australia (RBA). This speculation is driven by recent indicators such as subdued Aussie Consumer Confidence and Employment Change figures, contributing to concerns about the economic outlook.
The Chair of Australia's sovereign wealth fund Peter Costello commented that inflation in Australia is showing early signs of moderation. However, Costello emphasizes that there is still a considerable distance to cover to bring prices back within the RBA's target band. While inflation has decreased from its peak, it remains significantly outside the target range of 2.0% to 3.0%.
The US Dollar Index (DXY) holds steady following recent gains. The US Dollar experiences buying demand driven by risk aversion sentiment, a trend likely linked to the heightened geopolitical situation in the Middle East. Military actions conducted by the United States (US) and the United Kingdom (UK), including a new round of air strikes in Yemen targeting Iran-led Houthi terrorists, have contributed to an environment where investors seek safety in the safe-haven US Dollar.
US Conference Board has reported a slight improvement in the Leading Economic Index for December, moving from -0.5% in November to -0.1% in December. This surpassed expectations for an improvement to -0.3%. Looking ahead, Tuesday is expected to bring the release of the Richmond Fed Manufacturing Index for January.
Daily Digest Market Movers: Australian Dollar faces negative sentiment on risk aversion
- National Australia Bank's Business Conditions inched down to the reading of 7 in December from 9 prior.
- National Australia Bank's Business Confidence improved to -1 from the previous figure of -9.
- Australia’s Consumer Inflation Expectations remained steady at 4.5% in January.
- The People's Bank of China keeps its Loan Prime Rate (LPR) steady for both the one-year and five-year terms. The rate remains at 3.45% for the one year and 4.20% for the five years.
- San Francisco Fed President Mary Daly expressed her belief on Friday that the central bank still has significant work to accomplish in bringing inflation back down to the 2.0% target. She emphasized that it is premature to consider interest-rate cuts as an imminent measure.
- Atlanta Fed President Raphael Bostic reiterated his position on expectations for rate cuts ahead of the Fed entering the "blackout" period before the next rate meeting scheduled for January 31. Bostic emphasized his openness to adjusting his outlook on the timing of rate cuts and highlighted that the Fed remains data-dependent.
- The preliminary US Michigan Consumer Sentiment Index rose to 78.8 in January from 69.7 prior, exceeding the expected figure of 70.
- US Existing Home Sales Change (MoM) declined by 1.0% in December against the previous rise of 0.8%.
- US Housing Starts (MoM) surpassed expectations in December, reaching 1.46 million compared to the anticipated 1.426 million.
Technical Analysis: Australian Dollar floats below the psychological level at 0.6600
The Australian Dollar trades around 0.6580 on Tuesday, with immediate resistance noted at the psychological level of 0.6600. A decisive breakthrough above this psychological barrier may propel the AUD/USD pair to surpass the nine-day Exponential Moving Average (EMA) at 0.6609, followed by a notable level at 0.6650. Should the pair breach this significant level, it could set the stage for a potential test of the psychological barrier at 0.6700. Conversely, on the downside, key support is anticipated at the 50% retracement level of 0.6568, before reaching the major support level at 0.6550. A breach below the latter might trigger a downward move, prompting the AUD/USD pair to explore levels around the psychological mark of 0.6500, coupled with the 61.8% Fibonacci retracement level at 0.6497.
AUD/USD: Daily Chart
-638415702115877089.png)
Australian Dollar price today
The table below shows the percentage change of Australian Dollar (AUD) against listed major currencies today. Australian Dollar was the strongest against the US Dollar.
| USD | EUR | GBP | CAD | AUD | JPY | NZD | CHF | |
| USD | -0.01% | -0.03% | 0.00% | -0.09% | -0.02% | -0.03% | -0.04% | |
| EUR | 0.01% | -0.02% | 0.00% | -0.08% | -0.01% | -0.02% | -0.03% | |
| GBP | 0.03% | 0.02% | 0.02% | -0.06% | 0.00% | -0.01% | -0.02% | |
| CAD | 0.00% | 0.01% | -0.02% | -0.07% | -0.01% | 0.00% | -0.02% | |
| AUD | 0.08% | 0.07% | 0.07% | 0.06% | 0.07% | 0.08% | 0.05% | |
| JPY | 0.03% | 0.01% | -0.04% | 0.01% | -0.06% | 0.02% | -0.03% | |
| NZD | 0.02% | 0.01% | 0.00% | 0.02% | -0.08% | 0.00% | -0.02% | |
| CHF | 0.03% | 0.03% | 0.01% | 0.02% | -0.05% | 0.01% | 0.00% |
The heat map shows percentage changes of major currencies against each other. The base currency is picked from the left column, while the quote currency is picked from the top row. For example, if you pick the Euro from the left column and move along the horizontal line to the Japanese Yen, the percentage change displayed in the box will represent EUR (base)/JPY (quote).
Australian Dollar FAQs
What key factors drive the Australian Dollar?
One of the most significant factors for the Australian Dollar (AUD) is the level of interest rates set by the Reserve Bank of Australia (RBA). Because Australia is a resource-rich country another key driver is the price of its biggest export, Iron Ore. The health of the Chinese economy, its largest trading partner, is a factor, as well as inflation in Australia, its growth rate and Trade Balance. Market sentiment – whether investors are taking on more risky assets (risk-on) or seeking safe-havens (risk-off) – is also a factor, with risk-on positive for AUD.
How do the decisions of the Reserve Bank of Australia impact the Australian Dollar?
The Reserve Bank of Australia (RBA) influences the Australian Dollar (AUD) by setting the level of interest rates that Australian banks can lend to each other. This influences the level of interest rates in the economy as a whole. The main goal of the RBA is to maintain a stable inflation rate of 2-3% by adjusting interest rates up or down. Relatively high interest rates compared to other major central banks support the AUD, and the opposite for relatively low. The RBA can also use quantitative easing and tightening to influence credit conditions, with the former AUD-negative and the latter AUD-positive.
How does the health of the Chinese Economy impact the Australian Dollar?
China is Australia’s largest trading partner so the health of the Chinese economy is a major influence on the value of the Australian Dollar (AUD). When the Chinese economy is doing well it purchases more raw materials, goods and services from Australia, lifting demand for the AUD, and pushing up its value. The opposite is the case when the Chinese economy is not growing as fast as expected. Positive or negative surprises in Chinese growth data, therefore, often have a direct impact on the Australian Dollar and its pairs.
How does the price of Iron Ore impact the Australian Dollar?
Iron Ore is Australia’s largest export, accounting for $118 billion a year according to data from 2021, with China as its primary destination. The price of Iron Ore, therefore, can be a driver of the Australian Dollar. Generally, if the price of Iron Ore rises, AUD also goes up, as aggregate demand for the currency increases. The opposite is the case if the price of Iron Ore falls. Higher Iron Ore prices also tend to result in a greater likelihood of a positive Trade Balance for Australia, which is also positive of the AUD.
How does the Trade Balance impact the Australian Dollar?
The Trade Balance, which is the difference between what a country earns from its exports versus what it pays for its imports, is another factor that can influence the value of the Australian Dollar. If Australia produces highly sought after exports, then its currency will gain in value purely from the surplus demand created from foreign buyers seeking to purchase its exports versus what it spends to purchase imports. Therefore, a positive net Trade Balance strengthens the AUD, with the opposite effect if the Trade Balance is negative.
- GBP/USD gains ground near 1.2713 amid the risk-on mood.
- The Bank of England (BoE) is expected to hold the policy rate unchanged at 5.25% at its February 1 meeting.
- Investors have become less convinced that the Federal Reserve (Fed) will cut the interest rate in March.
The GBP/USD pair holds above the 1.2700 psychological mark during the early Asian session on Tuesday. The rebound of the major pair is supported by an improved risk appetite. Investors will keep an eye on the preliminary UK S&P Global PMI for January on Wednesday, which is expected to remain upbeat. At press time, GBP/USD is trading at 1.2713, gaining 0.04% on the day.
The restrictive monetary policy stance of the Bank of England provides some support to the Pound Sterling (GBP). All 70 economists who participated in the Reuters poll said that they anticipate the Bank of England (BoE) to hold the policy rate unchanged at 5.25% at its policy meeting on February 1. Nonetheless, the BoE is expected to cut the rate to 5% in Q2 of 2024 as inflation is projected to drop below the target, faster than the Q3 cut from the December poll.
Ahead of the BoE key event, the preliminary UK S&P Global PMI for January will be released on Wednesday. The Manufacturing PMI is estimated to improve to 46.7 from 46.2, while the Services PMI is projected to ease to 53.2 from 53.4. Finally, the Composite PMI is expected to show an increase of 52.2.
On the other hand, the markets have become less convinced that the Federal Reserve (Fed) will cut the interest rate in March after robust US economic data last week. According to the CME FedWatch Tool, the market has priced in a 42% chance of a rate cut at the March meeting.
However, two key events this week, including US Gross Domestic Product (GDP) for Q4 and the Core Personal Consumption Expenditures Price Index (Core PCE), might determine at least which way the central bank policymakers could lean on policy. The weaker-than-expected data might weigh on the US Dollar (USD).
Market participants will focus on the US Richmond Fed Manufacturing Index for January, due on Tuesday. The attention will shift to the UK and US PMI reports on Wednesday. Traders will take cues from these figures and find trading opportunities around the GBP/USD pair.
- The Japanese Yen struggles for a firm direction as traders keenly await BoJ's decision.
- The BoJ is expected to stick to its ultra-dovish monetary policy settings on Tuesday.
- The divergent BoJ-Fed policy expectations continue to act as a tailwind for USD/JPY.
The Japanese Yen (JPY) extends its sideways consolidative price move against its American counterpart during the Asian session on Tuesday and remains well within the striking distance of the lowest level since November 28 touched last week. Traders seem reluctant to place aggressive directional bets and opt to wait for the highly-anticipated Bank of Japan (BoJ) policy decision. The Japanese central bank is widely anticipated to maintain its Yield Curve Control (YCC) and negative interest rate policy at the end of the two-day meeting. Hence, the market focus will be on the central bank's view on economic activity and prices. Apart from this, comments by BoJ Governor Kazuo Ueda's comments at the post-meeting press conference will be scrutinized for cues about the interest rate outlook, which, in turn, could lead to volatility in the JPY.
Heading into the key central bank event risk, investors have been pushing back expectations for an imminent shift in the BoJ's policy stance amid a devastating New Year's Day earthquake in Japan, weak wage growth data and signs of easing inflation. This marks a big divergence in comparison to expectations that the Federal Reserve (Fed) might wait until May before cutting interest rates in the wake of a still-resilient economy. The hawkish outlook, meanwhile, remains supportive of elevated US Treasury bond yields and acts as a tailwind for the US Dollar (USD). Furthermore, the recent widening of the US-Japan rate differential undermines the JPY and contributes to limiting the downside for the USD/JPY pair.
Daily Digest Market Movers: Japanese Yen is undermined by expectations for a BoJ inaction
- The Japanese Yen remains on the back foot amid firming expectations that the Bank of Japan will maintain the status quo at the end of the January monetary policy meeting this Tuesday.
- Reports suggest that the BoJ will revise its forecast for the Consumer Price Index (CPI) through fiscal 2025 and will assess the sustainability of the virtuous cycle between wages and prices.
- The central bank will also publish a quarterly report, or the "Outlook for Economic Activity and Prices", which offers insights into economic growth, inflation risks, and labor market conditions.
- The US Dollar remains well supported by diminishing odds for an early rate cut by the Federal Reserve and the recent upbeat macro data, which suggested that the economy is in good shape.
- The current market pricing indicates a 40% chance of a March rate cut, down from as much as 80% a week ago, and a cumulative of five 25 bps rate cuts for 2024 as compared to six two weeks ago.
- The hawkish outlook allows the yield on the benchmark 10-year US government bond to hold steady at around 4.10%, just below the highest level since December touched last week.
- The conflict in the Middle East is showing no signs of easing, with the drone strikes by Iran-backed Houthi rebels continuing on commercial vessels in the Red Sea.
- Pakistan and Iran have decided to resolve their issues with diplomacy, while the Israel-Hamas conflict is threatening to erupt into a large-scale war and impact the global economy.
- Geopolitical tensions, along with persistent worries about slowing economic growth in China, could benefit the safe-haven JPY and cap any meaningful upside for the USD/JPY pair.
Technical Analysis: USD/JPY consolidates before the next leg up, 100-day SMA holds the key for bulls
From a technical perspective, the range-bound price action witnessed over the past four days comes on the back of the recent breakout through the 100-day Simple Moving Average (SMA) and might still be categorized as a bullish consolidation phase. Moreover, oscillators on the daily chart are holding comfortably in the positive territory, suggesting that the path of least resistance for the USD/JPY pair is to the upside. That said, bulls might still wait for a move beyond a multi-week top, around the 148.80 region touched last week before placing fresh bets. Spot prices might then aim to surpass an intermediate hurdle near the 149.30-149.35 zone and reclaim the 150.00 psychological mark for the first time since November 17.
On the flip side, the 100-day SMA resistance breakpoint, currently around the 147.55 region, offered some support to the USD/JPY pair on Monday and might continue to protect the immediate downside. That said, a convincing break below the said area might prompt some technical selling and drag spot prices to the 147.00 round figure en route to the next relevant support near the 146.60-146.55 area. Any subsequent fall, however, might still be seen as a buying opportunity and is more likely to remain limited near the 146.10-146.00 horizontal support.
Japanese Yen price this week
The table below shows the percentage change of Japanese Yen (JPY) against listed major currencies this week. Japanese Yen was the strongest against the New Zealand Dollar.
| USD | EUR | GBP | CAD | AUD | JPY | NZD | CHF | |
| USD | 0.12% | -0.12% | 0.32% | 0.21% | -0.01% | 0.60% | 0.01% | |
| EUR | -0.12% | -0.24% | 0.20% | 0.09% | -0.13% | 0.48% | -0.10% | |
| GBP | 0.11% | 0.22% | 0.41% | 0.32% | 0.10% | 0.71% | 0.12% | |
| CAD | -0.32% | -0.19% | -0.43% | -0.09% | -0.31% | 0.30% | -0.30% | |
| AUD | -0.23% | -0.09% | -0.33% | 0.09% | -0.24% | 0.40% | -0.19% | |
| JPY | 0.00% | 0.10% | -0.08% | 0.33% | 0.22% | 0.61% | 0.02% | |
| NZD | -0.61% | -0.50% | -0.74% | -0.30% | -0.40% | -0.62% | -0.60% | |
| CHF | -0.01% | 0.10% | -0.14% | 0.29% | 0.21% | -0.03% | 0.58% |
The heat map shows percentage changes of major currencies against each other. The base currency is picked from the left column, while the quote currency is picked from the top row. For example, if you pick the Euro from the left column and move along the horizontal line to the Japanese Yen, the percentage change displayed in the box will represent EUR (base)/JPY (quote).
Japanese Yen FAQs
What key factors drive the Japanese Yen?
The Japanese Yen (JPY) is one of the world’s most traded currencies. Its value is broadly determined by the performance of the Japanese economy, but more specifically by the Bank of Japan’s policy, the differential between Japanese and US bond yields, or risk sentiment among traders, among other factors.
How do the decisions of the Bank of Japan impact the Japanese Yen?
One of the Bank of Japan’s mandates is currency control, so its moves are key for the Yen. The BoJ has directly intervened in currency markets sometimes, generally to lower the value of the Yen, although it refrains from doing it often due to political concerns of its main trading partners. The current BoJ ultra-loose monetary policy, based on massive stimulus to the economy, has caused the Yen to depreciate against its main currency peers. This process has exacerbated more recently due to an increasing policy divergence between the Bank of Japan and other main central banks, which have opted to increase interest rates sharply to fight decades-high levels of inflation.
How does the differential between Japanese and US bond yields impact the Japanese Yen?
The BoJ’s stance of sticking to ultra-loose monetary policy has led to a widening policy divergence with other central banks, particularly with the US Federal Reserve. This supports a widening of the differential between the 10-year US and Japanese bonds, which favors the US Dollar against the Japanese Yen.
How does broader risk sentiment impact the Japanese Yen?
The Japanese Yen is often seen as a safe-haven investment. This means that in times of market stress, investors are more likely to put their money in the Japanese currency due to its supposed reliability and stability. Turbulent times are likely to strengthen the Yen’s value against other currencies seen as more risky to invest in.
The People’s Bank of China (PBoC) set the USD/CNY central rate for the trading session ahead on Tuesday at 7.1117 as compared to the previous day's fix of 7.1105 and 7.2033 Reuters estimates.
- NZD/USD trades with mild gains around 0.6077 on Tuesday.
- FOMC members emphasized that early rate cuts are probably not appropriate.
- New Zealand's Business NZ PSI fell back into contraction in December after reaching a six-month high in November.
The NZD/USD pair posts modest gains above the mid-0.6000s during the early Asian trading hours on Tuesday. The upside of the pair remains capped as investors remain concerned about a potential downturn in the property sector, a slowing economy, and subdued investor sentiment in China. NZD/USD currently trades near 0.6077, up 0.03% for the day.
FOMC members cautioned that early rate cuts are probably not appropriate and that the committee will need to be doubly sure that inflation is settling sustainably around 2.0% before cutting interest rates. San Francisco Federal Reserve Bank President Mary Daly said on Friday that the Fed has a lot of work left to do on bringing inflation back down to the 2% target, and it’s premature to think interest-rate cuts are around the corner.
The latest data from Business NZ revealed on Tuesday that New Zealand's Business NZ Performance of Services Index (PSI) came in at 48.8 in December from 51.2 in November. The Business NZ Head of Research Stephen Toplis stated that the softening PSI is bad news for both near-term growth and employment in New Zealand.
Additionally, concerns about China’s growth momentum remain amid a protracted property crisis, sluggish consumer and business confidence, and poor global growth. This, in turn, exerts some selling pressure on the China-proxy New Zealand Dollar (NZD) and acts as a headwind for NZD/USD.
Looking ahead, the US Richmond Fed Manufacturing Index for January will be due on Tuesday. On Wednesday, New Zealand’s Consumer Price Index for the fourth quarter (Q4) will be in the spotlight. Traders will take cues from these figures and find trading opportunities around the pair.
| Index | Change, points | Closed | Change, % |
|---|---|---|---|
| NIKKEI 225 | 583.68 | 36546.95 | 1.62 |
| Hang Seng | -347.51 | 14961.18 | -2.27 |
| KOSPI | -8.39 | 2464.35 | -0.34 |
| ASX 200 | 55.4 | 7476.6 | 0.75 |
| DAX | 128.23 | 16683.36 | 0.77 |
| CAC 40 | 41.61 | 7413.25 | 0.56 |
| Dow Jones | 138.01 | 38001.81 | 0.36 |
| S&P 500 | 10.62 | 4850.43 | 0.22 |
| NASDAQ Composite | 49.32 | 15360.29 | 0.32 |
| Pare | Closed | Change, % |
|---|---|---|
| AUDUSD | 0.6568 | -0.29 |
| EURJPY | 161.193 | -0.04 |
| EURUSD | 1.08818 | -0.08 |
| GBPJPY | 188.25 | 0.16 |
| GBPUSD | 1.2708 | 0.21 |
| NZDUSD | 0.60756 | -0.65 |
| USDCAD | 1.34788 | 0.39 |
| USDCHF | 0.86902 | 0.12 |
| USDJPY | 148.138 | -0.04 |


© 2000-2026. Уcі права захищені.
Cайт знаходитьcя під керуванням TeleTrade DJ. LLC 2351 LLC 2022 (Euro House, Richmond Hill Road, Kingstown, VC0100, St. Vincent and the Grenadines).
Інформація, предcтавлена на cайті, не є підcтавою для прийняття інвеcтиційних рішень і надана виключно для ознайомлення.
Компанія не обcлуговує та не надає cервіc клієнтам, які є резидентами US, Канади, Ірану, Ємену та країн, внеcених до чорного cпиcку FATF.
Проведення торгових операцій на фінанcових ринках з маржинальними фінанcовими інcтрументами відкриває широкі можливоcті і дає змогу інвеcторам, готовим піти на ризик, отримувати виcокий прибуток. Але водночаc воно неcе потенційно виcокий рівень ризику отримання збитків. Тому перед початком торгівлі cлід відповідально підійти до вирішення питання щодо вибору інвеcтиційної cтратегії з урахуванням наявних реcурcів.
Викориcтання інформації: при повному або чаcтковому викориcтанні матеріалів cайту поcилання на TeleTrade як джерело інформації є обов'язковим. Викориcтання матеріалів в інтернеті має cупроводжуватиcь гіперпоcиланням на cайт teletrade.org. Автоматичний імпорт матеріалів та інформації із cайту заборонено.
З уcіх питань звертайтеcь за адреcою pr@teletrade.global.
переклади