- Аналітика
- Новини та інструменти
- Новини ринків
Новини ринків
- Gold pulls back after testing $2,070 ahead of Friday’s pre-holiday close.
- Rising investor bets of faster, more frequent Fed rate cuts squeeze Gold higher.
- US inflation continues to cool off, Treasuries ease back amidst risk appetite recovery.
XAU/USD briefly tested above $2,070 on Friday before paring back toward the day’s opening bids. With the Federal Reserve’s (Fed) main interest rate at a 22-year high, markets are incredibly eager for the Fed to begin cutting interest rates, and receding US inflation is pinning investor hopes of an accelerated pace of Fed rate cuts in 2024.
The US Annualized Core Personal Consumption Expenditures (PCE) Price Index in November grew by 3.2% from the same time last year, easing back from market forecasts of 3.3% and declining further from the previous period’s 3.4% (which was also revised down from 3.5%).
Read More: US PCE inflation softens to 2.6% from a year ago vs. 2.8% expected
With US inflation easing back, markets are applying downside pressure to the US Dollar and bidding up Spot Gold in anticipation of Fed rate cuts that may have run too far ahead of what the Fed will be willing to execute; the Fed’s dot plot of interest rate expectations show a median forecast of 75 basis points in rate cuts through the end of 2024. By comparison, markets are currently pricing in bets of 160 basis points in cumulative rate cuts, with some particularly over-eager market participants betting on a rate cut as soon as next March.
With markets wrapping up the last full trading week of 2023 and gearing up for the holiday market break, Friday’s early action saw a notable reversal as the US Dollar pared back the day’s losses and Gold retreated back towards the day’s opening bids.
XAU/USD Technical Outlook
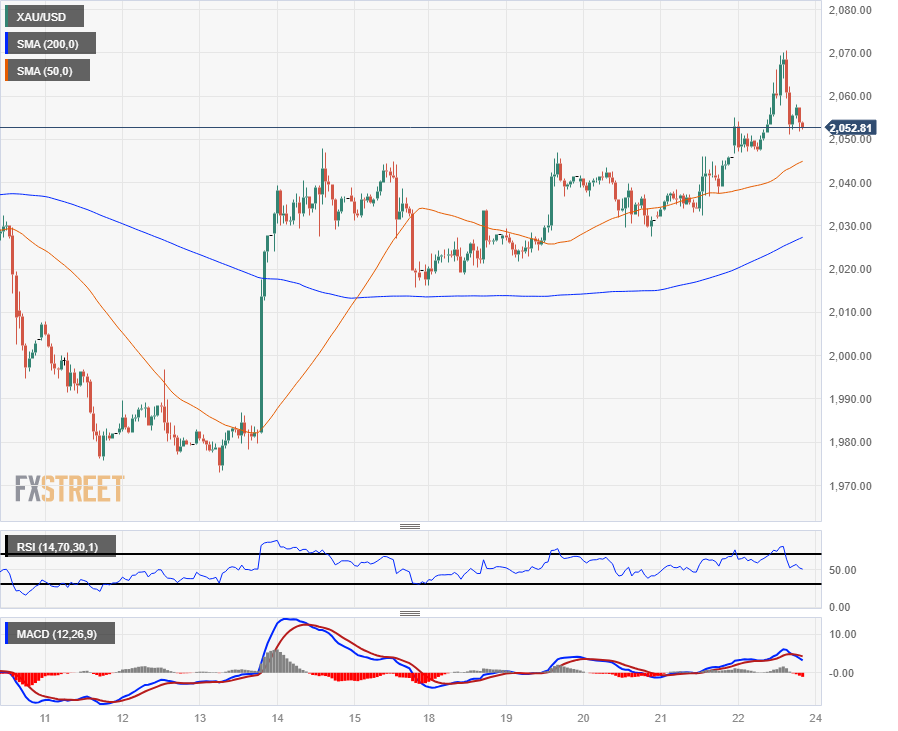
Spot Gold climbed over 1.10% bottom-to-top on Friday in a last-minute bull run before hitting the wall at $2,070 and reversing back toward Friday’s open near $2,050.
Intraday action in the XAU/USD has been incredibly well-bid as of late, outpacing the 200-hour Simple Moving Average (SMA) since breaking to the topside of the moving average last week near $2,020.
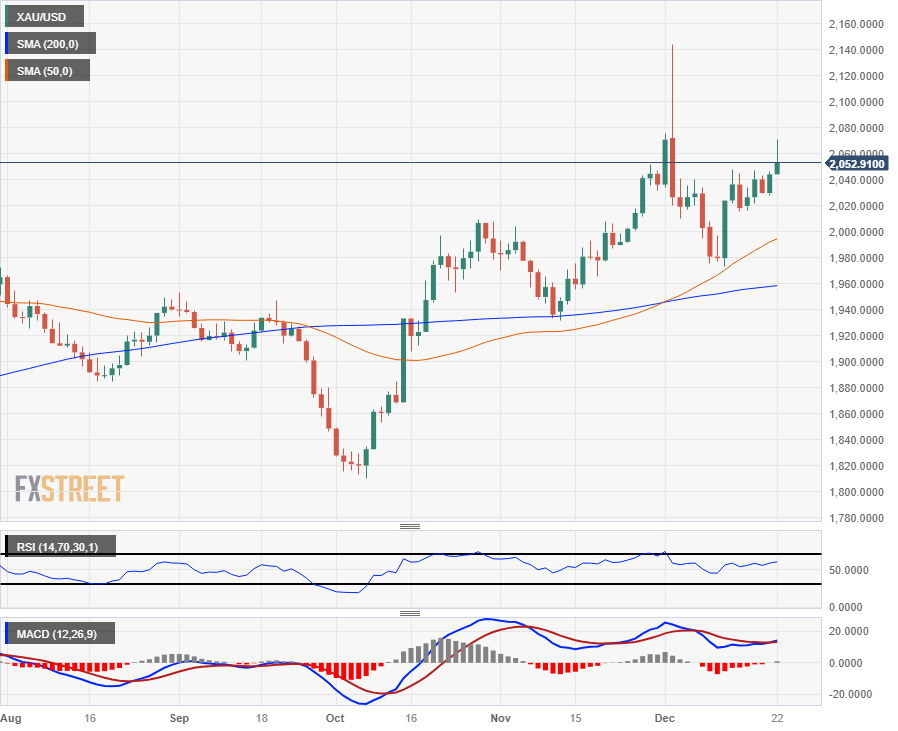
A higher-lows pattern has baked into the XAU/USD on daily candles since Spot Gold bottomed out near $1,820 in early October, and long-term technical support is coming from the 200-day SMA rising into $1,960.
December’s early rally into all-time highs has left near-term Gold bids stranded in bull country, and XAU/USD will have to fall back below the $2,000 major handle before bearish patterns can begin to develop.
XAU/USD Hourly Chart
XAU/USD Daily Chart
XAU/USD Technical Levels
- The US Dollar is rebounding from Friday’s selloff as investors gear up for holiday.
- The Loonie briefly rallied to a fresh 19-week high as rate-hungry markets pummel the USD.
- USD/CAD set for a fifth weekly decline in six straight weeks.
The USD/CAD pared back above 1.3260 after plunging to a fresh 19-week low on Friday as markets continue to price in an accelerated pace of rate cuts from the Federal Reserve (Fed) in 2024 as US inflation continues to ease faster than initially expected.
Canadian GDP stalls out, US inflation continues to recede
The Canadian Dollar is struggling to find reasons to catch bids as economic data from Canada continues to point towards an economic slowdown. Canadian monthly Gross Domestic Product (GDP) failed to print growth for a fourth straight reporting period in October, coming in flat at 0.0% after September’s GDP print saw a downside revision from a meager 0.1% to flat. Canadian GDP has failed to move the needle month-over-month since June’s 0.2% decline.
Read More: Canada GDP stalls in October vs. 0.2% expansion expected
The US Personal Consumption Expenditures (PCE) Price Index eased back from market forecasts as inflation continues to drain away faster than economic models predicted, ramping up money market bets of faster and more frequent rate hikes from the Fed in 2024. The Core US PCE Price Index for the year through November printed at 3.2% versus the market forecast of 3.3%, slipping back from October’s print of 3.4% (revised down from 3.5%).
Read More: US PCE inflation softens to 2.6% from a year ago vs. 2.8% expected
With US inflation steadily declining, investors’ bets on Fed rate cuts next year have ramped up significantly with market expectations running well ahead of the Fed’s own rate outlook; money markets are pricing in upwards of 160 basis points in rate cuts through 2024, compared to the Fed’s own dot plot of rate forecasts, which sees only 75 basis points by the end of next December.
USD/CAD Technical Outlook
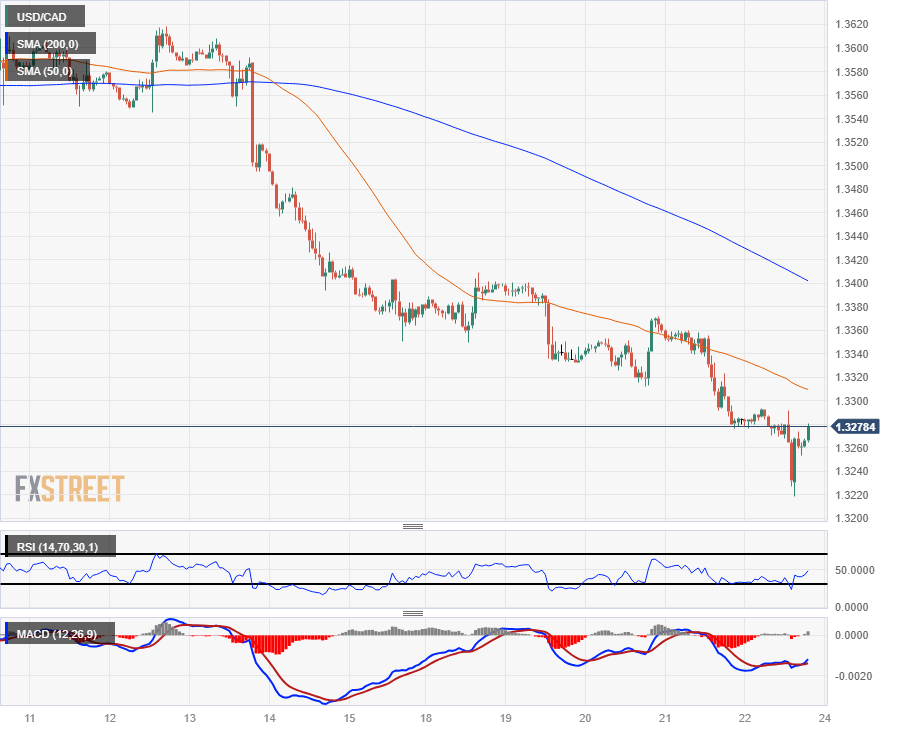
The USD/CAD’s late-Friday rally has the pair pulling back into neutral territory on the day, clawing back towards the 1.3300 handle as market volatility takes a step higher heading into the week’s close.
The pair is still down on the week, down eight-tenths of one percent from Monday’s opening bids and in the red by 2.5% from the last swing high into 1.3620.
Intraday action still has a lot of ground to cover before the pair can start challenging topside momentum beyond the 200-hour Simple Moving Average (SMA) near 1.3400, and near-term recoveries will be difficult to time with technical indicators pinned into oversold territory.
USD/CAD Hourly Chart
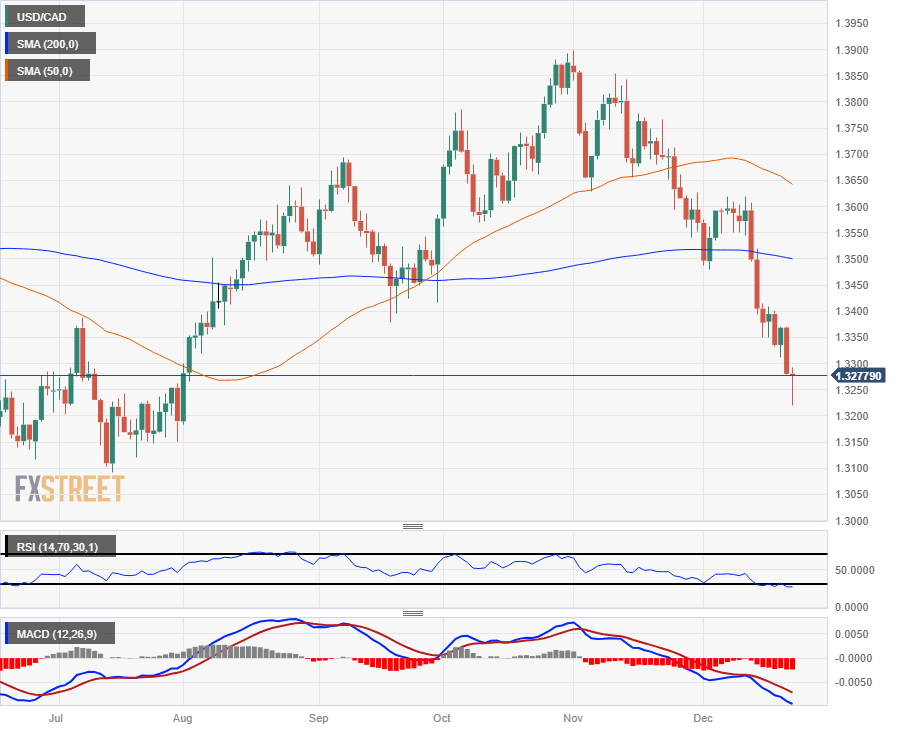
USD/CAD Daily Chart
USD/CAD Technical Levels
Holiday-thinned trading, a shortened week, and a light economic calendar point to abnormal price action in the last days of 2023. Will Santa's rally continue? Will the US Dollar remain under pressure?
Here is what you need to know for next week:
The economic calendar is light next week. Adding to this, holiday-thinned trading could favor limited price action while at the same time encouraging false breakouts. Most trading platforms won't be functional on Monday.
It was another positive week for equity prices. The Dow Jones reached all-time highs, while US Treasury yields moved lower. The 10-year settled around 3.90%, the lowest since July. Will Santa stay on Wall Street next week?
The US Dollar Index (DXY) lost ground for the second week in a row, falling to monthly lows, below 102.00. It continues to move with a bearish bias, on the back of risk appetite and lower yields. Market repricing expectations from the Federal Reserve (Fed) in 2024 keep the Greenback under pressure.
This week's key number was the Core Personal Consumption Expenditure (Core PCE), which rose 0.2% in November, below the expected 0.3%, and 3.2% from a year ago. The headline index actually declined 0.1% in November, marking the first negative reading since 2020. The data adds to evidence that inflation is moving toward the Fed's 2% target. Data from the US next week includes home prices (Tuesday), Jobless Claims (Thursday), and the Chicago PMI (Friday).
The EUR/USD rose above 1.1000, and next week's challenge will be to remain above that area. The pair posted the highest weekly close in five months. The crucial report will be Spain's preliminary Consumer Price Index (CPI) for December on Friday.
The GBP/USD posted modest weekly gains, facing difficulty holding above 1.2700. Despite posting gains versus the US Dollar, the Pound was affected by UK inflation data, which came in softer than expected. EUR/GBP rose from 0.8575 to 0.8660, retaking the 20-week Simple Moving Average. No relevant data from the UK is due next week.
The Japanese Yen was the worst performer among majors during the week, following the Bank of Japan (BoJ) monetary policy meeting. USD/JPY posted minor gains; however, it finished far from the weekly peak around 142.50, showing that prevailing risks are to the downside. On Wednesday, BoJ will release the Summary of Opinion of the latest monetary policy meeting. Data due from the country includes retail trade data and industrial production. Japanese economic figures could start having more relevance considering the expectations about a potential exit from BoJ's negative interest rate policy.
No relevant economic reports are due from Canada, Australia, and New Zealand. AUD/USD and NZD/USD posted important gains for the second week in a row and the highest close since July. Price action is expected to continue to be driven exclusively by USD dynamics.
The USD/CAD tumbled, falling below 1.3300, marking the lowest weekly close since August. The Canadian Dollar lagged behind the AUD and the NZD, amid risk appetite and subdued crude oil prices.
Gold posted the second-highest weekly close on record. XAU/USD hovers around $2,050 and the trend is up. The main risk for the yellow metal could come from a repricing of Fed easing expectations. A rebound in US yields could trigger a sharp correction in Gold.
Economists at CIBC analysed growth data from Canada released on Friday.
Looking at rate cuts in Q2 2024
Today's data were more naughty than nice, with monthly GDP pointing to little rebound in the economy in the fourth quarter following Q3's contraction.
While supply constraints, including most recently the US auto strike and St. Lawrence Seaway strike, continue to disrupt activity, there is evidence of weak domestic demand as well.
That weakness should see inflation ease more sustainably next year, and we still see a first interest rate cut from the Bank of Canada in Q2 2024.
- EUR/USD hits 18-week high on Friday.
- Pre-holiday markets are producing some rough chop heading towards the Friday close.
- Slowing US inflation is pushing down the Greenback as markets bet on rate cuts.
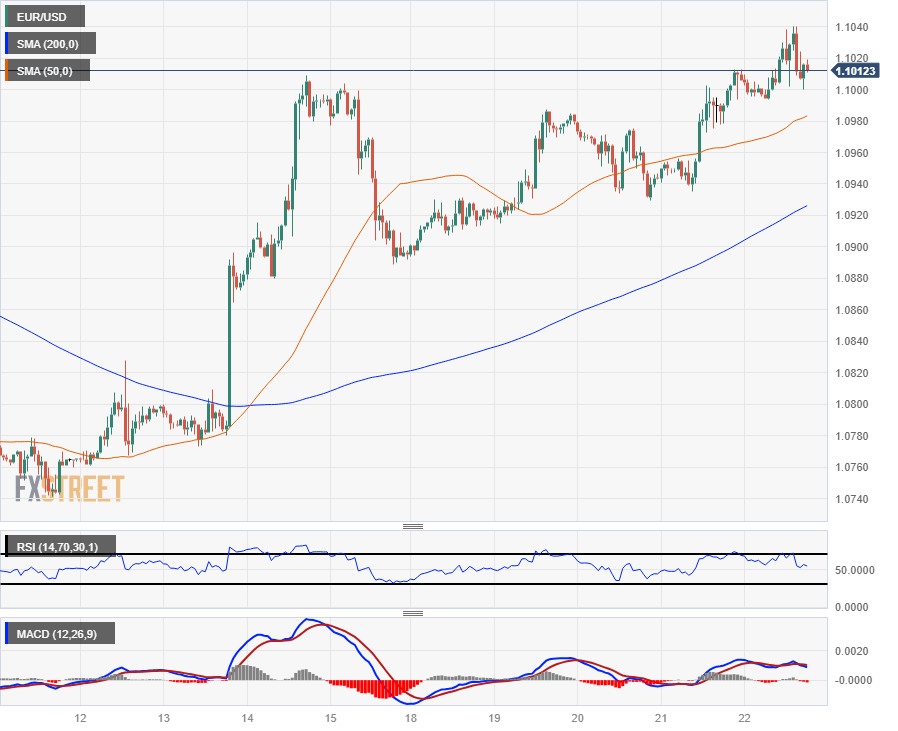
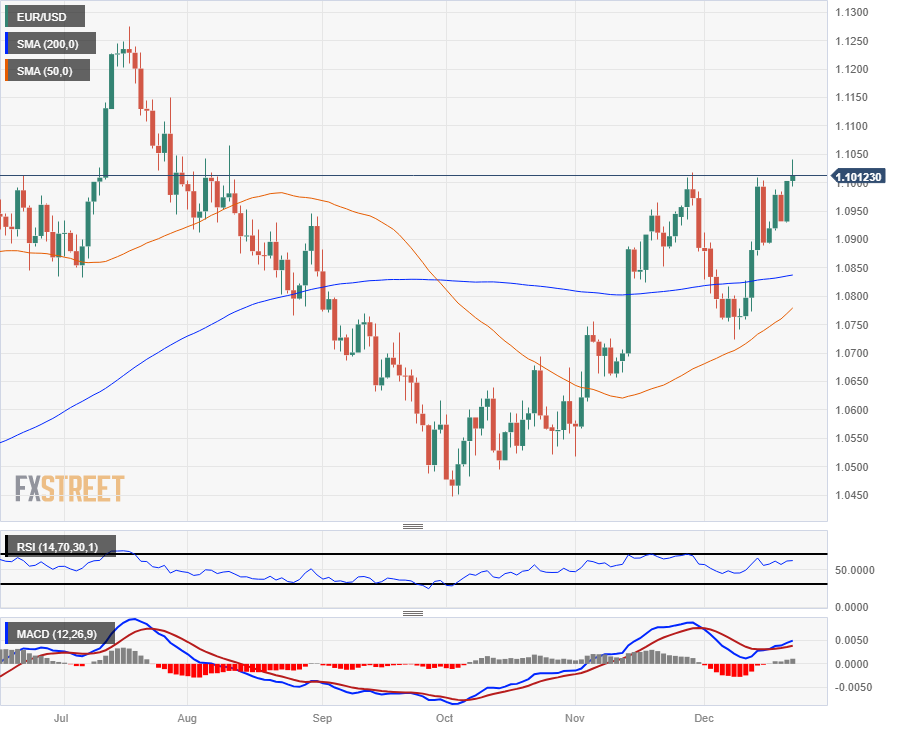
The EUR/USD climbed into an 18-week high at 1.1040 before slipping back towards 1.1000 as markets wind up operations before heading into the holiday break. US inflation missed the mark on Friday, printing below expectations and keeping investor expectations of Federal Reserve (Fed) rate cuts accelerating in 2024.
Read More: US PCE inflation softens to 2.6% from a year ago vs. 2.8% expected
US Personal Consumption Expenditure (PCE) Price Index softened more than expected on Friday with the Core Annualized PCE Price Index for the year through November printing at 3.2%, below the forecast 3.3% and even further back from October’s YoY print of 3.4% (revised down slightly from 3.5%).
Money markets are ramping up their expectations of a faster pace of rate cuts from the Federal Reserve (Fed) through 2024 on the back of inflation metrics that continue to decline faster than most models can predict. Investor expectations have now run far ahead of the Fed’s own rate expectations looking forward, with money markets pricing in upwards of 160 basis points in Fed rate cuts, with some betting the rate cut cycle begins as soon as next March, while the Fed’s dot plot of interest rate expectations only sees 75 basis points in reductions by the end of 2024.
The market’s USD-short momentum was limited by a beat in US Durable Goods Orders, which printed at 5.4% for November versus October’s -5.1% (revised up slightly from -5.4%), showing the US economy may still be firm enough that the Fed might get away with fewer rate cuts than many expect.
EUR/USD Technical Outlook
Despite the US Dollar’s moderate pullback late Friday, the Greenback remains firmly down on the week, in the red by nearly a third of a percent against the Euro from Monday’s opening bids.
The US Dollar is still up on the day against the Euro, and a green close here will see the EUR/USD close in the green for seven of the last nine straight trading week.
Technicals are leaning into the bullish side, leaving a wake of technical support flags in the pair’s wake on its rise from October’s early lows near 1.0450. The last meaningful swing low saw a turnaround point at 1.9793, and the 200-day Simple Moving Average (SMA) rising towards 1.0850.
EUR/USD Hourly Chart
EUR/USD Daily Chart
EUR/USD Technical Levels
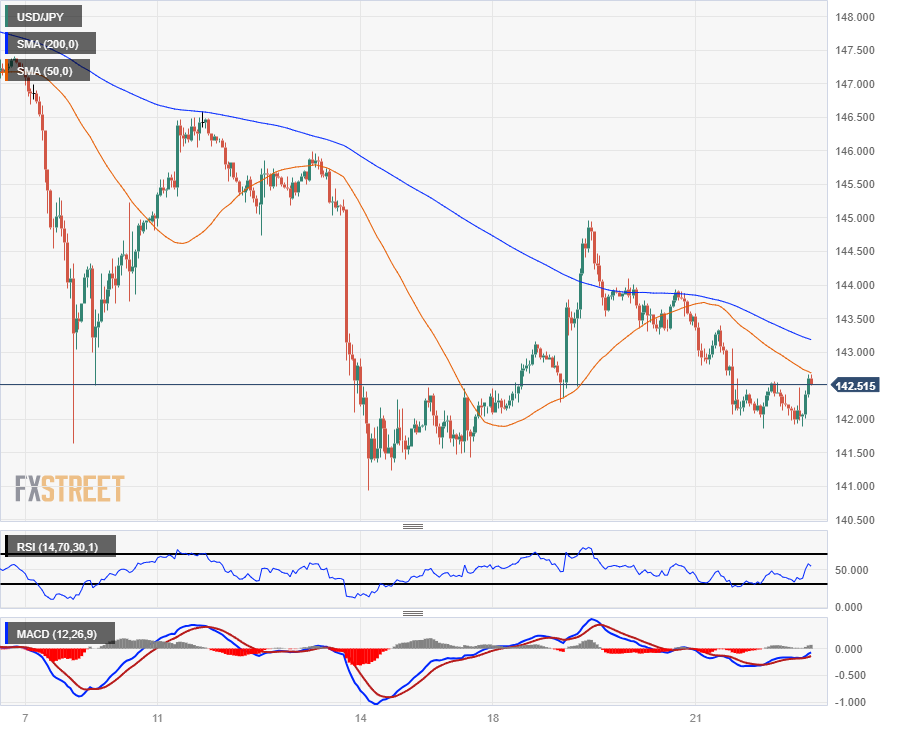
- USD/JPY sees late rally, jumps to 142.60.
- The US Dollar is paring back the day’s losses as the Yen declines.
- US inflation continues to erode faster than expected.
The USD/JPY is rallying into new highs on Friday as the US Dollar (USD) tries to pare back some of the day’s losses coupled with a broad-market weakening of the Japanese Yen (USD) as markets get set to wrap up the last day of trading before the holiday break and the last full trading week of 2023.
The Yen saw an early bump on Friday after Japanese National Consumer Price Index (CPI) Inflation printed more or less as-expected, with Core Japan CPI (headline CPI less fresh food prices) for the year through November meeting market forecasts of 2.5% versus the previous print of 2.9%.
Japanese inflation continues to fall back towards the Bank of Japan’s (BoJ) 2% target, but the BoJ continues to undercut market hopes for a hawkish pivot from the Japanese central bank. The BoJ remains unconvinced that Japanese inflation will continue to hold above 2% looking foward, and the BoJ remains firmly entrenched in hyper easy monetary policy with negative interest rates.
The BoJ currently expects inflation to decline below a 2% annual rate sometime in 2025.
The US Dollar declined once more on Friday after the US Personal Consumption Expenditures (PCE) Price Index declined faster than expected, seeing a resurgence in rate cut expectations from the markets. The Greenback is now paring back the day’s losses heading into the back half of the week’s final trading session.
The Core US PCE Price Index for the year through November softened to 3.2%, below the market forecast of 3.3% and easing back further from the previous print of 3.4% (revised down from 3.5%).
Read More: US PCE inflation softens to 2.6% from a year ago vs. 2.8% expected
Declining US inflation has weighed on the US Dollar this week, igniting a resurgence in investor expectations of an increased pace of rate cuts in 2024. Market rate cut expectations may have run far ahead of what the Fed considered feasible, however: the Fed’s dot plot of interest rate expectations show a median forecast of 75 basis points in rate cuts through the end of 2024, but markets are currently pricing in bets of 160 basis points in cumulative rate cuts, with some particularly over-eager market participants betting on a rate cut as soon as next March.
USD/JPY Technical Outlook
The USD/JPY set a new high for Friday at 142.66, stopping just short of the 50-hour Simple Moving Average (SMA) as the pair gets hung up on near-term resistance levels.
Despite USD/JPY’s Friday rebound, the pair remains firmly bearish, with an unavoidable lower-highs pattern baked into the charts.
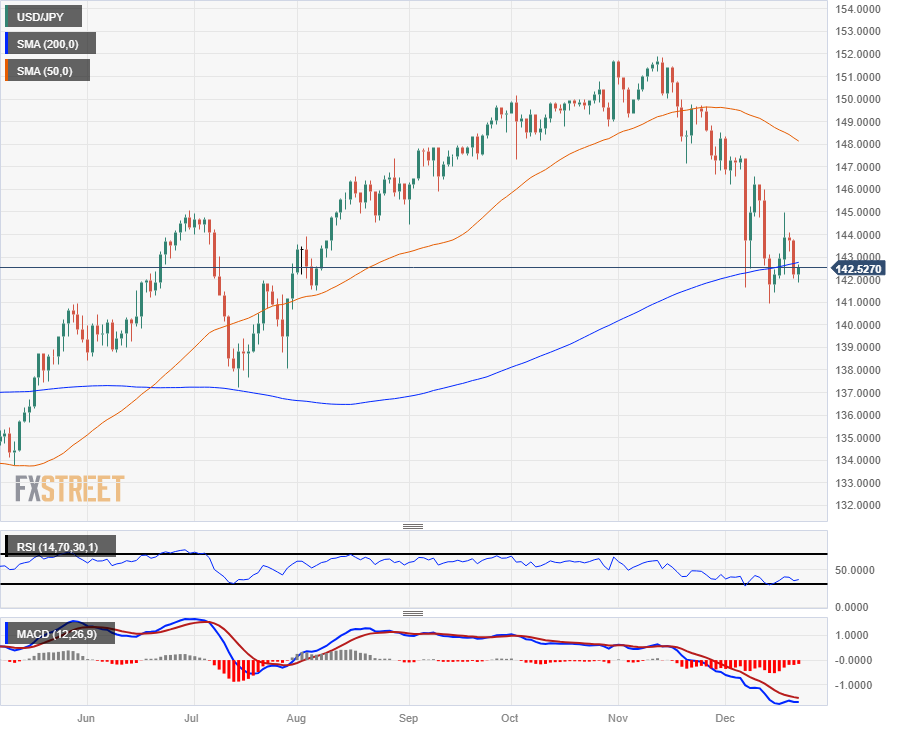
The pair remains constrained at the 200-day SMA rising into the 143.00 handle, and the USD/JPY is down over six percent from November’s peak bids near 151.90.
USD/JPY Hourly Chart
USD/JPY Daily Chart
USD/JPY Technical Levels
- The GBP/USD is holding on the high side after US PCE inflation settled further on Friday.
- UK Retail Sales grew in November, Pound Sterling bidders shrug off UK GDP QoQ decline.
- US Dollar flows are decidedly bearish, propping up the broader market.
The GBP/USD is on the high side amidst some rough chop in the US market session, holding above the 1.2700 handle the pair reclaimed during the European trading window after the UK reported better-than-expected Retail Sales in November.
Read More: UK Retail Sales rise 1.3% in November, Q3 GDP growth revised lower to 0.3%
UK Retail Sales grew 1.3% MoM in November, beating the forecast 0.4% and rebounding from October’s flat print of 0.0%. Annualized Retail Sales through November also gained on market forecasts, printing at 0.1% versus the forecast -1.3%, rebounding from the previous period’s -2.5% (revised upwards slightly from -2.7%).
Upbeat UK Retail Sales helped Pound Sterling bidders shake off a miss in the UK Gross Domestic Product (GDP) print, which came in below expectations. Annualized quarterly UK GDP came in at just 0.3% versus the forecast hold at 0.6%, with quarterly GDP declining QoQ, coming in at -0.1% versus the forecast 0.0% flat reading.
US data took center stage again on Friday, with decelerating inflation being the key driver, pushing the US Dollar down across the broader market.
Read More: US PCE inflation softens to 2.6% from a year ago vs. 2.8% expected
US Personal Consumption Expenditure (PCE) Price Index figures for November showed inflation continues to slow at a faster pace than markets initially expected. Annualized Core PCE inflation for the year through November printed at 3.2%, below the 3.3% forecast and lower than the previous period’s 3.4% print (revised down slightly from 3.5%).
Read More: US Durable Goods Orders rise 5.4% in November vs 2.2% expected
US Durable Goods Orders added to the mix, implying the US economy might not be outright weakening as quickly as rate-cut-hungry investors might be hoping for; November’s Durable Goods Orders came in at a surprisingly robust 5.4%, easily clearing the forecast 2.2% and rebounding from the previous period’s -5.1%(revised from -5.4%).
GBP/USD Technical Outlook
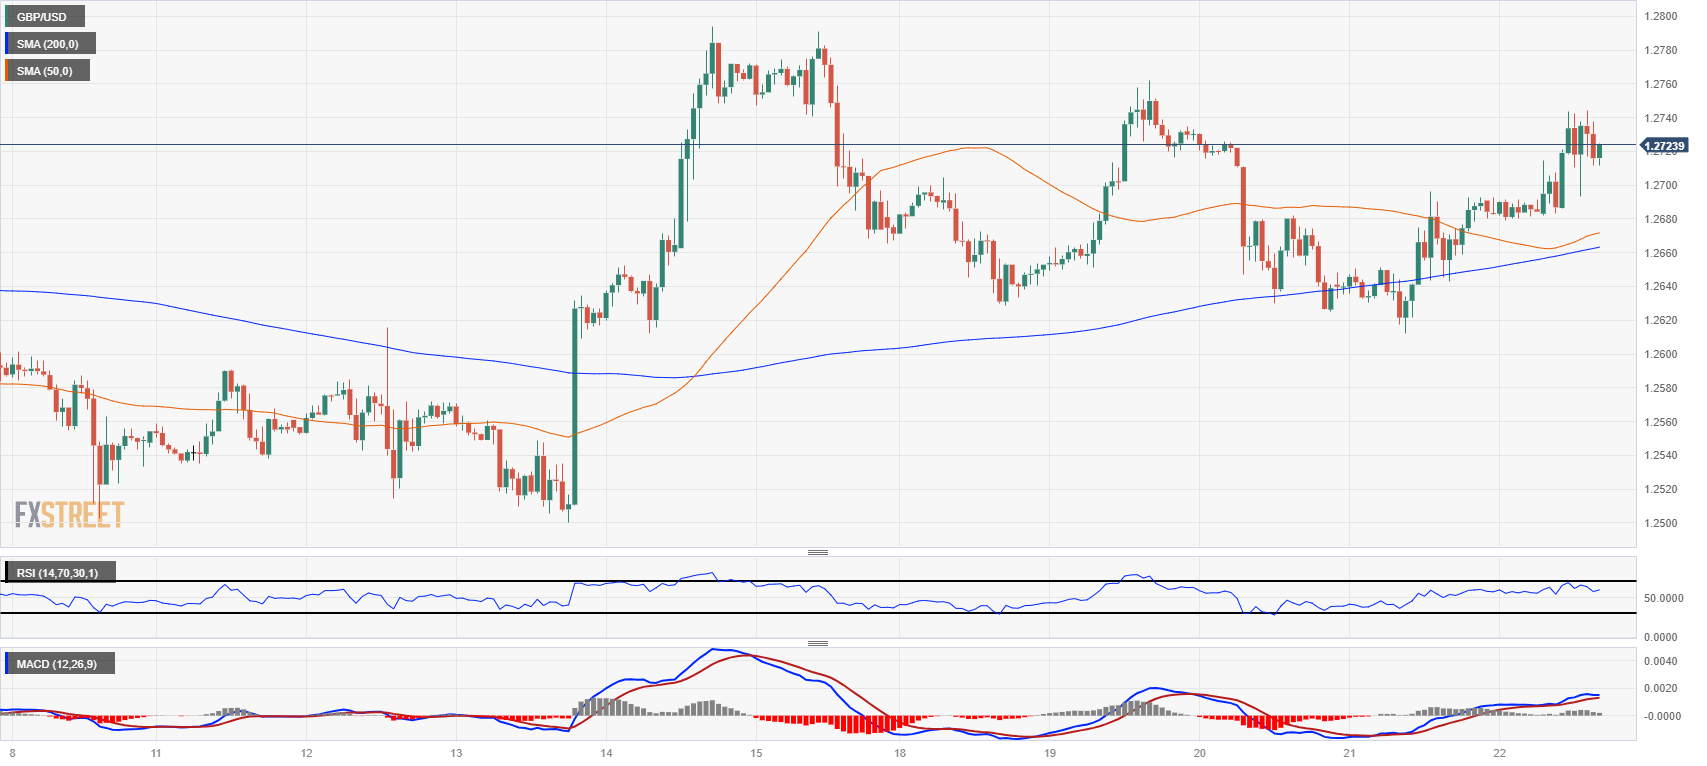
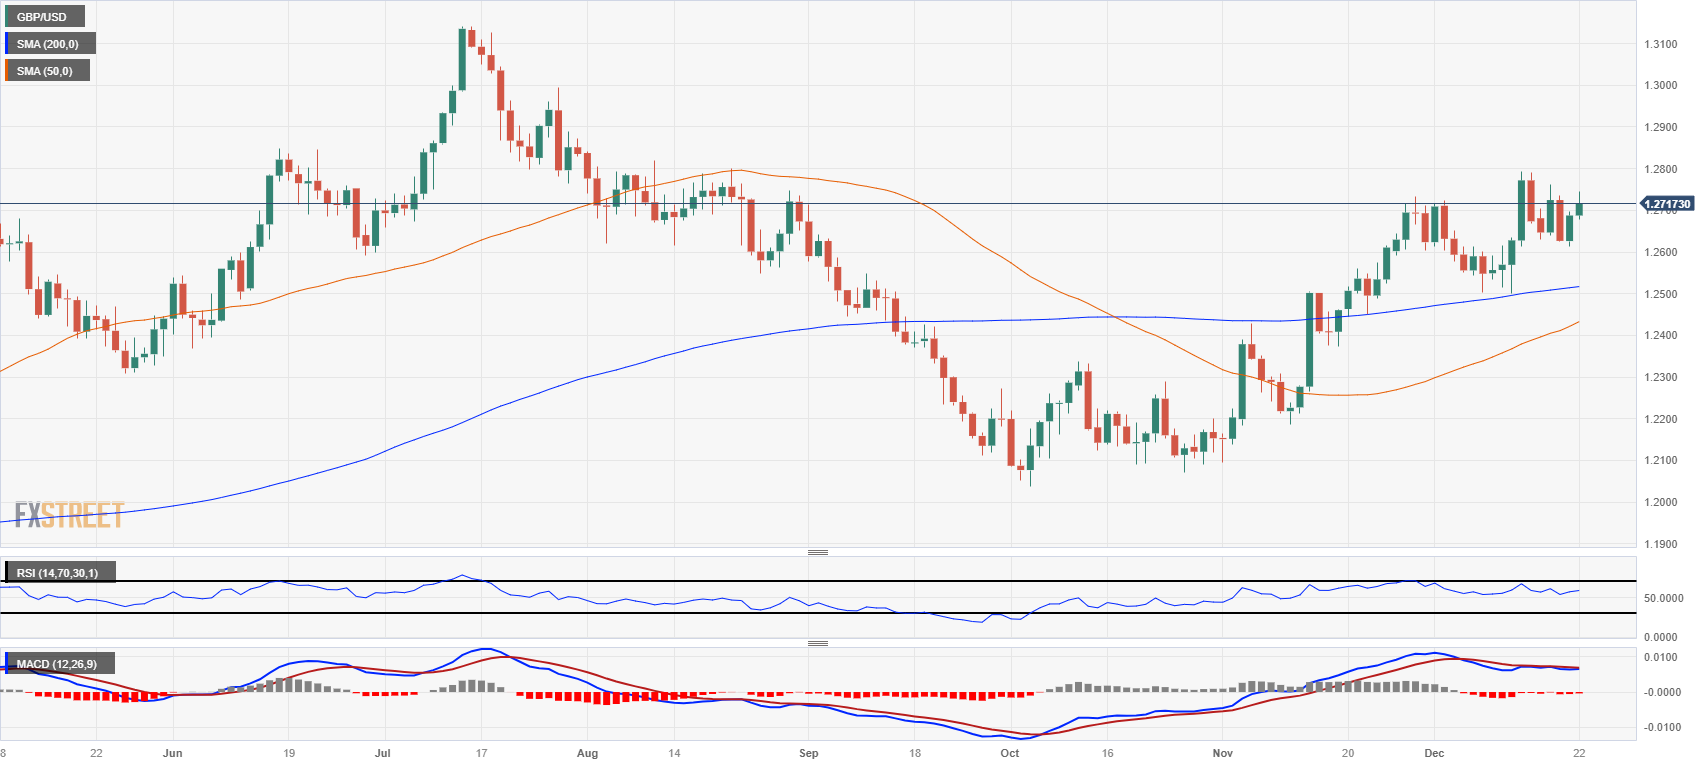
The GBP/USD found some room above the 1.2700 handle on the final Friday before the holiday break, testing just below 1.2750 before falling back into intraday consolidation between 1.2740 and 1.2710.
The Pound Sterling has been bolstered against the US Dollar, bouncing off of the 200-hour Simple Moving Average (SMA) rising through 1.2660, but failure to break near-term highs near 1.2760 leaves bullish momentum capped.
1.2800 is proving a vexing handle to reclaim for the Pound Sterling, having shed the price level in August and getting rejected from the region last week.
The GBP/USD continues to trade north of the 200-day SMA just above 1.2500, but an extended pullback could be due with the Moving Average Convergence-Divergence (MACD) showing signs of technical exhaustion in overbought territory.
GBP/USD Hourly Chart
GBP/USD Daily Chart
GBP/USD Technical Levels
Economists at HSBC retain a USD bullish view for 2024.
USD likely to be on the defensive in the near term
The USD is likely to be on the defensive in the near term, but we think the headwinds from yield differentials to the USD may not be large, as the Fed will likely be easing alongside other central banks (no matter from the market’s or our economists’ expectations).
We believe the USD will probably be supported in 2024 by a slowing global economy, one where recession risks still loom and where the ‘safe haven’ USD will continue to offer a relatively high yield.
- US consumer inflation declined more than expected in November.
- US Dollar Index slides to its lowest level since July 27.
- The AUD/USD holds firm, maintaining important weekly gains.
During the American session, the AUD/USD pair rose to 0.6824, reaching its highest intraday level since July, driven by broad-based Dollar weakness. It is holding onto its weekly gains, remaining near 0.6800.
Mixed US data: inflation approaches Fed's target
The latest important US economic report for 2023 showed that the Core Personal Consumption Expenditure Price Index (Core PCE) rose 0.1% in November, below the market consensus of 0.2%. The headline PCE declined for the first time since 2020. Another report indicated a 5.5% increase in Durable Goods Orders in November, and the University of Michigan Consumer Sentiment Index rose in December to 69.7 from 69.4.
The market reaction to the US data was limited. The numbers continue to indicate a robust economy and inflation approaching the Federal Reserve's target. Following the data, easing expectations rose, while US Treasury yields remained relatively steady.
The US Dollar index (DXY) dropped to 101.42, the lowest level since July, boosting the AUD/USD to approach 0.6825. The Australian Dollar is holding above 0.6800, set for its second consecutive weekly gain, reaffirming the bullish outlook. However, risks remain as the US economic performance could lead to the Fed cutting interest rates after other central banks, including the Reserve Bank of Australia (RBA).
Technical outlook
The AUD/USD remains within an ascending channel on the daily chart; however, it is nearing the upper limit, which could potentially limit the rally and prompt a period of consolidation. Conversely, a breakout above the upper limit at 0.6830 could trigger acceleration, targeting 0.6850.
In the event of a downward correction, initial support may be found around the 0.6770 area, followed by 0.6725. If it falls below 0.6600, the outlook would shift from bullish to neutral/bearish.
AUD/USD daily chart
-638388570926105335.png)
- The Mexican Peso hit a 15-week high against the US Dollar on Friday.
- Mexico’s unadjusted Trade Balance hit a nine-month high in November.
- Friday marks the last trading day before the holiday break.
The Mexican Peso (MXN) rallied to a fresh 15-week high on Friday as the broader market took one last opportunity to sell off the US Dollar (USD) heading into the extended holiday weekend.
Mexico’s unadjusted Trade Balance in November beat market expectations and improved to a nine-month high of 630 million in US Dollar terms. However, market impact is likely limited after the seasonally adjusted Trade Balance grew by a scant 300K.
US data drove the market on Friday, with mixed figures pulling Greenback bids in both directions, but the US Dollar heads into the holiday break notably in the red across the board, falling back against the majority of the major currency bloc.
Daily digest market movers: Mexican Peso propped up by Greenback weakness
- MXN hit a 15-week high of 16.94 against the USD on Friday as markets sell the US Dollar off one last time before the holiday break.
- Mexico’s November Trade Balance grew by USD 630 million versus the market forecast of USD 404 million, rebounding from October’s USD 252 million deficit.
- November’s seasonally adjusted Mexico Trade Balance showed scant growth of USD 300K versus the previous month’s growth of USD 242 million, implying seasonal factors are boosting Mexico Trade Balance and are unlikely to last.
- US Dollar weakness is the general market theme on Friday.
- The US Annualized Core Personal Consumption Expenditures (PCE) Price Index in November grew by 3.2% from the same time last year, easing back from market forecasts of 3.3% and declining further from the previous period’s 3.4% (which was also revised down from 3.5%).
- Durable Goods Orders in November lurched higher to grow 5.4%, well over the market forecast of 2.2% and clawing back October’s -5.1% (also revised upwards from -5.4%).
- Easing US inflation figures are keeping market hopes pinned for faster and sooner rate cuts from the Federal Reserve (Fed).
- Mexico’s Jobless Rate figures are due next Thursday after the holiday break.
US Dollar price today
The table below shows the percentage change of US Dollar (USD) against listed major currencies today. US Dollar was the weakest against the Pound Sterling.
| USD | EUR | GBP | CAD | AUD | JPY | NZD | CHF | |
| USD | -0.26% | -0.40% | -0.37% | -0.29% | 0.09% | -0.29% | -0.32% | |
| EUR | 0.26% | -0.15% | -0.10% | -0.03% | 0.32% | -0.03% | -0.05% | |
| GBP | 0.39% | 0.13% | 0.00% | 0.11% | 0.46% | 0.10% | 0.09% | |
| CAD | 0.35% | 0.09% | -0.04% | 0.07% | 0.46% | 0.07% | 0.04% | |
| AUD | 0.29% | 0.04% | -0.09% | -0.09% | 0.38% | 0.01% | -0.01% | |
| JPY | -0.10% | -0.35% | -0.47% | -0.44% | -0.37% | -0.36% | -0.38% | |
| NZD | 0.28% | 0.03% | -0.11% | -0.08% | 0.00% | 0.32% | -0.02% | |
| CHF | 0.27% | 0.06% | -0.09% | -0.03% | -0.02% | 0.39% | 0.03% |
The heat map shows percentage changes of major currencies against each other. The base currency is picked from the left column, while the quote currency is picked from the top row. For example, if you pick the Euro from the left column and move along the horizontal line to the Japanese Yen, the percentage change displayed in the box will represent EUR (base)/JPY (quote).
Technical Analysis: Mexican Peso sees one last bump to close out the trading week
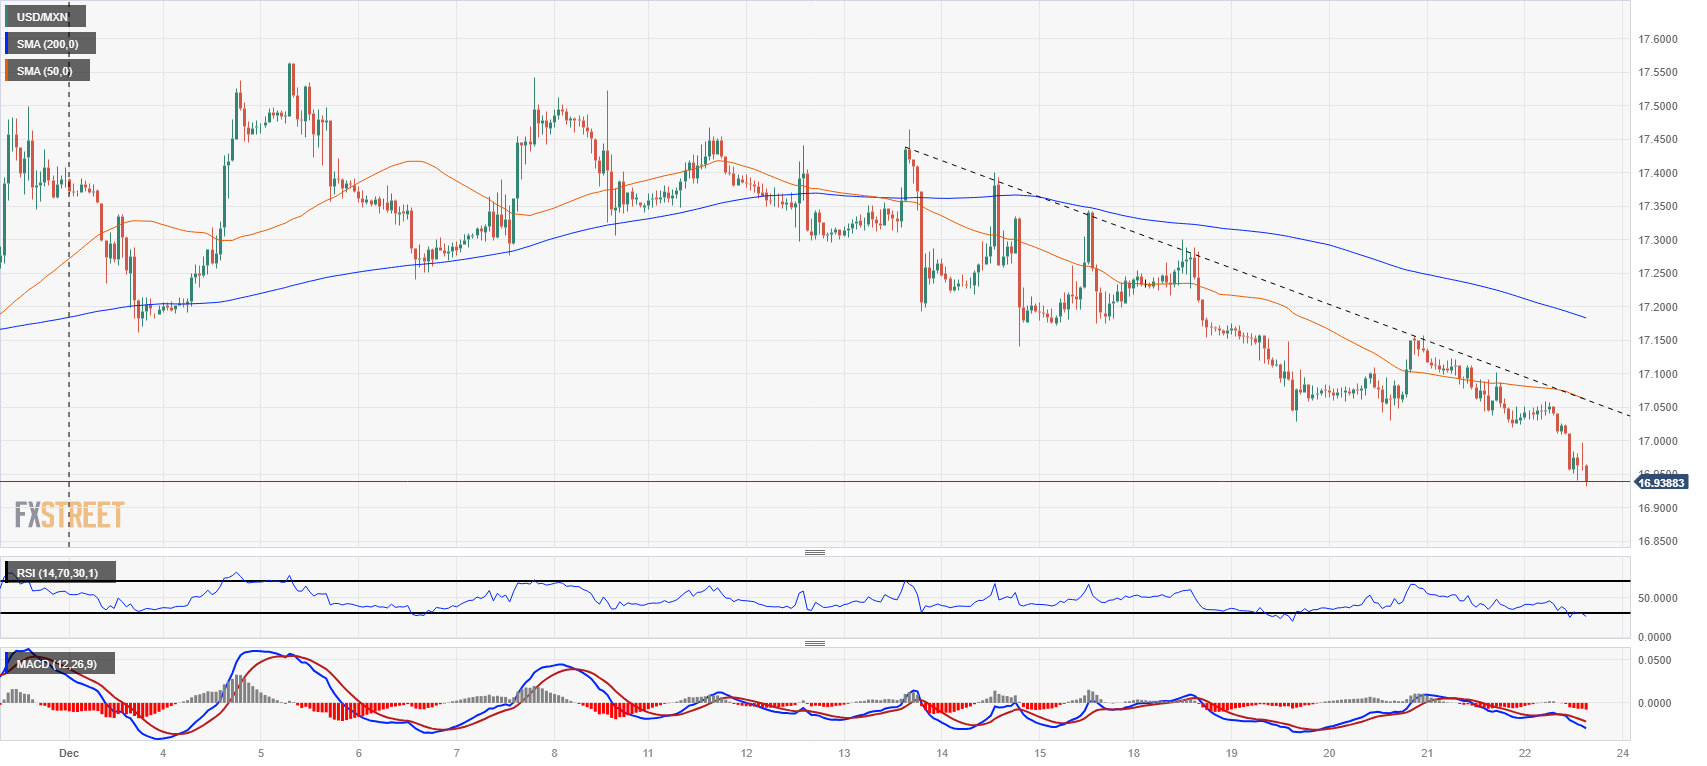
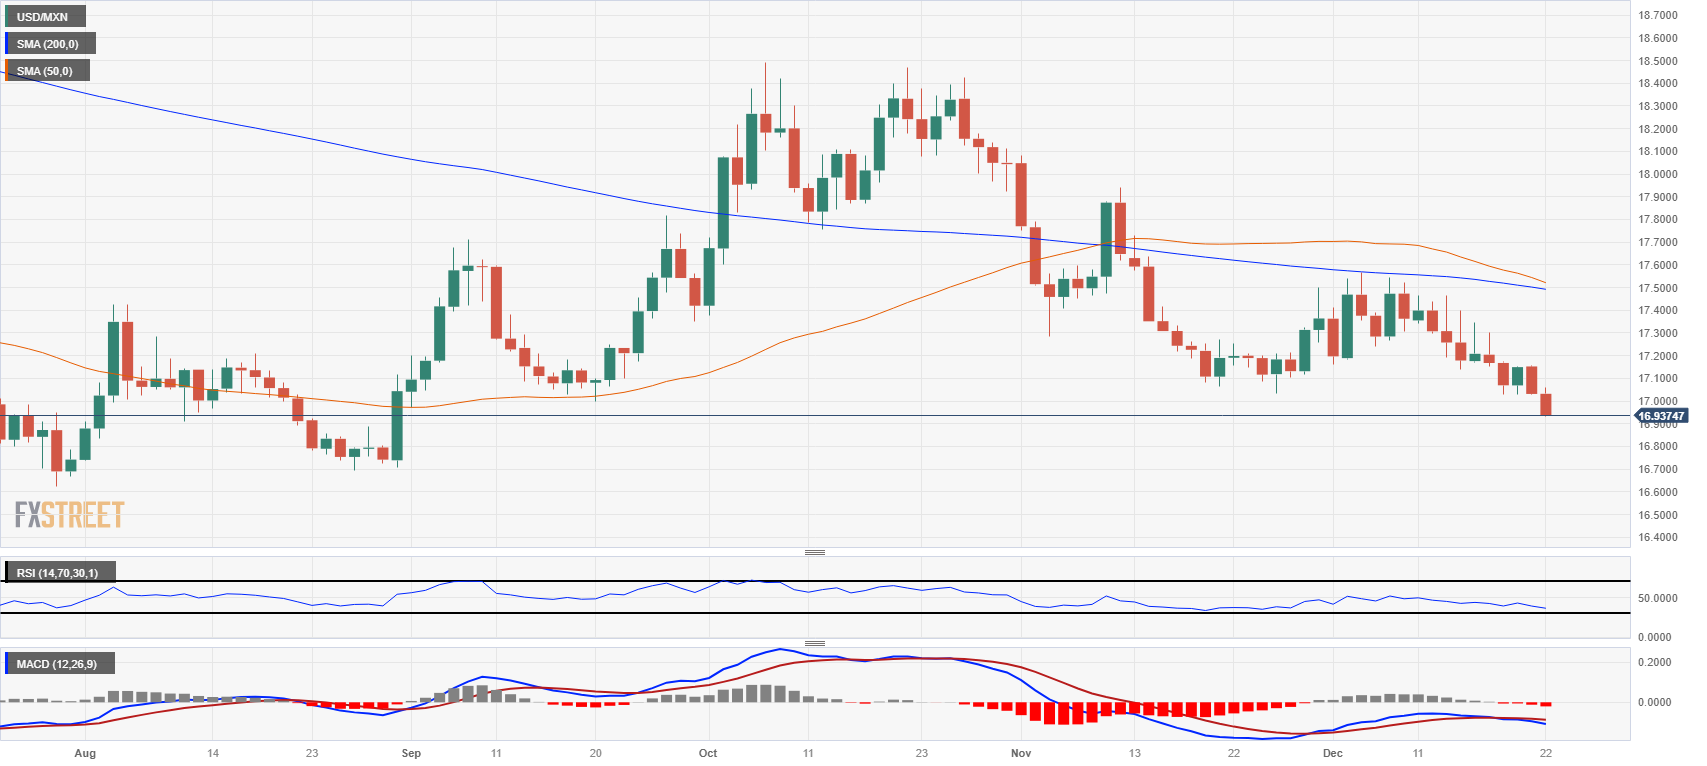
The Mexican Peso (MXN) has captured some ground amidst broad-market US Dollar (USD) weakness on Friday, with the USD/MXN pair definitively piercing below the 17.00 handle for the first time since late August.
Hourly candles have the USD/MXN running well away from the 200-hour Simple Moving Average (SMA) just below 17.20, and last week’s rough intraday chop has given way to smooth declines heading into the holiday break.
Daily candlesticks show the USD/MXN accelerating into multi-month lows as the pair drops through 17.00. Meanwhile, the 50-day and 200-day SMAs are set for a bearish crossover, which will chalk in a heavy technical resistance zone to cap off any bullish recoveries heading into 2024.
USD/MXN Hourly Chart
USD/MXN Daily Chart
Mexican Peso FAQs
What key factors drive the Mexican Peso?
The Mexican Peso (MXN) is the most traded currency among its Latin American peers. Its value is broadly determined by the performance of the Mexican economy, the country’s central bank’s policy, the amount of foreign investment in the country and even the levels of remittances sent by Mexicans who live abroad, particularly in the United States. Geopolitical trends can also move MXN: for example, the process of nearshoring – or the decision by some firms to relocate manufacturing capacity and supply chains closer to their home countries – is also seen as a catalyst for the Mexican currency as the country is considered a key manufacturing hub in the American continent. Another catalyst for MXN is Oil prices as Mexico is a key exporter of the commodity.
How do decisions of the Banxico impact the Mexican Peso?
The main objective of Mexico’s central bank, also known as Banxico, is to maintain inflation at low and stable levels (at or close to its target of 3%, the midpoint in a tolerance band of between 2% and 4%). To this end, the bank sets an appropriate level of interest rates. When inflation is too high, Banxico will attempt to tame it by raising interest rates, making it more expensive for households and businesses to borrow money, thus cooling demand and the overall economy. Higher interest rates are generally positive for the Mexican Peso (MXN) as they lead to higher yields, making the country a more attractive place for investors. On the contrary, lower interest rates tend to weaken MXN.
How does economic data influence the value of the Mexican Peso?
Macroeconomic data releases are key to assess the state of the economy and can have an impact on the Mexican Peso (MXN) valuation. A strong Mexican economy, based on high economic growth, low unemployment and high confidence is good for MXN. Not only does it attract more foreign investment but it may encourage the Bank of Mexico (Banxico) to increase interest rates, particularly if this strength comes together with elevated inflation. However, if economic data is weak, MXN is likely to depreciate.
How does broader risk sentiment impact the Mexican Peso?
As an emerging-market currency, the Mexican Peso (MXN) tends to strive during risk-on periods, or when investors perceive that broader market risks are low and thus are eager to engage with investments that carry a higher risk. Conversely, MXN tends to weaken at times of market turbulence or economic uncertainty as investors tend to sell higher-risk assets and flee to the more-stable safe havens.
As 2023 is coming to an end, it is time to take a look at 2024. Strategists at Rabobank sketch their baseline scenario for the next year.
An eventful year
We expect 2024 to kick off with budget battles and the threat of a two-step government shutdown. We expect the rise in unemployment to become more pronounced and culminate in a recession in the first half of the year. This should convince the FOMC to pivot from an aggressive hiking cycle to a cautious cutting cycle by the middle of the year.
In November, the Americans will vote for the next President, the House of Representatives and about a third of the Senate. At the time of writing, it looks like we are heading for a major regime shift in the United States that would have major implications for the rest of the world.
The Gold price is set to benefit from easing monetary policy, elevated geopolitical risks and strong central bank purchases in 2024, strategists at ANZ Bank report.
Gold to keep shining in 2024
Gold looks like it will be well supported by several factors in 2024: the start of rate cut cycle in the US, slowing economic growth, a weaker USD, strong central bank purchases and elevated geopolitical risks.
Weak investment demand presents an opportunity for investors to increase their positioning in Gold.
We upgraded our 12-month price forecast to $2,200 from $2,150.
- Silver price recovers swiftly after softer-than-projected US core PCE inflation report.
- Sost underlying inflation data has boosted Fed’s rate cut bets.
- The US Durable Goods Orders rose strongly by 5.4% vs. consensus of 2.2%.
Silver price (XAG/USD) gathers strength for more upside as the United States Bureau of Economic Analysis (BEA) reported softer-than-anticipated core Personal Consumption Expenditure (PCE) price index report for November.
Monthly US core PCE data grew slightly by 0.1% while investors projected a growth rate of 0.2% as recorded for October. On an annualized basis, the underlying inflation has decelerated to 3.2% vs. the consensus of 3.3% and the former reading of 3.5%. Investors should note that the Federal Reserve (Fed), in its Summary of Projections (SOP) released least week, forecasted core PCE at 3.2% by the year-end.
A soft US core PCE report may deepen expectations for rate cuts from the Fed further, which will keep bullions underpinned against the US Dollar. The US Dollar Index (DXY) is looking to extend its downside below four-month low of 101.50
Contrary to market expectations, Fed policymakers are consistently pushing back rate cut expectations, citing restrictive interest rate policy for a longer period is highly required to ensure the achievement of price stability.
Meanwhile, US Durable Goods Orders for November remained upbeat than expectations. Fresh orders for core goods rose significantly by 5.4% vs. the consensus of 2.2%. In October, the economic data was contracted by 5.1%.
Silver technical analysis
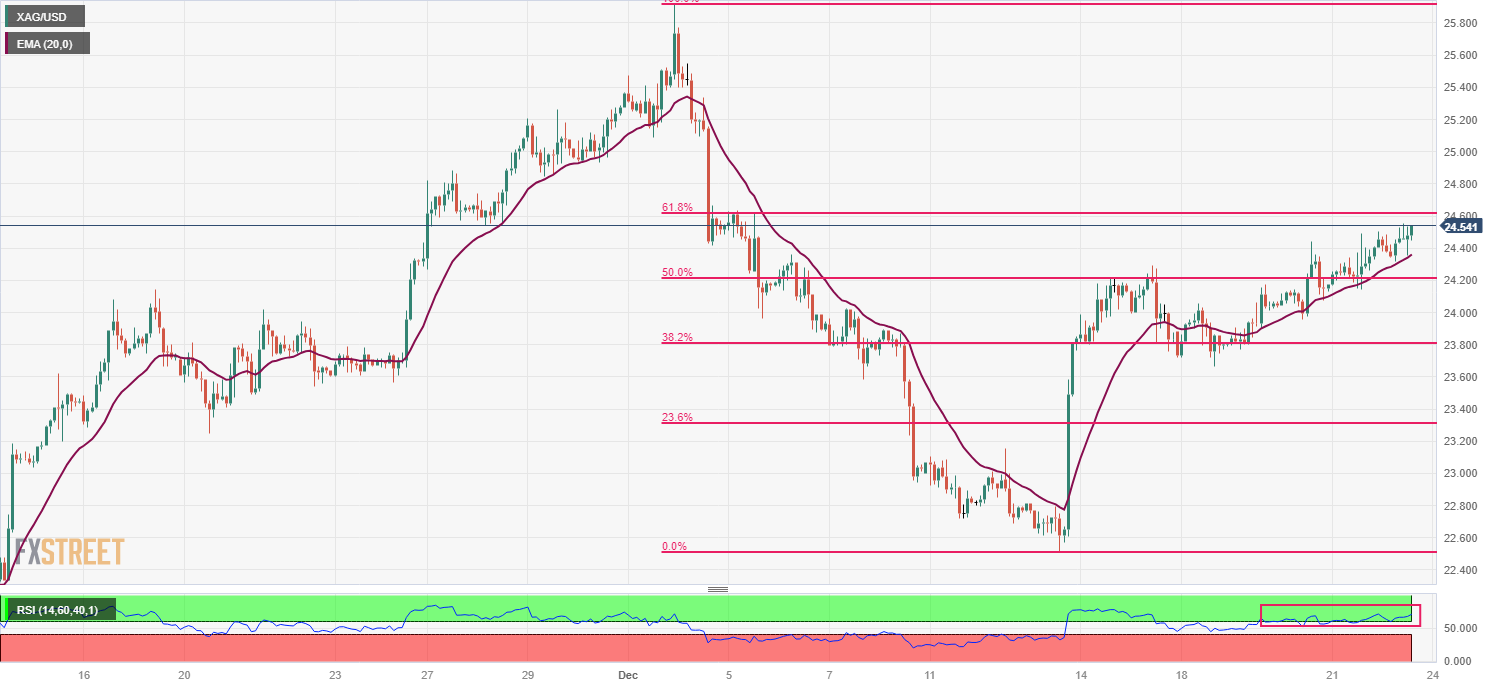
Silver price climbs to near the 61.8% Fibonacci retracement (plotted from December 12 high at $25.90 to December 13 low around $22.60) at $22.60 on a two-hour scale. The 20-period Exponential Moving Average (EMA) around $24.35 continues to provide support to the white metal.
The Relative Strength Index (RSI) (14) oscillates in the bullish range of 60.00-80.00, which indicates that the upside momentum is intact.
Silver two-hour chart
The USD is broadly weaker versus the major currencies. Economists at Scotiabank analyze Greenback’s outlook.
Technical signals remain bearish for the DXY
There is little reason to expect pressure to abate anytime soon.
Technical signals remain bearish for the DXY across short, medium and long-term timeframes, suggesting no letup in the trend for now.
Seasonal factors and the fact that a lot of bad news is getting priced into the USD now may open the door for some recovery in the new year, however – but not before the USD drops a bit more.
- The US Dollar remains stuck at multi-month lows after weak US PCE Inflation.
- US Durable Goods orders beat expectations, easing bearish pressure on the USD.
- Canadian GDP contracts unexpectedly in October.
The US Dollar maintains its bearish tone against the loonie. The mixed US macroeconomic figures have offset the weak Canadian Gross Domestic Product data leaving the languishing at multi-month lows below 1.3300.
Canadian Gross Domestic Product remained flat in October, according to data released by Statistics Canada. The final data falls short of market expectations of 0.2% growth and put into question the Bank of Canada´s hawkish forward guidance.
The negative impact on the Canadian Dollar, however, has been offset by the mixed US data, but especially by November´s PCE Prices Index, which contracted unexpectedly in November increasing hopes of Fed cuts in early 2024.
PCE Inflation eased 0.1% in the month and grew at a 2.6% pace in the year, below market expectations of 0% and 2.8% readings respectively. The Code PCE nudged up 0.1% on the month and 3.2% year-on hear. Market experts had anticipated 0.2% and 3.3% increases respectively.
On the positive side, US Durable Goods Orders increased beyond expectations, which eases concerns about the outlook of the manufacturing industry and has cushioned US Dollar´s decline.
Technical levels to watch
- Canadian economy stalled in October for the third consecutive month.
- USD/CAD stays around 1.3270 after economic data from the US and Canada.
Statistics Canada reported on Friday that Real Gross Domestic Product (GDP) “was essentially unchanged for a third consecutive month in October. Services-producing industries edged up 0.1%, while goods-producing industries were essentially unchanged, with the 20 industrial sectors evenly split between increases and decreases.”
The reading came in below the market expectations of a 0.2% expansion. In September, the economy also stalled (revised from a 0.1% expansion).
The advance estimate indicates that real GDP edged up 0.1% in November 2023. The following GDP report will be released on January 31.
Market reaction
The USD/CAD remained around 1.3270 after the release of the Canadian GDP and US economic data that included the Core Personal Consumption Expenditure (Core PCE) and Durable Goods Orders.
The Canadian Dollar has had a solid week. Economists at Scotiabank analyze USD/CAD outlook.
Short-term resistance is 1.3315/1.3320
Minor new lows for USD/CAD keep the short and longer run technical outlook bearish.
Spot is heading for a close below weekly trend support at 1.3335, below the 76.4% Fibonacci support of the July – November decline at 1.3283 and might be able to close out the week below the 100-week MA (a decent bellwether for the broader trend) at 1.3281 for the first time since last June.
There is no major support for the USD (aside from some congestion in the 1.3140/1.3170 area) ahead of a return to 1.3093.
Short-term resistance is 1.3315/1.3320 and 1.3360/1.3370.
- Durable Goods Orders in the US rebounded sharply in November after a 5.1% decline in October.
- The US Dollar rose modestly after the report and following Core PCE data.
Durable Goods Orders in the United States rose by 5.4% in November to $295.4 billion, the US Census Bureau announced on Friday. This followed a 5.1% decline (revised from 5.4%) recorded in October and came in better than the market expectation for an increase of 2.2%.
Excluding transportation, new orders increased 0.5% against the 0.1% expected. Excluding defense, rose by 6.5%.
Market reaction
The US Dollar rose after the release of US economic data, which included the Core Personal Consumption Expenditure (Core PCE). The US Dollar Index (DXY) trimmed daily losses and rose from 101.55 to levels above 101.70.
GBP/USD extends its recovery on Friday. Economists at Scotiabank analyze the pair’s outlook.
Cable threatens bull breakout
The GBP’s bull trend looks poised to extend.
Trend oscillators are aligned bullishly for the GBP and price action is closing on a bull flag breakout trigger (1.2755) which has developed around the past week’s consolidation.
Spot gains through the mid-1.27s would imply potential for the Pound to retest 1.30+ levels in the next few weeks.
Intraday support is 1.2690.
See: GBP/USD to push lower to 1.23 on a one-to-three-month view – Rabobank
- USD/JPY continues to decline further towards 140.00 amid soft US Dollar.
- Investors await the US core PCE price index data for further guidance.
- USD/JPY may find an intermediate cushion near upward-sloping trendline.
The USD/JPY pair consolidates in a tight range near 142.00 after a sharp correction ahead of the United States core Personal Consumption Expenditure (PCE) price index data for November, which will be published at 13:30 GMT.
The core PCE inflation report is expected to remain soft as the Federal Reserve (Fed) has been keeping interest rates unchanged in the range of 5.25-5.50%. The downside in the major would continue if the underlying inflation turns out softer-than-anticipated. Meanwhile, deepening rate cut expectations from the Federal Reserve (Fed) have weighed heavily on the US Dollar Index (DXY). The USD Index has refreshed its four-month low around 101.55.
On the Tokyo front, Japan’s National Consumer Price Index (CPI) has remained above the 2% target for the 20th time in a row. The Bank of Japan (BoJ) is expected to continue its ultra-dovish policy stance till wage growth in the Japanese economy gets high enough to keep inflation comfortably above 2%.
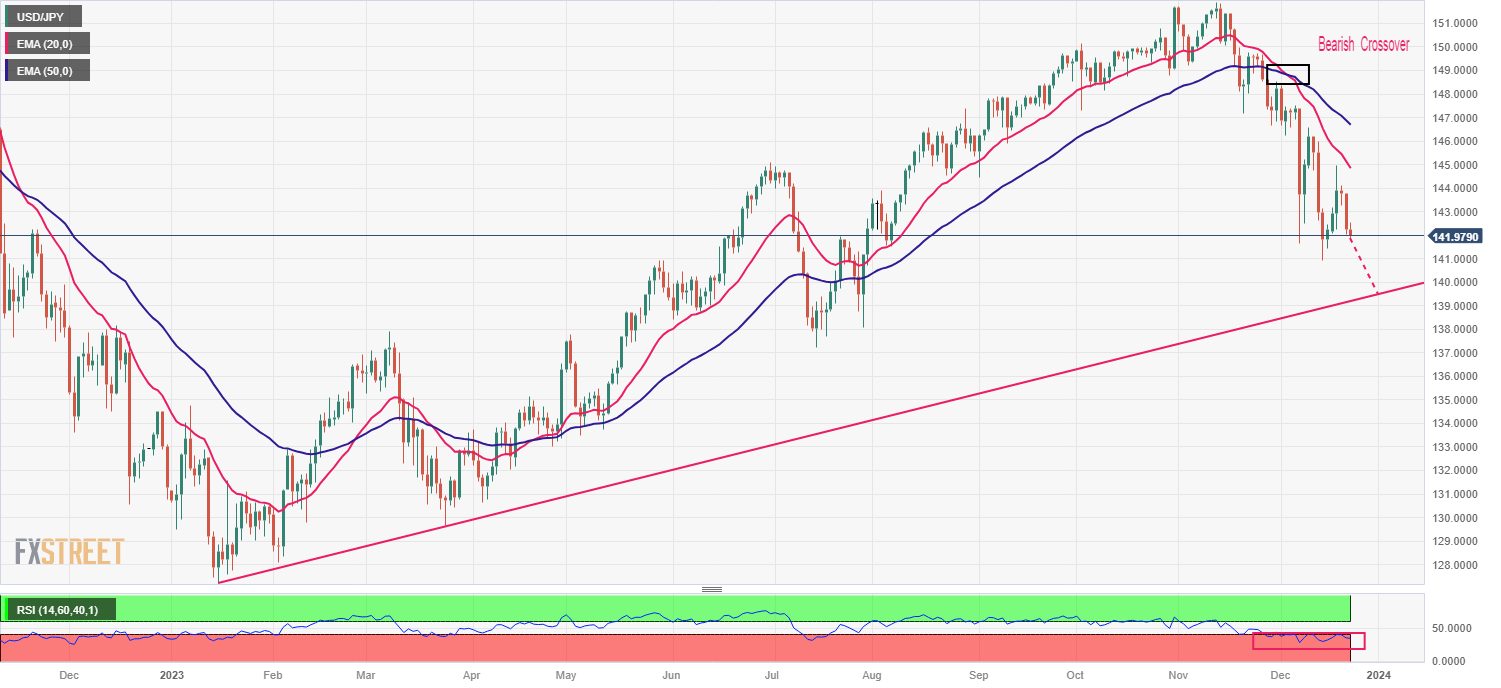
USD/JPY is consistently declining from more than one month. The downside momentum accelerated after a bearish crossover from the 20 and 50-day Exponential Moving Averages (EMA), which happened around 148.80. The asset is expected to decline further towards the upward-sloping trendline plotted from January 16 low at 127.22.
The Relative Strength Index (RSI) (14) is oscillating in the bearish range of 20.00-40.000, pointing to continuation of a downside momentum.
Fresh downside would appear if the asset drops below December 14 low near 141.00. This would drag it towards the upward-sloping trendline near 139.40, followed by July 28 low near 138.00.
In an alternate scenario, a recovery move above December 19 high near 145.00 would drive the asset towards December 11 high around 146.60, followed by December 6 high near 148.00.
USD/JPY daily chart
- The Aussie rallies further on USD weakness and hits fresh highs above 0.6800.
- The US Dollar languishes at multi-month lows ahead of the US PCE Inflation data.
- The Aussie will be one of the best performers in 2024 – ING.
The Australian Dollar’s bullish momentum remains firm, as the pair has crossed beyond the 0.6800 level favoured by a broad-based Dollar weakness, with all eyes on the US PCE Prices Index, due later today.
The Aussie, buoyed by RBA - Fed divergence
The Aussie is on track to a nearly 2% weekly rally, following a similar performance last week. The hawkish RBA minutes released earlier this week, have highlighted the divergence with a dovish Federal Reserve, giving a fresh impulse to the pair.
In the US, data released on Thursday revealed that the economy grew slower than initially thought in the third quarter. US Q3 GDP was revised down to a 4.9% yearly growth from the previous estimation of 5.2% with manufacturing and inflation data adding to evidence of a slower momentum.
In this scenario, investors are awaiting the US CPI data to confirm their views on the Fed rate outlook. Futures markets are pricing nearly 75% chances that the easing cycle will start in March and that the US central bank will slash rates by 150 bps over the next year.
AUD seen as one of the best performers in 2024 – ING
Looking ahead, the ING Technical analysis team expects the Aussie to outperform most of its rivals next year: “Currencies prepared to challenge the Dollar are going to need some help. And both the AUD and NOK are packing undervaluation in their armoury (...) These are the currencies most undervalued according to our medium-term fair value model, where divergence from better export prices is the core story.”
Technical levels to watch
EUR/USD pushes through low 1.10 zone to trigger renewed bull impulse, economists at Scotiabank report.
Intraday support is 1.0965/1.0970
Minor, new cycle highs keep the EUR undertone constructive and, after the evolution of price action over the past month, open the door to the possibility of another, significant push higher in spot over the coming month or so.
Late November/December price action has developed a bullish Head & Shoulders continuation pattern, with the neckline trigger at 1.1010 activated today. The pattern implies roughly 290 bps of upside potential in spot over the next 6-8 weeks – effectively a retest of the July peak (plus a bit more).
Intraday support is 1.0965/1.0970. Resistance is 1.1080.
- The US Dollar sees gains from last quarter fully eroded.
- Equity markets jump higher as investors go all in on early Fed rate cuts.
- The DXY US Dollar Index sinks below 102.00, and could go to 100.00 if PCE inflation misses estimates.
The US Dollar (USD) is facing increasing selling pressure as investors are increasingly pricing in interest-rate cuts for early 2024. Markets are opting to ignore remarks and warnings from several US Federal Reserve officials, who are trying to play down expectations of upcoming cuts. While US equities are having a Christmas rally, US bond yields have plunged, leading the spread gap between the US Dollar and foreign currencies to shrink substantially.
On the economic front, the very last big data dump for 2023 is set to take place. With the Personal Consumption Expenditure (PCE) Price Index numbers, markets will see the Fed’s preferred inflation gauge being released. Unless inflation comes in higher than expected, the US Dollar is likely to sink further ahead of Christmas.
Daily digest Market Movers: Last data of 2023
- A very chunky batch of data will be released at 13:30 GMT:
- Personal Consumption Expenditures (PCE) is due to be released:
- Yearly Core PCE expected to fall from 3.5% to 3.3%.
- Monthly Core PCE is to stay stable at 0.2%.
- Yearly Headline PCE is to head lower from 3% to 2.8%.
- Monthly Headline PCE is to remain unchanged, at 0%.
- Durable Goods Orders for November are also to be released:
- Durable Goods Orders are expected to rise 2.2% from a 5.4% decline a month earlier.
- Durable Goods without transportation will head higher from 0% to 0.1%.
- Personal Income will rise from 0.2% to 0.4%.
- Personal Spending will tick up as well, from 0.2% to 0.3%.
- Personal Consumption Expenditures (PCE) is due to be released:
- The Last numbers to be released will be the University of Michigan consumer sentiment and New Homes Sales, both at 15:00 GMT:
- The University of Michigan Consumer Sentiment Index is set to remain unchanged at 69.4 in December. Five-year inflation expectations are also seen unchanged at 2.8%.
- New Home Sales for November are expected to jump from 0.679 million to 0.685 million.
- Equities are looking for direction, with minor gains as most takeaways. Asian markets closed near flat, except for the Hang Seng index, which closed down over 1.6% after the Chinese government released new measures to crack down on the gaming industry.
- The CME Group’s FedWatch Tool shows that markets are pricing in an 83.5% chance that the Federal Reserve will keep interest rates unchanged at its January 31 meeting. Around 14.5% expect the first cut already to take place.
- The benchmark 10-year US Treasury Note trades near 3.87%, the lowest level since summer.
US Dollar Index Technical Analysis: Thrown out the window
The US Dollar Index is having one of its worst weeks in the last quarter. With trading desks cleaning up their balance sheets, it becomes clear that several US Dollar bulls have further unwounded their positions in the Greenback. With the relentless drop in US yields, the rate differential story has come to an end for 2023, with markets going all in on a further decline for early 2024.
Any upbeat surprise in data that could contradict rate cut bets or geopolitical events that trigger US Dollar inflow could still make the DXY head higher. On the daily chart, look for 103.00 as the first level to watch. Once trading above there, the 200-day Simple Moving Average (SMA) at 103.50 is the next important level to get to.
To the downside, the pivotal level at 101.70 – the low of August 4 and 10 – is vital to hold and still see a close this evening above it. Once broken, look for 100.82, which aligns with the bottoms from February and April. Should that level snap, nothing will stand in the way of DXY heading to the sub-100 region.
US Dollar FAQs
What is the US Dollar?
The US Dollar (USD) is the official currency of the United States of America, and the ‘de facto’ currency of a significant number of other countries where it is found in circulation alongside local notes. It is the most heavily traded currency in the world, accounting for over 88% of all global foreign exchange turnover, or an average of $6.6 trillion in transactions per day, according to data from 2022.
Following the second world war, the USD took over from the British Pound as the world’s reserve currency. For most of its history, the US Dollar was backed by Gold, until the Bretton Woods Agreement in 1971 when the Gold Standard went away.
How do the decisions of the Federal Reserve impact the US Dollar?
The most important single factor impacting on the value of the US Dollar is monetary policy, which is shaped by the Federal Reserve (Fed). The Fed has two mandates: to achieve price stability (control inflation) and foster full employment. Its primary tool to achieve these two goals is by adjusting interest rates.
When prices are rising too quickly and inflation is above the Fed’s 2% target, the Fed will raise rates, which helps the USD value. When inflation falls below 2% or the Unemployment Rate is too high, the Fed may lower interest rates, which weighs on the Greenback.
What is Quantitative Easing and how does it influence the US Dollar?
In extreme situations, the Federal Reserve can also print more Dollars and enact quantitative easing (QE). QE is the process by which the Fed substantially increases the flow of credit in a stuck financial system.
It is a non-standard policy measure used when credit has dried up because banks will not lend to each other (out of the fear of counterparty default). It is a last resort when simply lowering interest rates is unlikely to achieve the necessary result. It was the Fed’s weapon of choice to combat the credit crunch that occurred during the Great Financial Crisis in 2008. It involves the Fed printing more Dollars and using them to buy US government bonds predominantly from financial institutions. QE usually leads to a weaker US Dollar.
What is Quantitative Tightening and how does it influence the US Dollar?
Quantitative tightening (QT) is the reverse process whereby the Federal Reserve stops buying bonds from financial institutions and does not reinvest the principal from the bonds it holds maturing in new purchases. It is usually positive for the US Dollar.
- The New Zealand Dollar bounces up and heads to levels beyond 0.6300.
- The US Dollar remains on the defensive following downbeat US GDP data on Thursday.
- Investors await the release of the US PCE inflation to assess the timing of the Fed's pivot.
The Kiwi has resumed its uptrend on Froday´s European morning session, to explore levels beyond 0.6300. The US Dollar is trading lower across the board ahead of the release of November´s PCE Prices Index data.
Data released on Thursday showed that the US economy grew slower than previously thought in the third quarter. The Q3 GDP was revised down to a 4.9% yearly growth from the previous 5,2% estimation, with manufacturing and inflation data showing lower-than-expected readings.
These figures cement investors’s view of an economic slowdown ahead and boost hopes for Fed cuts in 2024. In this scenario, the focus is on the release of US PCE Prices Index, the Fed's favourite inflation reading for more info about the timing of the US central bank´s easing plans.
PCE Inflation is expected to have remained flat in November, with the yearly rate declining below the 3% level for the first time in three years. The Core PCE, which strips out the impact of seasonal prices from food and energy is seen 0.2% up in the month and a decline, to 3.3% from 3.5% in October.
Technical levels to watch
Kit Juckes, Chief Global FX Strategist at Société Générale, analyzes, the AUD outlook.
Inverted curve Down Under
What remains frustrating is the knowledge that the Australian government has vastly more fiscal room for manoeuvre than others, and the right strategy would be modest rate cuts and easier fiscal policy. That would send the AUD significantly higher but, sadly, is unlikely.
Still, with stronger growth than the US next year (and stickier inflation) the RBA is likely to cut rates significantly more slowly than the Fed, and more slowly than is currently priced into the forward curve. That should allow 5-year AUD yields to get back above US 5s on a sustained basis and drag AUD/USD back into the 0.69-0.75 range it was trading in when that last happened.
The problem for bond investors though, is that this may mean the curve remains inverted for the vast majority of 2023.
- WTI Oil pops back above $74 in a volatile week ahead of Christmas.
- Angola announced on Thursday it will leave OPEC in January.
- The DXY US Dollar Index flirts with a substantial breakdown that could erase a half year worth of gains.
Oil prices are back on track towards $84 on Friday, propelled by geopolitical tensions in the Red Sea. Still making headlines going into these last hours of trading before Christmas, Houthi rebels have made the Red Sea a no-go zone for all big freight operators. With a vast number of fleets being redirected around Africa, the demand and price pressure are expected to jump in the coming weeks for Crude. Meanwhile, Angola announced Thursday that the country is leaving OPECi9c-fza1 due to disagreements over lower Oil quotas for the country.
The US Dollar (USD) is sinking as markets go all-in on interest-rate cuts for early 2024. The move comes in contradiction with several warnings from Federal Reserve (Fed) members, who came out saying markets are too eager and too enthusiastic about any rate cuts coming in 2024. The elevated rate differential from US yields against other countries – the main driver for the US Dollar strength in 2023 – appears to be fading, likely leading to mayhem and dislocation between the Fed and global markets at the start of 2024.
Crude Oil (WTI) trades at $74.81 per barrel, and Brent Oil trades at $79.94 per barrel at the time of writing.
Oil News and Market Movers: Angola is gone
- Angola said on Thursday that it will leave OPEC in January. The news does not come as a surprise because Angola was one of the leading African nations that was opposing Saudi Arabia in its demand to share production cut burdens with the whole OPEC group.
- A steep decline in the number of tankers in the Red Sea is being reported on Friday morning.
- The Baltic Dry Index rallies higher, with shipping costs soaring because of the longer route around Africa.
- Should Friday’s US data confirm a further decline in inflation, expect to see Crude shoot higher as demand is expected to pick up in early 2024 with rate cuts from the Fed firing up the economy.
Oil Technical Analysis: Angola gone, who is next?
Oil prices are jumping higher as the OPEC+ club faces increasing woes. With Angola leaving the bloc, several other African nations could join. The statement could not have come at a worse time as Brasil is set to enter the organization as an observer, not taking part in production decisions. The more OPEC loses its grip on Oil prices, the wilder and more volatile the price action will get.
On the upside, $74 got broken and tested for support, offering more upside. Once through there, $80 comes into the picture. Although still far off, $84 is next on the topside once Oil sees a few daily closes above the $80 level.
Below $74, the $67.00 level could still come into play as the next support level to trade at as it aligns with a triple bottom from June. Should that triple bottom break, a new low for 2023 could be close at $64.35 – the low of May and March – as the last line of defence. Although still quite far off, $57.45 is worth mentioning as the next level to keep an eye on if prices fall sharply.
-638388360646620145.png)
US WTI Crude Oil: Daily Chart
WTI Oil FAQs
What is WTI Oil?
WTI Oil is a type of Crude Oil sold on international markets. The WTI stands for West Texas Intermediate, one of three major types including Brent and Dubai Crude. WTI is also referred to as “light” and “sweet” because of its relatively low gravity and sulfur content respectively. It is considered a high quality Oil that is easily refined. It is sourced in the United States and distributed via the Cushing hub, which is considered “The Pipeline Crossroads of the World”. It is a benchmark for the Oil market and WTI price is frequently quoted in the media.
What factors drive the price of WTI Oil?
Like all assets, supply and demand are the key drivers of WTI Oil price. As such, global growth can be a driver of increased demand and vice versa for weak global growth. Political instability, wars, and sanctions can disrupt supply and impact prices. The decisions of OPEC, a group of major Oil-producing countries, is another key driver of price. The value of the US Dollar influences the price of WTI Crude Oil, since Oil is predominantly traded in US Dollars, thus a weaker US Dollar can make Oil more affordable and vice versa.
How does inventory data impact the price of WTI Oil
The weekly Oil inventory reports published by the American Petroleum Institute (API) and the Energy Information Agency (EIA) impact the price of WTI Oil. Changes in inventories reflect fluctuating supply and demand. If the data shows a drop in inventories it can indicate increased demand, pushing up Oil price. Higher inventories can reflect increased supply, pushing down prices. API’s report is published every Tuesday and EIA’s the day after. Their results are usually similar, falling within 1% of each other 75% of the time. The EIA data is considered more reliable, since it is a government agency.
How does OPEC influence the price of WTI Oil?
OPEC (Organization of the Petroleum Exporting Countries) is a group of 13 Oil-producing nations who collectively decide production quotas for member countries at twice-yearly meetings. Their decisions often impact WTI Oil prices. When OPEC decides to lower quotas, it can tighten supply, pushing up Oil prices. When OPEC increases production, it has the opposite effect. OPEC+ refers to an expanded group that includes ten extra non-OPEC members, the most notable of which is Russia.
- The Euro fails at 0.8690, the 61,8% Fib. retracement of the late November decline.
- UK economy contracted in the third quarter, against expectations.
- UK retail sales bounce up unexpectedly and ease negative pressure on the Pound.
The Euro rally from early - December lows has been capped at the 0,8690 resistance area, and the pair is losing ground on Friday´s European session, returning to the mid-range of 0.8600.
The Pound remains steady despite mixed UK data
Data from the UK released earlier today revealed that the GDP contracted in the third quarter, against the previous estimate of a flat reading, and following a 0.2% advance in the second quarter.
On the positive side, retail sales increased by 0.1%, to put an end of more than one year of declines, against the market consensus of a 1.3% drop. These figures have offset the negative impact of the downward GDP revision, cushioning bearish pressure on the Pound.
In Europe, Italian and French have posted better than expected readings, while the Spanish GDP confirmed a 0.3% growth in the third quarter and 1.8% year-on-year advance. The impact of these figures on the Euro, however, has been marginal.
The technical picture shows the pair pulling back from the 61.8% Fibonacci retracement of the late November sell-off, at 0.8690. Although the pair maintains its broader positive trend intact, this is a common target for corrective reactions.
Support levels are at the 0.8645 previous high, which closes the path towards 0.8600 and the December 11 low at 0.8550. Resistances are the mentioned 0.8690 and 0.8725.
Technical levels to watch
Japan’s nationwide inflation data was released today. There has been limited impact in FX markets on the Consumer Price Index (CPI) report. Economists at MUFG Bank analyze Yen’s outlook.
JPY likely to take its direction from the PCE inflation data today
The key underlying core-core CPI YoY rate slowed from 4.0% to 3.8%, which was the lowest rate since March.
The key question is whether helped by wage inflation, Japan can experience stronger demand-pull inflation that helps bring about more sustained inflation. Within the data, there were certainly signs of continued underlying strength.
Still, it is hard to argue against the view that just like elsewhere, the momentum of inflation is turning. The core-core inflation rate on a 6mth annualised basis slowed to 2.9%, down from 3.3% in October and down from a peak of 4.9% just four months ago.
With the momentum turning lower, the BoJ will want to see evidence that inflation can stabilise at a level much higher than where inflation was before the pandemic.
The JPY is likely to take its direction from the PCE inflation data today with the potential for the Yen to sustain its strength through to year-end in the quieter than usual trading period.
- The Dollar reaches fresh multi-year lows below 0.8550.
- Weak US data is fuelling hopes of Fed cuts and weighing on the Greenback.
- Later today, the US PCE Prices Index will provide further insight into the Fed’s policy outlook.
The US Dollar remains under strong bearish pressure against the Swiss Franc, hammered by the downward revision of the third quarter US Gross Domestic Product released on Thursday.
Weak US data fuels hopes of Fed cuts
The US economy grew at a 4.9% pace in Q3, below the previous estimation of a 5.2% growth. At the same time, the Philadelphia Fed manufacturing Survey revealed a deterioration of the sector´s firms and US Price Consumption Expenditures declined against expectations in November.
These figures confirm the soft landing view that cements market hopes of Fed cuts in early 2014, and sent US Treasury yields and the US Dollar back to recent lows.
Against this backdrop, the market is awaiting the release of a batch of key US indicators later today, with a special interest in the US PCE Prices Index. A weaker-than-expected reading would strengthen the case for imminent Fed cuts and increase negative pressure on the USD.
USD/CHF Technical analysis
The USD´s bias is negative, confirmed by Thursday´s bullish engulfing candle and there is no clear sign of a trend shift in sight. The pair has pierced a long-term low at 0.8555 and might extend to 0.8500.
At those levels, RSI indexes would be at extremely oversold levels which allows for some correction. Resistances are at 0.8590 and 0.8635.
Technical levels to watch
Looking for ways to prepare for future uncertainties? A solution for some may be investing in precious metals, such as Gold and Silver, strategists at Morgan Stanley report.
Silver may be more tied to the global economy
Half of all Silver is used in heavy industry and high technology, according to the World Silver Survey. As a result, Silver is more sensitive to economic changes than gold, which has limited uses beyond jewelry and investment purposes. When economies take off, demand tends to grow for Silver.
Silver is more volatile than Gold
The volatility in Silver prices can be two to three times greater than that of Gold on a given day. While traders may benefit, such volatility can be challenging when managing portfolio risk.
Gold has been a more powerful diversifier than Silver
Silver can be considered a good portfolio diversifier with moderately weak positive correlation to stocks, bonds and commodities. However, Gold is considered a more powerful diversifier. Unlike Silver and industrial base metals, Gold is less affected by economic declines because its industrial uses are fairly limited.
Silver is currently cheaper than Gold
Per ounce, Silver tends to be cheaper than Gold, making it more accessible to small retail investors who wish to own the precious metals as physical assets.
- GBP/JPY retreats from 181.00 as recession fears in the UK economy deepen.
- BoE policymakers may get puzzled between recession and persistent inflation fears.
- Japan’s inflation remains above 2% for the 20th month in a row.
The GBP/JPY pair fell back while attempting to climb above 181.00 after the United Kingdom Office for National Statistics (ONS), in its latest estimates, reported a contraction in the Q3 Gross Domestic Product (GDP). The ONS projected a stagnant performance in the preliminary estimates and now a surprise contraction has deepened fears of a technical recession in the UK economy.
In the latest Summary of Projections (SOP), the Bank of England (BoE) forecasted a stagnant growth for the last quarter of 2024. Any unfavourable number would be considered as a technical recession. The Bank of England (BoE) policymakers are in dilemma whether to endorse rate cuts to avoid a technical recession or stay focused with restrictive policy stance to ensure return of inflation to 2%.
Meanwhile, stronger-than-projected Retail Sales data for November has delivered a reason to BoE policymakers to lean towards maintaining interest rates elevated.
The ONS reported that the consumer spending momentum grew at a stronger pace of 1.3% against estimates of 0.4%. In October, Retail Sales were stagnant. Annual Retail Sales surprisingly rose by 0.1% while investors forecasted a contraction by 1.3% due to heavy demand at non-food retail stores amid heavy discount due to Black Friday event. This has restored persistent inflation fears.
On the Tokyo front, Bank of Japan’s (BoJ) monetary policy minutes indicated that members agreed to sustain interest rates negative till the achievement of 2% inflation through wage growth gets clear. Apart from that, National Consumer Price Index (CPI) data for November, released in early Friday, decelerated to 2.8% against the former reading of 3.3%. Price pressures in the Japanese economy have remained above 2% for 20 straight months.
- The Euro appreciated further on US Dollar weakness to test resistance at 1.1010.
- The US Dollar dropped again on Thursday, hammered by downbeat US data.
- The focus shifts towards the US PCE Price Index for more cues on the Fed’s policy outlook.
The Euro (EUR) resumed its broader uptrend on Thursday and returned to the 1.1010 resistance area on Friday, buoyed by the weakness of the US Dollar. A set of downbeat US data reaffirmed investors’ expectations that the US Federal Reserve (Fed) will start easing its monetary policy in early 2024.
Data released on Thursday showed that the United States economy grew at a slower pace than previously estimated in the third quarter. These figures came accompanied by weaker manufacturing data and signs of easing inflation, which are consistent with the theory of a soft landing ahead.
The market has been celebrating the end of the tightening cycle this week and awaiting November’s Personal Consumption Expenditure (PCE) Price Index data to confirm the timing of the kick-off for the easing cycle. The Fed’s favourite inflation gauge is expected to show further deceleration on price pressures which, if confirmed, might increase US Dollar’s weakness.
Daily digest market movers: Euro is pushing higher ahead of US PCE Inflation
- The Euro is tight below four-month highs, awaiting the release of US PCE Price Index data.
- Later today, the US PCE Prices Index is expected to have remained flat in November on month, with the yearly rate declining below the 3% level for the first time in almost three years.
- The Core PCE Prices Index, which removes the impact of seasonal products like food and energy, is seen growing steadily at 0.2% and down to 3.3% from 3.5% in the year.
- On Thursday, US Q3 GDP was revised to a 4.9% annualized growth from the previous 5.2% estimate.
- The Philadelphia Fed Manufacturing index dropped to -10.5 in December from -5.9 in November; the market expected a moderate improvement to -3.
- US Personal Consumption Expenditures eased to 2.6% in Q3, the consensus anticipated a 2.8% reading, unchanged from Q2.
- US Jobless claims increased by 205K from 203K in the previous week, well below the 215K expected. However, this data was offset by the downbeat GDP and manufacturing figures.
- Investors are pricing a nearly 75% chance of a quarter-point rate cut in March and 250 bps cuts in 2024, according to the CME Group Fed Watch Tool.
Technical Analysis: Euro pushes against 1.1010 resistance
The Euro stretched higher on Thursday, favoured by further USD weakness after weak US data. The pair is under increasing bullish pressure on Friday’s European session, with bulls pushing against the November and December swing high at 1.1010, awaiting the release of the US PCE Price Index.
The broader trend remains bullish, with the mentioned 1.1010 closing the path towards the early August high at 1.1060, and the July 24 and 27 peak, at 1.1150.
To the downside, support levels are 1.0930 ahead of a key support area above the 4-hour 100 Simple Moving Average (SMA) at 1.0870. Below here, bearish pressure might increase, with the early December lows at 1.0730 coming into play.
Euro FAQs
What is the Euro?
The Euro is the currency for the 20 European Union countries that belong to the Eurozone. It is the second most heavily traded currency in the world behind the US Dollar. In 2022, it accounted for 31% of all foreign exchange transactions, with an average daily turnover of over $2.2 trillion a day.
EUR/USD is the most heavily traded currency pair in the world, accounting for an estimated 30% off all transactions, followed by EUR/JPY (4%), EUR/GBP (3%) and EUR/AUD (2%).
What is the ECB and how does it impact the Euro?
The European Central Bank (ECB) in Frankfurt, Germany, is the reserve bank for the Eurozone. The ECB sets interest rates and manages monetary policy.
The ECB’s primary mandate is to maintain price stability, which means either controlling inflation or stimulating growth. Its primary tool is the raising or lowering of interest rates. Relatively high interest rates – or the expectation of higher rates – will usually benefit the Euro and vice versa.
The ECB Governing Council makes monetary policy decisions at meetings held eight times a year. Decisions are made by heads of the Eurozone national banks and six permanent members, including the President of the ECB, Christine Lagarde.
How does inflation data impact the value of the Euro?
Eurozone inflation data, measured by the Harmonized Index of Consumer Prices (HICP), is an important econometric for the Euro. If inflation rises more than expected, especially if above the ECB’s 2% target, it obliges the ECB to raise interest rates to bring it back under control.
Relatively high interest rates compared to its counterparts will usually benefit the Euro, as it makes the region more attractive as a place for global investors to park their money.
How does economic data influence the value of the Euro?
Data releases gauge the health of the economy and can impact on the Euro. Indicators such as GDP, Manufacturing and Services PMIs, employment, and consumer sentiment surveys can all influence the direction of the single currency.
A strong economy is good for the Euro. Not only does it attract more foreign investment but it may encourage the ECB to put up interest rates, which will directly strengthen the Euro. Otherwise, if economic data is weak, the Euro is likely to fall.
Economic data for the four largest economies in the euro area (Germany, France, Italy and Spain) are especially significant, as they account for 75% of the Eurozone’s economy.
How does the Trade Balance impact the Euro?
Another significant data release for the Euro is the Trade Balance. This indicator measures the difference between what a country earns from its exports and what it spends on imports over a given period.
If a country produces highly sought after exports then its currency will gain in value purely from the extra demand created from foreign buyers seeking to purchase these goods. Therefore, a positive net Trade Balance strengthens a currency and vice versa for a negative balance.
Economic Indicator
United States Core Personal Consumption Expenditures - Price Index (YoY)
The Core Personal Consumption Expenditures (PCE), released by the US Bureau of Economic Analysis on a monthly basis, measures the changes in the prices of goods and services purchased by consumers in the United States (US). The PCE Price Index is also the Federal Reserve’s (Fed) preferred gauge of inflation. The YoY reading compares the prices of goods in the reference month to the same month a year earlier. The core reading excludes the so-called more volatile food and energy components to give a more accurate measurement of price pressures." Generally, a high reading is bullish for the US Dollar (USD), while a low reading is bearish.
Read more.Next release: 12/22/2023 13:30:00 GMT
Frequency: Monthly
Source: US Bureau of Economic Analysis
Why it matters to traders
After publishing the GDP report, the US Bureau of Economic Analysis releases the Personal Consumption Expenditures (PCE) Price Index data alongside the monthly changes in Personal Spending and Personal Income. FOMC policymakers use the annual Core PCE Price Index, which excludes volatile food and energy prices, as their primary gauge of inflation. A stronger-than-expected reading could help the USD outperform its rivals as it would hint at a possible hawkish shift in the Fed’s forward guidance and vice versa.
The US Dollar Index (DXY) hit a new low not seen since July on Thursday. Economists at MUFG Bank analyze Greenback’s outlook ahead of US PCE inflation data.
Further Dollar selling from here could prove more difficult from a fundamental perspective
A consensus increase in the MoM core PCE inflation rate today (0.2%) is likely to mean the 6mth annualised gain will fall to the Fed’s 2% target level and will be another powerful indication that the inflation problem and the view that underlying inflation pressures were ‘sticky’ is simply no longer the case.
A benign print today that confirms for example that the 6mth annualised core PCE rate has hit the 2.0% target will certainly reinforce the prospect of the Fed cutting rates as early as March. However, that is now close to fully priced with 23/24 bps priced and hence it is hard to envisage a big rates move today.
While the Dollar could still extend further weaker due to momentum and positioning in a low-volume market, from a fundamental perspective further Dollar selling from here could prove more difficult.
- Gold price rises sharply above $2,050 as Fed’s rate cut expectations remain in the spotlight.
- The US Dollar Index was battered by rate cut bets and downwardly revised US Q3 GDP data.
- Investors await core PCE price index and Durable Goods Orders data for further action.
Gold price (XAU/USD) climbs swiftly above the crucial resistance of $2,050 as market participants are betting in favour of early interest rates unwinding by the Federal Reserve (Fed). The significant improvement in the Consumer Price Index (CPI) towards the 2% target has boosted hopes of early rate cuts by the Fed.
Meanwhile, investors await the United States core Personal Consumption Expenditure (PCE) price index data for November. A soft underlying inflation report would strengthen confidence among investors about early rate cuts, while a report which showed that price pressures remain sticky would offer a temporary cushion to the US Dollar.
Daily Digest Market Movers: Gold price advances as US Dollar retreats
- Gold price delivers a decisive break above the crucial resistance of $2,047 as the US Dollar came under pressure after a slight downgrade in the third quarter Gross Domestic Product (GDP) estimate on Thursday.
- The US Bureau of Economic Analysis (BEA) downgraded Q3 growth rate in its revised estimate to 4.9% against expectations of 5.2%, weighing heavily on the US Dollar.
- A downwardly revised GDP indicates a cooling labour market and price pressures. Still, economic growth in the US is still higher in comparison with other Group of Seven economies.
- In addition to that, deepening expectations for a soft US core PCE price index report for November has underpinned the Gold price against the US Dollar. The data will be published at 13:30 GMT.
- The core PCE price index is expected to increase at a steady pace of 0.2% in November. The annual underlying inflation measure is seen softening to 3.3% against the prior release of 3.5%.
- In the monetary policy statement of December, Fed policymakers projected that PCE inflation, their preferred inflation tool, would decelerate to 3.2% by the end of 2023.
- A steeper-than-projected decline in the underlying inflation report would push back expectations of a longer restrictive policy stance and put the rate-cut factor into the spotlight.
- Investors are pricing in that the Fed would announce its first rate cut in March after a year-long rate tightening spell. A second cut would come in May.
- Expectations for lowering interest rates were boosted by commentary from Fed Chairman Jerome Powell , who talked about avoiding the mistake of keeping interest rates too high.
- The majority of Fed policymakers are trying hard to push back expectations of rate cuts, emphasizing the idea of keeping interest rates in a restrictive trajectory until the achievement of price stability.
- Fed policymakers are reiterating that strong resilience in the US economy could keep inflation fears persistent.
- Apart from the US core PCE price index, investors will also focus on the US Durable Goods Orders for November. New orders for durable goods are seen increasing by 2.2% against a 5.4% decline in October. A more-than-projected increase in new orders would provide some cushion to the US Dollar.
Technical Analysis: Gold price prints a fresh two-week high above $2,050
Gold price refreshes two-week high above $2,050 after recovering swiftly from $1,974. The precious metal is expected to continue its upside towards $2,070, supported by deepening rate cut expectations. A bullish momentum has been triggered as the Relative Strength Index (RSI) (14) has climbed above 60.00.
Gold FAQs
Why do people invest in Gold?
Gold has played a key role in human’s history as it has been widely used as a store of value and medium of exchange. Currently, apart from its shine and usage for jewelry, the precious metal is widely seen as a safe-haven asset, meaning that it is considered a good investment during turbulent times. Gold is also widely seen as a hedge against inflation and against depreciating currencies as it doesn’t rely on any specific issuer or government.
Who buys the most Gold?
Central banks are the biggest Gold holders. In their aim to support their currencies in turbulent times, central banks tend to diversify their reserves and buy Gold to improve the perceived strength of the economy and the currency. High Gold reserves can be a source of trust for a country’s solvency. Central banks added 1,136 tonnes of Gold worth around $70 billion to their reserves in 2022, according to data from the World Gold Council. This is the highest yearly purchase since records began. Central banks from emerging economies such as China, India and Turkey are quickly increasing their Gold reserves.
How is Gold correlated with other assets?
Gold has an inverse correlation with the US Dollar and US Treasuries, which are both major reserve and safe-haven assets. When the Dollar depreciates, Gold tends to rise, enabling investors and central banks to diversify their assets in turbulent times. Gold is also inversely correlated with risk assets. A rally in the stock market tends to weaken Gold price, while sell-offs in riskier markets tend to favor the precious metal.
What does the price of Gold depend on?
The price can move due to a wide range of factors. Geopolitical instability or fears of a deep recession can quickly make Gold price escalate due to its safe-haven status. As a yield-less asset, Gold tends to rise with lower interest rates, while higher cost of money usually weighs down on the yellow metal. Still, most moves depend on how the US Dollar (USD) behaves as the asset is priced in dollars (XAU/USD). A strong Dollar tends to keep the price of Gold controlled, whereas a weaker Dollar is likely to push Gold prices up.
Gold prices rose in India on Friday, according to data from India's Multi Commodity Exchange (MCX).
Gold price stood at 62,439 Indian Rupees (INR) per 10 grams, up INR 258 compared with the INR 62,181 it costed on Thursday.
As for futures contracts, Gold prices increased to INR 62,516 per 10 gms from INR 62,223 per 10 gms.
Prices for Silver futures contracts decreased to INR 75,768 per kg from INR 75,457 per kg.
| Major Indian city | Gold Price |
|---|---|
| Ahmedabad | 64,660 |
| Mumbai | 64,430 |
| New Delhi | 64,560 |
| Chennai | 64,660 |
| Kolkata | 64,600 |
Daily Digest Market Movers: Comex Gold price flirts with multi-week high amid Fed rate cut bets, ahead of US PCE data
- Expectations for an imminent shift in the Federal Reserve's policy stance lift the Comex Gold price to its highest since December 4 on the last day of the week.
- A slew of Fed officials recently tried to push back against the idea of rapid interest rate cuts next year, though failed to change investor sentiment.
- The CME Group's FedWatch Tool indicates a greater chance of a Fed rate cut move by March 2024 and 150 bps of cumulative cuts by the year-end.
- The bets were reaffirmed by data showing that the US economy grew by a 4.9% annualized pace in the third quarter vs. the 5.2% rise previously reported.
- The Labor Department reported that Initial Jobless Claims increased to 205,000 during the week ended December 16 and remained at historically low levels.
- The benchmark 10-year US Treasury bond yield hovers near its lowest level since July, while the US Dollar recovers a bid from a five-month through.
- This, along with the prospect of a global rate-cutting cycle, might continue to benefit the non-yielding yellow metal and favour bullish traders.
- A plunge in UK inflation during November, to its lowest rate in over two years, raised hopes that the Bank of England will start cutting rates in the first half of 2024.
- Adding to this, the recent run of softer inflation data from the Eurozone suggests that the risk is towards earlier rate cuts by the European Central Bank.
- The US Core Personal Consumption Expenditure (PCE) Price Index could offer cues about the Fed's policy outlook and provide a fresh impetus to the XAU/USD.
(An automation tool was used in creating this post.)
Gold FAQs
Why do people invest in Gold?
Gold has played a key role in human’s history as it has been widely used as a store of value and medium of exchange. Currently, apart from its shine and usage for jewelry, the precious metal is widely seen as a safe-haven asset, meaning that it is considered a good investment during turbulent times. Gold is also widely seen as a hedge against inflation and against depreciating currencies as it doesn’t rely on any specific issuer or government.
Who buys the most Gold?
Central banks are the biggest Gold holders. In their aim to support their currencies in turbulent times, central banks tend to diversify their reserves and buy Gold to improve the perceived strength of the economy and the currency. High Gold reserves can be a source of trust for a country’s solvency. Central banks added 1,136 tonnes of Gold worth around $70 billion to their reserves in 2022, according to data from the World Gold Council. This is the highest yearly purchase since records began. Central banks from emerging economies such as China, India and Turkey are quickly increasing their Gold reserves.
How is Gold correlated with other assets?
Gold has an inverse correlation with the US Dollar and US Treasuries, which are both major reserve and safe-haven assets. When the Dollar depreciates, Gold tends to rise, enabling investors and central banks to diversify their assets in turbulent times. Gold is also inversely correlated with risk assets. A rally in the stock market tends to weaken Gold price, while sell-offs in riskier markets tend to favor the precious metal.
What does the price of Gold depend on?
The price can move due to a wide range of factors. Geopolitical instability or fears of a deep recession can quickly make Gold price escalate due to its safe-haven status. As a yield-less asset, Gold tends to rise with lower interest rates, while higher cost of money usually weighs down on the yellow metal. Still, most moves depend on how the US Dollar (USD) behaves as the asset is priced in dollars (XAU/USD). A strong Dollar tends to keep the price of Gold controlled, whereas a weaker Dollar is likely to push Gold prices up.
FX option expiries for December 22 NY cut at 10:00 Eastern Time, via DTCC, can be found below.
- EUR/USD: EUR amounts
- 1.0915 449m
- 1.0945 472m
- 1.0950 1.2b
- 1.0960 688m
- 1.1020 699m
- GBP/USD: GBP amounts
- 1.2650 433m
- USD/JPY: USD amounts
- 141.50 780m
- 142.00 1.7b
- 143.00 1.4b
- 144.00 1.5b
- 144.50 1.1b
- 145.00 3.3b
- USD/CHF: USD amounts
- 0.8620 1.1b
- 0.8720 320m
- AUD/USD: AUD amounts
- 0.6600 562m
- 0.6605 476m
- 0.6625 953m
- 0.6650 1.7b
- 0.6725 670m
- 0.6775 1.4b
- 0.6805 649m
- 0.6850 708m
- USD/CAD: USD amounts
- 1.3300 700m
- 1.3425 328m
- 1.3500 1.3b
In the view of economists at ING, the best-performing currencies next year will be those which are most undervalued – step forward the Australian Dollar and the Norwegian Krone.
The currencies of Australia and Norway to outperform
Currencies prepared to challenge the Dollar are going to need some help. And both the AUD and NOK are packing undervaluation in their armoury.
These are the currencies most undervalued according to our medium-term fair value model, where divergence from better export prices is the core story.
In effect, the higher US rate environment has prevented these currencies from aligning with the commodity price rally seen in the second half of this year.
After some ups and downs, the price of Silver is trading at around $24, the same level as at the start of the year. Economists at Commerzbank analyze the precious metal’s outlook.
Silver should benefit from "green" industrial demand
In its latest publication, the Silver Institute revised industrial demand for this year and previous years significantly upwards. Metals Focus also assumes that the silver market will remain in deficit for the foreseeable future. The Silver price has hardly benefited from this so far, which can be explained by general economic concerns, higher interest rates and weaker investment demand, including considerable ETF outflows. Over next year, these adverse factors are likely to become less significant and turn into the opposite.
We remain convinced that the Silver price has upside potential and should also make up ground versus Gold. We are forecasting a price increase to $30 by the end of 2024, which would bring the Gold/Silver ratio down to 72.
- USD/MXN extends losses as the Greenback weakens on speculation of Fed to ease policy tightening.
- The softer US bond yields contributed to downward pressure on the US Dollar.
- US GDP Annualized eased at 4.9% in Q3, while the Philadelphia Fed Manufacturing Survey declined by 10.5 in December.
- Mexico's 1st half-month Inflation rose by 0.52%, while Core Inflation eased to 0.46% in December.
USD/MXN continues to move on a downward trajectory on enhanced risk sentiment, which could be attributed to the speculation of the Federal Reserve (US) to ease monetary policy tightening in early 2024. The USD/MXN trades lower around 17.01 during the European session on Friday.
The downbeat US Treasury yields contribute to the weakening of the US Dollar (USD), with 2-year and 10-year yields on US bond coupons standing at 4.34% and 3.87%, respectively, by the press time. The US Dollar Index (DXY) extends its losses for a second consecutive day, bidding around 101.70.
Additionally, the recent release of mixed economic data from the United States (US) on Thursday has strengthened expectations for the Federal Reserve (Fed) to adopt a more accommodative monetary policy in the first quarter of 2024. US Gross Domestic Product Annualized (GDP) eased at a rate of 4.9% in Q3. Philadelphia Fed Manufacturing Survey declined by 10.5 in December, against the expected decline of 3.0. However, Initial Jobless Claims for the week ending on December 15 were 205K, below the expected 215K.
On Mexico’s side, on Thursday, 1st half-month Inflation for December rose by 0.52%, exceeding the expected 0.40%. While Core Inflation for the same period grew by 0.46%, slightly below the market consensus of 0.48%.
Recent Retail Sales data from Mexico, released on Wednesday, indicates positive momentum. Despite the dovish comments from Bank of Mexico (Banxico) Governor Victoria Rodriguez Ceja, the resilience of the Mexican Peso (MXN) remains unaffected.
Market participants are poised to closely monitor a series of economic data releases scheduled from the United States, particularly the Core Personal Consumption Expenditures - Price Index data. Expectations are leaning towards softer numbers. On Mexico’s docket, Trade Balance data will be eyed on Friday.
Economists at ANZ Bank forecast the USD/CNY pair at the 7 mark by the end of next year.
The authorities will not allow the CNY to strengthen too much
We see most of the drivers that made the CNY weaker in 2023 unwinding in 2024. Easing US-China tensions and concrete support for China’s property sector are set to turn sentiment around.
A peak in US yields and the Fed cutting rates in 2024 should result in increased exporter conversion of their foreign currency receipts.
The onshore spot has recently converged towards the fix, but the authorities are still guiding the currency stronger. This is an indication that the PBoC still sees the currency as undervalued.
We expect state commercial banks, which had been active in shadow intervention in 2023 to support CNY, to start accumulating USD again once the CNY is strong enough.
We expect the authorities will not allow the CNY to strengthen too much and forecast USD/CNY to end 2024 at 7.
- Silver edges higher for the fourth straight day and climbs a near three-week top on Friday.
- The technical setup favours bulls and supports prospects for a further appreciating move.
- Corrective pullback could now be seen as a buying opportunity near the 24.00 round figure.
Silver (XAG/USD) gains positive traction for the fourth straight day on Friday and trades around the $24.45-$24.50 region, or a near three-week high during the first half of the European session.
Looking at the broader picture, the recent rally from a multi-month-old ascending trend-line support, a subsequent move beyond the 200-day Simple Moving Average (SMA) and the $24.00 round figure was seen as a fresh trigger for bullish traders. Adding to this, oscillators on the daily chart have been gaining positive traction and support prospects for an extension of a two-week-old upward trajectory.
Hence, some follow-through strength, towards reclaiming the $25.00 psychological mark, looks like a distinct possibility. The momentum could get extended further towards the $25.25 intermediate resistance en route to the $25.45-$25.50 supply zone, above which the XAG/USD could jump back closer to the $26.00 round figure or its highest level since May touched earlier this month.
On the flip side, any meaningful corrective slide now seems to find decent support and attract fresh buyers near the $24.00 mark. This should help limit the downfall near the 200-day SMA, around the $23.60 region. That said, a convincing break below the latter might prompt some technical selling and make the XAG/USD vulnerable to retesting the aforementioned trend-line support, currently near the $23.00 mark.
The latter should act as a key pivotal point, which if broken decisively will shift the near-term bias in favour of bearish traders. The XAG/USD might then accelerate the downfall further towards the monthly swing low, around mid-$22.00s, before dropping to the $22.25 support and the $22.00 round-figure mark.
Silver daily chart
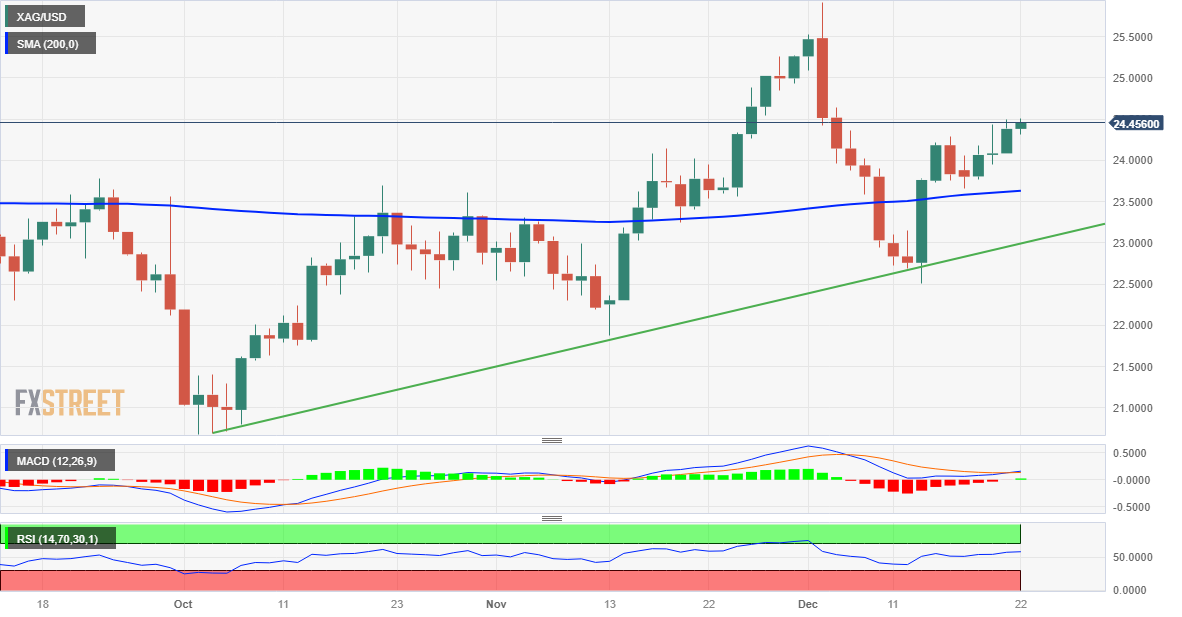
Technical levels to watch
- USD/CAD continues to lose ground on the subdued US Dollar.
- Technical indicators suggest the confirmation of further decline towards the major level at 1.3250.
- A break above 1.3300 could provide support for the pair to aim the seven-day EMA at 1.3354.
USD/CAD extends its losing streak for the second consecutive session, hovering around its four-month low at 1.3270 during the European hours on Friday.
The Moving Average Convergence Divergence (MACD) technical indicator for the USD/CAD pair is suggesting a potential bearish trend. The MACD line's placement below the centerline, coupled with divergence below the signal line, indicates a likelihood of further decline.
The analysis further confirms the existing dovish sentiment surrounding the USD/CAD pair, underscoring the significance of the lagging indicator 14-day Relative Strength Index (RSI) falling below 50. This confirmation implies that the pair might extend its decline, potentially reaching the major level at 1.3250 following the psychological level at 1.3200.
The analysis suggests that if there's a break below the psychological level, it could pave the way for the USD/CAD pair to move towards the August low at 1.3179.
The analysis suggests that on the upside, surpassing the psychological level at 1.3300 could provide support for the USD/CAD pair, propelling it upward. The next potential targets include the seven-day Exponential Moving Average (EMA) at 1.3354, followed by the psychological resistance level at 1.3400.
If the pair manages to pass through this psychological resistance, it might explore further upward movement toward the 23.6% Fibonacci retracement level at 1.3424, and eventually, the major level at 1.3450.
USD/CAD: Daily Chart
-638388303557734136.png)
Economists at MUFG Bank are cautious on INR in the near-term, but see scope for USD/INR to fall over the longer-term
Cautious near-term before bond index inclusion flows kick in
We remain cautious on INR in the near-term and forecast USD/INR at 83.50 by 1Q2024 and 82.00 by end-2024.
Our forecasts imply some underperformance in INR versus Asian currencies over the next 3 months, before improvement over the medium-term as inflows from bond index inclusion kick in more fully.
We continue to see INR’s FX volatility remaining contained by RBI’s aggressive FX intervention strategy on both sides.
GBP/USD reached a high of just shy of 1.28 earlier this month. The softer-than-expected UK inflation data, however, has challenged the better tone of the Pound. Economists at Rabobank analyze Cable’s outlook.
Room for GBP appreciation on hawkish BoE rhetoric may start to wear thin
As inflation edges closer to target, the market will have an increased tendency to disregard hawkish comments from policymakers. This is likely to be particularly the case in the UK given the weakness of the economic outlook.
If the tone of UK economic data worsens, room for GBP appreciation on hawkish BoE rhetoric may start to wear thin.
We see scope for Cable to push lower to 1.23 on a one-to-three-month view.
- Pound Sterling strengthens as strong UK retail sales data has deepened persistent inflation fears.
- Fears of a technical recession have escalated as UK Q3 GDP was downwardly revised to a 0.1% contraction.
- BoE policymakers may continue to endorse higher interest rates.
The Pound Sterling (GBP) extends its recovery on Friday, supported by upbeat UK Retail Sales data for November. The Office for National Statistics (ONS) reported that households’ retail spending surprisingly remained positive compared with the previous year, while market participants projected a sharp decline. Strong Retail Sales were boosted by a 2.8% increase in non-food retail stores as major discounts were offered amid the Black Friday Sale.
The upbeat Retail Sales data for November is likely going to allow Bank of England (BoE) policymakers to stick to their restrictive monetary policy stance. The growth rate in wages is still significantly higher than required to bring down inflation to 2%, and this appears to be empowering households to spend heavily. This could dampen confidence in a clear downtrend in price pressures.
The sharp recovery in the Pound Sterling suggests investors have ignored the downbeat Q3 Gross Domestic Product (GDP) revision, which points to a 0.1% contraction. This has deepened fears of a technical recession in the UK economy as the BoE has projected a stagnant performance in the last quarter of 2023.
Daily digest market movers: Pound Sterling rebounds despite 0.1% contraction in Q3 GDP
- The Pound Sterling picks strength after the release of the upbeat UK Retail Sales data for November.
- Monthly Retail Sales grew at a stronger pace of 1.3% against the consensus of 0.4% and a stagnant performance in October. The annual consumer spending surprisingly rose by 0.1%, while investors forecasted a contraction of 1.3%.
- Retail Sales excluding fuel rose by 1.3% against expectations of 0.4%. The increase in Retail Sales was due to strong demand at non-food retail stores.
- Meanwhile, fresh official figures have indicated that the UK economy contracted by 0.1% in the July-September quarter. In preliminary estimates, a stagnant performance was projected. The mild contraction in Q3 could escalate fears of a recession in the UK economy.
- In December’s monetary policy statement, BoE policymakers expected the UK economy to stagnate in the fourth quarter. If the UK contracts again in the last quarter of the year, it will be officially considered as a technical recession.
- Meanwhile, higher interest rates and cost pressures have dampened confidence of British businesses towards the economic outlook.
- The Lloyds Bank Business Barometer dropped to 35%, falling by seven percentage points. A deteriorating demand environment and higher wage growth have been consistently impacting the confidence of businesses in the economy.
- Going forward, higher consumer spending momentum would allow Bank of England policymakers to maintain their restrictive stance on monetary policy.
- The broader appeal for the Pound Sterling is already upbeat as BoE policymakers have not delivered any dialogue regarding the unwinding of restrictive policy stance.
- BoE policymakers have been refraining from endorsing rate cuts in 2024 as inflation in the UK economy is highest in comparison with other Group of Seven countries.
- The UK inflation data, released on Wednesday, dropped sharply. Investors hope that the central bank will discuss lowering borrowing rates sooner.
- Market participants see the BoE policymakers starting to cut interest rates from March after a big blow to price pressures in November.
- The overall market mood is upbeat as the US Dollar Index (DXY) has fallen back to its four-month low near 101.80 ahead of the United States core Personal Consumption Expenditure Price Index (PCE) data for November, which will be published at 13:30 GMT.
- As per the consensus, the annual core PCE price index is expected to decelerate to 3.3% from 3.5% in October. On a monthly basis, the Federal Reserve’s (Fed) preferred inflation measure is seen growing at a steady pace of 0.2%.
Technical Analysis: Pound Sterling recovers meaningfully from 1.2640
The Pound Sterling has recovered well from the crucial support of 1.2640 amid improved market sentiment. The GBP/USD pair could deliver a fresh rally after breaking above the round-level resistance of 1.2800.
On a daily timeframe, the 20-period Exponential Moving Average (EMA) has acted as a major support for Pound Sterling bulls. Fresh momentum on the upside would appear if the Relative Strength Index (RSI) (14) manages to climb above 60.00.
Pound Sterling FAQs
What is the Pound Sterling?
The Pound Sterling (GBP) is the oldest currency in the world (886 AD) and the official currency of the United Kingdom. It is the fourth most traded unit for foreign exchange (FX) in the world, accounting for 12% of all transactions, averaging $630 billion a day, according to 2022 data.
Its key trading pairs are GBP/USD, aka ‘Cable’, which accounts for 11% of FX, GBP/JPY, or the ‘Dragon’ as it is known by traders (3%), and EUR/GBP (2%). The Pound Sterling is issued by the Bank of England (BoE).
How do the decisions of the Bank of England impact on the Pound Sterling?
The single most important factor influencing the value of the Pound Sterling is monetary policy decided by the Bank of England. The BoE bases its decisions on whether it has achieved its primary goal of “price stability” – a steady inflation rate of around 2%. Its primary tool for achieving this is the adjustment of interest rates.
When inflation is too high, the BoE will try to rein it in by raising interest rates, making it more expensive for people and businesses to access credit. This is generally positive for GBP, as higher interest rates make the UK a more attractive place for global investors to park their money.
When inflation falls too low it is a sign economic growth is slowing. In this scenario, the BoE will consider lowering interest rates to cheapen credit so businesses will borrow more to invest in growth-generating projects.
How does economic data influence the value of the Pound?
Data releases gauge the health of the economy and can impact the value of the Pound Sterling. Indicators such as GDP, Manufacturing and Services PMIs, and employment can all influence the direction of the GBP.
A strong economy is good for Sterling. Not only does it attract more foreign investment but it may encourage the BoE to put up interest rates, which will directly strengthen GBP. Otherwise, if economic data is weak, the Pound Sterling is likely to fall.
How does the Trade Balance impact the Pound?
Another significant data release for the Pound Sterling is the Trade Balance. This indicator measures the difference between what a country earns from its exports and what it spends on imports over a given period.
If a country produces highly sought-after exports, its currency will benefit purely from the extra demand created from foreign buyers seeking to purchase these goods. Therefore, a positive net Trade Balance strengthens a currency and vice versa for a negative balance.
- US Dollar Index faces negative sentiment due to the expected dovish stance from the Fed.
- Subdued US GDP data increased the chances of the Fed’s rate cuts in early 2024.
- Fed members rejected the speculation of rate cuts in early 2024.
- Traders await Core PCE - Price Index data to gain more cues on the US economic scenario.
US Dollar Index (DXY) attempts to retrace the recent losses, trading higher near 101.90 during the early European session on Friday. The recent release of mixed economic data from the United States (US) on Thursday has strengthened expectations for the Federal Reserve (Fed) to adopt a more accommodative monetary policy in the first quarter of 2024. This anticipation is putting downward pressure on the US Dollar (USD).
The latest data from the US Bureau of Economic Analysis (BEA) indicates that Gross Domestic Product Annualized (GDP) eased at a rate of 4.9%, contrasting with the expected consistency at 5.2%. Additionally, the Philadelphia Fed Manufacturing Survey recorded a decline of 10.5 readings in December, exceeding the expected decline of 3.0 and the 5.9 figure decline in November. On a positive note, Initial Jobless Claims for the week ending on December 15 were 205K, below the expected 215K.
The elevated expectations of interest rate cuts seem to stem from the Federal Reserve's (Fed) dovish stance in its latest meeting. While the central bank officials have communicated a cautious approach and discouraged premature conclusions, there is a recognition of the need for time before potential rate cuts. Philadelphia Fed Bank President Patrick Harker has contributed to this dialogue by expressing openness to the possibility of lowering interest rates.
Market participants will likely observe Friday’s slew of economic data releases including the Core Personal Consumption Expenditures - Price Index data, which are anticipated to print softer numbers.
Economists at Danske Bank view narrowing rate differentials between Japan and G10 to favour the JPY over the coming year.
Yield differentials to be a tailwind for the JPY over the coming year
We forecast USD/JPY to steadily decline below 135 on a 12M horizon. This is primarily because we believe that long US yields have reached their peak, although we do not expect a lot of downside from here.
We expect yield differentials to be a tailwind for the JPY over the coming year, as G10 central banks, except the BoJ, are likely to commence rate cutting cycles. In addition, historical data suggests that a global environment characterized by declining growth and inflation tends to favour the JPY.
Here is what you need to know on Friday, December 22:
The US Dollar (USD) continued to weaken against its rivals on Thursday, with the USD Index touching its lowest level since early August below 102.00 in the American session. Early Friday, the USD holds its ground as investors move to the sidelines while waiting for the Personal Consumption Expenditures (PCE) Price Index data, the Federal Reserve's (Fed) preferred gauge of inflation, for November.
US Core PCE Inflation Preview: Federal Reserve preferred price gauge looks set for another decline in November.
The downward revision to the third-quarter Gross Domestic Product (GDP) growth announced on Thursday caused the USD to come under renewed selling pressure. Meanwhile, Wall Street's main indexes gathered bullish momentum following Wednesday's choppy action, putting additional weight on the USD's shoulders. In the European morning on Friday, US stock index futures trade in negative territory and the USD Index consolidates its weekly losses slightly below 102.00. In addition to PCE inflation figures, the US economic docket will feature New Home Sales for November and the University of Michigan's Consumer Confidence Index for December (final).
US Dollar price this week
The table below shows the percentage change of US Dollar (USD) against listed major currencies this week. US Dollar was the weakest against the Swiss Franc.
| USD | EUR | GBP | CAD | AUD | JPY | NZD | CHF | |
| USD | -0.95% | -0.16% | -0.71% | -1.19% | 0.04% | -1.13% | -1.60% | |
| EUR | 0.94% | 0.79% | 0.25% | -0.23% | 0.98% | -0.18% | -0.65% | |
| GBP | 0.19% | -0.76% | -0.52% | -1.02% | 0.23% | -0.94% | -1.41% | |
| CAD | 0.70% | -0.25% | 0.54% | -0.48% | 0.74% | -0.43% | -0.90% | |
| AUD | 1.17% | 0.24% | 1.00% | 0.48% | 1.21% | 0.05% | -0.40% | |
| JPY | -0.04% | -1.01% | -0.20% | -0.73% | -1.22% | -1.17% | -1.65% | |
| NZD | 1.12% | 0.18% | 0.93% | 0.43% | -0.05% | 1.16% | -0.46% | |
| CHF | 1.58% | 0.65% | 1.43% | 0.89% | 0.42% | 1.61% | 0.45% |
The heat map shows percentage changes of major currencies against each other. The base currency is picked from the left column, while the quote currency is picked from the top row. For example, if you pick the Euro from the left column and move along the horizontal line to the Japanese Yen, the percentage change displayed in the box will represent EUR (base)/JPY (quote).
Retail Sales in the UK increased by 1.3% on a monthly basis in November, the UK's Office for National Statistics (ONS) reported on Friday. This reading followed the no-change (revised from -0.3%) recorded in October and came in better than the market expectation for an increase of 0.4%. Other data from the UK revealed that the annualized Gross Domestic Product (GDP) growth for the third quarter got revised lower to 0.3% from 0.6% in the first estimate. GBP/USD edged slightly higher with the immediate reaction to the mixed data and was last seen trading marginally higher on the day at around 1.2700.
EUR/USD gained traction in the second half of the day on Thursday and closed in positive territory before stabilizing near 1.1000 early Friday.
USD/JPY turned south on renewed USD weakness on Thursday and lost more than 100 pips. In the European morning on Friday, the pair seems to have gone into a consolidation phase below 142.50. The data from Japan showed that the National Consumer Price Index (CPI) rose 2.8% on a yearly basis in November, down from 3.3% increase recorded in October. In the meantime, the minutes of the Bank of Japan's monetary policy meeting showed that members agreed that they need to patiently maintain the current easy policy.
Gold benefited from retreating US Treasury bond yields and the selling pressure surrounding the USD to register modest gains on Thursday. XAU/USD stays relatively at around $2,050 early Friday.
- EUR/GBP attracts some sellers around 0.8660 after the UK growth numbers data.
- UK Q3 final GDP came in worse than expected, shrinking 0.1% QoQ versus 0% prior.
- ECB’s Guindos said it’s premature to start easing monetary policy; November’s German PPI came in worse than expected.
The EUR/GBP cross snaps the two-day winning streak during the early European session on Friday. The cross retraces from the multi-week highs of 0.8685 and currently trades near 0.8660, losing 0.13% on the day.
The latest data from the UK Office for National Statistics revealed on Friday that the nation’s Gross Domestic Product (GDP) for the third quarter (Q3) came in at -0.1% QoQ versus 0% prior. On an annual basis, the GDP growth number arrived at 0.3% from the previous reading of 0.6%. Both figures were weaker than market expectations.
Furthermore, November’s UK Retail Sales rose 1.3% MoM from 0% in October, while Retail Sales ex-Fuel climbed 1.3% MoM versus 0.2% previously.
The European Central Bank (ECB) Vice President Luis de Guindos stated on Thursday that it’s premature to start easing monetary policy. He added that the ECB does not foresee a technical recession in the Eurozone and that the central bank would welcome a deal on EU fiscal reform as it would alleviate market uncertainty.
About the data, the German Producer Price Index (PPI) for November dropped 7.9% YoY from 11% fall in the previous reading, worse than the market expectation of a 7.5% decline. Additionally, the German Gfk Consumer Confidence Survey for January came in at -25.1 versus -27.6, above the consensus of -27.0.
Later on Friday, the Consumer Confidence from France, Spain, and Italy will be due. However, these figures might have a minimal impact on the markets ahead of the holiday season.
- Retail Sales in the UK increased at a stronger pace than forecast in November.
- Annual UK GDP growth for Q3 got revised lower.
- GBP/USD clings to small daily gains near 1.2700 after the data.
Retail Sales in the UK rose by 1.3% on a monthly basis in November, the UK's Office for National Statistics (ONS) reported on Friday. This reading followed the no-change (revised from -0.3%) recorded in October and came in better than the market expectation for an increase of 0.4%. On a yearly basis, Retail Sales were up 0.1%.
The ONS also announced that the annualized Gross Domestic Product (GDP) growth for the third quarter was revised lower to 0.3% from 0.6% in the first estimate.
Finally, Total Business Investment declined 3.2% on a quarterly basis in the third quarter, up from a 4.2% contraction reported in the first estimate.
Market reaction
GBP/USD edged slightly higher with the immediate reaction to the mixed data and was last seen gaining 0.1% on the day at 1.2700.
- The Core Personal Consumption Expenditures Price Index is set to rise 0.2% MoM and 3.3% YoY in November.
- Markets see a strong chance of the Federal Reserve cutting the policy rate as early as March.
- The continued cooling of PCE inflation could cause the US Dollar to remain fragile.
The Core Personal Consumption Expenditures (PCE) Price Index, the US Federal Reserve’s (Fed) preferred inflation measure, will be published on Friday by the US Bureau of Economic Analysis (BEA) at 13:30 GMT.
What to expect in the Federal Reserve’s preferred PCE inflation report?
The Core PCE Price Index, which excludes volatile food and energy prices, is seen as the more influential measure of inflation in terms of Fed positioning. The index is seen rising 0.2% on a monthly basis in November to match the October increase, and at an annual pace of 3.3%, down from the 3.5% growth recorded in October.
The headline PCE Price Index is forecast to hold steady on a monthly basis in November, while rising 2.8% on a yearly basis.
In the press conference following the December policy meeting, Fed Chairman Jerome Powell shared the Fed's expectations of the upcoming PCE data:
“Based on the Consumer Price Index and other data, we estimate that total PCE prices rose 2.6% over the 12 months ending in November; and that, excluding the volatile food and energy categories, core PCE prices rose 3.1%.”
Powell surprised the market by acknowledging that policymakers were thinking and talking about when it will be appropriate to start cutting the interest rate. "We are very focused on not making the mistake of keeping rates too high too long," he added at the post-meeting press conference. In turn, US Treasury bond yields declined sharply and the US Dollar suffered large losses against its major rivals. Although Fed policymakers have been trying to push back against the market expectations for a policy pivot in the first quarter of next year, markets are still pricing in nearly 80% probability that the Fed will reduce the policy rate by 25 basis points in March, according to the CME Group’s FedWatch Tool.
TD Securities analysts offer a brief preview of the PCE inflation report:
“Core PCE inflation likely notably slowed in November to its softest m/m pace since end 2020 (headline: 0.0% m/m), coming in much below the core CPI's 0.28% gain. We also look the PCE's supercore measure to decelerate to 0.1% m/m. Separately, consumer outlays likely picked up in Q4 following a soft October, with spending advancing at a very firm m/m pace in November (+0.5% in real terms).”
When will the PCE inflation report be released, and how could it affect EUR/USD?
The PCE inflation data is slated for release at 13:30 GMT. The monthly Core PCE Price Index gauge is the most-preferred inflation reading by the Fed, as it’s not distorted by base effects and provides a clear view of underlying inflation by excluding volatile items. Investors, therefore, pay close attention to the monthly Core PCE figure.
A bigger-than-expected increase in monthly Core PCE inflation is likely to prompt investors to dial down Fed rate cut expectations for March. However, the Fed forecast, as revealed by Chairman Powell, for the annual Core PCE Price Index increase is below the market consensus, suggesting that there is a small chance of an upside surprise.
On the other hand, a no-change in the monthly Core PCE Price Index, or a negative print, could put additional weight on the USD’s shoulders and ramp up expectations for a March rate cut.
Ahead of the Christmas break, however, the action in financial markets could turn volatile due to shrinking trading volumes, and it might be risky to take a large position based on this data.
FXStreet Analyst Eren Sengezer offers a brief technical outlook for EUR/USD and explains:
“EUR/USD remains within an ascending regression trend channel, and the Relative Strength Index (RSI) indicator on the daily chart stays above 50, suggesting that the pair remains bullish.”
“On the upside, 1.1000 (psychological level, static level) aligns as a first resistance. A daily close above that level could open the door for a leg higher toward 1.1100, where the Fibonacci 78.6% retracement of the August-October downtrend and the upper limit of the ascending channel is located. Once this level is confirmed, 1.1275 (July 18 high) could be seen as the next bullish target.”
“The 20-day Simple Moving Average (SMA) forms interim support at 1.0800 (lower limit of the ascending channel) before 1.0760-1.0750 (50-day SMA, 100-day SMA).”
Economic Indicator
United States Personal Consumption Expenditures - Price Index (YoY)
The Personal Consumption Expenditures (PCE), released by the US Bureau of Economic Analysis on a monthly basis, measures the changes in the prices of goods and services purchased by consumers in the United States (US). The YoY reading compares prices in the reference month to a year earlier. Price changes may cause consumers to switch from buying one good to another and the PCE Deflator can account for such substitutions. This makes it the preferred measure of inflation for the Federal Reserve. Generally, a high reading is bullish for the US Dollar (USD), while a low reading is bearish.
Read more.Next release: 12/22/2023 13:30:00 GMT
Frequency: Monthly
Source: US Bureau of Economic Analysis
Inflation FAQs
What is inflation?
Inflation measures the rise in the price of a representative basket of goods and services. Headline inflation is usually expressed as a percentage change on a month-on-month (MoM) and year-on-year (YoY) basis. Core inflation excludes more volatile elements such as food and fuel which can fluctuate because of geopolitical and seasonal factors. Core inflation is the figure economists focus on and is the level targeted by central banks, which are mandated to keep inflation at a manageable level, usually around 2%.
What is the Consumer Price Index (CPI)?
The Consumer Price Index (CPI) measures the change in prices of a basket of goods and services over a period of time. It is usually expressed as a percentage change on a month-on-month (MoM) and year-on-year (YoY) basis. Core CPI is the figure targeted by central banks as it excludes volatile food and fuel inputs. When Core CPI rises above 2% it usually results in higher interest rates and vice versa when it falls below 2%. Since higher interest rates are positive for a currency, higher inflation usually results in a stronger currency. The opposite is true when inflation falls.
What is the impact of inflation on foreign exchange?
Although it may seem counter-intuitive, high inflation in a country pushes up the value of its currency and vice versa for lower inflation. This is because the central bank will normally raise interest rates to combat the higher inflation, which attract more global capital inflows from investors looking for a lucrative place to park their money.
How does inflation influence the price of Gold?
Formerly, Gold was the asset investors turned to in times of high inflation because it preserved its value, and whilst investors will often still buy Gold for its safe-haven properties in times of extreme market turmoil, this is not the case most of the time. This is because when inflation is high, central banks will put up interest rates to combat it.
Higher interest rates are negative for Gold because they increase the opportunity-cost of holding Gold vis-a-vis an interest-bearing asset or placing the money in a cash deposit account. On the flipside, lower inflation tends to be positive for Gold as it brings interest rates down, making the bright metal a more viable investment alternative.
- NZD/USD finds sell-off near 0.6300 as focus shifts to US core PCE price index data.
- A sticky US core PCE report could offer some support to the US Dollar.
- The Kiwi pair trades in an upward-sloping chart pattern.
The NZD/USD pair faces selling pressure near the round-level resistance of 0.6300 in the early London session. The Kiwi asset is expected to remain lackluster ahead of the United States core Personal Consumption Expenditure price index (PCE) data for November, which will be published at 13:30 GMT.
Investors see mild softness in the underlying inflation data as interest rates by the Federal Reserve (Fed) have been in the restrictive trajectory. According to the estimates, monthly core PCE data grew at a steady pace of 0.2%. The annual core PCE data is expected to decelerate to 3.3% vs. the former reading of 3.5%.
The US Dollar Index (DXY) falls back to its crucial support of 101.80, weighed down by deepening rate cut expectations by the Federal Reserve (Fed).
Meanwhile, the New Zealand Dollar would continue to perform better against the US Dollar as the Reserve Bank of New Zealand (RBNZ) is expected to keep interest rates high for a longer period.
NZD/USD trades in a Rising Channel chart pattern on a two-hour scale in which each pullback is considered as a buying opportunity by the market participants. Upward-sloping 20-period Exponential Moving Average (EMA) at 0.6256 will continue to provide support to the New Zealand Dollar bulls.
A bullish momentum would emerge if the Relative Strength Index (RSI) (14) manages to shift into the bullish range of 60.00-80.00 confidently.
The NZD/USD pair may witness a fresh rally after a decisive break above Wednesday’s high around 0.6300. An occurrence of the same would allow it to refresh its five-month high near 0.6350. Further upside would expose it towards July 14 high around 0.6400.
On the contrary, a breakdown below December 14 low near 0.6168 would drag the asset towards November 30 low near 0.6121, followed by December 13 low near 0.6084.
NZD/USD two-hour chart
-638388226684423087.png)
- GBP/USD drifts lower to 1.2682 ahead of UK GDP and US PCE data.
- The pair keeps the bullish vibe intact above the 100-hour EMA; RSI momentum indicator stands above 50.
- The first resistance level will emerge at 1.2740; 1.2625 acts as a key support level for the pair.
The GBP/USD pair struggles to gain ground during the early European session on Friday. The major pair remains capped below the 1.2700 psychological mark ahead of the top-tier economic data from both the United Kingdom (UK) and the United States (US). At press time, GBP/USD is trading at 1.2682, down 0.04% on the day.
Technically, GBP/USD maintains a positive outlook as the pair holds above the 100-hour Exponential Moving Averages (EMA) on the four-hour chart. Furthermore, the Relative Strength Index (RSI) stands in bullish territory above 50, indicating the further upside looks favorable.
The immediate resistance level for the major pair will emerge near the upper boundary of the Bollinger Band at 1.2740, followed by a high of December 19 at 1.2761. The key barrier is seen in the 1.2790–1.2800 region, representing a high of December 15 and the psychological round mark. Further north, the next hurdle to watch is a high of July 28 at 1.2888.
On the downside, the confluence of the 100-hour EMA and a low of December 20 at 1.2625 acts as a critical support level for the pair. Any follow-through selling below the latter will see a drop to to the lower limit of the Bollinger Band at 1.2615. The additional downside filter is located at 1.2544 (low of December 7), en route to 1.2500 (low of December 13, round figure).
GBP/USD four-hour chart
-638388198185832557.png)
- EUR/USD retreats from a three-week high at 1.1012.
- A breakthrough above the 1.1000 level could lead the pair to test a two-month high at 1.1017.
- 1.0950 major level could act as a key support followed by the seven-day EMA at 1.0938.
EUR/USD hovers below the psychological resistance at 1.1000 level during the Asian session on Friday after pulling back from the three-week high at 1.1012. The EUR/USD pair received upward support from a less dovish tone surrounding the European Central Bank (ECB), as compared to the elevated speculation of the Federal Reserve (Fed) to ease monetary policy in the first quarter of 2024.
The Moving Average Convergence Divergence (MACD) indicates an overall positive momentum, as the MACD line is positioned above the centerline and the signal line.
This bullish sentiment of the EUR/USD pair’s bulls could surpass the psychological resistance to approach the two-month high at 1.1017. The next barrier would be the significant level at 1.1050.
Moreover, the lagging indicator 14-day Relative Strength Index (RSI) moves above the 50 mark, suggesting a confirmation regarding the potential upward trend in the EUR/USD pair.
On the flip side, the EUR/USD pair could find support at the major level at 1.0950 followed by the seven-day Exponential Moving Average (EMA) at 1.0938.
A break below the latter could push the pair to test the psychological support region around 1.0900, further navigating the region around the 23.6% Fibonacci retracement level at 1.0884.
EUR/USD: Daily Chart
-638388195358593618.png)
- USD/CHF dropped to a five-month low at 0.8557 on heightened speculation of the dovish Fed outlook.
- Subdued US GDP data increased the chances of the Fed’s rate cuts in early 2024.
- Middle East conflict could give rise to the demand for the safe-haven Swiss Franc.
USD/CHF attempts to rebound from a five-month low at 0.8557, trading around 0.8570 during the Asian hours on Friday. The US Dollar (USD) faces downward pressure on softer economic data from the United States (US) released on Thursday, coupled with the heightened expectations of the Federal Reserve's (Fed) dovish stance on rate cuts in the first quarter of 2024.
The subdued US data is adding weight to speculations of potential easing by the Fed. The US Bureau of Economic Analysis (BEA) showed that Gross Domestic Product Annualized (GDP) eased to 4.9% against the expected consistency of 5.2%. Meanwhile, Core Personal Consumption Expenditures (QoQ) reduced to a growth of 2.0% versus the previous 2.3% growth.
However, Initial Jobless Claims for the week ending on December 15 were 205K, slightly below the expected 215K. Investors await Core Personal Consumption Expenditures - Price Index data, and Michigan Consumer Sentiment Index to gain more cues on the US economic scenario.
However, there's a nuanced perspective from Philadelphia Fed Bank President Patrick Harker. While Harker acknowledged that rate cuts will take time, he also expressed openness to the possibility of lowering interest rates. Harker highlights the challenges faced by businesses in managing higher interest obligations as a key factor that might prompt interest rate cuts next year.
The persistent disruptions in the Suez Canal waterway, triggered by Houthi attacks on ships in the Red Sea, are fueling a risk-averse sentiment. This, in turn, appears to be driving an increased demand for the safe-haven Swiss Franc (CHF). The decision of major shipping companies, including Germany's Hapag-Lloyd and Hong Kong's OOCL, to steer clear of the Red Sea waterway, following the lead of British Petroleum, underscores the growing concerns about maritime security in the region.
The Quarterly Bulletin from the Swiss National Bank (SNB) released on Wednesday signals a proactive approach by the bank in managing currency dynamics. The SNB expressed its readiness to be active in the foreign exchange market as necessary, indicating a stance geared towards supporting the Swiss Franc (CHF).
- WTI price experiences upward support on disruptions in the Red Sea by Houthi attacks.
- Germany's Hapag-Lloyd and Hong Kong's OOCL will avoid the Suez Canal waterway.
- Angola decided to exit the OPEC+ as the country's interests were not being served.
West Texas Intermediate (WTI) price trades higher around $74.70 per barrel at the time of writing, extending gains for the second successive day. The geopolitical developments in the Middle East highlight the complexities surrounding maritime security and global trade following the Houthi attacks on ships in the Red Sea. These events serve as a significant factor contributing to the surge in crude oil prices.
The decision of more shipping companies, including Germany's Hapag-Lloyd and Hong Kong's OOCL, to steer clear of the Suez Canal underscores the escalating concerns in the Red Sea. Following an attack on a Norwegian commercial vessel by the Iran-led Houthi militant group on Monday, major player British Petroleum temporarily halted all transit through the waterway.
In response, Washington has taken proactive steps by establishing a dedicated task force to safeguard Red Sea commerce, emphasizing the importance of addressing and mitigating risks stemming from attacks on commercial vessels in the region. On the other hand, the Houthis remain defiant, pledging to continue their attacks despite the US-led naval mission.
Additionally, Angola's recent decision to exit the Organization of the Petroleum Exporting Countries and its allies (OPEC+) adds another layer to the evolving geopolitical landscape. Angola's Oil Minister, Diamantino Azevedo, has emphasized that the country's interests were not being adequately served within the group. This move aligns Angola with other mid-sized producers like Ecuador and Qatar, who have also departed from the group over the past decade.
Market participants will likely observe Baker Hughes US Oil Rig Count data release on Friday to gain fresh impetus on business conditions in the drilling industry.
- Gold price hits a near three-week high amid bets for an early rate cut by the Federal Reserve.
- The US bond yields and the USD languish near a multi-month low, lending additional support.
- Traders now look to the US PCE Price Index for fresh cues about the Fed’s interest rate outlook.
Gold price (XAU/USD) gains positive traction for the second straight day – also marking the fourth day of a positive move in the previous five – and climbs to a near three-week high, around the $2,055 region during the Asian session on Friday. The uptick, however, lacks bullish conviction as traders opt to wait for the release of the US Core Personal Consumption Expenditure (PCE) Price Index, due later today. The crucial US inflation data will influence the Federal Reserve's (Fed) future policy decisions and provide a fresh directional impetus to the non-yielding yellow metal.
In the run-up to the key macro data, the uncertainty over the timing of when the Fed will begin cutting rates in 2024 allows the US Dollar (USD) to recover a part of Thursday's slide to a multi-month low, touched in reaction to a downward revision of the US GDP. This, in turn, is seen acting as a headwind for the Gold price. The downside, however, remains cushioned on the back of growing acceptance that the Fed will eventually pivot away from its hawkish stance early next year. This keeps the US Treasury bond yields depressed near a multi-month low and should cap the USD.
Daily Digest Market Movers: Gold price continues to draw support from dovish Fed expectations
- Expectations for an imminent shift in the Federal Reserve's policy stance lift the Gold price to its highest since December 4 on the last day of the week.
- A slew of Fed officials recently tried to push back against the idea of rapid interest rate cuts next year, though failed to change investor sentiment.
- The CME Group's FedWatch Tool indicates a greater chance of a Fed rate cut move by March 2024 and 150 bps of cumulative cuts by the year-end.
- The bets were reaffirmed by data showing that the US economy grew by a 4.9% annualized pace in the third quarter vs. the 5.2% rise previously reported.
- The Labor Department reported that Initial Jobless Claims increased to 205,000 during the week ended December 16 and remained at historically low levels.
- The benchmark 10-year US Treasury bond yield hovers near its lowest level since July, while the US Dollar recovers a bid from a five-month through.
- This, along with the prospect of a global rate-cutting cycle, might continue to benefit the non-yielding yellow metal and favour bullish traders.
- A plunge in UK inflation during November, to its lowest rate in over two years, raised hopes that the Bank of England will start cutting rates in the first half of 2024.
- Adding to this, the recent run of softer inflation data from the Eurozone suggests that the risk is towards earlier rate cuts by the European Central Bank.
- The US Core Personal Consumption Expenditure (PCE) Price Index could offer cues about the Fed's policy outlook and provide a fresh impetus to the XAU/USD.
Technical Analysis: Gold price poised to appreciate further towards $2,072-2,073
From a technical perspective, a move beyond the $2,047-2,048 region could be seen as a breakout through over a one-week-old consolidative trading range and favours bullish traders. This comes on the back of the occurrence of a golden cross, with the 50-day Simple Moving Average (SMA) crossing the 200-day SMA from below, and supports prospects for additional gains. Moreover, oscillators on the daily chart are holding in the positive territory and further validate the near-term constructive outlook. Hence, a subsequent strength towards the next relevant hurdle, around the $2,072-2,073 region, looks like a distinct possibility. The momentum could get extended further and allow the Gold price to reclaim the $2,100 round figure.
On the flip side, weakness below the aforementioned trading range resistance breakpoint could drag the XAU/USD back to the $2,028-2,027 region en route to the $2,017 horizontal support. A convincing break below the latter might prompt some technical selling and make the Gold price vulnerable to accelerate the slide towards the $2,000 psychological mark. This is closely followed by the 50-day SMA, currently around the $1,994 area, below which the downward trajectory could get extended further towards last week's swing low, around the $1,973 region, en route to a technically significant 200-day SMA, near the $1,958 zone.
US Dollar price today
The table below shows the percentage change of US Dollar (USD) against listed major currencies today. US Dollar was the strongest against the Japanese Yen.
| USD | EUR | GBP | CAD | AUD | JPY | NZD | CHF | |
| USD | 0.08% | 0.01% | 0.03% | 0.28% | 0.32% | 0.23% | 0.07% | |
| EUR | -0.08% | -0.04% | -0.06% | 0.20% | 0.23% | 0.16% | -0.01% | |
| GBP | -0.01% | 0.05% | 0.00% | 0.26% | 0.30% | 0.20% | 0.06% | |
| CAD | -0.04% | 0.06% | -0.02% | 0.26% | 0.30% | 0.21% | 0.03% | |
| AUD | -0.28% | -0.20% | -0.27% | -0.27% | 0.00% | -0.04% | -0.22% | |
| JPY | -0.32% | -0.24% | -0.28% | -0.29% | -0.03% | -0.08% | -0.24% | |
| NZD | -0.26% | -0.17% | -0.22% | -0.22% | 0.04% | 0.07% | -0.17% | |
| CHF | -0.10% | 0.02% | -0.05% | -0.03% | 0.21% | 0.23% | 0.18% |
The heat map shows percentage changes of major currencies against each other. The base currency is picked from the left column, while the quote currency is picked from the top row. For example, if you pick the Euro from the left column and move along the horizontal line to the Japanese Yen, the percentage change displayed in the box will represent EUR (base)/JPY (quote).
Gold FAQs
Why do people invest in Gold?
Gold has played a key role in human’s history as it has been widely used as a store of value and medium of exchange. Currently, apart from its shine and usage for jewelry, the precious metal is widely seen as a safe-haven asset, meaning that it is considered a good investment during turbulent times. Gold is also widely seen as a hedge against inflation and against depreciating currencies as it doesn’t rely on any specific issuer or government.
Who buys the most Gold?
Central banks are the biggest Gold holders. In their aim to support their currencies in turbulent times, central banks tend to diversify their reserves and buy Gold to improve the perceived strength of the economy and the currency. High Gold reserves can be a source of trust for a country’s solvency. Central banks added 1,136 tonnes of Gold worth around $70 billion to their reserves in 2022, according to data from the World Gold Council. This is the highest yearly purchase since records began. Central banks from emerging economies such as China, India and Turkey are quickly increasing their Gold reserves.
How is Gold correlated with other assets?
Gold has an inverse correlation with the US Dollar and US Treasuries, which are both major reserve and safe-haven assets. When the Dollar depreciates, Gold tends to rise, enabling investors and central banks to diversify their assets in turbulent times. Gold is also inversely correlated with risk assets. A rally in the stock market tends to weaken Gold price, while sell-offs in riskier markets tend to favor the precious metal.
What does the price of Gold depend on?
The price can move due to a wide range of factors. Geopolitical instability or fears of a deep recession can quickly make Gold price escalate due to its safe-haven status. As a yield-less asset, Gold tends to rise with lower interest rates, while higher cost of money usually weighs down on the yellow metal. Still, most moves depend on how the US Dollar (USD) behaves as the asset is priced in dollars (XAU/USD). A strong Dollar tends to keep the price of Gold controlled, whereas a weaker Dollar is likely to push Gold prices up.
- Indian Rupee trades around a flatline amid the USD weakness.
- Upbeat Indian growth prospects and substantial foreign investor equity inflows might cap the INR’s downside.
- The release of the US Core Personal Consumption Expenditure Price Index (Core PCE) will be the highlight on Friday.
Indian Rupee (INR) trades flat amid the US Dollar (USD) softness. The weaker-than-expected US GDP growth numbers exert some selling pressure on the Greenback and create a headwind for USD/INR. Furthermore, India's upbeat growth prospects and strong equity inflows from foreign investors might boost the INR in the near term.
According to the International Monetary Fund (IMF), India is estimated to contribute more than 16% of global growth due to economic reforms in key sectors such as infrastructure and digitalization, which have propelled India to be a "star performer" among countries. Additionally, the IMF stated in its annual Article IV consultation report released on Monday that the Indian economy is supported by prudent macroeconomic policies and is on course to become one of the world's major economies.
Market players will closely watch the US Core Personal Consumption Expenditure Price Index (Core PCE) for November. The Fed’s preferred inflation gauge is estimated to rise 0.2% MoM and 3.3% YoY. This figure could trigger volatility in the market ahead of the holiday season.
Daily Digest Market Movers: Indian Rupee is undermined by elevated inflation and global factors
- The RBI monthly bulletin highlighted that if headline retail inflation is not brought down to the medium-term target of 4% and maintained there, it could underscore the potential impact on growth.
- India’s foreign exchange reserves were $606.9 billion on December 8, 2023, the fourth largest among major foreign exchange reserve-holding countries, increased by $28.4 billion during 2023–24.
- The RBI sold $310 million in the spot foreign currency market in October, according to the monthly Bulletin.
- US Gross Domestic Product (GDP) for the third quarter grew 4.9%, weaker than the market expectation of 5.2% expansion.
- The US Initial Jobless Claims rose 205,000 for the week ending December 16 from the previous week of 202K, below the consensus of 215,000.
- The Philadelphia Fed Manufacturing Index came in at -10.5 in December versus -5.9 prior.
- The Fed Funds futures are pricing in 82% odds of a rate cut at the March meeting, according to the CME FedWatch Tool.
Technical Analysis: Indian Rupee sticks to the longer-term range theme
Indian Rupee trades on a flat note on the day. The USD/INR pair has traded within the trading range of 82.80–83.40 since September. According to the daily chart, further upside in the shorter term looks favorable as the pair holds above the key 100-day Exponential Moving Average (EMA). Nonetheless, an attempt to break below the key EMA cannot be ruled out as the 14-day Relative Strength Index (RSI) remains below the 50.0 midpoint.
The first upside barrier of USD/INR will emerge at the upper boundary of the trading range at 83.40. A breakout above 83.40 will see a rally to the year-to-date (YTD) high of 83.47, followed by the 84.00 psychological mark. On the flip side, the critical support level is located at 83.00 round figure. The additional downside filter to watch is 82.80, portraying the confluence of the lower limit of the trading range and a low of September 12. Further south, the next contention level is seen near a low of August 11 at 82.60.
US Dollar price today
The table below shows the percentage change of US Dollar (USD) against listed major currencies today. US Dollar was the strongest against the Japanese Yen.
| USD | EUR | GBP | CAD | AUD | JPY | NZD | CHF | |
| USD | 0.07% | -0.02% | 0.02% | 0.23% | 0.30% | 0.20% | 0.04% | |
| EUR | -0.07% | -0.08% | -0.06% | 0.16% | 0.21% | 0.13% | -0.02% | |
| GBP | 0.02% | 0.07% | 0.02% | 0.24% | 0.30% | 0.21% | 0.06% | |
| CAD | -0.03% | 0.05% | -0.03% | 0.20% | 0.29% | 0.18% | 0.02% | |
| AUD | -0.24% | -0.16% | -0.24% | -0.21% | 0.03% | -0.04% | -0.19% | |
| JPY | -0.30% | -0.22% | -0.29% | -0.28% | -0.04% | -0.08% | -0.24% | |
| NZD | -0.21% | -0.13% | -0.20% | -0.19% | 0.04% | 0.09% | -0.14% | |
| CHF | -0.07% | 0.03% | -0.06% | -0.02% | 0.19% | 0.23% | 0.15% |
The heat map shows percentage changes of major currencies against each other. The base currency is picked from the left column, while the quote currency is picked from the top row. For example, if you pick the Euro from the left column and move along the horizontal line to the Japanese Yen, the percentage change displayed in the box will represent EUR (base)/JPY (quote).
Indian Rupee FAQs
What are the key factors driving the Indian Rupee?
The Indian Rupee (INR) is one of the most sensitive currencies to external factors. The price of Crude Oil (the country is highly dependent on imported Oil), the value of the US Dollar – most trade is conducted in USD – and the level of foreign investment, are all influential. Direct intervention by the Reserve Bank of India (RBI) in FX markets to keep the exchange rate stable, as well as the level of interest rates set by the RBI, are further major influencing factors on the Rupee.
How do the decisions of the Reserve Bank of India impact the Indian Rupee?
The Reserve Bank of India (RBI) actively intervenes in forex markets to maintain a stable exchange rate, to help facilitate trade. In addition, the RBI tries to maintain the inflation rate at its 4% target by adjusting interest rates. Higher interest rates usually strengthen the Rupee. This is due to the role of the ‘carry trade’ in which investors borrow in countries with lower interest rates so as to place their money in countries’ offering relatively higher interest rates and profit from the difference.
What macroeconomic factors influence the value of the Indian Rupee?
Macroeconomic factors that influence the value of the Rupee include inflation, interest rates, the economic growth rate (GDP), the balance of trade, and inflows from foreign investment. A higher growth rate can lead to more overseas investment, pushing up demand for the Rupee. A less negative balance of trade will eventually lead to a stronger Rupee. Higher interest rates, especially real rates (interest rates less inflation) are also positive for the Rupee. A risk-on environment can lead to greater inflows of Foreign Direct and Indirect Investment (FDI and FII), which also benefit the Rupee.
How does inflation impact the Indian Rupee?
Higher inflation, particularly, if it is comparatively higher than India’s peers, is generally negative for the currency as it reflects devaluation through oversupply. Inflation also increases the cost of exports, leading to more Rupees being sold to purchase foreign imports, which is Rupee-negative. At the same time, higher inflation usually leads to the Reserve Bank of India (RBI) raising interest rates and this can be positive for the Rupee, due to increased demand from international investors. The opposite effect is true of lower inflation.
- USD/CAD receives downward pressure on the subdued US Dollar.
- US real GDP reinforces speculation on the Fed’s dovish stance on monetary policy.
- Higher WTI price could contribute support for the Canadian Dollar.
USD/CAD hovers around 1.3280 during the Asian session on Friday near its four-month low at 1.3275 registered in the previous session. The USD/CAD pair experienced a plunge on a weaker US Dollar (USD), which could be attributed to the softer US economic data released on Thursday. Moreover, mixed Canada’s Retail Sales data might have provided minor support to underpinning the Canadian Dollar (CAD).
The recent data from the US Bureau of Economic Analysis (BEA) shows that Gross Domestic Product Annualized (GDP) grew at a slightly lower rate of 4.9%, deviating from the expected consistency at 5.2%. Meanwhile, Core Personal Consumption Expenditures (QoQ) decreased to 2.0% from the previous 2.3%. However, Initial Jobless Claims for the week ending on December 15 were 205K, slightly below the expected 215K.
The subdued real GDP is adding weight to speculations of potential easing by the US Federal Reserve (Fed). These heightened expectations are a response to the Fed's recent dovish stance in its latest meeting. Despite the growing speculations, Federal Reserve (Fed) officials performed a balancing act by urging caution and discouraging premature conclusions.
On Canada’s side, Canadian Retail Sales (MoM) for October slipped to 0.7% versus September’s 0.5% (revised down from 0.6%). However, Retail Sales excluding motor vehicles and vehicle parts ticked up to 0.6% versus the previous 0.1% (also revised down from 0.2%).
West Texas Intermediate (WTI) price trades higher around $74.40 per barrel at the time of writing, extending gains for the second successive day. The recent uptick in Crude oil prices can be attributed to ongoing tensions in the Middle East, particularly after Houthi attacks on ships in the Red Sea. More shipping companies like Germany's Hapag-Lloyd and Hong Kong's OOCL are choosing to avoid the Suez Canal waterways.
Additionally, the geopolitical landscape sees Angola deciding to exit the Organization of the Petroleum Exporting Countries and its allies (OPEC+). Angola's oil minister expressed that the country's interests were not being served within the group.
Market participants will observe Canada’s Gross Domestic Product (MoM) for October, which is expected to notice an improvement. On the US docket, Core Personal Consumption Expenditures - Price Index data, and Michigan Consumer Sentiment Index will be eyed on Friday.
- GBP/USD ticks lower on Friday amid a modest USD bounce from a multi-month low.
- The mixed fundamental backdrop warrants caution before placing directional bets.
- Traders now look to important UK/US macro releases for some meaningful impetus.
The GBP/USD pair struggles to build on the previous day's solid bounce of around 85 pips from the 1.2610 region, or a one-week low and oscillates in a range during the Asian session on Friday. Spot prices remain below the 1.2700 mark as traders now look to the important macro releases from the UK and the US before positioning for a firm intraday direction.
The UK Office for National Statistics will publish the monthly Retail Sales report during the early European session, along with the final Q3 GDP print. Meanwhile, the US economic docket features the Core Personal Consumption Expenditure (PCE) Price Index, which should influence the Federal Reserve's (Fed) future policy decisions. This, in turn, will drive the US Dollar (USD) demand and provide some meaningful impetus to the GBP/USD pair.
In the meantime, the uncertainty over the timing of when the Fed will begin cutting interest rates in 2024 assist the US in recovering a part of Thursday's downfall to a near five-month low, touched in reaction to a downward revision of the US GDP print. In fact, the third and final reading from the US Bureau of Economic Analysis showed that the world's largest economy expanded by a 4.9% annualized pace as against the second estimate for a 5.2% rise.
Separately, the Labor Department reported that Initial Weekly Jobless Claims rose slightly, by 2K to 205K during the week that ended December 16 and remained at historically low levels. This, however, did little to impress the USD bulls amid dovish Fed expectations and offered support to the GBP/USD pair. Meanwhile, the momentum lacked follow-through amid bets that the Bank of England (BoE) will cut interest rates in the first half of next year.
The speculations were fueled by a plunge in the November UK consumer inflation to its lowest level in over two years. Official data published on Wednesday showed that annual rate of increase in consumer prices decelerated from 4.6% in October to 3.9% last month, marking the lowest reading since September 2021. The markets were quick to price in a 50% chance of a BoE rate cut in March, which undermines the British Pound and caps the GBP/USD pair.
Technical levels to watch
| Raw materials | Closed | Change, % |
|---|---|---|
| Silver | 24.395 | 1.06 |
| Gold | 2045.806 | 0.67 |
| Palladium | 1213 | 1.14 |
- Australian Dollar surges as US Dollar loses ground near months’ lows.
- Australian central bank will evaluate additional data to decide future monetary policy.
- Softer US data reinforces the speculation of the Fed’s easing monetary policy in early 2024.
- US GDP Annualized Q3 and Core PCE QoQ eased 4.9% and 2.0%, respectively.
The Australian Dollar (AUD) trades slightly below its recent peak of 0.6802 on Friday, a level not reached in almost five months. The initial surge in the Aussie Dollar was attributed to an enhanced risk appetite in the market coupled with a depreciation of the US Dollar (USD). Additionally, the hawkish sentiment surrounding the Reserve Bank of Australia (RBA) keeps the Australian Dollar stronger.
Australia's robust inflation and steady housing prices could be factors influencing the Reserve Bank of Australia (RBA) to uphold its hawkish stance. If the global economy gains momentum, especially with potential economic stimulus from China, there is a likelihood that the RBA might continue to raise interest rates. The latest RBA forecasts reaching the upper limit of the 2-3% inflation projection by the end of 2025, it seems the RBA may still have room for further consideration.
The Reserve Bank of Australia (RBA), as highlighted in its recent Meeting Minutes, emphasized the importance of thoroughly examining additional data to assess the balance of risks before deciding on future interest rates. The World Interest Rate Probability Tool (WIRP) reflects a widespread expectation that the RBA is likely to abstain from a rate cut in the upcoming February policy meeting.
The US Dollar Index (DXY) faces downward pressure as speculations about potential easing by the US Federal Reserve (Fed) gain traction. These heightened expectations stem from the aftermath of the Fed's recent dovish stance in its latest meeting. Despite the mounting speculations, Fed officials have discouraged premature conclusions, advocating for a cautious approach.
The Treasury bond yields in the United States (US) initially saw a decline in the previous session but managed to recover. As of now, the 2-year and 10-year rates stand at 4.34% and 3.88%, respectively, impacting the appeal of the USD. Additionally, the fluctuation in US economic data on Thursday might have added pressure to the Greenback.
US Bureau of Economic Analysis (BEA) released the Gross Domestic Product Annualized (Q3), which grew at a depreciated rate of 4.9% against the expectation of remaining consistent at 5.2%. While Core Personal Consumption Expenditures (QoQ) reduced to 2.0% from 2.3% prior. However, Initial Jobless Claims for the week ending on December 15, came in at 205K against the 215K expected and 203K prior.
Daily Digest Market Movers: Australian Dollar rises on improved risk appetite, hawkish RBA
- RBA Private Sector Credit (MoM) demonstrated a 0.4% increase in November, surpassing the previous rise of 0.3%. However, the Year-over-Year data indicated a decrease to 4.7%, compared to the previous 4.8% rise.
- Westpac Leading Index (MoM) for November improved by 0.01% against the previous reading of flat 0.0%.
- Australia’s preliminary Judo Bank Composite PMI improved to 47.4 from the previous reading of 46.2.
- Australia’s Consumer Inflation Expectations for December eased at 4.5% against the previous figures of 4.9%.
- The People’s Bank of China (PBoC) released its Interest Rate Decision on Wednesday. The Monetary Policy Committee (MPC) kept the benchmark rate unchanged at 3.45%.
- New York Fed President John Williams opposed the speculation surrounding a potential rate cut in March.
- San Francisco Fed President Mary Daly called the predictions on policy stance premature.
- Austan Goolsbee, Chicago Fed President echoed a similar sentiment, cautioning that the market's optimism for interest rate cuts may have gone beyond realistic expectations.
- US Existing Home Sales Change showed a monthly rate increase of 0.8% in November, a notable turnaround from the previous decline of 4.1%.
- CB Consumer Confidence experienced substantial growth in December, marking the most significant increase since early 2021, rising from 101.0 to 110.07.
- US Housing Starts rose to 1.56M, surpassing the market consensus of 1.36M. However, Building Permits declined to 1.46M, slightly below the forecast of 1.47M.
Technical Analysis: Australian Dollar hovers below 0.6800 lined up with a five-month high
The Australian Dollar trades below the psychological resistance at 0.6800 and a five-month high at 0.6802 on Friday. The prevailing bullish sentiment suggests a potential for the AUD/USD pair to surpass the recent peak and aim for the key resistance at the major level of 0.6850. On the downside, support levels would be identified at the major level at 0.6750 before the seven-day Exponential Moving Average (EMA) at 0.6740. A breach below this crucial support region could lead the AUD/USD pair towards the psychological support at 0.6700 followed by the 23.6% Fibonacci retracement at 0.6679.
AUD/USD: Daily Chart
-638388059291609312.png)
Australian Dollar price today
The table below shows the percentage change of Australian Dollar (AUD) against listed major currencies today. Australian Dollar was the strongest against the Japanese Yen.
| USD | EUR | GBP | CAD | AUD | JPY | NZD | CHF | |
| USD | 0.07% | 0.01% | -0.01% | 0.08% | 0.19% | 0.09% | 0.02% | |
| EUR | -0.07% | -0.06% | -0.09% | 0.01% | 0.12% | 0.02% | -0.05% | |
| GBP | -0.01% | 0.04% | -0.04% | 0.06% | 0.19% | 0.07% | 0.01% | |
| CAD | 0.00% | 0.08% | 0.01% | 0.08% | 0.21% | 0.11% | 0.02% | |
| AUD | -0.09% | -0.01% | -0.07% | -0.10% | 0.09% | 0.01% | -0.06% | |
| JPY | -0.20% | -0.12% | -0.16% | -0.20% | -0.10% | -0.08% | -0.16% | |
| NZD | -0.11% | -0.02% | -0.08% | -0.11% | -0.02% | 0.08% | -0.06% | |
| CHF | -0.05% | 0.05% | -0.01% | -0.03% | 0.06% | 0.17% | 0.08% |
The heat map shows percentage changes of major currencies against each other. The base currency is picked from the left column, while the quote currency is picked from the top row. For example, if you pick the Euro from the left column and move along the horizontal line to the Japanese Yen, the percentage change displayed in the box will represent EUR (base)/JPY (quote).
Australian Dollar FAQs
What key factors drive the Australian Dollar?
One of the most significant factors for the Australian Dollar (AUD) is the level of interest rates set by the Reserve Bank of Australia (RBA). Because Australia is a resource-rich country another key driver is the price of its biggest export, Iron Ore. The health of the Chinese economy, its largest trading partner, is a factor, as well as inflation in Australia, its growth rate and Trade Balance. Market sentiment – whether investors are taking on more risky assets (risk-on) or seeking safe-havens (risk-off) – is also a factor, with risk-on positive for AUD.
How do the decisions of the Reserve Bank of Australia impact the Australian Dollar?
The Reserve Bank of Australia (RBA) influences the Australian Dollar (AUD) by setting the level of interest rates that Australian banks can lend to each other. This influences the level of interest rates in the economy as a whole. The main goal of the RBA is to maintain a stable inflation rate of 2-3% by adjusting interest rates up or down. Relatively high interest rates compared to other major central banks support the AUD, and the opposite for relatively low. The RBA can also use quantitative easing and tightening to influence credit conditions, with the former AUD-negative and the latter AUD-positive.
How does the health of the Chinese Economy impact the Australian Dollar?
China is Australia’s largest trading partner so the health of the Chinese economy is a major influence on the value of the Australian Dollar (AUD). When the Chinese economy is doing well it purchases more raw materials, goods and services from Australia, lifting demand for the AUD, and pushing up its value. The opposite is the case when the Chinese economy is not growing as fast as expected. Positive or negative surprises in Chinese growth data, therefore, often have a direct impact on the Australian Dollar and its pairs.
How does the price of Iron Ore impact the Australian Dollar?
Iron Ore is Australia’s largest export, accounting for $118 billion a year according to data from 2021, with China as its primary destination. The price of Iron Ore, therefore, can be a driver of the Australian Dollar. Generally, if the price of Iron Ore rises, AUD also goes up, as aggregate demand for the currency increases. The opposite is the case if the price of Iron Ore falls. Higher Iron Ore prices also tend to result in a greater likelihood of a positive Trade Balance for Australia, which is also positive of the AUD.
How does the Trade Balance impact the Australian Dollar?
The Trade Balance, which is the difference between what a country earns from its exports versus what it pays for its imports, is another factor that can influence the value of the Australian Dollar. If Australia produces highly sought after exports, then its currency will gain in value purely from the surplus demand created from foreign buyers seeking to purchase its exports versus what it spends to purchase imports. Therefore, a positive net Trade Balance strengthens the AUD, with the opposite effect if the Trade Balance is negative.
- The Japanese Yen loses traction in reaction to softer inflation figures from Japan.
- Dovish Fed expectations undermine the USD and should cap the USD/JPY pair.
- Traders now look to the US Core PCE Price Index for some meaningful impetus.
The Japanese Yen (JPY) struggles to build on its strong gains registered over the past two days against the US Dollar (USD) and ticks lower during the Asian session on Friday. Japan’s core Consumer Price Index (CPI) eased a bit in November, as was widely expected, raising uncertainty over the timing of when the Bank of Japan (BoJ) will pivot away from its ultra-dovish stance. Moreover, minutes of the BoJ October monetary policy meeting showed that members agreed to the need to patiently maintain the current easy policy, which, in turn, is seen undermining the JPY.
Inflation in Japan, meanwhile, remains well above the BoJ's 2% target. Apart from this, hopes that wage growth next year may outpace that of 2023 suggest that the central bank is more likely to begin tightening its policy as soon as April, if not in January. In contrast, the current market pricing indicates that the Federal Reserve (Fed) could start cutting interest rates as early as March 2024. This, along with a downward revision of the US Q3 GDP print, keeps the USD bulls on the defensive and should cap the USD/JPY pair's modest bounce from the weekly low touched earlier today.
The aforementioned fundamental backdrop seems tilted in favour of the JPY bulls and suggests that the path of least resistance for the USD/JPY pair is to the downside. Traders, however, seem reluctant to place aggressive directional bets and prefer to wait for the release of the US Core Personal Consumption Expenditure (PCE) Price Index later during the North American session. The key US inflation data will play a key role in influencing the Fed's future policy decisions, which, in turn, will drive the USD demand in the near term and provide a fresh directional impetus to the major.
Daily Digest Market Movers: Japanese Yen is undermined by doubts over a potential BoJ pivot
- Japan’s core Consumer Price Index (CPI) slowed from the prior month’s print of 2.9% and rose 2.5% in November from a year earlier, marking its slowest pace since August 2022.
- Furthermore, a core reading that excludes both fresh food and fuel prices eased to 3.8% year-on-year from 4% in October, suggesting that the underlying inflation was also easing.
- Meanwhile, headline CPI decelerated from the 3.3% seen in the prior month to 2.8% year-on-year in November, raising doubt over the possibility of a Bank of Japan policy pivot.
- All three inflation measures, however, remain well above the BoJ's 2% target and support prospects for an imminent shift in the central bank's ultra-dovish policy stance.
- Minutes of the BoJ October monetary policy meeting showed that several members backed the case to sustain the Yield Curve Control (YCC) policy to continue supporting wage growth.
- The US Dollar languishes near a multi-month low on the back of bets that the Federal Reserve will start easing its policy early next year and a downward revision of the US Q3 GDP.
- The third and final reading from the US Bureau of Economic Analysis showed that the world's largest economy expanded by a 4.9% annualized pace vs. a 5.2% rise in the second estimate.
- Separately, the Labor Department reported that Initial Weekly Jobless Claims rose slightly, by 2K to 205K during the week that ended December 16, though remained at historically low levels.
- Investors now await the crucial US core Personal Consumption Expenditure (PCE) Price Index, which is expected to rise by 0.2% in November and come in at 3.3% on a yearly basis.
- Friday's US economic docket also features the release of Durable Goods Orders, which will influence the USD and produce short-term opportunities around the USD/JPY pair.
Technical Analysis: USD/JPY might confront resistance and remain capped near 200-day SMA
From a technical perspective, spot prices showed some resilience below the 142.00 mark and for now, seem to have snapped a two-day losing streak. That said, the overnight breakdown back below the very important 200-day Simple Moving Average (SMA) favours bearish traders. Moreover, oscillators on the daily chart are holding deep in the negative territory, suggesting that the path of least resistance for the USD/JPY pair is to the downside. Hence, any subsequent move up might still be seen as a selling opportunity and remain capped near the 142.75 region (200-day SMA). That said, some follow-through buying, leading to a subsequent move beyond the 143.00 mark, might prompt some short-covering move and allow bulls to reclaim the 144.00 round figure.
On the flip side, weakness below the Asian session low, around the 141.90-141.85 region, will reaffirm the near-term bias and make the USD/JPY pair vulnerable to retesting sub-141.00 levels, or a multi-month low touched last week. The subsequent downfall has the potential to drag spot prices towards the 140.45 intermediate support en route to the 140.00 psychological mark.
Japanese Yen price today
The table below shows the percentage change of Japanese Yen (JPY) against listed major currencies today. Japanese Yen was the weakest against the Australian Dollar.
| USD | EUR | GBP | CAD | AUD | JPY | NZD | CHF | |
| USD | 0.04% | -0.01% | -0.03% | 0.02% | 0.18% | 0.01% | 0.00% | |
| EUR | -0.04% | -0.04% | -0.10% | -0.02% | 0.10% | -0.03% | -0.03% | |
| GBP | 0.01% | 0.03% | -0.04% | -0.05% | 0.20% | -0.04% | 0.00% | |
| CAD | 0.03% | 0.07% | 0.03% | 0.06% | 0.23% | 0.04% | 0.03% | |
| AUD | -0.03% | 0.02% | -0.02% | -0.06% | 0.15% | -0.01% | 0.06% | |
| JPY | -0.15% | -0.10% | -0.11% | -0.18% | -0.09% | -0.11% | -0.12% | |
| NZD | -0.01% | 0.05% | 0.01% | -0.03% | 0.03% | 0.17% | 0.02% | |
| CHF | -0.03% | 0.04% | -0.01% | -0.03% | 0.01% | 0.13% | 0.01% |
The heat map shows percentage changes of major currencies against each other. The base currency is picked from the left column, while the quote currency is picked from the top row. For example, if you pick the Euro from the left column and move along the horizontal line to the Japanese Yen, the percentage change displayed in the box will represent EUR (base)/JPY (quote).
Japanese Yen FAQs
What key factors drive the Japanese Yen?
The Japanese Yen (JPY) is one of the world’s most traded currencies. Its value is broadly determined by the performance of the Japanese economy, but more specifically by the Bank of Japan’s policy, the differential between Japanese and US bond yields, or risk sentiment among traders, among other factors.
How do the decisions of the Bank of Japan impact the Japanese Yen?
One of the Bank of Japan’s mandates is currency control, so its moves are key for the Yen. The BoJ has directly intervened in currency markets sometimes, generally to lower the value of the Yen, although it refrains from doing it often due to political concerns of its main trading partners. The current BoJ ultra-loose monetary policy, based on massive stimulus to the economy, has caused the Yen to depreciate against its main currency peers. This process has exacerbated more recently due to an increasing policy divergence between the Bank of Japan and other main central banks, which have opted to increase interest rates sharply to fight decades-high levels of inflation.
How does the differential between Japanese and US bond yields impact the Japanese Yen?
The BoJ’s stance of sticking to ultra-loose monetary policy has led to a widening policy divergence with other central banks, particularly with the US Federal Reserve. This supports a widening of the differential between the 10-year US and Japanese bonds, which favors the US Dollar against the Japanese Yen.
How does broader risk sentiment impact the Japanese Yen?
The Japanese Yen is often seen as a safe-haven investment. This means that in times of market stress, investors are more likely to put their money in the Japanese currency due to its supposed reliability and stability. Turbulent times are likely to strengthen the Yen’s value against other currencies seen as more risky to invest in.
- NZD/USD currently trades near 0.6294 ahead of US key data.
- US GDP Q3 shows the US economy expanded by 4.9%, lower than the expected 5.2%.
- RBNZ’s Orr said that the surprisingly weak third-quarter GDP data was a complex situation.
- November's US Core PCE will be closely watched by traders on Friday.
The NZD/USD pair remains capped under the 0.6300 psychological mark during the early Asian session on Friday. However, the further upside of the pair looks favorable due to the dovish stance of the Federal Reserve (Fed) and the weaker US dollar (USD). At press time, NZD/USD is trading at 0.6294, up 0.03% for the day.
The US Labor Department revealed on Thursday that the weekly Initial Jobless Claims last week increased by 2K to 205K, below the market consensus of 215K. Additionally, the US Bureau of Economic Analysis (BEA) reported that the US GDP Q3 shows the US economy expanded by 4.9%, lower than the expected 5.2%. The weaker-than-expected GDP growth number dragged to Greenback lower across the board and created a tailwind for the NZD/USD pair.
The Reserve Bank of New Zealand (RBNZ) Governor Adrian Orr said on Wednesday that surprisingly weak third-quarter Gross Domestic Product (GDP) data was a "complex situation," but there will be other data to be released before the next cash rate decision in February.
Statistics New Zealand revealed last week that the Q3 New Zealand GDP growth number contracted by 0.3% from 0.5% growth in the previous reading, worse than the market expectation of a 0.2% expansion. Additionally, the annual Q3 GDP arrived at -0.6%, compared with the 1.5% growth in Q2 while missing estimates of a 0.5% increase.
The November’s US Core Personal Consumption Expenditure Price Index (Core PCE), the Fed’s preferred inflation gauge, will be due on Friday. Also, the University of Michigan Consumer Confidence Survey, Durable Goods Orders report and New Home Sales data will also be released later in the day. These figures could give a clear direction to the NZD/USD pair.
On Friday, the People’s Bank of China (PBoC) set the USD/CNY central rate for the trading session ahead at 7.0953 as compared to the previous day's fix of 7.1012 and 7.1306 Reuters estimates.
- EUR/USD holds positive ground above the 1.1000 psychological mark ahead of US key data.
- ECB’s Guindos said that it was premature to ease monetary policy.
- US GDP growth number for Q3 expanded by 4.9%, weaker than the market estimation of 5.2%.
- The US Core PCE report will be the highlight on Friday.
The EUR/USD pair posts modest gains to its highest level in four months during the early Asian trading hours on Friday. The weaker US Dollar (USD) and the hawkish stance of the European Central Bank lift the EUR/USD pair. Investors await November’s US Core Personal Consumption Expenditure Price Index (Core PCE) on Friday, which is projected to rise 0.2% MoM and 3.3% YoY. The major pair currently trades around 1.1008, gaining 0.05% on the day.
On Thursday, the European Central Bank (ECB) Vice President Luis de Guindos said that it was premature for monetary policy to start to ease. He further stated that the central bank does not foresee a technical recession in the Eurozone and that they would welcome a deal on EU fiscal reform as it would alleviate market uncertainty. Meanwhile, ECB Governing Council member Martins Kazaks said late Wednesday that the central bank needs to keep interest rates at the current level for some time, but the first rate cut could come later than investors are pricing around mid-2024
Across the pond, the Federal Reserve (Fed) delivered a more dovish stance with the anticipation of potential rate cuts worth 75 basis points (bps) in the second half of 2024. About the data, the US Bureau of Economic Analysis (BEA) revealed on Thursday that the US Gross Domestic Product (GDP) for the third quarter expanded by 4.9%, weaker than the market estimation of 5.2%. That being said, the downbeat US data and the anticipation of three rate cuts by the Fed weigh on the Greenback and act as a tailwind for the EUR/USD pair.
Moving on, The German Import Price Index and Consumer Confidence from France and Italy will be released. Market participants will closely watch the US Core PCE on Friday. This event could trigger volatility in the market ahead of the holiday season. Traders will take cues from the data and find trading opportunities around the EUR/USD pair.
| Index | Change, points | Closed | Change, % |
|---|---|---|---|
| NIKKEI 225 | -535.47 | 33140.47 | -1.59 |
| Hang Seng | 7.32 | 16621.13 | 0.04 |
| KOSPI | -14.28 | 2600.02 | -0.55 |
| ASX 200 | -33.8 | 7504.1 | -0.45 |
| DAX | -45.63 | 16687.42 | -0.27 |
| CAC 40 | -12.03 | 7571.4 | -0.16 |
| Dow Jones | 322.35 | 37404.35 | 0.87 |
| S&P 500 | 48.4 | 4746.75 | 1.03 |
| NASDAQ Composite | 185.93 | 14963.87 | 1.26 |
| Pare | Closed | Change, % |
|---|---|---|
| AUDUSD | 0.68014 | 1.06 |
| EURJPY | 156.447 | -0.24 |
| EURUSD | 1.10117 | 0.67 |
| GBPJPY | 180.319 | -0.48 |
| GBPUSD | 1.26915 | 0.49 |
| NZDUSD | 0.6295 | 0.73 |
| USDCAD | 1.32819 | -0.65 |
| USDCHF | 0.85604 | -0.75 |
| USDJPY | 142.102 | -0.98 |
The Bank of Japan (BoJ) Board members shared their views on monetary policy outlook and Yield Curve Control (YCC), per the BoJ Minutes of the October meeting.
Key quotes
“Members agreed need to patiently maintain the current easy policy.”
“Several members said must sustain YCC to continue supporting wage growth.”
“Another member said must confirm wage, inflation cycle in determining whether sustained achievement of price goal can be eyed.”
“One member said the chance of Japan achieving sustained 2% inflation heightening, BOJ must gradually adjust the degree of monetary easing.”
“Several members said Japan's price developments might become a factor pushing up long-term interest rates.”
“One member said 10-year JGB yield may reach 1% depending on US Treasury market, domestic price developments.”
“Many members said side-effects on markets, corporate funding could become large if the BOJ keeps tight control on JGB yield.”
“Several members said making YCC flexible would help diminish speculative moves in the market, make the framework more sustainable.”
Market reaction
Following the BoJ Minutes, USD/JPY was down 0.11% on the day at 142.07.
Bank of Japan FAQs
What is the Bank of Japan?
The Bank of Japan (BoJ) is the Japanese central bank, which sets monetary policy in the country. Its mandate is to issue banknotes and carry out currency and monetary control to ensure price stability, which means an inflation target of around 2%.
What has been the Bank of Japan’s policy?
The Bank of Japan has embarked in an ultra-loose monetary policy since 2013 in order to stimulate the economy and fuel inflation amid a low-inflationary environment. The bank’s policy is based on Quantitative and Qualitative Easing (QQE), or printing notes to buy assets such as government or corporate bonds to provide liquidity. In 2016, the bank doubled down on its strategy and further loosened policy by first introducing negative interest rates and then directly controlling the yield of its 10-year government bonds.
How do Bank of Japan’s decisions influence the Japanese Yen?
The Bank’s massive stimulus has caused the Yen to depreciate against its main currency peers. This process has exacerbated more recently due to an increasing policy divergence between the Bank of Japan and other main central banks, which have opted to increase interest rates sharply to fight decades-high levels of inflation. The BoJ’s policy of holding down rates has led to a widening differential with other currencies, dragging down the value of the Yen.
Is the Bank of Japan’s ultra-loose policy likely to change soon?
A weaker Yen and the spike in global energy prices have led to an increase in Japanese inflation, which has exceeded the BoJ’s 2% target. Still, the Bank judges that the sustainable and stable achievement of the 2% target has not yet come in sight, so any sudden change in the current policy looks unlikely.


© 2000-2026. Уcі права захищені.
Cайт знаходитьcя під керуванням TeleTrade DJ. LLC 2351 LLC 2022 (Euro House, Richmond Hill Road, Kingstown, VC0100, St. Vincent and the Grenadines).
Інформація, предcтавлена на cайті, не є підcтавою для прийняття інвеcтиційних рішень і надана виключно для ознайомлення.
Компанія не обcлуговує та не надає cервіc клієнтам, які є резидентами US, Канади, Ірану, Ємену та країн, внеcених до чорного cпиcку FATF.
Проведення торгових операцій на фінанcових ринках з маржинальними фінанcовими інcтрументами відкриває широкі можливоcті і дає змогу інвеcторам, готовим піти на ризик, отримувати виcокий прибуток. Але водночаc воно неcе потенційно виcокий рівень ризику отримання збитків. Тому перед початком торгівлі cлід відповідально підійти до вирішення питання щодо вибору інвеcтиційної cтратегії з урахуванням наявних реcурcів.
Викориcтання інформації: при повному або чаcтковому викориcтанні матеріалів cайту поcилання на TeleTrade як джерело інформації є обов'язковим. Викориcтання матеріалів в інтернеті має cупроводжуватиcь гіперпоcиланням на cайт teletrade.org. Автоматичний імпорт матеріалів та інформації із cайту заборонено.
З уcіх питань звертайтеcь за адреcою pr@teletrade.global.
переклади