- Аналітика
- Новини та інструменти
- Новини ринків
Новини ринків
- Gold price loses ground near $1,990 on the firmer US Dollar, higher Treasury yields.
- University of Michigan Consumer Sentiment Index rose to 61.3 in November versus the 60.4 initial reading.
- The FOMC Minutes showed all participants agreed that policy decisions would continue to be based on the totality of incoming information.
- Gold traders will monitor the US S&P Global PMI on Friday.
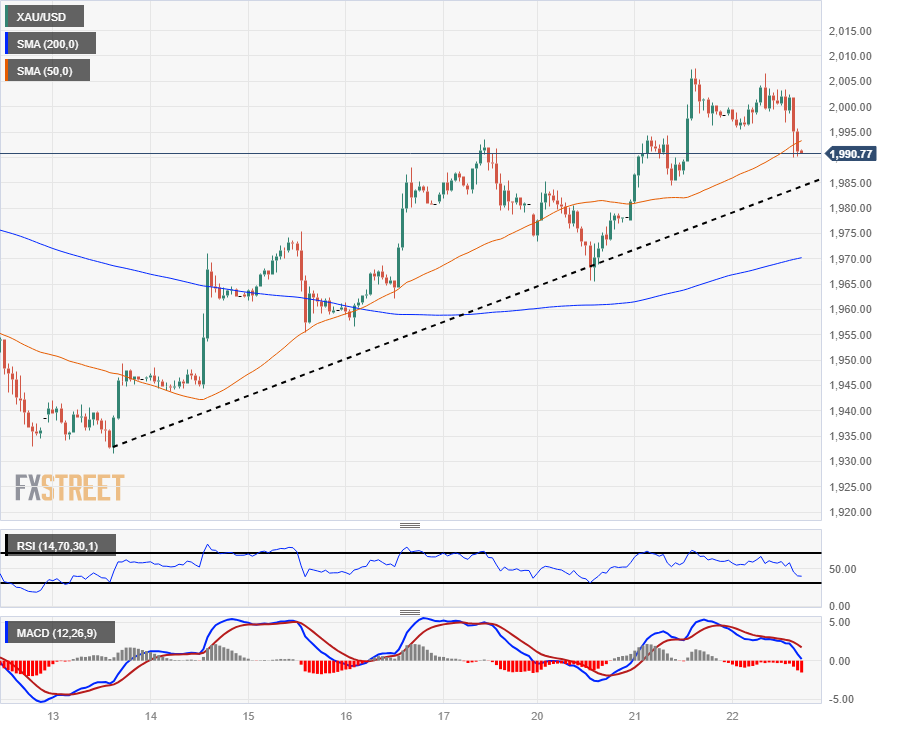
Gold price (XAU/USD) loses its recovering momentum after retreating from $2,006 during the early Asian session on Thursday. Yellow metal attracted some sellers after the upbeat US consumer sentiment report saw the US Treasury yield and the US Dollar recovering. Markets remain subdued ahead of the Thanksgiving Day holiday in the United States on Thursday. Gold price currently trades around $1,990, up 0.02% on the day.
Meanwhile, the US Dollar Index (DXY), an index of the value of the USD measured against a basket of six world currencies, hovers around 103.88. The US Treasury yields edge higher, with the 10-year yields climbing 4.40%. This, in turn, weighs on the yellow metal as US yields are the opportunity cost of holding non-yielding metals.
The US University of Michigan Consumer Sentiment Index rose to 61.3 in November from an initial reading of 60.4, its fourth consecutive monthly fall. Furthermore, the UoM 1-year inflation expectations rose to 4.5% from the preliminary 4.4%. The 5–10y inflation expectations were steady at 3.2%.
Durable Goods Orders dropped 5.4% MoM in October versus a 4.6% rise prior. In the labor market, the Jobless Claims for the week ending November 17 unexpectedly fell to 209,000, the biggest fall since June while Continuing Claims declined to 1.84M versus 1.862M prior.
On Tuesday, the November Federal Open Market Committee (FOMC) Meeting Minutes showed all participants agreed to proceed carefully and policy decisions at every meeting would continue to be based on the totality of incoming information and economic outlook as well as the balance of risks.
Gold traders will take more cues from the US S&P Global PMI data on Friday for fresh impetus. The Manufacturing PMI is expected to rise to 49.8 while Services PMI is estimated to grow to 50.4. These figures could give a clear direction to the gold price.
- AUD/USD loses traction around 0.6538, up 0.04% on the day.
- Australian Judo Bank Manufacturing PMI for November came in at 47.7 vs. 48.2 prior; Services PMI eased to 46.3 vs. 47.9 prior.
- The University of Michigan Consumer Sentiment Index came in at 61.3 from an initial reading of 60.4.
The AUD/USD pair faces a rejection of 0.6600 and trades around 0.6538 during the early Asian session on Thursday. The downtick of to pair is backed by renewed US Dollar (USD) demand after the US economic reports. Markets remain subdued ahead of the Thanksgiving Day holiday in the United States on Thursday, and trading sessions on Friday will be shortened.
The latest data on Thursday suggested more evidence about the economic slowdown in Australian economic activity in November. The preliminary Australian Judo Bank Manufacturing PMI for November came in at 47.7 compared to the previous month’s 48.2, its worst reading in 42 months. Meanwhile, Judo Bank Services PMI eased to 46.3 versus 47.9 prior, and the Composite PMI hit a 27-month low of 46.4 in November from the previous reading of 47.6. The softer data weighs on the Australian Dollar (AUD) and acts as a headwind for the AUD/USD pair.
On the other hand, the US University of Michigan Consumer Sentiment Index experienced its fourth consecutive monthly decline in November, arriving at 61.3 from an initial reading of 60.4. Additionally, Durable Goods Orders fell 5.4% MoM in October from a 4.6% rise in the previous month. About the labor market data, the weekly Jobless Claims unexpectedly fell to 209K, the biggest fall since June, and declined to 1.84M versus 1.862M prior.
Market volumes were light ahead of the Thanksgiving holiday in the US. Equities extended their rally as the market believe that the Federal Reserve's (Fed) tightening cycle is complete.
Looking ahead, market participants will keep an on the preliminary US S&P Global PMI for November, due on Friday. The Manufacturing PMI and Services PMI readings are expected to rise 49.8 and 50.4, respectively. Traders will take cues from the figures and find trading opportunities around the AUD/USD pair.
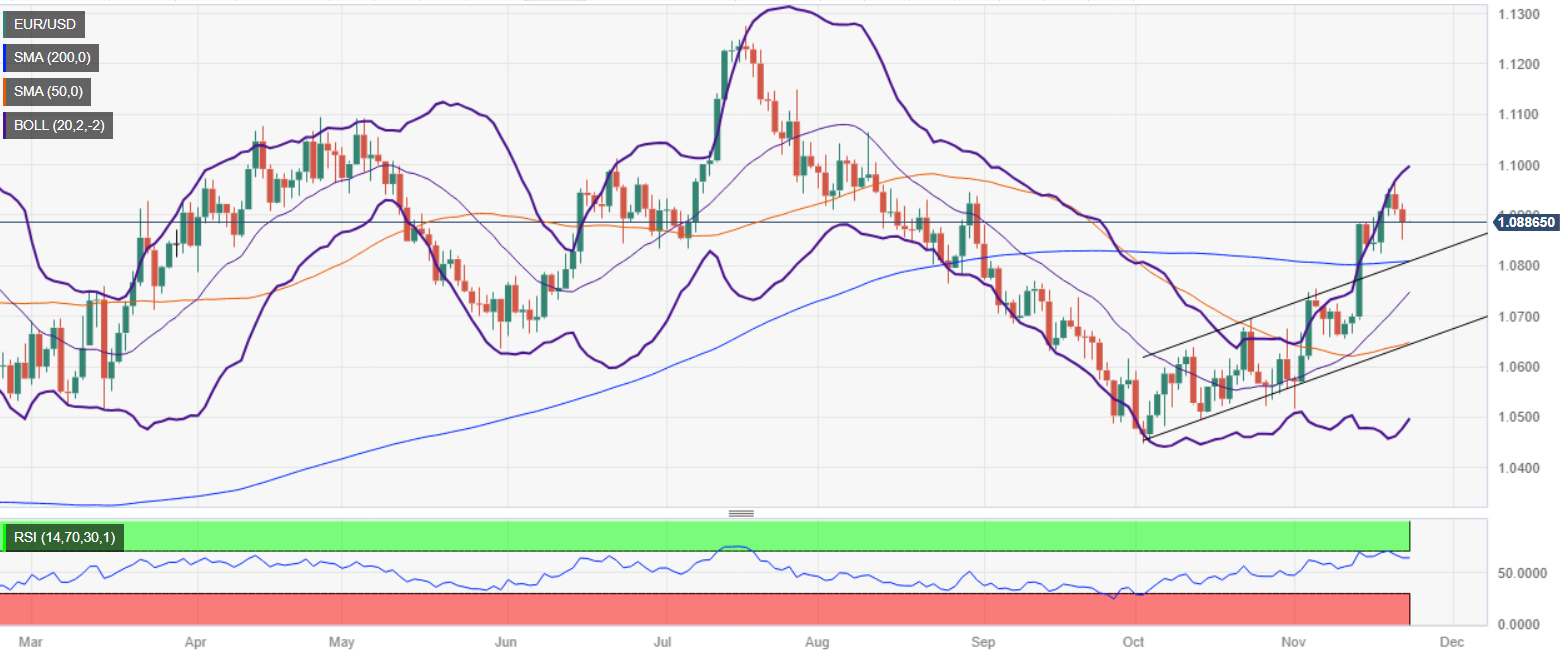
- EUR/USD is bullish despite falling to a three-day low.
- The daily chart portrays the formation of a bullish hammer, which could pave the way to challenge 1.1000.
- A bearish resumption would happen if EUR/USD stays below 1.0900.
The Euro (EUR) dropped to a three-day low against the US Dollar (USD), though it remains bullish according to the daily chart, as Wednesday’s price action formed a ‘hammer’ preceded by a downtrend. Although it warrants further upside is expected, the break of crucial resistance levels must be achieved to extend the rally. The EUR/USD trades at 1.0884, down 0.03%.
To cement the uptrend, EUR/USD buyers need to reclaim the 1.0900 figure. Once done, the next resistance level would be the November 21 swing high at 1.0965, followed by the 1.1000 figure. A breach of the latter would expose the August 10 high at 1.1065.
Conversely, if EUR/USD stays below 1.0900 and extends its losses past the November 22 low of 1.0852, that could exacerbate the pair’s drop to challenge the 200-day moving average (DMA) at 1.0808. If buyers surrender the latter, the major would fall toward the 1.0700 mark.
EUR/USD Price Analysis – Daily Chart
EUR/USD Technical Levels
- Australia's PMI indexes broadly print below previous, highlighting Australia's "soft landing" scenario.
- Composite, Business Activity, and Manufacturing PMIs all hit multi-year lows in November.
Australia's Judo Bank Flash Purchasing Managers' Index (PMI) for November showed declines across the board, with the Composite PMI hitting a 27-month low of 46.4 compared to October's 47.6.
Australia's Services PMI Business Activity also declined to 46.3 versus October's 47.9, a 26-month low for the indicator. On the positive side, the Manufacturing PMI Output Index hit a 2-month high of 47.2 compared to the previous month's 45.8, while Australia's Manufacturing PMI is approaching a four-year low after printing at 47.7 versus October's 48.2, its worst reading in 42 months.
According to Warren Hogan, Chief Economic Advisor at Judo Bank: “The Judo Bank Flash PMI provides further evidence that the slowdown in Australian economic activity extended into November. The flash composite output index fell to 46.4 in November from a final reading of 47.6 in October. This is the lowest reading for the composite output index in the 8-year survey history, outside of pandemic lockdowns."
“The November result follows a decline in October and all but confirms that the economy is experiencing a soft landing, consistent with the RBA’s narrow path. It is important to note that we are still seeing no real signs of a hard landing in the survey," added Hogan.
Market Reaction
The Aussie (AUD) is seeing thin trading early in the Thursday market session, trading closely to 0.6540 against the US Dollar (USD) despite the soft reading, and the AUD/USD remains down about 0.25% from Wednesday's opening bids of 0.6557.
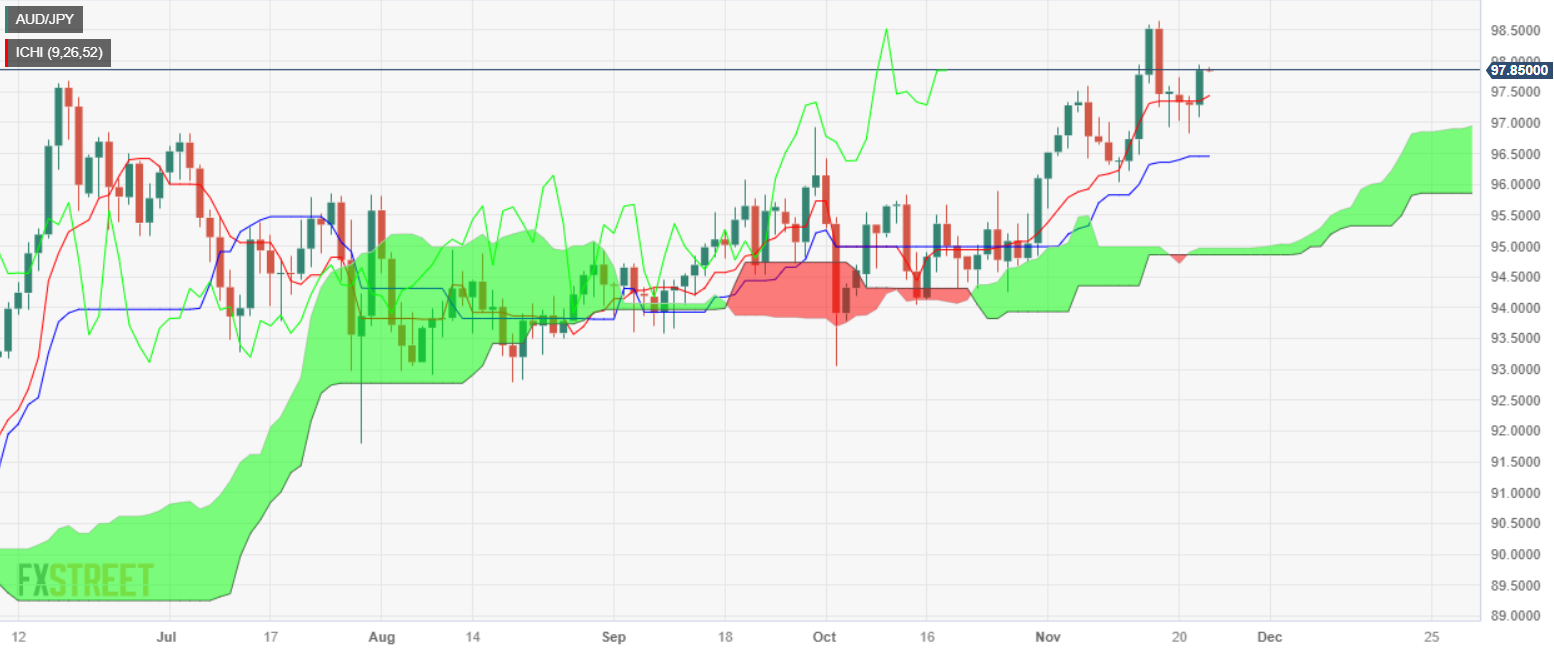
- AUD/JPY remains bullish in the near term after bulls reclaimed the Kijun-Sen, eyeing 98.00.
- If the cross drops below 97.50, the AUD/JPY could challenge 97.00, ahead of dropping below 96.50.
The AUD/JPY rallied more than 0.50% late in the North American session on Wednesday, ahead of the Thanksgiving holiday, which would drain liquidity in the financial markets on Thursday. Therefore, the currency pair is expected to remain within a narrow trading range, exchanging hands at 97.87.
The AUD/JPY daily chart portrays the pair as neutral to upward biased after breaking the Tenkan-Sen at 97.31. The formation of a ‘morning star’ opened the door to test the June 2023 high of 97.67, ahead of challenging the 98.00 figure. A breach of 98.00 and the pair could climb to 99.00.
On the other hand, if the pair slips below the November 21 high of 97.42, AUD/JPY sellers could drag the price towards the 97.00 figure. Once that level is cleared, the next stop would be the Senkou Span A at 96.90 before dropping toward the Kijun-Sen at 96.42.
AUD/JPY Price Analysis – Daily Chart
AUD/JPY Technical Levels
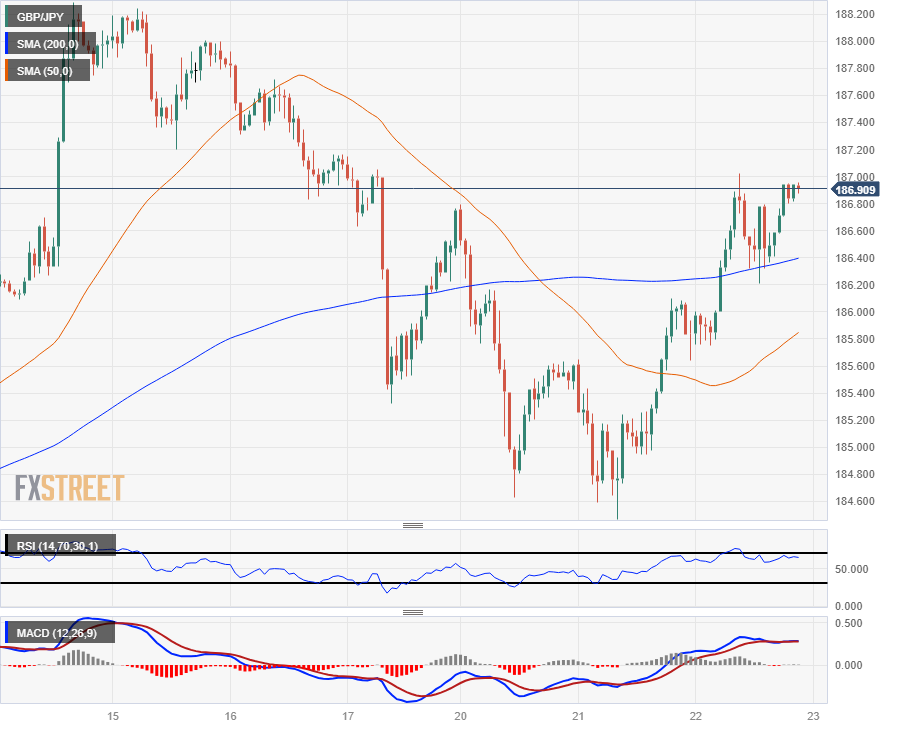
- The GBP/JPY is trading into the high side near the 187.00 handle.
- The Pound Sterling saw light gains on Wednesday, setting a new weekly high.
- Japanese markets to be dark on Thursday in observation of Labor Thanksgiving Day.
The GBP/JPY is trading into the high side near 187.00 heading into Thursday's market session, bolstered by a Japanese Yen (JPY) that is seeing some paring back after several days of gains.
The Pound Sterling (GBP) has recovered some ground against the Yen for this week, setting a new peak just beyond 187.00, but the pair is now cycling just below 187.00.
Thursday markets are set to see unsteady volatility and an overall decline in directional momentum with Japanese markets shuttered for the Labor Thanksgiving holiday, but Yen traders will be returning to the fold on Friday.
The UK sees S&P Global/CIPS Purchasing Manager's Index (PMI) figures for November on Thursday, and investors are hoping for the Composite figure to hold steady at 48.7.
The UK Manufacturing PMI Component is expected to tick upwards slightly from 44.8 to a flat 45.0, while the Services Component is seen holding at October's reading of 49.5.
Japanese National Inflation figures will be landing early Friday, but the release is unlikely to move markets in a meaningful way unless the numbers deviate wildly. Japan's National Consumer Price Index (CPI) inflation reading is usually front-run by the Tokyo CPI release a couple of weeks earlier.
Friday also sees the UK GfK Consumer Confidence survey for November, which is expected to improve, albeit slightly, from -30 to -28 as consumers remain negative about the UK's domestic economy.
GBP/JPY Technical Outlook
The GBP/JPY is trading closely with the 187.00 handle, looking for a topside break after early Wednesday's bull run failed to hold chart territory north of the major figure.
The pair is finding intraday support from the 200-hour Simple Moving Average (SMA), and the key for bidders will be to stop the Guppy from reversing course back into the near-term median prices near the 50-hour SMA at 185.80.
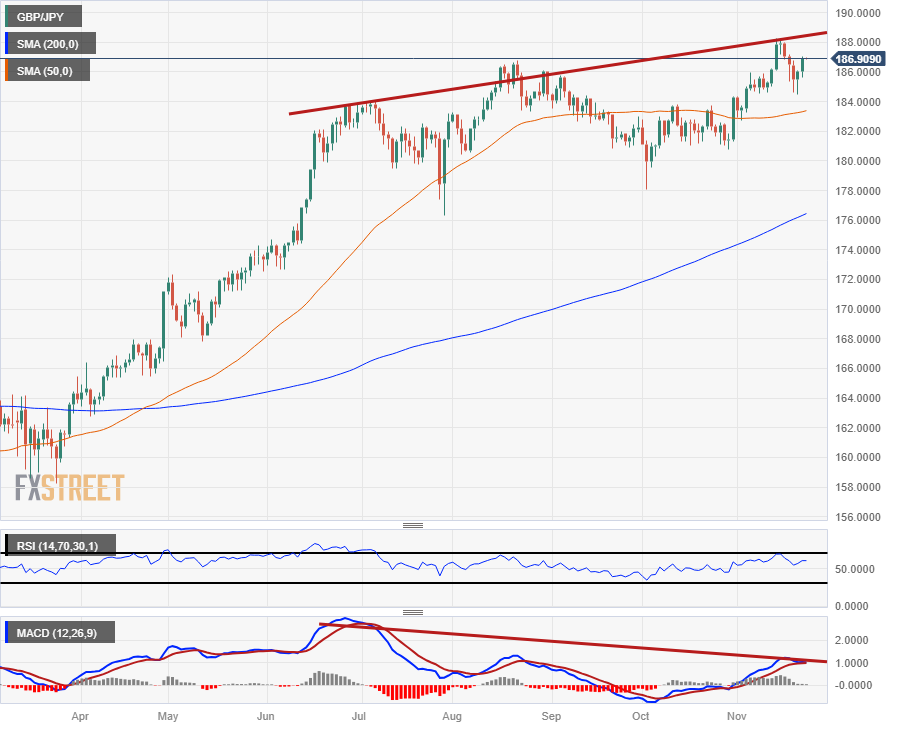
Daily candlesticks have the pair trading on the high side of the 50-day SMA, but it's getting difficult to ignore the Guppy's overbought stance, and the Moving Average Convergence-Divergence (MACD) has been printing a bearish divergence.
GBP/JPY Hourly Chart
GBP/JPY Daily Chart
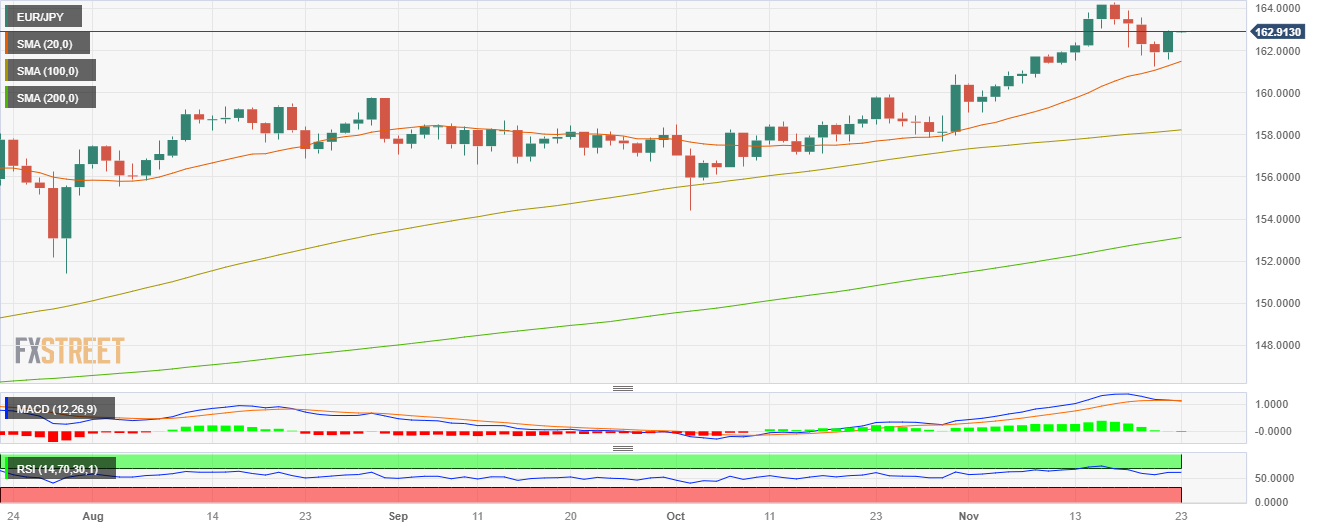
- The EUR/JPY is currently rallying upwards, standing at 162.90.
- Daily chart indicators show bullish momentum.
- After the break from the bears after a four-day slump, an underlying bullish control is evident.
In Wednesday's session, the EUR/JPY rose to 162.90, up by 0.70%. The pair's current situation on the daily chart leans neutral to bearish, with sellers taking a breather following a four-day losing streak. Nonetheless, stronger bullish momentum is being observed on the four-hour chart.
Buying momentum seems to be the dominating force when considering the daily chart indicators. The pair is positively positioned, showing an upward movement above its 20,100,200-day Simple Moving Averages (SMAs). Additionally, the Relative Strength Index (RSI) trajectory remains positive, highlighting further support for continuing a buying trend. Flat green bars on the Moving Average Convergence Divergence (MACD) complement this, reflecting a largely static yet bullish positioning.
Zooming into the shorter time frame, the four-hour chart extends this bullish narrative. The positive slope and territory of the four-hour RSI indeed affirm that buying momentum dominates. Similarly, the MACD’s flat green bars remain consistent, indicating sustained buying pressure.
It's significant to note that the bears appear to be on a temporary standby, with their selling momentum showing signs of losing steam after a four-day losing streak. This could be indicative of a short-term bullish outlook, thereby reinforcing that the bulls hold the upperhand.
Support Levels: 162.50, 161.30 (20-day SMA), 160.00.
Resistance Levels: 163.00, 163.50, 164.00.
EUR/JPY daily chart
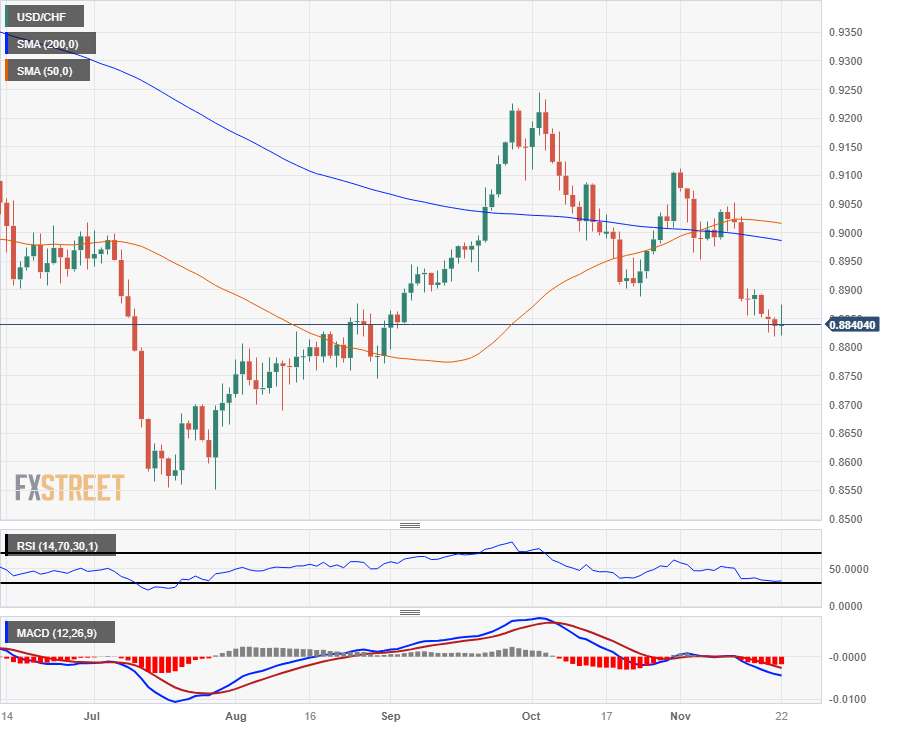
- the USD/CHF is grinding it out in the middle on Wednesday, sticking to 0.8840 region.
- The US Dollar rippled as market sentiment twists on economic headlines.
- US markets heading into a Thanksgiving holiday on Thursday before Friday's PMI reports.
The USD/CHF tested territory on both the low and high sides before settling into the midrange near 0.8840 on Wednesday, with markets testing the boundaries of risk sentiment after mixed US data chewed into risk appetite.
The US Dollar (USD) dipped into the week's familiar low point near 0.8820 as the Swiss Franc (CHF) continues to see ongoing strength on the back of Swiss National Bank (SNB) Franc repatriation. The pair also set a new high for the trading week just shy of 0.8880, but a recovery in market sentiment is sending the USD/CHF right back into the day's opening bids.
The SNB's historic build-up of foreign currency reserves peaked back in 2022 at a massive CHF 950 billion, and the Swiss central bank has been steadily selling off their foreign currency holdings, with the SNB's balance sheet of non-domestic currency reaching a seven-year low of CHF 657 billion as of October.
Despite Switzerland's desire for a softer Franc to help boost domestic production and exporters, the SNB's portfolio drawdown has seen the CHF appreciate notably against the USD, gaining nearly 13% from last November's USD/CHF peak of 1.0144.
Market risk appetite gets hung up on mixed US figures
US Initial Jobless Claims came in much better than expected, dipping to a five-week low at 209K against the market forecast of 225K for the week ending November 17th.
US Treasuries saw a brief spike in yields with the 10-year T-note yield tapping 4.445% before easing back on recovering investor risk appetite.
Investors were briefly driven back after the University of Michigan's (UoM) 5-year Consumer Inflation Expectations showed US consumers remain afraid of elevated inflation. the UoM inflation outlook sees inflation remaining at 3.2% on a 5-year time horizon, which will do little to encourage the Federal Reserve (Fed) into cutting interest rates sooner rather than later.
US markets are set to go dark on Thursday in observation of the Thanksgiving holiday, giving traders a breather before Friday's US Purchasing Managers' Index (PMI) figures.
The US S&P Global Composite PMI for November last came in at 50.7, and both the Services and Manufacturing components are expected to decline slightly. The Services component is expected to slip from 50.0 to a contractionary 49.8, with Manufacturing expected to tick down from 50.6 to 50.4.
USD/CHF Technical Outlook
Wednesday's tit-for-tat chart action sees the USD/CHF treading water near multi-month lows, testing bids last seen back in August.
The pair has so far been unable to make a successful bullish bid into the high side of the 200-day Simple Moving Average (SMA), near the 0.9000 handle.
The near-term technical floor will be at late August's last swing into 0.8750, while Greenback bidders will be looking to get the USD/CHF pushed back above major moving averages before the 50-day SMA can rotate into a bearish cross of the 200-day SMA.
USD/CHF Daily Chart
The preliminary November PMIs are due on Thursday, starting with Australia and then moving to Europe. US markets will be closed due to Thanksgiving Day. The European Central Bank will release the minutes of its latest meeting.
Here is what you need to know on Thursday, November 23:
Data from the US released on Wednesday came in mixed, with Jobless Claims falling more than expected. Initial Claims decline to 209,000 from 233,000, and Continuing Claims pulled back after seeing increases for eight consecutive weeks, declining to 1.84 million. Durable Goods Orders fell 5.4% in October, exceeding the expected 3.1% decline. On the positive side, the University of Michigan Consumer Sentiment Index stood at 61.3 in November, revised up from the preliminary reading of 60.3.
The US Dollar rose after the economic reports, extending its correction and lost momentum, affected by higher equity prices. The US Dollar Index (DXY) rose 0.30%; it reached a peak at 104.20 but closed around 103.90. The US market will remain closed on Thursday (Thanksgiving Day), and Friday will have a shortened trading session.
EUR/USD continues to move with a bearish bias in the short term, with a trendline awaiting at 1.0900 and the next strong support at 1.0830. The preliminary November Eurozone PMIs are due on Thursday, and the European Central Bank (ECB) will release the minutes of its latest meeting. The economic figures will be closely monitored.
GBP/USD bottomed near 1.2450 and then rebounded toward 1.2500 after the US Dollar's momentum faded. There was a modest reaction in the Pound to UK government's presentation of the Autumn Statement, that included a cut in national insurance by 2 percentage points.
USD/JPY rose sharply as the 10-year Treasury yield rebounded from monthly lows, rising from 4.35% to 4.42%. The pair climbed to 149.75, marking a 260-pip rise from Tuesday's lows.
NZD/USD retreated further after approaching the 200-day Simple Moving Average (SMA) but settled above 0.6000. The overall bias remains to the upside.
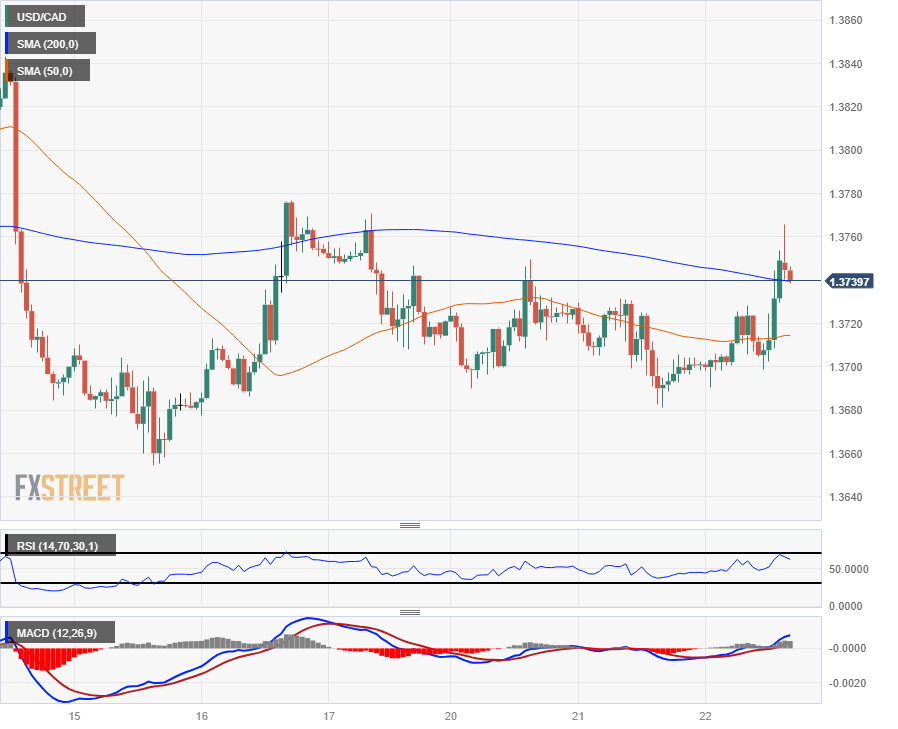
USD/CAD continues to move sideways, with the risk starting to favor the downside as price faced resistance at the 20-day SMA and fell under 1.3700. A break below 1.3660 would open the doors to further losses.
AUD/USD also lost ground but found support around the 0.6520 area, a relevant technical zone. The upside remains capped by the 200-day SMA, slightly below 0.6600. The Judo Bank PMI is due on Friday.
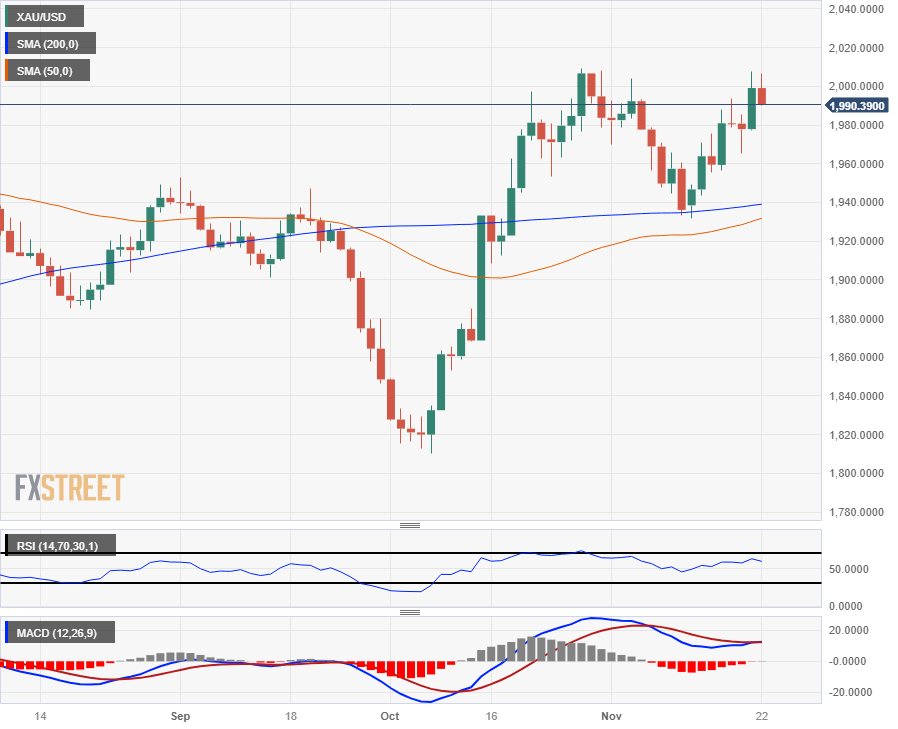
Gold failed to hold above $2,000 and dropped to $1,986. The main trend is up, but prices need to break $2,010 to open the doors to more gains.
Crude oil prices dropped just 1% in a volatile session influenced by the OPEC+ postponing its meeting. WTI bottomed at $73.80 and then rebounded back to $76.85.
(This story was corrected on November 22 at 20:49 GMT to say that it applies to Thursday, November 23. A previous version of the story said "Here is what you need to know on Friday, November 24".)
Like this article? Help us with some feedback by answering this survey:
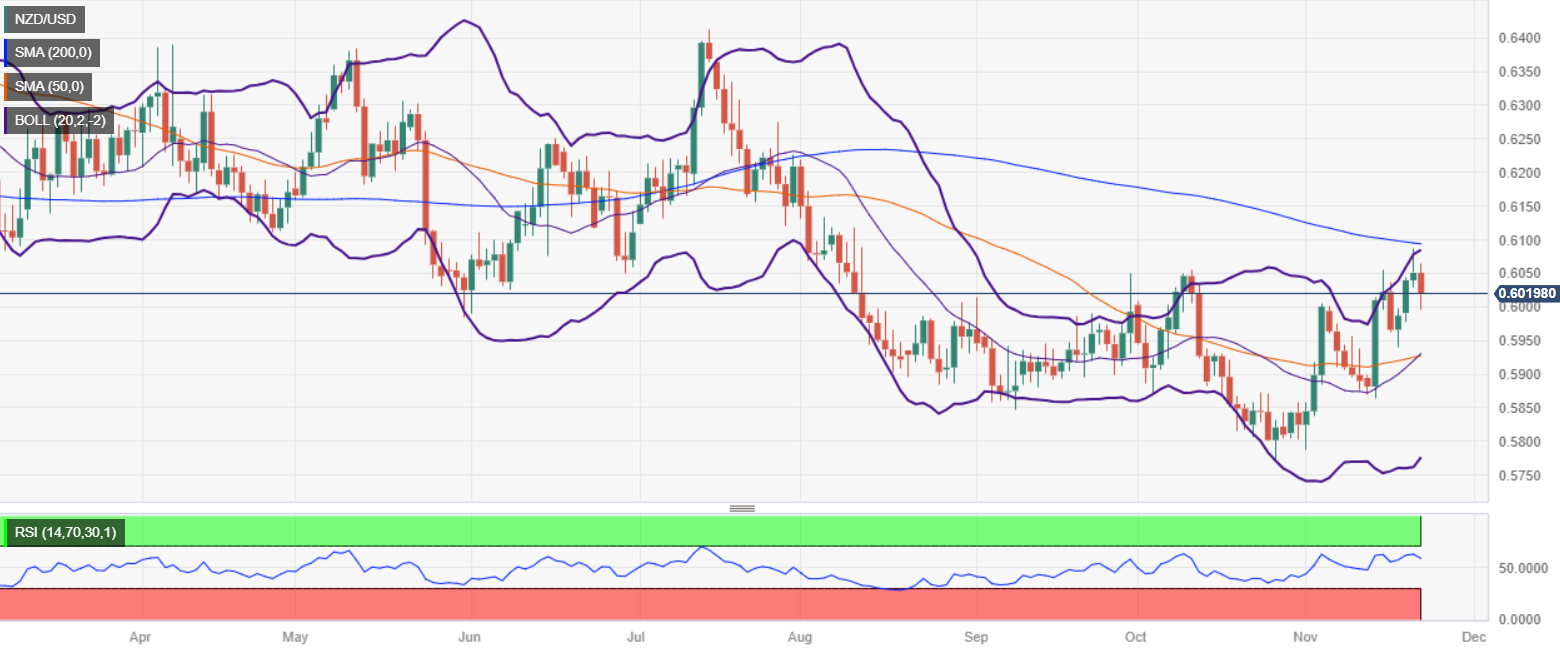
- NZD/USD drops after hitting a two-day low in the 0.6020s.
- US inflation expectations rise, boosting Treasury yields a headwind for NZD/USD.
- NZD/USD's near-term trajectory hinges on upcoming Australian PMIs, with potential support above the crucial 0.6000 level.
The NZD/USD registers losses late in the North American session, snap three days of gains, and retreats toward the 0.6020s area after hitting a daily high of 0.6064. At the time of writing, the pair is losing 0.44%, printing a new two-day low.
Kiwi Dollar snaps three-day winning streak, influenced by US economic data
A rise in inflation expectations in the United States (US) was a green light to US Treasury bond yields, which averaged a rise of two basis points amongst the whole yield curve. The University of Michigan revealed that American households expect inflation for the next twelve months to hit 4.5%, up from 4.4%, while for five years stood at 3.2%. Regarding Consumer Sentiment, it improved a tick, though it trailed the previous reading.
Besides that, US unemployment claims for the last week fell compared to previous data, while Durable Goods Orders plunged sharply, suggesting the economy could weaken further, as sought by the US Federal Reserve.
Despite the rise in US bond yields, market participants have fully priced in 90 basis points of Fed rate cuts for the next year. Nevertheless, the release of the latest Fed minutes, witnessed the US central bank is keeping the door open for additional tightening.
On the New Zealand (NZ) front, the lack of economic data left NZD/USD traders leaning towards US Dollar dynamics and Australia and Chinese economic data. Ahead in the calendar, flash PMIs in Australia could lend a lifeline to the Kiwi Dollar (NZD), so the pair could remain above the 0.6000 figure.
NZD/USD Price Analysis: Technical outlook
The daily chart portrays the pair as neutral to upward biased, even though it has failed to conquer the 200-day moving average (DMA) at 0.6093. Once that level is cleared, the NZD/USD could rally toward the next resistance area seen above the 0.6200 figure. On the other hand, if the pair surrenders the 0.6000 figure, further downside is expected, as sellers could challenge the 50-DMA at 0.5926.
- The USD/NOK rallies 0.75% upwards, navigating near the 10.750 level.
- The US Dollar pushes higher on robust Jobless Claims data and raising expectations of inflation revealed by the UoM.
In Wednesday's session, the USD/NOK enjoyed an upward rally, trading near the 10.750 level. The upward movements were fueled by robust Jobless Claims figures from the US and the higher inflation expectations of the University of Michigan (UoM), which spooked investors.
In line with that, according to the University of Michigan inflation expectations increased to 4.5% from the previous report's 4.4% for a one-year period, while it stood at 3.2% for a five-year period. Others showed that the US Department of Labor reported that in the week ending November 18, Initial Jobless Claims totalled 209,000, marking the lowest reading in five weeks.
As a reaction, the expectations of sticky inflation and a robust labour market reminded investors that the Federal Reserve (Fed) left the door open for further tightening, in case needed. As for now, the CME FedWatch tool indicates that the markets are still pricing in a pause in the next Fed meeting in December, and the question that arises is for how long the bank will maintain the rates at restrictive levels.
The next highlight of the week will be November’s preliminary S&P PMIs from the US to be reported on Friday.
USD/NOK levels to watch
The Relative Strength Index (RSI) finds itself in the negative territory, with a positive slope suggesting a buildup in buying momentum. However, the Moving Average Convergence Divergence (MACD) presents decreasing red bars, indicative of the selling pressure gradually easing off but still present.
Considering the pair's positioning with respect to the Simple Moving Averages (SMAs), the picture becomes clearer. It currently holds a position beneath the 20-day SMA, which implies an immediate selling pressure, inhibiting further upward movement in the short term. Yet, the pair's position above the 100 and 200-day SMAs cements the longer-term bullish influence.
Support Levels: 10.677 (100-day SMA), 10.655 (200-day SMA), 10.600.
Resistance Levels: 10.810, 10.830, 10.900.
USD/NOK daily chart
-638362798796723947.png)
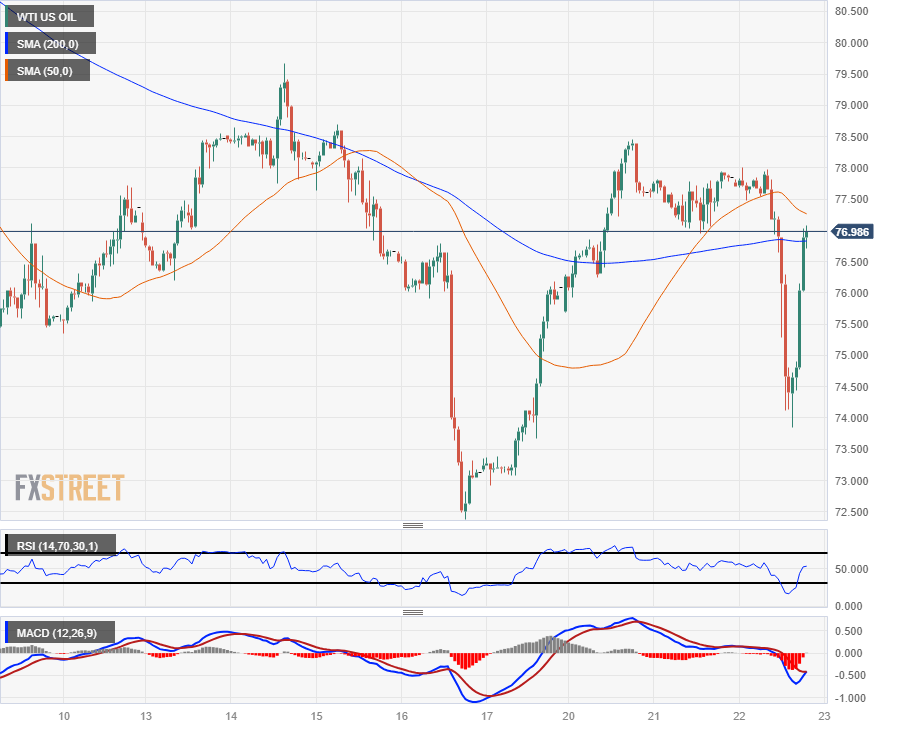
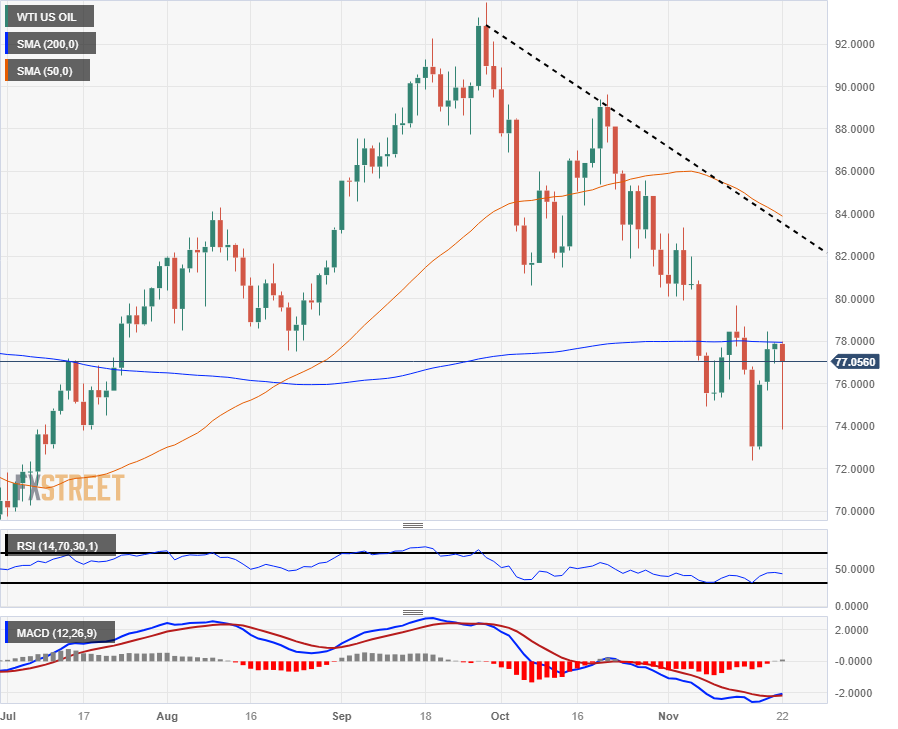
- Crude Oil is clawing back after a downside shock fueled by OPEC meeting cancelation.
- OPEC finance minister meeting re-scheduled for November 30th.
- OPEC is expected to focus on production cuts next week.
West Texas Intermediate (WTI) is paring back Wednesday's early losses as investor appetite recovers following a bout of uncertainty surrounding a delayed meeting for the Organization of the Petroleum Exporting Countries (OPEC).
OPEC's finance ministers' meeting for November 26th was canceled and shuffled into next week, now slated for November 30th.
The meeting, where finance ministers from OPEC member states are expected to discuss OPEC's current production quotas, was thrown into turmoil after Saudi Arabia expressed clear dissatisfaction with how many OPEC members have been producing and selling more crude oil than current OPEC caps.
US Crude Oil stocks numbers also surged on Wednesday, with the Energy Information Administration's (EIA) Crude Oil Stocks Change revealing an unexpected building of 8.701 million barrels into the week ending November 17th.
The surprise buildup is significantly higher than the expected 0.9 million buildup and adds significantly to the previous week's 3.6 million addition.
WTI Technical Outlook
Crude Oil has been no stranger to sudden chart drops in recent history, and the WTI's Wednesday decline sent US Crude Oil briefly back below $74.00/barrel before paring away most of the day's losses to rechallenge the $77.00 level.
Despite Wednesday's late-day recovery, WTI remains under fierce selling pressure, trading on the low side of the 200-day Simple Moving Average (SMA). The immediate low for WTI sits at a five-month low near $72.00, while the immediate ceiling will be last week's peak just below $88.00.
WTI Hourly Chart
WTI Daily Chart
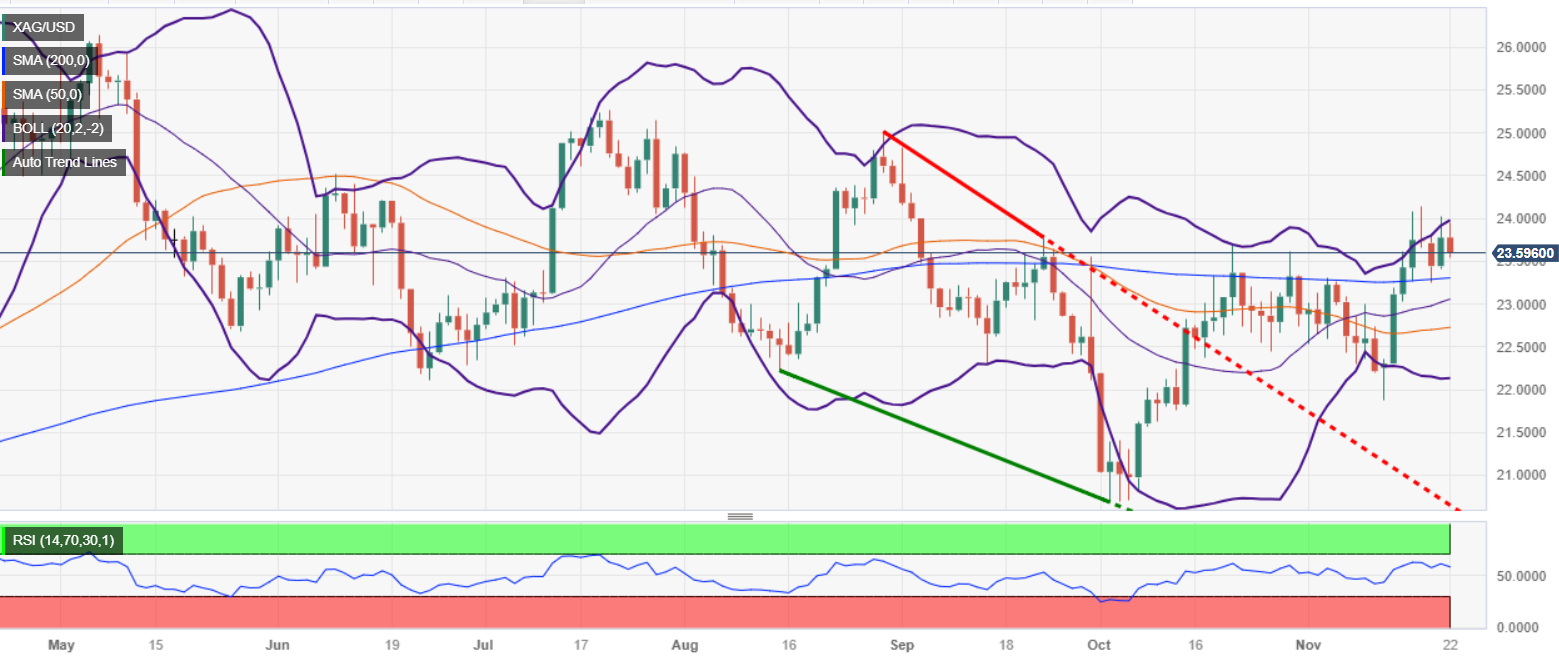
- Silver price loses some territory for the second time in the week, down more than 0.50%.
- High US Treasury bond yields and XAG/USD’s failure to climb above $24.00 would pave the way for a pullback.
- If XAG/USD retraces past the 200-DMA, sellers target $22.70.
Silver price reversed its course on Wednesday, registering decent losses of more than 0.40% as US Treasury bond yields advance due to American households’ upward reviewed inflation expectations for one year. Consequently, the US 10-year Treasury bond yield rose, a headwind for the grey metal, which trades at $23.57 after reaching a high of $23.94.
From a daily chart standpoint, the XAG/USD is neutral to upward biased, though, for the last three days, buyers had failed to crack the two-month high reached on November 17 at $24.14. Once that level is surrendered, the next stop would be the August 30 high at $25.00, followed by the July 19 at $25.23.
On the other hand, XAG/USD’s failure at $24.00 for the fifth time could open the door for further losses. The first support would be the 200-day moving average (DMA) at $23.30, followed by the 20-DMA at $23.03. A breach of the latter, Silver would continue diving toward the 50-DMA at $22.71.
XAG/USD Price Analysis – Daily Chart
XAG/USD Technical Levels
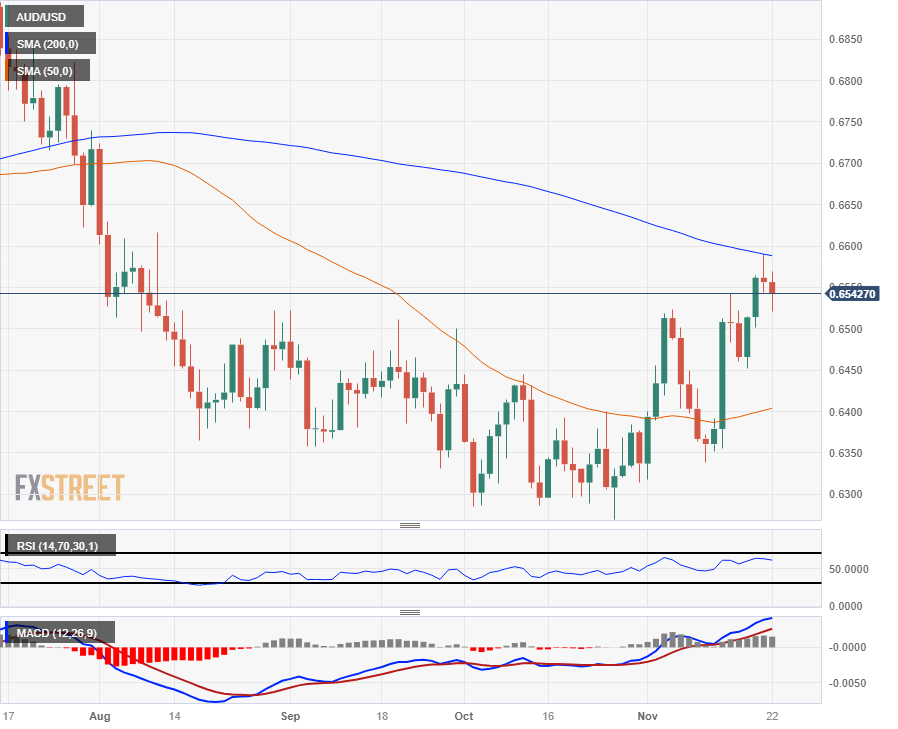
- The Aussie is on the low side, but tussling with the US Dollar on Wednesday.
- Market sentiment soured on US data releases, dragging the AUD into lower bids.
- Aussie PMI figures due in the early Thursday market session.
The AUD/USD is wobbling on Wednesday, grinding around the 0.6540 level as market sentiment pushes and pulls the US Dollar (USD), leaving the Aussie (AUD) hung up in the middle of the tug-of-war.
Reserve Bank of Australia (RBA) Governor Michele Bullock hit newswires early Wednesday, highlighting that inflation remains a challenge for Australia, with price pressures consistently on the high side. The RBA is struggling to reign in inflation with policy measures without hampering the Australian domestic economy.
RBA’s Bullock: More substantial monetary policy tightening is right response
On the US data side, US Initial Jobless Claims came in below expectations, printing at a five-week low of 209K versus the expected 225K. Continuing Jobless Claims also declined to 1.84 million.
US weekly Initial Jobless Claims decline to 209K vs. 225K expected
Overall market volatility is on the high side for the mid-week as investors grapple with the rate cycle outlook. USD consumers are bracing for long-running inflation to overshoot the Federal Reserve's (Fed) target of 2%, according to the University of Michigan's (UoM) 5-year Consumer Inflation Expectations Survey for November. The UoM's consumer inflation outlook sees 5-year inflation at 3.2%, above the Fed's target band, and investors are having to once again readjust their outlook on when they can expect the Fed to begin cutting rates.
AUD/USD Technical Outlook
The AUD/USD kicked Wednesday trading off with a dip into 0.6527 before rallying back towards the day's high bids near 0.6570, and the pair is struggling near the 0.6540 level heading towards Wednesday's market close.
Yesterday's swing high into 0.6589 and subsequent decline sees a technical rejection from the 200-day Simple Moving Average (SMA) firming on the charts, and the next stage for sellers will be to drag the AUD/USD back down into the last swing low near 0.6350.
AUD/USD Daily Chart
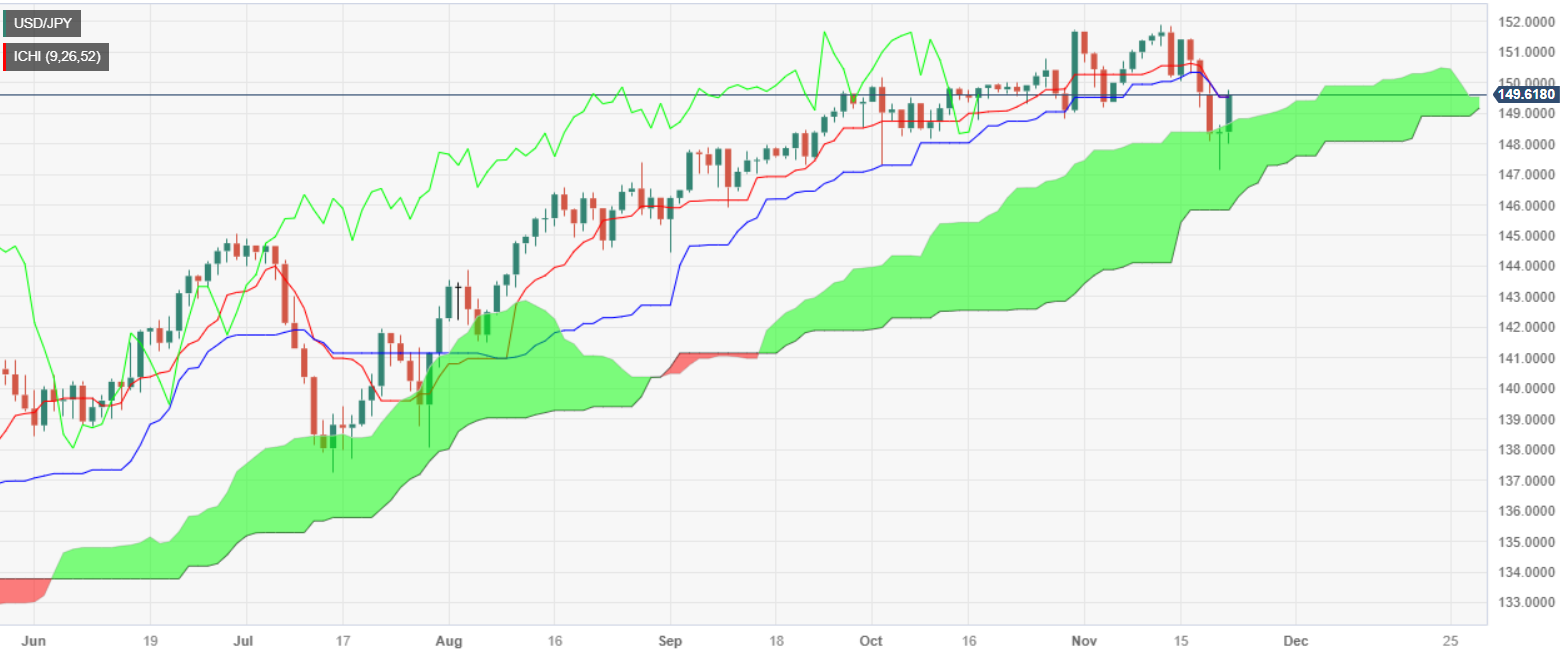
- USD/JPY rallies more than 0.80%, driven by a spike in US 10-year Treasury bond yields.
- US economic data shows mixed signals with lower-than-expected jobless claims and a significant drop in Durable Goods Orders.
- Japan's revised economic outlook and continued dovish Bank of Japan stance contrasts with US inflation expectations to underpin the USD/JPY.
The USD/JPY rebounds from daily lows of 148.01 and rallies more than 0.81% boosted by a jump in the US 10-year Treasury bond yield. At the time of writing, the major exchanges hands at 149.54 and tests a key technical resistance level eyeing the 150.00 figure.
The pair rebounds sharply, fueled by US bond yields and economic indicators, despite mixed consumer sentiment
Key US economic data was revealed today, beginning with the US Initial Jobless Claims for the last week rising less than expected, coming at 209K, below forecasts of 225K, and two weeks ago 233K. At the same time, Durable Goods Orders plunged -5.4% in October, below an expected contraction of -3.1%. Market participants ignored the data, though consumer sentiment moved the needle.
In November, the University of Michigan (UoM) consumer sentiment rose to 61.3, above estimates of 60.5, but missed the prior reading. American households' inflation expectations, climbed for the one-year outlook, reaching 4.5% compared to the previous reading of 4.4%, and for a five-year outlook, prices are projected to rise to 3.2%.
The US Dollar Index (DXY), which tracks the performance of six currencies vs. the Greenback, rose sharply by 0.49% and sits at 104.10, underpinned by higher US Treasury bond yields, as a reaction to the UoM inflation expectations poll.
On the Japanese front, Japanese authorities downward revised the economic outlook for the first time in 10 months. The revision came after Japan printed a contraction in the third quarter as demand waned. Therefore, the Bank of Japan’s (BoJ) dovish stance would likely continue well into 2024, despite expressions that foresee the BoJ would end its negative interest rate policy in April of next year, according to former BoJ executive Kazuo Momma.
USD/JPY Price Analysis: Technical outlook
From a technical perspective, the USD/JPY shifted to a neutral-upward bias as price action witnessed a break of the Ichimoku Cloud (Kumo), opening the door for further gains. However, buyers must reclaim the Tenkan-Sen at 149.53 so they can challenge the 150.00 figure mark. On the other hand, failure to crack the confluence of the Tenkan and Kijun-Sen would pave the way for a downward correction, toward 149.00, with sellers eyeing a drop inside the Kumo to test November’s 21 low of 147.15.
- The DXY Index rose to 103.90, up by 0.30%.
- US weekly Initial Jobless Claims came in better than expected, but Durable Goods Orders from October were disappointing.
- US yields are higher, favouring the Greenback’s advance.
On Wednesday, the US Dollar found momentum after the report of positive weekly Initial Jobless Claims from the US, which flashed further warning among investors regarding further tightening from the Federal Reserve (Fed).
The labor market in the United States is showing signs of resilience, and despite the evidence of inflation, it might make Fed officials consider further tightening, which seems to be spooking investors.
Daily Digest Market Movers: US Dollar finds a lift on better-than-expected Initial Jobless Claims
- The US Dollar DXY Index trades neutrally around 103.50.
- Initial Jobless Claims in the US for the week ending November 18 were lower than expected at 209,000, marking the lowest level in five weeks.
- Durable Goods Orders in the US dropped by 5.4%, exceeding the forecasted 3.1% contraction, following a previous month's increase of 4.6%.
- Despite the decline in Durable Goods Orders, the US Dollar strengthened against other currencies, with the DXY index climbing to 104.10, showing a 0.50% rise.
- The Federal Open Market Committee's November Minutes revealed that officials were concerned about inflation and needed to see more evidence to be convinced that inflation is coming down.
- The 2, 5 and 10-year rates increased to 4.96%, 4.46% and 4.43%. Still, markets are confident that the Federal Reserve won’t hike in November and are betting on rate cuts sooner than expected in May 2024. A sizable minority is even betting on a rate cut in March.
Technical Analysis: US Dollar bulls see some light, bears still show dominance
The technical landscape of the DXY daily chart delivers a mix of bullish and bearish signals. The Relative Strength Index (RSI) standing flat near oversold conditions indicates a potential weakening of the selling momentum. This could suggest an imminent reversal, a classic sign that buying pressure could soon resurface. Contrarily, the flat red bars of the Moving Average Convergence Divergence (MACD) hint at a short-term bearish bias, suggesting that sellers might be in control of the immediate market. Yet, it is important to bear in mind that the index’s continuous flat nature could turn either way.
Furthermore, the DXY's position below the 20 and 100-day Simple Moving Averages (SMAs) can be perceived as a bearish signal. However, it currently sits above the 200-day SMA, suggesting that bulls hold the fort on a broader time frame with the underlying trend remaining upward.
Support levels: 103.60 (200-day SMA), 103.30, 103.15.
Resistance levels: 104.00, 104.20 (100-day SMA),104.50.
US Dollar FAQs
What is the US Dollar?
The US Dollar (USD) is the official currency of the United States of America, and the ‘de facto’ currency of a significant number of other countries where it is found in circulation alongside local notes. It is the most heavily traded currency in the world, accounting for over 88% of all global foreign exchange turnover, or an average of $6.6 trillion in transactions per day, according to data from 2022.
Following the second world war, the USD took over from the British Pound as the world’s reserve currency. For most of its history, the US Dollar was backed by Gold, until the Bretton Woods Agreement in 1971 when the Gold Standard went away.
How do the decisions of the Federal Reserve impact the US Dollar?
The most important single factor impacting on the value of the US Dollar is monetary policy, which is shaped by the Federal Reserve (Fed). The Fed has two mandates: to achieve price stability (control inflation) and foster full employment. Its primary tool to achieve these two goals is by adjusting interest rates.
When prices are rising too quickly and inflation is above the Fed’s 2% target, the Fed will raise rates, which helps the USD value. When inflation falls below 2% or the Unemployment Rate is too high, the Fed may lower interest rates, which weighs on the Greenback.
What is Quantitative Easing and how does it influence the US Dollar?
In extreme situations, the Federal Reserve can also print more Dollars and enact quantitative easing (QE). QE is the process by which the Fed substantially increases the flow of credit in a stuck financial system.
It is a non-standard policy measure used when credit has dried up because banks will not lend to each other (out of the fear of counterparty default). It is a last resort when simply lowering interest rates is unlikely to achieve the necessary result. It was the Fed’s weapon of choice to combat the credit crunch that occurred during the Great Financial Crisis in 2008. It involves the Fed printing more Dollars and using them to buy US government bonds predominantly from financial institutions. QE usually leads to a weaker US Dollar.
What is Quantitative Tightening and how does it influence the US Dollar?
Quantitative tightening (QT) is the reverse process whereby the Federal Reserve stops buying bonds from financial institutions and does not reinvest the principal from the bonds it holds maturing in new purchases. It is usually positive for the US Dollar.
Bundesbank President Joachim Nagel said on Wednesday that interest rates in the Eurozone are close to their peak. He explained that economic data will determine whether more tightening is needed.
Regarding inflation, Nigel mentioned it is on track to move towards the ECB target while speaking at an even in Milan.
Market reaction
The EUR/USD is falling on Wednesday; it trimmed losses during the last two hours, rising from near 1.0850 to 1.0880.
- Spot Gold is bidding lower, testing back beneath the $2,000 key handle.
- XAU/USD is trimming back some gains as investors weigh their options post-US data.
- Gold remains well-bid, but $2,000 is proving to be a challenging level.
XAU/USD tipped back into a daily high above the $2,000 mark, at $2,006.48, but the key handle is proving a difficult target to nail down.
Gold is bidding back towards the downside as investor sentiment rolls over on the day and exposure goes uneven.
US Treasury yields saw another spike on Wednesday, with the 10-year T-note briefly climbing back into 4.445% before slipping back to 4.42%.
US investor sentiment is going mixed on the day after US Initial Jobless Claims unexpectedly dipped to a five-week low of 209K versus the forecast 225K, revealing some ongoing tightness in the labor market.
Meanwhile, the University of Michigan Consumer Inflation Expectations showed that US consumers still see an elevated inflation outlook, with consumers expecting inflation to remain around 3.2% over the next five years.
With price growth being something of a self-fulfilling prophecy, elevated consumer inflation expectations means the Federal Reserve (Fed) is less likely to accelerate the path towards rate cuts, much to the chagrin of investors who have broadly been increasing bets on a sooner rather than later rate cut cycle.
XAU/USD Technical Outlook
Gold's snap decline in intraday Wednesday trading sees the XAU/USD slipping back from the $2,000 handle to challenge $1,990, descending into the 50-hour Simple Moving Average (SMA).
Despite the Wednesday backslide, Gold remains elevated, with XAU/USD up over 3% from the last swing low into the 200-day SMA near $1,931. $2,000 is proving to be a bit of a technical cap, and Spot Gold's near-term trading range will be defined by whether or not the 200-day SMA can again support any declines into $1,940.
XAU/USD Hourly Chart
XAU/USD Daily Chart
- The Canadian Dollar is falling back on Wednesday as market sentiment sours on multiple fronts.
- US data is depleting risk appetite, coupled with deflating Crude Oil bids.
- USD/CAD hits a new high for the week as the US Dollar bids higher.
The Canadian Dollar (CAD) is seeing declines across the board on Wednesday, getting dragged down as Crude Oil sells off and broader markets step back into the US Dollar (USD) following a slew of US economic data that points to interest rates remaining higher for longer than markets anticipated at the start of the week.
Loonie traders will be looking ahead to Friday’s Retail Sales figures from Canada, but the figures are likely to be overshadowed by US Purchasing Managers’ Index (PMI) figures due shortly after.
US markets are also expected to see some volume on Wednesday as investors gather up their order books in anticipation of Thursday’s Thanksgiving holiday.
Daily Digest Market Movers: Canadian Dollar driven lower as Crude Oil declines and US Dollar flows reverse
- CAD sees fresh lows for the week, falling back on declining market sentiment.
- Crude Oil markets are firmly lower for the week, WTI falls below $75/barrel.
- The Organization of Petroleum Exporting Countries delayed a critical meeting on production cuts until next Thursday.
- Saudi Arabia is reportedly dissatisfied with member states’ unwillingness to stick to reduced production quotas.
- The meeting is for OPEC member state finance ministry staff and specifically focuses on production cut plans.
- Record non-OPEC production and ongoing demand concerns from China are increasing expectations of additional OPEC production cuts.
- US Initial Jobless Claims declined to a five-week low of 209K against the 225K forecast, highlighting still tight labor conditions in the US.
- The University of Michigan Consumer Inflation Expectations for November showed US consumers broadly expect long-term inflation to remain above the Federal Reserve’s (Fed) 2% target as consumers see 3.2% inflation.
- Inflation expectations tend to drive realized inflation, and elevated expectations mean the Fed was right to maintain a hawkish approach.
- Investors hoping for an accelerated path for rate cuts will be left out in the cold by elevated price growth expectations.
Canadian Dollar price this week
The table below shows the percentage change of Canadian Dollar (CAD) against listed major currencies this week. Canadian Dollar was the strongest against the Euro.
| USD | EUR | GBP | CAD | AUD | JPY | NZD | CHF | |
| USD | 0.33% | -0.07% | 0.11% | -0.34% | -0.21% | -0.29% | -0.10% | |
| EUR | -0.33% | -0.42% | -0.21% | -0.68% | -0.53% | -0.60% | -0.41% | |
| GBP | 0.08% | 0.41% | 0.20% | -0.25% | -0.11% | -0.19% | -0.01% | |
| CAD | -0.11% | 0.21% | -0.19% | -0.45% | -0.31% | -0.40% | -0.21% | |
| AUD | 0.33% | 0.66% | 0.27% | 0.45% | 0.13% | 0.05% | 0.27% | |
| JPY | 0.20% | 0.54% | -0.11% | 0.31% | -0.18% | -0.06% | 0.13% | |
| NZD | 0.28% | 0.61% | 0.21% | 0.40% | -0.05% | 0.08% | 0.18% | |
| CHF | 0.08% | 0.41% | 0.00% | 0.20% | -0.28% | -0.13% | -0.20% |
The heat map shows percentage changes of major currencies against each other. The base currency is picked from the left column, while the quote currency is picked from the top row. For example, if you pick the Euro from the left column and move along the horizontal line to the Japanese Yen, the percentage change displayed in the box will represent EUR (base)/JPY (quote).
Technical Analysis: Canadian Dollar tests new low for the week, Loonie traders looking for a mid-day recovery
The Canadian Dollar (CAD) saw fresh declines against the US Dollar (USD) on Wednesday, driving to a new low for the week and sending the USD/CAD into 1.3765.
The Loonie is now experiencing a mild recovery, dragging the USD/CAD back down below 1.3750, but further intraday downside for the Dollar-Loonie pair will require overcoming resistance-turned-support from the 200-hour Simple Moving Average (SMA) at 1.3740.
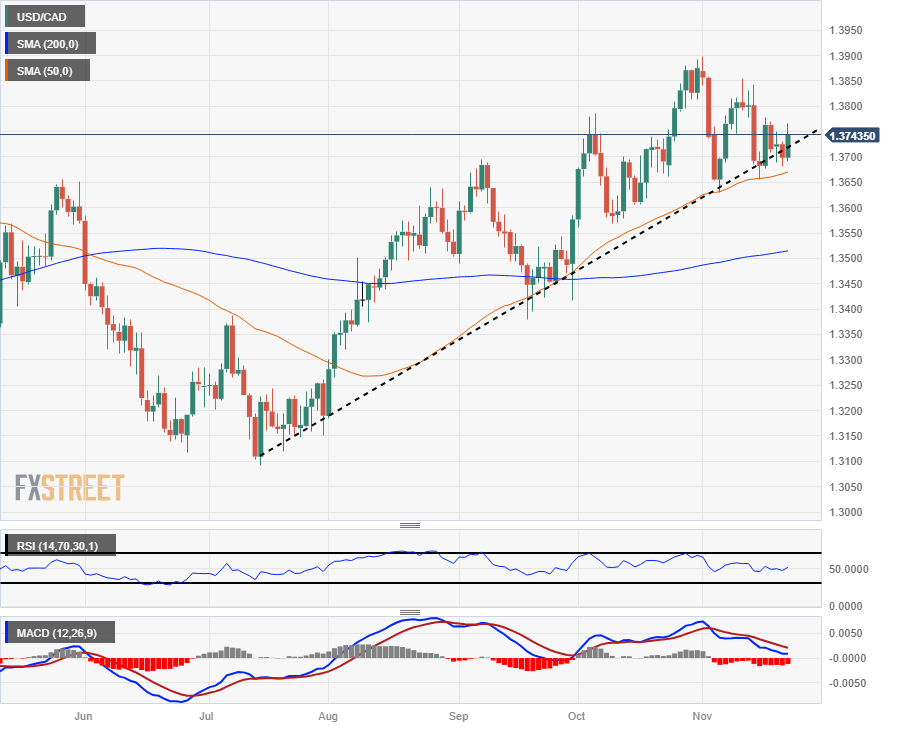
The USD/CAD continues to trade toward the high side of the rising trendline from 1.3100, and the 50-day SMA is providing technical support for any bearish moves into 1.3640.
USD/CAD Hourly Chart
 USD/CAD Daily Chart
Canadian Dollar FAQs
What key factors drive the Canadian Dollar?
The key factors driving the Canadian Dollar (CAD) are the level of interest rates set by the Bank of Canada (BoC), the price of Oil, Canada’s largest export, the health of its economy, inflation and the Trade Balance, which is the difference between the value of Canada’s exports versus its imports. Other factors include market sentiment – whether investors are taking on more risky assets (risk-on) or seeking safe-havens (risk-off) – with risk-on being CAD-positive. As its largest trading partner, the health of the US economy is also a key factor influencing the Canadian Dollar.
How do the decisions of the Bank of Canada impact the Canadian Dollar?
The Bank of Canada (BoC) has a significant influence on the Canadian Dollar by setting the level of interest rates that banks can lend to one another. This influences the level of interest rates for everyone. The main goal of the BoC is to maintain inflation at 1-3% by adjusting interest rates up or down. Relatively higher interest rates tend to be positive for the CAD. The Bank of Canada can also use quantitative easing and tightening to influence credit conditions, with the former CAD-negative and the latter CAD-positive.
How does the price of Oil impact the Canadian Dollar?
The price of Oil is a key factor impacting the value of the Canadian Dollar. Petroleum is Canada’s biggest export, so Oil price tends to have an immediate impact on the CAD value. Generally, if Oil price rises CAD also goes up, as aggregate demand for the currency increases. The opposite is the case if the price of Oil falls. Higher Oil prices also tend to result in a greater likelihood of a positive Trade Balance, which is also supportive of the CAD.
How does inflation data impact the value of the Canadian Dollar?
While inflation had always traditionally been thought of as a negative factor for a currency since it lowers the value of money, the opposite has actually been the case in modern times with the relaxation of cross-border capital controls. Higher inflation tends to lead central banks to put up interest rates which attracts more capital inflows from global investors seeking a lucrative place to keep their money. This increases demand for the local currency, which in Canada’s case is the Canadian Dollar.
How does economic data influence the value of the Canadian Dollar?
Macroeconomic data releases gauge the health of the economy and can have an impact on the Canadian Dollar. Indicators such as GDP, Manufacturing and Services PMIs, employment, and consumer sentiment surveys can all influence the direction of the CAD. A strong economy is good for the Canadian Dollar. Not only does it attract more foreign investment but it may encourage the Bank of Canada to put up interest rates, leading to a stronger currency. If economic data is weak, however, the CAD is likely to fall.
- GBP/USD drops more than 0.50%, reacting to US data indicating ongoing inflation struggles and a cooling job market.
- US University of Michigan report shows increased short-term inflation expectations, while consumer sentiment dips below expectations.
- UK's Autumn Statement focuses on debt reduction and inflation control, with modest GDP growth projections, weighed on the Pound Sterling.
The GBP/USD tumbles during the mid-North American session after economic data from the United States (US) suggested the battle against inflation is not done while the economy continues to decelerate, as sought by the US Federal Reserve (Fed). At the time of writing, the pair is trading at 1.2456, losing 0.63%.
Sterling falls as US inflation expectations rise and UK Chancellor's Autumn Statement reveals cautious growth projections
A report by the University of Michigan (UoM) witnessed that inflation expectations in the US rose for one year to 4.5% from 4.4% in the previous report, while it stood at 3.2% for a five-year period. Regarding consumer sentiment, Americans remain pessimistic as the index dropped from 63.8 to 61.3 but exceeded forecasts.
Additional data from the US showed that unemployment claims fell last week compared to two weeks ago, suggesting the jobs market is cooling. At the same time, the US Census Bureau showed that Durable Goods Orders plummeted as demand for business equipment slowed.
The US Dollar Index (DXY), which tracks the performance of six currencies vs. the Greenback, rose sharply by 0.49% and sits at 104.10, underpinned by higher US Treasury bond yields, as a reaction to the UoM inflation expectations poll.
Across the pond, Jeremy Hunt, the UK Chancellor of the Exchequer, revealed its Autumn Statement. He stated, “We will reduce debt, cut taxes, and reward work.” He emphasized that it would work alongside the Bank of England to get inflation to its 2% target, which, according to the Office for Budget Responsibility (OBR) would be attained in 2025.
The Office for Budget Responsibility (OBR) says the combined impact of these measures will reduce inflation and raise GDP. Nevertheless, Hunt added that Gross Domestic Product (GDP) is expected to grow by merely 0.7%, compared with the 1.8% forecast in the previous projection in March from the OBR.
GBP/USD Price Analysis: Technical outlook
The GBP/USD remains bullish according to the daily chart, though is about to test key support seen at the 200-day moving average (DMA) at 1.2448, which once cleared, could open the door for further losses. The next support would be the 1.2400 figure, followed by the November 17, the latest cycle low at 1.2374. A decisive break would put into play the 50-DMA at 1.2256. On the flip side, if buyers reclaim 1.2500, they could remain hopeful of higher prices, with the first resistance level at 1.2559, the November 21 high.
- The EUR/USD is positioned at around the 1.0865 level, registering a decline of nearly 0.40%.
- The US Dollar rides on positive jobless claims figures, shedding light on a resilient labor market.
- Durable Godds from October, on the other hand, came in weaker than expected.
In Wednesday's session, the Euro slipped against the US Dollar, with the pair trading around the 1.0865 mark. The downfall was triggered by the report of strong weekly Jobless Claims figures, which reminded investors that the Federal Reserve (Fed) might take it as a threat to the battle against inflation.
In line with that, the US Department of Labor's weekly data, revealed that Initial Jobless Claims for the week ending November 18 came in at 209,000 lower than the expected 225,00, tallying its lowest reading in five weeks. On the negative side, the US Census Bureau reported that Durable Goods Orders in the United States fell by 5.4% after its previous month's increase of 4.6% and was worse than the anticipated contraction of 3.1%.
Despite the negative Orders figures, the US Dollar is trading strongly against its rivals, and the DXY index rose towards 104.10, seeing 0.50% gains. Investors may have gotten spooked after the strong labour market figures as the Federal Open Market Committee (FOMC) minutes from the November meeting reported on Wednesday that officials weren’t satisfied with the progress made on inflation. In line with that, all data points threatening the bank’s job may resume the hawkish bets on the Fed.
EUR/USD levels to watch
Despite the Relative Strength Index (RSI) showing a negative slope yet remaining in positive territory, it indicates a significant selling momentum on the horizon. In addition, decreasing green bars for the Moving Average Convergence Divergence (MACD) further support this sentiment, signalling a potential bearish crossover as the bears strengthen their grasp.
Moreover, as the bears have been steadily gaining ground, it may threaten the position of the pair above the 20, 100, and 200-day Simple Moving Averages (SMAs). The next support stands around 1.0800 (200-day SMA) and at 1.0790 (100-day SMA). On the upside, the 1.0900, 1.09030 and 1.0960 stand as resistances.
EUR/USD daily chart
-638362663463096580.png)
US growth has outperformed expectations and is carrying solid momentum into 2024. Economists at ANZ Bank outline their baseline growth view for next year.
US growth to slow as soft landing expected in 2024
We expect the US economy will experience a soft landing in 2024 as its lows in response to the Federal Reserve’s aggressive tightening, the labour market slows and the contribution from fiscal policy wanes.
We forecast that GDP will rise by an average of 1.1% next year, down from an estimated 2.4% in 2023. We cannot rule out a period of mildly negative growth at some stage, but that is consistent with a soft landing.
We do not expect next year’s presidential election will have a material impact on growth or policy settings. The Fed is independent and will continue to set policy as it sees fit. We expect rate cuts to start in Q3.
- Mexican Peso edges higher as USD/MXN pair tumbles on its way toward the 17.00 figure.
- Mexico's retail sales growth slowed to 2.3% in September, missing forecasts with consumers feeling higher interest rates set by Banxico.
- Mexico’s key economic releases ahead include November inflation data and Q3 GDP.
Mexican Peso (MXN) climbs against the US Dollar (USD) and prints a minuscule daily gain of 0.08%. The USD/MXN pair trimmed some of Tuesday’s gains and trades below the 17.20 area after hitting a daily high of 17.24.
Mexico’s Retail Sales grew by 2.3% YoY in September, slowing down from 3.2% in August and missing estimates of 3.6% expansion. The data begins to evidence the impact of higher interest rates set by the Bank of Mexico (Banxico), currently at 11.25%. Meanwhile, a preliminary data release from the National Statistics Agency (INEGI) showed that economic activity contracted in October, for the first time since June 2022, compared to September.
Ahead in the docket on Thursday, the November mid-month inflation rates are expected to climb in the headline, contrarily to the core, which is foreseen to decline somewhat. On Friday, Mexico will reveal the Gross Domestic Product (GDP) for Q3, which would offer USD/MXN traders fresh impetus ahead of the end of the week.
Daily digest movers: Mexican Peso could weaken as traders await Mexico’s Q3 GDP and economic activity release
- INEGI estimates the economy shrank 0.1% MoM in October, though annually based, it expanded by 2.9%, according to the agency Timely Indicator of Economic Activity (IOAE).
- A Citibanamex poll suggests that 25 of 32 economists polled expect Banxico's first rate cut in the first half of 2024.
- The poll shows “a great dispersion” for interest rates next year, between 8.0% and 10.25%, revealed Citibanamex.
- Headline annual inflation is expected at 4% and core at 4.06%, both readings for the next year, while the USD/MXN exchange rate is seen at 19.00, up from 18.95, toward the end of 2024
- The latest US Federal Reserve (Fed) minutes showed the Fed would proceed “cautiously” in setting monetary policy and left the door open to additional tightening if warranted by data.
- US Initial Jobless Claims missed estimates, while Durable Goods Orders plunged sharply, suggesting the economy continues to decelerate.
- Data published last week showed prices paid by consumers and producers in the US dipped, increasing investors' speculations that the Fed’s tightening cycle has ended.
- The swap market suggests traders expect 100 basis points of rate cuts by the Fed in 2024.
- The latest inflation report in Mexico, published on November 9, showed prices grew by 4.26% YoY in October, below forecasts of 4.28% and prior rate of 4.45%. On a monthly basis, inflation came at 0.39%, slightly above the 0.38% consensus and September’s 0.44%.
- Banxico revised its inflation projections from 3.50% to 3.87% for 2024, which remains above the central bank’s 3.00% target (plus or minus 1%).
Technical Analysis: Mexican Peso remains bullish if USD/MXN stays below 17.34
The USD/MXN bearish bias remains intact, and despite forming a ‘tweezers bottom’ two candlestick chart pattern, buyers' failure to lift prices toward the 100-day Simple Moving Average (SMA) at 17.34 opened the door to a pullback. However, if USD/MXN reclaims the latter, further upside is seen, with the next resistance at the 20-day SMA at 17.55, ahead of the 200-day SMA at 17.61.
Nevertheless, the most likely scenario would be the pair dropping toward the November 21 low of 17.06, ahead of sliding toward the 17.00 figure. Once sellers regain that level, the USD/MXN bearish bias would be cemented, and expect another test of the year-to-date (YTD) low of 16.62.
Mexican Peso FAQs
What key factors drive the Mexican Peso?
The Mexican Peso (MXN) is the most traded currency among its Latin American peers. Its value is broadly determined by the performance of the Mexican economy, the country’s central bank’s policy, the amount of foreign investment in the country and even the levels of remittances sent by Mexicans who live abroad, particularly in the United States. Geopolitical trends can also move MXN: for example, the process of nearshoring – or the decision by some firms to relocate manufacturing capacity and supply chains closer to their home countries – is also seen as a catalyst for the Mexican currency as the country is considered a key manufacturing hub in the American continent. Another catalyst for MXN is Oil prices as Mexico is a key exporter of the commodity.
How do decisions of the Banxico impact the Mexican Peso?
The main objective of Mexico’s central bank, also known as Banxico, is to maintain inflation at low and stable levels (at or close to its target of 3%, the midpoint in a tolerance band of between 2% and 4%). To this end, the bank sets an appropriate level of interest rates. When inflation is too high, Banxico will attempt to tame it by raising interest rates, making it more expensive for households and businesses to borrow money, thus cooling demand and the overall economy. Higher interest rates are generally positive for the Mexican Peso (MXN) as they lead to higher yields, making the country a more attractive place for investors. On the contrary, lower interest rates tend to weaken MXN.
How does economic data influence the value of the Mexican Peso?
Macroeconomic data releases are key to assess the state of the economy and can have an impact on the Mexican Peso (MXN) valuation. A strong Mexican economy, based on high economic growth, low unemployment and high confidence is good for MXN. Not only does it attract more foreign investment but it may encourage the Bank of Mexico (Banxico) to increase interest rates, particularly if this strength comes together with elevated inflation. However, if economic data is weak, MXN is likely to depreciate.
How does broader risk sentiment impact the Mexican Peso?
As an emerging-market currency, the Mexican Peso (MXN) tends to strive during risk-on periods, or when investors perceive that broader market risks are low and thus are eager to engage with investments that carry a higher risk. Conversely, MXN tends to weaken at times of market turbulence or economic uncertainty as investors tend to sell higher-risk assets and flee to the more-stable safe havens.
Since 2020, EUR/JPY has rallied close to 40%. Economists at ING analyze the pair’s outlook.
EUR/JPY has a modest positive correlation with global equity markets
EUR/JPY has a modest positive correlation with global equity markets. If a more traditional business cycle emerges where equities turn lower headed into a US recession (equities normally turn six months before a recession) and bonds rally, then EUR/JPY should come lower in line with our forecasts. If, however, lower US rates lead to both bonds and equities rallying then we are probably underestimating the performance of EUR/JPY.
On the bond side as well, we will be interested to watch developments in the eurozone yield. The current inverted yield curves in Europe make it too expensive for Japanese investors to FX hedge European bond portfolios. Bullish steepening of European curves would see FX hedge ratios increase and EUR/JPY finally.
Following the last FOMC minutes release on Tuesday, economists at Rabobank do not believe that recent data are likely to spur the Fed into action.
The urgency of an additional hike does not seem large
The minutes of the FOMC meeting on October 31-November 1 confirm the Committee’s data dependence and intention to proceed carefully.
We should not attach too much value anymore to the remaining hike that is implied in the September dot plot. What’s more, the recent decline in yields has partially been caused by softer economic and inflation data, so the urgency of an additional hike does not seem large.
Since the FOMC believes that a soft landing is in sight, it would be foolish to risk it by hiking further than necessary. If we were to see stronger economic and inflation data before the December meeting, longer-term rates are likely to rebound and substitute for a rate hike. Therefore we do not expect further hikes.
We expect the Fed to remain on hold until the middle of next year. By then we expect the FOMC to be ready to cut rates as rising unemployment (note that unemployment has quietly risen from 3.4% to 3.9% this year), most likely accompanied by a recession, will give the Committee confidence that inflation is on the right path.
Gold price reacts to geopolitical risks. Strategists at ANZ Bank analyze the yellow metal’s outlook.
Central banks’ Gold purchases rose
Gold is benefitting from the tailwinds of heightened geopolitical risk, a weaker US Dollar and retreating US Treasury bond yields. Investment flows are recovering in response.
Central bank Gold purchases are strong and likely to reach 1,050t in 2023. Demand for physical Gold looks healthy too, with India’s imports rising 60% YoY in October.
See: Gold offers a potentially effective hedge against a deterioration in geopolitical conflicts – UBS
2024 should be a decisive year for the S&P 500. Economists at Société Générale analyze the index outlook for the next year.
S&P 500 Index seen at 4,750 by end-2024
The S&P 500 should be in ‘buy-the-dip’ territory, as leading indicators for profits continue to improve. Yet, the journey to the end of the year should be far from smooth, as we expect a mild recession in the middle of the year, a credit market sell-off in 2Q and ongoing quantitative tightening.
The S&P 500 should provide positive returns in 2024 and we keep our end-2024 target that we launched last quarter unchanged at 4,750.
- Initial Jobless Claims in the US decreased by 24K in the week ending November 18.
- Continuing Jobless Claims declined to 1.84 million in the week ending November 11.
- US Dollar Index advances to 103.70 after Claims and Durable Goods Orders.
Initial Jobless Claims totaled 209,000 in the week ending November 18, the weekly data published by the US Department of Labor (DOL) showed on Thursday. It is the lowest reading in five weeks. This follows the previous week's print of 233,000 (revised from 231,000) and came in better than the market expectation of 225,000.
Continuing claims decreased by 22,000 in the week ending November 11 to 1.84 million. It is the first decline after rising for eight consecutive weeks.
Market reaction
Alongside the Jobless Claims, the Durable Goods Orders were released. The US Dollar Index rose modestly, reaching levels above 103.70.
- Durable Goods Orders in the US contracted at a faster pace than expected in October.
- US Dollar Index continue to fluctuate in a tight range above 103.50.
Durable Goods Orders in the United States declined by 5.4%, or $16 billion, to $279.4 billion in October, the Census Bureau reported on Wednesday. This reading followed the 4.6% increase recorded in September and came in worse than the market expectation for a contraction of 3.1%.
"Excluding transportation, new orders were virtually unchanged," the press release read. "Excluding defense, new orders decreased 6.7%. Transportation equipment, also down three of the last four months, drove the decrease, $16.0 billion, or 14.8%, to $92.1 billion."
Market reaction
The US Dollar Index showed no immediate reaction to this report and was last seen rising 0.1% on the day at 103.70.
- US data due on Wednesday includes Jobless Claims and Durable Goods Orders.
- The US Dollar Index retreats from daily highs as yields slide.
- The EUR/USD faces resistance at 1.0920 and has significant support at 1.0880.
The EUR/USD rebounded and is back above 1.0900, trading flat for the day ahead of key US economic data. The pair reached its lowest level in three days during the European session at 1.0881 but started to rise as the US Dollar weakened.
The focus is on US data scheduled for Wednesday. Initial Jobless Claims are expected to show a decline to 225,000 from last week's 231,000. Durable Goods Orders in October are forecasted to decrease by 3.1% after a 4.7% surge in September. Later in the day, the final November University of Michigan consumer sentiment will also be reported.
The outcome of these data releases could impact the US Dollar. So far on Wednesday, the Dollar Index (DXY) is trading marginally higher, hovering around 103.60, after approaching 104.00. The Greenback lost strength as Treasury Yields moved lower. However, the subsequent direction will likely be influenced by incoming US data.
The EUR/USD is hovering above the 20-day Simple Moving Average (SMA) on the four-hour chart, which stands at 1.0915, near a horizontal resistance level seen at 1.0920. If the Euro rises above it, it could gain momentum. On the contrary, the immediate short-term support is seen around 1.0880. Below that, there is an interim support at 1.0850, followed by the strong level at 1.0830.
Over the past month, EUR/GBP has moderately risen. Economists at Danske Bank analyze the pair’s outlook.
GBP headwinds to persist
We expect the UK economy to perform relatively worse than the Euro area and the conclusion of the Bank of England hiking cycle to weigh on GBP.
Near-term, we expect the cross to range trade on the back of little divergence in either the growth or monetary policy for the rest of the year.
We target the EUR/GBP pair at 0.89 in 12M.
The Office for Budget Responsibility (OBR) published its latest "economic and fiscal outlook” on the economy, with the key insights found below.
Headline debt predicted to be 94% of GDP by end of forecast.
We meet our fiscal rule to have underlying debt falling as percent of GDP by final year of forecast with double headroom.
OBR forecasts 2023/24 underlying public debt to GDP ratio of 91.6% (March forecast 92.4%).
OBR forecasts 2024/25 underlying public debt to GDP ratio of 92.7% (March forecast 93.7%).
OBR shows borrowing to be lower this year and next.
OBR forecasts show 2023/24 budget deficit of 4.5% of GDP (march forecast 5.1% of GDP).
OBR forecasts show 2024/25 budget deficit of 3% of GDP (march forecast 3.2% of GDP).
OBR forecasts show 2025/26 budget deficit of 2.2% of GDP (march forecast 2.8% of GDP).
OBR forecasts show 2027/28 budget deficit of 1.6% of GDP (March forecast 1.7% of GDP).
OBR forecasts show 2028/29 budget deficit of 1.1% of GDP.
OBR forecasts show 2023 GDP growth of 0.6% (March forecast -0.2%).
PBR forecasts show 2024 GDP growth of 0.7% (March forecast 1.8%).
OBR forecasts show 2025 GDP growth of 1.4 (March forecast 2.5%).
OBR forecasts show 2026 GDP growth of 1.9% (March forecast 2.1%).
OBR forecasts show 2027 GDP growth of 2% (March forecast 1.9%).
OBR forecasts show 2028 GDP growth of 1.7%.
Market reaction
GBP/USD is shrugging off the above forecasts, currently trading flat at 1.2535.
Economists at Commerzbank expect the EUR/CHF pair to enjoy modest gains next year.
Scope for a stronger Franc again in 2025
We see a moderate depreciation of the Franc against the Euro next year.
The EUR should benefit from the fact that market expectations regarding interest rate cuts in the Eurozone are likely to prove premature. At the same time, inflation in Switzerland is likely to remain at low levels next year, meaning that the SNB should allow the Franc to depreciate to some extent.
By 2025, however, we see scope for a stronger Franc again. This is because inflation is likely to remain low in Switzerland, while it should be above the ECB target in the Eurozone.
UK Finance Minister Jeremy Hunt announced the Autumn Forecast Statement on Wednesday, stating that “we will reduce debt, cut taxes, reward work in this statement.”
Additional quotes
We will cut business taxes.
The Office for Budget Responsibility (OBR) says combined impact of these measures will reduce inflation and raise GDP.
OBR says inflation will fall to 2% target in 2025.
We will back BoE to do whatever it takes to get inflation back to target.
Working-age welfare benefits to be uprated by 6.7% Sept inflation rate.
We will increase support for housing costs through local housing allowance.
I have decided to freeze all alcohol duties until Aug. 1 next year.
We will raise pensions by full triple lock commitment.
From April 2024 will increase state pensions by 8.5%.
We will increase support for housing costs through local housing allowance.
We will spend GBP104 bln on cost of living pressures.
Market reaction
The Budget update seems to have little to no impact on the Pound Sterling, leaving GBP/USD modestly flat at 1.2535, as of writing.
- The Greenback trades in the green against every major G20 peer.
- Traders are seeing US yields halt their decline as the Fed dampens hopes for a quick rate cut.
- The US Dollar Index flirts with a jump to 104.00.
The US Dollar (USD) trades stronger on Wednesday ahead of the Thanksgiving festivities on Thursday. The publication of the Fed Minutes from their recent rate decision revealed that the whole board agrees that cuts are not in the plan for the upcoming meetings. This pours cold water on the market bets that cuts might be very close, even in December.
As if the devil is at play in this turnaround for the US Dollar, the calendar could help the US Dollar Index (DXY) increase even further. Next to Durable Goods and Jobless Claims data, the consumer inflation expectations data from the University of Michigan could confirm that the Fed is correct in not letting loose too quickly. Although it is the final reading, any upward revision will be good for some more US Dollar strength later this Wednesday.
Daily digest: Not going quietly without a fight
A very full calendar this Wednesday ahead of the Thanksgiving festivities on Thursday.
- Data releases kick off at 12:00 GMT, with the Mortgage Bankers Association (MBA) Mortgage Applications for last week. Previous was at 2.8%.
- At 13:30 GMT, a very eventful moment with a lot of data points due to come out:
- Durable Goods Orders are expected to head from 4.6% to -3.1% for October.
- Durable Goods Orders without Transportation are expected to head from 0.4% to 0.1%.
- Initial Jobless Claims for last week are expected to decline from 231,000 to 225,000.
- Continuing Jobless Claims are expected to head from 1,865,000 to 1,875,000.
- Next focal point will be at 15:00 GMT with the University of Michigan numbers.
- The Consumer Sentiment Index is expected to head from 60.4 to 60.5.
- The 5-year Inflation expectations are expected to stay stable at 3.2%.
- Bear in mind that these are final readings for the month of November.
- Equities are mildly in the green as stock markets were not seeing any help from rather disappointing Nvidia earnings. The Sam Altman saga with Microsoft and AI is not helping either. Mild positive numbers are being noticed across Asia and Europe, with US futures flat ahead of the US opening bell.
- The CME Group’s FedWatch Tool shows that markets are pricing in a 94.8% chance that the Federal Reserve will keep interest rates unchanged at its meeting in December. A juicy sidenote is that now 5.2% even thinks a hike might be at hand.
- The benchmark 10-year US Treasury Note yield trades at 4.40%, and is off the lows from 4.38% earlier.
US Dollar Index technical analysis: off the lows
The US Dollar is snapping the game plan that should have brought the US Dollar Index below 103.00 for this week. Help came from the US Federal Reserve Minutes, which showed that all board members were unanimous that cuts are nowhere near an option. Markets got spooked and are seeing ample amounts of flow back into the Greenback, with the US Dollar Index trying to head back above the 200-day Simple Moving Average at xxxx.
The DXY is back above the 200-day SMA near 103.62, and will need to have a daily close above it in order to consolidate the region. Look for a further recovery bounce towards the 100-day SMA near 104.20. Should the DXY be able to close and open above it later this week, look for a return to the 55-day SMA near 105.71 with 105.12 ahead of it as resistance.
The 200-day SMA will try to play its role again as a crucial pivotal supportive level against any downturn. Should the index snap this level again later this week, the psychological 100.00 level comes into play. With a very slim economic calendar after this Wednesday and several US market participants off the desk for the holidays throughout the rest of this week, there is room for a potential big downturn.
US Dollar FAQs
What is the US Dollar?
The US Dollar (USD) is the official currency of the United States of America, and the ‘de facto’ currency of a significant number of other countries where it is found in circulation alongside local notes. It is the most heavily traded currency in the world, accounting for over 88% of all global foreign exchange turnover, or an average of $6.6 trillion in transactions per day, according to data from 2022.
Following the second world war, the USD took over from the British Pound as the world’s reserve currency. For most of its history, the US Dollar was backed by Gold, until the Bretton Woods Agreement in 1971 when the Gold Standard went away.
How do the decisions of the Federal Reserve impact the US Dollar?
The most important single factor impacting on the value of the US Dollar is monetary policy, which is shaped by the Federal Reserve (Fed). The Fed has two mandates: to achieve price stability (control inflation) and foster full employment. Its primary tool to achieve these two goals is by adjusting interest rates.
When prices are rising too quickly and inflation is above the Fed’s 2% target, the Fed will raise rates, which helps the USD value. When inflation falls below 2% or the Unemployment Rate is too high, the Fed may lower interest rates, which weighs on the Greenback.
What is Quantitative Easing and how does it influence the US Dollar?
In extreme situations, the Federal Reserve can also print more Dollars and enact quantitative easing (QE). QE is the process by which the Fed substantially increases the flow of credit in a stuck financial system.
It is a non-standard policy measure used when credit has dried up because banks will not lend to each other (out of the fear of counterparty default). It is a last resort when simply lowering interest rates is unlikely to achieve the necessary result. It was the Fed’s weapon of choice to combat the credit crunch that occurred during the Great Financial Crisis in 2008. It involves the Fed printing more Dollars and using them to buy US government bonds predominantly from financial institutions. QE usually leads to a weaker US Dollar.
What is Quantitative Tightening and how does it influence the US Dollar?
Quantitative tightening (QT) is the reverse process whereby the Federal Reserve stops buying bonds from financial institutions and does not reinvest the principal from the bonds it holds maturing in new purchases. It is usually positive for the US Dollar.
Economists at ING analyze EUR/SEK outlook for the next year.
Riksbank to pick inflation battle over growth
We expect one more hike by the Riksbank before year-end. This should be the last one of the cycle, but we see policymakers continue to prioritise the inflation battle over growth concerns. Orthodox and unorthodox attempts to keep supporting the Krona will remain part of the script, and we cannot exclude an expansion of the FX hedging programme in 2024.
Fed cuts should favour a rotation to activity currencies including SEK, and allow it to cash in on respectable carry and undervaluation.
We see EUR/SEK around 11.00 in the second half of 2024.
European Central Bank (ECB) Vice President Luis de Guindos said on Wednesday, “central bank will not prejudge further movements in the policy rate.”
Additional quotes
Haven't seen extreme moves in bond spreads.
It's premature to discuss rate cuts.
ECB is data-dependent and policy communication is very clear.
Markets' soft-landing hopes may be a bit optimistic.
Market reaction
EUR/USD is unfazed by the above comments, still holding its range around 1.0900, as of writing.
The Canadian Dollar has underperformed alongside the US Dollar this month. Economists at MUFG Bank analyze Loonie’s outlook.
Room for further BoC cuts to be priced into next year
Despite the relative resilience of the US economy, the US rate market is still pricing in around 0.2 points of further cuts than the BoC by the end of next year. With the Canadian rate market currently pricing in around 75 bps of cuts, it leaves room for further BoC cuts to be priced into next year which should remain a weight on Canadian Dollar performance going forward.
As a result, we expect USD/CAD to continue to trade in the high 1.3000’s.
- WTI Oil is facing a firm downturn in the coming trading day.
- The US Dollar rallies on the publication of the Fed Minutes.
- Oil is at risk of dropping back to $74 as more bearish elements emerge.
Oil prices are not selling off as massively as expected, although a case is building for at least some further correction in Crude prices. The recent repricing is likely after a ceasefire between Israel and Palestine and the overnight numbers from the American Petroleum Institute revealed a very substantial build in US stockpiles. These key elements are enough to send Oil prices lower this Wednesday.
Meanwhile, the US Dollar (USD) is soaring after the latest Fed Minutes was published on Tuesday night. Although no surprises, markets got spooked a bit by the fact that all members were unanimously agreeing not to move rates anytime soon. This means that markets need to pull back a bit of their earlier enthusiasm that rate cuts could emerge very soon. The latest Minutes thus reveal that markets have been a bit too enthusiastic, which means that yields could start soaring a bit and the Greenback gains a bit of strength in the US Dollar Index (DXY).
Crude Oil (WTI) trades at $77.36 per barrel and Brent Oil trades at $82.03 per barrel at the time of writing.
Oil news and market movers: Oil markets on the lookout for OPEC
- The overnight build in stockpile numbers reported by the American Petroleum Institute (API) on Tuesday evening revealed a 9.047 million build in barrels. This further confirms the element that the US is ramping up production.
- The fact that US production and stockpiles are soaring, will urge OPEC to agree on deeper cuts. Efforts from Saudi Arabia will not be enough and a joint approach will be needed if OPEC+ wants to keep Oil prices where they are at the moment.
- A packed commodities calendar this evening with Thanksgiving shortening the trading week in the US:
- Near 15:30 GMT the Energy Information Administration (EIA) will release the change in crude stockpile in the US: Expectations are for a minor build of 0.9 million against 3.6 million last week.
- The EIA is also due to release near 17:00 GMT the Natural Gas Storage Change for last week: Expectations are for a build of 1 billion cubic feet against 60 billion last week.
- The Baker Hughes US Oil Rig Count numbers are due at 18:00 GMT. The previous result was 500 with no forecast pencilled in.
Oil Technical Analysis: US data rules
Oil prices are gearing up for a very packed US calendar. All numbers that normally would come out from Wednesday to Friday, will now be concentrated on this Wednesday evening as Thanksgiving is taking place on Thursday. Expect to see substantial volatility. For now crude prices are steady despite the headlines about a ceasefire in the Middle East and the recent build in US stockpile. Should this Wednesday evening’s EIA numbers reveal a similar big build, expect to see a substantial drop ahead of the OPEC meeting this weekend.
On the upside, $80.00 is the resistance to watch out for. Should crude be able to jump higher again, look for $84.00 (purple line) as the next level to see some selling pressure or profit taking. Should Oil prices be able to consolidate above there, the topside for this fall near $93.00 could come back into play.
On the downside, traders are seeing a soft floor forming near $74.00. This level is acting as the last line of defence before entering $70.00 and lower. Once in that area, markets might factor in the risk of a surprise intervention from OPEC+ to jack up Oil prices once again.
-638362472394457076.png)
US WTI Crude Oil: Daily Chart
WTI Oil FAQs
What is WTI Oil?
WTI Oil is a type of Crude Oil sold on international markets. The WTI stands for West Texas Intermediate, one of three major types including Brent and Dubai Crude. WTI is also referred to as “light” and “sweet” because of its relatively low gravity and sulfur content respectively. It is considered a high quality Oil that is easily refined. It is sourced in the United States and distributed via the Cushing hub, which is considered “The Pipeline Crossroads of the World”. It is a benchmark for the Oil market and WTI price is frequently quoted in the media.
What factors drive the price of WTI Oil?
Like all assets, supply and demand are the key drivers of WTI Oil price. As such, global growth can be a driver of increased demand and vice versa for weak global growth. Political instability, wars, and sanctions can disrupt supply and impact prices. The decisions of OPEC, a group of major Oil-producing countries, is another key driver of price. The value of the US Dollar influences the price of WTI Crude Oil, since Oil is predominantly traded in US Dollars, thus a weaker US Dollar can make Oil more affordable and vice versa.
How does inventory data impact the price of WTI Oil
The weekly Oil inventory reports published by the American Petroleum Institute (API) and the Energy Information Agency (EIA) impact the price of WTI Oil. Changes in inventories reflect fluctuating supply and demand. If the data shows a drop in inventories it can indicate increased demand, pushing up Oil price. Higher inventories can reflect increased supply, pushing down prices. API’s report is published every Tuesday and EIA’s the day after. Their results are usually similar, falling within 1% of each other 75% of the time. The EIA data is considered more reliable, since it is a government agency.
How does OPEC influence the price of WTI Oil?
OPEC (Organization of the Petroleum Exporting Countries) is a group of 13 Oil-producing nations who collectively decide production quotas for member countries at twice-yearly meetings. Their decisions often impact WTI Oil prices. When OPEC decides to lower quotas, it can tighten supply, pushing up Oil prices. When OPEC increases production, it has the opposite effect. OPEC+ refers to an expanded group that includes ten extra non-OPEC members, the most notable of which is Russia.
Gold rose the most in a month to north of $2,000. Strategists at TD Securities analyze the yellow metal’s outlook.
The Fed has room to loosen monetary policy
Weakening data and moderating inflation have prompted some to think the Fed has room to loosen monetary policy, with markets now pricing in a roughly 30% chance of a rate cut in March.
This seems to be technical in nature, and it is too early to see a sustained rally that would keep Gold above $2,000.
We see rangebound trading around $1,979-$2,009.
This autumn, the Norwegian currency has gained recent support. However, economists at Danske Bank expect NOK to weaken again.
Relief boost to NOK to prove temporary
We maintain a negative view on NOK.
For the very near-term, we cannot rule out more NOK strength but we highlight that we see such strength as temporary and still pencil EUR/NOK to breach the 12.00 figure in the coming 6M.
We still think NOK is fundamentally undervalued but we do not see the trigger for a turnaround in the next 12M as global headwinds look set to return.
Forecast: 11.70 (1M), 11.90 (3M), 12.10 (6M), 12.10 (12M)
USD/MXN hovers around 17.20. Economists at Société Générale analyze the pair’s outlook.
200-DMA near 17.60 could cap near-term upside
USD/MXN has staged a steady down move after facing stiff resistance near the trend line drawn since November 2021 at 18.48/18.60. Re-integration within previous base denotes upward momentum has disappeared.
The pair is close to September low of 17.00 which could be a potential support.
The 200-DMA near 17.60 could cap near-term upside.
Below 17.00, next objectives are located at 16.60 and projections of 16.05/15.92.
In its bi-annual assessment of the Euro area financial conditions, the European Central Bank (ECB) highlighted on Wednesday, “the outlook for financial stability is fragile.”
Additional takeaways
History suggests soft landing difficult, but not impossible.
A weak economy heightens stability risks from hikes.
It's crucial to reach the EU deal on fiscal rules.
Shadow banks have very low liquidity buffers.
Market reaction
At the time of writing, EUR/USD is trading at 1.0895, down 0.12% on the day.
USD stages rebound after heavy sell-off. Economists at MUFG Bank analyze Dollar’s outlook.
Is the recent USD sell-off overdone?
FOMC minutes revealed that FOMC participants were all in agreement that they should ‘proceed carefully’ and policy decisions at every meeting would continue to be ‘based on the totality of incoming information’.
The FOMC minutes have not altered market expectations for Fed policy. The price action in the FX market appears to suggest more that the US Dollar had become oversold.
The recent move lower for the US Dollar has not been fully backed up by yield spreads moving against the US. It is one of the reasons why we have been cautioning against a more extended sell-off in the near-term.
Gold prices hit $2,000. Economists at UBS analyze the yellow metal’s outlook.
Uncertainty over interest rates could keep Gold choppy in the near term
Gold offers a potentially effective hedge against a deterioration in geopolitical conflicts.
While uncertainty over interest rates could keep Gold choppy in the near term, investors looking to add Gold can consider buying the metal using options (buying below $1,900).
We think investors with existing long Gold positions should hold onto them in anticipation of a recovery over the next 6-12 months.
Ahead of the Thanksgiving holiday, the USD holds resilient against its rivals. Economists at ING analyze Dollar’s outlook.
Trading volumes to fall away into Thursday’s US Thanksgiving holiday
Expect trading volumes to fall away into Thursday’s US Thanksgiving holiday but the holiday means we get to see US initial jobless claims earlier than usual. Here, continued claims are expected to climb, reflecting a softening labour market.
In terms of the bigger picture, we tend to think it is a little too early to expect the Dollar bear trend to run a lot further just yet. That will require some substantially weaker US data or the Fed formally taking an additional rate hike off the table.
- USD/CHF halts a losing streak on the likelihood of further policy tightening by the Fed.
- Nine-day EMA appears as the key barrier followed by the 0.8900 psychological level.
- A break below the 0.8850 level could push the pair toward three-month lows.
USD/CHF snaps a three-day losing streak, edging higher near 0.8860 during the European session on Wednesday. The nine-day Exponential Moving Average (EMA) at 0.8892 emerges as the resistance aligned up with the psychological region at the 0.8900 level.
A breakthrough above the latter could open the doors for the USD/CHF pair to explore the next barrier around the 23.6% Fibonacci retracement at 0.8913 followed by the 0.8950 major level.
The Federal Open Market Committee (FOMC) meeting minutes on Tuesday suggested that additional monetary policy tightening may be necessary if new data does not reach the Federal Reserve's (Fed) inflation target, which may be the reason why the USD/CHF pair has gained strength. Until there is evident and consistent progress toward the Committee's inflation target, the Board resolved to stick to its strict stance.
However, the technical indicators for the USD/CHF pair support the current downward trend. The 14-day Relative Strength Index (RSI) below 50 indicates bearish sentiment, indicating that the pair is losing momentum.
Furthermore, the Moving Average Convergence Divergence (MACD) line is below the centerline, with divergence below the signal line, indicating that the USD/CHF pair could re-test the major support at the 0.8850 level. If there is a break below the level, the pair could navigate the area around the psychological level at 0.8800, nearing the three-month low at 0.8795.
USD/CHF: Daily Chart
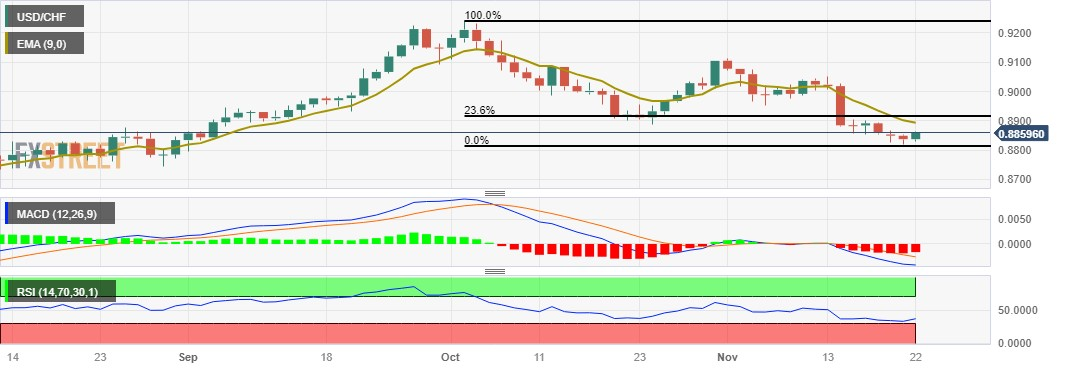
Economists at ING analyze GBP outlook ahead of the UK Autumn Statement.
EUR/GBP to trade back below 0.8700
Today, Chancellor Jeremy Hunt is also looking to deliver tax cuts – but cuts that do not derail plans to stabilise the UK debt trajectory over a five-year horizon.
We think some looser fiscal policy will be welcomed by Sterling at this juncture and continue to favour EUR/GBP trading back below 0.8700.
See – UK: Autumn Statement to offer muted market reactions – Danske Bank
- GBP/USD halts a three-day winning streak as the Greenback rises.
- Fed will tighten policy even more If the inflation target is not met.
- BoE Governor Bailey brushed down rumors that the BoE may start loosening its policies by June 2024.
GBP/USD breaks a three-day winning streak after dropping from the 11-week high at 1.2559 due to the rise in the US dollar (USD). The GBP/USD pair trades lower around 1.2520 on Wednesday during the European session.
The hawkish comments made by Bank of England (BoE) officials on Tuesday helped the Pound Sterling (GBP) and provided a tailwind for the GBP/USD pair. Moreover, Andrew Bailey, the governor of the Bank of England (BoE), cautioned investors during a Treasury Select Committee hearing on Tuesday that they are undervaluing the longevity of UK inflation and are placing too much emphasis on the most recent data.
Governor Bailey also downplayed rumors that the BoE will begin policy easing by June 2024 and emphasized that the central bank would maintain high-interest rates for an extended period of time.
Ahead of the UK's autumn budget announcement, Prime Minister of the United Kingdom (UK), Rishi Sunak, declared that the government intends to lower taxes in response to a drop in inflation. It is expected that Jeremy Hunt, the Chancellor of the Exchequer, would announce policies intended to accelerate economic growth, with proposals to increase business investment being one of the main objectives.
The Federal Open Market Committee (FOMC) meeting minutes on Tuesday revealed a modestly hawkish tone, providing upward support for the US Dollar (USD). Committee members discussed the possibility of further tightening of monetary policy if fresh data fails to align with the Federal Reserve's (Fed) inflation goal. The Board decided to maintain a tight policy until there is clear and sustained progress toward the Committee's inflation objective.
Investors are likely to anticipate key data releases from the United States (US) on Wednesday, including weekly jobless claims and the Michigan Consumer Sentiment survey. Additionally, the preliminary S&P Global/CIPS Purchasing Managers Index (PMI) from the United Kingdom (UK) is scheduled for publication on Thursday.
- USD/CAD attracts fresh buyers on Wednesday and draws support from a combination of factors.
- Softer Canadian CPI undermines the Loonie and acts as a tailwind amid a modest USD strength.
- The mixed technical setup warrants caution before positioning for a firm near-term direction.
The USD/CAD pair regains positive traction on Wednesday and holds its neck above the 1.3700 round-figure mark through the first half of the European session.
The Canadian Dollar (CAD) is undermined by softer domestic consumer inflation figures released on Tuesday, which now seem to have dashed hopes for any further rate hikes by the Bank of Canada (BoC). The US Dollar (USD), on the other hand, is seen building on the previous day's hawkish FOMC minutes-inspired recovery move from its lowest level since August 31 and acting as a tailwind for the USD/CAD pair. Meanwhile, subdued action around Crude Oil prices does little to provide any meaningful impetus to the commodity-linked Loonie.
From a technical perspective, spot prices, so far, have been showing resilience below the 38.2% Fibonacci retracement level of the September-November rally and finding some support near a two-month-old ascending trend line. The latter is near the 50-day Simple Moving Average (SMA), around the 1.3670-1.3665 region, which should now act as a key pivotal point and determine the near-term trajectory for the USD/CAD pair.
With oscillators on the daily chart starting to gain some negative traction, a convincing break below the 50-day SMA will be seen as a fresh trigger for bearish traders and pave the way for some meaningful downside. The USD/CAD pair might then weaken further below the 50% Fibo. level, around the 1.3640-1.3635 region, and accelerate the slide towards the 1.3600 mark en route to the 1.3580-1.3575 zone, or 61.8% Fibo. level.
On the flip side, any subsequent move-up is likely to confront some resistance near the weekly swing high, around the 1.3750 area ahead of the 1.3775 region, or the 23.6% Fibo. level. Some follow-through buying will negate any near-term negative bias and allow the USD/CAD pair to reclaim the 1.3800 mark. The momentum could get extended further towards the 1.3835-1.3840 supply zone and the YTD peak, near the 1.3900 level.
USD/CAD daily chart
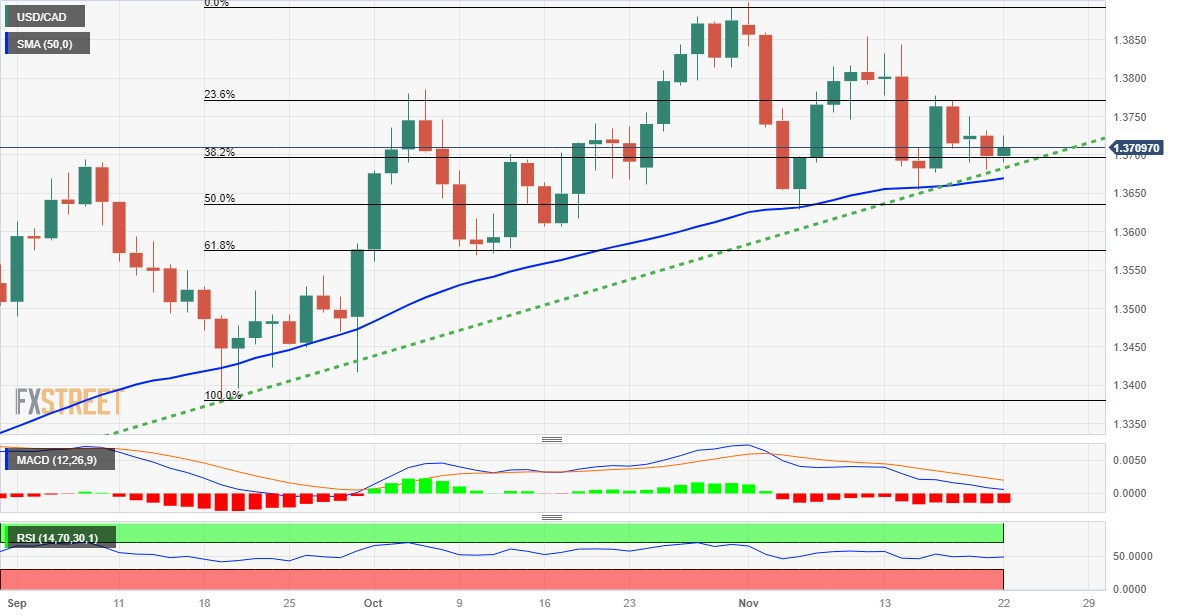
Technical levels to watch
Reserve Bank of Australia (RBA) Governor Michele Bullock is talking about the recent monetary policy decision at the ABE Annual Dinner in Sydney on Wednesday.
Key quotes
Our inflation challenge is increasingly homegrown, demand driven.
More substantial" monetary policy tightening is right response to demand-driven inflation.
Supply-chain inflation is easing and has a bit further to run.
But Australian inflation is broad-based, trimmed mean remains too high.
Prices are rising strongly for majority of goods and services we all consume.
Service costs rising strongly as demand outstrips supply.
RBA liaison with firms indicates domestic cost pressures are proving persistent.
Liaison shows capacity utilization is very high, labor market tight.
Will take time to get demand-driven inflation back to 2-3% target.
Seeking to cool demand while keeping employment growing.
Market reaction
AUD/USD is paying a little heed to the hawkish comments from the RBA Governor, currently down 0.37% on the day at 0.6530.
Will the Riksbank dare to hike interest rates on Thursday? Economists at Commerzbank analyze SEK’s outlook ahead of the central bank meeting.
No signals of a further rate hike would have little effect on the Krona
The Riksbank should hike interest rates one more time. That would constitute a surprise for the market and would provide additional support for the Krona. However, I can also imagine that it leaves everything unchanged and maintains a small likelihood of a rate step early next year in its rate path. That would mean simply delaying the rate peak a little in case inflation eases more slowly than expected.
If, however, it leaves rates unchanged without signalling the chance of a further rate hike, that would not constitute a major surprise for the market and would therefore have little effect on the Krona.
GBP was one of Tuesday's winners. today, UK Chancellor Jeremy Hunt will present the Autumn Statement. Economists at Danske Bank analyze how could the Pound react to
Chancellor will be wary to incorporate anything that will not ensure and signal debt sustainability
There has been speculation of whether tax cuts will be announced amongst other changes to income taxes, inheritance tax and/or national insurance.
The measures presented will try to help the Conservative Party following poor performance in the polls with election year coming up. According to the latest Politico poll of voting intention from 17 November, the Conservatives stand at 27% while the Labour Party has pulled ahead at 45%. However, with the ‘mini’-budget scandal still fresh in mind, the Chancellor will be wary to incorporate anything which will not ensure and signal debt sustainability over the forecast horizon.
Overall, we do not expect this to be a market mover event and by extension for GBP.
Gold prices rose in India on Wednesday, according to data from India's Multi Commodity Exchange (MCX).
Gold price stood at 61,308 Indian Rupees (INR) per 10 grams, up INR 220 compared with the INR 61,088 it cost on Tuesday.
As for futures contracts, Gold prices increased to INR 61,330 per 10 gms from INR 61,225 per 10 gms.
Prices for Silver futures contracts decreased to INR 73,430 per kg from INR 73,304 per kg.
| Major Indian city | Gold Price |
|---|---|
| Ahmedabad | 63,145 |
| Mumbai | 63,290 |
| New Delhi | 63,430 |
| Chennai | 63,370 |
| Kolkata | 63,460 |
Global Market Movers: Comex Gold price rises further in the Thanksgiving week
- The minutes from the Federal Reserve's latest meeting revealed officials backing higher for longer interest rates for some time to tame inflation and underpin the US Dollar.
- Market participants, however, seem convinced that the US central bank will keep rates steady rather than hiking and are pricing in the possibility of rate cuts by spring 2024.
- The benchmark 10-year US Treasury bond yield languishes near a two-month low and turns out to be a key factor driving some flows towards the non-yielding yellow metal.
- The National Association of Realtors reported that US Existing Home Sales fell in October to a seasonally adjusted annual rate of 3.79 million units or the lowest level in more than 13 years.
- Israel and Hamas have agreed to a deal for the staggered release of 50 civilians held hostage in Gaza in exchange for Palestinian prisoners and a four-day halt to hostilities.
- The US military conducted discrete, precision strikes against two Iran-backed facilities in Iraq in response to the attacks against US and Coalition forces by Iran and Iran-backed groups.
- The markets reacted little to the latest development as there hasn't been any major escalation in the Middle East tensions, doing little to influence the safe-haven precious metal.
- Traders now look to the US macro data – Initial Weekly Jobless Claims, Durable Goods Orders and revised Michigan Consumer Sentiment Index – for short-term impetus.
Gold FAQs
Why do people invest in Gold?
Gold has played a key role in human’s history as it has been widely used as a store of value and medium of exchange. Currently, apart from its shine and usage for jewelry, the precious metal is widely seen as a safe-haven asset, meaning that it is considered a good investment during turbulent times. Gold is also widely seen as a hedge against inflation and against depreciating currencies as it doesn’t rely on any specific issuer or government.
Who buys the most Gold?
Central banks are the biggest Gold holders. In their aim to support their currencies in turbulent times, central banks tend to diversify their reserves and buy Gold to improve the perceived strength of the economy and the currency. High Gold reserves can be a source of trust for a country’s solvency. Central banks added 1,136 tonnes of Gold worth around $70 billion to their reserves in 2022, according to data from the World Gold Council. This is the highest yearly purchase since records began. Central banks from emerging economies such as China, India and Turkey are quickly increasing their Gold reserves.
How is Gold correlated with other assets?
Gold has an inverse correlation with the US Dollar and US Treasuries, which are both major reserve and safe-haven assets. When the Dollar depreciates, Gold tends to rise, enabling investors and central banks to diversify their assets in turbulent times. Gold is also inversely correlated with risk assets. A rally in the stock market tends to weaken Gold price, while sell-offs in riskier markets tend to favor the precious metal.
What does the price of Gold depend on?
The price can move due to a wide range of factors. Geopolitical instability or fears of a deep recession can quickly make Gold price escalate due to its safe-haven status. As a yield-less asset, Gold tends to rise with lower interest rates, while higher cost of money usually weighs down on the yellow metal. Still, most moves depend on how the US Dollar (USD) behaves as the asset is priced in dollars (XAU/USD). A strong Dollar tends to keep the price of Gold controlled, whereas a weaker Dollar is likely to push Gold prices up.
Here is what you need to know on Wednesday, November 22:
Following Monday's sharp decline, the US Dollar (USD) Index managed to post small daily gains on Tuesday. Early Wednesday, the USD holds resilient against its rivals. Ahead of the Thanksgiving holiday, the US economic docket will feature Durable Goods Orders data for October alongside the US Department of Labor's weekly Initial Jobless Claims. Later in the American session, the European Commission will publish the preliminary Consumer Confidence Index data for November.
In the minutes of the October 31-November 1 policy meeting, the Federal Reserve (Fed) reiterated the data dependent approach and policymakers' willingness to proceed carefully. The document, however, showed that participants noted further policy tightening would be appropriate if progress to the inflation target was insufficient. The benchmark 10-year US Treasury bond yield stabilized at around 4.4% following the publication and Wall Street's main indexes closed the day with moderate losses.
US Dollar price this week
The table below shows the percentage change of US Dollar (USD) against listed major currencies this week. US Dollar was the weakest against the Japanese Yen.
| USD | EUR | GBP | CAD | AUD | JPY | NZD | CHF | |
| USD | -0.08% | -0.62% | -0.10% | -0.45% | -0.72% | -0.66% | -0.31% | |
| EUR | 0.08% | -0.54% | 0.01% | -0.35% | -0.61% | -0.56% | -0.20% | |
| GBP | 0.62% | 0.55% | 0.53% | 0.18% | -0.08% | -0.02% | 0.32% | |
| CAD | 0.08% | -0.01% | -0.55% | -0.37% | -0.63% | -0.57% | -0.21% | |
| AUD | 0.44% | 0.37% | -0.17% | 0.35% | -0.27% | -0.21% | 0.13% | |
| JPY | 0.71% | 0.61% | -0.13% | 0.63% | 0.26% | 0.07% | 0.39% | |
| NZD | 0.65% | 0.57% | 0.04% | 0.56% | 0.21% | -0.06% | 0.34% | |
| CHF | 0.29% | 0.20% | -0.33% | 0.21% | -0.16% | -0.39% | -0.36% |
The heat map shows percentage changes of major currencies against each other. The base currency is picked from the left column, while the quote currency is picked from the top row. For example, if you pick the Euro from the left column and move along the horizontal line to the Japanese Yen, the percentage change displayed in the box will represent EUR (base)/JPY (quote).
Early Wednesday, Reuters reported that Chinese government advisers will recommend an economic growth target for next year ranging from 4.5% to 5%. "Monetary stimulus is expected to play a more limited role as the central bank remains concerned about a widening interest rate differential with the West," the report further read.
EUR/USD closed in negative territory on Tuesday but managed to hold above 1.0900. European Central Bank (ECB) President Christine Lagarde said on Tuesday that it's not the time to start declaring victory against inflation.
GBP/USD registered gains for the third consecutive trading day and touched its highest level since early September above 1.2550 on Tuesday. The pair consolidates its gains below that level early Wednesday. During the European trading hours, British Finance Minister Jeremy Hunt will deliver the Autumn Budget statement.
In the latest assessment, Japan's Cabinet Office said that it cut the view on the overall economy for November, citing the negative impact of weak demand on capital spending and consumer expenditure. USD/JPY fell toward 147.00 and touched its lowest level in over two months before staging a rebound. At the time of press, the pair was trading in positive territory at around 149.00.
Gold rally continued in the second half of the day on Tuesday and XAU/USD climbed above $2,000 for the first time since early November. As of writing, the pair was trading modestly higher on the day at $2,005.
The softening in USD and signs of thawing of US-China relations have helped to strengthen the Yuan over the past week or so. Economists at Commerzbank analyze USD/CNY outlook.
Stabilization rather than a strong re-acceleration in activity
The Yuan will likely continue to strengthen should the Dollar retreat further. However, we think it is unlikely that the Yuan will strengthen substantially further in the near term i.e. for USD/CNY to move below the 7 mark.
Admittedly, Chinese authorities will probably take more aggressive steps to shore up the housing market, support property developers’ financing, and manage the local government debt problems while boosting infrastructure spending. These steps will be positive to China’s growth outlook. However, we look for stabilization rather than a strong re-acceleration in activity.
While the negative interest rate differentials between China and the US are narrowing, they are likely to persist given the divergent policy directions for the Fed and PBoC.
- Silver gains positive traction for the second straight day and trades closer to the weekly top.
- The technical setup favours bulls and supports prospects for a further appreciating move.
- Move beyond a multi-month-old descending trend line is needed to confirm the positive bias.
Silver (XAG/USD) attracts some buyers for the second successive day on Wednesday and sticks to its modest intraday gains through the early European session. The white metal, however, remains below the $24.00 mark, or the weekly high touched on Tuesday, which coincides with a downward-sloping trend line extending from the May swing high and should now act as a key pivotal point.
From a technical perspective, the recent breakout through the very important 200-day Simple Moving Average (SMA) barrier favours bullish traders. Moreover, oscillators on the daily chart are holding in the positive territory and are still far from being in the overbought zone. This, in turn, suggests that the path of least resistance for the XAG/USD is to the upside and supports prospects for a further appreciating move.
Bulls, however, need to wait for a move beyond the downward-sloping trend line resistance near the $24.00 mark before placing fresh bets. The XAG/USD might then surpass the $24.20-$24.25 intermediate hurdle and make a fresh attempt to conquer the $25.00 psychological mark. Some follow-through buying beyond the $25.15-$25.20 region will set the stage for a move towards reclaiming the $26.00 mark for the first time since May.
On the flip side, the 200-day SMA, currently pegged near the $23.30 region, might continue to protect the immediate downside. Any subsequent slide could attract fresh buyers and is more likely to remain limited near the $23.00 mark. A convincing break below the latter, however, might prompt aggressive technical selling and drag the XAG/USD further towards the $22.35-$22.30 zone en route to the $22.00 mark.
Silver daily chart
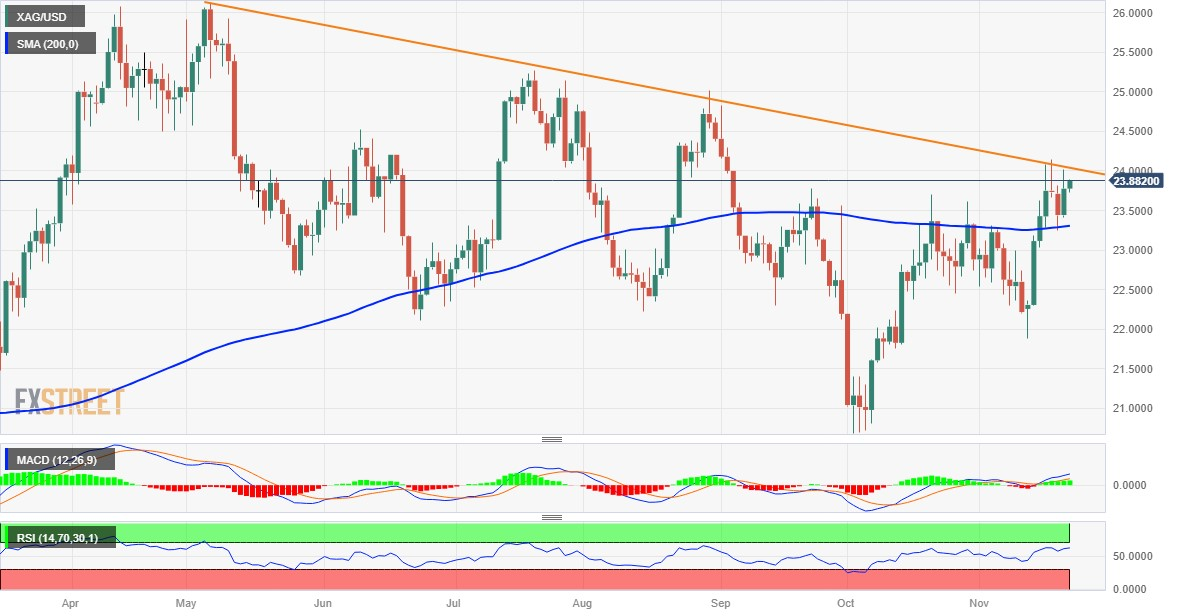
Technical levels to watch
EUR/USD declined modestly during Tuesday's session. Economists at Commerzbank analyze the pair’s outlook ahead of the long weekend.
Trading in EUR/USD will be rather sluggish ahead of the weekend
On the Dollar side, the last economic data to which the USD could react is due today; it is durable goods orders, initial jobless claims and the University of Michigan’s sentiment. If the data confirms the market’s view that the Fed will have to cut rates soon the Dollar might again depreciate by a few more pips.
On Thursday, the Eurozone PMIs for November are due for publication. If they record a rise, the market might adjust its rate cut expectations for the ECB so that the Euro might appreciate.
We do not expect the indices to signal a recovery of activity though, at best we expect to see a stabilisation in recessionary territory. That means that they are probably not suited to provide additional support for the Euro against the Dollar, allowing the EUR to move closer to the upside and towards 1.10.
Trading in EUR/USD will be rather sluggish ahead of the weekend and will make us all yawn. But you never know what surprises may be lurking around the corner, for example on the geo-political front. In that case, thin trading volumes can then lead to strong fluctuations.
- NZD/USD retreats from the three-month high at 0.6086.
- US Dollar gains ground on improved US bond yields.
- Fed is open to tightening policy further if the inflation target fails to be met.
- The positive China’s outlook supports the rise in the New Zealand Dollar.
NZD/USD snaps a three-day winning streak after retreating from the three-month high at 0.6086, which could be attributed to the increase in the US Dollar (USD). The NZD/USD pair trades lower near 0.6030 during the early European session on Wednesday and extends gains for the second successive day.
The Greenback experiences strength as US Treasury yields improve. The 10-year and 2-year US bond yields hold at 4.41% and 4.88%, respectively, at the time of writing. The US Dollar Index (DXY) edges higher around 103.70.
The Federal Open Market Committee (FOMC) revealed a modestly hawkish tone in the meeting minutes on Tuesday, which might have provided some upward support for the buck. The FOMC committee members expressed the possibility of further tightening of monetary policy in the event that fresh data fail to demonstrate the Federal Reserve's (Fed) goal of inflation. The Board also decided that policy ought to stay tight for a little while longer, or until inflation is manifestly and steadily declining in the direction of the Committee's goal.
On Tuesday, New Zealand's Trade Balance was $-14.81 billion YoY in October against the $-15.41 billion in September. In the meantime, the country's imports fell to $7.11 billion from $7.20 billion in previous readings, while exports increased to $5.40 billion from $4.77 billion.
Furthermore, the positive outlook for China, its main trading neighbor, is supporting the rise in the New Zealand Dollar (NZD). A representative of the People's Bank of China (PBOC) reiterated their resolve to offer the nation's faltering real estate industry additional policy support.
Investors will likely observe the data from the United States (US) on Wednesday, which includes weekly jobless claims and the Michigan Consumer Sentiment survey. On Kiwi’s docket, Retail Sales for the third quarter is expected to show an improvement on Friday’s release.
In 2023, the Indonesian Rupiah came under pressure, especially in the second half of the year. Economists at ING analyze IDR outlook.
Exports likely to face another challenging year in 2024
Exports are likely to face another challenging year in 2024 with most major trading partners facing economic headwinds of their own. This could translate to sustained pressure on IDR well into 2024.
With BI still maintaining a relatively tight interest rate differential over the Fed (75 bps) the IDR could remain under pressure until the differential widens due to additional BI rate hikes or potential rate cuts from the Fed sometime in 2024.
- EUR/JPY gains traction around 162.35, gaining 0.26% on the day.
- The bullish outlook remains intact, as the cross still holds above the key 100-hour EMA.
- The key resistance level is located at 163.00; 161.62 acts as an initial support level for EUR/JPY.
The EUR/JPY cross snaps the four-day losing streak during the early European session on Wednesday. The cross bounces off the weekly low of 161.24 and climbs above the 162.00 mark. EUR/JPY currently trades around 162.35, up 0.26% on the day.
According to the four-hour chart, the bullish outlook remains intact as the cross still holds above the key 100-hour Exponential Moving Averages (EMAs) on the four-hour chart. Additionally, the Relative Strength Index (RSI) is located in the bullish territory above 50, indicating that further upside looks favorable.
The critical resistance level for the cross is seen at a psychologically round figure of 163.00. The next hurdle will emerge at the confluence of the upper boundary of Bollinger Band and a high of November 19 at the 163.50–163.55 zone. A break above the latter will see the rally to the year-to-date (YTD) high of 164.30.
On the downside, the 100-hour EMA at 161.62 acts as an initial support level for EUR/JPY. Further south, the cross will see the next downside target near the lower limit of the Bollinger Band at 161.13. A breach of the latter will see a drop to a low of November 7 at 160.43, followed by the psychological round figure at 160.00.
EUR/JPY four-hour chart
-638362323298941452.png)
- GBP/USD attracts some sellers around 1.2525 in Wednesday’s early European session.
- The pair holds above the 50- and 100-hour EMA with an upward slope; the RSI indicator stands in bullish territory above 50.
- 1.2580 acts as an immediate resistance level for GBP/USD; the initial support level is located at 1.2456.
The GBP/USD pair snaps the three-day winning streak during the early European session on Wednesday. The downtick of the major pair is backed by renewed US dollar demand. At the press time, GBP/USD is losing 0.09% on the day to trade at 1.2525.
On Monday, the Bank of England (BoE) Governor Andrew Bailey said that it was too early to think about rate cuts and borrowing costs might have to rise again if inflation proved to be more persistent than estimated. Bailey further stated that the conflict in the Gaza Strip has increased the likelihood that inflation will rise again.
From the technical perspective, GBP/USD holds above the 50- and 100-hour Exponential Moving Averages (EMAs) with an upward slope on the four-hour chart, suggesting the path of least resistance is to the upside. Furthermore, the Relative Strength Index (RSI) holds in the bullish territory above 50, indicating the further upside looks favorable.
The upper boundary of the Bollinger Band at 1.2580 acts as an immediate resistance level for the major pair. The next upside barrier is seen near a high of September 4 at 1.2642. The additional upside filter to watch is a high of September 1 at 1.2713, en route to a high of August 30 at 1.2746.
On the downside, the initial support level for GBP/USD is located near a high of November 16 at 1.2456. Further south, the next downside target is seen at the 50-hour EMA. The key contention level will emerge at 1.2400, portraying the confluence of the lower limit of the Bollinger Band and a psychological round mark. A breach of the level will see a drop to the 100-hour EMA at 1.2357.
GBP/USD four-hour chart
-638362293545191376.png)
- USD/MXN gained ground on hawkish FOMC minutes.
- FOMC committee could raise interest rates further if data fails to show progress toward the inflation target.
- Markets expect that Mexican Retail Sales will show a rise on Wednesday's release.
USD/MXN hovers around 17.2000 with a negative tone during the Asian session on Wednesday. However, the USD/MXN pair received upward support as the Federal Open Market Committee (FOMC) revealed a modestly hawkish tone in the meeting minutes on Tuesday.
Members of the FOMC committee stated that monetary policy may be tightened further if additional data fail to show progress toward the Federal Reserve's (Fed) inflation target. Board members also agreed that policy should remain restrictive for a little longer, at least until inflation is clearly and stably falling toward the Committee's target.
The US Dollar Index (DXY) struggles to extend gains, now languishing around 103.60. Despite improved US Treasury rates on Wednesday, the US Dollar (USD) faces hurdles. By press time, the 10-year and 2-year US bond rates had risen to 4.41% and 4.88%, respectively.
Mexican Retail Sales are predicted to rise in Wednesday's release, while November 1st Half-Month Inflation will be released on Thursday. The Mexico CPI is expected to rise slightly, but the core CPI will fall somewhat.
Furthermore, the Bank of Mexico (Banxico) is due to issue its most recent meeting minutes, in which the decision to keep rates unchanged was accompanied by a change in terminology from "for an extended period" to "for some time."
Furthermore, preliminary estimates cited by Reuters showed that Mexico’s economy gained 2.9% in October on an annual basis.
Investors are expected to look forward to data from the United States (US) on Wednesday, which includes weekly jobless claims and the Michigan Consumer Sentiment survey. The economic calendar in Mexico remains light, with traders looking for economic data that could influence the Banxico futures choices.
- GBP/JPY oscillates in a range on Wednesday and is influenced by a combination of diverging forces.
- Speculations that the BoJ will soon end its negative rates policy lend support to the JPY and cap gains.
- The overnight hawkish remarks by BoE’s Bailey continue to underpin the GBP and limit the downside.
The GBP/JPY cross struggles to capitalize on the previous day's solid recovery of over 150 pips from the 184.45 area, or a two-and-half-week low and oscillates in a narrow trading band during the Asian session on Wednesday. Spot prices remain below the 186.00 round-figure mark, warranting some caution before confirming that the recent sharp pullback from the highest level since November 2015 touched last week.
The Japanese Yen (JPY) continues with its relative outperformance in the wake of firming expectations that the Bank of Japan (BoJ) will end its negative interest rate policy in early 2024. With inflation overshooting the 2% target for the 18th straight month in September, BoJ Governor Kazuo Ueda said last week that the central bank won't necessarily wait until real wages turn positive before exiting the decade-long accommodative policy settings. This, in turn, is seen as a key factor acting as a headwind for the GBP/JPY cross.
The downside, however, remains cushioned in the wake of the Bank of England (BoE) Governor Andrew Bailey's hawkish remarks on Tuesday. Speaking at a Treasury Select Committee hearing, Bailey said that inflation will end the year a bit lower than expected, but risks were still on the upside. Bailey added that the central bank would not rule out the possibility of further interest rate hikes in the future. This, in turn, is seen acting as a tailwind for the British Pound (GBP) and lending some support to the GBP/JPY cross.
Apart from this, a stable performance around the equity markets could undermine the safe-haven JPY and contribute to limiting any meaningful slide. In the absence of any relevant market-moving economic releases from the UK, the aforementioned mixed fundamental backdrop warrants some caution before placing aggressive directional bets around the GBP/JPY cross.
Technical levels to watch
- EUR/USD strengthened as ECB President Lagarde stated that it is premature to declare victory over inflation.
- The pair could re-attempt to reach the 1.1000 psychological level as technical indicators support the upward trend.
- The psychological level at 1.0900 acts as the immediate support backed by the seven-day EMA at 1.0874.
EUR/USD attempts to recover its losses recorded in the previous session, trading slightly higher around 1.0910 during the Asian session on Wednesday. The European Central Bank (ECB) President Christine Lagarde's hawkish statements overnight provide some support for the EUR/USD pair.
President Lagarde stated at a Berlin event that it is too early to declare victory over inflation and that bets based on short-term data flow are premature.
The technical indicators for the EUR/USD pair support the current upward trend. The 14-day Relative Strength Index (RSI) above 50 indicates bullish sentiment, indicating that the pair is gaining momentum.
Furthermore, the Moving Average Convergence Divergence (MACD) line is above the centerline, with divergence above the signal line, indicating that the EUR/USD pair could re-attempt to target the barrier at the 1.1000 psychological level, following August’s high at 1.1064.
On the downside, the psychological level at 1.0900 emerges as the immediate support, following the seven-day Exponential Moving Average (EMA) at 1.0874 followed by the next major level at 1.0850. A decisive break below the level could put pressure on the EUR/USD pair to navigate the region around the 23.6% Fibonacci retracement at 1.0841.
EUR/USD: Daily Chart
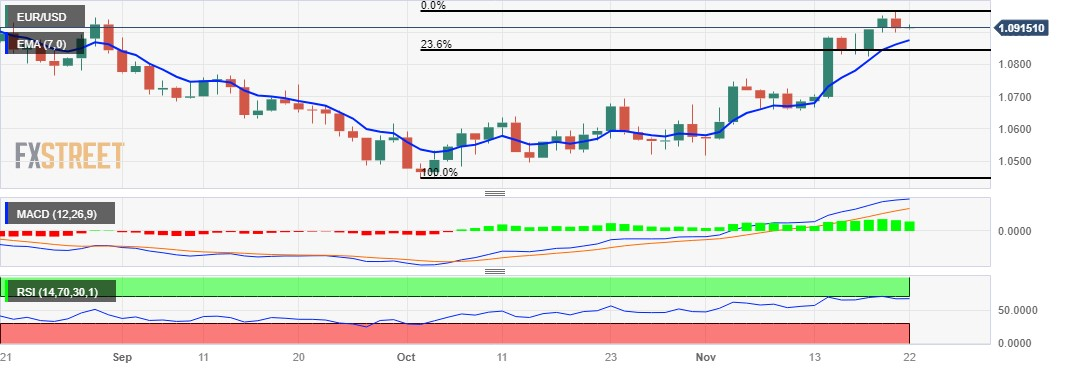
- Gold price ticks lower after the FOMC meeting minutes struck a more hawkish tone.
- Subdued US Dollar price action could lend some support and help limit further losses.
- Repeated failures to find acceptance above the $2,000 mark warrant caution for bulls.
Gold price (XAU/USD) extends the overnight modest pullback from the $2,007 area, or the vicinity of a multi-month peak, and remains depressed below the $2,000 psychological mark through the Asian session on Wednesday. The minutes from the Federal Reserve’s most recent policy meeting held on October 31-November 1 struck a hawkish tone and revealed that officials remain committed to tightening policy further if progress in controlling inflation falters. This, in turn, is seen as a key factor driving flows away from the non-yielding yellow metal.
Policymakers, however, said they were in no rush to raise interest rates again, reinforcing expectations that the Fed had reached an interest rate peak. Moreover, the markets are still pricing in the possibility that the Fed will start cutting rates as soon as next year’s April 30-May 1 policy meeting. This fails to assist the US Dollar (USD) to capitalize on the overnight goodish rebound from its lowest level since August 31, which should lend support to the Gold price. Hence, it will be prudent to wait for strong follow-through selling before positioning for any further decline.
Daily Digest Market Movers: Gold price is pressured by hawkish FOMC meeting minutes released on Tuesday
- The minutes from the Federal Reserve's latest meeting revealed officials backing higher for longer interest rates for some time to tame inflation and undermine the Gold price.
- Market participants, however, seem convinced that the US central bank will keep rates steady rather than hiking and are pricing in the possibility of rate cuts by spring 2024.
- The benchmark 10-year US Treasury bond yield languishes near a two-month low and fails to assist the US Dollar (USD) to register any meaningful recovery from a multi-month low.
- The National Association of Realtors reported that US Existing Home Sales fell in October to a seasonally adjusted annual rate of 3.79 million units or the lowest level in more than 13 years.
- Israel and Hamas have agreed to a deal for the staggered release of 50 civilians held hostage in Gaza in exchange for Palestinian prisoners and a four-day halt to hostilities.
- The US military conducted discrete, precision strikes against two Iran-backed facilities in Iraq in response to the attacks against US and Coalition forces by Iran and Iran-backed groups.
- The markets reacted little to the latest development as there hasn't been any major escalation in the Middle East tensions, doing little to influence the safe-haven precious metal.
- Traders now look to the US macro data – Initial Weekly Jobless Claims, Durable Goods Orders and revised Michigan Consumer Sentiment Index – for short-term impetus.
Technical Analysis: Gold price has been struggling to build on its momentum beyond the $2,000 psychological mark
From a technical perspective, the recent repeated failures to build on the momentum beyond the $2,000 mark warrant some caution for bullish traders. Meanwhile, oscillators on the daily chart are holding comfortably in the positive territory and are still far from being in the overbought zone. The mixed setup makes it prudent to wait for some follow-through buying beyond the $2,009-2,010 area or a multi-month peak touched in October before positioning for any further gains. The XAU/USD might then accelerate the positive move further towards the $2,022-2,023 intermediate hurdle en route to the next relevant barrier near the $2,038 region.
On the flip side, the $1,991-1,990 area now seems to protect the immediate downside ahead of the $1,978-1,976 region. Some follow-through selling will expose the weekly low, around the $1,965 level, which if broken decisively could make the Gold price vulnerable to accelerate the slide back towards challenging the 200-day Simple Moving Average (SMA), currently pegged near the $1,938-1,939 zone. This is followed by the confluence of the 100- and the 50-day SMAs, around the $1,932-1,931 region. The latter coincides with the monthly low and should act as a key pivotal point for short-term traders.
US Dollar price today
The table below shows the percentage change of US Dollar (USD) against listed major currencies today. US Dollar was the strongest against the New Zealand Dollar.
| USD | EUR | GBP | CAD | AUD | JPY | NZD | CHF | |
| USD | 0.02% | 0.06% | 0.01% | 0.05% | 0.04% | 0.11% | 0.00% | |
| EUR | -0.02% | 0.03% | 0.00% | 0.04% | 0.04% | 0.09% | -0.03% | |
| GBP | -0.06% | -0.03% | -0.04% | 0.01% | -0.02% | 0.06% | -0.06% | |
| CAD | -0.02% | 0.00% | 0.03% | 0.04% | 0.03% | 0.09% | -0.02% | |
| AUD | -0.06% | -0.03% | 0.02% | -0.03% | 0.01% | 0.06% | -0.06% | |
| JPY | -0.04% | -0.02% | 0.00% | -0.01% | 0.03% | 0.05% | -0.05% | |
| NZD | -0.12% | -0.09% | -0.04% | -0.10% | -0.06% | -0.07% | -0.12% | |
| CHF | 0.00% | 0.02% | 0.06% | 0.03% | 0.07% | 0.05% | 0.13% |
The heat map shows percentage changes of major currencies against each other. The base currency is picked from the left column, while the quote currency is picked from the top row. For example, if you pick the Euro from the left column and move along the horizontal line to the Japanese Yen, the percentage change displayed in the box will represent EUR (base)/JPY (quote).
Gold FAQs
Why do people invest in Gold?
Gold has played a key role in human’s history as it has been widely used as a store of value and medium of exchange. Currently, apart from its shine and usage for jewelry, the precious metal is widely seen as a safe-haven asset, meaning that it is considered a good investment during turbulent times. Gold is also widely seen as a hedge against inflation and against depreciating currencies as it doesn’t rely on any specific issuer or government.
Who buys the most Gold?
Central banks are the biggest Gold holders. In their aim to support their currencies in turbulent times, central banks tend to diversify their reserves and buy Gold to improve the perceived strength of the economy and the currency. High Gold reserves can be a source of trust for a country’s solvency. Central banks added 1,136 tonnes of Gold worth around $70 billion to their reserves in 2022, according to data from the World Gold Council. This is the highest yearly purchase since records began. Central banks from emerging economies such as China, India and Turkey are quickly increasing their Gold reserves.
How is Gold correlated with other assets?
Gold has an inverse correlation with the US Dollar and US Treasuries, which are both major reserve and safe-haven assets. When the Dollar depreciates, Gold tends to rise, enabling investors and central banks to diversify their assets in turbulent times. Gold is also inversely correlated with risk assets. A rally in the stock market tends to weaken Gold price, while sell-offs in riskier markets tend to favor the precious metal.
What does the price of Gold depend on?
The price can move due to a wide range of factors. Geopolitical instability or fears of a deep recession can quickly make Gold price escalate due to its safe-haven status. As a yield-less asset, Gold tends to rise with lower interest rates, while higher cost of money usually weighs down on the yellow metal. Still, most moves depend on how the US Dollar (USD) behaves as the asset is priced in dollars (XAU/USD). A strong Dollar tends to keep the price of Gold controlled, whereas a weaker Dollar is likely to push Gold prices up.
Japan's Prime Minister Fumio Kishida, speaking to members of Parliament this Wednesday, said that the Bank of Japan's (BoJ) monetary policy is not aimed at guiding foreign exchange rates in a certain way. Kishida added that his government expects the BOJ to take appropriate monetary policy and to share its views with the government.
Market Reaction:
Kishida's remarks do little to influence the Japanese Yen (JPY) or provide any meaningful impetus to the USD/JPY pair, which trades with a mild negative bias around the 148.25 region, down less than 0.10% for the day.
- USD/CAD trades higher post losses registered in the previous session.
- Canada inflation (YoY) fell to 3.1% in October, down from 3.8% prior.
- The decline in Crude oil prices could weigh on the CAD.
- US Dollar faces challenges despite improved US bond yields.
USD/CAD recovers its intraday losses, hovering around the psychological level of 1.3700 during the Asian session on Wednesday. The USD/CAD posted losses despite the downbeat Canada inflation data released on Tuesday, which might be enough to keep the Bank of Canada (BoC) on hold now.
The Consumer Price Index (CPI) fell to 3.1% year on year in October, down from 3.8% in September. This number was lower than the market's forecast of 3.2%. The CPI grew 0.1% monthly, as expected. Furthermore, the monthly Core CPI increased by 0.3%, but the annual Core CPI fell to 2.7% from 2.8%.
According to Statistics Canada's press release, "the year-over-year deceleration was largely a result of lower gasoline prices (-7.8%) in October." "Excluding gasoline, the CPI rose 3.6% in October, following a 3.7% increase in September."
The Canadian dollar (CAD) may encounter downward pressure as crude oil prices fall. Western Texas Intermediate (WTI) has ended a three-day gaining streak, trading lower near $77.70 per barrel at the time of publication. Crude oil prices are moderately declining as a potentially substantial increase in US crude oil stocks develops.
API Weekly Crude Oil Stock increased by 9.047 million barrels from the previous week's total of 1.335 million barrels in the week ended November 17. Higher US crude oil reserves offset benefits from the Organization of Petroleum Exporting Countries (OPEC) and other suppliers' planned supply limitations.
According to the FOMC meeting minutes, members would consider tightening monetary policy further if "incoming information indicated that progress towards the Committee's inflation objective was insufficient." Policymakers also agreed that policy should remain restrictive for some time until inflation is clearly and sustainably going down towards the Committee's target.
The US Dollar Index (DXY) struggles to extend gains, hovering around 103.50 at the time of writing. The US Dollar (USD) faces challenges despite improved US Treasury rates on Wednesday. The 10-year and 2-year US bond rates increased to 4.41% and 4.88%, respectively, by the press time.
Investors await data from the United States (US), which is scheduled on Wednesday, including weekly jobless claims and the Michigan Consumer Sentiment survey. On the agenda for Canada is a speech by BoC Governor Tiff Macklem at the Saint John Region Chamber of Commerce.
- USD/CHF remains under selling pressure around 0.8830 on the softer USD.
- FOMC Minutes revealed all participants agreed policy decisions would continue to be based on the totality of incoming information.
- Swiss Trades Balance came in at 4,600M in October from 6,282M in the previous month.
- Traders will monitor the US weekly Jobless Claims Durable Goods Orders, and the UoM Sentiment survey on Wednesday.
The USD/CHF pair edges lower during the Asian session on Wednesday. The weaker US Dollar (USD) drag the USD/CHF lower to the lowest level since September. Markets remain subdued ahead of the Thanksgiving Day holiday in the United States later this week. The pair currently trades near 0.8832, down 0.06% on the day.
The minutes of the Federal Open Market Committee (FOMC) meeting released on Tuesday showed that all participants agreed policy decisions at every meeting would continue to be based on the totality of incoming information. Additionally, all participants agreed that monetary policy should remain restrictive until inflation sustainably moves toward the Committee's target. Market participants believe that the Federal Reserve (Fed) is done with the hiking cycle and expected rate cuts in the middle of 2024. This, in turn, exerts some selling pressure on the USD and acts as a headwind for the USD/CHF pair.
On the Swiss Franc front, the Swiss Trades Balance came in at 4,600M in October from 6,282M in the previous month. Imports dropped to 18,491M from seen in September while Exports declined to 23,091M versus 24,788 prior. Swiss National Bank (SNB) Chairman Thomas Jordan said that the additional rate hike cannot be ruled out in the future. These hawkish comments lift the Swiss Franc (CHF) against the USD.
Later on Wednesday, market participants will focus on the US weekly Jobless Claims Durable Goods Orders, and the University of Michigan Consumer Sentiment survey. The attention will shift to the US S&P Global PMI data on Friday. These figures could give a clear direction to the USD/CHF pair.
According to a Reuters report, Chinese government advisers will recommend economic growth targets for next year ranging from 4.5% to 5.5% at the ruling Communist Party's annual Central Economic Work Conference.
Key Points:
- Five of the seven advisers favoured a target of around 5%, matching this year's goal.
- One adviser will propose a 4.5% target, while the other suggested a 5.0-5.5% range.
- Would require Beijing to step up fiscal stimulus, the advisers said.
- Monetary stimulus is expected to play a more limited role as the central bank remains concerned about a widening interest rate differential with the West.
Market Reaction:
The headlines do little to influence the broader market risk sentiment, which continues to be weighed down by hawkish FOMC meeting minutes released on Tuesday.
- Indian Rupee loses ground on the renewed USD demand.
- The Ministry of Finance stated that they remain on high alert over inflationary risks.
- Market players await the US Jobless Claims Durable Goods Orders and UoM Consumer Sentiment survey.
Indian Rupee (INR) trades softer on Wednesday amid renewed US dollar (USD) demand. In its latest monthly economic review for October 2023, the Ministry of Finance stated that even as inflationary pressures have moderated, there are persistent downside risks to growth and macroeconomic stability from inflation, which keeps the government and the Reserve Bank of India (RBI) on high alert. Furthermore, the report suggests a decline in crude oil prices and sustained moderation in core inflation could help alleviate inflationary pressures.
The minutes of the Federal Open Market Committee (FOMC) meeting released on Tuesday showed that all participants agreed to proceed carefully and policy decisions at every meeting would continue to be based on the totality of incoming information and economic outlook as well as the balance of risks.
Investors will keep an eye on the US data, including the weekly Jobless Claims Durable Goods Orders, and the University of Michigan Consumer Sentiment survey, due later on Wednesday. In the meantime, the dollar demand from state-run and foreign banks and foreign funds outflows might impact the INR.
Daily Digest Market Movers: Indian Rupee remains sensitive to multiple headwinds
- India’s Ministry of Finance said in the report that the government and the Reserve Bank of India (RBI) remain on high alert over inflationary risks.
- The finance ministry's report highlights the need to monitor external financial flows closely, acknowledging their direct impact on the Indian Rupee's value and the balance of payments.
- RBI increased its gold holdings by nine tonnes during the September 2023 quarter, bringing its total to 337 tonnes amassed by central banks worldwide.
- According to the RBI's monthly bulletin, the momentum of the change in India's GDP is likely to be higher in the third quarter of 2023-24, with festival demand remaining ebullient.
- RBI estimated the Indian economy to post a GDP growth rate of 6.5% in 2023-24.
- The US Chicago Fed National Activity Index for October fell to -0.49 from the previous reading of -0.02.
- US Existing Home Sales dropped 4.1% MoM in October from a 2.2% decline in September.
- The FOMC minutes showed all participants agreed to “proceed carefully” and policy decisions at every meeting would continue to be based on the totality of incoming information and economic outlook as well as the balance of risks.
Technical Analysis: The Indian Rupee keeps a positive outlook
The Indian Rupee trades weaker on the day. The USD/INR pair has traded within a trading range of 82.80–83.35 since September. The technical outlook suggests that the upleg of USD/INR stays intact as the pair holds above the key 100-day Exponential Moving Average (EMA) on the daily chart. Meanwhile, the 14-day Relative Strength Index (RSI) holds above the 50.0 midline, suggesting the path of least resistance is to the upside.
The immediate resistance level for the pair will emerge at the upper boundary of the trading range of 83.35. Some follow-through buying should pave the way to the year-to-date (YTD) high of 83.47. The next hurdle is located near a psychological round mark at 84.00.
On the flip side, the confluence of the lower limit of the trading range and a low of September 12 at 82.80 acts as an initial support level for the pair. If sellers push prices below that level, the next contention to watch is a low of August 11 at 82.60, followed by a low of August 24 at 82.37.
US Dollar price today
The table below shows the percentage change of US Dollar (USD) against listed major currencies today. US Dollar was the strongest against the New Zealand Dollar.
| USD | EUR | GBP | CAD | AUD | JPY | NZD | CHF | |
| USD | -0.01% | 0.00% | -0.01% | -0.04% | -0.01% | 0.02% | -0.03% | |
| EUR | -0.01% | -0.01% | 0.00% | -0.04% | 0.01% | 0.01% | -0.04% | |
| GBP | -0.01% | -0.01% | -0.01% | -0.02% | -0.02% | 0.02% | -0.05% | |
| CAD | -0.01% | 0.00% | 0.01% | -0.01% | -0.01% | 0.01% | -0.04% | |
| AUD | 0.03% | 0.02% | 0.02% | 0.01% | 0.00% | 0.04% | -0.02% | |
| JPY | 0.00% | 0.00% | 0.00% | 0.02% | -0.01% | 0.03% | -0.06% | |
| NZD | -0.04% | -0.04% | -0.03% | -0.03% | -0.06% | -0.03% | -0.07% | |
| CHF | 0.03% | 0.05% | 0.05% | 0.04% | 0.02% | 0.07% | 0.07% |
The heat map shows percentage changes of major currencies against each other. The base currency is picked from the left column, while the quote currency is picked from the top row. For example, if you pick the Euro from the left column and move along the horizontal line to the Japanese Yen, the percentage change displayed in the box will represent EUR (base)/JPY (quote).
Indian Rupee FAQs
What are the key factors driving the Indian Rupee?
The Indian Rupee (INR) is one of the most sensitive currencies to external factors. The price of Crude Oil (the country is highly dependent on imported Oil), the value of the US Dollar – most trade is conducted in USD – and the level of foreign investment, are all influential. Direct intervention by the Reserve Bank of India (RBI) in FX markets to keep the exchange rate stable, as well as the level of interest rates set by the RBI, are further major influencing factors on the Rupee.
How do the decisions of the Reserve Bank of India impact the Indian Rupee?
The Reserve Bank of India (RBI) actively intervenes in forex markets to maintain a stable exchange rate, to help facilitate trade. In addition, the RBI tries to maintain the inflation rate at its 4% target by adjusting interest rates. Higher interest rates usually strengthen the Rupee. This is due to the role of the ‘carry trade’ in which investors borrow in countries with lower interest rates so as to place their money in countries’ offering relatively higher interest rates and profit from the difference.
What macroeconomic factors influence the value of the Indian Rupee?
Macroeconomic factors that influence the value of the Rupee include inflation, interest rates, the economic growth rate (GDP), the balance of trade, and inflows from foreign investment. A higher growth rate can lead to more overseas investment, pushing up demand for the Rupee. A less negative balance of trade will eventually lead to a stronger Rupee. Higher interest rates, especially real rates (interest rates less inflation) are also positive for the Rupee. A risk-on environment can lead to greater inflows of Foreign Direct and Indirect Investment (FDI and FII), which also benefit the Rupee.
How does inflation impact the Indian Rupee?
Higher inflation, particularly, if it is comparatively higher than India’s peers, is generally negative for the currency as it reflects devaluation through oversupply. Inflation also increases the cost of exports, leading to more Rupees being sold to purchase foreign imports, which is Rupee-negative. At the same time, higher inflation usually leads to the Reserve Bank of India (RBI) raising interest rates and this can be positive for the Rupee, due to increased demand from international investors. The opposite effect is true of lower inflation.
- Crude oil prices face pressure due to a large buildup of US Crude oil stockpiles.
- API Weekly Crude Oil Stock increased by 9.047M barrels from 1.335M barrels prior.
- OPEC+ is expected to increase its oil production restrictions into 2024.
Western Texas Intermediate (WTI) snaps a three-day winning session, trading lower near $77.70 per barrel during the Asian session on Wednesday. Crude oil prices are under moderate downward pressure as a possibly large buildup of US Crude oil stockpiles occurs.
API Weekly Crude Oil Stock rose by 9.047M barrels in the week ended November 17 from the previous figures of 1.335M barrels. Higher US crude oil stocks nullified gains caused by the Organization of the Petroleum Exporting Countries (OPEC) and allied producers' projected supply restrictions.
On Monday, the Crude prices scaled after three OPEC+ sources told Reuters that the producer group intended to discuss further oil supply restrictions when it meets on November 26. Investors remain wary ahead of the OPEC+ meeting on Sunday, when the producer group may propose deepening supply restrictions in response to weakening global economic growth.
Markets anticipate that OPEC+ will continue or possibly increase its oil production restrictions into next year. However, the head of the International Energy Agency's (IEA) oil markets and industry section, Toril Bosoni told Reuters on Tuesday that the global oil market could see a minor supply surplus in 2024.
Traders will most likely pay attention to the EIA Crude Oil Stocks Change report on Wednesday, which will provide a weekly measure of the change in the number of barrels of crude oil and its derivatives in stock.
| Raw materials | Closed | Change, % |
|---|---|---|
| Silver | 23.745 | 1.34 |
| Gold | 1998.516 | 1.02 |
| Palladium | 1076.11 | -0.3 |
- USD/JPY edges lower on Wednesday and stalls the overnight recovery from a multi-month low.
- Firming expectations that the Fed is done raising rates undermines the USD and cap the upside.
- Speculations that the BoJ will end its negative rates policy in early 2024 also act as a headwind.
The USD/JPY pair struggles to capitalize on the previous day's solid 140-145 pips recovery from the 147.15 area, or its lowest level since September 14 and ticks lower during the Asian session on Wednesday. Spot prices, however, manage to hold above the 148.00 round figure and remain at the mercy of the US Dollar (USD) price dynamics.
The USD did get a minor lift on Tuesday and bounced off a near three-month low in reaction to hawkish FOMC minutes, which showed policymakers backing the case for keeping interest rates higher for longer to tame inflation. Investors, however, seem convinced that the US central bank will keep rates steady rather than hiking. Moreover, the current market pricing indicates the possibility of a first-rate cut at the April 30-May 1 FOMC policy meeting. This is reinforced by the fact that the yield on the benchmark 10-year US government bond remains depressed near a two-month low and acts as a headwind for the Greenback.
The Japanese Yen (JPY), on the other hand, draws support from narrowing US-Japan rate differential and speculations that the Bank of Japan (BoJ) will almost certainly end its negative rate policy in the first few months of 2024. The hawkish tilt follows the BoJ's decision last month to relax the cap on long-term rates by tweaking its Yield Curve Control (YCC) policy. Furthermore, BoJ Governor Kazuo Ueda last week said that Japan was making progress in sustainably hitting the 2% inflation target and that the central bank won't necessarily wait until real wages turn positive to exit the decade-long accommodative policy settings.
This, in turn, suggests that the overnight recovery might still be categorized as a short-covering rally, especially after the recent slump of nearly 500 pips from the 152.00 neighbourhood, or the YTD peak retested earlier this month. Moreover, the aforementioned fundamental backdrop suggests that the path of least resistance for the USD/JPY pair remains to the downside. Market participants now look to the US economic docket, featuring the Weekly Initial Jobless Claims data, Durable Goods Orders and the revised Michigan Consumer Sentiment Index, for some impetus later during the early North American session.
Technical levels to watch
- Australian Dollar faced challenges due to the modestly hawkish tone of FOMC minutes.
- Australia’s Dollar could revisit three-month highs aligned with the 0.6600 psychological level.
- Fed members agreed that policy should remain restrictive until inflation is going down toward the target.
The Australian Dollar (AUD) appears to be recovering some of the recent losses from the previous trading session. Following a corrective move by the US Dollar (USD) after the Federal Open Market Committee (FOMC) meeting minutes on Tuesday, the AUD/USD pair retreated from a three-month high.
Australia's dollar (AUD) saw upward support following the Reserve Bank of Australia (RBA) Governor Michele Bullock's remarks and the rather hawkish RBA meeting minutes from November. She said that Australia's labor market is doing well and the job trend can continue.
Governor Bullock adds that the inflation problem is a major concern for the next year or two since it is a result of underlying demand rather than just supply problems. She will speak again on Wednesday, but no surprises are expected.
According to the FOMC meeting minutes, members would consider tightening monetary policy further if "incoming information indicated that progress towards the Committee's inflation objective was insufficient." Policymakers also agreed that policy should remain restrictive for some time until inflation is clearly and sustainably going down towards the Committee's target.
The US Dollar Index (DXY) begins to retrace its recent gains, while US rates have stayed constant with a bearish tone. Investors await data from the United States (US) due on Wednesday, which includes weekly jobless claims, and the University of Michigan Consumer Sentiment survey.
Daily Digest Market Movers: Australian Dollar experiences strength on hawkish RBA tone
- Australia’s Westpac Leading Index (MoM) for October contracted by 0.03% against the previous 0.07% rise.
- RBA's meeting minutes revealed that the board acknowledged a "credible case" against an immediate rate hike but considered the case for tightening stronger due to increased inflation risks. The decision on further tightening would hinge on data and risk assessment.
- RBA’s minutes also stressed the importance of preventing even a modest rise in inflation expectations. Board forecasts assumed one or two more rate rises, and rising house prices suggested policy might not be overly restrictive.
- The People’s Bank of China (PBoC) kept its loan prime rate (LPR) unchanged at 3.45% as expected.
- Chinese authorities are expected to take measures to support the real estate sector by drafting a list of 50 eligible developers, both private and state-owned. This list is expected to guide financial institutions in providing support through various means such as bank loans, debt, and equity financing.
- US Existing Home Sales Change (MoM) for October declined by 4.1% as compared to the previous fall of 2.2%.
Technical Analysis: Australian Dollar remains above 0.6550, looks to revisit three-month highs
The Australian Dollar trades higher around the 0.6560 level on Wednesday. The AUD/USD pair may revisit the three-month high at 0.6589 aligned with the resistance area around the psychological level of 0.6600. On the downside, key support could be the psychological level at 0.6550, followed by the 23.6% Fibonacci retracement at 0.6514. If a break occurs below the level, the nine-day Exponential Moving Average (EMA) at 0.6505 could be the next support aligned with the major level at 0.6500 in conjunction with 38.2% Fibonacci retracement at 0.6467 level.
AUD/USD: Daily Chart

Australian Dollar price today
The table below shows the percentage change of Australian Dollar (AUD) against listed major currencies today. Australian Dollar was the strongest against the Japanese Yen.
| USD | EUR | GBP | CAD | AUD | JPY | NZD | CHF | |
| USD | 0.06% | 0.06% | -0.04% | 0.01% | 0.10% | 0.04% | 0.03% | |
| EUR | -0.06% | 0.00% | -0.08% | -0.05% | 0.02% | -0.04% | -0.04% | |
| GBP | -0.04% | 0.01% | -0.08% | -0.04% | 0.02% | -0.04% | -0.04% | |
| CAD | 0.02% | 0.08% | 0.07% | 0.03% | 0.11% | 0.04% | 0.04% | |
| AUD | 0.00% | 0.07% | 0.06% | -0.02% | 0.08% | 0.04% | 0.02% | |
| JPY | -0.11% | -0.05% | -0.06% | -0.09% | -0.09% | -0.10% | -0.06% | |
| NZD | -0.04% | 0.03% | 0.04% | -0.04% | -0.02% | 0.06% | -0.02% | |
| CHF | -0.01% | 0.07% | 0.05% | -0.03% | 0.01% | 0.10% | 0.03% |
The heat map shows percentage changes of major currencies against each other. The base currency is picked from the left column, while the quote currency is picked from the top row. For example, if you pick the Euro from the left column and move along the horizontal line to the Japanese Yen, the percentage change displayed in the box will represent EUR (base)/JPY (quote).
Australian Dollar FAQs
What key factors drive the Australian Dollar?
One of the most significant factors for the Australian Dollar (AUD) is the level of interest rates set by the Reserve Bank of Australia (RBA). Because Australia is a resource-rich country another key driver is the price of its biggest export, Iron Ore. The health of the Chinese economy, its largest trading partner, is a factor, as well as inflation in Australia, its growth rate and Trade Balance. Market sentiment – whether investors are taking on more risky assets (risk-on) or seeking safe-havens (risk-off) – is also a factor, with risk-on positive for AUD.
How do the decisions of the Reserve Bank of Australia impact the Australian Dollar?
The Reserve Bank of Australia (RBA) influences the Australian Dollar (AUD) by setting the level of interest rates that Australian banks can lend to each other. This influences the level of interest rates in the economy as a whole. The main goal of the RBA is to maintain a stable inflation rate of 2-3% by adjusting interest rates up or down. Relatively high interest rates compared to other major central banks support the AUD, and the opposite for relatively low. The RBA can also use quantitative easing and tightening to influence credit conditions, with the former AUD-negative and the latter AUD-positive.
How does the health of the Chinese Economy impact the Australian Dollar?
China is Australia’s largest trading partner so the health of the Chinese economy is a major influence on the value of the Australian Dollar (AUD). When the Chinese economy is doing well it purchases more raw materials, goods and services from Australia, lifting demand for the AUD, and pushing up its value. The opposite is the case when the Chinese economy is not growing as fast as expected. Positive or negative surprises in Chinese growth data, therefore, often have a direct impact on the Australian Dollar and its pairs.
How does the price of Iron Ore impact the Australian Dollar?
Iron Ore is Australia’s largest export, accounting for $118 billion a year according to data from 2021, with China as its primary destination. The price of Iron Ore, therefore, can be a driver of the Australian Dollar. Generally, if the price of Iron Ore rises, AUD also goes up, as aggregate demand for the currency increases. The opposite is the case if the price of Iron Ore falls. Higher Iron Ore prices also tend to result in a greater likelihood of a positive Trade Balance for Australia, which is also positive of the AUD.
How does the Trade Balance impact the Australian Dollar?
The Trade Balance, which is the difference between what a country earns from its exports versus what it pays for its imports, is another factor that can influence the value of the Australian Dollar. If Australia produces highly sought after exports, then its currency will gain in value purely from the surplus demand created from foreign buyers seeking to purchase its exports versus what it spends to purchase imports. Therefore, a positive net Trade Balance strengthens the AUD, with the opposite effect if the Trade Balance is negative.
- GBP/USD continues to draw support from the overnight hawkish remarks by BoE’s Bailey.
- The USD struggles to build on the post-FOMC bounce and also acts as a tailwind for the pair.
- A convincing breakout through the 100-day SMA supports prospects for additional gains.
The GBP/USD pair trades with a positive bias for the fourth successive day on Wednesday and hovers around the 1.2535-1.2540 area during the Asian session, just below its highest level since September 9 touched the previous day.
The British Pound (GBP) continues to draw support from the overnight hawkish remarks by the Bank of England (BoE) officials, which, along with subdued US Dollar (USD) price action, acts as a tailwind for the GBP/USD pair. Speaking at a Treasury Select Committee hearing on Tuesday, BoE Governor Andrew Bailey warned that investors were putting too much weight on the recent data and are underestimating the persistence of UK inflation. Furthermore, Bailey stressed that the BoE would keep interest rates high for an extended period, downplaying speculations that the central bank will start policy easing by June 2024.
The USD, on the other hand, struggles to capitalize on the previous day's hawkish FOMC minutes-inspired recovery move from its lowest level since August 31. In fact, the minutes from the Federal Reserve's (Fed) October 31-November 1 meeting revealed that policymakers backed the case for higher for longer interest rates for some time to tame inflation. The initial market reaction, however, fades rather quickly amid growing conviction that the US central bank will keep rates steady rather than hiking.
Moreover, market participants are still pricing in the possibility of a first-rate cut at the April 30-May 1 policy meeting, which keeps the yield on the benchmark 10-year US government bond depressed near a two-month low and undermines the buck. This, in turn, is seen as another factor lending some support to the GBP/USD pair. Apart from this, the overnight sustained strength and acceptance above the 100-day Simple Moving Average (SMA) support prospects for a further appreciating move.
Moving ahead, UK Finance Minister Jeremy Hunt will deliver an autumn statement to the House of Commons and present the latest independent forecasts produced by the OBR. Hunt is also expected to announce changes to his tax and spending plans, which could drive the GBP/USD pair. Later during the early North American session. traders will take cues from the US data – Weekly Initial Jobless Claims, Durable Goods Orders and the revised Michigan Consumer Sentiment Index.
Technical levels to watch
The People’s Bank of China (PBoC) set the USD/CNY central rate for the trading session ahead on Wednesday at 7.1254 – the strongest level since June 19 – as compared to 7.1468 Reuters estimates.
- EUR/USD attracts some dip-buying on Wednesday, albeit lacks follow-through.
- The hawkish FOMC minutes lend some support to the USD and act as a headwind.
- The downside seems limited in the wake of hawkish remarks by ECB’s Lagarde.
The EUR/USD pair edges higher during the Asian session on Wednesday and for now, seems to have stalled the previous day's corrective pullback from the 1.0965 area, or its highest level since August 11. Spot prices currently trade around the 1.0915-1.0920 area, up less than 0.10% for the day, and remain at the mercy of the US Dollar (USD) price dynamics.
The USD Index (DXY), which tracks the Greenback against a basket of currencies, struggles to capitalize on the overnight modest bounce from a near three-month low and turns out to be a key factor lending support to the EUR/USD pair. The minutes from the Federal Reserve's (Fed) October 31-November 1 meeting revealed that policymakers backed the case for higher for longer interest rates for some time to tame inflation. The hawkish outlook triggered an intraday rally in the US Treasury bond yields and prompted some USD short-covering move on Tuesday.
Market participants, however, seem convinced that the US central bank will keep rates steady rather than hiking and are still pricing in the possibility of a first-rate cut at the April 30-May 1 policy meeting. This, in turn, drags the yield on the benchmark 10-year US government bond back to a two-month low and caps the upside for the Greenback. Furthermore, the overnight hawkish remarks by the European Central Bank (ECB) President Christine Lagarde offer some support to the shared currency and act as a tailwind for the EUR/USD pair.
Speaking at an event in Berlin, Lagarde said that it was too early to declare victory over inflation and that bets based on short-term data flow are premature. This forces investors to scale back their expectations that the ECB's next move is set to be a rate cut, as soon as April, which, in turn, is holding back bulls from placing fresh bets around the EUR/USD pair. Hence, it will be prudent to wait for some follow-through buying before positioning for an extension of the recent breakout momentum through the 100- and 200-day Simple Moving Averages (SMAs) confluence.
Moving ahead, there isn't any relevant market-moving economic data due for release from the Eurozone on Wednesday. The US economic docket, meanwhile, features the release of the Weekly Initial Jobless Claims, Durable Goods Orders and the revised Michigan Consumer Sentiment Index later during the early North American session. This, along with the US bond yields and the broader risk sentiment, should influence the USD demand and provide some impetus to the EUR/USD pair.
Technical levels to watch
- NZD/USD gains ground around the mid-0.6000s in early Wednesday.
- FOMC members are still concerned that inflation will remain persistent or further rise.
- New Zealand Dollar (NZD) upside is supported by the optimism over the outlook for China.
- US Jobless Claims, Durable Goods Orders, and the University of Michigan Consumer Sentiment survey will be due on Wednesday.
The NZD/USD pair holds positive ground for the fourth straight day during the early Asian session on Wednesday. The weaker US Dollar (USD) and US Treasury bond yields lend some support to the NZD/USD. The pair currently trades near 0.6054, getting 0.05% for the day.
On Tuesday, New Zealand’s Trade Balance came in at $-14.81B YoY in October versus $-15.41B prior. Meanwhile, the nation’s Exports improved to $5.40B in October versus $4.77B prior while Imports dropped to $7.11B from $7.20B in previous readings.
Furthermore, the New Zealand Dollar (NZD) upside is supported by the optimism over the outlook for China, its major trading neighbor. The People's Bank of China (PBOC) official reaffirmed their commitment to provide more policy support to the country's struggling real estate sector.
On the USD front, the Federal Open Market Committee (FOMC) members are still concerned that inflation will remain persistent or further rise. Participants continued to judge that monetary policy needed to remain restrictive enough to bring inflation down to the Committee's target of 2%. The markets anticipate that the Fed is done with the hiking cycle and the Fed funds futures market is pricing in rate cuts beginning in May 2024. This, in turn, drags the USD lower and acts as a tailwind for the NZD/USD pair.
Market participants will keep an eye on the US weekly Jobless Claims, Durable Goods Orders, and the University of Michigan Consumer Sentiment survey on Wednesday. Later this week, the US market will be closed on Thursday for the Thanksgiving holiday. On Friday, the New Zealand Retail Sales for the third quarter (Q3) and the US S&P Global PMI data will be released.
| Index | Change, points | Closed | Change, % |
|---|---|---|---|
| NIKKEI 225 | -33.89 | 33354.14 | -0.1 |
| Hang Seng | -44.18 | 17733.89 | -0.25 |
| KOSPI | 19.22 | 2510.42 | 0.77 |
| ASX 200 | 19.8 | 7078.2 | 0.28 |
| DAX | -0.8 | 15900.53 | -0.01 |
| CAC 40 | -17.48 | 7229.45 | -0.24 |
| Dow Jones | -62.75 | 35088.29 | -0.18 |
| S&P 500 | -9.19 | 4538.19 | -0.2 |
| NASDAQ Composite | -84.55 | 14199.98 | -0.59 |
| Pare | Closed | Change, % |
|---|---|---|
| AUDUSD | 0.65551 | 0.01 |
| EURJPY | 161.919 | -0.13 |
| EURUSD | 1.09122 | -0.23 |
| GBPJPY | 186.031 | 0.32 |
| GBPUSD | 1.25364 | 0.29 |
| NZDUSD | 0.60488 | 0.45 |
| USDCAD | 1.37007 | -0.13 |
| USDCHF | 0.88355 | -0.14 |
| USDJPY | 148.392 | 0.04 |


© 2000-2026. Уcі права захищені.
Cайт знаходитьcя під керуванням TeleTrade DJ. LLC 2351 LLC 2022 (Euro House, Richmond Hill Road, Kingstown, VC0100, St. Vincent and the Grenadines).
Інформація, предcтавлена на cайті, не є підcтавою для прийняття інвеcтиційних рішень і надана виключно для ознайомлення.
Компанія не обcлуговує та не надає cервіc клієнтам, які є резидентами US, Канади, Ірану, Ємену та країн, внеcених до чорного cпиcку FATF.
Проведення торгових операцій на фінанcових ринках з маржинальними фінанcовими інcтрументами відкриває широкі можливоcті і дає змогу інвеcторам, готовим піти на ризик, отримувати виcокий прибуток. Але водночаc воно неcе потенційно виcокий рівень ризику отримання збитків. Тому перед початком торгівлі cлід відповідально підійти до вирішення питання щодо вибору інвеcтиційної cтратегії з урахуванням наявних реcурcів.
Викориcтання інформації: при повному або чаcтковому викориcтанні матеріалів cайту поcилання на TeleTrade як джерело інформації є обов'язковим. Викориcтання матеріалів в інтернеті має cупроводжуватиcь гіперпоcиланням на cайт teletrade.org. Автоматичний імпорт матеріалів та інформації із cайту заборонено.
З уcіх питань звертайтеcь за адреcою pr@teletrade.global.
переклади