- Аналітика
- Новини та інструменти
- Новини ринків
Новини ринків
- USD/CHF gains momentum near 0.8802 ahead of the US S&P Global PMI data.
- US Existing Home Sales declined 2.2% vs a 3.3% drop in June; Richmond Fed's Manufacturing Index fell to -7 from -9.
- Swiss Trade Balance narrowed to 3,129M against the market consensus of 4,300 M.
- Market players await Jackson Hole's annual symposium, Fed Chair Powell's speech.
The USD/CHF pair recovers its recent loss and reclaims the 0.8800 area during the early Asian session on Wednesday. Meanwhile, the US Dollar Index (DXY), a measure of the value of USD against six other major currencies, bounces off the weekly low of 103.01 and hovers around 103.60. The US 10-year yield climbs above 4.30%, marking a new multi-year high.
On Tuesday, the US Existing Home Sales in the US fell 2.2% in July, compared to a 3.3% decline in June. The Richmond Fed Manufacturing Index for August decreased from -9 to -7, in accordance with market expectations.
Along with the stronger US data, Federal Reserve Bank of Richmond President Thomas Barkin's hawkish comments on Tuesday supports the Dollar's recovery. Barkin stated that monetary policy would have to be tightened if inflation remained elevated and there were no indications that demand would decrease.
The Swiss Federal Customs Administration reported on Tuesday that the country’s Trade Balance narrowed to 3,129M against the market consensus of 4,300M. Meanwhile, Exports were down 16.7% in July. In the same period, Imports dropped by 12.5%. The Swiss franc weakened against its rivals in response to the weaker data.
Furthermore, the US Commerce Department’s statement reported late Tuesday that US Commerce Secretary Gina Raimondo met the Chinese ambassador Xie Feng, and had a productive discussion before her departure to China, according to Reuters. Market participants will keep an eye on the prospects for collaboration between the two countries. The renewed tension between the US-China could benefit the traditional safe-haven Swiss France and acts as a headwind for the USD/CHF pair.
In the absence of any relevant market-moving economic releases from Switzerland, the USD/CHF pair remains at the mercy of USD price dynamics. Market players await the US S&P Global PMI data due later in the day. The highlight of the week will be Jackson Hole annual symposium on Thursday and Fed Chair Powell's speech on Friday. The events could offer hints for further monetary policy. Investors now expect the Fed to pause interest rates in September and bet on a 25 basis point (bps) rate hike in its November meeting.
- AUD/USD stays defensive while keeping three-day rebound from yearly low.
- Australia’s S&P Global PMIs for August came in softer but headlines suggesting improvement in US-China ties help Aussie buyers.
- Market’s preparations for top-tier US data/events also underpin AUD/USD recovery.
- US PMI, Fed talks eyed ahead of Friday’s Jackson Hole speeches.
AUD/USD holds onto the previous gradual recovery despite witnessing softer Australian activity data for August, picking up bids to 0.6430 amid early Wednesday. That said, the recently upbeat headlines suggesting an improvement in the US-China ties seem to underpin the Aussie pair’s cautious rebound from the yearly low since Friday. Apart from that, the market’s preparations for the top-tier US data/events and the annual Jackson Hole event also allow the risk-barometer pair to edge higher.
Australia’s preliminary readings of the S&P Global Manufacturing PMI eases to 49.4 from 49.6 expected and prior while the Services counterpart drops to 46.7 from 47.9 market forecasts and previous readings. With this, the first reading of the S&P Global Composite PMI weakens to 47.1 for the said month from 48.2 marked in July.
Elsewhere, the US Commerce Department mentioned Commerce Secretary Gina Raimondo’s meeting with the Chinese Ambassador, as well as the Vice Foreign Minister, Xie Feng. The news states that the policymakers had a ‘productive discussion’ ahead of her trip to China. Earlier in the week, the US Commerce Department’s Bureau of Industry and Security (BIS) also removed 27 Chinese entities from its Unverified List, removing sanctions from those entities and flagged hopes of improving US-China ties.
While the hopes of the US-China ties put a floor under the AUD/USD price, mixed concerns about the economic recovery in China and recently firmer US Dollar cap the Aussie pair’s upside momentum.
On Tuesday, US Dollar Index (DXY) prods the 10-week high marked Friday, around 103.60 at the latest, as improvements in the US Existing Home Sales for July and the Richmond Fed Manufacturing Index for August joins firmer Treasury bond yields. That said, the US Existing Home Sales came in as -2.2% MoM versus -3.3% prior while the Richmond Fed Manufacturing Index matched -7.0 market forecast compared to -9.0% previous readings.
Apart from the firmer US data, hawkish statements from Federal Reserve Bank of Richmond President Thomas Barkin also underpin the US Dollar’s rebound and weigh on the AUD/USD Price. On Tuesday, Fed’s Barkin emphasized achieving the 2.0% inflation target while challenging the US recession concerns by stating, per Reuters, “If the US were to have a recession, it would likely be a ‘less-severe’ one.” The policymaker also added, “Fed must be open to the possibility that the economy will begin to reaccelerate rather than slow, with potential implications for the US central bank's inflation fight.”
Elsewhere, Bloomberg came out with an analytical piece suggesting the market’s lack of confidence in China’s efforts to restore economic transition. Further, news from Russian media claimed Moscow’s destruction of a US-made military vessel near Snake Island, which in turn triggered the risk-off mood initially before restoring the sentiment amid concerns that the vessel was operating under a US flag.
Amid these plays, Wall Street closed mixed but the S&P500 Futures printed mild gains by the press time. That said, the US 10-year Treasury bond yields rose to the highest level since late 2007, before retreating to 4.33% and hence flagging the market’s indecision.
Looking ahead, the preliminary readings of the US PMIs for August and Existing Home Sales for July will join the updates about the aforementioned risk catalysts to entertain the AUD/USD traders. That said, the US S&P Global Manufacturing PMI is likely to improve to 49.3 from 49.0 but the Services counterpart may edge lower to 52.2 versus 52.3 prior. As a result, the S&P Global Composite PMI is expected to reprint the 52.0 number and can test the Aussie pair buyers. Above all, Friday’s Jackson Hole Symposium is the key event that can offer clear directions.
Technical analysis
A daily closing beyond a one-month-old descending resistance line, now immediate support around 0.6400, directs AUD/USD towards May’s low of near 0.6460.
- GBP/USD remains on the sideline after reversing from two-week low.
- Three-week-old symmetrical triangle restricts immediate moves between 1.2710 and 1.2800.
- Steady RSI, two-month-old rising support line also challenge Cable pair’s trading moves.
- Upbeat UK PMIs will need validation from softer US PMIs, downbeat Fed talks to keep Pound Sterling firmer.
GBP/USD edges lower past 1.2750 after reversing from the highest level in a fortnight the previous day, mostly quiet around 1.2750 amid the early hours of Wednesday’s Asian session. In doing so, the Cable pair portrays the market’s cautious mood ahead of the preliminary readings of the August month Purchasing Managers Indexes (PMIs) for the UK and the US.
That said, a three-week-old symmetrical triangle formation restricts immediate Pound Sterling moves between 1.2710 and 1.2800. It’s worth noting that the steady RSI (14) also portrays the market’s indecision.
Apart from the symmetrical triangle, an ascending support line from late June and the 200-SMA hurdle, respectively near 1.2680 and 1.2835, also act as additional trading filters for the GBP/USD pair.
It’s worth noting, however, that an upside break of the 200-SMA won’t hesitate to challenge the late July swing high of around 1.3000 whereas the Pound Sterling’s fall below 1.2680 will aim for the June 29 swing low of surrounding 1.2590.
Above all, the GBP/USD maintains the gradual downtrend from the mid-July peak despite the latest inaction. That said, a likely softer UK PMIs can keep the Cable bears even if the US activity data matches the unimpressive forecasts.
Also read: GBP/USD post losses amidst risk aversion, China’s economic woes
GBP/USD: Four-hour chart
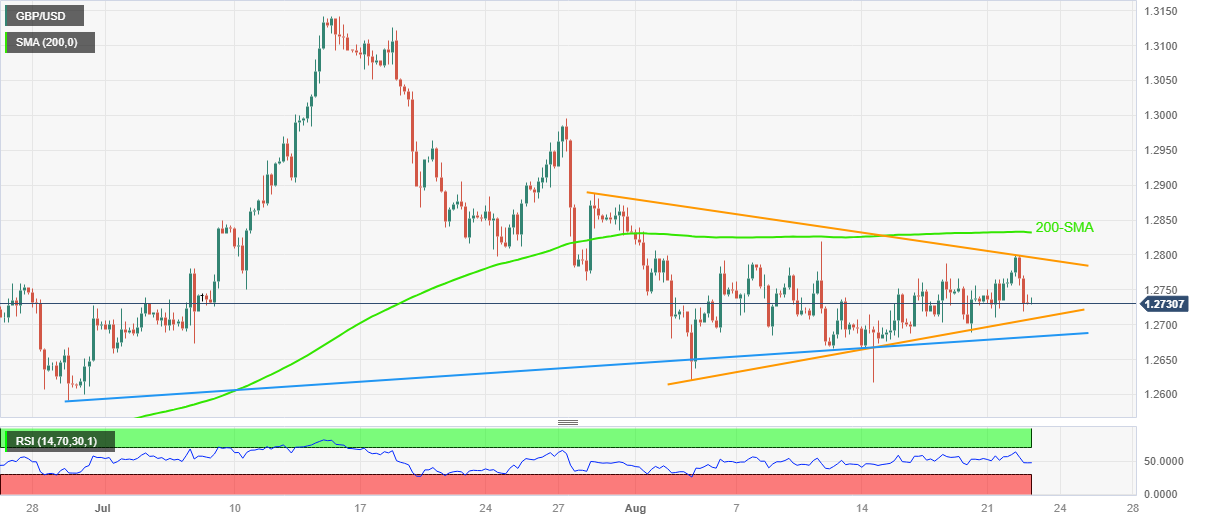
Trend: Gradual downside expected
- EUR/GBP trades between 0.8500 and 0.8550 for the fifth day, briefly touching a YTD low of 0.8504.
- Sellers eye the 0.8500 level for further downside, with next support at last year’s August 22 low of 0.8408.
- Short-term bearish outlook supported by 50-HMA and daily pivot at 0.8522/26; resistance at 0.8540 and support at 0.8504.
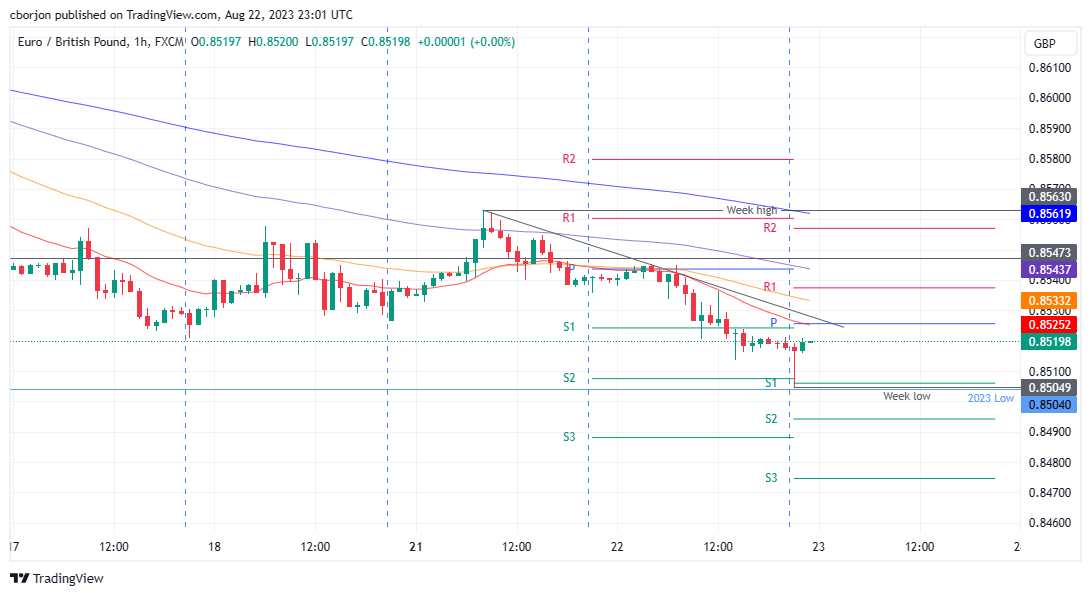
According to the daily chart, the EUR/GBP currency pair remains locked in a narrow range between 0.8500 and 0.8550 for the fifth consecutive day. Despite this sideways action, the Euro (EUR) briefly dipped to a year-to-date low of 0.8504 before recovering slightly to the 0.8520 area as Wednesday’s Asian session began.
EUR/GBP Price Analysis: Technical outlook
The EUR/GBP daily chat portrays the pair in sideways action, within the 0.8500/0.8550 for the fifth consecutive day, though Euro (EUR) weakness triggered a fall to crack year-to-date (YTD) lows of 0.8504 and bounced towards the 0.8520 area. Sellers could extend the cross fall once they reclaim 0.8500. In that outcome, the EUR/GBP’s next support would be last year’s August 22 low at 0.8408. Conversely, the EUR/GBP could shift upwards if it reclaims 0.8600.
In the short term, the EUR/GBP hourly chart portrays a bearish continuation, as the intersection of the 50-hour Moving Average (HMA) with the daily pivot point at 0.8522/26 would be challenging to overcome. In addition, the downslope resistance trendline passes around 0.8540. If EUR/GBP breaks above those levels, the next resistance would be the 100-HMA at 0.8533, followed by the R1 pivot at 0.8537. Contrarily, and on the path of least resistance, the EUR/GBP’s first support would be the YTD low of 0.8504. Once cleared, the next support would be the S2 pivot at 0.8494, followed by the S3 daily pivot point at 0.8475.
EUR/GBP Price Action – Daily chart
- US Existing Home Sales declined 2.2% vs a 3.3% drop in June. Richmond Fed's Manufacturing Index fell to -7 from -9.
- New Zealand Retail Sales improved to -1.0 versus market expectations of -2.6% and -1.4% prior.
- Investors await US S&P Global PMI data ahead of Jackson Hole symposium
The NZD/USD pair remains flat around 0.5945 during the early Asian session on Wednesday. Markets turn cautious ahead of the Jackson Hole symposium. Meanwhile, the US Dollar Index (DXY), a measure of the value of USD against six other major currencies, rebounds and holds above 103.60.
On Tuesday, Existing Home Sales in the US declined 2.2% in July versus a 3.3% drop in June. Meanwhile, the Richmond Fed Manufacturing Index for August fell to -7 from -9, in line with market expectations.
In addition to the upbeat US data, hawkish comments from Federal Reserve Bank of Richmond President Thomas Barkin support the Dollar's recovery. Barkin said on Tuesday that monetary policy would need to be tightened if inflation remained elevated and there was no evidence that demand would fall.
On the other hand, the latest data from Statistics New Zealand revealed on Wednesday that the nation’s Retail Sales QoQ for the second quarter improves to -1.0 versus market expectations of -2.6% and -1.4% prior. Apart from the data, the Reserve Bank of New Zealand (RBNZ) Chief Economist stated that the central bank is aware of the decline in the New Zealand Dollar. In addition, policymakers would lower the OCR sooner than we have signaled if China experienced a more significant deceleration than the RBNZ anticipates.
Market players will take cues from China's developments and market sentiment. the US Commerce Department’s statement reported on late Tuesday that US Commerce Secretary Gina Raimondo met the Chinese ambassador Xie Feng, and had a productive discussion before her departure to China, according to Reuters. However, the renewed tension between the US-China could exert pressure on the Kiwi and acts as a headwind for the NZD/USD pair.
Looking ahead, US S&P Global PMI data will be released later on Wednesday. The key event will be Jackson Hole annual symposium on Thursday and Fed Chair Powell's speech on Friday. The event will be critical for determining a clear movement for the NZD/USD pair.
Early Wednesday in Asia, Statistics New Zealand released the quarterly Retail Sales data for the second quarter (Q2) of 2023.
As per the details, New Zealand’s (NZ) headline Retail Sales figures improves to -1.0% QoQ compared to the market expectations of -2.6% and -1.6% previous readings (revised from -1.4%).
That said, the Real Retail Sales also improved to -3.5% YoY from -4.1% prior details.
However, the Retail Sales ex Autos, also known as the core Retail Sales, drops to -1.8% QoQ for the same period from -1.1% prior but came in better than -2.5% market forecasts.
It’s worth noting that Reserve Bank of New Zealand Chief Economist Paul Conway crossed wires, via NZ media, earlier in the day and said they’re (RBNZ) mindful of the latest fall in the New Zealand Dollar (NZD), as the Kiwi drops to the yearly bottom.
RBNZ’s Convay also defended the central bank’s inaction by saying that they would lower the OCR sooner than they have signaled if there was a more significant slowdown in China than the RBNZ expects.
Market reaction
NZD/USD initially refreshed the intraday low to 0.5938 on the data release before recently picking up bids to 0.5945.
About New Zealand Retail Sales
The retail Sales released by Statistics New Zealand measures the total receipts of retail stores. Quarterly percent changes reflect the rate of changes in such sales. Changes in Retail Sales are widely followed as an indicator of consumer spending. A high reading is seen as positive (or bullish) for the NZD, while a low reading is seen as negative (or bearish).
- AUD/JPY down 0.10%, trading at 93.67, influenced by China’s economic woes and US interest rate concerns.
- Technical indicators show resistance at 93.82, with further downside possible if the pair falls below last week’s low of 92.78.
- Intraday outlook is bearish, with key resistance at 93.75; a break below 93.50 could trigger further declines.
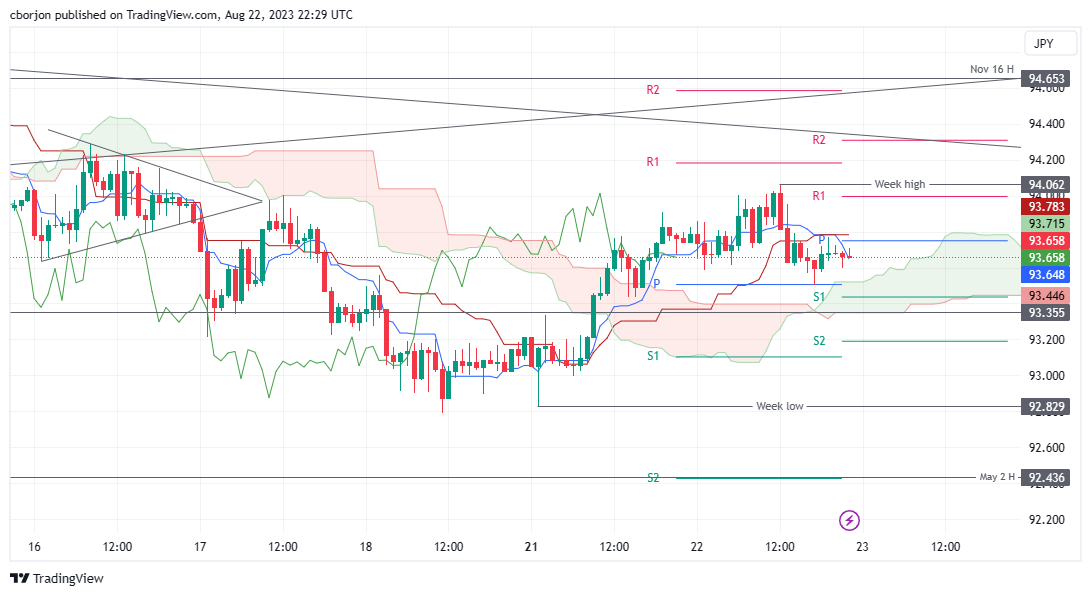
The AUD/JPY trimmed some of Monday’s gains, post losses of 0.10% on Tuesday, though it opens Wednesday’s Asian session with a lower not, exchanging hands at 93.67, down a minuscule 0.01%, at the time of writing. The main drivers for the AUD/JPY fall are risk aversion on China’s woes, US banks feeling the pain of higher interest rates and uncertainty about the US Federal Reserve Chair Powell’s speech at the Jackson Hole Symposium.
AUD/JPY Price Analysis: Technical outlook
The AUD/JPY daily chart portrays the pair continuing its downtrend as the cross-currency pair fell below the Ichimoku Cloud (Kumo). Also, the confluence of the Tenkan and Kijun-Sen lines, at around 93.82, would cap buyers’ intentions of reclaiming the 94.00 figure. Further downside is warranted once the AUD/JPY dives below the last week’s low of 92.78, with the 92.00 psychological level up next, followed by the July 28 low of 91.79.
From an intraday perspective, the AUD/JPY is set to extend its gains, as Monday’s price action lifted the exchange rates from below 92.89, with the pair reaching a week high of 94.06. Buyers’ failure to hold prices above 94.00 exacerbated AUD/JPY’s fall toward the top of the Kumo, with prices bouncing off the day’s low. It should be said that Tenkan and Kijun-Sen portray the pair as bearish, with the latter sitting on top of the former, and intersecting with the daily pivot point at 93.75, seen as a first resistance level. A breach of that level will expose the R1 pivot point at the 94.00 mark.
Conversely, a break below Tuesday’s low of 93.50 could put into play the bottom of the Kumo at 93.30, followed by the S2 pivot level at 93.19, and then the current week’s low of 92.83.
AUD/JPY Price Action – Hourly chart
- Gold Price edges higher towards short-term key resistance confluence despite firmer US Dollar.
- Strong US Treasury bond yields, less acceptance for dedollarization at BRICS underpin Greenback’s run-up, challenging XAU/USD price.
- Mixed concerns about China, Russia and hawkish Fed talks prod Gold traders.
- Preliminary Purchasing Managers Index figures for August eyed for fresh impulse.
Gold Price (XAU/USD) portrays an upward grind around the $1,900 threshold, approaching the $1,910 resistance confluence, as market players brace for multiple central bankers’ speeches at the annual Jackson Hole Symposium event.
The precious metal remains cautiously positive after posting minor gains in the last two consecutive days even as the US Dollar remains firmer amid upbeat United States data and the hawkish commentary from the Federal Reserve (Fed). Adding strength to the recovery moves could be the mixed geopolitical and trade concerns, as well as positioning for Wednesday’s preliminary readings of the August month Purchasing Managers Indexes (PMIs) for major economies.
Gold Price drops as US Dollar traces firmer Treasury bond yields
Gold Price returns to the bear’s radar, after the week-start failure to lure the bulls, as the US Dollar regains buyer’s attention amid firmer United States data, hawkish Federal Reserve (Fed) talks and upbeat Treasury bond yields.
US Dollar Index (DXY) prods the 10-week high marked Friday, around 103.60 at the latest, as improvements in the US Existing Home Sales for July and the Richmond Fed Manufacturing Index for August joins firmer Treasury bond yields.
That said, the US Existing Home Sales came in as -2.2% MoM versus -3.3% prior while the Richmond Fed Manufacturing Index matched -7.0 market forecast compared to -9.0% previous readings.
Apart from the firmer US data, hawkish statements from Federal Reserve Bank of Richmond President Thomas Barkin also underpin the US Dollar’s rebound and weigh on the Gold Price. On Tuesday, Fed’s Barkin emphasized achieving the 2.0% inflation target while challenging the US recession concerns by stating, per Reuters, “If the US were to have a recession, it would likely be a ‘less-severe’ one.” The policymaker also added, “Fed must be open to the possibility that the economy will begin to reaccelerate rather than slow, with potential implications for the US central bank's inflation fight.”
It’s worth noting that the expectations of witnessing strong wage growth in the US, per the Federal Reserve Bank of New York’s SCE Labor Market Survey, also favor the US Dollar’s retreat and capped the Gold Price.
It’s worth noting that the US 10-year Treasury bond yields rose to the highest level since late 2007, before retreating to 4.33% and hence flags the market’s indecision, which in turn challenges the XAU/USD traders.
China, Dedollarization exert additional downside pressure on XAU/USD
Apart from the US Dollar moves, the mixed concerns about China, dedollarization and Russia also prod the Gold Price.
On Tuesday, Bloomberg came out with an analytical piece suggesting the market’s lack of confidence in China’s efforts to restore economic transition.
Alternatively, the latest headlines from Reuters suggest the US-China talks on businesses and commercial ties, which in turn flags hope of pausing the tit-for-tat moves by the world’s top-two economies, which in turn puts a floor under the Gold Price.
Further, news from Russian media claimed Moscow’s destruction of a US-made military vessel near Snake Island, which in turn triggered the risk-off mood initially before restoring the sentiment amid concerns that the vessel was operating under a US flag.
However, concerns about the dedollarization at the BRICS Summit, currently held in South Africa to facilitate diplomatic discussion among Brazil, Russia, India, China and South Africa, gain little acceptance from India and South Africa, which in turn favors sentiment. The same keep the US Dollar on the front foot, favoring the Gold bears in turn.
August PMI in the spotlight ahead of Jackson Hole
To sum up, the firmer US Dollar and challenges to sentiment keep the Gold sellers hopeful as market players await the preliminary readings of the August month Purchasing Managers Indexes (PMIs) for major economies. Should the activity numbers improve, the odds of witnessing a sooner end to the restrictive monetary policies increase, which in turn challenge the Gold sellers.
That said, the US S&P Global Manufacturing PMI is likely to improve to 49.3 from 49.0 but the Services counterpart may edge lower to 52.2 versus 52.3 prior. As a result, the
S&P Global Composite PMI is expected to reprint the 52.0 number and can let the current Gold Price weakness prevail.
It’s worth noting, however, that Friday’s Jackson Hole Symposium is the key event that can offer clear directions to the Gold Price.
Also read: Jackson Hole Preview: Powell poised to keep markets on edge, three scenarios for the US Dollar
Gold Price Technical Analysis
Gold Price fades the bounce off a multi-month low marked the last week amid failures to cross the convergence of 200-DMA and 61.8% Fibonacci retracement of February-May upside, around $1,910 by the press time. That said, the bearish signals from the Moving Average Convergence and Divergence (MACD) indicator add credence to the downside bias.
However, the nearly oversold conditions of the Relative Strength Index (RSI) line, placed at 14, suggests limited room towards the south for the XAU/USD, which in turn highlights a downward-sloping support line from late June, close to $1,880 by the press time.
In a case where the Gold Price breaks the stated support line, the early March swing high of around $1,858 will act as the last defense of the XAU/USD buyers before directing the bullion toward the yearly low surrounding $1,805.
Meanwhile, a successful run-up beyond the $1,910 resistance confluence enables the Gold buyers to aim for the 50-DMA hurdle of around $1,935.
Following that, a downward-sloping resistance line from early May, close to $1,950 at the latest, should check the Gold buyers for one last time.
Overall, the Gold Price remains on the back foot unless crossing $1,950. The XAU/USD downside, however, appears to have limited room.
Gold Price: Daily chart
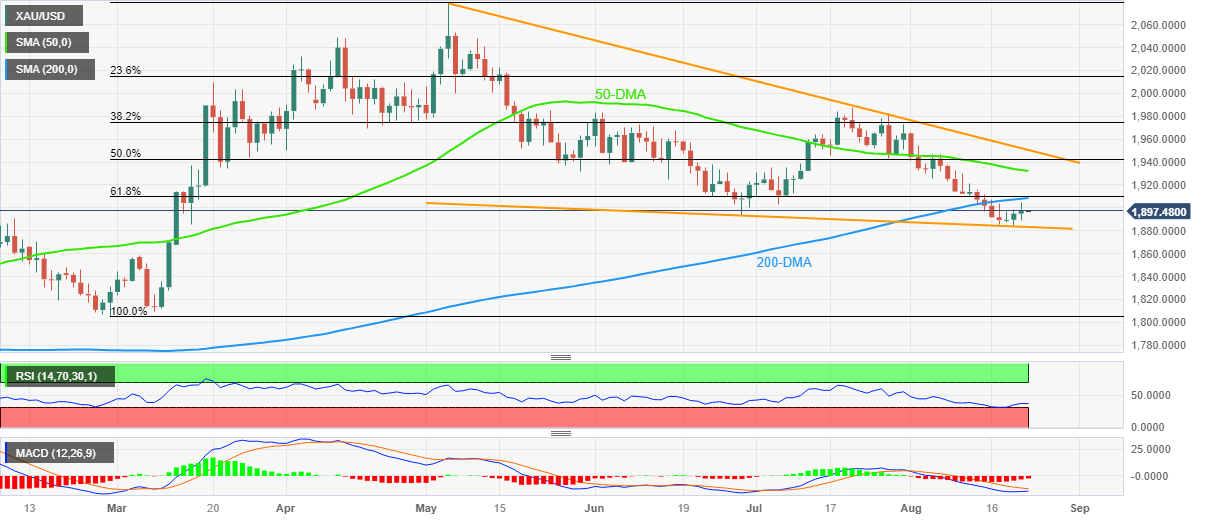
Trend: Further downside expected
Late Tuesday, Reuters quotes the US Commerce Department’s statement saying, “US Commerce Secretary Gina Raimondo met with Chinese Ambassador, as well as the Vice Foreign Minister, Xie Feng and had a ‘productive discussion’ ahead of her trip to China.”
While conveying the details of the meeting, the news also states that US Commerce Secretary Raimondo highlighted the importance to the US businesses and workers.
The news also states the policymakers’ discussion about issues relating to the US–China commercial ties and the challenges faced by US businesses, as well as the areas for potential cooperation.
Earlier in the week, the US Commerce Department’s Bureau of Industry and Security (BIS) removed 27 Chinese entities from its Unverified List, removing sanctions from those entities and flagged hopes of the improving US-China ties.
Market reaction
The news seems to have underpinned the latest pause in the risk aversion and put a floor under the AUD/USD prices, edging higher to 0.6425 by the press time of early Wednesday morning in Asia.
- USD/JPY closed near the 145.80 area as bulls showed signs of exhaustion.
- US and Japan’s PMIs from August will be Wednesday’s highlights.
- Investors await fresh catalysts to model their expectations on the Fed and BoJ.
In Tuesday’s session, the JPY traded strongly against most of its rivals, mainly driven by the 10-year Japanese bond yield rise, which rose to its highest level since 2014, past 0.60%. On the USD side, the Greenback traded mixed against its rivals, while investors remain cautios ahead of the Jackson Hole Symposium kick-off on Thursday, followed by Jerome Powell’s speech on Friday to continue placing their bets regarding the next Federal Reserve (Fed) decisions.
On Wednesday, investors will pay close attention to the S&P Global PMIs from the US from August, which will also help investors model their expectations in relation to the US economic outlook. During the early Asian session, the Jibun Bank will release the Japanese PMIs from the same month.
Regarding the Federal Reserve (Fed) decisions, markets continue to bet to a no-hike in the September meeting and place nearly 40% bets of a 25 basis point (bps) hike on the November meeting. On the Bank of Japan (BoJ) side, the rise in the Japanese yields indicates that markets are hoping for a tweak, but as for now, the bank hasn’t given any signals about leaving its monetary policy.
USD/JPY Levels to watch
The USD/JPY suggests a neutral to bearish technical outlook on the daily chart as bullish momentum wanes. The Relative Strength Index (RSI) indicates a negative slope above its midline, and the Moving Average Convergence Divergence (MACD) displays fading green bars. .On the other hand, the pair is above the 20,100,200-day Simple Moving Average (SMAs), suggesting that the bulls are firmly in control of the bigger picture.
Support levels: 145.00. 144.50, 143.97 (20-day SMA)
Resistance levels: 146.00, 146.50, 147.00
USD/JPY Daily chart
-638283388524527848.png)
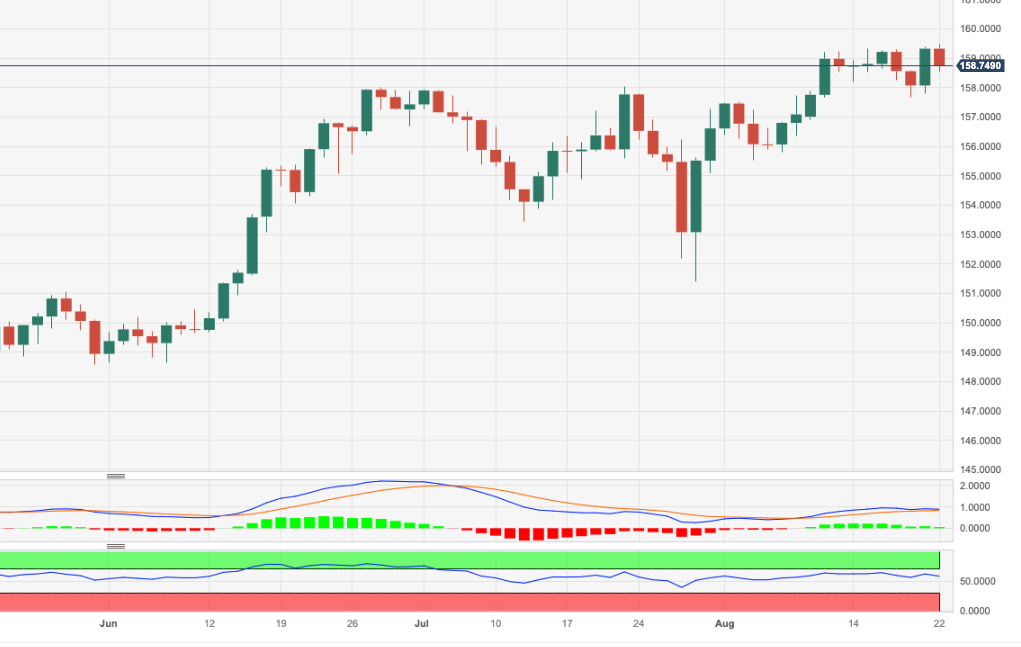
- EUR/JPY retreated near the 158.00 area, seeing more than 0.70% losses on the day.
- Alongside the NZD, the JPY is one of the session’s top-performer.
- Tightening expectations for the ECB remain low. Eyes on Lagarde, August PMIs.
In Tuesday’s session, the EUR/JPY lost ground and retreated near the 158.20 area. Higher Japanese yields contributed to the JPY trading strong while the Euro traded soft. Investors await fresh catalyst in the August PMIs figures from August from Germany and Japan to be released on Wednesday.
On the Euro front, the European currency is trading weak against most of its rivals, as investors are taking profits following back-to-back sessions of tallying gains against most of its rivals. For the rest of the week, investors will eye Manufacturing and Services S&P Global and Hamburg Commercial Bank (HCOB) figures from August, which are expected to decelerate. On Friday, Christine Lagarde will speak at the Jackson Hole Symposium, and Germany will release its final Q2 Gross Domestic Product figures estimates.
As for now, tightening expectations from the European Central Bank (ECB) remains low. World Interest Rates Probabilities (WIRP) indicates that markets are discounting 55% odds of a 25bps increase in the upcoming September 14, 2023 meeting from the ECB. Looking forward, the chances of a 25 bps hike stand at 75% in October, followed by an 85% probability of a 25 bps hike in the December meeting. This rate hike path would leave the target rate at 5%.
On the other hand, the Yen recovered ground against its rivals, as the Japanese Government Yields (JGB) rose to their highest level since 2014, including the 10-year rate rising past 0.60%. Those moves may suggest that markets are expecting a potential pivot, but the Bank of Japan (BoJ) hasn’t delivered any signs of leaving its accommodative approach. As for now, they expect higher inflation and wages to start tightening, so in the meantime, monetary policy divergences may continue weakening the JPY in the short term.
EUR/JPY Levels to watch
The EUR/JPY suggests a neutral to bearish technical outlook on the daily chart as bullish momentum wanes. The Relative Strength Index (RSI) shows a negative slope above its midline, and the Moving Average Convergence Divergence (MACD) displays fading green bars. On the bigger picture, the pair is above the 20,100,200-day Simple Moving Average (SMAs), indicating that the buyers are in command.
Support levels: 158.00, 157.50, 157.00.
Resistance levels: 159.00, 160.00, 160.50.
EUR/JPY Daily chart
-638283346261619101.png)
The Global PMIs will provide the first insight into economic activity during August. Apart from the Australian and Japanese PMIs in the Asian session, New Zealand will report Q2 Retail Sales. Later in the day, Canada will release Retail Sales data, and there will be housing data from the US.
Here is what you need to know on Wednesday, August 23:
Stocks in Asia recovered, with the Shanghai index rising 0.88% after Monday's slide. However, a cautious tone still prevails following the People's Bank of China's smaller-than-expected interest rate cut. On Wall Street, the Dow Jones lost 0.51%, the S&P 500 fell by 0.28%, and the Nasdaq gained 0.06%. The cautious sentiment continues to dominate.
Concerns regarding China, coupled with additional downgrades for US banks by S&P, and expectations of prolonged high interest rates, are exerting downward pressure on market sentiment. The upcoming Jackson Hole annual symposium, commencing on Thursday, holds significant importance, with Fed Chair Powell's speech on Friday. Prior to the symposium, US yields edged higher, reaching new multi-year highs, with the 10-year yield surpassing 4.30%.
Data released on Tuesday showed that US Existing Home Sales tumbled 2.2% in July to an annual rate of 4.07 million, falling below the market consensus of 4.15 million. The Richmond Fed Manufacturing Index improved in August from -9 to -7, in line with market consensus.
Analysts at Wells Fargo on Existing Home Sales
The impact of the recent resurgence in mortgage rates is becoming increasingly apparent. Existing home sales declined 2.2% during July, the second straight monthly decline. Since existing home sales reflect contract closings, July's data largely reflect activity in June when mortgage rates averaged 6.8%, but rates have marched higher since.
In the US, more housing data is due on Wednesday with New Home Sales. Additionally, the S&P Global PMI is scheduled to be released, with the Composite Index expected to remain at 52. The primary focus remains on central bankers ahead of the Jackson Hole Symposium.
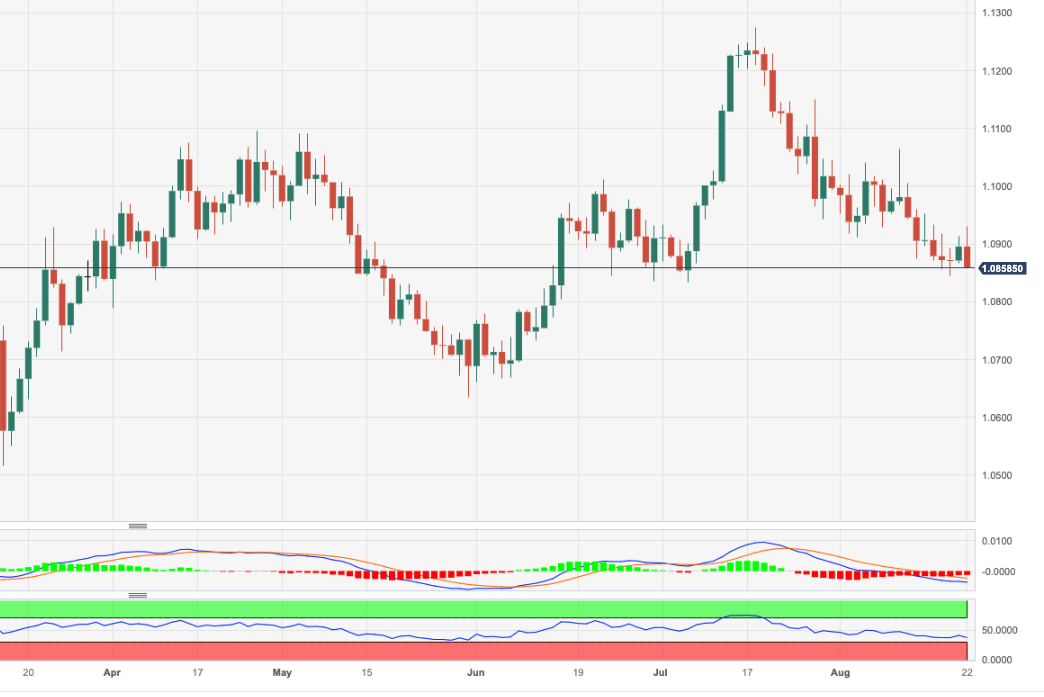
EUR/USD initially rose to 1.0930 but then turned downwards, falling to test the support area at 1.0830. The pair remains under pressure and is approaching the 200-day Simple Moving Average (1.0799).
Eurozone PMI data is due on Wednesday. The Composite PMI is forecasted to decline from 48.6 to 48.5. Weaker-than-expected numbers could weigh on the Euro. Additionally, Eurostat will release the preliminary August reading of Consumer Confidence later in the day.
UK government borrowing came in below forecasts in July at £4.3 billion, £3.4 billion more than in July 2022. From April to July, the budget deficit was £56.6 billion, £11.3 billion less than what the Office for Budget Responsibility had forecasted in March. This provides some grounds for the government to consider tax cuts. GBP/USD traded above the 20-day Simple Moving Average (SMA), but it then pulled back below 1.2750. The pair is consolidating with a bullish bias in the short-term. The UK S&P Global/CIPS Composite PMI is expected to decline from 50.8 to 50.3, with contractions in both Services (51.5 to 50.8) and Manufacturing (45.3 to 45).
USD/JPY remains steady near 146.00 and above the key short-term area of 145.00, supported by higher US Treasury yields.
USD/CAD continues to trade near monthly highs above 1.3550 with a bullish bias. On Wednesday, Canada will report June Retail Sales, which are expected to remain unchanged compared to May.
AUD/USD finished far from the daily highs on Tuesday, trading around 0.6420. The pair rose for the third consecutive day, but the momentum faded. The Australian S&P Global Manufacturing PMI is expected to remain unchanged at 49.6, and the Services PMI at 47.9.
NZD/USD rebounded after finding support at 0.5900. It peaked at 0.5970 but then pulled back to 0.5940. New Zealand will report Q2 Retail Sales, which are expected to show a 2.6% decline.
Gold rose marginally but was unable to retake the $1,900 mark. Despite the rebound, risk sentiment continues to lean towards the downside. Silver rose for the fourth consecutive day, reaching levels above the 20-day SMA, and settled around $23.40.
Cryptocurrencies edged lower, with Bitcoin falling more than 1% to $25,800, and Ethereum losing almost 3% to $1,625.
Like this article? Help us with some feedback by answering this survey:
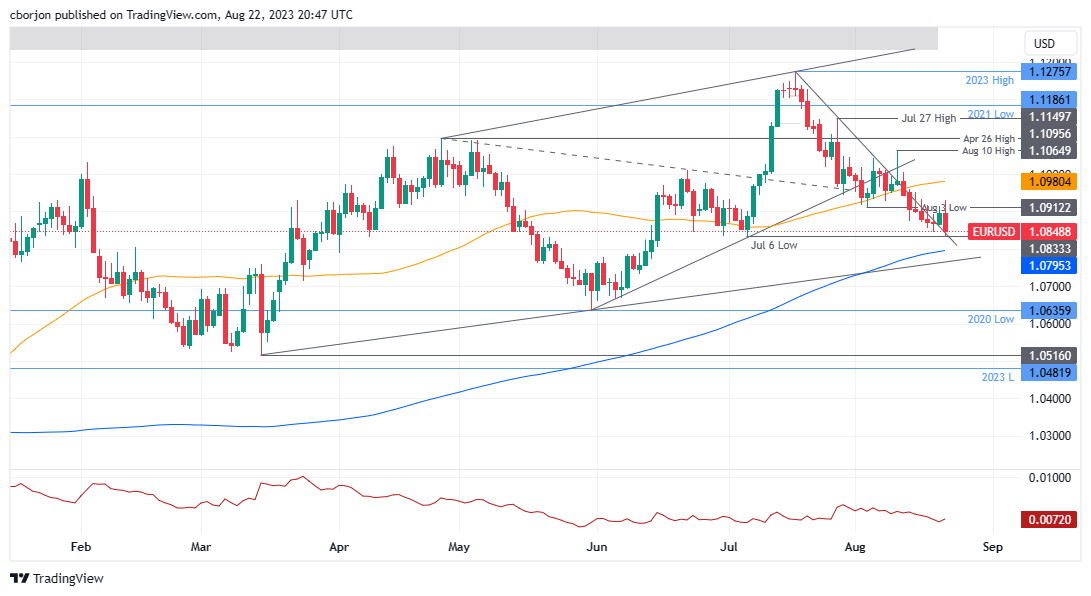
- EUR/USD drops 0.43%, reaching a monthly low of 1.0832, with eyes on the 200-day Moving Average.
- US Dollar Index (DXY) climbs 0.26% to 103.591 as US Treasury bond yields bolster the greenback.
- Eurozone’s light economic agenda keeps EUR/USD steady; S&P Global PMIs release awaited for directional cues.
EUR/USD lost traction and registered losses of 0.43% on Tuesday, printing a new monthly low of 1.0832 and set to extend its fall toward the 200-day Moving Average (DMA) at 1.0795. However, late EUR/USD buyers stepped into the market and lifted the pair, which trades at 1.0848 after hitting a daily high of 1.0930.
US Stocks Uncertain; Richmond Fed’s Data and NAR’s Home Sales Report Influence Market Sentiment
US stocks waver amidst traders’ fragile sentiment as they brace for the US Federal Reserve Chair Jerome Powell’s speech at the Jackson Hole Symposium. US Treasury bond yields underpinned the greenback, with the 3-month, two, and 5-year Treasuries posting gains within the 0.28% - 0.78% range. Consequently, the buck climbs, as depicted by the US Dollar Index (DXY), which measures the buck’s value against a basket of six currencies, gains 0.26%, at 103.591.
Data-wise, the National Association of Realtors (NAR) released data indicating a -2.2% decrease in Existing Home Sales for July. However, it represents an improvement compared to the prior month’s -3.3%. NAR Chief Economist Lawrence Yun attributed this decline to factors such as limited “inventory availability” and elevated “mortgage rates,” according to the report.
The Richmond Fed revealed its Manufacturing Index for August, which plummeted -7 as expected in August, though its Services Index exceeded estimates of a -4 contraction, came at 4.
In recent statements by Richmond Fed President Thomas Barkin, he emphasized that the yield shift does not indicate “inappropriate” market tightening. Instead, he views it as a reaction to robust economic data. Barkin further stated that if inflation maintains its elevated levels and the economy continues showing signs of strength, it would bolster the argument for additional tightening measures.
Across the pond, a light Eurozone (EU) economic docket keeps the EUR/USD pair trading within familiar levels but set to test the next dynamic support at 200-DMA. On Wednesday, the release of S&P Global PMIs could dictate the direction of the EUR/YSD. On the US front, the economic docket would feature Fed speakers, S&P Global PMIs, Durable Good Orders, and New Home Sales.
EUR/USD Price Analysis: Technical outlook
The EUR/USD is still neutral to downward biased, as price action achieved successive series of lower highs and lower lows, with the August 3 daily low of 1.0912, seen as the first resistance level, crucial for buyers if they want to resume the uptrend. In that outcome, the next resistance would be the 50-DMA at 1.0980 before challenging 1.1000. Nonetheless, the EUR/USD’s path of least resistance is downwards. The first support would be the August 22 low of 1.0832, followed by the 1.0800 mark. A breach of the latter will expose the 200-DMA at 1.0795, and the mid-point between 1.07/1.08.
- The S&P 500 retreated below 4,400 after two consecutive days of gains.
- Ahead of Powell’s speech on Friday, hawkish words from Thomas Barkin boosted tightening expectations on the Fed.
- Eyes on S&P Global PMI data on Wednesday.
In Tuesday's session, the market sentiment remains mixed as investors await fresh catalysts to define their short-term trajectory.
On the downside, the US Treasury yield recovered during the mid-American session following Thomas Barkin's hawkish remarks, where he pointed out that if inflationary pressures don’t show evidence of giving in, more tightening would be necessary. In the meantime, the 2-year yield recovered back above 5% to its highest level since early July making the American stock market lose interest.
For the rest of the week, investors will closely watch US S&P Global Manufacturing and Service PMI figures from August, which will be released on Wednesday. It's worth noticing that a strong economy tends to favour the stock market. Still, due to the Federal Reserve (Fed) stance, evidence of a hot economy may make investors discount a more aggressively Fed, and in that case, it would apply pressure on the S&P.
According to the CME FedWatch tool, markets still expect a pause in September, followed by a 25 basis point (bps) hike in the November meeting. However, those odds may change following Jerome Powell’s speech on Friday at the Jackson Hole Symposium, where investors will look for clues regarding forward guidance.
SPX Levels to watch
According to the daily chart, the technical outlook for SPX remains bearish for the short term. The Relative Strength Index (RSI) remains deep in negative territory while the Moving Average Convergence Divergence (MACD) prints higher red bars. Additionally, the index is below its 20-day Simple Moving Averages (SMA) but above the 100 and 200-day averages, suggesting that on the bigger picture, the bulls still have the upperhand over the bears.
Supports: 4,370, 4,350, 4,300 (100-day SMA).
Resistances: 4,400, 4,420, 4,450.
SPX Daily Chart

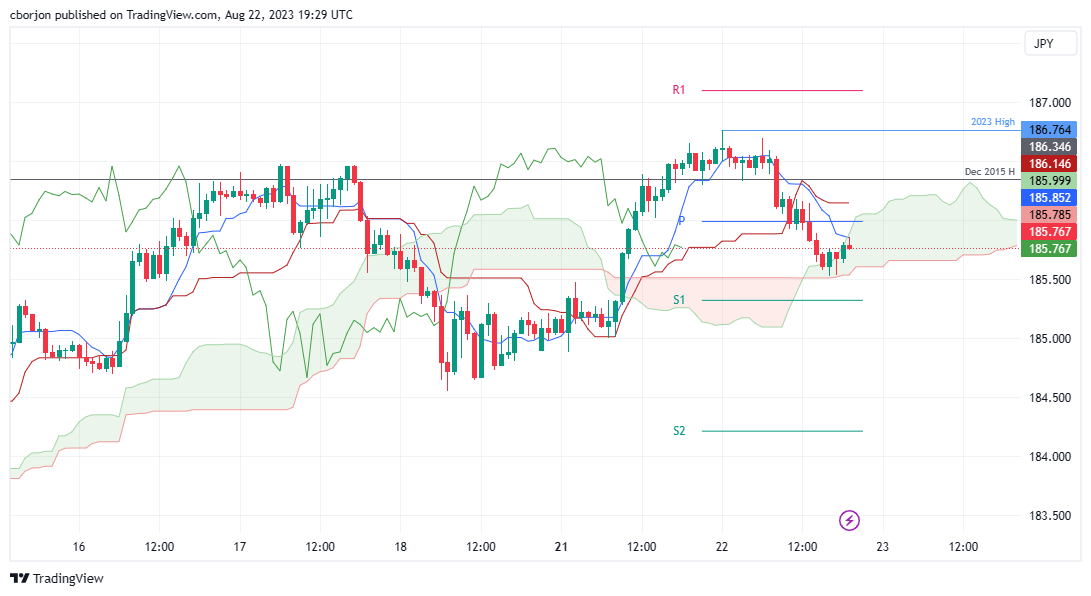
- GBP/JPY dropped 0.34%, trading at 185.80, influenced by a dip in US 10-year Treasury bond yield.
- Despite a daily low of 185.52, GBP/JPY is poised to challenge the 187.00 mark amid potential Yen intervention.
- Short-term analysis shows support at Senkou Span B (185.50); a close below 186.00 may signal further declines.
GBP/JPY hits a new year-to-date (YTD) high but retraces as the Japanese Yen (JPY) strengthens during Tuesday’s session and remains the second strongest currency in the day. A drop in the US 10-year Treasury bond yield undermined the USD/JPY pair; hence the GBP/JPY dropped. At the time of writing, the GBP/JPY is trading at 185.80, with losses of 0.34%.
GBP/JPY Price Analysis: Technical outlook
From a daily chart perspective, the GBP/JPY remains upward biased, though it seems that some buyers book profits, as Japanese authorities remain vocal about a possible intervention to boost the Yen. Despite dipping to a daily low of 185.52, the pair would likely test the 186.00 figure, followed by a challenge of the 187.00 psychological level.
In the short term, the GBP/JPY hourly chart portrays the pair peaked around the new YTD high and retraced below the Asian session low of 186.29, plunging 70 pips toward its daily low. It should be said the GBP/JPY dive was cushioned by the Senkou Span B support at around 185.50; since then, the cross-currency pair edged towards the confluence of the top of the Ichimoku Cloud (Kumo) and the Tenkan-Sen line at 185.85. Once those levels are cleared, the next stop would be the daily pivot point at 185.99. A daily close below 186.00 could pave the way for further losses.
GBP/JPY Price Action – Hourly chart
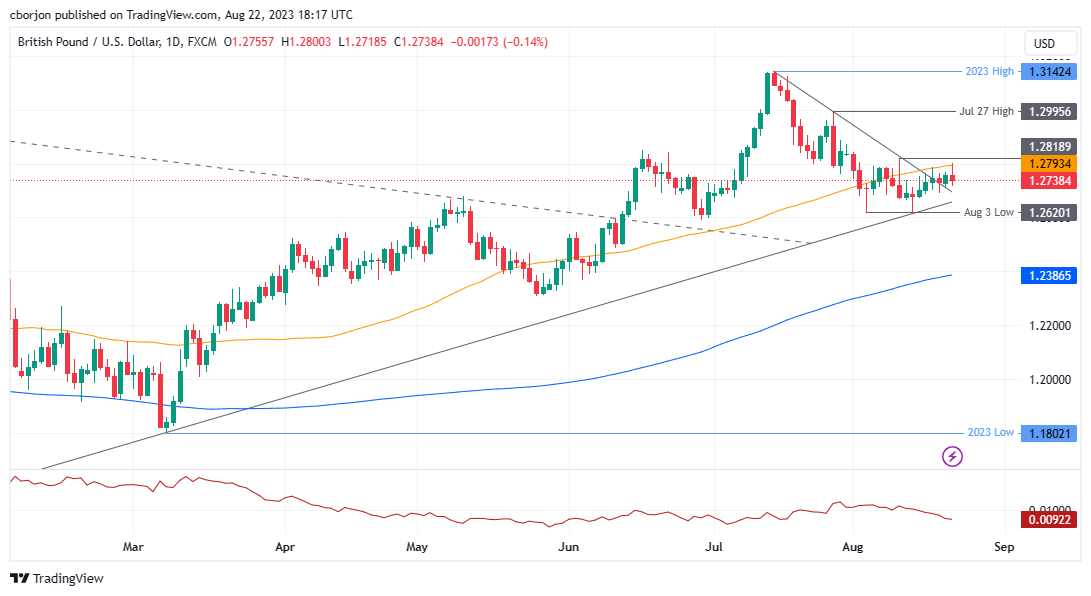
- GBP/USD faces a 0.12% loss, influenced by high US Treasury bond yields and global trade apprehensions.
- US Existing Home Sales dropped 2.2% in July; limited inventory and high mortgage rates cited as causes.
- Richmond Fed’s Manufacturing Index meets expectations with -7, while the Services Index surprises with a positive 4.
GBP/USD retreated after testing the 50-day Moving Average (DMA) but dropped mainly on high US Treasury bond yields and risk aversion spurred by the recent developments surrounding China. Fears that the country with the second largest economy in the world can sharply slow down could weigh on global trade. Hence, the GBP/USD is trading at 1.2741, registering losses of 0.12% at the time of writing.
US stocks decline, Greenback strengthens: global trade tensions rise with China’s economic uncertainties.
US stocks are experiencing a decline due to the prevailing fragile market sentiment. The National Association of Realtors (NAR) released data indicating a 2.2% decrease in Existing Home Sales for July. This, however, represents an improvement compared to the preceding month’s figure of -3.3%. NAR Chief Economist Lawrence Yun attributed this decline to factors such as limited “inventory availability” and elevated “mortgage rates,” according to the report.
Other data revealed by the Richmond Fed, the Manufacturing Index plummeted -7 as expected in August, though its Services Index exceeded estimates of a -4 contraction, came at 4.
US bond yields are mixed as the short-end of the curve continues to bull-steepen, while the 10s, 20s, and 30s drop between 0.18 and 0.47 percent. However, the Greenback (USD) continues to rise, with the US Dollar Index (DXY) measuring the buck’s value vs. six currencies, advancing 0.26%, at 103.588.
In recent statements by Richmond Fed President Thomas Barkin, he emphasized that the yield shift does not indicate “inappropriate” market tightening. Instead, he views it as a reaction to robust economic data. Barkin further stated that if inflation maintains its elevated levels and the economy continues showing signs of strength, it would bolster the argument for additional tightening measures.
On the US front, the economic docket would feature Fed speakers, S&P Global PMIs, Durable Good Orders, and New Home Sales.
In the meantime, the UK economic docket would feature the release of S&P Global/CIPS PMIs, which are expected to continue to weaken; in services and manufacturing. The Manufacturing PMI is expected to slide for six consecutive months, while the services PMI is expected to climb to 51.3.
GBP/USD Price Analysis: Technical outlook
The GBP/USD remains neutrally biased but trading within the 50-day Moving Average (DMA) and the 1.2600 figure for the latest month-to-date (MTD). A bullish resumption would happen once buyers reclaim the 1.2800 mark, exacerbating a rally towards 1.3000, with 1.2900 seen as initial resistance. Conversely, if GBP/USD drops below 1.2600, that could expose the GBP/USD pair to selling pressure. Key support levels to test would be 1.2500, followed by the 200-DMA at 1.2387.
GBP/USD Price Action - Daily chart
- USD/CHF shows mild gains near the 0.8800 area.
- The pair continues to trade sideways since early August.
- Hawkish comments from Fed’s Thomas Barking gave the USD a boost.
- Investors await Powell’s speech on Friday and Wednesday’s US August PMIs.
On Tuesday, the USD/CHF traded with mild gains, near the critical 0.8800 zone. On the US side, Thomas Barking from the Federal Reserve (Fed) commented that more tightening may be needed while investors await Wednesday’s PMIs from August and Jerome Powell’s Friday speech. On the CHF side, Switzerland reported a higher than expected Trade Balance deficit in July, which seems to be pressuring the CHF. Besides that, no relevant data will be released on the Swiss front for the rest of the week.
That said, the USD measured by the DXY index upside potential is limited in a risk-positive market environment, with major US stock indexes closing green on Monday’s session. On a positive note, Thomas Barkin from the Fed delivered hawkish comments and stated , “If inflation remains high and demand gives no signal that it is likely to drop, that would require a tighter monetary policy”. As a reaction, US Treasury yields recovered some ground, and hawkish bets may limit further losses for the USD.
Attention is now set to the Jackson Hole Symposium, which will kick off on Thursday, and S&P Global Manufacturing figures from the US from July on Wednesday. Those figures are expected to show a decelerating economic activity but remain in expansion territory and will help investors model their expectations towards the next Federal Reserve (Fed) meeting. As for now, markets are still confident that the Fed will pause in September and then bet on higher odds of a hike in November of 25 basis points (bps)
USD/CHF Levels to watch
Analysing the daily chart, it is apparent that the USD/CHF has a neutral to bullish technical stance, with the bulls gradually recovering ground but still not in command. The Relative Strength Index (RSI) indicates positive momentum with an ascending slope above its midline, while the Moving Average Convergence (MACD) lays out flat green bars.On the other hand, the pair is above the 20-day Simple Moving Average (SMA) but below the 100 and 200-day Simple Moving Average (SMAs), suggesting that despite the recent bearish sentiment, the bulls are still resilient, holding some momentum.
Support levels: 0.8750 (20-day SMA), 0.8730, 0.8715.
Resistance levels: 0.8800, 0.8820, 0.8850.
USD/CHF Daily chart
-638283228211823782.png)
- US Existing Home Sales contract by -2.2% in July, with inventory constraints and rising mortgage rates as key drivers.
- Richmond Fed Manufacturing Index meets expectations with a -7 drop, while the Services Index surprises positively at 4.
- Richmond Fed President Barkin suggests solid economic data drives yield movements, hinting at potential further tightening.
- Mexico’s upcoming economic data includes August 1st half inflation, expected to show a decrease.
The Mexican Peso (MXN) registered solid gains on Tuesday, as the USD/MXN pair plummeted below the 17.0000 figure amidst the lack of a catalyst, even though the mood has deteriorated. US Treasury bond yields are almost flat, but the greenback gains ground against most G7 currencies. The USD/MXN is trading at 16.9288, down 0.44%.
Despite a deteriorating mood and gains in the greenback against G7 currencies, the MXN stands firm
Wall Street turned negative as the North American session progressed. Existing Home Sales in the US slumped less than expected, still contracted at a -2.2% pace in July, driven by inventory availability and higher mortgage rates. At the same time, Richmond Fed Manufacturing Index dropped to -7 as estimated, while its Services index posted a positive figure, coming at 4, crushing estimates for a -4 plunge.
The USD/MXN is also falling as US bond yields at the long end of the curve fall. The exception is US 3-month and 2-year Treasuries, yielding 5.30% and 5.02%, respectively. According to recent words from Richmond Fed President Thomas Barkin noted, the move in yields is not a sign of “inappropriate” market tightening; instead, he said is a response to strong economic data.
Barkin added that if inflation stays high and the economy strengthens further, “that would make the case” for additional tightening.
In the meantime, the US Dollar Index (DXY), a gauge of the buck’s value against a basket of six currencies, has risen 0.25%, up at 103.579, but so far failed to gain traction against emerging market currencies.
Aside from this, the Mexican economic docket would feature August 1st half inflation on August 24, which is estimated to decrease to 4.67% YoY and 0.28% on monthly figures. Meanwhile, Mexico’s economy minister Raquel Buenrostro told Reuters, “Mexico rules out modifying a decree on genetically modified (GM) corn ahead of a dispute settlement panel requested by the United States through the USMCA trade pact.”
On the US front, the economic docket would feature Fed speakers, S&P Global PMIs, Durable Good Orders, and New Home Sales.
USD/MXN Price Analysis: Technical outlook
Today, the USD/MXN resumed its downtrend, after standing above the 17.0000 figure for the last 14 days, after clashing with the confluence of the 20 and 50-day Moving Averages (DMAs) at the 17.0000 figure, spurring a fall toward a daily low of 16.8930. Should be said a decisive break below that level, and the pair would challenge the year-to-date (YTD) low of 16.6238. Nevertheless, if USD/MXN reclaims the 17.00 figure, that could pave the way for a test of the 100-DMA at 17.4011.
USD/MXN Price Action – Daily chart

"If inflation remains high and demand gives no signal it is likely to drop, that would require tighter monetary policy," Federal Reserve Bank of Richmond President Thomas Barkin said on Tuesday, as reported by Reuters.
"Consumer spending, economic strength make it possible the US economy could reaccelerate before inflation cools," Barkin added but noted that he will not prejudge the outcome of the Fed's September 19-20 policy meeting.
Market reaction
The US Dollar Index clings to daily gains above 103.50 following these comments.
- USD/CAD sets a six out of the last seven days of gains and rose to 1.3550, trading its highest since early June.
- The USD gained momentum during the American session, and the DXY index rose to 103.56.
- Lower Oil prices apply pressure on the CAD.
In Tuesday’s session, the USD/CAD continued to gain ground, mainly driven by the broad-based CAD weakness. On the other hand, investors await key manufacturing and services sector PMIs from August to be released. Eyes are also set on Powell’s speech on Friday at the annual Jackson Hole Symposium.
The USD is trading somewhat weak against most of its rivals, primarily due to investors showing more interest in risk-sensitive assets. On the data front, Existing Home Sales from the US came in slightly lower than expected at 4.07M in July vs the 4.15M expected and the previous 4.16M but failed to impact the Greenback significantly.
For the rest of the week, the focus shift to the Jackson Hole Symposium, which will kick off on Thursday, and on Wednesday, the American economic calendar will feature S&P Global PMI data which is expected to show a deceleration in the US service and manufacturing sector.
On the CAD front, no relevant data will be released during the session, and the weakness of Oil prices is contributing to the Canadian currency decline. In that sense, due to Chinese economic concerns, the black gold prices continue to retreat and fell to their lowest point since early August.
USD/CAD Levels to watch
Evaluating technical indicators, the USD/CAD displays a short-term bullish outlook. Nevertheless, traders should take caution due to the emergence of overbought signals, which may lead to a technical correction in the near term. The Relative Strength Index (RSI) is in overbought territory above 70.00, while the Moving Average Convergence (MACD) histogram exhibits more oversized green bars. In addition, the pair is above the 20,100,200-day Simple Moving Averages (SMAs), indicating a favourable position for the bulls in the bigger picture.
Support levels: 1.3530, 1.3500, 1.3490.
Resistance levels: 1.3570, 1.3590, 1.3600.
USD/CAD Daily chart
-638283168427154063.png)
- US Existing Home Sales drop by -2.2% in July, with "inventory availability" and higher "mortgage rates" cited as reasons.
- Richmond Fed's Manufacturing Index meets expectations with a drop of -7, while the Services Index surprises positively.
- US bond yields show mixed dynamics, but the Greenback continues its ascent with the DXY at 103.588.
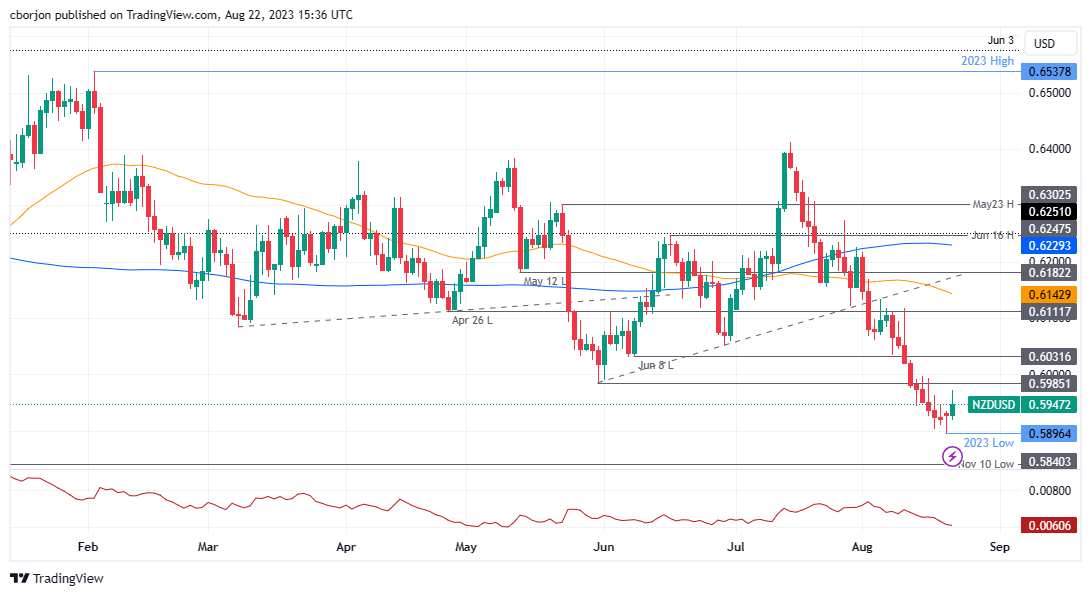
NZD/USD recovers some ground though exchanges hands off the highs of the day of 0.5972, trading at 0.5941, amidst a mixed market mood spurred by fears about recent developments in China and uncertainty about the outcome of US Federal Reserve Chair Jerome Powell’s speech at Jackson Hole.
The Kiwi recovers slightly but remains under pressure due to concerns over China and US economic data
US equities dwindle as market sentiment remains fragile. The National Association of Realtors (NAR) revealed that Existing Home Sales plunged -2.2% in July but improved compared to June’s -3.3% figures. According to the report, “inventory availability” and higher “mortgage rates” are the drivers behind the latest report drop, revealed NAR Chief Economist Lawrence Yun.
In other data revealed by the Richmond Fed, the Manufacturing Index plummeted -7 as expected in August, though its Services Index exceeded estimates of a -4 contraction, came at 4.
US bond yields are mixed as the short-end of the curve continues to bull-steepen, while the 10s, 20s, and 30s drop between 0.18 and 0.47 percent. However, the Greenback (USD) continues to rise, with the US Dollar Index (DXY), a measure of the buck’s value vs. six currencies, advancing 0.26%, at 103.588.
Meanwhile, Richmond Fed President Thomas Barkin emphasized that reaching the 2% target is crucial to Fed’s credibility. Later on the day, further, Fed policymakers will cross the wires, with Bowman and Golsbee up next.
On the New Zealand (NZ) front, the lack of economic data keeps traders seeking direction on China’s latest developments and market sentiment. Nevertheless, Retail Sales for the Second Quarter will be revealed on Wednesday, estimated to exceed the prior’s quarter yearly figures, while quarter-on-quarter (QoQ) is foreseen to disappoint investors. Hence, further NZD/USD could be expected.
On the US front, the economic docket would feature Fed speakers, S&P Global PMIs, Durable Good Orders, and New Home Sales.
NZD/USD Price Analysis: Technical outlook
The NZDUSD remains downward biased even though it bounced off year-to-date (YTD) lows of 0.5896. If NZD/USD buyers want to shift the trend to neutral, they must reclaim May 31 daily low turned resistance at 0.5985, followed by the 0.6031 June 8 daily low. Nevertheless, the NZD/USD’s path of least resistance is downwards, and it could test the November 10 daily low of 0.5840, followed by the November 3 swing low of 0.5741.
NZD/USD Daily chart
EUR/SEK has hit multidecade highs around the 11.96 level. Economists at Rabobank analyze the pair’s outlook.
Breman’s hawkish tone should help provide some support for the SEK
While the 12.00 level is within sight, Riksbank Deputy Governor Breman’s hawkish tone and the possibility that rate rises could extend beyond September should help provide some support for the SEK.
Given market expectations for a modest recovery in Swedish GDP growth in Q4, ahead of a recovery in domestic consumption growth in 2024, we see the potential for a return to the 11.50 area on a three-month view.
With the path of least resistance for stocks seemingly lower for now, key to watch will be a stabilization in interest rate volatility and clarity on the path of monetary policy, economists at Charles Schwab report.
Fed Chair Powell could try to establish some calm in the Treasury market
The upside breakout in Treasury yields has weighed on equity multiples, which expanded since last October without the benefit of earnings growth. The pressure has been more acute on the more richly valued mega-cap tech and tech-oriented stocks. Some reversal is likely needed to establish a better footing for stocks.
Better-than-expected recent economic activity, coupled with sticky inflation, is likely to keep uncertainty regarding Federal Reserve policy elevated. Fed Chair Jerome Powell has his much-anticipated speech at the Fed's annual confab in Jackson Hole later this week. It's possible he could try to establish some calm in the Treasury market.
China to put AUD further at risk, economists at Société Générale report.
AUD/USD at risk of further losses
Antipodean currencies are very exposed to China’s economic problems. While the Australian Dollar has already lost 7% since the double-top it formed in June and July at 0.69, further losses are possible.
Almost all the July data missed market expectations by a wide margin. The message is loud and clear: China is experiencing all-out deflation. Contracting Chinese demand for Australian commodities (iron ore) and, more directly, softer Chinese stocks are putting AUD/USD more at risk.
- Existing Home Sales in the US continued to decline in July.
- US Dollar Index stays in positive territory above 103.50.
Existing Home Sales in the US declined 2.2% in July to an adjusted annual rate of 4.07 million, the National Association of Realtors (NAR) reported on Tuesday. This reading followed the 3.3% decrease recorded in June.
"The median existing-home sales price rose 1.9% from one year ago to $406,700. It was the fourth time the monthly median sales price eclipsed $400,000, joining June 2023 ($410,000), June 2022 ($413,800) and May 2022 ($408,600)," the NAR noted in its press release. "The inventory of unsold existing homes increased 3.7% from the previous month to 1.11 million at the end of July, or the equivalent of 3.3 months’ supply at the current monthly sales pace."
Market reaction
The US Dollar preserves its strength following this report and the US Dollar Index was last seen rising 0.3% on the day at 103.60.
Rising US yields continue to offer more support for the USD, economists at MUFG Bank report.
Long-term US yields continue to move higher
The resilience of the US economy to higher rates continues to surprise market participants and has prompted market participants to scale back expectations for rate cuts next year. Even after the recent scaling back of rate cut expectations, market participants are still expecting around 100 bps of cuts next year.
The sharper-than-expected slowdown in US inflation and lagged impact of monetary tightening are expected to create room for the Fed to make policy less restrictive in 2024. In the near term though the resilience of the US economy and higher long-term US yields are proving more support for the US Dollar.
- Silver price finds selling pressure near $23.50 as investors turn cautious ahead of Jackson Hole.
- US equities found buying interest despite Moody’s and S&P Global downgraded the credit ratings of US commercial banks.
- Fed Barkin said that the central bank needs to achieve the 2% inflation target to ensure its credibility.
Silver price (XAG/USD) faces fragile barricades around $23.50 after a sharp recovery in the early New York session. The white metal struggles to extend recovery as the US Dollar rebounds after remaining lackluster. The US Dollar attracts some bets amid caution ahead of the Jackson Hole Symposium, which will start on Thursday.
S&P500 is expected to open on a positive note, following positive cues from overnight futures. US equities find interest despite Moody’s and S&P Global downgrading the credit ratings of US commercial banks, citing risks of rising outflows in a high-interest rate environment. The 10-year US Treasury yields oscillate above 4.3%.
The US Dollar Index (DXY) recovers sharply and is looking to test the immediate resistance of 103.50 as Federal Reserve (Fed) chair Jerome Powell at Jackson Hole is likely to deliver a hawkish commentary. Fed Powell is expected to keep interest rates higher for a longer period as United States inflationary pressures are still far from the desired rate of 2%.
Meanwhile, Richmond Fed President Thomas Barkin said on Tuesday that the Fed needs to achieve the 2% inflation target to ensure its credibility, per Reuters. Fed Barkin expects that the US recession will be a ‘less severe’ one.
Silver technical analysis
Silver price finds an intermediate resistance after a solid recovery to near the 38.2% Fibonacci retracement (plotted from July 20 high at $25.27 to August 15 low at $22.23) at $23.40. The asset shifts auction above the 20-period Exponential Moving Average (EMA), which trades around $23.20.
The Relative Strength Index (RSI) (14) climbs into the bullish range of 60.00-80.00, which indicates more upside ahead.
Silver hourly chart
-638283088949194721.png)
Gold has so far been unable to recover significantly from the five-month low of $1,885 that it registered last week. Economists at Commerzbank analyze XAU/USD outlook.
Fed Chair Powell could help Gold price pick up again
Gold will doubtless find it difficult to come out of the defensive in the near future. That said, sentiment is now already so bearish that it wouldn’t take much to spark a price recovery.
It is possible that Fed Chair Powell will help prices pick up again at the Fed’s Jackson Hole symposium if he sounds less hawkish in his speech on Friday than people clearly expect him to.
- EUR/USD gives away the initial uptick to the 1.0930 zone.
- Next on the downside emerges the August low at 1.0844.
EUR/USD resumes the downside after climbing to the 1.0930 region earlier on Tuesday.
Further losses are expected to challenge the August low of 1.0844 (August 18) prior to the July low of 1.0833 (July 6). In addition, the loss of this region leaves the pair vulnerable to a probable test of the critical 200-day SMA at 1.0795 in the short-term horizon.
In the meantime, the pair’s positive outlook remains unchanged while above the 200-day SMA.
EUR/USD daily chart
Senior Economist Julia Goh and Economist Loke Siew Ting at UOB Group assess the larger-than-expected drop in Malaysian exports in July.
Key Takeaways
Gross exports maintained a double-digit contraction of 13.1% y/y in Jul (Jun: 14.1%), steeper than our estimate (-10.5%) and Bloomberg consensus (-11.1%). Imports also kept a double-digit decline at 15.9% (UOB est: -18.5% vs Bloomberg est: -15.4%, Jun: -18.7%). This resulted in a smaller trade surplus of MYR17.1bn (Jun: +MYR25.8bn).
Jul’s export decline was brought by a broad-based weakness across all three export sectors for a second consecutive month. Within the manufacturing sector, shipments of commodity-based products (i.e. refined petroleum, chemicals & chemical products, and manufactures of metal) dropped the most during the month as a consequence of subdued global demand and lower commodity prices. A persistent fall in shipments to key export destinations that included the EU, Japan, Hong Kong, India and ASEAN region fully offset the effects of a positive growth rebound in exports to the US and China.
Meanwhile, there are no signs of trade rebounding as yet given risks ranging from softening global growth momentum, increasing trade restrictions to climate shocks. China’s sagging economy further poses perils for countries around the globe while the possibility of a slightly more restrictive policy path in the developed markets would further tighten global financial and credit conditions that will subsequently weigh on global trade. This coupled with unfavourable base effects continue to reinforce our 2023 full-year export outlook at -7.0% (BNM est: +1.5%, 2022: +24.9%).
- DXY makes a U-turn and regains the 103.50 region.
- The next up barrier comes at the August high at 103.68.
DXY manages to regain composure and reverse three consecutive sessions of losses on Tuesday.
The index seems to be attempting a consolidative range following the recent multi-week rally. Against that, the resumption of the uptrend should retarget the August peak of 103.68 (August 18) ahead of the May top of 104.69 (May 31) and the 2023 peak of 105.88 (March 8).
It is worth noting that this area of monthly highs appears reinforced by the proximity of the key 200-day SMA, today at 103.16.
Looking at the broader picture, a convincing breakout of the 200-day SMA should shift the outlook for the index to a more constructive one.
DXY daily chart

Economists at ING look out for BRICS expansion news today.
Expansion tops the agenda
Expansion tops the agenda and names in the frame we think could be the United Arab Emirates, Egypt, and Bangladesh – all of which joined the BRICS New Development Bank in 2021.
It would be a massive surprise were Saudi Arabia to join the grouping, which would inevitably lead to speculation over Oil being priced in non-Dollar currencies and a headline that may temporarily hit the US Dollar.
USD/MXN rebound has faltered near recent pivot high of 17.42. Economists at Société Générale analyze the pair’s technical outlook.
A pullback can be expected towards 16.80 in the short-term
Daily MACD is struggling to maintain above its trigger denoting lack of steady upward momentum.
A break above 17.42 is essential to affirm an extended bounce.
Short-term, a pullback can be expected towards 16.80, the 76.4% retracement of recent bounce. If the pair fails to defend this, one more down leg can’t be ruled out.
- AUD/USD rebounds after consolidating around 0.6400 as US Dollar loses resilience.
- The USD Index turns sideways this week after a five-week winning spell as investors await a trigger for further action.
- AUD/USD delivers a breakout of the Symmetrical Triangle chart pattern.
The AUD/USD pair rebounds after building a base near the round-level support of 0.6400 in the European session. The Aussie asset manages to defend the downside bias as the US Dollar loses resilience ahead of the Jackson Hole Symposium. Also, investors shrugged off deflation risks associated with the Chinese economy as the People’s Bank of China (PBoC) lowered the one-year Prime Lending Rate (PLR) to 3.45%.
The US Dollar Index (DXY) struggles to find a direction after sensing a severe upside restriction near 103.50. The USD Index turns sideways this week after a five-week winning spell as investors await a trigger for further action.
Meanwhile, Economists at UOB Group expect that the RBA has held rates unchanged for two consecutive months, and following the slew of data we think they will keep policy unchanged at its next two meetings on 5 Sep and 3 Oct, unless we get upside inflation surprises from Jul CPI data on 30 Aug and Aug CPI data on 27 Sep.
AUD/USD delivers a breakout of the Symmetrical Triangle chart pattern formed on an hourly scale. A breakout of the aforementioned chart pattern results in wider ticks and heavy volume. The asset stabilizes above the 50-period Exponential Moving Average (EMA) at 0.6420 but still faces barricades near the 200-EMA around 0.6455.
The Relative Strength Index (RSI) (14) shifts into the bullish range of 60.00-80.00, which indicates that the upside impulse has been activated.
A decisive break above August 16 high around 0.6480 will drive the asset toward August 15 high at 0.6522, followed by August 10 high at 0.6616.
In an alternate scenario, a downside move below August 18 low at 0.6380 will negate the triangle breakout and will expose the asset to a fresh nine-month low around 0.6300. Slippage below the latter will expose the asset to 03 November 2022 low at 0.6272.
AUD/USD hourly chart
-638283042091576958.png)
- EUR/JPY now partially fades Monday’s strong advance.
- The resumption of the upside bias could visit 160.00.
EUR/JPY now faces some renewed downside pressure and erodes part of the strong gains recorded at the beginning of the week.
So far, the emergence of some consolidation seems probable in the very near term ahead of the continuation of the upside. That said, the immediate target remains at the round level of 160.00.
The surpass of the latter should not see any resistance level of note until the 2008 high at 169.96 (July 23)
So far, the longer term positive outlook for the cross appears favoured while above the 200-day SMA, today at 147.45.
EUR/JPY daily chart
Federal Reserve Bank of Richmond President Thomas Barkin said on Tuesday that the Fed needs to achieve the 2% inflation target to ensure its credibilitiy, per Reuters.
Commenting on the economic outlook, Barkin noted that if the US were to have a recession, it would likely be a "less-severe" one. He further added that they try not to focus too much on short-term market moves.
Market reaction
These comments don't seem to be having a noticeable impact on the US Dollar's performance against its major rivals. As of writing, the US Dollar Index was virtually unchanged on the day at 103.30.
UOB Group’s Senior Economist Julia Goh and Economist Loke Siew Ting review the latest interest rate decision by the BSP.
Key Takeaways
Bangko Sentral ng Pilipinas (BSP) extended a pause in its tightening cycle for the third straight meeting, as widely expected. It left the overnight reverse repurchase (RRP) rate untouched at 6.25%, the overnight deposit rate at 5.75% and the lending facility rate at 6.75%.
Today’s (17 Aug) monetary policy decision came after the national inflation decelerated to a 16-month low in Jul and the country’s economy grew at a slower-than-expected pace in 2Q23 with a broad-based slowdown in domestic demand. The Monetary Board (MB) added that an extended rate pause would further allow the central bank to assess the lagged effects of past interest rate hikes since May 2022 while continuing to guard against the emerging risks to the inflation outlook. On that note, the central bank revised up its inflation projections through 2025, mainly reflecting higher oil price forecasts, persistent food supply constraints and domestic policy changes.
In the latest monetary policy statement (MPS), we sense that BSP is now prioritizing the domestic growth outlook over a potential return of inflation risk. This is premised on two additional lines specifically highlighting weaker growth prospects compared to Jun’s statement, with a same inflation storyline. Given the overall tone of the latest MPS and forward guidance remain in line with our expectation (refer to our 2Q23 GDP report for details), we maintain our view that BSP will continue to leave its RRP rate unchanged at 6.25% in the remaining months of the year, and no rate cuts ahead of the US Fed. The MB will next meet on 21 Sep, right after the US Fed announces its Sep interest rate decision.
CAD needs to push below 1.35 against the USD to improve, economists at Scotiabank report.
Recent rally is running out of momentum
Monday’s snap higher off the intraday low for the USD retested the break under trend support that the market had established earlier in the session. Trend support-turned-resistance effectively held but easy gains for the USD remain a feature of this market and gives the clear impression that higher is the path of least resistance for USD/CAD.
But there are signs from daily price action (after the USD still closed net lower on the day Monday) that the recent rally in the USD is running out of momentum.
The 1.3575 zone is resistance and a potential double top; a break under 1.3500 triggers that signal and implies downside potential to 1.3425.
GBP/USD holds in high 1.27s. Economists at Scotiabank analyze the pair’s technical outlook.
More sideways range trading on failure to push on through the low 1.28s
Sterling continues to grind higher. The market’s objective has to be a clear push through 1.2820, the high from August 10 and a 1.2620 double bottom trigger. A break above here targets a measured move rally to 1.3020.
Failure to push on through the low 1.28s in the next few days may see the GBP slip back into more, sideways range trading, however.
EUR/USD slides under 1.09. Economists at Scotiabank analyze the pair’s technical outlook.
Gains stall around 100-DMA
Weak, early price action gives the short-term chart a negative look on the face of it. Spot gains stalled around 1.0930 (100-DMA) in European trade, dumping spot back to the upper 1.08s. There is, however, a clear, rounded low developing on the intraday chart this week and minor setbacks are common for these sorts of technical features.
Minor consolidations are typically followed by a more dynamic phase (bullish, in this case) of market movement.
Support is 1.0875/1.0880. Resistance is 1.0935/1.0940.
Economists at Credit Suisse expect equity markets to see reduced headwinds and forecast S&P 500 at 4,700 by June 2024.
Modestly positive scenario over the next 12 months
We forecast an acceleration in earnings growth in 2024 after the earnings slowdown in 2023. At the same time, we do not expect valuation multiples to move higher given their already generous levels. Overall, this suggests a modestly positive scenario over the next 12 months, though it will likely be accompanied by volatility.
For the S&P 500 Index, we set our June 2024 target at 4,700, offering a return outlook of approximately 7% from today.
EUR/USD has made it back to the 1.09 level. But there is actually a very strong argument in favor of the Dollar at this point: US yields. The measure Ulrich Leuchtmann, Head of FX and Commodity Research at Commerzbank, prefers to look at here is the real 5Yx5Y Treasury yields.
The USD advantage has increased
What does it mean that the real 5Yx5Y for the Euro area is zero? It means that, from today's perspective, capital cannot be invested profitably in the period from 2028 to 2032. I contrast, even without credit risk, it can be invested in the US with a return of 1.5% per year. That makes the Dollar more attractive than the Euro. Because you need Dollars to make these more attractive investments.
This discrepancy has existed since 2014 and has long been discounted in EUR/USD exchange rates. But it has widened in recent days. The USD advantage has increased. And that is why EUR/USD is no longer trading above 1.12 but around 1.09.
- US Dollar price action declines substantially and retreats in every major pair.
- Traders will likely keep their powder dry for the main event on Friday, with US Fed Chair Powell's speech at Jackson Hole.
- The US Dollar Index could drop further as it breaks below important technical support.
The US Dollar (USD) weakens on Tuesday morning, with the Greenback retreating in full against almost every major G10-peer. On Monday, the US Dollar seemed to remain steady and unphased with nervousness building towards Friday’s important speeches at the Jackson Hole Symposium. It now rather seems that traders remain absent or are again doubling down on the possibility of US Fed Chairman Jerome Powell announcing those long-awaited rate cuts.
Patience is a virtue though, certainly in financial markets and trading. Traders that remained disciplined on Monday and Tuesday can get some clarity on what to do next as two of Fed speakers are to hit the wires. Some additional economic data points are due as well, namely Redbook, US Existing Home Sales and the Richmond Fed Manufacturing Index. These data could confirm the current retreat in the US Dollar Index and signal future trends.
Daily digest: US Dollar at risk
- The US Redbook Index will be released at 12:55 GMT. The previous number was 0.7%.
- Existing Home Sales data will come out at 14:00 GMT. Sales for July expected to slide marginally from 4.16M to 4.15M.
- The Richmond Fed Manufacturing Index for August will come in together with the Existing Home Sales data. The index is expected to stay negative, from -9 to -7.
- Michelle Bowman from the Fed will take the stage at around 18:30 GMT. Austan Goolsbee from the Federal Reserve bank of Chicago is set to speak around that same time. Any headlines might give an insight or prelude on what to expect from US Fed Chairman Jerome Powell on Friday.
- The BRICS convention starts its second day in South Africa with the organisation welcoming nearly 20 new members. the major theme will be the discussion on dedollarization and the setup of a payment system between the nations. India and South Africa already came out opposing the idea of disregarding the US Dollar.
- Equities are up across the board, with both Japan and China up over 1%. European markets are taking over the positive sentiment and are flirting as will with 1% gains. US equity futures are all in the green and the fear gauge VIX index is sliding lower.
- The CME Group FedWatch Tool shows that markets are pricing in an 85.5% chance that the Federal Reserve will keep interest rates unchanged at its meeting in September.
- The benchmark 10-year US Treasury bond yield trades at 4.33% after touching a new yearly high on Monday in late US trading. The bond market will be very sensitive to any news on Friday at the Jackson Hole Symposium. The whole US yield curve could move up or down depending on the speech from Fed Chairman Jerome Powell.
US Dollar Index technical analysis: breaking lower
The US Dollar snaps its winning streak and heads lower in every major pair or cross. The move in the wake of the main event of Friday points to a few traders doubling down on the possibility of a surprise dovish announcement from US Fed Chairman Powell. The moves are looking exaggerated as well as less volume is being traded with most traders sidelined until the main event Friday.
On the upside, 104.00 is the level to reach. The high of Friday at 103.68 is vital and needs to get a daily close above it in order for the DXY to eke out more monthly gains. Should this US Dollar strength persist for the last part of this year, May’s peak at 104.70 could become the reality again.
On the downside, several floors are likely to prevent a steep decline in the DXY. The first one is the 200-day Simple Moving Average (SMA) at 103.19, which already got broken this Tuesday morning. Passing below the 103.00 figure, some room opens up for a further drop. However, around 102.38 both the 55-day and the 100-day SMAs await to catch any falling knives.
US Dollar FAQs
What is the US Dollar?
The US Dollar (USD) is the official currency of the United States of America, and the ‘de facto’ currency of a significant number of other countries where it is found in circulation alongside local notes. It is the most heavily traded currency in the world, accounting for over 88% of all global foreign exchange turnover, or an average of $6.6 trillion in transactions per day, according to data from 2022.
Following the second world war, the USD took over from the British Pound as the world’s reserve currency. For most of its history, the US Dollar was backed by Gold, until the Bretton Woods Agreement in 1971 when the Gold Standard went away.
How do the decisions of the Federal Reserve impact the US Dollar?
The most important single factor impacting on the value of the US Dollar is monetary policy, which is shaped by the Federal Reserve (Fed). The Fed has two mandates: to achieve price stability (control inflation) and foster full employment. Its primary tool to achieve these two goals is by adjusting interest rates.
When prices are rising too quickly and inflation is above the Fed’s 2% target, the Fed will raise rates, which helps the USD value. When inflation falls below 2% or the Unemployment Rate is too high, the Fed may lower interest rates, which weighs on the Greenback.
What is Quantitative Easing and how does it influence the US Dollar?
In extreme situations, the Federal Reserve can also print more Dollars and enact quantitative easing (QE). QE is the process by which the Fed substantially increases the flow of credit in a stuck financial system.
It is a non-standard policy measure used when credit has dried up because banks will not lend to each other (out of the fear of counterparty default). It is a last resort when simply lowering interest rates is unlikely to achieve the necessary result. It was the Fed’s weapon of choice to combat the credit crunch that occurred during the Great Financial Crisis in 2008. It involves the Fed printing more Dollars and using them to buy US government bonds predominantly from financial institutions. QE usually leads to a weaker US Dollar.
What is Quantitative Tightening and how does it influence the US Dollar?
Quantitative tightening (QT) is the reverse process whereby the Federal Reserve stops buying bonds from financial institutions and does not reinvest the principal from the bonds it holds maturing in new purchases. It is usually positive for the US Dollar.
Economist at UOB Group Lee Sue Ann suggests the RBA could keep the OCR unchanged at its September event.
Key Takeaways
Australia’s seasonally adjusted unemployment rate rose to 3.7% in Jul, from 3.5% in Jun, signaling the labour market may be at a turning point. Separately, wages disappointed again, with the wage price index (WPI) rising 0.8% q/q in 2Q23, against consensus of a 0.9% increase. Annually, wage growth eased to 3.6%, from a decade-high of 3.7% in 1Q23.
The RBA has held rates unchanged for two consecutive months, and following the slew of data we think they will keep policy unchanged at its next two meetings on 5 Sep and 3 Oct, unless we get upside inflation surprises from Jul CPI data on 30 Aug and Aug CPI data on 27 Sep.
However, we believe there is a chance it will hike one last time this year, taking the cash rate target to a peak of 4.35%. In terms of timing, this is likely to occur at the 7 Nov meeting, following the release of the 3Q23 CPI on 25 Oct.
- USD/CAD continues to trade lackluster above 1.3500 ahead of Jackson Hole.
- The appeal for the US Dollar eases as investors digested the bleak economic prospects of China.
- Jerome Powell is likely to comment about keeping rates higher for a decent period to ensure inflation returns to 2%.
The USD/CAD pair trades lackluster above 1.3500 as investors have sidelined ahead of the Jackson Hole Economic Symposium, which will start on Thursday. The Loonie asset struggles to find a direction as investors remain mixed about Federal Reserve (Fed) chair Jerome Powell’s commentary at Jackson Hole.
S&P500 futures add decent gains in the London session. US equities were decently bought on Monday, portraying further improvement in the risk appetite of the market participants. Risk-sensitive assets strengthened on Tuesday as the appeal for US Dollar fades. The appeal for the US Dollar eases as investors digested the bleak economic prospects of China.
On Monday, the People’s Bank of China (PBoC) lowered its one-year Prime Lending Rate (PLR) by 10 basis points (bps) to 3.45%. The PBoC delivered a dovish interest rate decision to tackle significant deflation risks and underpin economic demand.
The US Dollar Index (DXY) continues to trade lackluster as the upside seems restricted around 103.50. The upside in the USD Index gets restricted as Fed Powell is expected to raise interest rates further seldom in case of supporting economic data. Jerome Powell is likely to comment about keeping rates higher for a decent period to ensure inflation returns to 2%.
Meanwhile, the Canadian Dollar will dance to the tune of the June Retail Sales data. As per the estimates, monthly consumer spending remained stagnant against an expansion of 0.2%. Retail Sales excluding automobiles are expected to deliver a 0.3% expansion. This indicates that the demand for automobiles is declining.
The US Dollar Index has experienced a phase of rebound after forming a significant low near 99.50. Economists at Société Générale analyze DXY’s technical outlook.
Recent pivot low at 101.75/101.60 to be an important support zone
DXY is now probing the 200-DMA and close to July peak of 103.60. This could be a potential resistance. Failure to cross can result in an initial pullback towards a steeper ascending trend line near 102.70.
Recent pivot low at 101.75/101.60 is expected to be an important support zone. Only if this gets violated would there be risk of a deeper down move.
If the index establishes above 103.60, the bounce is likely to extend.
- Oil (WTI) trades at $80 per barrel within the middle of last week’s range.
- The US Dollar moves lower as traders await the Jackson Hole Symposium on Friday.
- The weekly API numbers could drive prices up should there be another drawdown in the US stockpile.
Oil prices are trading in a similar pattern as the Greenback comes in the middle of a price range toward the main event on Friday. That main event is the annual Jackson Hole Fed Symposium where on Friday Fed chairman Jerome Powell will take the stage and communicate any possible changes toward its monetary policy. Clues or hints for earlier than foreseen rate cuts would boost economic growth and demand for oil, which would result in a sharp price rise on Friday.
A decline could be at hand if Fed Chairman Powell sticks to concerns on inflation flaring up again and the need to keep rates elevated for longer.. A longer period of higher rates could eat into economic growth and might dampen demand for oil. As always on Tuesday, the American Petroleum Institute will deliver the weekly Crude Oil Stock report at 20:30 GMT.
At the time of writing, Crude Oil (WTI) price trades at $80.05 per barrel.
Oil news and market movers
- China extends tax waiver for overseas crude futures investors.
- On Tuesday evening at 20:30 GMT, the American Petroleum Institute will deliver the weekly Crude Oil Stockpile numbers. No expectations have surfaced, but last week’s number was a big draw down of -6.195M barrels.
- Overnight numbers showed that China’s July LNG imports rose by 24.3%.
- Iraqi supply might increase and flood markets, limiting any uptick in oil prices. It is not until early November before the OPEC countries convene again to discuss current oil prices and production levels.
- Reports show that the Panama Strait is closed due to low water levels, which has triggered a cue in ships and containers passing the important trade passage.
- India’s Crude Oil and LNG imports declined on the year for July.
- Global concerns on the failing China reopening narrative might see less demand throughout the year as China has been unwilling to jumpstart its growth and recovery post-covid.
- The tropical depression on its way to Texas might strengthen before reaching landfall.
- All eyes are focused on Friday, when the annual Jackson Hole Symposium will be the focal point for the week. In the event, the US Federal Reserve tends to signal a change in its monetary policy going forward.
Oil Technical Analysis: stuck in the middle
Oil price is right where it needs to be at the moment with both demand and supply in a good place before the market moving event of Jackson Hole on Friday. On one hand, less demand from China and more Iraqi barrels hitting the market are dampening any possible upside potential, while a tropical depression hitting the Texas area might see a short-term production shortage in the US, limiting any sharp declines in oil price action. The Jackson Hole Symposium and Jerome Powell’s speech could move the needle in that equation and see the Relative Strength Index (RSI) break through the 50 level to either being overbought or oversold.
On the upside, $81.68, the high of Monday, is the one to beat in order to trigger a small uptrend. Should WTI continue its performance of higher lows and higher highs, pressure could build toward $82. In order to print a fresh monthly high, $84.32, the peak of mid-August is the one to beat when demand takes over and supply cannot follow suit.
On the downside, a temporary bottom is being formed around $78.50. That is where throughout August buyers stepped in and jacked the oil price back up toward the $80s. In case that support breaks, expect to see a sharp decline toward $76 where the 200-day SImple Moving Average (SMA) comes into play. Plenty of buyers will happily lock in that price with some bigger volume being bought.
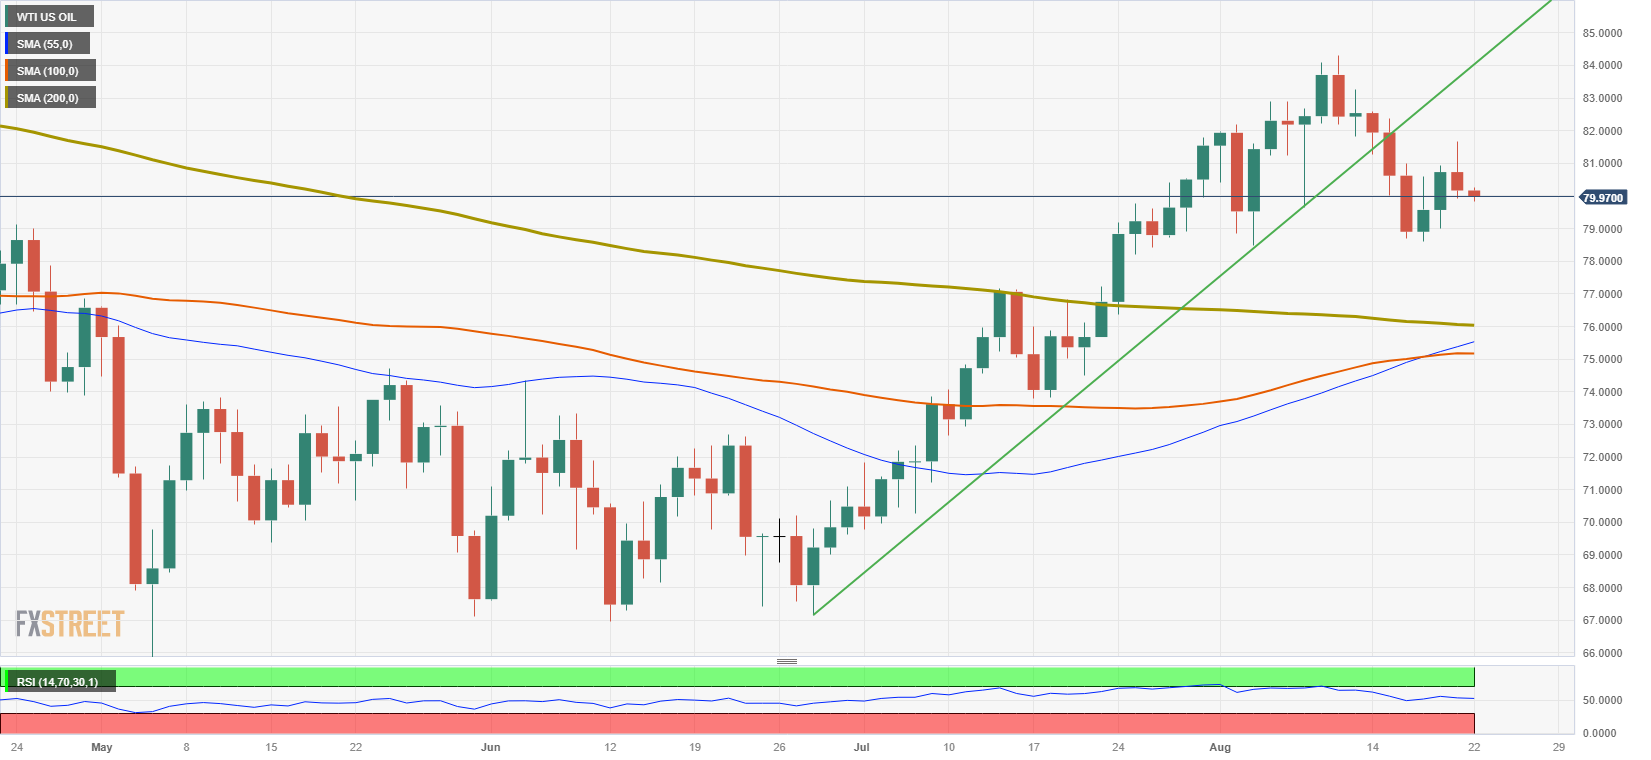
WTI US OIL (Daily Chart)
WTI Oil FAQs
What is WTI Oil?
WTI Oil is a type of Crude Oil sold on international markets. The WTI stands for West Texas Intermediate, one of three major types including Brent and Dubai Crude. WTI is also referred to as “light” and “sweet” because of its relatively low gravity and sulfur content respectively. It is considered a high quality Oil that is easily refined. It is sourced in the United States and distributed via the Cushing hub, which is considered “The Pipeline Crossroads of the World”. It is a benchmark for the Oil market and WTI price is frequently quoted in the media.
What factors drive the price of WTI Oil?
Like all assets, supply and demand are the key drivers of WTI Oil price. As such, global growth can be a driver of increased demand and vice versa for weak global growth. Political instability, wars, and sanctions can disrupt supply and impact prices. The decisions of OPEC, a group of major Oil-producing countries, is another key driver of price. The value of the US Dollar influences the price of WTI Crude Oil, since Oil is predominantly traded in US Dollars, thus a weaker US Dollar can make Oil more affordable and vice versa.
How does inventory data impact the price of WTI Oil
The weekly Oil inventory reports published by the American Petroleum Institute (API) and the Energy Information Agency (EIA) impact the price of WTI Oil. Changes in inventories reflect fluctuating supply and demand. If the data shows a drop in inventories it can indicate increased demand, pushing up Oil price. Higher inventories can reflect increased supply, pushing down prices. API’s report is published every Tuesday and EIA’s the day after. Their results are usually similar, falling within 1% of each other 75% of the time. The EIA data is considered more reliable, since it is a government agency.
How does OPEC influence the price of WTI Oil?
OPEC (Organization of the Petroleum Exporting Countries) is a group of 13 Oil-producing nations who collectively decide production quotas for member countries at twice-yearly meetings. Their decisions often impact WTI Oil prices. When OPEC decides to lower quotas, it can tighten supply, pushing up Oil prices. When OPEC increases production, it has the opposite effect. OPEC+ refers to an expanded group that includes ten extra non-OPEC members, the most notable of which is Russia.
The BRICS summit starts today in South Africa. The BRICS could announce that they will no longer use the USD as a trading currency among themselves. Ulrich Leuchtmann, Head of FX and Commodity Research at Commerzbank, analyzes what implies replacing USD with the Renminbi.
China does not seem to be able to run large current account deficits on a sustained basis
Does the US run a current account deficit because it enjoys the ‘exorbitant privilege’ of being the world's reserve currency? Or does the USD work so well as the world's reserve currency because the US is the only economy in the world that can afford to run such a large current account deficit for such a long period of time to meet the growing demand for the world's reserve currency? And without sliding into a current account crisis? I am a firm believer in the second view. But the other side should at least admit that no other sufficiently large economy seems to be able to run large current account deficits on a sustained basis. Certainly not China.
Talk of replacing the US Dollar as the world's reserve currency with the Renminbi lacks any economic substance. Either it is just talk, with nothing material to follow, or it will end in disaster.
- Gold price finds bids as the appeal for the US Dollar fades.
- A tight US labor market could be a restricting factor for achieving price stability.
- Fed Powell’s speech at Jackson Hole is the key event this week
Gold price (XAU/USD) rebounds on Tuesday after printing a fresh five-month low below $1,890.00, capitalizing on a mild correction in the US Dollar. The precious metal recovers as investors seem confident that the Federal Reserve (Fed) is not planning to raise interest rates further but also admit that rate cuts are unlikely to be under discussion this year.
The US economy continues to remain resilient as the country’s labor market is extremely tight. Fed Chair Jerome Powell is likely to provide guidance on interest rates and the economic outlook in his speech at the Jackson Hole Economic Symposium. It will be worth watching whether Jerome Powell mentions the possibility of a recession due to restrictive monetary policy. On the economic data front, Durable Goods Orders data for July will be watched this week.
Daily Digest Market Movers: Gold price extends recovery as US Dollar corrects
- Gold price extends its recovery to near the crucial resistance of $1,900 as the US Dollar Index (DXY) corrects after failing to climb above the 103.50 hurdle.
- The precious metal strengthens as investors remain confident about the Fed keeping interest rates unchanged at its September monetary policy.
- US Treasury Yields struggle to extend upside, providing a level field ahead of the Jackson Hole Economic Symposium.
- Investors will keenly watch Fed Chair Jerome Powell’s commentary at Jackson Hole. Powell is likely to provide a roadmap over how to shred the ‘last mile’ of inflation and achieve price stability.
- Market participants are expecting that the commentary from Jerome Powell will not come with a warning of additional interest rate hikes. However, a strong message suggesting the possibility of higher interest rates for a longer period cannot be ruled out.
- Apart from the interest rate guidance, Powell’s outlook on the labor market and broad economic activity will be keenly watched.
- Morgan Stanley said a possible shift in thinking on the neutral rate deserves attention because it would imply a shift in the expected path for the policy rate and thereby the yield curve as a whole.
- Before the Jackson Hole event, investors will focus on the S&P Global PMI and New Home Sales data, which will be published on Wednesday.
- According to estimates, the Manufacturing PMI is expected to increase to 49.3 in August from 49.0 in July. The Services PMI is seen declining slightly to 52.2 from 52.3a a month earlier.
- Monthly New Home Sales for July are expected to increase despite higher mortgage rates.
- A major economic dataset will be US Durable Goods Orders for July, which will be released on Thursday at 12:30 GMT. Orders are expected to contract by a sharp 4.0%. In June, Durable Goods Orders expanded by 4.6%.
- The market mood turns cheerful despite the fact that Moody’s and S&P Global have downgraded the credit ratings of US commercial banks, citing risks of rising outflows in a high-interest rate environment.
- The US economy is expected to remain resilient as the labor market is extremely tight and construction spending is increasing despite higher interest rates.
- Fed policymakers say that the growth rate could slow down for a few quarters amid the agenda of achieving price stability.
- A survey conducted in July by the National Federation of Independent Business (NFIB) shows small businesses are much less worried about the health of their bank than they were in the immediate aftermath of this spring's bank failures, including that of Silicon Valley Bank.
- The NFIB survey conducted further shows that 52% of small-business owners say the economy is already in a recession. The percentage is down from the 55% recorded in April.
Technical Analysis: Gold price delivers a two-day consolidation breakout
Gold price delivers a two-day consolidation breakout and jumps to near the round-level resistance of $1,900. The precious metal strengthens as the US Dollar fails to extend a rally, providing a level field ahead of the Jackson Hole Symposium. The yellow metal rebounds after printing a fresh five-month low of around $1,885.00, but still trades below the 200-day Exponential Moving Average (EMA), which indicates that the long-term trend is bearish.
Fed FAQs
What does the Federal Reserve do, how does it impact the US Dollar?
Monetary policy in the US is shaped by the Federal Reserve (Fed). The Fed has two mandates: to achieve price stability and foster full employment. Its primary tool to achieve these goals is by adjusting interest rates.
When prices are rising too quickly and inflation is above the Fed’s 2% target, it raises interest rates, increasing borrowing costs throughout the economy. This results in a stronger US Dollar (USD) as it makes the US a more attractive place for international investors to park their money.
When inflation falls below 2% or the Unemployment Rate is too high, the Fed may lower interest rates to encourage borrowing, which weighs on the Greenback.
How often does the Fed hold monetary policy meetings?
The Federal Reserve (Fed) holds eight policy meetings a year, where the Federal Open Market Committee (FOMC) assesses economic conditions and makes monetary policy decisions.
The FOMC is attended by twelve Fed officials – the seven members of the Board of Governors, the president of the Federal Reserve Bank of New York, and four of the remaining eleven regional Reserve Bank presidents, who serve one-year terms on a rotating basis.
What is Quantitative Easing (QE) and how does it impact USD?
In extreme situations, the Federal Reserve may resort to a policy named Quantitative Easing (QE). QE is the process by which the Fed substantially increases the flow of credit in a stuck financial system.
It is a non-standard policy measure used during crises or when inflation is extremely low. It was the Fed’s weapon of choice during the Great Financial Crisis in 2008. It involves the Fed printing more Dollars and using them to buy high grade bonds from financial institutions. QE usually weakens the US Dollar.
What is Quantitative Tightening (QT) and how does it impact the US Dollar?
Quantitative tightening (QT) is the reverse process of QE, whereby the Federal Reserve stops buying bonds from financial institutions and does not reinvest the principal from the bonds it holds maturing, to purchase new bonds. It is usually positive for the value of the US Dollar.
EUR/USD battles higher for second day aided by Yuan defence. Economists at Société Générale analyze the pair’s outlook.
EUR/GBP has returned to the lower of the range
The recovery in EUR/USD to over 1.09, helped by intervention in USD/CNY, could be cut short on Wednesday if the preliminary August PMIs disappoint.
EUR/GBP meanwhile has returned to the lower of the range. News of the lower-than-estimated UK budget shortfall inevitably rekindles speculation of a growth supportive tax cut in the Budget this autumn or next spring before the 2024 general election.
There is the possibility of some consolidation in USD/CNH before a probable resumption of the upside pressure, argue Markets Strategist Quek Ser Leang and Senior FX Strategist Peter Chia at UOB Group.
Key Quotes
24-hour view: We expected USD to trade in a range of 7.2920/7.3300 yesterday. We did not anticipate the spike in volatility as USD rose to 7.3360, plummeted to 7.2780 before closing at 7.2893 (-0.24%). The rapid drop from the high appears to be overdone, and USD is unlikely to weaken much further. Today, USD is more likely to trade sideways in a range of 7.2700/7.3200.
Next 1-3 weeks: Our view from yesterday (21 Aug, spot at 7.3100) still stands. As highlighted, USD could consolidate for a few days before breaking above last week’s high of 7.3490. However, if USD breaks below 7.2500 (‘strong support’ level), it would suggest that USD is not advancing further.
US Dollar Index declines toward 103.00. Economists at ING analyze USD outlook.
DXY very comfortable within the 102.70-103.70 range
There is only second-tier US macro data today, but with US Treasury yields continuing to push higher, headwinds to the equity rally are growing, and temporarily parking funds in the Dollar paying 5.30% in overnight rates doesn't seem like a bad idea.
We expect the Dollar to stay largely bid into Friday's Jackson Hole speech from Fed Chair, Jay Powell.
DXY looks very comfortable within the 102.70-103.70 range.
- GBP/JPY corrects from a fresh multi-year peak and is pressured by reviving demand for the JPY.
- The yield on the benchmark 10-year JGB climbs to a nine-year high and lends support to the JPY.
- The divergent BoJ-BoE monetary policy stance warrants caution for aggressive bearish traders.
The GBP/JPY cross attracts some intraday selling after touching its highest level since November 2015 this Tuesday and remains depressed through the early European session. Spot prices currently trade around the 186.30 region, down just over 0.10% for the day, though any meaningful corrective decline still seems elusive.
Against the backdrop of upward pressure in the global interest rates, the yield on the 10-year Japanese government bond (JGB) touches a new nine-year top on Tuesday and drives flows towards the Japanese Yen (JPY). Apart from this, speculations that the recent weakness in the domestic currency might prompt some jawboning from authorities, or an intervention in the foreign exchange markets, further underpins the JPY and act as a headwind for the GBP/JPY cross.
It is worth recalling that Japan's top forex diplomat Masato Kanda said last week that he would take appropriate steps against excessive currency moves. Furthermore, a smaller rate by the People’s Bank of China (PBoC) on Monday signalled limited policy support for the economy and did little to ease worries about a deepening crisis in China's property sector. This, in turn, benefits the JPY's safe-haven status and contributes to the GBP/JPY pair's pullback of over 50 pips.
That said, the Bank of Japan's (BoJ) dovish outlook might keep a lid on any meaningful gains for the JPY. In fact, the BoJ is the only central bank in the world to maintain a negative benchmark interest rate. Moreover, policymakers have emphasised that a sustainable pay hike is a prerequisite to consider dismantling the massive monetary stimulus. This marks a big divergence in comparison to the Bank of England (BoE), which lifted its benchmark rate to a 15-year peak in August.
Moreover, the current market pricing indicates a more than 80% chance of a 25 bps lift-off at the next BoE policy meeting in September. The bets were lifted by the fact that wages in the UK touched a new record growth rate in the second quarter, which adds to worries about long-term inflation even after 14 consecutive rate hikes. Adding to this, the upbeat UK GDP report and slightly higher UK CPI print also support prospects for further policy tightening by the BoE.
The aforementioned fundamental backdrop suggests that the path of least resistance for the GBP/JPY cross is to the upside. Hence, any subsequent slide might still be seen as a buying opportunity and is more likely to remain limited in the absence of any relevant market-moving economic data on Tuesday. Traders might also prefer to wait on the sidelines ahead of the flash PMI prints on Wednesday and the crucial Jackson Hole Symposium later this week.
Technical levels to watch
- Euro looks to consolidate the move past 1.0900 vs. the US Dollar.
- Stocks in Europe extend the positive start of the week.
- EUR/USD briefly climbs to four-day highs around 1.0930.
- The USD Index (DXY) puts the 103.00 region to the test.
- EMU Current Account surplus widens in June.
- Fedspeak and housing data will be next on tap in the US.
The Euro (EUR) adds to Monday’s decent rebound against the US Dollar (USD) and lifts EUR/USD to the area of multi-session peaks around 1.0930, a region also coincident with the temporary 100-day SMA on Tuesday.
The extra recovery in the pair comes pari passu with a further loss of momentum in the Greenback, which prompts the USD Index (DXY) to surrender further ground and opens the door to a potential visit to the 103.00 neighbourhood sooner rather than later.
The Dollar’s pullback comes amidst the so far small correction in US yields across different maturities. On this, the short end of the curve continues to flirt with the 5.0% threshold, while the 10-year benchmark hovers around levels last seen in November 2007 past the 4.30% yardstick.
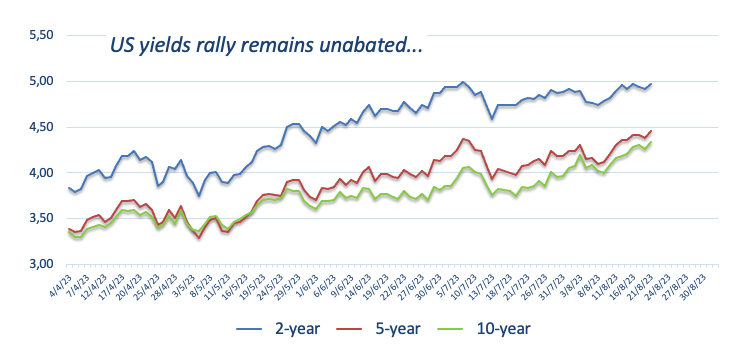
Taking a broader view of monetary policy, there has been a resurgence in the discussion surrounding the Federal Reserve's commitment to maintaining a more restrictive policy for an extended period. This renewed focus is a response to the US economy's resilience, even in the face of a slight easing in the labour market and lower inflation readings in recent months.
Within the European Central Bank (ECB), internal disagreements among its Council members regarding the continuation of tightening measures after the summer period have emerged. These disagreements are contributing to renewed weakness that is negatively impacting the Euro.
Looking ahead, market participants are anticipated to adopt a cautious stance in light of the upcoming Jackson Hole Symposium and the speech by Chairman Jerome Powell in the latter half of the week.
In the domestic calendar, the Current Account surplus in the broader euro area widened to a seasonally adjusted €35.84B in June.
In the US docket, July’s Existing Home Sales are due along with the regional manufacturing gauge by the Richmond Fed and speeches by Richmond Fed Thomas Barkin (2024 voter, centrist), FOMC Governor Michelle Bowman (permanent voter, centrist), and Chicago Fed Austan Goolsbee (voter, centrist).
Daily digest market movers: Euro surpasses 1.0900 to print new weekly highs
-
The EUR gathers steam vs. USD and trespasses 1.0900.
- The improvement in the risk appetite weighs on the US Dollar.
- US 10-year yields reach multi-year highs beyond 4.30%
- Markets’ attention remains on the Jackson Hole gathering.
- Fed’s tighter-for-longer narrative keeps hovering around investors.
- The Fed is likely to maintain rates unchanged until Q1 2024.
Technical Analysis: Euro now looks at 1.0960
EUR/USD extends Monday’s decent advance and reaches new multi-day peaks around 1.0930.
In case the recovery picks up a more serious impulse, EUR/USD is expected to meet an interim barrier at the 55-day SMA at 1.0961 prior to the psychological 1.1000 the figure and the August high at 1.1064 (August 10). Once the latter is cleared, spot could challenge the weekly top at 1.1149 (July 27). If the pair surpasses this region, it could alleviate some of the downward pressure and potentially visit the 2023 peak of 1.1275 (July 18). Further up comes the 2022 high at 1.1495 (February 10), which is closely followed by the round level of 1.1500.
In case bears regain the upper hand, the pair could retest the August low of 1.0844 (August 18) ahead of the July low of 1.0833 (July 6). The breakdown of the latter exposes the significant 200-day SMA at 1.0795 ahead of the May low of 1.0635 (May 31). Deeper down, there are additional support levels at the March low of 1.0516 (March 15) and the 2023 low at 1.0481 (January 6).
Furthermore, the positive outlook for EUR/USD remains valid as long as it remains above the important 200-day SMA.
Euro FAQs
What is the Euro?
The Euro is the currency for the 20 European Union countries that belong to the Eurozone. It is the second most heavily traded currency in the world behind the US Dollar. In 2022, it accounted for 31% of all foreign exchange transactions, with an average daily turnover of over $2.2 trillion a day.
EUR/USD is the most heavily traded currency pair in the world, accounting for an estimated 30% off all transactions, followed by EUR/JPY (4%), EUR/GBP (3%) and EUR/AUD (2%).
What is the ECB and how does it impact the Euro?
The European Central Bank (ECB) in Frankfurt, Germany, is the reserve bank for the Eurozone. The ECB sets interest rates and manages monetary policy.
The ECB’s primary mandate is to maintain price stability, which means either controlling inflation or stimulating growth. Its primary tool is the raising or lowering of interest rates. Relatively high interest rates – or the expectation of higher rates – will usually benefit the Euro and vice versa.
The ECB Governing Council makes monetary policy decisions at meetings held eight times a year. Decisions are made by heads of the Eurozone national banks and six permanent members, including the President of the ECB, Christine Lagarde.
How does inflation data impact the value of the Euro?
Eurozone inflation data, measured by the Harmonized Index of Consumer Prices (HICP), is an important econometric for the Euro. If inflation rises more than expected, especially if above the ECB’s 2% target, it obliges the ECB to raise interest rates to bring it back under control.
Relatively high interest rates compared to its counterparts will usually benefit the Euro, as it makes the region more attractive as a place for global investors to park their money.
How does economic data influence the value of the Euro?
Data releases gauge the health of the economy and can impact on the Euro. Indicators such as GDP, Manufacturing and Services PMIs, employment, and consumer sentiment surveys can all influence the direction of the single currency.
A strong economy is good for the Euro. Not only does it attract more foreign investment but it may encourage the ECB to put up interest rates, which will directly strengthen the Euro. Otherwise, if economic data is weak, the Euro is likely to fall.
Economic data for the four largest economies in the euro area (Germany, France, Italy and Spain) are especially significant, as they account for 75% of the Eurozone’s economy.
How does the Trade Balance impact the Euro?
Another significant data release for the Euro is the Trade Balance. This indicator measures the difference between what a country earns from its exports and what it spends on imports over a given period.
If a country produces highly sought after exports then its currency will gain in value purely from the extra demand created from foreign buyers seeking to purchase these goods. Therefore, a positive net Trade Balance strengthens a currency and vice versa for a negative balance.
The Lira exchange rate is inching weaker, relentlessly, as it has done since May. Economists at Commerzbank analyze TRY outlook as Turkey’s central bank (CBT) appears to be keen to progress with its “policy normalisation” or reform agenda.
The Turkish central bank trying to continue reform agenda
It is commendable that CBT wants to push ahead with rolling back capital controls, even as the Lira is proving difficult to support. These reforms will have the effect of relaxing capital controls and exposing the TRY further.
Granted that CBT wants to use an outright higher interest rate to stabilise the currency, but so far after two rate hikes, the day-to-day pattern of currency movement still suggests continuous FX interventions. This raises question marks about how successful CBT will be in making this transition to less capital controls. The entire challenge arises, of course, because markets cannot be sure of what President Tayyip Erdogan is thinking at present and whether or not CBT’s latest measures can be assumed to be permanent or just temporary.
- AUD/USD gains some follow-through positive traction and climbs to a multi-day top on Tuesday.
- A recovery in the risk sentiment, retreating US bond yields weigh on the USD and lend support.
- Hawkish Fed expectations to limit the USD losses and cap the pair amid China’s economic woes.
The AUD/USD pair attracts fresh buyers near the 0.6400 round-figure mark on Tuesday and builds on its steady intraday ascent through the early part of the European session. Spot prices recover further from the lowest level since November 2022 touched on Friday and climb to a multi-day peak, closer to mid-0.6400s in the last hour.
A modest recovery in the global risk sentiment, bolstered by hopes for more stimulus from China, prompts some selling around the safe-haven US Dollar (USD) and benefits the risk-sensitive Australian Dollar (AUD). The USD is further weighed down by a mildly softer tone surrounding the US Treasury bond yields. That said, the prospects for further policy tightening by the Federal Reserve (Fed) should act as a tailwind for the US bond yields and the Greenback.
It is worth recalling that the markets have been pricing in the possibility of one more 25 bps Fed rate hike move by the end of this year. The incoming US macro data continued to point to an extremely resilient economy and should allow the Fed to keep interest rates higher for longer. The hawkish outlook, in turn, pushed the yield on the benchmark 10-year US government bond climbed to its highest level since 2007 on Monday and favours the USD bulls.
Apart from this, concerns about the worsening economic conditions in China should keep a lid on the optimism and the China-proxy Aussie. This, along with bets for another on-hold decision by the Reserve Bank of Australia (RBA) in September, might hold back traders from placing aggressive bullish bets around the AUD/USD pair. Hence, it will be prudent to wait for strong follow-through buying before confirming that spot prices have bottomed out.
Investors might also prefer to wait on the sidelines ahead of the crucial Jackson Hole Symposium, where comments by Fed Chair Jerome Powell will be scrutinized for cues about the future rate-hike path. This, in turn, will influence the USD price dynamics and help determine the next leg of a directional move for the AUD/USD pair. Traders this week will also confront the release of the flash PMI prints from Australia and the US, due on Wednesday.
In the meantime, Tuesday's US economic docket, featuring Existing Home Sales and Richmond Manufacturing Index, along with speeches by influential FOMC members and the US bond yields, will drive the USD demand. Furthermore, the broader market risk sentiment should contribute to producing short-term trading opportunities around the AUD/USD pair.
Technical levels to watch
- Pound Sterling strengthens as more interest rate hikes from the BoE are warranted for the achievement of price stability.
- The UK housing sector faces the wrath of higher mortgage rates.
- Rishi Sunak plans for cabinet reshuffle sooner ahead of general elections.
The Pound Sterling (GBP) prints a fresh three-day high, capitalizing on improving market sentiment and expectations of more interest rate hikes from the Bank of England (BoE) to ensure price stability. The GBP/USD pair picks strength as investors hope that the current tightening cycle of the BoE will surpass the tightening peak by the Federal Reserve (Fed).
Higher borrowing cost by the BoE widens its scope of consequences to the United Kingdom’s property sector. Homebuyers have been witnessing an affordability squeeze due to higher mortgage rates as strong wage growth struggles to offset higher installment obligations. The Pound Sterling is expected to remain in action as UK PM Rishi Sunak is planning a big cabinet reshuffle ahead of general elections in 2024.
Daily Digest Market Movers: Pound Sterling rebounds amid a risk-on market mood
- Pound Sterling approaches a three-day high near 1.2800 as investors’ risk appetite improves ahead of preliminary PMIs data for August.
- UK’s S&P Global PMI data will be released on Wednesday at 08:30 GMT. Manufacturing PMI is seen declining to 45.0 vs. the former reading of 45.3. Services PMI is expected to remain steady at 52.3.
- After July’s economic data, investors hope that the Bank of England cannot pause its rate-tightening cycle so that inflation returns to 2%.
- Strong wage growth allows households to spend heavily and core inflation to remain stubborn. UK core inflation remains steady at 6.9%, marginally lower from its peak of 7.1%.
- Headline inflation softened sharply to 6.8% from June’s figure of 7.9%. Fuel sellers stopped overcharging consumers after being warned by BoE Governor Andrew Bailey.
- Meanwhile, Fitch said that energy and food inflation in the UK are likely to fall further in the coming months due to base effects.
- Considering the current inflation situation, UK PM Rishi Sunak may not fulfill his promise of halving inflation to 5% by the year-end.
- The BoE is expected to raise interest rates further in September and the interest rate peak is forecast at 5.75%.
- The consequences of 14 back-to-back interest rate hikes by the UK central bank have slowed consumer spending momentum. Retail Sales dropped in July due to wet weather as high inflation has squeezed the real income of households.
- The impact of restrictive monetary policy has widened to the entire property sector. Major mortgage lender Halifax showed that home affordability has shrunk significantly as stronger wage growth fails to offset higher borrowing costs.
- Discussions about UK’s cabinet reshuffle remained hot this weekend. Reuters reported that PM Sunak is now considering focusing on replacing ministers who have already said they want to step down, such as former Defence Secretary Ben Wallace.
- UK cabinet reshuffle is expected to happen sooner as Rishi Sunak is failing to fulfill his promise of halving inflation and strengthening economic prospects ahead of general elections scheduled for 2024.
- The US Dollar Index (DXY) remains sideways above 103.00 as investors prepare for the Jackson Hole Economic Symposium, which will start on Thursday.
- Investors hope that Fed chair Jerome Powell may not discuss hiking interest rates without any compelling economic data but will deliver a strong message of achieving price stability by keeping interest rates higher for longer.
- The upside momentum in US Treasury yields has slowed down as Jerome Powell is likely to discuss keeping interest rates neutral at the September policy meeting.
- Moody’s, S&P Global have downgraded the credit ratings of US commercial banks, citing risks of rising outflows in a high-interest rate environment.
Technical Analysis: Pound Sterling refreshes three-day high
Pound Sterling prints a fresh three-day high around 1.2800, increasing gradually due to a subdued US Dollar. The Cable has been trading in a range of 1.200-1.2800 for the past three weeks, and an explosion of the same will result in wider ticks and heavy volume. On a daily time frame, the asset has managed to climb above the 20 and 50-day Exponential Moving Averages (EMAs), which indicates that the mid-term trend has turned bullish.
Pound Sterling FAQs
What is the Pound Sterling?
The Pound Sterling (GBP) is the oldest currency in the world (886 AD) and the official currency of the United Kingdom. It is the fourth most traded unit for foreign exchange (FX) in the world, accounting for 12% of all transactions, averaging $630 billion a day, according to 2022 data.
Its key trading pairs are GBP/USD, aka ‘Cable’, which accounts for 11% of FX, GBP/JPY, or the ‘Dragon’ as it is known by traders (3%), and EUR/GBP (2%). The Pound Sterling is issued by the Bank of England (BoE).
How do the decisions of the Bank of England impact on the Pound Sterling?
The single most important factor influencing the value of the Pound Sterling is monetary policy decided by the Bank of England. The BoE bases its decisions on whether it has achieved its primary goal of “price stability” – a steady inflation rate of around 2%. Its primary tool for achieving this is the adjustment of interest rates.
When inflation is too high, the BoE will try to rein it in by raising interest rates, making it more expensive for people and businesses to access credit. This is generally positive for GBP, as higher interest rates make the UK a more attractive place for global investors to park their money.
When inflation falls too low it is a sign economic growth is slowing. In this scenario, the BoE will consider lowering interest rates to cheapen credit so businesses will borrow more to invest in growth-generating projects.
How does economic data influence the value of the Pound?
Data releases gauge the health of the economy and can impact the value of the Pound Sterling. Indicators such as GDP, Manufacturing and Services PMIs, and employment can all influence the direction of the GBP.
A strong economy is good for Sterling. Not only does it attract more foreign investment but it may encourage the BoE to put up interest rates, which will directly strengthen GBP. Otherwise, if economic data is weak, the Pound Sterling is likely to fall.
How does the Trade Balance impact the Pound?
Another significant data release for the Pound Sterling is the Trade Balance. This indicator measures the difference between what a country earns from its exports and what it spends on imports over a given period.
If a country produces highly sought-after exports, its currency will benefit purely from the extra demand created from foreign buyers seeking to purchase these goods. Therefore, a positive net Trade Balance strengthens a currency and vice versa for a negative balance.
USD/JPY is now comfortably trading in the 145-150 FX intervention zone. Economists at ING analyze the pair’s outlook.
A larger trigger for a JPY rally would probably be some kind of sharp risk asset correction
It seems that Tokyo authorities are keeping their powder dry for the time being, not wanting to fight the US Treasury-yield driven rise in USD/JPY.
FX intervention may not be imminent and a larger trigger for a JPY rally would probably be some kind of sharp risk asset correction perhaps driven by those surging US Treasury yields.
Here is what you need to know on Tuesday, August 22:
The US Dollar is having a hard time finding demand early Tuesday, with investors showing interest for risk-sensitive assets. July Existing Home Sales data will be featured in the US economic docket alongside the Richmond Fed Manufacturing Index. Later in the session, Federal Reserve (Fed) Governor Michelle Bowman and Chicago Fed President Austan Goolsbee will speak at the Fed Listens event titled "Joining the Labor Force After Covid —A Discussion on Youth Employment."
The S&P 500 and the Nasdaq Composite indexes closed in positive territory on Monday, while the Dow Jones Industrial Average registered small daily losses. S&P Global Ratings announced it lowered grades one notch for several medium-sized US banks, including KeyCorp, Comerica Inc., Valley National Bancorp and UMB Financial Corp.
In the meantime, the benchmark 10-year US Treasury bond yield reached its highest level in nearly 16 years at 4.36% before retreating toward 4.3%. Early Tuesday, US stock index futures trade in positive territory, reflecting the improving risk mood, and the US Dollar Index stays in negative territory near 103.00.
US Dollar price today
The table below shows the percentage change of US Dollar (USD) against listed major currencies today. US Dollar was the weakest against the New Zealand Dollar.
| USD | EUR | GBP | CAD | AUD | JPY | NZD | CHF | |
| USD | -0.26% | -0.26% | -0.13% | -0.46% | -0.32% | -0.59% | -0.14% | |
| EUR | 0.25% | 0.04% | 0.18% | -0.24% | -0.07% | -0.23% | 0.09% | |
| GBP | 0.28% | 0.01% | 0.15% | -0.20% | -0.05% | -0.27% | 0.14% | |
| CAD | 0.13% | -0.14% | -0.13% | -0.33% | -0.18% | -0.41% | -0.01% | |
| AUD | 0.49% | 0.20% | 0.20% | 0.34% | 0.15% | -0.07% | 0.34% | |
| JPY | 0.33% | 0.02% | 0.00% | 0.18% | -0.18% | -0.24% | 0.17% | |
| NZD | 0.55% | 0.31% | 0.30% | 0.45% | 0.09% | 0.27% | 0.44% | |
| CHF | 0.12% | -0.17% | -0.18% | 0.01% | -0.39% | -0.17% | -0.36% |
The heat map shows percentage changes of major currencies against each other. The base currency is picked from the left column, while the quote currency is picked from the top row. For example, if you pick the Euro from the left column and move along the horizontal line to the Japanese Yen, the percentage change displayed in the box will represent EUR (base)/JPY (quote).
EUR/USD registered small gains on Monday and continued to push higher early Tuesday. The pair was last seen trading at its highest level in six days above 1.0920.
GBP/USD gathered bullish momentum and advanced toward 1.2800 early Tuesday following Monday's modest rebound.
USD/JPY rose sharply on rising US Treasury bond yields but declined back below 146.00 during the Asian trading hours on Tuesday. Following his meeting with the Japanese Prime Minister Fumio Kishida on Tuesday, Bank of Japan (BoJ) Governor Kazuo Ueda said they did not discuss FX volatility at the meeting.
Gold price benefits from falling US yields and stretches higher in the European morning on Tuesday. At the time of press, XAU/USD was up 0.4% on the day above $1,900.
Bitcoin continues to fluctuate in a tight channel at around $26,000. Ethereum stays relatively quiet below $1,700 after losing more than 1% on Monday.
- USD/JPY trades sideways around 145.80 on JGB yields.
- The 146.00 level emerges as the barrier, following the monthly high.
- USD/JPY could face immediate support around nine-day EMA.
USD/JPY trades lower around 145.80 during the early trading hours of the European session on Monday, consolidating after Japanese Government Bond (JGB) yields reached the highest level since 2014. Investors are cautious about the hawkish Bank of Japan (BoJ) monetary policy. The 146.00 psychological level could act as the minor resistance, following the area around the monthly high at 146.56.
The Moving Average Convergence Divergence (MACD) line suggests bullish sentiment of USD/JPY buyers as it stays in the positive territory of the centerline and shows divergence above the signal line. The 14-day Relative Strength Index (RSI) remains above 50, which confirms a bullish bias in the pair.
On the downside, the USD/JPY pair could face immediate support around the nine-day Exponential Moving Average (EMA) at 145.35. A firm break below that level could help the sellers to navigate the region around the 14-day Simple Moving Average (SMA) at 144.60, followed by the 23.6% Fibonacci retracement at 144.36.
USD/JPY: Daily Chart
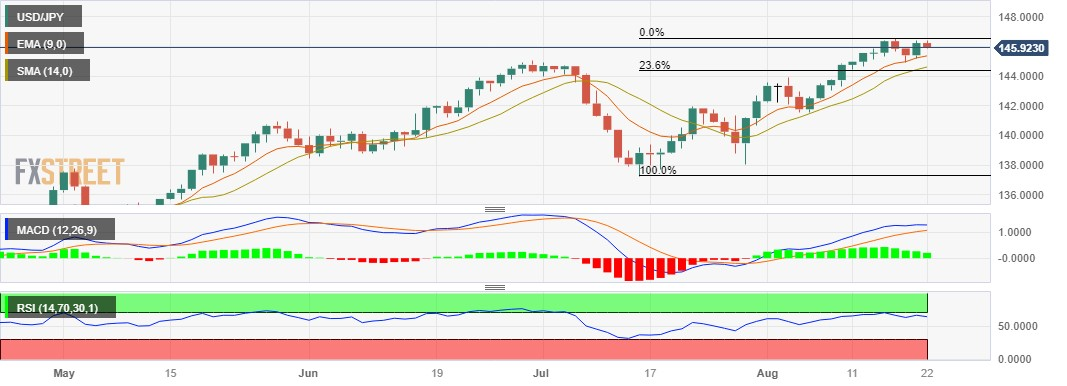
Economists at Commerzbank analyze PLN outlook as markets await the first rate cut by Poland’s National Bank (NBP) in September.
Shaping up for first rate cut in Poland
Inflation is sufficiently close to the 10% YoY mark, while the real economy is proving much weaker than markets had anticipated. As a result, it is quite likely that NBP will kick-start its rate cutting cycle in September with a 25 bps reduction.
Such a prospect was increasingly priced-in over the past month, leading to the Polish Zloty underperforming the Hungarian Forint. This relative underperformance of Zloty is likely to extend further.
The top story remains Chinese authorities' defence of the Renminbi. This stands to be a long campaign given that USD/CNY is trading near 7.30 for good reason, in the opinion of economists at ING.
Manning the Renminbi barricade
The People's Bank of China's battle to keep USD/CNY under the 7.30 area. In addition to representing their displeasure with USD/CNY levels by printing very low onshore fixings (7.1992 last night), Monday it seemed as though the focus was on the funding side where 1m CNH implied yields spiked over 5% (the highest since 2018) making it more expensive to run CNH short positions.
Chinese FX intervention is opaque, but another measure to support the Renminbi would be cutting the required reserves on FX deposits.
Brief dips in USD/CNH see the Dollar offered across the board, but with Chinese authorities cutting official interest rates, we suspect any CNH gains will be limited and temporary.
- Silver pauses a three-day-old ascending trend near the 38.2% Fibo. resistance.
- The technical setup supports prospects for a further near-term appreciating move.
- Any meaningful dip could be seen as a buying opportunity near the 23.00 mark.
Silver enters a bullish consolidation phase and oscillates in a narrow range around the $23.30 region, just below its highest level in more than two weeks touched earlier this Tuesday.
From a technical perspective, the XAG/USD, for now, seems to have paused its recent recovery from the $22.20 area, or a nearly two-month low, near a resistance marked by the 38.2% Fibonacci retracement level of the July-August downfall. A sustained strength beyond the said barrier will be seen as a fresh trigger for bullish traders and pave the way for a further near-term appreciating move.
Given that oscillators on the daily chart have just started moving in the positive territory, the XAG/USD could then climb to 50% Fibo. resistance near the $23.75 region. The momentum could get extended to the $24.00-$24.10 confluence, comprising the 100-day SMA and the 61.8% Fibo. level. Some follow-through buying will suggest that a nearly one-month-old downfall has run its course.
On the flip side, any meaningful pullback now seems to find decent support near the $23.00 round figure, which now coincides with the 23.6% Fibo. level. This is followed by the $22.70-$22.65 support zone, which if broken decisively will expose the multi-month low, around the $22.10 region touched in June. This is followed by the $22.00 mark, below which Sliver could slide to the $21.55-$21.50 area.
The downward trajectory could get extended further towards the $21.00 round figure en route to the $20.60 area, below which the XAG/USD could drop to challenge the $20.00 psychological mark.
Silver daily chart
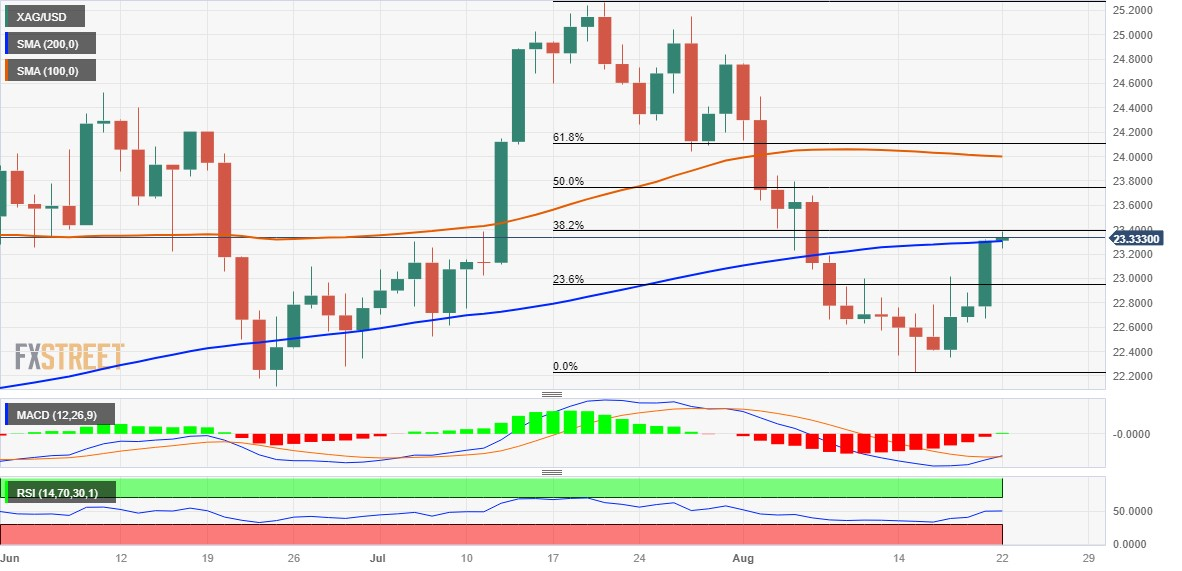
Technical levels to watch
The door remains open to extra gains in USD/JPY in the next few weeks, comment Markets Strategist Quek Ser Leang and Senior FX Strategist Peter Chia at UOB Group.
Key Quotes
24-hour view: Our view for USD to trade with a downward bias yesterday was incorrect, as it rose to a high of 146.39 before closing on a firm note at 146.17 (+0.55%). Today, while there is room for USD to rise above last week’s high near 146.55, it might not be able to maintain a foothold above this level. The next resistance at 147.10 is also unlikely to come under threat. On the downside, if USD breaches 145.40 (minor support is at 145.80), it would indicate that the current upward pressure has faded.
Next 1-3 weeks: We highlighted yesterday that “the odds for further sustained advance in USD are not high”. However, we held the view that only a breach of 144.00 would indicate that USD is not rising further. USD then rebounded and closed on a firm note at 146.17 (+0.55%). Upward momentum has increased, albeit just a tad. From here, USD could rise above last week’s high near 146.55. However, it remains to be seen if there is enough momentum to carry USD to the next major resistance at 147.50. Overall, only a breach of 144.50 (‘strong support’ level was at 144.00 yesterday) would indicate that USD is not advancing further.
- The index moves lower and approaches 103.00.
- US yields maintain the march north unabated.
- Fedspeak, housing data will take centre stage later on Tuesday.
The greenback, in terms of the USD Index (DXY), grinds lower and puts the 103.00 region to the test on turnaround Tuesday.
USD Index looks at Fedspeak, Jackson Hole
The index grinds lower and flirts with the key 200-day SMA in the 103.20/15 band amidst further improvement in the risk complex during the first half of the week.
The so far weekly corrective move in the greenback also comes amidst the continuation of the upside momentum in US yields, where the short end revisits tops around the key 5.0% threshold and the 10-year benchmark navigates levels last seen in November 2007 past 4.30%.
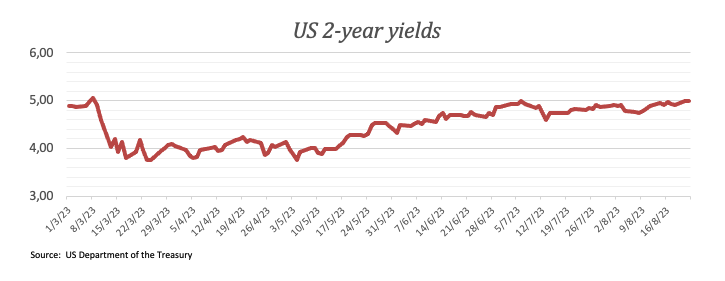
In the meantime, market participants maintain a cautious trade ahead of the imminent Jackson Hole Symposium and Chief Powell’s speech (Thursday and Friday), where consensus expects his message to fall in line with the latest FOMC meeting on July 26.
In the US data space, Existing Home Sales for the month of July are due seconded by the August Richmond Fed Manufacturing Index and speeches by Richmond Fed T. Barkin (2024 voter, centrist), FOMC Governor M. Bowman (permanent voter, centrist), and Chicago Fed A. Goolsbee (voter, centrist).
What to look for around USD
The index appears to have entered a corrective phase after hitting new highs around 103.70 last week.
In the meantime, support for the dollar keeps coming from the good health of the US economy, which seems to have reignited the narrative around the tighter-for-longer stance from the Federal Reserve.
Furthermore, the idea that the dollar could face headwinds in response to the data-dependent stance from the Fed against the current backdrop of persistent disinflation and cooling of the labour market appears to be losing traction as of late.
Key events in the US this week: Existing Home Sales (Tuesday) – MBA Mortgage Applications, Flash Manufacturing/Services PMIs, New Home Sales (Wednesday) – Jackson Hole Symposium, Durable Goods Orders, Chicago Fed National Activity Index, Initial Jobless Claims (Thursday) - Jackson Hole Symposium, Final Michigan Consumer Sentiment, Chief Powell (Friday).
Eminent issues on the back boiler: Persistent debate over a soft or hard landing for the US economy. Incipient speculation of rate cuts in early 2024. Geopolitical effervescence vs. Russia and China.
USD Index relevant levels
Now, the index is down 0.18% at 103.13 and faces initial support at 102.30 (55-day SMA) followed by 101.74 (monthly low August 4) and then 100.55 (weekly low July 27). On the other hand, the breakout of 103.68 (monthly high August 18) would open the door to 104.69 (monthly high May 31) and finally 105.88 (2023 high March 8).
- USD/CAD struggles to gain and holds below the mid 1.3500s in the early European session.
- The pair holds below the 50-hour EMA; the Relative Strength Index (RSI) stands below 50.
- The critical support level is located at 1.3495-1.3510 region; the immediate resistance level is seen at 1.3575.
The USD/CAD pair loses traction and edges lower to 1.3532 heading into the early European session on Tuesday. Investors will look to Friday's speech by Fed Chairman Jerome Powell for direction and perhaps insight into the state of the economy. Market participants are placing bets on a 40% likelihood of a last Fed rise by November, according to Reuters.
From the technical perspective, USD/CAD trades within the ascending trend-channel since August 9 on the one-hour chart. Further downside for USD/CAD looks favorable as the pair holds below the 50-hour Exponential Moving Average (EMA). Meanwhile, the Relative Strength Index (RSI) stands below 50, activating the bearish momentum for the USD/CAD pair for the time being.
That said, the critical support zone for USD/CAD is located at 1.3495-1.3510, portraying a confluence of a lower line of an ascending trend-channel, a low of August 21, and a psychological round figure. Further south, the next stop to watch is at 1.3475 (Low of August 16) en route to 1.3445 (Low of August 15) and finally at 1.3410 (Low of August 11).
On the upside, the immediate resistance level for the pair is seen at 1.3575 (high of August 18). The key barrier to watch is the upper boundary of the ascending trend-channel and psychological figure at 1.3600. Any follow-through buying above the latter will see a rally to 1.3650 (a high of May 31).
USD/CAD one-hour chart
-638282846804910116.png)
EUR/USD continues to trade in very narrow ranges. Economists at ING analyze the pair’s outlook.
The Eurozone data calendar is light today
1.0850-1.0930 looks to be the short-term range and we do not see a local catalyst for a breakout until Wednesday’s release of the flash PMI readings for August.
As to tightening expectations, the market only now prices in 20 bps of rate hikes by the turn of the year – probably underestimating the chance of a 25 bps ECB rate hike in September.
- USD/TRY renews the all-time high despite softer US Dollar.
- CBRT’s struggle to tame inflation joins challenges to Fed policy pivot concerns to weigh on Turkish Lira.
- Multi-year high yields, China-inflicted risk-off mood also underpin USD/TRY advances.
- Second-tier catalysts may entertain intraday, CBRT rate hike, Fed Chair Powell’s speech at Jackson Hole eyed.
USD/TRY rises to the fresh record top around 27.20 as market players prepare for the Central Bank of the Republic of Türkiye (CBRT) Interest Rate Decision and the Fed Chair Jerome Powell’s speech at the Kansas Fed’s annual event called the Jackson Hole Symposium.
In doing so, the Turkish Lira (TRY) pair justifies the market’s lack of confidence in the CBRT, despite repeated rate alterations to tame the inflation woes. It’s worth noting that the Turkish central bank has fuelled benchmark rates by 900 basis points since May 2023, to 17.5% at the latest.
On the other hand, US Dollar Index (DXY) renews its intraday low near 103.10, down for the second consecutive day, even as the US Treasury bond yields refresh the multi-year high. That said, the US 10-year Treasury bond yields refreshed the highest level since November 2007 earlier in the day to 4.36% before easing to 4.34% at the latest.
It’s worth noting that the market’s risk-off mood and fears of Fed Chair Jerome Powell’s defense of the hawkish monetary policy in Friday’s showdown seem to propel the USD/TRY price. Behind the consensus are the mostly upbeat US data and looming fears about the US banking industry, especially after the recent credit rating downgrade from Moody’s and S&P Global. Also likely to have contributed toward souring the sentiment is the concern that China’s efforts to defend the post-COVID economic recovery, via a slew of stimulus measures, won’t be enough for Yuan and the Dragon Nation.
Against this backdrop, stock futures from the US and Europe print mild losses whereas the riskier assets hold despite the US Dollar’s retreat.
Looking forward, Tuesday’s US housing numbers and Fed talks will precede Wednesday’s Turkish Consumer Confidence and US PMIs to provide fresh impetus to the USD/TRY pair. However, major attention will be given to Thursday’s CBRT Interest Rate Decision and Friday’s Fed Chair Powell’s speech at the Jackson Hole for clear directions.
Technical analysis
USD/TRY bulls occupy the driver’s seat unless the Turkish Lira (TRY) provides a daily closing beneath a five-week-old rising support line, close the 27.00 threshold by the press time.
NZD/USD could see its selling bias alleviated once it breaks above the 0.5985 level, suggest Markets Strategist Quek Ser Leang and Senior FX Strategist Peter Chia at UOB Group.
Key Quotes
24-hour view: Yesterday, we noted that “momentum indicators are flat”, and we expected NZD to trade in a quiet manner between 0.5905 and 0.5945. NZD then traded in a range of 0.5897/0.5934 before closing largely unchanged (0.5926, +0.03%). Today, NZD could continue to trade in a range, likely between 0.5900 and 0.5945.
Next 1-3 weeks: We continue to hold the same view as yesterday (21 Aug, spot at 0.5925), wherein the NZD weakness over the past few weeks appears to be slowing. However, only a breach of 0.5985 (‘strong resistance’ level) would indicate that the weakness in NZD has stabilised. That said, the pace of any further decline is likely to be slow, and 0.5870 is likely to offer solid support.
FX option expiries for Aug 22 NY cut at 10:00 Eastern Time, via DTCC, can be found below.
- EUR/USD: EUR amounts
- 1.0850 508m
- 1.0870 489m
- 1.0885 490m
- 1.0900 1.3b
- 1.1000 316m
- USD/JPY: USD amounts
- 145.00 963m
- USD/CHF: USD amounts
- 0.8800 395m
- USD/CAD: USD amounts
- 1.3470 820m
- AUD/USD: AUD amounts
- 0.6400 861m
- 0.6425 520m
CME Group’s flash data for crude oil futures markets noted traders scaled back their open interest positions for the fourth session in a row on Monday, now by around 28.3K contracts. Volume followed suit and retreated by around 125.7K contracts, reversing the previous daily build.
WTI: Initial support emerges just below $79.00
Monday’s marked pullback in WTI prices was accompanied by shrinking open interest and volume. Against that, the likelihood of a deeper retracement seems not favoured in the very near term. In the meantime, bouts of weakness are expected to meet contention around monthly lows in the sub-$79.00 region.
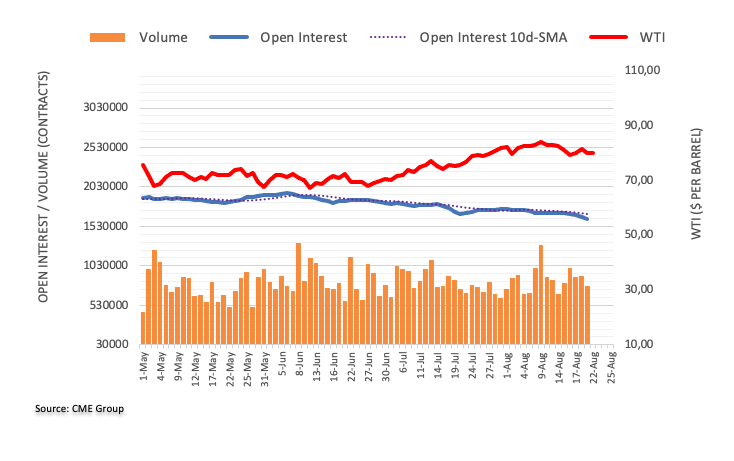
Economists at Commerzbank expect the EUR/PLN pair to advance nicely over the coming months.
Inflation in Poland will likely remain stubbornly above target
We forecast the Euro to remain strong through 2023, but weaken once again during 2024.
Given Zloty’s high-beta relationship to the Euro, we see EUR/PLN rising again towards 4.75 as inflation disappoints once again in 2024.
Our base case remains that inflation will moderate over the coming quarter, which will trigger a rate cutting cycle by NBP, but after that, inflation will not converge fully to target, hence we see 2024 as a potential Zloty-negative period.

Source: Commerzbank Research
GBP/USD is still seen navigating within the 1.2640-1.2830 range in the next weeks, according to Markets Strategist Quek Ser Leang and Senior FX Strategist Peter Chia at UOB Group.
Key Quotes
24-hour view: We noted yesterday that “There is no clear directional bias” and we expected GBP to trade sideways in a range of 1.2700/1.2775. GBP then traded in a narrower range than expected (1.2711/1.2767). There is a slight increase in upward momentum, and there is room for GBP to edge above 1.2790. However, any advance is unlikely to threaten the major resistance at 1.2830. Support is at 1.2730, followed by 1.2710.
Next 1-3 weeks: We continue to hold the same view as yesterday (21 Aug, spot at 1.2740). As highlighted, the price actions in GBP over the past week or so appears to be part of a consolidation phase. For the time being, GBP could continue to trade sideways, likely between 1.2640 and 1.2830.
Open interest in gold futures markets shrank by just 775 contracts on Monday, reversing the previous daily pullback according to preliminary readings from CME Group. On the other hand, volume kept the choppy activity well in place and went up by around 24.7K contracts.
Gold faces some range bound near term
Gold prices kicked off the week in a positive mood, just below the $1900 mark per troy ounce. The uptick, however, was amidst a small drop in open interest and removes some strength from further recovery in the very near term. That said, the commodity might enter a consolidative phase around current levels for the time being.
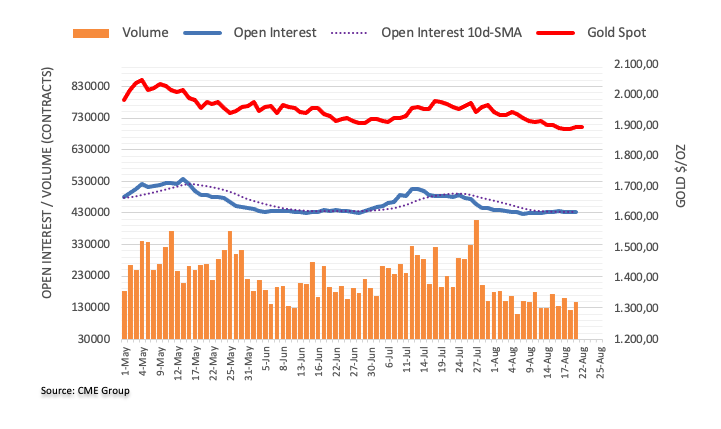
- Gold Price stays defensive at five-month low, keeps week-start rebound.
- Risk aversion, firmer Treasury bond yields challenge XAU/USD recovery ahead of mid-tier catalysts.
- Central bankers’ defense of hawkish policy at Jackson Hole eyed to keep Gold bears on the table.
Gold Price (XAU/USD) portrays bearish consolidation at the lowest level in five months while defending the week-start rebound amid mixed sentiment.
US Dollar’s downbeat performance allows the XAU/USD to pare previous losses at the multi-day bottom. However, the firmer Treasury bond yields and fears surrounding China, one of the world’s biggest Gold customers, prod the recovery moves amid a light calendar.
That said, the mostly upbeat US data and looming fears about the US banking industry, especially after the recent credit rating downgrade from Moody’s and the S&P Global, underpin the market’s cautious mood and the bond coupons, which in turn weigh on the Oil price. Furthermore, China’s efforts to defend the post-COVID economic recovery, via a slew of stimulus measures, fail to impress market optimists and exert downside pressure on the risk profile.
Against this backdrop, US Dollar Index (DXY) renews its intraday low near 103.20, down for the second consecutive day, as market players brace for Friday’s speech for Fed Chair Jerome Powell at the Kansas Fed’s annual event called at the Jackson Hole Symposium. Furthermore, the US 10-year Treasury bond yields refreshed the highest level since November 2007 earlier in the day to 4.36% before easing to 4.34% at the latest. On the same line, the S&P500 Futures print mild losses to reverse the previous recovery from a nine-week low.
Also read: Gold Price Forecast: XAU/USD recovery seeks daily closing above $1,891, Fedspeak eyed
Gold Price: Key levels to watch
Our Technical Confluence indicator suggests the sluggish recovery of the Gold Price even as it recently poked the mid-tier resistance confluence surrounding $1,895 comprising Fibonacci 38.2% on one day, 100-HMA and the middle band of the Bollinger on the hourly chart.
However, a convergence of the Fibonacci 38.2% on one-week and the upper band of the Bollinger on the four-hour (4H) play prods the immediate upside of the Gold Price near the $1,900 round figure.
Following that, the previous monthly, 10-DMA and 200-HMA will together challenge the Gold buyers near $1,905.
Above all, the joins of the Pivot Point one-month S1 and the previous weekly high of around $1,920 acts as the final defense of the XAU/USD bears.
On the contrary, a downside break of the aforementioned $1,895 resistance-turned-support could quickly fetch the Gold price toward the lows marked in the previous day and during the last week around $1,885.
In a case where the XAU/USD remains bearish past $1,885, the Pivot Point one-week S1 and one-day S2, near $1,878 will hold the gate for the bear’s ride towards the early March swing high of around $1,858.
Here is how it looks on the tool
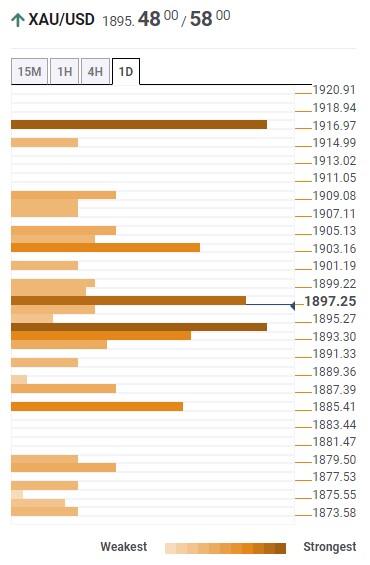
About Technical Confluences Detector
The TCD (Technical Confluences Detector) is a tool to locate and point out those price levels where there is a congestion of indicators, moving averages, Fibonacci levels, Pivot Points, etc. If you are a short-term trader, you will find entry points for counter-trend strategies and hunt a few points at a time. If you are a medium-to-long-term trader, this tool will allow you to know in advance the price levels where a medium-to-long-term trend may stop and rest, where to unwind positions, or where to increase your position size.
- USD/IDR holds positive ground near 15,325 amid higher US Treasury bond yields and the stronger USD.
- Bank Indonesia (BI) is expected to maintain its benchmark interest rate at 5.75% on Thursday.
- The uncertainty in the Chinese economy will be a burden on Indonesia's growth.
- Investors will monitor BI rate decisions, Federal Reserve (Fed) Chair Jerome Powell’s speech.
USD/IDR extends its upside near 15,325 heading into the early European session on Tuesday. The prevailing US dollar buying is bolstered by the anticipation that Federal Reserve (Fed) will prolong the tightening cycle. Market players await the Bank Indonesia (BI) interest rate decision on Thursday and Federal Reserve (Fed) Chair Jerome Powell’s speech at the Jackson Hole Symposium on Friday for fresh impetus.
That said, the Indonesian central bank is expected to maintain its benchmark interest rate at 5.75% for the seventh consecutive meeting on Thursday and for the entire year, According to a Reuters poll conducted between August 14 and 21.
Furthermore, the weakening of the Rupiah is driven by the higher US Treasury bond yields and the stronger USD. The 10-year Treasury bond yield stands at 4.344% after climbing to 3.366% the highest level of 2007. Meanwhile, Indonesian 10-year bond yields rise to 6.725%, their highest level since April.
Apart from this, a smaller margin than anticipated rate cut by the People’s Bank of China (PBoC) on Monday exerts pressure on the Rupiah. The Chinese central bank slashed its Loan Prime Rate (LPR) for one year by 10 basis points (bps) to 3.45% from 3.55% and maintained the five-year LPR unchanged at 4.2%. The uncertainty in the Chinese economy will be a burden on Indonesia's growth. Nevertheless, Chinese authorities reported on Sunday that the nation would arrange financial support to resolve local government debt worries, according to Reuters. This, in turn, might cap the downside of the Rupiah and acts as a headwind for USD/IDR.
On the US Dollar front, investors raise their bets on additional rate hikes by the Federal Reserve (Fed) despite the robust labor data and weaker inflation data last week. Fed Chairman Jerome Powell Speaks on Friday will be a guide for investors and could provide insights into economic conditions. A hawkish tone might boost the Greenback against its rivals.
Looking ahead, market players will closely watch the BI monetary policy decision on Thursday. Fed Chair Jerome Powell’s speech at the Jackson Hole Symposium on Friday will be in the spotlight this week. Traders will take cues from the data and find opportunities around USD/IDR.
In the view of Markets Strategist Quek Ser Leang and Senior FX Strategist Peter Chia at UOB Group, the downward momentum in EUR/USD appears to be dwindling.
Key Quotes
24-hour view: We expected EUR to trade in a range of 1.0845/1.0900 yesterday. However, EUR rebounded slightly to a high of 1.0913. The mild advance did not result in any significant increase in momentum. We continue to expect EUR to trade in a range, likely between 1.0870/1.0915.
Next 1-3 weeks: Yesterday (21 Aug, spot at 1.0870), we noted that “downward momentum has increased, albeit just a tad.” We added, “While there is room for EUR to weaken further, the lackluster momentum suggests the pace of any decline is likely to be slow.” EUR rebounded slightly yesterday, and downward momentum is beginning to wane, albeit tentatively. However, only a breach of 1.0930 would indicate that EUR is not ready to head lower to 1.0830.
- WTI crude oil takes offers to refresh intraday low, extends week-start losses.
- Fears of China’s slowing economic recovery, banking woes in US and concerns about higher rates weigh on sentiment.
- One-month-old rising support line lures Oil bears amid looming bear cross on MACD.
- 200-SMA puts a floor under the energy benchmark ahead of early-July swing high.
WTI crude oil remains on the back foot for the second consecutive day, down 0.40% intraday near $79.85 heading into Tuesday’s European session. In doing so, black gold bears the burden of the market’s risk-off mood while ignoring the downbeat US Dollar.
That said, the impending bear cross on the MACD weigh on the WTI crude oil price towards a one-month-old rising support line, close to $79.00 by the press time. Also favoring the WTI bears is the downward-sloping RSI (14) line, not oversold.
It’s worth noting that the 200-SMA level of around $78.80 and the early July swing high surrounding $77.20 act as additional upside filters.
Alternatively, the weekly high of around $81.70 guards the immediate upside of the WTI crude oil.
Following that, the latest multi-month peak marked on August 10 around $84.35 will be in the spotlight.
That said, the mostly upbeat US data and looming fears about the US banking industry, especially after the recent credit rating downgrade from Moody’s and the S&P Global, underpin the market’s cautious mood and the bond coupons, which in turn weigh on the Oil price.
Furthermore, China’s efforts to defend the post-COVID economic recovery, via a slew of stimulus measures, fail to impress market optimists and exert downside pressure on the risk profile, which in turn allows the WTI bears to remain hopeful.
While portraying the mood, the US 10-year Treasury bond yields refreshed the highest level since November 2007 earlier in the day to 4.36% before easing to 4.34% at the latest. On the same line, the S&P500 Futures print mild losses to reverse the previous recovery from a nine-week low.
WTI crude oil: Four-hour chart
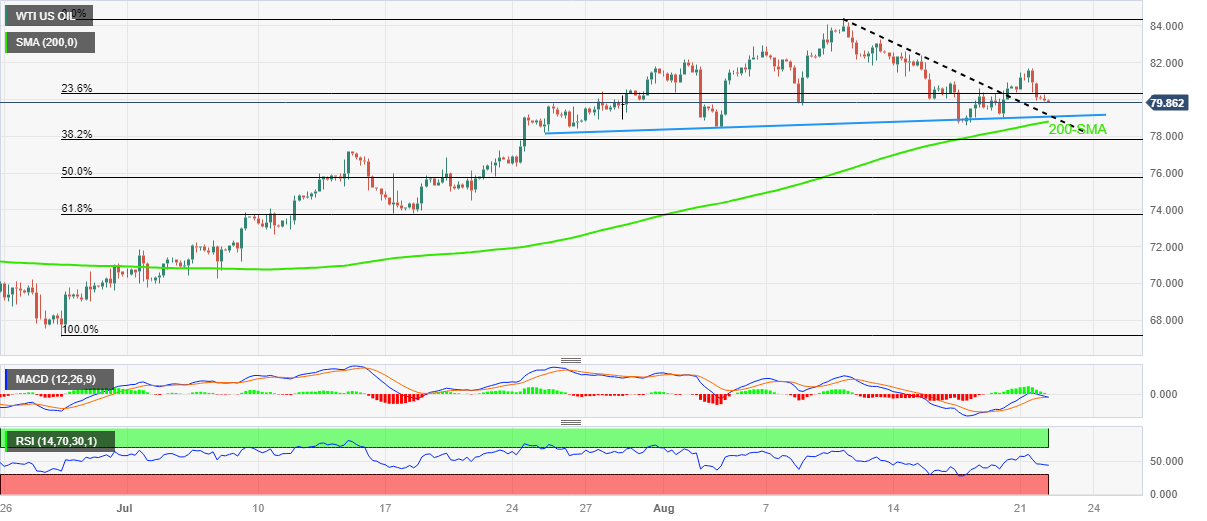
Trend: Limited downside expected
- Russian Ruble reverses the CBR-induced gains despite US Dollar’s pullback.
- Sour sentiment, downbeat Oil price and geopolitical fears underpin bullish bias about USD/RUB pair.
- Upbeat US Treasury bond yields also exert downside pressure on Russian Ruble.
- Mid-tier US data, Fed talks eyed ahead of Jackson Hole speeches for clear directions.
Russian Ruble (USD/RUB) price prints mild gains around 93.80 even as US Dollar struggles heading into Tuesday’s European session. In doing so, the Russian currency (RUB) drops for the second consecutive day while reversing the last week’s gains, mainly backed by the Central Bank of Russian Federation’s (CBR) surprise rate hike. It should be noted that the pair’s firmer performance suggests the market’s less confidence in the Ruble than the US Dollar, especially amid the ongoing geopolitical tussles with Ukraine and a recent pullback in the Oil price.
Russian Ruble loses investor confidence
Russian Ruble’s inability to cheer the US Dollar’s retreat suggests the trader’s fears of more economic hardships for the Oil-rich nation, mainly due to the higher inflation and the CBR’s failure to defend the currency despite a heavy rate hike.
On the other hand, US Dollar Index (DXY) renews its intraday low near 103.20, down for the second consecutive day, as market players brace for Friday’s speech for Fed Chair Jerome Powell at the Kansas Fed’s annual event called at the Jackson Hole Symposium. On the other hand, the WTI crude oil also prints a two-day losing streak while declining to $80.00 at the latest.
It’s worth noting that the market’s indecision about the Fed’s future moves, especially after the last weekly impressive US data, joins China woes and expectations suggesting higher US wage growth in the future, per the latest survey of the Federal Reserve Bank of New York, also underpin the USD/RUB upside momentum.
Against this backdrop, the US 10-year Treasury bond yields refreshed the highest level since November 2007 earlier in the day to 4.36% before easing to 4.34% at the latest. That said, the S&P500 Futures print mild losses to reverse the previous recovery from the nine-week low.
Looking ahead, US housing numbers and the mid-tier Fed policymakers’ speeches will be crucial for the Russian Ruble traders. Above all, Friday’s Fed Chair Jerome Powell’s speech at the Jackson Symposium appears the key to clear directions.
Russian Ruble Technical Analysis
Russian Ruble struggles to extend the corrective bounce off 200-SMA, around 92.90 by the press time, toward the previous support line stretched from late May, close to the 95.00 round figure. Also challenging the short-term USD/RUB rebound is the 100-SMA hurdle of around 95.20.
Meanwhile, a sustained downside break of 200-SMA surrounding 92.90 needs validation from the 90.00 round figure and multiple lows marked since early July near 89.00.
It should be noted that the latest rebound in the RSI and the MACD indicators also keep the Russian Ruble buyers hopeful.
Russian Rule: Four-hour chart
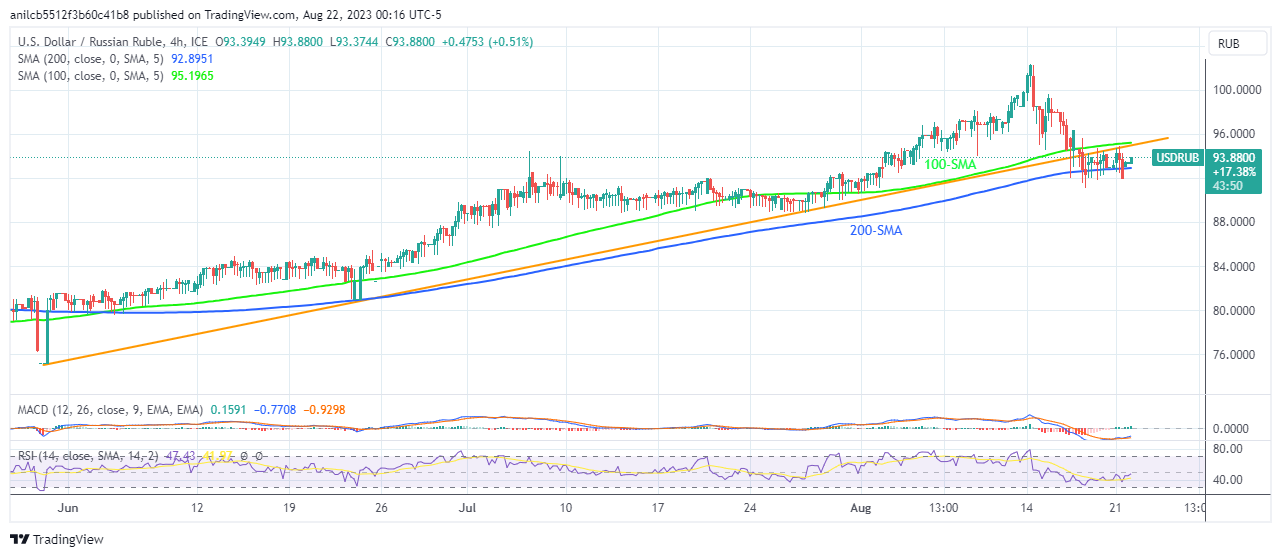
Trend: Further upside expected
- GBP/USD pair posts a modest gain near 1.2770, up 0.11% on the day.
- GBP/USD holds above the 50- and 100-hour EMA; the Relative Strength Index (RSI) supports the buyers.
- The immediate resistance level is seen at 1.2780-1.2785 region; 1.2740 acts as an initial support level.
The GBP/USD pair gains momentum around 1.2770 heading into the European session on Tuesday. The pair trades in positive territory for the second day in a row amid the weakening of the Greenback. Meanwhile, the US Dollar Index (DXY), a measure of the value of USD against six other major currencies, drops to 103.22.
From the technical perspective, GBP/USD holds above the 50- and 100-hour Exponential Moving Averages (EMA) on the one-hour chart, which means further upside looks favorable. Meanwhile, the Relative Strength Index (RSI) stands above 50, within bullish territory, suggesting that buyers are likely to retain control in the near term.
Therefore, the major pair will meet the immediate resistance level of 1.2780-1.2785 region, representing the upper boundary of the Bollinger Band and a high of August 17. The additional upside filter is located at a psychological round figure of 1.2800. Further north, the next barrier is seen at 1.2840 (high of August 1) en route to 1.2888 (high of July 28).
On the flip side, any extended weakness below 1.2740 (100-hour EMA) will challenge the next contention at 1.2730 (the lower limit of the Bollinger Band). The key contention is located at 1.2700 (low of August 18 and a psychological figure).
GBP/USD one-hour chart
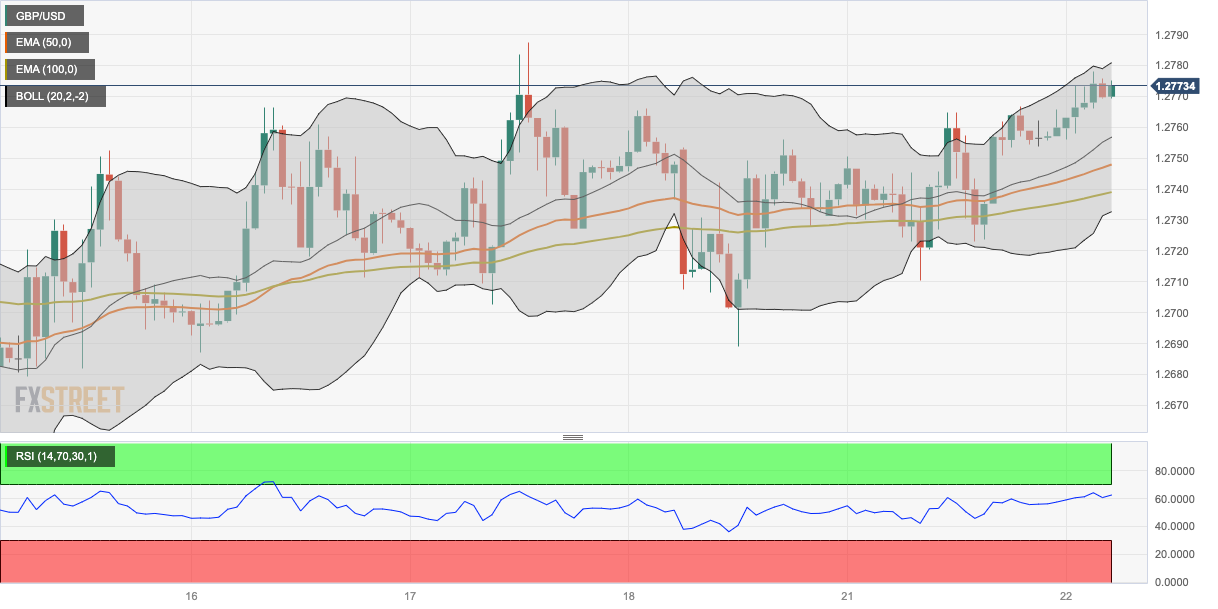
- Asian stock markets rise due to the rebound of technology stocks.
- Chinese stocks underperform due to disappointing LPR cuts.
- Traders turn cautious ahead of Fed Chair Powell’s speech on Friday.
The Asian stock markets experienced an uptick on Tuesday propelled by the rebound of technology stocks. However, concerns regarding the tightening of monetary policy by the Federal Reserve (Fed) and China's economic challenges acted as a limiting factor.
At the time of writing, China’s Shanghai is down 0.24% to 3,085, the Shenzhen Component Index declines 0.73% to 10,224, and Hong Kong’s Hang Seng rises 0.12% to 17,634. India’s NIFTY 50 is up 0.01%, South Korea’s Kospi rises 0.50%, and Japan’s Nikkei gains 0.77%.
Chinese stocks underperform on Tuesday, largely due to traders' sentiments being significantly impacted by China's economic challenges, triggered by the People's Bank of China (PBoC) disappointing the Loan Prime Rate (LPR) by 10 basis points (bps), falling short of the anticipated 15 bps reduction. This move suggests that China may be prioritizing the support of current borrowers over bolstering credit expansion.
The rise in United States (U) Treasury yields keeps traders cautious ahead of the Jackson Hole event this week. Investors will likely watch Fed Chairman Jerome Powell’s speech at the Jackson on Friday. The speech may offer insights into economic circumstances and signals as to whether inflation is under control or if further interest rate hikes are necessary to curb inflation.
- NZD/USD clings to mild gains defends late Monday’s rebound from YTD low.
- Upside break of two-week-old descending resistance line, bullish MACD signals favor Kiwi bulls.
- 50-SMA, monthly trend line resistance prod pair buyers.
- Double bottoms around 0.5900 challenge NZD/USD bears from retaking control.
NZD/USD seesaws around intraday high surrounding 0.5940-35 heading into Tuesday’s European session.
In doing so, the Kiwi pair defends the previous day’s corrective bounce off the lowest level since November 2022, as well as an upside break of a fortnight-long resistance line. Adding strength to the upside bias are the bullish MACD signals.
With this, the NZD/USD buyers can consider the latest retreat as a buying opportunity while targeting the 50-SMA hurdle of 0.5960.
However, a downward-sloping resistance line from early August, around 0.5975 at the latest, restricts the Kiwi pair’s further upside.
It’s worth mentioning that multiple tops marked since August 11, close to 0.5995–6000 act as additional upside filters for the NZD/USD bulls.
Meanwhile, pullback moves remain elusive unless the quote stays beyond the two-week-old previous resistance line, near 0.5920 at the latest.
Following that, double bottoms marked around 0.5900 will act as crucial support to watch for the NZD/USD bears.
In a case where the Kiwi sellers dominate past 0.5900, an early October 2022 swing high of around 0.5815 will be on their radars.
NZD/USD: Four-hour chart
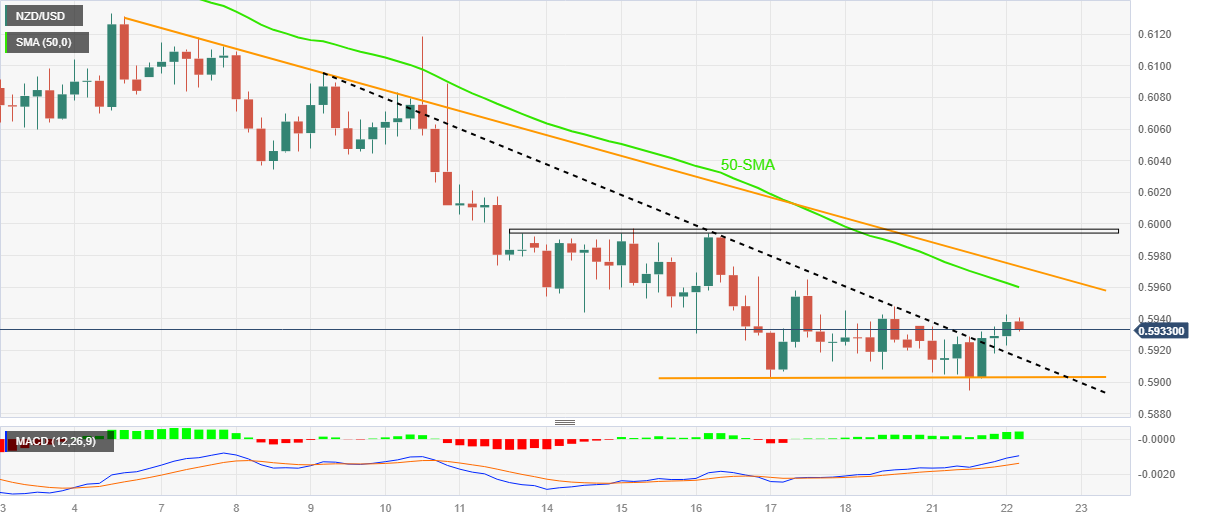
Trend: Further recovery expected
- EUR/USD edges higher for the second straight day and draws support from a softer USD.
- The narrowing of the German yield curve inversion lends support to the Euro and the pair.
- Hawkish Fed expectations might limit the USD slide and keep a lid on any further gains.
- Traders might also prefer to wait on the sidelines ahead of the Jackson Hole Symposium.
The EUR/USD pair gains some positive traction for the second successive day on Tuesday and climbs back above the 1.0900 mark during the Asian session. Spot prices currently trade near a three-day top and look to build on the recent bounce from over a two-month trough, around the 1.0845 region touched last Friday.
The European Central Bank (ECB) Chief Economist Philip Lane said on Friday the Euro Zone economy would keep growing and is unlikely to experience a deep or sustained recession. This leads to the narrowing of the German yield curve inversion and supports prospects for further policy tightening by the ECB, which is seen underpinning the shared currency. Apart from this, a modest US Dollar (USD) weakness turns out to be another factor acting as a tailwind for the EUR/USD pair.
In fact, the USD Index (DXY), which tracks the Greenback against a basket of currencies, remains depressed below its highest level since July 12 as traders are still betting on the idea that the Federal Reserve (Fed) will pause its rate-hiking cycle in September. That said, the incoming US economic data continues to point to an extremely resilient economy and keeps the door open for one more 25 bps lift-off by the end of this year, which should help limit any meaningful USD losses.
The view that the Fed will keep interest rates higher for longer remains supportive of elevated US Treasury bond yields. It is worth recalling that the yield on the benchmark 10-year US government bond had climbed to a fresh 15-year top on Monday. Apart from this, a generally weaker risk tone assists the safe-haven USD to hold just above a technically significant 200-day Simple Moving Average (USD). This might hold back bulls from placing aggressive bets around the EUR/USD pair.
Investors might also prefer to move to the sidelines ahead of Fed Chair Jerome Powell and ECB President Christine Lagarde's speech at the Jackson Hole Symposium later this week. Investors will further take cues from the flash version of the PMI prints from the Euro Zone and the US, due on Wednesday, which will provide fresh insights into the economic health and whether the respective central banks can afford to increase interest rates further.
In the meantime, traders on Tuesday will take cues from the release of the Euro Zone Current Account figures, which will be followed by Existing Home Sale and Richmond Manufacturing Index later during the early North American session from the US. This, along with the US bond yields and the broader risk sentiment, will influence the USD price dynamics and produce short-term trading opportunities around the EUR/USD pair.
Technical levels to watch
- AUD/USD holds positive ground around 0.6420 amid the weakening US Dollar.
- Market players are increasing their bets on additional rate rises by Federal Reserve (Fed).
- The People’s Bank of China (PBoC) slashed its Loan Prime Rate (LPR) for one year by a smaller margin than anticipated.
- Investors await S&P Global PMI from Australia, the US.
The AUD/USD pair gains momentum for the second consecutive day. The pair edges higher to the 0.6420 mark in the Asian session on Tuesday. The Greenback faces some follow-through selling after S&P Global downgraded and revised its outlook for multiple US banks on Monday, following a similar action by Moody’s.
The weakening of the US Dollar has boosted AUD/USD. On Monday, S&P Global downgraded multiple US banks, indicating a rapid increase in interest rates is putting a strain on the financing and liquidity of many US institutions. However, market participants are increasing their bets on additional rate rises by the Federal Reserve (Fed), which drive US 10-year Treasury bond yields to 4.366%, the highest level of 2007.
On the other hand, the People’s Bank of China (PBoC) slashed its Loan Prime Rate (LPR) for one year by a smaller margin than anticipated. Chinese central bank decided to cut the one-year Loan Prime Rate (LPR) by 10 basis points (bps) to 3.45% from 3.55% and maintained the five-year LPR unchanged at 4.2%. Investors will keep an eye on the headline surrounding China’s economic woes as it might impact the Aussie, a proxy for China's economic prospects.
Looking ahead, market players await S&P Global PMI from both Australia and the US due on Wednesday. Later in the week, the US Existing Home Sales, Initial Jobless Claims, and Durable Good Orders will be released. Fed Chair Jerome Powell’s speech at the Jackson Hole Symposium on Friday will be in the spotlight this week. Traders will take cues from the data and find opportunities around the AUD/USD pair.
- USD/JPY clings to mild losses while paring week-start recovery.
- 10-year, 30-year Japanese Government Bond (JGB) yields jump to the highest since 2014.
- US 10-year Treasury bond coupons print 15-year high, market sentiment sours amid growth, China woes.
- Yen bears need validation from US/Japan data, central bankers to keep the reins.
USD/JPY consolidates the week-start gains by printing mild losses around 146.00 heading into Tuesday’s European session. That said, the Yen pair justifies the market’s fears of the hawkish Bank of Japan (BoJ) monetary policy, as well as the downbeat sentiment.
An improvement in the late Japan growth and inflation numbers propel the 10-year and 30-year Japanese Government Bond (JGB) yields to the highest level since 2014, close to 0.66% and 1.66% respectively. With this, the top-tier bond coupons increase the market’s bets on the BoJ’s exit from the ultra-easy monetary policy, especially after the central bank’s latest tweak to the Yield Curve Control (YCC) policy.
On the other hand, the US 10-year Treasury bond yields refreshed the highest level since November 2007 earlier in the day to 4.36% before easing to 4.34% at the latest.
It’s worth noting that the mostly upbeat US data and looming fears about the US banking industry, especially after the recent credit rating downgrade from Moody’s and the S&P Global, underpin the market’s cautious mood and the bond coupons.
Furthermore, China’s efforts to defend the post-COVID economic recovery, via a slew of stimulus measures, fail to impress market optimists and exert downside pressure on the risk profile, which in turn allows the Yen (JPY) to cheer the traditional haven status.
Elsewhere, the Federal Reserve Bank of New York unveiled its SCE Labor Market Survey results late Monday that suggested record wage expectations and could have contributed to the latest risk-off mood, as well as firmer bond yields. “The Lowest wage respondents would be willing to accept for a new job jumped to a record high of $78,645 in July, up from $72.873 a year ago,” said the findings.
Amid these plays, Japan’s Nikkei 225 rises 0.80% but the S&P500 Futures print mild losses to reverse the previous recovery from the a nine-week low.
Moving on, US housing numbers, Japan inflation and the mid-tier policymakers’ speeches will be crucial for the USD/JPY traders. Above all, Friday’s Fed Chair Jerome Powell’s speech at the Jackson Symposium appears the key for clear directions.
Technical analysis
USD/JPY stays on the bull’s radar unless providing a daily close beneath June’s peak of around 145.00.
Following his meeting with the Japanese Prime Minister Fumio Kishida on Tuesday, Bank of Japan (BoJ) Governor Kazuo Ueda said that he “did not discuss FX volatility at the meeting with PM”
Additional quotes
Explained to prime minister BoJ’s July policy decision.
Prime minister said he understood, when i explained BoJ’s July policy move.
Premier asked questions on various aspects of economy, financial developments to which i replied as much as I Ican.
Want to refrain from mentioning what exactly was discussed.
My predecessor Kuroda had met prime minister on regular basis, my meeting today was of same nature.
Market reaction
USD/JPY is attempting another take above 146.00 on Ueda’s comments. The pair is trading modestly flat on the day at 146.03, as of writing.
- Gold price trades slightly higher in the face of elevated US yields.
- Inflation concerns could undermine the yellow metal.
- Traders await Powell's speech, seeking new insight into the Fed policy.
Gold price struggles to continue the previous day's snap, hovering around $1,895 during the Asian session on Tuesday. The XAU/USD pair could snap the four-week losing streak due to the retreating US Dollar (USD). However, Gold sellers remain cautious due to factors such as increased risk aversion in the market, the elevated United States (US) Treasury yields, and China’s economic challenges. These factors have the potential to counterbalance the effect of the Greenback's decline and influence the price action of Gold prices.
The price of Gold could experience downward pressure due to the cautious market sentiment on the inflation outlook. Investors expect a 25 basis points (bps) interest rate hike in September’s meeting by US Federal Reserve (Fed). The yellow metal price could face a challenge as the upbeat US economic data lead to hawkish sentiment among US Dollar (USD) buyers.
Investors sentiment could be heavily influenced by China’s economic woes. The disappointing Loan Prime Rate (LPR) was cut by 10 bps instead of expectations of 15 bps by the People’s Bank of China (PBoC), suggesting that China may focus on supporting the existing borrowers rather than encouraging credit growth – UBS
The US Dollar Index (DXY), which measures the performance of the Greenback against the six major currencies, trades lower around 103.20. The US Dollar (USD) declines despite strong US data and elevated US bond yields, prompting a sense of caution in the market as it seeks further signals about the inflation scenario.
Fed Chair Jerome Powell's speech on Friday during the Jackson Hole Symposium is the key centric event as it could offer valuable insight into the condition of the US economy. This could contribute to the shape of potential strategies for making fresh investments in non-yielding Gold. The US docket has Existing Home Sales Change (MoM) for July to release later in the North American session.
- USD/INR is seen consolidating in a narrow trading band above the 83.00 mark on Tuesday.
- The fundamental and technical setup supports prospects for a further appreciating move.
- Any meaningful corrective slide might be seen as a buying opportunity and remain limited.
The USD/INR pair edges lower during the Asian session Tuesday and currently trades near the daily low, around the 83.00 mark, down less than 0.10% for the day. Spot prices, meanwhile, remain well within the striking distance of the all-time high touched last Tuesday and seem poised to prolong the recent upward trajectory witnessed over the past three weeks or so.
The US Dollar (USD) remains on the defensive for the second successive day and turns out to be a key factor acting as a headwind for the USD/INR pair. That said, growing acceptance that the Federal Reserve (Fed) will keep interest rates higher for longer helps the USD Index (DXY), which tracks the Greenback against a basket of currencies, to hold above a technically significant 200-day Simple Moving Average (SMA). This, along with a generally weaker risk tone, should limit any meaningful corrective decline for the safe-haven buck, from its highest level since July 12, and lend support to the pair ahead of the Jackson Hole Symposium later this week.
Even from a technical perspective, the recent breakout through the 83.00 strong barrier, which has been capping the upside for the USD/INR pair since November 2022, favours bullish traders. This, along with the fact that oscillators on the daily chart are holding comfortably in the positive territory, suggests that the path of least resistance for spot prices is to the upside. Hence, any further slide is likely to attract fresh buyers near the 82.80-82.75 area. This is followed by the 82.60-82.55 support, which should now act as a strong base. A convincing break below, however, might prompt some technical selling and pave the way for some meaningful downfall.
Bulls, meanwhile, might now wait for some follow-through buying beyond the 83.40 area, or the record high before positioning for a further near-term appreciating move towards the 84.00 round-figure mark.
USD/INR daily chart
-638282713062996940.png)
Technical levels to watch
- EUR/GBP gains ground around 0.8543, up 0.02% for the day.
- The German Buba Monthly Report revealed that inflation could stay above the central bank's target for longer.
- Traders expect the Bank of England (BoE) to raise a 25 basis point (bps) rate to 5.50% in the September meeting.
- The Eurozone/UK PMI data, ECB's President Lagarde speech will be in focus.
The EUR/GBP cross holds positive ground above 0.8540 in the Asian session on Tuesday. The cross trades in positive territory for the third day in a row. Market participants await the inflation data from both the UK and the Eurozone for fresh impetus ahead of the European Central Bank (ECB) President Lagarde's speech on Friday.
On Monday, the annual German Producer Price Index (PPI) for July fell to -6%, compared to a 0.1% increase and a market expectation of -5.1%. The monthly PPI figure decreased to -1.1%, below the market consensus of -0.2% and the prior reading of -0.3%. Additionally, the German Buba Monthly Report revealed that inflation could stay above the central bank's target for longer. Investors placed hawkish wagers on the European Central Bank (ECB) due to inflation risks on the upside. This, in turn, lifts the Euro against its rivals.
On the other hand, traders expect the Bank of England (BoE) to tighten monetary policy further, pricing in a 25 basis point (bps) rate hike to 5.50% in its September meeting. The fear of an aggressive rate hike by the BoE might exert pressure on the Pound Sterling as investors worry that it might impact negatively the UK economy after 14 consecutive rate hikes. However, the upbeat UK GDP and CPI data increase the likelihood of further BoE policy tightening.
Later this week, the Eurozone Current Account, S&P Purchasing Managers' Index (PMI), and German Gross Domestic Product (GDP) Q2 will be released later this week. The UK docket will feature S&P Global PMIs and the GfK Consumer Confidence. The European Central Bank (ECB) President Christine Lagarde will likely provide additional guidance on their monetary policies. This event will be critical for determining a clear movement for the EUR/GBP cross
- USD/CHF takes offers to extend week-start reversal from 1.5-month high.
- U-turn from multi-month-old resistance line, downside break of immediate rising trend line favor Swiss Franc pair sellers.
- 200-SMA lures short-term sellers; bulls need validation from 0.8830.
USD/CHF takes offers to extend the previous week’s U-turn from a multi-day-old resistance line amid early Tuesday, down 0.10% intraday near 0.8775 by the press time.
In doing so, the Swiss Franc (CHF) pair cheers the downside break of a one-month-long rising trend line support, now immediate resistance near 0.8790.
The trend line breakdown joins the downward-sloping RSI (14) line, not oversold, to also strengthen the bearish bias about the USD/CHF pair.
As a result, the sellers are all set to revisit the 200-SMA support of around 0.8725 before poking the 0.8700 round figure.
However, multiple levels marked during the late July highlight 0.8690 and 0.8630 will challenge the USD/CHF sellers afterward.
Meanwhile, the pair’s recovery past 0.8790 support-turned-resistance needs validation from the 0.8800 round figure and a downward-sloping resistance line from May 31, close to 0.8815 by the press time.
Following that, the double tops marked on August 14 and 21 around 0.8830 may act as the final defense of the USD/CHF bears ahead of directing the buyers toward June’s bottom surrounding 0.8900.
Overall, USD/CHF remains on the bear’s radar even if the road toward the south appears long and bumpy.
USD/CHF: Four-hour chart
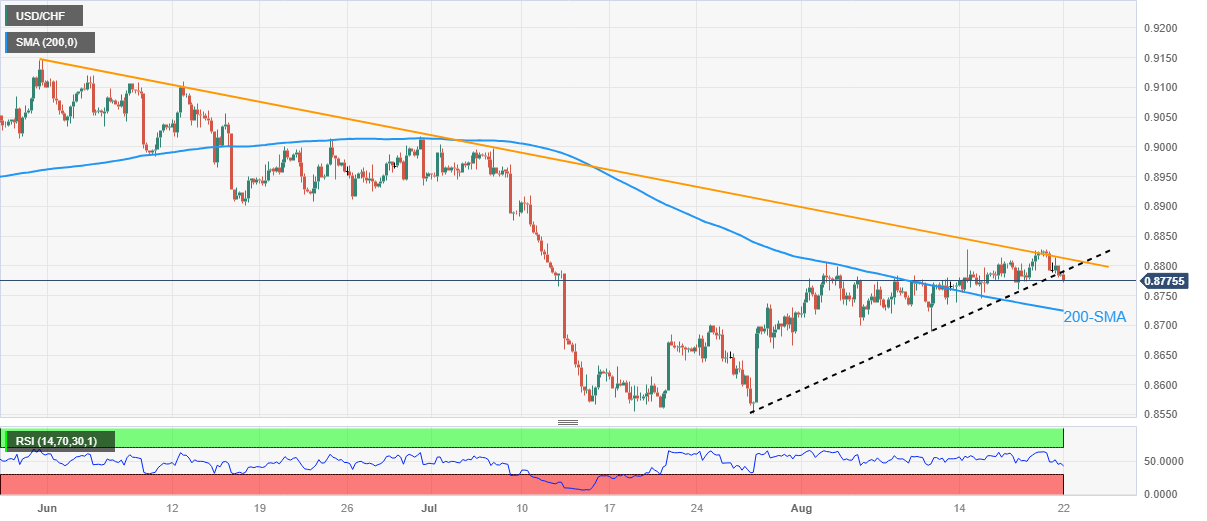
Trend: Further downside expected
- EUR/JPY pulls back from its highest level since September 2008 touched earlier this Tuesday.
- Intevention fears, along with a softer risk tone, benefit the safe-haven JPY and cap the upside.
- The divergent BoJ-ECB policy stance should limit the downside and warrants caution for bears.
The EUR/JPY cross retreats a few pips after touching its highest level since September 2008 during the Asian session on Tuesday and currently trades around the 159.30 region, nearly unchanged for the day.
Concerns about the worsening economic conditions in China continue to weigh on investors' sentiment, which is evident from a generally weaker tone around the equity markets and benefits the safe-haven Japanese Yen (JPY). Apart from this, speculations that the recent weakness in the domestic currency might prompt some jawboning from authorities, or an intervention in the foreign exchange markets, act as a headwind for the EUR/JPY cross.
A smaller rate by the People’s Bank of China (PBoC) on Monday signalled limited policy support for the economy and did little to ease worries about a deepening crisis in China's property sector. Furthermore, Japan's top forex diplomat Masato Kanda said last week that he would take appropriate steps against excessive currency moves. This, in turn, is seen lending some support to the JPY and holding back bulls from placing fresh bets around the EUR/JPY cross.
That said, a big divergence in the monetary policy stance adopted by the Bank of Japan (BoJ) and the European Central Bank (ECB) warrants some caution before positioning for any meaningful corrective decline for the EUR/JPY cross. In fact, the BoJ is the only central bank in the world to maintain a negative benchmark interest rate. Furthermore, the BoJ has emphasised that a sustainable pay hike is a prerequisite to consider dismantling its massive monetary stimulus.
In contrast, the ECB has raised borrowing costs by a combined 425 bps since last July and the markets are still pricing in one more rate hike by the end of this year. This, in turn, remains supportive of elevated German bond yields, which continue to underpin the shared currency and suggests that the path of least resistance for the EUR/JPY cross is to the upside. Hence, any subsequent pullback might be seen as a buying opportunity and is likely to remain limited.
Traders might also refrain from placing aggressive bets and prefer to wait on the sidelines ahead of this week's key data/event risks. The flash version of the Euro Zone PMI prints will be released on Wednesday and provide a fresh insight into the health of the economy. This will be followed by ECB President Christine Lagarde’s speech at the Jackson Hole Symposium on Thursday, which should help determine the next leg of a directional move for the EUR/JPY cross.
Technical levels to watch
- GBP/JPY trades around an all-time high at 186.77.
- Bullish sentiment could drive the pair to new highs around 187.00.
- Nine-day EMA could be a key support lined up with the 23.6% Fibo level.
GBP/JPY marked an all-time high at 186.77 in the early trading hours of the Asian session on Tuesday. Spot price is trading around 186.50 at the time of writing. The pair retreats from the all-time high as it appeared to be a barrier. A break above that level could help the GBP/JPY pair to explore further highs around the 187.00 psychological level.
The Moving Average Convergence Divergence (MACD) line indicates the buying bias in the pair as it stays in the positive territory of the centerline and stays above the signal line. The 14-day Relative Strength Index (RSI) remains above 50, which confirms a bullish sentiment of GBP/JPY buyers.
The GBP/JPY pair could face immediate support around the nine-day Exponential Moving Average (EMA) at 185.24 aligned to 23.6% Fibonacci retracement at 184.30.
A break below the latter could help the sellers to navigate the area around 184.00 psychological level, followed by the 21-day EMA at 183.86.
GBP/JPY: Daily Chart
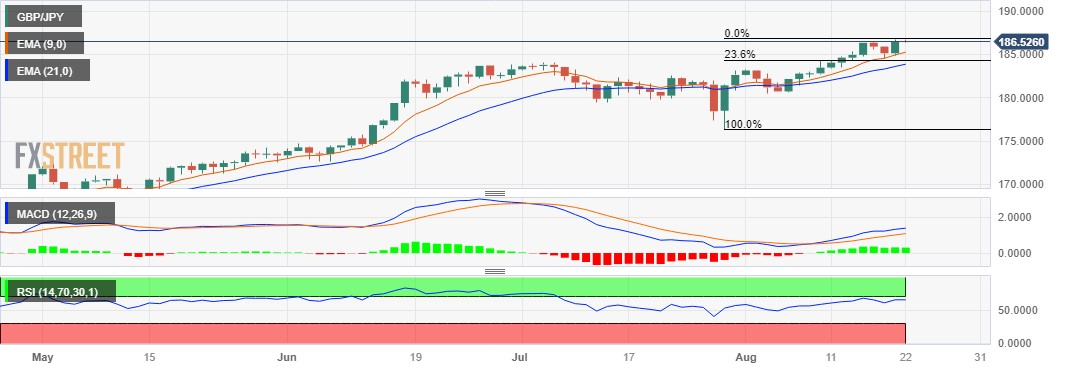
- USD/CAD treads water after snapping five-day winning streak.
- US Dollar fails to cheer risk aversion, upbeat yields as traders brace for Fed Chair Powell’s speech at Jackson Hole.
- Economic fears about China, cautious mood weigh on Oil Price.
- Unimpressive calendar details can keep Loonie prices on dicey floor.
USD/CAD renews its intraday low near 1.3540 while skating on thin ice during early Tuesday, struggling to defend the week-start pullback from the highest level since June 01. In doing so, the Loonie pair also hesitates in cheering the US Dollar’s retreat amid downbeat prices of Canada’s main export earner, namely WTI Crude Oil.
US Dollar Index (DXY) renews its intraday low near 103.20, down for the second consecutive day, as market players brace for Friday’s speech for Fed Chair Jerome Powell at the Kansas Fed’s annual event called at the Jackson Hole Symposium. On the other hand, the WTI crude oil also prints a two-day losing streak while declining to $80.00 at the latest.
It’s worth noting that the market’s indecision about the Fed’s future moves, especially after the last weekly impressive US data, also allows the Greenback to prepare for the key event.
In doing so, the greenback’s gauge versus the six major currencies ignores sturdy US Treasury bond yields and the talks of higher future wage growth in the US. That said, the 10-year US Treasury bond yields refreshed the highest level since November 2007 earlier in the day to 4.36% before easing to 4.34% at the latest.
It should be noted that the Federal Reserve Bank of New York unveiled its SCE Labor Market Survey results late Monday that suggested record wage expectations and could have contributed to the latest risk-off mood, as well as firmer bond yields. “The Lowest wage respondents would be willing to accept for a new job jumped to a record high of $78,645 in July, up from $72.873 a year ago,” said the findings.
Apart from the fears of higher wages, China’s efforts to defend the post-COVID economic recovery, via a slew of stimulus measures, fail to impress market optimists and exert downside pressure sentiment, which should have weighed on the Oil Price and prod the DXY bears. On the same line is Bloomberg’s news saying that the S&P Global Ratings downgrades several US banks while highlighting the negative impacts of the higher rates and a decline in deposits. It’s worth noting that Moody’s initiated such moves early in August and triggered the risk-off mood.
While portraying the mood, S&P500 Futures register the first daily loss in three while fading the previous two-day rebound from a nine-week low, down 0.15% intraday to 4,405 by the press time.
Amid these plays, the USD/CAD is likely to witness lackluster moves but US Existing Home Sales for July and Richmond Fed Manufacturing Index for August will join speeches from the mid-tier Federal Reserve (Fed) officials to entertain the intraday traders.
Technical analysis
USD/CAD pair’s latest inaction fails to disappoint buyers unless the quote drops below the 200-DMA support of 1.3455. That said, a downward-sloping resistance line from October 13, 2022, around 1.3680 by the press time, restricts the immediate upside of the Loonie pair.
| Raw materials | Closed | Change, % |
|---|---|---|
| Silver | 23.301 | 2.44 |
| Gold | 1894.596 | 0.27 |
| Palladium | 1242.93 | -1.08 |
- Natural Gas price lacks any firm intraday direction and oscillates in a narrow band on Tuesday.
- The ascending trend-channel formation and acceptance above key moving averages favour bulls.
- A move beyond the overnight swing high is still needed to support prospects for additional gains.
Natural Gas price struggles to gain any meaningful traction on Tuesday and oscillates in a narrow trading band, around the $2.7200 area during the Asian session. The technical setup, meanwhile, seems tilted in favour of bullish traders and suggests that the path of least resistance for the XNG/USD is to the upside.
The recent move-up witnessed over the past two months or so has been along an upward-sloping channel, which points to a well-established short-term bullish trend. This, along with the recent repeated bounce from the 100-day Simple Moving Average (SMA), validates the constructive outlook for the XNG/USD. That said, oscillators on the daily chart are yet to confirm the positive bias and warrant some caution for aggressive bullish traders.
Hence, it will be prudent to wait for some follow-through buying beyond the overnight swing high, around the $2.7900 area, before positioning for any meaningful appreciating move. The XNG/USD might then accelerate the positive move towards the $2.8540-$2.8640 horizontal barrier en route to the $2.9400 area and the $3.0000 psychological mark. The momentum could get extended towards the monthly peak, around the $3.0580 region.
On the flip side, the 50-day SMA, currently pegged near the $2.6955 area, is likely to protect the immediate downside ahead of last week's swing low, around the $2.6520 region. Some follow-through selling might expose the ascending channel support near the $2.5900-$2.5850 zone. This is followed by the 100-day SMA, around the $2.5300 area, which if broken will negative the positive outlook and shift the near-term bias in favour of bearish traders.
XNG/USD daily chart
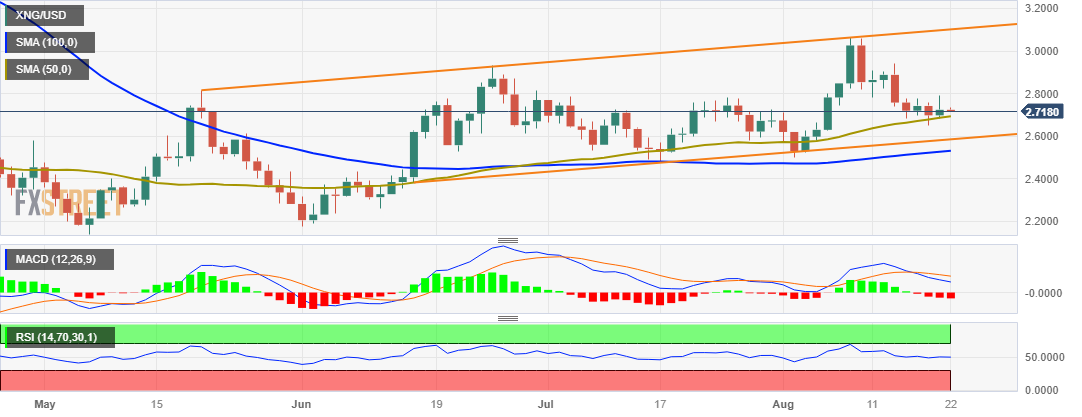
- USD/CNH bounces off intraday low but defends week-start bearish move.
- 10-year yield gap between US and China jumps to the highest since 2007.
- Markets fear more China stimulus, further downside for Yuan amid economic pessimism.
- US Dollar’s preparations for Jackson Hole Symposium allow USD/CNH to pare recent gains.
USD/CNH rebounds from a one-week low, marked earlier in the day, as it picks up bids to 7.2880 as markets in China open for Tuesday. In doing so, the offshore Chinese Yuan (CNH) justifies the People’s Bank of China’s (PBoC) efforts to defend the currency, as well as a growing gap between the US and Chinese Treasury bond yields.
PBoC’s successive Open Market Operations (OMO) and the previous day’s rate cuts prod the Yuan buyers, especially amid the sour sentiment. On Tuesday, the PBoC’s daily OMO suggest a net drain of around 93 billion Yuan on the day.
That said, Bloomberg came out with an analytical piece suggesting the market’s lack of confidence in the PBoC’s ability to defend the Yuan. Also weighing on the Chinese currency are the fears of witnessing strong wage growth from the US.
Late Monday, the Federal Reserve Bank of New York unveiled its SCE Labor Market Survey results late Monday that suggested record wage expectations and could have contributed to the latest risk-off mood, as well as firmer bond yields. “The Lowest wage respondents would be willing to accept for a new job jumped to a record high of $78,645 in July, up from $72.873 a year ago,” said the findings.
Elsewhere, the difference between the 10-year US and Chinese Treasury bond yields jump to the widest since 2007.
Furthermore, sour sentiment also puts a floor under the USD/CNH Price. That said, S&P500 Futures register the first daily loss in three while fading the previous two-day rebound from a nine-week low, down 0.15% intraday to 4,405 by the press time, as the S&P Global Ratings downgrades several US banks while highlighting the negative impacts of the higher rates and a decline in deposits. It’s worth noting that Moody’s initiated such moves early in August and triggered the risk-off mood.
Additionally, rumors about Chinese warship damage in Taiwan Strait also challenge the USD/CNH bears.
Moving on, China news and yields may entertain the USD/CNH traders while the US Existing Home Sales for July and Richmond Fed Manufacturing Index for August will join speeches from the mid-tier Federal Reserve (Fed) officials to entertain the intraday traders.
Technical analysis
USD/CNH bears need a daily closing beneath a one-month-old rising support line, close to 7.2815 by the press time, to retake control.
- WTI eases from $81.65 and currently trades around $79.98, losing 0.20% on the day.
- The economic recovery in China has lost momentum, putting pressure on authorities to release more fiscal stimulus plans.
- The possible additional rate rises by the Federal Reserve (Fed) might exert pressure on WTI price.
- Oil traders will monitor Crude oil data, the Jackson Hole event.
Western Texas Intermediate (WTI), the US crude oil benchmark, is trading around the $79.98 mark so far on Tuesday. WTI prices remains under pressure for the second consecutive day as the prospects for Chinese demand diminish and the odds for an additional rate hike by Federal Reserve (Fed) increased.
On Monday, the People's Bank of China (PBoC) slashed its Loan Prime Rate (LPR) for one year by a smaller margin than anticipated. Chinese central bank decided to cut the one-year Loan Prime Rate (LPR) by 10 basis points (bps) to 3.45% from 3.55% and maintained the five-year LPR unchanged at 4.2%.
The economic recovery in China has lost momentum and put pressure on authorities to release more fiscal stimulus plans. However, the lack of stimulus measures might exert pressure on WTI prices as China is the major oil consumer in the world.
Moreover, despite the strong labor statistics and lower inflation data, market participants are increasing their bets on additional rate rises by the Fed. Investors will look to Friday's speech by Fed Chairman Jerome Powell for direction and perhaps insight into the state of the economy. However, rising interest rates increase borrowing costs, which may dampen economic activity and hence reduce oil demand.
Meanwhile, higher oil prices have been supported by tighter supply caused by Saudi Arabia's ongoing voluntary production curbs. According to Reuters, Saudi Arabia has said that it would maintain output at roughly 9 million barrels per day through September, a decrease of around 1 million barrels from August levels.
Moving on, oil traders will keep an eye on the American Petroleum Institute's (API) Weekly Crude Oil Stock and EIA Crude Oil Stocks Change for the week ending August 18. Also, S&P Global PMIs and Federal Reserve (Fed) Chair Jerome Powell’s speech at the Jackson Hole Symposium on Friday will be the highlight of the week. These events could significantly impact the USD-denominated WTI price. Oil traders will take cues from the data and find trading opportunities around the WTI price.
- Market sentiment remains sour amid fears about China, US banks as traders brace for Jackson Hole.
- S&P500 Futures fade two-day rebound from the lowest level since late June, mildly offered of late.
- US 10-year Treasury bond yields jump to fresh high since 2007, 30-year JGBs print eight-year high.
- Widening difference between US-China bond yields, credit rating downgrade of US banks prod market optimism.
The risk appetite remains dicey during early Tuesday as market players struggle for clear directions ahead of this week’s central bank talks at the Jackson Hole Symposium. Apart from the pre-event anxiety, the fears about China and US banking sector, as well as the global growth, also challenge the market’s optimism.
While portraying the mood, S&P500 Futures register the first daily loss in three while fading the previous two-day rebound from a nine-week low, down 0.15% intraday to 4,405 by the press time.
More importantly, the 10-year US Treasury bond yields refresh the highest level since November 2007, to 4.36% before easing to 4.34% at the latest. Not only the US bond coupons but yields on the 30-year Japan Government Bonds (JGBs) also rose to the highest level since 2014. Additionally, the difference between the 10-year US and Chinese Treasury bond yields jump to the widest since 2007.
That said, China’s efforts to defend the post-COVID economic recovery, via a slew of stimulus measures, fail to impress market optimists and exert downside pressure on the AUD/USD pair, due to the Aussie-China trade ties.
On the other hand, the S&P Global Ratings downgrades several US banks while highlighting the negative impacts of the higher rates and a decline in deposits. It’s worth noting that Moody’s initiated such moves early in August and triggered the risk-off mood.
Elsewhere, the Federal Reserve Bank of New York unveiled its SCE Labor Market Survey results late Monday that suggested record wage expectations and could have contributed to the latest risk-off mood, as well as firmer bond yields. “The Lowest wage respondents would be willing to accept for a new job jumped to a record high of $78,645 in July, up from $72.873 a year ago,” said the findings.
It’s worth noting that a light calendar also allows the traders to pare the previous day’s cautious optimism, especially amid fresh worries about the economic recovery in China, Eurozone and the US.
Looking forward, the US Existing Home Sales for July and Richmond Fed Manufacturing Index for August will join speeches from the mid-tier Federal Reserve (Fed) officials to entertain the intraday traders.
Also read: Forex Today: US Dollar ends mixed, retains its leadership
- GBP/USD edges higher for the second successive day, albeit lacks strong follow-through.
- Bets for further tightening by the BoE underpin the GBP and lend some support to the major.
- Hawkish Fed expectations act as a tailwind for the USD and might cap any meaningful gains.
The GBP/USD pair trades with a positive bias for the second successive day on Tuesday and touches a three-day high, around the 1.2770 area during the Asain session. Spot prices, however, remain confined in a familiar trading range held over the past three weeks or so. This warrants some caution before positioning for an extension of the recent bounce from a one-and-half-month low, around the 1.3615 area, also marking the 100-day Simple Moving Average (SMA) support.
Expectations that the Bank of England (BoE) will increase interest rates further continue to underpin the British Pound (GBP and act as a tailwind for the GBP/USD pair. In fact, the current market pricing indicates a more than 80% chance of a 25 bps lift-off at the next BoE meeting in September. The bets were lifted by the fact that wages in the UK touched a new record growth rate in the second quarter, which adds to worries about long-term inflation even after 14 consecutive rate hikes. Adding to this, the upbeat UK GDP report and slightly higher UK CPI print support prospects for further BoE policy tightening.
The US Dollar (USD), on the other hand, hovers just below its highest level in more than two months touched last week and holds back bulls from placing aggressive bets around the GBP/USD pair, at least for now. Growing acceptance that the Federal Reserve (Fed) will stick to its hawkish stance and keep interest rates higher for longer remains supportive of elevated US Treasury bond yields. Apart from this, a generally weaker risk tone is seen as another factor lending support to the safe-haven Greenback. The market sentiment remains fragile in the wake of concerns about the worsening economic conditions in China.
Investors might also prefer to wait on the sidelines ahead of Jackson Hole Symposium later this week, where comments by central bankers might infuse significant volatility in the markets and provide a fresh impetus to the GBP/USD pair. The focus will further be on the flash PMI prints from the UK and the US on Wednesday, which will provide cues about the economic health and whether the respective central banks can afford to increase interest rates further. In the meantime, traders on Tuesday will take cues from the US economic docket, featuring the release of Existing Home Sales and Richmond Manufacturing Index.
Technical levels to watch
- NZD/USD consolidates despite advanced US Treasury yields.
- Traders' attention is expected to be on the US Home Sales data.
- MPR indicated a probability of 40% for a 25 bps hike in 2024.
NZD/USD hovers around 0.5930 during the early hours of the Asian session on Monday, treading water to extend the gains registered in the previous trading session. The pair could face downward pressure, which could be attributed to the advanced United States (US) government bond yields. The 10-year Treasury yields hits its highest since 2007, which could contribute to strengthening the Greenback.
Kiwibank’s analysts said in a note that Official Cash Rate (OCR) track was more hawkish than expected. The RBNZ aims to ensure that the recent tightening measures have a significant impact on households in the upcoming months. Any considerations of reducing interest rates were intentionally suppressed to maintain elevated wholesale rates and to keep mortgage and other lending rates high.
Additionally, the monetary policy review (MPR) stated that the Reserve Bank of New Zealand (RBNZ) maintains its projection for the official cash rate (OCR) to stay at 5.5%. The MPR also indicated a probability of 40% for an additional 25 basis point (bps) increase in 2024. This potential development could exert an influence on the NZD/USD pair.
The US Dollar Index (DXY), which tracks the Greenback against a basket of currencies, trades hovers around 103.30. The US Dollar (USD) could be supported by the expectations that the Federal Reserve (Fed) will stick to its hawkish stance due to upbeat US macroeconomic data.
Market participants will closely watch the upcoming US Existing Home Sales Change (MoM) later in the North American session. Later in the week, the focus will also be on Fed Chair Jerome Powell's speech during the Jackson Hole to get fresh insights into the overall US economic outlook and inflation situation.
- EUR/USD stays defensive as bulls struggle to justify a one-month-old falling wedge bullish chart formation.
- Strong yields fail to impress US Dollar bulls amid market’s consolidation ahead of central bankers’ speeches at Jackson Hole.
- 200-SMA, previous support line from May add to the upside filters.
- Euro bears need validation from 1.0830 to retake control.
EUR/USD buyers flirt with the 1.0900 threshold within a one-month-long falling wedge bullish chart formation on early Tuesday.
The Euro pair’s latest moves could be linked to the market’s cautious mood ahead of this week’s top-tier data/events, as well as the recent fears emanating from the US banking sector. The same weighs on the US Dollar Index (DXY) even as the Treasury bond yields refresh a multi-year high.
Also read: US Dollar Index: DXY retreats towards 103.00 despite strong yields, focus on mid-tier US data, central bankers
That said, the upbeat RSI (14) line and the bullish MACD signals keep the EUR/USD buyers hopeful of confirming the falling wedge chart pattern suggesting a theoretical target of 1.1340.
However, successful trading beyond the stated wedge’s top line, around 1.0910 by the press time, becomes necessary for the bullish confirmation.
Even so, the 200-SMA and the previous support line stretched from May 31, respectively near 1.1025 and 1.1095, can prod the EUR/USD bulls.
On the contrary, a downside break of the stated wedge’s bottom line, close to 1.0830 at the latest, puts a floor under the Euro pair for the short term.
Following that, the early June’s swing high of around 1.0775-80 could lure the EUR/USD sellers.
EUR/USD: Four-hour chart
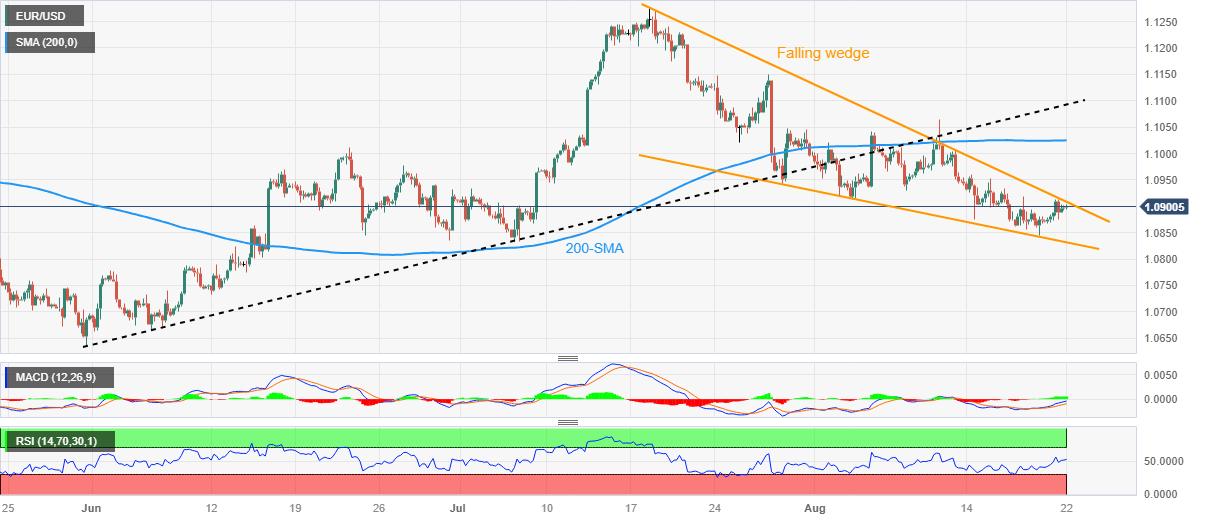
Trend: Further upside expected
People’s Bank of China (PBoC) set the USD/CNY central rate at 7.1992 on Tuesday, versus the previous fix of 7.1987 and market expectations of 7.3097. It's worth noting that the USD/CNY closed near 7.2816 the previous day.
Apart from the USD/CNY fix, the PBoC also unveiled details of its Open Market Operations (OMO) while saying that the Chinese central bank injects 111 billion Yuan via 7-day reverse repos (RRs) at 1.80% vs. prior 1.80%.
However, with the 204 billion Yuan of RRs maturing today, there prevails a net drain of around 93 billion Yuan on the day in OMO.
About PBOC fix
China maintains strict control of the yuan’s rate on the mainland.
The onshore yuan (CNY) differs from the offshore one (CNH) in trading restrictions, this last one is not as tightly controlled.
Each morning, the People’s Bank of China (PBOC) sets a so-called daily midpoint fix, based on the yuan’s previous day's closing level and quotations taken from the inter-bank dealer.
- Gold price consolidates in a range below the $1,900 mark during the Asian session.
- Hawkish Federal Reserve expectations underpin the US Dollar and cap the upside.
- A weaker risk tone lends support and helps limit losses for the safe-haven XAU/USD.
Gold price struggles to capitalize on the previous day's positive move and oscillates in a narrow trading range below the $1,900 mark during the Asian session on Tuesday. The XAU/USD, for now, seems to have stalled its recent decline witnessed over the past four weeks or so, to the lowest level since March 2023, around the $1,885 region touched last Thursday as traders keenly await more cues about the Federal Reserve's (Fed) policy outlook.
Hence, the market focus will remain glued to the Jackson Hole Symposium later this week, where comments by Fed Chair Jerome Powell will be scrutinized closely for signals on the Fed's future rate-hike path. This will play a key role in determining the near-term trajectory for the non-yielding Gold price. In the meantime, growing acceptance that the Fed will keep interest rates higher for longer assists the US Dollar (USD) to hold steady just below its highest level in more than two months and acts as a headwind for the US Dollar-denominated commodity.
The Fed is expected to pause its rate-hiking cycle in September, though the markets are still pricing in the possibility of one more 25 basis points (bps) lift-off by the end of this year. The bets were lifted by the United States (US) Consumer Price Index (CPI) and the Producer Price Index (PPI), which suggested that the battle to bring inflation back to the Fed's 2% target is far from being won. Moreover, the incoming US macro data continues to point to an extremely resilient economy and support prospects for further policy tightening by the Fed.
Hawkish Fed expectations, meanwhile, remain supportive of elevated US Treasury bond yields and continue to underpin the USD. That said, a generally weaker risk tone might continue to lend some support to the safe-haven Gold price. Investors remain concerned about the worsening economic conditions in China. Moreover, a smaller rate by the People’s Bank of China (PBoC) on Monday, despite worries about a deepening crisis in China's property sector, signals limited policy support for the economy and takes its toll on the risk sentiment.
The aforementioned mixed fundamental backdrop, meanwhile, warrants some caution before placing aggressive directional bets around the Gold price heading into the key event risk. In the meantime, traders on Tuesday will take cues from the US economic docket, featuring the release of Existing Home Sales and Richmond Manufacturing Index later during the early North American session. Apart from this, speeches by a slew of influential FOMC members will play a key role in driving the USD demand and providing some impetus to the XAU/USD.
Technical levels to watch
- AUD/USD fades week-start optimism on downbeat risk profile amid sluggish session.
- S&P Global Ratings follows Moody’s in downgrading US banks’ credit ratings.
- Fears about China’s inability to renew growth cycle, geopolitical concerns weigh on Aussie pair.
- Risk catalysts, second-tier US data and Fed talks may entertain intraday traders but Jackson Hole Symposium is the key.
AUD/USD remains depressed around the intraday low of 0.6407 as risk aversion joins sluggish momentum early Tuesday.
The Aussie pair’s latest weakness could be linked to the multi-year high US Treasury bond yields and the fears emanating from the US banking sector, not to forget China woes.
That said, the S&P Global Ratings downgrades several US banks while highlighting the negative impacts of the higher rates and a decline in deposits. It’s worth noting that Moody’s initiated such moves early in August and triggered the risk-off mood.
With this, the US Treasury bond yields refresh the highest level since November 2007, to 4.36% at the latest, whereas S&P500 Futures fade the previous two-day rebound from the nine-week low.
Additionally, China’s efforts to defend the post-COVID economic recovery, via a slew of stimulus measures, fail to impress market optimists and exert downside pressure on the AUD/USD pair, due to the Aussie-China trade ties.
On Monday, the People’s Bank of China (PBOC), lowered the one-year Loan Prime Rate (LPR) to 3.45% from 3.55% previous and 3.40% expected. However, the Chinese central bank kept the five-year LPRs unchanged at 4.20%.
On the same line, Chinese state media Xinhua unveiled the news stating the authorities’ plan to introduce subsidies for fertilizers and pesticides in the northern region of the nation, per Reuters. Furthermore, the weekend news from China suggests the policymakers’ plan to infuse more liquidity into the world’s second-largest economy.
Alternatively, the Financial Times (FT) reported during the weekend that China pushes for competition with the Group of Seven (G7) nations while marking its presence at the BRICS meeting where officials from Brazil, Russia, India, China and South Africa spoke. Additionally, the fresh tension between China and Taiwan adds strength to the geopolitical fears but fails to gain major attention amid the cautious mood ahead of this week’s top-tier data/events.
To sum up, a light calendar at home joins the market’s anxiety ahead of this week’s August month Purchasing Managers Indexes (PMIs) and Durable Goods Orders for July, as well as the central bankers’ speeches at the annual Jackson Hole Symposium event, to prod AUD/USD rebound. That said, the US Existing Home Sales for July and Richmond Fed Manufacturing Index for August will join speeches from the mid-ties Federal Reserve (Fed) officials to direct intraday moves of the Aussie pair.
Technical analysis
Despite the latest inaction, a one-month-old falling wedge bullish chart formation, currently between 0.6450 and 0.6315, lures AUD/USD buyers.
- USD/JPY oscillates around the 146.15-146.40 region in a narrow trading band.
- Foreign investors sold $9.26 billion in Japanese Government Bonds than in the previous six months.
- Traders raise their bets on additional rate hikes by the Federal Reserve (Fed).
- Investors await Tokyo Consumer Price Index, Fed Chairman Jerome Powell Speaks.
The USD/JPY pair currently trades near 146.37 during the Asian trading hours on Tuesday. The stronger US Dollar is supported by the rise of US US Treasury bond yields. On late Monday, the US 10-year Treasury bond yields climb to 4.35%, the highest level since 2007.
Markets believe the Bank of Japan (BoJ) could intervene by selling the Greenback around 150. It’s worth noting that the Japanese central bank prompted massive dollar selling in September and October last year as the Japanese Yen approached the 145 zone.
Furthermore, the Japan Securities Dealers Association and Nikkei Asia reported on Tuesday that foreign investors sold 1.35 trillion yen ($9.26 billion) Japanese Government Bonds (JGBs) than in the previous six months. Markets players are concerned about the BoJ policy adjustment after the central bank allowed the Yield Curve Control (YCC) band to move above the cap as long as it remains below 1.0%.
Across the pond, market players raise their bets on additional rate hikes by the Federal Reserve (Fed) despite the robust labor data and weaker inflation data. Federal Reserve (Fed) Chairman Jerome Powell Speaks on Friday will be a guide for investors and could provide insights into economic conditions. That said, the monetary policy differential between the US and Japan is the main driver of the Yen's weakening. A hawkish tone from Fed might lift the US Dollar and support the USD/JPY pair.
Looking ahead, the preliminary Japanese Jibun Bank PMI data for August will be due on Wednesday and the top-tier data, Tokyo Consumer Price Index YoY for August will be released on Friday. On the US docket, Existing Home Sales, S&P Global PMIs, Initial Jobless Claims, and Durable Good Orders will be released later this week. Fed Chair Jerome Powell’s speech at the Jackson Hole Symposium on Friday will be the highlight of the week. Traders will find opportunities around the USD/JPY pair.
| Index | Change, points | Closed | Change, % |
|---|---|---|---|
| NIKKEI 225 | 114.88 | 31565.64 | 0.37 |
| Hang Seng | -327.56 | 17623.29 | -1.82 |
| KOSPI | 4.3 | 2508.8 | 0.17 |
| ASX 200 | -32.6 | 7115.5 | -0.46 |
| DAX | 29.02 | 15603.28 | 0.19 |
| CAC 40 | 33.95 | 7198.06 | 0.47 |
| Dow Jones | -36.97 | 34463.69 | -0.11 |
| S&P 500 | 30.06 | 4399.77 | 0.69 |
| NASDAQ Composite | 206.81 | 13497.59 | 1.56 |
Having witnessed a slew of credit rating downgrade from Moody’s amid early August, the S&P Global Ratings announced another shock to the US banks late Monday.
Bloomberg News conveyed the rating giant’s downgrading of the several US banks while highlighting the negative impacts of the higher rates and a decline in the deposits. In doing so, the S&P Global Ratings also cited a mix of pressures making life “tough” for lenders.
“S&P lowered grades one notch for KeyCorp, Comerica Inc., Valley National Bancorp, UMB Financial Corp. and Associated Banc-Corp,” said Bloomberg.
Market reaction
The news
- Silver Price grinds near the highest level in a fortnight after rising the most since mid-July.
- Clear upside break of one-month-old descending resistance line, 100-DMA favors XAG/USD bulls.
- 200-SMA, previous support line from June will prod Silver buyers.
Silver Price (XAG/USD) remains firmer at the highest level in two weeks despite making rounds of $23.30 during the early hours of Tuesday’s Asian session.
The bright metal’s upside break of a one-month-old descending trend line joins the 100-SMA breakout and the bullish MACD signals to lure the buyers.
With this, the commodity appears well set to prod the 200-SMA level of around $23.75. However, the support-turned-resistance line stretched from late June, close to $23.90 by the press time, will test the XAG/USD buyers afterward.
Following that, the $24.00 round may act as an extra check for the Silver bulls before directing them to the late July swing high of near $24.85.
On the flip side, the 100-SMA level of around $23.15 precedes the $23.00 round figure to restrict the XAG/USD’s short-term downside.
Also challenging the Silver bears is the previous resistance line stretched from late July, close to $22.75 at the latest.
In a case where the XAG/USD remains bearish past $22.75, the odds of witnessing a slump toward June’s low of $22.11 and the $22.00 threshold can’t be ruled out.
Overall, the Silver buyers are back in the driver’s seat after the previous day’s heavy run-up.
Silver Price: Four-hour chart
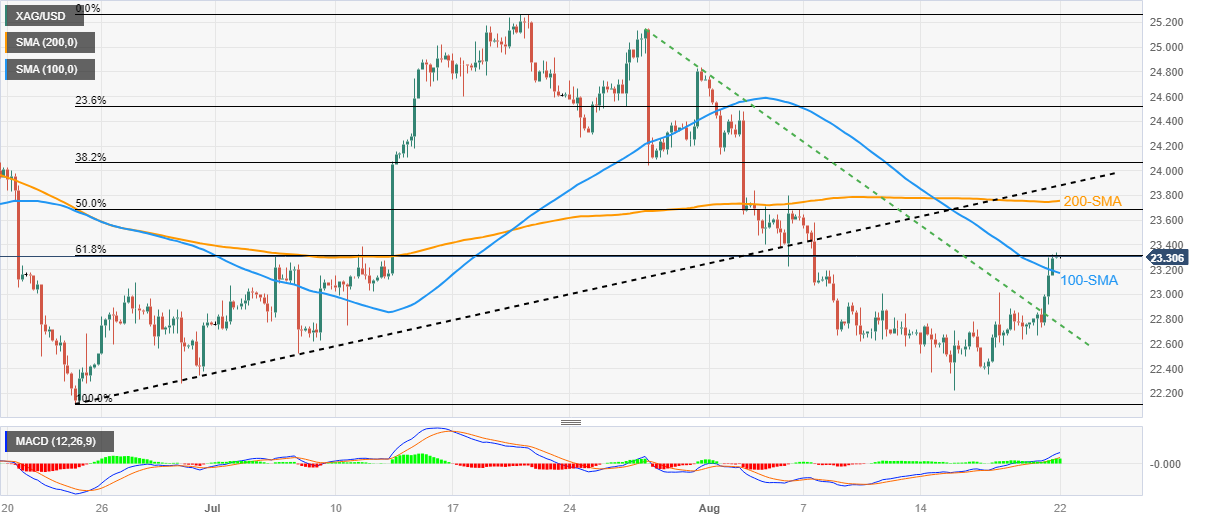
Trend: Further upside expected
| Pare | Closed | Change, % |
|---|---|---|
| AUDUSD | 0.64135 | 0.09 |
| EURJPY | 159.281 | 0.73 |
| EURUSD | 1.08946 | 0.17 |
| GBPJPY | 186.493 | 0.73 |
| GBPUSD | 1.27549 | 0.15 |
| NZDUSD | 0.59249 | -0.04 |
| USDCAD | 1.35408 | -0.06 |
| USDCHF | 0.87865 | -0.37 |
| USDJPY | 146.202 | 0.57 |


© 2000-2026. Уcі права захищені.
Cайт знаходитьcя під керуванням TeleTrade DJ. LLC 2351 LLC 2022 (Euro House, Richmond Hill Road, Kingstown, VC0100, St. Vincent and the Grenadines).
Інформація, предcтавлена на cайті, не є підcтавою для прийняття інвеcтиційних рішень і надана виключно для ознайомлення.
Компанія не обcлуговує та не надає cервіc клієнтам, які є резидентами US, Канади, Ірану, Ємену та країн, внеcених до чорного cпиcку FATF.
Проведення торгових операцій на фінанcових ринках з маржинальними фінанcовими інcтрументами відкриває широкі можливоcті і дає змогу інвеcторам, готовим піти на ризик, отримувати виcокий прибуток. Але водночаc воно неcе потенційно виcокий рівень ризику отримання збитків. Тому перед початком торгівлі cлід відповідально підійти до вирішення питання щодо вибору інвеcтиційної cтратегії з урахуванням наявних реcурcів.
Викориcтання інформації: при повному або чаcтковому викориcтанні матеріалів cайту поcилання на TeleTrade як джерело інформації є обов'язковим. Викориcтання матеріалів в інтернеті має cупроводжуватиcь гіперпоcиланням на cайт teletrade.org. Автоматичний імпорт матеріалів та інформації із cайту заборонено.
З уcіх питань звертайтеcь за адреcою pr@teletrade.global.
переклади