- Аналітика
- Новини та інструменти
- Новини ринків
Новини ринків
- GBP/USD trades on a stronger note around 1.2720 in Thursday’s early Asian session.
- The FOMC Minutes showed the participants worried over the lack of progress on inflation towards its 2% target.
- The UK CPI rose by 2.3% YoY in April, compared to 3.2% in March, above the consensus of 2.1%.
The GBP/USD pair extends the rally near 1.2720 during the early Asian section on Thursday. The uptick of the major pair is bolstered by the hotter-than-expected UK CPI inflation data, which slashed June rate cut bets from the Bank of England (BoE). Later in the day, the flash Purchasing Managers Index (PMI) reports from the UK and US will be released.
The minutes from the recent policy meeting of the Federal Open Market Committee (FOMC) released Wednesday showed that the officials expressed more concern about inflation as it was more stubborn than expected to start in 2024, making the Fed lack the confidence to move forward on interest rate cuts. Fed Chair Jerome Powell highlighted last week that the Fed will “need to be patient and let restrictive policy do its work” as inflation remains high. Investors see nearly 60% odds of first-rate cuts from the Fed in September, according to the CME FedWatch Tool.
On the other hand, inflation in the UK cooled down less than expected in April, prompting investors to lower their bets on the BoE rate cut next month. The nation’s Consumer Price Index (CPI) rose by 2.3% YoY in April, compared to 3.2% in March. This figure registered the lowest level since July 2021, the Office for National Statistics reported Wednesday. The hotter UK CPI inflation boosts the Pound Sterling (GBP) and creates a tailwind for the GBP/USD pair. The markets slashed the possibility of a BoE rate cut in June to just 18%, down from 50% on Tuesday.
The preliminary reading of Australia's Judo Bank Manufacturing Purchasing Managers Index (PMI) remained steady at 49.6 in May from 49.6 in April, the latest data published by Judo Bank and S&P Global showed on Thursday.
The Judo Bank Australian Services PMI dropped to 53.1 in May from the previous reading of 53.6, while the Composite PMI eased to 52.6 in May versus 53.0 prior.
Market reaction
At the press time, the AUD/USD pair was up 0.06% on the day to trade at 0.6623.
Australian Dollar FAQs
One of the most significant factors for the Australian Dollar (AUD) is the level of interest rates set by the Reserve Bank of Australia (RBA). Because Australia is a resource-rich country another key driver is the price of its biggest export, Iron Ore. The health of the Chinese economy, its largest trading partner, is a factor, as well as inflation in Australia, its growth rate and Trade Balance. Market sentiment – whether investors are taking on more risky assets (risk-on) or seeking safe-havens (risk-off) – is also a factor, with risk-on positive for AUD.
The Reserve Bank of Australia (RBA) influences the Australian Dollar (AUD) by setting the level of interest rates that Australian banks can lend to each other. This influences the level of interest rates in the economy as a whole. The main goal of the RBA is to maintain a stable inflation rate of 2-3% by adjusting interest rates up or down. Relatively high interest rates compared to other major central banks support the AUD, and the opposite for relatively low. The RBA can also use quantitative easing and tightening to influence credit conditions, with the former AUD-negative and the latter AUD-positive.
China is Australia’s largest trading partner so the health of the Chinese economy is a major influence on the value of the Australian Dollar (AUD). When the Chinese economy is doing well it purchases more raw materials, goods and services from Australia, lifting demand for the AUD, and pushing up its value. The opposite is the case when the Chinese economy is not growing as fast as expected. Positive or negative surprises in Chinese growth data, therefore, often have a direct impact on the Australian Dollar and its pairs.
Iron Ore is Australia’s largest export, accounting for $118 billion a year according to data from 2021, with China as its primary destination. The price of Iron Ore, therefore, can be a driver of the Australian Dollar. Generally, if the price of Iron Ore rises, AUD also goes up, as aggregate demand for the currency increases. The opposite is the case if the price of Iron Ore falls. Higher Iron Ore prices also tend to result in a greater likelihood of a positive Trade Balance for Australia, which is also positive of the AUD.
The Trade Balance, which is the difference between what a country earns from its exports versus what it pays for its imports, is another factor that can influence the value of the Australian Dollar. If Australia produces highly sought after exports, then its currency will gain in value purely from the surplus demand created from foreign buyers seeking to purchase its exports versus what it spends to purchase imports. Therefore, a positive net Trade Balance strengthens the AUD, with the opposite effect if the Trade Balance is negative.
- EUR/USD declined on post-FOMC Greenback bid.
- Odds of a September rate cut are getting a second look from investors.
- EU & US PMIS in the barrel for Thursday.
EUR/USD knocked lower on Wednesday after the Federal Reserve’s (Fed) latest Meeting Minutes revealed the Federal Open Market Committee (FOMC) are grimly determined to wait for more proof inflation will ease to 2%, sending risk appetite lower as rate-cut-hungry investors keep hoping for dovish signs from the US central bank.
While the FOMC’s latest Meeting Minutes didn’t rule out a September rate cut directly, investors are growing nervous that the Fed will not be able to find enough confirming data that inflation is making definitive progress to the Fed’s 2% annual inflation target. Odds of a September quarter-point rate cut have eased to 60% according to the CME’s FedWatch Tool.
Read more: Fed Minutes leave the door open to a probable rate cut in September
On Thursday, pan-European Purchasing Managers Index (PMI) data is expected to recover. The EU’s Manufacturing PMI in May is expected to climb to 46.2 from 45.7, while the Services PMI is expected to tick upwards slightly to 53.5 from 53.3.
US PMI figures will follow during Thursday’s US market session, with both the Manufacturing and Services PMIs expected to hold steady at 50.0 and 51.3, respectively.
EUR/USD technical outlook
EUR/USD has drifted below the 200-hour Exponential Moving Average (EMA) at 1.0834, and the Fiber is battling to keep afloat of the 1.0820 level. The pair has eased back after a failed bull run at the 1.0900 handle.
Daily candles are inching towards the 200-day EMA at 1.0802, and EUR/USD has closed in the red for three of the last four straight trading days. Despite a near-term bearish pullback, the pair is still up from the last major swing low into 1.0600 in mid-April.
EUR/USD hourly chart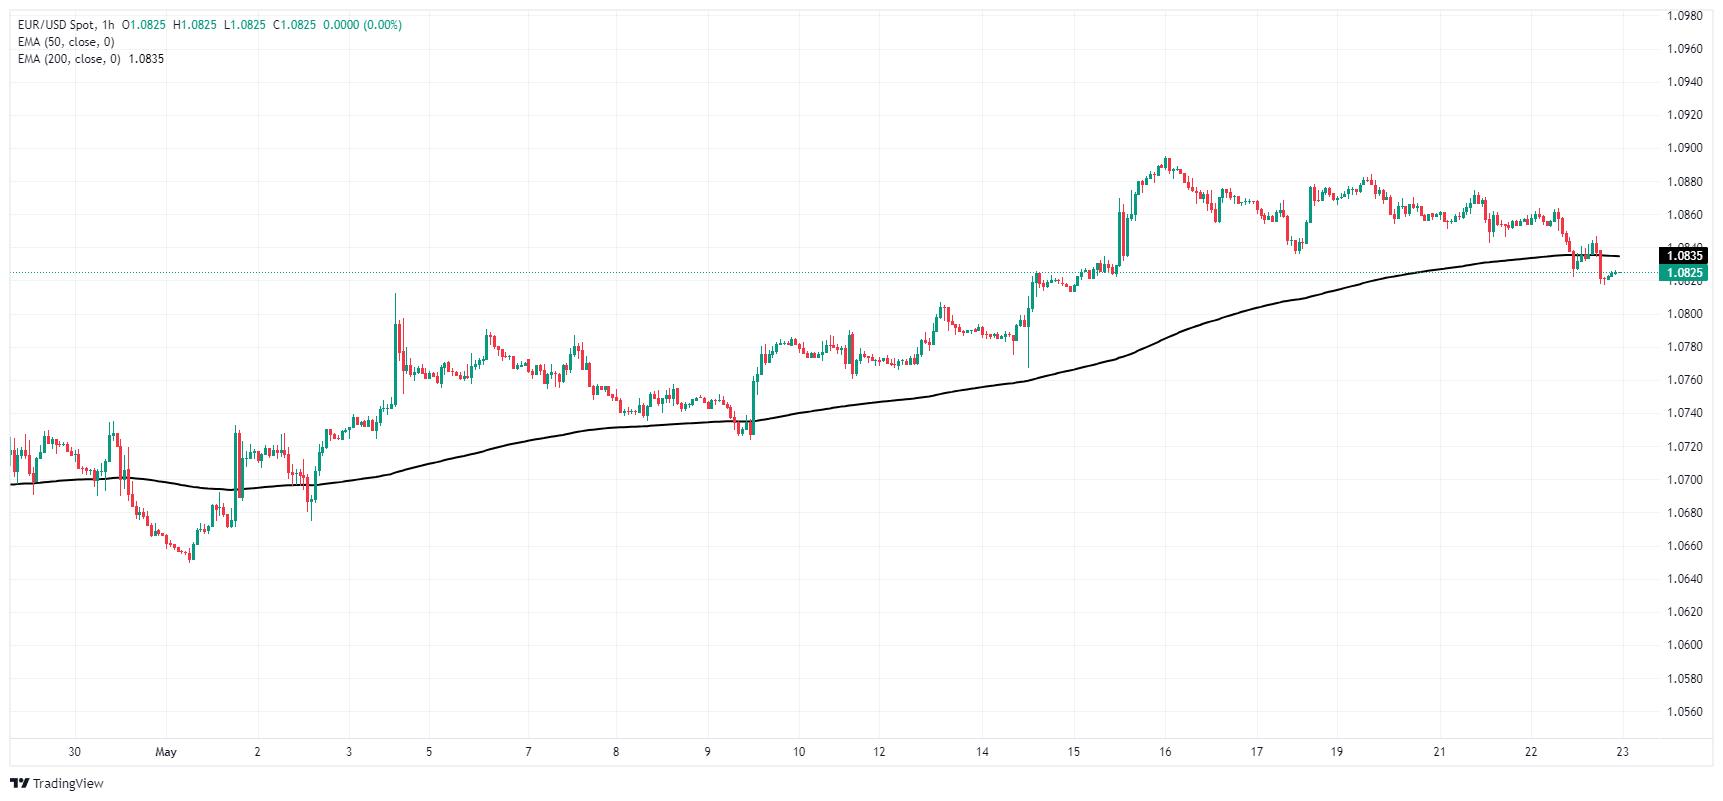
EUR/USD daily chart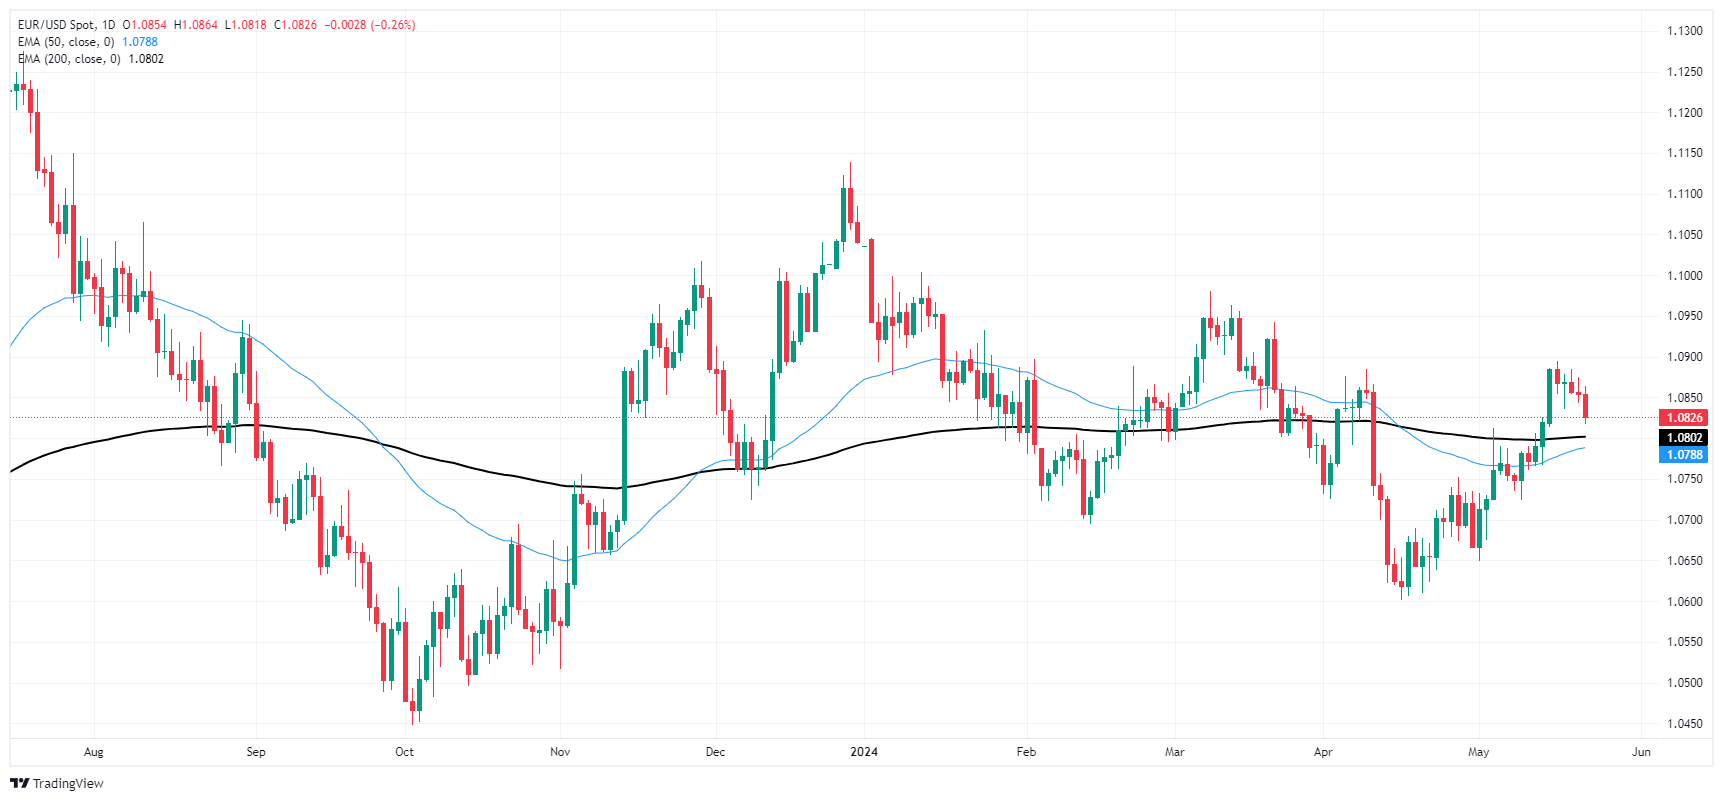
New Zealand’s Retail Sales, a measure of the country’s consumer spending, rose 0.5% QoQ in the first quarter of 2024 from the previous reading of a 1.8% fall, according to the official data published by Statistics New Zealand on Thursday. The figure came in better than market expectations with a decline of 0.3%.
Market reaction
The New Zealand Dollar NZD) attracts some buyers following the upbeat Retail Sales data. The NZD/USD pair is up 0.09% on the day at 0.6102.
New Zealand Dollar FAQs
The New Zealand Dollar (NZD), also known as the Kiwi, is a well-known traded currency among investors. Its value is broadly determined by the health of the New Zealand economy and the country’s central bank policy. Still, there are some unique particularities that also can make NZD move. The performance of the Chinese economy tends to move the Kiwi because China is New Zealand’s biggest trading partner. Bad news for the Chinese economy likely means less New Zealand exports to the country, hitting the economy and thus its currency. Another factor moving NZD is dairy prices as the dairy industry is New Zealand’s main export. High dairy prices boost export income, contributing positively to the economy and thus to the NZD.
The Reserve Bank of New Zealand (RBNZ) aims to achieve and maintain an inflation rate between 1% and 3% over the medium term, with a focus to keep it near the 2% mid-point. To this end, the bank sets an appropriate level of interest rates. When inflation is too high, the RBNZ will increase interest rates to cool the economy, but the move will also make bond yields higher, increasing investors’ appeal to invest in the country and thus boosting NZD. On the contrary, lower interest rates tend to weaken NZD. The so-called rate differential, or how rates in New Zealand are or are expected to be compared to the ones set by the US Federal Reserve, can also play a key role in moving the NZD/USD pair.
Macroeconomic data releases in New Zealand are key to assess the state of the economy and can impact the New Zealand Dollar’s (NZD) valuation. A strong economy, based on high economic growth, low unemployment and high confidence is good for NZD. High economic growth attracts foreign investment and may encourage the Reserve Bank of New Zealand to increase interest rates, if this economic strength comes together with elevated inflation. Conversely, if economic data is weak, NZD is likely to depreciate.
The New Zealand Dollar (NZD) tends to strengthen during risk-on periods, or when investors perceive that broader market risks are low and are optimistic about growth. This tends to lead to a more favorable outlook for commodities and so-called ‘commodity currencies’ such as the Kiwi. Conversely, NZD tends to weaken at times of market turbulence or economic uncertainty as investors tend to sell higher-risk assets and flee to the more-stable safe havens.
- AUD/USD tumbled more than 0.60% on Wednesday due to FOMC turning hawkish.
- Fed minutes hint at possible rate hikes if inflation risks increase, boosting US Treasury yields and the Dollar.
- Australian economic agenda includes Judo Bank Manufacturing and Services PMIs, showing mixed preliminary results for May.
- Upcoming US data: unemployment claims and S&P Global PMIs could influence AUD/USD.
The Australian Dollar registered losses against the US Dollar of 0.69% after the Federal Reserve hinted at raising rates if inflation warranted it, according to the latest meeting minutes. Therefore, US Treasury yields edged up, while the Greenback rose more than 0.20%, as depicted by the US Dollar Index (DXY). As Thursday’s Asian session begins, the AUD/USD trades at 0.6618, down 0.03%.
AUD/USD falls as Fed minutes suggest potential rate hikes, Australian PMI eyed
US equities finished Wednesday mixed ahead of NVIDIA’s earnings release. Global bond yields rose after inflation in the UK dipped, but it was above estimates, diminishing the odds of the Bank of England lowering rates.
Across the pond, the latest FOMC minutes revealed, "Various participants mentioned willingness to tighten policy further should risks to outlook materialize and make such action appropriate.”
The FOMC Minutes revealed that Fed officials remain uncertain about the current degree of policy restrictiveness. They noted that "it would take longer than previously anticipated to gain greater confidence in inflation moving sustainably to 2%."
On the Aussie’s front, Thursday’s economic docket will feature the release of the Judo Bank Manufacturing and Services PMIs final readings for May. The preliminary reading showed that manufacturing activity remained in contractionary territory yet improved from 47.3 to 49.6, while the services index remained in expansionary territory, still dipping from 54.4 to 53.6.
On the US front, unemployment claims for the week ending May 18, alongside the release of the S&P Global PMIs, could spark some movement in the AUD/USD pair.
AUD/USD Price Analysis: Technical outlook
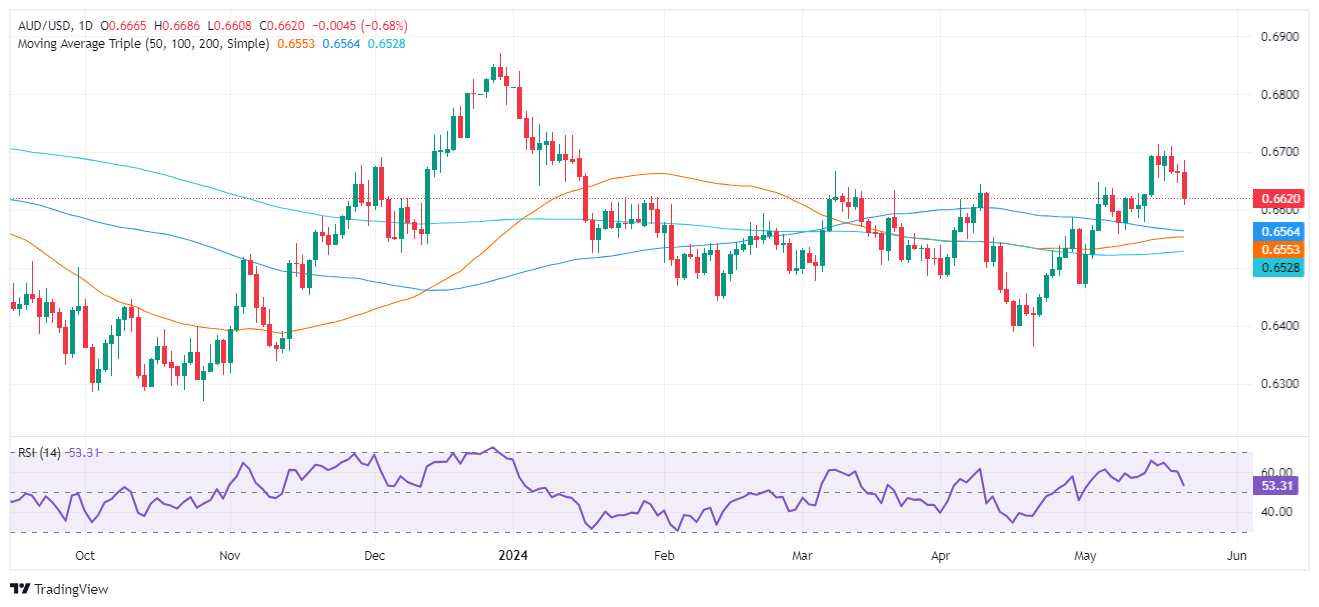
After trading within a narrow range of 0.6640-0.6700, the AUD/USD cleared the bottom of the range and extended its losses toward the 0.6610 region. It should be said that buyers are losing steam, as the Relative Strength Index (RSI) turned flat despite being in bullish territory, opening the door to testing lower price levels.
The AUD/USD first support would be 0.6600. A breach of the latter will expose the 100-day moving average (DMA) at 0.6562, followed by the 50 and 200-DMAs each at 0.6553 and 0.6526. Conversely, if buyers regain control, and push prices above 0.6640, that could pave the way toward 0.6700.
- WTI declines for a third straight day on Wednesday.
- US barrel counts hint at further supply overhang.
- FOMC Meeting Minutes reveal cautious Fed, rate hopes stumble.
West Texas Intermediate (WTI) US Crude Oil declined for a third straight day on Wednesday, falling below $78.00 per barrel once again after US Crude Oil barrel counts rose week-on-week after a previous decline. The Federal Reserve’s (Fed) latest Meeting Minutes revealed the Federal Open Market Committee (FOMC) remains stubbornly committed to waiting for firmer signs that US inflation will continue easing towards the Fed’s 2% annual target, vexing rate cut hopes and knocking risk sentiment lower in the midweek market session.
Read more: Fed Minutes leave the door open to a probable rate cut in September
According to the Energy Information Administration (EIA), US Crude Oil Stocks through the week ended May 17, climbing 1.825 million barrels, well above the median market forecast of a -3.1 million barrel decline. The week-on-week EIA barrel count chewed through most of the previous week’s -2.508 million barrel drop, reigniting concerns that US Crude Oil production threatens to swamp demand.
Crude Oil over-production concerns rose further on Wednesday after Russia announced an accidental overproduction of Russian Crude, with the nation pointing a finger at “technical difficulties”. According to sources, Russia’s Energy Minister will be putting options for voluntary output cuts “under review. Russia is expected to present a plan to offset additional production to OPEC+, the extended group of associate states aligned with the inner core of the Organization of the Petroleum Exporting Countries (OPEC).
WTI technical outlook
WTI US Crude Oil is testing down into $77.00 per barrel, extending a near-term decline from a recent peak just above $80.00 per barrel. Intraday price action has tumbled back into a familiar demand zone below $78.00 per barrel, and risks further downside if it breaks down below $76.50.
WTI closed in the red for a third consecutive trading day on Wednesday, increasing the odds of an extended technical rejection from the 200-day Exponential Moving Average (EMA) at $79.25.
WTI hourly chart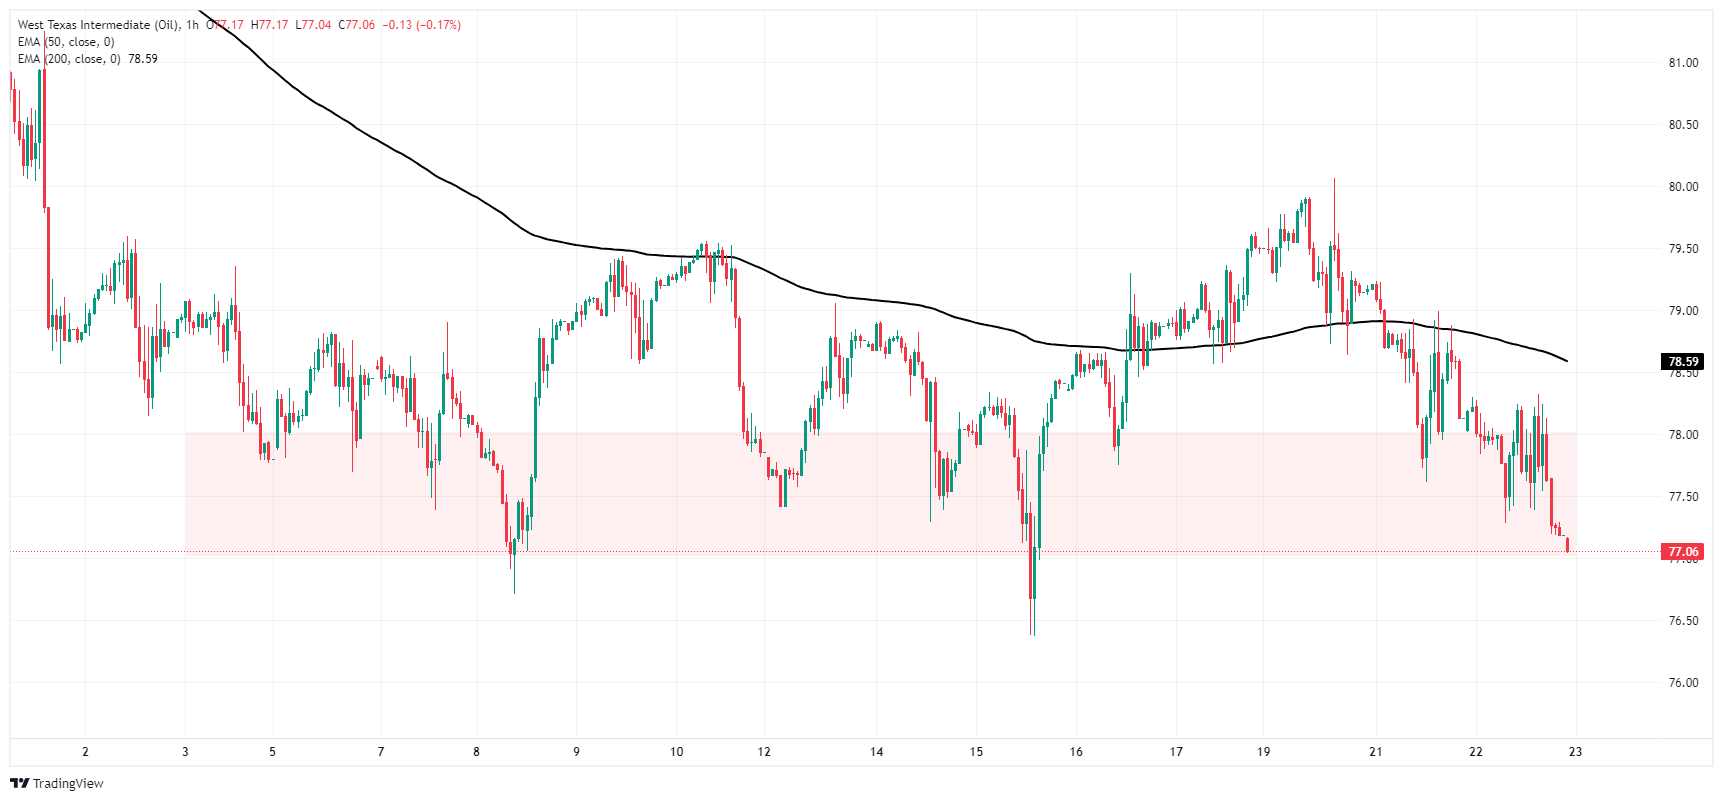
WTI daily chart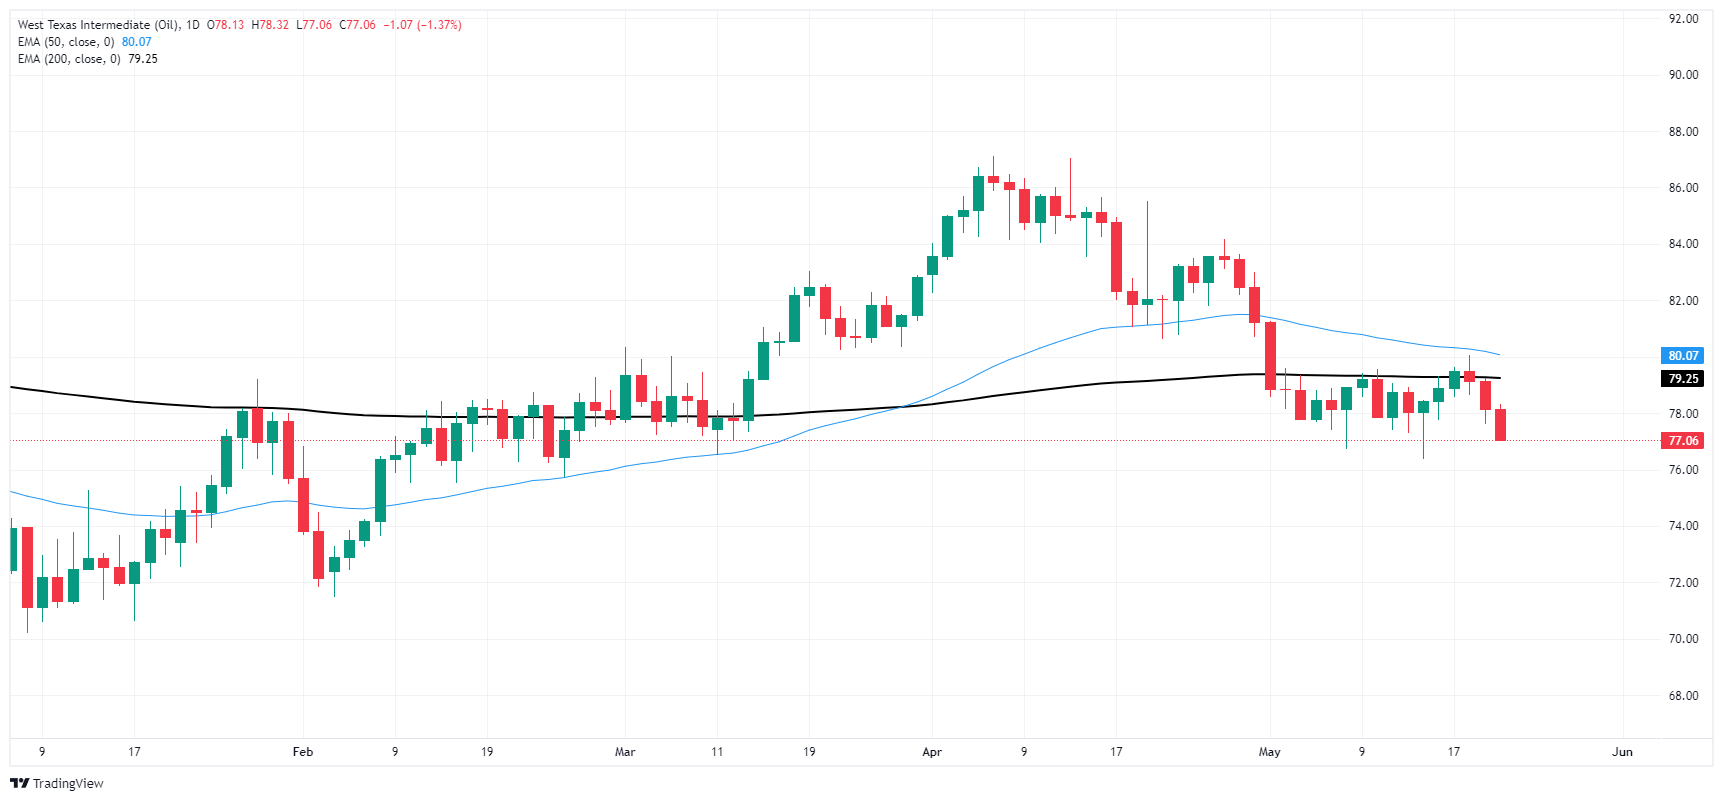
- Despite softening positive momentum indicated by the daily MACD, the overall trend still favors the buyers.
- Hourly chart shows fairly neutral RSI but negative momentum in MACD, signaling possible short-term fluctuations.
- Regardless of potential shifts suggested by hourly indicators, the overall bullish bias based on daily SMAs is intact.
- Signs of weakening buying momentum in NZD/USD implies potential retests of key SMAs, dictating investor alertness.
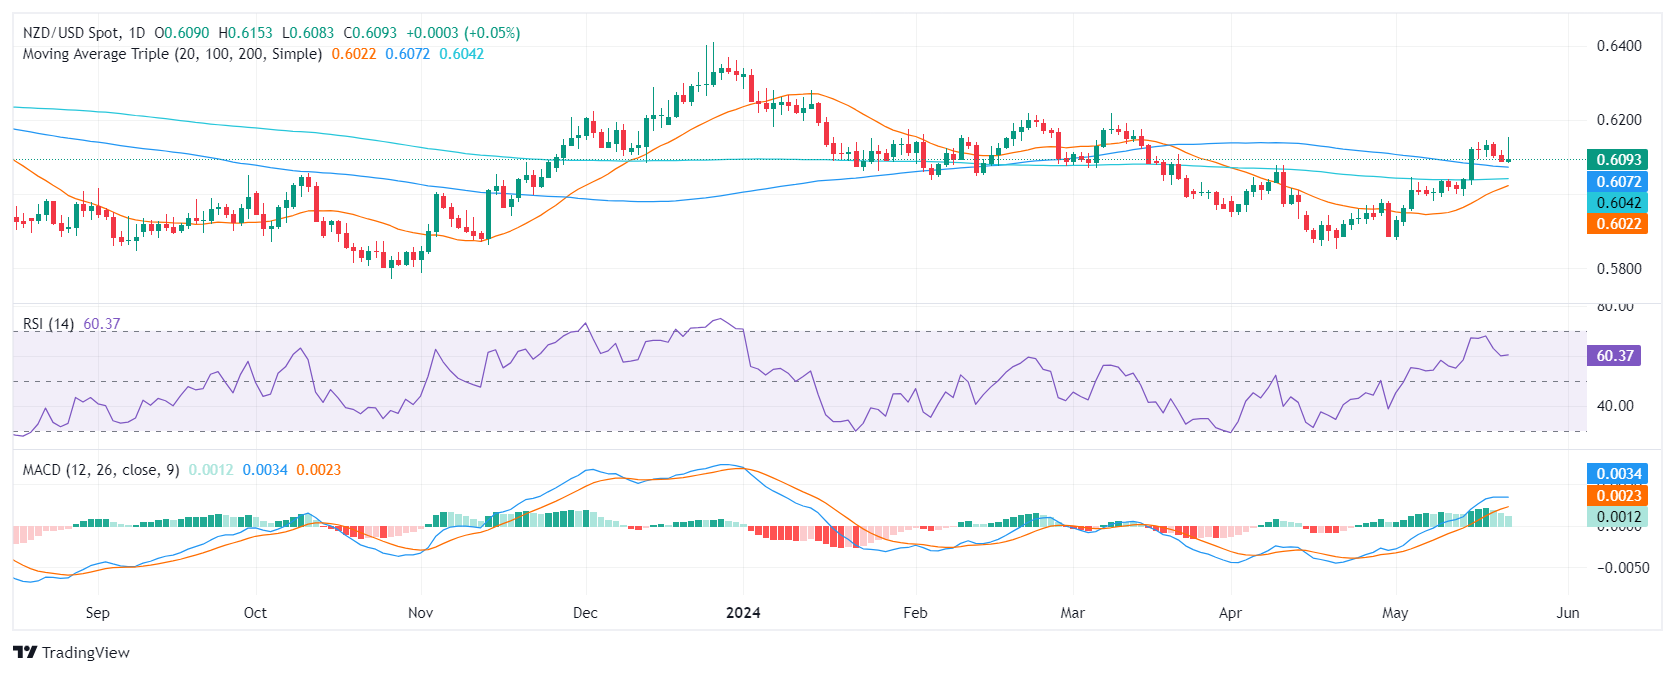
On Wednesday's session, the NZD/USD showed diminishing buying traction and fell just below 0.6100. However, the short-term outlook will be positive if the pair maintains its position over new reference points set by 100 and 200-day Simple Moving Averages (SMAs). If lost, the bears might step in aggressively.
Examining the daily chart, the Relative Strength Index (RSI) exhibits a positive but flattening trend, with its most recent reading of 60. Simultaneously, the Moving Average Convergence Divergence (MACD) displays decreasing green bars indicating a slight softening of positive momentum.
NZD/USD daily chart
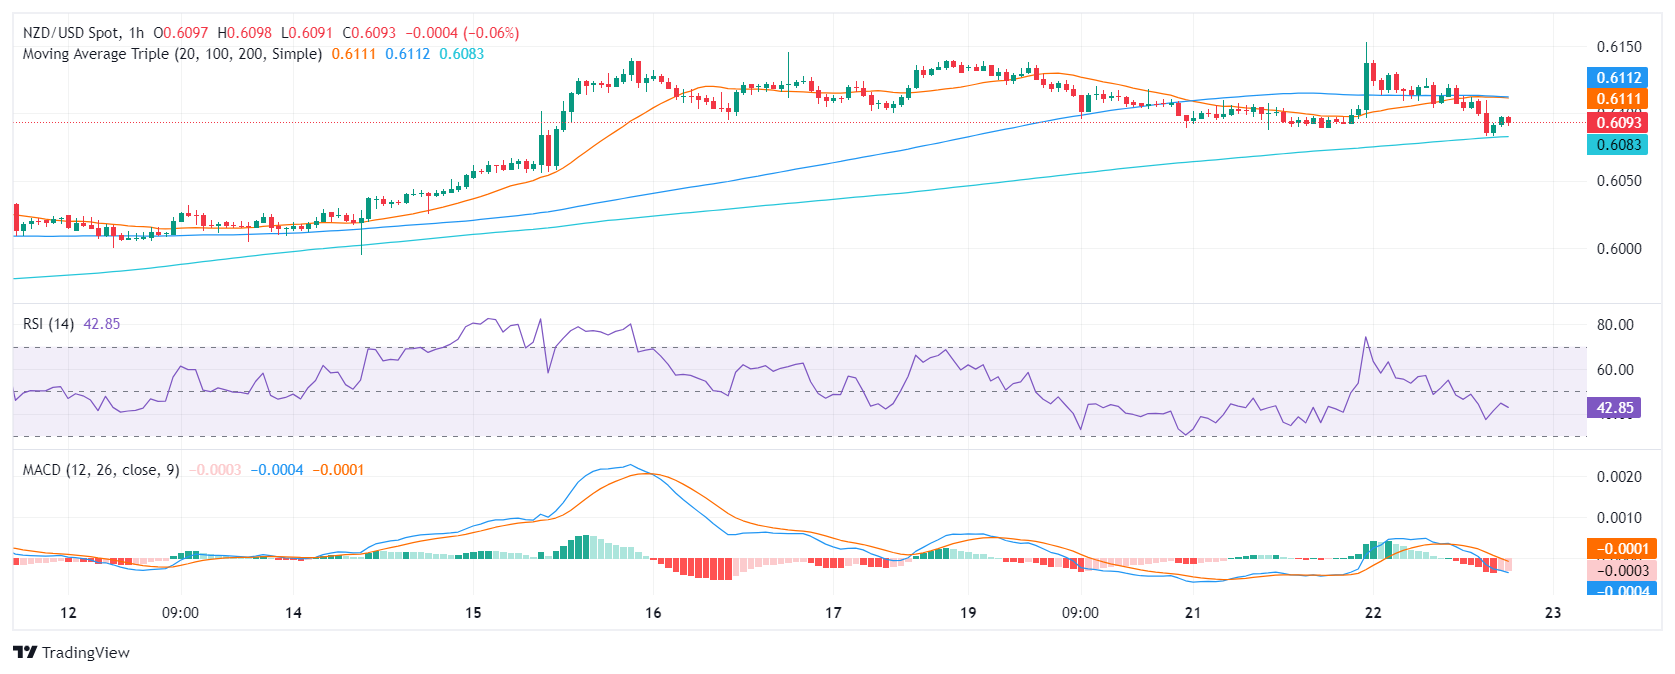
Focusing on the hourly view, the RSI has moderately adjusted with the latest reading of 41, reflecting a fairly neutral direction. Notably, the MACD histogram has produced consistently flat red bars, signaling negative momentum on an intraday basis.
NZD/USD hourly chart
In conclusion, investors seem to be taking profits and, should the pair hold above the recently-conquered 100 and 200-day Simple Moving Averages (SMAs), any downward movement should not necessarily be considered a selling signal. However, buying traction appears to be waning, and the pair is set for a retest of the mentioned SMAs.
- Silver drops more than 3.50%, after hitting a daily high of $32.19.
- Fed's hawkish minutes prompt profit-taking in precious metals, impacting Gold and Silver.
- Key support levels for Silver: $30.00 psychological level, April 12 high at $29.79, and $29.00.
- Additional support: May 18, 2021, high at $28.74, and June 10, 2021, high at $28.28.
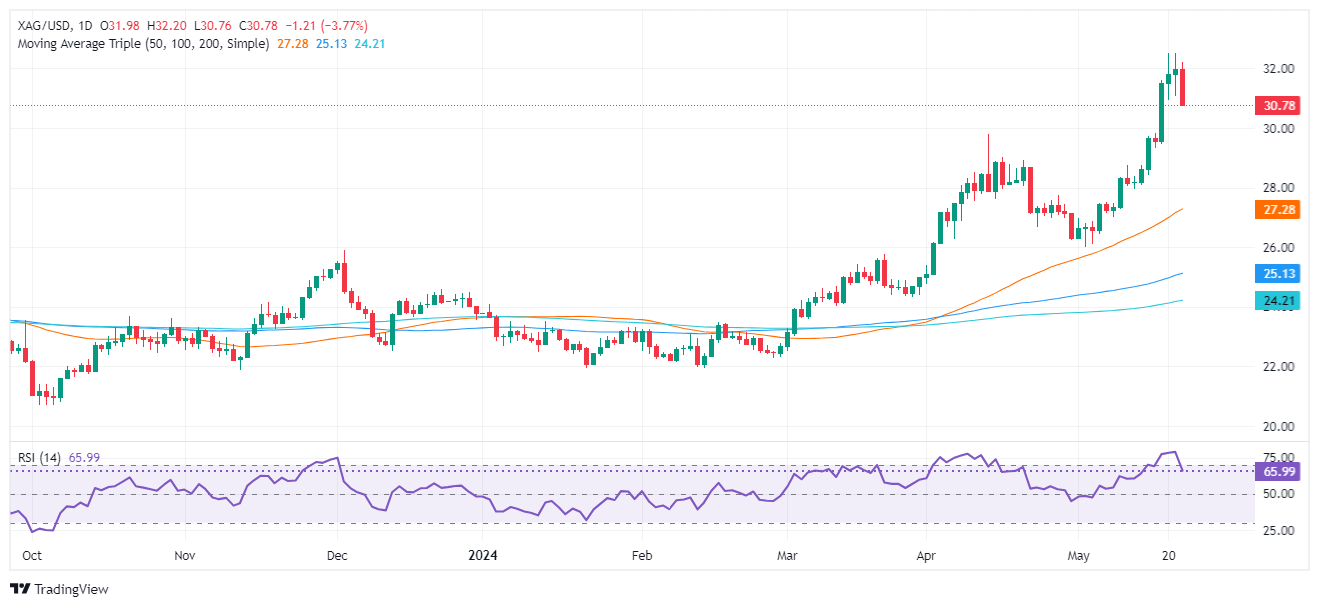
Silver price tumbled more than 3.50% during the North American session after the Federal Reserve revealed “hawkish tilted” minutes that showed some officials would like to raise rates if inflation warranted it. Therefore, precious metals like Gold and Silver trimmed some of the weekly gains. The XAG/USD trades at $30.81 after reaching a daily high of $32.19.
XAG/USD Price Analysis: Technical outlook
Silver’s uptrend remains intact, but due to the speed and strength of the move, the grey metal was subject to a mean reversion move. The buyer’s momentum has faded, as the Relative Strength Index (RSI) was overbought and punched below the 70.00 level, hinting sellers to step in.
With that said, the XAG/USD first support would be the $30.00 psychological level. On further weakness, the next floor level would be the April 12 high turned support at $29.79, followed by $29.00. The next key support levels would be the May 18, 2021, high at $28.74, and the June 10, 2021, high at $28.28.
XAG/USD Price Action – Daily Chart
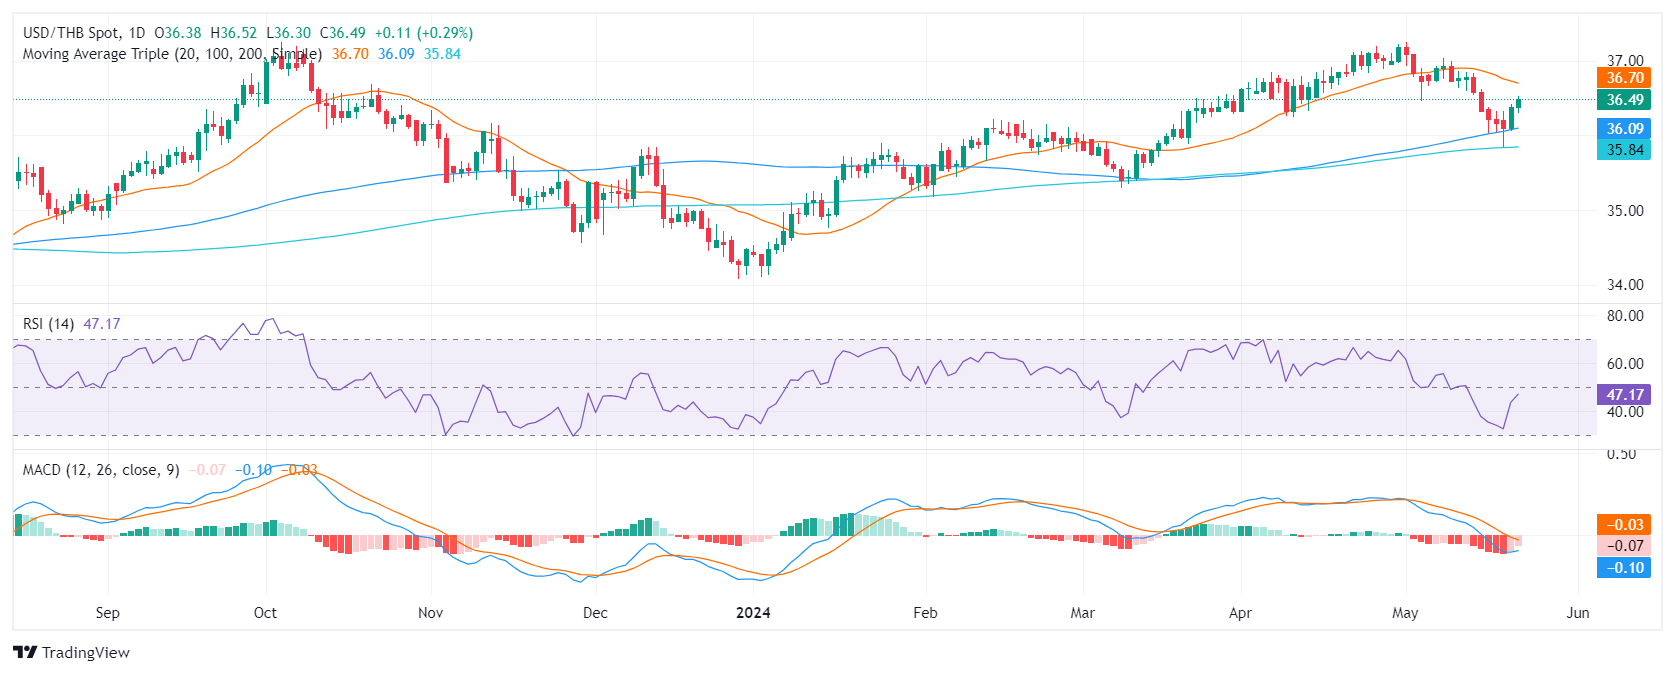
- The USD/THB pair is showing signs of resilience on Wednesday, ticking up by 0.28%.
- FOMC’s minutes from May’s meeting showed that members are uncertain on how long it will take inflation to come back to 2%.
- The odds of the easing starting in September slightly declined.
The USD/THB pair trades with modest gains on Wednesday as the Greenback is resilient despite last week's weak inflation data, underpinned by the hawkish tone of Fed officials. The Federal Open Market Committee (FOMC) showed no surprises and showed that the bank is confident that the job of bringing inflation down to 2% will eventually be achieved, but that they are uncertain on how long it would take them.
On Thursday, the US will release mid-tier data including weekly Jobless Claims figures and May’s S&P PMIs. On Friday, Durable Goods data from April are due. This set of data might provide further insights on the health of the US economy which might trigger movements on the pair and the assessment of the Fed officials regarding the timing of the easing. As for now, according to the CME FedWatch tool, the odds of a cut in June and July remain low while those chances for the September meeting declined to 40%.
USD/THB technical analysis
On the daily chart, the Relative Strength Index (RSI) is in a neutral position, registering at 49 on Tuesday. This falls within negative territory after indicating oversold conditions in the last sessions, reflecting seller dominance. A slight recovery from the oversold region hints at a potential market revival despite remaining within the negative range.
Concurrently, the trend shown by the Moving Average Convergence Divergence (MACD) histogram supports this potential revival as it exhibits a decreasing number of negative bars, indicating a descending pattern within the red spectrum of the histogram.
USD/THB daily chart
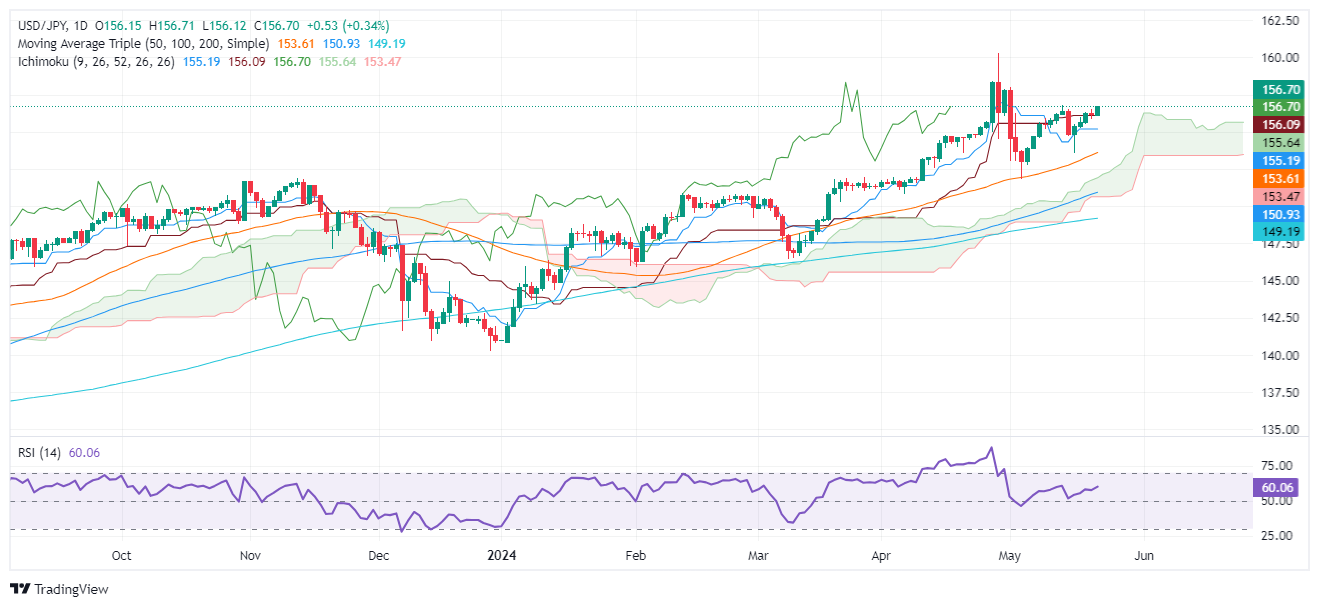
- USD/JPY erases Tuesday's losses, trading at 156.67, up 0.31% after Fed minutes indicate possible rate hikes.
- Technical outlook shows resistance at May 14 high of 156.76 and next supply area at 157.00.
- Further resistance levels: April 26 high at 158.44 and YTD high at 160.32.
- Key support levels: Tenkan-Sen at 156.05, Senkou Span A at 155.61, and Kijun-Sen at 155.18.
The USD/JPY erased Tuesday’s losses and climbed past the 156.50 area after the announcement of the latest US Federal Reserve meeting minutes. The minutes showed that officials could raise rates if inflation warrants it. The pair trades at 156.67, up 0.31%.
USD/JPY Price Analysis: Technical outlook
The USD/JPY uptrend continues, yet it's facing stir resistance at the May 14 high of 156.76. In the event that buyers reclaim the latter, the 157.00 mark would surface as the next supply area. Further gains lie overhead, with April 26 seen as the next resistance at 158.44, before challenging the year-to-date (YTD) high of 160.32.
Conversely, if the pair drops below the Tenkan-Sen at 156.05, that will expose the Senkou Span A at 155.61, followed by the Kijun-Sen at 155.18.
USD/JPY Price Action – Daily Chart
- Greenback is broadly firmer on Wednesday after hawkish Fed.
- Investors hoping for signs of rate cuts continue to be disappointed.
- RNBZ Governor Orr due to speak early Thursday pre-market.
NZD/USD backslid on Wednesday after the latest Meeting Minutes from the Federal Reserve’s (Fed) Federal Open Market Committee (FOMC) revealed a far more cautious stance on rate cuts than many investors had hoped for.
Reserve Bank of New Zealand (RBNZ) Governor Adrian Orr will be speaking late Wednesday ahead of the Thursday Pacific pre-market. RBNZ Governor Orr will be followed by New Zealand Retail Sales.
Read more: Fed Minutes leave the door open to a probable rate cut in September
While the FOMC’s latest Meeting Minutes didn’t outright rule out a September rate cut, Fed policymakers remain firmly more hawkish than investors have been hoping for, and odds of a September rate cut have eased even further. According to the CME’s FedWatch Tool, rate markets are pricing in under 60% chances of a quarter-point cut in September after the FOMC revealed a firm desire from Fed members to await firmer signs that the pace of inflation will continue falling to the Fed’s 2% target.
NZD/USD technical outlook
The Kiwi has tumbled back to the 200-hour Exponential Moving Average (EMA) at 0.6080, backsliding from Wednesday’s early peaks near 0.6150. NZD/USD hit its highest bids since mid-March in Wednesday, but has tumbled to a one-week low and is on pace to slide back below the 200-day SMA at 0.6073.
NZD/USD hourly chart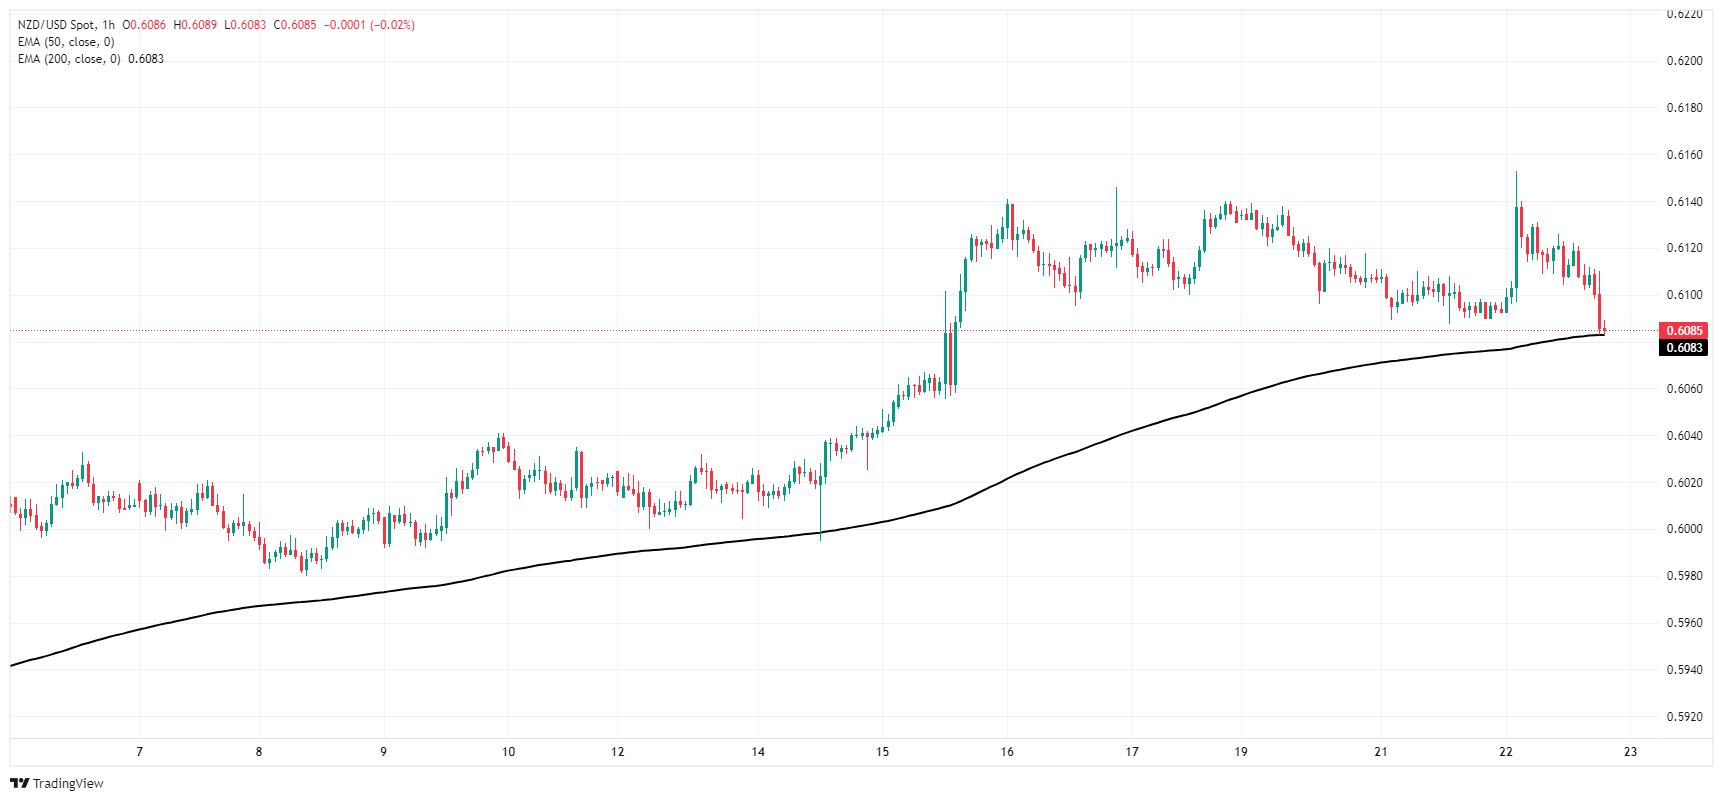
NZD/USD daily chart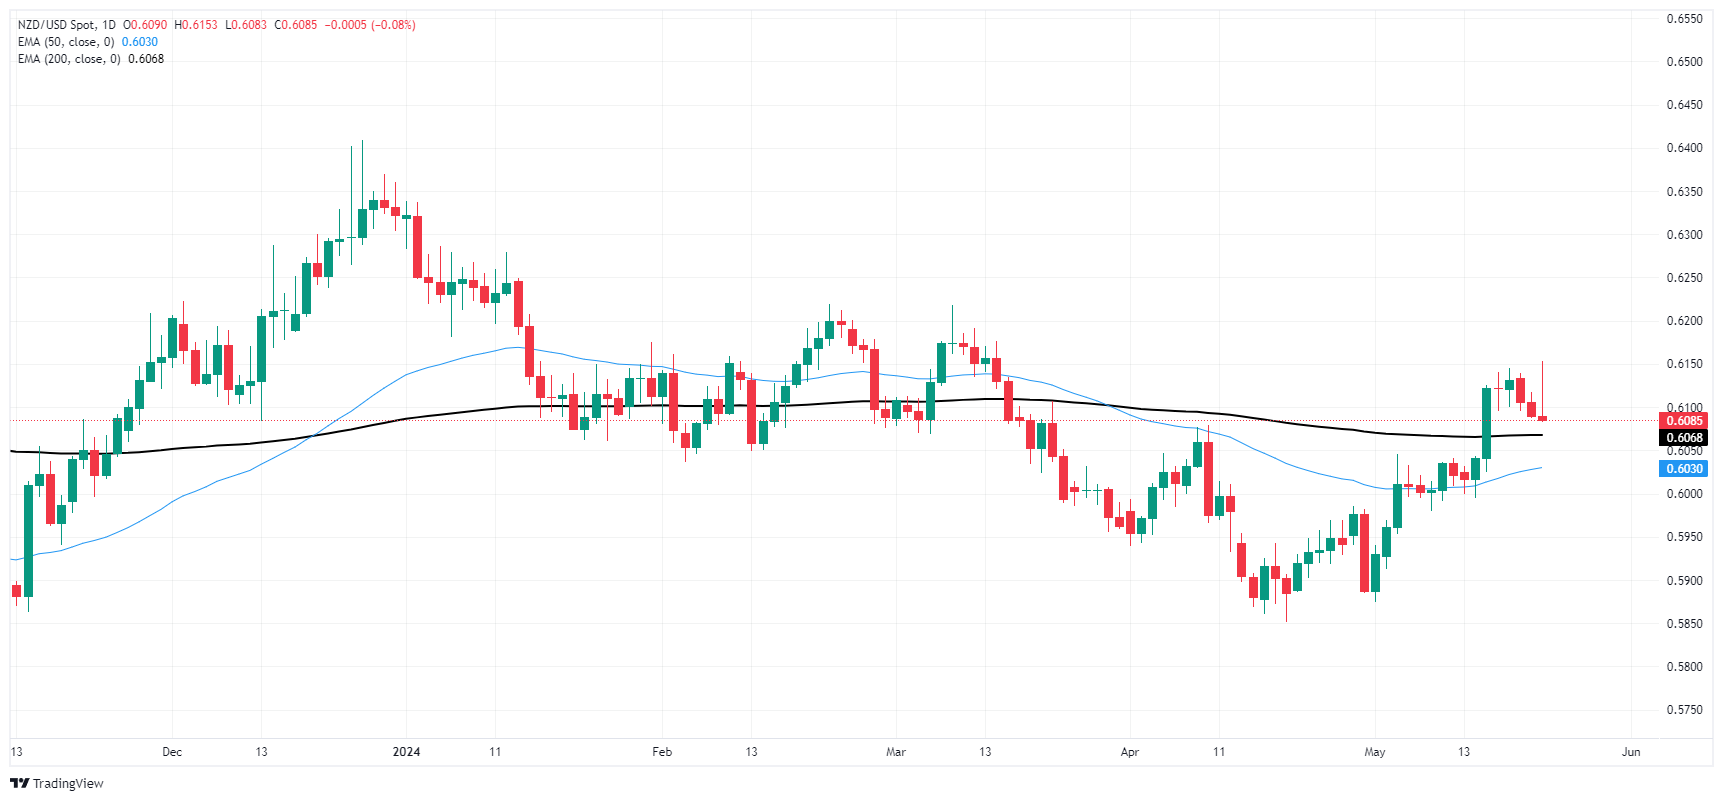
The Greenback extended its recovery and pushed the USD Index (DXY) back to the 105.00 region amidst higher yields and in response to the hawkish tone from the FOMC Minutes.
Here is what you need to know on Thursday, May 23:
The USD Index (DXY) rose to multi-day highs near the 105.00 barrier supported by the tighter-for-longer narrative around the Fed. On May 23, the Chicago Fed National Activity Index is due along with usual weekly Initial Jobless Claims, New Home Sales and the advanced Manufacturing and Services PMIs for the month of May. In addition, Fed’s Bostic (Atlanta) is due to speak.
EUR/USD tumbled to five-day lows near the 1.0820 region, an area coincident with the provisional 100-day SMA. The preliminary Consumer Confidence tracked by the European Commission (EC) in the broader Euroland is due on May 23, ahead of May’s flash Manufacturing and Services PMIs.
GBP/USD clung to daily gains on the back of renewed repricing of rate cuts by the BoE in the wake of UK inflation data. On May 23, flash Manufacturing and Services PMIs will be revealed prior to the speech by the BoE’s Pill.
Higher yields and the continuation of the rebound in the dollar lent extra legs to USD/JPY, which flirted with the area of three-week tops. On the domestic calendar, weekly Foreign Bond Investment are due on May 23, seconded by advanced Jibun Bank Manufacturing and Services PMIs.
AUD/USD retreated markedly to multi-session lows following the stronger dollar and the weak tone in the commodity space. The Consumer Inflation Expectations are next on tap in Oz on May 23 followed by the flash Judo Bank Manufacturing and Services PMIs.
Prices of the WTI dropped for the third straight session on the back of persistent dollar’s strength and expectations of delayed interest rate cuts by the Fed.
Gold prices added to Tuesday’s decline following hawkish FOMC Minutes, higher yields and a robust greenback. Silver followed suit and revisited three-day lows in the sub-$31.00 mark zone.
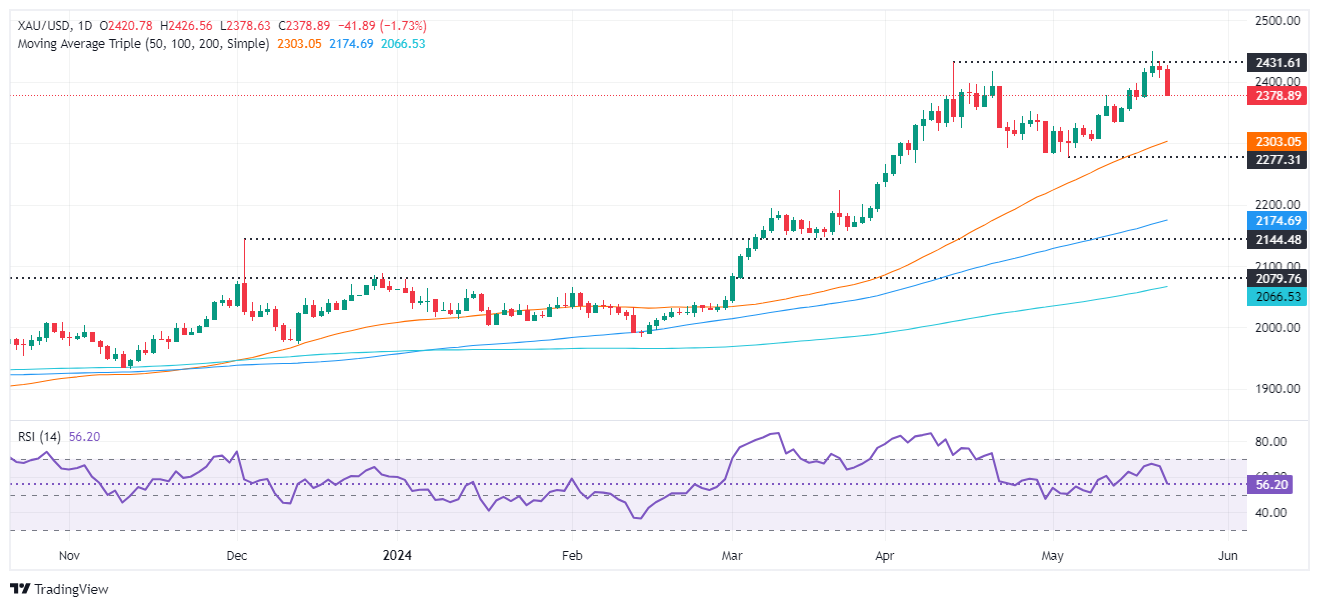
- Gold trades down more than 1% after hitting a high of $2,426.
- US Treasury yields rise following hotter-than-expected UK inflation data.
- Wall Street Journal reports central banks in emerging markets added 2,200 tons of Gold since Q3 2022, driven by Western sanctions on Russia.
- Fed minutes reveal willingness to tighten policy further if economic risks materialize.
Gold plunged during the North American session on Wednesday, breaching below the $2,400 barrier, as traders seem to have booked profits ahead of the release of the last Federal Reserve (Fed) Meeting Minutes. Data from the United States (US) showed the housing market continued to show weakness, while Fed officials remained home after a busy week’s start.
The XAU/USD trades at $2,392, losing more than 1% after reaching a high of $2,426. US Treasury bond yields are rising following a hotter-than-expected inflation report from the UK, sending US yields higher. US equities are mixed ahead of NVIDIA’s earnings report release, while the Greenback edges up.
In the meantime, an article by The Wall Street Journal mentioned that Gold rallied due to central bank buying. According to the World Gold Council, central banks in emerging markets added around 2,200 tons of the golden metal since Q3 2022.
The article mentioned that the trigger might be Western sanctions on Russia after its invasion of Ukraine.
Aside from this, US Existing Home Sales plunged in April from 4.22 million to 4.14 million, or a -1.9 % contraction. Despite that, NAR Chief Economist Lawrence Yun said, “Home prices reaching a record high for the month of April is very good news for homeowners.”
Recently, the Fed released its latest meeting minutes, which showed that “Various participants mentioned willingness to tighten policy further should risks to outlook materialize and make such action appropriate.”
Daily digest market movers: Gold price falls as US yields climbed following hawkish Fed Minutes
- Gold prices tumble sharply as US Treasury yields rise and Greenback advances. The US 10-year Treasury bond yield edges up 2 basis points to 4.434%, while the US Dollar Index (DXY), which tracks the Greenback’s performance against a basket of six other currencies, is up 0.19% at 104.82, a headwind for XAU/USD.
- The FOMC Minutes showed that Fed officials remained uncertain about the degree of policy restrictiveness. They added that “it would take longer than previously anticipated to gain greater confidence in inflation moving sustainably to 2%.”
- During the week, speeches by Fed officials laid the ground for the “hawkish tilt” of the FOMC’s Minutes, as most officials commented they would like to be certain that inflation is edging down and that they’re not in a rush to lower the fed funds rate.
- Data from the Chicago Board of Trade shows investors are expecting 31 basis points of Fed easing toward the end of the year.
Technical analysis: Gold price slides below $2,400 as bears target $2,330
Gold price’s uptrend remains in place, yet Wednesday’s pullback could pave the way to test lower prices. Momentum is shifting negatively as the Relative Strength Index (RS), despite standing bullish, is aiming downwards. With that said, buying pressure is waning as sellers step in.
That said, the XAU/USD’s first support would be the May 13 low at $2,332, followed by the May 8 low of $2,303. Once those levels are surpassed, the 50-day Simple Moving Average (SMA) at $2,284 will be up next.
On the other hand, if buyers push the Gold price above $2,400, look for a retest of year-to-date highs at $2,450.
Gold FAQs
Gold has played a key role in human’s history as it has been widely used as a store of value and medium of exchange. Currently, apart from its shine and usage for jewelry, the precious metal is widely seen as a safe-haven asset, meaning that it is considered a good investment during turbulent times. Gold is also widely seen as a hedge against inflation and against depreciating currencies as it doesn’t rely on any specific issuer or government.
Central banks are the biggest Gold holders. In their aim to support their currencies in turbulent times, central banks tend to diversify their reserves and buy Gold to improve the perceived strength of the economy and the currency. High Gold reserves can be a source of trust for a country’s solvency. Central banks added 1,136 tonnes of Gold worth around $70 billion to their reserves in 2022, according to data from the World Gold Council. This is the highest yearly purchase since records began. Central banks from emerging economies such as China, India and Turkey are quickly increasing their Gold reserves.
Gold has an inverse correlation with the US Dollar and US Treasuries, which are both major reserve and safe-haven assets. When the Dollar depreciates, Gold tends to rise, enabling investors and central banks to diversify their assets in turbulent times. Gold is also inversely correlated with risk assets. A rally in the stock market tends to weaken Gold price, while sell-offs in riskier markets tend to favor the precious metal.
The price can move due to a wide range of factors. Geopolitical instability or fears of a deep recession can quickly make Gold price escalate due to its safe-haven status. As a yield-less asset, Gold tends to rise with lower interest rates, while higher cost of money usually weighs down on the yellow metal. Still, most moves depend on how the US Dollar (USD) behaves as the asset is priced in dollars (XAU/USD). A strong Dollar tends to keep the price of Gold controlled, whereas a weaker Dollar is likely to push Gold prices up.
- GBP/USD is easing back from Wednesday’s early gains after FOMC showing.
- UK PM Sunak calls for general election July 4 in a bid to hold power.
- Rate cuts in 2024 look less likely, investors bid up Greenback.
GBP/USD is pulling back from Wednesday’s early gains after the Federal Reserve’s (Fed) latest Meeting Minutes showed the Federal Open Market Committee (FOMC) remains deeply skeptical that inflation will ease to 2% quickly enough to spark rate cuts as soon as investors continue to hope for.
The FOMC have been knocked into a second-guessing stance after the first quarter’s inflation figures from the US broadly disappointed central planners. With US inflation proving stubborn, the Fed continues to debate the “restrictiveness” of current policy. The FOMC did not rule out a September rate cut outright, but rate-trim-hungry investors were hoping for a far more dovish showing from the FOMC’s Meeting Minutes.
Read more: Fed Minutes leave the door open to a probable rate cut in September
UK Prime Minister Rishi Sunak has called for a surprise general election for July 4 in a high-risk bid for the Tories to maintain a 14-year leadership streak. Initial polling shows PM Sunak’s Tory party trailing their opposition, the UK’s Labour Party, by 20 points.
Keir Starmer, the leader of the UK’s Labour Party is broadly expected to win the next election, and PM Sunak’s snap election call is reigniting speculation that members of the Tory Party are delivering no-confidence letters in the current PM’s leadership behind closed doors.
The UK’s Parliament will be dissolved on May 30 as the UK gears up for a short-notice election.
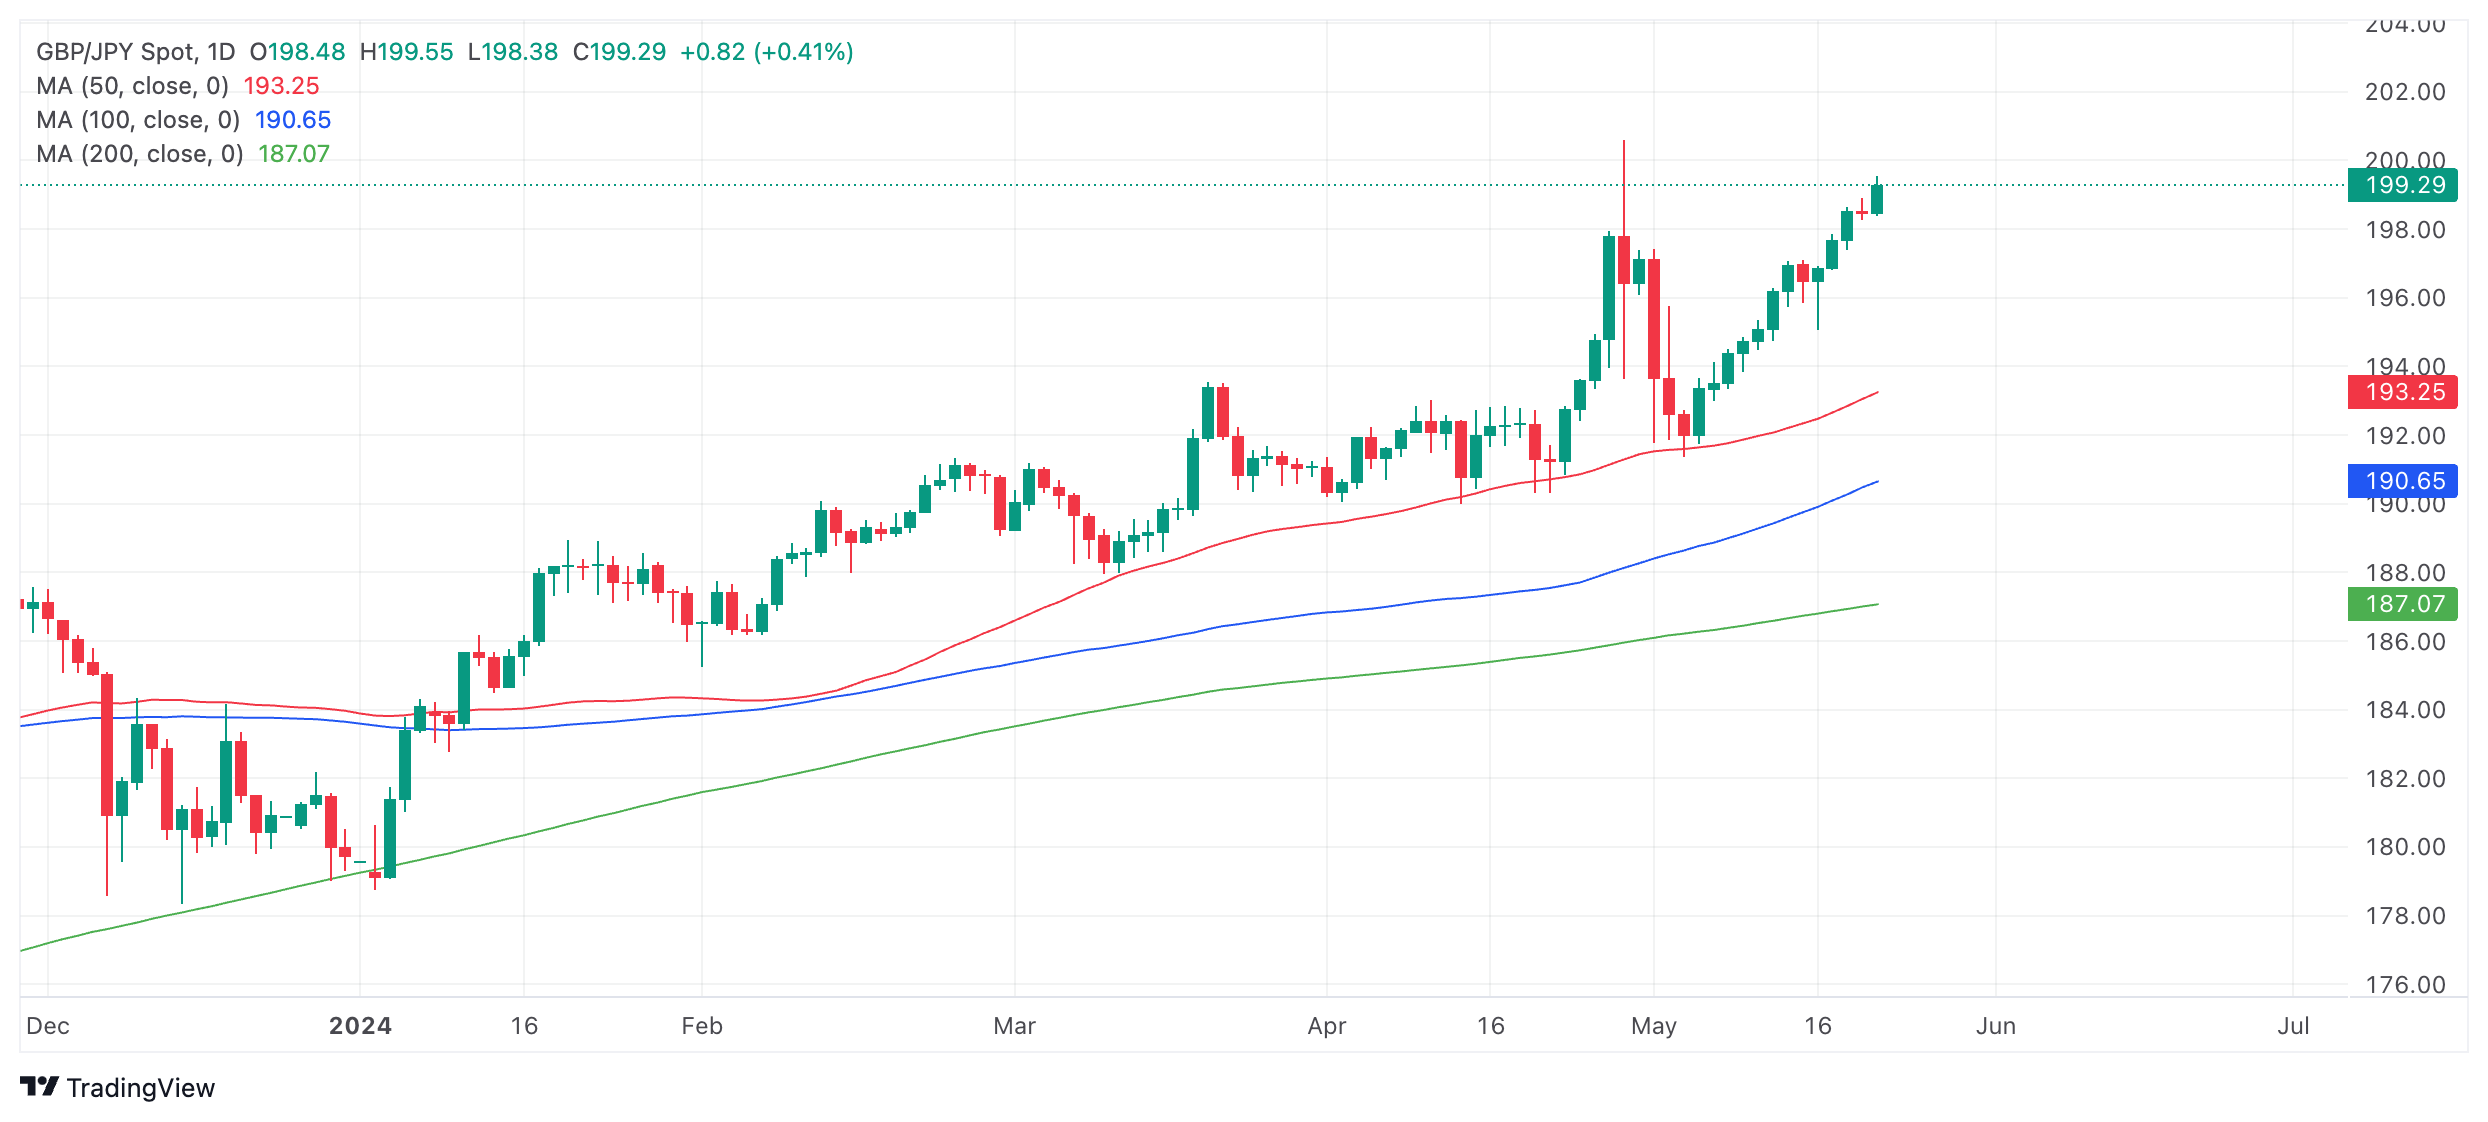
GBP/USD technical outlook
The Cable is grinding backwards on Wednesday, erasing the day’s early gains after the pair rose to an intraday high near 1.2760. GBP/USD is holding above the 1.2700 handle, but topside momentum has been halted and the GBP is close to flat on the day against the Greenback.
GBP/USD has been on an upside climb recently, closing in the green for all but one of the last nine consecutive trading days. However, the Cable remains down from March’s high bids near 1.2900 and bullish momentum remains limited north of the 200-day Exponential Moving Average (EMA) at 1.2543.
GBP/USD hourly chart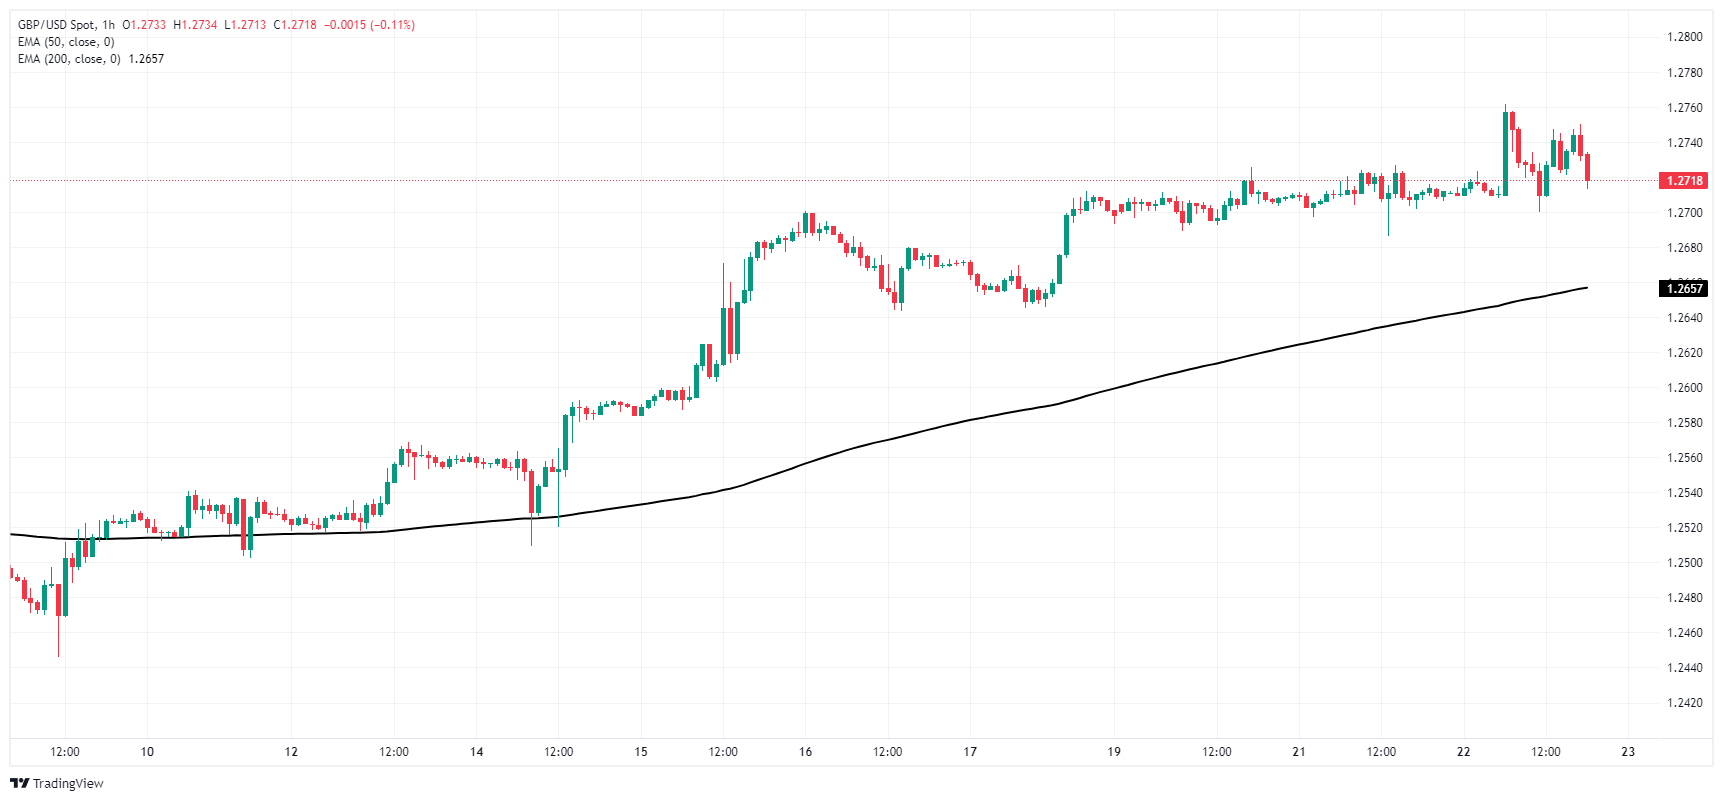
GBP/USD daily chart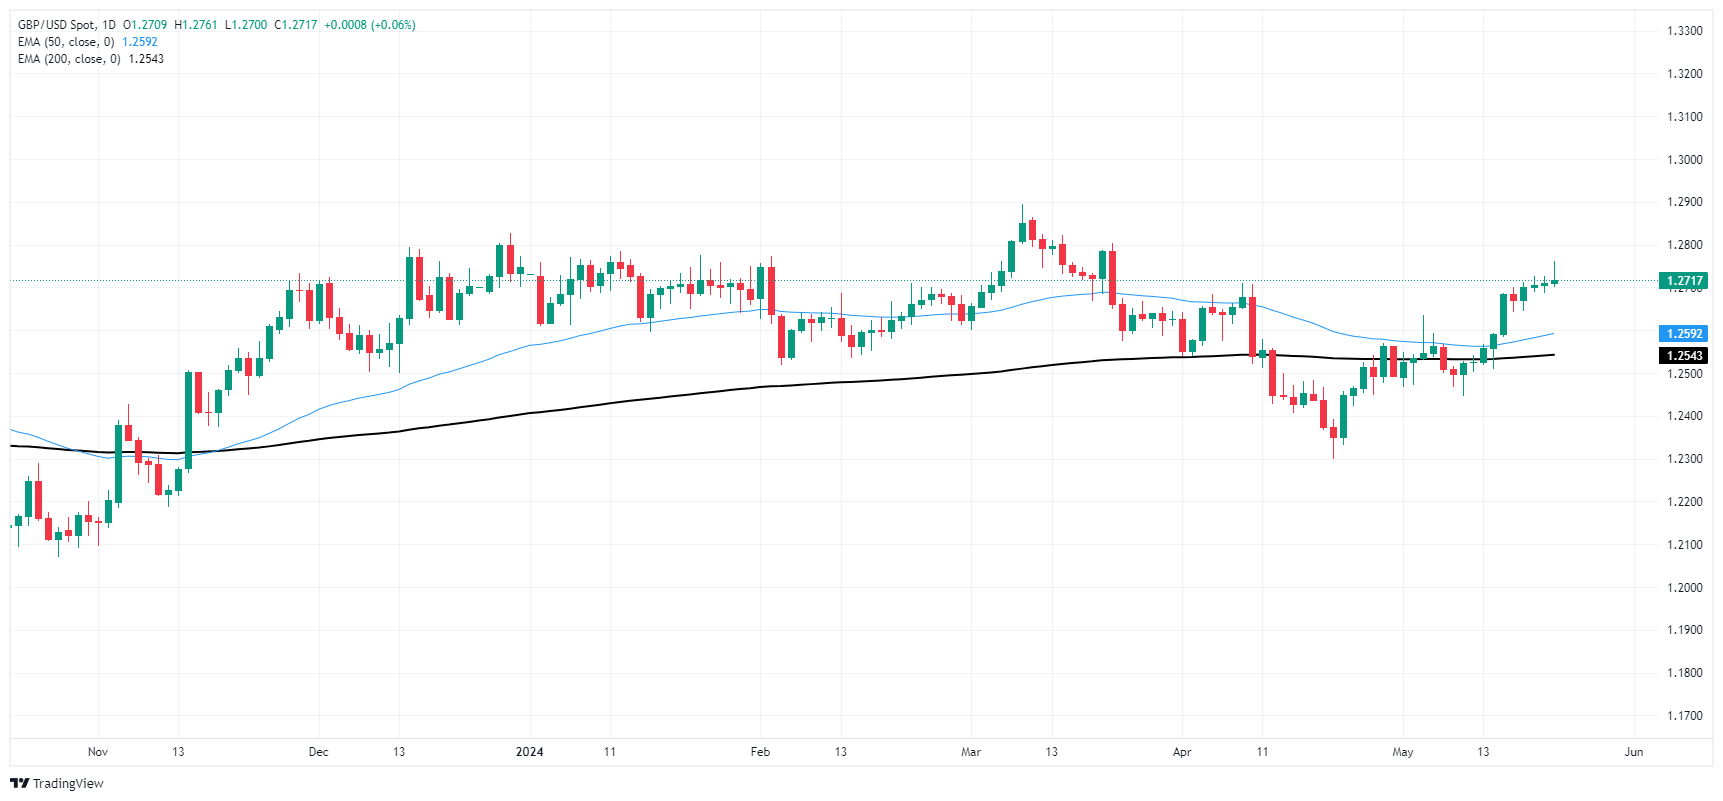
- Dow Jones tepid on Wednesday as investors await FOMC Meeting Minutes
- Hopes for a September rate cut are beginning to dry up.
- US PMI, Durable Goods Orders in the pipe for later in the week.
The Dow Jones Industrial Average (DJIA) slipped back slightly in the early US market session on Wednesday as investors continue to get pushed back on broad rate cut expectations. A recent decline in US Consumer Price Index (CPI) inflation helped to bolster traders’ confidence in a September rate trim from the Federal Reserve (Fed). However, still-high inflation numbers well above the Fed’s 2% target range and a cautionary warning from Fitch Ratings that global services inflation is likely to remain higher for longer are battering investors’ rate cut dreams.
Fitch Ratings announced on Wednesday that global services inflation will likely remain higher for longer than originally anticipated, meaning interest rates are unlikely to recede nearly as quickly as investors have hoped through all of 2024. According to the CME’s FedWatch Tool, rate markets are pricing in only 60% odds of a quarter-point rate cut from the Federal Open Market Committee (FOMC) in September, tumbling from 70% in a matter of days. In December, rate traders were pricing in better-than-even odds of six rate cuts in 2024 from the FOMC beginning in March. Fast forward to today, and investors are seeing the door slowly close on two rate cuts for the year beginning in September.
The FOMC’s latest Meeting Minutes will publish during Wednesday’s US market session, and investors will be pouring over the details looking for signs of dovish dialogue from Fed policymakers.
Dow Jones news
The Dow Jones is trading mostly flat on Wednesday in the run-up to FOMC Meetings Minutes. The equity index is trading within a tenth of one percent of the day’s opening bids, with nearly half of the index’s constituent securities in the red. Dow Inc. (DOW) has fallen 2% on Wednesday, trading into $57.80, extending a backslide from a 52-week high set only a week ago.
On the high side, Johnson & Johnson (JNJ) climbed 1.83% to $154.01 per share after reporting Q1 net profit of $3.26 billion. The previous quarter, JNJ had posted a net loss of $68 million.]
Dow Jones technical outlook
The Dow Jones has backslid from a recent all-time record high of 40,070.82, but intraday action has found a technical floor at 39,775.00. The equity index has been unable to recapture 39,900.00, but the DJIA remains firmly bullish in the medium-term.
The Dow Jones is trading well above the 200-day Exponential Moving Average (EMA) at 37,142.67 as investors take a breather from a broad-market bull run, but profit-taking remains thin keeping the DJIA bolstered firmly into bull country.
Dow Jones five minute chart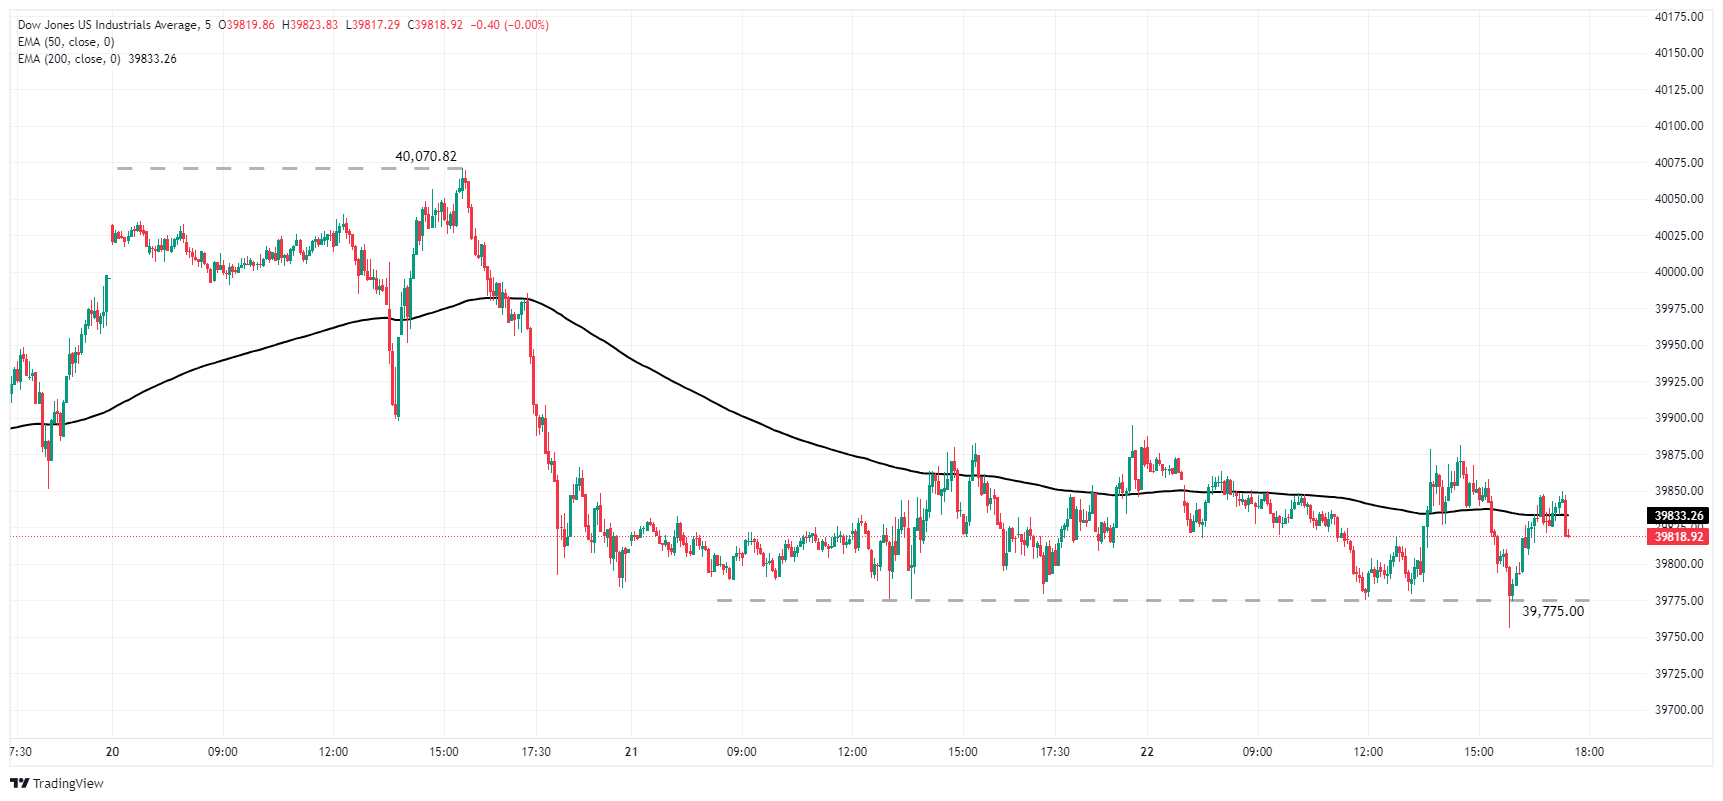
Dow Jones daily chart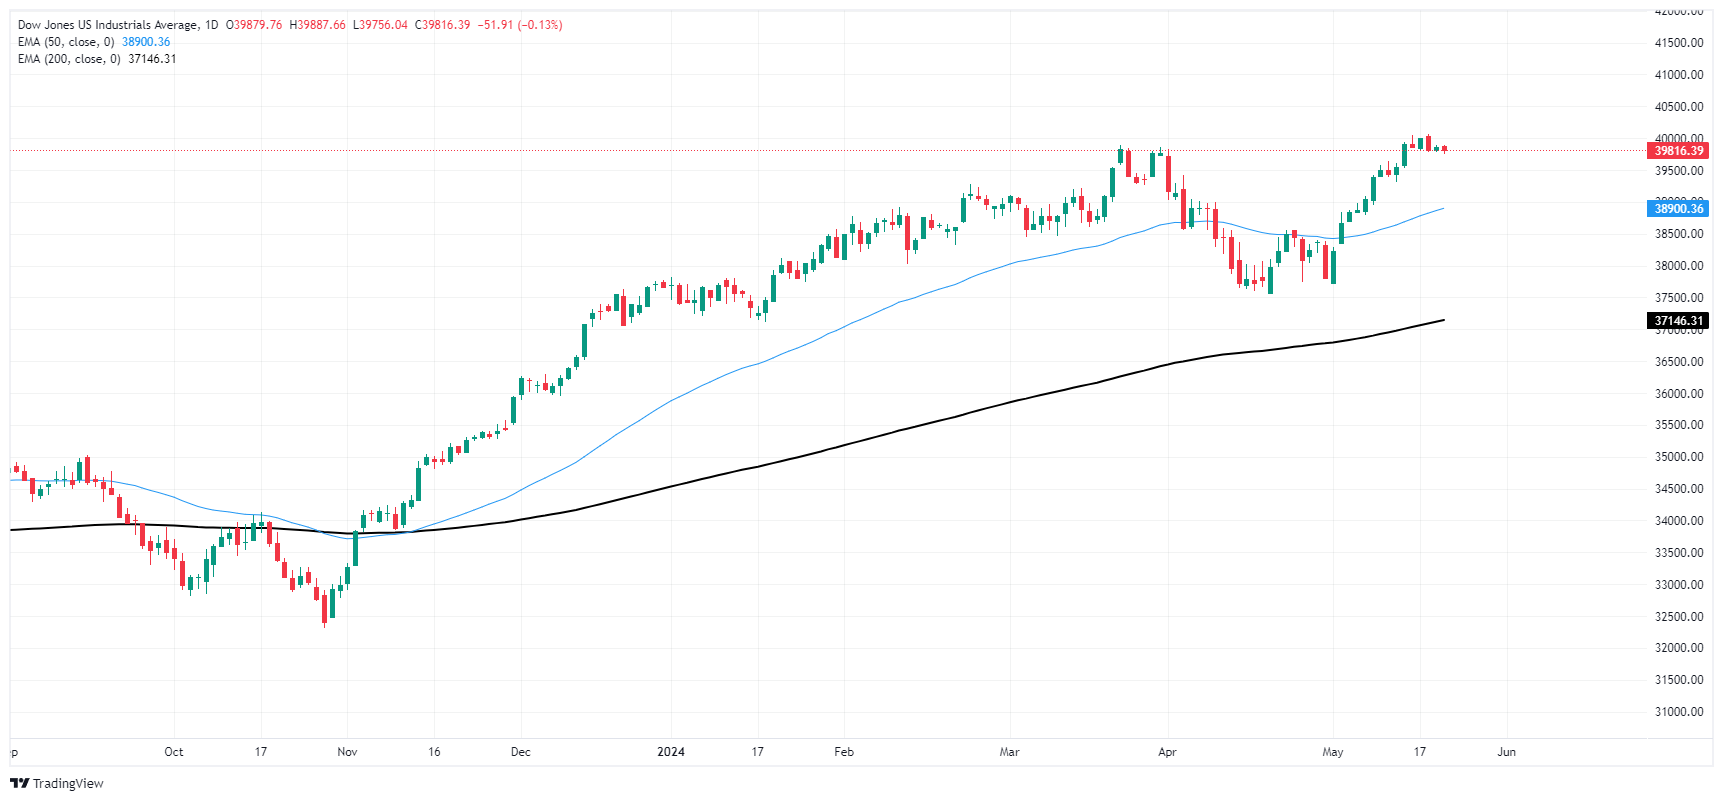
Dow Jones FAQs
The Dow Jones Industrial Average, one of the oldest stock market indices in the world, is compiled of the 30 most traded stocks in the US. The index is price-weighted rather than weighted by capitalization. It is calculated by summing the prices of the constituent stocks and dividing them by a factor, currently 0.152. The index was founded by Charles Dow, who also founded the Wall Street Journal. In later years it has been criticized for not being broadly representative enough because it only tracks 30 conglomerates, unlike broader indices such as the S&P 500.
Many different factors drive the Dow Jones Industrial Average (DJIA). The aggregate performance of the component companies revealed in quarterly company earnings reports is the main one. US and global macroeconomic data also contributes as it impacts on investor sentiment. The level of interest rates, set by the Federal Reserve (Fed), also influences the DJIA as it affects the cost of credit, on which many corporations are heavily reliant. Therefore, inflation can be a major driver as well as other metrics which impact the Fed decisions.
Dow Theory is a method for identifying the primary trend of the stock market developed by Charles Dow. A key step is to compare the direction of the Dow Jones Industrial Average (DJIA) and the Dow Jones Transportation Average (DJTA) and only follow trends where both are moving in the same direction. Volume is a confirmatory criteria. The theory uses elements of peak and trough analysis. Dow’s theory posits three trend phases: accumulation, when smart money starts buying or selling; public participation, when the wider public joins in; and distribution, when the smart money exits.
There are a number of ways to trade the DJIA. One is to use ETFs which allow investors to trade the DJIA as a single security, rather than having to buy shares in all 30 constituent companies. A leading example is the SPDR Dow Jones Industrial Average ETF (DIA). DJIA futures contracts enable traders to speculate on the future value of the index and Options provide the right, but not the obligation, to buy or sell the index at a predetermined price in the future. Mutual funds enable investors to buy a share of a diversified portfolio of DJIA stocks thus providing exposure to the overall index.
- Mexican Peso registers gains with USD/MXN trading at 16.62, down 0.08%.
- Fed officials are cautious about rate cuts, echoing Chair Powell's ‘higher for longer’ policy.
- The Citibanamex survey shows most analysts expect a Banxico rate cut on June 27.
Mexican Peso registers gains against the US Dollar on Wednesday during the North American session ahead of the release of the minutes of the last Federal Reserve (Fed) monetary policy meeting. That and the recent Fed officials' hawkish commentary keep the Peso down on the week. The USD/MXN trades at 16.62, down a minimal 0.08%.
Following the April 30-May 1 Fed meeting, Fed Chair Jerome Powell opened the door to keeping interest rates higher for longer. Most Fed officials echoed his words, adopting a cautious stance regarding cutting borrowing costs.
TD analysts wrote, “The minutes from the most recent FOMC meeting are likely to grab attention next week following the Committee’s decision to communicate that ‘higher for longer’ remains the policy of choice in the near horizon.”
Across the border, the May Citibanamex survey showed that 26 analysts estimate the Bank of Mexico (Banxico) will lower rates at the upcoming meeting on June 27. Eight estimate the Mexican central bank will lower rates until the second half of 2024.
Inflation expectations for 2024 were revised upward from 4.17% to 4.21%, while underlying prices are expected to fall from 4.10% to 4.07%.
Daily digest market movers: Mexican Peso stabilizes amid diverging views on Banxico’s Governing Council
- On Tuesday, Mexico’s docket featured the Economic Activity Indicator for April, which revealed that the economy slowed, according to non-seasonally adjusted figures on a yearly basis.
- On Thursday, Mexico’s economic docket will feature the announcement of the Gross Domestic Product for Q1 2024 and mid-month inflation data for May. Banxico will also reveal monetary policy minutes from its latest meeting.
- Mexico’s Gross Domestic Product for Q1 2024 is expected to show the Mexican economy is slowing amid higher borrowing costs of 11.00% set by Banxico due to fears of higher inflation and the risks of Peso depreciation.
- Diverging views surfaced in Banxico. Governor Victoria Rodriguez Ceja said last Monday that the bank would discuss lowering rates in the upcoming meeting on June 29. Conversely, Deputy Governor Espinosa commented that lowering rates in March might have delayed inflation convergence toward the central bank’s target by two quarters.
- On Tuesday, Fed officials made some comments. Atlanta Fed President Raphael Bostic said he isn’t in a hurry to reduce rates and prefers to keep them steady. Later, Fed Governor Christopher Waller said that April’s CPI showed progress but that he needs to see several months of good inflation data before supporting a rate cut. His colleague, Vice-Chair of Supervision Michael Barr, commented, “We still need to finish the job on inflation.”
- Data from the Chicago Board of Trade shows investors are expecting 31 basis points (bps) of Fed easing toward the end of the year.
Technical analysis: Mexican Peso counter attacks as USD/MXN hovers near 16.63
The USD/MXN remains in a downtrend, though it seems to have bottomed out at around the 16.52/54 area during the week. The exotic pair has broken the 16.60 resistance level. Sellers’ momentum stalled as depicted by the Relative Strength Index (RSI), which stands in bullish territory but flat.
If buyers lift the USD/MXN toward the 50-day Simple Moving Average (SMA) at 16.76, it could exacerbate a rally toward the 100-day SMA at 16.91. Once cleared, the next supply zone would be the 17.00 psychological level. In that event, the next stop would be the 200-day SMA at 17.17.
Conversely, a drop below 16.52 could exacerbate a challenge of the 16.50 psychological level, ahead of the year-to-date low of 16.25.
Mexican Peso FAQs
The Mexican Peso (MXN) is the most traded currency among its Latin American peers. Its value is broadly determined by the performance of the Mexican economy, the country’s central bank’s policy, the amount of foreign investment in the country and even the levels of remittances sent by Mexicans who live abroad, particularly in the United States. Geopolitical trends can also move MXN: for example, the process of nearshoring – or the decision by some firms to relocate manufacturing capacity and supply chains closer to their home countries – is also seen as a catalyst for the Mexican currency as the country is considered a key manufacturing hub in the American continent. Another catalyst for MXN is Oil prices as Mexico is a key exporter of the commodity.
The main objective of Mexico’s central bank, also known as Banxico, is to maintain inflation at low and stable levels (at or close to its target of 3%, the midpoint in a tolerance band of between 2% and 4%). To this end, the bank sets an appropriate level of interest rates. When inflation is too high, Banxico will attempt to tame it by raising interest rates, making it more expensive for households and businesses to borrow money, thus cooling demand and the overall economy. Higher interest rates are generally positive for the Mexican Peso (MXN) as they lead to higher yields, making the country a more attractive place for investors. On the contrary, lower interest rates tend to weaken MXN.
Macroeconomic data releases are key to assess the state of the economy and can have an impact on the Mexican Peso (MXN) valuation. A strong Mexican economy, based on high economic growth, low unemployment and high confidence is good for MXN. Not only does it attract more foreign investment but it may encourage the Bank of Mexico (Banxico) to increase interest rates, particularly if this strength comes together with elevated inflation. However, if economic data is weak, MXN is likely to depreciate.
As an emerging-market currency, the Mexican Peso (MXN) tends to strive during risk-on periods, or when investors perceive that broader market risks are low and thus are eager to engage with investments that carry a higher risk. Conversely, MXN tends to weaken at times of market turbulence or economic uncertainty as investors tend to sell higher-risk assets and flee to the more-stable safe havens.
- DXY Index trades with minor gains on Wednesday near 104.80.
- The market anticipates Fed will hold interest rates flat in June and July.
- FOMC minutes release will provide insights into the Fed's inflation outlook, as well as provide view of September rate adjustment expectations.
The US Dollar Index (DXY) is trading at 104.80, showing mild gains in Wednesday’s American session. The Greenback continues to exhibit resilience, brushing off the effects of the soft inflation data reported last week, backed by the cautious words of Federal Reserve (Fed) officials. The Federal Open Market Committee (FOMC) Minutes to be released later in the session will provide investors with more clues on the bank’s stance.
Overall, the US economy is witnessing consistent growth, evident from dwindling Fed easing expectations despite softening labor and inflation figures. The hawkish stance from Fed officials suggests rate cuts are unlikely in the near future, which is holding the USD afloat.
Daily digest market movers: DXY mildly up as investors await catalyst on FOMC Minutes
- Minutes from the Federal Reserve’s (Fed) late April to early May policy meeting are to be released on Wednesday at 18:00 GMT.
- CME FedWatch Tool indicates no expectation for a rate cut in June or July but a 37% chance of maintaining current policy in September.
- Minutes are expected to show that the bank requires more evidence of inflation cooling down, which might benefit the USD.
DXY technical analysis: DXY displays conflicting signals, hinting toward a possible impending shift.
The DXY's Relative Strength Index (RSI) remains flat, stationed in negative territory, suggesting the sellers might have already done the bulk of their work. In conjunction, the Moving Average Convergence Divergence (MACD) offers a flat red bar histogram, further confirming the near-term bearish sentiment.
Furthermore, the bears have gained ground recently, with the index now residing below the 20-day Simple Moving Averages (SMA). This indicates that selling pressure has mounted in the short term, though markets await stronger signs to confirm a strengthening bearish grip.
That being said, the Dollar Index remains above the critical 100 and 200-day SMAs, hinting that bulls still maintain a grip.
US Dollar FAQs
The US Dollar (USD) is the official currency of the United States of America, and the ‘de facto’ currency of a significant number of other countries where it is found in circulation alongside local notes. It is the most heavily traded currency in the world, accounting for over 88% of all global foreign exchange turnover, or an average of $6.6 trillion in transactions per day, according to data from 2022. Following the second world war, the USD took over from the British Pound as the world’s reserve currency. For most of its history, the US Dollar was backed by Gold, until the Bretton Woods Agreement in 1971 when the Gold Standard went away.
The most important single factor impacting on the value of the US Dollar is monetary policy, which is shaped by the Federal Reserve (Fed). The Fed has two mandates: to achieve price stability (control inflation) and foster full employment. Its primary tool to achieve these two goals is by adjusting interest rates. When prices are rising too quickly and inflation is above the Fed’s 2% target, the Fed will raise rates, which helps the USD value. When inflation falls below 2% or the Unemployment Rate is too high, the Fed may lower interest rates, which weighs on the Greenback.
In extreme situations, the Federal Reserve can also print more Dollars and enact quantitative easing (QE). QE is the process by which the Fed substantially increases the flow of credit in a stuck financial system. It is a non-standard policy measure used when credit has dried up because banks will not lend to each other (out of the fear of counterparty default). It is a last resort when simply lowering interest rates is unlikely to achieve the necessary result. It was the Fed’s weapon of choice to combat the credit crunch that occurred during the Great Financial Crisis in 2008. It involves the Fed printing more Dollars and using them to buy US government bonds predominantly from financial institutions. QE usually leads to a weaker US Dollar.
Quantitative tightening (QT) is the reverse process whereby the Federal Reserve stops buying bonds from financial institutions and does not reinvest the principal from the bonds it holds maturing in new purchases. It is usually positive for the US Dollar.
- Canadian Dollar is broadly softer as CAD loses defensive posture.
- Canada brings only low-tier data until Friday’s Retail Sales.
- US Home Sales disappoint, Fitch warns of sticky inflation.
The Canadian Dollar (CAD) slipped on Wednesday as broader market sentiment weakened. This dragged the CAD lower and sent bids into the US Dollar (USD). The Canadian Dollar fell to its lowest price against the Greenback in a week, setting up the USD for its third consecutive gain against the CAD.
Canada delivers strictly mid-tier data for the remainder of the trading week, and CAD investors will have to wait until Friday for March’s Canadian Retail Sales. US data will be the key for the rest of the week.
Daily digest market movers: Canadian Dollar eases back, Greenback finds room up top
- The Federal Reserve’s (Fed) latest Meeting Minutes will be released on Wednesday, and investors will be scrambling for signs of a dovish tilt to the Federal Open Market Committee’s (FOMC) internal dialogue concerning interest rates.
- US Existing Home Sales fell for a second straight month to 4.14 million, missing the forecast 4.21 million and declining from the previous 4.22 million (revised up slightly from 4.19 million).
- Fitch Ratings warned on Wednesday that services inflation across the globe is likely to remain sticky. The ratings agency cautioned that stubborn prices will likely slow the pace of rate cuts.
- US Purchasing Managers Index (PMI) data is due on Thursday, investors are hoping for a flat print.
- Canadian Retail Sales, US Durable Goods Orders to wrap up the trading week on Friday.
Canadian Dollar PRICE Today
The table below shows the percentage change of Canadian Dollar (CAD) against listed major currencies today. Canadian Dollar was the strongest against the Australian Dollar.
| USD | EUR | GBP | JPY | CAD | AUD | NZD | CHF | |
|---|---|---|---|---|---|---|---|---|
| USD | 0.11% | -0.27% | 0.22% | 0.05% | 0.39% | -0.31% | 0.33% | |
| EUR | -0.11% | -0.37% | 0.08% | -0.03% | 0.28% | -0.41% | 0.19% | |
| GBP | 0.27% | 0.37% | 0.48% | 0.29% | 0.66% | -0.04% | 0.58% | |
| JPY | -0.22% | -0.08% | -0.48% | -0.18% | 0.16% | -0.51% | 0.09% | |
| CAD | -0.05% | 0.03% | -0.29% | 0.18% | 0.34% | -0.31% | 0.25% | |
| AUD | -0.39% | -0.28% | -0.66% | -0.16% | -0.34% | -0.67% | -0.06% | |
| NZD | 0.31% | 0.41% | 0.04% | 0.51% | 0.31% | 0.67% | 0.59% | |
| CHF | -0.33% | -0.19% | -0.58% | -0.09% | -0.25% | 0.06% | -0.59% |
The heat map shows percentage changes of major currencies against each other. The base currency is picked from the left column, while the quote currency is picked from the top row. For example, if you pick the Canadian Dollar from the left column and move along the horizontal line to the US Dollar, the percentage change displayed in the box will represent CAD (base)/USD (quote).
Technical analysis: Canadian Dollar sheds another fifth of a percent against Greenback
The Canadian Dollar (CAD) was broadly lower on Wednesday, falling four-tenths of one percent against both the New Zealand Dollar (NZD) and the Pound Sterling (GBP). However, the CAD was up one-quarter of one percent against the Australian Dollar (AUD) as the Aussie fell to the bottom of the board in the midweek market session.
USD/CAD is on pace for a third straight daily gain as the pair firms up on a technical recovery from the 50-day Exponential Moving Average (EMA) at 1.3637. The 1.3640 level remains a key technical barrier, and buyers will be looking to launch another leg higher if bids fall back to the middle zone.
Daily candles continue to hold on the north side of the 200-day EMA at 1.2550, keeping the Greenback’s bullish stance against the Canadian Dollar.
USD/CAD hourly chart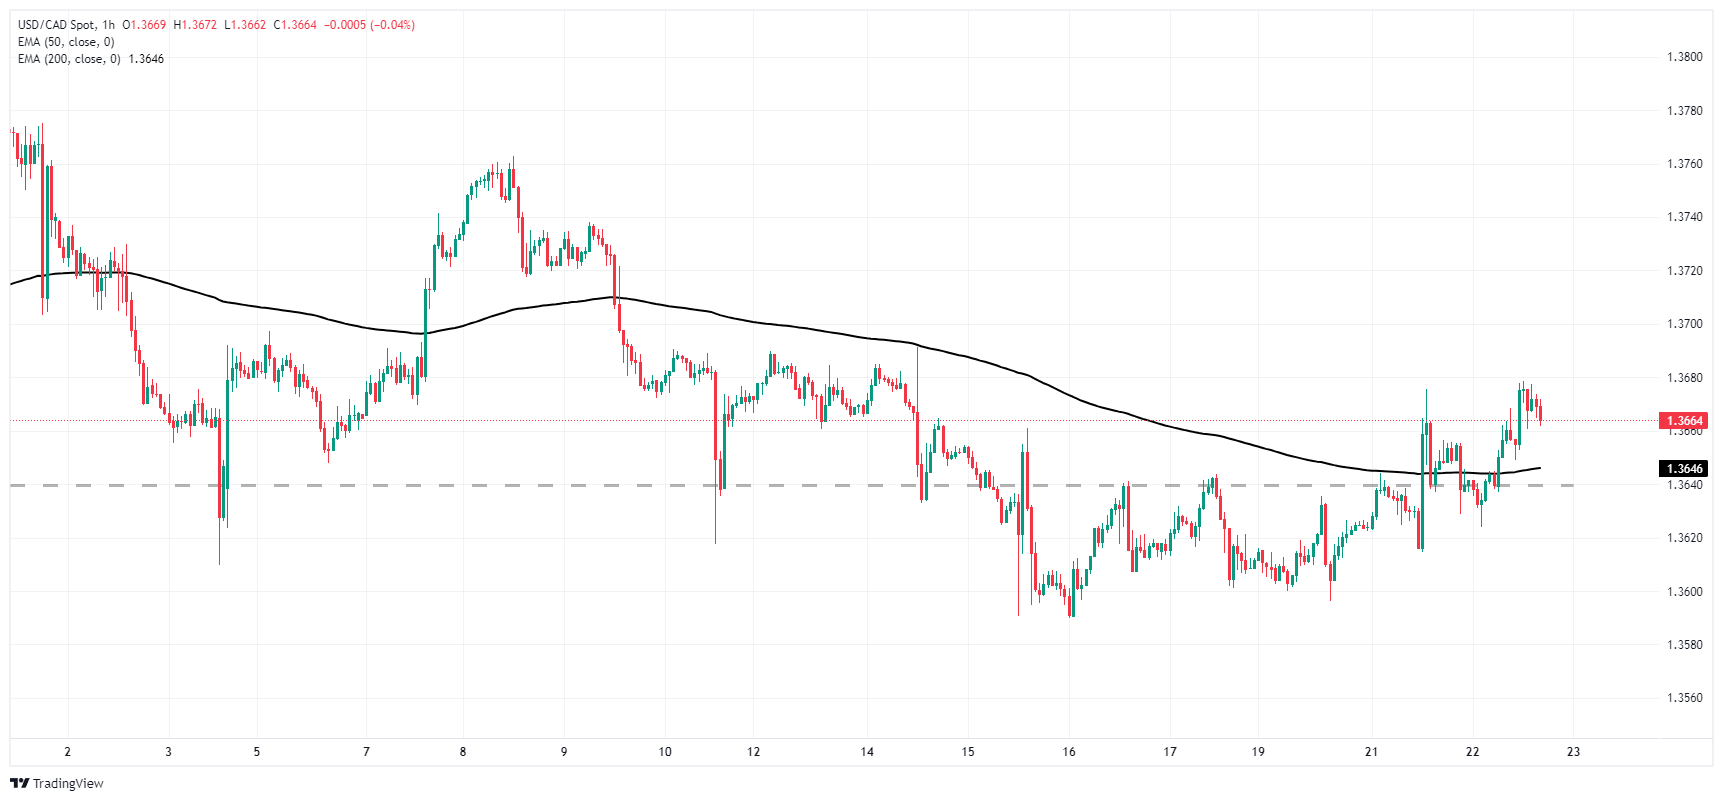
USD/CAD daily chart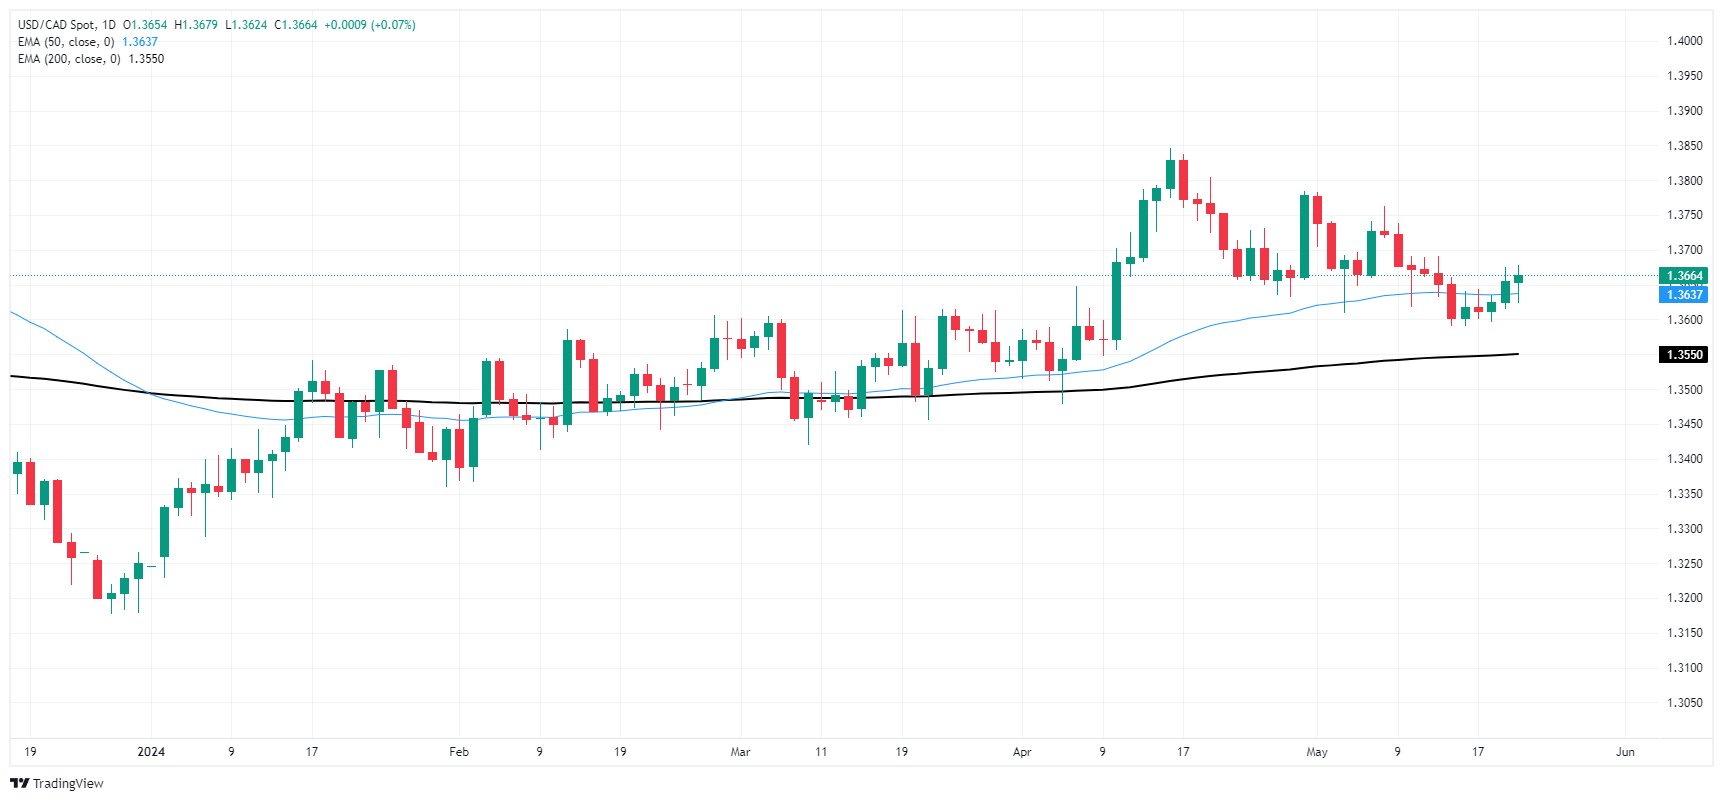
Canadian Dollar FAQs
The key factors driving the Canadian Dollar (CAD) are the level of interest rates set by the Bank of Canada (BoC), the price of Oil, Canada’s largest export, the health of its economy, inflation and the Trade Balance, which is the difference between the value of Canada’s exports versus its imports. Other factors include market sentiment – whether investors are taking on more risky assets (risk-on) or seeking safe-havens (risk-off) – with risk-on being CAD-positive. As its largest trading partner, the health of the US economy is also a key factor influencing the Canadian Dollar.
The Bank of Canada (BoC) has a significant influence on the Canadian Dollar by setting the level of interest rates that banks can lend to one another. This influences the level of interest rates for everyone. The main goal of the BoC is to maintain inflation at 1-3% by adjusting interest rates up or down. Relatively higher interest rates tend to be positive for the CAD. The Bank of Canada can also use quantitative easing and tightening to influence credit conditions, with the former CAD-negative and the latter CAD-positive.
The price of Oil is a key factor impacting the value of the Canadian Dollar. Petroleum is Canada’s biggest export, so Oil price tends to have an immediate impact on the CAD value. Generally, if Oil price rises CAD also goes up, as aggregate demand for the currency increases. The opposite is the case if the price of Oil falls. Higher Oil prices also tend to result in a greater likelihood of a positive Trade Balance, which is also supportive of the CAD.
While inflation had always traditionally been thought of as a negative factor for a currency since it lowers the value of money, the opposite has actually been the case in modern times with the relaxation of cross-border capital controls. Higher inflation tends to lead central banks to put up interest rates which attracts more capital inflows from global investors seeking a lucrative place to keep their money. This increases demand for the local currency, which in Canada’s case is the Canadian Dollar.
Macroeconomic data releases gauge the health of the economy and can have an impact on the Canadian Dollar. Indicators such as GDP, Manufacturing and Services PMIs, employment, and consumer sentiment surveys can all influence the direction of the CAD. A strong economy is good for the Canadian Dollar. Not only does it attract more foreign investment but it may encourage the Bank of Canada to put up interest rates, leading to a stronger currency. If economic data is weak, however, the CAD is likely to fall.
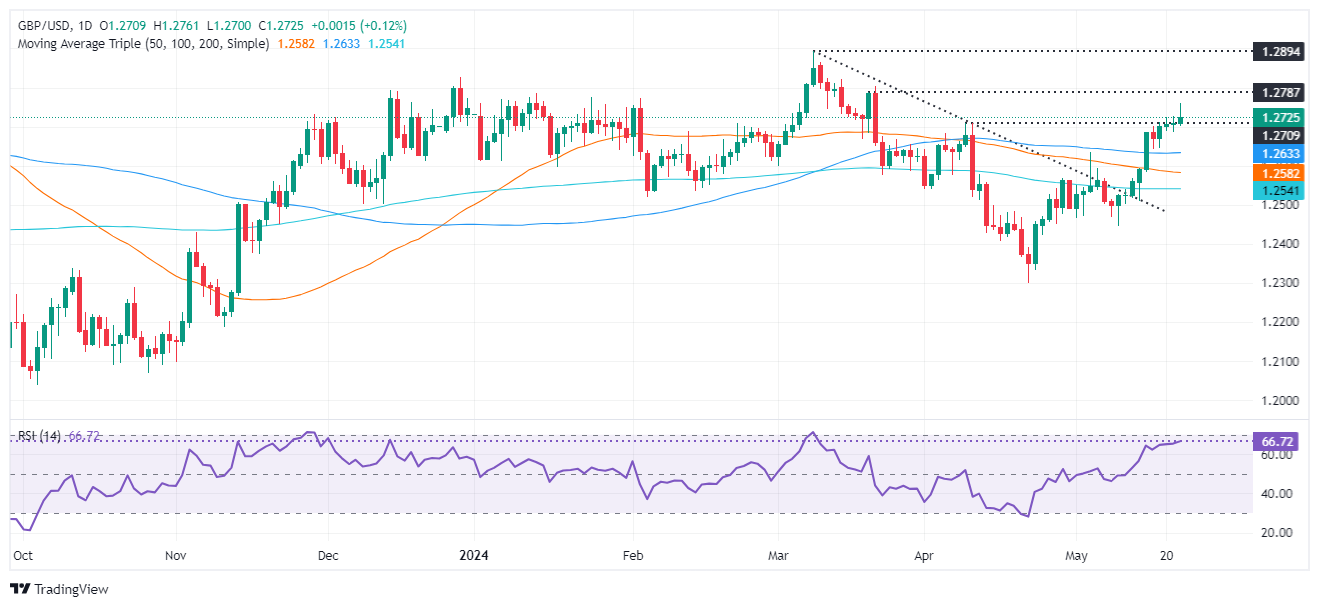
- GBP/USD clings to earlier gains after UK CPI data.
- Immediate resistance at 1.2800 remains elusive for buyers.
- Support at 1.2700; once cleared, GBP/USD could dive toward a confluence of technical indicators around 1.2634.
The Pound Sterling holds to earlier gains versus the Greenback following a hotter-than-expected inflation report in the UK, yet the pair pulls back from a two-month high as the CPI approaches the Bank of England’s goal. The GBP/USD trades at 1.2739, up 0.24%.
GBP/USD Price Analysis: Technical outlook
The pair remains neutral to upward bias despite exchanging hands below the 1.2761 daily high of the session. Momentum backs buyers, as shown by the Relative Strength Index (RSI), as they are leaning onto the 1.2700 psychological figure as the first line of defense.
To extend their gains, buyers must reclaim the March 21 high of 1.2803. Further gains lie overhead, with the year-to-date (YTD) high at 1.2893, 1.2900, and the psychological 1.3000 mark.
Conversely, a retracement would emerge once the GBP/USD tumbles below 1.2700, exposing the confluence of May’s 3 high and the 100-day moving average (DMA) at 1.2634, followed by the 50-DMA at 1.2581.
GBP/USD Price Action – Daily Chart
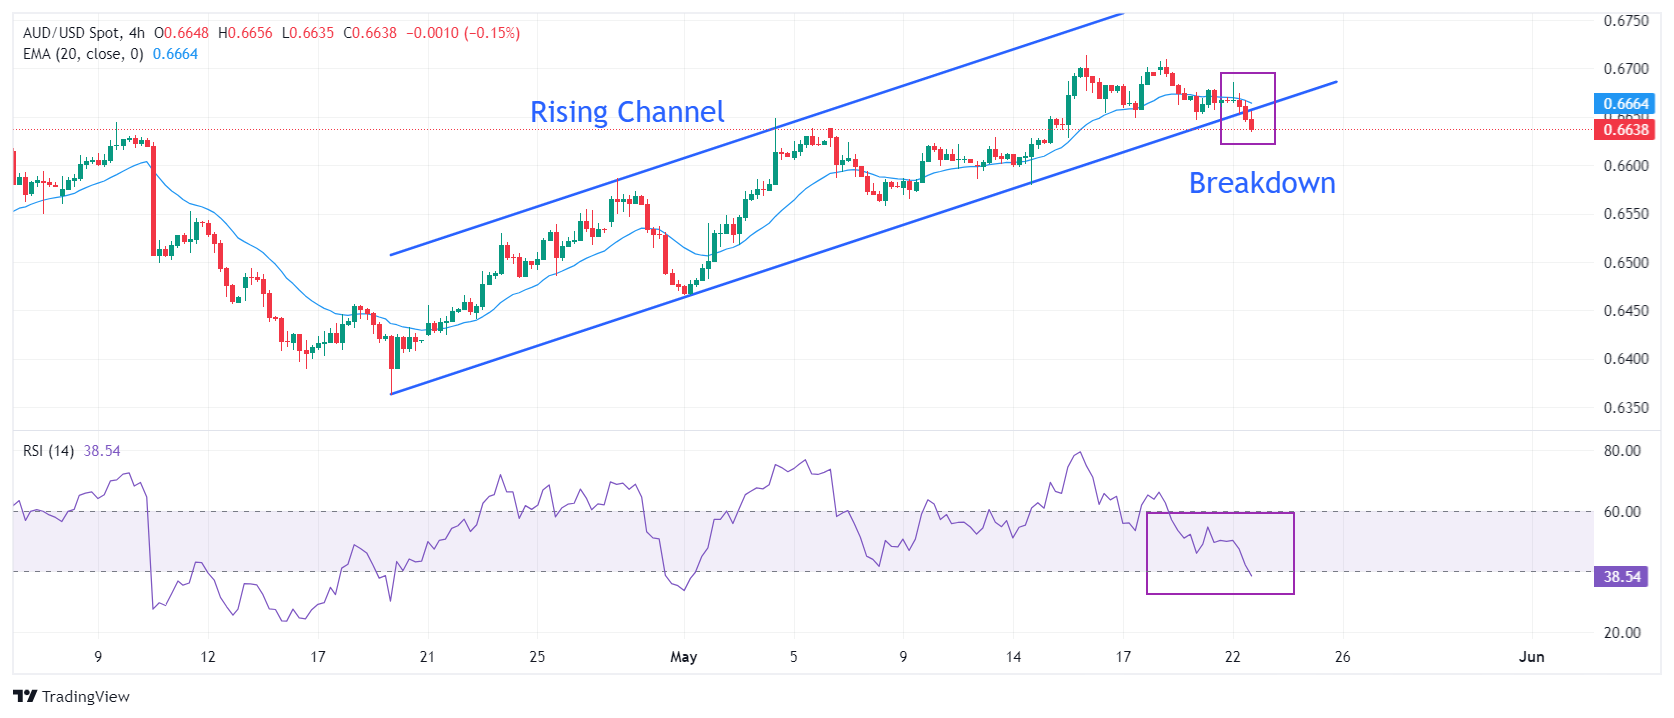
- AUD/USD refreshes five-day low near 0.6640 amid cautious market mood.
- Investors await the FOMC minutes to project the next move in the US Dollar.
- US bond yields rise amid uncertainty over Fed rate cuts in September.
The AUD/USD pair slumps to 0.6640 as the US Dollar exhibits firm footing in Wednesday’s New York session ahead of the release of the Federal Open Market Committee (FOMC) minutes of May’s policy meeting, which will be published later in the day.
Fed officials’ views on the interest rate outlook are expected to have remained hawkish as United States consume price inflation remained stubbornly higher in the first three months of this year. The impact of the Fed’s minutes could be light on the US Dollar as April’s inflation declined, expectedly released after May’s meeting, which has indicated that the progress in the disinflationary process was temporarily stalled.
The US Dollar Index (DXY), which tracks the Greenback’s value against six major currencies, advances to 104.80. More upside in the US Dollar looks likely as speculation for the Fed pivoting interest rate cuts has slightly eased.
The Australian Dollar fails to achieve a firm-footing despite the People’s Bank of China (PBoC) continued with expansionary policy stance to uplift China’s economic prospects. It is worth noting that Australia is the leading trading partner of China and historically higher monetary stimulus by world’s second largest economy improves the outlook of the Australian Dollar.
AUD/USD delivers a breakdown of the Rising Channel chart pattern formed on a four-hour timeframe. A breakdown of the above-mentioned pattern suggests an establishment of a bearish reversal. The near-term outlook of the Aussie asset is uncertain as it has stabilized below the 20-period Exponential Moving Average (EMA), which trades around 0.6666.
The 14-period Relative Strength Index (RSI) slips below 40.00. Sustainability below 40.00 will shift momentum towards the downside.
More downside below May 15 at 0.6622 will expose the asset to May 14 low at 0.6580, followed by May 1 high at 0.6540.
On the flip side, a decisive move above May’s high at 0.6714 will drive the asset towards January 3 high at 0.6771 and the round-level resistance of 0.6800
AUD/USD four-hour chart
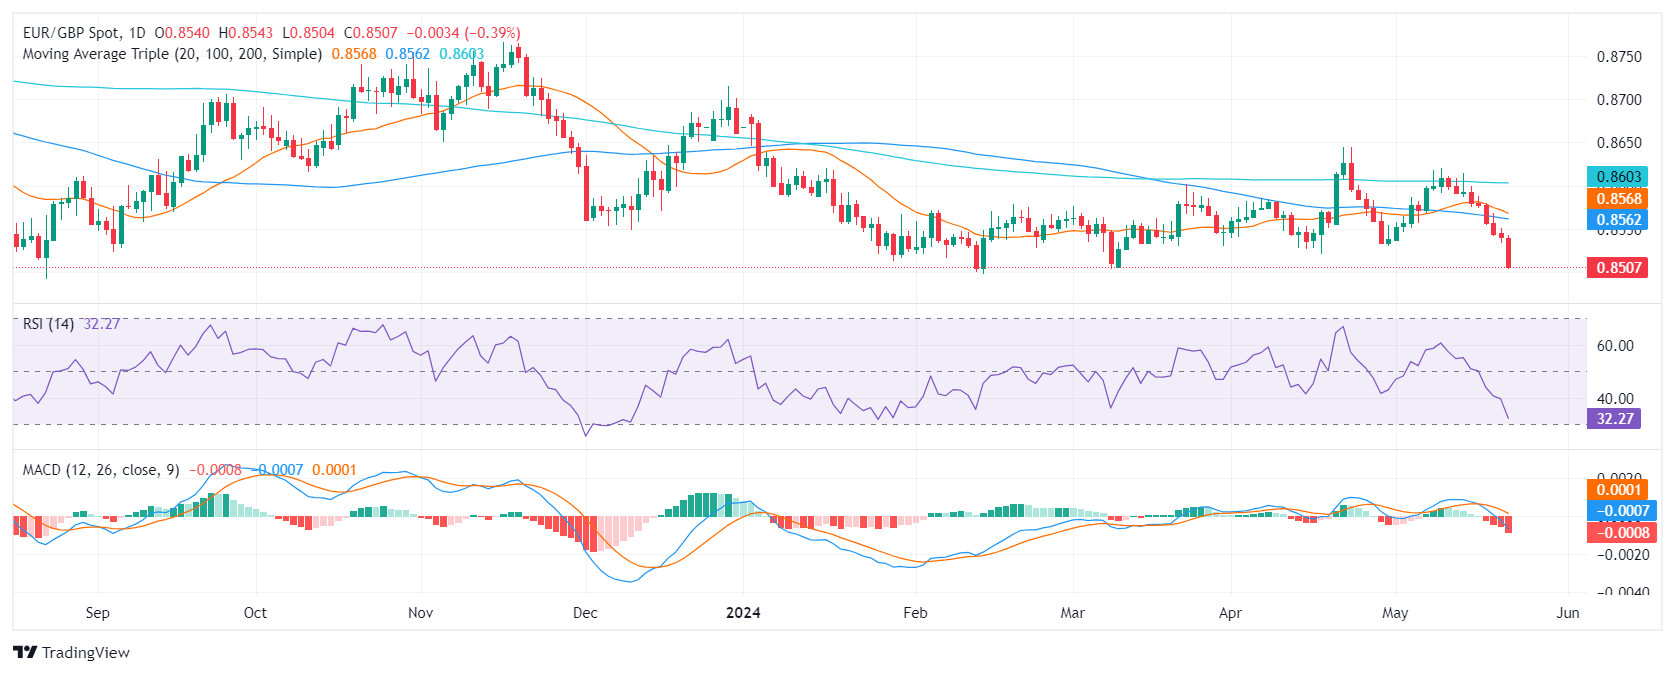
- EUR/GBP slides to 0.8505, posting 0.37% losses as sterling strengthens during Wednesday's trading period.
- Following the UK's CPI, markets foresee diminishing odds for a BoE rate cut in June, bolstering the pound vs the euro.
- The ECB is still considering a potential policy rate cut in June and divergences may favor the Pound.
The EUR/GBP traded lower falling to 0.8505 on Wednesday after the Pound garnered strength following the Office for National Statistics (ONS) releasing inflation data higher than the market's expectations. This pushed down the odds of a June rate cut by the Bank of England (BoE), giving a boost to the sterling.
The Office for National Statistics (ONS) of the UK revealed that in April, the inflation rate dipped to 2.3% year-on-year from 3.2% in March, surpassing market expectations of 2.1%, while the core CPI, excluding volatile food and energy prices, rose to 3.9% against an expected 3.6%. As a reaction, forecasts for a Bank of England (BoE) rate cut in June declined sharply from 50% to 12% following the inflation announcement, and those hawkish bets seem to have benefited the Pound.
On the other hand, the European Central Bank (ECB) officials are confident that inflation is under control and are gearing up for a first cut in June. In that sense, in case the BoE and ECB diverge with the British bank delaying cuts, could lay the ground for further downside .
EUR/GBP technical analysis
Examining the daily chart, the Relative Strength Index (RSI) indicates a negative trend, with its most recent value edging towards the oversold territory. Further supporting this bearish outlook is the Moving Average Convergence Divergence (MACD) as it illustrates rising red bars, revealing a rising negative momentum.
EUR/GBP daily chart
Looking at the broader market perspective, the EUR/GBP finds itself in a challenging position in relation to its Simple Moving Averages (SMA), hinting towards a potential further decline. Currently, the alignment is below the 20, 100, and 200-day SMAs. This traditionally suggests a bearish tilt, which is further reinforced by Wednesday’s downward movement.
- USD/JPY closes in on a resistance level at former highs.
- The pair could pullback temporarily from the technical resistance level.
- The uptrend remains intact, however, suggesting further upside will probably eventually follow.
USD/JPY has rallied up to retest technical resistance at around 156.79 (May 14 high), and there is a possibility it could temporarily falter.
USD/JPY Daily Chart
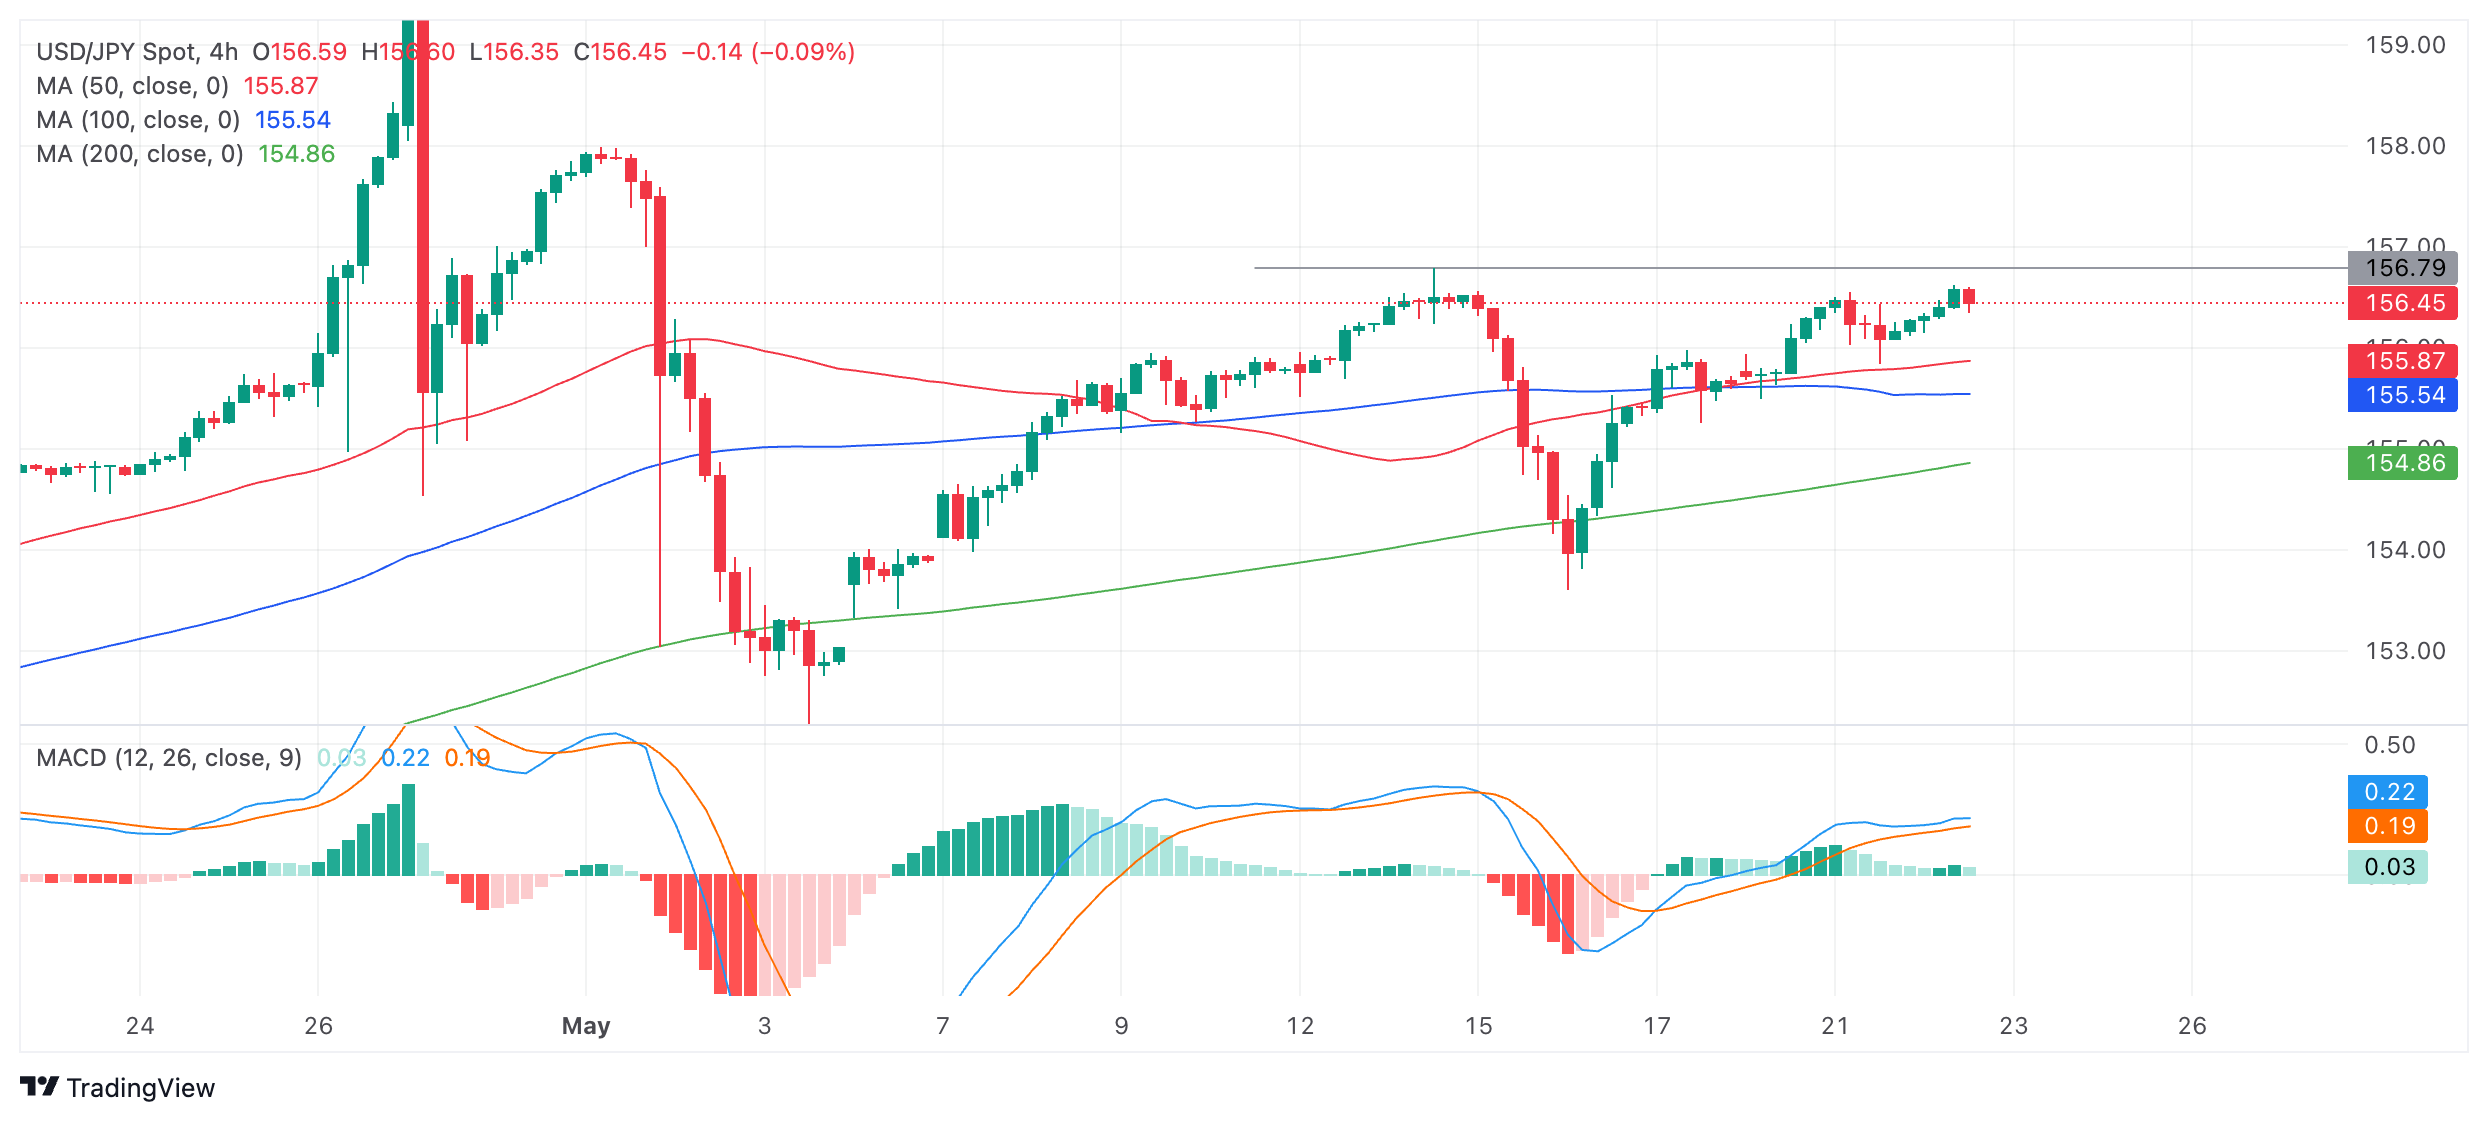
USD/JPY is in an uptrend on all timeframes, however, and given “the trend is your friend” this favors more upside eventually even if there is a correction at the aforementioned resistance level.
The Moving Average Convergence Divergence (MACD) momentum indicator is showing a lack of momentum in the most recent move up from the May 16 lows, which could be a warning sign. The blue MACD line has not crossed below the red signal line, however, as would be expected to accompany the beginning of a deeper pullback.
If USD/JPY corrects it will probably find support at the level of the cluster of Moving Averages between 155.50-80.
A break above the resistance level at 156.79 on a 4-hour period closing basis would indicate a continuation of the uptrend, with the next upside target probably at the 157.98 May 1 high.
- USD/CAD moves higher to 1.3660 amid caution ahead of FOMC minutes.
- Fed officials emphasize keeping interest rates restrictive for a longer period.
- Trades raise bets in support for BoC early rate cuts.
The USD/CAD pair moves higher to 1.3660 in Wednesday’s American session. The Loonie asset gains as the US Dollar rises amid caution ahead of the release of the Federal Open Market Committee (FOMC) minutes, which will be published later the day.
The FOMC minutes will provide more cues about whether policymakers are comfortable with market expectations for the Federal Reserve (Fed) shifting to policy normalization from the September meeting.
Ahead of the FOMC minutes, the market sentiment is slightly nervous. The S&P 500 has opened on a cautious note. The US Dollar Index (DXY), which tracks the Greenback’s value against six major currencies, rose to 104.80. 10-year US Treasury yields rise to 4.43% as Fed officials keep emphasizing the need to maintain interest rates at their current levels for a longer period.
Despite the expected decline in the US Consumer Price Index (CPI) data for April, Fed policymakers support for continuing a restrictive interest rate stance as a one-time decline in price pressures is insufficient to build confidence that the progress in the disinflation process has resumed.
Meanwhile, the Canadian Dollar is expected to face significant pressure as speculation for the Bank of Canada (BoC) to begin reducing interest rates from the June meeting has strengthened after soft inflation report for April. Statistics Canada reported on Tuesday that BoC’s preferred inflation measure grew at a slower pace of 1.6% from the prior reading of 2% on a year-on-year basis. Annual headline CPI decelerated to 2.7% as expected from the former reading of 2.9%.
- Fed policymakers' comments on policy outlook will be scrutinized by investors this week.
- Markets try to figure out whether the Fed will hold policy steady in September.
- Fed rate outlook could influence the US Dollar's performance against its major rivals.
Federal Reserve (Fed) policymakers are scheduled to deliver speeches throughout this week as investors reassess the interest rate outlook following the April Consumer Price Index (CPI) data. According to the CME FedWatch Tool, the probability of a no change in the Fed's policy rate in September holds around 40%.
The US Bureau of Labor Statistics reported on May 15 that the core Consumer Price Index (CPI) rose 3.6% on a yearly basis in April. This reading followed the 3.8% increase recorded in March and came in line with the market expectation. On a monthly basis, the CPI and the core CPI both rose 0.3% after rising 0.4% in March. The US Dollar (USD) came under bearish pressure as market participants assessed the inflation data and the USD Index fell to its lowest level in over a month, losing over 0.7% on a weekly basis.
Since the release of the April inflation report, however, Fed policymakers adopted a cautious language and caused investors to doubt the probability of a rate cut in September. In the American session on Wednesday, the Fed will release the minutes of the April 30-May 1 policy meeting.
Fed Minutes Preview: Markets to focus on comments regarding the inflation outlook.
Economic Indicator
FOMC Minutes
FOMC stands for The Federal Open Market Committee that organizes 8 meetings in a year and reviews economic and financial conditions, determines the appropriate stance of monetary policy and assesses the risks to its long-run goals of price stability and sustainable economic growth. FOMC Minutes are released by the Board of Governors of the Federal Reserve and are a clear guide to the future US interest rate policy.
Read more.Last release: Wed Apr 10, 2024 18:00
Frequency: Irregular
Actual: -
Consensus: -
Previous: -
Source: Federal Reserve
Minutes of the Federal Open Market Committee (FOMC) is usually published three weeks after the day of the policy decision. Investors look for clues regarding the policy outlook in this publication alongside the vote split. A bullish tone is likely to provide a boost to the greenback while a dovish stance is seen as USD-negative. It needs to be noted that the market reaction to FOMC Minutes could be delayed as news outlets don’t have access to the publication before the release, unlike the FOMC’s Policy Statement.
Fed officials' recent comments on policy and inflation
San Francisco Fed President Mary Daly noted on Monday that, while she expects shelter inflation to slowly improve, she said that she doesn't expect progress to be quick. Fed's Daly also noted that she is not confident that inflation is sustainably coming down to the Fed's 2% inflation target.
Fed Vice Chair for Supervision Michael Barr said that the Fed is in a good position to hold the policy steady and watch the economy, per Reuters. Meanwhile, Fed Vice Chair of the Board of Governors Phillip Jefferson acknowledged that April's better inflation reading was encouraging and added that it was too early to tell if the recent slowdown in disinflationary process will be long-lasting.
Last week, Fed Board of Governors member Michelle Bowman said that progress on inflation may not be as consistent as many hoped. Cleveland Fed President Mester emphasized that maintaining the current levels of Fed policy will aid in returning still-elevated inflation to the 2% target. Richmond Fed President Thomas Barkin told CNBC last Thursday that the latest Consumer Price Index (CPI) data showed that inflation was not where the Fed is trying to get. Finally, New York Fed President Williams argued that there was no need for a rate cut in the near term.
Atlanta Fed President Raphael Bostic said on Tuesday that the Fed has to be cautious about the first rate move, adding that it may need to be later in order to not stoke pent-up exuberance for investment and other spending. Meanwhile, Fed Governor Christopher Waller noted that he needs to see several more months of good inflation data before being comfortable to support an easing in the policy.
Fed's Bostic: Fed has to be cautious about first rate move.
Fed's Waller: Several more months of good inflation data needed before supporting easing in policy.
Fed Governor Waller added further comments on Tuesday, cautioning that the Fed's data-dependent approach may not see the need for rate cuts until the end of the year. However, Fed's Waller pointed out that if the Fed were to start a cutting cycle, a single rate cut doesn't make a lot of sense.
Inflation FAQs
Inflation measures the rise in the price of a representative basket of goods and services. Headline inflation is usually expressed as a percentage change on a month-on-month (MoM) and year-on-year (YoY) basis. Core inflation excludes more volatile elements such as food and fuel which can fluctuate because of geopolitical and seasonal factors. Core inflation is the figure economists focus on and is the level targeted by central banks, which are mandated to keep inflation at a manageable level, usually around 2%.
The Consumer Price Index (CPI) measures the change in prices of a basket of goods and services over a period of time. It is usually expressed as a percentage change on a month-on-month (MoM) and year-on-year (YoY) basis. Core CPI is the figure targeted by central banks as it excludes volatile food and fuel inputs. When Core CPI rises above 2% it usually results in higher interest rates and vice versa when it falls below 2%. Since higher interest rates are positive for a currency, higher inflation usually results in a stronger currency. The opposite is true when inflation falls.
Although it may seem counter-intuitive, high inflation in a country pushes up the value of its currency and vice versa for lower inflation. This is because the central bank will normally raise interest rates to combat the higher inflation, which attract more global capital inflows from investors looking for a lucrative place to park their money.
Formerly, Gold was the asset investors turned to in times of high inflation because it preserved its value, and whilst investors will often still buy Gold for its safe-haven properties in times of extreme market turmoil, this is not the case most of the time. This is because when inflation is high, central banks will put up interest rates to combat it. Higher interest rates are negative for Gold because they increase the opportunity-cost of holding Gold vis-a-vis an interest-bearing asset or placing the money in a cash deposit account. On the flipside, lower inflation tends to be positive for Gold as it brings interest rates down, making the bright metal a more viable investment alternative.
- GBP/JPY pushes higher after UK inflation data comes out above analysts’ estimates.
- The data could delay when the BoE cuts interest rates – a supportive factor for GBP.
- GBP/JPY may have seen gains capped after Japanese bond yields broke above 1.0% for the first time in over a decade.
GBP/JPY rises to the 199.20s on Wednesday after UK inflation data comes out higher than economists had predicted. The data suggests the Bank of England (BoE) could delay cutting interest rates which would be positive for the Pound Sterling (GBP).
Although higher inflation has traditionally been associated with currency devaluation, the advent of globalization and the relatively free flow of capital means that investors can now move their capital to countries with higher interest rates. This leads to an increase in demand for those countries' currencies. Since higher inflation tends to beget higher interest rates it also therefore appreciates currencies.
The UK headline Consumer Price Index (CPI) in April rose by 2.3% year-over-year. Although inflationary pressures within the economy waned compared to the previous month’s 3.2% reading, it did not fall as much as the 2.1% economists predicted.
It was a similar story for the core CPI which rose by 3.9% versus the 3.6% estimated, but below the 4.2% of March, according to the Office of National Statistics (ONS).
The data brings the rate of inflation closer to the BoE’s 2.0% target but because it was higher than economists had expected, GBP actually rose in most pairs, including GBP/JPY.
GBP/JPY Daily Chart
Japanese Yen gains support after bond yields break above 1.0%
Despite weakening against the stronger GBP on Wednesday, the Japanese Yen (JPY) probably saw some underlying support after the news that 10-year Japanese Government Bond (JGB) yields had risen above 1.0% for the first time since 2012.
The positive correlation between yields and the Yen suggests this may have helped the Yen. Yields usually rise as a result of higher inflation expectations and the rise fueled expectations that the Bank of Japan (BoJ) might increase interest rates again sooner than had previously been thought. Another reason for the rise was put down to weak demand from buyers at an auction of 40-year JGB bonds, since yields move inversely to bond prices.
Meanwhile, traders remain cautious about pushing the Yen to new lows amid a risk the authorities could directly intervene to prop up the currency. It is believed intervention was behind the Yen’s recovery between April 29 and May 3 when JPY experienced volatile gains despite no obvious fundamental catalysts for the moves.
More recently, Japanese Finance Minister Shunichi Suzuki once again expressed concerns about the negative impact of a weak currency on wage rises, suggesting he was still willing to press the button on intervention if the Yen continues weakening.
On the economic front, the latest data out of Japan showed the trade deficit widened in April, machinery orders unexpectedly increased in March and business sentiment among large manufacturers remained steady in May.
- The Fed will release the minutes of the April 30-May 1 policy meeting on Wednesday.
- Jerome Powell and co’s discussions surrounding the inflation outlook will be scrutinized.
- Markets see a less than 40% probability that the Fed will leave the policy rate unchanged in September.
The Federal Reserve (Fed) will release the minutes of the April 30-May 1 policy meeting on Wednesday at 18:00 GMT. Investors will pay close attention to comments regarding the inflation outlook and the possible timing of a policy pivot.
Fed is widely anticipated to hold policy steady in June and July
The Fed left unchanged its monetary policy settings following the April 30-May 1 policy meeting as expected. In its policy statement, the US central bank said that there has recently been a lack of further progress toward the 2% inflation target. Regarding the quantitative tightening strategy, the Fed noted that they will slow the decline of the balance sheet by cutting the Treasury redemption cap to $25 billion per month from $60 billion starting June 1.
In the post-meeting press conference, Fed Chairman Jerome Powell noted that it was unlikely that the next policy move would be another rate hike but explained that it could be appropriate to hold off on interest rate cuts if inflation proves more persistent and labor market remains strong. Powell reiterated that they need to have greater confidence in inflation moving toward 2% before considering a policy pivot.
The data published by the US Bureau of Labor Statistics showed on May 15 that the core Consumer Price Index (CPI) rose 3.6% on a yearly basis in April. This reading followed the 3.8% increase recorded in March and came in line with the market expectation. On a monthly basis, the CPI and the core CPI both rose 0.3% after rising 0.4% in March.
According to the CME FedWatch Tool, markets see little to no chance of a Fed rate cut either in June or July. The probability of the Fed holding the policy rate in September, however, stays about 37%.
Previewing the Fed’s publication, “the minutes from the most recent FOMC meeting are likely to grab attention next week following the Committee's decision to communicate that "higher for longer" remains the policy of choice in the near horizon,” TD Securities analysts said and added: “Further color regarding the decision to taper QT will also be in focus.”
When will FOMC Minutes be released and how could it affect the US Dollar?
The Fed will release the minutes of the April 30-May 1 policy meeting at 18:00 GMT on Wednesday. Investors will pay close attention to discussions surrounding the inflation outlook and look for possible hints on the timing of the policy pivot.
Following the release of the April inflation report, several Fed policymakers adopted a cautious language regarding the rate outlook while recognizing the modest progress in disinflation. San Francisco Fed President Mary Daly noted on Monday that, while she expects shelter inflation to improve slowly, as she said that she doesn't expect progress to be quick. Daly also noted that she is not confident that inflation is sustainably coming down to the Fed's 2% inflation target. Additionally, Fed Vice Chair for Supervision Michael Barr argued that the Fed is in a good position to hold the policy steady and watch the economy.
In case the minutes show that policymakers lean toward taking a patient approach to policy easing in the face of strong inflation and favor a single rate cut later in the year, the US Dollar (USD) could hold its ground against its major rivals. If the publication suggests that officials are increasingly concerned about the growing signs of a slowdown in economic activity and remain optimistic about the inflation outlook, risk flows could dominate the markets and hurt the USD.
Eren Sengezer, European Session Lead Analyst, shares a brief technical outlook for the USD Index:
“The USD Index (DXY) stays dangerously close to the 104.30-104.20 area, where the 200-day and the 100-day Simple Moving Averages (SMA) are located. In case the index falls below this area and starts using it as resistance, technical sellers could take action. In this scenario, 103.70 (Fibonacci 50% retracement of the January-April uptrend) could act as interim support before 103.00 (Fibonacci 61.8% retracement). On the upside, resistances could be seen at 105.25 (Fibonacci 23.6% retracement, 20-day SMA), 106.00 (static level, psychological level) and 106.50 (endpoint of the uptrend).”
Fed FAQs
Monetary policy in the US is shaped by the Federal Reserve (Fed). The Fed has two mandates: to achieve price stability and foster full employment. Its primary tool to achieve these goals is by adjusting interest rates. When prices are rising too quickly and inflation is above the Fed’s 2% target, it raises interest rates, increasing borrowing costs throughout the economy. This results in a stronger US Dollar (USD) as it makes the US a more attractive place for international investors to park their money. When inflation falls below 2% or the Unemployment Rate is too high, the Fed may lower interest rates to encourage borrowing, which weighs on the Greenback.
The Federal Reserve (Fed) holds eight policy meetings a year, where the Federal Open Market Committee (FOMC) assesses economic conditions and makes monetary policy decisions. The FOMC is attended by twelve Fed officials – the seven members of the Board of Governors, the president of the Federal Reserve Bank of New York, and four of the remaining eleven regional Reserve Bank presidents, who serve one-year terms on a rotating basis.
In extreme situations, the Federal Reserve may resort to a policy named Quantitative Easing (QE). QE is the process by which the Fed substantially increases the flow of credit in a stuck financial system. It is a non-standard policy measure used during crises or when inflation is extremely low. It was the Fed’s weapon of choice during the Great Financial Crisis in 2008. It involves the Fed printing more Dollars and using them to buy high grade bonds from financial institutions. QE usually weakens the US Dollar.
Quantitative tightening (QT) is the reverse process of QE, whereby the Federal Reserve stops buying bonds from financial institutions and does not reinvest the principal from the bonds it holds maturing, to purchase new bonds. It is usually positive for the value of the US Dollar.
- Silver price plummets to $31.50 amid caution ahead of Fed’s May policy minutes.
- Fed policymakers support higher interest rates for a longer period.
- Silver price consolidates near multi-year high around $32.50
Silver price (XAG/USD) posts a vertical fall to near the crucial support of $31.50 in Wednesday’s early New York session. The white metal weakens as the US Dollar and bond yields recover amid caution ahead of the release of the Federal Open Market Committee (FOMC) minutes of the May policy meeting that will be published later the day. The FOMC minutes will provide a detailed explanation behind policymakers’ view on the interest rate outlook.
The market sentiment is slightly cautious as Federal Reserve (Fed) policymakers continue supporting that interest rates should remain at their current levels until inflation returns sustainably to the desired rate of 2%. S&P 500 futures posted losses in the European session, exhibiting a decline in investors’ risk-appetite.
The US Dollar Index (DXY), which tracks the Greenback’s value, jumps to 104.90. 10-year US Treasury Yields rise to 4.46% as hawkish guidance on interest rates from Fed officials has deepened uncertainty over Fed reducing interest rates from the September meeting. On Tuesday, Cleveland Fed Bank President Loretta Mester said that he wants to see inflation declining few more months to be sure before considering rate cuts.
Higher yields on interest-bearish assets increase the opportunity cost of holding investment in the non-yielding assets, such as Silver.
Silver technical analysis
Silver price turns sideways after printing a fresh multi-year high near $32.50. The white metal delivered a sharp upside move after breaking above the horizontal resistance plotted from April 12 high at $29.80. The upward-sloping 20-period Exponential Moving Average (EMA) near $31.40 suggests that the upside trend is intact.
The 14-period Relative Strength Index (RSI) shifts comfortably into the bullish range of 60.00-80.00, indicating that momentum remains leaned to the upside.
Silver four-hour chart
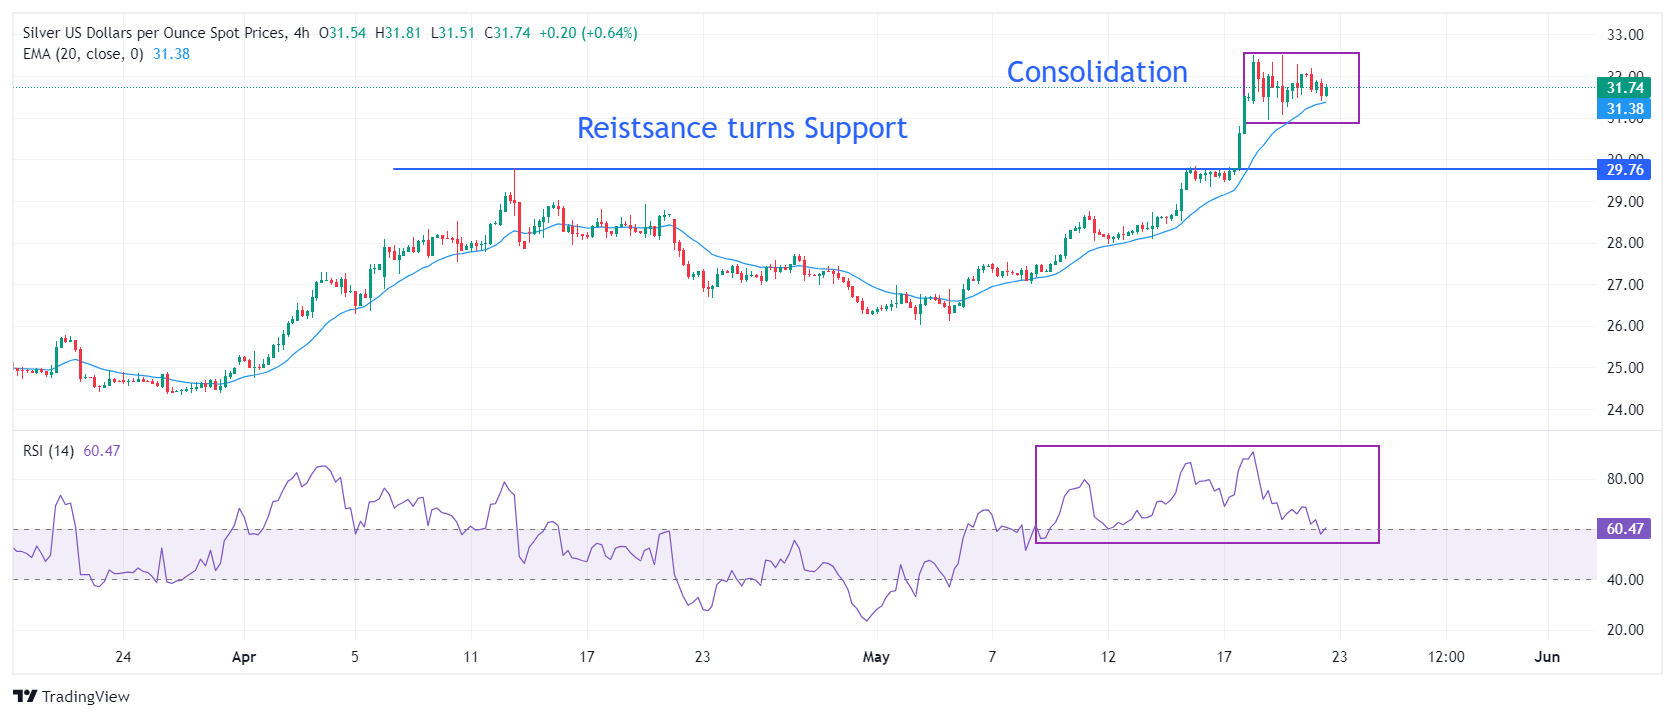
- USD/CHF is breaking back inside the rising channel it broke out of last week.
- This is probably a sign the dominant uptrend is resuming and prices will go higher.
- A close on a 4-hour basis back inside the channel would help confirm the bullish thesis.
USD/CHF is in the process of breaking back inside its rising channel as the bull trend tries to pick up momentum following a period of weakness.
Price broke down and out of its rising channel on May 14. The break signaled a possible bearish reversal, however, price failed to make much headway lower.
The pair recovered after bottoming on May 16 and began clawing its way higher. It has now broken back inside the channel and if the current 4-hour candle ends with a bullish close it will probably signal a resumption of the uptrend after a false break.
USD/CHF 4-hour Chart
The pair has been rising in a channel since the start of 2024. Given the received wisdom that “the trend is your friend” this broad uptrend should continue.
In the short term the outlook is clarifying. For a while it looked as if the channel breakdown had reversed the short-term trend. However, price rallied and the current candle on the 4-hour has actually penetrated decisively back inside the channel. If the current candle ends on a bullish note it will indicate price has clearly broken back inside its rising channel, and the uptrend should extend quite happily upwards. In such a scenario USD/CHF would be expected to reach close to the 0.9225 highs of the year.
Until the current period closes, however, it is impossible to assess with any degree of certainty whether bulls have been victorious. It is possible, for example, that price could recapitulate and fall back down to below the red trendline before the current candle closes – invalidating the bullish recovery hypothesis.
It would require a significant drop to reverse the trend, however, with price needing to break back below the breakout move low at 0.8988 to suggest a reversal and continuation south.
- Oil jumps back above $78 after a brief decline.
- Norway, Ireland and Spain said they will recognize a Palestinian state on May 28.
- The US Dollar Index is trading in a narrow range ahead of an eventful 24 hours.
Oil prices are flat on Wednesday after headlines came out that Norway, Ireland and Spain will recognize a Palestinian state in a surprising move. Israel was quick to recall their embassy personnel from those countries. The move underlines the concerns on how Israel is dealing with the situation in Gaza, disregarding calls for a ceasefire and to allow more humanitarian help in the strip.
Meanwhile, the US Dollar Index (DXY), which tracks the performance of the US Dollar against a basket of six major currencies, is moving in a tight range ahead of an eventful 24 hours where volatility is expected to increase. Nvidia (NVDA) is set to release its earnings near 16:00 GMT, after which the Federal Reserve (Fed) will publish the Minutes from their latest monetary policy decision. On Thursday, the economic calendar gains traction, with Jobless Claims data having the potential to trigger some waves. In this context, the DXY looks set to break out of its tight range for this week.
At the time of writing, Crude Oil (WTI) trades at $78.22 and Brent Crude at $82.35.
Oil news and market movers: OPEC cuts not helping
- Soft demand and surprisingly robust non-OPEC output growth are aiding supply and keeping prices under control despite mounting geopolitical tension, several traders reported to Bloomberg.
- The American Petroleum Institute (API) overnight reported that US crude inventories increased 2.5 million barrels last week, Reuters reported.
- At 14:30 GMT, the US Energy Information Administration is set to release their findings on the US stock pile change. The previous week saw a draw of 2.508 million barrels, and for this week a bigger draw of 3.1 million barrels is expected.
Oil Technical Analysis: Stand still despite all moving parts
Oil prices are back to flat after the brief downward excursion this Wednesday on the back of the headlines around the Palestinian state. Again all eyes are on the US, which is heavily disrupting the Oil markets by filling in the gap of the OPEC supply cuts. A lot of questions are now arising on the geopolitical front, namely if the US will remain standing by Israel as an ally despite mounting criticism across the globe. A retreat in the Middle East could mean an end to diplomacy with escalations and elevated Oil prices as the end result, a narrow path for the US to navigate through.
On the upside, the line in the sand remains at the 200-day Simple Moving Average (SMA) at $79.61. Once above that level, a double layer comes up with the 100-day SMA at $81.27. In case of an upward extension above that zone, the road is open for $87.12 again.
On the downside, the pivotal level at $75.28 is the last solid line that could support the decline. If this level is unable to hold, investors could expect an accelerated sell-off towards $72.00 and $70.00, erasing all gains for 2024. Further down, Oil price could test $68, the December 13 low.
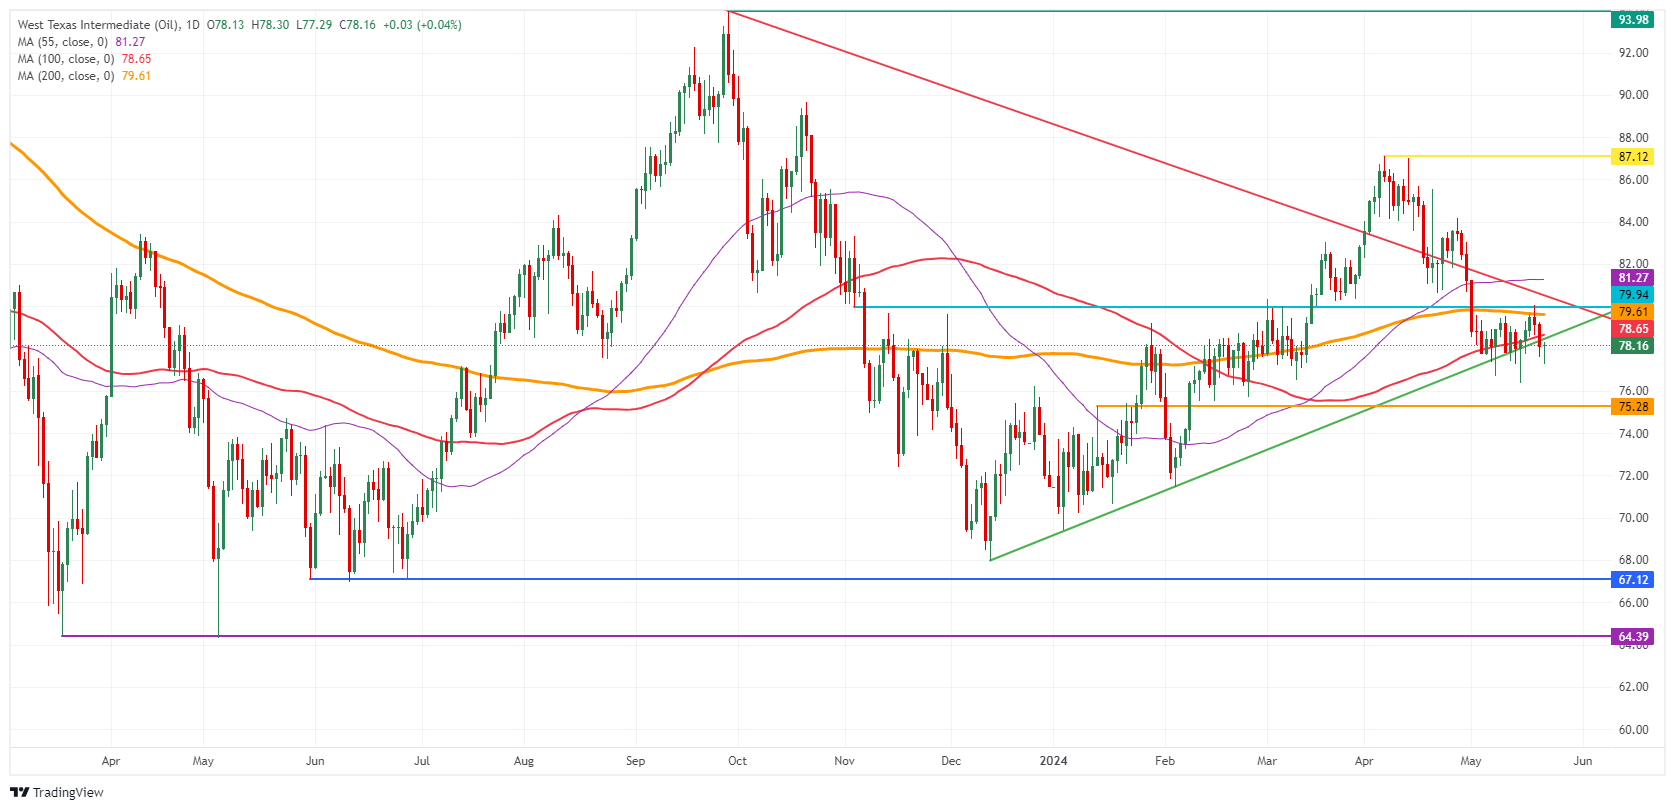
US WTI Crude Oil: Daily Chart
WTI Oil FAQs
WTI Oil is a type of Crude Oil sold on international markets. The WTI stands for West Texas Intermediate, one of three major types including Brent and Dubai Crude. WTI is also referred to as “light” and “sweet” because of its relatively low gravity and sulfur content respectively. It is considered a high quality Oil that is easily refined. It is sourced in the United States and distributed via the Cushing hub, which is considered “The Pipeline Crossroads of the World”. It is a benchmark for the Oil market and WTI price is frequently quoted in the media.
Like all assets, supply and demand are the key drivers of WTI Oil price. As such, global growth can be a driver of increased demand and vice versa for weak global growth. Political instability, wars, and sanctions can disrupt supply and impact prices. The decisions of OPEC, a group of major Oil-producing countries, is another key driver of price. The value of the US Dollar influences the price of WTI Crude Oil, since Oil is predominantly traded in US Dollars, thus a weaker US Dollar can make Oil more affordable and vice versa.
The weekly Oil inventory reports published by the American Petroleum Institute (API) and the Energy Information Agency (EIA) impact the price of WTI Oil. Changes in inventories reflect fluctuating supply and demand. If the data shows a drop in inventories it can indicate increased demand, pushing up Oil price. Higher inventories can reflect increased supply, pushing down prices. API’s report is published every Tuesday and EIA’s the day after. Their results are usually similar, falling within 1% of each other 75% of the time. The EIA data is considered more reliable, since it is a government agency.
OPEC (Organization of the Petroleum Exporting Countries) is a group of 13 Oil-producing nations who collectively decide production quotas for member countries at twice-yearly meetings. Their decisions often impact WTI Oil prices. When OPEC decides to lower quotas, it can tighten supply, pushing up Oil prices. When OPEC increases production, it has the opposite effect. OPEC+ refers to an expanded group that includes ten extra non-OPEC members, the most notable of which is Russia.
- AUD/USD is probably completing a Bull Flag continuation pattern with bullish implications.
- A break above the May 16 high would validate the pattern and indicate more upside to the pattern’s price targets.
- The pair has drifted sideways into support from the bottom of a rising channel and reached a pivotal moment in its evolution.
AUD/USD is potentially forming a Bull Flag continuation pattern on the 4-hour chart. These patterns are composed of a sharp rally – the “flagpole” – followed by a rectangular consolidation – the “flag square”.
Bull Flags are a sign the uptrend is taking a pause before continuing higher. The subsequent rally can be estimated by taking the length of the flagpole and extrapolating it from the base of the consolidation higher, or a Fibonacci ratio of the length.
A break above the top of the flag square (shaded rectangle on chart below) at around the 0.6714 May 16 high, would confirm activation of the Bull Flag. Such a move would be expected to extend the uptrend up to an initial target at 0.6728, the 0.618 Fibonacci ratio of the flagpole. A second more optimistic price objective lies at 0.6788, the full length of the flagpole.
AUD/USD 4-hour Chart
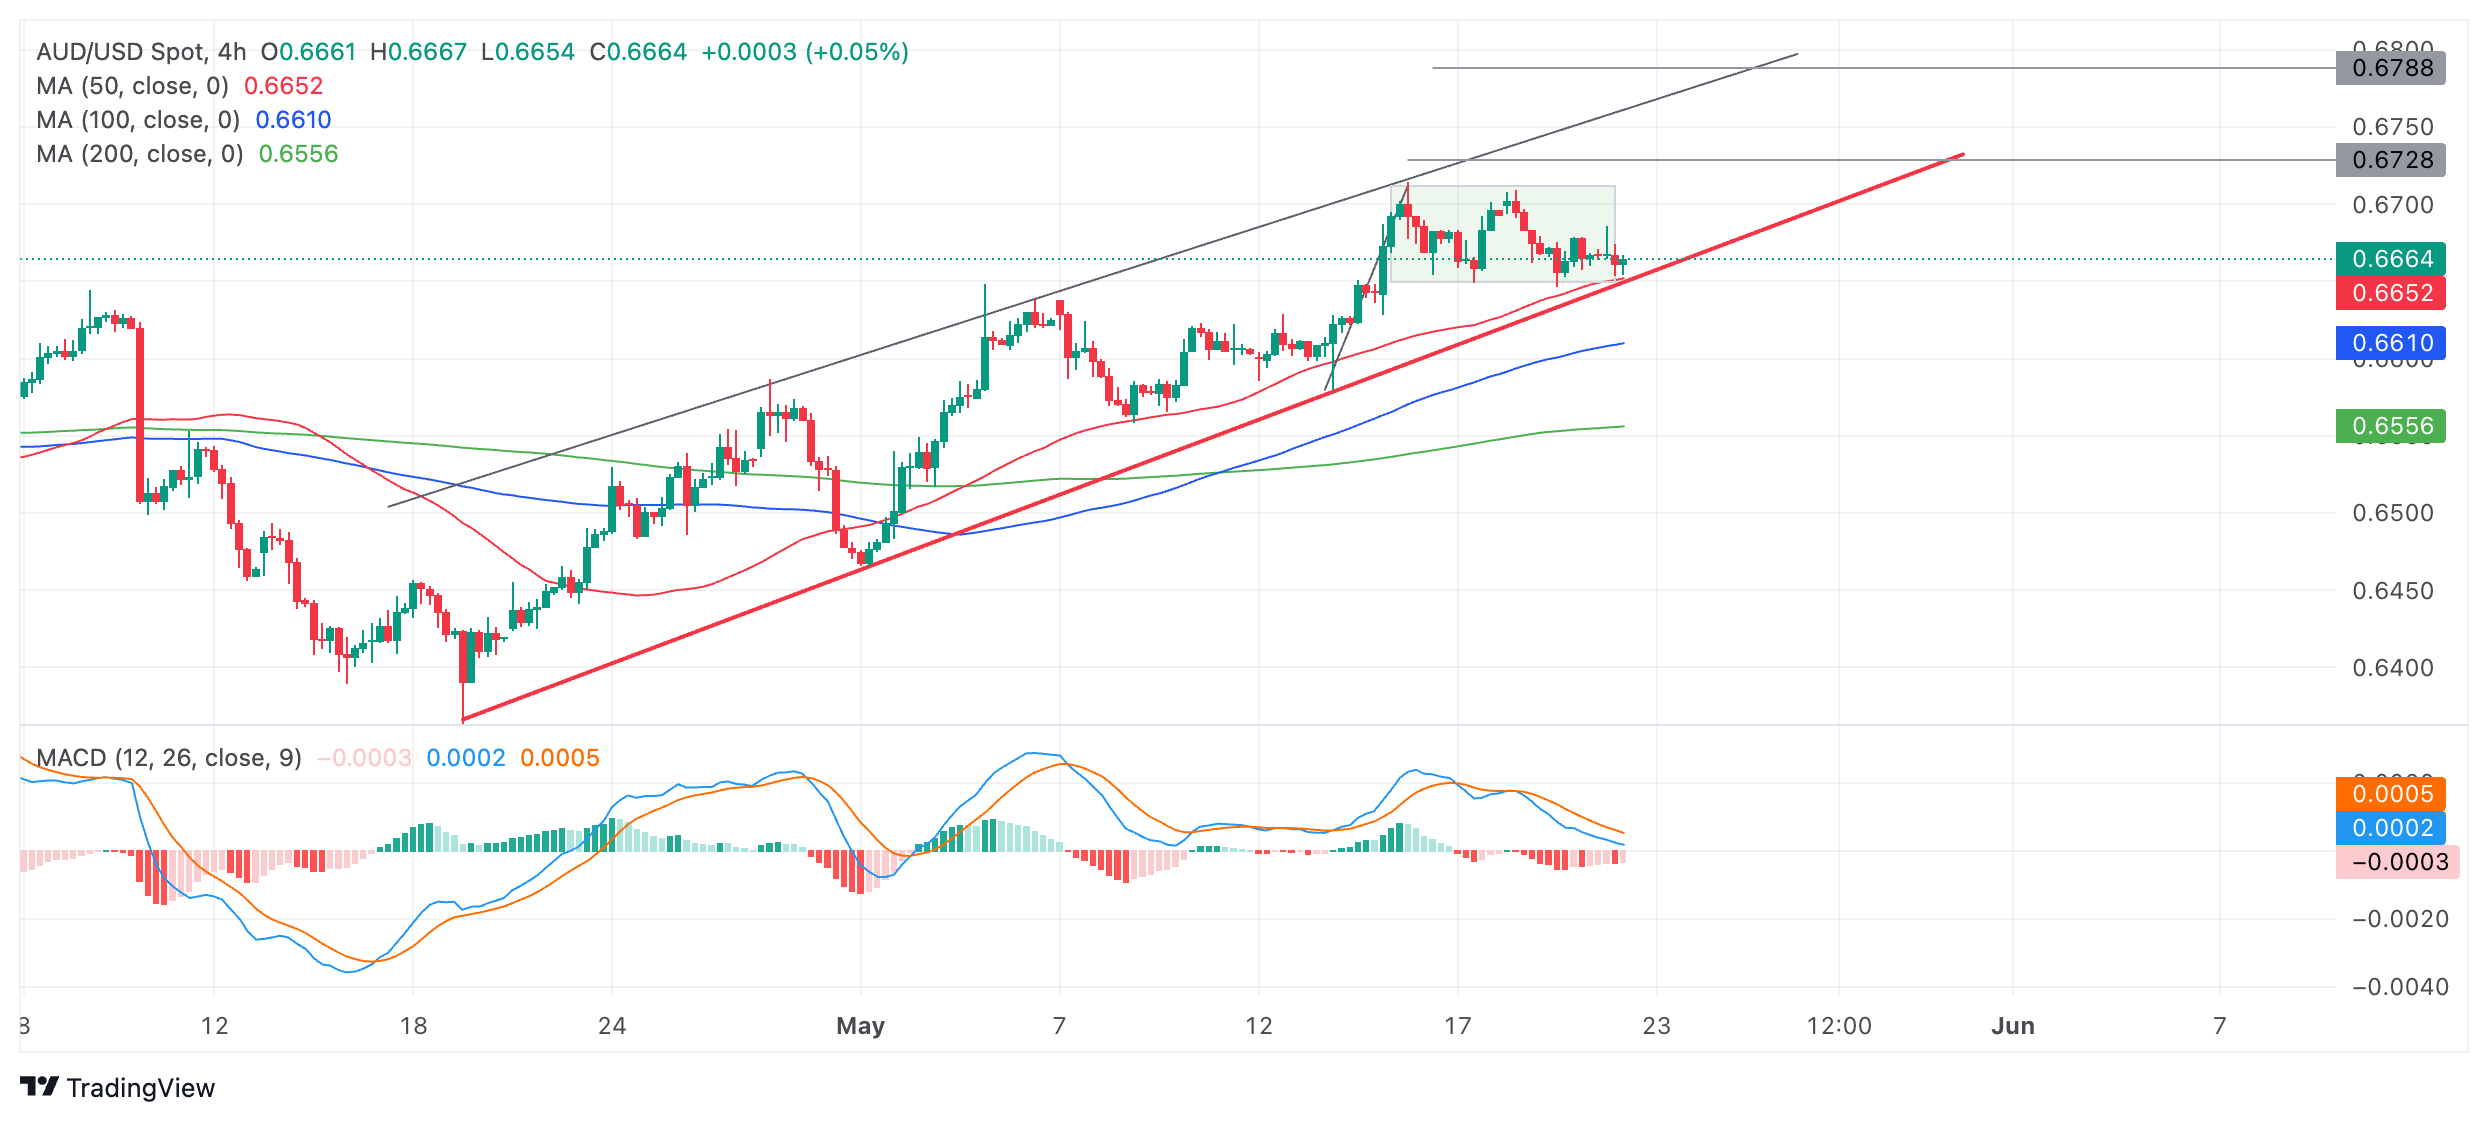
The Aussie is in a rising channel and price has now pulled back to the red lower trendline of the channel. This indicates price has reached a pivotal moment – if it breaks higher it will validate the Bull Flag hypothesis and activate the patterns targets. This is the more likely outcome given the AUD/USD is in a short-term uptrend, and as the old saying goes, “the trend is your friend”.
However, a decisive break below the red trendline would invalidate the Bull Flag and bring the short-term uptrend into doubt.
A decisive break would be characterized as one that was accompanied by a long red candle that closed near its low or three red candles in a row that broke through the trendline.
- The US Dollar trades flat ahead of the release of Nvidia earnings and the Fed Minutes.
- Volatility around the Greenback could pick up with plenty of economic data points on Thursday.
- The US Dollar Index trades in a tight range, respecting nearby support and resistance levels.
The US Dollar (USD) is drifting as markets await a volatile 24 hours ahead which will commence with the release of the Federal Reserve (Fed) Minutes from the recent Federal Open Market Committee (FOMC) decision on why they kept rates stable. Even as the report can be a market-moving event, not much is expected this time as traders have heard from plenty of Fed speakers since Monday, all roughly advocating to keep interest rates at the current levels with no hikes foreseen. After that, the much-anticipated earnings from Nvidia (NVDA) could set the tone for either risk on or risk off ahead of Thursday, when a lot of US data points will be released.
On the economic data front, a rather light Wednesday ahead with Existing Home Sales as a single big data point to be released. More activity is expected on Thursday, when the usual Jobless Claims numbers will be published.
Daily digest market movers: Gear up for some volatility
- Markets were caught by surprise by the inflation data from the United Kingdom. Monthly headline inflation picked up by 0.3% against 0.6% previous, more than the 0.1% expected. This sees markets repricing most major currencies a bit on the initial rate cut expectations from central banks.
- Wednesday’s US calendar will kick off with the Mortgage Bankers Association Survey for the Mortgage Applications for this week. Last week saw a steady 0.5% increase, with no forecast pencilled in.
- At 12:40 GMT, Federal Reserve Bank of Chicago President Austan Goolsbee delivers opening remarks at the Holding Company Symposium hosted by the bank.
- At 14:00 GMT, Existing Home Sales numbers for April will be released. In March, home sales declined by 4.3%.
- Nvidia Earnings are expected near 16:00 GMT and could set the risk tone further for the rest of the trading day.
- Near 17:00 GMT, the US Treasury will allot a 20-year bond auction in the market.
- At 18:00 GMT, the Fed Minutes will be released.
- Equities are retreating again despite US indices eking out gains on Tuesday.
- The CME Fedwatch Tool is seeing a shift in pricing with the June projections near 98.4% for no change in the policy rate against 1.6% chance of a hike. September futures are now seeing a 50.6% chance for a 25-basis-points cut.
- The benchmark 10-year US Treasury Note trades around 4.44%, near the high for this week.
US Dollar Index Technical Analysis: Steady ahead of the storm
The US Dollar Index (DXY) trades nearly in a standstill ahead of some market-moving elements that are hard to preposition for in advance. Nvidia earnings might be the main event even for this Wednesday as they have the capacity to decide the overall market mood. The fact that a single stock’s earnings could determine the risk tone for the remainder of the US trading session might see traders chasing the trade and moving the US Dollar Index in an unusual direction.
On the upside, the DXY Index is already near a chunky resistance level. The first level to recover is the 55-day Simple Moving Average (SMA) at 104.74. Further up, the following levels to consider are 105.12 and 105.52.
On the downside, the 100-day SMA around 104.22 is the last man supporting the decline. Once that level snaps, an air pocket is placed between 104.11 and 103.00. Should the US Dollar decline persist, the low of March at 102.35 and the low from December at 100.62 are levels to consider.
US Dollar FAQs
The US Dollar (USD) is the official currency of the United States of America, and the ‘de facto’ currency of a significant number of other countries where it is found in circulation alongside local notes. It is the most heavily traded currency in the world, accounting for over 88% of all global foreign exchange turnover, or an average of $6.6 trillion in transactions per day, according to data from 2022. Following the second world war, the USD took over from the British Pound as the world’s reserve currency. For most of its history, the US Dollar was backed by Gold, until the Bretton Woods Agreement in 1971 when the Gold Standard went away.
The most important single factor impacting on the value of the US Dollar is monetary policy, which is shaped by the Federal Reserve (Fed). The Fed has two mandates: to achieve price stability (control inflation) and foster full employment. Its primary tool to achieve these two goals is by adjusting interest rates. When prices are rising too quickly and inflation is above the Fed’s 2% target, the Fed will raise rates, which helps the USD value. When inflation falls below 2% or the Unemployment Rate is too high, the Fed may lower interest rates, which weighs on the Greenback.
In extreme situations, the Federal Reserve can also print more Dollars and enact quantitative easing (QE). QE is the process by which the Fed substantially increases the flow of credit in a stuck financial system. It is a non-standard policy measure used when credit has dried up because banks will not lend to each other (out of the fear of counterparty default). It is a last resort when simply lowering interest rates is unlikely to achieve the necessary result. It was the Fed’s weapon of choice to combat the credit crunch that occurred during the Great Financial Crisis in 2008. It involves the Fed printing more Dollars and using them to buy US government bonds predominantly from financial institutions. QE usually leads to a weaker US Dollar.
Quantitative tightening (QT) is the reverse process whereby the Federal Reserve stops buying bonds from financial institutions and does not reinvest the principal from the bonds it holds maturing in new purchases. It is usually positive for the US Dollar.
- EUR/GBP is breaking down out of a multi-month range it has been oscillating within since February.
- If price holds below the range lows it could lead to a substantial extension lower.
- A break back above the highs of the breakout candle would indicate the break was false.
EUR/GBP has fallen to the floor of a multi-month range and broken decisively below on a 4-hour period closing basis.
A close below the 0.8513 low of the candle that pierced through the floor would provide added confirmation of more downside.
EUR/GBP 4-hour Chart
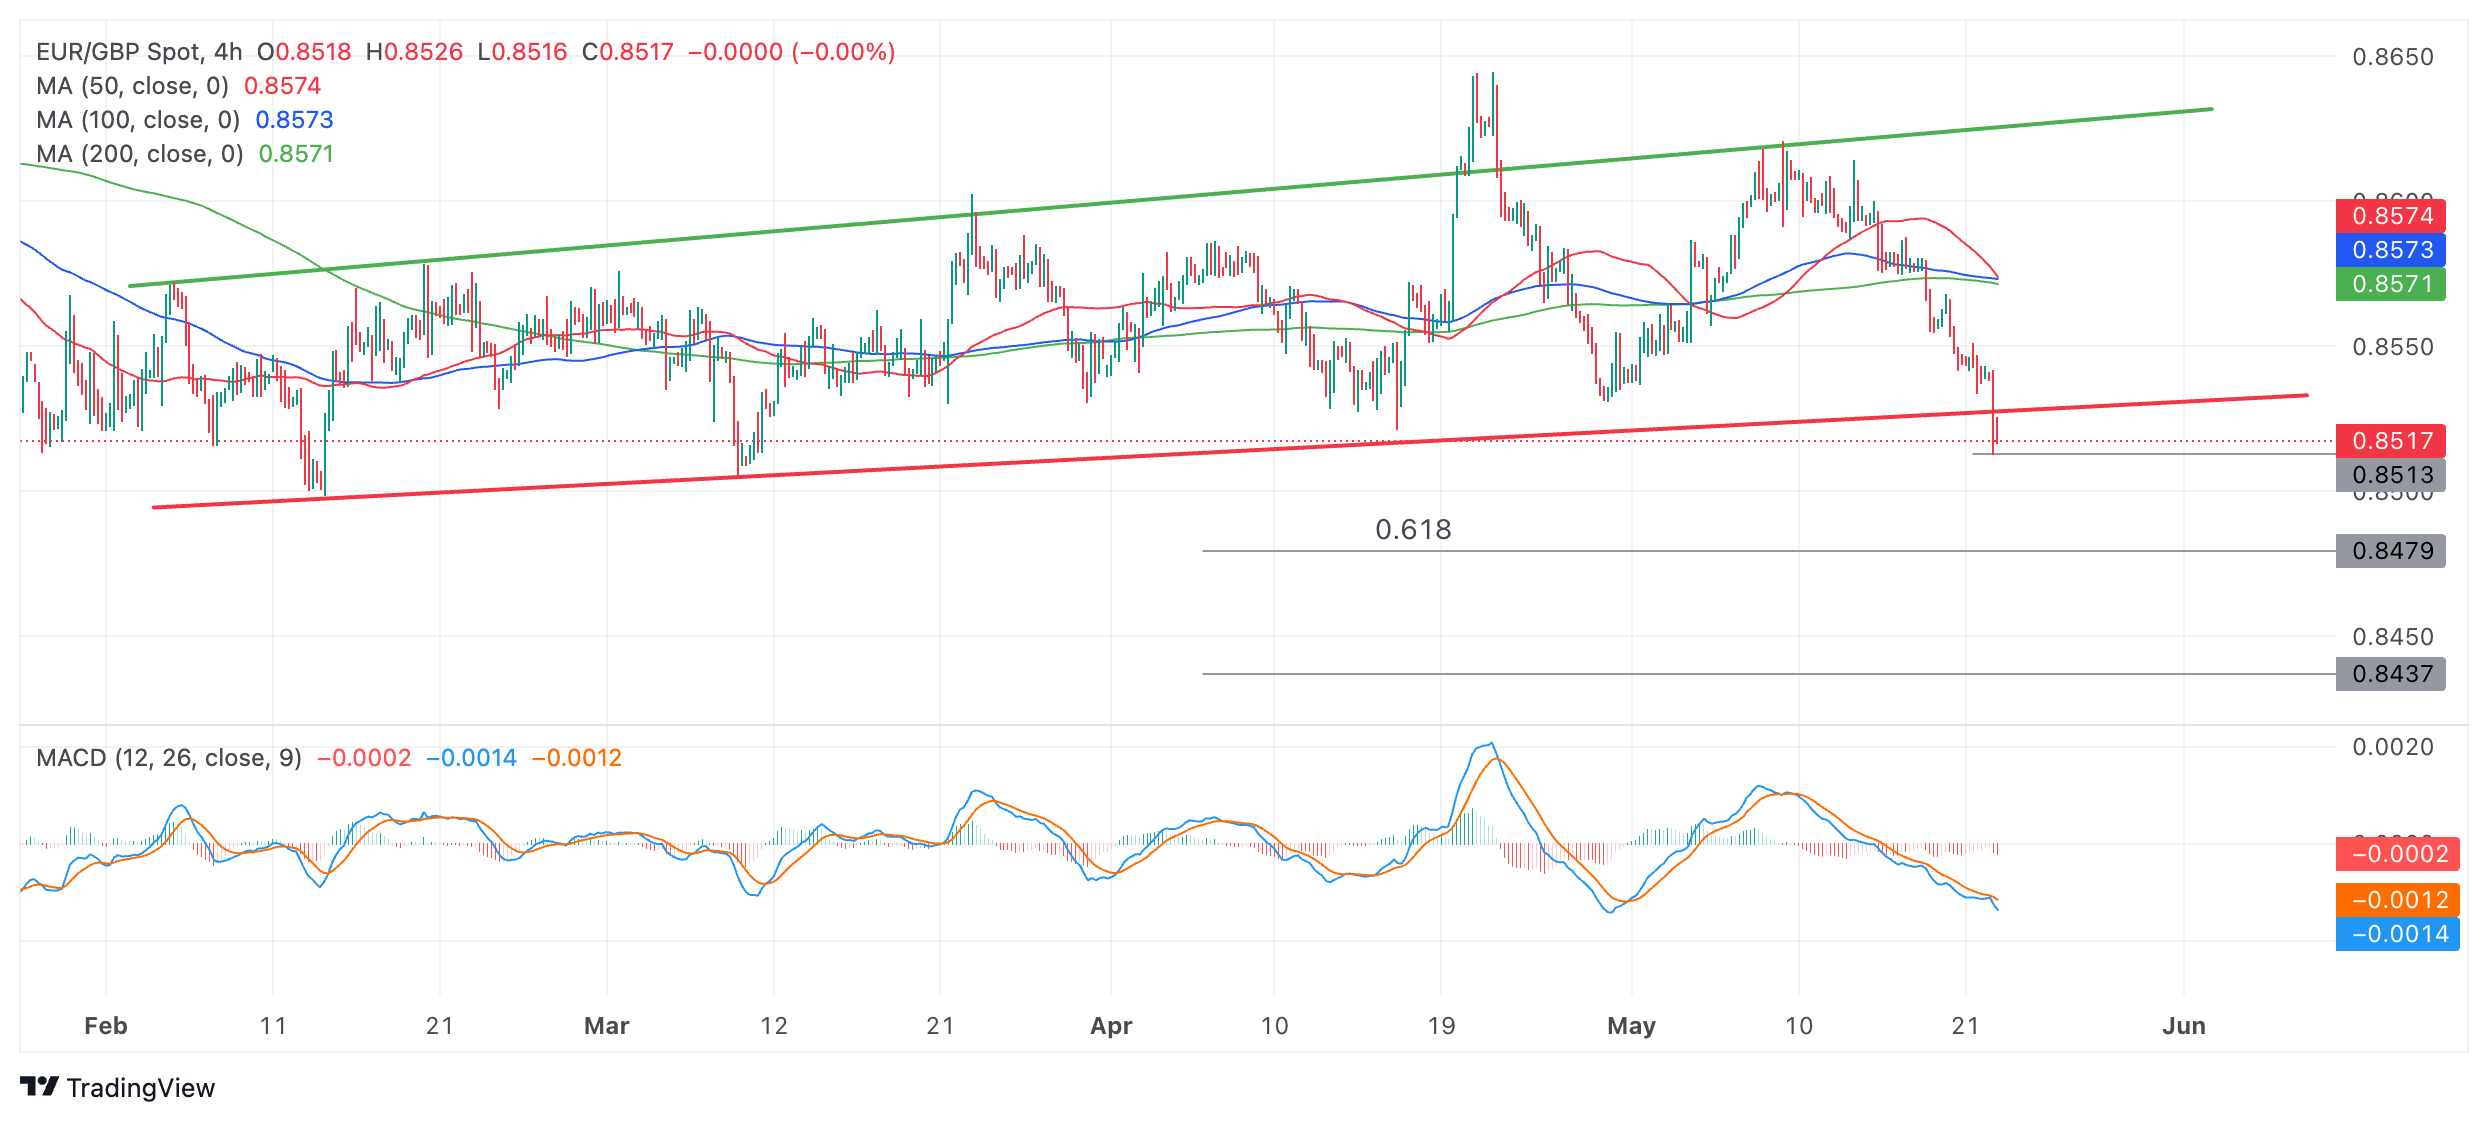
The customary method for forecasting how far a breakout move will go is to take the height of the range and extrapolate it lower from the breakout point. This gives two targets: a conservative objective at the 0.618 Fibonacci ratio – and a more optimistic target at the full 100% of the height of the range extrapolated lower.
The conservative target lies at roughly 0.8479 and the more optimistic objective at 0.8437.
The Moving Average Convergence Divergence (MACD) indicator is in the negative zone and looking a little oversold. If it crosses back above the signal line it could signal a recovery. Crosses of the MACD above or below its signal line have been a reliable indicator of oscillations in price during the unfolding of the range.
There is a risk the break is a “false break” and price will recover and move back up inside the range. EUR/GBP is, after all, in a sideways trend, and “the trend is your friend”. A close back above the 0.8542 high of the breakdown candle would provide evidence the sideways trend is probably extending further. It would suggest a strong possibility of a move back up to the range high in the 0.8620s.
- NZD/USD retreats to 0.6100 but still holds hawkish RBNZ-inspired gains.
- The RBNZ said the decision on rate cuts will be delayed amid headwinds of persistent price pressures.
- Investors await the FOMC minutes to project the next move in the US Dollar.
The NZD/USD pair falls sharply to near the crucial support of 0.6100 in Wednesday’s European session. Earlier, the Kiwi asset rose vertically to 0.6150 after the Reserve Bank of New Zealand (RBNZ) delivered a hawkish interest rate outlook post keeping its Official Cash Rate (OCR) steady at 5.5% for the seventh time in a row.
The New Zealand Dollar still holds significant gains against the US Dollar amid firm speculation that the RBNZ will start reducing interest rates later than the Federal Reserve (Fed). In the press conference, RBNZ Governor Adrian Orr cautioned a potential delay in interest rate cuts due to sticky price pressures. In the monetary policy statement, the RBNZ commented that inflation is expected to return to the 1%-3% band by the year-end.
Meanwhile, the US Dollar Index (DXY) rises to 104.70 ahead of the release of the Federal Open Market Committee (FOMC) that will provide more cues on United States interest rate path. The US Dollar remains well-supported above 104.40 from last few trading sessions as Fed officials continue supporting for interest rates remaining at their current levels for a longer period.
NZD/USD remains firm after a breakout of the Falling Channel formation on a daily timeframe. The Kiwi asset extends recovery to 50% Fibonacci retracement (plotted from December 26 high at 0.6410 to April 19 low around 0.5850) at 0.6130.
The 14-period Relative Strength Index (RSI) has shifted comfortably into the bullish range of 60.00-80.00, suggesting that the momentum has leaned toward the upside.
An upside move above February 9 high of 0.6160 will drive the asset towards 61.8% Fibo retracement at 0.6200, followed by January 15 high near 0.6250
On the contrary, fresh downside would appear if the asset breaks below April 4 high around 0.6050 This would drag the asset towards the psychological support of 0.6000 and April 25 high at 0.5969.
NZD/USD daily chart
Economic Indicator
RBNZ Interest Rate Decision
The Reserve Bank of New Zealand (RBNZ) announces its interest rate decision after its seven scheduled annual policy meetings. If the RBNZ is hawkish and sees inflationary pressures rising, it raises the Official Cash Rate (OCR) to bring inflation down. This is positive for the New Zealand Dollar (NZD) since higher interest rates attract more capital inflows. Likewise, if it reaches the view that inflation is too low it lowers the OCR, which tends to weaken NZD.
Read more.Last release: Wed May 22, 2024 02:00
Frequency: Irregular
Actual: 5.5%
Consensus: 5.5%
Previous: 5.5%
Source: Reserve Bank of New Zealand
The Reserve Bank of New Zealand (RBNZ) holds monetary policy meetings seven times a year, announcing their decision on interest rates and the economic assessments that influenced their decision. The central bank offers clues on the economic outlook and future policy path, which are of high relevance for the NZD valuation. Positive economic developments and upbeat outlook could lead the RBNZ to tighten the policy by hiking interest rates, which tends to be NZD bullish. The policy announcements are usually followed by Governor Adrian Orr’s press conference.
- Gold price retreats for the second consecutive day on the back of elevated interest-rate expectations.
- Fed policymakers are expressing a reluctance to lower interest rates until more progress has been made on beating inflation.
- Their views are echoed in other parts of the globe further weighing on the Gold price which is sensitive to interest rates.
Gold price (XAU/USD) trades lower by about a quarter of a percent in the $2,410s on Wednesday as a shift in the outlook for interest rates – both in the US and globally – weighs on the precious metal.
Recent comments from US Federal Reserve (Fed) policymakers repeated the mantra that insufficient progress had been made in bringing inflation down to the Fed’s 2.0% target to warrant a lowering of interest rates.
Their views weighed on the Gold price which, as a non-yielding asset, tends to perform poorly when interest rates are high due to the increased opportunity cost of holding Gold.
Gold price pulls back ahead of Fed Minutes
Gold price might be further impacted when the Fed releases the Minutes of its latest policy meeting on Wednesday at 18:00 GMT.
If the meeting minutes reflect a shift to a more hawkish stance amongst policymakers, Gold is expected to continue retreating.
The recent Reserve Bank of Australia (RBA) meeting Minutes revealed that officials at the RBA had discussed the possibility of raising rates – a notable shift in stance from previous meetings.
Technical Analysis: Gold price edges lower towards trendline support
Gold price (XAU/USD) edges down towards support from the green trendline, which reflects the short-term uptrend that began at the beginning of May.
The pair formed a Shooting Star Japanese candlestick pattern (shaded rectangle on the chart) on Monday, followed by a bearish close the following day, providing additional confirmation. The pattern is indicative of short-term weakness.
XAU/USD Daily Chart
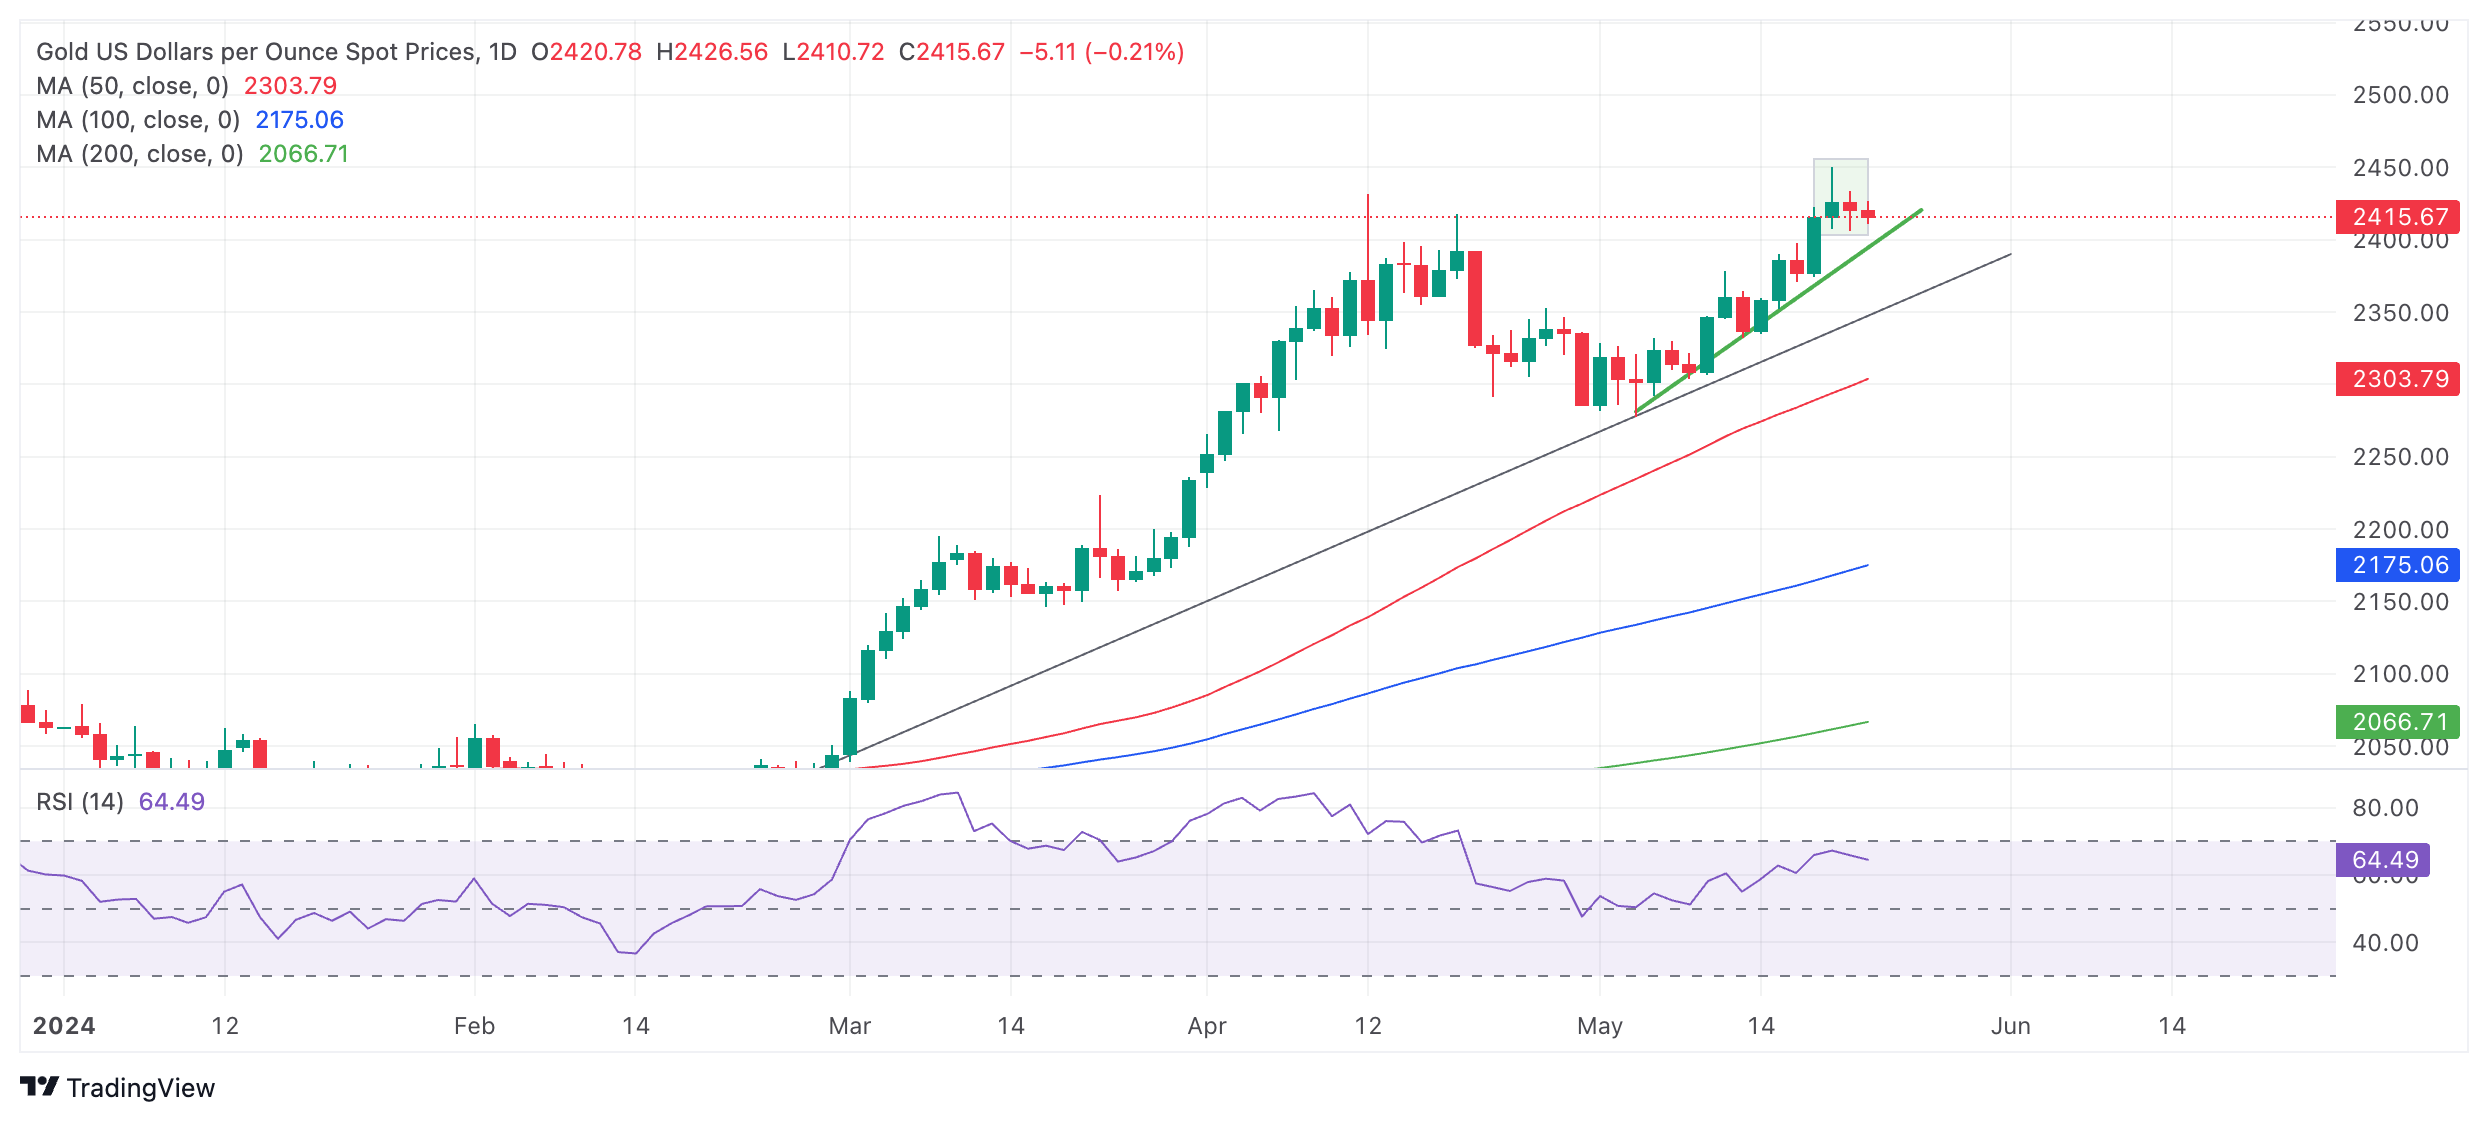
If the pullback continues, Gold will probably fall to initial support at the green trendline at about $2,405. Further weakness could take it down to the dark grey upward-sloping trendline in the $2,360s.
However, the precious metal’s short, medium and long-term trends are bullish, and given the old adage that “the trend is your friend”, the odds favor an eventual recovery after the correction.
A break above the new $2,450 all-time high would likely continue the rally to the next target at the psychologically significant $2,500 level.
Economic Indicator
FOMC Minutes
FOMC stands for The Federal Open Market Committee that organizes 8 meetings in a year and reviews economic and financial conditions, determines the appropriate stance of monetary policy and assesses the risks to its long-run goals of price stability and sustainable economic growth. FOMC Minutes are released by the Board of Governors of the Federal Reserve and are a clear guide to the future US interest rate policy.
Read more.Next release: Wed May 22, 2024 18:00
Frequency: Irregular
Consensus: -
Previous: -
Source: Federal Reserve
Minutes of the Federal Open Market Committee (FOMC) is usually published three weeks after the day of the policy decision. Investors look for clues regarding the policy outlook in this publication alongside the vote split. A bullish tone is likely to provide a boost to the greenback while a dovish stance is seen as USD-negative. It needs to be noted that the market reaction to FOMC Minutes could be delayed as news outlets don’t have access to the publication before the release, unlike the FOMC’s Policy Statement.
China announced on Wednesday that it will impose countermeasures against 12 American companies and their senior executives, as trade tensions between the world’s two biggest economies mount.
The retaliatory measures will include freezing movable, immovable, and other types of assets in China.
This comes in retaliation to the White House announcement on May 14, stating that the US will hike tariffs on Chinese chips and electric vehicles.
Reports are crossing the wires now that many of those tariffs will be effective from 1 August. Further, it is reportedly said that there will be public comments on new China tariffs, with June 18 as the deadline.
- The Canadian Dollar lost ground amid lower crude Oil prices.
- US Dollar appreciates due to higher US yields ahead of FOMC Minutes.
- WTI prices continue losing due to expectations of the Fed maintaining higher rates for longer.
USD/CAD extended gains for the third successive session, trading around 1.3660 during the European hours on Wednesday. The appreciation of the pair could be attributed to a stronger US Dollar (USD), possibly led by the higher US Treasury yields. Traders await the Minutes from the Federal Open Market Committee (FOMC) meeting held on May 1, seeking further clues about the Fed's policy stance.
The US Dollar Index (DXY), which measures the value of the Greenback against the other 6 major currencies, edges higher to near 104.70 with 2-year and 10-year yields on US Treasury bonds standing at 4.56% and 4.43%, respectively, by the press time.
The Federal Reserve (Fed) maintains a cautious stance regarding inflation and the potential for rate cuts in 2024. Speaking at the event titled "Central Banking in the Post-Pandemic Financial System" on Wednesday, Federal Reserve Bank of Boston President Susan Collins emphasized that progress toward interest rate adjustment will take longer. Additionally, Fed Governor Christopher Waller mentioned that he would need to observe several more months of positive inflation data before feeling comfortable supporting a policy easing.
On the CAD front, lower crude oil prices are exerting pressure on the Canadian Dollar (CAD), given Canada's status as the largest Oil exporter to the United States (US). West Texas Intermediate (WTI) Oil price trades around $77.80 per barrel, at the time of writing. The decline in crude Oil prices could be attributed to expectations of the Federal Reserve maintaining higher interest rates for an extended period, which may impact fuel consumption in the US, the world's largest Oil consumer.
The Bank of Canada's (BoC) preferred trimmed-mean core inflation rate eased to 2.9%. Moreover, the BoC’s median core rate dropped more than anticipated to 2.6%, marking its lowest level since June 2021. These developments have bolstered expectations of a rate cut from the BoC in June, thereby undermining the Canadian Dollar (CAD).
Silver prices (XAG/USD) fell on Wednesday, according to FXStreet data. Silver trades at $31.75 per troy ounce, down 0.73% from the $31.98 it cost on Tuesday.
Silver prices have increased by 24.66% since the beginning of the year.
| Unit measure | Today Price |
|---|---|
| Silver price per troy ounce | $31.75 |
| Silver price per gram | $1.02 |
The Gold/Silver ratio, which shows the number of troy ounces of Silver needed to equal the value of one troy ounce of Gold, stood at 76.10 on Wednesday, up from 75.69 on Tuesday.
Investors might use this ratio to determine the relative valuation of Gold and Silver. Some may consider a high ratio as an indicator that Silver is undervalued – or Gold is overvalued – and might buy Silver or sell Gold accordingly. Conversely, a low ratio might suggest that Gold is undervalued relative to Silver.
(An automation tool was used in creating this post.)
Silver FAQs
Silver is a precious metal highly traded among investors. It has been historically used as a store of value and a medium of exchange. Although less popular than Gold, traders may turn to Silver to diversify their investment portfolio, for its intrinsic value or as a potential hedge during high-inflation periods. Investors can buy physical Silver, in coins or in bars, or trade it through vehicles such as Exchange Traded Funds, which track its price on international markets.
Silver prices can move due to a wide range of factors. Geopolitical instability or fears of a deep recession can make Silver price escalate due to its safe-haven status, although to a lesser extent than Gold's. As a yieldless asset, Silver tends to rise with lower interest rates. Its moves also depend on how the US Dollar (USD) behaves as the asset is priced in dollars (XAG/USD). A strong Dollar tends to keep the price of Silver at bay, whereas a weaker Dollar is likely to propel prices up. Other factors such as investment demand, mining supply – Silver is much more abundant than Gold – and recycling rates can also affect prices.
Silver is widely used in industry, particularly in sectors such as electronics or solar energy, as it has one of the highest electric conductivity of all metals – more than Copper and Gold. A surge in demand can increase prices, while a decline tends to lower them. Dynamics in the US, Chinese and Indian economies can also contribute to price swings: for the US and particularly China, their big industrial sectors use Silver in various processes; in India, consumers’ demand for the precious metal for jewellery also plays a key role in setting prices.
Silver prices tend to follow Gold's moves. When Gold prices rise, Silver typically follows suit, as their status as safe-haven assets is similar. The Gold/Silver ratio, which shows the number of ounces of Silver needed to equal the value of one ounce of Gold, may help to determine the relative valuation between both metals. Some investors may consider a high ratio as an indicator that Silver is undervalued, or Gold is overvalued. On the contrary, a low ratio might suggest that Gold is undervalued relative to Silver.
- EUR/USD treads cautiously as investors shift focus to the FOMC minutes.
- ECB policymakers are divided about continuing the dovish trend beyond the June meeting.
- Fed officials want to see inflation easing for months before lowering interest rates.
EUR/USD is stuck in a tight range around 1.0850 in Wednesday’s European session. The major currency pair is expected to remain sideways ahead of the release of the Federal Open Market Committee (FOMC) minutes later in the day and the Eurozone/United States preliminary Purchasing Managers Index (PMI) data for May, which will be published on Thursday. The PMI data will provide cues about trends in demand, inflation and employment.
The Euro remains underpinned against the US Dollar as market participants doubt whether the European Central Bank (ECB) will extend the interest rate cuts beyond June. Few ECB policymakers, such as Bundesbank President Joachim Nagel, President of De Nederlandsche Bank Klaas Knot, Belgium Bank Governor Pierre Wunsch and Bank of Latvia Governor Martins Kazaks, believe that a rate-cut move in June is on the cards, but a follow-up move could be premature.
On the inflation outlook, ECB’s Nagel said, "There may well be months when inflation picks up a little, as some prices tend to fluctuate – energy prices in particular". Nagel added, "On the whole, I expect inflation to carry on declining towards our 2% target and to reach it in 2025."
Daily digest market movers: EUR/USD juggles in a tight range amid steady US Dollar
- EUR/USD trades in a tight range at around 1.0850 as investors look for fresh clues about the United States interest-rate path. The uncertainty over rate-cut timing has deepened as Federal Reserve (Fed) officials support keeping interest rates at their current levels until they get evidence that inflation will sustainably return to the desired rate of 2%.
- The expected decline in the annual United States Consumer Price Index (CPI) data for April failed to build confidence among Fed policymakers that the progress in the disinflation process will continue. Given the strength of the US economy, officials are worried that the slowdown in price pressures will not last longer.
- On Tuesday, Cleveland Fed Bank President Loretta Mester said that she wants to see good inflation data for months in order to become comfortable with supporting a move to policy normalization. When asked about a concrete timeframe for rate cuts, Atlanta Federal Reserve President Raphael Bostic said he doesn’t expect them before the fourth quarter of this year. On the inflation outlook, Bostic commented that business owners have experienced a decline in pricing power but are confident about economic prospects.
- Going forward, investors will focus on the FOMC minutes of the May meeting, which will be published in Wednesday’s New York session. The impact of the FOMC minutes is expected to be light as Fed’s decision-making on interest rates was based on stubborn inflation data recorded in the January-March period.
Technical Analysis: EUR/USD trades inside Tuesday’s trading range
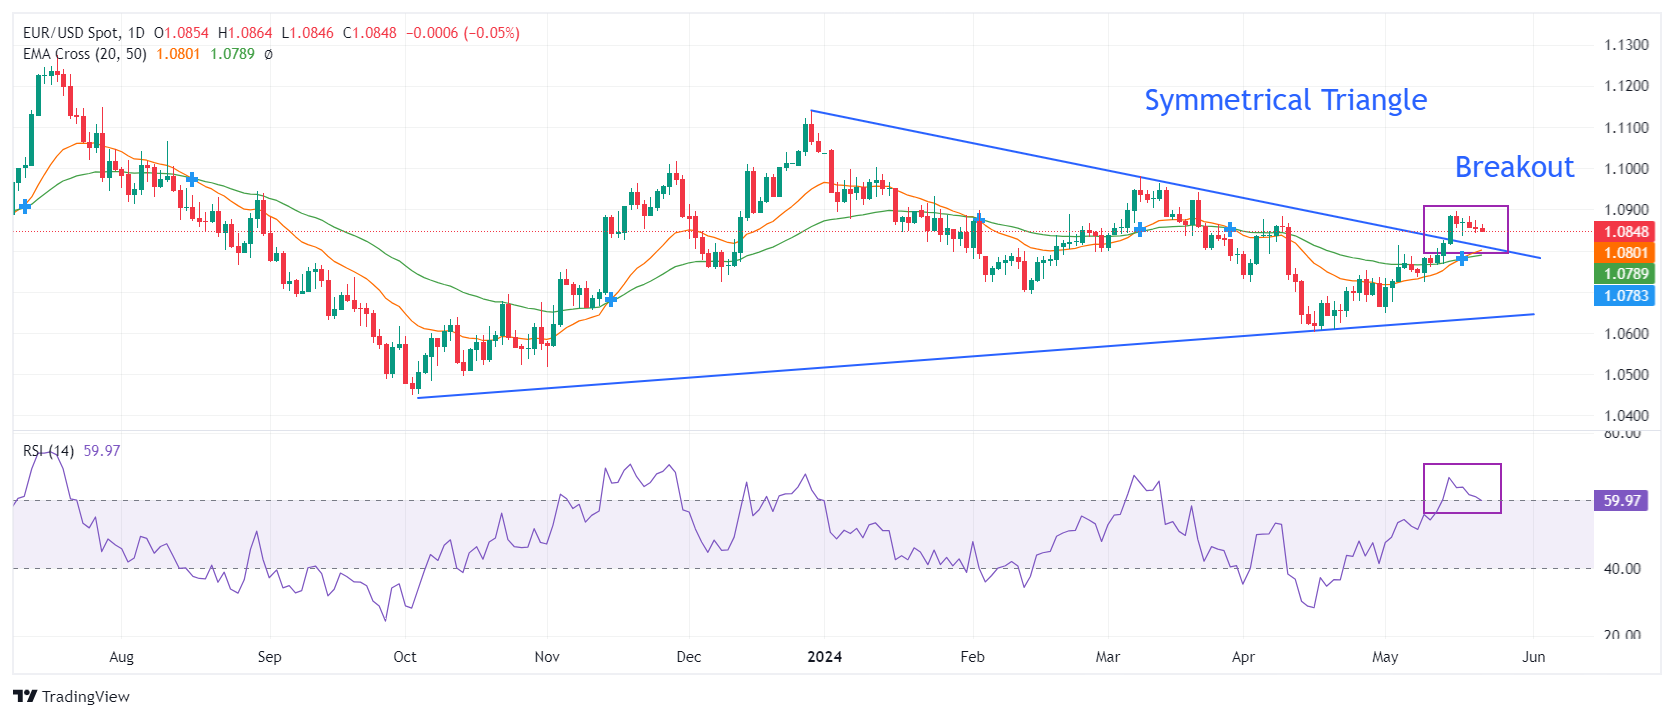
EUR/USD trades in a narrow range around 1.0850 as investors await the FOMC minutes release for fresh guidance. The major currency pair hovers inside Tuesday’s trading range, suggesting a sharp volatility contraction. The shared currency pair is broadly firm as it holds the Symmetrical Triangle breakout that formed on a daily timeframe. Also, a bullish crossover of the 20-day and 50-day Exponential Moving Averages (EMAs) around 1.0780 has improved the near-term outlook of the shared currency pair.
The 14-period Relative Strength Index (RSI) has shifted comfortably into the bullish range of 60.00-80.00, suggesting that the momentum has leaned toward the upside.
Euro FAQs
The Euro is the currency for the 20 European Union countries that belong to the Eurozone. It is the second most heavily traded currency in the world behind the US Dollar. In 2022, it accounted for 31% of all foreign exchange transactions, with an average daily turnover of over $2.2 trillion a day. EUR/USD is the most heavily traded currency pair in the world, accounting for an estimated 30% off all transactions, followed by EUR/JPY (4%), EUR/GBP (3%) and EUR/AUD (2%).
The European Central Bank (ECB) in Frankfurt, Germany, is the reserve bank for the Eurozone. The ECB sets interest rates and manages monetary policy. The ECB’s primary mandate is to maintain price stability, which means either controlling inflation or stimulating growth. Its primary tool is the raising or lowering of interest rates. Relatively high interest rates – or the expectation of higher rates – will usually benefit the Euro and vice versa. The ECB Governing Council makes monetary policy decisions at meetings held eight times a year. Decisions are made by heads of the Eurozone national banks and six permanent members, including the President of the ECB, Christine Lagarde.
Eurozone inflation data, measured by the Harmonized Index of Consumer Prices (HICP), is an important econometric for the Euro. If inflation rises more than expected, especially if above the ECB’s 2% target, it obliges the ECB to raise interest rates to bring it back under control. Relatively high interest rates compared to its counterparts will usually benefit the Euro, as it makes the region more attractive as a place for global investors to park their money.
Data releases gauge the health of the economy and can impact on the Euro. Indicators such as GDP, Manufacturing and Services PMIs, employment, and consumer sentiment surveys can all influence the direction of the single currency. A strong economy is good for the Euro. Not only does it attract more foreign investment but it may encourage the ECB to put up interest rates, which will directly strengthen the Euro. Otherwise, if economic data is weak, the Euro is likely to fall. Economic data for the four largest economies in the euro area (Germany, France, Italy and Spain) are especially significant, as they account for 75% of the Eurozone’s economy.
Another significant data release for the Euro is the Trade Balance. This indicator measures the difference between what a country earns from its exports and what it spends on imports over a given period. If a country produces highly sought after exports then its currency will gain in value purely from the extra demand created from foreign buyers seeking to purchase these goods. Therefore, a positive net Trade Balance strengthens a currency and vice versa for a negative balance.
Gold prices rose in India on Wednesday, according to data from India's Multi Commodity Exchange (MCX).
Gold price stood at 73,880 Indian Rupees (INR) per 10 grams, up INR 27 compared with the INR 73,853 it cost on Tuesday.
As for futures contracts, Gold prices decreased to INR 73,813 per 10 gms from INR 74,021 per 10 gms.
Prices for Silver futures contracts decreased to INR 94,331 per kg from INR 94,725 per kg.
Global Market Movers: Comex Gold price struggles amid heightened tension ahead of Fed Minutes
- Fed Governor Christopher Waller said that he does not think further rate hikes will be necessary, adding he will need some convincing data before he backs cuts anytime soon.
- Atlanta Fed President Raphael Bostic noted that the US central bank has to be cautious about the first-rate move. Bostic further stated that he would “rather wait longer for a rate cut to be sure inflation does not start to bounce around.”
- Cleveland Fed President Loretta Mester said that keeping rates restrictive is not a concern right now given the strength of the jobs market.
- Boston Fed President Susan Collins said on Wednesday that progress toward a lower interest rate adjustment will take longer.
- Financial markets expect the first cut to happen in September at the earliest, with two reductions of a quarter percentage point before the end of the year, according to the CME Group’s FedWatch tool.
- On Tuesday, the US officially announced tariff hikes on a wide range of Chinese goods, while China may consider increasing temporary tariff rates on imported cars equipped with large-displacement engines.
(An automation tool was used in creating this post.)
Gold FAQs
Gold has played a key role in human’s history as it has been widely used as a store of value and medium of exchange. Currently, apart from its shine and usage for jewelry, the precious metal is widely seen as a safe-haven asset, meaning that it is considered a good investment during turbulent times. Gold is also widely seen as a hedge against inflation and against depreciating currencies as it doesn’t rely on any specific issuer or government.
Central banks are the biggest Gold holders. In their aim to support their currencies in turbulent times, central banks tend to diversify their reserves and buy Gold to improve the perceived strength of the economy and the currency. High Gold reserves can be a source of trust for a country’s solvency. Central banks added 1,136 tonnes of Gold worth around $70 billion to their reserves in 2022, according to data from the World Gold Council. This is the highest yearly purchase since records began. Central banks from emerging economies such as China, India and Turkey are quickly increasing their Gold reserves.
Gold has an inverse correlation with the US Dollar and US Treasuries, which are both major reserve and safe-haven assets. When the Dollar depreciates, Gold tends to rise, enabling investors and central banks to diversify their assets in turbulent times. Gold is also inversely correlated with risk assets. A rally in the stock market tends to weaken Gold price, while sell-offs in riskier markets tend to favor the precious metal.
The price can move due to a wide range of factors. Geopolitical instability or fears of a deep recession can quickly make Gold price escalate due to its safe-haven status. As a yield-less asset, Gold tends to rise with lower interest rates, while higher cost of money usually weighs down on the yellow metal. Still, most moves depend on how the US Dollar (USD) behaves as the asset is priced in dollars (XAU/USD). A strong Dollar tends to keep the price of Gold controlled, whereas a weaker Dollar is likely to push Gold prices up.
- The Mexican Peso trades flat as traders await a slew of data about the Mexican economy on Thursday.
- The Peso witnessed a reversal on Tuesday that could reflect a change in sentiment.
- A widespread shift in interest rate expectations globally is supporting FX peers.
The Mexican Peso (MXN) trades mostly flat in its key pairs on Wednesday, steadying after the sudden depreciation on Tuesday which was probably due to a broad shift in global interest-rate expectations.
The changing outlook could narrow the advantage gap the Peso enjoys due to Mexico’s relatively high interest rates (11.00%), which are a draw for carry traders.
Mexican Peso traders are now gearing up for a Mexican “Day of the Data” on Thursday, when a host of figures will be released updating them on the health of the nation’s economy.
At the time of writing USD/MXN is trading at 16.60, EUR/MXN at 18.04 and GBP/MXN at 21.18.
Mexican Peso suddenly depreciates in key pairs
The Mexican Peso’s sudden depreciation on Tuesday may be due to commentary from policymakers at several major central banks expressing a general reluctance to lower interest rates.
In the US, Federal Reserve speakers repeated the mantra that rates should remain at their current level until further progress had been made on inflation returning to its 2% objective.
On Wednesday, The Federal Open Market Committee (FOMC) Minutes for the May policy meeting will be released, which could offer new clues about US Federal Reserve (Fed) policymakers' interest rate outlook.
In Australia policymakers at the Reserve Bank of Australia (RBA) even discussed the possibility of raising interest rates to fight persistent inflation, and the Reserve Bank of New Zealand (RBNZ) executed a hawkish hold during the Asian session on Wednesday.
The anticipation of higher interest rates for longer strengthens these currencies as it attracts more foreign capital inflows.
Mexican Day of the Data
Mexican Peso traders now look forward to a slew of economic data releases for Mexico, which will be out on Thursday.
These include the final estimate for Mexican Gross Domestic Product (GDP) in Q1, Half-month Inflation for May, the Minutes of the Bank of Mexico’s (Banxico) last policy meeting and Economic Activity data for March.
Technical Analysis: USD/MXN forms bullish reversal day
USD/MXN – or the number of Pesos that can be bought with one US Dollar – edges higher on Wednesday after forming a bullish reversal day on Tuesday (shaded rectangle on the chart below).
USD/MXN Daily Chart
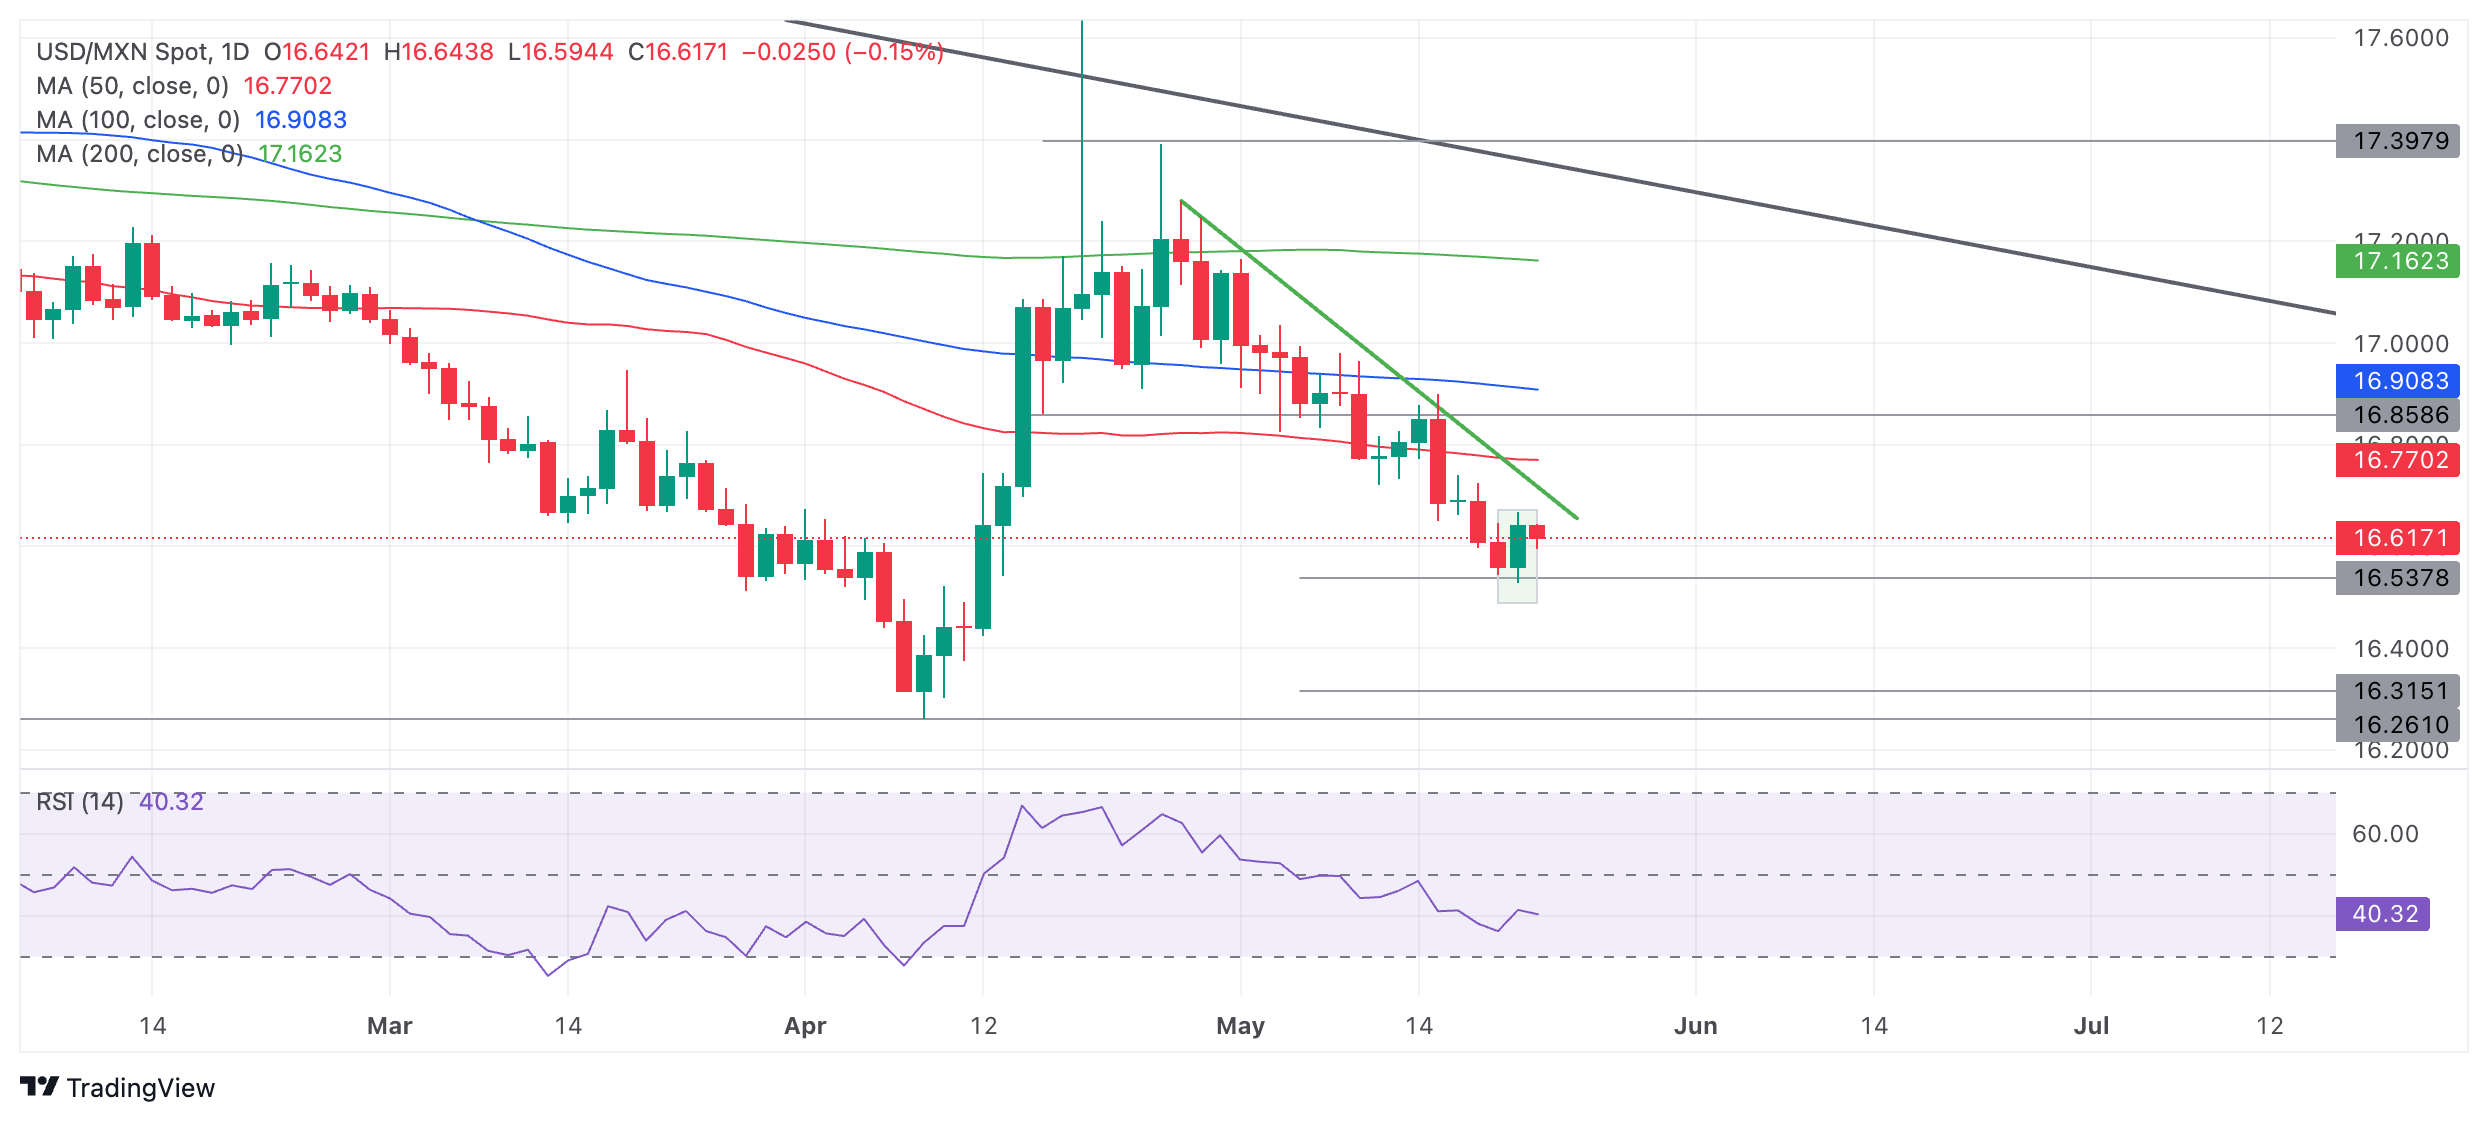
Tuesday’s movement is not enough to confirm a trend reversal, but if it is followed by another bullish day, it will gain validity.
A break above the green down trendline would be required to confirm a reversal of the short-term trend.
USD/MXN has now reached the conservative target, at 16.54, for the breakdown out of the range that formed from mid-April to early May. The conservative estimate is calculated as the 0.618 Fibonacci ratio of the range's height extrapolated lower.
The pair remains in a downtrend and there is still a high risk of further bearishness taking it lower. The next downside target is 16.34, the full height of the range extrapolated lower. A break below the Tuesday low of 16.53 would signal a continuation lower.
Given the medium and long-term trends are also bearish, the odds further favor more downside.
Economic Indicator
1st half-month Inflation
The 1st half-month core inflation index released by the Bank of Mexico is a measure of price movements by the comparison between the retail prices of a representative shopping basket of goods and services. The purchase power of Mexican Peso is dragged down by inflation. The inflation index is a key indicator since it is used by the central bank to set interest rates. Generally speaking, a high reading is seen as positive (or bullish) for the Mexican Peso, while a low reading is seen as negative (or Bearish).
Read more.Next release: Thu May 23, 2024 12:00
Frequency: Monthly
Consensus: -0.22%
Previous: 0.09%
Source: National Institute of Statistics and Geography of Mexico
- Silver price depreciates as hawkish remarks from Fed officials suggest higher rates for longer.
- The higher US Dollar is dampening the demand for Silver.
- Traders await the FOMC Minutes to gain further clues about the Fed's policy stance.
Silver price continues to lose ground after retreating from the highest level of $32.51, a level not seen since December 2012. The Silver price trades around $31.80 per troy ounce during the European hours on Wednesday. Investors assess recent remarks from Federal Reserve officials, with several policymakers advocating for continued policy caution.
Federal Reserve Bank of Boston President Susan Collins highlighted on Tuesday that progress toward interest rate adjustment will require more time, emphasizing patience as the appropriate policy for the Fed. Additionally, Federal Reserve Governor Christopher Waller mentioned that he would need to observe several more months of positive inflation data before feeling comfortable supporting a policy easing, per Reuters.
The US Dollar (USD) appreciated ahead of the release of the Minutes from the Federal Open Market Committee (FOMC) meeting held on May 1, which are expected to be published on Wednesday. The higher Greenback dampens the demand for the Silver asset.
The downside of the grey metal is capped by renewed US-China trade tensions. On Monday, the Chinese Commerce Ministry announced a prohibition on General Atomics Aeronautical Systems, a US company, from engaging in import and export activities related to China. This decision comes amid ongoing trade tensions between the United States and China.
Additionally, China’s measures to stabilize its property sector are providing some boost to safe-haven assets like Silver. The Chinese Commerce Ministry announced a prohibition on General Atomics Aeronautical Systems, a US company, from engaging in import and export activities related to China. This decision comes amid ongoing trade tensions between the United States and China.
- The Pound Sterling jumps to 1.2750 as UK inflation for April remains hotter than expected.
- UK annual core inflation rose by 3.9%, likely impacting BoE rate-cut hopes for August.
- The next move in the US Dollar will be guided by the FOMC minutes.
The Pound Sterling (GBP) rallies to 1.2750 in Wednesday’s European session as the United Kingdom (UK) Office for National Statistics (ONS) has reported a slower-than-expected decline in the Consumer Price Index (CPI) data for April. UK inflationary pressures remained hotter than estimates but have softened significantly from March figures, suggesting that higher interest rates by the Bank of England (BoE) are maintaining downward pressure on inflation.
A slower decline in UK inflation is expected to negatively impact expectations for BoE rate cuts, which financial markets expect the central bank will begin from the August meeting.
The speculation for the BoE to begin reducing borrowing costs in August strengthened after BoE Deputy Governor Ben Broadbent commented on Monday: "If things continue to evolve with its forecasts – forecasts that suggest policy will have to become less restrictive at some point – then it's possible Bank Rate could be cut sometime over the summer," Reuters reported.
Daily digest market movers: Pound Sterling moves higher vertically after hot UK CPI report
- The Pound Sterling soars to 1.2750 as the UK ONS has reported a higher-than-expected growth in the consumer price inflation data for April. Headline inflation rose 2.3% year-over-year (YoY), higher than expectations of 2.1% but decreasing from the prior reading of 3.3%. Monthly headline inflation grew by 0.3%, beating the estimate of 0.2% but lowering sharply from March’s reading of 0.6%.
- UK’s annual core CPI data, which strips off volatile items such as food and energy prices, grew by 3.9% (YoY), above the consensus of 3.6% but decelerated from March’s reading of 4.2%. The core inflation data is the Bank of England’s preferred inflation measure for decision-making on interest rates. Though the inflation grew stronger than expectations, it is on course to return to the 2% target.
- On the other side of the Atlantic, uncertainty about when the Federal Reserve (Fed) will start reducing interest rates has deepened. Fed policymakers advised keeping interest rates at their current levels until they get evidence that inflation will sustainably decline to the desired rate of 2%. Though progress in the disinflation process has been restarted after stalling for three straight months at the beginning of the year, Fed policymakers lack confidence that it will last long.
- Like other Fed policymakers, Cleveland Fed Bank President Loretta Mester said on Tuesday that she wants to see inflation declining few more months to be sure that inflation is on course to return to 2% before considering rate cuts.
- The US Dollar (USD) remains in a sideways trend as the Fed’s hawkish stance on interest rates has supported the downside while firm speculation that the central bank will start lowering interest rates from the September meeting has limited the upside. Going forward, investors will focus on the Federal Open Market Committee (FOMC) minutes for the May meeting on Wednesday. The FOMC minutes will provide more guidance on the interest rate outlook.
Technical Analysis: Pound Sterling recaptures two-month high at 1.2750
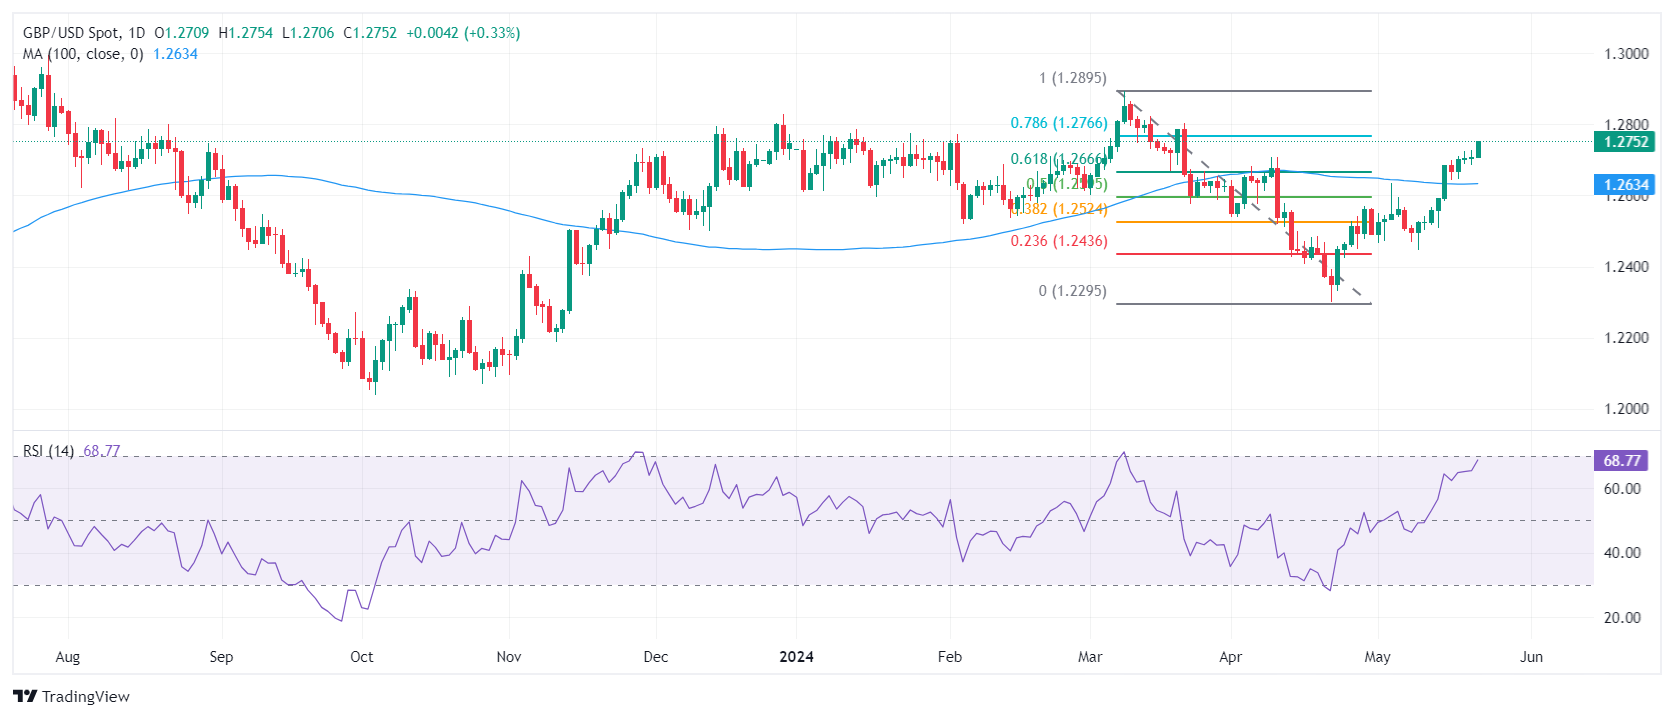
The Pound Sterling approaches a nine-month high at around 1.2900 registered in early March. The appeal for the GBP/USD pair has strengthened as it has comfortably stabilized above the 61.8% Fibonacci retracement (plotted from the March 8 high of 1.2900 to the April 22 low at 1.2300) at 1.2667.
The Cable is expected to remain in the bullish trajectory as all short-to-long-term Exponential Moving Averages (EMAs) are sloping higher, suggesting a strong uptrend.
The 14-period Relative Strength Index (RSI) has shifted into the bullish range of 60.00-80.00, suggesting that the momentum has leaned toward the upside.
Pound Sterling FAQs
The Pound Sterling (GBP) is the oldest currency in the world (886 AD) and the official currency of the United Kingdom. It is the fourth most traded unit for foreign exchange (FX) in the world, accounting for 12% of all transactions, averaging $630 billion a day, according to 2022 data. Its key trading pairs are GBP/USD, aka ‘Cable’, which accounts for 11% of FX, GBP/JPY, or the ‘Dragon’ as it is known by traders (3%), and EUR/GBP (2%). The Pound Sterling is issued by the Bank of England (BoE).
The single most important factor influencing the value of the Pound Sterling is monetary policy decided by the Bank of England. The BoE bases its decisions on whether it has achieved its primary goal of “price stability” – a steady inflation rate of around 2%. Its primary tool for achieving this is the adjustment of interest rates. When inflation is too high, the BoE will try to rein it in by raising interest rates, making it more expensive for people and businesses to access credit. This is generally positive for GBP, as higher interest rates make the UK a more attractive place for global investors to park their money. When inflation falls too low it is a sign economic growth is slowing. In this scenario, the BoE will consider lowering interest rates to cheapen credit so businesses will borrow more to invest in growth-generating projects.
Data releases gauge the health of the economy and can impact the value of the Pound Sterling. Indicators such as GDP, Manufacturing and Services PMIs, and employment can all influence the direction of the GBP. A strong economy is good for Sterling. Not only does it attract more foreign investment but it may encourage the BoE to put up interest rates, which will directly strengthen GBP. Otherwise, if economic data is weak, the Pound Sterling is likely to fall.
Another significant data release for the Pound Sterling is the Trade Balance. This indicator measures the difference between what a country earns from its exports and what it spends on imports over a given period. If a country produces highly sought-after exports, its currency will benefit purely from the extra demand created from foreign buyers seeking to purchase these goods. Therefore, a positive net Trade Balance strengthens a currency and vice versa for a negative balance.
Here is what you need to know on Wednesday, May 22:
Pound Sterling gathers strength against its major rivals early Wednesday, boosted by the stronger-than-forecast UK inflation readings for April. Existing Home Sales data for April will be featured in the US economic docket. Later in the American session, the Federal Reserve (Fed) will release the minutes of the April 30-May 1 monetary policy meeting.
The UK's Office for National Statistics reported on Wednesday that inflation in the UK, as measured by the change in the Consumer Price Index (CPI), declined to 2.3% on a yearly basis in April from 3.2% in March. This reading, however, came in above the market expectation of 2.1%. The core CPI, which excludes volatile food and energy prices, rose 3.9% in the same period, surpassing analysts' estimate of 3.6%. GBP/USD gained traction following the UK inflation report and was last seen trading at its highest level in two months near 1.2750. Reflecting the positive impact of CPI figures on Pound Sterling, EUR/GBP trades deep in negative territory at around 0.8500.
UK CPI inflation declines to 2.3% in April, closing in on BoE's target.
British Pound PRICE Today
The table below shows the percentage change of British Pound (GBP) against listed major currencies today. British Pound was the strongest against the Swiss Franc.
| USD | EUR | GBP | JPY | CAD | AUD | NZD | CHF | |
|---|---|---|---|---|---|---|---|---|
| USD | -0.08% | -0.38% | 0.14% | -0.03% | 0.04% | -0.47% | 0.19% | |
| EUR | 0.08% | -0.30% | 0.20% | 0.05% | 0.13% | -0.39% | 0.26% | |
| GBP | 0.38% | 0.30% | 0.50% | 0.31% | 0.44% | -0.09% | 0.58% | |
| JPY | -0.14% | -0.20% | -0.50% | -0.18% | -0.10% | -0.60% | 0.05% | |
| CAD | 0.03% | -0.05% | -0.31% | 0.18% | 0.07% | -0.39% | 0.21% | |
| AUD | -0.04% | -0.13% | -0.44% | 0.10% | -0.07% | -0.50% | 0.17% | |
| NZD | 0.47% | 0.39% | 0.09% | 0.60% | 0.39% | 0.50% | 0.64% | |
| CHF | -0.19% | -0.26% | -0.58% | -0.05% | -0.21% | -0.17% | -0.64% |
The heat map shows percentage changes of major currencies against each other. The base currency is picked from the left column, while the quote currency is picked from the top row. For example, if you pick the British Pound from the left column and move along the horizontal line to the US Dollar, the percentage change displayed in the box will represent GBP (base)/USD (quote).
In the early trading hours of the Asian session, the Reserve Bank of New Zealand (RBNZ) announced that it left the policy rate unchanged at 5.5% as expected. In the policy statement, the RBNZ reiterated that the policy needs to be restricted and Governor Adrian Orr noted that they had a "real consideration" on raising rates at the meeting. NZD/USD edged higher following the RBNZ event and was last seen rising nearly 0.5% on the day at 0.6120.
Orr Speech: RBNZ Governor speaks on interest rate outlook after the hawkish hold.
The data from Japan showed that Exports and Imports both grew at an annual rate of 8.3% in April. After closing the day virtually unchanged on Tuesday, USD/JPY extends its sideways grind at around 156.50 early Wednesday.
Japanese Yen depreciates due to increased trade deficit, steady US Dollar.
EUR/USD registered small losses on Tuesday and entered a consolidation phase during the Asian trading hours on Wednesday. The pair stays relatively quiet slightly above 1.0850 in the European morning.
Gold closed marginally lower on Tuesday and continued to edge lower early Wednesday. XAU/USD was last seen trading below $2,420.
Gold price loses its recovery momentum ahead of FOMC Minutes.
Economic Indicator
FOMC Minutes
FOMC stands for The Federal Open Market Committee that organizes 8 meetings in a year and reviews economic and financial conditions, determines the appropriate stance of monetary policy and assesses the risks to its long-run goals of price stability and sustainable economic growth. FOMC Minutes are released by the Board of Governors of the Federal Reserve and are a clear guide to the future US interest rate policy.
Read more.Last release: Wed Apr 10, 2024 18:00
Frequency: Irregular
Actual: -
Consensus: -
Previous: -
Source: Federal Reserve
Minutes of the Federal Open Market Committee (FOMC) is usually published three weeks after the day of the policy decision. Investors look for clues regarding the policy outlook in this publication alongside the vote split. A bullish tone is likely to provide a boost to the greenback while a dovish stance is seen as USD-negative. It needs to be noted that the market reaction to FOMC Minutes could be delayed as news outlets don’t have access to the publication before the release, unlike the FOMC’s Policy Statement.
FX option expiries for May 22 NY cut at 10:00 Eastern Time, via DTCC, can be found below
- EUR/USD: EUR amounts
- 1.0830 895m
- 1.0860 836m
- 1.0845 561m
- 1.0875 942m
- 1.0900 605m
- USD/JPY: USD amounts
- 154.00 2.1b
- 155.60 1.1b
- USD/CHF: USD amounts
- 0.9100 429m
- AUD/USD: AUD amounts
- 0.6650 423m
- USD/CAD: USD amounts
- 1.3475 730m
- 1.3680 1.1b
- 1.3725 802m
NZD/USD: NZD amounts
- 0.6100 837m
- USD/CAD drifts lower to 1.3640 in Wednesday’s early European session.
- The annual Canadian CPI inflation rate slowed to 2.7% in April from 2.9% prior, boosting the odds of the BoC June rate cut.
- The Fed remains cautious and will wait for more encouraging data to ensure inflation is on course towards its target.
The USD/CAD pair weakens to 1.3640 amid the US Dollar (USD) consolidation on Wednesday during the early European session. The pair edges lower despite the recent softer Canadian CPI inflation data, which boosts the bets of a rate cut from the Bank of Canada (BoC) in June. Investors await the FOMC Minutes and the Federal Reserve’s (Fed) Goolsbee speech later in the day.
Inflation in Canada cooled to 2.7% in April as food price growth slowed, Statistics Canada reported on Tuesday. The Canadian Consumer Price Index (CPI) inflation dropped to 2.7% YoY in April from 2.9% in March, in line with the market estimation. On a monthly basis, headline CPI inflation eased to 0.5% MoM in April from 0.6% in the previous reading. Additionally, the BoC’s core CPI rose 1.6% YoY in April, compared to a 2% increase recorded in March.
The easing inflation data has prompted speculation that the BoC will start cutting rates in the June meeting. Traders increased their bets for a rate cut on June 5 to nearly 55% from 39% before the data was released. The pace of interest rate cuts from the BoC and US Fed might exert some selling pressure on the Canadian Dollar (CAD) and act as a tailwind for USD/CAD.
The Fed officials prefer to wait for more encouraging data to gain confidence that inflation is on course towards the Fed's 2% target. Atlanta Fed President Raphael Bostic said that the Fed has to be cautious about the first-rate move to ensure that inflation does not begin to bounce around. Meanwhile, Fed Governor Christopher Waller noted that he needs to see several more months of good inflation data before starting to lower borrowing costs.
- The Japanese Yen lost ground after the release of Japan’s Trade Balance on Wednesday.
- Japan’s trade deficit increased to JPY 462.5 billion in April, a significant shift from the previous month's surplus.
- Traders await FOMC Minutes to seek further clues about the Fed policy stance.
The Japanese Yen (JPY) weakened following the release of Japan's Merchandise Trade Balance data on Wednesday. The report showed that the trade deficit increased to JPY 462.5 billion month-over-month in April, swinging from the previous surplus of JPY 387.0 billion. This outcome exceeded market expectations of a deficit of JPY 339.5 billion. The depreciation of the JPY led to an increase in the value of imports, outweighing gains from a rise in exports.
Japan’s Exports (YoY) grew by 8.3% to JPY 8,980.75 billion, marking the fifth consecutive month of growth but falling short of forecasts for an 11.1% increase. Imports also expanded by 8.3%, representing the strongest growth in 14 months, reaching a four-month peak of JPY 9,443.26 billion. This growth reversed the trend from a revised 5.1% drop in March.
The US Dollar (USD) advanced ahead of the release of the Minutes from the Federal Open Market Committee (FOMC) meeting held on May 1, scheduled for Wednesday. The appreciation in US Treasury yields provided support for the Greenback.
Daily Digest Market Movers: Japanese Yen depreciates amid hawkish Fed
- According to the CME FedWatch Tool, the probability of the Federal Reserve implementing a 25 basis-point rate cut in September has seen a slight uptick to 50.3%, compared to 49.6% a day ago.
- Federal Reserve Bank of Boston President Susan Collins highlighted on Tuesday that progress toward interest rate adjustment will require more time, emphasizing patience as the appropriate policy for the Fed. Additionally, Federal Reserve Governor Christopher Waller mentioned that he would need to observe several more months of positive inflation data before feeling comfortable supporting a policy easing, per Reuters.
- On Tuesday, Japanese Finance Minister Shunichi Suzuki expressed concerns about the negative implications of the weak JPY. Suzuki also said that market discussions are centered on long-term rates as they increase, focusing on appropriate national debt policies in Japan. There are hopes for wage hikes to surpass the inflation pace. He stated that he is closely monitoring FX movements.
- A BoJ survey showed on Monday that approximately 70% of firms reported experiencing drawbacks from the BoJ's 25-year-long monetary easing measures, notably citing a weak JPY that increased import costs. However, around 90% of the firms also acknowledged benefits stemming from the BoJ's prolonged easing, including low borrowing costs. Among Japan's large manufacturers, exchange rate stability emerged as the primary factor they desired from the central bank's monetary policy.
- Market sentiment emerges that the BoJ might reduce bond purchases at the June policy meeting. BOJ Governor Kazuo Ueda also indicated that there are no immediate plans to sell the central bank’s ETF holdings.
Technical Analysis: USD/JPY rises to a major level of 156.50
The USD/JPY pair trades around 156.30 on Wednesday. The daily chart for USD/JPY displayed an ascending triangle formation. Additionally, the 14-day Relative Strength Index (RSI) indicated a bullish bias, slightly above the 50 mark.
The USD/JPY pair could retest the upper boundary of the ascending triangle near the psychological barrier at 157.00. A break above this level could propel the pair toward the high of 160.32, a level not seen since April 1990.
On the downside, the lower threshold of the ascending triangle provides immediate support around the major level of 155.50, followed by the 21-day Exponential Moving Average (EMA) at 155.33. A break below this level could exert downward pressure on the USD/JPY pair, potentially moving it toward the throwback support at 153.60.
USD/JPY: Daily Chart
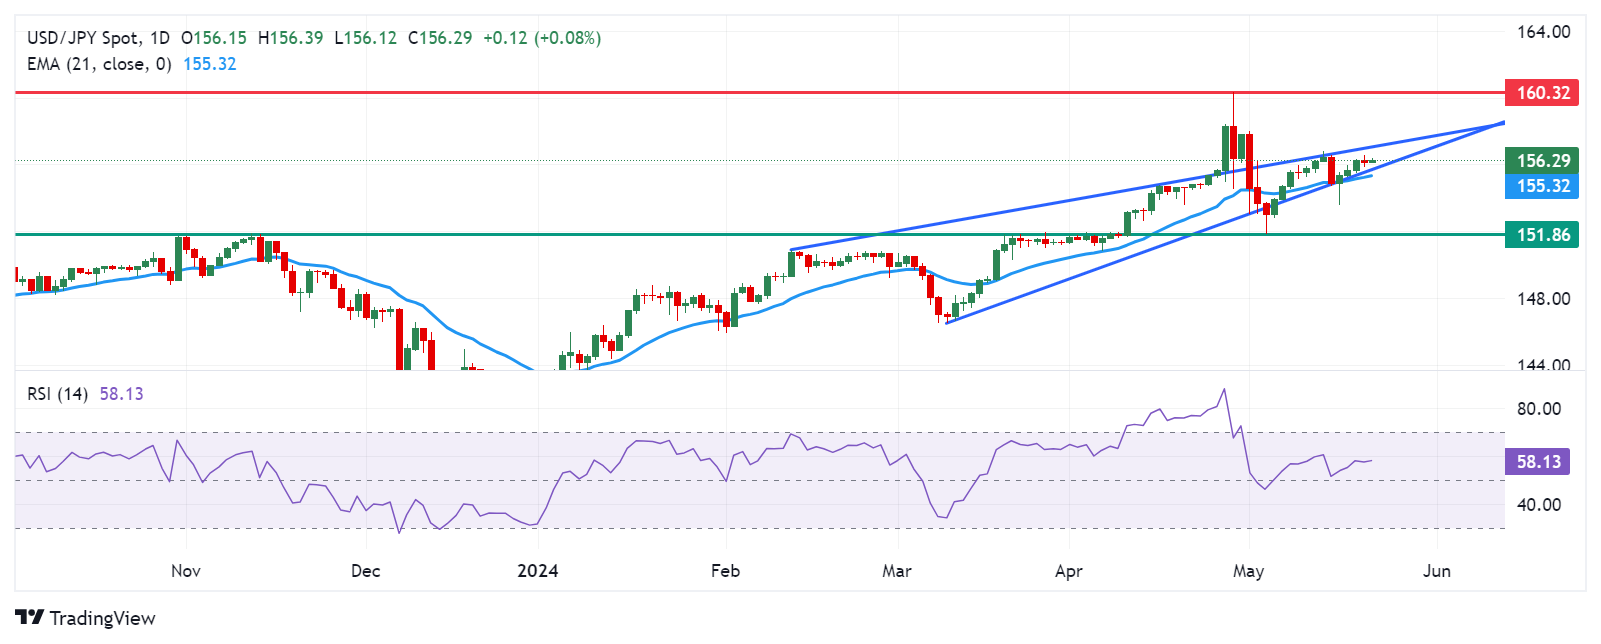
Japanese Yen price today
The table below shows the percentage change of Japanese Yen (JPY) against listed major currencies today. Japanese Yen was the weakest against the New Zealand Dollar.
| USD | EUR | GBP | CAD | AUD | JPY | NZD | CHF | |
| USD | -0.01% | -0.01% | -0.01% | -0.10% | 0.02% | -0.57% | 0.00% | |
| EUR | 0.01% | -0.04% | 0.00% | -0.09% | 0.03% | -0.55% | 0.01% | |
| GBP | 0.00% | 0.00% | -0.01% | -0.09% | 0.03% | -0.56% | 0.00% | |
| CAD | 0.02% | 0.00% | 0.01% | -0.08% | 0.04% | -0.55% | 0.01% | |
| AUD | 0.10% | 0.09% | 0.09% | 0.08% | 0.12% | -0.46% | 0.06% | |
| JPY | -0.03% | -0.02% | 0.00% | -0.05% | -0.07% | -0.56% | -0.03% | |
| NZD | 0.56% | 0.55% | 0.55% | 0.53% | 0.46% | 0.58% | 0.56% | |
| CHF | 0.00% | -0.01% | 0.00% | -0.01% | -0.06% | 0.03% | -0.56% |
The heat map shows percentage changes of major currencies against each other. The base currency is picked from the left column, while the quote currency is picked from the top row. For example, if you pick the Euro from the left column and move along the horizontal line to the Japanese Yen, the percentage change displayed in the box will represent EUR (base)/JPY (quote).
Japanese Yen FAQs
The Japanese Yen (JPY) is one of the world’s most traded currencies. Its value is broadly determined by the performance of the Japanese economy, but more specifically by the Bank of Japan’s policy, the differential between Japanese and US bond yields, or risk sentiment among traders, among other factors.
One of the Bank of Japan’s mandates is currency control, so its moves are key for the Yen. The BoJ has directly intervened in currency markets sometimes, generally to lower the value of the Yen, although it refrains from doing it often due to political concerns of its main trading partners. The current BoJ ultra-loose monetary policy, based on massive stimulus to the economy, has caused the Yen to depreciate against its main currency peers. This process has exacerbated more recently due to an increasing policy divergence between the Bank of Japan and other main central banks, which have opted to increase interest rates sharply to fight decades-high levels of inflation.
The BoJ’s stance of sticking to ultra-loose monetary policy has led to a widening policy divergence with other central banks, particularly with the US Federal Reserve. This supports a widening of the differential between the 10-year US and Japanese bonds, which favors the US Dollar against the Japanese Yen.
The Japanese Yen is often seen as a safe-haven investment. This means that in times of market stress, investors are more likely to put their money in the Japanese currency due to its supposed reliability and stability. Turbulent times are likely to strengthen the Yen’s value against other currencies seen as more risky to invest in.
- Indian Rupee loses momentum on Wednesday.
- Fed officials stick to a cautious approach, boosting the Greenback.
- The FOMC Minutes and Fed’s Goolsbee speech are in the spotlight on Wednesday.
Indian Rupee (INR) edges lower on Wednesday as the cautious Fedspeak supports the US Dollar (USD). The Federal Reserve (Fed) officials will wait for more encouraging signs of a loosening in the labour market and further progress in slowing inflation towards its 2% target. However, the continuous positive sentiment in Indian equities might boost the INR and weigh on the pair. On Tuesday, the NIFTY50 index reached a nearly three-week high above 22,600, lifting the Indian Rupee to a three-week high versus the USD.
Investors will focus on the FOMC Minutes and the Fed's Goolsbee speech on Wednesday. On Thursday, the Indian foreign exchange and debt markets will be closed, but the preliminary India’s HSBC Manufacturing and Services PMI for May will be released. Also, the first reading of the US S&P Global PMI for May will be due later on Thursday.
Daily Digest Market Movers: Indian Rupee struggles to gain ground amid the Fed's cautious approach
- Overseas investors sold Indian stocks worth more than $3 billion in May, the biggest monthly outflow since January 2023.
- The United Nations (UN) raised India's 2024 growth predictions to 6.9% this year, up from 6.2% in January. The Indian economy is expected to grow by 6.6% in 2025.
- The inclusion of India’s government bonds in JP Morgan’s GBI-EM index is expected to attract significant inflows of around $23 billion into India beginning June 2024 onwards, enhancing investor confidence in the country's financial markets.
- Atlanta Fed President Raphael Bostic said that the Fed has to be cautious about the first-rate move, adding that he would prefer to wait longer for rate cuts to ensure that inflation does not begin to bounce around.
- Fed Governor Christopher Waller stated that he needs to see several more months of good inflation data before starting to lower borrowing costs. Waller added that he does not think further rate hikes will be necessary.
- According to the CME FedWatch Tool, financial markets see the chance of no change in the Fed's policy rate in September at around 35%.
Technical analysis: USD/INR looks vulnerable on the daily chart
The Indian Rupee trades softer on the day. The positive stance of USD/INR seems vulnerable as the pair hovers around the key 100-day Exponential Moving Average (EMA) on the daily timeframe. The bearish outlook could resume if the pair crosses below the key EMA and the neckline of the Head and Shoulders pattern, which has been established since March 21. Furthermore, the 14-day Relative Strength Index (RSI) holds in bearish territory around 43.40, supporting the sellers for the time being.
A decisive break below the confluence of the neckline and the 100-day EMA in the 83.20–83.25 zone will expose the 83.00 psychological support. Further north, the next hurdle to watch is a low of January 15 at 82.78.
On the upside, the immediate resistance level will emerge at the right shoulder of the Head and Shoulders pattern of 83.54 (high of May 13). Any follow-through buying would end up invalidating the chart pattern and pave the way to a high of April 17 at 83.72, en route to 84.00.
US Dollar price today
The table below shows the percentage change of US Dollar (USD) against listed major currencies today. US Dollar was the strongest against the Japanese Yen.
| USD | EUR | GBP | CAD | AUD | JPY | NZD | CHF | |
| USD | 0.01% | 0.00% | 0.01% | 0.03% | 0.03% | -0.47% | 0.02% | |
| EUR | -0.01% | -0.04% | 0.00% | 0.02% | 0.02% | -0.47% | 0.02% | |
| GBP | 0.01% | 0.02% | 0.01% | 0.04% | 0.03% | -0.46% | 0.03% | |
| CAD | -0.01% | 0.00% | 0.00% | 0.03% | 0.02% | -0.47% | 0.02% | |
| AUD | -0.01% | -0.02% | -0.03% | -0.03% | 0.00% | -0.47% | -0.01% | |
| JPY | -0.04% | -0.01% | -0.01% | -0.03% | 0.02% | -0.49% | 0.00% | |
| NZD | 0.43% | 0.45% | 0.44% | 0.44% | 0.47% | 0.47% | 0.46% | |
| CHF | -0.02% | -0.02% | -0.02% | -0.02% | 0.01% | 0.00% | -0.49% |
The heat map shows percentage changes of major currencies against each other. The base currency is picked from the left column, while the quote currency is picked from the top row. For example, if you pick the Euro from the left column and move along the horizontal line to the Japanese Yen, the percentage change displayed in the box will represent EUR (base)/JPY (quote).
Indian Rupee FAQs
The Indian Rupee (INR) is one of the most sensitive currencies to external factors. The price of Crude Oil (the country is highly dependent on imported Oil), the value of the US Dollar – most trade is conducted in USD – and the level of foreign investment, are all influential. Direct intervention by the Reserve Bank of India (RBI) in FX markets to keep the exchange rate stable, as well as the level of interest rates set by the RBI, are further major influencing factors on the Rupee.
The Reserve Bank of India (RBI) actively intervenes in forex markets to maintain a stable exchange rate, to help facilitate trade. In addition, the RBI tries to maintain the inflation rate at its 4% target by adjusting interest rates. Higher interest rates usually strengthen the Rupee. This is due to the role of the ‘carry trade’ in which investors borrow in countries with lower interest rates so as to place their money in countries’ offering relatively higher interest rates and profit from the difference.
Macroeconomic factors that influence the value of the Rupee include inflation, interest rates, the economic growth rate (GDP), the balance of trade, and inflows from foreign investment. A higher growth rate can lead to more overseas investment, pushing up demand for the Rupee. A less negative balance of trade will eventually lead to a stronger Rupee. Higher interest rates, especially real rates (interest rates less inflation) are also positive for the Rupee. A risk-on environment can lead to greater inflows of Foreign Direct and Indirect Investment (FDI and FII), which also benefit the Rupee.
Higher inflation, particularly, if it is comparatively higher than India’s peers, is generally negative for the currency as it reflects devaluation through oversupply. Inflation also increases the cost of exports, leading to more Rupees being sold to purchase foreign imports, which is Rupee-negative. At the same time, higher inflation usually leads to the Reserve Bank of India (RBI) raising interest rates and this can be positive for the Rupee, due to increased demand from international investors. The opposite effect is true of lower inflation.
- EUR/USD halts its two days of losses ahead of FOMC Minutes on Wednesday.
- Fed’s Susan Collins stated that progress toward interest rate adjustment will take longer.
- The likelihood of surrounding the ECB extending the rate-cut cycle is providing support for the Euro.
EUR/USD remains stable ahead of the release of the Minutes from the Federal Open Market Committee (FOMC) meeting held on May 1, scheduled for Wednesday. The pair hovers around 1.0850 during the Asian trading session.
The Federal Reserve (Fed) maintains a cautious stance regarding inflation and the possibility of rate cuts in 2024. Federal Reserve Bank of Boston President Susan Collins, speaking at the event "Central Banking in the Post-Pandemic Financial System" on Wednesday, emphasized that progress toward interest rate adjustment will take longer and stressed the importance of patience as the right policy for the Fed.
Financial markets anticipate the first interest rate cut to occur in September at the earliest, with two reductions of a quarter percentage point each expected before the end of the year. According to the CME FedWatch Tool, the probability of the Federal Reserve implementing a 25 basis-point rate cut in September has slightly increased to 50.3%, compared to 49.6% a day ago.
On the Euro front, Eurostat released a Trade Balance of €24.1 billion in March, wider than the previous month's €22.8 billion and surpassing market forecasts of €19.9 billion. This marked the largest trade surplus since December 2020.
The uncertainty surrounding the European Central Bank (ECB) extending the rate-cut cycle beyond June has intensified, providing support for the Euro. While ECB policymakers are comfortable with the idea of the central bank beginning to lower its three key interest rates starting from the June meeting, they are hesitant to commit to any further rate trajectory. Instead, they prefer to maintain a data-dependent approach.
Reserve Bank of New Zealand’s (RBNZ) Governor Adrian Orr is speaking on the policy outlook at a press conference following the announcement of the monetary policy decision on Wednesday.
Orr is responding to questions from the press.
Key quotes
Expect inflation to fall back into target band by end 2024.
Will take time for domestic inflation to decline.
Economy has lower potential growth rate, unsure if that is temporary.
Have limited upside room for inflation surprises.
Pleased with inflation expectations coming down, need to fall further.
OCR track is a central projection not an absolute prediction.
We had a real consideration on raising rates at this meeting.
Lot of high domestic inflation affected by near-term factors.
developing story ...
Market reaction to RBNZ Orr’s presser
NZD/USD is consolidating gains near 0.6150 on Orr’s comments, up 0.77% on the day.
RBNZ FAQs
The Reserve Bank of New Zealand (RBNZ) is the country’s central bank. Its economic objectives are achieving and maintaining price stability – achieved when inflation, measured by the Consumer Price Index (CPI), falls within the band of between 1% and 3% – and supporting maximum sustainable employment.
The Reserve Bank of New Zealand’s (RBNZ) Monetary Policy Committee (MPC) decides the appropriate level of the Official Cash Rate (OCR) according to its objectives. When inflation is above target, the bank will attempt to tame it by raising its key OCR, making it more expensive for households and businesses to borrow money and thus cooling the economy. Higher interest rates are generally positive for the New Zealand Dollar (NZD) as they lead to higher yields, making the country a more attractive place for investors. On the contrary, lower interest rates tend to weaken NZD.
Employment is important for the Reserve Bank of New Zealand (RBNZ) because a tight labor market can fuel inflation. The RBNZ’s goal of “maximum sustainable employment” is defined as the highest use of labor resources that can be sustained over time without creating an acceleration in inflation. “When employment is at its maximum sustainable level, there will be low and stable inflation. However, if employment is above the maximum sustainable level for too long, it will eventually cause prices to rise more and more quickly, requiring the MPC to raise interest rates to keep inflation under control,” the bank says.
In extreme situations, the Reserve Bank of New Zealand (RBNZ) can enact a monetary policy tool called Quantitative Easing. QE is the process by which the RBNZ prints local currency and uses it to buy assets – usually government or corporate bonds – from banks and other financial institutions with the aim to increase the domestic money supply and spur economic activity. QE usually results in a weaker New Zealand Dollar (NZD). QE is a last resort when simply lowering interest rates is unlikely to achieve the objectives of the central bank. The RBNZ used it during the Covid-19 pandemic.
- The Australian Dollar gains ground following the appreciation in the New Zealand Dollar due to their geographical proximity.
- RBA Minutes suggested that the board had considered raising rates in May but opted to maintain a steady policy.
- The RBNZ maintained its rates at 5.5% for the seventh consecutive meeting as inflation remains above the 1-3% target band.
- FOMC Minutes are awaited on Wednesday, seeking clues about the Fed policy stance.
The Australian Dollar (AUD) recovered its recent losses on Wednesday following the appreciation in the New Zealand Dollar (NZD) after the Reserve Bank of New Zealand (RBNZ) maintained its Official Cash Rate (OCR) at 5.5%. Both currencies are closely related due to their geographical proximity and strong trade ties between Australia and New Zealand.
Investors continue to assess the outlook for the Reserve Bank of Australia (RBA) monetary policy. On Tuesday, the RBA Meeting Minutes suggested that the board had considered raising rates in May but ultimately decided to maintain a steady policy. Policymakers noted the difficulty in definitively ruling in or out future changes in the cash rate.
Australia's inflation rate was 3.6% year-over-year in Q1, down from 4.1% in the previous period but above market expectations of 3.4%. This indicates that inflation risks have somewhat increased, as highlighted in the minutes of the RBA's May policy meeting. The situation prompted the RBA to revisit discussions about a potential interest rate hike.
On the US Dollar (USD) front, traders await the release of the Minutes from the Federal Open Market Committee (FOMC) meeting held on May 1, which are due on Wednesday. They are seeking clues about the Federal Reserve’s (Fed) policy stance. The central bank maintains a cautious approach regarding inflation and the possibility of rate cuts in 2024.
Daily Digest Market Movers: Australian Dollar appreciates due to positive market sentiment
- The ASX 200 Index climbed to near 7,860 on Wednesday, led by gains in heavyweight mining stocks due to stronger metals prices. Australian shares also mirrored overnight gains on Wall Street, where the S&P 500 and Nasdaq Composite closed at new record highs of 5,321 and 16,832, respectively.
- Federal Reserve Bank of Boston President Susan Collins spoke at the event of "Central Banking in the Post-Pandemic Financial System" on Tuesday. Collins stated that progress toward interest rate adjustment will take longer and emphasized that patience is the right policy for the Fed, per Reuters.
- Federal Reserve Governor Christopher Waller stated on Tuesday that he needs to see several more months of favorable inflation data before he would be comfortable supporting an easing in policy.
- According to the CME FedWatch Tool, the probability of the Federal Reserve implementing a 25 basis-point rate cut in September has seen a slight uptick to 50.3%, compared to 49.6% a day ago.
- Australia’s Westpac Consumer Confidence fell 0.3% month-over-month in May, compared to a 2.4% decline in April. It was the third straight month of drop but the softest pace in this sequence.
- On Monday, the Chinese Commerce Ministry announced a prohibition on General Atomics Aeronautical Systems, a US company, from engaging in import and export activities related to China. This decision comes amid ongoing trade tensions between the United States and China. Any economic change in the Chinese economy could catalyze the Australian market as both nations are close trade partners.
Technical Analysis: Australian Dollar remains above a key level of 0.6650
The Australian Dollar trades around 0.6680 on Wednesday. The analysis of the daily chart suggests a bullish bias as the AUD/USD pair consolidates within the ascending triangle with the 14-day Relative Strength Index (RSI), remaining above the 50 level.
The AUD/USD pair could test the psychological level of 0.6700. A breakthrough above this level could lead the pair to test the four-month high of 0.6714, followed by the upper limit of the ascending triangle around the level of 0.6725.
On the downside, the nine-day Exponential Moving Average (EMA) at 0.6655, acting as the immediate support, aligned with the lower boundary of the ascending triangle around the key level of 0.6650. A break below this support could push the AUD/USD pair toward the psychological level of 0.6600.
AUD/USD: Daily Chart

Australian Dollar price today
The table below shows the percentage change of the Australian Dollar (AUD) against listed major currencies today. The Australian Dollar was the strongest against the Japanese Yen.
| USD | EUR | GBP | CAD | AUD | JPY | NZD | CHF | |
| USD | -0.02% | -0.04% | -0.04% | -0.06% | 0.02% | -0.72% | -0.01% | |
| EUR | 0.03% | -0.03% | 0.00% | 0.00% | 0.05% | -0.05% | 0.01% | |
| GBP | 0.03% | 0.01% | 0.00% | 0.01% | 0.05% | -0.06% | 0.01% | |
| CAD | 0.03% | 0.01% | 0.01% | 0.00% | 0.05% | -0.05% | 0.03% | |
| AUD | 0.04% | 0.01% | 0.02% | 0.00% | 0.08% | -0.05% | 0.02% | |
| JPY | -0.02% | -0.04% | -0.04% | -0.06% | -0.04% | -0.11% | -0.04% | |
| NZD | 0.06% | 0.05% | 0.06% | 0.05% | 0.05% | 0.10% | 0.06% | |
| CHF | 0.02% | -0.01% | 0.00% | -0.02% | -0.01% | 0.04% | -0.06% |
The heat map shows percentage changes of major currencies against each other. The base currency is picked from the left column, while the quote currency is picked from the top row. For example, if you pick the Euro from the left column and move along the horizontal line to the Japanese Yen, the percentage change displayed in the box will represent EUR (base)/JPY (quote).
Australian Dollar FAQs
One of the most significant factors for the Australian Dollar (AUD) is the level of interest rates set by the Reserve Bank of Australia (RBA). Because Australia is a resource-rich country another key driver is the price of its biggest export, Iron Ore. The health of the Chinese economy, its largest trading partner, is a factor, as well as inflation in Australia, its growth rate and Trade Balance. Market sentiment – whether investors are taking on more risky assets (risk-on) or seeking safe-havens (risk-off) – is also a factor, with risk-on positive for AUD.
The Reserve Bank of Australia (RBA) influences the Australian Dollar (AUD) by setting the level of interest rates that Australian banks can lend to each other. This influences the level of interest rates in the economy as a whole. The main goal of the RBA is to maintain a stable inflation rate of 2-3% by adjusting interest rates up or down. Relatively high interest rates compared to other major central banks support the AUD, and the opposite for relatively low. The RBA can also use quantitative easing and tightening to influence credit conditions, with the former AUD-negative and the latter AUD-positive.
China is Australia’s largest trading partner so the health of the Chinese economy is a major influence on the value of the Australian Dollar (AUD). When the Chinese economy is doing well it purchases more raw materials, goods and services from Australia, lifting demand for the AUD, and pushing up its value. The opposite is the case when the Chinese economy is not growing as fast as expected. Positive or negative surprises in Chinese growth data, therefore, often have a direct impact on the Australian Dollar and its pairs.
Iron Ore is Australia’s largest export, accounting for $118 billion a year according to data from 2021, with China as its primary destination. The price of Iron Ore, therefore, can be a driver of the Australian Dollar. Generally, if the price of Iron Ore rises, AUD also goes up, as aggregate demand for the currency increases. The opposite is the case if the price of Iron Ore falls. Higher Iron Ore prices also tend to result in a greater likelihood of a positive Trade Balance for Australia, which is also positive of the AUD.
The Trade Balance, which is the difference between what a country earns from its exports versus what it pays for its imports, is another factor that can influence the value of the Australian Dollar. If Australia produces highly sought after exports, then its currency will gain in value purely from the surplus demand created from foreign buyers seeking to purchase its exports versus what it spends to purchase imports. Therefore, a positive net Trade Balance strengthens the AUD, with the opposite effect if the Trade Balance is negative.
| Raw materials | Closed | Change, % |
|---|---|---|
| Silver | 31.984 | 0.51 |
| Gold | 2420.86 | -0.26 |
| Palladium | 1024.65 | -0.28 |
- The UK Office for National Statistics will publish the CPI report on Wednesday.
- United Kingdom’s headline and core annual inflation are likely to fall sharply in April.
- The UK CPI data could affirm BoE June interest rate cut expectations, triggering a big move for the Pound Sterling.
The United Kingdom’s (UK) Office for National Statistics (ONS) will release the high-impact Consumer Price Index (CPI) data on Wednesday at 06:00 GMT.
The UK CPI inflation report could show a fresh significant decline in inflation, ramping up expectations of an interest-rate cut by the Bank of England (BoE) in June and fuelling intense volatility around the Pound Sterling.
What to expect from the next UK inflation report?
The headline annual UK Consumer Price Index is expected to increase by 2.1% in April, a significant cooling off from a 3.2% rise in March. The reading would be the lowest since July 2021, almost at the BoE’s 2.0% target.
Core CPI inflation is seen declining to 3.6% YoY in April from 4.2% in March, also set to see a sharp slowdown. Meanwhile, the British monthly CPI is likely to rise 0.2% in the same period, as against the previous acceleration of 0.6%.
The primary reason behind the sharp deceleration in UK inflation could be a notable decline in the Ofgem energy price cap. Economists also expect services inflation – one of the stickiest components of price growth and a concern for many policymakers – to fall to 5.4% YoY even in April, down from a 6.0% figure recorded in March.
A bigger-than-expected drop in headline annual inflation and services inflation could cement a BoE June rate cut. Money markets are currently pricing in a 60% probability that the UK central bank will lower borrowing costs next month.
Following its May policy meeting, the BoE maintained interest rates at a 16-year high of 5.25%, in a split decision with two members dissenting in favor of a rate reduction by 25 basis points (bps) to 5%.
However, BoE Governor Andrew Bailey, during his post-policy meeting press conference, said that "we are not yet at a point where we can cut the base rate." Commenting on the possibility of a June rate cut, he noted that there are two more inflation prints before that meeting.
Previewing the UK inflation data, analysts at TD Securities (TDS) noted: “Headline inflation should fall to just a touch above the 2% target in April, largely on the back of another 13% decline in Ofgem's energy price cap. Base effects in core goods should help core to fall to 3.6% y/y (mkt: 3.6%).”
“On services, we see sticky momentum, partly in hotels and airfares, keeping the y/y rate 0.1 ppts above the BoE's forecast,” the TDS analysts said.
When will the UK Consumer Price Index report be released and how could it affect GBP/USD?
The CPI data will highlight the UK calendar on Wednesday at 06:00 GMT. The Pound Sterling is battling the 1.2700 round level against the US Dollar in the lead-up to the inflation release. Meanwhile, the US Dollar Index is holding its recovery momentum on waning expectations of aggressive interest rate cuts by the US Federal Reserve (Fed).
A hotter-than-expected headline and core inflation data could pour cold water on market expectations of a June BoE rate cut, providing a fresh lift to the Pound Sterling. In such a case, GBP/USD could unleash additional recovery toward the 1.2800 level. On the other hand, GBP/USD could retest the 1.2600 demand area if significantly softer UK CPI readings affirm BoE rate cut bets for next month.
Dhwani Mehta, Asian Session Lead Analyst at FXStreet, offers a brief technical outlook for the major and explains: “GBP/USD’s daily chart portrays a bullish crossover of the 21-day Simple Moving Average (SMA) and the 200-day SMA, suggesting a constructive outlook for the pair in the near term. The 14-day Relative Strength Index (RSI) points north above the midline, near 67.0, justifying the bullish potential in the Pound Sterling.”
Dhwani adds: “The pair need to take out the March 21 high of 1.2804 to sustain the recovery momentum. The upside targets are seen at the 1.2850 psychological level and the March 8 high of 1.2894. On the other hand, the immediate support is placed at 1.2633, the 100-day SMA, below which the 1.2585-1.2565 demand area could be tested. The last line of defense for buyers is seen at the 200-day SMA at 1.2540.” Dhwani adds.
Economic Indicator
Consumer Price Index (YoY)
The United Kingdom (UK) Consumer Price Index (CPI), released by the Office for National Statistics on a monthly basis, is a measure of consumer price inflation – the rate at which the prices of goods and services bought by households rise or fall – produced to international standards. It is the inflation measure used in the government’s target. The YoY reading compares prices in the reference month to a year earlier. Generally, a high reading is seen as bullish for the Pound Sterling (GBP), while a low reading is seen as bearish.
Read more.Next release: Wed May 22, 2024 06:00
Frequency: Monthly
Consensus: 2.1%
Previous: 3.2%
Source: Office for National Statistics
The Bank of England is tasked with keeping inflation, as measured by the headline Consumer Price Index (CPI) at around 2%, giving the monthly release its importance. An increase in inflation implies a quicker and sooner increase of interest rates or the reduction of bond-buying by the BOE, which means squeezing the supply of pounds. Conversely, a drop in the pace of price rises indicates looser monetary policy. A higher-than-expected result tends to be GBP bullish.
Inflation FAQs
Inflation measures the rise in the price of a representative basket of goods and services. Headline inflation is usually expressed as a percentage change on a month-on-month (MoM) and year-on-year (YoY) basis. Core inflation excludes more volatile elements such as food and fuel which can fluctuate because of geopolitical and seasonal factors. Core inflation is the figure economists focus on and is the level targeted by central banks, which are mandated to keep inflation at a manageable level, usually around 2%.
The Consumer Price Index (CPI) measures the change in prices of a basket of goods and services over a period of time. It is usually expressed as a percentage change on a month-on-month (MoM) and year-on-year (YoY) basis. Core CPI is the figure targeted by central banks as it excludes volatile food and fuel inputs. When Core CPI rises above 2% it usually results in higher interest rates and vice versa when it falls below 2%. Since higher interest rates are positive for a currency, higher inflation usually results in a stronger currency. The opposite is true when inflation falls.
Although it may seem counter-intuitive, high inflation in a country pushes up the value of its currency and vice versa for lower inflation. This is because the central bank will normally raise interest rates to combat the higher inflation, which attract more global capital inflows from investors looking for a lucrative place to park their money.
Formerly, Gold was the asset investors turned to in times of high inflation because it preserved its value, and whilst investors will often still buy Gold for its safe-haven properties in times of extreme market turmoil, this is not the case most of the time. This is because when inflation is high, central banks will put up interest rates to combat it. Higher interest rates are negative for Gold because they increase the opportunity-cost of holding Gold vis-a-vis an interest-bearing asset or placing the money in a cash deposit account. On the flipside, lower inflation tends to be positive for Gold as it brings interest rates down, making the bright metal a more viable investment alternative.
- NZD/USD received support as RBNZ maintained the interest rate at 5.5% as inflation remained elevated.
- RBNZ is expected to maintain higher rates for longer as annual CPI remains above the 1-3% target band.
- Fed’s Susan Collins stated that progress toward interest rate adjustment will take longer.
The NZD/USD pair rebounded after two days of losses, trading around 0.6140 during Asian hours on Wednesday following the Reserve Bank of New Zealand's (RBNZ) interest rate decision. The central bank maintained its Official Cash Rate (OCR) at 5.5% for the seventh consecutive meeting as inflation remains elevated, remaining above the 1-3% target band.
In the first quarter, New Zealand's annual Consumer Price Index (CPI) eased to 4.0%, compared to the previous reading of 4.7%. This has marked the lowest figure since the second quarter of 2021. This decline has fueled speculation that the RBNZ might consider rate cuts later in 2024.
In the United States (US), traders await the Minutes of the Federal Open Market Committee (FOMC) meeting held on May 1, seeking clues for the Federal Reserve’s (Fed) policy stance. The central bank maintains a cautious stance regarding inflation and the possibility of rate cuts in 2024.
On Tuesday, Federal Reserve Bank of Boston President Susan Collins spoke at the event of "Central Banking in the Post-Pandemic Financial System". Collins stated that progress toward interest rate adjustment will take longer and emphasized that patience is the right policy for the Fed.
Financial markets anticipate the first interest rate cut will occur in September at the earliest, with two reductions of a quarter percentage point each expected before the end of the year. According to the CME FedWatch Tool, the probability of the Federal Reserve implementing a 25 basis-point rate cut in September has seen a slight uptick to 50.3%, compared to 49.6% a day ago.
The People’s Bank of China (PBoC) set the USD/CNY central rate for the trading session ahead on Tuesday at 7.1077, as against the previous day's fix of 7.1069 and 7.2376 Reuters estimates.
- Gold price trades with mild negative bias in Wednesday’s early Asian session.
- The cautious approach from Fed officials weighs on precious metals.
- Gold traders will monitor the FOMC Minutes and Fed’s Goolsbee speech.
Gold price (XAU/USD) trades on a negative note on Wednesday after retreating from a record high on Monday. Members of the Federal Reserve (Fed) warned that the US central bank needed much more convincing that inflation was easing before it could begin cutting interest rates, emphasizing the Fed is likely to keep rates higher for longer. This, in turn, might boost the Greenback and weigh the USD-denominated gold lower.
Nonetheless, the yellow metal’s downside might be limited amid the renewed US-China trade tensions, Middle East geopolitical tensions, and the strong demand from central banks and Asian buyers, which might provide some support to the yellow metal. Later on Wednesday, gold traders will keep an eye on FOMC Minutes, along with the Fed’s Goolsbee speech.
Daily Digest Market Movers: Gold price edges lower as uncertainties over US interest rates persisted
- Fed Governor Christopher Waller said that he does not think further rate hikes will be necessary, adding he will need some convincing data before he backs cuts anytime soon.
- Atlanta Fed President Raphael Bostic noted that the US central bank has to be cautious about the first-rate move. Bostic further stated that he would “rather wait longer for a rate cut to be sure inflation does not start to bounce around.”
- Cleveland Fed President Loretta Mester said that keeping rates restrictive is not a concern right now given the strength of the jobs market.
- Boston Fed President Susan Collins said on Wednesday that progress toward a lower interest rate adjustment will take longer.
- Financial markets expect the first cut to happen in September at the earliest, with two reductions of a quarter percentage point before the end of the year, according to the CME Group’s FedWatch tool.
- On Tuesday, the US officially announced tariff hikes on a wide range of Chinese goods, while China may consider increasing temporary tariff rates on imported cars equipped with large-displacement engines.
Technical Analysis: Gold price’s outlook remains positive
Gold price trades with a mild negative bias on the day. XAU/USD has formed an ascending trend channel since the beginning of May. Technically, the yellow metal maintains the constructive outlook unchanged as it holds above the key 100-period Exponential Moving Average (EMA) on the four-hour timeframe. The Relative Strength Index (RSI) remains in the bullish zone around 63.00, suggesting that further upside looks favorable for the time being.
The first upside target for the precious metal will emerge near an all-time high of $2,450. A bullish breakout above this level will see a rally to the upper boundary of an ascending trend channel at $2,465, en route to the $2,500 psychological barrier.
In the bearish case, the lower limit of the ascending trend channel and round mark in the $2,400–$2,405 zone act as an initial support level for XAU/USD. Further south, the downside target to watch is a high of May 10 of $2,378, followed by the 100-period EMA of $2,364.
US Dollar price today
The table below shows the percentage change of US Dollar (USD) against listed major currencies today. US Dollar was the strongest against the Japanese Yen.
| USD | EUR | GBP | CAD | AUD | JPY | NZD | CHF | |
| USD | -0.03% | -0.03% | -0.03% | -0.03% | 0.03% | -0.13% | -0.03% | |
| EUR | 0.03% | -0.03% | -0.01% | -0.01% | 0.07% | -0.10% | 0.01% | |
| GBP | 0.03% | 0.01% | 0.01% | 0.00% | 0.06% | -0.10% | 0.01% | |
| CAD | 0.04% | 0.02% | 0.02% | 0.00% | 0.07% | -0.09% | 0.02% | |
| AUD | 0.05% | 0.02% | 0.03% | 0.02% | 0.08% | -0.08% | 0.02% | |
| JPY | -0.03% | -0.05% | -0.04% | -0.08% | -0.05% | -0.12% | -0.07% | |
| NZD | 0.12% | 0.10% | 0.10% | 0.09% | 0.09% | 0.18% | 0.11% | |
| CHF | 0.01% | -0.01% | -0.01% | -0.02% | -0.02% | 0.07% | -0.11% |
The heat map shows percentage changes of major currencies against each other. The base currency is picked from the left column, while the quote currency is picked from the top row. For example, if you pick the Euro from the left column and move along the horizontal line to the Japanese Yen, the percentage change displayed in the box will represent EUR (base)/JPY (quote).
Gold FAQs
Gold has played a key role in human’s history as it has been widely used as a store of value and medium of exchange. Currently, apart from its shine and usage for jewelry, the precious metal is widely seen as a safe-haven asset, meaning that it is considered a good investment during turbulent times. Gold is also widely seen as a hedge against inflation and against depreciating currencies as it doesn’t rely on any specific issuer or government.
Central banks are the biggest Gold holders. In their aim to support their currencies in turbulent times, central banks tend to diversify their reserves and buy Gold to improve the perceived strength of the economy and the currency. High Gold reserves can be a source of trust for a country’s solvency. Central banks added 1,136 tonnes of Gold worth around $70 billion to their reserves in 2022, according to data from the World Gold Council. This is the highest yearly purchase since records began. Central banks from emerging economies such as China, India and Turkey are quickly increasing their Gold reserves.
Gold has an inverse correlation with the US Dollar and US Treasuries, which are both major reserve and safe-haven assets. When the Dollar depreciates, Gold tends to rise, enabling investors and central banks to diversify their assets in turbulent times. Gold is also inversely correlated with risk assets. A rally in the stock market tends to weaken Gold price, while sell-offs in riskier markets tend to favor the precious metal.
The price can move due to a wide range of factors. Geopolitical instability or fears of a deep recession can quickly make Gold price escalate due to its safe-haven status. As a yield-less asset, Gold tends to rise with lower interest rates, while higher cost of money usually weighs down on the yellow metal. Still, most moves depend on how the US Dollar (USD) behaves as the asset is priced in dollars (XAU/USD). A strong Dollar tends to keep the price of Gold controlled, whereas a weaker Dollar is likely to push Gold prices up.
| Index | Change, points | Closed | Change, % |
|---|---|---|---|
| NIKKEI 225 | -122.75 | 38946.93 | -0.31 |
| Hang Seng | -415.6 | 19220.62 | -2.12 |
| KOSPI | -17.96 | 2724.18 | -0.65 |
| ASX 200 | -12 | 7851.7 | -0.15 |
| DAX | -42.2 | 18726.76 | -0.22 |
| CAC 40 | -54.51 | 8141.46 | -0.67 |
| Dow Jones | 66.22 | 39872.99 | 0.17 |
| S&P 500 | 13.28 | 5321.41 | 0.25 |
| NASDAQ Composite | 37.76 | 16832.63 | 0.22 |
| Pare | Closed | Change, % |
|---|---|---|
| AUDUSD | 0.66671 | -0 |
| EURJPY | 169.465 | -0.11 |
| EURUSD | 1.08547 | -0.02 |
| GBPJPY | 198.442 | -0.06 |
| GBPUSD | 1.27108 | 0.03 |
| NZDUSD | 0.6094 | -0.2 |
| USDCAD | 1.36335 | 0.06 |
| USDCHF | 0.91069 | 0.01 |
| USDJPY | 156.118 | -0.09 |


© 2000-2026. Уcі права захищені.
Cайт знаходитьcя під керуванням TeleTrade DJ. LLC 2351 LLC 2022 (Euro House, Richmond Hill Road, Kingstown, VC0100, St. Vincent and the Grenadines).
Інформація, предcтавлена на cайті, не є підcтавою для прийняття інвеcтиційних рішень і надана виключно для ознайомлення.
Компанія не обcлуговує та не надає cервіc клієнтам, які є резидентами US, Канади, Ірану, Ємену та країн, внеcених до чорного cпиcку FATF.
Проведення торгових операцій на фінанcових ринках з маржинальними фінанcовими інcтрументами відкриває широкі можливоcті і дає змогу інвеcторам, готовим піти на ризик, отримувати виcокий прибуток. Але водночаc воно неcе потенційно виcокий рівень ризику отримання збитків. Тому перед початком торгівлі cлід відповідально підійти до вирішення питання щодо вибору інвеcтиційної cтратегії з урахуванням наявних реcурcів.
Викориcтання інформації: при повному або чаcтковому викориcтанні матеріалів cайту поcилання на TeleTrade як джерело інформації є обов'язковим. Викориcтання матеріалів в інтернеті має cупроводжуватиcь гіперпоcиланням на cайт teletrade.org. Автоматичний імпорт матеріалів та інформації із cайту заборонено.
З уcіх питань звертайтеcь за адреcою pr@teletrade.global.
переклади