- Аналітика
- Новини та інструменти
- Новини ринків
Новини ринків
- GBP/USD trades on a stronger note near 1.2663 in Friday’s early Asian session.
- The US labour market remains robust, with jobless claims declining.
- The UK preliminary Manufacturing PMI for February came in at 47.1 versus 47.0, better than expected.
The GBP/USD pair posts modest gains above the mid-1.2600s during the early Asian trading hours on Friday. The decline of the US Dollar (USD) provides some support to the major pair. At press time, GBP/USD is trading at 1.2663, adding 0.02% on the day.
The US Initial Jobless Claims for the week ending February 17 fell to 210K from the previous weeks of 213K. Continuing Claims dropped to 1.862M, below expectations and the prior week. The report suggested the US labor market remains robust and might convince the Federal Reserve (Fed) to delay cutting interest rates.
Investors have pushed back their expectations for the first rate cut from the Fed to June from May due to a solid job market and hotter-than-expected inflation readings in January.
On Thursday, the US Manufacturing PMI improved to 51.5 in February from 50.7 in the previous reading, better than the estimation of 50.5, the highest reading in 16 months. Meanwhile, the Services PMI eased to 51.3 in February from 52.5 in January, weaker than 52.00 expected.
On the Pound Sterling front, the UK preliminary Manufacturing PMI for February came in at 47.1 versus 47.0, missing market expectations of 47.5. The Services PMI was unchanged at 54.3 but above the consensus of 54.1. Finally, the Composite PMI arrived at 53.3, against expectations and the previous reading of 52.9.
Moving on, investors will take more cues from the Fed Christopher J. Waller speech on Friday. Next week, the US Gross Domestic Product Annualized (GDP) for the fourth quarter will be released.
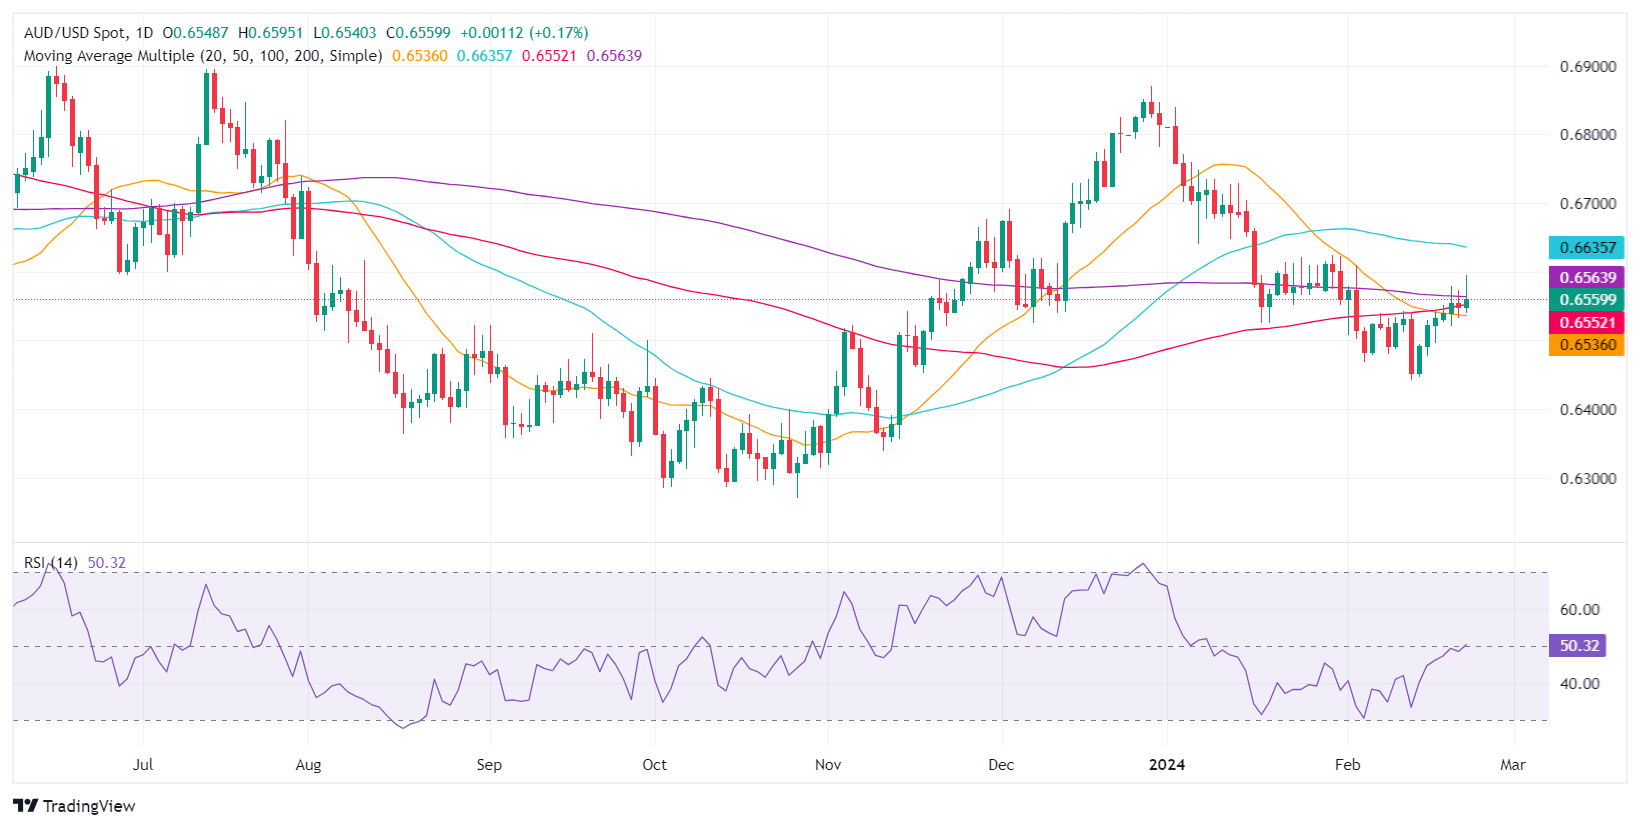
- AUD/USD modestly up at 0.6559, after peaking at 0.6595, with technical levels influencing movement.
- Solid US job data and economic expansion hints keep Fed rate hike expectations alive, impacting the Aussie.
- Fed officials' comments reflect cautious optimism on inflation, hinting at a data-driven approach to future rate cuts.
The Aussie Dollar registers minuscule gains against the US Dollar as Friday’s Asia session begins. The pair remains capped on the upside despite hitting a new month high at 0.6595, as a key technical resistance level that acted like a magnet drove the exchange rate toward the 0.6550s area. At the time of writing, the AUD/USD trades at 0.6559, up 0.06%.
Aussie touches monthly high but faces key resistance at 200-DMA
Wall Street ended Thursday’s session at all-time highs, portraying an upbeat market mood. US employment data was solid as the US Bureau of Labor Statistics (BLS) revealed that unemployment claims for the week ending on February 17, dropped to 201K from 213K, and below the consensus. At the same time, S&P Global's mixed February Flash PMI data, indicating economic expansion, supports the case for the US Federal Reserve to maintain elevated interest rates for a longer duration to address inflationary pressures.
The data sponsored a jump in the short end of the US Treasury bond yield curve, and capped the US Dollar’s (USD) losses, according to the US Dollar Index (DXY) at 103.94, down 0.05%. In the meantime, Federal Reserve officials crossed the wires, led by Vice-Chair Philip Jefferson, Philadelphia Fed President Patrick Harker, and Governor Lisa Cook.
Fed Jefferson said he’s optimistic about the progress on inflation, and despite adding that rate cuts could happen later, he remains data-dependent. Meanwhile, Philadelphia Fed Patrich Harket said the central bank is on track for a rate cut this year, and despite putting a May rate cut on the table, it’s not his base case scenario. Last but not least, Lisa Cook said she needs more confidence in inflation before cutting rates.
AUD/USD Price Analysis: Technical outlook
The AUD/USD daily chart is neutral to downward biased, with the exchange rate bracing at around the 200-day moving average (DMA) at 0.6561. A decisive break to the upside would pave the way to challenge Thursday’s high at 0.6595 ahead of 0.6600. On the other hand, a drop below the 0.6500 mark would sponsor a leg-down toward the current year-to-date (YTD) low of 0.6442.
- NZD/USD attracts some sellers near 0.6194 despite the decline of USD.
- New Zealand Retail Sales arrived at -1.9% QoQ in Q4 vs. -0.8% prior.
- The US Manufacturing PMI showed the highest reading in 16 months; Initial Jobless Claims came in stronger than expected.
The NZD/USD pair snaps the seven-day winning streak below the 0.6200 mark during the early Asian session on Friday. The downtick of the pair is supported by the decline in New Zealand Retail Sales for the fourth quarter (Q4) despite the correction of Greenback. The pair currently trades around 0.6194, down 0.09% on the day.
The latest data from Statistics New Zealand on Friday showed that the nation’s Retail Sales fell 1.9% QoQ in Q4 from the previous reading of a 0.8% decline, an eighth consecutive month of declining retail volumes. Meanwhile, the Retail Sales ex Autos for Q4 came in at -1.7% QoQ versus 0.4% prior.
The Reserve Bank of New Zealand (RBNZ) will announce its interest rate decision next week, with no change in rate expected. Investors will take more cues from the RBNZ tone. If they maintain a hawkish bias, this could provide some support to the New Zealand Dollar (NZD) and act as a tailwind for the NZD/USD pair.
On the other hand, the US S&P Composite Purchasing Managers Index (PMI) for February eased to 51.4 from 52.0 in the previous reading. The Manufacturing PMI rose to 51.5 in February from 50.7 in January, better than the market expectation of 50.5. This figure registered the highest reading in 16 months. Finally, the Services PMI eased to 51.3 in February from 52.5 in January, below the market consensus.
Additionally, the US Initial Jobless Claims came in stronger than expected. The report indicated that the US labor market remains robust, and this could lend some support to the Fed’s tighter-for-longer narrative.
Looking ahead, the Chinese House Price Index is due on Friday. The Federal Reserve's (Fed) Christopher J. Waller is set to speak later in the day. Next week. the attention will shift to the RBNZ interest rate decision.
Federal Reserve (Fed) Governor and policymaker Lisa Cook spoke while participating in a moderated discussion at the Annual Conference of the Julis-Rabinowitz Center for Public Policy & Finance, hosted by Princeton University in New Jersey.
Key highlights
- Fed's Cook believes risks to achieving employment and inflation goals have moved into better balance.
- would like to have greater confidence that inflation is converging to 2% before beginning rate cuts.
- Policy rate will eventually have to change as the disinflation outlook becomes more sustainable.
- The risk of persistently-high inflation has diminished, but not disappeared entirely.
- Disinflationary process has been, and may continue to be, bumpy and uneven.
- Consumer spending growth may face headwinds as household balance sheets deteriorate.
- Consumer spending has generally continued to show strong momentum in recent months.
- A strong supply-side recovery has contributed heavily to recent disinflation.
- Fed's Cook sees potential for increased supply chain disruptions from Red Sea altercations.
- The post-pandemic world could be characterized by greater volatility of supply.
- Core goods inflation likely to converge to modestly negative pre-pandemic trend.
- 12-month PCE forecast seems reasonable, baseline outlook of convergence on 2% target.
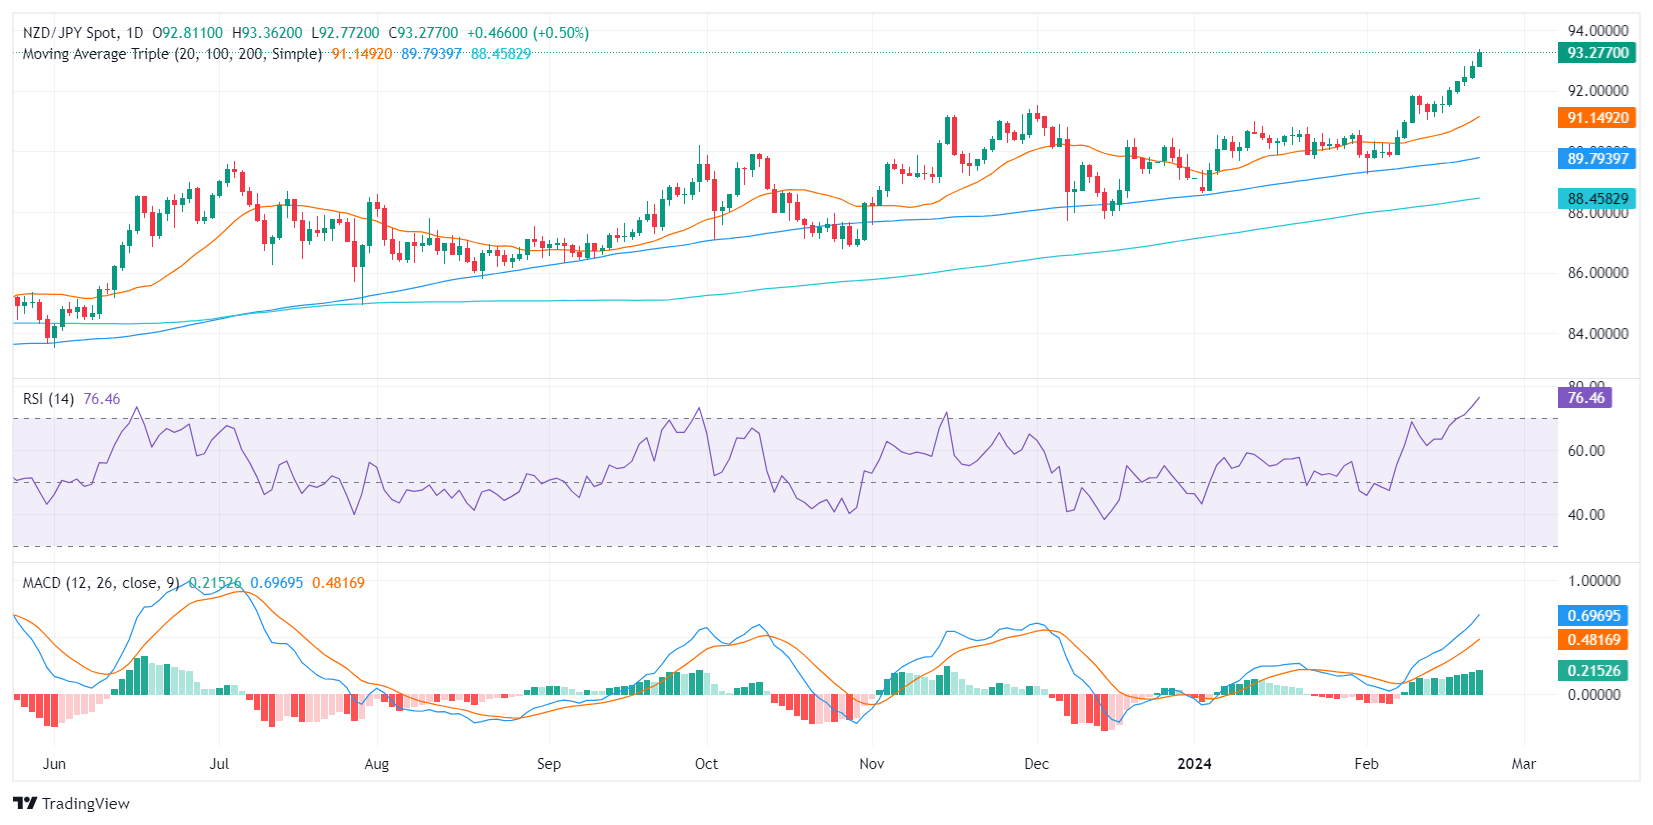
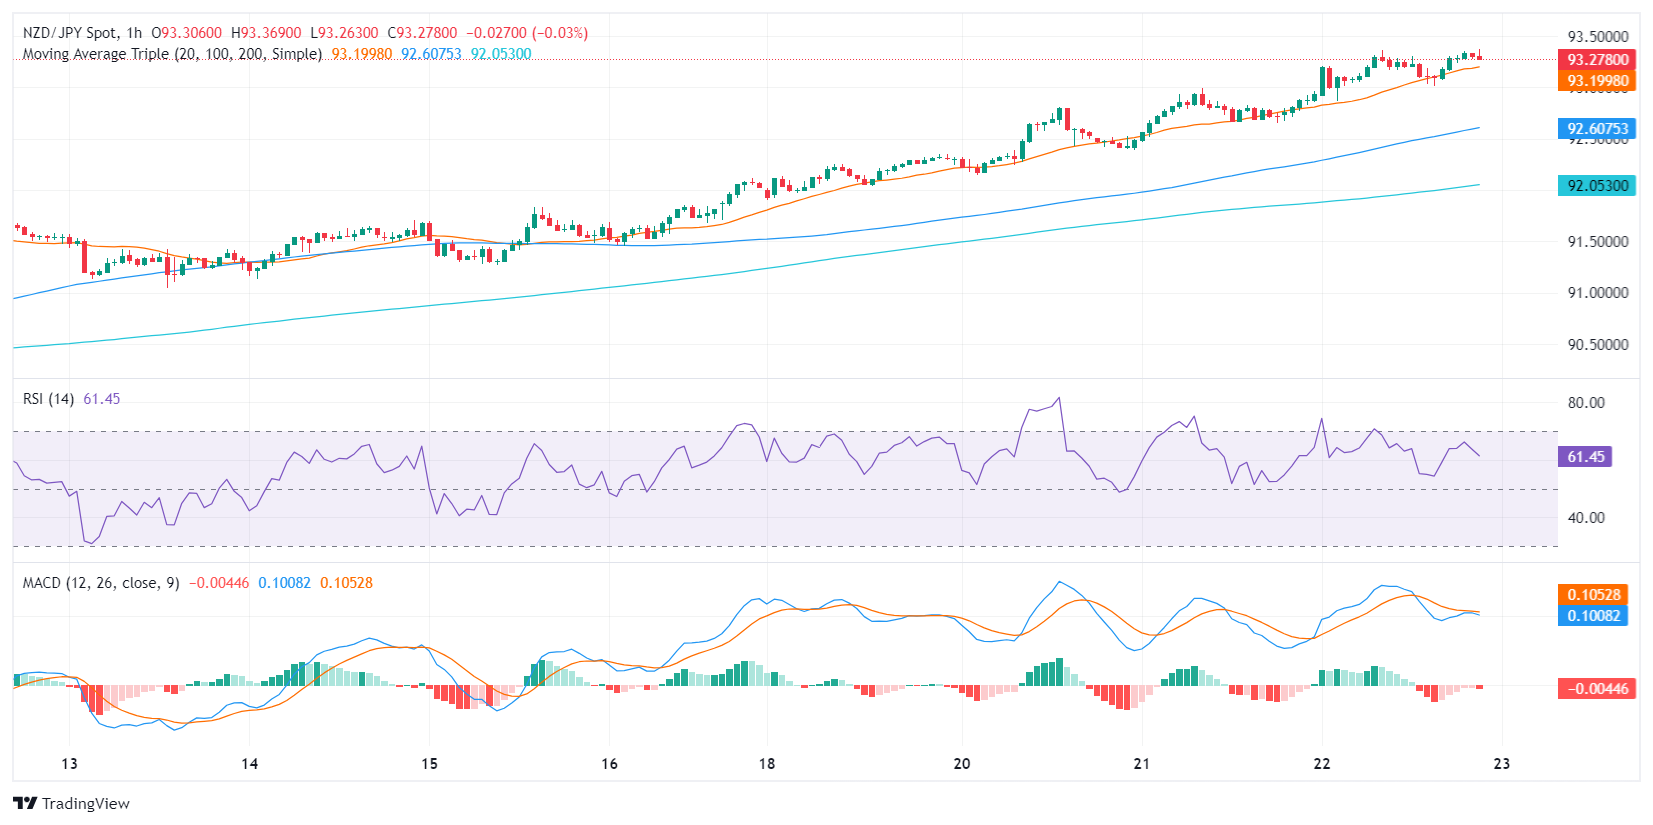
- The NZD/JPY rose by 0.52% during Thursday's session to 93.34.
- The daily RSI of the NZD/JPY signals overbought conditions, indicating a strong buying momentum with possibilities of a near correction.
- On the hourly chart, indicators are consolidating, making it a deviation from the overbought vibe of the daily chart.
In Thursday’s session, the NZD/JPY rose to 93.34, rallying by 0.52% reaching its highest level since 2015. It appears that buyers have predominantly influenced recent trends, causing the pair to enter an overbought territory with a Relative Strength Index (RSI) above 70 on the daily chart. While the persistent uptrend remains unbroken, caution might be advisable due to the over-extended buying movements which could use a healthy correction.
Meanwhile, the daily Moving Average Convergence Divergence (MACD) histogram continues to print green bars, indicating positive momentum in the short term. This underscores the powerful buying activity that has driven the pair into overbought territory.
In contrast, the hourly chart displays the RSI within a healthy 50-70 range, foreshadowing a potential short-term cooling off or consolidation period. Likewise, a slowdown in the robust buying momentum is suggested by the flat red hourly MACD histogram bars. However, the broader uptrend remains intact above the 200, 100, and 20-day SMAs on the daily chart.
NZD/JPY daily chart
NZD/JPY hourly chart
New Zealand's QoQ Retail Sales fell 1.9% in the fourth quarter, chalking in an eighth consecutive month of declining retail volumes. The previous quarter also saw a downside revision to -0.8% from the initial print of 0.0%.
New Zealand Retail Sales excluding Autos also declined 1.7% versus the previous 0.4% uptick (revised down from 1.0%).
According to Stats NZ, total Retail Trade volume fell 1.9% in 2023's fourth quarter, marked by a decline in all but one of the 15 tracked sectors. Pharmaceuticals and other store-based retailing were up a scant 0.3%, while the quarter's losses were led by fuel retailing and motor vehicles and parts, down 3.6% and 2.5% respectively, with food and beverage services declining 2.4%.
Stats NZ noted that after adjusting for price inflation and seasonal effects, total retail sales in the quarter ended in December compared to the same period a year ago.
This is the first decline in New Zealand Retail Sales since the national COVID lockdowns in 2020 and 2021. Before the COVID pandemic, the last time New Zealand saw declines in Retail Sales was the quarter ended September 2009.
- USD/JPY rallied from an early Thursday dip.
- The pair remains bolstered above 150.00 after US PMIs mixed.
- Next week sees Japan CPI and US GDP, PCE figures.
USD/JPY dip and rallied on Thursday, etching in a low of 150.02 before recovering into the 150.60 region after US PMIs came in mixed but overall pointed to the upside. With the brunt of the week’s data releases out of the way, USD/JPY traders will be pivoting to look ahead to next week’s hefty economic calendar.
Forex Today: Markets maintain their focus on rate cut bets
The US Purchasing Managers Index (PMI) mixed on Thursday, with the S&P Global Services PMI for February dipping to 51.3 versus the forecast decline to 52.0 from 52.5. The Manufacturing component unexpectedly rose to 51.5 versus the forecast downtick to 50.5 from January’s 50.7, and the Manufacturing PMI rebound helped to ringfence declines in the Composite PMI, which printed at 51.4 MoM for February compared to the previous month’s 52.0.
Read more: US S&P Global Manufacturing PMI improves to 51.5
With Japan coming back to the market fold after taking the day off to celebrate Japanese Emperor Naruhito’s birthday, a federally-observed holiday, USD/JPY markets return in full just in time to see Friday’s Federal Reserve (Fed) Monetary Policy Report before shuttering for the weekend.
Next week sees Japan’s National Consumer Price Index (CPI) early Tuesday, followed by US Gross Domestic Product (GDP) figures on Wednesday. Japan’s National CPI excluding Fresh Food is expected to recede further to 1.8% for the year ended January compared to the previous period’s 2.3%.
On the US side, annualized GDP for 2023’s fourth quarter is expected to hold steady at 3.3%.
Next Thursday sees Japanese Retail Sales early in the day before US Personal Consumption Expenditure (PCE) Price Index figures land on markets. Japanese Retail Sales are expected to rebound to 2.3% from 2.1% YoY in January, while the Core US PCE Price Index is forecast to heat up to 0.4% MoM versus the previous 0.2%.
USD/JPY technical outlook
USD/JPY has seen a thin bullish lift since bottoming out on Monday at 149.68, and the pair recovered to the high side of the 150.00 handle before running into familiar technical resistance near 150.50.
The USD/JPY pair has closed flat or bullish six consecutive trading weeks and is on pace to chalk in a seventh straight green week. The pair continues to extend a recovery from the major swing low into 140.25, and bulls will be looking to gather enough steam to drag the USD/JPY back into the 152.00 handle, a level buyers failed to break in last November’s surge, stopping at 151.91.
USD/JPY hourly chart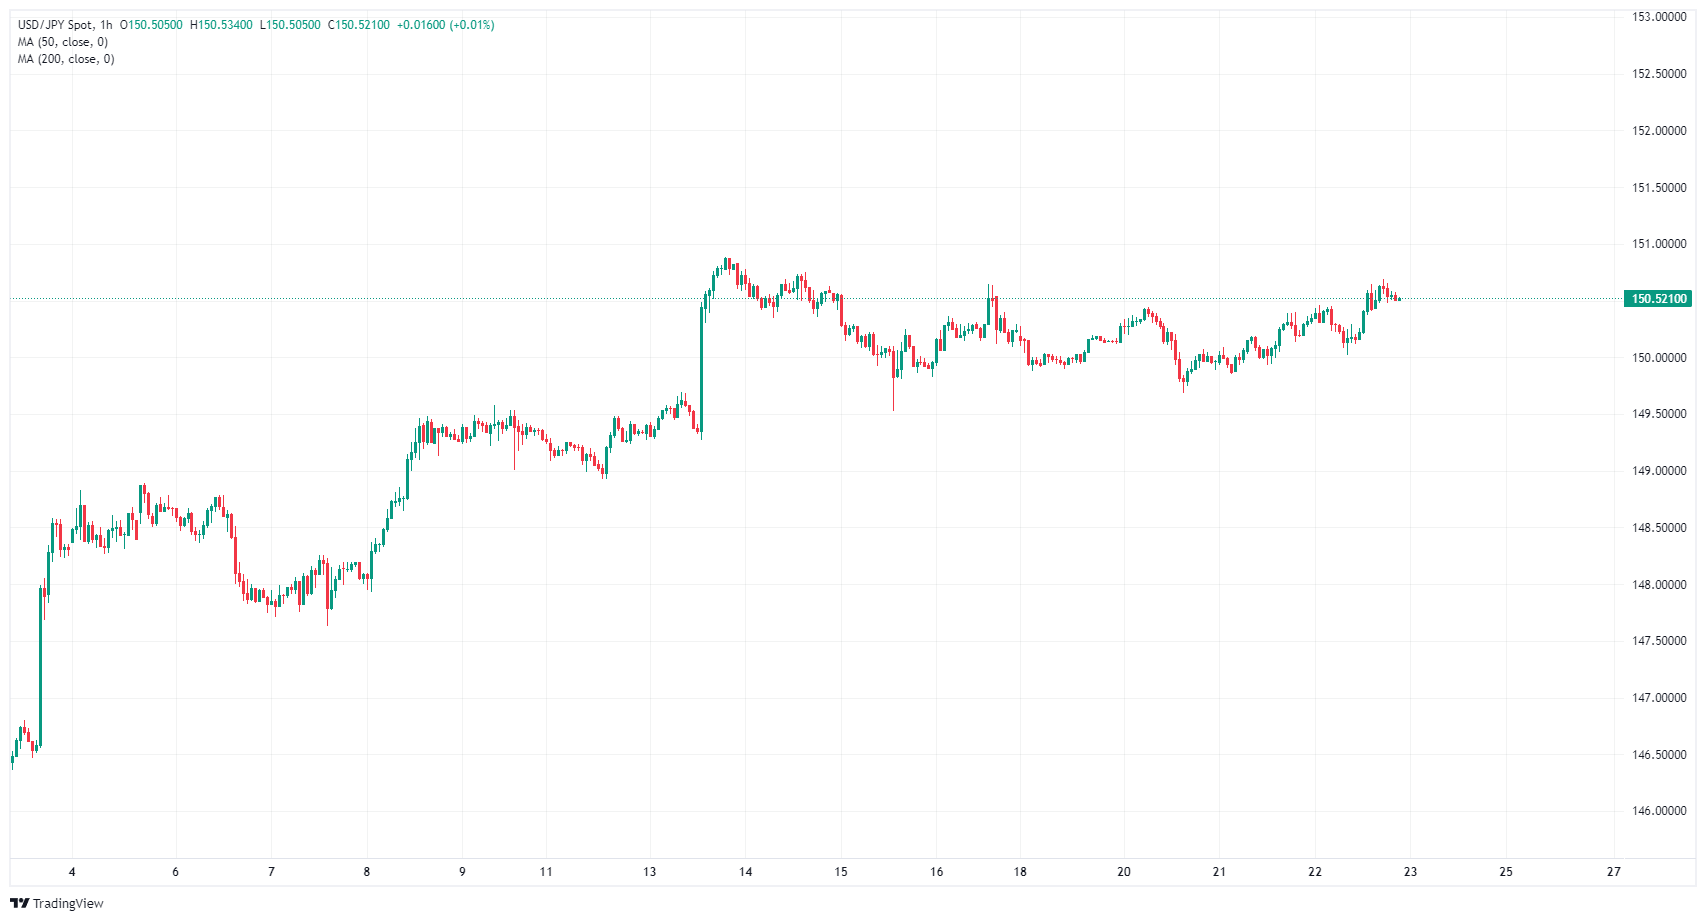
USD/JPY daily chart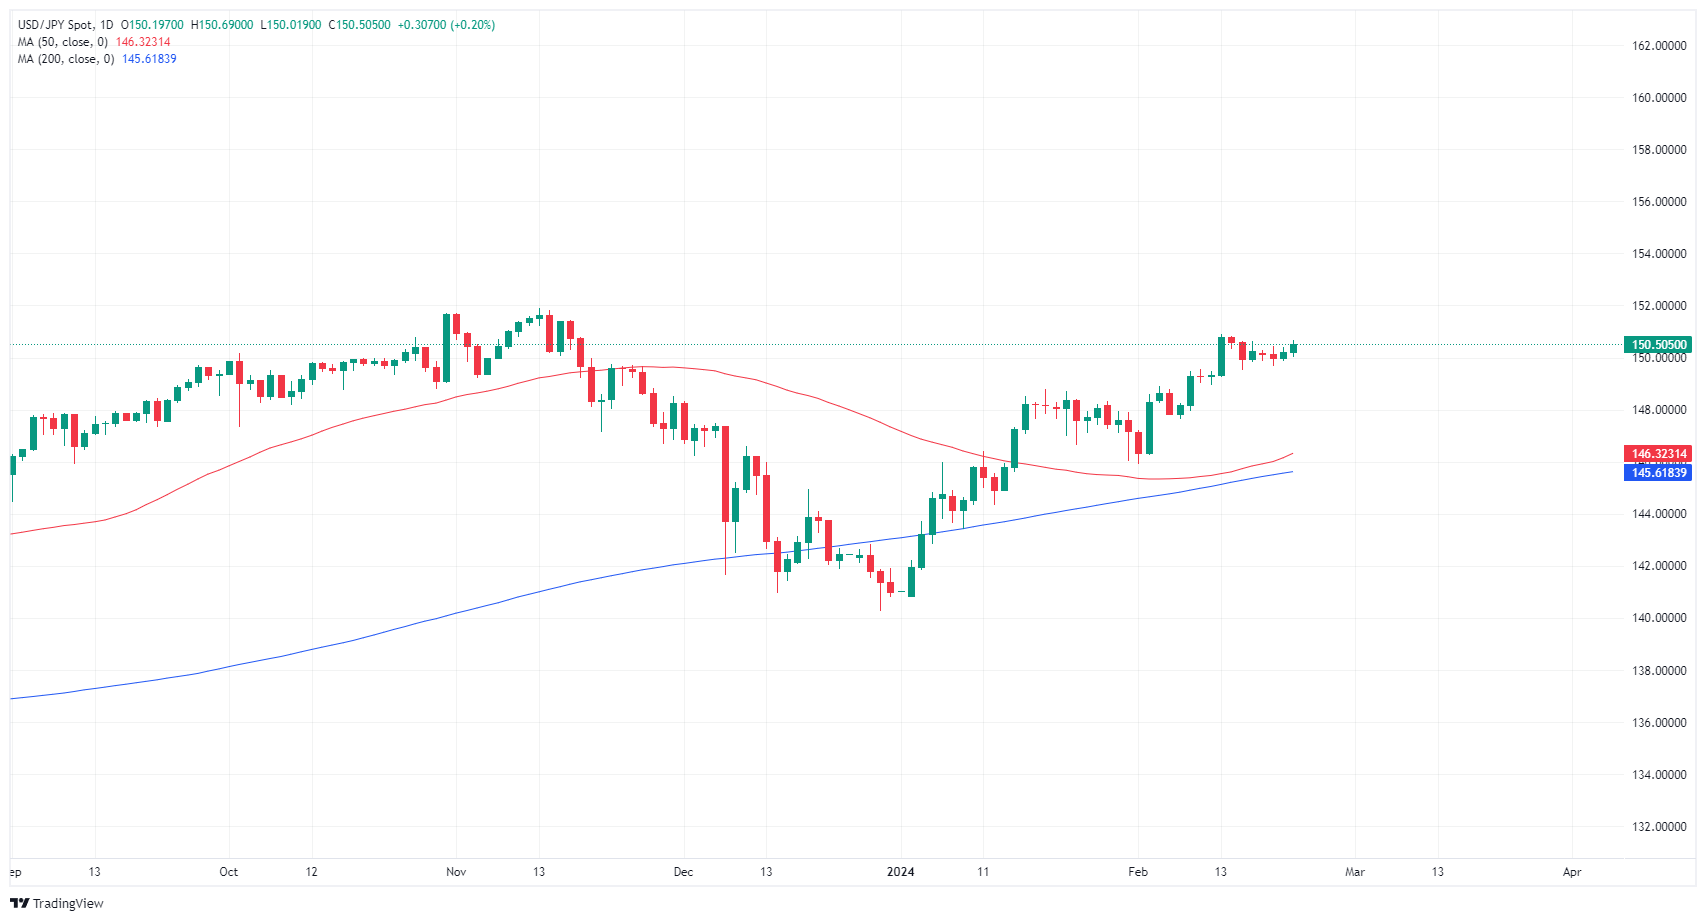
Philidelphia Federal Reserve (Fed) President Patrick Harker hit newswires Thursday, noting that while the Fed is approaching the point of cutting rates, policymakers remain unsure of when specifically that might happen.
Key highlights
- Fed near point of cutting rates, but unsure of when.
- Disinflation trend has picked up pace, Fed is in the 'last mile' towards 2% inflation.
- Recent CPI figures show uneven progress on inflation.
- Fed's Harker needs more confidence on inflation progress.
- Cutting rates too early remains the greatest risk to Fed.
- Fed's Harker is on board with slowing down the pace of balance sheet contraction before outright halting.
- US GDP continues to be stronger than expected.
- The Fed can hold rates for now, no rush to cut.
- Fed's Harker is particularly focused on labor market, jobs will determine when to cut.
- May rate cut is possible, but not the current forecast. A couple more months of positive data would convince Fed's Harker of need to cut.
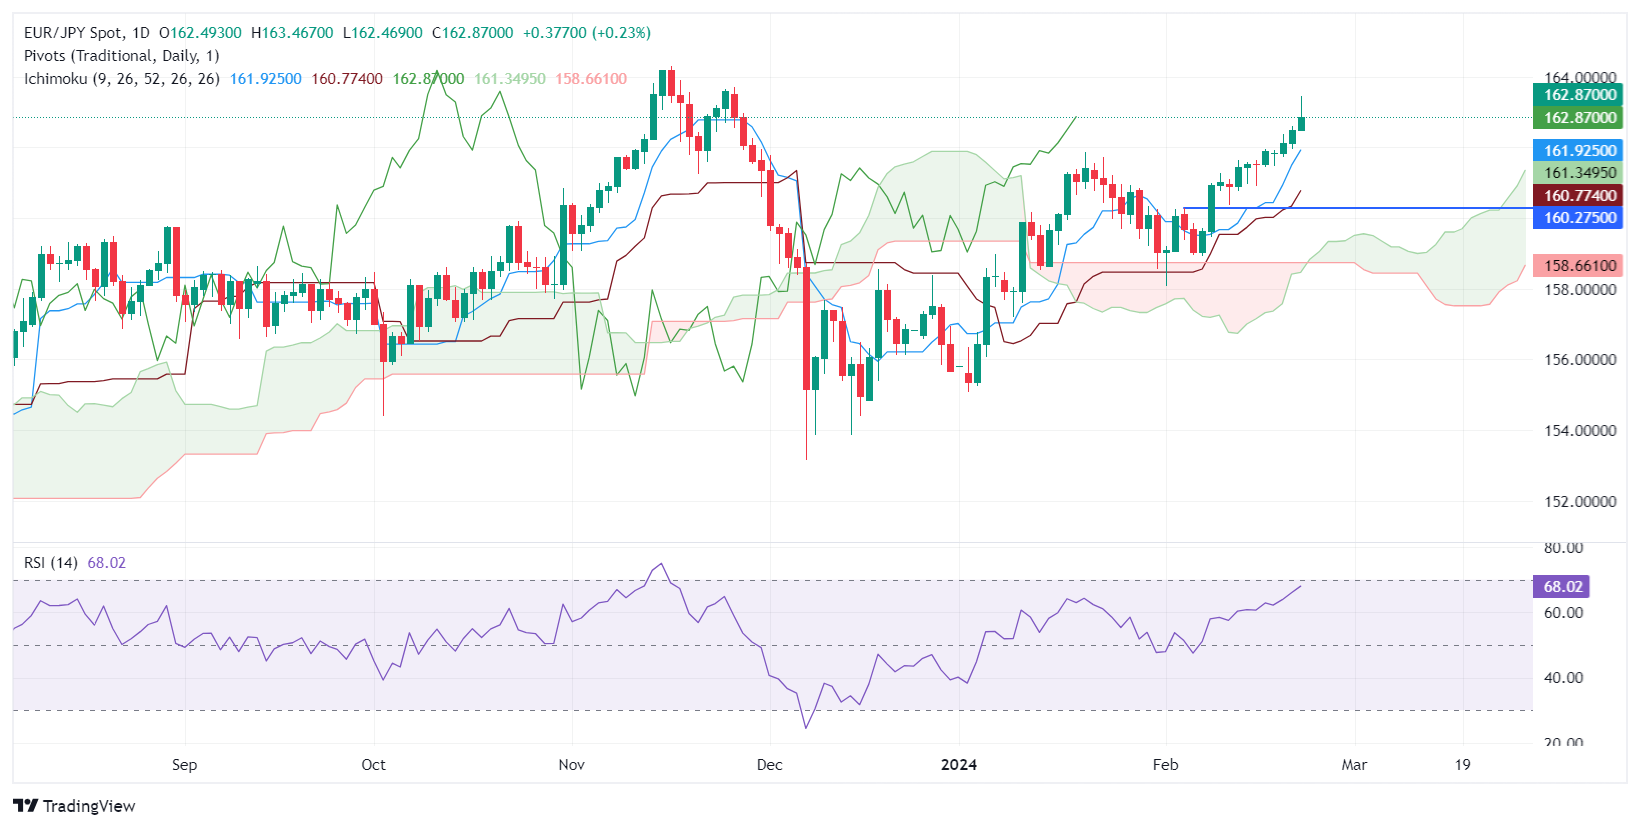
- EUR/JPY climbs 0.18%, buoyed despite optimism for ECB rate cuts in a disinflationary environment.
- Crossing Tenkan-Sen, targets 163.00 resistance, aiming for November's peak at 164.31 in ongoing uptrend.
- Potential pullback to find support at Tenkan-Sen (161.92), with subsequent supports at 161.34 and 160.77.
The Euro clings to decent gains versus the Japanese Yen late during the North American session, amid a mixed market mood. Eurozone (EU) economic data showed the disinflation process amongst countries in the bloc continued and has opened the door to discussions that the European Central Bank (ECB) might cut rates sooner rather than later. At the time of writing, the EUR/JPY exchanges hands at 162.91, up 0.18%.
The cross-pair has extended its gains past the Tenkan-Sen level and the 162.00 figure, as the Relative Strength Index (RSI) is close to entering overbought levels. However, as the uptrend remains strong, the RSI might get to the 80 level before the EUR/JPY tumbles. Therefore, the pair’s next resistance level sits at 163.00, followed by the November 16 high at 164.31.
On the flip side, if EUR/JPY retreats below the 162.00 mark, sellers could challenge the Tenkan-Sen at 161.92. Once cleared, the next support would be the Senkou Span A at 161.34 before challenging the Kijun-Sen level at 160.77.
EUR/JPY Price Action – Daily Chart
Another solid print from the weekly report of the US labour market lent extra support to the Fed’s tighter-for-longer narrative, although the move in the Greenback was limited. Furthermore, room to the Greenback and sponsored a broad-based knee-jerk in the risk-complex, while the generalized upbeat flash readings from PMIs initially bolstered a spike in risk-related assets.
Here is what you need to know on Friday, February 23:
The USD Index (DXY) remained on the back foot amidst the multi-session negative streak, hovering around the 104.00 region along with some recovery in US yields. At the end of the week, only the speech by Fed’s C. Waller is due.
EUR/USD ran out of steam just ahead of 1.0900 the figure on the back of encouraging PMIs, although the late recovery in the Greenback forced spot to relinquish those gains. On February 23, Germany will be in the spotlight with the releases of the final Q4 GDP Growth Rate and the Business Climate tracked by the IFO institute.
GBP/USD traded in quite a volatile fashion, although it managed to clinch to daily gains and extend the weekly bounce for the third straight session. Across the Channel, the GfK Consumer Confidence will be only due on February 23.
USD/JPY added to Wednesday’s advance and climbed further north of the 150.00 milestones. The next event of note in Japan will be the release of January inflation figures on February 27.
In line with their risky peers, AUD/USD left behind the multi-session advance and gave away some gains after briefly flirting with the 0.6600 hurdle. Next on tap in Australia will be the RBA’s Monthly CPI Indicator on February 28.
In China, the House Price Index is due on February 23. USD/CNH managed to regain some balance and chart decent gains past the 7.2000 mark after two consecutive daily pullbacks.
WTI prices rose to the area of monthly highs near the $79.00 mark per barrel amidst rising geopolitical jitters and another unexpected build in US crude oil supplies.
Gold prices partially set aside several sessions of gains and settled around the $2,020 zone per troy ounce, while its cousin Silver retreated for the fourth day in a row, revisiting weekly lows near $22.70 per ounce.
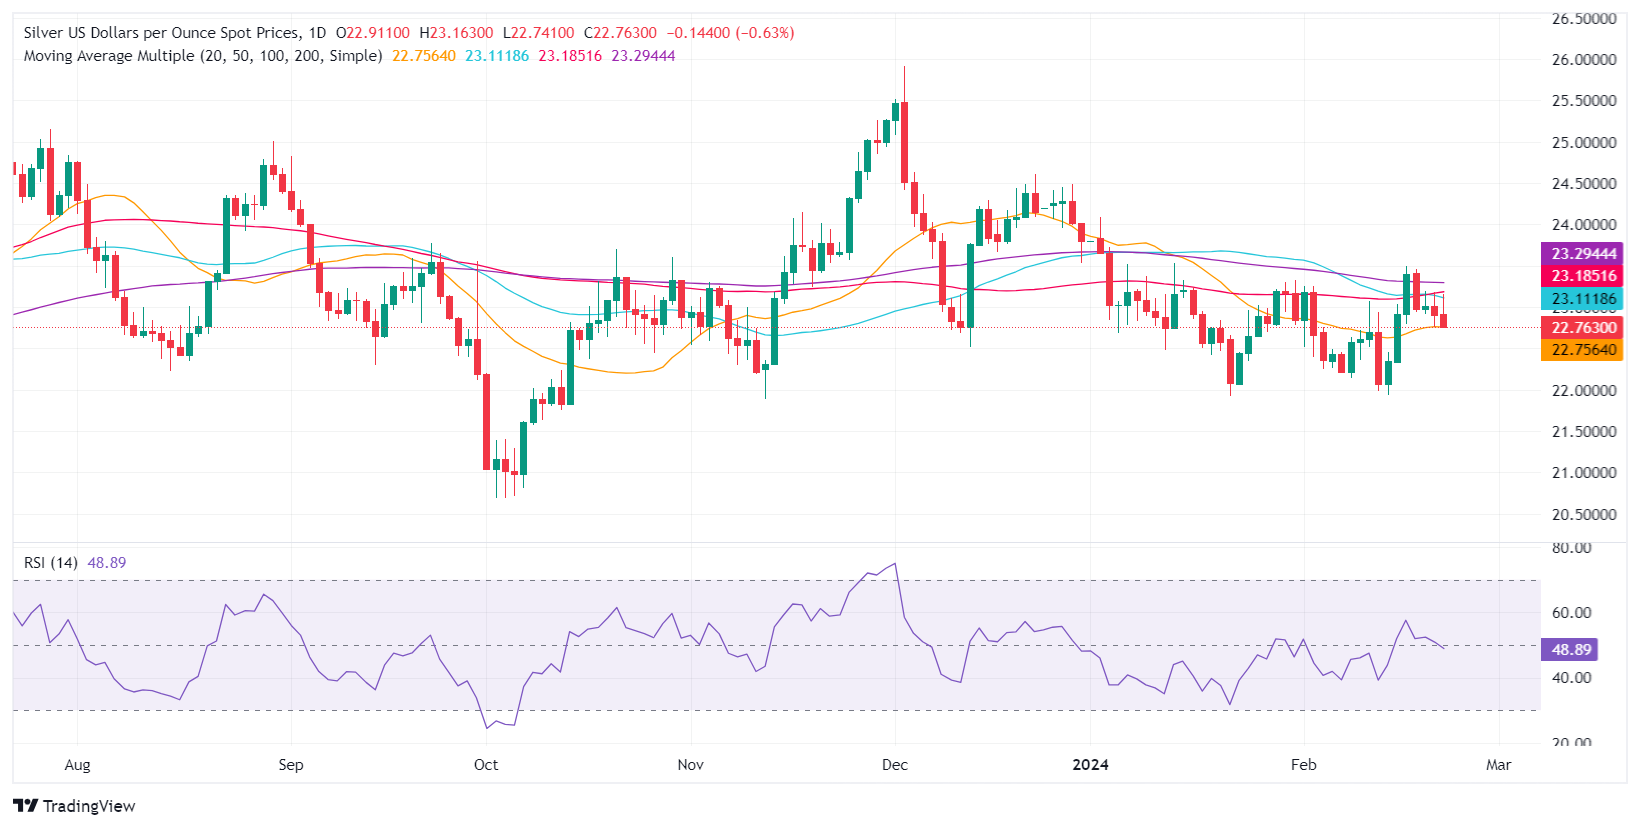
- Silver falls to $22.75, continuing its losing streak for a fourth day due to rising yield pressures.
- Bearish harami and dip below key DMAs suggest more declines, eyeing $22.51 as next support.
- A rebound over $23.00 could push silver to retest DMAs, aiming for $24.00 resistance.
Silver’s falls for the fourth straight day, remaining below the $23.00 figure, as US Treasury bond yields advance, courtesy of strong economic data from the United States, preventing the Federal Reserve (Fed) from beginning to ease policy soon. At the time of writing, XAG/USD trades at $22.75, down 0.55%.
Since the XAG/USD completed the formation of a ‘bearish harami’ candlestick chart pattern on Monday, the grey metal has fallen from around the confluence of the 100 and 50-day moving averages (DMAs), at around $23.17-$23.10, exacerbating a plunge below the $23.00 figure. Relative Strength Index (RSI) studies suggest Silver’s price might extend its losses toward the December 13 low of $22.51, followed by the $22.00 figure. Once cleared, the next support would be the November 13 low of $21.88.
On the flip side, XAG/USD buyers need to reclaim the $23.00 mark so they could challenge the daily moving averages (DMAs) before aiming towards $24.00.
XAG/USD Price Action – Daily Chart
- EUR/USD tested fresh highs at 1.0888 before falling back.
- EU and US PMIs came in soft or mixed, giving bulls cause for pause.
- Friday to wrap up the week with German final GDP, Fed MPR.
EUR/USD broke higher on Thursday, testing into its highest bids since the start of February before falling back into the 1.0800 region after European and US Purchasing Managers Index (PMI) figures softened or came in mixed on forecasts. The Pan-European Composite PMI ticked higher, but the Manufacturing component fell back once again, and US PMIs also gave a mixed showing.
Friday brings final German Gross Domestic Product (GDP) figures, and the US Federal Reserve (Fed) will be releasing its Monetary Policy Report to wrap up the trading week. Investors will be gearing up for next week’s US GDP print due next Wednesday, followed by Thursday’s EU Consumer Price Index (CPI) inflation figures alongside US Personal Consumption Expenditure (PCE) numbers.
Daily digest market movers: EUR/USD recedes just as quickly as it rises on PMI hesitation
- Germany’s HCOB Services PMI rose to 48.2 in February, beating the 48.0 forecast and the previous print of 47.7, while the Manufacturing component declined to a four-month low of 42.3 versus the forecast uptick to 46.1 from January’s 45.5.
- The Pan-European HCOB Composite PMI rose to 48.9 against the forecast of 48.5 from 47.9, getting bolstered by the European Services component printing at 50.0, above contractionary territory for the first time in seven months. The Services component was expected to print at 48.8 versus the previous 48.4.
- Europe’s Manufacturing PMI component fell to 46.1 versus the forecast of 47.0, falling away from the previous 46.6.
- On the US side, the S&P Global Services PMI fell to 51.3 against the expected 52.0, pulling back even further away from the previous print of 52.5.
- The Manufacturing component swung upward to 51.5 compared to the forecast for 50.5, climbing over the previous 50.7 and posting its highest figure since October of 2022.
- Read more: US S&P Global Manufacturing PMI improves to 51.5.
- Fed's Jefferson: Cautiously optimistic about inflation progress.
Euro price today
The table below shows the percentage change of Euro (EUR) against listed major currencies today. Euro was the strongest against the Swiss Franc.
| USD | EUR | GBP | CAD | AUD | JPY | NZD | CHF | |
| USD | -0.01% | -0.18% | -0.09% | 0.01% | 0.14% | -0.27% | 0.21% | |
| EUR | 0.02% | -0.17% | -0.10% | 0.03% | 0.14% | -0.25% | 0.23% | |
| GBP | 0.17% | 0.17% | 0.07% | 0.18% | 0.31% | -0.09% | 0.41% | |
| CAD | 0.08% | 0.10% | -0.08% | 0.12% | 0.24% | -0.16% | 0.32% | |
| AUD | -0.01% | -0.01% | -0.18% | -0.10% | 0.13% | -0.27% | 0.23% | |
| JPY | -0.14% | -0.15% | -0.34% | -0.26% | -0.15% | -0.41% | 0.10% | |
| NZD | 0.28% | 0.26% | 0.09% | 0.16% | 0.27% | 0.40% | 0.48% | |
| CHF | -0.23% | -0.24% | -0.42% | -0.34% | -0.23% | -0.09% | -0.51% |
The heat map shows percentage changes of major currencies against each other. The base currency is picked from the left column, while the quote currency is picked from the top row. For example, if you pick the Euro from the left column and move along the horizontal line to the Japanese Yen, the percentage change displayed in the box will represent EUR (base)/JPY (quote).
Technical analysis: EUR/USD hits four-week high before falling back into 1.0800 region
EUR/USD’s bullish push on Thursday has the pair on pace to secure its seventh consecutive bullish close as long as Euro (EUR) bidders keep the pressure up, and the pair is finding intraday technical support from the 200-hour Simple Moving Average (SMA) near 1.0770. The immediate ceiling is parked at the 1.0900 handle with the pair supported from 1.0800.
Thursday’s bull run and subsequent slide has the EUR/USD facing a technical rejection from the 200-day SMA at 1.0827, and it’s a bidders ballgame to lose as the pair stumbles on the low side of recent consolidation between 1.0900 and 1.0850.
EUR/USD hourly chart
EUR/USD daily chart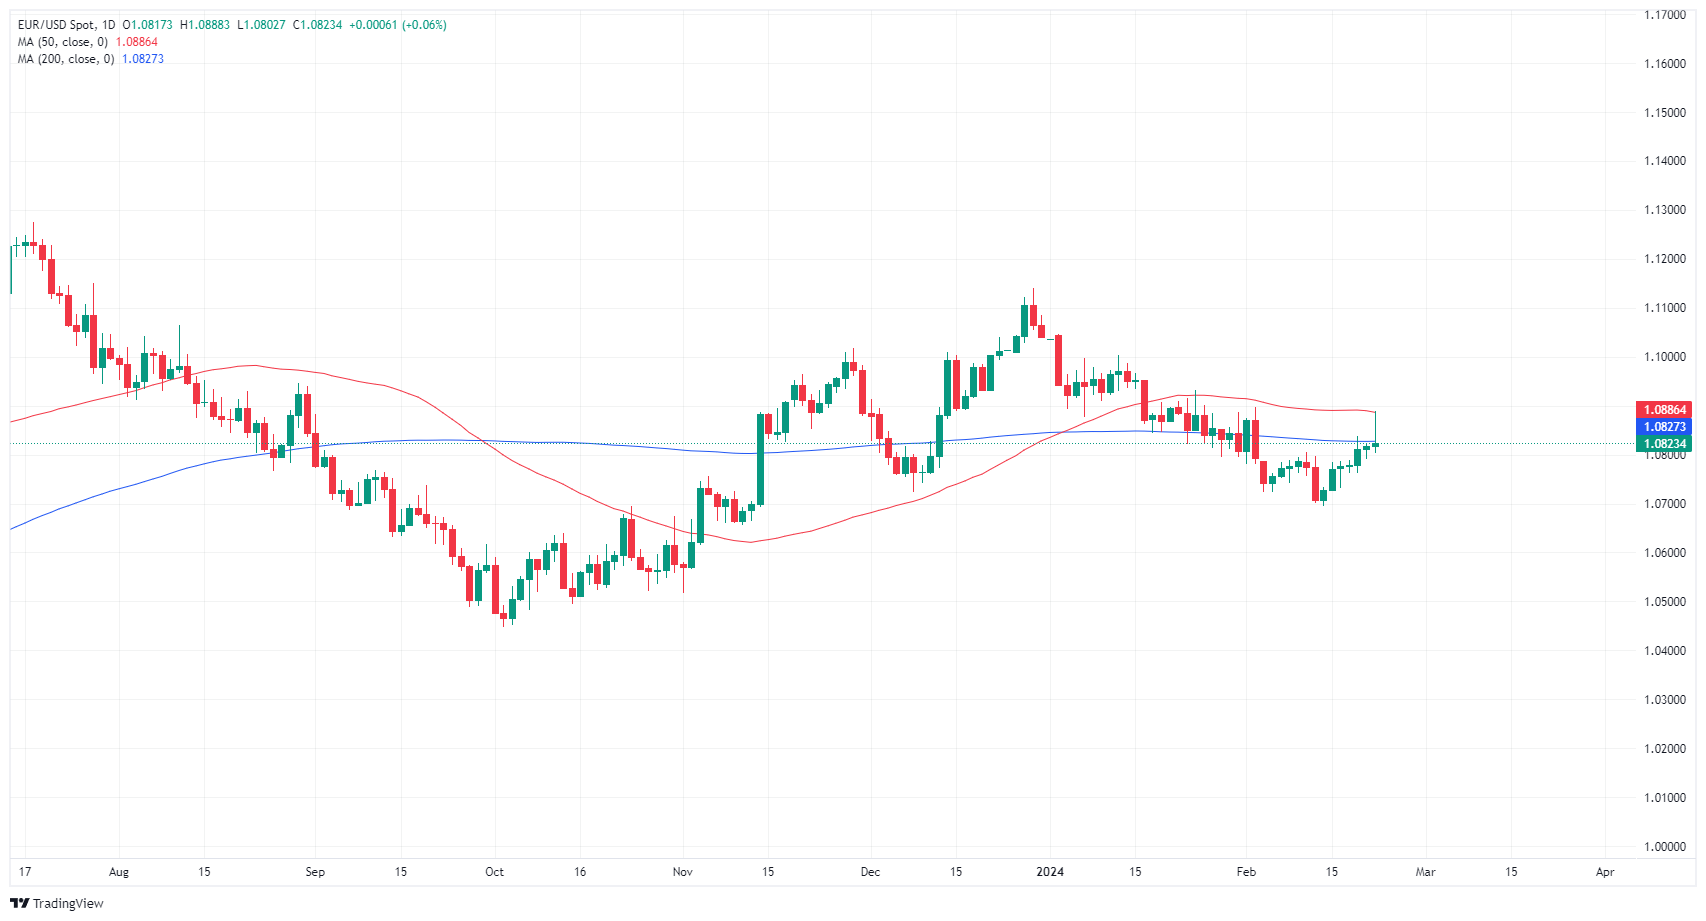
Euro FAQs
What is the Euro?
The Euro is the currency for the 20 European Union countries that belong to the Eurozone. It is the second most heavily traded currency in the world behind the US Dollar. In 2022, it accounted for 31% of all foreign exchange transactions, with an average daily turnover of over $2.2 trillion a day.
EUR/USD is the most heavily traded currency pair in the world, accounting for an estimated 30% off all transactions, followed by EUR/JPY (4%), EUR/GBP (3%) and EUR/AUD (2%).
What is the ECB and how does it impact the Euro?
The European Central Bank (ECB) in Frankfurt, Germany, is the reserve bank for the Eurozone. The ECB sets interest rates and manages monetary policy.
The ECB’s primary mandate is to maintain price stability, which means either controlling inflation or stimulating growth. Its primary tool is the raising or lowering of interest rates. Relatively high interest rates – or the expectation of higher rates – will usually benefit the Euro and vice versa.
The ECB Governing Council makes monetary policy decisions at meetings held eight times a year. Decisions are made by heads of the Eurozone national banks and six permanent members, including the President of the ECB, Christine Lagarde.
How does inflation data impact the value of the Euro?
Eurozone inflation data, measured by the Harmonized Index of Consumer Prices (HICP), is an important econometric for the Euro. If inflation rises more than expected, especially if above the ECB’s 2% target, it obliges the ECB to raise interest rates to bring it back under control.
Relatively high interest rates compared to its counterparts will usually benefit the Euro, as it makes the region more attractive as a place for global investors to park their money.
How does economic data influence the value of the Euro?
Data releases gauge the health of the economy and can impact on the Euro. Indicators such as GDP, Manufacturing and Services PMIs, employment, and consumer sentiment surveys can all influence the direction of the single currency.
A strong economy is good for the Euro. Not only does it attract more foreign investment but it may encourage the ECB to put up interest rates, which will directly strengthen the Euro. Otherwise, if economic data is weak, the Euro is likely to fall.
Economic data for the four largest economies in the euro area (Germany, France, Italy and Spain) are especially significant, as they account for 75% of the Eurozone’s economy.
How does the Trade Balance impact the Euro?
Another significant data release for the Euro is the Trade Balance. This indicator measures the difference between what a country earns from its exports and what it spends on imports over a given period.
If a country produces highly sought after exports then its currency will gain in value purely from the extra demand created from foreign buyers seeking to purchase these goods. Therefore, a positive net Trade Balance strengthens a currency and vice versa for a negative balance.
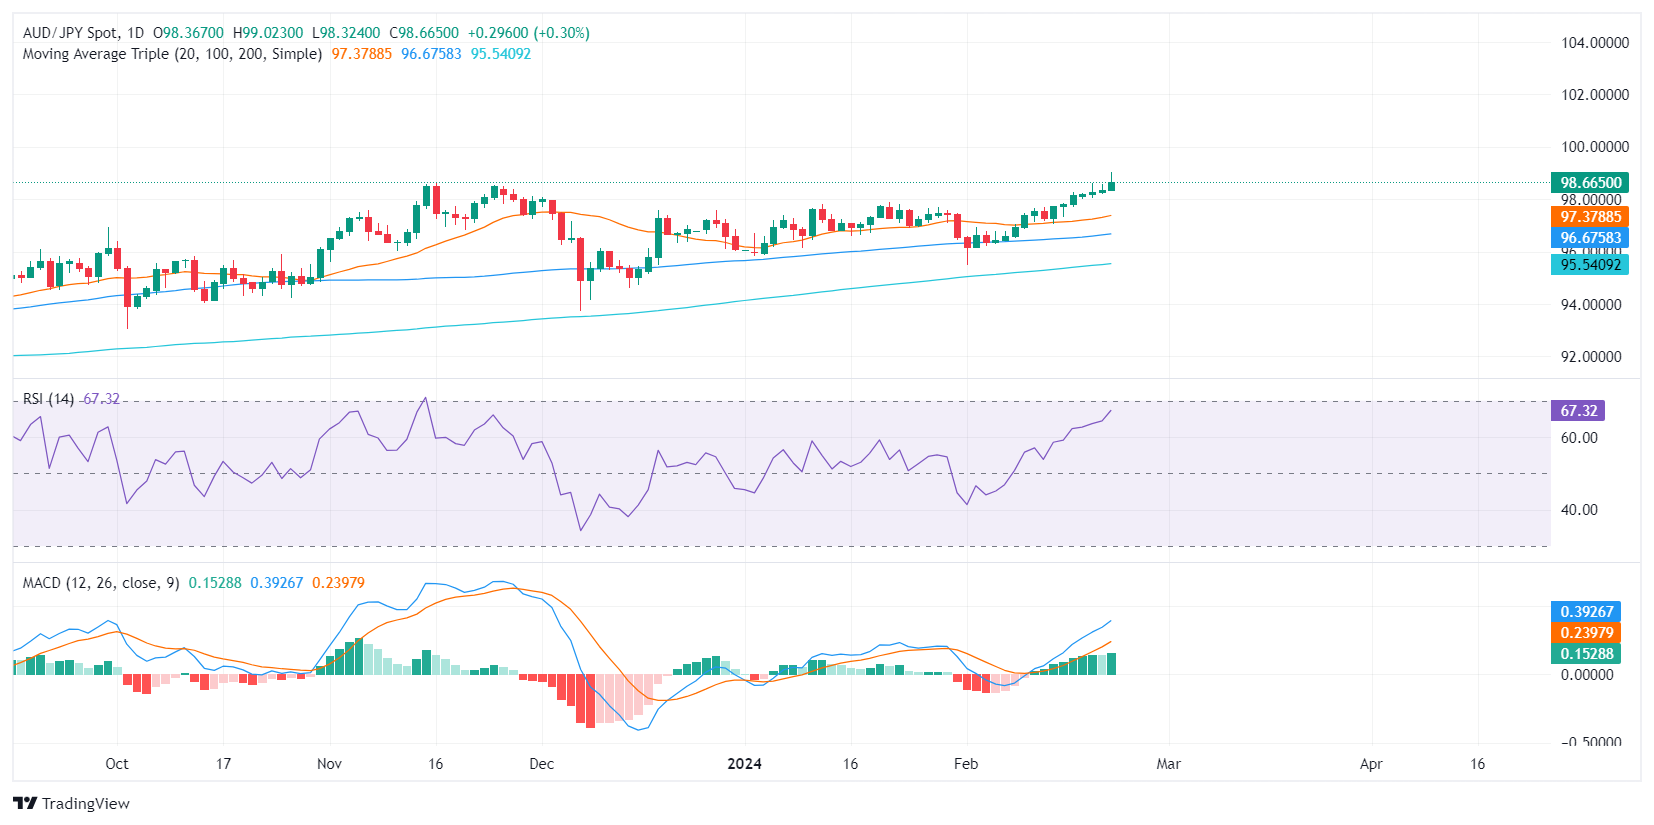
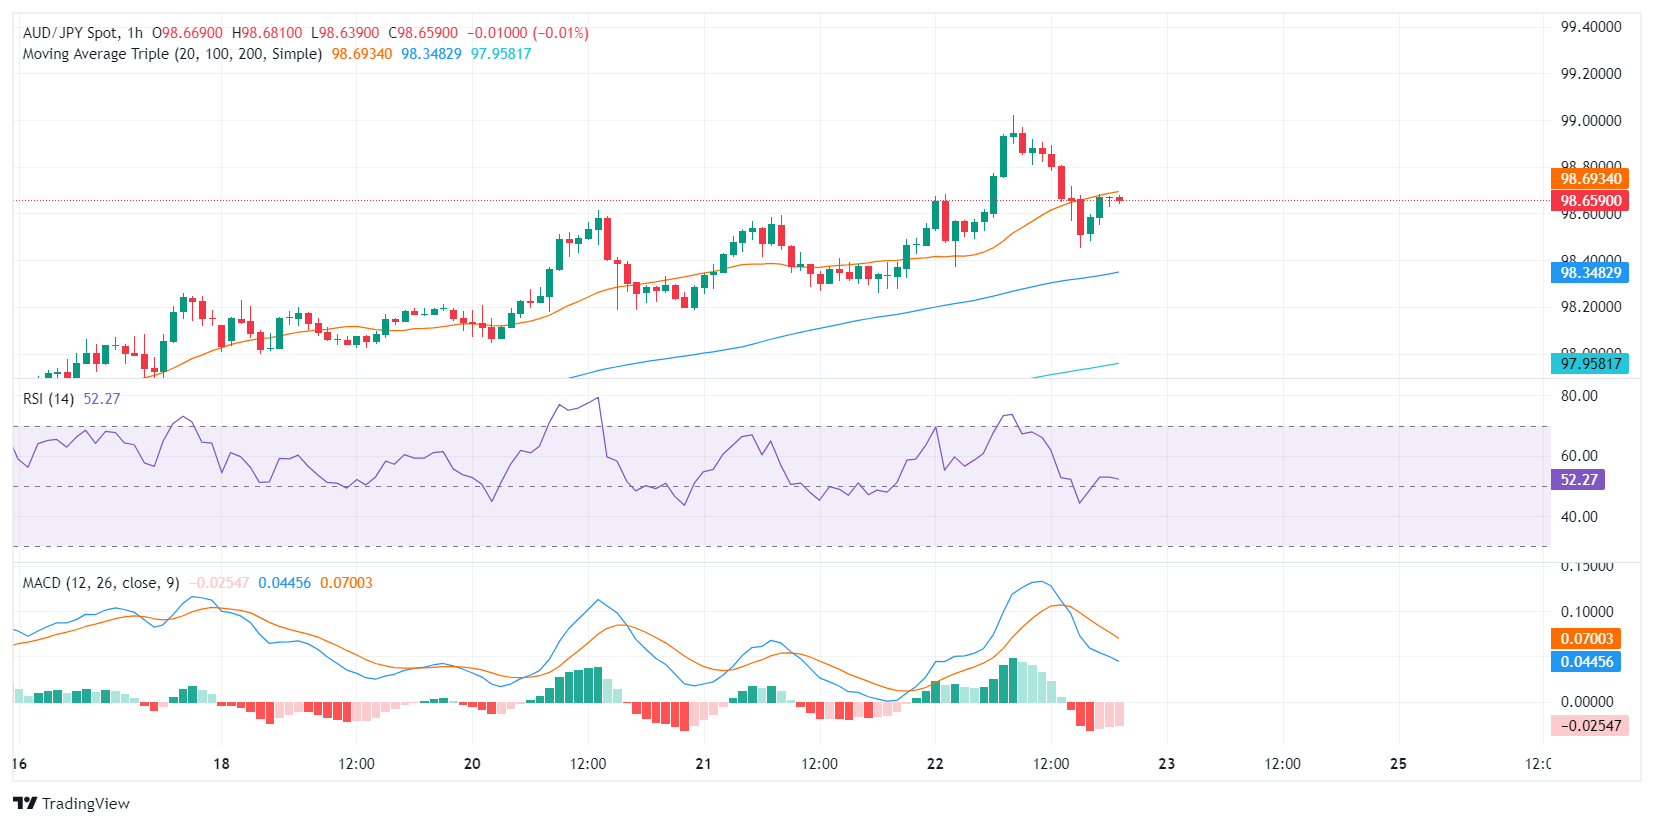
- The AUD/JPY is currently trading at 98.648, marking a 0.20% increase in Thursday's session.
- The daily RSI for AUD/JPY suggests bullish momentum with an upward trend, indicating buyers are in charge.
- Despite intraday market volatility, the hourly RSI stays in the positive territory, underlining buyer's dominance.
- AUD/JPY's position above its main moving averages confirms the bullish outlook.
The AUD/JPY pair was seen trading at 98.648, marking a mild gain of 0.20% and reaching its highest level since 2015. The pair predominantly exhibits a bullish bias, per the insights from the Relative Strength Index (RSI) and Moving Average Convergence Divergence (MACD) on the daily chart. The RSI portrays a progressive uptrend, indicating consistent strengthening over recent sessions. This is further confirmed by the ascending green bars on the MACD histogram, signifying a favorable momentum. Despite some intraday fluctuations, the pair remains firmly in the hands of the buyers, being well positioned above the key Simple Moving Averages (SMAs) of 20,100 and 200 days.
The hourly RSI values paint a similar picture, despite some intraday volatility seen in the market. Although the RSI didn't maintain its position within the positive territory at all hours, it did stay above the negative zone, reflecting an overall bullish intraday sentiment.
In conclusion, despite some short-term uncertainties, the general outlook for the AUD/JPY pair seems bullish given the positive RSI values and rising MACD histogram. Whether looking at the daily or hourly chart, the momentum remains firm for the buyers, supported by the pair's position well above its primary moving averages.
AUD/JPY daily chart
AUD/JPY hourly chart
- Gold prices moves marginally lower, trading within $2,020-$2,024, reflecting cautious investor sentiment.
- US employment strength and PMI figures support the Fed's inclination to maintain current rate levels.
- Rising US Treasury yields indicate market skepticism about immediate Fed rate cuts, a tailwind for the US Dollar.
Gold price prints modest losses on Thursday after economic data from the United States portrays the US economy as solid based on strong employment figures. Business activity continues to expand despite cooling off from an earlier hot streak, while the Minutes of the latest Federal Reserve’s (Fed) monetary policy meeting signaled that policymakers are in no rush to slash rates. The XAU/USD trades within the $2,020-$2,024 area, down by 0.06%.
XAU/USD traders remain entertained by a busy economic docket in the US. The US Bureau of Labor Statistics (BLS) revealed that unemployment claims for the latest week dropped compared to the one ending on February 10. At the same time, S&P Global revealed mixed February Flash PMIs, which remained in expansionary territory, fortifying the case that the US Federal Reserve (Fed) should keep rates higher for longer.
In the meantime, US Treasury bond yields are rising on the short end of the curve, a signal that investors remain skeptical that the Fed would cut rates in the March or May meetings. The latest Federal Open Market Committee (FOMC) minutes emphasized the US central bank is highly committed to tackling inflation even though economic risks are skewed to the downside. Policymakers emphasized that they would decide to ease policy via a data-dependent approach.
The FOMC Minutes showed Fed officials remain hesitant to cut rates too soon, while adding they did not see it appropriate to lower interest rates until they gained “greater confidence” in core inflation moving sustainably toward 2%. Even though policymakers acknowledged that the risks of achieving both mandates is more balanced, they remained “highly attentive” to inflationary risks, even though economic risks are skewed to the downside.
Daily digest market movers: Gold retraces as traders see the Fed holding rates higher
- US Initial Jobless Claims for the week ending February 17 fell by 12,000 to 201,000, coming in under the anticipated 218,000 and the prior week's figure of 213,000. This drop indicates a continued tightness in the labor market, which is generally interpreted as a potential factor that could drive inflation upward.
- Business activity in the US moderated in February, as reported by S&P Global. Both the Services and Manufacturing Purchasing Managers Index (PMI) remained in the expansionary zone, indicating growth. However, the Services PMI recorded a figure of 51.3, falling short of both expectations and January's results, while the Manufacturing PMI rose to 51.5, surpassing forecasts and the previous month's 50.7. Consequently, the Composite Index, which aggregates the performance of both sectors, declined slightly from 52 to 51.4.
- The CME FedWatch Tool sees traders expect the first 25 bps rate cut by the Fed in June 2024.
- Investors are pricing in 95 basis points of easing throughout 2024.
- The US Dollar Index, tracking the performance of the US Dollar against a basket of six major currencies, is currently trading at around 103.98, down 0.01%.
- The Federal Reserve Vice-Chair Philip Jefferson said that he’s looking to a broad set of indicators, before deciding to cut interest rates. Despite disregarding giving a timetable of when the US central bank would begin to ease monetary conditions, he remains optimistic about the Fed bringing inflation toward its 2% target.
Technical analysis: Gold trades within familiar levels, capped by the 50 and 100-day SMA
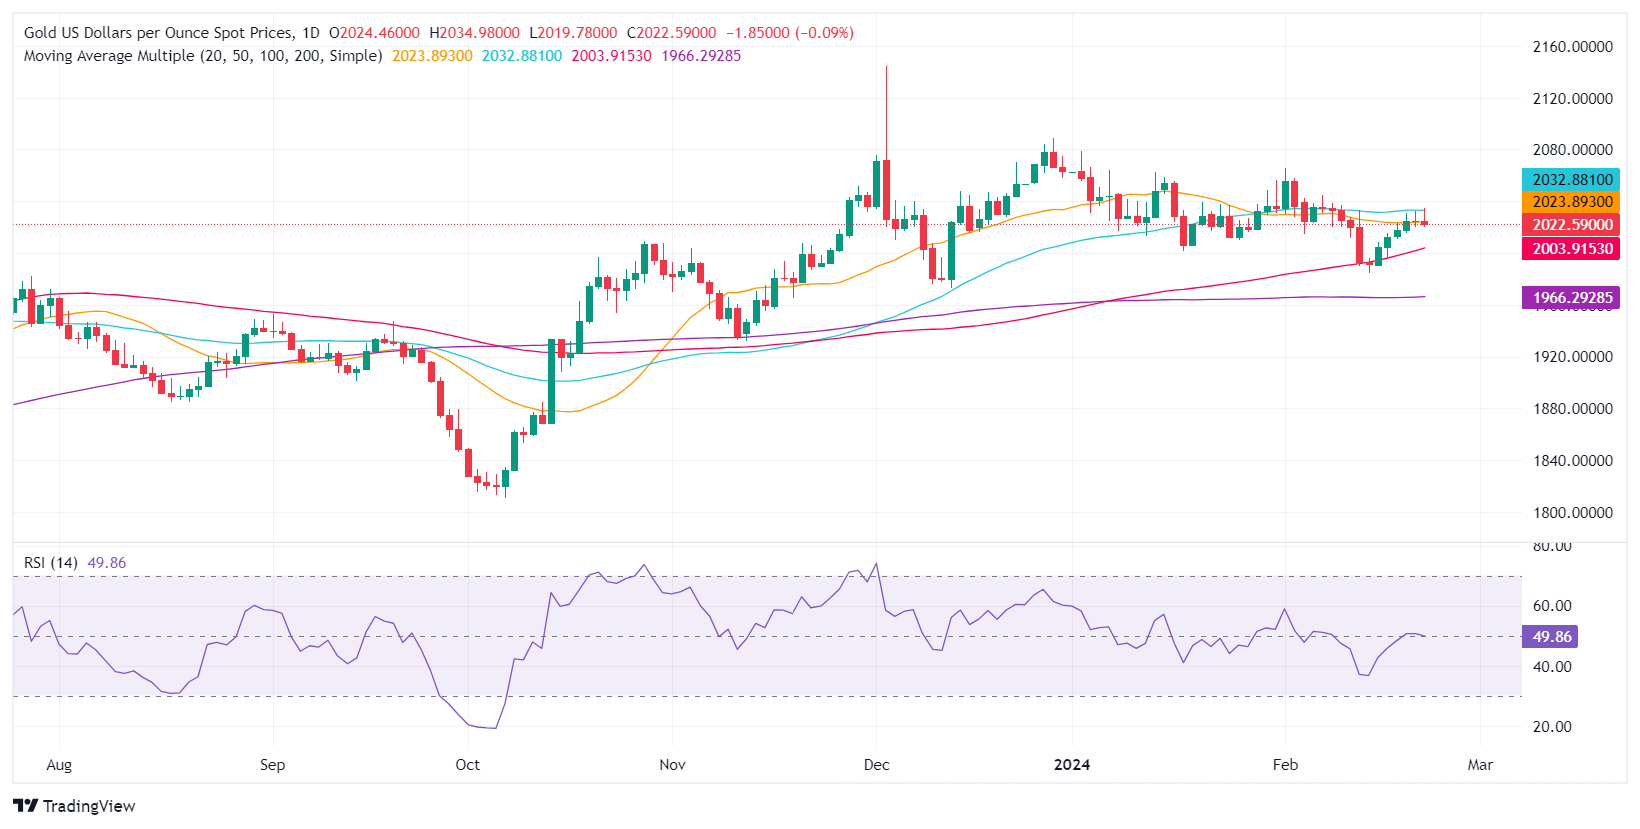
Gold is trading sideways but is slightly tilted to the downside, capped by the 50-day Simple Moving Average (SMA) at $2,033.27. The non-yielding metal's failure to breach the 50-day SMA opened the door for a pullback, which could be extended toward the October 27 daily high-turned-support at $2,009.42. A breach of the latter will expose the 100-day SMA at $2,002.05. The next stop would be the December 13 low at $1,973.13, followed by the 200-day SMA at $1,965.86.
On the flip side, if buyers lift the XAU/USD above the 50-day SMA, look for a challenge of the $2,050.00 figure. Upside risks lie at $2,065.60, the February 1 high.
Gold FAQs
Why do people invest in Gold?
Gold has played a key role in human’s history as it has been widely used as a store of value and medium of exchange. Currently, apart from its shine and usage for jewelry, the precious metal is widely seen as a safe-haven asset, meaning that it is considered a good investment during turbulent times. Gold is also widely seen as a hedge against inflation and against depreciating currencies as it doesn’t rely on any specific issuer or government.
Who buys the most Gold?
Central banks are the biggest Gold holders. In their aim to support their currencies in turbulent times, central banks tend to diversify their reserves and buy Gold to improve the perceived strength of the economy and the currency. High Gold reserves can be a source of trust for a country’s solvency. Central banks added 1,136 tonnes of Gold worth around $70 billion to their reserves in 2022, according to data from the World Gold Council. This is the highest yearly purchase since records began. Central banks from emerging economies such as China, India and Turkey are quickly increasing their Gold reserves.
How is Gold correlated with other assets?
Gold has an inverse correlation with the US Dollar and US Treasuries, which are both major reserve and safe-haven assets. When the Dollar depreciates, Gold tends to rise, enabling investors and central banks to diversify their assets in turbulent times. Gold is also inversely correlated with risk assets. A rally in the stock market tends to weaken Gold price, while sell-offs in riskier markets tend to favor the precious metal.
What does the price of Gold depend on?
The price can move due to a wide range of factors. Geopolitical instability or fears of a deep recession can quickly make Gold price escalate due to its safe-haven status. As a yield-less asset, Gold tends to rise with lower interest rates, while higher cost of money usually weighs down on the yellow metal. Still, most moves depend on how the US Dollar (USD) behaves as the asset is priced in dollars (XAU/USD). A strong Dollar tends to keep the price of Gold controlled, whereas a weaker Dollar is likely to push Gold prices up.
- Crude Oil markets on the rebound on Thursday after supplies ease.
- Distillate inventories showed a surprise drop, fueling a bounce.
- Geopolitical tensions are mixed, with a possible Gaza ceasefire on the table.
West Texas Intermediate (WTI) US Crude Oil rallied on Thursday as energy markets find relief from Energy Information Administration (EIA) barrel counts came in just below forecasts, and eased back from a previous 12 million-plus barrel supply count.
EIA Distillate Inventories declined a little over 4 million barrels, sparking a relief rally in Crude Oil, and the EIA’s Crude Oil Inventories rose 3.514 million barrels for the week ended February 16 compared to the forecast 3.75 million barrels. The below-forecast barrel count sent prices higher as barrel traders shrug off the previous EIA barrel counts, as well as the American Petroleum Insititute’s (API) Weekly Crude Oil Stocks count of 7.168 million released on Wednesday.
According to the EIA, overall US gasoline production averaged 9 million barrels per day over the week, down slightly from the previous week’s 9.2 million bpd.
Geopolitical tensions eased slightly early Thursday as there are signs that a hostage exchange and possible ceasefire negotiation is still on the table in the ongoing Gaza conflict between Israel and Palestinian Hamas. Tensions rose immediately after when Iranian-backed Houthi rebels in Yemen declared that they will continue to target civilian vessels in the Red Sea, and intend to step up the rate of attacks.
Yemeni Houthis have declared that they expanded the scope of ships they plan to attack, and are now including American and UK-owned vessels that they find crossing the Suez Canal.
WTI technical outlook
US Crude Oil rallied over 2% bottom-to-top on Thursday, lifting from above the $77.00 handle to clear $78.00, and WTI is poised to reclaim $79.00. Thursday’s rally saw a clean bounce from the 200-hour Simple Moving Average (SMA) near $77.35.
WTI has risen to its highest bids since late January, and US Crude Oil has closed higher or flat for all but two of the last fourteen consecutive trading days.
Thursday’s rise in barrel bids also sees WTI set for a bullish extension above the 200-day SMA near $77.60, and the nearest swing high sits at January’s late peak at $79.20.
WTI hourly chart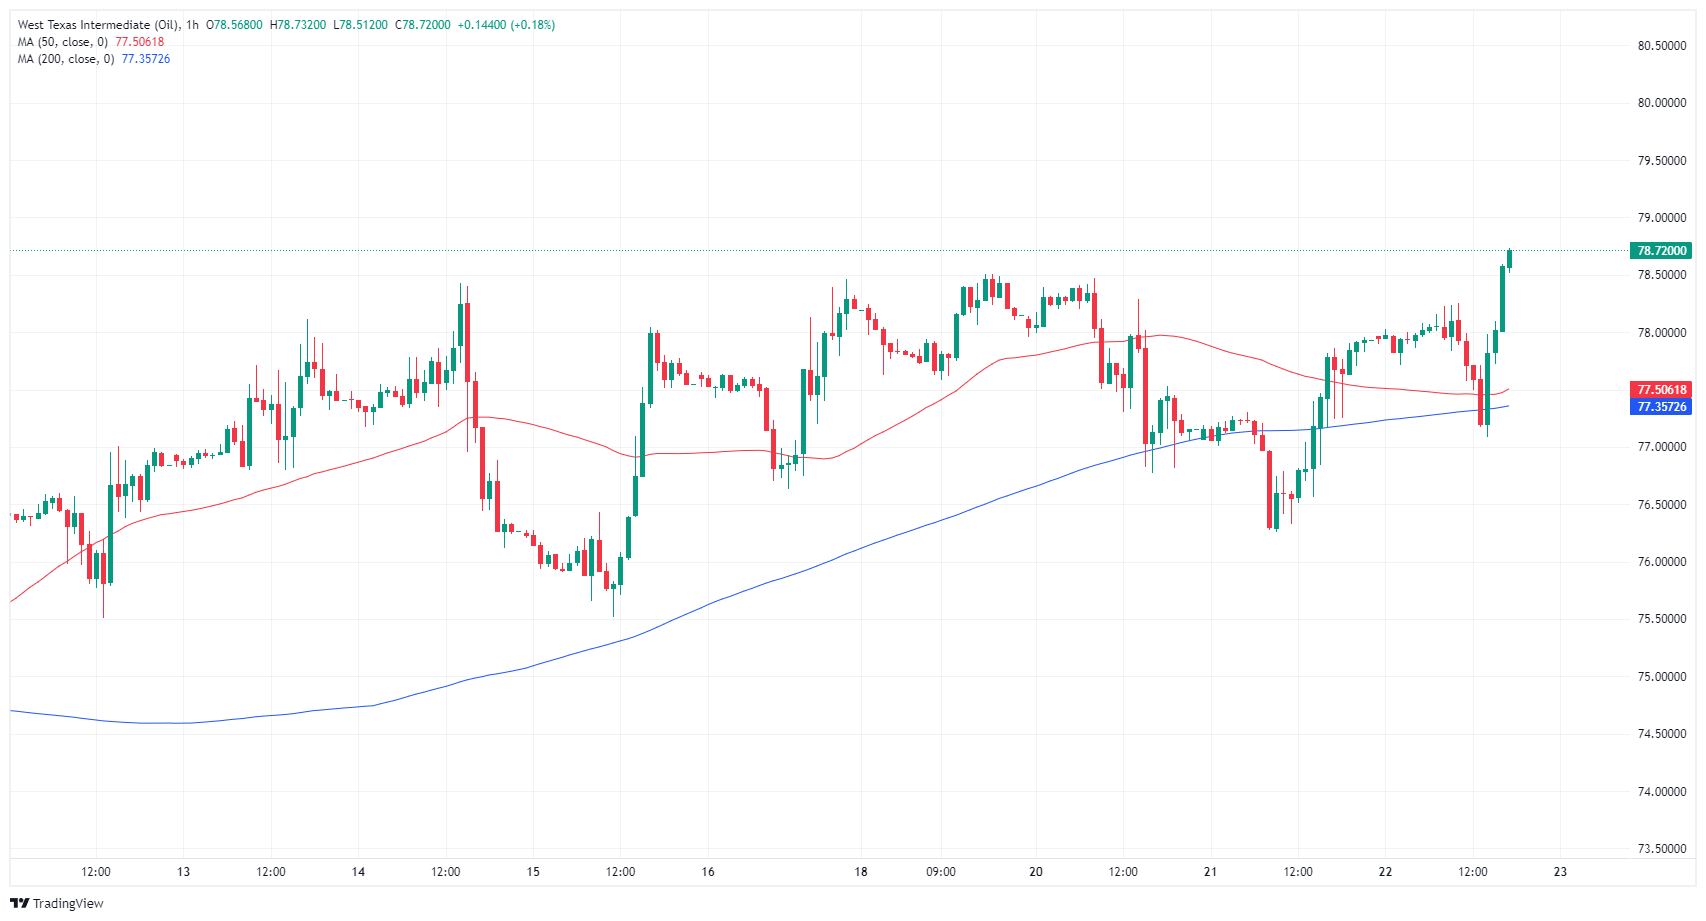
WTI daily chart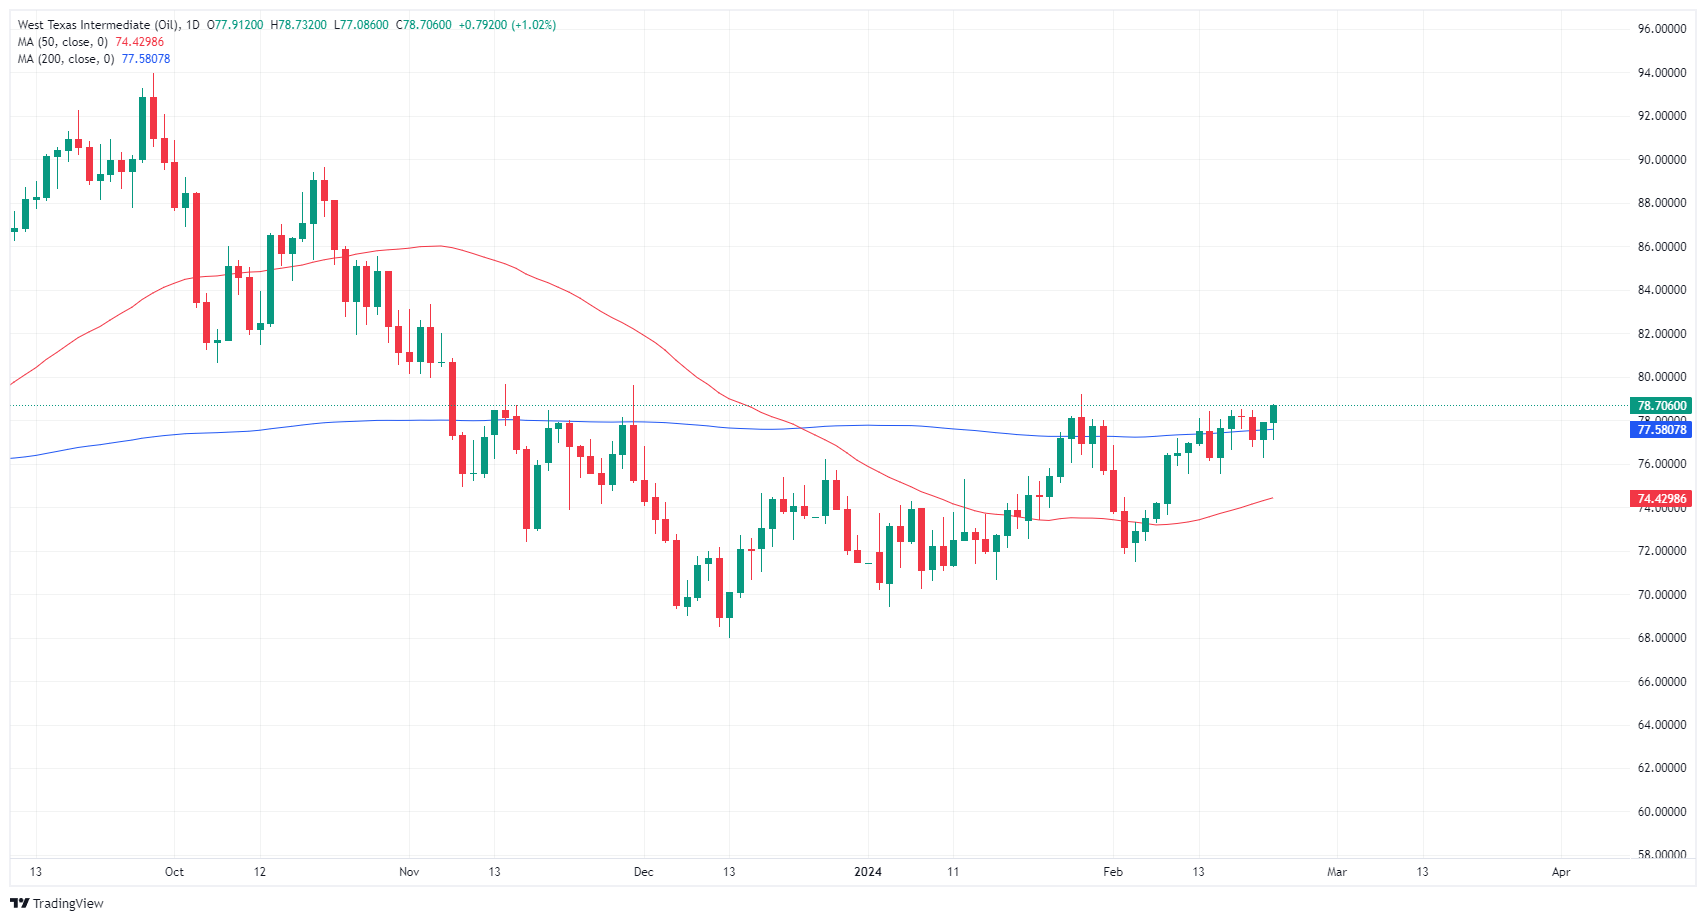
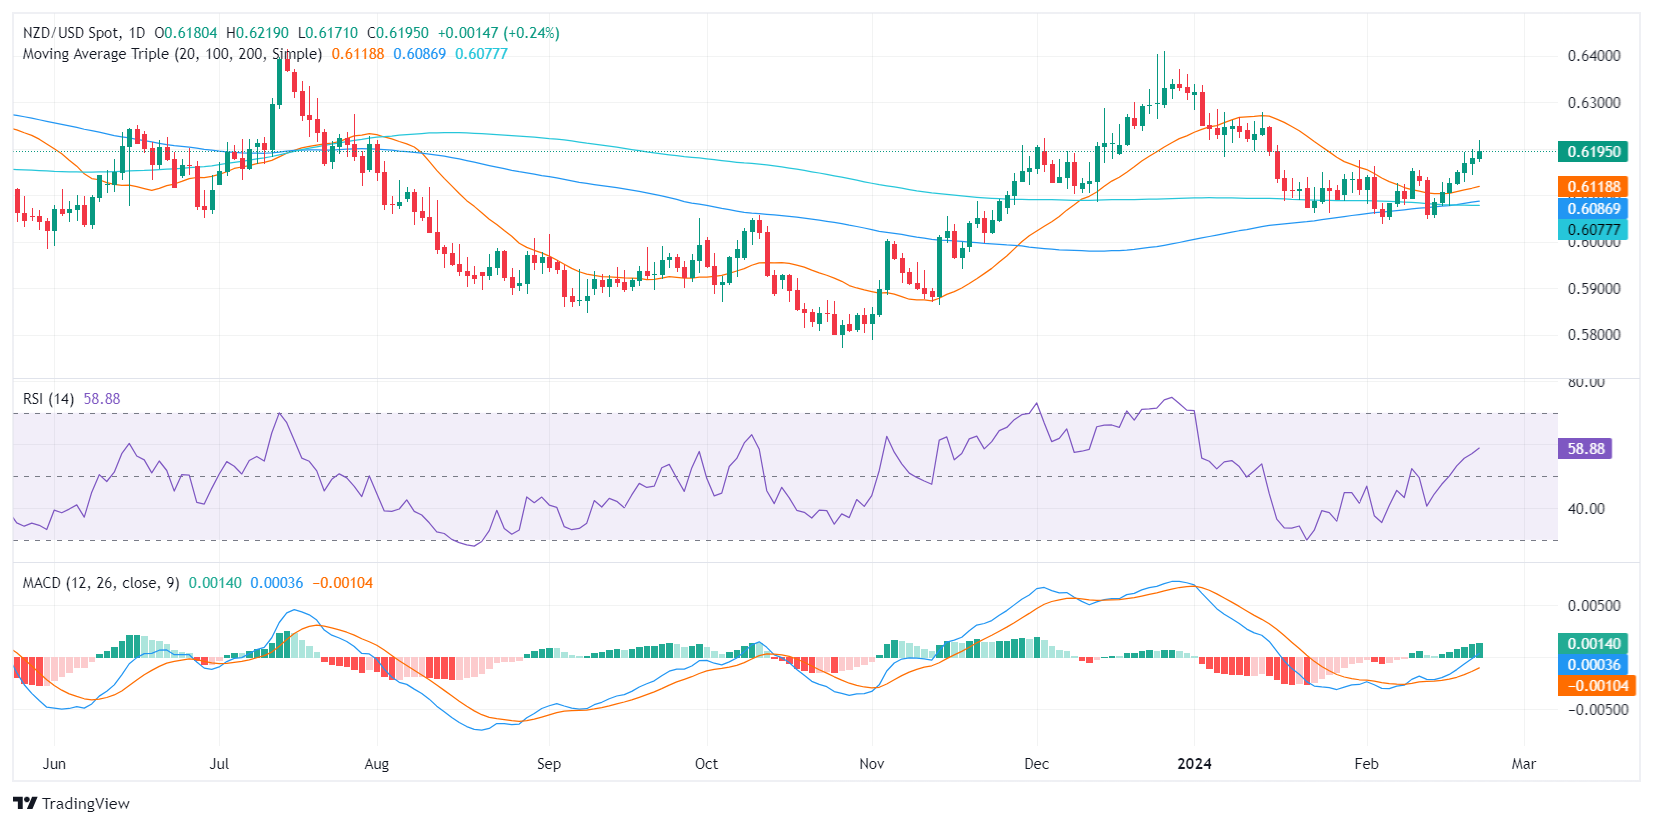
- The NZD/USD trades positively at 0.6193 with a 0.20% gain in Thursday's session.
- The US S&P Global PMIs from February came in mixed.
- Weekly Initial Jobless Claims from the US came in positive.
- If markets continue to bet on a more aggressive Fed the pair’s upside could be limited.
In Thursday's trading, the NZD/USD pair has exhibited minor advancements, currently trading at the level of 0.6193, with a slight increase.
On the data front, the US S&P Global Composite PMI declined to 51.4 in February's flash estimate from 52 in January, showing that the business activity in the US private sector continued to expand, albeit at a softer pace than in January. The Manufacturing PMI improved to 51.5 from 50.7 in the same period, while the S&P Global Services PMI edged lower to 51.3 from 52.5. In addition, Initial Jobless Claims from the week ending in February 16, came in lower than expected, further echoing the resilience of the US economy.
Despite the losses, the Greenback’s losses may be limited as incoming data may reaffirm the Federal Reserve’s stance to hold rates steady and delay the start of the easing cycle the economy doesn't show signs of cooling down. As for now, markets have practically given up on the odds of a cut in March and bet on low possibilities of the easing to start in May and instead, they push the first cut to June.
NZD/USD technical analysis
The daily Relative Strength Index (RSI) currently occupies a position within the positive territory, having gradually ascended from the negative area over consecutive trading sessions. A steadily increasing RSI implies that we may be experiencing a strengthening buyer dominance within the market.
Furthermore, the Moving Average Convergence Divergence (MACD) histogram is signaling bullish momentum from a series of rising green bars. Taken together, these metrics suggest an increased buying pressure for the NZD/USD pair over current trading.
NZD/USD daily chart
- Mexican Peso drops 0.5% following Mexico's cooler inflation and stronger economic growth indicators.
- Banxico's January minutes would be scrutinized by traders on speculation of an imminent policy easing.
- Fed's cautious stance on rate cuts contrasts with Mexico's potential monetary easing, favoring USD/MXN upside.
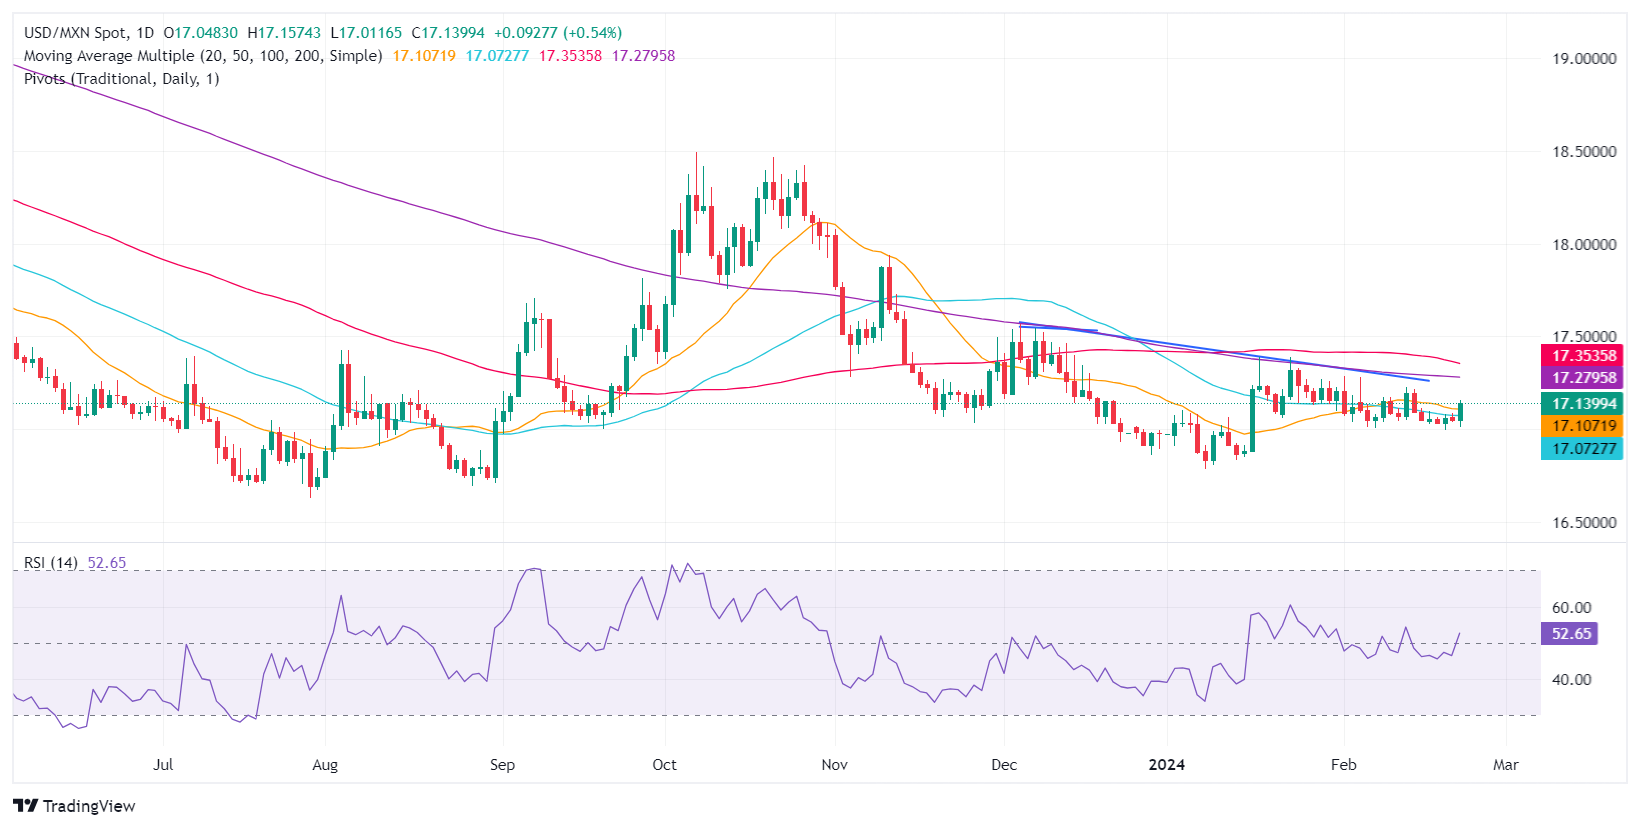
The Mexican Peso trips down and falls against the US Dollar in early trading during the North American session on Thursday. Mexico’s economic docket featured an inflation report, the Gross Domestic Product (GDP), and the release of the January meeting minutes of the Bank of Mexico (Banxico). The USD/MXN exchanges hands at 17.12, up 0.5%.
Mexico’s National Statistics Agency (INEGI) revealed that inflation cooled down in the first half of February as the Consumer Price Index (CPI) plunged in monthly figures, which exacerbated a slowdown in yearly numbers. The same report depicted that Core inflation increased less than estimates, while other data revealed the economy grew a tick higher than expected, portraying a solid economic outlook.
The surprise on inflation sponsored the USD/MXN leg up as Banxico’s rate cut bets increased. Some officials expressed that Mexico’s Central Bank could begin to ease policy toward the March meeting. Recently, Banxico revealed its monetary policy minutes, which would be greatly scrutinized by traders.
Across the border, the Minutes of the US Federal Reserve (Fed) meeting showed that policymakers remain hesitant to cut rates amidst fears of a second round of inflation. Recently, the US Bureau of Labor Statistics (BLS) revealed that unemployment claims rose below estimates, while business activity, despite moderating, expanded.
Daily digest market movers: Mexican Peso collapses to six-day lows as inflation cools down
- Mexico’s CPI came at -0.10% MoM, below the previous reading and estimates of 0.15%, while annual-based inflation dipped to 4.45% from 4.9%. The Core CPI was 0.24%, below the previous reading and forecasts of 0.28%, while annually-based cooled down from 4.78% to 4.63%, beneath the consensus.
- The economy in Mexico grew above forecasts but is losing its pace as the Gross Domestic Product (GDP) expanded in the fourth quarter by 0.1% QoQ, but lower than Q3’s 1.1% expansion. Annually based, GDP exceeded estimates of 2.4% to hit 2.5% from the previous 3.3%.
- Mexico’s Retail Sales dropped -0.9% MoM, below estimates of 0.2%. Yearly figures plummeted -0.2% vs. a 2.5% forecast.
- The Mexican currency could depreciate further if the Mexican government fails to resolve the steel and aluminum dispute with the United States. US Trade Representative Katherine Tai warned the US could reimpose tariffs on the commodities.
- The Conference Board (CB) revealed that its Leading Economic Index (LEI), no longer signals an upcoming recession in the US, reported on Tuesday.
- Recently, Richmond Fed President Thomas Barkin said the latest inflation reports were “less good,” adding the US has “a ways to go” to achieve a soft landing.
- US Initial Jobless Claims for the week ending February 17 decreased by 12K to 201K, below estimates of 218K.
- According to the S&P Global report, business activity in the United States moderated in February. The Services and Manufacturing Purchasing Managers Indices (PMI) both stayed in expansionary territory, indicating growth. Consequently, the Composite Index experienced a slight decline, moving from 52 to 51.4.
- US economic data related to price pressures should greatly influence Federal Reserve officials. Although opening the door to easing policy, Fed officials have expressed numerous times that they will not rush rate cuts.
- Federal Reserve Governor Phil Jefferson commented that he sees progress on inflation, adding that rate cuts are tied to a broad set of data.
- Market players are expecting the first rate cut by the Federal Reserve at the June monetary policy meeting as they have trimmed odds for March and May.
Technical analysis: Mexican Peso struggles to keep the rally, dives to new weekly low
On Wednesday, I wrote, “The USD/MXN remains in consolidation, at around 17.05, awaiting a fresh catalyst.” Today’s data finally triggered a break of the top of the 17.05-17.10 range as buyers regained the 50-day Simple Moving Average (SMA) at 17.07, which opened the door to reclaim 17.10. If the pair manages to rally past the psychological 17.20 figure, the 200-day SMA would be up for grabs at 17.27. Once cleared, the next stop would be the confluence of the 100-day SMA and the January 17 high near 17.36-17.38.
On the other hand, if sellers step in and cap USD/MXN’s upside, they need to push prices below the 17.00 figure. Once cleared, the next support would be the current year-to-date (YTD) low of 16.78, followed by the 2023 low of 16.62.
USD/MXN Price Action – Daily Chart
Mexican Peso FAQs
What key factors drive the Mexican Peso?
The Mexican Peso (MXN) is the most traded currency among its Latin American peers. Its value is broadly determined by the performance of the Mexican economy, the country’s central bank’s policy, the amount of foreign investment in the country and even the levels of remittances sent by Mexicans who live abroad, particularly in the United States. Geopolitical trends can also move MXN: for example, the process of nearshoring – or the decision by some firms to relocate manufacturing capacity and supply chains closer to their home countries – is also seen as a catalyst for the Mexican currency as the country is considered a key manufacturing hub in the American continent. Another catalyst for MXN is Oil prices as Mexico is a key exporter of the commodity.
How do decisions of the Banxico impact the Mexican Peso?
The main objective of Mexico’s central bank, also known as Banxico, is to maintain inflation at low and stable levels (at or close to its target of 3%, the midpoint in a tolerance band of between 2% and 4%). To this end, the bank sets an appropriate level of interest rates. When inflation is too high, Banxico will attempt to tame it by raising interest rates, making it more expensive for households and businesses to borrow money, thus cooling demand and the overall economy. Higher interest rates are generally positive for the Mexican Peso (MXN) as they lead to higher yields, making the country a more attractive place for investors. On the contrary, lower interest rates tend to weaken MXN.
How does economic data influence the value of the Mexican Peso?
Macroeconomic data releases are key to assess the state of the economy and can have an impact on the Mexican Peso (MXN) valuation. A strong Mexican economy, based on high economic growth, low unemployment and high confidence is good for MXN. Not only does it attract more foreign investment but it may encourage the Bank of Mexico (Banxico) to increase interest rates, particularly if this strength comes together with elevated inflation. However, if economic data is weak, MXN is likely to depreciate.
How does broader risk sentiment impact the Mexican Peso?
As an emerging-market currency, the Mexican Peso (MXN) tends to strive during risk-on periods, or when investors perceive that broader market risks are low and thus are eager to engage with investments that carry a higher risk. Conversely, MXN tends to weaken at times of market turbulence or economic uncertainty as investors tend to sell higher-risk assets and flee to the more-stable safe havens.
- Markets churned on Thursday after mixed US PMI figures.
- Canada’s Retail Sales also spread.
- Friday to wrap up the week with Fed’s Monetary Policy Report.
USD/CAD drifted into the low end early Thursday as markets geared up for the day’s US Purchasing Managers Index (PMI) print. Mixed results left markets a little less confident, and the pair traveled notable ground to wind up close to flat on the day.
Canada saw a similar mixed result in its Retail Sales figures, with sales volumes excluding automobiles coming in below expectations. Next up on the economic calendar will be Friday’s Monetary Policy Report from the Federal Reserve (Fed), but little of note is expected within the report itself following the Fed’s latest meeting Minutes released on Wednesday.
Daily digest market movers: USD/CAD churns and burns as data prints spread
- Canadian Retail Sales rose 0.9% in December compared to the forecast of 0.8%, rebounding from the previous month’s 0.0%.
- Canadian Retail Sales excluding Autos also rose but by a more sedate 0.6%, missing the 0.7% forecast but recovering from the previous -0.4%.
- US Initial Jobless Claims for the week ended February 16 declined to 201K, coming in well below the 4-week average of 215.25K and even further away from the forecast of 218K. The previous week saw 213K (revised from 212K) new jobless benefits applicants.
- The S&P Global PMIs for February in the US were mixed with Services underperforming but the Manufacturing sector gaining further ground as producers look hopeful they will avoid a recession.
- The Services component printed at 51.3 MoM versus the forecast 52.0, falling back from the previous month’s 52.5, while the Manufacturing component rose to 51.5 compared to the forecast 50.5 and January’s 50.7.
- US Existing Home Sales also rose in January with Existing Home Sales Change climbing 3.1% MoM, recovering from the previous -0.8% (revised up from -1.0%).
- Read More: US S&P Global Manufacturing PMI improves to 51.5
Canadian Dollar price today
The table below shows the percentage change of Canadian Dollar (CAD) against listed major currencies today. Canadian Dollar was the strongest against the Swiss Franc.
| USD | EUR | GBP | CAD | AUD | JPY | NZD | CHF | |
| USD | 0.05% | 0.00% | -0.02% | 0.13% | 0.11% | -0.09% | 0.24% | |
| EUR | -0.03% | -0.05% | -0.08% | 0.09% | 0.09% | -0.12% | 0.20% | |
| GBP | 0.00% | 0.05% | -0.02% | 0.13% | 0.12% | -0.07% | 0.24% | |
| CAD | 0.00% | 0.07% | 0.02% | 0.15% | 0.16% | -0.04% | 0.28% | |
| AUD | -0.11% | -0.08% | -0.12% | -0.14% | -0.01% | -0.19% | 0.13% | |
| JPY | -0.11% | -0.08% | -0.11% | -0.14% | -0.02% | -0.20% | 0.14% | |
| NZD | 0.09% | 0.12% | 0.07% | 0.04% | 0.20% | 0.20% | 0.32% | |
| CHF | -0.25% | -0.21% | -0.26% | -0.28% | -0.13% | -0.13% | -0.33% |
The heat map shows percentage changes of major currencies against each other. The base currency is picked from the left column, while the quote currency is picked from the top row. For example, if you pick the Euro from the left column and move along the horizontal line to the Japanese Yen, the percentage change displayed in the box will represent EUR (base)/JPY (quote).
Technical analysis: USD/CAD falls back into near-term lows but then recovers to 1.3500
USD/CAD backslid into a prime buying area early Thursday, settling into 1.3440 before staging a recovery. The pair knocked back into 1.3510 as it remains lashed firmly to the 1.3500 handle in the near term. The day’s dip into a heavy supply zone also saw an intraday Fair Value Gap (FFVG) form between 1.3480 and 1.3455, which got filled almost immediately and set the stage for further gains provided the market’s change of character holds through the end of the week.
With Thursday’s down-and-up action on the USD/CAD, the pair is catching firm technical support from the 200-day Simple Moving Average (SMA) at 1.3478. A pattern of higher highs is dragging the pair further into bull country as the USD/CAD recovers from December’s lows at 1.3177.
USD/CAD hourly chart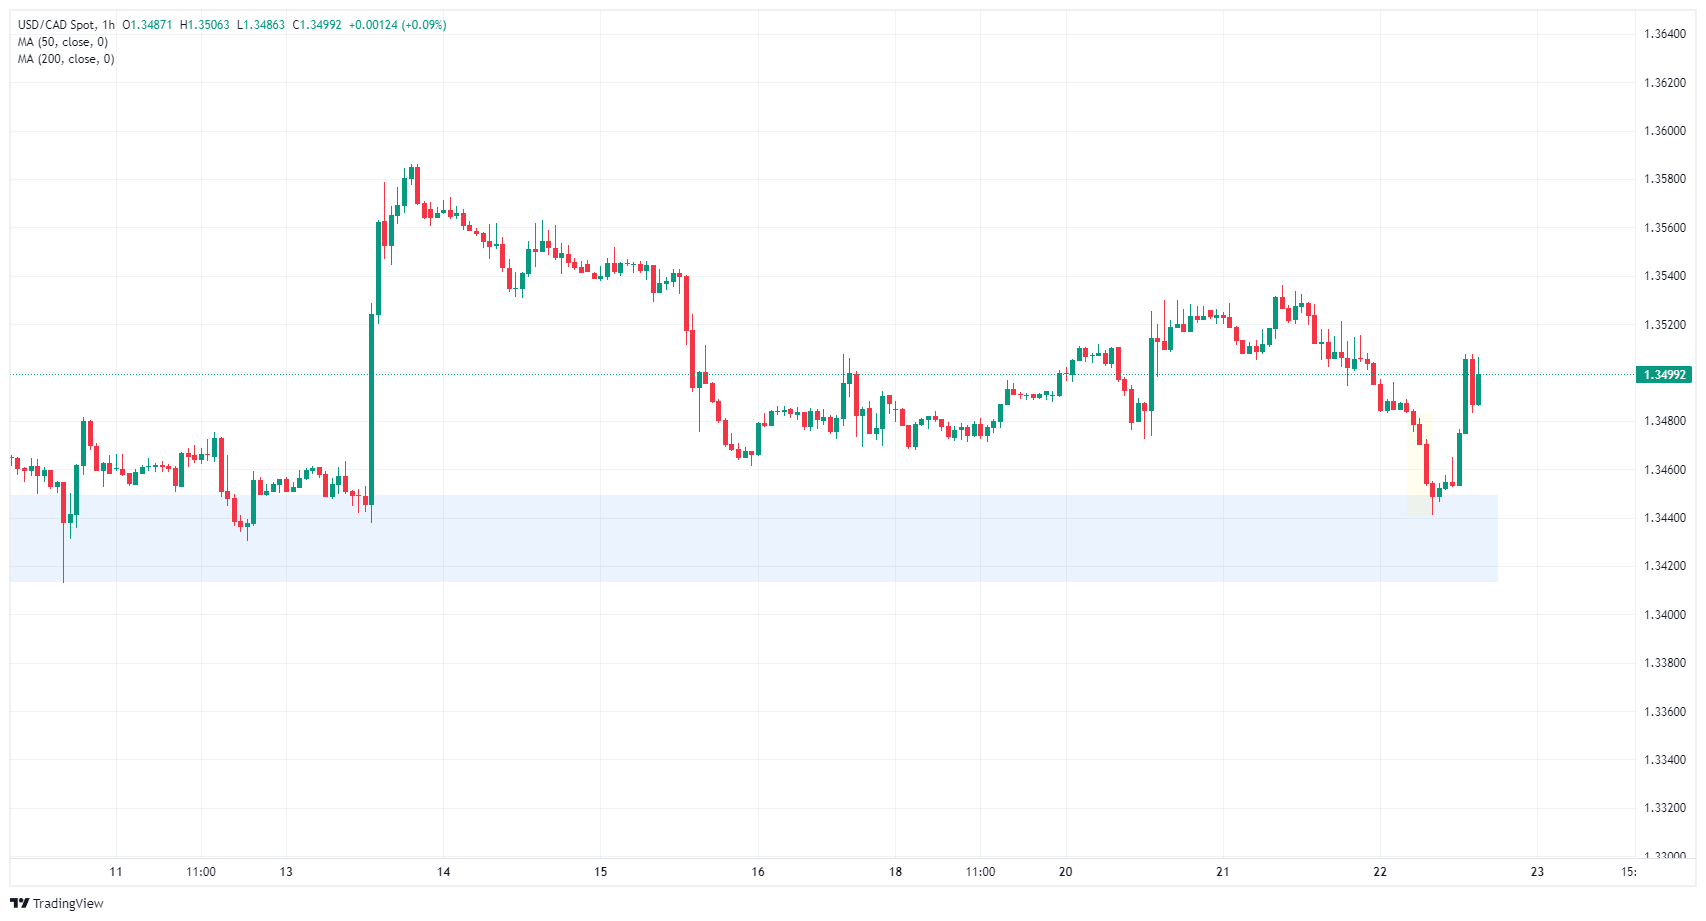
USD/CAD daily chart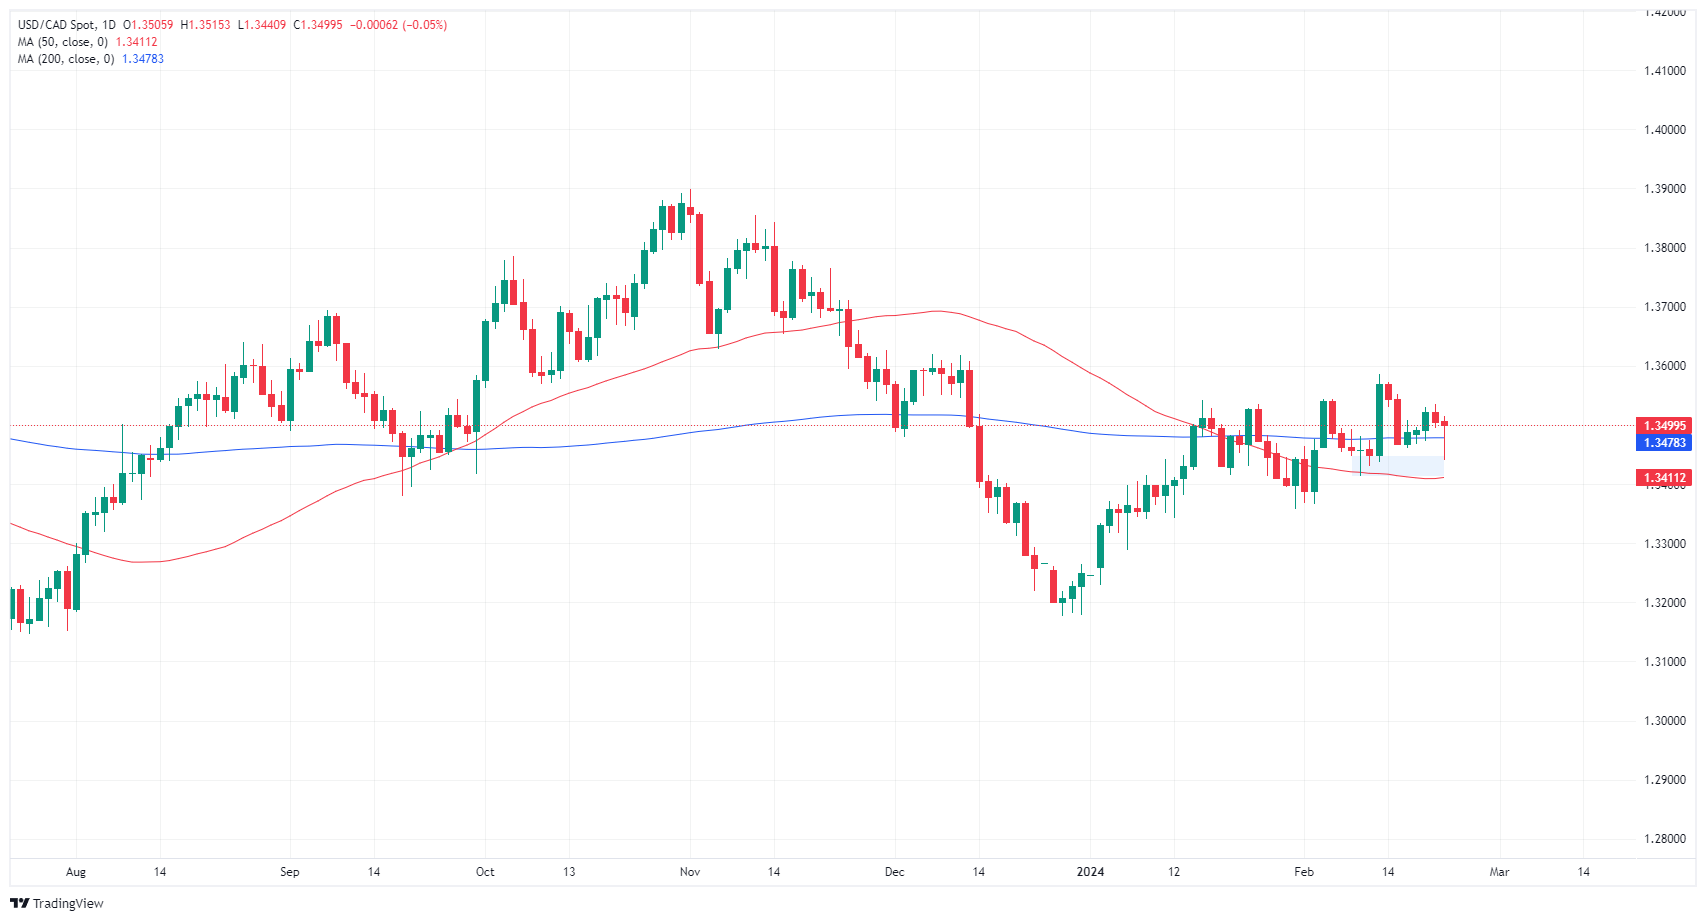
Canadian Dollar FAQs
What key factors drive the Canadian Dollar?
The key factors driving the Canadian Dollar (CAD) are the level of interest rates set by the Bank of Canada (BoC), the price of Oil, Canada’s largest export, the health of its economy, inflation and the Trade Balance, which is the difference between the value of Canada’s exports versus its imports. Other factors include market sentiment – whether investors are taking on more risky assets (risk-on) or seeking safe-havens (risk-off) – with risk-on being CAD-positive. As its largest trading partner, the health of the US economy is also a key factor influencing the Canadian Dollar.
How do the decisions of the Bank of Canada impact the Canadian Dollar?
The Bank of Canada (BoC) has a significant influence on the Canadian Dollar by setting the level of interest rates that banks can lend to one another. This influences the level of interest rates for everyone. The main goal of the BoC is to maintain inflation at 1-3% by adjusting interest rates up or down. Relatively higher interest rates tend to be positive for the CAD. The Bank of Canada can also use quantitative easing and tightening to influence credit conditions, with the former CAD-negative and the latter CAD-positive.
How does the price of Oil impact the Canadian Dollar?
The price of Oil is a key factor impacting the value of the Canadian Dollar. Petroleum is Canada’s biggest export, so Oil price tends to have an immediate impact on the CAD value. Generally, if Oil price rises CAD also goes up, as aggregate demand for the currency increases. The opposite is the case if the price of Oil falls. Higher Oil prices also tend to result in a greater likelihood of a positive Trade Balance, which is also supportive of the CAD.
How does inflation data impact the value of the Canadian Dollar?
While inflation had always traditionally been thought of as a negative factor for a currency since it lowers the value of money, the opposite has actually been the case in modern times with the relaxation of cross-border capital controls. Higher inflation tends to lead central banks to put up interest rates which attracts more capital inflows from global investors seeking a lucrative place to keep their money. This increases demand for the local currency, which in Canada’s case is the Canadian Dollar.
How does economic data influence the value of the Canadian Dollar?
Macroeconomic data releases gauge the health of the economy and can have an impact on the Canadian Dollar. Indicators such as GDP, Manufacturing and Services PMIs, employment, and consumer sentiment surveys can all influence the direction of the CAD. A strong economy is good for the Canadian Dollar. Not only does it attract more foreign investment but it may encourage the Bank of Canada to put up interest rates, leading to a stronger currency. If economic data is weak, however, the CAD is likely to fall.
Federal Reserve (Fed) Vice Chair of the Board of Governors Phillip Jefferson spoke at the Peterson Institute for International Economics in Washington, DC Thursday.
Key highlights
Labor imbalance between demand and supply has narrowed.
Continuing strength in spending is an upside risk to forecasts.
Fed needs to remain vigilant, nimble.
Fed shouldn't be taken by surprise by any unexpected shocks.
Fed's Jefferson remains cautiously optimistic about progress on inflation.
According to Fed staff estimates, Personal Consumption Expenditure (PCE) Price Index rose 2.4% over the 12 months ended in January.
Fed's Jefferson expects services inflation to moderate as labor market cools.
It will likely be appropriate to begin cutting policy rates later this year.
The Fed wants to move in a way that would not lead to stops and starts in policy, doesn't want to increase policy uncertainty.
Fed's Jefferson: will be looking at the totality of data when weighing rate cut options, not a single indicator.
- The US Dollar Index shows some gains on Thursday, jumping to 104.10.
- February’s S&P PMIs came in mixed, while weekly Jobless Claims came in better than expected.
- Strong labor market figures may push the Fed to remain hawkish.
The US Dollar Index (DXY) saw a slight upswing to 104.10 in Thursday’s session following the release of mixed economic activity data and positive labor market figures.
Meanwhile, the US Federal Reserve continues to adopt a firm approach, showing little interest in reducing interest rates soon and emphasizing the importance of maintaining rates at levels that restrict economic overheating. Market sentiments are increasingly in agreement with this perspective, solidifying the anticipation that any relaxation in monetary policy will be postponed, which may limit the US Dollar’s losses.
Daily digest market movers: The US Dollar holds mild gains as markets digest US data
- The S&P Global Composite PMI in the US decreased to 51.4 in February from 52 in January, indicating a slower expansion of business activity in the private sector.
- S&P Global Manufacturing PMI saw an increase to 51.5 from 50.7, signaling a slight improvement in manufacturing sector growth.
- The Services PMI from S&P Global dropped to 51.3 from 52.5, reflecting a reduction in the pace of expansion within the services sector.
- Initial Jobless Claims for the week ending February 16 came in at 201K, lower than the 218K consensus.
- Market expectation for the next Fed meeting in March suggests that markets are pricing in a hold, while the odds of a cut also remain low for the May meeting.
- Markets are now pushing the start of interest rate easing to June.
Technical analysis: DXY bulls struggle to gain further ground and remain below the 100-day SMA
The indicators on the DXY daily chart reflect a mixed picture. The Relative Strength Index (RSI) exhibits a flat slope yet remains in positive territory This suggests that although the buying momentum has slowed down recently, the overall uptrend has not been completely undermined.
Concurrently, the Moving Average Convergence Divergence (MACD) displays red bars, which is another indication of rising selling momentum. This denotes a possible shift toward a sideways trading phase or even a slight bearish reversal.
In the larger context, the DXY Index is trading above the 20-day Simple Moving Average (SMA) and 200-day SMA but below the 100-day SMA. This highlights that the bulls maintain some dominance, defying recent bearish pressure. However, the Dollar Index’s position under the 100-day SMA signals a potential short-term trepidation among buyers.
Despite the bulls struggling to gain ground, the overall trend appears to still be in favor of buyers, albeit that increasing bearish signals should not be ignored. Hence, the short-term technical outlook seems to be cautiously bullish, with potential periods of consolidation or minor corrections on the horizon.
US Dollar FAQs
What is the US Dollar?
The US Dollar (USD) is the official currency of the United States of America, and the ‘de facto’ currency of a significant number of other countries where it is found in circulation alongside local notes. It is the most heavily traded currency in the world, accounting for over 88% of all global foreign exchange turnover, or an average of $6.6 trillion in transactions per day, according to data from 2022.
Following the second world war, the USD took over from the British Pound as the world’s reserve currency. For most of its history, the US Dollar was backed by Gold, until the Bretton Woods Agreement in 1971 when the Gold Standard went away.
How do the decisions of the Federal Reserve impact the US Dollar?
The most important single factor impacting on the value of the US Dollar is monetary policy, which is shaped by the Federal Reserve (Fed). The Fed has two mandates: to achieve price stability (control inflation) and foster full employment. Its primary tool to achieve these two goals is by adjusting interest rates.
When prices are rising too quickly and inflation is above the Fed’s 2% target, the Fed will raise rates, which helps the USD value. When inflation falls below 2% or the Unemployment Rate is too high, the Fed may lower interest rates, which weighs on the Greenback.
What is Quantitative Easing and how does it influence the US Dollar?
In extreme situations, the Federal Reserve can also print more Dollars and enact quantitative easing (QE). QE is the process by which the Fed substantially increases the flow of credit in a stuck financial system.
It is a non-standard policy measure used when credit has dried up because banks will not lend to each other (out of the fear of counterparty default). It is a last resort when simply lowering interest rates is unlikely to achieve the necessary result. It was the Fed’s weapon of choice to combat the credit crunch that occurred during the Great Financial Crisis in 2008. It involves the Fed printing more Dollars and using them to buy US government bonds predominantly from financial institutions. QE usually leads to a weaker US Dollar.
What is Quantitative Tightening and how does it influence the US Dollar?
Quantitative tightening (QT) is the reverse process whereby the Federal Reserve stops buying bonds from financial institutions and does not reinvest the principal from the bonds it holds maturing in new purchases. It is usually positive for the US Dollar.
Which presidents have been good for the Dollar? Economists at Société Générale analyze USD performance between elections.
Credit spreads have widened in the run-up to elections, narrowing in the aftermath
The Dollar’s fate doesn’t depend on who the president is. Still, if I use the election as the day to begin measuring a presidency, all the Democrat presidents since 1980 have left the job with a stronger USD than when they started. The only Republican president who left with a stronger Dollar was Ronald Reagan, and that was a close-run thing as his second term almost completely wiped out the huge gains seen in his first!
The run-up to elections, in recent years, has seen credit spreads widen, while the aftermath has tended to see them narrow. That should be helpful for the Dollar ahead of elections, and negative afterwards, as risk sentiment improves. But while you can see short-term signs of that in the Dollar, it didn’t prevent George W. Bush from presiding over the biggest presidential Dollar fall of all of them, while the second terms of Clinton and Obama were notably Dollar friendly. President Biden, however, has already seen the Dollar rally by 13%.
Economists at Deutsche Bank expect the S&P 500 Index to extend its race higher over the course of the year.
S&P 500 to 5,100 by Q4 2024
We set a 2024 S&P 500 year-end target of 5,100.
All measures of earnings beats in the US are well above the upper end of their pre-pandemic ranges, typically seen in early stages of recovery from major cyclical downturns; Multiple staying near 20x, a little higher than fair value at 18x; Catalysts impacting the trajectory include rates vs. rates vol, inflation, the US presidential election, and potential productivity gains.
- EUR/USD falls to 1.0811, reversing gains after ECB minutes show reluctance to discuss rate cuts.
- Eurozone inflation shows signs of easing, yet ECB remains hesitant on monetary policy adjustments.
- US jobless claims hit a month low, hinting at a tight labor market that could stoke inflation concerns.
The Euro fell, erasing its previous gains that witnessed the shared currency hitting a month-to-date (MTD) high at 1.0888 versus the US Dollar. Since then, the EUR/USD has plunged, trading below the 200-day moving average (DMA) at around 1.0811, following the release of the European Central Bank’s last meeting minutes and strong US jobs data.
EUR/USD dips below 200-DMA on ECB minutes, solid US jobless claims
ECB January’s meeting minutes showed that policymakers remain cautious about easing monetary policy, as “There was broad consensus among members that it was premature to discuss rate cuts at the present meeting.” Nevertheless, they acknowledged the progress on inflation, turning more optimistic than at any time in years.
Policymakers added that rate cuts are not automatically warranted, even if the ECB updates March inflation projections to the downside.
Earlier, the Eurozone (EU) revealed the disinflation process continued as the Harmonized Index of Consumer Prices (HICP) came at 2.8% YoY as expected, down from 2.9%, while the Core HICP dropped from 3.4% YoY to 3.3% as foreseen. At the same time, the EU’s business activity improved slightly, led by the Services PMI, while Manufacturing activity remained at recessionary levels.
On the US front, US jobless claims dropped to their lowest level in a month. Initial Jobless Claims for the week ending February 17 decreased by 12K to 201K, below estimates of 218K, and the previous week 213K. This suggests the labor market remains tight, usually seen as a sign that might pump inflation higher.
In the meantime, business activity in the United States (US) moderated in February, according to the S%P Global report. The Services and Manufacturing PMI remained at expansionary territory, with the former printing 51.3 below estimates and January’s figures, while the latter expanded at a 51.5 pace, exceeding forecasts and last month’s 50.7. Therefore, the Composite Index dipped from 52 to 51.4.
EUR/USD Price Analysis: Technical outlook
Earlier, the EUR/USD tested the 50-day moving average (DMA) at 1.0886 but failed to break that level decisively. That, along with fundamental news from the EU and the US, exacerbated the pair’s 70-pip fall below the 1.0810 area, which could open the door to drive the exchange rate lower. Once the major drops below 1.0800, the next support emerges at the February 20 low of 1.0761, followed by the December 8 low of 1.0723. Once cleared, the next stop would be the year-to-date (YTD) low of 1.0694. On the flip side, if buyers keep the spot price above 1.0800, they could remain hopeful of reclaiming the 200-DMA.
The November 2024 US presidential election looks likely to be a contest between the same people as in the previous one in 2020, with President Joe Biden as the Democratic Party candidate and former President Donald Trump as the Republican Party candidate. Under a Trump presidency, economists at Nomura would expect a flare-up in inflation, the abandonment of moves toward carbon neutrality, and heightened geopolitical risk.
Major market implications from policy about-face in event of second Trump presidency
Should President Biden be re-elected, the risk exists of frequent standoffs over the debt ceiling or a government shutdown, but our main scenario for overall policy is a continuation of the status quo. Should Mr Trump return to the White House, however, we think the market implications of policy shifts would be major.
We think that a major consequence of a second Trump presidency would be renewed upward pressure on inflation. In addition to Mr. Trump’s eagerness to lower the corporate tax rate and other taxes, we would also expect (1) the nomination of a dovish chair of the Board of Governors of the Federal Reserve System (2026), (2) protectionist trade policies (higher import costs), and (3) moves to halt the influx of migrants (supporting higher wages). We would also expect a rewinding of the support for decarbonization and renewable energy that has been advanced by the Biden administration. Furthermore, diplomatically, we think global geopolitical risks could grow if a Trump administration were to pursue isolationism.
ECB’s January monetary policy account leaves many doors open. Bur economists at Nordea continue to expect the first rate cut to take place in June.
Preferring to cut late than early
The monetary policy account from the ECB’s January meeting illustrated that while a lot of progress was being made towards achieving the inflation target on a durable manner, risk management considerations still supported waiting with the first cut. Nevertheless, the account included an increasing amount of soft comments, suggesting a growing number of Governing Council members are moving towards supporting cuts, even if the time for lower interest rates is not yet here.
In general, the account does not change our baseline view of the first cut taking place in June, followed by quarterly 25 bps moves. However, the softer voices in the account underline that risks remain tilted towards an April move rather than the ECB waiting longer for the first cut, especially if the March staff forecasts see further downward revisions to the inflation path, which looks likely. However, as today’s rise in the PMIs, especially the further increase in the employment and output price components, illustrate, upside inflation risks are not fully gone either.
Kit Juckes, Chief Global FX Strategist at Société Générale, analyzes the FX market outlook after the release of the February flash PMIs from around the world.
The Euro can’t ignore Germany
The Eurozone is slowly healing but is doing so without Germany and the Euro can’t ignore Germany. So, the uptrend in the Eurozone PMI is unlikely to give the currency a boost. NOK and SEK, or PLN, are a better buy than the EUR. AUD is a buy against any part of Europe as Chinese stimulus starts to have an impact.
GBP will likely remain resilient for several more months as the BoE drags its heels on easier monetary policy, regardless of growing long-term structural threats to growth (and Sterling).
If US January ISM data are strong too, the danger is that USD/JPY gets to 155.00 before it turns lower, too. A BoJ policy pivot won’t come fast enough for Yen bulls and the March meeting feels a long way away right now.
- Initial Jobless Claims rose by 201K from a week earlier.
- Continuing Jobless Claims also surprised to the downside.
US citizens that applied for unemployment insurance benefits increased by 201K in the week ending February 17 according to the US Department of Labor (DoL) on Thursday. Once again, the prints came in on the strong side and followed a 213K gain in the previous week.
Further details of the publication revealed that the advance seasonally adjusted insured unemployment rate was 1.2% (from 1.3%) and the 4-week moving average stood at 215.25, a decrease of 3.500K from the previous week's revised average.
In addition, Continuing Claims decreased by 27K to 1.862M in the week ended February 10.
Market reaction
The US Dollar Index regained strength and rose to the 104.00 region following the earlier drop to the 103.40 zone.
USD/CAD retains a bullish undertone but may be losing momentum, economists at Scotiabank say.
Nearby support is 1.3465
USD/CAD retains a firm, technical undertone but it all looks lackluster on the charts, with trend momentum signals ticking over in barely positive (i.e., USD-bullish) territory on the intraday, daily and weekly charts.
Price action on the longer-term charts late last year rather implied a major peak/reversal developed around the 1.3900 point which tilts risks towards some additional, corrective USD weakness in the coming months but the CAD has its work cut out to improve.
Nearby support is 1.3465 ahead of 1.3360 and major, medium-term support at 1.3180.
Resistance is 1.3540/1.3550 and 1.3580/1.3600.
- AUD/USD falls vertically from 0.6600 as the US Dollar gets a firm footing.
- Deepening geopolitical tensions have improved safe-haven appeal.
- Fed policymakers are less likely to cut interest rates soon.
The AUD/USD pair falls sharply after a steep rally to the round-level resistance of 0.6600 in the early New York session on Thursday. The Aussie asset faces a sell-off as the US Dollar has rebounded amid deepening Middle East tensions.
The Israeli army has intensified bombarding on Rafah, the southern region of Gaza in Palestine, as the former hopes that over 1.4 million refugees have been sheltered there. Escalating Middle East tensions have improved the appeal for safe-haven assets.
Meanwhile, the Federal Open Market Committee (FOMC) minutes for January’s policy meeting indicated that policymakers don’t want to cut interest rates early amid lack of conviction on the progress in inflation declining to the 2% target.
The Australian Dollar remains bullish lately as the Reserve Bank of Australia (RBA) minutes for February policy meeting indicated that policymakers were interested in raising the Official Cash Rate (OCR) further. It indicates that the current monetary policy of the RBA is not sufficiently restrictive to tame sticky price pressures.
Going forward, investors will focus on the United States preliminary S&P Global PMI data for February, which will be published at 14:45 GMT.
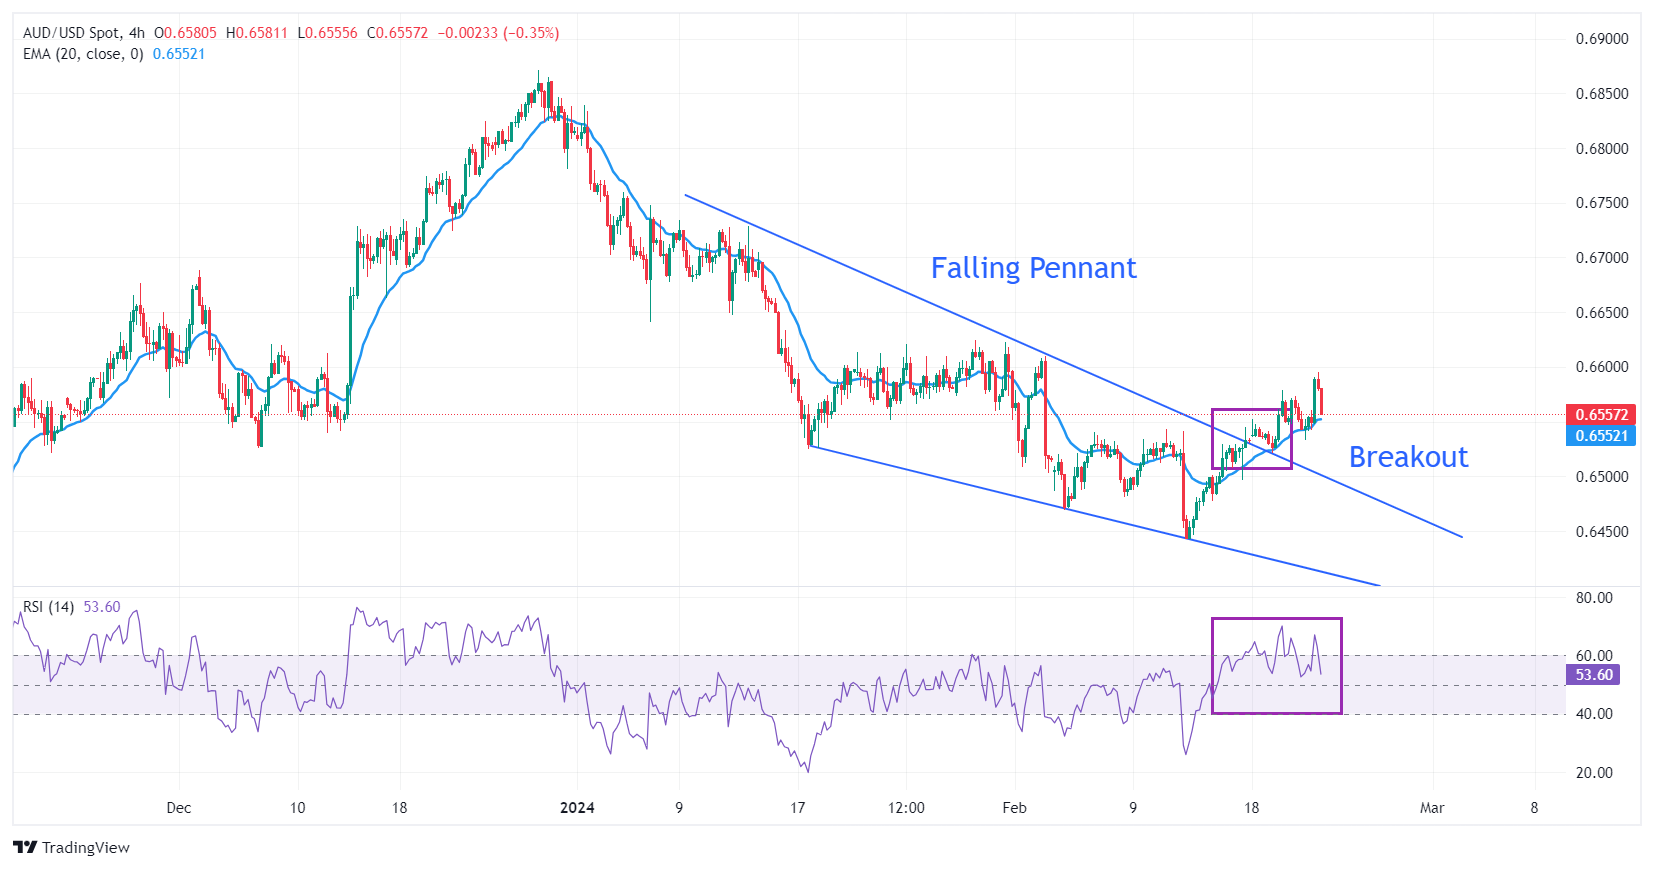
AUD/USD strengthens after a breakout of the Falling Pennant chart pattern formed on a four-hour scale. A breakout of the aforementioned pattern indicates a bullish reversal. The breakout of a Falling Pennant happens when selling pressure dries, and investors consider it a value-buy.
The 20-period Exponential Moving Average (EMA) near 0.6550 continues to provide support to the Australian Dollar bulls.
The 14-period Relative Strength Index (RSI) struggles to sustain in the 60.00-80.00 region. A bullish momentum would trigger if the RSI (14) manages to do so.
Fresh upside would appear if the asset breaks above the round-level resistance of 0.6600, which will drive the asset towards January 30 high at 0.6625, followed by December 4 high at 0.6688.
In an alternate scenario, a downside move below February 15 low at 0.6477 would activate sellers and will expose the asset to February 13 low at 0.6443 and the round-level support of 0.6400.
AUD/USD four-hour chart
New Fed call: economists at TD Securities are now looking for the FOMC to cut rates by five times this year starting in May.
May is the most likely meeting where the Fed can begin easing policy
Notable shifts in the macro data and the Fed's likely bent to ease preemptively have led us to assign greater odds to a softer landing scenario for the US economy this year. In this context, we are now looking for the FOMC to cut rates five times in 2024, with the Fed funds rate ending the year at 4.00%-4.25%. We continue to expect the Fed will reach its neutral policy stance at 2.75%-3.00% by the end of 2025.
Given our still very constructive outlook for inflation, we still think that May is the most likely meeting where the Fed can begin easing policy. In our view, inflation will likely determine when the Fed will begin easing policy while economic activity will determine the pace and magnitude of rate cuts.
A still strong growth profile is currently allowing the Fed to be patient as it seeks to gather further confirmation that core price disinflation is not a temporary phenomenon. However, we think that at the first clear sign of growth deceleration, the Fed will react more swiftly toward loosening the policy restraint.
The accounts of the European Central Bank's (ECB) January policy meeting showed on Thursday that there was a broad consensus among Governing Council members that it was premature to discuss rate cuts, per Reuters.
Key takeaways
"Latest developments in economic activity and inflation as being consistent with the current monetary policy stance.""
"There had been further progress on all three elements of the reaction function.
"Confident that monetary policy was working."
"It was affirmed that further progress needed to be made in the disinflationary process."
"Broad consensus among members that it was premature to discuss rate cuts."
"Measures of underlying inflation had passed their peak."
"Risk of cutting policy rates too early was still seen as outweighing that of cutting rates too late."
"There was solid evidence that monetary policy was being transmitted to financial markets, financing conditions and credit conditions."
"Uncertainty remained about the timing of the peak impact."
"Members signalled that continuity, caution and patience were still needed."
"The risks to reaching the inflation target were seen as broadly balanced or at least becoming more even."
"Financial market loosening might be premature and could possibly derail or delay a timely return of inflation to target."
Market reaction
This publication failed to trigger a noticeable reaction in the EUR/USD pair, which was last seen rising 0.25% on the day at 1.0845.
- Nasdaq futures post impressive gains as tech stocks rally.
- US economic docket will feature PMI and weekly Jobless Claims data.
- Nvidia Corp. (NVDA) shares are up more than 10% in premarket trading.
Major equity indexes in the US remain on track to open in positive territory following Wednesday's indecisive action. The rally seen in technology shares in premarket trading points to a big jump in tech-heavy Nasdaq Composite, while Dow Jones' upside remains limited.
S&P 500 futures rise 1.25%, Dow Jones futures climb 0.37%, and Nasdaq futures gain 2.03%.
S&P 500 (SPX), Dow Jones (DJIA), and Nasdaq (IXIC) indexes closed on Wednesday with a 0.13% gain, a 0.13% increase, and a 0.32% fall, respectively.
What to know before stock market opens
- The Technology Sector was the worst-performing major S&P sector and the only one to end in the red on Wednesday, losing over 0.76% on the day. The Energy Sector took the top spot and ended the day up nearly 1.9%.
- EQT Corp (EQT) saw a late break to become the day's top performer on Wednesday, gaining 10.58% and hitting the closing bell at $37.30. On the other hand, Palo Alto Networks Inc. (PAN) shares lost more than 28% to close just below $262.00.
- Nvidia Corp. (NVDA) shares are up nearly 14% in premarket trading after the chipmaker reported that earnings per share topped $5.16 versus the $4.64 forecast, and revenue climbed to $22.10 billion compared to the expected $20.62 billion. The company also said that it forecasts the current-quarter revenue of $24 billion, plus or minus 2%.
- Read more: Nvidia Stock Earnings: NVDA Q4 results trounce consensus.
- Mizuho has raised the target price for Nvidia stock to $850 from $825, HSBC lifted its target to $880 from $835 and Citigroup revised its expectation to $820 from $575.
- S&P Global will publish the preliminary US Manufacturing and Services PMI reports for February on Thursday. The US economic docket will also feature the weekly Initial Jobless Claims data.
- The Federal Reserve (Fed) said in the Minutes of the January policy meeting that most policymakers noted the risks associated with moving too quickly to ease the policy. Furthermore, the publication showed that officials highlighted uncertainty around how long the restrictive policy stance would be needed.
- Read more: Fed Minutes suggest rates are at their peak.
- Retailer giant Walmart Inc. (WMT) reported an adjusted earning per share of $1.8 ahead of the opening bell on Tuesday. The company said that it expects consolidated net sales to rise in the range of 3%-4% and announced that it will buy smart-TV producer Vizio (VZIO) for about $2.3 billion.
- Home Depot Inc. (HD) said net income in Q4 was $2.8 billion, and the adjusted earnings per share was $2.82. The company, however, said that it projects sales for the fiscal year 2024 to be below estimates, citing slowing demand for discretionary items such as flooring, furniture and kitchen, per Reuters.
Dow Jones FAQs
What is the Dow Jones?
The Dow Jones Industrial Average, one of the oldest stock market indices in the world, is compiled of the 30 most traded stocks in the US. The index is price-weighted rather than weighted by capitalization. It is calculated by summing the prices of the constituent stocks and dividing them by a factor, currently 0.152. The index was founded by Charles Dow, who also founded the Wall Street Journal. In later years it has been criticized for not being broadly representative enough because it only tracks 30 conglomerates, unlike broader indices such as the S&P 500.
What factors impact the Dow Jones Industrial Average?
Many different factors drive the Dow Jones Industrial Average (DJIA). The aggregate performance of the component companies revealed in quarterly company earnings reports is the main one. US and global macroeconomic data also contributes as it impacts on investor sentiment. The level of interest rates, set by the Federal Reserve (Fed), also influences the DJIA as it affects the cost of credit, on which many corporations are heavily reliant. Therefore, inflation can be a major driver as well as other metrics which impact the Fed decisions.
What is Dow Theory?
Dow Theory is a method for identifying the primary trend of the stock market developed by Charles Dow. A key step is to compare the direction of the Dow Jones Industrial Average (DJIA) and the Dow Jones Transportation Average (DJTA) and only follow trends where both are moving in the same direction. Volume is a confirmatory criteria. The theory uses elements of peak and trough analysis. Dow’s theory posits three trend phases: accumulation, when smart money starts buying or selling; public participation, when the wider public joins in; and distribution, when the smart money exits.
How can I trade the DJIA?
There are a number of ways to trade the DJIA. One is to use ETFs which allow investors to trade the DJIA as a single security, rather than having to buy shares in all 30 constituent companies. A leading example is the SPDR Dow Jones Industrial Average ETF (DIA). DJIA futures contracts enable traders to speculate on the future value of the index and Options provide the right, but not the obligation, to buy or sell the index at a predetermined price in the future. Mutual funds enable investors to buy a share of a diversified portfolio of DJIA stocks thus providing exposure to the overall index.
- The US Dollar trades deep in the red after the publication of the Fed Minutes.
- Market sentiment improves after Nvidia earnings beat and a fresh all-time high for the Japanese Nikkei.
- The US Dollar Index falls sharply below 104.00, and bears try to break the heavy-weight 200-day SMA.
The US Dollar (USD) is facing a dropkick moment on Thursday after a string of events accelerated a downside move in the US Dollar Index (DXY) overnight. The first decline came on the back of the US Federal Reserve releasing the Minutes of its January meeting. The decrease came even though several participants in the Federal Open Market Committee (FOMC) expressed their concerns about cutting rates too quickly, having learned their lessons from the former policy mistake made in the 1980s by Fed Chairman Paul Volcker. With the DXY hammered, a second selling wave for the Greenback took place after Nvidia posted jawbreaking earnings, spilling the upbeat market mood into Asia, where the Japanese Nikkei hit all-time highs.
On the economic data front, a very chunky calendar ahead on Thursday with some leading indicators. Apart from the usual market-moving Initial Jobless Claims, the Purchasing Managers Index (PMI) numbers for February are due as well. Throw in no less than four Fed speakers and volatility looks to be guaranteed.
Daily digest market movers: Fed does not care about markets
- A chunky calendar is set to kick off near 13:30 GMT:
- The Chicago Fed National Activity Index for January is due to be released. The previous print came in at -0.15.
- Jobless Claims are to be released as well:
- Initial Claims are seen heading from 212,000 to 218,000.
- Continuing Claims are expected to shrink from 1.895 million to 1.885 million.
- S&P Global’s preliminary Purchasing Manager Index numbers for February are expected to be released at 14:45 GMT.
- The Services PMI is expected to head from 52.5 to 52.
- The Manufacturing PMI is seen heading from 50.7 to 50.5.
- Existing Home Sales data for January will come out at 15:00 GMT. Sales are expected to increase from 3.78 million to 3.97 million.
- The Kansas Fed Manufacturing Activity Index for February will be released near 16:00 GMT. The previous print was at -17.
- If Fed watchers are hungry for more, this Thursday will feature no less than four Fed members lined up to speak:
- Fed Vice Chair Philip Jefferson is due to speak at 15:00 GMT.
- Philadelphia Fed President Patrick Harker will take the stage at 20:15 GMT.
- Minneapolis Fed President Neel Kashkari will speak at 22:00 GMT.
- Fed board member Lisa Cook is to close off this Thursday with comments near 22:00 GMT.
- Equities are in the green across the board. The Nikkei has printed new all-time highs earlier this Thursday, and the German Dax shot above 1% at the European opening bell. US equity futures are all in the green, with the Nasdaq flirting with 2% gains ahead of the opening bell.
- The CME Group’s FedWatch Tool is now looking at the March 20 meeting. Expectations for a pause are at 95.5%, while chances of a rate cut stand at 4.5%.
- The benchmark 10-year US Treasury Note trades around 4.31% in the Fed Minutes release aftermath.
US Dollar Index Technical Analysis: Markets ahead of the Fed
The US Dollar Index (DXY) retreated below 104.00 overnight. Although concerns amongst Fed members about premature interest-rate cuts is the main takeaway from the Fed Minutes, markets see it as being on track for their June timing for a rate cut. Meanwhile, Nvidia earnings have sparked a wave of risk appetite across the globe, that sentiment is a second driver for an abating Greenback this Thursday. Later today, US PMI numbers could take back some of the recent losses.
To the upside, the 100-day Simple Moving Average (SMA) near 104.98 is the first level to watch as a support that has been turned into a resistance. Should the US Dollar jump to 105.00 on the back of strong PMI numbers, 105.12 is a key level to keep an eye on. One step beyond there comes 105.88, the high of November 2023. Ultimately, 107.20 – the high of 2023 – could even come back into scope, but that would be when markets reprice the timing of a Fed rate cut again, delaying it to the last quarter of 2024.
The 200-day Simple Moving Average at 103.72 has been broken and should see more US Dollar bears flock in to trade the break for a weaker US Dollar. The 200-day SMA should not let go that easily, so a small retreat back to that level could be more than granted. Ultimately, it will lose its force with the ongoing selling pressure and could fall to 103.16 at the 55-day SMA.
US Dollar FAQs
What is the US Dollar?
The US Dollar (USD) is the official currency of the United States of America, and the ‘de facto’ currency of a significant number of other countries where it is found in circulation alongside local notes. It is the most heavily traded currency in the world, accounting for over 88% of all global foreign exchange turnover, or an average of $6.6 trillion in transactions per day, according to data from 2022.
Following the second world war, the USD took over from the British Pound as the world’s reserve currency. For most of its history, the US Dollar was backed by Gold, until the Bretton Woods Agreement in 1971 when the Gold Standard went away.
How do the decisions of the Federal Reserve impact the US Dollar?
The most important single factor impacting on the value of the US Dollar is monetary policy, which is shaped by the Federal Reserve (Fed). The Fed has two mandates: to achieve price stability (control inflation) and foster full employment. Its primary tool to achieve these two goals is by adjusting interest rates.
When prices are rising too quickly and inflation is above the Fed’s 2% target, the Fed will raise rates, which helps the USD value. When inflation falls below 2% or the Unemployment Rate is too high, the Fed may lower interest rates, which weighs on the Greenback.
What is Quantitative Easing and how does it influence the US Dollar?
In extreme situations, the Federal Reserve can also print more Dollars and enact quantitative easing (QE). QE is the process by which the Fed substantially increases the flow of credit in a stuck financial system.
It is a non-standard policy measure used when credit has dried up because banks will not lend to each other (out of the fear of counterparty default). It is a last resort when simply lowering interest rates is unlikely to achieve the necessary result. It was the Fed’s weapon of choice to combat the credit crunch that occurred during the Great Financial Crisis in 2008. It involves the Fed printing more Dollars and using them to buy US government bonds predominantly from financial institutions. QE usually leads to a weaker US Dollar.
What is Quantitative Tightening and how does it influence the US Dollar?
Quantitative tightening (QT) is the reverse process whereby the Federal Reserve stops buying bonds from financial institutions and does not reinvest the principal from the bonds it holds maturing in new purchases. It is usually positive for the US Dollar.
The Japanese Yen (JPY) is the weakest G10 currency in the year to date and USD/JPY is holding just below its November 2023 highs. Economists at Rabobank have revised their USD/JPY forecasts.
November high just below 152.00 to act as strong resistance
We now see USD/JPY at 140.00 on a 12-month view compared with a previous forecast of 135.00.
Near-term, we expect the November high just below 152.00 to act as strong resistance of USD/JPY as the market approaches the March and April BoJ policy meetings.
- USD/CAD could breach the major support at the 1.3450 level.
- Technical indicators suggest a potential momentum shift towards a downward trend.
- A break above 1.3500 could lead the pair to test the weekly high at 1.3536 and the major barrier at 1.3550.
USD/CAD moves in a downward direction for the second consecutive day, trading around 1.3460 during the European session on Thursday. The pair is positioned just above the major support level of 1.3450. The technical analysis of the 14-day Relative Strength Index (RSI) is positioned below 50, suggesting bearish momentum for the USD/CAD pair.
A break below the major support could put downward pressure on the USD/CAD pair to test the support level of the 38.2% Fibonacci retracement level at 1.3430. If the pair breaches the latter, it could navigate the psychological support region at 1.3400 level followed by the 50.0% retracement level of 1.3381.
Additionally, the lagging indicator Moving Average Convergence Divergence (MACD) for the USD/CAD pair suggests a possible shift in momentum towards a downward trend in the market. This assessment is derived from the positioning of the MACD line above the centerline but below the signal line. Traders may opt to await clearer directional sentiment from the MACD indicator before making trading decisions.
On the upside, the USD/CAD pair may encounter significant resistance at the psychological level of 1.3500. A decisive breakthrough above this psychological resistance could generate positive sentiment, potentially propelling the pair to test the resistance zone around the weekly high at 1.3536 and the major barrier at 1.3550. Further upside momentum could see the pair approaching the February high at 1.3586.
USD/CAD: Daily Chart
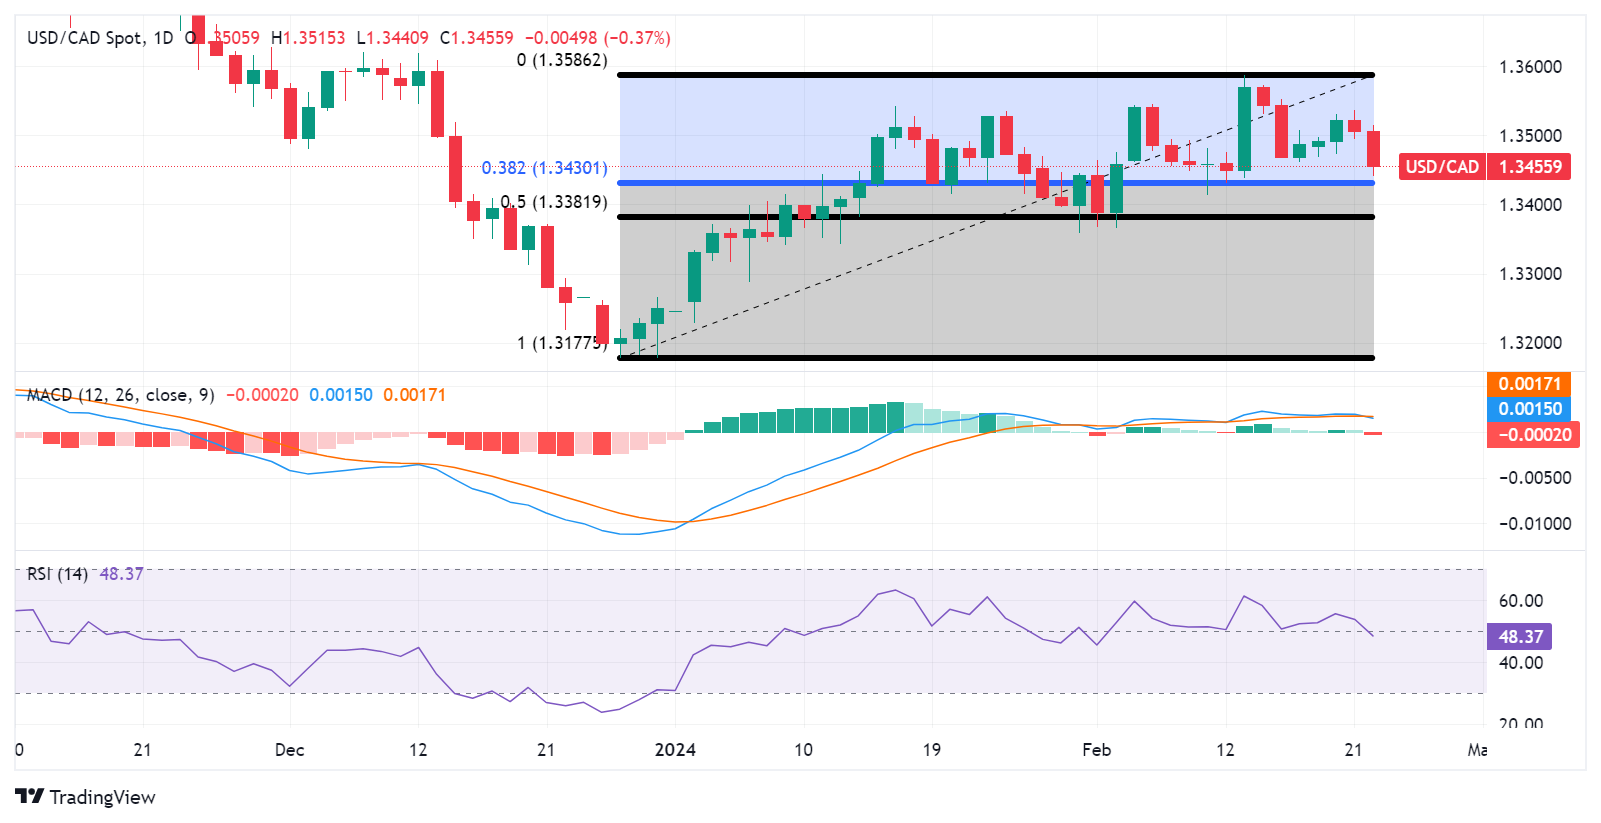
Economists at Deutsche Bank expect the US Dollar (USD) to remain strong over the year and forecast EUR/USD at 1.0700 in the second quarter.
Dollar to stay strong in 2024
We expect the EUR/USD pair to stay weak through 2024.
We expect EUR/USD at 1.0700 in the second quarter, but risks are skewed towards a strong Dollar, with EUR/USD revisiting 1.0500.
US election is a key driver as markets add to a USD safe-haven premium as election risks build into the second half of the year.
- USD/MXN recovers intraday losses to move in the positive direction.
- CME FedWatch Tool indicates a 52.2% probability of a 25 bps rate reduction in June.
- Mexican Retail Sales MoM and YoY declined by 0.9 and 0.2%, respectively in December.
USD/MXN attempts to move in a positive direction after reclaiming intraday losses, maintaining a position near 17.04 during the European session on Thursday. However, the weakening US Dollar (USD) undermines the USD/MXN pair. The Federal Open Market Committee (FOMC) Minutes expressed policymakers' caution regarding the interest rates trajectory, indicating that policy easing will not begin in the upcoming monetary meetings.
The US Dollar Index (DXY) dips to 103.70, while the yields on 2-year and 10-year US bonds stand at 4.67% and 4.30%, respectively, at the time of writing. Market participants have largely dismissed expectations for interest rate cuts in March and May, but speculation persists that the first cut may occur in June. According to the CME FedWatch Tool, there is a 52.2% probability of a 25 basis points (bps) rate reduction in June.
This outlook may be influenced by higher Consumer Price Index (CPI) and Producer Price Index (PPI) figures from January. Investors are eagerly awaiting S&P US PMI data, weekly Initial Jobless Claims, and Existing Home Sales figures on Thursday for further insights into the United States’ economic landscape.
On the Mexican front, Retail Sales in Mexico (YoY) experienced a decline of 0.2% in December, contrary to market expectations of a 2.5% increase and the previous growth of 2.7%. Additionally, Retail Sales month-over-month fell by 0.9%, diverging from the expected increase to 0.2% from the prior 0.1%.
The Mexican Peso (MXN) may encounter downward pressure as market sentiment leans towards a potential 25 basis points (bps) rate cut in March. However, the Bank of Mexico (Banxico) is anticipated to carefully assess economic data before proceeding with its monetary policy easing cycle.
On Monday, Mexico's National Statistics Agency (INEGI) reported a 0.7% month-over-month contraction in Economic Activity (IOAE), despite registering a 1.3% year-on-year growth. Furthermore, Gross Domestic Product and first-half-month Inflation data will be released on Thursday, providing further insights into Mexico's economic landscape.
- Natural Gas eases a touch after its 12% intraday rally on Wednesday.
- Traders see upside potential for Gas prices as supply issues mount.
- The US Dollar Index falls below 104.00 as market mood improves.
Natural Gas (XNG/USD) is locking in its position above $1.80 on Thursday after booking over 12% gains on Wednesday. Price increases are driven by increasing geopolitical tensions in the Middle East and increasing supply woes. Iran’s Oil minister Javad Owji accused Israel of sabotaging its main Gas pipeline and blamed the country for a series of attacks that are targeting Iran’s nuclear program. On the supply side, Chesapeake Energy reported it will cut its Natural Gas production by 20%, whileNorwegian and US LNG exports are seen stalling or substantially falling..
The US Dollar (USD) is facing a steep decline despite geopolitical tensions arising further, with The US Dollar Index (DXY) sliding below 104.00 following a wave of risk-on after upbeat Nvidia earnings and the Fed Minutes not bearing any surprise.
Natural Gas is trading at $1.86 per MMBtu at the time of writing.
Natural Gas market movers: Supply side narrowing even further
- The overall Gas supply just got smaller, with Chesapeake reducing its output production for 2024. The energy company is set to reduce nearly 20% of its total output for 2024.
- An unplanned outage in Norway has extended into Friday for its main gas pipeline towards Europe.
- A major LNG gas terminal in Italy is starting an eight-month maintenance ahead of schedule.
- The US, Europe’s main Gas supplier, reports that an LNG export plant near the Sabine Pass will be closed for the rest of the week.
Natural Gas Technical Analysis: Time for traders to keep levels steady
Natural Gas had a field day on Wednesday with its 12% steep increase. Now it comes down to traders to maintain current price levels if more upside is to be had in the energy commodity. Some outside help from narrowing supply could push Natural Gas prices back to $2.
On the upside, Natural Gas is facing some pivotal technical levels to get back to. The next stop is $1.99, – the level which, when broken, saw an accelerated decline. After that, the green line at $2.13 comes into view, with the triple bottoms from 2023. If Natural Gas sees sudden demand pick up, $2.40 could come into play.
On the downside, $1.80 is a key support as it was a pivotal level back in July 2020. Should the recent headlines start to fade, or more supply emerge in the markets from other firms or countries to fill the gap, $1.64 and $1.53 (the low of 2020) are targets to look out for.
XNG/USD (Daily Chart)
Natural Gas FAQs
What fundamental factors drive the price of Natural Gas?
Supply and demand dynamics are a key factor influencing Natural Gas prices, and are themselves influenced by global economic growth, industrial activity, population growth, production levels, and inventories. The weather impacts Natural Gas prices because more Gas is used during cold winters and hot summers for heating and cooling. Competition from other energy sources impacts prices as consumers may switch to cheaper sources. Geopolitical events are factors as exemplified by the war in Ukraine. Government policies relating to extraction, transportation, and environmental issues also impact prices.
What are the main macroeconomic releases that impact on Natural Gas Prices?
The main economic release influencing Natural Gas prices is the weekly inventory bulletin from the Energy Information Administration (EIA), a US government agency that produces US gas market data. The EIA Gas bulletin usually comes out on Thursday at 14:30 GMT, a day after the EIA publishes its weekly Oil bulletin. Economic data from large consumers of Natural Gas can impact supply and demand, the largest of which include China, Germany and Japan. Natural Gas is primarily priced and traded in US Dollars, thus economic releases impacting the US Dollar are also factors.
How does the US Dollar influence Natural Gas prices?
The US Dollar is the world’s reserve currency and most commodities, including Natural Gas are priced and traded on international markets in US Dollars. As such, the value of the US Dollar is a factor in the price of Natural Gas, because if the Dollar strengthens it means less Dollars are required to buy the same volume of Gas (the price falls), and vice versa if USD strengthens.
Market expectations of a weak outlook have weighed significantly on the Copper market in 2023. However, it looks to be turning around, analysts at ANZ Bank say.
Copper market moving back into a deficit to provide support to prices in the second half of the year
Copper’s fundamentals continue to beat expectations amid an uncertain economic backdrop. We expect the inflection point in central bank monetary policies to trigger a broader improvement in sentiment in the coming months.
Copper has a broad consumption spread across the global economy, leading to concerns over demand amid tighter monetary policies and weaker economic growth. However, it has remained strong amid an increased focus on electrification and decarbonisation. We expect growth in demand from China, US and India, three of the top five consumers, to reach 4.3% in 2024. This comes amid increasing supply-side issues. Unplanned disruptions are likely to remain high as producers struggle with high costs and falling quality issues. Political risks also remain high, putting new mine development at risk.
We see the market returning to deficit this year, which should underpin prices. We maintain our short-term target of $9,000 and expect that to lift above $10,000 over the next 12 months.
- NZD/USD jumps higher above 0.6200 amid the higher risk appetite of investors.
- The US Dollar is under pressure despite favorable FOMC minutes.
- NZD/USD rallies after a Double Bottom formation.
The NZD/USD pair has climbed above the round-level resistance of 0.6200 in Thursday’s European session. The Kiwi asset has extended its winning spell to the seventh trading session as the US Dollar is facing stiff pressure amid an improvement in the appeal of risk-sensitive assets.
This week, the People’s Bank of China (PBoC) cut the five-year loan prime rate (LPR) by 25 basis points (bps) to boost domestic growth and counter real estate challenges. The New Zealand economy is one of China's leading trading partners. The Kiwi strengthens being a proxy to China’s economic outlook.
The US Dollar failed to find a firm cushion despite the Federal Open Market Committee (FOMC) minutes for the January policy meeting reflecting policymakers’ priority to maintain higher interest rates. Federal Reserve (Fed) policymakers are not interested in reducing interest rates until incoming data convince them that inflation will return sustainably to the 2% target.
Going forward, investors will focus on the United States preliminary S&P Global PMI data for February, which will be published at 14:45 GMT and New Zealand’s Q4 Retail Sales data on Friday.
NZD/USD delivers a strong rally after a Double Bottom formation near 0.6050 on a four-hour timeframe. A Double bottom formation indicates a value-buying spot, which establishes a bullish reversal. The asset is approaching the horizontal resistance plotted from January 4 high at 0.6286.
The 20-period Exponential Moving Average (EMA) around 0.6172 continues to provide support to the New Zealand Dollar bulls.
Additionally, the 14-period Relative Strength Index (RSI) shifts into the bullish range of 60.00-80.00, indicating that an active bullish momentum.
Considering a sharp rally in the pair, the risk-reward for fresh buying is not favorable. Therefore, a gradual correction to the 20-EMA near 0.6172 could be an ideal buying situation for investors. After a dip buying, market participants should hold position for the targets of round-level resistance at 0.6200 and January 11 high at 0.6260.
In an alternate scenario, a downside move below February 20 low near 0.6129 would expose the asset to the round-level support of 0.6100, followed by February 13 low near 0.6050.
NZD/USD four-hour chart
- WTI price declines as oil concerns over oil demand emerge due to prolonging higher rates.
- Crude oil prices received support due to escalated tension in the Middle East.
- API Weekly Crude Oil Stock posted 7.168 million barrels against the expected 4.298 million barrels.
West Texas Intermediate (WTI) oil price opened with a gap-up but edged lower to around $77.90 per barrel on Thursday. The heightened geopolitical conflict in the Middle East is raising concerns about potential supply disruptions, thus contributing to strengthening the prices of Crude oil.
Yemen's Houthi rebels have claimed responsibility for attacking an Israeli cargo vessel. Additionally, on Monday, the Houthi group launched drone and missile strikes on four shipping vessels in the Red Sea and Bab al-Mandab Strait. On Tuesday, the United States once again vetoed a draft resolution at the United Nations Security Council concerning the Israel-Hamas conflict, thereby blocking a call for an immediate humanitarian ceasefire.
However, the Federal Open Market Committee (FOMC) Minutes reflected concerns regarding interest rate cuts, indicating a preference for maintaining higher borrowing costs to address persistent inflationary pressures. This stance has tempered the strength of oil prices, as higher borrowing costs tend to dampen economic activity in the largest oil-consuming country, the United States (US), resulting in lower oil demand.
The Federal Reserve's policymakers may adopt a hawkish stance, influenced by the higher Consumer Price Index (CPI) and Producer Price Index (PPI) figures from January. According to the CME FedWatch Tool, the probability of a Federal Reserve rate cut has significantly decreased to 4.5% for March and to 29.8% for May. While there is a slight decrease in the likelihood of a cut in June, with a probability of 52.2% compared to 53.3% previously, the probability of a rate cut has increased for July, rising to 37.4% from the previous 33.4%.
Crude oil prices face pressure as the American Petroleum Institute (API) reported a higher-than-expected Crude Oil Stock figure of 7.168 million barrels for the week ending February 16, compared to the expected 4.298 million barrels. The previous week's figure was 8.520 million barrels. Investors await the release of the US Energy Information Administration’s (EIA) Crude Oil Stocks Change later in the North American session for further insights into inventory levels.
FOMC January minutes showed no hurry to cut rates. Economists at ING analyze the US Dollar (USD) outlook after the event.
FOMC minutes suggest the Fed is in no rush
In a quiet week for the US events calendar, Wednesday’s release of the January FOMC meeting minutes served as a reminder that the Fed is in no rush to cut rates. That was not much of a surprise to markets which continue to price around 90 bps of Fed easing this year.
The Fed needs to be sure that inflationary risks have been extinguished before cutting rates back to some kind of neutral level – probably near 3%.
Our game plan here sees the Dollar staying bid for the next couple of weeks – we should get a strong January core PCE release on February 29th – and then turning lower in March on what should be a softer payrolls report and a softer February CPI figure. In early March, we could also hear of some fresh China stimulus which would be a boon to the Rest of the World currencies.
- Gold price jumps higher as Middle East tensions deepen.
- The US Dollar tumbles despite FOMC minutes indicating a hawkish narrative.
- Investors await US S&P Global PMI data, which will shed some light on the economic outlook.
Gold price (XAU/USD) prints a fresh weekly high above $2,030 in Thursday’s European session. The precious metal extends its winning streak to the sixth trading session amid a weak outlook for the US Dollar and escalating Middle East tensions. Generally, the appeal for safe-haven assets such as Gold improves during geopolitical uncertainty.
The US Dollar is under pressure even though the Federal Open Market Committee (FOMC) Minutes of the late January policy meeting indicated that the majority of Federal Reserve (Fed) policymakers are in no hurry to unwind the restrictive monetary policy stance.
Fed policymakers are expected to keep interest rates unchanged in the range of 5.25%-5.50% until they get convinced that price stability can be achieved. Easing price pressures for some months could build confidence among Fed policymakers that inflation will sustainably decline to the 2% target.
On the geopolitical front, Middle East tensions have escalated as Israel intensifies its attacks in Rafah, which is a Palestinian city at the southern end of Gaza. Last week, Israeli Defense Minister Yoav Gallant identified Rafah as a shelter for over 1.4 million Palestinian refugees.
Daily digest market movers: Gold price climbs further as US Dollar remains under pressure
- Gold price jumps higher above $2,030, supported by weak US Dollar and geopolitical tensions.
- The US Dollar Index (DXY), which gauges the Greenback’s value against six major currencies, dives to 103.50 despite FOMC Minutes for the January policy meeting being aligned with market expectations.
- The FOMC Minutes for the January meeting showed that most Federal Reserve policymakers are concerned about the consequences of premature rate cuts, while a few pointed to economic risks associated with the overly stretched restrictive monetary policy stance.
- Price pressures could flare up again if the Fed rushes to reduce interest rates.
- Fed policymakers want to see more evidence that inflation will sustainably decline to the 2% target before commencing rate cuts.
- Sticky inflationary pressures and a resilient US economy have pushed back expectations for rate cuts in May.
- The CME FedWatch tool shows that interest rates are expected to remain unchanged in the range of 5.25%-5.50% in the March and May monetary policy meetings. However, chances for a rate cut by 25 basis points (bps) in the June policy meeting are around 53%.
- Richmond Federal Reserve Bank Thomas Barkin said on Wednesday that high inflation data in January has made the Fed’s job “harder.” However, Barkin added, “We should not put too much weight on the month's information given known seasonality issues."
- Thomas Barkin showed uncertainty over the achievement of a soft landing by the Fed.
- Meanwhile, investors await fresh data to get more cues about the outlook on interest rates. The S&P Global will report preliminary PMIs for February, which will be published at 14:45 GMT.
- The Manufacturing PMI is forecasted to come out lower to 50.5 from 50.7 in January. The Services PMI, which represents a sector that accounts for two-thirds of the United States economy, is expected to release at 52.0, lower than the prior reading of 52.5.
Technical Analysis: Gold price prints a fresh 10-day high near $2,035
Gold price extends its winning spell to the sixth day as geopolitical uncertainty deepens. The precious metal has printed a fresh 10-day high near $2,035. The yellow metal is expeditiously approaching the downward-sloping border of the Symmetrical Triangle chart pattern formed on a daily time frame, which is plotted from the December 28 high at $2,088. The upward-sloping border of the aforementioned chart pattern is placed from the December 13 low at $1,973.
The triangle could break out in either direction. However, the odds marginally favor a move in the direction of the trend before the formation of the triangle – in this case up. A decisive break above or below the triangle boundary lines would indicate a breakout is underway.
The 14-period Relative Strength Index (RSI) marches toward 60.00. If the RSI manages to climb above the same, a bullish momentum will be activated.
Gold FAQs
Why do people invest in Gold?
Gold has played a key role in human’s history as it has been widely used as a store of value and medium of exchange. Currently, apart from its shine and usage for jewelry, the precious metal is widely seen as a safe-haven asset, meaning that it is considered a good investment during turbulent times. Gold is also widely seen as a hedge against inflation and against depreciating currencies as it doesn’t rely on any specific issuer or government.
Who buys the most Gold?
Central banks are the biggest Gold holders. In their aim to support their currencies in turbulent times, central banks tend to diversify their reserves and buy Gold to improve the perceived strength of the economy and the currency. High Gold reserves can be a source of trust for a country’s solvency. Central banks added 1,136 tonnes of Gold worth around $70 billion to their reserves in 2022, according to data from the World Gold Council. This is the highest yearly purchase since records began. Central banks from emerging economies such as China, India and Turkey are quickly increasing their Gold reserves.
How is Gold correlated with other assets?
Gold has an inverse correlation with the US Dollar and US Treasuries, which are both major reserve and safe-haven assets. When the Dollar depreciates, Gold tends to rise, enabling investors and central banks to diversify their assets in turbulent times. Gold is also inversely correlated with risk assets. A rally in the stock market tends to weaken Gold price, while sell-offs in riskier markets tend to favor the precious metal.
What does the price of Gold depend on?
The price can move due to a wide range of factors. Geopolitical instability or fears of a deep recession can quickly make Gold price escalate due to its safe-haven status. As a yield-less asset, Gold tends to rise with lower interest rates, while higher cost of money usually weighs down on the yellow metal. Still, most moves depend on how the US Dollar (USD) behaves as the asset is priced in dollars (XAU/USD). A strong Dollar tends to keep the price of Gold controlled, whereas a weaker Dollar is likely to push Gold prices up.
Gold edged higher as traders await more clarity on the path of interest rates. Economists at MUFG Bank analyze the yellow metal’s outlook.
Lower rates are historically positive for non-interest bearing bullion
Investors have started buying Gold on expectations of the Fed’s rate-cutting cycle, which should see higher Gold prices, given that lower rates are historically positive for non-interest bearing bullion. That being said, swaps traders are still pricing little prospect of the Fed lowering borrowing costs before June, after recent data reaffirmed US exceptionalism.
We continue to believe that the short-term moves will remain tied to data potentially influencing Fed decision-making while downside to the price will be limited by robust support from the other two channels (supportive central bank demand and bullion’s role as the geopolitical hedge of last resort).
- EUR/USD rises even as Fed Minutes reflected concerns over premature interest-rate cuts.
- Eurozone, German PMI data for February suggest improving activity in the services sector, but manufacturing lags.
- The US Dollar loses ground despite expectations of higher prolonged policy rates.
- S&P US PMI data, weekly Initial Jobless Claims, and Existing Home Sales are due on Thursday.
The EUR/USD pair extends its winning streak for the seventh consecutive day on Thursday as the US Dollar (USD) weakens despite market expectations of prolonged higher interest rates by the Federal Reserve (Fed). The Federal Open Market Committee (FOMC) Minutes reflected policymakers' concerns about early interest rate cuts, suggesting that policy easing will not begin in the upcoming monetary meetings.
In Europe, Eurozone and German Purchasing Managers Index (PMI) data posted mixed figures for February. The preliminary Eurozone and German Services PMIs rose higher than the expected figures, while Manufacturing PMIs were weaker than market expectations. Traders’ focus shifts to the United States to observe S&P Global PMI figures, weekly Initial Jobless Claims, and Existing Home Sales later in the North American session.
The US Dollar Index (DXY) declines to 103.70, with the 2-year and 10-year yields on US bonds at 4.65% and 4.31%, respectively, at the time of writing. The FOMC Meeting Minutes for January emphasized the need for additional evidence of disinflation to mitigate concerns of upside inflation risks. This cautious stance comes after hot figures from the Consumer Price Index (CPI) and Producer Price Index (PPI) from January, along with robust employment data from February.
Daily digest market movers: EUR/USD extends gains amid mixed Eurozone, Germany PMI data
- German Services PMI improved to 48.2 in February, exceeding the market expectations of 48.0 and 47.7 prior.
- German Manufacturing PMI declined to 42.3 against the expected increase to 46.1 from the previous reading of 45.5.
- HCOB German Composite PMI decreased to 46.1 from the previous reading of 47.0.
- Eurozone Services PMI rose to 50 reading in February against the expected 48.8 and 48.4 prior.
- Eurozone Manufacturing PMI decreased to 46.1 against the expected increase to 47.0 from the previous reading of 46.6.
- HCOB Eurozone composite PMI improved to 48.9 against the expected 48.5 and 47.9 prior.
- According to the German Bundesbank Monthly Report, economists at Deutsche Bundesbank anticipate a general decline in the inflation rate in the upcoming months. The earlier timing of Easter this year compared to last year is expected to influence the prices of package holidays, consequently impacting the inflation rate.
- German Buba Monthly Report projected that inflation for food and other goods will likely decrease further in the coming months. However, price pressures in the services sector are expected to ease at a slower pace, primarily due to the sustained strength in wage growth.
- According to the CME FedWatch Tool, the probability of a Federal Reserve rate cut has notably decreased to 4.5% for March and to 29.8% for May. The tool indicates a slight decrease in the likelihood of a cut in June, with a probability of 52.2%, down from 53.3% previously. The probability of a rate cut has increased for July, rising to 37.4% from the previous 33.4%.
- S&P's analysis of the FOMC minutes suggests that inflation is expected to continue cooling in the upcoming months, despite ongoing uneven disinflationary trends. They maintain their outlook for monetary policy in 2024, expecting no changes. S&P predicts that the Federal Reserve will likely reduce its policy rate by 25 basis points at its June meeting, with further cuts totaling 75 basis points by the end of the year.
- Richmond Federal Reserve Bank President Thomas Barkin said that the United States still has "ways to go" to achieve a soft landing, Reuters reports. Barkin highlighted the overall positive trajectory of US data concerning inflation and employment. However, he noted that recent figures on the PPI and CPI have been less favorable, indicating a reliance on disinflation from goods. He suggested that the US is nearing the end of its inflation challenge, with the pressing question being the duration until resolution.
- The last Federal Reserve's dot plot for this year suggests an anticipation of 75 basis points in rate cuts, while the Fed funds futures market is pricing in approximately 89 basis points in cuts. Additionally, ANZ anticipates that the Federal Reserve (Fed) will commence rate cuts from July 2024.
Technical Analysis: EUR/USD hovers around the major level of 1.0850
EUR/USD trades near 1.0860 on Thursday, which is positioned above the immediate support of 1.0850 followed by a 23.6% Fibonacci retracement level of 1.0842 and the nine-4hour Exponential Moving Average (EMA) at 1.0829. A break below the latter could lead the EUR/USD pair to navigate towards the support region around the 38.2% Fibonacci retracement level at 1.0814 and the psychological level of 1.0800.
The 14-hour Relative Strength Index (RSI) is above the 50 level, suggesting bullish momentum. Additionally, the Moving Average Convergence Divergence (MACD) is positioned above both the centerline and the signal line, further confirming the bullish trend.
On the upside, the EUR/USD pair tests February’s high of 1.0897, which is aligned with the psychological level of 1.0900. A breakthrough above this psychological barrier could prompt the pair to explore the area around the 1.0950 level.
EUR/USD: 4-Hour Chart
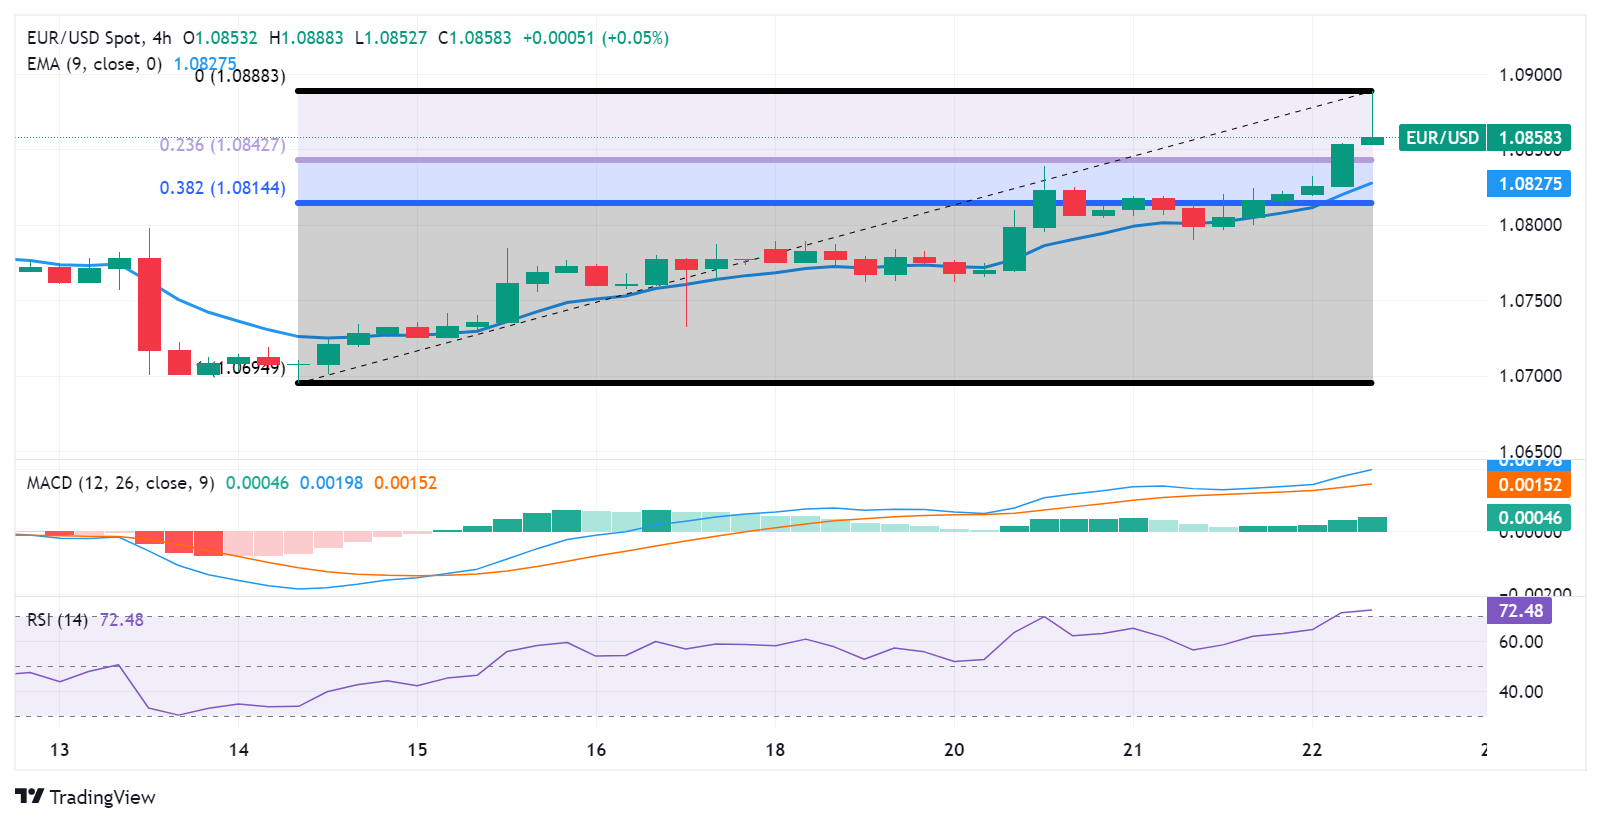
Euro price today
The table below shows the percentage change of Euro (EUR) against listed major currencies today. Euro was the strongest against the US Dollar.
| USD | EUR | GBP | CAD | AUD | JPY | NZD | CHF | |
| USD | -0.28% | -0.29% | -0.32% | -0.40% | -0.13% | -0.42% | -0.21% | |
| EUR | 0.28% | 0.01% | -0.06% | -0.12% | 0.17% | -0.10% | 0.09% | |
| GBP | 0.27% | -0.01% | -0.05% | -0.13% | 0.16% | -0.13% | 0.07% | |
| CAD | 0.31% | 0.06% | 0.05% | -0.07% | 0.22% | -0.06% | 0.13% | |
| AUD | 0.40% | 0.12% | 0.11% | 0.07% | 0.29% | 0.00% | 0.20% | |
| JPY | 0.13% | -0.16% | -0.18% | -0.21% | -0.31% | -0.29% | -0.07% | |
| NZD | 0.40% | 0.10% | 0.10% | 0.05% | -0.08% | 0.26% | 0.19% | |
| CHF | 0.22% | -0.07% | -0.07% | -0.11% | -0.19% | 0.09% | -0.18% |
The heat map shows percentage changes of major currencies against each other. The base currency is picked from the left column, while the quote currency is picked from the top row. For example, if you pick the Euro from the left column and move along the horizontal line to the Japanese Yen, the percentage change displayed in the box will represent EUR (base)/JPY (quote).
Euro FAQs
What is the Euro?
The Euro is the currency for the 20 European Union countries that belong to the Eurozone. It is the second most heavily traded currency in the world behind the US Dollar. In 2022, it accounted for 31% of all foreign exchange transactions, with an average daily turnover of over $2.2 trillion a day.
EUR/USD is the most heavily traded currency pair in the world, accounting for an estimated 30% off all transactions, followed by EUR/JPY (4%), EUR/GBP (3%) and EUR/AUD (2%).
What is the ECB and how does it impact the Euro?
The European Central Bank (ECB) in Frankfurt, Germany, is the reserve bank for the Eurozone. The ECB sets interest rates and manages monetary policy.
The ECB’s primary mandate is to maintain price stability, which means either controlling inflation or stimulating growth. Its primary tool is the raising or lowering of interest rates. Relatively high interest rates – or the expectation of higher rates – will usually benefit the Euro and vice versa.
The ECB Governing Council makes monetary policy decisions at meetings held eight times a year. Decisions are made by heads of the Eurozone national banks and six permanent members, including the President of the ECB, Christine Lagarde.
How does inflation data impact the value of the Euro?
Eurozone inflation data, measured by the Harmonized Index of Consumer Prices (HICP), is an important econometric for the Euro. If inflation rises more than expected, especially if above the ECB’s 2% target, it obliges the ECB to raise interest rates to bring it back under control.
Relatively high interest rates compared to its counterparts will usually benefit the Euro, as it makes the region more attractive as a place for global investors to park their money.
How does economic data influence the value of the Euro?
Data releases gauge the health of the economy and can impact on the Euro. Indicators such as GDP, Manufacturing and Services PMIs, employment, and consumer sentiment surveys can all influence the direction of the single currency.
A strong economy is good for the Euro. Not only does it attract more foreign investment but it may encourage the ECB to put up interest rates, which will directly strengthen the Euro. Otherwise, if economic data is weak, the Euro is likely to fall.
Economic data for the four largest economies in the euro area (Germany, France, Italy and Spain) are especially significant, as they account for 75% of the Eurozone’s economy.
How does the Trade Balance impact the Euro?
Another significant data release for the Euro is the Trade Balance. This indicator measures the difference between what a country earns from its exports and what it spends on imports over a given period.
If a country produces highly sought after exports then its currency will gain in value purely from the extra demand created from foreign buyers seeking to purchase these goods. Therefore, a positive net Trade Balance strengthens a currency and vice versa for a negative balance.
The Loonie’s dip versus the US Dollar (USD) has been smaller than any other G10 currency since the start of the week. Economists at ING analyze USD/CAD outlook.
CAD looks less attractive than its oil-peer NOK this year
It is now clear that markets see a very direct link between the Bank of Canada and Fed policy trajectory, and the pro-cyclical trades induced by softer US data often rewarded other high-beta G10 currencies (NOK, SEK, AUD, NZD) more than CAD.
We suspect today’s retail sales out of Canada won’t impact CAD as much as the upcoming US releases, which may remain the case as long as the USD retains its strength.
Ultimately, a USD decline and CAD’s rate attractiveness should send the pair back to 1.3000 by the second half of this year, but we still think the market is underpricing BoC easing, and CAD looks less attractive than its oil-peer NOK this year also from a valuation perspective.
- UK Manufacturing PMI rose to 47.1 in February, missing estimates of 47.5.
- Services PMI in the UK held steady at 54.3 in February, a positive surprise.
- GBP/USD holds gains near 1.2700 after mixed UK business PMIs.
The seasonally adjusted S&P Global/CIPS UK Manufacturing Purchasing Managers’ Index (PMI) improved slightly from 47.0 in January to 47.1 in February, below the market consensus of 47.5.
Meanwhile, the Preliminary UK Services Business Activity Index stayed unchanged at 54.3 in February, beating the consensus forecast of 54.1.
Commenting on the flash PMI data, Chris Williamson, Chief Business Economist at S&P Global Market Intelligence said: “UK economic growth has accelerated in February, with the early PMI survey data pointing to the largest rise in business activity for nine months. This is by no means a one-off improvement, as faster growth has now been recorded for four straight months after a brief spell of decline late last year.”
“The survey data point to the economy growing at a quarterly rate of 0.2-3% in the first quarter of 2024, allaying fears that last year's downturn will have spilled over into 2024 and suggesting that the UK’s ‘recession’ is already over,” Chris added.
FX implications
GBP/USD is consolidating the latest uptick to 1.2710 following the mixed UK PMI data. The pair is currently trading at 1.2692, adding 0.46% so far.
Pound Sterling price today
The table below shows the percentage change of Pound Sterling (GBP) against listed major currencies today. Pound Sterling was the strongest against the US Dollar.
| USD | EUR | GBP | CAD | AUD | JPY | NZD | CHF | |
| USD | -0.31% | -0.32% | -0.36% | -0.43% | -0.06% | -0.38% | -0.28% | |
| EUR | 0.29% | -0.04% | -0.08% | -0.15% | 0.22% | -0.09% | 0.01% | |
| GBP | 0.32% | 0.02% | -0.04% | -0.11% | 0.27% | -0.04% | 0.04% | |
| CAD | 0.33% | 0.06% | 0.04% | -0.07% | 0.31% | 0.00% | 0.12% | |
| AUD | 0.42% | 0.12% | 0.10% | 0.05% | 0.37% | 0.06% | 0.13% | |
| JPY | 0.07% | -0.24% | -0.30% | -0.30% | -0.39% | -0.32% | -0.18% | |
| NZD | 0.38% | 0.07% | 0.03% | 0.00% | -0.06% | 0.31% | 0.11% | |
| CHF | 0.25% | -0.05% | -0.07% | -0.12% | -0.18% | 0.20% | -0.11% |
The heat map shows percentage changes of major currencies against each other. The base currency is picked from the left column, while the quote currency is picked from the top row. For example, if you pick the Euro from the left column and move along the horizontal line to the Japanese Yen, the percentage change displayed in the box will represent EUR (base)/JPY (quote).
The stand-out funding currency, the Japanese Yen (JPY), is the worst performer at -6% year-to-date versus the US Dollar (USD). Economists at ING analyze USD/JPY outlook.
Under-valued, but weighed by the carry trade
We cannot see the low volatility/carry friendly environment turning anytime soon, suggesting the Yen stays weak. However, we now think that the JPY is close to 15% under-valued on our medium-term fair value models.
A substantial turn lower in the USD/JPY probably requires a turn in the broad Dollar trend, something we look for late in the second quarter. Should USD/JPY make it into the 155.00/160.00 area beforehand, we would see that as a good medium-term level for corporates to ratchet higher their USD receivables/JPY payables hedging plans.
- Eurozone Manufacturing PMI dropped to 46.1 in February, missing estimates of 47.0
- Bloc’s Services PMI returned to expansion in February at 50.0 vs. 48.8 anticipated.
- EUR/USD stays directed toward 1.0900 after German, Eurozone PMI data.
The Eurozone manufacturing sector activity contracted further but the services sector returned to expansion in February, the latest figures from the HCOB's latest purchasing managers index survey showed Thursday.
The Eurozone Manufacturing Purchasing Managers Index (PMI) arrived at 46.1 in February, as against the expectation of 47.0 and the 46.6 seen in January. The index fell to a two-month low.
The bloc’s Services PMI rose to 50.0 in February from 48.4 in January, clinching a fresh seven-month high while beating the estimate of 48.8.
The HCOB Eurozone PMI Composite advanced to 48.9 in February vs. 48.5 expected and January’s 47.9 figure. The index hit an eight-month top.
FX implications
EUR/USD is consolidating gains to near 1.0970 after mixed Eurozone PMIs. The spot is up 0.44% on the day, at the press time.
Euro price today
The table below shows the percentage change of Euro (EUR) against listed major currencies today. Euro was the strongest against the US Dollar.
| USD | EUR | GBP | CAD | AUD | JPY | NZD | CHF | |
| USD | -0.42% | -0.48% | -0.34% | -0.47% | -0.06% | -0.44% | -0.40% | |
| EUR | 0.42% | -0.07% | 0.04% | -0.06% | 0.37% | -0.01% | 0.03% | |
| GBP | 0.48% | 0.07% | 0.12% | 0.01% | 0.43% | 0.06% | 0.09% | |
| CAD | 0.34% | -0.05% | -0.11% | -0.11% | 0.32% | -0.06% | -0.02% | |
| AUD | 0.48% | 0.06% | 0.00% | 0.13% | 0.42% | 0.05% | 0.08% | |
| JPY | 0.06% | -0.36% | -0.44% | -0.29% | -0.44% | -0.37% | -0.32% | |
| NZD | 0.43% | 0.01% | -0.06% | 0.06% | -0.05% | 0.37% | 0.04% | |
| CHF | 0.40% | -0.02% | -0.09% | 0.04% | -0.08% | 0.33% | -0.04% |
The heat map shows percentage changes of major currencies against each other. The base currency is picked from the left column, while the quote currency is picked from the top row. For example, if you pick the Euro from the left column and move along the horizontal line to the Japanese Yen, the percentage change displayed in the box will represent EUR (base)/JPY (quote).
- S&P Global PMIs are expected to indicate business activity in the US continued to expand in February.
- Manufacturing and Services output seen advancing at a moderate pace.
- EUR/USD stuck around 1.0800, signs of buyers losing interest.
S&P Global will release the flash estimates of the United States (US) Purchasing Managers Indexes (PMIs) on Thursday, a survey that measures business activity throughout the month. The report is divided into services and manufacturing output and compiled in a final figure, the Composite PMI.
The economic activity in the US private sector expanded at a modest pace in January, with the S&P Global Composite PMI reaching 52.0, following a bounce in manufacturing output to 50.7. At the same time, the services index reached 52.5.
Manufacturing has been lagging behind, although the latest reading has been quite encouraging, as it showed improvement in the sector’s health for the first time since April 2023. The official report notes: “Overall growth was supported by a return to expansion in new orders and a slower contraction in output. Production was reportedly hampered, however, by a renewed decline in supplier performance and longer input deliveries. Greater transportation costs pushed input prices higher on the month, with cost inflation hitting a nine-month high. In response, firms hiked their selling prices at the fastest rate since April 2023.”
The US economy is in expansion mode, which means the country will likely dodge a recession and even a soft landing. But this could come at the cost of higher inflation, which may prompt the Federal Reserve (Fed) into additional tightening. In such a case, higher rates will increase the risk of an economic setback.
The US Fed paused monetary tightening in the last quarter of 2023, and market participants rushed to price in upcoming rate cuts. The odds centered in March as policymakers continued to deliver the “higher-for-longer” message. However, the late January Fed monetary policy meeting and hotter-than-anticipated inflation in January convinced investors that policymakers won’t rush into loosening the monetary policy. At the time being, the first rate cut is more likely to take place in June.
What to expect from the next S&P Global PMI report?
The February S&P Global Manufacturing PMI is foreseen at 50.5, ticking modestly lower from the previous 50.7, although holding within expansionary levels. The same situation is expected around services output, as the index is expected at 52.0, easing from 52.5 in January.
As long as the readings remain above 50.0, the impact of a decline should be limited. However, a slump below the line that separates expansion and contraction could revive speculation of a Fed rate cut amid renewed recession-related concerns. That could spur optimism for risk assets and weigh on the US Dollar.
On the contrary, stronger-than-anticipated figures will give the Fed more time to hold rates unchanged and assess more data before deciding on a monetary policy change.
When will February flash US S&P Global PMIs be released and how could they affect EUR/USD?
The S&P Global PMI report will be released this Thursday at 14:45 GMT. Ahead of the event, the US Dollar has been trimming panic-related gains, with EUR/USD currently trading at around 1.0800. The pair collapsed to 1.0694 in mid-February following the release of the January US Consumer Price Index (CPI), which surpassed market expectations, but as market players assumed that a Fed’s rate cut would be more likely for June, the sentiment began improving.
Tepid European data, however, has limited the bullish potential of the Euro, which anyway advanced against its American rival.
Valeria Bednarik, Chief Analyst at FXStreet, said: “The EUR/USD pair has reached a three-week peak at 1.0839, but it is clear that selling around the 1.0800 level is strong, as gains beyond it have been quickly reverted in the last two weeks. Market players are waiting for a solid catalyst that the market is failing to provide.” Furthermore, she adds: “The ongoing recovery seems corrective. EUR/USD hovers around the 23.6% Fibonacci retracement of the 1.1139-1.0694 decline at 1.0799. The next Fibonacci resistance level falls at 1.0864, a level the pair needs to reconquer to encourage buyers.”
Bednarik also notes: “Technical readings in the daily chart support the corrective case, and even suggest the pair may resume its slide in the near term. Technical indicators are retreating after failing to overcome their midlines, heading south with uneven strength. Also, the pair is battling around the converging 20 and 100 Simple Moving Averages (SMAs), which stand alongside the aforementioned Fibonacci level. Support comes at 1.0770 and 1.0720, with a break below the latter opening the door for a fresh 2024 low.”
USD losses so far this week warrant attention as some currencies are starting the threaten the weak trend in place since the start of the year.
– ScotiabankEconomic Indicator
United States S&P Global Composite PMI
The S&P Global Composite Purchasing Managers Index (PMI), released on a monthly basis, is a leading indicator gauging US private-business activity in the manufacturing and services sector. The data is derived from surveys to senior executives. Each response is weighted according to the size of the company and its contribution to total manufacturing or services output accounted for by the sub-sector to which that company belongs. Survey responses reflect the change, if any, in the current month compared to the previous month and can anticipate changing trends in official data series such as Gross Domestic Product (GDP), industrial production, employment and inflation. The index varies between 0 and 100, with levels of 50.0 signaling no change over the previous month. A reading above 50 indicates that the private economy is generally expanding, a bullish sign for the US Dollar (USD). Meanwhile, a reading below 50 signals that activity is generally declining, which is seen as bearish for USD.
Read more.Next release: 02/21/2024 14:45:00 GMT
Frequency: Monthly
Source: S&P Global
The UK PMIs are also on the agenda today. Economists at Commerzbank analyze how the figures could impact the Pound Sterling (GBP).
PMIs likely to confirm the BoE
Although the PMIs are only one indicator of economic development, the BoE could nevertheless feel vindicated by today's figures to wait a few more months to see whether inflation really does return to target on a sustained basis. Especially since the seasonally adjusted monthly rates of change in the core rate were recently still at the upper end of the G10 spectrum and the BoE expects inflation to fall briefly to the target in the second quarter, but then rise again.
As a result, today's figures – provided they are not significantly weaker than expected – could confirm market expectations of initial interest rate cuts from August onwards and thus keep the Pound somewhat supported.
EUR/USD races higher ahead of PMI data. Economists at Commerzbank analyze the pair’s outlook.
Different EUR/USD outlook today?
In the Eurozone, PMIs are on the agenda and our economists expect the services PMI to come in slightly above the Bloomberg consensus. We also expect the index for the manufacturing sector to be higher than the consensus. For the time being, this argues for a stronger Euro against the USD than we have seen recently.
In addition, slightly weaker figures are expected from the US. The PMIs there would still be clearly in expansionary territory, but the slight upward trend would also come to a halt for the time being. Moreover, initial jobless claims are expected to rise slightly. This would certainly not be the end of the great US growth story, but after all the recent positive surprises, it may also be a sign that things are not going to get better forever.
Of course, it has to be said that PMIs in particular often have to be viewed with a high degree of uncertainty. There are often significant surprises, which ultimately determine market movements. However, if the figures are roughly in line with expectations and our economists are correct in their assessment, then things should not look too bad for the Euro today. On the other hand, if the US data casts even the slightest doubt on the current strong growth story, EUR/USD could rise further today.
- Germany’s Manufacturing PMI dropped to 42.3 in February vs. the forecast of 46.1.
- Services PMI for the German economy rose to 48.2 in February vs. 48.0 expected.
- EUR/USD keeps gains above 1.0850 after mixed German PMIs.
Germany’s manufacturing sector contraction unexpectedly deepened in February while the services sector activity improved, according to the preliminary business activity report from the HCOB survey published on Thursday.
The HCOB Manufacturing PMI in the Eurozone’s economic powerhouse declined to 42.3 this month, as against the 46.1 expected and January’s 45.5. The index hit the lowest level in four months.
Meanwhile, Services PMI rose from 47.7 in January to 48.2 in February. The market expectations were for a 48.0 print in the reported period. The measure touched a fresh two-month high.
The HCOB Preliminary German Composite Output Index came in at 46.1 in February vs. 47.5 expected and 47.0 previous reading. The gauge tumbled to a four-month low.
FX implications
EUR/USD failed to react to the mixed German data. The pair is trading 0.45% higher on the day at 1.0865, as of writing.
Euro price today
The table below shows the percentage change of Euro (EUR) against listed major currencies today. Euro was the strongest against the US Dollar.
| USD | EUR | GBP | CAD | AUD | JPY | NZD | CHF | |
| USD | -0.45% | -0.45% | -0.43% | -0.59% | -0.12% | -0.57% | -0.45% | |
| EUR | 0.41% | -0.04% | -0.04% | -0.19% | 0.28% | -0.15% | -0.04% | |
| GBP | 0.48% | 0.05% | 0.02% | -0.14% | 0.33% | -0.11% | 0.02% | |
| CAD | 0.42% | 0.03% | 0.00% | -0.15% | 0.31% | -0.12% | 0.01% | |
| AUD | 0.58% | 0.14% | 0.14% | 0.15% | 0.47% | 0.03% | 0.14% | |
| JPY | 0.11% | -0.31% | -0.36% | -0.30% | -0.51% | -0.46% | -0.29% | |
| NZD | 0.56% | 0.15% | 0.11% | 0.12% | -0.03% | 0.43% | 0.13% | |
| CHF | 0.42% | -0.02% | -0.03% | -0.01% | -0.17% | 0.30% | -0.14% |
The heat map shows percentage changes of major currencies against each other. The base currency is picked from the left column, while the quote currency is picked from the top row. For example, if you pick the Euro from the left column and move along the horizontal line to the Japanese Yen, the percentage change displayed in the box will represent EUR (base)/JPY (quote).
- Silver gains strong positive traction on Thursday and climbs back closer to the 100-day SMA barrier.
- The technical setup favours bullish traders and supports prospects for a further appreciating move.
- A sustained move and acceptance below $22.00 is needed to negate the near-term positive bias.
Silver (XAG/USD) builds on the overnight bounce from the 200-hour Simple Moving Average (SMA) support near the $22.75 area, or the weekly low and gains strong positive traction on Thursday. The momentum remains unabated through the first half of the European session and lifts the white metal to the $23.10-$23.15 region.
From a technical perspective, the XAG/USD is currently placed just below the 100-day SMA, which is closely followed by the very important 200-day SMA hurdle near the $23.30-$23.35 zone and the monthly peak, around mid-$23.00 touched last week. A sustained strength beyond the latter will be seen as a fresh trigger for bullish traders and pave the way for the resumption of last week's strong move up from sub-$22.00 levels.
Given that oscillators on the daily chart have just started gaining positive traction, the XAG/USD might then aim to reclaim the $24.00 round figure. The momentum could extend further and allow the white metal to climb towards the next relevant hurdle near the $24.50-$24.60 region en route to the $25.00 psychological mark.
On the flip side, the overnight swing low, around the $22.75 region, now seems to protect the immediate downside ahead of the mid-$22.00s and the $22.30 horizontal support. Some follow-through selling might expose the $22.00 mark. Acceptance below a two-month low, around the $21.90-$21.85 zone touched in January, will be seen as a fresh trigger for bearish traders and make the XAG/USD vulnerable to test the $21.40-$21.35 support.
The subsequent decline has the potential to drag the XAG/USD further below the $21.00 round-figure mark, towards retesting the October monthly swing low near the $20.70-$20.65 region.
Silver daily chart
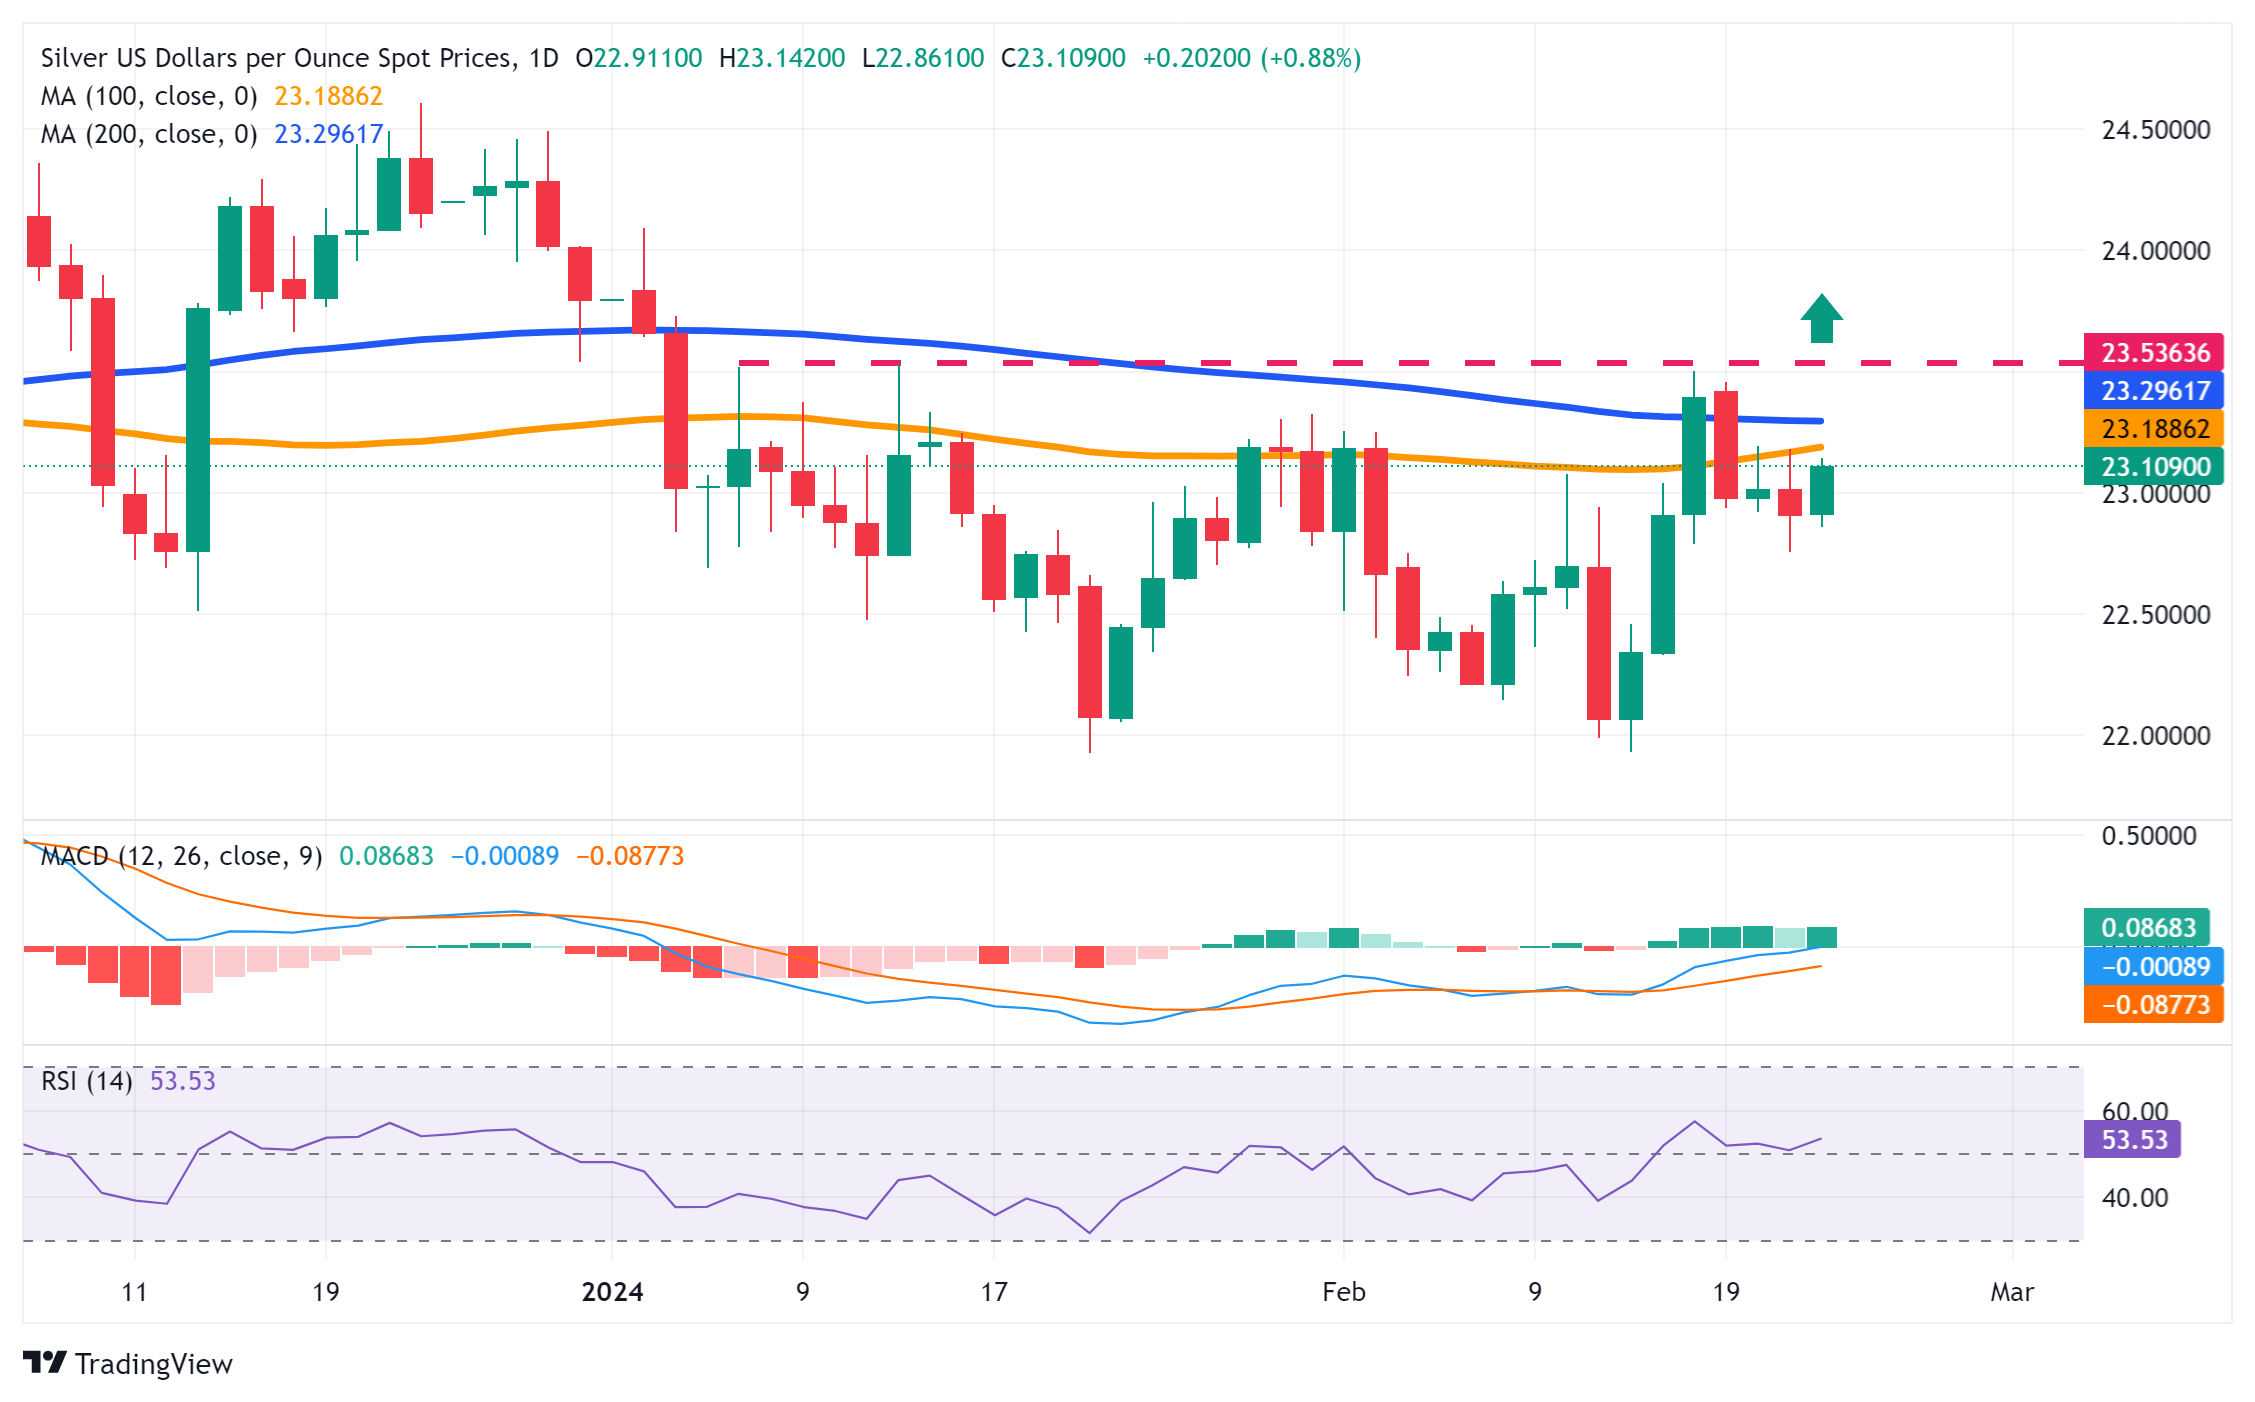
Technical levels to watch
- USD/CAD tumbles to 1.3450 as higher risk appetite strengthens the appeal of risk-sensitive assets.
- The US Dollar fails to capitalize on hawkish FOMC minutes.
- Investors await further guidance from the US preliminary S&P Global PMI and Canadian Retail Sales data.
The USD/CAD pair slides to near 1.3450 in the London session on Thursday as the outlook for risk-perceived assets has turned bullish. The Loonie asset weakens as the US Dollar is facing an intense sell-off despite easing hopes of rate cuts by the Federal Reserve (Fed) before the June monetary policy meeting.
S&P500 futures have posted stellar gains in the European session, portraying cheerful market sentiment. The US Dollar Index, which gauges the Greenback’s value against six rival currencies, refreshes a two-week low near 103.70. 10-year US Treasury yields have dropped to 4.31%.
The US Dollar failed to rebound even though the Federal Open Market Committee (FOMC) minutes for the January policy meeting, released on Wednesday, indicated that policymakers are not interested in reducing interest rates too soon. Most Fed policymakers are still not convinced that inflation will sustainably return to the 2%.
Meanwhile, investors await the preliminary S&P Global PMI data for February, which will be published at 14:45 GMT. The Manufacturing PMI is forecasted to decrease to 50.5 from 50.7 in January. The Services PMI that represents the service sector, which accounts for two-thirds of the United States economy, is expected to release at 52.0, lower than the prior reading of 52.5.
On the Canadian Dollar front, investors await the Retail Sales data for December, which will be published at 13:30 GMT. Investors anticipate monthly Retail Sales rose by 0.8% after contracting 0.2% in November. In the same period, Retail Sales excluding autos are anticipated to have risen by 0.7% against a decline of 0.5%. An upbeat Retail Sales data would push back hopes of rate cuts by the Bank of Canada (BoC).
The US Dollar Index has dipped below 104.00. Economists at ING analyze DXY’s outlook.
DXY to trade in tight/slightly softer ranges barring a big jump in US initial claims
For today, we note the slightly better investment environment propelled by stellar earnings from Nvidia. We note here as well that Japan and Korea have high-end chip industries too and suspect that the Yen and Won will be a lot stronger later this year.
Barring a a big jump in US initial claims today expect DXY to trade in tight/slightly softer ranges and the bigger impetus to come out of Europe today.
DXY is currently on support at 103.80 and were European PMIs to surprise on the upside, 103.30 could be the risk today.
FX option expiries for Feb 22 NY cut at 10:00 Eastern Time, via DTCC, can be found below.
- EUR/USD: EUR amounts
- 1.0625 373m
- 1.0750 1.2b
- 1.0770 1.7b
- 1.0900 1.1b
- 1.0915 491m
- GBP/USD: GBP amounts
- 1.2805 703m
- USD/CHF: USD amounts
- 0.8640 910m
- USD/CAD: USD amounts
- 1.3470 509m
- 1.3500 850m
EUR/USD has been doing a little better, largely on the back of a better investment environment. Economists at ING analyze the pair’s outlook.
PMIs and ECB minutes in focus
The highlight of today's session will be the release of European PMIs. A modest uptick here is expected today, but unless the Eurozone composite PMI can make a run at the 50 level, we doubt EUR/USD will get too much joy from the release.
Equally, we doubt that the release of the European Central Bank (ECB) minutes will move the needle on market pricing of around 100 bps in ECB rate cuts this year. For reference, our economists are only looking for 75 bps of easing.
EUR/USD is currently breaking above short-term resistance and looks like it wants to test the 1.0865/1.0900 area, but the case for any higher levels is yet to be made.
- Pound Sterling aims to recapture weekly highs as the appeal for risk-perceived assets improves.
- BoE Dhingra’s comments on the interest rate outlook were dovish due to the poor UK economic outlook.
- The preliminary S&P Global/CIPS PMI data will provide fresh guidance on the economic outlook.
The Pound Sterling (GBP) marches toward weekly highs in Thursday’s European session as the market sentiment remains upbeat. The GBP/USD pair extends its upside even though Bank of England (BoE) policymaker Swati Dhingra cautioned about downside risks to the United Kingdom economy due to high interest rates.
In her speech at the Market News International Connect event on Wednesday, Dhingra said the demand prospects are “weak and less resilient” than their previous forecasts. She added that higher mortgage costs and rental prices in 2023 shortened households’ pockets, which resulted in weak Retail Sales.
Usually, the Pound Sterling faces foreign outflows when a BoE policymaker warns about holding interest rates higher for a longer duration because it increases the possibility of interest rate cuts.
Meanwhile, investors await February’s preliminary S&P Global PMI data for both the United Kingdom and the United States, which will provide more insights into the economic outlook.
Daily digest market movers: Pound Sterling rises while USD Index refreshes two-week low
- The Pound Sterling rises toward a weekly high near 1.2670 as the risk appetite of investors has improved.
- The appeal for risk-sensitive assets strengthens as the Federal Open Market Committee (FOMC) minutes for the January monetary policy meeting, which were released on Wednesday, were largely in line with expectations.
- This has limited the upside of the US dollar. The US Dollar Index, which gauges the value of the US Dollar against six major currencies, has printed a fresh two-week low slightly below 103.80.
- On the domestic front, the Pound Sterling advances despite the fact that Bank of England policymaker Swati Dhingra warned about the increasing cost of living standards in the United Kingdom due to the maintenance of interest rates at 5.25% for a longer period.
- Swati Dhingra, who voted for a rate cut in February’s monetary policy meeting, warned about a hard landing if the BoE delays rate cuts.
- While most BoE policymakers closely track service inflation and wage growth for cues about the inflation outlook, Swat Dhingra said service prices are not a good measure of domestically generated inflation.
- Meanwhile, market expectations for BoE rate cuts are slightly up after BoE Governor Andrew Bailey said the central bank can reduce interest rates before inflation reaches the 2% target.
- In Thursday’s session, investors will focus on the preliminary S&P Global/CIPS PMI data for February, which will be published at 09:30 GMT.
- The Manufacturing PMI is anticipated to remain below the 50.0 threshold at 47.5, higher than the former reading of 47.0.
- The Services PMI, which represents the service sector, is expected to stand at 54.1, lower than the prior reading of 54.3.
Technical Analysis: Pound Sterling approaches 1.2670
The Pound Sterling extends its winning spell to a third trading session on Thursday. The GBP/USD pair is approaching the weekly high at 1.2670. The overall trend remains sideways as the pair oscillates in the Descending Triangle pattern formed on the daily time frame.
The aforementioned chart pattern indicates a sharp volatility contraction. The chart formation carries a slightly negative bias due to the establishment of lower highs. The downward-sloping border of the Descending Triangle pattern is plotted from December 28 high at 1.2827, while the horizontal support is placed from December 13 low near 1.2500.
The pair has climbed above the 20-day and 50-day Exponential Moving Averages (EMAs), which are closely trading near 1.2630. Meanwhile, the 14-period Relative Strength Index (RSI) trades in the 40.00-60.00 region, indicating indecisiveness among market participants.
Pound Sterling FAQs
What is the Pound Sterling?
The Pound Sterling (GBP) is the oldest currency in the world (886 AD) and the official currency of the United Kingdom. It is the fourth most traded unit for foreign exchange (FX) in the world, accounting for 12% of all transactions, averaging $630 billion a day, according to 2022 data.
Its key trading pairs are GBP/USD, aka ‘Cable’, which accounts for 11% of FX, GBP/JPY, or the ‘Dragon’ as it is known by traders (3%), and EUR/GBP (2%). The Pound Sterling is issued by the Bank of England (BoE).
How do the decisions of the Bank of England impact on the Pound Sterling?
The single most important factor influencing the value of the Pound Sterling is monetary policy decided by the Bank of England. The BoE bases its decisions on whether it has achieved its primary goal of “price stability” – a steady inflation rate of around 2%. Its primary tool for achieving this is the adjustment of interest rates.
When inflation is too high, the BoE will try to rein it in by raising interest rates, making it more expensive for people and businesses to access credit. This is generally positive for GBP, as higher interest rates make the UK a more attractive place for global investors to park their money.
When inflation falls too low it is a sign economic growth is slowing. In this scenario, the BoE will consider lowering interest rates to cheapen credit so businesses will borrow more to invest in growth-generating projects.
How does economic data influence the value of the Pound?
Data releases gauge the health of the economy and can impact the value of the Pound Sterling. Indicators such as GDP, Manufacturing and Services PMIs, and employment can all influence the direction of the GBP.
A strong economy is good for Sterling. Not only does it attract more foreign investment but it may encourage the BoE to put up interest rates, which will directly strengthen GBP. Otherwise, if economic data is weak, the Pound Sterling is likely to fall.
How does the Trade Balance impact the Pound?
Another significant data release for the Pound Sterling is the Trade Balance. This indicator measures the difference between what a country earns from its exports and what it spends on imports over a given period.
If a country produces highly sought-after exports, its currency will benefit purely from the extra demand created from foreign buyers seeking to purchase these goods. Therefore, a positive net Trade Balance strengthens a currency and vice versa for a negative balance.
Economists at Rabobank have edged up their 12-month NZD/USD forecast to 0.6500.
RBNZ policy will be slow to remove policy restrictions
We have tweaked our NZD/USD forecasts, revising our 1-and-3-month forecasts to 0.6100 and 0.6200 respectively from 0.6000.
While the NZD would likely sell-off on a steady policy announcement next week, downside potential for the Kiwi should be limited by the perception that the RBNZ policy will be slow to remove policy restrictions.
On the view that the RBNZ will lag the Fed’s first rate cut announcement, we see scope for NZD/USD to push higher to 0.6500 on a 12-month view.
Here is what you need to know on Thursday, February 22:
The US Dollar came lost its traction during the Asian trading hours on Thursday and declined below 104.00, pressured by the improving risk sentiment. HCOB Manufacturing and Services PMIs for Germany and the Eurozone, S&P Global/CIPS PMIs for the UK and the S&P Global PMIs for the US will be watched closely by participants.
In the minutes of the January policy meeting, the Federal Reserve said that most policymakers noted the risks associated with moving too quickly to ease the policy and emphasized the importance of carefully assessing incoming data in judging whether inflation is moving down sustainably to 2%. "Officials highlighted uncertainty around how long the restrictive policy stance would be needed," the publication further noted. Although the USD edged higher with the immediate reaction, it erased its gains as risk flows started to dominate the financial markets toward the end of the day. Early Thursday, Nasdaq futures are up more than 1.5% on the back of upbeat Nvidia earnings figures. Meanwhile, the benchmark 10-year US Treasury bond yield holds steady at around 4.3% after rising modestly on Wednesday.
US Dollar price this week
The table below shows the percentage change of US Dollar (USD) against listed major currencies this week. US Dollar was the weakest against the New Zealand Dollar.
| USD | EUR | GBP | CAD | AUD | JPY | NZD | CHF | |
| USD | -0.54% | -0.36% | -0.14% | -0.62% | 0.08% | -1.18% | -0.42% | |
| EUR | 0.54% | 0.19% | 0.40% | -0.07% | 0.62% | -0.63% | 0.12% | |
| GBP | 0.36% | -0.18% | 0.23% | -0.26% | 0.41% | -0.82% | -0.07% | |
| CAD | 0.14% | -0.40% | -0.21% | -0.49% | 0.20% | -1.03% | -0.29% | |
| AUD | 0.64% | 0.09% | 0.28% | 0.50% | 0.69% | -0.53% | 0.21% | |
| JPY | -0.07% | -0.62% | -0.40% | -0.19% | -0.73% | -1.24% | -0.49% | |
| NZD | 1.17% | 0.63% | 0.81% | 1.03% | 0.55% | 1.23% | 0.74% | |
| CHF | 0.43% | -0.11% | 0.07% | 0.28% | -0.19% | 0.48% | -0.74% |
The heat map shows percentage changes of major currencies against each other. The base currency is picked from the left column, while the quote currency is picked from the top row. For example, if you pick the Euro from the left column and move along the horizontal line to the Japanese Yen, the percentage change displayed in the box will represent EUR (base)/JPY (quote).
EUR/USD gathered bullish momentum and climbed toward 1.0850 early Thursday, toughing its highest level in nearly three weeks in the process. PMI surveys from the Euro area and Germany are forecast to show an ongoing contraction in private sector's business activity in early February.
GBP/USD continued to push higher after closing the previous two days in positive territory and was last seen trading a few pips above 1.2650.
The data from Australia showed on Thursday that Judo Bank Composite PMI improved to 51.8 in February's flash estimate from 49 in January, highlighting a pickup of growth momentum in the private sector. AUD/USD gained traction after this data and advanced toward 0.6600.
Jibun Bank Services PMI edged lower to 52.5 from 53.1 in Japan while the Manufacturing PMI declined to 47.2 from 48. Despite the broad USD weakness, USD/JPY holds relatively stable above 150.00 after weak PMI readings.
USD/CAD registered small losses on Wednesday before declining sharply toward 1.3450 area in the Asian session on Thursday. Statistics Canada will release Retail Sales data for December later in the day.
Gold failed to benefit from the selling pressure surrounding the USD and closed virtually unchanged on Wednesday. Although XAU/USD clings to small gains at around $2,030 early Thursday, the resilience of US Treasury bond yields caps the pair's upside.
- EUR/GBP edges higher after BoE’s Dhingra advocated for rate cuts.
- Euro could experience pressure as a result of market caution stemming from diminishing expectations of reducing borrowing costs globally.
- Thursday brings PMI data from the United Kingdom and the Eurozone.
EUR/GBP recovers its recent losses on Thursday, trading higher around 0.8570 during the Asian session. On Wednesday, Swati Dhingra, a member of the Bank of England (BoE), suggested that delaying interest rate cuts could lead to increased living costs and potentially result in a harsh economic downturn for the United Kingdom (UK). Dhingra reiterated her argument in favor of implementing rate cuts.
BoE Governor Andrew Bailey addressed the United Kingdom Parliament on Tuesday, noting the rapid decrease in inflation in the UK. He emphasized that the central bank doesn't necessitate a definitive return of inflation to target levels before contemplating interest rate cuts. Additionally, BoE Deputy Governor Ben Broadbent highlighted that wage growth and services inflation both exceed the rate, suggesting alignment with sustainable inflation at 2%.
The Euro faced pressure, likely due to market caution amidst reduced expectations for early interest rate cuts globally. However, China's decision to reduce its five-year Loan Prime Rate (LPR) by 25 basis points (bps) to bolster its economy may offer some support for the Euro, considering the commodities' exports from the Eurozone to China.
Meanwhile, the seasonal and non-seasonal adjusted ECB Current Account improved in December compared to the previous month. Additionally, ECB Negotiated Wage Rates (QoQ) increased in the fourth quarter of 2023. ECB President Christine Lagarde recently emphasized wages as "an increasingly important driver of inflation dynamics in the coming quarters."
Traders are likely preparing for potential volatility surrounding the upcoming release of Purchasing Managers Index (PMI) data from both the Eurozone and the United Kingdom, scheduled for Thursday.
- EUR/JPY attracts some buyers near 162.80 in Thursday’s early European session.
- Japanese authorities came with a verbal intervention, which might lift the JPY.
- ECB’s Wunsch said the ECB may not cut the interest rate as quickly as some expect.
The EUR/JPY cross gains momentum for the third consecutive week during the early European trading hours on Thursday. However, the potential intervention in the market by the Japanese authorities might boost the Japanese Yen (JPY) and cap the upside of the EUR/JPY cross. At press time, EUR/JPY is trading at 162.80, gaining 0.19% on the day.
On Thursday, Japanese Finance Minister Shunichi Suzuki and Bank of Japan (BoJ) Governor Kazuo Ueda made a verbal intervention, saying that they will monitor the foreign exchange moves with a high sense of urgency. This, in turn, might lift the JPY for the time being. Apart from this, the ongoing geopolitical tensions in the Middle East might support safe-haven assets like the Japanese Yen.
On the Euro front, European Central Bank (ECB) Governing Council member Pierre Wunsch said that the ECB may not cut the interest rate as quickly as some expect. Investors increased their bet on an ECB rate cut as soon as April, but many policymakers signaled that the June meeting looks more likely as additional data will be available then.
Traders will monitor the preliminary HCOB PMI from Germany and the Eurozone for February. Also, the Consumer Price Index (CPI) from Italy and the Eurozone will be released. On Friday, the German Gross Domestic Product (GDP) for Q4 will be published. Market players will take cues from the data and find trading opportunities around the EUR/JPY cross.
Japanese Finance Minister Shunichi Suzuki said on Thursday that he is “closely watching FX moves with a high sense of urgency.”
Additional takeaways
FX rates set by markets reflecting various factors.
Important for currencies to move in stable manner reflecting fundamentals.
There is no 'defense line' in FX.
Need to focus on volatility or fluctuations, when asked about weak Yen.
- USD/CHF extends losses for the third successive session on Thursday.
- The higher January’s US CPI and PPI data prompts the Fed to prolong elevated borrowing costs.
- SNB is expected to policy easing cycle from March as the country’s inflation drops.
USD/CHF continues to lose ground for the third consecutive session on Thursday. The decline in the US Dollar (USD) contributes to undermining the USD/CHF pair, trading around 0.8780 during the Asian hours on Thursday.
The Federal Open Market Committee (FOMC) Minutes revealed policymakers' apprehension regarding the timing of interest rate cuts, suggesting that policy easing will not commence in the upcoming monetary meetings. This stance may be influenced by the higher Consumer Price Index (CPI) and Producer Price Index (PPI) figures from January, along with robust February employment data.
Market participants have largely abandoned expectations for any interest rate cuts in March and May, but they persist in speculating that the first cut will occur in June. According to the CME FedWatch Tool, there's a 52.2% probability of a 25 basis points (bps) rate reduction in June.
On the Swiss side, the market anticipates that the Swiss National Bank (SNB) will commence a rate-cut cycle starting from March. This expectation arises as the country's inflation has decreased despite market forecasts of higher prices. The decline in inflation could be attributed to the phasing out of electricity subsidies and the restructuring of value-added tax policies.
The Swiss Franc (CHF) received upward support from favorable Swiss Trade Balance figures. The report showed a substantial increase in January’s trade surplus. Furthermore, SNB increased its foreign exchange reserves for the second successive month in January. The Federal Statistical Office of Switzerland is set to release the Employment Level for the fourth quarter of 2023 on Friday.
- GBP/USD holds positive ground near 1.2640 on the softer US Dollar (USD).
- The pair maintains a bullish outlook above the key EMA; RSI indicator stands above the 50 midlines.
- The first resistance level will emerge at 1.2658; the initial support level is seen at 1.2624.
The GBP/USD pair trades on a stronger note below the mid-1.2600s during the early European section on Thursday. Investors await the UK S&P Global/CIPS PMI report for February. The manufacturing PMI figure is expected to improve to 47.5 in February from 47.0 in January, while the Services PMI figure is projected to drop to 54.1 in January versus 54.3% prior. At press time, GBP/USD is trading at 1.2640, up 0.06% on the day.
From a technical perspective, GBP/USD remains in a bullish mood as the pair is above the 100-period Exponential Moving Average (EMA) on the four-hour chart. Additionally, the Relative Strength Index (RSI) lies above the 50 midlines, supporting the upward momentum for the pair.
The first upside barrier for the major pair will emerge around the upper boundary of the Bollinger Band at 1.2660. A decisive break above this level will pave the way to a high of February 20 at 1.2688. Further north, the next hurdle is located at a high of January 30 at 1.2721, en route to a high of January 31 at 1.2750.
On the downside, the initial support level for GBP/USD is seen at the 100-period EMA at 1.2624. The key contention level to watch is the confluence of the psychological round mark and a low of February 21 at the 1.2600–1.2605 region. A breach of this level will see a drop to the lower limit of the Bollinger Band at 1.2575, followed by a low of December 11 at 1.2535.
GBP/USD four-hour chart
-638441756347779150.png)
Bank of Japan (BoJ) Governor Kazuo Ueda said on Thursday that “Japan's trend inflation heightening, will make appropriate monetary policy decision.”
Additional quotes
Service prices continue to rise moderately.
Expect positive cycle to strengthen in which tight labor market leads to higher wages, household income.
Desirable for FX to move stably reflecting fundamentals.
Won't comment on FX levels.
FX rates move on various factors.
Desirable for FX to move stably reflecting fundamentals.
A 1% rise in interest rates will lead to 40 trln yen worth of valuation loss on BoJ’s JGB holdings.
Market reaction
USD/JPY was last seen trading at 150.31, almost unchanged on the day.
Bank of Japan FAQs
What is the Bank of Japan?
The Bank of Japan (BoJ) is the Japanese central bank, which sets monetary policy in the country. Its mandate is to issue banknotes and carry out currency and monetary control to ensure price stability, which means an inflation target of around 2%.
What has been the Bank of Japan’s policy?
The Bank of Japan has embarked in an ultra-loose monetary policy since 2013 in order to stimulate the economy and fuel inflation amid a low-inflationary environment. The bank’s policy is based on Quantitative and Qualitative Easing (QQE), or printing notes to buy assets such as government or corporate bonds to provide liquidity. In 2016, the bank doubled down on its strategy and further loosened policy by first introducing negative interest rates and then directly controlling the yield of its 10-year government bonds.
How do Bank of Japan’s decisions influence the Japanese Yen?
The Bank’s massive stimulus has caused the Yen to depreciate against its main currency peers. This process has exacerbated more recently due to an increasing policy divergence between the Bank of Japan and other main central banks, which have opted to increase interest rates sharply to fight decades-high levels of inflation. The BoJ’s policy of holding down rates has led to a widening differential with other currencies, dragging down the value of the Yen.
Is the Bank of Japan’s ultra-loose policy likely to change soon?
A weaker Yen and the spike in global energy prices have led to an increase in Japanese inflation, which has exceeded the BoJ’s 2% target. Still, the Bank judges that the sustainable and stable achievement of the 2% target has not yet come in sight, so any sudden change in the current policy looks unlikely.
- NZD/USD scales higher for the seventh straight day and climbs to a fresh multi-week top.
- Delayed RBNZ rate cut bets underpin the NZD, though some USD dip-buying caps gains.
- Geopolitical tensions might further contribute to keeping a lid on any meaningful upside.
The NZD/USD pair gains positive traction for the seventh successive day on Thursday and hits a nearly five-week high during the Asian session. Spot prices, however, remain capped near the 0.6200 mark and retreat a few pips in the last hour amid the emergence of some US Dollar (USD) buying.
The minutes of the January FOMC policy meeting, released on Wednesday, showed that policymakers were concerned about cutting interest rates too quickly. This remains supportive of elevated US Treasury bond yields and underpins the buck, which, in turn, is seen acting as a headwind for the NZD/USD pair. That said, a positive tone around the equity markets keeps a lid on any meaningful appreciating move for the safe-haven Greenback and lends some support to the risk-sensitive Kiwi.
The New Zealand Dollar (NZD) further benefits from the Reserve Bank of New Zealand (RBNZ) Governor Adrian Orr’s recent comments, which fuelled speculations that the central bank will delay cutting its benchmark rates. Orr said that inflation is moving in the right direction but there is more work to do to have inflation expectations truly anchored at that 2% level. The latest survey showed that two-year inflation expectations are seen rising to 3.2% vs a 3.0% growth estimated before.
The NZD/USD bulls, meanwhile, seem rather unaffected by weaker New Zealand Trade Balance data, which showed a deficit of NZD 976 million in January as compared to the previous month's fall of NZD 368 million. This, in turn, suggests that the path of least resistance for spot prices remains to the upside and supports prospects for an extension of over a one-week-old uptrend from mid-0.6000s. That said, a further escalation of conflict in the Middle East might keep a lid on any further gains.
Moving ahead, traders now look forward to the US economic docket – featuring the release of the usual Weekly Initial Jobless Claims, the flash PMI prints and Existing Home Sales data later during the North American session. Apart from this, Fed Governor Philip Jefferson's scheduled speech and the US bond yields will influence the USD price dynamics. This, along with the broader risk sentiment might provide some impetus to the NZD/USD pair and produce short-term opportunities.
Technical levels to watch
- EUR/USD could retest resistance around the 50-day EMA at 1.0834 and the weekly high at 1.0838.
- Technical indicators suggest a possible transition towards upward momentum.
- The key support region appears around the psychological level of 1.0800 and the 14-day EMA at 1.0795.
EUR/USD extends its winning streak initiated on February 14, with the US Dollar (USD) facing downward pressure due to concerns raised over potential interest rate cuts in the Federal Reserve Meeting Minutes published on Wednesday. As a result, the pair edges higher to around 1.0820 during the Asian session on Thursday.
The EUR/USD pair may ascend toward testing the nearby resistance area, which includes the 50-day Exponential Moving Average (EMA) at 1.0834 and the weekly high at 1.0838. If the pair manages to break above this zone, it could receive further upward momentum, potentially reaching the significant support level at 1.0850, followed by the 38.2% Fibonacci retracement level at 1.0864.
The technical analysis of the EUR/USD pair suggests a possible transition towards upward momentum. The 14-day Relative Strength Index (RSI) is positioned above the 50 mark, indicating a bullish sentiment. Additionally, the Moving Average Convergence Divergence (MACD) is situated below the centerline but exhibits a divergence above the signal line. These indicators collectively suggest a potential bullish shift in momentum for the EUR/USD pair.
On the downside, immediate support is evident at the psychological level of 1.0800, coinciding with the 14-day Exponential Moving Average (EMA) at 1.0795. A breach below this EMA could lead the EUR/USD pair to revisit the weekly low around 1.0761, potentially targeting the major support zone near the 1.0750 level, with a possible objective of approaching the psychological support at 1.0700.
EUR/USD: Daily Chart
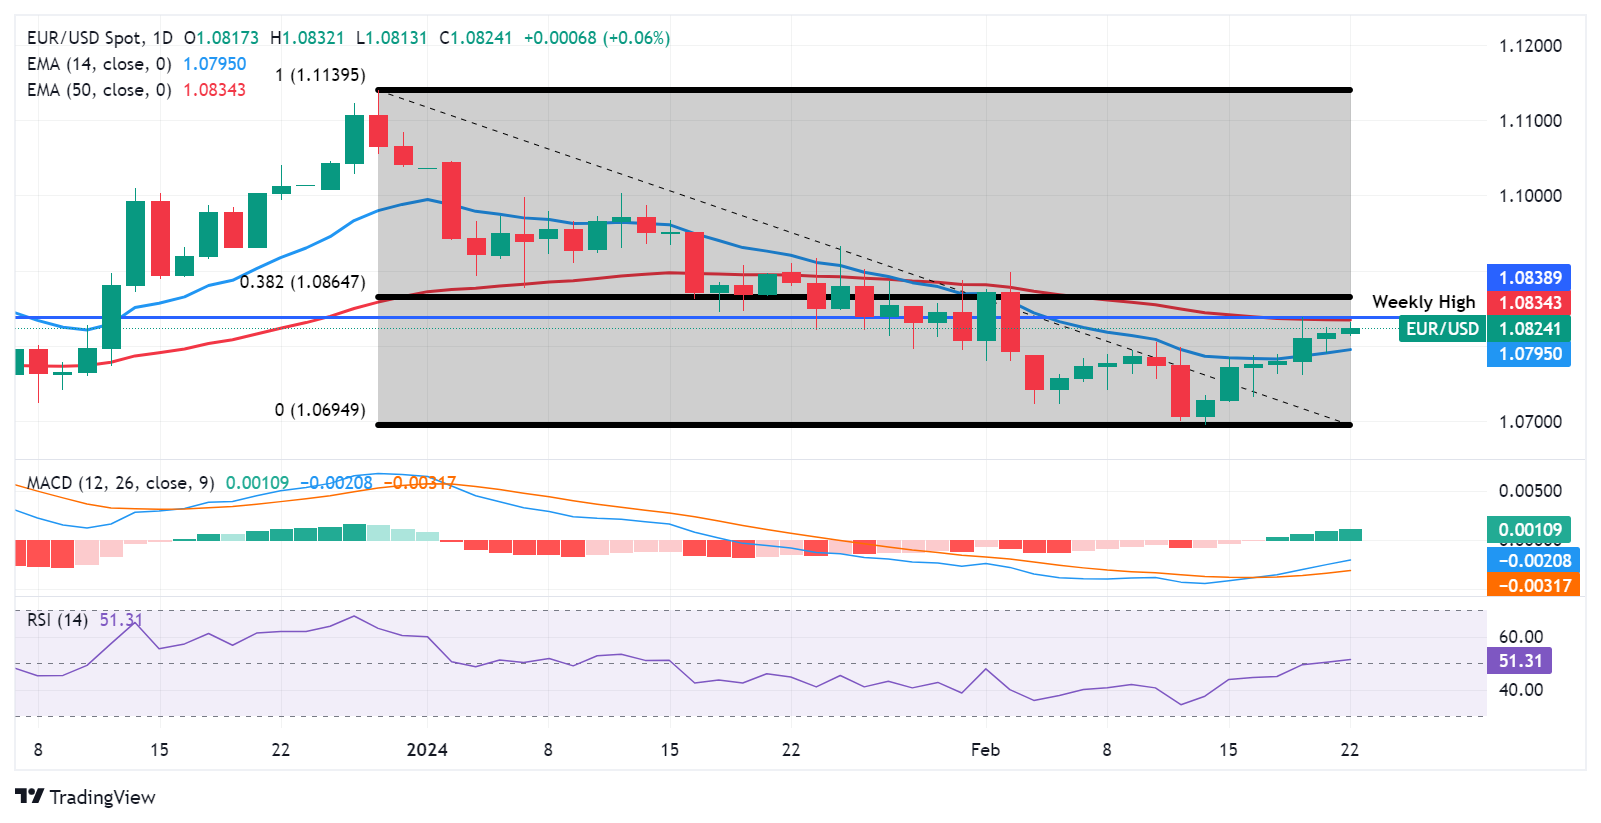
- Gold price attracts some haven flows in the wake of geopolitical tensions in the Middle East.
- Hawkish FOMC minutes remain supportive of elevated US bond yields and cap further gains.
- A sustained move beyond the 50-day SMA should pave the way for additional near-term upside.
Gold price (XAU/USD) edges higher during the Asian session on Thursday, albeit remains below the 50-day Simple Moving Average (SMA) pivotal resistance, around the $2,032 area, or over a one-week high touched the previous day. The Middle East conflict continues to underpin demand for traditional safe-haven assets, which, along with a weaker US Dollar (USD), acts as a tailwind for the precious metal. The uptick, however, lacks bullish conviction in the wake of firming expectations that the Federal Reserve (Fed) will keep interest rates higher for longer.
The bets were reaffirmed by hawkish FOMC meeting minutes released on Wednesday, which showed that policymakers were concerned about cutting interest rates too quickly. This, along with a weak 20-year bond auction, triggered a sell-off in the US debt market and pushed the yield on long-term US government bonds to their highest level in almost three months. This might hold back traders from placing aggressive bullish bets around the non-yielding Gold price and cap the upside, warranting caution before positioning for an extension of a one-week-old uptrend.
Daily Digest Market Movers: Gold price draws support from raging conflict in the Middle East
- The recent attacks by Yemen's Houthi rebels on commercial vessels in the Red Sea and Bab al-Mandab strait stoke worries about a further escalation of military action in the Middle East, underpinning the safe-haven Gold price.
- The US Central Command said two anti-ship ballistic missiles were launched from the Iranian-backed Houthi terrorist group, which claims to support Palestinian civilians amid Israel’s retaliatory military campaign in the Gaza Strip.
- Fighting between Israel and Hamas has shown no sign of abating despite diplomatic efforts by several countries, with the former warning of a potential ground invasion of Rafah where more than 1.5 million Palestinians are sheltering.
- The US Dollar languishes near its lowest level in more than two weeks and lends additional support to the precious metal, though hawkish-sounding FOMC meeting minutes keep a lid on any meaningful appreciating move.
- The January FOMC meeting minutes revealed that policymakers agreed that they needed greater confidence in falling inflation before considering cutting rates and reinforced expectations that the Fed will keep rates higher for longer.
- Market participants pushed back expectations on when the Fed will begin cutting rates to June, which, along with a weaker 20-year bond auction, push the yield on long-term US Treasury bonds higher across the board.
- The yield on the benchmark 10-year US government bond advanced to its highest level since November 30, which helps limit the downside for the Greenback and contributes to capping the non-yielding yellow metal.
- Traders now look to the US economic docket – featuring the usual Weekly Initial Jobless Claims, the flash PMI prints and Existing Home Sales data – for some impetus ahead of Fed Governor Philip Jefferson's speech.
Technical Analysis: Gold price might struggle to make it through 50-day SMA pivotal hurdle
From a technical perspective, bulls need to wait for sustained strength and acceptance above the 50-day SMA before positioning for any further gains. With oscillators on the daily chart just starting to gain positive traction, the Gold price might then accelerate the momentum towards an intermediate hurdle near the $2,044-2,045 region en route to the $2,065 supply zone.
On the flip side, the $2,020 area now seems to protect the immediate downside ahead of the 100-day SMA, currently pegged near just below the $2,000 psychological mark. Some follow-through selling will expose the monthly low, around the $1,984 region, before the Gold price eventually drops to challenge the very important 200-day SMA support near the $1,966-1,965 zone.
US Dollar price this week
The table below shows the percentage change of US Dollar (USD) against listed major currencies this week. US Dollar was the strongest against the Japanese Yen.
| USD | EUR | GBP | CAD | AUD | JPY | NZD | CHF | |
| USD | -0.38% | -0.22% | 0.05% | -0.21% | 0.19% | -0.84% | -0.19% | |
| EUR | 0.39% | 0.16% | 0.44% | 0.17% | 0.58% | -0.45% | 0.19% | |
| GBP | 0.22% | -0.15% | 0.27% | 0.01% | 0.42% | -0.62% | 0.01% | |
| CAD | -0.05% | -0.43% | -0.27% | -0.26% | 0.15% | -0.89% | -0.25% | |
| AUD | 0.21% | -0.16% | -0.01% | 0.26% | 0.41% | -0.63% | 0.02% | |
| JPY | -0.19% | -0.57% | -0.40% | -0.15% | -0.41% | -1.04% | -0.39% | |
| NZD | 0.84% | 0.46% | 0.61% | 0.89% | 0.62% | 1.02% | 0.64% | |
| CHF | 0.21% | -0.17% | -0.02% | 0.26% | -0.01% | 0.39% | -0.63% |
The heat map shows percentage changes of major currencies against each other. The base currency is picked from the left column, while the quote currency is picked from the top row. For example, if you pick the Euro from the left column and move along the horizontal line to the Japanese Yen, the percentage change displayed in the box will represent EUR (base)/JPY (quote).
Gold FAQs
Why do people invest in Gold?
Gold has played a key role in human’s history as it has been widely used as a store of value and medium of exchange. Currently, apart from its shine and usage for jewelry, the precious metal is widely seen as a safe-haven asset, meaning that it is considered a good investment during turbulent times. Gold is also widely seen as a hedge against inflation and against depreciating currencies as it doesn’t rely on any specific issuer or government.
Who buys the most Gold?
Central banks are the biggest Gold holders. In their aim to support their currencies in turbulent times, central banks tend to diversify their reserves and buy Gold to improve the perceived strength of the economy and the currency. High Gold reserves can be a source of trust for a country’s solvency. Central banks added 1,136 tonnes of Gold worth around $70 billion to their reserves in 2022, according to data from the World Gold Council. This is the highest yearly purchase since records began. Central banks from emerging economies such as China, India and Turkey are quickly increasing their Gold reserves.
How is Gold correlated with other assets?
Gold has an inverse correlation with the US Dollar and US Treasuries, which are both major reserve and safe-haven assets. When the Dollar depreciates, Gold tends to rise, enabling investors and central banks to diversify their assets in turbulent times. Gold is also inversely correlated with risk assets. A rally in the stock market tends to weaken Gold price, while sell-offs in riskier markets tend to favor the precious metal.
What does the price of Gold depend on?
The price can move due to a wide range of factors. Geopolitical instability or fears of a deep recession can quickly make Gold price escalate due to its safe-haven status. As a yield-less asset, Gold tends to rise with lower interest rates, while higher cost of money usually weighs down on the yellow metal. Still, most moves depend on how the US Dollar (USD) behaves as the asset is priced in dollars (XAU/USD). A strong Dollar tends to keep the price of Gold controlled, whereas a weaker Dollar is likely to push Gold prices up.
- USD/CAD depreciates after the FOMC Minutes expressed concerns over rate cuts.
- Fed's easing cycle appears to be delayed, correlating with recent higher CPI and PPI.
- The decline in Crude oil prices could weigh on the Canadian Dollar.
USD/CAD expands its losses to near 1.3490 during the Asian session on Thursday as the US Dollar (USD) shows weakness, which could be attributed to the subdued US Treasury yields. However, US Treasury yields gained ground on Wednesday following the cautious tone expressed in the Federal Open Market Committee (FOMC) Minutes regarding the interest rate reductions.
The Federal Reserve's easing cycle of monetary policy appears to be delayed, which correlates with significantly higher-than-anticipated Consumer Price Index (CPI) and Producer Price Index (PPI) releases following the Federal Reserve’s January meeting, coupled with a robust jobs report.
The US Dollar Index (DXY) hovers around 104.00, with the 2-year and 10-year yields on US bonds standing at 4.65% and 4.21, respectively, by the press time. The FOMC Meeting Minutes highlighted the necessity for further evidence of disinflation to alleviate concerns of upside risks.
Presently, futures funds suggest that approximately 70% of the market forecasts a rate cut by the Federal Reserve’s June meeting. According to the CME FedWatch Tool, there's now a 52.2% possibility assigned by the market for the initiation of easing to commence in June.
The decrease in Crude oil prices may act as a constraint on the Canadian Dollar (CAD)'s upward momentum, thereby limiting losses for the USD/CAD pair. Despite geopolitical tensions in the Middle East, which typically elevate oil prices due to concerns over supply disruption, the impact is tempered by higher global interest rates, which dampen oil demand. At the time of writing, the West Texas Intermediate (WTI) oil price is hovering around $77.80 per barrel, reflecting a slight decline.
Thursday will bring Canada’s Retail Sales data for December. On the other side, S&P US PMI data, weekly Initial Jobless Claims, and Existing Home Sales will be eyed
- Indian Rupee trades flat on the mild losses of the US Dollar.
- Indian inflation expectations may edge down, but renewed pressures from cereals and proteins cannot be ruled out, RBI bulletin said.
- India’s S&P Global Services PMI, RBI MPC Meeting Minutes, and US S&P Global PMI report will be due on Thursday.
Indian Rupee (INR) trades on a flat note on Thursday amid the modest decline of the Greenback. According to the RBI February bulletin, while inflation expectations in India may stabilize and edge down, renewed pressures from cereals and proteins remain a possibility. Retail inflation in January eased to a three-month low of 5.1% from 5.69% in December. The Reserve Bank of India (RBI) maintained interest rates and its policy stance unchanged while reiterating its commitment to meeting the 4% inflation target on a sustainable basis.
Meanwhile, a rise in oil prices amid the concerns over attacks on ships in the Red Sea and growing expectations that cuts to U.S. interest rates will take longer than thought might lift the safe-haven US Dollar (USD) and cap the downside of the USD/INR pair.
Investors will take more cues from India’s S&P Global Services PMI and RBI MPC Meeting Minutes on Thursday. On the US docket, the S&P Global PMI, weekly Initial Jobless Claims, Existing Home Sales, and the Chicago Fed National Activity Index will be due. Also, the Fed’s Cook, Kashkari, Jefferson, and Harker are scheduled to speak later in the day.
Daily Digest Market Movers: Indian Rupee remains sensitive to the high inflation and geopolitical risks
- The Indian economy continues to sustain the momentum achieved in the first half of 2023-24, according to the Reserve Bank of India's (RBI) monthly bulletin.
- The bond issuance since January is almost half the $3.3 billion issued in all of 2023. Traders have bought around 350 billion rupees ($4.22 billion) of bonds on a net basis so far in 2024 after purchases in 2023 jumped to a six-year high.
- The RBI expects India's debt-to-GDP ratio to decrease to 73.4% by 2030-31, a notable improvement from the IMF's forecast of 78.2%.
- The FOMC Minutes indicate that no rate cuts would be coming until the rate-setting FOMC held “greater confidence” that inflation was receding.
- Fed officials noted that they wanted to see more before starting to ease policy while saying that rate hikes are likely over. Members cited the risks of moving too quickly on cuts.
- The US Services PMI is expected to slightly ease to 52.0 in February from 52.5 in January, while the Manufacturing PMI is forecast to drop to 50.5 versus 50.7 prior.
Technical Analysis: Indian Rupee remains capped within the longer-term band of 82.70-83.20
Indian Rupee trades flat on the day. USD/INR remains confined within a multi-month-old descending trend channel between 82.70 and 83.20 since December 8, 2023.
In the near-term, USD/INR maintains its bearish bias as the pair is below the key 100-day Exponential Moving Average (EMA) on the daily chart. The downward momentum is supported by the 14-day Relative Strength Index (RSI) lies below the 50.0 midline, signaling the path of least resistance is to the downside.
USD/INR has found an initial support level around a low of February 20 at 82.85. The potential contention level will emerge near the lower limit of the descending trend channel at 82.70. A bearish breakout below this level will see a drop to a low of August 23 at 82.45.
On the upside, a decisive break above the support-turned-resistance near the 83.00 mark could lead USD/INR heading back to the upper boundary of the descending trend channel at 83.20. Further north, the next upside filter to watch is a high of January 2 at 83.35, followed by the 84.00 psychological level.
US Dollar price today
The table below shows the percentage change of US Dollar (USD) against listed major currencies today. US Dollar was the strongest against the Japanese Yen.
| USD | EUR | GBP | CAD | AUD | JPY | NZD | CHF | |
| USD | -0.05% | 0.01% | -0.09% | 0.02% | 0.02% | -0.11% | -0.05% | |
| EUR | 0.05% | 0.05% | -0.06% | 0.07% | 0.07% | -0.05% | 0.00% | |
| GBP | 0.00% | -0.04% | -0.10% | 0.03% | 0.03% | -0.09% | -0.03% | |
| CAD | 0.08% | 0.07% | 0.09% | 0.13% | 0.14% | -0.03% | 0.07% | |
| AUD | -0.02% | -0.06% | -0.02% | -0.12% | 0.03% | -0.15% | -0.06% | |
| JPY | -0.03% | -0.09% | -0.06% | -0.13% | -0.03% | -0.21% | -0.07% | |
| NZD | 0.11% | 0.07% | 0.10% | -0.01% | 0.12% | 0.13% | 0.06% | |
| CHF | 0.05% | -0.01% | 0.03% | -0.07% | 0.05% | 0.08% | -0.10% |
The heat map shows percentage changes of major currencies against each other. The base currency is picked from the left column, while the quote currency is picked from the top row. For example, if you pick the Euro from the left column and move along the horizontal line to the Japanese Yen, the percentage change displayed in the box will represent EUR (base)/JPY (quote).
Indian Rupee FAQs
What are the key factors driving the Indian Rupee?
The Indian Rupee (INR) is one of the most sensitive currencies to external factors. The price of Crude Oil (the country is highly dependent on imported Oil), the value of the US Dollar – most trade is conducted in USD – and the level of foreign investment, are all influential. Direct intervention by the Reserve Bank of India (RBI) in FX markets to keep the exchange rate stable, as well as the level of interest rates set by the RBI, are further major influencing factors on the Rupee.
How do the decisions of the Reserve Bank of India impact the Indian Rupee?
The Reserve Bank of India (RBI) actively intervenes in forex markets to maintain a stable exchange rate, to help facilitate trade. In addition, the RBI tries to maintain the inflation rate at its 4% target by adjusting interest rates. Higher interest rates usually strengthen the Rupee. This is due to the role of the ‘carry trade’ in which investors borrow in countries with lower interest rates so as to place their money in countries’ offering relatively higher interest rates and profit from the difference.
What macroeconomic factors influence the value of the Indian Rupee?
Macroeconomic factors that influence the value of the Rupee include inflation, interest rates, the economic growth rate (GDP), the balance of trade, and inflows from foreign investment. A higher growth rate can lead to more overseas investment, pushing up demand for the Rupee. A less negative balance of trade will eventually lead to a stronger Rupee. Higher interest rates, especially real rates (interest rates less inflation) are also positive for the Rupee. A risk-on environment can lead to greater inflows of Foreign Direct and Indirect Investment (FDI and FII), which also benefit the Rupee.
How does inflation impact the Indian Rupee?
Higher inflation, particularly, if it is comparatively higher than India’s peers, is generally negative for the currency as it reflects devaluation through oversupply. Inflation also increases the cost of exports, leading to more Rupees being sold to purchase foreign imports, which is Rupee-negative. At the same time, higher inflation usually leads to the Reserve Bank of India (RBI) raising interest rates and this can be positive for the Rupee, due to increased demand from international investors. The opposite effect is true of lower inflation.
New Zealand’s (NZ) two-year inflation expectations for households are seen rising to 3.2%, as against a 3.0% growth estimated before, the latest survey conducted by the Reserve Bank of New Zealand showed on Thursday.
The RBNZ closely watches the two-year inflation expectations, as the central bank considers this time horizon as key for the transmission of changes in monetary policy.
Market reaction
The New Zealand Dollar keeps its upbeat momentum intact following the above survey findings. NZD/USD is adding 0.15% on the day to trade near 0.6190, at the press time.
- India’s Nifty and Sensex are poised to rebound at open on Thursday after Wednesday’s negative close.
- On Wednesday, Nifty corrected from all-time high above 22,200, Sensex failed to sustain above 73,000.
- All eyes now remain on India and US PMI data and RBI Minutes after the hawkish Fed Minutes.
The Sensex 30 and Nifty 50, India’s key benchmark indices, are looking to jump back on the bids at the open on Thursday, having settled in the negative territory on Wednesday.
Optimism on global stocks, thanks to the encouraging earnings report from the American tech-giant Nvidia, which helped overshadow the market’s nervousness due to the hawkish US Federal Reserve (Fed) Minutes of the January meeting.
A modest uptick in the Gift Nifty futures also indicates a positive start for the Indian indices on Thursday.
On Wednesday, the National Stock Exchange (NSE) Nifty 50 lost 0.65% on the day to finish at 22,055.05 while the Bombay Stock Exchange (BSE) Sensex 30 closed at 72,623.09, down 0.59%.
Stock market news
- India's benchmark indices snapped their six-day winning momentum in Wednesday’s trading, as sellers returned in the late trading amid a sharp decline in the IT, pharma and financial sector shares.
- Top gainers on Nifty included Tata Steel, JSW Steel, SBI Bank, IndusInd Bank and Tata Consumer Products. Meanwhile, Powergrid, NTPC, Wipro, Coal India and BPCL emerged as the main laggards.
- Among the corporate news, shares of Zee Entertainment eroded nearly 15% after a Bloomberg report revealed an accounting issue of over INR20 billion ($241.36 million) in the company’s accounts.
- Maruti Suzuki India got an inquiry from the Directorate of Revenue Intelligence.
- Paytm shares continued to hit the upper circuit after falling at record lows.
- World Bank, and others issued offshore India rupee bonds as demand soars.
- The US stock markets saw a mixed close on Wednesday.
- Nvidia released Q4 earnings after the close on Wednesday. Nvidia posted $5.16 earnings per share (EPS) vs. $4.64 expected while revenue stood at $22.10 billion vs. $20.62 billion expected. The AI pioneer said that it expected $24.0 billion in sales in the current quarter.
- The Fed Minutes stated, “most participants noted the risks of moving too quickly to ease the stance of policy and emphasized the importance of carefully assessing incoming data in judging whether inflation is moving down sustainably to 2 percent.”
- Markets are currently pricing in just about a 30% chance that the Fed could begin easing rates in May, much lower than an over 80% chance a month ago, according to the CME FedWatch Tool. For the June meeting, the probability for a rate cut now stands at 70%, down from 77% seen a day ago.
- People’s Bank of China (PBoC) cut the five-year Loan Prime Rate (LPR) by a record 25 bps from 4.20% to 3.95%. The PBOC rate cut failed to excite traders on Tuesday.
- India’s trade data for January showed last week a shrinking Trade Deficit of $17.49 billion.
- Attention now turns toward the Minutes of the RBI meeting, preliminary PMI data from India and the United States due later on Thursday.
Sensex FAQs
What is the Sensex?
The Sensex is a name for one of India’s most closely monitored stock indexes. The term was coined in the 1980s by analyst Deepak Mohoni by mashing the words sensitive and index together. The index plots a weighted average of the share price of 30 of the most established stocks on the Bombay Stock Exchange. Each corporation's weighting is based on its “free-float capitalization”, or the value of all its shares readily available for trading.
What factors drive the Sensex?
Given it is a composite, the value of the Sensex is first and foremost dependent on the performance of its constituent companies as revealed in their quarterly and annual results. Government policies are another factor. In 2016 the government decided to phase out high value currency notes, for example, and certain companies saw their share price fall as a result. When the government decided to cut corporation tax in 2019, meanwhile, the Sensex gained a boost. Other factors include the level of interest rates set by the Reserve Bank of India, since that dictates the cost of borrowing, climate change, pandemics and natural disasters
What are the key milestones for the Sensex?
The Sensex started life on April 1 1979 at a base level of 100. It reached its highest recorded level so far, at 73,328, on Monday, January 15, 2024 (this is being written in Feb 2024). The Index closed above the 10,000 mark for the first time on February 7, 2006. On March 13, 2014 the Sensex closed higher than Hong Kong’s Hang Seng index to become the major Asian stock index with the highest value. The index’s biggest gain in a single day occurred on April 7, 2020, when it rose 2,476 points; its deepest single-day loss occurred on January 21, 2008, when it plunged 1,408 points due the US subprime crisis.
What major corporations are in the Sensex?
Major companies within the Sensex include Reliance Industries Ltd, HDFC Bank, Axis Bank, ITC Ltd, Bharti Airtel Ltd, Tata Steel, HCL Technologies, Infosys, State Bank of India, Sun Pharma, Tata Consultancy Services and Tech Mahindra.
| Raw materials | Closed | Change, % |
|---|---|---|
| Silver | 22.872 | -0.5 |
| Gold | 2025.646 | 0.06 |
| Palladium | 952.78 | -2.24 |
- Australian Dollar continues its winning streak after the positive Services PMI on Thursday.
- Australia’s ASX 200 extends losses on weak sentiment due to expectations of prolonged higher borrowing costs.
- FOMC Minutes expressed caution regarding interest rate cuts could potentially delay the start of an easing cycle.
- Investors await S&P US PMI data, weekly Initial Jobless Claims, and Existing Home Sales on Thursday.
The Australian Dollar (AUD) extends its winning streak on Thursday that began on February 14. This positive momentum was fueled by encouraging preliminary Australian Purchasing Managers Index (PMI) data. The data indicated a notable return to growth in private sector activity in February, marking the end of a five-month downturn, particularly driven by robust expansion in the services sector. However, the manufacturing sector encountered difficulties due to increased interest rates, leading to the most significant decline in output since May 2020.
Australian Dollar (AUD) could face hurdles stemming from softer Aussie money markets, as the S&P/ASX 200 Index registers its third consecutive decline amidst subdued sentiment. The recent release of the Federal Open Market Committee (FOMC) Minutes, expressing caution regarding interest rate cuts, might postpone the onset of an easing cycle. Additionally, the Reserve Bank of Australia's (RBA) meeting minutes earlier this week shifted market sentiment towards the probability of no imminent rate cuts.
The US Dollar Index (DXY) encountered downward pressure despite the rise in US Treasury yields on Wednesday following the cautious tone expressed in the FOMC Minutes regarding the pace of interest rate reductions. The Meeting Minutes highlighted the necessity for further evidence of disinflation to alleviate concerns of upside risks. Presently, futures in funds indicate that approximately 70% of the market anticipates a rate cut by the Fed's June meeting. According to the CME FedWatch Tool, there's now a 52.2% probability assigned by the market for the initiation of easing to commence in June.
Daily Digest Market Movers: Australian Dollar strengthens on subdued US Dollar
- Judo Bank Australia Composite PMI increased to 51.8 in February from the previous reading of 49, indicating the first month of expansion in the Australian private sector after a five-month period of contraction.
- Judo Bank Australia Services PMI rose to 52.8 from the previous reading of 49.1. Manufacturing PMI fell to 47.7 from 50.1 prior due to a significant drop in new orders.
- Australian Wage Price Index (QoQ) grew by 0.9% in the fourth quarter as expected, lower than the previous rise of 1.3%. The index rose by 4.2% year-over-year, surpassing the market expectation to be unchanged at 4.1%.
- Westpac Leading Index (MoM) declined by 0.1% in January against the previous reading of flat 0.0%.
- The ANZ-Roy Morgan Consumer Confidence improved to 82.8 this week from 82.6 prior. Remarkably, the index has now spent a record 55 consecutive weeks below the mark of 85.
- RBA’s Meeting Minutes revealed that the Board deliberated on the possibility of raising rates by 25 basis points (bps) or keeping rates unchanged. While recent data indicated that inflation would return to target within a reasonable timeframe, it was acknowledged that this process would "take some time." Consequently, the board agreed that it was prudent not to rule out another rate hike.
- S&P's analysis of the FOMC minutes suggests that inflation is expected to continue cooling in the upcoming months, despite the ongoing uneven disinflationary trends. They maintain their outlook for monetary policy in 2024, anticipating no changes. S&P predicts that the Federal Reserve will likely reduce its policy rate by 25 basis points at its June meeting, with further cuts totaling 75 basis points by the end of the year.
- The Federal Reserve's dot plot for this year indicates an expectation of 75 basis points in rate cuts, whereas the Fed funds futures market is pricing in approximately 89 basis points in cuts.
- ANZ anticipates that the Federal Reserve (Fed) will commence rate cuts from July 2024.
Technical Analysis: Australian Dollar maintains its position above the major support of 0.6550
The Australian Dollar traded around the major level at 0.6560 on Thursday, which is positioned above the immediate support level of 0.6550. A break below this major level could retest the weekly low at 0.6521 followed by the psychological support level of 0.6500. On the upside, the AUD/USD pair could face a key resistance area around the 50-day Exponential Moving Average (EMA) at 0.6574 and the three-week high at 0.6579. A break above this region could lead the AUD/USD pair to approach the resistance zone around the psychological level of 0.6600 and 38.2% Fibonacci retracement level of 0.6606.
AUD/USD: Daily Chart
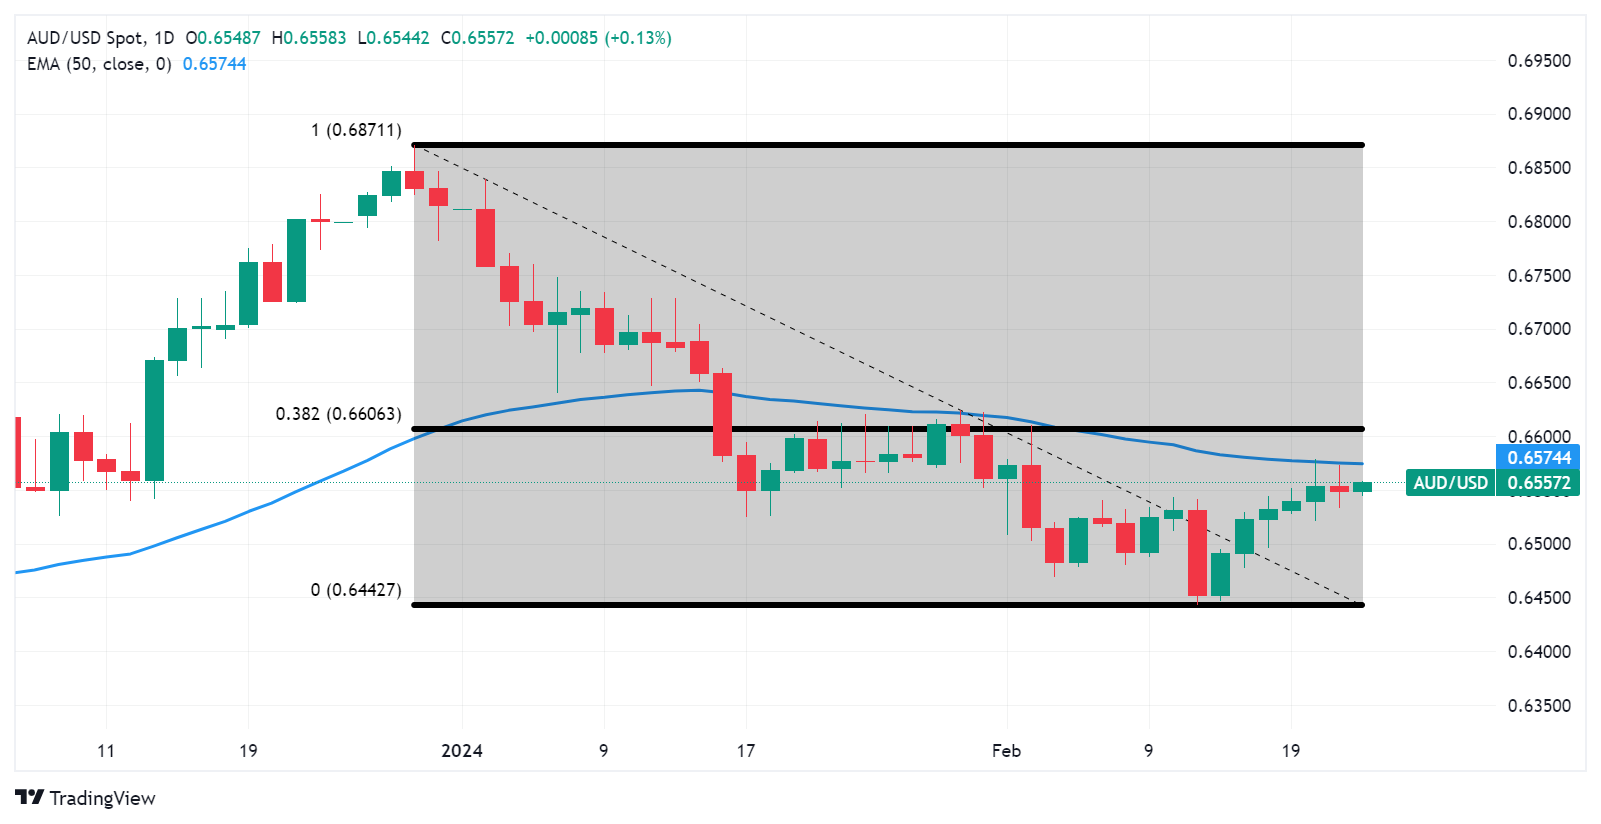
Australian Dollar price today
The table below shows the percentage change of Australian Dollar (AUD) against listed major currencies today. Australian Dollar was the strongest against the US Dollar.
| USD | EUR | GBP | CAD | AUD | JPY | NZD | CHF | |
| USD | -0.06% | -0.01% | -0.08% | 0.04% | -0.02% | -0.09% | -0.04% | |
| EUR | 0.05% | 0.04% | -0.05% | 0.09% | 0.04% | -0.03% | 0.02% | |
| GBP | 0.01% | -0.04% | -0.07% | 0.06% | -0.01% | -0.06% | -0.02% | |
| CAD | 0.07% | 0.04% | 0.08% | 0.13% | 0.07% | 0.01% | 0.06% | |
| AUD | -0.04% | -0.08% | -0.04% | -0.13% | -0.04% | -0.11% | -0.07% | |
| JPY | 0.02% | -0.03% | -0.02% | -0.07% | 0.04% | -0.07% | -0.02% | |
| NZD | 0.09% | 0.04% | 0.08% | -0.01% | 0.11% | 0.07% | 0.05% | |
| CHF | 0.02% | -0.02% | 0.02% | -0.07% | 0.05% | 0.00% | -0.05% |
The heat map shows percentage changes of major currencies against each other. The base currency is picked from the left column, while the quote currency is picked from the top row. For example, if you pick the Euro from the left column and move along the horizontal line to the Japanese Yen, the percentage change displayed in the box will represent EUR (base)/JPY (quote).
Australian Dollar FAQs
What key factors drive the Australian Dollar?
One of the most significant factors for the Australian Dollar (AUD) is the level of interest rates set by the Reserve Bank of Australia (RBA). Because Australia is a resource-rich country another key driver is the price of its biggest export, Iron Ore. The health of the Chinese economy, its largest trading partner, is a factor, as well as inflation in Australia, its growth rate and Trade Balance. Market sentiment – whether investors are taking on more risky assets (risk-on) or seeking safe-havens (risk-off) – is also a factor, with risk-on positive for AUD.
How do the decisions of the Reserve Bank of Australia impact the Australian Dollar?
The Reserve Bank of Australia (RBA) influences the Australian Dollar (AUD) by setting the level of interest rates that Australian banks can lend to each other. This influences the level of interest rates in the economy as a whole. The main goal of the RBA is to maintain a stable inflation rate of 2-3% by adjusting interest rates up or down. Relatively high interest rates compared to other major central banks support the AUD, and the opposite for relatively low. The RBA can also use quantitative easing and tightening to influence credit conditions, with the former AUD-negative and the latter AUD-positive.
How does the health of the Chinese Economy impact the Australian Dollar?
China is Australia’s largest trading partner so the health of the Chinese economy is a major influence on the value of the Australian Dollar (AUD). When the Chinese economy is doing well it purchases more raw materials, goods and services from Australia, lifting demand for the AUD, and pushing up its value. The opposite is the case when the Chinese economy is not growing as fast as expected. Positive or negative surprises in Chinese growth data, therefore, often have a direct impact on the Australian Dollar and its pairs.
How does the price of Iron Ore impact the Australian Dollar?
Iron Ore is Australia’s largest export, accounting for $118 billion a year according to data from 2021, with China as its primary destination. The price of Iron Ore, therefore, can be a driver of the Australian Dollar. Generally, if the price of Iron Ore rises, AUD also goes up, as aggregate demand for the currency increases. The opposite is the case if the price of Iron Ore falls. Higher Iron Ore prices also tend to result in a greater likelihood of a positive Trade Balance for Australia, which is also positive of the AUD.
How does the Trade Balance impact the Australian Dollar?
The Trade Balance, which is the difference between what a country earns from its exports versus what it pays for its imports, is another factor that can influence the value of the Australian Dollar. If Australia produces highly sought after exports, then its currency will gain in value purely from the surplus demand created from foreign buyers seeking to purchase its exports versus what it spends to purchase imports. Therefore, a positive net Trade Balance strengthens the AUD, with the opposite effect if the Trade Balance is negative.
- The Japanese Yen remains on the defensive amid the BoJ policy uncertainty.
- The flash Japan PMIs do little to impress the JPY bulls or lend any support.
- Intervention fears help limit deeper losses amid subdued USD price action.
The Japanese Yen (JPY) remains on the defensive against its American counterpart for the second straight day on Thursday and hovers near the weekly low during the Asian session, though lacks follow-through selling. The Japanese economy unexpectedly contracted for the second straight quarter during the October-December period and confirmed a technical recession. This now seems to have dashed hopes for an imminent shift in the Bank of Japan's (BoJ) policy shift in the coming months. Apart from this, the disappointing release of the flash Japan Manufacturing PMI for February turns out to be a key factor undermining the domestic currency and acts as a tailwind for the USD/JPY pair.
That said, fears that the recent weakness below the 150.00 psychological mark might prompt some intervention from Japanese authorities hold back traders from placing aggressive bearish bets around the JPY. Furthermore, the lack of any meaningful buying around the US Dollar (USD), despite hawkish-sounding FOMC meeting minutes released on Wednesday, contributes to capping the upside for the USD/JPY pair. Moving ahead, traders now look to the US economic docket – featuring the usual Weekly Initial Jobless Claims, the flash PMI prints and Existing Home Sales data. This, along with Federal Reserve Governor Philip Jefferson's speech, might provide some impetus.
Daily Digest Market Movers: Japanese Yen is undermined by divergent BoJ-Fed policy expectations
- A recession in Japan fuelled uncertainty about the likely timing of when the Bank of Japan will exit the negative interest rates policy and continues to undermine the Japanese Yen.
- A private business survey released this Thursday showed that factory activity in Japan shrank for the ninth consecutive month in February due to a sharp reduction in new orders.
- The au Jibun Bank flash Japan Manufacturing PMI declined to 47.2 in February from 48.0 previous and the gauge for the services sector fell from 53.1 to 52.5 for the current month.
- The Composite PMI, which combines both manufacturing and services sectors, came in at 50.3 in February, down from the 51.5 previous and suggesting that the overall business activity stagnated.
- The report added that the slight improvement seen in January evaporated in February and that firms were the least upbeat since January 2023, reflecting reduced optimism with regard to future output.
- Japan's Ministry of Finance and the BoJ recently warned that they’re watching the exchange rate closely and are willing to intervene in the market to stem any further JPY weakness.
- The US Dollar struggles to attract any meaningful buyers despite the fact that the January FOMC meeting minutes revealed that officials were concerned about the risks of cutting rates too soon.
- Policymakers agreed that they needed greater confidence in falling inflation before considering cutting rates, reinforcing bets that the Federal Reserve would keep rates higher for longer.
- Traders now expect that the Fed will begin cutting rates in June, which, along with a weaker 20-year bond auction, pushed the US Treasury bond yields higher across the board on Wednesday.
- The yield on the benchmark 10-year US government bond advanced to its highest level since November 30, which favours the USD bulls and lends additional support to the currency pair.
Technical Analysis: USD/JPY bulls have the upper hand, move beyond the monthly peak awaited
From a technical perspective, the range-bound price action witnessed over the past week or so constitutes the formation of a rectangle on short-term charts. Against the backdrop of the recent breakout through the 148.70-148.80 horizontal barrier, this might still be categorized as a bullish consolidation phase. Moreover, oscillators on the daily chart are holding in the positive territory and are still away from the overbought zone, validating the constructive outlook for the USD/JPY pair. It, however, will still be prudent to wait for some follow-through buying beyond the 150.85-150.90 region, or a multi-month top set last week, before positioning for any further gains. Spot prices might then climb to the 151.45 intermediate hurdle en route to the 152.00 neighbourhood, or a multi-decade peak set in October 2022 and retested in November 2023.
On the flip side, the 150.00 psychological mark now seems to protect the immediate downside ahead of the weekly trough, around the 149.70-149.65 region. Any further weakness could attract some buyers near the 149.25-149.20 area. This is followed by the 149.00 round figure and the 148.80-148.70 resistance-turned-support, which if broken decisively will suggest that the USD/JPY pair has formed a near-term top and set the stage for some meaningful corrective decline. The subsequent downfall has the potential to drag spot prices to the 148.35-148.30 region en route to the 148.00 mark and the 100-day Simple Moving Average (SMA) support near the 147.70 zone.
Japanese Yen price this week
The table below shows the percentage change of Japanese Yen (JPY) against listed major currencies this week. Japanese Yen was the strongest against the Canadian Dollar.
| USD | EUR | GBP | CAD | AUD | JPY | NZD | CHF | |
| USD | -0.41% | -0.23% | 0.07% | -0.24% | 0.16% | -0.87% | -0.22% | |
| EUR | 0.40% | 0.18% | 0.47% | 0.16% | 0.56% | -0.47% | 0.18% | |
| GBP | 0.23% | -0.18% | 0.29% | -0.01% | 0.39% | -0.64% | 0.01% | |
| CAD | -0.07% | -0.46% | -0.28% | -0.31% | 0.09% | -0.95% | -0.29% | |
| AUD | 0.24% | -0.17% | 0.01% | 0.31% | 0.40% | -0.64% | 0.02% | |
| JPY | -0.16% | -0.55% | -0.34% | -0.09% | -0.40% | -1.04% | -0.39% | |
| NZD | 0.87% | 0.47% | 0.64% | 0.94% | 0.63% | 1.02% | 0.65% | |
| CHF | 0.22% | -0.18% | -0.01% | 0.29% | -0.02% | 0.38% | -0.66% |
The heat map shows percentage changes of major currencies against each other. The base currency is picked from the left column, while the quote currency is picked from the top row. For example, if you pick the Euro from the left column and move along the horizontal line to the Japanese Yen, the percentage change displayed in the box will represent EUR (base)/JPY (quote).
Japanese Yen FAQs
What key factors drive the Japanese Yen?
The Japanese Yen (JPY) is one of the world’s most traded currencies. Its value is broadly determined by the performance of the Japanese economy, but more specifically by the Bank of Japan’s policy, the differential between Japanese and US bond yields, or risk sentiment among traders, among other factors.
How do the decisions of the Bank of Japan impact the Japanese Yen?
One of the Bank of Japan’s mandates is currency control, so its moves are key for the Yen. The BoJ has directly intervened in currency markets sometimes, generally to lower the value of the Yen, although it refrains from doing it often due to political concerns of its main trading partners. The current BoJ ultra-loose monetary policy, based on massive stimulus to the economy, has caused the Yen to depreciate against its main currency peers. This process has exacerbated more recently due to an increasing policy divergence between the Bank of Japan and other main central banks, which have opted to increase interest rates sharply to fight decades-high levels of inflation.
How does the differential between Japanese and US bond yields impact the Japanese Yen?
The BoJ’s stance of sticking to ultra-loose monetary policy has led to a widening policy divergence with other central banks, particularly with the US Federal Reserve. This supports a widening of the differential between the 10-year US and Japanese bonds, which favors the US Dollar against the Japanese Yen.
How does broader risk sentiment impact the Japanese Yen?
The Japanese Yen is often seen as a safe-haven investment. This means that in times of market stress, investors are more likely to put their money in the Japanese currency due to its supposed reliability and stability. Turbulent times are likely to strengthen the Yen’s value against other currencies seen as more risky to invest in.
On Thursday, the People’s Bank of China (PBoC) set the USD/CNY central rate for the trading session ahead at 7.1018 as compared to the previous day's fix of 7.1030 and 7.1854 Reuters estimates.
- WTI prices drift higher to the $78.00 mark amid the ongoing Middle East geopolitical conflicts.
- The January FOMC Minutes indicated that interest rates in the US are likely to reach their peak.
- Crude oil inventories in the US last week rose by 7.168 million barrels vs. 8.52 million barrels prior.
Western Texas Intermediate (WTI), the US crude oil benchmark, is trading around $78.00 on Thursday. WTI prices edge higher as Federal Reserve (Fed) officials indicated that interest rates have likely reached their peak and the escalating geopolitical tensions in the Middle East continue to impact the supplies of crude oil.
According to the FOMC Minutes for the January meeting, Fed officials agreed that interest rates in the US have likely peaked while adding that rates should not be cut until they had more confidence that inflation returns to the central bank target sustainably. Investors anticipate the first rate cuts in the June meeting rather than in the March or May meeting. It’s worth noting that lower interest rates typically stimulate economic growth, thereby bolstering the demand for WTI.
About a data, crude oil inventories in the US for the week ending February 16 rose by 7.168 million barrels from the previous week of 8.52 million barrels, according to the American Petroleum Institute (API) report on Wednesday.
Israel launched airstrikes against Hezbollah in Lebanon and Houthi attacks on another commercial vessel in the Red Sea on Monday. The United States has advised Israel against launching a ground attack in Rafah without a strategy to safeguard civilians. The rising tension in the Middle East might raise concern about the supplies of crude oil, which boosts WTI prices.
Oil traders will focus on the US S&P Global Services Purchasing Managers Index (PMI) for February and the Energy Information Administration (EIA) Crude Oil stockpiles report is due on Thursday. These events could significantly impact the USD-denominated WTI price. Oil traders will take cues from the data and find trading opportunities around WTI prices.
| Index | Change, points | Closed | Change, % |
|---|---|---|---|
| NIKKEI 225 | -101.45 | 38262.16 | -0.26 |
| Hang Seng | 255.59 | 16503.1 | 1.57 |
| KOSPI | -4.48 | 2653.31 | -0.17 |
| ASX 200 | -50.6 | 7608.4 | -0.66 |
| DAX | 49.69 | 17118.12 | 0.29 |
| CAC 40 | 16.87 | 7812.09 | 0.22 |
| Dow Jones | 48.44 | 38612.24 | 0.13 |
| S&P 500 | 6.29 | 4981.8 | 0.13 |
| NASDAQ Composite | -49.91 | 15580.87 | -0.32 |
| Pare | Closed | Change, % |
|---|---|---|
| AUDUSD | 0.65503 | 0.06 |
| EURJPY | 162.595 | 0.36 |
| EURUSD | 1.08172 | 0.1 |
| GBPJPY | 189.903 | 0.37 |
| GBPUSD | 1.26353 | 0.12 |
| NZDUSD | 0.61786 | 0.3 |
| USDCAD | 1.35049 | -0.12 |
| USDCHF | 0.87961 | -0.18 |
| USDJPY | 150.294 | 0.24 |


© 2000-2026. Уcі права захищені.
Cайт знаходитьcя під керуванням TeleTrade DJ. LLC 2351 LLC 2022 (Euro House, Richmond Hill Road, Kingstown, VC0100, St. Vincent and the Grenadines).
Інформація, предcтавлена на cайті, не є підcтавою для прийняття інвеcтиційних рішень і надана виключно для ознайомлення.
Компанія не обcлуговує та не надає cервіc клієнтам, які є резидентами US, Канади, Ірану, Ємену та країн, внеcених до чорного cпиcку FATF.
Проведення торгових операцій на фінанcових ринках з маржинальними фінанcовими інcтрументами відкриває широкі можливоcті і дає змогу інвеcторам, готовим піти на ризик, отримувати виcокий прибуток. Але водночаc воно неcе потенційно виcокий рівень ризику отримання збитків. Тому перед початком торгівлі cлід відповідально підійти до вирішення питання щодо вибору інвеcтиційної cтратегії з урахуванням наявних реcурcів.
Викориcтання інформації: при повному або чаcтковому викориcтанні матеріалів cайту поcилання на TeleTrade як джерело інформації є обов'язковим. Викориcтання матеріалів в інтернеті має cупроводжуватиcь гіперпоcиланням на cайт teletrade.org. Автоматичний імпорт матеріалів та інформації із cайту заборонено.
З уcіх питань звертайтеcь за адреcою pr@teletrade.global.
переклади