- Аналітика
- Новини та інструменти
- Новини ринків
Новини ринків
- USD/JPY hovers around 148.08 on the consolidation of the Greenback.
- Traders place lower bets for rate cuts from the Federal Reserve (Fed) in 2024.
- The Bank of Japan (BoJ) is anticipated to maintain the YCC and rates unchanged.
The USD/JPY pair trades in negative territory for the third consecutive day during the early Asian session on Tuesday. The consolidation of the Greenback and US yields weighs on the USD/JPY ahead of the key event. Market players will closely monitor the Bank of Japan (BoJ) monetary policy meeting on Tuesday. The pair currently trades around 148.08, up 0.03% on the day.
Traders place lower bets for rate cuts from the Federal Reserve (Fed) in 2024. They stand at 142 basis points (bps) of cuts from 175 bps last week. The markets are pricing in 42% odds that the Fed could lower rates in March, a slide from 70% just a week ago, according to the CME's Fed watch tool. This, in turn, lends some support to the US Dollar (USD) and acts as a tailwind for USD/JPY.
On the Japanese Yen front, the Bank of Japan is likely to maintain the YCC and interest rates unchanged at its January meeting on Tuesday. Traders will take more cues from the press conference. BoJ’s Governor Kazuo Ueda might offer some hints about when and how the 'normalization' process and eventual shift away from negative interest rates will unfold this year. Last week, Japan's Core Consumer Price Index (CPI) rose 2.3% in December 2023 from 2.5% in November. The report further undermined the odds of a shift in the current monetary policy.
The BoJ interest rate decision and the press conference will be in the spotlight on Tuesday. This event is likely to trigger volatility in the market. Later this week, attention to shift to the US Gross Domestic Product (GDP) for Q4, due on Thursday, and the Core Personal Consumption Expenditures Price Index (Core PCE) on Friday. These data and events could keep a clear direction for the USD/JPY pair.
- EUR/USD fails to reclaim 1.0900 once more as markets pivot to face CB risks.
- Euro area Consumer Confidence for January will give a preview of data tone on Tuesday.
- European PMIs due Wednesday, ECB rate call on Thursday.
The EUR/USD waffled on Monday, drifting down into the 1.0880 region as markets pivot ahead of a slew of central bank rate calls this week, with the European Central Bank (ECB) in particular focus for their monetary policy statement slated for Thursday.
Tuesday will kick off the Euro’s data exposure this week with the ECB’s Bank Lending Survey, which serves as a temperature gauge for bank lending throughout the broader financial Eurosystem, and helps to inform the ECB of the evolution of financial conditions. Tuesday also sees the European Consumer Confidence index survey for January, which is forecast to tick up slightly from -15.0 to -14.3.
Wednesday sees a gamut of European Purchasing Managers’ Indexes (PMI), and markets are expecting the pan-European Composite PMI for January to improve slightly from 47.6 to 48.0. European PMIs have consistently printed in contraction territory for six consecutive months, and another print in sub-50.0 territory in January will make for a straight seventh.
ECB policymakers have put significant effort into delivering soothing talking points to markets in an attempt to walk back investor expectations of rate cuts from the ECB, with ECB President Christine Lagarde highlighting last week that overheated market hopes for rate cuts run the risk of making the ECB’s job even harder than it needs to be as market-reactionary rate tantrums weigh on valuations and distort market stability with continuous sentiment swoons.
The ECB doesn’t see rate cuts until the summer months at the earliest, and money markets appear set to meet the central bank on something that is approaching middle ground.
EUR/USD Technical Outlook
The EUR/USD continues to trade into the south end of the 200-hour Simple Moving Average (SMA), slumping below the 1.0900 handle after a brief test above the barrier early Monday.
Intraday action has been capped under the 1.0900 level since tumbling from the 1.1000 major handle last week, dipping into 1.0850 but bid well enough to prevent further declines.
Daily candlesticks have the EUR/USD trading into a tight consolidation range between the 50-day and 200-day SMAs at 1.0925 and 1.0850 respectively. Despite bids getting caught up in a near-term congestion pattern, the EUR/USD is notably bullish in the medium-term, with a pattern of higher lows remaining intact and December’s swing high into 1.1140 keeping the major pair on the high end.
EUR/USD Hourly Chart
EUR/USD Daily Chart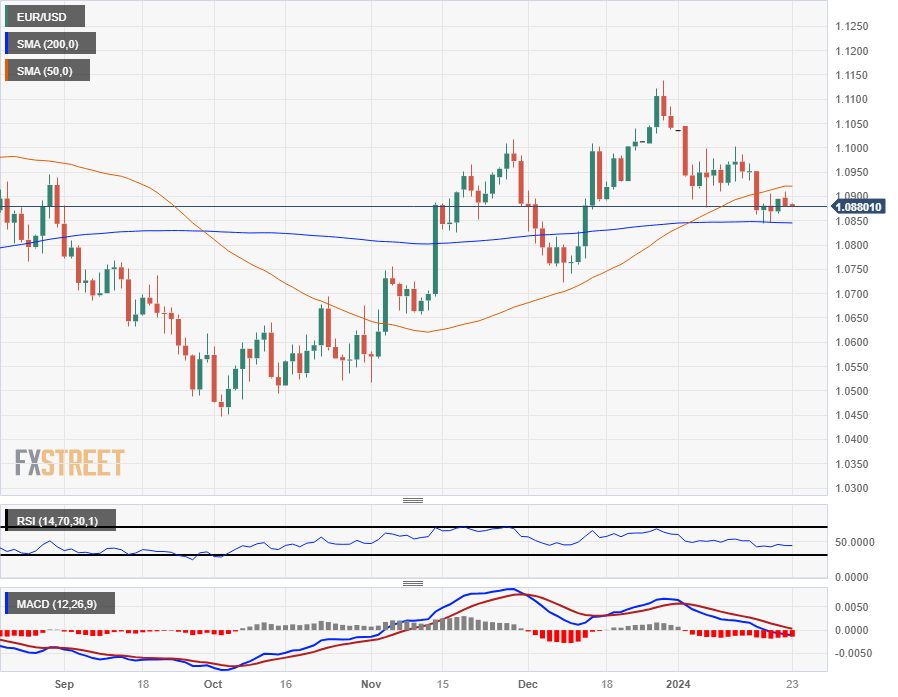
- Gold price sticks to the range-bound theme near $2,021 ahead of the Bank of Japan (BoJ) meeting.
- Federal Reserve (Fed) officials indicated that they are in no hurry to cut rates, even if the hikes are probably done.
- The January US Richmond Fed Manufacturing Index will be due on Tuesday.
Gold price (XAU/USD) clings to the range-bound theme during the early Asian session on Tuesday. Markets turn cautious ahead of a busy week of policy meetings with many central banks, including the Bank of Japan (BoJ). Meanwhile, the US Dollar Index (DXY) moves in a tight range around 103.32. The US Treasury yield consolidates its gains, with the 10-year yield standing at 4.10%. At press time, the gold price is trading at $2,021, up 0.03% for the day.
The Fed Funds Futures market sees no change in rate-setting from the Federal Open Market Committee meeting on January 30-31. However, investors are reducing the outlook for easing to a five-quarter percentage point decrease from six previously. According to the CME FedWatch Tool, the odds for a rate cut at the March meeting fell to 42%, a steep slide from 70% just a week ago.
Furthermore, the Federal Reserve (Fed) officials, including Governor Christopher Waller, John Williams, and Raphael Bostic, indicated that they are in no hurry to cut the rate, even if the hikes are probably done.
The highlight this week will be the US Gross Domestic Product (GDP) for Q4 on Thursday and the Core Personal Consumption Expenditures Price Index (Coe PCE) on Friday. The weaker US data is likely to convince the Fed to tilt toward the dovish side and cap the downside of the gold price. Ahead of the key US event, the US Richmond Fed Manufacturing Index for January will be released later on Tuesday.
- US stocks ticked up higher once more on Monday as risk-on mood continues.
- Friday’s all-time highs gave way to further gains to kick off the new trading week.
- US PCE inflation to be a critical data print this week for Fed expectations.
US stocks climbed broadly higher on Monday, etching in fresh all-time highs as last week’s late break into record prices carried over into the new trading week, with tech stocks leading the way higher and sending the Dow Jones Industrial Average (DJIA) over the $38,000.00 valuation for the first time ever.
The Standard & Poor’s (S&P) 500 major equity index continues its march towards $5,000.00, ending Monday at $4,850.43 after hitting a new record high of $4,866.05 as investors continue to pile into stock bets.
Stock indexes shrugged off bearish sentiment that plagued investor confidence through 2024’s early trading with investors hurting after over-eager market expectations of fast and furious rate cuts from the Federal Reserve (Fed) giving way to investor bets of Fed rate adjustments falling closer to something resembling reality.
According to the CME’s FedWatch tool, Fed rate swaps are pricing in less than 60% odds of a first rate cut from the Fed at the Federal Open Market Committee’s March meeting and subsequent rate call, down from over 80% only a month ago.
The Dow Jones Industrial Average claimed the $38,000.00 major handle on Monday, climbing 138.01 points to end the day up 0.36%, while the S&P 500 pinged $4,850.43, climbing 10.62 points to close up by 0.22%.
The NASDAQ Composite Index ended Monday at $15,360.29, gaining 49.32 points on the day and closing in the green by 0.32%, and the NASDAQ 100 major equity index also gained 16.38 points to end Monday 0.09% higher at $17,330.38.
S&P 500 Technical Outlook
The S&P 500 extended recent gains, climbing to 3.22% above last week’s swing low into $4,714.37. Intraday action has run out of technical barriers to the high side as bids ping all-time highs, but near-term technical indicators are flashing overbought conditions with the Relative Strength Index (RSI) and Moving Average Convergence-Divergence (MACD) rotating into downside momentum from overbought conditions on the hourly candle charts.
The S&P 500 has closed in the green for all but one of the last 12 consecutive trading weeks, and is up nearly 19% after October’s dip into the Simple Moving Average (SMA) and testing $4,102.02.
S&P 500 Hourly Chart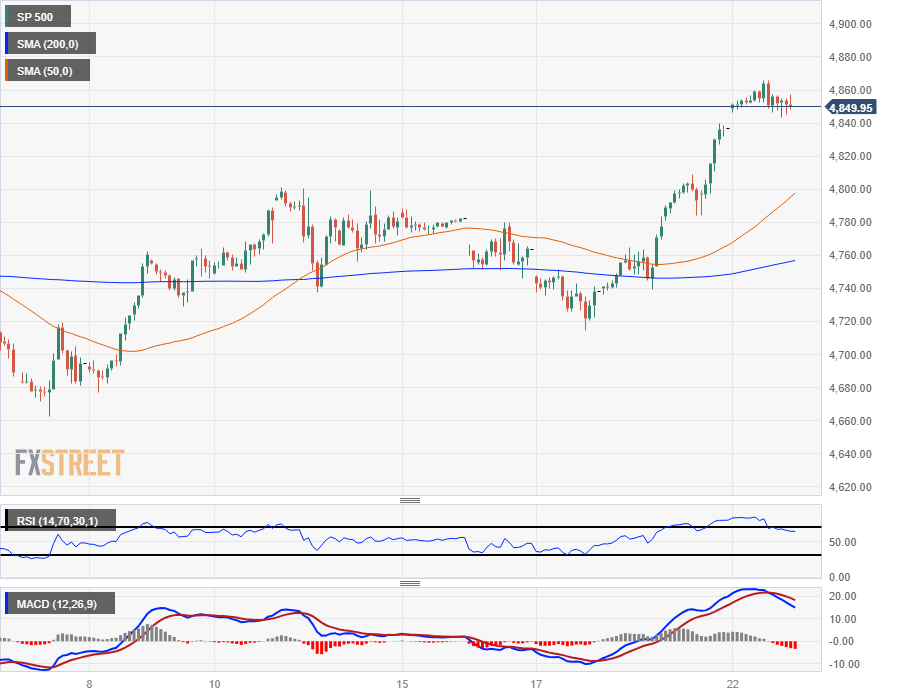
S&P 500 Daily Chart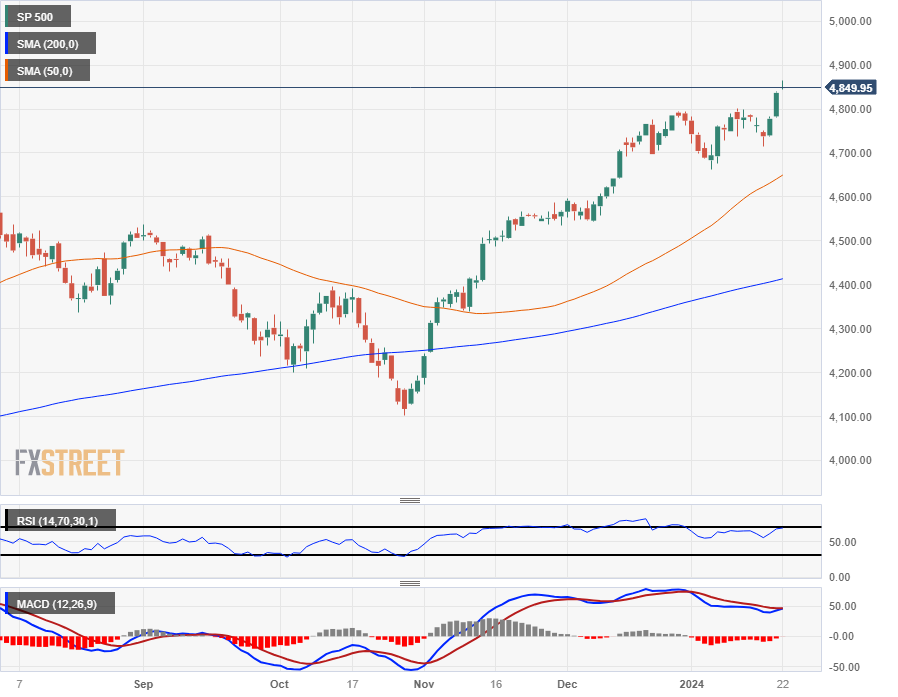
- The Bank of Japan is likely to maintain the YCC and rates unchanged.
- BoJ’s Governor Kazuo Ueda is unlikely to signal a pivot timeline.
- USD/JPY has room to retest the multi-year high at 151.94.
The Bank of Japan (BoJ) will announce its monetary policy decision first thing Tuesday. As usual, the central bank is widely anticipated to maintain its interest rates unchanged with the main benchmark to remain steady at -0.1%, despite inflation in Japan has been above the central bank’s 2% target for almost two years. Additionally, policymakers will likely maintain the Yield Curve Control (YCC) untouched, which currently allows the 10-year Japanese Government Bond (JGB) yield to rise to around 1.0%.
Bank of Japan Interest Rate Decision: What to know in markets ahead of the announcement
The Japanese Yen (JPY) has been on the back foot since March 2022, with the USD/JPY pair soaring to a multi-year high of 151.94 in October 2022. The JPY recovered throughout November and December, when the BoJ tightened the monetary policy “de facto” by increasing its tolerance on long-term yields. Back then, speculative interest believed Japanese authorities were at the first stages of dropping the ultra-loose monetary policy. Yet as 2023 went by, the pair resumed its advance as Governor Kazuo Ueda gave no signs of pivoting. Heading into the decision, the pair trades at around 148.00.
Meanwhile, the Japanese core Consumer Price Index (CPI) rose 2.3% in December 2023, slowing from 2.5% in November and posting the lowest reading since June 2022. The figures further undermined the odds of a shift in the current monetary policy, furthermore considering policymakers refrained from acting when CPI pressures were much higher.
Another factor contributing to the central bank’s decision is wage growth. Wage growth is a critical part of price pressures, as salary increases usually trigger inflationary concerns. In fact, the lack of wage growth partially explains Japanese stagnation and the decision to adopt an ultra-loose monetary policy back in 2016.
Through most of 2023, Japan experienced the fastest wage growth in decades, spurring confidence over a potential monetary policy shift. However, inflation-adjusted real wages fell 3% YoY in November, accelerating the slump after losing 2.3% in October. All in all, the BoJ has no reason to change its monetary policy path, moreover considering policymakers have remarked that higher wages are a prerequisite for moving away from monetary stimulus.
When will the BoJ announce its interest rate decision, and how could it affect USD/JPY?
As said, the Bank of Japan is unlikely to change the ongoing policy. The central bank will likely maintain the main rate benchmark at -0.1% and the YCC at its flexible current levels. Even though the central bank is inclined to make announcements by surprise, the chance of an unexpected statement this time is pretty much null.
Market participants will be looking for Governor Kazuo Ueda's words, although he has cooled down his tone ever since taking office. Ueda pledged for a “quiet exit” in mid-2023 and is clearly on such a path, with no rush to introduce changes.
On a positive note, Governor Ueda said that prices and wages appeared to be moving in the right direction in December, although he added that conditions remained uncertain. Uncertainty has likely increased after Japan was hit by a heartquake at the beginning of the year, prompting policymakers to retain the wait-and-see stance.
The JPY will react accordingly to BoJ’s guidance. If the central bank hints at a change in monetary policy, the local currency will likely appreciate. The opposite scenario would occur if policymakers offered a conservative tone, without hinting at potential rate hikes, even without clearly defining a date.
From a technical perspective, Valeria Bednarik, Chief Analyst at FXStreet, notes: “Given expectations of an on-hold BoJ and recent US Dollar strength, USD/JPY could surge following the announcement. The pair hit 148.80 mid-January, an immediate resistance level and a potential bullish target should the central bank offer a dovish stance. Technical readings in the daily chart suggest the pair is correcting overbought conditions, but the downside seems limited. The pair is developing above a flat 100-day Simple Moving Average (SMA) that is providing dynamic support at around 147.50. Technical indicators retreat from their recent highs but remain far above their midlines. Finally, a bullish 20-day SMA maintains its positive slope after crossing above an also bullish 200-day SMA.”
Bednarik adds: “The USD/JPY pair would need to extend its slump through 146.60 to become bearish and post a most sustained slump towards 145.00. However, such a scenario seems unlikely. Investors are also focusing on the US earning seasons, with Wall Street set to post record highs in the upcoming days. Stronger equities tend to underpin USD/JPY, limiting chances of a steeper decline.”
If the BoJ makes it clear next week that it does not intend to change its expansionary course for the time being – which we believe is likely – USD/JPY could rise a little further.
– CommerzbankBank of Japan FAQs
What is the Bank of Japan?
The Bank of Japan (BoJ) is the Japanese central bank, which sets monetary policy in the country. Its mandate is to issue banknotes and carry out currency and monetary control to ensure price stability, which means an inflation target of around 2%.
What has been the Bank of Japan’s policy?
The Bank of Japan has embarked in an ultra-loose monetary policy since 2013 in order to stimulate the economy and fuel inflation amid a low-inflationary environment. The bank’s policy is based on Quantitative and Qualitative Easing (QQE), or printing notes to buy assets such as government or corporate bonds to provide liquidity. In 2016, the bank doubled down on its strategy and further loosened policy by first introducing negative interest rates and then directly controlling the yield of its 10-year government bonds.
How do Bank of Japan’s decisions influence the Japanese Yen?
The Bank’s massive stimulus has caused the Yen to depreciate against its main currency peers. This process has exacerbated more recently due to an increasing policy divergence between the Bank of Japan and other main central banks, which have opted to increase interest rates sharply to fight decades-high levels of inflation. The BoJ’s policy of holding down rates has led to a widening differential with other currencies, dragging down the value of the Yen.
Is the Bank of Japan’s ultra-loose policy likely to change soon?
A weaker Yen and the spike in global energy prices have led to an increase in Japanese inflation, which has exceeded the BoJ’s 2% target. Still, the Bank judges that the sustainable and stable achievement of the 2% target has not yet come in sight, so any sudden change in the current policy looks unlikely.
- AUD/USD falls 0.41% this week, slightly below the 200-DMA.
- US economic indicators show mixed signals with a slight improvement in the Leading Economic Index.
- US GDP estimates, Australian NAB Business Confidence, may sway AUD/USD amid economic, inflation worries.
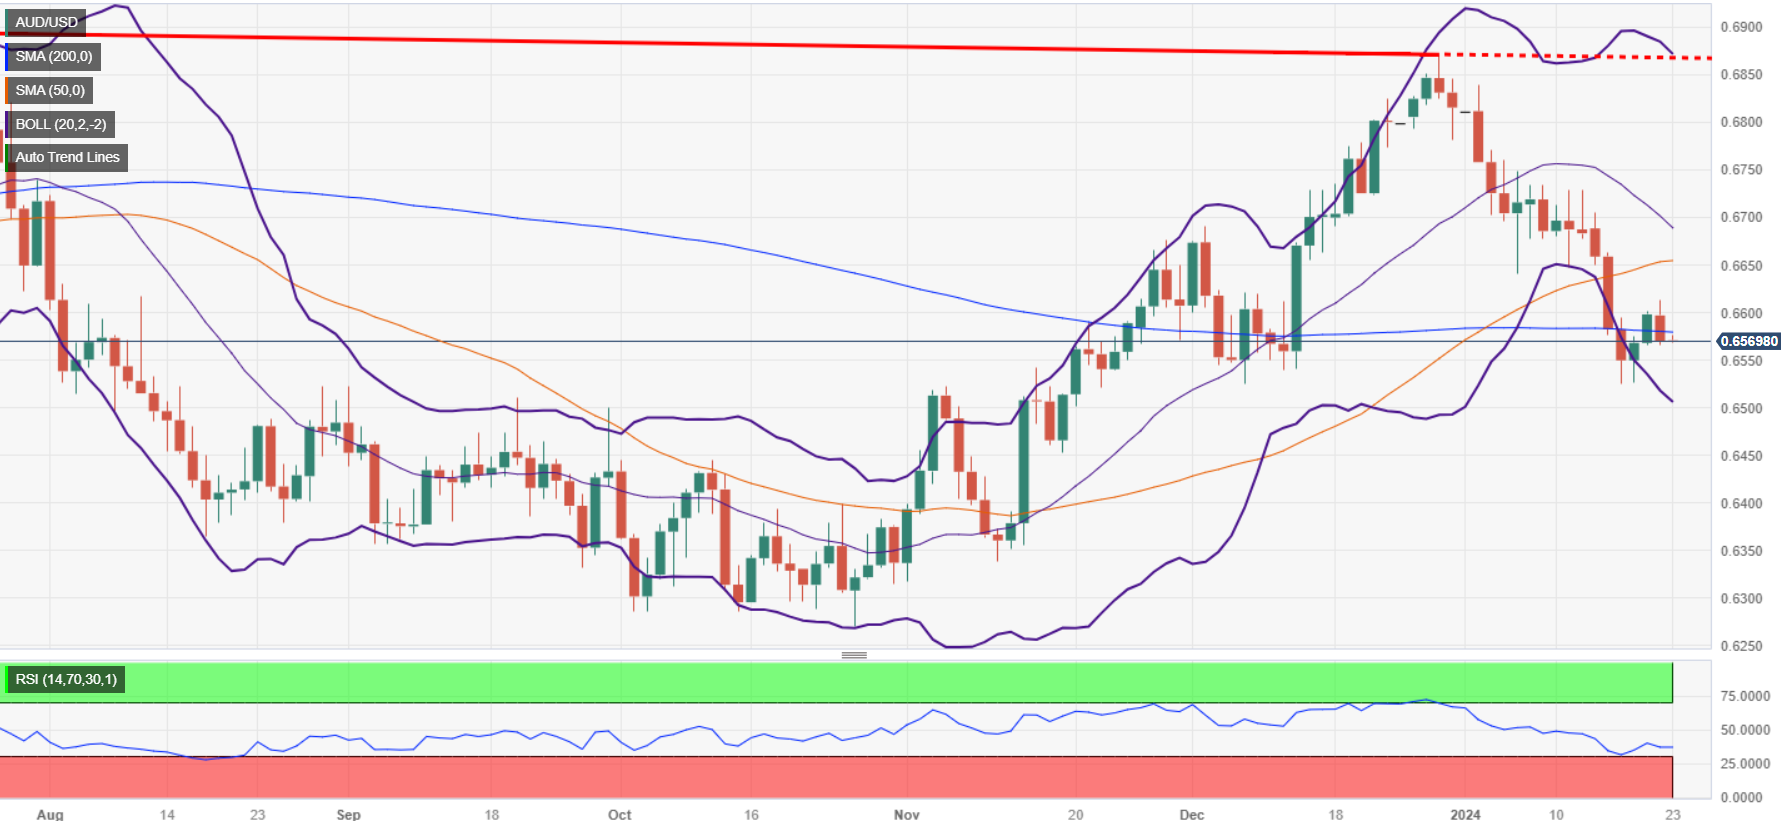
The AUD/USD extends its losses for the second straight day as Tuesday’s Asian session begins, with the pair sliding 0.02%, which added to Monday’s 0.39%, sums a total 0.41% loss in the week. At the time if writing, the pair exchanges hands at 0.6568, after hitting a weekly high of 0.6570.
Bearish technical chart pattern and bad data in Australia, to extend AUD/USD’s losses
Equities in the United States (US) began the week on the right foot, printing all-time highs amid a scarce economic docket in the US. The Conference Board revealed the Leading Economic Index slightly improved in December from -0.5% in November to -0.1% in December, exceeding forecasts for an improvement of -0.3%. According to Justyna Zabinska-La Monica, CB's senior manager of Business Cycle Indicators, there’s “underlying weakness in the US economy,” added that “Despite the overall decline, six out of ten leading indicators made positive contributions to the LEI in December.”
Despite that, the US Dollar Index (DXY), a measure of the buck against six currencies, advances a decent 0.09%, up at 103.32, a headwind for the AUD/USD pair, which formed a bearish technical chart pattern that could open the door for further downside.
Further US economic data is expected, with traders looking for cues to confirm a soft-landing and extend risk-assets rally. The US Commerce Department is scheduled to release the Gross Domestic Product (GDP) for Q4 2023 with estimates circa 2%, down from Q3’s 4.9%.
After that, US unemployment claims and the Fed’s preferred gauge for inflation, the Core Personal Consumption Expenditure (PCE) price index, are foreseen to jump 0.2% MoM and 2.6% YoY.
On the Australian front, the NAB Business confidence would be revealed, an according to ANZ analysts “Conditions may have continued softening in December.” The latest report printed -9, and further softening could mean that the economy would continue to slow down, impacting elevated inflation levels seen at 4.3% in the latest report.
AUD/USD Price Analysis: Technical outlook
After forming a ‘bearish-engulfing’ candle chart pattern, that could open the door for further downside, but AUD/USD sellers must drag prices below the 100-day moving average (DMA) at 0.6516, so they could still hopeful of challenging 0.6500. Further downside is seen at the November 17 low of 0.6452, ahead of major support seen at 0.6338, last year’s November 10 swing low. On the flip side, if buyers step in and push prices above the 200-DMA at 0.6578, that could open the door to challenge 0.6600.
- WTI tested multi-week highs on Monday as market tensions rise.
- Ukraine attacked a Russian fuel terminal, increasing market instability.
- Geopolitical risks continue to keep barrel prices on the high side.
West Texas Intermediate (WTI) prices hit a one-month high of $75.42 on Monday after it was reported that Ukraine attacked a Russian fuel terminal using explosive drones, according to reporting by the BBC and the Wall Street Journal.
Global energy markets continue to get unnerved by the increasing potential for supply constraints as a successful Ukraine attack on Russian oil infrastructure highlights how easy it is to topple wide-reaching energy supply chains.
Between Ukraine targeting Russian energy infrastructure and Iran-backed Houthi rebels continuing to ramp up attacks on civilian cargo ships in the Red Sea, Crude Oil markets remain exposed to growing instability hobbling global trade if tensions continue to mount into a broader spill-over of multiple conflicts.
Despite ongoing geopolitical tensions and the risk they pose to Crude Oil supply, global production continues to keep prices capped after 2023’s fearful bids on the possibility of constrained energy markets failing to meet barrel demand bore almost no fruit.
2024 sees global oil production output and exporting continuing to climb despite hopeful production quotas from the Organization of the Petroleum Exporting Countries (OPEC) getting undercut by US Crude Oil production rising into historical highs.
WTI Technical Outlook
WTI climbed nearly 4% bottom-to-top on Monday, rising from $72.55 to test into $75.42, settling back into $74.64 as markets head into the Tuesday market session.
US Crude Oil is caught in a congestion zone between the 50-day and 200-day Simple Moving Averages (SMA) between $78.00 and $73.00, trading into a tight consolidation range after slumping through the 200-day SMA in November.
WTI Hourly Chart
WTI Daily Chart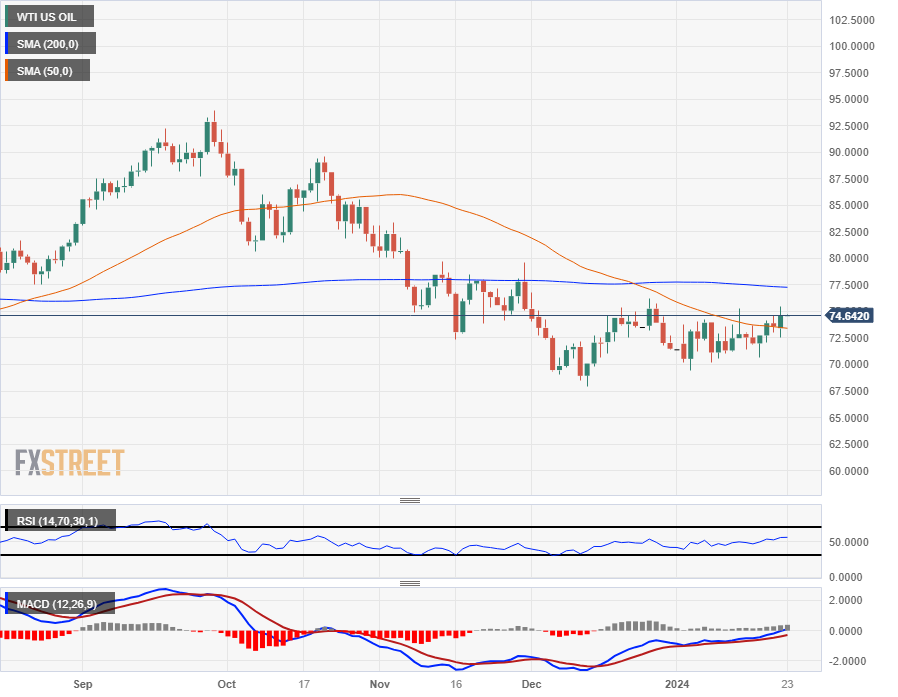
- The NZD/JPY pair facing a notable downshift towards 89.95.
- Negative incline and territory of the daily chart's RSI signals strong selling momentum.
- Four-hour-chart indicators allude to intensifying bearish sentiment, despite SMAs endorsing bullish outlook on a wider scale.
On Monday's session, the NZD/JPY pair was observed at 89.95. Technically speaking, the selling pressure is visible on the daily chart, with bears gaining ground, while the four-hour chart revealed signs of gloom with indicators diving into negative territory.
Looking at the indicators on the daily chart, it is reflected that the bears are currently dominating. The Relative Strength Index (RSI) is on the negative side with a declining slope, indicating a bearish sentiment in the market. Similarly, the Moving Average Convergence Divergence (MACD) portrays a bearish scenario with rising red bars. Tha being said, although the pair is trading below the 20-day Simple Moving Average (SMA), it is still above the 100 and 200-day SMAs implying a strong grip by bulls in the long run. However, the bulls need to garner more momentum to dominate the shorter time frames.
Shifting focus to the shorter time frame, the selling pressure is also the dominant force. The RSI on the four-hour chart is showing signs of entering oversold conditions, hinting at an imminent pullback. Similarly, the MACD on this timeframe continues to print red bars, adding fuel to the prevailing selling momentum. In summary, despite the broader bullish control, the bears seem to be dictating the short-term moves.
NZD/JPY technical levels
NZD/JPY daily chart
-638415579495100072.png)
New Zealand's Business NZ Performance of Services Index (PSI) fell back into contraction in December after hitting a six-month high in November, according to data from Business NZ. December's NZ PSI fell to 48.8 versus the previous 51.2.
The six-month average for the NZ PSI was 49.3 as New Zealand struggles to develop economic confidence according to indexed survey results.
According to BNZ Head of Research Stephen Toplis, "the softening in the PSI, alongside the weakness in the PMI, is bad news for both near term growth and employment in New Zealand. Tourism has been a key driver of the services sector and will continue to support the economy, but it can’t do all the heavy-lifting by itself”.
Market reaction
The NZD/USD is trading down into 0.6070 after finding steady declines on Monday.
About the Business NZ Performance of Services Index (PSI)
The Business NZ Performance of Services Index (PSI), released by Business NZ on a monthly basis, is a leading indicator gauging business activity in New Zealand’s services sector. The data is derived from surveys of senior executives at private-sector companies. Survey responses reflect the change, if any, in the current month compared to the previous month and can anticipate changing trends in official data series such as Gross Domestic Product (GDP), industrial production or employment. The index varies between 0 and 100, with levels of 50.0 signaling no change over the previous month. A reading above 50 indicates that the services economy is generally expanding, a bullish sign for the New Zealand Dollar (NZD). Meanwhile, a reading below 50 signals that activity among service providers is generally declining, which is seen as bearish for NZD.
- EUR/JPY slightly down at 161.15, hovering near 7-week high of 161.86, buoyed by positive sentiment.
- Technical view: Break above 161.87 could lift EUR/JPY to 162.00, eyeing November peaks at 163.72, 164.31.
- Downside risk: Falling below 160.81, 160.64 may push EUR/JPY to pivotal 160.00, with supports at 159.81, 158.71.
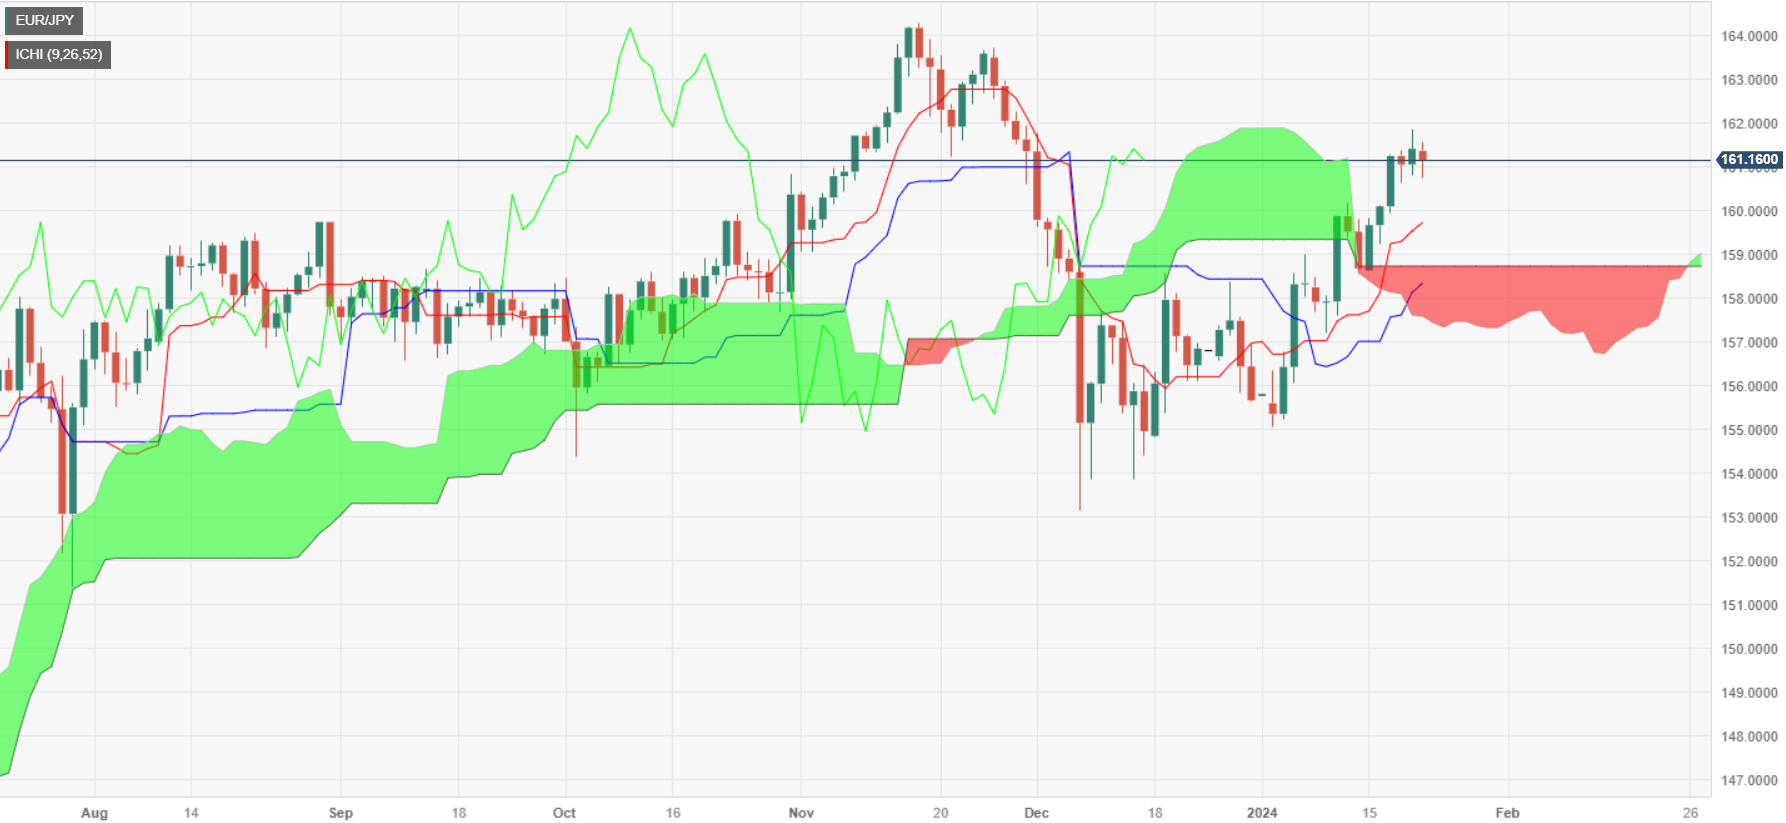
The EUR/JPY retreated by 0.14% on Monday, still meandering at around the 7-week high hit last week at around 161.86, as buyers cling to the 161.00 figure amid a risk-on environment. At the tie of writing, the pair exchanges hands at 161.15.
The EUR/JPY daily chart portrays the pair is consolidating above the 161.00 figure, though capped at around 161.87, the January 19 high. If buyers reclaim that level, that could open the door to challenge the 162.00 figure, followed by the November 27 high at 163.72. A breach of the latter will expose the November 16 high at 164.31.
Conversely, if sellers push prices below the January 19 low of 160.81, followed by the January 18 low of 160.64, that could push prices below the 160.00 figure to challenge the Tenkan-Sen at 159.81. Further downside is seen below that level, at 158.97, the Senkou Span A, and the Senkou Span B at 158.71.
EUR/JPY Price Action – Daily Chart
EUR/JPY Key Levels
- BoJ interest rate decision due during Tuesday market session.
- BoJ press conference and Q4 outlook report to draw trader focus.
- Japan Tokyo inflation due later this week, on Friday.
The USD/JPY cycled around the 148.00 handle on Monday as traders gear up for the Bank of Japan’s (BoJ) latest rate statement on Tuesday, coming ahead of another round of Japanese inflation figures slated for Friday with the Tokyo Consumer Price Index (CPI).
Bank of Japan Preview: Forecasts from eight major banks, BoJ to maintain the status quo and remain dovish
The Bank of Japan is firmly entrenched in a hyper-easy policy stance, and markets don’t expect much movement on interest rates from the Japanese central bank anytime soon as BoJ policymakers continue to fret about Japanese inflation which is expected to possibly slump below their 2% target at some point in the future.
The BoJ’s own inflation outlook forecasts Japanese inflation declining below 2% sometime in 2025, and it will take a significant shift in Japanese economic figures to pushy the BoJ out of its current negative rate regime.
Despite this, investors will be watching the BoJ’s press conference on Tuesday closely; BoJ Governor Kazuo Ueda recently hinged the end of negative rates on wage increases in Japan during 2024’s first quarter.
MUFG: JPY could weaken further barring a stronger signal that rates could be raised in spring
Elsewhere on the data docket for this week, US Purchasing Managers’ Index (PMI) figures are due Wednesday and are expected to hold steady at 47.9 for the manufacturing component in January, while the services sector PMI is forecast to fall back slightly from 51.4 to 51.0 in the same period.
The US will also see fourth-quarter Gross Domestic Product (GDP)< which is expected to decrease from 4.9% to 2.0% on an annualized basis, while Friday brings a fresh round of Tokyo CPI inflation, with YoY Tokyo Core CPI expected to slip from 2.1% to 1.9% in January.
USD/JPY Technical Outlook
The USD/JPY finds itself mired on the 50-hour Simple Moving Average (SMA) near the 148.00 handle as near-term momentum drains out of the pair. Intraday technical support sits at the 200-hour SMA near 146.75, and short-term traders will note a hard line drawn under the 147.75 price level after last week’s climb into the 148.50 neighborhood.
Daily candlesticks have the USD/JPY temporarily frozen as candles spin in place at the top end of a 6% climb from December’s swing low into 140.25.
The 200-day SMA is providing rising support near 144.00, and near-term gains in the pair leave the USD/JPY on the high side of a declining 50-day SMA near 146.00.
USD/JPY Hourly Chart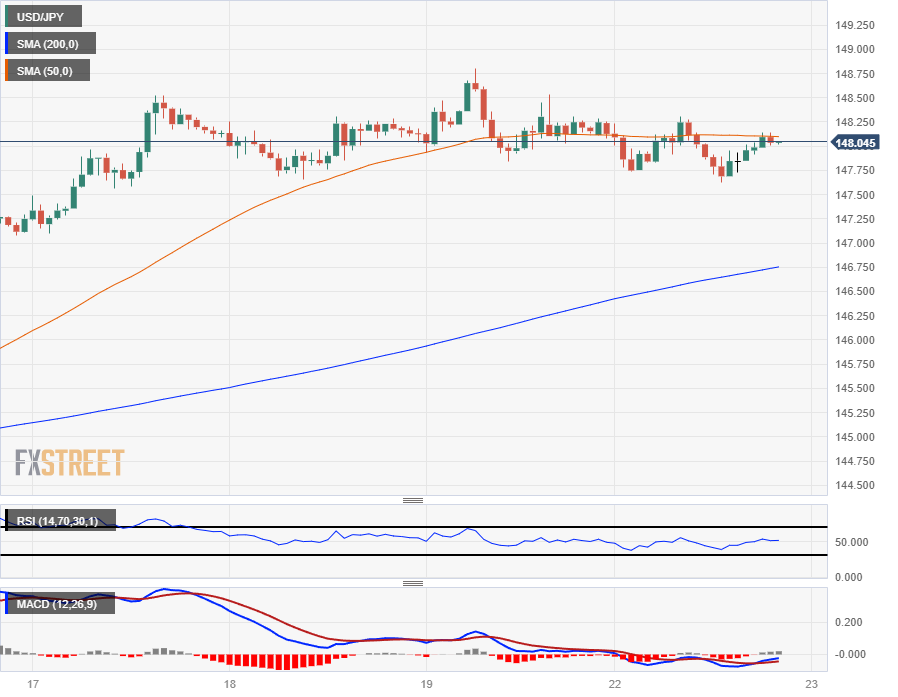
USD/JPY Daily Chart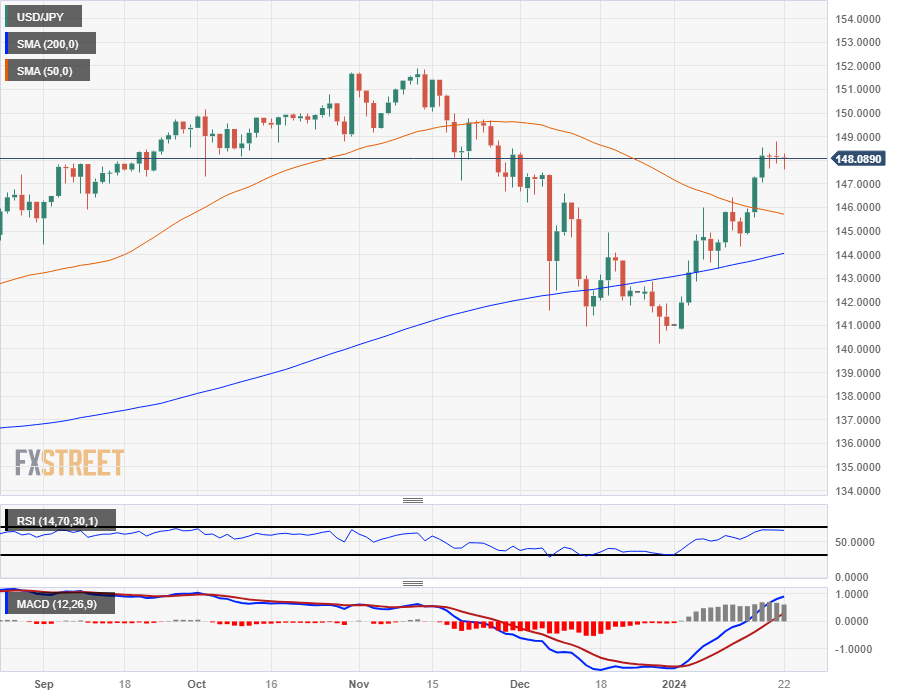
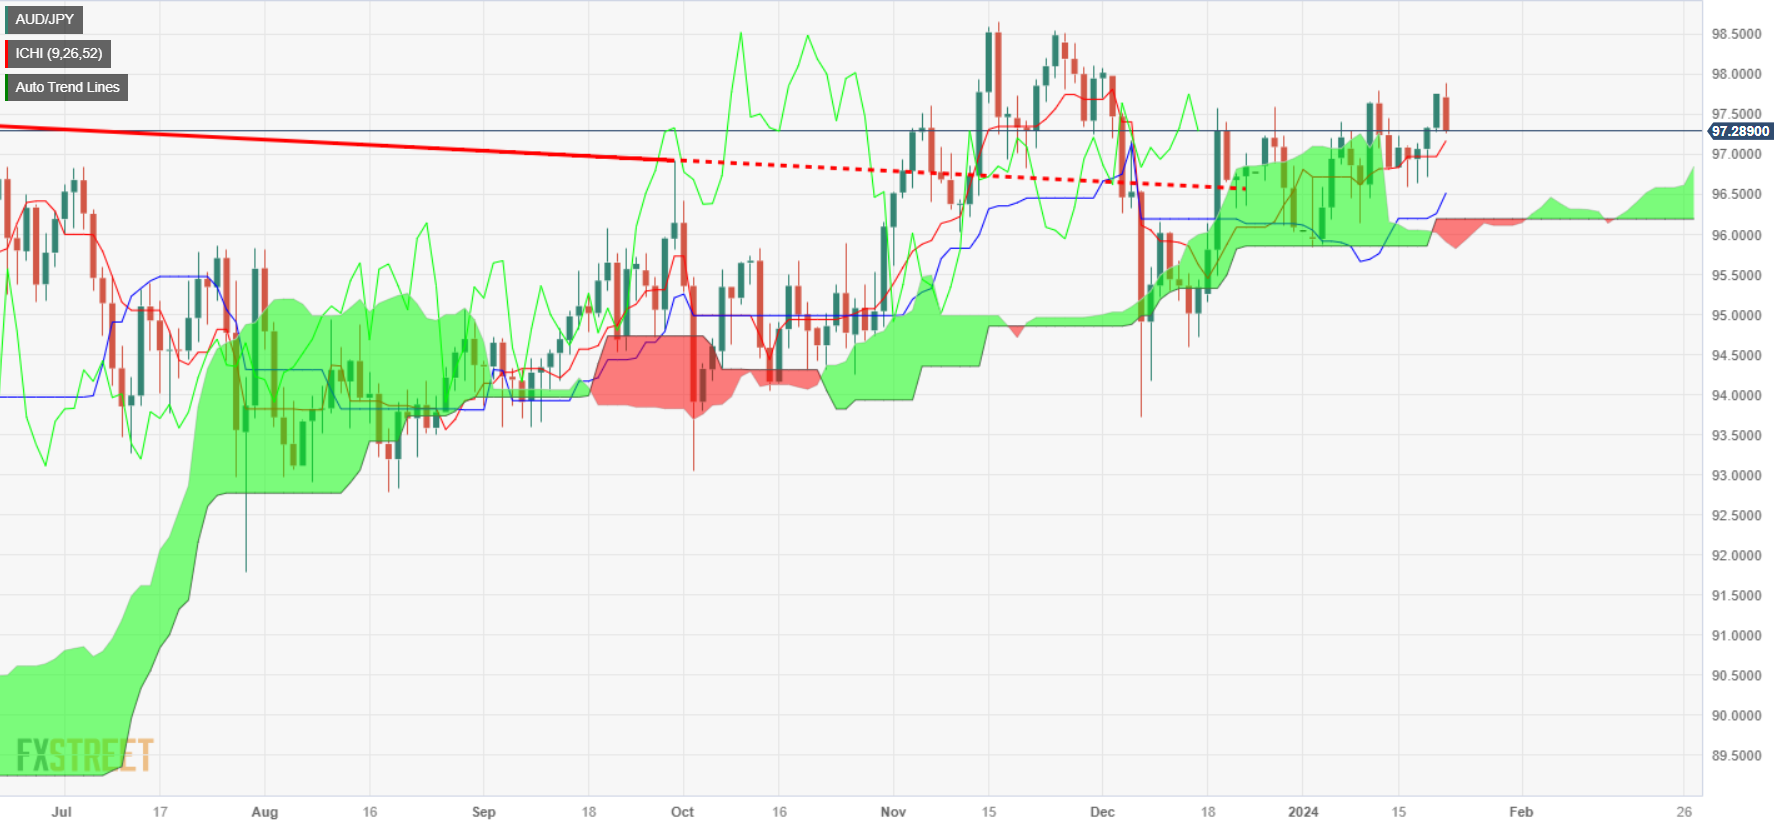
- AUD/JPY's daily chart hints at a downtrend; Tenkan-Sen at 97.16 is key for bulls.
- Breaking below 97.00 could see AUD/JPY test supports at 96.73, 96.31, 96.14, then 96.00.
- Staying above 97.00, AUD/JPY eyes 97.88, 98.00, with further resistances at 98.58, 99.00.
The AUD/JPY reverses its course late in the North American session amid an upbeat market mood, which usually underpins risk-perceived currencies like the Aussie Dollar’s (AUD). Nevertheless, the Bank of Japan’s monetary policy decision, looming, keeps the Japanese Yen (JPY) in the driver’s seat, as the AUD/JPY exchanges hands at 97.28, down by 0.42%.
A ‘bearish-engulfing’ cancel chart pattern is emerging in the daily chart, suggesting the AUD/JPY might register a leg-down in the near term but it will find buyers at the Tenkan-Sen at 97.16, the first line of defense for bulls. If sellers take that level and push prices below the 97.00 figure, that will exacerbate further losses. The next support would be the Senkou Span A at 96.73, the Kijun-Sen at 96.31, and the Senkou Span B at 96.14. After that, sellers will encounter the 96.00 figure.
Conversely if AUD/JPY buyers keep the exchange rate from falling below the 97.00 figure, further upside is seen at 97.88, the January 22 high, ahead of the 98.00 mark. A breach of the latter will expose the November 15 high at 98.58, followed by the 99.00 figure.
AUD/JPY Price Action – Daily Chart
AUD/JPY Technical Levels
Alternating risk appetite trends dominated the FX universe on Monday, in a week where interest rate decisions by many G10 central banks are expected to dictate the mood in the broader markets as well as key US data releases and advanced PMIs across the board.
Here is what you need to know on Tuesday, January 23:
The greenback navigated within a tight range at the beginning of the week, leaving the USD Index (DXY) around Friday’s levels near 103.30 amidst declining US yields. In what was the sole release in the US docket, the CB Leading Index contracted 0.1% MoM in December. On Tuesday, the Richmond Fed will publish its manufacturing gauge for the month of January.
EUR/USD traded mostly on the defensive, managing to ephemerally revisit the area beyond 1.0900 the figure amidst vacillating appetite for the risk complex and diminishing yields in the German money market. On Tuesday, the European Commission will release its flash Consumer Sentiment print for the first month of 2024.
The initial positive mood sustained the early bullish momentum around the British pound, prompting GBP/USD to advance north of the 1.2700 barrier. The move, however, fizzled out towards the end of the session in response to the late bounce in the greenback. Next on tap across the Channel will be the UK Public Sector finances during December.
Scarce volatility in the greenback in combination with the generalized downward bias in US yields sparked the first daily decline in USD/JPY after five consecutive sessions of gains. The BoJ takes centre stage on Tuesday, although no surprises are expected at its meeting.
AUD/USD resumed the downside and returned to the sub-0.6600 region after a failed move to the 0.6610/15 band during early trade. The negative session in copper and iron ore also added to AUD’s weakness.
WTI prices flirted with multi-day highs near the $75.00 mark per barrel on the back of escalating geopolitical concerns in the Middle East and Red Sea disruptions fears.
The resurgence of the selling bias saw prices of Gold partially fade the bounce seen in the latter part of last week, while Silver prices sank to multi-week lows, briefly piercing the $22.00 support.
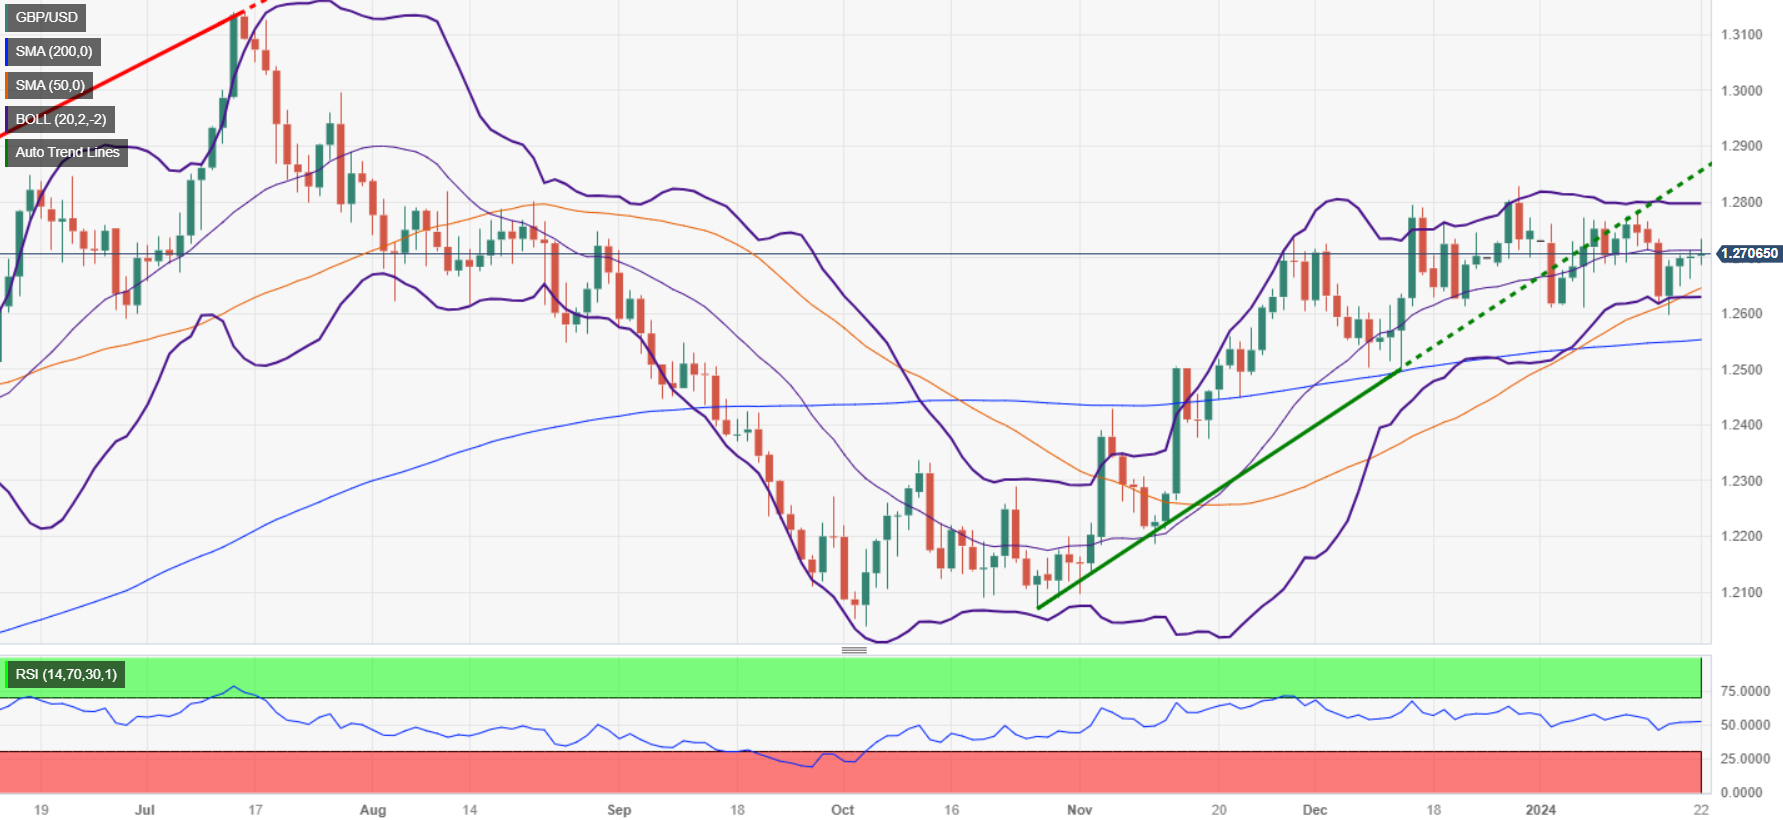
- GBP/USD rises 0.13% on upbeat market mood, steady USD.
- Despite printing poor UK retail sales, a strong UK inflation report keeps GBP/USD stable, with Wall Street's performance as a key driver.
- The US Dollar Index (DXY) up 0.07%, limits the Pound's advance, though it remains resilient.
- San Francisco Fed President Daly indicates current policy is appropriate and rate cuts wouldn't impact inflation progress.
The Pound Sterling (GBP) climbed late in the North American session against the US Dollar (USD) up by 0.13%, sponsored by an improvement in risk appetite as shown by US stocks registering gains between 0.25% and 0.36%.
An upbeat sentiment underpins the GBP/USD amid firm US Dollar
Wall Street is trading with gains as a tailwind for risk-perceived currencies like the Pound, which, despite weakening last Friday on a bad retail sales report, a hot inflation report on January 17, would likely keep the GBP/USD underpinned amid the lack of catalysts in the US economic docket. Meanwhile, an uptick in the US Dollar Index (DXY) of 0.07% up at 103.31, capped the major’s advance, after hitting a daily high of 1.2732.
Last Friday, the San Francisco Fed President Mary Daly said that policy is appropriate and that if the Fed lowered rates, they would not impact the progress in inflation achieving its 2% target. Ahead in the week. In the meantime, last week’s economic data supports a soft landing scenario, as strong retail sales, optimism among American households, and a strong labor market outshined mixed US housing figures.
This week UK’s economic docket will feature S&P Global Flash PMIs on Wednesday, alongside the UK’s Business Confidence indicator. On the US front, the calendar will feature PMIs, Q4’s 2023 Gross Domestic Product, housing data and inflation figures.
GBP/USD Price Analysis: Technical outlook
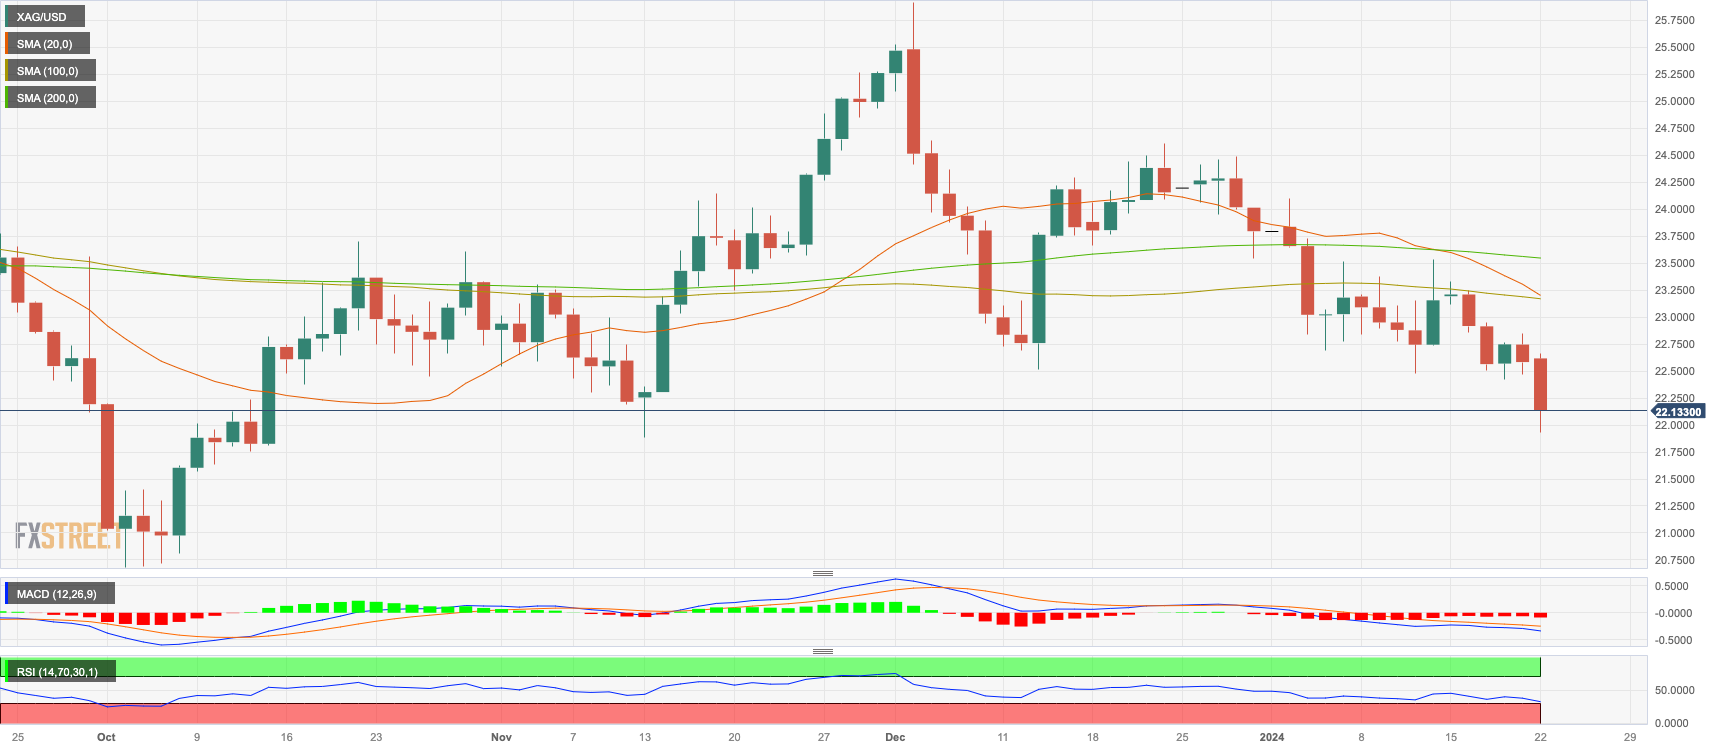
- The XAG/USD declined to its lowest level since mid-November near $22.20.
- Markets are repricing their bets on the Fed, and the odds of cuts in March decline.
- Despite recovery signals from four-hour chart indicators, the prevailing bearish trend keeps the bulls at bay with the pair positioned under key SMAs.
In Monday's session, the XAG/USD pair is trading at $22.14, showcasing 2% decline, following to multi-month lows. The daily chart paints a largely bearish picture, with selling pressure beginning to assert dominance. The 4-hour technical outlook indicates a recovery from oversold conditions, offering a glimmer of respite in an otherwise downwardly skewed market.
In the meantime, markets are making some adjustments in easing expectations and now, the swaps market is pricing in 125 bp of easing over the course of 2024 vs. nearly 175 bp seen earlier this month while the odds of a cut in March dropped below 50%. However, this seems highly unlikely considering the strength of the US economy. Important upcoming events include key central bank meetings this week and an official Q4 GDP data to be reported on Thursday alongside, Personal Consumption Expenditures (PCE), the Fed’s preferred gauge of inflation, from the last month of 2023. The outcome of this data may shape the expectations from the markets and set the precious metal’s pace for the next sessions.
XAG/USD levels to watch
Analyzing daily chart movements, the technical situation reveals dominance of selling momentum. The Relative Strength Index (RSI) is descending and in a downtrend, signaling an intensification of bearish momentum. Consistent with this, the Moving Average Convergence Divergence (MACD) red bars are on the rise, which also suggests strengthening of bearish momentum. In addition, the pair is trading beneath their 20, 100, and 200-day Simple Moving Averages (SMAs), which confirms that the bears are in control on a broader spectrum, further reinforcing the notion of enhanced bearish momentum.
Moving to the shorter time frame, the four-hour chart suggest thatindicators are correcting oversold conditions, showing some respite for the buyers. Yet, the bearish momentum is too dominant to dismiss. The Relative Strength Index (RSI) continues to descend in the negative territory, lending weight to the bearish bias. In conjection, the Moving Average Convergence Divergence (MACD) reflects rising red bars, yet again indicating increased seller influence.
XAG/USD daily chart
- European indexes broadly climbed to kick off the new trading week.
- Risk appetite is extending bids in echoes of last week’s bidding frenzy.
- FOMO-inflicted investors are piling into stocks ahead of data risks.
European equity indexes gained ground across the board on Monday, reaching for further gains as traders dogpile into indexes ahead of a mid-week plethora of European data events on the calendar, with euro area Purchasing Managers’ Indexes (PMI) and a rate call from the European Central Bank (ECB) on the offering.
European indexes wrapped up last week largely in the green despite a steep pullback a week ago, and EU equities are extending late last week’s risk appetite into further gains with US Treasury yields easing back. The 20-year US Treasury yield fell back below 4.4% once again on Monday, hitting a low of 4.366% and sending equity investors back into stocks.
This week sees a wave of European data slated for the mid-week hump, with euro area PMIs broadly forecast to show slight but determined upticks, and markets will be pivoting to focus on the ECB’s latest rate call on Thursday.
The ECB is all but guaranteed to continue holding rates until at least the summer months as premature market hopes of first-quarter rate cuts get dashed by still-high inflation figures and wobbly economic figures throughout the European continent.
ECB policymakers have been working overtime trying to talk down market expectations of fast and deep rate cuts from the ECB in 2024, spurring ECB President Christine Lagarde last week to warn that heavy-handed market bets on fast and soon rate cuts are muddling the outlook, making the ECB’s job harder and risking further damage to the European economy.
The pan-European STOXX600 major equity index climbed 3.62 points on Monday to close 0.77% higher at €472.86, while France’s CAC gained 0.56% to close at €7,413.25, up 41.61 points.
London’s FTSE index also gained 25.78 points, climbing 0.35% to end Monday at £7,487.71 to gain 35.87 points.
The Germam DAX also gained 0.77% gain on Monday, gaining 128.33 points to close at €16,683.36.
DAX Technical Outlook
The German Dax equity index extended higher on Monday, climbing further out of recent declines. The German index fell peak-to-trough nearly 4% from December’s peak near €16,984.00, and bidders will be looking to wrestle back control of the DAX. The major index continue to find technical support from the 50-day Simple Moving Average (SMA) near €16,400.00, and long-term technical support is pricing in a floor just above €15,800.
DAX Hourly Chart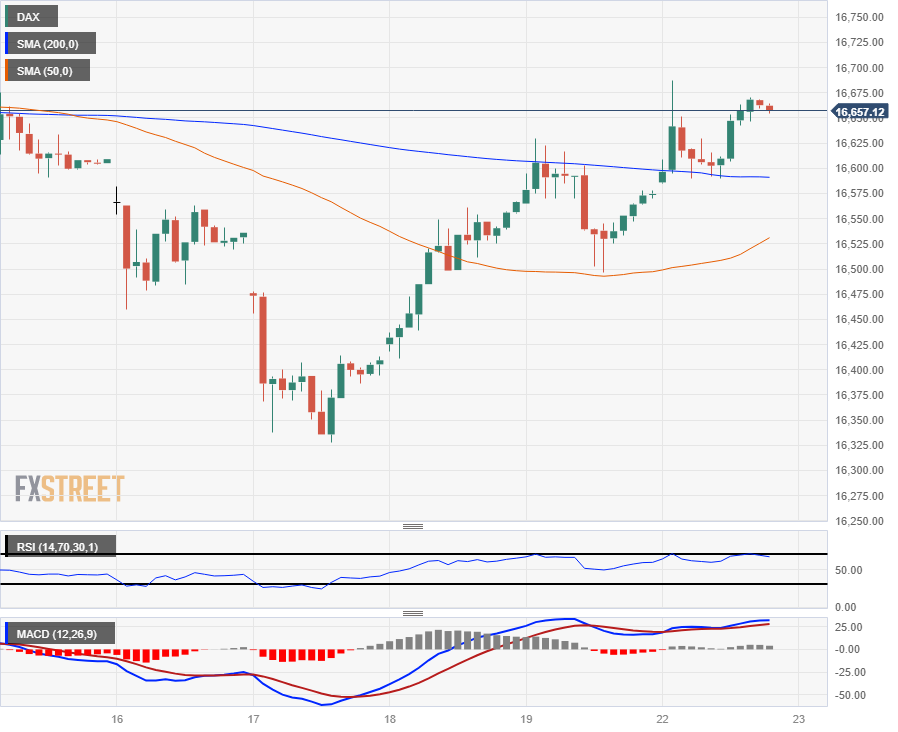
DAX Daily Chart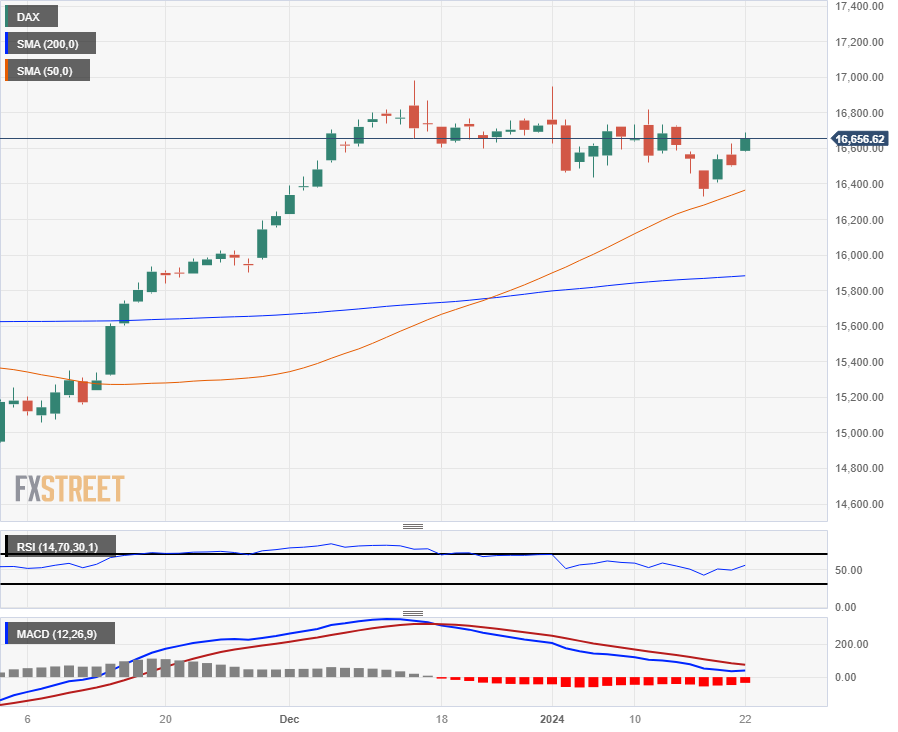
- DXY Index sees mild losses and trades around 103.20.
- Key US inflation and economic activity data are due this week .
- Market bets on the Fed cutting rates continue to adjust.
The US Dollar (USD) is currently trading at a mild loss at 103.25. This slight dip comes in light of a quiet session ahead of an eventful week.
The US economy remains robust with consistently firm data suggesting potential growth in Q4 and likely stability in Q1 2024. Regarding the Federal Reserve, market expectations have adjusted with the market anticipating approximately 125 basis points (bps) of easing over the course of 2024, compared to nearly 175 bps anticipated earlier that gave the Greenback a lift earlier in January. Core Personal Consumption Expenditures (PCE) may shape the short-term expectations from the Fed and are set to be released on Friday.
Daily Digest Market Movers: US Dollar under mild pressure on quiet session, eyes on PCE and GDP data
- On Thursday, the US will release December Personal Consumption Expenditures (PCE) data, which is expected to show that inflation has stagnated. Gross Domestic Product (GDP) figures from Q4 are also due that day and markets expect the economic activity to have cooled off.
- US Treasury yields are in a downturn with the 2-year yield at 4.37%, the 5-year yield at 4.02%, and the 10-year yield at 4.10%.
- The CME FedWatch Tool indicates the odds of a rate cut in March have fallen to 50%. No policy changes are expected in next week’s Fed meeting.
Technical Analysis: DXY bullish momentum wanes, fails to hold above 200-day SMA
The Relative Strength Index (RSI) in flat and positive territory hints toward a neutral stance in the current market dynamics, not leaning distinctly toward either buyers or sellers. Paired with the flat green bars of the Moving Average Convergence Divergence (MACD), this suggests a minor bullish momentum waiting in the wings for DXY, especially as it implies a diminishing seller's market.
The positioning of the DXY in relation to the Simple Moving Averages (SMAs) provides a more detailed picture of the market trend. The presence above the 20-day SMA reveals that buyers have basic control in the short term. However, The DXY’s positioning below the 100-day and 200-day SMAs indicates that sellers hold dominance in the long run.
Support levels: 103.20, 103.00, 102.80.
Resistance levels 103.40 (200-day SMA), 103.60, 103.80.
US Dollar FAQs
What is the US Dollar?
The US Dollar (USD) is the official currency of the United States of America, and the ‘de facto’ currency of a significant number of other countries where it is found in circulation alongside local notes. It is the most heavily traded currency in the world, accounting for over 88% of all global foreign exchange turnover, or an average of $6.6 trillion in transactions per day, according to data from 2022.
Following the second world war, the USD took over from the British Pound as the world’s reserve currency. For most of its history, the US Dollar was backed by Gold, until the Bretton Woods Agreement in 1971 when the Gold Standard went away.
How do the decisions of the Federal Reserve impact the US Dollar?
The most important single factor impacting on the value of the US Dollar is monetary policy, which is shaped by the Federal Reserve (Fed). The Fed has two mandates: to achieve price stability (control inflation) and foster full employment. Its primary tool to achieve these two goals is by adjusting interest rates.
When prices are rising too quickly and inflation is above the Fed’s 2% target, the Fed will raise rates, which helps the USD value. When inflation falls below 2% or the Unemployment Rate is too high, the Fed may lower interest rates, which weighs on the Greenback.
What is Quantitative Easing and how does it influence the US Dollar?
In extreme situations, the Federal Reserve can also print more Dollars and enact quantitative easing (QE). QE is the process by which the Fed substantially increases the flow of credit in a stuck financial system.
It is a non-standard policy measure used when credit has dried up because banks will not lend to each other (out of the fear of counterparty default). It is a last resort when simply lowering interest rates is unlikely to achieve the necessary result. It was the Fed’s weapon of choice to combat the credit crunch that occurred during the Great Financial Crisis in 2008. It involves the Fed printing more Dollars and using them to buy US government bonds predominantly from financial institutions. QE usually leads to a weaker US Dollar.
What is Quantitative Tightening and how does it influence the US Dollar?
Quantitative tightening (QT) is the reverse process whereby the Federal Reserve stops buying bonds from financial institutions and does not reinvest the principal from the bonds it holds maturing in new purchases. It is usually positive for the US Dollar.
- Mexican Peso starts the session lower as the US Dollar Index (DXY) remains steady around 103.24.
- Despite Wall Street gains, USD/MXN fails to rally sharply due to improved risk appetite and lower US Treasury bond yields.
- Mexico’s economic docket is eyed by traders, expecting the release of Economic Activity and inflation data.
The Mexican Peso begins the Monday session on a lower note against the US Dollar (USD) due to the Greenback capping its earlier losses as shown by the US Dollar Index (DXY), which is virtually unchanged near 103.24. Alongside that, an improvement in risk appetite and falling US Treasury bond yields have deterred the USD/MXN from gaining ground to higher levels with the pair trading at 17.13, up 0.35%.
Wall Street prints solid gains, which would usually bolster the Mexican currency. Nevertheless, the lack of economic data in Mexico’s docket on Monday and Tuesday leaves traders leaning on data from the United States. Mexico’s calendar will gain traction on Wednesday with the release of the Economic Activity report, along with January’s mid-month inflation data.
In the meantime, Federal Reserve (Fed) officials are absent as they enter their blackout period ahead of the January 30-31 monetary policy meeting.
Daily digest market movers: Mexican Peso on the defensive with traders awaiting further data
- In the meantime, former Bank of Mexico (Banxico) Deputy Governor Everardo Elizondo commented that it’s too soon to relax monetary policy in Mexico, adding, “There are enough reasons to remain worried.” Elizondo argued, "If [policy] is loosened, inflationary expectations will deteriorate.”
- Mexico’s latest economic data points to the economy slowing down as Retail Sales missed the forecast and trailed October’s data. At the same time, the economy is expected to grow by 2.6%, below forecasts of 3%.
- On the US front, last week’s economic data paints a soft-landing outlook. Even though housing data was mixed, American household sentiment improvement and lower inflation expectations underpinned the USD/MXN.
- Atlanta GDPNow model suggests last year’s Q4 would likely expand by 2.4%, spurred by strong retail sales, firm industrial production, a tight labor market and consumer sentiment improvement.
- Traders trimmed their bets for a dovish Federal Reserve in 2024. They stand at 142 basis points (bps) of cuts from 175 bps last week.
- The strongest catalyst last week was Federal Reserve Governor Christopher Waller’s speech: “No reason to move as quickly or cut as rapidly as in the past.” This kept investors in check despite Waller supporting rate cuts if inflation indeed gets lowered.
- Mexico witnessed a jump in headline inflation, but core data suggests the Bank of Mexico (Banxico) has done a good job, curbing elevated prices after hiking rates toward 11.25%.
- Despite indications from the December meeting minutes of Banxico (the Central Bank of Mexico) that it may consider easing its monetary policy, the inflation report for December poses a potential obstacle to any such policy relaxation.
- Standard Chartered analysts estimate the Bank of Mexico (Banxico) will lower rates to 9.25% in 2024.
- On January 5, a Reuters poll suggested the Mexican Peso could weaken 5.4% to 18.00 per US Dollar in the 12 months following December.
Technical analysis: Mexican Peso remains soft as USD/MXN meanders around 50-day SMA
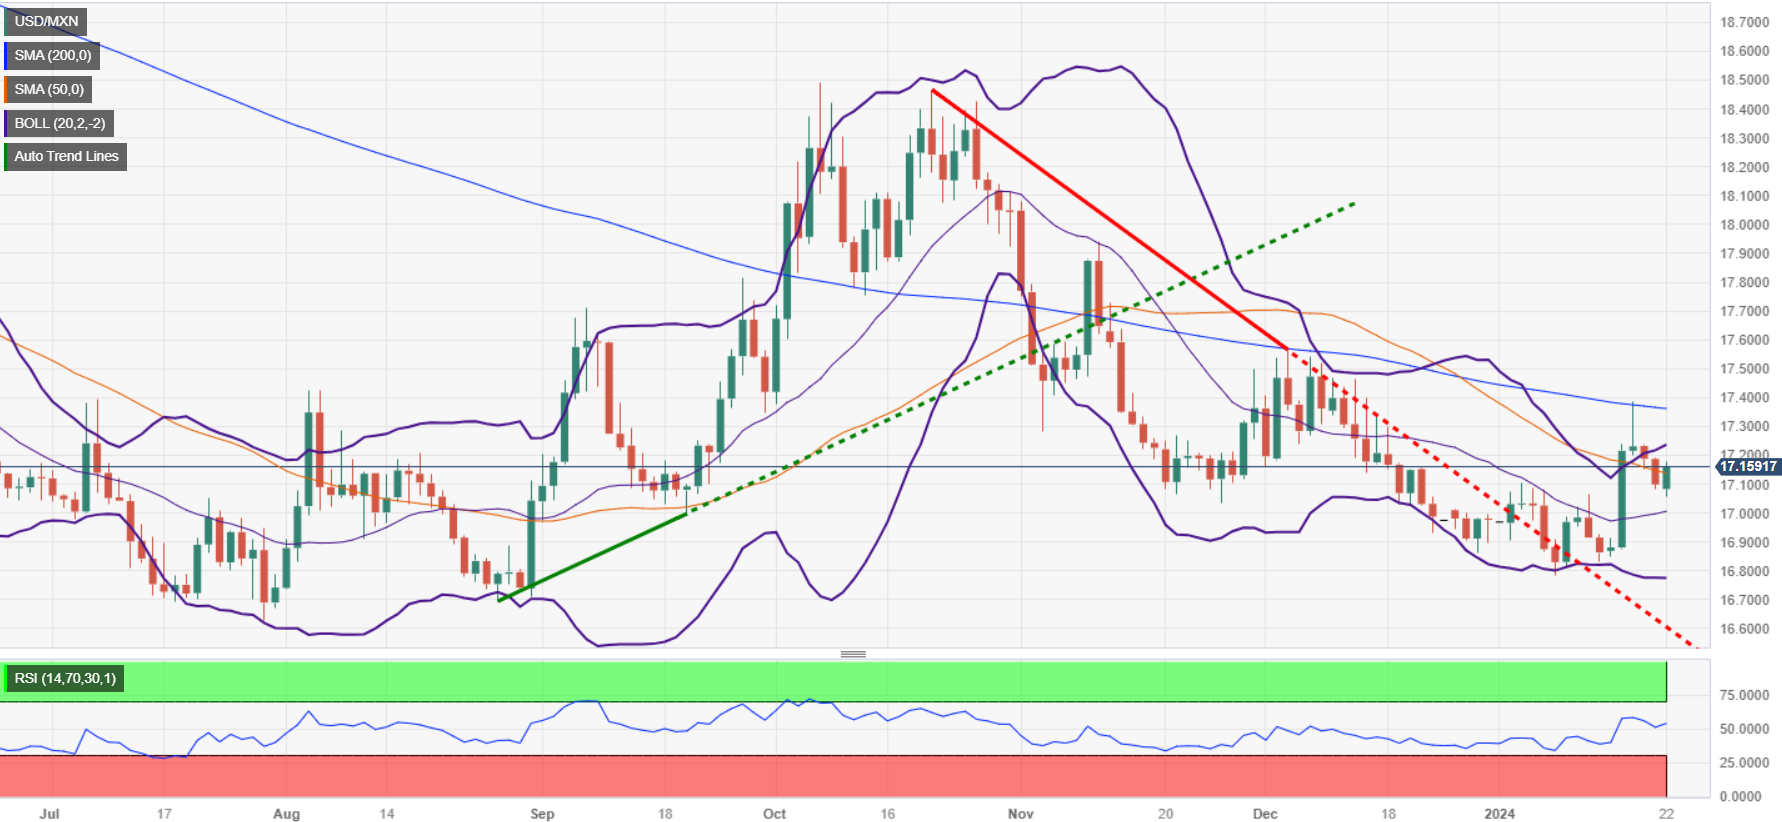
The USD/MXN daily chart shows the pair is strengthening, testing the 50-day Simple Moving Average (SMA) at 17.15, ahead of a key resistance level at the 200-day SMA at 17.36. Further upside is seen once those levels are taken, followed by the 100-day SMA at 17.42 and 17.50. A breach of the latter will expose the May 23 high of 17.99.
On the flip side, if sellers cap the exotic pair from reclaiming the 50-day SMA, that would expose the pair to further losses. The first support would be the January 22 low of 17.05, the figure at 17.00, and the January 12 cycle low seen at 16.82.
USD/MXN Price Action – Daily Chart
Mexican Peso FAQs
What key factors drive the Mexican Peso?
The Mexican Peso (MXN) is the most traded currency among its Latin American peers. Its value is broadly determined by the performance of the Mexican economy, the country’s central bank’s policy, the amount of foreign investment in the country and even the levels of remittances sent by Mexicans who live abroad, particularly in the United States. Geopolitical trends can also move MXN: for example, the process of nearshoring – or the decision by some firms to relocate manufacturing capacity and supply chains closer to their home countries – is also seen as a catalyst for the Mexican currency as the country is considered a key manufacturing hub in the American continent. Another catalyst for MXN is Oil prices as Mexico is a key exporter of the commodity.
How do decisions of the Banxico impact the Mexican Peso?
The main objective of Mexico’s central bank, also known as Banxico, is to maintain inflation at low and stable levels (at or close to its target of 3%, the midpoint in a tolerance band of between 2% and 4%). To this end, the bank sets an appropriate level of interest rates. When inflation is too high, Banxico will attempt to tame it by raising interest rates, making it more expensive for households and businesses to borrow money, thus cooling demand and the overall economy. Higher interest rates are generally positive for the Mexican Peso (MXN) as they lead to higher yields, making the country a more attractive place for investors. On the contrary, lower interest rates tend to weaken MXN.
How does economic data influence the value of the Mexican Peso?
Macroeconomic data releases are key to assess the state of the economy and can have an impact on the Mexican Peso (MXN) valuation. A strong Mexican economy, based on high economic growth, low unemployment and high confidence is good for MXN. Not only does it attract more foreign investment but it may encourage the Bank of Mexico (Banxico) to increase interest rates, particularly if this strength comes together with elevated inflation. However, if economic data is weak, MXN is likely to depreciate.
How does broader risk sentiment impact the Mexican Peso?
As an emerging-market currency, the Mexican Peso (MXN) tends to strive during risk-on periods, or when investors perceive that broader market risks are low and thus are eager to engage with investments that carry a higher risk. Conversely, MXN tends to weaken at times of market turbulence or economic uncertainty as investors tend to sell higher-risk assets and flee to the more-stable safe havens.
- EUR/USD continues to get vexed by 1.0900 level in the near-term.
- Europe inflation, ECB rate call in the pipe for the mid-week.
- ECB Bank Lending Survey, euro area January Consumer Confidence due Tuesday.
The EUR/USD is shuffling its feet on Monday as traders take the opportunity to gather themselves up ahead of this week’s hectic showing from multiple central banks across the globe.
Europe sees an update from the European Central Bank’s (ECB) Bank Lending Survey and January’s preliminary Consumer Confidence, both due on Tuesday. Wednesday drops a fresh round of euro area Purchasing Manager Index (PMI) figures, and investors will be bracing for another rate call from the ECB on Thursday.
Daily digest market movers: EUR/USD continues to hold near 1.0900 after trimming gains last week
- A quiet Monday is set to give way to a hectic midweek with an ECB rate call taking center stage.
- Market expectations of rate cuts in 2024 have run well ahead of what policymakers might be able or willing to deliver.
- ECB is firmly entrenched in holding rates steady until summer at the earliest, barring any significant developments in economic data.
- Tuesday’s euro area Consumer Confidence in January is forecast to uptick from -15.0 to -14.3.
- Wednesday’s pan-EU HCOB Composite PMI is expected to rebound slightly in January, from 47.6 to 48.0.
- Germany’s HCOB Composite PMI is likewise seen rising from 47.4 to 47.8 in January.
- With the ECB functionally guaranteed to hold its main reference rate at 4.5% on Thursday, investors will be deep-diving on the ECB’s ensuing Monetary Policy Statement.
Euro price today
The table below shows the percentage change of Euro (EUR) against listed major currencies today. Euro was the strongest against the New Zealand Dollar.
| USD | EUR | GBP | CAD | AUD | JPY | NZD | CHF | |
| USD | -0.04% | -0.23% | 0.14% | 0.15% | -0.13% | 0.27% | -0.05% | |
| EUR | 0.06% | -0.18% | 0.20% | 0.20% | -0.07% | 0.32% | 0.01% | |
| GBP | 0.24% | 0.19% | 0.38% | 0.39% | 0.12% | 0.51% | 0.20% | |
| CAD | -0.14% | -0.17% | -0.38% | 0.02% | -0.26% | 0.15% | -0.18% | |
| AUD | -0.15% | -0.19% | -0.39% | 0.00% | -0.27% | 0.13% | -0.18% | |
| JPY | 0.12% | 0.06% | -0.08% | 0.26% | 0.28% | 0.42% | 0.09% | |
| NZD | -0.27% | -0.33% | -0.52% | -0.13% | -0.13% | -0.41% | -0.32% | |
| CHF | 0.03% | -0.01% | -0.20% | 0.18% | 0.18% | -0.10% | 0.30% |
The heat map shows percentage changes of major currencies against each other. The base currency is picked from the left column, while the quote currency is picked from the top row. For example, if you pick the Euro from the left column and move along the horizontal line to the Japanese Yen, the percentage change displayed in the box will represent EUR (base)/JPY (quote).
Technical Outlook: EUR/USD remains caught in consolidation as markets await the mid-week
The EUR/USD continues to trade into a technical midrange between major moving averages as markets reach a shaky equilibrium between rate expectations and economic outlook between the Euro (EUR) and the US Dollar (USD).
Intraday action continues to squeeze into chart space near 1.0900, capped off by the 200-hour Simple Moving Average (SMA) near 1.0920, and the Euro is down 1.3% against the US Dollar in 2024. Despite recent decline, the EUR/USD is stubbornly holding onto recent technical levels.
Daily candlesticks see the EUR/USD drifting within chart paper between the 50-day and 200-day SMAs at 1.0921 and 1.0845 respectively. The pair’s long-term momentum is still leaning bullish as higher lows continue to march upwards, but topside gains are beginning to thin out and the 1.1000 handle is beginning to form into a hard technical resistance barrier.
EUR/USD Hourly Chart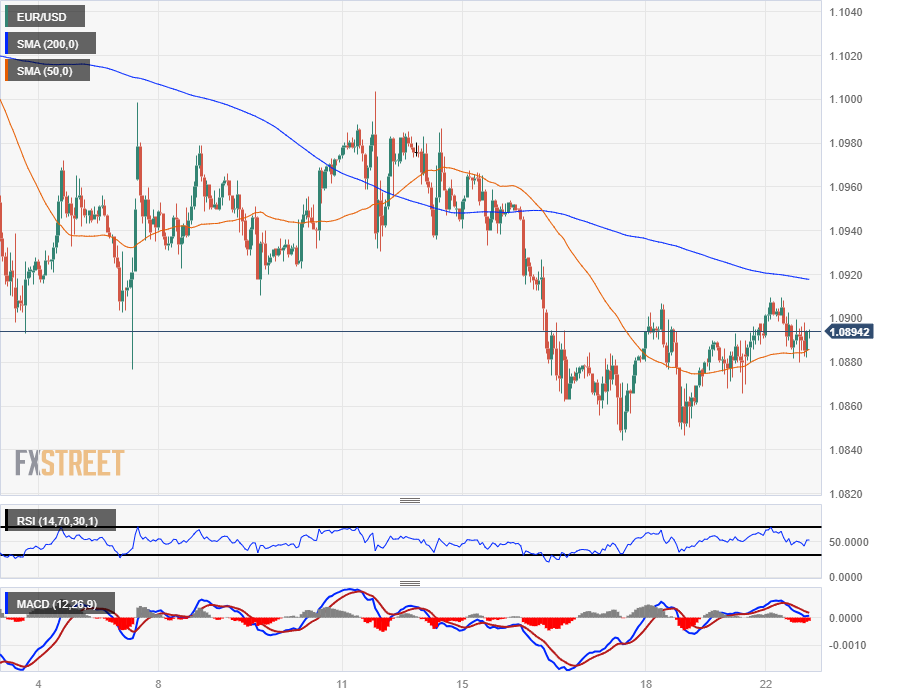
EUR/USD Daily Chart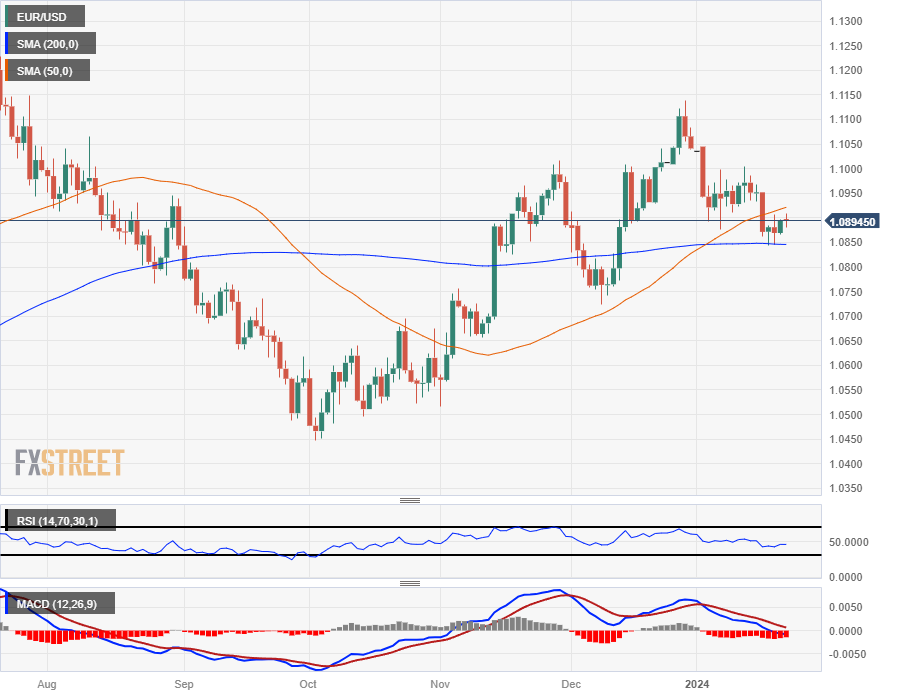
Euro FAQs
What is the Euro?
The Euro is the currency for the 20 European Union countries that belong to the Eurozone. It is the second most heavily traded currency in the world behind the US Dollar. In 2022, it accounted for 31% of all foreign exchange transactions, with an average daily turnover of over $2.2 trillion a day.
EUR/USD is the most heavily traded currency pair in the world, accounting for an estimated 30% off all transactions, followed by EUR/JPY (4%), EUR/GBP (3%) and EUR/AUD (2%).
What is the ECB and how does it impact the Euro?
The European Central Bank (ECB) in Frankfurt, Germany, is the reserve bank for the Eurozone. The ECB sets interest rates and manages monetary policy.
The ECB’s primary mandate is to maintain price stability, which means either controlling inflation or stimulating growth. Its primary tool is the raising or lowering of interest rates. Relatively high interest rates – or the expectation of higher rates – will usually benefit the Euro and vice versa.
The ECB Governing Council makes monetary policy decisions at meetings held eight times a year. Decisions are made by heads of the Eurozone national banks and six permanent members, including the President of the ECB, Christine Lagarde.
How does inflation data impact the value of the Euro?
Eurozone inflation data, measured by the Harmonized Index of Consumer Prices (HICP), is an important econometric for the Euro. If inflation rises more than expected, especially if above the ECB’s 2% target, it obliges the ECB to raise interest rates to bring it back under control.
Relatively high interest rates compared to its counterparts will usually benefit the Euro, as it makes the region more attractive as a place for global investors to park their money.
How does economic data influence the value of the Euro?
Data releases gauge the health of the economy and can impact on the Euro. Indicators such as GDP, Manufacturing and Services PMIs, employment, and consumer sentiment surveys can all influence the direction of the single currency.
A strong economy is good for the Euro. Not only does it attract more foreign investment but it may encourage the ECB to put up interest rates, which will directly strengthen the Euro. Otherwise, if economic data is weak, the Euro is likely to fall.
Economic data for the four largest economies in the euro area (Germany, France, Italy and Spain) are especially significant, as they account for 75% of the Eurozone’s economy.
How does the Trade Balance impact the Euro?
Another significant data release for the Euro is the Trade Balance. This indicator measures the difference between what a country earns from its exports and what it spends on imports over a given period.
If a country produces highly sought after exports then its currency will gain in value purely from the extra demand created from foreign buyers seeking to purchase these goods. Therefore, a positive net Trade Balance strengthens a currency and vice versa for a negative balance.
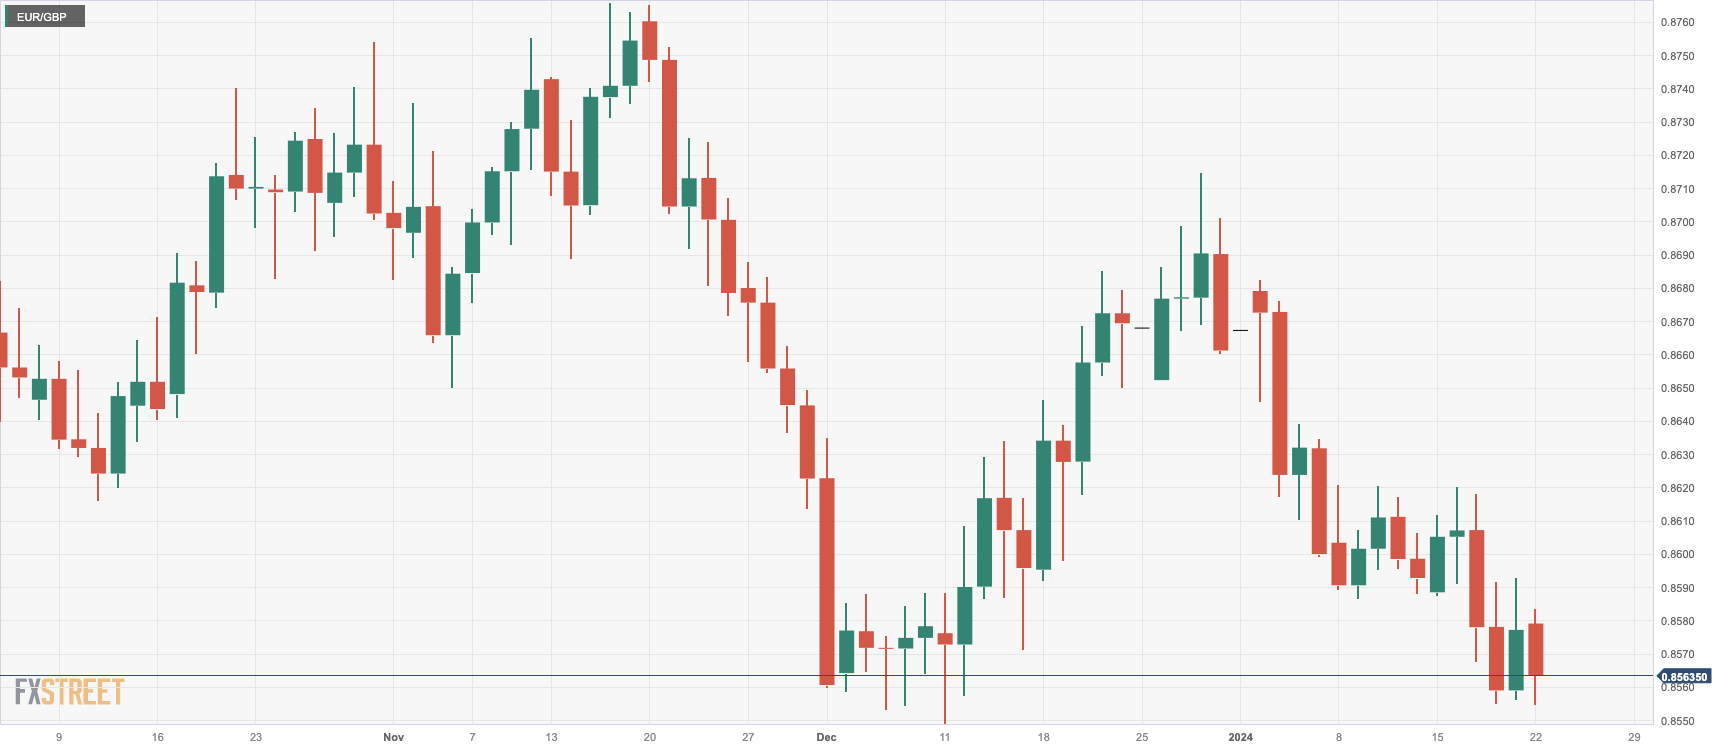
- The EUR/GBP records 0.20% losses standing at 0.8562.
- The ECB meets on Thursday, no policy change expected.
- Daily chart indicators present bearish sentiment: RSI indicates a negative slope in unfavorable territory with MACD's rising red bars hinting at a selling momentum.
On Monday's session, the EUR/GBP pair was seen trading at the 0.8562 level, depicting a 0.20% loss. The daily chart indicates a neutral to bearish outlook with bulls struggling to find solid ground. On the four-hour chart, indicators suggest a flattened momentum within negative territory, pointing to a domination of sellers over buyers. Overall, the Pound seems to have a slight command over the Euro mainly due to the British economy holding stronger than the majority of the EU countries and markets betting on a more dovish European Central Bank (ECB).
In that sense, markets are pricing in the European Central Bank to begin its rate cuts in Q2, with nearly 150 bp of total easing seen this year due to the latest round of weak economic data. On Thursday the ECB meets, were markets await the bank to hold its policy rate unchanged for the fourth consecutive time and investors will look for clues forward guidance, which may affect the crosses’s dynamics. As for the Bank of England (BoE), despite the relative robustness of the UK economy, market sentiments project the first rate cut in Q2, with approximately 125 bp of total rate cuts anticipated throughout the year.
EUR/GBP levels to watch
On the daily chart, the Relative Strength Index (RSI) is in a downward trajectory within the negative region, indicating an ongoing selling pressure. The positioning of the pair under the three key Simple Moving Averages (SMAs) - the 20, 100 and 200-day SMAs - corroborates this bearishness. This unfavorable climate is further solidified by the increasing red bars observed on the Moving Average Convergence Divergence (MACD) histogram.
Zooming into the four-hour chart, the indicators have stagnated within the negative arena, portraying a pause in the bearish momentum. The four-hour RSI is hovering flat in the negative space, yet the MACD histogram displays rising red bars. This suggests a lukewarm selling momentum, implying buyers yet have to exhibit concrete attempts to shift the scales.
EUR/GBP daily chart
- Canadian Dollar markets flatten out in quiet Monday trading.
- Canada New Housing Price Index due Tuesday, BoC lands Wednesday.
- Churning Crude Oil markets limit CAD losses.
The Canadian Dollar (CAD) sees thin action on Monday to kick off the trading week with limited momentum across the major currency board. CAD traders will be looking ahead to Wednesday’s rate call from the Bank of Canada (BoC), and markets are set for a blustery Friday to end the week with a fresh print of the US Personal Consumption Expenditure (PCE) Price Index.
The latest New Housing Price Index figures from Canada are due in the early US session on Tuesday but are expected to have a limited impact. In the meantime, downside pressure on the Canadian Dollar is limited on Monday as the Crude Oil market retests higher levels.
Daily digest market movers: Canadian Dollar mostly flat in thin Monday action
- The Canadian Dollar has a notable lack of momentum on Monday.
- Markets are treading softly to kick off the new trading week but sticking close to the high end after US stocks hit all-time record prices last Friday.
- The Bank of Canada is broadly expected to hold rates steady at 5%, and investors will keep a close eye on the press conference to follow.
- According to a poll by Reuters, 22 of 34 surveyed economists see the first rate cut from the BoC to happen in June, with the remaining 12 calling for April.
- Back in December, swap markets were pricing in a 60% chance of a first rate cut from the BoC in March. Markets have since broadly pivoted their rate forecasts further out.
- This week sees rate calls from three central banks, but market sentiment is set to hinge on press conferences and central bank statements with broad-market hopes of early rate cuts thoroughly disappointed in recent weeks.
- Crude Oil markets continue to bid into recent highs, keeping the Canadian Dollar aloft.
- Geopolitical concerns see Crude Oil bids remaining elevated, but buildups in refined products are getting difficult to ignore as the global demand outlook for fossil fuels begins to wither.
Canadian Dollar price today
The table below shows the percentage change of Canadian Dollar (CAD) against listed major currencies today. Canadian Dollar was the weakest against the Japanese Yen.
| USD | EUR | GBP | CAD | AUD | JPY | NZD | CHF | |
| USD | 0.05% | -0.12% | 0.10% | 0.13% | -0.14% | 0.25% | 0.12% | |
| EUR | -0.05% | -0.17% | 0.04% | 0.07% | -0.20% | 0.20% | 0.07% | |
| GBP | 0.11% | 0.17% | 0.20% | 0.25% | -0.03% | 0.38% | 0.23% | |
| CAD | -0.12% | -0.06% | -0.23% | 0.02% | -0.26% | 0.15% | 0.01% | |
| AUD | -0.15% | -0.09% | -0.27% | -0.04% | -0.29% | 0.12% | -0.01% | |
| JPY | 0.15% | 0.18% | 0.08% | 0.25% | 0.30% | 0.43% | 0.26% | |
| NZD | -0.27% | -0.22% | -0.40% | -0.19% | -0.15% | -0.42% | -0.16% | |
| CHF | -0.11% | -0.06% | -0.23% | -0.02% | 0.01% | -0.26% | 0.14% |
The heat map shows percentage changes of major currencies against each other. The base currency is picked from the left column, while the quote currency is picked from the top row. For example, if you pick the Euro from the left column and move along the horizontal line to the Japanese Yen, the percentage change displayed in the box will represent EUR (base)/JPY (quote).
Technical Analysis: Canadian Dollar treads water on Monday, USD/CAD cycling near 1.3450
The Canadian Dollar (CAD) sees limited momentum in either direction as markets get the new trading week underway. The CAD is down around a quarter of a percent against the Pound Sterling (GBP) and the Japanese Yen (JPY) as broader markets drive up those currencies specifically, but the CAD is essentially flat against the rest of its major currency peers.
The USD/CAD is tangled up on the 200-hour Simple Moving Average (SMA) on the intraday chart as the pair continues to find reasons to stick close to the 1.34500 region.
On the daily candlesticks, the USD/CAD is at risk of continuing a bearish rejection from a technical consolidation of the 50-day and 200-day SMAs just below 1.3500, and near-term risks are pointed firmly to the downside.
On the high side, the USD/CAD is poised for a fresh run at last November’s peak near 1.3900 if near-term bullish momentum extends beyond last week’s swing high into 1.3550.
USD/CAD Hourly Chart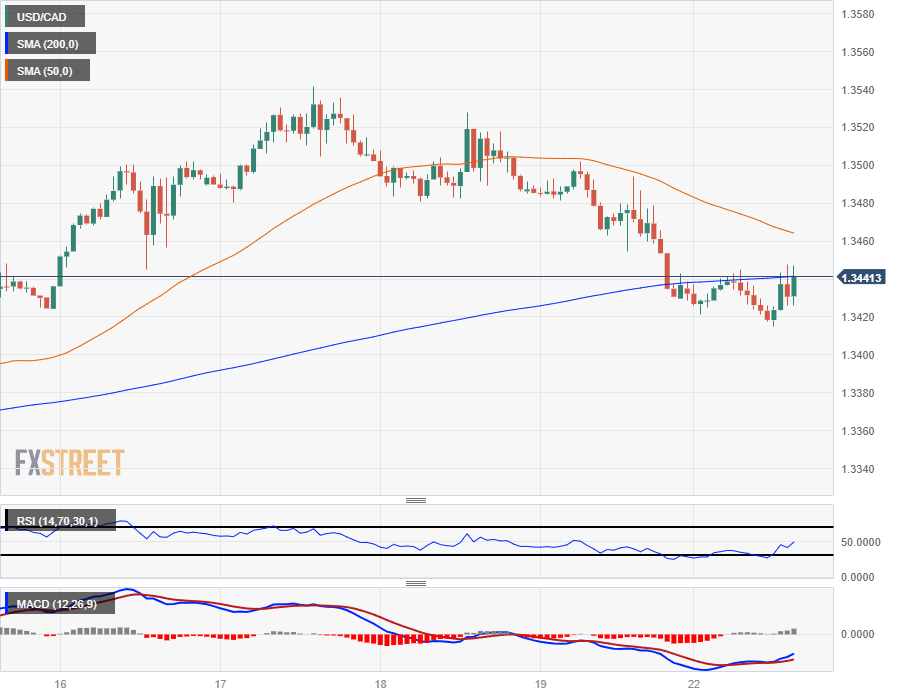
USD/CAD Daily Chart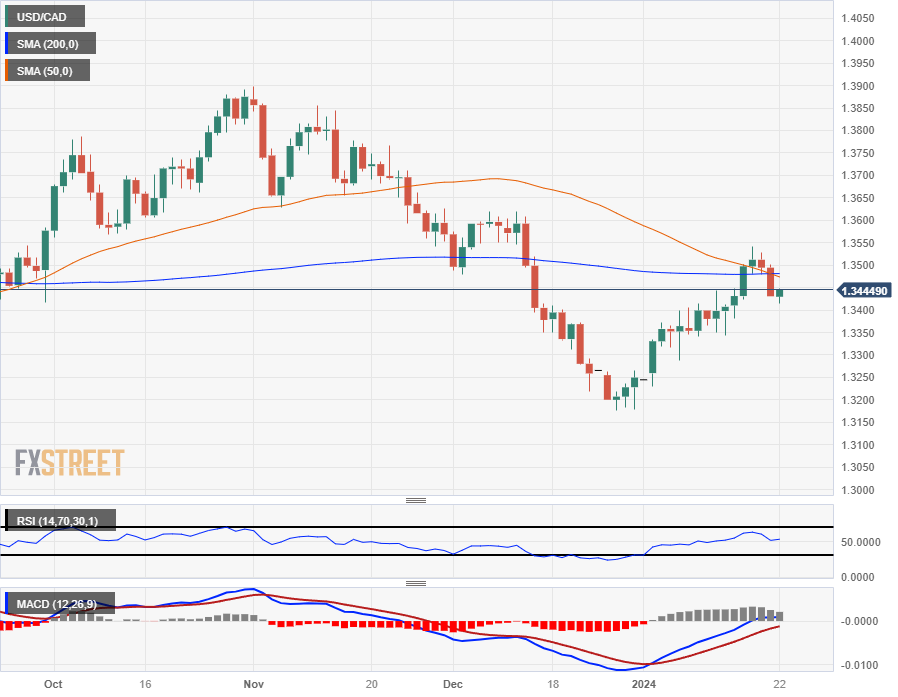
Canadian Dollar FAQs
What key factors drive the Canadian Dollar?
The key factors driving the Canadian Dollar (CAD) are the level of interest rates set by the Bank of Canada (BoC), the price of Oil, Canada’s largest export, the health of its economy, inflation and the Trade Balance, which is the difference between the value of Canada’s exports versus its imports. Other factors include market sentiment – whether investors are taking on more risky assets (risk-on) or seeking safe-havens (risk-off) – with risk-on being CAD-positive. As its largest trading partner, the health of the US economy is also a key factor influencing the Canadian Dollar.
How do the decisions of the Bank of Canada impact the Canadian Dollar?
The Bank of Canada (BoC) has a significant influence on the Canadian Dollar by setting the level of interest rates that banks can lend to one another. This influences the level of interest rates for everyone. The main goal of the BoC is to maintain inflation at 1-3% by adjusting interest rates up or down. Relatively higher interest rates tend to be positive for the CAD. The Bank of Canada can also use quantitative easing and tightening to influence credit conditions, with the former CAD-negative and the latter CAD-positive.
How does the price of Oil impact the Canadian Dollar?
The price of Oil is a key factor impacting the value of the Canadian Dollar. Petroleum is Canada’s biggest export, so Oil price tends to have an immediate impact on the CAD value. Generally, if Oil price rises CAD also goes up, as aggregate demand for the currency increases. The opposite is the case if the price of Oil falls. Higher Oil prices also tend to result in a greater likelihood of a positive Trade Balance, which is also supportive of the CAD.
How does inflation data impact the value of the Canadian Dollar?
While inflation had always traditionally been thought of as a negative factor for a currency since it lowers the value of money, the opposite has actually been the case in modern times with the relaxation of cross-border capital controls. Higher inflation tends to lead central banks to put up interest rates which attracts more capital inflows from global investors seeking a lucrative place to keep their money. This increases demand for the local currency, which in Canada’s case is the Canadian Dollar.
How does economic data influence the value of the Canadian Dollar?
Macroeconomic data releases gauge the health of the economy and can have an impact on the Canadian Dollar. Indicators such as GDP, Manufacturing and Services PMIs, employment, and consumer sentiment surveys can all influence the direction of the CAD. A strong economy is good for the Canadian Dollar. Not only does it attract more foreign investment but it may encourage the Bank of Canada to put up interest rates, leading to a stronger currency. If economic data is weak, however, the CAD is likely to fall.
The Bank of Japan (BoJ) will hold its Monetary Policy Committee (MPC) on Tuesday, January 23 and as we get closer to the Interest Rate Decision, here are the expectations forecast by the economists and researchers of eight major banks. The BoJ will release its Outlook for Economic Activity and Prices, i.e. its Outlook Report at the same time.
No tweak in the Yield Curve Control (YCC) and no change in easy monetary policy are anticipated by market participants as recent events put the BoJ in a difficult spot to advocate any significant shift in its ultra-easy monetary stance.
ING
The BoJ is expected to maintain its YCC policy and negative short-term rate policy at its January meeting. Inflation will likely slow further in January and the cautionary mood following the recent earthquake will prevail.
Standard Chartered
We expect the BoJ to remain dovish given (1) the recent easing of CPI inflation, (2) the US Fed’s likely dovish policy direction, (3) a stable Japanese Yen (JPY), (4) modest domestic growth, and (5) the economic impact of the earthquake in early January. We do not foresee a deviation from its existing framework at the January meeting. YCC currently shows enough flexibility to accommodate market fluctuations with minimal effects. We think the BoJ will only consider normalising policy when the growth trend is more robust and inflation is driven by wage growth and demand-pull factors. A normalisation of negative rates and YCC adjustments will also likely be contingent on tangible signs of wage growth, with a potential timeline of April 2024 following the spring wage negotiations.
Deutsche Bank
We expect the central bank to stick with its current policy stance but further out see the BoJ abandoning its negative interest rate policy in April.
Danske Bank
We expect an unchanged rate decision. Wage growth remains the missing piece of the puzzle before the BoJ can look towards rate hikes and letting go of the yield curve, but we will likely have to wait for the spring wage negotiations for hard evidence.
ABN Amro
We expect the BoJ to maintain its policy rate settings. We still expect a very gradual rate hike cycle to start in mid-2024 when the BoJ will have more insights into wage and inflation developments.
TDS
Recent events (e.g., earthquakes/political scandals) put BoJ in a difficult spot to advocate any significant shift in policy. We get fresh forecasts and expect BoJ to revise lower their core CPI forecast to 2.5% for FY2024 vs 2.8% prior and maintain FY2025 at 1.8%. Attention will be on FY2025 f/c if the BoJ plans to signal any imminent exit, it would probably upgrade it to >2%.
SocGen
We expect that the BoJ will maintain its current monetary policies in January. We expect the core CPI forecasts (excluding only fresh food) for FY24 to decrease from +2.8% in October to +2.5%. However, the FY25 core CPI forecast and the more underlying core core CPI (CPI excluding fresh food and energy) forecasts are likely to remain largely unchanged from October. Looking forward, we continue to believe that the BoJ is unlikely to become fully confident about the sustainable and stable realisation of its 2% price target by April of this year. It is also unlikely to abolish the YCC and negative rates by the same period of time.
Wells Fargo
We expect the BoJ to hold its policy rate steady at -0.10% and to make no further changes to its Yield Curve Control policy. To the extent the BoJ highlights the importance of the spring wage negotiations and offers positive comments on wage prospects for 2024, as well as maintains or increases its medium-term core inflation forecasts, we think the possibility of an April interest rate increase remains on the table.
All 70 economists participated in a recently conducted Reuters poll said that they expect the Bank of England (BoE) to hold the policy rate unchanged at 5.25% at the February 1 policy meeting.
38 of those economists noted that they expect the BoE to lower the policy rate in the second quarter and the median forecast for the bank rate by end-June stood at 5%.
Market reaction
This headline failed to trigger a noticeable reaction in Pound Sterling's valuation. At the time of press, GBP/USD was trading modestly higher on the day at 1.2720.
The Canadian Dollar (CAD) sat in the middle of the pack when it came to performance last year. Economists at Rabobank analyze Loonie’s outlook.
Boring picture
The beginning of the year has been characterised by a move from the 1.3200 region back up above 1.3400, and we expect further upside, with USD/CAD likely to trade above 1.3500 before the end of January.
A glance at our USD/CAD forecast for the year paints a rather boring picture with our base case being for similar price action as last year.
The recent rally in the Japanese Yen has reversed with USD/JPY trading nearly four figures higher than at year-end. Economists at Danske Bank analyze the pair’s outlook.
Strong year ahead for the JPY
We forecast USD/JPY to steadily decline towards 135.00 on a 12M horizon. This is primarily because we expect limited upside to US yields from here. Hence, we expect yield differentials to be a tailwind for the JPY during the year, as G10 central banks, except the BoJ, are likely to commence rate-cutting cycles.
In addition, historical data suggests that a global environment characterized by declining growth and inflation tends to favour the JPY.
- Euro registers minor losses as markets prepare for the European Central Bank's monetary policy announcement.
- Federal Reserve officials enter blackout period; San Francisco's Fed President Daly adopts a dovish stance on monetary policy.
- Traders eagerly await ECB President Lagarde's comments on forward guidance, with expectations of potential rate cuts by the Summer.
The Euro (EUR) registers minuscule losses against the US Dollar (USD) early in the North American session as risk appetite improved and traders brace for the European Central Bank (ECB) monetary policy decision on Thursday. At the time of writing, the EUR/USD meanders at around 1.0890, down 0.06%.
EUR/USD could witness sideways price action ahead of ECB’s meeting
Wall Street has opened Monday’s session in the green, while US and global bond yields take a toll and are lower in the day. Even though the Greenback (USD) is down as shown by the US Dollar Index (DXY) at 103.45, losing a mediocre 0.02%, Euro buyers had failed to underpin the pair, failing to crack key resistance at 1.0900.
Meanwhile, Federal Reserve (Fed) officials began their blackout period ahead of January’s 30-31 meeting. The latest policymaker that crossed the newswires was San Francisco’s Fed President Mary Daly, who commented that monetary policy is fine and that risks of achieving the central bank’s mandates are more balanced. She’s adopted a more dovish stance, adding that rates could be lowered without impacting the progress on inflation.
In the Eurozone (EU), traders are laser-focused on the ECB’s monetary policy meeting. The ECB is expected to keep the deposit rate at 4%, though traders would be dissecting ECB’s President Christine Lagarde’s comments on forward guidance. Even though she said that it’s too early to cut rates, she added the central bank could begin reducing interest rates by the Summer.
EUR/USD Price Analysis: Technical outlook
Although the EUR/USD headed south, it found support at the 200-day moving average (DMA) for two consecutive days in January 17 and 18, forming a ‘tweezers bottom’ chart pattern, that could open the door for further upside. Despite hitting a daily high above 1.0900, buyers need a daily close above that level to begin trading within the 1.0900/1.1000 area. On the other hand, if sellers drag prices below the 200-DMA at 1.0845, that would expose the 100-DMA at 1.0770.
The Euro (EUR) has been the third best performing G10 currency so far this year. Economists at MUFG Bank analyze the shared currency’s outlook ahead of the ECB meeting.
ECB policy meeting is key risk event in week ahead
We expect the ECB to continue presenting a relatively hawkish message at this week’s policy meeting which has been helping to support the Euro at the start of this year.
The Eurozone rate market has already taken out around 40 bps of expected cuts by the end of this year.
- Silver price plummets to near $22 as the Fed is expected to reduce interest rates from May.
- The USD Index struggles for a firm-footing despite easing Fed rate-cut bets.
- Silver price declines further towards $21.88.
Silver price (XAG/USD) nosedived to near $22.00 on Monday, more than 2.5% down from its previous close. The white metal is heavily dumped by the market participants as trades dialled back expectations of early rate cuts by the Federal Reserve (Fed).
The S&P500 is expected to open on a positive note, considering positive cues from the overnight futures. The US Dollar Index (DXY) is also facing pressure despite investors have postponed their expectations of rate cut from Fed to May. 10-year US Treasury yields have dropped further to near 4.09%.
The CME Fedwatch tool indicates that investors are now anticipating an interest rate cut in May as price pressures are still stubborn due to robust households’ spending and upbeat labor market conditions.
This week, market participants will focus on the United States Q4 Gross Domestic Product (GDP) data, which will be published on Thursday. An upbeat GDP data would underscore the ‘higher interest rates’ narrative. Fed policymakers have been considering early rate cuts as premature that could dampen all efforts yet don to tame price pressures.
Silver technical analysis
Silver price witnesses an intense sell-off after delivering a breakdown of the horizontal support plotted from December 13 low at $22.51. The asset is expected to find an interim support near November 13 low at $21.88. The 50-period Exponential Moving Average (EMA) near $22.80 continues to act as a barricade for the Silver price bulls.
The 14-period Relative Strength Index (RSI) has shifted into the bearish range of 20.00-40.00, which indicates that a downside momentum has been triggered.
Silver four-hour chart
-638415305122759123.png)
The US Dollar Index (DXY) remains underpinned after surpassing 103.00 last week. Economists at DBS Bank analyze Greenback’s outlook.
US GDP and PCE deflator to underpin USD before next week’s FOMC meeting
Critical support levels include the 103.10 mark, aligning with its 50-DMA, and the 38.2% Fibonacci retracement level from its plunge from 107.10 to 100.60 in November-December.
Despite the Federal Reserve's blackout period, Fed officials have clearly dismissed endorsing the March rate cut pushed by markets at the FOMC meeting on 30-31 January. This week’s important economic data should reinforce the Fed’s patient stance.
On Thursday, consensus sees advanced GDP growth declining to 2% QoQ saar in 4Q 2023 from 4.9% in the previous quarter, supporting a soft-landing scenario. On Friday, markets will be wary of PCE inflation echoing the CPI's uptick by rising 0.2% MoM in December vs. the 0.1% decline a month earlier. Any unexpected results in these reports could push the DXY to test resistance near 104.50, near its 100-DMA and 61.8% Fibo level.
The CAD was softer against a broadly stronger USD over the past week. Economists at Scotiabank analyze USD/CAD outlook.
Bearish near-term technical undertone
1) spot is trading close to fair value but factors are moving against the CAD in the model. 2) Risk appetite (i.e., equities) remains a key influence on short-term CAD movement and the rising rate environment and tense geo-political backdrop suggest some headwinds at least for stocks. 3) The USD rebound is nowhere near overextended, according to the TRIX oscillator. Overall, risks appear to be tilted towards a bit more CAD softness in the near-term at least.
Minor new lows for the USD today keep the near-term technical undertone for USD/CAD bearish below short-term bull channel support at 1.3440 and make last week’s failure at 1.3540 Fibonacci resistance look all the more meaningful now.
Congestion support in the 1.3350/1.3400 zone may slow USD losses from here.
Resistance is 1.3445/1.3450.
The US Dollar (USD) is narrowly mixed in quiet trade. Economists at Scotiabank analyze Greenback’s outlook.
Potential for the USD to recover more of its Q4 decline
The USD still appears to be consolidating after its early January rebound.
The recovery in the USD has a bit more to go as US short-term yields reprice March FOMC risks but markets need a catalyst to drive more decisive movement.
Recall that the USD may also find support from bullish seasonal trends while longer-term technical signals suggest potential for the USD to recover more of its Q4 decline.
- EUR/USD faces pressure near 1.0900 amid uncertainty over the ECB interest rate decision.
- The ECB is expected to keep interest rates unchanged at 4.5% straight for fourth time.
- Fed Daly warned that interest rate cuts should not be compromised with the agenda of price stability.
The EUR/USD pair falls from the round-level resistance of 1.0900 in the late European session. The major currency pair struggles to hold ground amid uncertainty over central bank decisions ahead.
S&P500 futures have added significant gains in the London session, portraying an improvement in the risk-appetite of the market participants. The US Dollar Index (DXY) recovers day’s losses but struggle to hold the immediate support of 103.15. A breakdown below the same would open fresh downside towards the crucial support of 103.00.
The USD Index is failing to have a firm-footing despite the odds of an interest rate cut by the Federal Reserve (Fed) in the March monetary policy meeting have dropped significantly. As per the CME Fedwatch tool, chances favouring a rate cut by 25 basis-points (bps) in march have dropped to 46% from 70%, which were recorded two weeks ago.
San Francisco Fed Bank President Mary Daly cited current monetary policy as in good shape and risks are more balanced. He advised for Fed to reduce rates carefully without impacting the progress in inflation towards the 2% target.
On the Eurozone front, investors shift focus towards the monetary policy decision by the European Central Bank (ECB), which will be announced on Thursday. The ECB is expected to maintain the main refinancing operations rate unchanged at 4.5% for the fourth time in a row. Market participants will keenly focus on the guidance on interest rates.
While talking at the sidelines of World Economic Forum (WEF), ECB President Chistine Lagarde cited that the central bank could start reducing interest rates from late Summer.
GBP/USD is holding a neutral point within the recent 1.2600/1.2800 trading range. Economists at Scotiabank analyze the pair’s outlook.
Short-term technicals lean bearish
Traders have little to go on and Cable is likely to hold within the recent 1.2600/1.2800 range for a little longer.
Trend signals are flat to slightly negative on the shorter-term studies but price action does have a mildly negative look to it on the short-term chart, with GBP gains developing a bearish wedge pattern over the past few sessions (negative on a break under 1.2685/1.2690). Resistance is 1.2735/1.2740.
- The US Dollar faces slight selling pressure on Monday.
- Traders brace for US GDP, PCE data and ECB decision this week.
- The US Dollar Index looks set to sell off as it is unable to breach through technical resistance.
The US Dollar (USD) is opening the week a bit on the backfoot. Some selling pressure appeared in Asia on early Monday morning, ahead of a packed week with a lot of data points. The busy week in the macroeconomic calendar comes along with no speeches from US Federal Reserve (Fed) officials as they are in their blackout period ahead of the January 31 rate decision.
On the economic front, the main elements will come on Thursday and Friday, with the US Gross Domestic Product (GDP) numbers and the Personal Consumption Expenditures (PCE) Price Index, the Fed’s preferred inflation measure, respectively.. The European Central Bank (ECB) will also decide on monetary policy on Thursday. Until then, a very quiet start of the week is ahead on Monday, with no big economic data points scheduled.
Daily digest market movers: Easy start ahead
- China disappointed markets this morning by keeping its Loan Prime Rates unchanged. Several market participants were expecting some easing to support the Chinese economy.
- A new $20 billion dollar plan to support Ukraine might be put on hold by the EU.
- Nasdaq futures rally substantially ahead of the US opening bell.
- The US Treasury is heading to markets to allocate a 6-month and a 3-month bill at 16:30 GMT.
- Equity markets are up across the board, with Japan leading the uprising. Both the Nikkei and the Topix are up over 1% near their closing bell. The laggards are markets in mainland China, which are down over 1% for both the Hang Seng and the Shenzhen Index.
- The CME Group’s FedWatch Tool shows that markets are pricing in a 100% chance that the Federal Reserve will keep interest rates unchanged at its January 31 meeting. Meanwhile, the Fed is in its blackout period, so officials will not communicate any further until the end-month meeting.
- The benchmark 10-year US Treasury Note remains steady at 4.13%.
US Dollar Index Technical Analysis: Pressure is on
The US Dollar Index (DXY) is facing substantial selling pressure. A daily chart shows a third consecutive day with lower highs and lower lows. This points to increasing selling pressure, while the DXY is failing to hold ground above the very important technical levels in the form of the 200-day Simple Moving Average (SMA) at 103.47 and the 55-day SMA at 103.28.
There are some economic data points that could still build a case for the DXY to get through those two moving averages again and run away. Look for 104.44 as the first resistance level on the upside, in the form of the 100-day SMA. If that gets scattered as well, nothing will hold the DXY from heading to either 105.88 or 107.20, the high of September.
A bull trap looks to be underway, where US Dollar bulls were caught buying into the Greenback when it broke above both the 55-day and the 200-day SMA in last week's trading. Price action could decline substantially and force US Dollar bulls to sell their positions at a loss. This would see the DXY first drop to 102.60, at the ascending trend line from September. Once below it, the downturn is open towards 102.00.
US Dollar FAQs
What is the US Dollar?
The US Dollar (USD) is the official currency of the United States of America, and the ‘de facto’ currency of a significant number of other countries where it is found in circulation alongside local notes. It is the most heavily traded currency in the world, accounting for over 88% of all global foreign exchange turnover, or an average of $6.6 trillion in transactions per day, according to data from 2022.
Following the second world war, the USD took over from the British Pound as the world’s reserve currency. For most of its history, the US Dollar was backed by Gold, until the Bretton Woods Agreement in 1971 when the Gold Standard went away.
How do the decisions of the Federal Reserve impact the US Dollar?
The most important single factor impacting on the value of the US Dollar is monetary policy, which is shaped by the Federal Reserve (Fed). The Fed has two mandates: to achieve price stability (control inflation) and foster full employment. Its primary tool to achieve these two goals is by adjusting interest rates.
When prices are rising too quickly and inflation is above the Fed’s 2% target, the Fed will raise rates, which helps the USD value. When inflation falls below 2% or the Unemployment Rate is too high, the Fed may lower interest rates, which weighs on the Greenback.
What is Quantitative Easing and how does it influence the US Dollar?
In extreme situations, the Federal Reserve can also print more Dollars and enact quantitative easing (QE). QE is the process by which the Fed substantially increases the flow of credit in a stuck financial system.
It is a non-standard policy measure used when credit has dried up because banks will not lend to each other (out of the fear of counterparty default). It is a last resort when simply lowering interest rates is unlikely to achieve the necessary result. It was the Fed’s weapon of choice to combat the credit crunch that occurred during the Great Financial Crisis in 2008. It involves the Fed printing more Dollars and using them to buy US government bonds predominantly from financial institutions. QE usually leads to a weaker US Dollar.
What is Quantitative Tightening and how does it influence the US Dollar?
Quantitative tightening (QT) is the reverse process whereby the Federal Reserve stops buying bonds from financial institutions and does not reinvest the principal from the bonds it holds maturing in new purchases. It is usually positive for the US Dollar.
EUR/USD capped in the low 1.0900 area ahead of the ECB meeting. Economists at Scotiabank analyze the pair’s outlook.
More range trading is likely for the session ahead
More range trading is likely for the session ahead, with the EUR still looking a better sell on minor rallies as Eurozone-US short-term spreads edge a little wider again.
Spot trends look flat on the short-term chart, with the EUR capped in the low 1.0900 area but well-supported near 1.0850 (200-DMA at 1.0848). The technical undertone for the EUR remains soft, however, with the EUR holding last week’s break of bull trend support (now resistance) at 1.0955/1.0960.
More corrective losses in the EUR – to unwind a bit more of the Q4 USD sell-off – look likely in the next few weeks.
A daily close under 1.0875 targets a push back to 1.0700/1.0800.
The highlight this week will be central bank meetings in many parts of the world, including Japan and the Eurozone. US Gross Domestic Product (GDP) will also be in focus. Kit Juckes, Chief Global FX Strategist at Société Générale, analyzes the FX market outlook.
Complete BoJ silence could see another test of USD/JPY 150.00
This week, the US calendar starts slowly with leading indicators today; a largely ignored series nowadays, but one warning of weakness ahead. The most-watched release will be the Q4 GDP report, where the consensus call is 2%.
We also get the BoJ on Tuesday, where inaction is almost certain but a market reaction will be seen anyway. Any hint of concern about market distortion from yield curve control could trigger a sharp Yen rally, but complete silence could see another test of USD/JPY 150.00.
The Bank of Canada meets on Wednesday, and will do nothing but there too, any hints will prompt a reaction and the same will be true of the ECB on Thursday, where push-back against market pricing seems almost a done deal.
We’ll also get a look at PMI data for January, and from current depressed expectations, any upside in European PMIs can help the Euro push back above USD 1.1000. The same is true of any good news in UK data after last week’s horror show.
- WTI Oil slides by 1% on Monday as supply normalizes.
- Libya opens up its biggest oilfield after a two-week halt due to an outage.
- The US Dollar Index faces selling pressure and could slide lower this week.
Oil prices are sliding lower by 1% on Monday as Libya’s state-run National Oil Corporation has said its biggest Oil field is coming back online. This means an additional production of 270,000 barrels per day, putting overall output back above 1 million barrels per day for the OPEC country.
Meanwhile, the DXY US Dollar Index is facing some selling pressure from a technical point of view. The index posted lower highs and lower lows on the daily chart, signalling that the US Dollar is set to slide lower soon. On the economic data front this week, traders will face the US Gross Domestic Product (GDP) print and the Fed’s preferred inflation index, the Personal Consumption Expenditure (PCE) Price Index.
Crude Oil (WTI) trades at $72.78 per barrel, and Brent Oil trades at $77.72 per barrel at the time of writing.
- Oil news and market movers: Libya adds supply
- Libya’s Sahara field has restarted its production after a two-week halt, putting the country back above 1 million barrels per day on output, Bloomberg reported.
- Chinese Oil data shows Russia has become the main supplier for the Asian country.
- Chinese demand surged by 8.6% to 14.24 million barrels per day.
- China kept its Prime Loan rates again unchanged on Monday, while markets anticipated further easing in order to support the economy. This could mean demand for Oil could abate in the coming months.
Oil Technical Analysis: More pressure for OPEC
Oil prices are struggling with again an OPEC member defying the production cuts Saudi Arabia is enforcing. After Russia already breached its production cut commitments, Libya is adding more supply as its biggest Oil field comes back online, putting the country back above 1 million barrels per day in production.
On the upside, $74 continues to act as a line in the sand after a failed break above it on Friday. Although quite far off, $80 comes into the picture should tensions build further. Once $80 is broken, $84 is next on the topside.
Below $74, the $67 level could still come into play as the next support to trade at, as it aligns with a triple bottom from June. Should that triple bottom break, a new lowcould be close at $64.35 – the low of May and March 2023 – as the last line of defence. Although still quite far off, $57.45 is worth mentioning as the next level to keep an eye on if prices fall sharply.
-638415144654676072.png)
US WTI Crude Oil: Daily Chart
WTI Oil FAQs
What is WTI Oil?
WTI Oil is a type of Crude Oil sold on international markets. The WTI stands for West Texas Intermediate, one of three major types including Brent and Dubai Crude. WTI is also referred to as “light” and “sweet” because of its relatively low gravity and sulfur content respectively. It is considered a high quality Oil that is easily refined. It is sourced in the United States and distributed via the Cushing hub, which is considered “The Pipeline Crossroads of the World”. It is a benchmark for the Oil market and WTI price is frequently quoted in the media.
What factors drive the price of WTI Oil?
Like all assets, supply and demand are the key drivers of WTI Oil price. As such, global growth can be a driver of increased demand and vice versa for weak global growth. Political instability, wars, and sanctions can disrupt supply and impact prices. The decisions of OPEC, a group of major Oil-producing countries, is another key driver of price. The value of the US Dollar influences the price of WTI Crude Oil, since Oil is predominantly traded in US Dollars, thus a weaker US Dollar can make Oil more affordable and vice versa.
How does inventory data impact the price of WTI Oil
The weekly Oil inventory reports published by the American Petroleum Institute (API) and the Energy Information Agency (EIA) impact the price of WTI Oil. Changes in inventories reflect fluctuating supply and demand. If the data shows a drop in inventories it can indicate increased demand, pushing up Oil price. Higher inventories can reflect increased supply, pushing down prices. API’s report is published every Tuesday and EIA’s the day after. Their results are usually similar, falling within 1% of each other 75% of the time. The EIA data is considered more reliable, since it is a government agency.
How does OPEC influence the price of WTI Oil?
OPEC (Organization of the Petroleum Exporting Countries) is a group of 13 Oil-producing nations who collectively decide production quotas for member countries at twice-yearly meetings. Their decisions often impact WTI Oil prices. When OPEC decides to lower quotas, it can tighten supply, pushing up Oil prices. When OPEC increases production, it has the opposite effect. OPEC+ refers to an expanded group that includes ten extra non-OPEC members, the most notable of which is Russia.
The Japanese Yen (JPY) has continued to trade at weaker levels ahead of Tuesday’s BoJ policy update. Economists at MUFG Bank analyze Yen’s outlook.
The performance of the Yen will be driven by the updated guidance from the BoJ
It appears highly unlikely now that the BoJ will raise rates and/or adjust YCC policy settings again as soon as Tuesday’s policy meeting.
Furthermore, the recent earthquake in Japan has created additional uncertainty which makes it even less likely that the cautious BoJ will make such an important decision to exit negative rates until they have more clarity over the impact on the economy.
With market participants now expecting no change in BoJ policy this week, the performance of the Yen will be driven by the updated guidance from the BoJ. The JPY could weaken further if the BoJ does not provide a stronger signal that rates could be raised at either the March or April meetings. One potential bearish trigger for the Yen would be if the BoJ lowers the core-core CPI projections although that is not our base case scenario.
The US Dollar is the best performing G10 currency in the year to date. Economists at Rabobank analyze EUR/USD outlook for the coming months.
EUR/USD to dip to 1.0500 on a three-month view
The cautious tone of the messaging from ECB policymakers has been similar to that of the Fed, but the USD was sold more aggressively into year-end allowing for a greater rebound.
The resilience of recent US economic data releases suggests further upside potential for the USD, while weak growth expectations from the Eurozone could weigh on the EUR.
Additionally, suppose the probability of Trump re-entering the White House strengthens. In that case, this will likely stir up issues related to Europe’s defence spending about Nato and Ukraine and concerns around trade tariffs. This could enhance the USD’s safe-haven appeal.
We continue to see risk of EUR/USD pushing lower to 1.0500 on a three-month view.
- GBP/JPY struggles for a direction ahead of the BoJ meeting.
- No surprise is anticipated in BoJ’s meeting amid insignificant wage growth.
- The BoE could consider rate cuts if fears of a technical recession remain persistent.
The GBP/JPY pair trades inside Friday’s trading range as investors shift focus towards the monetary policy meeting by the Bank of Japan (BoJ), which will be announced on Tuesday. The BoJ is less-likely to provide roadmap about exiting the decade-long ultra-loose monetary policy.
Slower wage growth and earthquake on New Year’s Day in Japan have dampened the overall economic outlook of the economy, offering a strong argument to BoJ policymakers to extending the expansionary monetary policy stance. Therefore, no tweak in the Yield Curve Control (YCC) and no change in easy monetary policy is anticipated by market participants.
While the underlying inflation in the Japanese economy has been above 2% consistently, BoJ policymakers are less convinced for persistent inflation above the 2% target amid insignificant contribution from the labor cost index. The maintenance of a status-quo by the BoJ could build more pressure on the Japanese Yen.
On the Pound Sterling front, fears of a technical recession in the United Kingdom economy have escalated as households’ spending has been suffered significantly due to higher interest rates by the Bank of England (BoE) and persistent inflationary pressures.
The BoE could be prompted to exit from the historically aggressive interest rate stance to tame risks of economy shifting into a recession. Meanwhile, investors await for preliminary S&P Global UK PMI for January, which will be published on Wednesday.
Over the past two years, we have seen that the major G10 currencies (except the Japanese Yen) have enjoyed the limelight at the cost of smaller currencies. Looking ahead, analysts at Nordea favour the JPY.
Normalisation of monetary policy in Japan to begin this year
Eventually, cyclical currencies should start to perform once global growth is allowed to pick up steam and inflation becomes less of a concern.
The JPY has been a huge disappointment over the last two years. We expect the normalisation of monetary policy in Japan to begin this year. Higher rates in Japan bundled with cuts elsewhere should give a stronger JPY ahead.
- Gold price faces pressure as hopes for an interest rate cut by the Fed have been postponed to May.
- Fed Daly emphasized the need to calibrate interest rates moves very carefully to keep risks balanced.
- Market participants will focus on the preliminary Q4 GDP and core PCE price index data this week.
Gold price (XAU/USD) falls back on Monday as investors reconsider the outlook on interest rates by the Federal Reserve (Fed). Policymakers are consistently supporting the tight interest rates narrative to ensure the return of inflation to the 2% target in a sustainable manner. The precious metal is facing some sell-off as the prospect of imminent rate cuts fades amid still-high price pressures due to robust consumer spending and full employment conditions.
Meanwhile, the absence of fresh cues about Middle-East tensions has also trimmed the appeal for bullions. Investors should brace for a sharp volatility ahead amid a data-packed week. The US Dollar Index (DXY) hovers near the crucial support of 103.00 ahead of the release of key economic indicators such as preliminary Q4 Gross Domestic Product (GDP) data and core Personal Consumption Expenditure (PCE) price index for December.
Daily digest market movers: Gold price falls ahead of data-packed week
- Gold price corrects to near $2,020 as investors dialed back expectations of early rate cuts by the Federal Reserve.
- Stubborn price pressures, robust consumer spending and upbeat labor market conditions have forced traders to pare bets supporting an interest rate cut decision in March.
- As per the CME Group Fedwatch tool, chances in favour of an interest rate cut by 25 basis points (bps) in March have dropped to 42%, sharply down from the 70% seen two weeks ago.
- This indicates that investors don’t expect the Fed to reduce borrowing costs before the May monetary policy meeting.
- Apart from easing rate-cut expectations, the scheduled monetary policy announcement by the European Central Bank (ECB) for this week is also capping the upside for Gold price.
- Meanwhile, Fed policymakers continued to warn last week about a rapid ‘rate-cut campaign’ as it could spoil the entire efforts yet made to bring inflation to current levels of 3.9% from a whooping high of 6.6%.
- Early reduction in interest rates could also bring an uptick in the overall demand and henceforth boost prices.
- On Friday, San Francisco Fed Bank President Mary Daly said current monetary policy is in good shape and risks towards the economy are balanced.
- Mary Daly advised to reduce interest rates very carefully, keeping in mind that the return of inflation to the 2% target should not be compromised. She said the Fed will focus on maintaining full employment this year in contrast with the agenda of ensuring price stability in 2023.
- No comments from Fed officials are expected this week as the US central bank has entered its blackout period ahead of its meeting on January 31.
- This week, market participants will focus on the preliminary S&P Global PMIs for January, preliminary Q4 GDP data, and core PCE price index for December. Upbeat economic data would further squeeze expectations of a rate cut in March.
Technical Analysis: Gold price falls towards 20-day EMA
Gold price drops gradually to near $2,020 as bets supporting a rate-cut decision by the Fed in March have eased significantly. The precious metal struggles to regain traction as the 20-day Exponential Moving Average (EMA) around $2,031 is consistently acting as a barricade for bulls. Going forward, a sideways performance is highly likely as investors await the crucial economic data due later this week, which is expected to provide a fresh outlook on inflation and the interest rate outlook.
Gold FAQs
Why do people invest in Gold?
Gold has played a key role in human’s history as it has been widely used as a store of value and medium of exchange. Currently, apart from its shine and usage for jewelry, the precious metal is widely seen as a safe-haven asset, meaning that it is considered a good investment during turbulent times. Gold is also widely seen as a hedge against inflation and against depreciating currencies as it doesn’t rely on any specific issuer or government.
Who buys the most Gold?
Central banks are the biggest Gold holders. In their aim to support their currencies in turbulent times, central banks tend to diversify their reserves and buy Gold to improve the perceived strength of the economy and the currency. High Gold reserves can be a source of trust for a country’s solvency. Central banks added 1,136 tonnes of Gold worth around $70 billion to their reserves in 2022, according to data from the World Gold Council. This is the highest yearly purchase since records began. Central banks from emerging economies such as China, India and Turkey are quickly increasing their Gold reserves.
How is Gold correlated with other assets?
Gold has an inverse correlation with the US Dollar and US Treasuries, which are both major reserve and safe-haven assets. When the Dollar depreciates, Gold tends to rise, enabling investors and central banks to diversify their assets in turbulent times. Gold is also inversely correlated with risk assets. A rally in the stock market tends to weaken Gold price, while sell-offs in riskier markets tend to favor the precious metal.
What does the price of Gold depend on?
The price can move due to a wide range of factors. Geopolitical instability or fears of a deep recession can quickly make Gold price escalate due to its safe-haven status. As a yield-less asset, Gold tends to rise with lower interest rates, while higher cost of money usually weighs down on the yellow metal. Still, most moves depend on how the US Dollar (USD) behaves as the asset is priced in dollars (XAU/USD). A strong Dollar tends to keep the price of Gold controlled, whereas a weaker Dollar is likely to push Gold prices up.
The Dollar looks to be trading in a supported fashion. Economists at ING analyze USD outlook.
Dollar can stay supported
For the Dollar this week, our macro team forecasts above-consensus fourth quarter GDP on Thursday. Decent fourth quarter US GDP data could see US interest rates back up a little further, keeping the Dollar supported.
We would say it looks like a range-bound week for the Dollar where DXY could trade out something like a 103.00-104.00 range. That will continue to see the market interested in carry, and we note that the Turkish Lira and the Indian Rupee have still managed to deliver year-to-date total positive returns against the Dollar – in a broadly bid USD environment.
EUR/GBP has stayed pretty offered. Economists at ING analyze the pair’s outlook.
Sterling may continue to hold gains against the Euro
Given that it is Purchasing Managers Index (PMI) week, Sterling may continue to hold gains against the Euro. This is because the UK's composite PMI is smartly above 50 (last reading 52.2) compared to the Eurozone's (48.0).
The EUR/GBP pair has lots of support in the 0.8500/0.8550 area and our base case assumes this is the bottom of the trading range this quarter.
- EUR/GBP extends gains as the ECB is expected to not adjust its monetary policy.
- ECB President Christine Lagarde has shifted expectations for a rate cut to late summer.
- The disappointing UK Retail Sales data has contributed pressure to undermining the Pound Sterling.
EUR/GBP extends its gains for the second successive session on Monday, trading higher near 0.8580 during the European trading hours. The EUR/GBP pair received upward support as the European Central Bank (ECB) is expected to not adjust its monetary policy in Thursday’s meeting.
ECB President Christine Lagarde has shifted expectations for a rate cut to late summer, citing caution due to higher inflation levels that exceed the central bank's target. The members of the European Central Bank Governing Council are exercising caution to avoid prematurely easing financial conditions.
The British Pound (GBP) faced challenges against the Euro (EUR) following the release of vulnerable Retail Sales data for December by the United Kingdom (UK) Office for National Statistics (ONS) on Friday. The month-over-month (MoM) UK Retail Sales registered a decline of 3.2%, contrasting with the previous increase of 1.4%. On a year-over-year basis, Retail Sales fell by 2.4%, compared to the previous growth of 0.2%.
The significant decline in UK Retail Sales signals deep economic challenges, accompanied by elevated price pressures. The outlook for the UK economy appears pessimistic, raising concerns about the possibility of a technical recession. In this context, policymakers at the Bank of England (BoE) face a challenging dilemma. This balancing act requires a careful approach from the BoE regarding potential rate cuts.
Gold performed poorly over the last week. Economists at TD Securities analyze the yellow metal’s outlook.
Only weaker US data is likely to convince the Fed to tilt toward the dovish side
With prices again moving well above the psychologically important $2,000 mark, there may likely be more short covering and new longs coming this week.
But only weaker US data is likely to convince the Fed to tilt toward the dovish side. This implies that a convincing upward trend to our $2,200 average price next quarter is unlikely to develop until then.
Gold prices rose in India on Monday, according to data from India's Multi Commodity Exchange (MCX).
Gold price stood at 62,143 Indian Rupees (INR) per 10 grams, up INR 129 compared with the INR 62,014 it cost on Friday.
As for futures contracts, Gold prices decreased to INR 62,010 per 10 gms from INR 62,094 per 10 gms.
Prices for Silver futures contracts decreased to INR 71,638 per kg from INR 71,839 per kg.
| Major Indian city | Gold Price |
|---|---|
| Ahmedabad | 64,205 |
| Mumbai | 64,020 |
| New Delhi | 64,085 |
| Chennai | 64,280 |
| Kolkata | 64,260 |
Global Market Movers: Comex Gold price is weighed down by reduced bets for an early Fed rate cut
- Reduced bets for an early interest rate cut by the Federal Reserve, along with a generally positive risk tone, prompt fresh selling around the Comex Gold price on the first day of a new week.
- The better-than-expected US macro data released last week, along with the recent comments by Fed officials, force investors to further trim their bets for an early interest rate cut.
- The University of Michigan's preliminary survey showed that the US Consumer Sentiment Index rose from 69.7 in December to 78.8 this month, or the highest level since July 2021.
- According to CME Group's Fed Watch Tool, traders are now pricing in a less than 50% chance of a Fed rate cut move at the March policy meeting, down from over 70% last week.
- Chicago Fed President Austan Goolsbee said on Friday that the central bank needs more inflation data in hand before any decision could be made to cut interest rates.
- Separately, San Francisco Fed President Mary Daly said there is still a lot of work left to do on inflation and it is premature to think that rate cuts are around the corner.
- The US launched an attack on a Houthi anti-ship missile on Sunday, its seventh round of strikes since the Iran-backed rebel group began targeting merchant vessels in the Red Sea.
- There have been at least 140 attacks on US bases since October 17 and seven in the past week, including the heavy military strikes on Ain al-Assad base in Iraq, which injured US and Iraqi soldiers.
- Iran has vowed retaliation for a strike that killed five senior military officials in Damascus yesterday, an attack it blamed on Israel, which has neither confirmed nor denied involvement.
- Israeli forces and Hamas fighters clashed in several places on Sunday, while Israeli planes resumed heavy bombing on Khan Younis in the southern Gaza Strip.
- Israeli Prime Minister Benjamin Netanyahu appeared to rule out the two-state solution to the conflict and said that Israel must retain security control over all the territory west of Jordan.
- The People's Bank of China (PBoC) decided earlier this Monday to leave the one-year and five-year Loan Prime Rate (LPR) unchanged at 3.45% and 4.20%, respectively.
(An automation tool was used in creating this post.)
Gold FAQs
Why do people invest in Gold?
Gold has played a key role in human’s history as it has been widely used as a store of value and medium of exchange. Currently, apart from its shine and usage for jewelry, the precious metal is widely seen as a safe-haven asset, meaning that it is considered a good investment during turbulent times. Gold is also widely seen as a hedge against inflation and against depreciating currencies as it doesn’t rely on any specific issuer or government.
Who buys the most Gold?
Central banks are the biggest Gold holders. In their aim to support their currencies in turbulent times, central banks tend to diversify their reserves and buy Gold to improve the perceived strength of the economy and the currency. High Gold reserves can be a source of trust for a country’s solvency. Central banks added 1,136 tonnes of Gold worth around $70 billion to their reserves in 2022, according to data from the World Gold Council. This is the highest yearly purchase since records began. Central banks from emerging economies such as China, India and Turkey are quickly increasing their Gold reserves.
How is Gold correlated with other assets?
Gold has an inverse correlation with the US Dollar and US Treasuries, which are both major reserve and safe-haven assets. When the Dollar depreciates, Gold tends to rise, enabling investors and central banks to diversify their assets in turbulent times. Gold is also inversely correlated with risk assets. A rally in the stock market tends to weaken Gold price, while sell-offs in riskier markets tend to favor the precious metal.
What does the price of Gold depend on?
The price can move due to a wide range of factors. Geopolitical instability or fears of a deep recession can quickly make Gold price escalate due to its safe-haven status. As a yield-less asset, Gold tends to rise with lower interest rates, while higher cost of money usually weighs down on the yellow metal. Still, most moves depend on how the US Dollar (USD) behaves as the asset is priced in dollars (XAU/USD). A strong Dollar tends to keep the price of Gold controlled, whereas a weaker Dollar is likely to push Gold prices up.
- USD/MXN attempts to snap its losing streak on improved Greenback.
- US Dollar could face pressure as the Fed is expected to reduce policy rates more than other major central banks in 2024.
- The downbeat Mexico Retail Sales data might have put downward pressure on the MXN.
USD/MXN snaps a three-day losing streak amid an improved US Dollar (USD). The USD/MXN pair trades higher near 17.10 during the early European hours on Monday. The US Dollar Index (DXY) rising to near 103.20 with improved 2-year and 10-year yields on US Treasury bond coupons standing at 4.41% and 4.12%, respectively, at the time of writing.
However, the US Dollar encountered downward pressure due to prevailing market expectations leaning towards the US Federal Reserve (Fed) reducing policy rates more than other major central banks in 2024. However, the Greenback may find support, benefiting from its safe-haven status, especially amid concerns surrounding maritime trade in the Red Sea. Consequently, this contributes upward support to underpinning the USD/MXN pair.
The heightened geopolitical threat, as the United States (US) and the United Kingdom (UK) aim to escalate their campaign without triggering a broader conflict with Iran, has led to more ships diverting away from the Suez Canal and the Red Sea. This redirection is prompting shipping vessels to carefully assess the risks associated with navigating the Red Sea, with rising insurance costs becoming a significant consideration.
On the other side, the Retail Sales released by INEGI on Friday showed a decline in the retail sales in Mexico in November. The annual growth reduced to 2.7% from the previous increase of 3.4%, falling short of expected 3.2%. In the meantime, the monthly sales came at 0.1% against the expected 0.5%. The previous reading was 0.8%.
The Bank of Mexico (Banxico) will release the 1st half-month Inflation data for January on Wednesday. The market expects a reduction to 0.38% from the 0.58% prior. While the core inflation could report a figure of 0.28% against the previous reading of 0.46%.
FX option expiries for January 22 NY cut at 10:00 Eastern Time, via DTCC, can be found below.
- EUR/USD: EUR amounts
- 1.0800 536m
- 1.0850 579m
- 1.1000 840m
- GBP/USD: GBP amounts
- 1.2650 440m
- USD/JPY: USD amounts
- 148.00 1b
- 148.50 874m
- 149.50 668m
- AUD/USD: AUD amounts
- 0.6535 797m
- 0.6575 582m
- 0.6580 455m
- 0.6600 624m
- USD/CAD: USD amounts
- 1.3200 970m
The first policy meeting from the Bank of Japan (BoJ) in 2024 is scheduled for Tuesday, January 23. Economists at ING analyze Yen’s outlook ahead of the Monetary Policy Decision.
Bank of Japan likely to retain YCC
The earthquake in Japan makes it too early for the Bank of Japan (BoJ) to unwind its Yield Curve Control this week. There have been surprisingly few source stories ahead of this particular meeting, even though we will see a crucial set of new forecasts for prices and activity.
Assuming the BoJ springs no surprise, USD/JPY should continue to hover around 148.
- USD/CAD drops to near 1.3440 on upbeat market mood.
- Lower oil prices weigh on the Canadian Dollar.
- USD/CAD hovers near the lower leg of the Rising Channel pattern.
The USD/CAD pair turns sideways near 1.3440 after a sharp downside from the psychological resistance of 1.3500 in the early European session. The Loonie asset faces pressure as the appeal for safe-haven assets has dented despite fresh hopes that the Federal Reserve (Fed) will not reduce interest rates until May.
S&P500 futures have added decent gains in the Asian session, portraying an improvement in the risk-appetite of the market participants. The US Dollar Index (DXY) struggles for a firm-footing after declining to near 103.10. 10-year US Treasury yields have dropped to near 4.12%.
The oil prices have dropped slightly below $73.00 due to economic headwinds. Global demand for the oil price is expected to remain lower as central banks are hoping to extend restrictive interest rates a little ahead amid stick price pressures. Also, vulnerable post-pandemic recovery in China keeping weighing on the oil demand.
It is worth noting that Canada is the leading exporter of oil to the United States and higher oil prices support the Canadian Dollar.
USD/CAD has dropped to near the lower portion of the Rising Channel chart pattern formed on a two-hour scale. The Loonie asset could face a sell-off if the asset drops below the immediate support of 1.3410. The asset remains below the 50-period Exponential Moving Average (EMA), which hovers around 1.3464.
The 14-period Relative Strength Index (RSI) has slipped into the bearish range of 20.00-40.000, which indicates that a downside momentum has been triggered.
Fresh downside would appear if the asset will drop below January 9 high of 1.3415, which would expose the asset to January 3 high at 1.3372 and January 4 low at 1.3317.
On the contrary, a significant recovery above January 18 low at 1.3480 would open doors for further upside towards January 18 high at 1.3528, followed by 12 December 2023 low at 1.3545.
USD/CAD two-hour chart
-638415082905703341.png)
The Euro has plenty to sink its teeth into this week. Economists at ING analyze the shared currency’s outlook.
Lots of input this week
Beyond Thursday's European Central Bank (ECB) meeting, Tuesday sees the latest ECB bank lending survey and Wednesday sees the flash PMIs for January. These two data sets weighed quite heavily on the Euro last autumn/winter and will be closely watched ahead of the ECB policy meeting.
Our baseline view sees EUR/USD hanging around these 1.0900 levels as the ECB tries to re-position for a data-dependent approach for future policy.
EUR/USD itself looks set to trade out something like a 1.0850-1.0960 range near term.
- NZD/USD continues to lose ground as the US Dollar recovers intraday losses.
- The improved risk appetite weighs on the Greenback.
- New Zealand Dollar faces challenges due to the decline in the domestic manufacturing sector.
NZD/USD trims its intraday gains, continuing the losing streak for the second successive session on Monday. The NZD/USD pair trades near 0.6110 during the Asian session. However, the US Dollar (USD) receives a modest downward pressure due to the improved risk appetite.
As FOMC (Federal Open Market Committee) committee members enter the blackout period ahead of the January meeting, the Greenback faces downward pressure despite hawkish comments from Federal Reserve (Fed) members. The market sentiment appears to be influenced by the expectation that the Fed may cut interest rates more than other major central banks in 2024, which could exert selling pressure on the US Dollar.
San Francisco Fed President Mary Daly's acknowledgment of substantial work ahead in bringing inflation back to the 2.0% target reflects a cautious stance. Furthermore, Atlanta Fed President Raphael Bostic has highlighted his openness to adjusting his outlook on the timing of rate cuts, emphasizing the US Fed's commitment to a data-dependent approach.
Furthermore, the upbeat US Consumer Sentiment Index likely played a role in constraining the losses of the US Dollar. The preliminary Index rose to 78.8 in January from 69.7 prior, exceeding the market consensus of 70 reading. US Existing Home Sales Change (MoM) declined by 1.0% against the previous growth of 0.8%.
On the New Zealand front, the Business NZ Performance of Manufacturing Index (PMI) reported a contraction on Friday. The index decreased to 43.1, down from the previous figure of 46.5. This suggests potential challenges in New Zealand’s manufacturing sector. Looking ahead, market participants will closely watch the upcoming Kiwi’s Consumer Price Index (CPI) data scheduled for Wednesday. Expectations are for a reduction in the fourth quarter.
- Pound Sterling reclaims weekly high on upbeat market sentiment.
- Investors see a technical recession in the UK economy as the cost-of-living crisis deepens.
- The appeal of risk-sensitive assets remains upbeat despite easing Fed rate-cut bets.
The Pound Sterling (GBP) recaptures weekly high amid higher risk-appetite. The GBP/USD pair remains upbeat despite the United Kingdom economy threatening to tip into a technical recession. This has come about due to vulnerable household spending and steep pessimism among business owners over the economic outlook.
The Bank of England (BoE) is expected to struggle to reach a decision because of stubbornly higher price pressures and recession fears. This will make it difficult for policymakers to stick to a restrictive interest rate stance. The market mood remains cheerful despite investors shifting their bets to the May monetary policy meeting for the first rate-cut by the Federal Reserve (Fed), which was previously anticipated in March. Fed policymakers have been supporting the narrative of higher interest rates for a longer period to ensure inflation returning to the 2% target in a timely manner.
Daily Digest Market Movers: Pound Sterling capitalizes on risk-on mood
- Pound Sterling rises sustainably above the crucial resistance of 1.2700 despite unfavourable conditions for Bank of England policymakers in maintaining a restrictive monetary policy stance after a big drop in the Retail Sales data for December.
- The UK Office for National Statistics (ONS) reported that annual Retail Sales surprisingly fell 2.4% while investors projected a growth of 1.1%. The ONS said households were doing Christmas shopping earlier than usual. Sales at food stores were significantly down.
- A sharp decline in consumer spending indicates a deepening cost-of-living crisis due to higher interest rates and stubborn price pressures.
- This has tipped fears of a recession in the UK economy as weak spending by households would discourage firms to maintain current production levels.
- It is worth mentioning that the UK economy, as per the latest estimates from the ONS, reported a decline in growth in the Q3 Gross Domestic Product (GDP) of 2023 by 0.1%. If the economy contracts in Q4 too, it will be considered a technical recession.
- On the inflation side, the UK economy is operating with core inflation at 5.1% and the service price index at 6.4%, which are BoE’s preferred inflation tools while considering monetary policy decisions.
- Price pressures in the UK economy are stubborn if compared with inflation in other Group of Seven economies, making it complicated for policymakers to choose between a restrictive policy stance for higher inflation or unwinding of tight interest rates to safeguard the economy from shifting into a recession.
- This week, market participants will focus on the preliminary S&P Global PMI for January, which will be published on Wednesday. As per the expectations, the economic data is expected to remain upbeat.
- Meanwhile, the market mood is upbeat despite chances of the Federal Reserve (Fed) keeping interest rates unchanged in March rising significantly.
- As per the CME FedWatch tool, traders see a more than 54% chance of the Fed keeping interest rates unchanged in March.
- The US Dollar Index (DXY) has dropped to near 103.20 amid a cheerful market mood. 10-year US Treasury yields have dropped to near 4.12%.
Technical Analysis: Pound Sterling aims at stabilization above 1.2700
Pound Sterling climbs above round-number-level resistance at 1.2700 amid risk-on market sentiment. The near-term demand for the GBP/USD pair has turned bullish as it has jumped above the 20-day Exponential Moving Average (EMA), which trades near 1.2700. The 50-day EMA is near 1.2617. Fresh upside would appear if the Cable manages to climb above the round-level resistance of 1.2800.
The 14-period Relative Strength Index (RSI) trades in the 40.00-60.00 range, which indicates a sideways performance.
Pound Sterling FAQs
What is the Pound Sterling?
The Pound Sterling (GBP) is the oldest currency in the world (886 AD) and the official currency of the United Kingdom. It is the fourth most traded unit for foreign exchange (FX) in the world, accounting for 12% of all transactions, averaging $630 billion a day, according to 2022 data.
Its key trading pairs are GBP/USD, aka ‘Cable’, which accounts for 11% of FX, GBP/JPY, or the ‘Dragon’ as it is known by traders (3%), and EUR/GBP (2%). The Pound Sterling is issued by the Bank of England (BoE).
How do the decisions of the Bank of England impact on the Pound Sterling?
The single most important factor influencing the value of the Pound Sterling is monetary policy decided by the Bank of England. The BoE bases its decisions on whether it has achieved its primary goal of “price stability” – a steady inflation rate of around 2%. Its primary tool for achieving this is the adjustment of interest rates.
When inflation is too high, the BoE will try to rein it in by raising interest rates, making it more expensive for people and businesses to access credit. This is generally positive for GBP, as higher interest rates make the UK a more attractive place for global investors to park their money.
When inflation falls too low it is a sign economic growth is slowing. In this scenario, the BoE will consider lowering interest rates to cheapen credit so businesses will borrow more to invest in growth-generating projects.
How does economic data influence the value of the Pound?
Data releases gauge the health of the economy and can impact the value of the Pound Sterling. Indicators such as GDP, Manufacturing and Services PMIs, and employment can all influence the direction of the GBP.
A strong economy is good for Sterling. Not only does it attract more foreign investment but it may encourage the BoE to put up interest rates, which will directly strengthen GBP. Otherwise, if economic data is weak, the Pound Sterling is likely to fall.
How does the Trade Balance impact the Pound?
Another significant data release for the Pound Sterling is the Trade Balance. This indicator measures the difference between what a country earns from its exports and what it spends on imports over a given period.
If a country produces highly sought-after exports, its currency will benefit purely from the extra demand created from foreign buyers seeking to purchase these goods. Therefore, a positive net Trade Balance strengthens a currency and vice versa for a negative balance.
Gold (XAU/USD) has risen along with geopolitical risks and expectations of US rate cuts. Strategists at ANZ bank analyze the yellow metal’s outlook.
Central bank Gold purchases rose
Heightened geopolitical risks should support haven investment in Gold; but waning market expectations of early rate cuts by the Fed and a rebound in the USD are likely to limit the upside.
Central bank Gold purchases remain strong and likely to reach 1,050t in 2023.
Demand for physical Gold still looks healthy.
See – Gold Price Forecast: The Fed’s explicit pivot will create a constructive outlook for XAU/USD – OCBC
Here is what you need to know on Monday, January 22:
Major currency pairs trade in familiar ranges early Monday as investors stay on the sidelines ahead of this week's key macroeconomic events. The economic calendar will not offer any high-impact data releases. Germany's Bundesbank will release its monthly report during the European trading hours and the Bank of Japan (BoJ) will announce monetary policy decisions in the Asian session on Tuesday.
The US Dollar (USD) Index fluctuates in a tight channel above 103.00 after gaining nearly 1% in the previous week, while the benchmark 10-year US Treasury bond yield sits above 4%. Meanwhile, US stock index futures trade modestly higher to start the week.
US Dollar price today
The table below shows the percentage change of US Dollar (USD) against listed major currencies today. US Dollar was the weakest against the Euro.
| USD | EUR | GBP | CAD | AUD | JPY | NZD | CHF | |
| USD | -0.12% | -0.11% | 0.05% | 0.16% | -0.03% | 0.21% | 0.00% | |
| EUR | 0.11% | 0.00% | 0.16% | 0.26% | 0.07% | 0.32% | 0.12% | |
| GBP | 0.10% | -0.02% | 0.14% | 0.26% | 0.07% | 0.32% | 0.10% | |
| CAD | -0.05% | -0.15% | -0.14% | 0.13% | -0.06% | 0.18% | -0.03% | |
| AUD | -0.17% | -0.28% | -0.28% | -0.11% | -0.20% | 0.05% | -0.15% | |
| JPY | 0.03% | -0.08% | -0.02% | 0.08% | 0.22% | 0.26% | 0.03% | |
| NZD | -0.21% | -0.33% | -0.32% | -0.18% | -0.05% | -0.25% | -0.21% | |
| CHF | 0.00% | -0.12% | -0.11% | 0.03% | 0.14% | -0.05% | 0.19% |
The heat map shows percentage changes of major currencies against each other. The base currency is picked from the left column, while the quote currency is picked from the top row. For example, if you pick the Euro from the left column and move along the horizontal line to the Japanese Yen, the percentage change displayed in the box will represent EUR (base)/JPY (quote).
Pressured by the broad-based USD strength, EUR/USD closed in negative territory last week. While speaking at the World Economic Forum (WEF) in Davos on Friday, European Central Bank (ECB) President Lagarde refrained from commenting on the near-term monetary policy outlook but noted that inflation was coming down in the Eurozone and worldwide. Early Monday, the pair holds steady at around 1.0900.
USD/JPY touched its highest level since late November at 148.80 on Friday but erased its gains to end the day flat, slightly above 148.00. The pair moves up and down in a narrow channel near the weekly closing level. Previewing the potential impact of the BoJ event on the pair, "if the BoJ makes it clear that it does not intend to change its expansionary course for the time being – which we believe is likely – USD/JPY could rise a little further," said analysts at Commerzbank.
After posting marginal losses in the previous week, GBP/USD seems to have gone into a consolidation phase at around 1.2700 on Monday. Services and Manufacturing PMIs on Wednesday will be the next important data releases from the UK.
Despite recovering on Thursday and Friday, Gold lost nearly 1% in the previous week. XAU/USD stays on the back foot early Monday and was last seen losing nearly 0.5% on the day at around $2,020.
AUD/USD posted losses for the third consecutive week and spent the Asian session trading in a tight band below 0.6600 on Monday. National Australia Bank will release Business Conditions and Business Confidence data for December on Tuesday.
- EUR/JPY gains ground near 161.48 ahead of the Bank of Japan's (BoJ) key event.
- The bullish outlook of the cross remains intact above the key EMA; RSI indicator stands in bullish territory.
- 161.60 acts as an immediate upside barrier for the cross; the critical support level to watch is at 160.65.
The EUR/JPY cross holds positive ground around the mid-161.00s during the early European trading hours on Monday. Investors await the Bank of Japan's (BoJ) monetary policy decision on Tuesday. This event is likely to trigger volatility in the market. The BoJ is anticipated to keep its ultra-loose monetary policy unchanged at its January meeting, focusing on any signals Governor Kazuo Ueda gives about when the central bank will raise short-term interest rates out of negative territory. The cross currently trades around 161.48, up 0.04% on the day.
From the technical perspective, EUR/JPY keeps the bullish vibe unchanged as the cross holds above the 50- and 100-hour Exponential Moving Averages (EMA) on the four-hour chart with an upward slope. The upward momentum is supported by the 14-day Relative Strength Index (RSI) which stands above the 50 midline, indicating the path of least resistance level is to the upside.
The upper boundary of the Bollinger Band at 161.60 acts as an immediate upside barrier for the cross. A break above the latter will pave the way to a high of January 19 of 161.86. Further north, the next hurdle is seen at the 162.00 psychological round mark.
On the other hand, the critical support level to watch is the confluence of the lower limit of the Bollinger Band and a low of January 18 at 160.65. A breach of this level will see a drop to the 50-hour EMA at 160.15, en route to the 100-hour EMA at 159.25.
EUR/JPY four-hour chart
-638415029292642071.png)
- GBP/USD gains traction near 1.2722 on a risk-on mood.
- The pair resumes its uptrend above the 100-hour EMA; RSI indicator stands in bullish territory above the 50 midline.
- The first upside barrier is located at 1.2725; the initial support level is seen at 1.2655.
The GBP/USD pair kicks off the new week on a positive note during the early European session on Monday. The rebound of the major pair is bolstered by the risk-on environment. However, the rising tension in the Red Sea might boost safe-haven asset demand and cap the upside of GBP/USD. At press time, the pair is trading at 1.2722, up 0.16% for the day.
Technically, GBP/USD resumes its uptrend as the pair holds above the 100-hour Exponential Moving Averages (EMA) on the four-hour chart. Furthermore, the 14-day Relative Strength Index (RSI) stands in bullish territory above the 50 midlines, indicating that further upside looks favorable.
A decisive break above the upper boundary of the Bollinger Band at 1.2725 will expose a high of January 8 at 1.2767. The additional upside barrier will emerge at a high of December 14 at 1.2795, and finally a high of December 28 at 1.2828.
On the flip side, the initial support level for GBP/USD is located near the lower limit of the Bollinger Band at 1.2655. The key contention level is seen at the 1.2600–1.2610 region, portraying the confluence of the psychological mark and a low of January 2. Any follow-through selling below the latter will see a drop to a low of December 11 at 1.2535.
GBP/USD four-hour chart
-638415005857485648.png)
- USD/CHF moves on an upward trajectory after hawkish remarks from the Fed members.
- Fed’s Mary Daly stated that the central bank has substantial work in achieving the 2.0% inflation target.
- Swiss Franc continues to lose ground after SNB Jordan’s warning on appreciated CHF.
USD/CHF could extend its winning streak that began on January 11, trading near 0.8680 during the Asian hours on Monday. However, the US Dollar (USD) could receive downward pressure as the market participants expect that the US Federal Reserve (Fed) might implement more significant policy rate reductions in 2024 compared to other major central banks worldwide.
However, the hawkish comments from Federal Reserve (Fed) members may serve to mitigate the losses of the US Dollar. San Francisco Fed President Mary Daly, in her remarks on Friday, conveyed the view that the central bank has substantial work ahead in achieving the goal of bringing inflation back down to the 2.0% target. Furthermore, Atlanta Fed President Raphael Bostic emphasized his willingness to adjust his outlook on the timing of rate cuts, underscoring the Fed's commitment to a data-dependent approach.
The Swiss Franc (CHF) faced selling pressure after Swiss National Bank (SNB) Chairman Thomas Jordan warned last week regarding the appreciating trend of the Swiss Franc (CHF). Speaking at the World Economic Forum (WEF) in Davos, Jordan expressed concerns about the potential impact of the Swiss Franc's strength on the SNB's ability to maintain inflation above zero in the Swiss domestic economy.
The Federal Statistical Office of Switzerland has reported that the Producer and Import Prices (YoY) declined by 1.1% in December. Although this is a decrease, it is slightly less than the previous decline of 1.3%. On a monthly basis, the data showed a decrease of 0.6%, aligning with expectations. With no new data on the Swiss economic calendar this week, traders are anticipated to await the release of Real Retail Sales and the ZEW Survey – Expectations next week for further insights into the economic landscape of Switzerland.
- EUR/USD could find immediate resistance at 23.6% Fibonacci retracement level at 1.0913.
- A breakthrough above the 14-day EMA at 1.0922 could lead the pair to reach the major level at 1.0950.
- A break below the psychological level at 1.0900 could push the pair to revisit the monthly low at 1.0884.
EUR/USD extends its gains on the second successive day, trading around 1.0910 during the Asian hours on Monday. The EUR/USD pair receives upward support on an improved risk appetite sentiment ahead of the European Central Bank's (ECB) January monetary policy meeting scheduled to be released on Thursday.
The 23.6% Fibonacci retracement level at 1.0913 acts as an immediate barrier followed by the 14-day Exponential Moving Average (EMA) at 1.0922. If the EUR/USD pair surpasses the latter, it could approach the major level at 1.0950 followed by the 38.2% Fibonacci retracement level at 1.0957.
The 14-day Relative Strength Index (RSI), which serves as a momentum oscillator measuring the speed and change of price movements, is positioned below the 50 mark, suggesting a tendency towards bearish sentiment in the market.
Additionally, the trend-following momentum indicator suggests a confirmation of the bearish trend in the EUR/USD pair as the “Moving Average Convergence Divergence (MACD)” line lies below the centreline and shows a divergence below the signal line.
The EUR/USD pair faces immediate support at the psychological level of 1.0900. A firm collapse below the level could lead the pair to navigate the monthly low at 1.0884 followed by the major support at 1.0850 level.
EUR/USD: Daily Chart
-638414955475099553.png)
- Gold price meets with a fresh supply on Monday and snaps a two-day winning streak.
- Reduced bets that the Fed will cut rates in March act as a headwind for the XAU/USD.
- Retreating US bond yields, softer USD and geopolitical risk could limit any further slide.
Gold price (XAU/USD) struggles to capitalize on its two-day-old recovery trend from over a one-month low and comes under some renewed selling pressure during the Asian session on Monday. The incoming US macro data, including Friday's upbeat consumer sentiment index, suggested that the economy is in good shape. This, along with the recent hawkish comments from a slew of influential Federal Reserve (Fed) policymakers, lowered market expectations of an early rate cut. This, in turn, is seen as a key factor acting as a headwind for the non-yielding yellow metal.
Apart from this, a generally positive tone around the equity markets contributes to a mildly offered tone surrounding the Gold price. That said, a further escalation of geopolitical tensions in the Middle East, along with China's economic woes, might lend some support to the safe-haven XAU/USD. Meanwhile, the flight to safety triggers a modest pullback in the US Treasury bond yields, which keeps the US Dollar (USD) bulls on the defensive. This might further hold back traders from placing aggressive bearish bets around the precious metal and help limit deeper losses.
Daily Digest Market Movers: Gold price is pressured by hawkish Fed expectations, downside seems cushioned
- Reduced bets for an early interest rate cut by the Federal Reserve, along with a generally positive risk tone, prompt fresh selling around the Gold price on the first day of a new week.
- The better-than-expected US macro data released last week, along with the recent comments by Fed officials, force investors to further trim their bets for an early interest rate cut.
- The University of Michigan's preliminary survey showed that the US Consumer Sentiment Index rose from 69.7 in December to 78.8 this month, or the highest level since July 2021.
- According to CME Group's Fed Watch Tool, traders are now pricing in a less than 50% chance of a Fed rate cut move at the March policy meeting, down from over 70% last week.
- Chicago Fed President Austan Goolsbee said on Friday that the central bank needs more inflation data in hand before any decision could be made to cut interest rates.
- Separately, San Francisco Fed President Mary Daly said there is still a lot of work left to do on inflation and it is premature to think that rate cuts are around the corner.
- The US launched an attack on a Houthi anti-ship missile on Sunday, its seventh round of strikes since the Iran-backed rebel group began targeting merchant vessels in the Red Sea.
- There have been at least 140 attacks on US bases since October 17 and seven in the past week, including the heavy military strikes on Ain al-Assad base in Iraq, which injured US and Iraqi soldiers.
- Iran has vowed retaliation for a strike that killed five senior military officials in Damascus yesterday, an attack it blamed on Israel, which has neither confirmed nor denied involvement.
- Israeli forces and Hamas fighters clashed in several places on Sunday, while Israeli planes resumed heavy bombing on Khan Younis in the southern Gaza Strip.
- Israeli Prime Minister Benjamin Netanyahu appeared to rule out the two-state solution to the conflict and said that Israel must retain security control over all the territory west of Jordan.
- The People's Bank of China (PBoC) decided earlier this Monday to leave the one-year and five-year Loan Prime Rate (LPR) unchanged at 3.45% and 4.20%, respectively.
Technical Analysis: Gold price stalls its recovery from over one-month low, remains below $2,040-2,042 supply zone
From a technical perspective, some follow-through below the $2,022-2,020 immediate support will expose the $2,000 psychological mark, or over a one-month low touched last week. The latter should act as a key pivotal point, which if broken decisively could make the Gold price vulnerable. The subsequent downfall has the potential to drag the XAU/USD further towards the $1,988 intermediate support en route to the 100-day Simple Moving Average (SMA), currently around the $1,972 area and the 200-day SMA, near the $1,964-1,963 region.
On the flip side, Friday's swing high, around the $2,040-2,042 supply zone, might continue to act as an immediate strong barrier. A sustained strength beyond could trigger a short-covering rally and lift the XAU/USD towards the $2,077 area. The upward trajectory could extend further and allow bulls to reclaim the $2,100 round-figure mark.
US Dollar price today
The table below shows the percentage change of US Dollar (USD) against listed major currencies today. US Dollar was the strongest against the .
| USD | EUR | GBP | CAD | AUD | JPY | NZD | CHF | |
| USD | -0.12% | -0.14% | 0.02% | -0.04% | -0.17% | -0.11% | -0.07% | |
| EUR | 0.12% | -0.01% | 0.14% | 0.08% | -0.05% | 0.01% | 0.06% | |
| GBP | 0.14% | 0.01% | 0.14% | 0.10% | -0.03% | 0.03% | 0.07% | |
| CAD | -0.01% | -0.12% | -0.14% | -0.04% | -0.17% | -0.10% | -0.07% | |
| AUD | 0.04% | -0.08% | -0.10% | 0.04% | -0.12% | -0.06% | -0.01% | |
| JPY | 0.16% | 0.04% | 0.06% | 0.15% | 0.14% | 0.07% | 0.10% | |
| NZD | 0.10% | -0.02% | -0.04% | 0.11% | 0.06% | -0.06% | 0.04% | |
| CHF | 0.06% | -0.06% | -0.07% | 0.06% | 0.02% | -0.11% | -0.05% |
The heat map shows percentage changes of major currencies against each other. The base currency is picked from the left column, while the quote currency is picked from the top row. For example, if you pick the Euro from the left column and move along the horizontal line to the Japanese Yen, the percentage change displayed in the box will represent EUR (base)/JPY (quote).
Gold FAQs
Why do people invest in Gold?
Gold has played a key role in human’s history as it has been widely used as a store of value and medium of exchange. Currently, apart from its shine and usage for jewelry, the precious metal is widely seen as a safe-haven asset, meaning that it is considered a good investment during turbulent times. Gold is also widely seen as a hedge against inflation and against depreciating currencies as it doesn’t rely on any specific issuer or government.
Who buys the most Gold?
Central banks are the biggest Gold holders. In their aim to support their currencies in turbulent times, central banks tend to diversify their reserves and buy Gold to improve the perceived strength of the economy and the currency. High Gold reserves can be a source of trust for a country’s solvency. Central banks added 1,136 tonnes of Gold worth around $70 billion to their reserves in 2022, according to data from the World Gold Council. This is the highest yearly purchase since records began. Central banks from emerging economies such as China, India and Turkey are quickly increasing their Gold reserves.
How is Gold correlated with other assets?
Gold has an inverse correlation with the US Dollar and US Treasuries, which are both major reserve and safe-haven assets. When the Dollar depreciates, Gold tends to rise, enabling investors and central banks to diversify their assets in turbulent times. Gold is also inversely correlated with risk assets. A rally in the stock market tends to weaken Gold price, while sell-offs in riskier markets tend to favor the precious metal.
What does the price of Gold depend on?
The price can move due to a wide range of factors. Geopolitical instability or fears of a deep recession can quickly make Gold price escalate due to its safe-haven status. As a yield-less asset, Gold tends to rise with lower interest rates, while higher cost of money usually weighs down on the yellow metal. Still, most moves depend on how the US Dollar (USD) behaves as the asset is priced in dollars (XAU/USD). A strong Dollar tends to keep the price of Gold controlled, whereas a weaker Dollar is likely to push Gold prices up.
- Indian Rupee trades flat with mild losses despite the weaker USD.
- Three union ministers said India’s economic growth now is not only high but also inclusive.
- US GDP Annualized (Q4) and the Core PCE data will be the key events to watch this week.
Indian Rupee trades flat on Monday despite the decline of the US Dollar (USD). Three union ministers said at the World Economic Forum Annual Meeting 2024 last week that the country's economic growth now is not only high but also inclusive. They further stated that as China’s economy slows down, India’s relatively rapid growth stands out as a clear opportunity for investors in Davos looking for bright spots. However, India still faces plenty of challenges as the INR has weakened heavily, pressured by high US interest rates and volatile oil prices.
The Bombay Stock Exchange (BSE) and National Exchange (NSE) will be closed on Monday due to the Ayodhya Ram Mandir ‘Pran Pratishtha’ ceremony. The two key events this week will be the preliminary US Gross Domestic Product Annualized for the fourth quarter (Q4), due on Thursday. On Friday, the December Core Personal Consumption Expenditures Price Index (Core PCE) will be in the spotlight.
Daily Digest Market Movers: Indian Rupee remains sensitive to the multiple challenges
- India's foreign exchange reserves increased USD 1.634 billion to USD 618.937 billion for the week ended January 12, according to the Reserve Bank of India (RBI).
- The RBI Governor Shaktikanta Das said that the central bank won’t consider interest rate cuts unless inflation is achieved around the 4% target on a durable basis.
- India's Gross Domestic Product (GDP) grew 7.2% in the last fiscal year, down from just over 9% a year earlier.
- The US Michigan Consumer Sentiment Index rose to 78.8, the highest level since July 2021. The assessment of current economic conditions grew to 83.3, and the expectations component climbed to 75.9.
- The monthly and annual Core Personal Consumption Expenditures Price Index (Core PCE) are expected to show an increase of 0.2% MoM and 3% YoY, respectively.
- According to the CME FedWatch Tool, the odds for a cut at the March meeting fell to 49.3%, a slide from 81% just a week ago.
- Fed’s Daly said that it’s premature to think interest rate cuts are around the corner.
Technical Analysis: Indian Rupee keeps the range within 82.80–83.40
Indian Rupee trades on a flat note on the day. The USD/INR pair has traded within a familiar trading range between 82.80 and 83.40 since September 2023. USD/INR seems vulnerable above the key 100-period Exponential Moving Average (EMA) on the daily chart. However, the 14-day Relative Strength Index (RSI) stands below the 50.0 midline, indicating that further decline cannot be ruled out.
The key resistance level will emerge at the upper boundary of the trading range at 83.40. A break above the mentioned level will see a rally to a 2023 high of 83.47, en route to the 84.00 round figure. On the downside, the 83.00 psychological mark acts as an initial support level for USD/INR. Further south, the next contention level is located at the confluence of the lower limit of the trading range and a low of January 15 at 82.80, and finally a low of August 11 at 82.60.
US Dollar price today
The table below shows the percentage change of US Dollar (USD) against listed major currencies today. US Dollar was the strongest against the Canadian Dollar.
| USD | EUR | GBP | CAD | AUD | JPY | NZD | CHF | |
| USD | -0.12% | -0.13% | -0.03% | -0.09% | -0.16% | -0.17% | -0.08% | |
| EUR | 0.12% | -0.01% | 0.08% | 0.02% | -0.04% | -0.06% | 0.04% | |
| GBP | 0.12% | 0.00% | 0.09% | 0.10% | -0.02% | 0.00% | 0.05% | |
| CAD | 0.03% | -0.09% | -0.09% | 0.01% | -0.11% | -0.09% | -0.04% | |
| AUD | 0.09% | -0.09% | -0.10% | 0.00% | -0.12% | -0.10% | -0.04% | |
| JPY | 0.14% | 0.02% | 0.05% | 0.10% | 0.05% | -0.02% | 0.06% | |
| NZD | 0.13% | 0.00% | -0.01% | 0.08% | 0.03% | -0.04% | 0.05% | |
| CHF | 0.07% | -0.06% | -0.06% | 0.03% | -0.03% | -0.09% | -0.11% |
The heat map shows percentage changes of major currencies against each other. The base currency is picked from the left column, while the quote currency is picked from the top row. For example, if you pick the Euro from the left column and move along the horizontal line to the Japanese Yen, the percentage change displayed in the box will represent EUR (base)/JPY (quote).
Indian Rupee FAQs
What are the key factors driving the Indian Rupee?
The Indian Rupee (INR) is one of the most sensitive currencies to external factors. The price of Crude Oil (the country is highly dependent on imported Oil), the value of the US Dollar – most trade is conducted in USD – and the level of foreign investment, are all influential. Direct intervention by the Reserve Bank of India (RBI) in FX markets to keep the exchange rate stable, as well as the level of interest rates set by the RBI, are further major influencing factors on the Rupee.
How do the decisions of the Reserve Bank of India impact the Indian Rupee?
The Reserve Bank of India (RBI) actively intervenes in forex markets to maintain a stable exchange rate, to help facilitate trade. In addition, the RBI tries to maintain the inflation rate at its 4% target by adjusting interest rates. Higher interest rates usually strengthen the Rupee. This is due to the role of the ‘carry trade’ in which investors borrow in countries with lower interest rates so as to place their money in countries’ offering relatively higher interest rates and profit from the difference.
What macroeconomic factors influence the value of the Indian Rupee?
Macroeconomic factors that influence the value of the Rupee include inflation, interest rates, the economic growth rate (GDP), the balance of trade, and inflows from foreign investment. A higher growth rate can lead to more overseas investment, pushing up demand for the Rupee. A less negative balance of trade will eventually lead to a stronger Rupee. Higher interest rates, especially real rates (interest rates less inflation) are also positive for the Rupee. A risk-on environment can lead to greater inflows of Foreign Direct and Indirect Investment (FDI and FII), which also benefit the Rupee.
How does inflation impact the Indian Rupee?
Higher inflation, particularly, if it is comparatively higher than India’s peers, is generally negative for the currency as it reflects devaluation through oversupply. Inflation also increases the cost of exports, leading to more Rupees being sold to purchase foreign imports, which is Rupee-negative. At the same time, higher inflation usually leads to the Reserve Bank of India (RBI) raising interest rates and this can be positive for the Rupee, due to increased demand from international investors. The opposite effect is true of lower inflation.
- USD/CAD edges higher on the escalated situation in the Middle East.
- Canadian Dollar faces challenges due to the lower Crude oil prices.
- US Fed is expected to implement more significant policy rate reductions in 2024 compared to other central banks.
USD/CAD grapples to snap a two-day losing streak with starting the week trading higher near 1.3430 during the Asian hours on Monday. The lower Crude oil prices are putting pressure on the Canadian Dollar (CAD), which in turn, underpins the USD/CAD pair. Additionally, the US Dollar could potentially find support due to its safe-haven status, particularly amid concerns regarding maritime trade in the Red Sea. Both the US and the UK are looking to escalate their campaign without inciting a broader conflict with Iran, leading to more ships diverting away from the Suez Canal and the Red Sea.
West Texas Intermediate (WTI) price continues to move on a downward trajectory, trading near $73.30 per barrel, by the press time. Crude oil prices are under downward pressure due to various factors. One significant factor is the sluggish economic recovery in China, casting uncertainty on oil demand in the world's largest oil-importing country. Additionally, the extreme cold weather in the United States (US) has constrained travel in extensive regions, raising concerns about a potential slowdown in oil demand.
The US Dollar Index (DXY) moves on a consecutive two-session decline, influenced by market expectations that the US Federal Reserve (Fed) might implement more significant policy rate reductions in 2024 compared to other major central banks worldwide.
Traders will observe the economic indicators such as the US Richmond Fed Manufacturing Index and Canadian housing data scheduled for release on Tuesday. These data points could offer further impetus to the economic scenarios in both nations.
- GBP/USD moves higher on the subdued US Dollar amid a risk-on sentiment.
- The softer UK Retail Sales data might have contributed to the losses of the British Pound.
- US Dollar could draw support from safe-haven status during escalated geopolitical threats in the Middle East.
GBP/USD retraces its recent losses registered on Friday, trading higher near 1.2720 during the Asian session on Monday. The Pound Sterling (GBP) makes advances against the US Dollar (USD), a movement potentially linked to the prevailing risk-on market sentiment. However, challenges arose for the GBP/USD pair following the release of lackluster December Retail Sales data from the United Kingdom (UK) on Friday.
Office for National Statistics (ONS) released the monthly Retail Sales data for December, revealing a notable decline of 3.2%, compared to the previous figure of 1.4%. This exceeded the anticipated decrease of 0.5%. On an annual basis, the data indicated a decrease of 2.4%, contrasting with the expected increase of 1.1%.
The significant drop in consumer spending poses a potential obstacle for the Bank of England (BoE) in maintaining a tight policy without risking a downturn in the economy. The policymakers of the Bank of England (BoE) will observe further data to gauge whether underlying inflation is on track to return to the targeted 2.0% level in a timely and sustainable manner.
The US Dollar Index (DXY) extends its losses for the second straight session on a weaker 10-year US yield, which could be attributed to the market expectations that the US Federal Reserve (Fed) would reduce policy rates by more than any other major central bank in the world in 2024. The DXY trades around 103.10 with 10-year US bond yield trading lower at 4.11%. While the 2-year yield stands at 4.39%, at the time of writing.
However, the US Dollar may find support, given the safe-haven status, amid concerns regarding maritime trade in the Red Sea. Both the US and the UK seek to escalate their campaign without triggering a broader conflict with Iran, resulting in more ships diverting away from the Suez Canal and the Red Sea. Shipping vessels are carefully evaluating the risks associated with navigating the Red Sea, as rising insurance costs become a significant factor.
This geopolitical threat has the potential to amplify risk aversion sentiments, prompting traders to seek refuge in safe-haven assets, which could increase the demand for the US Dollar, which in turn, exerts downward pressure on the GBP/USD pair.
On Friday, San Francisco Fed President Mary Daly shared her perspective, stating that the central bank still has considerable work to do to bring inflation back down to the targeted 2.0%. She underscored that considering interest-rate cuts as an imminent measure is premature at this point.
Meanwhile, Atlanta Fed President Raphael Bostic reaffirmed his stance on expectations for rate cuts just before the Fed entered the "blackout" period before the upcoming rate meeting scheduled for January 31. Bostic reiterated his openness to adjusting his outlook on the timing of rate cuts and emphasized that the Fed continues to rely on data to guide its decisions.
In the absence of high-impact data from the United States (US) and the United Kingdom (UK), traders will observe the US Richmond Fed Manufacturing Index and the UK Public Sector Net Borrowing on Tuesday.
- WTI Oil prices remain under some selling pressure for the second straight day on Monday.
- Concerns over a near-term slowdown in demand continue to undermine the black liquid.
- Fears of supply disruptions in the Middle East could lend support and limit deeper losses.
West Texas Intermediate (WTI) US Crude Oil prices drift lower for the second successive day on Monday and trade around the $73.00/barrel mark during the Asian session. The commodity, however, remains confined in a familiar trading range held over the past three weeks or so amid mixed fundamental cues, warranting caution before placing aggressive directional bets.
Extreme cold weather in the US has limited travel in large parts of the country and raised concerns about a slowdown in demand from the world’s largest fuel consumer. Furthermore, a sluggish economic recovery in China – the world's largest Oil importer – turns out to be another factor undermining the black liquid. Meanwhile, Oil markets are expected to remain well supplied in the first half of 2024, amid underwhelming production cuts from OPEC and record-high US output, and support prospects for additional near-term losses.
Investors, meanwhile, remain worried that the Israel-Hamas war could spill over into other parts of the region and disrupt Oil supply from the Middle East. This, along with the expected improvement in the global Oil demand over the next two years, is holding back bearish traders from positioning for deeper losses. In fact, both the OPEC and the International Energy Agency (IEA) last week raised the global Oil demand forecast for 2024. Apart from this, an attack on a Russian fuel export terminal over the weekend should limit losses for Oil prices.
Traders now await this week's key central bank meetings and economic readings for a fresh impetus. The Bank of Japan (BoJ) is set to announce its policy decision on Tuesday and the European Central Bank (ECB) will meet on Thursday. Apart from this, the release of the flash global PMI prints for January, along with the fourth-quarter US GDP print, will be watched for cues about fuel demand and infuse some volatility around Oil prices.
Technical levels to watch
| Raw materials | Closed | Change, % |
|---|---|---|
| Silver | 22.608 | -0.57 |
| Gold | 2029.216 | 0.26 |
| Palladium | 947.59 | 0.79 |
- The Japanese Yen attracts some haven flows in the wake of rising geopolitical tensions.
- Bets that the BoJ will stick to its dovish stance on Tuesday might cap any further gains.
- Diminishing odds for more aggressive Fed policy easing should lend support to USD/JPY.
The Japanese Yen (JPY) kicks off the new week on a positive note and recovers further from its lowest level since November 28 touched on Friday against the US Dollar (USD). Traders, however, might refrain from placing aggressive directional bets and prefer to wait on the sidelines ahead of the highly-anticipated Bank of Japan (BoJ) policy decision on Tuesday. Heading into the key central bank event risk, growing acceptance that the Japanese central bank will show little desire towards ending negative rates or tweaking the Yield Curve Control (YCC) policy might continue to undermine the JPY. Apart from this, a generally positive tone around the equity markets could further dent the JPY's relative safe-haven status.
The USD, on the other hand, is likely to draw support from reduced bets for an early rate cut by the Federal Reserve (Fed) and the upbeat US consumer sentiment data released on Friday. This, along with the upbeat US Retail Sales figures and a solid labor market report, indicated that the economy remained in good shape. Adding to this, hawkish remarks by influential Fed officials forced investors to further scale back their expectations for a more aggressive Fed policy easing in 2024. This remains supportive of elevated US Treasury bond yields and acts as a tailwind for the buck. Apart from this, the recent widening of the US-Japan rate differential suggests that the path of least resistance for the USD/JPY pair is to the upside.
Daily Digest Market Movers: Japanese Yen benefits from geopolitical tensions, hopes for a dovish BoJ cap gains
- The Japanese Yen recovers further from a multi-week low, though might struggle amid expectations that the Bank of Japan will not pivot away from its ultra-dovish monetary policy stance on Tuesday.
- The bets were reaffirmed by Friday's data showing that the headline Consumer Price Index (CPI) in Japan and the core gauge dropped to the lowest level since June 2022 and July 2022, respectively.
- Adding to this, the New Year's Day earthquake in Japan and weak domestic wage growth data ensure that the BoJ is unlikely to exit the decade-long accommodative regime anytime soon.
- The University of Michigan's preliminary survey report showed that Friday's US Consumer Sentiment Index rose from 69.7 in December to 78.8 this month, hitting the highest level since July 2021.
- According to CME Group's FedWatch Tool, traders now see May as the likely month for a Fed rate cut announcement, with chances for a move at the March monetary policy meeting falling to 50%.
- Meanwhile, consumers' inflation expectations over the next 12 months were the lowest in three years, reaffirming the view that the US central bank will start cutting rates in the first half of this year.
- Apart from this, the risk of a further escalation of geopolitical tensions in the Middle East and China's economic woes, which tend to benefit the safe-haven JPY, exerts some pressure on the USD/JPY pair.
- The US launched an attack on a Houthi anti-ship missile on Sunday, its seventh round of strikes since the Iran-backed rebel group began targeting merchant vessels in the Red Sea.
- There have been at least 140 attacks on U.S. bases since October 17 and seven in the past week, including the heavy military strikes on Ain al-Assad base in Iraq, which injured US and Iraqi soldiers.
- Iran has vowed retaliation for a strike that killed five senior military officials in Damascus yesterday, an attack it blamed on Israel, which has neither confirmed nor denied involvement.
- Israeli forces and Hamas fighters clashed in several places on Sunday, while Israeli planes resumed heavy bombing on Khan Younis in the southern Gaza Strip.
- Israeli Prime Minister Benjamin Netanyahu appeared to rule out the two-state solution to the conflict and said that Israel must retain security control over all the territory west of Jordan.
Technical Analysis: USD/JPY to attract buyers near 100-day SMA resistance turned support around mid-147.00s
From a technical perspective, any subsequent downfall is more likely to find decent support near the 100-day Simple Moving Average (SMA), currently pegged near mid-147.00s. The said area could act as a pivotal point, which if broken decisively might prompt aggressive technical selling and drag the USD/JPY pair towards the 147.00 mark en route to the next relevant support near the 146.60-146.55 area.
On the flip side, the 148.00 round figure, followed by the 148.15-20 region now seems to act as an immediate hurdle ahead of the multi-week high, around the 148.80 zone touched on Friday. Some follow-through buying, leading to a subsequent strength beyond the 149.00 mark, will be seen as a fresh trigger for bullish traders. The USD/JPY pair might then aim to conquer the 150.00 psychological mark with some intermediate hurdle near the 149.70-149.75 area.
Japanese Yen price today
The table below shows the percentage change of Japanese Yen (JPY) against listed major currencies today. Japanese Yen was the strongest against the US Dollar.
| USD | EUR | GBP | CAD | AUD | JPY | NZD | CHF | |
| USD | -0.09% | -0.09% | -0.05% | -0.08% | -0.17% | -0.16% | -0.08% | |
| EUR | 0.09% | 0.00% | 0.05% | 0.00% | -0.08% | -0.07% | 0.01% | |
| GBP | 0.09% | 0.00% | 0.04% | -0.02% | -0.09% | -0.05% | 0.00% | |
| CAD | 0.05% | -0.03% | -0.04% | -0.03% | -0.12% | -0.10% | -0.04% | |
| AUD | 0.10% | 0.02% | 0.02% | 0.07% | -0.06% | -0.03% | 0.03% | |
| JPY | 0.20% | 0.09% | 0.13% | 0.12% | 0.09% | 0.04% | 0.10% | |
| NZD | 0.14% | 0.03% | 0.05% | 0.09% | 0.05% | -0.03% | 0.05% | |
| CHF | 0.08% | -0.02% | 0.00% | 0.03% | -0.03% | -0.11% | -0.07% |
The heat map shows percentage changes of major currencies against each other. The base currency is picked from the left column, while the quote currency is picked from the top row. For example, if you pick the Euro from the left column and move along the horizontal line to the Japanese Yen, the percentage change displayed in the box will represent EUR (base)/JPY (quote).
Japanese Yen FAQs
What key factors drive the Japanese Yen?
The Japanese Yen (JPY) is one of the world’s most traded currencies. Its value is broadly determined by the performance of the Japanese economy, but more specifically by the Bank of Japan’s policy, the differential between Japanese and US bond yields, or risk sentiment among traders, among other factors.
How do the decisions of the Bank of Japan impact the Japanese Yen?
One of the Bank of Japan’s mandates is currency control, so its moves are key for the Yen. The BoJ has directly intervened in currency markets sometimes, generally to lower the value of the Yen, although it refrains from doing it often due to political concerns of its main trading partners. The current BoJ ultra-loose monetary policy, based on massive stimulus to the economy, has caused the Yen to depreciate against its main currency peers. This process has exacerbated more recently due to an increasing policy divergence between the Bank of Japan and other main central banks, which have opted to increase interest rates sharply to fight decades-high levels of inflation.
How does the differential between Japanese and US bond yields impact the Japanese Yen?
The BoJ’s stance of sticking to ultra-loose monetary policy has led to a widening policy divergence with other central banks, particularly with the US Federal Reserve. This supports a widening of the differential between the 10-year US and Japanese bonds, which favors the US Dollar against the Japanese Yen.
How does broader risk sentiment impact the Japanese Yen?
The Japanese Yen is often seen as a safe-haven investment. This means that in times of market stress, investors are more likely to put their money in the Japanese currency due to its supposed reliability and stability. Turbulent times are likely to strengthen the Yen’s value against other currencies seen as more risky to invest in.
- NZD/USD trades on a positive note near 0.6131 on Monday.
- People's Bank of China (PBoC), the Chinese central bank, maintained the Loan Prime Rate (LPR) unchanged across the time curve.
- The US Michigan Consumer Sentiment Index climbed to 78.8, the highest level since July 2021.
- Traders await the New Zealand CPI inflation report on Wednesday.
The NZD/USD pair gains momentum during the early Asian trading hours on Monday. The uptick of the pair is supported by the modest decline of the US Dollar (USD). The highlight this week will be New Zealand’s Consumer Price Index (CPI) for the fourth quarter (Q4) due on Wednesday. The pair currently trades around 0.6131, gaining 0.30% on the day.
Early Monday, the People's Bank of China (PBoC) maintained the Loan Prime Rate (LPR) unchanged across the time curve. The Chinese central bank left the one-year and five-year LPR steady at 3.45% and 4.20%, respectively.
The New Zealand inflation report will be the key event for the pair. The CPI inflation figures are estimated to show an increase of 0.6% QoQ and 4.7% YoY in Q4. According to ANZ chief economist Sharon Zollner, the RBNZ is expected to lower the OCR by 25 basis points (bps) beginning in August, bringing it down from 5.5% to 3.5% over the next 12 months.
On the USD’s front, the Consumer Sentiment Index climbed to 78.8, the highest level since July 2021, the University of Michigan reported on Friday. The assessment of current economic conditions grew to 83.3, while the expectations component rose to 75.9.
FOMC committee members enter the black-out period as they prepare for its January meeting. Investors will monitor the New Zealand CPI inflation report on Wednesday for fresh impetus. On Thursday, the preliminary US GDP Annualized (Q4) will be due. On Friday, the attention will shift to the December Core Personal Consumption Expenditures Price Index (Core PCE), which is projected to show an increase of 0.2% MoM and 3% YoY, respectively.
- Australian Dollar rises as the US Dollar declines due to the lower 10-year US bond yield.
- Australian Central Bank is expected to reduce the policy rate after the softer Consumer Confidence and Employment Change figures.
- AUD could find support as the domestic share market surges following a rally in the US markets on Friday.
- PBoC keeps its Loan Prime Rate (LPR) steady at 3.45% and 4.20% for the one-year and the five years, respectively.
- US and UK could intensify their campaign against Iran-backed Houthi terrorists in Yemen.
The Australian Dollar (AUD) hovers around a psychological level at 0.6600 on Monday amid market uncertainty driven by discussions between the United States (US) and the United Kingdom (UK) on intensifying actions against Iran-backed Houthi terrorists in Yemen. Nevertheless, the AUD/USD pair finds some uplift from a subdued US Dollar (USD), influenced by a reduction in long-term US Treasury yields.
Australia’s dollar faces a setback amidst speculation about potential early interest rate cuts by the Reserve Bank of Australia (RBA). This speculation is fueled by the latest subdued Aussie Consumer Confidence and Employment Change figures. However, the AUD could cheer the surge in the domestic share market, mirroring a rally in the US that propelled the S&P 500 and the Nasdaq to new records on Friday. This surge was driven by expectations that the US Federal Reserve (Fed) is poised to lower interest rates later in the year. Furthermore, optimism was fueled by the projection from the world's largest contract chipmaker, Taiwan Semiconductor Manufacturing, indicating a forecast of more than 20% revenue growth in 2024, which had a positive impact on global stocks.
The People's Bank of China has decided to keep its Loan Prime Rate (LPR) steady for both the one-year and five-year terms. The rate remains at 3.45% for the one-year period and 4.20% for the five-year period.
The US Dollar Index (DXY) consolidates after recent losses in the previous session. The US Dollar could find some support due to concerns about maritime trade in the Red Sea. The US and the UK are looking to intensify their campaign without inciting a broader conflict with Iran. More ships are diverting away from the Suez Canal and the Red Sea. Shipping vessels are assessing the risks associated with navigating the Red Sea, as insurance costs rise. Opting for the alternative route around the southern tip of Africa may increase delivery times, shipping costs, and inflation. This situation could enhance risk aversion sentiments, leading traders to seek the safe-haven US Dollar, consequently exerting downward pressure on the AUD/USD pair.
San Francisco Fed President Mary Daly expressed her belief on Friday that the central bank still has significant work to accomplish in bringing inflation back down to the 2.0% target. She emphasized that it is premature to consider interest-rate cuts as an imminent measure. Atlanta Fed President Raphael Bostic reiterated his position on expectations for rate cuts ahead of the Fed entering the "blackout" period before the next rate meeting scheduled for January 31. Bostic emphasized his openness to adjusting his outlook on the timing of rate cuts and highlighted that the Fed remains data-dependent.
Daily Digest Market Movers: Australian Dollar rises on weaker US Dollar
- Australia’s Consumer Inflation Expectations remained steady at 4.5% in January.
- Aussie seasonally adjusted Unemployment Rate held firm at 3.9% in line with expectations for December.
- Australian Employment Change decreased by 65.1K, contrary to the anticipated increase of 17.6K.
- The preliminary US Michigan Consumer Sentiment Index rose to 78.8 in January from 69.7 prior, exceeding the expected figure of 70.
- US Existing Home Sales Change (MoM) declined by 1.0% in December against the previous rise of 0.8%.
- US Housing Starts (MoM) surpassed expectations in December, reaching 1.46 million compared to the anticipated 1.426 million.
- US Building Permits for the month increased, rising to 1.495 million, surpassing the market consensus of 1.48 million.
- US Initial Jobless Claims for the week ending on January 12 decreased to 187,000 from the previous reading of 203,000.
Technical Analysis: Australian Dollar hovers above the psychological level at 0.6550
The Australian Dollar trades near 0.6610 on Monday. In the AUD/USD pair, potential resistance lies around the nine-day Exponential Moving Average (EMA) at 0.6624, followed by a significant level at 0.6650. If the pair surpasses this major level, it may aim for a test of the psychological level at 0.6700. On the downside, immediate support is evident at the psychological level of 0.6600, followed by the 50% retracement level at 0.6568, and then the major support at 0.6550. A breach below the latter could prompt the AUD/USD pair to explore levels around the psychological mark of 0.6500, in conjunction with the 61.8% Fibonacci retracement level at 0.6497.
AUD/USD: Daily Chart
-638414849026060319.png)
Australian Dollar price today
The table below shows the percentage change of Australian Dollar (AUD) against listed major currencies today. Australian Dollar was the strongest against the US Dollar.
| USD | EUR | GBP | CAD | AUD | JPY | NZD | CHF | |
| USD | -0.11% | -0.08% | -0.07% | -0.18% | -0.22% | -0.25% | -0.10% | |
| EUR | 0.11% | 0.03% | 0.04% | -0.05% | -0.09% | -0.12% | 0.03% | |
| GBP | 0.08% | -0.03% | 0.00% | -0.07% | -0.12% | -0.14% | -0.01% | |
| CAD | 0.06% | -0.04% | -0.01% | -0.08% | -0.13% | -0.15% | -0.02% | |
| AUD | 0.17% | 0.05% | 0.07% | 0.10% | -0.05% | -0.07% | 0.07% | |
| JPY | 0.22% | 0.06% | 0.15% | 0.12% | 0.04% | -0.01% | 0.11% | |
| NZD | 0.22% | 0.10% | 0.13% | 0.14% | 0.04% | -0.01% | 0.11% | |
| CHF | 0.10% | -0.03% | 0.01% | 0.02% | -0.07% | -0.12% | -0.14% |
The heat map shows percentage changes of major currencies against each other. The base currency is picked from the left column, while the quote currency is picked from the top row. For example, if you pick the Euro from the left column and move along the horizontal line to the Japanese Yen, the percentage change displayed in the box will represent EUR (base)/JPY (quote).
Australian Dollar FAQs
What key factors drive the Australian Dollar?
One of the most significant factors for the Australian Dollar (AUD) is the level of interest rates set by the Reserve Bank of Australia (RBA). Because Australia is a resource-rich country another key driver is the price of its biggest export, Iron Ore. The health of the Chinese economy, its largest trading partner, is a factor, as well as inflation in Australia, its growth rate and Trade Balance. Market sentiment – whether investors are taking on more risky assets (risk-on) or seeking safe-havens (risk-off) – is also a factor, with risk-on positive for AUD.
How do the decisions of the Reserve Bank of Australia impact the Australian Dollar?
The Reserve Bank of Australia (RBA) influences the Australian Dollar (AUD) by setting the level of interest rates that Australian banks can lend to each other. This influences the level of interest rates in the economy as a whole. The main goal of the RBA is to maintain a stable inflation rate of 2-3% by adjusting interest rates up or down. Relatively high interest rates compared to other major central banks support the AUD, and the opposite for relatively low. The RBA can also use quantitative easing and tightening to influence credit conditions, with the former AUD-negative and the latter AUD-positive.
How does the health of the Chinese Economy impact the Australian Dollar?
China is Australia’s largest trading partner so the health of the Chinese economy is a major influence on the value of the Australian Dollar (AUD). When the Chinese economy is doing well it purchases more raw materials, goods and services from Australia, lifting demand for the AUD, and pushing up its value. The opposite is the case when the Chinese economy is not growing as fast as expected. Positive or negative surprises in Chinese growth data, therefore, often have a direct impact on the Australian Dollar and its pairs.
How does the price of Iron Ore impact the Australian Dollar?
Iron Ore is Australia’s largest export, accounting for $118 billion a year according to data from 2021, with China as its primary destination. The price of Iron Ore, therefore, can be a driver of the Australian Dollar. Generally, if the price of Iron Ore rises, AUD also goes up, as aggregate demand for the currency increases. The opposite is the case if the price of Iron Ore falls. Higher Iron Ore prices also tend to result in a greater likelihood of a positive Trade Balance for Australia, which is also positive of the AUD.
How does the Trade Balance impact the Australian Dollar?
The Trade Balance, which is the difference between what a country earns from its exports versus what it pays for its imports, is another factor that can influence the value of the Australian Dollar. If Australia produces highly sought after exports, then its currency will gain in value purely from the surplus demand created from foreign buyers seeking to purchase its exports versus what it spends to purchase imports. Therefore, a positive net Trade Balance strengthens the AUD, with the opposite effect if the Trade Balance is negative.
The People's Bank of China announced on Monday that it maintained the Loan Prime Rate (LPR) unchanged across the time curve.
The Chinese central bank left the one-year and five-year LPR steady at 3.45% and 4.20%, respectively.
Market reaction
At the time of writing, AUD/USD is holding higher ground near 0.6610, adding 0.18% on the day.
About the People’s Bank of China Interest Rate Decision
The People’s Bank of China’s (PBoC) Monetary Policy Committee (MPC) holds scheduled meetings on a quarterly basis. However, China’s benchmark interest rate – the loan prime rate (LPR), a pricing reference for bank lending – is fixed every month. If the PBoC forecasts high inflation (hawkish) it raises interest rates, which is bullish for the Renminbi (CNY). Likewise, if the PBoC sees inflation in the Chinese economy falling (dovish) and cuts or keeps interest rates unchanged, it is bearish for CNY. Still, China’s currency doesn’t have a floating exchange rate determined by markets and its value against the US Dollar is fixed mainly by the PBoC on a daily basis.
On Monday, the People’s Bank of China (PBoC) set the USD/CNY central rate for the trading session ahead at 7.1105 as compared to Friday's fix of 7.1167 and 7.1870 Reuters estimates.
A maritime advisory firm Sea-Intelligence said the disruptions to shipping from the Houthi rebel attacks in the Red Sea are already more damaging to the supply chain than the early COVID-19 pandemic.
The vessel capacity drop is the second largest in recent years. The only single event with a bigger impact than the Red Sea crisis was “Ever Given,” the giant cargo ship that got stuck in the Suez Canal for six days during March 2021.
Market reaction
At the time of writing, the US Dollar Index (DXY) is trading near 103.17, down 0.08% on the day.
- EUR/USD kicks off the new week on a positive note on the weaker USD.
- The chance for a Fed rate cut at the March meeting fell to 49.3%, a slide from 81% just a week ago.
- The European Central Bank (ECB) is expected to maintain the interest rate unchanged at its January meeting.
- The ECB rate decision, US GDP (Q4), and US Core PCE data will be in the spotlight this week.
The EUR/USD pair posts modest gains under the 1.0900 barrier during the early Asian trading hours on Monday. The European Central Bank's (ECB) January monetary policy meeting on Thursday will be a closely watched event by traders. At press time, EUR/USD is trading at 1.0897, up 0.03% on the day.
The markets have become less convinced that the Federal Reserve (Fed) will cut the interest rate in March after the US economic data last week, including Retail Sales and Consumer Sentiment Index showed an improvement in the US economy. According to the CME FedWatch Tool, the odds for a cut at the March meeting fell to 49.3%, a slide from 81% just a week ago.
On the other hand, the ECB Governing Council members are cautious about prematurely easing financial conditions. No change is anticipated at its January policy meeting on Thursday. Nonetheless, traders will take more cues from ECB President Christine Lagarde's speech after the meeting whether she confirms the first rate cuts this year. Investors believe the ECB will begin cutting interest rates in spring, as sustained progress towards the 2% inflation target is driven by the implementation of tighter real policy rates.
The ECB monetary policy decision will be announced on Thursday, with no change in policy expected. Also, the US preliminary Gross Domestic Product Annualized (Q4) will be due on Thursday. On Friday, the Commerce Department will release the December reading on the Personal Consumption Expenditures Price Index (PCE), a favorite Fed inflation gauge.
| Index | Change, points | Closed | Change, % |
|---|---|---|---|
| NIKKEI 225 | 497.1 | 35963.27 | 1.4 |
| Hang Seng | -83.1 | 15308.69 | -0.54 |
| KOSPI | 32.7 | 2472.74 | 1.34 |
| ASX 200 | 74.7 | 7421.2 | 1.02 |
| DAX | -12.22 | 16555.13 | -0.07 |
| CAC 40 | -29.71 | 7371.64 | -0.4 |
| Dow Jones | 395.19 | 37863.8 | 1.05 |
| S&P 500 | 58.87 | 4839.81 | 1.23 |
| NASDAQ Composite | 255.32 | 15310.97 | 1.7 |
| Pare | Closed | Change, % |
|---|---|---|
| AUDUSD | 0.65959 | 0.42 |
| EURJPY | 161.423 | 0.36 |
| EURUSD | 1.08944 | 0.19 |
| GBPJPY | 188.175 | 0.02 |
| GBPUSD | 1.26994 | -0.05 |
| NZDUSD | 0.61126 | 0.02 |
| USDCAD | 1.34311 | -0.39 |
| USDCHF | 0.86824 | 0.06 |
| USDJPY | 148.176 | 0.05 |
- Gold price loses ground near $2,027 on robust US data.
- US University of Michigan consumer sentiment rose to its highest since July 2021, coming in at 78.8 in January vs. 69.7 prior.
- Investors await the People’s Bank of China interest rate decision on Monday.
Gold price (XAU/USD) drifts lower to $2,027 during the early Asian session on Monday. The robust US economic data have triggered the expectation that the Federal Reserve (Fed) might delay interest rate cuts, which boost the US Dollar (USD). The key support level of yellow metal is seen at the $2,000 psychological mark. The US Core Personal Consumption Expenditures Price Index (Core PCE) for December on Friday might trigger volatility in the market.
US consumer sentiment improved in January, hitting the highest level since July 2021. The University of Michigan's preliminary reading on the consumer sentiment index arrived at 78.8 in January versus 69.7 in December, better than the market expectation of 70.0.
On Friday, San Francisco Federal Reserve Bank President Mary Daly stated that the central bank has a lot of work left to do on bringing inflation back down to the Fed's 2% target and that it’s premature to think about interest rate cuts. Nonetheless, two key events this week might determine at least which way central bank policymakers could lean on policy. The US GDP growth numbers will be due on Thursday, and the Core PCE will be released on Friday. The weaker US data is likely to convince the Fed to tilt toward the dovish side and cap the downside of the gold price.
The People’s Bank of China is expected to leave the benchmark one- and five-year loan prime rates (LPR) unchanged at 3.45% and 4.20%, respectively. Bearish sentiment toward China has intensified as the latest economic data indicates that the world's second-biggest economy continues in a slump. Any negative development surrounding Chinese economy could drag the gold price lower, as China is one of the world's largest gold consumers.


© 2000-2026. Уcі права захищені.
Cайт знаходитьcя під керуванням TeleTrade DJ. LLC 2351 LLC 2022 (Euro House, Richmond Hill Road, Kingstown, VC0100, St. Vincent and the Grenadines).
Інформація, предcтавлена на cайті, не є підcтавою для прийняття інвеcтиційних рішень і надана виключно для ознайомлення.
Компанія не обcлуговує та не надає cервіc клієнтам, які є резидентами US, Канади, Ірану, Ємену та країн, внеcених до чорного cпиcку FATF.
Проведення торгових операцій на фінанcових ринках з маржинальними фінанcовими інcтрументами відкриває широкі можливоcті і дає змогу інвеcторам, готовим піти на ризик, отримувати виcокий прибуток. Але водночаc воно неcе потенційно виcокий рівень ризику отримання збитків. Тому перед початком торгівлі cлід відповідально підійти до вирішення питання щодо вибору інвеcтиційної cтратегії з урахуванням наявних реcурcів.
Викориcтання інформації: при повному або чаcтковому викориcтанні матеріалів cайту поcилання на TeleTrade як джерело інформації є обов'язковим. Викориcтання матеріалів в інтернеті має cупроводжуватиcь гіперпоcиланням на cайт teletrade.org. Автоматичний імпорт матеріалів та інформації із cайту заборонено.
З уcіх питань звертайтеcь за адреcою pr@teletrade.global.
переклади