- Аналітика
- Новини та інструменти
- Новини ринків
Новини ринків
- Gold price attracts some buyers to $2,055 amid the weaker US Dollar.
- US Q3 GDP came in weaker than expected, expanding at 4.9%.
- The markets are pricing in around 79% odds of a rate cut in March.
- Gold traders await the US Core Personal Consumption Expenditure Price Index (Core PCE), due on Friday.
Gold price (XAU/USD) extends its gains during the early Asian session on Friday. The softer US Dollar (USD) and the downbeat US GDP growth number lends some support to the yellow metal. Gold price currently trades near $2,055, gaining 0.53% on the day.
Meanwhile, the US Dollar Index (DXY), a measure of the value of the USD against a weighted basket of currencies used by US trade partners, has dropped to its lowest level since August, near 101.80. The Treasury yields rose modestly, with the 10-year yield standing at 3.89%.
Data released on Thursdays showed that the US Gross Domestic Product (GDP) for the third quarter came in weaker than expected, expanding at 4.9%, according to the US Bureau of Economic Analysis (BEA) report. Furthermore, Initial claims for unemployment benefits increased by 2,000 to a seasonally adjusted 205,000 for the week ending December 16, worse than the market expectation of 215,000.
Softening US economic data and moderating inflation indicated that the Federal Reserve (Fed) monetary policies are restrictive enough to bring inflation sustainably back to target. Fed committee members expected at least three rate cuts in 2024, and the markets are pricing in around 79% possibility of a rate cut in March, according to the CME FedWatch tool. That being said, the lower US might boost the appeal of gold.
Looking ahead, gold traders will closely monitor November’s US Core Personal Consumption Expenditure Price Index (Core PCE) on Friday. The Fed’s preferred inflation gauge is estimated to show an increase of 0.2% MoM and 3.3% YoY. Furthermore, the University of Michigan Consumer Confidence Survey, Durable Goods Orders report, and New Home Sales data will also be released from the US docket.
Japan’s National Consumer Price Index (CPI) for November came in at 2.8% YoY from 3.3% in October, according to the latest data released by the Japan Statistics Bureau on Friday,
Further details unveil that the National CPI ex Fresh Food arrived at 2.5% YoY in November versus 2.9% prior.
Market reaction
Following the Japan inflation data, the USD/JPY pair is down 0.05% on the day at 142.15
About Japan’s National CPI
The National Consumer Price Index is released by the Statistics Bureau and it's a measure of price movements obtained by comparison of the retail prices of a representative shopping basket of goods and services. CPI is the most significant way to measure changes in purchasing trends. The purchase power of JPY is dragged down by inflation. Generally a high reading is seen as positive for the JPY.
Japanese Yen FAQs
What key factors drive the Japanese Yen?
The Japanese Yen (JPY) is one of the world’s most traded currencies. Its value is broadly determined by the performance of the Japanese economy, but more specifically by the Bank of Japan’s policy, the differential between Japanese and US bond yields, or risk sentiment among traders, among other factors.
How do the decisions of the Bank of Japan impact the Japanese Yen?
One of the Bank of Japan’s mandates is currency control, so its moves are key for the Yen. The BoJ has directly intervened in currency markets sometimes, generally to lower the value of the Yen, although it refrains from doing it often due to political concerns of its main trading partners. The current BoJ ultra-loose monetary policy, based on massive stimulus to the economy, has caused the Yen to depreciate against its main currency peers. This process has exacerbated more recently due to an increasing policy divergence between the Bank of Japan and other main central banks, which have opted to increase interest rates sharply to fight decades-high levels of inflation.
How does the differential between Japanese and US bond yields impact the Japanese Yen?
The BoJ’s stance of sticking to ultra-loose monetary policy has led to a widening policy divergence with other central banks, particularly with the US Federal Reserve. This supports a widening of the differential between the 10-year US and Japanese bonds, which favors the US Dollar against the Japanese Yen.
How does broader risk sentiment impact the Japanese Yen?
The Japanese Yen is often seen as a safe-haven investment. This means that in times of market stress, investors are more likely to put their money in the Japanese currency due to its supposed reliability and stability. Turbulent times are likely to strengthen the Yen’s value against other currencies seen as more risky to invest in.
- AUD/USD holds above 0.6800 amid the USD weakness.
- US Q3 GDP grew at a 4.9% annualized rate, missing the expectation of 5.2%.
- The RBA indicated in its December minutes that there are upside risks of inflation, and the policy setting will depend on the incoming data.
- The US Core Personal Consumption Expenditure Price Index (Core PCE) will be in the spotlight on Friday.
The AUD/USD pair gains ground above the 0.6800 mark, the highest in five months during the early Asian session on Friday. The uptick of the pair is bolstered by the softer US Dollar (USD) and risk appetite. At press time, AUD/USD is trading at 0.6801, down 0.02% on the day.
On Thursday, the new estimate of the US Gross Domestic Product (GDP) Annualized for the third quarter (Q3) expanded 4.9%, below the market consensus of 5.2%. Additionally, the weekly Initial Jobless Claims for the week ending December 16 came in at 205,000 from 203,000 in the previous week. The Philadelphia Fed Manufacturing Index fell to -10.5 in December from -5.9 in November.
The Federal Reserve (Fed) delivered a dovish tone last week while indicating that the hiking cycle is done and rate cuts are on the cards next year. Fed Chair Jerome Powell did not declare victory over inflation and reiterated that the central bank wants to see further evidence of falling inflation before it would feel confident that it is sustainably headed back to the 2% target. Traders will take more cues from the US Core Personal Consumption Expenditure Price Index (Core PCE) due later on Friday.
The Reserve Bank of Australia (RBA) decided to hold the cash rate at 4.35% amid the "encouraging signs" of the inflation battle. However, the RBA indicated in its December minutes there are risks that inflation will hold above the 2%-3% target for longer than expected. The central bank will wait for further data to assess how the balance of risks was evolving.
Australia will release Private Sector Credit data on Friday. Market players will closely monitor the US Core PCE, the Fed’s preferred inflation gauge, which is expected to rise 3.3%. Also, the University of Michigan Consumer Confidence Survey, Durable Goods Orders report, and New Home Sales data will be released later on Friday. These figures could give a clear direction to the AUD/USD pair.
- The S&P 500 clawed back most of Wednesday’s declines as US inflation eases back faster than expected.
- Market bets of increased Fed rate cuts next year sparked a risk appetite recovery.
- Investors’ rate hike expectations risk running well ahead of what the Fed is willing to commit to in 2024.
The Standard & Poor’s (S&P) 500 major equity index climbed on Thursday to chew through late Wednesday’s losses as investor risk appetite surged higher after US inflation figures came in below expectations, ramping up investor hopes of a faster, deeper pace of rate hikes from the Federal Reserve (Fed) in 2024.
The Fed’s dot plot of interest rate expectations sees around 75 basis points in rate cuts through 2024. Thursday’s US data prints see markets pushing their 2024 median rate cut expectations to an eye-watering 160 basis points by the end of next December.
Thursday’s market focus was US Core Personal Consumption Expenditures for the third quarter, which slipped to 2.0% versus the forecast steady print of 2.3%, bringing inflation measures down to a key target level for the Fed.
US Initial Jobless Claims ticked up slightly for the week into December 15, but much less than markets were expecting, printing at 205K versus the previous week’s 203K (revised up from 202K).
Adding onto easing expectations, US Annualized third quarter Gross Domestic Product (GDP) also softened on Thursday to round out the US data dump, coming in at 4.9% versus the forecast steady reading of 5.2%.
The S&P 500 gained 48.4 points on Thursday, climbing a little over one percent to close at $4,746.75.
The Dow Jones Industrial Average (DJIA) climbed over 322 points to close at $37,404, gaining eight-tenths of one percent.
Thursday’s big winner was the NASDAQ tech index, bolstered by chip manufacturers and tech stocks. The NASDAQ gained over one and a quarter percent to add nearly 186 points, wrapping up Thursday’s trading at $13,963.87.
S&P 500 Technical Outlook
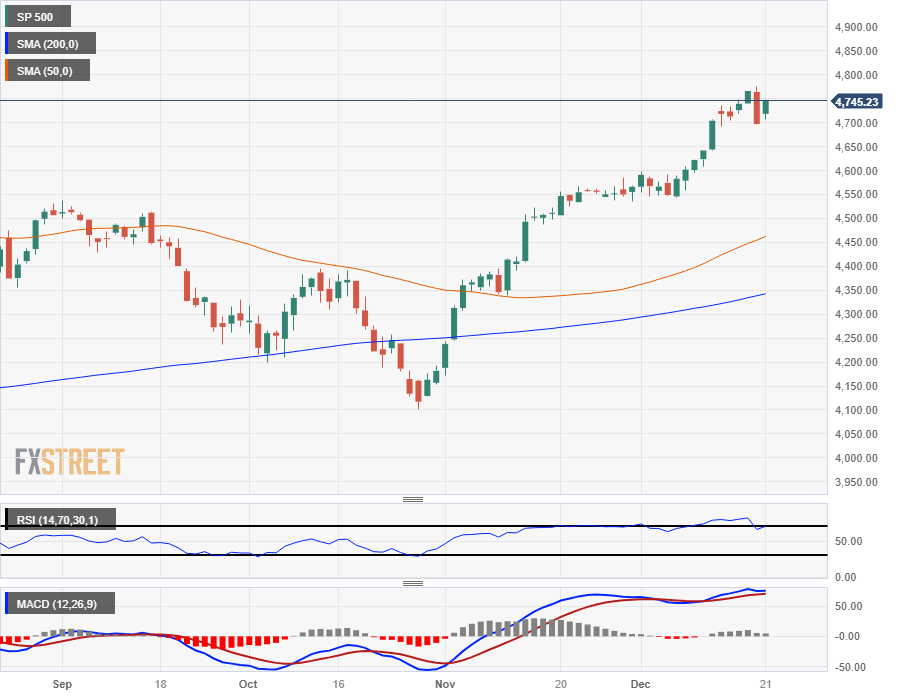
The S&P 500 has recovered its footing from Wednesday’s backslide, returning to top side territory and the major index is now within reach distance of all-time highs beyond the $4,800 major handle at $4,812.38, set back in December of 2021.
The S&P has gained nearly 16% from October’s late lows near $4,100, and price action has run well above the 200-day Simple Moving Average (SMA) near $4,350.
The S&P’s latest bull run is pinning technical indicators into overbought conditions, with the Relative Strength Index (RSI) hitting 82.00, a level not seen since mid-2021.
S&P Daily Chart
S&P Technical Levels
- The EUR/GBP rose towards 0.8675 with gains of 0.25%.
- The pair now sustains above the 20,100,200-day SMAs, affirming the positive bias on the wider frames.
- The four-hour chart indicators near overbought conditions suggest a correction may be on the horizon.
In Thursday's session, the EUR/GBP rose to 0.8675, registering gains of 0.25%. On the daily chart, the bullish sentiment prevailed as the bulls continued to gain ground. Nevertheless, on the four-hour chart, indicators suggest a nearing overbought market, hinting at a potential reversal.
The buying momentum is reflected in the positive territory and incline of the Relative Strength Index (RSI). Furthermore, the Moving Average Convergence Divergence (MACD) also depicts an identical scenario with the rising green bars, a strong indication of bullish pressure. Moreover, the pair's position relative to the 20,100,200-day Simple Moving Averages (SMAs) reaffirms this stance. The pair lying above these SMAs suggest that the bulls have taken the reins, driving the overall trend.
On examining the four-hour chart, it's evident that the momentum remains on the buyer's side as well. However, the notion of the indicators nearing overbought territories hints that a brief respite for the bulls may be on the horizon to consolidate bays. Nevertheless, as the RSI remains in the upward trajectory and the green bars of MACD are on a climb, the short-term technical outlook remains bullish, albeit with a likely slight impending pullback.
Support Levels: 0.8660 (200-day SMA), 0.8640 (100-day SMA), 0.8600.
Resistance Levels: 0.8700, 0.8730, 0.8750.
EUR/GBP daily chart
-638387928375793714.png)
- EUR/USD pierced 1.1000 on Thursday as broad-market risk appetite pins into the high side.
- US inflation figures point to continued price growth deceleration, ramping up rate-cut bets.
- Friday poised to wrap up the trading week with a final round of US PCE inflation.
The EUR/USD climbed on Thursday, bolstered back into the 1.1000 handle as broad-market risk appetite pinned into the high side, fueled by US inflation figures continuing to decline faster than market forecast models can account for. Investors are increasing their bets that the Federal Reserve (Fed) will face faster, deeper rate cuts, with money market expectations running far ahead of the Fed’s own rate expectations for 2024.
The Fed’s dot plot of interest rate expectations currently sees 75 basis points of rate cuts by the end of 2024, and money markets have deeply repriced their rate forecasts for next year, projecting upwards of 160 basis points through 2024, with many investors banking on rate cuts beginning as soon as next March.
US inflation continues to cool faster than expected, ramping up rate cut hopes
US Core Personal Consumption Expenditures (PCE) rose 2.0% in the third quarter versus the second quarter’s 2.3%, slipping below the median market forecast of a hold at 2.3%.
US Annualized Gross Domestic Product (GDP) also grew at a slower pace in the third quarter than markets were forecasting, coming in at 4.9% over the third quarter last year, missing the market expectations of a hold at 5.2%.
Friday sees the US’ last inflation print of the year with the US PCE Price Index expected to tick lower from 3.5% to 3.3%, and another miss in inflation numbers will likely see markets pin rate cut hopes even higher than they already are.
EUR/USD Technical Outlook
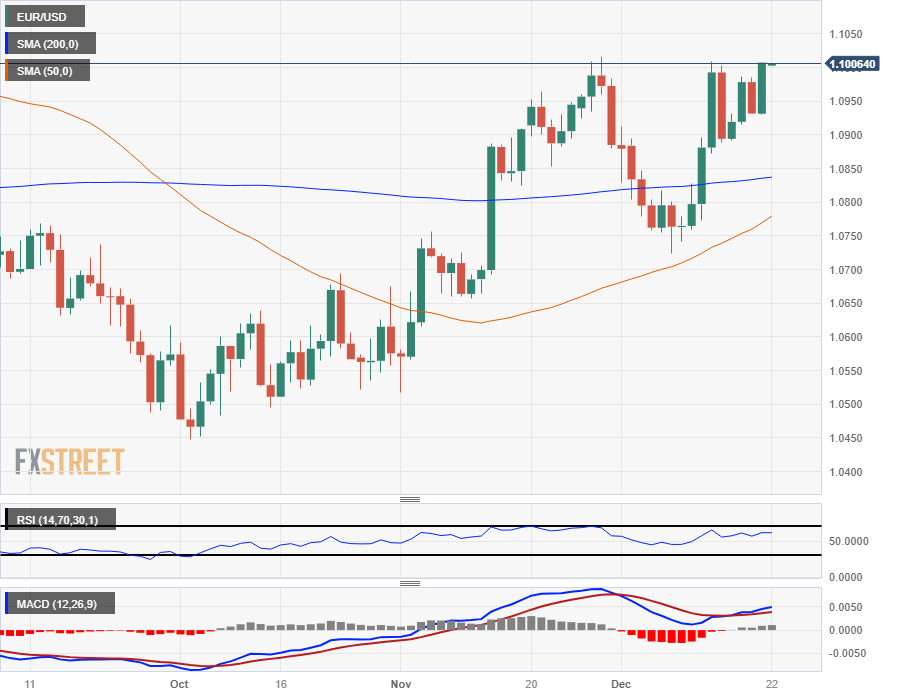
EUR/USD’s climb into the 1.1000 handle has the pair testing into last week’s peak bids, and the pair is up over one percent from the week’s low bids at 1.0888.
Intraday price action continues to bid well above the 200-hour Simple Moving Average (SMA) rising into 1.0900, and near-term technical resistance remains thin as the pair takes a run at November’s peak of 1.1017.
EUR/USD Hourly Chart

EUR/USD Daily Chart
EUR/USD Technical Levels
During the Asian session, Japan will release the National Consumer Price Index for November, and the Bank of Japan will release the minutes of the October meeting. Australia will release Private Sector Credit data. Later in the day, UK GDP data and Retail Sales are due. The key report of the day will be the US Core Personal Consumption Expenditure Price Index, which is the Federal Reserve's preferred inflation gauge.
Here is what you need to know on Friday, December 22:
Economic data released on Thursday showed that initial jobless claims stood at 205,000 in the week ended December 16, a 2,000 increase from the previous week, while continuing claims remained around 1.86 million. A new estimate of Q3 Gross Domestic Product (GDP) showed the economy expanded at a 4.9% annualized rate, below the previous estimate of 5.2%. The Philadelphia Fed Manufacturing Index unexpectedly fell to -10.5 from -5.9 in December. However, these numbers had a limited impact on the US Dollar.
US stocks resumed Santa's’s rally after pulling back on Wednesday, with major indexes posting gains of around 1%. The 10-year US Treasury yield finished higher, nearing 3.90% after hitting a low of 3.83%, the lowest level in months. Despite higher yields, the US Dollar Index fell and posted its lowest daily close since July, trading below 102.00. The Greenback remains under pressure.
Friday will be a busy day regarding crucial economic data, particularly due to US reports that include the Core Personal Consmainlynditure Price Index, a closely watched inflation indicator followed by the Federal Reserve. Also due are the University of Michigan Consumer Confidence Survey, Durable Goods Orders report, and New Home Sales data. Could weaker inflation data from the US further weaken the Greenback, or would it be the definitive turning point?
EUR/USD is trading near the 1.1000 area with a bullish bias, supported by the decline of the US Dollar. The pair is approaching its highest level in four months.
GBP/USD rebounded from the 20-day Simple Moving Average (SMA) rising toward 1.2700. On Friday, the UK will report GDP data and November Retail Sales. These figures could significantly impact the Pound, which has been one of the worst performers of the week, affected by softer-than-expected inflation figures.
Retail Sales in Canada rose 0.7% in October, below the market consensus of 0.8%, with estimates pointing to relatively unchanged sales in November. USD/CAD dropped below 1.3300, falling to 1.3285, the lowest since early August. On Friday, Canada will report October GDP growth, expected to show a 0.2% advance.
AUD/USD is testing the 0.6800 zone, trading at levels not seen in almost five months, supported by risk appetite and a weaker US dollar. Australia will release Private Sector Credit data on Friday.
USD/JPY resumed its downside, falling below 143.00. The bias is towards the downside. The National Consumer Price Index is due on Friday, and the Bank of Japan will release the October 30-31 meeting minutes.
- Crude Oil whipsawed on Thursday as energies grappled with headlines pulling in multiple directions.
- Angola is the latest country to quit OPEC, further reducing OPEC’s market share.
- Red Sea attacks have diverted shipments between Asia and Europe, propping up Crude Oil bids.
West Texas Intermediate (WTI) Crude Oil tumbled nearly three percent to $72.50 per barrel on Thursday after Angola formally announced it would be leaving the Organization of the Petroleum Exporting Countries (OPEC), citing a lack of benefit to participating in the global oil cartel’s framework.
With Angola’s departure from OPEC, the oil consortium’s market share declines to 27% of all global oil production, which has declined from 34% in 2010.
Further reducing OPEC’s share of global oil trade is a new record for US Crude Oil production, which hit 13.3 million barrels per day. Angola, by comparison, produced 1.1 million bpd and was struggling to hit OPEC quotas for the country.
Crude Oil down, then back up as market factors spread in both directions
Despite the barrel crunch following Angola’s announcement, Crude Oil rebounded o nthe day as tensions over the Red Seas continue to mount on energies and trade. Houthi rebel forces have declared that they will continue to attack any ships that come within reach of their bases in Yemen, and have vowed to increase the ferocity of their attacks if the US interferes were to attack in retaliation.
A coalition battle group, led by US forces, is currently moving into position in the Red Sea in an effort to police trade waters, but nearly all trade through the region has been re-routed in the meantime, adding time and costs to shipping lanes.
Despite OPEC’s best efforts to curtail pumping within its consortium, global oil production continues to outpace demand and Crude Oil prices are likely to keep feeling the pressure.
WTI Technical Outlook
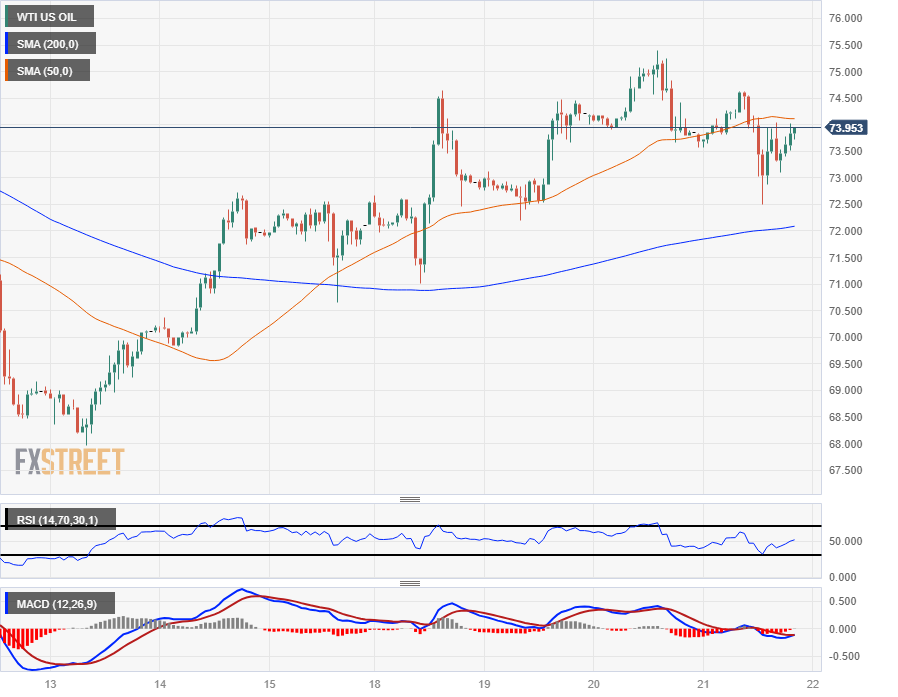
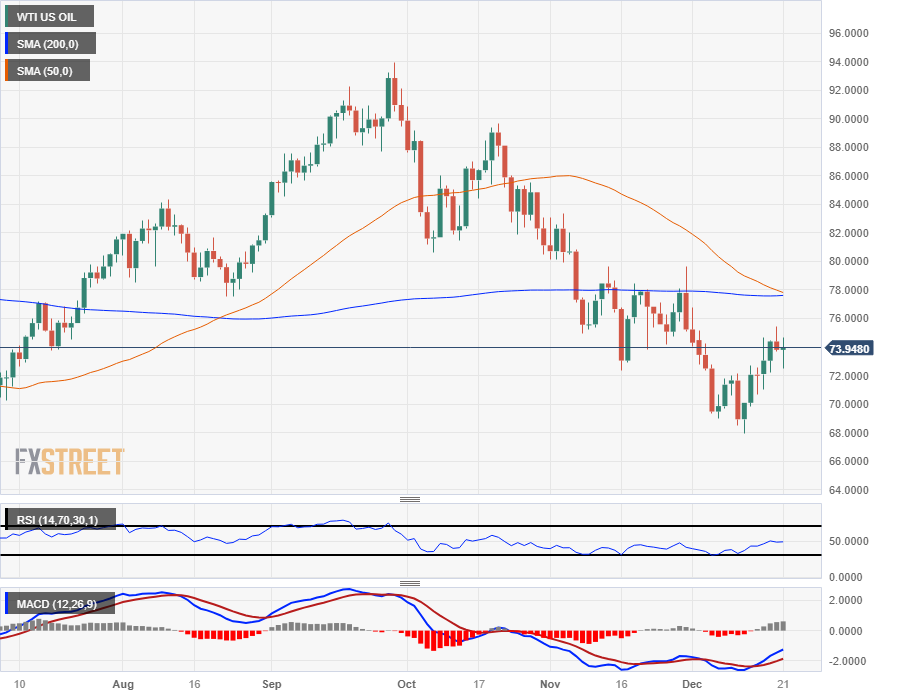
WTI’s dip-and-bounce on Thursday has Crude Oil prices near where the day started just below $74 per barrel, and US Crude Oil is bidding down from yesterday’s peak of $75.40.
Crude Oil’s near-term rally is quickly coming under threat after rising nearly eleven percent from last week’s low of $67.97 to this week’s high, but ongoing shortside pressure is capping off WTI below the 200-day Simple Moving Average (SMA) near $78.00 per barrel.
WTI Hourly Chart
WTI Daily Chart
WTI Technical Levels
- The XAG/USD is hovering near the $24.30 mark, showing 0.60% gains.
- The Q3 GDP real growth was revised to 4.9%, lower from the previous 5.2%.
- The Fed's dovish shifts and the US yields in multi-month lows make the metal gain appeal.
In Thursday's trading session, the Silver's spot price XAG/USD edged higher and reached a level of around $24.30. The primary driver of this upward trend has been the weakening of the USD following Gross Domestic Product (GDP) revisions and negative weekly Jobless Claims, which pushed the price higher.
In line with that, the US Bureau of Economic Analysis revealed on Thursday that the United States real GDP grew annually by 4.9% in Q3, which is a downward revision from previous estimates and market forecasts of 5.2%. In addition, the US Department of Labor's initial Jobless Claims report for the week ending December 16 revealed an increase in claims to 205K, compared to the previous week's 203K. Despite the rise, the figure was lower than the expected 215K. Personal Consumption Expenditures figures from the US from November are due on Friday, which may fuel additional volatility on the index.
On the other hand, US Treasury yields slightly recovered after hitting multi-month lows. The 2-year rate is seen at 4.30%, while both the 5-year and 10-year yields are seen at 3.89%, both near their lowest level since July. This came in line with the markets betting on a less aggressive Federal Reserve (Fed) after the Summary of Economic Proyections (SEP) revealed last week that the officials are seeing 75 bps of easing next year. In that sense, this downward trend bolsters non-yielding assets as Treasury bond yields are often perceived as the opportunity cost of holding such metals.
XAG/USD levels to watch
The daily chart suggests that the pair has an impressive buying momentum in the short term. The positive slope in the positive territory of the Relative Strength Index (RSI) signifies a strengthening in the power of buyers in the market. Further solidifying this bullish sentiment is the sight of the Moving Average Convergence Divergence (MACD) flashing rising green bars, typically signaling that the buyers have taken the reins of market momentum.
Supplementing this view, the pair's position above the 20, 100, and 200-day Simple Moving Averages (SMAs) unequivocally outlines a robust control by the bulls in the broader time horizon.
Support Levels: $24.15 (20-day SMA), $23.60 (200-day SMA), $23.30.
Resistance Levels: $24.70, $24.90, $25.00.
XAG/USD daily chart
-638387835322621351.png)
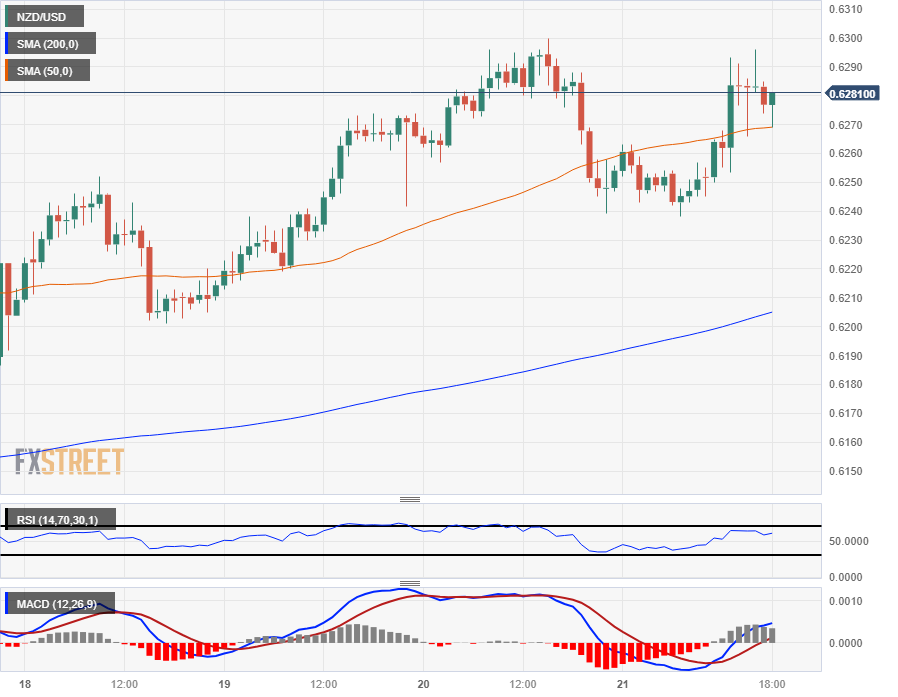
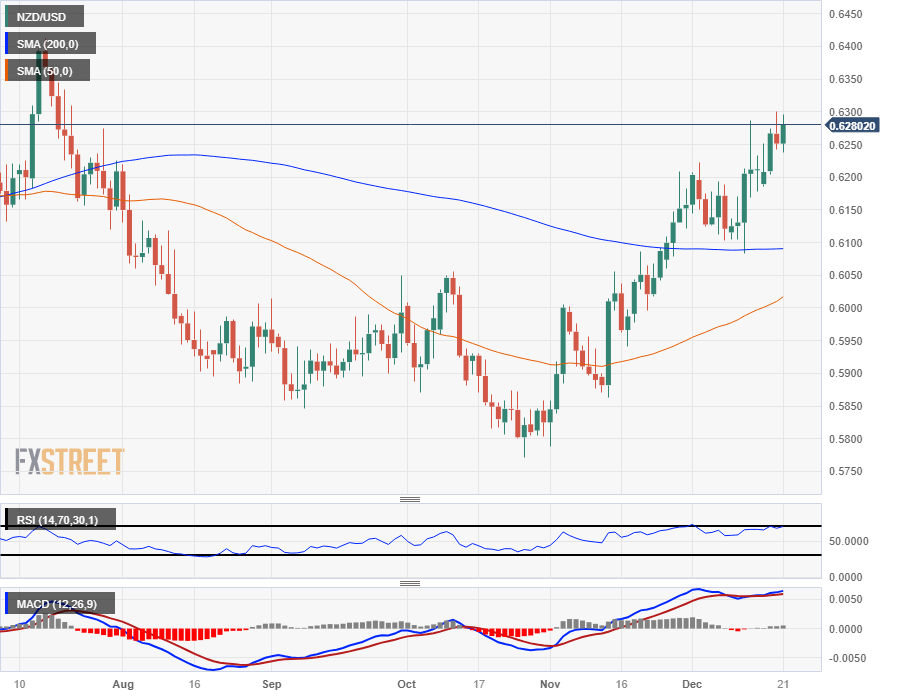
- The NZD/USD erased Wednesday’s late pullback but failed to capture new territory.
- Broader market flows are pressing down the US Dollar across boards, bolstering risk assets.
- Friday to wrap up the pre-holiday trading week with US PCE Price Index inflation.
The NZD/USD caught a ride back up the charts on Thursday as market sentiment tips firmly risk on US economic data showing inflation continues to erode faster than markets previously expected. Slumping inflation prints are driving up market expectations of additional rate cuts from the Federal Reserve (Fed), bolstering the Kiwi (NZD) heading into the end of the last full trading week of 2023.
Early Thursday showed New Zealand Credit Card Spending for the year through November bounced back to grow 3.3% YoY after declining 2.8% YoY in October, which saw a late revision up from -2.9%.
Markets were largely non-plussed by the NZ data, with the majority of investors focused squarely on US inflation numbers.
US Initial Jobless Claims grew by an additional 2055K claimants for the week ending December 15, a minor uptick from the previous week’s 203K (revised upwards from 202K), but still came in below the market’s expected 215K.
US Annualized Gross Domestic Product (GDP) for the third quarter also came in below expectations, showing growth slowed to 4.9% from last year’s third quarterly print of 5.2%; markets were expecting GDP growth to hold steady at the previous figure.
Read More: US Real GDP grows at an annual rate of 4.9% in Q3
US Core Personal Consumption Expenditures (PCE) for the third quarter likewise came in below forecasts, printing at 2.0% versus the expected steady reading of 2.3%.
With growth slowing and declines in inflation outpacing market forecasts, investors are ramping up expectations of additional rate cuts from the Fed in 2024. Over-eager markets may be running far ahead of the Fed, whose dot plot of interest rate expectations currently sees around three rate hikes for a total 75 basis points in rate hikes through 2024.
Money markets are currently pricing in an eye-watering 160 basis points in rate cuts through 2024, with particularly eager investors betting on rate cuts beginning as soon as next March.
Friday will close out the trading week with the US PCE Price Index for the year through November, which is expected to tick down from 3.5% to 3.3%. Another below-forecast print for US inflation data could see even more furious market bets of additional cuts from the Fed next year.
NZD/USD Technical Outlook
The NZD/USD rebounded back into the top end of the trading week but failed to chalk in additional gains beyond 0.6300 as the pair remains capped below the major handle.
Broad-market risk flows forcing down the US Dollar is helping to keep the NZD/USD propped up above the 200-day Simple Moving Average (SMA) near 0.6100, but bullish momentum is starting to wane with the Kiwi up over nine percent against the USD from October’s bottom bids near 0.5770.
The NZD/USD has closed in the green for five of the last seven consecutive trading weeks and is on pace to chalk in one more green bar heading into the tail end of the year.
NZD/USD Hourly Chart
NZD/USD Daily Chart
NZD/USD Technical Levels
- DXY Index plunged towards the 101.90 area, posting 0.40% daily losses.
- Gross Domestic Product of the United States expanded at an annual rate of 4.9% in Q3, revised from 5.2%
- US Jobless Claims accelerated in the second week of December.
The US Dollar (USD) measured by the DXY index plunged to 101.90 and nears December lows struck last week, steered by the downward revisions in US Gross Domestic Product (GDP) from Q3. Negative Jobless Claims and Philadelphia’s Fed manufacturing conditions figures also added to the downturn.
At the Fed's last meeting, policymakers sent a dovish signal to markets. The cooling inflation and the absence of rate hikes in 2024, alongside 75 bps of easing forecasts, are all reflective of a less aggressive stance that weakened the US Dollar. Until the next bank’s meeting, all data that suggest a slowdown in the economy may pave the way for further downside, and the expectations of sooner rate cuts next year may come to fruition.
Daily digest market movers: US Dollar plunges as soft data and lower yields weigh
- The US Dollar trending downward, bordering on December lows.
- The US Q3 real GDP growth was revised down to 4.9%, from the initial 5.2% estimate due to reduced consumer spending and lower imports reported by the Bureau of Economic Analysis (BEA).
- The Philly Fed Manufacturing sector survey for December plunged to -10.5.
- Initial Jobless Claims for the week ending December 16, published by the US Department of Labor, increased to 205K from the previous 202K, but came in lower than the 215K expected.
- US bond yields declined following the release but seem to be recovering, with the 2-year yield at 4.34%, the 5-year yield at 3.86%, and the 10-year yield also at 3.87%, near multi-month lows, adding pressure to the USD.
- As per the CME FedWatch Tool, markets are betting on rate cuts on March 2024.
- November Personal Consumption Expenditures (PCE) Price Index figures from the US are due on Friday, which may fuel additional volatility on the index.
Technical Analysis: US Dollar Index selling momentum resumes, dampening recent upsurge
On the DXY daily chart, the Relative Strength Index (RSI) exhibits a downward slope within negative territory, indicating a strong bearish momentum. Despite bulls gaining some ground in the last sessions, the overwhelming selling force isn't allowing a significant shift in the short-term trend. On the Moving Average Convergence Divergence (MACD), rising red bars signal a sell-off is underway, further validating the negative outlook.
Looking at the Simple Moving Averages (SMAs), the index position below the 20,100, and 200-day metrics shows a long-term dominance of the bears. This challenging position for the buyers, combined with the RSI and MACD indications, brings forth a short-term, bearish technical outlook.
Support levels: 101.80,101.50, 101.30.
Resistance levels: 103.10 (20-day SMA), 103.50 (200-day SMA), 104.00.
US Dollar FAQs
What is the US Dollar?
The US Dollar (USD) is the official currency of the United States of America, and the ‘de facto’ currency of a significant number of other countries where it is found in circulation alongside local notes. It is the most heavily traded currency in the world, accounting for over 88% of all global foreign exchange turnover, or an average of $6.6 trillion in transactions per day, according to data from 2022.
Following the second world war, the USD took over from the British Pound as the world’s reserve currency. For most of its history, the US Dollar was backed by Gold, until the Bretton Woods Agreement in 1971 when the Gold Standard went away.
How do the decisions of the Federal Reserve impact the US Dollar?
The most important single factor impacting on the value of the US Dollar is monetary policy, which is shaped by the Federal Reserve (Fed). The Fed has two mandates: to achieve price stability (control inflation) and foster full employment. Its primary tool to achieve these two goals is by adjusting interest rates.
When prices are rising too quickly and inflation is above the Fed’s 2% target, the Fed will raise rates, which helps the USD value. When inflation falls below 2% or the Unemployment Rate is too high, the Fed may lower interest rates, which weighs on the Greenback.
What is Quantitative Easing and how does it influence the US Dollar?
In extreme situations, the Federal Reserve can also print more Dollars and enact quantitative easing (QE). QE is the process by which the Fed substantially increases the flow of credit in a stuck financial system.
It is a non-standard policy measure used when credit has dried up because banks will not lend to each other (out of the fear of counterparty default). It is a last resort when simply lowering interest rates is unlikely to achieve the necessary result. It was the Fed’s weapon of choice to combat the credit crunch that occurred during the Great Financial Crisis in 2008. It involves the Fed printing more Dollars and using them to buy US government bonds predominantly from financial institutions. QE usually leads to a weaker US Dollar.
What is Quantitative Tightening and how does it influence the US Dollar?
Quantitative tightening (QT) is the reverse process whereby the Federal Reserve stops buying bonds from financial institutions and does not reinvest the principal from the bonds it holds maturing in new purchases. It is usually positive for the US Dollar.
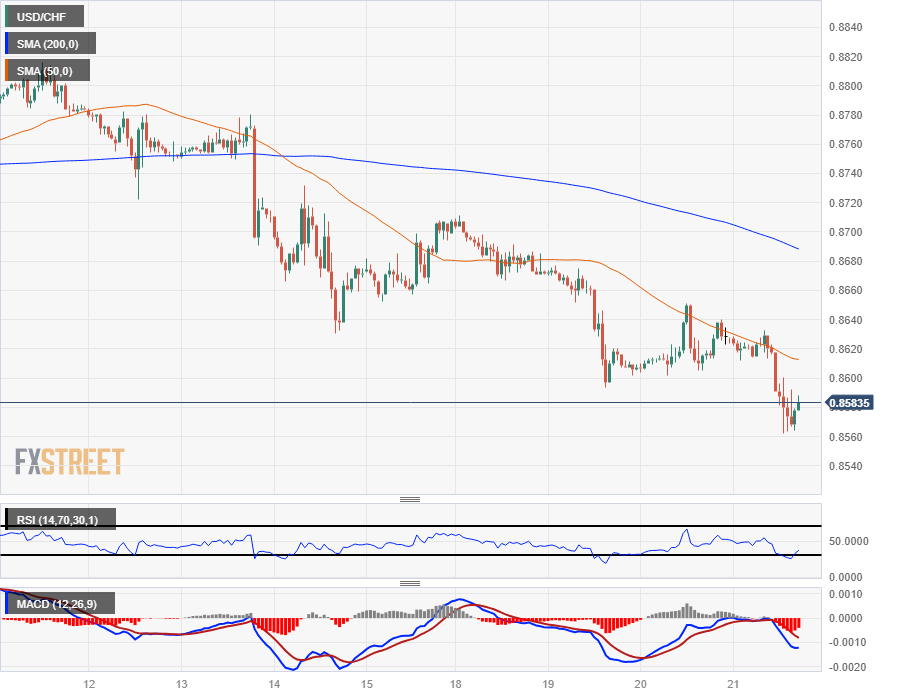
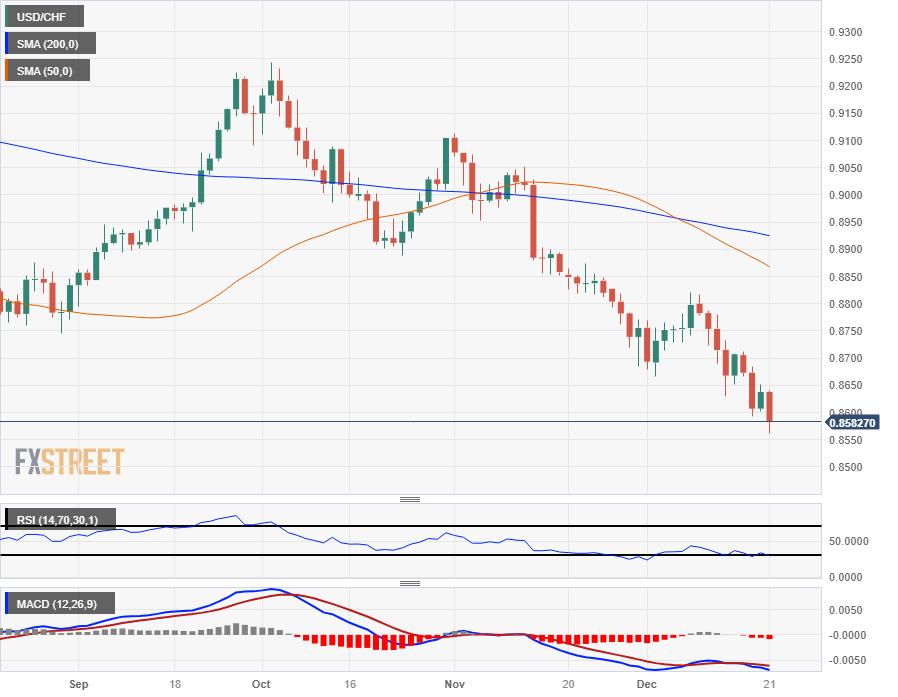
- The Swiss Franc is testing further high ground against the US Dollar on Thursday.
- Risk appetite is cranking up after US inflation data tips lower.
- US Dollar declines across the board ahead of the holiday market wrap.
The USD/CHF slipped through the 0.8600 handle on Thursday as broader markets push over the US Dollar (USD), bolstering all other major currencies across the board and lifting the Swiss Franc into a new twenty-week high against the Greenback.
US inflation figures missed expectations on Thursday, coming on below forecasts and sparking a risk appetite rally as price growth deceleration takes hold in the US faster than most market participants anticipated, re-igniting market bets of a faster pace of Federal Reserve (Fed) rate cuts in 2024.
At current cut, the Fed’s dot plot of interest rate expectations sees around three rate cuts next year for a combined 75 basis points in interest rate declines, but Thursday’s softer-than-expected inflation print sees markets widening the gap between the Fed’s outlook and investor expectations. Money markets are now pricing in a heady 160 bps in rate cuts through the end of next December.
US Initial Jobless Claims ticked up slightly for the week into December 15, but much less than markets were expecting, printing at 205K versus the previous week’s 203K (revised up from 202K).
Data focus on Thursday was squarely on US Core Personal Consumption Expenditures (PCE) for the third quarter, which declined from 2.3% to 2.0% for the quarter. US Annualized third quarter Gross Domestic Product (GDP) also softened on Thursday to round out the US data dump, coming in at 4.9% versus the forecast steady reading of 5.2%.
With nothing else of note on the economic calendar this week for the Swiss France, market focus will be drawn squarely to US PCE Price Index figures on Friday. The US Core PCE Price Index from November is forecast to print flat at 0.2%, but odds of a downside print are increasing as preview PCE inflation data miss the mark on Thursday.
USD/CHF Technical Outlook
Thursday’s declines in the US Dollar dragged the USD/CHF into a new twenty-week low, slipping below the 0.8600 handle and driving towards 0.8550.
Daily candles show price action continuing to drop away from the 200-day Simple Moving Average (SMA) descending towards 0.8900, and medium-term momentum is tilting towards the downside with the 50-day SMA confirming a bearish cross of the 200-day SMA, and slipping towards 0.8850.
Intraday action continues to play into bearish territory, with bids facing steady rejection from the 50-hour SMA. A topside run will hit the 200-hour SMA near 0.8680, while the downside below 0.860 will see the way paved for additional declines into 2023’s lows.
USD/CHF Hourly Chart
USD/CHF Daily Chart
USD/CHF Technical Levels
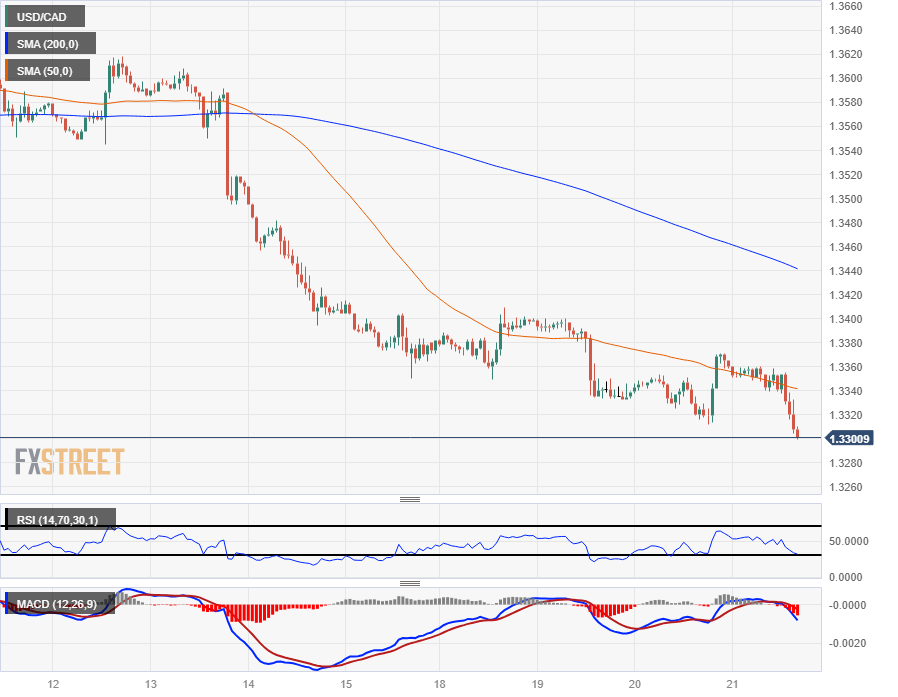
- USD/CAD sets another 19-week low as the Loonie climbs into 1.3300 against the Greenback.
- Broader markets are pushing down the USD as risk appetite recovers from Wednesday's late-day plunge.
- US PCE inflation undercuts market forecasts, markets race to peg 2024 rate cut bets even higher.
The USD/CAD eased into 1.3300 as the Canadian Dollar (CAD) gets one last crack at the handle as markets gear up for the holiday shutdown with a broad-base selloff of the US Dollar (USD).
US inflation figures came in below expectations as price growth decelerated quicker than most expected, giving markets the excuse they needed to ramp up bets of even further rate cuts from the Federal Reserve (Fed) next year, and the gap between the Fed and money markets continues to widen.
The Fed’s own dot plot of interest rate expectations sees around 75 basis points in rate cuts through 2024, and Thursday’s US data prints see markets pushing their 2024 median rate cut expectations to an eye-watering 160 basis points by the end of next December.
CAD Retail Sales barely register on the needle as markets chew on US PCE preview
Canadian Retail Sales mixed on Thursday, with October’s Retail Sales slipping back from 0.8% to 0.78% versus September’s 0.5% (revised down from 0.6%). However, Retail Sales excluding motor vehicles and vehicle parts from the same period beat expectations, ticking up from 0.5% to 0.6% versus the previous 0.1% (also revised down from 0.2%).
US Initial Jobless Claims ticked up slightly for the week into December 15, but much less than markets were expecting, printing at 205K versus the previous week’s 203K (revised up from 202K).
The market’s key focal point on Thursday was US Core Personal Consumption Expenditures for the third quarter, which slipped to 2.0% versus the forecast steady print of 2.3%, bringing inflation measures down to a key target level for the Fed.
US Annualized third quarter Gross Domestic Product (GDP) also softened on Thursday to round out the US data dump, coming in at 4.9% versus the forecast steady reading of 5.2%.
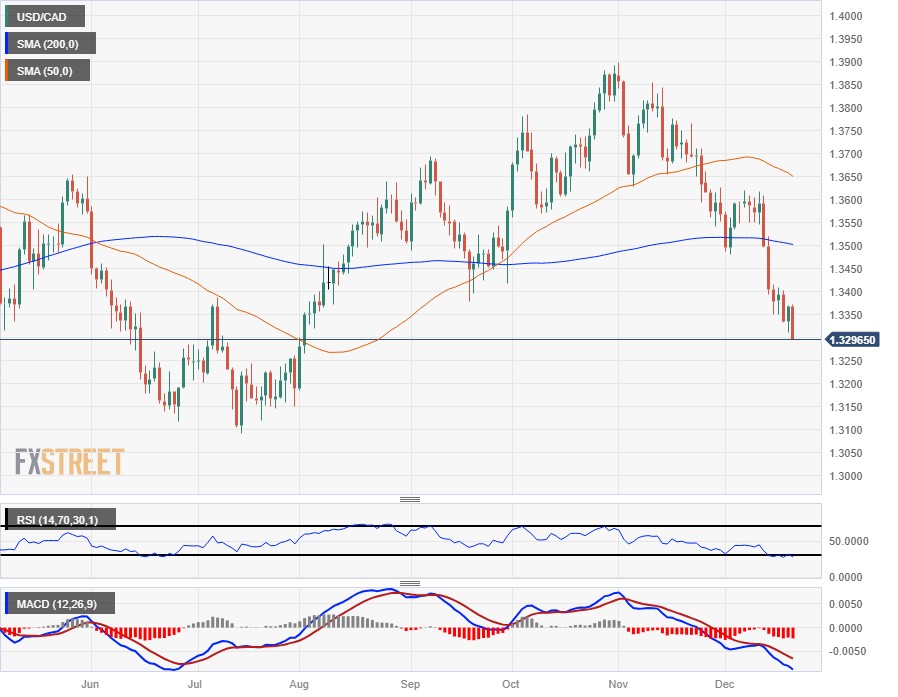
USD/CAD Technical Outlook
With the USD/CAD setting a fresh 19-week low into the 1.33 handle, further declines could easily be on the cards for the pair as the Canadian Dollar bids into chart territory with limited technical barriers against the US Dollar.
The USD/CAD is set for another week of declines, having closed in the red for five of the last seven consecutive trading weeks.
Intraday price action has run well ahead of the median bids, with the 200-day Simple Moving Average (SMA) falling behind at 1.3440 as price accelerates declines.
Daily candlesticks reveal much of the same as price drops away from the 200-day SMA at the 1.3500 handle, and the USD/CAD is down around four and one-third of a percent from November’s peak bids just shy of the 1.3900 handle.
USD/CAD Hourly Chart
USD/CAD Daily Chart
USD/CAD Technical Levels
- Mexican Peso propped up by recovering market sentiment.
- Mexico Trade Balance due Friday to be overshadowed by US PCE Price Index inflation.
- Surprise drop in US inflation indicators pins risk appetite despite overall mixed bag.
The Mexican Peso (MXN) is on the rebound for Thursday, gaining ground against the US Dollar (USD) as broader markets sell off the Greenback despite mixed results from the day’s slew of US data points.
Economic data from Mexico was limited on Thursday, and November’s Mexico Trade Balance figures due on Friday are set to continue being eclipsed by one last print of the US Personal Consumption Expenditures (PCE) Price Index.
Wednesday’s late decline in the Mexican Peso, sparked by a broad-market pullback in equities and other risk assets, has evaporated on Thursday as pre-holiday market churn produces plenty of froth and market moves become harder to explain.
Daily digest market movers: Mexican Peso rebounds to familiar highs in a risk-bid resurgence
- Mexican Peso climbs back into familiar highs against the US Dollar as stock markets rally.
- Broad-market risk appetite rebound sees the MXN up around half a percent against the USD.
- Mexico inflation for the first half-month of December came in above expectations but still declined from the previous period’s 0.63%, printing at 0.52% for the first two weeks of the month versus the forecast decline to 0.4%.
- The Greenback is the single worst-performing currency of the majors on Thursday.
- Easing inflation and growth figures from the US are ramping up market bets of even further rate cuts in 2024.
- US Initial Jobless Claims rose to 205K from 203K (revised upwards slightly from 202K), undercutting the market forecast of 215K.
- Money market rate cut expectations have run far ahead of the Fed’s dot plot; investors see 160 basis points in rate cuts for 2024 versus the Fed’s own expectations of 75 bps.
- US Core PCE inflation settled at 2.0% in the third quarter, below the median market forecast of a hold at 2.3%.
- US Annualized Gross Domestic Product (GDP) also undercut forecasts, printing at 4.9% compared to the expected print of 5.2%.
- Mexico November Trade Balance (in USD terms) is expected to rebound from -252 million to 404 million.
- November’s YoY US Core PCE Price Index inflation, forecast to decline from 3.5% to 3.3%, will be the headliner on Friday and set overall market direction heading into the holiday break.
US Dollar price today
The table below shows the percentage change of US Dollar (USD) against listed major currencies today. US Dollar was the weakest against the Japanese Yen.
| USD | EUR | GBP | CAD | AUD | JPY | NZD | CHF | |
| USD | -0.38% | -0.07% | -0.42% | -0.70% | -0.91% | -0.53% | -0.65% | |
| EUR | 0.38% | 0.30% | -0.07% | -0.36% | -0.53% | -0.16% | -0.30% | |
| GBP | 0.07% | -0.32% | -0.34% | -0.63% | -0.84% | -0.46% | -0.59% | |
| CAD | 0.42% | 0.02% | 0.35% | -0.28% | -0.48% | -0.11% | -0.24% | |
| AUD | 0.73% | 0.33% | 0.66% | 0.30% | -0.16% | 0.20% | 0.06% | |
| JPY | 0.91% | 0.50% | 0.83% | 0.47% | 0.17% | 0.38% | 0.23% | |
| NZD | 0.52% | 0.17% | 0.47% | 0.11% | -0.19% | -0.36% | -0.15% | |
| CHF | 0.65% | 0.29% | 0.60% | 0.22% | -0.07% | -0.25% | 0.12% |
The heat map shows percentage changes of major currencies against each other. The base currency is picked from the left column, while the quote currency is picked from the top row. For example, if you pick the Euro from the left column and move along the horizontal line to the Japanese Yen, the percentage change displayed in the box will represent EUR (base)/JPY (quote).
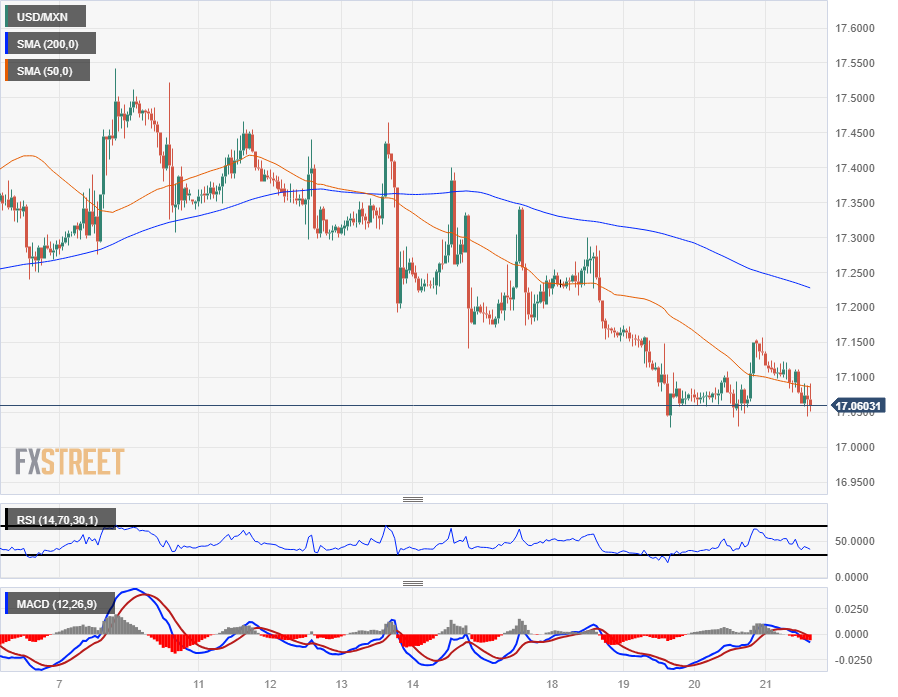
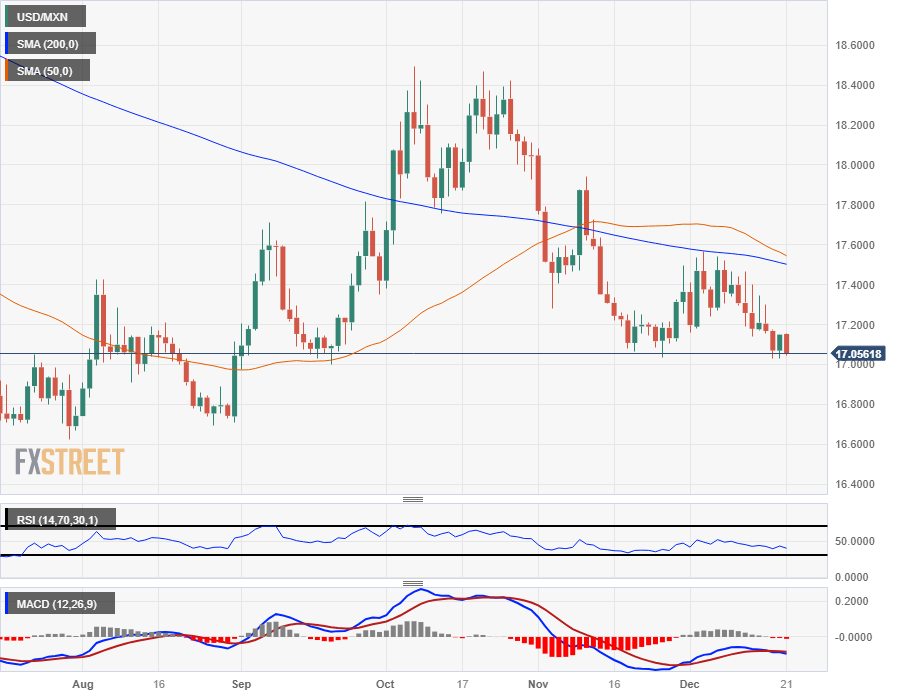
Technical analysis: Mexican Peso recovers to near-term upper bound
The Mexican Peso (MXN) is pushing back into recent highs against the US Dollar, driving the USD/MXN pair back into the 17.05 neighborhood after etching in a fresh 12-week low of 17.02.
Despite the USD/MXN’s recent downside, meaningful momentum remains limited for the Mexican Peso, and chart activity is set to continue squeezing into consolidation as the 50-day and 200-day Simple Moving Averages (SMA) congest just above the 17.50 level.
It will take a decisive break of support at 16.75 to chalk in a new low for the year and kick off a new uptrend in the Peso for 2024, while any USD/MXN bullish reversals are going to see stiff resistance as a pattern of lower highs sees confluence between the major moving averages and the last swing high.
USD/MXN Hourly Chart
USD/MXN Daily Chart
Mexican Peso FAQs
What key factors drive the Mexican Peso?
The Mexican Peso (MXN) is the most traded currency among its Latin American peers. Its value is broadly determined by the performance of the Mexican economy, the country’s central bank’s policy, the amount of foreign investment in the country and even the levels of remittances sent by Mexicans who live abroad, particularly in the United States. Geopolitical trends can also move MXN: for example, the process of nearshoring – or the decision by some firms to relocate manufacturing capacity and supply chains closer to their home countries – is also seen as a catalyst for the Mexican currency as the country is considered a key manufacturing hub in the American continent. Another catalyst for MXN is Oil prices as Mexico is a key exporter of the commodity.
How do decisions of the Banxico impact the Mexican Peso?
The main objective of Mexico’s central bank, also known as Banxico, is to maintain inflation at low and stable levels (at or close to its target of 3%, the midpoint in a tolerance band of between 2% and 4%). To this end, the bank sets an appropriate level of interest rates. When inflation is too high, Banxico will attempt to tame it by raising interest rates, making it more expensive for households and businesses to borrow money, thus cooling demand and the overall economy. Higher interest rates are generally positive for the Mexican Peso (MXN) as they lead to higher yields, making the country a more attractive place for investors. On the contrary, lower interest rates tend to weaken MXN.
How does economic data influence the value of the Mexican Peso?
Macroeconomic data releases are key to assess the state of the economy and can have an impact on the Mexican Peso (MXN) valuation. A strong Mexican economy, based on high economic growth, low unemployment and high confidence is good for MXN. Not only does it attract more foreign investment but it may encourage the Bank of Mexico (Banxico) to increase interest rates, particularly if this strength comes together with elevated inflation. However, if economic data is weak, MXN is likely to depreciate.
How does broader risk sentiment impact the Mexican Peso?
As an emerging-market currency, the Mexican Peso (MXN) tends to strive during risk-on periods, or when investors perceive that broader market risks are low and thus are eager to engage with investments that carry a higher risk. Conversely, MXN tends to weaken at times of market turbulence or economic uncertainty as investors tend to sell higher-risk assets and flee to the more-stable safe havens.
The incidence of violent conflict has been multiplying globally. Conflicts from Ukraine to the Middle East – and beyond – will dominate in 2024. Strategists at Standard Chartered report.
Global fragmentation will remain a central theme
The war in Ukraine and the Israel-Hamas conflict will continue to have profound implications for global policy and geopolitics. They will demand significant policy bandwidth from major powers, most notably the US. In addition, they will further strain fiscal positions in the US and Europe (both directly and indirectly) at a time when fiscal and debt dynamics are increasingly constrained.
Recent conflicts are reinforcing the pre-existing trend of global fragmentation. As much of the developing world aligns itself against Israel and the US in the current conflict, this may weaken US efforts to increase its global influence, while strengthening the China-Russia axis.
- The AUD/USD rallied towards the 0.6775 level, marking a 0.70% upward surge.
- The US Q3 GDP growth revised down to 4.9% from 5.2%, indicating slower economic expansion than expected.
- The US 5-year and 10-year treasury rates hit multi-month lows, adding pressure to the US Dollar.
The Australian Dollar (AUD) enjoyed an upward rally against the US Dollar (USD) in Thursday's trading session, stimulated by the revision of the Q3 Gross Domestic Product (GDP) numbers that worked to soften the Greenback. Other medium-tier economic reports, including Jobless Claims and Philly's Federal Reserve (Fed) Manufacturing Survey, added to the upside.
In that sense, the final estimate by the US Bureau of Economic Analysis (BEA) revealed a 4.9% annual increase in the US real GDP for Q3, which fell short of the projected market expectation of 5.2%. Other data showed that, in December, the Philly Fed Manufacturing sector survey recorded a significant decline, falling to -10.5, while the US Department of Labor's initial Jobless Claims report for the week ending December 16 revealed an increase in claims to 215K, compared to the previous week's 202K. Despite the rise, the figure was lower than the expected 215K.
Zooming out, the US dollar is under downward pressure due to increased speculations of Federal Reserve easing. The intensifying expectations are a response to the fallout from the recent Fed's dovish stance in its last meeting from 2023 last Wednesday, which weakened the US dollar despite its officials' latest attempts for damage control in the last sessions. To add to that, incoming data that favors the dovish stance and the case for sooner rate cuts may pave the way for further upside for the AUD/USD. For Friday, investors will eye November's Personal Consumption Expenditures (PCE) figures from the US, a metric closely monitored by the Fed to gauge inflation.
In the meantime, US bond yields hit multi-month lows earlier in the session but seem to be recovering. The 2-year rate sits at 4.34%, and the 5 and 10-year yields are both at 3.86%, making the USD lose interest.
AUD/USD levels to watch
The daily chart suggests that the pair has a bullish inclination. This is primarily driven by the Relative Strength Index (RSI) showcasing a positive slope and maintaining its presence in the positive territory. This is indicative of the underlying strength in buying momentum. Further evidence of this bullish bias is mirrored by the Moving Average Convergence Divergence (MACD), which lays out rising green bars.
Siding with the bullish momentum, the pair steadily cruises above the 20,100,200-day Simple Moving Averages (SMAs). This not only attests to the grip that buyers have on the market but also reflects their unwavering control on a broader scale.
Support Levels: 0.6730, 0.6700, 0.6680.
Resistance Levels: 0.6800, 0.6830, 0.6850.
AUD/USD daily chart
-638387688141559983.png)
Gold is MUFG Bank’s most bullish call and is to hit record levels in 2024.
Uncertainty leaves Gold in the driver’s seat this week
Geopolitical tensions have become a key driver for the precious metals complex following developments in the Middle East. The Red Sea has become breeding ground of uncertainty, and this seems to leave Gold in the driver’s seat. The renewed US Dollar weakness has also assisted Gold in holding the high ground and continuing its advance.
Federal Reserve policymakers have this week struck a dovish tone with most speaking about the amount of rate cuts needed in 2024 with very little push back besides the odd comment about monitoring data moving forward. The significant revision to the Fed’s policy path in last week’s dovish pivot reinforces our US rates strategist call for rate cuts to commence early in 2024.
A friendlier Fed and falling US Dollar strength should act to remove fundamental hurdles from gold’s upside path. Indeed, Gold is our most bullish call and is to hit record levels in 2024 on a trifecta of Fed cuts, supportive central bank demand and bullion’s role as the geopolitical hedge of last resort.
Cuts from the Fed and the ECB are on the horizon. But how will the path for US and Euro area interest rates affect carry on EUR/USD? Economists at Danske Bank analyze the pair’s outlook.
The outlook for EUR/USD carry has not changed materially
It looks like carry on EUR/USD will stay around the current level next year, but the re-pricing of EUR/USD FX forwards since before the summer serves as a reminder of how quickly things can change.
Before the summer, the outlook for the US economy was grimmer and the market expected the Fed to cut much more than the ECB in 2024, which would reduce carry to around 1%. If the outlook deteriorates again, pricing of EUR/USD FX forwards will likely follow.
We are strategically bearish EUR/USD and look for the pair to fall to 1.05 in 12M. Whether carry stays around current level or falls next year, we think there are good arguments for why EUR/USD should still drop, including relative productivity, energy terms of trade and fiscal sustainability to name the most prominent.
The Bank of Canada's Summary of Deliberations of the December 6 meeting was released on Wednesday. Economists at TD Securities analyze the minutes.
Any substantial discussion around easing will require more progress on the CPI front
The Bank of Canada's Summary of Deliberations delivered some dovish tweaks with the Bank expressing higher conviction that interest rates are sufficiently restrictive to bring inflation sustainably back to target. However, the Bank also repeated that inflation risks remain elevated and that they remain prepared to hike again if needed.
Even if the Bank is growing more comfortable with a 5% terminal rate, we believe any substantial discussion around easing will require more progress on the CPI front, and given the expected path of inflation we look for the Bank to remain on hold until July.
Economists at ANZ Bank believe Gold’s recent price rally is ahead of fundamentals. A steady rate and falling inflation could see real rates rising, capping the rally in the short-term.
Q1 2024 forecast lowered to $1,950
Softening US economic data and moderating inflation suggest that the Fed’s monetary policies are restrictive enough to return inflation sustainably to target.
The Fed’s shift in stance surprised the market, lifting the Gold price to a record high of $2,135. This looks excessive against our view of the easing cycle starting from H2 2024. This could curb the upward momentum. Upside risk for real rates looks elevated as the Fed funds rate remains steady and inflation falls.
We estimate real rates will rise by 100 bps, presenting a downside risk for Gold due to the rising opportunity cost of holding a non-yielding asset. Therefore, we lowered our forecast to $1,950 for Q1 2024.
- USD/CAD faces pressure near 1.3350 after downbeat final US Q3 GDP reading.
- Investors hope that the Fed would exit from its restrictive policy stance sooner.
- Canadian Retail Sales grew by 0.7%, misses expectations of 0.8% marginally.
The USD/CAD pair falls back after failing to climb above the immediate resistance of 1.3350 in the early New York session. The Loonie asset faces selling pressure as weaker-than-anticipated final reading of Q3 Gross Domestic Product (GDP) has weighed heavily on the US Dollar.
The United States Bureau of Economic Analysis (BEA) reported in its final report that the economy grew at a slower pace of 4.9% against expectations of 5.2%. The appeal for the US Dollar is downbeat as investors are hoping that Federal Reserve (Fed) policymakers would unwind restrictive monetary policy stance sooner than earlier anticipated.
Meanwhile, the Department of Labor has reported lower Initial Jobless Claims (IJC) for the week ending December 15. Individuals claiming jobless benefits were 205K, which were slightly higher than the former reading of 203K but lower than the consensus of 215K.
Considering overnight futures, the S&P500 is expected to open on a positive note, indicating an upbeat market mood.
While investors are betting big on early rate cuts, Philadelphia Fed Bank President Patrick Harker said rate cuts will take time but showed his openness to lowering interest rates. He further added that one major reason to cut interest rates next year is that businesses are struggling to augment higher interest obligations.
On the Canadian Dollar front, Statistics Canada has reported mixed monthly Retail Sales data for November. Consumer spending grew by 0.7%, missed expectations of 0.8% but outperformed prior reading of 0.5%. Retail Sales excluding autos rose by 0.6%, outperformed expectations of 0.5%.
- US Q3 GDP has been revised down to a 4.9% year-on-year from 5.2%
- US Jobless claims increase by 205K, well below the 215K expected.
- USD/JPY extends its reversal to fresh intra-day lows at 142.10.
US Dollar has extended losses on Thursday, piercing the support area at 142.35 after the US Bureau of Economic Analysis confirmed that US economy grew at a slower-than-expected pace in Q3.
The final US Gross Domestic Product has shown a 4.9% increase from the same quarter last year, down from the 5.2% increase estimated in the preliminary readings.
At the same time, the Philadelphia Fed Manufacturing Survey revealed that the business conditions in the region to a -10.5 reading from -5.9% In November well below the -3 anticipated by market analysts.
These figures have offset the positive impact of the Initial Jobless claims figures, which grew by 205K in the week of December 5, from 203K in the previous week. These figures are well below the 215K expected and reflect the resilience of the US labor market.
Technical levels to watch
- Retail Sales rose 0.7% in October, slightly below expectations.
- USD/CAD drops from 1.3350 to fresh daily lows, as the US Dollar weakens following US data.
Retail Sales in Canada increased by 0.7% on a monthly basis to C$66.9 billion, Statistics Canada reported on Thursday. This reading followed a 0.5% advance in September (revised from 0.6%) and came in below the expectation of a 0.8% increase expected.
In the same period, Retail Sales ex Autos rose by 0.6%, above the 0.5% of market consensus. "Core retail sales—which exclude gasoline stations and fuel vendors and motor vehicle and parts dealers—were up 1.2% in October," the press release further read.
Statistics Canada provided an advance estimate of retail sales for November, "which suggests that sales were relatively unchanged".
Market reaction
The USD/CAD fell from 1.3350 after the release of Canadian and US economic data (Philly Fed, Jobless Claims and Q3 GDP). The Greenback weakened after the report with the US Dollar Index falling to fresh daily lows under 102.00.
- Philadelphia Fed Manufacturing Index drops unexpectedly to -10.5 in December.
- The US Dollar Index breaks below 102.00 after US economic reports.
The Diffusion Index for current general activity of the Federal Reserve Bank of Philadelphia's Manufacturing Survey declined to -10.5 in December from -5.9 in November. This reading came in worse than the market expectation of -3.
The New Orders index dropped from 1.3 to -25.6 in December. The Shipments index rose 7 points to -10.8. The Employment index declined 3 points to -1.7 in December. The Prices Paid index climbed 10 points to 25.1 in December,
"Responses to the December Manufacturing Business Outlook Survey suggest overall declines in the region's manufacturing sector. The indicators for current activity, new orders, and shipments were all negative. On balance, the firms continued to indicate overall increases in prices and mostly steady employment. The survey's broad indicators for future activity improved, suggesting more widespread expectations for growth over the next six months", the publication read.
Market reaction
The US Dollar Index (DXY) fell below 102.00, toward last week's lows, following the release of US economic data that included the Philly Fed, the third Q3 GDP reading and Jobless Claims.
USD retains a weak undertone. Economists at Scotiabank analyze Greenback’s outlook.
DXY pressures consolidation base
Even with the risk aversion-led lift for the USD on Wednesday, the DXY was unable to break out of its week-long consolidation range and broader price trends still lean bearish for the US Dollar Index.
Note that the DXY is pressuring consolidation support in the low 102 area today.
Recall that US equity market outperformance through December rather suggests that passive hedge rebalancing flows will run against the USD through month end; while markets look relatively calm and trade flows appear to be thinning out, there may still be motivation to push spot rates around after all.
- The US economy grew at an annual rate of 4.9% in Q3, revised from 5.2%.
- The US Dollar Index remains in negative territory, struggling to hold above 102.00.
The real Gross Domestic Product (GDP) of the United States expanded at an annual rate of 4.9% in the third quarter, the US Bureau of Economic Analysis' (BEA) final estimate showed on Thursday. This reading came below the the previous estimate and the market expectation of 5.2%.
“The update primarily reflected a downward revision to consumer spending. Imports, which are a subtraction in the calculation of GDP, were revised down”, the BEA said.
“Compared to the second quarter, the acceleration in real GDP in the third quarter primarily reflected an upturn in exports and accelerations in consumer spending and private inventory investment that were partly offset by a deceleration in nonresidential fixed investment”, the publication read.
The price index for gross domestic purchases increased 2.9% in the third quarter, a downward revision of 0.1 percentage point from the previous estimate. The Personal Consumption Expenditures (PCE) Price Index increased 2.6% percent, a downward revision of 0.2 percentage point. Excluding food and energy prices, the PCE Price Index increased 2.0%, a downward revision of 0.3 percentage point.
Market reaction
The US Dollar Index (DXY) declined following the release of US economic data that included the new GDP reading, Jobless Claims data, and the Philly Fed. The DXY dropped below 102.00.
- Initial Jobless Claims in the US increased by 2,000 in the week ending December 16.
- US Dollar Index stays under modest bearish pressure, drops below 102.00.
There were 205,000 initial jobless claims in the week ending December 16, the weekly data published by the US Department of Labor (DOL) showed on Thursday. This print followed the previous week's print of 203,000 (revised from 202,000) and came in better than the market expectation of 215,000.
Further details of the publication revealed that the advance seasonally adjusted insured unemployment rate was 1.3% and the 4-week moving average stood at 212,000, a decrease of 1,500 from the previous week's revised average.
"The advance number for seasonally adjusted insured unemployment during the week ending December 9 was 1,865,000, a decrease of 1,000 from the previous week's revised level." the publication read.
Market reaction
The US Dollar Index edged lower in the early American session and was last seen losing 0.5% on the day at 101.92.
USD/CAD steadies after stock-driven surge on Wednesday. Economists at Scotiabank analyze the pair’s outlook.
Ongoing downside pressure
The sharp squeeze higher in the USD late on Wednesday left a small, bull signal on the 6-hour chart (outside range) but the lack of follow-through demand and weak price action in European trade suggests scope for additional USD gains is limited.
Trend strength oscillators still aligned bearishly on the intraday, daily and weekly oscillators, supporting the outlook for limited USD rebounds and ongoing downside pressure on spot.
Support is 1.3320/1.3330 and 1.3280/85. Resistance is 1.3375/1.3400.
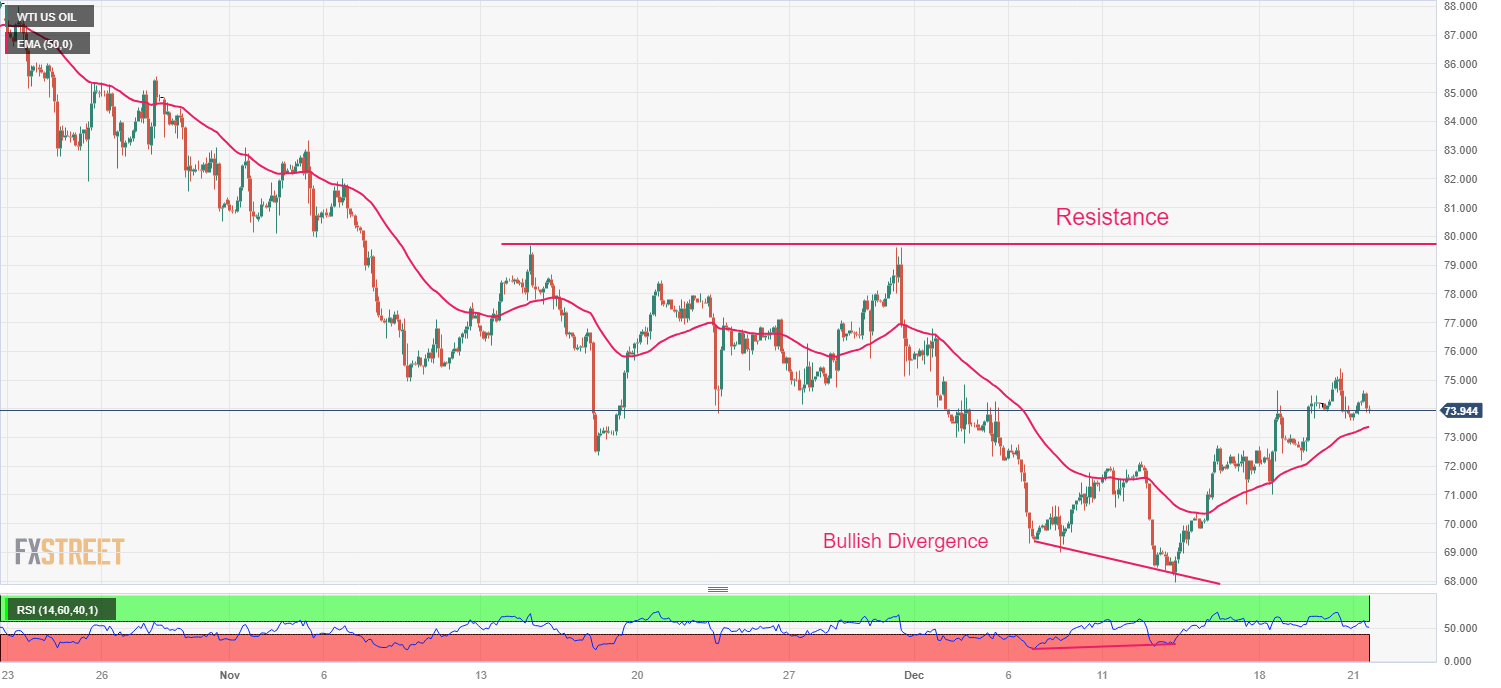
- The oil price faces some sell-off near $75.00 ahead of US economic data.
- US weekly crude oil inventories were surprisingly rose by 2.9 million barrels for the week ending Dec 15.
- WTI recovered swiftly after a bullish divergence formation.
West Texas Intermediate (WTI), futures on NYMEX, falls back after failing to climb above the immediate resistance of $75.00. The broader appeal for the oil price is upbeat as Federal Reserve (Fed) policymakers are expected to unwind their tight interest rate stance sooner.
In addition to deepening Fed rate cut expectations, trade issues near the Red sea are expected to keep oil supply limited.
The oil price continues to find bids despite a surprise jump in crude oil inventories by 2.9 million barrels for the week ending December 15. On the contrary, investors projected a drawdown in oil stockpiles by 2.3 million barrels.
WTI has recovered strongly after discovering buying interest near $68.00 post a bullish divergence formation. While oil prices were consistently forming lower highs lower lows the Relative Strength Index (RSI) (14) formed a higher low, demonstrated an end to the downside momentum.
The asset is confidently sustaining above the 50-period Exponential Moving Average (EMA), which indicates that the near-term trend has turned bullish.
The oil price may fetch significant bids after a decisive break above Wednesday’s high of $75.00, which will drive the asset towards November 30 high around $79.63, followed by November 6 high near $82.00.
In an alternate scenario, a breakdown below December 13 low at $68.00 would expose the asset to eight-month low near $66.88, which is March 24 low. Further breakdown would drag the asset to May’s low near $64.30.
WTI two-hour chart
- The Aussie remains near recent highs with bears capped above 0.6700.
- Hawkish RBA minutes and hopes of Fed cuts keep supporting the AUD.
- AUD/USD is seen at 0.70 by the end of next year – BNP Paribas.
Australian Dollar’s reversal from five-month hoghs at 0.6780 has been contained at 0.6700 and the pair is trimming losses on Thursday´s European season with all eyes on Friday´s US data,
The pair has extended its rally this week, buoyed by the hawkish tone of the minutes of the RBA’s last meeting. The Australian central bank kept options open for further tightening if necessary highlighting the divergence with a dovish US Fed.
All eyes are on the US PCE inflation data
Later today, the final reading of the Q3 US GDP and initial Jobless claims might provide some impulse to the USD, although the main attraction of the week is Friday´s PCE Prices Index.
The Fed’s inflation gauge of choice is seen to have dropped below the 3% yearly rate for the first time in nearly three years, with the core reading down to 3.3% from 3.5% in October. These figures are not USD-supportive, but a bullish USD reaction as traders square short dollar positions ahead of the data should not be discarded.
AUD/USD is seen at 0.70 by the end of next year – BNP Paribas
The technical analysis team at BNP Paribas sees the Aussie at 0.70 in the next 12 months: “Further support for AUD and NZD is expected from a potential medium-term recovery in China (...) We raise our end-2024 forecasts for AUD/USD to 0.70 from 0.65 and NZD/USD to 0.63 from 0.59.”
Technical levels to watch
GBP/USD recovers from low 1.26s. Economists at Scotiabank analyze the pair’s outlook.
Price trends turn more bullish above 1.2735
Sharp-ish, intraday gains for GBP/USD through late morning London dealing leave the pair pressuring minor resistance at 1.2665 on the hourly chart and put it within reach of 1.2680, a more important intraday point.
Solid gains intraday suggest Cable gains may be able to stretch to 1.2735 into the end of the week. Price trends turn more bullish above there.
Support is 1.2590/1.2595.
- The US Dollar continues to trade mixed ahead of final US GDP data.
- Equity markets are shaky after Wednesday's 500-points drop in the Dow Jones.
- The DXY US Dollar Index is torn between risk-on mood and Fed speakers pushing back on rate cut bets.
The US Dollar (USD) trades broadly flat on Thursday after a very calm Asian session. From a technical point of view, the US Dollar Index (DXY) is likely to face a breakout soon, and lower liquidity ahead of Christmas could lead to large moves as the economic calendar gains momentum at the end of the week.
On the economic front, some heavyweight data is set to hit the markets on Thursday. All eyes will be on the third estimate of the US Gross Domestic Product (GDP) reading. Although not much movement is expected in this third reading, it could remind markets that the US economy is in good shape, putting the US Dollar back in favour of investors’ last bets before New Year.
Daily digest Market Movers: Big data ahead
- A very chunky batch of data will be released at 13:30 GMT:
- The third estimate of US Gross Domestic Product (GDP) numbers. Expectations are for economic growth to be unrevised at a 5.2% annualized rate in the third quarter. The Personal Consumption Expenditures Prices for the quarter is expected at 2.8% and the core measure is seen at 2.3%.
- Weekly Initial Jobless Claims are expected to pick up from 202,000 to 215,000.Continuing Claims are expected to rise from 1.876 million to 1.888 million.
- At 16:00 GMT, the Kansas Fed Manufacturing Activity Index for December will be published. The previous number was at -3.
- Equities are struggling for direction after US equities sold off in the last trading hour on Wednesday. Japanese equities saw profit taking, with more than 1% losses in both the Nikkei and Topix indexes. European indices are down by 0.50%, while US equities futures are up 0.50%.
- The CME Group’s FedWatch Tool shows that markets are pricing in an 87.6% chance that the Federal Reserve will keep interest rates unchanged at its January 31 meeting. Around 12.4% expect the first cut already to take place.
- The benchmark 10-year US Treasury Note trades near 3.86%, the lowest level since summer.
US Dollar Index Technical Analysis: Third-reading surprises
The US Dollar Index is in full consolidation mode. With clear lower highs and higher lows, buyers and sellers are pushed toward each other. A breakout looks primed for either Thursday (with the US GDP and Jobless Claims releases) or Friday (with Durable Goods and Personal Consumption Expenditures numbers). Either way, the US Dollar could still sink or rally by 1% into the last trading day before Christmas.
Any upbeat surprise in data that could contradict rate cuts bets or geopolitical events that trigger US Dollar inflow could still make the DXY head higher. On the daily chart, look for 103.00 as the first level to watch. Once trading above there, the 200-day Simple Moving Average (SMA) at 103.50 is the next important level to get to.
To the downside, the pivotal level at 101.70 – the low of August 4 and 10 – is vital to hold. Once broken, look for 100.82, which aligns with the bottoms from February and April. Should that level snap, nothing will stand in the way of DXY heading to the sub-100 region.
US Dollar FAQs
What is the US Dollar?
The US Dollar (USD) is the official currency of the United States of America, and the ‘de facto’ currency of a significant number of other countries where it is found in circulation alongside local notes. It is the most heavily traded currency in the world, accounting for over 88% of all global foreign exchange turnover, or an average of $6.6 trillion in transactions per day, according to data from 2022.
Following the second world war, the USD took over from the British Pound as the world’s reserve currency. For most of its history, the US Dollar was backed by Gold, until the Bretton Woods Agreement in 1971 when the Gold Standard went away.
How do the decisions of the Federal Reserve impact the US Dollar?
The most important single factor impacting on the value of the US Dollar is monetary policy, which is shaped by the Federal Reserve (Fed). The Fed has two mandates: to achieve price stability (control inflation) and foster full employment. Its primary tool to achieve these two goals is by adjusting interest rates.
When prices are rising too quickly and inflation is above the Fed’s 2% target, the Fed will raise rates, which helps the USD value. When inflation falls below 2% or the Unemployment Rate is too high, the Fed may lower interest rates, which weighs on the Greenback.
What is Quantitative Easing and how does it influence the US Dollar?
In extreme situations, the Federal Reserve can also print more Dollars and enact quantitative easing (QE). QE is the process by which the Fed substantially increases the flow of credit in a stuck financial system.
It is a non-standard policy measure used when credit has dried up because banks will not lend to each other (out of the fear of counterparty default). It is a last resort when simply lowering interest rates is unlikely to achieve the necessary result. It was the Fed’s weapon of choice to combat the credit crunch that occurred during the Great Financial Crisis in 2008. It involves the Fed printing more Dollars and using them to buy US government bonds predominantly from financial institutions. QE usually leads to a weaker US Dollar.
What is Quantitative Tightening and how does it influence the US Dollar?
Quantitative tightening (QT) is the reverse process whereby the Federal Reserve stops buying bonds from financial institutions and does not reinvest the principal from the bonds it holds maturing in new purchases. It is usually positive for the US Dollar.
EUR/USD pushes higher. Economists at Scotiabank analyze the pair’s outlook.
Focus on low 1.10s
A solid bid for the EUR in late morning European trade puts a positive spin on the intraday chart and suggests spot may be poised to take another run at major resistance in the 1.1015 area shortly.
Trend oscillators are aligned bullishly for the EUR on short, medium and long-term studies, suggesting that a break above the recent spot peaks should have some legs (for 1.11/1.12).
Intraday support is 1.0935/1.0940.
- The US Dollar remains on the defensive with bulls capped at 1.3375.
- Strong Canadian CPI and the rebound in Oil prices are supporting the CAD.
- The US PCE Prics Index data will determine the USD’s direction on Friday.
The Greenback remains on its back foot against the loonie on Thursday. The mild upside attempt seen on Wednesday has been halted at 1.3370, which leaves the multi-month low 1.3305 at a short distance.
CAD surges on higher oil prices and a hawkish BoC
The Canadian Dollar keeps the upper hand with the Greenback looking vulnerable amid increasing speculation that the Federal Reserve is starting to reverse its restrictive policy in March.
In Canada, data released earlier this week revealed that Consumer inflation remains sticky above the 3% yearly rate. This backs the hawkish message conveyed by the Bank of Canada after December´s policy meeting and is underpinning support for the CAD.
Apart from that, Oil prices remain at two-week highs fuelled by Houthi attacks in the Red Sea that have forced shipping firms to reroute their vessels. This provides additional support to the loonie as Canada is one of the world´s major oil exporters.
Later today, the US Jobless claims and the final reading of the Q3 GDP might give some impulse to the USD, although the highlight of the week is Friday´s US PCE Prices Index data. This is the Fed´s favourite inflation gauge and it will provide further insight into the bank´s next steps.
Technical levels to watch
Economists at Société Générale analyze how the Czech Central Bank decision could impact the EUR/CZK pair.
A close call between no change and a 25 bps cut
For the Czech National Bank, it could be a close call between no change and a 25 bps cut. Most economists surveyed by Bloomberg are pencilling in a first rate cut. We are in the minority camp and predict a first reduction in February 2024.
Headline CPI decelerated to 7.3% in November after topping out at 18% in September 2022. The base line forecast of the CNB is for inflation to slow below 3% in 1Q24. The dilemma is whether to wait (maintain positive real rates) or trust the forecast and cut today.
For EUR/CZK, today’s decision could be the difference between returning to 24.60 or 24.20.
Developments in the world economy and the financial markets in 2023 were fortunately much better than feared. Now a new year awaits us, which already promises to be very challenging, according to Helge J. Pedersen, Group Chief Economist at Nordea.
A challenging year lies ahead
My best guess is that 2024 will be very challenging and that developments in the first six months will be defining for Europe, which is on the brink of recession. Still, if interest rates have really peaked and inflation remains subdued, I think that a soft landing – without a plunge in GDP and steep rise in unemployment – is the most likely scenario. If so, there is even a good chance that the economies could resume a stronger growth pattern towards the end of the year.
At that time stronger purchasing power could thus lead to a renewed pick-up in consumer spending just as the expected large investments in the green and digital transition as well as increased defence spending would be able to stimulate the overall economy.
- Natural Gas tries to hold above $2.30 after severe profit taking.
- Traders are cleaning up balance sheets ahead of New Year's close.
- The US Dollar remains steady ahead of US GDP and PCE inflation data.
Natural Gas (XNG/USD) tries to recover somewhat on Thursday after it took a nosedive move on Wednesday as investors cashed in the last few profits ahead of Christmas close. The upward squeeze following rising tensions in the Red Sea failed to post new highs, prompting investors to opt for profit taking. The firm build up in US oil stockpiles also added to the downward move.
Meanwhile, the US Dollar (USD) is continuing its consolidation. A breakout could be soon at hand, and could come from the last two big datasets from the US this year, due on Thursday and Friday.. traders brace for the third reading of US Gross Domestic Product numbers this Thursday, while Friday the Personal Consumption Expenditures (PCE) Price Index numbers are up.
Natural Gas is trading at $2.33 per MMBtu at the time of writing.
Natural Gas Market Movers: Can we go home now?
- Tensions remain present around the Red Sea as ships pass the region. The number of vessels has slumped to the lowest level this year, with all big freight operators steering their fleet around Africa in a two-week-longer journey.
- Price pressure in Natural Gas prices should remain subdued as European gas storages remain fully equipped to withstand a severe winter.
- Around 15:30 GMT, the weekly Natural Gas Storage numbers will be released by the Energy Information Administration. The previous number was a drawdown of 55 billion cubic metres. The Forecast pencils in an 80 billion cubic metres reduction.
- Recent weather models show a very mild period ahead for the UK, Germany and France. This means less consumption of Gas in the bloc during the Christmas period.
Natural Gas Technical Analysis: A return to $3 isn’t in the cards
Natural Gas fell sharply on Wednesday as speculators cashed in on profits when prices soared on the back of Red Sea tensions. Although tensions are still there, positions have been reduced ahead of the Christmas holidays in a global balance sheet cleanup. Although some more upside could be in the cards, do not expect any quick return to $3 with European gas storage facilities still well-equipped and mild temperatures across Europe.
On the upside, Natural Gas could still try to return to the purple line near $2.60 as the first hurdle. Next, the 200-day Simple Moving Average (SMA) at $2.74 will act as a resistance, which if breached will allow Gas prices to soar to $3.00 and the 100-day SMA nearby.
With the dust settling on the Red Sea tensions and another mild front nearing Europe for Christmas, Gas prices can retreat further towards $2.20, and the low of June. Firmer support should come in near $2.10, April’s low, at the yellow supportive line.
-638387519878857931.png)
XNG/USD (Daily Chart)
Natural Gas FAQs
What fundamental factors drive the price of Natural Gas?
Supply and demand dynamics are a key factor influencing Natural Gas prices, and are themselves influenced by global economic growth, industrial activity, population growth, production levels, and inventories. The weather impacts Natural Gas prices because more Gas is used during cold winters and hot summers for heating and cooling. Competition from other energy sources impacts prices as consumers may switch to cheaper sources. Geopolitical events are factors as exemplified by the war in Ukraine. Government policies relating to extraction, transportation, and environmental issues also impact prices.
What are the main macroeconomic releases that impact on Natural Gas Prices?
The main economic release influencing Natural Gas prices is the weekly inventory bulletin from the Energy Information Administration (EIA), a US government agency that produces US gas market data. The EIA Gas bulletin usually comes out on Thursday at 14:30 GMT, a day after the EIA publishes its weekly Oil bulletin. Economic data from large consumers of Natural Gas can impact supply and demand, the largest of which include China, Germany and Japan. Natural Gas is primarily priced and traded in US Dollars, thus economic releases impacting the US Dollar are also factors.
How does the US Dollar influence Natural Gas prices?
The US Dollar is the world’s reserve currency and most commodities, including Natural Gas are priced and traded on international markets in US Dollars. As such, the value of the US Dollar is a factor in the price of Natural Gas, because if the Dollar strengthens it means less Dollars are required to buy the same volume of Gas (the price falls), and vice versa if USD strengthens.
- The Pound is trading near recent lows weighed by weak UK Inflation data.
- Investors are betting on BoE cuts in the first half of 2024.
- The dovish BoJ stance is cushioning the Pound's reversal.
The Pound is trading within a narrow range, with upside attempts capped below 181.00 so fast, as the soft inflation levels seen on Wednesday have boosted speculation of BoE cuts.
The sharp decline in UK consumer prices, with the yearly CPI declining below 4% for the first time in two years, surprised investors and has raised hopes that the Bank of England might start easing its monetary policy in May.
From a wider perspective, the pair has been trading in a mixed and volatile way over the last two weeks. This has resulted in a triangle formation, with trendline support, right above 180.00, holding the pair right now.
This pattern has a bias to break lower, with the next targets at 178.34 and 176.25, although the Bearish BoJ outlook is cushioning the GBP´s bearish attempts.
On the upside, the pair should breach 182.35 to test a major resistance area at 184.35
GBP/JPY 4-hour chart
-638387547666188486.png)
Technical levels to watch
Economists at Danske Bank still favour a break of 12.00 in EUR/NOK during 2024.
More NOK strength on the cards for the very near-term
The outlook for easier monetary conditions, higher short-end NOK rates alongside lower fiscal NOK sales is likely to act as a near-term boost to NOK. That said, we still think the downside potential remains limited and we still favour the topside in EUR/NOK as we enter 2024.
Relative rates are likely to remain a strategic supportive factor for the cross as NB cuts policy rates earlier and by more than the ECB. Also, we still believe weaker growth and contractionary global monetary conditions (albeit easier than previously) ultimately will mark a headwind for cyclically sensitive currencies incl. NOK.
We think NOK is fundamentally undervalued but we do not see the trigger for a turnaround in the next 12M.
Forecast: 11.50 (1M), 11.70 (3M), 12.10 (6M), 12.10 (12M)
- NZD/USD consolidates after correcting from 0.6300 ahead of US economic data, namely core PCE price index.
- A sticky inflation report may offer temporary cushion to the US Dollar.
- NZD/USD continues to trade in a Rising Channel chart pattern.
The NZD/USD pair turns sideways after correcting from the round-level resistance of 0.6300 in the European session. The Kiwi asset struggles to find a direction as investors are awaiting the release of the United States core Personal Consumption Expenditure price index (PCE) data for further guidance.
The market participants keenly await the underlying inflation data as it will suggest how long interest rates should remain in the restrictive trajectory. A sticky inflation report may offer temporary cushion to the US Dollar but rising hopes of early rate cuts by the Federal Reserve (Fed) will keep it in the negative territory.
On the Kiwi front, Reserve Bank of New Zealand’s (RBNZ) restrictive stance for the Official Cash Rate (OCR) has maintained strength in the New Zealand Dollar. RBNZ Governor Adrian Orr said, in his commentary on Wednesday, decline in Q3 Gross Domestic Product (GDP) has made the overall situation complex. The central bank will consider more indicators before the next interest rate decision.
NZD/USD continues to trade in a Rising Channel chart pattern in which each pullback is considered as a buying opportunity by the market participants. The kiwi asset finds resistance while breaking above the round-level resistance of 0.6300. The 20-day Exponential Moving Average (EMA) around 0.6165 continues to provide support to the kiwi bulls.
The Relative Strength Index (RSI) (14) oscillates in the bullish range of 60.00-80.00, which indicates that the bullish momentum has already been triggered.
The NZD/USD pair may witness a fresh rally after a decisive break above Wednesday’s high around 0.6300. An occurrence of the same would allow it to refresh its five-month high near 0.6350. Further upside would expose it towards July 14 high around 0.6400.
On the contrary, a breakdown below December 14 low near 0.6168 would drag the asset towards November 30 low near 0.6121, followed by December 13 low near 0.6084.
NZD/USD daily chart

- The Euro remains moderately bid approaching resistance at 0.8680.
- The soft UK inflation levels are weighing on the Pound.
- EUR/GBP is likely to face strong resistance at the 0.8680/90 area.
The Euro maintains a moderately bid tone on Thursday´s European session, with the pair edging closer to the 0.8685 resistance area. The weak UK inflation data released on Wednesday is hampering any meaningful GBP recovery.
Soft UK inflation raises hopes of BoE rate cuts
Consumer prices decelerated well below expectations in November in the UK, with the yearly CPI dropping below the 4% threshold for the first time in two years.
These figures have put into question the BoE’s hawkish rhetoric, boosting hopes that the bank might start cutting rates as soon as May, which has pushed the Sterling lower across the board.
The Euro, however, is facing hurdles of its own. The downbeat macroeconomic data suggests a scenario of weak growth with falling inflation which is fuelling investors’ bets on rate cuts in early 2024.
In this scenario, the hawkish comments by ECB Vice President De Guindos in an interview released earlier today have had a marginal impact on the pair.
Technically speaking, the immediate bias remains bullish although the 0.8680/90 area might offer a strong resistance. This is the 61.8% retracement of the late-November sell-off and a common target for corrective moves.
Technical levels to watch
- The Euro is trading with a moderate bearish tone, yet still within previous ranges around 1.0950.
- Risk appetite has faded on Thursday, increasing pressure on the Euro.
- The focus is now on the US PCE Price Index for more cues on the Fed’s policy outlook.
The Euro (EUR) is trading with a moderate bearish tone at the mid-range of 1.0900 on Thursday’s European morning session. The negative market mood, reflected by the negative opening on European stock markets and investors’ caution ahead of the US Personal Consumption Expenditures (PCE) Price Index is weighing on the common currency.
European Central Bank (ECB) Vice-President Luis De Guindos has reaffirmed President Christine Lagarde’s hawkish position, playing down any possibility of monetary easing, although the recent macroeconomic data show otherwise.
Data released on Tuesday showed that Eurozone construction output declined, adding to evidence that the region’s economy is stuttering. Beyond that, the German Federation of Industries (BDI) warned that the Eurozone’s largest economy is heading for a recession, which has increased pressure on the Euro.
The focus is now shifting towards an array of key US indicators. Today, the Initial Jobless Claims and the final reading of the Q3 Gross Domestic Product (GDP) might provide some guidance to US Dollar crosses. The highlight of the week, however, is the PCE Price Index, which will be analyzed in detail to assess the timing for the first Federal Reserve’s (Fed) rate cuts.
Daily digest market movers: Euro treads water as market braces for US data
- The Euro has lost steam, although it maintains its broader positive bias intact, with bears contained well above the 1.0880 support area.
- ECB Vice-President De Guindos acknowledges a clear downtrend in inflation but affirms that is too early to talk about rate cuts.
- Market sentiment deteriorated on Wednesday, and the risk-averse mood has extended into the Asian and European sessions, providing some support to the safe-haven USD.
- The Greenback, however, remains depressed, with the US bond yields near multi-month lows on hopes of Fed cuts in early 2024.
- Investors are pricing a nearly 75% chance of a quarter-point rate cut in March followed by another one in May, according to data by the CME Group Fed Watch Tool.
- In the calendar today, US GDP is expected to confirm a 5.2% annualized growth in the third quarter, and Initial Jobless claims are seen growing to 220K from 202K in the previous week.
- The main focus, however, is the US PCE Prices Index, due on Friday. The Fed’s preferred inflation measure is seen dipping below the 3% year-on-year rate for the first time in almost three years. A soft PCE inflation reading would increase bearish pressure on the USD.
Technical Analysis: Euro fluctuates around 1.0950 ahead of US PCE Inflation data
The Euro is trading without a clear direction around the 1.0950 level, with a moderate bearish tone on Thursday as the risk appetite seen earlier this week faded.
The pair has been looking for direction after rejection at levels right below
1.1000, with US Dollar weakness keeping the common currency from a deeper correction so far.
From a wider perspective, the broader trend remains bullish, although resistance at the 1.1010 area is likely to be a serious obstacle. Above here, the next targets would be the August high at 1.1060, and the July 24 and 27 high at 1.1150.
To the downside, the pair should break the 1.0880 and the 4-hour 100 Simple Moving Average (SMA) at 1.0870 to increase bearish pressure. In this scenario, bears’ focus could shift towards 1.0825 on the way to December lows at 1.0715.
Euro FAQs
What is the Euro?
The Euro is the currency for the 20 European Union countries that belong to the Eurozone. It is the second most heavily traded currency in the world behind the US Dollar. In 2022, it accounted for 31% of all foreign exchange transactions, with an average daily turnover of over $2.2 trillion a day.
EUR/USD is the most heavily traded currency pair in the world, accounting for an estimated 30% off all transactions, followed by EUR/JPY (4%), EUR/GBP (3%) and EUR/AUD (2%).
What is the ECB and how does it impact the Euro?
The European Central Bank (ECB) in Frankfurt, Germany, is the reserve bank for the Eurozone. The ECB sets interest rates and manages monetary policy.
The ECB’s primary mandate is to maintain price stability, which means either controlling inflation or stimulating growth. Its primary tool is the raising or lowering of interest rates. Relatively high interest rates – or the expectation of higher rates – will usually benefit the Euro and vice versa.
The ECB Governing Council makes monetary policy decisions at meetings held eight times a year. Decisions are made by heads of the Eurozone national banks and six permanent members, including the President of the ECB, Christine Lagarde.
How does inflation data impact the value of the Euro?
Eurozone inflation data, measured by the Harmonized Index of Consumer Prices (HICP), is an important econometric for the Euro. If inflation rises more than expected, especially if above the ECB’s 2% target, it obliges the ECB to raise interest rates to bring it back under control.
Relatively high interest rates compared to its counterparts will usually benefit the Euro, as it makes the region more attractive as a place for global investors to park their money.
How does economic data influence the value of the Euro?
Data releases gauge the health of the economy and can impact on the Euro. Indicators such as GDP, Manufacturing and Services PMIs, employment, and consumer sentiment surveys can all influence the direction of the single currency.
A strong economy is good for the Euro. Not only does it attract more foreign investment but it may encourage the ECB to put up interest rates, which will directly strengthen the Euro. Otherwise, if economic data is weak, the Euro is likely to fall.
Economic data for the four largest economies in the euro area (Germany, France, Italy and Spain) are especially significant, as they account for 75% of the Eurozone’s economy.
How does the Trade Balance impact the Euro?
Another significant data release for the Euro is the Trade Balance. This indicator measures the difference between what a country earns from its exports and what it spends on imports over a given period.
If a country produces highly sought after exports then its currency will gain in value purely from the extra demand created from foreign buyers seeking to purchase these goods. Therefore, a positive net Trade Balance strengthens a currency and vice versa for a negative balance.
Economic Indicator
United States Personal Consumption Expenditures - Price Index (YoY)
The Personal Consumption Expenditures (PCE), released by the US Bureau of Economic Analysis on a monthly basis, measures the changes in the prices of goods and services purchased by consumers in the United States (US). The YoY reading compares prices in the reference month to a year earlier. Price changes may cause consumers to switch from buying one good to another and the PCE Deflator can account for such substitutions. This makes it the preferred measure of inflation for the Federal Reserve. Generally, a high reading is bullish for the US Dollar (USD), while a low reading is bearish.
Read more.Next release: 12/22/2023 13:30:00 GMT
Frequency: Monthly
Source: US Bureau of Economic Analysis
Türkiye’s central bank (CBRT) meets today. Economists at Société Générale analyze Lira’s outlook ahead of the Interest Rate Decision.
CBRT tightening not over
The Central Bank of Türkiye has gone fully conventional by delivering a cumulative 3,250 bps of policy tightening since the new Treasury and Finance minister, and CBRT governor Hafize Gaye Erkan were installed after the spring election. The policy rate has been raised dramatically from 8.50% pre-election to 40.0% in November, and another layer of policy restraint may be added today.
Our house view calls for a terminal rate of 45.00%, so another two 250 bps hikes, today and one more in January 2024.
We do not think the TRY is out of the woods and further depreciation towards 35.00/USD is possible next year (EUR/TRY 40.00).
- Gold price trades lackluster as investors await key US economic data, namely PCE inflation.
- A sticky US core PCE report may dampen investors’ short-term appeal for Gold.
- Fed Harker said that rate cuts won’t come sooner that what the market is expecting.
Gold price (XAU/USD) struggles to come out of woods as investors are awaiting the release of the United States core Personal Consumption Expenditure Price Index (PCE) for November, due on Friday. A report signalling that inflation remains sticky could slow down a broader rally in the Gold price as it would likely force Federal Reserve (Fed) policymakers to opt for a more restrictive monetary policy stance.
Meanwhile, Philadelphia Fed Bank President Patrick Harker joined the club and pushed back expectations of upcoming cuts in borrowing costs. Harker said he sees a soft landing, but warned that unemployment could rise moderately.
The US Dollar has been on the back foot due to soaring expectations of rate cuts by the Fed, but some still believe that the US central bank is not going to lower rates sooner amid the resilience of the US economy.
Daily Digest Market Movers: Outlook for Gold price remains broadly upbeat
- Gold price struggles for a direction as investors await the United States core PCE Price Index data for November, which is scheduled for Friday.
- Fed’s preferred inflation measure is likely to provide clues over how long the central bank is required to keep interest rates in a restrictive trajectory.
- Themonthly core PCE price index is expected to increase at a steady pace of 0.2%. On an annual basis, PCE inflation is expected to decelerate to 3.3% from 3.5%.
- A sticky underlying inflation report may trim expectations of early rate cuts by the Federal Reserve and compel policymakers to keep interest rates in the restrictive trajectory for longer until the return of inflation to 2% is confirmed.
- This could also improve appeal for the US Dollar and benefit irisk-sensitive assets.
- In the Summary of Economic Projections (SEP) released last week, all Fed policymakers favoured no further rate hikes and the majority of members supported a decline in borrowing costs by 75 basis points (bps) in 2024.
- Atlanta Fed Bank President Raphael Bostic, New York Fed Bank President John Williams, and Philadelphia Fed Bank President Patrick Harker showed their openness to lowering interest rates, but said that an immediate cut isn’t expected.
- Harker said that one major reason to cut interest rates next year is that businesses are struggling to augment higher interest obligations.
- While asked about the possibility of a soft landing, Harker said that it is quite possible, but warned that the Unemployment Rate could rise moderately. A ‘soft landing’ is a scenario in which inflation returns to 2% without triggering a recession
- In addition to the US core PCE price index data, investors will also focus on the Durable Goods Orders data for November, also due Friday.
- Fresh orders for Durable Goods are expected to increase by 2.2% against a decline of 5.4% a month earlier. A higher-than-anticipated increase in new orders would provide some cushion to the US Dollar.
- Deepening hopes of early cuts in borrowing costs by the Fed have weighed down US Treasury yields further. The 10-year US Treasury yields have dropped to near 3.87%.
Technical Analysis: Gold price consolidates below $2,040
Gold price continues to trade sideways below $2,040.00. The precious metal trades inside Tuesday’s range amid the absence of a potential trigger. The broader appeal for Gold is quite bullish as short-to-long-term daily Exponential Moving Averages (EMAs) are sloping higher.
Gold FAQs
Why do people invest in Gold?
Gold has played a key role in human’s history as it has been widely used as a store of value and medium of exchange. Currently, apart from its shine and usage for jewelry, the precious metal is widely seen as a safe-haven asset, meaning that it is considered a good investment during turbulent times. Gold is also widely seen as a hedge against inflation and against depreciating currencies as it doesn’t rely on any specific issuer or government.
Who buys the most Gold?
Central banks are the biggest Gold holders. In their aim to support their currencies in turbulent times, central banks tend to diversify their reserves and buy Gold to improve the perceived strength of the economy and the currency. High Gold reserves can be a source of trust for a country’s solvency. Central banks added 1,136 tonnes of Gold worth around $70 billion to their reserves in 2022, according to data from the World Gold Council. This is the highest yearly purchase since records began. Central banks from emerging economies such as China, India and Turkey are quickly increasing their Gold reserves.
How is Gold correlated with other assets?
Gold has an inverse correlation with the US Dollar and US Treasuries, which are both major reserve and safe-haven assets. When the Dollar depreciates, Gold tends to rise, enabling investors and central banks to diversify their assets in turbulent times. Gold is also inversely correlated with risk assets. A rally in the stock market tends to weaken Gold price, while sell-offs in riskier markets tend to favor the precious metal.
What does the price of Gold depend on?
The price can move due to a wide range of factors. Geopolitical instability or fears of a deep recession can quickly make Gold price escalate due to its safe-haven status. As a yield-less asset, Gold tends to rise with lower interest rates, while higher cost of money usually weighs down on the yellow metal. Still, most moves depend on how the US Dollar (USD) behaves as the asset is priced in dollars (XAU/USD). A strong Dollar tends to keep the price of Gold controlled, whereas a weaker Dollar is likely to push Gold prices up.
Iron ore prices have risen more than 25% in the second half of 2023. Strategists at ANZ Bank are upgrading price forecasts.
Short-term target raised to $110
This rally looks susceptible to a retracement if demand does not eventuate as expected, which could be triggered by steel production cuts over the northern winter.
Nevertheless, the downside looks limited amid the tightness in the market. As such, we are upgrading our short-term (0-3mth) target to $110/t. We have also raised our 2024 forecasts, with prices unlikely to drop below $100/t.
- USD/CHF remains choppy above 0.8600 ahead of Fed’s preferred inflation tool.
- The appeal for the US Dollar remains bearish as rate cut expectations by the Fed deepen.
- USD/CHF may continue its downside journey towards 0.8555.
The USD/CHF pair trades in a tight range above the round-level support of 0.8600 in the European session. The Swiss Franc asset struggles for a direction as investors await the United States core Personal Consumption Expenditure price index (PCE) for November, which will be published on Friday.
S&P500 futures have added decent gains in the London session, portraying a revival in the risk-appetite of the market participants. The US Dollar Index (DXY) consolidates around 102.40 but downside remains favoured as bets in favour of early rate cuts from the Federal Reserve (Fed) have deepend.
Meanwhile, the Swiss Franc continues to perform well as the Swiss National Bank (SNB) is expected to keep policy rates restricted for the forseeable future.
USD/CHF has remained in the negative trajectory from last two months and is expected to extend its downside journey towards July 18 low around 0.8555. The 20-day Exponential Moving Average (EMA) at 0.8730 has been acting as a barricade for the US Dollar bulls. A potential resistance is plotted from December 4 low around 0.8666.
The Relative Strength Index (RSI) (14) has shifted into the bearish range of 20.00-40.00, which indicates that the momentum is in the downside direction.
Going forward, a decisive break below December 19 low of 0.8593 would drag the asset towards July 18 low at 0.8555 and the psychological support of 0.8500.
On the flip side, a recovery move above December 18 high at 0.8711 would drive the asset towards December 06 high around 0.8750. A breach of the latter would open doors for more upside towards August 03 high at 0.8800.
USD/CHF daily chart
-638387488524987709.png)
USD/CNY has declined lately generally following the swings in the Dollar. Economists at Danske Bank analyze the pair’s outlook.
EUR/CNY to revert lower towards 7.70 in 12M shadowing EUR/USD lower
We keep our view of a moderate rise in USD/CNY on a 12M horizon towards 7.40 as we expect economic and financial risks in China to prevail for some time underpinning some further CNY weakness. Our view of a stronger USD in the medium to longer term also points to a higher USD/CNY. However, in the short term, we expect the cross to stay close to current levels around 7.15.
For EUR/CNY we look for the cross to follow EUR/USD slightly higher in the short term but to revert lower towards 7.70 in 12M shadowing EUR/USD lower. The two crosses still trade with a high correlation.
- US Dollar Index gains ground on higher US Treasury yields.
- Speculation over the Fed's dovish outlook weakened the US Dollar.
- Fed members dismissed speculations on rate cuts in the first quarter of 2024.
- The improved US data provided support for the Greenback.
US Dollar Index (DXY) attempts to extend its gains on the second successive day, trading slightly higher near 102.40 during the European session on Thursday. The uptick in US Treasury yields might have ignited the strength of the US Dollar (USD). The 2-year and 10-year yields on US bond coupons stand higher at 4.37% and 3.86%, respectively, as of the latest update.
However, the Greenback received downward pressure due to the market sentiment about the Federal Reserve’s (Fed) dovish outlook over the interest rate trajectory in the first quarter of 2024. Several Fed members have dismissed the premature speculations of interest rate cuts any time sooner. New York Fed President John Williams has outright opposed the idea, while San Francisco Fed President Mary Daly considers predictions on policy stance as premature. Austan Goolsbee, Chicago Fed President, shares a similar sentiment, cautioning that the market's optimism for rate cuts might be exceeding realistic expectations.
A resurgence in existing home sales and a significant boost in consumer confidence serve as positive indicators for the United States (US) economy, and might have lent support for the US Dollar. November's US Existing Home Sales Change showed a noteworthy monthly increase of 0.8%, marking a substantial recovery from the preceding decline of 4.1%. The CB Consumer Confidence witnessed remarkable growth., registering its most significant increase since early 2021, climbing from 101.0 to 110.07.
Investors are poised to closely watch crucial economic releases during the North American session to gain deeper insights into the state of the US economy. Among these, notable indicators include US Gross Domestic Product Annualized (Q3), Initial Jobless Claims, and the Philadelphia Fed Manufacturing Survey.
Gold prices fell in India on Thursday, according to data from India's Multi Commodity Exchange (MCX).
Gold price stood at 62,181 Indian Rupees (INR) per 10 grams, down INR 43 compared with the INR 62,224 it costed on Wednesday.
As for futures contracts, Gold prices decreased to INR 62,223 per 10 gms from INR 62,585 per 10 gms.
Prices for Silver futures contracts decreased to INR 75,457 per kg from INR 74,927 per kg.
| Major Indian city | Gold Price |
|---|---|
| Ahmedabad | 64,340 |
| Mumbai | 64,145 |
| New Delhi | 64,280 |
| Chennai | 64,290 |
| Kolkata | 64,305 |
Daily Digest Market Movers: Comex Gold price remains confined in a familiar range ahead of US macro data
- Rising bets that the Federal Reserve will eventually pivot away from its hawkish stance early next year turn out to be a key factor acting as a tailwind for the Comex Gold price.
- Dovish Fed expectations drag the yield on the benchmark 10-year US government bond to its lowest level since July and keep the US Dollar bulls on the defensive.
- A slew of Fed officials recently tried to push back on the idea of rapid interest rate cuts next year, albeit did little to provide any meaningful impetus to the buck.
- The Conference Board's US Consumer Confidence Index jumped to a five-month high level of 110.7 in December from 101, rising the most since early 2021.
- US existing home sales unexpectedly rose by 0.8% in November, to a seasonally adjusted annual rate of 3.82 million units, snapping five straight months of decline.
- The overnight dramatic turnaround in the US equity markets is seen as another factor that benefits the safe-haven precious metal and remains supportive of the uptick.
- Traders now look forward to the final US GDP print, which is expected to show that the world's largest economy grew by a 5.2% annualized pace during the third quarter.
- Thursday's US economic docket also features the release of Weekly Initial Jobless Claims data and the Philly Fed Manufacturing Index later during the US session. The focus, meanwhile, remains on the Core PCE Price Index, due on Friday, which will influence the Fed's future rate decisions and infuse volatility in the markets.
(An automation tool was used in creating this post.)
Gold FAQs
Why do people invest in Gold?
Gold has played a key role in human’s history as it has been widely used as a store of value and medium of exchange. Currently, apart from its shine and usage for jewelry, the precious metal is widely seen as a safe-haven asset, meaning that it is considered a good investment during turbulent times. Gold is also widely seen as a hedge against inflation and against depreciating currencies as it doesn’t rely on any specific issuer or government.
Who buys the most Gold?
Central banks are the biggest Gold holders. In their aim to support their currencies in turbulent times, central banks tend to diversify their reserves and buy Gold to improve the perceived strength of the economy and the currency. High Gold reserves can be a source of trust for a country’s solvency. Central banks added 1,136 tonnes of Gold worth around $70 billion to their reserves in 2022, according to data from the World Gold Council. This is the highest yearly purchase since records began. Central banks from emerging economies such as China, India and Turkey are quickly increasing their Gold reserves.
How is Gold correlated with other assets?
Gold has an inverse correlation with the US Dollar and US Treasuries, which are both major reserve and safe-haven assets. When the Dollar depreciates, Gold tends to rise, enabling investors and central banks to diversify their assets in turbulent times. Gold is also inversely correlated with risk assets. A rally in the stock market tends to weaken Gold price, while sell-offs in riskier markets tend to favor the precious metal.
What does the price of Gold depend on?
The price can move due to a wide range of factors. Geopolitical instability or fears of a deep recession can quickly make Gold price escalate due to its safe-haven status. As a yield-less asset, Gold tends to rise with lower interest rates, while higher cost of money usually weighs down on the yellow metal. Still, most moves depend on how the US Dollar (USD) behaves as the asset is priced in dollars (XAU/USD). A strong Dollar tends to keep the price of Gold controlled, whereas a weaker Dollar is likely to push Gold prices up.
The Yen has continued to recover lost ground following the heavy sell-off earlier in the week in response to the BoJ’s latest policy update. Economists at MUFG Bank analyze JPY outlook.
What’s needed for USD/JPY to stage a more sustained rebound?
The price action supports our view that a delayed BoJ exit from negative rates is unlikely to be sufficient in the current external environment to trigger another sustained sell-off for the Yen at a time when there is intensifying speculation that other major central banks will begin to cut rates earlier and deeper next year.
For USD/JPY to stage a more sustained rebound, market participants would have to more seriously question whether the Fed will deliver earlier and deeper rate cuts currently priced into next year. The next important text of that view will be provided by the release tomorrow of the latest US PCE deflator report for November. In light of the already released softer-than-expected PPI report for November, the report appears more likely to provide further evidence of slowing inflation that supports current market expectations for the Fed to move rates into less restrictive territory next year.
- USD/CAD moves down in the negative territory as US Dollar fails to hold gains.
- A break above 1.3350 could lead the pair to approach the seven-day EMA at 1.3398 aligned with the psychological level at 1.3400.
- Technical indicators suggest the confirmation of further decline and testing the weekly low at 1.3311.
USD/CAD retraces its recent gains, trading below the major resistance at the 1.3350 level. The USD/CAD pair faces downward pressure on the subdued US Dollar (USD), along with higher Crude oil prices.
Breaking through the significant level has the potential to propel the USD/CAD pair upward, targeting the seven-day Exponential Moving Average (EMA) at 1.3398, in conjunction with the psychological resistance level at 1.3400.
Further surpassing this psychological resistance may lead the pair to explore the vicinity of the major level at 1.3450, followed by the 23.6% Fibonacci retracement level at 1.3452.
On the flip side, the Moving Average Convergence Divergence (MACD) technical indicator for the USD/CAD pair hints at a potential bearish trend. With the MACD line positioned below the centerline and showing divergence below the signal line, there's an indication of a possible further decline.
The analysis adds weight to the prevailing dovish sentiment surrounding the USD/CAD pair, emphasizing the importance of the 14-day Relative Strength Index (RSI) dipping below 50. This confirmation suggests that the pair could revisit the weekly low around the 1.3311 level. A break below the weekly low holds the potential to push the USD/CAD pair towards the psychological level at 1.3300.
USD/CAD: Daily Chart
-638387444809513282.png)
Economists at BNP Paribas expect a bullish year for AUD/USD and NZD/USD in 2024.
Positive developments in China’s economy to support Aussie and Kiwi
Further support for AUD and NZD is expected from a potential medium-term recovery in China.
We raise our end-2024 forecasts for AUD/USD to 0.70 from 0.65 and NZD/USD to 0.63 from 0.59.
A recovery in capital expenditure (CAPEX) in Australia, now aligned with other commodity exporters, supports a stronger AUD. Higher commodity prices could enhance AUD appreciation due to increased production capacity. Relative to other G10 currencies (excluding Japan), fewer rate cuts are priced in for the Reserve Bank of Australia (RBA), making the interest rate channel more supportive for the AUD.
- Silver gains some positive traction for the third successive day on Thursday.
- The technical setup favours bulls and supports prospects for further gains.
- A break below an ascending trend line is needed to negate the positive bias.
Silver (XAG/USD) attracts some buyers for the third straight day on Thursday and stalls the previous day's late pullback from the vicinity of mid-$24.00s or over a two-week high. The white metal sticks to its intraday gains through the early European session and is currently placed around the $24.25-$24.30 region, up nearly 1% for the day.
Against the backdrop of the recent solid bounce from a multi-month-old ascending trend-line support, acceptance above the 200-day Simple Moving Average (SMA) and the $24.00 round figure favours bullish traders. Moreover, oscillators on the daily chart have just started gaining positive traction and suggest that the path of least resistance for the XAG/USD is to the upside.
Some follow-through buying beyond the overnight swing high, around the $24.45 zone, will reaffirm the constructive outlook and allow bulls to reclaim the $25.00 psychological mark. The momentum could get extended further towards the $25.25 hurdle en route to the $25.45-$25.50 area and the $26.00 neighbourhood, or the highest level since May touched earlier this month.
On the flip side, the $24.00 mark now seems to protect the immediate downside. Any subsequent decline is more likely to attract fresh buyers and remain limited near the 200-day SMA, around the $23.60 region. A convincing break below the latter, however, might prompt technical selling and drag the XAG/USD to the aforementioned trend-line support, currently near the $23.00 mark.
The latter should act as a key pivotal point, which if broken decisively might shift the near-term bias in favour of bearish traders. The XAG/USD might then accelerate the downfall further towards the monthly swing low, around mid-$22.00s before dropping to the $22.25 intermediate support and the $22.00 round-figure mark.
Silver daily chart
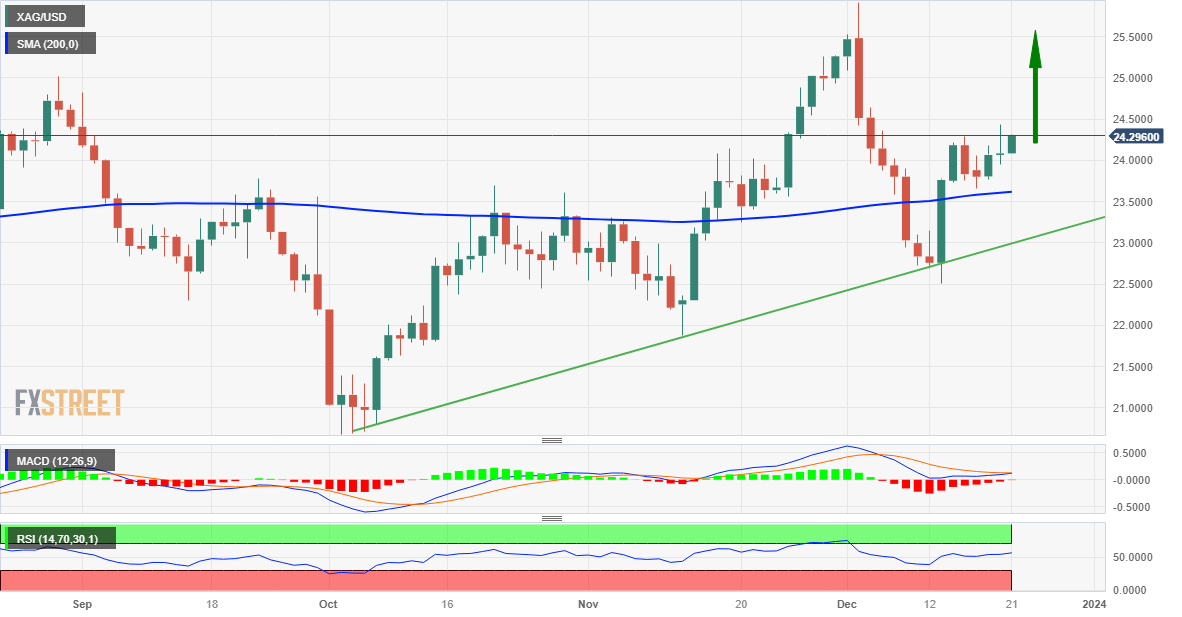
Technical levels to watch
FX option expiries for December 21 NY cut at 10:00 Eastern Time, via DTCC, can be found below.
- EUR/USD: EUR amounts
- 1.0830 1.4b
- 1.0845 953m
- 1.0900 1.6b
- 1.0955 1.5b
- 1.1000 1.1b
- GBP/USD: GBP amounts
- 1.2600 816m
- 1.2620 457m
- 1.2745 1b
- 1.2750 715m
- USD/JPY: USD amounts
- 142.00 429m
- 143.50 465m
- 144.75 420m
- 144.80 703m
- 145.00 1.3b
- USD/CHF: USD amounts
- 0.8550 500m
- 0.8700 516m
- 0.8800 615m
- AUD/USD: AUD amounts
- 0.6600 348m
- 0.6650 399m
- 0.6690 943m
- 0.6800 1.1b
- USD/CAD: USD amounts
- 1.3410 914m
- 1.3485 499m
- 1.3550 739m
Economists at Nordea expect risk-sensitive FX to benefit in 2024 with the EUR/USD pair also gaining ground.
Weaker USD due to a dovish Fed
We expect EUR/USD to rise in the year to come.
Faster rate cuts in the US than elsewhere point to more Dollar weakening. The US rate cuts should also underpin the global economy, commodity and energy prices and risk sentiment. Thus, risk sensitive currencies, such as NOK and SEK, should fare better in the time to come. However, there are numerous risks on the horizon including potential government debt troubles, the US Presidential election and geopolitical challenges. Many of these could send the USD stronger than we have pencilled in.
We do expect the high volatility in the FX market to continue in the year to come.
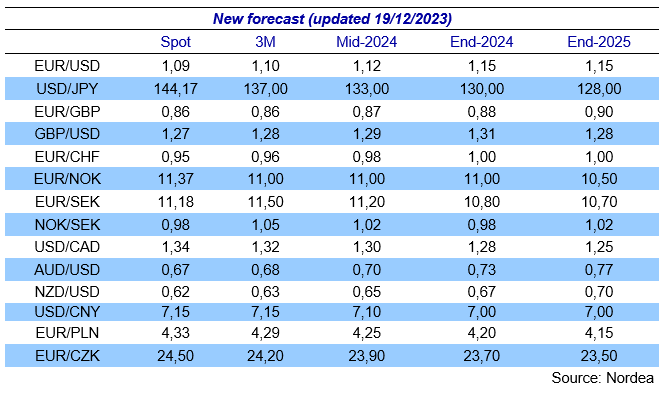
In an interview with Spanish newspaper 20 Minutos on Thursday, European Central Bank (ECB) Vice-President Luis de Guindos said that it was too early for the monetary policy to start to ease, per Reuters.
De Guindos added that the ECB does not expect a technical recession in the Euro area and said that they would welcome a deal on the EU fiscal reform because that would reduce uncertainty in markets.
Market reaction
EUR/USD showed no immediate reaction to these comments. At the time of press, the pair was virtually unchanged on the day at 1.0945.
- USD/MXN retraces its recent profits despite the dovish Banxico’s outlook.
- Mexico’s Retail Sales MoM rose to 0.8%, while year-on-year improved to 3.4%.
- US Dollar demonstrates weakness despite the Fed’s dismissal of rate cut speculations.
USD/MXN trades lower near 17.10 during the European session on Thursday. However, the USD/MXN pair received upward support as improved data from the United States (US) dampened the upbeat Mexico’s Retail Sales data on Wednesday.
Mexico’s Retail Sales (MoM) rose to 0.8% against the flat 0.0% as expected in October, swinging from the previous 0.2% decline. While Retail Sales year-on-year improved to 3.4% versus 2.0% readings and 2.3% previously. 1st half-month Inflation data for December are due on Thursday.
However, the dovish comments from Bank of Mexico (Banxico) Governor Victoria Rodriguez Ceja seem failing to affect the resilience of the Mexican Peso (MXN). Governor Ceja commented on the decline in inflation, highlighting the potential consideration of interest rate cuts in the first quarter of 2024 if the disinflationary trend persists.
On the US side, market participants await key economic releases later in the North American session for further insights into the US economy. These include US Gross Domestic Product Annualized (Q3), Initial Jobless Claims, and the Philadelphia Fed Manufacturing Survey.
On Wednesday, the US Existing Home Sales Change indicated a notable monthly rate increase of 0.8% in November. CB Consumer Confidence experienced substantial growth in December, marking the most significant increase to 110.07.
The US Dollar (USD) experiences a decline even though several Fed officials have discouraged premature speculations on policy rate cuts in early 2024. Also, the higher US Treasury yields failed to feed strength into the USD. The DXY moves sideways near 102.30, with the 2-year and 10-year yields on US bond coupons are at 4.37% and 3.87%, respectively, at the time of writing.
- Pound Sterling falls sharply after the big drop in UK inflation data.
- A steady US Dollar and increasing bets over upcoming BoE rate cut weigh on the Pound Sterling.
- This week, the US core PCE price index and UK Retail Sales data will be keenly watched.
The Pound Sterling (GBP) struggles for a firm footing as a sharp drop in the United Kingdom Consumer Price Index (CPI) for November has deepened expectations of early rate cuts by the Bank of England (BoE). The GBP/USD pair is exposed to more downside as the Pound Sterling has lost its competitive advantage of a longer restrictive policy stance after a sharp decline in inflation.
BoE policymakers may continue favouring a restrictive policy stance until price stability is ensured, but market participants are expected to keep rate cut expectations alive. The next economic trigger for the Pound Sterling will be the Retail Sales data for November, which is scheduled for Friday. Higher-than-projected growth in consumer spending may bring some relief for the Pound Sterling.
Daily Digest Market Movers: Pound Sterling faces pressure ahead of Retail Sales data
- Pound Sterling falls after a bigger-than-anticipated drop in UK inflation.
- Annual headline inflation fell sharply below 4.0% amid a significant decline in fuel prices.
- Annual core CPI that excludes volatile food and Oil prices softened to 5.1% against expectations of 5.6%.
- After a sharp decline in UK inflation, Finance Minister Jeremy Hunt said the data showed inflation pressures were being removed from the economy, Reuters reported.
- A bigger drop in price pressures in November has bolstered bets in favour of early rate cuts by the BoE in 2024.
- Investors see a 50% chance for first rate cut by the BoE in March. On the contrary, investment banking firm Goldman Sachs advanced its projection for the first rate cut to May from June after inflation fell to two-year low.
- While significant improvement in inflation towards 2% has escalated bets in favour of early rate cuts, policymakers are expected to remain lean towards a restrictive monetary policy stance.
- This week, BoE policymakers Sarah Breeden and Ben Broadbent emphasized keeping interest rates higher for longer to keep price pressures in check.
- The major reason behind favouring a restrictive monetary policy stance for longer is to gain confidence that inflation is clearly in a downtrend as price pressures in the UK region are highest than peers in Group of Seven economies.
- Going forward, investors will focus on the Retail Sales data for November, which will be published on Friday at 07:00 GMT.
- As per the preliminary estimates, monthly Retail Sales are expected to grow by 0.4% against a contraction of 0.3% in October. Annually, retail spending contracted at a slower pace of 1.3% against a former decline of 2.7%.
- The US Dollar Index (DXY) consolidates in a tight range as the upside is capped due to deepening rate cut expectations by the Federal Reserve (Fed). The downside seems limited temporarily as investors await the release of the core Personal Consumption Expenditure Price Index (PCE) for November, scheduled for Friday.
Technical Analysis: Pound Sterling sees more downside to near 1.2500
Pound Sterling struggles for a firm footing after an intense sell-off to near a weekly low of around 1.2640. The GBP/USD pair is expected to see more downside as a further breakdown would expose it towards the psychological support of 1.2500.
On a daily timeframe, the trend is still bullish as 20-day and 50-day Exponential Moving Averages (EMAs) are advancing. Momentum oscillator, Relative Strength Index (RSI) (14), is indicating further consolidation ahead.
Pound Sterling FAQs
What is the Pound Sterling?
The Pound Sterling (GBP) is the oldest currency in the world (886 AD) and the official currency of the United Kingdom. It is the fourth most traded unit for foreign exchange (FX) in the world, accounting for 12% of all transactions, averaging $630 billion a day, according to 2022 data.
Its key trading pairs are GBP/USD, aka ‘Cable’, which accounts for 11% of FX, GBP/JPY, or the ‘Dragon’ as it is known by traders (3%), and EUR/GBP (2%). The Pound Sterling is issued by the Bank of England (BoE).
How do the decisions of the Bank of England impact on the Pound Sterling?
The single most important factor influencing the value of the Pound Sterling is monetary policy decided by the Bank of England. The BoE bases its decisions on whether it has achieved its primary goal of “price stability” – a steady inflation rate of around 2%. Its primary tool for achieving this is the adjustment of interest rates.
When inflation is too high, the BoE will try to rein it in by raising interest rates, making it more expensive for people and businesses to access credit. This is generally positive for GBP, as higher interest rates make the UK a more attractive place for global investors to park their money.
When inflation falls too low it is a sign economic growth is slowing. In this scenario, the BoE will consider lowering interest rates to cheapen credit so businesses will borrow more to invest in growth-generating projects.
How does economic data influence the value of the Pound?
Data releases gauge the health of the economy and can impact the value of the Pound Sterling. Indicators such as GDP, Manufacturing and Services PMIs, and employment can all influence the direction of the GBP.
A strong economy is good for Sterling. Not only does it attract more foreign investment but it may encourage the BoE to put up interest rates, which will directly strengthen GBP. Otherwise, if economic data is weak, the Pound Sterling is likely to fall.
How does the Trade Balance impact the Pound?
Another significant data release for the Pound Sterling is the Trade Balance. This indicator measures the difference between what a country earns from its exports and what it spends on imports over a given period.
If a country produces highly sought-after exports, its currency will benefit purely from the extra demand created from foreign buyers seeking to purchase these goods. Therefore, a positive net Trade Balance strengthens a currency and vice versa for a negative balance.
The last meeting of the Czech National Bank (CNB) this year promises a nail-biting finale. Economists at Commerzbank analyze Koruna’s outlook ahead of the decision.
A close call
For once, CNB board members, themselves, seem to be unsure about how to think about this – they are calling it a 50:50 outcome.
The actual outcome may not impact the Koruna too strongly. The FX market will probably expect a 50 bps rate cut in February 2024 if the rate is kept on hold today.
Hence, the current projection of the terminal rate will not change much, whatever the outcome this week, which means that the impact on CZK will likely be modest.
- NZD/USD grapples to gain ground after retreating from a five-month high at 0.6298.
- Improved US data showed positive signs for the US economy, providing support for USD.
- Investors await US GDP data for further impetus on the US economy.
NZD/USD holds its position below 0.6250 during the early European hours on Thursday, struggling to retrace its recent losses recorded on Wednesday. The NZD/USD pair pulled back from the five-month high at 0.6298 reached in the previous session, which could be attributed to the improved economic data from the United States (US).
A rebound in existing home sales and a substantial increase in consumer confidence are both positive signs for the US economy. The US Existing Home Sales Change indicated a notable monthly rate increase of 0.8% in November, swinging from the previous decline of 4.1%. While CB Consumer Confidence experienced substantial growth in December, rising from 101.0 to 110.07.
The decline in the US Dollar Index (DXY) despite higher Treasury yields suggests that investors are keeping a close eye on the Federal Reserve's stance. It seems like the dovish sentiment regarding the interest rate trajectory is influencing market speculation. The DXY trades lower around 102.40, with the 2-year and 10-year yields on US bond coupons bidding at 4.38% and 3.88%, respectively, by the press time.
On the Kiwi side, On Wednesday, the improved Consumer Confidence data contributed support to underpinning the New Zealand Dollar (NZD) against the US Dollar (USD). The Reserve Bank of New Zealand (RBNZ) Governor Adrian Orr's cautious approach and acknowledgment of the journey ahead, particularly with high inflation levels, reflect the complexity of navigating economic landscapes.
On Thursday, Kiwi Credit Card Spending (YoY) showed an increase of 3.3% in November, versus the 2.8% drop in October. On the United States docket, investors await the US Gross Domestic Product Annualized (Q3), Initial Jobless Claims, and the Philadelphia Fed Manufacturing Survey.
Here is what you need to know on Thursday, December 21:
Major currency pairs stay relatively calm early Thursday as investors wait for the US Bureau of Economic Analysis to publish final revisions to the third-quarter Gross Domestic Product (GDP) data. The US economic calendar will also offer weekly Jobless Claims and Federal Reserve Bank of Philadelphia's Manufacturing Survey for December.
After edging lower in the first half of the day on Wednesday, the US Dollar (USD) Index staged a late rebound to close the day with marginal gains. The negative shift seen in risk sentiment, as reflected by the bearish action in Wall Street's main indexes, helped the USD find demand in the American session. Additionally, upbeat consumer sentiment and housing data supported the currency. Early Thursday, the USD Index seems to have gone into a consolidation phase below 102.50. US stock index futures trade in positive territory in the European morning, while the benchmark 10-year US Treasury bond yield recovers toward 3.9%. The US' annualized GDP growth is expected to be confirmed at 5.2% in Q3.
US Dollar price this week
The table below shows the percentage change of US Dollar (USD) against listed major currencies this week. US Dollar was the weakest against the Swiss Franc.
| USD | EUR | GBP | CAD | AUD | JPY | NZD | CHF | |
| USD | -0.46% | 0.28% | -0.16% | -0.68% | 0.56% | -0.54% | -0.97% | |
| EUR | 0.46% | 0.74% | 0.31% | -0.21% | 1.02% | -0.07% | -0.50% | |
| GBP | -0.28% | -0.74% | -0.44% | -0.96% | 0.28% | -0.83% | -1.26% | |
| CAD | 0.16% | -0.31% | 0.43% | -0.53% | 0.71% | -0.39% | -0.82% | |
| AUD | 0.67% | 0.22% | 0.96% | 0.53% | 1.23% | 0.14% | -0.29% | |
| JPY | -0.56% | -1.02% | -0.26% | -0.70% | -1.26% | -1.09% | -1.55% | |
| NZD | 0.53% | 0.07% | 0.82% | 0.39% | -0.14% | 1.09% | -0.43% | |
| CHF | 0.95% | 0.49% | 1.23% | 0.80% | 0.28% | 1.52% | 0.42% |
The heat map shows percentage changes of major currencies against each other. The base currency is picked from the left column, while the quote currency is picked from the top row. For example, if you pick the Euro from the left column and move along the horizontal line to the Japanese Yen, the percentage change displayed in the box will represent EUR (base)/JPY (quote).
EUR/USD turned south and registered losses on Wednesday after closing the first two trading days of the week in the green. Early Thursday, the pair fluctuates in a tight channel at around 1.0950.
Following the sharp decline seen after softer-than-forecast inflation data from the UK, GBP/USD stabilized slightly below 1.2650 on Thursday. On Friday, the UK's Office for National Statistics will release Retail Sales and third-quarter GDP data.
USD/JPY edged lower on Wednesday after posting strong gains following the Bank of Japan (BoJ) policy announcements earlier in the week but managed to find a foothold near 143.00 on Thursday. The National Consumer Price Index data and the minutes of the BoJ's December policy meeting will be looked upon for fresh impetus in the early trading hours of Friday.
After dropping to a fresh multi-month low near 1.3300, USD/CAD regained its traction and closed in positive territory on Wednesday. The pullback seen in crude oil prices made it difficult for the commodity-sensitive Loonie to continue to outperform the USD. Statistics Canada will release October Retail Sales data later in the day.
Gold price turned south and declined to the $2,030 area on Wednesday. Falling US Treasury bond yields, however, allowed XAU/USD to limit its losses. Early Thursday, the pair moves up and down in a narrow band below $2,040.
- EUR/GBP trades in positive territory for two straight days on Thursday.
- The sharp fall in UK inflation data raises the odds that the Bank of England (BoE) will cut interest rates by May 2024.
- Many ECB policymakers warned markets against betting on imminent rate cuts.
- Investors will closely watch the UK’s GDP growth numbers for the third quarter (Q3), due on Friday.
The EUR/GBP cross holds positive ground for the second consecutive day during the early European session on Thursday. The hawkish stance of the European Central Bank (ECB) lends some support to the cross. EUR/GBP currently trades near 0.8663, up 0.06% on the day.
Late Wednesday, European Central Bank (ECB) Governing Council member Martins Kazaks said that they need to maintain interest rates at the current level for some time, but the first rate cut could come around mid-2024.
Meanwhile, the two hawks from the ECB warned markets against betting on imminent rate cuts. ECB policymaker Klaas Knot stated that the potential for economic recovery in the eurozone next year and uncertainty over the strength of wage growth mean there’s no reason for the central bank to rush into rate cuts. Additionally, Joachim Nagel said that they must keep the current interest rate plateau so that monetary policy can fully develop its inflation-dampening effect.
On the other hand, the sharp fall in UK inflation data prompted investors to increase their bets that the Bank of England (BoE) will cut interest rates in the first half of next year. The annual UK Consumer Price Index (CPI) for November rose 3.9% versus 4.6% prior, below the market expectation of 4.4%, while the Core CPI eased from 5.7% in October to 5.1% in November, worse than the expectation of 5.6%.
The markets are now fully pricing in a BoE rate cut by May 2024 and now see a nearly 50% chance of a cut by March. This, in turn, exerts some selling pressure on the British Pound (GBP) and acts as a tailwind for the EUR/GBP cross.
Later on Thursday, November’s UK Public Sector Net Borrowing and Italy’s Producer Price Index (PPI) will be released. On Friday, the UK’s Gross Domestic Product (GDP) for the third quarter (Q3) will be in the spotlight. Traders will take cues from the data and find trading opportunities around the EUR/GBP cross.
- EUR/JPY loses traction around 156.60, backed by the positive economic outlook from the Japanese government.
- The cross maintains the bearish vibe as it holds below the key EMA; RSI indicator stands in bearish territory below 50.
- The immediate resistance level is seen at 157.71; the initial support level is located at 155.38.
The EUR/JPY cross extends its downside near 156.60 during the early European session on Thursday. That being said, the upward revision of economic growth estimates by the Japanese government lifts the Japanese Yen (JPY) and creates a headwind for the EUR/JPY cross.
From the technical perspective, EUR/JPY keeps the bearish potential intact as the cross holds below the key 100-hour Exponential Moving Averages (EMAs) on the four-hour chart. Additionally, the 14-day Relative Strength Index (RSI) stands in bearish territory below 50, indicating further downside looks favorable.
Any follow-through buying above the 100-hour EMA at 157.71 will see a rally to a high of December 19 at 158.60. The next upside barrier is seen near the upper boundary of the Bollinger Band at 158.75, en route to a high of December 5 at 159.72.
On the flip side, the initial support level for EUR/JPY is located near a low of December 19 at 155.38. The key contention level will emerge near the lower limit of the Bollinger Band and a psychological level at the 155.00–155.05 zone. A breach of this level will see a drop to a low of December 15 at 154.40. The additional downside filter to watch is a low of December 14 at 153.85.
EUR/JPY four-hour chart
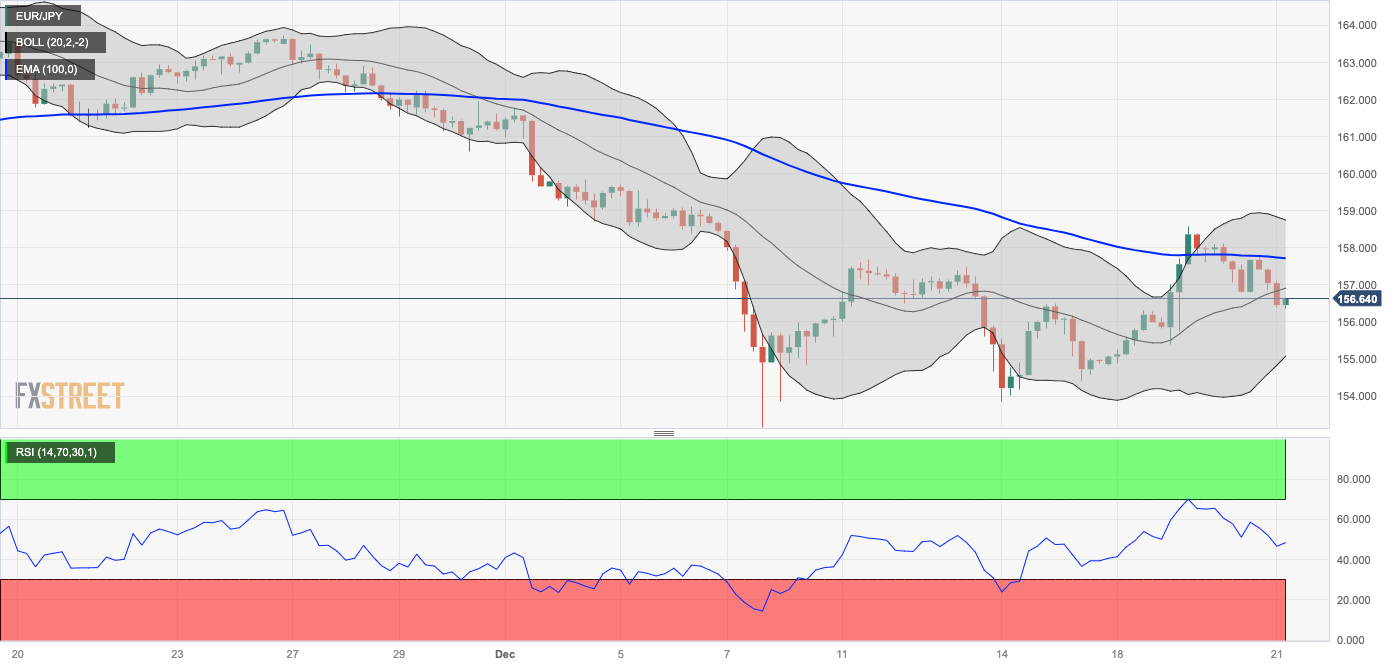
- GBP/USD remains calm due to lowered inflation from the United Kingdom.
- UK CPI and Core CPI YoY eased at 3.9% and 5.1%, respectively.
- Several Fed officials have denied speculations on the Fed's rate cuts and called it premature.
GBP/USD hovers around 1.2640 during the Asian hours on Thursday, attempting to recover its recent losses registered on Wednesday. The Pound Sterling (GBP) faced a challenge due to downbeat inflation from the United Kingdom (UK). Additionally, the US Dollar (USD) witnessed gains on improved economic data from the United States (US).
UK Consumer Price Index (CPI) (YoY) eased at 3.9% from the previous figures of 4.6%, against the expected readings of 4.4% in November. The CPI (MoM) dropped 0.2% MoM in November from a flat 0.0% in the previous reading and below the 0.1% estimated. The Core CPI (YoY) rose 5.1% versus 5.7% prior and the market consensus of 5.6%. Investors will further observe Gross Domestic Product and Retail Sales data scheduled to be released on Friday.
The US Dollar Index (DXY) experiences a decline, hovering around 102.30, despite the presence of higher US Treasury yields. The 2-year and 10-year yields on US bond coupons are at 4.36% and 3.86%, respectively, at the time of writing. The market is reflecting speculation fueled by the dovish sentiment surrounding the US Federal Reserve's (Fed) interest rate trajectory in early 2024, which is contributing to the downward pressure on the Greenback.
However, it's crucial that several Fed officials have emphasized a cautious approach and discouraged premature speculations on policy rate cuts. The dynamic interplay between interest rates, central bank sentiment, and market expectations continues to shape the movements of the US Dollar.
The US Existing Home Sales Change indicated a notable monthly rate increase of 0.8% in November, representing a significant rebound from the previous decline of 4.1%. Adding to the positive economic indicators, CB Consumer Confidence experienced substantial growth in December, marking the most significant increase since early 2021, rising from 101.0 to 110.07.
Looking ahead, market participants are likely awaiting key economic releases on Thursday for further insights into the US economy. These include US Gross Domestic Product Annualized (Q3), Initial Jobless Claims, and the Philadelphia Fed Manufacturing Survey.
- EUR/USD recovers on the back of the weaker Greenback.
- The 1.1000 level could act as the psychological barrier before the two-month high at 1.1017.
- The seven-day EMA at 1.0922 emerges as the key support followed by the psychological level at 1.0900.
EUR/USD stages a recovery, bouncing back from the intraday low at 1.0929 incurred in the previous session. The Euro faced a challenge against the US Dollar (USD) due to the improved economic data emerging from the United States (US). As of the Asian hours on Thursday, the EUR/USD pair is trading higher, hovering around the significant level of 1.0950.
The Moving Average Convergence Divergence (MACD) indicates an overall positive momentum, as the MACD line is positioned above the centerline and the signal line. However, the 14-day Relative Strength Index (RSI) moves below the 50 mark. Investors may choose to exercise patience and wait for confirmation from this lagging indicator regarding the potential upward trend.
The EUR/USD pair could revisit the psychological resistance at the 1.1000 level, followed by the two-month high at 1.1017. The prevailing bullish sentiment, supported by the MACD, could reinforce the EUR/USD pair to surpass the psychological barrier and aim for a significant level at 1.1050.
Looking at the downside, the EUR/USD pair could find support at the seven-day Exponential Moving Average (EMA) at 1.0922 followed by the psychological support region around 1.0900. A firm break below the latter could inspire the bears of the pair to navigate around the 23.6% Fibonacci retracement level at 1.0884.
EUR/USD: Daily Chart
-638387304857420132.png)
- Gold price regained positive traction on Thursday and reversed a part of the overnight losses.
- Dovish Fed expectations keep the USD bulls on the defensive and lend support to the metal.
- The overnight late sell-off in the US equity markets further benefits the safe-haven XAU/USD.
Gold price (XAU/USD) posted modest losses on Wednesday and snapped a two-day winning streak to the weekly top, around the $2,047 region touched the previous day. The downfall was sponsored by a modest pickup in the US Dollar (USD) demand, though the overnight abrupt sell-off in the US equity markets helped limit the downside for the safe-haven metal. Looking at the broader picture, the commodity has been oscillating in a familiar range over the past week or so, awaiting a fresh catalyst before the next leg of a directional move.
Hence, the focus remains glued to Friday's release of the US Core Personal Consumption Expenditure (PCE) Price Index. The key inflation data should influence the Federal Reserve's (Fed) future policy decisions and determine the near-term trajectory for the non-yielding Gold price. In the meantime, growing acceptance that the US central bank will start cutting interest rates as early as March 2024 drags the US Treasury bond yields to a fresh multi-month low. This is seen weighing on the USD and lending some support to the precious metal.
Daily Digest Market Movers: Gold price remains supported by March Fed rate cut bets
- Rising bets that the Federal Reserve will eventually pivot away from its hawkish stance early next year turn out to be a key factor acting as a tailwind for the Gold price.
- Dovish Fed expectations drag the yield on the benchmark 10-year US government bond to its lowest level since July and keep the US Dollar bulls on the defensive.
- A slew of Fed officials recently tried to push back on the idea of rapid interest rate cuts next year, albeit did little to provide any meaningful impetus to the buck.
- The Conference Board's US Consumer Confidence Index jumped to a five-month high level of 110.7 in December from 101, rising the most since early 2021.
- US existing home sales unexpectedly rose by 0.8% in November, to a seasonally adjusted annual rate of 3.82 million units, snapping five straight months of decline.
- The overnight dramatic turnaround in the US equity markets is seen as another factor that benefits the safe-haven precious metal and remains supportive of the uptick.
- Traders now look forward to the final US GDP print, which is expected to show that the world's largest economy grew by a 5.2% annualized pace during the third quarter.
- Thursday's US economic docket also features the release of Weekly Initial Jobless Claims data and the Philly Fed Manufacturing Index later during the US session.
- The focus, meanwhile, remains on the Core PCE Price Index, due on Friday, which will influence the Fed's future rate decisions and infuse volatility in the markets.
Technical Analysis: Gold price remains confined in over a one-week-old trading range
From a technical perspective, the recent range-bound price action constitutes the formation of a rectangle pattern on short-term charts. This marks a consolidation phase before the next leg of a directional move. Against the backdrop of last week's post-FOMC rally from the vicinity of the 50-day Simple Moving Average (SMA) and the occurrence of a golden cross, with the 50-day SMA holding above the 200-day SMA, support prospects for an eventual break higher. The constructive setup is reinforced by the fact that oscillators on the daily chart are holding in the positive territory and are still far from being in the overbought zone. This, in turn, suggests that the path of least resistance for the Gold price is to the upside.
That said, it will still be prudent to wait for a sustained breakout through the $2,047-2,048 region, or the top boundary of the aforementioned trading band, before positioning for any further gains. The XAU/USD might then accelerate the positive move towards the next relevant resistance near the $2,072-2,073. The momentum could get extended further and allow the Gold price to reclaim the $2,100 round figure.
On the flip side, the $2,028 region is likely to protect the immediate downside ahead of the trading range support, near the $2,017 zone. A convincing break below the latter might shift the short-term bias in favour of bearish traders. The subsequent decline could then drag the Gold price to the $2,000 psychological mark. This is closely followed by the 50-day SMA, near the $1,992-1,991 zone, below which the XAU/USD could retest last week's swing low, around the $1,973 region, and decline further to the 200-day SMA, currently near the $1,957 area.
US Dollar price this week
The table below shows the percentage change of US Dollar (USD) against listed major currencies this week. US Dollar was the strongest against the Japanese Yen.
| USD | EUR | GBP | CAD | AUD | JPY | NZD | CHF | |
| USD | -0.49% | 0.29% | -0.16% | -0.76% | 0.44% | -0.67% | -0.99% | |
| EUR | 0.49% | 0.78% | 0.35% | -0.26% | 0.94% | -0.18% | -0.50% | |
| GBP | -0.29% | -0.78% | -0.45% | -1.05% | 0.14% | -0.96% | -1.28% | |
| CAD | 0.17% | -0.33% | 0.44% | -0.60% | 0.58% | -0.51% | -0.84% | |
| AUD | 0.75% | 0.26% | 1.04% | 0.60% | 1.17% | 0.09% | -0.22% | |
| JPY | -0.46% | -0.93% | -0.16% | -0.58% | -1.22% | -1.13% | -1.42% | |
| NZD | 0.65% | 0.18% | 0.95% | 0.49% | -0.08% | 1.09% | -0.33% | |
| CHF | 0.98% | 0.49% | 1.27% | 0.83% | 0.22% | 1.40% | 0.32% |
The heat map shows percentage changes of major currencies against each other. The base currency is picked from the left column, while the quote currency is picked from the top row. For example, if you pick the Euro from the left column and move along the horizontal line to the Japanese Yen, the percentage change displayed in the box will represent EUR (base)/JPY (quote).
Gold FAQs
Why do people invest in Gold?
Gold has played a key role in human’s history as it has been widely used as a store of value and medium of exchange. Currently, apart from its shine and usage for jewelry, the precious metal is widely seen as a safe-haven asset, meaning that it is considered a good investment during turbulent times. Gold is also widely seen as a hedge against inflation and against depreciating currencies as it doesn’t rely on any specific issuer or government.
Who buys the most Gold?
Central banks are the biggest Gold holders. In their aim to support their currencies in turbulent times, central banks tend to diversify their reserves and buy Gold to improve the perceived strength of the economy and the currency. High Gold reserves can be a source of trust for a country’s solvency. Central banks added 1,136 tonnes of Gold worth around $70 billion to their reserves in 2022, according to data from the World Gold Council. This is the highest yearly purchase since records began. Central banks from emerging economies such as China, India and Turkey are quickly increasing their Gold reserves.
How is Gold correlated with other assets?
Gold has an inverse correlation with the US Dollar and US Treasuries, which are both major reserve and safe-haven assets. When the Dollar depreciates, Gold tends to rise, enabling investors and central banks to diversify their assets in turbulent times. Gold is also inversely correlated with risk assets. A rally in the stock market tends to weaken Gold price, while sell-offs in riskier markets tend to favor the precious metal.
What does the price of Gold depend on?
The price can move due to a wide range of factors. Geopolitical instability or fears of a deep recession can quickly make Gold price escalate due to its safe-haven status. As a yield-less asset, Gold tends to rise with lower interest rates, while higher cost of money usually weighs down on the yellow metal. Still, most moves depend on how the US Dollar (USD) behaves as the asset is priced in dollars (XAU/USD). A strong Dollar tends to keep the price of Gold controlled, whereas a weaker Dollar is likely to push Gold prices up.
- USD/CHF edges lower as the US Dollar fails to continue gaining.
- The Greenback faces challenges despite upbeat US bond yields.
- SNB can intervene in the foreign exchange market to support the Swiss Franc.
USD/CHF trades lower around 0.8620 during the Asian session on Thursday. The USD/CHF pair loses ground as the US Dollar (USD) moves downward despite improved US Treasury yields. The 2-year and 10-year yields on United States (US) bond coupons stand higher at 4.36% and 3.86%, respectively, by the press time.
The US Dollar Index (DXY) trades around 102.30, and it seems like the dovish sentiment surrounding the US Federal Reserve's interest rate trajectory in early 2024 is putting pressure on the Greenback. Despite Fed officials urging a cautious approach and discouraging premature speculations, the Dollar is facing downward pressure.
However, the Greenback found support on Wednesday with improved economic data from the United States. The US Existing Home Sales Change revealed a monthly rate increase of 0.8% in November, a significant rebound from the previous decline of 4.1%. Additionally, CB Consumer Confidence experienced substantial growth in December, marking the most significant increase since early 2021, rising from 101.0 to 110.07.
Market participants await the US Gross Domestic Product Annualized (Q3), Initial Jobless Claims, and Philadelphia Fed Manufacturing Survey on Thursday to gain more cues in the US economy.
In its December meeting, the Swiss National Bank (SNB) opted to keep the policy rate unchanged at 1.75%. According to the Quarterly Bulletin released on Wednesday, SNB's sight deposits held at the central bank are remunerated at the SNB policy rate up to a specific threshold, and at 1.25% above this threshold. Additionally, the SNB expressed its readiness to be active in the foreign exchange market as deemed necessary, indicating a proactive stance in managing currency dynamics.
The inflationary pressure has seen a slight decrease over the past quarter, but uncertainty in the economic landscape remains elevated. In November, inflation stood at 1.4%, showing a modest decline compared to previous months. However, the expectation is that inflation will likely increase once again in the coming months. This anticipated uptick is attributed to factors such as higher electricity prices, rising rents, and the impact of an increase in Value Added Tax (VAT).
The SNB has affirmed its commitment to closely monitor the development of inflation. Should the need arise, the SNB is prepared to make adjustments to its monetary policy. The primary objective is to ensure that inflation stays within the range that aligns with price stability over the medium term.
- Indian Rupee drifts lower amid the modest rebound of the USD.
- The Reserve Bank of India’s (RBI) monthly bulletin emphasized a strong warning on inflation.
- Market players will focus on the US GDP for Q3, due later on Thursday.
Indian Rupee (INR) trades on the weaker side on Thursday. The Reserve Bank of India’s (RBI) monthly bulletin emphasized that if headline retail inflation is not brought down to the medium-term target of 4% and tethered there, it could underscore the potential impact on growth.
Indian headline retail inflation rate rose 5.55% in November, worse than the market expectation. According to the RBI's latest estimations, Consumer Price Index (CPI) inflation is seen averaging 4% in July-September 2024. RBI governor Shaktikanta Das stated that reaching 4% should not just be a one-off event, the MPC should have confidence that 4% has become durable.
Investors will monitor the US Gross Domestic Product Annualized (Q3), due later on Thursday. The growth number is projected to remain steady at 5.2%. The attention will shift to November’s Core Personal Consumption Expenditures Price Index (PCE) on Friday, which is estimated to grow 0.2% MoM and 3.3% YoY, respectively.
Daily Digest Market Movers: Indian Rupee stays vulnerable amid the elevated inflation
- India’s foreign exchange reserves stood at $606.9 billion on December 8, 2023, the fourth highest among major foreign exchange reserve-holding countries, having increased by
- $28.4 billion during 2023–24.
- India's total outstanding bonds traded in the market surged to $2.47 trillion in the September quarter from $2.34 trillion in the March quarter.
- According to the RBI's monthly Bulletin, the RBI sold $310 million in the spot foreign currency market in October.
- The International Monetary Fund (IMF) has reclassified India's exchange rate regime from floating to a stabilized arrangement.
- Consumer confidence in the United States increased by the most since early 2021, rising to 110.7 in December from 101.0 the previous month (revised down from 102.0).
- The annual rate of Existing Home Sales jumped to 3.82 million in November, above the market consensus of 3.77 million.
- The market expects the Fed to hold its benchmark rate steady at its January meeting but could begin cutting it as soon as March, according to the CME FedWatch Tool.
Technical Analysis: Indian Rupee to remain range-bound between 82.80 and 83.40
Indian Rupee trades weaker on the day. The USD/INR pair has remained stuck within the 82.80–83.40 range since September. Technically, USD/INR holds above the key 100-day Exponential Moving Average (EMA) on the daily chart. However, further challenges to the key EMA cannot be ruled out as the 14-day Relative Strength Index (RSI) lies below the 50.0 midpoint.
The upper boundary of the trading range at 83.40 acts as an immediate resistance level for USD/INR. A decisive break above 83.40 will see the next hurdle at the year-to-date (YTD) high of 83.47, en route to the psychological round figure of 84.00.
On the downside, the key contention level will emerge at the 83.00 psychological mark. Further south, the next downside stop to watch is the confluence of the lower limit of the trading range and a low of September 12 at 82.80. A breach of this level will see a drop to a low of August 11 at 82.60.
US Dollar price today
The table below shows the percentage change of US Dollar (USD) against listed major currencies today. US Dollar was the strongest against the Pound Sterling.
| USD | EUR | GBP | CAD | AUD | JPY | NZD | CHF | |
| USD | -0.04% | 0.05% | -0.03% | -0.12% | -0.36% | 0.05% | -0.04% | |
| EUR | 0.03% | 0.09% | 0.02% | -0.08% | -0.29% | 0.10% | 0.00% | |
| GBP | -0.05% | -0.10% | -0.07% | -0.16% | -0.43% | 0.00% | -0.10% | |
| CAD | 0.03% | -0.02% | 0.07% | -0.09% | -0.35% | 0.08% | -0.03% | |
| AUD | 0.12% | 0.06% | 0.15% | 0.08% | -0.25% | 0.16% | 0.05% | |
| JPY | 0.37% | 0.30% | 0.42% | 0.32% | 0.24% | 0.43% | 0.31% | |
| NZD | -0.05% | -0.11% | -0.01% | -0.06% | -0.16% | -0.42% | -0.12% | |
| CHF | 0.06% | 0.00% | 0.10% | 0.02% | -0.07% | -0.31% | 0.10% |
The heat map shows percentage changes of major currencies against each other. The base currency is picked from the left column, while the quote currency is picked from the top row. For example, if you pick the Euro from the left column and move along the horizontal line to the Japanese Yen, the percentage change displayed in the box will represent EUR (base)/JPY (quote).
Indian Rupee FAQs
What are the key factors driving the Indian Rupee?
The Indian Rupee (INR) is one of the most sensitive currencies to external factors. The price of Crude Oil (the country is highly dependent on imported Oil), the value of the US Dollar – most trade is conducted in USD – and the level of foreign investment, are all influential. Direct intervention by the Reserve Bank of India (RBI) in FX markets to keep the exchange rate stable, as well as the level of interest rates set by the RBI, are further major influencing factors on the Rupee.
How do the decisions of the Reserve Bank of India impact the Indian Rupee?
The Reserve Bank of India (RBI) actively intervenes in forex markets to maintain a stable exchange rate, to help facilitate trade. In addition, the RBI tries to maintain the inflation rate at its 4% target by adjusting interest rates. Higher interest rates usually strengthen the Rupee. This is due to the role of the ‘carry trade’ in which investors borrow in countries with lower interest rates so as to place their money in countries’ offering relatively higher interest rates and profit from the difference.
What macroeconomic factors influence the value of the Indian Rupee?
Macroeconomic factors that influence the value of the Rupee include inflation, interest rates, the economic growth rate (GDP), the balance of trade, and inflows from foreign investment. A higher growth rate can lead to more overseas investment, pushing up demand for the Rupee. A less negative balance of trade will eventually lead to a stronger Rupee. Higher interest rates, especially real rates (interest rates less inflation) are also positive for the Rupee. A risk-on environment can lead to greater inflows of Foreign Direct and Indirect Investment (FDI and FII), which also benefit the Rupee.
How does inflation impact the Indian Rupee?
Higher inflation, particularly, if it is comparatively higher than India’s peers, is generally negative for the currency as it reflects devaluation through oversupply. Inflation also increases the cost of exports, leading to more Rupees being sold to purchase foreign imports, which is Rupee-negative. At the same time, higher inflation usually leads to the Reserve Bank of India (RBI) raising interest rates and this can be positive for the Rupee, due to increased demand from international investors. The opposite effect is true of lower inflation.
- WTI price faced the challenge as US Crude inventories rose unexpectedly.
- US EIA Crude Oil Stocks Change rose to 2.909M barrels against the expected decrease of 2.233M barrels.
- US-led coalition revised its compliance regime to confirm that the Russian oil was sold within the imposed price cap.
- US Treasury Department imposed fresh sanctions on a ship manager and three oil traders engaged in the Russian oil trade.
West Texas Intermediate (WTI) price hovers around $74.00 per barrel during the Asian session on Thursday, following losses in the previous session. Crude oil prices face downward pressure due to concerns about low demand, sparked by a surprise increase in US Crude inventory.
US EIA Crude Oil Stocks Change revealed that US Crude inventories for the week ending on December 15 unexpectedly rose to 2.909 million barrels. This contrasts with the anticipated decrease of 2.233 million barrels and the prior substantial drop of 4.259 million barrels. The unexpected inventory build contributes to the bearish sentiment in the Crude oil market.
The US Energy Information Administration (EIA) added to the market dynamics by reporting that US Crude output reached a record 13.3 million barrels per day (bpd) in the last week. This marks an increase from the previous all-time high of 13.2 million bpd.
The complex dynamics in the Crude oil market continue as prices find support from escalating tensions in the Middle East. The attacks by the Iran-led Houthi militant group on commercial vessels in the Red Sea have heightened concerns. The Suez Canal, a critical waterway through which approximately 12% of world shipping traffic passes, is now facing disruptions. Several shipping companies have opted to temporarily halt all transit through the canal, adding an element of uncertainty to global shipping.
In response to these events, the United States (US) has taken proactive measures by establishing a task force. This task force is dedicated to safeguarding Red Sea commerce, underlining the significance of addressing and mitigating risks arising from the attacks on commercial vessels in the region.
The US-led coalition, overseeing the price cap on seaborne Russian oil, made significant changes to its compliance regime on Wednesday. In addition to these adjustments, the US Treasury Department imposed fresh sanctions on a ship manager owned by the Russian government and three oil traders engaged in the Russian oil trade.
Under the revised compliance regime, Western maritime service providers will soon be required to obtain declarations from their counterparties, confirming that the Russian oil was sold within the imposed price cap. The mechanism of the price cap prohibits Western companies from offering maritime services, including financing, insurance, and shipping, for oil transactions exceeding the established cap.
These measures reflect the coalition's efforts to tighten restrictions and ensure compliance with the price cap on seaborne Russian oil, signaling ongoing economic pressures on Russia.
The Biden administration's auction of Gulf of Mexico drilling rights on Wednesday proved to be successful, raising an impressive $382 million. According to a Reuters tally, this auction total stands as the highest for any federal offshore oil and gas lease sale since 2015.
Moreover, a survey of oil and gas executives by the Dallas Federal Reserve Bank revealed that oil and gas activity kept unchanged in the fourth quarter.
| Raw materials | Closed | Change, % |
|---|---|---|
| Silver | 24.131 | 0.44 |
| Gold | 2030.856 | -0.45 |
| Palladium | 1197.96 | -2.02 |
- EUR/USD regains positive traction during the Asian session on Thursday amid a modest USD downtick.
- The fundamental backdrop seems tilted in favour of bulls and supports prospects for a further move up.
- Investors now look forward to the US macroeconomic releases for short-term trading opportunities.
The EUR/USD pair attracts some dip-buying during the Asian session on Thursday and reverses a part of the previous day's retracement slide from the weekly top. Spot prices currently trade around mid-1.0900s, up just over 0.15% for the day, and draw support from a modest US Dollar (USD) downtick.
Investors now seem convinced that the Federal Reserve (Fed) will start cutting interest rates early next year, which leads to a further decline in the US Treasury bond yields. In fact, the yield on the benchmark 10-year US government bond drops to its lowest level since July and fails to assist the Greenback to capitalize on Wednesday's upbeat US macro data-inspired gains. Apart from this, a modest recovery in the US equity futures, following the overnight late sell-off, further undermines the safe-haven buck and lends support to the EUR/USD pair.
The shared currency, on the other hand, draws support from reduced bets for early interest rate cuts by the European Central Bank (ECB). In fact, Slovak central bank chief Peter Kazimir said on Monday that any talk of the ECB cutting rates is premature. Echoing the view, ECB policymaker Bostjan Vasle noted that the central bank will need at least until spring before it can reassess its policy outlook and market expectations for an interest rate cut in March or April are premature. This is seen as another factor acting as a tailwind for the EUR/USD pair.
That said, a slew of Fed officials recently tried to push back against expectations that the US central bank will completely pivot away from its hawkish stance in the wake of still-elevated inflation. This, in turn, raises the uncertainty over the timing of when the Fed will begin easing its monetary policy and might help limit losses for the buck. Traders might also refrain from placing aggressive USD bearish best ahead of the release of the US Core PCE Price Index on Friday, which will influence the Fed's future policy decision and provide a fresh impetus.
Nevertheless, the aforementioned fundamental backdrop seems tilted in favour of bullish traders and suggests that the path of least resistance for the EUR/USD pair is to the upside. Market participants now look to the US economic docket, featuring the final Q3 GDP print, the usual Weekly Initial Jobless Claims data and the Philly Fed Manufacturing Index. This, along with the US bond yields and the broader risk sentiment, will influence the USD price dynamics and produce short-term trading opportunities later during the early North American session.
Technical levels to watch
- USD/CAD edges lower to 1.3351 amid the ongoing sell-off in USD.
- The annual rate of US Existing Home Sales arrived at 3.82M in November, better than expected.
- BoC Governing Council agreed that rates were high enough to curb inflation, but the risks to the inflation outlook remained high.
- Investors will focus on Canadian Retail Sales and US GDP Annualized for Q3.
The USD/CAD pair trades on a softer note during the early Asian session on Thursday. The pair bounces off the four-month lows of 1.3310 and rebounds to 1.3350. However, the upside of the US Dollar (USD) might be limited due to the anticipation of the three rate cuts from the Federal Reserve (Fed). Investors await the Canadian Retail Sales and US GDP growth numbers on Thursday. These events could trigger volatility in the currency pair ahead of the holiday.
The hawkish remarks from the Fed last week and the signal that the central bank will cut interest rates by a total of 75 basis points (bps) have exerted some selling pressure on the US Dollar (USD) broadly. The Fed Chair Jerome Powell didn’t provide any guidance on the timeline of rate cuts, but the markets are expecting a cut as early as March.
On Wednesday, US CB Consumer Confidence for December grew by the most since early 2021, rising to 110.7 versus 101.0 prior (revised down from 102.0). Furthermore, the annual rate of Existing Home Sales climbed to 3.82M in November, better than the market expectation of 3.77M.
On the Loonie front, the Bank of Canada (BoC) revealed the Summary of Deliberations of the December 6 meeting. The Governing Council agreed that interest rates were high enough to curb inflation when they decided to leave borrowing costs on hold at its December meeting. However, the risks to the inflation outlook remained high, and central bank opened the door for another rate hike.
Traders will take more cues from the Canadian Retail Sales for October, which is estimated to show an increase of 0.8% MoM from 0.6% in the previous reading. Also, the US Gross Domestic Product Annualized for the third quarter (Q3) will be due on Thursday. The growth rate is projected to remain steady at 5.2%.
- Australian Dollar trades higher on improved risk appetite and hawkish RBA.
- Australian central bank will observe data to evaluate the risks before making future policy decisions.
- US Dollar faces negative sentiment due to speculation on the Fed’s rate cuts in early 2024.
The Australian Dollar (AUD) retraces its recent losses on Thursday after pulling back from a five-month high at 0.6779. The US Dollar (USD) gained ground against the Aussie Dollar in the previous session on the back of improved economic data from the United States (US). Consequently, the AUD/USD pair snapped its five-day winning streak.
Australia's central bank takes a hawkish stance, as indicated in the Meeting Minutes on Tuesday, providing a boost to the Australian Dollar. The Reserve Bank of Australia (RBA) is expected to carefully scrutinize additional data to evaluate the balance of risks before making future interest rate decisions. According to the World Interest Rate Probability Tool (WIRP), there's widespread anticipation that the RBA will refrain from a rate cut in February's policy meeting.
The US Dollar Index (DXY) loses ground on Thursday despite improved US Treasury yields. Additionally, the dovish sentiment surrounding the US Federal Reserve’s (Fed) interest rate trajectory in early 2024 put pressure on the US Dollar. However, Fed officials discouraged premature speculations and urged a cautious approach.
US Existing Home Sales Change showed a monthly rate increase of 0.8% in November, a notable turnaround from the previous decline of 4.1%. CB Consumer Confidence for December experienced substantial growth in December, marking the most significant increase since early 2021, rising from 101.0 to 110.07.
Daily Digest Market Movers: Australian Dollar remains bullish on improved risk sentiment
- Westpac Leading Index (MoM) for November improved by 0.01% against the previous reading of flat 0.0%.
- Australia’s preliminary Judo Bank Composite PMI improved to 47.4 from the previous reading of 46.2.
- The Manufacturing PMI registered 47.8, a slight increase from the prior figure of 47.7.
- The Services PMI grew to 47.6 compared to the previous reading of 46.0.
- Australia’s Consumer Inflation Expectations for December eased at 4.5% against the previous figures of 4.9%.
- The People’s Bank of China (PBoC) released its Interest Rate Decision on Wednesday. The Monetary Policy Committee (MPC) kept the benchmark rate unchanged at 3.45%.
- New York Fed President John Williams opposed the speculation surrounding a potential rate cut in March.
- San Francisco Fed President Mary Daly called the predictions on policy stance premature.
- Austan Goolsbee, Chicago Fed President echoed a similar sentiment, cautioning that the market's optimism for interest rate cuts may have gone beyond realistic expectations.
- US Housing Starts rose to 1.56M, surpassing the market consensus of 1.36M. However, Building Permits declined to 1.46M, slightly below the forecast of 1.47M.
Technical Analysis: Australian Dollar maintains its position below 0.6750 major level
The Australian Dollar trades higher around 0.6740 on Thursday, slightly below the significant level at 0.6750. The prevailing bullish sentiment suggests a potential for the AUD/USD pair to revisit the recent peak at 0.6779 and aim for the key resistance at the psychological level of 0.6800. On the downside, support levels may be identified at the seven-day Exponential Moving Average (EMA) at 0.6707, followed by the psychological level at 0.6700. A breach below this crucial support region could lead the AUD/USD pair towards the 23.6% Fibonacci retracement at 0.6659 before reaching the major zone at 0.6650.
AUD/USD: Daily Chart
-638387197039212522.png)
Australian Dollar price today
The table below shows the percentage change of Australian Dollar (AUD) against listed major currencies today. Australian Dollar was the strongest against the US Dollar.
| USD | EUR | GBP | CAD | AUD | JPY | NZD | CHF | |
| USD | -0.06% | -0.03% | -0.04% | -0.05% | -0.35% | -0.02% | -0.06% | |
| EUR | 0.06% | 0.04% | 0.04% | 0.03% | -0.25% | 0.06% | 0.01% | |
| GBP | 0.02% | -0.04% | 0.00% | -0.02% | -0.34% | 0.00% | -0.05% | |
| CAD | 0.05% | -0.03% | 0.02% | 0.00% | -0.30% | 0.03% | -0.02% | |
| AUD | 0.05% | -0.02% | 0.02% | 0.00% | -0.30% | 0.03% | -0.03% | |
| JPY | 0.36% | 0.27% | 0.33% | 0.29% | 0.32% | 0.33% | 0.27% | |
| NZD | 0.03% | -0.05% | -0.01% | -0.02% | -0.03% | -0.32% | -0.06% | |
| CHF | 0.07% | 0.00% | 0.05% | 0.03% | 0.02% | -0.26% | 0.04% |
The heat map shows percentage changes of major currencies against each other. The base currency is picked from the left column, while the quote currency is picked from the top row. For example, if you pick the Euro from the left column and move along the horizontal line to the Japanese Yen, the percentage change displayed in the box will represent EUR (base)/JPY (quote).
Australian Dollar FAQs
What key factors drive the Australian Dollar?
One of the most significant factors for the Australian Dollar (AUD) is the level of interest rates set by the Reserve Bank of Australia (RBA). Because Australia is a resource-rich country another key driver is the price of its biggest export, Iron Ore. The health of the Chinese economy, its largest trading partner, is a factor, as well as inflation in Australia, its growth rate and Trade Balance. Market sentiment – whether investors are taking on more risky assets (risk-on) or seeking safe-havens (risk-off) – is also a factor, with risk-on positive for AUD.
How do the decisions of the Reserve Bank of Australia impact the Australian Dollar?
The Reserve Bank of Australia (RBA) influences the Australian Dollar (AUD) by setting the level of interest rates that Australian banks can lend to each other. This influences the level of interest rates in the economy as a whole. The main goal of the RBA is to maintain a stable inflation rate of 2-3% by adjusting interest rates up or down. Relatively high interest rates compared to other major central banks support the AUD, and the opposite for relatively low. The RBA can also use quantitative easing and tightening to influence credit conditions, with the former AUD-negative and the latter AUD-positive.
How does the health of the Chinese Economy impact the Australian Dollar?
China is Australia’s largest trading partner so the health of the Chinese economy is a major influence on the value of the Australian Dollar (AUD). When the Chinese economy is doing well it purchases more raw materials, goods and services from Australia, lifting demand for the AUD, and pushing up its value. The opposite is the case when the Chinese economy is not growing as fast as expected. Positive or negative surprises in Chinese growth data, therefore, often have a direct impact on the Australian Dollar and its pairs.
How does the price of Iron Ore impact the Australian Dollar?
Iron Ore is Australia’s largest export, accounting for $118 billion a year according to data from 2021, with China as its primary destination. The price of Iron Ore, therefore, can be a driver of the Australian Dollar. Generally, if the price of Iron Ore rises, AUD also goes up, as aggregate demand for the currency increases. The opposite is the case if the price of Iron Ore falls. Higher Iron Ore prices also tend to result in a greater likelihood of a positive Trade Balance for Australia, which is also positive of the AUD.
How does the Trade Balance impact the Australian Dollar?
The Trade Balance, which is the difference between what a country earns from its exports versus what it pays for its imports, is another factor that can influence the value of the Australian Dollar. If Australia produces highly sought after exports, then its currency will gain in value purely from the surplus demand created from foreign buyers seeking to purchase its exports versus what it spends to purchase imports. Therefore, a positive net Trade Balance strengthens the AUD, with the opposite effect if the Trade Balance is negative.
The Japanese Cabinet Office on Thursday revised its economic growth forecasts for this fiscal year from previous estimates, indicating that external demand is likely to more than offset sluggish domestic consumption.
Key quotes
“The real economic growth rate for fiscal 2023/24 is estimated at 1.6%, up from 1.3% seen half a year ago.”
“The fiscal year 2024/25, economic growth projection was bumped up to 1.3%, slightly higher than the previous estimate of 1.2%.”
“External demand is likely to more than offset weak domestic consumption.”
“Domestic demand is expected to rebound in the next fiscal year with the help of planned income tax cuts on top of the ongoing trend of wage hikes
Inflation is seen slowing down to 2.5% for the next fiscal year.”
Market reaction
The Japanese Yen attracts some buyers following the economic growth estimates. At the time of writing, the USD/JPY pair is trading around 143.05, down 0.48% on the day.
Japanese Yen FAQs
What key factors drive the Japanese Yen?
The Japanese Yen (JPY) is one of the world’s most traded currencies. Its value is broadly determined by the performance of the Japanese economy, but more specifically by the Bank of Japan’s policy, the differential between Japanese and US bond yields, or risk sentiment among traders, among other factors.
How do the decisions of the Bank of Japan impact the Japanese Yen?
One of the Bank of Japan’s mandates is currency control, so its moves are key for the Yen. The BoJ has directly intervened in currency markets sometimes, generally to lower the value of the Yen, although it refrains from doing it often due to political concerns of its main trading partners. The current BoJ ultra-loose monetary policy, based on massive stimulus to the economy, has caused the Yen to depreciate against its main currency peers. This process has exacerbated more recently due to an increasing policy divergence between the Bank of Japan and other main central banks, which have opted to increase interest rates sharply to fight decades-high levels of inflation.
How does the differential between Japanese and US bond yields impact the Japanese Yen?
The BoJ’s stance of sticking to ultra-loose monetary policy has led to a widening policy divergence with other central banks, particularly with the US Federal Reserve. This supports a widening of the differential between the 10-year US and Japanese bonds, which favors the US Dollar against the Japanese Yen.
How does broader risk sentiment impact the Japanese Yen?
The Japanese Yen is often seen as a safe-haven investment. This means that in times of market stress, investors are more likely to put their money in the Japanese currency due to its supposed reliability and stability. Turbulent times are likely to strengthen the Yen’s value against other currencies seen as more risky to invest in.
- The Japanese Yen scales higher for the second straight day amid reviving safe-haven demand.
- The BoJ’s dovish stance might cap gains for the JPY and help limit losses for the USD/JPY pair.
- The market focus remains glued to the key inflation data from Japan and the US, due on Friday.
The Japanese Yen (JPY) ticks higher against its American counterpart for the second straight day on Thursday, with the USD/JPY pair moving back closer to the 143.00 round figure during the Asian session. A turnaround in the global risk sentiment, as depicted by the overnight abrupt sell-off in the US equity markets, is seen as a key factor benefitting the JPY's relative safe-haven status. That said, the Bank of Japan's (BoJ) decision to maintain its ultra-dovish stance earlier this week might keep a lid on any further gains for the domestic currency.
The US Dollar (USD), on the other hand, is underpinned by the upbeat US macro data released on Wednesday and the fact that Federal Reserve (Fed) officials have been pushing back against the idea of rapid rate cuts next year. This is seen as another factor lending support to the USD/JPY pair. Meanwhile, the markets seem convinced that the Fed will start cutting rates as early as March 2024. Apart from this, the global flight to safety drags the yield on the benchmark 10-year US government bond to its lowest level since July, which could cap the buck.
Traders might also refrain from placing aggressive directional bets ahead of the Japanese inflation data and the US Core Personal Consumption Expenditure (PCE) Price Index – the Fed's preferred inflation gauge – on Friday. The inflation data will, in turn, play a key role in determining the next leg of a directional move for the USD/JPY pair. In the meantime, Thursday's US economic docket – featuring the final Q3 GDP print, the usual Weekly Initial Jobless Claims and the Philly Fed Manufacturing Index – will be looked upon for short-term opportunities.
Daily Digest Market Movers: Japanese Yen attracts haven flows amid a turnaround in risk sentiment
- The overnight slump on Wall Street, breaking a nine-day winning streak, is seen as a key factor underpinning the safe-haven Japanese Yen and weighing on the USD/JPY pair.
- Japan's Cabinet Office published its twice-yearly economic outlook and estimated real economic growth rate for fiscal 2023/24 at 1.6%, up from 1.3% seen half a year ago.
- Economic growth projection for the fiscal 2024/25 was also bumped up to 1.3%, slightly higher than the previous estimate of 1.2%, further benefiting the JPY.
- The Bank of Japan's (BoJ) decision earlier this week to stick to its ultra-loose monetary policy settings should keep a lid on any meaningful appreciating move for the JPY.
- The BoJ also made no changes to its dovish policy guidance, while Governor Kazuo Ueda gave no clear hints on the timing of an exit from the negative interest rates policy.
- The uncertainty over the timing of when the Federal Reserve will begin easing, along with Wednesday's upbeat US macro data, lends some support to the US Dollar.
- A slew of influential Fed officials recently tried to downplay bets that the US central bank will completely pivot away from its hawkish stance despite still-elevated inflation.
- The Conference Board reported that the US Consumer Confidence Index surged in December by the most since early 2021, to 110.7 from the downwardly revised 101 a month earlier.
- US Existing Home Sales unexpectedly rose in November, by 0.8% from the prior month to a seasonally adjusted annualized rate of 3.82 million units, ending five straight monthly declines.
- Investors are still pricing in the possibility of an early interest rate cut by the Fed in 2024, dragging the US bond yields to a fresh multi-month low and capping the Greenback.
- Traders now look to the final US Q3 GDP print, which, along with the usual Weekly Jobless Claims and the Philly Fed Manufacturing Index, might provide some impetus.
- The market attention will then turn to the release of the National Core CPI from Japan and the US Core PCE Price Index – the Fed's preferred inflation gauge – on Friday.
Technical Analysis: USD/JPY could find decent support near 200-day SMA, around 142.70 region
From a technical perspective, the recent failures ahead of the 145.00 psychological mark, coinciding with the 38.2% Fibonacci retracement level of the November-December downfall, and the subsequent slide warrant some caution for bulls. That said, any further decline could find some support near the 143.00 mark. This is followed by the very important 200-day Simple Moving Average (SMA), currently around the 142.70 region. A convincing break below the latter could make the USD/JPY pair vulnerable to accelerate the downward trajectory towards the 142.00 mark en route to the 141.75 horizontal support and sub-141.00 levels, or a multi-month low touched last week.
On the flip side, the 143.85 region now seems to act as an immediate strong resistance ahead of the 144.00 level, which if cleared should allow the USD/JPY pair to make a fresh attempt towards conquering the 145.00 mark. Some follow-through buying will suggest that spot prices have formed a near-term bottom and pave the way for a move beyond the mid-145.00s, towards the 146.00 round figure and the 50% Fibo. level, around the 146.40 region.
Japanese Yen price today
The table below shows the percentage change of Japanese Yen (JPY) against listed major currencies today. Japanese Yen was the strongest against the .
| USD | EUR | GBP | CAD | AUD | JPY | NZD | CHF | |
| USD | -0.06% | -0.07% | -0.05% | -0.11% | -0.27% | -0.11% | -0.09% | |
| EUR | 0.05% | -0.01% | 0.02% | -0.04% | -0.18% | -0.03% | -0.03% | |
| GBP | 0.07% | -0.02% | 0.02% | -0.02% | -0.26% | -0.03% | -0.05% | |
| CAD | 0.04% | -0.03% | -0.01% | -0.04% | -0.25% | -0.03% | -0.06% | |
| AUD | 0.07% | -0.01% | 0.00% | 0.02% | -0.18% | -0.04% | -0.03% | |
| JPY | 0.30% | 0.20% | 0.22% | 0.23% | 0.19% | 0.18% | 0.17% | |
| NZD | 0.08% | 0.00% | 0.02% | 0.03% | 0.00% | -0.21% | -0.04% | |
| CHF | 0.10% | 0.02% | 0.03% | 0.05% | -0.02% | -0.15% | -0.02% |
The heat map shows percentage changes of major currencies against each other. The base currency is picked from the left column, while the quote currency is picked from the top row. For example, if you pick the Euro from the left column and move along the horizontal line to the Japanese Yen, the percentage change displayed in the box will represent EUR (base)/JPY (quote).
Japanese Yen FAQs
What key factors drive the Japanese Yen?
The Japanese Yen (JPY) is one of the world’s most traded currencies. Its value is broadly determined by the performance of the Japanese economy, but more specifically by the Bank of Japan’s policy, the differential between Japanese and US bond yields, or risk sentiment among traders, among other factors.
How do the decisions of the Bank of Japan impact the Japanese Yen?
One of the Bank of Japan’s mandates is currency control, so its moves are key for the Yen. The BoJ has directly intervened in currency markets sometimes, generally to lower the value of the Yen, although it refrains from doing it often due to political concerns of its main trading partners. The current BoJ ultra-loose monetary policy, based on massive stimulus to the economy, has caused the Yen to depreciate against its main currency peers. This process has exacerbated more recently due to an increasing policy divergence between the Bank of Japan and other main central banks, which have opted to increase interest rates sharply to fight decades-high levels of inflation.
How does the differential between Japanese and US bond yields impact the Japanese Yen?
The BoJ’s stance of sticking to ultra-loose monetary policy has led to a widening policy divergence with other central banks, particularly with the US Federal Reserve. This supports a widening of the differential between the 10-year US and Japanese bonds, which favors the US Dollar against the Japanese Yen.
How does broader risk sentiment impact the Japanese Yen?
The Japanese Yen is often seen as a safe-haven investment. This means that in times of market stress, investors are more likely to put their money in the Japanese currency due to its supposed reliability and stability. Turbulent times are likely to strengthen the Yen’s value against other currencies seen as more risky to invest in.
The People’s Bank of China (PBoC) set the USD/CNY central rate for the trading session ahead on Thursday at 7.1012 as compared to the previous day's fix of 7.0966 and 7.1401 Reuters estimates.
- GBP/USD drops to 1.2638 on the modest rebound in USD, softer UK inflation data.
- The annual rate of Existing Home Sales climbed to 3.82M in November, better than the 3.77M expected.
- November’s UK CPI figure climbed 3.9% MoM vs. 4.6% prior, the Core CPI rose 5.1% YoY in November vs. 5.7% previously.
- The US Q3 Gross Domestic Product (GDP) growth numbers will be a closely watched event.
The GBP/USD pair holds below the mid-1.2600s during the early Asian trading hours on Thursday. The downtick of the pair is backed by the weaker-than-expected UK inflation data and a modest recovery of the US Dollar (USD). At press time, the major pair is trading at 1.2638, up 0.08% on the day.
US consumers were more optimistic about the US economy in December. The US CB Consumer Confidence rose to 110.7 versus 101.0 prior (revised down from 102.0). Additionally, the annual rate of Existing Home Sales arrived at 3.82M in November, above the market consensus of 3.77M.
The Federal Reserve (Fed) showed a dovish tone after the interest rate decision meeting last week and 75 basis points (bps) of rate cuts are expected in 2024 due to the cooling inflationary pressure. However, traders will take more cues from the economic data this week, including the US GDP growth numbers for the third quarter and the Core PCE Price Index, the Fed's preferred gauge of inflation. The softer-than-estimated data could drag the Greenback lower against the British Pound (GBP).
On the UK docket, the nation’s Consumer Price Index (CPI) came in worse than market expectations, dropping 0.2% MoM in November from 0% in the previous reading and below the 0.1% estimated. On an annual basis, the CPI figure climbed 3.9% versus 4.6% prior, missing the expectation of 4.4%. Finally, the Core CPI, which excludes volatile food and energy prices, rose 5.1% YoY in November from 5.7% in October, below the market consensus of 5.6%. The downbeat UK inflation data exerts some selling pressure on the GBP and acts as a headwind for the GBP/USD pair.
Moving on, the UK will release Public Borrowing data for November. Also, the Q3 Gross Domestic Product (GDP), weekly Initial Jobless Claims, and the Philly Fed Manufacturing Survey will be due later on Thursday.
| Index | Change, points | Closed | Change, % |
|---|---|---|---|
| NIKKEI 225 | 456.55 | 33675.94 | 1.37 |
| Hang Seng | 108.81 | 16613.81 | 0.66 |
| KOSPI | 45.75 | 2614.3 | 1.78 |
| ASX 200 | 48.8 | 7537.9 | 0.65 |
| DAX | -11.36 | 16733.05 | -0.07 |
| CAC 40 | 8.76 | 7583.43 | 0.12 |
| Dow Jones | -475.92 | 37082 | -1.27 |
| S&P 500 | -70.02 | 4698.35 | -1.47 |
| NASDAQ Composite | -225.28 | 14777.94 | -1.5 |
| Pare | Closed | Change, % |
|---|---|---|
| AUDUSD | 0.67293 | -0.5 |
| EURJPY | 157.095 | -0.42 |
| EURUSD | 1.09422 | -0.35 |
| GBPJPY | 181.428 | -0.8 |
| GBPUSD | 1.26368 | -0.68 |
| NZDUSD | 0.6246 | -0.38 |
| USDCAD | 1.33683 | 0.27 |
| USDCHF | 0.86266 | 0.29 |
| USDJPY | 143.574 | -0.1 |
- NZD/USD gains ground near 0.6253 despite a modest rebound in USD.
- New Zealand ANZ – Roy Morgan Consumer Confidence for November improved to 93.1 vs. 91.9 prior.
- Existing Home Sales came in at 3.82M in November, better than the 3.77M expected.
- A new estimate for GDP growth numbers for Q3 will be in the spotlight on Thursday.
The NZD/USD pair hovers around the mid-0.6200s after retreating from a five-month high slightly below 0.6300 during the early Asian session on Thursday. At press time, the pair is trading at 0.6253, gaining 0.03% for the day.
The Reserve Bank of New Zealand (RBNZ) Governor Adrian Orr stated on Wednesday that they were surprised by GDP data last week indicating the economy shrank, but they will be back in February with the monetary policy statement.”
On Thursday, the New Zealand ANZ – Roy Morgan Consumer Confidence for November improved to 93.1 from 91.9 in the previous reading. Earlier this week, the Business NZ Performance of Services Index (PSI) rose to 51.2 in November versus 48.9 prior.
On the USD’s front, the annual rate of Existing Home Sales came in at 3.82M in November, beating the market expectation of 3.77M. Additionally, CB Consumer Confidence for December climbed from 101.0 to 110.07. The Greenback attracted some buyers following the upbeat data. However, the anticipation of three rate cuts from the Federal Reserve (Fed) next year might cap the USD’s upside and create a tailwind for the NZD/USD pair.
Philadelphia Fed President Patrick Harker said on Wednesday that any future interest rate rises while signaling openness to lowering short-term borrowing costs, albeit not imminently.
Looking ahead, New Zealand will release Credit Card Spending on Thursday. Later in the day, the US weekly Initial Jobless Claims, a new estimate for Gross Domestic Product (GDP) for the third quarter (Q3), and the Philly Fed Manufacturing Survey will be due.


© 2000-2026. Уcі права захищені.
Cайт знаходитьcя під керуванням TeleTrade DJ. LLC 2351 LLC 2022 (Euro House, Richmond Hill Road, Kingstown, VC0100, St. Vincent and the Grenadines).
Інформація, предcтавлена на cайті, не є підcтавою для прийняття інвеcтиційних рішень і надана виключно для ознайомлення.
Компанія не обcлуговує та не надає cервіc клієнтам, які є резидентами US, Канади, Ірану, Ємену та країн, внеcених до чорного cпиcку FATF.
Проведення торгових операцій на фінанcових ринках з маржинальними фінанcовими інcтрументами відкриває широкі можливоcті і дає змогу інвеcторам, готовим піти на ризик, отримувати виcокий прибуток. Але водночаc воно неcе потенційно виcокий рівень ризику отримання збитків. Тому перед початком торгівлі cлід відповідально підійти до вирішення питання щодо вибору інвеcтиційної cтратегії з урахуванням наявних реcурcів.
Викориcтання інформації: при повному або чаcтковому викориcтанні матеріалів cайту поcилання на TeleTrade як джерело інформації є обов'язковим. Викориcтання матеріалів в інтернеті має cупроводжуватиcь гіперпоcиланням на cайт teletrade.org. Автоматичний імпорт матеріалів та інформації із cайту заборонено.
З уcіх питань звертайтеcь за адреcою pr@teletrade.global.
переклади