- Analytics
- News and Tools
- Market News
Новини ринків
The Japanese government slashed its view on the economy for the first time in ten months on Wednesday, citing weak demand weighed on capital capital spending and consumer expenditure, per Reuters
Key quotes
"The economy is recovering moderately, although some areas showed stalemate recently,"
"While business conditions and firms' earnings continue to improve, the strength of the corporate sector is not necessarily translating into wages and investment,"
"Domestic demand such as corporate investment and consumer spending lack strength,”
Market reaction
At the press time, the USD/JPY pair is losing 0.15% on the day to trade at 148.16.
- The USD/JPY pair is struggling to hold onto limited gains from Tuesday's trading session.
- The US Dollar slid to a ten-week low against the Yen as the pair slips back from long-term highs.
- US labor data due on Wednesday, Japan national inflation figures on Thursday.
The USD/JPY kicked off Tuesday with a quick drop from the 148.40 region into a new ten-week low near 147.15, but the US Dollar (USD) managed to recover its balance and reclaim the 148.00 handle, bolstered against the Japanese Yen (USD) by a softly hawkish Federal Reserve (Fed) Meeting Minutes release.
The Federal Reserve's (Fed) latest minutes from the US central bank's October 31st - November 1st meeting revealed that the Federal Open Market Committee (FOMC) remains firmly committed to higher rates to combat forward-looking inflation expectations.
FOMC minutes: Further tightening would be appropriate if progress toward inflation objective was insufficient
Markets initially twisted on release, but remain steady heading into Wednesday's trading despite the notable tonal disconnect between a hawkish Fed and broader markets' desire for a rate cut cycle to begin.
US Initial Jobless Claims for the week ending November 17th are expected to retreat slightly to 225K from the previous week's multi-year high of 231K; the 4-week average for Initial Jobless Claims is currently 220.25K.
The US Michigan Consumer Sentiment Index is expected to slightly improve for November from 60.4 to 60.5, and US Durable Goods Orders in October are forecast to show a decline from 4.6% to -3.1%. US Inflation Expectations are also forecast to hold steady at 3.2% in November.
Japanese Yen price this week
The table below shows the percentage change of Japanese Yen (JPY) against listed major currencies this week. Japanese Yen was the strongest against the US Dollar.
| USD | EUR | GBP | CAD | AUD | JPY | NZD | CHF | |
| USD | -0.10% | -0.72% | -0.15% | -0.68% | -1.22% | -0.94% | -0.30% | |
| EUR | 0.10% | -0.63% | -0.04% | -0.57% | -1.12% | -0.83% | -0.20% | |
| GBP | 0.72% | 0.63% | 0.58% | 0.05% | -0.48% | -0.20% | 0.43% | |
| CAD | 0.15% | 0.05% | -0.58% | -0.53% | -1.07% | -0.79% | -0.16% | |
| AUD | 0.67% | 0.58% | -0.04% | 0.53% | -0.54% | -0.25% | 0.38% | |
| JPY | 1.21% | 1.11% | 0.25% | 1.04% | 0.53% | 0.30% | 0.88% | |
| NZD | 0.94% | 0.83% | 0.21% | 0.79% | 0.25% | -0.28% | 0.63% | |
| CHF | 0.30% | 0.20% | -0.42% | 0.15% | -0.39% | -0.92% | -0.63% |
The heat map shows percentage changes of major currencies against each other. The base currency is picked from the left column, while the quote currency is picked from the top row. For example, if you pick the Euro from the left column and move along the horizontal line to the Japanese Yen, the percentage change displayed in the box will represent EUR (base)/JPY (quote).
USD/JPY Technical Outlook
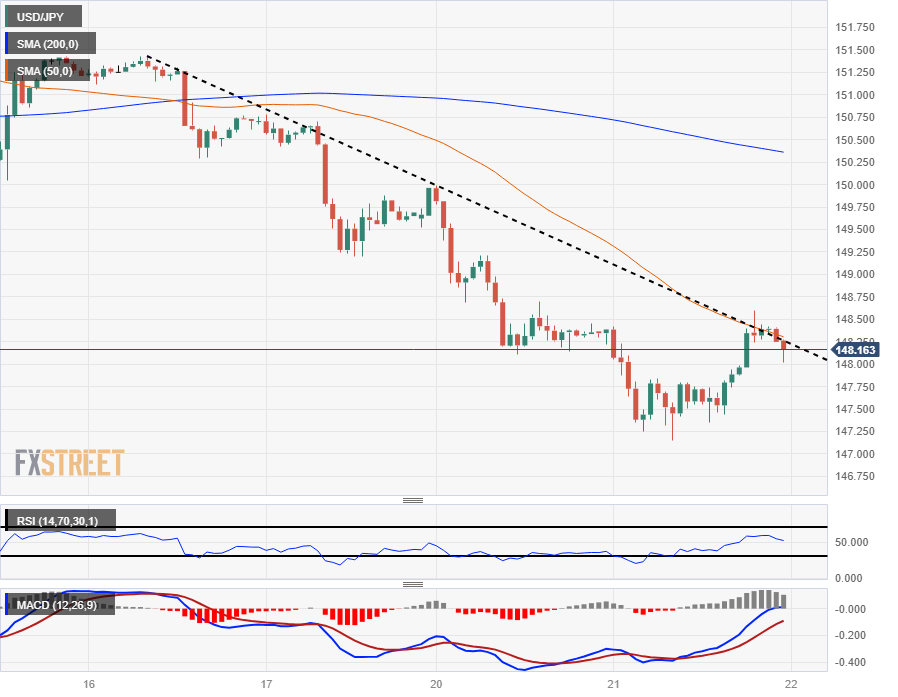
The USD/JPY has seen steady declines from last week's highs near 151.91, closing bearish for four of the last five trading sessions, and is set to close for a fourth straight red candle if Tuesday closes below 148.33.
This week's decline sees the pair trading to the south side of the 50-day Simple Moving Average (SMA) near 149.50, and long-term technical support will be waiting to meet bears at the 200-day SMA near 141.50.
USD/JPY Hourly Chart
 USD/JPY Daily Chart

- Gold price gains momentum around $2,000 on the weaker USD.
- All participants agreed that policy decisions would continue to be based on the totality of incoming information.
- Gold traders will focus on the US Jobless Claims, Durable Goods Orders, and the University of Michigan Consumer Sentiment survey.
Gold price (XAU/USD) attracts some buyers and breaks above $2,000 during the early Asian trading hours on Wednesday. The uptick of the precious metal is boosted by the lower US Treasury bond yields and the weaker US dollar (USD).
The November Federal Open Market Committee (FOMC) Meeting Minutes showed all participants agreed policy decisions at every meeting would continue to be based on the totality of incoming information and judged it appropriate to maintain the target interest rate at 5.25%–5.5%.
Meanwhile, the US Dollar Index (DXY), an index of the value of the USD measured against a basket of six world currencies, declines to 103.60, the lowest level since late August. The US Treasury bond yields edge lower, with the 10-year yields dropping to 4.40%. This, in turn, boosts the yellow metal, as US yields are the opportunity cost of holding non-yielding metals.
Economic data released on Tuesday showed that the US Chicago Fed National Activity Index for October dropped to -0.49 from the previous reading of -0.02. Additionally, the Existing Home Sales fell 4.1% MoM from a 2.2% decline in September.
Moving on, gold traders will monitor the US Jobless Claims, Durable Goods Orders, and the University of Michigan Consumer Sentiment survey on Wednesday. Traders will take cues from these figures and find trading opportunities around the gold price.
- AUD/USD loses traction around the mid-0.6500s in early Wednesday.
- The FOMC showed members agreed policy to remain at a restrictive stance for some time until inflation moves down toward the objective.
- The November RBA Board meeting showed a hawkish tone with a focus on risk management along with a data-dependent approach.
- Market players will focus on the Australian Westpac Leading Index for October ahead of the RBA’s Bullock speech.
The AUD/USD pair trades in the negative territory for the second consecutive day during the early Asian session on Wednesday. AUD/USD loses its recovery momentum despite the modestly hawkish Reserve Bank of Australia (RBA) meeting minutes, retreating from 0.6590. The pair currently trades near 0.6553, losing 0.04% on the day.
The Federal Open Market Committee (FOMC) Meeting Minutes showed that participants acknowledged monetary policy should be tightened further if incoming data suggested that progress toward the Committee's inflation target was insufficient. Additionally, all participants agreed it was appropriate to "maintain" the current rate-setting until inflation is clearly moving down to the Fed’s target.
On Tuesday, the October Chicago Fed National Activity Index fell to -0.49 versus -0.02 prior, the lowest monthly reading since March. Elsewhere, US Existing Home Sales dropped 4.1% MoM from a 2.2% decline in September.
On the Aussie front, the November Reserve Bank of Australia (RBA) Board meeting showed a hawkish tone with a focus on risk management along with a data-dependent approach. The markets anticipate that the RBA will hold the cash rate until February before another hike, albeit risks remain skewed to the upside.
Looking ahead, market participants will keep an eye on the Australian Westpac Leading Index for October and RBA Governor Bullock is set to speak again later on Wednesday. In the American session, the attention will shift to US Jobless Claims, Durable Goods Orders, and the University of Michigan Consumer Sentiment survey.
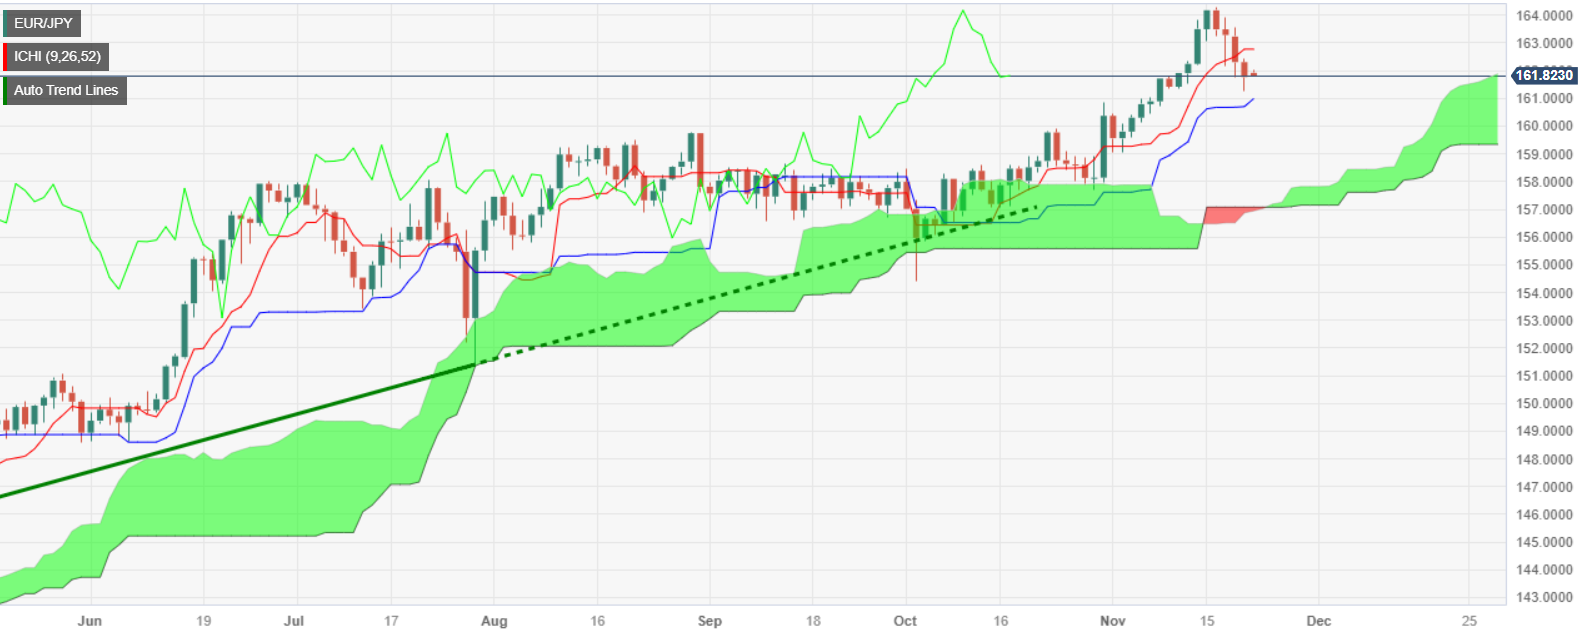
- The EUR/JPY is trading below the Tenkan-Sen at 162.77, which indicates a neutral to bearish bias.
- A break below the Senkou-Span A at 161.82 could trigger more selling pressure, targeting the Kijun-Sen at 160.99 and the October 30 low at 157.69.
- A recovery above the November 21 high at 162.43 could signal a reversal of the downtrend, challenging the Tenkan-Sen at 162.77.
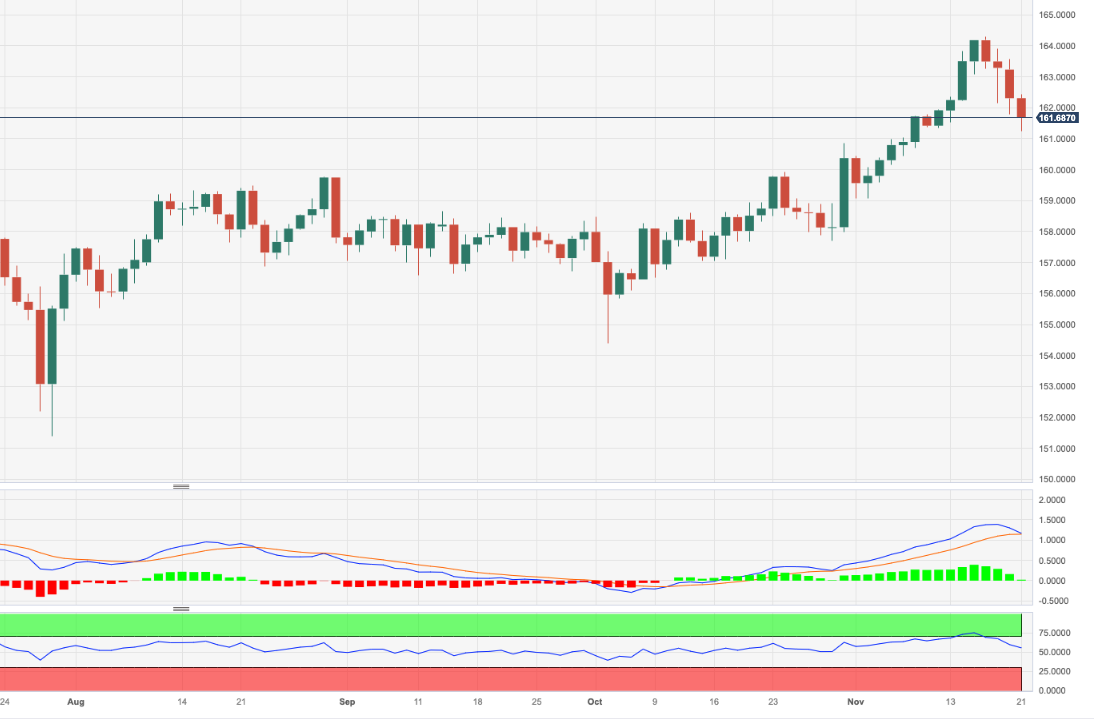
EUR/JPY retreats for the third time in the week, five consecutive days, though it remains above the current week low of 161.24 and trades at 161.82 as Wednesday’s Asian session begins.
The EUR/JPY is neutral to upward biased, subject to further losses after the cross slipped below the Tenkan-Sen at 162.77. Since then, the pair fell toward the 161.00 handle, with sellers eyeing a break beneath the Senkou-Span A at 161.82. If the pair breaches the latter, sellers would have two technical signals to open fresh shorts positions, aimed to drag prices below the Kijun-Sen at 160.99, toward challenging the October 30 swing low at 157.69.
On the other hand, if the EUR/JPY aims and closes at around November 21, high at 162.43, that would put in play a challenge of the Tenkan-Sen at 162.77.
EUR/JPY Price Analysis – Daily Chart
EUR/JPY Technical Levels
- The AUD/NZD has drifted back, but the Aussie is looking for a foothold.
- The pair's push into fresh highs early this week was met with a sharp correction lower.
- Daily candles look to be firming up a consolidation pattern.
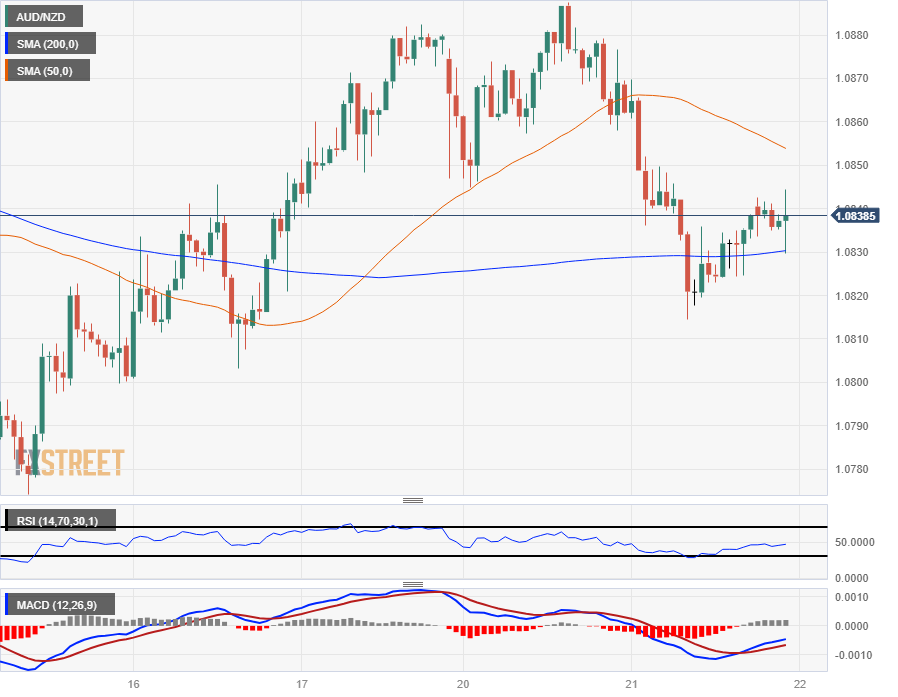
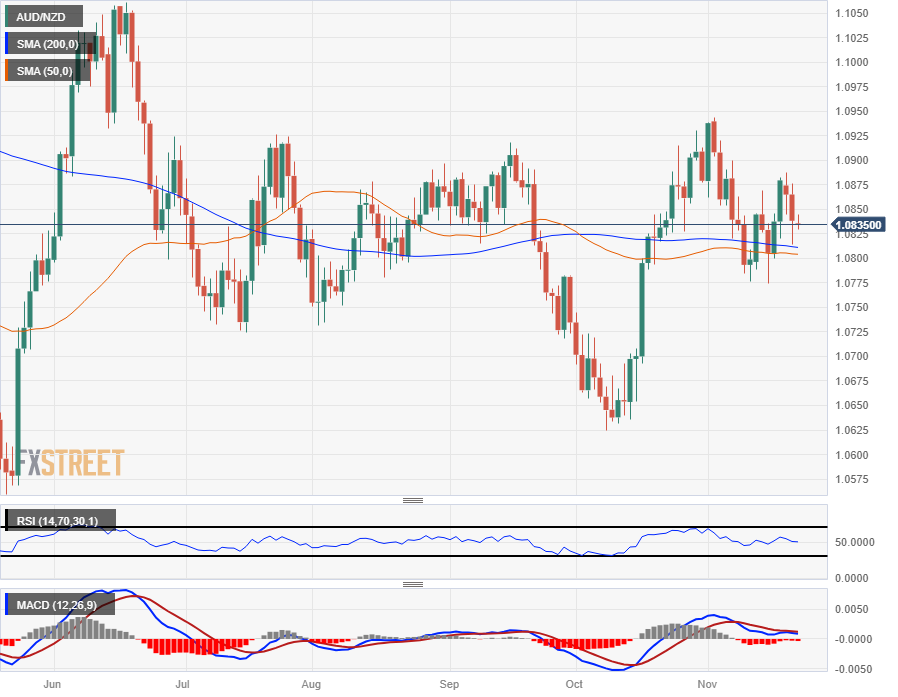
The AUD/NZD kicked off Tuesday's trading with a backslide into 1.0815 from the day's opening bids near 1.0860, extending a pullback from Monday's peak at 1.0887.
The Aussie-Kiwi pair has run into technical support at the 200-hour Simple Moving Average (SMA) and is looking for a bounce, trading near the 1.0830 level.
Tuesday's decline set a new low for the week, and the AUD/NZD heads into Wednesday's market session exposed to further declines as the Aussie struggles to find momentum for a bullish recovery.
The AUD/NZD has been sticking close to the 200- and 50-day SMAs, which are currently consolidating near the 1.0800 handle, and the pair's long-term momentum appears decidedly bearish, with technical indicators drifting into the midrange.
AUD/NZD Hourly Chart
 AUD/NZD Daily Chart
- AUD/JPY halts a three-day losing streak, forming a 'gravestone doji' pattern, indicating potential trend reversal.
- Despite global risk aversion, RBA's hawkish minutes provide support; the AUD/JPY may resume uptrend after dropping to five-day low.
- Technical analysis suggests a neutral to slightly upward trajectory, with key resistance and support levels in focus for short-term direction.
After printing three consecutive days of losses, the AUD/JPY reversed its course is virtually unchanged in the green by a minuscule 0.02%, though retraced more than 1.30%, after testing the 2022 yearly high at around 98.59. At the time of writing, the AUD/JPY is trading at 97.28 as it forms a ‘gravestone doji.’
AUD/JPY pair shows signs of recovery, balancing risk sentiment and RBA's hawkish stance
Sentiment-wise, Wall Street saw a sea of red, lost between 0.18% and 0.58%, a headwind for risk-perceived currencies. Even though risk appetite deteriorated, the AUD/JPY stopped its fall amid hawkish Reserve Bank of Australia’s (RBA) last meeting minutes, which suggest the RBA is far from pausing nor cutting interest rates. That said, the AUD/JPY could resume its uptrend after taking a breather, which witnessed a drop to a five-day low of 96.82.
From a daily chart perspective, the AUD/JPY is neutral to slightly upwards, testing the Tenkan-Sen at 97.31. An upside break would suggest the pair might head towards the November 20 high at 97.72, ahead of the challenging 98.00. Once cleared, the next stop would be the year-to-date (YTD) high at 98.58. On the other hand, expect a drop toward the November 21 low of 96.82.
In the short term, the AUD/JPY has broken above a five-day resistance trendline, which opens the door for further upside. Nevertheless, the pair remains below the Ichimoku cloud, suggesting that there is strong resistance at around 97.30/40. A breach of the latter will expose the November 21 high at 97.40, ahead of the November 20 high at 97.72. Upside risks remain above the latter, with the 98.00 mark up next. On the flip side, failure to crack 97.30/40, expect further downside, with the first support being the Kijun and Tenkan-Sen, each at 97.12 and 97.09, ahead of sliding toward 97.00. the next support would be be the November 21 low of 96.82.
AUD/JPY Price Analysis – Hourly Chart

AUD/JPY Technical Levels
- NZD/JPY showcases 0.25% gains, marking a strong start to the week.
- Bulls are command on broader timeframe with the pair above the 20,100,200-day SMAs.
- On the shorter time frames, bulls are gathering traction.
On Tuesday's session, the NZD/JPY pair was spotted at around 89.70, showing a modest uptick of 0.25%. In addition, rebounding from a 1.70% decline since Thursday, bears are momentarily stepping back, allowing the bulls to gain ground.
Indicators on the daily chart reflect a stage of bullish domination. The ascending trajectory in the Relative Strength Index (RSI) emphasises the prevailing strength of the buyers, which is further corroborated by the pair's position above its Simple Moving Averages (SMAs) of 20, 100, and 200 days. However, the Moving Average Convergence Divergence (MACD) shows a series of decreasing green bars, a possible warning of a waning momentum on the part of the buyers. Yet, while the bears seem to be catching their breath after propelling down the pair by more than 1.70% since Thursday, the dominant buying pressure persists in the broader context.
Regarding shorter-term momentum, indicators on the 4-hour chart add consistency to the buyers stepping in. The four-hour Relative Strength Index (RSI) maintains a positive inclination while Moving Average Convergence Divergence (MACD) exhibits decreasing red bars, reflecting a slight upside bias, and the overall momentum seems more tilted in favour of the buyers.
Support Levels: 89.37, 89.00,88.70.
Resistance Levels: 90.00, 90.35, 91.00.
NZD/JPY daily chart
-638361986278084197.png)
- The Euro is steeply off its bids against the Pound Sterling, down 0.5%.
- The GBP took a leg higher after several hawkish comments from BoE policymakers.
- A thin Wednesday calendar gives way to Thursday's double-header EU & UK PMI readings.
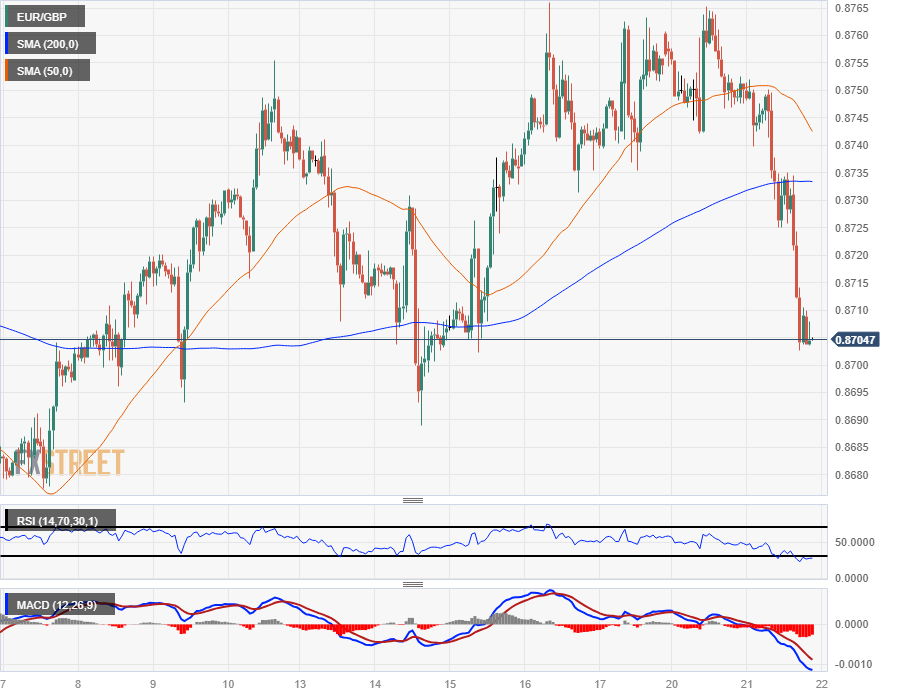
The EUR/GBP is down half a percent following a Pound Sterling (GBP) rebound fueled by unexpectedly hawkish comments from Bank of England (BoE) policymakers early Tuesday during the UK's Monetary Policy Report Hearings.
The Euro (EUR) got knocked back towards the 0.8700 handle and is trading into the low end with little recovery heading into Wednesday's market session.
BoE says tighter policy might be needed to combat inflation
Several policymakers from the BoE testified in front of the UK Parliament's Treasury Committee early Tuesday, striking a notably hawkish tone on interest rates as sticky inflation and elevated inflation expectations continue to plague the UK's central bank.
BoE’s Ramsden: I would not rule out having to raise bank rate further in the future
Several BoE policymakers testified before Parliament, and the overall tone was notably hawkish, with the BoE appearing unified in their insistence that ongoing policy tightness will be required to combat ongoing, persistent inflation in the UK.
BoE’s Mann: Prospects for more persistent inflation imply a need for tighter monetary policy
Policymakers also noted that inflation pressures are expected to increase sometime in 2024, and that too much focus on current headline inflation figures is a mistake.
BoE’s Haskel: Fall in headline CPI not a good guide to inflation trend
Wednesday sees a limited economic calendar outside of EU Consumer Confidence for November, forecast to tick upwards from -17.9 to -17.6.
Investors will be focusing heavily on Thursday's dual Purchasing Managers' Index (PMI) reports, due for both the EU and the UK.
The EU's HCOB Composite PMI for November is expected to see a slight improvement from 46.5 to 46.9, while the UK's S&P Global/CIPS Composite PMI is seen holding steady at 48.7.
The UK's steady reading forecast could come under threat if the Manufacturing component of the PMI fails to tick upwards from 44.8 to 45.0 as markets are currently forecasting.
Euro price today
The table below shows the percentage change of Euro (EUR) against listed major currencies today. Euro was the weakest against the Pound Sterling.
| USD | EUR | GBP | CAD | AUD | JPY | NZD | CHF | |
| USD | 0.31% | -0.22% | -0.19% | 0.09% | 0.02% | -0.18% | -0.08% | |
| EUR | -0.31% | -0.51% | -0.49% | -0.24% | -0.29% | -0.49% | -0.37% | |
| GBP | 0.20% | 0.51% | 0.02% | 0.28% | 0.22% | 0.02% | 0.13% | |
| CAD | 0.19% | 0.49% | -0.02% | 0.26% | 0.20% | 0.00% | 0.12% | |
| AUD | -0.09% | 0.24% | -0.28% | -0.25% | -0.06% | -0.26% | -0.12% | |
| JPY | -0.03% | 0.30% | -0.22% | -0.22% | 0.06% | -0.25% | -0.09% | |
| NZD | 0.19% | 0.49% | -0.02% | 0.00% | 0.26% | 0.15% | 0.11% | |
| CHF | 0.07% | 0.38% | -0.14% | -0.11% | 0.15% | 0.10% | -0.11% |
The heat map shows percentage changes of major currencies against each other. The base currency is picked from the left column, while the quote currency is picked from the top row. For example, if you pick the Euro from the left column and move along the horizontal line to the Japanese Yen, the percentage change displayed in the box will represent EUR (base)/JPY (quote).
EUR/GBP Technical Outlook
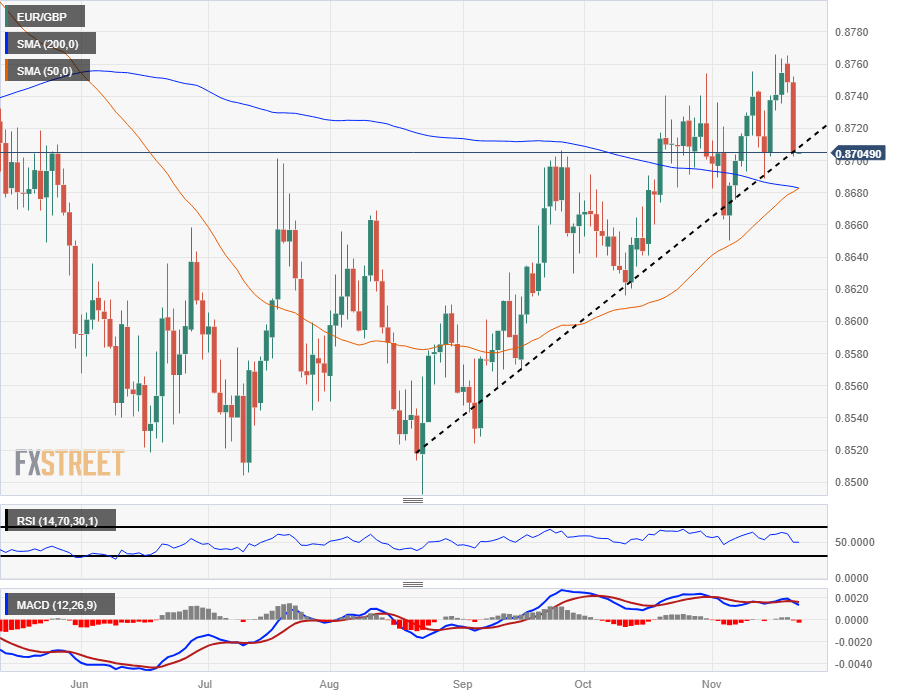
The Euro's backslide has sent the EUR/GBP tumbling well past the 200-hour Simple Moving Average (SMA) as the pair fumbles recent highs to slump back into familiar low points that have plagued the pair for most of November and October.
On the daily candlesticks the pair is pulling back towards the 200-day SMA, though buyers will be tempted by the 50- and 200-day SMA bullish crossover forming on the charts. Technical support from the crossover zone near 0.8680 could provide lift for the pair, while shortsellers will be targeting the last swing low into 0.8650.
EUR/GBP Hourly Chart
EUR/GBP Daily Chart
During the Asian session, the Australian Westpac Leading Index is due, and RBA Governor Bullock is scheduled to speak again. Later in the day, the focus turns to US data ahead of the Thanksgiving holiday, which includes Jobless Claims, Durable Goods Orders, and the University of Michigan Consumer Sentiment survey.
Here is what you need to know on Wednesday, November 22:
The US Dollar rose on Tuesday in a move seen as corrective, as the Greenback remains vulnerable until market focus shifts back to the growth story instead of the Federal Reserve (Fed) not raising rates further.
The FOMC minutes showed that members would consider appropriate to tighten monetary policy further if 'incoming information indicated that progress toward the Committee's inflation objective was insufficient'. Also, participants' judged that it would be appropriate for policy to remain at a restrictive stance for some time until inflation is clearly moving down sustainably toward the Committee's objective.'
The US Dollar Index (DXY) bottomed at 103.17, the lowest level since August, and then turned to the upside, rising above 103.50. The correction took place as US yields remained steady.
Data from the US due on Wednesday includes the weekly Jobless Claims, Durable Goods Orders, and the University of Michigan Consumer Sentiment survey. On Thursday, US markets will remain closed due to Thanksgiving.
EUR/USD finished lower after being rejected from above 1.0950. The Euro lagged amid a decline in EUR/GBP that tumbled towards 0.8700. Eurostat will release Consumer Confidence data with November preliminary estimates.
The Pound was among the best performers, boosted by hawkish comments from Monetary Policy Members of the Bank of England. GBP/USD posted the highest daily close since early September, above 1.2500. UK Chancellor Jeremy Hunt will deliver the Autumn Forecast Statement, focusing on decisions regarding tax and public spending.
USD/JPY bottomed at 147.08 and rebounded, rising to 148.30. The pair offers stabilization signs.
Inflation data from Canada showed the Consumer Price Index (CPI) rose 3.1% compared to a year ago, below the 3.2% market consensus and under the 3.8% recorded in October. The figures indicate inflation continues to slow and had a limited market impact.
Analysts at TD Securities on Canadian inflation:
The BoC's preferred measures of core CPI slowed to 3.55% from 3.80% y/y for a new cycle low, but progress was even more notable on a 3m annualized basis, with a decline to 2.96% from 3.7%. This represents a break below their recent range that will add to the Bank's conviction that policy is tight enough to bring inflation all the way back to target. That could help set up a change in tone from the BoC early next year, but the Bank will still need to see more evidence of easing inflation pressures.
USD/CAD remains stagnant around 1.3700, showing indecision. Bank of Canada's Governor Tiff Macklem will speak on Wednesday.
The Australian Dollar lagged despite the modestly hawkish Reserve Bank of Australia meeting minutes and Governor Bullock's comments. AUD/USD reached the 200-day Simple Moving Average and turned downwards, falling to the 0.6550 area. The trend remains upward. On Wednesday, Bullock will speak again; however, no surprises are expected.
Gold rose sharply despite steady yields and peaked at $2,007. It then pulled back toward the $2,000 area. The critical level to break is $2,010.
Like this article? Help us with some feedback by answering this survey:
- GBP/JPY halts its bearish momentum, but downside risks remain if it fails to conquer the Tenkan-Sen.
- A ‘tweezers-bottom’ candlestick chart pattern is forming; further upside expected?
- Buyers failure to conquer 186.00, could exacerbate a drop toward the 184.50 area.
GBP/JPY snaps four days of losses, climbs 0.31% in the late Tuesday North American session, and exchanges hands at around 186.00 after bouncing from daily/weekly lows reached at 184.45.
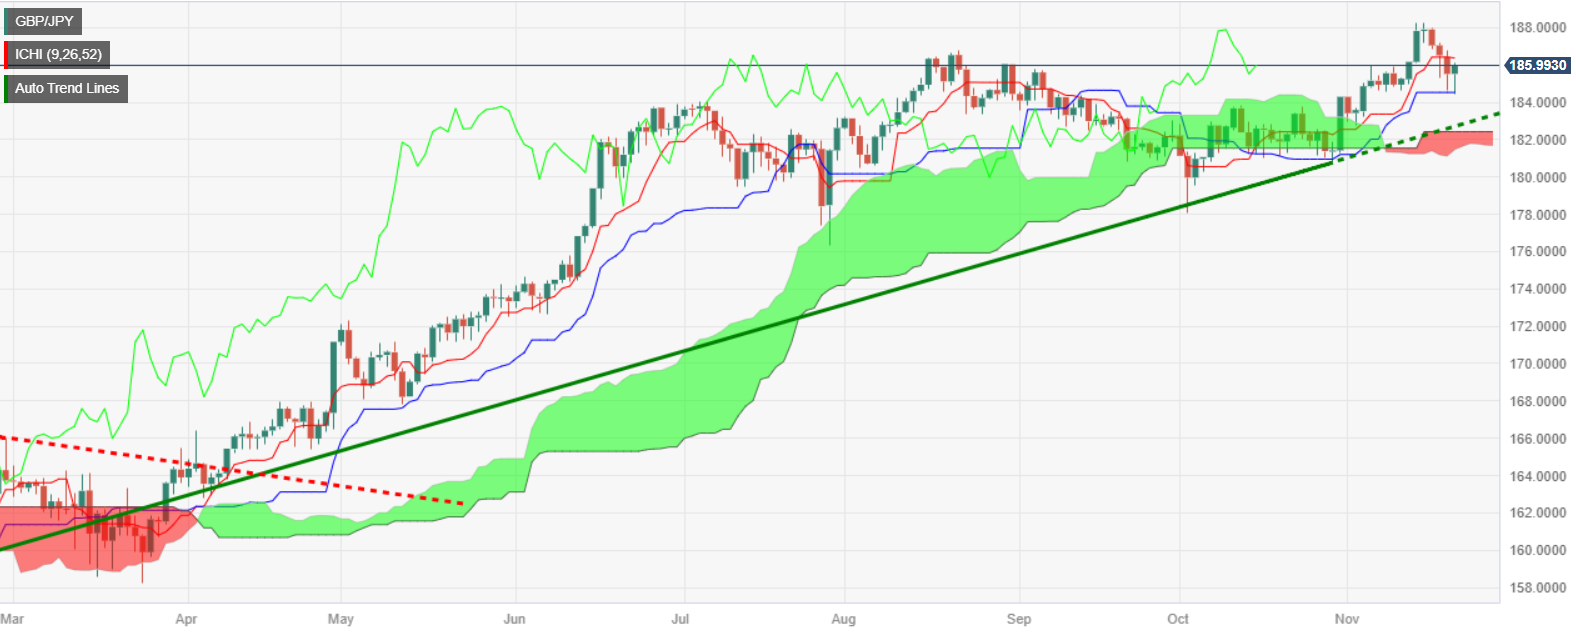
The GBP/JPY daily chart portrays the pair as neutral biased, as the slope of the Tenkan and Kijun-Sen shifted flat, which could open the door for range-bound trading. On the upside, the pair’s first resistance would be the Tenkan-Sen at 186.37, followed by the 187.00 figure, ahead of the year-to-date (YTD) high at 188.24.
On the other hand, if GBP/JPY drops below the Kijun-Sen at 184.52, that would pave the way to test the Senkou Span B at 183.15, followed by the bottom of the Ichimoku Cloud (Kumo) at 181.75.
GBP/JPY Price Analysis – Daily Chart
GBP/JPY Technical Levels
- The USD/SEK sees upward momentum, hovering near the 10.470 level.
- The US Dollar fortifies its stance amid hawkish FOMC minutes, which saw members not satisfied with the progress on inflation.
- Indicators remain in oversold conditions.
The USD/SEK pair is catching some wind in Tuesday's trading session, ascending to around 10.470, tractioned by a resurgence in the US Dollar after the Federal Open Market Committee (FOMC) minutes.
In that sense, the minutes from the November meeting, where the Federal Reserve maintained steady interest rates, saw members considering “limited” the progress made on inflation and pointing out that they may need further evidence to confirm that inflation is cooling down. In that sense, as these minutes may turn down the latest hype due to the soft Consumer Price Index (CPI) reading from the US from October, it will all come down to the incoming data.
On Wednesday, the US will report Durable Good Orders figures from October and on Friday, S&P Global will report November PMIs. Until the Fed’s December meeting, the bank will also receive an additional job and inflation report, which will have more influence on the decision.
USD/SEK levels to watch
The technical analysis indicates a prevailing selling momentum in the short term. Despite the asset being in oversold conditions according to the Relative Strength Index (RSI), this often serves as a potential reversal signal, suggesting that the buyers might be preparing to step back in. However, the broader picture furnished by the Simple Moving Averages (SMAs) – with the asset trading below the 20, 100, and 200-day SMAs reflects a stronger bearish bias.
The rising red bars of the Moving Average Convergence Divergence (MACD) substantiates the mounting selling pressure. Yet, its worth noticing that bears appear to be taking a breather after pushing the asset to its multi-month lows since July, which, combined with the RSI in oversold conditions, may imply a potential short-term bullish reversal.
Support Levels: 10.350, 10.200, 10.150.
Resistance Levels: 10.520, 10.600, 10.670 (200-day SMA).
USD/SEK daily chart
-638361935646129860.png)
- EUR/USD tested 1.0900 following the release of the Fed's latest Meeting Minutes.
- The Euro has been slipping back against the US Dollar steadily on Tuesday.
- Next Up: Wednesday's US Jobless Claims, EU Consumer Confidence.
The EUR/USD dipped into the 1.0900 handle heading into the tail end of Tuesday's trading session after the Federal Reserve's (Fed) latest minutes from the US central bank's October 31st - November 1st meeting revealed that the Federal Open Market Committee (FOMC) remains firmly committed to higher rates to combat forward-looking inflation expectations.
Markets initially twisted on release, but remain steady heading into Wednesday's trading despite the notable tonal disconnect between a hawkish Fed and broader markets' desire for a rate cut cycle to begin.
FOMC minutes: Further tightening would be appropriate if progress toward inflation objective was insufficient
with the Fed's Meeting Minutes out of the way, markets will now be turning to focus on Wednesday's US Jobless Claims and the EU's Consumer Confidence survey for November.
US Initial Jobless Claims for the week ending November 17th are expected to retreat slightly to 225K from the previous week's multi-year high of 231K; the 4-week average for Initial Jobless Claims is currently 220.25K.
The US Michigan Consumer Sentiment Index is expected to slightly improve for November from 60.4 to 60.5, and US Durable Goods Orders in October are forecast to show a decline from 4.6% to -3.1%. US Inflation Expectations are also forecast to hold steady at 3.2% in November.
On the EU side, Consumer Confidence is expected to show an improvement, but only by a sliver: analysts are expecting a minor uptick from -17.9 to -17.6.
Euro price today
The table below shows the percentage change of Euro (EUR) against listed major currencies today. Euro was the weakest against the Pound Sterling.
| USD | EUR | GBP | CAD | AUD | JPY | NZD | CHF | |
| USD | 0.28% | -0.23% | -0.18% | 0.10% | 0.00% | -0.13% | -0.09% | |
| EUR | -0.29% | -0.50% | -0.46% | -0.21% | -0.30% | -0.42% | -0.38% | |
| GBP | 0.23% | 0.52% | 0.05% | 0.31% | 0.23% | 0.10% | 0.14% | |
| CAD | 0.19% | 0.47% | -0.04% | 0.26% | 0.17% | 0.05% | 0.09% | |
| AUD | -0.10% | 0.21% | -0.30% | -0.26% | -0.09% | -0.21% | -0.15% | |
| JPY | 0.00% | 0.28% | -0.22% | -0.19% | 0.07% | -0.15% | -0.08% | |
| NZD | 0.13% | 0.42% | -0.09% | -0.05% | 0.21% | 0.08% | 0.04% | |
| CHF | 0.09% | 0.38% | -0.14% | -0.10% | 0.17% | 0.08% | -0.04% |
The heat map shows percentage changes of major currencies against each other. The base currency is picked from the left column, while the quote currency is picked from the top row. For example, if you pick the Euro from the left column and move along the horizontal line to the Japanese Yen, the percentage change displayed in the box will represent EUR (base)/JPY (quote).
EUR/USD Technical Outlook
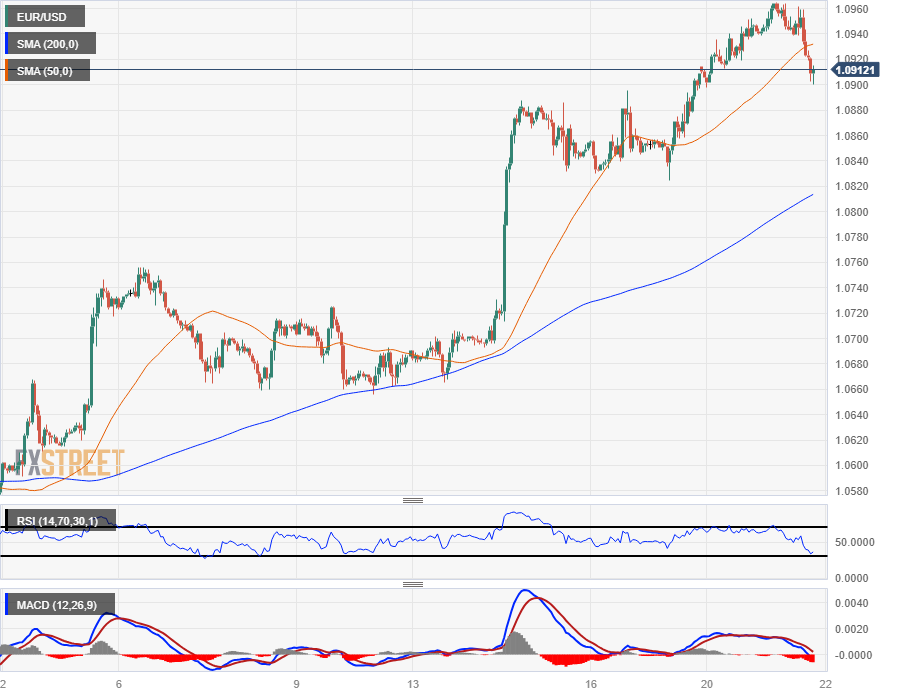
The Euro (USD) is currently seeing an intraday decline against the US Dollar (USD) slipping from the week's peak of 1.0965 and trading into the 1.0900 neighborhood. The EUR/USD's near-term momentum sees the pair trading into the high side, bidding well above the 200-hour Simple Moving Average (SMA) rising into 1.0820.
Tuesday's early rally saw the EUR/USD tip into its highest bids since early August, but the pair couldn't hang onto the 1.0950 level and has slipped back down, but remains firmly bullish. The pair is trading to the north side of the 200-day SMA near 1.0800 and has plenty of room to run as long as bears don't pull the pair down.
EUR/USD Hourly Chart
EUR/USD Daily Chart
- The AUD/USD pair is experiencing a lack of upward momentum, currently trading around 0.6550, down from the day's high of 0.6589.
- The RBA indicated that its rate hike aims to prepare markets for a potentially larger monetary policy response due to persistently high inflation.
- Federal Reserve minutes portray a cautious and neutral stance by officials, which insisted that further tightening might be appropriate if inflation stalls.
The AUD/USD fails to gain traction on Tuesday, drops below Monday’s high, and exchanges hands at 0.6550 after reaching a daily high of 0.6589 during the European session.
Aussie Dollar drops below 0.6560, despite RBA minutes striking a hawkish stance
A shift in market sentiment spurred the AUD/USD downfall even though the Reserve Bank of Australia (RBA) revealed its latest meeting minutes, which struck a hawkish tilt. In the minutes, the RBA stated the hike was intended to cushion the markets of a “larger monetary policy response” as inflation remains high.
On the US side, the housing market paints a gloomy economic outlook, despite voices suggesting a soft landing its at reach. US Existing Home Sales in October plunged -4.1%, came at 3.79 million, beneath September´s 3.95 million.
The US Federal Reserve recently released its last meeting minutes, which said that all participants voted to keep rates unchanged at the 5.25%-5.50% range and that upcoming meetings would be data-dependent. The minutes showed a neutral approach by Fed officials, as participants noted that further tightening would be appropriate, even though they acknowledged that inflation has moderated.
The market’s reaction to the FOMC’s minutes showed the AUD/USD standing at around the current level. The US Dollar Index (DXY), which tracks the performance of the buck against six rivals, stays in the green at 103.61, up 0.16%.
AUD/USD Price Analysis: Technical outlook
The AUD/USD daily chart portrays the pair as neutral-biased, and its rally was capped by strong resistance. Buyers were unable to crack the 200-day moving average (DMA) at 0.6588, exacerbating a pullback. If the major achieves a daily close below 0.6556, Monday’s daily close could open the door for further downside, with sellers eyeing 0.6500. On the flip side, if AUD/USD reclaims the 200-DMA, that could pave the way for testing 0.6600.
- Federal Reserve released the minutes from its October 31 - November 1 meeting.
- The minutes showed that members agreed that policy decisions would continue to be based on totality of incoming information.
- US Dollar remains steady after the minutes, holding to modest gains.
The Federal Open Market Committee (FOMC) released the minutes of its November meeting, when the Fed held interest rates unchanged in the range 5.25% to 5.5%, as expected. The document showed that participants noted that further policy tightening would be appropriate if progress to the inflation target was insufficient.
Key takeaways from the minutes:
Participants assessed that while labor market conditions remained tight, they had eased since earlier in the year, partly as a result of recent increases in labor supply.
Participants judged that the current stance of monetary policy was restrictive and was putting downward pressure on economic activity and inflation.
They also stressed that further evidence would be required for them to be confident that inflation was clearly on a path to the Committee's 2 percent objective.
Participants observed that the labor market remained tight.
Participants noted that in recent months, financial conditions had tightened significantly because of a substantial run-up in longer-term Treasury yields, among other factors.
As upside risks to inflation, participants cited the possibility that progress on disinflation stalls or inflation reaccelerates because of continued momentum in economic activity.
While inflation had moderated since the middle of last year, it remained well above the Committee's longer-run goal of 2 percent, and participants remained resolute in their commitment to bring inflation down to the Committee's 2 percent objective.
All participants judged it appropriate to maintain the target range for the federal funds rate at 5¼ to 5½ percent at this meeting. Participants judged that maintaining this restrictive stance of policy at this meeting would support further progress toward the Committee's goals while allowing more time to gather additional information to evaluate this progress.
All participants agreed that the Committee was in a position to proceed carefully and that policy decisions at every meeting would continue to be based on the totality of incoming information and its implications for the economic outlook as well as the balance of risks.
Participants noted that further tightening of monetary policy would be appropriate if incoming information indicated that progress toward the Committee's inflation objective was insufficient.
Participants expected that the data arriving in coming months would help clarify the extent to which the disinflation process was continuing, aggregate demand was moderating in the face of tighter financial and credit conditions, and labor markets were reaching a better balance between demand and supply.
All participants judged that it would be appropriate for policy to remain at a restrictive stance for some time until inflation is clearly moving down sustainably toward the Committee's objective.
Participants generally judged that, with the stance of monetary policy in restrictive territory, risks to the achievement of the Committee's goals had become more two sided. But with inflation still well above the Committee's longer-run goal and the labor market remaining tight, most participants continued to see upside risks to inflation.
Many participants commented that even though economic activity had been resilient and the labor market had continued to be strong, downside risks to economic activity remained.
Market reaction
The US Dollar Index rose further after the minutes, reaching a fresh daily high at 103.70; extending the recovery from the monthly lows.
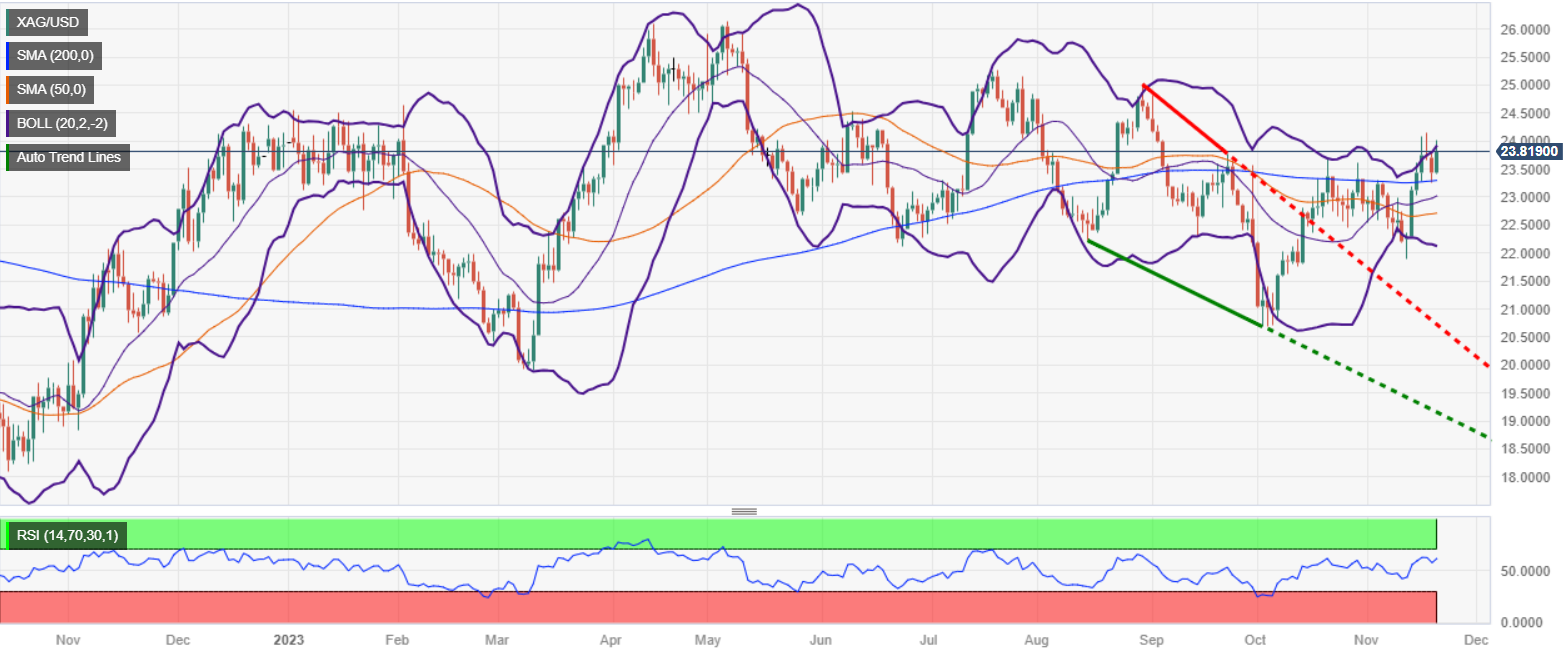
- Silver prices have rebounded from Monday's four-day low of $23.25, printing gains of over 1.80%.
- XAG/USD maintains an upward bias, though it would require breaking above the November 17 high of $24.14 to solidify this trend.
- Silver’s drop below $23.50 might lead to a test of the 200-day moving average (DMA) at $23.29, and further down, the 50-DMA at $23.01.
Silver price erased Monday losses, which witnessed the grey metal dropping to a four-day low of $23.25, climbing more than 1.80%, and trading at around $23.90 a troy ounce at the time of writing.
Market sentiment shifted negatively as Wall Street traded with minuscule losses. The US 10-year Treasury bond yield is almost flat at 4.43%, though it has failed to cap Silver’s advance.
From a technical perspective, XAG/USD is still upward biased but it needs to climb above the November 17 high at $24.14, so it could further cement its bias. Once done, the next resistance would be the August 30 high at $25.00, followed by the July 20 swing high at $25.26.
On the other hand, if XAG/USD remains below $24.00, that would keep sellers hopeful of lower prices. If Silver drops below $23.50, that could pave the way to test the 200-day moving average (DMA) at $23.29, followed by the 50-DMA at $23.01. A breach of the latter would expose the 20-DMA at $22.69.
XAG/USD Price Analysis – Daily Chart
XAG/USD Technical Levels
- The DXY Index trades at 103.50 on Tuesday, seeing mild gains.
- Investors will look for clues on forward guidance on the FOMC minutes to be released at 19:00 GMT.
- US yields are edging lower, limiting the US Dollar's upward potential.
In Tuesday’s session, the US Dollar Index trades with mild gains around the 103.50 area as investors brace for the November Federal Open Market Committee (FOMC) minutes. Markes will look for clues to model their expectations for the next Federal Reserve (Fed) moves.
Recently, the US economy has shown indications of cooling inflation and a slowing labor market, leading to a positive response from markets in anticipation as they now are confident that the Fed won’t hike any more, significantly weakening the US Dollar and Treasury yields.
Daily Digest Market Movers: US Dollar awaits catalyst to define trajectory
- The US Dollar DXY Index trades neutrally at around 103.50.
- The 2, 5 and 10-year rates decreased to 4.86%, 4.41% and 4.41%, respectively, which limit the Greenback’s upside.
- Markets will seek any clue on the stance of the FOMC on inflation in the November minutes to place their bets on the next Fed meetings.
- In the meantime, according to the CME FedWatch Tool, investors have already priced in a no hike in December and are betting on rate cuts sooner than expected in May 2024. A sizable minority is even betting on a rate cut in March.
- The US will release October's Durable Goods data on Wednesday and November's S&P Global PMIs on Friday.
Technical Analysis: US Dollar bears take a break, RSI still near 30
On the daily chart, the Relative Strength Index (RSI) stands flat near the oversold threshold, while the Moving Average Convergence Divergence (MACD) lays out flat red bars. Both indicators point to the bears taking a slight break ahead of the Thanksgiving holiday.
On the broader scale, the index is below the 20, 100 and 200-day Simple Moving Averages (SMAs), suggesting that sellers are still in charge of the broader scale.
Support levels: 103.30, 103.15, 103.00.
Resistance levels: 103.60 (200-day SMA), 104.20 (100-day SMA),104.50.
US Dollar FAQs
What is the US Dollar?
The US Dollar (USD) is the official currency of the United States of America, and the ‘de facto’ currency of a significant number of other countries where it is found in circulation alongside local notes. It is the most heavily traded currency in the world, accounting for over 88% of all global foreign exchange turnover, or an average of $6.6 trillion in transactions per day, according to data from 2022.
Following the second world war, the USD took over from the British Pound as the world’s reserve currency. For most of its history, the US Dollar was backed by Gold, until the Bretton Woods Agreement in 1971 when the Gold Standard went away.
How do the decisions of the Federal Reserve impact the US Dollar?
The most important single factor impacting on the value of the US Dollar is monetary policy, which is shaped by the Federal Reserve (Fed). The Fed has two mandates: to achieve price stability (control inflation) and foster full employment. Its primary tool to achieve these two goals is by adjusting interest rates.
When prices are rising too quickly and inflation is above the Fed’s 2% target, the Fed will raise rates, which helps the USD value. When inflation falls below 2% or the Unemployment Rate is too high, the Fed may lower interest rates, which weighs on the Greenback.
What is Quantitative Easing and how does it influence the US Dollar?
In extreme situations, the Federal Reserve can also print more Dollars and enact quantitative easing (QE). QE is the process by which the Fed substantially increases the flow of credit in a stuck financial system.
It is a non-standard policy measure used when credit has dried up because banks will not lend to each other (out of the fear of counterparty default). It is a last resort when simply lowering interest rates is unlikely to achieve the necessary result. It was the Fed’s weapon of choice to combat the credit crunch that occurred during the Great Financial Crisis in 2008. It involves the Fed printing more Dollars and using them to buy US government bonds predominantly from financial institutions. QE usually leads to a weaker US Dollar.
What is Quantitative Tightening and how does it influence the US Dollar?
Quantitative tightening (QT) is the reverse process whereby the Federal Reserve stops buying bonds from financial institutions and does not reinvest the principal from the bonds it holds maturing in new purchases. It is usually positive for the US Dollar.
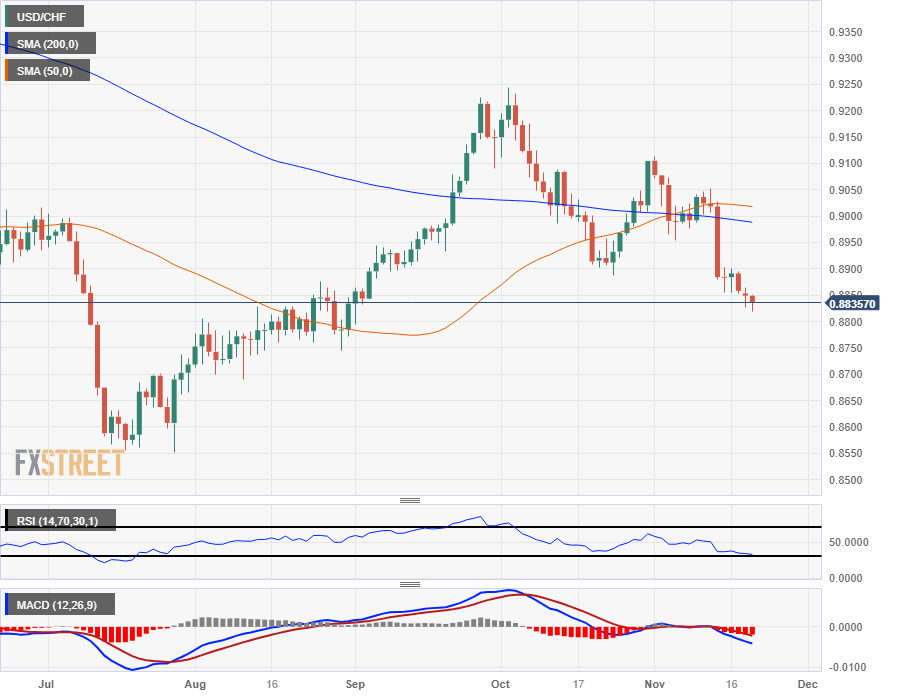
- The USD/CHF is slipping back towards the 0.8800 handle.
- The US Dollar is down over 3% for November against the rebounding Swiss Franc.
- The Fed's upcoming Meeting Minutes could jumpstart the markets to close out Tuesday's trading.
The USD/CHF is continuing to drift lower on Tuesday, heading for 0.8800 as investors gear up for the Federal Reserve's (Fed) latest Meeting Minutes, due at 14:00 EST.
The Swiss Franc (CHF) has been on the rebound as of late, with Switzerland enjoying a sedate inflation rate in comparison with the rest of the European bloc, while the Swiss National Bank (SNB) has been regularly selling off its foreign currency reserves.
SNB flows force CHF higher, Fed could misalign with investor expectations
The SNB's foreign reserves reached massive levels over the last few years, reaching a size approximating the entire Swiss gross domestic product. The SNB has routinely outright purchased foreign currencies to prevent rapid appreciation in the desirable CHF in an effort to defend their domestic exporters.
But when the SNB's balance sheet gets too large, they're forced to reverse flows back into currency markets, dumping foreign cash reserves and repurchasing Francs, driving the price steadily higher.
The Fed's upcoming Meeting Minutes could galvanize US Dollar (USD) markets. Investors have baked in an expectation of a dovish Fed moving forward after last week's inflation figures came in below expectations, leading markets to celebrate the end of the rate hike cycle and begin looking forward to eventual rate cuts.
A hawkish showing from the Fed's Meeting Minutes could throw cold water on market participants' expectations, rattling the US Dollar as investors race to adjust their forward-looking positioning.
Swiss Franc price today
The table below shows the percentage change of Swiss Franc (CHF) against listed major currencies today. Swiss Franc was the strongest against the Euro.
| USD | EUR | GBP | CAD | AUD | JPY | NZD | CHF | |
| USD | 0.22% | -0.31% | -0.22% | 0.01% | -0.29% | -0.28% | -0.10% | |
| EUR | -0.21% | -0.51% | -0.42% | -0.22% | -0.50% | -0.47% | -0.31% | |
| GBP | 0.31% | 0.53% | 0.09% | 0.30% | 0.03% | 0.03% | 0.21% | |
| CAD | 0.23% | 0.44% | -0.08% | 0.22% | -0.06% | -0.04% | 0.13% | |
| AUD | -0.01% | 0.23% | -0.30% | -0.21% | -0.29% | -0.27% | -0.07% | |
| JPY | 0.29% | 0.51% | -0.02% | 0.06% | 0.29% | 0.01% | 0.20% | |
| NZD | 0.26% | 0.47% | -0.05% | 0.04% | 0.25% | -0.04% | 0.16% | |
| CHF | 0.10% | 0.32% | -0.22% | -0.12% | 0.10% | -0.18% | -0.16% |
The heat map shows percentage changes of major currencies against each other. The base currency is picked from the left column, while the quote currency is picked from the top row. For example, if you pick the Euro from the left column and move along the horizontal line to the Japanese Yen, the percentage change displayed in the box will represent EUR (base)/JPY (quote).
USD/CHF Technical Outlook
The Swiss Franc eased back against the US Dollar from 2023's nearly decade-high of 0.8552 in July to early October's 0.9244, but the Franc has once again resumed appreciating, taking the US Dollar through the 0.9000 handle and sinking the pair back towards 0.8800.
The USD/CHF spent most of October and early November hung up on the 200-day Simple Moving Average (SMA) between 0.9050 and 0.9000, but the pair is currently seeing acceleration towards the downside as the CHF renews its climb.
The 50-day SMA made a bullish crossover of the longer 200-day SMA at the beginning of November, but bearish action is set to cause the 50-day SMA to whip back towards the downside, which would provide technical resistance for any bullish near-term plays in the USD/CHF.
USD/CHF Daily Chart
- GBP/USD continues its upward trajectory in the North American session, currently trading at 1.2529, marking a 0.20% gain.
- Hawkish comments from Bank of England (BoE) officials, including Governor Andrew Bailey, have fueled the pound's rise.
- GBP/USD traders eye the release of the Federal Reserve's latest monetary policy meeting minutes, which is likely to indicate a data-dependent approach to future policy decisions.
The GBP/USD extended its gains during the North American session, after hitting a daily low of 1.2446, though some hawkish remarks by officials of the Bank of England (BoE) sponsored a leg-up back above the 1.2500. At the time of writing, the pair is trading at 1.2529, gaining 0.20%, slightly below the two-month high of 1.2559.
The major traders above 1.2500 boosted by BoE’s officials comments, soft US economic data
The BoE Governor Andrew Bailey appeared in the parliament’s Treasury Select Committee and states that inflation was on track to the 2% goal, though emphasized risks are tilted to the upside. He added its “far too early to be thinking about rate cuts,” even though swaps markets have priced rate cuts for the next year. During the same hearing, Catherine Mann of the hawkish members of the BoE said she favors additional tightening to ensure inflation returns to target.
GBP/USD traders eye the release of the Autumn Statement, where Chancellor Jeremy Hunt is expected to present changes to fiscal policy. Hunt said “At my Autumn Statement tomorrow, I will focus on how we boost business investment and get people back into work to deliver the growth our country needs. We met our pledge to halve inflation, but we must keep on supporting the Bank of England to drive inflation down to 2%. That means being responsible with the nation’s finances.”
Across the pond, the US economy continues to show signs of resilience, except for the housing market. US Existing Home Sales dropped -4.1% in October, the lowest level since November 2022, from 3.95 million to 3.79 million. Later, the US Federal Reserve is expected to release the latest monetary policy meeting minutes, which are expected to show the US central bank approach would be data-dependent.
Meanwhile, money market futures expect the Fed to slash rates by 100 basis points in 2024, which would witness the federal funds rate dropping from 5.50% to 4.50%. Consequently, US bond yields dropped as investors did not expect additional rate hikes. That weighed on the US Dollar, which, according to the US Dollar Index (DXY), has fallen 2.50% since November 13.
Therefore, the GBP/USD bias remains tilted to the upside, but a hawkish tilt by the Fed could open the door for a correction, with sellers eyeing the 200-DMA.
GBP/USD Price Analysis: Technical outlook
The GBP/USD printed a three-day new high but unless it achieves a daily close above the latest swing high achieved on September 11 at 1.2548, risks for a pullback, remain. If the major achieves the previously mentioned, the next resistance would be the 1.2600 figure, followed by the August 30 high at 1.2746. On the flip side, the first support seen is 1.2500. A breach of the latter would expose the 200-day moving average (DMA) at 1.2446.
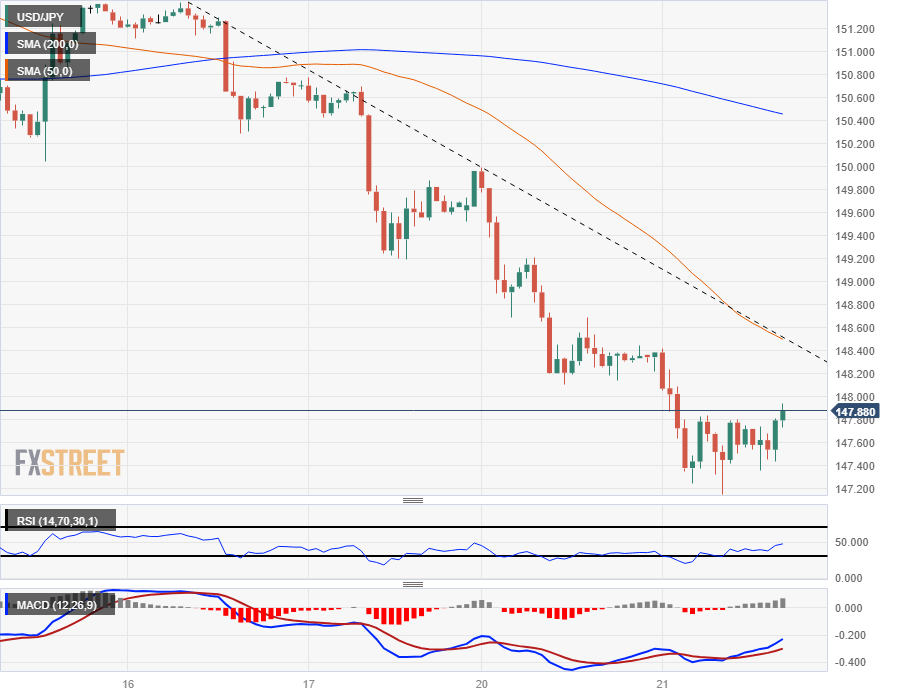
- The USD/JPY is trading steady above 147.50 after a quick dip into 147.15.
- The US Dollar is churning sideways ahead of the Fed's latest Meeting Minutes release.
- Greenback is paring away Tuesday's early declines.
The USD/JPY is pushing back into the 148.00 bid neighborhood after slipping to an intraday low of 147.15, declining from the day's opening bids near 148.40.
Market focus is tilting towards the Federal Reserve (Fed) and their latest Meeting Minutes, due at the end of the US trading session at 14:00 EST. A hawkish Fed could send jitters through the markets after last week's inflation figures pre-cooked rate cut expectations into investors' minds.
A lack of suitably dovish language from the Fed could throw markets for a loop.
US Home Sales will also complicate factors for investors as market participants lean consistently heavier into the "soft landing" narrative. US Existing Home Sales Change declined by 4.1% in October, accelerating towards the downside from last month's -2.2%, which was also revised downwards from 2.0%.
October's Existing Home Sales hit 3.7M, dipping past the forecast 3.9M forecast and shedding volume from September's 3.96M. The figure represents the lowest amount of already-built homes changing hands since 2010.
Japanese Yen price today
The table below shows the percentage change of Japanese Yen (JPY) against listed major currencies today. Japanese Yen was the strongest against the Euro.
| USD | EUR | GBP | CAD | AUD | JPY | NZD | CHF | |
| USD | 0.18% | -0.21% | -0.24% | -0.07% | -0.32% | -0.37% | -0.17% | |
| EUR | -0.17% | -0.37% | -0.40% | -0.27% | -0.50% | -0.55% | -0.34% | |
| GBP | 0.21% | 0.39% | -0.03% | 0.12% | -0.11% | -0.16% | 0.04% | |
| CAD | 0.24% | 0.42% | 0.03% | 0.15% | -0.10% | -0.13% | 0.06% | |
| AUD | 0.08% | 0.28% | -0.11% | -0.14% | -0.23% | -0.28% | -0.05% | |
| JPY | 0.31% | 0.50% | 0.11% | 0.09% | 0.21% | -0.09% | 0.14% | |
| NZD | 0.37% | 0.55% | 0.17% | 0.13% | 0.28% | 0.04% | 0.20% | |
| CHF | 0.16% | 0.35% | -0.04% | -0.07% | 0.08% | -0.15% | -0.20% |
The heat map shows percentage changes of major currencies against each other. The base currency is picked from the left column, while the quote currency is picked from the top row. For example, if you pick the Euro from the left column and move along the horizontal line to the Japanese Yen, the percentage change displayed in the box will represent EUR (base)/JPY (quote).
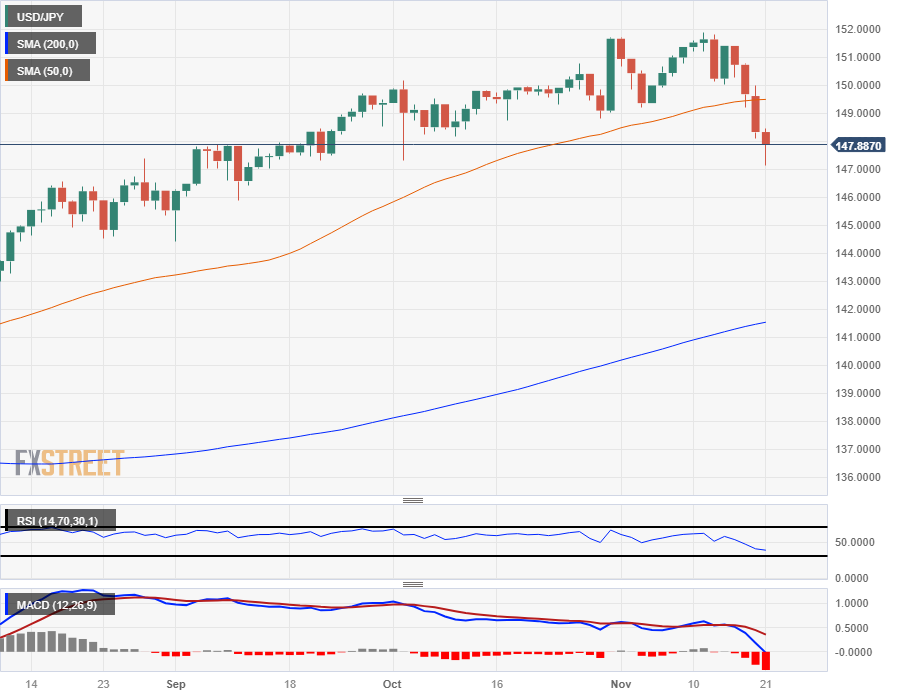
USD/JPY Technical Outlook
The USD/JPY has seen steady declines from last week's highs near 151.91, closing bearish for four of the last five trading sessions, and is set to close for a fourth straight red candle if Tuesday closes below 148.33.
This week's decline sees the pair trading to the south side of the 50-day Simple Moving Average (SMA) near 149.50, and long-term technical support will be waiting to meet bears at the 200-day SMA near 141.50.
USD/JPY Hourly Chart
USD/JPY Daily Chart
- The XAU/USD edged significantly higher towards the $2,005 level, with a 1.40% rally.
- US Treasury yields are declining, and the US dollar is trading soft, allowing the metal to advance.
- The November FOMC minutes will be closely watched.
In Tuesday's trading session, the Gold spot price XAU/USD experienced a remarkable surge, breaking the $2,000 barrier and seeing a 1.40% increase. This notable performance was primarily driven by the downdraft in US yields, often seen as the opportunity cost of holding non-yielding metals and by a weak US dollar.
Today’s highlight will be the Federal Open Market Committee (FOMC) November’s minutes to be released later in the session, where investors will look for further clues on forward guidance. As for now, inflation in the US has shown signs of cooling down, as well as the labor market, while economic activity also saw signs of weakening. On the Federal Reserve (Fed) side, officials kept a cautious tone, warning that if needed, further tightening would be implemented.
In line with that, the bond market could see some volatility if investors detect any fresh clues on the Fed’s next steps. Meanwhile, the 2,5 and 10-year rates declined to 4.86%, 4.40% and 4.39% which benefited the yellow metal.
XAU/USD Levels to watch
The indicators on the daily chart reflect the dominance of buying momentum. In particular, the Relative Strength Index (RSI), nearing overbought conditions, indicates that bullish sentiment is driving the market. This surge in buying pressure is underscored by the Moving Average Convergence Divergence (MACD), which displays rising green bars, alluding to increased buying traction in the short term.
This is reinforced by the XAU/USD placement above the 20,100, and 200-day Simple Moving Averages (SMAs), suggesting that buyers have taken control over the broader market outlook.
Support Levels: $1,980, $1,960, $1,935.
Resistance Levels: $2,010, $2,030, $2,050.
XAU/USD Daily chart
-638361802517122340.png)
- The Canadian Dollar is seeing higher bids on Tuesday, but momentum remains thin.
- Fed’s latest Meeting Minutes are due in the early afternoon.
- Crude Oil is grinding sideways above $77.00, limiting CAD support.
The Canadian Dollar (CAD) is looking for further upside against the US Dollar (USD). Loonie momentum remains limited with Crude Oil spinning in place and investors focusing on the Federal Reserve’s (Fed) latest Meeting Minutes due at the top of the US market session.
Canadian Consumer Price Index (CPI) inflation figures missed expectations in the annualized headline number, and the Bank of Canada’s (BoC) Core CPI was mixed between the monthly and annual results.
Daily Digest Market Movers: Canadian Dollar finds little legroom, moves remain tight
- Canadian headline CPI inflation in October missed expectations in the annualized figure, coming in at 3.1% versus the forecast of 3.2%, backsliding from the previous 3.8%.
- MoM CPI printed as expected at 0.1%, rebounding slightly from September’s -0.1% decline.
- Core CPI lurched higher to 0.3% against the previous -0.1%.
- The BoC’s own YoY Core CPI watchlist shed some weight in October, coming down to 2.7% from 2.8%.
- Markets are turning to focus on the Fed’s upcoming Meeting Minutes release, due at 14:00 EST.
- An overly hawkish Fed could throw jitters through the market.
- Crude Oil is churning in the $77.00/barrel region, providing little support for the Loonie.
Canadian Dollar price today
The table below shows the percentage change of Canadian Dollar (CAD) against listed major currencies today. Canadian Dollar was the strongest against the Euro.
| USD | EUR | GBP | CAD | AUD | JPY | NZD | CHF | |
| USD | 0.05% | -0.26% | -0.29% | -0.05% | -0.40% | -0.41% | -0.24% | |
| EUR | -0.04% | -0.30% | -0.33% | -0.12% | -0.46% | -0.45% | -0.27% | |
| GBP | 0.26% | 0.31% | -0.03% | 0.19% | -0.13% | -0.15% | 0.02% | |
| CAD | 0.30% | 0.34% | 0.04% | 0.25% | -0.11% | -0.12% | 0.07% | |
| AUD | 0.05% | 0.08% | -0.19% | -0.22% | -0.33% | -0.34% | -0.15% | |
| JPY | 0.40% | 0.46% | 0.15% | 0.11% | 0.31% | -0.02% | 0.17% | |
| NZD | 0.42% | 0.44% | 0.15% | 0.12% | 0.34% | 0.01% | 0.15% | |
| CHF | 0.23% | 0.28% | -0.04% | -0.07% | 0.16% | -0.17% | -0.18% |
The heat map shows percentage changes of major currencies against each other. The base currency is picked from the left column, while the quote currency is picked from the top row. For example, if you pick the Euro from the left column and move along the horizontal line to the Japanese Yen, the percentage change displayed in the box will represent EUR (base)/JPY (quote).
Technical Analysis: Canadian Dollar struggles to capitalize but looks for further gains against the US Dollar
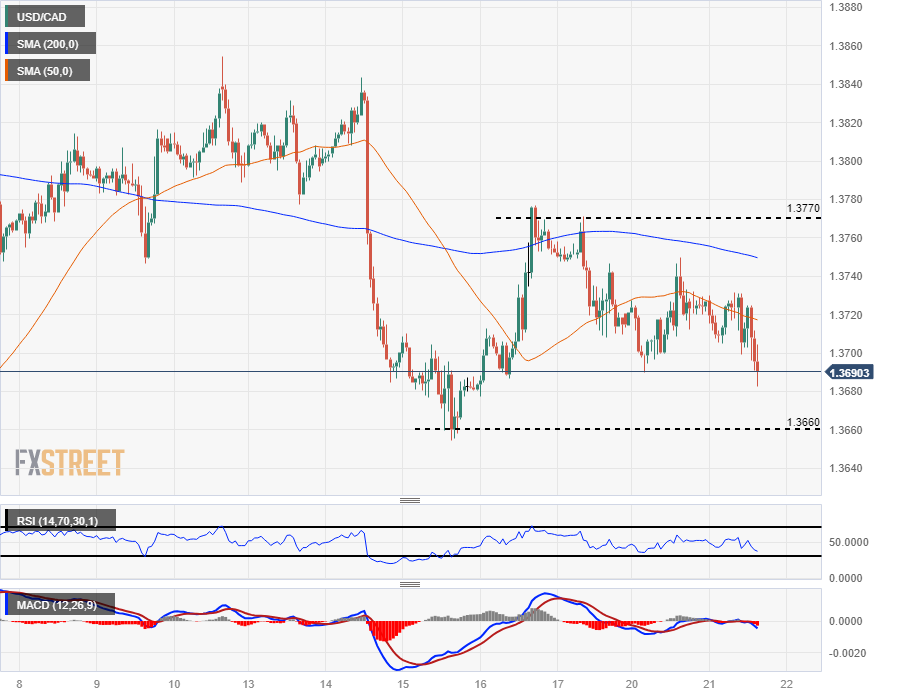
The Canadian Dollar (CAD) is on the rise against the US Dollar (USD) in Tuesday’s trading, but topside momentum remains limited and the USD/CAD is seeing hesitation after slipping below the 1.3700 handle.
The pair remains capped on the low end after catching a downside bounce from the 200-hour Simple Moving Average (SMA) last week.
The short-term technical barriers for intraday trading will be last week’s low bids near 1.3660 and the USD/CAD’s bearish rejection of the 200-hour SMA at 1.3770.
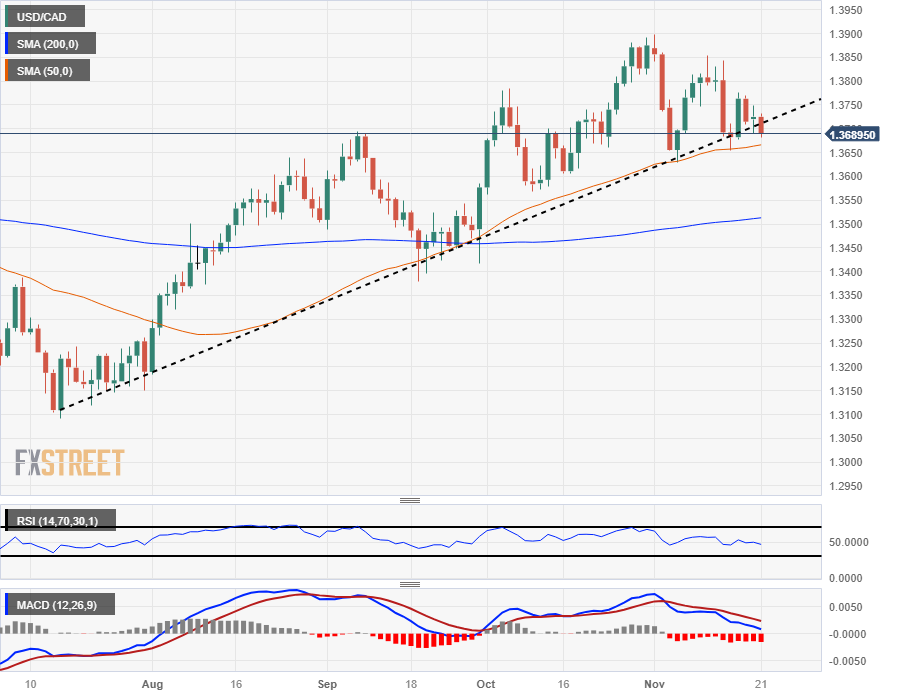
Tuesday’s bearish action sees the pair experimenting with a downside break of a bullish trendline from July’s swing low into the 1.3100 handle. Technical support is stacked from the 50-day SMA near 1.3665 and the 200-day SMA rising from 1.3500.
USD/CAD Hourly Chart
USD/CAD Daily Chart
Canadian Dollar FAQs
What key factors drive the Canadian Dollar?
The key factors driving the Canadian Dollar (CAD) are the level of interest rates set by the Bank of Canada (BoC), the price of Oil, Canada’s largest export, the health of its economy, inflation and the Trade Balance, which is the difference between the value of Canada’s exports versus its imports. Other factors include market sentiment – whether investors are taking on more risky assets (risk-on) or seeking safe-havens (risk-off) – with risk-on being CAD-positive. As its largest trading partner, the health of the US economy is also a key factor influencing the Canadian Dollar.
How do the decisions of the Bank of Canada impact the Canadian Dollar?
The Bank of Canada (BoC) has a significant influence on the Canadian Dollar by setting the level of interest rates that banks can lend to one another. This influences the level of interest rates for everyone. The main goal of the BoC is to maintain inflation at 1-3% by adjusting interest rates up or down. Relatively higher interest rates tend to be positive for the CAD. The Bank of Canada can also use quantitative easing and tightening to influence credit conditions, with the former CAD-negative and the latter CAD-positive.
How does the price of Oil impact the Canadian Dollar?
The price of Oil is a key factor impacting the value of the Canadian Dollar. Petroleum is Canada’s biggest export, so Oil price tends to have an immediate impact on the CAD value. Generally, if Oil price rises CAD also goes up, as aggregate demand for the currency increases. The opposite is the case if the price of Oil falls. Higher Oil prices also tend to result in a greater likelihood of a positive Trade Balance, which is also supportive of the CAD.
How does inflation data impact the value of the Canadian Dollar?
While inflation had always traditionally been thought of as a negative factor for a currency since it lowers the value of money, the opposite has actually been the case in modern times with the relaxation of cross-border capital controls. Higher inflation tends to lead central banks to put up interest rates which attracts more capital inflows from global investors seeking a lucrative place to keep their money. This increases demand for the local currency, which in Canada’s case is the Canadian Dollar.
How does economic data influence the value of the Canadian Dollar?
Macroeconomic data releases gauge the health of the economy and can have an impact on the Canadian Dollar. Indicators such as GDP, Manufacturing and Services PMIs, employment, and consumer sentiment surveys can all influence the direction of the CAD. A strong economy is good for the Canadian Dollar. Not only does it attract more foreign investment but it may encourage the Bank of Canada to put up interest rates, leading to a stronger currency. If economic data is weak, however, the CAD is likely to fall.
AUD/USD is still trading around 5% below its mid-July high. Economists at Commerzbank analyze Aussie’s outlook.
Downside potential again in 2025
With the US likely to enter a recession in the coming months, while the Australian economy is expected to have a soft landing, the trend is likely to reverse in the coming weeks. As a result, we see further recovery potential for the AUD in the medium term.
In 2025, inflation is likely to prove more stubborn than expected globally, as it has already in Australia. As the RBA is perceived as more hesitant and the Fed as more determined in its fight against inflation, we then see slight downside potential for AUD/USD again.
- Mexican Peso (MXN) has paused its seven-day rally against the US Dollar (USD), with the USD/MXN pair having seen a slight uptick on Tuesday.
- Mexico's economic calendar remains relatively quiet, with upcoming mid-November inflation report relevant to Banxico's future monetary policy decisions.
- USD/MXN traders await the latest Federal Reserve (Fed) meeting minutes.
Mexican Peso (MXN) loses some ground against the US Dollar (USD) in early trading during Tuesday’s North American session, despite overall US Dollar weakness, mostly against G8 currencies in the Forex space. The Peso’s seven-day rally halted after refreshing a two-month high of 17.06, but the USD/MXN has reversed its downtrend and climbed 0.47%, trading at 17.18.
Mexico’s economic calendar remains light, with USD/MXN traders eyeing economic data that could weigh on the Bank of Mexico (Banxico) futures decisions, regarding monetary policy. On Wednesday, Mexican Retail Sales are expected to show an improvement, and on Thursday, the November mid-month inflation report most likely witnessed a jump in headline inflation, in contrast to the core, expected to dip further toward the 5% threshold.
Meanwhile, the USD/MXN pair remains driven by economic data from the United States (US) and market mood. The latest data revealed that US Existing Home Sales dropped the most since November 2022. The US Federal Reserve (Fed) will reveal the latest meeting minutes at 19:00 GMT.
Daily digest movers: Mexican Peso retreats despite a weaker US Dollar, USD/MXN challenges 17.20
- The USD/MXN pair is trading well below the 20, 50, 100, and 200-day Simple Moving Averages (SMAs), portraying a bearish bias.
- The US Dollar Index (DXY), which measures the Greenback’s value against a basket of peers, posts losses of more than 0.15%, trading at 103.28.
- The US 10-year Treasury bond yield tumbles two basis points (bps) to 4.39%.
- US Existing Home Sales plunged 4.1% from 3.95 million to 3.79 million, missing estimates of 3.9 million in October.
- Mexico’s Gross Domestic Product (GDP) figures will be revealed on Friday, alongside the third quarter current account.
- Data published last week showed prices paid by consumers and producers in the US dipped, increasing investors' speculations that the Fed’s tightening cycle has ended.
- The swap market suggests traders expect 100 basis points of rate cuts by the Fed in 2024.
- The latest inflation report in Mexico, published on November 9, showed prices grew by 4.26% YoY in October, below forecasts of 4.28% and prior rate of 4.45%. On a monthly basis, inflation came at 0.39%, slightly above the 0.38% consensus and September’s 0.44%.
- Banxico revised its inflation projections from 3.50% to 3.87% for 2024, which remains above the central bank’s 3.00% target (plus or minus 1%).
Technical Analysis: Mexican Peso loses a step as USD/MXN exchanges hands above 17.15
The USD/MXN bearish bias remains intact, but Tuesday’s price action is forming a ‘bullish engulfing’ candlestick pattern, which suggests the pair could shift upwards in the near term. If the pair breaks above 17.28, that could pave the way for a test of the 100-day Simple Moving Average (SMA) At 17.34. Once cleared, that could open the door to challenge the confluence of the 20 and 200-day SMAs at around 17.61.
On the flip side, if USD/MXN sellers keep the spot price below 17.28, they would remain in charge but must drag prices below 17.00 to cement the downward bias on its way toward the year-to-date (YTD) low of 16.62.
Mexican Peso FAQs
What key factors drive the Mexican Peso?
The Mexican Peso (MXN) is the most traded currency among its Latin American peers. Its value is broadly determined by the performance of the Mexican economy, the country’s central bank’s policy, the amount of foreign investment in the country and even the levels of remittances sent by Mexicans who live abroad, particularly in the United States. Geopolitical trends can also move MXN: for example, the process of nearshoring – or the decision by some firms to relocate manufacturing capacity and supply chains closer to their home countries – is also seen as a catalyst for the Mexican currency as the country is considered a key manufacturing hub in the American continent. Another catalyst for MXN is Oil prices as Mexico is a key exporter of the commodity.
How do decisions of the Banxico impact the Mexican Peso?
The main objective of Mexico’s central bank, also known as Banxico, is to maintain inflation at low and stable levels (at or close to its target of 3%, the midpoint in a tolerance band of between 2% and 4%). To this end, the bank sets an appropriate level of interest rates. When inflation is too high, Banxico will attempt to tame it by raising interest rates, making it more expensive for households and businesses to borrow money, thus cooling demand and the overall economy. Higher interest rates are generally positive for the Mexican Peso (MXN) as they lead to higher yields, making the country a more attractive place for investors. On the contrary, lower interest rates tend to weaken MXN.
How does economic data influence the value of the Mexican Peso?
Macroeconomic data releases are key to assess the state of the economy and can have an impact on the Mexican Peso (MXN) valuation. A strong Mexican economy, based on high economic growth, low unemployment and high confidence is good for MXN. Not only does it attract more foreign investment but it may encourage the Bank of Mexico (Banxico) to increase interest rates, particularly if this strength comes together with elevated inflation. However, if economic data is weak, MXN is likely to depreciate.
How does broader risk sentiment impact the Mexican Peso?
As an emerging-market currency, the Mexican Peso (MXN) tends to strive during risk-on periods, or when investors perceive that broader market risks are low and thus are eager to engage with investments that carry a higher risk. Conversely, MXN tends to weaken at times of market turbulence or economic uncertainty as investors tend to sell higher-risk assets and flee to the more-stable safe havens.
Economists at Danske Bank expect the EUR/CHF to move gradually lower.
Upside potential in the near-term if the SNB decides to fully stop intervening
We expect FX intervention to continue to limit imported inflation and thus keep a cap on EUR/CHF in the near-term.
We forecast a sustained move lower in EUR/CHF on the back of fundamentals, continued tight financial conditions and a global growth slowdown.
We target the cross at 0.94 in 6-12M.
If the SNB decides to fully stop intervening, we see upside potential to EUR/CHF in the near-term. Likewise, global growth holding up remains an upside risk.
- Existing Home Sales in the US continued to decline in October.
- US Dollar Index stays in negative territory below 103.40.
Existing Home Sales in the US declined 4.1% in October to a seasonally adjusted annual rate of 3.79 million, below the 3.9 million of market consensus.
“The median existing-home sales price climbed 3.4% from one year ago to $391,800 – the fourth consecutive month of year-over-year price increases”, the report mentioned.
The inventory of unsold existing homes rose 1.8% from September to 1.15 million in October, “or the equivalent of 3.6 months' supply at the current monthly sales pace.”
Market reaction
The US Dollar is falling for the third consecutive day, trading under 103.40, at the lowest level since August.
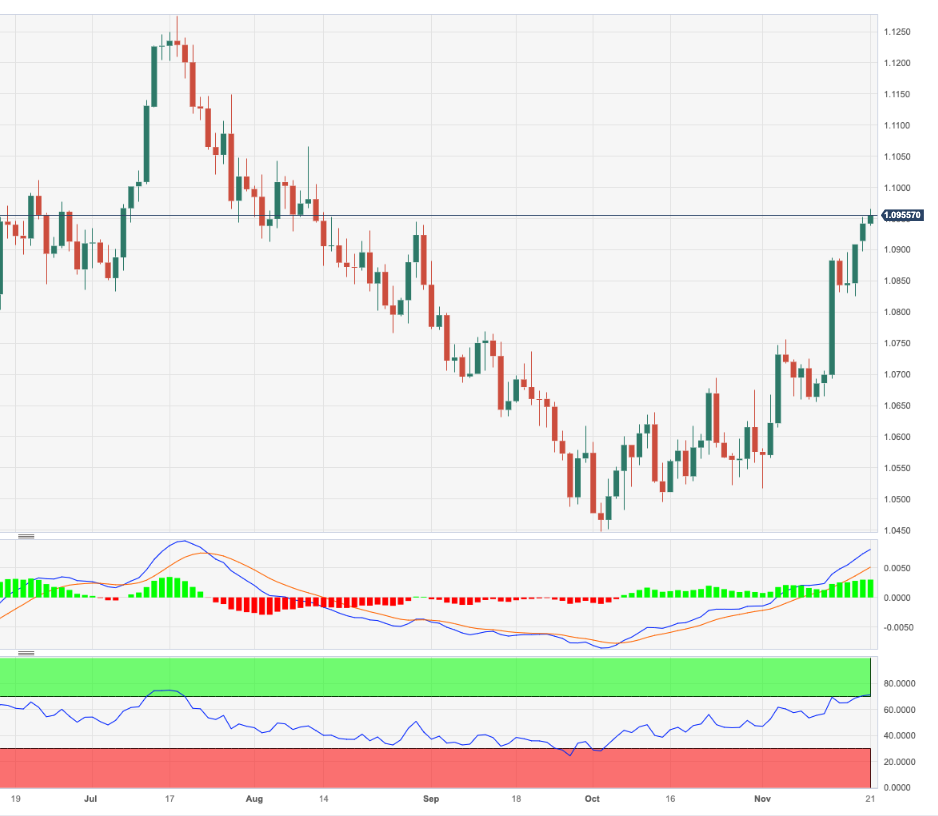
- EUR/USD reaches fresh three-month highs around 1.0965.
- The continuation of the bullish trend should meet 1.1000.
EUR/USD advances for the fourth consecutive session, hitting new peaks around 1.0965 on turnaround Tuesday.
The continuation of the upward bias could see the psychological threshold of 1.1000 revisited prior to the August high of 1.1064 (August 10).
So far, while above the significant 200-day SMA, today at 1.0806, the pair’s outlook should remain constructive.
EUR/USD daily chart
Economists at Commerzbank expect stronger EUR/USD levels until mid-2024.
EUR/USD to rise to around 1.12
We continue to expect the US economy to slide into recession in 2024 and the Fed to cut its key interest rate by a total of 150 bps in response. However, as the market still seems confident that the US economy will manage a ‘soft landing’, we, therefore, expect the EUR/USD pair to rise to around 1.12.
The EUR should also receive a further tailwind if it becomes clear that the ECB will cut its key interest rate later and less sharply than the Fed in view of persistently high core inflation.
Towards the end of the forecast horizon, however, we expect the EUR to weaken moderately again if inflation in the Eurozone is perceived as a persistent phenomenon.
EUR/USD – Dec. 23 1.06 Mar. 24 1.09 Jun. 24 1.12 Sep. 24 1.10 Dec. 24 1.09 Mar. 25 1.08
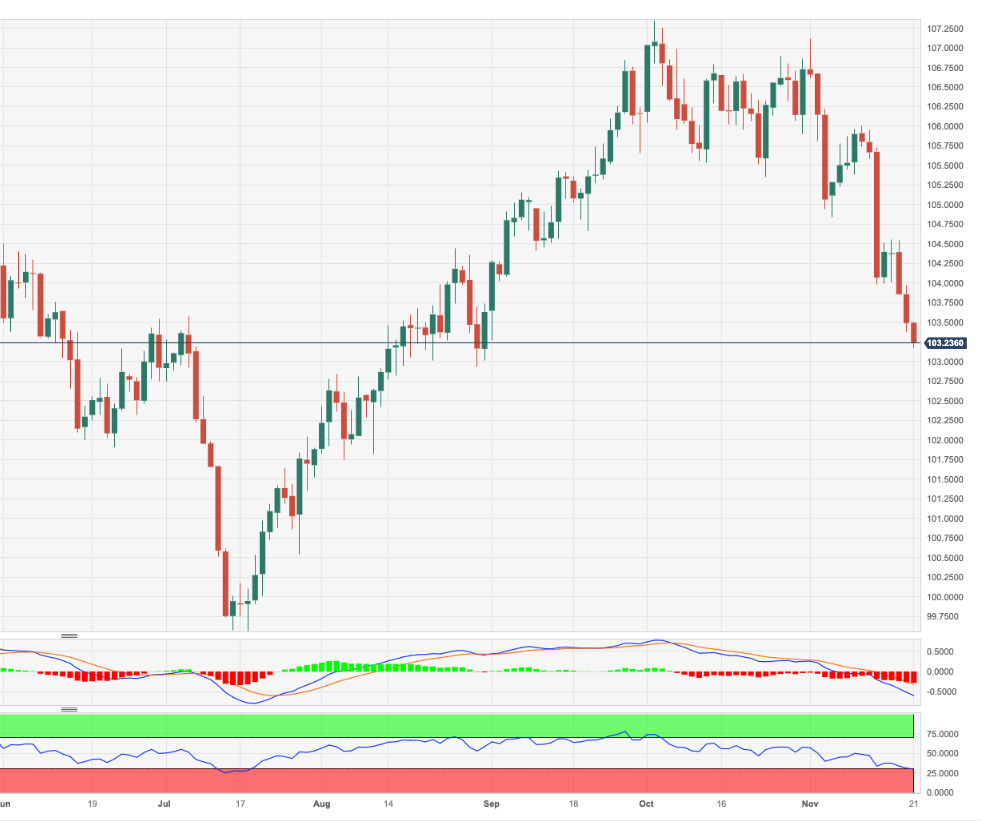
- DXY accelerates its losses and approaches 103.00.
- Immediately to the downside comes the weekly low of 102.93.
DXY retreats for the third session in a row and trades at shouting distance from the key 103.00 support, or three-month lows.
In case bears push harder, the breakdown of the November low of 103.17 should leave the door open to further retracements in the short-term horizon. That said, the next support emerges at the weekly low of 102.93 (August 30) prior to the psychological 100.00 threshold.
In the meantime, while below the key 200-day SMA at 103.61, the outlook for the index is expected to remain bearish.
DXY daily chart
GBP/USD is gradually inching towards 1.2610. Economists at Société Générale analyze the pair’s outlook.
October high near 1.2330 should provide support
GBP/USD met target for Head and Shoulders and formed low near 1.2035. It carved a higher trough near 1.2180 recently and is attempting a break above the 200-DMA.
Daily MACD has a rising slope and has stabilized within positive territory denoting prevalence of upward momentum. The pair is expected to head higher gradually towards neckline of the pattern at 1.2610 and 1.2720.
October high near 1.2330 should provide support near term.
The US Dollar declined further at the beginning of Thanksgiving week. Economists at UBS analyze Greenback’s outlook.
US Dollar to remain around current levels in the months ahead
We expect the US Dollar to stay stable in the first months of 2024, due to robust US economic growth and high US interest rates relative to the rest of the world.
With a sharp narrowing of yield differentials unlikely over this period, we expect a rangebound US Dollar for the first quarter of 2024 and before the USD resumes its weakening against the Euro, British Pound, Japanese Yen, and Swiss Franc.
- EUR/JPY comes under extra pressure and approaches 161.00.
- Immediately to the downside now comes the 55-day SMA.
EUR/JPY retreats for the fourth session in a row and visits multi-session lows near 161.20 on Tuesday.
Further downside appears well on the cards for the cross in the short-term horizon.
That said, losses could then accelerate to the provisional 55-day SMA at 158.93 ahead of the interim 100-day SMA at 158.07.
So far, the longer term positive outlook for the cross appears favoured while above the 200-day SMA, today at 152.88.
EUR/JPY daily chart
USD/MXN is drifting towards 17.00/16.60, economists at Société Générale report.
18.00 is near term hurdle
USD/MXN rebound petered out near the trend line drawn since November 2021 at 18.48/18.60. This test has resulted in a sharp pullback.
The pair has given up its 200-Day Moving Average and re-integrated within the previous base. This denotes upward momentum has disappeared.
USD/MXN is expected to drift towards the next potential supports at 17.00 and July/August lows near 16.60.
Recent pivot high near 18.00 is near term hurdle.
Senior Economist Julia Goh and Economist Loke Siew Ting at UOB Group comment on the performance of the exports sector in Malaysia.
Key Takeaways
Export contraction narrowed for the second straight month to a single-digit of 4.4% y/y in Oct (from -13.8% in Sep), a strong signal that the worst may be behind us. The outturn came in better than our estimate and Bloomberg consensus of -5.0%. In comparison, import contraction narrowed at an even faster pace to just 0.2% last month (UOB est: -12.0% vs Bloomberg est: -9.3%, Sep: -11.1%), largely saved by a strong rebound in imports of capital and consumption goods. This brought trade surplus down to MYR12.9bn (from +MYR24.4bn in Sep), the smallest trade surplus in six months.
Oct’s export performance came after all three export sectors penciled in improvement, with exports of agriculture goods posting the first gain in 13 months. Exports of manufactured goods registered a smaller contraction following a turnaround in shipments of manufactures of metal; optical & scientific equipment; and machinery, equipment & parts. Exports of mining goods fell at a slower pace after the contraction in shipments of liquefied natural gas (LNG) tapered off. Demand also improved across almost all export destinations, with the US, Hong Kong, South Korea and India posting a positive increase.
Reflecting the year-to-date (ytd) export performance (at –8.0% in Jan-Oct 2023) and signs of a further recovery in the global tech cycle amid expectations of a soft landing in the global economy, we revise our 2023 full-year export growth forecast to -7.2% (from -9.0% previously; MOF est: -7.8%, 2022: +24.9%). For 2024, we maintain our export outlook at +3.5% (MOF est: +5.1%) in view of lingering downside risks including tensions in the Middle East, tighter financial and monetary conditions for a prolonged period, persistent property sector drag on China’s economy and ongoing US-China trade conflicts.
- The New Zealand Dollar rises on increased optimism regarding its largest trading partner, China.
- The Kiwi gains after the US Dollar weakens and the PBOC decides to keep rates unchanged whilst pumping more liquidity into the economy.
- NZD/USD continues to rally. The medium-term outlook could now be bullish.
The New Zealand Dollar (NZD) benefits from an overall positive, risk-on mood in the markets on Tuesday. The US Dollar, meanwhile, remains pressured ahead of the release of the Federal Reserve’s last meeting minutes.
After Chinese central bank officials pledged to support the Chinese economy, optimism surrounding the outlook for New Zealand’s chief trading partner has remained strong.
The NZD/USD pair has broken above an important technical resistance level that has stubbornly held for over 3-months at 0.6050-0.6055 despite repeated attempts. If it can hold onto Tuesday’s gains, the break could be classed as ‘decisive’, shifting the intermediate outlook to bullish.
Daily digest market movers: New Zealand Dollar rises ahead of Fed minutes
- The New Zealand Dollar rises, benefiting from increased optimism over the outlook for China, its biggest trading neighbor.
- This suggests continued strong demand for Kiwi goods, which translates into increased demand for the currency, strengthening it.
- On Monday, People's Bank of China (PBOC) officials reiterated their vow to roll out more policy support for the country’s beleaguered real estate sector.
- The PBOC also decided to leave its benchmark Loan Prime Rate (LPR) near record lows of 3.45%, further supporting the flow of easy credit.
- The US Dollar, on the other hand, continues to be weighed down by the expectation that the Federal Reserve (Fed) has concluded raising interest rates for this cycle and now sits at a pivotal turning point.
- Since higher interest rates tend to increase demand for a currency because they attract foreign capital inflows, this has weighed on USD.
- Markets are now pricing in the possibility of nearly 100 bps of Fed rate cuts by December 2024, which has led to a sharp decline in US Treasury bond yields, which are closely correlated with the USD. The yield on the benchmark 10-year US government bond fell to a two-month low on Friday and continues to undermine the US Dollar.
- The next major release for NZD/USD is the minutes from the November Federal Reserve meeting.
- This will provide analysts with more information regarding the Fed’s interest-rate setters and whether they concur with the market about the peak rate having been reached.
New Zealand Dollar technical analysis: NZD/USD breaks through key resistance level
NZD/USD – the number of US Dollars one New Zealand Dollar can buy – breaks above the key October highs at (0.6050 – 0.6055).
-638361713553114345.png)
New Zealand Dollar vs US Dollar: Daily Chart
The pair remains in a short-term bullish trend, biasing longs. Since the break above the October highs, it may also now be deemed to be in a medium-term bullish trend too.
A decisive break above 0.6055 would change the outlook to bullish in the medium term, indicating the possibility of the birth of a new uptrend. Such a move would then initially target the 200-day Simple Moving Average (SMA) at around 0.6100.
If Tuesday’s daily candlestick closes green and on a bullish note, it will suggest more upside is probable.
A possible bullish inverse head and shoulders (H&S) pattern may have formed at the lows. The pattern is identified by the labels applied to the chart above. L and R stand for the left and right shoulders, whilst H stands for the head. The target for the inverse H&S is at 0.6215.
A decisive break would be one accompanied by a long green candle or three green candles in a row.
The long-term trend is still bearish, suggesting downside risks remain.
New Zealand Dollar FAQs
What key factors drive the New Zealand Dollar?
The New Zealand Dollar (NZD), also known as the Kiwi, is a well-known traded currency among investors. Its value is broadly determined by the health of the New Zealand economy and the country’s central bank policy. Still, there are some unique particularities that also can make NZD move. The performance of the Chinese economy tends to move the Kiwi because China is New Zealand’s biggest trading partner. Bad news for the Chinese economy likely means less New Zealand exports to the country, hitting the economy and thus its currency. Another factor moving NZD is dairy prices as the dairy industry is New Zealand’s main export. High dairy prices boost export income, contributing positively to the economy and thus to the NZD.
How do decisions of the RBNZ impact the New Zealand Dollar?
The Reserve Bank of New Zealand (RBNZ) aims to achieve and maintain an inflation rate between 1% and 3% over the medium term, with a focus to keep it near the 2% mid-point. To this end, the bank sets an appropriate level of interest rates. When inflation is too high, the RBNZ will increase interest rates to cool the economy, but the move will also make bond yields higher, increasing investors’ appeal to invest in the country and thus boosting NZD. On the contrary, lower interest rates tend to weaken NZD. The so-called rate differential, or how rates in New Zealand are or are expected to be compared to the ones set by the US Federal Reserve, can also play a key role in moving the NZD/USD pair.
How does economic data influence the value of the New Zealand Dollar?
Macroeconomic data releases in New Zealand are key to assess the state of the economy and can impact the New Zealand Dollar’s (NZD) valuation. A strong economy, based on high economic growth, low unemployment and high confidence is good for NZD. High economic growth attracts foreign investment and may encourage the Reserve Bank of New Zealand to increase interest rates, if this economic strength comes together with elevated inflation. Conversely, if economic data is weak, NZD is likely to depreciate.
How does broader risk sentiment impact the New Zealand Dollar?
The New Zealand Dollar (NZD) tends to strengthen during risk-on periods, or when investors perceive that broader market risks are low and are optimistic about growth. This tends to lead to a more favorable outlook for commodities and so-called ‘commodity currencies’ such as the Kiwi. Conversely, NZD tends to weaken at times of market turbulence or economic uncertainty as investors tend to sell higher-risk assets and flee to the more-stable safe havens.
ANZ’s view is that the Fed is done with rate hikes.
Real policy rate is sufficiently restrictive to bring inflation back to the Fed’s 2% price stability target
October’s CPI data, along with the softish jobs number reported by the October NFP, suggest the Fed will again leave rates unchanged at its December meeting for the third successive meeting. This means the FFR would fall 25 bps short of the median projection made at the September FOMC meeting.
For some time, we have believed the Fed is done with rate rises. Indeed, we think the real policy rate is sufficiently restrictive to bring inflation to the Fed’s 2% price stability target.
- Annual inflation in Canada declined at a faster pace than forecast in October.
- USD/CAD trades in negative territory at around 1.3700 after the data.
Inflation in Canada, as measured by the change in the Consumer Price Index (CPI), softened to 3.1% on a yearly basis in October from 3.8% in September. This reading came in below the market expectation of 3.2%. On a monthly basis, the CPI rose 0.1%, matching analysts' estimate.
"The year-over-year deceleration was largely a result of lower prices for gasoline (-7.8%) in October," Statistics Canada noted in the press release. "Excluding gasoline, the CPI rose 3.6% in October, following a 3.7% increase in September."
Moreover, the Bank of Canada reported that the monthly Core CPI, which excludes volatile food and energy prices, increased 0.3%, while the annual Core CPI edged lower to 2.7% from 2.8%.
Market reaction
USD/CAD stays under modest bearish pressure and trades in negative territory at around 1.3700 after the inflation report.
USD soft tone extends but may consolidate into Thanksgiving, economists at Scotiabank report.
USD losses may moderate in the short term
The overall downtrend in the USD may consolidate in the short run; US markets will be thinking about Thanksgiving and lightening up on positioning while month-end flows could also give the USD a minor boost.
Modest USD gains are still likely to attract better selling interest.
See : The Dollar is now close to oversold levels and a rebound could be overdue – SocGen
GBP/USD edges off high but should hold 1.25 for now, economists at Scotiabank report.
Intraday price action is a little soft-looking
New short-term cycle highs for Cable above 1.25 (100-DMA at 1.2505, now support) keep the broader undertone positive but intraday price action is a little soft-looking, with the Pound edging back from the mid-1.25s.
Support around the figure should hold up in the near-term at least.
Trend momentum is bullish on the intraday, daily and (just about) weekly DMI studies, implying a strong uptrend is developing still.
Resistance is 1.2590 (50% Fibonacci of the H2 drop in Sterling).
EUR’s gains stall around retracement resistance. Economists at Scotiabank analyze EUR/USD outlook.
Euro may consolidate
Spot gains are overshooting the narrowing in Eurozone/US yields somewhat and EUR gains may slow or consolidate in the short run unless Thursday’s Eurozone PMI data bring positive news to bolster bullish momentum.
The broader trend higher in the EUR remains solid-looking but gains have been quite significant in a short space of time and the EUR topping out today right on the 61.8% retracement of the July/September decline warrants attention. Some consolidation – that is to say, drift lower – in spot could develop from here.
Support on dips should be firm, with trend momentum signals aligned bullishly across the short, medium and long-term DMIs.
Support is 1.0840/1.0880.
UOB Group’s Senior Economist Julia Goh and Economist Loke Siew Ting review the latest GDP figures in Malaysia.
Key Takeaways
Malaysia’s final GDP growth edged up to 3.3% y/y in 3Q23 (from +2.9% in 2Q23), matching the advance estimate reading released on 20 Oct. On a seasonally adjusted basis, real GDP posted the largest expansion in five quarters by 2.6% q/q (2Q23: +1.5%), suggesting a sustained recovery amid rising challenges and an accommodative monetary policy stance during the quarter.
3Q23’s real GDP growth was mainly anchored by resilient domestic demand and stock replenishment activities. An improvement in the services, agriculture and construction sectors helped to cushion the sluggishness in the manufacturing and mining & quarrying sectors last quarter. Although the external sector remained weak, but the country was still able to record a sustained current account surplus of MYR9.1bn or 2.0% of GDP in 3Q23 (2Q23: +MYR9.1bn or 2.1%).
Cumulatively, real GDP growth stood at 3.9% in the first nine months of 2023 (Jan-Sep 2022: +9.2%). The larger seasonally adjusted GDP growth implies the persistence of a gradual recovery in the economy in 4Q23, which we estimate at ~4.0% y/y. It will take the full-year growth rate to ~4.0% for 2023, in line with our existing projection and the Ministry of Finance (MOF)’s revised growth target of ~4.0%. We expect the growth momentum to improve further to 4.6% in 2024 (MOF est: 4.0%-5.0% or mid-point forecast of 4.8%), backed by a base case scenario of a soft landing in the global economy despite rising global uncertainties. This respectable growth outlook along with broad market expectations of a Fed easing starting from the middle of 2024 continue to support our call for the Overnight Policy Rate (OPR) to stay unchanged at 3.00% through 2024.
USD/CAD holds near 1.37 ahead of Canadian Consumer Price Index (CPI) data. Economists at Scotiabank analyze the pair’s outlook.
Back to the 1.34/1.35 range on a break below 1.3660
The CAD may slip a bit on lower headline inflation data but the elevated core prices will keep the BoC sounding relatively hawkish and limit CAD losses.
Trend signals are still reading flat to ever so slightly bearish for the USD, which suggests more range trading ahead – unless spot slips under key support at 1.3660 or moves back above resistance at 1.3770/1.3775.
Below 1.3660 should drive the USD back to the 1.34/1.35 range.
See – Canada CPI Preview: Forecasts from six major banks, inflation to decelerate further
- The Greenback trades mixed on Tuesday ahead of the release of the FOMC Minutes.
- Traders are opting for risk-on bets, undermining safe havens like the Swiss Franc and the US Dollar.
- The US Dollar Index falls to around 103.00, with risks of more downturn to come.
The US Dollar (USD) posted another fresh two-month low during the Asian trading session on Tuesday. The Greenback is down over 0.50% against the Japanese Yen (JPY) and the Chinese Renminbi (CNY) as the overall risk sentiment looks to be in favour of risk-on investment, with equities soaring and safe havens abating, adding to the depreciation call for the Greenback.
The calendar for this Tuesday is picking up pace, with one main event right at the end of the day: the FOMC Minutes from the latest Federal Reserve (Fed) meeting in November, when the central bank opted to leave interest rates unchanged. Traders and analysts will look for clues and side remarks on whether inflation is coming down quickly enough for the Fed to end its hiking cycle and either stay steady or enter a cutting cycle immediately thereafter. On Monday, the Chicago Mercantile Exchange (CME) Fed Fund futures, a tool that gauges market expectation of potential changes to the Fed funds rate, briefly priced in a small possibility of already a rate cut at the upcoming December meeting.
Daily digest: Markets going too quick?
- Tuesday’s economic calendar takes off at 13:30 GMT, with the Chicago Fed National Activity Index release for October. Previous reading was at 0.02.
- At 13:55 GMT, the Redbook Index for last week is due to be released. Previous was at 3%.
- At 15:00 GMT, Existing Home Sales data for October is due to come out. Expectations are for a small decline from 3.96 million to 3.9 million.
- At18:00 GMT, the US Treasury department will issue a 10-year TIPS auction.
- At 19:00 GMT, the main event for this Tuesday is the publication of the Fed’s latest FOMC Minutes.
- Equities are flat and looking for direction as Asian markets are not taking over the risk on sentiment that came from the US on Monday. Markets are bracing for the Nvidia earnings, which will come out after the US closing bell.
- The CME Group’s FedWatch Tool shows that markets are pricing in a 100% chance that the Federal Reserve will keep interest rates unchanged at its meeting in December.
- The benchmark 10-year US Treasury Note yield trades at 4.40%, extending its decline as demand remains present in buying US debt. The 20-year allocation on Monday was a big success with a bid-to-cover ratio of 2.58, above the 2.4 average.
US Dollar Index technical analysis: A doom scenario
The US Dollar is sticking to the technical approach after on Monday it breached the 200-day Simple Moving Average (SMA) at 103.62 when gauged by the US Dollar Index (DXY). The Fed FOMC Minutes could briefly provide some support and ease the Relative Strength Index, which is starting to trade in the oversold area on the daily chart. Although relief, do not expect a substantial turnaround as the market broadly anticipated that the Fed is done hiking, at least for now.
The DXY was unable to bounce off the 100-day SMA and is treading further water at the 200-day SMA. Look for the recovery bounce towards the 100-day SMA near 104.20. Should the DXY be able to close and open above it, look for a return to the 55-day SMA near 105.71 with 105.12 ahead of it as resistance.
Traders were warned that when the US Dollar Index would slide below that 55-day SMA, a big air pocket was opening up that could see the DXY fall substantially. The 200-day SMA is trying to keep everything together, though it is losing its impact quickly. The psychological 100-level comes into play. With a very slim economic calendar and several US market participants off the desk for the holidays, there is room for a potential big downturn this week.
US Dollar FAQs
What is the US Dollar?
The US Dollar (USD) is the official currency of the United States of America, and the ‘de facto’ currency of a significant number of other countries where it is found in circulation alongside local notes. It is the most heavily traded currency in the world, accounting for over 88% of all global foreign exchange turnover, or an average of $6.6 trillion in transactions per day, according to data from 2022.
Following the second world war, the USD took over from the British Pound as the world’s reserve currency. For most of its history, the US Dollar was backed by Gold, until the Bretton Woods Agreement in 1971 when the Gold Standard went away.
How do the decisions of the Federal Reserve impact the US Dollar?
The most important single factor impacting on the value of the US Dollar is monetary policy, which is shaped by the Federal Reserve (Fed). The Fed has two mandates: to achieve price stability (control inflation) and foster full employment. Its primary tool to achieve these two goals is by adjusting interest rates.
When prices are rising too quickly and inflation is above the Fed’s 2% target, the Fed will raise rates, which helps the USD value. When inflation falls below 2% or the Unemployment Rate is too high, the Fed may lower interest rates, which weighs on the Greenback.
What is Quantitative Easing and how does it influence the US Dollar?
In extreme situations, the Federal Reserve can also print more Dollars and enact quantitative easing (QE). QE is the process by which the Fed substantially increases the flow of credit in a stuck financial system.
It is a non-standard policy measure used when credit has dried up because banks will not lend to each other (out of the fear of counterparty default). It is a last resort when simply lowering interest rates is unlikely to achieve the necessary result. It was the Fed’s weapon of choice to combat the credit crunch that occurred during the Great Financial Crisis in 2008. It involves the Fed printing more Dollars and using them to buy US government bonds predominantly from financial institutions. QE usually leads to a weaker US Dollar.
What is Quantitative Tightening and how does it influence the US Dollar?
Quantitative tightening (QT) is the reverse process whereby the Federal Reserve stops buying bonds from financial institutions and does not reinvest the principal from the bonds it holds maturing in new purchases. It is usually positive for the US Dollar.
Gold is trading at just under $2,000. Economists at Commerzbank analyze the yellow metal’s outlook.
FOMC Minutes hardly likely to leave any significant mark on Gold
Now that concerns about the conflict in the Middle East have abated noticeably, the US interest rate outlook has regained the upper hand for Gold. Against this backdrop, the Minutes of the latest FOMC meeting, which are due to be published today, are likely to be of interest.
The fact that for many FOMC members, another rate hike is not yet off the table could be reflected again in the Minutes. That said, there have been increasing indications since the meeting in early November that the Fed has probably reached its interest rate peak. After all, besides weak economic indicators, inflation also fell more steeply than expected in October.
Any negative impact of the Minutes on prices should therefore be limited.
Citing a source briefed on the latest developments, Reuters reported on Tuesday that a Qatar-mediated agreement between Israel and Hamas was in its final stages.
According to the news outlet, the deal will include a multi-day pause in hostilities, the release of around 50 civilian hostages by Hamas and the release of Palestinian women and children from Israeli jails.
Market reaction
This headline doesn't seem to be having a significant impact on market mood. At the time of press, US stock index futures were down between 0.1% and 0.2%.
EUR/SEK ended Monday around the 11.45 mark. Economists at Société Générale analyze the pair’s outlook.
Failure to recapture 11.54 could spark deeper drop
EUR/SEK has given a break below its 200-DMA and is at the lower limit of its range since July near 11.40. This is a crucial support.
It would be interesting to see if the pair can reclaim the MA near 11.54. Inability to cross above this could eventually lead to a deeper downtrend.
In case the pair fails to defend 11.40, there would be risk of an extended down move. Next objectives are located at projections of 11.31 and 11.19/11.16.
- WTI Oil traders brace for headline risk as OPEC ministers are due to meet this weekend.
- The US Dollar continues to weaken, supporting commodity prices.
- Oil could recover to $84 should more and longer production cuts be announced at the next OPEC+ meeting.
Oil prices have been jumping higher for two consecutive days in a row as market participants are gearing up for possible supply cuts at hand from OPEC+. Although the next meeting is due on November 26th, it looks like rumours are spreading in the markets that Saudi Arabia might prolong and broaden its production cut in volume and duration. Oil refineries are caught in the middle with stock piles rising, triggering less demand, margins becoming thinner and supply wearing thin.
Meanwhile, the US Dollar (USD) keeps printing a fresh two-month high and is at a crucial point in terms of price action in the US Dollar Index (DXY). The DXY price is crossing two very crucial technical moving averages which means that a more substantial downside could come. The Greenback could ease further, for example against the Euro (EUR/USD) to 1.1180, which would mean another 2.5% devaluation for the Greenback.
Crude Oil (WTI) trades at $77.34 per barrel and Brent Oil trades at $81.85 per barrel at the time of writing.
Oil news and market movers: Oil markets on the lookout for OPEC
- Russia has axed its seaborne Crude exports to the lowest since August of this year. The cut comes to counterweigh the recent uptick in October, ahead of an OPEC minister’s meeting this weekend.
- RBC Capital Markets LLC issued a report warning that more and deeper production cuts could come at the next OPEC+ meeting on November 26th. Efforts this time would not come from Saudi Arabia alone, and would be a joint effort in order to share the burden, RBC’s analyst Helima Croft said.
- Iranian Oil Minister Javad Owji said that Iran’s Oil production will rise to 3.6 million barrels by March next year and to 4m bbl/day in the year after.
- This Tuesday the American Petroleum Institute is due to release its weekly stockpile numbers. Previous data showed a build of 1.335 million barrels, no forecast foreseen for this week’s number.
Oil Technical Analysis: OPEC to make a move
Oil prices are set to move as market expectations are soaring for any kind of production cuts from OPEC. With the OPEC+ ministers meeting this weekend, markets will be on the lookout for any additional action that could cement a floor in crude prices, which at the moment is proving a challenge. The lingering Israeli-Palestinian situation remains an elephant in the room, certainly after the seizing of a tanker in the Strait of Hormuz by Iran-backed Houthi rebels.
On the upside, $80.00 is the resistance to watch out for. Should crude be able to jump higher again, look for $84.00 (purple line) as the next level to see some selling pressure or profit taking. Should Oil prices be able to consolidate above there, the topside for this fall near $93.00 could come back into play.
On the downside, traders are seeing a soft floor forming near $74.00. This level is acting as the last line of defence before entering $70.00 and lower. Once in that area, markets might factor in the risk of a surprise intervention from OPEC+ to jack Oil prices back up again.
-638361599147867006.png)
US WTI Crude Oil: Daily Chart
WTI Oil FAQs
What is WTI Oil?
WTI Oil is a type of Crude Oil sold on international markets. The WTI stands for West Texas Intermediate, one of three major types including Brent and Dubai Crude. WTI is also referred to as “light” and “sweet” because of its relatively low gravity and sulfur content respectively. It is considered a high quality Oil that is easily refined. It is sourced in the United States and distributed via the Cushing hub, which is considered “The Pipeline Crossroads of the World”. It is a benchmark for the Oil market and WTI price is frequently quoted in the media.
What factors drive the price of WTI Oil?
Like all assets, supply and demand are the key drivers of WTI Oil price. As such, global growth can be a driver of increased demand and vice versa for weak global growth. Political instability, wars, and sanctions can disrupt supply and impact prices. The decisions of OPEC, a group of major Oil-producing countries, is another key driver of price. The value of the US Dollar influences the price of WTI Crude Oil, since Oil is predominantly traded in US Dollars, thus a weaker US Dollar can make Oil more affordable and vice versa.
How does inventory data impact the price of WTI Oil
The weekly Oil inventory reports published by the American Petroleum Institute (API) and the Energy Information Agency (EIA) impact the price of WTI Oil. Changes in inventories reflect fluctuating supply and demand. If the data shows a drop in inventories it can indicate increased demand, pushing up Oil price. Higher inventories can reflect increased supply, pushing down prices. API’s report is published every Tuesday and EIA’s the day after. Their results are usually similar, falling within 1% of each other 75% of the time. The EIA data is considered more reliable, since it is a government agency.
How does OPEC influence the price of WTI Oil?
OPEC (Organization of the Petroleum Exporting Countries) is a group of 13 Oil-producing nations who collectively decide production quotas for member countries at twice-yearly meetings. Their decisions often impact WTI Oil prices. When OPEC decides to lower quotas, it can tighten supply, pushing up Oil prices. When OPEC increases production, it has the opposite effect. OPEC+ refers to an expanded group that includes ten extra non-OPEC members, the most notable of which is Russia.
GBP/USD is breaking free from monetary policy expectations. Economists at Société Générale analyze the pair’s outlook.
No room for negative UK economic surprises versus peers
We expect UK growth to average 0.6% in 2024 versus 0.8% for the Eurozone and 0.9% for the US. This is more optimistic than the consensus, which sees only 0.4% and would make the UK economy underperform even Sweden and be the slowest economy next year. This leaves almost no room for negative UK economic surprises versus peers.
On the monetary policy front, BoE and Fed implied pricing for June 2024 has converged, with the first rate cuts expected by mid-year. But the market might be too dovish regarding the BoE given growth and inflation paths in the US and UK.
GBP/USD is already breaking free from monetary policy expectations, an early bullish move that is due solely to November’s Dollar weakness. If the next leg comes from Sterling strength, GBP/USD could go much higher.
AUD/USD is set for a retest of multi-year trend line at 0.6600/0.6660, economists at Société Générale report.
0.6450 should cushion downside
Daily MACD has crossed above the equilibrium line after posting positive divergence; this denotes a regain of upward momentum.
The pair is expected to inch higher towards the 200-DMA near 0.6600/0.6660 which is also the trend line drawn since 2022. This could be an important hurdle.
Recent pivot low at 0.6450 should cushion downside.
If AUD/USD establishes above 0.6660, a larger uptrend is likely.
The Euro enjoyed a resurgence since the start of the month and continued to build gains last week. Economists at Société Générale analyze EUR/USD outlook.
1.0750 is likely to provide support
EUR/USD has recently crossed the upper limit of a small base denoting a regain of upward momentum. This is also highlighted by daily MACD which has entered positive territory. The pair has now also reclaimed its flattish 200-DMA. These signals point towards potential upside.
The pair is inching towards 1.0960, the 61.8% retracement from July. An initial pullback could take shape however pivot high near 1.0750 is likely to provide support. Beyond 1.0960, next hurdle is expected to be at graphical levels of 1.1065/1.1080.
The 1.8% decline in the US Dollar Index (DXY) last week was the largest since the second week of July. Economists at Société Générale analyze Greenback’s outlook.
DXY at risk of a deeper retracement towards 102.55
A close below the 200-DMA (103.62) put the DXY at risk of a deeper retracement towards 102.55.
In the most bearish tactical case, a decline towards 100 could follow if real yields keep falling towards 2% and nominal 10-year UST breaks below 4.36%/4.33%. However, the Dollar is now close to oversold levels and a rebound could be overdue.
The question is whether a rebound in Oil prices (Saudi/ OPEC+ production cut extension) would negate confidence of a soft landing in the US economy and speculation of a first rate cut in 1H24 which explains Dollar profit taking.
Bank of England (BoE) policymaker Jonathan Haskel is testifying on the November Monetary Policy Report (MPR) before the UK’s Parliament's Treasury Select Committee (TSC) on Tuesday.
Haskel said that the “fall in headline CPI is not a good guide to inflation trend.”
Market reaction
The Pound Sterling is little changed on the above comments, with GBP/USD currently trading at 1.2540, adding 0.30% on the day.
Bank of England (BoE) Deputy Governor for Markets and Banking, Dave Ramsden, is testifying on the November Monetary Policy Report (MPR) before the UK’s Parliament's Treasury Select Committee (TSC) on Tuesday.
Key quotes
I continue to characterise my approach to monetary policy as being watchful and responsive.
A restrictive policy stance is likely to be warranted for an extended period of time.
I would not rule out having to raise bank rate further in the future.
Speed limit of the UK economy is low now.
Low speed limit increases chance of above-target inflation.
more to come ....
Market reaction
GBP/USD was last seen trading at 1.2537, up 0.28% on the day.
Bank of England (BoE) policymaker Catherine Mann is testifying on the November Monetary Policy Report (MPR) before the UK’s Parliament's Treasury Select Committee (TSC) on Tuesday.
Key quotes
The prospects for more persistent inflation imply a need for tighter monetary policy.
Monetary policy has only recently become restrictive and not by so much.
Surveys of firms point towards inflation pressures for 2024.
More tightness in monetary policy now is important.
Need to cement commitment to 2% target.
more to come ....
Market reaction
The Pound Sterling is gaining fresh upside traction on the hawkish comments. The GBP/USD pair is trading at 1.2540, adding 0.30% so far.
Bank of England (BoE) Governor Andrew Bailey is testifying on the November Monetary Policy Report (MPR) before the UK’s Parliament's Treasury Select Committee (TSC) on Tuesday.
Key quotes
Latest fall in inflation was good news.
News on inflation was largely as we expected.
Inflation will end year a little lower than we expected, but not by much.
We've seen some weakening on the quantity side of labor market.
Some signs that wage growth is coming off, but well above inflation target consistent level.
We are on target to get inflation back to 2%.
‘Table mountain’ is a good analogy for keeping rates on hold.
Risks are on the upside.
Inefficient labor market is one upside risk to inflation.
Situation in Middle East is a risk to Oil prices, if there is wider regional engagement.
Sensible to keep rates where they are.
Market is putting too much weight on current data releases.
We are concerned about potential inflation persistence.
Markets underestimate risk of inflation persistence.
developing story ...
Market reaction
The Pound Sterling is holding higher ground on the above comments, with GBP/USD currently trading at 1.2540, up 0.30% on the day.
EUR/USD has stabilised above the 1.09 mark. Kit Juckes, Chief Global FX Strategist at Société Générale, analyzes the pair’s outlook.
CFTC data suggests the speculative market is long Euros
EUR/USD has risen fast enough in recent days for RSIs to be overbought and the same is true of the Euro Stoxx index.
A correction is a risk and at the very least, a period of EUR/USD consolidation is likely, while economic data aren’t that good, and the CFTC data suggests the speculative market is long Euros.
Short-term, I’d rather own GBP than EUR, on positioning, and even on talk of ill-advised tax cuts which could nevertheless delay rate cuts.
Further selling pressure could drag USD/CNH to the 7.1100 region in the near term, argue Economist Lee Sue Ann and Markets Strategist Quek Ser Leang at UOB Group.
Key Quotes
24-hour view: We expected USD to weaken yesterday, but we held the view that 7.2000 is unlikely to come under threat. We did not anticipate the outsized and sharp selloff that sent USD plunging to a low of 7.1631. USD continues to decline in early Asian trade, and the risk is for further USD weakness. In view of the severely oversold conditions, it remains to be seen if the next major resistance at 7.1100 is within reach today (there is a minor support at 7.1300). Resistance is at 7.1750; a breach of 7.1950 would mean that the weakness in USD has likely stabilised.
Next 1-3 weeks: Yesterday (20 Nov, spot at 7.2220), we indicated that USD “must break clearly below 7.0000 before a sustained decline to 7.1800 is likely.” We added, “only a breach of 7.2600 would indicate that the downside risk has eased.” We were surprised by the manner in which USD not only sliced through 7.2000 but also nose-dived to 7.1631. What is unsurprising is that further USD weakness is likely. The next support is near 7.1100, just above the 55-week exponential moving average (see weekly chart in the 1-3 months update below). On the upside, the ‘strong resistance’ level has moved markedly lower to 7.2200 from 7.2600
Precious metals prices have remained resilient after more than a month since the war in the Middle East. Economists at TD Securities analyze commodities outlook.
Macro headwinds may increasingly work against bears in Gold
More than a month has passed since the war in the Middle East catalyzed a massive short squeeze in precious metals markets. Crude Oil markets have melted, erasing the risk premium associated with the war, and yet precious metals prices have remained resilient (it was a bear trap!) in defiance of the traditional playbook pointing to a fading risk premium. Finally, it is time to come to the dark side.
We now see risks that buying exhaustion could soon morph into selling activity. Zooming out, however, macro headwinds may increasingly work against discretionary bears in Gold, but the door is open for some tactical downside.
The Dollar continues to edge lower. Economists at ING analyze USD outlook.
Focus on US October Existing Home Sales data and FOMC Minutes
Look for further Dollar weakness today given the risk of the lowest US Existing Home Sales data since 2010 and some FOMC Minutes which could be read less hawkishly.
DXY traded below support at 103.45 (now resistance) and could drift towards 102.95/103.00 and possibly 102.55 depending on today's data and the minutes.
See: EUR/USD to break 1.0960/1.0965 resistance and test 1.10 on soft US Existing Home Sales data – ING
Gold prices rose in India on Tuesday, according to data from India's Multi Commodity Exchange (MCX).
Gold price stood at 61,088 Indian Rupees (INR) per 10 grams, up INR 304 compared with the INR 60,784 it cost on Monday.
As for futures contracts, Gold prices increased to INR 60,956 per 10 gms from INR 60,657 per 10 gms.
Prices for Silver futures contracts decreased to INR 72,788 per kg from INR 72,644 per kg.
| Major Indian city | Gold Price |
|---|---|
| Ahmedabad | 63,215 |
| Mumbai | 63,105 |
| New Delhi | 63,180 |
| Chennai | 63,150 |
| Kolkata | 63,270 |
Global Market Movers: Comex Gold price jumps on dovish Fed expectations
- The US Dollar selling remains unabated in the wake of dovish Federal Reserve expectations and assisted the Comex Gold price to regain strong positive traction on Tuesday.
- Investors now seem convinced that the Fed has completed its interest rate-hiking cycle and are looking for cues on when the central bank could begin easing its monetary policy.
- The rate-sensitive 2-year US government bond yield remains below the current 5.25-to-5.50% Fed funds target, suggesting that momentum in favor of rate cuts is building.
- The CME’s Fedwatch tool points to a roughly 30% chance that the Fed will start cutting rates as soon as March 2024 and a nearly 100 bps of cumulative easing by the year-end.
- The benchmark US 10-year Treasury yield drops to a fresh two-month low and undermines USD, offsetting the upbeat market mood and benefitting the non-yielding yellow metal.
- Investors turned optimistic after Chinese officials vowed to roll out more policy support for the country’s beleaguered real estate sector and drive stronger momentum for growth.
- China’s new finance minister Lan Fo’an said that the country would boost budget spending to support the post-pandemic recovery in the world’s second-largest economy.
- Fed officials, meanwhile, have not ruled out the possibility that more interest rate hikes could be needed should a change in economic data require it.
- Richmond Fed President Thomas Barkin said on Monday that inflation is likely to remain stubborn and force the central bank to keep rates higher for longer than investors currently anticipate.
- This, in turn, could act as a headwind for the precious metal as traders look to the FOMC minutes for fresh cues about the Fed's future policy action and some meaningful impetus.
Gold FAQs
Why do people invest in Gold?
Gold has played a key role in human’s history as it has been widely used as a store of value and medium of exchange. Currently, apart from its shine and usage for jewelry, the precious metal is widely seen as a safe-haven asset, meaning that it is considered a good investment during turbulent times. Gold is also widely seen as a hedge against inflation and against depreciating currencies as it doesn’t rely on any specific issuer or government.
Who buys the most Gold?
Central banks are the biggest Gold holders. In their aim to support their currencies in turbulent times, central banks tend to diversify their reserves and buy Gold to improve the perceived strength of the economy and the currency. High Gold reserves can be a source of trust for a country’s solvency. Central banks added 1,136 tonnes of Gold worth around $70 billion to their reserves in 2022, according to data from the World Gold Council. This is the highest yearly purchase since records began. Central banks from emerging economies such as China, India and Turkey are quickly increasing their Gold reserves.
How is Gold correlated with other assets?
Gold has an inverse correlation with the US Dollar and US Treasuries, which are both major reserve and safe-haven assets. When the Dollar depreciates, Gold tends to rise, enabling investors and central banks to diversify their assets in turbulent times. Gold is also inversely correlated with risk assets. A rally in the stock market tends to weaken Gold price, while sell-offs in riskier markets tend to favor the precious metal.
What does the price of Gold depend on?
The price can move due to a wide range of factors. Geopolitical instability or fears of a deep recession can quickly make Gold price escalate due to its safe-haven status. As a yield-less asset, Gold tends to rise with lower interest rates, while higher cost of money usually weighs down on the yellow metal. Still, most moves depend on how the US Dollar (USD) behaves as the asset is priced in dollars (XAU/USD). A strong Dollar tends to keep the price of Gold controlled, whereas a weaker Dollar is likely to push Gold prices up.
- USD/JPY moves on the downward trajectory to an eight-week low.
- 147.00 psychological level appears to be a key support following the 38.2% Fibonacci retracement.
- A breakthrough above the 148.00 level could support the pair to explore the region near the nine-day EMA.
USD/JPY extended the losing streak that began on Thursday and marked an eight-week low, trading around 147.40 during the European session on Tuesday. The 147.00 psychological level emerges as the immediate support following the 38.2% Fibonacci retracement at 146.32.
The US Dollar (USD) has plunged to a nearly three-month low, influenced by dovish expectations from the Federal Reserve (Fed). This development is a significant factor contributing to the decline of the USD/JPY pair.
The 14-day Relative Strength Index (RSI) lies below the 50 level, signaling a weaker sentiment for the USD/JPY pair. This could potentially prompt bearish movements toward the psychological support region around 146.00. If a decisive break occurs below this level, it may pave the way for the USD/JPY pair to navigate the area near the 50.0% retracement at the 144.60 level.
Moreover, the Moving Average Convergence Divergence (MACD) line is positioned below the centerline and diverges below the signal line, signaling a bearish momentum in the market for the USD/JPY pair.
On the upside, the major level at 147.50 serves as the immediate barrier, followed by the psychological level at 148.00. A breakthrough above the latter could provide support for the USD/JPY pair to explore the region around the 149.00 level following the nine-day Exponential Moving Average (EMA) at 149.62.
USD/JPY: Daily Chart
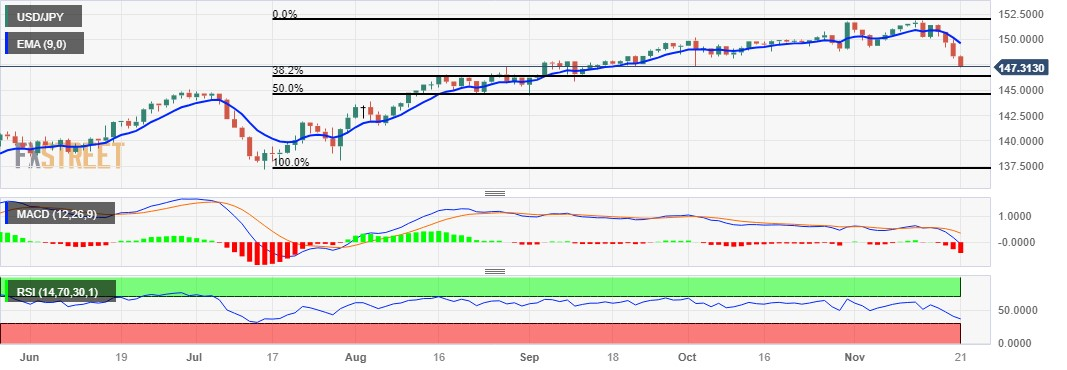
Economists at Commerzbank analyze GBP outlook after Bank of England (BoE) Governor Andrew Bailey’s speech at the Henry Plumb Memorial Lecture.
BoE Governor has some words of warning
The Governor of the BoE Andrew Bailey repeated in a speech on Monday that it was too early to consider rate cuts, as some components of inflation remained far too high and as wage growth continues to rise sharply. That means his comments are in sharp contrast with comments by BoE member Huw Pill who considered rate cuts, like those expected by the financial markets as of mid-2024, to be quite possible.
As long as Bailey does not represent the majority of BoE members with his warning words they are likely to provide little support for Sterling.
- The Euro extends the upside bias vs. the US Dollar.
- European stocks open in a mixed tone on Tuesday.
- The FOMC Minutes, ECB Lagarde will grab all the attention later in the day.
The Euro continues its upward trend against the US Dollar, pushing EUR/USD towards new three-month peaks around 1.0960, a level unseen since mid August.
On the other side of the coin, the Greenback, in terms of the USD Index (DXY), intensifies its decline following the recent breakdown of the crucial 200-day SMA and approaches the key contention area of 103.00.
The Dollar's persistent decline is happening amidst minimal downward bias in US yields across the curve. This decline is fueled by growing speculation about a potential Federal Reserve (Fed) interest rate cut in spring 2024, which remains underpinned by lower-than-expected inflation indicators (CPI and PPI) released last week.
On the euro docket, European Central Bank’s (ECB) President Christine Lagarde will speak on “Inflation kills democracy” in Germany.
Across the ocean, the FOMC Minutes of the November 1 meeting takes centre stage seconded by Existing Home Sales and the Chicago Fed National Activity Index.
Daily digest market movers: Euro opens the door to extra upside
- The EUR accelerates its gains vs. the USD on Tuesday.
- US and German yields kicked off the session on the defensive.
- Investors continue to price in interest rate cuts by the Fed in Q1 2024.
- Markets now expect the ECB to extend its pause until early next year.
- The RBA Minutes came in on the hawkish side.
Technical Analysis: Euro now shifts its attention to 1.1000
EUR/USD extends the bullish move to fresh multi-week tops past 1.0960 on Tuesday.
The November high of 1.0965 (November 21) is currently just ahead of the psychological milestone of 1.1000 for EUR/USD. Further north, the pair might run into the August top of 1.1064 (August 10) and another weekly peak of 1.1149 (July 27), all of which precede the 2023 high of 1.1275 (July 18).
On the other hand, occasional bearish rallies should find first support at the key 200-day SMA at 1.0806, seconded by the temporary 55-day SMA at 1.0648. South of here, the weekly low of 1.0495 (October 13) appears before the 2023 low of 1.0448 (October 3).
Overall, the pair's chances should stay strong as long as it continues above the 200-day SMA.
Euro FAQs
What is the Euro?
The Euro is the currency for the 20 European Union countries that belong to the Eurozone. It is the second most heavily traded currency in the world behind the US Dollar. In 2022, it accounted for 31% of all foreign exchange transactions, with an average daily turnover of over $2.2 trillion a day.
EUR/USD is the most heavily traded currency pair in the world, accounting for an estimated 30% off all transactions, followed by EUR/JPY (4%), EUR/GBP (3%) and EUR/AUD (2%).
What is the ECB and how does it impact the Euro?
The European Central Bank (ECB) in Frankfurt, Germany, is the reserve bank for the Eurozone. The ECB sets interest rates and manages monetary policy.
The ECB’s primary mandate is to maintain price stability, which means either controlling inflation or stimulating growth. Its primary tool is the raising or lowering of interest rates. Relatively high interest rates – or the expectation of higher rates – will usually benefit the Euro and vice versa.
The ECB Governing Council makes monetary policy decisions at meetings held eight times a year. Decisions are made by heads of the Eurozone national banks and six permanent members, including the President of the ECB, Christine Lagarde.
How does inflation data impact the value of the Euro?
Eurozone inflation data, measured by the Harmonized Index of Consumer Prices (HICP), is an important econometric for the Euro. If inflation rises more than expected, especially if above the ECB’s 2% target, it obliges the ECB to raise interest rates to bring it back under control.
Relatively high interest rates compared to its counterparts will usually benefit the Euro, as it makes the region more attractive as a place for global investors to park their money.
How does economic data influence the value of the Euro?
Data releases gauge the health of the economy and can impact on the Euro. Indicators such as GDP, Manufacturing and Services PMIs, employment, and consumer sentiment surveys can all influence the direction of the single currency.
A strong economy is good for the Euro. Not only does it attract more foreign investment but it may encourage the ECB to put up interest rates, which will directly strengthen the Euro. Otherwise, if economic data is weak, the Euro is likely to fall.
Economic data for the four largest economies in the euro area (Germany, France, Italy and Spain) are especially significant, as they account for 75% of the Eurozone’s economy.
How does the Trade Balance impact the Euro?
Another significant data release for the Euro is the Trade Balance. This indicator measures the difference between what a country earns from its exports and what it spends on imports over a given period.
If a country produces highly sought after exports then its currency will gain in value purely from the extra demand created from foreign buyers seeking to purchase these goods. Therefore, a positive net Trade Balance strengthens a currency and vice versa for a negative balance.
- XAG/USD attracts fresh buying on Tuesday and reverses the previous day’s slide.
- The technical setup favours bullish traders and supports prospects for further gains.
- A move beyond a descending trend-line is needed to reaffirm the positive outlook.
Silver (XAG/USD) regains positive traction on Tuesday to reverse the previous day's losses and maintains its bid tone through the first half of the European session. The white metal currently trades around the $23.65-$23.70 region, up 1.0% for the day, and seems poised to appreciate further.
From a technical perspective, the recent pullback from the $24.15 region, or the highest level since September 4, stalled near the very important 200-day Simple Moving Average (SMA) resistance breakpoint, now turned support. The subsequent move up favours bullish traders and supports prospects for a further appreciating move. Moreover, oscillators on the daily chart are holding in the positive territory and are still far from being in the overbought zone, validating the positive outlook for the XAG/USD.
Bulls, however, might wait for a sustained breakout through a downward-sloping trend line extending from the May swing high, currently pegged near the $24.00 mark, before placing fresh bets. The XAG/USD might then aim to surpass the $24.20-$24.25 intermediate resistance and make a fresh attempt towards conquering the $25.00 psychological mark. Some follow-through buying beyond the $25.15-$25.20 region should set the stage for a move towards reclaiming the $26.00 round figure for the first time since May.
On the flip side, the 200-day SMA, currently pegged near the $23.30 region, might continue to protect the immediate downside. Any further decline might still be seen as a buying opportunity and remain limited near the $23.00 mark. That said, a convincing break below the latter might prompt aggressive technical selling and drag the XAG/USD further towards the $22.35-$22.30 zone en route to the $22.00 mark.
Silver daily chart
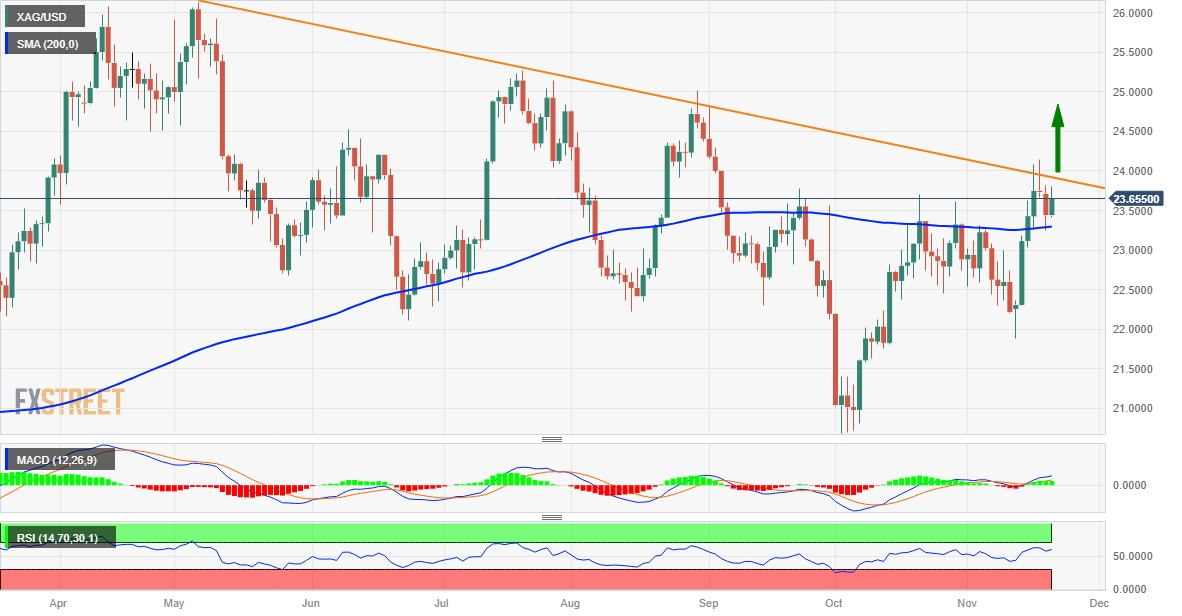
Technical levels to watch
Extra weakness appears the name of the game for USD/JPY for the time being, comment Economist Lee Sue Ann and Markets Strategist Quek Ser Leang at UOB Group.
Key Quotes
24-hour view: The sharp and swift drop that sent USD plummeting to a low of 148.13 came as a surprise (we were expecting range-trading). Not surprisingly, the decline is severely oversold. However, there is scope for USD to drop to 147.60 before stabilisation can be expected. Today, the next support at 147.35 could be out of reach. On the upside, if USD breaks above 148.90 (minor resistance), it would indicate the weakness has likely stabilised.
Next 1-3 weeks: After USD dropped to 149.18 the previous day, we highlighted yesterday (20 Nov, spot at 149.90) that “the increase in downward momentum is not enough to suggest that USD is ready to head lower in a sustained manner.” We were of the view that USD must break clearly below the major support near 148.90 before a sustained decline is likely. We did not anticipate the sharp selloff as USD broke below 148.90 and plunged to 148.13. There is a clear increase in momentum, and USD is likely to decline further to 147.35. The risk of further USD decline will remain as long as it does not break above 149.70 (‘strong resistance’ level was at 151.10 yesterday).
EUR/USD edges close to the 1.10 level. Economists at ING analyze the pair’s outlook.
Another poor set of European PMI readings could again pull the rug from under the Euro
We would again expect the Dollar story to dominate today. Some soft US existing home sales data is probably the best chance of EUR/USD breaking 1.0960/1.0965 resistance and testing 1.10. But without short-dated US yields starting to break substantially lower – e.g., US two-year Treasury yields remain at 4.90% – we would be reluctant to chase EUR/USD too much above 1.10.
Equally, another poor set of European PMI readings on Thursday could again pull the rug from under the Euro.
- The index remains well under pressure near the 103.00 support.
- Investors continue to price in Fed rate cuts in the spring of 2024.
- The FOMC Minutes take centre stage later in the session.
The USD Index (DXY), which tracks the greenback vs. a bundle of its main competitors, keeps the downtrend well in place and threatens to revisit the 103.00 region on turnaround Tuesday.
USD Index maintains the offered tone ahead of FOMC Minutes
The selling pressure around the index accelerates its pace and gradually approaches the key 103.00 neighbourhood on Tuesday. Furthermore, the downside bias in the dollar seems to have gathered extra pace following the recent breach of the key 200-day SMA (103.61).
In addition, the dollar’s negative price action so far comes in tandem with the small retracement in US yields across different timeframes, always against the backdrop of rising speculation that the Federal Reserve might start reducing its interest rate as soon as in the spring of 2024.
On the US calendar, markets’ attention is expected to be on the publication of the FOMC Minutes of the November meeting seconded by Existing Home Sales and the Chicago Fed National Activity Index.
What to look for around USD
In the meantime, the downward bias maintains its dominance on the greenback and forces the index to shift its focus to the 103.00 support in the short term.
Furthermore, the dollar appears depressed against the backdrop of rising speculation of probable interest rate cuts in H1 2024, all in response to further disinflationary pressures and the gradual cooling of the labour market.
Some support for the greenback, however, still emerges the resilience of the US economy as well as a hawkish narrative from some Fed rate setters.
Key events in the US this week: Chicago Fed National Activity Index, Existing Home Sales, FOMC Minutes Tuesday) – MBA Mortgage Applications, Durable Goods Orders, Initial Jobless Claims, Final Michigan Consumer Sentiment (Wednesday) – S&P Global Flash Manufacturing/ Services PMIs (Friday).
USD Index relevant levels
Now, the index is down 0.19% at 103.25 and faces immediate contention at 103.00 (round level) ahead of 102.93 (weekly low August 30) and then the psychological 100.00 threshold. On the upside, the breakout of 104.19 (100-day SMAZ) could expose a move to 106.00 (weekly high November 10) and finally 106.88 (weekly high October 26).
USD/CNH is trading back at 7.14 levels. Economists at ING analyze Renminbi’s outlook.
Renminbi shorts on the run
Two factors have driven the renminbi stronger today. The first is the People's Bank of China (PBoC) delivering a much lower USD/CNY fix than expected. Additionally, the PBoC drained liquidity when it did not need to, which could be read as a further attempt to squeeze out those holding short Renminbi positions.
It is unclear how much lower Chinese authorities would like USD/CNY to be and local authorities cannot necessarily rely on a broadly soft Dollar environment for long. But for the short term, we think these moves can lift the Asian FX bloc in general and add to the current soft Dollar environment.
According to advanced prints from CME Group for natural gas futures markets, open interest reversed two consecutive daily builds and dropped by nearly 10K contracts, while volume added to the previous daily pullback and went down markedly by around 154.4K contracts.
Natural Gas: Initial support emerges around $2.90
Prices of natural gas extended the bearish move on Monday. The negative price action was in tandem with diminishing open interest and volume and opens the door to a probable near-term rebound. So far, there is initial contention just below the $3.000 mark per MMBtu for the time being.
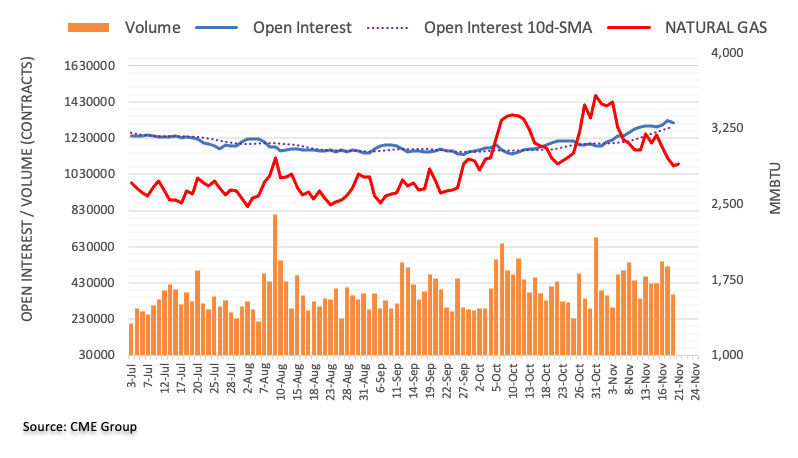
- USD/MXN faces challenges on improved risk appetite.
- Mexico’s mid-November inflation is expected to rise slightly.
- Downbeat US bond yields contribute to pressure on the US Dollar.
USD/MXN extends its losses for the second consecutive day, hovering around 17.1000 during the European session on Tuesday. The pair faces downward pressure fueled by risk-on sentiment, contributing to the overall weakness of the US Dollar (USD). The prevailing market consensus suggests that the Federal Reserve (Fed) has wrapped up its policy-tightening measures. Moreover, sentiment in the market is increasingly favoring the possibility of rate cuts by the Fed, expected to commence in March 2024.
The downbeat Consumer Price Index (CPI) in the United States (US) for October has led investors to reassess the likelihood of a Federal Reserve (Fed) rate hike at the December meeting and consider the potential for rate cuts in 2024.
US Dollar weakness persists on weaker US Treasury bond yields, with 10-year US Treasury yield and 2-year US bond yield stand at 4.39% and 4.90%, respectively.
According to the latest report from the US Bureau of Labor Statistics, the US CPI decelerated to 3.2% (YoY), falling below the consensus of 3.3% and down from the previous reading of 3.7%. The Core CPI eased to 4.0% (YoY), slightly below the previous figure of 4.1%, which was expected to remain unchanged.
FOMC meeting minutes are scheduled to be released on Tuesday, which could provide insights into the decision-making process of the Federal Reserve (Fed) committee regarding interest rates.
Mexico’s economic docket for Thursday will highlight the release of 1st half-month Inflation for November. The expectation is for a slight increase in the Mexico CPI and a marginal reduction in core CPI.
Additionally, the Bank of Mexico (Banxico) is set to release its latest meeting minutes, where the decision to maintain rates at current levels was accompanied by a shift in language from "for an extended period" to "for some time." The swap market indicates pricing in 50 basis points of cuts in the first half of 2024.
- GBP/USD scales higher for the third successive day and advances to over a two-month top.
- Dovish Fed expectations, sliding US bond yields and a positive risk tone undermine the USD.
- Technical buying above the 100-day SMA fuels the momentum ahead of the FOMC minutes.
The GBP/USD pair continues to gain positive traction for the third successive day and climbs to over a two-month peak during the first half of trading action on Tuesday. Spot prices maintain the bid tone around the 1.2530-1.2535 region through the early European session and seem poised to build on the ascending trend in the wake of the underlying bearish sentiment surrounding the US Dollar (USD).
In fact, the USD Index (DXY), which tracks the Greenback against a basket of currencies, dives to its lowest level since August 31 amid dovish Federal Reserve (Fed) expectations. Market participants now seem convinced that the US central bank is done with its policy-tightening campaign and have been pricing in the possibility of a series of rate cuts in 2024. This leads to a further decline in the US Treasury bond yields, which, along with a positive tone around the equity markets, is seen undermining the safe-haven buck and acting as a tailwind for the GBP/USD pair.
The British Pound (GBP), on the other hand, draws support from the fact that the Bank of England (BoE) Governor Andrew Bailey downplayed speculations about a possible rate cut. Speaking at an event on Monday, Bailey said that it was far too early to be thinking about rate cuts and borrowing costs might have to go up again if there were signs that inflation was proving more persistent than expected. This is seen as another factor lending support to the GBP/USD pair, though bulls might refrain from placing aggressive bets ahead of the crucial FOMC meeting minutes.
Investors will get a fresh insight into Fed officials' view on whether the US central bank should raise interest rates again. This will play a key role in influencing the near-term USD price dynamics and provide a fresh directional impetus to the GBP/USD pair. Nevertheless, spot prices now seem to have found acceptance above the 100-day Simple Moving Average (SMA), which might have already set the stage for a further near-term appreciating move.
Technical levels to watch
Here is what you need to know on Tuesday, November 21:
The US Dollar (USD) suffered losses against its major rivals on Monday as the bullish action in Wall Street allowed risk flows to continue to dominate the financial markets. The USD stays under modest bearish pressure early Tuesday as investors shift their focus to the minutes of the Federal Reserve's October 31-November 1 policy meeting. The US economic docket will also feature Existing Home Sales data and Statistics Canada will release Consumer Price Index (CPI) figures for October.
The USD Index registered its weakest lowest close since late August below 104.00 on Monday and extended its slide below 103.50 on Tuesday. In the meantime, the benchmark 10-year US Treasury bond yield dropped below 4.4% in the Asian session and put additional weight on the currency's shoulders.
US Dollar price this week
The table below shows the percentage change of US Dollar (USD) against listed major currencies this week. US Dollar was the weakest against the Japanese Yen.
| USD | EUR | GBP | CAD | AUD | JPY | NZD | CHF | |
| USD | -0.47% | -0.57% | 0.00% | -0.97% | -1.64% | -1.25% | -0.30% | |
| EUR | 0.47% | -0.11% | 0.47% | -0.48% | -1.16% | -0.77% | 0.17% | |
| GBP | 0.57% | 0.14% | 0.59% | -0.38% | -1.06% | -0.66% | 0.30% | |
| CAD | 0.00% | -0.46% | -0.62% | -0.95% | -1.63% | -1.25% | -0.29% | |
| AUD | 0.94% | 0.49% | 0.38% | 0.95% | -0.67% | -0.29% | 0.65% | |
| JPY | 1.61% | 1.17% | 0.83% | 1.64% | 0.72% | 0.42% | 1.35% | |
| NZD | 1.20% | 0.77% | 0.64% | 1.23% | 0.28% | -0.42% | 0.94% | |
| CHF | 0.30% | -0.17% | -0.29% | 0.30% | -0.66% | -1.37% | -0.95% |
The heat map shows percentage changes of major currencies against each other. The base currency is picked from the left column, while the quote currency is picked from the top row. For example, if you pick the Euro from the left column and move along the horizontal line to the Japanese Yen, the percentage change displayed in the box will represent EUR (base)/JPY (quote).
In the minutes of the November policy meeting, the Reserve Bank of Australia (RBA) said that policymakers considered for raising rates or holding steady but saw the case for hiking was stronger given inflation risks had increased. The RBA noted that whether further tightening will be required depend on data and the assessment of risks. After posting strong gains on Monday, AUD/USD continued to push higher in the Asian session and touched its highest level since early August near 0.6600.
EUR/USD registered modest gains on Monday and rose above 1.0950 early Tuesday. European Central Bank Governing Council member Francois Villeroy de Galhau said on Tuesday that interest rates have reached a plateau, where they will remain for the next few quarters.
GBP/USD closed the first trading day of the week above 1.2500 and advanced to its highest level in over two months beyond 1.2540 in the early European morning on Tuesday.
USD/JPY extended its downtrend for the third straight day on Monday and lost nearly 1% on a daily basis. The pair stays on the back foot on Tuesday and it was last seen trading at its weakest level since mid-September at around 147.50.
Inflation in Canada, as measured by the change in the Consumer Price Index (CPI), is forecast to soften to 3.2% on a yearly basis in October from 3.8% in September. Ahead of this data, USD/CAD fluctuates in a very tight range slightly above 1.3700.
Canada CPI Preview: Inflation to soften further while Loonie awaits its momentum
Following Monday's choppy action, Gold gathered bullish momentum and was last seen rising 0.8% on the day above $1,990.
The USD-weakness continued again on Monday. How much further this downside correction can continue? Economists at Commerzbank analyze Dollar’s outlook.
USD correction is probably justified
USD correction is probably justified, as a lot of optimism had already been priced in. There is no reason on the other hand for excessive pessimism as regards USD. In particular, as the economy probably looks worse in other regions. For example, in the Eurozone.
If the economic outlook remains subdued, speculation on the market that the ECB will lower interest rates next year is likely to continue, which might limit an uptrend in EUR/USD.
FX option expiries for Nov 21 NY cut at 10:00 Eastern Time, via DTCC, can be found below.
- EUR/USD: EUR amounts
- 1.0850 957m
- 1.0855 452m
- 1.0930 618m
- GBP/USD: GBP amounts
- 1.2375 356m
- USD/JPY: USD amounts
- 148.50 475m
- 149.00 2.3b
- 149.05 628m
- 149.10 438m
- 149.25 690m
- 149.50 1.6b
- 150.00 595m
- USD/CHF: USD amounts
- 0.8720 715m
- 0.8900 706m
- AUD/USD: AUD amounts
- 0.6520 493m
- 0.6525 1b
- USD/CAD: USD amounts
- 1.3750 404m
In the view of Economist Lee Sue Ann and Markets Strategist Quek Ser Leang at UOB Group, NZD/USD could advance to the 0.6100 region in the short-term horizon.
Key Quotes
24-hour view: Yesterday, we expected NZD to edge higher to 0.6020 before easing. We also expected the major resistance at 0.6055 not to come into view. NZD rose above 0.6020 but did not ease; neither did it reach 0.6055 (high has been 0.6044). In view of the improved momentum, NZD is likely to break above 0.6055. This time around, the next major resistance at 0.6100 is likely out of reach for now. Support is at 0.6020, followed by 0.6000.
Next 1-3 weeks: Our most recent narrative was from last Wednesday (15 Nov, spot at 0.6000), wherein while NZD “is likely to strengthen further, it has to break clearly above 0.6055 before an advance to 0.6100 is likely.” Yesterday (20 Nov), NZD rose to a high of 0.6044. The increase in momentum suggests that a break of 0.6055 will not be surprising. As indicated, a breach of this level is likely to lead to further advance to 0.6100. To keep the momentum going, NZD must stay above 0.5970 (‘strong support’) level previously at 0.5920.
CME Group’s flash data for crude oil futures markets noted traders reduced their open interest positions for yet another session on Monday, this time by around 10.7K contracts. In the same line, volume shrank for the second session in a row, now by around 210.5K contracts.
WTI: Another visit to $72.00 seems likely
Monday’s positive start of the week in prices of WTI was in tandem with shrinking open interest and volume, which dwindles the probability of further recovery in the very near term. Against that, the resumption of the selling pressure and a potential visit to recent lows near the $72.00 mark per barrel should not be ruled out.
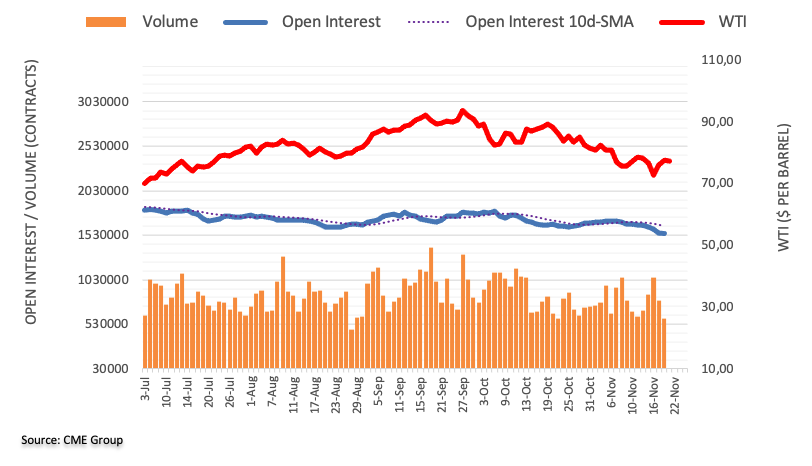
Are the stars aligning for a repeat of last year’s Asia FX rally? Economists at MUFG Bank analyze Asia FX outlook.
Asian currencies unlikely to see a repeat of outsized gains from late last year
We expect Asian currencies to strengthen further in the near term.
The broad-based USD sell-off and correction lower for US yields are helping to ease the downward pressure on Asian currencies that has been in place for most of this year.
Recent political developments in Taiwan which are encouraging investors to scale back geopolitical risks related to the region is further supportive development for Asian currencies as well.
However, the lack of investor enthusiasm over the recent improvement in cyclical momentum in China suggests that it will remain challenging for Asian currencies to extend their rebound.
We do not expect a repeat of the powerful Asian currency rally that took place late last year.
- NZD/USD trades higher on the expectation that the Fed has ended its rate-hike cycle.
- Technical indicators suggest a bullish sentiment to explore the psychological resistance around 0.6100.
- 23.6% Fibonacci retracement at 0.6004 could act as the support aligned with the nine-day EMA.
NZD/USD extends gains around three-month highs, trading around 0.6050 during the early European session on Tuesday. The selling pressure on the US Dollar (USD) continues, as there is increasing consensus that the Federal Reserve (Fed) has concluded its policy-tightening campaign. Market sentiment is now leaning towards the likelihood of rate cuts by the Fed starting in March 2024.
The 14-day Relative Strength Index (RSI) is above the 50 level, indicating a bullish sentiment for the NZD/USD pair. This could encourage bullish moves towards the psychological resistance level around 0.6100.
Moreover, the Moving Average Convergence Divergence (MACD) line, situated above the centerline and diverging above the signal line, is suggestive of a bullish momentum in the market.
On the downside, the 23.6% Fibonacci retracement at 0.6004 may serve as a crucial support level, followed by the nine-day Exponential Moving Average (EMA) at 0.5988. A decisive break below the EMA could potentially pave the way for the pair to test the 38.2% Fibonacci retracement at 0.5960, aligning with the significant level at 0.5950.
NZD/USD: Daily Chart
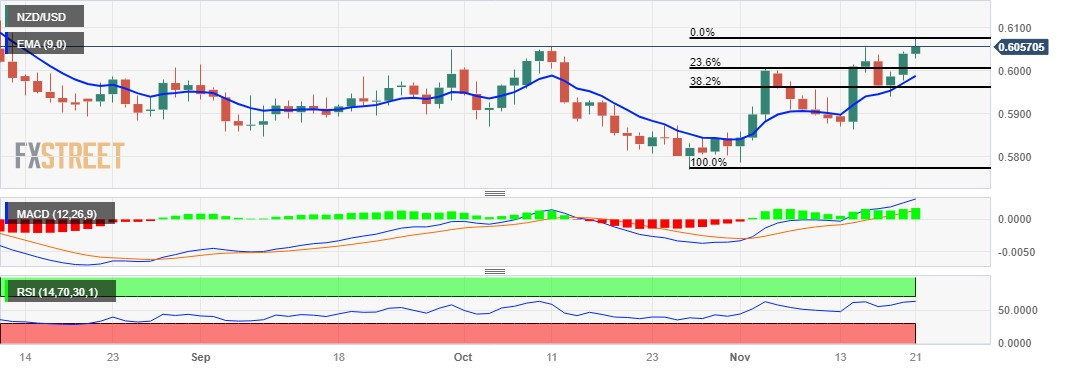
There still seem to be room for GBP/USD to reach the 1.2580 zone in the near term, note Economist Lee Sue Ann and Markets Strategist Quek Ser Leang at UOB Group.
Key Quotes
24-hour view: We indicated yesterday that “there is room for GBP to rise further, but any advance is likely to encounter solid resistance near last week’s high, near 1.2505.” We added, “In order to maintain the buildup in momentum, GBP must stay above 1.2420 (minor support is at 1.2440).” GBP stayed above the minor support of 1.2440 (low of 1.2448), rose, and broke above 1.2505 (high of 1.2518). Upward momentum has increased, albeit not by as much as we would like. That said, as long as GBP stays above 1.2460 (minor support is at 1.2480), it could continue to rise. Based on the current level of momentum, 1.2580 is likely out of reach for now (there is another resistance at 1.2545).
Next 1-3 weeks: Last Wednesday (15 Nov, spot at 1.2490), we highlighted that GBP “is likely to continue to advance, but it has to break clearly above 1.2580 before a further sustained rise is likely.” After GBP pulled back from 1.2506, we highlighted yesterday that GBP “has to break and stay above 1.2505 before an advance to 1.2580 can be expected.” While GBP broke above 1.2505 in NY trade (high of 1.2518), the price action only generated a mild increase in momentum. However, as long as 1.2420 (‘strong support’ level previously at 1.2350) is not breached, there is still a chance for GBP to rise to 1.2580.
Open interest in gold futures markets increased by around 3.2K contracts following the previous daily drop on Monday, according to preliminary readings from CME Group. Volume followed suit and kept the erratic performance, this time rising by more than 63K contracts.
Gold: Next on the upside comes $2000
Monday’s bounce in gold prices off the $1965 level was accompanied by rising open interest and volume and suggests that further recovery appears in store for the yello metal in the very near term. That said, the next up-barrier remains at the key $2000 mark per troy ounce.
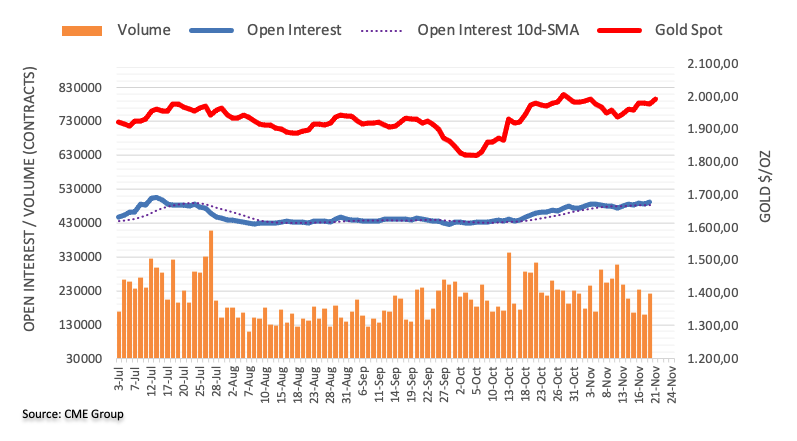
- EUR/JPY loses traction amid the lack of a catalyst in early European session on Tuesday.
- The bullish outlook remains intact as the cross still holds above the key 100-hour EMA.
- The immediate resistance level is located at 161.46; the initial support level is seen at 161.60.
The EUR/JPY cross extends its downside during the early European session on Tuesday. That being said, the lack of a catalyst triggers the demand for safe-haven flows, which lifts the Japanese Yen (JPY) against the Euro (EUR). Market players await the speech by European Central Bank (ECB) President Christine Lagarde at high-level public discussion "Inflation kills democracy” at 06.00 GMT for fresh impetus. The cross currently trades around 161.83, losing 0.29% on the day.
On Tuesday, ECB Governing Council member Francois Villeroy de Galhau said that interest rates have reached a plateau where they will remain for the next few quarters. However, he dismissed discussion of a rate cut as premature.
Technically, the bullish outlook remains intact as the cross still holds above the key 100-hour Exponential Moving Averages (EMAs) on the four-hour chart. However, the Relative Strength Index (RSI) is located in the bearish territory below 50, indicating the pair's upside is likely to remain limited in the near term.
The 50-hour EMA at 161.46 acts as an immediate resistance level for the cross. The additional upside filter to watch is a high of November 20 at 163.56. The next barrier is seen at the upper boundary of Bollinger Band and a high of November 16 at 164.34. A break below the latter will see the rally to the year-to-date (YTD) high of 164.21.
On the other hand, the initial support level for EUR/JPY is seen near the 100-hour EMA at 161.60. Further south, the cross will see the next downside target near the lower limit of the Bollinger Band at 161.48. A breach of the latter will see a drop to a high of October 31 at 160.85, followed by the psychological round figure at 160.00.
EUR/JPY four-hour chart
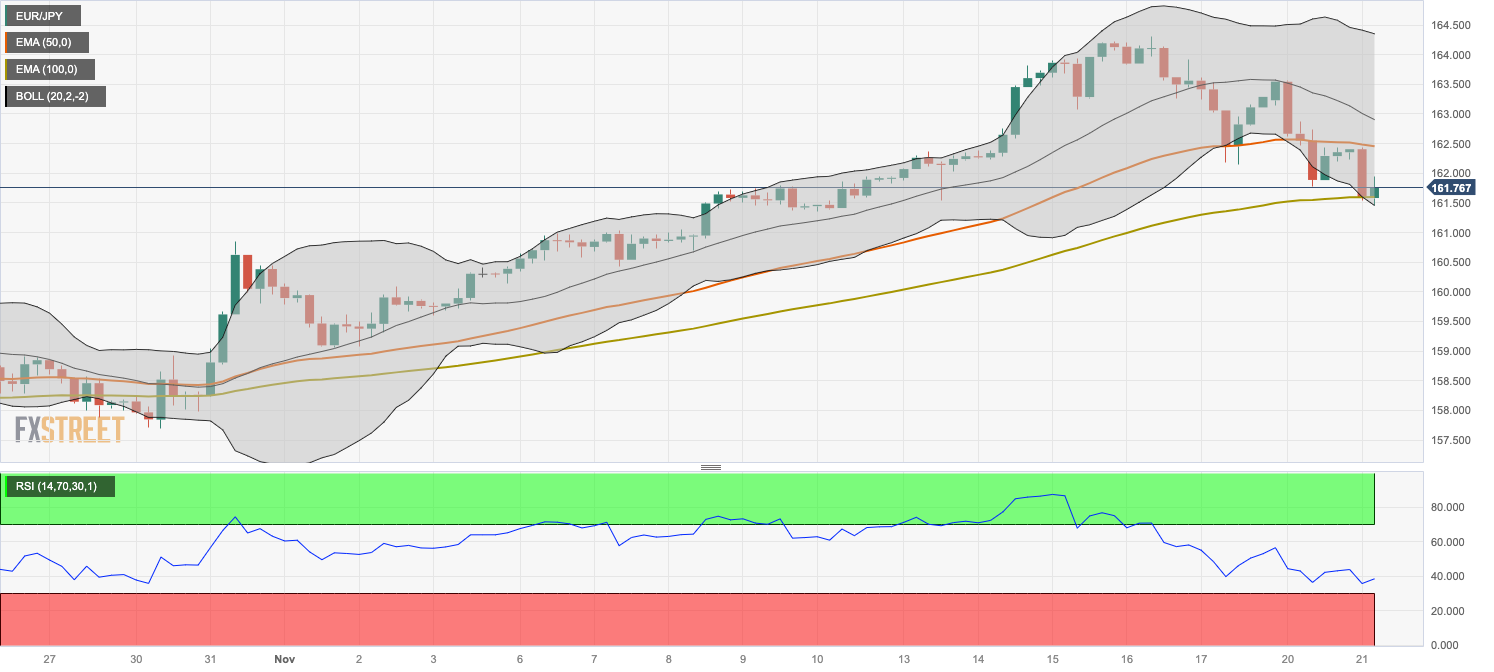
The continuation of the upside bias could lift EUR/USD to the key 1.1000 region in the next few weeks, according to Economist Lee Sue Ann and Markets Strategist Quek Ser Leang at UOB Group.
Key Quotes
24-hour view: We highlighted yesterday that “further EUR strength appears likely, but a sustained rise above 1.0945 is unlikely.” We added, “the next major resistance at 1.1000 is also unlikely to come into view.” Our view was not wrong, as EUR rose to a high of 1.0951 before settling at 1.0938 (+0.28%). Upward momentum has increased, albeit not much. Today, the risk is still for a higher EUR, even though it may not have enough momentum to reach 1.1000. Support is at 1.0920; a breach of 1.0900 would mean that the upside risk has eased.
Next 1-3 weeks: Last Wednesday (15 Nov, spot at 1.0880), we highlighted that “further EUR strength appears likely, and the level to monitor is 1.0945.” Yesterday (20 Nov, spot at 1.0905), we highlighted that EUR is likely to strengthen further, and if it breaks above 1.0945, the next level to watch is 1.1000. EUR then broke above 1.0945 in NY trade (high of 1.0951). We continue to expect EUR to strengthen, and as indicated, the next to watch now is 1.1000. Looking ahead, a breach of 1.1000 will shift the focus to 1.1065. On the downside, the ‘strong support’ level has moved higher to 1.0860 from 1.0820. If EUR breaks below the ‘strong support’, it would mean that it is not strengthening further.
- EUR/USD extends its upside above 1.0950, up 0.18% on the day.
- The pair holds above the 50- and 100-hour EMA with the overbought RSI condition.
- The first upside barrier is seen at 1.0978; the 1.0895–1.0900 zone acts as an initial support level for the pair.
The EUR/USD pair trades in positive territory for the fourth consecutive day during the early European session on Tuesday. The weaker US dollar and lower US Treasury bond yields lend some support to EUR/USD. Investors will take more cues from the Federal Open Market Committee (FOMC) Meeting Minutes on Tuesday, which could potentially provide insights into the trajectory of future policy rates.
According to the four-hour chart, the bullish potential of EUR/USD remains intact as the major pair holds above the 50- and 100-hour Exponential Moving Averages (EMA). It’s worth noting that the Relative Strength Index (RSI) holds in bullish territory above 50. However, the overbought RSI condition indicates that further consolidation cannot be ruled out before positioning for any near-term EUR/USD appreciation.
That being said, the immediate resistance level for EUR/USD is seen near the upper boundary of the Bollinger Band at 1.0978. The critical upside barrier is located near a psychological round figure and a high of August 11 at 1.1000. Any follow-through buying will see a rally to a high of August 4 at 1.1042, en route to a high of July 27 at 1.1149.
On the downside, the 1.0895–1.0900 region acts as an initial support level for the major pair. The mentioned level is the confluence of the psychological mark and a high of November 16. Further south, the next contention level will emerge near the lower limit of the Bollinger Band at 1.0817. A break below the latter will see a drop to the 50-hour EMA at 1.0759, followed by a high of November 9 at 1.0725.
EUR/USD four-hour chart
-638361421982109102.png)
- USD/CHF moves on a downward trajectory on improved risk appetite.
- Downbeat US CPI for October leads investors to view rate cuts in 2024.
- Swiss Franc receives strength on the possibility of more interest rate hikes by SNB.
USD/CHF pair faces challenges for the third consecutive day, possibly influenced by improved risk appetite and indications of a cooling labor market, as investors anticipate a dovish stance from the Federal Reserve (Fed). During the Asian session on Tuesday, the pair trades around 0.8830.
The softer Consumer Price Index (CPI) in the United States (US) for October has prompted investors to reconsider the possibility of a rate hike by the Fed at the December meeting and contemplate potential rate cuts in 2024. According to the latest report from the US Bureau of Labor Statistics, the US CPI decelerated to 3.2% (YoY), below the consensus of 3.3% and down from the previous reading of 3.7%. The Core CPI eased to 4.0% (YoY), slightly below the previous figure of 4.1%, which was expected to remain unchanged.
Swiss National Bank (SNB) Chairman Thomas Jordan's hawkish comments, where he does not rule out the possibility of more interest rate hikes in the future, continue to support and underpin the strength of the Swiss Franc (CHF). Furthermore, Swiss Industrial Production (YoY) for the third quarter exceeded expectations, coming in at 2.0%, a significant improvement from the previous quarter's -0.7% (Revised from -0.8%), reported by Swiss Statistics. This positive trend is considered inflationary and may have contributed to undermining the USD/CHF pair.
On Tuesday, Swiss Import and Export data are set to be released, adding to market developments. Traders will shift their focus on pivotal US economic indicators such as Existing Home Sales and the Chicago Fed National Activity Index. Furthermore, FOMC meeting minutes may provide insights into the decision-making process of the Federal Reserve (Fed) committee regarding interest rates.
- GBP/JPY drifts lower for the fourth straight day and is pressured by a combination of factors.
- Expectations of a policy shift by the BoJ continue to boost the JPY and drag the cross lower.
- Bets that the BoE will cut rates in 2024 further contribute to Sterling’s underperformance.
The GBP/JPY cross remains under heavy selling pressure for the fourth successive day on Tuesday and drops to the 184.70 area during the Asian session, back closer to over a one-week low touched the previous day.
Investors now seem convinced that the Bank of Japan (BoJ) will almost certainly end its negative interest rate policy by early next year in the wake of higher inflation, which remained above the 2% target for the 18th consecutive month in September. This is seen as a key factor behind the Japanese Yen's (JPY) relative outperformance and continues to exert downward pressure on the GBP/JPY cross.
The British Pound (GBP), on the other hand, is weighed down by speculations that the Bank of England (BoE) will start cutting interest rates from their 15-year peak in the wake of looming recession risks. The bets were reaffirmed by weaker UK Retail Sales figures, which fitted with the darkening outlook for Britain's economy. This further contributes to the offered tone surrounding the GBP/JPY cross.
Even the upbeat market mood, which tends to undermine demand for the traditional safe-haven JPY, also does little to ease the bearish pressure or lend any support to spot prices. The GBP/JPY cross has now retreated over 350 pips from its highest level since November 2015, around the 188.25-188.30 region touched last week. Moreover, the lack of any buying supports prospects for further downside.
That said, the prevalent selling bias surrounding the US Dollar (USD) is seen benefitting the Sterling. This, in turn, could lend some support to the GBP/JPY cross, though the fundamental backdrop suggests that the path of least resistance is to the downside. Market participants now look forward to the BoE's Monetary Policy Report Hearings on Wednesday for some meaningful impetus.
Technical levels to watch
- Gold price catches fresh bids on Tuesday as dovish Fed expectations continue to weigh on the USD.
- The upbeat market mood also does little to hinder the positive move back closer to a two-week high.
- Investors now look to the crucial FOMC meeting minutes for future policy action and a fresh impetus.
Gold price (XAU/USD) builds on the overnight bounce from the $1,966-1,965 area and gains strong positive traction during the Asian session on Tuesday. The recent data from the United States (US) pointed to a slowing jobs market and easing inflationary pressures, fueling speculations that the Federal Reserve (Fed) could begin easing its monetary policy sooner than expected. This is reinforced by a further decline in the US Treasury bond yields, which drags the US Dollar (USD) to its lowest level since August 31 and lifts the non-yielding yellow metal back closer to a two-week peak touched last Friday.
The strong intraday move up, meanwhile, seems rather unaffected by a generally positive risk tone, which tends to undermine the safe-haven Gold price. China's promise of additional government stimulus measures boosted investors' confidence and remains supportive of the upbeat market mood, though a bearish USD continues to act as a tailwind for the precious metal. However, it remains to be seen if the XAU/USD is able to capitalize on the momentum ahead of the release of the FOMC meeting minutes, against the backdrop of the uncertainty over the timing of when the Fed will start cutting interest rates.
Daily Digest Market Movers: Gold price jumps back closer to a two-week high touched last Friday amid sustained USD selling
- The US Dollar selling remains unabated in the wake of dovish Federal Reserve expectations and assisted the Gold price to regain strong positive traction on Tuesday.
- Investors now seem convinced that the Fed has completed its interest rate-hiking cycle and are looking for cues on when the central bank could begin easing its monetary policy.
- The rate-sensitive 2-year US government bond yield remains below the current 5.25-to-5.50% Fed funds target, suggesting that momentum in favour of rate cuts is building.
- The CME’s Fedwatch tool points to a roughly 30% chance that the Fed will start cutting rates as soon as March 2024 and a nearly 100 bps of cumulative easing by the year-end.
- The benchmark US 10-year Treasury yield drops to a fresh two-month low and undermines USD, offsetting the upbeat market mood and benefitting the non-yielding yellow metal.
- Investors turned optimistic after Chinese officials vowed to roll out more policy support for the country’s beleaguered real estate sector and drive stronger momentum for growth.
- China’s new finance minister Lan Fo’an said that the country would boost budget spending to support the post-pandemic recovery in the world’s second-largest economy.
- Fed officials, meanwhile, have not ruled out the possibility that more interest rate hikes could be needed should a change in economic data require it.
- Richmond Fed President Thomas Barkin said on Monday that inflation is likely to remain stubborn and force the central bank to keep rates higher for longer than investors currently anticipate.
- This, in turn, could act as a headwind for the precious metal as traders look to the FOMC minutes for fresh cues about the Fed's future policy action and some meaningful impetus.
Technical Analysis: Gold price could aim back to retest multi-month peak around $2.009-2,010 region touched in October
From a technical perspective, some follow-through buying beyond last week's swing high, around the $1,993 area, should allow the Gold price to reclaim the $2,000 psychological mark. The momentum could get extended further towards retesting a multi-month peak, around the $2,009-2,010 area touched in October. A sustained strength beyond the latter will be seen as a fresh trigger for bearish traders and set the stage for an extension of the recent goodish rebound from levels just below the 200-day Simple Moving Average (SMA).
On the flip side, the $1,978-1,977 region now seems to protect the immediate downside ahead of the overnight swing low, around the $1,965 zone. Failure to defend the said support levels could make the Gold price vulnerable to accelerate the slide back towards challenging the 200-day SMA, currently near the $1,938-1,937 zone. This is followed by the 100- and the 50-day SMAs confluence, around the $1,930-1,929 area, which if broken decisively will shift the near-term bias in favour of bearish traders and prompt some technical selling.
US Dollar price this week
The table below shows the percentage change of US Dollar (USD) against listed major currencies this week. US Dollar was the strongest against the Canadian Dollar.
| USD | EUR | GBP | CAD | AUD | JPY | NZD | CHF | |
| USD | -0.49% | -0.65% | -0.09% | -1.06% | -1.69% | -1.27% | -0.30% | |
| EUR | 0.49% | -0.16% | 0.40% | -0.56% | -1.18% | -0.77% | 0.19% | |
| GBP | 0.65% | 0.16% | 0.57% | -0.40% | -0.98% | -0.60% | 0.35% | |
| CAD | 0.09% | -0.40% | -0.57% | -0.97% | -1.59% | -1.17% | -0.21% | |
| AUD | 1.04% | 0.56% | 0.41% | 0.96% | -0.62% | -0.21% | 0.75% | |
| JPY | 1.66% | 1.13% | 0.78% | 1.52% | 0.57% | 0.37% | 1.36% | |
| NZD | 1.25% | 0.77% | 0.61% | 1.17% | 0.20% | -0.41% | 0.95% | |
| CHF | 0.31% | -0.19% | -0.35% | 0.21% | -0.75% | -1.38% | -0.96% |
The heat map shows percentage changes of major currencies against each other. The base currency is picked from the left column, while the quote currency is picked from the top row. For example, if you pick the Euro from the left column and move along the horizontal line to the Japanese Yen, the percentage change displayed in the box will represent EUR (base)/JPY (quote).
Gold FAQs
Why do people invest in Gold?
Gold has played a key role in human’s history as it has been widely used as a store of value and medium of exchange. Currently, apart from its shine and usage for jewelry, the precious metal is widely seen as a safe-haven asset, meaning that it is considered a good investment during turbulent times. Gold is also widely seen as a hedge against inflation and against depreciating currencies as it doesn’t rely on any specific issuer or government.
Who buys the most Gold?
Central banks are the biggest Gold holders. In their aim to support their currencies in turbulent times, central banks tend to diversify their reserves and buy Gold to improve the perceived strength of the economy and the currency. High Gold reserves can be a source of trust for a country’s solvency. Central banks added 1,136 tonnes of Gold worth around $70 billion to their reserves in 2022, according to data from the World Gold Council. This is the highest yearly purchase since records began. Central banks from emerging economies such as China, India and Turkey are quickly increasing their Gold reserves.
How is Gold correlated with other assets?
Gold has an inverse correlation with the US Dollar and US Treasuries, which are both major reserve and safe-haven assets. When the Dollar depreciates, Gold tends to rise, enabling investors and central banks to diversify their assets in turbulent times. Gold is also inversely correlated with risk assets. A rally in the stock market tends to weaken Gold price, while sell-offs in riskier markets tend to favor the precious metal.
What does the price of Gold depend on?
The price can move due to a wide range of factors. Geopolitical instability or fears of a deep recession can quickly make Gold price escalate due to its safe-haven status. As a yield-less asset, Gold tends to rise with lower interest rates, while higher cost of money usually weighs down on the yellow metal. Still, most moves depend on how the US Dollar (USD) behaves as the asset is priced in dollars (XAU/USD). A strong Dollar tends to keep the price of Gold controlled, whereas a weaker Dollar is likely to push Gold prices up.
- USD/CAD receives upward support on improved Crude oil prices.
- WTI improves on speculation that OPEC may decide on more production cuts.
- CPI Canada is anticipated to have eased at 3.2% in October.
USD/CAD retraces its recent gains, trading lower around 1.3710 during the Asian session on Tuesday. The Canadian Dollar (CAD) receives upward support against the Greenback due to the higher Crude Oil prices.
Western Texas Intermediate (WTI) trades near $77.50 per barrel, by the press time. Market speculation suggests that the Organization of the Petroleum Exporting Countries (OPEC) may decide to cut production even more during its upcoming meeting on November 26.
Canada's Consumer Price Index (CPI) data is set to be released on Tuesday. The year-on-year inflation rate in October is anticipated to have reduced to 3.2% from the previous reading of 3.8%. A decline in inflation could provide the Bank of Canada (BoC) with room to keep its target for the overnight rate unchanged at 5.0% during its December meeting, especially as the central bank has signaled that rate decisions will be influenced by the economic indicators.
US Dollar (USD) encounters challenges as improved risk appetite prevails, driven by expectations of a dovish stance from the Federal Reserve (Fed). Last week's release of softer inflation figures, with the Consumer Price Index (CPI) decelerating to 3.2% (YoY) and the core CPI falling to 4.0% (YoY), has led investors to reconsider the likelihood of a rate hike at the December meeting and contemplate potential rate cuts in 2024.
Traders will closely monitor key US economic indicators, including Existing Home Sales and the Chicago Fed National Activity Index on Tuesday. Additionally, insights from the Federal Reserve's minutes from its recent meeting are eagerly awaited by market participants.
- WTI prices trade in positive territory for the third consecutive day on Tuesday.
- Saudi Arabia is planning to prolong oil production cuts of 1 million barrels per day through next year.
- The concern about a slowing global economy outweighed the prospect of deepening supply cuts by OPEC+.
- Oil traders will focus on the FOMC Meeting Minutes and US crude oil inventory data.
Western Texas Intermediate (WTI), the US crude oil benchmark, is trading around $77.50 so far on Tuesday. WTI prices extend their upside amid the expectation that OPEC+ is likely to announce further supply cuts following a meeting early next week.
Saudi Arabia, the world's largest oil exporter, is planning to extend oil production cuts by 1 million barrels a day through next year, while OPEC+ considers additional cuts in response to declining prices and rising tensions over the Israel-Hamas conflict. If additional cuts are agreed upon, this could boost WTI prices in the near term.
On the other hand, the concern about a slowing global economy outweighed the prospect of deepening supply cuts by OPEC and its allies, such as Saudi Arabia and Russia. The Conference Board revealed on Monday that the US leading indicator for October fell 0.8% MoM from a 0.7% MoM drop in September. The report suggested that elevated inflation, high interest rates, and contracting consumer spending would push the US economy into a very short recession. This, in turn, might cap the upside of WTI prices.
Oil traders will monitor the Federal Open Market Committee (FOMC) Meeting Minutes on Tuesday, which might offer hints regarding future policy rate direction. Additionally, the US crude oil inventory data, including API Weekly Crude Oil Stock and EIA Crude Oil Stocks Change for the week ending November 17, will be released on Tuesday and Wednesday, respectively. These events could significantly impact the USD-denominated WTI price. Oil traders will take cues from the data and find trading opportunities around WTI prices.
- Indian Rupee holds positive ground amid the softer US Dollar.
- Sustained dollar demand from state-run and foreign banks, overseas outflows, and higher crude oil prices might cap the INR’s upside.
- The FOMC Meeting Minutes will be in the spotlight on Tuesday.
Indian Rupee (INR) recovers some lost ground on Tuesday on the decline of the US Dollar Index to the lowest level since late August. On Monday, the Indian Rupee ended lower, matching its record closing low of 83.34 as a decline in the US Dollar (USD) offset the impact of higher crude oil prices. According to S&P Global Ratings, the Indian economy would be somewhat less influenced by global uncertainties owing to the country's domestic orientation.
Nonetheless, the renewed dollar demand from state-run and foreign banks and foreign funds outflows might exert some selling pressure on the INR in the near term. Market players will monitor the Federal Open Market Committee (FOMC) Meeting Minutes on Tuesday, which might offer hints regarding future policy rate direction and inflation improvement amid the quiet day in terms of economic data releases.
Daily Digest Market Movers: Indian Rupee remains under pressure amid mixed global cues
- India will be a $7-trillion economy by 2030 if the present growth trajectory is maintained, chief economic advisor (CEA) V. Anantha Nageswaran said on Saturday.
- Increasing crude oil prices, foreign funds outflows, and weakness in domestic equities weighed on Indian investor sentiments.
- According to a report in the Reserve Bank of India’s (RBI) monthly bulletin, the momentum of change in India's GDP is estimated to be higher in October-December due to "ebullient" festive demand.
- According to the RBI, the Indian economy is expected to grow at a 6.5% annual pace between 2023 and 2024. The International Monetary Fund (IMF) has estimated growth of 6.3% every year until 2028.
- RBI is anticipated to maintain the policy rate during its upcoming monetary policy meeting scheduled for December 6-8.
- The India’s Consumer Price Index (CPI) climbed by 4.87% YoY in October versus 5.02% prior, above the market consensus of 4.80%.
- The US October leading indicator dropped 0.8% MoM from the previous reading of 0.7% MoM fall, the Conference Board revealed Monday.
- Investors anticipate the US Federal Reserve (Fed) to begin to cut the rates around the middle of 2024.
- According to CME's FedWatch Tool, money market futures have priced in 50% chance of a rate cut of at least 25 basis points (bps) by May 2024.
Technical Analysis: Indian Rupee keeps the positive outlook
The Indian Rupee trades firmer on the day. The USD/INR pair has traded within a range of 82.80–83.35 since September. Technically, the USD/INR maintains a bullish bias as the pair holds above the key 100-day Exponential Moving Average (EMA) on the daily chart. This outlook is supported by the 14-day Relative Strength Index (RSI) holding above the 50.0 midline.
The upper boundary of the trading range of 83.35 acts as an immediate resistance level for the pair. Any follow-through buying above 83.35 will pave the way to the year-to-date (YTD) high of 83.47. The next upside target is seen at a psychological round figure at 84.00.
On the flip side, an initial support level for USD/INR is located near the confluence of the lower limit of the trading range and a low of September 12 at 82.80. A decisive break below will see a drop to a low of August 11 at 82.60, en route to a low of August 24 at 82.37.
US Dollar price in the last 7 days
The table below shows the percentage change of US Dollar (USD) against listed major currencies in the last 7 days. US Dollar was the strongest against the Canadian Dollar.
| USD | EUR | GBP | CAD | AUD | JPY | NZD | CHF | |
| USD | -2.42% | -2.09% | -0.67% | -3.15% | -2.67% | -3.11% | -2.04% | |
| EUR | 2.37% | 0.33% | 1.70% | -0.70% | -0.24% | -0.71% | 0.38% | |
| GBP | 2.05% | -0.33% | 1.38% | -1.00% | -0.56% | -1.04% | 0.06% | |
| CAD | 0.66% | -1.74% | -1.41% | -2.46% | -2.00% | -2.47% | -1.34% | |
| AUD | 3.04% | 0.68% | 1.01% | 2.38% | 0.44% | -0.03% | 1.06% | |
| JPY | 2.60% | 0.23% | 0.55% | 1.95% | -0.46% | -0.47% | 0.61% | |
| NZD | 3.06% | 0.71% | 1.04% | 2.42% | 0.01% | 0.50% | 1.09% | |
| CHF | 1.99% | -0.39% | -0.06% | 1.33% | -1.09% | -0.62% | -1.11% |
The heat map shows percentage changes of major currencies against each other. The base currency is picked from the left column, while the quote currency is picked from the top row. For example, if you pick the Euro from the left column and move along the horizontal line to the Japanese Yen, the percentage change displayed in the box will represent EUR (base)/JPY (quote).
Indian Rupee FAQs
What are the key factors driving the Indian Rupee?
The Indian Rupee (INR) is one of the most sensitive currencies to external factors. The price of Crude Oil (the country is highly dependent on imported Oil), the value of the US Dollar – most trade is conducted in USD – and the level of foreign investment, are all influential. Direct intervention by the Reserve Bank of India (RBI) in FX markets to keep the exchange rate stable, as well as the level of interest rates set by the RBI, are further major influencing factors on the Rupee.
How do the decisions of the Reserve Bank of India impact the Indian Rupee?
The Reserve Bank of India (RBI) actively intervenes in forex markets to maintain a stable exchange rate, to help facilitate trade. In addition, the RBI tries to maintain the inflation rate at its 4% target by adjusting interest rates. Higher interest rates usually strengthen the Rupee. This is due to the role of the ‘carry trade’ in which investors borrow in countries with lower interest rates so as to place their money in countries’ offering relatively higher interest rates and profit from the difference.
What macroeconomic factors influence the value of the Indian Rupee?
Macroeconomic factors that influence the value of the Rupee include inflation, interest rates, the economic growth rate (GDP), the balance of trade, and inflows from foreign investment. A higher growth rate can lead to more overseas investment, pushing up demand for the Rupee. A less negative balance of trade will eventually lead to a stronger Rupee. Higher interest rates, especially real rates (interest rates less inflation) are also positive for the Rupee. A risk-on environment can lead to greater inflows of Foreign Direct and Indirect Investment (FDI and FII), which also benefit the Rupee.
How does inflation impact the Indian Rupee?
Higher inflation, particularly, if it is comparatively higher than India’s peers, is generally negative for the currency as it reflects devaluation through oversupply. Inflation also increases the cost of exports, leading to more Rupees being sold to purchase foreign imports, which is Rupee-negative. At the same time, higher inflation usually leads to the Reserve Bank of India (RBI) raising interest rates and this can be positive for the Rupee, due to increased demand from international investors. The opposite effect is true of lower inflation.
- GBP/USD receives upward support on BoE Governor Bailey’s hawkish comments.
- UK Prime Minister Rishi Sunak plans to cut taxes following a decline in inflation.
- US Dollar faces challenges on dovish sentiment from the Fed following the softer inflation.
GBP/USD continues to trade higher for the third consecutive session, reinforced by the Bank of England (BoE) Governor Andrew Bailey’s speech at the Henry Plumb Memorial Lecture on Monday. The GBP/USD pair trades around 1.2530 during the Asian session on Tuesday, nearing 11-week highs.
BoE Governor Bailey remarked that while inflation has exceeded the main targets, signs are emerging that runaway prices, particularly in the food sector, are starting to stabilize. He acknowledged that overall inflation surpassed the BoE's main 2.0% target. Despite UK inflation easing to 4.6% in the latest reading, there is still a significant gap to bridge before returning to the 2.0% target. Governor Bailey cautions that it is certainly premature to "declare victory" over inflation.
United Kingdom (UK) Prime Minister, Rishi Sunak, announced that the government plans to reduce taxes following a decline in inflation ahead of the UK's autumn budget release. Chancellor of the Exchequer Jeremy Hunt is anticipated to unveil measures aimed at accelerating economic growth, with plans to boost business investment among the key initiatives.
US Dollar Index (DXY) continues to lose ground for the third successive trading session, nearing three-month lows around 103.40. The decline is attributed to increased risk appetite and lower US Treasury yields. This sentiment is fueled by expectations of a less aggressive stance from the Federal Reserve (Fed) following last week's release of softer inflation figures.
In October, the Consumer Price Index (CPI) in the United States decelerated to 3.2% (YoY), while the core CPI fell to 4.0% (YoY). Market optimism stems from the belief that easing inflationary pressures may lead to a more restrained Federal Reserve. Investors seem to be ruling out a rate hike at the December meeting and anticipating potential rate cuts in 2024.
Traders’ focus will be on key US economic indicators, including Existing Home Sales and the Chicago Fed National Activity Index on Tuesday. Additionally, market participants await insights from the Federal Reserve's minutes from its recent meeting.
| Raw materials | Closed | Change, % |
|---|---|---|
| Silver | 23.426 | -0.93 |
| Gold | 1977.426 | -0.01 |
| Palladium | 1076.47 | 2.76 |
- NZD/USD scales higher for the third straight day and climbs to over a three-month peak.
- Best that the Fed is done raising rates continue to undermine the USD and lend support.
- The optimism over more stimulus from China also lends support to the antipodean Kiwi.
The NZD/USD pair attracts some follow-through buying for the third successive trading day on Tuesday and touched its highest level since August 11, around the 0.6060 area during the Asian session.
The US Dollar (USD) selling bias remains unabated in the wake of growing acceptance that the Federal Reserve (Fed) was done with its policy-tightening campaign. Moreover, the markets are now pricing in the possibility that the Fed will start cutting rates soon, as early as March 2024. This leads to a further decline in the US Treasury bond yields and drags the USD to a near three-month low, which, in turn, is seen as a key factor that continues to push the NZD/USD pair higher
Apart from this, the optimism over additional stimulus from China undermines the safe-haven buck and benefits antipodean currencies, including the New Zealand Dollar (NZD). In fact, Chinese officials vowed to roll out more policy support for the country’s beleaguered real estate sector. Furthermore, the People’s Bank of China (PBoC) held its benchmark Loan Prime Rate (LPR) near record lows on Monday and also injected about 80 billion Yuan of liquidity into the economy.
Despite the supporting factors, the NZD/USD pair is struggling to capitalize on the move beyond the 0.6050-0.6055 supply zone. Traders now seem reluctant to place aggressive bets and prefer to wait on the sidelines ahead of the FOMC meeting minute, due for release later during the US session amid the uncertainty over the timing when the Fed will begin cutting rates. Investors will get a fresh insight into policymakers' view on whether the US central bank should raise interest rates again.
The outlook, meanwhile, will play a key role in influencing the near-term USD price dynamics and provide some meaningful impetus to the NZD/USD pair. Heading into the event risk, the US economic docket, featuring the release of Existing Home Sales data, will be looked upon to grab short-term opportunities during the early North American session.
Technical levels to watch
- USD/JPY drifts lower for the fourth straight day and drops to a fresh low since early October.
- Dovish Fed expectations continue to drag the US bond yields lower and undermine the USD.
- A positive risk tone could help limit any further losses ahead of the FOMC meeting minutes.
The USD/JPY pair remains under some selling pressure for the fourth straight day on Tuesday – also marking the fifth day of a negative move in the previous six – and drops to its lowest level since October 4 during the Asian session. Spot prices, however, rebound a few pips in the last hour and currently trade around the 148.00 mark, though remain vulnerable to prolong the recent retracement slide from the 152.00 neighbourhood, or the YTD peak touched in October.
The US Dollar (USD) plummets to a near three-month low in the wake of dovish Federal Reserve (Fed) expectations and turns out to be a key factor dragging the USD/JPY pair lower. Investors now seem convinced that the US central bank is done with its policy-tightening campaign and are now pricing in the possibility of a 25 bps rate cut as soon as March 2024. This, in turn, drags the yield on the benchmark 10-year US government bond to a two-month low and continues to undermine the Greenback.
The Japanese Yen (JPY), meanwhile, has been able to capitalize on the declining US-Japan rate differential and speculations that the Bank of Japan (BoJ) will almost certainly end its negative interest rate policy by early next year. This further contributes to the offered tone surrounding the USD/JPY pair, though the risk-on mood could dent the JPY's safe-haven status and lend some support. Traders might also prefer to wait on the sidelines ahead of the FOMC minutes, due later during the US session.
Investors, meanwhile, remain uncertain over the timing when the Fed will begin cutting rates. Moreover, Fed officials have not ruled out the possibility that more rate hikes could be needed should a change in economic data require it. In fact, Richmond Fed President Thomas Barkin said on Monday that inflation is likely to remain stubborn and force the central bank to keep interest rates higher for longer than investors currently anticipate. This could help limit the downside for the USD/JPY pair.
Hence, the minutes will be closely scrutinized for a fresh insight into the path of interest rates and policymakers' views on whether the US central bank should raise interest rates again this year. This, in turn, should provide some meaningful impetus to the USD and the USD/JPY pair. Nevertheless, the aforementioned fundamental backdrop favours bearish traders and suggests that the path of least resistance for the USD/JPY pair is to the downside.
Technical levels to watch
- Australian Dollar gains ground as Governor Bullock stated that inflation is a challenge.
- Australia’s central bank is optimistic that the progress in employment can be sustained.
- Chinese authorities are expected to provide additional stimulus measures to support the real estate sector.
- US Dollar weakens on improved risk appetite and lower US Treasury yields.
The Australian Dollar (AUD) extends its gains for the third successive session on Tuesday. This rally is fueled by the hawkish comments made by the Reserve Bank of Australia (RBA) Governor Michele Bullock. Furthermore, the AUD/USD pair is finding support from the hawkish tone found in the RBA's November meeting minutes, coupled with the rising commodity prices, reflecting investor optimism about potential additional stimulus measures in China.
Australia’s central bank is increasingly optimistic about the labor market as per Governor Bullock. She believes that the progress in employment can be sustained. Moreover, Bullock notes that underlying demand, rather than just supply issues, is contributing to the inflation challenge, making it a significant concern for the next one or two years.
The Reserve Bank of Australia's November meeting minutes reveal that the board acknowledged a "credible case" against an immediate rate hike but considered the case for tightening stronger due to increased inflation risks. The decision on further tightening would hinge on data and risk assessment. The minutes stressed the importance of preventing even a modest rise in inflation expectations. Staff forecasts assumed one or two more rate rises, and rising house prices suggested policy might not be overly restrictive.
According to sources cited by Bloomberg, Chinese authorities are expected to take measures to support the real estate sector by drafting a list of 50 eligible developers, both private and state-owned. This list is expected to guide financial institutions in providing support through various means such as bank loans, debt, and equity financing.
US Dollar Index (DXY) extended its decline, nearing three-month lows due to a combination of improved risk appetite and lower US Treasury yields. Despite the growth in the United States (US) economy, the Greenback finds itself in a vulnerable position in the short term.
Investors will likely focus on Existing Home Sales and the Chicago Fed National Activity Index from the US. Additionally, the Federal Reserve (Fed) is set to release the minutes from its recent meeting.
Daily Digest Market Movers: Australian Dollar continues to gain ground on hawkish RBA tone
- Australia’s seasonally adjusted Employment Change reported an increase of 55K in October, compared with the market anticipation of 20K and 6.7K in the previous month.
- The Aussie Unemployment Rate came in at 3.7% in October as expected against the previous figure of 3.6%.
- Australia’s Wage Price Index grew 1.3% as expected compared to the previous reading of 0.8%. The year-over-year data showed an increase of 4.0% more than the anticipated 3.9%.
- The Reserve Bank of Australia (RBA) Assistant Governor Marion Kohler stated that inflation is expected to decrease but won't hit the RBA's 2%-3% target until the end of 2025.
- The People’s Bank of China (PBoC) kept its loan prime rate (LPR) unchanged at 3.45% as expected.
- Boston Federal Reserve (Fed) President Susan Collins expressed optimism on Friday that the Fed can lower inflation without causing significant damage to the labor market by being "patient" with further interest rate moves.
- US Continuing Jobless Claims for the week ending on November 3 reached the highest level since 2022 at 1.865M from the previous reading of 1.833M.
- US Initial Jobless Claims for the week ending on November 10 rose to 231K against the 220K as expected, marking the highest level in nearly three months.
- The October's US Consumer Price Index (CPI) showed lower readings than expected, with the annual rate slowing from 3.7% to 3.2%, falling below the consensus forecast of 3.3%. The monthly CPI reduced to 0.0% from 0.4%.
- The US Core CPI rose by 0.2% below the expectations of 0.3%, and the annual rate decreased to 4.0% from 4.1% prior.
Technical Analysis: Australian Dollar maintains its position above 0.6550, supported by the 23.6% Fibonacci retracement
The Australian Dollar trades higher around the 0.6560 level on Tuesday. The AUD/USD pair may encounter resistance near the psychological level at 0.6600. On the downside, immediate support is anticipated around the psychological level at 0.6550, followed by the 23.6% Fibonacci retracement at 0.6500. If a break occurs below the level, the nine-day Exponential Moving Average (EMA) at 0.6493 could be the next support.
AUD/USD: Daily Chart
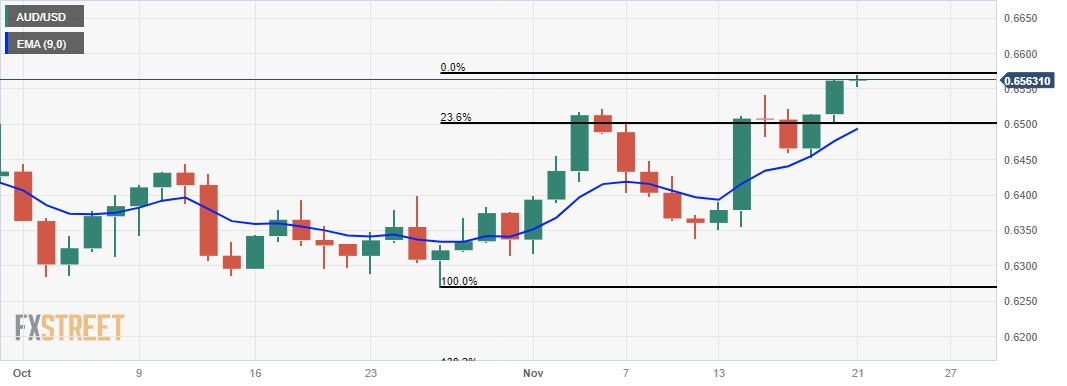
Australian Dollar price today
The table below shows the percentage change of Australian Dollar (AUD) against listed major currencies today. Australian Dollar was the strongest against the US Dollar.
| USD | EUR | GBP | CAD | AUD | JPY | NZD | CHF | |
| USD | -0.07% | -0.07% | -0.07% | -0.17% | -0.19% | -0.21% | -0.09% | |
| EUR | 0.07% | 0.02% | 0.01% | -0.12% | -0.12% | -0.14% | -0.01% | |
| GBP | 0.07% | 0.00% | 0.01% | -0.12% | -0.11% | -0.14% | -0.01% | |
| CAD | 0.07% | 0.00% | 0.00% | -0.13% | -0.13% | -0.15% | -0.01% | |
| AUD | 0.17% | 0.13% | 0.13% | 0.13% | 0.00% | -0.02% | 0.15% | |
| JPY | 0.19% | 0.12% | 0.13% | 0.12% | 0.01% | -0.03% | 0.11% | |
| NZD | 0.20% | 0.13% | 0.13% | 0.14% | 0.01% | 0.01% | 0.11% | |
| CHF | 0.07% | 0.02% | 0.01% | 0.02% | -0.11% | -0.10% | -0.13% |
The heat map shows percentage changes of major currencies against each other. The base currency is picked from the left column, while the quote currency is picked from the top row. For example, if you pick the Euro from the left column and move along the horizontal line to the Japanese Yen, the percentage change displayed in the box will represent EUR (base)/JPY (quote).
Australian Dollar FAQs
What key factors drive the Australian Dollar?
One of the most significant factors for the Australian Dollar (AUD) is the level of interest rates set by the Reserve Bank of Australia (RBA). Because Australia is a resource-rich country another key driver is the price of its biggest export, Iron Ore. The health of the Chinese economy, its largest trading partner, is a factor, as well as inflation in Australia, its growth rate and Trade Balance. Market sentiment – whether investors are taking on more risky assets (risk-on) or seeking safe-havens (risk-off) – is also a factor, with risk-on positive for AUD.
How do the decisions of the Reserve Bank of Australia impact the Australian Dollar?
The Reserve Bank of Australia (RBA) influences the Australian Dollar (AUD) by setting the level of interest rates that Australian banks can lend to each other. This influences the level of interest rates in the economy as a whole. The main goal of the RBA is to maintain a stable inflation rate of 2-3% by adjusting interest rates up or down. Relatively high interest rates compared to other major central banks support the AUD, and the opposite for relatively low. The RBA can also use quantitative easing and tightening to influence credit conditions, with the former AUD-negative and the latter AUD-positive.
How does the health of the Chinese Economy impact the Australian Dollar?
China is Australia’s largest trading partner so the health of the Chinese economy is a major influence on the value of the Australian Dollar (AUD). When the Chinese economy is doing well it purchases more raw materials, goods and services from Australia, lifting demand for the AUD, and pushing up its value. The opposite is the case when the Chinese economy is not growing as fast as expected. Positive or negative surprises in Chinese growth data, therefore, often have a direct impact on the Australian Dollar and its pairs.
How does the price of Iron Ore impact the Australian Dollar?
Iron Ore is Australia’s largest export, accounting for $118 billion a year according to data from 2021, with China as its primary destination. The price of Iron Ore, therefore, can be a driver of the Australian Dollar. Generally, if the price of Iron Ore rises, AUD also goes up, as aggregate demand for the currency increases. The opposite is the case if the price of Iron Ore falls. Higher Iron Ore prices also tend to result in a greater likelihood of a positive Trade Balance for Australia, which is also positive of the AUD.
How does the Trade Balance impact the Australian Dollar?
The Trade Balance, which is the difference between what a country earns from its exports versus what it pays for its imports, is another factor that can influence the value of the Australian Dollar. If Australia produces highly sought after exports, then its currency will gain in value purely from the surplus demand created from foreign buyers seeking to purchase its exports versus what it spends to purchase imports. Therefore, a positive net Trade Balance strengthens the AUD, with the opposite effect if the Trade Balance is negative.
- EUR/USD remains well supported by the underlying bearish sentiment surrounding the USD.
- Expectations that the Fed is done raising rates and a positive risk tone undermine the buck.
- The recent hawkish remarks by ECB officials lend some support ahead of the FOMC minutes.
The EUR/USD pair enters a bullish consolidation phase during the Asian session on Tuesday and oscillates in a narrow trading band just below mid-1.0900s, or its highest level since August 14 touched the previous day.
The US Dollar (USD) remains depressed near its lowest in more than two months in the wake of growing acceptance that the Federal Reserve (Fed) is done with its policy-tightening campaign. In fact, the markets have priced out the possibility of any additional rate hikes and expect that the US central bank may start to cut rates soon. Meanwhile, expectations for the Fed's future policy action dragged the yield on the benchmark 10-year US government bond to a two-month low. Apart from this, the risk-on environment is seen undermining the safe-haven Greenback and acting as a tailwind for the EUR/USD pair.
That said, Fed officials have still not ruled out the possibility that more rate hikes could be needed should a change in economic data require it. In fact, Richmond Fed President Thomas Barkin said on Monday that inflation is likely to remain stubborn and force the central bank to keep interest rates higher for longer than investors currently anticipate. This, in turn, raises the uncertainty over the timing of when the Fed will begin cutting rates. Hence, Tuesday's release of the FOMC meeting minutes, due later during the US session, will be scrutinized closely for cues about the Fed's future policy action.
The outlook, in turn, will determine the next leg of a directional move for the buck and the EUR/USD pair. Heading into the key event risk, the recent hawkish remarks by the European Central Bank (ECB) officials, pushing back against expectations for early rate cut bets, should lend support to the major. Bundesbank President Joachim Nagel said on Friday that it would be unwise to start cutting interest rates too soon. Moreover, ECB policymaker Robert Holzmann argued that the second quarter was simply too soon for a rate cut. This, in turn, suggests that the path of least resistance for spot prices is to the upside.
There isn't any relevant market-moving macro data due for release from the Eurozone on Tuesday, leaving the EUR/USD pair at the mercy of the USD price dynamics. The US economic docket, meanwhile, features Existing Home Sales data, though might do little to provide any impetus ahead of ECB President Christine Lagarde's appearance at an event in Berlin and the crucial FOMC meeting minutes. Nevertheless, the aforementioned fundamental backdrop favours bullish traders, suggesting that any meaningful corrective decline might be seen as a buying opportunity and is more likely to remain limited.
Technical levels to watch
The Reserve Bank of Australia (RBA) published the Minutes of its November monetary policy meeting on Tuesday, highlighting that judged case for hiking was the stronger one given inflation risks had increased. Additional details of the RBA Minutes suggest that the central bank saw the risk that inflation expectations could increase if rates were not raised.
Key takeaways
“Considered case for raising rates or holding steady.”
“Board saw "credible case" that a rate rise was not needed at this meeting.”
“But judged case for hiking was the stronger one given inflation risks had increased.”
“Whether further tightening required would depend on data, assessment of risks.”
“Saw risk that inflation expectations could increase if rates were not raised.”
“Important to prevent even a modest further increase in inflation expectations.”
“Growing mindset among businesses that cost increases could be passed on to customers.”
“Noted staff forecasts for inflation at meeting assumed one or two more rate rises.”
“Board noted cash rate remained below that in many other countries.”
“Rising house prices could indicate policy was not especially restrictive.”
“Surge in domestic population growth made it harder to judge resilience of economy.”
“Inflation and economy were slowing, geopolitical and global outlook uncertain.”
“An escalation in tensions in the middle east could be a drag on global growth.”
Market reaction
At the time of writing, the AUD/USD pair is trading near 0.6568, holding higher while adding 0.11% on the day.
About RBA Minutes
The minutes of the Reserve Bank of Australia meetings are published two weeks after the interest rate decision. The minutes give a full account of the policy discussion, including differences of view. They also record the votes of the individual members of the Committee. Generally speaking, if the RBA is hawkish about the inflationary outlook for the economy, then the markets see a higher possibility of a rate increase, and that is positive for the AUD.
| Index | Change, points | Closed | Change, % |
|---|---|---|---|
| NIKKEI 225 | -197.17 | 33388.03 | -0.59 |
| Hang Seng | 323.88 | 17778.07 | 1.86 |
| KOSPI | 21.35 | 2491.2 | 0.86 |
| ASX 200 | 9 | 7058.4 | 0.13 |
| DAX | -17.83 | 15901.33 | -0.11 |
| CAC 40 | 13.02 | 7246.93 | 0.18 |
| Dow Jones | 203.76 | 35151.04 | 0.58 |
| S&P 500 | 33.36 | 4547.38 | 0.74 |
| NASDAQ Composite | 159.05 | 14284.53 | 1.13 |
| Pare | Closed | Change, % |
|---|---|---|
| AUDUSD | 0.65563 | 0.82 |
| EURJPY | 162.356 | -0.5 |
| EURUSD | 1.09405 | 0.28 |
| GBPJPY | 185.586 | -0.37 |
| GBPUSD | 1.2505 | 0.48 |
| NZDUSD | 0.60362 | 0.94 |
| USDCAD | 1.37249 | 0.13 |
| USDCHF | 0.8851 | -0.05 |
| USDJPY | 148.407 | -0.81 |
Reserve Bank of Australia (RBA) Governor Michele Bullock said on Tuesday that inflation will be the major challenge for the economy over the next two years.
Key quotes
“Underlying demand was fueling part of the inflation challenge, and it was not entirely a supply-driven issue.”
“Says inflation is a crucial challenge in the next one or two years.”
“Says inflation is not only about supply issues, gasoline and rent, that there is still ongoing & underlying demand.”
“If inflation expectations adjust higher in response that's a problem.”
“We haven't had any productivity growth in Australia for a number of years.”
Market reaction
At the press time, the AUD/USD pair is losing 0.04% on the day to trade at 0.6558.


© 2000-2024. Уcі права захищені.
Cайт знаходитьcя під керуванням TeleTrade DJ. LLC 2351 LLC 2022 (Euro House, Richmond Hill Road, Kingstown, VC0100, St. Vincent and the Grenadines).
Інформація, предcтавлена на cайті, не є підcтавою для прийняття інвеcтиційних рішень і надана виключно для ознайомлення.
Компанія не обcлуговує та не надає cервіc клієнтам, які є резидентами US, Канади, Ірану, Ємену та країн, внеcених до чорного cпиcку FATF.
Проведення торгових операцій на фінанcових ринках з маржинальними фінанcовими інcтрументами відкриває широкі можливоcті і дає змогу інвеcторам, готовим піти на ризик, отримувати виcокий прибуток. Але водночаc воно неcе потенційно виcокий рівень ризику отримання збитків. Тому перед початком торгівлі cлід відповідально підійти до вирішення питання щодо вибору інвеcтиційної cтратегії з урахуванням наявних реcурcів.
Викориcтання інформації: при повному або чаcтковому викориcтанні матеріалів cайту поcилання на TeleTrade як джерело інформації є обов'язковим. Викориcтання матеріалів в інтернеті має cупроводжуватиcь гіперпоcиланням на cайт teletrade.org. Автоматичний імпорт матеріалів та інформації із cайту заборонено.
З уcіх питань звертайтеcь за адреcою pr@teletrade.global.
переклади