- Аналітика
- Новини та інструменти
- Новини ринків
Новини ринків
- USD/JPY strung up the middle for Friday after Thursday's reversal flows.
- Japan's National CPI headline figure came in slightly below previous print, inflation cools slightly.
- The Core Japanese National CPI stayed on the higher end than markets expected, steady for the annualized period into August.
The USD/JPY is holding steady with a bullish lean for early Friday trading, teasing into the 147.650 region as the Japanese Yen (JPY) eases on softly-declining national inflation figures.
Markets initially expected national Consumer Price Index (CPI) figures for Japan to step back slightly, with the core CPI (inflation less food price changes) printing in line with the previous figure of 3.1%, beating the median forecast of a flat 3%.
Read more:
Japan inflation: National CPI eases to 3.2% YoY in August vs. 3.3% prior
Friday's economic calendar isn't finished with the USD/JPY yet, with the Bank of Japan (BoJ) expected to give their latest inflation rate call. The BoJ is broadly forecast to keep their negative rate regime steady at -0.1%, but abnormally hawkish comments from BoJ officials recently have ramped up expectations of a potential policy adjustment from Japan's central bank.
Read more:
Japan Interest Rate Decision Preview: Bank of Japan expected to stand pat despite Ueda hawkish hint
USD/JPY technical outlook
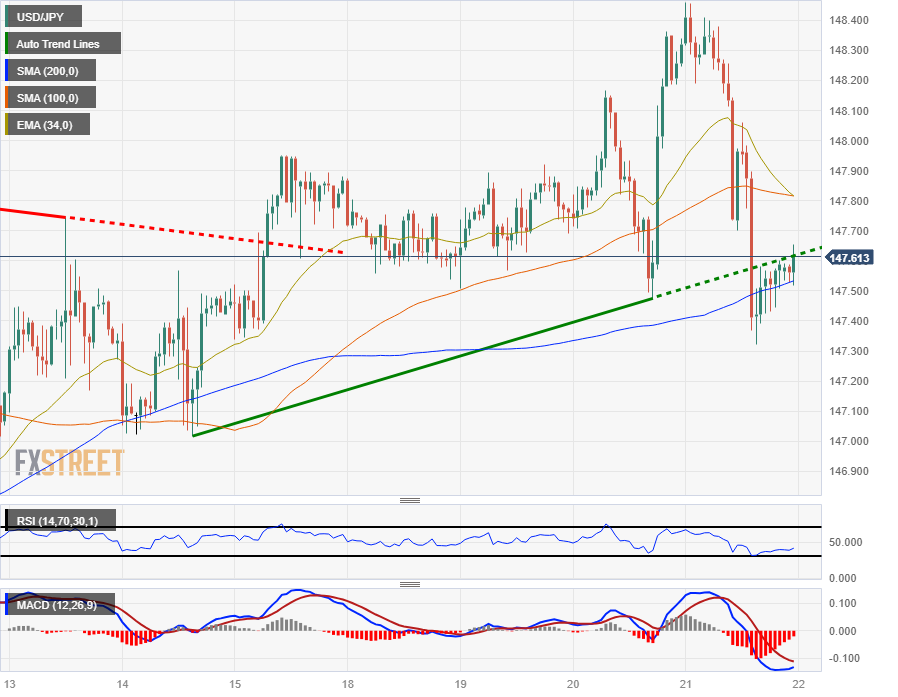
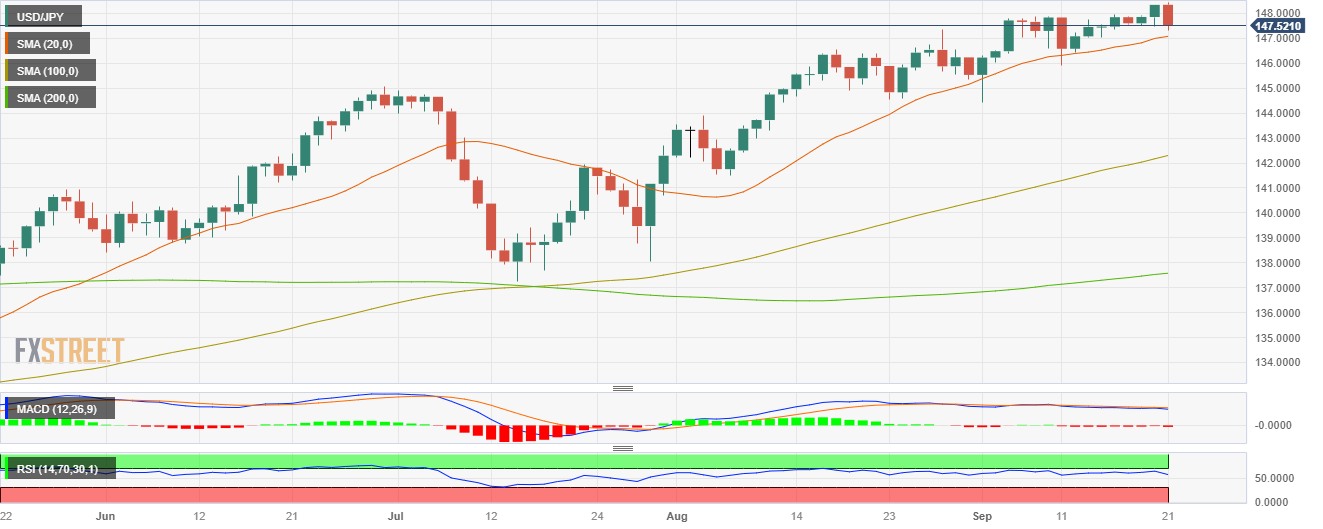
The USD/JPY pair is seeking higher territory early in Friday trading, probing for firmer ground above 147.50.
The pair got knocked off an up-and-down pattern through the midweek, peaking near 148.50 before checking the plumbing at 147.30.
The USD/JPY is now looking to stage a slow and steady recovery into the midrange after catching support from the 200-hour Simple Moving Average (SMA), and is facing descending technical resistance from the 100-hour SMA just north of 147.80.
On the daily charts, the USD/JPY is enjoying a consistent bullish trend, rising steadily from early 2023's lows near the 128.00 major handle, with prices seeing steady support from a bullish 34-day Exponential Moving Average (EMA) near 146.00.
USD/JPY hourly chart
USD/JPY technical levels
According to the latest data released by the Japan Statistics Bureau on Friday, the National Consumer Price Index (CPI) for August came in at 3.2% YoY from 3.3% in July.
Further details unveil that the National CPI ex Fresh Food improved from 3.0% in July to 3.1% in August, whereas the National CPI ex Food, Energy came in at 4.3% compared to 4.3% in previous readings.
Market reaction
Following the Japan inflation data, the USD/JPY pair is down 0.01% on the day at 147.57.
- AUD/NZD is seeing extended declines, continuing Wednesday's backslide.
- Aussie is reaching lower against the Kiwi, down 0.95% for the week.
- Australian PMI figures came in mixed with manufacturing seeing further declines.
The AUD/NZD has broken out of recent consolidation on the weak side, and the pair shrugged off a mixed trade balance printing from New Zealand (NZ) as markets focus on weakened manufacturing figures from the Australian Purchasing Manager Index (PMI) printing.
Read more:
Australia: S&P Global Manufacturing PMI drops to 48.2, Services PMI improves to 50.5 in September
New Zealand Trade Balance came in mixed for August, NZD/USD remains flat above 0.5900
Australian PMI figures came in mixed, with the services component seeing a minor bump into 50.5 from 47.8, but weak spots in the manufacturing component are keeping the Aussie (AUD) on the weak side, with the Manufacturing PMI declining further to 48.2 from 49.6.
AUD/NZD technical outlook
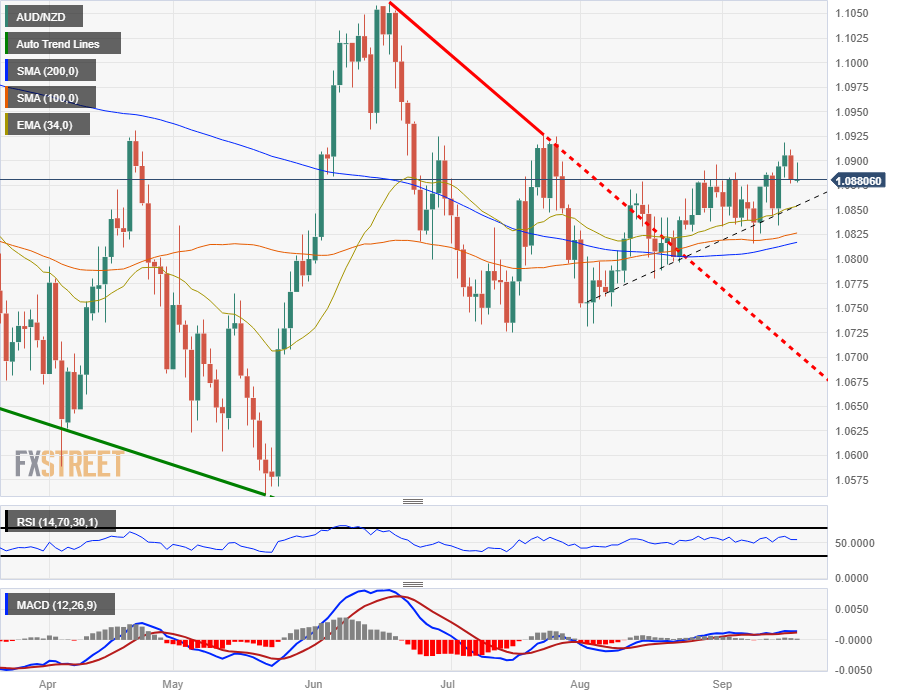
The Aussie-Kiwi pair has tumbled into the 200-day Simple Moving Average currently capping off prices near 1.0820.
Continued declines will see the pair testing August's early lows near 1.0720, while a bullish recovery will see the AUD/NZD challenging the recent swing high into 1.0920.
AUD/NZD daily chart
AUD/NZD technical outlook
- AUD/USD remains flat around 0.6415 after the Australian data.
- The US Initial Jobless Claims dropped to 201K; the Philly Fed declined to -13.5 in September vs. 12 prior.
- Australian Manufacturing PMI dropped to 48.2 from 49.6; Services PMI posted 50.5 in September vs. 47.8 prior.
- Market players await the US S&P Global/CIPS PMI data due later on Friday.
The AUD/USD pair remains on the defensive during the early Asian session on Friday. The pair faces some follow-through selling after the Federal Reserve (Fed) decided to hold the interest rate on Wednesday but expected at least one more rate hike for the year. The pair The pair currently trades near 0.6415, losing 0.02% on the day.
Data from the US economic data showed mixed results on Thursday, with the weekly Initial Jobless Claims dropping to 201K, the lowest level since January. Meanwhile, the Philly Fed dropped to -13.5 in September from 12.0 in the previous reading, worse than expected at -0.7. Existing Home Sales fell to 4.04M MoM in August from the previous reading of 4.07M.
The Federal Reserve (Fed) held interest rates unchanged at the 5.25-5.50% range on Wednesday, as widely predicted in the market. Fed Chairman Jerome Powell reaffirmed the Fed's commitment to achieving 2% inflation in a press conference while mentioning that the Fed is ready to raise rates if necessary. These hawkish remarks boost the Greenback against the Swiss Franc and act as a headwind for the AUD/USD pair.
On the other hand, the recent data from Australia revealed on Friday that the preliminary S&P Global Services PMI posted 50.5 in September, improved from 47.8 in August. While the Manufacturing PMI dropped to 48.2 from 49.6 in the previous reading. The Composite Index was also improved from 48.0 to 50.2.
Looking ahead, market participants will closely monitor the preliminary US S&P Global/CIPS PMI data for September. Traders will take cues from these figures and find trading opportunities around the AUD/USD pair.
The latest data on Friday showed that the preliminary S&P Global Australian Services PMI posted 50.5 in September, improved from 47.8 in August. On the other hand, the Manufacturing PMI declined to 48.2 from 49.6 in the previous reading.
Furthermore, the Composite Index also improved from 48.0 to 50.2.
Market reaction
At the press time, the AUD/USD pair is losing 0.01% on the day to trade at 0.6415.
- Japan's central bank is expected to maintain rates on hold one more time.
- The Bank of Japan could hint at the end of the ultra-loose monetary policy.
- BoJ’s Governor Kazuo Ueda said the focus is on a “quiet exit.”
The Bank of Japan (BoJ) is set to announce its monetary policy decision early on Friday. The Japanese Yen (JPY) could see a wide reaction, not because of the decision itself, but because of any potential hint to the end of the ultra-loose monetary policy that has been in place since early 2016. After cutting rates to -0.1% in January 2016, the central bank announced the Yield Curve Control (YCC) in September, initially aimed to maintain the 10-year government bond yield at around 0%.
Bank of Japan Interest Rate Decision: What to know in markets on Friday, September 22
USD/JPY trades near a fresh 2023 high as the US Dollar got a boost from the latest Federal Reserve (Fed) hawkish pause. As widely anticipated, the central bank left rates unchanged in the September meeting but left the door open for another rate hike and hinted that borrowing costs could remain higher for longer. Fed projections imply one more 25 basis points (bps) rate hike this year and 50 bps of rate cuts in 2024, half the cuts previously anticipated for next year.
The US Dollar is supported by generalized optimism ahead of the BoJ announcement despite the 2-year Treasury note yield peaking at a multi-year high of 5.202% in the Fed’s aftermath, its highest since 2006. It later eased to currently stand at 5.14%. The 10-year Treasury note offers 4.94%, ending the day unchanged.
Global inflation has been generally hotter-than-anticipated in August, although the United Kingdom Consumer Price Index (CPI) rose 0.3% MoM against expectations of a 0.7% advance, while the annual reading came in at 6.7%, easing from the previous 6.8% and below the 7.1% anticipated.
The Bank of England (BoE) somehow surprised market players on Thursday as the central bank decided to leave the benchmark rate unchanged at 5.25% after fourteen hikes in a row. Financial markets somehow anticipated the decision amid cooling inflation data. Bets on additional rate hikes decreased, with one more 25 bps hike in the docket, yet the odds for a rate hike in November, however, slid from 81% before the announcement to 64% afterwards.
Wall Street closed in the red as the dismal mood triggered by the Fed and exacerbated by the BoE continued throughout Thursday.
When will the BoJ announce its interest rate decision, and how could it affect USD/JPY?
The Bank of Japan is widely anticipated to maintain rates unchanged at -0.1% once again in their September meeting. No changes to the YCC are expected either, as the BoJ is well-known for being a slow machine.
As inflation in Japan has been exceeding the BoJ’s 2% target for over a year, policymakers have been under increased pressure to change course and tighten monetary policy.
On a negative note, wage growth remains subdued, and the central bank has remarked that higher wages are a prerequisite for moving away from monetary stimulus. Average cash earnings in Japan rose by 1.3% YoY in July, slowing from 2.3% in June, although up for the nineteenth consecutive month.
As inflation rose, the central bank introduced changes to the yield curve control, allowing the 10-year yield on the Japanese Government Bond (JGB) to move in a wider band. Bottom line, the central bank has decided to intervene only when the 10-year JGB yield moves past 1.0%.
What puzzles investors and may introduce noise to the announcement is Governor Kazuo Ueda's latest comments. In an interview with the Yomiuri Shimbun, Ueda said the monetary policy tweak in July was “a mechanism to change the balance between the effects and side effects” of monetary easing measures. But he also added that the focus will shift to a “quiet exit” from the ultra-loose policy to avoid any significant impact.
However, financial markets head into the event with little hope of a relevant change in the forward guidance. “It seems that the Japanese central bankers want a stronger Yen, but without this being based on the expectation of a less expansionary monetary policy,” economists at Commerzbank said in a research note.
Ueda’s words raised some alarms. Financial markets began speculating on a potential shift, although not for this year. The Nikkei reported, “A January decision to end negative interest rates appears to be a more realistic scenario, with practical factors delaying implementation to February. The BoJ is set to update its economic and price outlook for fiscal 2023 to fiscal 2025 at that time, giving it material to help explain the basis for the policy change.”
If the Bank of Japan introduces a hawkish shift, USD/JPY could plunge. The fall could be substantial considering the pair trades near this year’s high at 148.45, having appreciated sharply after bottoming at 127.21 in January.
Valeria Bednarik, Chief Analyst at FXStreet, said: “There are no technical signs suggesting the USD/JPY rally is over. On the contrary, the pair could keep running towards the 2022 high at 151.93 in the upcoming weeks, particularly if the market sentiment remains depressed, boosting demand for the American currency.
From a technical point of view, the pair is bullish in its daily chart, with the 20-day Simple Moving Average (SMA) leading the way north, as per advancing above also bullish longer moving averages. The 20-day SMA is currently located at around 146.90, a potential bearish target should the BoJ surprise with a hawkish message. Below such area, the slump could continue towards 146.05.”
Bednarik added: “Keep in mind the initial reaction may not lead to a long-lasting trend, particularly if it results against the current bullish trend. Also, government bond yields reaction could provide clues on what to expect after the dust settles.”
Bank of Japan FAQs
What is the Bank of Japan?
The Bank of Japan (BoJ) is the Japanese central bank, which sets monetary policy in the country. Its mandate is to issue banknotes and carry out currency and monetary control to ensure price stability, which means an inflation target of around 2%.
What has been the Bank of Japan’s policy?
The Bank of Japan has embarked in an ultra-loose monetary policy since 2013 in order to stimulate the economy and fuel inflation amid a low-inflationary environment. The bank’s policy is based on Quantitative and Qualitative Easing (QQE), or printing notes to buy assets such as government or corporate bonds to provide liquidity. In 2016, the bank doubled down on its strategy and further loosened policy by first introducing negative interest rates and then directly controlling the yield of its 10-year government bonds.
How do Bank of Japan’s decisions influence the Japanese Yen?
The Bank’s massive stimulus has caused the Yen to depreciate against its main currency peers. This process has exacerbated more recently due to an increasing policy divergence between the Bank of Japan and other main central banks, which have opted to increase interest rates sharply to fight decades-high levels of inflation. The BoJ’s policy of holding down rates has led to a widening differential with other currencies, dragging down the value of the Yen.
Is the Bank of Japan’s ultra-loose policy likely to change soon?
A weaker Yen and the spike in global energy prices have led to an increase in Japanese inflation, which has exceeded the BoJ’s 2% target. Still, the Bank judges that the sustainable and stable achievement of the 2% target has not yet come in sight, so any sudden change in the current policy looks unlikely.
- EUR/USD slips on hawkish Fed but recovers Thursday to end the day flat.
- Fed sees rates higher and longer, sending US Dollar up across the board.
- PMI figures to cap off the economic calendar for the trading week.
The EUR/USD slid further down the charts on Thursday, testing into new six-month lows near 1.0617 before recovering from the bottom to close out the day near 1.0660 and now heads into the Friday market session with the Greenback (USD) taking a step back.
The Federal Reserve held benchmark interest rates at 5.5% as markets broadly expected on Wednesday, but the US central bank is seeing interest rates holding higher for longer than previously anticipated, and the Fed now only expects interest rates to cut by half a percent by the end of 2024.
Fed sees a longer rate cut schedule, bolstering US Dollar
With the hawkish outlook in the books, US equities declined and US Treasury yields spiked higher, sending the US Dollar index higher across the entire global currency space, and the Euro fell to a new low.
The EUR/USD pair is already decidedly bearish, having closed in the red for the past nine consecutive weeks. This week will only break the near-term trend if markets are able to push the Euro higher and hold ground before Friday's closing bell.
Friday's Purchasing Manager Index (PMI) figures are expected to twist, with the EU forecast to see a slight decline and a minor uptick in US numbers.
European PMI composite is slated to come in at 46.5 versus the previous 46.7, while the US side sees manufacturing rising from 57.9 to an even 48, and the services PMI component lifting from 50.5 to 50.6.
EUR/USD technical outlook
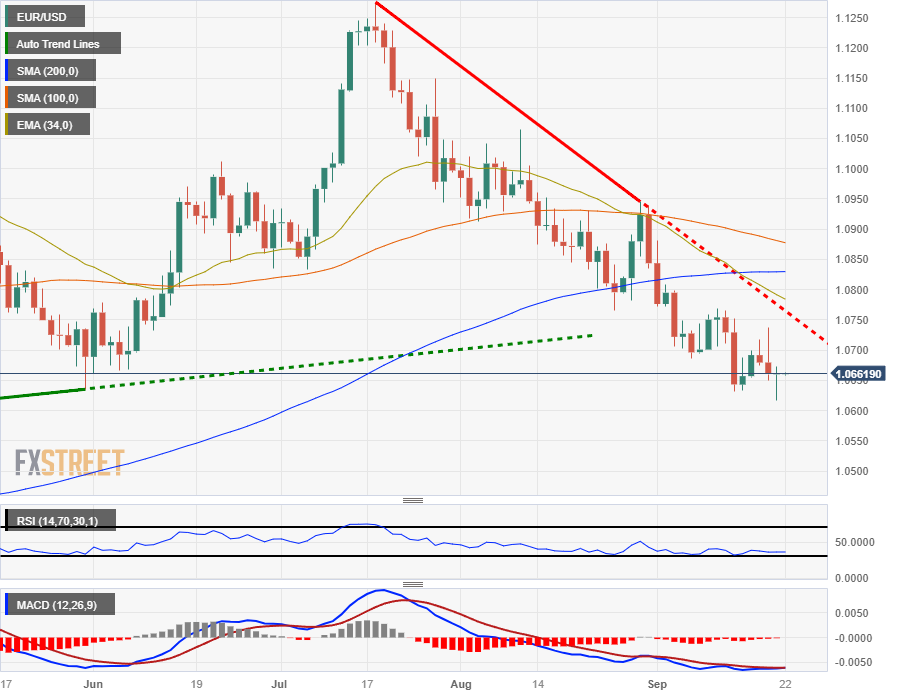
The EUR/USD is currently trapped into the 34-hour Exponential Moving Average (EMA), and sitting on the bearish side of the 200-hour Simple Moving Average (SMA) currently parked just north of 1.0690.
The Euro is rising from Thursday's low of 1.0620, but the pair is still significantly off Wednesday's peak at 1.0737.
On the daily charts, the EUR/USD spun out a hammer candlestick, and technical indicators are starting to flash oversold conditions.
The Relative Strength Index (RSI) and Moving Average Convergence-Divergence (MACD) indicators are on the low end and threatening to turn bullish, and a recovery from here could see the EUR/USD set to make another challenge run at the descending trendline from July's swing high into 1.1250.
EUR/USD daily chart
EUR/USD technical levels
According to the latest data released by Statistics New Zealand on Friday, the nation’s Trade Balance (NZD) dropped to $-2,291M MoM in August versus $-1,107M prior. The annual trade deficit improved to $15.54B for the said month versus $-15.88B prior figures.
Further details suggest that Exports eased to $4.99B during the said month versus $5.38B prior whereas Imports improves to $7.28B compared to $6.55B in previous readings.
Market reaction
At the press time, the NZD/USD pair is up 0.07% on the day to trade at 0.5934.
- AUD/JPY retraces from 96.06 to 94.67, influenced by central banks' focus on high inflation and a sour market mood.
- The pair has fallen inside the Ichimoku Cloud, suggesting potential further downside with first support at the Kijun-Sen at 94.43.
- The short-term outlook is bearish, but an upward correction towards 94.88 is possible before extending losses past 94.53 to 94.00.
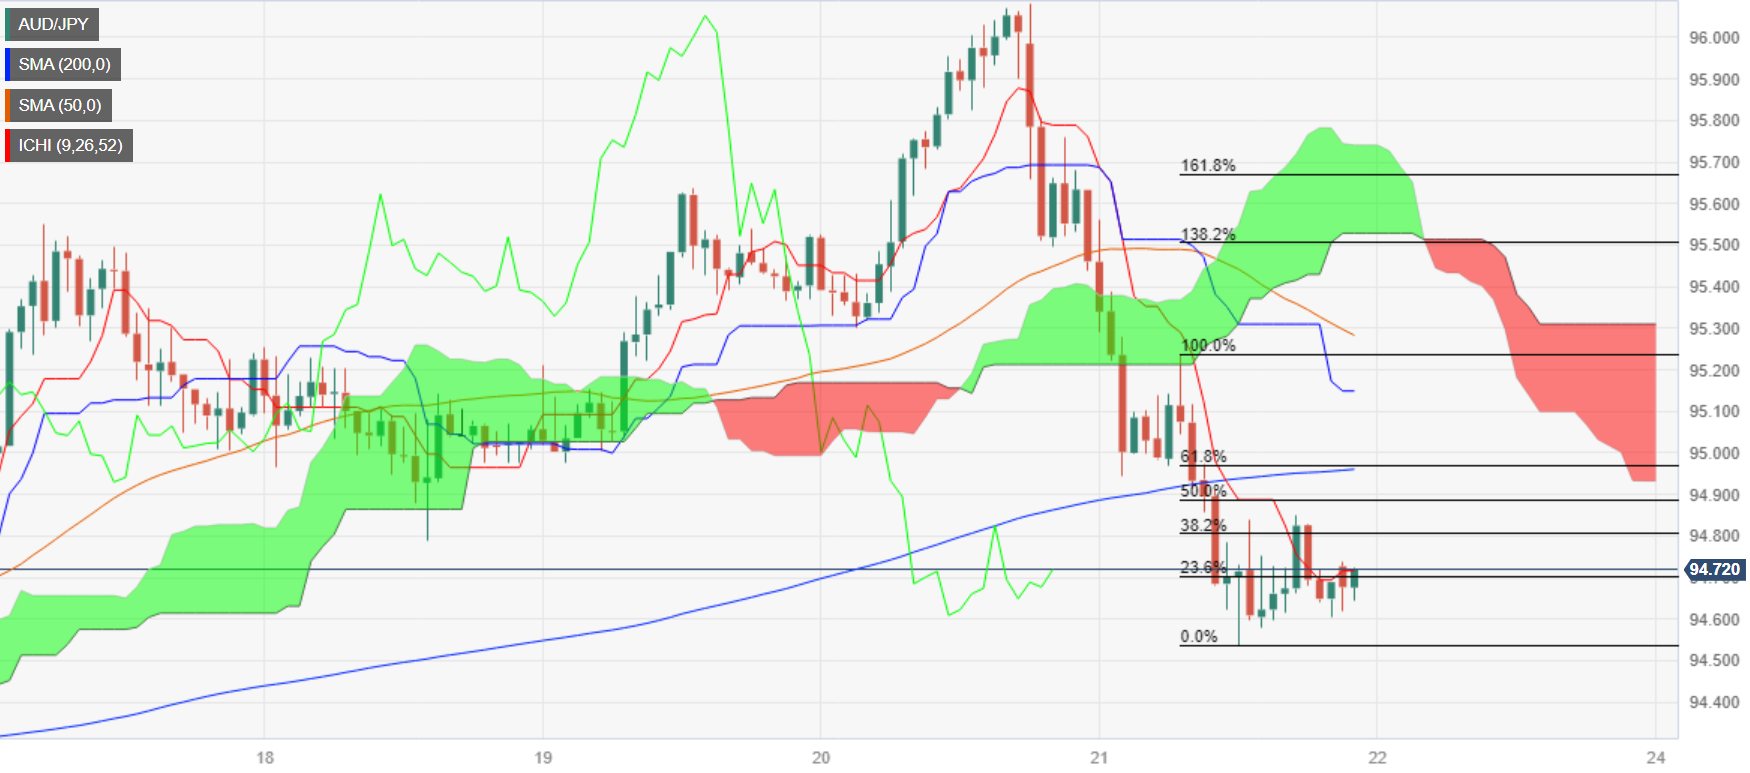
The AUD/JPY retraces from weekly highs of 96.06 extended its losses past the 95.00 figure, spurred by a sour market mood, as global central banks remain focused on tackling sticky high inflation. Hence, the pair dropped 1% or 95 pips on Thursday, and as the Asian session commences, it hovers around 94.67 flat.
The daily chart depicts the pair as neutral biased, but the AUD/JPY has fallen inside the Ichimoku Cloud (Kumo), which could open the door for further downside. The cross-currency pair first support would be the Kijun-Sen at 94.43, followed by an upslope support trendline at 94.30. Once cleared, the next support would be the Senkou Span B at 93.93, followed by the bottom of the Kumo at 93.80.
Short-term, the AUD/JPY pair is in a downtrend, below the Kumo, with price action below the Kijun and Tenkan-Sen lines, respectively. At the same time, the Chikou Span is also below the Kumo and price action, meaning the pair is bearish-biased. However, recent price action suggests an upward correction could be on the cards, with the pair set to edge towards the 50% Fibonacci retracement at 94.88. Once reached, the pair could extend its losses past the September 21 low of 94.53, followed by the 94.00 figure.
AUD/JPY Price Action – Hourly chart
AUD/JPY Key Technical Levels
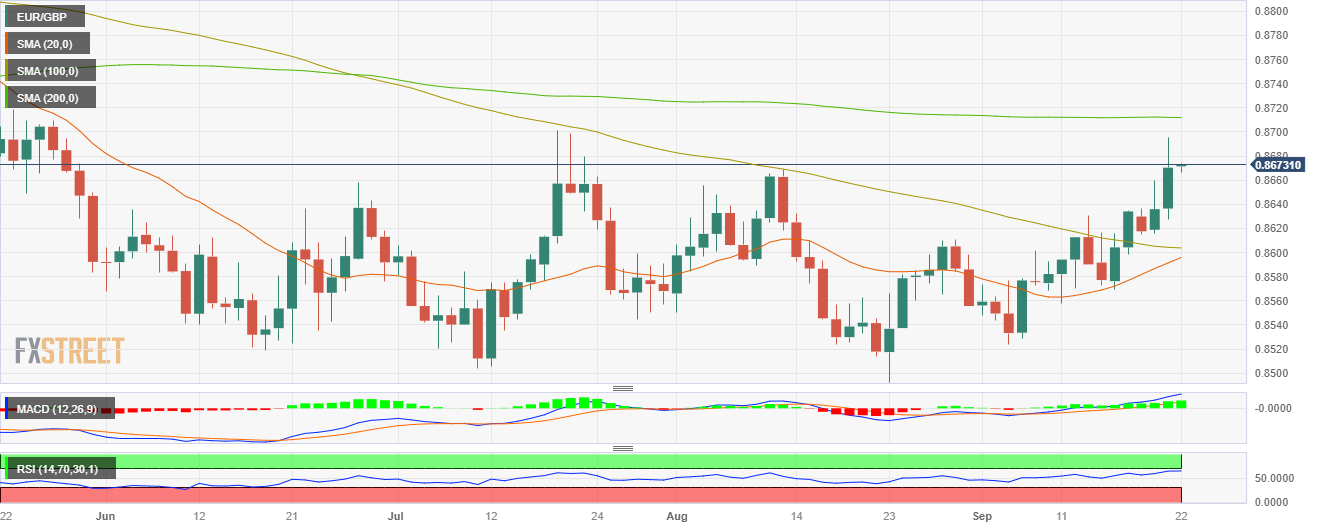
- EUR/GBP closed Thursday at 0.8670, up by 0.20%, hitting a daily high of 0.8695 near the 200-day SMA.
- The daily and four-hour chart flashes bullish signals.
- The 20-day SMA and 100-day SMA are about to perform a bullish cross on the daily chart.
On Thursday, the EUR/GBP cross gained further momentum, closing towards the 0.8670 area, and has already gained 1.34% in September.
In line with that, the daily chart indicates that the technical outlook favours the bulls over the bears. The Relative Strength Index (RSI) and Moving Average Convergence Divergence (MACD) are comfortably placed on the daily chart in positive territory. Moreover, the pair is above the 20 and 100-day Simple Moving Averages (SMAs), but below the 200-day SMA, suggesting that the bears struggle to challenge the overall bullish trend. Traders should eye the convergence of the 20 and 100-day averages towards the 0.8600 area, which seems to be about to perform a bullish cross, which could boost the buying impulse.
On the four-hour chart, technical indicators also point to a clear dominance of the bulls, with the RSI printing a slight upward slope near the 70 threshold while the MACD displays flat green bars.
Support Levels: 0.8630, 0.8600 (20 and 100-day SMA convergence), 0.8570.
Resistance Levels: 0.8700, 0.8710 (200-day SMA), 0.8750.
EUR/GBP Daily chart
- S&P 500 firmly off course as US equities take a tumble on hawkish Fed.
- Equity indexes extending daily declines heading into Friday market session.
- US Treasury yields stepped higher as Fed sees rate higher for longer.
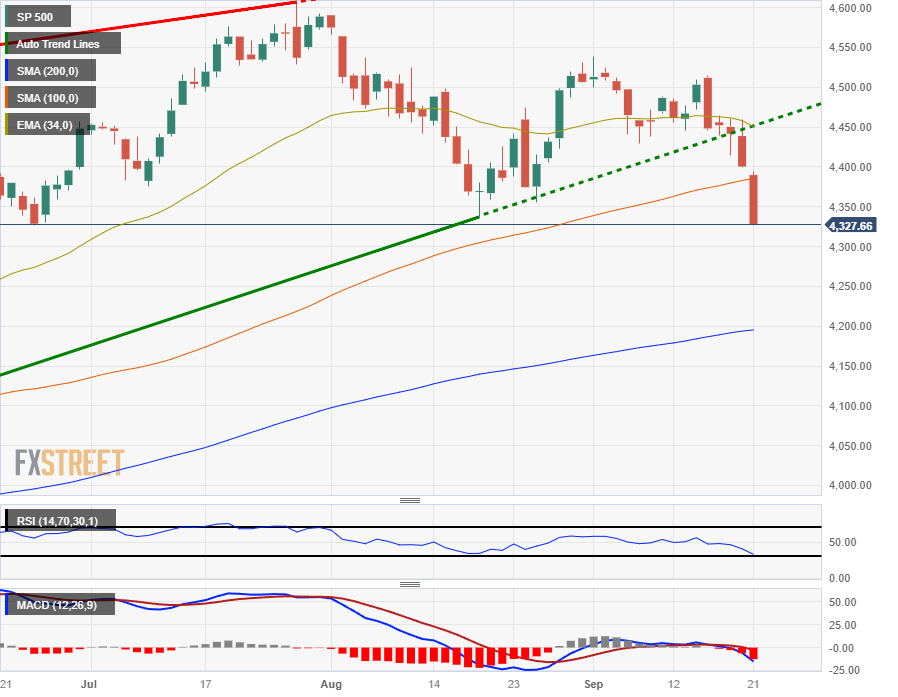
The Standard & Poor's (S&P) 500 continued its trip down the charts, sliding into $4,330.00 to end Thursday trading down 1.64%.
The Dow Jones Industrial Average (DJIA) declined over 370 points to end the day at $34,070.42, retreating 1.08%.
The biggest loser for the major US equity indexes was the NASDAQ Composite, backsliding 1.82% to end Thursday at $13,223.99.
The S&P is down 2.55% from Wednesday's pre-Federal Reserve (Fed) peak, and has declined over 4% since last Friday's peak of $4,515.
Fed to see rates held higher longer, knocking equities back for a second day
The Fed held rates at 5.5% as markets broadly expected, but the Federal Open Market Committee (FOMC) raised their forward-looking rate expectations, with Fed officials seeing the year-end interest rate for 2024 at 5.1% versus the previously forecast 4.6%.
Inflation continues to recede in the US domestic economy, but sticking points remain and the Fed is leery of approaching a rate cut cycle too quickly, and interest rates are now only expected to decline by half a percent next year.
S&P 500 technical outlook
The S&P's decline for Thursday sees the equity index tumbling through the 100-day Simple Moving Average (SMA) currently resting just below $4,400.00.
The week's action also sees the S&P 500 skidding through a rising trendline from March's early lows near $3,800.00, and the equity index's recovery appears to be under threat as prices inch towards the 200-day SMA currently rising into the $4,200.00 region.
S&P 500 daily chart
S&P 500 technical levels
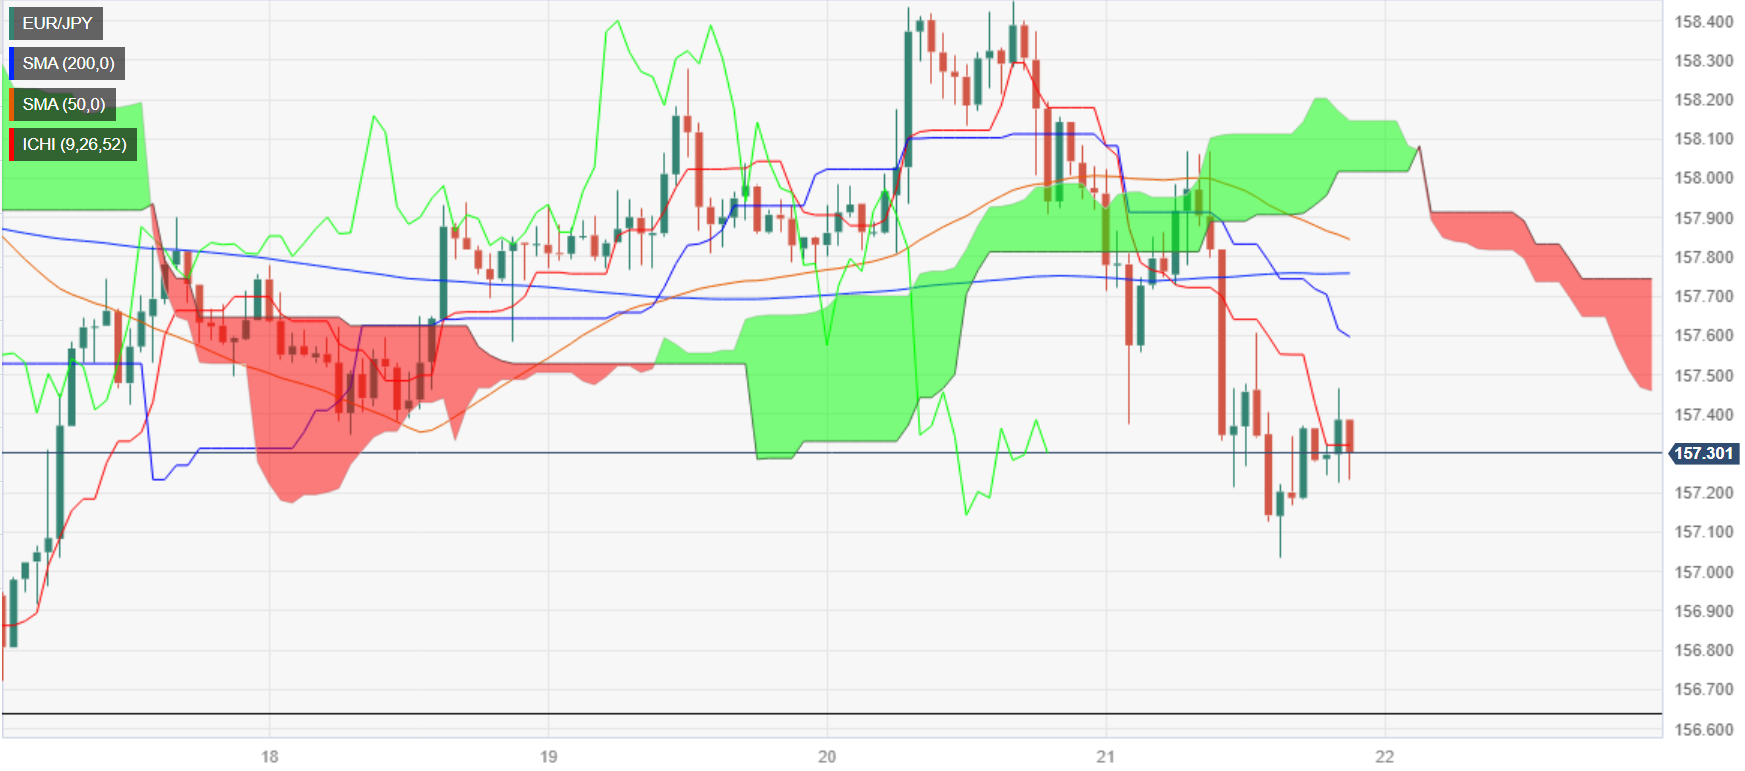
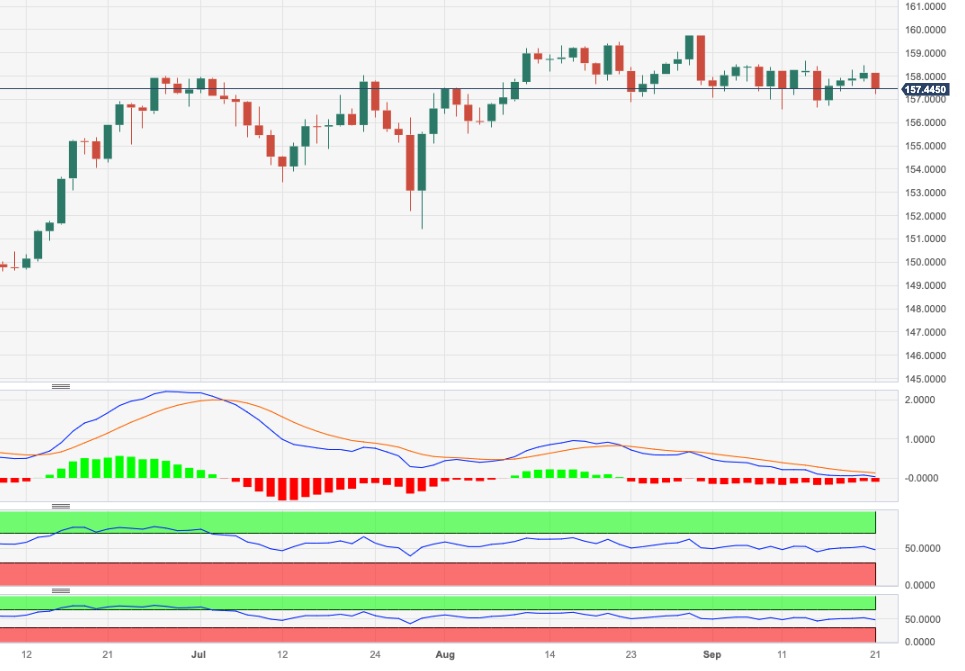
- EUR/JPY dips to 157.03, influenced by the restrictive policy stance of major global central banks.
- The cross is bearish after failing to cling to the 158.00 figure.
- The EUR/JPY could rally and test 157.55/60, before resuming its downtrend.
EUR/JPY dropped to a new four-day low of 157.03 on Thursday, courtesy of risk-aversion, after major global central banks decided to hold rates unchanged but kept their restrictive policy stance, led by the Federal Reserve and the Bank of England. At the time of writing, the pair exchanges hands at 157.27, losses a minuscule 0.07%, as Friday's Asian session begins.
The EUR/JPY daily chart portrays the pair as neutral-biased, though tilted to the downside. Failure to cling to the 158.00 mark exacerbated the cross fall, clearing crucial support levels, like the Kijun and Tenkan-Sen levels, each at 158.17 and 157.64. Nevertheless, bears must drag prices below the latest two swing lows, September 14 and 11, each at 156.64 and 156.58, respectively. At that point, the pair could extend its losses toward the bottom of the Ichimoku Cloud (Kumo) at 154.50.
Short-term, the EUR/JPY is downward biased, with price action in the hourly chart standing below the Kumo, while the Tenkan and Kijun-Sen are in a bearish, orderly way. Nonetheless, the cross is set for an upward correction towards the confluence of the Kijun-Sen and the 50% Fibonacci retracement at around 157.55/60. After that, the cross-currency pair's first support would be the Tenkan-Sen at 157.28, followed by the 157.00 figure, ahead of dropping towards 156.50.
EUR/JPY Price Action – Hourly chart
EUR/JPY Key Technical Levels
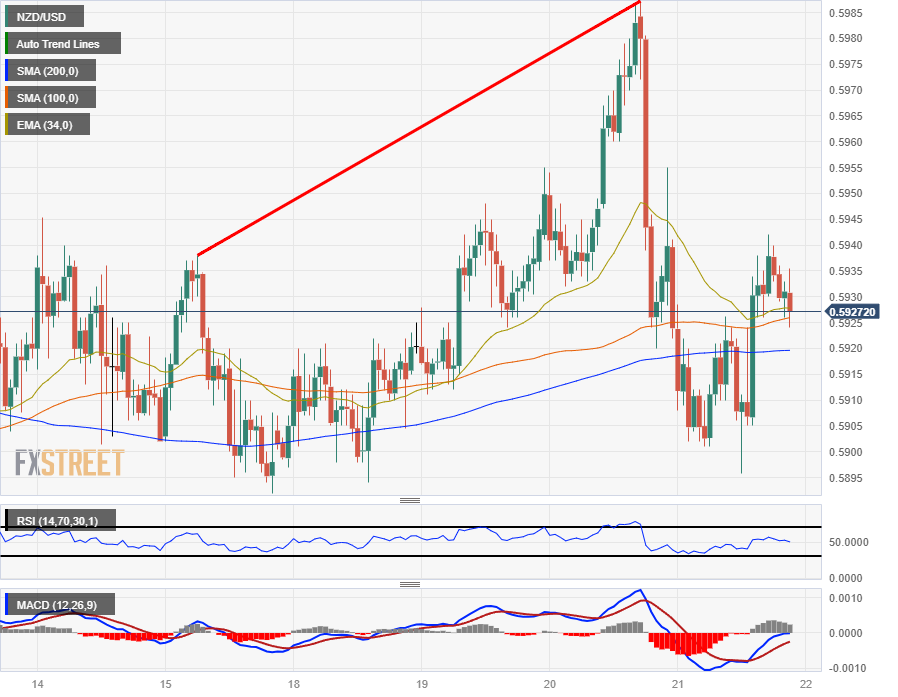
- The NZD/USD fell on Thursday, but recovered in the midday as the US Dollar takes a breather.
- USD eases pressure and gives the Kiwi a chance to recover Fed-led swoon.
- New Zealand and the US set for Friday PMIs to close out the trading week.
The NZD/USD got knocked lower following a hawkish Fed on Wednesday, tumbling 1.5% before the Kiwi (NZD) managed to find a floor near 0.5895.
The trading week will cap off action with Purchasing Manager Index (PMI) figures for both New Zealand and the US markets.
Fed holds rates, but sees holding longer rate cycle
The Federal Reserve (Fed) held benchmark interest rates at 5.5% on Wednesday, but the US central bank is forecasting that rates will remain higher for longer than previously anticipated. 2024's year-end interest rate is currently expected to be 5.1%, compared to the previously forecast 4.6%.
With the Fed hitting hawkish notes, the US Dollar (USD) climbed across the entire global currency market. Thursday saw the Greenback continue its march until the midday, where currency counterparts found some breathing room and eased back recent losses.
Friday markets will finish up the trading week with NZ and US PMIs, but NZ PMIs are unlikely to drive much market momentum. Most investors will be keeping their eyes turned to the US PMI release, where the manufacturing and services components are anticipated to tick upwards, albeit slightly.
The US Manufacturing PMI component is seen rising to 48.0 from 47.9, while the services sector is expected to rise from 50.5 to 50.6.
NZD/USD technical outlook
The Kiwi-Dollar pairing fell through the 200-hour Simple Moving Average (SMA) early Thursday, slipping to a near-term low of 0.5895. Hourly candles could see the NZD/USD slip back to the 200-hour SMA is bullish momentum falters or Dollar bulls return to the fold.
Daily candlesticks see the Kiwi trading into familiar five-week ranges after getting knocked back from the 34-day Exponential Moving Average (EMA) just above 0.5950.
A sustained bull move will see technical resistance from the 200-day Simple Moving Average (SMA) drifting below the 0.6200 handle, while further downside sees little in the way of support until 2022's late low far below current price action, near 0.5500.
NZD/USD hourly chart
NZD/USD technical levels
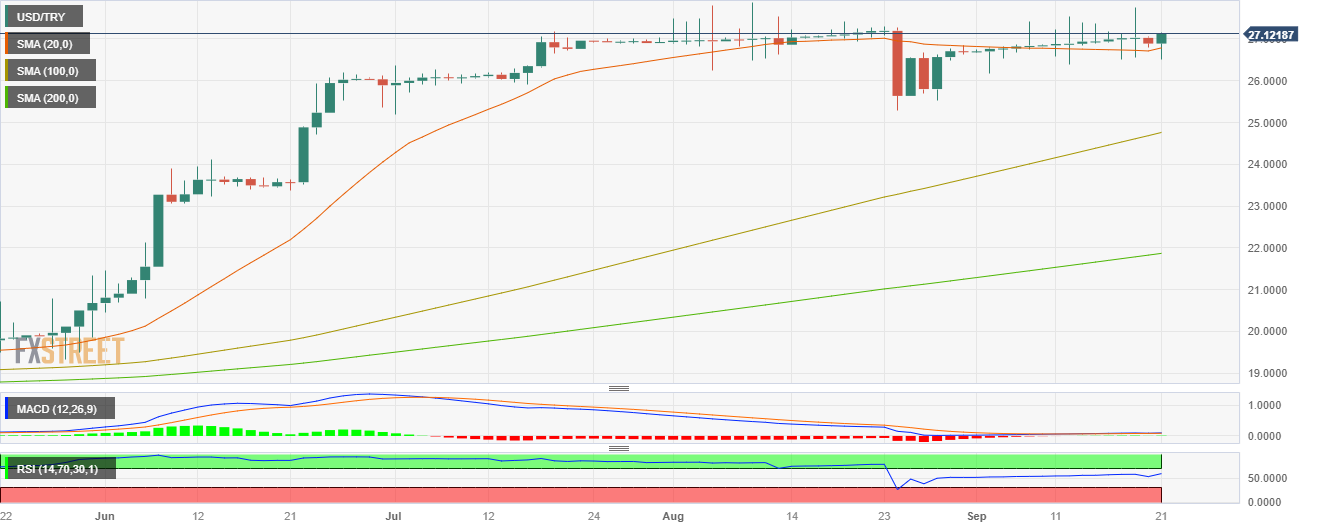
- The USD/TRY is rising by 0.45% to 27.11.
- The CBRT hiked rates to 30% as expected.
- Due to the Fed’s hawkish pause, US yields continue to rise, pushing the pair to the upside.
In Thursday’s session, the USD/TRY gained more ground and broke the 27.00 barrier while investors digested the fresh Central Bank of the Republic of Türkiye (CBRT) and Federal Reserve (Fed) decisions.
On the TRY’s side, the CBRT hiked rates by 500 bps to 30% and reflected the urgency of Turkish policymakers to fight its double-digit inflation, which rose above 58% YoY last month. It's worth noting that the bank started a new tightening cycle in June after years of an accommodative policy. Turkish leaders refrained from hiking rates to battle inflation, which made the Lira lose nearly 78% of its value against the US Dollar and the country seems to be suffering the effects of "doing too little".
On the USD side, the US Federal Reserve (Fed) decided on Wednesday to hold the federal funds rate at the 5.25% to 5.5% range, consistent with market expectations. The Fed's policy statement acknowledged the ongoing solid pace of economic growth while recognising a moderation in job gains, but remained robust. Furthermore, the revised Summary of Economic Projections (SEP) or dot plot revealed policymakers are anticipating a single 25 basis points rate increase before the year's end and virtually delayed rate cuts into September 2024.
As a reaction, US yields are seeing gains across the curve and stand at multi-year highs, which explains the strength of the USD and the pair’s upward movements. The 10-year rate rose to 4.46%, while the 2- and 5-year yields stood at 5.16% and 4.62%.
USD/TRY Levels to watch
Based on the daily chart, the USD/TRY exhibits a bullish outlook for the short term. The Relative Strength Index (RSI) and Moving Average Convergence Divergence (MACD) remain in positive territory, with the RSI above its midline and showing a northward slope. The MACD is also displaying green bars, indicating a strengthening bullish momentum. Furthermore, the pair is above the 20-, 100- and 200-day Simple Moving Average (SMA), indicating a favourable position for the bulls in the bigger picture.
On the upside, the first target stands near 27.20, while on the downside is the 20-day SMA at 26.80.
USD/TRY Daily Chart
The highlights of the Asian session will be the Bank of Japan meeting. Japan's National CPI and New Zealand's trade data are due on Friday. The first glimpse of economic activity in September will be provided by the Global PMIs, starting with the preliminary numbers from Australia and Japan. Later in the day, the UK and Canada will report retail sales data.
Here is what you need to know on Friday, September 22:
The US Dollar Index finished marginally lower on Thursday after reaching 105.73, the highest level since March. The DXY pulled back during the American session amid a correction of the US Dollar and a pullback in US Treasury yields.
Data from the US came in mixed, with a decline in Initial Jobless Claims to 201,000, the lowest level since January. The Philly Fed tumbled to -13.5 in September, and Existing Home Sales fell in August to an annual rate of 4.04 million. The Greenback peaked after the Jobless Claims data, which pointed to a still robust labor market, and then started to correct. On Friday, the US S&P Global PMIs are due.
Stocks in Wall Street fell for the second consecutive day on Thursday, but this time the negative market sentiment did not help the Dollar. The Dow Jones lost 1.08%, and the Nasdaq tumbled 1.82%.
EUR/USD hit fresh monthly lows at 1.0616 and then erased losses to end around 1.0660. On Friday, the preliminary September PMIs are due.
USD/JPY reached multi-month highs near 148.50 before turning to the downside, falling more than a hundred pips. The pair had its worst daily performance in weeks. On Friday, the Bank of Japan will announce its decision on monetary policy. No change is expected.
The Swiss Franc tumbled on Thursday after the Swiss National Bank (SNB) surprised the market by keeping interest rates on hold at 1.75%, against expectations of an increase to 2%. USD/CHF finally broke above 0.9000, hitting three-month highs, while EUR/CHF rose from 0.9580 to 0.9680.
The Pound was among the worst performers after the Bank of England decided to keep its key rate unchanged. It was a close call, with a 5-4 vote at the Monetary Policy Committee. GBP/USD bottomed at 1.2234 and then rebounded to the 1.2300 area, boosted by the decline of the US Dollar. On Friday, the UK will report Retail Sales.
AUD/USD lost ground again but managed to rise back above 0.6400, even amid a deterioration in market sentiment. On Friday, Australia's PMI data is also due.
USD/CAD rose for the second day in a row but pulled back under 1.3500 during the American session. Canada will report Retail Sales on Friday.
Like this article? Help us with some feedback by answering this survey:
- USD/CHF gains to 0.9038 after the SNB surprises markets by keeping rates at 1.75%, with the market pricing in a hike to 2%.
- The Fed’s hawkish hold and upward revision of the Federal Funds Rates for 2024 underpin the US Dollar strength.
- With the interest rate differential favoring the USD, a sustained break above the 200-DMA could see USD/CHF testing the YTD high above 0.9400.
The Swiss Franc (CHF) lost ground against the US Dollar (USD) on Thursday after the Swiss National Bank (SNB) surprisingly decided to hold rates unchanged, surprising the markets, which priced in a rate hike to 2%. Hence, the USD/CHF edges higher by 0.59%, exchanging hands at 0.9038.
Swiss Franc weakens on an unexpected decision by the Swiss National Bank
In the early European session, the SNB unexpectedly held rates at 1.75% as money market futures estimated a 25 bps rate hike. Although it was a dovish surprise, the Swiss National Bank commented that further tightening may be necessary to ensure price stability over the medium term.
The central bank updated its inflation forecasts for 2023 and 2024, seeing the Consumer Price Index (CPI) at 2.2%. Even though it’s just within the price stability range, the SNB foresees inflation to rise to 1.9% in 2025.
Aside from this, the aftermath of the US Federal Reserve’s hawkish hold also weighed on the Swiss Franc (CHF). Market players were surprised by the Fed’s upward revision to the Federal Funds Rates (FFR) above 5% in 2024, compared to June’s 4.6% projection. That’s the primary driver of price action in the financial markets, which sent US equities tumbling, US bond yields rising, and the Greenback holding its ground against most G8 currencies.
US Treasury bond yields had extended their gains, with the US 2-year bond yield, the most sensitive to short-term interest rate adjustments, at 5.146%, after reaching a multi-year high of 5.202%.
That said, the USD/CHF would rely on an interest rate differential between the US and Switzerland, thus favoring the Greenback. Therefore, the USD/CHF could continue to trend up, and a clear break above the 200-DMA could sponsor a test of the year-to-date (YTD) high above the 0.9400 mark.
USD/CHF Price Analysis: Technical outlook
USD/CHF resumed its uptrend, conquering the 0.9000 threshold after the SNB decision. On its way north, the pair reached a daily high of 0.9078 but retraced toward the 200-day moving average (DMA) at 0.9033. Daily close above the latter, a move towards the May 31 swing high of 0.9147 is on the cards. Otherwise, expect a consolidation within the 0.9000/0.9040 area unless it bears drag prices below the 0.9000 mark.
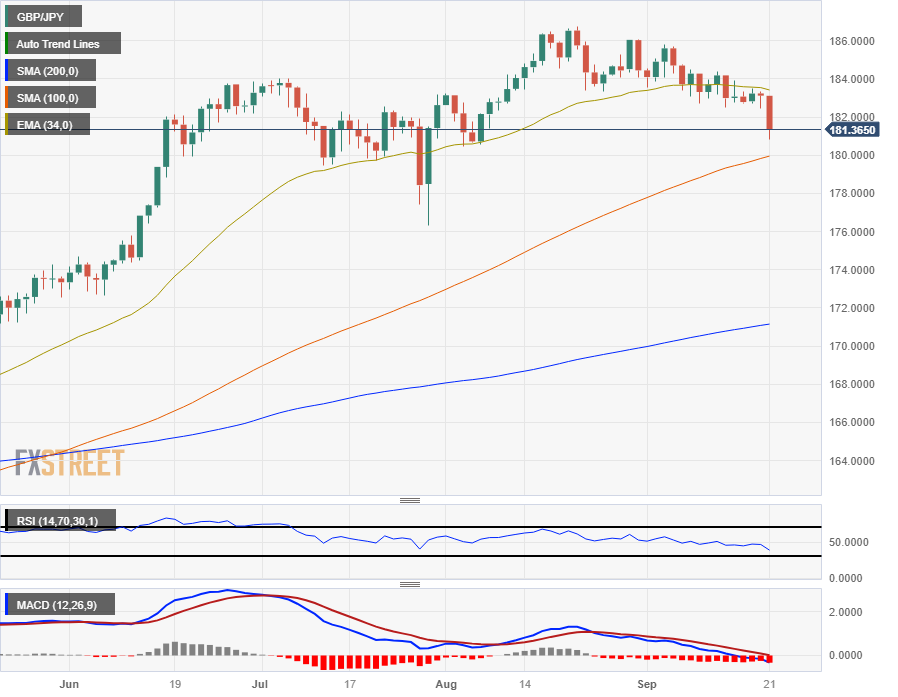
- The GBP/JPY skidded into the 181.00 handle after the BoE stepped back from an anticipated rate hike.
- Inflation might be falling faster than previously thought in the UK, rapidly cooling rate expectations.
- UK retail sales and PMI still in the pipe for Friday.
The GBP/JPY fell out of its recent trading range, colliding with the 181.00 major level before GBP bulls were able to catch a mild intraday relief rally to keep the Guppy trading into 181.30 heading into the end of Thursday trading.
BoE turns dovish on subsiding inflation
The United Kingdom's (UK) Consumer Price Index (CPI) figures on Tuesday came in below expectations, printing at 0.3% versus the expected 0.7%. The decline in headline inflation was enough to knock the UK's central bank back from a broadly expected rate hike as inflation appears to recede faster than previously expected.
The Bank of England (BoE) stepped back from the rate hike cycle, holding its benchmark interest rate at 5.25% versus the expected 25-basis-point hike to 5.5%.
The Bank of Japan (BoJ) is similarly expected to hold interest rates steady at -0.1% when the Japanese central bank meets on Friday.
Friday will also see Retail Sales and Purchasing Manager Index (PMI) figures for the UK. Retail Sales for August are expected to rebound from -1.2% to 0.5%, and Composite PMIs are expected to tick up slightly to 48.7 from 48.6.
The recent miss on CPI could see economic data for the UK come in below expectations, pushing the BoE further back on their rate expectations looking forward.
GBP/JPY technical outlook
The GBP/JPY fell a full percentage point after the BoE blinked on rates, taking the Guppy down into the 181.00 region. GBP bulls were able to recover the pair into 181.30, but further downside remains on the cards if buyers can't push the pair back towards the 200-hour Simple Moving Average (SMA) near 183.25.
In the meantime, a pattern of lower highs remains intact from late August's peaks near 186.70.
On the daily candlesticks, the Guppy is set to challenge the 100-day SMA currently parked near 180.00, and a rebound into bullish momentum will need to remount the 186.00 level before extending further.
GBP/JPY daily chart
GBP/JPY technical levels
- USD/SEK increased to 11.247, seeing a 1% gains and then retreated to 11.152.
- The Riksbank hiked to 4%, leaving the door open for further hikes.
- US yields continue to rise, benefiting the USD.
On Thursday’s session, the USD/SEK climbed to its highest level since October 2022, towards 11.247, seeing 1% daily gains, but failed to hold its momentum and settled at 11.152. On the SEK's side, the Swedish Riksbank hiked rates by 25 bps and sounded hawkish, while on the USD side, the Greenback eased during the American session, and seems to be consolidating gains.
Investors assess Riksbank and Fed decisions
The Swedish Riksbank announced on Thursday that it would hike rates from 3.75% to 4% as widely anticipated. In the policy statement, the bank commented that progress was being made, but inflation remained too high, noting that further hikes may be necessary. In the meantime, markets are discounting that the Riksbank will deliver one final hike in November to end the tightening cycle, mainly due to concerns over the health of the Swedish economy, amongst the worst performers in Europe.
On the US side, the Federal Reserve (Fed) held rates steady on Wednesday. Still, their Summary of Economic Projections (SEP) revealed that the median rate forecast of the Federal Open Market Committee (FOMC) members stood at 5.6% for 2023, meaning that one more hike in on the table. In addition, the rate projections 2024 were revised to 5.1% and virtually delayed rate cuts. These hawkish projections boosted the US yields, which trade in multi-year highs as investors are bracing for one more hike by the Fed and rates being higher for longer. The 10-year bond yield reached 4.47% while the two and 5-year yield rose to 5.14% and 4.61%, respectively. That being said, the DXY index found support at a high near 105.70 and eased to 105.30 but the expectations of a more aggressive Fed will likely limit its losses.
USD/SEK Levels to watch
The USD/SEK daily chart signals a bullish sentiment for the short term. The Relative Strength Index (RSI) is favourably positioned in positive territory above its midline, reflecting an upward movement. Similarly, Moving Average Convergence Divergence (MACD) depicts green bars, affirming the bullish momentum. In addition, the pair is above the 20,100,200-day Simple Moving Average (SMA), implying that the bulls retain control on a broader scale.
Support levels: 11.150, 11.070 (20-day SMA), 11.000.
Resistance levels: 11.289, 11.300, 11.406.
USD/SEK Daily Chart
-638309194362788292.png)
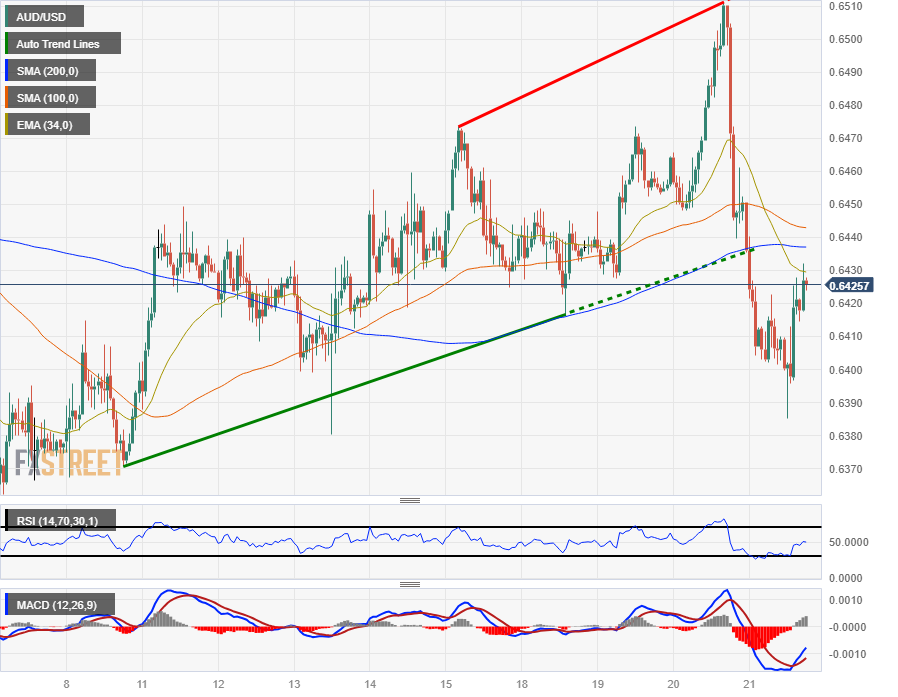
- The AUD/USD is recovering into the back end of Thursday trading as risk appetite recovers.
- The Aussie knocked into 0.6385 as US Dollar flows take the AUD back into familiar territory.
- The week is set to cap off chart action with PMI figures for both Australia and the US.
The AUD/USD is catching a bounce heading into the back end of Thursday's market session, lifting into 0.6425 after hitting a near-term low of 0.6385.
The US Dollar (USD) took a ride up the charts across the board after yesterday's Federal Reserve (Fed) which saw the US central bank hold rates steady for the time being, but an increase in the Fed's rate outlook sees markets baking in at least one more rate hike for the year.
The Federal Open Market Committee (FOMC) sees the US interest rate at 5.1% by the end of 2024, a half-percentage point higher than originally expected. The potential for higher, longer Fed rates saw the Greenback gain ground against all of its global competitors, and markets are still scrambling to correct the slide.
Australian, US PMIs on Friday to close out the trading week
Friday markets will see Purchasing Manager Index (PMI) figures for both the AUD and the USD.
The Australian Composite PMI last printed at 48, while the US Composite PMI last came in at 50.2. Purchasing managers in both economies are seeing a discrepancy in economic activity. US purchasing managers see activity and prices rising in September, while their Australian counterparts are still facing a steepening of constraint factors for the Antipodean economy.
AUD/USD technical outlook
The Aussie tumbled from a near-term peak of 0.6510 on Thursday after the Fed threw gas over the USD, and the AUD/USD fell nearly 2% before recovering from a new floor at 0.6385.
The pair has slipped below the 200-hour Simple Moving Average (SMA) near 0.6440, and fallen to the bearish side of a rising trendline on hourly candles from last week's low end near 0.6370.
On the daily candlesticks, the AUD/USD continues to fall back into familiar consolidation territory. Wednesday's backslide saw the pair cleanly reject the 34-day Exponential Moving Average (EMA), and technical support comes from recent swing lows below 0.6375.
AUD/USD hourly chart
AUD/USD technical levels
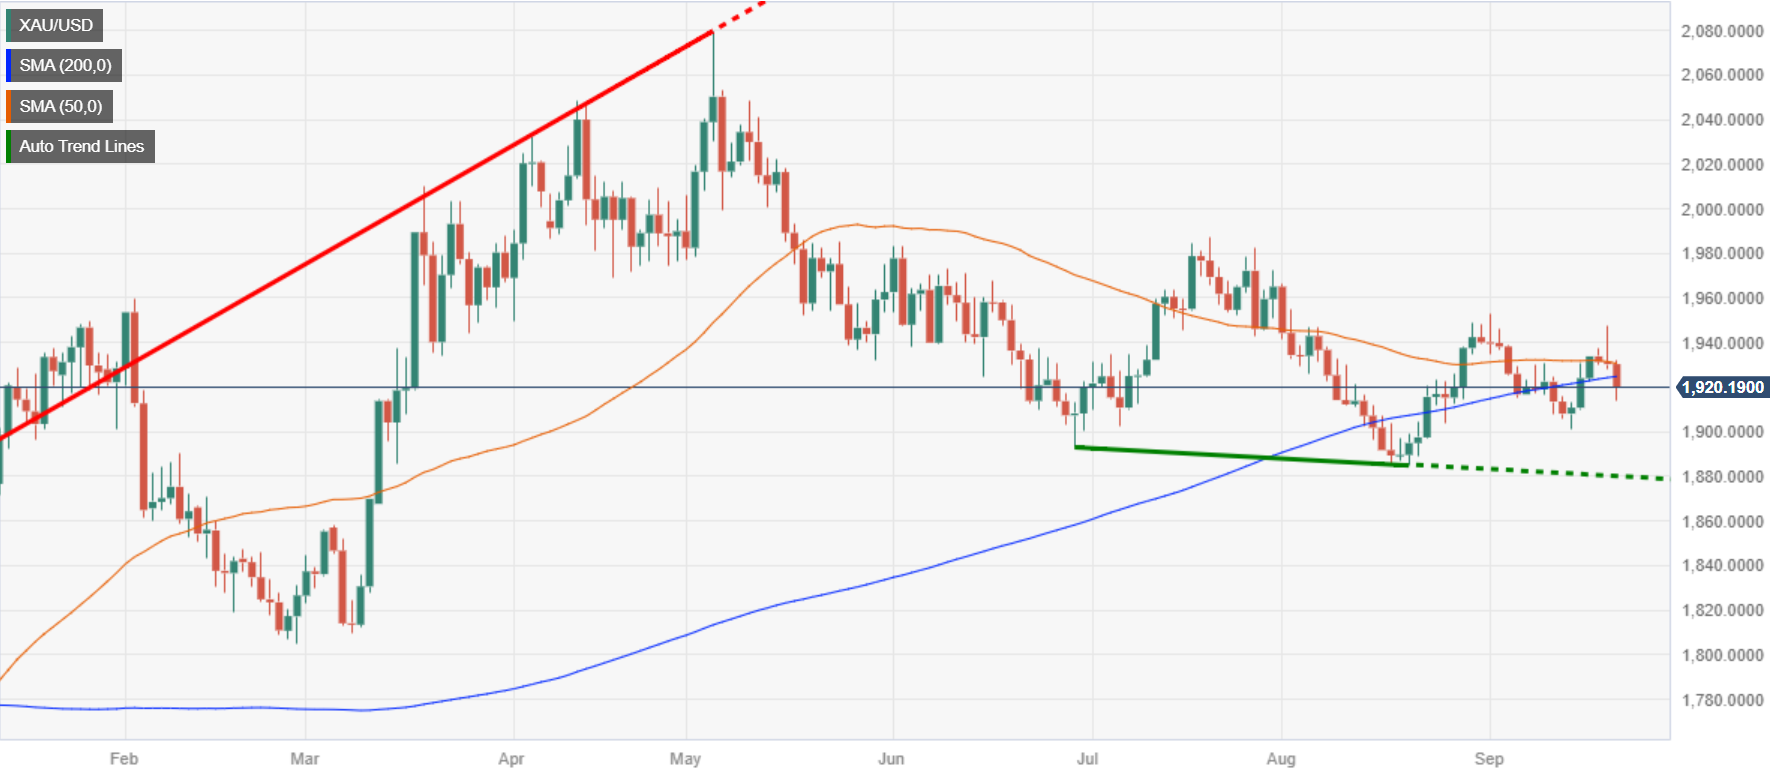
- XAU/USD drops 0.56% to $1919.74 as the Fed’s decision to maintain and revise rates upward pressures gold prices.
- US real yields hit a YTD high at 2.115%, which continues to be a significant headwind for Gold.
- Mixed US economic data and hawkish stances from other central banks globally add to the bearish outlook for the precious metal.
Gold price slides for the third straight day against the US Dollar (USD), following the Federal Reserve’s hawkish hold that bolstered the Greenback. Hence, higher US Treasury bond yields rose, while the XAU/USD traded at $1919.74, losing 0.56% after reaching a daily high of $1931.57.
Gold price continues to slide, trades below $1920 as high US Treasury yields and strong US Dollar weighs on precious metals
The aftermath of the US central bank decision keeps market participants averse to risk. US equities are dropping, US Treasury bond yields skyrocket, and the Greenback stays firm above the 105.00 threshold.
Jerome Powell and his colleagues’ decision to hold rates while upward revising the Federal Funds Rate (FFR) for 2024 from 44.6% to 5.1% was the reason behind the market’s reaction. Even though policymakers see another 25 bps rate hike toward the end of the year, market participants remain skeptical about a hike in November, but not so much in December. The odds of a 25 bps hike in the former are 26.3%, while the latter stands at 38.4%.
That spurred Gold’s fall, as US Treasury bond yields skyrocketed, while US real yields reached a year-to-date (YTD) high at 2.115%, as shown by US 10-year TIPS (Treasury Inflation-Protected Securities).
Additionally, more central banks kept rates unchanged but stressed the need to add to the Fed’s mantra of holding rates “higher for longer.” The Bank of England (BoE) kept rates at 5.25% but maintained the door open for additional rate increases. Also, the Swiss National Bank (SNB) held its policy rates unchanged at 1.75% and warned about future tightening.
On the data front, US unemployment claims for the week ending on September 16 rose below estimates of 225K at 201K. The Philadelphia Fed Manufacturing Index, a gauge for business activity, plummeted to -13.5, below forecasts of -0.7, while Existing Home Sales for August improved to -0.7% MoM, compared to July -2.2% plunge.
XAU/USD Price Analysis: Technical outlook
After spiking due to the Fed’s decision day, the XAU/USD retraced and printed a daily close below the 50-day moving average (DMA) at $1930.40, with the yellow metal extending its losses past the Asian session. As price action continued to drop, the XAU/USD broke crucial technical support levels, like the confluence of the 20 and 200-DMA at around $1925.00/58, exposing the non-yielding metal to additional selling pressure. Next, support emerges at the September 14 swing low of $1901.11, followed by the August 21 swing low of $1884.89.
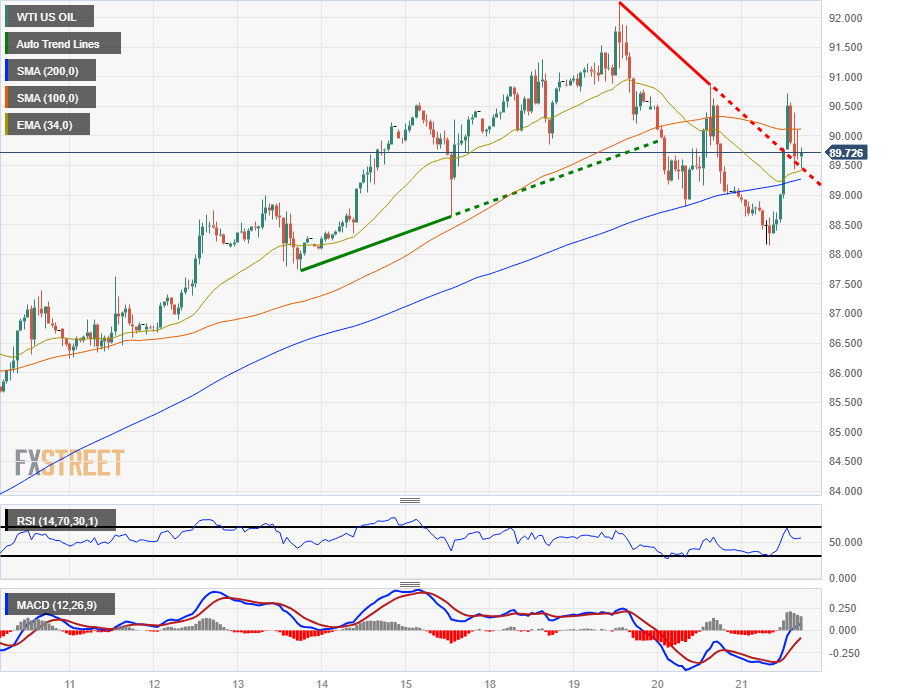
WTI spiked in Thursday trading, briefly retaking $90.50/bbl before settling back towards $89.50.
Crude oil gained nearly $2/bbl for the day as supply constraints keep barrel prices pinned.
Intraday prices set to continue cycling the $90 figure in the interim as analysts expect $100 in the future.
West Texas Intermediary (WTI )crude oil barrels caught another run up the charts on Thursday, spiking from the day's low to retake a near-term high water mark. The move ran out of gas heading into the back of the trading day, and prices are currently looking for a foothold just beneath $90/bbl.
OPEC+ producers continue their intentional production drawdown, and market analysts expect crude prices to bleed upwards into the $100/bbl range in the coming months.
Supply constraints cut barrel production deep
Saudi Arabia and Russia's 1.3 million barrel per day combined supply cuts have been extended through the end of the year, exacerbating what analysts foresee as a 2 million bpd shortfall in global oil supplies.
Global oil reserves are expected to dwindle in the coming months as governments and independent producers bleed barrels, either to help stabilize domestic fuel costs or to take advantage of rising barrel prices.
With oil barrel prices getting squeezed at the origin point, oil refiners will be scrambling to capture as much of the constrained market as possible, adding further upside pressure. Refinery profit margins are at their highest point in years, and facilities will be looking to increase their supply as much as possible as barrel prices move higher.
WTI technical outlook
WTI crude barrels caught a bounce from the near-term low of $88.25, retaking the 200-hour Simple Moving Average (SMA) near $89.30.
Intraday prices still remain below last week's swing high above $92.00, though a bullish break of a descending trendline from that level could lend support for upside price movements.
US crude barrel prices have climbed nearly 35% from the year's lows near $65.00, and daily candlesticks see recent price expansion climbing away from the 34-day Exponential Moving Average (EMA) currently testing into $85.00.
WTI hourly chart
WTI technical levels
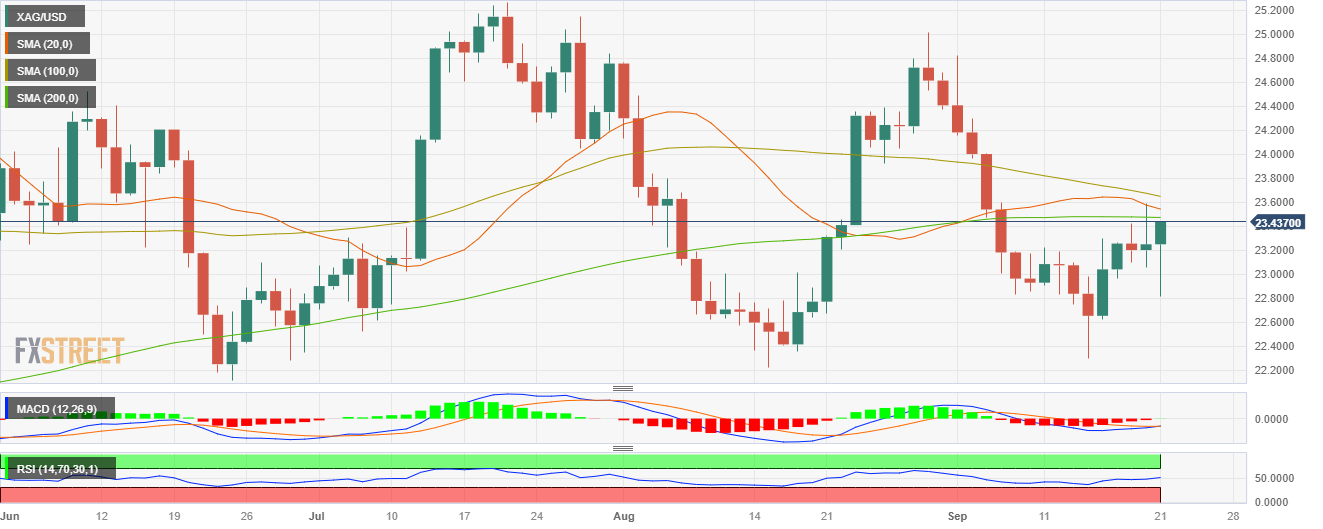
- After failing to a low of $22.80, the XAG/USD recovered to $23.40.
- US Jobless Claims from the second week of September came in lower than expected.
- Philadelphia’s Fed Manufacturing Index alsocame in lower than expected.
- Higher US yields limit the upside potential of the grey metal.
On Thursday, the XAG/USD Silver Spot price found support at $22.80 and then climbed back to $23.40 On the downside, higher US yields favour a bearish outlook for Silver in the short term, while poor Manufacturing data from the US softened the USD, allowing the metal to find demand.
The Philadelphia Fed Manufacturing Survey is a proxy of manufacturing conditions from September, came in lower than expected at -13.5. On the upside, Initial Jobless Claims for the week ending in September 15 of the US came in below the expectations at 201,000, lower than the 225,000 expected and the previous 221,000.
It is worth noticing that, as Chair Powell stated on Wednesday, the Federal Reserve (Fed) will remain data-dependent so that economic figures will set the pace of the US Dollar until the next decision. In addition, the policy statement revealed that most members are seeing an additional hike in 2023, while the projections pushed back cuts from 2024 to September. In that sense, expectations of higher rates for a longer time fueled US bond yield, limiting the XAG/USD upside potential.
In the meantime, the 2-year yield stands at 5.14% while the 5 and 10-year rates at 4.60% and 4.46%, all three in multi-year highs. The Greenback, measured by the DXY index, retreated from it highest level since March 9 of 105.73 towards 105.40 following the data and allowed the XAG/USD to gather some momentum.
XAG/USD Levels to watch
Analyzing the daily chart, a bearish outlook is seen for the short term regarding XAG/USD despite indicators turning flat. The metal is below the 20,100 and 200-day Simple Moving Averages (SMAs), pointing towards the prevailing strength of the bears in the larger context; those averages are about to perform a bearish cross at the $23.50 area.
Support levels: $23.00, $22.80, $22.50.
Resistance levels: $23.50 (20,100 and 200-day SMA convergence), $23.70, $24.00
XAG/USD Daily Chart
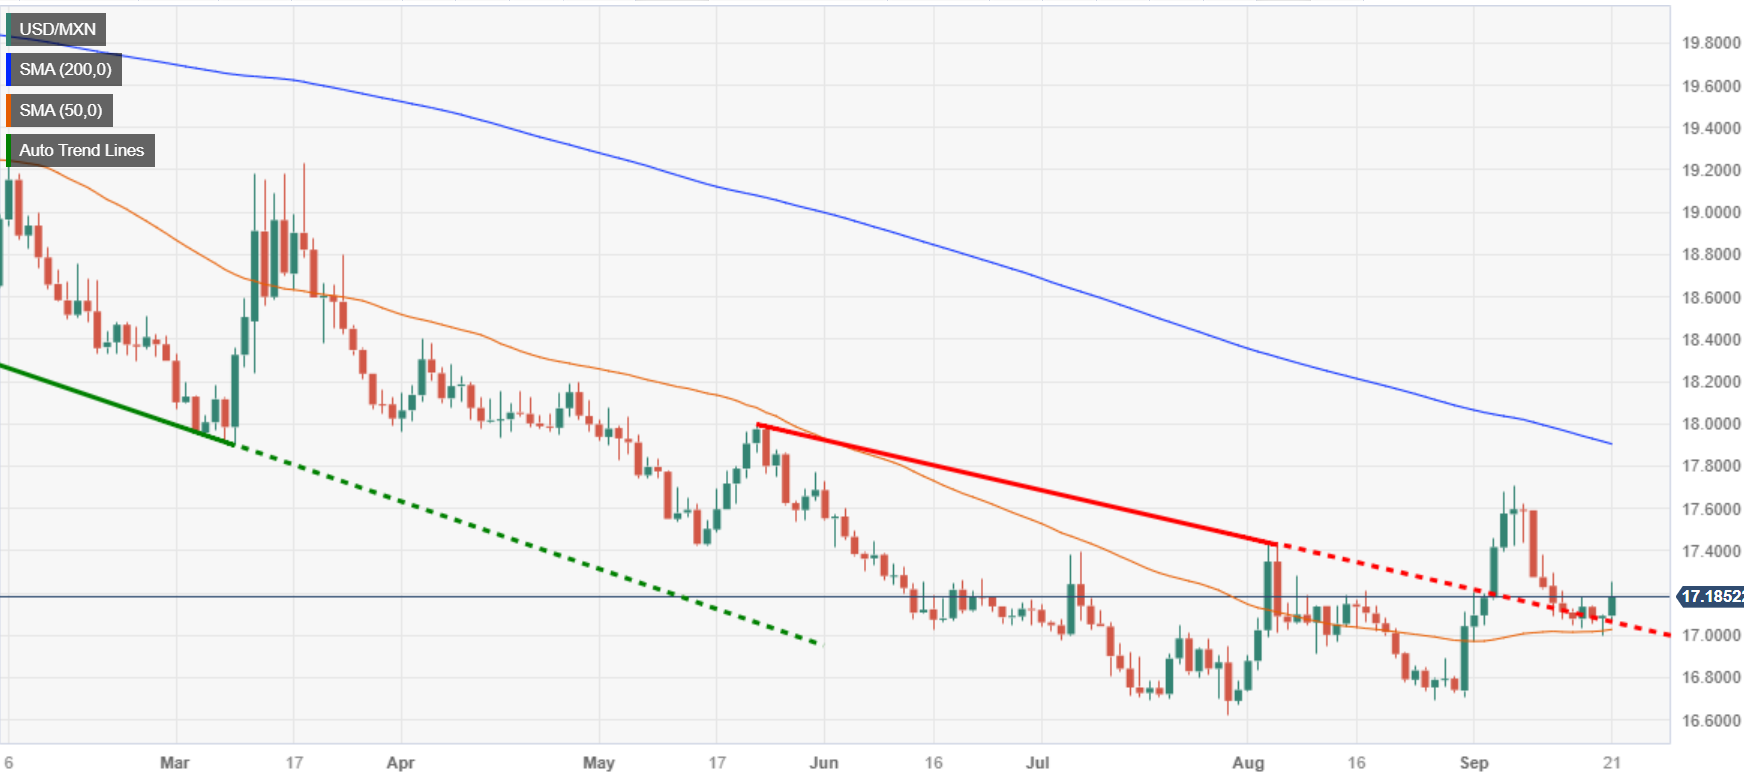
- USD/MXN climbs to 17.1637, up 0.43%, fueled by the Fed’s hawkish hold and upward revisions of future interest rates.
- Mixed US economic data contrasts with strong consumer spending in Mexico, but the Greenback maintains its upward momentum.
- The pair’s trajectory is influenced by multi-year highs in US Treasury bond yields and solid labor market conditions in the US.
The Greenback stages a recovery vs. the Mexican Peso on Thursday, spurred by a hawkish hold by the US Federal Reserve. Although economic data from Mexico showed consumer spending remains strong despite higher interest rates, the pair edges higher. The USD/MXN is trading at 17.1637, up 0.43% after printing a low of 17.0363.
USD/MXN rises 0.43% as the Fed delivers a hawkish Fed, foreseen rates above 5% in 2024
On Wednesday, the US central bank decided to keep rates at their current level while updating its economic forecasts. The monetary policy statement acknowledged a strong labor market, tightening credit conditions, and expanding economy. They emphasized that “Inflation remains elevated” due to the last two inflation readings witnessing an uptick.
However, most market participants were looking for the rest of the year and future projections, as the Fed revealed its Summary of Economic Projections (SEP). Policymakers foresee an additional rate hike in 2023 while revising the Federal Funds rate (FFR) for 2024, with the median seen rates at 5.1%, up from 4.6%.
That has been the main driver of price action since yesterday. The USD/MXN extended its gains, while US Treasury bond yields along the short and medium end of the curve reached multi-year highs, a tailwind for the American Dollar (USD). The US Dollar Index (DXY), a gauge of the buck’s value vs. a basket of peers, remains at 105.39, almost flat, following post-Fed’s reaction.
The US economic agenda recently featured Initial Jobless Claims for the last week came in at 201,000, beating the 225,000 estimates, reflecting a solid labor market. However, the September Philadelphia Fed Manufacturing Index dropped significantly to -13.5, well below the expected -0.5. US Existing Home Sales also fell short of expectations, declining by -0.7% month-on-month, while a 1.5% expansion was projected.
Across the border, the Instituto Nacional de Estadistica Geografia e Informatica (INEGI) revealed that Mexican Retail Sales came at 0.2% MoM in June, aligned with estimates and 5.1% YoY, exceeding 4.9% forecasts.
USD/MXN Price Analysis: Technical outlook
After the Fed’s decision, the USD/MXN pierced the 17.00 figure before rallying sharply toward the 17.10 area. Since then, the pair seesawed around 17.0500/17.1000 and rallied, reclaiming the 20-day moving average (DMA) at 17.1402, eyeing the 100-DMA at 17.1941. In the outcome of achieving a daily close above that level, the exotic pair could test the September 7 daily high at 17.7074 before challenging 18.0000. On the downside, a drop below the 20-DMA could exacerbate a dip to the 17.0000 psychological level.
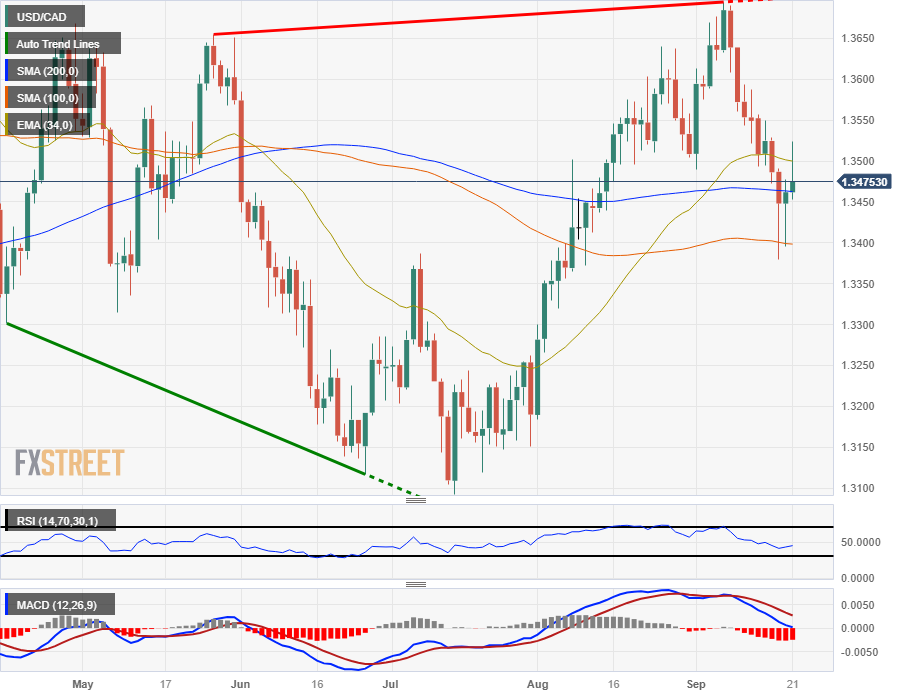
- USD/CAD seeing mid-Thursday rejection from the topside as Greenback pauses.
- Oil-based CAD getting bolstered by rebounding oil prices.
- US PMIs, CAD Retail Sales still in the pipe for Friday.
The USD/CAD lifted in early Thursday trading, clipping into 1.3520 before seeing a clean rejection, and is now trading down into 1.3475 as the Greenback (USD) takes a breather and the Loonie (CAD) finds support from bouncing crude oil prices.
The oil-based Loonie is finding some minor support from crude prices heading into the end of the week, rebounding after the USD caught a firm bid across the board after Thursday's Federal Reserve (Fed) rate call. The Fed stood still on interest rates, but a rising rate outlook firmed up the chances of another rate hike before the end of the year.
On the economic calendar, Friday comes in with CAD Retail Sales and US Purchasing Manager Index (PMI) figures.
CAD retail sales, US PMIs both seen improving
Canadian retail sales from July are forecast to see confirmed month-over-month growth of 0.4%, an uptick from the previous period's 0.1%.
On the US side, PMIs are expected to improve slightly, with the manufacturing component forecast to lift from 47.9 to 48.0, and the services side moving from 50.5 to 50.6.
USD/CAD technical outlook
The USD/CAD has been catching bids ever since the Fed release yesterday, taking the pair up nearly a full percent bottom-to-top, before running aground on the 200-hour Simple Moving Average (SMA) near 1.3520.
The pair is now set to fall further, declining past the 100-hour SMA and looking at the top side of the descending intraday trendline, marked in from 1.3580.
On the daily candlesticks, the USD/CAD is looking for a rebound from the 34-day Exponential Moving Average (EMA) near 1.3400, and is getting hung up on the 200-day SMA close to the current price action.
USD/CAD daily chart
USD/CAD technical levels
- The USD/JPY took a hit and declined near 147.50.
- The US reported mixed economic data. Treasury yields are soaring high.
- Investors await BoJ's decision and Japanese inflation figures during the Asian session.
On Thursday, the USD/JPY faced downward pressure, declining near 147.50 and seeing 0.60% losses. On the one hand, hopes of a Bank of Japan (BoJ) policy shift (or a signal) keep the JPY afloat while the USD is holding its ground, driven by US Treasury yields rallying after the Federal Reserve (Fed) decision on Wednesday.
Despite the JPY trading strong against most of its rivals, the BoJ may disappoint markets on Friday and keep its dovish stance. As highlighted, local wage and inflation trends are key drivers in the decision-making process around monetary policy shifts so until those figures don’t align with the bank’s forecast, they won’t consider leaving their negative interest rate policy. However, any additional clues the BoJ gives in its statement will help investors model their expectations regarding the next meetings and affect Yen’s price dynamics.
On the other hand, the Federal Reserve (Fed) was more hawkish than expected on its September meeting with its rate projections as they hinted at one more hike in 2023 and practically delayed rate cuts in 2024. The combination of higher and higher interest rates for longer fueled the US Dollar via higher Treasury yields, which stand at multi-year highs. The 2-year rate is 5.16%, while the 5 and 10-year yields soared to 4.60% and 4.47%, respectively.
Moreover, the US reported mixed data during the session, as Jobless Claims for the second week of September were lower than expected, while the Philadelphia’s Fed Manufacturing Survey declined to 13.5, missing by wide margin expectations. It's worth mentioning that despite the Fed being hawkish in interest rate terms, Chair Powell noted that the next decisions will rely solely on incoming data, so the US price dynamics will see volatility on releasing high-tier economic figures. On Friday, markets await September S&P Global PMI figures.
USD/JPY Levels to watch
Despite the daily declines, the USD/JPY suggest that the outlook for the pair on the daily chart is still bullish. The Relative Strength Index (RSI) is favourably positioned in positive territory above its midline but reflects a downward movement. Similarly, Moving Average Convergence Divergence (MACD) depicts red bars, affirming that the bears are gaining ground but aren’t there yet. In line with that, the pair is above the 20,100,200-day Simple Moving Average (SMA), suggesting that the bulls are firmly in control of the bigger picture.
Support levels: 147.10 (20-day SMA), 146.00, 145.00
Resistance levels: 148.00, 149.00, 150.00.
USD/JPY Daily Chart
- The EUR/USD churns sideways for Thursday, near where the day started.
- US jobless claims beat, EU consumer confidence miss, keeping the Euro contained.
- EU and US PMIs to close out the trading week.
The EUR/USD is cycling familiar territory on Thursday, looking for a break higher but thus far unable to find one.
The Euro (EUR) kicked off Thursday trading near 1.0660 before continuing Wednesday's Fed-inspired slide to the day's low near 1.0620. The EUR/USD now remains trapped between those two points, trading up and down and up again as Euro bulls try to break out of the ceiling.
September's preliminary consumer confidence reading came in below expectations at -17.8 compared to the previous -16 and steepening the descent from the forecast -16.5.
US initial jobless claims for the week into September 15th printed notably better than expected, coming in at 201K versus the previous 221K, and erasing the expected 225K increase.
Euro flat for Thursday with Friday PMI in the barrel
Next up on the economic calendar will be Friday's Purchasing Manager Index (PMI) printings for both the EUR and the USD.
the EU's preliminary composite PMI for September is forecast to tick lower from 46.7 to 46.5, while the US side sees PMIs taking a small step higher.
US services PMI is forecast to move from 50.5 to 50.6, while the manufacturing component is expected to print at an even 48, up from the previous 47.9.
EUR/USD technical outlook
Hourly candles still have the EUR/USD on the downside after failing to make a clean break of the 200-hour Simple Moving Average (SMA) near 1.0700. the 100-hour SMA currently sits at 1.0675, providing additional resistance as the pair remains stuck to the 34-hour Exponential Moving Average (EMA) near current price levels just above 1.0660.
On the daily candles, a descending trendline from July's swing high at 1.1250 remains fully intact, and the 200-day SMA sits overhead price action just south of 1.0850, acting as a ceiling for any bullish attempts at upside momentum.
EUR/USD technical levels
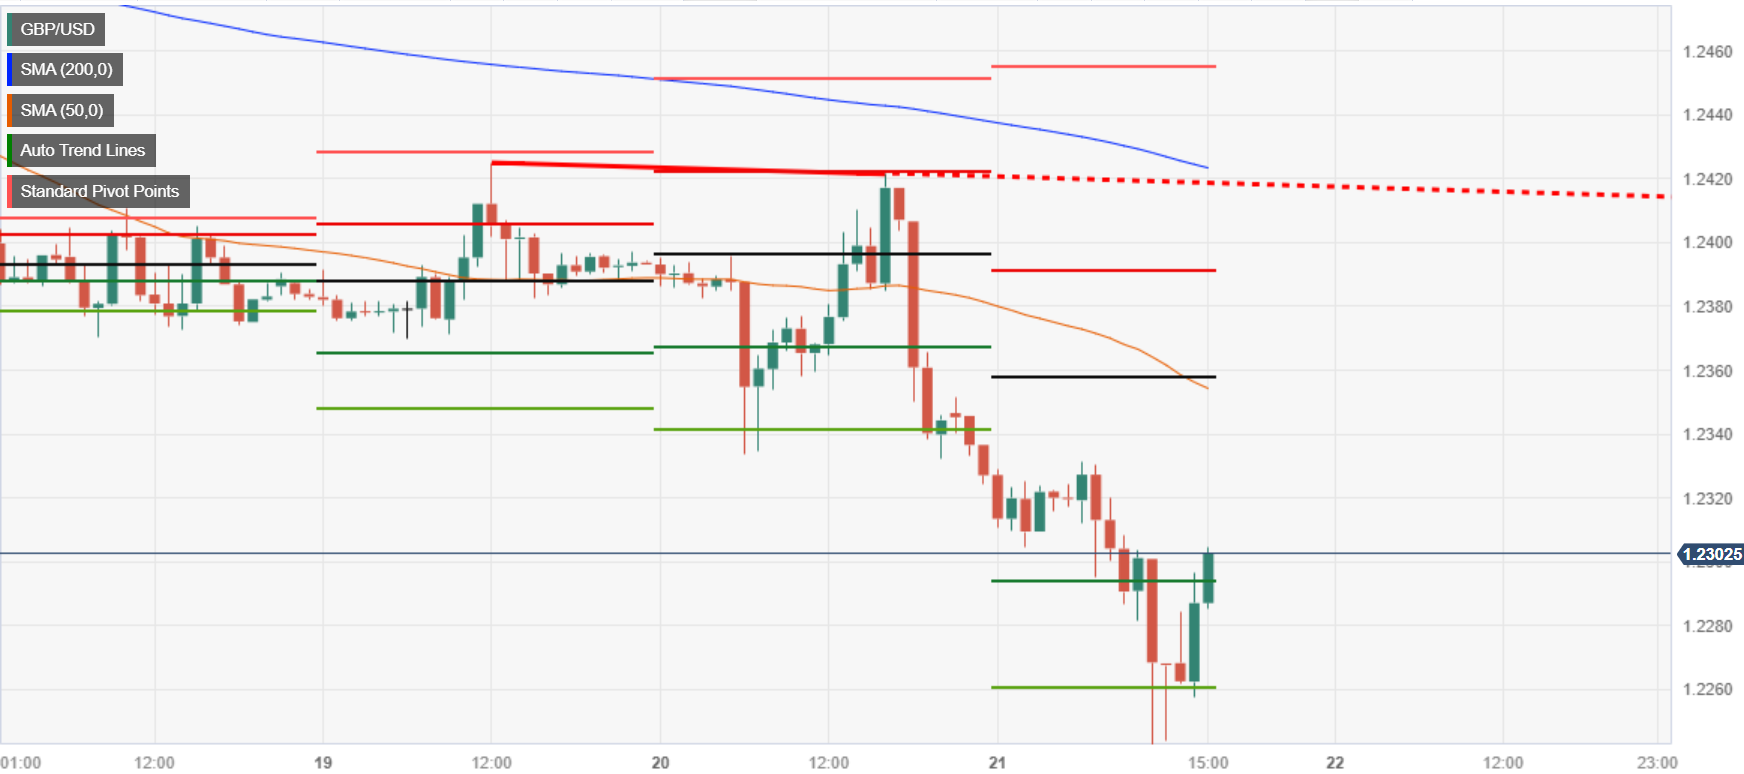
- GBP/USD registers losses, trading at 1.2285, following the BoE’s decision to hold rates unchanged amid slowing UK inflation.
- US economic data reveals a mixed landscape with lower-than-expected Initial Jobless Claims and a plunge in the Philadelphia Fed Manufacturing Index.
- Given the solid US economy and rate differences, GBP/USD will likely continue its downward trajectory soon.
The British Pound (GBP) registers solid losses against the US Dollar (USD) after the Bank of England’s (BoE) decision to hold rates unchanged in a 5-4 vote split, with BoE’s Governor Bailey providing the decisive vote. A slowdown in UK inflation, reported on Wednesday, was the main driver behind BoE’s decision. The GBP/USD is trading at 1.2295 after hitting a daily high of 1.2331.
GBP/USD drops to 1.2300 as BoE holds rates and US economic data paints a mixed picture
Earlier, the BoE decided to hold rates unchanged at 5.25% due to the deceleration of inflation, a loosening labor market, and a deterioration in business sentiment. The BoE added that rates would remain high for an extended period and “Further tightening would be needed if evidence of more persistent inflationary pressures.”
Bailey and Co. updated their GDP forecasts, and for the Q3, the economy is expected to grow by 0.1%, below the 0.4% August estimate, underscoring that growth in the year’s second half would be weaker. The BoE would also tweak its quantitative tightening program from £80bn to £100bn.
The BoE’s decision hurt the GBP/USD upside prospects, as the pair was already downward pressured after the Federal Reserve decided to hold rates unchanged but revised the interest rates for 2024 upward. In the Summary of Economic Projections (SEP), Powell and his colleagues updated the dot plots, with most Fed officials expecting to keep rates above the 5% threshold in the next year.
Data-wise, the US economic docket featured Initial Jobless Claims for the last week, which rose by 201K below estimates of 225K, and drafts a solid labor market. Further data revealed that the September Philadelphia Fed Manufacturing Index plunged -13.5, well below forecasts for a -0.5 contraction. US Existing Home Sales data was worse than expected, at -0.7% MoM, beneath projections of 1.5% expansion.
Given the backdrop, the GBP/USD would likely continue to trend lower as the US economy remains solid. Also, the rate difference between the US and the UK suggests further downside is expected.
GBP/USD Price Analysis: Technical outlook
The daily chart portrays the pair set to extend its losses. Still, the GBP/USD must achieve a daily close below April’s 3 daily low of 1.2274 to exacerbate a March 15 daily low test at 1.2010 before testing yearly lows at 1.1802. Short term, the GBP/USD hourly chart depicts the pair recovering from daily lows reached at 1.2237, with traders eyeing a re-test of the 1.2300 figure. Given the interest rate differential between the UK and the US favors the latter, expect some selling pressure at the figure. A daily close above 1.2300 could pave the way toward 1.2400.
The Bank of Japan (BoJ) will hold its Monetary Policy Committee (MPC) meeting on Friday, September 22 and as we get closer to the Interest Rate Decision, here are the expectations forecast by the economists and researchers of eight major banks.
No change is expected, especially after reports emerged last week that BoJ policymakers were concerned with how markets took Governor Ueda’s recent comments.
ANZ
We don’t expect the BoJ to change policy at its upcoming meeting, but there is a good chance it drops its guidance that it won’t hesitate to take additional easing measures. Our inflation outlook suggests that the BoJ won’t be dropping its negative rate policy for the foreseeable future despite Ueda’s claim there is a non-zero chance of it happening by year’s end.
Standard Chartered
We expect the BoJ to keep its policy balance rate unchanged at - 0.1% and the 10Y yield target at 0.0%. We think stickier-than-expected inflation may make the central bank hawkish. BoJ Governor Kazuo Ueda has discussed the possibility of lifting negative interest rates as part of the central bank’s strategy to address ongoing inflation and wage increases. However, he clarified that this decision is not imminent but could be considered in the future.
Deutsche Bank
We expect the BoJ to stick to its current policy stance but revise the MPM statement to point to policy normalisation. Further out, we see the YCC and negative interest rate policy ending at the October and January meetings, respectively.
Danske Bank
We expect no changes in monetary policy by the BoJ. We do however expect another tweak to YCC later this year.
ING
The BoJ is likely to stay pat. The central bank could however probably send a subtle hawkish message to the market after higher-than-expected inflation and a weak JPY, combined with rising global oil prices, pushed inflation up further.
TDS
We expect BoJ to leave all policy levers unchanged and doubt the BoJ is eager to spring another curveball at markets after July's surprise YCC tweak. Instead, a lot of focus will be on Ueda's comments on the Yen as he may be under pressure to lean against JPY weakness in his remarks after USD/JPY continues to drift towards 150 despite verbal interventions from MoF officials.
SocGen
We expect the BoJ to pursue its main monetary policy, i.e. YCC and ETF purchases, but it may reiterate the somewhat hawkish message from Governor Ueda, which, in our view, was aimed mostly at containing the mounting depreciation pressure on the Yen.
Wells Fargo
We believe the BoJ will ultimately choose to keep the current policy rate of -0.10% in place, and we also believe the BoJ will opt to not make any further adjustments to its YCC policy. Our rationale stems from a seemingly unsustainable source of Japan's inflation as well as recent comments that suggest policymakers still prefer to keep monetary policy accommodative. Global bond yields are close to topping out and should eventually move lower next year as central banks flip to easing. As the Fed approaches rate cuts and US yields fall, bond yield differentials between JGBs and Treasuries should narrow, ultimately supporting the Yen over the course of 2024. JPY is very sensitive to yield differentials, and as yields narrow, the Yen can be the key outperformer in the G10.
EUR/USD moved lower around a half figure on the hawkish hold from the Fed. Economists at Danske Bank analyze the pair’s outlook.
Near-term USD tailwinds could be fading
The outcome was about as hawkish as the Fed could have engineered without actually delivering a surprise hike.
Despite the ongoing USD strength, we think there could be some potential for some EUR/USD tailwinds in the near-term.
We think that peak policy rates, improving manufacturing sector relative to the service sector and/or easing pessimism priced on China could add some support to EUR/USD within the next month. On the longer horizon, however, we maintain our strategic case for a lower EUR/USD, expecting the cross at 1.03 in 12M.
Carry proposition for MXN still intact, although headwinds have been strengthening, economists at Société Générale report.
MXN valuations in an EM context
Strong growth outperformance and progress on inflation containment have helped MXN to eclipse the EM currency complex this year. However, headwinds are accumulating from currently rich valuations, shift in Developed Markets rates paradigm, and changes to domestic policies regarding currency intervention.
We highlight key features of the Mexican Peso’s outlook over the coming quarters, in a comparative context: Robust returns anticipated over the next 12 months, particularly in terms of total returns. Real policy rates are likely to remain sustainably high over the next year. Currency carry profile compares favourably with most other EM currencies. Carry-to-vol is still compelling. Limited financial market spill-over into MXN from China woes. Portfolios flows may not provide much of a boost to MXN valuations until the US rates picture stabilise. FX options market reflects already highly bearish MXN positioning. REER model signals MXN valuations as rich, but for this particular currency, the relationship with spot exchange rates is modest.
The Yuan has taken a beating, slumping by >5% YTD in spot for both onshore and offshore, and is visibly one of the worst performing currencies in Asia against the USD. Economists at TD Securities analyze USD/CNY outlook.
A rangey USD/CNY in Q4
We expect USD/CNY to stay in a 7.10-7.35 range for the rest of the year, primarily because the USD is likely to enter a period of choppiness ahead.
Data surprises have now turned in favour of China vs. the US, undermining the ‘bad China news is good news for the USD’ narrative while USD exhaustion may have occurred. However, we reckon the PBoC may look for some trade-weighted CNY weakness in the near-term to support exports, which should pin USD/CNY at 7.20 by year-end despite our bearish USD view.
The Bank of Japan’s monetary policy decision is due on Friday. Economists at Commerzbank analyze JPY outlook ahead of the Interest Rate Decision.
Threat of interventions overshadows BoJ meeting
Friday’s meeting is unlikely to bring any changes, but market participants are likely to expect indications as to whether Ueda’s comments regarding more clarity at the end of the year are to be understood as a monetary policy signal or not from the subsequent press conference. That is likely to contribute to whether USD/JPY will move closer towards 150.
In any case, as the Yen continues to weaken, the likelihood of renewed currency market intervention is likely to increase.
In an interview with Dutch broadcaster Radio 1, European Central Bank (ECB) Governing Council member Klaas Knot said that he does not expect a rate hike at the next policy meeting, per Reuters.
"I think interest rates are currently at the right level for us and I don't think we need to change them in the very short term," Knot explained and said that the ECB will stay alert to signals indicating inflation remain too high.
Market reaction
EUR/USD edged lower after these comments and was last seen losing 0.16% on the day at 1.0642.
The Bank of England (BoE) decided to keep the Bank Rate (key policy rate) unchanged at 5.25%. EUR/GBP initially moved higher but partly retraced the move later on. Economists at Danske Bank analyze the pair’s outlook.
The peak in the Bank Rate has been reached
The BoE decided to keep the policy rate unchanged at 5.25% with forward guidance remaining broadly unchanged.
We think that this marks the peak in the Bank Rate of 5.25%, although wage growth and service inflation remain a joker.
We continue to see relative rates as a moderate positive for EUR/GBP, although GBP has largely decoupled from moves in relative rates the past month.
We expect the relative performance of the Euro area and the UK economy to be a driver, targeting a moderate rise in EUR/GBP to 0.88 the next year.
Bank of England (BoE) Governor Andrew Bailey said on Thursday that their job is not done yet and added that he is not predicting what the next interest rate move will be, per Reuters.
"There is no premature celebration here on inflation falling," Bailey noted and said that the Monetary Policy Committee has not had any discussions about lowering the interest rate.
Earlier in the day, the BoE announced that they left the policy rate unchanged at 5.25%, going against the market expectation of a 25 basis points rate hike.
Market reaction
These comments failed to help Pound Sterling find demand and GBP/USD was last seen losing 0.6% on the day at 1.2270.
The USD is likely to strengthen further in the months to come and into 2024, in the view of economists at HSBC.
No additional rate hikes, first rate cut in 3Q24
We expect the USD to strengthen in the months to come, notably against the EUR and GBP. Where the USD is priced for a sequence of rate cuts in 2024, both the EUR and GBP have relatively modest easing in mind. Relative policy expectations could shift in favour of the USD. In addition, cyclical support for the EUR and GBP is likely behind us, whereas the USD can capitalise on the resilience of its economy.
Our economists expect unchanged policy rates through mid-2024 and now see just 50 bps in rate cuts starting 3Q24.
While speaking at the Reuters Global Market Forum on Thursday, European Central Bank (ECB) Governing Council member Pierre Wunsch said that he can't conclude yet that they have reached the terminal rate.
"Whether we need to do more or not is a very difficult question," Wunsch noted and added they have greater confidence that projections can be used as an anchor.
Market reaction
EUR/USD edged slightly higher following these comments and the pair was last seen trading virtually unchanged on the day at 1.0660.
"I think we have reached the interest rate peak," European Central Bank (ECB) Governing Council member Yannis Stournaras told Boersen-Zeitung on Thursday. "As things stand, I assume that our next step will be an interest rate cut," he added.
Stournaras further added that it was still too early to discuss the timing of rate cuts and said that they could reach the inflation target by the end of 2025, maybe a bit earlier.
Market reaction
These comments failed to trigger a noticeable reaction in EUR/USD and the pair was last seen losing 0.1% on the day at 1.0648.
- Metals remain under pressure after the Fed’s hawkish pause and US data.
- XAG/USD breaks under $23.00, reaching the lowest level in six days.
Silver has lost more than 1.50% in the last two hours, dropping from $23.25 to $22.80, marking its lowest since last Friday. It remains below $23.00, indicating ongoing pressure. Gold is also falling sharply.
First the Fed, and then US data
On Wednesday, following the FOMC meeting, metals began to decline from their weekly highs. Silver slid from above $23.50 and found support at $23.00. It briefly rebounded to $23.25 early on Thursday but turned lower again before the release of US data. The decline accelerated after the release of Jobless Claims, pushing Silver below $23.00.
US Initial Jobless Claims dropped more than expected during the week ending September 16 to 201K, the lowest reading since January. These numbers indicate that the labor market remains resilient despite the Federal Reserve's tightening monetary policy.
US yields surged to fresh multi-year highs, while Wall Street futures printed new lows after Jobless Claims. Silver bottomed at $22.79 and, as of writing, it is trading at $22.94, down 1.45% for the day. The bearish pressure is likely to persist while it remains below $23.00. The next support level is at $22.60, followed by $22.45. A recovery above the 20-Simple Moving Average on the hourly chart, currently at $23.17, could strengthen the short-term outlook for silver.
Technical levels
Economists at OCBC Bank analyze USD/CNH outlook.
Upside risks
Higher for longer may undermine risk sentiments in the interim while USD could stay bid overall.
For CNH, we continue to monitor if early signs of China data improvement and PBoC warning can further translate into more meaningful pullback in USD/CNH.
For RMB to stabilise fundamentally and recover would still require China economic activities to pick up, confidence to be ‘repaired’ (foreign inflows to return) and USD to turn lower (dependent on timing of Fed pivot). On the latter, the Fed pivot is still nowhere seen for now.
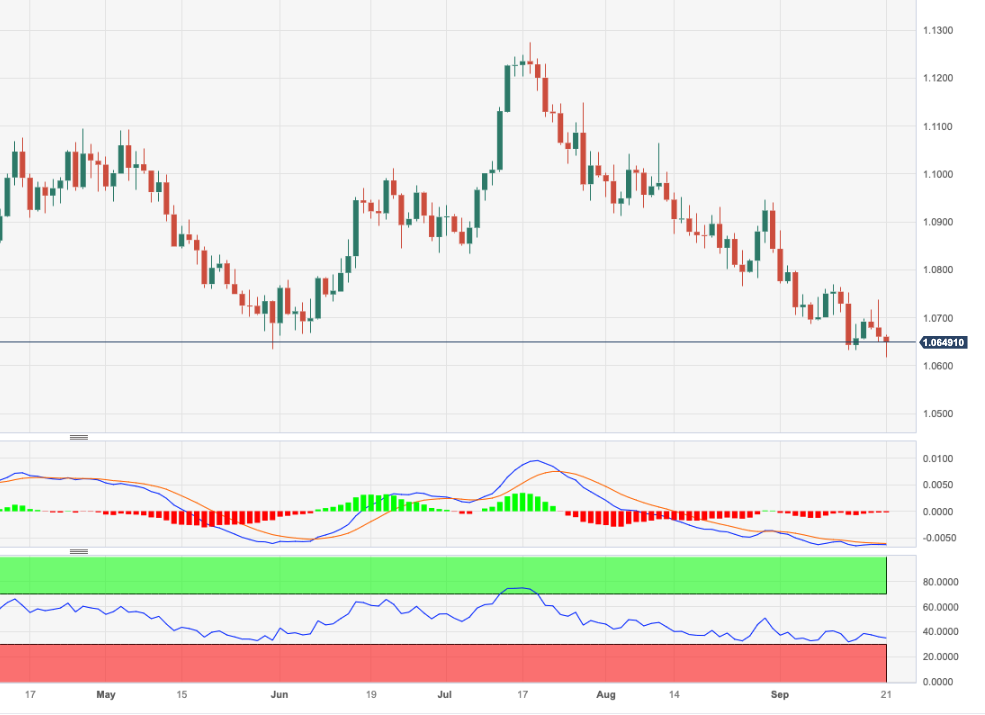
- EUR/USD slips back to the 1.0615 region, reaching new six-month lows.
- Extra losses should meet the March low of around 1.0516.
EUR/USD retreats for the third session in a row and prints fresh lows around 1.0615 on Thursday.
If the pair breaches this level in the short-term horizon, it could then open the door to a potential retracement to the March low of 1.0516 (Mar 8), which is the last defence ahead of an assault on the 2023 low at 1.0481 (January 6).
While below the key 200-day SMA at 1.0828, the pair is likely to face extra weakness.
EUR/USD daily chart
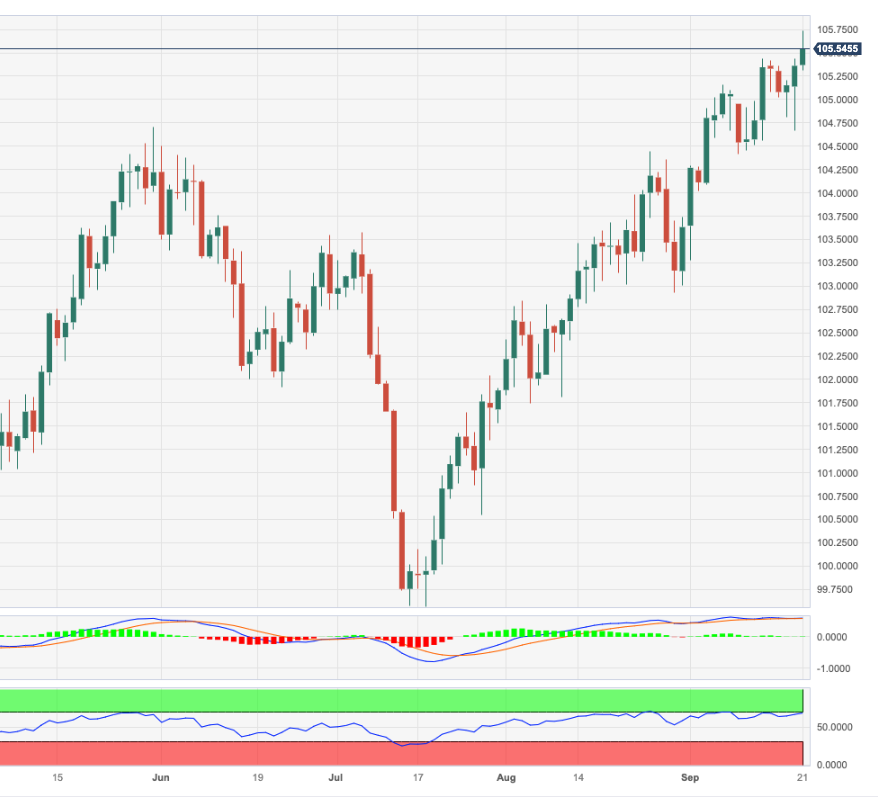
- DXY extends the uptrend to the 105.70 region.
- Further gains could see the 2023 near 105.90 revisited.
DXY manages to reach new multi-month tops in the 105.70/75 band on Thursday.
The continuation of the upside momentum in the index is expected to challenge the 2023 top at 105.88 (March 8) sooner rather than later. The surpass of this level could put a move to the round level at 106.00 rapidly back on the radar.
While above the key 200-day SMA, today at 103.04, the outlook for the index is expected to remain constructive.
DXY daily chart
Kit Juckes, Chief Global FX Strategist at Société Générale, analyzes the FX market outlook amid real support for the Dollar.
USD/JPY will break 150 unless the Japanese authorities “do something”
If the legendary soft landing does materialise, the Fed cuts rates and markets watch endless political arguments about the rise in US debt levels, then the Dollar will weaken, but that’s for another day. For now, the USD is basking in US economic exceptionalism.
The Treasury is selling bonds, yields are rising, and money is being sucked into the USD, comfortably financing the current account deficit – a fiscal/monetary policy mix that is designed to help the Dollar overshoot to the upside and there’s further to go.
EUR/USD is heading for a a look at parity, and USD/JPY will break 150 unless the Japanese authorities ‘do something’. Unless ‘something’ extends beyond token intervention and harsh words, we’ll carry on testing that level.
- EUR/JPY halts a four-session positive streak and revisits 157.20.
- Bullish attempts keep targeting the September top around 158.65.
EUR/JPY comes under marked selling pressure, revisiting the low-157.00s and reversing four consecutive daily advances on Thursday.
In the meantime, the cross remains stuck within the consolidative range and the breakout of it exposes a visit to the so far monthly high of 158.65 (September 13) prior to the 2023 top at 159.76 (August 30), which precedes the key round level at 160.00.
The surpass of the latter should not see any resistance level of note until the 2008 high at 169.96 (July 23).
So far, the longer term positive outlook for the cross appears favoured while above the 200-day SMA, today at 148.96.
EUR/JPY daily chart
The Bank of England voted 5-4 in favor of keeping the Base Rate unchanged. The surprise hold has caught GBP off guard. Economists at TD Securities analyze Sterling’s outlook.
The BoE's move and cooling inflation provide a green light for GBP to lag on the crosses
In a very close vote, the MPC opted 5-4 for a ‘hawkish hold’, threatening more hikes if inflation further surprises to the upside. We think, however, that constructive price dynamics will leave the BoE on hold from here, with Bank Rate at 5.25% until May 2024.
GBP/USD opens up a move to 1.21 here, but we also think GBP slides on the crosses.
Economists at OCBC Bank analyze USD outlook after the Fed maintained optionality with regard to another hike down the road.
Risk sentiment comes under pressure
USD inflection point requires a dovish pivot and that is still not in sight. More entrenched disinflation trend and further softening in labour market are prerequisites for a peak and perhaps pivot to play out.
For now, hawkish repricing can see UST yields climb higher alongside the USD while risk sentiment comes under pressure.
Alongside higher for longer, upward pressure on inflation and yields may persist. This can result in a deterioration of global growth/inflation mix and can cause headwind to risk appetite and undermine Asian FX, especially those that are net-Oil importers, such as THB, PHP, KRW, JPY.
- Philadelphia Fed Manufacturing Index dropped to -13.5 in September.
- US Dollar Index stays in positive territory above 105.50.
The Diffusion Index for current general activity of the Federal Reserve Bank of Philadelphia's Manufacturing Survey declined sharply to -13.5 in September from 12 in August. This reading came in much worse than the market expectation of -0.7.
Further detail of the publication revealed that the Prices Paid Index rose to 25.7 from 20.8, the Employment Index improved slightly to -5.7 from -6 and the Six-month Business Conditions Index rose to 11.1 from 3.9.
Market reaction
These figures don't seem to be having a noticeable impact on the US Dollar's (USD) performance against its major rivals. As of writing, the US Dollar Index was up 0.25% on the day at 105.70.
- US Initial Jobless Claims in the US decreased by 20,000 in the week ending September 16.
- Continuing Claims declined by 21,000 in the week ending September 9.
- US Dollar Index rises further above 105.50, to fresh multi-month highs.
Initial Jobless Claims totaled 201,000 in the week ending September 16, the weekly data published by the US Department of Labor (DOL) showed on Thursday. It is the lowest reading since late January. This follows the previous week's print of 221,000 (revised from 220,000) and came in below the market expectation of 225,000. “The 4-week moving average was 217,000, a decrease of 7,750 from the previous week's revised average”, the DOL revealed.
Continuing claims decreased by 21,000 in the week ending September 9 to 1.662 million, the lowest since January, and below market expectations of 1.695 million.
Market reaction
The US Dollar Index continues to push higher after this data, rising above 105.70, to fresh multi-month highs.
- Gold price declined to below $1,920 on Thursday.
- 10-year US Treasury bond yield climbed to fresh multi-year highs above 4.5%.
Gold price turned south in the second half of the day and declined to a fresh six-day low below $1,920. At the time of press, XAU/USD was down 0.6% on the day at $1,918.50.
On Wednesday, XAU/USD climbed toward $1,950 before making a sharp U-turn in the late American session. Although the Federal Reserve left the policy rate unchanged at 5.25%-5.5% as expected after the September policy meeting, hawkish revisions to the Summary of Economic Projections triggered a rally in US yields and weighed heavily on the pair.
The dot plot confirmed that the US central bank intends to lift the policy rate by another 25 basis points in 2023 and showed that policymakers expect a total of 50 bps rate cut in 2024, compared to 100 bps in June's dot plot.
Following a quiet European session, the benchmark 10-year US Treasury bond yield regained its traction and climbed above 4.5% for the first time since November 2007, forcing XAU/USD to stay on the back foot.
Meanwhile, the Bank of England went against the market expectation of a 25 bps rate hike and held its policy rate steady at 5.25%. The sharp decline seen in GBP/USD after this decision highlighted that the USD managed to capture capital outflows out of Pound Sterling. In turn, the USD gathered additional strength and caused XAU/USD to decline further.
Technical levels to consider
EUR/CHF spiked higher on today’s steady policy announcement from the SNB. Economists at Rabobank analyze the pair’s outlook.
CHF can be the subject of safe haven inflows when risks rise in the Eurozone
Today’s statement from the SNB makes it very clear why it surprised the market by keeping rates on hold this morning. While the central bank kept the door open for another rate hike, the outlook for growth and inflation in Switzerland suggests that the central bank has likely already done enough.
However, one obvious concern is the impact on the currency from an unexpected decision to leave rates unchanged in a month when the ECB opted to hike. To offset an inflationary drop in the value of the CHF vs. the EUR, the SNB included in the first paragraph of today’s statement the warning that it is ‘willing to be active in the foreign exchange market as necessary. In the current environment, the focus is on selling foreign currency’.
Going forward, we expect the worsened growth outlook in the Eurozone will allow EUR/CHF to dip back below the 0.95 level in Q4 on safe-haven flows.
The US Dollar has continued to strengthen following the FOMC meeting. Economists at MUFG Bank analyze Greenback’s outlook.
The Fed plans to keep rates higher for longer
While the Fed left the policy rate unchanged, the updated guidance provided a stronger signal that the Fed plans to keep rates higher for longer. It has prompted the US rate market to scale back expectations for rate cuts from the Fed next year. Almost 50 bps of cuts have been taken out of the US curve so far this month which is helping to provide more support for the USD.
There is a higher risk of one final hike in November or December although weaker economic activity and core inflation data in Q4 should deter the Fed from delivering on those plans. Similarly, we expect to see a bigger negative impact on the US economy in the year ahead from the lagged impact of aggressive tightening to date that will encourage the Fed to cut rates more than the planned 50 bps by the end of 2024.
“We will be watching closely to see if further increases to interest rates are needed,” Bank of England (BoE) Governor Andrew Bailey said following the surprise no-rate change decision in the September meeting.
This comment is from the inflation letter sent by Governor Bailey to the UK Finance Minister Jeremy Hunt. The inflation letter was published alongside the September monetary policy statement.
“According to Reuters' calculations, markets price in a 64% chance of the BoE raising the policy rate by 25 bps in November, down from 81% before the rate announcement. Additionally, investors now see a 55% probability that the BoE will lower the policy rate to 5% in September 2024,” FXStreet’s Analyst, Eren Sengezer, noted.
Related reads
- BoE holds interest rate steady at 5.25% in split vote
- GBP/USD hits fresh six-month low below 1.2250 on BoE’s surprise hold
Norges Bank hikes and promises one more in December. Despite the hawkish surprise, EUR/NOK has remained attached to the 11.50 gravity line. Economists at ING analyze the pair’s outlook.
Krone still waits for external cues to rally
Norges Bank delivered a well-telegraphed 25 bps hike today, but surprised markets by signalling rates will likely be increased again to 4.50% in December and left at that level throughout 2024.
Once the US story and the Dollar turn lower, NOK should be at the forefront of the rally in pro-cyclical currencies, and today’s hawkish hike by Norges Bank endorses this view.
For now, however, 11.50 is the gravity line, and only a change in external conditions seems likely to shake NOK from its low-volatility torpor.
- GBP/JPY came under heavy bearish pressure and dropped to multi-week lows on Thursday.
- Bank of England left its policy rate unchanged at 5.25% in split vote.
- Bank of Japan will announce policy decisions early Friday.
GBP/JPY turned south in the European session on Thursday and dropped to its lowest level since early August at 180.83 before recovering to the 181.50 area. As of writing, the pair was down 0.9% on the day at 181.54.
Following the September policy meeting, the Bank of England (BoE) decided to leave the interest rate unchanged at 5.25%. Although investors were expecting the BoE to raise the policy rate by 25 basis points, soft inflation data from the UK revived expectations for a no change. "inflation has fallen a lot in recent months, we think it will continue to do so," the BoE said in its policy statement.
Nevertheless, the immediate reaction caused Pound Sterling to suffer large losses against its major rivals. GBP/USD was last seen losing 0.6% on the day and EUR/GBP was up 0.4% at 0.8670, highlighting the negative impact of the BoE's policy decision on the currency.
According to Reuters, the chance of the BoE raising rates by 25 bps in November declined to 64% from 81% before the rate decision.
Pound Sterling price today
The table below shows the percentage change of Pound Sterling (GBP) against listed major currencies today. Pound Sterling was the weakest against the Japanese Yen.
| USD | EUR | GBP | CAD | AUD | JPY | NZD | CHF | |
| USD | 0.06% | 0.53% | 0.22% | 0.47% | -0.27% | 0.13% | 0.65% | |
| EUR | -0.08% | 0.45% | 0.14% | 0.38% | -0.35% | 0.06% | 0.57% | |
| GBP | -0.48% | -0.45% | -0.30% | -0.06% | -0.79% | -0.35% | 0.12% | |
| CAD | -0.22% | -0.16% | 0.31% | 0.24% | -0.50% | -0.09% | 0.42% | |
| AUD | -0.45% | -0.40% | 0.08% | -0.23% | -0.72% | -0.32% | 0.19% | |
| JPY | 0.25% | 0.34% | 0.81% | 0.48% | 0.73% | 0.41% | 0.91% | |
| NZD | -0.12% | -0.05% | 0.42% | 0.09% | 0.36% | -0.38% | 0.52% | |
| CHF | -0.66% | -0.57% | -0.12% | -0.44% | -0.20% | -0.92% | -0.52% |
The heat map shows percentage changes of major currencies against each other. The base currency is picked from the left column, while the quote currency is picked from the top row. For example, if you pick the Euro from the left column and move along the horizontal line to the Japanese Yen, the percentage change displayed in the box will represent EUR (base)/JPY (quote).
During the Asian trading hours on Friday, the Bank of Japan will announce its monetary policy decisions. Investors expect the BoJ to keep its policy settings, including the yield curve control strategy, unchanged.
Technical levels to watch for
- The US Dollar trades firmly in the green after making new highs.
- Several central banks from G20 nations report this Thursday.
- The US Dollar Index prints a new six-month high but fades ahead of yearly high.
The US Dollar (USD) gained in strength as US Federal Reserve (Fed) Chairman Jerome Powell delivered what was expected: a hawkish pause. The devil was in the details in the US Dot Plot (Phillips curve), where the Fed remains above 5% for the better part of 2024. In the previous forecast, the Dot Plot showed rates between 4.5% and 5%. This surprise jacked up the 2-year US Treasury yield, which peaked at a 16-year high at 5.1973%. That news fuelled a rally in the Greenback.
Expect to see more volatility pick up this Thursday as a packed calendar for the US is not the only game in town. Five G20 central banks are set to issue rate decisions on Thursday. All eyes will be on Scandinavia, Switzerland, the United Kingdom and India as the most important ones. Expect to see some interesting moves across the markets, especially in the forex crosses where rate decisions will need to be digested and demand repricing.
Daily digest: US Dollar facing outside forces
- Swedish Riksbank hiked 25 basis points as expected to 4% and saw some Swedish Krona strength rippling through in USD/SEK and EUR/SEK.
- The Swiss National Bank (SNB) kept its policy unchanged at 1.75% against the odds of hiking to 2%. The Swiss Franc gets hammered against the USD (USD/CHF) and EUR (EUR/CHF).
- The Norwegian central bank, Norges Bank, hiked as expected from 4% to 4.25%. The Norwegian Krone strengthens in USD/NOK and EUR/NOK.
- The British central bank kept its benchmark rate unchanged at 5.25%, where an increase to 5.50% was expected. Even the surprise uptick in recent inflation numbers made the BoE split over wether to hike. The knife edge vote came out at 5-4, in favor of a pause in stead of a hike. The split decision together with the unchanged stance makes the Pound Sterling fall near 0.70% against the US Dollar (GBP/USD).
- At 12:30 GMT the US calendar kicks off with Jobless Claims. Both the Continuing and Initial are expected to only marginally grind higher. The Initial is set to head from 220,000 to 225,000. The Continuing Claims are expected to head from 1,688,000 to 1,695,000 from last week.
- At that same time the Philadelphia Fed Manufacturing Survey for September will come out, from 12 to -0.7.
- Around 14:00 GMT, Existing Home Sales arrive with the previous index at -2.2%. No forecast is available for this release.
- The US Treasury at 15:30 GMT will auction a 4-week bill at a substantially higher rate after the Fed decision overnight.
- Equities are in the red across the board in a flight to safety. It makes sense that equities are on the back foot as higher rates means less money flowing into equities with funding costs rising again on the back of the US Fed rate decision.
- The CME Group FedWatch Tool shows that markets are pricing in a 68.5% chance that the Federal Reserve will keep interest rates unchanged at its meeting in November. The last rate hike is expected for either December of January 2024.
- The benchmark 10-year US Treasury yield trades at 4.4192%, which is a 15-year high. The whole US yield curve got propped up higher after the US Dot Plot revealed Fed officials see rates higher for longer in 2024.
US Dollar Index technical analysis: Will it get there?
THe US Dollar breaks higher and prints another six-month high in the US Dollar Index (DXY). No yearly high just yet though, as 105.88 remains unthreatened for now. Expect with all the other central banks hiking this Thursday, that some headwinds could emerge for the Greenback with several currency crosses being repriced.
The US Dollar Index (DXY) has edged up, reaching 105.68. Should the DXY close above the yearly high, expect the US Dollar to follow on with more bullish moves in the medium turn.
On the downside, the 104.44 level seen on August 25 kept the Index supported on Monday, halting the DXY from selling off any further. Should the uptick that started on September 12 reverse and 104.44 give way, a substantial downturn could take place to 103.04, where the 200-day Simple Moving Average (SMA) comes into play for support.
US Dollar FAQs
What is the US Dollar?
The US Dollar (USD) is the official currency of the United States of America, and the ‘de facto’ currency of a significant number of other countries where it is found in circulation alongside local notes. It is the most heavily traded currency in the world, accounting for over 88% of all global foreign exchange turnover, or an average of $6.6 trillion in transactions per day, according to data from 2022.
Following the second world war, the USD took over from the British Pound as the world’s reserve currency. For most of its history, the US Dollar was backed by Gold, until the Bretton Woods Agreement in 1971 when the Gold Standard went away.
How do the decisions of the Federal Reserve impact the US Dollar?
The most important single factor impacting on the value of the US Dollar is monetary policy, which is shaped by the Federal Reserve (Fed). The Fed has two mandates: to achieve price stability (control inflation) and foster full employment. Its primary tool to achieve these two goals is by adjusting interest rates.
When prices are rising too quickly and inflation is above the Fed’s 2% target, the Fed will raise rates, which helps the USD value. When inflation falls below 2% or the Unemployment Rate is too high, the Fed may lower interest rates, which weighs on the Greenback.
What is Quantitative Easing and how does it influence the US Dollar?
In extreme situations, the Federal Reserve can also print more Dollars and enact quantitative easing (QE). QE is the process by which the Fed substantially increases the flow of credit in a stuck financial system.
It is a non-standard policy measure used when credit has dried up because banks will not lend to each other (out of the fear of counterparty default). It is a last resort when simply lowering interest rates is unlikely to achieve the necessary result. It was the Fed’s weapon of choice to combat the credit crunch that occurred during the Great Financial Crisis in 2008. It involves the Fed printing more Dollars and using them to buy US government bonds predominantly from financial institutions. QE usually leads to a weaker US Dollar.
What is Quantitative Tightening and how does it influence the US Dollar?
Quantitative tightening (QT) is the reverse process whereby the Federal Reserve stops buying bonds from financial institutions and does not reinvest the principal from the bonds it holds maturing in new purchases. It is usually positive for the US Dollar.
- GBP/USD extends sell-off to hit a fresh six-month low, nearing the 1.2200 mark.
- Bank of England surprises by holding interest rate at 5.25% in the September meeting.
- Focus shifts to the US economic data for further trading impetus on GBP/USD.
GBP/USD sees a fresh bout of selling pressure, hitting the lowest level since March this year, as the Pound Sterling feels the heat of the dovish Bank of England (BoE) interest rate decision.
BoE pauses, hits Pound Sterling
Following the September meeting, the BoE decided to keep the benchmark interest rate steady at 5.25%, as against market expectations of a 25 basis points (bps) hike to 5.50%. However, industry experts and analysts had begun pricing chances of a status quo after the unexpected fall in the UK inflation data for August.
The Office for National Statistics (ONS) said on Wednesday that the UK annual Consumer Price Index (CPI) edged 6.7% higher in August, cooling off from a 6.8% rise in July. The market consensus was for a 7.1% increase. The Services CPI rose 6.8% YoY vs. July’s 7.4% surge. The ONS said, “the largest downward contributions to CPI rates came from food and accommodation services.”
According to the Overnight Index Swaps (OIS) curve, the odds of a 25 bps November BoE rate hike have dropped to 64% from 81% before the interest rate decision.
In the last minutes, GBP/USD is reversing the dip to multi-month lows, recovering above the 1.2250 barrier, still down 0.60% on the day.
Attention now turns toward the US economic data releases, including the weekly Jobless Claims and the Existing Home Sales for fresh US Dollar valuations, especially after the US Federal Reserve (Fed) held rates steady on Wednesday but projected one more 25 bps rate hike this year and 50 bps of rate cuts in 2024, versus 100 bps of 2024 cuts in June projections.
GBP/USD: Technical levels to watch
- EUR/GBP adds to Thursday’s gains and approaches 0.8700.
- The BoE kept its policy rate unchanged at 5.25% on Thursday.
- Next on the upside for the cross comes the 200-day SMA (0.8709).
The British pound surrenders extra ground and lifts EUR/GBP to new two-month tops just below 0.8700 the figure on Thursday.
EUR/GBP up on BoE surprise
The cross gathers extra steam following the strong selling pressure around the sterling, all after the BoE caught markets off guard and kept its policy rate unchanged at 5.25% at its meeting vs. expectations for a 25 bps rate hike.
From the bank’s statement, further tightening might be required in case inflation persists. Additionally, the bank revises lower its GDP forecast and sees the economy expanding 0.1% in Q3 (from 0.4%).
In addition, the decision to maintain the policy rate at 5.25% was supported by MPC members Bailey, Broadbent, Dhingra, Pill and Ramsden, while their colleagues Cunliffe, Haskel and Mann favoured a 25 bps rate hike.
EUR/GBP key levels
The cross is gaining 0.54% at 0.8682 and faces the next hurdle at 0.8700 (monthly high July 19) seconded by 0.8709 (200-day SMA) and then 0.8875 (monthly high April 25). On the other hand, the breakdown of 0.8586 (55-day SMA) would expose 0.8523 (monthly low September 5) and finally 0.8492 (2023 low August 23).
The BoE’s latest policy update today is unlikely to soften downward pressure on Cable, economists at MUFG Bank report.
Any relief rally would likely prove short-lived
There is little in the way of technical support now until closer to the 1.2000 level which leaves the Pound vulnerable to further weakness after today’s MPC meeting.
Even if the BoE delivers one final hike today, any relief rally would likely prove short-lived as we expect the BoE’s updated guidance to signal that it is close to or at the end of their hiking cycle and they now favour leaving rates at higher levels for longer in order to bring inflation back to target.
- Natural Gas is up 0.90% as gas demand from Pakistan is expected to pick up.
- The US Dollar strengthens, though it faces headwinds from other central bank decisions on Thursday.
- US Natural Gas prices are in an ascending trend line formation and could break above $3.
Natural Gas prices are grinding higher again in a choppy week with several positive and negative headlines guiding gas prices. The biggest headline on Thursday is Pakistan hitting gas markets in search of LNG as its domestic gas production dwindles. If this trend persists, Pakistan’s demand could triple in five years.
The US Dollar (USD) gained strength as the US Federal Reserve (Fed) delivered what was expected: a hawkish pause. The devil was in the details in the Dot Plot, in which the Fed is anticipated to hold rates above 5% for the most part of 2024. In the previous forecast, the Dot Plot showed rates between 4.5% and 5%. This surprise jacked up the 2-year US Treasury yield, which peaked at a 16-year high at 5.1973%. The news fuelled a rally in the Greenback.
Natural Gas is trading at $2.955 per MMBtu at the time of writing.
Natural Gas news and market movers
- The Energy Information Administration (EIA) is set to deliver the weekly gas storage changes at 14:30 GMT. Another build is expected from 57 billion to 67 billion.
- China is set to launch new LNG Futures contracts later this year. The proposed sizes per contract will be 20 tons and limits are in place with a maximum of 8% fluctuations from the previous day’s settlement. China is seeking more influence in the gas market by setting Asian gas prices.
- The demand side could be in for a big newcomer to the market as Pakistan sees its local gas production slowing down from 6 billion cubic feet per day to 3.8 billion cubic feet. Local demand is expected to remain unchanged, so Pakistan will need to buy its gas abroad. This means that Pakistan could triple its demand on the market in the coming five years.
- The Norwegian Troll Fields supply is coming back online after repeated and prolonged delays.
- Germany is due to hold tests on Thursday to see if it would be able to make it through the winter in case of gas shortages.
- Headlines suggest that Chevron and the unions are nearing a deal to end local shutdowns in Australia. . Chevron Union workers are expected to follow the recommendations from the Fair Work Commission, the country’s workplace relations tribunal.
Natural Gas Technical Analysis: bullish triangle chart
Natural Gas appears to be in a bullish triangle with on the top side a triple top at $3.06 on the daily chart. Meanwhile, higher lows are being formed with the green ascending trend line showing support since the beginning of September. Expect to see a breakout above $3.06, which means natural gas prices are set to jump higher.
Awaiting the breakout of the triangle, $3 remains a key level that needs to be broken. Seeing the current equilibrium, a catalyst is needed to move the needle upwards. Gas prices could rally to $3.25 in the bullish triangle breakout, testing the upper band of the ascending trend channel.
On the downside, the ascending trend line at $2.90 should support any attempts to break lower. The 200-day Simple Moving Average (SMA) at $2.80 could act as circuit breaker in case there is a nosedive move. Should that give way on a downside move, some area will be crossed before the next support kicks in at $2.75. This level aligns with the 55-day SMA, which is likely to step in to avoid any nosedive moves in the commodity.
-638308886511342891.png)
XNG/USD (Daily Chart)
Natural Gas FAQs
What fundamental factors drive the price of Natural Gas?
Supply and demand dynamics are a key factor influencing Natural Gas prices, and are themselves influenced by global economic growth, industrial activity, population growth, production levels, and inventories. The weather impacts Natural Gas prices because more Gas is used during cold winters and hot summers for heating and cooling. Competition from other energy sources impacts prices as consumers may switch to cheaper sources. Geopolitical events are factors as exemplified by the war in Ukraine. Government policies relating to extraction, transportation, and environmental issues also impact prices.
What are the main macroeconomic releases that impact on Natural Gas Prices?
The main economic release influencing Natural Gas prices is the weekly inventory bulletin from the Energy Information Administration (EIA), a US government agency that produces US gas market data. The EIA Gas bulletin usually comes out on Thursday at 14:30 GMT, a day after the EIA publishes its weekly Oil bulletin. Economic data from large consumers of Natural Gas can impact supply and demand, the largest of which include China, Germany and Japan. Natural Gas is primarily priced and traded in US Dollars, thus economic releases impacting the US Dollar are also factors.
How does the US Dollar influence Natural Gas prices?
The US Dollar is the world’s reserve currency and most commodities, including Natural Gas are priced and traded on international markets in US Dollars. As such, the value of the US Dollar is a factor in the price of Natural Gas, because if the Dollar strengthens it means less Dollars are required to buy the same volume of Gas (the price falls), and vice versa if USD strengthens.
GBP/JPY is at intermittent support of 182 representing the trend line drawn since May. Economists at Société Générale analyze the pair’s outlook.
Recent pivot high at 184.20 is near term hurdle
Daily MACD has dipped below the equilibrium line denoting prevalence of steady downward momentum.
In case the pair fails to defend support at 182, the phase of decline could extend. Next potential objectives could be at 180.30 and July low of 176.30.
Recent pivot high at 184.20 is near term hurdle.
Riksbank’s half-hawkish hike leaves the Krona vulnerable, economists at ING report.
12.00+ risk remains on the table in the short-term
We want to stress this was a missed chance for the Riksbank to materially lift SEK. The new rate forecasts suggest another hike is not particularly likely, but markets still see good chances of that being delivered. Once again, EUR/SEK is left to be driven by external factors, at least until key Swedish data are released. This isn’t great news for SEK in the near term.
Another jump to 12.00 is absolutely possible, and breaking above that level is also a very tangible risk given global risk instability and Swedish data volatility.
We agree with the Riksbank that the shockingly undervalued Krona will ultimately appreciate and that hedging FX reserves is a good idea. We still think that our 11.00 EUR/SEK target for the second half of next year can be reached. However, the Riksbank missed another opportunity to insulate SEK from more short-term pain.
The Swiss Franc has understandably weakened after the surprise hold in the policy rate. Economists at ING analyze CHF outlook.
Temporary setback for the Swiss Franc
The SNB surprised today by deciding to keep its key rate at 1.75%, whereas the consensus was for it to rise by 25 bps to 2%. However, the SNB has said that it will still be using the exchange rate to "provide appropriate monetary conditions" and to do this will likely continue to sell FX.
Looking ahead, the strong Dollar environment – keeping USD/CHF bid – means that the SNB will have to manage EUR/CHF lower to get the nominal CHF appreciation it needs. That is why we suspect that any near-term spike in EUR/CHF is not sustained and that as long as the SNB is leaning hawkish, levels near 0.9500 and possibly a little below are likely later this year.
Kit Juckes, Chief Global FX Strategist at Société Générale, analyzes today’s rate decision in the UK.
Rate hike not enough to prevent a break of GBP/USD 1.20 in due course
A 25 bps hike would be justified on the grounds that softer inflation will be too little to offset the strength of wage growth and the tightness of the labour market.
GBP might get a bit of relief if rates do rise, but not enough to prevent a break of GBP/USD 1.20 in due course.
See – BoE Preview: Forecasts from 10 major banks, the final hike?
Norges Bank decided to up the ante again and not only increased the key rate by 25 bps to 4.25% but also signalled one more rate hike before the end of this year. However, the NOK is fairly unchanged after the message. Economists at Nordea analyze Krone’s outlook.
Another hike is not a given
Norges Bank increased the key rate as expected and somewhat unexpectedly signaled a new hike in December.
We are not buying Norges Bank’s CPI estimates for next year and believe that a hike in December is not cut in stone.
The hawkish signals from Norges Bank are probably in an effort to support the NOK and curtail further weakening. If Norges Bank does not hike in December, as we think is a fair possibility, the NOK is vulnerable.
A hawkish hold from the Fed has seen the US yield curve shift 15 bps higher and the Dollar strengthen. Economists at ING analyze Greenback’s outlook.
DXY to grind up to 106
This hawkish hold may well keep the Dollar bid into October and it will have to be softer US activity data – particularly a rise in jobless claims or a decline in consumer confidence and retail sales – which will be required to soften up the Dollar. Dollar bears will get no joy from the Fed.
With US yields firm and US rate volatility sinking again, USD/JPY will be on the front line of this period of Dollar strength. Expect to hear more verbal intervention from Tokyo and we suspect the trigger will be pulled on the approach to 150.
Expect DXY to grind up to 106.
- USD/TRY trades above 27.00 due to the Fed’s hawkish stance regarding the interest rate trajectory.
- Momentum indicators suggest that bullish sentiment prevails in the market.
- The pair could find the key resistance around the monthly high at 27.75.
USD/TRY holds ground above the 27.00 psychological level aligned to the immediate support level of 38.2% Fibonacci retracement at 26.82 during the European session on Thursday.
A firm break below the latter could exert pressure on the USD/TRY pair to navigate the region around the 50-day Exponential Moving Average (EMA) at 26.38, followed by the 61.8% Fibonacci retracement at 26.24 aligned to the 26.00 psychological level.
The US Dollar (USD) is receiving upward support against the Turkish Lira (TRY) as a result of the US Federal Reserve's (Fed) hawkish stance regarding the trajectory of interest rates. This is attributed to the robust economic growth and inflationary pressures in the United States (US).
On the upside, the USD/TRY pair could face a challenge around the monthly high at 27.75, followed by August’s high at 27.88 level.
The Moving Average Convergence Divergence (MACD) line remains above the centerline and the signal line. This configuration suggests that the momentum in the underlying asset's price is relatively strong.
However, the momentum in the pair indicates that bullish sentiment prevails in the market as the 14-day Relative Strength Index (RSI) remains above the 50 level.
USD/TRY: Daily Chart
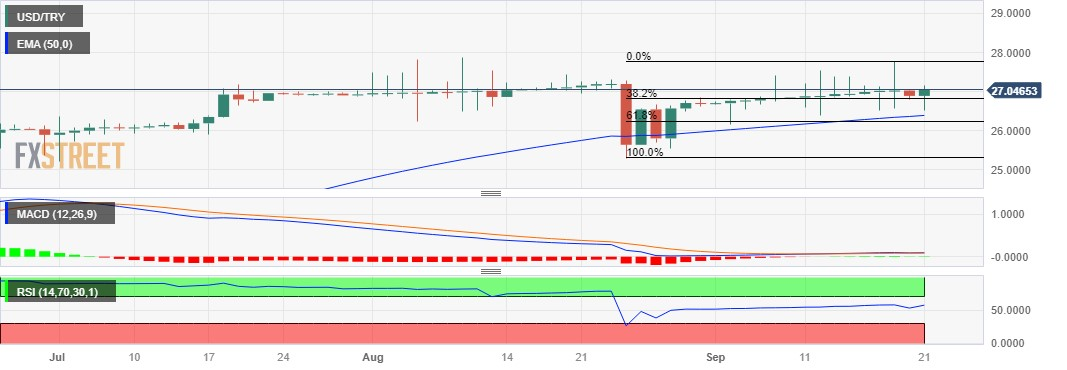
Gold pared those gains after the Fed left rates unchanged but signalled they will stay higher for longer than expected. Strategists at ANZ Bank analyze the yellow metal’s outlook.
Investment demand remains lacklustre
Gold’s macroeconomic backdrop looks a bit uncertain after the US Fed hinted at another rate rise this year though kept rates steady in the latest meeting. We expect shifting expectations around its terminal rate could cap the upside in the near term.
Investment demand remains lacklustre, as investors wait for the Fed to end its tightening cycle.
- Silver reverses an intraday dip to the $23.00 neighbourhood, albeit lacks follow-through.
- The technical setup warrants caution for bulls and before positioning for any further gains.
- Weakness below $23.00 will expose an ascending trend-line support or the monthly low.
Silver attracts some dip-buying in the vicinity of the $23.00 mark on Thursday and climbs to the top end of its intraday trading range during the first half of the European session. The white metal is currently placed around the $23.25 region and for now, seems to have stalled its retracement slide from the $23.60 area, or a two-week high touched on Wednesday.
The lack of follow-through, however, warrants some caution for the XAG/USD bulls, against the backdrop of the previous day's failure to find acceptance above a technically significant 200-day Simple Moving Average (SMA). Moreover, oscillators on the daily chart – though have been recovering from lower levels – are still holding in the negative territory. Hence, it will be prudent to wait for some follow-through buying beyond the overnight swing high, around the $23.60 region, before positioning for any further appreciating move.
The XAG/USD might then aim to surpass the 100-day SMA and accelerate the momentum towards reclaiming the $24.00 round-figure mark. The next relevant hurdle is pegged near the $24.30-$24.35 region, which if cleared decisively should pave the way for a move towards the $25.00 psychological mark.
The latter coincides with the August monthly swing high and is followed by the July peak, around the $25.25 region, which if cleared will set the stage for the recent bounce from an ascending trend line extending from the June swing low.
On the flip side, the $23.00 mark might continue to protect the immediate downside. Any further slide below the weekly trough, around the $22.95 region, could find decent support near the $22.30 region, or a nearly one-month low touched last Thursday. A convincing break below the said support levels will confirm a fresh breakdown and make the XAG/USD vulnerable. The white metal could then accelerate the downward trajectory towards the next relevant support near the $21.25 zone before eventually dropping to the $21.00 round figure.
Silver daily chart
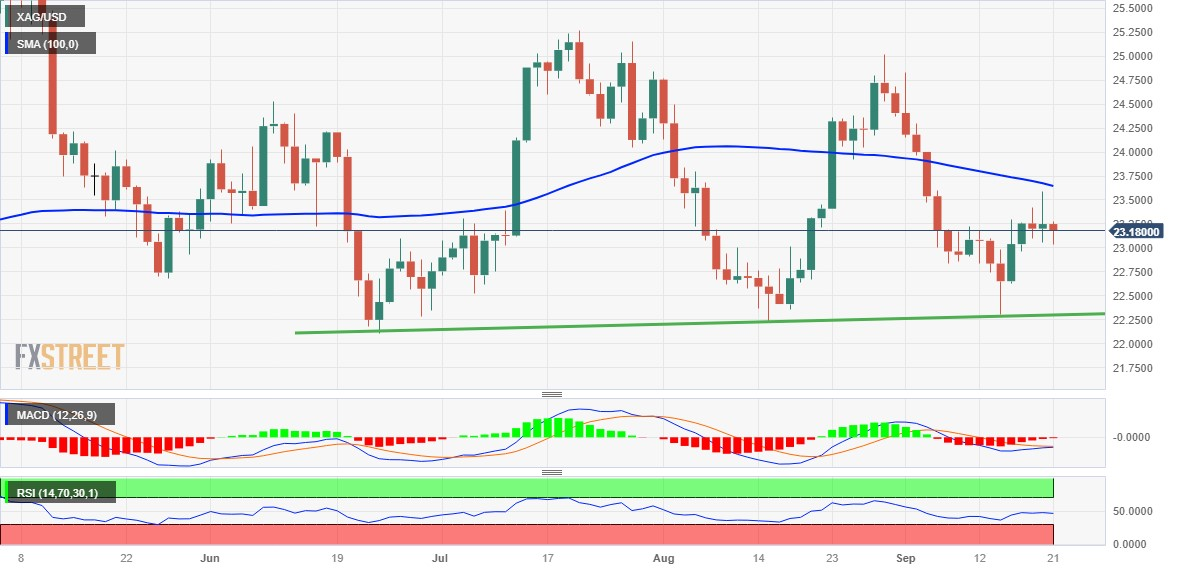
Technical levels to watch
The dramatic repricing of the Bank of England tightening cycle has taken its toll on Sterling over recent weeks. Economists at ING analyze GBP outlook ahead of the Interest Rate Decision.
EUR/GBP would test the July high at 0.87 were the BoE to surprise with a pause
The market now only prices a 47% chance of a 25 bps rate hike today. The BoE may not be swayed by some of the volatile factors that drove CPI lower in August and instead, continued high wage growth may be the swing factor that sees it deliver a 25 bps hike after all. That is ING's call.
A hike would provide GBP/USD with some much-needed support. If not the path to 1.2100 would be open. Equally, EUR/GBP would test the July high at 0.87 were the BoE to surprise with a pause.
European Central Bank (ECB) policymaker and Bundesbank Chief Joachim Nagel commented on the interest rate outlook during his scheduled appearance on Thursday.
Nagel said that “rates must stay sufficiently high for sufficiently long.”
Market reaction
At the time of writing, EUR/USD is trading near 1.0660, attempting recovery from six-month lows, modestly flat on the day.
Swiss National Bank (SNB) Chairman Thomas Jordan is speaking at the post-policy meeting press conference on Thursday. The central bank raised rates by 25 basis points (bps) to 2.0% in the September quarter, as widely expected.
Key takeaways
The battle against inflation is not yet over.
We will decide in December whether further tightening is needed or not.
Given comfortable level of swiss inflation, the best solution was to wait and see what happens over next 3 months.
Clear focus is on price stability, uncertainty at the moment relatively high.
We don't have the goal of reducing the balance sheet.
We have had nominal overvaluation of the franc, that has contributed to lower inflation in Switzerland.
We not reacting to the weakning in the economy, but to lower inflation.
Related reads
- USD/CHF spikes to mid-0.9000s, highest since June 13 in reaction to SNB’s unexpected pause
- SNB’s Jordan: Further tightening of monetary policy cannot be ruled out
EUR/USD fell in the aftermath of the Fed’s hawkish outcome. Economists at OCBC Bank analyze the pair’s outlook.
Downside risks ahead
Mild bearish momentum on the daily chart intact while the Relative Strength Index (RSI) fell towards near oversold conditions. Downside risks ahead.
Support at 1.0630, 1.06 levels. A break could bring the EUR/USD pair back down to the year-low of 1.0510 levels.
Resistance at 1.0750 (21-Day Moving Average), 1.0830 levels (200-DMA).
See – EUR/USD: 1.0600/1.0610 looks like the last line of support before 1.0500 – ING
- NZD/USD struggles to capitalize on its modest uptick led by the upbeat New Zealand GDP data.
- The Fed’s hawkish outlook, rising US bond yields continue to underpin the USD and cap gains.
- A softer risk tone also benefits the safe-haven USD and supports prospects for deeper losses.
The NZD/USD pair attracts fresh sellers following an intraday uptick to mid-0.5900s and drops to a fresh daily low during the early part of the European session on Thursday. Spot prices, however, manage to defend the 0.5900 round figure, though the fundamental backdrop supports prospects for an extension of the retracement slide from a nearly three-week high, around the 0.5985 region touched on Wednesday.
The New Zealand Dollar (NZD) did get a minor lift earlier today in reaction to the better-than-expected domestic data, showing that the economy expanded by 0.9% in the June quarter. Adding to this, the first quarter reading was also revised higher to 0.0% from a 0.1% contraction reported originally. The NZD/USD pair, however, struggles to attract any meaningful buying and the intraday uptick runs out of steam rather quickly in the wake of some follow-through US Dollar (USD) buying, bolstered by the Federal Reserve's (Fed) hawkish stance.
As was widely anticipated, the US central bank decided to keep interest rates unchanged at a 22-year high, though warned that sticky inflation was likely to attract at least one more interest rate hike in 2023. Furthermore, policymakers maintained the forecast for rates to peak between 5.5%-5.75% by the end of this year and see the benchmark rate at 5.1% next year, suggesting just two rate cuts in 2024 as compared to four projected previously. This remains supportive of rising US Treasury bond yields and lifts the USD back closer to a six-month top.
In fact, the yield on the rate-sensitive two-year US government bond rallies to its highest level since July 2006 and the benchmark 10-year US Treasury yield touches a 16-year peak. This revives concerns about headwinds stemming from rapidly rising borrowing costs and weighs on investors' sentiment. This is evident from a weaker tone around the equity markets, which should benefit the safe-haven buck and contribute to driving flows away from the risk-sensitive Kiwi, validating the negative outlook for the NZD/USD pair.
That said, a modest intraday USD pullback assists spot prices to defend the 0.5900 mark. Market participants now look to the US economic docket – featuring the release of the usual Weekly Initial Jobless Claims, the Philly Fed Manufacturing Index and Existing Home Sales data later during the early North American session. This, along with the US bond yields and the broader risk sentiment, might influence the USD price dynamics and produce short-term trading opportunities around the NZD/USD pair.
Technical levels to watch
Speaking at the Reuters Global Markets Forum on Thursday, European Central Bank policymaker Martins Kazaks said that he is “quite satisfied where rates stand now.”
Additional quotes
Will take decisions meeting by meeting.
Rates will need to remain restrictive for quite a while.
Energy price rise does create upside risk to inflation.
Recent energy price rise is structural, not a short term transitory rise.
Given the current outlook, mid 2024 rate cut expectations are too early.
Need to start cutting rates when inflation forecast consistently undershooting target.
APP sales, end of PEPP reinvestments should be discussed before rate cuts.
Market reaction
EUR/USD was last seen trading at 1.0658, almost unchanged on the day.
Swiss National Bank (SNB) Vice Chairman Martin Schlegel said on Thursday, the SNB will expand ways for making liquidity available to banks.
Further comments
SNB expects banks involved in mortgage lending to take part in the initiative.
SNB to provide liquidity against mortgages as collateral to all banks in Switzerland, not just systemically important banks.
This will benefit not only the participating banks but also Switzerland as a whole.
A bank must transfer mortgages to snb to obtain liquidity using mortgages as collateral.
Related reads
- SNB unexpectedly leaves Deposit Rate unchanged at 1.75%
- SNB’s Jordan: Further tightening of monetary policy cannot be ruled out
Swiss National Bank (SNB) Chairman Thomas Jordan is speaking at the post-policy meeting press conference on Thursday. The central bank held key rates at 1.75% in the September quarter.
Key takeaways
Significant tightening of monetary policy recently is countering inflationary pressure.
Swiss inflation has returned to range of price stability.
Further tightening of monetary policy cannot be ruled out.
There is some uncertainty about impact of monetary tightening already carried out.
Although inflation is likely to increase again, underlying pressure has decreased slightly.
Focus remains on maintaining price stability.
Situation allows us to wait for now and review later.
Will not hesitate to tighten policy again to keep inflation below 2%.
Market reaction
USD/CHF is off the multi-month highs of 0.9070, gaining 0.70% on the day to trade at 0.9050, as of writing.
- The Euro remains offered against the US Dollar in the wake of the Fed event.
- Stocks in Europe started Thursday session deep in the red.
- EUR/USD rebounds from the vicinity of 1.0615.
- The USD Index (DXY) reaches new highs.
- The Fed left the door open to another 25 bps rate hike before year-end.
- Weekly Initial Jobless Claims, Philly Fed Index will take centre stage in the US calendar.
- ECB President Christine Lagarde speaks later in the session.
Following an early dop to fresh multi-month lows, the Euro (EUR) manages to trim part of the losses against the US Dollar (USD), prompting EUR/USD to regain the 1.0650 region in Europe's opening bell on Thursday.
The Greenback extends its march north as investors keep digesting the Federal Reserve (Fed) event, reaching a new six-month high near 105.70 when measured by the USD Index (DXY). The index trades just a few pips away from the year-to-date top of around 105.90 seen on March 8.
The pullback in the pair comes in tandem with some corrective moves in the short end of the US yield curve against humble gains in the belly and the long end. Meanwhile, the 10-year bund yields regain the area of recent peaks near 2.75%.
Following the hawkish hold by the Fed at its meeting on Wednesday, Chairman Jerome Powell emphasized that there is still a significant journey ahead in achieving the target inflation rate of 2%. Additionally, he stated that the FOMC decided to maintain the current interest rates in light of the progress made thus far but remains prepared to raise rates when deemed suitable.
In the eurozone's economic calendar, the preliminary reading of Consumer Confidence tracked by the European Commission is due, along with a speech by the ECB President Christine Lagarde.
In the US, usual weekly Initial Jobless Claims are due, followed by the Philly Fed Manufacturing Index, the CB Leading Economic Index and Existing Home Sales.
Daily digest market movers: Euro drops to new lows near 1.0600
- The EUR rebounds from fresh lows against the USD.
- US and German yields advance marginally on Thursday.
- The Fed left the door open to another 25 bps rate raise in the next months.
- The BoE is expected to hike rates by 25 bps.
- Markets price in probable rate cuts by the Fed in Q3 2024.
- An impasse in the ECB’s hiking cycle appears to be gathering traction.
- Intervention fears surround the price action around USD/JPY.
Technical Analysis: Euro opens door to drop toward 1.0516
EUR/USD kicks off Thursday’s session with marked losses and reaches new lows in the 1.0620-1.0615 band.
If the EUR/USD breaches its September 14 low of 1.0616, there is a chance it could revisit the March 15 low of 1.0516 before reaching the 2023 bottom of 1.0481 from January 6.
On the upside, there is a minor resistance level at the weekly high of 1.0767 from September 12, followed by the more significant 200-day Simple Moving Average (SMA) at 1.0828. If the pair manages to break above this level, it could pave the way for a continued recovery towards the temporary 55-day SMA at 1.0911, with the possibility of reaching the August 30 top of 1.0945. Surpassing the latter could bring the psychological level of 1.1000 into focus, followed by the August 10 peak of 1.1064. Beyond that, the pair might retest the July 27 high at 1.1149 and potentially reach the 2023 top at 1.1275 from July 18.
As long as the EUR/USD remains below the 200-day SMA, there is a chance that the pair will continue to face downward pressure.
Euro FAQs
What is the Euro?
The Euro is the currency for the 20 European Union countries that belong to the Eurozone. It is the second most heavily traded currency in the world behind the US Dollar. In 2022, it accounted for 31% of all foreign exchange transactions, with an average daily turnover of over $2.2 trillion a day.
EUR/USD is the most heavily traded currency pair in the world, accounting for an estimated 30% off all transactions, followed by EUR/JPY (4%), EUR/GBP (3%) and EUR/AUD (2%).
What is the ECB and how does it impact the Euro?
The European Central Bank (ECB) in Frankfurt, Germany, is the reserve bank for the Eurozone. The ECB sets interest rates and manages monetary policy.
The ECB’s primary mandate is to maintain price stability, which means either controlling inflation or stimulating growth. Its primary tool is the raising or lowering of interest rates. Relatively high interest rates – or the expectation of higher rates – will usually benefit the Euro and vice versa.
The ECB Governing Council makes monetary policy decisions at meetings held eight times a year. Decisions are made by heads of the Eurozone national banks and six permanent members, including the President of the ECB, Christine Lagarde.
How does inflation data impact the value of the Euro?
Eurozone inflation data, measured by the Harmonized Index of Consumer Prices (HICP), is an important econometric for the Euro. If inflation rises more than expected, especially if above the ECB’s 2% target, it obliges the ECB to raise interest rates to bring it back under control.
Relatively high interest rates compared to its counterparts will usually benefit the Euro, as it makes the region more attractive as a place for global investors to park their money.
How does economic data influence the value of the Euro?
Data releases gauge the health of the economy and can impact on the Euro. Indicators such as GDP, Manufacturing and Services PMIs, employment, and consumer sentiment surveys can all influence the direction of the single currency.
A strong economy is good for the Euro. Not only does it attract more foreign investment but it may encourage the ECB to put up interest rates, which will directly strengthen the Euro. Otherwise, if economic data is weak, the Euro is likely to fall.
Economic data for the four largest economies in the euro area (Germany, France, Italy and Spain) are especially significant, as they account for 75% of the Eurozone’s economy.
How does the Trade Balance impact the Euro?
Another significant data release for the Euro is the Trade Balance. This indicator measures the difference between what a country earns from its exports and what it spends on imports over a given period.
If a country produces highly sought after exports then its currency will gain in value purely from the extra demand created from foreign buyers seeking to purchase these goods. Therefore, a positive net Trade Balance strengthens a currency and vice versa for a negative balance.
- AUD/USD holds ground above 0.6400 post losses after Fed day.
- Investors await S&P Global PMIs from both nations, seeking valuable insights into the health of both economies.
- Market speculation on RBA to end the rate-hike cycle exerts pressure on the Aussie pair.
AUD/USD extends the losses on the second day, trading sideways around 0.6410 during the European session on Thursday. The US Federal Reserve’s (Fed) hawkish stance on interest rates trajectory exerts pressure on the pair.
However, Investors’ attention has been shifted towards the upcoming economic data from the United States (US) and Australia. These data include the US weekly Initial Jobless Claims, the Philadelphia Fed Manufacturing Survey, and the change in Existing Home Sales due for Thursday.
On Friday, preliminary S&P Global PMIs from both countries will be eyed. These reports can provide valuable insights into the health of both economies, which are all important factors influencing trading strategies regarding the AUD/USD pair.
The Australian Dollar (AUD) is affected by China's cautious approach to implementing additional stimulus measures during periods of economic uncertainty. China is a significant trading partner of Australia, and its economic conditions can have a substantial impact on the Australian economy and, by extension, the value of the AUD against the Greenback.
Additionally, market speculations that the Reserve Bank of Australia (RBA) may have concluded its cycle of interest rate hikes, which contributes support to the prevailing bearish sentiment surrounding the Aussie pair.
The Federal Reserve chose to maintain the current benchmark policy rates at 5.5% during the meeting held on Wednesday. Furthermore, market participants expect that the central bank will pursue an additional rate hike in 2023, following the Federal Open Market Committee's (FOMC) projection of slightly higher inflation compared to its previous forecasts.
Consequently, Federal Reserve officials unexpectedly adjusted their projected interest rates for 2024, increasing them from 4.6% to 5.1%. This adjustment played a significant role in bolstering the strength of the buck.
The US Dollar Index (DXY), which gauges the Greenback's performance against six other major currencies, has extended its gains and is trading at a six-month high of around 105.50.
Moreover, the surge in US Treasury yields has contributed to the US Dollar's strength. The yield on the 10-year US Treasury note stands at 4.41% by the press time, marking the highest level since 2007.
During a press conference held immediately after the rate decision on Wednesday, Federal Reserve Chair Jerome Powell reiterated the Fed's commitment to achieving its long-term inflation target of 2%. Powell also suggested that the central bank is likely approaching the peak of its interest rate hike cycle, but he emphasized that future policy decisions would continue to rely on data-driven analysis.
EUR/USD took its time, but ultimately the Fed's hawkish message resonated with the US yield curve and EUR/USD slumped back to the recent lows. Economists at ING analyze the pair’s outlook.
Looking vulnerable
Until this late cycle Dollar strength breaks, EUR/USD remains vulnerable – especially since it does not enjoy any support from extreme undervaluation according to our medium-term fair value models.
1.0600/1.0610 looks like the last line of support before 1.0500, which could be the direction of travel should the Bank of England (BoE) fail to hike today and GBP/USD break sharply lower.
On the calendar today is the European Central Bank's Isabel Schnabel, who will surely market the risks of another ECB rate hike. However, Friday sees the release of flash European PMIs for September, another negative event risk for the Euro.
The Bank of England (BoE) is holding its monetary policy meeting today. Economists at Commerzbank analyze GBP ahead of the Interest Rate Decision.
BoE could hint that interest rates have now peaked
The BoE has often seemed hesitant over the past months and has ultimately only reacted to inflationary pressures. It is therefore quite possible that it will announce a surprise rate pause while keeping the possibility of a rate step later in the year open. However, we assume that the BoE is more likely to take another rate step while at the same time sounding more dovish. It could for example hint that interest rates have now peaked.
If inflation then turns out to be more stubborn after all, Sterling would come under pressure again.
See – BoE Preview: Forecasts from 10 major banks, the final hike?
- USD/CHF prolongs its recent upward trajectory and jumps to a fresh multi-month peak on Thursday.
- The SNB defies expectations and leaves its key rate unchanged, which weighs heavily on the CHF.
- The hawkish Fed-inspired follow-through USD rally remains supportive of the strong intraday move.
The USD/CHF pair catches aggressive bids during the early part of the European session on Thursday and rallies to its highest level since mid-June after the Swiss National Bank (SNB) announced its policy decision. Spot prices currently trade around mid-0.9000s, with bulls now looking to build on the momentum further beyond a technically significant 200-day Simple Moving Average (SMA) before placing fresh bets.
The Swiss Franc (CHF) weakens across the board after the SNB decided to leave the key policy rate unchanged at 1.75%, defying expectations for one final 25 bps in September. In the accompanying policy statement, the central bank stated that significant tightening of policy in recent quarters is countering remaining inflationary pressure, suggesting that the rate-hiking cycles might be over. This, along with the underlying bullish sentiment surrounding the US Dollar (USD) continues to act as a tailwind for the USD/CHF pair.
In fact, the USD Index (DXY), which tracks the Greenback against a basket of currencies, climbs back closer to a six-month peak and continues to push the USD/CHF pair higher. On Wednesday, the Federal Reserve (Fed) decided to keep interest rates unchanged at a 22-year high, between 5.25%-5.5%, though warned that sticky inflation was likely to attract at least one more interest rate hike in 2023. Furthermore, policymakers now see the benchmark rate at 5.1% next year, suggesting just two rate cuts in 2024 as compared to four projected previously.
This, in turn, reaffirms the higher-for-longer narrative and continues to push the US Treasury bond yields higher. In fact, the yield on the rate-sensitive two-year US government bond has touched its highest level since July 2006. Moreover, the benchmark 10-year Treasury yield rallies to a 16-year peak, which continues to underpin the Greenback and assists the USD/CHF pair to prolong its strong upward trajectory witnessed over the past two months or so. That said, a softer risk tone could benefit the safe-haven CHF and keep a lid on any further gains.
Market participants now look to the US economic docket – featuring the release of the usual Weekly Initial Jobless Claims, the Philly Fed Manufacturing Index and Existing Home Sales data later during the early North American session. This, along with the US bond yields, should influence the USD price dynamics and provide some impetus to the USD/CHF pair. Traders will further take cues from the broader risk sentiment to grab short-term opportunities. The fundamental backdrop, meanwhile, suggests that the path of least resistance remains up.
Technical levels to watch
At its quarterly monetary policy assessment on September 21, the Swiss National Bank (SNB) kept the benchmark Sight Deposit Rate on hold at 1.75%.
The rate decision was against the market expectations of a 25 basis points (bps) rate hike to 2.0%.
Summary of the statement
The significant tightening of monetary policy over recent quarters is countering remaining inflationary pressure.
From today’s perspective, it cannot be ruled out that a further tightening of monetary policy may become necessary to ensure price stability over the medium term.
It cannot be ruled out that additional interest rate hikes will be necessary.
Will remain active in foreign exchange markets as necessary.
Will therefore monitor the development of inflation closely in the coming months.
To provide appropriate monetary conditions, the SNB is also willing to be active in the foreignexchange market as necessary.
Foreign currency sales in focus.
In the current environment, the focus is on selling foreign currency.
The forecast for Switzerland, as for the global economy, is subject to high uncertainty.
Inflation has declined further in recent months, and stood at 1.6% in August.
The main risk is a more pronounced economic slowdown abroad.
This decreasewas above all attributable to lower inflation on imported goods and services.
Growth is expected to remain weak for the rest of the year.
New conditional inflation forecast is based on the assumption that the SNB policy rate is 1.75% over the entire forecast horizon.
In this environment, unemployment will probably continue to rise slightly, and the utilisation of production capacity is likely to decline somewhat.
In the medium term, the new forecast issomewhat below that of June, mainly due to the economic slowdown and slightly lowerinflationary pressure from abroad
Global economic growth was moderate in the second quarter of this year.
The growth outlook for the global economy in the coming quarters remains subdued.
Although inflation continued to decline in many countries, it remains clearly above the respective targets.
Against this background, numerous central banks tightened their monetary policy furtherduring the last quarter, albeit at a slower pace than in the previous quarters
At the same time, inflation is likely to remain elevated worldwide for the time being.
Over the medium term, however, it should return to more moderate levels, not least due to more restrictive monetary policy.
A pronounced slowdown in the global economy therefore cannot be ruled out.
Momentum on the mortgage and real estate markets has weakened noticeably in recent quarters. However, the vulnerabilities in these markets remain.
Market reaction
In a knee-jerk reaction to the SNB rate hike pause decision, the USD/CHF pair jumped to fresh three-month highs at 0.9059, up 0.69% on the day.
About SNB Rate Decision
The Swiss National Bank conducts the country’s monetary policy as an independent central bank. It is obliged by the Constitution and by statute to act in accordance with the interests of the country as a whole. Its primary goal is to ensure price stability, while taking due account of economic developments. In so doing, it creates an appropriate environment for economic growth.
USD/CNH is now predicted to navigate within the 7.2800-7.3400 range in the next few weeks, argue Economist Lee Sue Ann and Markets Strategist Quek Ser Leang at UOB Group.
Key Quotes
24-hour view: Yesterday, we expected USD to trade in a range between 7.2850 and 7.3150. USD then trade in a range of 7.2895/7.3160. In early Asian trade today, USD traded on strong note, and it is likely to rise further. That said, it is unlikely to reach the major resistance at 7.3400. In order to keep the momentum going, USD must not break below 7.2950 (minor support is at 7.3050).
Next 1-3 weeks: We noted yesterday (20 Sep, spot at 7.3030) that “downward momentum has slowed.” We indicated that “if USD breaks above 7.3150, it would indicate that 7.2390 is not coming into view this time around.” USD broke above 7.3150 in NY trade. The price action suggests the downward pressure that started early last week has faded. From here, USD is likely to trade in a range, probably between 7.2800 and 7.3400.
Considering advanced readings from CME Group for natural gas futures markets, open interest went up by around 5.1K contracts after two consecutive daily pullbacks on Wednesday. In the same line, volume rose by around 18K contracts, reversing two consecutive daily builds.
Natural Gas: Immediate support comes at $2.60
Wednesday’s downtick in prices of natural gas was on the back of rising open interest, which suggests that extra downside appears likely in the very near term. In the meantime, the weekly low around the $2.60 region per MMBtu (September 18) initially emerges as an interim support for the time being.
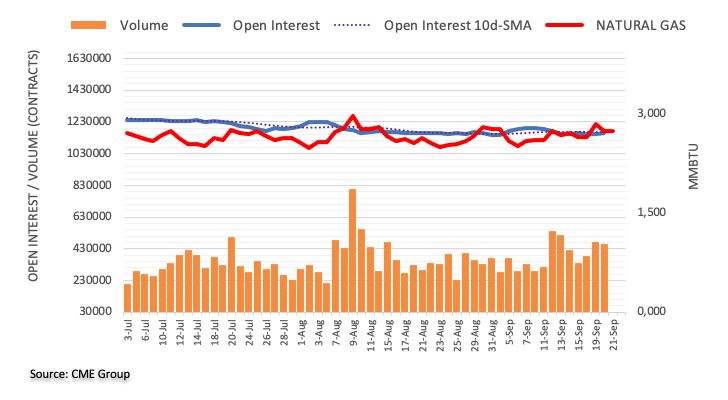
Norges Bank is widely expected to raise rates by 25 bps. Economists at ING analyze NOK outlook ahead of the Interest Rate Decision.
NOK could receive some short-term support, but a longer recovery relies on external drivers
Norges Bank is widely expected to hike by 25 bps, in line with its August guidance. We don’t think policymakers will pre-commit to a November hike. However, there are good chances they will at least signal the risk of another rate increase via a revision of the rate projections.
The outcome should be broadly supportive for NOK, but we still think the Krone will respond primarily to US activity data and the general market environment moving ahead.
In the near term, the 11.50 level in EUR/NOK may continue to be the gravity level.
Swiss National Bank (SNB) meets today. Economists at ING analyze EUR/CHF ahead of the Interest Rate Decision.
SNB to hike the policy rate by 25 bps
A 25 bps hike in the policy rate to 2.00% is widely expected. Also expected is commentary that the SNB will be using the Swiss Franc to meet its monetary goals and that it will continue to sell FX.
In what should be a familiar story now, the SNB is trying to keep the real Franc stable for monetary purposes, which in practice means engineering a stronger nominal Swiss Franc. Given the strong Dollar, it seems the SNB will have to try harder to get EUR/CHF lower to deliver that nominal CHF strength.
Expect EUR/CHF to stay offered near 0.95 multi-month and any rallies to prove fleeting.
- Gold price maintains its position around $1,930 ahead of US economic data.
- Fed’s hawkish stance on interest rate trajectory bolsters the US Dollar (USD).
- Higher US bond yields are weakening the non-yield-bearing assets like the Gold.
Gold price hovers around $1,930 during the early trading hours of the European session on Thursday. Investors seem to shift their focus on upcoming US data after the US Federal Reserve’s (Fed) decision on policy rates.
However, the Fed's hawkish stance on interest rates trajectory exerts pressure on the prices of the yellow metal.
As expected, the Federal Reserve opted to maintain the current benchmark policy rates at 5.5% during the meeting held on Wednesday.
Moreover, it is anticipated that the central bank will pursue an additional rate hike in 2023, in line with the Federal Open Market Committee's (FOMC) projection of slightly higher inflation compared to its previous forecasts.
Hence, Federal Reserve officials unexpectedly revised their projected interest rates for 2024, increasing them from 4.6% to 5.1%. This adjustment played a significant role in supporting the US Dollar (USD).
The US Dollar Index (DXY), which measures the Greenback's performance against six other major currencies, extends its gains and trades at a six-month high of around 105.50.
Additionally, higher US Treasury yields have contributed to the US Dollar's strength and increased the opportunity cost of holding non-interest-bearing assets like Gold. The yield on the 10-year US Treasury note has risen to 4.43%, the highest level since 2007.
Moreover, in a press conference held immediately after the rate decision on Wednesday, Federal Reserve Chair Jerome Powell reiterated the Fed's commitment to achieving its long-term inflation target of 2%. Powell also suggested that the central bank is likely approaching the peak of its interest rate hike cycle, but he emphasized that future policy decisions would be based on data-driven analysis.
Investors will closely monitor the upcoming data releases from the United States (US) scheduled for Thursday. This data includes the weekly Initial Jobless Claims, the Philadelphia Fed Manufacturing Survey, and the change in Existing Home Sales.
These reports can provide valuable insights into the health of the US labor market, manufacturing sector, and real estate market, which are all important factors influencing economic sentiment.
- USD/CAD gains traction near the 1.3500 psychological mark amid the renewed USD.
- The pair holds below the 50- and 100-hour EMAs; Relative Strength Index (RSI) stands in bullish territory above 50.
- The first resistance level is seen at 1.3510; the initial support level is located at 1.3465.
The USD/CAD pair trades in positive territory for the second straight day during the early European session on Thursday. The pair's recovery is bolstered by the Federal Reserve's (Fed) hawkish stance after holding the interest rate unchanged in its policy meeting on Wednesday. Additionally, a decline in oil prices weighs on the commodity-linked Loonie as the country is the leading oil exporter to the United States. The pair currently trades near 1.3495, gaining 0.26% on the day.
According to the four-hour chart, USD/CAD holds below the 50- and 100-hour Exponential Moving Averages (EMAs) with a downward slope, which supports the sellers for the time being.
The first resistance level for the pair is seen near the 50-hour EMA at 1.3510. The additional upside filter to watch is near the confluence of the 100-hour EMA and the upper boundary of the Bollinger Band at 1.3530. Any follow-through buying above the latter will pave the way to a high of September 13 at 1.3586, followed by a psychological round figure at 1.3600.
Looking at the downside, the initial support level is located at 1.3465 (a high of September 20). The critical contention is seen at the 1.3400-1.3410 region, representing a psychological figure, the lower limit of Bollinger Band and a low of August 11. Further south, the next downside stop will emerge at 1.3380 (a low of September 19).
It’s worth noting that the Relative Strength Index (RSI) stands above 50, activating the bullish momentum for the USD/CAD pair for the USD/CAD pair.
USD/CAD four-hour chart
-638308758580623549.png)
The Riksbank meets today. Economists at ING analyze SEK outlook ahead of the Interest Rate Decision.
A crucial moment for SEK
Markets are fully pricing in a 25 bps hike, which is also the consensus view and our house call. The weakness of the Swedish Krona is a major reason why the Riksbank cannot underdeliver compared to market expectations.
The risks are that some Riksbank members focus on the economic and inflation slowdown and oppose a rate hike or an upward revision in the rate path. This happened back in April and paved the way for a long period of SEK depreciation. Our base case is that the Riksbank will not make the same mistake again and deliver a convincingly hawkish and FX-supportive hike today.
We see EUR/SEK drop to the 11.77 mark in a hawkish scenario today.
A dovish surprise would make a rally to above 12.00 levels very feasible.
It took the Dollar a moment before it was able to benefit from Wednesday’s FOMC decision. Esther Reichelt, FX Analyst at Commerzbank, analyzes Greenback’s outlook.
Ammunition for the Dollar bulls
The really USD relevant change constituted the adjustment of the growth and labour market projections. Powell did not want to commit on this front during the press conference, but the updated projections paint the picture of a soft landing for the US economy, which would justify higher interest rates for longer. In my view, the Fed therefore confirmed exactly the narrative that has been supporting the USD rally since the end of July.
So what is decisive for the medium-term USD outlook is whether these projections will actually materialise. Our economists remain sceptical and see clear downside risks for the US economy. Experience teaches us: as soon as the economy disappoints or the adjustments on the labour market have an effect on the unemployment rate the market is likely to price in more significant rate cuts after all, with the dollar suffering as a result. We therefore continue to see the possibility of an upside correction in EUR/USD over the coming months.
The FOMC kept rates on hold while projecting one more hike this year, economists at the National Bank of Canada report.
Proceeding carefully but upward “dot drift” on clear display
In an almost universally anticipated decision, the FOMC voted to leave the target range for the federal funds rate unchanged at 5.25% to 5.50%.
As expected, the FOMC is trying to keep alive the prospect of one final hike before the year is out. And while the implied near-term terminal rate may not be changed vs. June, the eventual implied pace of easing has been adjusted and pushed back. Relative to the FOMC’s prior guidance, there’s now a greater length of time where restrictive higher rates are thought to be needed to secure the inflation goal. This captures and is in response to the ongoing economic resilience on display in America (and now embedded in the FOMC’s baseline economic view). In the FOMC’s view, we’ll need to be more patient before less restrictive policy can be contemplated.
While the FOMC remains data dependent, we should expect it to hike one time before the year is out and there will presumably be some convincing needed before their guard can be lowered. Simply put, the evidence in hand is not yet convincing enough.
Here is what you need to know on Thursday, September 21:
The US Dollar (USD) gathered strength in the late American session on Wednesday and the USD Index reached a fresh multi-month high above 105.50 early Thursday as investors reacted to the Federal Reserve's (Fed) hawkish rate pause. The Swiss National Bank (SNB) and the Bank of England (BoE) will announce policy decisions in the European session. Later in the day, the US economic docket will feature weekly Initial Jobless Claims and August Existing Home Sales data.
The Fed left its policy rate unchanged at 5.25%-5.5% as expected following the September policy meeting. The revised Summary of Economic Projections (SEP) - the so-called dot plot, however, confirmed that the US central bank was on track to raise the policy rate by another 25 basis points before the end of the year. Additionally, policymakers now see a total of 50 bps rate cuts next year, compared to the 100 bps rate cut projection seen in June's dot plot. While speaking in the post-meeting press conference, "majority of policymakers believe it is more likely than not another rate hike will be appropriate," FOMC Chairman Jerome Powell said.
US Dollar price this week
The table below shows the percentage change of US Dollar (USD) against listed major currencies this week. US Dollar was the strongest against the Pound Sterling.
| USD | EUR | GBP | CAD | AUD | JPY | NZD | CHF | |
| USD | 0.26% | 0.65% | -0.22% | 0.45% | 0.30% | -0.04% | 0.34% | |
| EUR | -0.26% | 0.40% | -0.49% | 0.20% | 0.04% | -0.29% | 0.09% | |
| GBP | -0.64% | -0.39% | -0.87% | -0.18% | -0.36% | -0.70% | -0.31% | |
| CAD | 0.22% | 0.47% | 0.85% | 0.64% | 0.51% | 0.17% | 0.55% | |
| AUD | -0.46% | -0.20% | 0.19% | -0.67% | -0.17% | -0.49% | -0.11% | |
| JPY | -0.30% | -0.06% | 0.34% | -0.50% | 0.17% | -0.34% | 0.06% | |
| NZD | 0.05% | 0.31% | 0.70% | -0.16% | 0.49% | 0.34% | 0.41% | |
| CHF | -0.34% | -0.09% | 0.32% | -0.56% | 0.12% | -0.05% | -0.40% |
The heat map shows percentage changes of major currencies against each other. The base currency is picked from the left column, while the quote currency is picked from the top row. For example, if you pick the Euro from the left column and move along the horizontal line to the Japanese Yen, the percentage change displayed in the box will represent EUR (base)/JPY (quote).
USD/CHF gained traction and climbed above 0.9000 for the first time since early July on Thursday. The SNB is forecast to raise the policy rate by 25 basis points to 2%.
The BoE is forecast to lift its key rate to 5.5% from 5.25%. Following Wednesday's soft inflation readings, several institutions noted that they were now expecting the BoE to hold the rate steady. There will not be a press conference and markets will pay close attention to the vote split and scrutinize the policy statement. GBP/USD suffered large losses on Wednesday and continued to push lower on Thursday. At the time of press, the pair was trading at its weakest level since May slightly above 1.2300.
UK Interest Rate Decision Preview: BoE hike hangs in the balance as inflation cools.
After rising above 1.0700 during the European trading hours on Wednesday, EUR/USD reversed its direction in the late American session and closed the day in negative territory. The pair extended its slide early Thursday and touched its lowest level since March below 1.0620 before recovering toward 1.0650.
USD/JPY gathered bullish momentum and advanced to its strongest level since November above 148.00. The Bank of Japan (BoJ) will announce monetary policy decisions in the Asian session on Friday.
Gold price came within a touching distance of $1,950 ahead of the Fed event on Wednesday but erased all of its daily gains to close in negative territory as the benchmark 10-year US Treasury bond yield climbed above 4.4% on hawkish dot plot. Early Thursday, XAU/USD holds steady at around $1,930.
Türkiye's central bank (CBT) holds its monthly rate meeting today. The Lira has kept creeping weaker and breached the psychological 27.00 level versus the Dollar. Economists at Commerzbank analyze USD/TRY outlook.
Today’s rate hike can at best add some volatility to the Lira
The FX market’s scepticism arises from a divergence between what authorities say Erdogan will support and what the market thinks he will support. Once this question has arisen, verbal assurances and remarks lose all significance: it becomes all about waiting and watching through tough times to confirm Erdogan’s views.
If this assessment is correct, then today’s rate hike can at best add some volatility to the Lira, but the currency’s fundamental outlook will remain undetermined for some time longer.
In an interview with an Irish newspaper on Thursday, European Central Bank (ECB) policymaker Gabriel Makhlouf said that “a further rate hike is possible.”
Additional comments
There's little chance of a rate cut before March.
We are not saying that at the next meeting we will hold.
If inflation stays the same, rates may not have to rise.
ECB rates could just stay where they are for longer.
Market reaction
EUR/USD seems to be finding fresh demand on the hawkish comments, recovering to 1.0640, still down 0.18% on the day.
FX option expiries for Sept 21 NY cut at 10:00 Eastern Time, via DTCC, can be found below.
- EUR/USD: EUR amounts
- 1.0600 1.8b
- 1.0640-50 771m
- 1.0675 832m
- 1.0700-10 1.5b
- 1.0725 555m
- 1.0745-50 1.6b
- GBP/USD: GBP amounts
- 1.2300-05 853m
- 1.2330-35 623m
- 1.2350 211m
- 1.2400 375m
- USD/JPY: USD amounts
- 147.50 316m
- 148.00 619m
- 148.50 406m
- 149.75 600m
- USD/CHF: USD amounts
- 0.8890-0.8900 571m
- 0.8950 290m
- AUD/USD: AUD amounts
- 0.6275 744m
- 0.6450 1b
- 0.6500 1b
- EUR/GBP: EUR amounts
- 0.8625 471m
- 0.8645 324m
- 0.8660 250m
- 0.8700-05 558m
- EUR/JPY: EUR amounts
- 157.50 230m
- 157.70 290m
- 158.50 205m
Economists at Danske Bank discuss EUR/GBP outlook ahead of the Bank of England (BoE) meeting.
GBP headwinds to set in
In our base case of a 25 bps hike, we expect EUR/GBP to end the day higher on dovish commentary.
We anticipate the statement to strike a dovish tone, noting that monetary policy is restrictive while reiterating the BoE’s data dependent approach. We expect the BoE to highlight that elevated wage growth and service inflation remain the upside risks.
We continue to forecast EUR/GBP to move modestly higher in the coming year to 0.88 on the UK economy performing relatively worse than the Euro area.
Economist Lee Sue Ann and Markets Strategist Quek Ser Leang at UOB Group see the door open for USD/JPY to reach the 149.00 region.
Key Quotes
24-hour view: We expected USD to trade in a range of 147.50/148.10 yesterday. We did not anticipate the elevated volatility as USD traded choppily between 147.46 and 148.36 before closing at 148.33 (+0.32%). Upward momentum has increased, albeit not much. Today, USD could edge higher, but it is unlikely to threaten the major resistance at 149.00. In order to maintain the momentum, USD must stay above 147.90 (minor support is at 148.10).
Next 1-3 weeks: Our latest narrative was from three days ago (18 Sep, spot at 147.80), wherein “upward momentum has increased slightly, and USD could edge higher to 148.40, but the likelihood of a sustained rise above this level is not high.” Yesterday, USD rose to a high of 146.36. Upward momentum has increased further, and USD has room to rise to 149.00. Overall, only a break of 147.45 (‘strong support’ level previously at 147.00) would indicate that the current upward pressure has faded.
- EUR/USD experiences pressure due to the Fed's projection of an additional rate hike in 2023.
- MACD line levels with the signal line, suggesting that recent momentum is relatively neutral.
- Six-month low lined up with the 1.0600 psychological level could act as immediate support.
EUR/USD extends the losses for the third successive day. Spot price is trading lower around 1.0640 during the Asian session on Thursday. As expected, the US Federal Reserve (Fed) chose to maintain the current benchmark policy rates at 5.5% during the meeting convened on Wednesday.
The Fed's projection of an additional rate hike in 2023 has exerted downward pressure on the EUR/USD pair. Furthermore, in its monetary policy statement, the Federal Open Market Committee (FOMC) has indicated an anticipation of slightly higher inflation compared to its previous forecasts.
The six-month low at 1.0616 marked on Thursday could act as immediate support, followed by the 1.0600 psychological level.
On the upside, the 18-day Exponential Moving Average (EMA) at 1.0728 appears to be the key barrier aligned to the 21-day EMA at the 1.0742 level.
A break above the latter could provide support for the pair to navigate the region around the 23.6% Fibonacci retracement at 1.0772, followed by the 1.0800 psychological level.
The Moving Average Convergence Divergence (MACD) line remains below the centerline but is at the same level as the signal line. This configuration suggests that the momentum in the underlying asset's price is relatively neutral, with neither bullish nor bearish dominance.
However, the momentum in the EUR/USD pair indicates bearish sentiment in the market as the 14-day Relative Strength Index (RSI) remains below the 50 level.
EUR/USD: Daily Chart
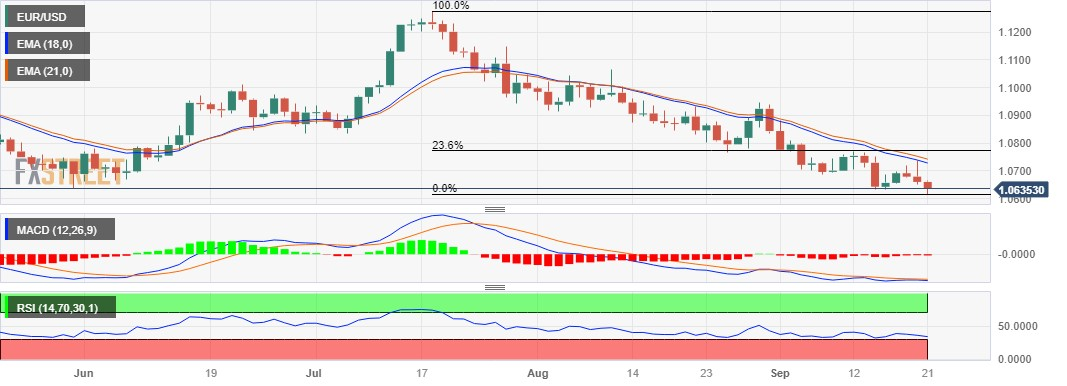
CME Group’s flash data for crude oil futures markets noted traders reduced their open interest positions for yet another session on Wednesday, this time by around 9.5K contracts. In the same line, volume remained choppy and went down by around 382.1K contracts, setting aside the previous daily build.
WTI: Further downside appears contained
WTI prices extended the rejection from the 2023 high, breaking below the key $90.00 barrier per barrel on Wednesday. The downtick was on the back of shrinking open interest and volume and suggests that a sustained decline appears not favoured for the time being. On the downside, there is a provisional support at the 55-day SMA, today at $81.87.
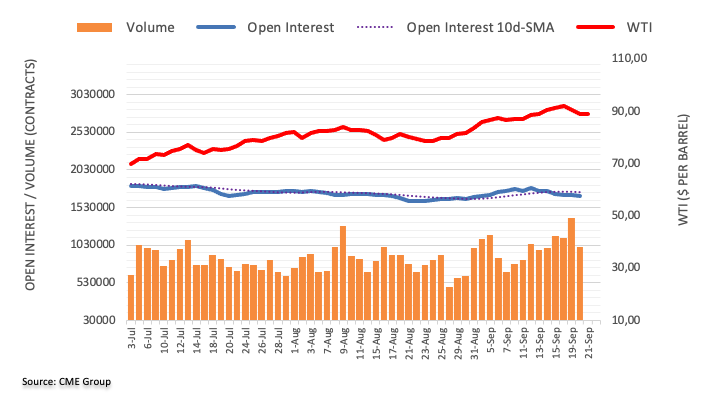
- The UK central bank is on track for another 25 bps hike on Thursday, lifting interest rate to 5.50%.
- The Bank of England could signal the end of its tightening cycle as economic woes mount.
- Pound Sterling set to rock after surprise fall in UK inflation raises odds of a BoE rate hike pause.
The Bank of England (BoE) is set for the fifteenth consecutive interest rate hike since December 2021 on Thursday. The Pound Sterling (GBP) is poised for a big reaction even though it is not a ‘Super Thursday’, as it could probably be the final lift-off for one of the United Kingdom’s (UK) greatest tightening cycles in the last century.
However, markets have recently lowered expectations of a rate increase after UK inflation in August came in softer than expected.
Bank of England Interest Rate Decision: What to know in markets on Thursday, September 21
- GBP/USD remains vulnerable near five-month lows of 1.2304, as the US Dollar (USD) clinches fresh a six-month high.
- The US Dollar and the US Treasury bond yields continue to soar on the hawkish US Federal Reserve (Fed) rate hike pause.
- The Summary of Economic Projections (SEP), the so-called ‘Dot Plot’ chart, showed that the “Fed projections imply one more 25 basis points (bps) rate hike this year and 50 bps of rate cuts in 2024, versus 100 bps of 2024 cuts in June projections.”
- US S&P 500 futures drop amid risk-aversion on the Fed’s ‘high for longer’ interest rate view.
- The BoE policy guidance will hold the key for a clear directional impetus for the GBP/USD pair while the Jobless Claims and Existing Home Sales data from the United States will also entertain Cable traders.
When will the BoE announce its interest rate decision and how could it affect GBP/USD?
The Bank of England is widely expected to raise the benchmark interest rate, the Bank Rate, by 25 basis points (bps) from 5.25% to 5.50% at 11:00 GMT, taking borrowing costs to the highest level since 2007.
The big question is whether it will be the last hurrah for the BoE hawks. The UK central bank could take the lead from the European Central Bank (ECB) and deliver a dovish hike by signaling the end of its rate hike cycle amid increasing risks of stagflation.
In the second quarter, the UK economy defied expectations of stagnation, expanding by 0.2% in the second quarter. However, economists say that the growth outlook appeared grim, as the impact of higher rates had still not fully fed through.
Meanwhile, the Unemployment Rate climbed to 4.3% in the quarter through July from the 4.2% seen during the three months to June. The economy saw an employment loss of 207K in July, having shredded 66K jobs in June. Average Earnings excluding bonuses rose 7.8% 3M YoY in July as expected but at a joint-record pace.
Against the backdrop of a slowing economy and loosening labor market conditions, the BoE could be well-positioned to hint at a pause after the expected rate hike. Goldman Sachs and Citigroup expect Thursday's decision to be the BoE's last rate hike.
Governor Andrew Bailey said earlier this month that the BoE was "much nearer" to ending its tightening cycle. On the other hand, Catherine Mann, a member of the BoE Monetary Policy Committee (MPC), said last week, “I would rather err on the side of over-tightening,” adding that underestimating the persistence of inflation will lead to an overshoot.
However, the unexpected fall in the UK inflation cast clouds on the BoE’s rate hike plan on Thursday. Bailey and his colleagues could opt for a pause, as services inflation points to easing inflationary pressures.
The Office for National Statistics (ONS) said on Wednesday that the UK annual Consumer Price Index (CPI) edged 6.7% higher in August, cooling off from a 6.8% rise in July. The market consensus was for a 7.1% increase.
The Services CPI rose 6.8% YoY vs. July’s 7.4% surge. The ONS said, “the largest downward contributions to CPI rates came from food and accommodation services.”
Markets are pricing a 50% probability of a 25 bps rate increase by the Bank of England, down sharply from an 80% chance seen before the UK inflation data.
Analysts at TD Securities (TDS) noted: “Upside surprises to wage data are enough to justify a 25bps hike, but Wednesday's downside shock to August inflation and worries about tepid GDP growth and a rapidly rising unemployment rate lead the MPC to soften forward guidance and votes skew toward a hold, effectively signaling an end to the hiking cycle.”
If the Bank of England delivers a dovish message alongside a 25 bps rate hike or decides to put brakes on its tightening cycle, GBP/USD is likely to see a fresh downswing toward the 1.2250 psychological level. In case the Bank hints at a possibility of one more rate hike by the turn of the year, the Pound Sterling could stage a decent recovery toward the 1.2500 threshold.
Dhwani Mehta, Asian Session Lead Analyst at FXStreet, offers a brief technical outlook for the major and explains: “Having consolidated the downside break below the critical 200-Daily Moving Average (DMA) at 1.2433 so far this week, GBP/USD is extending the downtrend even as the 14-day Relative Strength Index (RSI) has entered the oversold territory, suggesting that the pair risks a correction from the multi-month trough.”
Dhwani also outlines important technical levels to trade the GBP/USD pair: “On the upside, recapturing the 200 DMA support-turned-resistance is critical to initiating any meaningful recovery toward the 1.2500 figure. Further up, the descending 21 DMA at 1.2520 will challenge Pound Sterling buyers. Conversely, the immediate support aligns at the April low of 1.2275, below which a sell-off toward the 1.2200 threshold cannot be ruled out.”
Pound Sterling price today
The table below shows the percentage change of Pound Sterling (GBP) against listed major currencies today. Pound Sterling was the weakest against the US Dollar.
| USD | EUR | GBP | CAD | AUD | JPY | NZD | CHF | |
| USD | 0.15% | 0.07% | 0.11% | 0.42% | 0.03% | 0.29% | 0.04% | |
| EUR | -0.16% | -0.08% | -0.05% | 0.25% | -0.13% | 0.13% | -0.11% | |
| GBP | -0.07% | 0.07% | 0.04% | 0.34% | -0.04% | 0.22% | -0.03% | |
| CAD | -0.10% | 0.04% | -0.03% | 0.31% | -0.08% | 0.17% | -0.07% | |
| AUD | -0.40% | -0.30% | -0.34% | -0.30% | -0.38% | -0.13% | -0.36% | |
| JPY | -0.04% | 0.13% | 0.06% | 0.07% | 0.39% | 0.27% | 0.02% | |
| NZD | -0.28% | -0.13% | -0.21% | -0.17% | 0.14% | -0.24% | -0.22% | |
| CHF | -0.06% | 0.09% | 0.02% | 0.04% | 0.35% | -0.03% | 0.23% |
The heat map shows percentage changes of major currencies against each other. The base currency is picked from the left column, while the quote currency is picked from the top row. For example, if you pick the Euro from the left column and move along the horizontal line to the Japanese Yen, the percentage change displayed in the box will represent EUR (base)/JPY (quote).
Economic Indicator
United Kingdom BoE Interest Rate Decision
BoE Interest Rate Decision is announced by the Bank of England. If the BoE is hawkish about the inflationary outlook of the economy and raises the interest rates it is positive, or bullish, for the GBP. Likewise, if the BoE has a dovish view on the UK economy and keeps the ongoing interest rate, or cuts the interest rate it is seen as negative, or bearish.
Read more.Next release: 09/21/2023 11:00:00 GMT
Frequency: Irregular
Source: Bank of England
In the view of Economist Lee Sue Ann and Markets Strategist Quek Ser Leang at UOB Group, NZD/USD is now likely to trade within a range bound theme.
Key Quotes
24-hour view: Yesterday, we indicated that NZD “is likely to break above 0.5945.” However, we held the view that it “does not appear to have enough momentum to threaten the next major resistance at 0.6010. While our view turned out to be correct as NZD rose to 0.5985 in NY trade, we did not anticipate the sharp selloff from the high. The sharp drop from the high has room to extend, but a sustained drop below 0.5900 appears unlikely. Resistance is at 0.5945, followed by 0.5965.
Next 1-3 weeks: We expected NZD to trade in a range of 0.5860/0.5960 for more than a week, until yesterday (20 Sep, spot at 0.5945), when we indicated that “the resistance at 0.5960 is likely to give way, and NZD is likely to trade with an upward bias towards 0.6010.” NZD then rose sharply, but briefly, to 0.5985 before dropping back down. The momentum buildup has eased, and the upward bias has faded. To put it another way, NZD is likely to trade in a range for now, probably between 0.5870 and 0.5985.
- USD/CHF extends its upside for the third straight day, hovering around the 0.9000 area.
- The pair holds above the 50- and 100-hour EMAs; Overbought RSI condition indicates that further consolidation cannot be ruled out.
- The immediate resistance level emerges at 0.9032; 0.8906 acts as a critical support level for the pair.
The USD/CHF pair gains momentum near the 0.9000 psychological mark during the early European session on Thursday. Market players await the Swiss National Bank (SNB) interest rate decision later in the day.
SNB is expected to raise additional interest rates by 25 basis points (bps) from 1.75% to 2% on Thursday. However, if SNB offers hints about its last hike, the monetary policy divergences between the US and Switzerland might continue to drive the pair higher.
On the US Dollar front, the Federal Reserve (Fed) held interest rates unchanged at the 5.25-5.50% range on Wednesday, as widely predicted in the market. Fed Chairman Jerome Powell reaffirmed the Fed's commitment to achieving 2% inflation in a press conference while mentioning that the Fed is ready to raise rates if necessary. These hawkish remarks boost the Greenback against the Swiss Franc and act as a tailwind for the USD/CHF pair.
According to the four-hour chart, USD/CHF holds above the 50- and 100-hour Exponential Moving Averages (EMAs), which means the path of least resistance for the pair is to the upside. The Relative Strength Index (RSI) holds in bullish territory above 50. However, the overbought condition indicates that further consolidation cannot be ruled out before positioning for any near-term USD/CHF appreciation.
That said, the immediate resistance level for USD/CHF will emerge near the upper boundary of the Bollinger Band at 0.9032. The additional upside filter is located at 0.9060 (a high of May 19) en route to 0.9073 (a high of May 25) and finally at 0.9105 (a high of June 8).
On the downside, the 100-hour EMA at 0.8906 acts as a critical support level for the pair. Further south, the next stop of the USD/CHF pair is located at 0.8870 (the 50-hour EMA), followed by a psychological round figure at 0.8800. Any intraday pullback below the latter would expose the next downside stop at 0.8775, portraying the confluence of the lower limit of the Bollinger Band and a low of August 23.
USD/CHF four-hour chart
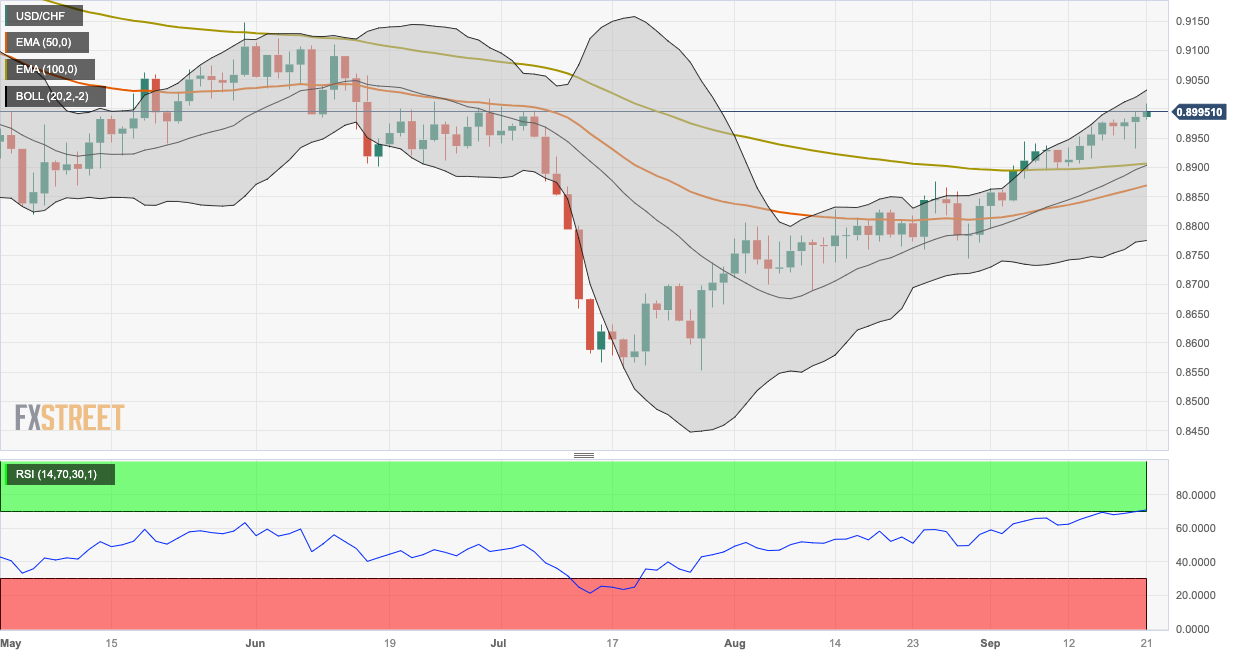
- The index adds to the weekly uptrend and revisits 105.70.
- Investors continue to digest Wednesday’s hawkish hold by. The Fed.
- Weekly Claims, Philly Fed Index take centre stage in the US docket.
The greenback gathers extra steam and climbs to fresh six-month tops near 105.70 when gauged by the USD Index (DXY) on Thursday.
USD Index now looks at data
The index advances for the third session in a row so far on Thursday as market participants continue to assess Wednesday’s decision by the Federal Reserve to keep rates unchanged, as widely anticipated.
The dollar derived extra strength in response to the upbeat assessment of the US economic growth by the Fed and prospects of another 25 bps rate hike before the end of the year.
The continuation of the march north in the dollar so far appears underpinned by the equally robust pace of US yields across the curve, where the short end navigates levels last seen in July 2006 near 5.20%.
In the US docket, usual weekly Initial Claims are due seconded by the Philly Fed Manufacturing Index, the CB Leading Index and Existing Home Sales.
What to look for around USD
The index grabs fresh oxygen and advances to new multi-session highs near 105.70 in the wake of the FOMC event.
In the meantime, support for the dollar keeps coming from the good health of the US economy, which at the same time appears underpinned by the tighter-for-longer stance narrative from the Federal Reserve.
Key events in the US this week: Initial Jobless Claims, Philly Fed Index, CB Leading Index, Existing Home Sales (Thursday) – Flash Manufacturing/Services PMIs (Friday).
Eminent issues on the back boiler: Persevering debate over a soft or hard landing for the US economy. Incipient speculation of rate cuts in early 2024. Geopolitical effervescence vs. Russia and China.
USD Index relevant levels
Now, the index is up 0.24% at 105.58 and a breakout of 105.68 (monthly high September 21) would open the door to 105.88 (2023 high March 8) and finally 106.00 (round level). On the other hand, initial support emerges at 104.42 (weekly low September 11) ahead of 103.04 (200-day SMA) and then 102.93 (weekly low August 30).
Further downside in GBP/USD remains in the pipeline and could motivate the pair to break below the 1.2300 region in the near term, suggest Economist Lee Sue Ann and Markets Strategist Quek Ser Leang at UOB Group.
Key Quotes
24-hour view: We did not anticipate GBP to trade in a very volatile manner, as it plummeted to 1.2333, snapped back up to a high of 1.2421, and then fell sharply to end the day at 1.2344 (-0.39%). Despite the choppy price action, downward momentum appears to have increased slightly. Today, GBP could dip below the major support at 1.2305. The next support at 1.2265 is likely out of reach for now. If GBP breaks above 1.2390 (minor resistance is at 1.2365), it would indicate that the current downward pressure has faded.
Next 1-3 weeks: Our most recent narrative was from last Friday (15 Sep, spot at 1.2405), wherein the weakness in GBP has not stabilised and GBP could continue to weaken. We pointed out that “The next level to watch is May’s low near 1.2305.” Yesterday, GBP fell to a low of 1.2333. There is still no sign of stabilisation, and a break of 1.2305 will not be surprising. As conditions are approaching oversold, it remains to be seen if 1.2265 will come into view. Overall, only a breach of 1.2420 (‘strong resistance’ level previously at 1.2455) would indicate the weakness in GBP that started more than two weeks ago has stabilised.
Open interest in gold futures markets rose by nearly 10K contracts after two consecutive daily drops on Wednesday, according to preliminary readings from CME Group. Volume followed suit and went up by more than 94K contracts following three straight daily drops.
Gold faces the next contention around $1900
Prices of gold rose to multi-session peaks around the $1945, just to come all the way down and close Wednesday’s session with modest losses. The marginal pullback was on the back of increasing open interest and volume, which leaves room for further losses in the very near term. That said, next on the downside emerges the key contention area around the $1900 region per troy ounce.
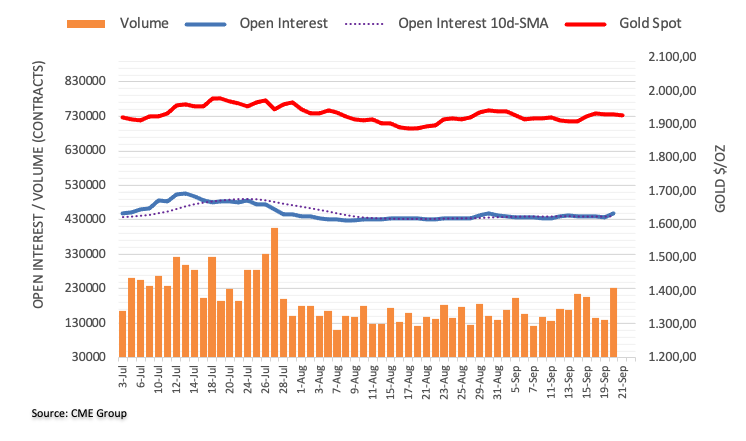
EUR/USD is now expected to trade within the 1.0590-1.0730 range in the next few weeks, according to Economist Lee Sue Ann and Markets Strategist Quek Ser Leang at UOB Group.
Key Quotes
24-hour view: Our view that EUR could trade in a range yesterday was incorrect, as it soared to 1.0736, plunged to 1.0648, and then closed at 1.0659 (-0.17%). The sharp and swift drop appears to be overdone, but with no signs of stabilisation just yet, EUR could dip below the major support at 1.0630 before stabilisation is likely. The next support at 1.0590 is unlikely to come under threat. On the upside, a breach of 1.0700 (minor resistance is at 1.0675) would indicate that EUR is not weakening further.
Next 1-3 weeks: Two days ago (19 Sep, spot at 1.0690), we indicated that “downward momentum is beginning to wane.” We added, “in order to keep the momentum going, EUR must break and stay below 1.0630 in the next couple of days, or the odds of further decline will diminish rapidly.” Yesterday, EUR broke above our ‘strong resistance’ level of 1.0730 (high of 1.0736) before dropping back down quickly. Downward pressure appears to have eased. From here, EUR is likely to trade in a range of 1.0590/1.0730. Looking ahead, if EUR breaks clearly below 1.0590, it will likely lead to a sustained decline towards the major support at 1.0515.
- Asian equities trade in negative territory after the Federal Reserve (Fed) held the interest rate unchanged.
- Bank of Japan (BoJ) is expected to maintain monetary policy on Friday.
- Central bank officials in the Philippines and Indonesia will announce monetary policy decisions.
Asian stocks trade lower on Thursday amid the higher-for-longer interest rate narrative in the US following the Federal Reserve (Fed) meeting.
At press time, China’s Shanghai is down 0.59% to 3,090, the Shenzhen Component Index declines 0.71% to 10,001. South Korea’s KOSPI, Hong Kong’s Hang Seng, and the Nikkei 225 are the worst performers for the day. Hang Sang falls 1.31% to 17,651, Kospi drops 1.61% and Japan’s Nikkei falls 1.25%.
In China, the People's Bank of China (PBoC) maintained benchmark lending rates steady on Wednesday, as expected by the market. The one-year Loan Prime Rate (LPR), was kept at 3.45%, while the five-year LPR was unchanged at 4.20%. However, investors remain concerned about the economic slowdown in the second’s world largest economies.
In Japan, the Bank of Japan (BoJ) interest rate decision will be the highlight on Friday. BoJ is widely expected to keep its short-term interest rate target of -0.1% and its 10-year bond yield target of around 0%. The Japanese central bank has previously declared that monetary policy shifts would not be considered until local wage and inflation data meet its projections.
Former top currency diplomat Takehiko Nakao said on Wednesday that Japanese authorities could intervene in FX again to support the yen if it declines further.
On Thursday, central bank officials in the Philippines and Indonesia will announce monetary policy decisions. The Bangko Sentral ng Pilipinas is expected to raise rates by a quarter point, while the Indonesian central bank is expected to maintain rates unchanged.
The closely watched event this week will be the BoJ meeting on Friday. On the US docket, the US weekly Jobless Claims, the Philly Fed, and Existing Home Sales will be due later on Thursday and the preliminary US S&P Global PMI for September will be released on Friday.
- Natural Gas price attracts some dip-buying on Thursday and reverses a part of the overnight slide.
- The technical setup still seems tilted in favour of bulls and supports prospects for additional gains.
- A break below the ascending channel/100-day SMA confluence should negate the positive outlook.
Natural Gas price edges higher during the Asian session on Thursday and reverses a part of the previous day's heavy losses, though the intraday uptick lacks bullish conviction. The XNG/USD currently trades around the $2.9430 region, up over 0.50% for the day, and for now, seems to have stalled this week's retracement slide from the vicinity of a multi-month top touched in August.
From a technical perspective, the recent move-up witnessed over the past four months or so has been along an upward-sloping channel, which points to a well-established short-term uptrend. The subsequent breakout through and acceptance above the very important 200-day Simple Moving Average (SMA) favours bullish traders. This, along with the fact that oscillators on the daily chart are holding comfortably in the positive territory and are still far from being in the overbought zone, suggests that the path of least resistance for the XNG/USD pair is to the upside.
That said, a bullish rejection near the $3.0620 level, ahead of the August swing high, warrants some caution before positioning for additional gains. The overnight trough, around the $2.9000 area, however, might now protect the immediate downside ahead of the $2.8850 region and the weekly low, around the $2.8520 zone. The latter coincides with the 200-day SMA, which if broken will expose the monthly trough, around the $2.7150 area. The XNG/USD could drop further to test the ascending channel support near the $2.700 area and the 100-day SMA around $2.6500.
Some follow-through selling below the latter will suggest that the recovery from the $2.1780 area, or a multi-year low touched in June has run its course and shift the near-term bias back in favour of bearish traders.
On the flip side, any subsequent intraday move-up is likely to confront stiff resistance ahead of the $3.0000 psychological mark. The next relevant hurdle is pegged near the $3.0200 area, above which the XNG/USD could climb to challenge the $3.0620-$3.0650 supply zone. A sustained strength beyond should pave the way for a move towards testing the top boundary of the aforementioned trend-channel, currently pegged around the $3.2550 region.
XNG/USD daily chart
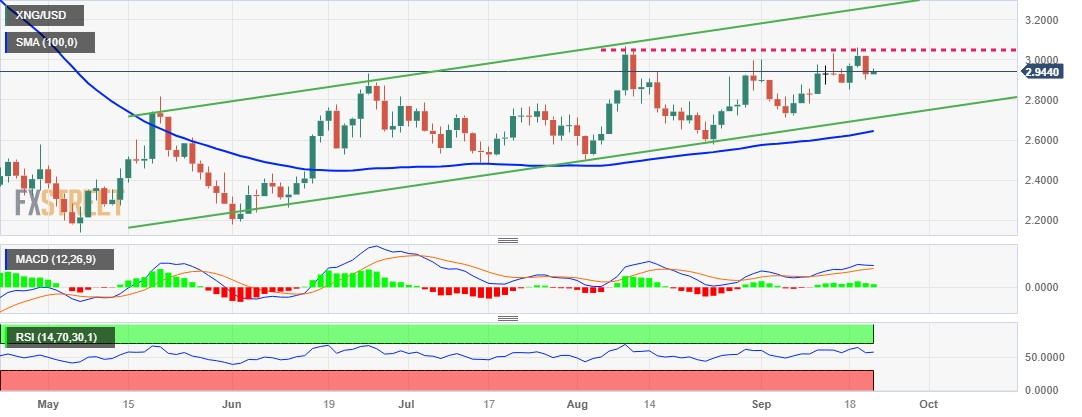
- GBP/USD extends its losses on the second successive day on the Fed's hawkish tone.
- Fed revised the projected interest rates for 2024, elevating them from 4.6% to 5.1%.
- The market expects an imminent halt in the BoE’s interest rate-hike cycle due to UK soft data on Wednesday.
GBP/USD expands losses on the second successive day, trading lower around 1.2320 during the Asian session on Thursday. US Federal Reserve’s (Fed) hawkish stance exerts downward pressure on the pair.
As anticipated, the Fed chose to keep the existing benchmark policy rates unchanged at 5.5% during the meeting held on Wednesday.
The central bank is expected to attempt an additional rate hike in 2023, following the Federal Open Market Committee’s (FOMC) expectation for slightly elevated inflation compared to its previous forecasts.
Therefore, Fed officials unexpectedly revised their projected interest rates for 2024, increasing them from 4.6% to 5.1%, which contributes to the support in underpinning the US Dollar (USD).
US Dollar Index (DXY), which gauges the performance of the Greenback against the six other major currencies, extends its gains and trades a six-month high of around 105.50 at the time of writing. Additionally, Higher US Treasury yields help the buck to rise.
The yield on 10-year US note rose to 4.43% by the press time, the highest since 2007.
Furthermore, during a press conference held immediately after the rate decision, Federal Reserve Chair Jerome Powell reiterated the Fed's dedication to achieving its long-term inflation target of 2%.
Powell indicated that the central bank is probably nearing the apex of its interest rate hike cycle, yet he underscored that forthcoming policy determination would hinge on data-driven analysis.
On the GBP side, the anticipation of an imminent halt in the Bank of England's (BoE) cycle of raising interest rates continues to exert downward pressure on the British Pound, causing the GBP/USD pair to decline.
Market sentiment experienced a significant shift following the release of UK data on Wednesday, which showed that the annual headline Consumer Price Index (CPI) dropped to 6.7% in August from 6.8% in July, contradicting the consensus forecast of an increase to 7.1%.
Moreover, the core CPI registered at 6.2% for the 12 months ending in August, down from 6.9% in July. These developments occurred alongside resurfacing concerns of a potential economic downturn and signs of a cooling labor market in the UK, aligning with market expectations.
Consequently, the focal point will remain fixed on the eagerly awaited policy decision by the Bank of England, set to be announced later in the day.
Investors will likely watch the upcoming data release from the United States (US) due on Thursday, including the weekly Initial Jobless Claims, Philadelphia Fed Manufacturing Survey, and Existing Home Sales Change.
- Gold price currently trades around $1,928 after seeing a rejection from the $1,948 mark.
- The Federal Reserve (Fed) held interest rates steady at the 5.25-5.50% range on Wednesday.
- Fed is expected to hike the rate one more time this year.
- The US weekly Jobless Claims, the Philly Fed, and Existing Home Sales will be due on Thursday.
Gold price (XAU/USD) experiences a partial recovery from its recent decline of around $1,928 during the Asian trading hours on Thursday. Gold price remains under selling pressure as the Federal Reserve (Fed) held the benchmark policy rates at 5.5% while delivering the hawkish remarks.
The Federal Reserve (Fed) held interest rates steady at the 5.25-5.50% range during its September meeting, as widely predicted in the market. Officials are more optimistic that they might curb inflation without damaging the economy or causing significant job losses. Fed Chairman Jerome Powell reaffirmed the Fed's commitment to achieving 2% inflation in a press conference. Powel added that the Fed is ready to raise rates if necessary.
According to the Fed's most recent quarterly predictions, the benchmark overnight interest rate may be hiked one more time this year to a peak range of 5.50% to 5.75%, and rates could be significantly tighter through 2024 than previously anticipated. Additionally, the Fed updated its Summary of Projections (SEP), indicating that Fed officials expect interest rates to reach 5.1% by the end of 2024 (from 4.6% prior). It’s worth noting that rising interest rates raise the opportunity cost of investing in non-yielding assets, implying a negative outlook for precious metals.
Gold traders will keep an eye on the US weekly Jobless Claims, the Philly Fed, and Existing Home Sales due later on Thursday. On Friday, the preliminary US S&P Global PMI for September will be released. These figures could provide a clear direction for gold price.
XAU/USD technical outlook
On the four-hour chart, gold price saw a rejection from the $1,948 mark following the Fed interest rate decision. The precious metal has remained well supported above the 100-hour Exponential Moving Average (EMA) at $1924.
Meanwhile, the Relative Strength Index (RSI) is located in the 40-60 zone, indicating a non-directional movement for gold price for the time being.
Resistance level: $1,950, $1,965 and $1,982
Support level: $1,924, $1,915 and $1,900

- USD/INR regains positive traction on Thursday and recovers a part of the previous day's losses.
- The technical setup remains tilted in favour of bulls and supports prospects for further gains.
- A convincing break below the 100/200-day SMAs confluence would negate the positive bias.
The USD/INR pair attracts fresh buyers near the 82.90 region on Thursday and reverses a part of the previous day's downfall from the 83.30 area, or over a one-month top. Spot prices currently trade just above the 83.00 mark and remain well within the striking distance of the all-time peak touched on August 15.
From a technical perspective, the fact that the USD/INR pair is holding comfortably above technically significant 100-day and 200-day Simple Moving Averages (SMAs) favours bullish traders. Moreover, oscillators on the daily chart are holding in the positive territory and are still far from being in the overbought one. This, in turn, suggests that the path of least resistance for spot prices is to the upside.
Hence, a subsequent strength beyond the overnight swing high, around the 83.30 region, en route to the 83.45 area or the YTD high, remains a distinct possibility. Some follow-through buying will be seen as a fresh trigger for bullish traders and set the stage for a further near-term appreciating move for the USD/INR pair.
On the flip side, the 82.90-82.80 area, might continue to protect the immediate downside. Any further decline is more likely to attract fresh buyers and remain limited near the 82.40-82.30 confluence, comprising the 100-day and the 200-day SMAs. The latter should act as a pivotal point, which if broken will make the USD/INR pair vulnerable to accelerate the corrective decline towards the 82.00 mark.
USD/INR daily chart

Technical levels to watch
- USD/JPY eases from the YTD peak touched earlier this Thursday, though lacks follow-through.
- Comments by Japan’s Matsuno fuel intervention fears and prompt some selling around the pair.
- The Fed's hawkish outlook continues to underpin the USD and helps limit losses for the major.
- The technical setup remains tilted in favour of bulls and supports prospects for a further move up.
The USD/JPY pair pulls back after hitting a fresh YTD peak, around the 148.45 region during the Asian session this Thursday, albeit lacks follow-through and manages to hold above the daily trough. Spot prices currently trade around the 148.25 area, down less than 0.10% for the day, and seem poised to appreciate further.
Against the backdrop of the recent breakout through the 146.50-146.60 strong horizontal barrier, the overnight sustained strength and a daily close above the 148.00 mark could be seen as a fresh trigger for bullish traders. The positive outlook for the USD/JPY pair is reinforced by the underlying bullish sentiment surrounding the US Dollar (USD), bolstered by the Federal Reserve's (Fed) hawkish outlook.
That said, comments by Japan’s Chief Cabinet Secretary Hirokazu Matsuno, saying that he won't rule out any options for response to FX moves, raises the risk of an intervention by authorities to prop up the domestic currency. Apart from this, speculations that the Bank of Japan (BoJ) could move away from the negative interest rates policy benefit the Japanese Yen (JPY) and cap the upside for the USD/JPY pair.
Technical indicators on the daily chart, meanwhile, are holding comfortably in the positive territory and are still far from being in the overbought zone. This, in turn, favours bullish traders and suggests that the path of least resistance for the USD/JPY pair is to the upside. Hence, any meaningful corrective decline below the 148.00 round figure might still be seen as a buying opportunity near the 147.70-147.65 area
The latter is closely followed by the weekly trough, around mid-147.00s, which if broken decisively might prompt some technical selling and drag the USD/JPY pair back towards the 147.00 round figure. Spot prices could then slide to the 146.50 horizontal support before eventually dropping to last week's swing low or sub-146.00 levels.
On the flip side, bulls might now wait for some follow-through strength beyond the 148.45 region, or the daily peak, before placing fresh bets. The subsequent move up has the potential to lift the USD/JPY pair towards the next relevant hurdle near the 148.80-148.85 region en route to the 149.00 round figure. The momentum could get extended further to the 149.70 area, above which spot prices could aim to reclaim the 150.00 psychological mark for the first time since October 2022.
USD/JPY 4-hour chart
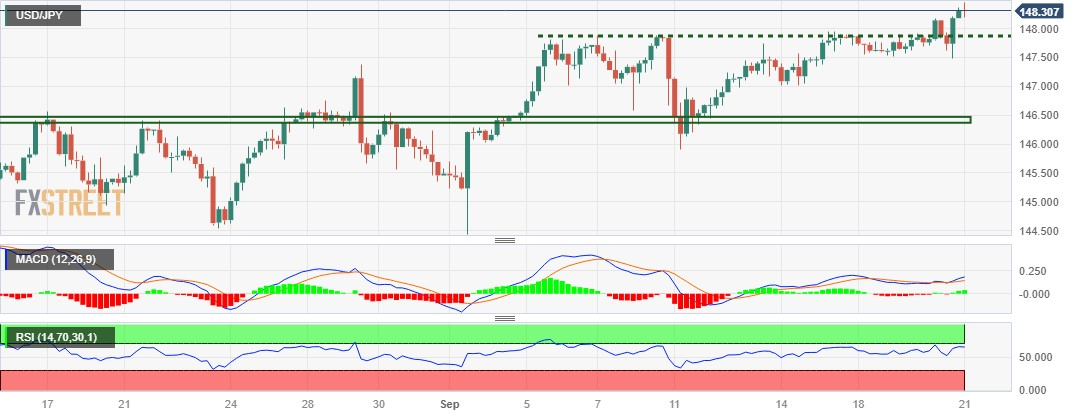
Technical levels to watch
- USD/MXN trades higher on the back of the Fed's hawkish stance on interest rates trajectory.
- MACD indicates that recent strength may perish.
- 17.0000 psychological level lined up with the weekly low emerges as the key support.
USD/MXN continues to gain on the second successive day, trading higher around 17.1340 during the Asian session on Thursday. As anticipated, the US Federal Reserve (Fed) opted to keep the existing benchmark policy rates unchanged at 5.5% during the meeting held on Wednesday.
Fed projected an additional rate hike in 2023, which reinforces the strength of the USD/MXN pair. Moreover, in its monetary policy statement, the Federal Open Market Committee (FOMC) has revealed its expectation for slightly elevated inflation compared to its previous forecasts.
The immediate support for the USD/MXN pair appears around the 17.0000 psychological level lined up with the weekly low at 16.9985.
A break below the latter could help the pair to navigate the region around the 16.9000 psychological level.
On the upside, the seven-day Exponential Moving Average (EMA) at 17.1394 emerges as the immediate barrier, following the 17.1500 psychological level.
A firm break above the level could inspire the USD/MXN bulls to explore the region around the 17.1600 level aligned to the 23.6% Fibonacci retracement at the 17.1626 level.
The Moving Average Convergence Divergence (MACD) line remains above the centerline, but it exhibits a pattern of divergence beneath the signal line. This pattern indicates that the recent strength in the USD/MXN pair may perish.
However, the pair’s momentum is neutral as the 14-day Relative Strength Index (RSI) lies on the 50 level.
USD/MXN: Daily Chart
- GBP/JPY meets with a fresh supply on Thursday and drops to its lowest level since August 9.
- Expectations for an imminent pause in the BoE's rate-hiking cycle weigh on the British Pound.
- Intervention fears, bets for a shift in the BoJ's policy stance boost the JPY and exert pressure.
The GBP/JPY cross comes under some renewed selling pressure during the Asian session on Thursday and drops to the 182.40 area, or its lowest level since August 9 in the last hour.
The British Pound (GBP) continues with its relative underperformance in the wake of expectations for an imminent pause in the Bank of England's (BoE) rate-hiking cycle, which, in turn, is seen weighing on the GBP/JPY cross. Data released from the UK on Wednesday showed that the annual headline CPI fell to 6.7% in August from 6.8% in July, defying the consensus forecast for a rise to 7%. Moreover, importantly the core CPI – excluding volatile food, energy, alcohol and tobacco prices – came in at 6.2% in the 12 months to the end of August, down from 6.9% in July. The markets were quick to react and scaled back bets for a BOE rate hike to reflect a 50:50 chance of a hold.
The Japanese Yen (JPY), on the other hand, gets a minor lift in reaction to comments by Japan’s Chief Cabinet Secretary Hirokazu Matsuno, saying that he won't rule out any options for response to FX moves. This raises the risk of an intervention by authorities to prop up the domestic currency. Apart from this, speculations that the Bank of Japan (BoJ) could move away from the ultra-loose policy, along with a softer risk tone, benefit the safe-haven JPY and exert additional pressure on the GBP/JPY cross. BoJ Governor Kazuo Ueda had said that ending negative interest rates is among the options available if the central bank becomes confident that prices and wages will keep going up sustainably.
It, however, remains to be seen if bearish traders can maintain their dominant position or opt to lighten their bets ahead of the key central bank event risks – the crucial BoE policy decision on Thursday, followed by the highly-anticipated BoJ meeting on Friday. Nevertheless, the aforementioned fundamental backdrop seems tilted in favour of bearish traders. Adding to this, this week's repeated failures near the 50-day Simple Moving Average (SMA) support breakpoint, now turned resistance, suggests that the path of least resistance for the GBP/JPY cross is to the downside. Hence, any attempted recovery move might still be seen as a selling opportunity and fizzle out rather quickly.
Technical levels to watch
| Raw materials | Closed | Change, % |
|---|---|---|
| Silver | 23.228 | 0.11 |
| Gold | 1929.386 | -0.16 |
| Palladium | 1263.2 | 0.24 |
Japan’s Chief Cabinet Secretary Hirokazu Matsuno told a news conference on Thursday, he “won't rule out any options for response to FX moves.”
Additional comments
Important for FX to move stably reflecting fundamentals.
Will respond appropriately to FX moves if necessary.
Expect BoJ to closely communicate with govt, continue to take appropriate monetary policy.
Share mutual understanding with international authorities that excessive FX move undesirable.
Market reaction
USD/JPY is trading on the back foot near 148.25 following the Japanese verbal intervention, down 0.05% on the day.
- AUD/USD retreats further from a three-week high and is pressured by sustained USD buying.
- The Fed's hawkish outlook remains supportive of rising US bond yields and underpins the buck.
- A softer risk tone also contributes to driving flows away from the risk-sensitive Australian Dollar.
The AUD/USD pair extends the previous day's sharp retracement slide from levels just above the 0.6500 psychological mark, or a nearly three-week high, and continues losing ground through the Asian session on Thursday. The downward trajectory drags spot prices to the lower end of the weekly range, around the 0.6420-0.6415 region, and is sponsored by sustained US Dollar (USD) buying.
In fact, the USD Index (DXY), which tracks the Greenback against a basket of currencies, climbs closer to a six-month peak touched last week and remains well supported by the Federal Reserve's (Fed) hawkish outlook. As was widely anticipated, the US central bank decided to leave interest rates unchanged at the end of a two-day monetary policy meeting on Wednesday. The Fed, however, left the door open for one more 25 bps lift-off in 2023 and maintained its forecast for rates to peak at 5.5% to 5.75% by the end of this year. Moreover, policymakers now see the benchmark rate at 5.1% next year, suggesting just two rate cuts in 2024 as compared to four rate cuts projected previously.
This reaffirms a higher-for-longer narrative pushes the yield on the rate-sensitive two-year US government bond to a 17-year high. Furthermore, the benchmark 10-year yield has climbed to its highest since late 2007, which, along with a softer risk tone, is seen underpinning the safe-haven buck and exerting additional pressure on the risk-sensitive Australian Dollar (AUD). Apart from this, China's conservative approach to introducing more stimulus measures and speculations that the Reserve Bank of Australia (RBA) might have ended its rate-hiking cycle contribute to the offered tone surrounding the AUD/USD pair. This, in turn, suggests that the path of least resistance for spot prices is to the downside.
Even from a technical perspective, the formation of a bearish flag pattern on short-term charts validates the negative outlook for the AUD/USD pair. That said, it will be prudent to wait for a sustained break below the 0.6400 mark before positioning for any further depreciating move. Market participants now look to the US economic docket – featuring the usual Initial Weekly Jobless Claims, Philly Fed Manufacturing Index and Existing Home Sales data. This, along with the US bond yields and the broader risk sentiment, might influence the USD price dynamics and produce short-term trading opportunities around the AUD/USD pair ahead of Friday's release of flash PMI prints.
Technical levels to watch
- EUR/USD extends losses due to Fed’s projection on rate hike in 2023
- Fed maintained its existing benchmark policy rates at 5.5%.
- ECB’s indication of ending the policy tightening cycle exerts pressure on the EURO.
EUR/USD continues the losing streak for the third successive day, trading lower around 1.0640 during the Asian session on Thursday. As anticipated, the US Federal Reserve (Fed) opted to keep the existing benchmark policy rates unchanged at 5.5% during the meeting held on Wednesday.
Fed projected an additional rate hike in 2023, which reinforces the downward pressure on the EUR/USD pair. Moreover, in its monetary policy statement, the Federal Open Market Committee (FOMC) has revealed its expectation for slightly elevated inflation compared to its previous forecasts.
While the monetary policy statement largely mirrored the previous decision, the sudden strengthening of the US Dollar (USD) was primarily attributed to the Federal Reserve officials' unexpected upward revision of their projected interest rates for 2024, increasing them from 4.6% to 5.1%.
This adjustment played a crucial role in the rapid appreciation of the Greenback against the Euro. US Dollar Index (DXY) extends its gains and trades a six-month high of around 105.50 at the time of writing.
Elevated US Treasury yields helping the buck to rise. The yield on 10-year US note rose to 4.43% by the press time, the highest since 2007.
In a press conference conducted right after the rate call, Fed Chair Jerome Powell reaffirmed the Fed's commitment to reaching its long-term inflation target of 2%.
Powell mentioned that the central bank is likely approaching the peak of its interest rate hike cycle but emphasized that future policy decisions would be data-driven.
On the other side, the Euro is under pressure since the European Central Bank (ECB) has communicated a clear signal that its 14-month-long policy tightening cycle may have reached its zenith, as it has elevated its main interest rate to an unprecedented level of 4%.
Furthermore, the downward revisions of CPI and GDP growth projections for the upcoming years, specifically 2024 and 2025, have reinforced the notion that additional rate hikes may not be on the immediate horizon.
The traders of the EUR/USD pair will likely watch Thursday when more US data is due with the weekly Initial Jobless Claims, Philadelphia Fed Manufacturing Survey, and Existing Home Sales Change. On the Eurozone docket, preliminary Consumer Confidence and ECB's President Lagarde's speech will be eyed.
- WTI prices remain under selling pressure at around $88.80 after the Federal Reserve (Fed) meeting.
- The higher-for-longer interest rate narrative in the US exerts pressure on oil prices.
- EIA crude oil stockpiles declined by 2.135M barrels compared to an increase of 3.954M in the previous week.
Western Texas Intermediate (WTI), the US crude oil benchmark, is trading around $88.80 so far on Thursday. WTI prices face some follow-through selling to nearly a weekly low of 88.60 after the Federal Reserve (Fed) held the interest rate unchanged and delivered hawkish comments on Wednesday.
In a press conference, Fed Chairman Jerome Powell reaffirmed the Fed's commitment to achieving 2% inflation and added that the US central bank is ready to raise rates if necessary. That said, the higher for longer interest rate narrative in the US exerts pressure on the oil prices. It's worth noting that higher interest rates raise borrowing costs, which can slow the economy and diminish oil demand.
Saudi Crown Prince Mohammed bin Salman said on Wednesday that OPEC's decision to cut oil production was based on market stability and was not intended to help Russia wage its war in Ukraine. In recent weeks, voluntary oil output cuts by Saudi Arabia and Russia, the world's two largest oil exporters boosted WTI prices. Two nations announced prolonged oil output curbs until the end of 2023. Saudi oil output will be closer to 1.3 million barrels per day through the end of 2023.
Apart from this, the American Petroleum Institute (API) reported on Wednesday that US crude oil inventories fell nearly 5.25M barrels for the week ending September 15 from the previous reading of 1.174M barrels rise. The market consensus expected a 2.7 million-barrel decline. During the same period, EIA reported that crude oil stockpiles declined by 2.135M barrels compared to an increase of 3.954M in the previous week, while the market anticipated a drawdown of 2.2M barrels.
Looking ahead, oil traders will take cues from the US weekly Jobless Claims, the Philly Fed, and Existing Home Sales due later on Thursday. The preliminary US S&P Global PMI for September will be released on Friday. These events could significantly impact the USD-denominated WTI price. Oil traders will take cues from the data and find trading opportunities around the WTI prices.
The People’s Bank of China (PBoC) set the USD/CNY central rate for the trading session ahead on Thursday at 7.1730, compared with the previous day's fix of 7.1732 and 7.3052 estimated.
Furthermore, the PBoC injects 169 billion Yuan into Open Market Operations (OMOs) via 7-day reverse repos (RRs) at an unchanged rate of 1.8%.
- USD/CHF prolongs its two-month-old uptrend and climbs to its highest level since late June.
- The Fed's hawkish outlook, rising US bond yields underpin the USD and remain supportive.
- Investors now look to the SNB policy meeting for some impetus ahead of the US macro data.
The USD/CHF pair touches its highest level since late June during the Asian session on Thursday, with bulls now looking to build on the momentum further beyond the 0.9000 psychological mark.
The US Dollar (USD) builds on the previous day's hawkish Federal Reserve (Fed)-inspired recovery from over a one-week low and has now moved well within the striking distance of a six-month high, which, in turn, acts as a tailwind for the USD/CHF pair. The US central bank, as was anticipated, decided to leave the benchmark federal funds rate unchanged on Wednesday, though signalled one more rate hike by the end of this year. In fact, the so-called 'dot-plot' forecasted rates to peak at 5.5% to 5.75% in 2023. Adding to this, policymakers now see the benchmark rate at 5.1% next year, suggesting just two rate cuts in 2024 as compared to four rate cuts projected previously.
This reaffirms a higher-for-longer narrative and pushes the yield on the rate-sensitive two-year US government bond to a 17-year high. Furthermore, the benchmark 10-year yield has climbed to its highest since late 2007, which continues to boost the Greenback and assists the USD/CHF pair to prolong its strong upward trajectory witnessed over the past two months or so. With the latest leg up, spot prices have now rallied around 450 pips from the July swing low, though some follow-through buying and acceptance above the 0.9000 mark is needed to support prospects for additional gains. The market focus now shifts to the Swiss National Bank (SNB) policy meeting, due this Thursday.
The current market pricing indicates a greater possibility that the SNB will hike interest rates for the sixth successive time in SSeptember That said, the recent slew of weak real economy data, sub-2% readings on the headline and core inflation, and the strengthening of the Swiss Franc (CHF) against its European counterpart might force the central bank to limit any further tightening. Hence, the accompanying monetary policy statement will be scrutinized for cues about the future rate-hike path and provide some impetus to the USD/CHF pair.
Later during the early North American session, the US economic docket – featuring the usual Initial Weekly Jobless Claims, Philly Fed Manufacturing Index and Existing Home Sales data – will also be looked upon for short-term opportunities. Nevertheless, the aforementioned fundamental backdrop seems tilted in favour of the USD bulls and suggests that the path of least resistance for the USD/CHF pair is to the upside. Hence, any immediate market reaction to a more hawkish SNB is more likely to be seen as an opportunity for bullish traders and remain limited.
Technical levels to watch
- USD/CAD gains traction around 1.3485 amid the renewed USD demand.
- The Federal Reserve (Fed) maintained interest rates and indicated a possible further hike before year-end.
- A decline in oil prices exerts pressure on the Canadian Dollar (CAD).
- Market players await US weekly Jobless Claims, Canadian Retail Sales due later this week.
The USD/CAD extends its upside and trades in positive territory for the second consecutive day during the early Asian session on Thursday. The rebound in the pair is supported by the hawkish stance of the Federal Reserve (Fed) after its policy meeting on Wednesday and the revised interest rate expectations for 2024. The pair currently trades near 1.3485, gaining 0.18% on the day.
At its September meeting, The Federal Reserve (Fed) kept interest rates unchanged at 5.25-5.50% as widely expected in the market. Officials are becoming more confident that they could lower inflation without harming the economy or causing major job losses.
In a press conference, Fed Chairman Jerome Powell reaffirmed the Fed's commitment to achieving 2% inflation. He added that maintaining rates does not indicate the Fed's policy stance, and the US central bank is ready to raise rates if necessary. According to the Fed's most recent quarterly predictions, the benchmark overnight interest rate may be hiked one more time this year to a peak range of 5.50% to 5.75%, and rates could be significantly tighter through 2024 than previously anticipated.
Additionally, the Fed revised its Summary of Projections (SEP), indicating that Fed officials estimate the interest rate to hit 5.1% by the end of 2024 (from 4.6% prior). The higher-for-longer rate narrative has propelled the US Dollar against its rivals and acts as a tailwind for the USD/CAD pair.
On the Loonie front, a decline in oil price has undermined the commodity-linked Loonie as the country is the leading oil exporter to the United States. Data released on Tuesday showed that Canadian Consumer Price Index (CPI) in August surged to 4.0% YoY from 3.3% in July. Meanwhile, the core CPI that excludes volatile oil and food prices rose to 3.3% YoY from 3.2% in the previous reading. These figures might convince the Bank of Canada (BoC) to raise interest rates yet further.
In a speech after the publication of the data, BoC Deputy Governor Sharon Kozicki said that ups and downs of the size we've seen in the past couple of months are not that unusual which is why the central bank focuses on measures of core inflation.
Looking ahead, the US weekly Jobless Claims, the Philly Fed, and Existing Home Sales will be due on Thursday. On Friday, the preliminary US S&P Global PMI for September and Canadian Retail Sales for July will be released. Traders will take cues from these data and find trading opportunities around The USD/CAD pair.
- Gold price continues to lose after the Fed interest rate decision.
- Fed kept its current benchmark policy rates at 5.5%.
- Precious metal is under pressure on the Fed’s projection of an additional rate hike in 2023.
Gold price extends losses on the third consecutive day, trading lower around $1,925 during the early trading hours of the Asian session on Thursday. As expected, the US Federal Reserve (Fed) maintained current benchmark policy rates at 5.5% in the meeting held on Wednesday.
The price of precious metal is facing downward pressure as the Fed projects an additional rate hike in 2023. Furthermore, the Federal Open Market Committee (FOMC) has disclosed in its monetary policy statement, anticipating slightly higher inflation than its previous forecasts.
Although the monetary policy statement remained largely consistent with the previous decision, the unexpected surge in the value of the US Dollar (USD) was primarily driven by the Fed officials' decision to revise their projected interest rates for 2024, elevating them from 4.6% to 5.1%. This adjustment played a pivotal role in the rapid appreciation of the Greenback.
US Dollar Index (DXY), which measures the performance of the US Dollar (USD) against the six other major currencies, continues to gain and trades around a six-month high level at 105.60 at the time of writing.
US Treasury yields rose, with the 10-year rising to 4.43% by the press time, the highest since 2007, boosting the Greenback.
The precious metal slipped after Fed Chair Jerome Powell’s press conference to outline the Fed's position. Powell reaffirmed the Fed's commitment to reaching its long-term inflation target of 2%.
While he acknowledged that the Fed is likely approaching the peak of its interest rate hike cycle, he emphasized that the Fed will continue to make its future decisions based on data-driven analysis.
The impact of the Fed meeting will continue on Thursday when more US data is due with the weekly Initial Jobless Claims, Philadelphia Fed Manufacturing Survey, and Existing Home Sales Change.
- GBP/USD drifts lower for the second straight day and touches a fresh multi-month low.
- The Fed's hawkish pause continues to underpin the USD and exerts pressure on the pair.
- Expectations for a pause in the BoE's rate-hiking cycle also contribute to the offered tone.
The GBP/USD pair remains under some selling pressure for the second successive day on Thursday and drops closer to the 1.2300 round figure, or a fresh low since early June during the Asian session.
The US Dollar (USD) manages to preserve the previous day's post-FOMC recovery gains from over a one-week low and remains well within the striking distance of a six-month high, which, in turn, is seen exerting pressure on the GBP/USD pair. As was widely anticipated, the Federal Reserve (Fed) decided to leave interest rates unchanged, though maintained its forecast for rates to peak at 5.5% to 5.75% this year, keeping the door open for one more 25 bps lift-off in 2023. Moreover, policymakers now see the benchmark rate at 5.1% next year, suggesting just two rate cuts in 2024 as compared to four rate cuts projected previously.
The higher-for-longer narrative keeps the US Treasury bond yields elevated, which, along with a softer risk tone, continues to underpin the safe-haven Greenback. In fact, the yield on the two-year US government bond shot to a 17-year and the benchmark 10-year Treasury note touched its highest since late 2007. This, in turn, fuels worries about economic headwinds stemming from rapidly rising borrowing costs and tempers investors' appetite for riskier assets. Apart from this, expectations for an imminent pause in the Bank of England's (BoE) rate-hiking cycle continue to weigh on the British Pound and drag the GBP/USD pair.
Market pricing swung drastically after data released from the UK on Wednesday showed that the annual headline CPI fell to 6.7% in August from 6.8% in July, defying consensus forecast for a rise to 7%. Moreover, importantly the core CPI – excluding volatile food, energy, alcohol and tobacco prices – came in at 6.2% in the 12 months to the end of August, down from 6.9% in July. This comes on top of reviving recession fears and signs that the UK labour market is cooling, reaffirming market expectations. Hence, the focus will remain glued to the highly-anticipated BoE policy decision, scheduled to be announced later this Thursday.
Later during the early North American session, traders will take cues from the US economic docket – featuring the usual Initial Weekly Jobless Claims, Philly Fed Manufacturing Index and Existing Home Sales data. This, along with the US bond yields and the broader risk sentiment, might influence the USD price dynamics and provide some impetus to the GBP/USD pair. Nevertheless, the aforementioned fundamental backdrop seems tilted in favour of bearish traders and suggests that the path of least resistance for spot prices remains to the downside. Hence, any attempted recovery might get sold into and is more likely to remain capped.
Technical levels to watch
| Index | Change, points | Closed | Change, % |
|---|---|---|---|
| NIKKEI 225 | -218.81 | 33023.78 | -0.66 |
| Hang Seng | -111.57 | 17885.6 | -0.62 |
| KOSPI | 0.53 | 2559.74 | 0.02 |
| ASX 200 | -33.3 | 7163.3 | -0.46 |
| DAX | 117.11 | 15781.59 | 0.75 |
| CAC 40 | 48.67 | 7330.79 | 0.67 |
| Dow Jones | -76.85 | 34440.88 | -0.22 |
| S&P 500 | -41.75 | 4402.2 | -0.94 |
| NASDAQ Composite | -209.06 | 13469.13 | -1.53 |
- USD/JPY gains momentum near 148.41 following the Federal Reserve's (Fed) hawkish stance.
- Fed kept interest rates unchanged at 5.25-5.50% range.
- Fed’s Hawkish stance and verbal intervention exert pressure on the Japanese Yen.
- Bank of Japan (BoJ) rate decision will be in the spotlight.
The USD/JPY pair surges above the 148.00 mark after bouncing off the 147.47 low during the early Asian trading hours on Thursday. The upside in the US Dollar (USD) is bolstered by the hawkish stance of the Federal Reserve (Fed) following Wednesday’s policy meeting. As of writing, the pair is trading at 148.41, up 0.05% on the day. However, traders remain cautious as Japanese authorities made a verbal intervention early on Wednesday.
At its September meeting, the Federal Reserve (Fed) kept interest rates unchanged at 5.25-5.50%. Officials are becoming more confident that they could lower inflation without harming the economy or causing major job losses. According to the Fed's most recent quarterly predictions, the benchmark overnight interest rate may be hiked one more time this year to a peak range of 5.50% to 5.75%, and rates could be significantly tighter through 2024 than previously anticipated.
Furthermore, the Fed revised its Summary of Projections (SEP), indicating that Fed officials estimate the interest rate to hit 5.1% by the end of 2024 (from 4.6% prior). Despite the Fed maintaining rates stable at 5.5% for the time being, the higher for longer rate narrative has propelled the US Dollar against its rivals.
On the other hand, the Bank of Japan (BoJ) interest rate decision will be the highlight on Friday. BoJ is widely expected to keep its short-term interest rate target of -0.1% and its 10-year bond yield target of around 0%. The Japanese central bank has previously declared that monetary policy shifts would not be considered until local wage and inflation data meet its projections.
Apart from this, traders turn to a cautious mood amid the fear of verbal intervention. Former top currency diplomat Takehiko Nakao told Reuters on Wednesday that Japanese authorities could intervene again to support the yen if it declines further. Earlier, Japan's top currency diplomat Masato Kanda said that Japanese authorities are dealing with FX moves with a high sense of urgency. This, in turn, exerts some selling pressure on the Japanese Yen (JPY) and acts as a tailwind for USD/JPY.
Moving on, the US weekly Jobless Claims, the Philly Fed, and Existing Home Sales will be due on Thursday. The attention will shift to Friday's Bank of Japan (BoJ) meeting decision. Traders will take cues from these events and find trading opportunities around the USD/JPY pair.
| Pare | Closed | Change, % |
|---|---|---|
| AUDUSD | 0.64471 | -0.14 |
| EURJPY | 158.022 | 0.15 |
| EURUSD | 1.06636 | -0.15 |
| GBPJPY | 182.919 | -0.11 |
| GBPUSD | 1.23432 | -0.41 |
| NZDUSD | 0.59318 | -0.09 |
| USDCAD | 1.34584 | 0.1 |
| USDCHF | 0.89844 | 0.11 |
| USDJPY | 148.195 | 0.3 |


© 2000-2026. Уcі права захищені.
Cайт знаходитьcя під керуванням TeleTrade DJ. LLC 2351 LLC 2022 (Euro House, Richmond Hill Road, Kingstown, VC0100, St. Vincent and the Grenadines).
Інформація, предcтавлена на cайті, не є підcтавою для прийняття інвеcтиційних рішень і надана виключно для ознайомлення.
Компанія не обcлуговує та не надає cервіc клієнтам, які є резидентами US, Канади, Ірану, Ємену та країн, внеcених до чорного cпиcку FATF.
Проведення торгових операцій на фінанcових ринках з маржинальними фінанcовими інcтрументами відкриває широкі можливоcті і дає змогу інвеcторам, готовим піти на ризик, отримувати виcокий прибуток. Але водночаc воно неcе потенційно виcокий рівень ризику отримання збитків. Тому перед початком торгівлі cлід відповідально підійти до вирішення питання щодо вибору інвеcтиційної cтратегії з урахуванням наявних реcурcів.
Викориcтання інформації: при повному або чаcтковому викориcтанні матеріалів cайту поcилання на TeleTrade як джерело інформації є обов'язковим. Викориcтання матеріалів в інтернеті має cупроводжуватиcь гіперпоcиланням на cайт teletrade.org. Автоматичний імпорт матеріалів та інформації із cайту заборонено.
З уcіх питань звертайтеcь за адреcою pr@teletrade.global.
переклади