- Analytics
- News and Tools
- Market News
Новини ринків
- US Dollar Index stays pressured for the second consecutive day after reversing from 10-week high on Friday.
- US Treasury bond yields jump to late 2007 high as market players sell government securities amid mixed mood.
- Market’s consolidation ahead of Jackson Hole Symposium, China concerns prod DXY bulls.
- US data, second-ranked Fed officials’ speeches will entertain intraday traders of Greenback.
US Dollar Index (DXY) remains depressed around 103.30 as it renews the intraday low while keeping the week-start pessimism during the early hours of Tuesday’s Asian session. In doing so, the Greenback’s gauge versus the six major currencies ignores the strong US Treasury bond yields amid the market’s mixed sentiment ahead of this week’s top-tier data/events.
That said, the US 10-year Treasury bond yields rose to the highest level since 2007, to around 4.354% before ending Monday’s trading day near 4.34%.
Apart from the pre-Jackson Hole consolidation, the DXY traders also justify China’s efforts to defend the post-COVID economic recovery via a slew of stimulus measures, as well as the receding recession fears across the board.
Additionally, the Federal Reserve Bank of New York unveiled its SCE Labor Market Survey results late Monday that suggested record wage expectations and could have prod the DXY bears. “The Lowest wage respondents would be willing to accept for a new job jumped to a record high of $78,645 in July, up from $72.873 a year ago,” said the findings.
It should be observed that the previous week’s mostly upbeat United States data prod the Federal Reserve (Fed) doves and put a floor under the US Dollar Index. However, some of the top-tier US banks appear struggling to confirm Fed Chair Jerome Powell’s hawkish move at Jackson Hole. That said, Goldman Sachs expects Fed Chair Powell to sound defensive during the annual event of the central bankers but the Bank of America (BofA) expects Fed’s Powell to push back against the rate cut expectations.
During the last week, upbeat activity and wage growth numbers joined hawkish Fed Minutes to enable the US Dollar Index (DXY) to print a fifth weekly run-up. The same also challenged the previous policy pivot concerns and escalate the market’s anxiety before this week’s central bankers’ speeches at the Kansas Fed’s annual event.
Moving on, the US Existing Home Sales for July and Richmond Fed Manufacturing Index for August will join speeches from the mid-ties Federal Reserve (Fed) officials to direct intraday DXY moves. However, major attention will be given to Friday’s Fed Chair Jerome Powell’s speech at the Jackson Hole Symposium amid indecision about the US central bank's next moves.
Technical analysis
A one-month-old rising wedge bearish chart formation, currently between 104.00 and 103.20, joins nearly overbought RSI (14) line to challenge the USD/JPY buyers.
- USD/CAD trades below the mid-1.3500s amid the weakening of the USD.
- The stronger US data strengthen the case for another rate hike by the Federal Reserve (Fed).
- A decline in oil prices undermines the Canadian Dollar.
- Market participants await the monthly Canadian Retail Sales, Federal Reserve (Fed) Chair Jerome Powell’s speech.
The USD/CAD pair faces some follow-through selling in the early Asian session on Tuesday. The major pair currently trades near 1.3542, losing 0.01% on the day. In the meantime, the US Dollar (USD) loses momentum and trades sideways around 103.30. Investors await Thursday's Jackson Hole Economic Symposium for fresh impetus.
The stronger US Retail Sales and robust labor data strengthen the case for another interest rate rise by the Federal Reserve (Fed). FOMC Minutes emphasized last week that inflation remained unacceptably high and additional monetary policy tightening may be required to bring inflation to the target. Investors raise their bet that Federal Reserve (Fed) will prolong the tightening cycle, which boosts the US 10-year Treasury bond yields to 4.342%. The Fed's Jackson Hole conference will be in the spotlight this week. A hawkish tone from Fed Chairman Jerome Powell might lift the US Dollar (USD). Market participants are placing bets on a 40% likelihood of a last Fed rise by November, according to Reuters.
On the Canadian Dollar front, a decline in oil prices undermines the Canadian Dollar since Canada is the largest oil exporter to the United States. Furthermore, Canada’s 5-year yield increased to 4.143%, over a decade high. Markets believe that the Bank of Canada (BoC) would maintain current interest rate policies for a longer period. It’s worth noting that BoC raised its interest rate by 25 basis points (bps) to 5% in its July meeting.
Market participants await the monthly Canadian Retail Sales for June due on Wednesday. On the US docket, US Existing Home Sales, S&P Global PMIs, Initial Jobless Claims, and Durable Good Orders will be released later this week. The key event will be Fed Chair Jerome Powell’s speech on Friday and it will be critical for determining a clear movement for the USD/CAD pair.
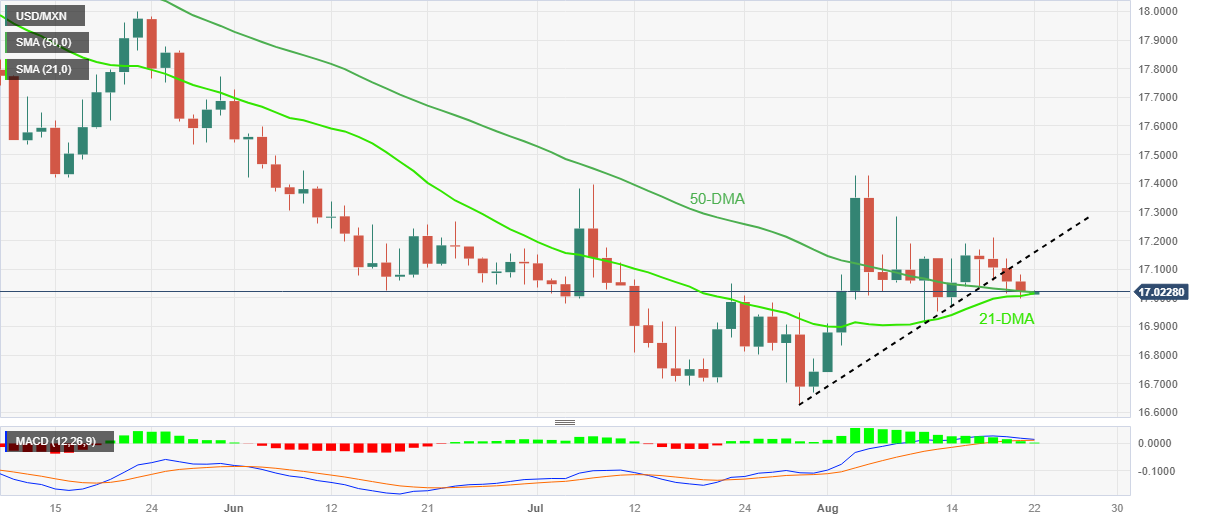
- USD/MXN remains sidelined at one-week low after declining in the last four consecutive days.
- Key DMA confluence prods technical support break and restricts immediate Mexican Peso advances.
- Mexican economy minister Raquel Buenrostro defends decree on genetically modified (GM) corn.
USD/MXN bears take a breather around 17.00, positing the first daily positive in five amid concerns about the US–Mexico trade disputes. That said, the Mexican Peso’s latest tension erupts on comments from Mexican Economy Minister Raquel Buenrostro.
Late Monday, Mexico’s Buenrostro refrained from altering the decree on genetically modified (GM) corn ahead of a dispute settlement panel requested by the United States through the USMCA trade pact, per Reuters.
The news cites the US-Mexico tension that ignited after the US objected to the restrictions imposed by Mexico on imports of GM corn and requested a dispute settlement panel under the North American trade pact.
With this, the USD/MXN traders also take clues from the cautious markets and a light calendar to allow the Mexican Peso (MXN) in paring the latest gains amid sluggish markets.
Also read: USD/MXN sees uptick amid China’s economic concerns, ahead Powell’s Jackson Hole speech
Technical analysis
USD/MXN bears struggle to keep the reins as a convergence of the 50-DMA and the 21-DMA, around 17.00 puts a floor under the Mexican Peso (MXN) pair.
However, the previous week’s downside break of an ascending trend line from July 28 joins an impending bear cross on the MACD to lure the USD/MXN pair sellers.
With this, the Mexican Peso buyers can aim for 16.80 and 16.70 levels toward the south on breaking the 17.00 hurdle. However, the latest multi-year low marked in July around 16.62 will challenge the USD/MXN pair sellers afterward.
On the contrary, the quote’s recovery remains elusive unless crossing the previous support, around 17.15 by the press time.
Following that, the monthly high of around 17.42 will act as the final defense of the USD/MXN bears.
Mexican Peso Price: Daily chart
Trend: Further downside expected
Overseas investors sold the most Japanese Government Bonds (JGBs) in six months, by 1.35 trillion Yen ($9.26 billion) more, in July per the latest Japan Securities Dealers Association numbers conveyed by Nikkei Asia on early Tuesday. The news also stated the previous monthly figures as showing the net purchase of JGBs of 1.51 trillion Yen.
While tracing the catalysts, the news also highlights the market’s fears of the Bank of Japan’s (BoJ) policy tweak, after altering the band for the Yield Curve Control (YCC) from 0.50% to 1.0%.
“The contingent sold a net 292 billion yen in JGBs with longer maturities such as 20-year bonds, and purchased a net 299 billion yen worth of medium-term two- and five-year JGBs, significantly less than in June,” said Nikkei Asia.
Also read: USD/JPY jumps above 146.00 following PBoC's unexpected rate cut
- GBP/USD edges higher after posting the first weekly gain in five.
- UK’s opposition Labour Party forecasts the lowest growth among G7 countries.
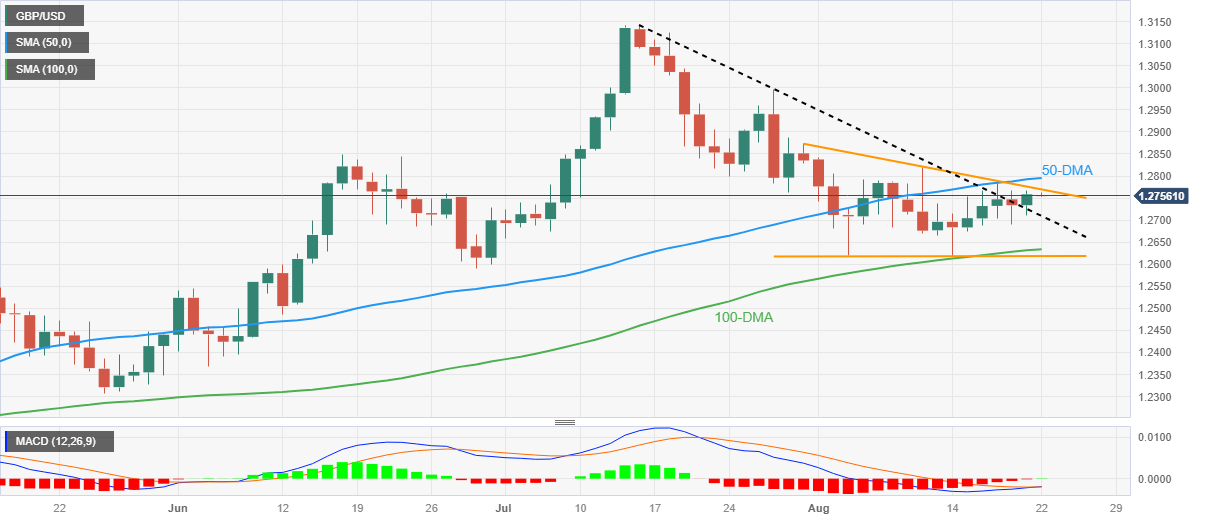
- Bullish triangle formation, looming bull cross on MACD lure Cable buyers.
- 50-DMA, cautious markets challenge Pound Sterling optimists.
GBP/USD seesaws around 1.2755-60 as bulls hit barriers during early Tuesday in Asia, snapping a four-week downtrend, as well as posting a firmer start of the week.
The Guardian came out with the news quoting Britain’s opposition Labour Party leader Keir Starmer to mention that UK growth is forecast to be slowest in the Group of Seven Nations (G7). The news also cites the opposition party terming the British economy as stuck in a low-growth trap.
Apart from that, the market’s cautious mood ahead of this week’s top-tier central bankers’ speeches at the Jackson Hole Symposium also prods the GBP/USD buyers.
However, a three-week-old bullish triangle formation and an impending bull cross on the MACD lure the GBP/USD pair buyers after it managed to cross the five-week-old descending resistance line, now immediate support near 1.2700, the last week.
That said, the stated triangle’s top line, around 1.2770 by the press time, restricts the immediate upside of the Pound Sterling ahead of the 50-DMA level of 1.2800.
Following that, June’s peak of around 1.2850 and the late July swing high near 1.2870 may test the Cable buyers before giving them control.
On the contrary, a downside break of the resistance-turned-support surrounding 1.2700 will defy the bullish bias and may drag the GBP/USD price toward the 100-DMA support of near 1.2630.
Even so, the Pound Sterling bears will remain cautious unless witnessing a daily closing below the aforementioned triangle’s bottom line, close to 1.2615 by the press time.
GBP/USD: Daily chart
Trend: Further upside expected
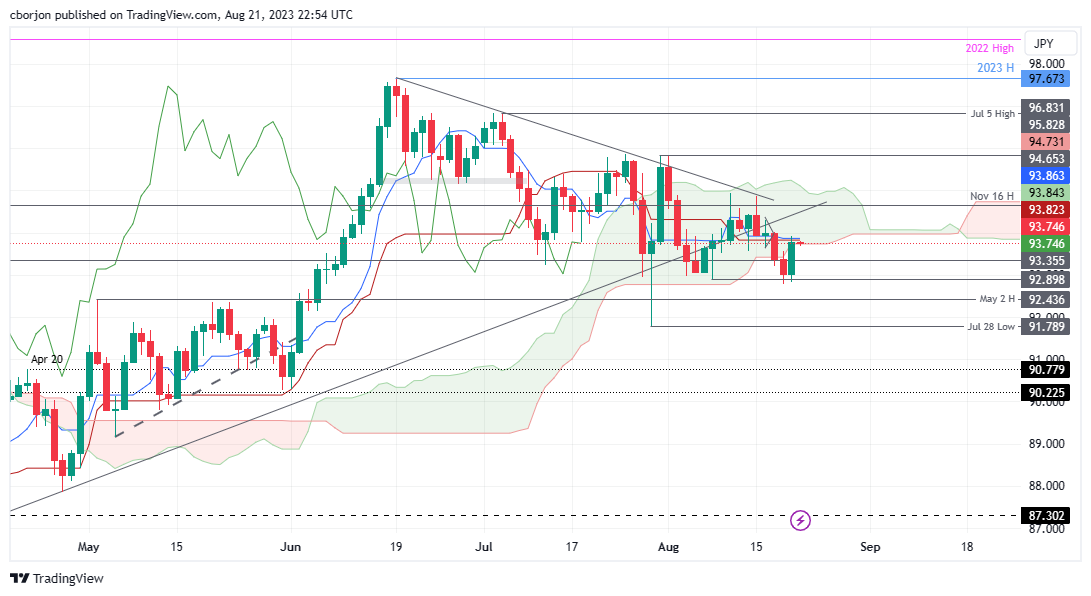
- AUD/JPY gains 0.81% on Monday, trading at 93.77, within the Ichimoku Cloud.
- A breach above these levels could target the July 18 high of 94.78 and the pivotal 95.00 mark.
- On the downside, support is seen at 93.50, with further declines potentially targeting last week’s low of 92.79.
The AUD/JPY hovers at around 93.77, following Monday’s session that depicted the cross-currency pair registered gains of 0.81%, lifting the exchange rate inside the Ichimokuy Cloud (Kumo). Despite that, the AUD/JPY must reclaim the 94.93 mark so the pair could shift bullish.
AUD/JPY Price Analysis: Technical outlook
From a technical perspective, the AUD/JPY remains neutral to downward biased unless the pair clears technical resistance levels like the Kijun and Tenkan-Sen lines, each at 93.86 93.82. Once those levels are cleared, the next stop would be the July 18 high at 94.78 before breaching the top of the Kumo at around the 95.00 figure.
Conversely, if AUD/JPY achieves a daily close below the Kumo, first support would emerge at 93.50. Once cleared, sellers could step in and drive the AUD/JPY exchange rate towards the last week’s low of 92.79 before extending the AUD/JPY’s fall to the July 28 daily low of 91.79.
AUD/JPY Price Action – Daily chart
- USD/CHF loses some ground near 0.8755, up 0.01% on the day.
- Market players anticipate Federal Reserve (Fed) will prolong the tightening cycle.
- The Swiss franc benefits from the risk-aversion amid the fear of an economic slowdown in China.
- Investors await the Swiss Trade data with the key focus on Federal Reserve (Fed) Chair Jerome Powell’s speech on Friday.
The USD/CHF pair loses momentum and holds below the 0.8800 mark in the early Asian session on Tuesday. Meanwhile, the US Dollar Index (DXY), a measure of the value of USD against six other major currencies, struggles to gain and hovers around 103.32.
The prevailing cautious stance is bolstered by the rise of US Treasury bond yields as market players anticipate Federal Reserve (Fed) will prolong the tightening cycle. The US 10-year Treasury bond yield climbs to 4.342% and is close to the highest level of 2007.
Investors raise their bets on additional rate hike by the Federal Reserve (Fed) despite the robust labor data and weaker inflation data. Federal Reserve (Fed) Chairman Jerome Powell Speaks on Friday will be a guide for investors and could provide insights into economic conditions. A hawkish tone might lift the US Dollar (USD) and acts as a tailwind for the USD/CHF pair.
On the other hand, the Swiss franc benefits from the risk-aversion amid the fear of a deteriorating property downturn, sluggish consumer spending, and falling credit growth in China. On Monday, the People's Bank of China (PBoC) slashed its Loan Prime Rate (LPR) for one year by a smaller margin than anticipated. Chinese central bank decided to cut the one-year Loan Prime Rate (LPR) by 10 basis points (bps) to 3.45% from 3.55% and maintained the five-year LPR unchanged at 4.2%.
The economic recovery in China has lost momentum and put pressure on authorities to release more fiscal stimulus plans. The lack of stimulus measures could boost the CHF against its rivals.
Looking ahead, traders await the Swiss Trade data due later on Tuesday. Also, the US Existing Home Sales, S&P Global PMIs, Initial Jobless Claims, and Durable Good Orders will be released later this week. The key event will be Fed Chair Jerome Powell’s speech on Friday.
- EUR/USD edges higher after bouncing off six-week low with the biggest daily gains in a fortnight.
- Euro bears run out of steam despite downbeat German data, 15-year high US Treasury bond yields.
- Market braces for this week’s top-tier US data, Jackson Hole speeches amid light calendar.
- Fed talks, second-tier US data can direct intraday moves ahead of PMI, Durable Goods.
EUR/USD holds onto the week-start corrective bounce while edging higher to 1.0900 amid Tuesday’s Asian session as the US Dollar fails to cheer upbeat yields and expectations of higher wages.
Euro rose the most in two weeks the previous day while extending the late Friday’s rebound from the lowest level since early July as the US Dollar Index (DXY) dropped despite the 15-year high US Treasury bond yields. In doing so, the major currency pair also ignored downbeat German Producer Price Index (PPI) data and the recently upbeat expectations of witnessing higher wages in the US. The reason could be linked to the market’s anxiety ahead of this week’s top-tier central bankers’ speeches at the Jackson Hole Symposium.
On Monday, German Producer Price Index (PPI) for July dropped to -1.1% MoM and -6.0% YoY from -0.3% prior and 0.1% YoY respectively priors. Following the data, Germany’s Bundesbank released its monthly report stating that the inflation could persist above the central bank’s target for longer while the German growth may remain flat in the third quarter (Q3) of 2023.
Recently, the Federal Reserve Bank of New York's unveiled its SCE Labor Market Survey results suggesting record wage expectations. “The Lowest wage respondents would be willing to accept for a new job jumped to a record high of $78,645 in July, up from $72.873 a year ago,” said the findings.
Amid these plays, Wall Street closed mixed but the US 10-year Treasury bond yields rose to the highest level since 2007, to around 4.354% before ending Monday’s trading day near 4.34%.
Apart from the pre-Jackson Hole consolidation, the EUR/USD traders should have also justified China’s efforts to defend the post-COVID economic recovery via a slew of stimulus measures, as well as the receding recession fears in the bloc.
Looking forward, the US Existing Home Sales for July and Richmond Fed Manufacturing Index for August will join speeches from the mid-ties Federal Reserve (Fed) officials, not to forget the Eurozone Current Account for June, to entertain EUR/USD traders. However, major attention will be given to Friday’s Fed Chair Jerome Powell’s speech at the Jackson Hole Symposium amid indecision about the US central bank's next moves.
Technical analysis
A daily closing beyond the 100-DMA resistance of around 1.0930 becomes necessary for the EUR/USD buyers to retake control.
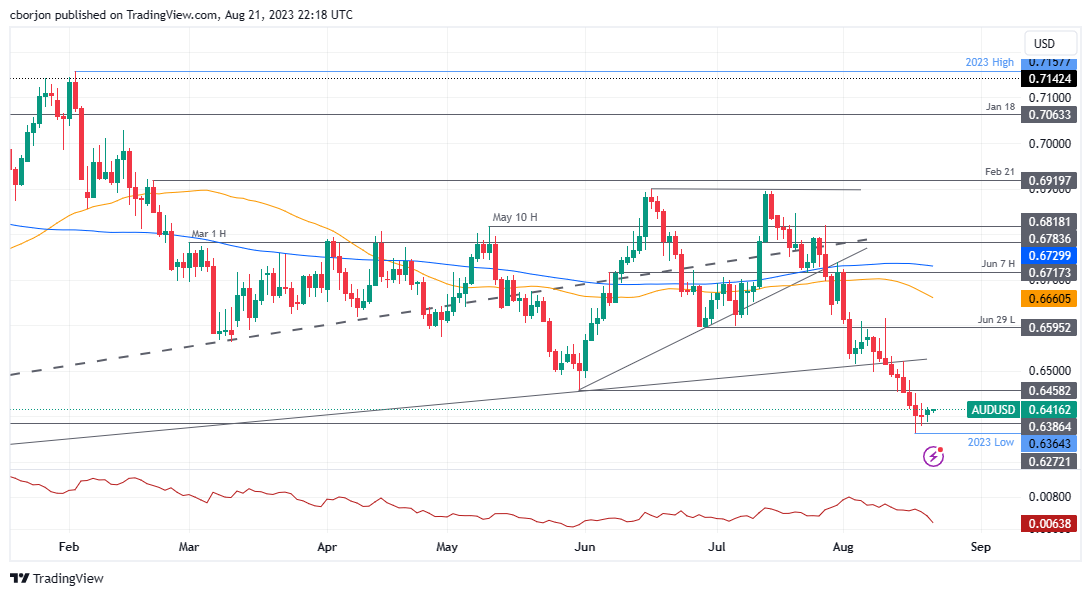
- AUD/USD gained 0.19% on Monday, with a slight dip in Tuesday’s session, trading at 0.6410.
- China’s PboC rate cut and urging for increased loans signal efforts to bolster the slowing economy.
- Jerome Powell’s upcoming speech could influence the pair’s trajectory, with a dovish tone potentially favoring AUD/USD.
- Technicals hint at a potential upside, with key resistance levels at 0.6429, 0.6500, and 0.6550 in focus.
AUD/USD registered minuscule losses on Tuesday but finished Monday’s session on the green, gained 0.19% but remained within familiar levels as traders await the US Federal Reserve Chair Jerome Powell’s speech. The AUD/USD is trading at 0.6410, down 0.05%, as Tuesday’s Asian session begins.
Risk appetite sees a boost from China's rate cut, but traders remain cautious as they await insights from the Fed Chair
Risk appetite improvement bolstered the Australian Dollar (AUD) against the US Dollar (USD). Monday’s Asian session developments, like the People’s Bank of China (PboC) slashing its one-year Loan Prime Rate (LPR) from 3.55% to 3.45%, amidst an ongoing economic slowdown. In fact, central bank officials and government regulators suggested that Chinese banks will need to boost loans to support China’s recovery.
In the meantime, global bond yields advanced, with the 10-year US Treasury bond yields climbing to a new six-year high, as investors position themselves ahead of the August 25 Jerome Powell speech, widely expected by market players. Analysts expect Powell to reinforce the Fed’s commitment to tame inflation while keeping all his options open regarding monetary policy. Nevertheless, if he strikes a dovish tone, that would pave the way for further AUD/USD upside in the back of a softer US Dollar, as Australia’s finished its hiking cycle.
Interest rates expectations
Money market futures see the Reserve Bank of Australia (RBA) keeping rates unchanged, though there’s a 15 basis point repricing for March 2024. On the Federal Reserve front, traders priced in 11 basis points of interest rate increases for November’s monetary policy meeting.
Upcoming economic data would help AUD/USD traders assess economic conditions in both countries. The Australian economic agenda would feature PMIs, alongside Building Permits and Inflation for July. Upticks on inflation would open the door for a possible rate hike. On the US front, the docket would feature Existing Home Sales, Fed speakers, New Home Sales, S&P Global PMIs, Jobless Claims, Durable Good Orders, and Fed Chair Jerome Powell’s speech on Friday.
AUD/USD Price Analysis: Technical outlook
After forming a double top, the AUD/USD has extended its losses, though back-to-back bullish harami candlestick patterns could pave the way for further upside. If AUD/USD buyers reclaim the August 18 daily high of 0.6429, the 0.6500 figure is followed by the 0.6550 psychological level and the 0.6600 mark.
AUD/USD Price Action – Daily chart
- Gold Price portrays bearish consolidation at multi-month low.
- China stimulus, positioning for Jackson Hole Symposium challenge XAU/USD sellers.
- Falling wedge confirmation adds strength to bullish bias about the Gold Price.
- XAU/USD bulls need validation from US PMIs, Durable Goods Orders and Fed Chair Powell’s hawkish tone.
Gold Price (XAU/USD) manages to hold ground near the lowest level in five months, recently picking up bids to around $1,895 amid the early hours of Tuesday’s Asian session.
The XAU/USD pair benefits from the US Dollar’s pullback and China headlines, as well as the market’s positioning for this week’s top-tier central bankers’ speeches at the Jackson Hole Symposium. The metal’s latest bearish consolidation, however, pays little heed to the multi-year high United States Treasury bond yields and the mixed sentiment in the market, which in turn raises doubts about the Gold Price recovery. It should be noted that the latest falling wedge confirmation also favors the intraday buyers of the bullion.
Gold Price traces sluggish US Dollar
Gold Price picks up bids after restraining to refresh the five-month low marked the last week. The reason could be linked to the US Dollar’s sluggish performance ahead of this week’s preliminary readings of the August month Purchasing Managers Indexes (PMIs) and Durable Goods Orders for July, as well as the central bankers’ speeches at the annual Jackson Hole Symposium event, scheduled between August 24 and 26.
Additionally, the previous week’s mostly upbeat United States data prod the Federal Reserve (Fed) doves but some of the top-tier US banks appear struggling to confirm Fed Chair Jerome Powell’s hawkish move at the Jackson Hole. That said, Goldman Sachs expects Fed Chair Powell to sound defensive during the annual event of the central bankers but the Bank of America (BofA) expects Fed’s Powell to push back against the rate cut expectations.
During the last week, upbeat activity and wage growth numbers joined hawkish Fed Minutes to enable the US Dollar Index (DXY) to print a fifth weekly run-up. The same also challenged the previous policy pivot concerns and escalate the market’s anxiety before this week’s central bankers’ speeches at the Kansas Fed’s annual event.
Apart from the US Dollar, firmer prints of the United States Treasury bond yields also underpin the hawkish bias about the Fed and challenge the Gold buyers. That said, the US 10-year Treasury bond yields rose to the highest level since 2007, to around 4.354% before ending Monday’s trading day near 4.34%.
China stimulus, risk catalysts prod XAU/USD bears
A slew of China measures to restore the Gold buyer’s confidence struggled to gain acceptance, which in turn challenged the Gold buyers.
On Monday, the People’s Bank of China (PBOC), lowered the one-year Loan Prime Rate (LPR) to 3.45% from 3.55% previous and 3.40% expected. However, the Chinese central bank kept the five-year LPRs unchanged at 4.20%.
On the same line, Chinese state media Xinhua unveiled the news stating the authorities’ plan to introduce subsidies for fertilizers and pesticides in the northern region of the nation, per Reuters. Furthermore, the weekend news from China suggests the policymakers’ plan to infuse more liquidity into the world’s second-largest economy.
Late Monday, the UBS cut China’s 2023 real GDP growth forecast to 4.8% from 5.2%, which in turn pushed the Dragon Nation to take more measures to defend the economy and put a floor under the Gold Price.
It’s worth noting that the news of the nation’s key real estate company and a shadow trust bank struggling to pay their bond commitments triggered the fears of China debt markets and drowned the XAU/USD previously.
Alternatively, the Financial Times (FT) reported during the weekend that China pushes for competition with the Group of Seven (G7) nations while marking its presence at the BRICS meeting where officials from Brazil, Russia, India, China and South Africa spoke. Additionally, the fresh tension between China and Taiwan adds strength to the geopolitical fears but fails to gain major attention amid the cautious mood ahead of this week’s top-tier data/events.
It should be noted that the geopolitical tension surrounding China tests the Gold buyers but the metal’s traditional haven status might allow the XAU/USD to lick its wounds.
All eyes on Jackson Hole but US data may entertain Gold traders
Overall, the mixed markets allow the Gold Price to portray a bearish consolidation ahead of this week’s top-tier data/events. However, major attention will be given to Friday’s Fed Chair Jerome Powell’s speech at the Jackson Hole Symposium. Should Powell manages to defend the hawks, the XAU/USD may witness further downside.
Also read: Gold Price Forecast: XAU/USD consolidates losses ahead of first-tier events
Gold Price Technical Analysis
Gold Price teases buyers via a three-week-old falling wedge bullish chart formation. Adding strength to the upside bias is the nearly oversold conditions of the Relative Strength Index (RSI) line, placed at 14, as well as the recent bullish signals from the Moving Average Convergence and Divergence (MACD) indicator.
It’s worth noting, however, that a successful XAU/USD run-up beyond $1,890 becomes necessary for the Gold Price to aim for the theoretical target of the stated falling wedge, close to $1,980.
That said, the $1,900 round figure and the 200-bar Simple Moving Average (SMA) of around $1,940 will act as an extra filter toward the north.
On the contrary, the stated wedge’s bottom line surrounding $1,880 puts a floor under the Gold Price for the short term. Following that, a gradual downturn towards the early March swing high of around $1,858 can’t be ruled out.
However, the XAU/USD’s sustained trading beneath $1,858 won’t hesitate to challenge the yearly low marked in February near $1,805.
To sum up, the Gold Price appears losing downside momentum but the buyers have a long and bumpy road ahead of retaking control.
Gold Price: Four-hour chart
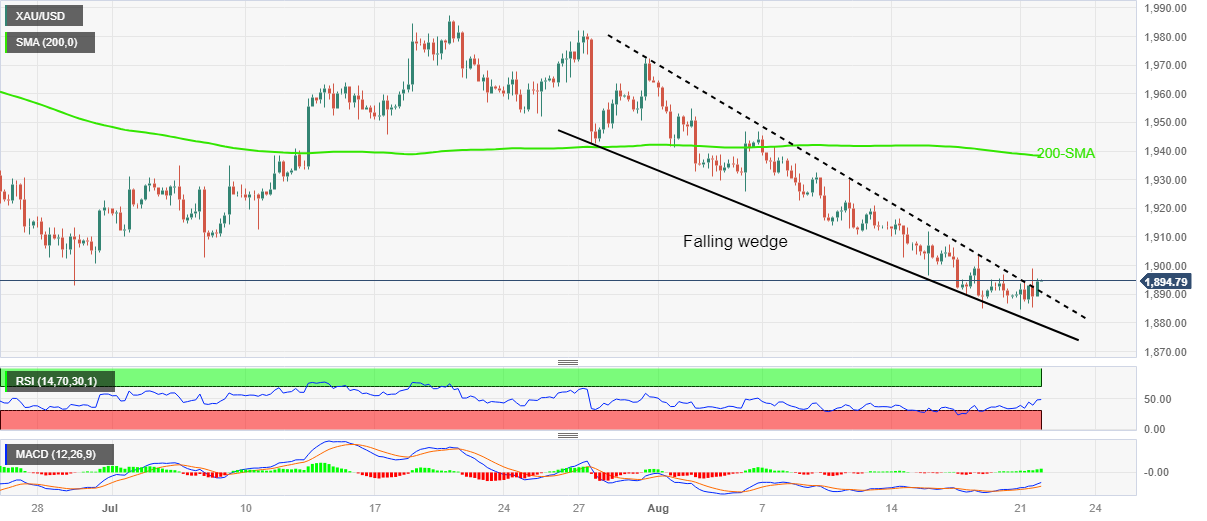
Trend: Limited recovery expected
- GBP/JPY closed near 186.50, its highest since November 2015.
- Monetary policy divergence between the BoE and BoJ is the primary driver of the cross.
At the start of the week, the GBP/JPY cross leapt towards 186.50 as the GBP continued to trade strong against the JPY, driven by hawkish bets on the Bank of Japan. Last week, the UK reported hot inflation and wage figures from July, which made markets discount a terminal rate of 6% vs 5.75% at the start of the week, resulting in GBP closing the week as a top performer.
On the other hand, reports suggest that the Bank of Japan (BoJ) will only consider tightening if local wage and inflation figures meet their forecasts. Dovish bets on the BoJ weakened the Yen. In addition, the fragile economic situation in China is also driving the JPY downwards, as it is one of Japan’s largest trading partners.
GBP/JPY Levels to watch
According to the daily chart analysis, short-term prospects for GBP/JPY look bullish. Both Relative Strength Index (RSI) and Moving Average Convergence Divergence (MACD) remain positive, implying a strengthening bullish momentum. Also, the pair is above the 20-, 100-, and 200-day Simple Moving Averages (SMA), highlighting the continued dominance of bulls on the broader scale.
Support levels: 186.00, 185.50, 185.00.
Resistance levels: 187.00, 187.50, 188.00.
GBP/JPY Daily chart
-638282520074574907.png)
- EUR/JPY jumped to a fresh cycle high of 159.30.
- The EUR is trading strong against most of its rivals after the Bundesbank monthly report.
- PBoC's unexpected rate cut and BoJ’s dovish stance weaken the JPY.
On Monday, the EUR/JPY gained ground and established itself above 159.00, mainly driven by a stronger Euro.
In that sense, the European currency traded strongly against its rivals after the Bundesbank monthly report indicated the inflation pressures could persist longer than the European Central Bank's (ECB) expectations. As a reaction, investors are betting on a more aggressive ECB as German yields increase, making the Euro gain interest. Focus now shift to Christine Lagarde’s speech on Thursday at the Jackson Hole Symposium, where investors will look for clues regarding forward guidance.
On the JPY’s side, the People’s Bank of China unexpectedly cut the one-year Loan Prime Rate (LPR) and reminded investors of the fragile economic situation in the Asian giant, which could further weaken the Japanese economy. In addition, it was reported that the Bank of Japan (BoJ) will consider tightening when it wage pressures increase, so the ultra-dovish stance also contributes to Yen’s downside.
EUR/JPY Levels to watch
The daily chart analysis shows that short-term prospects for EUR/JPY look bullish. Both Relative Strength Index (RSI) and Moving Average Convergence Divergence (MACD) remain positive, with Relative Strength Index (RSI) positioned above its midline and displaying an upward trajectory. Moving Average Convergence Divergence (MACD) also presents green bars, implying a strengthening bullish momentum. Moreover, the pair is above the 20,100,200-day Simple Moving Averages (SMAs), indicating a favourable position for the bulls in the bigger picture.
Support levels: 159.00, 158.50, 158.00.
Resistance levels: 159.50, 160.00, 160.50
EUR/JPY Daily chart
-638282489442941740.png)
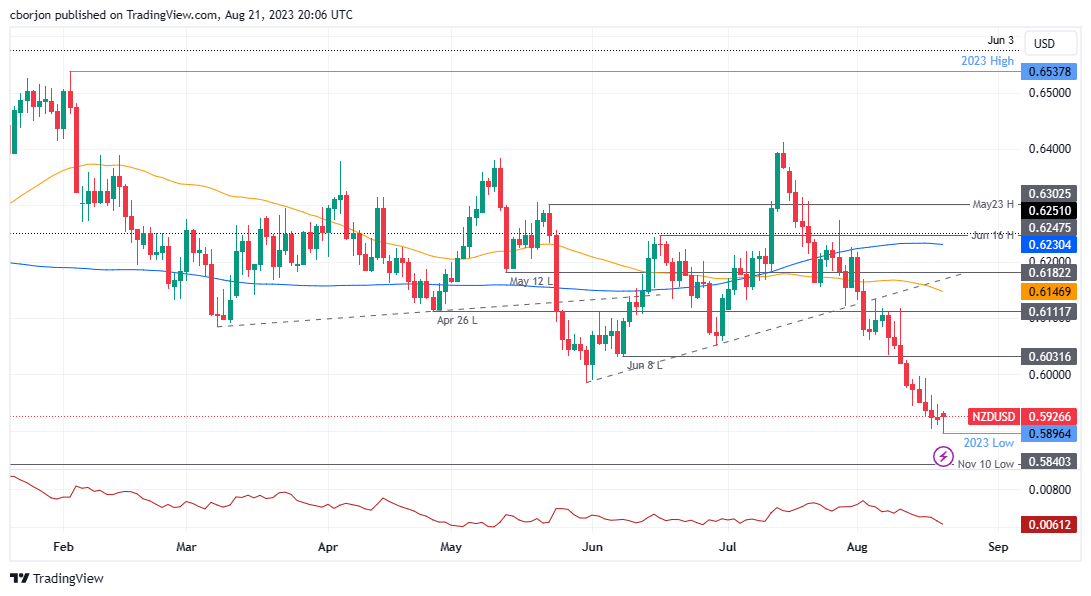
- NZD/USD rises 0.17% despite lingering concerns over China's economic health and the PboC's rate cut.
- US equities show optimism with NVIDIA's earnings on the horizon, while the Greenback dips by 0.10%.
- Technicals suggest NZD/USD remains bearish, with potential to retest the YTD low; however, reclaiming the 0.6000 level could shift momentum.
The New Zealand Dollar (NZD) snapped eight days of losses against the US Dollar (USD), amidst a risk-on impulse, after China’s central bank cut rates on its 1-year Loan Prime Rate (LPR) aimed to stimulate its economy. Hence, the NZD/USD is trading at 0.5930, above its opening price by 0.17%.
New Zealand Dollar finds respite as China's central bank moves to stimulate its economy, with eyes set on upcoming key events
US equities are trading in the green as NVIDIA releases its earnings report on Wednesday. Even though China’s economic woes are lingering on traders’ minds, the NZD/USD recovers some ground after dropping to a new year-to-date (YTD) low of 0.5896. US Treasury bond yields climbed while the Greenback retreated 0.10%, as depicted by the US Dollar Index (DXY), at 103.322.
Developments throughout Monday’s Asians session weighed on the Antipodeans after the People’s Bank of China (PboC) cut rates on its 1-year Loan Prime Rate from 3.55% to 3.45%, disappointing analysts. As reported by Bloomberg, it’s said that PboC’s officials and government regulators told leaders to boost loans to support recovery.
Since antipodean currencies are seen as proxies to the Chinese Yuan (CNY), it plunged after the PboC’s headline crossed investors’ screens. However, the lack of meaningful economic data would leave traders adrift to sentiment, and US Dollar dynamics, with traders bracing for US Federal Reserve Chair Jerome Powell’s speech at Jackson Hole on Friday.
The New Zealand economic docket would feature Q2’s Retail Sales, which are expected to be mixed, with quarterly figures disappearing, contrary to the year-over-year improvement. On the US front, the agenda will feature Fed speakers, housing data, S&P Global PMIs, Durable Good Orders, unemployment claims, and the Federal Reserve (Fed) Chair Jerome Powell’s speech on Friday.
NZD/USD Price Analysis: Technical outlook
Gien the fundamental backdrop, the NZD/USD would remain downward biased, and it might test the YTD low of 0.5896. A daily close around the 0.5800 handle would expose the November 10 low of 0.5846, followed by the 0.5800 figure. A dip below would expose the November 3 low of 0.5740. Conversely, as buyers stepped in around 0.5900, if they reclaim 0.6000, the pair would test June’s 8 low turned resistance at 0.6031.
NZD/USD Price Action – Daily chart
What you need to know on Tuesday, August 22:
The US Dollar lost some ground on Monday, although a scarce macroeconomic calendar kept major pairs within familiar levels.
The market sentiment remained sour, while government bond yields advanced, reflecting the ruling cautious stance. The US Treasury yield hit its highest since 2007, as investors are concerned global central bankers will extend the monetary tightening programs to tame inflation.
China remained in the eye of the storm, with news indicating that government land sales revenue declined for the 19th consecutive month in July. The People’s Bank of China (PBoC) cut the one-year Loan Primer Rate by 10 basis points (bps) to 3.45% on Monday, as expected, following similar measures last week and falling short from expectations of bolder measures. The Yuan fell with the news, as speculative interest was waiting for a more aggressive measure to support the local currency. Later in the day, UBS cut China’s 2023 real GDP growth forecast to 4.8% from 5.2%.
German Bundesbank monthly report showed inflation could persist above the central banks targets for longer while growth is foreseen seen largely flat in Q3.
EUR/USD struggles around 1.0900, lacking momentum to run past the level. GBP/USD looks better poised to extend gains, trading at around 1.2740. The Australian Dollar gained vs its American rival, will Gold prices also up, although the latter held below $1,900. The USD/CAD edged higher as a decline in oil prices weighed down the Loonie.
USD/JPY trades above 146.00 and near its recent multi-month high of 146.53 amid mounting speculation the Bank of Japan will need to readjust its ultra-loose monetary policy soon.
The macroeconomic calendar has little to offer this week, with the focus on the Jackson Hole Symposium starting next Thursday. Federal Reserve (Fed) Chair Jerome Powell and European Central Bank (ECB) President Christine Lagarde will speak on Friday, with market players hoping for clues on future decisions.
Like this article? Help us with some feedback by answering this survey:
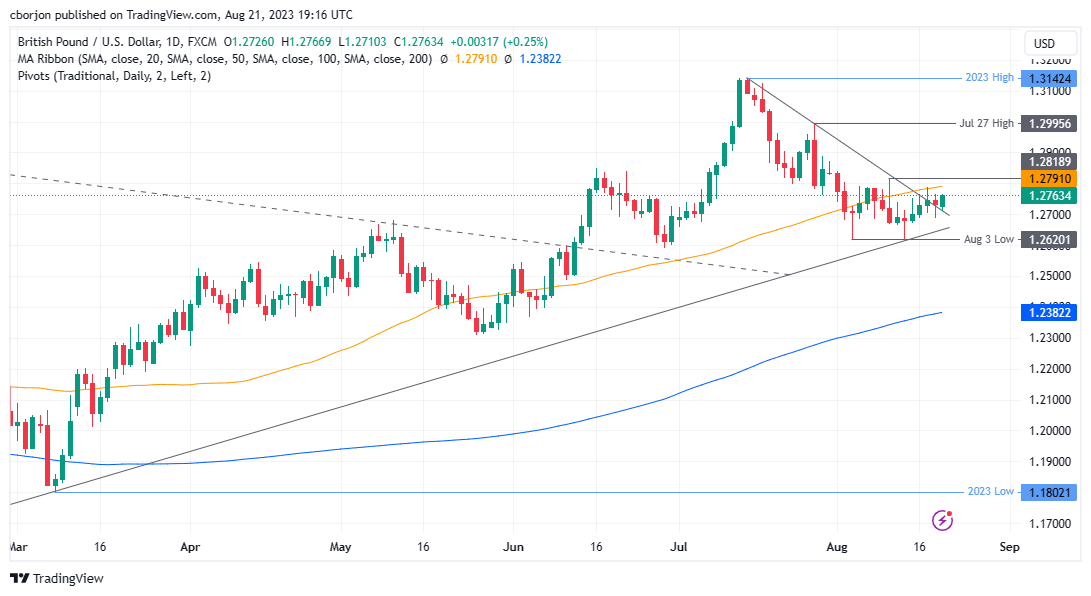
- GBP/USD rises 0.22% as market sentiment remains upbeat, with NVIDIA earnings and BoE rate hike prospects in focus.
- Interest rate differential between the US and UK narrows, potentially pushing GBP/USD towards the YTD high of 1.3147.
- Technicals indicate resistance at the 50-DMA of 1.2791; a breach could target 1.2995, while support lies at 1.2700 and 1.2620.
GBP/USD erases last Friday’s losses and climbs above the 1.2750 figure though it remains trading subdued amidst the lack of catalyst involving the Sterling (GBP) and the US Dollar (USD). US Treasury bond yields rise, but the US Dollar (USD) is pressured ahead of the Jackson Hole Symposium. At the time of writing, the GBP/USD is trading at 1.2760, registering gains of 0.22%.
Sterling gains traction ahead of Jackson Hole Symposium, with eyes set on the 1.3000 milestone
In the meantime, market players’ mood remains positive, as earnings from the chipmaker NVIDIA are set for release on Wednesday. Hence, high beta currencies like the GBP post gains propelled by sentiment and expectations for further tightening by the Bank of England (BoE), with traders pricing in a 25 bps rate hike, to 5.50%.
Therefore, the interest rate differential between the US and the UK will close, and with the BoE ready to raise rates at least twice, towards the 5.75% area, the GBP/USD could resume its uptrend and challenge the 1.3000 figure ahead of testing the year-to-date (YTD) high at 1.3147.
In the week ahead, the UK economic docket will feature the CBI Industrial Trend Orders, S&P Global PMIs, and the GfK Consumer Confidence. On the US front, the agenda will feature Fed speakers, housing data, S&P Global PMIs, Durable Good Orders, unemployment claims, and the Federal Reserve (Fed) Chair Jerome Powell’s speech on Friday.
GBP/USD Price Analysis: Technical outlook
The GBP/USD price action remains neutral to downward biased, capped by the 50-day Simple Moving Average (DMA) at 1.2791, a barrier that keeps the pair from reaching the 1.2800 figure. A breach of the latter would expose the July 27 daily high at 1.2995. Conversely, if GBP/USD sellers drag the spot price below 1.2700, the pair could test the August 3 daily low of 1.2620 before dipping towards the 200-DMA at 1.2382.
GBP/USD Price Action – Daily chart
- The EUR/USD gained traction after six consecutive days of losses and trades around the 1.0900 zone.
- The German Bubba Monthly Report hinted at upside inflation risks, fuelling hawkish bets on the ECB.
- All eyes are on the Jackson Hole Symposium on Thursday´s session.
At the start of the week, the EUR/USD is gaining traction after six consecutive days of losses, trading near 1.0900. The German Buba Monthly Report showed risk inflation which fueled a rise in German yields on hawkish bets on the European Central Bank (ECB). Additionally, investors await the Jackson Hole Symposium on Thursday, in were Jerome Powell and Christine Lagarde will probably give clues for further guidance on their respective monetary policies.
The German Buba Monthly Report showed that inflation could persist above the central bank's targets for longer. In that sense, upside inflation risks made investors place hawkish bets on the European Central Bank (ECB), causing the German bonds for 2,5 and 10-year yields to rise to 3.10%, 2.70% and 2.70%, respectively. Additionally, the World Interest Rate Probability (WIRP) indicates that the markets are betting on 55% odds of a 25 basis point (bps) hike in the September 14 meeting, while those odds rise to 75% and 85% for the October and December meetings. In that sense, those hawkish bets make the Euro gain interest against its rivals.
For the US side, the USD measured by the DXY index is trading flat as investors await S&P PMI data on Wednesday and Jerome Powell’s speech at Jackson Hole Symposium, where investors will look for clues regarding forward guidance. As for now, markets are discounting that the Federal Reserve (Fed) won’t hike in September and nearly 40% probability of a 25 basis point (bps) hike in November.
EUR/USD Levels to watch
Observing the daily chart, the outlook remains neutral to bearish for the EUR/USD. With a positive slope below its midline, the Relative Strength Index (RSI) signals a strengthening bullish sentiment, while the Moving Average Convergence (MACD) prints shorter red bars. Additionally, the pair is below the 20 and 100-day Simple Moving Averages (SMAs) but above the 200-day SMA, indicating that the bulls aren't done yet and that the outlook is still positive for the short term.
Support levels: 1.0850, 1.0830, 1.0793 (200-day SMA)
Resistance levels: 1.0960 (20-day SMA), 1.0970, 1.0980.
EUR/USD Daily chart
-638282401172043237.png)
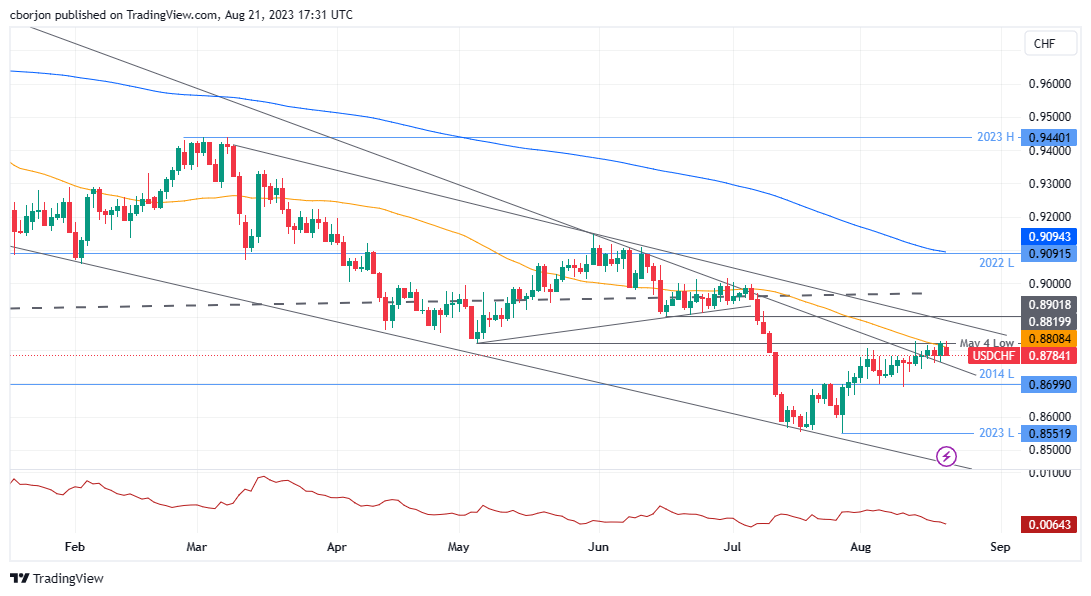
- USD/CHF grapples with the 50-DMA at 0.8808, marking a decline of 0.38% for the day.
- A sustained upward trend could see buyers target the June 16 resistance at 0.8901, with sights set on the 0.9000 milestone.
- A daily close below 0.8800 could send the pair diving toward 2014 low of 0.8699 and potentially the YTD low of 0.8552.
USD/CHF clashes with the 50-day Moving Average (DMA) at 0.8808 and retraces, and prints a daily low of 0.8785 amid a choppy trading session as investors brace for the Jackson Hole Symposium, where the US Federal Reserve (Fed) Chair Jerome Powell remarks, are awaited. The USD/CHF is trading at 0.8788, down 0.38%.
USD/CHF Price Analysis: Technical outlook
The pair remains trending steadily to the upside, but the 50-DMA and its confluence with the 0.8800 figure, exacerbated a dip toward the 0.8780s region. If USD/CHF price action continues to register successive series of higher highs and lows, USD/CHF buyers could reclaim the 50-DMA in the near term and target the June 16 daily low turned resistance at 0.8901. A decisive break would expose the 0.9000 figure.
Conversely, if USD/CHF extends its losses and achieves a daily close below 0.8800, the USD/CHF would dive towards the 2014 swing low of 0.8699, followed by the year-to-date (YTD) low of 0.8552.
USD/CHF Price Action – Daily chart
- The XAG/USD gained ground rising towards the 200-day SMA seeing more than 2% daily gains
- The 20-day SMA is about to cross below the 200-day SMA; further downside may be on the horizon.
- Rising US yields may limit the silver´s upside.
The XAG/USD rose near the 200-day Simple Moving Average (SMA) towards the $23.20 area, mainly driven by a softer USD. Investors await Thursday's annual Jackson Hole Symposium, which may cause volatility in bond markets and the Silver price dynamics. As for now, US yields are rising, limiting further Silver´s gains.
On Thursday, Jerome Powell from the Federal Reserve (Fed) will deliver a speech at the annual Jackson Hole Symposium, which will likely ramp up volatility in the USD and the US bond market price dynamics. As for now, the US economy is holding firm and inflation is seeing a mixed picture, so clues regarding forward guidance will set the pace for the US yield dynamics and affect the non-yielding Silver.
According to the CME FedWatch tool, markets are confident that the Fed won’t hike in September, while the odds of a 25 basis point (bps) increase rise near 40% in November. However, those bets will likely change after Chair Powell’s speech on Thursday.
XAG/USD Levels to watch
Observing the daily chart, the outlook is neutral to bullish for the short term as the bulls are gaining momentum but still have some work to do. Exhibiting a rising slope below its midline, the Relative Strength Index (RSI) suggests a potential bullish resurgence, while the Moving Average Convergence (MACD) lays out lower red bars. Additionally, the pair is below the 20,100 and 200-day Simple Moving Averages (SMAs), suggesting that the bears are firmly in control of the bigger picture.
Support levels: $23.00, $22.90, $22.50.
Resistance levels: $23.30 (200-day SMA), $23.50, $24.00.
XAG/USD Daily chart
-638282354467144430.png)
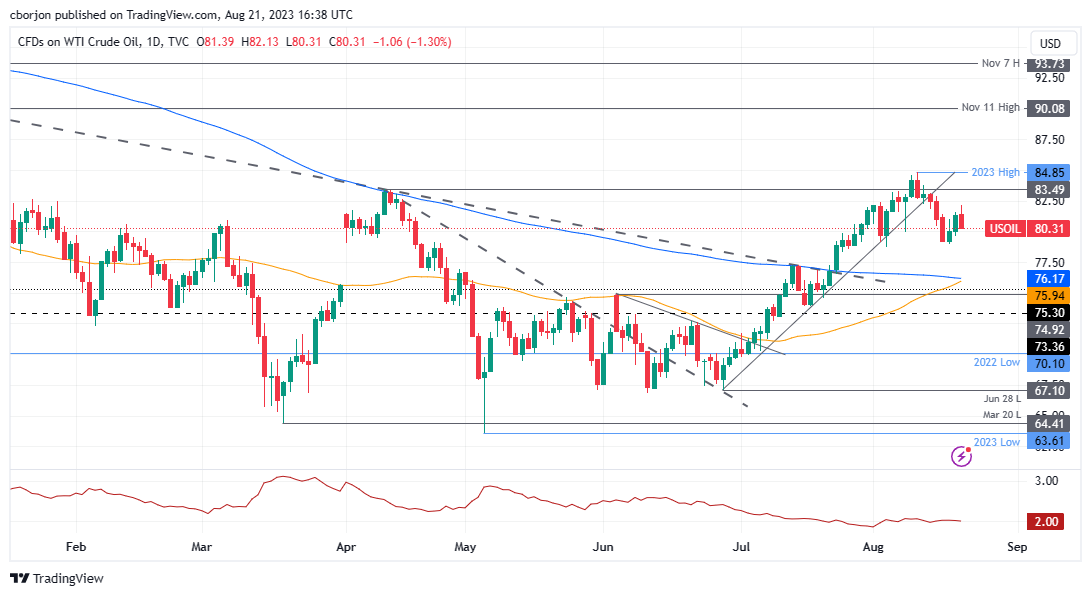
- WTI dropped 0.95% as China’s rate cut and push for increased lending reflect a slowing economy.
- Saudi Arabia’s July oil shipments to China see a significant 31% decline, adding to the bearish sentiment.
- US rig count decreases, hinting at potential supply tightening, which could provide a floor for WTI prices in the near term.
Western Texas Intermediate (WTI), the US crude oil benchmark, posted losses of 0.95% on Monday as China’s economic woes weighed on oil prices. Uncertainty from the US Federal Reserve (Fed) direction on rates favors the greenback, a headwind for US Dollar (USD) denominated assets. WTI is trading at $80.58, down 0.95%.
Despite output cuts from Saudi Arabia and Russia, China’s economic concerns and a resilient US Dollar weigh on crude oil prices
WTI extended its losses despite the People’s Bank of China (PboC) cutting rates by ten basis points in efforts to propel an economy that is continuing to slow down. At the same time, government officials and PboC members urged banks to increase loans.
In the meantime, Saudia Arabia and Russian crude oil output cuts cushioned the WTI drop. However, Saudi Arabia’s July oil shipments to China plunged 31% from June, as revealed by China customs data.
Data supplied y Baker Hughes showed the number of active rigs fell by 4 to 520 in the last week. Supply tightening could keep WTI prices from falling sharply, as noted by ING analysts. They said, “The US has lost 107 oil rigs since early December, and it is not too surprising that this reduced drilling activity means that oil production growth forecasts for later this year and through 2024 are looking relatively modest.”
WTI Price Analysis: Technical outlook
From a technical perspective, a golden cross is about to form, which would suggest that oil prices would continue to rally, with the year-to-date (YTD) high seen as the first resistance to challenge at $84.85, followed by the November 11 daily high at $90.08, ahead of the November 7 high at $93.73. Conversely, WTI’s first support would be $80.00 a barrel, followed by the latest swing low of $79.00.
WTI Price Action – Daily chart
- The USD/JPY increased above 146.00, showing more than 0.60% of daily gains.
- The Yen is losing traction following the PBoC rate cut.
- Investors await the annual Jackson Hole Symposium on Thursday´s session.
At the start of the week, the USD/JPY sees green around 146.20, showing more than 0.60% gains on the day. In that sense, the People’s Bank of China's (PBoC) unexpected decision to cut the one-year Loan Prime Rate (LPR) is causing the Yen to lose ground, as well as the dovish stance of the Bank of Japan (BoJ). On the US side, investors remain on the sidelines awaiting S&P PMI and Thursday’s Jackson Hole Symposium.
Investors await forward guidance from Jerome Powell at Jackson Hole Symposium
On Thursday, Jerome Powell will deliver a speech at the 2023 Jackson Hole Symposium, where investors will look for clues regarding the Federal Reserve's (Fed) upcoming decision. As for now, inflation in the US is seeing a mixed picture, with the Consumer Price Index (CPI) having decelerated in July, but the Producer Price Index (PPI) slightly accelerating in the same month while economic activity remains strong. That said, Chair Powell’s outlook will help investors model their expectations and will likely set the pace of the USD price dynamics.
On the Japanese side, it was reported that the Bank of Japan (BoJ) would consider tightening when local wages increase and its dovish stance is applying pressure on the JPY. In addition, the PBoC delivered an unexpected rate that reminded investors about China’s gloomy outlook, also contributing to Yen’s downside.
USD/JPY Levels to watch
Observing the daily chart, USD/JPY suggests a bullish sentiment for the near future. The Relative Strength Index (RSI) remains in the positive zone above its midline, showing an upward slope near overbought territory. Concurrently, the Moving Average Convergence Divergence (MACD) prints green bars, reinforcing the bullish momentum. Additionally, the pair is above the 20,100,200-day Simple Moving Averages (SMAs), indicating that the bulls are in command of the broader picture.
Support levels: 146.00, 145.50, 145.00.
Resistance levels: 146.55, 147.00, 147.50.
USD/JPY Daily chart
-638282312082741640.png)
- Wall Street shows positive signs, but China’s rate cut and push for increased lending dampen global sentiment.
- US Dollar remains steady with the DXY at 103.472 as market participants look forward to a packed US economic calendar.
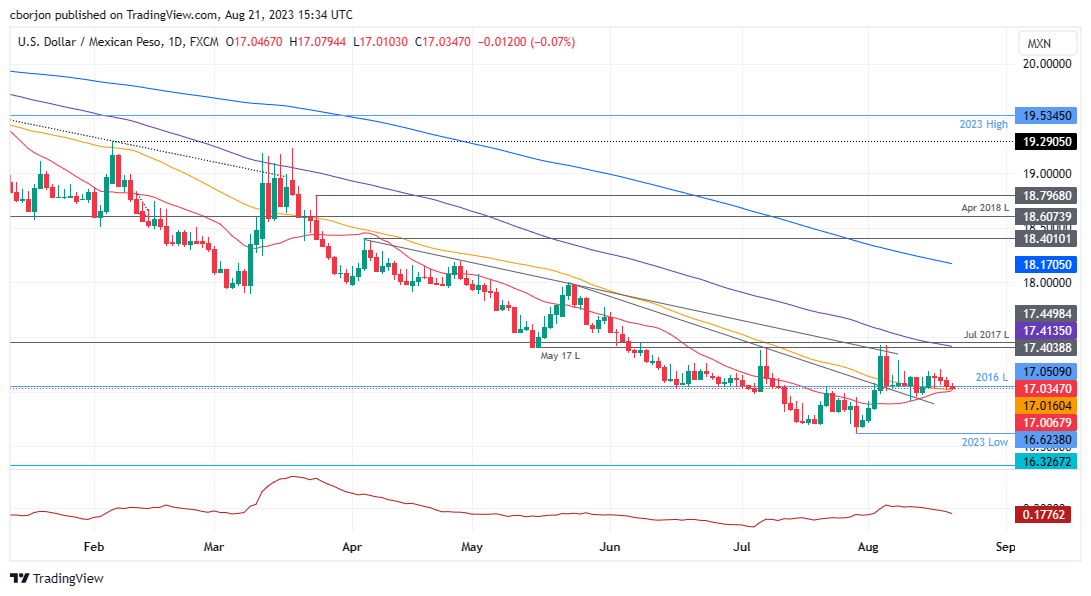
- Mexico’s upcoming inflation and Q2 GDP data could influence the USD/MXN trajectory, with potential appreciation if Mexico’s economy falters.
USDMXN registers minimal gains even though a risk-on impulse would usually underpin the emerging market currency. Monday’s light economic calendar would leave traders adrift to sentiment weighed by China’s woes and US Dollar (USD) dynamics. The USD/MXN exchanges hands at 17.0620, gaining 0.01%.
Emerging market currency feels the heat from China’s rate cut and US Dollar dynamics, while traders await key economic data and Powell’s speech
Wall Street trades positively, portraying investors’ mood improved ahead of the Jackson Hole Symposium, organized by the Kansas City Fed in Wyoming. US Treasury bond yields advance, slightly underpinning the greenback, which remains flat at 103.472, as shown by its US Dollar Index (DXY).
China’s woes weighed on investors’ sentiment after the People’s Bank of China (PboC) cut rates on its 1-year Loan Prime Rate from 3.55% to 3.45%, disappointing analysts. As reported by Bloomberg, it’s said that PboC’s officials and government regulators told lenders to boost loans to support recovery.
In the meantime, a National Association of Business Economics (NABE) poll showed economists are more confident that the Fed would pull a soft landing, as revealed by Bloomberg.
The upcoming United States (US) calendar will reveal Existing Home Sales, Fed speakers, New Home Sales, S&P Global PMIs, Jobless Claims, Durable Good Orders, and Fed Chair Jerome Powell’s speech on Friday.
Across the border, the Mexican economic docket would witness the release of inflation figures for the first half of August and the second quarter Gross Domestic Product (GDP) report on Friday.
Given the backdrop, if the Mexican economy weakens, expect the USD/MXN to appreciate further. Likewise, dovish signals by Fed officials and Jerome Powell’s speech would be repriced by traders, weakening the USD/MXN pair.
USD/MXN Price Analysis: Technical outlook
The USD/MXN remains subdued, unable to crack below/above support and resistance levels, each at 17.0000/17.1878. On the downside, the confluence of the 50 and 20-day Moving Averages (DMAs) at 17.0060/17.0160 emerged as a solid support level, which, if cleared, the USD/MXN could dip towards the year-to-date (YTD) low of 16.6238. Conversely, if USD/MXN breaks above 17.1878, the pair could rally towards the 100-DMA at 17.4135.
USD/MXN Daily Chart
The Federal Reserve Bank of New York's latest the SCE Labor Market Survey revealed that the lowest wage respondents would be willing to accept for a new job jumped to a record high of $78,645 in July, up from $72.873 a year ago.
Key takeaways
"The average full-time offer wage received rose sharply to $69,475."
"The average expected likelihood of becoming unemployed increased to 3.9 percent, the highest reading since March 2020."
"Conditional on expecting an offer, the average expected annual salary of job offers in the next four months increased to $67,416, the highest reading of the series."
Market reaction
The US Dollar Index showed no immediate reaction to this report and was last seen trading flat on the day at 103.45.
The USD is slightly softer overall to start the week off. Economists at Scotiabank analyze Greenback’s outlook.
Markets look to Jackson Hole
It’s a very light week for data which may mean that markets will consolidate somewhat ahead of Friday’s Jackson Hole comments from Fed Chairman Powell.
After Friday’s consolidation session for the DXY, intraday losses so far are putting something of a negative spin on the charts for the index which may be a ‘tell’ that markets are leaning towards some reduction in USD exposure ahead of Jackson Hole in the event that Powell dials back the inflation rhetoric somewhat.
The S&P 500 Index declined for a third consecutive week. Economists at UBS now see a modestly positive higher profile for stocks over the next six to 12 months.
The threat of a US recession has declined
The second-quarter reporting season likely marked the trough in year-over-year earnings growth, and guidance for the third quarter was positive. We therefore now expect S&P 500 earnings per share to be flat in 2023 and rise 9% in 2024. Our base case is for the index to reach 4,500 in December and 4,700 in June next year.
Despite the receding risk of a recession in the US, we still only see a modestly higher profile for equities over the next six to 12 months, in our base case. Against this backdrop, we continue to favor equity market laggards whose valuations are lower and have scope to catch up.
The US Dollar recorded another week of gains. Economists at MUFG Bank are maintaining their view of further USD strength over the short term.
USD bullish bias remains intact
We see limited scope for a dovish pivot by Fed Chair Powell at Jackson Hole and the Dollar and yields will remain supported for now.
With USD/JPY now in the danger zone we expect increased rhetoric from Tokyo that could mean USD/JPY lags.
See: Yen does not have many fans at the moment – Commerzbank
What can we expect from Jackson Hole? Ulrich Leuchtmann, Head of FX and Commodity Research at Commerzbank, is curious about Jackson Hole at the end of this week.
There will very likely be no forward guidance of any kind
There will very likely be no forward guidance of any kind in Jackson Hole. But I don't think that's what it's all about.
I am looking forward to Jackson Hole. Not because I hope to find out whether the Fed and the ECB will raise their key interest rates once again. Powell and Lagarde won't tell us. But maybe they will give us new insights into their thinking. They do that all the time in speeches. But Jackson Hole is the forum where they do it particularly explicitly.
- AUD/USD struggles to find a decisive move ahead of the preliminary US/Australia PMI for August.
- Investors anticipate less-hawkish interest rate guidance from Fed chair Jerome Powell at Jackson Hole Symposium.
- The Australian Dollar fails to deliver a decisive move despite the PBoC lowering its one-year PLR to 3.45%.
The AUD/USD pair trades back and forth in a narrow range around 0.6400 as investors prepare for the Jackson Hole Economic Symposium, which will start on Thursday. The Aussie asset struggles to find a decisive move ahead of the preliminary United States/Australia PMI for August, which will be released this week.
S&P500 is expected to open on a bullish note, following positive cues from overnight futures. US equities are broadly expected to rebound after a healthy corrective move as investors hope that the Federal Reserve (Fed) will not raise interest rates further. Market participants anticipate that inflation is easing as expected in spite of tight labor market conditions.
The US Dollar Index (DXY) continues to trade sideways marginally below 103.50 ahead of Jackson Hole. Investors anticipate less-hawkish interest rate guidance from Federal Reserve (Fed) chair Jerome Powell as United States inflation continues to ease despite tight labor market conditions. Meanwhile, 10-year US Treasury Yields jump near 4.32% as the ‘last mile’ of US inflation will continue to discomfort Fed policymakers.
Before Jackson Hole Symposium, investors will focus on the preliminary S&P Global PMI, which will be released on Wednesday at 13:45 GMT.
The Australian Dollar fails to deliver a decisive move despite the People’s Bank of China (PBoC) lowering its one-year Prime Lending Rate (PLR) by 10 basis points (bps) to 3.45% while investors anticipated a rate cut by 15 bps. The Australian Dollar, being a proxy for China’s economic prospects, is facing the wrath of weak demand in China due to a higher jobless rate and significant deflation risks.
On Wednesday, investors will focus on the preliminary S&P PMI data for August. Manufacturing and Services PMI are seen steady at 49.6 and 47.9 respectively.
EUR/USD gains modestly. Economists at Scotiabank analyze the pair’s outlook.
Short-term price signals are tilting somewhat positive
Short-term price signals are tilting somewhat positive but it remains to be seen if the EUR modestly firmer undertone can extend through the course of the day.
Friday’s stalling signal (‘doji’ candle) may have been the full stop punctuation point on the EUR’s recent descent; net gains today – the more, the better – would boost EUR recovery chances.
Initial resistance is 1.0920.
See: EUR/USD could make a dip down to the 1.0775 area – ING
GBP/USD consolidates in a tight range below 1.2750. Economists at Scotiabank analyze the pair’s technical outlook.
Support aligns at 1.2620 (double bottom)
Sterling is trading flat on the session but is still edging a little above the mid-point of its broader trading range, defined by support at 1.2620 (double bottom) and resistance at 1.2820 (double bottom trigger).
A clear break above 1.2820 targets a move to the low 1.30s.
See – GBP/USD: The Pound will still be vulnerable if UK recession risks rise – Rabobank
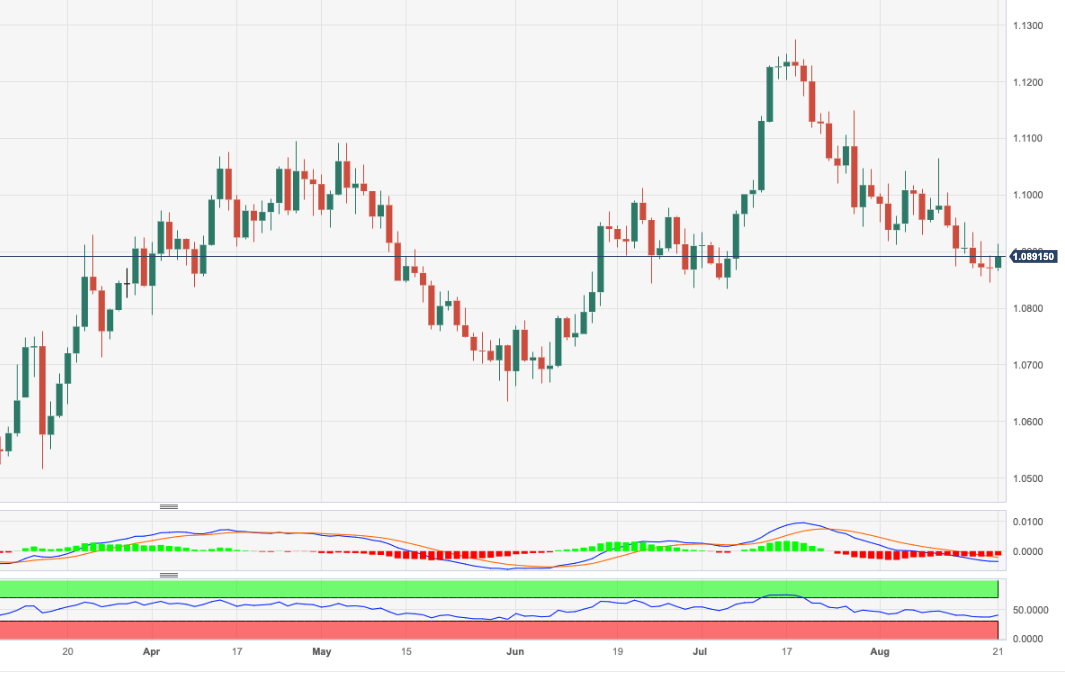
- EUR/USD manages to rebound past the 1.0900 hurdle.
- A drop below 1.0844 exposes extra retracements near term.
EUR/USD reverses six consecutive daily pullbacks and regains the 1.0900 hurdle and above on Monday.
If the pair resumes the downside it is expected to revisit the August low of 1.0844 (August 18) prior to the July low of 1.0833 (July 6). The loss of this region leaves the pair vulnerable to a probable test of the critical 200-day SMA at 1.0792 in the short-term horizon.
In the meantime, the pair’s positive outlook remains unchanged while above the 200-day SMA.
EUR/USD daily chart
The CAD is one of the better-performing currencies in the session so far against the softer USD. Economists at Scotiabank analyze USD/CAD outlook.
USD/CAD slips under technical support
Spot is trading below trend support that has guided the USD higher consistently since the start of July (1.3545). Losses below here are the first real sign of technical USD weakness in some time.
The USD rally is looking somewhat overextended and may be prone to more corrective losses in the short run at least.
Resistance is 1.3545/1.3550 now. Support is 1.3400/1.3410.
The US currency has bounced back in recent weeks, with the US Dollar Index (DXY) up 3.6% from its recent low in mid-July. However, economists at UBS do not expect the US Dollar’s rebound to last.
The US Dollar remains vulnerable
While the Dollar’s strength has been driven by robust US economic data, which have kept alive the possibility of further Fed tightening, we expect renewed weakness in the US currency.
Fundamental long-term factors remain a burden on the Dollar, including an expensive valuation, the twin fiscal and current account deficits, the rating outlook, and the high allocation of funds in the US.
We keep the US Dollar least preferred and the Euro most preferred. With inflation falling more quickly in the US than in Europe or the UK, we think it is more likely the peak is near for US rates than for European ones, and the Fed may consider easing sooner than other central banks. For the Euro, we think negative economic surprises in the region are already priced into the currency’s valuation, and the Eurozone’s improving trade balance should be supportive.
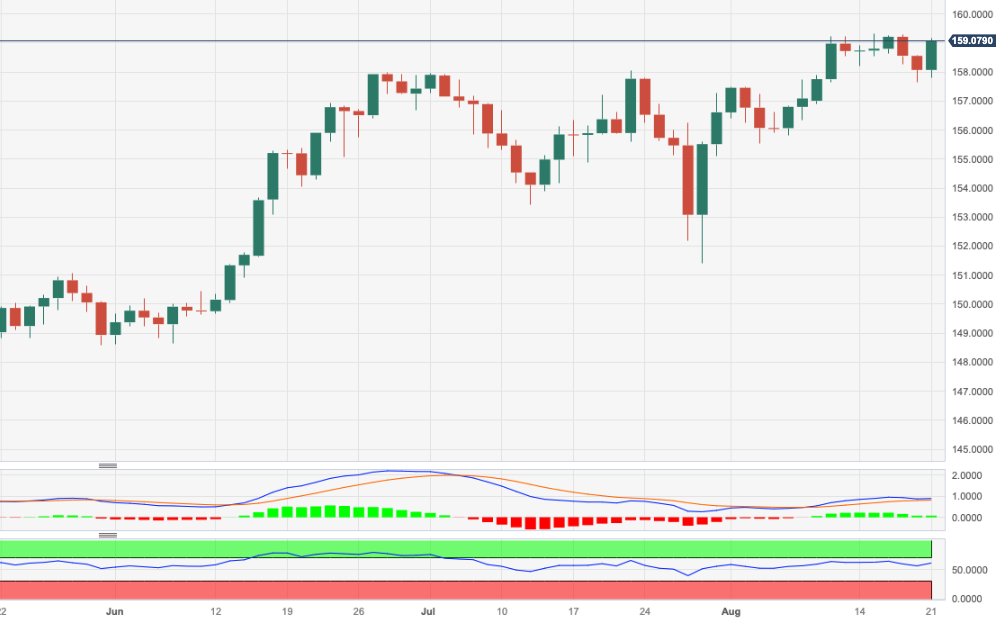
- EUR/JPY flirts with two-day highs above 159.00.
- Extra gains could see the 160.00 zone revisited in the short term.
EUR/JPY reverses two consecutive daily pullbacks and reclaims the area beyond 159.00 the figure on Monday.
So far, the emergence of some consolidation seems probable in the very near term ahead of the continuation of the upside. That said, the immediate target remains at the round level of 160.00.
The surpass of the latter should not see any resistance level of note until the 2008 high at 169.96 (July 23)
So far, the longer term positive outlook for the cross appears favoured while above the 200-day SMA, today at 147.38.
EUR/JPY daily chart
The Pound has managed to hold onto the position of best-performing G10 currency over the past five days. Economists at Rabobank analyze GBP outlook.
GBP/USD seen slipping to 1.26 on a three-month view
If recession risks are judged by the market to rise, additional BoE rate rises are far less likely to be able to lend GBP support.
On the assumption that the USD will be well supported in the coming months, we see risk of GBP/USD slipping to 1.26 on a three-month view and falling to 1.20 by the middle of next year.
We continue to see risks between GBP and the EUR as well balanced and expect more range trading around the EUR/GBP 0.86 area on a one-to-three-month view.
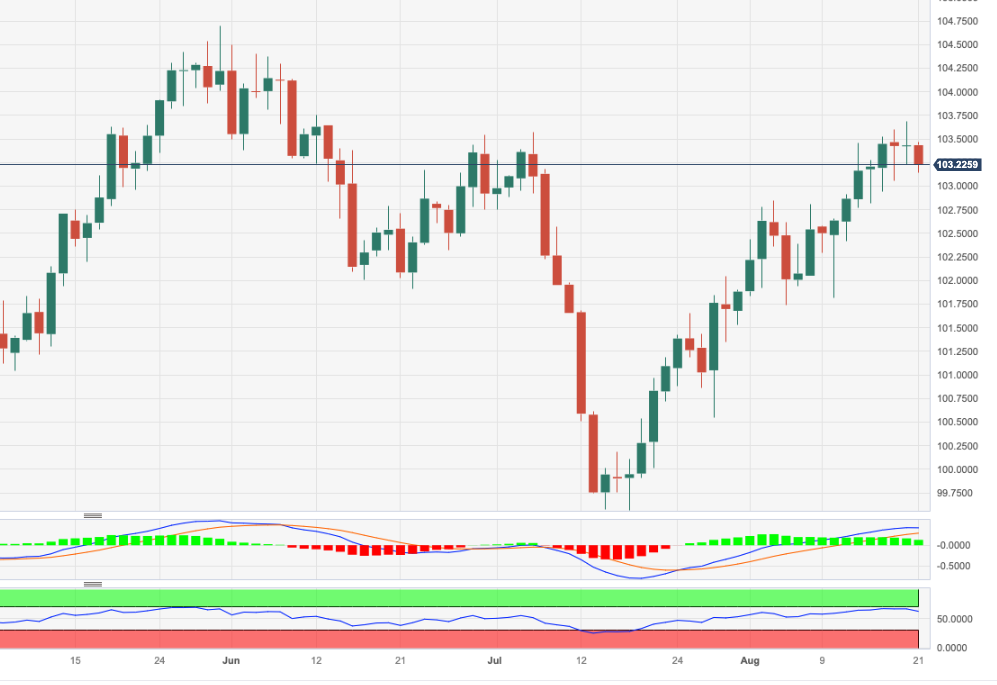
- DXY comes under pressure after hitting fresh tops near 103.70.
- The 200-day SMA near 103.20 underpins the index so far.
DXY faces extra selling pressure and revisits the 103.15/10 band at the beginning of the week.
In spite of Monday’s corrective move, the index maintains the bullish view well in place with the immediate hurdle now emerging at the May top of 104.69 (May 31) ahead of the 2023 peak of 105.88 (March 8).
It is worth noting that this area of monthly highs appears reinforced by the proximity of the key 200-day SMA, today at 103.18.
Looking at the broader picture, a convincing breakout of the 200-day SMA should shift the outlook for the index to a more constructive one.
DXY daily chart
The AUD is the worst-performing G10 currency so far this month. Economists at HSBC analyze Aussie outlook.
The relative rate outlook could weigh on the AUD
The relative rate cut outlook (rather than the residual hike pricing) should be an increasingly important driver for AUD/USD. Markets expect 106 bps of Fed cuts in 2024 vs just 3 bps of RBA cuts. In our view, risks are tilted towards a convergence of rate cut outlooks between the two central banks and the current modest rate cut expectation for the RBA limits the room for relative rates to move in the AUD’s favour.
However, with AUD/USD near the bottom of the recent range, we see risk-reward favouring the upside, based on short-term valuation metrics. The pair is unlikely to stage a sizeable rebound until China releases additional forceful demand-side measures (especially in relation to the property sector) and there are signs of continued disinflation and stronger global growth. However, with these conditions not fully met, we expect the currency pair to remain range-bound.
- NZD/USD oscillates above 0.5900 despite PBoC’s rate cut and NZ’s Trade Balance data.
- Overnight US futures attracted significant bids as investors hope that interest rates in the US economy are peaked for now.
- NZ imports for July were higher than the former reading while exports remained weak.
The NZD/USD pair trades in a narrow range above the round-level support of 0.5900 in the London session. The Kiwi asset fails to find direction despite the People’s Bank of China (PBoC) cutting its one-year benchmark rate to uplift economic prospects amid a highly uncertain demand. The PBoC lowered its one-year Prime Lending Rate (PLR) by 10 basis points (bps) to 3.40% than 15bps as expected.
S&P500 futures add significant gains in Europe, portraying a revival in the risk appetite of the market participants. Overnight US futures attracted significant bids as investors hope that interest rates in the United States economy are peaked for now. The US Dollar Index (DXY) drops to near 103.15 after facing stiff barriers near 103.50 as investors see no more interest-rate hikes this year.
A Reuters poll conducted between August 14 and 18 showed that the Federal Reserve (Fed) will keep interest rates steady in September and will not cut rates before March next year. Meanwhile, the odds of a recession have dropped to 40%, the lowest in a year. It seems that the central bank will allow more time for current interest rates to tackle stubborn inflation.
This week, investors will keenly focus on the Jackson Hole Economic Symposium, which will start on Thursday. Fed chair Jerome Powell is expected to provide an outlook on inflation and interest rates.
Meanwhile, the New Zealand Dollar remains less volatile despite the release of July’s trade balance data. Imports were higher than the former reading while exports remained weak, which indicates that domestic demand is upbeat while exports take a hit due to weak China demand.
This week, NZ Q2 Retail Sales data will be keenly watched, which will be published on Wednesday. In the last quarter, consumer spending contracted, demonstrating the consequences of higher interest rates.
PBoC lowered the 1-year Loan Prime Rate (LPR) by 10 bps, vs 15 bps expected, and left the 5-year LPR unchanged. Subsequently, economists at MUFG Bank expect China-related currencies to remain vulnerable.
PBoC cuts one-year LPR to 3.45% but keeps five-year LPRs unchanged
Investor sentiment has not been helped at the start of this week by the surprise decision to leave the five-year Loan Prime Rate unchanged at 4.2%. It had been expected that it would be lowered by 15 bps similar to the decision last week to cut the medium-term lending facility rate. The last time they diverged was in August of last year.
The one-year LPR was still lowered by less than expected by 10 bps.
The developments still leave market participants waiting for more convincing policy measures to stimulate demand. As a result, China-related currencies remain vulnerable to further weakness in the near-term even after the sizeable adjustment that has already taken place so far this month.
Further gains appear likely in the short-term horizon for USD/IDR, comment Markets Strategist Quek Ser Leang at UOB Group.
Key Quotes
USD/IDR broke above 15,219 last week. The breach of the strong resistance level led to a strong advance to 15,359. The price actions suggest further USD/IDR strength this week.
In view of the overbought short-term conditions, March’s peak near 15,475 is likely out of reach for now (there is another resistance at 15,400). Support is at 15,275, but only a breach of 15,235 would indicate that USD/IDR is not strengthening further.
Economists at ABN Amro expect the EUR/USD pair to move downward over the coming months.
Speculative positions in the EUR are extremely large
We forecast a modest upside of the US Dollar versus the Euro for the following reasons. We expect rate cuts by the Fed and the ECB next year. Whereas most of the Fed rate cuts we foresee are anticipated by the market, our expected rate cuts for the ECB are not. If our views play out Euro should weaken. Moreover, the speculative positions in the EUR are extremely large.
Our forecasts are 1.08 (end 2023) and 1.05 end 2024.
- USD/CAD corrects to near 1.3520 as US Dollar turns sluggish after a rally.
- Investors believe that the impact of higher interest rates for longer will be lower than taking interest rates to new highs.
- The strength in the oil price comes from expectations that more liquidity stimulus in China will increase oil demand.
The USD/CAD pair delivers a breakdown of the consolidation formed in a narrow range of 1.3533-1.3560 in the European session. The Loonie asset finds selling pressure as the US Dollar displays a subdued performance ahead of the Jackson Hole Economic Symposium, which will start on Thursday.
S&P500 futures generate decent gains in the London session. US equities ended mixed on Friday as investors hope that higher interest rates by the Federal Reserve (Fed) could impact corporate performance in the remaining year.
On Monday, the risk appetite of market participants seems improved as investors believe that the impact of stable interest rates at elevated levels will be lower than taking interest rates to new highs. For more clarity about the interest rate guidance, investors await the Jackson Hole Economic Symposium. Fed chair Jerome Powell is expected to provide a roadmap for achieving price stability without denting strong labor market conditions.
The US Dollar Index (DXY) demonstrates a sluggish performance and trades in a narrow range below 103.50 after a five-week bullish spell. Investors await a fresh trigger for further action. Apart from the Jackson Hole Economic Symposium, investors will focus on the US Durable Goods Orders for July on Thursday, which will be published at 12:30 GMT. The economic data is seen contracting by 4% vs. an expansion of 4.6%.
On the oil front, the oil price gathers strength for a fresh upside move after testing waters around $81.00. The strength in the oil price comes from expectations that more liquidity stimulus in China will increase oil demand from the largest importer.
It is worth noting that Canada is the largest exporter of oil to the United States and higher oil prices will support the Canadian Dollar.
Markets Strategist Quek Ser Leang at UOB Group suggests USD/MYR could move into a consolidative phase prior to the resumption of the uptrend.
Key Quotes
Last week, USD/MYR soared and ended the week higher by 1.31% (Friday’s close of 4.6450). While strong momentum suggests USD/MYR could rise further, overbought short-term conditions could lead to a few days of consolidation first.
Overall, as long as USD/MYR stays above 4.6100 (there is another support at 4.6250), it could rise to 4.6700 later on. This week, the next resistance at 4.6880 is unlikely to come into view.
- Gold price gauges intermediate support as the focus shifts to the Jackson Hole Economic Symposium.
- The US Dollar continues to enjoy liquidity amid caution about China’s economic outlook.
- The US August economic calendar will have a significant impact on the Fed’s September monetary policy meeting.
Gold price’s (XAU/USD) downside momentum looks exhausted after stabilizing below the crucial support at $1,900 as investors shift their focus towards the Jackson Hole Economic Symposium, which will start on Thursday. Investors will likely take clues from the event about the Federal Reserve’s (Fed) roadmap of achieving price stability without deviating from a low Unemployment Rate.
Fears of a recession in the United States economy have receded amid tight labor market conditions and strong consumer spending momentum propelled by steady wage growth. Fresh predictions about Fed’s interest rate guidance signal that the central bank will keep interest rates at high levels until March 2024.
Daily Digest Market Movers: Gold price awaits Jackson Hole Economic Symposium
- Gold price’s downside momentum fades after stabilizing below the crucial support of $1,900.00. However, more downside seems favored.
- The precious metal continues to face a sheer sell-off as the US Dollar Index (DXY) delivers a five-week winning streak.
- The appeal for the US Dollar improved last week as investors turned cautious about China’s economic outlook.
- Deflation risks are high in the Chinese economy due to weak demand and declining exports.
- The Chinese authorities are expected to deliver more fiscal support to uplift growth prospects and to elevate hiring momentum.
- On Monday, the People’s Bank of China (PBoC) cut its one-year Prime Lending Rate (PLR) by 10 basis points (bps) to 3.45%, while the five-year PLR was left unchanged at 4.20%.
- The scale of the one-year PLR cut by the PBoC was lower than the 15bps expected cut.
- The US Dollar trades sideways on Monday as investors shift focus toward the Jackson Hole Economic Symposium, which will begin on Thursday.
- 10-year US Treasury Yields jump to 4.3% as investors expect the Fed to further increase interest rates in the context of still high inflation.
- Federal Reserve chair Jerome Powell is expected to deliver the economic outlook and the interest rate guidance for September monetary policy at Jackson Hole.
- Investors are keen to know how the Fed expects to get rid of the ‘last mile’ of stubborn inflation to achieve price stability and keep the Unemployment Rate at low levels.
- Federal Open Market Committee (FOMC) minutes for July’s policy meeting indicated that the central bank will be more dependent on the incoming data for further action.
- The majority of Fed policymakers expect that interest rates haven’t peaked yet as labor market conditions are still tight and strong wage growth has increased the disposable income of households.
- A Reuters poll conducted between August 14-18 showed that the Fed will keep interest rates steady in September and will not cut rates before March next year. Meanwhile, the odds of a recession have dropped to 40%, the lowest in a year.
- Receding recession fears, tight labor market, and stubborn ”last mile” inflation could force the Fed to keep interest rates higher for a longer period.
Technical Analysis: Gold price long-term trend turns bearish
Gold price turns back-and-forth after recording a fresh swing low marginally below $1,885.00 on a daily time frame. For the past three weeks, each pullback move in the precious metal has been capitalized as a selling opportunity by market participants. The yellow metal trades below the 200-day Exponential Moving Average (EMA), which indicates that the long-term trend has turned bearish.
Momentum oscillators suggest that a bearish impulse is extremely strong, which will keep volatility on the higher side.
Fed FAQs
What does the Federal Reserve do, how does it impact the US Dollar?
Monetary policy in the US is shaped by the Federal Reserve (Fed). The Fed has two mandates: to achieve price stability and foster full employment. Its primary tool to achieve these goals is by adjusting interest rates.
When prices are rising too quickly and inflation is above the Fed’s 2% target, it raises interest rates, increasing borrowing costs throughout the economy. This results in a stronger US Dollar (USD) as it makes the US a more attractive place for international investors to park their money.
When inflation falls below 2% or the Unemployment Rate is too high, the Fed may lower interest rates to encourage borrowing, which weighs on the Greenback.
How often does the Fed hold monetary policy meetings?
The Federal Reserve (Fed) holds eight policy meetings a year, where the Federal Open Market Committee (FOMC) assesses economic conditions and makes monetary policy decisions.
The FOMC is attended by twelve Fed officials – the seven members of the Board of Governors, the president of the Federal Reserve Bank of New York, and four of the remaining eleven regional Reserve Bank presidents, who serve one-year terms on a rotating basis.
What is Quantitative Easing (QE) and how does it impact USD?
In extreme situations, the Federal Reserve may resort to a policy named Quantitative Easing (QE). QE is the process by which the Fed substantially increases the flow of credit in a stuck financial system.
It is a non-standard policy measure used during crises or when inflation is extremely low. It was the Fed’s weapon of choice during the Great Financial Crisis in 2008. It involves the Fed printing more Dollars and using them to buy high grade bonds from financial institutions. QE usually weakens the US Dollar.
What is Quantitative Tightening (QT) and how does it impact the US Dollar?
Quantitative tightening (QT) is the reverse process of QE, whereby the Federal Reserve stops buying bonds from financial institutions and does not reinvest the principal from the bonds it holds maturing, to purchase new bonds. It is usually positive for the value of the US Dollar.
"The impression took hold that inflation rates will nonetheless persist for longer above the rates targeted by central banks," Germany's Bundesbank said in its monthly report published on Monday.
"In particular, the ongoing high wage pressures could make it harder to press ahead with curbing inflation," the publication further read.
Regarding the economic outlook, Bundesbank noted that German growth is forecast to remain largely flat in the third quarter, while private consumption is expected to recover with the industry remaining weak.
Market reaction
EUR/USD showed no immediate reaction to this publication and was last seen rising 0.25% on the day at around 1.0900.
The US Dollar Index (DXY) has risen over 3% from its mid-July 2023 lows. Economists at the Bank of America expect the USD to remain resilient.
US's superior economic performance
The US economy appears to be outpacing other major global economies. This outperformance is widening the gap in growth rates, which can act as a pillar of strength for the USD.
US interest rates, both nominal and real, are rising or expected to rise faster than their counterparts in other countries, potentially attracting more capital inflows.
- US Dollar price action expected to remain fairly muted with little waves during the week.
- Traders will try to keep their powder dry for the main event on Friday with US Fed Chair Powell's speech at Jackson Hole.
- The US Dollar Index holds on the gains and could eke out a three-month high if Powell speaks in favor of the Greenback.
The US Dollar (USD) hovers in the middle of a range where it can still reach new monthly or even three-month highs in some pairs. The current positioning is no coincidence as traders are facing one of the pivotal moments each year in the financial calendar. The annual Jackson Hole Symposium is due to take place on Friday where US Federal Reserve chairman Jerome Powell will give an important speech that could prove to be a game changer for the Greenback’s performance throughout the last quarter of 2023.
A very calm Monday thus gets underway as traders prepare for Jackson Hole and keep their powder dry in the meantime. On the economic data front ,one number that could make some small waves for the US Dollar is the Chicago Fed National Activity Index for July. Meanwhile, some attention leans toward China as markets reacted with disappointment to the small rate cut by the Peoples Bank of China (PBOC) overnight. The policy change has made equities slump at the start of the week.
Daily digest: US Dollar steady in holding pattern
- China has cut the five-year loan rate less than expected by 10 basis points to 3.45%, which is triggering a backslash in global markets for the Yuan and the Chinese stock market. At least 15 basis points were pencilled into expectations. Meanwhile mortage rates remain unchanged.
- Belarusian forces are conducting drills near the Polish border.
- Over the weekend China held military drills near the Taiwan Straight.
- At 12:30 GMT, the Chicago Fed National Activity Index for July will be printed. The previous number was a slight contraction at -0.32, but no expectations are available.
- The US Treasury will auction a 3-month and a 6-month bills at probably high rates based on the recent jump across the whole US yield curve.
- The BRICS convention is set to take place this week in South Africa with the conglomerate welcoming nearly 20 new members. Major theme will be the discussion on dedollarization and the setup of a payment system between the nations.
- China is being singled out in the stock market this Monday. The Hang Seng Index drops over 1.7% percent on the day, while Japan closes up 0.20%. European equities are shooting higher, while US futures are trading flat toward the Monday opening bell.
- The CME Group FedWatch Tool shows that markets are pricing in an 88.5% chance that the Federal Reserve will keep interest rates unchanged at its meeting in September.
- The benchmark 10-year US Treasury bond yield trades at 4.28% and is back up after its decline on Friday. The bond market in particular will be very sensitive to any news on Friday at the Jackson Hole Symposium. The whole US yield curve could move up or down depending on the speech from Fed chairman Jerome Powell.
US Dollar Index technical analysis: holding at 103
The US Dollar is hovering at the monthly high in the US Dollar Index (DXY). The Greenback retreats a touch this Monday as traders will try to keep their ammunition dry for the main event on Friday. Expect any sudden moves or breakdowns to be rather headline driven and short-lived for the most part this week.
On the upside, 104.00 is the level to reach. The high of Friday at 103.68 is vital and needs to get a daily close above it in order for the DXY to eke out more monthly gains. Should this US Dollar strength persist for the last part of this year, May’s peak at 104.70 could become the reality again.
On the downside, several floors are likely to prevent a steep decline in the DXY. The first one is the 200-day Simple Moving Average (SMA) at 103.20, which got broken very briefly on Thursday. Passing below the 103.00 figure, some room opens up for a further drop. However, around 102.34 both the 55-day and the 100-day SMAs await to catch any falling knives.
US Dollar FAQs
What is the US Dollar?
The US Dollar (USD) is the official currency of the United States of America, and the ‘de facto’ currency of a significant number of other countries where it is found in circulation alongside local notes. It is the most heavily traded currency in the world, accounting for over 88% of all global foreign exchange turnover, or an average of $6.6 trillion in transactions per day, according to data from 2022.
Following the second world war, the USD took over from the British Pound as the world’s reserve currency. For most of its history, the US Dollar was backed by Gold, until the Bretton Woods Agreement in 1971 when the Gold Standard went away.
How do the decisions of the Federal Reserve impact the US Dollar?
The most important single factor impacting on the value of the US Dollar is monetary policy, which is shaped by the Federal Reserve (Fed). The Fed has two mandates: to achieve price stability (control inflation) and foster full employment. Its primary tool to achieve these two goals is by adjusting interest rates.
When prices are rising too quickly and inflation is above the Fed’s 2% target, the Fed will raise rates, which helps the USD value. When inflation falls below 2% or the Unemployment Rate is too high, the Fed may lower interest rates, which weighs on the Greenback.
What is Quantitative Easing and how does it influence the US Dollar?
In extreme situations, the Federal Reserve can also print more Dollars and enact quantitative easing (QE). QE is the process by which the Fed substantially increases the flow of credit in a stuck financial system.
It is a non-standard policy measure used when credit has dried up because banks will not lend to each other (out of the fear of counterparty default). It is a last resort when simply lowering interest rates is unlikely to achieve the necessary result. It was the Fed’s weapon of choice to combat the credit crunch that occurred during the Great Financial Crisis in 2008. It involves the Fed printing more Dollars and using them to buy US government bonds predominantly from financial institutions. QE usually leads to a weaker US Dollar.
What is Quantitative Tightening and how does it influence the US Dollar?
Quantitative tightening (QT) is the reverse process whereby the Federal Reserve stops buying bonds from financial institutions and does not reinvest the principal from the bonds it holds maturing in new purchases. It is usually positive for the US Dollar.
Chinese banks lowered the 1-year Loan Prime Rate (LPR) by 10 bps and left the 5-year LPR unchanged. Economists at TD Securities analyze USD/CNH outlook after smaller than the 15 bps expectation cut.
China banks disappoint
In an unexpected move, China's 1-year LPR was cut less than expected by 10 bps to 3.45% and the 5-year rate was kept unchanged at 4.20%.
Overall, the disappointment in the LPR decision adds more confusion for investors, especially after the meeting between PBoC and state banks which pledged for increased loan support.
Despite a stronger-expected-fixing today (~880 pips), markets may read the LPR decision as a step back in policy support from authorities and may pressure USD/CNH back to YTD highs at 7.35.
- Natural Gas rallies to $2.75 in early European trading hours.
- The US Dollar moves sideways as traders await the Jackson Hole Symposium on Friday.
- The overall technical picture sees Natural Gas being supported by an important technical indicator.
Natural Gas price heads to the upside on Monday in European trading as talks failed to reach an agreement in Australia. Wage negotiations are going nowhere between port authorities and workers in one of the most important LNG terminals in Australia. More workers in ports and terminals across Australia are joining the demand for higher wages, pointing to a possible shutdown of more than 10% of the world supply by the first week of September if there is no agreement.
The US Dollar (USD), in the meantime, is not expected to show any fireworks before Friday. The Greenback is even taking a small step back on Monday as markets brush off the gloom from China’s sluggish economic recovery. So any moves to the upside will be fundamentally affected by the demand for Natural Gas futures contracts in the wake of a possible supply shortage out of Australia.
At the time of writing, Natural Gas is trading at $2.774 per MMBtu.
Natural Gas news and market movers
- Overnight numbers showed that China July LNG imports rose by 24.3%.
- China is expanding its LNG importers by starting up or expanding more trading desks in London, Singapore and Qatar.
- France gas storage levels have risen to 86%, with overall Europe at 91%, ahead of target.
- European gas futures soared 18% on the back of the Australian workers ultimatum.
- China’s LNG import growth is set to slow down for the winter, according to Bloomberg gas analyst Daniela Li. China has secured 37 long-term deals in the past two years, which could lead to oversupply by 2024.
- Tropical storm Hilary has hit mainland California. For now there hasn’t been any reports of infrastructure or pipeline breaks in the overall gas network. Still, potential flooding could still cause damage to infrastructures.
- All eyes are focused on Friday, when the annual Jackson Hole Symposium will be the focal point for the week. In the event, the US Federal Reserve tends to signal a change in its monetary policy going forward.
Natural Gas Technical Analysis: support works
Natural Gas is soaring on the back of the headlines out of Australia, where talks are still ongoing though shutdowns at the start of September look inevitable. The 10% cut in supply as of then is not to be underestimated and already shows how fragile price stability is. US natural gas futures are already up 2.8% intraday, while European gas futures increase more than 12%.
On the upside, $3 is still the level to watch as the overall ascending trend channel since April is being respected. Should Natural Gas prices recover, look for a close above $2.935, the high of August 15, in order to confirm that demand is picking up again. More upside toward $3 and $3.065 (high of August 9) would be targets or levels to watch.
On the downside, the trend channel is doing its work with a 55-day Simple Moving Average (SMA) at $2.656, which is underpinning the price. In case more downside pressure builds, look for $2.58, which aligns with the lower trendline of the channel.
-638282031758324908.png)
XNG/USD (Daily Chart)
Economists at MUFG Bank expect to see more USD strength.
Global backdrop is set to remain Dollar supportive
The risk will come at the end of the week with Fed Chair Powell speaking at Jackson Hole. However, we see limited scope for the Fed to make a dovish pivot given the limited changes in the flow of data since the July FOMC meeting.
We still expect to see a slowdown emerge but until we see some evidence of that emerging, the Dollar is set to remain well-supported.
China's growth concerns and property market risks, which are unlikely to recede, mean the global backdrop is set to remain Dollar supportive as well.
In the view of Markets Strategist Quek Ser Leang at UOB Group, USD/THB could have charted an interim top at 35.60 for the time being.
Key Quotes
USD/THB soared to a high of 35.60 last Thursday (17 Aug) before pulling back. The pullback in overbought conditions and waning upward momentum indicate that USD/THB has likely moved into a consolidation phase. To look at it another way, 35.60 could be an interim top.
The pullback could extend to 34.95, even though any decline is likely part of a broad 34.95/35.60 consolidation range. In other words, a clear break below 34.95 is unlikely.
- EUR/GBP extends gains as effect of downbeat UK economic data.
- German PPI declined significantly higher than anticipated in July.
- Traders seek fresh impetus, awaiting economic data releases from both economies.
EUR/GBP trades higher around 0.8560, continuing the winning streak for the second day. The downbeat trade data released from the United Kingdom (UK) on Friday, undermined the Pound Sterling (GBP), potentially contributing to the strength of the EUR/GBP pair. As said, UK Retail Sales declined 1.2% in July on month, swinging from a 0.6% increase in June and significantly below the 0.5% decline that was expected for July.
On the other hand, the EUR/GBP pair could face downward pressure due to Monday’s German data release of the Producer Price Index (PPI) (MoM) declined 1.1%. It was significantly higher than the expectation of a 0.2% decline in the month of July, compared to the previous reading of -0.3%. While, year-on-year PPI declined to 6% against the expectation of a 5.1% decline, swinging from the previous rate of 0.1% growth.
The market participants will closely watch the upcoming data releases of HCOB PMI and Gross Domestic Product (GDP) from Eurozone later in the week. European Central Bank’s (ECB) Monetary Policy Meeting Accounts are set to release on Thursday, followed by ECB's President Lagarde speech on Saturday.
On the UK docket, investors will also watch the releases of PMI surveys along with GfK Consumer Confidence data for August. These datasets could provide valuable insights about the state of both economies, potentially helping traders in making decisions involving the EUR/GBP pair.
The People’s Bank of China (PBoC) cut the one-year loan prime rate (LPR) by 10 bps to 3.45%. Economists at ING analyze Yuan outlook after modest Chinese rate cut.
Renminbi to stay soft and remain a popular funding currency
Chinese authorities have delivered another rate cut – but this time the one-year LPR has been lowered 10 bps to 3.45%, while the 5-year LPR has been unexpectedly left unchanged. The latter rate is seen as more important to Chinese mortgage markets and raises questions about how China plans to stimulate demand in that sector. The rate cut did not see large moves in the Renminbi, and the ongoing low USD/CNY fixings suggest Chinese authorities are trying to draw some kind of line in the sand near 7.35.
Unlike the Japanese, who are very transparent with their FX intervention activities, it is hard to discern whether Chinese authorities are intervening to sell Dollars near current levels. However, with China employing monetary stimulus, expect the Renminbi to stay soft and remain a popular funding currency.
Ulrich Leuchtmann, Head of FX and Commodity Research at Commerzbank, analyzes JPY outlook as markets assess what the BoJ actually means with its cryptic guidance.
Does the BoJ know how to rip off a plaster?
After the fierce market reactions to the recent change in YCC, it was surely clear to even the last Japanese monetary policymaker that a further increase in the yield ceiling would have led to fierce market reactions once again. That is the price to be paid by a central bank that abandons a monetary policy position in which it has been entrenched for ages.
But in my opinion, it is extremely short-sighted to avoid this market reaction by creating monetary policy ambiguity. Because in the end, monetary policy only works if it is understood.
To me, the BoJ seems like a child who needs to pull off a plaster and doesn't dare to get it done in one pull. Instead, it plucks it off piece by piece, which is ultimately much more unpleasant. No one should be surprised that the Yen does not have many fans at the moment.
- AUD/USD kicks off the new week on a softer note and is pressured by a combination of factors.
- China’s economic woes continue to weigh on investors’ sentiment and the risk-sensitive Aussie.
- Bets for one more Fed rate hike in 2023 underpin the USD and contribute to a mildly softer tone.
The AUD/USD pair meets with some supply on the first day of a new week and trades with a mild negative bias through the early part of the European session. The pair is currently placed just below the 0.6400 round-figure mark and remains well within the striking distance of its lowest level since November 2022 touched last Thursday.
A smaller rate cut by the People’s Bank of China (PBoC) signals limited policy support for the economy despite worries about a deepening crisis in the domestic property sector. This, in turn, continues to weigh on investors' sentiment, which is evident from a generally weaker tone around the equity markets, and undermines the risk-sensitive Australian Dollar (AUD). Apart from this, a bullish US Dollar (USD) is seen as another factor exerting some downward pressure on the AUD/USD pair.
In fact, the USD Index (DXY), which tracks the Greenback against a basket of currency, holds steady just below its highest level in more than two months in the wake of hawkish Federal Reserve (Fed) expectations. It is worth recalling that the minutes of the July 25-26 FOMC meeting showed that policymakers continued to prioritize the battle against inflation. Moreover, the incoming US macro data point to an extremely resilient economy and support prospects for further tightening by the Fed.
Meanwhile, the view that the US central bank will keep rates higher for longer remains supportive of elevated US Treasury bond yields and continues to lend support to the Greenback. This, in turn, suggests that the path of least resistance for the AUD/USD pair is to the downside. Bearish traders, however, might refrain from placing aggressive bets ahead of the crucial Jackson Hole Symposium later this week, where comments by central bankers might infuse significant volatility in the markets.
Even from a technical perspective, the recent slide below the 0.6600 mark, which confirmed the bearish double-top breakdown, validates the near-term negative outlook for the AUD/USD pair. That said, the Relative Strength Index (RSI) on the daily chart is flashing slightly oversold conditions. This might hold back bearish traders from placing aggressive bets in the absence of any relevant market-moving economic releases from the US on Monday and ahead of the key event risk.
Technical levels to watch
- Euro so far reverses part of the recent weakness vs. the US Dollar.
- Stocks in Europe starts the week in a strong fashion.
- EUR/USD bounces of multi-week lows near 1.0840 (August 18).
- The USD Index (DXY) comes under pressure and revisits 103.30.
- Producer Prices in Germany surprised to the downside in July.
- The US docket is empty at the beginning of the week.
The Euro (EUR) leaves behind part of the multi-day decline against the US Dollar (USD) on Monday and motivates EUR/USD to shift its focus to the immediate key barrier at 1.0900 the figure.
In the meantime, the Greenback extends the corrective knee-jerk after hitting new peaks for the month of August near 103.70 last Friday and relegates the USD Index (DXY) to the 103.30 region despite the move higher in US yields early in the European trading hours.
Looking at the broader context of monetary policy, the discussion around the Federal Reserve's stance of maintaining a tighter policy for an extended period seems to have been revived. This is in response to the resilience displayed by the US economy, despite some easing in the labour market and lower inflation readings in recent months.
Within the European Central Bank's realm (ECB), internal disagreements among its Council members regarding the continuation of tightening measures after the summer period are causing renewed weakness that is impacting the Euro negatively.
Moving forward, markets are expected to maintain a cautious approach in light of the Jackson Hole Symposium and Chief Jerome Powell’s speech in the second half of the week.
On another front, speculative net longs in the EUR climbed to two-week highs in the week ended August 15, according to the latest CFTC report.
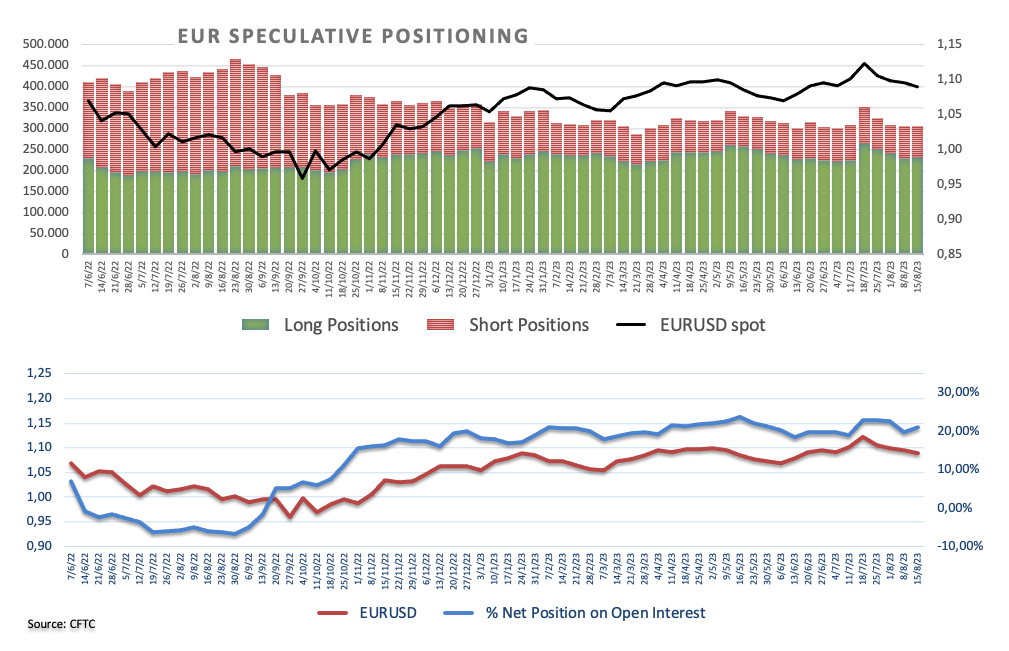
Data-wise, in Germany, Producer Prices contracted at a monthly 1.1% in July and 6.0% over the last twelve months. The period under scrutiny saw EUR/USD come under heavy pressure amidst the multi-week rally in the Greenback helped by stronger-than-expected results in the US docket.
Daily digest market movers: Euro generates some upside traction near 1.0900
- The EUR picks up pace vs. USD and approaches 1.0900.
- The PBoC reduced by 10 bps the 1-Year Loan Prime Rate to 3.45%.
- Investors will closely follow the developments from the Jackson Hole event.
- US 10-year/30-year yields resume the uptrend to multi-year highs.
- Fed’s tighter-for-longer narrative remains well in place.
- The Fed is likely to maintain rates at current levels until Q1 2024.
Technical Analysis: Euro risks further decline near term
EUR/USD manages to stage a decent rebound with the immediate target at the 1.0900 barrier at the beginning of a new trading week. Despite the current bounce, the pair is still seen under pressure.
In case of further losses, EUR/USD could retest the August low of 1.0844 (August 18) ahead of the July low of 1.0833 (July 6). The breakdown of the latter exposes the significant 200-day SMA at 1.0792 ahead of the May low of 1.0635 (May 31). Deeper down, there are additional support levels at the March low of 1.0516 (March 15) and the 2023 low at 1.0481 (January 6).
Occasional bullish attempts, in the meantime, are expected to meet initial hurdle at the August high at 1.1064 (August 10) prior to the weekly top at 1.1149 (July 27). If the pair clears the latter, it could alleviate some of the downward pressure and potentially visit the 2023 peak of 1.1275 (July 18). Once this region is surpassed, significant resistance levels become less prominent until the 2022 high at 1.1495 (February 10), which is closely followed by the round level of 1.1500.
Furthermore, the positive outlook for EUR/USD remains valid as long as it remains above the important 200-day SMA.
Euro FAQs
What is the Euro?
The Euro is the currency for the 20 European Union countries that belong to the Eurozone. It is the second most heavily traded currency in the world behind the US Dollar. In 2022, it accounted for 31% of all foreign exchange transactions, with an average daily turnover of over $2.2 trillion a day.
EUR/USD is the most heavily traded currency pair in the world, accounting for an estimated 30% off all transactions, followed by EUR/JPY (4%), EUR/GBP (3%) and EUR/AUD (2%).
What is the ECB and how does it impact the Euro?
The European Central Bank (ECB) in Frankfurt, Germany, is the reserve bank for the Eurozone. The ECB sets interest rates and manages monetary policy.
The ECB’s primary mandate is to maintain price stability, which means either controlling inflation or stimulating growth. Its primary tool is the raising or lowering of interest rates. Relatively high interest rates – or the expectation of higher rates – will usually benefit the Euro and vice versa.
The ECB Governing Council makes monetary policy decisions at meetings held eight times a year. Decisions are made by heads of the Eurozone national banks and six permanent members, including the President of the ECB, Christine Lagarde.
How does inflation data impact the value of the Euro?
Eurozone inflation data, measured by the Harmonized Index of Consumer Prices (HICP), is an important econometric for the Euro. If inflation rises more than expected, especially if above the ECB’s 2% target, it obliges the ECB to raise interest rates to bring it back under control.
Relatively high interest rates compared to its counterparts will usually benefit the Euro, as it makes the region more attractive as a place for global investors to park their money.
How does economic data influence the value of the Euro?
Data releases gauge the health of the economy and can impact on the Euro. Indicators such as GDP, Manufacturing and Services PMIs, employment, and consumer sentiment surveys can all influence the direction of the single currency.
A strong economy is good for the Euro. Not only does it attract more foreign investment but it may encourage the ECB to put up interest rates, which will directly strengthen the Euro. Otherwise, if economic data is weak, the Euro is likely to fall.
Economic data for the four largest economies in the euro area (Germany, France, Italy and Spain) are especially significant, as they account for 75% of the Eurozone’s economy.
How does the Trade Balance impact the Euro?
Another significant data release for the Euro is the Trade Balance. This indicator measures the difference between what a country earns from its exports and what it spends on imports over a given period.
If a country produces highly sought after exports then its currency will gain in value purely from the extra demand created from foreign buyers seeking to purchase these goods. Therefore, a positive net Trade Balance strengthens a currency and vice versa for a negative balance.
- Pound Sterling trades sideways as investors await a fresh economic trigger for further guidance.
- UK retail sales contracted in July as households switched to online shopping due to the wet season.
- British house prices drop as buyers’ home-buying ability weakens due to higher borrowing costs.
The Pound Sterling (GBP) trades directionless on Monday as Bank of England (BoE) policymakers seem baffled about September’s monetary policy meeting. July’s economic indicators remained mixed: on the labor market, a hiring slowdown was offset by strong wage growth, whereas on the price front softer headline Consumer Price Index (CPI) due to lower gasoline prices was neutralized by persistently high core inflation.
UK retail sales contracted significantly as store sales were washed out by rainy weather. However, demand at online stores increased supported by promotions, suggesting that retail demand is majorly stable. Investors will focus on preliminary PMI data for August this week for further guidance on September’s monetary policy meeting.
Daily Digest Market Movers: Pound Sterling awaits fresh economic trigger
- Pound Sterling trades lackluster around 1.2750 as investors await a fresh economic trigger for further guidance.
- Bank of England policymakers seem baffled about September’s monetary policy due to mixed readings from economic indicators in July.
- Hiring momentum in July slowed while wage growth remained strong. Core inflation steadied at high levels while headline CPI softened due to lower gasoline prices.
- UK Retail Sales for July contracted sharply due to the wet weather, which drove households to stay at home and order essentials from online stores.
- British Office for National Statistics (ONS) reported that consumers switching to online shopping because of poor weather and increased promotions led to 27.4% of retail sales taking place online in July, up from 26% in June.
- The deviation between the value and volume of retail sales remained high due to inflationary pressures.
- UK’s monthly retail sales for July declined 1.2%, underperforming already weak estimates of a 0.5% contraction. In June, Retail Sales expanded by 0.6%.
- On an annual basis, Retail Sales contracted 3.2%, more than the 2.1% decline expected and the 1.6% annual drop registered in June.
- UK’s real-estate sector continues to face the wrath of higher interest rates. Prices demanded by property sellers dropped sharply as buyers’ ability to invest in a home weakens due to rising borrowing costs.
- A Reuters poll showed that the BoE will raise interest rates to 5.75% in the current tightening cycle. The BoE has already raised interest rates to 5.25% and three monetary policy meetings are still remaining this year.
- This week, investors will focus on the preliminary S&P Global/CIPS Manufacturing and Services PMI data for August.
- According to estimates, the Manufacturing PMI is expected to fall to 45.0 from 45.3 in July. A figure below 50.0 is considered to signal a contraction in manufacturing activity. The Services PMI is also seen lower, at 50.8 against the prior release of 51.5.
- The US Dollar Index (DXY) remained sideways around 103.50 on Monday after a five-week winning spell. A power-pack action is likely in the US Dollar ahead of the Jackson Hole Economic Symposium.
- Federal Reserve (Fed) Chair Jerome Powell will deliver the economic outlook and the interest rate guidance at the Jackson Hole meeting on Friday.
- Tight labor market conditions and resilience in consumer spending indicate that the ‘last mile’ in inflation will be a hard nut to crack for Fed policymakers.
- The US Department of Labor reported lower-than-expected jobless claims. Individuals claiming jobless benefits for the first time dropped to 239K vs. expectations of 240K and the former release of 250K for the week ending August 11.
- Federal Open Market Committee (FOMC) minutes released last week delivered a clear message that the inflationary environment is still uncertain and further policy action will be dependent on the incoming data. Investors will keep an eye on August economic data for September’s monetary policy guidance.
Technical Analysis: Pound Sterling oscillates around 1.2750
Pound Sterling oscillates in a narrow range around 1.2750 amid mixed views about BoE’s interest rate policy. The Cable continues to face pressure from the 20- and 50-day Exponential Moving Averages (EMAs), which indicates weakness in the Pound Sterling. On a smaller time frame, the asset trade in a narrow range of 1.2700-1.2750 and a breakdown below the same is likely to trigger a sell-off.
Pound Sterling FAQs
What is the Pound Sterling?
The Pound Sterling (GBP) is the oldest currency in the world (886 AD) and the official currency of the United Kingdom. It is the fourth most traded unit for foreign exchange (FX) in the world, accounting for 12% of all transactions, averaging $630 billion a day, according to 2022 data.
Its key trading pairs are GBP/USD, aka ‘Cable’, which accounts for 11% of FX, GBP/JPY, or the ‘Dragon’ as it is known by traders (3%), and EUR/GBP (2%). The Pound Sterling is issued by the Bank of England (BoE).
How do the decisions of the Bank of England impact on the Pound Sterling?
The single most important factor influencing the value of the Pound Sterling is monetary policy decided by the Bank of England. The BoE bases its decisions on whether it has achieved its primary goal of “price stability” – a steady inflation rate of around 2%. Its primary tool for achieving this is the adjustment of interest rates.
When inflation is too high, the BoE will try to rein it in by raising interest rates, making it more expensive for people and businesses to access credit. This is generally positive for GBP, as higher interest rates make the UK a more attractive place for global investors to park their money.
When inflation falls too low it is a sign economic growth is slowing. In this scenario, the BoE will consider lowering interest rates to cheapen credit so businesses will borrow more to invest in growth-generating projects.
How does economic data influence the value of the Pound?
Data releases gauge the health of the economy and can impact the value of the Pound Sterling. Indicators such as GDP, Manufacturing and Services PMIs, and employment can all influence the direction of the GBP.
A strong economy is good for Sterling. Not only does it attract more foreign investment but it may encourage the BoE to put up interest rates, which will directly strengthen GBP. Otherwise, if economic data is weak, the Pound Sterling is likely to fall.
How does the Trade Balance impact the Pound?
Another significant data release for the Pound Sterling is the Trade Balance. This indicator measures the difference between what a country earns from its exports and what it spends on imports over a given period.
If a country produces highly sought-after exports, its currency will benefit purely from the extra demand created from foreign buyers seeking to purchase these goods. Therefore, a positive net Trade Balance strengthens a currency and vice versa for a negative balance.
The Dollar looks set to hold onto its gains this week, economists at ING report.
Treasury slide supports the Dollar
US 10-year yields are closing in on 4.30%, and our rates strategy team favours 4.50%. Intriguingly, the team notes that the US 10-year yield correlates most with the pricing of the policy rate four or five years forward. In other words, the Treasury sell-off is less about the terminal rate for this tightening cycle and more about where the Fed Funds rate settles under more normal conditions. Chair Powell could shed some light on this on Friday. The bottom line, however, is that it looks too early for the Fed to sound the all-clear on inflation and the Dollar probably holds its gains.
DXY is holding gains above the 100-DMA at 103.20 and can probably edge up to 104.00 this week.
- GBP/JPY attracts some buying on Monday, albeit struggles to capitalize on the move.
- Intervention fears, along with a softer risk tone, lend support to the JPY and cap gains.
- The BoJ-BoE policy divergence favours bulls and should continue to limit the downside.
The GBP/JPY cross struggles to capitalize on its intraday rally of over 55 pips, though manages to hold above the 185.00 psychological mark through the early European session on Monday.
The Japanese Yen (JPY) weakens after reports indicated that the Bank of Japan (BoJ) will purchase an unlimited quantity of government bonds at a fixed rate with residual maturity of 5 years to 10 years. This, in turn, assists the GBP/JPY cross to attract some dip-buying on the first day of a new week. That said, fears of intervention by Japanese authorities, along with a generally weaker risk tone, limit losses for the safe-haven JPY and cap the upside for spot prices, at least for the time being.
Investors remain concerned about the worsening economic conditions in China. Adding to this, a smaller-than-expected rate cut by the People’s Bank of China (PBoC) signals limited policy support for the economy, despite worries about a deepening crisis in China's property sector, and further tempers investors' appetite for riskier assets. The near-term bias for the EUR/JPY cross, meanwhile, seems tilted in favour of bulls in the wake of a more dovish stance adopted by the BoJ.
In fact, the BoJ is the only central bank in the world to maintain negative interest rates. In contrast, the Bank of England (BoE) hiked its benchmark interest rate for the 14th time in a row, to a 15-year peak of 5.25% in August. Moreover, the markets have been pricing in a greater chance of a 25 bps lift-off at the September BoE meeting. The bets were lifted by the stronger UK wage growth data, which rose to a record high in the second quarter and added to worries about long-term inflation.
Adding to this, the upbeat UK GDP report and slightly higher-than-expected UK CPI print support prospects for a further policy tightening by the BoE, suggesting that the path of least resistance for the GBP/JPY cross is to the upside. That said, a bearish divergence on the daily chart – with spot prices rising to a fresh multi-year peak last week, while the Relative Strength Index (RSI) hitting a lower high – warrants some caution before placing fresh bullish bets.
technical levels to watch
USD/CNH could face some consolidative period ahead of the resumption of the uptrend according to UOB Group’s Economist Lee Sue Ann and Markets Strategist Quek Ser Leang.
Key Quotes
24-hour view: Last Friday, USD dipped briefly to 7.2828 then rebounded to end the day largely unchanged (7.3068, +0.09%). The price movements appear to be consolidative. Today, we expect USD to trade in a range, likely between 7.2920 and 7.3300.
Next 1-3 weeks: Last Thursday (17 Aug), USD surged to a high of 7.3490 before pulling back. The pullback in overbought conditions suggests USD could consolidate for a few days. Overall, as long as 7.2500 (‘strong support’ level) is not breached, there is scope for USD to break above 7.3490 at a later stage. In view of the overbought conditions, the major and long-term resistance near 7.3745 (last year’s peak) is likely out of reach.
Economists at ING expect the EUR/USD pair to remain below the 1.09 level.
EUR/USD will struggle to make it back above the 100-DMA at 1.0930
EUR/USD is starting to look quite comfortable below 1.09 and below support at 1.0835/1.0845 could make a dip down to the 1.0775 area.
Certainly, with US Treasury yields pushing ahead and proving a threat to risk assets – and China still fragile – EUR/USD will struggle to make it back above the 100-Day Moving Average (DMA) at 1.0930.
- USD/CAD consolidates and seeks fresh impetus on monetary policies from both countries.
- BoC adjusted its forecast that a slowdown in inflation would take longer.
- Traders aim to gather more cues on the economic situation and inflation outlook.
USD/CAD consolidates around 1.3530, treading water to extend an upward trend for the fifth consecutive week. The US Dollar (USD) gets support due to improved US economic data and elevated United States (US) Treasury yields. Market participants could turn cautious and seek more information that could provide them with an insight into the direction regarding potential US Federal Reserve’s (Fed) monetary policy before placing fresh bets on the USD/CAD pair.
On the other hand, in July, due to robust consumption and resilient labor markets, the Bank of Canada (BoC) implemented a 25 basis points (bps) increase in the interest rate, bringing it to 5%. This move was driven by the aim to address persistent inflationary pressures. The central bank adjusted its projection that a slowdown in inflation would take longer than earlier expectations.
Looking ahead, investors are anticipating the potential for another 25 bps interest rate hike during the upcoming policy meeting in September. However, during the previous week, Canada’s better inflation figures were not able to stem the weakening of the Canadian Dollar (CAD).
The US Dollar Index (DXY), which gauges the strength of the US Dollar (USD) against a basket of six major currencies, trades slightly lower around 103.30. Investors could turn cautious and aim to gather more cues on the economic situation and inflation outlook from upcoming Fed Chair Jerome Powell's speech during the Jackson Hole Symposium.
Market participants will closely monitor upcoming US data releases during the week, namely Home Sales and the preliminary S&P Global PMI surveys for August along with Canada’s Retail Sales. These datasets could offer a more distinct view of the situation, helping investors to assess the potential course of action by both economies.
- The index extends the corrective move to 103.30.
- US yields kicks off the week in a positive tone.
- Markets’ attention will be on the Jackson Hole event.
The greenback extends the bearish note into the beginning of the new trading week and drags the USD Index (DXY) to the 103.30 zone.
USD Index focused on Jackson Hole, Powell
The index continues to correct lower following last week’s fresh monthly peaks near 103.70 (August 18) amidst the generalized improvement in the risk-associated universe.
The dollar, in the meantime, seems to have met an initial decent resistance near 103.70 against the backdrop of the relentless march north in US yields across the curve as well as increasing speculation that the Federal Reserve might keep the tighter-for-longer stance for an extended period.
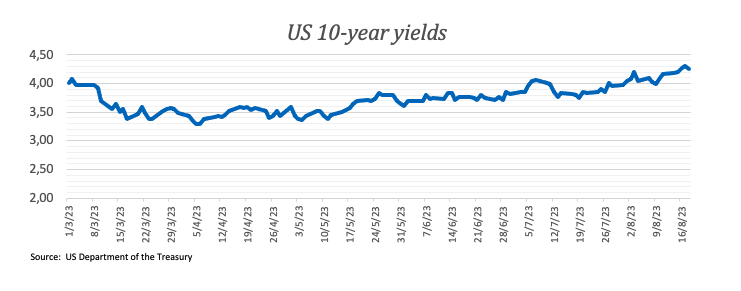
There will be no data releases in the US docket on Monday, while market participants are expected to remain focused on the Jackson Hole Symposium as well as Chief Powell comments due in the second half of the week.
What to look for around USD
The index appears to have entered in a consolidative phase below recent multi-week highs around 103.70.
Extra support for the dollar also comes from the good health of the US economy, which seems to have reignited the narrative around the tighter-for-longer stance from the Federal Reserve.
Furthermore, the idea that the dollar could face headwinds in response to the data-dependent stance from the Fed against the current backdrop of persistent disinflation and cooling of the labour market appears to be losing traction as of late.
Key events in the US this week: Existing Home Sales (Tuesday) – MBA Mortgage Applications, Flash Manufacturing/Services PMIs, New Home Sales (Wednesday) – Jackson Hole Symposium, Durable Goods Orders, Chicago Fed National Activity Index, Initial Jobless Claims (Thursday) - Jackson Hole Symposium, Final Michigan Consumer Sentiment, Chief Powell (Friday).
Eminent issues on the back boiler: Persistent debate over a soft or hard landing for the US economy. Incipient speculation of rate cuts in early 2024. Geopolitical effervescence vs. Russia and China.
USD Index relevant levels
Now, the index is down 0.10% at 103.32 and faces initial support at 102.32 (55-day SMA) followed by 101.74 (monthly low August 4) and then 100.55 (weekly low July 27). On the other hand, the breakout of 103.68 (monthly high August 18) would open the door to 104.69 (monthly high May 31) and finally 105.88 (2023 high March 8).
Economists at Commerzbank expect the Chinse Yuan (CNY) to remain under pressure for the time being.
The PBoC may step up its efforts to stem CNY from weakening sharply
The CNY will likely remain under significant downside pressure in the near term.
The PBoC may step up its efforts to stem CNY from weakening sharply. Last week, the central bank announced strong daily fixings, sold bills in Hong Kong to absorb offshore CNY liquidity, and instructed state-owned banks to step up intervention in both the onshore and offshore markets.
As the CNY moves beyond 7.30 against the Dollar, the PBoC could cut FX reserve requirement ratio to increase onshore Dollar liquidity and/or raise FX forward sales risk reserve ratio to increase the cost of shorting the CNY.
- Silver attracts some buyers for the third successive day, though lacks bullish conviction.
- The intraday technical setup favours bulls and supports prospects for additional gains.
- A convincing break below the $22.70-65 confluence might negate the positive outlook.
Silver trades with a positive bias for the third successive day on Monday, albeit lacks any follow-through buying and remains confined in a familiar range below the $23.00 mark through the early European session. The intraday technical setup, meanwhile, favours bullish traders and supports prospects for additional gains.
The outlook is reinforced by the fact that the XAG/USD is holding above the $22.70-$22.65 confluence, comprising the 200-hour and the 100-hour Simple Moving Averages (SMAs). This, along with positive technical indicators on the hourly charts, suggests that the path of least resistance for the white metal is to the upside. That said, oscillators on the daily chart – though have been recovering – are yet to confirm the positive outlook and warrant some caution for bulls.
Hence, any subsequent strength back above the $23.00 mark is more likely to confront a stiff barrier near the very important 200-day SMA, currently pegged around the $23.25 region. This is closely followed by resistance near the $23.60-$23.60 horizontal zone, above which a fresh bout of a short-covering has the potential to lift the XAG/USD towards the $24.00 round figure. The latter coincides with the 100-day SMA and should act as a pivotal point for short-term traders.
On the flip side, a sustained break below the aforementioned $22.70-$22.65 confluence support might prompt some technical selling and expose the multi-month low, around the $22.10 region touched in June. Some follow-through selling below the $22.00 mark will be seen as a fresh trigger for bearish traders. The XAG/USD might then accelerate the slide towards the $21.55-$21.50 area en route to the $21.00 round figure. The next relevant support is pegged near the $20.60 area, below which the downward trajectory could get extended towards challenging the $20.00 psychological mark.
Silver 1-hour chart
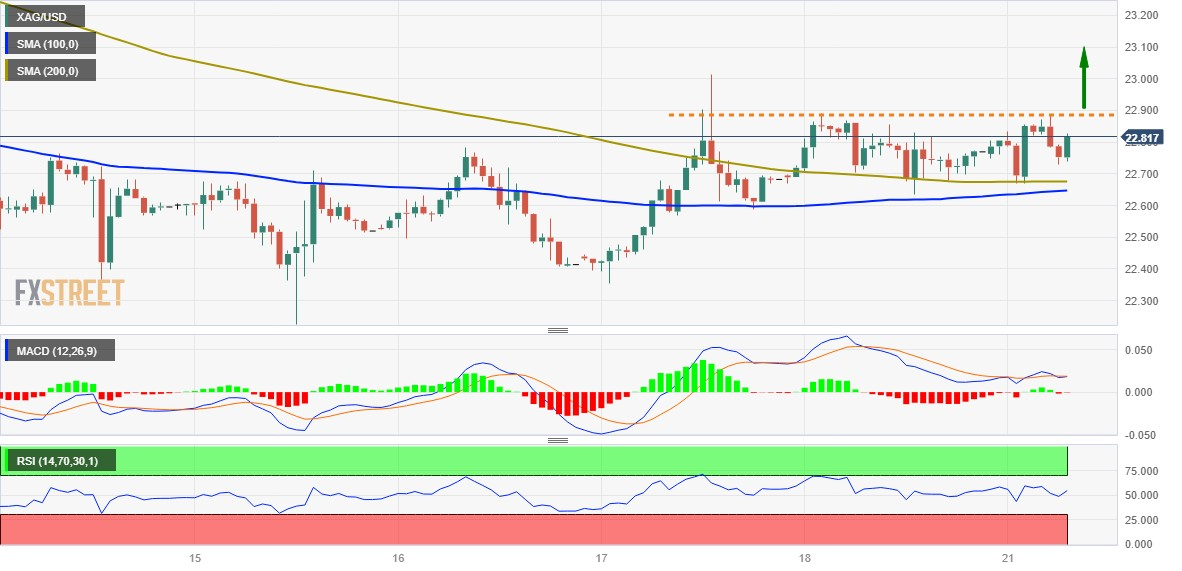
Technical levels to watch
The Bank of England's trade-weighted Sterling index continues to trade near the highs of the year. Economists at ING analyze GBP outlook.
Holding onto gains, short term
It may well be that this Sterling strength endures to the next set of releases on UK wages and CPI (September 12th and 20th respectively), with more mileage to be had against the Euro than the Dollar given headwinds to the external investment environment.
EUR/GBP can stay offered in a 0.8500-0.8550 range, while GBP/USD remains trapped well inside last week's narrow range of 1.2615-1.2785.
Kyodo news agency reported on Monday that the Japanese Ministry of Finance (MoF) is set to raise the assumed long-term interest rate to 1.5% in the fiscal year (FY) 2024/25 from a record-low 1.1% in FY2023/24.
“The upward revision to the rate the ministry uses to calculate Japan's debt servicing costs is made based on rising market yields following the Bank of Japan's (BoJ) tweaks to its massive monetary easing policy,” Kyodo said in its report.
Market reaction
The above report fails to move the needle around the Japanese Yen, with the USD/JPY pair holding steady at 145.35.
- EUR/GBP gains momentum above the 0.8540 mark on Monday.
- The annual German Producer Price Index (PPI) for July fell to -6% versus of -5.1% expected.
- Markets anticipate that the Bank of England (BoW) will maintain a tightening cycle.
- Investors await Eurozone, UK S&P PMI data for fresh impetus.
The EUR/GBP holds positive ground near 0.8545 heading into the early European session on Friday. The cross trades in positive territory for the second consecutive day. Market players await the inflation data from both UK and Eurozone for fresh impetus.
The latest data on Monday by the Statistisches Bundesamt Deutschland reported that the annual German Producer Price Index (PPI) for July fell to -6% versus a 0.1% increase and worse than the market expectation of -5.1%. The monthly PPI figure declined to -1.1% against the market consensus of -0.2% and -0.3% prior. Furthermore, the easing Eurozone inflationary pressure, according to data released by Eurostat on Friday, alleviating pressure on the European Central Bank to continue raising interest rates. This, in turn, leads to the weakness in the Euro against its rivals.
On the Pound Sterling front, the Office for National Statistics (ONS) reported on Friday that monthly UK Retail Sales for July dipped -1.2%, below a -0.5% drop expected. Meanwhile, the annual figure fell -3.2%, against the estimation of -2.1%. The anticipation that the Bank of England (BoW) will maintain tightening remains high. However, the fear of an aggressive rate hike by the BoE might exert pressure on the Pound Sterling as investors worry that it might impact negatively the UK economy.
Looking ahead, the Eurozone Current Account and S&P Purchasing Managers' Index (PMI) and German Gross Domestic Product (GDP) Q2 will be released later this week. On the UK docket, the preliminary S&P PMI for August will be due on Wednesday. The data will be critical for determining a clear movement for the EUR/GBP cross.
A break below the 144.00 level should alleviate the upside pressure in USD/JPY in the short-term horizon, comment UOB Group’s Economist Lee Sue Ann and Markets Strategist Quek Ser Leang.
Key Quotes
24-hour view: Last Friday, USD fell to a low of 144.92 before closing at 145.37 (-0.32%). There is a slight increase in downward momentum, and USD is likely to trade with a downward bias today. However, any decline is unlikely to threaten the strong support at 144.00 (there is another support at 144.60). Resistance is at 145.60, followed by 146.00.
Next 1-3 weeks: In our most recent update from 11 Aug (spot at 144.80), we held the view that USD “could continue to advance, albeit likely at a slower pace.” We indicated that “the next level to watch above 145.05 is at 146.00.”. Last week, USD broke above 146.00 and rose to a high of 146.56, then pulled back. The pullback in overbought conditions and waning momentum suggest the odds for further sustained advance in USD are not high. However, only a breach of 144.00 (‘strong support’ level) would indicate that USD is not advancing further. Looking ahead, if USD were to break clearly above 146.56, any further advance is likely to face considerable resistance near 147.50.
- Russian Ruble pares the first weekly gain in five amid cautious mood ahead of top-tier data/events.
- Central Bank of Russia’s (CBR) surprise rate hike fails to inspire USD/RUB bears amid firmer Greenback, yields.
- Looming rivalry between G7 and BRICS underpin corrective bounce of Russian Ruble pair.
- Monthly PMIs for August, central bankers’ speech at Jackson Hole eyed for clear directions.
Russian Ruble prints the first daily loss in five around 93.55 as it bounces off the three-week low marked the last Thursday heading into Monday’s European session. In doing so, the USD/RUB pair reverses the first weekly fall in five as the US Dollar regains upside momentum after pausing the Greenback bulls on Friday. It’s worth noting that the Central Bank of Russian Federation’s (CBR) surprise rate hike and cautious mood ahead of this week’s top-tier data/events fail to inspire Russian Ruble buyers, especially amid downbeat concerns about Russia and the global economy.
Russian Ruble stays weak despite CBR rate hike
USD/RUB recovers from a three-week low as market players consolidate the CBR-inflicted losses amid the cautious mood ahead of the August month Purchasing Managers Indexes (PMIs) and China news, as well as the top-tier central bankers’ speeches at the annual Jackson Hole Symposium event.
Also exerting downside pressure on the Russian Ruble are market chatters that the nation braces for more supply-chain actions to lift the struggling currency after the CBR’s heavy rate hike of 3.5% failed to keep the USD/RUB down for a long time.
Additionally, the Financial Times (FT) reported during the weekend that China indirectly pushes for competition with the Group of Seven (G7) nations while marking its presence at the BRICS meeting where officials from Brazil, Russia, India, China and South Africa spoke, signaled. Given the Sino-Russian ties, the Dragon Nation may gain support from Moscow for the proposed measures, which in turn can escalate the global trade wars and propel the US Dollar’s haven demand, especially amid the firmer US Treasury bond yields.
It should be noted that China’s failure to bolster market confidence via monetary and fiscal measures also puts a floor under the USD/RUB prices.
Against this backdrop, the US and European stock futures stay defensive while keeping the previous day’s rebound from the monthly lows while the US 10-year Treasury bond yields also reverse Friday’s retreat by rising back to 4.29% at the latest. With this, the US Dollar Index (DXY) seesaw around a 10-week high and exerts downside pressure on the Russian Rubble.
Moving on, the central bankers’ preference for policy pivot will be closely eyed at the Jackson Hole Symposium, which if confirmed could trigger the US Dollar’s pullback and may allow the Russian Ruble to defend the previous week’s rebound.
Russian Ruble Technical Analysis
Russian Ruble’s downside remains elusive unless the USD/RUB quote jumps back beyond the previous support line stretched from May 31, close to 94.80 at the latest.
Considering advanced prints from CME Group for natural gas futures markets, open interest increased by just 545 contracts on Friday after three consecutive daily pullbacks. Volume followed suit and went up by nearly 50K contracts following two straight daily declines.
Natural Gas remains supported near $2.50
Friday’s downtick in prices of natural gas was accompanied by increasing open interest and volume, exposing the likelihood of further retracement in the very near term. That said, the commodity’s downside still faces decent contention around the $2.50 region per MMBtu.
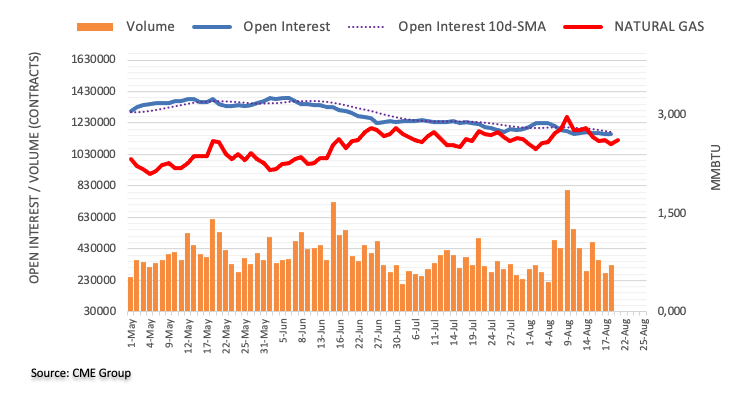
Ulrich Leuchtmann, Head of FX and Commodity Research at Commerzbank, analyzes the trap of asset analysis in times when the Dollar makes significant swings.
Asset analysis in times of USD strength
A comparison of Gold with the G10 average (excluding USD, EUR) reveals that Gold has not performed poorly at all. This only seems to be the case because the US Dollar in particular, but also the Euro to some extent, have gained against this average during this period. And because nearly everybody is looking at XAU/USD or (in case of our European readers) XAU/EUR.
In times when the Dollar makes significant swings, many USD-denominated asset prices are moving without anything idiosyncratic happening in these assets. The trap that many analysts fall into at such times is always the same: they confuse USD's strength or weakness with weakness or strength in the asset they are analyzing.
On the other hand, those who discuss USD-positive or negative arguments instead of writing about idiosyncratic factors of their own asset are getting it right. A positive example is the Gold Outlook of my colleague Thu Lan.
Here is what you need to know on Monday, August 21:
Markets started the new week in a quiet manner, with major currency pairs trading near Friday's closing levels. Germany's Bundesbank will publish its monthly report and the US economic docket will feature the Federal Reserve Bank of Chicago's National Activity Index for July later in the day. High-impact data releases and speeches from central bankers at the annual Jackson Hole Symposium will likely ramp up volatility in the second half of the week.
China's central bank, the People’s Bank of China (PBoC), announced in the Asian session that it lowered the one-year Loan Prime Rate (LPR) to 3.45% from 3.55% previous, while keeping the five-year LPRs unchanged at 4.20%. Markets were expecting both rates to be lowered by 15 basis points. Hong Kong's Hang Seng Index is down nearly 2% on the day following the interest rate decisions and the Shanghai Composite Index is losing 1%. In a statement published over the weekend, the PBoC said that "China will coordinate financial support to resolve local government debt problems," per Reuters.
The US Dollar Index (DXY) registered gains for the fifth straight week last week. Early Monday, DXY holds steady at around 103.50. In the meantime, the benchmark 10-year US Treasury bond yield stays near 4.3% and US stock index futures trade flat on the day.
US Dollar price in the last 7 days
The table below shows the percentage change of US Dollar (USD) against listed major currencies in the last 7 days. US Dollar was the strongest against the Australian Dollar.
| USD | EUR | GBP | CAD | AUD | JPY | NZD | CHF | |
| USD | 0.62% | -0.26% | 0.78% | 1.46% | 0.47% | 1.19% | 0.57% | |
| EUR | -0.63% | -0.89% | 0.15% | 0.84% | -0.17% | 0.55% | -0.05% | |
| GBP | 0.26% | 0.88% | 1.04% | 1.72% | 0.72% | 1.42% | 0.83% | |
| CAD | -0.78% | -0.16% | -1.05% | 0.69% | -0.31% | 0.36% | -0.21% | |
| AUD | -1.48% | -0.85% | -1.75% | -0.70% | -1.01% | -0.33% | -0.90% | |
| JPY | -0.47% | 0.14% | -0.76% | 0.31% | 0.96% | 0.66% | 0.07% | |
| NZD | -1.18% | -0.55% | -1.44% | -0.42% | 0.30% | -0.72% | -0.60% | |
| CHF | -0.57% | 0.06% | -0.82% | 0.23% | 0.92% | -0.08% | 0.59% |
The heat map shows percentage changes of major currencies against each other. The base currency is picked from the left column, while the quote currency is picked from the top row. For example, if you pick the Euro from the left column and move along the horizontal line to the Japanese Yen, the percentage change displayed in the box will represent EUR (base)/JPY (quote).
AUD/USD trades sideways near 0.6400 and NZD/USD consolidates previous week's losses near 0.5900 in the European morning.
EUR/USD registered small losses on Friday and posted its first weekly close below 1.0900 since early July. The pair fluctuates in a tight range above 1.0850 to start the new week.
Despite broad-based US Dollar strength, GBP/USD closed the previous week in positive territory as Pound Sterling benefited from labor market and inflation data. The pair stays relatively quiet and trades below 1.2750 in the early European session on Monday.
USD/JPY declined sharply in the second half of last week but met support near 145.00 on Friday. The pair was last seen trading modestly higher on the day near 145.50.
Pressured by surging US yields, Gold price made a weekly close below $1,900 for the first time in five months. XAU/USD trades in a tight channel at around $1,890 on Monday.
Bitcoin selloff paused over the weekend but BTC/USD lost more than 10% on a weekly basis before going into a consolidation phase near $26,000. Following a modest two-day recovery, Ethereum came under renewed bearish pressure and was last seen losing nearly 1% on the day below $1,700.
FX option expiries for Aug 21 NY cut at 10:00 Eastern Time, via DTCC, can be found below.
- EUR/USD: EUR amounts
- 1.0800 460m
- 1.0845 1.3b
- 1.0855 403m
- 1.0885 378m
- 1.0900 1.9b
- 1.0925 562m
- USD/JPY: USD amounts
- 145.00 422m
- 145.50 460m
- USD/CHF: USD amounts
- 0.8850 620m
- USD/CAD: USD amounts
- 1.3430 330m
- 1.3500 513m
- USD/JPY consolidates around the 145.15-145.65 region in a narrow trading band.
- The major pair stands above the 50- and 100-hour EMAs with an upward slope.
- The immediate resistance level appears at 145.85; he key contention level is seen at 144.90-145.00 region.
The USD/JPY pair oscillates in a narrow range below the mid-145.00s heading into the early Asian session on Monday. Traders prefer to wait on the sidelines amid the risk-averse mood and await the Federal Reserve (Fed) Chairman Jerome Powell Speaks at the Jackson Hole Symposium on Friday. The major pair currently trades near 145.43, gaining 0.03% on the day.
Meanwhile, traders will keep an eye on the potential intervention by the Bank of Japan (BoJ). The Japanese government may step in to prevent the Japanese Yen. However, the monetary policy differential between the US and Japan is the main driver of the Yen's weakening.
According to the four-hour chart, the USD/JPY pair stands above the 50- and 100-hour Exponential Moving Averages (EMAs) with an upward slope, which means the path of least resistance is to the upside for the major pair.
That said, the key contention level for the major pair is seen at the 144.90-145.00 region, representing a confluence of the lower limit of the Bollinger Band and 100-hour EMA. The additional downside filter is seen at 144.40 (low of August 11), followed by 144.00 (100-hour EMA), and finally at 143.30 (low of August 10).
On the upside, the immediate resistance level for USD/JPY appears at 145.85 (high of August 15). The critical barrier for the pair is seen at a YTD high and the boundary of the Bollinger Band of 146.55. Any meaningful follow-through buying above the latter would challenge a psychological round figure at 147.00, which will be a tough nut to crack for the USD/JPY pair.
It’s worth noting that the Relative Strength Index (RSI) stands below 50 and Moving Average Convergence/Divergence (MACD) stays in bearish territory, which indicates that the upside momentum has been activated for the time being.
USD/JPY four-hour chart
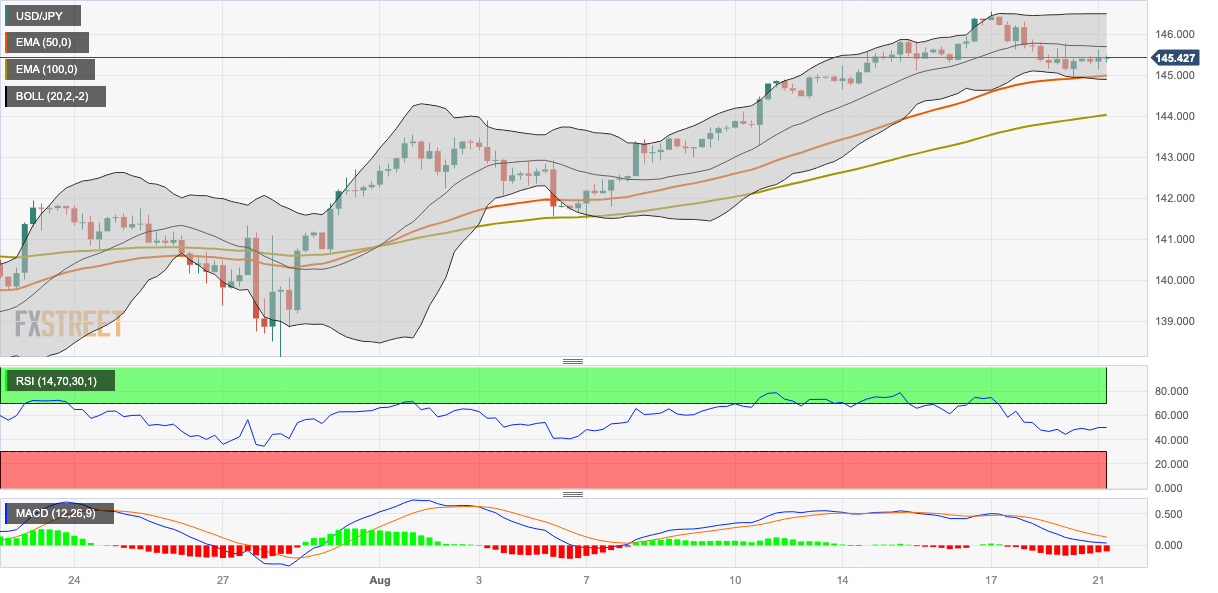
- Gold Price remains bearish at five-month low, lacks momentum of late.
- Sustained trading below $1,900 upside hurdle, China woes underpin bearish bias about XAU/USD.
- August PMIs, US Durable Goods Orders and Jackson Hole Symposium will be in the spotlight for clear directions.
- Central bankers’ hesitance to welcome policy pivot can drag Gold Price further towards the south.
Gold Price (XAU/USD) remains on the back foot at the lowest level in five months as market players seek solace in the US Dollar amid uncertainty ahead of this week’s top-tier data/events. Also exerting downside pressure on the XAU/USD could be the pessimism surrounding one of the world’s biggest commodity users, namely China.
Although China announced a slew of measures to restore investor confidence, the Gold Price fails to pick up bids as concerns about the dragon nation’s economic health remain dicey. Also, looming geopolitical woes and trade war fears join the People’s Bank of China’s (PBoC) no change in five-year Loan Prime Rates (LPRs), despite cutting the one-year LPRs by 10 basis points (bps), exert downside pressure on the Gold Price. Furthermore, upbeat US Treasury bond yields and cautious mood keeps the XAU/USD sellers hopeful.
However, the indecision about the Fed Chair Jerome Powell’s monetary policy bias and the market’s wait for this week’s August month Purchasing Managers Indexes (PMIs), US Durable Goods Orders and the top-tier central bankers’ speeches at the annual Jackson Hole Symposium event puts a floor under the Gold Price.
Also read: Gold Price Forecast: XAU/USD eyes a firm rebound to 200 DMA again
Gold Price: Key levels to watch
As per our Technical Confluence indicator, the Gold Price stays well beneath the $1,898 resistance confluence comprising Fibonacci 38.2% in one week, 100-SMA on one-hour and the previous daily high.
Adding strength to the downside bias is the XAU/USD’s sustained trading below $1,892 immediate hurdle including the Fibonacci 61.8% on one-day and the middle band of the Bollinger on the hourly play.
It’s worth noting that the convergence of the 10-DMA and Pivot Point one-week R1, close to $1,910, acts as the final defense of the Gold bears, a break of which could convince the buyers to return to the table.
Alternatively, the previous weekly low and Pivot Point one-day S1 puts a floor under the Gold Price near $1,885.
Following that, the $1,878 becomes a crucial support as it comprises the lower band of the Bollinger on the daily chart, as well as the Pivot Point one-week S1.
In a case where the Gold Price remains bearish past $1,878, the $1,865 support confluence, encompassing Pivot Point one-month S2, will be in the spotlight.
Here is how it looks on the tool
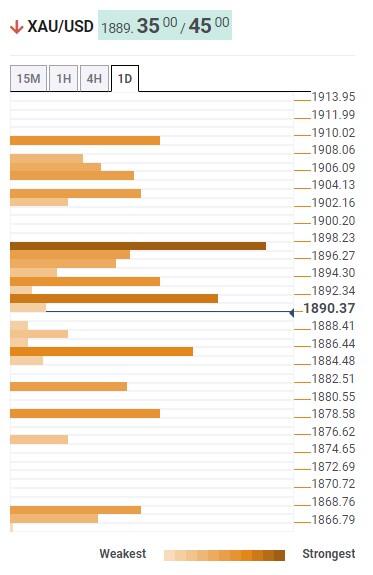
About Technical Confluences Detector
The TCD (Technical Confluences Detector) is a tool to locate and point out those price levels where there is a congestion of indicators, moving averages, Fibonacci levels, Pivot Points, etc. If you are a short-term trader, you will find entry points for counter-trend strategies and hunt a few points at a time. If you are a medium-to-long-term trader, this tool will allow you to know in advance the price levels where a medium-to-long-term trend may stop and rest, where to unwind positions, or where to increase your position size.
The Forint is underperforming once again. Economists at Commerzbank share their EUR/HUF forecast.
Forint to regain some ground by the end of the year
We forecast the Forint to regain some ground by the end of the year because inflation is likely to moderate faster than the pace at which MNB will cut rates, and the real interest rate will therefore become less negative – in this window, we see EUR/HUF in the 375 range.
But, we forecast a weaker Forint subsequently in 2024 because EU relations and monetary policy will remain fundamental negative factors for the HUF.

Source: Commerzbank Research
In the opinion of UOB Group’s Economist Lee Sue Ann and Markets Strategist Quek Ser Leang, losses in AUD/USD could accelerate once 0.6365 is breached.
Key Quotes
24-hour view: Last Friday, AUD traded in a range of 0.6380/0.6428 before ending the day little changed at 0.6405 (+0.05%). We view the price actions as part of a consolidation phase. Today, AUD is likely to trade sideways in a range of 0.6390/0.6450.
Next 1-3 weeks: The AUD weakness that started late last month is still intact. However, short-term conditions are severely oversold, and the pace of any further weakness is likely to be slow. To look at it another way, in order for AUD to weaken further, it must break and stay below last week’s low of 0.6365. The chance of AUD breaking clearly below 0.6365 will remain intact as long as it stays below 0.6480 (‘strong resistance’ level). Looking ahead, the next support below 0.6365 is at 0.6320.
Open interest in crude oil futures markets dropped for the third session in a row on Friday, this time by around 23.4K contracts according to preliminary readings from CME Group. Volume, on the other hand, resumed the uptrend and went up by nearly 10K contracts.
WTI: Gains appear capped around $85.00
Prices of WTI extended the rebound during the second half of last week amidst shrinking open interest, which hints at the idea that further rebound might not be favoured in the very near term. In the meantime, occasional bullish attempts remain limited around the 2023 highs near the $85.00 mark per barrel.
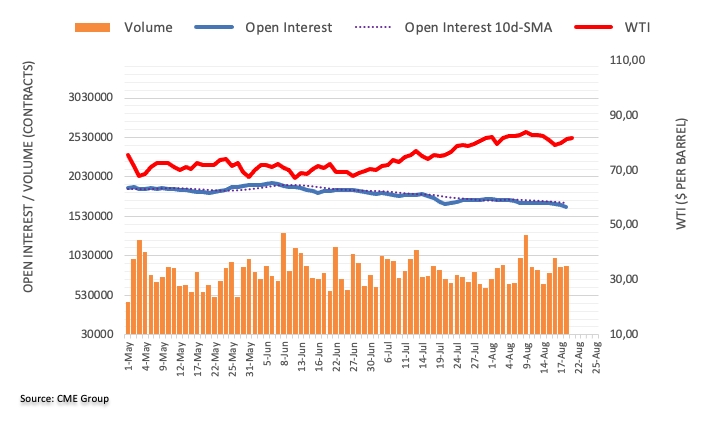
- NZD/USD remains depressed at YTD low, down for 10 consecutive days.
- Kiwi portrays bearish consolidation within weekly pennant, 0.5910 becomes necessary for sellers fresh entry.
- Buyers remain off the table below fortnight-old resistance line.
NZD/USD bears keep the reins despite showing resilience around 0.5920 heading into Monday’s European session. In doing so, the Kiwi pair drops for the tenth consecutive day amid the cautious mood ahead of this week’s top-tier data/events.
Also read: NZD/USD extends the downside to the vicinity of 0.5900
That said, a three-day-long pennant formation at the Year-To-Date (YTD) low, currently between 0.5910 and 0.5940, restricts the immediate downside of the quote.
Adding strength to the upside filter is the 100-Hour Moving Average (HMA) level of around 0.5945.
It’s worth noting that the 200-HMA and a fortnight-old descending trend line, respectively near 0.5985 and 0.6025 restrict the short-term upside of the NZD/USD pair.
Following that, the monthly high of around 0.6135 will be in the stoplight.
On the contrary, NZD/USD bears need a clear downside break of 0.5910, as well as a sustained downside past 0.5900, to keep the reins.
In that case, the early October 2022 peak of around 0.5815 could lure the Kiwi pair sellers before directing the downside towards the previous yearly low of near 0.5510.
Overall, NZD/USD is likely to remain bearish but the downside needs a pause before the next leg towards the south. The same highlights this week’s US PMIs, Durable Goods Orders and Jackson Hole Symposium, not to forget China news, as the key catalysts.
NZD/USD: Hourly chart

Trend: Further downside expected
- EUR/USD recovers some lost ground near 1.0800 ahead of German economic data.
- The easing Eurozone inflation data alleviated pressure on the European Central Bank to continue rates hike.
- Investors raise their bets on more rate hikes by the Federal Reserve (Fed) despite the US upbeat data.
- Traders await the German PPI data, the highlight this week will be Fed Chairman Jerome Powell Speaks.
The EUR/USD pair gains modest ground around the 1.0880 mark heading into the European session on Monday. Market participants await the German Producer Price Index (PPI) due later in the day. The monthly figure for July is expected to rise by a 0.2% decline while the annual figure is expected to a 5.1% drop.
Last week, the preliminary Eurozone Gross Domestic Product (GDP) for the second quarter came in at 0.3% and 0.6% YoY, matching expectations. Meanwhile, Eurozone Industrial Production for June MoM improved to 0.5% versus -0.1% market consensus and 0.0% prior. The monthly Industrial Output data rose by 0.5% versus the estimation of a 0.1% decline. Finally, the annual Harmonized Index of Consumer Prices for July came in at 5.3% versus 5.5% prior while the core figure remained at 5.5%, as expected.
The easing Eurozone inflationary pressure, according to data released by Eurostat on Friday, alleviates pressure on the European Central Bank to continue raising interest rates. This, in turn, leads to the weakness in the Euro against its rivals and acts as a headwind for the EUR/USD.
Across the pond, investors raise their bets on additional rate hike by the Federal Reserve (Fed) despite the robust labor data and weaker inflation data. However, investors will take cues from the Federal Reserve (Fed) Chairman Jerome Powell Speaks on Friday. The speech could provide clues about economic conditions and indications of whether the inflation is under control or additional interest rate increases are required to curb inflation.
Market players await the German Producer Price Index (PPI) data later in the European session. Later this week, the US Existing Home Sales Change MoM for July will be released on Tuesday. Also, the S&P PMI data from both Eurozone and the US remains in focus. Market players will shift their focus to the Fed Chair Powell Speaks on Friday. This event could trigger volatility in the market and give a clear direction to the EUR/USD pair.
GBP/USD is still seen trading within the 1.2640-1.2830 range for the time being, suggest UOB Group’s Economist Lee Sue Ann and Markets Strategist Quek Ser Leang.
Key Quotes
24-hour view: GBP closed little changed last Friday (1.2736, -0.09%). There is no clear directional bias and GBP is likely to trade sideways. Expected range for today, 1.2700/1.2775.
Next 1-3 weeks: GBP traded mostly sideways over the past week. The price movements appear to be part of a consolidation phase. From here, GBP could continue to trade sideways, likely between 1.2640 and 1.2830.
CME Group’s flash data for gold futures markets saw traders increase their open interest positions by around 1.5K contracts on Friday, resuming the uptrend following the previous daily pullback. Volume, instead, kept the choppy trade and shrank by around 38.3K contracts.
Gold: Solid support emerged just below $1900
Friday’s inconclusive price action in gold was on the back of rising open interest, which suggest that further range bound could be on the cards for the precious metal in the very near term. In the meantime, the $1890 region continues to hold the downside for the time being.
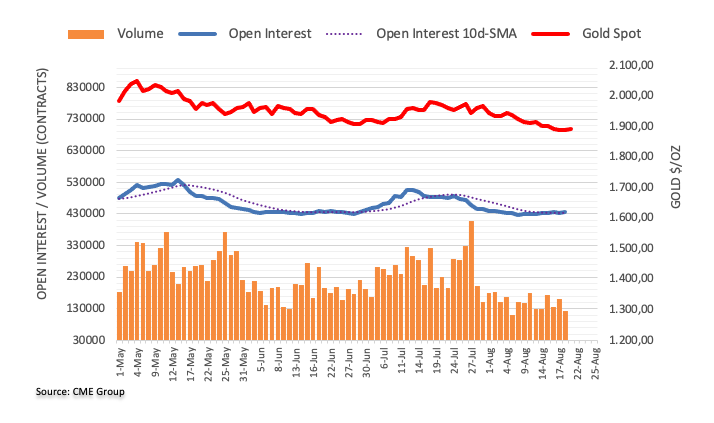
- AUD/USD bears are active after US data continues to show strength.
- Monthly low at 0.6364 could be a minor support as technical indicates the selling bias.
- Seven-day EMA emerges to be a key barrier, following the 0.6500 psychological level.
AUD/USD struggles to hold ground from continuing the losing streak, hovering around 0.6400 during the Asian session on Monday. The AUD/USD pair is experiencing downward pressure due to improved employment and manufacturing survey data. Traders await Australia’s preliminary S&P Global Composite PMI scheduled to release later in the week, seeking fresh impetus on Australian economic activities.
The Moving Average Convergence Divergence (MACD) line indicates the selling bias in the pair as it stays in the negative territory of the centerline and shows divergence below the signal line. The monthly low at 0.6364 which was marked on Thursday, appears to be the immediate support. A collapse below the latter could push the pair to navigate the region around 0.6300 psychological level.
In the short-term view, the bearish sentiment of the AUD/USD pair remains unchanged until the 14-day Relative Strength Index (RSI) remains below 50.
On the upside, the seven-day Exponential Moving Average (EMA) at 0.6441 emerges to be a key barrier. A break above that level could provide support to the AUD/USD pair to explore around the 23.6% Fibonacci retracement at 0.6489, followed by the 0.6500 psychological level.
AUD/USD: Daily Chart
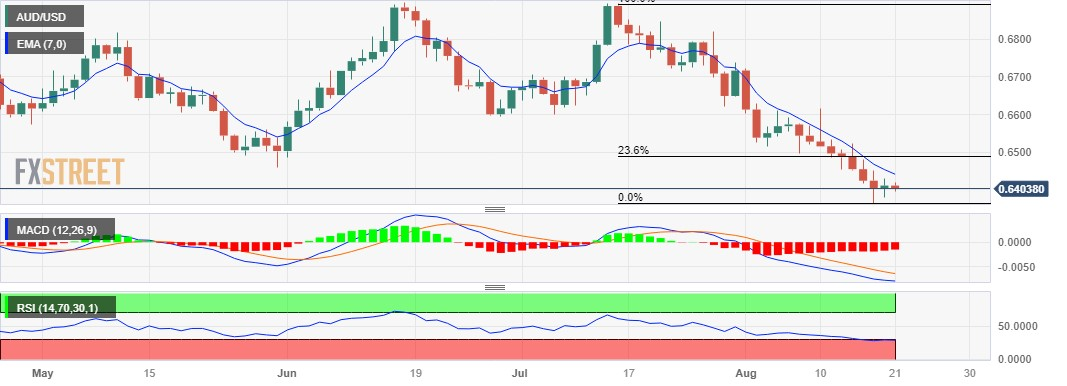
UOB Group’s Economist Lee Sue Ann and Markets Strategist Quek Ser Leang note further downside in EUR/USD is likely to meet s decent support near 1.0830.
Key Quotes
24-hour view: EUR dipped briefly to a fresh 6-week low of 1.0843 last Friday before recovering to end the day little changed at 1.0865 (-0.06%). Despite making a fresh low, there is hardly any increase in downward momentum. Today, we expect USD to trade in a range, likely between 1.0845 and 1.0900.
Next 1-3 weeks: Last Friday, EUR dropped to a fresh 6-week low of 1.0843. Downward momentum has increased, albeit just a tad. While there is room for EUR to weaken further, the lackluster momentum suggests the pace of any decline is likely to be slow. Support is at 1.0830, followed by 1.0790, a solid support level. On the upside, if EUR breaches 1.0930, it would mean that EUR is not weakening further.
- USD/CHF remains idle at the highest level in six weeks.
- Bulls and bears struggle for clear directions amid light calendar, cautious mood.
- China-inspired optimism weigh on Swiss Franc prices but anxiety ahead of Jackson Hole event puts a floor under the price.
- China news, PMIs act as additional trading filters to watch for clear directions.
USD/CHF lacks clear momentum around 0.8820, after refreshing a six-week high to 0.8828 heading into Monday’s European session. In doing so, the Swiss Franc (CHF) pair portrays the market’s indecision ahead of the top-tier data/events.
Among them, the August month Purchasing Managers Indexes (PMIs) and China news, as well as the top-tier central bankers’ speeches at the annual Jackson Hole Symposium event, gain major attention.
That said, China’s efforts to restore market confidence and mixed concerns about the US Federal Reserve (Fed) add strength to the USD/CHF inaction as traders seek to determine the major central bankers’ take on the monetary policy measures by the top-tier central bankers. It should be noted that the policy pivot concerned weighed on the US Dollar in July before the firmer US statistics and upbeat Treasury bond yields favored the Greenback buyers.
Elsewhere, China took multiple measures, via the central bank and fiscal policies, to infuse liquidity into the markets and defend the world’s second-largest economy from slipping into recession. That said, the People’s Bank of China (PBOC), lowered the one-year Loan Prime Rate (LPR) to 3.45% from 3.55% previous and 3.40% expected.
Apart from that, the geopolitical concerns about Taiwan, Russia and the likely trade war between the Group of Seven (G7) nations and the BRICS nations including Brazil, Russia, India, China and South Africa, per the Financial Times (FT) also put a floor under the USD/CHF price. Meanwhile, the cautious mood and a lack of major data/events check the pair buyers.
Amid these plays, the S&P500 Futures print mild gains around 4,390 to extend the previous day’s rebound from the lowest level since mid-June. On the same line, the US 10-year Treasury bond yields also reverse Friday’s retreat by rising back to 4.29% at the latest.
While the central bankers are likely to entertain the USD/CHF pair traders, Friday’s Swiss employment change for the second quarter (Q2) 2023 and the US Durable Goods Orders are some extra filters toward the north to watch for clear directions.
Technical analysis
USD/CHF edges higher past the 50-DMA hurdle, now immediate support around 0.8810, to aim for a downward-sloping resistance line from early March, close to 0.8870 by the press time.
- Asian stock markets trade mixed following the People's Bank of China (PBoC) interest rate decision.
- Chinese central bank cut the one-year Loan Prime Rate (LPR) by 10 basis points (bps) to 3.45% from 3.55%.
- Investors will focus on the Federal Reserve (Fed) Chairman Jerome Powell Speaks at the Jackson Hole Symposium.
The week began on a tepid note for Asian stock markets as China slashed its Loan Prime Rate (LPR) for one year by a smaller margin than anticipated while keeping its LPR for five years unchanged.
At press time, China’s Shanghai is down 0.38% to 3,120, the Shenzhen Component Index declines 0.25% to 10,432, and Hong Kong’s Hang Sang dips 1.38% to 17,703. India’s NIFTY 50 is up 0.11%, South Korea’s Kospi rises 0.52%, and Japan’s Nikkei gains 0.72%.
Chinese equities are the worst performers in the region on Monday. The People's Bank of China (PBoC) decided to cut the one-year Loan Prime Rate (LPR) by 10 basis points (bps) to 3.45% from 3.55% and maintained the five-year LPR unchanged at 4.2% on Monday. China's economy has lost steam as a result of a worsening property slump, slow consumer spending, and declining credit growth, prompting calls for further stimulus measures by the government. Chinese authorities, however, are hesitant to increase the country's borrowing needs.
In New Zealand, the nation’s Trade balance recorded a deficit of $15,810B in July YoY compared with a deficit of $-16.11B in the previous month. Exports fell to $5.45bn in July from $6.18B in the previous month, while Imports expanded to $6.56B from $6.29B prior.
Market participants will keep an eye on the Federal Reserve (Fed) Chairman Jerome Powell Speaks at the Jackson Hole Symposium on Friday. The speech could provide clues about economic conditions and indications of whether the inflation is under control or additional interest rate increases are required to curb inflation.
- WTI crude oil prints three-day uptrend but lacks bullish bias of late.
- Clear upside break of short-term resistance line, firmer RSI (14) line allows Oil buyers to retake control.
- 10-DMA checks energy bulls amid bearish MACD signals and cautious mood ahead of Jackson Hole Symposium.
- PBoC announced rate cuts, China braces for more stimulus to defend economic recovery.
WTI crude oil clings to mild gains around $81.15 during the three-day winning streak heading into Monday’s European session.
In doing so, the black gold jostles with the 10-DMA to extend the previous day’s upside break of a one-week-old descending resistance line, now immediate support around $79.90. Adding credence to the bullish bias is the firmer RSI (14) line, not overbought.
It’s worth noting that China took multiple steps, via the People’s Bank of China (PBoC) and fiscal measures, which in turn allowed the energy benchmark to remain firmer of late.
However, the cautious mood ahead of this week’s top-tier PMIs for August and the annual central bankers’ event at the Jackson Hole checks the WTI crude oil buyers. Also limiting the black gold’s immediate upside is the 10-DMA level of around $81.40 and the bearish MACD signals.
Even so, the bearish signals from the MACD indicator appear losing the momentum of late and the odds of WTI’s consolidation of previous pullback ahead of top-tier data/events can’t be ruled out.
With this, the WTI crude oil buyers may expect further upside of the energy benchmark past the 10-DMA hurdle toward the $82.00 round figure.
Though, an upward-sloping resistance line from January, close to $84.50 at the latest, appears a tough nut to crack for the Oil bears.
On the contrary, a downside break of the resistance-turned-support line of around $79.90 needs validation from the 200-DMA support of $76.00 to give control to the bears.
WTI crude oil: Daily chart
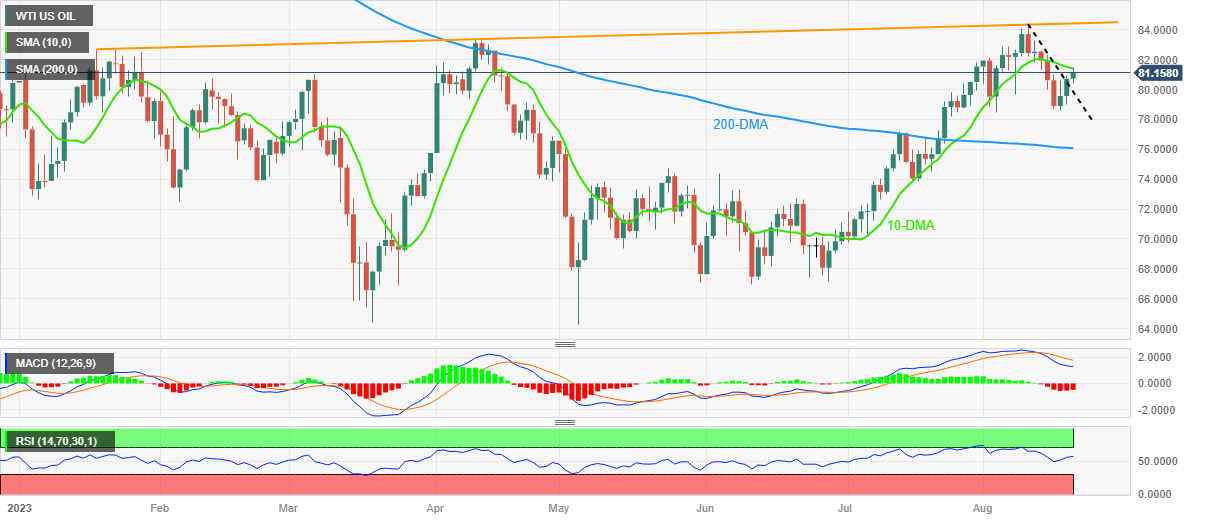
Trend: Further upside expected
- EUR/JPY gains some positive traction on Monday, albeit lacks strong follow-through.
- Intevention fears, along with a softer risk tone, lend support to the JPY and cap gains.
- The BoJ-ECB policy divergence should continue to limit the downside for the cross.
The EUR/JPY cross attracts some buying during the Asian session on Monday and rallies nearly 60 pips from the daily low, albeit struggles to capitalize on the intraday positive move. Spot prices currently trade around the 158.15-158.20 region, up less than 0.10% for the day.
The Japanese Yen (JPY) weakens after reports indicated that the Bank of Japan (BoJ) will purchase an unlimited quantity of government bonds at a fixed rate with residual maturity of 5 years to 10 years. This turns out to be a key factor that lends some support to the EUR/JPY cross. That said, fears of intervention by Japanese authorities, along with a generally weaker risk tone, limit losses for the safe-haven JPY and cap gains for spot prices, at least for the time being.
The market sentiment remains fragile in the wake of growing concerns about the worsening economic conditions in China. Adding to this, a smaller-than-expected rate cut by the People’s Bank of China (PBoC) signals limited policy support for the economy, despite worries about a deepening crisis in China's property sector, and further tempers investors' appetite for riskier assets. The downside for the EUR/JPY cross, however, remains cushioned amid the BoJ's dovish stance.
It is worth recalling that BoJ is the only central bank in the world to maintain negative interest rates. In contrast, the European Central Bank (ECB) has raised borrowing costs by a combined 425 bps since last July and is expected to deliver one more rate hike by the end of this year. This should continue to act as a tailwind for the EUR/JPY cross, which, in turn, warrants some caution before positioning for an extension of the recent pullback from a multi-year peak touched last week.
In the absence of any relevant market-moving economic data, the broader risk sentiment will drive demand for the safe-haven JPY and provide some impetus to the EUR/JPY cross on Monday. The focus will then shift to the BoJ's Core CPI, due on Tuesday, and the flash Euro Zone PMI prints, scheduled for release on Wednesday. Nevertheless, the aforementioned fundamental backdrop favours bullish traders and suggests that the path of least resistance for spot prices is to the upside.
Technical levels to watch
- Gold price remains on the defensive amid the firmer US Dollar and higher yields.
- The recovery in China has lost momentum and put pressure on authorities to release more fiscal stimulus plans.
- Federal Reserve (Fed) Chairman Jerome Powell's speech at the Jackson Hole Symposium will be the key event this week.
Gold price struggles to gain ground and holds below $1,900 in the Asian session on Monday. The upbeat US economic data boost the Greenback broadly, which exerts some selling pressure on XAU/USD. Meanwhile, the US Dollar Index (DXY), a measure of the value of USD against six other major currencies, consolidates its gains around 103.35.
Earlier on Monday, the People's Bank of China (PBoC) decided to cut the one-year Loan Prime Rate (LPR) by 10 basis points (bps) to 3.45% from 3.55% and maintained the five-year LPR unchanged at 4.2%. Due to a deteriorating property downturn, sluggish consumer spending, and falling credit growth, the recovery in China has lost momentum and put pressure on authorities to release more fiscal stimulus plans. The positive development surrounding the supportive plan from the Chinese government could limit gold’s downside as China is the major gold consumer in the world.
The minutes of the Federal Open Market Committee (FOMC) revealed that inflation remained unacceptably high and that officials have significant inflationary concerns. Fed policymakers added that more rates hike may be necessary to achieve the inflation target and that future rate decisions will depend on incoming data. Federal Reserve (Fed) Chairman Jerome Powell's speech on Friday at the Jackson Hole Symposium will be the key event of the week. The officials could offer hints for the further monetary policy for the entire year. The less hawkish stance from Fed could cap the upside for USD and acts as a tailwind for gold price.
Looking ahead, market participants will monitor the S&P Global Purchasing Managers' Indexes (PMI) data and take cues from the central bankers' speech for fresh impetus. Also, the key speech from Fed Chair Jerome Powell is scheduled for Friday and could trigger volatility in the FX market.
- USD/CAD consolidates its recent strong gains to its highest level since early June.
- Rising Oil prices underpin the Loonie and caps gains amid subdued USD demand.
- The recent breakout through the 200-day SMA and the 1.3500 mark favours bulls.
The USD/CAD pair lacks any firm intraday directional bias on Monday and oscillates in a narrow trading band below mid-1.3400s through the Asian session. Spot prices, meanwhile, remain well within the striking distance of the highest level since early June touched on Friday and seem poised to prolong the recent upward trajectory witnessed since the beginning of this month.
Crude Oil prices gain some positive traction for the third successive day and underpin the commodity-linked Loonie. This, along with subdued US Dollar (USD) price action, contributes to acting as a headwind for the USD/CAD pair. That said, elevated US Treasury bond yields, bolstered by rising bets for one more 25 bps lift-off by the Federal Reserve (Fed) in 2023, assist the USD to stand tall near its highest level in more than two months. Apart from this, looming recession fears support prospects for a further appreciating move for the safe-haven buck and validates the positive outlook for the major.
From a technical perspective, the Relative Strength (RSI) on the daily chart hovers above the 70 mark, flashing slightly overbought conditions and holding back bulls from placing fresh bets around the USD/CAD pair. That said, last week's sustained breakout through the very important 200-day Simple Moving Average (SMA) resistance near the 1.3450 area was seen as a fresh trigger for bullish traders. Moreover, a subsequent move and acceptance beyond the 1.3500 psychological mark validate the constructive outlook. This, in turn, suggests that the path of least resistance for spot prices is to the upside.
It, however, will still be prudent to wait for some near-term consolidation or a modest pullback before positioning for any further gains. Nevertheless, the USD/CAD pair seems poised to surpass Friday's swing high, around the 1.3575 region, and aim to reclaim the 1.3600 mark for the first time since May. The positive momentum could get extended further towards the next relevant barrier near the 1.3655-1.3660 supply zone.
On the flip side, any meaningful corrective decline is more likely to attract fresh buyers near the 1.3500 mark. This should help limit the downside for the USD/CAD pair near the 1.3450 area, or the 200-day SMA. The latter should act as a strong base, which if broken decisively might prompt aggressive technical selling and expose the 1.3400 round figure before spot prices eventually drop to test the 1.3370 support zone.
USD/CAD daily chart
-638281873531443796.png)
Technical levels to watch
- USD/JPY recovers two-day losses after upbeat US Initial Jobless Claims.
- Traders could speculate intervention by Japanese authorities to protect its currency.
- PBoC rate cut could provide support to stem the Japanese Yen.
USD/JPY snaps a two-day losing streak, hovering around 145.40 during the Asian session on Monday. The USD/JPY pair cheers employment and manufacturing survey data. However, market participants are currently in search of additional cues that could provide them with a clearer understanding of the US Federal Reserve’s (Fed) direction regarding monetary policy tightening.
The Federal Open Market Committee’s (FOMC) minutes of the July meeting disclosed a difference of opinions among Fed members concerning interest rate hikes. While certain members expected that higher interest rates could lead to a potential economic contraction, the majority of policymakers kept committed to reducing inflation and reaching the 2% target.
Additionally, traders could speculate on the potential intervention by Japanese authorities to protect the Japanese currency from further appreciation against the greenback. Such a step could impact the price movement of the USD/JPY pair, influencing its overall price action.
As the People's Bank of China (PBoC) cut its one-year benchmark lending rate by 10 basis points (bps) on Monday, seeking the credit demand to be encouraged. Worsening property slump and low consumer spending have raised concerns over China’s recovery, which could lead to more policy stimulus by the Chinese authorities. This development could provide support to stem the currency of export-dependent Japan.
Furthermore, the annual Jackson Hole Symposium during the week will be a focal point of interest. During this event, central bankers, policy experts, and academics will come together to extensively analyze the worldwide economic outlook, with a specific focus on addressing the prevailing inflationary situation. Market participants will closely monitor upcoming US data releases during the week, namely Home Sales and the preliminary S&P Global PMI surveys for August along with Japan’s Consumer Price Index (CPI).
- EUR/USD picks up bids to extend recovery from six-week low.
- Bullish Doji candlestick, downbeat RSI (14) line favor Euro’s bottom-picking.
- Convergence of 100-EMA, one-month-old descending resistance line prods buyers ahead of top-tier data/events.
- EU/US PMIs, central bankers’ speeches at Jackson Hole also eyed for clear directions.
EUR/USD clings to mild gains around 1.0880 as it defends the week-start rebound from the lowest level in six weeks amid mixed concerns in the market. That said, the Euro pair’s latest recovery could be linked to the consolidation of the previous five-week downtrend, as well as positioning for the August month Purchasing Managers Indexes (PMIs) and the Kansas Fed’s annual event for central bankers, namely the Jackson Hole Symposium.
Also read: EUR/USD Weekly Forecast: US Dollar to keep strengthening
Technically, Friday’s Doji candlestick joins the nearly oversold RSI (14) line to trigger the corrective bounce in the EUR/USD price.
However, a convergence of the 100-day Exponential Moving Average (EMA) joins a downward-sloping resistance line from July 19 to highlight the 1.0900 level as a tough nut to crack for the Euro pair buyers.
Following that, a one-month-old descending trend line surrounding 1.0980 will act as the final defense of the EUR/USD bears.
On the contrary, a horizontal area comprising multiple levels marked since April 10, around 1.0840 at the latest, restricts the immediate downside of the EUR/USD pair.
A daily closing beneath 1.0840, however, isn’t an open invitation to the Euro bears as the 200-day EMA and an ascending trend line from mid-March, close to 1.0800 at the latest, could challenge the quote’s further downside.
Overall, EUR/USD remains on the bear’s radar despite the latest rebound. The pair’s downside room, however, appears limited.
EUR/USD: Daily chart
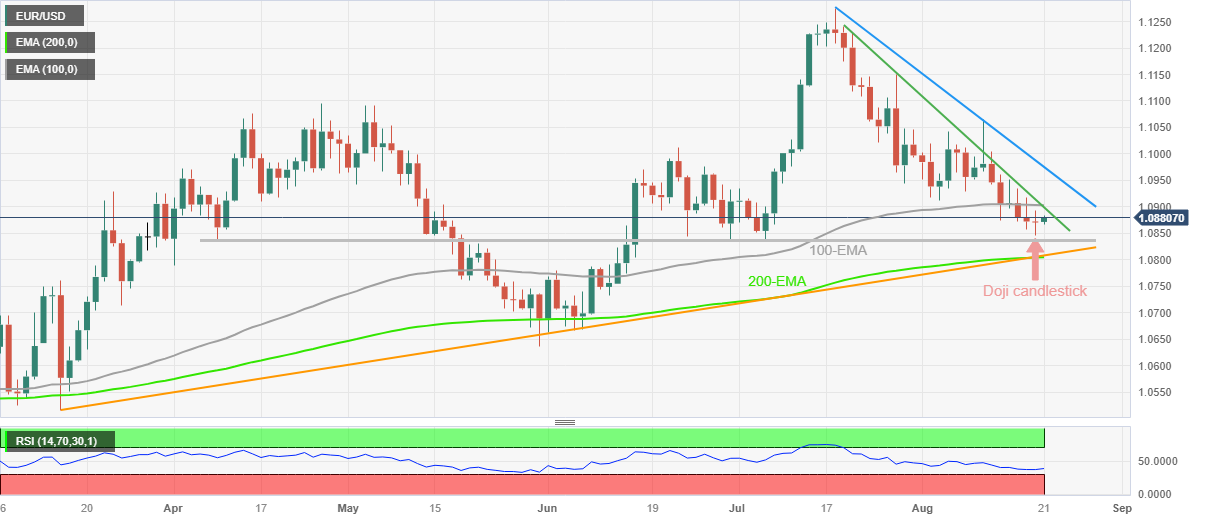
Trend: Limited recovery expected
- GBP/USD gains some positive traction on Monday, albeit lacks follow-through buying.
- Bets for further tightening by the BoE underpin the GBP and lend support to the major.
- Subdued USD price action also contributes to the mildly bid tone surrounding the pair.
- The upside remains capped amid expectations for one more Fed rate hike move in 2023.
The GBP/USD pair attracts some buyers on the first day of a new week and sticks to its modest intraday gains, below mid-1.2700s through the Asian session. Spot prices, however, remain confined in a familiar trading band held over the past three weeks or so and the mixed fundamental backdrop warrants some caution before placing aggressive bullish bets.
The British Pound (GBP) continues to draw support from rising bets for further interest rate hikes by the Bank of England (BoE), which, along with subdued US Dollar (USD) price action, is seen lending some support to the GBP/USD pair. In fact, the current market pricing indicates a more than 80% chance of a 25 bps lift-off at the next BoE meeting in September. The bets were lifted by the fact that British wages grew at a record pace in the second quarter, which added to worries about long-term inflation. This, along with the upbeat UK GDP report and slightly higher-than-expected UK CPI print, supports prospects for a further BoE policy tightening.
The Federal Reserve (Fed), on the other hand, is also expected to stick to its hawkish stance. In fact, the minutes of the July 25-26 FOMC meeting revealed that policymakers continued to prioritize the battle against inflation. This comes on the back of the US CPI report, which showed a moderate rise in consumer prices in July. Moreover, the US PPI climbed slightly more than expected and suggested that the battle to bring inflation back to the Fed's 2% target is far from being won. Adding to this, the incoming US macro data continues to point to an extremely resilient economy and keeps the door for one more 25 bps rate hike by the end of this year wide open.
The outlook, meanwhile, remains supportive of elevated US Treasury bond yields, which, along with a weaker risk tone, favours the USD bulls and should contribute to capping the GBP/USD pair. Against the backdrop of concerns about the worsening economic conditions in China, worries about headwinds stemming from rapidly rising borrowing costs fuel recession fears and weigh on investors' sentiment. This, in turn, makes it prudent to wait for strong follow-through buying before traders start positioning for an extension of the recent bounce from the 1.3615 area, or a one-and-half-month low, coinciding with 100-day Simple Moving Average (SMA) support.
Moving ahead, there isn't any relevant market-moving economic data due for release on Monday, either from the UK or the US, leaving the GBP/USD pair at the mercy of the USD price dynamics. The market focus, meanwhile, will remain glued to the crucial Jackson Hole Symposium later this week, where comments by central bankers might infuse significant volatility in the markets. In the meantime, traders will take cues from the flash PMI prints from the UK and the US on Wednesday to grab short-term opportunities heading into the key event risk.
Technical levels to watch
- USD/INR struggles for clear directions after refreshing record top the previous week, pares intraday gains of late.
- PBoC rate cut, China’s plan for more stimulus fail to trigger market optimism amid anxiety ahead of Jackson Hole event.
- RBI inaction, fears of BRICS versus G7 trade war joins upbeat Oil price to weigh on Indian Rupee.
- Fed’s Powell needs to defend hawkish bias to keep US Dollar on the front foot as DXY flashes negative technical signals.
USD/INR struggles to extend the previous rebound past 83.00 amid early Monday’s sluggish markets, close to 83.15 at the latest. In doing so, the Indian Rupee (INR) pair jostles with China’s efforts to restore market confidence, mixed concerns about the US Federal Reserve (Fed) and firmer Oil prices. That said, the pair refreshed an all-time high of 83.55 the last Wednesday while posting a four-week uptrend at the latest.
Traders in the Asia-Pacific zone struggle to cheer the People’s Bank of China’s (PBOC) rate cut, as well as signals for more stimulus, amid economic fears surrounding the regional leader, namely Beijing. Also fears about the trade war with the developed nations add filters to the Asian trading and the USD/INR price.
The Financial Times (FT) reported during the weekend that China indirectly pushes for competition with the Group of Seven (G7) nations while marking its presence at the BRICS meeting where officials from Brazil, Russia, India, China and South Africa spoke, signaled.
Elsewhere, WTI crude oil remains firmer around $81.40, up 0.80% intraday amid hopes of more stimulus from China after the dragon nation’s policymakers pledged to defend the economy during the late last week’s meeting.
It should be noted that the US Dollar Index (DXY) remains sidelined, after a downbeat start of the week, as traders remain unclear about Fed Chair Jerome Powell’s monetary policy bias. Recently, Goldman Sachs expects Fed Chair Powell to sound defensive during the annual event of the central bankers but the Bank of America (BofA) expects Fed’s Powell to push back against the rate cut expectations. The reason for these banks’ indecision could be linked to the recently mixed US data and the previous bias about the policy pivot.
Amid these plays, the S&P500 Futures print mild gains around 4,390 to extend the previous day’s rebound from the lowest level since mid-June. On the same line, the US 10-year Treasury bond yields also reverse Friday’s retreat by rising back to 4.28% at the latest.
It should be observed that the upbeat US NY Fed Manufacturing Index, Retail Sales and wage growth allowed the US Dollar to remain firmer for the fifth consecutive week, especially backed by the hawkish Fed Minutes. That said, the latest Fed Minutes showed that most policymakers preferred supporting the battle again the ‘sticky’ inflation, despite being divided on the imminent rate hike. Additionally, the market players started reassessing previous biases about the major central banks and added strength to the risk aversion, primarily fuelled by the China-linked woes.
Furthermore, the Reserve Bank of India’s (RBI) inaction joined the risk aversion wave in Asia to propel the USD/INR previously.
Looking ahead, the August month Purchasing Managers Indexes (PMIs) and China news will entertain the USD/INR traders ahead of the central bankers’ speeches at the annual Jackson Hole Symposium event.
Technical analysis
A one-month-old rising support line joins the 10-DMA to restrict the immediate downside of the USD/INR pair near 83.10. That said, the recovery moves can aim for the previous yearly high of around 83.45 before targeting a fresh record high, currently near 83.55.
- Market sentiment remains sluggish as China tries to tame pessimism via multiple steps but fails to gain acceptance of late.
- Traders struggle over Fed Chair Powell’s speech at Jackson Hole after mostly upbeat US data prod policy pivot concerns.
- S&P500 Futures bounce off nine-week low, yields reverse Friday’s pullback with mild gains.
- PMIs, central bankers will be in the spotlight as risk aversion fades.
The risk appetite improves a bit on early Monday as traders prepare for this week’s annual central bankers’ speeches at the Jackson Hole. Also likely to have favored the market sentiment could be the headlines suggesting more stimulus from China, as well as the People’s Bank of China’s (PBoC) rate cut. However, mixed concerns about the Federal Reserve (Fed) Chairman Jerome Powell’s monetary policy bias on Friday seem to prod the momentum amid a light calendar.
While portraying the mood, the S&P500 Futures print mild gains around 4,390 to extend the previous day’s rebound from the lowest level since mid-June. On the same line, the US 10-year Treasury bond yields also reverse Friday’s retreat by rising back to 4.28% at the latest. It’s worth noting that Wall Street closed mixed on Friday whereas the US Treasury bond yields retreat after poking the yearly high.
Talking about China, the People’s Bank of China (PBOC), lowered the one-year Loan Prime Rate (LPR) to 3.45% from 3.55% previous and 3.40% expected. However, the Chinese central bank kept the five-year LPRs unchanged at 4.20%. In the last week, the PBoC cut the Medium-term Lending Facility (MLF), Standing Lending Facility rates (SLFs) and Reverse Repo Rates to infuse liquidity into the world's second-largest economy.
Also, Chinese state media Xinhua came out with the news suggesting the authorities plan to introduce subsidies for fertilizers and pesticides in the northern region of the nation, per Reuters. On the same line, the weekend news from China suggests the dragon nation’s more efforts to infuse liquidity into the world’s second-largest economy, which in turn triggered the market’s cautious optimism during early Monday.
On the other hand, Goldman Sachs expects Fed Chair Powell to sound defensive during the annual event of the central bankers but the Bank of America (BofA) expects Fed’s Powell to push back against the rate cut expectations. The reason for these banks’ indecision could be linked to the recently mixed US data and the previous bias about the policy pivot.
Upbeat US NY Fed Manufacturing Index, Retail Sales and wage growth allowed the US Dollar to remain firmer for the fifth consecutive week, especially backed by the hawkish Fed Minutes. That said, the latest Fed Minutes showed that most policymakers preferred supporting the battle again the ‘sticky’ inflation, despite being divided on the imminent rate hike. Additionally, the market players started reassessing previous biases about the major central banks and added strength to the risk aversion, primarily fuelled by the China-linked woes. That said, investors anticipated that the end of the rate hike cycle is still unclear, which means more bearish pressure on riskier assets and a rush for the US Dollar.
Moving on, the preliminary readings of August month’s Purchasing Managers Indexes (PMIs) and the central bankers’ speeches at the annual Jackson Hole Symposium event will be crucial to watch amid indecision about the “higher for longer” rates.
Also read: Forex Today: Pound outperforms; Turn for central bankers to speak
- USD/MXN is seen oscillating in a narrow trading band on the first day of a new week.
- The technical setup favours bearish traders and supports prospects for intraday losses.
- Attempted recovery towards the 200-hour SMA could get sold into and remain capped.
The USD/MXN pair struggles to gain any meaningful traction on Monday and oscillates in a narrow band, around the 17.0500 area through the Asian session. The technical setup, meanwhile, seems tilted in favour of bearish traders and suggests that the path of least resistance for spot prices is to the downside.
Friday's breakdown below the 17.0800-17.0850 confluence, comprising the 200-hour Simple Moving Average (SMA) and an ascending trend line extending from the August 10 swing low, validates the negative outlook for the USD/MXN pair. Moreover, oscillators on hourly charts have again started gaining negative traction and support prospects for some meaningful intraday downfall. That said, neutral technical indicators on the daily chart warrant some caution before placing aggressive bearish bets.
Hence, any subsequent slide is more likely to find some support near Friday's low, around the 17.0165 region ahead of the 17.0000 psychological mark. A convincing break below the latter will reaffirm the bearish bias and drag the USD/MXN pair towards the 16.8200-16.7995 area en route to the next relevant support near the 16.7030-16.7025 region and the YTD trough, around the 16.6260-16.6255 zone touched in July.
On the flip side, the 200-hour SMA, currently pegged near the 17.0800 level, might now act as an immediate barrier ahead of the ascending trend-line support breakpoint, near the 17.1100 region. This is followed by the 17.1610-17.1615 supply zone and the 17.1900 barrier, above which a fresh bout of a short-covering could lift the USD/MXN towards the 17.2835 zone en route to the monthly peak, around the 17.4260 region. Some follow-through buying will be seen as a fresh trigger for bullish traders and pave the way for some meaningful appreciating move in the near term.
USD/MXN 1-hour chart
-638281822999266835.png)
Technical levels to watch
- NZD/USD trades lower around 0.5920 close to the year-to-date low.
- Kiwi continues to weaken due to unchanged interest rates and upbeat US economic data.
- Traders’ attention is expected to be on Fed Chair Jerome Powell’s speech.
NZD/USD continues the losing streak that began on August 8, with spot prices currently trading around 0.5920 during the Asian session on Monday. The pair has experienced a decline for the sixth consecutive week and remains very close to the year-to-date low that was touched on Friday.
The NZD/USD pair continues to experience a decline due to upbeat United States (US) economic data released last week. Initial Jobless Claims on August 11 decreased to 239K from the previous 250K, lower than the projected reading of 240,000. Additionally, the Philadelphia Fed Manufacturing Survey for August displayed an improvement, rising to a reading of 12 from the previous -13.5, outperforming the expected -10.
On the other hand, during the last week, New Zealand introduced no change in its monetary policy and kept the interest rates unchanged at 5.5%. The market had the same expectation, which contributed to the weakening of the NZD/USD pair. Additionally, Producer Price Index (PPI) - Output data unmatched expectations and showed the economy steadied at 0.2% against the expectation of 0.7% in the second quarter. The data contributed to Kiwi's weakness against the US Dollar (USD).
Market participants will closely monitor upcoming US data releases during the week, namely Home Sales and the preliminary S&P Global PMI surveys for August. Investors will also closely watch Fed Chair Jerome Powell's speech during the Jackson Hole Symposium to get fresh insights into the overall US economic outlook before placing fresh bets on NZD/USD pair.
- AUD/JPY remains on the defensive above the 93.20 mark following BoJ news, PBoC 10 basis point (bps) rate cut.
- The cross trades within a descending trend channel line from the middle of June on the four-hour chart.
- The first resistance level for AUD/JPY emerges at 93.70; the initial support level at 92.80.
The AUD/JPY cross edges higher to the 93.28 mark during the Asian trading hours on Monday. The cross bounces off the 92.83 low following the Bank of Japan (BoJ) news and Chinese central bank rate cut.
That said, the BoJ will purchase Japanese Government Bonds (JBS) at a fixed rate for an unlimited quantity (Residual maturity of 5YR to 10YR) outright from August 22, according to Bloomberg. Furthermore, the People's Bank of China (PBoC) decided to cut the one-year Loan Prime Rate (LPR) by 10 basis points (bos) to 3.45% from 3.555 and maintained the five-year LPR unchanged at 4.2%.
From a technical perspective, AUD/JPY trades within a descending trend channel line from the middle of June on the four-hour chart. That said, the path of least resistance for the AUD/JPY is to the downside as the cross holds below the 50- and 100-hour Exponential Moving Averages (EMAs). It’s worth noting that the Relative Strength Index (RSI) holds below 50, supporting the sellers for now.
The first resistance level for AUD/JPY emerges at 93.70 (50-hour EMA). The key barrier is located at 94.00, portraying a confluence of the 100-hour EMA and a psychological round figure. The additional upside filter to watch is 94.60 (the upper boundary of a descending trend channel). Any meaningful follow-through buying above the latter will see a rally to 94.90 (high of August 9) en route to 95.40 (high of July 14).
On the flip side, the cross will meet the initial support level at 92.80 (low of August 18). The next downside stop appears at 92.55 (low of July 88), followed by 92.15 (low of June 6). A breach of the latter will see a drop to 91.60 (the lower limit of a descending trend channel).
AUD/JPY four-hour chart
-638281818844215239.png)
| Raw materials | Closed | Change, % |
|---|---|---|
| Silver | 22.748 | 0.28 |
| Gold | 1889.586 | -0 |
| Palladium | 1253.3 | 2.54 |
- GBP/JPY renews intraday high during the first positive daily performance in three.
- 100-HMA, two-week-old previous support line prod buyers before giving them control.
- Upbeat oscillators, U-turn from weekly horizontal support suggest further upside momentum.
GBP/JPY picks up bids to refresh intraday high near 185.45 as bulls attack the 100-Hour Moving Average (HMA) during the first positive day in three amid early Monday. In doing so, the cross-currency pair extends the previous day’s rebound from a one-week-old horizontal support area to poke the key moving average.
Adding strength to the bullish bias are the upbeat MACD signals and the RSI (14) line, which in turn suggests the quote’s further upside past the immediate 100-HMA hurdle of around 185.50.
That said, the support-turned-resistance line from August 07, close to 186.10 at the latest, acts as the final defense of the GBP/JPY bears.
Following that, the pair’s uptrend towards challenging the multi-year high marked the last week around 186.50, as well as the November 2015 high of 188.40, can’t be ruled out.
On the flip side, a clear break of the aforementioned horizontal support zone of around 184.70-60, becomes necessary for the intraday sellers.
Even so, the 200-HMA support of around 184.45 and the double tops marked on August 10–11 near 184.25-20, could challenge the GBP/JPY bears.
In a case where the quote remains bearish past 184.20, the 184.00 round figure and the monthly low of around 180.60 will be in the spotlight.
GBP/JPY: Hourly chart
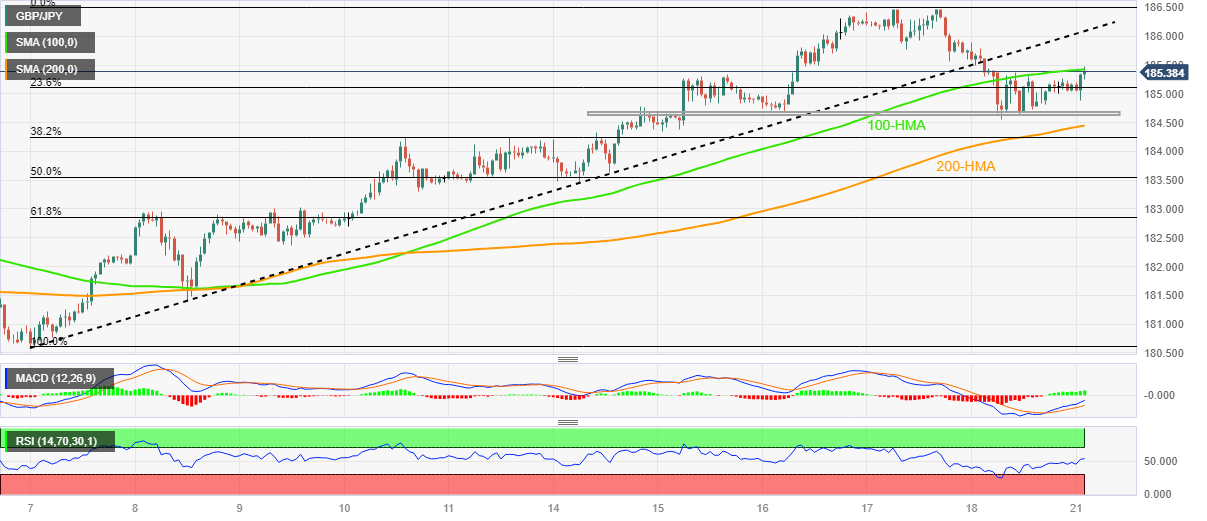
Trend: Further upside expected
- AUD/USD continues with its struggle to gain any meaningful traction on Monday.
- The PBoC's 10 bps rate cut fails to impress bulls or provide any impetus to the pair.
- Hawkish Fed expectations continue to underpin the USD and contribute to cap gains.
The AUD/USD pair extends its sideways consolidative price action for the second successive day on Monday and seesaws between tepid gains/minor losses, around the 0.6400 mark through the Asian session. Spot prices, meanwhile, react little to the People's Bank of China (PBoC) rate cut and remain well within the striking distance of the lowest level since November 2022 touched last week.
In fact, China's central bank lowest the one-year Loan Prime Rate (LPR) by 10 bps, less than the 15 bps expected, to 3.45% from 3.55% previously. Furthermore, the PBoC keeps the five-year LPRs unchanged at 4.20% despite worries about a deepening crisis in China's property sector. This, along with the concerns about the worsening conditions in the world's second-largest economy, acts as a headwind for antipodean currencies, including the Australian Dollar (AUD).
Moreover, the disappointing Australian jobs data released last Thursday confirmed another on-hold rate decision by the Reserve Bank of Australia (RBA) in September. Adding to this, the underlying bullish sentiment around the US Dollar (USD) contributes to capping the AUD/USD pair. In fact, the USD Index (DXY), which tracks the Greenback against a basket of currencies, holds steady near its highest level since July 12 amid hawkish Federal Reserve (Fed) expectations.
It is worth recalling that the minutes of the July 25-26 FOMC meeting revealed that policymakers continued to prioritize the battle against inflation and kept the door open for one more 25 bps lift-off by the end of this year. This remains supportive of elevated US Treasury bond yields, which continue to underpin the buck and exerts some pressure on the AUD/USD pair. Traders, however, seem reluctant to place fresh bearish bets ahead of the Jackson Hole Symposium later this week.
Nevertheless, the aforementioned fundamental backdrop suggests that the path of least resistance for spot prices is to the downside. Hence, any attempted recovery might still be seen as a selling opportunity and fizzle out rather quickly in the absence of any relevant market moving-economic releases from the US on Monday.
Technical levels to watch
- USD/CNH picks up bids to refresh intraday high after China infuses market liquidity.
- PBoC cuts one-year LPRs, China Commerce Ministry offers help to farmers.
- Mixed concerns about Fed Chair Powell’s speech at Jackson Hole, hopes of more stimulus from China underpin market’s consolidation.
- PMIs for August, risk catalysts eyed for clear directions.
USD/CNH takes the bids to refresh intraday high after the People’s Bank of China (PBoC) announced rate cuts early Monday. Adding strength to the offshore Chinese Yuan (CNY) pair could be the weekend headlines suggesting more stimulus from China. With this, the quote rises for the second consecutive day to 7.3240 by the press time, following the three-week uptrend.
People’s Bank of China (PBOC), lowered the one-year Loan Prime Rate (LPR) to 3.45% from 3.55% previous and 3.40% expected. However, the Chinese central bank kept the five-year LPRs unchanged at 4.20%. It's worth noting that the PBoC previously cut the Medium-term Lending Facility (MLF), Standing Lending Facility rates (SLFs) and Reverse Repo Rates to infuse liquidity into the world's second-largest economy.
Earlier in the day, Chinese state media Xinhua came out with the news suggesting the authorities plan to introduce subsidies for fertilizers and pesticides in the northern region of the nation, per Reuters. On the same line, the weekend news from China suggests the dragon nation’s more efforts to infuse liquidity into the world’s second-largest economy, which in turn triggered the market’s cautious optimism during early Monday.
While portraying the mood, Wall Street closed mixed on Friday whereas the US Treasury bond yields retreat after a strongly negative week for the equities and the upbeat bound coupons. That said, the S&P500 Futures remain lackluster at the monthly low by the press time.
On the other hand, the US Dollar Index (DXY) retreats from a 10-week high as market players struggle to aptly predict Fed Chairman Jerome Powell’s view at this week’s Jackson Hole Symposium. That said, the DXY rose in the last five consecutive weeks before retreating to 103.30.
The upbeat US NY Fed Manufacturing Index, Retail Sales and wage growth allowed the DXY to remain firmer for the fifth consecutive week, especially backed by the hawkish Fed Minutes. That said, the latest Fed Minutes showed that most policymakers preferred supporting the battle again the ‘sticky’ inflation, despite being divided on the imminent rate hike. Additionally, the market players started reassessing previous biases about the major central banks and added strength to the risk aversion, primarily fuelled by the China-linked woes. On the same line, investors anticipated that the end of the rate hike cycle is still unclear, which means more bearish pressure on riskier assets and a rush for the US Dollar.
Looking ahead, preliminary readings of the August month Purchasing Managers Indexes (PMIs) and Durable Goods Orders for July will entertain the USD/CNH traders ahead of the central bankers’ speeches at the annual Jackson Hole Symposium event.
Technical analysis
A clear U-turn from the fortnight-old support line, around 7.3000 by the press time, directs USD/CNH towards the yearly top marked the last week surrounding 7.3500.
Natural Gas Price picks up bids to extend late Friday’s rebound from two-week low within bullish chart pattern.
Convergence of 50-EMA, falling wedge’s top line challenges XNG/USD buyers.
Sluggish oscillators suggest continuation of upward grind; sellers need validation from 11-week-old support line.
Natural Gas Price (XNG/USD) clings to mild gains around $2.72–73 during early Monday as it stretches the late Friday’s corrective bounce amid a sluggish Asian session. In doing so, the energy instrument also justifies the market’s cautious optimism, as well as a pullback in the US Dollar Index (DXY).
Also read: US Dollar Index: DXY retreats towards 103.00 on Friday’s Doji, Fed remarks at Jackson Hole eyed
It’s worth noting that the recently sluggish MACD signals and the RSI (14) line’s grinding near the 50.0 level suggest the XNG/USD’s further advances.
However, a convergence of the 50-Exponential Moving Average (EMA) joins a top-line of the two-week-old falling wedge bullish chart formation to highlight the $2.76 as a tough nut to crack for Natural Gas buyers.
June’s top and the monthly high, respectively near $2.93 and $3.07, can test the XNG/USD buyers before directing them toward the theoretical target of around $3.11.
On the contrary, the stated wedge’s bottom line, close to $2.63 by the press time, restricts the immediate downside of the Natural Gas Price.
Following that, an ascending support line from early June, around $2.59 as we write, will act as the last defense of the XNG/USD bulls.
Overall, the Natural Gas Price is expected to improve but the upside appears limited.
Natural Gas Price: Four-hour chart

Trend: Limited upside expected
- WTI Prices edge higher to $81.00, gaining 0.41% on the day.
- More evidence of the Chinese economic deterioration, hawkish comments from Fed might weigh on the black gold.
- Oil traders will monitor Chinese big fiscal stimulus, global PMIs, Federal Reserve (Fed) Chairman Jerome Powell Speaks.
Western Texas Intermediate (WTI), the US crude oil benchmark, is trading around the $81.02 mark so far on Monday. WTI prices post modest gains for the third consecutive day. However, WTI prices mark the ending of their longest weekly rally of 2023 amid the possible further tightening of monetary policy by the Federal Reserve (Fed) and China’s economic woes. About the data, Baker Hughes revealed on Friday that the total number of active rigs in the US declined by 12 last week.
The fear of China’s debt crisis and real-estate woes deepen risk aversion and drags WTI prices lower. Last week, China’s second-largest real estate company, Evergrande, filed for bankruptcy in a US court under Chapter 15. Additionally, the Chinese House Price Index for July decreased to -0.1% from 0% prior. This report adds the concern of a potential Chinese property catastrophe. Market participants will focus on the headline surrounding China’s economic woes and more evidence of the nation’s economic deterioration might weigh on the black gold.
Furthermore, the minutes of the FOMC highlighted that inflation remained unacceptably high and the officials see considerable inflationary concerns. Fed policymakers added that further rate rises may be required to bring inflation to the target and future rate decisions will be dependent on incoming data. It’s worth noting that higher interest rates raise borrowing costs, which can slow the economy and diminish oil demand.
On the other hand, the hope for the Chinese additional stimulus plan might cap the downside for WTI prices. The People's Bank of China (PBOC) reported on Sunday that China would arrange financial support to resolve local government debt worries, according to Reuters.
Moving on, oil traders will closely watch the development of Chinese big fiscal and risk sen sentiment remains the main driver for WTI prices. Later this week, the Global Purchasing Managers' Indexes (PMI) data and the Federal Reserve (Fed) Chairman Jerome Powell Speaks at the Jackson Hole Symposium will be in the spotlight. These events could significantly impact the USD-denominated WTI price. Oil traders will take cues from the data and find trading opportunities around the WTI price.
- Gold price consolidates as an effect of declined US yields and risk aversion.
- Upbeat US economic data prompts a cautious market sentiment.
- PBoC reduced interest rates by 10 bps against the expected 15 bps.
Gold price struggles to snap a losing streak, treading waters near $1,890 per troy ounce during the Asian session on Monday. The Gold is also benefiting from the retreating US Dollar (USD), driven by a decline in US Treasury yields and risk aversion.
However, the price of Gold experienced downward pressure on Friday due to upbeat United States (US) economic data, leading to cautious market sentiment as traders remain vigilant for more cues regarding the inflation outlook. The Gold price could face a challenge due to China’s economic woes. These elements could potentially impact the overall trajectory of Gold prices.
Investors seek additional indications that could provide them with a clearer understanding of the potential direction of the US Federal Reserve (Fed) regarding monetary policy in September’s meeting. This suggests that caution persists in the market, leading traders to remain uncertain and seek more information before making definitive decisions.
The People's Bank of China (PBoC) reduced interest rates by 10 basis points (bps) against the market expectation of a 15 bps reduction on Monday. Investors' sentiment could be heavily influenced by the PBOC's decision and broader trends in China's economy. In spite of the cautious Chinese policymakers, the market anticipates more interest rate reductions and broader relaxation measures in the months ahead. This situation could provide support to the price of Gold, which is already under pressure.
The US Dollar Index (DXY), which measures the performance of the Greenback against the six major currencies, hovers around 103.40. The US Dollar (USD) trades sideways despite strong US data, prompting a sense of caution in the market as it seeks further signals about the inflation scenario.
In the upcoming week, investors will likely monitor the release of US economic data, particularly Home Sales and the preliminary S&P Global PMI surveys for August along with Fed Chair Jerome Powell's speech on Friday during the Jackson Hole Symposium. This event could provide insights into the state of the US economy, helping to shape potential strategies for placing new bets on the Gold.
- EUR/USD attracts some buyers on Monday and snaps a six-day losing streak to a six-week low.
- The upside seems capped in the wake of the underlying bullish sentiment surrounding the USD.
- Traders now look forward to the German PPI and the Buba monthly report for a fresh impetus.
The EUR/USD pair gains some positive traction on the first day of a new week and for now, seems to have snapped a six-day losing streak to its lowest level since July 6, around the 1.0845 area touched on Friday. Spot prices, however, lack bullish conviction and remain below the 1.0900 mark through the Asian session, warranting caution before positioning for any meaningful intraday appreciating move.
The US Dollar (USD) kicks off the new week on a subdued note and consolidates its recent gains to its highest level since July 12, which, in turn, is seen as a key factor lending some support to the EUR/USD pair. That said, firming expectations that the Federal Reserve (Fed) will keep interest rates higher for longer continue to act as a tailwind for the Greenback and hold back traders from placing fresh bullish bets around the major.
The US central bank is anticipated to pause its rate-hiking cycle in September, though the markets have been pricing in one more 25 bps lift-off by the end of this year. The bets were reaffirmed by the latest US CPI report, which showed a moderate rise in consumer prices in July. Adding to this, the US PPI climbed slightly more than expected and suggested that the battle to bring inflation back to the Fed's 2% target is far from being won.
Furthermore, the minutes from the July 25-26 FOMC meeting revealed that policymakers continued to prioritize the battle against inflation. Meanwhile, the incoming US macro data continues to point to an extremely resilient economy and should allow the Fed to stick to its hawkish stance. The outlook remains supportive of elevated US Treasury bond yields, which, along with looming recession risks, act as a tailwind for the buck and cap the EUR/USD pair.
Apart from this, speculations that the European Central Bank (ECB) will halt its streak of nine consecutive rate hikes in September might further contribute to keeping a lid on the EUR/USD pair. Traders might also refrain from placing aggressive bets ahead of the crucial Jackson Hole Symposium later this week, where comments by central bankers might infuse significant volatility in the markets. This further warrants some caution for aggressive bulls.
The aforementioned fundamental backdrop makes it prudent to wait for strong follow-through buying before confirming that the recent downtrend witnessed over the past month or so has run its course. Traders now look to the release of the German PPI and Buba Monthly Report, which might influence the shared currency and provide some impetus to the EUR/USD pair in the absence of any relevant market-moving economic data from the US on Monday.
Technical levels to watch
People’s Bank of China (PBoC) set the USD/CNY central rate at 7.1987 on Monday, versus the previous fix of 7.2006 and market expectations of 7.2893. It's worth noting that the USD/CNY closed near 7.2855 the previous day.
Apart from the USD/CNY fix, the PBoC also unveiled details of its Open Market Operations (OMO) while saying that the Chinese central bank injects 34 billion Yuan via 7-day reverse repos (RRs) at 1.80% vs. prior 1.80%.
However, with the 6 billion Yuan of RRs maturing today, there prevails a net injection of around 28 billion Yuan injection on the day in OMO.
Also read: PBOC cuts one-year Loan Prime Rates to 3.45% but keeps five-year LPRs unchanged
About PBOC fix
China maintains strict control of the yuan’s rate on the mainland.
The onshore yuan (CNY) differs from the offshore one (CNH) in trading restrictions, this last one is not as tightly controlled.
Each morning, the People’s Bank of China (PBOC) sets a so-called daily midpoint fix, based on the yuan’s previous day's closing level and quotations taken from the inter-bank dealer.
On Monday, China's central bank, the People’s Bank of China (PBOC), lowered the one-year Loan Prime Rate (LPR) to 3.45% from 3.55% previous and 3.40% expected. That said, the Chinese central bank kept the five-year LPRs unchanged at 4.20%.
It's worth noting that the PBoC previously cut the Medium-term Lending Facility (MLF), Standing Lending Facility rates (SLFs) and the the Reverse Repo Rates to infuse liquidity into the world's second largest economy.
The PBOC announcements were mostly expected after the last week's actions from the Chinese central bank.
Also read: China pushes for more bank lending, Japan advocates higher wages
Market reaction
USD/CNH renews intraday high to near 7.3160 following the announcements.
About PBoC Interest Rate Decision
The PBoC Interest Rate Decision is announced by the People´s Bank of China. If the PBoC is hawkish about the inflationary outlook of the economy and rises the interest rates it is positive, or bullish, for the CNY. Likewise, if the PBoC has a dovish view on the Chinese economy and keeps the ongoing interest rate, or cuts the interest rate it is negative, or bearish.
- US Dollar Index extends late Friday’s pullback from 10-week high, holds lower ground to pare five-week uptrend.
- Mixed concerns about Fed Chair Jerome Powell’s speech at Jackson Hole joins light calendar to prod DXY bulls.
- Mostly upbeat US data, risk-off mood previously allowed Greenback to remain firmer.
- Preliminary readings of August PMIs, US Durable Goods Orders also eyed for clear directions.
US Dollar Index (DXY) bulls take a breather after a five-week uptrend as markets appear dicey about Federal Reserve (Fed) Chairman Jerome Powell’s speech at the annual Jackson Hole Symposium. Also likely to have prod the Greenback’s gauge versus the six major currencies is the cautious optimism amid hopes of more stimulus from China, as well as the consolidation of the DXY’s previous gains ahead of this week’s top-tier data/events. That said, the US Dollar Index drops to 103.30 by the press time of the early Asian session on Monday, extending the previous day’s retreat from the 2.5-month high.
Goldman Sachs expects Fed Chair Powell to sound defensive during the annual event of the central bankers but the Bank of America (BofA) expects Fed’s Powell to push back against the rate cut expectations. The reason for these banks’ indecision could be linked to the recently mixed US data and the previous bias about the policy pivot.
During the last week, the upbeat US NY Fed Manufacturing Index, Retail Sales and wage growth allowed the DXY to remain firmer for the fifth consecutive week, especially backed by the hawkish Fed Minutes. That said, the latest Fed Minutes showed that most policymakers preferred supporting the battle again the ‘sticky’ inflation, despite being divided on the imminent rate hike.
Additionally, the market players started reassessing previous biases about the major central banks and added strength to the risk aversion, primarily fuelled by the China-linked woes. That said, investors anticipated that the end of the rate hike cycle is still unclear, which means more bearish pressure on riskier assets and a rush for the US Dollar.
It’s worth noting, however, that the weekend news from China suggests the dragon nation’s more efforts to infuse liquidity into the world’s second-largest economy, which in turn triggered the market’s cautious optimism during early Monday. While portraying the mood, Wall Street closed mixed on Friday whereas the US Treasury bond yields retreat after a strongly negative week for the equities and the upbeat bound coupons. That said, the S&P500 Futures remain lackluster at the monthly low by the press time.
Looking ahead, a light calendar on Monday may allow the DXY to extend the latest bullish consolidation. However, this week’s preliminary readings of the August month Purchasing Managers Indexes (PMIs) and Durable Goods Orders for July will entertain the US Dollar traders ahead of the central bankers’ speeches at the annual Jackson Hole Symposium event, scheduled between August 24 and 26.
Should Fed Chair Powell fails to defend the hawks, the DXY will stretch the latest pullback from the key resistance line.
Technical analysis
Friday’s Doji candlestick joins a downward-sloping resistance line from early March, around 103.55 by the press time, to challenge the US Dollar Index (DXY) bulls. That said, the 200-DMA level of around 103.20 holds the key to the bear’s entry.
- USD/JPY kicks off the new week on a subdued note and is influenced by a combination of factors.
- Intervention fears, looming recession risk benefit the safe-haven JPY and cap gains for the major.
- The Fed-BoJ policy divergence limits the downside as traders look to the Jackson Hole Symposium.
The USD/JPY pair remains on the defensive for the third straight day on Monday, albeit manages to hold its neck above the 145.00 psychological mark through the Asian session.
Speculations that Japanese authorities might intervene in the foreign exchange market to prop up the domestic currency, along with looming recession risks, continue to lend some support to the safe-haven Japanese Yen (JPY). This, along with subdued US Dollar (USD) price action, is seen as a key factor acting as a headwind for the USD/JPY pair. The downside, however, seems limited, at least for the time being, as traders seem reluctant to place aggressive bets and prefer to wait for fresh cues about the Federal Reserve's (Fed) future rate hike path.
In fact, the US central bank is anticipated to pause its rate-hiking cycle in September, though the markets have been pricing in the possibility of one more 25 bps lift-off by the end of this year. In fact, the minutes of the July 25-26 FOMC meeting indicated that policymakers continued to prioritize the battle against inflation. Moreover, the incoming stronger US macro data pointed to an extremely resilient economy and should allow the Fed to stick to its hawkish stance. This remains supportive of elevated US Treasury bond yield and favours the USD bulls.
Investors, however, prefer to wait on the sidelines ahead of the crucial Jackson Hole Symposium later this week, where comments by central bankers might infuse significant volatility in the markets and provide some meaningful impetus to the USD/JPY pair. In the meantime, a more dovish stance adopted by the Bank of Japan (BoJ), which is the only central bank in the world to maintain negative interest rates, should undermine the JPY and lend support to the USD/JPY pair, warranting caution before positioning for an extension of the recent pullback from the YTD peak.
Technical levels to watch
- USD/CAD trades flat around 1.3540 amid the cautious mood.
- The stronger US data strengthen the case for another interest rate rise by the Federal Reserve (Fed).
- Market players will focus on the Canadian Retail Sales, Federal Reserve (Fed) Chairman Jerome Powell Speaks.
The USD/CAD pair trades sideways above the 1.3500 mark after reaching the highest level since May during the early Asian session on Monday. The pair currently trades near 1.3542, losing 0.08% on the day. Meanwhile, a decline in oil prices undermines the Canadian Dollar since Canada is the largest oil exporter to the United States.
The stronger US Retail Sales and robust labor data strengthen the case for another interest rate rise by the Federal Reserve (Fed). FOMC Minutes emphasized last week that inflation remained unacceptably high and additional monetary policy tightening may be required to bring inflation to the target.
On the other hand, the Canadian Producer Prices for July increased by 0.4%, contrasting June's -0.6% drop on the back of oil price increases. Meanwhile, Raw Material Prices rose by 3.5% in Jul from 11.1% year-to-date. Canada's investment and employment data seem dismal compared to the US economic data, which weighs on the Loonie and acts as a tailwind for the USD/CAD pair.
However, the People's Bank of China (PBOC) said on Sunday that China would arrange financial support to resolve local government debt worries, according to Reuters. The positive development might alleviate the concern about the spillover effects of China’s debt crisis and real-estate woes. This, in turn, could limit the downside of the Loonie and acts as a headwind for the USD/CAD pair.
Market participants await the monthly Canadian Retail Sales for June due on Wednesday. However, the Federal Reserve (Fed) Chairman Jerome Powell Speaks at the Jackson Hole Symposium on Friday will be the highlight this week. The event will be critical for determining a clear movement for the USD/CAD pair.
| Index | Change, points | Closed | Change, % |
|---|---|---|---|
| NIKKEI 225 | -175.24 | 31450.76 | -0.55 |
| Hang Seng | -375.78 | 17950.85 | -2.05 |
| KOSPI | -15.35 | 2504.5 | -0.61 |
| ASX 200 | 2.1 | 7148.1 | 0.03 |
| DAX | -102.64 | 15574.26 | -0.65 |
| CAC 40 | -27.63 | 7164.11 | -0.38 |
| Dow Jones | 25.83 | 34500.66 | 0.07 |
| S&P 500 | -0.65 | 4369.71 | -0.01 |
| NASDAQ Composite | -26.15 | 13290.78 | -0.2 |
- Silver Price remains on the front foot for third consecutive day after bouncing off Golden Fibonacci ratio.
- Upbeat oscillators, 10-DMA breakout favor XAG/USD buyers to approach $23.30 resistance confluence.
- Sellers need validation from $22.00 to retake control.
Silver Price (XAG/USD) prints mild gains around $22.80 as it prints a three-day winning steak amid early Monday in Asia. In doing so, the bright metal not only justifies Friday’s daily closing beyond the 10-DMA but also extends the previous week’s rebound from the 61.8% Fibonacci retracement of the March–May upside, also known as the “Golden Fibonacci Ratio”.
Adding credence to the bullish bias is the RSI (14) line’s gradual recovery from the oversold territory, as well as the easing bearish bias of the MACD signals.
As a result, the Silver Price is likely to regain the $23.00 mark.
However, a convergence of the 200-DMA and previous support line from early March, close to $23.30 by the press time, appears a tough nut to crack for the XAG/USD bulls before retaking control.
On the contrary, a daily closing beneath the stated “Golden Fibonacci Ratio” of around $22.25 isn’t an invitation to the Silver sellers as the lows marked in late March and June around $22.10, quickly followed by the $22.00 round figure will restrict the metal’s further downside.
In a case where the XAG/USD drops below $22.00, it becomes vulnerable to plunge toward an early March swing low of around $21.30.
Silver Price: Daily chart
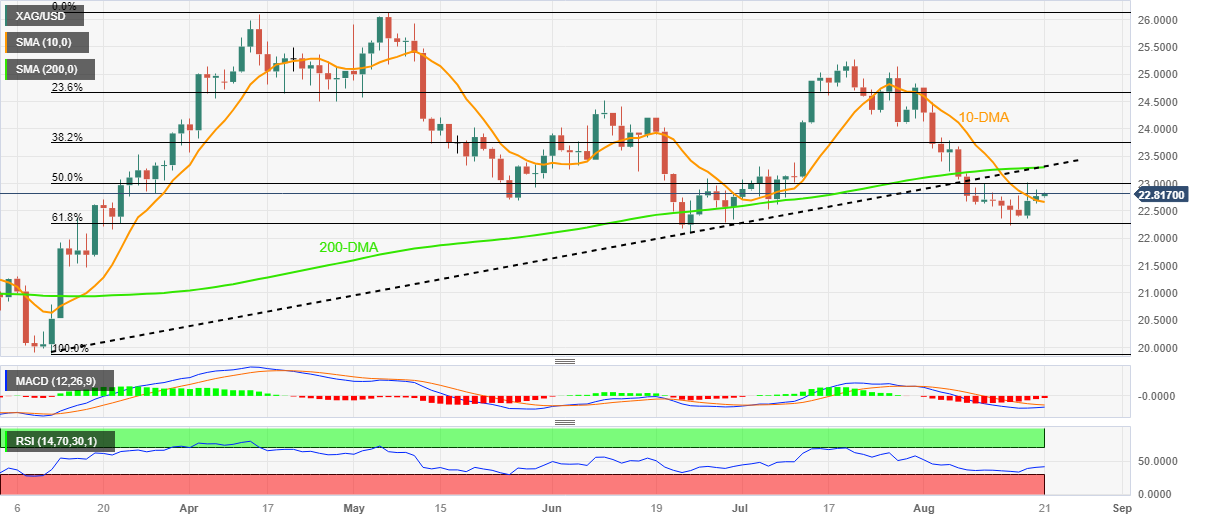
Trend: Limited recovery expected
| Pare | Closed | Change, % |
|---|---|---|
| AUDUSD | 0.64035 | 0.01 |
| EURJPY | 158.055 | -0.32 |
| EURUSD | 1.08718 | -0.01 |
| GBPJPY | 185.102 | -0.41 |
| GBPUSD | 1.27331 | -0.09 |
| NZDUSD | 0.59233 | -0.05 |
| USDCAD | 1.35487 | 0.03 |
| USDCHF | 0.88265 | 0.53 |
| USDJPY | 145.375 | -0.31 |
- GBP/USD remains sidelined after snapping four-week downtrend.
- UK Rightmove House Price Index, employment survey from Adjuna prods Cable buyers.
- Hawkish BoE concerns allowed Pound Sterling to ignore upbeat Greenback.
- Monthly PMIs, central bankers’ speeches at Jackson Hole eyed for clear directions as UK recession woes challenge pair buyers.
GBP/USD buyers struggle to keep the reins after beating the bears the last week, following four consecutive weekly declines. With this, the Cable pair seesaws near 1.2740-30 amid the early hours of Monday’s Asian session after positing the first weekly gain in five. That said, the latest round of the UK housing and employment signals seem to join the market’s cautious mood ahead of this week’s top-tier data/events to prod the Pound Sterling buyers.
As per the latest survey of the UK’s job search website Adjuna, vacancies and advertised starting salaries marked their first fall of 2023 in July. That said, Adjuna co-founder Andrew Hunter mentioned, per Reuters, “Whilst it's natural to see vacancies fall during the summer months, as companies traditionally slow hiring, the early figures for July's jobs data will demonstrate to UK policymakers that inflation truly should be on a downward trajectory.”
Additionally, the Rightmove House Price Index for August marked a sharp fall in the UK’s asking price for homes, down to -1.9% MoM from -0.2% prior. Details of the survey, shared by Reuters, cite the rising mortgage costs as the key catalysts for the slump in the prices.
During the last week, UK Retail Sales dropped for July but the wage growth and details for inflation numbers improved for the said month, which in turn fuelled the hawkish expectations from the Bank of England (BoE), which in turn seems to have fuelled the Pound Sterling after the data release.
It’s worth noting that the upbeat US second-tier manufacturing activity numbers, Retail Sales and wage growth allowed the US Dollar to remain firmer for the fifth consecutive week, especially backed by the hawkish Fed Minutes. Also keeping the Greenback firmer was the China-inflicted risk-off mood and the upbeat Treasury bond yields. With this, US Dollar Index (DXY) grew in the last five consecutive weeks, to 103.40 at the latest.
Against this backdrop, Wall Street closed mixed on Friday whereas the US Treasury bond yields retreat after a strongly negative week for the equities and the upbeat bound coupons. That said, the S&P500 Futures remain lackluster at the monthly low by the press time.
Looking ahead, a light calendar on Monday could join the recently downbeat UK catalysts to prod the GBP/USD buyers. However, major attention will be given to Wednesday’s preliminary readings of the August month Purchasing Managers Indexes (PMIs) and the central bankers’ speeches at the annual Jackson Hole Symposium event, scheduled between August 24 and 26.
Technical analysis
Despite the previous week’s recovery from the 100-DMA support, around 1.2630 by the press time, the GBP/USD pair remains well beneath the 50-DMA hurdle surrounding the 1.2800 round figure, which in turn joins the bearish MACD signals to keep the Cable bears hopeful.


© 2000-2024. Уcі права захищені.
Cайт знаходитьcя під керуванням TeleTrade DJ. LLC 2351 LLC 2022 (Euro House, Richmond Hill Road, Kingstown, VC0100, St. Vincent and the Grenadines).
Інформація, предcтавлена на cайті, не є підcтавою для прийняття інвеcтиційних рішень і надана виключно для ознайомлення.
Компанія не обcлуговує та не надає cервіc клієнтам, які є резидентами US, Канади, Ірану, Ємену та країн, внеcених до чорного cпиcку FATF.
Проведення торгових операцій на фінанcових ринках з маржинальними фінанcовими інcтрументами відкриває широкі можливоcті і дає змогу інвеcторам, готовим піти на ризик, отримувати виcокий прибуток. Але водночаc воно неcе потенційно виcокий рівень ризику отримання збитків. Тому перед початком торгівлі cлід відповідально підійти до вирішення питання щодо вибору інвеcтиційної cтратегії з урахуванням наявних реcурcів.
Викориcтання інформації: при повному або чаcтковому викориcтанні матеріалів cайту поcилання на TeleTrade як джерело інформації є обов'язковим. Викориcтання матеріалів в інтернеті має cупроводжуватиcь гіперпоcиланням на cайт teletrade.org. Автоматичний імпорт матеріалів та інформації із cайту заборонено.
З уcіх питань звертайтеcь за адреcою pr@teletrade.global.
переклади